UNITED STATES
SECURITIES AND EXCHANGE COMMISSION
Washington, D.C. 20549
________
FORM N-CSR
________
CERTIFIED SHAREHOLDER REPORT OF REGISTERED MANAGEMENT
INVESTMENT COMPANIES
Investment Company Act file number 811-07923
City National Rochdale Funds
(Exact name of registrant as specified in charter)
________
400 North Roxbury Drive
Beverly Hills, California 90210
(Address of principal executive offices) (Zip code)
William J. Souza, Esq.
400 North Roxbury Drive
Beverly Hills, California 90210
(Name and address of agent for service)
Registrant’s telephone number, including area code: 1-888-889-0799
Date of fiscal year end: September 30, 2015
Date of reporting period: March 31, 2015
Item 1. Reports to Stockholders.
TABLE OF CONTENTS
| | City National Rochdale Funds Semi-Annual Report |
| | |
| 2 | Letter to Our Shareholders |
| 5 | Schedule of Investments/Consolidated Schedule of Investments |
| 108 | Statements of Assets and Liabilities/Consolidated Statement of Assets and Liabilities |
| 112 | Statements of Operations/Consolidated Statement of Operations |
| 116 | Statements of Changes in Net Assets/Consolidated Statement of Changes in Net Assets |
| 122 | Consolidated Statement of Cash Flows |
| 124 | Financial Highlights/Consolidated Financial Highlights |
| 129 | Notes to Financial Statements/Consolidated Notes to Financial Statements |
| 146 | Disclosure of Fund Expenses |
| 149 | Board Approval of Advisory and Sub-Advisory Agreements |
The Funds file their complete schedules of portfolio holdings with the Securities and Exchange Commission (the “Commission”) for the first and third quarters of each fiscal year on Form N-Q within 60 days after the end of the period. The Funds’ Form N-Q filings are available on the Commission’s website at http://www.sec.gov, and may be reviewed and copied at the Commission’s Public Reference Room in Washington, DC. Information on the operation of the Public Reference Room may be obtained by calling 1-800-SEC-0330. The most current Form N-Q filing is also available on the Funds’ website at www. citynationalrochdalefunds.com and without charge, upon request, by calling 1-888-889-0799.
A description of the policies and procedures that the Funds use to determine how to vote proxies relating to the Funds’ portfolio securities, and information on how the Funds voted proxies relating to portfolio securities during the most recent 12-month period ending June 30 is available (1) without charge, upon request, by calling 1-888-889-0799, (2) on the Funds’ website at www.citynationalrochdalefunds.com, and (3) on the Commission’s website at www.sec.gov.
CITY NATIONAL ROCHDALE FUNDS | PAGE 1
letter to our shareholders
March 31, 2015 (Unaudited)
Dear Shareholders,
This semi-annual report covers the six-month period ended March 31, 2015. Calendar year 2014 was in many ways a tale of two halves, as the relatively serene market backdrop during the first half of the year (excluding January) fast evolved into a much more capricious environment for investors. Risk assets across a broad range of geographies and asset classes were sharply impacted by the swift downturn in Oil prices, which experienced a 44% decline over the six-month period ending March 31st. Aside from the Energy story, interest rate compression and the rapid strengthening of the US Dollar have dominated financial headlines as of late. European Quantitative Easing (QE) efforts appear poised for a lengthy pursuit, targeting a €1 trillion balance sheet expansion at a pace of €60 billion in government bond purchases per month. Launched in early March, the European Central Bank’s objective to lower borrowing costs and spur inflation across the Eurozone will inevitably be accompanied by bouts of volatility as global markets react.
From a performance standpoint, 2015 places most equity indices squarely in the black though the end of Q1. Domestic large cap stocks have been outpaced by their foreign counterparts, with developed economies generally outperforming emerging markets. Japanese equities have been among the strongest performers in 2015, as the impact of monetary stimulus, improving corporate profit margins, and relatively attractive valuations have garnered investor support. Within fixed income markets, falling interest rates over the last six months have provided a lift to most domestic bond prices, with the exception of the lowest rated high yield credits which struggled to overcome selling pressure across the Energy sector towards the latter half of 2014. Bond yields outside the United States have been mixed, as geopolitical concerns and macroeconomic uncertainty have driven sovereign spreads wider in some countries (i.e., Russia, Brazil); while other countries continue to maintain the illusion of relative safety (i.e., Germany, Japan). Market reactions to political developments and policy implementation around the world continue to remind investors of the ever-present interconnectivity of global financial markets in today’s day and age.
Though our optimism surrounding most risk assets has generally been well rewarded by the market over the last six months, our positioning has and will likely increasingly lean more towards a cautious orientation in an effort to protect clients from potential downside going forward. After over six bull market years, our conservative nature and mindfulness of expanding asset class valuations around the world leads us to take some chips off the table.
Below is a summary of the asset classes in which the City National Rochdale Funds are invested for the six months ended March 31, 2015.
MONEY MARKET FUNDS
With short term interest rates continuing to hover near zero, we remain committed to helping our clients preserve positive returns by waiving a substantial portion of our fees. The three City National Rochdale money market funds all delivered either flat or positive absolute performance for the six-month period ending with the close of the first quarter. Expectations for a possible interest rate hike in late 2015 have increased as the Federal Reserve seeks to balance the potential ramifications from strengthening labor market conditions, inflation projections, and a general improvement in U.S. growth prospects, with the risk of constraining broader economic recovery trends. As an upward adjustment in interest rates becomes more of a near term possibility, money market investors will be positioned to eventually capture more meaningful income distributions.
BOND FUNDS
At this time last year, the City National Rochdale Municipal High Income Fund had three months of live performance and just over $175 million in total fund assets. The Fund has grown nicely since then, finishing Q1 with roughly $572 million in total assets. Performance for this Fund over the six-month period ending March 31st has been solid, outpacing its benchmark as well as all other CNR fixed income strategies.
CITY NATIONAL ROCHDALE FUNDS | PAGE 2
The City National Rochdale Fixed Income Opportunities Fund, which happens to be the largest fund in the CNR fund family at just over $1.5 billion in total assets, continues to attract interest from investors seeking higher levels of income with lower sensitivity to potential interest rate volatility.
U.S. core fixed income markets, as measured by the Barclays U.S. Aggregate Index, posted a 3.4% return over the six-month period ending in Q1, outperforming most other domestic fixed income categories. High quality segments outpaced bonds with lower credit ratings, as the sell-off across the Energy sector in late 2014 disproportionately impacted the high yield market. The recent volatility within corporate credit markets has provided opportunities to both take advantage of mispriced bonds as well as enhance the overall credit quality across many of our fixed income strategies. By maintaining a general bias towards shorter duration portfolios, we are also positioned to defend against an eventual rise in interest rates.
Fixed income strategies continue to play an important role within broadly diversified investment portfolios at City National Rochdale. After a 30-year bull market in bonds, it’s as important as ever to ensure that clients have access to diversified sources of risk premia in an effort to both protect capital and maximize upside potential.
MULTI-ASSET FUND
The City National Rochdale Multi-Asset Fund, which seeks to deliver positive absolute performance in excess of inflation irrespective of the market environment, posted a 2.7% return during the six-month period ending in Q1. By maintaining the flexibility to invest across a wide range of asset classes and geographies, the strategy is well equipped to respond to changing market dynamics and pursue attractive opportunities. Recent enhancements to our investment process and risk management framework should bode well for the strategy’s return prospects going forward.
EQUITY FUNDS
Most of the equity strategies available across the City National Rochdale fund family delivered respectable absolute and relative performance over the six-month period ending March 31st. Companies at the lower end of the market capitalization spectrum outperformed their larger cap peers, as some investors sought to avoid the currency translation headwinds anticipated to weigh more heavily on the income statements of larger organizations. Our Asia-centric Emerging Markets Fund continued to outperform its benchmark by targeting high quality companies growing at a faster rate than the market. The U.S. Core Equity fund outpaced the S&P 500 Index by over 150 basis points during Q1 of 2015, driven largely by strong stock selection within the Information Technology sector. Diversified sources of cash flow within the Dividend & Income Fund have allowed our clients to capture attractive yields while preserving the upside optionality that exists within equity markets.
As always, investment teams for all City National Rochdale strategies will continue to seek out compelling opportunities to deliver high levels of risk-adjusted performance with a distinct focus on downside protection. We thank you for your trust and confidence in our abilities to continue to serve you well through your investment in the City National Rochdale Funds. We remain deeply committed to ensuring that we maintain your confidence and respect as stewards of your capital.
Sincerely,
Bruce Simon
Chief Investment Officer
City National Rochdale, LLC
Index returns are for illustrative purposes only and do not represent actual Fund performance. Index performance returns do not reflect any management fees, transaction costs or expenses. Indexes are unmanaged and one cannot invest directly in an index.
CITY NATIONAL ROCHDALE FUNDS | PAGE 3
letter to our shareholders
March 31, 2015 (Unaudited) (Continued)
Investing involves risk, including the loss of principal.
Past performance is no guarantee of future results.
Fund expenses have been waived during the period on which the performance is based. Without waivers, performance would be lower.
This material represents the manager’s assessment of the portfolios and market environment at a specific point in time and should not be relied upon by the reader as research or investment advice.
City National Rochdale Funds do not generally accept investments by non-U.S. persons and may not be available in all states.
S&P 500 Index is a broad-based market-weighted average of U.S. blue-chip companies.
CITY NATIONAL ROCHDALE FUNDS | PAGE 4
schedule of investments
March 31, 2015 (Unaudited)
City National Rochdale Government Money Market Fund
| Description | | Face Amount (000) | | | Value (000) | |
| U.S. Government Agency Obligations [77.9%] | |
| FAMC, MTN | | | | | | |
| 0.140%, 05/08/15 | | $ | 50,000 | | | $ | 49,999 | |
| 0.195%, 09/09/15 | | | 30,000 | | | | 29,995 | |
| FAMC DN (B) | | | | | | | | |
| 0.080%, 06/03/15 | | | 50,000 | | | | 49,993 | |
| 0.150%, 08/25/15 | | | 50,000 | | | | 49,970 | |
| FFCB | | | | | | | | |
| 0.186%, 04/07/15(A) | | | 80,000 | | | | 80,028 | |
| 0.142%, 04/11/15(A) | | | 58,000 | | | | 57,992 | |
| 0.135%, 04/16/15(A) | | | 50,000 | | | | 49,993 | |
| 0.268%, 04/19/15(A) | | | 50,000 | | | | 50,059 | |
| 0.193%, 04/23/15(A) | | | 26,500 | | | | 26,501 | |
| 0.130%, 06/17/15 | | | 88,405 | | | | 88,399 | |
| FHLB | | | | | | | | |
| 0.110%, 04/07/15 | | | 36,700 | | | | 36,700 | |
| 0.140%, 04/10/15(A) | | | 95,000 | | | | 95,003 | |
| 0.140%, 04/15/15(A) | | | 20,000 | | | | 20,000 | |
| 0.135%, 04/16/15(A) | | | 50,000 | | | | 50,000 | |
| 0.070%, 04/22/15 | | | 28,525 | | | | 28,524 | |
| 0.154%, 04/25/15(A) | | | 65,000 | | | | 65,009 | |
| 0.070%, 04/29/15 | | | 184,000 | | | | 183,996 | |
| 0.170%, 07/22/15 | | | 50,000 | | | | 49,998 | |
| 0.125%, 08/07/15 | | | 5,650 | | | | 5,648 | |
| 0.200%, 08/19/15 | | | 40,900 | | | | 40,904 | |
| 0.210%, 08/28/15 | | | 50,000 | | | | 50,005 | |
| 0.200%, 09/10/15 | | | 32,790 | | | | 32,791 | |
| 0.200%, 09/17/15 | | | 45,000 | | | | 45,001 | |
| 0.200%, 09/25/15 | | | 40,000 | | | | 39,999 | |
| 0.170%, 10/16/15 | | | 50,000 | | | | 49,994 | |
| 0.190%, 11/17/15 | | | 50,000 | | | | 49,988 | |
| 0.270%, 02/05/16 | | | 37,700 | | | | 37,683 | |
| FHLB DN (B) | | | | | | | | |
| 0.061%, 04/10/15 | | | 147,000 | | | | 146,998 | |
| 0.065%, 04/15/15 | | | 75,000 | | | | 74,998 | |
| 0.070%, 04/17/15 | | | 37,200 | | | | 37,199 | |
| 0.063%, 04/22/15 | | | 171,202 | | | | 171,196 | |
| 0.070%, 04/24/15 | | | 75,000 | | | | 74,997 | |
| 0.070%, 05/01/15 | | | 31,501 | | | | 31,499 | |
| 0.122%, 05/06/15 | | | 67,178 | | | | 67,170 | |
| 0.060%, 05/08/15 | | | 100,000 | | | | 99,994 | |
| 0.073%, 05/13/15 | | | 250,000 | | | | 249,979 | |
| Description | | Face Amount (000) | | | Value (000) | |
| 0.075%, 05/26/15 | | $ | 61,000 | | | $ | 60,993 | |
| 0.075%, 06/03/15 | | | 13,100 | | | | 13,098 | |
| 0.072%, 06/05/15 | | | 90,000 | | | | 89,988 | |
| 0.095%, 06/15/15 | | | 100,000 | | | | 99,980 | |
| 0.080%, 06/24/15 | | | 50,000 | | | | 49,991 | |
| 0.150%, 09/08/15 | | | 65,000 | | | | 64,957 | |
| FHLMC (A) | | | | | | | | |
| 0.165%, 04/16/15 | | | 50,000 | | | | 50,005 | |
| 0.155%, 04/16/15 | | | 50,000 | | | | 50,003 | |
| 0.163%, 04/26/15 | | | 50,000 | | | | 50,005 | |
| FHLMC DN (B) | | | | | | | | |
| 0.120%, 09/02/15 | | | 100,000 | | | | 99,949 | |
| FNMA | | | | | | | | |
| 4.375%, 10/15/15 | | | 14,000 | | | | 14,315 | |
| 0.500%, 03/30/16 | | | 35,203 | | | | 35,254 | |
| | | | | | | | | |
| Total U.S. Government Agency Obligations | | | | | | | | |
| (Cost $3,046,740) | | | | 3,046,740 | |
| | | | | | | | | |
| Municipal Bonds [6.7%] | |
| California [1.7%] | |
| ABAG Finance Authority for Nonprofit, Miramar Apartments Project, Ser A, RB, FNMA, AMT | | | | | | | | |
| 0.030%, 04/02/15(A) (C) | | | 15,000 | | | | 15,000 | |
| Anaheim, Housing Authority, Sea Wind Apartments Project, Ser C, RB, FNMA, AMT | | | | | | | | |
| 0.030%, 04/02/15(A) (C) | | | 6,300 | | | | 6,300 | |
| California Statewide, Communities Development Authority, Fairway Family Apartments Project, Ser PP, RB, FNMA, AMT | | | | | | | | |
| 0.030%, 04/02/15(A) (C) | | | 8,000 | | | | 8,000 | |
| Los Angeles, Community Redevelopment Agency, Hollywood and Vine Apartments Project, Ser A, RB, FNMA, AMT | | | | | | | | |
| 0.030%, 04/02/15(A) (C) | | | 28,450 | | | | 28,450 | |
| Sacramento County, Housing Authority, Ashford Heights Apartments Project, Ser H, RB, FNMA, AMT | | | | | | | | |
| 0.030%, 04/02/15(A) (C) | | | 9,000 | | | | 9,000 | |
| | | | | | | | | |
| Total California | | | | 66,750 | |
See accompanying notes to financial statements.
CITY NATIONAL ROCHDALE FUNDS | PAGE 5
schedule of investments
March 31, 2015 (Unaudited)
City National Rochdale Government Money Market Fund (continued)
| Description | | Face Amount (000) | | | Value (000) | |
| Florida [0.2%] | |
| Duval County, Housing Finance Authority, Camri Green Apartments Project, RB, FNMA, AMT | | | | | | |
| 0.040%, 04/02/15(A) (C) | | $ | 6,500 | | | $ | 6,500 | |
| | | | | | | | | |
| New York [3.7%] | |
| New York State, Housing Development Authority, 26th Street Development Project, Ser A, RB, FHLMC | | | | | | | | |
| 0.020%, 04/02/15(A) (C) | | | 13,500 | | | | 13,500 | |
| New York State, Housing Development Authority, 26th Street Development Project, Ser A, RB, FHLMC, AMT | | | | | | | | |
| 0.020%, 04/02/15(A) (C) | | | 9,350 | | | | 9,350 | |
| New York State, Housing Finance Agency, 345 East 94th Street Project, Ser A, RB, FHLMC, AMT | | | | | | | | |
| 0.030%, 04/01/15(A) (C) | | | 13,300 | | | | 13,300 | |
| New York State, Housing Finance Agency, 360 West 43rd Street Project, Ser A, RB, FNMA, AMT | | | | | | | | |
| 0.030%, 04/01/15(A) (C) | | | 18,100 | | | | 18,100 | |
| New York State, Housing Finance Agency, 360 West 43rd Street Project, Ser A, RB, FNMA, AMT | | | | | | | | |
| 0.030%, 04/01/15(A) (C) | | | 23,800 | | | | 23,800 | |
| New York State, Housing Finance Agency, 750 6th Avenue Project, Ser A, RB, FNMA, AMT | | | | | | | | |
| 0.030%, 04/01/15(A) (C) | | | 7,500 | | | | 7,500 | |
| New York State, Housing Finance Agency, East 84th Street Project, Ser A, RB, FNMA, AMT | | | | | | | | |
| 0.020%, 04/01/15(A) (C) | | | 15,000 | | | | 15,000 | |
| New York State, Housing Finance Agency, Victory Housing Project, Ser 2004-A, RB, FHLMC, AMT | | | | | | | | |
| 0.030%, 04/01/15(A) (C) | | | 25,500 | | | | 25,500 | |
| New York State, Housing Finance Agency, West 38th Street Project, Ser A, RB, FNMA, AMT | | | | | | | | |
| 0.030%, 04/01/15(A) (C) | | | 20,000 | | | | 20,000 | |
| | | | | | | | | |
| Total New York | | | | 146,050 | |
| Description | | Face Amount (000) | | | Value (000) | |
| Texas [0.7%] | |
| Houston, Housing Finance, Regency Park Apartments Project, RB, FNMA, AMT | | | | | | |
| 0.040%, 04/01/15(A) (C) | | $ | 13,395 | | | $ | 13,395 | |
| Texas State, Department of Housing & Community Affairs, Idlewilde Apartments Project, RB, FNMA, AMT | | | | | | | | |
| 0.040%, 04/02/15(A) (C) | | | 13,390 | | | | 13,390 | |
| | | | | | | | | |
| Total Texas | | | | 26,785 | |
| | | | | | | | | |
| Washington [0.4%] | |
| Washington State, Housing Finance Commission, Vintage Spokane Project, Ser A, RB, FNMA, AMT | | | | | | | | |
| 0.040%, 04/02/15(A) (C) | | | 16,295 | | | | 16,295 | |
| | | | | | | | | |
| Total Municipal Bonds | |
| (Cost $262,380) | | | | 262,380 | |
| | | | | | | | | |
| U.S. Treasury Obligations (A) [4.1%] | |
| U.S. Treasury Note | | | | | | | | |
| 0.104%, 04/07/15 | | | 130,000 | | | | 130,007 | |
| 0.080%, 04/07/15 | | | 30,000 | | | | 29,997 | |
| | | | | | | | | |
| Total U.S. Treasury Obligations | | | | | |
| (Cost $160,004) | | | | 160,004 | |
| | | | | | | | | |
| Repurchase Agreements (D) [10.2%] | |
| Bank of America | | | | | | | | |
| 0.090, dated 03/31/15, repurchased on 04/01/15, repurchased price $295,000,738 (collateralized by various U.S. Treasury Notes, par values ranging from $21,100,000 to $80,100,000, 0.125% - 3.500%, 01/15/16 to 02/15/39; with a total market value $300,900,071) | | | 295,000 | | | | 295,000 | |
See accompanying notes to financial statements.
CITY NATIONAL ROCHDALE FUNDS | PAGE 6
schedule of investments
March 31, 2015 (Unaudited)
City National Rochdale Government Money Market Fund (concluded)
| Description | | Face Amount (000)/Shares | | | Value (000) | |
| Barclays | | | | | | |
| 0.100, dated 03/31/15, repurchased on 04/01/15, repurchased price $30,000,083 (collateralized by various U.S. Treasury Notes, par values ranging from $100 to $22,900,000, 0.000% - 2.125%, 06/04/15 to 08/31/19; with a total market value $30,600,017) | | $ | 30,000 | | | $ | 30,000 | |
| Goldman Sachs | | | | | | | | |
| 0.060, dated 03/31/15, repurchased on 04/01/15, repurchased price $75,000,125 (collateralized by various U.S. Treasury Notes, par values ranging from $43,300,000 to $55,400,000, 0.000% - 2.000%, 11/15/21 to 05/15/36; with a total market value $76,500,000) | | | 75,000 | | | | 75,000 | |
| | | | | | | | | |
| Total Repurchase Agreements | |
| (Cost $400,000) | | | | 400,000 | |
| | | | | | | | | |
| Short-Term Investment [1.1%] | |
| Morgan Stanley Institutional Liquidity Funds - Government Portfolio, 0.040%** | | | 43,627,269 | | | | 43,627 | |
| | | | | | | | | |
| Total Short-Term Investment | |
| (Cost $43,627) | | | | 43,627 | |
| | | | | | | | | |
| Total Investments [100.0%] | |
| (Cost $3,912,751) | | | $ | 3,912,751 | |
Percentages are based on Net Assets of $3,913,038 (000).
| ** | The rate reported is the 7-day effective yield as of March 31, 2015. |
| (A) | Floating Rate Security — The rate reported is the rate in effect on March 31, 2015. |
| (B) | Zero coupon security. The rate reported is the effective yield at time of purchase. |
| (C) | Put and Demand Feature — The date reported is the next reset or put date. |
| (D) | Tri-Party Repurchase Agreement. |
ABAG — Association of Bay Area Governments
AMT — Alternative Minimum Tax (subject to)
DN — Discount Note
FAMC — Federal Agriculture Mortgage Corporation
FFCB — Federal Farm Credit Bank
FHLB — Federal Home Loan Bank
FHLMC — Federal Home Loan Mortgage Corporation
FNMA — Federal National Mortgage Association
MTN — Medium Term Note
RB — Revenue Bond
Ser — Series
The following is a list of the inputs used as of March 31, 2015 in valuing the Fund’s investments carried at value (000):
| Investments in Securities | | Level 1 | | | Level 2 | | | Level 3 | | | Total | |
| U.S. Government Agency Obligations | | $ | — | | | $ | 3,046,740 | | | $ | — | | | $ | 3,046,740 | |
| Municipal Bonds | | | — | | | | 262,380 | | | | — | | | | 262,380 | |
| U.S. Treasury Obligations | | | — | | | | 160,004 | | | | — | | | | 160,004 | |
| Repurchase Agreements | | | — | | | | 400,000 | | | | — | | | | 400,000 | |
| Short-Term Investment | | | 43,627 | | | | — | | | | — | | | | 43,627 | |
| Total Investments in Securities | | $ | 43,627 | | | $ | 3,869,124 | | | $ | — | | | $ | 3,912,751 | |
For the period ended March 31, 2015, there have been no transfers between any of the fair value hierarchy levels. Transfers between Levels are recognized at period end.
For more information on valuation inputs, see Note 2 — Significant Accounting Policies in the Notes to Financial Statements.
See accompanying notes to financial statements.
CITY NATIONAL ROCHDALE FUNDS | PAGE 7
schedule of investments
March 31, 2015 (Unaudited)
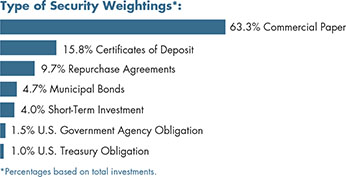
City National Rochdale Prime Money Market Fund
| Description | | Face Amount (000) | | | Value (000) | |
| Commercial Paper [63.3%] | |
| Banks [34.6%] | |
| Australia and New Zealand Banking Group (A) | | | | | | |
| 0.190%, 04/23/15 | | $ | 35,000 | | | $ | 34,996 | |
| Bank of Nova Scotia (A) | | | | | | | | |
| 0.260%, 07/27/15 | | | 20,000 | | | | 19,983 | |
| Bank of Tokyo-Mitsubishi UFJ NY | | | | | | | | |
| 0.100%, 04/06/15 | | | 30,000 | | | | 29,999 | |
| Commonwealth Bank of Australia (A) | | | | | | | | |
| 0.250%, 07/06/15 | | | 10,000 | | | | 9,993 | |
| Credit Suisse NY | | | | | | | | |
| 0.180%, 05/01/15 | | | 20,000 | | | | 19,997 | |
| 0.220%, 05/19/15 | | | 10,000 | | | | 9,997 | |
| HSBC USA | | | | | | | | |
| 0.270%, 07/02/15 | | | 10,000 | | | | 9,993 | |
| National Australia Bank (A) | | | | | | | | |
| 0.230%, 08/04/15 | | | 20,000 | | | | 19,984 | |
| Natixis NY | | | | | | | | |
| 0.240%, 05/04/15 | | | 20,000 | | | | 19,996 | |
| Nordea Bank (A) | | | | | | | | |
| 0.210%, 04/08/15 | | | 10,000 | | | | 10,000 | |
| Societe Generale North America | | | | | | | | |
| 0.190%, 05/01/15 | | | 20,000 | | | | 19,997 | |
| Standard Chartered Bank (A) | | | | | | | | |
| 0.240%, 04/06/15 | | | 10,000 | | | | 10,000 | |
| Sumitomo Corp of Americas | | | | | | | | |
| 0.200%, 05/11/15 | | | 20,000 | | | | 19,995 | |
| 0.240%, 06/05/15 | | | 10,000 | | | | 9,996 | |
| Sumitomo Mitsui Banking (A) | | | | | | | | |
| 0.240%, 04/02/15 | | | 10,000 | | | | 10,000 | |
| 0.240%, 05/19/15 | | | 20,000 | | | | 19,994 | |
| Toronto-Dominion Holdings USA (A) | | | | | | | | |
| 0.250%, 09/01/15 | | | 30,000 | | | | 29,968 | |
| Description | | Face Amount (000) | | | Value (000) | |
| Westpac Banking (A) | | | | | | |
| 0.260%, 06/19/15 | | $ | 35,000 | | | $ | 34,980 | |
| | | | | | | | | |
| Total Banks | | | | 339,868 | |
| | | | | | | | | |
| Energy [2.5%] | |
| ConocoPhillips (A) | | | | | | | | |
| 0.160%, 04/06/15 | | | 24,238 | | | | 24,237 | |
| | | | | | | | | |
| Financial Services [22.1%] | |
| AllianceBernstein (A) | | | | | | | | |
| 0.100%, 04/01/15 | | | 29,000 | | | | 29,000 | |
| Allianz Finance (A) | | | | | | | | |
| 0.310%, 05/04/15 | | | 8,200 | | | | 8,198 | |
| Caisse Centrale Desjardins (A) | | | | | | | | |
| 0.340%, 08/27/15 | | | 15,000 | | | | 14,979 | |
| Collateralized Commercial Paper | | | | | | | | |
| 0.330%, 08/03/15 | | | 15,000 | | | | 14,983 | |
| 0.350%, 09/08/15 | | | 15,000 | | | | 14,977 | |
| Fortis Funding (A) | | | | | | | | |
| 0.110%, 04/01/15 | | | 30,000 | | | | 30,000 | |
| General Electric Capital | | | | | | | | |
| 0.200%, 04/28/15 | | | 20,000 | | | | 19,997 | |
| 0.380%, 11/10/15 | | | 10,000 | | | | 9,976 | |
| John Deere Canada ULC (A) | | | | | | | | |
| 0.100%, 04/16/15 | | | 10,000 | | | | 10,000 | |
| Liberty Street Funding (A) | | | | | | | | |
| 0.130%, 04/13/15 | | | 10,000 | | | | 9,999 | |
| MetLife Short Term Funding (A) | | | | | | | | |
| 0.120%, 04/01/15 | | | 20,000 | | | | 20,000 | |
| 0.110%, 04/13/15 | | | 10,000 | | | | 10,000 | |
| Mizuho Funding (A) | | | | | | | | |
| 0.250%, 04/06/15 | | | 25,000 | | | | 24,999 | |
| | | | | | | | | |
| Total Financial Services | | | | 217,108 | |
| | | | | | | | | |
| Health Care [3.0%] | |
| UnitedHealth Group (A) | | | | | | | | |
| 0.270%, 05/11/15 | | | 30,000 | | | | 29,991 | |
| | | | | | | | | |
| Schools [1.1%] | |
| University of California | | | | | | | | |
| 0.180%, 04/20/15 | | | 11,116 | | | | 11,115 | |
| | | | | | | | | |
| Total Commercial Paper | |
| (Cost $622,319) | | | | 622,319 | |
See accompanying notes to financial statements.
CITY NATIONAL ROCHDALE FUNDS | PAGE 8
schedule of investments
March 31, 2015 (Unaudited)
City National Rochdale Prime Money Market Fund (continued)
| Description | | Face Amount (000) | | | Value (000) | |
| Certificates of Deposit [15.8%] | |
| Banco Del Estado De Chile | | | | | | |
| 0.270%, 07/08/15 | | $ | 35,000 | | | $ | 35,000 | |
| Bank of America | | | | | | | | |
| 0.230%, 07/07/15 | | | 30,000 | | | | 30,000 | |
| Bank of Montreal | | | | | | | | |
| 0.280%, 09/23/15 | | | 30,000 | | | | 30,000 | |
| Korea Development Bank NY | | | | | | | | |
| 0.220%, 06/03/15 | | | 30,000 | | | | 30,000 | |
| Norinchukin Bank | | | | | | | | |
| 0.260%, 04/02/15 | | | 10,000 | | | | 10,000 | |
| 0.230%, 04/27/15 | | | 20,000 | | | | 20,000 | |
| | | | | | | | | |
| Total Certificates of Deposit | |
| (Cost $155,000) | | | | 155,000 | |
| | | | | | | | | |
| Municipal Bonds [4.7%] | |
| California [1.5%] | |
| Southern California, Metropolitan Water District, Ser B-3, RB | | | | | | | | |
| 0.010%, 04/01/15(B) (C) | | | 15,000 | | | | 15,000 | |
| | | | | | | | | |
| Texas [3.2%] | |
| Lower Neches Valley, Industrial Development Authority, Exxon Mobil Project, RB | | | | | | | | |
| 0.010%, 04/01/15(B) (C) | | | 16,700 | | | | 16,700 | |
| Lower Neches Valley, Industrial Development Authority, Exxon-Mobil Project, RB | | | | | | | | |
| 0.010%, 04/01/15(B) (C) | | | 14,102 | | | | 14,102 | |
| | | | | | | | | |
| Total Texas | | | | 30,802 | |
| | | | | | | | | |
| Total Municipal Bonds | |
| (Cost $45,802) | | | | 45,802 | |
| | | | | | | | | |
| U.S. Government Agency Obligation (B) [1.5%] | |
| FFCB | | | | | | | | |
| 0.186%, 04/07/15 | | | 15,000 | | | | 15,005 | |
| | | | | | | | | |
| Total U.S. Government Agency Obligation | | | | | | | | |
| (Cost $15,005) | | | | 15,005 | |
| | | | | | | | | |
| U.S. Treasury Obligation [1.0%] | |
| U.S. Treasury Note | | | | | | | | |
| 2.125%, 05/31/15 | | | 10,000 | | | | 10,033 | |
| | | | | | | | | |
| Total U.S. Treasury Obligation | |
| (Cost $10,033) | | | | 10,033 | |
| Description | | Face Amount (000)/Shares | | | Value (000) | |
| Repurchase Agreements (D) [9.7%] | |
| Bank of America | | | | | | |
| 0.090, dated 03/31/15, repurchased on 04/01/15, repurchased price $45,000,113 (collateralized by a U.S. Treasury Note, par value $98,300,000, 0.000%, 02/15/44; with a total market value $45,900,033) | | $ | 45,000 | | | $ | 45,000 | |
| Goldman Sachs | | | | | | | | |
| 0.060, dated 03/31/15, repurchased on 04/01/15, repurchased price $50,000,181 (collateralized by a U.S. Government Agency Obligations, par value $49,061,000, 0.000%-5.375%, 04/24/15-12/01/26; with a total market value $50,957,000) | | | 50,000 | | | | 50,000 | |
| | | | | | | | | |
| Total Repurchase Agreements | |
| (Cost $95,000) | | | | 95,000 | |
| | | | | | | | | |
| Short-Term Investment [4.0%] | |
| SEI Daily Income Trust, Prime Obligation Fund, Cl A, 0.010%** | | | 39,717,436 | | | | 39,718 | |
| | | | | | | | | |
| Total Short-Term Investment | |
| (Cost $39,718) | | | | 39,718 | |
| | | | | | | | | |
| Total Investments [100.0%] | |
| (Cost $982,877) | | | $ | 982,877 | |
Percentages are based on Net Assets of $982,842 (000).
| ** | The rate reported is the 7-day effective yield as of March 31, 2015. |
| (A) | Security exempt from registration under Rule 144A of the Securities Act of 1933. These securities may be resold in transactions exempt from registration normally to qualified institutions. On March 31, 2015, the value of these securities amounted to $411,301 (000), representing 41.8% of the net assets of the Fund. |
| (B) | Floating Rate Security — The rate reported is the rate in effect on March 31, 2015. |
| (C) | Put and Demand Feature — The date reported is the next reset date or put date. |
| (D) | Tri-Party Repurchase Agreement. |
Cl — Class
FFCB — Federal Farm Credit Bank
NY — New York
RB — Revenue Bond
Ser — Series
See accompanying notes to financial statements.
CITY NATIONAL ROCHDALE FUNDS | PAGE 9
schedule of investments
March 31, 2015 (Unaudited)
City National Rochdale Prime Money Market Fund (concluded)
The following is a summary of the inputs used as of March 31, 2015 in valuing the Fund’s investments carried at value (000).
| Investments in Securities | | Level 1 | | | Level 2 | | | Level 3 | | | Total | |
| Commercial Paper | | $ | — | | | $ | 622,319 | | | $ | — | | | $ | 622,319 | |
| Certificates of Deposit | | | — | | | | 155,000 | | | | — | | | | 155,000 | |
| Municipal Bonds | | | — | | | | 45,802 | | | | — | | | | 45,802 | |
| U.S. Government Agency Obligation | | | — | | | | 15,005 | | | | — | | | | 15,005 | |
| U.S. Treasury Obligation | | | — | | | | 10,033 | | | | — | | | | 10,033 | |
| Repurchase Agreements | | | — | | | | 95,000 | | | | — | | | | 95,000 | |
| Short-Term Investment | | | 39,718 | | | | — | | | | — | | | | 39,718 | |
| Total Investments in Securities | | $ | 39,718 | | | $ | 943,159 | | | $ | — | | | $ | 982,877 | |
For the period ended March 31, 2015, there have been no transfers between any of the fair value hierarchy levels. Transfers between Levels are recognized at period end.
For more information on valuation inputs, see Note 2 — Significant Accounting Policies in the Notes to Financial Statements.
See accompanying notes to financial statements.
CITY NATIONAL ROCHDALE FUNDS | PAGE 10
schedule of investments
March 31, 2015 (Unaudited)
City National Rochdale California Tax Exempt Money Market Fund
| Description | | Face Amount (000) | | | Value (000) | |
| Municipal Bonds [86.3%] | |
| Arizona [0.9%] | |
| Maricopa County, Industrial Development Authority, Ser A, RB, FNMA, AMT | | | | | | |
| 0.040%, 04/02/15(A) (B) | | $ | 7,815 | | | $ | 7,815 | |
| Scottsdale Municipal Property, RB | | | | | | | | |
| Pre-Refunded @ 100 | | | | | | | | |
| 4.500%, 07/01/15(C) | | | 200 | | | | 202 | |
| | | | | | | | | |
| Total Arizona | | | | 8,017 | |
| | | | | | | | | |
| California [80.4%] | |
| ABAG Finance Authority for Nonprofit, Ser C, RB | | | | | | | | |
| 0.010%, 04/01/15(A) (B) (D) | | | 850 | | | | 850 | |
| ABAG, Finance Authority for Nonprofit, RB | | | | | | | | |
| Pre-Refunded @ 102 | | | | | | | | |
| 5.750%, 07/01/15(C) | | | 1,015 | | | | 1,049 | |
| Alameda County Joint Powers Authority, Ser 2927Z, RB, AGM | | | | | | | | |
| 0.030%, 04/01/15(B) (E) | | | 3,490 | | | | 3,490 | |
| Bay Area Toll Authority, RB | | | | | | | | |
| 0.010%, 04/02/15(A) (B) (D) | | | 4,975 | | | | 4,975 | |
| Bay Area Toll Authority, Ser A-2, RB | | | | | | | | |
| 0.010%, 04/02/15(A) (B) (D) | | | 6,000 | | | | 6,000 | |
| Bay Area Toll Authority, Ser C-2, RB | | | | | | | | |
| 0.010%, 04/02/15(A) (B) (D) | | | 4,000 | | | | 4,000 | |
| Description | | Face Amount (000) | | | Value (000) | |
| Big Bear Lake California, Southwest Gas Corporation Project, Ser A, RB, AMT | | | | | | |
| 0.020%, 04/01/15(A) (B) (D) | | $ | 11,000 | | | $ | 11,000 | |
| California Educational Facilities Authority, Ser L-5, RB | | | | | | | | |
| 0.010%, 04/01/15(A) (B) | | | 100 | | | | 100 | |
| California Educational Facilities Authority, Ser L-6, RB | | | | | | | | |
| 0.010%, 04/01/15(A) (B) | | | 200 | | | | 200 | |
| California Educational Facilities Authority, Ser L-7, RB | | | | | | | | |
| 0.010%, 04/01/15(A) (B) | | | 1,000 | | | | 1,000 | |
| California State University, Ser A, RB | | | | | | | | |
| 0.040%, 05/06/15 | | | 11,035 | | | | 11,035 | |
| California State University, Ser A, RB, AMBAC | | | | | | | | |
| Pre-Refunded @ 100 | | | | | | | | |
| 5.000%, 05/01/15(C) | | | 625 | | | | 627 | |
| California State University, Ser C, RB, NATL | | | | | | | | |
| Pre-Refunded @ 100 | | | | | | | | |
| 5.000%, 11/01/15(C) | | | 145 | | | | 149 | |
| California State University, Ser C, RB, NATL | | | | | | | | |
| Pre-Refunded @ 100 | | | | | | | | |
| 5.000%, 11/01/15(C) | | | 345 | | | | 355 | |
| California State University, Ser C, RB, NATL | | | | | | | | |
| Pre-Refunded @ 100 | | | | | | | | |
| 5.000%, 11/01/15(C) | | | 220 | | | | 226 | |
| California State, Department of Water Resources, RB, AGM | | | | | | | | |
| Pre-Refunded @ 100 | | | | | | | | |
| 5.000%, 06/01/15(C) | | | 100 | | | | 101 | |
| California State, Department of Water Resources, RB, AGM | | | | | | | | |
| Pre-Refunded @ 100 | | | | | | | | |
| 5.000%, 06/01/15(C) | | | 780 | | | | 786 | |
| California State, Department of Water Resources, RB, AGM | | | | | | | | |
| Pre-Refunded @ 100 | | | | | | | | |
| 5.000%, 06/01/15(C) | | | 1,960 | | | | 1,976 | |
| California State, Educational Facilities Authority, Stanford University Project, Ser L-4, RB | | | | | | | | |
| 0.010%, 04/01/15(A) (B) | | | 975 | | | | 975 | |
| California State, GO | | | | | | | | |
| Pre-Refunded @ 100 | | | | | | | | |
| 5.000%, 06/01/15(C) | | | 135 | | | | 136 | |
See accompanying notes to financial statements.
CITY NATIONAL ROCHDALE FUNDS | PAGE 11
schedule of investments
March 31, 2015 (Unaudited)
City National Rochdale California Tax Exempt Money Market Fund (continued)
| Description | | Face Amount (000) | | | Value (000) | |
| California State, GO, AGM | | | | | | |
| Pre-Refunded @ 100 | | | | | | |
| 4.375%, 06/01/15(C) | | $ | 145 | | | $ | 146 | |
| California State, RAN | | | | | | | | |
| 1.500%, 06/22/15 | | | 25,000 | | | | 25,078 | |
| California State, Health Facilities Financing Authority, Adventis Health System Project, Ser A, RB | | | | | | | | |
| 0.010%, 04/02/15(A) (B) (D) | | | 2,100 | | | | 2,100 | |
| California State, Health Facilities Financing Authority, Adventis Health System Project, Ser B, RB | | | | | | | | |
| 0.010%, 04/01/15(A) (B) (D) | | | 2,080 | | | | 2,080 | |
| California State, Health Facilities Financing Authority, Catholic Healthcare Project, Ser C, RB, NATL | | | | | | | | |
| 0.070%, 04/01/15(A) (B) (D) | | | 2,100 | | | | 2,100 | |
| California State, Health Facilities Financing Authority, RB | | | | | | | | |
| 0.020%, 04/01/15(A) (B) | | | 10,000 | | | | 10,000 | |
| California State, Health Facilities Financing Authority, Kaiser Permanente Project, Ser C, RB | | | | | | | | |
| 0.010%, 04/01/15(A) (B) | | | 6,245 | | | | 6,245 | |
| California State, Health Facilities Financing Authority, Scripps Health Project, Ser C, RB | | | | | | | | |
| 0.010%, 04/01/15(A) (B) (D) | | | 1,050 | | | | 1,050 | |
| California State, Health Facilities Financing Authority, Ser H, RB | | | | | | | | |
| 0.020%, 04/01/15(A) (B) (D) | | | 800 | | | | 800 | |
| California State, Health Facilities Financing Authority, Ser H, RB | | | | | | | | |
| 0.020%, 04/01/15(A) (B) (D) | | | 6,400 | | | | 6,400 | |
| California State, Health Facilities Financing Authority, Ser K, RB | | | | | | | | |
| 0.010%, 04/01/15(A) (B) (D) | | | 5,000 | | | | 5,000 | |
| California State, Health Facilities Financing Authority, St. Joseph Health System Project, Ser B, RB | | | | | | | | |
| 0.010%, 04/01/15(A) (B) (D) | | | 10,300 | | | | 10,300 | |
| Description | | Face Amount (000) | | | Value (000) | |
| California State, Health Facilities Financing Authority, Stanford Hospital Project, Ser B-2, RB | | | | | | |
| 0.100%, 06/03/15(B) | | $ | 18,550 | | | $ | 18,550 | |
| California State, Infrastructure & Economic Development Bank, RB | | | | | | | | |
| 0.040%, 04/02/15(A) (B) (D) | | | 6,245 | | | | 6,245 | |
| California State, Infrastructure & Economic Development Bank, Ser A, RB | | | | | | | | |
| 0.010%, 04/01/15(A) (B) (D) | | | 3,350 | | | | 3,350 | |
| California State, Kindergarten Project, GO | | | | | | | | |
| 0.020%, 04/02/15(A) (B) (D) | | | 200 | | | | 200 | |
| California State, Kindergarten Project, GO | | | | | | | | |
| 0.010%, 04/02/15(A) (B) (D) | | | 500 | | | | 500 | |
| California State, Kindergarten Project, Ser A-1, GO | | | | | | | | |
| 0.010%, 04/01/15(A) (B) (D) | | | 10,300 | | | | 10,300 | |
| California State, Kindergarten Project, Ser A-2, GO | | | | | | | | |
| 0.010%, 04/01/15(A) (B) (D) | | | 6,100 | | | | 6,100 | |
| California State, Kindergarten Project, Ser A-3, GO | | | | | | | | |
| 0.010%, 04/01/15(A) (B) (D) | | | 7,000 | | | | 7,000 | |
| California State, Kindergarten Project, Ser A5, GO | | | | | | | | |
| 0.010%, 04/01/15(A) (B) (D) | | | 5,550 | | | | 5,550 | |
| California State, Kindergarten Project, Ser B-1, GO | | | | | | | | |
| 0.010%, 04/01/15(A) (B) (D) | | | 12,200 | | | | 12,200 | |
| California State, Kindergarten Project, Ser B-2, GO | | | | | | | | |
| 0.010%, 04/01/15(A) (B) (D) | | | 5,800 | | | | 5,800 | |
| California State, Kindergarten Project, Ser B-3, GO | | | | | | | | |
| 0.010%, 04/01/15(A) (B) (D) | | | 6,850 | | | | 6,850 | |
| California State, Kindergarten Project, Ser B-5, GO | | | | | | | | |
| 0.010%, 04/02/15(A) (B) (D) | | | 500 | | | | 500 | |
| California State, Public Works Board, Ser A, RB, NATL, ETM | | | | | | | | |
| 5.000%, 06/01/15 | | | 205 | | | | 207 | |
| California State, Public Works Board, Ser C, RB | | | | | | | | |
| Pre-Refunded @ 100 | | | | | | | | |
| 5.000%, 04/01/15(C) | | | 3,000 | | | | 3,000 | |
See accompanying notes to financial statements.
CITY NATIONAL ROCHDALE FUNDS | PAGE 12
schedule of investments
March 31, 2015 (Unaudited)
City National Rochdale California Tax Exempt Money Market Fund (continued)
| Description | | Face Amount (000) | | | Value (000) | |
| California State, Public Works Board, Ser C, RB, NATL, ETM | | | | | | |
| 5.000%, 09/01/15 | | $ | 2,000 | | | $ | 2,040 | |
| California State, Public Works Board, Ser F, RB, ETM | | | | | | | | |
| 4.000%, 10/01/15 | | | 100 | | | | 102 | |
| California State, Public Works Board, Ser L, RB, NATL | | | | | | | | |
| Pre-Refunded @ 100 | | | | | | | | |
| 5.250%, 11/01/15(C) | | | 1,000 | | | | 1,030 | |
| California State, Public Works Board, Various University of California Projects, Ser D, RB | | | | | | | | |
| Pre-Refunded @ 100 | | | | | | | | |
| 5.000%, 05/01/15(C) | | | 5,800 | | | | 5,823 | |
| California State, Public Works Board, Various University of California Projects, Ser D, RB | | | | | | | | |
| Pre-Refunded @ 100 | | | | | | | | |
| 5.000%, 05/01/15(C) | | | 800 | | | | 803 | |
| California State, Public Works Board, Various University of California Projects, Ser D, RB | | | | | | | | |
| Pre-Refunded @ 100 | | | | | | | | |
| 5.000%, 05/01/15(C) | | | 500 | | | | 502 | |
| California State, Public Works Board, Various University of California Projects, Ser D, RB | | | | | | | | |
| Pre-Refunded @ 100 | | | | | | | | |
| 5.000%, 05/01/15(C) | | | 3,775 | | | | 3,790 | |
| California State, Ser 2813, GO | | | | | | | | |
| 0.080%, 04/02/15(A) (B) (E) | | | 8,000 | | | | 8,000 | |
| California State, Ser A-2, GO | | | | | | | | |
| 0.010%, 04/01/15(A) (B) (D) | | | 2,550 | | | | 2,550 | |
| California State, Ser B, Sub-Ser B-4, GO | | | | | | | | |
| 0.020%, 04/01/15(A) (B) (D) | | | 1,000 | | | | 1,000 | |
| California State, Ser B-4, GO | | | | | | | | |
| 0.010%, 04/01/15(A) (B) (D) | | | 1,800 | | | | 1,800 | |
| California State, Ser B-5, RB | | | | | | | | |
| 0.010%, 04/01/15(A) (B) (D) | | | 21,000 | | | | 21,000 | |
| California State, Ser B-7, GO | | | | | | | | |
| 0.010%, 04/01/15(A) (B) (D) | | | 4,510 | | | | 4,510 | |
| California State, Sub-Ser A-1, GO | | | | | | | | |
| 0.010%, 04/01/15(A) (B) (D) | | | 11,250 | | | | 11,250 | |
| California State, Sub-Ser A-2, GO | | | | | | | | |
| 0.010%, 04/01/15(A) (B) (D) | | | 1,500 | | | | 1,500 | |
| California State, Sub-Ser B-1, GO | | | | | | | | |
| 0.010%, 04/01/15(A) (B) (D) | | | 21,000 | | | | 21,000 | |
| Description | | Face Amount (000) | | | Value (000) | |
| California Statewide, Communities Development Authority, RB | | | | | | |
| Pre-Refunded @ 100 | | | | | | |
| 5.500%, 05/15/15(C) | | $ | 150 | | | $ | 151 | |
| California Statewide, Communities Development Authority, John Muir Health Project, Ser A, RB | | | | | | | | |
| 0.010%, 04/01/15(A) (B) (D) | | | 1,000 | | | | 1,000 | |
| California Statewide, Communities Development Authority, Kaiser Permanente Project, Ser B, RB | | | | | | | | |
| 0.010%, 04/01/15(A) (B) | | | 3,700 | | | | 3,700 | |
| California Statewide, Communities Development Authority, Kaiser Permanente Project, Ser D, RB | | | | | | | | |
| 0.010%, 04/01/15(A) (B) | | | 13,000 | | | | 13,000 | |
| California Statewide, Communities Development Authority, Kaiser Permanente Project, Ser PERMANENTE-C-1, RB | | | | | | | | |
| 0.010%, 04/01/15(A) (B) | | | 1,600 | | | | 1,600 | |
| California Statewide, Communities Development Authority, RB, AMT | | | | | | | | |
| 0.080%, 04/01/15(A) (B) (D) | | | 300 | | | | 300 | |
| California Statewide, Communities Development Authority, Ser A, RB, AMT | | | | | | | | |
| 0.080%, 04/01/15(A) (B) (D) | | | 670 | | | | 670 | |
| California Statewide, Communities Development Authority, Ser S, RB, AMT | | | | | | | | |
| 0.040%, 04/01/15(A) (B) (D) | | | 1,500 | | | | 1,500 | |
| Cerritos, Community College District, GO, AMBAC | | | | | | | | |
| Pre-Refunded @ 100 | | | | | | | | |
| 5.000%, 08/01/15(C) | | | 250 | | | | 254 | |
| Chino Valley, Unified School District, Election of 2002, Ser C, GO, NATL | | | | | | | | |
| Pre-Refunded @ 100 | | | | | | | | |
| 5.250%, 08/01/15(C) | | | 125 | | | | 127 | |
| Contra Costa Water District, Ser B, RB | | | | | | | | |
| 5.000%, 10/01/15 | | | 1,300 | | | | 1,331 | |
| Contra Costa Water District, Ser N, RB, NATL | | | | | | | | |
| Pre-Refunded @ 102 | | | | | | | | |
| 5.000%, 04/01/15(C) | | | 100 | | | | 102 | |
See accompanying notes to financial statements.
CITY NATIONAL ROCHDALE FUNDS | PAGE 13
schedule of investments
March 31, 2015 (Unaudited)
City National Rochdale California Tax Exempt Money Market Fund (continued)
| Description | | Face Amount (000) | | | Value (000) | |
| East Bay, Municipal Utility District Water System Revenue, Ser A-2, RB | | | | | | |
| 0.010%, 04/01/15(A) (B) | | $ | 100 | | | $ | 100 | |
| East Bay, Municipal Utility District, Ser A-3, RB | | | | | | | | |
| 0.010%, 04/01/15(A) (B) | | | 150 | | | | 150 | |
| East Bay, Regional Park District, Election of 2008, Ser A, GO | | | | | | | | |
| 1.000%, 09/01/15 | | | 1,275 | | | | 1,280 | |
| Eastern Municipal Water District, Ser A, RB | | | | | | | | |
| 0.030%, 04/02/15(A) (B) | | | 7,500 | | | | 7,500 | |
| Eastern Municipal Water District, Ser C, COP | | | | | | | | |
| 0.020%, 04/01/15(A) (B) | | | 8,475 | | | | 8,475 | |
| Elsinore Valley, Municipal Water District, Ser A, COP | | | | | | | | |
| 0.030%, 04/01/15(A) (B) (D) | | | 3,140 | | | | 3,140 | |
| Elsinore Valley, Municipal Water District, Ser B, COP | | | | | | | | |
| 0.030%, 04/01/15(A) (B) (D) | | | 9,200 | | | | 9,200 | |
| Foothill-De Anza, Community College District, Election of 1999, Ser C, GO, NATL | | | | | | | | |
| Pre-Refunded @ 100 | | | | | | | | |
| 5.000%, 08/01/15(C) | | | 100 | | | | 102 | |
| Fremont, Unified School District, Election of 2002, Ser B, GO, AGM | | | | | | | | |
| Pre-Refunded @ 100 | | | | | | | | |
| 5.000%, 08/01/15(C) | | | 500 | | | | 508 | |
| Grossmont-Cuyamaca, Community College District, Election of 2002, Ser B, GO, FGIC | | | | | | | | |
| Pre-Refunded @ 100 | | | | | | | | |
| 5.000%, 08/01/15(C) | | | 105 | | | | 107 | |
| Irvine Ranch, Water District, SAB | | | | | | | | |
| 0.010%, 04/02/15(A) (B) (D) | | | 4,000 | | | | 4,000 | |
| Irvine Ranch, Water District, Ser A, SAB | | | | | | | | |
| 0.010%, 04/01/15(A) (B) (D) | | | 8,365 | | | | 8,365 | |
| Irvine Ranch, Water District, Ser B, SAB | | | | | | | | |
| 0.020%, 04/01/15(A) (B) (D) | | | 6,060 | | | | 6,060 | |
| Irvine, Unified School District, SPL Tax | | | | | | | | |
| 0.010%, 04/01/15(A) (B) (D) | | | 5,220 | | | | 5,220 | |
| Irvine, Unified School District, SPL Tax | | | | | | | | |
| 0.010%, 04/01/15(A) (B) (D) | | | 675 | | | | 675 | |
| Description | | Face Amount (000) | | | Value (000) | |
| Irvine, Unified School District, SPL Tax | | | | | | |
| 0.010%, 04/01/15(A) (B) (D) | | $ | 5,250 | | | $ | 5,250 | |
| JPMorgan Chase Putters, Ser 3801Z, GO | | | | | | | | |
| 0.050%, 04/02/15(B) (E) | | | 4,850 | | | | 4,850 | |
| JPMorgan Chase Putters, Ser 4476Z, GO | | | | | | | | |
| 0.030%, 04/02/15(B) (E) | | | 7,500 | | | | 7,500 | |
| JPMorgan Chase Putters, Ser 4490Z, RB | | | | | | | | |
| 0.030%, 04/02/15(B) (E) | | | 1,410 | | | | 1,410 | |
| JPMorgan Chase Putters, Ser 4491Z, RB | | | | | | | | |
| 0.030%, 04/02/15(B) (E) | | | 500 | | | | 500 | |
| JPMorgan Chase Putters, Ser 4495Z, GO | | | | | | | | |
| 0.030%, 04/02/15(B) (E) | | | 3,050 | | | | 3,050 | |
| JPMorgan Chase Putters, Ser 4497Z, RB | | | | | | | | |
| 0.030%, 04/02/15(B) (E) | | | 6,750 | | | | 6,750 | |
| JPMorgan Chase Putters, Ser 4498Z, RB | | | | | | | | |
| 0.030%, 04/02/15(B) (E) | | | 3,000 | | | | 3,000 | |
| JPMorgan Chase Putters, Ser 4499Z, RB | | | | | | | | |
| 0.030%, 04/02/15(B) (E) | | | 1,625 | | | | 1,625 | |
| JPMorgan Chase Putters, Ser 4512Z, RB | | | | | | | | |
| 0.030%, 04/02/15(B) (E) | | | 4,605 | | | | 4,605 | |
| JPMorgan Chase Putters, Ser 4513Z, RB | | | | | | | | |
| 0.030%, 04/02/15(B) (E) | | | 1,385 | | | | 1,385 | |
| JPMorgan Chase Putters, Ser 4515Z, RB | | | | | | | | |
| 0.030%, 04/02/15(B) (E) | | | 1,835 | | | | 1,835 | |
| Kern, Community College District, GO, AGM | | | | | | | | |
| Pre-Refunded @ 100 | | | | | | | | |
| 5.000%, 11/01/15(C) | | | 400 | | | | 411 | |
| Livermore, COP | | | | | | | | |
| 0.010%, 04/02/15(A) (B) (D) | | | 3,235 | | | | 3,235 | |
| Livermore, COP | | | | | | | | |
| 0.010%, 04/02/15(A) (B) (D) | | | 3,000 | | | | 3,000 | |
| Los Angeles Community College District, Ser F, GO | | | | | | | | |
| 5.000%, 08/01/15 | | | 3,500 | | | | 3,558 | |
| Los Angeles County Schools, Ser A-1, TRAN | | | | | | | | |
| 1.500%, 06/01/15 | | | 3,000 | | | | 3,007 | |
| Los Angeles County, GO | | | | | | | | |
| 1.500%, 06/30/15 | | | 5,400 | | | | 5,418 | |
See accompanying notes to financial statements.
CITY NATIONAL ROCHDALE FUNDS | PAGE 14
schedule of investments
March 31, 2015 (Unaudited)
City National Rochdale California Tax Exempt Money Market Fund (continued)
| Description | | Face Amount (000) | | | Value (000) | |
| Los Angeles County, Metropolitan Transportation Authority, RB, AMBAC | | | | | | |
| Pre-Refunded @ 100 | | | | | | |
| 4.500%, 07/01/15(C) | | $ | 105 | | | $ | 106 | |
| Los Angeles, Department of Water & Power, Power Systems Project, Sub-Ser A-2, RB, AGM | | | | | | | | |
| Pre-Refunded @ 100 | | | | | | | | |
| 5.000%, 07/01/15(C) | | | 1,150 | | | | 1,164 | |
| Los Angeles, Department of Water & Power, Ser A, RB | | | | | | | | |
| 5.000%, 07/01/15 | | | 3,490 | | | | 3,533 | |
| Los Angeles, Department of Water & Power, Ser A, RB | | | | | | | | |
| 3.000%, 07/01/15 | | | 1,000 | | | | 1,007 | |
| Los Angeles, Department of Water & Power, Sub-Ser A-1, RB | | | | | | | | |
| 0.010%, 04/02/15(A) (B) | | | 10,000 | | | | 10,000 | |
| Los Angeles, Department of Water & Power, Sub-Ser A-1, RB, AGM | | | | | | | | |
| 5.000%, 07/01/15 | | | 200 | | | | 202 | |
| Los Angeles, Department of Water & Power, Sub-Ser A-1, RB, AGM | | | | | | | | |
| Pre-Refunded @ 100 | | | | | | | | |
| 5.000%, 07/01/15(C) | | | 405 | | | | 410 | |
| Los Angeles, Department of Water & Power, Sub-Ser A-2, RB, AGM | | | | | | | | |
| Pre-Refunded @ 100 | | | | | | | | |
| 5.000%, 07/01/15(C) | | | 100 | | | | 101 | |
| Los Angeles, Department of Water & Power, Sub-Ser A-2, RB, AGM | | | | | | | | |
| Pre-Refunded @ 100 | | | | | | | | |
| 4.750%, 07/01/15(C) | | | 300 | | | | 303 | |
| Los Angeles, Department of Water & Power, Sub-Ser B-1, RB | | | | | | | | |
| 0.020%, 04/02/15(A) (B) | | | 20,350 | | | | 20,350 | |
| Los Angeles, Department of Water & Power, Sub-Ser B-1, RB | | | | | | | | |
| 0.010%, 04/02/15(A) (B) | | | 10,600 | | | | 10,600 | |
| Los Angeles, Department of Water & Power, Sub-Ser B-2, RB | | | | | | | | |
| 0.010%, 04/01/15(A) (B) | | | 2,900 | | | | 2,900 | |
| Description | | Face Amount (000) | | | Value (000) | |
| Los Angeles, Department of Water & Power, Sub-Ser B-4, RB | | | | | | |
| 0.020%, 04/02/15(A) (B) | | $ | 2,400 | | | $ | 2,400 | |
| Los Angeles, Unified School District, Ser E, GO, AMBAC | | | | | | | | |
| Pre-Refunded @ 100 | | | | | | | | |
| 5.000%, 07/01/15(C) | | | 1,125 | | | | 1,139 | |
| Los Angeles, Unified School District, Ser E, GO, AMBAC | | | | | | | | |
| Pre-Refunded @ 100 | | | | | | | | |
| 5.000%, 07/01/15(C) | | | 500 | | | | 506 | |
| Los Angeles, Varous Loans to Lender Program, Ser A, RB, AMT | | | | | | | | |
| 0.060%, 04/01/15(A) (B) (D) | | | 2,359 | | | | 2,359 | |
| Los Angeles, Wastewater System Revenue, Ser A, RB, NATL | | | | | | | | |
| Pre-Refunded @ 100 | | | | | | | | |
| 4.750%, 06/01/15(C) | | | 1,880 | | | | 1,894 | |
| Los Angeles, Wastewater System Revenue, Ser A, RB, NATL | | | | | | | | |
| Pre-Refunded @ 100 | | | | | | | | |
| 5.000%, 06/01/15(C) | | | 460 | | | | 464 | |
| Los Angeles, Wastewater System Revenue, Ser A, RB, NATL | | | | | | | | |
| Pre-Refunded @ 100 | | | | | | | | |
| 5.000%, 06/01/15(C) | | | 1,750 | | | | 1,764 | |
| Los Angeles, Water & Power Resource Authority, Sub-Ser B-2, RB | | | | | | | | |
| 0.010%, 04/02/15(A) (B) | | | 100 | | | | 100 | |
| Los Angeles, Water & Power Resource Authority, Sub-Ser B-3, RB | | | | | | | | |
| 0.010%, 04/01/15(A) (B) | | | 680 | | | | 680 | |
| Los Gatos-Saratoga Joint High School District, Election of 2014, Ser A, GO | | | | | | | | |
| 2.000%, 08/01/15 | | | 1,540 | | | | 1,550 | |
| Los Gatos-Saratoga Joint High School District, GO | | | | | | | | |
| 2.000%, 06/01/15 | | | 925 | | | | 928 | |
| Los Gatos-Saratoga Joint High School District, GO | | | | | | | | |
| 1.500%, 06/30/15 | | | 2,000 | | | | 2,007 | |
| Los Gatos-Saratoga Joint High School District, GO | | | | | | | | |
| 2.000%, 12/01/15 | | | 4,740 | | | | 4,798 | |
| Metropolitan Water District of Southern California, Ser A-1, RB | | | | | | | | |
| 0.040%, 04/02/15(A) (B) | | | 15,000 | | | | 15,000 | |
See accompanying notes to financial statements.
CITY NATIONAL ROCHDALE FUNDS | PAGE 15
schedule of investments
March 31, 2015 (Unaudited)
City National Rochdale California Tax Exempt Money Market Fund (continued)
| Description | | Face Amount (000) | | | Value (000) | |
| Metropolitan Water District of Southern California, Ser A-2, RB | | | | | | |
| 0.070%, 04/02/15(A) (B) | | $ | 7,500 | | | $ | 7,500 | |
| Metropolitan Water District of Southern California, Ser A-3, RB | | | | | | | | |
| 0.040%, 04/02/15(A) (B) | | | 11,000 | | | | 11,000 | |
| Metropolitan Water District of Southern California, Ser C, RB | | | | | | | | |
| 4.000%, 10/01/15 | | | 125 | | | | 127 | |
| Metropolitan Water District of Southern California, Ser D, RB | | | | | | | | |
| 0.010%, 04/02/15(A) (B) | | | 600 | | | | 600 | |
| Modesto, Water Revenue, Ser A, COP | | | | | | | | |
| 0.020%, 04/02/15(A) (B) (D) | | | 200 | | | | 200 | |
| Monterey Peninsula, Water Management District, COP | | | | | | | | |
| 0.030%, 04/02/15(A) (B) (D) | | | 6,167 | | | | 6,167 | |
| Mount San Antonio, Community College District, GO, ETM | | | | | | | | |
| 0.302%, 05/01/15(F) | | | 4,520 | | | | 4,519 | |
| Napa Valley, Unified School District, Election of 2002, GO, NATL | | | | | | | | |
| Pre-Refunded @ 100 | | | | | | | | |
| 4.400%, 08/01/15(C) | | | 100 | | | | 101 | |
| Ohlone Community College District, Ser B, GO, AGM | | | | | | | | |
| Pre-Refunded @ 100 | | | | | | | | |
| 5.000%, 08/01/15(C) | | | 2,000 | | | | 2,033 | |
| Orange County, Apartment Development Authority, Riverbend Apartments Project, Ser B, RB | | | | | | | | |
| 0.020%, 04/02/15(A) (B) | | | 10,000 | | | | 10,000 | |
| Orange County, SAB | | | | | | | | |
| 0.020%, 04/01/15(A) (B) (D) | | | 4,000 | | | | 4,000 | |
| Orange County, Sanitation District, Ser A, RB | | | | | | | | |
| 5.000%, 08/01/15 | | | 500 | | | | 508 | |
| Orange County, Water District Authority, Ser A, COP | | | | | | | | |
| 0.020%, 04/01/15(A) (B) (D) | | | 20,350 | | | | 20,350 | |
| Pajaro Valley, Unified School District, GO, AGM | | | | | | | | |
| Pre-Refunded @ 100 | | | | | | | | |
| 5.250%, 08/01/15(C) | | | 100 | | | | 102 | |
| Description | | Face Amount (000) | | | Value (000) | |
| Pajaro Valley, Unified School District, GO, AGM | | | | | | |
| Pre-Refunded @ 100 | | | | | | |
| 5.250%, 08/01/15(C) | | $ | 100 | | | $ | 102 | |
| Palm Springs, Unified School District, Election of 2004, Ser B, GO, AGM | | | | | | | | |
| Pre-Refunded @ 100 | | | | | | | | |
| 4.750%, 08/01/15(C) | | | 100 | | | | 102 | |
| Palm Springs, Unified School District, Election of 2004, Ser B, GO, AGM | | | | | | | | |
| Pre-Refunded @ 100 | | | | | | | | |
| 4.750%, 08/01/15(C) | | | 150 | | | | 152 | |
| Palo Alto, Unified School District, GO | | | | | | | | |
| 5.000%, 08/01/19 | | | 175 | | | | 178 | |
| Palo Alto, Unified School District, GO, AGM | | | | | | | | |
| Pre-Refunded @ 100 | | | | | | | | |
| 5.000%, 08/01/15(C) | | | 100 | | | | 102 | |
| Palomar Community College District, GO | | | | | | | | |
| 2.000%, 05/01/15 | | | 1,575 | | | | 1,577 | |
| Pasadena, Unified School District, GO, AGM | | | | | | | | |
| Pre-Refunded @ 102 | | | | | | | | |
| 5.000%, 11/01/15(C) | | | 300 | | | | 314 | |
| Riverside County, RAN | | | | | | | | |
| 1.500%, 06/30/15 | | | 10,000 | | | | 10,034 | |
| Sacramento City, Unified School District, GO, NATL | | | | | | | | |
| Pre-Refunded @ 100 | | | | | | | | |
| 5.000%, 07/01/15(C) | | | 190 | | | | 192 | |
| Sacramento County, Sanitation Districts Financing Authority, RB, NATL | | | | | | | | |
| Pre-Refunded @ 100 | | | | | | | | |
| 4.750%, 12/01/15(C) | | | 250 | | | | 257 | |
| Sacramento Municipal Utility District, Sub-Ser L, RB | | | | | | | | |
| 0.010%, 04/02/15(A) (B) (D) | | | 2,345 | | | | 2,345 | |
| San Bernardino, Community College District, GO, AGM | | | | | | | | |
| Pre-Refunded @ 100 | | | | | | | | |
| 5.000%, 08/01/15(C) | | | 350 | | | | 356 | |
| San Bernardino, Community College District, GO, AGM | | | | | | | | |
| Pre-Refunded @ 100 | | | | | | | | |
| 4.000%, 08/01/15(C) | | | 200 | | | | 203 | |
See accompanying notes to financial statements.
CITY NATIONAL ROCHDALE FUNDS | PAGE 16
schedule of investments
March 31, 2015 (Unaudited)
City National Rochdale California Tax Exempt Money Market Fund (continued)
| Description | | Face Amount (000) | | | Value (000) | |
| San Bernardino, Community College District, GO, AGM | | | | | | |
| Pre-Refunded @ 100 | | | | | | |
| 5.000%, 08/01/15(C) | | $ | 125 | | | $ | 127 | |
| San Diego County, Regional Transportation Commission, Ser A, RB | | | | | | | | |
| 5.000%, 04/01/16 | | | 1,000 | | | | 1,048 | |
| San Diego County, Regional Transportation Commission, Ser B, RB | | | | | | | | |
| 0.020%, 04/02/15(A) (B) | | | 280 | | | | 280 | |
| San Diego County, Regional Transportation Commission, Ser D, RB | | | | | | | | |
| 0.010%, 04/02/15(A) (B) | | | 12,540 | | | | 12,540 | |
| San Diego County, Water Authority Financing, Ser A, COP, AGM | | | | | | | | |
| Pre-Refunded @ 100 | | | | | | | | |
| 5.000%, 05/01/15(C) | | | 100 | | | | 100 | |
| San Diego County, Water Authority Financing, Ser A, COP, AGM | | | | | | | | |
| Pre-Refunded @ 100 | | | | | | | | |
| 5.000%, 05/01/15(C) | | | 1,125 | | | | 1,130 | |
| San Diego County, Water Authority, Ser A, COP, AGM | | | | | | | | |
| Pre-Refunded @ 100 | | | | | | | | |
| 5.000%, 05/01/15(C) | | | 2,710 | | | | 2,721 | |
| San Diego, Community College District, Election of 2002, GO, AGM | | | | | | | | |
| Pre-Refunded @ 100 | | | | | | | | |
| 5.000%, 05/01/15(C) | | | 6,585 | | | | 6,611 | |
| San Diego, Unified School District, Election of 1998, Ser G, GO, AGM | | | | | | | | |
| Pre-Refunded @ 100 | | | | | | | | |
| 5.000%, 07/01/15(C) | | | 160 | | | | 162 | |
| San Diego, Unified School District, Election of 1998, Ser G, GO, AGM | | | | | | | | |
| Pre-Refunded @ 100 | | | | | | | | |
| 5.000%, 07/01/15(C) | | | 300 | | | | 304 | |
| San Francisco City & County, Airports Comm-San Francisco International Airport, Ser 36B-RMKT, RB | | | | | | | | |
| 0.010%, 04/01/15(A) (B) (D) | | | 2,900 | | | | 2,900 | |
| Description | | Face Amount (000) | | | Value (000) | |
| San Francisco City & County, Airports Comm-San Francisco International Airport, Ser 37C, RB | | | | | | |
| 0.010%, 04/01/15(A) (B) (D) | | $ | 15,900 | | | $ | 15,900 | |
| San Francisco City & County, Laguna Hond Hospital, Ser R3, GO | | | | | | | | |
| Pre-Refunded @ 100 | | | | | | | | |
| 5.000%, 06/15/15(C) | | | 200 | | | | 202 | |
| San Francisco City & County, Public Utilities Commission Water Revenue, Ser B, RB, XLCA | | | | | | | | |
| 5.000%, 11/01/15 | | | 500 | | | | 514 | |
| San Gorgonio Memorial Health Care District, Election of 2006, Ser C, GO, ETM | | | | | | | | |
| 6.500%, 08/01/15 | | | 100 | | | | 102 | |
| San Jose Evergreen Community College District, Ser A, GO, NATL | | | | | | | | |
| Pre-Refunded @ 100 | | | | | | | | |
| 5.000%, 09/01/15(C) | | | 165 | | | | 168 | |
| San Juan, Unified School District, Election of 2002, GO, NATL | | | | | | | | |
| Pre-Refunded @ 100 | | | | | | | | |
| 5.000%, 08/01/15(C) | | | 200 | | | | 203 | |
| San Mateo, Joint Powers Financing Authority, Public Safety Project, Ser A, RB | | | | | | | | |
| 0.020%, 04/02/15(A) (B) (D) | | | 100 | | | | 100 | |
| Santa Clara Valley, Transportation Authority, Ser A, RB | | | | | | | | |
| 0.010%, 04/02/15(A) (B) | | | 15,000 | | | | 15,000 | |
| Santa Clara Valley, Transportation Authority, Ser C, RB | | | | | | | | |
| 0.020%, 04/02/15(A) (B) | | | 540 | | | | 540 | |
| Santa Clara Valley, Transportation Authority, Ser D, RB | | | | | | | | |
| 0.020%, 04/02/15(A) (B) | | | 10,000 | | | | 10,000 | |
| Santa Maria Joint, Unified High School District, Ser A, GO, AGM | | | | | | | | |
| Pre-Refunded @ 102 | | | | | | | | |
| 5.375%, 08/01/15(C) | | | 150 | | | | 156 | |
See accompanying notes to financial statements.
CITY NATIONAL ROCHDALE FUNDS | PAGE 17
schedule of investments
March 31, 2015 (Unaudited)
City National Rochdale California Tax Exempt Money Market Fund (continued)
| Description | | Face Amount (000) | | | Value (000) | |
| Simi Valley, Unified School District, Election of 2004, Ser B, GO, FGIC | | | | | | |
| Pre-Refunded @ 100 | | | | | | |
| 5.000%, 08/01/15(C) | | $ | 200 | | | $ | 203 | |
| Southern California, Public Power Authority, RB | | | | | | | | |
| 4.000%, 07/01/15 | | | 150 | | | | 151 | |
| Southern California, Public Power Authority, Magnolia Power Project, Ser A-1, RB | | | | | | | | |
| 0.010%, 04/01/15(A) (B) (D) | | | 11,045 | | | | 11,045 | |
| State of California, Department of Water Resources, RB, AGM | | | | | | | | |
| Pre-Refunded @ 100 | | | | | | | | |
| 5.000%, 06/01/15(C) | | | 1,975 | | | | 1,991 | |
| State of California, Department of Water Resources, Ser AJ, RB | | | | | | | | |
| 5.000%, 12/01/15 | | | 1,150 | | | | 1,186 | |
| University of California, Regents Medical Center, Ser B-1, RB | | | | | | | | |
| 0.020%, 04/01/15(A) (B) | | | 3,925 | | | | 3,925 | |
| University of California, Ser Z-1, RB | | | | | | | | |
| 0.080%, 04/02/15(A) (B) | | | 20,000 | | | | 20,000 | |
| Vacaville, Unified School District, GO, NATL | | | | | | | | |
| Pre-Refunded @ 100 | | | | | | | | |
| 5.000%, 08/01/15(C) | | | 125 | | | | 127 | |
| Ventura County, TRAN | | | | | | | | |
| 1.500%, 07/01/15 | | | 5,000 | | | | 5,017 | |
| Ventura County, Public Financing Authority, Ser 2008-3380X, RB | | | | | | | | |
| 0.060%, 04/02/15(A) (B) (E) | | | 5,630 | | | | 5,630 | |
| Ventura County, Public Financing Authority, Ser 2008-3381X, RB | | | | | | | | |
| 0.060%, 04/02/15(A) (B) (E) | | | 3,685 | | | | 3,685 | |
| West Covina, Public Financing Authority, Golf Course Project, Ser B, RB | | | | | | | | |
| 0.010%, 04/01/15(A) (B) (D) | | | 800 | | | | 800 | |
| West Covina, Public Financing Authority, Ser A, RB | | | | | | | | |
| 0.010%, 04/01/15(A) (B) (D) | | | 300 | | | | 300 | |
| | | | | | | | | |
| Total California | | | | 726,641 | |
| Description | | Face Amount (000) | | | Value (000) | |
| Colorado [0.8%] | |
| Colorado State, Housing & Finance Authority, Multi-Family Project, RB | | | | | | |
| 0.040%, 04/01/15(A) (B) | | $ | 4,200 | | | $ | 4,200 | |
| Colorado State, Housing & Finance Authority, Ser B-3, RB | | | | | | | | |
| 0.140%, 04/01/15(A) (B) | | | 2,645 | | | | 2,645 | |
| | | | | | | | | |
| Total Colorado | | | | 6,845 | |
| | | | | | | | | |
| Indiana [0.0%] | |
| Portage Township, Multi-School Building, RB, NATL | | | | | | | | |
| Pre-Refunded @ 100 | | | | | | | | |
| 5.250%, 07/15/15(C) | | | 100 | | | | 101 | |
| | | | | | | | | |
| Iowa [0.1%] | |
| Iowa State, Finance Authority, Ser C, RB, GNMA/FNMA, AMT | | | | | | | | |
| 0.050%, 04/02/15(A) (B) | | | 1,300 | | | | 1,300 | |
| | | | | | | | | |
| Massachusetts [0.0%] | |
| Massachusetts Bay, Transportation Authority, Ser A, RB | | | | | | | | |
| Pre-Refunded @ 100 | | | | | | | | |
| 5.000%, 07/01/15(C) | | | 150 | | | | 152 | |
| | | | | | | | | |
| New York [1.1%] | |
| JPMorgan Chase Putters, Ser 4479, RB | | | | | | | | |
| 0.030%, 04/02/15(B) (E) | | | 6,665 | | | | 6,665 | |
| JPMorgan Chase Putters, Ser 4485, RB | | | | | | | | |
| 0.030%, 04/02/15(B) (E) | | | 3,145 | | | | 3,145 | |
| | | | | | | | | |
| Total New York | | | | 9,810 | |
| | | | | | | | | |
| Utah [1.3%] | |
| Utah Housing, Ser A-1, RB, AMT | | | | | | | | |
| 0.050%, 04/01/15(A) (B) | | | 3,820 | | | | 3,820 | |
| Utah Housing, Ser B, RB, AMT | | | | | | | | |
| 0.050%, 04/01/15(A) (B) | | | 3,390 | | | | 3,390 | |
| Utah Housing, Ser G-2, RB, AMT | | | | | | | | |
| 0.060%, 04/01/15(A) (B) | | | 4,550 | | | | 4,550 | |
| | | | | | | | | |
| Total Utah | | | | 11,760 | |
See accompanying notes to financial statements.
CITY NATIONAL ROCHDALE FUNDS | PAGE 18
schedule of investments
March 31, 2015 (Unaudited)
City National Rochdale California Tax Exempt Money Market Fund (concluded)
| Description | | Face Amount (000) | | | Value (000) | |
| Washington [0.7%] | |
| Washington State, Housing Finance Commission, Eagles Lending Apartments Project, Ser A, RB, FNMA, AMT | | | | | | |
| 0.040%, 04/02/15(A) (B) | | $ | 6,065 | | | $ | 6,065 | |
| | | | | | | | | |
| Wyoming [1.0%] | |
| Wyoming Community Development Authority, Ser 11, RB, AMT | | | | | | | | |
| 0.050%, 04/02/15(A) (B) | | | 6,000 | | | | 6,000 | |
| Wyoming Community Development Authority, Ser 6, RB, AMT | | | | | | | | |
| 0.050%, 04/02/15(A) (B) | | | 3,000 | | | | 3,000 | |
| | | | | | | | | |
| Total Wyoming | | | | 9,000 | |
| | | | | | | | | |
| Total Municipal Bonds | |
| (Cost $779,691) | | | | 779,691 | |
| | | | | | | | | |
| Commercial Paper [11.0%] | |
| California [11.0%] | |
| California State, Ser A-3 | | | | | | | | |
| 0.040%, 05/05/15 | | | 5,285 | | | | 5,285 | |
| California State, Ser B-2 | | | | | | | | |
| 0.140%, 04/07/15 | | | 17,000 | | | | 17,000 | |
| California State, Educational Facilities Authority | | | | | | | | |
| 0.130%, 07/08/15 | | | 25,000 | | | | 25,000 | |
| San Diego, Water Authority | | | | | | | | |
| 0.040%, 05/05/15 | | | 15,000 | | | | 15,000 | |
| San Diego, Water Authority, Ser 5 | | | | | | | | |
| 0.070%, 04/06/15 | | | 8,100 | | | | 8,100 | |
| San Diego, Water Authority, Ser 8 | | | | | | | | |
| 0.070%, 04/06/15 | | | 4,000 | | | | 4,000 | |
| San Francisco City & County, Ser 2 | | | | | | | | |
| 0.040%, 05/05/15 | | | 12,254 | | | | 12,254 | |
| University of California, Ser B | | | | | | | | |
| 0.140%, 06/10/15 | | | 12,500 | | | | 12,497 | |
| | | | | | | | | |
| Total California | | | | 99,136 | |
| | | | | | | | | |
| Total Commercial Paper | |
| (Cost $99,136) | | | | 99,136 | |
| Description | | Face Amount (000) | | | Value (000) | |
| Repurchase Agreement [1.4%] | |
| Bank of America | | | | | | |
| 0.090, dated 03/31/15, repurchased on 04/01/15, repurchased price $13,000,033 (collateralized by various U.S. Treasury Notes, par values ranging from $4,677,566 to $9,932,231, 0.000%, 05/15/18 to 08/15/26; with a total market value $13,260,000) | | $ | 13,000 | | | $ | 13,000 | |
| | | | | | | | | |
| Total Repurchase Agreement | |
| (Cost $13,000) | | | | 13,000 | |
| | | | | | | | | |
| Total Investments [98.7%] | |
| (Cost $891,827) | | | $ | 891,827 | |
Percentages are based on Net Assets of $903,818 (000).
| (A) | Put and Demand Feature — The date reported is the next reset or put date. |
| (B) | Floating Rate Security — The rate reported is the rate in effect on March 31, 2015. |
| (C) | Pre-Refunded Security — The maturity date shown is the pre-refunded date. |
| (D) | Securities are held in conjunction with a letter of credit from a major bank or financial institution. |
| (E) | Security exempt from registration under Rule 144A of the Securities Act of 1933. These securities may be resold in transactions exempt from registration normally to qualified institutions. On March 31, 2015, the value of these securities amounted to $67,125 (000), representing 7.4% of the net assets of the Fund. |
| (F) | Zero coupon security. The rate reported is the effective yield at time of purchase. |
ABAG — Association of Bay Area Governments
AGM — Assured Guarantee Municipal
AMBAC — American Municipal Bond Assurance Company
AMT — Alternative Minimum Tax (subject to)
COP — Certificate of Participation
ETM — Escrowed to Maturity
FGIC — Financial Guaranty Insurance Company
FNMA — Federal National Mortgage Association
GNMA — Government National Mortgage Association
GO — General Obligation
NATL — National Public Finance Guarantee Corporation
RAN — Revenue Anticipation Note
RB — Revenue Bond
SAB — Special Assessment Board
Ser — Series
SPL Tax — Special Tax
TRAN — Tax and Revenue Anticipation Note
XLCA — XL Capital Assurance
As of March 31, 2015, all of the Fund’s investments are Level 2 in accordance with authoritative guidance on fair value measurements and disclosure under U.S. GAAP.
For the period ended March 31, 2015, there have been no transfers between any of the fair value hierarchy levels. Transfers between Levels are recognized at period end.
For more information on valuation inputs, see Note 2 — Significant Accounting Policies in the Notes to Financial Statements.
See accompanying notes to financial statements.
CITY NATIONAL ROCHDALE FUNDS | PAGE 19
schedule of investments
March 31, 2015 (Unaudited)
City National Rochdale Limited Maturity Fixed Income Fund
| Description | | Face Amount (000) | | | Value (000) | |
| Corporate Bonds [52.3%] | |
| Automotive [3.0%] | |
| Harley-Davidson Financial Services, MTN | | | | | | |
| 1.550%, 11/17/17(A) | | $ | 275 | | | $ | 277 | |
| Volkswagen Group of America Finance | | | | | | | | |
| 1.600%, 11/20/17(A) | | | 500 | | | | 504 | |
| | | | | | | | | |
| Total Automotive | | | | 781 | |
| | | | | | | | | |
| Banks [25.6%] | |
| Australia & New Zealand Banking Group NY, MTN | | | | | | | | |
| 1.500%, 01/16/18 | | | 500 | | | | 501 | |
| Bank of America, MTN | | | | | | | | |
| 6.400%, 08/28/17 | | | 800 | | | | 886 | |
| Barclays Bank, MTN | | | | | | | | |
| 1.135%, 01/10/15(B) | | | 545 | | | | 532 | |
| Citigroup | | | | | | | | |
| 1.957%, 05/15/18(B) | | | 805 | | | | 831 | |
| Credit Suisse NY, MTN | | | | | | | | |
| 1.750%, 01/29/18 | | | 500 | | | | 502 | |
| Goldman Sachs Group | | | | | | | | |
| 6.150%, 04/01/18 | | | 730 | | | | 821 | |
| JPMorgan Chase | | | | | | | | |
| 6.300%, 04/23/19 | | | 500 | | | | 581 | |
| Korea Development Bank | | | | | | | | |
| 3.250%, 03/09/16 | | | 575 | | | | 586 | |
| Morgan Stanley, MTN | | | | | | | | |
| 5.950%, 12/28/17 | | | 745 | | | | 826 | |
| Wachovia | | | | | | | | |
| 5.750%, 06/15/17 | | | 500 | | | | 550 | |
| Wells Fargo | | | | | | | | |
| 2.125%, 04/22/19 | | | 40 | | | | 40 | |
| | | | | | | | | |
| Total Banks | | | | 6,656 | |
| Description | | Face Amount (000) | | | Value (000) | |
| Diversified Operations [2.9%] | |
| Glencore Funding | | | | | | |
| 1.700%, 05/27/16(A) | | $ | 250 | | | $ | 251 | |
| MUFG Americas Holdings | | | | | | | | |
| 0.826%, 02/09/18(B) | | | 500 | | | | 501 | |
| | | | | | | | | |
| Total Diversified Operations | | | | 752 | |
| | | | | | | | | |
| Financial Services [6.8%] | |
| Daimler Finance North America | | | | | | | | |
| 1.450%, 08/01/16(A) | | | 500 | | | | 504 | |
| Export-Import Bank of Korea | | | | | | | | |
| 4.125%, 09/09/15 | | | 500 | | | | 507 | |
| Ford Motor Credit | | | | | | | | |
| 0.899%, 03/27/17 | | | 250 | | | | 250 | |
| General Electric Capital, MTN | | | | | | | | |
| 2.950%, 05/09/16 | | | 500 | | | | 513 | |
| | | | | | | | | |
| Total Financial Services | | | | 1,774 | |
| | | | | | | | | |
| Food-Confectionery [1.0%] | |
| JM Smucker | | | | | | | | |
| 2.500%, 03/15/20(A) | | | 250 | | | | 253 | |
| | | | | | | | | |
| Metal-Copper [0.9%] | |
| Freeport-McMoRan | | | | | | | | |
| 2.300%, 11/14/17 | | | 250 | | | | 249 | |
| | | | | | | | | |
| Oil, Gas & Consumable Fuels [2.5%] | |
| ConocoPhillips Canada Funding I | | | | | | | | |
| 5.625%, 10/15/16 | | | 600 | | | | 643 | |
| | | | | | | | | |
| Petroleum & Fuel Products [1.6%] | |
| Occidental Petroleum | | | | | | | | |
| 1.750%, 02/15/17 | | | 400 | | | | 405 | |
| | | | | | | | | |
| Telephones & Telecommunications [8.0%] | |
| America Movil | | | | | | | | |
| 1.268%, 03/12/15(B) | | | 1,000 | | | | 1,004 | |
| AT&T | | | | | | | | |
| 2.400%, 08/15/16 | | | 800 | | | | 814 | |
| Verizon Communications | | | | | | | | |
| 1.801%, 03/15/15(B) | | | 250 | | | | 254 | |
| | | | | | | | | |
| Total Telephones & Telecommunications | | | | 2,072 | |
| | | | | | | | | |
| Total Corporate Bonds | |
| (Cost $13,546) | | | | 13,585 | |
See accompanying notes to financial statements.
CITY NATIONAL ROCHDALE FUNDS | PAGE 20
schedule of investments
March 31, 2015 (Unaudited)
City National Rochdale Limited Maturity Fixed Income Fund (continued)
| Description | | Face Amount (000) | | | Value (000) | |
| U.S. Government Agency Obligations [22.5%] | |
| Farmer Mac Guaranteed Notes Trust 2007-1 | | | | | | |
| 5.125%, 04/19/17(A) | | $ | 1,000 | | | $ | 1,085 | |
| FFCB | | | | | | | | |
| 0.290%, 01/21/16 | | | 830 | | | | 830 | |
| 0.227%, 01/17/15(B) | | | 395 | | | | 395 | |
| FNMA | | | | | | | | |
| 5.000%, 03/15/16 | | | 980 | | | | 1,023 | |
| 1.375%, 11/15/16 | | | 800 | | | | 811 | |
| 1.000%, 09/27/17 | | | 900 | | | | 903 | |
| 0.500%, 03/30/16 | | | 800 | | | | 802 | |
| | | | | | | | | |
| Total U.S. Government Agency Obligations | | | | | | | | |
| (Cost $5,840) | | | | 5,849 | |
| | | | | | | | | |
| U.S. Treasury Obligations [7.5%] | |
| U.S. Treasury Notes | | | | | | | | |
| 3.125%, 10/31/16 | | | 425 | | | | 443 | |
| 1.000%, 08/31/16 | | | 650 | | | | 655 | |
| 0.875%, 01/31/17 | | | 830 | | | | 836 | |
| | | | | | | | | |
| Total U.S. Treasury Obligations | |
| (Cost $1,929) | | | | 1,934 | |
| | | | | | | | | |
| Asset-Backed Securities [6.8%] | |
| CarMax Auto Owner Trust, Ser 2014-4, Cl A2A | | | | | | | | |
| 0.670%, 02/15/18 | | | 910 | | | | 909 | |
| Honda Auto Receivables Owner Trust, Ser 2014-4, Cl A2 | | | | | | | | |
| 0.580%, 01/17/17 | | | 500 | | | | 500 | |
| Hyundai Auto Receivables Trust, Ser 2015-A, Cl A3 | | | | | | | | |
| 1.050%, 04/15/19 | | | 360 | | | | 360 | |
| | | | | | | | | |
| Total Asset-Backed Securities | |
| (Cost $1,770) | | | | 1,769 | |
| | | | | | | | | |
| Municipal Bonds [5.3%] | |
| California [3.0%] | |
| Southern California Public Power Authority, Sub-Ser B, AGM, ETM | | | | | | | | |
| 6.930%, 05/15/17 | | | 595 | | | | 667 | |
| University of California, Ser A | | | | | | | | |
| 2.253%, 05/15/20 | | | 100 | | | | 102 | |
| | | | | | | | | |
| Total California | | | | 769 | |
| Description | | Face Amount (000) | | | Value (000) | |
| Florida [2.3%] | |
| Florida State, Hurricane Catastrophe Fund Finance, Ser A, RB | | | | | | |
| 2.107%, 07/01/18 | | $ | 595 | | | $ | 601 | |
| | | | | | | | | |
| Total Municipal Bonds | |
| (Cost $1,346) | | | | 1,370 | |
| | | | | | | | | |
| U.S. Government Mortgage-Backed Obligations [3.5%] | |
| FHLMC, Pool G12806 | | | | | | | | |
| 5.500%, 09/01/22 | | | 44 | | | | 48 | |
| FHLMC, Pool G18247 | | | | | | | | |
| 5.000%, 04/01/23 | | | 26 | | | | 29 | |
| FHLMC, Pool G18251 | | | | | | | | |
| 5.000%, 05/01/23 | | | 42 | | | | 46 | |
| FHLMC, Pool G18321 | | | | | | | | |
| 4.500%, 08/01/24 | | | 22 | | | | 24 | |
| FHLMC, Pool J04241 | | | | | | | | |
| 5.500%, 01/01/22 | | | 23 | | | | 25 | |
| FHLMC, Pool J04459 | | | | | | | | |
| 5.000%, 03/01/22 | | | 25 | | | | 27 | |
| FHLMC, Pool J04508 | | | | | | | | |
| 5.000%, 03/01/22 | | | 14 | | | | 14 | |
| FHLMC, Pool J07575 | | | | | | | | |
| 5.000%, 04/01/23 | | | 20 | | | | 21 | |
| FHLMC REMIC, Ser 2011-3877, Cl ND, | | | | | | | | |
| 3.000%, 02/15/25 | | | 334 | | | | 342 | |
| FNMA, Pool 837196 | | | | | | | | |
| 5.500%, 02/01/21 | | | 42 | | | | 44 | |
| FNMA, Pool 933915 | | | | | | | | |
| 4.500%, 06/01/23 | | | 26 | | | | 28 | |
| FNMA, Pool 961783 | | | | | | | | |
| 4.500%, 02/01/23 | | | 39 | | | | 42 | |
| FNMA, Ser 2010-39, Cl PD, | | | | | | | | |
| 3.000%, 06/25/38 | | | 210 | | | | 213 | |
| | | | | | | | | |
| Total U.S. Government Mortgage-Backed Obligations | | | | | |
| (Cost $865) | | | | 903 | |
See accompanying notes to financial statements.
CITY NATIONAL ROCHDALE FUNDS | PAGE 21
schedule of investments
March 31, 2015 (Unaudited)
City National Rochdale Limited Maturity Fixed Income Fund (concluded)
| Description | | Shares | | | Value (000) | |
| Short-Term Investments [1.6%] | |
| City National Rochdale Government Money Market Fund, Institutional Class 0.010%**‡ | | | 209,440 | | | $ | 210 | |
| SEI Daily Income Trust Government Fund, Cl A, 0.020%** | | | 209,440 | | | | 210 | |
| | | | | | | | | |
| Total Short-Term Investments | |
| (Cost $420) | | | | 420 | |
| | | | | | | | | |
| Total Investments [99.5%] | |
| (Cost $25,716) | | | $ | 25,830 | |
Percentages are based on Net Assets of $25,962 (000).
| ** | The rate reported is the 7-day effective yield as of March 31, 2015. |
| ‡ | Investment in Affiliate. |
| (A) | Security exempt from registration under Rule 144A of the Securities Act of 1933. These securities may be resold in transactions exempt from registration normally to qualified institutions. On March 31, 2015, the value of these securities amounted to $2,874 (000), representing 11.1% of the net assets of the Fund. |
| (B) | Floating Rate Security — The rate reported is the rate in effect on March 31, 2015. |
AGM — Assured Guarantee Municipal
Cl — Class
ETM — Escrowed to Maturity
FFCB — Federal Farm Credit Bank
FHLMC — Federal Home Loan Mortgage Corporation
FNMA — Federal National Mortgage Association
MTN — Medium Term Note
NY — New York
RB — Revenue Bond
REMIC — Real Estate Mortgage Investment Conduit
Ser — Series
The following is a list of the inputs used as of March 31, 2015 in valuing the Fund’s investments carried at value (000):
| Investments in Securities | | Level 1 | | | Level 2 | | | Level 3 | | | Total | |
| Corporate Bonds | | $ | — | | | $ | 13,585 | | | $ | — | | | $ | 13,585 | |
| U.S. Government Agency Obligations | | | — | | | | 5,849 | | | | — | | | | 5,849 | |
| U.S. Treasury Obligations | | | — | | | | 1,934 | | | | — | | | | 1,934 | |
| Asset-Backed Securities | | | — | | | | 1,769 | | | | — | | | | 1,769 | |
| Municipal Bonds | | | — | | | | 1,370 | | | | — | | | | 1,370 | |
| U.S. Government Mortgage-Backed Obligations | | | — | | | | 903 | | | | — | | | | 903 | |
| Short-Term Investments | | | 420 | | | | — | | | | — | | | | 420 | |
| Total Investments in Securities | | $ | 420 | | | $ | 25,410 | | | $ | — | | | $ | 25,830 | |
For the period ended March 31, 2015, there have been no transfers between any of the fair value hierarchy levels. Transfers between Levels are recognized at period end.
For more information on valuation inputs, see Note 2 — Significant Accounting Policies in the Notes to Financial Statements.
See accompanying notes to financial statements.
CITY NATIONAL ROCHDALE FUNDS | PAGE 22
schedule of investments
March 31, 2015 (Unaudited)
City National Rochdale Government Bond Fund
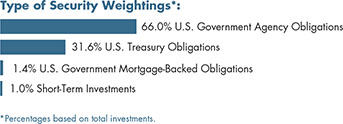
| Description | | Face Amount (000) | | | Value (000) | |
| U.S. Government Agency Obligations [65.7%] | |
| FFCB | | | | | | |
| 0.290%, 01/21/16 | | $ | 5,250 | | | $ | 5,250 | |
| 0.256%, 01/26/15(A) | | | 10,000 | | | | 10,012 | |
| FHLB | | | | | | | | |
| 1.150%, 07/25/18 | | | 1,520 | | | | 1,516 | |
| 1.000%, 06/09/17 | | | 6,675 | | | | 6,715 | |
| FHLMC, MTN | | | | | | | | |
| 1.500%, 01/30/20 | | | 5,000 | | | | 4,994 | |
| 1.250%, 05/12/17 | | | 2,350 | | | | 2,378 | |
| 1.000%, 06/29/17 | | | 4,000 | | | | 4,022 | |
| 1.000%, 09/29/17 | | | 4,130 | | | | 4,143 | |
| FNMA | | | | | | | | |
| 5.000%, 03/15/16 | | | 5,475 | | | | 5,716 | |
| 5.000%, 02/13/17 | | | 5,200 | | | | 5,626 | |
| 4.875%, 12/15/16 | | | 5,000 | | | | 5,363 | |
| 2.430%, 10/09/19(B) | | | 5,805 | | | | 5,334 | |
| 2.375%, 04/11/16 | | | 5,000 | | | | 5,101 | |
| 1.875%, 02/19/19 | | | 445 | | | | 455 | |
| 1.625%, 11/27/18 | | | 5,000 | | | | 5,079 | |
| 1.625%, 01/21/20 | | | 5,000 | | | | 5,035 | |
| 1.000%, 10/16/17 | | | 7,000 | | | | 6,966 | |
| 0.875%, 02/08/18 | | | 5,500 | | | | 5,496 | |
| 0.875%, 05/21/18 | | | 4,500 | | | | 4,489 | |
| 0.625%, 08/26/16 | | | 4,805 | | | | 4,818 | |
| 0.195%, 01/15/15(A) | | | 5,000 | | | | 5,003 | |
| Tennessee Valley Authority, Ser E | | | | | | | | |
| 6.250%, 12/15/17 | | | 8,000 | | | | 9,130 | |
| | | | | | | | | |
| Total U.S. Government Agency Obligations | | | | | | | | |
| (Cost $111,897) | | | | 112,641 | |
| | | | | | | | | |
| U.S. Treasury Obligations [31.5%] | |
| U.S. Treasury Bonds | | | | | | | | |
| 2.195%, 11/15/21(B) | | | 6,100 | | | | 5,439 | |
| U.S. Treasury Notes | | | | | | | | |
| 3.250%, 05/31/16 | | | 5,000 | | | | 5,169 | |
| 3.250%, 03/31/17 | | | 5,000 | | | | 5,266 | |
| 3.000%, 02/28/17 | | | 2,415 | | | | 2,528 | |
| 2.875%, 03/31/18 | | | 5,000 | | | | 5,292 | |
| 2.750%, 02/28/18 | | | 5,000 | | | | 5,270 | |
| Description | | Face Amount (000)/Shares | | | Value (000) | |
| 2.375%, 07/31/17 | | $ | 5,000 | | | $ | 5,198 | |
| 2.125%, 01/31/21 | | | 5,000 | | | | 5,159 | |
| 2.000%, 11/30/20 | | | 5,000 | | | | 5,130 | |
| 1.375%, 09/30/18 | | | 5,000 | | | | 5,053 | |
| 0.875%, 02/28/17 | | | 4,500 | | | | 4,529 | |
| | | | | | | | | |
| Total U.S. Treasury Obligations | |
| (Cost $53,452) | | | | 54,033 | |
| | | | | | | | | |
| U.S. Government Mortgage-Backed Obligations [1.4%] | |
| FHLMC REMIC, Ser 2011-3877, Cl ND, | | | | | | | | |
| 3.000%, 02/15/25 | | | 1,326 | | | | 1,361 | |
| FNMA ARM, Pool 766620 | | | | | | | | |
| 2.261%, 01/01/15(A) | | | 171 | | | | 183 | |
| FNMA REMIC, Ser 2011-144, Cl CE, | | | | | | | | |
| 1.250%, 06/25/35 | | | 461 | | | | 463 | |
| GNMA, Pool 329656 | | | | | | | | |
| 8.000%, 08/15/22 | | | 5 | | | | 5 | |
| GNMA, Pool 376533 | | | | | | | | |
| 7.500%, 06/15/24 | | | 1 | | | | 1 | |
| GNMA, Pool 398660 | | | | | | | | |
| 7.500%, 05/15/26 | | | 2 | | | | 2 | |
| GNMA, Pool 497411 | | | | | | | | |
| 6.000%, 01/15/29 | | | 4 | | | | 5 | |
| GNMA, Pool 571376 | | | | | | | | |
| 7.000%, 12/15/16 | | | 1 | | | | 1 | |
| GNMA, Pool 584992 | | | | | | | | |
| 7.500%, 04/15/32 | | | 27 | | | | 30 | |
| GNMA ARM, Pool G2 81318 | | | | | | | | |
| 1.625%, 01/01/15(A) | | | 244 | | | | 252 | |
| GNMA ARM, Pool G2 81447 | | | | | | | | |
| 1.625%, 01/01/15(A) | | | 52 | | | | 54 | |
| | | | | | | | | |
| Total U.S. Government Mortgage-Backed Obligations | | | | | |
| (Cost $2,295) | | | | 2,357 | |
| | | | | | | | | |
| Short-Term Investments [1.0%] | |
| City National Rochdale Government Money Market Fund, Institutional Class 0.010%** ‡ | | | 851,755 | | | | 852 | |
| SEI Daily Income Trust Government Fund, Cl A, 0.020%** | | | 851,755 | | | | 852 | |
| | | | | | | | | |
| Total Short-Term Investments | |
| (Cost $1,704) | | | | 1,704 | |
| | | | | | | | | |
| Total Investments [99.6%] | |
| (Cost $169,348) | | | $ | 170,735 | |
See accompanying notes to financial statements.
CITY NATIONAL ROCHDALE FUNDS | PAGE 23
schedule of investments
March 31, 2015 (Unaudited)
City National Rochdale Government Bond Fund (concluded)
Percentages are based on Net Assets of $171,413 (000).
| ** | The rate reported is the 7-day effective yield as of March 31, 2015. |
| ‡ | Investment in Affiliate. |
| (A) | Floating Rate Security — The rate reported is the rate in effect on March 31, 2015. |
| (B) | Zero coupon security. The rate reported is the effective yield at time of purchase. |
ARM — Adjustable Rate Mortgage
Cl — Class
FFCB — Federal Farm Credit Bank
FHLB — Federal Home Loan Bank
FHLMC — Federal Home Loan Mortgage Corporation
FNMA — Federal National Mortgage Association
GNMA — Government National Mortgage Association
MTN — Medium Term Note
REMIC — Real Estate Mortgage Investment Conduit
Ser — Series
The following is a list of the inputs used as of March 31, 2015 in valuing the Fund’s investments carried at value (000):
| Investments in Securities | | Level 1 | | | Level 2 | | | Level 3 | | | Total | |
| U.S. Government Agency Obligations | | $ | — | | | $ | 112,641 | | | $ | — | | | $ | 112,641 | |
| U.S. Treasury Obligations | | | — | | | | 54,033 | | | | — | | | | 54,033 | |
| U.S. Government Mortgage-Backed Obligations | | | — | | | | 2,357 | | | | — | | | | 2,357 | |
| Short-Term Investments | | | 1,704 | | | | — | | | | — | | | | 1,704 | |
| Total Investments in Securities | | $ | 1,704 | | | $ | 169,031 | | | $ | — | | | $ | 170,735 | |
For the period ended March 31, 2015, there have been no transfers between any of the fair value hierarchy levels. Transfers between Levels are recognized at period end.
For more information on valuation inputs, see Note 2 — Significant Accounting Policies in the Notes to Financial Statements.
See accompanying notes to financial statements.
CITY NATIONAL ROCHDALE FUNDS | PAGE 24
schedule of investments
March 31, 2015 (Unaudited)
City National Rochdale Corporate Bond Fund
| Description | | Face Amount (000) | | | Value (000) | |
| Corporate Bonds [91.0%] | |
| Banks [14.4%] | |
| Bank of America, MTN | | | | | | |
| 6.400%, 08/28/17 | | $ | 400 | | | $ | 443 | |
| Barclays Bank, MTN | | | | | | | | |
| 1.135%, 01/10/14(A) | | | 1,950 | | | | 1,903 | |
| Capital One Financial | | | | | | | | |
| 5.500%, 06/01/15 | | | 1,400 | | | | 1,411 | |
| Citigroup | | | | | | | | |
| 5.500%, 02/15/17 | | | 1,250 | | | | 1,341 | |
| Countrywide Financial | | | | | | | | |
| 6.250%, 05/15/16 | | | 1,200 | | | | 1,262 | |
| Fifth Third Bank | | | | | | | | |
| 1.150%, 11/18/16 | | | 3,060 | | | | 3,064 | |
| HSBC Finance | | | | | | | | |
| 5.250%, 04/15/15 | | | 1,250 | | | | 1,252 | |
| JPMorgan Chase | | | | | | | | |
| 6.300%, 04/23/19 | | | 2,000 | | | | 2,323 | |
| 6.000%, 01/15/18 | | | 405 | | | | 453 | |
| Morgan Stanley, MTN | | | | | | | | |
| 5.950%, 12/28/17 | | | 465 | | | | 516 | |
| National Australia Bank, MTN | | | | | | | | |
| 2.750%, 03/09/17 | | | 480 | | | | 496 | |
| Nordea Bank | | | | | | | | |
| 2.375%, 04/04/19(B) | | | 1,500 | | | | 1,528 | |
| UBS, MTN | | | | | | | | |
| 5.875%, 12/20/17 | | | 2,000 | | | | 2,220 | |
| Description | | Face Amount (000) | | | Value (000) | |
| Wells Fargo Bank | | | | | | |
| 5.750%, 05/16/16 | | $ | 2,400 | | | $ | 2,533 | |
| | | | | | | | | |
| Total Banks | | | | 20,745 | |
| | | | | | | | | |
| Broadcasting & Cable [2.6%] | |
| CBS | | | | | | | | |
| 4.300%, 02/15/21 | | | 1,400 | | | | 1,512 | |
| Time Warner Cable | | | | | | | | |
| 5.000%, 02/01/20 | | | 2,000 | | | | 2,232 | |
| | | | | | | | | |
| Total Broadcasting & Cable | | | | 3,744 | |
| | | | | | | | | |
| Computers-Memory Devices [0.7%] | |
| NetApp | | | | | | | | |
| 2.000%, 12/15/17 | | | 1,000 | | | | 1,003 | |
| | | | | | | | | |
| Diversified Metals & Mining [1.8%] | |
| Rio Tinto | | | | | | | | |
| 2.250%, 09/20/16 | | | 2,500 | | | | 2,549 | |
| | | | | | | | | |
| Diversified Minerals [3.3%] | |
| BHP Billiton | | | | | | | | |
| 5.250%, 12/15/15 | | | 2,377 | | | | 2,455 | |
| Teck Resources | | | | | | | | |
| 3.150%, 01/15/17 | | | 1,250 | | | | 1,265 | |
| 2.500%, 02/01/18 | | | 1,000 | | | | 997 | |
| | | | | | | | | |
| Total Diversified Minerals | | | | 4,717 | |
| | | | | | | | | |
| Diversified Operations [2.5%] | |
| Glencore Funding | | | | | | | | |
| 1.700%, 05/27/16(B) | | | 1,500 | | | | 1,506 | |
| Siemens Finc | | | | | | | | |
| 5.750%, 10/17/16(B) | | | 2,000 | | | | 2,151 | |
| | | | | | | | | |
| Total Diversified Operations | | | | 3,657 | |
| | | | | | | | | |
| Drugs [2.2%] | |
| AbbVie | | | | | | | | |
| 1.200%, 11/06/15 | | | 1,000 | | | | 1,001 | |
| Wyeth | | | | | | | | |
| 5.500%, 02/15/16 | | | 2,000 | | | | 2,085 | |
| | | | | | | | | |
| Total Drugs | | | | 3,086 | |
| | | | | | | | | |
| Electric Utilities [3.2%] | |
| American Electric Power | | | | | | | | |
| 1.650%, 12/15/17 | | | 1,000 | | | | 1,006 | |
| Commonwealth Edison | | | | | | | | |
| 6.950%, 07/15/18 | | | 1,000 | | | | 1,156 | |
See accompanying notes to financial statements.
CITY NATIONAL ROCHDALE FUNDS | PAGE 25
schedule of investments
March 31, 2015 (Unaudited)
City National Rochdale Corporate Bond Fund (continued)
| Description | | Face Amount (000) | | | Value (000) | |
| Exelon | | | | | | |
| 4.900%, 06/15/15 | | $ | 1,138 | | | $ | 1,147 | |
| Exelon Generation | | | | | | | | |
| 6.200%, 10/01/17 | | | 1,200 | | | | 1,329 | |
| | | | | | | | | |
| Total Electric Utilities | | | | 4,638 | |
| | | | | | | | | |
| Financial Services [17.4%] | |
| American Honda Finance | | | | | | | | |
| 1.600%, 02/16/18(B) | | | 1,900 | | | | 1,916 | |
| Caisse Centrale Desjardins du Quebec | | | | | | | | |
| 2.650%, 09/16/15(B) | | | 3,000 | | | | 3,028 | |
| Daimler Finance North America | | | | | | | | |
| 2.250%, 07/31/19(B) | | | 2,900 | | | | 2,933 | |
| Ford Motor Credit | | | | | | | | |
| 8.000%, 12/15/16 | | | 1,000 | | | | 1,108 | |
| 2.375%, 01/16/18 | | | 1,000 | | | | 1,017 | |
| General Electric Capital, MTN | | | | | | | | |
| 5.300%, 02/11/21 | | | 2,500 | | | | 2,888 | |
| 2.950%, 05/09/16 | | | 50 | | | | 51 | |
| Harley Davidson Funding | | | | | | | | |
| 6.800%, 06/15/18(B) | | | 2,500 | | | | 2,897 | |
| Harley-Davidson Financial Services, MTN | | | | | | | | |
| 3.875%, 03/15/16(B) | | | 1,000 | | | | 1,028 | |
| Nissan Motor Acceptance, MTN | | | | | | | | |
| 1.950%, 09/12/17(B) | | | 2,000 | | | | 2,032 | |
| Toyota Motor Credit, MTN | | | | | | | | |
| 2.050%, 01/12/17 | | | 2,000 | | | | 2,042 | |
| VW Credit, MTN | | | | | | | | |
| 1.875%, 10/13/16 | | | 3,000 | | | | 3,041 | |
| Western Union | | | | | | | | |
| 5.930%, 10/01/16 | | | 1,000 | | | | 1,066 | |
| | | | | | | | | |
| Total Financial Services | | | | 25,047 | |
| | | | | | | | | |
| Food, Beverage & Tobacco [1.0%] | |
| Dr Pepper Snapple Group | | | | | | | | |
| 6.820%, 05/01/18 | | | 1,300 | | | | 1,499 | |
| | | | | | | | | |
| Food-Confectionery [0.2%] | |
| JM Smucker | | | | | | | | |
| 2.500%, 03/15/20(B) | | | 250 | | | | 253 | |
| | | | | | | | | |
| Home Decoration Products [0.7%] | |
| Newell Rubbermaid | | | | | | | | |
| 2.875%, 12/01/19 | | | 1,000 | | | | 1,019 | |
| Description | | Face Amount (000) | | | Value (000) | |
| Insurance [5.3%] | |
| Aflac | | | | | | |
| 8.500%, 05/15/19 | | $ | 1,100 | | | $ | 1,389 | |
| Berkshire Hathaway | | | | | | | | |
| 2.100%, 08/14/19 | | | 2,000 | | | | 2,046 | |
| Genworth Financial | | | | | | | | |
| 7.700%, 06/15/20 | | | 1,400 | | | | 1,488 | |
| Metropolitan Life Global Funding I, MTN | | | | | | | | |
| 1.875%, 06/22/18(B) | | | 2,700 | | | | 2,724 | |
| | | | | | | | | |
| Total Insurance | | | | 7,647 | |
| | | | | | | | | |
| Investment Banker/Broker Dealer [7.6%] | |
| Deutsche Bank | | | | | | | | |
| 1.400%, 02/13/17 | | | 2,500 | | | | 2,502 | |
| Goldman Sachs Group | | | | | | | | |
| 5.625%, 01/15/17 | | | 1,700 | | | | 1,823 | |
| 2.625%, 01/31/19 | | | 500 | | | | 511 | |
| Jefferies Group | | | | | | | | |
| 8.500%, 07/15/19 | | | 1,370 | | | | 1,639 | |
| Macquarie Group | | | | | | | | |
| 6.000%, 01/14/20(B) | | | 2,000 | | | | 2,286 | |
| Morgan Stanley, MTN | | | | | | | | |
| 6.250%, 08/28/17 | | | 2,000 | | | | 2,209 | |
| | | | | | | | | |
| Total Investment Banker/Broker Dealer | | | | 10,970 | |
| | | | | | | | | |
| Medical Labs and Testing Srv [1.1%] | |
| Laboratory Corp of America Holdings | | | | | | | | |
| 2.625%, 02/01/20 | | | 1,500 | | | | 1,510 | |
| | | | | | | | | |
| Medical Products & Services [1.8%] | |
| Genentech | | | | | | | | |
| 4.750%, 07/15/15 | | | 2,500 | | | | 2,529 | |
| | | | | | | | | |
| Medical-HMO [1.0%] | |
| UnitedHealth Group | | | | | | | | |
| 1.625%, 03/15/19 | | | 1,500 | | | | 1,503 | |
| | | | | | | | | |
| Petroleum & Fuel Products [8.2%] | |
| BP Capital Markets | | | | | | | | |
| 1.375%, 05/10/18 | | | 2,800 | | | | 2,788 | |
| Kinder Morgan Energy Partners | | | | | | | | |
| 6.000%, 02/01/17 | | | 1,000 | | | | 1,075 | |
| Plains Exploration & Production | | | | | | | | |
| 6.125%, 06/15/19 | | | 1,300 | | | | 1,374 | |
See accompanying notes to financial statements.
CITY NATIONAL ROCHDALE FUNDS | PAGE 26
schedule of investments
March 31, 2015 (Unaudited)
City National Rochdale Corporate Bond Fund (continued)
| Description | | Face Amount (000) | | | Value (000) | |
| Sunoco Logistics Partners Operations | | | | | | |
| 4.650%, 02/15/22 | | $ | 1,300 | | | $ | 1,379 | |
| Total Capital International | | | | | | | | |
| 2.875%, 02/17/22 | | | 4,000 | | | | 4,097 | |
| Transocean | | | | | | | | |
| 6.500%, 11/15/20 | | | 1,250 | | | | 1,048 | |
| | | | | | | | | |
| Total Petroleum & Fuel Products | | | | 11,761 | |
| | | | | | | | | |
| Real Estate Investment Trusts [4.8%] | |
| American Tower | | | | | | | | |
| 7.250%, 05/15/19 | | | 1,200 | | | | 1,410 | |
| HCP | | | | | | | | |
| 5.625%, 05/01/17 | | | 1,000 | | | | 1,085 | |
| Health Care REIT | | | | | | | | |
| 4.700%, 09/15/17 | | | 1,000 | | | | 1,074 | |
| Kimco Realty | | | | | | | | |
| 6.875%, 10/01/19 | | | 1,080 | | | | 1,285 | |
| Simon Property Group | | | | | | | | |
| 6.100%, 05/01/16 | | | 2,000 | | | | 2,090 | |
| | | | | | | | | |
| Total Real Estate Investment Trusts | | | | 6,944 | |
| | | | | | | | | |
| Regional Authority [1.6%] | | | | | | | | |
| Province of Ontario Canada | | | | | | | | |
| 4.400%, 04/14/20 | | | 2,000 | | | | 2,261 | |
| | | | | | | | | |
| Retail [4.1%] | |
| AutoZone | | | | | | | | |
| 4.000%, 11/15/20 | | | 1,400 | | | | 1,510 | |
| CVS Health | | | | | | | | |
| 2.250%, 08/12/19 | | | 1,000 | | | | 1,015 | |
| Lowe’s | | | | | | | | |
| 6.100%, 09/15/17 | | | 3,000 | | | | 3,365 | |
| | | | | | | | | |
| Total Retail | | | | 5,890 | |
| | | | | | | | | |
| Telephones & Telecommunications [4.6%] | |
| America Movil | | | | | | | | |
| 5.000%, 03/30/20 | | | 2,600 | | | | 2,946 | |
| AT&T | | | | | | | | |
| 2.950%, 05/15/16 | | | 2,600 | | | | 2,657 | |
| Telefonica Emisiones SAU | | | | | | | | |
| 6.421%, 06/20/16 | | | 1,000 | | | | 1,063 | |
| | | | | | | | | |
| Total Telephones & Telecommunications | | | | 6,666 | |
| Description | | Face Amount (000) | | | Value (000) | |
| Trucking & Leasing [0.9%] | |
| Penske Truck Leasing | | | | | | |
| 3.750%, 05/11/17(B) | | $ | 750 | | | $ | 782 | |
| 3.125%, 05/11/15(B) | | | 500 | | | | 501 | |
| | | | | | | | | |
| Total Trucking & Leasing | | | | 1,283 | |
| | | | | | | | | |
| Total Corporate Bonds | |
| (Cost $129,143) | | | | 130,921 | |
| | | | | | | | | |
| Municipal Bonds [4.1%] | |
| California [1.2%] | |
| California State, GO | | | | | | | | |
| 5.700%, 11/01/21 | | | 185 | | | | 219 | |
| State of California | | | | | | | | |
| 6.200%, 03/01/19 | | | 1,300 | | | | 1,501 | |
| | | | | | | | | |
| Total California | | | | 1,720 | |
| | | | | | | | | |
| Florida [2.9%] | |
| Florida State, Hurricane Catastrophe Fund Finance, Ser A, RB | | | | | | | | |
| 2.107%, 07/01/18 | | | 4,130 | | | | 4,173 | |
| | | | | | | | | |
| Total Municipal Bonds | |
| (Cost $5,814) | | | | 5,893 | |
| | | | | | | | | |
| Unaffiliated Registered Investment Company [1.9%] | |
| Ivy High Income Fund | | | 343,249 | | | | 2,777 | |
| | | | | | | | | |
| Total Unaffiliated Registered Investment Company | | | | | | | | |
| (Cost $3,000) | | | | 2,777 | |
| | | | | | | | | |
| Sovereign Debt [1.8%] | |
| Petroleum & Fuel Products [1.8%] | |
| Korea National Oil | | | | | | | | |
| 2.875%, 11/09/15(B) | | | 1,000 | | | | 1,011 | |
| 2.750%, 01/23/19(B) | | | 1,500 | | | | 1,538 | |
| | | | | | | | | |
| Total Petroleum & Fuel Products | | | | 2,549 | |
| | | | | | | | | |
| Total Sovereign Debt | |
| (Cost $2,518) | | | | 2,549 | |
See accompanying notes to financial statements.
CITY NATIONAL ROCHDALE FUNDS | PAGE 27
schedule of investments
March 31, 2015 (Unaudited)
City National Rochdale Corporate Bond Fund (concluded)
| Description | | Face Amount (000)/Shares | | | Value (000) | |
| U.S. Government Mortgage-Backed Obligation [0.1%] | |
| FNMA REMIC, Ser 2002-56, Cl MC | | | | | | |
| 5.500%, 09/25/17 | | $ | 46 | | | $ | 47 | |
| | | | | | | | | |
| Total U.S. Government Mortgage-Backed Obligation | | | | | |
| (Cost $46) | | | | 47 | |
| | | | | | | | | |
| Short-Term Investments [0.3%] | | | | | |
| City National Rochdale Prime Money Market Fund, Institutional Class, 0.010%**‡ | | | 231,769 | | | | 232 | |
| SEI Daily Income Trust, Prime Obligation Fund, Cl A, 0.010%** | | | 231,769 | | | | 232 | |
| | | | | | | | | |
| Total Short-Term Investments | | | | | |
| (Cost $464) | | | | | | | 464 | |
| | | | | | | | | |
| Total Investments [99.2%] | | | | | |
| (Cost $140,985) | | | | | | $ | 142,651 | |
Percentages are based on Net Assets of $143,820 (000).
| ** | The rate reported is the 7-day effective yield as of March 31, 2015. |
| ‡ | Investment in Affiliate. |
| (A) | Floating Rate Security — The rate reported is the rate in effect on March 31, 2015. |
| (B) | Security exempt from registration under Rule 144A of the Securities Act of 1933. These securities may be resold in transactions exempt from registration normally to qualified institutions. On March 31, 2015, the value of these securities amounted to $28,114 (000), representing 19.5% of the net assets of the Fund. |
Cl — Class
FNMA — Federal National Mortgage Association
GO — General Obligation
MTN — Medium Term Note
RB — Revenue Bond
REIT — Real Estate Investment Trust
REMIC — Real Estate Mortgage Investment Conduit
Ser — Series
The following is a list of the inputs used as of March 31, 2015 in valuing the Fund’s investments carried at value (000):
| Investments in Securities | | Level 1 | | | Level 2 | | | Level 3 | | | Total | |
| Corporate Bonds | | $ | — | | | $ | 130,921 | | | $ | — | | | $ | 130,921 | |
| Municipal Bonds | | | — | | | | 5,893 | | | | — | | | | 5,893 | |
| Unaffiliated Registered Investment Company | | | 2,777 | | | | — | | | | — | | | | 2,777 | |
| Sovereign Debt | | | — | | | | 2,549 | | | | — | | | | 2,549 | |
| U.S. Government Mortgage-Backed Obligation | | | — | | | | 47 | | | | — | | | | 47 | |
| Short-Term Investments | | | 464 | | | | — | | | | — | | | | 464 | |
| Total Investments in Securities | | $ | 3,241 | | | $ | 139,410 | | | $ | — | | | $ | 142,651 | |
For the period ended March 31, 2015, there have been no transfers between any of the fair value hierarchy levels. Transfers between Levels are recognized at period end.
For more information on valuation inputs, see Note 2 — Significant Accounting Policies in the Notes to Financial Statements.
See accompanying notes to financial statements.
CITY NATIONAL ROCHDALE FUNDS | PAGE 28
schedule of investments
March 31, 2015 (Unaudited)
City National Rochdale California Tax Exempt Bond Fund
| Description | | Face Amount (000) | | | Value (000) | |
| Municipal Bonds [95.8%] | |
| California [93.1%] | |
| Bay Area Toll Authority, Ser C, RB | | | | | | |
| Callable 10/01/18 @ 100 | | | | | | |
| 1.875%, 04/01/47(A) | | $ | 1,200 | | | $ | 1,224 | |
| Bay Area Toll Authority, Ser D, RB | | | | | | | | |
| Callable 10/01/19 @ 100 | | | | | | | | |
| 1.875%, 04/01/34(A) | | | 750 | | | | 761 | |
| Beverly Hills, Community Facilities District, Ser 2002-A, SPL Tax | | | | | | | | |
| 4.000%, 09/01/22 | | | 250 | | | | 278 | |
| Brea, Redevelopment Agency, Redevelopment Project AB, TA | | | | | | | | |
| 5.000%, 08/01/20 | | | 500 | | | | 589 | |
| California State, Department of Water Resources, Ser F-3, RB | | | | | | | | |
| Callable 05/01/18 @ 100 | | | | | | | | |
| 4.375%, 05/01/20 | | | 200 | | | | 221 | |
| California State, Economic Recovery Authority, Ser A, GO | | | | | | | | |
| Pre-Refunded @ 100 | | | | | | | | |
| 5.000%, 07/01/20(B) | | | 1,000 | | | | 1,163 | |
| California State, GO | | | | | | | | |
| Callable 04/17/15 @ 100 | | | | | | | | |
| 5.000%, 03/01/16 | | | 1,485 | | | | 1,487 | |
| California State, GO | | | | | | | | |
| 4.000%, 02/01/18 | | | 1,000 | | | | 1,087 | |
| California State, GO | | | | | | | | |
| 4.000%, 03/01/18 | | | 1,000 | | | | 1,089 | |
| Description | | Face Amount (000) | | | Value (000) | |
| California State, GO | | | | | | |
| 3.000%, 03/01/18 | | $ | 1,000 | | | $ | 1,060 | |
| California State, GO | | | | | | | | |
| 4.000%, 02/01/19 | | | 1,000 | | | | 1,107 | |
| California State, GO | | | | | | | | |
| 5.000%, 11/01/19 | | | 1,000 | | | | 1,166 | |
| California State, GO | | | | | | | | |
| 5.000%, 09/01/20 | | | 1,000 | | | | 1,184 | |
| California State, GO | | | | | | | | |
| 5.000%, 09/01/21 | | | 1,200 | | | | 1,444 | |
| California State, GO | | | | | | | | |
| 5.000%, 12/01/21 | | | 1,000 | | | | 1,207 | |
| California State, GO | | | | | | | | |
| 5.250%, 09/01/22 | | | 1,000 | | | | 1,233 | |
| California State, GO | | | | | | | | |
| Callable 11/01/20 @ 100 | | | | | | | | |
| 5.000%, 11/01/22 | | | 1,025 | | | | 1,226 | |
| California State, GO | | | | | | | | |
| Callable 12/01/23 @ 100 | | | | | | | | |
| 5.000%, 12/01/26 | | | 1,000 | | | | 1,212 | |
| California State, GO | | | | | | | | |
| Callable 11/01/23 @ 100 | | | | | | | | |
| 5.000%, 11/01/27 | | | 500 | | | | 600 | |
| California State, GO | | | | | | | | |
| Callable 06/01/19 @ 100 | | | | | | | | |
| 3.000%, 12/01/32(A) | | | 1,000 | | | | 1,068 | |
| California State, Health Facilities Financing Authority, Catholic Healthcare, Ser A, RB | | | | | | | | |
| Callable 03/01/21 @ 100 | | | | | | | | |
| 5.250%, 03/01/22 | | | 265 | | | | 317 | |
| California State, Health Facilities Financing Authority, Cedars-Sinai Medical Center, RB | | | | | | | | |
| 5.000%, 08/15/17 | | | 750 | | | | 828 | |
| California State, Health Facilities Financing Authority, City of Hope, Ser A, RB | | | | | | | | |
| 5.000%, 11/15/17 | | | 375 | | | | 414 | |
| California State, Health Facilities Financing Authority, Memorial Health Services Corp, Ser A, RB | | | | | | | | |
| 5.000%, 10/01/15 | | | 450 | | | | 460 | |
| California State, Health Facilities Financing Authority, St. Joseph Health System, Ser B, RB | | | | | | | | |
| 5.000%, 07/01/15(A) | | | 875 | | | | 968 | |
See accompanying notes to financial statements.
CITY NATIONAL ROCHDALE FUNDS | PAGE 29
schedule of investments
March 31, 2015 (Unaudited)
City National Rochdale California Tax Exempt Bond Fund (continued)
| Description | | Face Amount (000) | | | Value (000) | |
| California State, Health Facilities Financing Authority, St. Joseph Health System, Ser D, RB | | | | | | |
| 5.000%, 07/01/43(A) | | $ | 975 | | | $ | 1,154 | |
| California State, Health Facilities Financing Authority, Sutter Health, Ser A, RB | | | | | | | | |
| 5.500%, 08/15/17 | | | 500 | | | | 556 | |
| California State, Health Facilities Financing Authority, Sutter Health, Ser A, RB | | | | | | | | |
| 5.500%, 08/15/18 | | | 125 | | | | 144 | |
| California State, Public Works Board, Department of Corrections and Rehab Project, Ser A, RB | | | | | | | | |
| 4.000%, 09/01/17 | | | 500 | | | | 539 | |
| California State, Public Works Board, Department of Corrections and Rehab Project, Ser A, RB | | | | | | | | |
| 5.000%, 09/01/22 | | | 1,000 | | | | 1,213 | |
| California State, Public Works Board, Department of Corrections-State Prisons, Ser A, RB, AMBAC | | | | | | | | |
| 5.000%, 12/01/19 | | | 755 | | | | 835 | |
| California State, Public Works Board, Judicial Council, Ser B, RB | | | | | | | | |
| 5.000%, 10/01/23 | | | 475 | | | | 585 | |
| California State, Public Works Board, State Prisons, Ser C, RB | | | | | | | | |
| 5.000%, 10/01/16 | | | 1,000 | | | | 1,068 | |
| California State, Public Works Board, Various Capital Projects, Ser A, RB | | | | | | | | |
| 4.000%, 04/01/17 | | | 500 | | | | 533 | |
| California State, Public Works Board, Various Capital Projects, Ser G-1, RB | | | | | | | | |
| Callable 10/01/19 @ 100 | | | | | | | | |
| 5.250%, 10/01/23 | | | 250 | | | | 291 | |
| California State, Ser E, GO | | | | | | | | |
| Callable 06/01/18 @ 100 | | | | | | | | |
| 0.953%, 04/02/15(A) | | | 1,000 | | | | 1,011 | |
| California Statewide, Communities Development Authority, RB | | | | | | | | |
| Callable 11/01/24 @ 100 | | | | | | | | |
| 5.000%, 11/01/25 | | | 350 | | | | 425 | |
| Description | | Face Amount (000) | | | Value (000) | |
| California Statewide, Communities Development Authority, RB | | | | | | |
| 1.375%, 04/01/28(A) | | $ | 500 | | | $ | 500 | |
| California Statewide, Communities Development Authority, Kaiser Permanente, Ser A, RB | | | | | | | | |
| 5.000%, 04/01/19 | | | 1,200 | | | | 1,378 | |
| California Statewide, Communities Development Authority, Kaiser Permanente, Ser B, RB | | | | | | | | |
| Callable 02/01/17 @ 100 | | | | | | | | |
| 0.970%, 04/02/15(A) | | | 2,000 | | | | 2,003 | |
| California Statewide, Communities Development Authority, Sutter Health, Ser A, RB | | | | | | | | |
| 5.000%, 08/15/18 | | | 200 | | | | 226 | |
| Carlsbad, Public Financing Authority, Municipal Golf Course Project, Ser A, RB, AMBAC | | | | | | | | |
| 4.500%, 09/01/16 | | | 350 | | | | 370 | |
| Chula Vista, Elementary School District, School Building Project, Ser A, COP, AGM | | | | | | | | |
| 5.000%, 09/01/22 | | | 1,000 | | | | 1,190 | |
| Chula Vista, Police Facility Project, COP | | | | | | | | |
| 5.000%, 10/01/21 | | | 360 | | | | 431 | |
| El Dorado, Irrigation District, Ser A, RB, AGM | | | | | | | | |
| 4.500%, 03/01/19 | | | 500 | | | | 562 | |
| Encinitas, Unified School District, GO, NATL | | | | | | | | |
| 0.793%, 08/01/17(C) | | | 500 | | | | 490 | |
| Fairfield County, Redevelopment Agency, TA | | | | | | | | |
| 4.000%, 08/01/17 | | | 2,630 | | | | 2,826 | |
| Gilroy, Public Facilities Fincancing Authority, RB | | | | | | | | |
| 5.000%, 11/01/21 | | | 940 | | | | 1,072 | |
| Golden State Tobacco Securitization, Ser A, RB | | | | | | | | |
| 5.000%, 06/01/19 | | | 1,000 | | | | 1,151 | |
| Golden State Tobacco Securitization, Ser A, RB | | | | | | | | |
| Callable 06/01/23 @ 100 | | | | | | | | |
| 5.000%, 06/01/30 | | | 1,075 | | | | 1,232 | |
| Hemet, Unified School District, GO, AGM | | | | | | | | |
| 4.000%, 08/01/24 | | | 500 | | | | 572 | |
See accompanying notes to financial statements.
CITY NATIONAL ROCHDALE FUNDS | PAGE 30
schedule of investments
March 31, 2015 (Unaudited)
City National Rochdale California Tax Exempt Bond Fund (continued)
| Description | | Face Amount (000) | | | Value (000) | |
| Jurupa, Unified School District, GO, AGM | | | | | | |
| 5.000%, 08/01/22 | | $ | 1,000 | | | $ | 1,210 | |
| Long Beach California, Harbor Revenue, Ser C, RB | | | | | | | | |
| 4.000%, 11/15/18 | | | 500 | | | | 554 | |
| Los Angeles County, Metropolitan Transportation Authority, Ser A, RB | | | | | | | | |
| 5.000%, 07/01/21 | | | 520 | | | | 628 | |
| Los Angeles, Department of Airports, Ser C, RB | | | | | | | | |
| 4.000%, 05/15/17 | | | 545 | | | | 585 | |
| Los Angeles, Department of Airports, Ser C, RB | | | | | | | | |
| 5.000%, 05/15/25 | | | 550 | | | | 684 | |
| Los Angeles, Department of Water & Power, Power Systems Revenue, Ser A, RB | | | | | | | | |
| 5.000%, 07/01/19 | | | 500 | | | | 580 | |
| Los Angeles, Department of Water & Power, Ser C, RB | | | | | | | | |
| 5.000%, 07/01/23 | | | 500 | | | | 621 | |
| Los Angeles, Municipal Improvement Authority, Capital Equipment, Ser A, RB | | | | | | | | |
| 4.000%, 11/01/19 | | | 575 | | | | 641 | |
| Los Angeles, Municipal Improvement Authority, Real Property, Ser E, RB | | | | | | | | |
| 5.000%, 09/01/15 | | | 275 | | | | 280 | |
| Los Angeles, Municipal Improvement Authority, Ser C, RB | | | | | | | | |
| 4.000%, 09/01/16 | | | 500 | | | | 524 | |
| Los Angeles, Ser A, GO | | | | | | | | |
| 5.000%, 09/01/21 | | | 240 | | | | 292 | |
| Los Angeles, Ser B, GO | | | | | | | | |
| Callable 09/01/21 @ 100 | | | | | | | | |
| 5.000%, 09/01/22 | | | 530 | | | | 644 | |
| Los Angeles, Unified School District, Election of 2005, Ser E, GO, AGM | | | | | | | | |
| Pre-Refunded @ 100 | | | | | | | | |
| 5.000%, 07/01/17(B) | | | 500 | | | | 548 | |
| Los Angeles, Unified School District, Headquarters Building Project, Ser A, COP | | | | | | | | |
| 5.000%, 10/01/20 | | | 1,000 | | | | 1,182 | |
| Los Angeles, Unified School District, Ser A, GO | | | | | | | | |
| 5.000%, 07/01/18 | | | 350 | | | | 395 | |
| Description | | Face Amount (000) | | | Value (000) | |
| Los Angeles, Unified School District, Ser B, GO, AMBAC | | | | | | |
| Callable 07/01/17 @ 100 | | | | | | |
| 5.000%, 07/01/19 | | $ | 2,000 | | | $ | 2,194 | |
| Merced, Irrigation District, Ser A, RB, AGM | | | | | | | | |
| 5.000%, 10/01/20 | | | 500 | | | | 590 | |
| Modesto, Irrigation District, Ser A, RB | | | | | | | | |
| 5.000%, 07/01/17 | | | 1,000 | | | | 1,096 | |
| Northern California, Power Agency, Hydroelectric Project Number 1, Ser C, RB | | | | | | | | |
| Callable 07/01/18 @ 100 | | | | | | | | |
| 5.000%, 07/01/20 | | | 500 | | | | 565 | |
| Oakland-Alameda County, Coliseum Authority, Ser A, RB | | | | | | | | |
| 5.000%, 02/01/20 | | | 820 | | | | 952 | |
| Orange County, Public Financing Authority, RB, NATL | | | | | | | | |
| 5.000%, 07/01/17 | | | 1,050 | | | | 1,147 | |
| Orange County, Sanitation District, Ser A, COP | | | | | | | | |
| 3.000%, 02/01/17 | | | 500 | | | | 521 | |
| Orange Redevelopment Agency Successor Agency, TA, AGM | | | | | | | | |
| 5.000%, 09/01/23 | | | 320 | | | | 385 | |
| Petaluma, Joint Unified High School District, Election of 2014, Ser A, GO | | | | | | | | |
| 4.000%, 08/01/18 | | | 595 | | | | 653 | |
| Port of Oakland, Ser B, RB, NATL | | | | | | | | |
| Callable 11/01/17 @ 100 | | | | | | | | |
| 5.000%, 11/01/23 | | | 500 | | | | 553 | |
| Port of Oakland, Ser C, RB, NATL | | | | | | | | |
| 5.000%, 11/01/15 | | | 450 | | | | 462 | |
| Riverside County, Public Safety Communication, Ser A, COP, AMBAC | | | | | | | | |
| 5.000%, 11/01/17 | | | 1,600 | | | | 1,754 | |
| Riverside, Public Financing Authority, Ser A, RB | | | | | | | | |
| 5.000%, 11/01/21 | | | 1,000 | | | | 1,165 | |
| Roseville, Finance Authority, RB | | | | | | | | |
| 4.000%, 02/01/18 | | | 500 | | | | 542 | |
| Sacramento County, Sanitation District Financing Authority, Sewer Revenue, Ser A, RB | | | | | | | | |
| 5.000%, 12/01/20 | | | 500 | | | | 600 | |
See accompanying notes to financial statements.
CITY NATIONAL ROCHDALE FUNDS | PAGE 31
schedule of investments
March 31, 2015 (Unaudited)
City National Rochdale California Tax Exempt Bond Fund (continued)
| Description | | Face Amount (000) | | | Value (000) | |
| Sacramento, Area Flood Control Agency, SAB, BAM | | | | | | |
| Callable 10/01/24 @ 100 | | | | | | |
| 5.000%, 10/01/30 | | $ | 250 | | | $ | 292 | |
| Sacramento, Area Flood Control Agency, Ser A, SAB, NATL | | | | | | | | |
| Callable 10/01/17 @ 100 | | | | | | | | |
| 5.000%, 10/01/21 | | | 400 | | | | 441 | |
| Sacramento, Financing Authority, EPA Building Project, Ser A, RB | | | | | | | | |
| 4.000%, 05/01/18 | | | 850 | | | | 926 | |
| Sacramento, Unified School District, Election of 2002, GO, NATL | | | | | | | | |
| Pre-Refunded @ 100 | | | | | | | | |
| 5.000%, 07/01/15(B) | | | 300 | | | | 304 | |
| San Francisco City & County, Airports Commission, Ser B, RB | | | | | | | | |
| 5.000%, 05/01/17 | | | 495 | | | | 541 | |
| San Francisco City & County, Multiple Capital Improvement Projects, Ser B, COP | | | | | | | | |
| Callable 04/01/19 @ 100 | | | | | | | | |
| 5.000%, 04/01/22 | | | 735 | | | | 838 | |
| San Francisco City & County, Public Utilities Commission Water Revenue, Ser A, RB | | | | | | | | |
| 5.000%, 11/01/20 | | | 250 | | | | 298 | |
| San Francisco City & County, Redevelopment Agency, Redevelopment Projects, Ser B, TA | | | | | | | | |
| 5.000%, 08/01/17 | | | 540 | | | | 587 | |
| San Francisco City & County, Redevelopment Agency, Redevelopment Projects, Ser B, TA, NATL | | | | | | | | |
| Callable 05/04/15 @ 100 | | | | | | | | |
| 5.250%, 08/01/18 | | | 600 | | | | 601 | |
| San Francisco, City & Open Space Fund, Various Park Projects, RB, NATL | | | | | | | | |
| Callable 05/04/15 @ 100 | | | | | | | | |
| 3.750%, 07/01/18 | | | 500 | | | | 501 | |
| San Marcos, Public Facilities Authority, Ser A, SPL Tax | | | | | | | | |
| 5.000%, 09/01/19 | | | 330 | | | | 379 | |
| San Mateo County, Joint Powers Financing Authority, Maple Street Project, RB | | | | | | | | |
| 3.000%, 06/15/17 | | | 1,000 | | | | 1,052 | |
| Description | | Face Amount (000) | | | Value (000) | |
| San Mateo County, Transportation Authority, Ser A, RB, NATL, ETM | | | | | | |
| 5.250%, 06/01/19 | | $ | 755 | | | $ | 882 | |
| San Pablo County, Redevelopment Agency, Ser A, TA, AGM | | | | | | | | |
| 5.000%, 06/15/21 | | | 480 | | | | 568 | |
| Santa Clara County, Financing Authority, Lease Revenue Capital Project, RB | | | | | | | | |
| 5.000%, 02/01/20 | | | 500 | | | | 583 | |
| Santa Cruz County, Redevelopment Agency, TA, BAM | | | | | | | | |
| 5.000%, 09/01/19 | | | 640 | | | | 738 | |
| Santa Rosa, Wastewater Revenue, Ser A, RB | | | | | | | | |
| 4.000%, 09/01/17 | | | 415 | | | | 447 | |
| Semitropic Improvement District, Ser A, RB, AGM | | | | | | | | |
| 5.000%, 12/01/25 | | | 500 | | | | 617 | |
| Southern California, Metropolitan Water District, Ser G-4, RB | | | | | | | | |
| Callable 07/01/19 @ 100 | | | | | | | | |
| 3.000%, 07/01/37(A) | | | 1,000 | | | | 1,074 | |
| Southern California, Public Power Authority, Ser A, RB | | | | | | | | |
| Callable 07/01/20 @ 100 | | | | | | | | |
| 5.000%, 07/01/27 | | | 1,065 | | | | 1,244 | |
| Southern California, Public Power Authority, Subordinated Southern Transmission Project, Ser A, RB | | | | | | | | |
| 5.000%, 07/01/17 | | | 1,375 | | | | 1,512 | |
| Turlock, Irrigation District, RB | | | | | | | | |
| 5.000%, 01/01/19 | | | 200 | | | | 228 | |
| Turlock, Irrigation District, Ser A, RB | | | | | | | | |
| 5.000%, 01/01/17 | | | 575 | | | | 618 | |
| University of California, Regents Medical Center Pooled Revenue, Ser J, RB | | | | | | | | |
| Callable 05/15/23 @ 100 | | | | | | | | |
| 5.000%, 05/15/26 | | | 500 | | | | 605 | |
| University of California, Revenues Limited Project, Ser E, RB | | | | | | | | |
| Callable 05/15/20 @ 100 | | | | | | | | |
| 5.000%, 05/15/22 | | | 500 | | | | 587 | |
See accompanying notes to financial statements.
CITY NATIONAL ROCHDALE FUNDS | PAGE 32
schedule of investments
March 31, 2015 (Unaudited)
City National Rochdale California Tax Exempt Bond Fund (concluded)
| Description | | Face Amount (000)/Shares | | | Value (000) | |
| Ventura County, Public Financing Authority, Ser 2008-3381X, RB | | | | | | |
| Callable 11/01/22 @ 100 | | | | | | |
| 0.060%, 04/02/15(A) (D) | | $ | 2,000 | | | $ | 2,000 | |
| Ventura County, Public Financing Authority, Ser A, RB | | | | | | | | |
| 4.000%, 11/01/18 | | | 500 | | | | 553 | |
| Ventura County, Public Financing Authority, Ser B, RB | | | | | | | | |
| 5.000%, 11/01/18 | | | 500 | | | | 569 | |
| Walnut, Energy Center Authority, RB | | | | | | | | |
| 5.000%, 01/01/19 | | | 300 | | | | 344 | |
| | | | | | | | | |
| Total California | | | | 88,226 | |
| | | | | | | | | |
| Connecticut [2.1%] | |
| Connecticut State, Ser A, GO | | | | | | | | |
| Callable 04/17/15 @ 100 | | | | | | | | |
| 1.370%, 04/02/15(A) | | | 1,000 | | | | 1,001 | |
| Connecticut State, Ser D, GO | | | | | | | | |
| 0.900%, 04/02/15(A) | | | 1,000 | | | | 1,013 | |
| | | | | | | | | |
| Total Connecticut | | | | 2,014 | |
| | | | | | | | | |
| Guam [0.6%] | |
| Territory of Guam, Ser A, RB | | | | | | | | |
| 5.000%, 01/01/17 | | | 500 | | | | 535 | |
| | | | | | | | | |
| Total Municipal Bonds | |
| (Cost $88,745) | | | | 90,775 | |
| | | | | | | | | |
| Short-Term Investment [5.1%] | |
| City National Rochdale California Tax Exempt Money Market Fund, Institutional Class, 0.010%**‡ | | | 4,867,761 | | | | 4,868 | |
| | | | | | | | | |
| Total Short-Term Investment | |
| (Cost $4,868) | | | | 4,868 | |
| | | | | | | | | |
| Total Investments [100.9%] | |
| (Cost $93,613) | | | $ | 95,643 | |
Percentages are based on Net Assets of $94,810 (000).
| ** | The rate reported is the 7-day effective yield as of March 31, 2015. |
| ‡ | Investment in Affiliate. |
| (A) | Floating Rate Security — The rate reported is the rate in effect on March 31, 2015. |
| (B) | Pre-Refunded Security — The maturity date shown is the pre-refunded date. |
| (C) | Zero coupon security. The rate reported is the effective yield at time of purchase. |
| (D) | Security exempt from registration under Rule 144A of the Securities Act of 1933. These securities may be resold in transactions exempt from registration normally to qualified institutions. On March 31, 2015, the value of these securities amounted to $2,000 (000), representing 2.1% of the net assets of the Fund. |
AGM — Assured Guarantee Municipal
AMBAC — American Municipal Bond Assurance Company
BAM — Build America Mutual
COP — Certificate of Participation
EPA — Environmental Protection Agency
ETM — Escrowed to Maturity
GO — General Obligation
NATL — National Public Finance Guarantee Corporation
RB — Revenue Bond
SAB — Special Assessment Board
Ser — Series
SPL Tax — Special Tax
TA — Tax Allocation
The following is a list of the inputs used as of March 31, 2015 in valuing the Fund’s investments carried at value (000):
| Investments in Securities | | Level 1 | | | Level 2 | | | Level 3 | | | Total | |
| Municipal Bonds | | $ | — | | | $ | 90,775 | | | $ | — | | | $ | 90,775 | |
| Short-Term Investment | | | 4,868 | | | | — | | | | — | | | | 4,868 | |
| Total Investments in Securities | | $ | 4,868 | | | $ | 90,775 | | | $ | — | | | $ | 95,643 | |
For the period ended March 31, 2015, there have been no transfers between any of the fair value hierarchy levels. Transfers between Levels are recognized at period end.
For more information on valuation inputs, see Note 2 — Significant Accounting Policies in the Notes to Financial Statements.
See accompanying notes to financial statements.
CITY NATIONAL ROCHDALE FUNDS | PAGE 33
schedule of investments
March 31, 2015 (Unaudited)
City National Rochdale Municipal High Income Fund
| Description | | Face Amount (000) | | | Value (000) | |
| Municipal Bonds [89.8%] | |
| Alabama [3.0%] | |
| Birmingham Water Works Board, Ser A, RB | | | | | | |
| Callable 01/01/25 @ 100 | | | | | | |
| 5.000%, 01/01/42 | | $ | 5,000 | | | $ | 5,661 | |
| Cullman County, Health Care Authority, Cullman Regional Medical Center Project, Ser A, RB | | | | | | | | |
| Callable 02/01/19 @ 100 | | | | | | | | |
| 7.000%, 02/01/36 | | | 4,315 | | | | 4,701 | |
| Jefferson County, Sewer Revenue, Sub-Ser D, RB | | | | | | | | |
| Callable 10/01/23 @ 105 | | | | | | | | |
| 6.000%, 10/01/42 | | | 4,000 | | | | 4,480 | |
| Jefferson County, Sewer Revenue, Sub-Ser D, RB | | | | | | | | |
| Callable 10/01/23 @ 105 | | | | | | | | |
| 6.500%, 10/01/53 | | | 2,000 | | | | 2,325 | |
| | | | | | | | | |
| Total Alabama | | | | 17,167 | |
| | | | | | | | | |
| Alaska [0.8%] | |
| Northern Tobacco Securitization, Ser A, RB | | | | | | | | |
| Callable 04/17/15 @ 100 | | | | | | | | |
| 5.000%, 06/01/46 | | | 6,000 | | | | 4,685 | |
| Description | | Face Amount (000) | | | Value (000) | |
| Arizona [0.5%] | |
| Pima County, Industrial Development Authority, Noah Webster School Project, RB | | | | | | |
| Callable 12/15/23 @ 100 | | | | | | |
| 7.000%, 12/15/43 | | $ | 1,500 | | | $ | 1,574 | |
| Pima County, Industrial Development Authority, Noah Webster School Project, Ser A, RB | | | | | | | | |
| Callable 05/04/15 @ 100 | | | | | | | | |
| 6.125%, 12/15/34 | | | 1,000 | | | | 969 | |
| | | | | | | | | |
| Total Arizona | | | | 2,543 | |
| | | | | | | | | |
| California [11.4%] | |
| Adelanto, Public Utility Authority, Utility System Project, Ser A, RB | | | | | | | | |
| Callable 07/01/19 @ 100 | | | | | | | | |
| 6.750%, 07/01/39 | | | 6,500 | | | | 7,428 | |
| California State, GO | | | | | | | | |
| Callable 12/01/23 @ 100 | | | | | | | | |
| 5.000%, 12/01/31 | | | 1,500 | | | | 1,758 | |
| California State, Pollution Control Financing Authority, San Diego Water Project, RB | | | | | | | | |
| Callable 07/01/17 @ 100 | | | | | | | | |
| 5.000%, 11/21/45(A) | | | 2,000 | | | | 2,083 | |
| California State, Public Works Board, Department of Corrections and Rehab Project, Ser A, RB | | | | | | | | |
| Callable 09/01/24 @ 100 | | | | | | | | |
| 5.000%, 09/01/31 | | | 5,000 | | | | 5,850 | |
| California State, Public Works Board, Various Capital Projects, Ser A, RB | | | | | | | | |
| Callable 04/01/22 @ 100 | | | | | | | | |
| 5.000%, 04/01/37 | | | 1,000 | | | | 1,117 | |
| California State, School Finance Authority, View Park Elementary & Middle School Project, Ser A, RB | | | | | | | | |
| Callable 10/01/24 @ 100 | | | | | | | | |
| 5.625%, 10/01/34 | | | 575 | | | | 590 | |
| California State, School Finance Authority, View Park Elementary & Middle School Project, Ser A, RB | | | | | | | | |
| Callable 10/01/24 @ 100 | | | | | | | | |
| 5.875%, 10/01/44 | | | 1,000 | | | | 1,027 | |
See accompanying notes to financial statements.
CITY NATIONAL ROCHDALE FUNDS | PAGE 34
schedule of investments
March 31, 2015 (Unaudited)
City National Rochdale Municipal High Income Fund (continued)
| Description | | Face Amount (000) | | | Value (000) | |
| California State, School Finance Authority, View Park Elementary & Middle School Project, Ser A, RB | | | | | | |
| Callable 10/01/24 @ 100 | | | | | | |
| 6.000%, 10/01/49 | | $ | 720 | | | $ | 738 | |
| Golden State Tobacco Securitization, Golden State Tobacco Settlement, Ser A, RB | | | | | | | | |
| Callable 06/01/15 @ 100 | | | | | | | | |
| 5.000%, 06/01/45 | | | 1,000 | | | | 1,008 | |
| Golden State Tobacco Securitization, Golden State Tobacco Settlement, Ser A-1, RB | | | | | | | | |
| Callable 06/01/17 @ 100 | | | | | | | | |
| 4.500%, 06/01/27 | | | 4,655 | | | | 4,511 | |
| Golden State Tobacco Securitization, Golden State Tobacco Settlement, Ser A-1, RB | | | | | | | | |
| Callable 06/01/17 @ 100 | | | | | | | | |
| 5.750%, 06/01/47 | | | 5,000 | | | | 4,215 | |
| Golden State Tobacco Securitization, Golden State Tobacco Settlement, Ser A-1, RB | | | | | | | | |
| Callable 06/01/17 @ 100 | | | | | | | | |
| 5.125%, 06/01/47 | | | 7,280 | | | | 5,603 | |
| Golden State Tobacco Securitization, Ser A, RB | | | | | | | | |
| Callable 06/01/25 @ 100 | | | | | | | | |
| 5.000%, 06/01/35 | | | 5,000 | | | | 5,714 | |
| Inland Empire Tobacco Securitization Authority, Ser A, RB | | | | | | | | |
| Callable 06/01/17 @ 100 | | | | | | | | |
| 4.625%, 06/01/21 | | | 5,000 | | | | 4,938 | |
| Lake Elsinore, Public Financing Authority, SAB | | | | | | | | |
| Callable 09/01/25 @ 100 | | | | | | | | |
| 5.000%, 09/01/35 | | | 2,650 | | | | 2,936 | |
| M-S-R Energy Authority, Ser C, RB | | | | | | | | |
| 7.000%, 11/01/34 | | | 2,500 | | | | 3,528 | |
| Palomar Pomerado Health Care District, COP | | | | | | | | |
| Callable 11/01/20 @ 100 | | | | | | | | |
| 6.000%, 11/01/30 | | | 3,920 | | | | 4,183 | |
| Description | | Face Amount (000) | | | Value (000) | |
| San Buenaventura, Community Memorial Health System Project, RB | | | | | | |
| Callable 12/01/21 @ 100 | | | | | | |
| 7.000%, 12/01/26 | | $ | 1,000 | | | $ | 1,225 | |
| San Buenaventura, Community Memorial Health System Project, RB | | | | | | | | |
| Callable 12/01/21 @ 100 | | | | | | | | |
| 7.500%, 12/01/41 | | | 1,000 | | | | 1,238 | |
| San Mateo, Community Facilities District, SAB | | | | | | | | |
| Callable 09/01/22 @ 100 | | | | | | | | |
| 5.500%, 09/01/44 | | | 1,000 | | | | 1,121 | |
| Southern California, Tobacco Securitization Authority, Ser A-1, RB | | | | | | | | |
| Callable 04/17/15 @ 100 | | | | | | | | |
| 5.000%, 06/01/37 | | | 3,000 | | | | 2,556 | |
| Southern California, Tobacco Securitization Authority, Ser A1-SNR, RB | | | | | | | | |
| Callable 04/17/15 @ 100 | | | | | | | | |
| 5.125%, 06/01/46 | | | 3,000 | | | | 2,483 | |
| | | | | | | | | |
| Total California | | | | 65,850 | |
| | | | | | | | | |
| Colorado [4.2%] | |
| Arkansas State, River Power Authority, Colorado Improvement Project, RB | | | | | | | | |
| Callable 10/01/20 @ 100 | | | | | | | | |
| 6.125%, 10/01/40 | | | 2,500 | | | | 2,885 | |
| Arkansas State, River Power Authority, Colorado Improvement Project, RB | | | | | | | | |
| Callable 10/01/18 @ 100 | | | | | | | | |
| 6.000%, 10/01/40 | | | 2,965 | | | | 3,242 | |
| Colorado State, Educational & Cultural Facilities Authority, RB | | | | | | | | |
| Callable 04/01/25 @ 100 | | | | | | | | |
| 5.125%, 04/01/35 | | | 1,515 | | | | 1,495 | |
| Colorado State, Educational & Cultural Facilities Authority, RB | | | | | | | | |
| Callable 04/01/25 @ 100 | | | | | | | | |
| 5.250%, 04/01/45 | | | 2,655 | | | | 2,616 | |
| Colorado State, Educational & Cultural Facilities Authority, Charter School Skyview Project, RB | | | | | | | | |
| Callable 07/01/24 @ 100 | | | | | | | | |
| 5.375%, 07/01/44(A) | | | 1,350 | | | | 1,409 | |
See accompanying notes to financial statements.
CITY NATIONAL ROCHDALE FUNDS | PAGE 35
schedule of investments
March 31, 2015 (Unaudited)
City National Rochdale Municipal High Income Fund (continued)
| Description | | Face Amount (000) | | | Value (000) | |
| Colorado State, Educational & Cultural Facilities Authority, Charter School Skyview Project, RB | | | | | | |
| Callable 07/01/24 @ 100 | | | | | | |
| 5.500%, 07/01/49(A) | | $ | 1,600 | | | $ | 1,669 | |
| Colorado State, High Performance Transportation Enterprise, US 36 & I-25 Managed Lanes Project, RB, AMT | | | | | | | | |
| Callable 01/01/23 @ 100 | | | | | | | | |
| 5.750%, 01/01/44 | | | 2,000 | | | | 2,156 | |
| Colorado State, Public Energy Authority, RB | | | | | | | | |
| 6.500%, 11/15/38 | | | 4,000 | | | | 5,503 | |
| Denver City & County, United Airlines Project, Ser A, RB, AMT | | | | | | | | |
| Callable 10/01/17 @ 100 | | | | | | | | |
| 5.250%, 10/01/32 | | | 1,000 | | | | 1,052 | |
| Regional Transportation District, Denver Transportaion Partners Project, RB | | | | | | | | |
| Callable 07/15/20 @ 100 | | | | | | | | |
| 6.000%, 01/15/41 | | | 1,000 | | | | 1,146 | |
| Wildgrass County, Metropolitan District, GO | | | | | | | | |
| Pre-Refunded @ 100 | | | | | | | | |
| 6.200%, 12/01/34(B) | | | 1,000 | | | | 1,080 | |
| | | | | | | | | |
| Total Colorado | | | | 24,253 | |
| | | | | | | | | |
| Delaware [1.2%] | |
| Delaware State, Economic Development Authority, Indian River Power Project, RB | | | | | | | | |
| Callable 10/01/20 @ 100 | | | | | | | | |
| 5.375%, 10/01/45 | | | 6,500 | | | | 7,149 | |
| | | | | | | | | |
| District of Columbia [0.4%] | |
| Metropolitan Washington, Airports Authority, Dulles Toll Road Revenue, Ser B, RB | | | | | | | | |
| Callable 10/01/28 @ 100 | | | | | | | | |
| 6.500%, 10/01/44(C) | | | 2,000 | | | | 2,159 | |
| Description | | Face Amount (000) | | | Value (000) | |
| Florida [7.2%] | |
| Alachua County, Health Facilities Authority, East Ridge Retirement Village Project, RB | | | | | | |
| Callable 11/15/24 @ 100 | | | | | | |
| 6.000%, 11/15/34 | | $ | 2,500 | | | $ | 2,729 | |
| Alachua County, Health Facilities Authority, East Ridge Retirement Village Project, RB | | | | | | | | |
| Callable 11/15/24 @ 100 | | | | | | | | |
| 6.250%, 11/15/44 | | | 1,000 | | | | 1,103 | |
| Brevard County, Industrial Development Authority, TUFF Florida Tech Project, RB | | | | | | | | |
| Callable 11/01/19 @ 100 | | | | | | | | |
| 6.750%, 11/01/39 | | | 745 | | | | 825 | |
| Capital Trust Agency, Silver Creek Street Project, Ser A, RB | | | | | | | | |
| Callable 01/01/21 @ 103 | | | | | | | | |
| 8.250%, 01/01/44 | | | 3,390 | | | | 3,651 | |
| Capital Trust Agency, Silver Creek Street Project, Ser A, RB | | | | | | | | |
| Callable 01/01/21 @ 103 | | | | | | | | |
| 8.250%, 01/01/49 | | | 1,000 | | | | 1,073 | |
| Florida State, Development Finance Corp., Renaissance Charter School Project, Ser A, RB | | | | | | | | |
| Callable 06/15/22 @ 100 | | | | | | | | |
| 6.125%, 06/15/43 | | | 1,000 | | | | 995 | |
| Florida State, Development Finance, RB | | | | | | | | |
| Callable 06/01/22 @ 103 | | | | | | | | |
| 7.000%, 06/01/35(A) | | | 1,350 | | | | 1,394 | |
| Florida State, Development Finance, RB | | | | | | | | |
| Callable 06/01/22 @ 103 | | | | | | | | |
| 7.000%, 06/01/45(A) | | | 2,500 | | | | 2,569 | |
| Florida State, Development Finance, Renaissance Charter School Project, Ser A, RB | | | | | | | | |
| Callable 06/15/24 @ 100 | | | | | | | | |
| 6.000%, 06/15/34 | | | 2,110 | | | | 2,123 | |
| Florida State, Development Finance, Renaissance Charter School Project, Ser A, RB | | | | | | | | |
| Callable 06/15/24 @ 100 | | | | | | | | |
| 6.125%, 06/15/44 | | | 3,000 | | | | 3,013 | |
See accompanying notes to financial statements.
CITY NATIONAL ROCHDALE FUNDS | PAGE 36
schedule of investments
March 31, 2015 (Unaudited)
City National Rochdale Municipal High Income Fund (continued)
| Description | | Face Amount (000) | | | Value (000) | |
| Florida State, Village Community Development District No. 10, SAB | | | | | | |
| Callable 05/01/23 @ 100 | | | | | | |
| 6.000%, 05/01/44 | | $ | 1,000 | | | $ | 1,170 | |
| Miami-Dade County, Industrial Development Authority, Pinecrest Academy Project, RB | | | | | | | | |
| Callable 09/15/24 @ 100 | | | | | | | | |
| 5.250%, 09/15/44 | | | 2,500 | | | | 2,619 | |
| Mid-Bay Bridge Authority, Ser A, RB | | | | | | | | |
| Callable 10/01/21 @ 100 | | | | | | | | |
| 7.250%, 10/01/34 | | | 5,200 | | | | 6,399 | |
| Osceola County, Poinciana Parkway Project, Ser A, RB | | | | | | | | |
| Callable 10/01/24 @ 100 | | | | | | | | |
| 5.375%, 10/01/47 | | | 5,000 | | | | 5,460 | |
| Palm Beach County, Health Facilities Authority, Sinai Residences Project, Ser A, RB | | | | | | | | |
| Callable 06/01/22 @ 102 | | | | | | | | |
| 7.250%, 06/01/34 | | | 500 | | | | 570 | |
| Palm Beach County, Health Facilities Authority, Sinai Residences Project, Ser A, RB | | | | | | | | |
| Callable 06/01/22 @ 102 | | | | | | | | |
| 7.500%, 06/01/49 | | | 2,000 | | | | 2,289 | |
| Saint Johns County, Industrial Development Authority, Presbyterian Retirement Project, Ser A, RB | | | | | | | | |
| Callable 08/01/20 @ 100 | | | | | | | | |
| 6.000%, 08/01/45 | | | 3,000 | | | | 3,396 | |
| | | | | | | | | |
| Total Florida | | | | 41,378 | |
| | | | | | | | | |
| Georgia [0.9%] | |
| Atlanta, Department of Aviation, Ser A, RB | | | | | | | | |
| Callable 01/01/24 @ 100 | | | | | | | | |
| 5.000%, 01/01/31 | | | 2,500 | | | | 2,903 | |
| DeKalb County, Hospital Authority, Dekalb Medical Center Project, RB | | | | | | | | |
| Callable 09/01/20 @ 100 | | | | | | | | |
| 6.125%, 09/01/40 | | | 1,000 | | | | 1,103 | |
| Description | | Face Amount (000) | | | Value (000) | |
| Savannah, Economic Development Authority, Marshes Skidaway Island Project, RB | | | | | | |
| Callable 01/01/24 @ 100 | | | | | | |
| 7.250%, 01/01/49 | | $ | 810 | | | $ | 926 | |
| | | | | | | | | |
| Total Georgia | | | | 4,932 | |
| | | | | | | | | |
| Guam [1.4%] | |
| Territory of Guam, Government Waterworks Authority, RB | | | | | | | | |
| Callable 07/01/20 @ 100 | | | | | | | | |
| 5.625%, 07/01/40 | | | 2,000 | | | | 2,244 | |
| Territory of Guam, Ser A, GO | | | | | | | | |
| Callable 11/15/19 @ 100 | | | | | | | | |
| 7.000%, 11/15/39 | | | 5,000 | | | | 5,864 | |
| | | | | | | | | |
| Total Guam | | | | 8,108 | |
| | | | | | | | | |
| Hawaii [0.5%] | |
| Hawaii State, Department of Budget & Finance, 15 Craigside Project, Ser A, RB | | | | | | | | |
| Callable 11/15/19 @ 100 | | | | | | | | |
| 8.750%, 11/15/29 | | | 2,450 | | | | 3,064 | |
| | | | | | | | | |
| Illinois [5.2%] | |
| Bridgeview Village, Ser A, GO | | | | | | | | |
| Callable 06/01/24 @ 100 | | | | | | | | |
| 5.500%, 12/01/43 | | | 4,880 | | | | 5,197 | |
| Chicago, Midway International Airport, Ser B, RB | | | | | | | | |
| Callable 01/01/24 @ 100 | | | | | | | | |
| 5.000%, 01/01/35 | | | 3,000 | | | | 3,372 | |
| Chicago, Midway International Airport, Ser B, RB | | | | | | | | |
| Callable 01/01/23 @ 100 | | | | | | | | |
| 5.000%, 01/01/35 | | | 2,000 | | | | 2,223 | |
| Chicago, Refunding Project, Ser A, GO, AGM | | | | | | | | |
| Callable 01/01/24 @ 100 | | | | | | | | |
| 5.250%, 01/01/31 | | | 1,000 | | | | 1,109 | |
| Illinois State, Finance Authority, Admiral at Lake Project, Ser A, RB | | | | | | | | |
| Callable 05/15/20 @ 100 | | | | | | | | |
| 8.000%, 05/15/40 | | | 4,000 | | | | 4,502 | |
| Illinois State, Finance Authority, Admiral at Lake Project, Ser A, RB | | | | | | | | |
| Callable 05/15/20 @ 100 | | | | | | | | |
| 8.000%, 05/15/46 | | | 1,825 | | | | 2,036 | |
See accompanying notes to financial statements.
CITY NATIONAL ROCHDALE FUNDS | PAGE 37
schedule of investments
March 31, 2015 (Unaudited)
City National Rochdale Municipal High Income Fund (continued)
| Description | | Face Amount (000) | | | Value (000) | |
| Illinois State, Finance Authority, Lutheran Home and Services Project, RB | | | | | | |
| Callable 05/15/22 @ 100 | | | | | | |
| 5.625%, 05/15/42 | | $ | 5,000 | | | $ | 5,264 | |
| Illinois State, Finance Authority, Roosevelt Universitiy Project, RB | | | | | | | | |
| Callable 10/01/19 @ 100 | | | | | | | | |
| 6.250%, 04/01/29 | | | 1,000 | | | | 1,127 | |
| Illinois State, Finance Authority, Roosevelt Universitiy Project, RB | | | | | | | | |
| Callable 10/01/19 @ 100 | | | | | | | | |
| 6.500%, 04/01/39 | | | 3,445 | | | | 3,891 | |
| Illinois State, Finance Authority, Three Crowns Park Plaza Project, Ser A, RB | | | | | | | | |
| Callable 02/15/16 @ 100 | | | | | | | | |
| 5.875%, 02/15/38 | | | 1,000 | | | | 1,006 | |
| Southwestern Illinois, Development Authority, Collinsville Project, RB | | | | | | | | |
| Callable 03/01/16 @ 100 | | | | | | | | |
| 5.350%, 03/01/31 | | | 450 | | | | 354 | |
| | | | | | | | | |
| Total Illinois | | | | 30,081 | |
| | | | | | | | | |
| Indiana [2.0%] | |
| Carmel, Barrington Carmel Project, Ser A, RB | | | | | | | | |
| Callable 11/15/22 @ 100 | | | | | | | | |
| 7.000%, 11/15/32 | | | 1,650 | | | | 1,845 | |
| Carmel, Barrington Carmel Project, Ser A, RB | | | | | | | | |
| Callable 11/15/22 @ 100 | | | | | | | | |
| 7.125%, 11/15/47 | | | 2,000 | | | | 2,222 | |
| Indiana State, Finance Authority, Ohio Valley Electric Corporation Project, Ser A, RB | | | | | | | | |
| Callable 06/01/22 @ 100 | | | | | | | | |
| 5.000%, 06/01/39 | | | 1,000 | | | | 1,069 | |
| Indianapolis, Ritter Affordable Assisted Living Project, RB | | | | | | | | |
| Callable 12/01/22 @ 102 | | | | | | | | |
| 6.900%, 12/01/33 | | | 4,000 | | | | 4,137 | |
| Terre Haute, Westminster Village Project, RB | | | | | | | | |
| Callable 08/01/22 @ 100 | | | | | | | | |
| 6.000%, 08/01/39 | | | 2,355 | | | | 2,371 | |
| | | | | | | | | |
| Total Indiana | | | | 11,644 | |
| Description | | Face Amount (000) | | | Value (000) | |
| Kansas [0.5%] | |
| Arkansas City, Public Building Commission, South Central Regional Medical Center, RB | | | | | | |
| Callable 09/01/19 @ 100 | | | | | | |
| 7.000%, 09/01/29 | | $ | 2,550 | | | $ | 2,810 | |
| | | | | | | | | |
| Kentucky [1.9%] | |
| Kentucky State, Economic Development Finance Authority, Owensboro Medical Health System Project, Ser A, RB | | | | | | | | |
| Callable 06/01/20 @ 100 | | | | | | | | |
| 6.375%, 06/01/40 | | | 1,000 | | | | 1,155 | |
| Kentucky State, Economic Development Finance Authority, Owensboro Medical Health System Project, Ser A, RB | | | | | | | | |
| Callable 06/01/20 @ 100 | | | | | | | | |
| 6.500%, 03/01/45 | | | 2,960 | | | | 3,414 | |
| Kentucky State, Public Transportation Infrastructure Authority, Downtown Crossing Project, RB | | | | | | | | |
| Callable 07/01/23 @ 100 | | | | | | | | |
| 5.750%, 07/01/49 | | | 5,650 | | | | 6,510 | |
| | | | | | | | | |
| Total Kentucky | | | | 11,079 | |
| | | | | | | | | |
| Louisiana [2.1%] | |
| Juban Crossing Economic Development District, General Infrastructure Project, Ser C, RB | | | | | | | | |
| Callable 03/15/25 @ 100 | | | | | | | | |
| 7.000%, 09/15/44(A) | | | 5,665 | | | | 5,765 | |
| Louisiana State, Public Facilities Authority, Pellets Inc. Project, RB, AMT | | | | | | | | |
| Callable 07/01/23 @ 100 | | | | | | | | |
| 10.500%, 07/01/39 | | | 1,000 | | | | 1,095 | |
| Louisiana State, Public Facilities Authority, Pellets Inc. Project, Ser A, RB, AMT | | | | | | | | |
| Callable 07/01/24 @ 100 | | | | | | | | |
| 8.375%, 07/01/39 | | | 5,000 | | | | 5,156 | |
| | | | | | | | | |
| Total Louisiana | | | | 12,016 | |
See accompanying notes to financial statements.
CITY NATIONAL ROCHDALE FUNDS | PAGE 38
schedule of investments
March 31, 2015 (Unaudited)
City National Rochdale Municipal High Income Fund (continued)
| Description | | Face Amount (000) | | | Value (000) | |
| Maryland [1.5%] | |
| Howard County, Annapolis Junction Town Center Project, TA | | | | | | |
| Callable 02/15/24 @ 100 | | | | | | |
| 5.800%, 02/15/34 | | $ | 725 | | | $ | 771 | |
| Howard County, Annapolis Junction Town Center Project, TA | | | | | | | | |
| Callable 02/15/24 @ 100 | | | | | | | | |
| 6.100%, 02/15/44 | | | 1,425 | | | | 1,514 | |
| Westminster, Luther Village Millers Grant Inc. Project, RB | | | | | | | | |
| Callable 07/01/24 @ 100 | | | | | | | | |
| 6.000%, 07/01/34 | | | 1,205 | | | | 1,296 | |
| Westminster, Luther Village Millers Grant Inc. Project, RB | | | | | | | | |
| Callable 07/01/24 @ 100 | | | | | | | | |
| 6.125%, 07/01/39 | | | 750 | | | | 799 | |
| Westminster, Luther Village Millers Grant Inc. Project, RB | | | | | | | | |
| Callable 07/01/24 @ 100 | | | | | | | | |
| 6.250%, 07/01/44 | | | 3,780 | | | | 4,051 | |
| | | | | | | | | |
| Total Maryland | | | | 8,431 | |
| | | | | | | | | |
| Massachusetts [0.9%] | |
| Massachusetts Port Authority, Ser B, RB, AMBAC, AMT | | | | | | | | |
| 0.155%, 01/01/31(D) | | | 6,000 | | | | 5,078 | |
| | | | | | | | | |
| Michigan [2.7%] | |
| Kent, Hospital Finance Authority, Metropolitan Hospital Project, Ser A, RB | | | | | | | | |
| Callable 07/01/15 @ 100 | | | | | | | | |
| 6.000%, 07/01/35 | | | 4,805 | | | | 4,857 | |
| Michigan State, Finance Authority, Old Redford School Project, Ser A, RB | | | | | | | | |
| Callable 12/01/20 @ 100 | | | | | | | | |
| 6.500%, 12/01/40 | | | 3,745 | | | | 3,826 | |
| Michigan State, Public Educational Facilities Authority, Old Redford Project, Ser A, RB | | | | | | | | |
| Callable 12/01/15 @ 100 | | | | | | | | |
| 5.875%, 12/01/30 | | | 2,000 | | | | 2,004 | |
| Michigan State, Tobacco Settlement Finance Authority, Ser A, RB | | | | | | | | |
| Callable 06/01/17 @ 100 | | | | | | | | |
| 5.125%, 06/01/22 | | | 2,990 | | | | 2,691 | |
| Description | | Face Amount (000) | | | Value (000) | |
| Michigan State, Tobacco Settlement Finance Authority, Turbo Project, Ser A, RB | | | | | | |
| Callable 06/01/18 @ 100 | | | | | | |
| 6.875%, 06/01/42 | | $ | 2,000 | | | $ | 1,984 | |
| | | | | | | | | |
| Total Michigan | | | | 15,362 | |
| | | | | | | | | |
| Missouri [1.2%] | |
| Kirkwood, Industrial Development Authority, Aberdeen Heights Project, Ser A, RB | | | | | | | | |
| Callable 05/15/20 @ 100 | | | | | | | | |
| 8.250%, 05/15/45 | | | 3,000 | | | | 3,460 | |
| Saint Joseph, Industrial Development Authority, Living Community Saint Joseph Project, RB | | | | | | | | |
| Callable 05/04/15 @ 100 | | | | | | | | |
| 7.000%, 08/15/32 | | | 1,000 | | | | 1,000 | |
| Saint Louis County, Lambert Airport Project, SAB | | | | | | | | |
| Callable 11/01/16 @ 105 | | | | | | | | |
| 9.000%, 11/01/31 | | | 2,500 | | | | 2,671 | |
| | | | | | | | | |
| Total Missouri | | | | 7,131 | |
| | | | | | | | | |
| Nebraska [1.2%] | |
| Central Plains Energy Project, Project #3, RB | | | | | | | | |
| Callable 09/01/22 @ 100 | | | | | | | | |
| 5.250%, 09/01/37 | | | 1,000 | | | | 1,116 | |
| Central Plains Energy Project, Project #3, RB | | | | | | | | |
| Callable 09/01/22 @ 100 | | | | | | | | |
| 5.000%, 09/01/42 | | | 5,500 | | | | 5,974 | |
| | | | | | | | | |
| Total Nebraska | | | | 7,090 | |
| | | | | | | | | |
| Nevada [0.6%] | |
| Clark County, Department of Aviation, Sub-Ser A-2, RB | | | | | | | | |
| Callable 07/01/24 @ 100 | | | | | | | | |
| 5.000%, 07/01/35 | | | 3,000 | | | | 3,396 | |
| | | | | | | | | |
| New Jersey [2.1%] | |
| New Jersey State, Economic Development Authority, Continental Airlines Project, RB, AMT | | | | | | | | |
| Callable 08/20/22 @ 101 | | | | | | | | |
| 5.250%, 09/15/29 | | | 1,000 | | | | 1,097 | |
See accompanying notes to financial statements.
CITY NATIONAL ROCHDALE FUNDS | PAGE 39
schedule of investments
March 31, 2015 (Unaudited)
City National Rochdale Municipal High Income Fund (continued)
| Description | | Face Amount (000) | | | Value (000) | |
| New Jersey State, Economic Development Authority, School Facilities Construction, Ser UU, RB | | | | | | |
| Callable 06/15/24 @ 100 | | | | | | |
| 5.000%, 06/15/40 | | $ | 5,000 | | | $ | 5,314 | |
| Tobacco Settlement Financing, Ser 1A, RB | | | | | | | | |
| Callable 06/01/17 @ 100 | | | | | | | | |
| 5.000%, 06/01/41 | | | 7,500 | | | | 5,740 | |
| | | | | | | | | |
| Total New Jersey | | | | 12,151 | |
| | | | | | | | | |
| New York [4.8%] | |
| Metropolitan Transportation Authority, Sub-Ser A-1, RB | | | | | | | | |
| Callable 05/15/25 @ 100 | | | | | | | | |
| 5.000%, 11/15/45 | | | 5,000 | | | | 5,693 | |
| Nassau County, Industrial Development Agency, Ser A, RB | | | | | | | | |
| Callable 01/01/25 @ 101 | | | | | | | | |
| 6.700%, 01/01/49 | | | 4,789 | | | | 4,839 | |
| Nassau County, Industrial Development Agency, Ser C, RB | | | | | | | | |
| Callable 01/01/18 @ 100 | | | | | | | | |
| 2.000%, 01/01/49 | | | 1,728 | | | | 138 | |
| New York City, Industrial Development Agency, American Airlines JFK International Airport Project, RB, AMT | | | | | | | | |
| Callable 08/01/16 @ 101 | | | | | | | | |
| 7.750%, 08/01/31(D) | | | 4,000 | | | | 4,364 | |
| New York Liberty Development, RB | | | | | | | | |
| Callable 11/15/24 @ 100 | | | | | | | | |
| 5.000%, 11/15/44(A) | | | 10,000 | | | | 10,514 | |
| Niagara, Tobacco Asset Securitization, RB | | | | | | | | |
| Callable 05/15/24 @ 100 | | | | | | | | |
| 5.250%, 05/15/34 | | | 1,000 | | | | 1,136 | |
| Niagara, Tobacco Asset Securitization, RB | | | | | | | | |
| Callable 05/15/24 @ 100 | | | | | | | | |
| 5.250%, 05/15/40 | | | 1,000 | | | | 1,127 | |
| | | | | | | | | |
| Total New York | | | | 27,811 | |
| Description | | Face Amount (000) | | | Value (000) | |
| North Carolina [0.3%] | |
| North Carolina State, Medical Care Commission, RB | | | | | | |
| Callable 09/01/24 @ 100 | | | | | | |
| 5.000%, 09/01/37 | | $ | 1,655 | | | $ | 1,672 | |
| | | | | | | | | |
| Ohio [3.5%] | |
| Muskingum County, Genesis Healthcare System Project, RB | | | | | | | | |
| Callable 02/15/23 @ 100 | | | | | | | | |
| 5.000%, 02/15/33 | | | 1,000 | | | | 1,059 | |
| Muskingum County, Hospital Facilities Authority, Genesis Healthcare Systems Project, RB | | | | | | | | |
| Callable 02/15/23 @ 100 | | | | | | | | |
| 5.000%, 02/15/44 | | | 1,000 | | | | 1,037 | |
| Muskingum County, Hospital Facilities Authority, Genesis Healthcare Systems Project, RB | | | | | | | | |
| Callable 02/15/23 @ 100 | | | | | | | | |
| 5.000%, 02/15/48 | | | 3,000 | | | | 3,094 | |
| Ohio State, Air Quality Development Authority, Pollution Control Firstenergy Project, Ser B, RB | | | | | | | | |
| 3.625%, 12/01/33(D) | | | 1,000 | | | | 1,043 | |
| Ohio State, Air Quality Development Authority, Pollution Control Firstenergy Project, Ser S, RB | | | | | | | | |
| 3.625%, 10/01/33(D) | | | 1,000 | | | | 1,042 | |
| Ohio State, Air Quality Development Authority, Ser E, RB | | | | | | | | |
| 5.625%, 10/01/19 | | | 3,350 | | | | 3,794 | |
| Ohio State, Water Development Authority, Pollution Control Firstenergy Project, Ser S, RB | | | | | | | | |
| 3.625%, 10/01/33(D) | | | 1,500 | | | | 1,562 | |
| Southeastern Ohio, Port Authority, Memorial Health System Project, RB | | | | | | | | |
| Callable 12/01/22 @ 100 | | | | | | | | |
| 6.000%, 12/01/42 | | | 7,000 | | | | 7,655 | |
| | | | | | | | | |
| Total Ohio | | | | 20,286 | |
See accompanying notes to financial statements.
CITY NATIONAL ROCHDALE FUNDS | PAGE 40
schedule of investments
March 31, 2015 (Unaudited)
City National Rochdale Municipal High Income Fund (continued)
| Description | | Face Amount (000) | | | Value (000) | |
| Pennsylvania [3.1%] | |
| Beaver County, Industrial Development Authority, Ser B, RB | | | | | | |
| 3.500%, 12/01/35(D) | | $ | 5,000 | | | $ | 5,184 | |
| Delaware County, Industrial Development Authority, Chester Community Charter School Project, Ser A, RB | | | | | | | | |
| Callable 08/15/20 @ 100 | | | | | | | | |
| 6.125%, 08/15/40 | | | 4,000 | | | | 4,148 | |
| Pennsylvania Turnpike Commission, Ser A, RB | | | | | | | | |
| Callable 12/01/24 @ 100 | | | | | | | | |
| 5.000%, 12/01/33 | | | 1,500 | | | | 1,723 | |
| Philadelphia, Authority for Industrial Development, Mariana Bracetti Academy, RB | | | | | | | | |
| Callable 12/15/21 @ 100 | | | | | | | | |
| 7.150%, 12/15/36 | | | 165 | | | | 184 | |
| Philadelphia, Hospitals & Higher Education Facilities Authority, Temple University Health Systems Project, Ser A, RB | | | | | | | | |
| Callable 07/01/22 @ 100 | | | | | | | | |
| 5.625%, 07/01/42 | | | 3,000 | | | | 3,206 | |
| Pottsville, Hospital Authority, Schuykill Health System Project, RB | | | | | | | | |
| Callable 07/01/24 @ 100 | | | | | | | | |
| 6.500%, 07/01/28 | | | 3,000 | | | | 3,297 | |
| | | | | | | | | |
| Total Pennsylvania | | | | 17,742 | |
| | | | | | | | | |
| Rhode Island [0.9%] | |
| Tobacco Settlement Financing, Ser A, RB | | | | | | | | |
| Callable 06/01/25 @ 100 | | | | | | | | |
| 5.000%, 06/01/35 | | | 2,500 | | | | 2,731 | |
| Tobacco Settlement Financing, Ser A, RB | | | | | | | | |
| Callable 06/01/25 @ 100 | | | | | | | | |
| 5.000%, 06/01/40 | | | 2,250 | | | | 2,427 | |
| | | | | | | | | |
| Total Rhode Island | | | | 5,158 | |
| | | | | | | | | |
| South Carolina [1.0%] | |
| South Carolina State, Public Service Authority, Ser E, RB | | | | | | | | |
| Callable 12/01/23 @ 100 | | | | | | | | |
| 5.500%, 12/01/53 | | | 5,000 | | | | 5,745 | |
| Description | | Face Amount (000) | | | Value (000) | |
| Tennessee [0.4%] | |
| Johnson City, Health & Educational Facilities Board, Mountain States Health Alliance Project, RB | | | | | | |
| Callable 07/01/20 @ 100 | | | | | | |
| 6.000%, 07/01/38 | | $ | 2,000 | | | $ | 2,287 | |
| | | | | | | | | |
| Texas [10.2%] | |
| Arlington, Higher Education Finance Corp., Universal Academy Project, Ser A, RB | | | | | | | | |
| Callable 03/01/24 @ 100 | | | | | | | | |
| 7.000%, 03/01/34 | | | 400 | | | | 422 | |
| Arlington, Higher Education Finance Corp., Universal Academy Project, Ser A, RB | | | | | | | | |
| Callable 03/01/24 @ 100 | | | | | | | | |
| 7.125%, 03/01/44 | | | 2,300 | | | | 2,454 | |
| Bexar County, Health Facilities Development Corp., Army Retirement Residence Project, RB | | | | | | | | |
| Callable 07/01/20 @ 100 | | | | | | | | |
| 6.200%, 07/01/45 | | | 3,250 | | | | 3,583 | |
| Celina, SAB | | | | | | | | |
| 5.375%, 09/01/28 | | | 400 | | | | 396 | |
| Celina, SAB | | | | | | | | |
| 5.500%, 09/01/32 | | | 250 | | | | 247 | |
| Celina, SAB | | | | | | | | |
| 5.875%, 09/01/40 | | | 600 | | | | 592 | |
| Central Texas, Regional Mobility Authority, Sub-Ser, RB | | | | | | | | |
| Callable 01/01/23 @ 100 | | | | | | | | |
| 5.000%, 01/01/33 | | | 1,000 | | | | 1,093 | |
| Central Texas, Regional Mobility Authority, Sub-Ser, RB | | | | | | | | |
| Callable 01/01/23 @ 100 | | | | | | | | |
| 5.000%, 01/01/42 | | | 1,000 | | | | 1,077 | |
| Grand Parkway Transportation, Toll Revenue, Sub-Ser B, RB | | | | | | | | |
| Callable 10/01/23 @ 100 | | | | | | | | |
| 5.000%, 04/01/53 | | | 2,000 | | | | 2,213 | |
| Hackberry, Public Improvement District #3, SAB | | | | | | | | |
| Callable 09/01/19 @ 103 | | | | | | | | |
| 6.750%, 09/01/28 | | | 500 | | | | 513 | |
| Hackberry, Public Improvement District #3, SAB | | | | | | | | |
| Callable 09/01/19 @ 103 | | | | | | | | |
| 7.000%, 09/01/33 | | | 475 | | | | 487 | |
See accompanying notes to financial statements.
CITY NATIONAL ROCHDALE FUNDS | PAGE 41
schedule of investments
March 31, 2015 (Unaudited)
City National Rochdale Municipal High Income Fund (continued)
| Description | | Face Amount (000) | | | Value (000) | |
| Hackberry, Public Improvement District #3, SAB | | | | | | |
| Callable 09/01/19 @ 103 | | | | | | |
| 6.625%, 09/01/37 | | $ | 450 | | | $ | 461 | |
| Hackberry, Public Improvement District #3, SAB | | | | | | | | |
| Callable 09/01/19 @ 103 | | | | | | | | |
| 6.750%, 09/01/44 | | | 525 | | | | 538 | |
| Houston, Airport System Revenue, United Airlines Project, RB, AMT | | | | | | | | |
| Callable 07/01/24 @ 100 | | | | | | | | |
| 5.000%, 07/01/29 | | | 3,000 | | | | 3,227 | |
| Houston, Higher Education Finance, Ser A, RB | | | | | | | | |
| Callable 05/15/21 @ 100 | | | | | | | | |
| 6.875%, 05/15/41 | | | 5,000 | | | | 6,132 | |
| Leander, Oak Creek Public Improvement District, SAB | | | | | | | | |
| Callable 09/01/19 @ 103 | | | | | | | | |
| 5.750%, 09/01/38 | | | 500 | | | | 503 | |
| Leander, Oak Creek Public Improvement District, SAB | | | | | | | | |
| Callable 09/01/19 @ 103 | | | | | | | | |
| 5.875%, 09/01/44 | | | 500 | | | | 503 | |
| Lubbock, Health Facilities Development, First Mortgage - Carillon Project, Ser A, RB | | | | | | | | |
| Callable 07/01/16 @ 101 | | | | | | | | |
| 6.500%, 07/01/26 | | | 430 | | | | 442 | |
| Lubbock, Health Facilities Development, First Mortgage - Carillon Project, Ser A, RB | | | | | | | | |
| Callable 07/01/16 @ 101 | | | | | | | | |
| 6.625%, 07/01/36 | | | 255 | | | | 261 | |
| North Texas, Tollway Authority, Convertible Capital Appreciation Project, Ser C, RB | | | | | | | | |
| Callable 09/01/31 @ 100 | | | | | | | | |
| 7.000%, 09/01/43(C) | | | 5,000 | | | | 4,599 | |
| Red River, Health Facilities Development, MRC Crossings Project, Ser B, RB | | | | | | | | |
| Callable 05/15/15 @ 100 | | | | | | | | |
| 5.000%, 11/15/19 | | | 1,075 | | | | 1,078 | |
| Sanger, Industrial Development Authority, Pellets Project, Ser B, RB, AMT | | | | | | | | |
| Callable 07/01/22 @ 100 | | | | | | | | |
| 8.000%, 07/01/38 | | | 5,000 | | | | 5,652 | |
| Description | | Face Amount (000) | | | Value (000) | |
| Tarrant County, Cultural Education Facilities Finance Corp., Buckingham Senior Living Community Project, RB | | | | | | |
| Callable 11/15/17 @ 100 | | | | | | |
| 5.750%, 11/15/37 | | $ | 6,000 | | | $ | 6,161 | |
| Tarrant County, Cultural Education Facilities Finance Corp., Trinity Basin Preparatory Project, Ser A, RB | | | | | | | | |
| Pre-Refunded @ 100 | | | | | | | | |
| 7.300%, 06/01/29(B) | | | 605 | | | | 743 | |
| Texas State, Municipal Gas Acquisition & Supply I, Ser D, RB | | | | | | | | |
| 6.250%, 12/15/26 | | | 3,575 | | | | 4,418 | |
| Texas State, Private Activity Bond Surface Transportation Corp., LBJ Infrastructure Project, RB | | | | | | | | |
| Callable 06/30/20 @ 100 | | | | | | | | |
| 7.000%, 06/30/40 | | | 3,500 | | | | 4,250 | |
| Texas State, Private Activity Bond Surface Transportation Corp., NTE Mobility Project, RB | | | | | | | | |
| Callable 12/31/19 @ 100 | | | | | | | | |
| 6.875%, 12/31/39 | | | 5,350 | | | | 6,412 | |
| | | | | | | | | |
| Total Texas | | | | 58,457 | |
| | | | | | | | | |
| Virginia [1.8%] | |
| James City County, Economic Development Authority, United Methodist Home Project, Ser A, RB | | | | | | | | |
| Callable 06/01/23 @ 100 | | | | | | | | |
| 6.000%, 06/01/43 | | | 4,690 | | | | 4,461 | |
| Virginia College Building Authority, Marymount University Project, Ser A, RB | | | | | | | | |
| Callable 07/01/25 @ 100 | | | | | | | | |
| 5.000%, 07/01/35 | | | 1,200 | | | | 1,275 | |
| Virginia College Building Authority, Marymount University Project, Ser A, RB | | | | | | | | |
| Callable 07/01/25 @ 100 | | | | | | | | |
| 5.000%, 07/01/45 | | | 3,110 | | | | 3,294 | |
See accompanying notes to financial statements.
CITY NATIONAL ROCHDALE FUNDS | PAGE 42
schedule of investments
March 31, 2015 (Unaudited)
City National Rochdale Municipal High Income Fund (continued)
| Description | | Face Amount (000) | | | Value (000) | |
| Virginia State, Small Business Financing Authority, Elizabeth River Project, RB, AMT | | | | | | |
| Callable 07/01/22 @ 100 | | | | | | |
| 6.000%, 01/01/37 | | $ | 1,000 | | | $ | 1,162 | |
| | | | | | | | | |
| Total Virginia | | | | 10,192 | |
| | | | | | | | | |
| Washington [0.7%] | |
| Washington State, Housing Finance Commission, Rockwood Retirement Community Project, RB | | | | | | | | |
| Callable 04/22/15 @ 100 | | | | | | | | |
| 5.375%, 01/01/20(A) | | | 2,000 | | | | 2,001 | |
| Washington State, Housing Finance Commission, Rockwood Retirement Community Project, RB | | | | | | | | |
| Callable 01/01/24 @ 100 | | | | | | | | |
| 7.500%, 01/01/49(A) | | | 2,000 | | | | 2,192 | |
| | | | | | | | | |
| Total Washington | | | | 4,193 | |
| | | | | | | | | |
| Wisconsin [5.3%] | |
| Public Finance Authority, Airport Facilities, Senior Trips Obligation Group Project, RB, AMT | | | | | | | | |
| Callable 07/01/22 @ 100 | | | | | | | | |
| 5.000%, 07/01/42 | | | 1,000 | | | | 1,066 | |
| Public Finance Authority, Coral Academy Project, RB | | | | | | | | |
| Callable 07/01/24 @ 100 | | | | | | | | |
| 5.375%, 07/01/34 | | | 2,000 | | | | 2,085 | |
| Public Finance Authority, Coral Academy Project, RB | | | | | | | | |
| Callable 07/01/24 @ 100 | | | | | | | | |
| 5.625%, 07/01/44 | | | 3,500 | | | | 3,676 | |
| Public Finance Authority, RB | | | | | | | | |
| Callable 09/01/24 @ 100 | | | | | | | | |
| 5.000%, 09/01/30(A) | | | 800 | | | | 822 | |
| Public Finance Authority, RB | | | | | | | | |
| Callable 09/01/24 @ 100 | | | | | | | | |
| 5.000%, 09/01/38(A) | | | 1,580 | | | | 1,589 | |
| Public Finance Authority, Las Ventanas Retirement Community Project, RB | | | | | | | | |
| Callable 10/01/20 @ 102 | | | | | | | | |
| 7.000%, 10/01/42 | | | 5,400 | | | | 5,446 | |
| Description | | Face Amount (000) | | | Value (000) | |
| Public Finance Authority, Ser A, RB | | | | | | |
| Callable 06/15/25 @ 100 | | | | | | |
| 5.500%, 06/15/35 | | $ | 3,000 | | | $ | 3,007 | |
| Public Finance Authority, Ser A, RB | | | | | | | | |
| Callable 06/15/25 @ 100 | | | | | | | | |
| 5.500%, 06/15/45 | | | 4,280 | | | | 4,218 | |
| Wisconsin State, Health & Educational Facilities Authority, RB | | | | | | | | |
| Callable 10/01/22 @ 102 | | | | | | | | |
| 5.500%, 10/01/49 | | | 2,500 | | | | 2,548 | |
| Wisconsin State, Health & Educational Facilities Authority, RB | | | | | | | | |
| Callable 12/01/22 @ 102 | | | | | | | | |
| 5.250%, 12/01/49 | | | 6,000 | | | | 6,139 | |
| | | | | | | | | |
| Total Wisconsin | | | | 30,596 | |
| | | | | | | | | |
| Puerto Rico [4.4%] | |
| Puerto Rico Commonwealth, Aqueduct & Sewer Authority, Ser A, RB | | | | | | | | |
| Callable 07/01/22 @ 100 | | | | | | | | |
| 5.250%, 07/01/24 | | | 2,590 | | | | 1,956 | |
| Puerto Rico Commonwealth, Aqueduct & Sewer Authority, Ser A, RB | | | | | | | | |
| Callable 07/01/22 @ 100 | | | | | | | | |
| 5.250%, 07/01/42 | | | 840 | | | | 557 | |
| Puerto Rico Commonwealth, Aqueduct & Sewer Authority, Ser Senior A, RB | | | | | | | | |
| Callable 07/01/18 @ 100 | | | | | | | | |
| 6.000%, 07/01/38 | | | 4,000 | | | | 2,770 | |
| Puerto Rico Commonwealth, Aqueduct & Sewer Authority, Ser Senior A, RB | | | | | | | | |
| Callable 07/01/18 @ 100 | | | | | | | | |
| 6.000%, 07/01/44 | | | 3,000 | | | | 2,040 | |
| Puerto Rico Commonwealth, Ser A, GO | | | | | | | | |
| Callable 07/01/20 @ 100 | | | | | | | | |
| 8.000%, 07/01/35 | | | 10,000 | | | | 8,200 | |
| Puerto Rico, Electric Power Authority, Ser A, RB | | | | | | | | |
| Callable 07/01/23 @ 100 | | | | | | | | |
| 7.000%, 07/01/33 | | | 1,440 | | | | 842 | |
See accompanying notes to financial statements.
CITY NATIONAL ROCHDALE FUNDS | PAGE 43
schedule of investments
March 31, 2015 (Unaudited)
City National Rochdale Municipal High Income Fund (concluded)
| Description | | Face Amount (000)/Shares | | | Value (000) | |
| Puerto Rico, Electric Power Authority, Ser A, RB | | | | | | |
| Callable 07/01/23 @ 100 | | | | | | |
| 7.000%, 07/01/40 | | $ | 1,000 | | | $ | 585 | |
| Puerto Rico, Electric Power Authority, Ser A, RB | | | | | | | | |
| Callable 07/01/22 @ 100 | | | | | | | | |
| 5.000%, 07/01/42 | | | 1,310 | | | | 766 | |
| Puerto Rico, Electric Power Authority, Ser WW, RB | | | | | | | | |
| Callable 07/01/18 @ 100 | | | | | | | | |
| 5.500%, 07/01/38 | | | 1,060 | | | | 620 | |
| Puerto Rico, Electric Power Authority, Ser XX, RB | | | | | | | | |
| Callable 07/01/20 @ 100 | | | | | | | | |
| 5.750%, 07/01/36 | | | 940 | | | | 550 | |
| Puerto Rico, Sales Tax Financing, Sub-Ser A, RB | | | | | | | | |
| Callable 02/01/20 @ 100 | | | | | | | | |
| 5.375%, 08/01/39 | | | 5,000 | | | | 2,988 | |
| Puerto Rico, Sales Tax Financing, Sub-Ser A, RB | | | | | | | | |
| Callable 08/01/19 @ 100 | | | | | | | | |
| 6.000%, 08/01/42 | | | 3,500 | | | | 2,188 | |
| Puerto Rico, Sales Tax Financing, Sub-Ser A, RB | | | | | | | | |
| Callable 08/01/19 @ 100 | | | | | | | | |
| 6.500%, 08/01/44 | | | 1,250 | | | | 800 | |
| Puerto Rico, Sales Tax Financing, Sub-Ser C, RB | | | | | | | | |
| Callable 08/01/20 @ 100 | | | | | | | | |
| 5.250%, 08/01/41 | | | 1,000 | | | | 593 | |
| | | | | | | | | |
| Total Puerto Rico | | | | 25,455 | |
| | | | | | | | | |
| Total Municipal Bonds | |
| (Cost $497,657) | | | | 517,151 | |
| | | | | | | | | |
| Short-Term Investments [12.5%] | |
| City National Rochdale Government Money Market Fund, Institutional Class, 0.010%**‡ | | | 38,476,491 | | | | 38,476 | |
| SEI Daily Income Trust Government Fund, Cl A, 0.020%** | | | 33,540,566 | | | | 33,541 | |
| | | | | | | | | |
| Total Short-Term Investments | |
| (Cost $72,017) | | | | 72,017 | |
| | | | | | | | | |
| Total Investments [102.3%] | |
| (Cost $569,674) | | | $ | 589,168 | |
Percentages are based on Net Assets of $576,072 (000).
| ** | The rate reported is the 7-day effective yield as of March 31, 2015. |
| ‡ | Investment in Affiliate. |
| (A) | Security exempt from registration under Rule 144A of the Securities Act of 1933. These securities may be resold in transactions exempt from registration normally to qualified institutions. On March 31, 2015, the value of these securities amounted to $32,007 (000), representing 5.6% of the net assets of the Fund. |
| (B) | Pre-Refunded Security — The maturity date shown is the pre-refunded date. |
| (C) | Step Bond — The rate reported is the rate in effect on March 31, 2015. The coupon on a step bond changes on a specific date. |
| (D) | Floating Rate Security — The rate reported is the rate in effect on March 31, 2015. |
AGM — Assured Guarantee Municipal
AMBAC — American Municipal Bond Assurance Company
AMT — Alternative Minimum Tax (subject to)
Cl — Class
COP — Certificate of Participation
GO — General Obligation
RB — Revenue Bond
SAB — Special Assessment Board
Ser — Series
TA — Tax Allocation
The following is a list of the inputs used as of March 31, 2015 in valuing the Fund’s investments carried at value (000):
| Investments in Securities | | Level 1 | | | Level 2 | | | Level 3 | | | Total | |
| Municipal Bonds | | $ | — | | | $ | 517,151 | | | $ | — | | | $ | 517,151 | |
| Short-Term Investments | | | 72,017 | | | | — | | | | — | | | | 72,017 | |
| Total Investments in Securities | | $ | 72,017 | | | $ | 517,151 | | | $ | — | | | $ | 589,168 | |
For the period ended March 31, 2015, there have been no transfers between any of the fair value hierarchy levels. Transfers between Levels are recognized at period end.
For more information on valuation inputs, see Note 2 — Significant Accounting Policies in the Notes to Financial Statements.
See accompanying notes to financial statements.
CITY NATIONAL ROCHDALE FUNDS | PAGE 44
schedule of investments
March 31, 2015 (Unaudited)
City National Rochdale High Yield Bond Fund
| Description | | Face Amount (000) | | | Value (000) | |
| Corporate Bonds [86.9%] | |
| Advertising Agencies [1.5%] | |
| MDC Partners | | | | | | |
| 6.750%, 04/01/20(A) | | $ | 1,450 | | | $ | 1,528 | |
| | | | | | | | | |
| Aerospace & Defense [0.5%] | |
| LMI Aerospace | | | | | | | | |
| 7.375%, 07/15/19(A) | | | 350 | | | | 353 | |
| Moog | | | | | | | | |
| 5.250%, 12/01/22(A) | | | 150 | | | | 155 | |
| | | | | | | | | |
| Total Aerospace & Defense | | | | 508 | |
| | | | | | | | | |
| Air Transportation [1.1%] | |
| CEVA Group | | | | | | | | |
| 7.000%, 03/01/21(A) | | | 1,100 | | | | 1,067 | |
| | | | | | | | | |
| Airlines [0.1%] | |
| Continental Airlines, Ser 2009-2, Cl B | | | | | | | | |
| 9.250%, 05/10/17 | | | 98 | | | | 108 | |
| | | | | | | | | |
| Automotive [0.7%] | |
| Midas Intermediate Holdco II | | | | | | | | |
| 7.875%, 10/01/22(A) | | | 675 | | | | 663 | |
| | | | | | | | | |
| Broadcasting & Cable [1.8%] | |
| CSC Holdings | | | | | | | | |
| 5.250%, 06/01/24(A) | | | 200 | | | | 204 | |
| Description | | Face Amount (000) | | | Value (000) | |
| DISH DBS | | | | | | |
| 5.875%, 07/15/22 | | $ | 600 | | | $ | 610 | |
| 5.875%, 11/15/24 | | | 100 | | | | 100 | |
| Unitymedia Hessen GmbH & KG | | | | | | | | |
| 5.000%, 01/15/25(A) | | | 650 | | | | 656 | |
| Unitymedia KabelBW GmbH | | | | | | | | |
| 6.125%, 01/15/25(A) | | | 200 | | | | 212 | |
| | | | | | | | | |
| Total Broadcasting & Cable | | | | 1,782 | |
| | | | | | | | | |
| Building & Construction [0.8%] | |
| Dycom Investments | | | | | | | | |
| 7.125%, 01/15/21 | | | 300 | | | | 314 | |
| Reliance Intermediate Holdings | | | | | | | | |
| 6.500%, 04/01/23(A) | | | 500 | | | | 514 | |
| | | | | | | | | |
| Total Building & Construction | | | | 828 | |
| | | | | | | | | |
| Business Services [0.7%] | |
| FTI Consulting | | | | | | | | |
| 6.000%, 11/15/22 | | | 700 | | | | 736 | |
| | | | | | | | | |
| Coal Mining [1.1%] | |
| CONSOL Energy | | | | | | | | |
| 8.000%, 04/01/23(A) | | | 700 | | | | 686 | |
| 5.875%, 04/15/22 | | | 450 | | | | 407 | |
| | | | | | | | | |
| Total Coal Mining | | | | 1,093 | |
| | | | | | | | | |
| Commercial Serv-Finance [0.5%] | |
| WEX | | | | | | | | |
| 4.750%, 02/01/23(A) | | | 550 | | | | 546 | |
| | | | | | | | | |
| Computer Graphics [0.4%] | |
| Epicor Software | | | | | | | | |
| 8.625%, 05/01/19 | | | 400 | | | | 418 | |
| | | | | | | | | |
| Computer System Design & Services [1.5%] | |
| Brocade Communications Systems | | | | | | | | |
| 4.625%, 01/15/23 | | | 450 | | | | 449 | |
| NCR | | | | | | | | |
| 6.375%, 12/15/23 | | | 400 | | | | 426 | |
| 5.875%, 12/15/21 | | | 600 | | | | 626 | |
| | | | | | | | | |
| Total Computer System Design & Services | | | | 1,501 | |
| | | | | | | | | |
| Consumer Products & Services [3.5%] | |
| Central Garden and Pet | | | | | | | | |
| 8.250%, 03/01/18 | | | 1,955 | | | | 2,000 | |
See accompanying notes to financial statements.
CITY NATIONAL ROCHDALE FUNDS | PAGE 45
schedule of investments
March 31, 2015 (Unaudited)
City National Rochdale High Yield Bond Fund (continued)
| Description | | Face Amount(1) (000) | | | Value (000) | |
| WMG Acquisition | | | | | | |
| 6.750%, 04/15/22(A) | | $ | 550 | | | $ | 521 | |
| 6.000%, 01/15/21(A) | | | 993 | | | | 1,013 | |
| | | | | | | | | |
| Total Consumer Products & Services | | | | 3,534 | |
| | | | | | | | | |
| Containers & Packaging [0.9%] | |
| Novelis | | | | | | | | |
| 8.750%, 12/15/20 | | | 850 | | | | 911 | |
| | | | | | | | | |
| Data Processing/Mgmt [0.5%] | |
| First Data | | | | | | | | |
| 8.750%, 01/15/22(A) (B) | | | 460 | | | | 495 | |
| | | | | | | | | |
| Distribution/Wholesale [0.3%] | |
| VWR Funding | | | | | | | | |
| 4.625%, 04/15/22(A) | | EUR 300 | | | | 318 | |
| | | | | | | | | |
| Diversified Operations [0.8%] | |
| Amsted Industries | | | | | | | | |
| 5.375%, 09/15/24(A) | | | 150 | | | | 150 | |
| 5.000%, 03/15/22(A) | | | 650 | | | | 654 | |
| | | | | | | | | |
| Total Diversified Operations | | | | 804 | |
| | | | | | | | | |
| Drugs [1.3%] | |
| Valeant Pharmaceuticals International | | | | | | | | |
| 5.500%, 03/01/23(A) | | | 250 | | | | 252 | |
| VRX Escrow | | | | | | | | |
| 5.375%, 03/15/20(A) | | | 1,000 | | | | 1,009 | |
| | | | | | | | | |
| Total Drugs | | | | 1,261 | |
| | | | | | | | | |
| E-Commerce/Services [0.9%] | |
| IAC | | | | | | | | |
| 4.750%, 12/15/22 | | | 900 | | | | 893 | |
| | | | | | | | | |
| Electric Utilities [1.2%] | |
| AES | | | | | | | | |
| 7.375%, 07/01/21 | | | 750 | | | | 833 | |
| 3.234%, 06/01/19(C) | | | 350 | | | | 348 | |
| | | | | | | | | |
| Total Electric Utilities | | | | 1,181 | |
| | | | | | | | | |
| Energy & Power [1.6%] | |
| ContourGlobal Power Holdings | | | | | | | | |
| 7.125%, 06/01/19(A) | | | 1,250 | | | | 1,275 | |
| Description | | Face Amount (000) | | | Value (000) | |
| TerraForm Power Operating | | | | | | |
| 5.875%, 02/01/23(A) | | $ | 350 | | | $ | 363 | |
| | | | | | | | | |
| Total Energy & Power | | | | 1,638 | |
| | | | | | | | | |
| Engines-Internal Combust [0.9%] | |
| Briggs & Stratton | | | | | | | | |
| 6.875%, 12/15/20 | | | 800 | | | | 877 | |
| | | | | | | | | |
| Enterprise Software/Serv [2.1%] | |
| Eagle Midco | | | | | | | | |
| 9.000%, 06/15/18(A) | | | 950 | | | | 968 | |
| Infor US | | | | | | | | |
| 6.500%, 05/15/22(A) | | | 700 | | | | 718 | |
| Open Text | | | | | | | | |
| 5.625%, 01/15/23(A) | | | 400 | | | | 415 | |
| | | | | | | | | |
| Total Enterprise Software/Serv | | | | 2,101 | |
| | | | | | | | | |
| Entertainment & Gaming [1.5%] | |
| Buffalo Thunder Development Authority | | | | | | | | |
| 11.000%, 12/09/22(A) (H) | | | 35 | | | | 30 | |
| 0.000%, 11/15/29(A) (E) (H) | | | 16 | | | | — | |
| Inn of the Mountain Gods Resort & Casino | | | | | | | | |
| 9.250%, 11/30/20(A) (D) (H) | | | 99 | | | | 92 | |
| Mashantucket Western Pequot Tribe | | | | | | | | |
| 6.500%, 07/01/36 (H) | | | 80 | | | | — | |
| Seminole Hard Rock Entertainment | | | | | | | | |
| 5.875%, 05/15/21(A) | | | 200 | | | | 201 | |
| Speedway Motorsports | | | | | | | | |
| 5.125%, 02/01/23(A) | | | 50 | | | | 51 | |
| Wynn Las Vegas | | | | | | | | |
| 5.500%, 03/01/25(A) | | | 1,100 | | | | 1,114 | |
| | | | | | | | | |
| Total Entertainment & Gaming | | | | 1,488 | |
| | | | | | | | | |
| Financial Services [5.3%] | |
| Credit Acceptance | | | | | | | | |
| 6.125%, 02/15/21 | | | 1,400 | | | | 1,340 | |
| Icahn Enterprises | | | | | | | | |
| 5.875%, 02/01/22 | | | 1,150 | | | | 1,185 | |
| Jefferies Finance | | | | | | | | |
| 7.500%, 04/15/21(A) | | | 1,000 | | | | 965 | |
| 7.375%, 04/01/20(A) | | | 495 | | | | 480 | |
| Jefferies LoanCore | | | | | | | | |
| 6.875%, 06/01/20(A) | | | 450 | | | | 417 | |
See accompanying notes to financial statements.
CITY NATIONAL ROCHDALE FUNDS | PAGE 46
schedule of investments
March 31, 2015 (Unaudited)
City National Rochdale High Yield Bond Fund (continued)
| Description | | Face Amount (000) | | | Value (000) | |
| Oxford Finance | | | | | | |
| 7.250%, 01/15/18(A) | | $ | 950 | | | $ | 979 | |
| | | | | | | | | |
| Total Financial Services | | | | 5,366 | |
| | | | | | | | | |
| Food, Beverage & Tobacco [3.1%] | |
| Bumble Bee Holdings | | | | | | | | |
| 9.000%, 12/15/17(A) | | | 923 | | | | 969 | |
| Darling Ingredients | | | | | | | | |
| 5.375%, 01/15/22 | | | 300 | | | | 302 | |
| Le-Nature’s | | | | | | | | |
| 9.000%, 06/15/13(A) (E) (G) (H) | | | 150 | | | | — | |
| Vector Group | | | | | | | | |
| 7.750%, 02/15/21 | | | 1,750 | | | | 1,862 | |
| | | | | | | | | |
| Total Food, Beverage & Tobacco | | | | 3,133 | |
| | | | | | | | | |
| Food-Wholesale/Distrib [1.5%] | |
| American Seafoods Group | | | | | | | | |
| 10.750%, 05/15/16(A) (H) | | | 350 | | | | 328 | |
| KeHE Distributors | | | | | | | | |
| 7.625%, 08/15/21(A) | | | 1,100 | | | | 1,167 | |
| | | | | | | | | |
| Total Food-Wholesale/Distrib | | | | 1,495 | |
| | | | | | | | | |
| Gas-Distribution [1.2%] | |
| LBC Tank Terminals Holding Netherlands | | | | | | | | |
| 6.875%, 05/15/23(A) | | | 1,200 | | | | 1,227 | |
| | | | | | | | | |
| Gold Mining [0.8%] | |
| Eldorado | | | | | | | | |
| 6.125%, 12/15/20(A) | | | 800 | | | | 778 | |
| | | | | | | | | |
| Hazardous Waste Disposal [0.3%] | |
| Clean Harbors | | | | | | | | |
| 5.125%, 06/01/21 | | | 300 | | | | 305 | |
| | | | | | | | | |
| Industrial [1.3%] | |
| Penske Truck Leasing Lp | | | | | | | | |
| 3.375%, 02/01/22(A) | | | 250 | | | | 249 | |
| Unifrax I | | | | | | | | |
| 7.500%, 02/15/19(A) | | | 1,025 | | | | 1,030 | |
| | | | | | | | | |
| Total Industrial | | | | 1,279 | |
| | | | | | | | | |
| Insurance [2.7%] | |
| American Equity Investment Life Holding | | | | | | | | |
| 6.625%, 07/15/21 | | | 1,050 | | | | 1,126 | |
| Description | | Face Amount (000) | | | Value (000) | |
| Fidelity & Guaranty Life Holdings | | | | | | |
| 6.375%, 04/01/21(A) | | $ | 425 | | | $ | 446 | |
| Ironshore Holdings US | | | | | | | | |
| 8.500%, 05/15/20(A) | | | 950 | | | | 1,154 | |
| | | | | | | | | |
| Total Insurance | | | | 2,726 | |
| | | | | | | | | |
| Internet Connectiv Svcs [0.3%] | |
| Cogent Communications Group | | | | | | | | |
| 5.375%, 03/01/22(A) | | | 300 | | | | 299 | |
| | | | | | | | | |
| Internet Security [0.2%] | |
| VeriSign | | | | | | | | |
| 5.250%, 04/01/25(A) | | | 150 | | | | 153 | |
| | | | | | | | | |
| Investment Banks [1.7%] | |
| Bank of America | | | | | | | | |
| 6.250%, 09/29/49(C) | | | 500 | | | | 509 | |
| Citigroup | | | | | | | | |
| 6.300%, 12/29/49(C) | | | 400 | | | | 409 | |
| Royal Bank of Scotland Group | | | | | | | | |
| 1.197%, 03/01/17(C) | | | 800 | | | | 803 | |
| | | | | | | | | |
| Total Investment Banks | | | | 1,721 | |
| | | | | | | | | |
| Machinery [0.4%] | |
| Tempel Steel | | | | | | | | |
| 12.000%, 08/15/16(A) | | | 500 | | | | 424 | |
| | | | | | | | | |
| Medical Products & Services [1.7%] | |
| Halyard Health | | | | | | | | |
| 6.250%, 10/15/22(A) | | | 400 | | | | 419 | |
| Physio-Control International | | | | | | | | |
| 9.875%, 01/15/19(A) | | | 1,200 | | | | 1,275 | |
| | | | | | | | | |
| Total Medical Products & Services | | | | 1,694 | |
| | | | | | | | | |
| Metal-Copper [1.2%] | |
| KGHM International | | | | | | | | |
| 7.750%, 06/15/19(A) | | | 1,200 | | | | 1,236 | |
| | | | | | | | | |
| Metals & Mining [0.5%] | |
| Kaiser Aluminum | | | | | | | | |
| 8.250%, 06/01/20 | | | 500 | | | | 545 | |
| | | | | | | | | |
| Miscellaneous Business Services [2.0%] | |
| ADT | | | | | | | | |
| 6.250%, 10/15/21 | | | 400 | | | | 426 | |
| 3.500%, 07/15/22 | | | 200 | | | | 182 | |
See accompanying notes to financial statements.
CITY NATIONAL ROCHDALE FUNDS | PAGE 47
schedule of investments
March 31, 2015 (Unaudited)
City National Rochdale High Yield Bond Fund (continued)
| Description | | Face Amount (000) | | | Value (000) | |
| Sitel | | | | | | |
| 11.000%, 08/01/17(A) | | $ | 1,375 | | | $ | 1,423 | |
| | | | | | | | | |
| Total Miscellaneous Business Services | | | | 2,031 | |
| | | | | | | | | |
| Motion Pictures and Services [0.1%] | |
| DreamWorks Animation SKG | | | | | | | | |
| 6.875%, 08/15/20(A) | | | 150 | | | | 146 | |
| | | | | | | | | |
| Office Automation and Equip [0.4%] | |
| Xerox | | | | | | | | |
| 2.750%, 09/01/20 | | | 450 | | | | 449 | |
| | | | | | | | | |
| Oil-Field Services [1.1%] | |
| Exterran Holdings | | | | | | | | |
| 7.250%, 12/01/18 | | | 550 | | | | 555 | |
| FTS International | | | | | | | | |
| 6.250%, 05/01/22(A) | | | 700 | | | | 514 | |
| | | | | | | | | |
| Total Oil-Field Services | | | | 1,069 | |
| | | | | | | | | |
| Oil-US Royalty Trusts [0.2%] | |
| IronGate Energy Services | | | | | | | | |
| 11.000%, 07/01/18(A) (H) | | | 275 | | | | 182 | |
| | | | | | | | | |
| Paper & Related Products [2.1%] | |
| Argos Merger Sub | | | | | | | | |
| 7.125%, 03/15/23(A) | | | 300 | | | | 311 | |
| Opal Acquisition | | | | | | | | |
| 8.875%, 12/15/21(A) | | | 1,800 | | | | 1,831 | |
| | | | | | | | | |
| Total Paper & Related Products | | | | 2,142 | |
| | | | | | | | | |
| Petrochemicals [1.0%] | |
| TPC Group | | | | | | | | |
| 8.750%, 12/15/20(A) | | | 1,045 | | | | 956 | |
| | | | | | | | | |
| Petroleum & Fuel Products [10.6%] | |
| Antero Resources | | | | | | | | |
| 5.625%, 06/01/23(A) | | | 350 | | | | 346 | |
| 5.125%, 12/01/22 | | | 350 | | | | 336 | |
| Atlas Energy Holdings Operating | | | | | | | | |
| 9.250%, 08/15/21 | | | 875 | | | | 604 | |
| 7.750%, 01/15/21 | | | 975 | | | | 663 | |
| BreitBurn Energy Partners | | | | | | | | |
| 7.875%, 04/15/22 | | | 1,400 | | | | 1,008 | |
| Comstock Resources | | | | | | | | |
| 10.000%, 03/15/20(A) | | | 750 | | | | 726 | |
| Crestwood Midstream Partners | | | | | | | | |
| 6.125%, 03/01/22 | | | 550 | | | | 554 | |
| Description | | Face Amount (000) | | | Value (000) | |
| Endeavor Energy Resources | | | | | | |
| 7.000%, 08/15/21(A) | | $ | 250 | | | $ | 241 | |
| Legacy Reserves | | | | | | | | |
| 8.000%, 12/01/20 | | | 760 | | | | 623 | |
| 6.625%, 12/01/21 | | | 750 | | | | 592 | |
| Milagro Oil & Gas | | | | | | | | |
| 10.500%, 05/15/16(E) (H) | | | 400 | | | | 232 | |
| Precision Drilling | | | | | | | | |
| 6.625%, 11/15/20 | | | 475 | | | | 448 | |
| QEP Resources | | | | | | | | |
| 5.250%, 05/01/23 | | | 300 | | | | 294 | |
| Regency Energy Partners | | | | | | | | |
| 8.375%, 06/01/19(A) | | | 455 | | | | 477 | |
| Sabine Pass Liquefaction | | | | | | | | |
| 5.750%, 05/15/24 | | | 1,000 | | | | 1,005 | |
| 5.625%, 04/15/23 | | | 200 | | | | 199 | |
| 5.625%, 03/01/25(A) | | | 300 | | | | 297 | |
| SandRidge Energy | | | | | | | | |
| 8.125%, 10/15/22 | | | 1,000 | | | | 614 | |
| Ultra Petroleum | | | | | | | | |
| 5.750%, 12/15/18(A) | | | 700 | | | | 632 | |
| Unit | | | | | | | | |
| 6.625%, 05/15/21 | | | 850 | | | | 799 | |
| | | | | | | | | |
| Total Petroleum & Fuel Products | | | | 10,690 | |
| | | | | | | | | |
| Phys Therapy/Rehab Cntrs [0.3%] | |
| HealthSouth | | | | | | | | |
| 5.125%, 03/15/23 | | | 250 | | | | 254 | |
| | | | | | | | | |
| Printing & Publishing [0.0%] | |
| Expo Event Transco | | | | | | | | |
| 9.000%, 06/15/21(A) | | | 10 | | | | 10 | |
| | | | | | | | | |
| Property/Casualty Ins [0.8%] | |
| Lancashire Holdings | | | | | | | | |
| 5.700%, 10/01/22(A) | | | 480 | | | | 526 | |
| QBE Capital Funding III | | | | | | | | |
| 7.250%, 05/24/41(A) (C) | | | 250 | | | | 278 | |
| | | | | | | | | |
| Total Property/Casualty Ins | | | | 804 | |
| | | | | | | | | |
| Publishing-Books [1.3%] | |
| McGraw-Hill Global Education Holdings | | | | | | | | |
| 9.750%, 04/01/21 | | | 1,150 | | | | 1,271 | |
| | | | | | | | | |
| Radio [1.3%] | |
| Sirius XM Radio | | | | | | | | |
| 5.375%, 04/15/25(A) | | | 1,350 | | | | 1,357 | |
See accompanying notes to financial statements.
CITY NATIONAL ROCHDALE FUNDS | PAGE 48
schedule of investments
March 31, 2015 (Unaudited)
City National Rochdale High Yield Bond Fund (continued)
| Description | | Face Amount (000) | | | Value (000) | |
| Real Estate [0.8%] | |
| Kennedy-Wilson | | | | | | |
| 5.875%, 04/01/24 | | $ | 800 | | | $ | 802 | |
| | | | | | | | | |
| Real Estate Investment Trusts [0.6%] | |
| Hospitality Properties Trust | | | | | | | | |
| 4.500%, 03/15/25 | | | 550 | | | | 563 | |
| | | | | | | | | |
| Real Estate Oper/Develop [0.2%] | |
| Greystar Real Estate Partners | | | | | | | | |
| 8.250%, 12/01/22(A) | | | 200 | | | | 209 | |
| | | | | | | | | |
| Retail [7.6%] | |
| AmeriGas Finance | | | | | | | | |
| 7.000%, 05/20/22 | | | 1,510 | | | | 1,619 | |
| Brunswick | | | | | | | | |
| 4.625%, 05/15/21(A) | | | 550 | | | | 554 | |
| Checkers Drive-In Restaurants | | | | | | | | |
| 11.000%, 12/01/17(A) | | | 650 | | | | 707 | |
| Ferrellgas | | | | | | | | |
| 6.750%, 01/15/22 | | | 300 | | | | 305 | |
| 6.500%, 05/01/21 | | | 50 | | | | 51 | |
| GRD Holdings III | | | | | | | | |
| 10.750%, 06/01/19(A) | | | 1,320 | | | | 1,435 | |
| Guitar Center | | | | | | | | |
| 6.500%, 04/15/19(A) | | | 50 | | | | 44 | |
| Men’s Wearhouse | | | | | | | | |
| 7.000%, 07/01/22(A) | | | 250 | | | | 263 | |
| Nathan’s Famous | | | | | | | | |
| 10.000%, 03/15/20(A) | | | 150 | | | | 158 | |
| Petco Animal Supplies | | | | | | | | |
| 9.250%, 12/01/18(A) | | | 300 | | | | 315 | |
| PF Chang’s China Bistro | | | | | | | | |
| 10.250%, 06/30/20(A) | | | 285 | | | | 295 | |
| QVC | | | | | | | | |
| 4.450%, 02/15/25 | | | 450 | | | | 453 | |
| Rite Aid | | | | | | | | |
| 6.125%, 04/01/23(A) | | | 700 | | | | 717 | |
| Suburban Propane Partners | | | | | | | | |
| 5.750%, 03/01/25 | | | 250 | | | | 255 | |
| 5.500%, 06/01/24 | | | 450 | | | | 461 | |
| | | | | | | | | |
| Total Retail | | | | 7,632 | |
| | | | | | | | | |
| Semi-Conductors [1.2%] | |
| Micron Technology | | | | | | | | |
| 5.250%, 08/01/23(A) | | | 1,150 | | | | 1,170 | |
| Description | | Face Amount(1) (000) | | | Value (000) | |
| Telecommunication Equip [1.1%] | |
| Alcatel-Lucent USA | | | | | | |
| 8.875%, 01/01/20(A) | | $ | 150 | | | $ | 164 | |
| Avaya | | | | | | | | |
| 7.000%, 04/01/19(A) | | | 1,000 | | | | 992 | |
| | | | | | | | | |
| Total Telecommunication Equip | | | | 1,156 | |
| | | | | | | | | |
| Telephones & Telecommunications [2.8%] | |
| CenturyLink | | | | | | | | |
| 5.625%, 04/01/25(A) | | | 350 | | | | 352 | |
| Sirius XM Canada Holdings | | | | | | | | |
| 5.625%, 04/23/21(A) | | | 600 | | | | 477 | |
| Sprint | | | | | | | | |
| 7.625%, 02/15/25 | | | 350 | | | | 348 | |
| Sprint Nextel | | | | | | | | |
| 7.000%, 03/01/20(A) | | | 500 | | | | 551 | |
| UPCB Finance V | | | | | | | | |
| 7.250%, 11/15/21(A) | | | 500 | | | | 538 | |
| Virgin Media Secured Finance | | | | | | | | |
| 5.250%, 01/15/26(A) | | | 500 | | | | 510 | |
| | | | | | | | | |
| Total Telephones & Telecommunications | | | | 2,776 | |
| | | | | | | | | |
| Transportation Services [3.0%] | |
| Harbinger Group | | | | | | | | |
| 7.875%, 07/15/19 | | | 554 | | | | 583 | |
| 7.750%, 01/15/22 | | | 1,083 | | | | 1,078 | |
| Marquette Transportation | | | | | | | | |
| 10.875%, 01/15/17 | | | 1,110 | | | | 1,145 | |
| Moto Finance | | | | | | | | |
| 6.375%, 09/01/20(A) | | GBP 150 | | | | 225 | |
| | | | | | | | | |
| Total Transportation Services | | | | 3,031 | |
| | | | | | | | | |
| Total Corporate Bonds | |
| (Cost $89,179) | | | | 87,360 | |
| | | | | | | | | |
| Loan Participations [6.9%] | |
| Automotive [1.4%] | |
| American Tire Distributors, Cov-Lite, First Lien Term Loan | | | | | | | | |
| 0.000%, 09/24/21 (F) | | | 695 | | | | 697 | |
| American Tire Distributors, First Lien Term Loan | | | | | | | | |
| 5.750%, 06/01/18 | | | 695 | | | | 695 | |
| | | | | | | | | |
| Total Automotive | | | | 1,392 | |
See accompanying notes to financial statements.
CITY NATIONAL ROCHDALE FUNDS | PAGE 49
schedule of investments
March 31, 2015 (Unaudited)
City National Rochdale High Yield Bond Fund (continued)
| Description | | Face Amount (000) | | | Value (000) | |
| Communications [1.3%] | |
| Balboa Merger Sub, First Lien Term Loan B | | | | | | |
| 6.500%, 11/25/20 | | $ | 350 | | | $ | 350 | |
| Sky Bet, Cov-Lite, First Lien Term Loan | | | | | | | | |
| 0.000%, 02/09/22 (F) | | | 650 | | | | 960 | |
| | | | | | | | | |
| Total Communications | | | | 1,310 | |
| | | | | | | | | |
| Computer & Electronics [0.9%] | |
| Evergreen Skills, First Lien Term Loan | | | | | | | | |
| 5.750%, 04/28/21 | | | 172 | | | | 170 | |
| Evergreen Skillsoft, Term Loan | | | | | | | | |
| 5.750%, 04/28/21 | | | 270 | | | | 266 | |
| Flexera Software, Term Loan | | | | | | | | |
| 4.500%, 04/02/20 | | | 461 | | | | 460 | |
| | | | | | | | | |
| Total Computer & Electronics | | | | 896 | |
| | | | | | | | | |
| Energy [0.1%] | |
| Magnum Hunter Resources Corporation, Term Loan (Second Lien ) | | | | | | | | |
| 8.500%, 10/17/19 | | | 129 | | | | 127 | |
| | | | | | | | | |
| Food and Drug [0.0%] | |
| Rite Aid Corporation, Unfunded Bridge, First Lien Term Loan | | | | | | | | |
| 0.000%, 02/10/16 (I) (H) | | | 150 | | | | — | |
| | | | | | | | | |
| Information Technology [0.4%] | |
| Advanced Computer Services, First Lien Term Loan | | | | | | | | |
| 0.000%, 01/28/22 (F) | | | 400 | | | | 395 | |
| | | | | | | | | |
| Manufacturing [0.2%] | |
| Pelican Products, Term Loan | | | | | | | | |
| 9.250%, 04/09/21 | | | 250 | | | | 248 | |
| | | | | | | | | |
| Metals & Mining [0.4%] | |
| Noranda Aluminum, Term Loan | | | | | | | | |
| 5.750%, 02/24/19 | | | 398 | | | | 370 | |
| | | | | | | | | |
| Oil & Gas [0.6%] | |
| Cactus Wellhead, First Lien Term Loan | | | | | | | | |
| 7.000%, 07/31/20 | | | 349 | | | | 213 | |
| Expro Holding, Term Loan | | | | | | | | |
| 5.750%, 09/02/21 | | | 299 | | | | 254 | |
| Description | | Face Amount (000)/Shares | | | Value (000) | |
| Frac Tech International, Term Loan B | | | | | | |
| 5.750%, 04/16/21 | | $ | 175 | | | $ | 135 | |
| | | | | | | | | |
| Total Oil & Gas | | | | 602 | |
| | | | | | | | | |
| Professional & Business Services [0.2%] | |
| Intertrust Group, Second Lien Term Loan | | | | | | | | |
| 8.000%, 04/15/22 | | | 200 | | | | 199 | |
| | | | | | | | | |
| Retail [0.7%] | |
| Hardware Holdings, Term Loan | | | | | | | | |
| 8.000%, 03/30/20 (G) (H) | | | 398 | | | | 386 | |
| Neiman Marcus (fka Mariposa), New Term Loan | | | | | | | | |
| 4.250%, 10/25/20 | | | 347 | | | | 345 | |
| | | | | | | | | |
| Total Retail | | | | 731 | |
| | | | | | | | | |
| Telecommunications [0.5%] | |
| Avaya Inc., Term B3 Extended | | | | | | | | |
| 4.672%, 10/26/17 | | | 496 | | | | 487 | |
| | | | | | | | | |
| Transportation [0.2%] | |
| CEVA Group, First Lien Term Loan | | | | | | | | |
| 6.500%, 03/19/21 | | | 199 | | | | 186 | |
| | | | | | | | | |
| Total Loan Participations | |
| (Cost $7,135) | | | | 6,943 | |
| | | | | | | | | |
| Preferred Stock [1.0%] | |
| Insurance [1.0%] | |
| Aspen Insurance Holdings (C) | | | 40,000 | | | | 1,027 | |
| | | | | | | | | |
| Miscellaneous Manufacturing [0.0%] | |
| CEVA Group * | | | 49 | | | | 41 | |
| | | | | | | | | |
| Total Preferred Stock | |
| (Cost $1,044) | | | | 1,068 | |
| | | | | | | | | |
| Common Stock [0.7%] | |
| Electronic Equipment & Instruments [0.0%] | |
| CUI * (G) (H) | | | — | | | | 8 | |
| | | | | | | | | |
| Metals & Mining [0.3%] | |
| Mirabela Nickel * | | | 2,465,571 | | | | 263 | |
See accompanying notes to financial statements.
CITY NATIONAL ROCHDALE FUNDS | PAGE 50
schedule of investments
March 31, 2015 (Unaudited)
City National Rochdale High Yield Bond Fund (continued)
| Description | | Shares/Face Amount (000)/
Number of Warrants | | | Value (000) | |
| Miscellaneous Manufacturing [0.0%] | |
| CEVA Group * (G) | | | 22 | | | $ | 19 | |
| | | | | | | | | |
| Printing & Publishing [0.4%] | |
| Houghton Mifflin Harcourt * | | | 16,866 | | | | 396 | |
| | | | | | | | | |
| Total Common Stock | |
| (Cost $853) | | | | 686 | |
| | | | | | | | | |
| Convertible Bond [0.6%] | |
| Metals & Mining [0.6%] | |
| Mirabela Nickel | | | | | | | | |
| 9.500%, 06/24/19(A) (G) (H) | | $ | 568 | | | | 568 | |
| | | | | | | | | |
| Total Convertible Bond | |
| (Cost $569) | | | | 568 | |
| | | | | | | | | |
| Asset-Backed Security [0.4%] | |
| Airlines [0.4%] | |
| United Airlines 2013-1 Class B Pass Through Trust | | | | | | | | |
| 5.375%, 08/15/21 | | | 382 | | | | 399 | |
| | | | | | | | | |
| Total Asset-Backed Security | |
| (Cost $382) | | | | 399 | |
| | | | | | | | | |
| Mortgage-Backed Security [0.3%] | |
| SRERS Funding, Ser 2011-RS, Cl A1B1 | | | | | | | | |
| 0.417%, 10/09/14(A) (C) | | | 330 | | | | 314 | |
| | | | | | | | | |
| Total Mortgage-Backed Security | |
| (Cost $291) | | | | 314 | |
| | | | | | | | | |
| Warrant [0.0%] | |
| Alion Science and Technology, | | | | | | | | |
| Expires 03/15/17*(H) | | | 380 | | | | — | |
| | | | | | | | | |
| Total Warrant | |
| (Cost $—) | | | | — | |
| | | | | | | | | |
| Special Stock [0.0%] | |
| Broadcasting & Cable [0.0%] | |
| Adelphia Recovery Trust*(G) (H) | | | 8,500 | | | | — | |
| | | | | | | | | |
| Total Special Stock | |
| (Cost $9) | | | | — | |
| Description | | Shares | | | Value (000) | |
| Short-Term Investments [0.5%] | |
| City National Rochdale Prime Money Market Fund, Institutional Class, 0.010%**‡ | | | 471,399 | | | $ | 471 | |
| SEI Daily Income Trust, Prime Obligation Fund, Cl A, 0.010%** | | | 9,487 | | | | 10 | |
| | | | | | | | | |
| Total Short-Term Investments | |
| (Cost $481) | | | | 481 | |
| | | | | | | | | |
| Total Investments [97.3%] | |
| (Cost $99,943) | | | $ | 97,819 | |
Percentages are based on Net Assets of $100,524 (000).
| (1) | In U.S. Dollars unless otherwise indicated. |
| * | Non-income producing security. |
| ** | The rate reported is the 7-day effective yield as of March 31, 2015. |
| ‡ | Investment in Affiliate. |
| (A) | Security exempt from registration under Rule 144A of the Securities Act of 1933. These securities may be resold in transactions exempt from registration normally to qualified institutions. On March 31, 2015, the value of these securities amounted to $53,029 (000), representing 52.8% of the net assets of the Fund. |
| (C) | Floating Rate Security — The rate reported is the rate in effect on March 31, 2015. |
| (D) | Step Bond — The rate reported is the rate in effect on March 31, 2015. The coupon on a step bond changes on a specific date. |
| (E) | In default on interest payments. Rate shown represents the last coupon rate prior to default. |
| (G) | Security fair valued using methods determined in good faith by the Fair Value Committee designated by the Board of Trustees. The total market value of such securities as of March 31, 2015 was $981 (000) and represented 1.0% of net assets of the Fund. |
| (H) | Security is considered illiquid. The total market value of such securities as of March 31, 2015 was $1,826 (000) and represented 1.8% of net assets of the Fund. |
AUD — Australian Dollar
CAD — Canadian Dollar
Cl — Class
EUR — Euro
GBP— British Pound Sterling
Ser — Series
USD — United States Dollar
See accompanying notes to financial statements.
CITY NATIONAL ROCHDALE FUNDS | PAGE 51
schedule of investments
March 31, 2015 (Unaudited)
City National Rochdale High Yield Bond Fund (concluded)
Amounts designated as “—” are either $0 or have been rounded to $0.
A list of the open forward foreign currency contracts held by the Fund at March 31, 2015, is as follows:
| Settlement Date | Currency to Deliver (000) | | Currency to Receive (000) | | | Unrealized Appreciation (000) | |
| 4/7/2015 | AUD | | | 210 | | USD | | | 163 | | | $ | 3 | |
| 4/7/2015 | CAD | | | 300 | | USD | | | 481 | | | | 7 | |
| 4/7/2015 | EUR | | | 300 | | USD | | | 323 | | | | 1 | |
| 4/7/2015 | GBP | | | 770 | | USD | | | 1,145 | | | | 3 | |
| | | | | | | | | | | | | $ | 14 | |
A list of the counterparties for the outstanding forward foreign currency contracts held by the Fund at March 31, 2015, is as follows:
| Counterparty | | Currency to Deliver (000) | | | Currency to Receive (000) | | | Unrealized Appreciation (000) | |
| US Bank | | $ | (2,098 | ) | | $ | 2,112 | | | $ | 14 | |
For the period ended March 31, 2015, the total amount of all open forward foreign currency contracts, as presented in the table above, are representative of the volume of activity for this derivative type during the period.
The following is a list of the inputs used as of March 31, 2015 in valuing the Fund’s investments carried at value (000):
| Investments in Securities | | Level 1 | | | Level 2 | | | Level 3(1) | | | Total | |
| Corporate Bonds | | $ | — | | | $ | 87,360 | | | $ | — | | | $ | 87,360 | |
| Loan Participations | | | — | | | | 6,557 | | | | 386 | | | | 6,943 | |
| Preferred Stock | | | 1,027 | | | | 41 | | | | — | | | | 1,068 | |
| Common Stock | | | 659 | | | | — | | | | 27 | | | | 686 | |
| Convertible Bond | | | — | | | | — | | | | 568 | | | | 568 | |
| Asset-Backed Security | | | — | | | | 399 | | | | — | | | | 399 | |
| Mortgage-Backed Security | | | — | | | | 314 | | | | — | | | | 314 | |
| Warrant | | | — | | | | — | | | | — | | | | — | |
| Special Stock | | | — | | | | — | | | | — | | | | — | |
| Short-Term Investments | | | 481 | | | | — | | | | — | | | | 481 | |
| Total Investments in Securities | | $ | 2,167 | | | $ | 94,671 | | | $ | 981 | | | $ | 97,819 | |
| Other Financial Instruments | | Level 1 | | | Level 2 | | | Level 3 | | | Total | |
| Forwards Contracts* | | | | | | | | | | | | |
| Unrealized Appreciation | | $ | — | | | $ | 14 | | | $ | — | | | $ | 14 | |
| Total Other Financial Instruments | | $ | — | | | $ | 14 | | | $ | — | | | $ | 14 | |
| * | Forwards contracts are valued at the unrealized appreciation (depreciation) on the instrument. |
| (1) | Of the $981 (000) in Level 3 securities as of March 31, 2015, all are not valued via third party pricing vendors and broker quotes. If significant, the disclosure of the unobservable inputs is required for those Level 3 securities that are not valued by third party pricing vendors or broker quotes. |
The following is a reconciliation of investments in which significant unobservable inputs (Level 3) were used in determining value (000) as of March 31, 2015:
| | | Investments in Corporate Bonds (000) | | | Investments in Convertible Bonds (000) | | | Investments in Loan Participations (000) | |
| Beginning balance as of October 1, 2014 | | $ | 5 | | | $ | 542 | | | $ | — | |
| Accrued discounts/ premiums | | | — | | | | — | | | | — | |
| Realized gain/(loss) | | | — | | | | — | | | | — | |
| Change in unrealized appreciation/(depreciation) | | | — | | | | — | | | | — | |
| Purchases | | | — | | | | 26 | | | | — | |
| Sales/paydowns | | | (5 | ) | | | — | | | | — | |
| Transfers into Level 3 | | | — | | | | — | | | | 386 | |
| Transfers out of Level 3 | | | — | | | | — | | | | — | |
| Ending balance as of March 31, 2015 | | $ | — | | | $ | 568 | | | $ | 386 | |
| Changes in unrealized gains/(losses) included in earnings related to securities still held at reporting date | | $ | — | | | $ | — | | | $ | — | |
| | | Investments in Common Stock (000) | | | Total
(000) | |
| Beginning balance as of October 1, 2014 | | $ | 13 | | | $ | 560 | |
| Accrued discounts/ premiums | | | — | | | | — | |
| Realized gain/(loss) | | | — | | | | — | |
| Change in unrealized appreciation/(depreciation) | | | (5 | ) | | | (5 | ) |
| Purchases | | | — | | | | 26 | |
| Sales/paydowns | | | — | | | | (5 | ) |
| Transfers into Level 3 | | | 19 | | | | 405 | |
| Transfers out of Level 3 | | | — | | | | — | |
| Ending balance as of March 31, 2015 | | $ | 27 | | | $ | 981 | |
| Changes in unrealized gains/(losses) included in earnings related to securities still held at reporting date | | $ | (5 | ) | | $ | (5 | ) |
For the period ended March 31, 2015, there have been transfers between Level 1 and Level 2 assets and liabilities. For the period ended March 31, 2015, there have been transfers between Level 2 and Level 3 assets and liabilities. The transfers out of Level 3 were due to changes in the availability of observable inputs to determine fair value. Transfers between Levels are recognized at period end.
For more information on valuation inputs, see Note 2 — Significant Accounting Policies in the Notes to Financial Statements.
See accompanying notes to financial statements.
CITY NATIONAL ROCHDALE FUNDS | PAGE 52
schedule of investments
March 31, 2015 (Unaudited)
City National Rochdale Intermediate Fixed Income Fund
| Description | | Face Amount (000) | | | Value (000) | |
| Corporate Bonds [71.9%] | |
| Consumer Discretionary [4.2%] | |
| AutoZone | | | | | | |
| 3.700%, 04/15/22 | | $ | 250 | | | $ | 260 | |
| Best Buy | | | | | | | | |
| 3.750%, 03/15/16 | | | 300 | | | | 307 | |
| CBS | | | | | | | | |
| 3.375%, 03/01/22 | | | 175 | | | | 178 | |
| Comcast | | | | | | | | |
| 3.125%, 07/15/22 | | | 200 | | | | 207 | |
| Expedia | | | | | | | | |
| 5.950%, 08/15/20 | | | 250 | | | | 282 | |
| Gap | | | | | | | | |
| 5.950%, 04/12/21 | | | 495 | | | | 568 | |
| Harley-Davidson Financial Services, MTN | | | | | | | | |
| 1.550%, 11/17/17(A) | | | 3,725 | | | | 3,749 | |
| Hyundai Capital America | | | | | | | | |
| 2.600%, 03/19/20(A) | | | 1,000 | | | | 1,011 | |
| Johnson Controls | | | | | | | | |
| 5.500%, 01/15/16 | | | 100 | | | | 104 | |
| Newell Rubbermaid | | | | | | | | |
| 2.875%, 12/01/19 | | | 2,000 | | | | 2,038 | |
| Scripps Networks Interactive | | | | | | | | |
| 2.700%, 12/15/16 | | | 1,000 | | | | 1,030 | |
| Description | | Face Amount (000) | | | Value (000) | |
| Time Warner Cable | | | | | | |
| 4.125%, 02/15/21 | | $ | 165 | | | $ | 177 | |
| Toys R Us Property II | | | | | | | | |
| 8.500%, 12/01/17 | | | 1 | | | | 1 | |
| Tupperware Brands | | | | | | | | |
| 4.750%, 06/01/21 | | | 500 | | | | 541 | |
| Viacom | | | | | | | | |
| 6.250%, 04/30/16 | | | 125 | | | | 132 | |
| Yum! Brands | | | | | | | | |
| 6.250%, 03/15/18 | | | 30 | | | | 34 | |
| | | | | | | | | |
| Total Consumer Discretionary | | | | 10,619 | |
| | | | | | | | | |
| Consumer Staples [2.5%] | |
| Avon Products | | | | | | | | |
| 6.500%, 03/01/19 | | | 250 | | | | 249 | |
| Bunge Finance | | | | | | | | |
| 8.500%, 06/15/19 | | | 105 | | | | 129 | |
| 5.900%, 04/01/17 | | | 100 | | | | 108 | |
| 5.100%, 07/15/15 | | | 500 | | | | 506 | |
| Campbell Soup | | | | | | | | |
| 8.875%, 05/01/21 | | | 350 | | | | 461 | |
| ConAgra Foods | | | | | | | | |
| 4.950%, 08/15/20 | | | 410 | | | | 452 | |
| 1.900%, 01/25/18 | | | 200 | | | | 200 | |
| Dr Pepper Snapple Group | | | | | | | | |
| 2.900%, 01/15/16 | | | 2,200 | | | | 2,235 | |
| JM Smucker | | | | | | | | |
| 3.000%, 03/15/22(A) | | | 500 | | | | 507 | |
| Lorillard Tobacco | | | | | | | | |
| 8.125%, 06/23/19 | | | 500 | | | | 612 | |
| Reynolds American | | | | | | | | |
| 6.750%, 06/15/17 | | | 100 | | | | 111 | |
| WM Wrigley Jr | | | | | | | | |
| 4.650%, 07/15/15 | | | 750 | | | | 759 | |
| | | | | | | | | |
| Total Consumer Staples | | | | 6,329 | |
| | | | | | | | | |
| Energy [4.2%] | |
| Boardwalk Pipelines | | | | | | | | |
| 5.875%, 11/15/16 | | | 146 | | | | 153 | |
| 5.750%, 09/15/19 | | | 175 | | | | 190 | |
| 5.500%, 02/01/17 | | | 221 | | | | 231 | |
| 5.200%, 06/01/18 | | | 84 | | | | 87 | |
| BP Capital Markets | | | | | | | | |
| 3.200%, 03/11/16 | | | 100 | | | | 102 | |
| 3.125%, 10/01/15 | | | 145 | | | | 147 | |
| Buckeye Partners | | | | | | | | |
| 6.050%, 01/15/18 | | | 155 | | | | 168 | |
| ConocoPhillips | | | | | | | | |
| 5.750%, 02/01/19 | | | 290 | | | | 333 | |
See accompanying notes to financial statements.
CITY NATIONAL ROCHDALE FUNDS | PAGE 53
schedule of investments
March 31, 2015 (Unaudited)
City National Rochdale Intermediate Fixed Income Fund (continued)
| Description | | Face Amount (000) | | | Value (000) | |
| DCP Midstream | | | | | | |
| 9.750%, 03/15/19(A) | | $ | 114 | | | $ | 127 | |
| DCP Midstream Operating | | | | | | | | |
| 3.250%, 10/01/15 | | | 120 | | | | 121 | |
| Ecopetrol | | | | | | | | |
| 7.625%, 07/23/19 | | | 250 | | | | 294 | |
| Enbridge Energy Partners | | | | | | | | |
| 5.875%, 12/15/16 | | | 191 | | | | 205 | |
| Energy Transfer Partners | | | | | | | | |
| 9.700%, 03/15/19 | | | 330 | | | | 415 | |
| 9.000%, 04/15/19 | | | 189 | | | | 234 | |
| 6.125%, 02/15/17 | | | 426 | | | | 460 | |
| 3.600%, 02/01/23 | | | 200 | | | | 198 | |
| Enterprise Products Operating | | | | | | | | |
| 6.500%, 01/31/19 | | | 140 | | | | 162 | |
| 3.700%, 06/01/15 | | | 125 | | | | 126 | |
| EOG Resources | | | | | | | | |
| 5.625%, 06/01/19 | | | 290 | | | | 333 | |
| FMC Technologies | | | | | | | | |
| 3.450%, 10/01/22 | | | 200 | | | | 197 | |
| Husky Energy | | | | | | | | |
| 3.950%, 04/15/22 | | | 150 | | | | 152 | |
| Kinder Morgan Energy Partners | | | | | | | | |
| 5.950%, 02/15/18 | | | 75 | | | | 83 | |
| 5.300%, 09/15/20 | | | 125 | | | | 138 | |
| Marathon Oil | | | | | | | | |
| 6.000%, 10/01/17 | | | 150 | | | | 167 | |
| National Oilwell Varco | | | | | | | | |
| 6.125%, 08/15/15 | | | 100 | | | | 100 | |
| ONEOK Partners | | | | | | | | |
| 2.000%, 10/01/17 | | | 155 | | | | 155 | |
| Panhandle Eastern Pipe Line | | | | | | | | |
| 7.000%, 06/15/18 | | | 396 | | | | 450 | |
| Petrofac | | | | | | | | |
| 3.400%, 10/10/18(A) | | | 125 | | | | 123 | |
| Plains All American Pipeline | | | | | | | | |
| 5.875%, 08/15/16 | | | 205 | | | | 217 | |
| Plains Exploration & Production | | | | | | | | |
| 6.125%, 06/15/19 | | | 1,309 | | | | 1,384 | |
| PPL Energy Supply | | | | | | | | |
| 6.200%, 05/15/16 | | | 105 | | | | 109 | |
| Puget Energy | | | | | | | | |
| 6.000%, 09/01/21 | | | 500 | | | | 590 | |
| Rowan | | | | | | | | |
| 4.875%, 06/01/22 | | | 200 | | | | 192 | |
| Sabine Pass LNG | | | | | | | | |
| 7.500%, 11/30/16 | | | 100 | | | | 106 | |
| Spectra Energy Capital | | | | | | | | |
| 6.750%, 07/15/18 | | | 745 | | | | 841 | |
| 6.200%, 04/15/18 | | | 135 | | | | 150 | |
| Description | | Face Amount (000) | | | Value (000) | |
| Total Capital International | | | | | | |
| 1.500%, 02/17/17 | | $ | 100 | | | $ | 101 | |
| Transocean | | | | | | | | |
| 7.375%, 04/15/18 | | | 494 | | | | 480 | |
| 6.000%, 03/15/18 | | | 500 | | | | 471 | |
| Williams Partners | | | | | | | | |
| 3.350%, 08/15/22 | | | 200 | | | | 193 | |
| | | | | | | | | |
| Total Energy | | | | 10,485 | |
| | | | | | | | | |
| Financials [30.2%] | |
| ACE INA Holdings | | | | | | | | |
| 5.800%, 03/15/18 | | | 300 | | | | 338 | |
| Alleghany | | | | | | | | |
| 5.625%, 09/15/20 | | | 270 | | | | 302 | |
| American Express | | | | | | | | |
| 0.852%, 05/22/18(B) | | | 3,000 | | | | 3,002 | |
| American Express Credit, MTN | | | | | | | | |
| 2.800%, 09/19/16 | | | 175 | | | | 180 | |
| American International Group | | | | | | | | |
| 6.400%, 12/15/20 | | | 49 | | | | 60 | |
| Aon | | | | | | | | |
| 3.500%, 09/30/15 | | | 200 | | | | 203 | |
| Associates Corp of North America | | | | | | | | |
| 6.950%, 11/01/18 | | | 150 | | | | 175 | |
| Axis Specialty Finance | | | | | | | | |
| 5.875%, 06/01/20 | | | 250 | | | | 287 | |
| Bank of America | | | | | | | | |
| 10.200%, 07/15/15 | | | 350 | | | | 359 | |
| 5.700%, 05/02/17 | | | 950 | | | | 1,023 | |
| 5.420%, 03/15/17 | | | 42 | | | | 45 | |
| Bank of America, MTN | | | | | | | | |
| 5.650%, 05/01/18 | | | 145 | | | | 161 | |
| Bank of Montreal, MTN | | | | | | | | |
| 1.450%, 04/09/18 | | | 340 | | | | 340 | |
| Barclays Bank | | | | | | | | |
| 5.125%, 01/08/20 | | | 100 | | | | 114 | |
| BB&T, MTN | | | | | | | | |
| 1.600%, 08/15/17 | | | 355 | | | | 357 | |
| Bear Stearns | | | | | | | | |
| 7.250%, 02/01/18 | | | 275 | | | | 317 | |
| 5.550%, 01/22/17 | | | 468 | | | | 501 | |
| Capital One Financial | | | | | | | | |
| 5.500%, 06/01/15 | | | 2,000 | | | | 2,016 | |
| 1.500%, 03/22/18 | | | 475 | | | | 472 | |
| Citigroup | | | | | | | | |
| 6.125%, 05/15/18 | | | 140 | | | | 158 | |
| 4.500%, 01/14/22 | | | 2,000 | | | | 2,208 | |
| CNA Financial | | | | | | | | |
| 6.950%, 01/15/18 | | | 1,076 | | | | 1,215 | |
See accompanying notes to financial statements.
CITY NATIONAL ROCHDALE FUNDS | PAGE 54
schedule of investments
March 31, 2015 (Unaudited)
City National Rochdale Intermediate Fixed Income Fund (continued)
| Description | | Face Amount (000) | | | Value (000) | |
| Commonwealth Bank of Australia, MTN | | | | | | |
| 5.000%, 10/15/19(A) | | $ | 150 | | | $ | 169 | |
| Countrywide Financial, MTN | | | | | | | | |
| 6.000%, 08/26/20(C) | | | 313 | | | | 313 | |
| Credit Suisse NY, MTN | | | | | | | | |
| 5.300%, 08/13/19 | | | 150 | | | | 169 | |
| Daimler Finance North America | | | | | | | | |
| 1.875%, 01/11/18(A) | | | 4,200 | | | | 4,248 | |
| Dresdner Bank NY | | | | | | | | |
| 7.250%, 09/15/15 | | | 1,150 | | | | 1,178 | |
| ERAC USA Finance | | | | | | | | |
| 3.300%, 10/15/22(A) | | | 250 | | | | 254 | |
| Ford Motor Credit | | | | | | | | |
| 4.250%, 02/03/17 | | | 2,000 | | | | 2,100 | |
| 1.700%, 05/09/16 | | | 1,000 | | | | 1,005 | |
| Goldman Sachs Group | | | | | | | | |
| 6.250%, 09/01/17 | | | 550 | | | | 610 | |
| 6.150%, 04/01/18 | | | 150 | | | | 169 | |
| 5.625%, 01/15/17 | | | 700 | | | | 751 | |
| 5.350%, 01/15/16 | | | 250 | | | | 259 | |
| Goldman Sachs Group, MTN | | | | | | | | |
| 6.000%, 06/15/20 | | | 500 | | | | 584 | |
| HSBC Finance | | | | | | | | |
| 6.676%, 01/15/21 | | | 83 | | | | 98 | |
| ING Bank | | | | | | | | |
| 3.750%, 03/07/17(A) | | | 200 | | | | 209 | |
| Janus Capital Group | | | | | | | | |
| 6.700%, 06/15/17 | | | 600 | | | | 659 | |
| Jefferies Group | | | | | | | | |
| 8.500%, 07/15/19 | | | 1,000 | | | | 1,196 | |
| 5.500%, 03/15/16 | | | 1,000 | | | | 1,034 | |
| JPMorgan Chase | | | | | | | | |
| 4.950%, 03/25/20 | | | 100 | | | | 112 | |
| 4.250%, 10/15/20 | | | 150 | | | | 164 | |
| 3.125%, 01/23/25 | | | 4,700 | | | | 4,714 | |
| JPMorgan Chase, MTN | | | | | | | | |
| 5.300%, 05/15/18 | | | 150 | | | | 150 | |
| Lehman Brothers Holdings, MTN | | | | | | | | |
| 7.000%, 09/28/37(D) | | | 400 | | | | 57 | |
| Macquarie Bank, MTN | | | | | | | | |
| 2.600%, 06/24/19(A) | | | 4,200 | | | | 4,260 | |
| Marsh & McLennan, MTN | | | | | | | | |
| 2.550%, 10/15/18 | | | 100 | | | | 103 | |
| MetLife | | | | | | | | |
| 6.817%, 08/15/18 | | | 3,500 | | | | 4,079 | |
| Metropolitan Life Global Funding I | | | | | | | | |
| 3.875%, 04/11/22(A) | | | 125 | | | | 134 | |
| Description | | Face Amount (000) | | | Value (000) | |
| Moody’s | | | | | | |
| 5.500%, 09/01/20 | | $ | 800 | | | $ | 913 | |
| Morgan Stanley, MTN | | | | | | | | |
| 5.625%, 09/23/19 | | | 2,000 | | | | 2,276 | |
| MUFG Americas Holdings | | | | | | | | |
| 2.250%, 02/10/20 | | | 2,000 | | | | 2,004 | |
| NASDAQ OMX Group | | | | | | | | |
| 5.550%, 01/15/20 | | | 1,249 | | | | 1,403 | |
| National Bank of Canada, MTN | | | | | | | | |
| 1.450%, 11/07/17 | | | 750 | | | | 747 | |
| National Rural Utilities Cooperative Finance | | | | | | | | |
| 10.375%, 11/01/18 | | | 125 | | | | 162 | |
| 6.550%, 11/01/18 | | | 300 | | | | 349 | |
| Navient, MTN | | | | | | | | |
| 5.000%, 06/15/18 | | | 2 | | | | 2 | |
| Penske Truck Leasing | | | | | | | | |
| 3.750%, 05/11/17(A) | | | 3,000 | | | | 3,129 | |
| Principal Financial Group | | | | | | | | |
| 8.875%, 05/15/19 | | | 130 | | | | 164 | |
| 3.300%, 09/15/22 | | | 200 | | | | 204 | |
| Protective Life | | | | | | | | |
| 6.400%, 01/15/18 | | | 250 | | | | 280 | |
| Prudential Financial, MTN | | | | | | | | |
| 5.375%, 06/21/20 | | | 145 | | | | 167 | |
| Royal Bank of Canada, MTN | | | | | | | | |
| 0.724%, 09/09/16(B) | | | 125 | | | | 125 | |
| Silicon Valley Bank | | | | | | | | |
| 6.050%, 06/01/17 | | | 355 | | | | 382 | |
| Simon Property Group | | | | | | | | |
| 10.350%, 04/01/19 | | | 3,500 | | | | 4,537 | |
| SunTrust Banks | | | | | | | | |
| 6.000%, 09/11/17 | | | 254 | | | | 281 | |
| Svenska Handelsbanken, MTN | | | | | | | | |
| 5.125%, 03/30/20(A) | | | 5,800 | | | | 6,647 | |
| TD Ameritrade Holding | | | | | | | | |
| 5.600%, 12/01/19 | | | 290 | | | | 336 | |
| Toronto-Dominion Bank, MTN | | | | | | | | |
| 0.815%, 11/05/19(B) | | | 3,100 | | | | 3,119 | |
| Toyota Motor Credit, MTN | | | | | | | | |
| 2.000%, 09/15/16 | | | 100 | | | | 102 | |
| UBS, MTN | | | | | | | | |
| 7.375%, 06/15/17 | | | 388 | | | | 434 | |
| US Bank | | | | | | | | |
| 2.125%, 10/28/19 | | | 4,500 | | | | 4,558 | |
| Volkswagen International Finance | | | | | | | | |
| 2.375%, 03/22/17(A) | | | 125 | | | | 128 | |
| Wells Fargo Bank | | | | | | | | |
| 5.750%, 05/16/16 | | | 100 | | | | 106 | |
See accompanying notes to financial statements.
CITY NATIONAL ROCHDALE FUNDS | PAGE 55
schedule of investments
March 31, 2015 (Unaudited)
City National Rochdale Intermediate Fixed Income Fund (continued)
| Description | | Face Amount (000) | | | Value (000) | |
| Wilmington Trust | | | | | | |
| 8.500%, 04/02/18 | | $ | 315 | | | $ | 370 | |
| | | | | | | | | |
| Total Financials | | | | 75,536 | |
| | | | | | | | | |
| Health Care [2.2%] | |
| Actavis | | | | | | | | |
| 3.250%, 10/01/22 | | | 500 | | | | 499 | |
| Boston Scientific | | | | | | | | |
| 6.400%, 06/15/16 | | | 145 | | | | 154 | |
| Laboratory Corp of America Holdings | | | | | | | | |
| 3.200%, 02/01/22 | | | 2,500 | | | | 2,531 | |
| Teva Pharmaceutical Finance BV | | | | | | | | |
| 2.950%, 12/18/22 | | | 1,808 | | | | 1,805 | |
| UnitedHealth Group | | | | | | | | |
| 4.700%, 02/15/21 | | | 200 | | | | 228 | |
| 1.625%, 03/15/19 | | | 250 | | | | 250 | |
| | | | | | | | | |
| Total Health Care | | | | 5,467 | |
| | | | | | | | | |
| Industrials [4.1%] | |
| Carlisle | | | | | | | | |
| 3.750%, 11/15/22 | | | 250 | | | | 257 | |
| CNH America | | | | | | | | |
| 7.250%, 01/15/16 | | | 388 | | | | 402 | |
| Eaton | | | | | | | | |
| 8.875%, 06/15/19 | | | 125 | | | | 155 | |
| Embraer Overseas | | | | | | | | |
| 5.696%, 09/16/23(A) | | | 520 | | | | 556 | |
| GATX | | | | | | | | |
| 6.000%, 02/15/18 | | | 170 | | | | 187 | |
| General Electric Capital, MTN | | | | | | | | |
| 6.000%, 08/07/19 | | | 410 | | | | 479 | |
| 5.625%, 09/15/17 | | | 300 | | | | 332 | |
| 5.300%, 02/11/21 | | | 3,500 | | | | 4,043 | |
| 4.375%, 09/16/20 | | | 150 | | | | 166 | |
| IDEX | | | | | | | | |
| 4.200%, 12/15/21 | | | 250 | | | | 266 | |
| Joy Global | | | | | | | | |
| 6.000%, 11/15/16 | | | 500 | | | | 536 | |
| Lennox International | | | | | | | | |
| 4.900%, 05/15/17 | | | 250 | | | | 261 | |
| NuStar Logistics | | | | | | | | |
| 8.150%, 04/15/18 | | | 250 | | | | 280 | |
| 4.800%, 09/01/20 | | | 200 | | | | 196 | |
| Owens Corning | | | | | | | | |
| 6.500%, 12/01/16 | | | 36 | | | | 39 | |
| Description | | Face Amount (000) | | | Value (000) | |
| Penske Truck Leasing | | | | | | |
| 4.875%, 07/11/22(A) | | $ | 200 | | | $ | 216 | |
| 4.250%, 01/17/23(A) | | | 300 | | | | 312 | |
| 3.375%, 03/15/18(A) | | | 250 | | | | 260 | |
| 2.500%, 03/15/16(A) | | | 500 | | | | 507 | |
| Republic Services | | | | | | | | |
| 3.550%, 06/01/22 | | | 250 | | | | 262 | |
| Roper Industries | | | | | | | | |
| 3.125%, 11/15/22 | | | 200 | | | | 199 | |
| 1.850%, 11/15/17 | | | 250 | | | | 252 | |
| Xylem | | | | | | | | |
| 3.550%, 09/20/16 | | | 200 | | | | 206 | |
| | | | | | | | | |
| Total Industrials | | | | 10,369 | |
| | | | | | | | | |
| Information Technology [6.0%] | |
| Apple | | | | | | | | |
| 0.512%, 02/07/20(B) | | | 7,238 | | | | 7,245 | |
| Arrow Electronics | | | | | | | | |
| 6.875%, 06/01/18 | | | 400 | | | | 451 | |
| Avnet | | | | | | | | |
| 6.625%, 09/15/16 | | | 128 | | | | 137 | |
| Fiserv | | | | | | | | |
| 3.500%, 10/01/22 | | | 250 | | | | 258 | |
| KLA-Tencor | | | | | | | | |
| 4.125%, 11/01/21 | | | 1,000 | | | | 1,053 | |
| Lexmark International | | | | | | | | |
| 5.125%, 03/15/20 | | | 2,250 | | | | 2,413 | |
| Nokia | | | | | | | | |
| 5.375%, 05/15/19 | | | 950 | | | | 1,021 | |
| Texas Instruments | | | | | | | | |
| 1.650%, 08/03/19 | | | 295 | | | | 293 | |
| Western Union | | | | | | | | |
| 5.253%, 04/01/20 | | | 2,000 | | | | 2,222 | |
| | | | | | | | | |
| Total Information Technology | | | | 15,093 | |
| | | | | | | | | |
| Materials [6.1%] | |
| Airgas | | | | | | | | |
| 2.900%, 11/15/22 | | | 250 | | | | 248 | |
| AngloGold Ashanti Holdings | | | | | | | | |
| 5.375%, 04/15/20 | | | 1,317 | | | | 1,302 | |
| ArcelorMittal | | | | | | | | |
| 9.850%, 06/01/19 | | | 200 | | | | 245 | |
| 6.125%, 06/01/18 | | | 800 | | | | 859 | |
| Avery Dennison | | | | | | | | |
| 5.375%, 04/15/20 | | | 405 | | | | 445 | |
| Cabot | | | | | | | | |
| 5.000%, 10/01/16 | | | 300 | | | | 317 | |
See accompanying notes to financial statements.
CITY NATIONAL ROCHDALE FUNDS | PAGE 56
schedule of investments
March 31, 2015 (Unaudited)
City National Rochdale Intermediate Fixed Income Fund (continued)
| Description | | Face Amount (000) | | | Value (000) | |
| Glencore Canada | | | | | | |
| 6.000%, 10/15/15 | | $ | 1,192 | | | $ | 1,222 | |
| 5.500%, 06/15/17 | | | 1,010 | | | | 1,081 | |
| Glencore Funding | | | | | | | | |
| 1.700%, 05/27/16(A) | | | 1,500 | | | | 1,506 | |
| 1.613%, 01/15/19(A) (B) | | | 2,000 | | | | 2,001 | |
| International Paper | | | | | | | | |
| 7.950%, 06/15/18 | | | 130 | | | | 154 | |
| Kinross | | | | | | | | |
| 5.125%, 09/01/21 | | | 303 | | | | 290 | |
| Rio Tinto Finance USA | | | | | | | | |
| 6.500%, 07/15/18 | | | 100 | | | | 115 | |
| 3.500%, 03/22/22 | | | 4,000 | | | | 4,133 | |
| Southern Copper | | | | | | | | |
| 6.375%, 07/27/15 | | | 380 | | | | 386 | |
| Vale Overseas | | | | | | | | |
| 5.625%, 09/15/19 | | | 505 | | | | 536 | |
| Worthington Industries | | | | | | | | |
| 6.500%, 04/15/20 | | | 250 | | | | 286 | |
| | | | | | | | | |
| Total Materials | | | | 15,126 | |
| | | | | | | | | |
| REITs [4.3%] | |
| American Tower | | | | | | | | |
| 3.400%, 02/15/19 | | | 2,100 | | | | 2,169 | |
| BioMed Realty | | | | | | | | |
| 3.850%, 04/15/16 | | | 500 | | | | 512 | |
| Boston Properties | | | | | | | | |
| 5.875%, 10/15/19 | | | 140 | | | | 162 | |
| CommonWealth | | | | | | | | |
| 6.650%, 01/15/18 | | | 300 | | | | 328 | |
| 5.875%, 09/15/20 | | | 105 | | | | 117 | |
| DDR | | | | | | | | |
| 4.625%, 07/15/22 | | | 250 | | | | 269 | |
| Equity One | | | | | | | | |
| 3.750%, 11/15/22 | | | 250 | | | | 254 | |
| HCP | | | | | | | | |
| 6.000%, 01/30/17 | | | 350 | | | | 378 | |
| 2.625%, 02/01/20 | | | 175 | | | | 175 | |
| HCP, MTN | | | | | | | | |
| 6.300%, 09/15/16 | | | 462 | | | | 495 | |
| Health Care | | | | | | | | |
| 5.875%, 05/15/15 | | | 268 | | | | 270 | |
| 4.950%, 01/15/21 | | | 155 | | | | 172 | |
| Healthcare Realty Trust | | | | | | | | |
| 6.500%, 01/17/17 | | | 250 | | | | 272 | |
| Highwoods Realty | | | | | | | | |
| 3.625%, 01/15/23 | | | 200 | | | | 204 | |
| Description | | Face Amount (000) | | | Value (000) | |
| Liberty Property, MTN | | | | | | |
| 7.500%, 01/15/18 | | $ | 177 | | | $ | 201 | |
| National Retail Properties | | | | | | | | |
| 6.875%, 10/15/17 | | | 300 | | | | 336 | |
| 3.800%, 10/15/22 | | | 350 | | | | 363 | |
| Prologis | | | | | | | | |
| 6.875%, 03/15/20 | | | 101 | | | | 120 | |
| 3.350%, 02/01/21 | | | 2,200 | | | | 2,284 | |
| Realty Income | | | | | | | | |
| 5.950%, 09/15/16 | | | 129 | | | | 138 | |
| 3.250%, 10/15/22 | | | 200 | | | | 201 | |
| Senior Housing Properties Trust | | | | | | | | |
| 6.750%, 12/15/21 | | | 500 | | | | 582 | |
| 4.300%, 01/15/16 | | | 500 | | | | 507 | |
| Washington Real Estate Investment Trust | | | | | | | | |
| 3.950%, 10/15/22 | | | 250 | | | | 253 | |
| | | | | | | | | |
| Total REITs | | | | 10,762 | |
| | | | | | | | | |
| Shipping & Transportation [0.1%] | |
| Federal Express 1998 Pass-Through Trust | | | | | | | | |
| 7.020%, 01/15/16 | | | 197 | | | | 202 | |
| | | | | | | | | |
| Telecommunication Services [4.9%] | |
| America Movil | | | | | | | | |
| 3.125%, 07/16/22 | | | 4,000 | | | | 4,068 | |
| AT&T | | | | | | | | |
| 5.600%, 05/15/18 | | | 310 | | | | 344 | |
| CenturyLink | | | | | | | | |
| 6.450%, 06/15/21 | | | 355 | | | | 383 | |
| 5.800%, 03/15/22 | | | 250 | | | | 260 | |
| COX Communications | | | | | | | | |
| 7.250%, 11/15/15 | | | 231 | | | | 240 | |
| COX Communications, MTN | | | | | | | | |
| 6.850%, 01/15/18 | | | 224 | | | | 252 | |
| Deutsche Telekom International Finance BV | | | | | | | | |
| 6.000%, 07/08/19 | | | 50 | | | | 58 | |
| Qwest | | | | | | | | |
| 6.500%, 06/01/17 | | | 100 | | | | 109 | |
| Telefonica Emisiones SAU | | | | | | | | |
| 6.421%, 06/20/16 | | | 275 | | | | 292 | |
| 6.221%, 07/03/17 | | | 286 | | | | 316 | |
| 5.462%, 02/16/21 | | | 115 | | | | 132 | |
| 5.134%, 04/27/20 | | | 300 | | | | 339 | |
| 3.992%, 02/16/16 | | | 500 | | | | 513 | |
| 3.729%, 04/27/15 | | | 400 | | | | 401 | |
See accompanying notes to financial statements.
CITY NATIONAL ROCHDALE FUNDS | PAGE 57
schedule of investments
March 31, 2015 (Unaudited)
City National Rochdale Intermediate Fixed Income Fund (continued)
| Description | | Face Amount (000) | | | Value (000) | |
| Verizon Communications | | | | | | |
| 4.600%, 04/01/21 | | $ | 4,100 | | | $ | 4,554 | |
| | | | | | | | | |
| Total Telecommunication Services | | | | 12,261 | |
| | | | | | | | | |
| Utilities [3.1%] | |
| AmeriGas Partners | | | | | | | | |
| 6.500%, 05/20/21 | | | 477 | | | | 499 | |
| Arizona Public Service | | | | | | | | |
| 6.250%, 08/01/16 | | | 44 | | | | 47 | |
| British Transco Finance | | | | | | | | |
| 6.625%, 06/01/18 | | | 128 | | | | 148 | |
| Cleveland Electric Illuminating | | | | | | | | |
| 7.880%, 11/01/17 | | | 10 | | | | 12 | |
| 5.700%, 04/01/17 | | | 6 | | | | 6 | |
| Entergy Mississippi | | | | | | | | |
| 6.640%, 07/01/19 | | | 540 | | | | 638 | |
| Entergy Texas | | | | | | | | |
| 7.125%, 02/01/19 | | | 190 | | | | 226 | |
| Exelon Generation | | | | | | | | |
| 6.200%, 10/01/17 | | | 2,125 | | | | 2,354 | |
| Jersey Central Power & Light | | | | | | | | |
| 5.625%, 05/01/16 | | | 265 | | | | 277 | |
| KeySpan | | | | | | | | |
| 8.000%, 11/15/30 | | | 50 | | | | 71 | |
| Korea Electric Power | | | | | | | | |
| 6.750%, 08/01/27 | | | 75 | | | | 97 | |
| National Fuel Gas | | | | | | | | |
| 4.900%, 12/01/21 | | | 500 | | | | 550 | |
| Nisource Capital Markets, MTN | | | | | | | | |
| 7.860%, 03/27/17 | | | 163 | | | | 179 | |
| Northern Indiana Public Service, MTN | | | | | | | | |
| 7.590%, 06/12/17 | | | 440 | | | | 485 | |
| ONEOK | | | | | | | | |
| 4.250%, 02/01/22 | | | 294 | | | | 279 | |
| Pennsylvania Electric | | | | | | | | |
| 6.625%, 04/01/19 | | | 15 | | | | 17 | |
| PPL Energy Supply | | | | | | | | |
| 5.700%, 10/15/15 | | | 75 | | | | 76 | |
| Puget Energy | | | | | | | | |
| 5.625%, 07/15/22 | | | 250 | | | | 291 | |
| Puget Sound Energy, MTN | | | | | | | | |
| 6.740%, 06/15/18 | | | 57 | | | | 65 | |
| Southwestern Electric Power | | | | | | | | |
| 5.875%, 03/01/18 | | | 581 | | | | 648 | |
| 3.550%, 02/15/22 | | | 500 | | | | 528 | |
| Southwestern Public Service | | | | | | | | |
| 8.750%, 12/01/18 | | | 250 | | | | 311 | |
| Description | | Face Amount (000)/Shares | | | Value (000) | |
| Xcel Energy | | | | | | |
| 5.613%, 04/01/17 | | $ | 10 | | | $ | 11 | |
| | | | | | | | | |
| Total Utilities | | | | 7,815 | |
| | | | | | | | | |
| Total Corporate Bonds | |
| (Cost $175,478) | | | | 180,064 | |
| | | | | | | | | |
| U.S. Government Agency Obligations [7.7%] | |
| FHLB | | | | | | | | |
| 0.875%, 05/24/17 | | | 2,000 | | | | 2,009 | |
| FHLMC | | | | | | | | |
| 1.750%, 05/30/19 | | | 3,000 | | | | 3,045 | |
| 1.000%, 09/29/17 | | | 660 | | | | 662 | |
| FNMA | | | | | | | | |
| 5.000%, 03/15/16 | | | 5,700 | | | | 5,951 | |
| 1.875%, 09/18/18 | | | 150 | | | | 154 | |
| 1.625%, 11/27/18 | | | 6,000 | | | | 6,095 | |
| 1.375%, 11/15/16 | | | 460 | | | | 467 | |
| 1.125%, 04/27/17 | | | 470 | | | | 474 | |
| 0.875%, 05/21/18 | | | 350 | | | | 349 | |
| | | | | | | | | |
| Total U.S. Government Agency Obligations | | | | | | | | |
| (Cost $19,009) | | | | 19,206 | |
| | | | | | | | | |
| Preferred Stock [3.2%] | |
| Financials [1.1%] | |
| BB&T | | | 10,000 | | | | 253 | |
| Citigroup | | | 10,000 | | | | 254 | |
| Goldman Sachs Group | | | 25,000 | | | | 635 | |
| HSBC Holdings | | | 30,000 | | | | 787 | |
| JPMorgan Chase | | | 20,000 | | | | 496 | |
| Prudential Financial | | | 10,000 | | | | 259 | |
| | | | | | | | | |
| Total Financials | | | | 2,684 | |
| | | | | | | | | |
| Industrials [0.3%] | |
| Pitney Bowes | | | 10,000 | | | | 267 | |
| Stanley Black & Decker | | | 20,000 | | | | 514 | |
| | | | | | | | | |
| Total Industrials | | | | 781 | |
| | | | | | | | | |
| REITs [1.3%] | |
| Digital Realty Trust | | | 10,000 | | | | 259 | |
| Kimco Realty | | | 10,000 | | | | 243 | |
| National Retail Properties | | | 20,000 | | | | 525 | |
| Realty Income | | | 20,000 | | | | 528 | |
| Senior Housing Properties Trust | | | 52,500 | | | | 1,307 | |
See accompanying notes to financial statements.
CITY NATIONAL ROCHDALE FUNDS | PAGE 58
schedule of investments
March 31, 2015 (Unaudited)
City National Rochdale Intermediate Fixed Income Fund (continued)
| Description | | Shares/Face Amount (000) | | | Value (000) | |
| Vornado Realty Trust | | | 20,000 | | | $ | 498 | |
| | | | | | | | | |
| Total REITs | | | | 3,360 | |
| |
| Telecommunication Services [0.3%] | |
| Telephone & Data Systems | | | 30,000 | | | | 723 | |
| | | | | | | | | |
| Utilities [0.2%] | |
| SCE Trust I | | | 20,000 | | | | 508 | |
| | | | | | | | | |
| Total Preferred Stock | |
| (Cost $7,904) | | | | 8,056 | |
| | |
| Municipal Bonds [3.2%] | |
| California [1.6%] | |
| California State, Department of Water Resources, Ser L, RB | | | | | | |
| Callable 05/01/20 @ 100 | | | | | | |
| 5.000%, 05/01/21 | | $ | 3,460 | | | | 4,078 | |
| | | | | | | | | |
| Florida [1.6%] | |
| Florida State, Hurricane Catastrophe Fund Finance, Ser A, RB | | | | | | | | |
| 2.107%, 07/01/18 | | | 3,870 | | | | 3,910 | |
| | | | | | | | | |
| Total Municipal Bonds | |
| (Cost $7,866) | | | | 7,988 | |
| | | | | | | | | |
| Asset-Backed Securities [2.5%] | |
| Bayview Financial Acquisition Trust, Ser 2007-A, Cl 1A2 | | | | | | | | |
| 6.205%, 05/28/37 | | | 101 | | | | 107 | |
| BT SPE (Acquired 07/06/11, Acquisition Cost $1,102,589) | | | | | | | | |
| 9.250%, 06/06/16(E) (F) (G) | | | 751 | | | | 709 | |
| Carmax Auto Owner Trust, Ser 2014-2, Cl A3 | | | | | | | | |
| 0.980%, 01/15/19 | | | 5,350 | | | | 5,355 | |
| Cityscape Home Equity Loan Trust Series, Ser 1997-C, Cl A4 | | | | | | | | |
| 7.000%, 07/25/28(D) (E) (F) | | | 5 | | | | — | |
| Conseco Financial, Ser 1997-7, Cl A6 | | | | | | | | |
| 6.760%, 07/15/28 | | | 21 | | | | 22 | |
| Contimortgage Home Equity Loan Trust, Ser 1997-2, Cl A9 | | | | | | | | |
| 7.090%, 04/15/28 | | | — | | | | — | |
| Description | | Face Amount (000) | | | Value (000) | |
| GMACM Mortgage Loan Trust, Ser 2004-GH1, Cl A6 | | | | | | |
| 4.810%, 07/25/35 | | $ | 21 | | | $ | 21 | |
| | | | | | | | | |
| Total Asset-Backed Securities | |
| (Cost $6,249) | | | | 6,214 | |
| | | | | | | | | |
| U.S. Government Mortgage-Backed Obligations [2.4%] | |
| FHLMC, Pool 1B2677 | | | | | | | | |
| 2.421%, 01/01/35(B) | | | 6 | | | | 7 | |
| FHLMC, Pool 1B2683 | | | | | | | | |
| 2.431%, 01/01/35(B) | | | 4 | | | | 4 | |
| FHLMC, Pool 1B2692 | | | | | | | | |
| 2.361%, 12/01/34(B) | | | 12 | | | | 12 | |
| FHLMC, Pool A93505 | | | | | | | | |
| 4.500%, 08/01/40 | | | 46 | | | | 50 | |
| FHLMC, Pool A93996 | | | | | | | | |
| 4.500%, 09/01/40 | | | 68 | | | | 75 | |
| FHLMC, Pool C03490 | | | | | | | | |
| 4.500%, 08/01/40 | | | 356 | | | | 389 | |
| FHLMC, Pool C09015 | | | | | | | | |
| 3.000%, 10/01/42 | | | 231 | | | | 236 | |
| FHLMC, Pool C20300 | | | | | | | | |
| 6.500%, 01/01/29 | | | 4 | | | | 4 | |
| FHLMC, Pool E01280 | | | | | | | | |
| 5.000%, 12/01/17 | | | 3 | | | | 3 | |
| FHLMC, Pool G02940 | | | | | | | | |
| 5.500%, 05/01/37 | | | 13 | | | | 14 | |
| FHLMC, Pool G04222 | | | | | | | | |
| 5.500%, 04/01/38 | | | 21 | | | | 23 | |
| FHLMC, Pool G04913 | | | | | | | | |
| 5.000%, 03/01/38 | | | 79 | | | | 87 | |
| FHLMC, Pool G08003 | | | | | | | | |
| 6.000%, 07/01/34 | | | 20 | | | | 23 | |
| FHLMC, Pool G11431 | | | | | | | | |
| 6.000%, 08/01/18 | | | 2 | | | | 2 | |
| FHLMC, Pool G11880 | | | | | | | | |
| 5.000%, 12/01/20 | | | 15 | | | | 16 | |
| FHLMC, Pool G18124 | | | | | | | | |
| 6.000%, 06/01/21 | | | 11 | | | | 12 | |
| FHLMC, Pool J19197 | | | | | | | | |
| 3.000%, 05/01/27 | | | 166 | | | | 174 | |
| FHLMC, Pool Q08998 | | | | | | | | |
| 3.500%, 06/01/42 | | | 196 | | | | 206 | |
| FHLMC, Pool Q10378 | | | | | | | | |
| 3.000%, 08/01/42 | | | 222 | | | | 227 | |
| FHLMC, Ser 2004-2804, Cl VC, Pool FHR 2804 VC | | | | | | | | |
| 5.000%, 07/15/21 | | | 94 | | | | 99 | |
See accompanying notes to financial statements.
CITY NATIONAL ROCHDALE FUNDS | PAGE 59
schedule of investments
March 31, 2015 (Unaudited)
City National Rochdale Intermediate Fixed Income Fund (continued)
| Description | | Face Amount (000) | | | Value (000) | |
| FHLMC Multifamily Structured Pass Through Certificates, Ser K003, Cl A4 | | | | | | |
| 5.053%, 01/25/19 | | $ | 150 | | | $ | 168 | |
| FHLMC Multifamily Structured Pass Through Certificates, Ser K704, Cl A2 | | | | | | | | |
| 2.412%, 08/25/18 | | | 400 | | | | 414 | |
| FHLMC Multifamily Structured Pass Through Certificates, Ser K705, Cl A2 | | | | | | | | |
| 2.303%, 09/25/18 | | | 200 | | | | 206 | |
| FHLMC Multifamily Structured Pass Through Certificates, Ser K708, Cl A2 | | | | | | | | |
| 2.130%, 01/25/19 | | | 300 | | | | 307 | |
| FNMA, Pool 252570 | | | | | | | | |
| 6.500%, 07/01/29 | | | 6 | | | | 7 | |
| FNMA, Pool 253183 | | | | | | | | |
| 7.500%, 04/01/30 | | | 1 | | | | 1 | |
| FNMA, Pool 253398 | | | | | | | | |
| 8.000%, 08/01/30 | | | 2 | | | | 2 | |
| FNMA, Pool 254545 | | | | | | | | |
| 5.000%, 12/01/17 | | | 9 | | | | 10 | |
| FNMA, Pool 254685 | | | | | | | | |
| 5.000%, 04/01/18 | | | 9 | | | | 9 | |
| FNMA, Pool 254949 | | | | | | | | |
| 5.000%, 11/01/33 | | | 15 | | | | 16 | |
| FNMA, Pool 255814 | | | | | | | | |
| 5.500%, 08/01/35 | | | 26 | | | | 30 | |
| FNMA, Pool 303168 | | | | | | | | |
| 9.500%, 02/01/25 | | | 2 | | | | 2 | |
| FNMA, Pool 725424 | | | | | | | | |
| 5.500%, 04/01/34 | | | 23 | | | | 26 | |
| FNMA, Pool 735060 | | | | | | | | |
| 6.000%, 11/01/34 | | | 14 | | | | 16 | |
| FNMA, Pool 735228 | | | | | | | | |
| 5.500%, 02/01/35 | | | 12 | | | | 14 | |
| FNMA, Pool 735230 | | | | | | | | |
| 5.500%, 02/01/35 | | | 30 | | | | 34 | |
| FNMA, Pool 745275 | | | | | | | | |
| 5.000%, 02/01/36 | | | 123 | | | | 136 | |
| FNMA, Pool 745418 | | | | | | | | |
| 5.500%, 04/01/36 | | | 140 | | | | 157 | |
| FNMA, Pool 827223 | | | | | | | | |
| 1.968%, 04/01/35(B) | | | 67 | | | | 71 | |
| FNMA, Pool 844809 | | | | | | | | |
| 5.000%, 11/01/35 | | | 59 | | | | 66 | |
| FNMA, Pool AD0454 | | | | | | | | |
| 5.000%, 11/01/21 | | | 30 | | | | 32 | |
| FNMA, Pool AD8522 | | | | | | | | |
| 4.000%, 08/01/40 | | | 49 | | | | 53 | |
| Description | | Face Amount (000) | | | Value (000) | |
| FNMA, Pool AE0828 | | | | | | |
| 3.500%, 02/01/41 | | $ | 362 | | | $ | 381 | |
| FNMA, Pool AH0621 | | | | | | | | |
| 3.500%, 01/01/41 | | | 89 | | | | 94 | |
| FNMA, Pool AJ1407 | | | | | | | | |
| 4.000%, 09/01/41 | | | 79 | | | | 85 | |
| FNMA, Pool AJ7689 | | | | | | | | |
| 4.000%, 12/01/41 | | | 256 | | | | 274 | |
| FNMA, Pool AK0971 | | | | | | | | |
| 3.000%, 02/01/27 | | | 154 | | | | 162 | |
| FNMA, Pool AO2970 | | | | | | | | |
| 3.000%, 05/01/42 | | | 211 | | | | 217 | |
| FNMA, Pool AO4137 | | | | | | | | |
| 3.500%, 06/01/42 | | | 213 | | | | 224 | |
| FNMA, Pool MA1277 | | | | | | | | |
| 2.500%, 12/01/27 | | | 146 | | | | 151 | |
| FNMA REMIC Trust, Ser 2004-W6, Cl 1A6 | | | | | | | | |
| 5.500%, 07/25/34 | | | 67 | | | | 68 | |
| GNMA, Pool 780315 | | | | | | | | |
| 9.500%, 12/15/17 | | | 2 | | | | 2 | |
| GNMA, Pool G2 4696 | | | | | | | | |
| 4.500%, 05/20/40 | | | 167 | | | | 183 | |
| GNMA, Pool G2 4747 | | | | | | | | |
| 5.000%, 07/20/40 | | | 63 | | | | 71 | |
| GNMA, Pool G2 4923 | | | | | | | | |
| 4.500%, 01/20/41 | | | 91 | | | | 99 | |
| GNMA, Pool G2 MA0155 | | | | | | | | |
| 4.000%, 06/20/42 | | | 221 | | | | 238 | |
| GNMA, Pool G2 MA0392 | | | | | | | | |
| 3.500%, 09/20/42 | | | 240 | | | | 253 | |
| | | | | | | | | |
| Total U.S. Government Mortgage-Backed Obligations | | | | | |
| (Cost $5,709) | | | | 5,942 | |
| | | | | | | | | |
| Commercial Mortgage-Backed Obligations [0.9%] | |
| Bear Stearns Commercial Mortgage Securities Trust, Ser PWR9, Cl A4A | | | | | | | | |
| 4.871%, 09/11/42 | | | 144 | | | | 145 | |
| CD 2005-CD1 Commercial Mortgage Trust, Ser CD1, Cl A4 | | | | | | | | |
| 5.226%, 07/15/44(B) | | | 181 | | | | 181 | |
| Commercial Mortgage Trust, Ser 2005-C6, Cl A5A | | | | | | | | |
| 5.116%, 06/10/44(B) | | | 121 | | | | 121 | |
| Commercial Mortgage Trust, Ser 2012-CR2, Cl A4 | | | | | | | | |
| 3.147%, 08/15/45 | | | 125 | | | | 131 | |
See accompanying notes to financial statements.
CITY NATIONAL ROCHDALE FUNDS | PAGE 60
schedule of investments
March 31, 2015 (Unaudited)
City National Rochdale Intermediate Fixed Income Fund (continued)
| Description | | Face Amount (000) | | | Value (000) | |
| Credit Suisse First Boston Mortgage Securities, Ser C5, Cl A4 | | | | | | |
| 5.100%, 08/15/38(B) | | $ | 144 | | | $ | 144 | |
| GS Mortgage Securities II, Ser GCJ9, Cl A3 | | | | | | | | |
| 2.773%, 11/10/45 | | | 275 | | | | 281 | |
| JP Morgan Chase Commercial Mortgage Securities Trust, Ser 2005-CB12, Cl A4 | | | | | | | | |
| 4.895%, 09/12/37 | | | 239 | | | | 239 | |
| JP Morgan Chase Commercial Mortgage Securities Trust, Ser 2013-LC11, Cl A5 | | | | | | | | |
| 2.960%, 04/15/46 | | | 150 | | | | 154 | |
| Morgan Stanley Bank of America Merrill Lynch Trust, Ser C6, Cl A4 | | | | | | | | |
| 2.858%, 11/15/45 | | | 275 | | | | 282 | |
| NCUA Guaranteed Notes Trust, Ser 2010-C1, Cl A2 | | | | | | | | |
| 2.900%, 10/29/20 | | | 225 | | | | 231 | |
| NCUA Guaranteed Notes Trust, Ser 2010-R1, Cl 2A | | | | | | | | |
| 1.840%, 10/07/20 | | | 18 | | | | 19 | |
| Wachovia Bank Commercial Mortgage Trust Series, Ser C22, Cl A4 | | | | | | | | |
| 5.271%, 12/15/44(B) | | | 221 | | | | 224 | |
| | | | | | | | | |
| Total Commercial Mortgage-Backed Obligations | | | | | |
| (Cost $2,178) | | | | 2,152 | |
| | | | | | | | | |
| Certificate of Deposit [0.1%] | |
| Swiss Bank | | | | | | | | |
| 7.375%, 07/15/15 | | | 175 | | | | 178 | |
| | | | | | | | | |
| Total Certificate of Deposit | |
| (Cost $176) | | | | 178 | |
| | | | | | | | | |
| Foreign Government Bonds [0.1%] | |
| Mexico Government International Bond, MTN | | | | | | | | |
| 5.125%, 01/15/20 | | | 100 | | | | 112 | |
| Province of Newfoundland and Labrador Canada | | | | | | | | |
| 7.320%, 10/13/23 | | | 100 | | | | 135 | |
| Description | | Face Amount (000) | | | Value (000) | |
| Province of Quebec Canada, MTN | | | | | | |
| 7.380%, 04/09/26(C) | | $ | 100 | | | $ | 139 | |
| | | | | | | | | |
| Total Foreign Government Bonds | |
| (Cost $359) | | | | 386 | |
| | | | | | | | | |
| Residential Mortgage-Backed Securities [0.0%] | |
| Banc of America Alternative Loan Trust, Ser 2004-2, Cl 5A1 | | | | | | | | |
| 5.500%, 03/25/19 | | | 23 | | | | 23 | |
| RAAC, Ser 2004-SP1, Cl AI4 | | | | | | | | |
| 5.285%, 08/25/27(B) | | | 3 | | | | 3 | |
| Residential Accredit Loans, Ser 2004-QS5, Cl A5 | | | | | | | | |
| 4.750%, 04/25/34 | | | 7 | | | | 7 | |
| Residential Accredit Loans, Ser 2004-QS6, Cl A1 | | | | | | | | |
| 5.000%, 05/25/19 | | | 12 | | | | 12 | |
| Residential Asset Mortgage Products, Ser 2002-RS3, Cl AI5 | | | | | | | | |
| 5.572%, 06/25/32(B) | | | 29 | | | | 29 | |
| WaMu Mortgage Pass-Through Certificates Series Trust, Ser 2004-CB2, Cl 5A | | | | | | | | |
| 5.000%, 07/25/19 | | | 36 | | | | 36 | |
| | | | | | | | | |
| Total Residential Mortgage-Backed Securities | | | | | |
| (Cost $109) | | | | 110 | |
| | | | | | | | | |
| U.S. Treasury Obligations [5.2%] | |
| U.S. Treasury Note | | | | | | | | |
| 2.750%, 02/15/19 | | | 845 | | | | 896 | |
| 2.625%, 11/15/20 | | | 425 | | | | 450 | |
| 2.375%, 07/31/17 | | | 1,010 | | | | 1,050 | |
| 2.250%, 11/15/24 | | | 4,500 | | | | 4,626 | |
| 2.000%, 02/15/25 | | | 2,300 | | | | 2,315 | |
| 1.750%, 10/31/18 | | | 610 | | | | 624 | |
| 1.250%, 04/30/19 | | | 2,375 | | | | 2,378 | |
| 0.875%, 07/31/19 | | | 815 | | | | 802 | |
| | | | | | | | | |
| Total U.S. Treasury Obligations | |
| (Cost $13,039) | | | | 13,141 | |
See accompanying notes to financial statements.
CITY NATIONAL ROCHDALE FUNDS | PAGE 61
schedule of investments
March 31, 2015 (Unaudited)
City National Rochdale Intermediate Fixed Income Fund (continued)
| Description | | Shares | | | Value (000) | |
| Short-Term Investments [1.8%] | |
| City National Rochdale Government Money Market Fund, Institutional Class, 0.010%**‡ | | | 2,868,901 | | | $ | 2,869 | |
| SEI Daily Income Trust Government Fund, Cl A, 0.020%** | | | 1,558,396 | | | | 1,558 | |
| | | | | | | | | |
| Total Short-Term Investments | |
| (Cost $4,427) | | | | 4,427 | |
| | | | | | | | | |
| Total Investments [99.0%] | |
| (Cost $242,503) | | | $ | 247,864 | |
Percentages are based on Net Assets of $250,350 (000).
| ** | The rate reported is the 7-day effective yield as of March 31, 2015. |
| ‡ | Investment in Affiliate. |
| (A) | Security exempt from registration under Rule 144A of the Securities Act of 1933. These securities may be resold in transactions exempt from registration normally to qualified institutions. On March 31, 2015, the value of these securities amounted to $30,053 (000), representing 12.0% of the net assets of the Fund. |
| (B) | Floating Rate Security — The rate reported is the rate in effect on March 31, 2015. |
| (C) | Step Bond — The rate reported is the rate in effect on March 31, 2015. The coupon on a step bond changes on a specific date. |
| (D) | In default on interest payments. Rate shown represents the last coupon rate prior to default. |
| (E) | Security is considered illiquid. The total market value of such security as of March 31, 2015 was $709 (000) and represented 0.3% of net assets of the Fund. |
| (F) | Security fair valued using methods determined in good faith by the Fair Value Committee designated by the Board of Trustees. The total market value of such securities as of March 31, 2015 was $709 (000) and represented 0.3% of net assets of the Fund. |
| (G) | Security is considered restricted. The total market value of such security as of March 31, 2015 was $709 (000) and represented 0.3% of net assets of the Fund. |
Cl — Class
FHLB — Federal Home Loan Bank
FHLMC — Federal Home Loan Mortgage Corporation
FNMA — Federal National Mortgage Association
GNMA — Government National Mortgage Association
MTN — Medium Term Note
NCUA — National Credit Union Administration
NY — New York
RB — Revenue Bond
REMIC — Real Estate Mortgage Investment Conduit
Ser — Series
SPE — Special Purpose Entity
Amounts designated as “—” are either $0 or have been rounded to $0.
The following is a list of the inputs used as of March 31, 2015 in valuing the Fund’s investments carried at value (000):
| Investments in Securities | | Level 1 | | | Level 2 | | | Level 3 | | | Total | |
| Corporate Bonds | | $ | — | | | $ | 180,064 | | | $ | — | | | $ | 180,064 | |
| U.S. Government Agency Obligations | | | — | | | | 19,206 | | | | — | | | | 19,206 | |
| Preferred Stock | | | 5,506 | | | | 2,550 | | | | — | | | | 8,056 | |
| Municipal Bonds | | | — | | | | 7,988 | | | | — | | | | 7,988 | |
| Asset-Backed Securities | | | — | | | | 5,505 | | | | 709 | | | | 6,214 | |
| U.S. Government Mortgage-Backed Obligations | | | — | | | | 5,942 | | | | — | | | | 5,942 | |
| Commercial Mortgage-Backed Obligations | | | — | | | | 2,152 | | | | — | | | | 2,152 | |
| Certificate of Deposit | | | — | | | | 178 | | | | — | | | | 178 | |
| Foreign Government Bonds | | | — | | | | 386 | | | | — | | | | 386 | |
| Residential Mortgage-Backed Securities | | | — | | | | 110 | | | | — | | | | 110 | |
| U.S. Treasury Obligations | | | — | | | | 13,141 | | | | — | | | | 13,141 | |
| Short-Term Investments | | | 4,427 | | | | — | | | | — | | | | 4,427 | |
| Total Investments in Securities | | $ | 9,933 | | | $ | 237,222 | | | $ | 709 | | | $ | 247,864 | |
The following is a reconciliation of investments in which significant unobservable inputs (Level 3) were used in determining value (000) as of March 31, 2015:
| | | Investments in Asset-Backed Securities | |
| Beginning balance as of October 1, 2014 | | $ | 807 | |
| Accrued discounts/premiums | | | — | |
| Realized gain/(loss) | | | — | |
| Change in unrealized appreciation/(depreciation) | | | 8 | |
| Purchases | | | — | |
| Sales/paydowns | | | (106 | ) |
| Transfers into Level 3 | | | — | |
| Transfers out of Level 3 | | | — | |
| Ending balance as of March 31, 2015 | | $ | 709 | |
| Changes in unrealized gains/(losses) included in earnings related to securities still held at reporting date | | $ | 8 | |
See accompanying notes to financial statements.
CITY NATIONAL ROCHDALE FUNDS | PAGE 62
schedule of investments
March 31, 2015 (Unaudited)
City National Rochdale Intermediate Fixed Income Fund (concluded)
The following table summarizes the quantitative inputs and assumptions used for items categorized as material Level 3 investments as of March 31, 2015. The disclosures below also include qualitative information on the sensitivity of the fair value measurements to changes in the significant unobservable inputs.
| | Fair Value at
March 31, 2015
(000) | Valuation Techniques | |
| BT SPE | $709 | FMV Decision based on actual collection level and experienced defaults | |
| | | | |
| | | Observable Inputs | |
| | | Cumulated Collections | |
| | | Cumulated Defaults | |
| | | Annualized Default Rate | |
| | | Cumulated Default Rate | |
| | | Pace of Collection Pace of Defaults | |
| | | Interest Rates | |
| | | | |
| | | Unobservable Inputs | Range |
| | | Projected Default Rates | 5%-12% |
| | | Projected Collection Rates | 90%-100% |
| | | Expected Discount Rates | 7%-9.25% |
The unobservable inputs used to determine fair value of recurring Level 3 assets may have similar or diverging impacts on valuation. Significant increased and decreased in these inputs in isolation and interrelationships between those inputs could result in significantly higher or lower fair value measurement.
For the period ended March 31, 2015, there have been no transfers between any of the fair value hierarchy levels. Transfers between Levels are recognized at period end.
For more information on valuation inputs, see Note 2 — Significant Accounting Policies in the Notes to Financial Statements.
See accompanying notes to financial statements.
CITY NATIONAL ROCHDALE FUNDS | PAGE 63
consolidated schedule of investments
March 31, 2015 (Unaudited)
City National Rochdale Fixed Income Opportunities Fund
| Description | | Face Amount (000) | | | Value (000) | |
| Corporate Bonds [47.8%] | |
| Advertising Sales [0.2%] | |
| Lamar Media | | | | | | |
| 5.875%, 02/01/22 | | $ | 525 | | | $ | 553 | |
| 5.375%, 01/15/24 | | | 475 | | | | 495 | |
| 5.000%, 05/01/23 | | | 450 | | | | 460 | |
| Outfront Media Capital | | | | | | | | |
| 5.875%, 03/15/25 | | | 550 | | | | 582 | |
| 5.625%, 02/15/24 | | | 275 | | | | 288 | |
| 5.625%, 02/15/24(A) | | | 325 | | | | 340 | |
| 5.250%, 02/15/22 | | | 125 | | | | 131 | |
| | | | | | | | | |
| Total Advertising Sales | | | | 2,849 | |
| | | | | | | | | |
| Aerospace & Defense [0.2%] | |
| Accudyne Industries Borrower | | | | | | | | |
| 7.750%, 12/15/20(A) | | | 975 | | | | 870 | |
| KLX | | | | | | | | |
| 5.875%, 12/01/22(A) | | | 600 | | | | 598 | |
| TransDigm | | | | | | | | |
| 7.500%, 07/15/21 | | | 100 | | | | 107 | |
| 6.500%, 07/15/24 | | | 725 | | | | 729 | |
| 6.000%, 07/15/22 | | | 950 | | | | 950 | |
| 5.500%, 10/15/20 | | | 350 | | | | 346 | |
| | | | | | | | | |
| Total Aerospace & Defense | | | | 3,600 | |
| | | | | | | | | |
| Agricultural [0.1%] | |
| Avangardco Investments Public | | | | | | | | |
| 10.000%, 10/29/15 | | | 1,250 | | | | 462 | |
| Mriya Agro Holding | | | | | | | | |
| 9.450%, 04/19/18(B) | | | 1,195 | | | | 120 | |
| Description | | Face Amount (000) | | | Value (000) | |
| UKRLANDFARMING | | | | | | |
| 10.875%, 03/26/18 | | $ | 2,760 | | | $ | 994 | |
| | | | | | | | | |
| Total Agricultural | | | | 1,576 | |
| | | | | | | | | |
| Airlines [0.2%] | |
| Avianca Holdings | | | | | | | | |
| 8.375%, 05/10/20 | | | 2,000 | | | | 2,000 | |
| SriLankan Airlines | | | | | | | | |
| 5.300%, 06/27/19 | | | 1,500 | | | | 1,468 | |
| | | | | | | | | |
| Total Airlines | | | | 3,468 | |
| | | | | | | | | |
| Airport Develop/Maint [0.1%] | |
| Aeropuertos Dominicanos Siglo XXI | | | | | | | | |
| 9.750%, 11/13/19(C) | | | 1,340 | | | | 1,290 | |
| | | | | | | | | |
| Applications Software [0.1%] | |
| Emdeon | | | | | | | | |
| 11.000%, 12/31/19 | | | 525 | | | | 573 | |
| Nuance Communications | | | | | | | | |
| 5.375%, 08/15/20(A) | | | 900 | | | | 909 | |
| | | | | | | | | |
| Total Applications Software | | | | 1,482 | |
| | | | | | | | | |
| Auto Rent & Lease [0.3%] | |
| Hertz | | | | | | | | |
| 6.750%, 04/15/19 | | | 825 | | | | 852 | |
| 6.250%, 10/15/22 | | | 1,025 | | | | 1,058 | |
| United Rentals North America | | | | | | | | |
| 8.375%, 09/15/20 | | | 675 | | | | 726 | |
| 6.125%, 06/15/23 | | | 575 | | | | 609 | |
| 5.750%, 11/15/24 | | | 175 | | | | 181 | |
| 5.500%, 07/15/25 | | | 975 | | | | 993 | |
| 4.625%, 07/15/23 | | | 325 | | | | 329 | |
| | | | | | | | | |
| Total Auto Rent & Lease | | | | 4,748 | |
| | | | | | | | | |
| Auto/Trk Prts and Equip-Repl [0.2%] | |
| Allison Transmission | | | | | | | | |
| 7.125%, 05/15/19(A) | | | 650 | | | | 677 | |
| JB Poindexter | | | | | | | | |
| 9.000%, 04/01/22(A) | | | 725 | | | | 787 | |
| UCI International | | | | | | | | |
| 8.625%, 02/15/19 | | | 1,275 | | | | 1,154 | |
| | | | | | | | | |
| Total Auto/Trk Prts and Equip-Repl | | | | 2,618 | |
See accompanying notes to financial statements.
CITY NATIONAL ROCHDALE FUNDS | PAGE 64
consolidated schedule of investments
March 31, 2015 (Unaudited)
City National Rochdale Fixed Income Opportunities Fund (continued)
| Description | | Face Amount (000) | | | Value (000) | |
| Automotive [0.3%] | |
| Automotores Gildemeister | | | | | | |
| 8.250%, 05/24/21 | | $ | 2,109 | | | $ | 844 | |
| 6.750%, 01/15/23 | | | 665 | | | | 241 | |
| General Motors | | | | | | | | |
| 4.000%, 04/01/25 | | | 700 | | | | 711 | |
| Hyva Global BV | | | | | | | | |
| 8.625%, 03/24/16 | | | 1,425 | | | | 1,311 | |
| MPM Global Pte | | | | | | | | |
| 6.750%, 09/19/19 | | | 2,500 | | | | 2,463 | |
| | | | | | | | | |
| Total Automotive | | | | 5,570 | |
| | | | | | | | | |
| Autoparts [0.7%] | |
| Affinia Group | | | | | | | | |
| 7.750%, 05/01/21 | | | 1,325 | | | | 1,371 | |
| American Axle & Manufacturing | | | | | | | | |
| 7.750%, 11/15/19 | | | 600 | | | | 683 | |
| 6.250%, 03/15/21 | | | 275 | | | | 289 | |
| International Automotive Components Group | | | | | | | | |
| 9.125%, 06/01/18(A) | | | 850 | | | | 864 | |
| Lear | | | | | | | | |
| 5.250%, 01/15/25 | | | 200 | | | | 204 | |
| 4.750%, 01/15/23 | | | 1,075 | | | | 1,080 | |
| MPG Holdco I | | | | | | | | |
| 7.375%, 10/15/22(A) | | | 1,100 | | | | 1,176 | |
| Schaeffler Finance BV | | | | | | | | |
| 4.750%, 05/15/21(A) | | | 625 | | | | 631 | |
| 4.750%, 05/15/23(A) | | | 800 | | | | 808 | |
| Schaeffler Finance BV, MTN | | | | | | | | |
| 4.250%, 05/15/21(A) | | | 375 | | | | 373 | |
| Schaeffler Holding Finance BV | | | | | | | | |
| 6.875%, 08/15/18(A) (D) | | | 850 | | | | 887 | |
| 6.750%, 11/15/22(A) | | | 575 | | | | 621 | |
| Stackpole International Intermediate | | | | | | | | |
| 7.750%, 10/15/21(A) | | | 950 | | | | 941 | |
| Tenneco | | | | | | | | |
| 5.375%, 12/15/24 | | | 450 | | | | 468 | |
| Tupy Overseas | | | | | | | | |
| 6.625%, 07/17/24 | | | 500 | | | | 480 | |
| | | | | | | | | |
| Total Autoparts | | | | 10,876 | |
| | | | | | | | | |
| Banks [3.8%] | |
| Access Bank, MTN | | | | | | | | |
| 9.250%, 06/24/21(E) | | | 2,275 | | | | 1,832 | |
| Agromercantil Senior Trust | | | | | | | | |
| 6.250%, 04/10/19 | | | 1,000 | | | | 1,019 | |
| Description | | Face Amount (000) | | | Value (000) | |
| Akbank, MTN | | | | | | |
| 5.125%, 03/31/25 | | $ | 2,000 | | | $ | 1,967 | |
| Alfa Bank Via Alfa Bond Issuance | | | | | | | | |
| 7.750%, 04/28/21 | | | 960 | | | | 940 | |
| 7.500%, 09/26/19 | | | 2,280 | | | | 2,113 | |
| Banco BMG | | | | | | | | |
| 8.000%, 04/15/18 | | | 1,000 | | | | 985 | |
| Bank of Georgia JSC, MTN | | | | | | | | |
| 7.750%, 07/05/17 | | | 2,200 | | | | 2,256 | |
| CIT Group | | | | | | | | |
| 5.250%, 03/15/18 | | | 875 | | | | 906 | |
| 5.000%, 05/15/17 | | | 625 | | | | 643 | |
| 5.000%, 08/01/23 | | | 1,175 | | | | 1,204 | |
| Commercial Bank Privatbank JSC Via Standard Bank | | | | | | | | |
| 5.799%, 02/09/16(C) (E) | | | 370 | | | | 78 | |
| Credit Bank of Moscow Via CBOM Finance | | | | | | | | |
| 7.700%, 02/01/18 | | | 1,350 | | | | 1,286 | |
| Diamond Bank | | | | | | | | |
| 8.750%, 05/21/19 | | | 940 | | | | 752 | |
| Eastern and Southern African Trade and Development Bank, MTN | | | | | | | | |
| 6.375%, 12/06/18 | | | 3,200 | | | | 3,207 | |
| FBN Finance | | | | | | | | |
| 8.250%, 08/07/20 | | | 2,790 | | | | 2,205 | |
| FBN Finance BV | | | | | | | | |
| 8.000%, 07/23/21(E) | | | 5,743 | | | | 4,473 | |
| Finansbank | | | | | | | | |
| 6.250%, 04/30/19 | | | 2,000 | | | | 2,032 | |
| Halyk Savings Bank of Kazakhstan JSC | | | | | | | | |
| 7.250%, 05/03/17 | | | 2,000 | | | | 2,010 | |
| 7.250%, 01/28/21 | | | 1,425 | | | | 1,384 | |
| ICBC Standard Bank, MTN | | | | | | | | |
| 8.125%, 12/02/19 | | | 1,000 | | | | 1,125 | |
| International Bank of Azerbaijan Via Rubrika Finance, MTN | | | | | | | | |
| 7.750%, 09/26/18 | | | 2,000 | | | | 1,920 | |
| 7.200%, 10/31/16 | | | 500 | | | | 496 | |
| Kaspi Bank JSC | | | | | | | | |
| 9.875%, 10/28/16 | | | 1,605 | | | | 1,565 | |
| Kazkommertsbank | | | | | | | | |
| 8.500%, 05/11/18 | | | 1,780 | | | | 1,633 | |
| Kazkommertsbank JSC | | | | | | | | |
| 6.765%, 07/27/16(C) (E) | | | 4,000 | | | | 3,617 | |
| 5.500%, 12/21/22 | | | 596 | | | | 405 | |
See accompanying notes to financial statements.
CITY NATIONAL ROCHDALE FUNDS | PAGE 65
consolidated schedule of investments
March 31, 2015 (Unaudited)
City National Rochdale Fixed Income Opportunities Fund (continued)
| Description | | Face Amount (000) | | | Value (000) | |
| Kazkommertsbank JSC, MTN | | | | | | |
| 8.000%, 11/03/15 | | $ | 1,940 | | | $ | 1,936 | |
| 7.500%, 11/29/16 | | | 2,205 | | | | 2,180 | |
| 6.875%, 02/13/17 | | | 2,270 | | | | 2,392 | |
| NDR Finance | | | | | | | | |
| 8.000%, 06/22/17(E) (J) | | | 721 | | | | 58 | |
| Oschadbank Via SSB #1 | | | | | | | | |
| 8.875%, 03/20/18 | | | 350 | | | | 140 | |
| 8.250%, 03/10/16 | | | 505 | | | | 210 | |
| Privatbank CJSC Via UK SPV Credit Finance, MTN | | | | | | | | |
| 9.375%, 09/23/15 | | | 300 | | | | 132 | |
| Renaissance Capital Via Renaissance Consumer Funding | | | | | | | | |
| 13.500%, 06/21/18 | | | 1,624 | | | | 1,250 | |
| Russian Standard Bank Via Russian Standard Finance | | | | | | | | |
| 9.250%, 07/11/17 | | | 1,625 | | | | 1,590 | |
| Russian Standard Bank Via Russian Standard Finance, MTN | | | | | | | | |
| 10.750%, 04/10/18(C) | | | 1,380 | | | | 734 | |
| Sberbank of Russia Via SB Capital | | | | | | | | |
| 5.125%, 10/29/22 | | | 1,000 | | | | 800 | |
| Tinkoff Credit Systems Via TCS Finance, MTN | | | | | | | | |
| 14.000%, 06/06/18 | | | 1,075 | | | | 946 | |
| Trade & Development Bank of Mongolia, MTN | | | | | | | | |
| 8.500%, 09/20/15 | | | 1,105 | | | | 1,090 | |
| Turkiye Is Bankasi | | | | | | | | |
| 6.000%, 10/24/22 | | | 1,210 | | | | 1,198 | |
| Turkiye Vakiflar Bankasi Tao | | | | | | | | |
| 6.000%, 11/01/22(A) | | | 1,000 | | | | 976 | |
| VTB Bank via VTB Eurasia | | | | | | | | |
| 9.500%, 12/06/49(E) | | | 50 | | | | 40 | |
| | | | | | | | | |
| Total Banks | | | | 57,725 | |
| | | | | | | | | |
| Beauty Products [0.1%] | |
| First Quality Finance | | | | | | | | |
| 4.625%, 05/15/21(A) | | | 950 | | | | 895 | |
| | | | | | | | | |
| Broadcasting & Cable [2.0%] | |
| AMC Networks | | | | | | | | |
| 7.750%, 07/15/21 | | | 600 | | | | 651 | |
| 4.750%, 12/15/22 | | | 325 | | | | 323 | |
| Anixter | | | | | | | | |
| 5.625%, 05/01/19 | | | 600 | | | | 645 | |
| 5.125%, 10/01/21 | | | 300 | | | | 308 | |
| Description | | Face Amount (000) | | | Value (000) | |
| Belden | | | | | | |
| 5.500%, 09/01/22(A) | | $ | 1,050 | | | $ | 1,076 | |
| 5.250%, 07/15/24(A) | | | 375 | | | | 378 | |
| CCO Holdings | | | | | | | | |
| 7.375%, 06/01/20 | | | 300 | | | | 321 | |
| 6.625%, 01/31/22 | | | 650 | | | | 695 | |
| 5.750%, 09/01/23 | | | 525 | | | | 549 | |
| 5.750%, 01/15/24 | | | 250 | | | | 260 | |
| 5.250%, 03/15/21 | | | 675 | | | | 691 | |
| 5.125%, 02/15/23 | | | 500 | | | | 505 | |
| CCOH Safari | | | | | | | | |
| 5.750%, 12/01/24 | | | 325 | | | | 335 | |
| 5.500%, 12/01/22 | | | 550 | | | | 562 | |
| Cequel Communications Holdings I | | | | | | | | |
| 6.375%, 09/15/20(A) | | | 850 | | | | 896 | |
| 5.125%, 12/15/21(A) | | | 750 | | | | 749 | |
| Clear Channel Communications | | | | | | | | |
| 9.000%, 03/01/21 | | | 1,150 | | | | 1,101 | |
| Clear Channel Worldwide Holdings | | | | | | | | |
| 6.500%, 11/15/22 | | | 2,000 | | | | 2,105 | |
| Columbus International | | | | | | | | |
| 7.375%, 03/30/21 | | | 2,740 | | | | 2,880 | |
| Crown Media Holdings | | | | | | | | |
| 10.500%, 07/15/19 | | | 975 | | | | 1,043 | |
| DISH DBS | | | | | | | | |
| 5.875%, 07/15/22 | | | 2,425 | | | | 2,464 | |
| 5.000%, 03/15/23 | | | 100 | | | | 97 | |
| General Cable | | | | | | | | |
| 5.750%, 10/01/22 | | | 275 | | | | 256 | |
| Gray Television | | | | | | | | |
| 7.500%, 10/01/20 | | | 1,000 | | | | 1,053 | |
| LIN Television | | | | | | | | |
| 6.375%, 01/15/21 | | | 175 | | | | 181 | |
| 5.875%, 11/15/22(A) | | | 650 | | | | 663 | |
| Nexstar Broadcasting | | | | | | | | |
| 6.125%, 02/15/22(A) | | | 875 | | | | 897 | |
| Numericable Group | | | | | | | | |
| 6.250%, 05/15/24(A) | | | 575 | | | | 582 | |
| 6.000%, 05/15/22(A) | | | 800 | | | | 810 | |
| Sinclair Television Group | | | | | | | | |
| 5.625%, 08/01/24(A) | | | 1,775 | | | | 1,806 | |
| Unitymedia Hessen GmbH & KG | | | | | | | | |
| 5.500%, 01/15/23(A) | | | 525 | | | | 549 | |
| Unitymedia KabelBW GmbH | | | | | | | | |
| 6.125%, 01/15/25(A) | | | 1,125 | | | | 1,190 | |
| VTR Finance BV | | | | | | | | |
| 6.875%, 01/15/24 | | | 3,165 | | | | 3,284 | |
See accompanying notes to financial statements.
CITY NATIONAL ROCHDALE FUNDS | PAGE 66
consolidated schedule of investments
March 31, 2015 (Unaudited)
City National Rochdale Fixed Income Opportunities Fund (continued)
| Description | | Face Amount (000) | | | Value (000) | |
| Ziggo Bond Finance BV | | | | | | |
| 5.875%, 01/15/25(A) | | $ | 275 | | | $ | 288 | |
| | | | | | | | | |
| Total Broadcasting & Cable | | | | 30,193 | |
| | | | | | | | | |
| Building & Construction [2.1%] | |
| Allegion US Holding | | | | | | | | |
| 5.750%, 10/01/21 | | | 550 | | | | 575 | |
| Cemex | | | | | | | | |
| 7.250%, 01/15/21 | | | 565 | | | | 606 | |
| 6.500%, 12/10/19 | | | 1,955 | | | | 2,073 | |
| 5.875%, 03/25/19 | | | 770 | | | | 795 | |
| 5.700%, 01/11/25 | | | 560 | | | | 552 | |
| CEMEX Espana | | | | | | | | |
| 9.875%, 04/30/19 | | | 1,250 | | | | 1,391 | |
| Cemex Finance | | | | | | | | |
| 9.375%, 10/12/22 | | | 3,760 | | | | 4,268 | |
| China Shanshui Cement Group | | | | | | | | |
| 10.500%, 04/27/17 | | | 545 | | | | 572 | |
| 7.500%, 03/10/20 | | | 1,500 | | | | 1,492 | |
| CPG Merger Sub | | | | | | | | |
| 8.000%, 10/01/21(A) | | | 925 | | | | 936 | |
| Dry Mix Solutions Investissements SAS | | | | | | | | |
| 4.277%, 06/15/21(E) | | | 3,000 | | | | 3,202 | |
| Elementia | | | | | | | | |
| 5.500%, 01/15/25 | | | 300 | | | | 299 | |
| Grupo Cementos de Chihuahua | | | | | | | | |
| 8.125%, 02/08/20 | | | 1,580 | | | | 1,683 | |
| Interline Brands | | | | | | | | |
| 10.000%, 11/15/18(D) | | | 1,054 | | | | 1,106 | |
| Masco | | | | | | | | |
| 4.450%, 04/01/25 | | | 325 | | | | 336 | |
| Masonite International | | | | | | | | |
| 8.250%, 04/15/21(A) | | | 925 | | | | 986 | |
| 5.625%, 03/15/23(A) | | | 475 | | | | 487 | |
| NCI Building Systems | | | | | | | | |
| 8.250%, 01/15/23(A) | | | 575 | | | | 608 | |
| Nortek | | | | | | | | |
| 8.500%, 04/15/21 | | | 1,600 | | | | 1,712 | |
| OAS Investments GmbH | | | | | | | | |
| 8.250%, 10/19/19 | | | 2,000 | | | | 295 | |
| Roofing Supply Group | | | | | | | | |
| 10.000%, 06/01/20(A) | | | 500 | | | | 489 | |
| Saderea, MTN | | | | | | | | |
| 12.500%, 11/30/26 | | | 2,000 | | | | 1,813 | |
| USG | | | | | | | | |
| 7.875%, 03/30/20(A) | | | 250 | | | | 270 | |
| 5.875%, 11/01/21(A) | | | 650 | | | | 691 | |
| 5.500%, 03/01/25(A) | | | 400 | | | | 408 | |
| Description | | Face Amount (000) | | | Value (000) | |
| West China Cement | | | | | | |
| 6.500%, 09/11/19 | | $ | 2,000 | | | $ | 1,977 | |
| Wise Metals Intermediate Holdings | | | | | | | | |
| 9.750%, 06/15/19(A) | | | 550 | | | | 595 | |
| Yuksel Insaat | | | | | | | | |
| 9.500%, 11/10/15 | | | 1,465 | | | | 806 | |
| | | | | | | | | |
| Total Building & Construction | | | | 31,023 | |
| | | | | | | | | |
| Building & Construction Supplies [0.2%] | |
| GTL Trade Finance | | | | | | | | |
| 5.893%, 04/29/24 | | | 1,000 | | | | 961 | |
| Signode Industrial Group Lux | | | | | | | | |
| 6.375%, 05/01/22(A) | | | 1,575 | | | | 1,565 | |
| | | | | | | | | |
| Total Building & Construction Supplies | | | | 2,526 | |
| | | | | | | | | |
| Building-Heavy Construct [0.6%] | |
| Empresas ICA | | | | | | | | |
| 8.900%, 02/04/21 | | | 2,834 | | | | 2,458 | |
| 8.875%, 05/29/24 | | | 3,400 | | | | 2,710 | |
| Odebrecht Offshore Drilling Finance | | | | | | | | |
| 6.750%, 10/02/22 | | | 1,228 | | | | 954 | |
| 6.625%, 10/01/23 | | | 949 | | | | 726 | |
| Pratama Agung Pte | | | | | | | | |
| 6.250%, 02/24/20 | | | 2,500 | | | | 2,447 | |
| | | | | | | | | |
| Total Building-Heavy Construct | | | | 9,295 | |
| | | | | | | | | |
| Business Services [0.1%] | |
| CoreLogic | | | | | | | | |
| 7.250%, 06/01/21 | | | 775 | | | | 825 | |
| | | | | | | | | |
| Chemicals [0.6%] | |
| Ashland | | | | | | | | |
| 4.750%, 08/15/22 | | | 950 | | | | 964 | |
| Axiall | | | | | | | | |
| 4.875%, 05/15/23 | | | 100 | | | | 99 | |
| Celanese US Holdings | | | | | | | | |
| 4.625%, 11/15/22 | | | 375 | | | | 378 | |
| Eagle Spinco | | | | | | | | |
| 4.625%, 02/15/21 | | | 175 | | | | 173 | |
| Eco Services Operations | | | | | | | | |
| 8.500%, 11/01/22(A) | | | 475 | | | | 480 | |
| Fufeng Group | | | | | | | | |
| 7.625%, 04/13/16 | | | 1,500 | | | | 1,523 | |
| Hexion US Finance | | | | | | | | |
| 8.875%, 02/01/18 | | | 1,625 | | | | 1,434 | |
See accompanying notes to financial statements.
CITY NATIONAL ROCHDALE FUNDS | PAGE 67
consolidated schedule of investments
March 31, 2015 (Unaudited)
City National Rochdale Fixed Income Opportunities Fund (continued)
| Description | | Face Amount (000) | | | Value (000) | |
| Huntsman International | | | | | | |
| 5.125%, 11/15/22(A) | | $ | 300 | | | $ | 301 | |
| 4.875%, 11/15/20 | | | 650 | | | | 650 | |
| Novacap International SAS, MTN | | | | | | | | |
| 5.052%, 05/01/19(E) | | | 1,000 | | | | 1,081 | |
| Platform Specialty | | | | | | | | |
| 6.500%, 02/01/22 | | | 1,250 | | | | 1,306 | |
| WR Grace & -Conn | | | | | | | | |
| 5.625%, 10/01/24(A) | | | 225 | | | | 240 | |
| 5.125%, 10/01/21(A) | | | 225 | | | | 233 | |
| | | | | | | | | |
| Total Chemicals | | | | 8,862 | |
| | | | | | | | | |
| Coal Mining [0.8%] | |
| Berau Capital Resources | | | | | | | | |
| 12.500%, 07/08/15 | | | 587 | | | | 411 | |
| Berau Coal Energy | | | | | | | | |
| 7.250%, 03/13/17 | | | 4,335 | | | | 2,839 | |
| Indo Energy Finance II BV | | | | | | | | |
| 6.375%, 01/24/23 | | | 2,895 | | | | 1,911 | |
| Mongolian Mining, MTN | | | | | | | | |
| 8.875%, 03/29/17 | | | 9,813 | | | | 6,918 | |
| New World Resources | | | | | | | | |
| 8.000%, 04/07/20 | | | 850 | | | | 540 | |
| | | | | | | | | |
| Total Coal Mining | | | | 12,619 | |
| | | | | | | | | |
| Coatings/Paint [0.1%] | |
| US Coatings Acquisition | | | | | | | | |
| 7.375%, 05/01/21(A) | | | 1,300 | | | | 1,398 | |
| | | | | | | | | |
| Commercial Serv-Finance [0.4%] | |
| Igloo Holdings | | | | | | | | |
| 8.250%, 12/15/17(A) (D) | | | 975 | | | | 980 | |
| Interactive Data | | | | | | | | |
| 5.875%, 04/15/19(A) | | | 1,350 | | | | 1,362 | |
| TMF Group Holding BV | | | | | | | | |
| 5.415%, 12/01/18(E) | | | 1,000 | | | | 1,087 | |
| TransUnion Holding | | | | | | | | |
| 9.625%, 06/15/18(D) | | | 1,200 | | | | 1,212 | |
| 8.125%, 06/15/18 | | | 475 | | | | 487 | |
| | | | | | | | | |
| Total Commercial Serv-Finance | | | | 5,128 | |
| | | | | | | | | |
| Commercial Services [0.3%] | |
| Anna Merger Sub | | | | | | | | |
| 7.750%, 10/01/22(A) | | | 2,050 | | | | 2,119 | |
| BC Luxco 1 | | | | | | | | |
| 7.375%, 01/29/20 | | | 2,470 | | | | 2,439 | |
| Description | | Face Amount (000) | | | Value (000) | |
| Iron Mountain | | | | | | |
| 5.750%, 08/15/24 | | $ | 550 | | | $ | 557 | |
| | | | | | | | | |
| Total Commercial Services | | | | 5,115 | |
| | | | | | | | | |
| Computer Aided Design [0.2%] | |
| Rolta Americas | | | | | | | | |
| 8.875%, 07/24/19 | | | 1,600 | | | | 1,532 | |
| 8.875%, 07/24/19(A) | | | 2,130 | | | | 2,039 | |
| | | | | | | | | |
| Total Computer Aided Design | | | | 3,571 | |
| | | | | | | | | |
| Computer Graphics [0.2%] | |
| Epicor Software | | | | | | | | |
| 8.625%, 05/01/19 | | | 1,325 | | | | 1,385 | |
| Southern Graphics | | | | | | | | |
| 8.375%, 10/15/20(A) | | | 1,375 | | | | 1,392 | |
| | | | | | | | | |
| Total Computer Graphics | | | | 2,777 | |
| | | | | | | | | |
| Computer System Design & Services [0.3%] | |
| Compiler Finance Sub | | | | | | | | |
| 7.000%, 05/01/21(A) (J) | | | 900 | | | | 691 | |
| IHS | | | | | | | | |
| 5.000%, 11/01/22(A) | | | 225 | | | | 226 | |
| NCR | | | | | | | | |
| 6.375%, 12/15/23 | | | 525 | | | | 559 | |
| 5.875%, 12/15/21 | | | 400 | | | | 417 | |
| 5.000%, 07/15/22 | | | 800 | | | | 808 | |
| 4.625%, 02/15/21 | | | 250 | | | | 250 | |
| SunGard Data Systems | | | | | | | | |
| 6.625%, 11/01/19 | | | 1,600 | | | | 1,648 | |
| | | | | | | | | |
| Total Computer System Design & Services | | | | 4,599 | |
| | | | | | | | | |
| Consumer Products & Services [0.5%] | |
| Prestige Brands | | | | | | | | |
| 8.125%, 02/01/20 | | | 475 | | | | 509 | |
| 5.375%, 12/15/21(A) | | | 825 | | | | 835 | |
| Serta Simmons Holdings | | | | | | | | |
| 8.125%, 10/01/20(A) | | | 1,950 | | | | 2,052 | |
| ServiceMaster | | | | | | | | |
| 7.450%, 08/15/27 | | | 225 | | | | 228 | |
| 7.100%, 03/01/18 | | | 475 | | | | 499 | |
| 7.000%, 08/15/20 | | | 1,610 | | | | 1,711 | |
| Spectrum Brands | | | | | | | | |
| 6.750%, 03/15/20 | | | 925 | | | | 976 | |
| 6.125%, 12/15/24(A) | | | 575 | | | | 614 | |
| | | | | | | | | |
| Total Consumer Products & Services | | | | 7,424 | |
See accompanying notes to financial statements.
CITY NATIONAL ROCHDALE FUNDS | PAGE 68
consolidated schedule of investments
March 31, 2015 (Unaudited)
City National Rochdale Fixed Income Opportunities Fund (continued)
| Description | | Face Amount (000) | | | Value (000) | |
| Containers & Packaging [0.9%] | |
| Ardagh Packaging Finance | | | | | | |
| 9.125%, 10/15/20(A) | | $ | 2,200 | | | $ | 2,353 | |
| 6.750%, 01/31/21(A) | | | 200 | | | | 202 | |
| Ball | | | | | | | | |
| 4.000%, 11/15/23 | | | 825 | | | | 804 | |
| Berry Plastics | | | | | | | | |
| 5.500%, 05/15/22 | | | 1,575 | | | | 1,618 | |
| Beverage Packaging Holdings Luxembourg II | | | | | | | | |
| 6.000%, 06/15/17(A) | | | 325 | | | | 326 | |
| 5.625%, 12/15/16(A) | | | 300 | | | | 301 | |
| BWAY Holding | | | | | | | | |
| 9.125%, 08/15/21(A) | | | 1,175 | | | | 1,222 | |
| Crown Americas | | | | | | | | |
| 4.500%, 01/15/23 | | | 1,025 | | | | 1,034 | |
| Graphic Packaging International | | | | | | | | |
| 4.875%, 11/15/22 | | | 350 | | | | 363 | |
| 4.750%, 04/15/21 | | | 200 | | | | 208 | |
| Owens-Brockway Glass Container | | | | | | | | |
| 5.375%, 01/15/25(A) | | | 300 | | | | 309 | |
| 5.000%, 01/15/22(A) | | | 125 | | | | 127 | |
| Pactiv | | | | | | | | |
| 7.950%, 12/15/25 | | | 200 | | | | 204 | |
| Reynolds Group Issuer | | | | | | | | |
| 9.875%, 08/15/19 | | | 515 | | | | 551 | |
| 8.250%, 02/15/21 | | | 1,300 | | | | 1,391 | |
| 5.750%, 10/15/20 | | | 1,350 | | | | 1,396 | |
| Sealed Air | | | | | | | | |
| 6.500%, 12/01/20(A) | | | 725 | | | | 807 | |
| 5.125%, 12/01/24(A) | | | 725 | | | | 750 | |
| 4.875%, 12/01/22(A) | | | 725 | | | | 740 | |
| | | | | | | | | |
| Total Containers & Packaging | | | | 14,706 | |
| | | | | | | | | |
| Data Processing/Mgmt [0.3%] | |
| Audatex North America | | | | | | | | |
| 6.125%, 11/01/23(A) | | | 175 | | | | 185 | |
| 6.000%, 06/15/21(A) | | | 1,175 | | | | 1,243 | |
| First Data | | | | | | | | |
| 8.750%, 01/15/22(A) (D) | | | 3,225 | | | | 3,471 | |
| 8.250%, 01/15/21(A) | | | 150 | | | | 161 | |
| | | | | | | | | |
| Total Data Processing/Mgmt | | | | 5,060 | |
| | | | | | | | | |
| Decision Support Software [0.0%] | |
| MSCI | | | | | | | | |
| 5.250%, 11/15/24(A) | | | 225 | | | | 232 | |
| Description | | Face Amount (000) | | | Value (000) | |
| Dental Supplies and Equip [0.3%] | |
| IDH Finance | | | | | | |
| 5.562%, 12/01/18(E) | | $ | 3,000 | | | $ | 4,428 | |
| | | | | | | | | |
| Diagnostic Equipment [0.1%] | |
| Crimson Merger Sub | | | | | | | | |
| 6.625%, 05/15/22(A) | | | 2,200 | | | | 1,953 | |
| | | | | | | | | |
| Dialysis Centers [0.1%] | |
| DaVita HealthCare Partners | | | | | | | | |
| 5.750%, 08/15/22 | | | 875 | | | | 930 | |
| 5.125%, 07/15/24 | | | 175 | | | | 179 | |
| | | | | | | | | |
| Total Dialysis Centers | | | | 1,109 | |
| | | | | | | | | |
| Distribution/Wholesale [0.3%] | |
| American Builders & Contractors Supply | | | | | | | | |
| 5.625%, 04/15/21(A) | | | 900 | | | | 911 | |
| DH Services Luxembourg Sarl | | | | | | | | |
| 7.750%, 12/15/20(A) | | | 1,350 | | | | 1,411 | |
| HD Supply | | | | | | | | |
| 7.500%, 07/15/20 | | | 200 | | | | 214 | |
| 5.250%, 12/15/21(A) | | | 100 | | | | 103 | |
| VWR Funding | | | | | | | | |
| 7.250%, 09/15/17 | | | 1,875 | | | | 1,957 | |
| | | | | | | | | |
| Total Distribution/Wholesale | | | | 4,596 | |
| | | | | | | | | |
| Diversified Minerals [0.1%] | |
| China Hongqiao Group | | | | | | | | |
| 7.625%, 06/26/17 | | | 1,370 | | | | 1,350 | |
| 6.875%, 05/03/18 | | | 600 | | | | 579 | |
| | | | | | | | | |
| Total Diversified Minerals | | | | 1,929 | |
| | | | | | | | | |
| Drugs [0.5%] | |
| Endo Finance | | | | | | | | |
| 6.000%, 02/01/25(A) | | | 1,100 | | | | 1,133 | |
| Grifols Worldwide Operations | | | | | | | | |
| 5.250%, 04/01/22(A) | | | 900 | | | | 915 | |
| Valeant Pharmaceuticals International | | | | | | | | |
| 5.625%, 12/01/21(A) | | | 425 | | | | 431 | |
| 5.500%, 03/01/23(A) | | | 100 | | | | 101 | |
| VPII Escrow | | | | | | | | |
| 7.500%, 07/15/21(A) | | | 1,400 | | | | 1,514 | |
See accompanying notes to financial statements.
CITY NATIONAL ROCHDALE FUNDS | PAGE 69
consolidated schedule of investments
March 31, 2015 (Unaudited)
City National Rochdale Fixed Income Opportunities Fund (continued)
| Description | | Face Amount (000) | | | Value (000) | |
| VRX Escrow | | | | | | |
| 6.125%, 04/15/25(A) | | $ | 1,650 | | | $ | 1,708 | |
| 5.875%, 05/15/23(A) | | | 1,300 | | | | 1,332 | |
| 5.375%, 03/15/20(A) | | | 100 | | | | 101 | |
| | | | | | | | | |
| Total Drugs | | | | 7,235 | |
| | | | | | | | | |
| E-Commerce/Services [0.1%] | |
| IAC | | | | | | | | |
| 4.750%, 12/15/22 | | | 1,250 | | | | 1,241 | |
| | | | | | | | | |
| Educational Software [0.0%] | |
| Blackboard | | | | | | | | |
| 7.750%, 11/15/19(A) | | | 675 | | | | 648 | |
| | | | | | | | | |
| Electric Utilities [0.3%] | |
| Calpine | | | | | | | | |
| 5.875%, 01/15/24(A) | | | 550 | | | | 590 | |
| 5.750%, 01/15/25 | | | 950 | | | | 957 | |
| Eskom Holdings SOC | | | | | | | | |
| 7.125%, 02/11/25 | | | 1,000 | | | | 1,007 | |
| NRG Energy | | | | | | | | |
| 6.625%, 03/15/23 | | | 400 | | | | 414 | |
| 6.250%, 05/01/24 | | | 500 | | | | 504 | |
| Star Energy Geothermal Wayang Windu | | | | | | | | |
| 6.125%, 03/27/20 | | | 270 | | | | 275 | |
| | | | | | | | | |
| Total Electric Utilities | | | | 3,747 | |
| | | | | | | | | |
| Electrical Products [0.1%] | |
| WESCO Distribution | | | | | | | | |
| 5.375%, 12/15/21 | | | 1,275 | | | | 1,297 | |
| | | | | | | | | |
| Electronic Parts Distrib [0.1%] | |
| Rexel | | | | | | | | |
| 6.125%, 12/15/19(A) | | | 1,275 | | | | 1,336 | |
| | | | | | | | | |
| Energy [0.3%] | |
| CGG | | | | | | | | |
| 6.875%, 01/15/22 | | | 525 | | | | 417 | |
| 6.500%, 06/01/21 | | | 200 | | | | 160 | |
| ContourGlobal Power Holdings | | | | | | | | |
| 7.125%, 06/01/19 | | | 3,150 | | | | 3,213 | |
| Viridian Group | | | | | | | | |
| 7.500%, 03/01/20 | | | 500 | | | | 550 | |
| | | | | | | | | |
| Total Energy | | | | 4,340 | |
| Description | | Face Amount (000) | | | Value (000) | |
| Energy & Power [0.0%] | |
| TerraForm Power Operating | | | | | | |
| 5.875%, 02/01/23(A) | | $ | 425 | | | $ | 441 | |
| | | | | | | | | |
| Enterprise Software/Serv [0.5%] | |
| BMC Software Finance | | | | | | | | |
| 8.125%, 07/15/21(A) | | | 875 | | | | 801 | |
| Boxer Parent | | | | | | | | |
| 9.000%, 10/15/19(A) (D) | | | 1,200 | | | | 990 | |
| Eagle Midco | | | | | | | | |
| 9.000%, 06/15/18(A) | | | 750 | | | | 764 | |
| Infor Software Parent | | | | | | | | |
| 7.125%, 05/01/21(A) | | | 1,700 | | | | 1,684 | |
| Infor US | | | | | | | | |
| 9.375%, 04/01/19 | | | 1,225 | | | | 1,313 | |
| 6.500%, 05/15/22(A) | | | 1,850 | | | | 1,896 | |
| Open Text | | | | | | | | |
| 5.625%, 01/15/23(A) | | | 650 | | | | 674 | |
| | | | | | | | | |
| Total Enterprise Software/Serv | | | | 8,122 | |
| | | | | | | | | |
| Entertainment & Gaming [1.0%] | |
| Affinity Gaming | | | | | | | | |
| 9.000%, 05/15/18 | | | 375 | | | | 366 | |
| Ameristar Casinos | | | | | | | | |
| 7.500%, 04/15/21 | | | 600 | | | | 633 | |
| Chester Downs & Marina | | | | | | | | |
| 9.250%, 02/01/20(A) | | | 450 | | | | 342 | |
| Churchill Downs | | | | | | | | |
| 5.375%, 12/15/21 | | | 300 | | | | 304 | |
| Cinemark USA | | | | | | | | |
| 7.375%, 06/15/21 | | | 200 | | | | 214 | |
| 5.125%, 12/15/22 | | | 300 | | | | 304 | |
| GLP Capital | | | | | | | | |
| 5.375%, 11/01/23 | | | 500 | | | | 517 | |
| 4.875%, 11/01/20 | | | 600 | | | | 615 | |
| MGM Resorts International | | | | | | | | |
| 7.750%, 03/15/22 | | | 1,400 | | | | 1,577 | |
| 6.750%, 10/01/20 | | | 250 | | | | 268 | |
| 6.000%, 03/15/23 | | | 375 | | | | 385 | |
| 5.250%, 03/31/20 | | | 350 | | | | 355 | |
| Mohegan Tribal Gaming Authority | | | | | | | | |
| 9.750%, 09/01/21 | | | 750 | | | | 795 | |
| Penn National Gaming | | | | | | | | |
| 5.875%, 11/01/21 | | | 1,525 | | | | 1,514 | |
| Pinnacle Entertainment | | | | | | | | |
| 7.750%, 04/01/22 | | | 525 | | | | 584 | |
| 6.375%, 08/01/21 | | | 400 | | | | 424 | |
See accompanying notes to financial statements.
CITY NATIONAL ROCHDALE FUNDS | PAGE 70
consolidated schedule of investments
March 31, 2015 (Unaudited)
City National Rochdale Fixed Income Opportunities Fund (continued)
| Description | | Face Amount (000) | | | Value (000) | |
| Regal Entertainment Group | | | | | | |
| 5.750%, 03/15/22 | | $ | 500 | | | $ | 511 | |
| 5.750%, 02/01/25 | | | 375 | | | | 375 | |
| Seminole Hard Rock Entertainment | | | | | | | | |
| 5.875%, 05/15/21(A) | | | 1,525 | | | | 1,531 | |
| Seminole Indian Tribe of Florida | | | | | | | | |
| 7.804%, 10/01/20(A) | | | 555 | | | | 602 | |
| Station Casinos | | | | | | | | |
| 7.500%, 03/01/21 | | | 1,125 | | | | 1,198 | |
| | | | | | | | | |
| Total Entertainment & Gaming | | | | 13,414 | |
| | | | | | | | | |
| Entertainment Software [0.0%] | |
| Activision Blizzard | | | | | | | | |
| 6.125%, 09/15/23(A) | | | 400 | | | | 436 | |
| | | | | | | | | |
| E-Services/Consulting [0.1%] | |
| TES Finance | | | | | | | | |
| 6.750%, 07/15/20 | | | 1,000 | | | | 1,435 | |
| | | | | | | | | |
| Financial Services [0.9%] | |
| AerCap Ireland Capital | | | | | | | | |
| 4.500%, 05/15/21(A) | | | 800 | | | | 827 | |
| Ally Financial | | | | | | | | |
| 5.125%, 09/30/24 | | | 450 | | | | 464 | |
| 4.750%, 09/10/18 | | | 1,150 | | | | 1,183 | |
| 4.625%, 03/30/25 | | | 1,300 | | | | 1,281 | |
| 4.125%, 03/30/20 | | | 425 | | | | 422 | |
| 4.125%, 02/13/22 | | | 400 | | | | 390 | |
| 2.750%, 01/30/17 | | | 1,150 | | | | 1,146 | |
| Arrow Global Finance | | | | | | | | |
| 5.290%, 11/01/21(E) | | | 1,000 | | | | 1,083 | |
| Astana Finance BV | | | | | | | | |
| 9.000%, 11/16/11(B) (J) | | | 3,000 | | | | 450 | |
| Astana Finance BV, MTN | | | | | | | | |
| 7.875%, 06/08/10(B) (J) | | | 250 | | | | 40 | |
| Credito Real | | | | | | | | |
| 7.500%, 03/13/19 | | | 2,500 | | | | 2,563 | |
| General Motors Financial | | | | | | | | |
| 4.375%, 09/25/21 | | | 250 | | | | 265 | |
| 4.000%, 01/15/25 | | | 150 | | | | 153 | |
| International Lease Finance | | | | | | | | |
| 5.875%, 08/15/22 | | | 1,025 | | | | 1,138 | |
| 4.625%, 04/15/21 | | | 1,225 | | | | 1,268 | |
| Lock | | | | | | | | |
| 5.548%, 08/15/20(E) | | | 2,000 | | | | 2,175 | |
| | | | | | | | | |
| Total Financial Services | | | | 14,848 | |
| Description | | Face Amount (000) | | | Value (000) | |
| Firearms and Ammunition [0.1%] | |
| FGI Operating Company | | | | | | |
| 7.875%, 05/01/20 | | $ | 925 | | | $ | 789 | |
| | | | | | | | | |
| Food, Beverage & Tobacco [2.2%] | |
| Ajecorp BV | | | | | | | | |
| 6.500%, 05/14/22 | | | 1,000 | | | | 600 | |
| ARAMARK | | | | | | | | |
| 5.750%, 03/15/20 | | | 1,800 | | | | 1,881 | |
| B&G Foods | | | | | | | | |
| 4.625%, 06/01/21 | | | 425 | | | | 424 | |
| Boparan Finance | | | | | | | | |
| 5.500%, 07/15/21 | | | 1,000 | | | | 1,319 | |
| Boparan Finance, MTN | | | | | | | | |
| 4.375%, 07/15/21 | | | 1,000 | | | | 988 | |
| CEDC Finance International | | | | | | | | |
| 9.000%, 04/30/15(C) | | | 2,005 | | | | 1,855 | |
| CFG Investment SAC | | | | | | | | |
| 9.750%, 07/30/19 | | | 820 | | | | 725 | |
| Dean Foods | | | | | | | | |
| 6.500%, 03/15/23(A) | | | 950 | | | | 955 | |
| Galapagos | | | | | | | | |
| 4.832%, 06/15/21(E) | | | 3,000 | | | | 3,185 | |
| Hearthside Group Holdings | | | | | | | | |
| 6.500%, 05/01/22(A) | | | 1,400 | | | | 1,390 | |
| HJ Heinz | | | | | | | | |
| 4.875%, 02/15/25(A) | | | 1,450 | | | | 1,571 | |
| 4.250%, 10/15/20 | | | 1,175 | | | | 1,206 | |
| JBS Investments GmbH | | | | | | | | |
| 7.750%, 10/28/20 | | | 700 | | | | 740 | |
| Marfrig Holding Europe BV | | | | | | | | |
| 8.375%, 05/09/18 | | | 2,580 | | | | 2,438 | |
| 6.875%, 06/24/19 | | | 1,230 | | | | 1,045 | |
| Marfrig Overseas | | | | | | | | |
| 9.500%, 05/04/20 | | | 4,469 | | | | 4,223 | |
| MHP | | | | | | | | |
| 10.250%, 04/29/15 | | | 1,665 | | | | 1,565 | |
| 8.250%, 04/02/20 | | | 3,850 | | | | 2,518 | |
| Minerva Luxembourg | | | | | | | | |
| 8.750%, 12/29/49(E) | | | 2,000 | | | | 1,900 | |
| 7.750%, 01/31/23 | | | 265 | | | | 261 | |
| Pinnacle Foods Finance | | | | | | | | |
| 4.875%, 05/01/21 | | | 1,675 | | | | 1,688 | |
| Shearer’s Foods | | | | | | | | |
| 9.000%, 11/01/19(A) | | | 325 | | | | 354 | |
| Smithfield Foods | | | | | | | | |
| 6.625%, 08/15/22 | | | 1,175 | | | | 1,257 | |
| Sun Merger Sub | | | | | | | | |
| 5.875%, 08/01/21(A) | | | 600 | | | | 629 | |
| | | | | | | | | |
| Total Food, Beverage & Tobacco | | | | 34,717 | |
See accompanying notes to financial statements.
CITY NATIONAL ROCHDALE FUNDS | PAGE 71
consolidated schedule of investments
March 31, 2015 (Unaudited)
City National Rochdale Fixed Income Opportunities Fund (continued)
| Description | | Face Amount (000) | | | Value (000) | |
| Food-Canned [0.0%] | |
| TreeHouse Foods | | | | | | |
| 4.875%, 03/15/22 | | $ | 100 | | | $ | 102 | |
| | | | | | | | | |
| Food-Wholesale/Distrib [0.1%] | |
| US Foods | | | | | | | | |
| 8.500%, 06/30/19 | | | 1,875 | | | | 1,969 | |
| | | | | | | | | |
| Gaming [0.1%] | |
| Rivers Pittsburgh Borrower | | | | | | | | |
| 9.500%, 06/15/19(A) | | | 809 | | | | 851 | |
| | | | | | | | | |
| Gold Mining [0.1%] | |
| Banro | | | | | | | | |
| 10.000%, 03/01/17(J) | | | 500 | | | | 250 | |
| Polyus International | | | | | | | | |
| 5.625%, 04/29/20 | | | 1,200 | | | | 1,097 | |
| | | | | | | | | |
| Total Gold Mining | | | | 1,347 | |
| | | | | | | | | |
| Health Care [0.1%] | |
| Envision Healthcare | | | | | | | | |
| 5.125%, 07/01/22(A) | | | 950 | | | | 971 | |
| Omnicare Inc | | | | | | | | |
| 5.000%, 12/01/24 | | | 125 | | | | 131 | |
| | | | | | | | | |
| Total Health Care | | | | 1,102 | |
| | | | | | | | | |
| Home Decoration Products [0.1%] | |
| RSI Home Products | | | | | | | | |
| 6.500%, 03/15/23(A) | | | 750 | | | | 761 | |
| | | | | | | | | |
| Hotels and Motels [0.1%] | |
| Hilton Worldwide Finance | | | | | | | | |
| 5.625%, 10/15/21 | | | 700 | | | | 737 | |
| | | | | | | | | |
| Industrial [0.1%] | |
| Unifrax I | | | | | | | | |
| 7.500%, 02/15/19(A) | | | 900 | | | | 905 | |
| | | | | | | | | |
| Insurance [0.2%] | |
| Hockey Merger Sub 2 | | | | | | | | |
| 7.875%, 10/01/21(A) | | | 1,250 | | | | 1,281 | |
| Hub Holdings | | | | | | | | |
| 8.125%, 07/15/19(A) (D) | | | 1,050 | | | | 1,042 | |
| | | | | | | | | |
| Total Insurance | | | | 2,323 | |
| | | | | | | | | |
| Internet Connectiv Svcs [0.1%] | |
| Adria Bidco BV | | | | | | | | |
| 7.875%, 11/15/20 | | | 1,000 | | | | 1,153 | |
| Description | | Face Amount (000) | | | Value (000) | |
| Internet Security [0.0%] | |
| VeriSign | | | | | | |
| 5.250%, 04/01/25(A) | | $ | 525 | | | $ | 536 | |
| | | | | | | | | |
| Investment Banker/Broker Dealer [0.1%] | |
| First Investment Finance BV | | | | | | | | |
| 11.625%, 03/29/16(C) (J) | | | 200 | | | | 140 | |
| Intercorp Peru | | | | | | | | |
| 5.875%, 02/12/25 | | | 2,000 | | | | 1,985 | |
| Neuberger Berman Group | | | | | | | | |
| 5.875%, 03/15/22(A) | | | 400 | | | | 427 | |
| | | | | | | | | |
| Total Investment Banker/Broker Dealer | | | | 2,552 | |
| | | | | | | | | |
| Mach Tools and Rel Products [0.1%] | |
| Mcron Finance Sub | | | | | | | | |
| 8.375%, 05/15/19(A) | | | 461 | | | | 492 | |
| Milacron | | | | | | | | |
| 7.750%, 02/15/21(A) | | | 350 | | | | 362 | |
| | | | | | | | | |
| Total Mach Tools and Rel Products | | | | 854 | |
| | | | | | | | | |
| Machinery-General Indust [0.2%] | |
| Gardner Denver | | | | | | | | |
| 6.875%, 08/15/21(A) | | | 1,000 | | | | 900 | |
| Waterjet Holdings | | | | | | | | |
| 7.625%, 02/01/20(A) | | | 225 | | | | 237 | |
| Zebra Technologies | | | | | | | | |
| 7.250%, 10/15/22(A) | | | 825 | | | | 889 | |
| | | | | | | | | |
| Total Machinery-General Indust | | | | 2,026 | |
| | | | | | | | | |
| Manufacturing [0.0%] | |
| Cleaver-Brooks | | | | | | | | |
| 8.750%, 12/15/19(A) | | | 675 | | | | 688 | |
| | | | | | | | | |
| Media - Non-Cable [0.1%] | |
| Intelsat Jackson Holdings | | | | | | | | |
| 6.625%, 12/15/22 | | | 1,275 | | | | 1,230 | |
| | | | | | | | | |
| Medical Products & Services [1.4%] | |
| Biomet | | | | | | | | |
| 6.500%, 08/01/20 | | | 1,150 | | | | 1,219 | |
| Care UK Health & Social Care | | | | | | | | |
| 5.560%, 07/15/19(E) | | | 1,000 | | | | 1,402 | |
| CHS | | | | | | | | |
| 6.875%, 02/01/22 | | | 1,750 | | | | 1,870 | |
| 5.125%, 08/01/21 | | | 450 | | | | 463 | |
| DJO Finance | | | | | | | | |
| 7.750%, 04/15/18 | | | 1,150 | | | | 1,167 | |
See accompanying notes to financial statements.
CITY NATIONAL ROCHDALE FUNDS | PAGE 72
consolidated schedule of investments
March 31, 2015 (Unaudited)
City National Rochdale Fixed Income Opportunities Fund (continued)
| Description | | Face Amount (000) | | | Value (000) | |
| HCA | | | | | | |
| 7.500%, 02/15/22 | | $ | 1,625 | | | $ | 1,895 | |
| 6.500%, 02/15/20 | | | 450 | | | | 507 | |
| 5.875%, 05/01/23 | | | 825 | | | | 891 | |
| 5.375%, 02/01/25 | | | 375 | | | | 393 | |
| 5.250%, 04/15/25 | | | 725 | | | | 783 | |
| 5.000%, 03/15/24 | | | 1,875 | | | | 1,987 | |
| HCA Holdings | | | | | | | | |
| 7.750%, 05/15/21 | | | 575 | | | | 612 | |
| 6.250%, 02/15/21 | | | 550 | | | | 595 | |
| IASIS Healthcare | | | | | | | | |
| 8.375%, 05/15/19 | | | 1,200 | | | | 1,248 | |
| LifePoint Hospitals | | | | | | | | |
| 5.500%, 12/01/21 | | | 1,025 | | | | 1,074 | |
| Teleflex | | | | �� | | | | |
| 5.250%, 06/15/24(A) | | | 175 | | | | 179 | |
| Tenet Healthcare | | | | | | | | |
| 8.125%, 04/01/22 | | | 1,275 | | | | 1,406 | |
| 4.500%, 04/01/21 | | | 850 | | | | 833 | |
| 4.375%, 10/01/21 | | | 925 | | | | 904 | |
| United Surgical Partners International | | | | | | | | |
| 9.000%, 04/01/20 | | | 1,050 | | | | 1,128 | |
| | | | | | | | | |
| Total Medical Products & Services | | | | 20,556 | |
| | | | | | | | | |
| Medical-HMO [0.1%] | |
| MPH Acquisition Holdings | | | | | | | | |
| 6.625%, 04/01/22(A) | | | 1,700 | | | | 1,762 | |
| | | | | | | | | |
| Medical-Outptnt/Home Med [0.1%] | |
| Amsurg | | | | | | | | |
| 5.625%, 11/30/20 | | | 300 | | | | 306 | |
| 5.625%, 07/15/22 | | | 1,075 | | | | 1,099 | |
| | | | | | | | | |
| Total Medical-Outptnt/Home Med | | | | 1,405 | |
| | | | | | | | | |
| Metal-Copper [0.2%] | |
| First Quantum Minerals | | | | | | | | |
| 7.250%, 10/15/19 | | | 3,800 | | | | 3,610 | |
| | | | | | | | | |
| Metal-Iron [0.2%] | |
| Ferrexpo Finance | | | | | | | | |
| 10.375%, 04/07/19(A) (J) | | | 1,302 | | | | 1,035 | |
| 7.875%, 04/07/16 | | | 579 | | | | 463 | |
| Metalloinvest Finance | | | | | | | | |
| 5.625%, 04/17/20 | | | 1,805 | | | | 1,619 | |
| | | | | | | | | |
| Total Metal-Iron | | | | 3,117 | |
| Description | | Face Amount (000) | | | Value (000) | |
| Metals & Mining [0.5%] | |
| Consolidated Minerals | | | | | | |
| 8.000%, 05/15/20 | | $ | 2,000 | | | $ | 1,410 | |
| TiZir | | | | | | | | |
| 9.000%, 09/28/17 | | | 4,000 | | | | 3,440 | |
| Vedanta Resources | | | | | | | | |
| 9.500%, 07/18/18 | | | 306 | | | | 309 | |
| 8.250%, 06/07/21 | | | 1,265 | | | | 1,148 | |
| 7.125%, 05/31/23 | | | 1,240 | | | | 1,026 | |
| | | | | | | | | |
| Total Metals & Mining | | | | 7,333 | |
| | | | | | | | | |
| Mining Other [0.1%] | |
| Uranium One Investments | | | | | | | | |
| 6.250%, 12/13/18 | | | 2,150 | | | | 1,699 | |
| | | | | | | | | |
| Miscellaneous Business Services [0.1%] | |
| Garda World Security | | | | | | | | |
| 7.250%, 11/15/21(A) | | | 1,300 | | | | 1,277 | |
| | | | | | | | | |
| Miscellaneous Manufacturing [0.6%] | |
| Dana Gas Sukuk | | | | | | | | |
| 9.000%, 10/31/17 | | | 2,000 | | | | 1,583 | |
| Jasper Explorer | | | | | | | | |
| 13.500%, 05/27/16(A) (J) | | | 5,500 | | | | 275 | |
| MAF Global Securities | | | | | | | | |
| 7.125%, 10/29/49(E) | | | 3,500 | | | | 3,732 | |
| Rio Oil Finance Trust Series 2014-1 | | | | | | | | |
| 6.250%, 07/06/24 | | | 1,500 | | | | 1,360 | |
| Sistema via Sistema International Funding | | | | | | | | |
| 6.950%, 05/17/19 | | | 475 | | | | 428 | |
| TMK OAO Via TMK Capital | | | | | | | | |
| 7.750%, 01/27/18 | | | 1,765 | | | | 1,571 | |
| 6.750%, 04/03/20 | | | 1,100 | | | | 849 | |
| | | | | | | | | |
| Total Miscellaneous Manufacturing | | | | 9,798 | |
| | | | | | | | | |
| MRI/Medical Diag Imaging [0.0%] | |
| Surgical Care Affiliates | | | | | | | | |
| 6.000%, 04/01/23(A) | | | 625 | | | | 631 | |
| | | | | | | | | |
| Multi-line Insurance [0.0%] | |
| Onex York Acquisition | | | | | | | | |
| 8.500%, 10/01/22(A) | | | 650 | | | | 614 | |
See accompanying notes to financial statements.
CITY NATIONAL ROCHDALE FUNDS | PAGE 73
consolidated schedule of investments
March 31, 2015 (Unaudited)
City National Rochdale Fixed Income Opportunities Fund (continued)
| Description | | Face Amount (000) | | | Value (000) | |
| Office Automation and Equip [0.1%] | |
| CDW | | | | | | |
| 6.000%, 08/15/22 | | $ | 1,125 | | | $ | 1,208 | |
| 5.500%, 12/01/24 | | | 550 | | | | 576 | |
| | | | | | | | | |
| Total Office Automation and Equip | | | | 1,784 | |
| | | | | | | | | |
| Oil-Field Services [0.7%] | |
| FTS International | | | | | | | | |
| 6.250%, 05/01/22(A) | | | 725 | | | | 533 | |
| Hiland Partners | | | | | | | | |
| 5.500%, 05/15/22(A) | | | 375 | | | | 384 | |
| Oro Negro Drilling Pte | | | | | | | | |
| 7.500%, 01/24/19(A) | | | 2,049 | | | | 1,475 | |
| Schahin II Finance SPV | | | | | | | | |
| 5.875%, 09/25/22 | | | 1,737 | | | | 1,050 | |
| Sea Trucks Group | | | | | | | | |
| 9.000%, 03/26/18(A) | | | 9,095 | | | | 5,639 | |
| Western Refining Logistics | | | | | | | | |
| 7.500%, 02/15/23(A) | | | 725 | | | | 740 | |
| | | | | | | | | |
| Total Oil-Field Services | | | | 9,821 | |
| | | | | | | | | |
| Paper & Related Products [0.4%] | |
| Argos Merger Sub | | | | | | | | |
| 7.125%, 03/15/23(A) | | | 1,625 | | | | 1,684 | |
| Bio Pappel | | | | | | | | |
| 10.000%, 08/27/13(C) | | | 2,575 | | | | 2,551 | |
| Clearwater Paper | | | | | | | | |
| 5.375%, 02/01/25(A) | | | 1,300 | | | | 1,326 | |
| | | | | | | | | |
| Total Paper & Related Products | | | | 5,561 | |
| | | | | | | | | |
| Petrochemicals [0.1%] | |
| Braskem Finance | | | | | | | | |
| 7.000%, 05/07/20 | | | 1,500 | | | | 1,497 | |
| | | | | | | | | |
| Petroleum & Fuel Products [6.3%] | |
| Access Midstream Partners | | | | | | | | |
| 4.875%, 03/15/24 | | | 825 | | | | 829 | |
| Afren | | | | | | | | |
| 6.625%, 12/09/20 | | | 2,000 | | | | 900 | |
| Antero Resources | | | | | | | | |
| 5.625%, 06/01/23(A) | | | 200 | | | | 198 | |
| 5.125%, 12/01/22 | | | 350 | | | | 336 | |
| Antero Resources Finance | | | | | | | | |
| 6.000%, 12/01/20 | | | 650 | | | | 650 | |
| 5.375%, 11/01/21 | | | 475 | | | | 461 | |
| Approach Resources | | | | | | | | |
| 7.000%, 06/15/21 | | | 900 | | | | 805 | |
| Description | | Face Amount (000) | | | Value (000) | |
| Blue Racer Midstream | | | | | | |
| 6.125%, 11/15/22(A) | | $ | 450 | | | $ | 462 | |
| BreitBurn Energy Partners | | | | | | | | |
| 7.875%, 04/15/22 | | | 525 | | | | 378 | |
| California Resources | | | | | | | | |
| 6.000%, 11/15/24(A) | | | 975 | | | | 856 | |
| 5.500%, 09/15/21(A) | | | 175 | | | | 155 | |
| Carrizo Oil & Gas | | | | | | | | |
| 7.500%, 09/15/20 | | | 775 | | | | 796 | |
| Chaparral Energy | | | | | | | | |
| 9.875%, 10/01/20 | | | 275 | | | | 203 | |
| 7.625%, 11/15/22 | | | 425 | | | | 285 | |
| Chesapeake Energy | | | | | | | | |
| 6.875%, 11/15/20 | | | 525 | | | | 549 | |
| 5.750%, 03/15/23 | | | 650 | | | | 634 | |
| 5.375%, 06/15/21 | | | 500 | | | | 485 | |
| China Oil & Gas Group | | | | | | | | |
| 5.250%, 04/25/18 | | | 2,675 | | | | 2,648 | |
| Crestwood Midstream Partners | | | | | | | | |
| 6.250%, 04/01/23(A) | | | 425 | | | | 429 | |
| 6.125%, 03/01/22 | | | 250 | | | | 252 | |
| 6.000%, 12/15/20 | | | 425 | | | | 427 | |
| CrownRock | | | | | | | | |
| 7.750%, 02/15/23(A) | | | 225 | | | | 228 | |
| CVR Refining | | | | | | | | |
| 6.500%, 11/01/22 | | | 350 | | | | 350 | |
| Energy Transfer Equity | | | | | | | | |
| 5.875%, 01/15/24 | | | 2,300 | | | | 2,426 | |
| Energy XXI Gulf Coast | | | | | | | | |
| 7.500%, 12/15/21 | | | 700 | | | | 252 | |
| 6.875%, 03/15/24(A) | | | 175 | | | | 60 | |
| EP Energy | | | | | | | | |
| 9.375%, 05/01/20 | | | 575 | | | | 602 | |
| 7.750%, 09/01/22 | | | 150 | | | | 153 | |
| EP PetroEcuador via Noble Sovereign Funding I | | | | | | | | |
| 5.897%, 09/24/19(E) | | | 947 | | | | 817 | |
| Genel Energy Finance | | | | | | | | |
| 7.500%, 05/14/19(A) | | | 3,200 | | | | 2,832 | |
| GeoPark Latin America Agencia en Chile | | | | | | | | |
| 7.500%, 02/11/20 | | | 1,000 | | | | 770 | |
| Georgian Oil and Gas | | | | | | | | |
| 6.875%, 05/16/17 | | | 2,200 | | | | 2,212 | |
| Gulf Keystone Petroleum | | | | | | | | |
| 13.000%, 04/18/17(J) | | | 4,200 | | | | 2,793 | |
| Gulfport Energy | | | | | | | | |
| 7.750%, 11/01/20 | | | 650 | | | | 666 | |
| Holly Energy Partners | | | | | | | | |
| 6.500%, 03/01/20 | | | 900 | | | | 886 | |
See accompanying notes to financial statements.
CITY NATIONAL ROCHDALE FUNDS | PAGE 74
consolidated schedule of investments
March 31, 2015 (Unaudited)
City National Rochdale Fixed Income Opportunities Fund (continued)
| Description | | Face Amount (000) | | | Value (000) | |
| InterOil Exploration and Production | | | | | | |
| 6.000%, 01/22/20(J) | | $ | 2,323 | | | $ | 952 | |
| KazMunayGas National JSC | | | | | | | | |
| 7.000%, 05/05/20 | | | 2,000 | | | | 2,031 | |
| Kinder Morgan | | | | | | | | |
| 5.625%, 11/15/23(A) | | | 1,200 | | | | 1,320 | |
| Kuwait Energy | | | | | | | | |
| 9.500%, 08/04/19 | | | 1,350 | | | | 1,168 | |
| Laredo Petroleum | | | | | | | | |
| 7.375%, 05/01/22 | | | 100 | | | | 103 | |
| 6.250%, 03/15/23 | | | 200 | | | | 199 | |
| 5.625%, 01/15/22 | | | 300 | | | | 291 | |
| Legacy Reserves | | | | | | | | |
| 6.625%, 12/01/21 | | | 950 | | | | 750 | |
| Linn Energy | | | | | | | | |
| 7.750%, 02/01/21 | | | 250 | | | | 199 | |
| 6.500%, 05/15/19 | | | 275 | | | | 231 | |
| 6.500%, 09/15/21 | | | 275 | | | | 217 | |
| 6.250%, 11/01/19 | | | 425 | | | | 336 | |
| Lone Pine Resources Canada | | | | | | | | |
| 0.000%, 02/15/17(J) | | | 75 | | | | — | |
| MarkWest Energy Partners | | | | | | | | |
| 6.250%, 06/15/22 | | | 601 | | | | 628 | |
| 4.875%, 12/01/24 | | | 700 | | | | 716 | |
| Metro Exploration Holding | | | | | | | | |
| 11.250%, 02/15/15(C) (J) | | | 4,050 | | | | 567 | |
| MIE Holdings | | | | | | | | |
| 7.500%, 04/25/19 | | | 2,450 | | | | 1,461 | |
| MIE Holdings, MTN | | | | | | | | |
| 6.875%, 02/06/18 | | | 2,385 | | | | 1,516 | |
| Northern Oil and Gas | | | | | | | | |
| 8.000%, 06/01/20 | | | 1,150 | | | | 1,021 | |
| Nostrum Oil & Gas Finance BV | | | | | | | | |
| 6.375%, 02/14/19 | | | 4,195 | | | | 3,613 | |
| Oasis Petroleum | | | | | | | | |
| 6.875%, 03/15/22 | | | 150 | | | | 146 | |
| 6.500%, 11/01/21 | | | 850 | | | | 812 | |
| Odebrecht Drilling Norbe VIII | | | | | | | | |
| 6.350%, 06/30/21 | | | 1,118 | | | | 964 | |
| Pacific Rubiales Energy | | | | | | | | |
| 7.250%, 12/12/21 | | | 2,770 | | | | 1,841 | |
| 5.625%, 01/19/25 | | | 5,066 | | | | 2,980 | |
| 5.375%, 01/26/19 | | | 970 | | | | 640 | |
| 5.125%, 03/28/23 | | | 1,610 | | | | 940 | |
| Petrobras Global Finance BV | | | | | | | | |
| 6.875%, 01/20/40 | | | 3,600 | | | | 3,271 | |
| 6.250%, 03/17/24 | | | 4,985 | | | | 4,700 | |
| Description | | Face Amount (000) | | | Value (000) | |
| Petroleos de Venezuela | | | | | | |
| 9.750%, 05/17/35 | | $ | 3,906 | | | $ | 1,486 | |
| 8.500%, 11/02/17 | | | 3,863 | | | | 2,549 | |
| 5.125%, 10/28/16 | | | 1,614 | | | | 956 | |
| 5.000%, 10/28/15 | | | 1,101 | | | | 1,035 | |
| Puma International Financing | | | | | | | | |
| 6.750%, 02/01/21 | | | 3,845 | | | | 3,893 | |
| QGOG Atlantic | | | | | | | | |
| 5.250%, 07/30/18 | | | 690 | | | | 598 | |
| QGOG Constellation | | | | | | | | |
| 6.250%, 11/09/19 | | | 1,305 | | | | 741 | |
| Range Resources | | | | | | | | |
| 5.000%, 03/15/23 | | | 475 | | | | 473 | |
| Regency Energy Partners | | | | | | | | |
| 5.875%, 03/01/22 | | | 400 | | | | 434 | |
| 5.500%, 04/15/23 | | | 200 | | | | 206 | |
| 5.000%, 10/01/22 | | | 150 | | | | 156 | |
| 4.500%, 11/01/23 | | | 350 | | | | 352 | |
| Rice Energy | | | | | | | | |
| 7.250%, 05/01/23(A) | | | 200 | | | | 200 | |
| 6.250%, 05/01/22 | | | 675 | | | | 658 | |
| Rose Rock Midstream | | | | | | | | |
| 5.625%, 07/15/22 | | | 1,300 | | | | 1,281 | |
| Rosneft Oil via Rosneft International Finance | | | | | | | | |
| 4.199%, 03/06/22 | | | 200 | | | | 157 | |
| RSP Permian | | | | | | | | |
| 6.625%, 10/01/22(A) | | | 175 | | | | 176 | |
| Sabine Pass Liquefaction | | | | | | | | |
| 6.250%, 03/15/22 | | | 525 | | | | 543 | |
| 5.625%, 02/01/21 | | | 1,225 | | | | 1,233 | |
| 5.625%, 04/15/23 | | | 175 | | | | 175 | |
| 5.625%, 03/01/25(A) | | | 625 | | | | 618 | |
| SandRidge Energy | | | | | | | | |
| 8.125%, 10/15/22 | | | 975 | | | | 598 | |
| 7.500%, 03/15/21 | | | 75 | | | | 47 | |
| Santa Maria Offshore | | | | | | | | |
| 8.875%, 07/03/18(A) | | | 2,000 | | | | 1,750 | |
| Seven Energy, MTN | | | | | | | | |
| 10.250%, 10/11/21 | | | 2,600 | | | | 1,957 | |
| SM Energy | | | | | | | | |
| 5.000%, 01/15/24 | | | 200 | | | | 188 | |
| State Oil of the Azerbaijan Republic | | | | | | | | |
| 6.950%, 03/18/30 | | | 1,300 | | | | 1,292 | |
| Summit Midstream Holdings | | | | | | | | |
| 7.500%, 07/01/21 | | | 200 | | | | 208 | |
| 5.500%, 08/15/22 | | | 425 | | | | 403 | |
See accompanying notes to financial statements.
CITY NATIONAL ROCHDALE FUNDS | PAGE 75
consolidated schedule of investments
March 31, 2015 (Unaudited)
City National Rochdale Fixed Income Opportunities Fund (continued)
| Description | | Face Amount (000) | | | Value (000) | |
| Targa Resources Partners | | | | | | |
| 5.250%, 05/01/23 | | $ | 825 | | | $ | 829 | |
| 5.000%, 01/15/18(A) | | | 275 | | | | 283 | |
| Tesoro | | | | | | | | |
| 5.125%, 04/01/24 | | | 600 | | | | 612 | |
| Tesoro Logistics | | | | | | | | |
| 6.250%, 10/15/22(A) | | | 125 | | | | 129 | |
| 6.125%, 10/15/21 | | | 225 | | | | 232 | |
| 5.875%, 10/01/20 | | | 924 | | | | 947 | |
| 5.500%, 10/15/19(A) | | | 50 | | | | 52 | |
| Tullow Oil | | | | | | | | |
| 6.250%, 04/15/22 | | | 755 | | | | 647 | |
| 6.000%, 11/01/20 | | | 735 | | | | 643 | |
| W&T Offshore | | | | | | | | |
| 8.500%, 06/15/19 | | | 725 | | | | 439 | |
| Whiting Petroleum | | | | | | | | |
| 6.250%, 04/01/23(A) | | | 650 | | | | 647 | |
| Yingde Gases Investment | | | | | | | | |
| 8.125%, 04/22/18 | | | 1,335 | | | | 1,171 | |
| Zhaikmunai LLP | | | | | | | | |
| 7.125%, 11/13/19 | | | 3,095 | | | | 2,654 | |
| | | | | | | | | |
| Total Petroleum & Fuel Products | | | | 95,046 | |
| | | | | | | | | |
| Pharmacy Services [0.0%] | |
| Catamaran | | | | | | | | |
| 4.750%, 03/15/21 | | | 175 | | | | 194 | |
| Omnicare | | | | | | | | |
| 4.750%, 12/01/22 | | | 150 | | | | 155 | |
| | | | | | | | | |
| Total Pharmacy Services | | | | 349 | |
| | | | | | | | | |
| Printing & Publishing [0.4%] | |
| Expo Event Transco | | | | | | | | |
| 9.000%, 06/15/21(A) | | | 1,175 | | | | 1,201 | |
| Multi-Color | | | | | | | | |
| 6.125%, 12/01/22(A) | | | 900 | | | | 936 | |
| Mustang Merger | | | | | | | | |
| 8.500%, 08/15/21(A) | | | 850 | | | | 861 | |
| Nielsen Finance | | | | | | | | |
| 5.000%, 04/15/22(A) | | | 1,075 | | | | 1,082 | |
| 4.500%, 10/01/20 | | | 1,475 | | | | 1,501 | |
| Time | | | | | | | | |
| 5.750%, 04/15/22(A) | | | 700 | | | | 684 | |
| | | | | | | | | |
| Total Printing & Publishing | | | | 6,265 | |
| Description | Face Amount (000) | | | Value (000) | |
| Publishing-Newspapers [0.1%] | |
| Gannett | | | | | | | | |
| 6.375%, 10/15/23 | | $ | 925 | | | $ | 1,004 | |
| 5.500%, 09/15/24(A) | | | 50 | | | | 52 | |
| 5.125%, 10/15/19 | | | 175 | | | | 183 | |
| 4.875%, 09/15/21(A) | | | 50 | | | | 51 | |
| | | | | | | | | |
| Total Publishing-Newspapers | | | | 1,290 | |
| | | | | | | | | |
| Radio [0.5%] | |
| Cumulus Media Holdings | | | | | | | | |
| 7.750%, 05/01/19 | | | 1,050 | | | | 1,029 | |
| Entercom Radio | | | | | | | | |
| 10.500%, 12/01/19 | | | 600 | | | | 651 | |
| Radio One | | | | | | | | |
| 9.250%, 02/15/20(A) | | | 900 | | | | 859 | |
| Sirius XM Holdings | | | | | | | | |
| 4.625%, 05/15/23(A) | | | 1,425 | | | | 1,372 | |
| Sirius XM Radio | | | | | | | | |
| 6.000%, 07/15/24(A) | | | 975 | | | | 1,024 | |
| 5.375%, 04/15/25(A) | | | 650 | | | | 653 | |
| Townsquare Media | | | | | | | | |
| 6.500%, 04/01/23(A) | | | 750 | | | | 752 | |
| Townsquare Radio | | | | | | | | |
| 9.000%, 04/01/19(A) | | | 975 | | | | 1,039 | |
| | | | | | | | | |
| Total Radio | | | | 7,379 | |
| | | | | | | | | |
| Real Estate Oper/Develop [1.8%] | |
| Agile Property Holdings | | | | | | | | |
| 9.875%, 03/20/17 | | | 650 | | | | 645 | |
| 8.875%, 04/28/17 | | | 730 | | | | 716 | |
| Alpha Star Holding | | | | | | | | |
| 4.970%, 04/09/19 | | | 2,500 | | | | 2,212 | |
| Central China Real Estate | | | | | | | | |
| 8.000%, 01/28/20 | | | 780 | | | | 750 | |
| Central China Real Estate, MTN | | | | | | | | |
| 6.500%, 06/04/18 | | | 950 | | | | 902 | |
| China SCE Property Holdings | | | | | | | | |
| 11.500%, 11/14/17 | | | 2,520 | | | | 2,432 | |
| CIFI Holdings Group | | | | | | | | |
| 12.250%, 04/15/18 | | | 1,037 | | | | 1,114 | |
| Jababeka International BV | | | | | | | | |
| 7.500%, 09/24/19 | | | 2,000 | | | | 2,002 | |
| Kaisa Group Holdings | | | | | | | | |
| 10.250%, 01/08/20 | | | 1,575 | | | | 898 | |
| 9.000%, 06/06/19 | | | 700 | | | | 399 | |
| 8.875%, 03/19/18 | | | 3,220 | | | | 1,835 | |
See accompanying notes to financial statements.
CITY NATIONAL ROCHDALE FUNDS | PAGE 76
consolidated schedule of investments
March 31, 2015 (Unaudited)
City National Rochdale Fixed Income Opportunities Fund (continued)
| Description | | Face Amount (000) | | | Value (000) | |
| KWG Property Holding | | | | | | |
| 13.250%, 03/22/17 | | $ | 600 | | | $ | 641 | |
| 8.975%, 01/14/19 | | | 1,400 | | | | 1,358 | |
| Pakuwon Prima Pte | | | | | | | | |
| 7.125%, 07/02/19 | | | 2,000 | | | | 1,995 | |
| Sunac China Holdings | | | | | | | | |
| 9.375%, 04/05/18 | | | 2,140 | | | | 2,118 | |
| Times Property Holdings | | | | | | | | |
| 12.625%, 03/21/19 | | | 1,370 | | | | 1,392 | |
| Trillion Chance | | | | | | | | |
| 8.500%, 01/10/19 | | | 1,270 | | | | 1,153 | |
| Vingroup JSC | | | | | | | | |
| 11.625%, 05/07/18 | | | 1,365 | | | | 1,440 | |
| Yuzhou Properties | | | | | | | | |
| 8.750%, 10/04/18 | | | 680 | | | | 646 | |
| 8.625%, 01/24/19 | | | 1,950 | | | | 1,848 | |
| | | | | | | | | |
| Total Real Estate Oper/Develop | | | | 26,496 | |
| | | | | | | | | |
| Research and Development [0.2%] | |
| Jaguar Holding I | | | | | | | | |
| 9.375%, 10/15/17(A) (D) | | | 1,625 | | | | 1,661 | |
| Jaguar Holding II | | | | | | | | |
| 9.500%, 12/01/19(A) | | | 650 | | | | 699 | |
| | | | | | | | | |
| Total Research and Development | | | | 2,360 | |
| | | | | | | | | |
| Resorts/Theme Parks [0.2%] | |
| Cedar Fair | | | | | | | | |
| 5.250%, 03/15/21 | | | 1,300 | | | | 1,342 | |
| Six Flags Entertainment | | | | | | | | |
| 5.250%, 01/15/21(A) | | | 1,325 | | | | 1,362 | |
| | | | | | | | | |
| Total Resorts/Theme Parks | | | | 2,704 | |
| | | | | | | | | |
| Retail [2.0%] | |
| Academy | | | | | | | | |
| 9.250%, 08/01/19(A) | | | 1,050 | | | | 1,113 | |
| BKW | | | | | | | | |
| 6.000%, 04/01/22(A) | | | 1,950 | | | | 2,018 | |
| Edcon Holdings Pty | | | | | | | | |
| 13.375%, 06/30/19 | | | 2,720 | | | | 644 | |
| Edcon Pty | | | | | | | | |
| 9.500%, 03/01/18 | | | 3,890 | | | | 3,171 | |
| Family Tree Escrow | | | | | | | | |
| 5.750%, 03/01/23(A) | | | 425 | | | | 447 | |
| 5.250%, 03/01/20(A) | | | 125 | | | | 131 | |
| Ferrellgas | | | | | | | | |
| 6.750%, 01/15/22 | | | 725 | | | | 737 | |
| 6.500%, 05/01/21 | | | 675 | | | | 682 | |
| Description | | Face Amount (000) | | | Value (000) | |
| Grupo Famsa | | | | | | |
| 7.250%, 06/01/20 | | $ | 2,500 | | | $ | 2,287 | |
| Hillman Group | | | | | | | | |
| 6.375%, 07/15/22(A) | | | 1,225 | | | | 1,225 | |
| Jo-Ann Stores | | | | | | | | |
| 8.125%, 03/15/19(A) | | | 1,000 | | | | 1,002 | |
| Jo-Ann Stores Holdings | | | | | | | | |
| 9.750%, 10/15/19(A) (D) | | | 600 | | | | 582 | |
| L Brands | | | | | | | | |
| 5.625%, 10/15/23 | | | 700 | | | | 777 | |
| Limited Brands | | | | | | | | |
| 5.625%, 02/15/22 | | | 350 | | | | 385 | |
| Michaels FinCo Holdings | | | | | | | | |
| 7.500%, 08/01/18(A) (D) | | | 304 | | | | 310 | |
| Michaels Stores | | | | | | | | |
| 5.875%, 12/15/20(A) | | | 1,275 | | | | 1,310 | |
| Neiman Marcus Group | | | | | | | | |
| 8.750%, 10/15/21(A) | | | 900 | | | | 954 | |
| 8.000%, 10/15/21(A) | | | 275 | | | | 291 | |
| New Academy Finance | | | | | | | | |
| 8.000%, 06/15/18(A) (D) | | | 1,175 | | | | 1,175 | |
| NPC International | | | | | | | | |
| 10.500%, 01/15/20 | | | 1,075 | | | | 1,129 | |
| Party City Holdings | | | | | | | | |
| 8.875%, 08/01/20 | | | 900 | | | | 970 | |
| PC Nextco Holdings | | | | | | | | |
| 8.750%, 08/15/19 | | | 1,275 | | | | 1,297 | |
| Petco Animal Supplies | | | | | | | | |
| 9.250%, 12/01/18(A) | | | 1,200 | | | | 1,260 | |
| Petco Holdings | | | | | | | | |
| 8.500%, 10/15/17(A) (D) | | | 600 | | | | 617 | |
| Rite Aid | | | | | | | | |
| 6.125%, 04/01/23(A) | | | 1,050 | | | | 1,076 | |
| Sally Holdings | | | | | | | | |
| 6.875%, 11/15/19 | | | 725 | | | | 767 | |
| Stonegate Pub Financing | | | | | | | | |
| 5.310%, 04/15/19(E) | | | 1,000 | | | | 1,480 | |
| Stretford 79 | | | | | | | | |
| 4.810%, 07/15/20(E) | | | 1,000 | | | | 1,203 | |
| | | | | | | | | |
| Total Retail | | | | 29,040 | |
| | | | | | | | | |
| Rubber/Plastic Products [0.1%] | |
| Gates Global | | | | | | | | |
| 6.000%, 07/15/22(A) | | | 1,125 | | | | 1,062 | |
| | | | | | | | | |
| Semicon Compo-Intg Circu [0.0%] | |
| NXP BV | | | | | | | | |
| 5.750%, 03/15/23(A) | | | 200 | | | | 212 | |
See accompanying notes to financial statements.
CITY NATIONAL ROCHDALE FUNDS | PAGE 77
consolidated schedule of investments
March 31, 2015 (Unaudited)
City National Rochdale Fixed Income Opportunities Fund (continued)
| Description | | Face Amount (000) | | | Value (000) | |
| Semi-Conductors [0.3%] | |
| Advanced Micro Devices | | | | | | |
| 7.500%, 08/15/22 | | $ | 325 | | | $ | 311 | |
| 7.000%, 07/01/24 | | | 850 | | | | 733 | |
| Entegris | | | | | | | | |
| 6.000%, 04/01/22(A) | | | 1,025 | | | | 1,069 | |
| Freescale Semiconductor | | | | | | | | |
| 6.000%, 01/15/22(A) | | | 450 | | | | 490 | |
| Magnachip Semiconductor | | | | | | | | |
| 6.625%, 07/15/21 | | | 750 | | | | 525 | |
| Micron Technology | | | | | | | | |
| 5.250%, 08/01/23(A) | | | 575 | | | | 585 | |
| Sensata Technologies BV | | | | | | | | |
| 5.625%, 11/01/24(A) | | | 300 | | | | 319 | |
| 5.000%, 10/01/25(A) | | | 500 | | | | 507 | |
| | | | | | | | | |
| Total Semi-Conductors | | | | 4,539 | |
| | | | | | | | | |
| Special Purpose Banks [0.1%] | |
| Development Bank of Kazakhstan JSC | | | | | | | | |
| 4.125%, 12/10/22 | | | 1,000 | | | | 852 | |
| Vnesheconombank Via VEB Finance | | | | | | | | |
| 6.902%, 07/09/20 | | | 510 | | | | 467 | |
| 6.025%, 07/05/22 | | | 200 | | | | 169 | |
| 5.942%, 11/21/23 | | | 700 | | | | 570 | |
| 4.224%, 11/21/18 | | | 200 | | | | 176 | |
| | | | | | | | | |
| Total Special Purpose Banks | | | | 2,234 | |
| | | | | | | | | |
| Steel & Steel Works [0.2%] | |
| Gerdau Trade | | | | | | | | |
| 4.750%, 04/15/23 | | | 250 | | | | 233 | |
| Metinvest BV | | | | | | | | |
| 8.750%, 02/14/18 | | | 3,519 | | | | 1,440 | |
| Metinvest BV, MTN | | | | | | | | |
| 10.500%, 11/28/17 | | | 1,560 | | | | 702 | |
| Steel Dynamics | | | | | | | | |
| 5.500%, 10/01/24(A) | | | 375 | | | | 380 | |
| 5.250%, 04/15/23 | | | 125 | | | | 127 | |
| 5.125%, 10/01/21(A) | | | 225 | | | | 226 | |
| | | | | | | | | |
| Total Steel & Steel Works | | | | 3,108 | |
| | | | | | | | | |
| Sugar [0.1%] | |
| Cosan Luxembourg | | | | | | | | |
| 5.000%, 03/14/23 | | | 1,000 | | | | 888 | |
| Description | | Face Amount (000) | | | Value (000) | |
| Technology [0.1%] | |
| Sophia | | | | | | |
| 9.750%, 01/15/19(A) | | $ | 1,050 | | | $ | 1,126 | |
| Sophia Holding Finance | | | | | | | | |
| 9.625%, 12/01/18(A) | | | 500 | | | | 505 | |
| Truven Health Analytics | | | | | | | | |
| 10.625%, 06/01/20 | | | 775 | | | | 814 | |
| | | | | | | | | |
| Total Technology | | | | 2,445 | |
| | | | | | | | | |
| Telecommunication Equip [0.1%] | |
| CommScope | | | | | | | | |
| 5.500%, 06/15/24(A) | | | 525 | | | | 525 | |
| CommScope Holding | | | | | | | | |
| 6.625%, 06/01/20(A) (D) | | | 1,350 | | | | 1,384 | |
| | | | | | | | | |
| Total Telecommunication Equip | | | | 1,909 | |
| | | | | | | | | |
| Telephones & Telecommunications [4.1%] | |
| Altice | | | | | | | | |
| 7.750%, 05/15/22(A) | | | 1,100 | | | | 1,119 | |
| 7.625%, 02/15/25(A) | | | 500 | | | | 502 | |
| Altice Financing | | | | | | | | |
| 6.625%, 02/15/23 | | | 200 | | | | 205 | |
| 6.625%, 02/15/23(A) | | | 275 | | | | 283 | |
| Banglalink Digital Communications | | | | | | | | |
| 8.625%, 05/06/19 | | | 4,430 | | | | 4,541 | |
| Bite Finance International BV, MTN | | | | | | | | |
| 7.548%, 02/15/18(E) | | | 1,810 | | | | 1,897 | |
| Colombia Telecomunicaciones ESP | | | | | | | | |
| 8.500%, 12/29/49(E) | | | 2,000 | | | | 2,003 | |
| 5.375%, 09/27/22 | | | 2,090 | | | | 2,129 | |
| Comcel Trust | | | | | | | | |
| 6.875%, 02/06/24 | | | 2,495 | | | | 2,658 | |
| Digicel | | | | | | | | |
| 7.000%, 02/15/20(A) | | | 325 | | | | 331 | |
| 6.750%, 03/01/23 | | | 1,500 | | | | 1,442 | |
| 6.000%, 04/15/21(A) | | | 175 | | | | 166 | |
| 6.000%, 04/15/21 | | | 3,985 | | | | 3,785 | |
| Digicel Group | | | | | | | | |
| 8.250%, 09/30/20 | | | 8,135 | | | | 8,188 | |
| 8.250%, 09/30/20(A) | | | 1,375 | | | | 1,377 | |
| 7.125%, 04/01/22 | | | 2,080 | | | | 1,903 | |
| Intelsat Jackson Holdings | | | | | | | | |
| 5.500%, 08/01/23 | | | 1,000 | | | | 944 | |
| Intelsat Luxembourg | | | | | | | | |
| 8.125%, 06/01/23 | | | 600 | | | | 552 | |
| 7.750%, 06/01/21 | | | 825 | | | | 761 | |
See accompanying notes to financial statements.
CITY NATIONAL ROCHDALE FUNDS | PAGE 78
consolidated schedule of investments
March 31, 2015 (Unaudited)
City National Rochdale Fixed Income Opportunities Fund (continued)
| Description | | Face Amount (000) | | | Value (000) | |
| Level 3 Communications | | | | | | |
| 5.750%, 12/01/22 | | $ | 350 | | | $ | 359 | |
| Level 3 Financing | | | | | | | | |
| 8.125%, 07/01/19 | | | 500 | | | | 526 | |
| 7.000%, 06/01/20 | | | 500 | | | | 540 | |
| MetroPCS Wireless | | | | | | | | |
| 6.625%, 11/15/20 | | | 600 | | | | 627 | |
| Millicom International Cellular | | | | | | | | |
| 6.625%, 10/15/21 | | | 1,650 | | | | 1,743 | |
| 6.000%, 03/15/25(A) (J) | | | 1,100 | | | | 1,098 | |
| 4.750%, 05/22/20 | | | 690 | | | | 676 | |
| Sixsigma Networks Mexico | | | | | | | | |
| 8.250%, 11/07/21 | | | 2,000 | | | | 2,091 | |
| Sprint | | | | | | | | |
| 7.875%, 09/15/23 | | | 1,725 | | | | 1,759 | |
| Sprint Capital | | | | | | | | |
| 6.875%, 11/15/28 | | | 1,500 | | | | 1,376 | |
| Sprint Nextel | | | | | | | | |
| 7.000%, 03/01/20(A) | | | 600 | | | | 661 | |
| 6.000%, 11/15/22 | | | 1,100 | | | | 1,045 | |
| Syniverse Holdings | | | | | | | | |
| 9.125%, 01/15/19(J) | | | 1,550 | | | | 1,527 | |
| T-Mobile USA | | | | | | | | |
| 6.836%, 04/28/23 | | | 925 | | | | 974 | |
| 6.731%, 04/28/22 | | | 125 | | | | 132 | |
| 6.633%, 04/28/21 | | | 125 | | | | 131 | |
| 6.625%, 04/01/23 | | | 1,450 | | | | 1,517 | |
| 6.500%, 01/15/24 | | | 575 | | | | 601 | |
| 6.125%, 01/15/22 | | | 275 | | | | 284 | |
| Vimpel Communications Via VIP Finance Ireland | | | | | | | | |
| 7.748%, 02/02/21 | | | 2,170 | | | | 2,135 | |
| VimpelCom Holdings BV | | | | | | | | |
| 7.504%, 03/01/22 | | | 2,630 | | | | 2,495 | |
| Virgin Media Finance | | | | | | | | |
| 6.375%, 04/15/23(A) | | | 675 | | | | 719 | |
| Virgin Media Secured Finance | | | | | | | | |
| 5.250%, 01/15/26(A) | | | 1,350 | | | | 1,377 | |
| Vivacom, MTN | | | | | | | | |
| 6.625%, 11/15/18 | | | 2,073 | | | | 2,302 | |
| | | | | | | | | |
| Total Telephones & Telecommunications | | | | 61,481 | |
| | | | | | | | | |
| Textile-Apparel [0.1%] | |
| Texhong Textile Group | | | | | | | | |
| 6.500%, 01/18/19 | | | 1,000 | | | | 990 | |
| | | | | | | | | |
| Textile-Home Furnishings [0.0%] | |
| Springs Industries | | | | | | | | |
| 6.250%, 06/01/21 | | | 650 | | | | 642 | |
| Description | | Face Amount (000) | | | Value (000) | |
| Textile-Products [0.2%] | |
| Golden Legacy PTE | | | | | | |
| 9.000%, 04/24/19 | | $ | 3,010 | | | $ | 3,025 | |
| | | | | | | | | |
| Transactional Software [0.0%] | |
| ACI Worldwide | | | | | | | | |
| 6.375%, 08/15/20(A) | | | 125 | | | | 131 | |
| | | | | | | | | |
| Transportation Services [1.4%] | |
| Brunswick Rail Finance | | | | | | | | |
| 6.500%, 11/01/17 | | | 1,685 | | | | 725 | |
| DTEK Finance | | | | | | | | |
| 7.875%, 04/04/18 | | | 3,991 | | | | 1,397 | |
| DTEK Finance BV | | | | | | | | |
| 9.500%, 04/28/15 | | | 945 | | | | 616 | |
| Dubai Holding Commercial Operations, MTN | | | | | | | | |
| 6.000%, 02/01/17 | | | 5,200 | | | | 7,832 | |
| Equiniti Newco 2 | | | | | | | | |
| 6.314%, 12/15/18(E) | | | 1,000 | | | | 1,380 | |
| Far East Capital | | | | | | | | |
| 8.750%, 05/02/20 | | | 1,190 | | | | 427 | |
| 8.000%, 05/02/18 | | | 1,880 | | | | 677 | |
| Favor Sea | | | | | | | | |
| 11.750%, 02/04/19 | | | 1,265 | | | | 1,193 | |
| Georgian Railway JSC | | | | | | | | |
| 7.750%, 07/11/22 | | | 1,000 | | | | 1,071 | |
| Grupo KUO De | | | | | | | | |
| 6.250%, 12/04/22 | | | 972 | | | | 993 | |
| Kazakhstan Temir Zholy Finance BV | | | | | | | | |
| 6.375%, 10/06/20 | | | 480 | | | | 476 | |
| NCL | | | | | | | | |
| 5.250%, 11/15/19(A) | | | 425 | | | | 436 | |
| Nielsen Luxembourg SaRL | | | | | | | | |
| 5.500%, 10/01/21(A) | | | 250 | | | | 258 | |
| Travelex Financing | | | | | | | | |
| 6.565%, 08/01/18(E) | | | 1,000 | | | | 1,483 | |
| Ukraine Railways via Shortline | | | | | | | | |
| 9.500%, 05/21/18 | | | 1,131 | | | | 419 | |
| Yasar Holdings | | | | | | | | |
| 8.875%, 05/06/20 | | | 2,010 | | | | 2,075 | |
| | | | | | | | | |
| Total Transportation Services | | | | 21,458 | |
| | | | | | | | | |
| Transport-Equip and Leasng [0.1%] | |
| Jurassic Holdings III | | | | | | | | |
| 6.875%, 02/15/21(A) | | | 1,050 | | | | 914 | |
See accompanying notes to financial statements.
CITY NATIONAL ROCHDALE FUNDS | PAGE 79
consolidated schedule of investments
March 31, 2015 (Unaudited)
City National Rochdale Fixed Income Opportunities Fund (continued)
| Description | | Face Amount (000) | | | Value (000) | |
| Utility [0.1%] | |
| Greenko Dutch BV | | | | | | |
| 8.000%, 08/01/19 | | $ | 265 | | | $ | 244 | |
| Suburban Propane Partners | | | | | | | | |
| 7.375%, 08/01/21 | | | 275 | | | | 296 | |
| 5.500%, 06/01/24 | | | 1,125 | | | | 1,153 | |
| | | | | | | | | |
| Total Utility | | | | 1,693 | |
| | | | | | | | | |
| Web Portals/ISP [0.2%] | |
| Pacnet | | | | | | | | |
| 9.000%, 12/12/18 | | | 2,500 | | | | 2,806 | |
| | | | | | | | | |
| X-Ray Equipment [0.0%] | |
| Hologic | | | | | | | | |
| 6.250%, 08/01/20 | | | 600 | | | | 622 | |
| | | | | | | | | |
| Total Corporate Bonds | |
| (Cost $777,221) | | | | 720,800 | |
| | | | | | | | | |
| Loan Participations [29.2%] | |
| Aerospace [1.0%] | |
| Air Canada, Term Loan B | | | | | | | | |
| 5.500%, 09/26/19 | | | 2,677 | | | | 2,705 | |
| AM General Corporation, Term Loan B - 2013 | | | | | | | | |
| 10.250%, 03/22/18 | | | 348 | | | | 330 | |
| American Airlines Inc, Exit Term Loan | | | | | | | | |
| 3.750%, 06/27/19 | | | 2,310 | | | | 2,307 | |
| BE Aerospace Inc, Term Loan B | | | | | | | | |
| 4.000%, 11/19/21 | | | 524 | | | | 527 | |
| Dae Aviation Holdings, Second Lien Term Loan | | | | | | | | |
| 7.750%, 08/05/19 | | | 1,370 | | | | 1,372 | |
| Dae Aviation Holdings, Term Loan B1 - 2014 | | | | | | | | |
| 5.000%, 11/02/18 | | | 357 | | | | 357 | |
| Dae Aviation Holdings, Term Loan B2 - 2014 | | | | | | | | |
| 5.000%, 11/02/18 | | | 162 | | | | 162 | |
| LM U.S. (Landmark Aviation), Canadian Term Loan | | | | | | | | |
| 4.750%, 10/25/19 | | | 14 | | | | 14 | |
| LM U.S. (Landmark Aviation), Second Lien | | | | | | | | |
| 8.250%, 10/26/20(F) | | | 785 | | | | 777 | |
| LM U.S. (Landmark Aviation), US Term Loan | | | | | | | | |
| 4.750%, 10/25/19 | | | 344 | | | | 344 | |
| Tasc Inc, Second Lien | | | | | | | | |
| 12.000%, 05/23/21 | | | 360 | | | | 379 | |
| Description | | Face Amount (000) | | | Value (000) | |
| Tasc Inc, Term Loan | | | | | | |
| 6.500%, 05/23/20 | | $ | 714 | | | $ | 722 | |
| TransDigm Inc., Term Loan C | | | | | | | | |
| 3.750%, 02/28/20 | | | 1,230 | | | | 1,227 | |
| TransDigm Inc., Term Loan D | | | | | | | | |
| 3.750%, 06/04/21 | | | 1,703 | | | | 1,698 | |
| US Airways Group Inc, Term Loan B-1 | | | | | | | | |
| 3.500%, 05/23/19 | | | 1,144 | | | | 1,139 | |
| WP CPP Holdings, Second Lien | | | | | | | | |
| 8.750%, 04/30/21 | | | 45 | | | | 45 | |
| WP CPP Holdings, Term Loan | | | | | | | | |
| 4.750%, 12/28/19 | | | 170 | | | | 171 | |
| Wyle Services Corporation, Term Loan B | | | | | | | | |
| 5.000%, 05/21/21 | | | 222 | | | | 222 | |
| | | | | | | | | |
| Total Aerospace | | | | 14,498 | |
| | | | | | | | | |
| Automotive [0.4%] | |
| Car Trawler, Term Loan | | | | | | | | |
| 4.251%, 04/30/21 | | | 3,000 | | | | 3,214 | |
| Metaldyne Performance Cov-Lite Term Loan | | | | | | | | |
| 4.251%, 10/20/21 | | | 521 | | | | 523 | |
| Oasis Holdings | | | | | | | | |
| 3.500%, 11/19/20 | | | 4,580 | | | | 2,519 | |
| | | | | | | | | |
| Total Automotive | | | | 6,256 | |
| | | | | | | | | |
| Broadcasting [1.1%] | |
| Clear Channel Communication, Term Loan D Extended | | | | | | | | |
| 6.922%, 01/30/19 | | | 7,283 | | | | 6,916 | |
| Clear Channel Communication, Term Loan E | | | | | | | | |
| 7.670%, 07/30/19 | | | 2,027 | | | | 1,950 | |
| Cumulus Media, Term Loan B | | | | | | | | |
| 4.250%, 12/23/20 | | | 1,651 | | | | 1,619 | |
| Gray Television, Inc., Term Loan B | | | | | | | | |
| 3.750%, 06/13/21 | | | 1,589 | | | | 1,588 | |
| Hubbard Broadcasting, Term Loan B | | | | | | | | |
| 4.500%, 04/28/17 | | | 230 | | | | 229 | |
| Media General Inc, Term Loan B | | | | | | | | |
| 4.250%, 07/31/20 | | | 614 | | | | 617 | |
| Radio One, Term Loan | | | | | | | | |
| 7.500%, 03/31/16 | | | 429 | | | | 426 | |
See accompanying notes to financial statements.
CITY NATIONAL ROCHDALE FUNDS | PAGE 80
consolidated schedule of investments
March 31, 2015 (Unaudited)
City National Rochdale Fixed Income Opportunities Fund (continued)
| Description | | Face Amount (000) | | | Value (000) | |
| Sinclair Broadcasting Group, Term Loan B - 2011 | | | | | | |
| 3.000%, 10/28/16 | | $ | 152 | | | $ | 151 | |
| Univision Comm (fka Umbrella), Replacement First-Lien Term Loans | | | | | | | | |
| 4.000%, 03/01/20 | | | 2,254 | | | | 2,249 | |
| Univision Comm (fka Umbrella), TL C-3 (2013 Inc. Term Loans) | | | | | | | | |
| 4.000%, 03/01/20 | | | 1,329 | | | | 1,326 | |
| | | | | | | | | |
| Total Broadcasting | | | | 17,071 | |
| | | | | | | | | |
| Building Materials [0.1%] | |
| Cemex | | | | | | | | |
| 0.000%, 02/14/17 | | | 1,469 | | | | 1,460 | |
| | | | | | | | | |
| Cable/Wireless Video [1.9%] | |
| Altice Financing, Term Loan B | | | | | | | | |
| 5.500%, 07/02/19 | | | 3,617 | | | | 3,667 | |
| Altice Financing, Term Loan B 2022 | | | | | | | | |
| 5.250%, 01/28/22 | | | 230 | | | | 232 | |
| Cablevision Systems Corp, Term Loan B - 2013 | | | | | | | | |
| 2.672%, 04/17/20 | | | 1,116 | | | | 1,110 | |
| Cequel Communications, LLC, Term Loan B 2012 | | | | | | | | |
| 3.500%, 02/10/19 | | | 1,128 | | | | 1,128 | |
| Charter Comm Operating, LLC, Term Loan A1 | | | | | | | | |
| 2.160%, 04/22/18 | | | 445 | | | | 441 | |
| Charter Comm Operating, LLC, Term Loan E | | | | | | | | |
| 3.000%, 04/10/20 | | | 2,680 | | | | 2,669 | |
| Charter Comm Operating, LLC, Term Loan G | | | | | | | | |
| 4.250%, 09/12/21 | | | 230 | | | | 232 | |
| Intelsat Jackson Holdings, Term Loan B2 | | | | | | | | |
| 3.750%, 06/30/19 | | | 1,948 | | | | 1,940 | |
| Liberty Cablevision of Puerto Rico, First Lien Term Loan | | | | | | | | |
| 4.500%, 12/24/21 | | | 355 | | | | 353 | |
| Liberty Cablevision of Puerto Rico, Second Lien - 2014 | | | | | | | | |
| 7.750%, 06/26/23 | | | 215 | | | | 215 | |
| Liberty Cablevision of Puerto Rico, Term Loan B-1 | | | | | | | | |
| 0.000%, 01/07/22(G) | | | 335 | | | | 330 | |
| Description | | Face Amount (000) | | | Value (000) | |
| MCC Iowa (Broadband), Term Loan G | | | | | | |
| 4.000%, 01/20/20 | | $ | 254 | | | $ | 253 | |
| MCC Iowa (Broadband), Term Loan H | | | | | | | | |
| 3.250%, 01/22/21 | | | 1,283 | | | | 1,270 | |
| MCC Iowa (Broadband), Term Loan J | | | | | | | | |
| 3.750%, 06/18/21 | | | 79 | | | | 79 | |
| Primacom, Term Loan A | | | | | | | | |
| 5.000%, 02/28/17(I) | | | 2,539 | | | | 2,730 | |
| Quebecor Media, Term Loan B | | | | | | | | |
| 3.250%, 08/17/20 | | | 1,583 | | | | 1,560 | |
| UPC Financing, Term Loan AH | | | | | | | | |
| 3.250%, 06/10/21 | | | 860 | | | | 854 | |
| Virgin Media Invst Hlds Ltd, Term Loan B | | | | | | | | |
| 3.500%, 02/15/20 | | | 2,697 | | | | 2,692 | |
| Ziggo B.V., Term Loan B1 | | | | | | | | |
| 3.250%, 01/15/22 | | | 2,589 | | | | 2,571 | |
| Ziggo B.V., Term Loan B2 | | | | | | | | |
| 3.250%, 01/15/22 | | | 1,668 | | | | 1,657 | |
| Ziggo B.V., Term Loan B3 | | | | | | | | |
| 3.500%, 01/15/22 | | | 2,743 | | | | 2,725 | |
| | | | | | | | | |
| Total Cable/Wireless Video | | | | 28,708 | |
| | | | | | | | | |
| Chemicals [1.0%] | |
| Aruba Investments Cov-Lite Term Loan | | | | | | | | |
| 0.000%, 01/28/22 | | | 1,000 | | | | 1,085 | |
| Axalta Coating Systems US Holdings, Term Loan B - 2014 | | | | | | | | |
| 3.750%, 02/01/20 | | | 319 | | | | 317 | |
| Constantia Flexibles Cov-Lite, 1st Lien | | | | | | | | |
| 0.000%, 02/25/22(G) | | | 163 | | | | 163 | |
| 0.000%, 04/29/22(G) | | | 837 | | | | 836 | |
| Flint Group SA, Term Loan B-2 | | | | | | | | |
| 0.000%, 09/03/21 | | | 2,568 | | | | 2,557 | |
| Flint Group SA, Term Loan C | | | | | | | | |
| 0.000%, 09/03/21 | | | 425 | | | | 423 | |
| Gemini HDPE LLC, Term Loan B | | | | | | | | |
| 4.750%, 07/24/21 | | | 577 | | | | 576 | |
| Huntsman International LLC, Term Loan C | | | | | | | | |
| 2.460%, 06/30/16 | | | 13 | | | | 13 | |
| Ineos Group Holdings PLC, Dollar Term Loans - 2018 | | | | | | | | |
| 3.750%, 04/27/18 | | | 3,246 | | | | 3,222 | |
See accompanying notes to financial statements.
CITY NATIONAL ROCHDALE FUNDS | PAGE 81
consolidated schedule of investments
March 31, 2015 (Unaudited)
City National Rochdale Fixed Income Opportunities Fund (continued)
| Description | | Face Amount (000) | | | Value (000) | |
| Ineos Group Holdings PLC, Term Loan - 2022 | | | | | | |
| 4.250%, 03/11/22(G) | | $ | 270 | | | $ | 270 | |
| MacDermid Holdings, LLC, Tranche B Term Loan | | | | | | | | |
| 4.000%, 06/05/20 | | | 344 | | | | 345 | |
| Minerals Technologies Inc., Term Loan B | | | | | | | | |
| 4.000%, 05/07/21 | | | 1,431 | | | | 1,436 | |
| Nexeo Solutions, Term Loan B | | | | | | | | |
| 5.000%, 09/08/17 | | | 369 | | | | 358 | |
| Perstorp Holding AB, Facility A (Mezzanine) | | | | | | | | |
| 14.000%, 12/27/17 | | | 2,152 | | | | 2,106 | |
| Polymer Group inc, Term Loan B | | | | | | | | |
| 5.250%, 12/19/19 | | | 643 | | | | 645 | |
| Styrolution, Term Loan B-1 | | | | | | | | |
| 6.500%, 11/07/19 | | | 1,117 | | | | 1,117 | |
| | | | | | | | | |
| Total Chemicals | | | | 15,469 | |
| | | | | | | | | |
| Communications [0.1%] | |
| Sky Bet, Cov-Lite, First Lien Term Loan | | | | | | | | |
| 0.000%, 02/09/22 | | | 1,000 | | | | 1,478 | |
| | | | | | | | | |
| Consumer Non-Durables [0.2%] | |
| Eastman Kodak Company, Exit Term Loan | | | | | | | | |
| 7.250%, 09/03/19 | | | 334 | | | | 332 | |
| Kate Spade & Company, Term Loan B | | | | | | | | |
| 4.000%, 04/09/21 | | | 269 | | | | 268 | |
| Libbey Glass Inc., Term Loan B | | | | | | | | |
| 3.750%, 04/09/21 | | | 248 | | | | 247 | |
| Party City Holdings Inc., 2014 Replacement Term Loans | | | | | | | | |
| 4.000%, 07/27/19 | | | 225 | | | | 224 | |
| 4.000%, 07/27/19 | | | 194 | | | | 193 | |
| 4.000%, 07/27/19 | | | 29 | | | | 29 | |
| 4.000%, 07/27/19 | | | 41 | | | | 41 | |
| 4.000%, 07/27/19 | | | 29 | | | | 29 | |
| Revlon Consumer Products, Replacement Term Loan | | | | | | | | |
| 3.250%, 11/20/17 | | | 246 | | | | 245 | |
| Varsity Brands (Hercules Achievement), Term Loan B | | | | | | | | |
| 6.000%, 12/10/21 | | | 1,052 | | | | 1,062 | |
| WNA Holdings, Inc, Term Loan - USD Borrower | | | | | | | | |
| 4.500%, 06/07/20 | | | 71 | | | | 71 | |
| Description | | Face Amount (000) | | | Value (000) | |
| WNA Holdings, Inc, TL (PolarPak) - CAD Borrower | | | | | | |
| 5.500%, 06/07/20 | | $ | 137 | | | $ | 137 | |
| | | | | | | | | |
| Total Consumer Non-Durables | | | | 2,878 | |
| | | | | | | | | |
| Diversified Media [1.6%] | |
| Affinion Group Inc., Term Loan B | | | | | | | | |
| 6.750%, 10/08/16 | | | 316 | | | | 299 | |
| ALM Media, LLC, Term Loan B | | | | | | | | |
| 5.500%, 07/29/20 | | | 217 | | | | 212 | |
| Block Communication, Term Loan B | | | | | | | | |
| 5.750%, 10/29/21 | | | 179 | | | | 179 | |
| Bureau Van Dijk | | | | | | | | |
| 5.216%, 09/17/21 | | | 1,000 | | | | 1,488 | |
| Deluxe Entertainment Services Group, Term Loan | | | | | | | | |
| 6.500%, 02/28/20 | | | 573 | | | | 555 | |
| Emerald Expositions Holding, Inc., Term Loan B | | | | | | | | |
| 4.750%, 06/17/20 | | | 292 | | | | 293 | |
| Harland Clarke Holdings, Cov-Lite Term Loan B-4 | | | | | | | | |
| 6.000%, 08/04/19 | | | 3,715 | | | | 3,726 | |
| Harland Clarke Holdings, Term Loan B3 | | | | | | | | |
| 7.000%, 05/22/18 | | | 4,894 | | | | 4,922 | |
| Harland Clarke Holdings, Tranche B-2 TL | | | | | | | | |
| 5.510%, 06/30/17 | | | 167 | | | | 167 | |
| Learfield Communications, 2014 Replacement Term Loan | | | | | | | | |
| 4.500%, 10/09/20 | | | 168 | | | | 168 | |
| Lions Gate Entertainment, Second Lien | | | | | | | | |
| 5.000%, 03/11/22 | | | 740 | | | | 741 | |
| Live Nation, Term Loan B | | | | | | | | |
| 3.500%, 08/17/20 | | | 522 | | | | 521 | |
| McGraw-Hill, Cov-Lite Term Loan | | | | | | | | |
| 5.750%, 03/22/19 | | | 262 | | | | 263 | |
| MediArena Acquisition (Endemol), First Lien Term Loan | | | | | | | | |
| 6.750%, 08/11/21 | | | 264 | | | | 261 | |
| Merrill Corp, Term Loan | | | | | | | | |
| 5.750%, 03/08/18 | | | 385 | | | | 386 | |
| Regal Cinemas, Term Loan | | | | | | | | |
| 3.750%, 03/25/22(G) | | | 470 | | | | 471 | |
See accompanying notes to financial statements.
CITY NATIONAL ROCHDALE FUNDS | PAGE 82
consolidated schedule of investments
March 31, 2015 (Unaudited)
City National Rochdale Fixed Income Opportunities Fund (continued)
| Description | | Face Amount (000) | | | Value (000) | |
| Rovi Solutions Corporation, Term Loan B | | | | | | |
| 3.750%, 07/02/21 | | $ | 412 | | | $ | 410 | |
| Tribune Company, Term Loan B - 2013 | | | | | | | | |
| 4.000%, 12/27/20 | | | 3,758 | | | | 3,759 | |
| Village Roadshow Limited, Ultimates Facility Tranche A-2 | | | | | | | | |
| 4.750%, 11/21/17 | | | 705 | | | | 705 | |
| Warner Music Group Corp., Term Loan - 2013 | | | | | | | | |
| 3.750%, 07/01/20 | | | 1,024 | | | | 999 | |
| WME IMG Holdings LLC, Second Lien | | | | | | | | |
| 8.250%, 05/06/22 | | | 360 | | | | 343 | |
| WME IMG Holdings LLC, Term Loan B | | | | | | | | |
| 5.250%, 05/06/21 | | | 3,295 | | | | 3,263 | |
| | | | | | | | | |
| Total Diversified Media | | | | 24,131 | |
| | | | | | | | | |
| Energy [1.6%] | |
| Alon USA Inc, MLP Term Loan | | | | | | | | |
| 9.250%, 11/26/18 | | | 551 | | | | 546 | |
| Aventine Renewable Energy Holdings | | | | | | | | |
| 0.000%, (J) | | | 4 | | | | 52 | |
| Azure Midstream Holdings LLC, Term Loan B | | | | | | | | |
| 7.500%, 11/15/18 | | | 256 | | | | 242 | |
| BlackBrush Oil & Gas, L.P., Second Lien | | | | | | | | |
| 8.750%, 07/21/21 | | | 365 | | | | 293 | |
| Chief Exploration & Development LLC, Second Lien | | | | | | | | |
| 7.500%, 05/16/21 | | | 570 | | | | 525 | |
| CITGO Petroleum Corp., Term Loan B | | | | | | | | |
| 4.500%, 07/23/21 | | | 358 | | | | 354 | |
| CITGO Petroleum Corp., Term Loan B 2015 | | | | | | | | |
| 9.500%, 05/09/18 | | | 1,526 | | | | 1,517 | |
| Drillships Financing Holding Inc., Term Loan B1 | | | | | | | | |
| 6.000%, 03/31/21 | | | 2,126 | | | | 1,617 | |
| EMG Utica, Term Loan | | | | | | | | |
| 4.750%, 03/27/20 | | | 740 | | | | 689 | |
| Energy Transfer Equity LP, Loans | | | | | | | | |
| 4.000%, 12/02/19 | | | 580 | | | | 578 | |
| Description | | Face Amount (000) | | | Value (000) | |
| Energy Transfer Equity LP, Term Loan B | | | | | | |
| 3.250%, 12/02/19 | | $ | 4,555 | | | $ | 4,478 | |
| EP Energy (aka Everest Acquisition), Term Loan B-3 | | | | | | | | |
| 3.500%, 05/24/18 | | | 644 | | | | 619 | |
| Frac Tech International, Term Loan B - 2014 | | | | | | | | |
| 5.750%, 04/16/21 | | | 641 | | | | 495 | |
| Glenn Pool Oil, Term Loan | | | | | | | | |
| 4.500%, 05/02/16 | | | 428 | | | | 426 | |
| Harvey Gulf Int’l Marine, Term Loan B | | | | | | | | |
| 5.500%, 06/18/20(J) | | | 1,321 | | | | 903 | |
| KCA Deutag, Term Loan | | | | | | | | |
| 6.250%, 05/15/20 | | | 263 | | | | 220 | |
| MEG Energy Corp, Term Loan B - 2013 | | | | | | | | |
| 3.750%, 03/31/20 | | | 351 | | | | 336 | |
| New World Resources | | | | | | | | |
| 5.575%, 10/07/16(J) | | | 300 | | | | 323 | |
| Obsidian Natural Gas Trust | | | | | | | | |
| 7.000%, 11/02/15 | | | 334 | | | | 336 | |
| Osum Production Corp., Term Loan B | | | | | | | | |
| 6.500%, 07/31/20(J) | | | 1,731 | | | | 1,350 | |
| Pacific Drilling, Term Loan B | | | | | | | | |
| 4.500%, 05/18/18 | | | 568 | | | | 470 | |
| Paradigm, Term C Loan | | | | | | | | |
| 4.750%, 07/24/19 | | | 183 | | | | 164 | |
| Petroleum Geo-Services, Term Loan B | | | | | | | | |
| 3.250%, 03/19/21 | | | 468 | | | | 399 | |
| Philadelphia Energy Solutions, Term Loan | | | | | | | | |
| 6.250%, 04/04/18 | | | 358 | | | | 342 | |
| Seadrill Operating LP, Term Loan B | | | | | | | | |
| 4.000%, 02/21/21 | | | 1,375 | | | | 1,089 | |
| Sheridan Production Partners, Term Loan II-A | | | | | | | | |
| 4.250%, 12/16/20 | | | 37 | | | | 32 | |
| Sheridan Production Partners, Term Loan II-M | | | | | | | | |
| 4.250%, 12/16/20 | | | 14 | | | | 12 | |
| Sheridan Production Partners, Term Loan II-SIP | | | | | | | | |
| 4.250%, 12/16/20 | | | 267 | | | | 231 | |
| Southcross Holdings Borrower LP, Term Loan B | | | | | | | | |
| 6.000%, 07/29/21 | | | 179 | | | | 169 | |
See accompanying notes to financial statements.
CITY NATIONAL ROCHDALE FUNDS | PAGE 83
consolidated schedule of investments
March 31, 2015 (Unaudited)
City National Rochdale Fixed Income Opportunities Fund (continued)
| Description | | Face Amount (000) | | | Value (000) | |
| Stonewall Gas Gathering LLC, Loan | | | | | | |
| 8.750%, 01/28/22 | | $ | 370 | | | $ | 371 | |
| Templar Energy LLC, Second Lien - 2014 | | | | | | | | |
| 8.500%, 11/25/20 | | | 4,345 | | | | 2,935 | |
| Vantage Drilling Co (Offshore), Term Loan | | | | | | | | |
| 5.000%, 10/25/17(J) | | | 547 | | | | 340 | |
| Vantage Drilling Co (Offshore), Term Loan B (2013) | | | | | | | | |
| 5.750%, 03/28/19(J) | | | 494 | | | | 281 | |
| Veresen Midstream LP, Term Loan | | | | | | | | |
| 0.000%, 02/25/22(G) | | | 235 | | | | 235 | |
| Western Refining, Term Loan B | | | | | | | | |
| 4.250%, 11/12/20 | | | 487 | | | | 483 | |
| | | | | | | | | |
| Total Energy | | | | 23,452 | |
| | | | | | | | | |
| Financial [1.9%] | |
| Alliant Holdings Inc., Term Loan | | | | | | | | |
| 5.000%, 12/07/19 | | | 290 | | | | 291 | |
| American Capital Holdings, Inc., Term Loan B - 2017 | | | | | | | | |
| 3.500%, 08/22/17 | | | 381 | | | | 380 | |
| Clipper Acquisitions (aka TCW), Initial Term Loan | | | | | | | | |
| 3.000%, 02/06/20 | | | 221 | | | | 218 | |
| Compass Investors Inc. (USI), Term Loan | | | | | | | | |
| 4.250%, 12/27/19 | | | 347 | | | | 347 | |
| Delos, Term Loan B | | | | | | | | |
| 3.500%, 03/06/21 | | | 370 | | | | 370 | |
| Dubai World | | | | | | | | |
| 3.760%, 09/30/22(J) | | | 12,455 | | | | 10,172 | |
| 0.000%, 09/30/18 | | | 7,835 | | | | 6,268 | |
| 1.000%, 09/30/15(J) | | | 2,268 | | | | 2,234 | |
| Foncia Groupe, Term Loan D | | | | | | | | |
| 0.000%, 06/01/18(G) | | | 2,000 | | | | 2,156 | |
| 0.000%, 03/24/21(G) | | | 1,000 | | | | 1,079 | |
| Grosvenor Capital Mngt Hlgs LLP, Cov-Lite Term Loan | | | | | | | | |
| 3.750%, 01/04/21 | | | 243 | | | | 240 | |
| Hub International Holdings, Initial Term Loan | | | | | | | | |
| 4.250%, 10/02/20 | | | 349 | | | | 346 | |
| Hyperion Insurance Group Ltd, Term Loan B | | | | | | | | |
| 0.000%, 03/26/22(G) | | | 245 | | | | 246 | |
| Description | | Face Amount (000) | | | Value (000) | |
| Ineos U.S. Finance LLC, 1st Lien | | | | | | |
| 0.000%, 03/11/22(G) | | $ | 1,000 | | | $ | 1,074 | |
| Ion Trading Technologies, Term Loan | | | | | | | | |
| 4.500%, 06/04/21 | | | 1,800 | | | | 1,945 | |
| iStar Financial Inc., Term Loan A-2 - 2012 | | | | | | | | |
| 7.000%, 03/19/17 | | | 130 | | | | 133 | |
| RCS Capital Corporation, Term Loan | | | | | | | | |
| 6.500%, 04/29/19 | | | 510 | | | | 505 | |
| Starwood Property Trust, Inc., Term Loan | | | | | | | | |
| 3.500%, 04/17/20 | | | 447 | | | | 443 | |
| Victory Capital Management, Term Loan B | | | | | | | | |
| 7.000%, 10/31/21 | | | 278 | | | | 276 | |
| | | | | | | | | |
| Total Financial | | | | 28,723 | |
| | | | | | | | | |
| Food and Drug [0.4%] | |
| Albertsons, LLC, Term Loan B-2 | | | | | | | | |
| 5.375%, 03/21/19 | | | 1,591 | | | | 1,602 | |
| Albertsons, LLC, Term Loan B-3 | | | | | | | | |
| 4.000%, 08/09/19 | | | 320 | | | | 322 | |
| Albertsons, LLC, Term Loan B-4 | | | | | | | | |
| 5.500%, 08/25/21 | | | 125 | | | | 126 | |
| New Albertsons’s, Inc., Term Loan | | | | | | | | |
| 4.750%, 06/27/21 | | | 547 | | | | 549 | |
| Rite Aid Corporation, Second Lien - Tranche 1 Term Loans | | | | | | | | |
| 5.750%, 07/07/20 | | | 1,085 | | | | 1,096 | |
| Rite Aid Corporation, Second Lien - Tranche 2 Term Loans | | | | | | | | |
| 4.875%, 06/21/21 | | | 440 | | | | 440 | |
| Stater Bros. Markets, Term Loan B | | | | | | | | |
| 4.750%, 05/12/21 | | | 280 | | | | 279 | |
| Supervalu Inc., Term Loan B - 2013 | | | | | | | | |
| 4.500%, 03/21/19 | | | 863 | | | | 865 | |
| | | | | | | | | |
| Total Food and Drug | | | | 5,279 | |
See accompanying notes to financial statements.
CITY NATIONAL ROCHDALE FUNDS | PAGE 84
consolidated schedule of investments
March 31, 2015 (Unaudited)
City National Rochdale Fixed Income Opportunities Fund (continued)
| Description | | Face Amount (000) | | | Value (000) | |
| Food/Tobacco [0.8%] | |
| Burger King (1011778 B.C. / New Red), Term Loan B | | | | | | |
| 4.500%, 12/12/21 | | $ | 1,512 | | | $ | 1,526 | |
| Deoleo, Term Loan | | | | | | | | |
| 4.500%, 06/02/21 | | | 3,000 | | | | 3,072 | |
| HJ Heinz, Term Loan B1 | | | | | | | | |
| 3.250%, 06/07/19 | | | 1,931 | | | | 1,932 | |
| HJ Heinz, Term Loan B2 | | | | | | | | |
| 3.500%, 06/05/20 | | | 1,546 | | | | 1,548 | |
| JBS USA LLC, Term Loan B-2 | | | | | | | | |
| 3.750%, 09/18/20 | | | 291 | | | | 290 | |
| Landry’s Inc., Term Loan B | | | | | | | | |
| 4.000%, 04/19/18 | | | 902 | | | | 903 | |
| Post Holdings Inc, Term Loan B | | | | | | | | |
| 3.750%, 06/02/21 | | | 948 | | | | 949 | |
| United Biscuits | | | | | | | | |
| 5.234%, 12/10/21 | | | 1,000 | | | | 1,496 | |
| | | | | | | | | |
| Total Food/Tobacco | | | | 11,716 | |
| | | | | | | | | |
| Forest Prod/Containers [0.6%] | |
| Anchor Glass Container Corporation, Term Loan B | | | | | | | | |
| 4.250%, 05/14/21 | | | 310 | | | | 310 | |
| Ardagh Holdings USA Inc., Incremental Term Loan B | | | | | | | | |
| 4.000%, 12/17/19 | | | 990 | | | | 992 | |
| Berry Plastics Corp., Term Loan D | | | | | | | | |
| 3.500%, 02/08/20 | | | 2,847 | | | | 2,839 | |
| Caraustar Industries, Inc., Term Loan | | | | | | | | |
| 7.500%, 05/01/19 | | | 141 | | | | 140 | |
| CD&R Millennium LLC (Mauser), Second Lien | | | | | | | | |
| 8.250%, 07/31/22 | | | 150 | | | | 146 | |
| NewPage Corporation, Term Loan B | | | | | | | | |
| 9.500%, 02/11/21 | | | 490 | | | | 468 | |
| Oak Tea Inc. | | | | | | | | |
| 3.500%, 07/02/21 | | | 2,000 | | | | 2,159 | |
| Reynolds Group Holdings, Term Loan B - 2013 | | | | | | | | |
| 4.000%, 12/01/18 | | | 1,856 | | | | 1,863 | |
| SIG Combibloc (Onex Wizard), Term Loan B | | | | | | | | |
| 0.000%, 02/03/22(G) | | | 330 | | | | 333 | |
| | | | | | | | | |
| Total Forest Prod/Containers | | | | 9,250 | |
| Description | | Face Amount (000) | | | Value (000) | |
| Gaming/Leisure [1.9%] | |
| Amaya, First Lien Term Loan | | | | | | |
| 5.000%, 08/01/21 | | $ | 512 | | | $ | 507 | |
| Belmond Interfin Ltd., Term Loan | | | | | | | | |
| 4.000%, 03/19/21 | | | 396 | | | | 394 | |
| Boyd Gaming Corp, Term Loan B | | | | | | | | |
| 4.000%, 08/14/20 | | | 191 | | | | 191 | |
| Caesars Entertainment Op Co Inc, Prop Co Term Loan | | | | | | | | |
| 7.000%, 10/11/20 | | | 1,402 | | | | 1,325 | |
| Caesars Entertainment Op Co Inc, Term Loan B-4 | | | | | | | | |
| 10.500%, 01/28/15 | | | 116 | | | | 108 | |
| Caesars Entertainment Op Co Inc, Term Loan B-6 Extended | | | | | | | | |
| 6.985%, 01/28/18 | | | 4,192 | | | | 3,845 | |
| Caesars Entertainment Op Co Inc, Term Loan B7 | | | | | | | | |
| 9.750%, 03/01/17 | | | 751 | | | | 684 | |
| CCM Merger (Motor City), Term Loan B - new | | | | | | | | |
| 4.500%, 08/06/21 | | | 1,732 | | | | 1,737 | |
| Clubcorp Club Operations, Term Loan B - 2013 | | | | | | | | |
| 4.500%, 07/24/20 | | | 1,070 | | | | 1,075 | |
| Diamond Resorts Corp, Cov-Lite Term Loan | | | | | | | | |
| 5.500%, 05/09/21 | | | 1,398 | | | | 1,403 | |
| Four Seasons Holdings Inc., Second Lien | | | | | | | | |
| 6.250%, 12/27/20 | | | 150 | | | | 151 | |
| Four Seasons Holdings Inc., Term Loan (12/13) | | | | | | | | |
| 3.500%, 06/27/20 | | | 928 | | | | 926 | |
| Global Cash Access, Term Loan B | | | | | | | | |
| 6.250%, 11/25/20 | | | 403 | | | | 400 | |
| Great Wolf Resorts, Term Loan | | | | | | | | |
| 5.750%, 08/06/20 | | | 405 | | | | 406 | |
| Hilton Worldwide Finance, LLC., Term Loan B-1 | | | | | | | | |
| 3.500%, 10/26/20 | | | 7,275 | | | | 7,282 | |
| La Quinta Intermediate Holdings, Term Loan B | | | | | | | | |
| 4.000%, 04/14/21 | | | 574 | | | | 575 | |
| Mohegan Tribal Gaming, Term Loan B | | | | | | | | |
| 5.500%, 11/19/19 | | | 222 | | | | 220 | |
| NCL Corp Ltd, Term Loan B | | | | | | | | |
| 4.000%, 11/05/21 | | | 175 | | | | 176 | |
See accompanying notes to financial statements.
CITY NATIONAL ROCHDALE FUNDS | PAGE 85
consolidated schedule of investments
March 31, 2015 (Unaudited)
City National Rochdale Fixed Income Opportunities Fund (continued)
| Description | | Face Amount (000) | | | Value (000) | |
| Parques, Term Loan | | | | | | |
| 5.000%, 03/26/19 | | $ | 3,000 | | | $ | 3,239 | |
| Playa Resorts Holding, Term Loan B | | | | | | | | |
| 4.000%, 08/09/19 | | | 187 | | | | 187 | |
| RHP Hotel Properties, LP, Term Loan B | | | | | | | | |
| 3.750%, 01/15/21 | | | 749 | | | | 752 | |
| Scientific Games Inc., Term Loan B | | | | | | | | |
| 4.250%, 10/18/20 | | | 149 | | | | 150 | |
| 4.250%, 10/18/20 | | | 895 | | | | 897 | |
| 4.250%, 10/18/20 | | | 1,523 | | | | 1,527 | |
| Shingle Springs Tribal, Term Loan B | | | | | | | | |
| 6.250%, 08/29/19 | | | 135 | | | | 135 | |
| | | | | | | | | |
| Total Gaming/Leisure | | | | 28,292 | |
| | | | | | | | | |
| Healthcare [2.8%] | |
| Aenova | | | | | | | | |
| 0.000%, 09/29/20(G) | | | 1,000 | | | | 1,079 | |
| 5.000%, 07/10/20 | | | 1,000 | | | | 1,077 | |
| Allscripts Healthcare Solutions Inc, Term Loan A1 | | | | | | | | |
| 2.920%, 06/28/18 | | | 450 | | | | 449 | |
| Amdipharm Mercury Ltd. | | | | | | | | |
| 5.250%, 11/07/19 | | | 2,000 | | | | 2,974 | |
| Capella Healthcare, Inc., Term Loan | | | | | | | | |
| 5.250%, 12/16/21 | | | 294 | | | | 296 | |
| Carestream Health Holdings, Inc., Term Loan | | | | | | | | |
| 5.000%, 06/05/19 | | | 1,209 | | | | 1,212 | |
| Catalent Pharma, Term Loan | | | | | | | | |
| 4.250%, 05/07/21 | | | 993 | | | | 1,074 | |
| CDRH (Healogics), Term Loan B | | | | | | | | |
| 5.250%, 07/01/21 | | | 358 | | | | 358 | |
| Community Health Systems, Inc., 2021 Term D Loan | | | | | | | | |
| 4.250%, 01/27/21 | | | 422 | | | | 424 | |
| Community Health Systems, Inc., Term Loan A - 2019 | | | | | | | | |
| 2.671%, 01/25/19 | | | 3,700 | | | | 3,643 | |
| Community Health Systems, Inc., Term Loan F | | | | | | | | |
| 3.425%, 01/25/18 | | | 2,500 | | | | 2,499 | |
| ConvaTec Healthcare, Term Loan B | | | | | | | | |
| 4.000%, 12/30/16 | | | 430 | | | | 430 | |
| Description | | Face Amount (000) | | | Value (000) | |
| DPX Holdings B.V., Term Loan B | | | | | | |
| 4.250%, 03/11/21 | | $ | 1,777 | | | $ | 1,767 | |
| Envision Acquisition Company, LLC , First Lien Term Loan | | | | | | | | |
| 5.750%, 11/04/20 | | | 167 | | | | 168 | |
| Gesundheits | | | | | | | | |
| 4.750%, 07/25/21 | | | 1,000 | | | | 1,079 | |
| Grifols, Inc, Term Loan B | | | | | | | | |
| 3.178%, 02/27/21 | | | 2,166 | | | | 2,163 | |
| Halyard Health, Inc., Term Loan B | | | | | | | | |
| 4.000%, 10/01/21 | | | 364 | | | | 367 | |
| Hologic Inc., Term Loan B - Refi | | | | | | | | |
| 3.250%, 08/01/19 | | | 236 | | | | 236 | |
| Iasis Healthcare Corporation, Term Loan B - 2013 | | | | | | | | |
| 4.500%, 05/03/18 | | | 261 | | | | 262 | |
| IMS Healthcare, Term Loan B - 2021 | | | | | | | | |
| 3.500%, 03/17/21 | | | 171 | | | | 170 | |
| Indivior Finance S.Ã r.l., Term Loan B | | | | | | | | |
| 7.000%, 12/19/19 | | | 395 | | | | 373 | |
| inVentiv Health, Inc., Term B-4 Loan | | | | | | | | |
| 7.750%, 05/15/18 | | | 475 | | | | 476 | |
| Kindred Healthcare Inc., Term Loan B | | | | | | | | |
| 4.250%, 04/09/21 | | | 464 | | | | 466 | |
| Kinetic Concepts, Term Loan E-1 | | | | | | | | |
| 4.500%, 05/04/18 | | | 259 | | | | 260 | |
| LGC Science Holdings, Term Loan | | | | | | | | |
| 4.001%, 03/12/21 | | | 3,000 | | | | 3,218 | |
| MultiPlan Inc, Term Loan | | | | | | | | |
| 3.750%, 03/31/21 | | | 989 | | | | 986 | |
| P2 Lower Acq. (Progressive), Term Loan | | | | | | | | |
| 5.500%, 10/22/20 | | | 1,507 | | | | 1,504 | |
| Par Pharmaceuticals, Term B-2 Loan | | | | | | | | |
| 4.000%, 09/30/19 | | | 975 | | | | 973 | |
| Par Pharmaceuticals, Term B-3 Loan | | | | | | | | |
| 4.250%, 09/30/19 | | | 234 | | | | 234 | |
| PharMedium Healthcare Corporation, First Lien Term Loan | | | | | | | | |
| 4.250%, 01/28/21 | | | 117 | | | | 116 | |
See accompanying notes to financial statements.
CITY NATIONAL ROCHDALE FUNDS | PAGE 86
consolidated schedule of investments
March 31, 2015 (Unaudited)
City National Rochdale Fixed Income Opportunities Fund (continued)
| Description | | Face Amount (000) | | | Value (000) | |
| Regional Care (aka RCHP, Inc.), First Lien Term Loan | | | | | | |
| 6.000%, 04/23/19 | | $ | 1,206 | | | $ | 1,207 | |
| Regional Care (aka RCHP, Inc.), Second Lien | | | | | | | | |
| 0.000%, 10/23/19(G) | | | 95 | | | | 96 | |
| Royalty Pharma (aka RPI), Term Loan B-4 | | | | | | | | |
| 3.500%, 11/09/20 | | | 299 | | | | 301 | |
| Salix Pharmaceuticals, Ltd., Term Loan | | | | | | | | |
| 4.250%, 01/02/20 | | | 1,108 | | | | 1,108 | |
| Siemens Audiology Solutions | | | | | | | | |
| 0.000%, 12/10/21 | | | 1,000 | | | | 1,089 | |
| Valeant Pharmaceuticals International, Series C-2 TLB | | | | | | | | |
| 3.500%, 12/11/19 | | | 756 | | | | 756 | |
| Valeant Pharmaceuticals International, Series D-2 TLB | | | | | | | | |
| 3.750%, 02/13/19 | | | 309 | | | | 309 | |
| Valeant Pharmaceuticals International, Series E Tranche B Term Loan | | | | | | | | |
| 3.500%, 06/26/20 | | | 3,706 | | | | 3,706 | |
| Valeant Pharmaceuticals International, Series F-1 Tranche B Term Loan | | | | | | | | |
| 0.000%, 03/11/22(G) | | | 1,631 | | | | 1,638 | |
| Valeant Pharmaceuticals International, Series F-2 Tranche B Term Loan - DD | | | | | | | | |
| 0.000%, 03/11/22(G) | | | 1,249 | | | | 1,254 | |
| | | | | | | | | |
| Total Healthcare | | | | 41,797 | |
| | | | | | | | | |
| Housing [0.1%] | |
| ABC Supply Company, Term Loan B | | | | | | | | |
| 3.500%, 04/16/20 | | | 824 | | | | 822 | |
| Continental Building Products LLC, First Lien Term Loan | | | | | | | | |
| 4.000%, 08/28/20 | | | 296 | | | | 294 | |
| DTZ US Borrower LLC, Term Loan | | | | | | | | |
| 5.500%, 11/04/21 | | | 329 | | | | 331 | |
| QUIKRETE Holdings, Inc., First Lien Term Loan | | | | | | | | |
| 4.000%, 09/28/20 | | | 269 | | | | 270 | |
| Realogy Corporation, New Term Loan B | | | | | | | | |
| 3.750%, 03/05/20 | | | 314 | | | | 313 | |
| | | | | | | | | |
| Total Housing | | | | 2,030 | |
| Description | | Face Amount (000) | | | Value (000) | |
| Industrials [0.2%] | |
| AHT Cooling Systems, First Lien | | | | | | |
| 0.000%, 11/01/20 | | $ | 1,000 | | | $ | 1,081 | |
| Delachaux | | | | | | | | |
| 0.000%, 09/25/21 | | | 500 | | | | 746 | |
| Interpipe Ukraine | | | | | | | | |
| 4.273%, 03/06/16(J) | | | 3,624 | | | | 1,087 | |
| | | | | | | | | |
| Total Industrials | | | | 2,914 | |
| | | | | | | | | |
| Information Technology [1.9%] | |
| Aricent Technologies, Term Loan | | | | | | | | |
| 5.500%, 04/14/21 | | | 427 | | | | 428 | |
| Arris Group, Inc., Term Loan B | | | | | | | | |
| 3.250%, 04/17/20 | | | 574 | | | | 573 | |
| Avago Technologies Finance, Term Loan B | | | | | | | | |
| 3.750%, 05/06/21 | | | 2,452 | | | | 2,456 | |
| Avaya Inc., Term B3 Extended | | | | | | | | |
| 4.672%, 10/26/17 | | | 1,624 | | | | 1,597 | |
| Avaya Inc., Term B-6 Loans | | | | | | | | |
| 6.500%, 03/31/18 | | | 1,374 | | | | 1,369 | |
| Blackboard Inc, Term Loan B3 | | | | | | | | |
| 4.750%, 10/04/18 | | | 883 | | | | 882 | |
| CDW LLC, Term Loan | | | | | | | | |
| 3.250%, 04/29/20 | | | 1,184 | | | | 1,172 | |
| CompuCom Systems, Inc., Term Loan B | | | | | | | | |
| 4.250%, 05/07/20 | | | 138 | | | | 129 | |
| Dell Inc, Term Loan B | | | | | | | | |
| 4.500%, 04/29/20 | | | 3,348 | | | | 3,369 | |
| Dell Inc, Term Loan C | | | | | | | | |
| 3.750%, 10/29/18 | | | 650 | | | | 651 | |
| Fidji Luxembourg (BC3) S.Ã r.l., Term Loan | | | | | | | | |
| 6.250%, 12/24/20 | | | 231 | | | | 231 | |
| Freescale Semiconductor, Tranche B4 Term Loan | | | | | | | | |
| 4.250%, 02/28/20 | | | 2,996 | | | | 3,001 | |
| Infor (US) , Term Loan B-3 | | | | | | | | |
| 3.750%, 06/03/20 | | | 187 | | | | 185 | |
| Infor (US), Term Loan B-5 | | | | | | | | |
| 3.750%, 06/03/20 | | | 885 | | | | 877 | |
| Internap Network Services, Term Loan | | | | | | | | |
| 6.000%, 11/26/19 | | | 311 | | | | 311 | |
| iParadigms Holdings LLC, First Lien Term Loan | | | | | | | | |
| 5.000%, 07/23/21 | | | 254 | | | | 253 | |
See accompanying notes to financial statements.
CITY NATIONAL ROCHDALE FUNDS | PAGE 87
consolidated schedule of investments
March 31, 2015 (Unaudited)
City National Rochdale Fixed Income Opportunities Fund (continued)
| Description | | Face Amount (000) | | | Value (000) | |
| IPC Corp., Term Loan | | | | | | |
| 6.500%, 07/06/21 | | $ | 280 | | | $ | 281 | |
| Microsemi Corporation, Term Loan B-1 | | | | | | | | |
| 3.250%, 02/19/20 | | | 160 | | | | 160 | |
| Nuance Communications, Term Loan | | | | | | | | |
| 2.920%, 08/07/19 | | | 187 | | | | 184 | |
| On Semiconductor Corp, Term Loan | | | | | | | | |
| 1.980%, 01/02/18(J) | | | 488 | | | | 471 | |
| Presidio, Inc., Term Loan | | | | | | | | |
| 6.250%, 02/02/22 | | | 500 | | | | 498 | |
| Riverbed Technology, Inc., Term Loan B | | | | | | | | |
| 0.000%, 02/25/22(G) | | | 680 | | | | 686 | |
| Sophia LP, Term Loan B-1 | | | | | | | | |
| 4.000%, 07/19/18 | | | 476 | | | | 475 | |
| Southern Graphics Inc., Term Loan - 2013 | | | | | | | | |
| 4.250%, 10/17/19 | | | 204 | | | | 203 | |
| Technicolor, Term Loan | | | | | | | | |
| 5.500%, 07/11/20 | | | 3,850 | | | | 3,867 | |
| The Active Network, Inc., First Lien Term Loan | | | | | | | | |
| 5.500%, 11/13/20 | | | 109 | | | | 108 | |
| Vertafore, Inc., Term Loan - 2013 | | | | | | | | |
| 4.250%, 10/03/19 | | | 275 | | | | 275 | |
| ViaWest Inc - Shaw, Term Loan B | | | | | | | | |
| 0.000%, 03/25/22(G) | | | 270 | | | | 271 | |
| Zebra Technologies Corp, Term Loan B | | | | | | | | |
| 4.750%, 09/30/21 | | | 3,504 | | | | 3,541 | |
| | | | | | | | | |
| Total Information Technology | | | | 28,504 | |
| | | | | | | | | |
| Manufacturing [0.4%] | |
| Alliance Laundry, Term Loan - 2013 | | | | | | | | |
| 4.250%, 12/07/18 | | | 659 | | | | 660 | |
| Boomerang Tube, Term Loan B | | | | | | | | |
| 11.000%, 10/11/17(J) | | | 213 | | | | 117 | |
| Brand Energy & Infrastructure, Term Loan B | | | | | | | | |
| 4.750%, 11/26/20 | | | 1,983 | | | | 1,924 | |
| Doosan Infracore, Term Loan B | | | | | | | | |
| 4.500%, 05/28/21 | | | 353 | | | | 356 | |
| Generac Power Systems Inc, Term Loan B | | | | | | | | |
| 3.250%, 06/22/18 | | | 188 | | | | 188 | |
| Description | | Face Amount (000) | | | Value (000) | |
| Mirror Bidco Corp. (Dematic), Cov-Lite Term Loan | | | | | | |
| 4.250%, 12/28/19 | | $ | 293 | | | $ | 292 | |
| Otter Products, LLC, Term Loan B | | | | | | | | |
| 5.750%, 06/03/20 | | | 239 | | | | 237 | |
| Signode Industrial Group US Inc., Term Loan B | | | | | | | | |
| 3.750%, 05/01/21 | | | 1,407 | | | | 1,397 | |
| Utex Industries, First Lien Term Loan | | | | | | | | |
| 5.000%, 05/14/21 | | | 1,320 | | | | 1,186 | |
| | | | | | | | | |
| Total Manufacturing | | | | 6,357 | |
| | | | | | | | | |
| Media [0.1%] | |
| Tyrol Acquisition 2 SAS, Facility A-2 | | | | | | | | |
| 3.001%, 01/29/16 | | | 2,000 | | | | 2,154 | |
| | | | | | | | | |
| Metals/Minerals [0.6%] | |
| Atkore International, Inc., Term Loan | | | | | | | | |
| 4.500%, 04/09/21 | | | 357 | | | | 354 | |
| Atlas Iron Limited, Term Loan | | | | | | | | |
| 8.750%, 12/10/17(J) | | | 117 | | | | 70 | |
| Dynacast International LLC, Term Loan | | | | | | | | |
| 5.250%, 01/28/22 | | | 365 | | | | 368 | |
| Fortescue Metals Group (FMG), Cov-Lite Term Loan | | | | | | | | |
| 3.750%, 06/30/19 | | | 7,983 | | | | 7,214 | |
| Murray Energy, Term Loan | | | | | | | | |
| 5.250%, 12/05/19 | | | 490 | | | | 480 | |
| Peabody Energy Corp, Term Loan B | | | | | | | | |
| 4.250%, 09/24/20 | | | 517 | | | | 464 | |
| | | | | | | | | |
| Total Metals/Minerals | | | | 8,950 | |
| | | | | | | | | |
| Retail [1.5%] | |
| Abercrombie & Fitch Management Co., Term Loan B | | | | | | | | |
| 4.750%, 07/30/21 | | | 998 | | | | 976 | |
| Capital Automotive LP, Second Lien | | | | | | | | |
| 6.000%, 04/30/20 | | | 1,530 | | | | 1,553 | |
| Capital Automotive LP, Term Loan - 2013 | | | | | | | | |
| 4.000%, 04/10/19 | | | 1,675 | | | | 1,680 | |
See accompanying notes to financial statements.
CITY NATIONAL ROCHDALE FUNDS | PAGE 88
consolidated schedule of investments
March 31, 2015 (Unaudited)
City National Rochdale Fixed Income Opportunities Fund (continued)
| Description | | Face Amount (000) | | | Value (000) | |
| CWGS Group, LLC, Term Loan | | | | | | |
| 5.750%, 02/20/20 | | $ | 964 | | | $ | 971 | |
| Dollar Tree Inc, Term Loan B | | | | | | | | |
| 4.250%, 02/06/22(G) | | | 3,090 | | | | 3,121 | |
| HMK Intermediate Hldg (Sleepys), Term Loan | | | | | | | | |
| 5.000%, 03/30/19 | | | 334 | | | | 331 | |
| Hudson’s Bay Company, Term Loan B | | | | | | | | |
| 4.750%, 11/04/20 | | | 171 | | | | 171 | |
| J Crew Group Inc, Term Loan B | | | | | | | | |
| 4.000%, 03/05/21 | | | 813 | | | | 753 | |
| JC Penney, Term Loan B | | | | | | | | |
| 6.000%, 05/21/18 | | | 2,724 | | | | 2,716 | |
| Jo-Ann Stores, Inc., Initial Loans | | | | | | | | |
| 4.000%, 03/16/18 | | | 601 | | | | 596 | |
| Lands™ End, Inc., Term Loan B | | | | | | | | |
| 4.250%, 04/04/21 | | | 327 | | | | 311 | |
| Michaels Stores, Term Loan B | | | | | | | | |
| 3.750%, 01/28/20 | | | 354 | | | | 354 | |
| Neiman Marcus (fka Mariposa), New Term Loan | | | | | | | | |
| 4.250%, 10/25/20 | | | 2,453 | | | | 2,443 | |
| Petco Animal Supplies Inc, Term Loan B - 2013 | | | | | | | | |
| 4.000%, 11/24/17 | | | 371 | | | | 371 | |
| Petsmart (fka Argos Merger), Term Loan B | | | | | | | | |
| 5.000%, 03/11/22 | | | 1,260 | | | | 1,269 | |
| Sears Roebuck Acceptance Corp., Term Loan B | | | | | | | | |
| 5.500%, 06/30/18 | | | 2,191 | | | | 2,156 | |
| Toys R Us Property Company, Initial Term Loan | | | | | | | | |
| 6.000%, 08/21/19 | | | 1,390 | | | | 1,312 | |
| Toys R Us-Delaware, Inc., FILO CAD Term Loan | | | | | | | | |
| 8.250%, 10/09/19 | | | 125 | | | | 124 | |
| Toys R Us-Delaware, Inc., FILO US Term Loan | | | | | | | | |
| 8.250%, 10/09/19 | | | 155 | | | | 153 | |
| Toys R Us-Delaware, Inc., Term Loan B-3 | | | | | | | | |
| 5.250%, 05/25/18 | | | 34 | | | | 26 | |
| Toys R Us-Delaware, Inc., Term Loan B4 | | | | | | | | |
| 9.750%, 04/09/20 | | | 1,335 | | | | 1,239 | |
| | | | | | | | | |
| Total Retail | | | | 22,626 | |
| Description | | Face Amount (000) | | | Value (000) | |
| Service [2.6%] | |
| 4L Technologies Inc., Term Loan B | | | | | | |
| 5.500%, 05/08/20 | | $ | 65 | | | $ | 63 | |
| Advanced Disposal Services, Term Loan B-2 | | | | | | | | |
| 3.750%, 10/09/19 | | | 1,123 | | | | 1,109 | |
| AI Avocado BV | | | | | | | | |
| 4.251%, 10/08/21 | | | 1,000 | | | | 1,084 | |
| Asurion Corporation, Incremental Term Loan B-2 | | | | | | | | |
| 4.250%, 07/08/20 | | | 1,258 | | | | 1,254 | |
| Asurion Corporation, Incremental Tranche B-1 | | | | | | | | |
| 5.000%, 05/24/19 | | | 3,669 | | | | 3,677 | |
| Asurion Corporation, Second Lien | | | | | | | | |
| 8.500%, 03/03/21 | | | 1,800 | | | | 1,806 | |
| Asurion Corporation, Term Loan B3 | | | | | | | | |
| 3.750%, 03/03/17 | | | 150 | | | | 150 | |
| Callcredit Information Group, 1st Lien | | | | | | | | |
| 5.183%, 02/12/21 | | | 3,000 | | | | 4,391 | |
| Digital River, Inc., Term Loan | | | | | | | | |
| 7.500%, 02/13/21 | | | 305 | | | | 301 | |
| DigitalGlobe Inc., Term Loan B | | | | | | | | |
| 3.750%, 01/31/20 | | | 444 | | | | 445 | |
| Dorna Sports, Term Loan | | | | | | | | |
| 4.172%, 04/30/21 | | | 2,000 | | | | 2,165 | |
| Environmental Resources, Term Loan | | | | | | | | |
| 5.000%, 05/09/22 | | | 2,000 | | | | 1,920 | |
| 8.000%, 05/07/21 | | | 2,000 | | | | 1,960 | |
| Evertec Group, LLC, Term Loan A | | | | | | | | |
| 2.700%, 04/17/18 | | | 548 | | | | 539 | |
| Evertec Group, LLC, Term Loan B | | | | | | | | |
| 3.500%, 04/17/20 | | | 92 | | | | 90 | |
| First Data Corporation, 2018 New Dollar Term Loan | | | | | | | | |
| 3.672%, 03/23/18 | | | 4,425 | | | | 4,421 | |
| First Data Corporation, 2018B Second New Term Loan | | | | | | | | |
| 3.672%, 09/24/18 | | | 805 | | | | 804 | |
| First Data Corporation, 2021 Extended Dollar Term Loan | | | | | | | | |
| 4.168%, 03/24/21 | | | 1,745 | | | | 1,749 | |
| Interactive Data Corporation, Term Loan B - 2014 | | | | | | | | |
| 4.750%, 05/02/21 | | | 1,464 | | | | 1,470 | |
See accompanying notes to financial statements.
CITY NATIONAL ROCHDALE FUNDS | PAGE 89
consolidated schedule of investments
March 31, 2015 (Unaudited)
City National Rochdale Fixed Income Opportunities Fund (continued)
| Description | | Face Amount (000) | | | Value (000) | |
| iQor US Inc., Term Loan B | | | | | | |
| 6.000%, 04/01/21 | | $ | 1,050 | | | $ | 995 | |
| Nets Holdings, Term Loan | | | | | | | | |
| 4.250%, 05/04/21 | | | 3,000 | | | | 3,237 | |
| PODS LLC, Term Loan B | | | | | | | | |
| 5.250%, 01/28/22 | | | 185 | | | | 186 | |
| PrePaid Legal Services, Inc., Term Loan B | | | | | | | | |
| 6.250%, 07/01/19 | | | 137 | | | | 137 | |
| Redtop Acquisitions Limited, First Lien Term Loan | | | | | | | | |
| 4.500%, 12/03/20 | | | 309 | | | | 308 | |
| Redtop Acquisitions Limited, Second Lien | | | | | | | | |
| 8.250%, 06/03/21 | | | 188 | | | | 189 | |
| Securitas Direct, Term Loan | | | | | | | | |
| 10.493%, 08/30/19 | | | 3,000 | | | | 3,352 | |
| Sedgwick, Inc., First Lien Term Loan | | | | | | | | |
| 3.750%, 03/01/21 | | | 1,494 | | | | 1,475 | |
| Sedgwick, Inc., Second Lien | | | | | | | | |
| 6.750%, 02/28/22 | | | 260 | | | | 253 | |
| Spin Holdco (Coinmach), Term Loan B | | | | | | | | |
| 4.250%, 11/14/19 | | | 109 | | | | 108 | |
| STG-Fairway Acq. - First Advantage, Term Loan B | | | | | | | | |
| 6.250%, 02/28/19 | | | 284 | | | | 282 | |
| | | | | | | | | |
| Total Service | | | | 39,920 | |
| | | | | | | | | |
| Sovereign [0.9%] | |
| Arab Republic of Egypt | | | | | | | | |
| 4.479%, 01/04/21(F) (J) | | | 3,000 | | | | 2,695 | |
| Republic of Angola | | | | | | | | |
| 6.600%, 12/06/20 | | | 7,000 | | | | 6,991 | |
| Tanzania Term Loan | | | | | | | | |
| 6.130%, 03/03/20 | | | 4,000 | | | | 3,995 | |
| | | | | | | | | |
| Total Sovereign | | | | 13,681 | |
| | | | | | | | | |
| Telecommunications [1.7%] | |
| Cable & Wireless Communications PLC (Sable), Term Loan | | | | | | | | |
| 5.500%, 11/25/16 | | | 683 | | | | 683 | |
| Cable & Wireless Communications PLC (Sable), Term Loan Unsecured | | | | | | | | |
| 6.500%, 11/25/16 | | | 1,060 | | | | 1,063 | |
| Description | | Face Amount (000) | | | Value (000) | |
| Cincinnati Bell Inc., Term Loan B - 2013 | | | | | | |
| 4.000%, 09/10/20 | | $ | 263 | | | $ | 263 | |
| 4.000%, 09/10/20 | | | 263 | | | | 263 | |
| 4.000%, 09/10/20 | | | 913 | | | | 911 | |
| Datapipe, Term Loan B | | | | | | | | |
| 5.250%, 03/15/19 | | | 108 | | | | 105 | |
| Eircom Finco, Term Loan | | | | | | | | |
| 4.582%, 09/30/19 | | | 3,002 | | | | 3,176 | |
| Frontier Communications, Term Loan A | | | | | | | | |
| 3.050%, 10/14/16 | | | 3,298 | | | | 3,249 | |
| Integra Telecom, Term B Loan | | | | | | | | |
| 5.250%, 02/22/19 | | | 406 | | | | 405 | |
| Level 3 Communications, Term Loan B - 2020 | | | | | | | | |
| 4.000%, 01/15/20 | | | 3,665 | | | | 3,671 | |
| Level 3 Communications, Term Loan B-3 -2019 | | | | | | | | |
| 4.000%, 08/01/19 | | | 735 | | | | 736 | |
| LTS Buyer LLC (Light Tower), Term Loan | | | | | | | | |
| 4.000%, 04/13/20 | | | 804 | | | | 800 | |
| Numericable U.S. LLC, Term Loan B-1 | | | | | | | | |
| 4.500%, 05/21/20 | | | 3,670 | | | | 3,677 | |
| Numericable U.S. LLC, Term Loan B-2 | | | | | | | | |
| 4.500%, 05/21/20 | | | 3,175 | | | | 3,181 | |
| Telx Group, Term Loan B (2014) | | | | | | | | |
| 4.500%, 04/09/20 | | | 566 | | | | 562 | |
| WestCorp, Term Loan B-10 | | | | | | | | |
| 3.250%, 06/30/18 | | | 439 | | | | 438 | |
| Zayo Group LLC, Term Loan B - 2012 | | | | | | | | |
| 4.000%, 07/02/19 | | | 3,046 | | | | 3,049 | |
| | | | | | | | | |
| Total Telecommunications | | | | 26,232 | |
| | | | | | | | | |
| Textile & Apparel Mfg. [0.1%] | |
| Vivarte | | | | | | | | |
| 0.000%, 10/29/19(G) | | | 1,000 | | | | 1,016 | |
| | | | | | | | | |
| Transportation [0.5%] | |
| Allison Transmission Inc, Term Loan B3 (2013) | | | | | | | | |
| 3.500%, 08/23/19 | | | 1,639 | | | | 1,638 | |
| Chrysler Automotive, 2014 Term Loan B | | | | | | | | |
| 3.250%, 12/31/18 | | | 1,485 | | | | 1,483 | |
See accompanying notes to financial statements.
CITY NATIONAL ROCHDALE FUNDS | PAGE 90
consolidated schedule of investments
March 31, 2015 (Unaudited)
City National Rochdale Fixed Income Opportunities Fund (continued)
| Description | | Face Amount (000) | | | Value (000) | |
| Chrysler Group | | | | | | |
| 4.250%, 05/24/17 | | $ | 877 | | | $ | 877 | |
| Commercial Barge Line Company, Term Loan B | | | | | | | | |
| 7.500%, 09/22/19 | | | 1 | | | | 1 | |
| 7.500%, 09/22/19 | | | 293 | | | | 293 | |
| CS Intermedia Holdco 2 LLC, Term Loan | | | | | | | | |
| 4.000%, 04/04/21 | | | 283 | | | | 282 | |
| FleetPride, Term Loan B | | | | | | | | |
| 5.250%, 11/15/19 | | | 210 | | | | 208 | |
| Key Safety Systems, Inc, First Lien Term Loan | | | | | | | | |
| 4.750%, 07/25/21 | | | 184 | | | | 185 | |
| Navios Maritime Partners LP, Term Loan B | | | | | | | | |
| 5.250%, 06/27/18 | | | 332 | | | | 332 | |
| Schaeffler Finance BV, Term Loan E | | | | | | | | |
| 4.250%, 05/15/20 | | | 1,170 | | | | 1,177 | |
| Tower Auto Holdings, Term Loan B - 2020 | | | | | | | | |
| 4.000%, 04/23/20 | | | 209 | | | | 208 | |
| Travelport, Term Loan B | | | | | | | | |
| 6.000%, 09/02/21 | | | 379 | | | | 382 | |
| U.S. Shipping Corp, Term Loan B | | | | | | | | |
| 5.500%, 04/11/18 | | | 200 | | | | 198 | |
| Visteon Corporation, Term Loan B | | | | | | | | |
| 3.500%, 04/09/21 | | | 531 | | | | 530 | |
| Wabash National Corporation, Term Loan B | | | | | | | | |
| 0.000%, 03/16/22(G) | | | 325 | | | | 326 | |
| | | | | | | | | |
| Total Transportation | | | | 8,120 | |
| | | | | | | | | |
| Utility [0.8%] | |
| Bronco Midstream Funding, LLC, Term Loan B | | | | | | | | |
| 5.000%, 08/15/20 | | | 1,081 | | | | 1,043 | |
| Calpine, Construction TL B1 (2020) | | | | | | | | |
| 3.000%, 05/03/20 | | | 147 | | | | 145 | |
| Calpine, Construction TL B2 (2022) | | | | | | | | |
| 3.250%, 01/31/22 | | | 1,085 | | | | 1,075 | |
| Calpine, Term Loan B3 | | | | | | | | |
| 4.000%, 09/27/19 | | | 1,557 | | | | 1,559 | |
| Calpine, Term Loan B4 | | | | | | | | |
| 4.000%, 10/31/20 | | | 832 | | | | 833 | |
| Description | | Face Amount (000) | | | Value (000) | |
| EFS Cogen Holdings I LLC, Term Loan | | | | | | |
| 3.750%, 12/17/20 | | $ | 434 | | | $ | 435 | |
| Empire Generating Co, LLC, Term Loan B | | | | | | | | |
| 5.250%, 03/12/21 | | | 1,559 | | | | 1,558 | |
| Empire Generating Co, LLC, Term Loan C | | | | | | | | |
| 5.250%, 03/12/21 | | | 110 | | | | 110 | |
| ExGen Renewables I, LLC, Term Loan | | | | | | | | |
| 5.250%, 02/06/21 | | | 375 | | | | 377 | |
| Green Energy Partners / Stonewall LLC, Term Loan B-1 | | | | | | | | |
| 6.500%, 11/12/21 | | | 205 | | | | 206 | |
| La Frontera Generation LLC, Term Loan B | | | | | | | | |
| 4.500%, 09/30/20 | | | 1,484 | | | | 1,486 | |
| Panda Temple Power II, LLC, Term Loan | | | | | | | | |
| 7.250%, 04/03/19 | | | 150 | | | | 146 | |
| Power Buyer, LLC, Delay Draw | | | | | | | | |
| 4.250%, 05/06/20 | | | 65 | | | | 65 | |
| Power Buyer, LLC, Second Lien | | | | | | | | |
| 8.250%, 11/06/20 | | | 180 | | | | 175 | |
| Power Buyer, LLC, Term Loan | | | | | | | | |
| 4.250%, 05/06/20 | | | 522 | | | | 516 | |
| Terra-Gen Finance Company, LLC, Term Loan B | | | | | | | | |
| 5.250%, 11/26/21 | | | 325 | | | | 326 | |
| Texas Competitive Electric, Extended Term Loan | | | | | | | | |
| 4.662%, 10/10/17(B) | | | 1,440 | | | | 864 | |
| TPF Generation Holdings, Term Loan B - 2013 | | | | | | | | |
| 4.750%, 12/31/17 | | | 915 | | | | 858 | |
| Viva Alamo LLC, Term Loan B | | | | | | | | |
| 5.250%, 02/22/21 | | | 461 | | | | 456 | |
| | | | | | | | | |
| Total Utility | | | | 12,233 | |
| | | | | | | | | |
| Wireless Communications [0.4%] | |
| Aircell Business Aviation Services LLC (GOGO), Term Loan - B-2 | | | | | | | | |
| 7.500%, 03/21/18 | | | 228 | | | | 218 | |
| Aircell Business Aviation Services LLC (GOGO), Term Loan B | | | | | | | | |
| 11.250%, 06/21/17 | | | 1,954 | | | | 1,993 | |
See accompanying notes to financial statements.
CITY NATIONAL ROCHDALE FUNDS | PAGE 91
consolidated schedule of investments
March 31, 2015 (Unaudited)
City National Rochdale Fixed Income Opportunities Fund (continued)
| Description | | Face Amount/Acquisition Cost (000) | | | Value (000) | |
| Crown Castle Int’l, Extended Increm Tranche B2 | | | | | | |
| 3.000%, 01/31/21 | | $ | 1,835 | | | $ | 1,830 | |
| nTelos, Term Loan B | | | | | | | | |
| 5.750%, 11/09/19 | | | 928 | | | | 793 | |
| Syniverse Technologies, Inc., Old Term Loan B | | | | | | | | |
| 4.000%, 04/23/19 | | | 665 | | | | 626 | |
| Syniverse Technologies, Inc., Tranche B Term Loan | | | | | | | | |
| 4.000%, 04/23/19 | | | 652 | | | | 612 | |
| | | | | | | | | |
| Total Wireless Communications | | | | 6,072 | |
| | | | | | | | | |
| Total Loan Participations | |
| (Cost $460,439) | | | | 441,267 | |
| | | | | | | | | |
| Life Settlement Contracts(H) (I) (J) [9.8%] | |
| American General Life #460L, | | | | | | | | |
| Acquired 05/30/2014* | | | 303 | | | | 367 | |
| American General Life #508L, | | | | | | | | |
| Acquired 05/30/2014* | | | 2,595 | | | | 2,184 | |
| American General Life #634L, | | | | | | | | |
| Acquired 05/30/2014* | | | 530 | | | | 651 | |
| AXA Equitable Life #0474, | | | | | | | | |
| Acquired 11/04/2013* | | | 7,290 | | | | 11,096 | |
| AXA Equitable Life #0932, | | | | | | | | |
| Acquired 11/04/2013* | | | 1,014 | | | | 3,870 | |
| AXA Equitable Life #1600, | | | | | | | | |
| Acquired 05/30/2014* | | | 1,436 | | | | 1,616 | |
| AXA Equitable Life #1616, | | | | | | | | |
| Acquired 05/30/2014* | | | 3,254 | | | | 3,447 | |
| AXA Equitable Life #1898, | | | | | | | | |
| Acquired 11/04/2013* | | | 441 | | | | 307 | |
| AXA Equitable Life #4496, | | | | | | | | |
| Acquired 11/04/2013* | | | 115 | | | | 692 | |
| AXA Equitable Life #7233, | | | | | | | | |
| Acquired 11/04/2013* | | | 395 | | | | 1,184 | |
| AXA Equitable Life #7578, | | | | | | | | |
| Acquired 11/04/2013* | | | 2,104 | | | | 2,245 | |
| AXA Equitable Life #7857, | | | | | | | | |
| Acquired 11/04/2013* | | | 2,297 | | | | 4,465 | |
| AXA Equitable Life #8538, | | | | | | | | |
| Acquired 11/04/2013* | | | 1,333 | | | | 2,424 | |
| AXA Equitable Life #9345, | | | | | | | | |
| Acquired 11/04/2013* | | | 143 | | | | 332 | |
| Guardian Insurance #0346, | | | | | | | | |
| Acquired 11/04/2013* | | | 646 | | | | 2,702 | |
| ING #3394, | | | | | | | | |
| Acquired 05/30/2014* | | | 3,687 | | | | 3,903 | |
| Description | | Acquisition Cost (000) | | | Value (000) | |
| ING Reliastar #1234, | | | | | | |
| Acquired 12/05/2013* | | $ | 1,067 | | | $ | 3,145 | |
| ING Reliastar #1649, | | | | | | | | |
| Acquired 12/05/2013* | | | 61 | | | | 1,207 | |
| ING Reliastar #4842, | | | | | | | | |
| Acquired 11/20/2013* | | | 921 | | | | 3,650 | |
| ING Reliastar #776H, | | | | | | | | |
| Acquired 05/30/2014* | | | 1,518 | | | | 1,612 | |
| John Hancock #0430, | | | | | | | | |
| Acquired 05/30/2014* | | | 2,418 | | | | 3,083 | |
| John Hancock #0801, | | | | | | | | |
| Acquired 05/30/2014* | | | 1,564 | | | | 1,905 | |
| John Hancock #1929, | | | | | | | | |
| Acquired 05/30/2014* | | | 3,813 | | | | 4,601 | |
| John Hancock #2223, | | | | | | | | |
| Acquired 11/19/2013* | | | 1,279 | | | | 2,646 | |
| John Hancock #5072, | | | | | | | | |
| Acquired 05/30/2014* | | | 1,409 | | | | 1,542 | |
| John Hancock #5080, | | | | | | | | |
| Acquired 11/19/2013* | | | 313 | | | | 1,629 | |
| John Hancock #5885, | | | | | | | | |
| Acquired 05/30/2014* | | | 894 | | | | 893 | |
| John Hancock #6686, | | | | | | | | |
| Acquired 05/30/2014* | | | 3,035 | | | | 2,425 | |
| John Hancock #6912, | | | | | | | | |
| Acquired 05/30/2014* | | | 1,065 | | | | 1,146 | |
| Lincoln Benefit Life #9330, | | | | | | | | |
| Acquired 05/30/2014* | | | 5,482 | | | | 3,822 | |
| Lincoln National #4654, | | | | | | | | |
| Acquired 05/30/2014* | | | 721 | | | | 601 | |
| Lincoln National #9239, | | | | | | | | |
| Acquired 05/30/2014* | | | 2,181 | | | | 2,447 | |
| Mass Mutual #1849, | | | | | | | | |
| Acquired 11/05/2013* | | | 2,926 | | | | 3,664 | |
| Mass Mutual #5167, | | | | | | | | |
| Acquired 05/30/2014* | | | 63 | | | | 671 | |
| Mass Mutual #5681, | | | | | | | | |
| Acquired 11/05/2013* | | | 288 | | | | 1,309 | |
| Mass Mutual #5864, | | | | | | | | |
| Acquired 05/30/2014* | | | 4,668 | | | | 4,255 | |
| Mass Mutual #6620, | | | | | | | | |
| Acquired 11/05/2013* | | | 222 | | | | 1,390 | |
| Met Life #8MLU, | | | | | | | | |
| Acquired 05/30/2014* | | | 1,413 | | | | 3,904 | |
| NY Life & Annuity #4757, | | | | | | | | |
| Acquired 05/30/2014* | | | 3,159 | | | | 3,807 | |
| NY Life Insurance #5673, | | | | | | | | |
| Acquired 05/30/2014* | | | 3,334 | | | | 4,102 | |
| Pacific Life #7850, | | | | | | | | |
| Acquired 05/30/2014* | | | 550 | | | | 554 | |
See accompanying notes to financial statements.
CITY NATIONAL ROCHDALE FUNDS | PAGE 92
consolidated schedule of investments
March 31, 2015 (Unaudited)
City National Rochdale Fixed Income Opportunities Fund (continued)
| Description | | Acquisition Cost/Face Amount (000) | | | Value (000) | |
| Penn Mutual #3106, | | | | | | |
| Acquired 05/30/2014* | | $ | 1,294 | | | $ | 1,308 | |
| Phoenix Life #5555, | | | | | | | | |
| Acquired 05/30/2014* | | | 3,946 | | | | 4,777 | |
| Phoenix Life #6161, | | | | | | | | |
| Acquired 05/30/2014* | | | 3,472 | | | | 5,047 | |
| Phoenix Life #8499, | | | | | | | | |
| Acquired 05/30/2014* | | | 756 | | | | 455 | |
| Phoenix Life #8509, | | | | | | | | |
| Acquired 05/30/2014* | | | 761 | | | | 455 | |
| Principal Financial #6653, | | | | | | | | |
| Acquired 10/30/2013* | | | 306 | | | | 709 | |
| Security Mutual Life #5380, | | | | | | | | |
| Acquired 10/30/2013* | | | 410 | | | | 982 | |
| Transamerica #0152, | | | | | | | | |
| Acquired 10/28/2013* | | | 2,916 | | | | 7,002 | |
| Transamerica #1708, | | | | | | | | |
| Acquired 10/28/2013* | | | 957 | | | | 3,130 | |
| Transamerica #2275, | | | | | | | | |
| Acquired 10/28/2013* | | | 6,242 | | | | 16,696 | |
| Transamerica #3426, | | | | | | | | |
| Acquired 11/12/2013* | | | 275 | | | | 624 | |
| Transamerica #8205, | | | | | | | | |
| Acquired 10/28/2013* | | | 714 | | | | 1,157 | |
| Union Central Life #4500, | | | | | | | | |
| Acquired 10/30/2013* | | | 790 | | | | 3,568 | |
| | | | | | | | | |
| Total Life Settlement Contracts | |
| (Cost $94,786) | | | | 147,405 | |
| | | | | | | | | |
| Sovereign Debt [1.2%] | |
| Bosnia & Herzegovina Government International Bond | | | | | | | | |
| 0.938%, 12/11/17(E) | | | 1,927 | | | | 1,819 | |
| City of Buenos Aires Argentina, MTN | | | | | | | | |
| 8.950%, 02/19/21 | | | 200 | | | | 207 | |
| Ecuador Government International Bond | | | | | | | | |
| 10.500%, 03/24/20 | | | 1,000 | | | | 1,001 | |
| Egyptian Paris Club | | | | | | | | |
| 2.779%, 01/01/21(J) | | | 161 | | | | 145 | |
| Federal Democratic Republic of Ethiopia | | | | | | | | |
| 6.625%, 12/11/24 | | | 2,500 | | | | 2,428 | |
| Mozambique EMATUM Finance 2020 BV | | | | | | | | |
| 6.305%, 09/11/20 | | | 3,000 | | | | 2,881 | |
| Description | | Face Amount (000)/Shares | | | Value (000) | |
| Pakistan Government International Bond | | | | | | |
| 6.875%, 06/01/17 | | $ | 2,000 | | | $ | 2,045 | |
| Republic of Armenia | | | | | | | | |
| 6.000%, 09/30/20 | | | 501 | | | | 488 | |
| Republic of Belarus | | | | | | | | |
| 8.950%, 01/26/18 | | | 920 | | | | 836 | |
| 8.750%, 08/03/15 | | | 1,500 | | | | 1,468 | |
| Republic of Iraq | | | | | | | | |
| 5.800%, 01/15/28 | | | 1,000 | | | | 835 | |
| Senegal Government International Bond | | | | | | | | |
| 8.750%, 05/13/21 | | | 500 | | | | 558 | |
| 6.250%, 07/30/24 | | | 1,500 | | | | 1,462 | |
| Sri Lanka Government International Bond | | | | | | | | |
| 6.000%, 01/14/19 | | | 1,500 | | | | 1,538 | |
| Venezuela Government International Bond | | | | | | | | |
| 8.250%, 10/13/24 | | | 1,500 | | | | 517 | |
| 7.650%, 04/21/25 | | | 1,500 | | | | 506 | |
| | | | | | | | | |
| Total Sovereign Debt | |
| (Cost $18,796) | | | | 18,734 | |
| | | | | | | | | |
| Closed-End Fund [1.0%] | |
| Stone Ridge Reinsurance Risk Premium Interval Fund**(J) | | | 1,476,378 | | | | 15,103 | |
| | | | | | | | | |
| Total Closed-End Fund | |
| (Cost $15,000) | | | | 15,103 | |
| | | | | | | | | |
| Asset-Backed Securities [0.9%] | |
| BT SPE (Acquired 07/06/11, Acquisition Cost $10,781,378) | | | | | | | | |
| 9.250%, 06/06/16(H) (I) (J) | | | 7,344 | | | | 6,935 | |
| Sealane Trade Finance, Ser 2011-1X, Cl A | | | | | | | | |
| 2.258%, 02/12/16(E) (J) | | | 121 | | | | 106 | |
| Start CLO, Ser 2011-7A, Cl A | | | | | | | | |
| 15.264%, 06/09/16(A) (E) | | | 7,000 | | | | 6,986 | |
| | | | | | | | | |
| Total Asset-Backed Securities | |
| (Cost $14,531) | | | | 14,027 | |
See accompanying notes to financial statements.
CITY NATIONAL ROCHDALE FUNDS | PAGE 93
consolidated schedule of investments
March 31, 2015 (Unaudited)
City National Rochdale Fixed Income Opportunities Fund (continued)
| Description | | Face Amount (000)/
Number of Warrants | | | Value (000) | |
| Convertible Bonds [0.6%] | |
| Coal Mining [0.0%] | |
| Enercoal Resources Pte | | | | | | |
| 9.250%, 08/05/18 | | $ | 200 | | | $ | 38 | |
| New World Resources | | | | | | | | |
| 4.000%, 10/07/20 | | | 326 | | | | 88 | |
| | | | | | | | | |
| Total Coal Mining | | | | 126 | |
| | | | | | | | | |
| Food, Beverage & Tobacco [0.0%] | |
| CEDC Finance International | | | | | | | | |
| 10.000%, 04/30/18 | | | 1,523 | | | | 913 | |
| | | | | | | | | |
| Medical Products & Services [0.1%] | |
| Bio City Development B.V | | | | | | | | |
| 8.000%, 07/06/18(J) | | | 1,000 | | | | 650 | |
| | | | | | | | | |
| Metal-Iron [0.0%] | |
| London Mining Jersey | | | | | | | | |
| 12.000%, 02/15/16(J) | | | 1,500 | | | | 77 | |
| | | | | | | | | |
| Miscellaneous Business Services [0.3%] | |
| DP World | | | | | | | | |
| 1.750%, 06/19/24 | | | 3,800 | | | | 4,085 | |
| | | | | | | | | |
| Petroleum & Fuel Products [0.2%] | |
| Lukoil International Finance BV | | | | | | | | |
| 2.625%, 06/16/15 | | | 3,000 | | | | 2,970 | |
| | | | | | | | | |
| Total Convertible Bonds | |
| (Cost $11,129) | | | | 8,821 | |
| | | | | | | | | |
| Warrants [0.3%] | |
| Central Bank of Nigeria, | | | | | | | | |
| Expires 11/15/20* | | | 34,250 | | | | 5,001 | |
| Gulf Keystone Petro, | | | | | | | | |
| Expires 04/18/17(J)* | | | 661,000 | | | | 165 | |
| | | | | | | | | |
| Total Warrants | |
| (Cost $6,033) | | | | 5,166 | |
| Description | | Shares | | | Value (000) | |
| Common Stock [0.1%] | |
| Energy [0.0%] | |
| Lone Pine Resource(J)* | | | 9,355 | | | $ | — | |
| Lone Pine Resource A(I) (J)* | | | 9,355 | | | | 9 | |
| | | | | | | | | |
| Total Energy | | | | 9 | |
| | | | | | | | | |
| Metals & Mining [0.1%] | |
| New World Resources, Cl A * | | | 44,276,198 | | | | 562 | |
| Petropavlovsk | | | 5,828,677 | | | | 495 | |
| | | | | | | | | |
| Total Metals & Mining | | | | 1,057 | |
| | | | | | | | | |
| Petroleum & Fuel Products [0.0%] | |
| InterOil Exploration and Production(J)* | | | 5,032,258 | | | | 181 | |
| | | | | | | | | |
| Services [0.0%] | |
| A’Ayan Leasing(I) (J)* | | | 1,113,750 | | | | 155 | |
| | | | | | | | | |
| Total Common Stock | |
| (Cost $2,194) | | | | 1,402 | |
| | | | | | | | | |
| Short-Term Investments [8.0%] | |
| City National Rochdale Government Money Market Fund, Institutional Class 0.010%** | | | 7,263 | | | | 7 | |
| SEI Daily Income Trust Government Fund, Cl A, 0.020%** | | | 120,234,382 | | | | 120,234 | |
| | | | | | | | | |
| Total Short-Term Investments | |
| (Cost $120,241) | | | | 120,241 | |
| | | | | | | | | |
| Total Investments [98.9%] | |
| (Cost $1,520,370) | | | $ | 1,492,966 | |
Percentages are based on Net Assets of $1,509,508 (000).
See accompanying notes to financial statements.
CITY NATIONAL ROCHDALE FUNDS | PAGE 94
consolidated schedule of investments
March 31, 2015 (Unaudited)
City National Rochdale Fixed Income Opportunities Fund (continued)
| * | Non-income producing security. |
| ** | The rate reported is the 7-day effective yield as of March 31, 2015. |
| ‡ | Investment in Affiliate. |
| (A) | Security exempt from registration under Rule 144A of the Securities Act of 1933. These securities may be resold in transactions exempt from registration normally to qualified institutions. On March 31, 2015, the value of these securities amounted to $177,575 (000), representing 11.8% of the net assets of the Fund. |
| (B) | In default on interest payments. Rate shown represents the last coupon rate prior to default. |
| (C) | Step Bond — The rate reported is the rate in effect on March 31, 2015. The coupon on a step bond changes on a specific date. |
| (E) | Floating Rate Security — The rate reported is the rate in effect on March 31, 2015. |
| (F) | Rate shown is the effective yield at time of purchase. |
| (H) | Security is considered restricted. The total market value of such security as of March 31, 2015 was $154,340 (000) and represented 10.2% of net assets of the Fund. |
| (I) | Security fair valued using methods determined in good faith by the Fair Value Committee designated by the Board of Trustees. The total market value of such securities as of March 31, 2015 was $157,234 (000) and represented 10.4% of net assets of the Fund. |
| (J) | Security is considered illiquid. The total market value of such securities as of March 31, 2015 was $200,902 (000) and represented 13.3% of net assets of the Fund. |
CHF — Swiss Franc
Cl — Class
EUR — Euro
GBP — British Pound Sterling
LLC — Limited Liability Corporation
LP — Limited Partnership
MTN — Medium Term Note
NOK — Norwegian Krone
PLC — Public Limited Company
REIT — Real Estate Investment Trust
Ser — Series
SPE — Special Purpose Entity
USD — United School District
Amounts designated as “—” are either $0 or have been rounded to $0.
A list of the open forward foreign currency contracts held by the Fund at March 31, 2015, is as follows:
| Maturity Date | Currency to Deliver (000) | | Currency to Receive (000) | | | Unrealized Appreciation (Depreciation) (000) | |
| 4/17/15 | USD | | | 1,956 | | EUR | | | 1,834 | | | $ | 17 | |
| 4/17/15-5/29/15 | EUR | | | 69,394 | | USD | | | 75,465 | | | | 798 | |
| 4/17/15-5/29/15 | GBP | | | 24,877 | | USD | | | 36,917 | | | | 27 | |
| 4/30/15 | NOK | | | 26,729 | | USD | | | 4,410 | | | | 1,095 | |
| 4/30/15 | USD | | | 3,461 | | NOK | | | 26,729 | | | | (147 | ) |
| 7/13/15 | CHF | | | 2,299 | | USD | | | 2,265 | | | | (111 | ) |
| | | | | | | | | | | | | $ | 1,679 | |
A list of the counterparties for the outstanding forward foreign currency contracts held by the Fund at March 31, 2015, is as follows:
| Counterparty | | Currency to Deliver (000) | | | Currency to Receive (000) | | | Unrealized Appreciation (000) | |
| US Bank | | $ | (122,665 | ) | | $ | 124,344 | | | $ | 1,679 | |
For the period ended March 31, 2015, the total amount of all open forward foreign currency contracts, as presented in the table above, are representative of the volume of activity for this derivative type during the period.
The following is a list of the inputs used as of March 31, 2015 in valuing the Fund’s investments carried at value (000):
| Investments in Securities | | Level 1 | | | Level 2 | | | Level 3 | | | Total | |
| Corporate Bonds | | $ | — | | | $ | 720,800 | | | $ | — | | | $ | 720,800 | |
| Loan Participations | | | — | | | | 435,842 | | | | 5,425 | | | | 441,267 | |
| Life Settlement Contracts | | | — | | | | — | | | | 147,405 | | | | 147,405 | |
| Sovereign Debt | | | — | | | | 18,589 | | | | 145 | | | | 18,734 | |
| Closed-End Fund | | | 15,103 | | | | — | | | | — | | | | 15,103 | |
| Asset-Backed Securities | | | — | | | | 7,092 | | | | 6,935 | | | | 14,027 | |
| Convertible Bonds | | | — | | | | 8,821 | | | | — | | | | 8,821 | |
| Warrants | | | 5,001 | | | | 165 | | | | — | | | | 5,166 | |
| Common Stock | | | 831 | | | | 562 | | | | 9 | | | | 1,402 | |
| Short-Term Investments | | | 120,241 | | | | — | | | | — | | | | 120,241 | |
| Total Investments in Securities | | $ | 141,176 | | | $ | 1,191,871 | | | $ | 159,919 | | | $ | 1,492,966 | |
| Other Financial Instruments | | Level 1 | | | Level 2 | | | Level 3 | | | Total | |
| Forwards Contracts* | | | | | | | | | | | | |
| Unrealized Appreciation | | $ | — | | | $ | 1,937 | | | $ | — | | | $ | 1,937 | |
| Unrealized Depreciation | | | — | | | | (258 | ) | | | — | | | | (258 | ) |
| Total Other Financial Instruments | | $ | — | | | $ | 1,679 | | | $ | — | | | $ | 1,679 | |
| * | Forwards contracts are valued at the unrealized appreciation (depreciation) on the instrument. |
See accompanying notes to financial statements.
CITY NATIONAL ROCHDALE FUNDS | PAGE 95
consolidated schedule of investments
March 31, 2015 (Unaudited)
City National Rochdale Fixed Income Opportunities Fund (concluded)
The following is a reconciliation of investments in which significant unobservable inputs (Level 3) were used in determining value (000) as of March 31, 2015:
| | | Investments in Loan Participations | | | Investments in Life Settlement Contracts | | | Investments in Sovereign Debt | |
| Beginning balance as of October 1, 2014 | | $ | 6,000 | | | $ | 130,798 | | | $ | 179 | |
| Accrued discounts/ premiums | | | — | | | | — | | | | 2 | |
| Realized gain/(loss) | | | — | | | | — | | | | — | |
| Change in unrealized appreciation/(depreciation) | | | (355 | ) | | | 16,607 | | | | 11 | |
| Purchases | | | — | | | | — | | | | — | |
| Sales/paydowns | | | (220 | ) | | | — | | | | (47 | ) |
| Transfers into Level 3 | | | — | | | | — | | | | — | |
| Transfers out of Level 3 | | | — | | | | — | | | | — | |
| Ending balance as of March 31, 2015 | | $ | 5,425 | | | $ | 147,405 | | | $ | 145 | |
| Changes in unrealized gains/(losses) included in earnings related to securities still held at reporting date | | $ | (355 | ) | | $ | 16,607 | | | $ | 11 | |
| | | Investments in Asset-Backed Securities | | | Investments in Corporate Bonds | |
| Beginning balance as of October 1, 2014 | | $ | 7,886 | | | $ | 165 | |
| Accrued discounts/ premiums | | | — | | | | — | |
| Realized gain/(loss) | | | 78 | | | | — | |
| Change in unrealized appreciation/(depreciation) | | | — | | | | — | |
| Purchases | | | — | | | | — | |
| Sales/paydowns | | | (1,029 | ) | | | (165 | ) |
| Transfers into Level 3 | | | — | | | | — | |
| Transfers out of Level 3 | | | — | | | | — | |
| Ending balance as of March 31, 2015 | | $ | 6,935 | | | $ | — | |
| Changes in unrealized gains/(losses) included in earnings related to securities still held at reporting date | | $ | — | | | $ | — | |
| | | Investments in Common Stock | | | Total | |
| Beginning balance as of October 1, 2014 | | $ | 18 | | | $ | 145,046 | |
| Accrued discounts/ premiums | | | — | | | | 2 | |
| Realized gain/(loss) | | | — | | | | 78 | |
| Change in unrealized appreciation/(depreciation) | | | (9 | ) | | | 16,254 | |
| Purchases | | | — | | | | — | |
| Sales/paydowns | | | — | | | | (1,461 | ) |
| Transfers into Level 3 | | | — | | | | — | |
| Transfers out of Level 3 | | | — | | | | — | |
| Ending balance as of March 31, 2015 | | $ | 9 | | | $ | 159,919 | |
| Changes in unrealized gains/(losses) included in earnings related to securities still held at reporting date | | $ | (9 | ) | | $ | 16,254 | |
The following table summarizes the quantitative inputs and assumptions used for items categorized as material Level 3 investments as of March 31, 2015. The disclosures below also include qualitative information on the sensitivity of the fair value measurements to changes in the significant unobservable inputs.
| | Fair Value at
March 31, 2015 (000) | Valuation Techniques | |
| BT SPE | $6,935 | Discounted Cash Flow Model based on actual collection level and experienced defaults | |
| | | | |
| | | Observable Inputs | |
| | | Accumulated Collections | |
| | | Accumulated Defaults | |
| | | Annualized Default Rate | |
| | | Accumulated Default Rate | |
| | | Pace of Collection Pace of Defaults | |
| | | Interest Rates | |
| | | | |
| | | Unobservable Inputs | Range |
| | | Projected Default Rates | 5%-12% |
| | | Projected Collection Rates | 90%-100% |
| | | Expected Discount Rates | 9.25% |
| | | | |
| | | Valuation Techniques | |
| Life Settlement Contracts | $147,405 | Discounted Cash Flow Model | |
| | | Observable Inputs | |
| | | Maturity Value | |
| | | | |
| | | Unobservable Inputs | Range |
| | | Discount Rate | 13% |
| | | Expected Maturity (months) | 33-128 |
The unobservable inputs used to determine fair value of recurring Level 3 assets may have similar or diverging impacts on valuation. Significant increases and decreases in these inputs in isolation and interrelationships between those inputs could result in significantly higher or lower fair value measurement. Increases in projected collection rates in isolation, would result in a higher fair value measurement, while increases in expected discount rates, projected default rates, and maturities of life settlement contracts, in isolation would result in a lower fair value measurement.
For the period ended March 31, 2015, there have been no transfers between Level 1 and Level 2 assets and liabilities. For the period ended March 31, 2015, there were no transfers between Level 2 and Level 3 assets and liabilities. Transfers between Levels are recognized at period end.
For more information on valuation inputs, see Note 2 — Significant Accounting Policies in the Notes to Financial Statements.
See accompanying notes to financial statements.
CITY NATIONAL ROCHDALE FUNDS | PAGE 96
schedule of investments
March 31, 2015 (Unaudited)
City National Rochdale Multi-Asset Fund
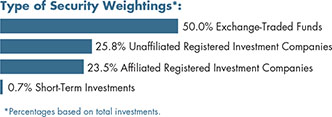
| Description | | Shares | | | Value (000) | |
| Exchange Traded Funds [48.0%] | |
| iShares 7-10 Year Treasury Bond ETF | | | 32,745 | | | $ | 3,549 | |
| iShares MSCI World ETF | | | 12,400 | | | | 911 | |
| iShares Russell 3000 Index Fund | | | 10,280 | | | | 1,273 | |
| iShares S&P MidCap 400 Index Fund | | | 7,075 | | | | 1,075 | |
| Powershares DB Gold | | | 5,600 | | | | 219 | |
| SPDR S&P 500 | | | 3,148 | | | | 650 | |
| SPDR S&P Dividend | | | 13,237 | | | | 1,035 | |
| SPDR S&P Telecom ETF | | | 6,265 | | | | 366 | |
| Technology Select Sector SPDR | | | 7,625 | | | | 316 | |
| Utilities Select Sector SPDR Fund | | | 19,440 | | | | 864 | |
| Vanguard REIT | | | 10,280 | | | | 864 | |
| | | | | | | | | |
| Total Exchange Traded Funds | |
| (Cost $10,269) | | | | 11,122 | |
| | | | | | | | | |
| Unaffiliated Registered Investment Companies [24.7%] | |
| Ashmore Emerging Markets Corporate Debt Fund | | | 73,482 | | | | 612 | |
| DoubleLine Total Return Bond Fund | | | 50,612 | | | | 559 | |
| Ivy High Income Fund | | | 145,239 | | | | 1,175 | |
| Oppenheimer Senior Floating Rate Fund | | | 150,612 | | | | 1,223 | |
| Vanguard Short-Term Bond Index Fund | | | 82,715 | | | | 873 | |
| Voya Global Real Estate Fund | | | 39,879 | | | | 842 | |
| WisdomTree Europe Hedged Equity Fund | | | 6,835 | | | | 452 | |
| | | | | | | | | |
| Total Registered Investment Companies | | | | | | | | |
| (Cost $5,650) | | | | 5,736 | |
| | | | | | | | | |
| Affiliated Registered Investment Companies [22.5%] | |
| City National Rochdale Corporate Bond Fund, Servicing Class | | | 130,479 | | | | 1,379 | |
| City National Rochdale Emerging Markets Fund | | | 28,193 | | | | 1,168 | |
| Description | | Shares | | | Value (000) | |
| City National Rochdale Government Bond Fund, Institutional Class | | | 95,670 | | | $ | 1,011 | |
| City National Rochdale High Yield Bond Fund, Institutional Class | | | 73,357 | | | | 597 | |
| City National Rochdale Limited Maturity Fixed Income Fund, Institutional Class | | | 95,108 | | | | 1,063 | |
| | | | | | | | | |
| Total Affiliated Registered Investment Companies | | | | | | | | |
| (Cost $5,286) | | | | 5,218 | |
| | | | | | | | | |
| Short-Term Investments [0.6%] | |
| City National Rochdale Prime Money Market Fund, Institutional Class, 0.010%**‡ | | | 72,459 | | | | 73 | |
| SEI Daily Income Trust, Prime Obligation Fund, Cl A, 0.010%** | | | 72,459 | | | | 73 | |
| | | | | | | | | |
| Total Short-Term Investments | |
| (Cost $146) | | | | 146 | |
| | | | | | | | | |
| Total Investments [95.8%] | |
| (Cost $21,351) | | | $ | 22,222 | |
Percentages are based on Net Assets of $23,193 (000).
| ** | The rate reported is the 7-day effective yield as of March 31, 2015. |
| ‡ | Investment in Affiliate. |
Cl — Class
ETF — Exchange Traded Fund
MSCI — Morgan Stanley Capital International
REIT — Real Estate Investment Trust
S&P — Standard & Poor’s
SPDR — Standard & Poor’s Depositary Receipts
As of March 31, 2015, all of the Fund’s investments are Level 1, in accordance with the authoritative guidance on fair value measurements and disclosure under U.S. GAAP.
For the period ended March 31, 2015, there have been no transfers between any of the fair value hierarchy levels. Transfers between Levels are recognized at period end.
For more information on valuation inputs, see Note 2 — Significant Accounting Policies in the Notes to Financial Statements.
See accompanying notes to financial statements.
CITY NATIONAL ROCHDALE FUNDS | PAGE 97
schedule of investments
March 31, 2015 (Unaudited)
City National Rochdale Dividend & Income Fund
| Description | | Shares | | | Value (000) | |
| Common Stock [95.6%] | |
| Consumer Discretionary [2.3%] | |
| Hasbro | | | 20,000 | | | $ | 1,265 | |
| McDonald’s | | | 33,800 | | | | 3,293 | |
| | | | | | | | | |
| Total Consumer Discretionary | | | | 4,558 | |
| | | | | | | | | |
| Consumer Staples [24.8%] | |
| Altria Group | | | 64,250 | | | | 3,214 | |
| B&G Foods | | | 102,900 | | | | 3,028 | |
| Campbell Soup | | | 15,000 | | | | 698 | |
| Clorox | | | 32,100 | | | | 3,544 | |
| Coca-Cola | | | 28,000 | | | | 1,135 | |
| ConAgra Foods | | | 27,800 | | | | 1,016 | |
| Dr Pepper Snapple Group | | | 52,900 | | | | 4,152 | |
| General Mills | | | 66,680 | | | | 3,774 | |
| Hershey | | | 24,400 | | | | 2,462 | |
| Imperial Tobacco Group ADR | | | 23,152 | | | | 2,037 | |
| Kellogg | | | 40,500 | | | | 2,671 | |
| Kimberly-Clark | | | 18,200 | | | | 1,949 | |
| Lorillard | | | 25,590 | | | | 1,672 | |
| PepsiCo | | | 8,000 | | | | 765 | |
| Philip Morris International | | | 52,600 | | | | 3,962 | |
| Procter & Gamble | | | 39,149 | | | | 3,208 | |
| Reynolds American | | | 10,692 | | | | 737 | |
| Sysco | | | 31,600 | | | | 1,192 | |
| Unilever ADR | | | 22,200 | | | | 926 | |
| Universal | | | 38,592 | | | | 1,820 | |
| Description | | Shares | | | Value (000) | |
| Vector Group | | | 139,279 | | | $ | 3,060 | |
| Wal-Mart Stores | | | 29,200 | | | | 2,402 | |
| | | | | | | | | |
| Total Consumer Staples | | | | 49,424 | |
| | | | | | | | | |
| Energy [10.3%] | |
| Buckeye Partners | | | 12,400 | | | | 936 | |
| Chevron | | | 30,683 | | | | 3,221 | |
| ConocoPhillips | | | 27,500 | | | | 1,712 | |
| Enbridge Energy Partners | | | 15,000 | | | | 540 | |
| Energy Transfer Partners | | | 3,700 | | | | 206 | |
| Enterprise Products Partners | | | 72,584 | | | | 2,390 | |
| Exxon Mobil | | | 25,838 | | | | 2,196 | |
| Kinder Morgan | | | 33,500 | | | | 1,409 | |
| NuStar Energy | | | 11,250 | | | | 683 | |
| Occidental Petroleum | | | 25,500 | | | | 1,862 | |
| ONEOK | | | 18,500 | | | | 892 | |
| ONEOK Partners | | | 2,400 | | | | 98 | |
| Plains All American Pipeline | | | 60,725 | | | | 2,962 | |
| Spectra Energy | | | 4,753 | | | | 172 | |
| TransCanada | | | 25,928 | | | | 1,108 | |
| | | | | | | | | |
| Total Energy | | | | 20,387 | |
| | | | | | | | | |
| Financials [7.5%] | |
| Arthur J Gallagher | | | 13,200 | | | | 617 | |
| BB&T | | | 44,000 | | | | 1,715 | |
| Cincinnati Financial | | | 51,700 | | | | 2,755 | |
| Compass Diversified Holdings | | | 52,000 | | | | 889 | |
| FirstMerit | | | 19,571 | | | | 373 | |
| JPMorgan Chase | | | 32,000 | | | | 1,939 | |
| Lamar Advertising, Cl A | | | 70,000 | | | | 4,149 | |
| Mercury General | | | 15,000 | | | | 866 | |
| NBT Bancorp | | | 25,935 | | | | 650 | |
| People’s United Financial | | | 30,000 | | | | 456 | |
| US Bancorp | | | 10,000 | | | | 437 | |
| | | | | | | | | |
| Total Financials | | | | 14,846 | |
| | | | | | | | | |
| Health Care [7.7%] | |
| Bristol-Myers Squibb | | | 52,000 | | | | 3,354 | |
| Eli Lilly | | | 48,400 | | | | 3,516 | |
| GlaxoSmithKline ADR | | | 32,000 | | | | 1,477 | |
| Johnson & Johnson | | | 38,200 | | | | 3,843 | |
| Merck | | | 28,150 | | | | 1,618 | |
| Pfizer | | | 41,944 | | | | 1,459 | |
| | | | | | | | | |
| Total Health Care | | | | 15,267 | |
See accompanying notes to financial statements.
CITY NATIONAL ROCHDALE FUNDS | PAGE 98
schedule of investments
March 31, 2015 (Unaudited)
City National Rochdale Dividend & Income Fund (continued)
| Description | | Shares | | | Value (000) | |
| Industrials [4.9%] | |
| 3M | | | 1,000 | | | $ | 165 | |
| Eaton | | | 39,700 | | | | 2,697 | |
| General Dynamics | | | 14,500 | | | | 1,968 | |
| General Electric | | | 37,400 | | | | 928 | |
| Lockheed Martin | | | 19,200 | | | | 3,897 | |
| | | | | | | | | |
| Total Industrials | | | | 9,655 | |
| | | | | | | | | |
| Information Technology [0.9%] | |
| Paychex | | | 20,000 | | | | 992 | |
| Seagate Technology | | | 15,000 | | | | 781 | |
| | | | | | | | | |
| Total Information Technology | | | | 1,773 | |
| | | | | | | | | |
| Materials [2.6%] | |
| Dow Chemical | | | 19,000 | | | | 912 | |
| EI du Pont de Nemours | | | 32,700 | | | | 2,337 | |
| Olin | | | 28,000 | | | | 897 | |
| Sonoco Products | | | 24,000 | | | | 1,091 | |
| | | | | | | | | |
| Total Materials | | | | 5,237 | |
| | | | | | | | | |
| REITs [12.7%] | |
| Apartment Investment & Management, Cl A | | | 17,229 | | | | 678 | |
| Camden Property Trust | | | 8,914 | | | | 697 | |
| EPR Properties | | | 33,200 | | | | 1,993 | |
| Government Properties Income Trust | | | 35,000 | | | | 800 | |
| Health Care Property Investors | | | 33,546 | | | | 1,450 | |
| Health Care REIT | | | 11,612 | | | | 898 | |
| Healthcare Realty Trust | | | 17,000 | | | | 472 | |
| Healthcare Trust of America, Cl A | | | 20,000 | | | | 557 | |
| Home Properties | | | 35,000 | | | | 2,425 | |
| Liberty Property Trust | | | 17,385 | | | | 621 | |
| Mid-America Apartment Communities | | | 12,000 | | | | 927 | |
| National Health Investors | | | 20,000 | | | | 1,420 | |
| National Retail Properties | | | 48,500 | | | | 1,987 | |
| Plum Creek Timber | | | 24,000 | | | | 1,043 | |
| Public Storage | | | 10,000 | | | | 263 | |
| QTS Realty Trust, Cl A | | | 8,000 | | | | 291 | |
| Ramco-Gershenson Properties Trust | | | 4,000 | | | | 75 | |
| Select Income REIT | | | 62,000 | | | | 1,549 | |
| Senior Housing Properties Trust | | | 13,000 | | | | 289 | |
| Simon Property Group | | | 10,000 | | | | 1,956 | |
| Sovran Self Storage | | | 10,036 | | | | 943 | |
| Tanger Factory Outlet Centers | | | 27,984 | | | | 984 | |
| Description | | Shares | | | Value (000) | |
| Ventas | | | 38,632 | | | $ | 2,821 | |
| Weyerhaeuser | | | 6,552 | | | | 217 | |
| | | | | | | | | |
| Total REITs | | | | 25,356 | |
| | | | | | | | | |
| Shipping & Transportation [0.6%] | |
| Fly Leasing ADR | | | 87,370 | | | | 1,272 | |
| | | | | | | | | |
| Telecommunication Services [4.8%] | |
| AT&T | | | 84,500 | | | | 2,759 | |
| Consolidated Communications Holdings | | | 125,400 | | | | 2,558 | |
| Verizon Communications | | | 68,067 | | | | 3,310 | |
| Windstream Holdings | | | 136,128 | | | | 1,008 | |
| | | | | | | | | |
| Total Telecommunication Services | | | | 9,635 | |
| | | | | | | | | |
| Utilities [16.5%] | |
| AGL Resources | | | 19,000 | | | | 943 | |
| American Electric Power | | | 33,500 | | | | 1,884 | |
| AmeriGas Partners | | | 28,200 | | | | 1,346 | |
| Atmos Energy | | | 15,000 | | | | 830 | |
| Avista | | | 30,000 | | | | 1,026 | |
| Brookfield Infrastructure Partners, Cl Miscellaneous | | | 36,000 | | | | 1,640 | |
| Dominion Resources | | | 24,000 | | | | 1,701 | |
| DTE Energy | | | 15,000 | | | | 1,210 | |
| Duke Energy | | | 59,006 | | | | 4,531 | |
| Entergy | | | 13,700 | | | | 1,062 | |
| Eversource Energy | | | 37,492 | | | | 1,894 | |
| Ferrellgas Partners | | | 7,300 | | | | 178 | |
| FirstEnergy | | | 38,000 | | | | 1,332 | |
| NiSource | | | 20,000 | | | | 883 | |
| Northwest Natural Gas | | | 8,396 | | | | 403 | |
| OGE Energy | | | 33,600 | | | | 1,062 | |
| Pinnacle West Capital | | | 28,885 | | | | 1,841 | |
| Portland General Electric | | | 12,000 | | | | 445 | |
| PPL | | | 20,000 | | | | 673 | |
| SCANA | | | 38,000 | | | | 2,090 | |
| Sempra Energy | | | 9,000 | | | | 981 | |
| Suburban Propane Partners | | | 11,200 | | | | 481 | |
| UIL Holdings | | | 14,000 | | | | 720 | |
| United Utilities Group ADR | | | 17,318 | | | | 478 | |
| Wisconsin Energy | | | 36,500 | | | | 1,807 | |
| Xcel Energy | | | 40,000 | | | | 1,392 | |
| | | | | | | | | |
| Total Utilities | | | | 32,833 | |
| | | | | | | | | |
| Total Common Stock | |
| (Cost $147,757) | | | | 190,243 | |
See accompanying notes to financial statements.
CITY NATIONAL ROCHDALE FUNDS | PAGE 99
schedule of investments
March 31, 2015 (Unaudited)
City National Rochdale Dividend & Income Fund (continued)
| Description | | Shares/Face Amount (000) | | | Value (000) | |
| Unaffiliated Registered Investment Company [2.0%] | |
| PowerShares Preferred Portfolio | | | 269,500 | | | $ | 4,018 | |
| | | | | | | | | |
| Total Unaffiliated Registered Investment Company | | | | | | | | |
| (Cost $3,943) | | | | 4,018 | |
| | | | | | | | | |
| Preferred Stock [1.4%] | |
| Financials [0.6%] | |
| Bank of America | | | 10,000 | | | | 256 | |
| Capital One Financial | | | 10,000 | | | | 267 | |
| JPMorgan Chase | | | 10,000 | | | | 254 | |
| Wells Fargo | | | 10,000 | | | | 258 | |
| Wells Fargo Real Estate Investment | | | 10,000 | | | | 260 | |
| | | | | | | | | |
| Total Financials | | | | 1,295 | |
| | | | | | | | | |
| REITs [0.5%] | |
| Equity Commonwealth | | | 10,000 | | | | 261 | |
| First Potomac Realty Trust | | | 10,000 | | | | 257 | |
| National Retail Properties | | | 10,000 | | | | 263 | |
| Public Storage | | | 10,000 | | | | 257 | |
| | | | | | | | | |
| Total REITs | | | | 1,038 | |
| | | | | | | | | |
| Telecommunication Services [0.3%] | |
| Qwest | | | 10,000 | | | | 263 | |
| Verizon Communications | | | 10,000 | | | | 270 | |
| | | | | | | | | |
| Total Telecommunication Services | | | | 533 | |
| | | | | | | | | |
| Total Preferred Stock | |
| (Cost $2,732) | | | | 2,866 | |
| | | | | | | | | |
| Exchange Traded Fund [0.4%] | |
| iShares US Preferred Stock ETF | | | 19,500 | | | | 782 | |
| | | | | | | | | |
| Total Exchange Traded Fund | |
| (Cost $782) | | | | 782 | |
| | | | | | | | | |
| Asset-Backed Security [0.2%] | |
| BT SPE (Acquired 07/06/11, Acquisition Cost $551,294) | | | | | | | | |
| 9.250%, 06/06/16(A) (B) | | $ | 376 | | | | 355 | |
| | | | | | | | | |
| Total Asset-Backed Security | |
| (Cost $376) | | | | 355 | |
| | | | | | | | | |
| Total Investments [99.6%] | |
| (Cost $155,590) | | | $ | 198,264 | |
Percentages are based on Net Assets of $199,007 (000).
| (A) | Security is considered illiquid. The total market value of such security as of March 31, 2015 was $355 (000) and represented 0.2% of net assets of the Fund. |
| (B) | Security fair valued using methods determined in good faith by the Fair Value Committee designated by the Board of Trustees. The total market value of such securities as of March 31, 2015 was $355 (000) and represented 0.2% of net assets of the Fund. |
ADR — American Depositary Receipt
Cl — Class
ETF — Exchange-Traded Fund
REIT — Real Estate Investment Trust
SPE — Special Purpose Entity
The following is a list of the inputs used as of March 31, 2015 in valuing the Fund’s investments carried at value (000):
| Investments in Securities | | Level 1 | | | Level 2 | | | Level 3 | | | Total | |
| Common Stock | | $ | 190,243 | | | $ | — | | | $ | — | | | $ | 190,243 | |
| Unaffiliated Registered Investment Company | | | 4,018 | | | | — | | | | — | | | | 4,018 | |
| Preferred Stock | | | 2,866 | | | | — | | | | — | | | | 2,866 | |
| Exchange Traded Fund | | | 782 | | | | — | | | | — | | | | 782 | |
| Asset-Backed Security | | | — | | | | — | | | | 355 | | | | 355 | |
| Total Investments in Securities | | $ | 197,909 | | | $ | — | | | $ | 355 | | | $ | 198,264 | |
The following is a reconciliation of investments in which significant unobservable inputs (Level 3) were used in determining value (000) as of March 31, 2015:
| | | Investments in Asset-Backed Security | |
| Beginning balance as of October 1, 2014 | | $ | 403 | |
| Accrued discounts/premiums | | | — | |
| Realized gain/(loss) | | | — | |
| Change in unrealized appreciation/(depreciation) | | | 4 | |
| Purchases | | | — | |
| Sales/paydowns | | | (52 | ) |
| Transfers into Level 3 | | | — | |
| Transfers out of Level 3 | | | — | |
| Ending balance as of March 31, 2015 | | $ | 355 | |
| Changes in unrealized gains/(losses) included in earnings related to securities still held at reporting date | | $ | 4 | |
See accompanying notes to financial statements.
CITY NATIONAL ROCHDALE FUNDS | PAGE 100
schedule of investments
March 31, 2015 (Unaudited)
City National Rochdale Dividend & Income Fund (concluded)
The following table summarizes the quantitative inputs and assumptions used for items categorized as material Level 3 investments as of March 31, 2015. The disclosures below also include qualitative information on the sensitivity of the fair value measurements to changes in the significant unobservable inputs.
| | Fair Value at March 31, 2015
(000) | Valuation Technique | |
| BT SPE | $355 | Discounted Cash Flow Model based on actual collection level and experienced defaults | |
| | | | |
| | | Observable Inputs | |
| | | Accumulated Collections | |
| | | Accumulated Defaults | |
| | | Annualized Default Rate | |
| | | Accumulated Default Rate | |
| | | Pace of Collection Pace of Defaults | |
| | | Interest Rates | |
| | | | |
| | | Unobservable Inputs | Range |
| | | Projected Default Rates | 5%-12% |
| | | Projected Collection Rates | 90%-100% |
| | | Expected Discount Rates | 9.25% |
The unobservable inputs used to determine fair value of recurring Level 3 assets may have similar or diverging impacts on valuation. Significant increased and decreased in these inputs in isolation and interrelationships between those inputs could result in significantly higher or lower fair value measurement.
For the period ended March 31, 2015, the transfers into Level 1 were due to changes in the availability of observable inputs to determine fair value. Transfers between Levels are recognized at period end.
For more information on valuation inputs, see Note 2 — Significant Accounting Policies in the Notes to Financial Statements.
See accompanying notes to financial statements.
CITY NATIONAL ROCHDALE FUNDS | PAGE 101
schedule of investments
March 31, 2015 (Unaudited)
City National Rochdale U.S. Core Equity Fund
| Description | | Shares | | | Value (000) | |
| Common Stock [98.5%] | |
| Aerospace & Defense [5.6%] | |
| Boeing | | | 20,200 | | | $ | 3,032 | |
| Hexcel * | | | 69,300 | | | | 3,563 | |
| Textron | | | 127,000 | | | | 5,630 | |
| | | | | | | | | |
| Total Aerospace & Defense | | | | 12,225 | |
| | | | | | | | | |
| Auto Components [1.4%] | |
| Magna International | | | 55,800 | | | | 2,994 | |
| | | | | | | | | |
| Biotechnology [8.3%] | |
| Biogen Idec * | | | 10,800 | | | | 4,560 | |
| Celgene * | | | 65,900 | | | | 7,597 | |
| Gilead Sciences * | | | 61,100 | | | | 5,996 | |
| | | | | | | | | |
| Total Biotechnology | | | | 18,153 | |
| | | | | | | | | |
| Capital Markets [5.9%] | |
| Affiliated Managers Group * | | | 14,400 | | | | 3,093 | |
| Charles Schwab | | | 207,400 | | | | 6,313 | |
| State Street | | | 48,700 | | | | 3,581 | |
| | | | | | | | | |
| Total Capital Markets | | | | 12,987 | |
| | | | | | | | | |
| Chemicals [0.9%] | |
| Eastman Chemical | | | 28,300 | | | | 1,960 | |
| | | | | | | | | |
| Commercial Banks [1.4%] | |
| Wells Fargo | | | 58,200 | | | | 3,166 | |
| | | | | | | | | |
| Communications Equipment [1.2%] | |
| Qualcomm | | | 38,900 | | | | 2,697 | |
| Description | | Shares | | | Value (000) | |
| Computers & Peripherals [3.8%] | |
| Apple | | | 67,000 | | | $ | 8,337 | |
| | | | | | | | | |
| Construction & Engineering [1.0%] | |
| Quanta Services * | | | 76,500 | | | | 2,182 | |
| | | | | | | | | |
| Diversified Financial Services [1.7%] | |
| JPMorgan Chase | | | 61,300 | | | | 3,714 | |
| | | | | | | | | |
| Diversified Telecommunication Services [1.4%] | |
| Verizon Communications | | | 65,000 | | | | 3,161 | |
| | | | | | | | | |
| Energy Equipment & Services [1.6%] | |
| Schlumberger | | | 41,900 | | | | 3,496 | |
| | | | | | | | | |
| Food & Staples Retailing [4.8%] | |
| Costco Wholesale | | | 24,400 | | | | 3,696 | |
| CVS Health | | | 67,300 | | | | 6,946 | |
| | | | | | | | | |
| Total Food & Staples Retailing | | | | 10,642 | |
| | | | | | | | | |
| Food Products [3.0%] | |
| Tyson Foods, Cl A | | | 101,000 | | | | 3,868 | |
| WhiteWave Foods, Cl A * | | | 62,300 | | | | 2,763 | |
| | | | | | | | | |
| Total Food Products | | | | 6,631 | |
| | | | | | | | | |
| Health Care Equipment & Supplies [3.5%] | |
| Edwards Lifesciences * | | | 32,600 | | | | 4,644 | |
| Intuitive Surgical * | | | 5,900 | | | | 2,980 | |
| | | | | | | | | |
| Total Health Care Equipment & Supplies | | | | 7,624 | |
| | | | | | | | | |
| Health Care Providers & Services [1.4%] | |
| HCA Holdings * | | | 39,500 | | | | 2,972 | |
| | | | | | | | | |
| Hotels, Restaurants & Leisure [1.4%] | |
| Starbucks | | | 33,500 | | | | 3,173 | |
| | | | | | | | | |
| Household Durables [1.9%] | |
| PulteGroup | | | 191,800 | | | | 4,264 | |
| | | | | | | | | |
| Insurance [3.8%] | |
| American International Group | | | 79,500 | | | | 4,356 | |
| Prudential Financial | | | 50,800 | | | | 4,079 | |
| | | | | | | | | |
| Total Insurance | | | | 8,435 | |
See accompanying notes to financial statements.
CITY NATIONAL ROCHDALE FUNDS | PAGE 102
schedule of investments
March 31, 2015 (Unaudited)
City National Rochdale U.S. Core Equity Fund (concluded)
| Description | | Shares | | | Value (000) | |
| Internet Software & Services [4.9%] | |
| Facebook, Cl A * | | | 51,100 | | | $ | 4,201 | |
| Google, Cl A * | | | 11,800 | | | | 6,519 | |
| | | | | | | | | |
| Total Internet Software & Services | | | | 10,720 | |
| | | | | | | | | |
| IT Services [5.2%] | |
| MasterCard, Cl A | | | 64,200 | | | | 5,546 | |
| Visa, Cl A | | | 88,000 | | | | 5,756 | |
| | | | | | | | | |
| Total IT Services | | | | 11,302 | |
| | | | | | | | | |
| Leisure Equipment & Products [1.5%] | |
| Polaris Industries | | | 23,700 | | | | 3,344 | |
| | | | | | | | | |
| Life Sciences Tools & Services [1.9%] | |
| Thermo Fisher Scientific | | | 30,300 | | | | 4,070 | |
| | | | | | | | | |
| Machinery [2.0%] | |
| Wabtec | | | 46,500 | | | | 4,418 | |
| | | | | | | | | |
| Media [6.2%] | |
| Comcast, Cl A | | | 105,000 | | | | 5,929 | |
| Lions Gate Entertainment | | | 86,400 | | | | 2,931 | |
| Walt Disney | | | 45,000 | | | | 4,720 | |
| | | | | | | | | |
| Total Media | | | | 13,580 | |
| | | | | | | | | |
| Multi-Utilities [2.5%] | |
| PG&E | | | 103,000 | | | | 5,466 | |
| | | | | | | | | |
| Oil, Gas & Consumable Fuels [4.1%] | |
| Cabot Oil & Gas | | | 78,900 | | | | 2,330 | |
| Exxon Mobil | | | 55,200 | | | | 4,692 | |
| Occidental Petroleum | | | 26,600 | | | | 1,942 | |
| | | | | | | | | |
| Total Oil, Gas & Consumable Fuels | | | | 8,964 | |
| | | | | | | | | |
| Pharmaceuticals [1.5%] | |
| Eli Lilly | | | 46,500 | | | | 3,378 | |
| | | | | | | | | |
| Real Estate Investment Trusts [1.6%] | |
| Host Hotels & Resorts | | | 178,400 | | | | 3,600 | |
| | | | | | | | | |
| Road & Rail [2.4%] | |
| Union Pacific | | | 48,000 | | | | 5,199 | |
| Description | | Shares | | | Value (000) | |
| Semiconductors & Semiconductor Equipment [3.8%] | |
| Applied Materials | | | 142,900 | | | $ | 3,224 | |
| NXP Semiconductor * | | | 52,000 | | | | 5,219 | |
| | | | | | | | | |
| Total Semiconductors & Semiconductor Equipment | | | | 8,443 | |
| | | | | | | | | |
| Software [1.6%] | |
| Adobe Systems * | | | 46,000 | | | | 3,401 | |
| | | | | | | | | |
| Specialty Retail [4.0%] | |
| Home Depot | | | 43,900 | | | | 4,988 | |
| Lowe’s | | | 51,100 | | | | 3,801 | |
| | | | | | | | | |
| Total Specialty Retail | | | | 8,789 | |
| | | | | | | | | |
| Water Utilities [1.3%] | |
| American Water Works | | | 52,800 | | | | 2,863 | |
| | | | | | | | | |
| Total Common Stock | |
| (Cost $176,588) | | | | 216,350 | |
| | | | | | | | | |
| Short-Term Investments [5.7%] | |
| City National Rochdale Prime Money Market Fund, Institutional Class, 0.010%**‡ | | | 6,235,978 | | | | 6,236 | |
| SEI Daily Income Trust, Prime Obligation Fund, Cl A, 0.010%** | | | 6,235,978 | | | | 6,236 | |
| | | | | | | | | |
| Total Short-Term Investments | |
| (Cost $12,472) | | | | 12,472 | |
| | | | | | | | | |
| Total Investments [104.2%] | |
| (Cost $189,060) | | | $ | 228,822 | |
Percentages are based on Net Assets of $219,678 (000).
| * | Non-income producing security. |
| ** | The rate reported is the 7-day effective yield as of March 31, 2015. |
| ‡ | Investment in Affiliate. |
Cl — Class
As of March 31, 2015, all of the Fund’s investments are Level 1, in accordance with the authoritative guidance on fair value measurements and disclosure under U.S. GAAP.
For the period ended March 31, 2015, there have been no transfers between any of the fair value hierarchy levels. Transfers between Levels are recognized at period end.
For more information on valuation inputs, see Note 2 — Significant Accounting Policies in the Notes to Financial Statements.
See accompanying notes to financial statements.
CITY NATIONAL ROCHDALE FUNDS | PAGE 103
schedule of investments
March 31, 2015 (Unaudited)
City National Rochdale Socially Responsible Equity Fund
| Description | | Shares | | | Value (000) | |
| Common Stock [96.0%] | |
| Automotive [5.9%] | |
| Ford Motor | | | 420,000 | | | $ | 6,779 | |
| Johnson Controls | | | 109,700 | | | | 5,533 | |
| PACCAR | | | 53,200 | | | | 3,359 | |
| | | | | | | | | |
| Total Automotive | | | | 15,671 | |
| | | | | | | | | |
| Banks [2.4%] | |
| Bank of America | | | 418,700 | | | | 6,444 | |
| | | | | | | | | |
| Biotechnology [1.5%] | |
| Gilead Sciences * | | | 39,200 | | | | 3,847 | |
| | | | | | | | | |
| Building & Construction [2.1%] | |
| USG * | | | 212,000 | | | | 5,660 | |
| | | | | | | | | |
| Chemicals [1.9%] | |
| EI du Pont de Nemours | | | 70,500 | | | | 5,039 | |
| | | | | | | | | |
| Commercial Banks [2.8%] | |
| BB&T | | | 192,300 | | | | 7,498 | |
| | | | | | | | | |
| Commercial Services & Supplies [2.4%] | |
| Republic Services, Cl A | | | 156,400 | | | | 6,344 | |
| | | | | | | | | |
| Communication & Media [2.2%] | |
| Starz * | | | 169,000 | | | | 5,816 | |
| | | | | | | | | |
| Communications Equipment [1.3%] | |
| Qualcomm | | | 51,000 | | | | 3,536 | |
| Description | | Shares | | | Value (000) | |
| Computer Software [4.2%] | |
| Microsoft | | | 132,200 | | | $ | 5,374 | |
| Oracle | | | 130,100 | | | | 5,614 | |
| | | | | | | | | |
| Total Computer Software | | | | 10,988 | |
| | | | | | | | | |
| Drugs [2.0%] | |
| AbbVie | | | 89,300 | | | | 5,227 | |
| | | | | | | | | |
| Electronic Equipment & Instruments [6.4%] | |
| Cisco Systems | | | 187,800 | | | | 5,170 | |
| Corning | | | 243,300 | | | | 5,518 | |
| TE Connectivity | | | 89,000 | | | | 6,374 | |
| | | | | | | | | |
| Total Electronic Equipment & Instruments | | | | 17,062 | |
| | | | | | | | | |
| Energy Equipment & Services [1.0%] | |
| National Oilwell Varco | | | 56,300 | | | | 2,814 | |
| | | | | | | | | |
| Financial Services [1.0%] | |
| American Express | | | 32,200 | | | | 2,515 | |
| | | | | | | | | |
| Food, Beverage & Tobacco [2.3%] | |
| PepsiCo | | | 62,500 | | | | 5,976 | |
| | | | | | | | | |
| Health Care Products & Services [6.2%] | |
| Cardinal Health | | | 31,600 | | | | 2,853 | |
| DaVita HealthCare Partners * | | | 86,700 | | | | 7,047 | |
| Express Scripts Holding * | | | 75,500 | | | | 6,551 | |
| | | | | | | | | |
| Total Health Care Products & Services | | | | 16,451 | |
| | | | | | | | | |
| Household Furniture & Fixtures [2.3%] | |
| Stanley Black & Decker | | | 65,100 | | | | 6,208 | |
| | | | | | | | | |
| Household Products [2.6%] | |
| Procter & Gamble | | | 85,200 | | | | 6,982 | |
| | | | | | | | | |
| Independent Power Producers & Energy Trader [1.5%] | |
| Calpine * | | | 170,900 | | | | 3,908 | |
| | | | | | | | | |
| Industrial Products & Services [4.5%] | |
| Eaton | | | 115,800 | | | | 7,867 | |
| Tyco International | | | 92,675 | | | | 3,991 | |
| | | | | | | | | |
| Total Industrial Products & Services | | | | 11,858 | |
| | | | | | | | | |
| Information Technology [2.0%] | |
| IBM | | | 33,400 | | | | 5,361 | |
See accompanying notes to financial statements.
CITY NATIONAL ROCHDALE FUNDS | PAGE 104
schedule of investments
March 31, 2015 (Unaudited)
City National Rochdale Socially Responsible Equity Fund (concluded)
| Description | | Shares | | | Value (000) | |
| Insurance [14.8%] | |
| American International Group | | | 141,600 | | | $ | 7,758 | |
| Berkshire Hathaway, Cl B * | | | 33,600 | | | | 4,849 | |
| FNF Group | | | 136,600 | | | | 5,022 | |
| Genworth Financial, Cl A * | | | 508,700 | | | | 3,719 | |
| HCC Insurance Holdings | | | 85,600 | | | | 4,851 | |
| MetLife | | | 122,500 | | | | 6,192 | |
| Symetra Financial | | | 288,100 | | | | 6,759 | |
| | | | | | | | | |
| Total Insurance | | | | 39,150 | |
| | | | | | | | | |
| Medical Products & Services [4.5%] | |
| Baxter International | | | 118,200 | | | | 8,097 | |
| Becton Dickinson | | | 25,800 | | | | 3,704 | |
| | | | | | | | | |
| Total Medical Products & Services | | | | 11,801 | |
| | | | | | | | | |
| Petroleum & Fuel Products [5.2%] | |
| ConocoPhillips | | | 73,000 | | | | 4,545 | |
| Devon Energy | | | 42,000 | | | | 2,533 | |
| Phillips 66 | | | 26,400 | | | | 2,075 | |
| Spectra Energy | | | 125,700 | | | | 4,547 | |
| | | | | | | | | |
| Total Petroleum & Fuel Products | | | | 13,700 | |
| | | | | | | | | |
| Real Estate Investment Trusts [1.4%] | |
| Weyerhaeuser | | | 110,400 | | | | 3,660 | |
| | | | | | | | | |
| Real Estate Management & Development [3.4%] | |
| Brookfield Asset Management, Cl A | | | 92,900 | | | | 4,980 | |
| Kennedy-Wilson Holdings | | | 151,900 | | | | 3,971 | |
| | | | | | | | | |
| Total Real Estate Management & Development | | | | 8,951 | |
| | | | | | | | | |
| Retail [2.9%] | |
| AutoNation * | | | 60,000 | | | | 3,860 | |
| Target | | | 48,000 | | | | 3,939 | |
| | | | | | | | | |
| Total Retail | | | | 7,799 | |
| | | | | | | | | |
| Semi-Conductors [1.8%] | |
| Broadcom, Cl A | | | 111,200 | | | | 4,814 | |
| | | | | | | | | |
| Telephone & Telecommunications [3.5%] | |
| Verizon Communications | | | 188,000 | | | | 9,142 | |
| | | | | | | | | |
| Total Common Stock | |
| (Cost $239,183) | | | | 254,222 | |
| Description | | Shares | | | Value (000) | |
| Short-Term Investment [4.7%] | |
| AIM STIT-Government TaxAdvantage Portfolio, 0.020%** | | | 12,301,267 | | | $ | 12,301 | |
| | | | | | | | | |
| Total Short-Term Investment | |
| (Cost $12,301) | | | | 12,301 | |
| | | | | | | | | |
| Total Investments [100.7%] | |
| (Cost $251,484) | | | $ | 266,523 | |
Percentages are based on Net Assets of $264,718 (000).
| * | Non-income producing security. |
| ** | The rate reported is the 7-day effective yield as of March 31, 2015. |
Cl — Class
As of March 31, 2015, all of the Fund’s investments are Level 1in accordance with authoritative guidance on fair value measurements and disclosure under U.S GAAP.
For the period ended March 31, 2015, there have been no transfers between any of the fair value hierarchy levels. Transfers between Levels are recognized at period end.
For more information on valuation inputs, see Note 2 — Significant Accounting Policies in the Notes to Financial Statements.
See accompanying notes to financial statements.
CITY NATIONAL ROCHDALE FUNDS | PAGE 105
consolidated schedule of investments
March 31, 2015 (Unaudited)
City National Rochdale Emerging Markets Fund
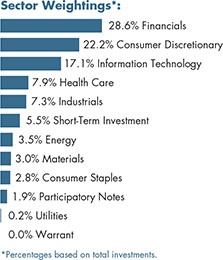
| Description | | Shares | | | Value (000) | |
| Common Stock [90.7%] | |
| China [32.9%] | |
| AAC Technologies Holdings | | | 1,585,200 | | | $ | 9,784 | |
| Agricultural Bank of China, Cl H | | | 12,754,000 | | | | 6,317 | |
| Alibaba Group Holding ADR * | | | 125,519 | | | | 10,448 | |
| ANTA Sports Products | | | 6,033,000 | | | | 11,035 | |
| Baidu ADR * | | | 60,500 | | | | 12,608 | |
| China Pioneer Pharma Holdings | | | 14,755,000 | | | | 9,440 | |
| China Railway Group, Cl H | | | 10,796,000 | | | | 11,057 | |
| China State Construction International Holdings | | | 5,155,091 | | | | 7,181 | |
| CIMC Enric Holdings | | | 7,014,000 | | | | 6,840 | |
| Dongfeng Motor Group, Cl H | | | 4,027,388 | | | | 6,462 | |
| Fufeng Group | | | 15,762,000 | | | | 9,556 | |
| Great Wall Motor, Cl H | | | 3,990,500 | | | | 28,207 | |
| Man Wah Holdings | | | 9,403,200 | | | | 9,036 | |
| New Oriental Education & Technology Group ADR * | | | 244,000 | | | | 5,410 | |
| Ping An Insurance Group of China, Cl H | | | 1,322,500 | | | | 15,899 | |
| Shanghai Fosun Pharmaceutical Group, Cl H (B) | | | 2,092,500 | | | | 6,977 | |
| Sunac China Holdings | | | 11,898,000 | | | | 10,329 | |
| Sunny Optical Technology Group | | | 8,747,132 | | | | 15,909 | |
| Tencent Holdings | | | 1,380,200 | | | | 26,206 | |
| XTEP International Holdings | | | 3,639,652 | | | | 1,131 | |
| Zhejiang Expressway, Cl H | | | 5,586,000 | | | | 7,407 | |
| ZTE, Cl H | | | 4,345,187 | | | | 9,965 | |
| | | | | | | | | |
| Total China | | | | 237,204 | |
| | | | | | | | | |
| Hong Kong [6.2%] | |
| CPMC Holdings | | | 7,728,937 | | | | 4,067 | |
| Description | | Shares | | | Value (000) | |
| Galaxy Entertainment Group * | | | 1,904,000 | | | $ | 8,670 | |
| MTR | | | 1,510,000 | | | | 7,187 | |
| NagaCorp | | | 19,980,063 | | | | 13,298 | |
| Sands China | | | 394,689 | | | | 1,634 | |
| Skyworth Digital Holdings | | | 12,276,814 | | | | 9,660 | |
| | | | | | | | | |
| Total Hong Kong | | | | 44,516 | |
| | | | | | | | | |
| India [23.1%] [A] | |
| Amtek Auto | | | 3,034,666 | | | | 7,044 | |
| Bharat Petroleum | | | 995,193 | | | | 12,894 | |
| CESC | | | 150,000 | | | | 1,447 | |
| Coal India | | | 1,416,958 | | | | 8,217 | |
| Crompton Greaves | | | 2,321,888 | | | | 6,159 | |
| Dr. Reddy’s Laboratories ADR | | | 152,200 | | | | 8,690 | |
| Emami | | | 681,022 | | | | 10,895 | |
| HDFC Bank | | | 353,793 | | | | 6,733 | |
| HDFC Bank ADR | | | 239,000 | | | | 14,075 | |
| ICICI Bank ADR | | | 1,026,492 | | | | 10,634 | |
| ITC | | | 1,675,823 | | | | 8,726 | |
| Kotak Mahindra Bank | | | 463,470 | | | | 9,726 | |
| Mindtree | | | 406,968 | | | | 8,478 | |
| Shriram City Union Finance | | | 271,500 | | | | 8,526 | |
| Sobha | | | 729,724 | | | | 4,688 | |
| State Bank of India | | | 701,700 | | | | 3,001 | |
| Sun Pharmaceutical Industries | | | 539,878 | | | | 8,833 | |
| Taro Pharmaceutical Industries * | | | 62,169 | | | | 8,768 | |
| Tata Motors, Cl A | | | 1,001,070 | | | | 5,303 | |
| Tata Motors ADR | | | 111,800 | | | | 5,038 | |
| Tech Mahindra | | | 852,336 | | | | 8,576 | |
| | | | | | | | | |
| Total India | | | | 166,451 | |
| | | | | | | | | |
| Indonesia [9.0%] | |
| Bank Mandiri Persero | | | 10,427,400 | | | | 9,949 | |
| Blue Bird * | | | 7,218,600 | | | | 5,493 | |
| Ciputra Development | | | 58,351,400 | | | | 6,582 | |
| Kalbe Farma | | | 41,503,100 | | | | 5,920 | |
| Lippo Karawaci | | | 87,737,461 | | | | 9,059 | |
| Mitra Adiperkasa | | | 18,996,500 | | | | 7,628 | |
| MNC Kapital Indonesia | | | 89,000,000 | | | | 11,878 | |
| Surya Citra Media | | | 33,593,500 | | | | 8,723 | |
| | | | | | | | | |
| Total Indonesia | | | | 65,232 | |
| | | | | | | | | |
| Malaysia [3.3%] | |
| Berjaya Sports Toto | | | 1,661,055 | | | | 1,507 | |
| Genting Malaysia | | | 2,972,956 | | | | 3,396 | |
| Inari Amertron | | | 8,045,311 | | | | 7,190 | |
| Magnum | | | 2,239,127 | | | | 1,626 | |
See accompanying notes to financial statements.
CITY NATIONAL ROCHDALE FUNDS | PAGE 106
consolidated schedule of investments
March 31, 2015 (Unaudited)
City National Rochdale Emerging Markets Fund (concluded)
| Description | | Shares/Number of Warrants | | | Value (000) | |
| My EG Services | | | 8,737,800 | | | $ | 6,583 | |
| Nirvana Asia * (C) | | | 12,326,000 | | | | 3,720 | |
| | | | | | | | | |
| Total Malaysia | | | | 24,022 | |
| | | | | | | | | |
| Philippines [9.2%] | |
| GT Capital Holdings | | | 454,850 | | | | 13,615 | |
| Jollibee Foods | | | 2,012,040 | | | | 9,903 | |
| Megaworld | | | 124,813,526 | | | | 15,162 | |
| Metropolitan Bank & Trust | | | 3,941,893 | | | | 8,603 | |
| Security Bank | | | 2,015,720 | | | | 7,756 | |
| SM Prime Holdings | | | 25,310,875 | | | | 11,313 | |
| | | | | | | | | |
| Total Philippines | | | | 66,352 | |
| | | | | | | | | |
| Singapore [1.0%] | |
| Raffles Medical Group | | | 2,593,770 | | | | 7,428 | |
| | | | | | | | | |
| Thailand [5.3%] | |
| Krung Thai Bank - Foreign | | | 10,441,450 | | | | 7,316 | |
| Land & Houses | | | 22,703,884 | | | | 6,802 | |
| LPN Development | | | 2,200,000 | | | | 1,136 | |
| LPN Development NVDR | | | 6,174,501 | | | | 3,188 | |
| Minor International - Foreign | | | 8,002,550 | | | | 8,608 | |
| PTT Exploration & Production - Foreign | | | 1,052,912 | | | | 3,527 | |
| Siam Cement - Foreign | | | 470,600 | | | | 7,376 | |
| | | | | | | | | |
| Total Thailand | | | | 37,953 | |
| | | | | | | | | |
| United States [0.7%] | |
| Cognizant Technology Solutions, Cl A * | | | 85,500 | | | | 5,334 | |
| | | | | | | | | |
| Total Common Stock | |
| (Cost $524,352) | | | | 654,492 | |
| | | | | | | | | |
| Participatory Notes [1.9%] | |
| China [1.9%] | |
| Boci Financial * | | | 3,138,651 | | | | 12,586 | |
| SAIC Motor * | | | 299,987 | | | | 1,203 | |
| | | | | | | | | |
| Total Participatory Notes | |
| (Cost $11,110) | | | | 13,789 | |
| | | | | | | | | |
| Warrant [0.0%] | |
| Minor International, | | | | | | | | |
| Expires 12/31/29* | | | 400,127 | | | $ | — | |
| | | | | | | | | |
| Total Warrant | |
| (Cost $—) | | | | — | |
| Description | | Shares | | | Value (000) | |
| Short-Term Investments [5.4%] | |
| City National Rochdale Government Money Market Fund, Institutional Class, 0.010%**‡ | | | 21,610,142 | | | $ | 21,610 | |
| SEI Daily Income Trust Government Fund, Cl A, 0.020%** | | | 17,250,801 | | | | 17,251 | |
| | | | | | | | | |
| Total Short-Term Investments | |
| (Cost $38,861) | | | | 38,861 | |
| | | | | | | | | |
| Total Investments [98.0%] | |
| (Cost $574,323) | | | $ | 707,142 | |
Percentages are based on Net Assets of $721,291 (000).
| * | Non-income producing security. |
| ** | The rate reported is the 7-day effective yield as of March 31, 2015. |
| ‡ | Investment in Affiliate. |
| (A) | Securities held through a Mauritius Subsidiary. |
| (B) | Security fair valued using methods determined in good faith by the Fair Value Committee designated by the Board of Trustees. The total market value of such security as of March 31, 2015 was $6,977 (000) and represented 0.9% of net assets of the Fund. |
| (C) | Security exempt from registration under Rule 144A of the Securities Act of 1933. These securities may be resold in transactions exempt from registration normally to qualified institutions. On March 31, 2015, the value of these securities amounted to $3,720 (000), representing 0.5% of the net assets of the Fund. |
ADR — American Depositary Receipt
Cl — Class
NVDR — Non Voting Depository Receipt
Amounts designated as “—” are either $0 or have been rounded to $0.
The following is a list of the inputs used as of March 31, 2015 in valuing the Fund’s investments carried at value (000):
| Investments in Securities | | Level 1 | | | Level 2 | | | Level 3(1) | | | Total | |
| Common Stock | | $ | 647,515 | | | $ | — | | | $ | 6,977 | | | $ | 654,492 | |
| Participatory Notes | | | — | | | | 13,789 | | | | — | | | | 13,789 | |
| Warrant | | | — | | | | — | | | | — | | | | — | |
| Short-Term Investments | | | 38,861 | | | | — | | | | — | | | | 38,861 | |
| Total Investments in Securities | | $ | 686,376 | | | $ | 13,789 | | | $ | 6,977 | | | $ | 707,142 | |
| (1) | A reconciliation of Level 3 investments is presented when the Fund has a significant amount of Level 3 investments at the beginning and/or end of the period in relation to the net assets. |
For the period ended March 31, 2015, there have been no transfers between Level 1 and Level 2 assets and liabilities. For the period ended March 31, 2015, there have been no transfers between Level 2 and Level 3 assets and liabilities. Transfers between Levels are recognized at period end.
For more information on valuation inputs, see Note 2 — Significant Accounting Policies in the Notes to Financial Statements.
See accompanying notes to financial statements.
CITY NATIONAL ROCHDALE FUNDS | PAGE 107
statements of assets and liabilities (000)
March 31, 2015 (Unaudited)
| | | City National Rochdale Government Money Market Fund | | | City National Rochdale Prime Money Market Fund | | | City National Rochdale California Tax Exempt Money Market Fund | | | City National Rochdale Limited Maturity Fixed Income Fund | |
| ASSETS: | | | | | | | | | | | | |
| Cost of securities (including affiliated investments and repurchase agreements) | | $ | 3,912,751 | | | $ | 982,877 | | | $ | 891,827 | | | $ | 25,716 | |
| Investments in securities, at value | | $ | 3,512,751 | | | $ | 887,877 | | | $ | 878,827 | | | $ | 25,620 | |
| Affiliated investments, at value | | | — | | | | — | | | | — | | | | 210 | |
| Repurchase agreements, at value | | | 400,000 | | | | 95,000 | | | | 13,000 | | | | — | |
| Cash | | | — | | | | — | | | | 8,958 | | | | — | |
| Dividend and interest receivable | | | 573 | | | | 127 | | | | 1,573 | | | | 165 | |
| Receivable for investment securities sold | | | — | | | | — | | | | 5,000 | | | | — | |
| Investment advisory fees receivable | | | — | | | | — | | | | 24 | | | | — | |
| Receivable for capital shares sold | | | — | | | | — | | | | — | | | | 9 | |
| Prepaid expenses | | | 153 | | | | 40 | | | | 35 | | | | 1 | |
| Total Assets | | | 3,913,477 | | | | 983,044 | | | | 907,417 | | | | 26,005 | |
| | | | | | | | | | | | | | | | | |
| LIABILITIES: | | | | | | | | | | | | | | | | |
| Payable for income distributions | | | 12 | | | | 5 | | | | 3 | | | | 12 | |
| Payable for capital shares redeemed | | | — | | | | — | | | | — | | | | 1 | |
| Payable for investment securities purchased | | | — | | | | — | | | | 3,514 | | | | — | |
| Investment advisory fees payable | | | 121 | | | | 89 | | | | — | | | | 1 | |
| Shareholder servicing and distribution fees payable | | | — | | | | — | | | | — | | | | 5 | |
| Administrative fees payable | | | 49 | | | | 17 | | | | 6 | | | | 9 | |
| Accrued expenses | | | 257 | | | | 91 | | | | 76 | | | | 15 | |
| Total Liabilities | | | 439 | | | | 202 | | | | 3,599 | | | | 43 | |
| Net Assets | | $ | 3,913,038 | | | $ | 982,842 | | | $ | 903,818 | | | $ | 25,962 | |
| | | | | | | | | | | | | | | | | |
| NET ASSETS: | | | | | | | | | | | | | | | | |
| Paid-in Capital (unlimited authorization — $0.01 par value) | | $ | 3,913,037 | | | $ | 982,853 | | | $ | 903,782 | | | $ | 27,630 | |
| Distributions in excess of net investment income | | | — | | | | — | | | | — | | | | (2 | ) |
| Accumulated net realized gain (loss) on investments | | | 1 | | | | (11 | ) | | | 36 | | | | (1,780 | ) |
| Net unrealized appreciation on investments | | | — | | | | — | | | | — | | | | 114 | |
| Net Assets | | $ | 3,913,038 | | | $ | 982,842 | | | $ | 903,818 | | | $ | 25,962 | |
| | | | | | | | | | | | | | | | | |
| Institutional Class Shares: | | | | | | | | | | | | | | | | |
| Net Assets ($Dollars) | | $ | — | | | $ | 66,297,592 | | | $ | — | | | $ | 21,530,555 | |
| Total shares outstanding at end of period | | | — | | | | 66,297,507 | | | | — | | | | 1,926,023 | |
| Net asset value, offering and redemption price per share | | | | | | | | | | | | | | | | |
| (net assets ÷ shares outstanding) | | $ | — | | | $ | 1.00 | | | $ | — | | | $ | 11.18 | |
| | | | | | | | | | | | | | | | | |
| Class N Shares: | | | | | | | | | | | | | | | | |
| Net Assets ($Dollars) | | $ | 2,930,891,835 | | | $ | 315,112,088 | | | $ | 608,892,712 | | | $ | 4,430,991 | |
| Total shares outstanding at end of period | | | 2,930,888,419 | | | | 315,173,314 | | | | 608,869,813 | | | | 396,134 | |
| Net asset value, offering and redemption price per share | | | | | | | | | | | | | | | | |
| (net assets ÷ shares outstanding) | | $ | 1.00 | | | $ | 1.00 | | | $ | 1.00 | | | $ | 11.19 | |
| | | | | | | | | | | | | | | | | |
| Class S Shares: | | | | | | | | | | | | | | | | |
| Net Assets ($Dollars) | | $ | 763,850,941 | | | $ | 236,743,136 | | | $ | 62,194,855 | | | $ | — | |
| Total shares outstanding at end of period | | | 763,851,487 | | | | 236,708,074 | | | | 62,188,045 | | | | — | |
| Net asset value, offering and redemption price per share | | | | | | | | | | | | | | | | |
| (net assets ÷ shares outstanding) | | $ | 1.00 | | | $ | 1.00 | | | $ | 1.00 | | | $ | — | |
| | | | | | | | | | | | | | | | | |
| Servicing Class Shares: | | | | | | | | | | | | | | | | |
| Net Assets ($Dollars) | | $ | 218,295,499 | | | $ | 364,688,861 | | | $ | 232,730,402 | | | $ | — | |
| Total shares outstanding at end of period | | | 218,296,880 | | | | 364,767,172 | | | | 232,726,146 | | | | — | |
| Net asset value, offering and redemption price per share | | | | | | | | | | | | | | | | |
| (net assets ÷ shares outstanding) | | $ | 1.00 | | | $ | 1.00 | | | $ | 1.00 | | | $ | — | |
Amounts designated as “—” are either $0 or have been rounded to $0.
See accompanying notes to financial statements.
CITY NATIONAL ROCHDALE FUNDS | PAGE 108
statements of assets and liabilities (000)
March 31, 2015 (Unaudited)
| | | City National Rochdale Government Bond Fund | | | City National Rochdale Corporate Bond Fund | | | City National Rochdale California Tax Exempt Bond Fund | | | City National Rochdale Municipal High Income Fund | |
| ASSETS: | | | | | | | | | | | | |
| Cost of securities (including affiliated investments) | | $ | 169,348 | | | $ | 140,985 | | | $ | 93,613 | | | $ | 569,674 | |
| Investments in securities, at value | | $ | 169,883 | | | $ | 142,419 | | | $ | 90,775 | | | $ | 550,692 | |
| Affiliated investments, at value | | | 852 | | | | 232 | | | | 4,868 | | | | 38,476 | |
| Dividend and income receivable | | | 637 | | | | 1,393 | | | | 889 | | | | 8,511 | |
| Cash | | | — | | | | 14 | | | | — | | | | — | |
| Receivable for capital shares sold | | | 249 | | | | 198 | | | | 147 | | | | 4,584 | |
| Deferred offering costs | | | — | | | | — | | | | — | | | | — | |
| Prepaid expenses | | | 7 | | | | 6 | | | | 3 | | | | 17 | |
| Total Assets | | $ | 171,628 | | | $ | 144,262 | | | $ | 96,682 | | | $ | 602,280 | |
| | | | | | | | | | | | | | | | | |
| LIABILITIES: | | | | | | | | | | | | | | | | |
| Payable for income distributions | | | 54 | | | | 213 | | | | 86 | | | | 1,199 | |
| Payable for capital shares redeemed | | | 43 | | | | 123 | | | | 91 | | | | 324 | |
| Payable for investment securities purchased | | | — | | | | — | | | | 1,624 | | | | 24,120 | |
| Due to custodian | | | 1 | | | | — | | | | — | | | | — | |
| Investment advisory fees payable | | | 55 | | | | 41 | | | | 13 | | | | 212 | |
| Shareholder servicing and distribution fees payable | | | 24 | | | | 32 | | | | 28 | | | | 284 | |
| Administrative fees payable | | | 11 | | | | 11 | | | | 10 | | | | 16 | |
| Accrued expenses | | | 27 | | | | 22 | | | | 20 | | | | 53 | |
| Total Liabilities | | | 215 | | | | 442 | | | | 1,872 | | | | 26,208 | |
| Net Assets | | $ | 171,413 | | | $ | 143,820 | | | $ | 94,810 | | | $ | 576,072 | |
| | | | | | | | | | | | | | | | | |
| NET ASSETS: | | | | | | | | | | | | | | | | |
| Paid-in Capital (unlimited authorization — $0.01 par value) | | $ | 170,176 | | | $ | 141,959 | | | $ | 92,740 | | | $ | 556,351 | |
| Undistributed net investment income | | | 4 | | | | 6 | | | | 4 | | | | 130 | |
| Accumulated net realized gain (loss) on investments | | | (154 | ) | | | 189 | | | | 36 | | | | 97 | |
| Net unrealized appreciation on investments | | | 1,387 | | | | 1,666 | | | | 2,030 | | | | 19,494 | |
| Net Assets | | $ | 171,413 | | | $ | 143,820 | | | $ | 94,810 | | | $ | 576,072 | |
| | | | | | | | | | | | | | | | | |
| Institutional Class Shares: | | | | | | | | | | | | | | | | |
| Net Assets ($Dollars) | | $ | 59,727,746 | | | $ | — | | | $ | — | | | $ | — | |
| Total shares outstanding at end of period | | | 5,648,124 | | | | — | | | | — | | | | — | |
| Net asset value, offering and redemption price per share | | | | | | | | | | | | | | | | |
| (net assets ÷ shares outstanding) | | $ | 10.57 | | | $ | — | | | $ | — | | | $ | — | |
| | | | | | | | | | | | | | | | | |
| Class N Shares: | | | | | | | | | | | | | | | | |
| Net Assets ($Dollars) | | $ | 1,849,450 | | | $ | 4,436,071 | | | $ | 11,837,868 | | | $ | 301,101,154 | |
| Total shares outstanding at end of period | | | 174,627 | | | | 419,038 | | | | 1,104,206 | | | | 27,694,429 | |
| Net asset value, offering and redemption price per share | | | | | | | | | | | | | | | | |
| (net assets ÷ shares outstanding) | | $ | 10.59 | | | $ | 10.59 | | | $ | 10.72 | | | $ | 10.87 | |
| | | | | | | | | | | | | | | | | |
| Servicing Class Shares: | | | | | | | | | | | | | | | | |
| Net Assets ($Dollars) | | $ | 109,835,500 | | | $ | 139,383,501 | | | $ | 82,972,284 | | | $ | 274,970,727 | |
| Total shares outstanding at end of period | | | 10,390,204 | | | | 13,182,200 | | | | 7,761,344 | | | | 25,280,473 | |
| Net asset value, offering and redemption price per share | | | | | | | | | | | | | | | | |
| (net assets ÷ shares outstanding) | | $ | 10.57 | | | $ | 10.57 | | | $ | 10.69 | | | $ | 10.88 | |
Amounts designated as “—” are either $0 or have been rounded to $0.
See accompanying notes to financial statements.
CITY NATIONAL ROCHDALE FUNDS | PAGE 109
statements of assets and liabilities/
consolidated statement of assets and liabilities (000)
March 31, 2015 (Unaudited)
| | | City National Rochdale High Yield Bond Fund | | | City National Rochdale Intermediate Fixed Income Fund | | | City National Rochdale Fixed Income Opportunities Fund | | | City National Rochdale Multi-Asset Fund | |
| ASSETS: | | | | | | | | | | | | |
| Cost of securities (including affiliated investments) | | $ | 99,943 | | | $ | 242,503 | | | $ | 1,520,370 | | | $ | 21,351 | |
| Investments in securities, at value | | $ | 97,348 | | | $ | 244,995 | | | $ | 1,372,732 | | | $ | 16,931 | |
| Affiliated investments, at value | | | 471 | | | | 2,869 | | | | 120,234 | | | | 5,291 | |
| Cash | | | 18 | | | | — | | | | 17,074 | | | | 27 | |
Foreign Currency(1) | | | 1 | | | | — | | | | 1,851 | | | | — | |
| Dividend and income receivable | | | 1,694 | | | | 2,104 | | | | 18,083 | | | | 15 | |
| Receivable for capital shares sold | | | 1,579 | | | | 670 | | | | 7,660 | | | | 900 | |
| Receivable for investment securities sold | | | 2,406 | | | | — | | | | 9,396 | | | | 1,611 | |
| Unrealized gain on forward foreign currency contracts | | | 14 | | | | — | | | | 2,098 | | | | — | |
| Prepaid expenses | | | 4 | | | | 9 | | | | 55 | | | | 1 | |
| Total Assets | | | 103,535 | | | | 250,647 | | | | 1,549,183 | | | | 24,776 | |
| | | | | | | | | | | | | | | | | |
| LIABILITIES: | | | | | | | | | | | | | | | | |
| Payable for income distributions | | | 208 | | | | — | | | | — | | | | — | |
| Payable for capital shares redeemed | | | 18 | | | | 57 | | | | 1,720 | | | | — | |
| Payable for investment securities purchased | | | 2,670 | | | | — | | | | 35,539 | | | | 1,548 | |
| Unrealized loss on forward foreign currency contracts | | | — | | | | — | | | | 419 | | | | — | |
| Investment advisory fees payable | | | 40 | | | | 81 | | | | 599 | | | | 4 | |
| Shareholder servicing and distribution fees payable | | | 32 | | | | 101 | | | | 625 | | | | 9 | |
| Administrative fees payable | | | 10 | | | | 12 | | | | 29 | | | | 9 | |
| Accrued expenses | | | 33 | | | | 46 | | | | 744 | | | | 13 | |
| Total Liabilities | | | 3,011 | | | | 297 | | | | 39,675 | | | | 1,583 | |
| Net Assets | | $ | 100,524 | | | $ | 250,350 | | | $ | 1,509,508 | | | $ | 23,193 | |
| | | | | | | | | | | | | | | | | |
| NET ASSETS: | | | | | | | | | | | | | | | | |
| Paid-in Capital (unlimited authorization — $0.01 par value) | | | 103,228 | | | | 247,697 | | | $ | 1,564,539 | | | | 22,614 | |
| Undistributed (Distributions in excess of) net investment income | | | (34 | ) | | | 80 | | | | (924 | ) | | | (23 | ) |
| Accumulated net realized (loss) on investments and foreign currency | | | (560 | ) | | | (2,788 | ) | | | (7,472 | ) | | | (269 | ) |
| Net unrealized appreciation (depreciation) on: | | | | | | | | | | | | | | | | |
| Investments | | | (2,124 | ) | | | 5,361 | | | | (48,466 | ) | | | 871 | |
| Foreign currencies and translation of other assets and liabilities denominated in foreign currencies | | | 14 | | | | — | | | | 1,831 | | | | — | |
| Net Assets | | $ | 100,524 | | | $ | 250,350 | | | $ | 1,509,508 | | | $ | 23,193 | |
| | | | | | | | | | | | | | | | | |
| Institutional Class Shares: | | | | | | | | | | | | | | | | |
| Net Assets ($Dollars) | | $ | 40,203,863 | | | $ | 9,977,508 | | | $ | — | | | $ | — | |
| Total shares outstanding at end of period | | | 4,936,208 | | | | 376,845 | | | | — | | | | — | |
| Net asset value, offering and redemption price per share | | | | | | | | | | | | | | | | |
| (net assets ÷ shares outstanding) | | $ | 8.14 | | | $ | 26.48 | | | $ | — | | | $ | — | |
| | | | | | | | | | | | | | | | | |
| Class N Shares: | | | | | | | | | | | | | | | | |
| Net Assets ($Dollars) | | $ | 22,688,003 | | | $ | 240,372,315 | | | $ | 1,509,507,606 | | | $ | 18,323,055 | |
| Total shares outstanding at end of period | | | 2,786,638 | | | | 9,080,422 | | | | 58,121,240 | | | | 1,632,763 | |
| Net asset value, offering and redemption price per share | | | | | | | | | | | | | | | | |
| (net assets ÷ shares outstanding) | | $ | 8.14 | | | $ | 26.47 | | | $ | 25.97 | | | $ | 11.22 | |
| | | | | | | | | | | | | | | | | |
| Servicing Class Shares: | | | | | | | | | | | | | | | | |
| Net Assets ($Dollars) | | $ | 37,632,322 | | | $ | — | | | $ | — | | | $ | 4,870,095 | |
| Total shares outstanding at end of period | | | 4,622,065 | | | | — | | | | — | | | | 433,601 | |
| Net asset value, offering and redemption price per share | | | | | | | | | | | | | | | | |
| (net assets ÷ shares outstanding) | | $ | 8.14 | | | $ | — | | | $ | — | | | $ | 11.23 | |
Amounts designated as “—” are either $0 or have been rounded to $0.
| (1) | Cost of foreign currency $1 (000) and $1,851 (000), respectively. |
See accompanying notes to financial statements.
CITY NATIONAL ROCHDALE FUNDS | PAGE 110
statements of assets and liabilities/
consolidated statement of assets and liabilities (000)
March 31, 2015 (Unaudited)
| | | City National Rochdale Dividend & Income Fund | | | City National Rochdale U.S. Core Equity Fund | | | City National Rochdale Socially Responsible Fund | | | City National Rochdale Emerging Markets Fund | |
| ASSETS: | | | | | | | | | | | | |
| Cost of securities (including affiliated investments) | | $ | 155,590 | | | $ | 189,060 | | | $ | 251,484 | | | $ | 574,323 | |
| Investments in securities, at value | | $ | 198,264 | | | $ | 222,586 | | | $ | 266,523 | | | $ | 685,532 | |
| Affiliated investments, at value | | | — | | | | 6,236 | | | | — | | | | 21,610 | |
| Cash | | | — | | | | — | | | | 13 | | | | 6 | |
Foreign Currency(1) | | | — | | | | — | | | | — | | | | 18,555 | |
| Dividend and income receivable | | | 420 | | | | 182 | | | | 230 | | | | 405 | |
| Receivable for investment securities sold | | | 1,182 | | | | — | | | | 3,666 | | | | 4,958 | |
| Receivable for capital shares sold | | | 335 | | | | 337 | | | | 257 | | | | 3,922 | |
| Prepaid expenses | | | 7 | | | | 9 | | | | 9 | | | | 23 | |
| Total Assets | | | 200,208 | | | | 229,350 | | | | 270,698 | | | | 735,011 | |
| | | | | | | | | | | | | | | | | |
| LIABILITIES: | | | | | | | | | | | | | | | | |
| Payable for capital shares redeemed | | | 233 | | | | 250 | | | | 103 | | | | 684 | |
| Payable for investment securities purchased | | | 281 | | | | 9,207 | | | | 5,664 | | | | 12,107 | |
| Due to custodian | | | 485 | | | | — | | | | — | | | | — | |
| Investment advisory fees payable | | | 81 | | | | 76 | | | | 168 | | | | 572 | |
| Shareholder servicing and distribution fees payable | | | 85 | | | | 96 | | | | 9 | | | | 295 | |
| Administrative fees payable | | | 11 | | | | 12 | | | | 12 | | | | 18 | |
| Accrued expenses | | | 25 | | | | 31 | | | | 24 | | | | 44 | |
| Total Liabilities | | | 1,201 | | | | 9,672 | | | | 5,980 | | | | 13,720 | |
| Net Assets | | $ | 199,007 | | | $ | 219,678 | | | $ | 264,718 | | | $ | 721,291 | |
| | | | | | | | | | | | | | | | | |
| NET ASSETS: | | | | | | | | | | | | | | | | |
| Paid-in Capital (unlimited authorization — $0.01 par value) | | $ | 154,892 | | | $ | 178,638 | | | $ | 250,207 | | | $ | 599,225 | |
| Undistributed (Distributions in excess of) net investment income | | | (172 | ) | | | 83 | | | | 99 | | | | (2,589 | ) |
| Accumulated net realized gain (loss) on investments and foreign currency | | | 1,613 | | | | 1,195 | | | | (627 | ) | | | (8,099 | ) |
| Net unrealized appreciation (depreciation) on: | | | | | | | | | | | | | | | | |
| Investments | | | 42,674 | | | | 39,762 | | | | 15,039 | | | | 132,819 | |
| Foreign currencies and translation of other assets and liabilities denominated in foreign currencies | | | — | | | | — | | | | — | | | | (65 | ) |
| Net Assets | | $ | 199,007 | | | $ | 219,678 | | | $ | 264,718 | | | $ | 721,291 | |
| | | | | | | | | | | | | | | | | |
| Institutional Class Shares: | | | | | | | | | | | | | | | | |
| Net Assets ($Dollars) | | $ | — | | | $ | 7,169,307 | | | $ | 238,259,669 | | | $ | — | |
| Total shares outstanding at end of period | | | — | | | | 524,947 | | | | 21,177,287 | | | | — | |
| Net asset value, offering and redemption price per share | | | | | | | | | | | | | | | | |
| (net assets ÷ shares outstanding) | | $ | — | | | $ | 13.66 | | | $ | 11.25 | | | $ | — | |
| | | | | | | | | | | | | | | | | |
| Class N Shares: | | | | | | | | | | | | | | | | |
| Net Assets ($Dollars) | | $ | 199,007,160 | | | $ | 104,561,768 | | | $ | 26,458,482 | | | $ | 721,290,548 | |
| Total shares outstanding at end of period | | | 5,483,607 | | | | 7,728,158 | | | | 2,357,103 | | | | 17,415,548 | |
| Net asset value, offering and redemption price per share | | | | | | | | | | | | | | | | |
| (net assets ÷ shares outstanding) | | $ | 36.29 | | | $ | 13.53 | | | $ | 11.23 | | | $ | 41.42 | |
| | | | | | | | | | | | | | | | | |
| Servicing Class Shares: | | | | | | | | | | | | | | | | |
| Net Assets ($Dollars) | | $ | — | | | $ | 107,947,247 | | | $ | — | | | $ | — | |
| Total shares outstanding at end of period | | | — | | | | 7,968,300 | | | | — | | | | — | |
| Net asset value, offering and redemption price per share | | | | | | | | | | | | | | | | |
| (net assets ÷ shares outstanding) | | $ | — | | | $ | 13.55 | | | $ | — | | | $ | — | |
Amounts designated as “—” are either $0 or have been rounded to $0.
| (1) | Cost of foreign currency $18,614 (000). |
See accompanying notes to financial statements.
CITY NATIONAL ROCHDALE FUNDS | PAGE 111
statements of operations (000)
For the six months ended March 31, 2015 (Unaudited)
| | | City National Rochdale Government Money Market Fund | | | City National Rochdale Prime Money Market Fund | | | City National Rochdale California Tax Exempt Money Market Fund | | | City National Rochdale Limited Maturity Fixed Income Fund | |
| INCOME: | | | | | | | | | | | | |
| Interest Income | | $ | 2,000 | | | $ | 916 | | | $ | 252 | | | $ | 172 | |
| Total Investment Income | | | 2,000 | | | | 916 | | | | 252 | | | | 172 | |
| | | | | | | | | | | | | | | | | |
| EXPENSES: | | | | | | | | | | | | | | | | |
| Investment Advisory Fees | | | 5,288 | | | | 1,339 | | | | 1,231 | | | | 68 | |
Shareholder Servicing Fees — Class N(1) | | | 8,462 | | | | 993 | | | | 1,741 | | | | 13 | |
Shareholder Servicing Fees — Class S(1) | | | 2,746 | | | | 875 | | | | 294 | | | | — | |
| Shareholder Servicing Fees — Servicing Class | | | 323 | | | | 515 | | | | 250 | | | | — | |
| Administration Fees | | | 387 | | | | 140 | | | | 127 | | | | 54 | |
| Transfer Agent Fees | | | 174 | | | | 44 | | | | 37 | | | | 1 | |
| Trustee Fees | | | 87 | | | | 31 | | | | 28 | | | | 11 | |
| Professional Fees | | | 198 | | | | 55 | | | | 48 | | | | 8 | |
| Custody Fees | | | 77 | | | | 23 | | | | 15 | | | | 1 | |
| Registration Fees | | | 111 | | | | 31 | | | | 23 | | | | 1 | |
| Printing Fees | | | 83 | | | | 21 | | | | 18 | | | | 1 | |
| Insurance and Other Expenses | | | 112 | | | | 35 | | | | 33 | | | | 3 | |
| Total Expenses | | | 18,048 | | | | 4,102 | | | | 3,845 | | | | 161 | |
| Less, Waivers and/or Reimbursements of: | | | | | | | | | | | | | | | | |
| Investment Advisory Fees | | | (4,634 | ) | | | (826 | ) | | | (1,262 | ) | | | (58 | ) |
Shareholder Servicing Fees — Class N(1) | | | (8,462 | ) | | | (993 | ) | | | (1,741 | ) | | | (6 | ) |
Shareholder Servicing Fees — Class S(1) | | | (2,746 | ) | | | (875 | ) | | | (294 | ) | | | — | |
| Shareholder Servicing Fees — Servicing Class | | | (323 | ) | | | (515 | ) | | | (250 | ) | | | — | |
| Administration Fees | | | (87 | ) | | | (31 | ) | | | (91 | ) | | | — | |
| Net Expenses | | | 1,796 | | | | 862 | | | | 207 | | | | 97 | |
| | | | | | | | | | | | | | | | | |
| Net Investment Income | | | 204 | | | | 54 | | | | 45 | | | | 75 | |
| Net Realized Gain from Securities Transactions | | | — | | | | — | | | | 36 | | | | 48 | |
| Net Change in Unrealized Depreciation on Investments | | | — | | | | — | | | | — | | | | (19 | ) |
| Net Increase in Net Assets Resulting from Operations | | $ | 204 | | | $ | 54 | | | $ | 81 | | | $ | 104 | |
| (1) | Includes class specific distribution expenses. |
Amounts designated as “—” are either $0 or have been rounded to $0.
See accompanying notes to financial statements.
CITY NATIONAL ROCHDALE FUNDS | PAGE 112
statements of operations (000)
For the six months ended March 31, 2015 (Unaudited)
| | | City National Rochdale Government Bond Fund | | | City National Rochdale Corporate Bond Fund | | | City National Rochdale California Tax Exempt Bond Fund | | | City National Rochdale Municipal High Income Fund | |
| INCOME: | | | | | | | | | | | | |
| Dividend Income | | $ | — | | | $ | — | | | $ | — | | | $ | 3 | |
| Dividend Income from Affiliated Investments | | | — | | | | — | | | | — | | | | 2 | |
| Interest Income | | | 890 | | | | 1,780 | | | | 878 | | | | 11,913 | |
| Total Investment Income | | | 890 | | | | 1,780 | | | | 878 | | | | 11,918 | |
| | | | | | | | | | | | | | | | | |
| EXPENSES: | | | | | | | | | | | | | | | | |
| Investment Advisory Fees | | | 366 | | | | 287 | | | | 119 | | | | 1,103 | |
Shareholder Servicing Fees — Class N(1) | | | 5 | | | | 11 | | | | 28 | | | | 606 | |
| Shareholder Servicing Fees — Servicing Class | | | 138 | | | | 174 | | | | 96 | | | | 310 | |
| Administration Fees | | | 66 | | | | 63 | | | | 59 | | | | 92 | |
| Transfer Agent Fees | | | 10 | | | | 9 | | | | 5 | | | | 29 | |
| Trustee Fees | | | 14 | | | | 14 | | | | 13 | | | | 20 | |
| Professional Fees | | | 15 | | | | 14 | | | | 12 | | | | 30 | |
| Custody Fees | | | 4 | | | | 6 | | | | 1 | | | | 7 | |
| Registration Fees | | | 4 | | | | 4 | | | | 2 | | | | 8 | |
| Printing Fees | | | 3 | | | | 3 | | | | 2 | | | | 10 | |
| Offering Costs | | | — | | | | — | | | | — | | | | 7 | |
| Insurance and Other Expenses | | | 6 | | | | 13 | | | | 8 | | | | 13 | |
| Total Expenses | | | 631 | | | | 598 | | | | 345 | | | | 2,235 | |
| Less, Waivers of: | | | | | | | | | | | | | | | | |
| Investment Advisory Fees | | | (38 | ) | | | (46 | ) | | | (54 | ) | | | — | |
| Net Expenses | | | 593 | | | | 552 | | | | 291 | | | | 2,235 | |
| | | | | | | | | | | | | | | | | |
| Net Investment Income | | | 297 | | | | 1,228 | | | | 587 | | | | 9,683 | |
| Net Realized Gain from Securities Transactions | | | 34 | | | | 189 | | | | 129 | | | | 98 | |
| Net Change in Unrealized Appreciation (Depreciation) on Investments | | | 1,312 | | | | (218 | ) | | | 72 | | | | 6,633 | |
| Net Increase in Net Assets Resulting from Operations | | $ | 1,643 | | | $ | 1,199 | | | $ | 788 | | | $ | 16,414 | |
| (1) | Includes class specific distribution expenses. |
Amounts designated as “—” are either $0 or have been rounded to $0.
See accompanying notes to financial statements.
CITY NATIONAL ROCHDALE FUNDS | PAGE 113
statements of operations/
consolidated statement of operations (000)
For the six months ended March 31, 2015 (Unaudited)
| | | City National Rochdale High Yield Bond Fund | | | City National Rochdale Intermediate Fixed Income Fund | | | City National Rochdale Fixed Income Opportunities Fund | | | City National Rochdale Multi-Asset Fund | |
| INCOME: | | | | | | | | | | | | |
| Dividend Income | | $ | 35 | | | $ | 228 | | | $ | — | | | $ | 229 | |
| Dividend Income from Affiliated Investments | | | — | | | | — | | | | — | | | | 82 | |
| Interest Income | | | 3,359 | | | | 3,044 | | | | 42,944 | | | | — | |
| Less: Foreign Taxes Withheld | | | — | | | | — | | | | (65 | ) | | | — | |
| Total Investment Income | | | 3,394 | | | | 3,272 | | | | 42,879 | | | | 311 | |
| | | | | | | | | | | | | | | | | |
| EXPENSES: | | | | | | | | | | | | | | | | |
| Investment Advisory Fees | | | 307 | | | | 458 | | | | 3,488 | | | | 61 | |
Shareholder Servicing Fees — Class N(1) | | | 60 | | | | 551 | | | | 3,488 | | | | 46 | |
| Shareholder Servicing Fees — Servicing Class | | | 48 | | | | — | | | | — | | | | 8 | |
| Administration Fees | | | 60 | | | | 70 | | | | 204 | | | | 54 | |
| Transfer Agent Fees | | | 6 | | | | 13 | | | | 83 | | | | 1 | |
| Trustee Fees | | | 13 | | | | 16 | | | | 47 | | | | 11 | |
| Professional Fees | | | 12 | | | | 17 | | | | 120 | | | | 9 | |
| Custody Fees | | | 6 | | | | 5 | | | | 213 | | | | 1 | |
| Registration Fees | | | 4 | | | | 6 | | | | 52 | | | | 1 | |
| Printing Fees | | | 2 | | | | 5 | | | | 28 | | | | 1 | |
| Insurance and Other Expenses | | | 17 | | | | 23 | | | | 74 | | | | 1 | |
| Total Expenses | | | 535 | | | | 1,164 | | | | 7,797 | | | | 194 | |
Recovery of Investment Advisory Fees Previously Waived(2) | | | — | | | | — | | | | — | | | | — | |
| Less, Waiver of: | | | | | | | | | | | | | | | | |
| Investment Advisory Fees | | | (68 | ) | | | (28 | ) | | | (91 | ) | | | (19 | ) |
| Net Expenses | | | 467 | | | | 1,136 | | | | 7,706 | | | | 175 | |
| | | | | | | | | | | | | | | | | |
| Net Investment Income | | | 2,927 | | | | 2,136 | | | | 35,173 | | | | 136 | |
| Net Realized Gain (Loss) from: | | | | | | | | | | | | | | | | |
| Securities Transactions | | | (606 | ) | | | 382 | | | | (20,649 | ) | | | 136 | |
| Affiliated Investments | | | — | | | | — | | | | — | | | | 39 | |
| Distributions of Realized Gains from Investment Company Shares | | | — | | | | — | | | | — | | | | 19 | |
| Forward Foreign Currency Contracts | | | — | | | | — | | | | 17,601 | | | | — | |
| Foreign Currency Transactions | | | 65 | | | | — | | | | (4,133 | ) | | | — | |
| Net Change in Unrealized Appreciation (Depreciation) on: | | | | | | | | | | | | | | | | |
| Investments | | | (2,070 | ) | | | 1,620 | | | | (41,160 | ) | | | 269 | |
| Affiliated Investments | | | — | | | | — | | | | — | | | | 16 | |
| Forward Foreign Currency Contracts | | | 14 | | | | — | | | | (368 | ) | | | — | |
| Foreign Currency Transactions | | | — | | | | — | | | | 3 | | | | — | |
| Net Increase (Decrease) in Net Assets Resulting from Operations | | $ | 330 | | | $ | 4,138 | | | $ | (13,533 | ) | | $ | 615 | |
| (1) | Includes class specific distribution expenses. |
| (2) | See Note 4 for Advisory Fees recovered. |
Amounts designated as “—” are either $0 or have been rounded to $0.
See accompanying notes to financial statements.
CITY NATIONAL ROCHDALE FUNDS | PAGE 114
statements of operations/
consolidated statement of operations (000)
For the six months ended March 31, 2015 (Unaudited)
| | | City National Rochdale Dividend & Income Fund | | | City National Rochdale U.S. Core Equity Fund | | | City National Rochdale Socially Responsible Fund | | | City National Rochdale Emerging Markets Fund | |
| INCOME: | | | | | | | | | | | | |
| Dividend Income | | $ | 3,274 | | | $ | 1,470 | | | $ | 2,781 | | | $ | 2,570 | |
| Dividend Income from Affiliated Investments | | | — | | | | — | | | | — | | | | 1 | |
| Interest Income | | | 473 | | | | — | | | | — | | | | — | |
| Less: Foreign Taxes Withheld | | | (3 | ) | | | (5 | ) | | | — | | | | (53 | ) |
| Total Investment Income | | | 3,744 | | | | 1,465 | | | | 2,781 | | | | 2,518 | |
| | | | | | | | | | | | | | | | | |
| EXPENSES: | | | | | | | | | | | | | | | | |
| Investment Advisory Fees | | | 472 | | | | 431 | | | | 935 | | | | 3,171 | |
Shareholder Servicing Fees — Class N(1) | | | 472 | | | | 252 | | | | 67 | | | | 1,585 | |
| Shareholder Servicing Fees — Servicing Class | | | — | | | | 134 | | | | — | | | | — | |
| Administration Fees | | | 67 | | | | 69 | | | | 72 | | | | 104 | |
| Transfer Agent Fees | | | 11 | | | | 12 | | | | 15 | | | | 37 | |
| Trustee Fees | | | 15 | | | | 15 | | | | 15 | | | | 22 | |
| Professional Fees | | | 16 | | | | 16 | | | | 20 | | | | 36 | |
| Custody Fees | | | 5 | | | | 5 | | | | 2 | | | | 179 | |
| Registration Fees | | | 4 | | | | 6 | | | | 14 | | | | 22 | |
| Printing Fees | | | 4 | | | | 4 | | | | 5 | | | | 12 | |
| Insurance and Other Expenses | | | 5 | | | | 6 | | | | 3 | | | | 33 | |
| Total Expenses | | | 1,071 | | | | 950 | | | | 1,148 | | | | 5,201 | |
| Less, Waiver of: | | | | | | | | | | | | | | | | |
| Investment Advisory Fees | | | (22 | ) | | | — | | | | (3 | ) | | | (96 | ) |
| Shareholder Servicing Fees — Class N | | | — | | | | — | | | | (33 | ) | | | — | |
| Net Expenses | | | 1,049 | | | | 950 | | | | 1,112 | | | | 5,105 | |
| | | | | | | | | | | | | | | | | |
| Net Investment Income (Loss) | | | 2,695 | | | | 515 | | | | 1,669 | | | | (2,587 | ) |
| Net Realized Gain (Loss) from: | | | | | | | | | | | | | | | | |
| Securities Transactions | | | 4,380 | | | | 1,766 | | | | 312 | | | | (5,990 | ) |
| Foreign Currency Transactions | | | — | | | | — | | | | — | | | | (598 | ) |
| Net Change in Unrealized Appreciation on: | | | | | | | | | | | | | | | | |
| Investments | | | 1,375 | | | | 10,120 | | | | 1,392 | | | | 51,510 | |
| Foreign Currency Transactions | | | — | | | | — | | | | — | | | | 262 | |
| Net Increase in Net Assets Resulting from Operations | | $ | 8,450 | | | $ | 12,401 | | | $ | 3,373 | | | $ | 42,597 | |
| (1) | Includes class specific distribution expenses. |
Amounts designated as “—” are either $0 or have been rounded to $0.
See accompanying notes to financial statements.
CITY NATIONAL ROCHDALE FUNDS | PAGE 115
statements of changes in net assets (000)
For the six months ended March 31, 2015 (Unaudited) and the year ended September 30, 2014
| | | City National Rochdale Government Money Market Fund | | | City National Rochdale Prime Money Market Fund | |
| | | 2015 | | | 2014 | | | 2015 | | | 2014 | |
| OPERATIONS: | | | | | | | | | | | | |
| Net Investment Income | | $ | 204 | | | $ | 378 | | | $ | 54 | | | $ | 120 | |
| Net Realized Gain (Loss) from Security Transactions | | | — | | | | 2 | | | | — | | | | 4 | |
| Net Change in Unrealized Appreciation (Depreciation) on Investments | | | — | | | | — | | | | — | | | | — | |
| Net Increase in Net Assets Resulting from Operations | | | 204 | | | | 380 | | | | 54 | | | | 124 | |
| | | | | | | | | | | | | | | | | |
| DIVIDENDS AND DISTRIBUTIONS FROM: | | | | | | | | | | | | | | | | |
| Net Investment Income: | | | | | | | | | | | | | | | | |
| Institutional Class | | | — | | | | — | | | | (3 | ) | | | (4 | ) |
| Class N | | | (154 | ) | | | (300 | ) | | | (18 | ) | | | (36 | ) |
| Class S | | | (37 | ) | | | (61 | ) | | | (12 | ) | | | (23 | ) |
| Servicing Class | | | (13 | ) | | | (17 | ) | | | (21 | ) | | | (57 | ) |
| Realized Capital Gains: | | | | | | | | | | | | | | | | |
| Institutional Class | | | — | | | | — | | | | — | | | | — | |
| Class N | | | — | | | | — | | | | — | | | | — | |
| Servicing Class | | | — | | | | — | | | | — | | | | — | |
| Total Dividends and Distributions | | | (204 | ) | | | (378 | ) | | | (54 | ) | | | (120 | ) |
| | | | | | | | | | | | | | | | | |
CAPITAL SHARE TRANSACTIONS:(1) | | | | | | | | | | | | | | | | |
| Institutional Class: | | | | | | | | | | | | | | | | |
| Shares Issued | | | — | | | | — | | | | 57,672 | | | | 177,330 | |
| Shares Issued in Lieu of Dividends and Distributions | | | — | | | | — | | | | 2 | | | | — | |
| Shares Redeemed | | | — | | | | — | | | | (45,351 | ) | | | (134,563 | ) |
| Increase (Decrease) in Net Assets from Institutional Class Share Transactions | | | — | | | | — | | | | 12,323 | | | | 42,767 | |
| | | | | | | | | | | | | | | | | |
| Class N: | | | | | | | | | | | | | | | | |
| Shares Issued | | | 1,996,940 | | | | 4,544,028 | | | | 389,867 | | | | 712,240 | |
| Shares Issued in Lieu of Dividends and Distributions | | | 129 | | | | 249 | | | | 12 | | | | 24 | |
| Shares Redeemed | | | (2,240,529 | ) | | | (4,410,324 | ) | | | (408,230 | ) | | | (803,775 | ) |
| Increase (Decrease) in Net Assets from Class N Share Transactions | | | (243,460 | ) | | | 133,953 | | | | (18,351 | ) | | | (91,511 | ) |
| | | | | | | | | | | | | | | | | |
| Class S: | | | | | | | | | | | | | | | | |
| Shares Issued | | | 526,561 | | | | 1,522,771 | | | | 496,724 | | | | 869,219 | |
| Shares Issued in Lieu of Dividends and Distributions | | | — | | | | — | | | | — | | | | — | |
| Shares Redeemed | | | (468,642 | ) | | | (1,291,990 | ) | | | (458,218 | ) | | | (878,235 | ) |
| Increase (Decrease) in Net Assets from Class S Share Transactions | | | 57,919 | | | | 230,781 | | | | 38,506 | | | | (9,016 | ) |
| | | | | | | | | | | | | | | | | |
| Servicing Class: | | | | | | | | | | | | | | | | |
| Shares Issued | | | 842,014 | | | | 1,008,445 | | | | 551,540 | | | | 1,057,487 | |
| Shares Issued in Lieu of Dividends and Distributions | | | — | | | | — | | | | 5 | | | | 9 | |
| Shares Redeemed | | | (835,676 | ) | | | (924,910 | ) | | | (650,489 | ) | | | (1,207,309 | ) |
| Increase (Decrease) in Net Assets from Servicing Class Share Transactions | | | 6,338 | | | | 83,535 | | | | (98,944 | ) | | | (149,813 | ) |
| | | | | | | | | | | | | | | | | |
| Net Increase (Decrease) in Net Assets from Share Transactions | | | (179,203 | ) | | | 448,269 | | | | (66,466 | ) | | | (207,573 | ) |
| Total Increase (Decrease) in Net Assets | | | (179,203 | ) | | | 448,271 | | | | (66,466 | ) | | | (207,569 | ) |
| | | | | | | | | | | | | | | | | |
| NET ASSETS: | | | | | | | | | | | | | | | | |
| Beginning of Year/Period | | | 4,092,241 | | | | 3,643,970 | | | | 1,049,308 | | | | 1,256,877 | |
| End of Year/Period | | $ | 3,913,038 | | | $ | 4,092,241 | | | $ | 982,842 | | | $ | 1,049,308 | |
| Undistributed (Distributions in excess of) net investment income | | $ | — | | | $ | — | | | $ | — | | | $ | — | |
| (1) | See Note 8 for shares issued and redeemed. |
Amounts designated as “—” are either $0 or have been rounded to $0.
See accompanying notes to financial statements.
CITY NATIONAL ROCHDALE FUNDS | PAGE 116
City National Rochdale California Tax Exempt Money Market Fund | | | City National Rochdale Limited Maturity Fixed Income Fund | | | City National Rochdale Government Bond Fund | | | City National Rochdale Corporate Bond Fund | |
| 2015 | | | 2014 | | | 2015 | | | 2014 | | | 2015 | | | 2014 | | | 2015 | | | 2014 | |
| | | | | | | | | | | | | | | | | | | | | | |
| $ | 45 | | | $ | 96 | | | $ | 75 | | | $ | 199 | | | $ | 297 | | | $ | 738 | | | $ | 1,228 | | | $ | 2,226 | |
| | 36 | | | | (2 | ) | | | 48 | | | | 123 | | | | 34 | | | | 1,551 | | | | 189 | | | | 1,186 | |
| | — | | | | — | | | | (19 | ) | | | (65 | ) | | | 1,312 | | | | (1,205 | ) | | | (218 | ) | | | (775 | ) |
| | 81 | | | | 94 | | | | 104 | | | | 257 | | | | 1,643 | | | | 1,084 | | | | 1,199 | | | | 2,637 | |
| | | | | | | | | | | | | | | | | | | | | | | | | | | | | | | |
| | | | | | | | | | | | | | | | | | | | | | | | | | | | | | | |
| | | | | | | | | | | | | | | | | | | | | | | | | | | | | | | |
| | — | | | | — | | | | (67 | ) | | | (184 | ) | | | (148 | ) | | | (402 | ) | | | — | | | | — | |
| | (31 | ) | | | (69 | ) | | | (9 | ) | | | (20 | ) | | | (1 | ) | | | (2 | ) | | | (32 | ) | | | (44 | ) |
| | (4 | ) | | | (7 | ) | | | — | | | | — | | | | — | | | | — | | | | — | | | | — | |
| | (10 | ) | | | (20 | ) | | | — | | | | — | | | | (146 | ) | | | (346 | ) | | | (1,191 | ) | | | (2,181 | ) |
| | | | | | | | | | | | | | | | | | | | | | | | | | | | | | | |
| | — | | | | — | | | | — | | | | — | | | | — | | | | — | | | | — | | | | — | |
| | — | | | | — | | | | — | | | | — | | | | — | | | | — | | | | (35 | ) | | | (20 | ) |
| | — | | | | — | | | | — | | | | — | | | | — | | | | — | | | | (1,106 | ) | | | (914 | ) |
| | (45 | ) | | | (96 | ) | | | (76 | ) | | | (204 | ) | | | (295 | ) | | | (750 | ) | | | (2,364 | ) | | | (3,159 | ) |
| | | | | | | | | | | | | | | | | | | | | | | | | | | | | | | |
| | | | | | | | | | | | | | | | | | | | | | | | | | | | | | | |
| | | | | | | | | | | | | | | | | | | | | | | | | | | | | | | |
| | — | | | | — | | | | 568 | | | | 744 | | | | 5,809 | | | | 9,605 | | | | — | | | | — | |
| | — | | | | — | | | | 33 | | | | 77 | | | | 144 | | | | 338 | | | | — | | | | — | |
| | — | | | | — | | | | (2,130 | ) | | | (18,040 | ) | | | (3,398 | ) | | | (9,682 | ) | | | — | | | | — | |
| | — | | | | — | | | | (1,529 | ) | | | (17,219 | ) | | | 2,555 | | | | 261 | | | | — | | | | — | |
| | | | | | | | | | | | | | | | | | | | | | | | | | | | | | | |
| | | | | | | | | | | | | | | | | | | | | | | | | | | | | | | |
| | 353,057 | | | | 988,104 | | | | 1,359 | | | | 1,191 | | | | 130 | | | | 385 | | | | 1,360 | | | | 1,625 | |
| | 31 | | | | 67 | | | | 9 | | | | 20 | | | | — | | | | 1 | | | | 41 | | | | 47 | |
| | (367,782 | ) | | | (1,037,816 | ) | | | (1,560 | ) | | | (1,125 | ) | | | (323 | ) | | | (871 | ) | | | (936 | ) | | | (750 | ) |
| | (14,694 | ) | | | (49,645 | ) | | | (192 | ) | | | 86 | | | | (193 | ) | | | (485 | ) | | | 465 | | | | 922 | |
| | | | | | | | | | | | | | | | | | | | | | | | | | | | | | | |
| | | | | | | | | | | | | | | | | | | | | | | | | | | | | | | |
| | 198,165 | | | | 372,122 | | | | — | | | | — | | | | — | | | | — | | | | — | | | | — | |
| | — | | | | — | | | | — | | | | — | | | | — | | | | — | | | | — | | | | — | |
| | (217,385 | ) | | | (370,022 | ) | | | — | | | | — | | | | — | | | | — | | | | — | | | | — | |
| | (19,220 | ) | | | 2,100 | | | | — | | | | — | | | | — | | | | — | | | | — | | | | — | |
| | | | | | | | | | | | | | | | | | | | | | | | | | | | | | | |
| | | | | | | | | | | | | | | | | | | | | | | | | | | | | | | |
| | 429,758 | | | | 698,593 | | | | — | | | | — | | | | 11,867 | | | | 28,483 | | | | 17,128 | | | | 43,257 | |
| | — | | | | — | | | | — | | | | — | | | | 71 | | | | 193 | | | | 198 | | | | 241 | |
| | (398,404 | ) | | | (662,963 | ) | | | — | | | | — | | | | (16,469 | ) | | | (30,360 | ) | | | (19,580 | ) | | | (35,408 | ) |
| | 31,354 | | | | 35,630 | | | | — | | | | — | | | | (4,531 | ) | | | (1,684 | ) | | | (2,254 | ) | | | 8,090 | |
| | | | | | | | | | | | | | | | | | | | | | | | | | | | | | | |
| | (2,560 | ) | | | (11,915 | ) | | | (1,721 | ) | | | (17,133 | ) | | | (2,169 | ) | | | (1,908 | ) | | | (1,789 | ) | | | 9,012 | |
| | (2,524 | ) | | | (11,917 | ) | | | (1,693 | ) | | | (17,080 | ) | | | (821 | ) | | | (1,574 | ) | | | (2,954 | ) | | | 8,490 | |
| | | | | | | | | | | | | | | | | | | | | | | | | | | | | | | |
| | | | | | | | | | | | | | | | | | | | | | | | | | | | | | | |
| | 906,342 | | | | 918,259 | | | | 27,655 | | | | 44,735 | | | | 172,234 | | | | 173,808 | | | | 146,774 | | | | 138,284 | |
| $ | 903,818 | | | $ | 906,342 | | | $ | 25,962 | | | $ | 27,655 | | | $ | 171,413 | | | $ | 172,234 | | | $ | 143,820 | | | $ | 146,774 | |
| $ | — | | | $ | — | | | $ | (2 | ) | | $ | (1 | ) | | $ | 4 | | | $ | 2 | | | $ | 6 | | | $ | 1 | |
See accompanying notes to financial statements.
CITY NATIONAL ROCHDALE FUNDS | PAGE 117
statements of changes in net assets/
consolidated statement of changes in net assets (000)
For the six months ended March 31, 2015 (Unaudited) and the year ended September 30, 2014
| | | City National Rochdale California Tax Exempt Bond Fund | | | City National Rochdale Municipal High Income Fund | |
| | | 2015 | | | 2014 | | | 2015 | | | 2014 | |
| OPERATIONS: | | | | | | | | | | | | |
| Net Investment Income | | $ | 587 | | | $ | 1,008 | | | $ | 9,683 | | | $ | 7,598 | |
| Net Realized Gain (Loss) from: | | | | | | | | | | | | | | | | |
| Security Transactions and Affiliated Investments | | | 129 | | | | 461 | | | | 98 | | | | 74 | |
| Distributions of Realized Gains from Investment Company Shares | | | — | | | | — | | | | — | | | | — | |
| Foreign Currency Transactions | | | — | | | | — | | | | — | | | | — | |
| Net Change in Unrealized Appreciation (Depreciation) on: | | | | | | | | | | | | | | | | |
| Investments and Affiliated Investments | | | 72 | | | | 1,052 | | | | 6,633 | | | | 12,861 | |
| Foreign Currency Transactions | | | — | | | | — | | | | — | | | | — | |
| Net Increase (Decrease) in Net Assets Resulting from Operations | | | 788 | | | | 2,521 | | | | 16,414 | | | | 20,533 | |
| DIVIDENDS AND DISTRIBUTIONS FROM: | | | | | | | | | | | | | | | | |
| Net Investment Income: | | | | | | | | | | | | | | | | |
| Institutional Class | | | — | | | | — | | | | — | | | | — | |
| Class N | | | (61 | ) | | | (115 | ) | | | (4,634 | ) | | | (3,407 | ) |
| Servicing Class | | | (522 | ) | | | (893 | ) | | | (5,049 | ) | | | (4,062 | ) |
| Realized Capital Gains: | | | | | | | | | | | | | | | | |
| Institutional Class | | | — | | | | — | | | | — | | | | — | |
| Class N | | | (52 | ) | | | (17 | ) | | | (36 | ) | | | — | |
| Servicing Class | | | (355 | ) | | | (110 | ) | | | (38 | ) | | | — | |
| Total Dividends and Distributions | | | (990 | ) | | | (1,135 | ) | | | (9,757 | ) | | | (7,469 | ) |
CAPITAL SHARE TRANSACTIONS:(1) | | | | | | | | | | | | | | | | |
| Institutional Class: | | | | | | | | | | | | | | | | |
| Shares Issued | | | — | | | | — | | | | — | | | | — | |
Shares Issued from Merger(3) | | | — | | | | — | | | | — | | | | — | |
| Shares Issued in Lieu of Dividends and Distributions | | | — | | | | — | | | | — | | | | — | |
| Shares Redeemed | | | — | | | | — | | | | — | | | | — | |
| Increase (Decrease) in Net Assets from Institutional Class Share Transactions | | | — | | | | — | | | | — | | | | — | |
| Class N: | | | | | | | | | | | | | | | | |
| Shares Issued | | | 2,591 | | | | 4,384 | | | | 107,432 | | | | 212,375 | |
Shares Issued from Merger(3) | | | — | | | | — | | | | — | | | | — | |
| Shares Issued in Lieu of Dividends and Distributions | | | 71 | | | | 75 | | | | 3,113 | | | | 2,227 | |
| Shares Redeemed | | | (1,754 | ) | | | (1,893 | ) | | | (13,848 | ) | | | (19,319 | ) |
| Increase (Decrease) in Net Assets from Class N Share Transactions | | | 908 | | | | 2,566 | | | | 96,697 | | | | 195,283 | |
| Servicing Class: | | | | | | | | | | | | | | | | |
| Shares Issued | | | 20,064 | | | | 26,391 | | | | 70,260 | | | | 220,241 | |
| Shares Issued in Lieu of Dividends and Distributions | | | 79 | | | | 97 | | | | 231 | | | | 74 | |
| Shares Redeemed | | | (7,692 | ) | | | (16,133 | ) | | | (19,824 | ) | | | (6,611 | ) |
| Increase (Decrease) in Net Assets from Servicing Class Share Transactions | | | 12,451 | | | | 10,355 | | | | 50,667 | | | | 213,704 | |
| Net Increase (Decrease) in Net Assets from Share Transactions | | | 13,359 | | | | 12,921 | | | | 147,364 | | | | 408,987 | |
| Total Increase (Decrease) in Net Assets | | | 13,157 | | | | 14,307 | | | | 154,021 | | | | 422,051 | |
| NET ASSETS: | | | | | | | | | | | | | | | | |
| Beginning of Year/Period | | | 81,653 | | | | 67,346 | | | | 422,051 | | | | — | |
| End of Year/Period | | $ | 94,810 | | | $ | 81,653 | | | $ | 576,072 | | | $ | 422,051 | |
| Undistributed (distribution in excess of) net investment income | | $ | 4 | | | $ | — | | | $ | 130 | | | $ | 130 | |
| (1) | See Note 8 for shares issued and redeemed. |
| (2) | Institutional Class ceased operations on January 31, 2014. |
Amounts designated as “—” are either $0 or have been rounded to $0.
See accompanying notes to financial statements.
CITY NATIONAL ROCHDALE FUNDS | PAGE 118
| City National Rochdale High Yield Bond Fund | | | City National Rochdale Intermediate Fixed Income Fund | | | City National Rochdale Fixed Income Opportunities Fund | | | City National Rochdale Multi-Asset Fund (2) | |
| 2015 | | | 2014 | | | 2015 | | | 2014 | | | 2015 | | | 2014 | | | 2015 | | | 2014 | |
| | | | | | | | | | | | | | | | | | | | | | |
| $ | 2,927 | | | $ | 7,711 | | | $ | 2,136 | | | $ | 4,535 | | | $ | 35,173 | | | $ | 56,680 | | | $ | 136 | | | $ | 199 | |
| | | | | | | | | | | | | | | | | | | | | | | | | | | | | | | |
| | (606 | ) | | | 5,028 | | | | 382 | | | | (123 | ) | | | (20,649 | ) | | | 4,871 | | | | 175 | | | | 1,226 | |
| | — | | | | — | | | | — | | | | — | | | | — | | | | — | | | | 19 | | | | 38 | |
| | 65 | | | | — | | | | — | | | | — | | | | 13,468 | | | | 5,476 | | | | — | | | | — | |
| | | | | | | | | | | | | | | | | | | | | | | | | | | | | | | |
| | (2,070 | ) | | | (1,148 | ) | | | 1,620 | | | | 2,982 | | | | (41,525 | ) | | | (2,897 | ) | | | 285 | | | | (275 | ) |
| | 14 | | | | — | | | | — | | | | — | | | | — | | | | 2,649 | | | | — | | | | — | |
| | 330 | | | | 11,591 | | | | 4,138 | | | | 7,394 | | | | (13,533 | ) | | | 66,779 | | | | 615 | | | | 1,188 | |
| | | | | | | | | | | | | | | | | | | | | | | | | | | | | | | |
| | | | | | | | | | | | | | | | | | | | | | | | | | | | | | | |
| | (1,193 | ) | | | (2,421 | ) | | | (99 | ) | | | (611 | ) | | | — | | | | — | | | | — | | | | (28 | ) |
| | (663 | ) | | | (1,899 | ) | | | (2,020 | ) | | | (3,973 | ) | | | (43,054 | ) | | | (54,067 | ) | | | (109 | ) | | | (149 | ) |
| | (1,111 | ) | | | (3,386 | ) | | | — | | | | — | | | | — | | | | — | | | | (50 | ) | | | (57 | ) |
| | | | | | | | | | | | | | | | | | | | | | | | | | | | | | | |
| | (1,868 | ) | | | (90 | ) | | | — | | | | — | | | | — | | | | — | | | | — | | | | — | |
| | (1,142 | ) | | | (83 | ) | | | — | | | | — | | | | (6,421 | ) | | | (5,256 | ) | | | — | | | | — | |
| | (1,982 | ) | | | (208 | ) | | | — | | | | — | | | | — | | | | — | | | | — | | | | — | |
| | (7,959 | ) | | | (8,087 | ) | | | (2,119 | ) | | | (4,584 | ) | | | (49,475 | ) | | | (59,323 | ) | | | (159 | ) | | | (234 | ) |
| | | | | | | | | | | | | | | | | | | | | | | | | | | | | | | |
| | | | | | | | | | | | | | | | | | | | | | | | | | | | | | | |
| | 3,444 | | | | 7,321 | | | | 1,023 | | | | 1,175 | | | | — | | | | — | | | | — | | | | 783 | |
| | — | | | | — | | | | — | | | | 44,899 | | | | — | | | | — | | | | — | | | | — | |
| | 2,921 | | | | 2,362 | | | | 99 | | | | 648 | | | | — | | | | — | | | | — | | | | 27 | |
| | (4,016 | ) | | | (9,031 | ) | | | (14 | ) | | | (38,696 | ) | | | — | | | | — | | | | — | | | | (7,291 | ) |
| | 2,349 | | | | 652 | | | | 1,108 | | | | 8,026 | | | | — | | | | — | | | | — | | | | (6,481 | ) |
| | | | | | | | | | | | | | | | | | | | | | | | | | | | | | | |
| | 2,671 | | | | 4,360 | | | | 50,484 | | | | 98,095 | | | | 331,049 | | | | 629,065 | | | | 1,007 | | | | 650 | |
| | — | | | | — | | | | — | | | | — | | | | — | | | | 58,518 | | | | — | | | | — | |
| | 1,002 | | | | 1,220 | | | | 1,404 | | | | 2,343 | | | | 29,276 | | | | 32,489 | | | | 78 | | | | 105 | |
| | (5,405 | ) | | | (14,526 | ) | | | (17,713 | ) | | | (53,966 | ) | | | (179,306 | ) | | | (260,475 | ) | | | (1,865 | ) | | | (4,588 | ) |
| | (1,732 | ) | | | (8,946 | ) | | | 34,175 | | | | 46,472 | | | | 181,019 | | | | 459,597 | | | | (780 | ) | | | (3,833 | ) |
| | | | | | | | | | | | | | | | | | | | | | | | | | | | | | | |
| | 7,141 | | | | 26,803 | | | | — | | | | — | | | | — | | | | — | | | | 2,008 | | | | 1,149 | |
| | 543 | | | | 557 | | | | — | | | | — | | | | — | | | | — | | | | 36 | | | | 33 | |
| | (10,927 | ) | | | (74,330 | ) | | | — | | | | — | | | | — | | | | — | | | | (3,332 | ) | | | (228 | ) |
| | (3,243 | ) | | | (46,970 | ) | | | — | | | | — | | | | — | | | | — | | | | (1,288 | ) | | | 954 | |
| | (2,626 | ) | | | (55,264 | ) | | | 35,283 | | | | 54,498 | | | | 181,019 | | | | 459,597 | | | | (2,068 | ) | | | (9,360 | ) |
| | (10,255 | ) | | | (51,760 | ) | | | 37,302 | | | | 57,308 | | | | 118,011 | | | | 467,053 | | | | (1,612 | ) | | | (8,406 | ) |
| | | | | | | | | | | | | | | | | | | | | | | | | | | | | | | |
| | 110,779 | | | | 162,539 | | | | 213,048 | | | | 155,740 | | | | 1,391,497 | | | | 924,444 | | | | 24,805 | | | | 33,211 | |
| $ | 100,524 | | | $ | 110,779 | | | $ | 250,350 | | | $ | 213,048 | | | $ | 1,509,508 | | | $ | 1,391,497 | | | $ | 23,193 | | | $ | 24,805 | |
| $ | (34 | ) | | $ | 6 | | | $ | 80 | | | $ | 63 | | | $ | (924 | ) | | $ | (8,772 | ) | | $ | (23 | ) | | $ | — | |
See accompanying notes to financial statements.
Amounts designated as “—” are either $0 or have been rounded to $0.
See accompanying notes to financial statements.
CITY NATIONAL ROCHDALE FUNDS | PAGE 119
statements of changes in net assets/
consolidated statement of changes in net assets (000)
For the six months ended March 31, 2015 (Unaudited) and the year ended September 30, 2014
| | | City National Rochdale
Dividend & Income Fund | |
| | | 2015 | | | 2014 | |
| OPERATIONS: | | | | | | |
| Net Investment Income (Loss) | | $ | 2,695 | | | $ | 4,785 | |
| Net Realized Gain (Loss) from: | | | | | | | | |
| Security Transactions | | | 4,380 | | | | 5,858 | |
| Distributions of Realized Gains from Investment Company Shares | | | — | | | | — | |
| Foreign Currency Transactions | | | — | | | | — | |
| Net Change in Unrealized Appreciation (Depreciation) on: | | | | | | | | |
| Investments | | | 1,375 | | | | 9,234 | |
| Foreign Currency Transactions | | | — | | | | — | |
| Net Increase in Net Assets Resulting from Operations | | | 8,450 | | | | 19,877 | |
| DIVIDENDS AND DISTRIBUTIONS FROM: | | | | | | | | |
| Net Investment Income: | | | | | | | | |
| Institutional Class | | | — | | | | — | |
| Class N | | | (2,863 | ) | | | (5,449 | ) |
| Servicing Class | | | — | | | | — | |
| Realized Capital Gains: | | | | | | | | |
| Institutional Class | | | — | | | | — | |
| Class N | | | — | | | | — | |
| Servicing Class | | | — | | | | — | |
| Return of Capital: | | | | | | | | |
| Class N | | | — | | | | — | |
| Total Dividends and Distributions | | | (2,863 | ) | | | (5,449 | ) |
CAPITAL SHARE TRANSACTIONS:(1) | | | | | | | | |
| Institutional Class: | | | | | | | | |
| Shares Issued | | | — | | | | — | |
Shares Issued from Merger(2) | | | — | | | | — | |
| Shares Issued in Lieu of Dividends and Distributions | | | — | | | | — | |
| Shares Redeemed | | | — | | | | — | |
| Increase in Net Assets from Institutional Class Share Transactions | | | — | | | | — | |
| Class N: | | | | | | | | |
| Shares Issued | | | 43,799 | | | | 68,568 | |
Shares Issued from Merger(2) | | | — | | | | — | |
| Shares Issued in Lieu of Dividends and Distributions | | | 1,726 | | | | 3,535 | |
| Shares Redeemed | | | (25,022 | ) | | | (69,421 | ) |
| Increase (Decrease) in Net Assets from Class N Share Transactions | | | 20,503 | | | | 2,682 | |
| Servicing Class: | | | | | | | | |
| Shares Issued | | | — | | | | — | |
| Shares Issued in Lieu of Dividends and Distributions | | | — | | | | — | |
| Shares Redeemed | | | — | | | | — | |
| Increase in Net Assets from Servicing Class Share Transactions | | | — | | | | — | |
| Net Increase in Net Assets from Share Transactions | | | 20,503 | | | | 2,682 | |
| Total Increase in Net Assets | | | 26,090 | | | | 17,110 | |
| NET ASSETS: | | | | | | | | |
| Beginning of Year/Period | | | 172,917 | | | | 155,807 | |
| End of Year/Period | | $ | 199,007 | | | $ | 172,917 | |
| Undistributed (Distributions in excess of) net investment income | | $ | (172 | ) | | $ | (4 | ) |
| (1) | See Note 8 for shares issued and redeemed. |
Amounts designated as “—” are either $0 or have been rounded to $0.
See accompanying notes to financial statements.
CITY NATIONAL ROCHDALE FUNDS | PAGE 120
City National Rochdale U.S. Core Equity Fund | | | City National Rochdale Socially Responsible Equity Fund | | | City National Rochdale Emerging Markets Fund | |
| 2015 | | | 2014 | | | 2015 | | | 2014 | | | 2015 | | | 2014 | |
| | | | | | | | | | | | | | | | |
| $ | 515 | | | $ | 468 | | | $ | 1,669 | | | $ | 1,396 | | | $ | (2,587 | ) | | $ | 2,603 | |
| | | | | | | | | | | | | | | | | | | | | | | |
| | 1,766 | | | | 19,801 | | | | 312 | | | | 6,101 | | | | (5,990 | ) | | | (405 | ) |
| | — | | | | — | | | | — | | | | — | | | | — | | | | — | |
| | — | | | | — | | | | — | | | | — | | | | (598 | ) | | | (579 | ) |
| | | | | | | | | | | | | | | | | | | | | | | |
| | 10,120 | | | | 10,820 | | | | 1,392 | | | | (169 | ) | | | 51,510 | | | | 53,480 | |
| | — | | | | — | | | | — | | | | — | | | | 262 | | | | (330 | ) |
| | 12,401 | | | | 31,089 | | | | 3,373 | | | | 7,328 | | | | 42,597 | | | | 54,769 | |
| | | | | | | | | | | | | | | | | | | | | | | |
| | | | | | | | | | | | | | | | | | | | | | | |
| | (26 | ) | | | (82 | ) | | | (1,438 | ) | | | (939 | ) | | | — | | | | — | |
| | (140 | ) | | | (82 | ) | | | (132 | ) | | | (461 | ) | | | (2,025 | ) | | | (1,072 | ) |
| | (266 | ) | | | (306 | ) | | | — | | | | — | | | | — | | | | — | |
| | | | | | | | | | | | | | | | | | | | | | | |
| | (621 | ) | | | — | | | | (5,652 | ) | | | (7,405 | ) | | | — | | | | — | |
| | (9,079 | ) | | | (1,261 | ) | | | (672 | ) | | | (5,241 | ) | | | — | | | | — | |
| | (10,078 | ) | | | (1,354 | ) | | | — | | | | — | | | | — | | | | — | |
| | | | | | | | | | | | | | | | | | | | | | | |
| | — | | | | — | | | | — | | | | — | | | | — | | | | — | |
| | (20,210 | ) | | | (3,085 | ) | | | (7,894 | ) | | | (14,046 | ) | | | (2,025 | ) | | | (1,072 | ) |
| | | | | | | | | | | | | | | | | | | | | | | |
| | | | | | | | | | | | | | | | | | | | | | | |
| | — | | | | 1,318 | | | | 80,887 | | | | 131,401 | | | | — | | | | — | |
| | — | | | | 50,817 | | | | — | | | | — | | | | — | | | | — | |
| | 647 | | | | 81 | | | | 7,059 | | | | 8,341 | | | | — | | | | — | |
| | (8 | ) | | | (47,918 | ) | | | (18,454 | ) | | | (7,405 | ) | | | — | | | | — | |
| | 639 | | | | 4,298 | | | | 69,492 | | | �� | 132,337 | | | | — | | | | — | |
| | | | | | | | | | | | | | | | | | | | | | | |
| | 10,325 | | | | 27,776 | | | | 2,610 | | | | 11,122 | | | | 155,927 | | | | 295,842 | |
| | — | | | | 2,752 | | | | — | | | | — | | | | — | | | | — | |
| | 8,078 | | | | 1,216 | | | | 796 | | | | 5,563 | | | | 1,003 | | | | 530 | |
| | (7,665 | ) | | | (13,106 | ) | | | (3,252 | ) | | | (19,455 | ) | | | (58,701 | ) | | | (61,619 | ) |
| | 10,738 | | | | 18,638 | | | | 154 | | | | (2,770 | ) | | | 98,229 | | | | 234,753 | |
| | | | | | | | | | | | | | | | | | | | | | | |
| | 23,643 | | | | 38,171 | | | | — | | | | — | | | | — | | | | — | |
| | 61 | | | | 11 | | | | — | | | | — | | | | — | | | | — | |
| | (14,804 | ) | | | (16,976 | ) | | | — | | | | — | | | | — | | | | — | |
| | 8,900 | | | | 21,206 | | | | — | | | | — | | | | — | | | | — | |
| | 20,277 | | | | 44,142 | | | | 69,646 | | | | 129,567 | | | | 98,229 | | | | 234,753 | |
| | 12,468 | | | | 72,146 | | | | 65,125 | | | | 122,849 | | | | 138,801 | | | | 288,450 | |
| | | | | | | | | | | | | | | | | | | | | | | |
| | 207,210 | | | | 135,064 | | | | 199,593 | | | | 76,744 | | | | 582,490 | | | | 294,040 | |
| $ | 219,678 | | | $ | 207,210 | | | $ | 264,718 | | | $ | 199,593 | | | $ | 721,291 | | | $ | 582,490 | |
| $ | 83 | | | $ | — | | | $ | 99 | | | $ | — | | | $ | (2,589 | ) | | $ | 2,023 | |
See accompanying notes to financial statements.
Amounts designated as “—” are either $0 or have been rounded to $0.
See accompanying notes to financial statements.
CITY NATIONAL ROCHDALE FUNDS | PAGE 121
consolidated statement of cash flows (000)
For the six months ended March 31, 2015 (Unaudited)
| | | City National
Rochdale
Fixed Income
Opportunities Fund | |
| CASH FLOWS FROM OPERATING ACTIVITIES: | | | |
| Net Decrease in Net Assets from Operations | | $ | (13,533 | ) |
| Adjustments to Reconcile Net Decrease in Net Assets Resulting from Operations to Net Cash Used in Operating Activities: | | | | |
| Purchase of Investment Securities | | | (956,315 | ) |
| Proceeds from Disposition of Investment Securities | | | 805,115 | |
| Amortization (Accretion of Market Discount) | | | (1,219 | ) |
| Premium Payments | | | (9,485 | ) |
| Net Realized Loss on Investments | | | 7,234 | |
| Net Change in Unrealized Depreciation on Investments | | | 41,526 | |
| | | | | |
| Changes in assets: | | | | |
| Foreign currency | | | (775 | ) |
| Receivable for investment securities sold | | | 4,122 | |
| Dividends and interest receivable | | | (208 | ) |
| Unrealized gain on forward foreign currency contracts | | | 34 | |
| Prepaid expenses | | | (33 | ) |
| | | | | |
| Changes in liabilities: | | | | |
| Payable for investment securities purchased | | | (2,837 | ) |
| Unrealized gain on forward foreign currency contracts | | | 334 | |
| Investment advisory fees payable | | | 135 | |
| Shareholder servicing and distribution fees payable | | | 50 | |
| Administrative fees payable | | | 2 | |
| Accrued expense payable | | | 246 | |
| Net Cash Used in Operating Activities | | | (125,607 | ) |
| | | | | |
| CASH FLOWS FROM FINANCING ACTIVITIES: | | | | |
| Proceeds from Shares Issued | | | 358,361 | |
| Cost of Shares Redeemed | | | (177,947 | ) |
| Distributions | | | (49,475 | ) |
| Net Cash Provided by Financing Activities | | | 130,939 | |
| Net Change in Cash | | | 5,332 | |
| Cash at beginning of period | | | 11,742 | |
| Cash at end of period | | $ | 17,074 | |
See accompanying notes to financial statements.
CITY NATIONAL ROCHDALE FUNDS | PAGE 122
This page intentionally left blank.
CITY NATIONAL ROCHDALE FUNDS | PAGE 123
financial highlights
For a Share Outstanding Throughout Each Period
For the six months ended March 31, 2015 (Unaudited) and the year or period ended September 30,
| | | Net Asset Value Beginning of Period | | | Net Investment Income† | | | Dividends from Net Investment Income | | | Net Asset Value End of Period | | | Total Return‡ | | | Net Assets End of Period (000) | | | Ratio of Expenses to Average Net Assets(1)(2) | | | Ratio of Net Investment Income to Average Net Assets(1) | | | Ratio of Expenses to Average Net Assets (Excluding Waivers & Recovered Fees)(1) | |
| City National Rochdale Government Money Market Fund | |
| Class N (commenced operations on June 21, 1999) | |
| 2015** | | $ | 1.00 | | | $ | 0.000 | ^ | | $ | (0.000 | )^ | | $ | 1.00 | | | | 0.00 | % | | $ | 2,930,892 | | | | 0.09 | % | | | 0.01 | % | | | 0.87 | % |
| 2014 | | | 1.00 | | | | 0.000 | ^ | | | (0.000 | )^ | | | 1.00 | | | | 0.01 | | | | 3,174,351 | | | | 0.08 | | | | 0.01 | | | | 0.88 | |
| 2013 | | | 1.00 | | | | 0.000 | ^ | | | (0.000 | )^ | | | 1.00 | | | | 0.01 | | | | 3,040,396 | | | | 0.13 | | | | 0.01 | | | | 0.97 | |
| 2012 | | | 1.00 | | | | 0.000 | ^ | | | (0.000 | )^ | | | 1.00 | | | | 0.00 | | | | 2,808,068 | | | | 0.14 | | | | 0.01 | | | | 1.11 | |
| 2011 | | | 1.00 | | | | 0.000 | ^ | | | (0.000 | )^ | | | 1.00 | | | | 0.02 | | | | 2,926,120 | | | | 0.14 | | | | 0.02 | | | | 1.11 | |
| 2010 | | | 1.00 | | | | 0.000 | ^ | | | (0.000 | )^ | | | 1.00 | | | | 0.02 | | | | 2,598,035 | | | | 0.19 | | | | 0.02 | | | | 1.12 | |
| Class S (commenced operations on October 6, 1999) | |
| 2015** | | $ | 1.00 | | | $ | 0.000 | ^ | | $ | (0.000 | )^ | | $ | 1.00 | | | | 0.00 | % | | $ | 763,851 | | | | 0.09 | % | | | 0.01 | % | | | 1.07 | % |
| 2014 | | | 1.00 | | | | 0.000 | ^ | | | (0.000 | )^ | | | 1.00 | | | | 0.01 | | | | 705,932 | | | | 0.08 | | | | 0.01 | | | | 1.08 | |
| 2013 | | | 1.00 | | | | 0.000 | ^ | | | (0.000 | )^ | | | 1.00 | | | | 0.01 | | | | 475,151 | | | | 0.12 | | | | 0.01 | | | | 1.11 | |
| 2012 | | | 1.00 | | | | 0.000 | ^ | | | (0.000 | )^ | | | 1.00 | | | | 0.00 | | | | 288,922 | | | | 0.14 | | | | 0.01 | | | | 1.11 | |
| 2011 | | | 1.00 | | | | 0.000 | ^ | | | (0.000 | )^ | | | 1.00 | | | | 0.01 | | | | 291,194 | | | | 0.15 | | | | 0.01 | | | | 1.11 | |
| 2010 | | | 1.00 | | | | 0.000 | ^ | | | (0.000 | )^ | | | 1.00 | | | | 0.01 | | | | 348,698 | | | | 0.20 | | | | 0.01 | | | | 1.12 | |
| Servicing Class (commenced operations on April 3, 2000)^^ | |
| 2015** | | $ | 1.00 | | | $ | 0.000 | ^ | | $ | (0.000 | )^ | | $ | 1.00 | | | | 0.00 | % | | $ | 218,295 | | | | 0.09 | % | | | 0.01 | % | | | 0.57 | % |
| 2014 | | | 1.00 | | | | 0.000 | ^ | | | (0.000 | )^ | | | 1.00 | | | | 0.01 | | | | 211,958 | | | | 0.08 | | | | 0.01 | | | | 0.58 | |
| 2013 | | | 1.00 | | | | 0.000 | ^ | | | (0.000 | )^ | | | 1.00 | | | | 0.01 | | | | 128,423 | | | | 0.12 | | | | 0.01 | | | | 0.61 | |
| 2012 | | | 1.00 | | | | 0.000 | ^ | | | (0.000 | )^ | | | 1.00 | | | | 0.00 | | | | 96,452 | | | | 0.14 | | | | 0.01 | | | | 0.61 | |
| 2011 | | | 1.00 | | | | 0.000 | ^ | | | (0.000 | )^ | | | 1.00 | | | | 0.02 | | | | 51,705 | | | | 0.14 | | | | 0.03 | | | | 0.61 | |
| 2010 | | | 1.00 | | | | 0.000 | ^ | | | (0.000 | )^ | | | 1.00 | | | | 0.04 | | | | 81,050 | | | | 0.17 | | | | 0.04 | | | | 0.62 | |
| City National Rochdale Prime Money Market Fund | |
| Institutional Class (commenced operations on December 19, 2012) | |
| 2015** | | $ | 1.00 | | | $ | 0.000 | ^ | | $ | (0.000 | )^ | | $ | 1.00 | | | | 0.00 | % | | $ | 66,298 | | | | 0.16 | % | | | 0.01 | % | | | 0.32 | % |
| 2014 | | | 1.00 | | | | 0.000 | ^ | | | (0.000 | )^ | | | 1.00 | | | | 0.01 | | | | 53,975 | | | | 0.15 | | | | 0.01 | | | | 0.33 | |
| 2013 | | | 1.00 | | | | 0.000 | ^ | | | (0.000 | )^ | | | 1.00 | | | | 0.02 | | | | 11,207 | | | | 0.18 | | | | 0.02 | | | | 0.35 | |
| Class N (commenced operations on October 18, 1999) | |
| 2015** | | $ | 1.00 | | | $ | 0.000 | ^ | | $ | (0.000 | )^ | | $ | 1.00 | | | | 0.00 | % | | $ | 315,112 | | | | 0.16 | % | | | 0.01 | % | | | 0.87 | % |
| 2014 | | | 1.00 | | | | 0.000 | ^ | | | (0.000 | )^ | | | 1.00 | | | | 0.01 | | | | 333,463 | | | | 0.15 | | | | 0.01 | | | | 0.88 | |
| 2013 | | | 1.00 | | | | 0.000 | ^ | | | (0.000 | )^ | | | 1.00 | | | | 0.02 | | | | 424,972 | | | | 0.20 | | | | 0.02 | | | | 0.96 | |
| 2012 | | | 1.00 | | | | 0.000 | ^ | | | (0.000 | )^ | | | 1.00 | | | | 0.00 | | | | 394,036 | | | | 0.24 | | | | 0.01 | | | | 1.10 | |
| 2011 | | | 1.00 | | | | 0.000 | ^ | | | (0.000 | )^ | | | 1.00 | | | | 0.03 | | | | 450,282 | | | | 0.25 | | | | 0.03 | | | | 1.10 | |
| 2010 | | | 1.00 | | | | 0.000 | ^ | | | (0.000 | )*^ | | | 1.00 | | | | 0.06 | | | | 432,235 | | | | 0.28 | | | | 0.04 | | | | 1.10 | |
| Class S (commenced operations on October 26, 1999) | |
| 2015** | | $ | 1.00 | | | $ | 0.000 | ^ | | $ | (0.000 | )^ | | $ | 1.00 | | | | 0.00 | % | | $ | 236,743 | | | | 0.16 | % | | | 0.01 | % | | | 1.07 | % |
| 2014 | | | 1.00 | | | | 0.000 | ^ | | | (0.000 | )^ | | | 1.00 | | | | 0.01 | | | | 198,237 | | | | 0.15 | | | | 0.01 | | | | 1.08 | |
| 2013 | | | 1.00 | | | | 0.000 | ^ | | | (0.000 | )^ | | | 1.00 | | | | 0.01 | | | | 207,252 | | | | 0.21 | | | | 0.01 | | | | 1.09 | |
| 2012 | | | 1.00 | | | | 0.000 | ^ | | | (0.000 | )^ | | | 1.00 | | | | 0.00 | | | | 256,060 | | | | 0.24 | | | | 0.01 | | | | 1.10 | |
| 2011 | | | 1.00 | | | | 0.000 | ^ | | | 0.000 | ^ | | | 1.00 | | | | 0.02 | | | | 265,116 | | | | 0.27 | | | | 0.01 | | | | 1.10 | |
| 2010 | | | 1.00 | | | | 0.000 | ^ | | | (0.000 | )*^ | | | 1.00 | | | | 0.04 | | | | 352,575 | | | | 0.30 | | | | 0.02 | | | | 1.10 | |
| Servicing Class (commenced operations on March 23, 1998)^^ | |
| 2015** | | $ | 1.00 | | | $ | 0.000 | ^ | | $ | (0.000 | )^ | | $ | 1.00 | | | | 0.00 | % | | $ | 364,689 | | | | 0.16 | % | | | 0.01 | % | | | 0.57 | % |
| 2014 | | | 1.00 | | | | 0.000 | ^ | | | (0.000 | )^ | | | 1.00 | | | | 0.01 | | | | 463,633 | | | | 0.15 | | | | 0.01 | | | | 0.58 | |
| 2013 | | | 1.00 | | | | 0.000 | ^ | | | (0.000 | )^ | | | 1.00 | | | | 0.02 | | | | 613,445 | | | | 0.19 | | | | 0.02 | | | | 0.59 | |
| 2012 | | | 1.00 | | | | 0.000 | ^ | | | (0.000 | )^ | | | 1.00 | | | | 0.00 | | | | 506,728 | | | | 0.23 | | | | 0.02 | | | | 0.60 | |
| 2011 | | | 1.00 | | | | 0.001 | | | | (0.001 | ) | | | 1.00 | | | | 0.06 | | | | 630,250 | | | | 0.22 | | | | 0.05 | | | | 0.60 | |
| 2010 | | | 1.00 | | | | 0.001 | | | | (0.001 | )* | | | 1.00 | | | | 0.09 | | | | 489,980 | | | | 0.24 | | | | 0.08 | | | | 0.60 | |
| City National Rochdale California Tax Exempt Money Market Fund | |
| Class N (commenced operations on June 21, 1999) | |
| 2015** | | $ | 1.00 | | | $ | 0.000 | ^ | | $ | (0.000 | )^ | | $ | 1.00 | | | | 0.00 | % | | $ | 608,893 | | | | 0.05 | % | | | 0.01 | % | | | 0.89 | % |
| 2014 | | | 1.00 | | | | 0.000 | ^ | | | (0.000 | )^ | | | 1.00 | | | | 0.01 | | | | 623,561 | | | | 0.05 | | | | 0.01 | | | | 0.90 | |
| 2013 | | | 1.00 | | | | 0.000 | ^ | | | (0.000 | )^ | | | 1.00 | | | | 0.01 | | | | 673,208 | | | | 0.11 | | | | 0.01 | | | | 0.97 | |
| 2012 | | | 1.00 | | | | 0.000 | ^ | | | (0.000 | )^ | | | 1.00 | | | | 0.00 | | | | 666,532 | | | | 0.12 | | | | 0.01 | | | | 1.11 | |
| 2011 | | | 1.00 | | | | 0.000 | ^ | | | (0.000 | )^ | | | 1.00 | | | | 0.02 | | | | 628,163 | | | | 0.17 | | | | 0.02 | | | | 1.12 | |
| 2010 | | | 1.00 | | | | 0.000 | ^ | | | (0.000 | )*^ | | | 1.00 | | | | 0.03 | | | | 638,839 | | | | 0.20 | | | | 0.02 | | | | 1.12 | |
| Class S (commenced operations on November 12, 1999) | |
| 2015** | | $ | 1.00 | | | $ | 0.000 | ^ | | $ | (0.000 | )^ | | $ | 1.00 | | | | 0.00 | % | | $ | 62,195 | | | | 0.05 | % | | | 0.01 | % | | | 1.09 | % |
| 2014 | | | 1.00 | | | | 0.000 | ^ | | | (0.000 | )^ | | | 1.00 | | | | 0.01 | | | | 81,412 | | | | 0.05 | | | | 0.01 | | | | 1.10 | |
| 2013 | | | 1.00 | | | | 0.000 | ^ | | | (0.000 | )^ | | | 1.00 | | | | 0.01 | | | | 79,312 | | | | 0.11 | | | | 0.01 | | | | 1.11 | |
| 2012 | | | 1.00 | | | | 0.000 | ^ | | | (0.000 | )^ | | | 1.00 | | | | 0.00 | | | | 99,970 | | | | 0.12 | | | | 0.01 | | | | 1.11 | |
| 2011 | | | 1.00 | | | | 0.000 | ^ | | | (0.000 | )^ | | | 1.00 | | | | 0.01 | | | | 78,221 | | | | 0.17 | | | | 0.01 | | | | 1.12 | |
| 2010 | | | 1.00 | | | | 0.000 | ^ | | | (0.000 | )*^ | | | 1.00 | | | | 0.01 | | | | 48,265 | | | | 0.22 | | | | 0.01 | | | | 1.12 | |
| Servicing Class (commenced operations on April 3, 2000)^^ | |
| 2015** | | $ | 1.00 | | | $ | 0.000 | ^ | | $ | (0.000 | )^ | | $ | 1.00 | | | | 0.00 | % | | $ | 232,730 | | | | 0.04 | % | | | 0.01 | % | | | 0.59 | % |
| 2014 | | | 1.00 | | | | 0.000 | ^ | | | (0.000 | )^ | | | 1.00 | | | | 0.01 | | | | 201,369 | | | | 0.05 | | | | 0.01 | | | | 0.60 | |
| 2013 | | | 1.00 | | | | 0.000 | ^ | | | (0.000 | )^ | | | 1.00 | | | | 0.01 | | | | 165,740 | | | | 0.10 | | | | 0.01 | | | | 0.61 | |
| 2012 | | | 1.00 | | | | 0.000 | ^ | | | (0.000 | )^ | | | 1.00 | | | | 0.00 | | | | 137,665 | | | | 0.12 | | | | 0.01 | | | | 0.61 | |
| 2011 | | | 1.00 | | | | 0.000 | ^ | | | (0.000 | )^ | | | 1.00 | | | | 0.02 | | | | 169,932 | | | | 0.16 | | | | 0.02 | | | | 0.62 | |
| 2010 | | | 1.00 | | | | 0.000 | ^ | | | (0.000 | )*^ | | | 1.00 | | | | 0.04 | | | | 140,238 | | | | 0.19 | | | | 0.04 | | | | 0.63 | |
| ** | For the six months ended March 31, 2015. |
| † | Per share calculations are based on Average Shares outstanding throughout the period. |
| ‡ | Returns are for the period indicated and have not been annualized. Fee waivers are in effect; if they had not been in effect, performance would have been lower. Returns shown do not reflect the deduction of taxes that a shareholder would pay on fund distributions or the redemption of fund shares. |
| ^ | Amount represents less than $0.001. |
| ^^ | Effective November 28, 2012, Institutional Class Shares were redesignated as Servicing Class Shares. This share class name change had no impact on the Fund’s operations or investment policy. |
| * | Includes a realized capital gain distribution of less than $0.001. |
| (1) | Annualized for periods less than one year. |
| (2) | Ratio includes waivers and previously waived investment advisory fees recovered. The impact of the recovered fees may cause a higher net expense ratio. |
See accompanying notes to financial statements.
CITY NATIONAL ROCHDALE FUNDS | PAGE 124
| | | Net Asset Value Beginning of Period | | | Net Investment Income† | | | Net Realized and Unrealized Gains (Losses) on Securities† | | | Dividends from Net Investment Income | | | Distri-butions from Realized Capital Gains | | | Net Asset Value End of Period | | | Total Return‡ | | | Net Assets End of Period (000) | | | Ratio of Expenses to Average Net Assets(1)(2) | | | Ratio of Net Investment Income to Average Net Assets(1) | | | Ratio of Expenses to Average Net Assets (Excluding Waivers & Recovered Fees)(1) | | | Portfolio Turnover Rate | |
| City National Rochdale Limited Maturity Fixed Income Fund | |
| Institutional Class (commenced operations on October 22,1988) | |
| 2015** | | $ | 11.17 | | | $ | 0.03 | | | $ | 0.01 | | | $ | (0.03 | ) | | $ | — | | | $ | 11.18 | | | | 0.39 | % | | $ | 21,531 | | | | 0.67 | % | | | 0.60 | % | | | 1.10 | % | | | 26 | % |
| 2014 | | | 11.16 | | | | 0.07 | | | | 0.01 | | | | (0.07 | ) | | | — | | | | 11.17 | | | | 0.75 | | | | 23,035 | | | | 0.67 | | | | 0.64 | | | | 0.95 | | | | 49 | |
| 2013 | | | 11.25 | | | | 0.06 | | | | (0.08 | ) | | | (0.07 | ) | | | — | | | | 11.16 | | | | (0.15 | ) | | | 40,205 | | | | 0.64 | | | | 0.51 | | | | 0.64 | | | | 32 | |
| 2012 | | | 11.15 | | | | 0.09 | | | | 0.12 | | | | (0.11 | ) | | | — | | | | 11.25 | | | | 1.88 | | | | 48,141 | | | | 0.68 | | | | 0.85 | | | | 0.68 | | | | 87 | |
| 2011 | | | 11.21 | | | | 0.16 | | | | (0.06 | ) | | | (0.16 | ) | | | — | | | | 11.15 | | | | 0.92 | | | | 31,743 | | | | 0.66 | | | | 1.46 | | | | 0.67 | | | | 50 | |
| 2010 | | | 11.06 | | | | 0.20 | | | | 0.16 | | | | (0.21 | ) | | | — | | | | 11.21 | | | | 3.28 | | | | 33,279 | | | | 0.73 | | | | 1.82 | | | | 0.71 | | | | 118 | |
| Class N (commenced operations on October 22, 2004) | |
| 2015** | | $ | 11.17 | | | $ | 0.02 | | | $ | 0.02 | | | $ | (0.02 | ) | | $ | — | | | $ | 11.19 | | | | 0.36 | % | | $ | 4,431 | | | | 0.92 | % | | | 0.35 | % | | | 1.59 | % | | | 26 | % |
| 2014 | | | 11.16 | | | | 0.05 | | | | 0.01 | | | | (0.05 | ) | | | — | | | | 11.17 | | | | 0.50 | | | | 4,620 | | | | 0.92 | | | | 0.40 | | | | 1.47 | | | | 49 | |
| 2013 | | | 11.26 | | | | 0.03 | | | | (0.08 | ) | | | (0.05 | ) | | | — | | | | 11.16 | | | | (0.49 | ) | | | 4,530 | | | | 0.89 | | | | 0.26 | | | | 1.14 | | | | 32 | |
| 2012 | | | 11.15 | | | | 0.08 | | | | 0.11 | | | | (0.08 | ) | | | — | | | | 11.26 | | | | 1.71 | | | | 4,347 | | | | 0.94 | | | | 0.69 | | | | 1.19 | | | | 87 | |
| 2011 | | | 11.22 | | | | 0.14 | | | | (0.08 | ) | | | (0.13 | ) | | | — | | | | 11.15 | | | | 0.58 | | | | 6,402 | | | | 0.91 | | | | 1.21 | | | | 1.17 | | | | 50 | |
| 2010 | | | 11.07 | | | | 0.16 | | | | 0.17 | | | | (0.18 | ) | | | — | | | | 11.22 | | | | 3.04 | | | | 9,262 | | | | 0.98 | | | | 1.48 | | | | 1.22 | | | | 118 | |
| City National Rochdale Government Bond Fund | |
| Institutional Class (commenced operations on February 1, 2012) | |
| 2015** | | $ | 10.49 | | | $ | 0.03 | | | $ | 0.08 | | | $ | (0.03 | ) | | $ | — | | | $ | 10.57 | | | | 1.02 | % | | $ | 59,728 | | | | 0.53 | % | | | 0.52 | % | | | 0.57 | % | | | 6 | % |
| 2014 | | | 10.47 | | | | 0.06 | | | | 0.02 | | | | (0.06 | ) | | | — | | | | 10.49 | | | | 0.80 | | | | 56,722 | | | | 0.53 | | | | 0.59 | | | | 0.57 | | | | 59 | |
| 2013 | | | 10.73 | | | | 0.11 | | | | (0.23 | ) | | | (0.14 | ) | | | — | | | | 10.47 | | | | (1.11 | ) | | | 56,351 | | | | 0.54 | | | | 1.03 | | | | 0.52 | | | | 28 | |
| 2012 | | | 10.75 | | | | 0.05 | | | | 0.04 | | | | (0.11 | ) | | | — | | | | 10.73 | | | | 0.01 | | | | 55,502 | | | | 0.55 | | | | 0.96 | | | | 0.53 | | | | 55 | |
| Class N (commenced operations on April 13, 2000) | |
| 2015** | | $ | 10.51 | | | $ | 0.00 | | | $ | 0.08 | | | $ — | | | $ | — | | | $ | 10.59 | | | | 0.77 | % | | $ | 1,849 | | | | 1.03 | % | | | 0.02 | % | | | 1.07 | % | | | 6 | % |
| 2014 | | | 10.49 | | | | 0.01 | | | | 0.02 | | | | (0.01 | ) | | | — | | | | 10.51 | | | | 0.29 | | | | 2,027 | | | | 1.03 | | | | 0.10 | | | | 1.07 | | | | 59 | |
| 2013 | | | 10.75 | | | | 0.04 | | | | (0.21 | ) | | | (0.09 | ) | | | — | | | | 10.49 | | | | (1.60 | ) | | | 2,505 | | | | 1.03 | | | | 0.38 | | | | 1.02 | | | | 28 | |
| 2012 | | | 10.77 | | | | 0.06 | | | | 0.05 | | | | (0.12 | ) | | | (0.01 | ) | | | 10.75 | | | | 0.01 | | | | 2,970 | | | | 1.03 | | | | 0.56 | | | | 1.03 | | | | 55 | |
| 2011 | | | 10.68 | | | | 0.12 | | | | 0.15 | | | | (0.18 | ) | | | — | | | | 10.77 | | | | 2.60 | | | | 2,940 | | | | 0.95 | | | | 1.17 | | | | 1.03 | | | | 86 | |
| 2010 | | | 10.60 | | | | 0.16 | | | | 0.16 | | | | (0.24 | ) | | | — | | | | 10.68 | | | | 3.10 | | | | 3,251 | | | | 0.95 | | | | 1.57 | | | | 1.03 | | | | 93 | |
| Servicing Class (commenced operations on January 14, 2000)^ | |
| 2015** | | $ | 10.49 | | | $ | 0.01 | | | $ | 0.21 | | | $ | (0.14 | ) | | $ | — | | | $ | 10.57 | | | | 0.90 | % | | $ | 109,836 | | | | 0.78 | % | | | 0.27 | % | | | 0.82 | % | | | 6 | % |
| 2014 | | | 10.47 | | | | 0.04 | | | | 0.02 | | | | (0.04 | ) | | | — | | | | 10.49 | | | | 0.54 | | | | 113,485 | | | | 0.78 | | | | 0.34 | | | | 0.82 | | | | 59 | |
| 2013 | | | 10.72 | | | | 0.07 | | | | (0.20 | ) | | | (0.12 | ) | | | — | | | | 10.47 | | | | (1.26 | ) | | | 114,953 | | | | 0.79 | | | | 0.62 | | | | 0.77 | | | | 28 | |
| 2012 | | | 10.75 | | | | 0.09 | | | | 0.03 | | | | (0.14 | ) | | | (0.01 | ) | | | 10.72 | | | | 0.01 | | | | 124,121 | | | | 0.77 | | | | 0.83 | | | | 0.78 | | | | 55 | |
| 2011 | | | 10.66 | | | | 0.15 | | | | 0.15 | | | | (0.21 | ) | | | — | | | | 10.75 | | | | 2.86 | | | | 175,866 | | | | 0.70 | | | | 1.40 | | | | 0.78 | | | | 86 | |
| 2010 | | | 10.58 | | | | 0.19 | | | | 0.16 | | | | (0.27 | ) | | | — | | | | 10.66 | | | | 3.37 | | | | 155,376 | | | | 0.70 | | | | 1.81 | | | | 0.78 | | | | 93 | |
| City National Rochdale Corporate Bond Fund | |
| Class N (commenced operations on April 13, 2000) | |
| 2015** | | $ | 10.67 | | | $ | 0.08 | | | $ | — | | | $ | (0.08 | ) | | $ | (0.08 | ) | | $ | 10.59 | | | | 0.78 | % | | $ | 4,436 | | | | 1.01 | % | | | 1.46 | % | | | 1.07 | % | | | 10 | % |
| 2014 | | | 10.71 | | | | 0.14 | | | | 0.03 | | | | (0.14 | ) | | | (0.07 | ) | | | 10.67 | | | | 1.64 | | | | 4,008 | | | | 1.01 | | | | 1.32 | | | | 1.07 | | | | 37 | |
| 2013 | | | 10.91 | | | | 0.16 | | | | (0.10 | ) | | | (0.17 | ) | | | (0.09 | ) | | | 10.71 | | | | 0.49 | | | | 3,100 | | | | 1.00 | | | | 1.51 | | | | 1.00 | | | | 29 | |
| 2012 | | | 10.59 | | | | 0.22 | | | | 0.37 | | | | (0.22 | ) | | | (0.05 | ) | | | 10.91 | | | | 0.06 | | | | 2,535 | | | | 1.00 | | | | 2.05 | | | | 1.00 | | | | 31 | |
| 2011 | | | 10.89 | | | | 0.29 | | | | (0.30 | ) | | | (0.29 | ) | | | — | | | | 10.59 | | | | (0.10 | ) | | | 2,481 | | | | 1.00 | | | | 2.69 | | | | 1.00 | | | | 40 | |
| 2010 | | | 10.57 | | | | 0.33 | | | | 0.32 | | | | (0.33 | ) | | | — | | | | 10.89 | | | | 6.23 | | | | 2,384 | | | | 0.99 | | | | 3.05 | | | | 1.00 | | | | 28 | |
| Servicing Class (commenced operations on January 14, 2000)^ | |
| 2015** | | $ | 10.66 | | | $ | 0.09 | | | $ | (0.01 | ) | | $ | (0.09 | ) | | $ | (0.08 | ) | | $ | 10.57 | | | | 0.81 | % | | $ | 139,384 | | | | 0.76 | % | | | 1.72 | % | | | 0.83 | % | | | 10 | % |
| 2014 | | | 10.70 | | | | 0.17 | | | | 0.03 | | | | (0.17 | ) | | | (0.07 | ) | | | 10.66 | | | | 1.89 | | | | 142,766 | | | | 0.76 | | | | 1.57 | | | | 0.82 | | | | 37 | |
| 2013 | | | 10.90 | | | | 0.19 | | | | (0.11 | ) | | | (0.19 | ) | | | (0.09 | ) | | | 10.70 | | | | 0.75 | | | | 135,184 | | | | 0.75 | | | | 1.77 | | | | 0.75 | | | | 29 | |
| 2012 | | | 10.58 | | | | 0.25 | | | | 0.37 | | | | (0.25 | ) | | | (0.05 | ) | | | 10.90 | | | | 0.06 | | | | 133,787 | | | | 0.75 | | | | 2.30 | | | | 0.75 | | | | 31 | |
| 2011 | | | 10.88 | | | | 0.32 | | | | (0.30 | ) | | | (0.32 | ) | | | — | | | | 10.58 | | | | 0.15 | | | | 111,563 | | | | 0.75 | | | | 2.94 | | | | 0.75 | | | | 40 | |
| 2010 | | | 10.56 | | | | 0.35 | | | | 0.32 | | | | (0.35 | ) | | | — | | | | 10.88 | | | | 6.50 | | | | 105,571 | | | | 0.74 | | | | 3.32 | | | | 0.75 | | | | 28 | |
| City National Rochdale California Tax Exempt Bond Fund | |
| Class N (commenced operations on April 13, 2000) | |
| 2015** | | $ | 10.74 | | | $ | 0.06 | | | $ | 0.03 | | | $ | (0.06 | ) | | $ | (0.05 | ) | | $ | 10.72 | | | | 0.83 | % | | $ | 11,838 | | | | 0.88 | % | | | 1.12 | % | | | 1.00 | % | | | 4 | % |
| 2014 | | | 10.54 | | | | 0.13 | | | | 0.22 | | | | (0.13 | ) | | | (0.02 | ) | | | 10.74 | | | | 3.31 | | | | 10,955 | | | | 0.88 | | | | 1.17 | | | | 1.02 | | | | 36 | |
| 2013 | | | 10.86 | | | | 0.18 | | | | (0.22 | ) | | | (0.18 | ) | | | (0.10 | ) | | | 10.54 | | | | (0.45 | ) | | | 8,197 | | | | 0.87 | | | | 1.64 | | | | 0.86 | | | | 34 | |
| 2012 | | | 10.70 | | | | 0.22 | | | | 0.23 | | | | (0.22 | ) | | | (0.07 | ) | | | 10.86 | | | | 4.32 | | | | 6,093 | | | | 0.83 | | | | 2.07 | | | | 0.86 | | | | 27 | |
| 2011 | | | 10.73 | | | | 0.26 | | | | 0.01 | | | | (0.26 | ) | | | (0.04 | ) | | | 10.70 | | | | 2.65 | | | | 4,563 | | | | 0.75 | | | | 2.46 | | | | 0.87 | | | | 26 | |
| 2010 | | | 10.60 | | | | 0.29 | | | | 0.13 | | | | (0.29 | ) | | | — | | | | 10.73 | | | | 4.06 | | | | 3,309 | | | | 0.75 | | | | 2.75 | | | | 0.87 | | | | 28 | |
| Servicing Class (commenced operations on January 14, 2000)^ | |
| 2015** | | $ | 10.71 | | | $ | 0.07 | | | $ | 0.03 | | | $ | (0.07 | ) | | $ | (0.05 | ) | | $ | 10.69 | | | | 0.96 | % | | $ | 82,972 | | | | 0.63 | % | | | 1.37 | % | | | 0.75 | % | | | 4 | % |
| 2014 | | | 10.51 | | | | 0.15 | | | | 0.22 | | | | (0.15 | ) | | | (0.02 | ) | | | 10.71 | | | | 3.58 | | | | 70,698 | | | | 0.63 | | | | 1.43 | | | | 0.77 | | | | 36 | |
| 2013 | | | 10.83 | | | | 0.20 | | | | (0.22 | ) | | | (0.20 | ) | | | (0.10 | ) | | | 10.51 | | | | (0.20 | ) | | | 59,149 | | | | 0.62 | | | | 1.91 | | | | 0.62 | | | | 34 | |
| 2012 | | | 10.67 | | | | 0.25 | | | | 0.23 | | | | (0.25 | ) | | | (0.07 | ) | | | 10.83 | | | | 4.59 | | | | 51,840 | | | | 0.58 | | | | 2.34 | | | | 0.61 | | | | 27 | |
| 2011 | | | 10.70 | | | | 0.29 | | | | 0.01 | | | | (0.29 | ) | | | (0.04 | ) | | | 10.67 | | | | 2.92 | | | | 53,464 | | | | 0.50 | | | | 2.73 | | | | 0.62 | | | | 26 | |
| 2010 | | | 10.57 | | | | 0.32 | | | | 0.13 | | | | (0.32 | ) | | | — | | | | 10.70 | | | | 4.34 | | | | 40,457 | | | | 0.50 | | | | 3.03 | | | | 0.62 | | | | 28 | |
| ** | For the six months ended March 31, 2015. |
| † | Per share calculations are based on Average Shares outstanding throughout the period. |
| ‡ | Returns are for the period indicated and have not been annualized. Fee waivers are in effect; if they had not been in effect, performance would have been lower. Returns shown do not reflect the deduction of taxes that a shareholder would pay on fund distributions or the redemption of fund shares. |
| ^ | Effective December 19, 2011, Institutional Class Shares were redesignated as Servicing Class Shares. This share class name change had no impact on the Fund’s operations or investment policy. |
| (1) | Annualized for periods less than one year. |
| (2) | Ratio includes waivers and previously waived investment advisory fees recovered. The impact of the recovered fees may cause a higher net expense ratio. |
Amounts designated as “—” are either $0 or have been rounded to $0.
See accompanying notes to financial statements.
CITY NATIONAL ROCHDALE FUNDS | PAGE 125
financial highlights/consolidated financial highlights
For a Share Outstanding Throughout Each Period
For the six months ended March 31, 2015 (Unaudited) and the year or period ended September 30,
| | | Net Asset Value Beginning of Period | | | Net Investment Income† | | | Net Realized and Unrealized Gains (Losses) on Securities† | | | Dividends from Net Investment Income | | | Distri-butions from Realized Capital Gains | | | Net Asset Value End of Period | | | Total Return‡ | | | Net Assets End of Period (000) | | | Ratio of Expenses to Average Net Assets(1)(2) | | | Ratio of Net Investment Income to Average Net Assets(1) | | | Ratio of Expenses to Average Net Assets (Excluding Waivers & Recovered Fees)(1) | | | Portfolio Turnover Rate | |
| City National Rochdale Municipal High Income Fund | |
| Class N (commenced operations on December 30, 2013) | |
| 2015** | | $ | 10.71 | | | $ | 0.21 | | | $ | 0.16 | | | $ | (0.21 | ) | | $ | — | | | $ | 10.87 | | | | 3.46 | % | | $ | 301,101 | | | | 1.04 | % | | | 3.82 | % | | | 1.04 | % | | | 2 | % |
| 2014 | | | 10.00 | | | | 0.32 | | | | 0.71 | | | | (0.32 | ) | | | — | | | | 10.71 | | | | 10.38 | | | | 201,200 | | | | 1.08 | | | | 4.02 | | | | 1.08 | | | | 1 | |
| Servicing Class (commenced operations on December 30, 2013) | |
| 2015** | | $ | 10.72 | | | $ | 0.22 | | | $ | 0.16 | | | $ | (0.22 | ) | | $ | — | | | $ | 10.88 | | | | 3.59 | % | | $ | 274,971 | | | | 0.79 | % | | | 4.08 | % | | | 0.79 | % | | | 2 | % |
| 2014 | | | 10.00 | | | | 0.34 | | | | 0.72 | | | | (0.34 | ) | | | — | | | | 10.72 | | | | 10.68 | | | | 220,851 | | | | 0.83 | | | | 4.27 | | | | 0.84 | | | | 1 | |
| City National Rochdale High Yield Bond Fund | |
| Institutional Class (commenced operations on February 2, 2012) | |
| 2015** | | $ | 8.76 | | | $ | 0.25 | | | $ | (0.21 | ) | | $ | (0.25 | ) | | $ | (0.41 | ) | | $ | 8.14 | | | | 0.63 | % | | $ | 40,204 | | | | 0.70 | % | | | 5.94 | % | | | 0.83 | % | | | 40 | % |
| 2014 | | | 8.59 | | | | 0.53 | | | | 0.19 | | | | (0.53 | ) | | | (0.02 | ) | | | 8.76 | | | | 8.49 | | | | 40,639 | | | | 0.70 | | | | 5.98 | | | | 0.78 | | | | 59 | |
| 2013 | | | 8.64 | | | | 0.60 | | | | (0.05 | ) | | | (0.60 | ) | | | — | | | | 8.59 | | | | 6.49 | | | | 39,219 | | | | 0.75 | | | | 6.87 | | | | 0.75 | | | | 56 | |
| 2012 | | | 8.39 | | | | 0.43 | | | | 0.26 | | | | (0.44 | ) | | | — | | | | 8.64 | | | | 8.39 | | | | 40,891 | | | | 0.85 | | | | 7.66 | | | | 0.85 | | | | 41 | |
| Class N (commenced operations on January 14, 2000) | |
| 2015** | | $ | 8.76 | | | $ | 0.23 | | | $ | (0.21 | ) | | $ | (0.23 | ) | | $ | (0.41 | ) | | $ | 8.14 | | | | 0.39 | % | | $ | 22,688 | | | | 1.20 | % | | | 5.42 | % | | | 1.33 | % | | | 40 | % |
| 2014 | | | 8.59 | | | | 0.49 | | | | 0.18 | | | | (0.48 | ) | | | (0.02 | ) | | | 8.76 | | | | 7.95 | | | | 26,166 | | | | 1.20 | | | | 5.49 | | | | 1.28 | | | | 59 | |
| 2013 | | | 8.64 | | | | 0.56 | | | | (0.05 | ) | | | (0.56 | ) | | | — | | | | 8.59 | | | | 5.95 | | | | 34,371 | | | | 1.27 | | | | 6.37 | | | | 1.26 | | | | 56 | |
| 2012 | | | 7.98 | | | | 0.62 | | | | 0.66 | | | | (0.62 | ) | | | — | | | | 8.64 | | | | 16.56 | | | | 38,629 | | | | 1.38 | | | | 7.43 | | | | 1.39 | | | | 41 | |
| 2011 | | | 8.31 | | | | 0.69 | | | | (0.33 | ) | | | (0.69 | ) | | | — | | | | 7.98 | | | | 4.14 | | | | 28,672 | | | | 1.30 | | | | 8.12 | | | | 1.40 | | | | 56 | |
| 2010 | | | 7.56 | | | | 0.70 | | | | 0.74 | | | | (0.69 | ) | | | — | | | | 8.31 | | | | 19.81 | | | | 24,010 | | | | 1.30 | | | | 8.68 | | | | 1.40 | | | | 87 | |
| Servicing Class (commenced operations on January 14, 2000)^ | |
| 2015** | | $ | 8.76 | | | $ | 0.24 | | | $ | (0.21 | ) | | $ | (0.24 | ) | | $ | (0.41 | ) | | $ | 8.14 | | | | 0.51 | % | | $ | 37,632 | | | | 0.95 | % | | | 5.67 | % | | | 1.08 | % | | | 40 | % |
| 2014 | | | 8.59 | | | | 0.51 | | | | 0.19 | | | | (0.51 | ) | | | (0.02 | ) | | | 8.76 | | | | 8.22 | | | | 43,974 | | | | 0.95 | | | | 5.83 | | | | 1.02 | | | | 59 | |
| 2013 | | | 8.63 | | | | 0.58 | | | | (0.04 | ) | | | (0.58 | ) | | | — | | | | 8.59 | | | | 6.35 | | | | 88,949 | | | | 0.99 | | | | 6.58 | | | | 0.99 | | | | 56 | |
| 2012 | | | 7.98 | | | | 0.65 | | | | 0.65 | | | | (0.65 | ) | | | — | | | | 8.63 | | | | 16.77 | | | | 74,245 | | | | 1.08 | | | | 7.76 | | | | 1.09 | | | | 41 | |
| 2011 | | | 8.31 | | | | 0.72 | | | | (0.33 | ) | | | (0.72 | ) | | | — | | | | 7.98 | | | | 4.45 | | | | 65,829 | | | | 1.00 | | | | 8.43 | | | | 1.10 | | | | 56 | |
| 2010 | | | 7.56 | | | | 0.72 | | | | 0.75 | | | | (0.72 | ) | | | — | | | | 8.31 | | | | 20.17 | | | | 33,845 | | | | 1.00 | | | | 8.89 | | | | 1.10 | | | | 87 | |
| City National Rochdale Intermediate Fixed Income Fund | |
| Institutional Class (commenced operations on December 20, 2013) | |
| 2015** | | $ | 26.23 | | | $ | 0.31 | | | $ | 0.24 | | | $ | (0.30 | ) | | $ | — | | | $ | 26.48 | | | | 2.09 | % | | $ | 9,978 | | | | 0.51 | % | | | 2.34 | % | | | 0.54 | % | | | 9 | % |
| 2014 | | | 25.89 | | | | 0.53 | | | | 0.33 | | | | (0.52 | ) | | | — | | | | 26.23 | | | | 3.35 | | | | 8,784 | | | | 0.51 | | | | 2.57 | | | | 0.52 | | | | 28 | |
| Class N (commenced operations on December 31, 1999) | |
| 2015** | | $ | 26.23 | | | $ | 0.24 | | | $ | 0.23 | | | $ | (0.23 | ) | | $ | — | | | $ | 26.47 | | | | 1.81 | % | | $ | 240,372 | | | | 1.01 | % | | | 1.84 | % | | | 1.03 | % | | | 9 | % |
| 2014 | | | 25.89 | | | | 0.57 | | | | 0.34 | | | | (0.57 | ) | | | — | | | | 26.23 | | | | 3.54 | | | | 204,264 | | | | 1.01 | | | | 2.17 | | | | 1.04 | | | | 28 | |
| 2013* | | | 26.76 | | | | 0.60 | | | | (0.85 | ) | | | (0.62 | ) | | | — | | | | 25.89 | | | | (0.96 | ) | | | 155,740 | | | | 1.02 | | | | 3.04 | | | | 1.04 | | | | 21 | |
| 2012 | | | 25.68 | | | | 0.95 | | | | 1.08 | | | | (0.95 | ) | | | — | | | | 26.76 | | | | 7.99 | | | | 130,359 | | | | 1.13 | | | | 3.59 | | | | 1.12 | | | | 26 | |
| 2011 | | | 25.89 | | | | 0.97 | | | | (0.23 | ) | | | (0.95 | ) | | | — | | | | 25.68 | | | | 2.88 | | | | 107,957 | | | | 1.15 | | | | 3.74 | | | | 1.15 | | | | 58 | |
| 2010 | | | 25.11 | | | | 0.95 | | | | 0.79 | | | | (0.96 | ) | | | — | | | | 25.89 | | | | 7.01 | | | | 75,900 | | | | 1.15 | | | | 3.79 | | | | 1.12 | | | | 52 | |
| City National Rochdale Fixed Income Opportunities Fund | |
| Class N (commenced operations on July 1, 2009) | |
| 2015** | | $ | 27.19 | | | $ | 0.66 | | | $ | (1.86 | ) | | $ | (0.02 | ) | | $ | — | | | $ | 25.97 | | | | (1.02 | )% | | $ | 1,509,508 | | | | 1.10 | % | | | 5.04 | % | | | 1.12 | % | | | 42 | % |
| 2014 | | | 26.83 | | | | 1.28 | | | | 0.38 | | | | (1.17 | ) | | | (0.13 | ) | | | 27.19 | | | | 6.20 | | | | 1,391,497 | | | | 1.11 | (3) | | | 4.65 | | | | 1.12 | (3) | | | 82 | |
| 2013* | | | 27.20 | | | | 1.28 | | | | (0.43 | ) | | | (1.22 | ) | | | — | ^^ | | | 26.83 | | | | 3.16 | | | | 924,444 | | | | 1.08 | | | | 6.24 | | | | 1.11 | | | | 52 | |
| 2012 | | | 26.16 | | | | 1.70 | | | | 1.04 | | | | (1.64 | ) | | | (0.06 | ) | | | 27.20 | | | | 10.70 | | | | 654,095 | | | | 1.12 | | | | 6.29 | | | | 1.12 | | | | 41 | |
| 2011 | | | 27.34 | | | | 1.58 | | | | (1.02 | ) | | | (1.45 | ) | | | (0.29 | ) | | | 26.16 | | | | 2.04 | | | | 497,684 | | | | 1.16 | | | | 5.80 | | | | 1.16 | | | | 60 | |
| 2010 | | | 26.56 | | | | 1.79 | | | | 1.07 | | | | (1.79 | ) | | | (0.29 | ) | | | 27.34 | | | | 11.10 | | | | 257,900 | | | | 1.18 | | | | 6.60 | | | | 1.18 | | | | 62 | |
| ** | For the six months ended March 31, 2015. |
| * | For the nine months ended September 30, 2013 and the year or period ended December 31. Effective March 29, 2013, Rochdale Investment Trust’s Rochdale Intermediate Fixed Income Portfolio and Rochdale Fixed Income Opportunities Portfolio (each a “Predecessor Fund”) were merged into City National Rochdale Funds’ Intermediate Fixed Income Fund and Fixed Income Opportunities Fund, respectively. Information presented for the period prior to March 29, 2013, is that of the respective Predecessor Fund, which had a December 31 fiscal year end. See Note 1 for additional information. |
| † | Per share calculations are based on Average Shares outstanding throughout the period. |
| ‡ | Returns are for the period indicated and have not been annualized. Fee waivers are in effect; if they had not been in effect, performance would have been lower. Returns shown do not reflect the deduction of taxes that a shareholder would pay on fund distributions or the redemption of fund shares. |
| ^ | Effective December 19, 2011, Institutional Class Shares were redesignated as Servicing Class Shares. This share class name change had no impact on the Fund’s operations or investment policy. |
| ^^ | Amount represents less than $0.01 per share. |
| (1) | Annualized for periods less than one year. |
| (2) | Ratio includes waivers and previously waived investment advisory fees recovered. The impact of the recovered fees may cause a higher net expense ratio. |
| (3) | The expense ratio includes acquired fund fee expenses from the investment in Subsidiary. Had this expense been excluded, the ratios would have been 1.09% and 1.10%, respectively. |
Amounts designated as “—” are either $0 or have been rounded to $0.
See accompanying notes to financial statements.
CITY NATIONAL ROCHDALE FUNDS | PAGE 126
| | | Net Asset Value Beginning of Period | | | Net Invest-ment Income† | | | Net Realized and Unrealized Gains (Losses) on Securities† | | | Redem-ption Fees | | | Dividends from Net Investment Income | | | Distri-butions from Realized Capital Gains | | | Distri-butions from Return of Capital | | | Net Asset Value End of Period | | | Total Return‡ | | | Net Assets End of Period (000) | | | Ratio of Expenses to | | | Ratio of Net Investment Income to Average Net
Assets(1) | | | Ratio of Expenses to Average Net Assets (Excluding Waivers & Recovered Fees)(1) | | | Portfolio Turnover Rate | |
| City National Rochdale Multi-Asset Fund | |
| Class N (commenced operations on October 1, 2007) | |
| 2015** | | $ | 11.01 | | | $ | 0.06 | | | $ | 0.22 | | | $ | — | | | $ | (0.07 | ) | | $ | — | | | $ | — | | | $ | 11.22 | | | | 2.52 | % | | $ | 18,323 | | | | 1.49 | % | | | 1.23 | % | | | 1.65 | % | | | 40 | % |
| 2014 | | | 10.70 | | | | 0.07 | | | | 0.32 | | | | — | | | | (0.08 | ) | | | — | | | | — | | | | 11.01 | | | | 3.67 | | | | 18,760 | | | | 1.49 | | | | 0.63 | | | | 1.53 | | | | 75 | |
| 2013 | | | 10.44 | | | | 0.15 | | | | 0.29 | | | | — | | | | (0.18 | ) | | | — | | | | — | | | | 10.70 | | | | 4.25 | | | | 21,966 | | | | 1.09 | | | | 1.45 | | | | 1.10 | | | | 56 | |
| 2012 | | | 9.88 | | | | 0.18 | | | | 0.57 | | | | — | | | | (0.19 | ) | | | — | | | | — | | | | 10.44 | | | | 7.61 | | | | 25,001 | | | | 1.09 | | | | 1.72 | | | | 1.10 | | | | 89 | |
| 2011 | | | 10.36 | | | | 0.17 | | | | (0.48 | ) | | | — | | | | (0.17 | ) | | | — | | | | — | | | | 9.88 | | | | (3.11 | ) | | | 26,377 | | | | 1.09 | | | | 1.57 | | | | 1.10 | | | | 67 | |
| 2010 | | | 9.86 | | | | 0.17 | | | | 0.50 | | | | — | | | | (0.17 | ) | | | — | | | | — | | | | 10.36 | | | | 6.89 | | | | 22,019 | | | | 1.09 | | | | 1.69 | | | | 1.10 | | | | 76 | |
| Servicing Class (commenced operations on October 1, 2007)^^ | |
| 2015** | | $ | 11.02 | | | $ | 0.07 | | | $ | 0.22 | | | $ | — | | | $ | (0.08 | ) | | $ | — | | | $ | — | | | $ | 11.23 | | | | 2.65 | % | | $ | 4,870 | | | | 1.24 | % | | | 1.48 | % | | | 1.39 | % | | | 40 | % |
| 2014 | | | 10.71 | | | | 0.10 | | | | 0.32 | | | | — | | | | (0.11 | ) | | | — | | | | — | | | | 11.02 | | | | 3.94 | | | | 6,045 | | | | 1.24 | | | | 0.87 | | | | 1.29 | | | | 75 | |
| 2013 | | | 10.45 | | | | 0.18 | | | | 0.29 | | | | — | | | | (0.21 | ) | | | — | | | | — | | | | 10.71 | | | | 4.51 | | | | 4,938 | | | | 0.84 | | | | 1.70 | | | | 0.84 | | | | 56 | |
| 2012 | | | 9.88 | | | | 0.20 | | | | 0.57 | | | | — | | | | (0.20 | ) | | | — | | | | — | | | | 10.45 | | | | 7.89 | | | | 7,230 | | | | 0.84 | | | | 1.99 | | | | 0.84 | | | | 89 | |
| 2011 | | | 10.37 | | | | 0.19 | | | | (0.48 | ) | | | — | | | | (0.20 | ) | | | — | | | | — | | | | 9.88 | | | | (2.97 | ) | | | 19,084 | | | | 0.84 | | | | 1.76 | | | | 0.85 | | | | 67 | |
| 2010 | | | 9.87 | | | | 0.20 | | | | 0.50 | | | | — | | | | (0.20 | ) | | | — | | | | — | | | | 10.37 | | | | 7.15 | | | | 11,258 | | | | 0.84 | | | | 1.96 | | | | 0.85 | | | | 76 | |
| City National Rochdale Dividend & Income Fund | |
| Class N (commenced operations on June 1, 1999) | |
| 2015** | | $ | 35.08 | | | $ | 0.52 | | | $ | 1.23 | | | $ | — | | | $ | (0.54 | ) | | $ | — | | | $ | — | | | $ | 36.29 | | | | 4.98 | % | | $ | 199,007 | | | | 1.11 | % | | | 2.85 | % | | | 1.13 | % | | | 9 | % |
| 2014 | | | 32.25 | | | | 0.95 | | | | 2.96 | | | | — | | | | (1.08 | ) | | | — | | | | — | | | | 35.08 | | | | 12.20 | | | | 172,917 | | | | 1.09 | | | | 2.74 | | | | 1.14 | | | | 16 | |
| 2013* | | | 29.07 | | | | 0.62 | | | | 3.37 | | | | — | | | | (0.54 | ) | | | — | | | | (0.27 | ) | | | 32.25 | | | | 13.74 | | | | 155,807 | | | | 1.16 | | | | 2.55 | | | | 1.19 | | | | 17 | |
| 2012 | | | 28.06 | | | | 0.92 | | | | 1.17 | | | | — | | | | (0.92 | ) | | | — | | | | (0.16 | ) | | | 29.07 | | | | 7.49 | | | | 116,138 | | | | 1.38 | | | | 3.18 | | | | 1.37 | | | | 13 | |
| 2011 | | | 26.73 | | | | 0.90 | | | | 1.46 | | | | 0.01 | | | | (0.88 | ) | | | — | | | | (0.16 | ) | | | 28.06 | | | | 9.02 | | | | 107,012 | | | | 1.40 | | | | 3.27 | | | | 1.40 | | | | 21 | |
| 2010 | | | 23.71 | | | | 0.82 | | | | 3.24 | | | | — | | | | (0.81 | ) | | | — | | | | (0.23 | ) | | | 26.73 | | | | 17.48 | | | | 70,800 | | | | 1.35 | | | | 3.29 | | | | 1.35 | | | | 16 | |
| City National Rochdale U.S. Core Equity Fund | |
| Institutional Class (commenced operations on December 3, 2012) | |
| 2015** | | $ | 14.21 | | | $ | 0.06 | | | $ | 0.75 | | | $ | — | | | $ | (0.05 | ) | | $ | (1.31 | ) | | $ | — | | | $ | 13.66 | | | | 6.23 | % | | $ | 7,169 | | | | 0.53 | % | | | 0.84 | % | | | 0.53 | % | | | 18 | % |
| 2014 | | | 12.13 | | | | 0.08 | | | | 2.30 | | | | — | | | | (0.08 | ) | | | (0.22 | ) | | | — | | | | 14.21 | | | | 19.86 | | | | 6,759 | | | | 0.53 | | | | 0.59 | | | | 0.53 | | | | 60 | |
| 2013 | | | 10.00 | | | | 0.14 | | | | 2.08 | | | | — | | | | (0.09 | ) | | | — | | | | — | | | | 12.13 | | | | 22.23 | | | | — | | | | 0.00 | (3) | | | 1.57 | | | | 0.00 | (3) | | | 32 | |
| Class N (commenced operations on December 3, 2012) | |
| 2015** | | $ | 14.09 | | | $ | 0.02 | | | $ | 0.75 | | | $ | — | | | $ | (0.02 | ) | | $ | (1.31 | ) | | $ | — | | | $ | 13.53 | | | | 5.96 | % | | $ | 104,562 | | | | 1.03 | % | | | 0.34 | % | | | 1.03 | % | | | 18 | % |
| 2014 | | | 12.08 | | | | 0.01 | | | | 2.23 | | | | — | | | | (0.01 | ) | | | (0.22 | ) | | | — | | | | 14.09 | | | | 18.80 | | | | 97,205 | | | | 1.03 | | | | 0.09 | | | | 1.04 | | | | 60 | |
| 2013 | | | 10.00 | | | | 0.05 | | | | 2.08 | | | | — | | | | (0.05 | ) | | | — | | | | — | | | | 12.08 | | | | 21.33 | | | | 66,145 | | | | 0.99 | | | | 0.52 | | | | 0.99 | | | | 32 | |
| Servicing Class (commenced operations on December 3, 2012) | |
| 2015** | | $ | 14.11 | | | $ | 0.04 | | | $ | 0.74 | | | $ | — | | | $ | (0.03 | ) | | $ | (1.31 | ) | | $ | — | | | $ | 13.55 | | | | 6.07 | % | | $ | 107,947 | | | | 0.78 | % | | | 0.59 | % | | | 0.78 | % | | | 18 | % |
| 2014 | | | 12.09 | | | | 0.05 | | | | 2.24 | | | | — | | | | (0.05 | ) | | | (0.22 | ) | | | — | | | | 14.11 | | | | 19.15 | | | | 103,246 | | | | 0.78 | | | | 0.34 | | | | 0.79 | | | | 60 | |
| 2013 | | | 10.00 | | | | 0.07 | | | | 2.08 | | | | — | | | | (0.06 | ) | | | — | | | | — | | | | 12.09 | | | | 21.60 | | | | 68,919 | | | | 0.74 | | | | 0.73 | | | | 0.74 | | | | 32 | |
| ** | For the six months ended March 31, 2015. |
| * | For the nine months ended September 30, 2013 and the year or period ended December 31. Effective March 29, 2013, the Rochdale Investment Trust’s Rochdale Dividend & Income Portfolio (the “Predecessor Fund”) was merged into City National Rochdale Funds’ Dividend & Income Fund. Information presented for the period prior to March 29, 2013, is that of the Predecessor Fund, which had a December 31 fiscal year end. See Note 1 for additional information. |
| † | Per share calculations are based on Average Shares outstanding throughout the period. |
| ‡ | Returns are for the period indicated and have not been annualized. Fee waivers are in effect; if they had not been in effect, performance would have been lower. Returns shown do not reflect the deduction of taxes that a shareholder would pay on fund distributions or the redemption of fund shares. |
| ^ | Amount represents less than $0.01 per share. |
| ^^ | Effective December 19, 2011, Institutional Class Shares were redesignated as Servicing Class Shares. This share class name change had no impact on the Fund’s operations or investment policy. |
| (1) | Annualized for periods less than one year. |
| (2) | Ratio includes waivers and previously waived investment advisory fees recovered. The impact of the recovered fees may cause a higher net expense ratio. |
| (3) | Amount represents less than 0.01%. |
Amounts designated as “—” are either $0 or have been rounded to $0.
See accompanying notes to financial statements.
CITY NATIONAL ROCHDALE FUNDS | PAGE 127
financial highlights/consolidated financial highlights
For a Share Outstanding Throughout Each Period
For the six months ended March 31, 2015 (Unaudited) and the year or period ended September 30,
| | | Net Asset Value Beginning of Period | | | Net Invest-ment Income (Loss)† | | | Net Realized and Unrealized Gains (Losses) on Securities† | | | Redem-ption Fees | | | Dividends from Net Invest-ment Income | | | Distri-butions from Realized Capital Gains | | | Distri-butions from Return of Capital | | | Net Asset Value End of Period | | | Total Return‡ | | | Net Assets End of Period (000) | | | Ratio of Expenses to Average Net Assets(1)(2) | | | Ratio of Net Investment Income (Loss) to Average Net
Assets(1) | | | Ratio of Expenses to Average Net Assets (Excluding Waivers & Recovered Fees)(1) | | | Portfolio Turnover Rate | |
| City National Rochdale Socially Responsible Equity Fund | |
| Institutional Class (commenced operations on January 3, 2005) | |
| 2015** | | $ | 11.45 | | | $ | 0.08 | | | $ | 0.08 | | | $ | — | | | $ | (0.07 | ) | | $ | (0.29 | ) | | $ | — | | | $ | 11.25 | | | | 1.42 | % | | $ | 238,260 | | | | 0.87 | % | | | 1.36 | % | | | 0.87 | % | | | 15 | % |
| 2014 | | | 12.28 | | | | 0.19 | | | | 1.18 | | | | — | | | | (0.18 | ) | | | (2.02 | ) | | | — | | | | 11.45 | | | | 12.46 | | | | 172,830 | | | | 0.89 | | | | 1.62 | | | | 0.96 | | | | 34 | |
| 2013 | | | 10.06 | | | | 0.12 | | | | 2.22 | | | | — | | | | (0.12 | ) | | | — | | | | — | | | | 12.28 | | | | 23.38 | | | | 45,357 | | | | 0.87 | | | | 1.10 | | | | 0.87 | | | | 42 | |
| 2012 | | | 8.38 | | | | 0.13 | | | | 1.68 | | | | — | | | | (0.13 | ) | | | — | | | | — | | | | 10.06 | | | | 21.63 | | | | 80,109 | | | | 0.90 | | | | 1.37 | | | | 0.90 | | | | 38 | |
| 2011 | | | 8.81 | | | | 0.12 | | | | (0.43 | ) | | | — | | | | (0.12 | ) | | | — | | | | — | | | | 8.38 | | | | (3.67 | ) | | | 62,193 | | | | 0.88 | | | | 1.27 | | | | 0.89 | | | | 22 | |
| 2010 | | | 8.20 | | | | 0.09 | | | | 0.61 | | | | — | | | | (0.09 | ) | | | — | | | | — | ^ | | | 8.81 | | | | 8.51 | | | | 59,746 | | | | 0.95 | | | | 1.01 | | | | 0.96 | | | | 36 | |
| Class N (commenced operations on August 12, 2005) | |
| 2015** | | $ | 11.42 | | | $ | 0.06 | | | $ | 0.10 | | | $ | — | | | $ | (0.06 | ) | | $ | (0.29 | ) | | $ | — | | | $ | 11.23 | | | | 1.39 | % | | $ | 26,458 | | | | 1.11 | % | | | 1.14 | % | | | 1.37 | % | | | 15 | % |
| 2014 | | | 12.26 | | | | 0.18 | | | | 1.15 | | | | — | | | | (0.15 | ) | | | (2.02 | ) | | | — | | | | 11.42 | | | | 12.11 | | | | 26,763 | | | | 1.14 | | | | 1.55 | | | | 1.46 | | | | 34 | |
| 2013 | | | 10.04 | | | | 0.09 | | | | 2.22 | | | | — | | | | (0.09 | ) | | | — | | | | — | | | | 12.26 | | | | 23.12 | | | | 31,387 | | | | 1.13 | | | | 0.81 | | | | 1.38 | | | | 42 | |
| 2012 | | | 8.37 | | | | 0.11 | | | | 1.67 | | | | — | | | | (0.11 | ) | | | — | | | | — | | | | 10.04 | | | | 21.28 | | | | 25,631 | | | | 1.15 | | | | 1.13 | | | | 1.40 | | | | 38 | |
| 2011 | | | 8.79 | | | | 0.10 | | | | (0.42 | ) | | | — | | | | (0.10 | ) | | | — | | | | — | | | | 8.37 | | | | (3.80 | ) | | | 3,132 | | | | 1.13 | | | | 1.05 | | | | 1.39 | | | | 22 | |
| 2010 | | | 8.19 | | | | 0.07 | | | | 0.60 | | | | — | | | | (0.07 | ) | | | — | | | | — | | | | 8.79 | | | | 8.15 | | | | 2,424 | | | | 1.20 | | | | 0.81 | | | | 1.46 | | | | 36 | |
| City National Rochdale Emerging Markets Fund | |
| Class N (commenced operations on December 14, 2011) | |
| 2015** | | $ | 38.90 | | | $ | (0.16 | ) | | $ | 2.81 | | | $ | — | | | $ | (0.13 | ) | | $ | — | | | $ | — | | | $ | 41.42 | | | | 6.83 | % | | $ | 721,291 | | | | 1.61 | % | | | (0.82 | )% | | | 1.64 | % | | | 18 | % |
| 2014 | | | 34.24 | | | | 0.22 | | | | 4.55 | | | | — | | | | (0.11 | ) | | | — | | | | — | | | | 38.90 | | | | 13.96 | | | | 582,490 | | | | 1.61 | | | | 0.58 | | | | 1.64 | | | | 42 | |
| 2013* | | | 32.31 | | | | 0.33 | | | | 1.60 | | | | — | | | | — | | | | — | | | | — | | | | 34.24 | | | | 5.97 | | | | 294,040 | | | | 1.62 | | | | 1.31 | | | | 1.69 | | | | 25 | |
| 2012 | | | 25.28 | | | | 0.04 | | | | 7.00 | | | | 0.01 | | | | — | | | | — | | | | (0.02 | ) | | | 32.31 | | | | 27.87 | | | | 136,838 | | | | 1.97 | | | | 0.15 | | | | 1.94 | | | | 69 | |
| 2011 | | | 25.00 | | | | (0.02 | )(3) | | | 0.30 | | | | — | ^ | | | — | | | | — | | | | — | | | | 25.28 | | | | 1.12 | | | | 5,934 | | | | 2.25 | | | | (2.15 | ) | | | 9.74 | | | | 6 | |
| ** | For the six months ended March 31, 2015. |
| * | For the nine months ended September 30, 2013 and the year or period ended December 31. Effective March 29, 2013, the Rochdale Investment Trust’s Rochdale Emerging Markets Portfolio (the “Predecessor Fund”) was merged into City National Rochdale Funds’ Emerging Markets Fund. Information presented for the period prior to March 29, 2013, is that of the Predecessor Fund, which had a December 31 fiscal year end. See Note 1 for additional information. |
| † | Per share calculations are based on Average Shares outstanding throughout the period. |
| ‡ | Returns are for the period indicated and have not been annualized. Fee waivers are in effect; if they had not been in effect, performance would have been lower. Returns shown do not reflect the deduction of taxes that a shareholder would pay on fund distributions or the redemption of fund shares. |
| ^ | Amount represents less than $0.01 per share. |
| (1) | Annualized for periods less than one year. |
| (2) | Ratio includes waivers and previously waived investment advisory fees recovered. The impact of the recovered fees may cause a higher net expense ratio. |
| (3) | Net investment loss per share is calculated using ending balances prior to consideration of adjustments for permanent book and tax differences. |
Amounts designated as “—” are either $0 or have been rounded to $0.
See accompanying notes to financial statements.
CITY NATIONAL ROCHDALE FUNDS | PAGE 128
notes to financial statements/
consolidated notes to financial statements
March 31, 2015 (Unaudited)
1. ORGANIZATION:
City National Rochdale Funds, a Delaware statutory trust (the “Trust”), is registered under the Investment Company Act of 1940, as amended (the “1940 Act”), as an open-end management investment company currently offering the following 16 series (each a “Fund” and collectively, the “Funds”): City National Rochdale Government Money Market Fund (“Government Money Market Fund”), City National Rochdale Prime Money Market Fund (“Prime Money Market Fund”), and City National Rochdale California Tax Exempt Money Market Fund (“California Money Market Fund”) (collectively, the “Money Market Funds”); City National Rochdale Limited Maturity Fixed Income Fund (“Limited Maturity Fixed Income Fund”), City National Rochdale Government Bond Fund (“Government Bond Fund”), City National Rochdale Corporate Bond Fund (“Corporate Bond Fund”), City National Rochdale California Tax Exempt Bond Fund (“California Tax Exempt Bond Fund”), City National Rochdale Municipal High Income Fund (“Municipal High Income Fund”), City National Rochdale High Yield Bond Fund (“High Yield Bond Fund”), City National Rochdale Intermediate Fixed Income Fund (“Intermediate Fixed Income Fund”), and City National Rochdale Fixed Income Opportunities Fund (“Fixed Income Opportunities Fund”) (collectively, the “Fixed Income Funds”); City National Rochdale Multi-Asset Fund (“Multi-Asset Fund”); City National Rochdale Dividend & Income Fund (“Dividend & Income Fund”), City National Rochdale U.S. Core Equity Fund (“U.S. Core Equity Fund”), City National Rochdale Socially Responsible Equity Fund (“Socially Responsible Equity Fund”), and City National Rochdale Emerging Markets Fund (“Emerging Markets Fund”) (collectively, the “Equity Funds”).
On December 11, 2012, the Board of Trustees of the Rochdale Investment Trust, an open-end management investment company registered under the 1940 Act, approved the reorganization of each Portfolio of the Rochdale Investment Trust into a corresponding Fund of the Trust. This included the Rochdale Dividend & Income Portfolio, the Rochdale Intermediate Fixed Income Portfolio, the Rochdale Fixed Income Opportunities Portfolio and the Rochdale Emerging Markets Portfolio. The effective date of the reorganization of each Portfolio (each a “Predecessor Fund” and collectively the “Predecessor Funds”) into a corresponding Fund of the Trust was March 29, 2013. Each Predecessor Fund was the accounting survivor in the reorganization and, therefore, the statements of changes in net assets and financial highlights of each corresponding Fund reflect the financial information of the corresponding Predecessor Fund through March 28, 2013.
Prior to September 10, 2013, the name of the Trust was CNI Charter Funds.
Effective September 10, 2013, Rochdale Investment Management, LLC, investment manager of the Intermediate Fixed Income Fund, Fixed Income Opportunities Fund, Dividend & Income Fund and Emerging Markets Fund, changed its name to City National Rochdale, LLC (“City National Rochdale”). Also effective September 10, 2013, City National Asset Management, Inc. (“CNAM”), a wholly-owned subsidiary of City National Bank and investment manager of all the Funds except the Intermediate Fixed Income Fund, Fixed Income Opportunities Fund, Dividend & Income Fund and Emerging Markets Fund, reorganized into City National Rochdale. City National Rochdale, LLC acts as the investment adviser to the Funds.
On September 17, 2013, the Board of Trustees of the Trust approved the reorganizations of the City National Rochdale Full Maturity Fixed Income Fund into the Intermediate Fixed Income Fund and the City National Rochdale Diversified Equity Fund into the U.S. Core Equity Fund. The reorganizations were effective as of the close of business on December 20, 2013, and March 21, 2014, respectively.
On May 30, 2014, the Board of Trustees of the Trust approved the reorganization of City National Rochdale Alternative Total Return Fund LLC, an affiliate of City National Rochdale, into the Fixed Income Opportunities Fund. The reorganization was effective as of the close of business on May 30, 2014.
The Municipal High Income Fund commenced operations on December 30, 2013.
On December 20, 2013, a new Institutional Class of the Intermediate Fixed Income Fund opened.
On January 31, 2014, the Institutional Class of the Multi-Asset Fund closed.
The assets of each Fund are segregated, and a shareholder’s interest is limited to the Fund in which shares are held. Each Fund is diversified with the exception of the California Tax Exempt Bond Fund and the Emerging Markets Fund, which are non-diversified. The Funds’ prospectus provides descriptions of each Fund’s investment objectives, policies and strategies.
CITY NATIONAL ROCHDALE FUNDS | PAGE 129
notes to financial statements/
consolidated notes to financial statements
March 31, 2015 (Unaudited)
2. SIGNIFICANT ACCOUNTING POLICIES:
The following is a summary of significant accounting policies followed by the Funds.
Use of Estimates – The Funds are investment companies that conform with accounting principles generally accepted in the United States of America (“GAAP”). Therefore the Funds follow the accounting and reporting guidance for investment companies. The preparation of financial statements in conformity with GAAP requires management to make estimates and assumptions that affect the reported amounts of assets and liabilities and disclosure of contingent assets and liabilities at the date of the financial statements and the reported amounts of increases and decreases in net assets from operations during the reporting period. Actual results could differ from those estimates.
Security Valuation – Securities listed on a securities exchange, market or automated quotation system for which quotations are readily available (except for securities traded on NASDAQ) are valued at the last quoted sale price on the primary exchange or market (foreign or domestic) on which they are traded, or, if there is no such reported sale, at the most recent quoted bid price. For securities traded on NASDAQ, the NASDAQ Official Closing Price is used. If available, debt securities are priced based upon valuations provided by independent, third-party pricing agents. Such values generally reflect the last reported sales price if the security is actively traded. The third-party pricing agents may also value debt securities at an evaluated bid price by employing methodologies that utilize actual market transactions, broker-supplied valuations, or other methodologies designed to identify the market value for such securities. Debt obligations with remaining maturities of sixty days or less may be valued at their amortized cost, if the Funds’ Fair Value Committee concludes it approximates market value after taking into account factors such as credit, liquidity and interest rate conditions as well as issuer specific factors. Investments in underlying registered investment companies are valued at their respective daily net assets in accordance with pricing procedures approved by their respective boards. The prices for foreign securities are reported in local currency and converted to U.S. dollars using currency exchange rates. Prices for most securities held by the Funds are provided daily by recognized independent pricing agents. If a security price cannot be obtained from an independent, third-party pricing agent, the Funds seek to obtain a bid price from one or more independent brokers.
Securities for which market prices are not “readily available” are valued in accordance with Fair Value Procedures established by the Trust’s Board of Trustees. The Funds’ Fair Value Procedures are implemented through a Fair Value Committee (the “Committee”) designated by the Trust’s Board of Trustees. Some of the more common reasons that may necessitate that a security be valued using Fair Value Procedures include: the security’s trading has been halted or suspended; the security has been de-listed from a national exchange; the security’s primary trading market is temporarily closed at a time when under normal conditions it would be open; for international securities, market events occur after the close of the foreign markets that make closing prices not representative of fair value; or the security’s primary pricing source is not able or willing to provide a price. When a security is valued in accordance with the Fair Value Procedures, the Committee will determine the value after taking into consideration relevant information reasonably available to the Committee.
Investments in life settlement policies (“Policies”) are valued using the fair value method of accounting. The Fair Value Procedures recognize that the Policies are illiquid and that no market currently exists for the Policies. Under the fair value method, the Fixed Income Opportunities Fund recognizes the initial investment in its Policies at the transaction price. In subsequent periods, the Fund re-measures the investment in its Policies at fair value daily and recognizes changes in fair value in earnings, less Policy premiums paid and continuing costs, plus proceeds from Policy maturities in the period in which the changes occur. Due to the inherent uncertainty of this method of valuation, the estimated values may differ significantly from the value that would have been used had a ready market value for the investment existed, and the difference could be material. Life settlement contracts are included in Level 3 of the fair value hierarchy.
In accordance with GAAP, the objective of a fair value measurement is to determine the price that would be received to sell an asset or paid to transfer a liability in an orderly transaction between market participants at the measurement date (an exit price). The fair value hierarchy gives the highest priority to quoted prices (unadjusted) in active markets for identical assets or liabilities (Level 1) and the lowest priority to unobservable inputs (Level 3). The three levels of the fair value hierarchy are described below:
| • | Level 1 — Unadjusted quoted prices in active markets for identical, unrestricted assets or liabilities that the Funds have the ability to access at the measurement date; |
| • | Level 2 — Quoted prices in inactive markets, or inputs that are observable (either directly or indirectly) for substantially the full term of the asset or liability; and |
CITY NATIONAL ROCHDALE FUNDS | PAGE 130
| • | Level 3 — Prices, inputs or exotic modeling techniques which are both significant to the fair value measurement and unobservable (supported by little or no market activity). |
Investments are classified within the level of the lowest significant input considered in determining fair value. Investments classified within Level 3, the fair value measurement of which considers several inputs, may include Level 1 or Level 2 inputs as components of the overall fair value measurement.
For the period ended March 31, 2015, there have been no changes to the Funds’ fair valuation methodologies. For more details of the investment classification, refer to the Schedules of Investments/Consolidated Schedule of Investments.
Security Transactions and Related Income – Security transactions are accounted for on the trade date of the security purchase or sale. Costs used in determining net realized capital gains and losses on the sale of securities are those of the specific securities sold. Interest income is recognized on an accrual basis and dividend income is recognized on the ex-dividend date. Purchase discounts and premiums on securities held by the Funds are accreted and amortized to maturity using the scientific method, which approximates the effective interest method over the holding period of a security, except for the Money Market Funds, which use a straight line basis which is not materially different from the scientific method.
Repurchase Agreements – Securities pledged as collateral for repurchase agreements are held by each Fund’s custodian bank, U.S. Bank, N.A., until maturity of the repurchase agreements. Provisions of the agreements and procedures adopted by the investment adviser require that the market value of the collateral, including accrued interest thereon, is sufficient in the event of default by the counterparty. The Funds also invest in tri-party repurchase agreements. Securities held as collateral for tri-party repurchase agreements are maintained by the broker’s custodian bank in a segregated account until maturity of the repurchase agreement. Provisions of the agreements require that the market value of the collateral, including accrued interest thereon, is sufficient in the event of default. If the counterparty defaults and the value of the collateral declines or if the counterparty enters into an insolvency proceeding, realization of the collateral by the Fund may be delayed or limited.
TBA Transactions – The Funds may engage in “to be announced” (“TBA”) security transactions. Such transactions involve a commitment by a Fund to purchase or sell securities for a predetermined price or yield, with payment and delivery taking place beyond the customary settlement period. The Funds record TBA securities on the trade date and maintain security positions such that sufficient liquid assets will be available to make payments for the securities purchased.
Expense Allocation – Common expenses incurred by the Funds are allocated among the Funds (i) based upon relative average daily net assets, (ii) as incurred on a specific identification basis, (iii) equally among the Funds, or (iv) a combination of the above, depending on the nature of the expenditure.
Classes – Class-specific expenses are borne by that class. Income, non class-specific expenses, and realized and unrealized gains/losses are allocated to the respective class on the basis of relative net asset value each day.
Dividends and Distributions to Shareholders – Dividends from net investment income are declared daily and paid to shareholders monthly for the Money Market Funds and Fixed Income Funds except for the Intermediate Fixed Income Fund, Fixed Income Opportunities Fund and Dividend & Income Fund. Dividends from net investment income are declared and paid quarterly for the Intermediate Fixed Income Fund, Fixed Income Opportunities Fund, Dividend & Income Fund, Multi-Asset Fund and Equity Funds except for the Emerging Markets Fund. Dividends from net investment income are declared and paid annually for the Emerging Markets Fund. Distributions from net realized capital gains are distributed to shareholders at least annually.
Foreign Currency – Values of investments denominated in foreign currencies are converted into U.S. dollars using the spot market rate of exchange at the time of valuation. Purchases and sales of investments and dividend and interest income are translated into U.S. dollars using the spot market rate of exchange prevailing on the respective dates of such translations. The gain or loss upon the sale of a security resulting from changes in foreign exchange rates is included with net realized and unrealized gain or loss from investments, as appropriate. Foreign securities and currency transactions may involve certain considerations and risks not typically associated with those of domestic origin.
Forward Foreign Currency Contracts – A forward foreign currency contract is an agreement between two parties to buy or sell a currency at a set price on a future date. Forward contracts are marked to market daily and the change in market value is recorded as an unrealized gain (loss) on forward foreign currency contracts in the Statements of Assets and Liabilities/Consolidated Statements of Assets and Liabilities. When a contract is closed, a Fund records a realized gain or loss equal to the difference between the value of the contract at the time it was opened and
CITY NATIONAL ROCHDALE FUNDS | PAGE 131
notes to financial statements/
consolidated notes to financial statements
March 31, 2015 (Unaudited)
the value at the time it was closed, which is included within realized gain (loss) on foreign currency transactions in the Statements of Operations/Consolidated Statement of
Operations. A Fund could be at risk if the counterparties are unable to meet the terms of the contracts or if the value of the currency changes unfavorably.
To reduce counterparty risk with respect to over-the-counter (“OTC”) transactions, the High Yield Bond Fund and the Fixed Income Opportunities Fund have entered into master netting arrangements, established within the High Yield Bond Fund’s and the Fixed Income Opportunities Fund’s International Swap and Derivatives Association, Inc. (“ISDA”) master agreements, which allows the High Yield Bond Fund and the Fixed Income Opportunities Fund to make (or to have an entitlement to receive) a single net payment in the event of default (close-out netting) for outstanding payables and receivables with respect to certain OTC positions in forward foreign currency contracts for each individual counterparty. In addition, the High Yield Bond Fund and the Fixed Income Opportunities Fund may require that certain counterparties post cash and/or securities in collateral accounts to cover their net payment obligations for those derivative contracts subject to ISDA master agreements. If the counterparty fails to perform under these contracts and agreements, the cash and/or securities will be made available to the High Yield Bond Fund and the Fixed Income Opportunities Fund.
For financial reporting purposes, the High Yield Bond Fund and the Fixed Income Opportunities Fund do not offset derivative assets and derivative liabilities that are subject to netting arrangements in the Statement of Assets and Liabilities/Consolidated Statement of Assets and Liabilities. Bankruptcy or insolvency laws of a particular jurisdiction may impose restrictions on or prohibitions against the right of offset in bankruptcy, insolvency or other events.
Collateral terms are contract specific for OTC derivatives. For derivatives traded under an ISDA master agreement, the collateral requirements are typically calculated by netting the mark to market amount of each transaction under such agreement and comparing that amount to the value of any collateral currently pledged by the High Yield Bond Fund and the Fixed Income Opportunities Fund or the counterparty.
For financial reporting purposes, cash collateral that has been pledged to cover obligations of the High Yield Bond Fund and the Fixed Income Opportunities Fund, if any, is reported separately on the Statement of Assets and Liabilities/Consolidated Statement of Assets and Liabilities as cash pledged as collateral. Non-cash collateral pledged by the High Yield Bond Fund and the Fixed Income Opportunities Fund, if any, is noted in the Schedule of Investments/Consolidated Schedule of Investments. Generally, the amount of collateral due from or to a party must exceed a minimum transfer amount threshold before a transfer has to be made. To the extent amounts due to the High Yield Bond Fund and the Fixed Income Opportunities Fund from its counterparties are not fully collateralized, contractually or otherwise, the High Yield Bond Fund and the Fixed Income Opportunities Fund bear the risk of loss from counterparty nonperformance.
The following tables present, by derivative type, the High Yield Bond Fund’s and the Fixed Income Opportunities Fund’s OTC derivative assets net of the related collateral posted for the benefit of the High Yield Bond Fund and the Fixed Income Opportunities Fund at March 31, 2015 (000):
| Derivative Type | | Derivative Assets Subject to a Netting Agreement or Similar Arrangement | | | Derivative Available for Offset | | | Collateral Received | | | Net Amount | |
| High Yield Bond Fund | |
| Forward Foreign Currency Contracts | | $ | 14 | | | $ | — | | | $ | — | | | $ | 14 | |
| Fixed Income Opportunities Fund | |
| Forward Foreign Currency Contracts | | | 1,937 | | | | (258 | ) | | | — | | | | 1,679 | |
The following tables present, by derivative type, the High Yield Bond Fund’s and the Fixed Income Opportunities Fund’s OTC derivative liabilities net of the related collateral posted for the benefit of the High Yield Bond Fund’s and the Fixed Income Opportunities Fund at March 31, 2015 (000):
| Derivative Type | | Derivative Liabilities Subject to a Netting Agreement or Similar Arrangement | | | Derivative Available for Offset | | | Collateral Pledged | | | Net Amount | |
| High Yield Bond Fund | |
| Forward Foreign Currency Contracts | | $ | — | | | $ | — | | | $ | — | | | $ | — | |
| Fixed Income Opportunities Fund | |
| Forward Foreign Currency Contracts | | | 258 | | | | (258 | ) | | | — | | | | — | |
Restricted Securities – Restricted securities include securities that have not been registered under the Securities Act of 1933, as amended, and securities that are subject to restrictions on resale.
CITY NATIONAL ROCHDALE FUNDS | PAGE 132
A Fund may invest in restricted securities that are consistent with the Fund’s investment objective and investment strategies. A Fund will not invest in a restricted security if, immediately after and as a result of the investment in such security, more than 15% (5% in the case of the Money Market Funds) of the Fund’s net assets would be invested in illiquid securities. In some cases, the issuer of restricted securities has agreed to register such securities for resale, at the issuer’s expense either upon demand by the Fund or in connection with another registered offering of the securities. Investments in restricted securities are valued at fair value as determined in good faith in accordance with procedures adopted by the Board of Trustees. It is possible that the estimated value may differ significantly from the amount that might ultimately be realized in the near term, and the difference could be material.
Master Limited Partnerships – Entities commonly referred to as “MLPs” are generally organized under state law as limited partnerships or limited liability companies. The City National Rochdale Dividend & Income Fund may, as a non-principal investment strategy, invest in MLPs receiving partnership taxation treatment under the Internal Revenue Code of 1986, interests or “units” of which are traded on securities exchanges like shares of corporate stock. To qualify as an MLP for U.S. federal income tax purposes, an entity must receive at least 90% of its income from qualifying sources such as interest, dividends, real estate rents, gain from the sale or disposition of real property, income and gain from certain mineral or natural resources activities, income and gain from the transportation or storage of certain fuels, and, in certain circumstances, income and gain from commodities or futures, forwards and options with respect to commodities, and gain from the sale or other disposition of a capital asset held for the production of such income. Mineral or natural resources activities include exploration, development, production, mining, processing, refining, marketing and transportation (including pipelines), of oil and gas, minerals, geothermal energy, fertilizer, timber or industrial source carbon dioxide. An MLP consists of a general partner and limited partners (or in the case of MLPs organized as limited liability companies, a managing member and members). The general partner or managing member typically controls the operations and management of the MLP and has an ownership stake in the partnership. The limited partners or members, through their ownership of limited partner or member interests, provide capital to the entity, are intended to have no role in the operation and management of the entity and receive cash distributions. The MLPs themselves generally do not pay U.S. federal income taxes. Thus, unlike investors in corporate securities, direct MLP investors are generally not subject to double taxation (i.e., corporate level tax and tax on corporate dividends). Currently, most MLPs operate in the energy, natural resources or real estate sectors.
Investments in Irish Subsidiary – The Fixed Income Opportunities Fund may invest up to 15% of its net assets in life insurance policies and interests related thereto purchased through life settlement transactions. The Fund may invest in life insurance policies and related interests directly or through a wholly-owned subsidiary of the Fund under the laws of Ireland (the “Subsidiary”).
The principal purpose of investment in the Subsidiary is to allow the Fixed Income Opportunities Fund to gain exposure to life insurance policies within the limitations of the federal tax law requirements applicable to regulated investment companies. The Subsidiary is a company organized under the laws of Ireland and is overseen by its own board of directors. Although the Subsidiary has its own board of directors, the Subsidiary is wholly-owned and controlled by the Fund. The Subsidiary is not an investment company registered under the 1940 Act and is not subject to all of the investor protections of the 1940 Act.
Information regarding the Fixed Income Opportunities Fund and the Subsidiary has been consolidated in the Consolidated Schedule of Investments, Consolidated Statement of Assets and Liabilities, Consolidated Statement of Operations and Consolidated Statement of Changes in Net Assets.
The Subsidiary commenced operations on October 3, 2013. The net assets of the Subsidiary at March 31, 2015, were $160,215,917, which represented 10.6% of the net assets of the Fixed Income Opportunities Fund.
Investments in Mauritius Subsidiary – To the extent that the Emerging Markets Fund seeks to invest in the securities of Indian companies, it currently intends to do so by investing in shares of a wholly-owned collective investment vehicle (the “Mauritius Subsidiary”) registered with and regulated by the Mauritius Financial Services Commission that is also managed by City National Rochdale. The Mauritius Subsidiary was formed to allow the Fund’s investments in Indian companies to benefit from a favorable tax treaty between Mauritius and India. In order to do so, the Mauritius Subsidiary will seek to maintain residency in Mauritius.
Investment in Affiliated Security – The Funds may invest excess cash in the Money Market Funds. The Multi-Asset Fund also invests in other series of the Trust.
CITY NATIONAL ROCHDALE FUNDS | PAGE 133
notes to financial statements/
consolidated notes to financial statements
March 31, 2015 (Unaudited)
3. ADMINISTRATION, TRANSFER AGENT, DISTRIBUTION AND SHAREHOLDER SERVICES AGREEMENTS:
Pursuant to an Amended and Restated Administration Agreement dated January 1, 2013, as amended (the “Agreement”), SEI Investments Global Funds Services (the “Administrator”), a wholly owned subsidiary of SEI Investments Company, acts as the Trust’s administrator. Under the terms of the Agreement, the Administrator is entitled to receive an annual fee of 0.050% of aggregate average daily net assets of the Trust not exceeding $2.0 billion, 0.040% of aggregate average daily net assets of the Trust exceeding $2.0 billion but not exceeding $4 billion, 0.030% of aggregate average daily net assets of the Trust exceeding $4 billion but not exceeding $6 billion, 0.025% of aggregate average daily net assets of the Trust exceeding $6 billion but not exceeding $8 billion, and 0.020% of aggregate average net assets of the Trust exceeding $8 billion. The Trust is subject to a minimum annual fee of $1,800,000 for the first 20 portfolios of the Trust and $90,000 for each portfolio thereafter which may be reduced at the sole discretion of the Administrator.
The Trust has adopted a Rule 12b-1 Distribution Plan (“the Plan”) with respect to Class N and Class S Shares that allows each Fund to pay distribution and servicing fees. Pursuant to the Plan, SEI Investments Distribution Co. (the “Distributor”) receives a distribution fee, computed daily and paid monthly, at the annual rate of 0.50% of the average daily net assets of the Class S Shares and 0.30% of the average daily net assets of the Class N Shares of the Money Market Funds and 0.25% of the Class N Shares of the Fixed Income Funds, Multi-Asset Fund and Equity Funds, which may be used by the Distributor to provide compensation for sales support and distribution-related activities.
US Bancorp Fund Services, LLC (the “Transfer Agent”) serves as transfer agent for the Trust and provides services at an annual rate of $20,000 per share class for all Funds plus other transaction based fees and out-of-pocket expenses.
The Trust has entered into Shareholder Servicing Agreements that permit payment of compensation to City National Bank (“CNB”) and its affiliates (including City National Rochdale), which provide certain shareholder support for their customers who own Class N, Class S or Servicing Class Shares, as applicable. In consideration for such services, a shareholder servicing fee is charged at the annual rate of up to 0.25% of average daily net assets of the relevant class of each Fund. CNB and City National Rochdale have agreed to voluntarily waive portions of their shareholder servicing fees with respect to certain Funds. For the period ended March 31, 2015, CNB and City National Rochdale received $4,634,448 in shareholder servicing fees from the Trust.
Certain officers of the Trust are also officers or employees of City National Rochdale or the Administrator. Such officers are paid no fees by the Trust for serving as officers of the Trust.
4. INVESTMENT ADVISORY FEES AND OTHER AGREEMENTS:
Under the terms of the current investment management agreements, City National Rochdale receives an annual fee equal to a percentage of the average daily net assets of each Fund, as follows:
| Fund | Fee |
| Government Money Market Fund | 0.26% |
| Prime Money Market Fund | 0.25 |
| California Tax Exempt Money Market Fund | 0.27 |
| Limited Maturity Fixed Income Fund | 0.50 |
| Government Bond Fund | 0.43 |
| Corporate Bond Fund | 0.40 |
| California Tax Exempt Bond Fund | 0.27 |
| Municipal High Income Fund | 0.45 |
| High Yield Bond Fund | 0.60 |
| Intermediate Fixed Income Fund | 0.40 |
| Fixed Income Opportunities Fund | 0.50 |
| Multi-Asset Fund | 0.50 |
| Dividend & Income Fund | 0.50 |
| U.S. Core Equity Fund | 0.40 |
| Socially Responsible Equity Fund | 0.75 |
| Emerging Markets Fund | 1.00 |
Guggenheim Partners Investment Management, LLC (“Guggenheim”) acts as the investment sub-adviser with respect to the High Yield Bond Fund.
Alcentra LTD, All Financial Partners II LLC, Ashmore Investment Management Limited, Federated Investment Management Corp., GML Capital LLP and Seix Investment Advisors LLC act as the investment sub-advisers with respect to the Fixed Income Opportunities Fund.
SKBA Capital Management, LLC acts as the investment sub-adviser with respect to the Socially Responsible Equity Fund.
Waddell & Reed Investment Management Company acts as the investment sub-adviser with respect to the Municipal High Income Fund.
Sub-adviser fees are paid by City National Rochdale.
City National Rochdale has voluntarily agreed to limit its fees or reimburse expenses to the extent necessary to keep operating expenses at or below certain percentages of certain of the Funds’
CITY NATIONAL ROCHDALE FUNDS | PAGE 134
respective average daily net assets. With respect to the Limited Maturity Fixed Income Fund and Socially Responsible Equity Fund, voluntary limits are in addition to the contractual expense limitations described in the fee table in each Fund’s prospectus. The voluntary expense limitations (expressed as percentages of average daily net assets) are as follows:
| | Government Money Market Fund | Prime Money Market Fund | California Tax Exempt Money Market Fund | |
| Institutional Class | n/a | 0.38% | n/a | |
| Class N | 0.93% | 0.93% | 0.85% | |
| Class S | 1.13% | 1.13% | 1.05% | |
| Servicing Class | 0.63% | 0.63% | 0.55% | |
| | Limited Maturity Fixed Income Fund | Government Bond Fund | Corporate Bond Fund | California Tax Exempt Bond Fund |
| Institutional Class | 0.67% | 0.53% | n/a | n/a |
| Class N | 0.92% | 1.03% | 1.01% | 0.88% |
| Servicing Class | n/a | 0.78% | 0.76% | 0.63% |
| | Municipal High Income Fund | High Yield Bond Fund | Intermediate Fixed Income Fund | Fixed Income Opportunities Fund |
| Institutional Class | n/a | 0.70% | 0.51% | n/a |
| Class N | 1.15% | 1.20% | 1.01% | 1.09% |
| Servicing Class | 0.90% | 0.95% | n/a | n/a |
| | Multi-Asset Fund | Dividend & Income Fund | U.S. Core Equity Fund | Socially Responsible Equity Fund |
| Institutional Class | n/a | n/a | 0.55% | 0.89% |
| Class N | 1.49% | 1.11% | 1.05% | 1.14% |
| Servicing Class | 1.24% | n/a | 0.80% | n/a |
| | Emerging Markets Fund | | |
| Class N | 1.61% | | |
The contractual limitations for the Limited Maturity Fixed Income Fund and Socially Responsible Equity Fund are as follows:
| | Limited Maturity Fixed Income Fund | Socially Responsible Equity Fund |
| Institutional Class | 1.00% | 1.25% |
| Class N | 1.25% | 1.50% |
Any fee reductions or expense reimbursements may be repaid by a Fund to City National Rochdale, within three years after occurrence if such repayments can be achieved within the Fund’s expense limit in effect at the time such expenses were incurred and if certain other conditions are satisfied.
As of March 31, 2015, fees which were previously waived by City National Rochdale (or CNAM, prior to September 10, 2013) which may be subject to possible future reimbursement were as follows:
| Fund | Potential Amount of Recovery (000) | Expiration |
| Government Money Market Fund | $6,662 | 2015 |
| | 7,131 | 2016 |
| | 9,264 | 2017 |
| | 4,634 | 2018 |
| Prime Money Market Fund | 1,222 | 2015 |
| | 1,741 | 2016 |
| | 2,095 | 2017 |
| | 826 | 2018 |
| California Tax Exempt Money Market Fund | 2,066 | 2015 |
| | 2,275 | 2016 |
| | 2,592 | 2017 |
| | 1,262 | 2018 |
| Limited Maturity Fixed Income Fund | 95 | 2017 |
| | 58 | 2018 |
| Government Bond Fund | 25 | 2015 |
| | 5 | 2016 |
| | 67 | 2017 |
| | 38 | 2018 |
| Corporate Bond Fund | 83 | 2017 |
| | 46 | 2018 |
| California Tax Exempt Bond Fund | 17 | 2015 |
| | 3 | 2016 |
| | 99 | 2017 |
| | 54 | 2018 |
| Municipal High Income Fund | 13 | 2017 |
| High Yield Bond Fund | 17 | 2015 |
| | 6 | 2016 |
| | 101 | 2017 |
| | 68 | 2018 |
| Intermediate Fixed Income Fund | 16 | 2016 |
| | 59 | 2017 |
| | 28 | 2018 |
| Fixed Income Opportunities Fund | 42 | 2016 |
| | 263 | 2017 |
| | 91 | 2018 |
| Multi-Asset Fund | 11 | 2017 |
| | 19 | 2018 |
| Dividend & Income Fund | 23 | 2016 |
| | 90 | 2017 |
| | 22 | 2018 |
| U.S. Core Equity | 9 | 2017 |
| Socially Responsible Fund | 61 | 2017 |
| | 3 | 2018 |
| Emerging Markets Fund | 115 | 2016 |
| | 145 | 2017 |
| | 96 | 2018 |
CITY NATIONAL ROCHDALE FUNDS | PAGE 135
notes to financial statements/
consolidated notes to financial statements
March 31, 2015 (Unaudited)
City National Rochdale, CNB, the Administrator, the transfer agent and the Funds’ legal counsel have voluntarily agreed to further waive and reduce their fees and/or reimburse certain expenses of the Money Market Funds in order to maintain a one-day net income yield (yield floor) of each Fund of not less than 0.01% of the Fund’s average daily net assets. The following table shows waivers, with respect to such yield floor, by class for the period ended March 31, 2015:
| | | Shareholder Servicing Fee Waiver
(000) | | | Investment Advisory Fee Waiver
(000) | | | Administration Fee Waiver
(000) | |
| Government Money Market Fund | |
| Class N | | $ | 7,539 | (1) | | $ | 3,507 | | | $ | 66 | |
| Class S | | | 2,526 | (1) | | | 833 | | | | 16 | |
| Servicing Class | | | 323 | | | | 294 | | | | 5 | |
| | | | | | | | | | | | | |
| Prime Money Market Fund | |
| Institutional Class | | $ | — | | | $ | 50 | | | $ | 2 | |
| Class N | | | 884 | (1) | | | 279 | | | | 11 | |
| Class S | | | 805 | (1) | | | 180 | | | | 6 | |
| Servicing Class | | | 515 | | | | 317 | | | | 12 | |
| | | | | | | | | | | | | |
| California Tax Exempt Money Market Fund | |
| Class N | | $ | 1,520 | (1) | | $ | 746 | | | $ | 63 | |
| Class S | | | 266 | (1) | | | 92 | | | | 8 | |
| Servicing Class | | | 250 | | | | 236 | | | | 20 | |
| (1) | Includes class specific distribution expenses. |
5. INVESTMENT TRANSACTIONS:
The cost of security purchases and proceeds from the sale and maturities of securities, other than temporary investments in short-term securities for the period ended March 31, 2015, were as follows for the Fixed Income Funds, Multi-Asset Fund and Equity Funds:
| | | Purchases | | | Sales and Maturities | |
| Fund | | U.S. Gov’t
(000) | | | Other
(000) | | | U.S. Gov’t
(000) | | | Other
(000) | |
| Limited Maturity Fixed Income Fund | | | 834 | | | | 4,980 | | | | 1,901 | | | | 6,077 | |
| Government Bond Fund | | | 10,163 | | | | — | | | | 5,599 | | | | 3,076 | |
| Corporate Bond Fund | | | — | | | | 14,632 | | | | 22 | | | | 13,761 | |
| California Tax Exempt Bond Fund | | | — | | | | 15,721 | | | | — | | | | 3,174 | |
| Municipal High Income Fund | | | — | | | | 159,311 | | | | — | | | | 6,546 | |
| High Yield Bond Fund | | | — | | | | 40,874 | | | | — | | | | 35,828 | |
| Intermediate Fixed Income Fund | | | 6,892 | | | | 41,912 | | | | 453 | | | | 19,159 | |
| Fixed Income Opportunities Fund | | | — | | | | 362,077 | | | | — | | | | 403,761 | |
| Multi-Asset Fund | | | — | | | | 9,416 | * | | | — | | | | 12,055 | * |
| Dividend & Income Fund | | | — | | | | 38,640 | | | | — | | | | 17,102 | |
| U.S. Core Equity | | | — | | | | 40,130 | | | | — | | | | 37,676 | |
| Socially Responsible Equity Fund | | | — | | | | 105,188 | | | | — | | | | 35,852 | |
| Emerging Markets Fund | | | — | | | | 194,992 | | | | — | | | | 105,683 | |
| * | Includes $237 (000) and $964 (000) of purchases and sales, respectively, of affiliated registered investment companies. |
The Funds may purchase or sell investment securities in transactions with affiliated entities under procedures adopted by the Board, pursuant to the 1940 Act. These transactions are effected at market rates without incurring broker commissions.
The following is a summary of the transactions with affiliates for the Multi-Asset Fund for the period ended March 31, 2015:
| | | Corporate Bond Fund, Servicing Class
(000) | | | Government Bond Fund, Institutional Class
(000) | | | High Yield Bond Fund, Institutional Class
(000) | |
| Beginning balance as of October 1, 2014 | | $ | 1,588 | | | $ | 1,145 | | | $ | 745 | |
| Purchases at Cost | | | 82 | | | | 55 | | | | 36 | |
| Proceeds from Sales | | | (278 | ) | | | (197 | ) | | | (132 | ) |
| Realized Gain (Loss) | | | (4 | ) | | | (2 | ) | | | (10 | ) |
| Unrealized Gain (Loss) | | | (9 | ) | | | 10 | | | | (42 | ) |
| Ending balance as of March 31, 2015 | | $ | 1,379 | | | $ | 1,011 | | | $ | 597 | |
| | | Limited Maturity Fixed Income Fund, Institutional Class
(000) | | | Emerging Markets Fund, Institutional Class
(000) | |
| Beginning balance as of October 1, 2014 | | $ | 1,213 | | | $ | 736 | |
| Purchases at Cost | | | 64 | | | | 516 | |
| Proceeds from Sales | | | (214 | ) | | | (143 | ) |
| Realized Gain (Loss) | | | (1 | ) | | | 2 | |
| Unrealized Gain (Loss) | | | 1 | | | | 57 | |
| Ending balance as of March 31, 2015 | | $ | 1,063 | | | $ | 1,168 | |
The Funds may also invest in the affiliated CNR Money Market Funds to manage excess cash or to serve as margin or collateral for derivative positions.
CITY NATIONAL ROCHDALE FUNDS | PAGE 136
The following is a summary of the transactions with affiliates for the period ended March 31, 2015:
| California Tax Exempt Money Market Fund | | Purchases
at Cost
(000) | | | Proceeds
from Sales
(000) | | | Value
3/31/2015
(000) | | | Dividend
Income
(000) | |
| California Tax Exempt Bond Fund | | $ | 18,423 | | | $ | (16,434 | ) | | $ | 4,868 | | | $ | — | |
| Government Money Market Fund | |
| Limited Maturity Fixed Income Fund | | | 2,186 | | | | (2,064 | ) | | | 210 | | | | — | |
| Government Bond Fund | | | 7,212 | | | | (8,731 | ) | | | 852 | | | | — | |
| Municipal High Income Fund | | | 61,492 | | | | (53,713 | ) | | | 38,476 | | | | 2 | |
| Intermediate Fixed Income Fund | | | 23,855 | | | | (25,162 | ) | | | 2,869 | | | | — | |
| Fixed Income Opportunities Fund | | | 13 | | | | (6 | ) | | | 7 | | | | — | |
| Dividend & Income Fund | | | 15,409 | | | | (16,003 | ) | | | — | | | | — | |
| Emerging Markets Fund | | | 48,242 | | | | (46,421 | ) | | | 21,610 | | | | 1 | |
| Prime Money Market Fund | |
| Corporate Bond Fund | | | 8,059 | | | | (10,049 | ) | | | 232 | | | | — | |
| High Yield Bond Fund | | | 19,732 | | | | (20,117 | ) | | | 471 | | | | — | |
| Multi-Asset Fund | | | 2,259 | | | | (2,431 | ) | | | 73 | | | | — | |
| U.S. Core Equity Fund | | | 17,783 | | | | (14,011 | ) | | | 6,236 | | | | — | |
6. FEDERAL TAX INFORMATION:
Each Fund intends to qualify or continue to qualify as a regulated investment company for Federal income tax purposes and distribute all of its taxable income and net capital gains. Accordingly, no provisions for Federal income taxes are required.
Effective September 30, 2013, the Intermediate Fixed Income Fund, Fixed Income Opportunities Fund, Dividend & Income Fund and the Emerging Markets Fund changed their tax year-ends from December 31 to September 30.
Management has analyzed the Funds’ tax position taken on Federal income tax returns for all open tax years and has concluded that as of September 30, 2014, no provision for income tax would be required in the Funds’ financial statements. The Funds’ Federal and state income and Federal excise tax returns for tax years for which the applicable statutes of limitations have not expired are subject to examination by the Internal Revenue Service and state departments of revenue.
The Funds may be subject to taxes imposed by countries in which they invest, with respect to their investments in issuers existing or operating in such countries. Such taxes are generally based on income earned. The Funds accrue such taxes when the related income is earned.
The timing and characterization of certain income and capital gains distributions are determined annually in accordance with Federal tax regulations, which may differ from accounting principles generally accepted in the United States of America. As a result, net investment income (loss) and net realized gain (loss) on investment transactions for a reporting period may differ significantly from distributions during such period. These book/tax differences may be temporary or permanent. To the extent these differences are permanent in nature, they are charged or credited to undistributed net investment income (loss), accumulated net realized gain (loss), or paid-in capital, as appropriate, in the period that the differences arise.
Accordingly, the following permanent differences, primarily attributable to REIT adjustments, MLP dividend income reclasses, realized gains (losses) on paydowns, expiration of capital loss carryovers, net operating losses, return of capital distributions, distributions in excess of net investment income, investments in defaulted bonds, investments in Passive Foreign Investment Companies and timing of distributions, were reclassified to/from the following accounts as of September 30, 2014:
| | | Increase (Decrease) Undistributed Net Investments Income (Loss) (000) | | | Increase (Decrease) Accumulated Net Realized Gain (Loss) (000) | | | Increase (Decrease) Paid-in Capital
(000) | |
| Limited Maturity Fixed Income Fund | | $ | 4 | | | $ | 42 | | | $ | (46 | ) |
| Government Bond Fund | | | 14 | | | | (14 | ) | | | — | |
| High Yield Bond Fund | | | 1 | | | | (1 | ) | | | — | |
| Intermediate Fixed Income Fund | | | 94 | | | | (94 | ) | | | — | |
| Fixed Income Opportunities Fund | | | 4,148 | | | | (4,148 | ) | | | — | |
| Multi-Asset Fund | | | 35 | | | | (28 | ) | | | (7 | ) |
| Dividend & Income Fund | | | 666 | | | | 731 | | | | (1,397 | ) |
| U.S. Core Equity Fund | | | 1 | | | | (1 | ) | | | — | |
| Socially Responsible Equity Fund | | | 4 | | | | (4 | ) | | | — | |
| Emerging Markets Fund | | | (579 | ) | | | 579 | | | | — | |
Amounts designated as “—” are either $0 or have been rounded to $0.
CITY NATIONAL ROCHDALE FUNDS | PAGE 137
notes to financial statements/
consolidated notes to financial statements
March 31, 2015 (Unaudited)
The tax character of dividends and distributions declared during the years ended September 30, 2014 and September 30, 2013 unless otherwise indicated were as follows:
| Fund | | | Tax Exempt Income (000) | | | Ordinary Income (000) | | | Long-Term Capital Gain (000) | | | Return of Capital (000) | | | Total
(000) | |
| Government Money Market Fund | |
| 2014 | | | $ | — | | | $ | 378 | | | $ | — | | | $ | — | | | $ | 378 | |
| 2013 | | | | — | | | | 330 | | | | — | | | | — | | | | 330 | |
| Prime Money Market Fund | |
| 2014 | | | | — | | | | 120 | | | | — | | | | — | | | | 120 | |
| 2013 | | | | — | | | | 228 | | | | — | | | | — | | | | 228 | |
| California Tax Exempt Money Market Fund | |
| 2014 | | | | 96 | | | | — | | | | — | | | | — | | | | 96 | |
| 2013 | | | | 94 | | | | — | | | | — | | | | — | | | | 94 | |
| Limited Maturity Fixed Income Fund | |
| 2014 | | | | — | | | | 204 | | | | — | | | | — | | | | 204 | |
| 2013 | | | | — | | | | 307 | | | | — | | | | — | | | | 307 | |
| Government Bond Fund | |
| 2014 | | | | — | | | | 750 | | | | — | | | | — | | | | 750 | |
| 2013 | | | | — | | | | 2,054 | | | | — | | | | — | | | | 2,054 | |
| Corporate Bond Fund | |
| 2014 | | | | — | | | | 2,225 | | | | 934 | | | | — | | | | 3,159 | |
| 2013 | | | | — | | | | 2,507 | | | | 1,038 | | | | — | | | | 3,545 | |
| California Tax Exempt Bond Fund | |
| 2014 | | | | 1,008 | | | | — | | | | 127 | | | | — | | | | 1,135 | |
| 2013 | | | | 1,190 | | | | 150 | | | | 379 | | | | — | | | | 1,719 | |
| Municipal High Income Fund | |
| 2014^^ | | | | 7,464 | | | | 5 | | | | — | | | | — | | | | 7,469 | |
| High Yield Bond Fund | |
| 2014 | | | | — | | | | 7,732 | | | | 355 | | | | — | | | | 8,087 | |
| 2013 | | | | — | | | | 10,996 | | | | — | | | | — | | | | 10,996 | |
| Intermediate Fixed Income Fund | |
| 2014 | | | $ | — | | | $ | 4,584 | | | $ | — | | | $ | — | | | $ | 4,584 | |
| 2013 | | | | — | | | | 3,505 | | | | — | | | | — | | | | 3,505 | |
| | 2012† | | | | — | | | | 4,065 | | | | — | | | | — | | | | 4,065 | |
| Fixed Income Opportunities Fund | |
| | 2014 | | | | — | | | | 54,067 | | | | 5,256 | | | | — | | | | 59,323 | |
| | 2013 | | | | — | | | | 34,355 | | | | 52 | | | | — | | | | 34,407 | |
| | 2012† | | | | — | | | | 35,978 | | | | 1,348 | | | | — | | | | 37,326 | |
| Multi-Asset Fund | |
| | 2014 | | | | — | | | | 234 | | | | — | | | | — | | | | 234 | |
| | 2013 | | | | — | | | | 667 | | | | — | | | | — | | | | 667 | |
| Dividend & Income Fund | |
| | 2014 | | | | — | | | | 5,449 | | | | — | | | | — | | | | 5,449 | |
| | 2013 | | | | — | | | | 2,296 | | | | — | | | | 1,135 | | | | 3,431 | |
| | 2012† | | | | — | | | | 4,044 | | | | — | | | | 727 | | | | 4,771 | |
| U.S. Core Equity Fund | |
| | 2014 | | | | — | | | | 3,085 | | | | — | | | | — | | | | 3,085 | |
| 2013^ | | | | — | | | | 571 | | | | — | | | | — | | | | 571 | |
| Socially Responsible Equity Fund | |
| | 2014 | | | | — | | | | 1,409 | | | | 12,637 | | | | — | | | | 14,046 | |
| | 2013 | | | | — | | | | 1,134 | | | | — | | | | — | | | | 1,134 | |
| Emerging Markets Fund | |
| | 2014 | | | | — | | | | 1,072 | | | | — | | | | — | | | | 1,072 | |
| | 2013 | | | | — | | | | — | | | | — | | | | — | | | | — | |
| | 2012† | | | | — | | | | — | | | | — | | | | 67 | | | | 67 | |
| † | For the year ended December 31, 2012. |
| ^ | For the period December 3, 2012 (commencement of operations) through September 30, 2013. |
| ^^ | For the period December 30, 2013 (commencement of operations) through September 30, 2014. |
CITY NATIONAL ROCHDALE FUNDS | PAGE 138
As of September 30, 2014, the components of Distributable Earnings/(Accumulated Losses) on a tax basis were as follows:
| Fund | | Undistributed Tax-Exempt Income
(000) | | | Undistributed Ordinary Income
(000) | | | Undistributed Long-Term Capital Gain (000) | | | Capital Loss Carryforwards (000) | | | Post-October Losses
(000) | | | Unrealized Appreciation (000) | | | Other Temporary Differences (000) | | | Total Distributable Earnings (Accumulated Losses)
(000) | |
| Government Money Market Fund | | $ | — | | | $ | 36 | | | $ | — | | | $ | — | | | $ | — | | | $ | — | | | $ | (35 | ) | | $ | 1 | |
| Prime Money Market Fund | | | — | | | | 9 | | | | — | | | | (12 | ) | | | — | | | | — | | | | (8 | ) | | | (11 | ) |
| California Tax Exempt Money Market Fund | | | 8 | | | | — | | | | — | | | | (2 | ) | | | — | | | | — | | | | (6 | ) | | | — | |
| Limited Maturity Fixed Income Fund | | | — | | | | 14 | | | | — | | | | (1,823 | ) | | | (5 | ) | | | 133 | | | | (15 | ) | | | (1,696 | ) |
| Government Bond Fund | | | — | | | | 48 | | | | — | | | | (188 | ) | | | — | | | | 75 | | | | (46 | ) | | | (111 | ) |
| Corporate Bond Fund | | | — | | | | 253 | | | | 1,082 | | | | — | | | | — | | | | 1,884 | | | | (193 | ) | | | 3,026 | |
| California Tax Exempt Bond Fund | | | 81 | | | | 28 | | | | 286 | | | | — | | | | — | | | | 1,958 | | | | (81 | ) | | | 2,272 | |
| Municipal High Income Fund | | | 1,315 | | | | 73 | | | | — | | | | — | | | | — | | | | 12,991 | | | | (1,315 | ) | | | 13,064 | |
| High Yield Bond Fund | | | — | | | | 1,389 | | | | 4,068 | | | | — | | | | — | | | | (73 | ) | | | (459 | ) | | | 4,925 | |
| Intermediate Fixed Income Fund | | | — | | | | 71 | | | | — | | | | (2,821 | ) | | | (349 | ) | | | 3,740 | | | | (7 | ) | | | 634 | |
| Fixed Income Opportunities Fund | | | — | | | | 12,889 | | | | 2,715 | | | | — | | | | — | | | | (5,608 | ) | | | (2,019 | ) | | | 7,977 | |
| Multi-Asset Fund | | | — | | | | — | | | | — | | | | (461 | ) | | | — | | | | 584 | | | | — | | | | 123 | |
| Dividend & Income Fund | | | — | | | | — | | | | — | | | | (4,541 | ) | | | — | | | | 43,074 | | | | (5 | ) | | | 38,528 | |
| U.S. Core Equity Fund | | | — | | | | 1,199 | | | | 18,029 | | | | — | | | | — | | | | 29,621 | | | | — | | | | 48,849 | |
| Socially Responsible Equity Fund | | | — | | | | — | | | | 5,481 | | | | — | | | | — | | | | 13,551 | | | | — | | | | 19,032 | |
| Emerging Markets Fund | | | — | | | | 2,023 | | | | — | | | | (1,305 | ) | | | — | | | | 80,776 | | | | — | | | | 81,494 | |
For tax purposes, the losses in the Funds generated prior to the Regulated Investment Company Modernization Act of 2010 can be carried forward for a maximum of eight years to offset any future net realized capital gains. As of September 30, 2014, the breakdown of capital loss carryforwards was as follows:
| | | Expiring September 30, | |
| Fund | | | 2015 (000) | | | | | | | | | | | | | | | Total
(000) | |
| Limited Maturity Fixed Income Fund | | $ | 1,415 | | | $ | 81 | | | $ | 327 | | | $ | — | | | | 1,823 | |
| Multi-Asset Fund | | | — | | | | 461 | | | | — | | | | — | | | | 461 | |
| | | Expiring December 31, | |
| Fund | | | | | | | | | | | | | | Total
(000) | |
| Intermediate Fixed Income Fund | | $ | 192 | | | $ | 2,240 | | | $ | — | | | $ | 2,432 | |
| Dividend & Income Fund | | | — | | | | 3,086 | | | | 1,455 | | | | 4,541 | |
Post-October losses represent losses realized on investments and foreign currency transactions from November 1, 2013, through September 30, 2014, that, in accordance with Federal income tax regulations, the Funds have elected to defer and treat as having arisen in the following fiscal year.
Under the Regulated Investment Company Modernization Act of 2010, the Funds will be permitted to carry forward capital losses incurred in taxable years beginning after December 22, 2010 for an unlimited period. However, any losses incurred during those future taxable years will be required to be utilized prior to the losses incurred in pre-enactment taxable years. As a result of this ordering rule, pre-enactment capital loss carryforwards may be more likely to expire unused. Additionally, post-enactment capital losses that are carried forward will retain their character as either short-term or long-term capital losses rather than being considered all short-term as under previous law. Losses carried forward under these new provisions are as follows:
CITY NATIONAL ROCHDALE FUNDS | PAGE 139
notes to financial statements/
consolidated notes to financial statements
March 31, 2015 (Unaudited)
| Fund | | Short-Term Loss
(000) | | | Long-Term Loss
(000) | | | Total
(000)* | |
| Prime Money Market Fund | | $ | 12 | | | $ | — | | | $ | 12 | |
| California Tax Exempt Money Market Fund | | | 2 | | | | — | | | | 2 | |
| Government Bond Fund | | | 188 | | | | — | | | | 188 | |
| Intermediate Fixed Income Fund | | | 308 | | | | 81 | | | | 389 | |
| Emerging Markets Fund | | | 1,305 | | | | — | | | | 1,305 | |
| * | This table should be used in conjunction with the capital loss carryforwards table. |
During the year ended September 30, 2014, the following Funds utilized capital loss carryforwards to offset capital gains amounting to:
| Fund | | Amount
(000) | |
| Government Money Market Fund | | $ | 1 | |
| Prime Money Market Fund | | | 2 | |
| Limited Maturity Fixed Income Fund | | | 86 | |
| Government Bond Fund | | | 784 | |
| Intermediate Fixed Income Fund | | | 126 | |
| Multi-Asset Fund | | | 1,237 | |
| Dividend & Income Fund | | | 5,582 | |
The aggregate gross unrealized appreciation on securities, the aggregate gross unrealized depreciation on securities and the net unrealized appreciation/ (depreciation) for tax purposes as of March 31, 2015, for each of the Fixed Income Funds, Multi-Asset Fund and Equity Funds were as follows:
| Fund | | Federal Tax Cost
(000) | | | Aggregate Gross Unrealized Appreciation (000) | | | Aggregate Gross Unrealized Depreciation (000) | | | Net Unrealized Appreciation (Depreciation) (000) | |
| Limited Maturity Fixed Income Fund | | $ | 25,716 | | | $ | 133 | | | $ | (19 | ) | | $ | 114 | |
| Government Bond Fund | | | 169,348 | | | | 1,450 | | | | (63 | ) | | | 1,387 | |
| Corporate Bond Fund | | | 140,985 | | | | 2,490 | | | | (824 | ) | | | 1,666 | |
| California Tax Exempt Bond Fund | | | 93,613 | | | | 2,090 | | | | (60 | ) | | | 2,030 | |
| Municipal High Income Fund | | | 569,674 | | | | 25,254 | | | | (5,760 | ) | | | 19,494 | |
| High Yield Bond Fund | | | 99,943 | | | | 1,747 | | | | (3,871 | ) | | | (2,124 | ) |
| Intermediate Fixed Income Fund | | | 242,503 | | | | 6,138 | | | | (777 | ) | | | 5,361 | |
| Fixed Income Opportunities Fund | | | 1,520,370 | | | | 70,175 | | | | (97,579 | ) | | | (27,404 | ) |
| Multi-Asset Fund | | | 21,351 | | | | 1,136 | | | | (265 | ) | | | 871 | |
| Dividend & Income Fund | | | 155,590 | | | | 45,393 | | | | (2,719 | ) | | | 42,674 | |
| U.S. Core Equity Fund | | | 189,060 | | | | 43,180 | | | | (3,418 | ) | | | 39,762 | |
| Socially Responsible Equity Fund | | | 251,484 | | | | 23,102 | | | | (8,063 | ) | | | 15,039 | |
| Emerging Markets Fund | | | 574,323 | | | | 145,232 | | | | (12,413 | ) | | | 132,819 | |
At March 31, 2015, the Money Market Funds’ cost of securities for Federal income tax purposes approximates the cost disclosed in the Schedule of Investments.
7. CONCENTRATION OF RISK
In the normal course of business, the Funds enter into contracts that provide general indemnifications. The Funds’ maximum exposure under these arrangements is dependent on future claims that may be made against the Funds and, therefore, cannot be established; however, based on experience, the risk of loss from such claims is considered remote.
The Multi-Asset Fund may invest in exchange-traded notes (“ETNs”) as a non-principal investment strategy. ETNs are unsecured debt obligations of investment banks which are traded on exchanges and the returns of which are linked to the performance of market indexes. In addition to trading ETNs on exchanges, investors may redeem ETNs directly with the issuer on a weekly basis, typically in a minimum amount of 50,000 units, or hold the ETNs until maturity. ETNs are riskier than ordinary unsecured debt securities and have no principal protection. The Fund will generally invest in ETNs which are linked to commodities indexes. The Fund’s investment in an ETN may be influenced by many unpredictable factors, including highly volatile commodities prices, changes in supply and demand relationships, weather, agriculture, trade, changes in interest rates, and monetary and other governmental policies, action and inaction. Investing in ETNs is not equivalent to investing directly in index components or the relevant index itself. Because ETNs are debt securities, they possess credit risk; if the issuer has financial difficulties or goes bankrupt, the investor may not receive the return it was promised.
The Municipal High Income Fund, High Yield Bond Fund, Intermediate Fixed Income Fund, Fixed Income Opportunities Fund and Multi-Asset Fund may invest in lower-rated corporate bonds, known as high yield bonds. High yield bonds involve greater risks of default, downgrade, or price declines and are more volatile than investment grade securities. Issuers of high yield bonds may be more susceptible than other issuers to economic downturns and are subject to a greater risk that the issuer may not be able to pay interest or dividends and ultimately to repay principal upon maturity. Discontinuation of these payments could have a substantial adverse effect on the market value of the security.
The Intermediate Fixed Income Fund and Fixed Income Opportunities Fund may invest in asset-backed and mortgage-backed securities. As a general rule, prepayments of the principal of the loans underlying mortgage-backed or other pass-through securities increase during a period of falling interest rates and
CITY NATIONAL ROCHDALE FUNDS | PAGE 140
decrease during a period of rising interest rates. In periods of declining interest rates, as a result of prepayments a Fund may be required to reinvest its assets in securities with lower interest rates. In periods of increasing interest rates, the securities subject to prepayment risk held by a Fund may exhibit price characteristics of longer-term debt securities.
The Intermediate Fixed Income Fund and Fixed Income Opportunities Fund may invest in bank loans. Bank loans are not traded on an exchange and purchasers and sellers of bank loans generally rely on market makers, typically the administrative agent under a bank loan, to effect private sales transactions. As a result, bank loans may have relatively less liquidity than other types of fixed income assets, and a Fund may be more likely to incur losses on the sale of bank loans than on other, more liquid, investments.
The Fixed Income Opportunities Fund may invest in beneficial interests in individual life insurance policies (“Policies”). A Policy owner transfers his or her Policy at a discount to its face value (the amount that is payable upon the death of the insured) in return for an immediate cash settlement. The ultimate purchaser of the Policy (in this case, the Fund) is responsible for premiums payable on the Policy and is entitled to receive the full face value from the insurance company upon the death of the insured. If the Fund is unable to make premium payments on a Policy, the Policy will lapse and the Fund will lose its ownership interest in the Policy. There is currently no established secondary market for Policies, and the Policies are not considered liquid investments by the Fund. If the Fund must sell Policies to meet redemption requests or other cash needs, the Fund may be forced to sell at a loss. The longer the insured lives, the lower the Fund’s rate of return on the Policy. The underwriter’s estimate of the insured’s life expectancy may be incorrect. An insurance company may be unable or refuse to pay benefits on a Policy. In addition, market quotations will not be readily available for the Policies and the Policies will be priced using a fair value methodology adopted by the Trust’s Board. The sales price the Fund could receive for a Policy may differ from the Trust’s valuation of the Policy. A Policy is a liability of the issuing life insurance company, and if the life insurance company goes out of business, sufficient funds may not be available to pay that liability.
California Tax Exempt Funds – Specific Risks
The ability of issuers to pay interest on, and repay principal of, California municipal securities may be affected by economic and political developments in the State of California.
Certain securities are backed by letters of credit from various financial institutions and financial guaranty assurance agencies. These letters of credit enhance the credit quality of the individual securities; however, if any of the financial institutions’ or financial guaranty assurance agencies’ credit quality should deteriorate, it could cause the individual security’s credit quality to change. Additionally, if any of the Funds concentrate their letters of credit in any one financial institution, the risk of credit quality deterioration increases.
The Funds invest in Certificates of Participation in a municipal obligation, which are subject to annual appropriation risk.
Emerging Markets Fund – Specific Risks
Foreign investments tend to be more volatile than domestic securities, and are subject to risks that are not typically associated with domestic securities (e.g., changes in currency rates and exchange control regulations, future political and economic developments and the possibility of seizure or nationalization of companies, or the imposition of withholding taxes on income). There may be less government supervision of foreign markets. As a result, foreign issuers may not be subject to the uniform accounting, auditing, and financial reporting standards and practices applicable to domestic issuers, and there may be less publicly available information about foreign issuers.
As long as the Emerging Markets Fund holds a foreign security, its value will be affected by the value of the local currency relative to the U.S. dollar. The value of a foreign currency may decline in relation to the U.S. dollar while the Fund holds securities denominated in such currency. Currency exchange rates can be volatile and can be affected by, among other factors, the general economics of a country or the actions of the U.S. or foreign governments or central banks. U.S. dollar-denominated securities of foreign issuers may also be affected by currency risk, as the value of these securities may also be affected by changes in the issuer’s local currency.
Risks associated with foreign investments may be intensified in the case of investments in emerging market countries, the political, legal and economic systems of which are less developed and less stable than those of more developed nations. Emerging markets may have relatively unstable governments, immature economic structures, national policies restricting investments by foreigners, social instability, and different and/or developing legal systems. In some countries, there is the risk that the government may take over the assets or operations of a company or that the government may impose withholding and other taxes or limits on the removal of the Emerging Market Fund’s assets from that country. In addition, the economies of emerging markets may be predominantly based on only a few industries, may be highly vulnerable to changes in local or global trade conditions, and may suffer from extreme and volatile debt burdens or inflation rates. Such investments are often less liquid and/or more volatile than securities issued by companies located in developed nations. Emerging market securities are also subject to the risk that the securities may not be sold at the quoted market price within a reasonable period of time.
CITY NATIONAL ROCHDALE FUNDS | PAGE 141
notes to financial statements/
consolidated notes to financial statements
March 31, 2015 (Unaudited)
8. CAPITAL SHARES ISSUED AND REDEEMED:
Capital share activity for the six months ended March 31, 2015 and the year ended September 30, 2014 were as follows (000):
| | | Government Money Market Fund | | | Prime Money
Market Fund (1) | | | California Tax Exempt Money Market Fund | |
| | | 2015 | | | 2014 | | | 2015 | | | 2014 | | | 2015 | | | 2014 | |
| CAPITAL SHARES ISSUED AND REDEEMED: | | | | | | | | | | | | | | | | |
| Institutional Class: | | | | | | | | | | | | | | | | | | |
| Shares issued | | | — | | | | — | | | | 57,672 | | | | 177,330 | | | | — | | | | — | |
| Shares issued in Lieu of Dividends and Distributions | | | — | | | | — | | | | 2 | | | | — | | | | — | | | | — | |
| Shares redeemed | | | — | | | | — | | | | (45,350 | ) | | | (134,563 | ) | | | — | | | | — | |
| Net Institutional Class transactions | | | — | | | | — | | | | 12,324 | | | | 42,767 | | | | — | | | | — | |
| Class N: | | | | | | | | | | | | | | | | | | | | | | | | |
| Shares issued | | | 1,996,940 | | | | 4,544,028 | | | | 389,867 | | | | 712,240 | | | | 353,057 | | | | 988,104 | |
| Shares issued in Lieu of Dividends and Distributions | | | 129 | | | | 249 | | | | 12 | | | | 24 | | | | 31 | | | | 67 | |
| Shares redeemed | | | (2,240,529 | ) | | | (4,410,324 | ) | | | (408,230 | ) | | | (803,775 | ) | | | (367,782 | ) | | | (1,037,816 | ) |
| Net Class N transactions | | | (243,460 | ) | | | 133,953 | | | | (18,351 | ) | | | (91,511 | ) | | | (14,694 | ) | | | (49,645 | ) |
| Class S: | | | | | | | | | | | | | | | | | | | | | | | | |
| Shares issued | | | 526,561 | | | | 1,522,771 | | | | 496,724 | | | | 869,219 | | | | 198,165 | | | | 372,122 | |
| Shares issued in Lieu of Dividends and Distributions | | | — | | | | — | | | | — | | | | — | | | | — | | | | — | |
| Shares redeemed | | | (468,643 | ) | | | (1,291,990 | ) | | | (458,218 | ) | | | (878,235 | ) | | | (217,385 | ) | | | (370,022 | ) |
| Net Class S transactions | | | 57,918 | | | | 230,781 | | | | 38,506 | | | | (9,016 | ) | | | (19,220 | ) | | | 2,100 | |
| Servicing Class: | | | | | | | | | | | | | | | | | | | | | | | | |
| Shares issued | | | 842,014 | | | | 1,008,445 | | | | 551,539 | | | | 1,057,487 | | | | 429,758 | | | | 698,593 | |
| Shares issued in Lieu of Dividends and Distributions | | | — | | | | — | | | | 5 | | | | 9 | | | | — | | | | — | |
| Shares redeemed | | | (835,676 | ) | | | (924,910 | ) | | | (650,489 | ) | | | (1,207,309 | ) | | | (398,403 | ) | | | (662,963 | ) |
| Net Servicing Class transactions | | | 6,338 | | | | 83,535 | | | | (98,945 | ) | | | (149,813 | ) | | | 31,355 | | | | 35,630 | |
| | | Limited Maturity Fixed Income Fund | | | Government Bond Fund | | | Corporate Bond Fund | | | California Tax Exempt Bond Fund | |
| | | 2015 | | | 2014 | | | 2015 | | | 2014 | | | 2015 | | | 2014 | | | 2015 | | | 2014 | |
| CAPITAL SHARES ISSUED AND REDEEMED: | | | | | | | | | | | | | | | | | | | | | | |
| Institutional Class: | | | | | | | | | | | | | | | | | | | | | | | | |
| Shares issued | | | 51 | | | | 67 | | | | 550 | | | | 915 | | | | — | | | | — | | | | — | | | | — | |
| Shares issued in Lieu of Dividends and Distributions | | | 3 | | | | 7 | | | | 14 | | | | 32 | | | | — | | | | — | | | | — | | | | — | |
| Shares redeemed | | | (191 | ) | | | (1,614 | ) | | | (322 | ) | | | (922 | ) | | | — | | | | — | | | | — | | | | — | |
| Net Institutional Class transactions | | | (137 | ) | | | (1,540 | ) | | | 242 | | | | 25 | | | | — | | | | — | | | | — | | | | — | |
| Class N: | | | | | | | | | | | | | | | | | | | | | | | | | | | | | | | | |
| Shares issued | | | 121 | | | | 106 | | | | 12 | | | | 37 | | | | 128 | | | | 152 | | | | 241 | | | | 413 | |
| Shares issued in Lieu of Dividends and Distributions | | | 1 | | | | 2 | | | | — | | | | — | | | | 4 | | | | 4 | | | | 7 | | | | 7 | |
| Shares redeemed | | | (139 | ) | | | (101 | ) | | | (30 | ) | | | (83 | ) | | | (88 | ) | | | (70 | ) | | | (164 | ) | | | (178 | ) |
| Net Class N transactions | | | (17 | ) | | | 7 | | | | (18 | ) | | | (46 | ) | | | 44 | | | | 86 | | | | 84 | | | | 242 | |
| Servicing Class: | | | | | | | | | | | | | | | | | | | | | | | | | | | | | | | | |
| Shares issued | | | — | | | | — | | | | 1,126 | | | | 2,715 | | | | 1,617 | | | | 4,041 | | | | 1,874 | | | | 2,482 | |
| Shares issued in Lieu of Dividends and Distributions | | | — | | | | — | | | | 7 | | | | 18 | | | | 19 | | | | 23 | | | | 7 | | | | 9 | |
| Shares redeemed | | | — | | | | — | | | | (1,563 | ) | | | (2,893 | ) | | | (1,846 | ) | | | (3,309 | ) | | | (718 | ) | | | (1,522 | ) |
| Net Servicing Class transactions | | | — | | | | — | | | | (430 | ) | | | (160 | ) | | | (210 | ) | | | 755 | | | | 1,163 | | | | 969 | |
| (1) | Institutional Class commenced operations December 19, 2012. |
CITY NATIONAL ROCHDALE FUNDS | PAGE 142
| | Municipal High Income Fund | | | High Yield Bond Fund | | | Intermediate Fixed Income Fund (1) | | | Fixed Income Opportunities Fund | |
| | | 2015 | | | 2014 | | | 2015 | | | 2014 | | | 2015 | | | 2014 | | | 2015 | | | 2014 | |
| CAPITAL SHARES ISSUED AND REDEEMED: | | | | | | | | | | | | | | | | |
| Institutional Class: | | | | | | | | | | | | | | | | | | | | | | | | |
| Shares issued | | | — | | | | — | | | | 418 | | | | 831 | | | | 39 | | | | 45 | | | | — | | | | — | |
Shares issued from Merger(3) | | | — | | | | — | | | | — | | | | — | | | | — | | | | 1,734 | | | | — | | | | — | |
| Shares issued in Lieu of Dividends and Distributions | | | — | | | | — | | | | 361 | | | | 267 | | | | 4 | | | | 25 | | | | — | | | | — | |
| Shares redeemed | | | — | | | | — | | | | (482 | ) | | | (1,023 | ) | | | (1 | ) | | | (1,469 | ) | | | — | | | | — | |
| Net Institutional Class transactions | | | — | | | | — | | | | 297 | | | | 75 | | | | 42 | | | | 335 | | | | — | | | | — | |
| Class N: | | | | | | | | | | | | | | | | | | | | | | | | | | | | | | | | |
| Shares issued | | | 9,903 | | | | 20,399 | | | | 326 | | | | 494 | | | | 1,912 | | | | 3,739 | | | | 12,619 | | | | 22,889 | |
Shares issued from Merger(3) | | | — | | | | — | | | | — | | | | — | | | | — | | | | — | | | | — | | | | 2,105 | |
| Shares issued in Lieu of Dividends and Distributions | | | 287 | | | | 211 | | | | 124 | | | | 138 | | | | 53 | | | | 89 | | | | 1,133 | | | | 1,185 | |
| Shares redeemed | | | (1,278 | ) | | | (1,828 | ) | | | (651 | ) | | | (1,645 | ) | | | (671 | ) | | | (2,058 | ) | | | (6,817 | ) | | | (9,450 | ) |
| Net Class N transactions | | | 8,912 | | | | 18,782 | | | | (201 | ) | | | (1,013 | ) | | | 1,294 | | | | 1,770 | | | | 6,935 | | | | 16,729 | |
| Servicing Class: | | | | | | | | | | | | | | | | | | | | | | | | | | | | | | | | |
| Shares issued | | | 6,478 | | | | 21,234 | | | | 863 | | | | 3,068 | | | | — | | | | — | | | | — | | | | — | |
| Shares issued in Lieu of Dividends and Distributions | | | 21 | | | | 7 | | | | 67 | | | | 63 | | | | — | | | | — | | | | — | | | | — | |
| Shares redeemed | | | (1,827 | ) | | | (633 | ) | | | (1,329 | ) | | | (8,462 | ) | | | — | | | | — | | | | — | | | | — | |
| Net Servicing Class transactions | | | 4,672 | | | | 20,608 | | | | (399 | ) | | | (5,331 | ) | | | — | | | | — | | | | — | | | | — | |
| | | Multi-Asset Fund (2) | | | Dividend & Income Fund | | | U.S. Core Equity Fund | |
| | | 2015 | | | 2014 | | | 2015 | | | 2014 | | | 2015 | | | 2014 | |
| CAPITAL SHARES ISSUED AND REDEEMED: | | | | | | | | | | | | | | | | |
| Institutional Class: | | | | | | | | | | | | | | | | | | |
| Shares issued | | | — | | | | 71 | | | | — | | | | — | | | | — | | | | 100 | |
Shares issued from Merger(3) | | | — | | | | — | | | | — | | | | — | | | | — | | | | 3,795 | |
| Shares issued in Lieu of Dividends and Distributions | | | — | | | | 3 | | | | — | | | | — | | | | 50 | | | | 6 | |
| Shares redeemed | | | — | | | | (664 | ) | | | — | | | | — | | | | (1 | ) | | | (3,425 | ) |
| Net Institutional Class transactions | | | — | | | | (590 | ) | | | — | | | | — | | | | 49 | | | | 476 | |
| Class N: | | | | | | | | | | | | | | | | | | | | | | | | |
| Shares issued | | | 90 | | | | 59 | | | | 1,194 | | | | 2,007 | | | | 756 | | | | 2,093 | |
Shares issued from Merger(3) | | | — | | | | — | | | | — | | | | — | | | | — | | | | 207 | |
| Shares issued in Lieu of Dividends and Distributions | | | 7 | | | | 10 | | | | 47 | | | | 102 | | | | 631 | | | | 97 | |
| Shares redeemed | | | (168 | ) | | | (418 | ) | | | (687 | ) | | | (2,010 | ) | | | (556 | ) | | | (977 | ) |
| Net Class N transactions | | | (71 | ) | | | (349 | ) | | | 554 | | | | 99 | | | | 831 | | | | 1,420 | |
| Servicing Class: | | | | | | | | | | | | | | | | | | | | | | | | |
| Shares issued | | | 180 | | | | 105 | | | | — | | | | — | | | | 1,729 | | | | 2,881 | |
| Shares issued in Lieu of Dividends and Distributions | | | 3 | | | | 3 | | | | — | | | | — | | | | 4 | | | | 1 | |
| Shares redeemed | | | (297 | ) | | | (21 | ) | | | — | | | | — | | | | (1,084 | ) | | | (1,265 | ) |
| Net Servicing Class transactions | | | (114 | ) | | | 87 | | | | — | | | | — | | | | 649 | | | | 1,617 | |
| (1) | Institutional Class commenced operations on December 20, 2013. |
| (2) | Institutional Class ceased operations on January 31, 2014. |
| (3) | See Note 9 in Notes to Financial Statements. |
CITY NATIONAL ROCHDALE FUNDS | PAGE 143
notes to financial statements/
consolidated notes to financial statements
March 31, 2015 (Unaudited)
| | | Socially Responsible Equity Fund | | | Emerging Markets Fund | |
| | | 2015 | | | 2014 | | | 2015 | | | 2014 | |
| CAPITAL SHARES ISSUED AND REDEEMED: | | | | | | | | | | | | |
| Institutional Class: | | | | | | | | | | | | |
| Shares issued | | | 7,073 | | | | 11,271 | | | | — | | | | — | |
| Shares issued in Lieu of Dividends and Distributions | | | 638 | | | | 768 | | | | — | | | | — | |
| Shares redeemed | | | (1,631 | ) | | | (635 | ) | | | — | | | | — | |
| Net Institutional Class transactions | | | 6,080 | | | | 11,404 | | | | — | | | | — | |
| Class N: | | | | | | | | | | | | | | | | |
| Shares issued | | | 230 | | | | 968 | | | | 3,884 | | | | 8,011 | |
| Shares issued in Lieu of Dividends and Distributions | | | 72 | | | | 514 | | | | 26 | | | | 15 | |
| Shares redeemed | | | (288 | ) | | | (1,699 | ) | | | (1,468 | ) | | | (1,641 | ) |
| Net Class N transactions | | | 14 | | | | (217 | ) | | | 2,442 | | | | 6,385 | |
9. FUND REORGANIZATIONS
Intermediate Fixed Income Fund:
On December 20, 2013, the assets of the Full Maturity Fixed Income Fund were reorganized into the Intermediate Fixed Income Fund. In this reorganization, 4,352,128 shares of the Full Maturity Fixed Income Fund were exchanged for 1,734,179 shares of the Intermediate Fixed Income Fund in a tax-free exchange.
The value of the Full Maturity Fixed Income Fund on December 20, 2013 was $44,899,004. Upon the business combination of such Funds on December 20, 2013, the value of the Full Maturity Fixed Income Fund, which included accumulated realized losses of $124,817 and unrealized loss of $238,709, combined with the value of the Intermediate Fixed Income Fund was $209,405,691.
Assuming the reorganization had been completed on October 1, 2013, the beginning of the fiscal year end, the Intermediate Fixed Income Fund’s pro-forma net investment income, net gain/(loss) on investments and net increase in net assets from operations, for the year ended September 30, 2014, would have been $4,836,013, $2,902,040 and $7,738,053, respectively. Because the combined investment portfolios have been managed as a single integrated portfolio since the reorganization was completed, it is not practicable to separate the amounts of revenue and earnings of the Full Maturity Fixed Income Fund that have been included in the Intermediate Fixed Income Fund’s Statement of Operations since December 20, 2013. Because the Intermediate Fixed Income Fund and Full Maturity Fixed Income Fund sold and redeemed shares throughout the period, it is not practicable to provide pro-forma information on a per-share basis.
U.S. Core Equity Fund:
On March 21, 2014, the assets of the Diversified Equity Fund were reorganized into the U.S. Core Equity Fund. In this reorganization, 3,019,691 shares of the Diversified Equity Fund were exchanged for 207,167 Class N shares and 3,794,815 Institutional Class shares of the U.S. Core Equity Fund in a taxable exchange.
The value of the Diversified Equity Fund on March 21, 2014 was $53,568,331. Upon the business combination of such Funds on March 21, 2014, the value of the Diversified Equity Fund, which included accumulated realized losses of $451,745 and distributions in excess of net investment income of $210, combined with the value of the U.S. Core Equity Fund was $223,593,114.
Assuming the reorganization had been completed on October 1, 2013, the beginning of the fiscal year end, the U.S. Core Equity Fund’s pro-forma net investment income, net gain/(loss) on investments and net increase in net assets from operations for the year ended September 30, 2014, would have been $1,073,823, $35,415,034 and $36,488,858, respectively. Because the combined investment portfolios have been managed as a single integrated portfolio since the reorganization was completed, it is not practicable to separate the amounts of revenue and earnings of the Diversified Equity Fund that have been included in the U.S. Core Equity Fund’s Statement of Operations since March 21, 2014. Because the U.S. Core Equity Fund and Diversified Equity Fund sold and redeemed shares throughout the period, it is not practicable to provide pro-forma information on a per-share basis
CITY NATIONAL ROCHDALE FUNDS | PAGE 144
Fixed Income Opportunities Fund:
On May 30, 2014, the assets of City National Rochdale Alternative Total Return Fund LLC were reorganized into the Fixed Income Opportunities Fund. In this reorganization, the total net assets of City National Rochdale Alternative Total Return Fund LLC were exchanged for 2,104,921 shares of the Fixed Income Opportunities Fund in a taxable exchange.
The value of City National Rochdale Alternative Total Return Fund LLC on May 30, 2014 was $58,518,275. Upon the business combination of such Funds on May 30, 2014, the value of City National Rochdale Alternative Total Return Fund LLC, which included realized gains of $49,195,270 and distributions in excess of net investment income of $28,972,614, combined with the value of the Fixed Income Opportunities Fund was $1,349,061,955.
Assuming the reorganization had been completed on October 1, 2013, the beginning of the fiscal year end, the Fixed Income Opportunities Fund’s pro-forma net investment income, net gain/(loss) on investments and net increase in net assets from operations for the year ended September 30, 2014, would have been $57,319,270, $8,564,090 and $65,883,360, respectively. The only investments acquired as part of the reorganization were life settlement contracts. Since the date of reorganization there were no realized gains with respect to the merged assets and the net change in unrealized loss amounted to $2,969,202. Because the Fixed Income Opportunities Fund and City National Rochdale Alternative Total Return Fund LLC sold and redeemed shares throughout the period, it is not practicable to provide pro-forma information on a per-share basis.
The Intermediate Fixed Income Fund and Fixed Income Opportunities Fund may invest in bank loans. Bank loans are not traded on an exchange and purchasers and sellers of bank loans generally rely on market makers, typically the administrative agent under a bank loan, to effect private sales transactions. As a result, bank loans may have relatively less liquidity than other types of fixed income assets, and a Fund may be more likely to incur losses on the sale of bank loans than on other, more liquid, investments.
10. REGULATORY MATTERS
On July 23, 2014, the Securities and Exchange Commission voted to amend the rules under the Investment Company Act of 1940, as amended, which currently govern the operations of the Money Market Funds (the “MMFs”). The most significant change resulting from these amendments is a requirement that certain types of money market funds transact fund shares based on a market-based NAV. Other types of money market funds may continue to transact fund shares at an NAV calculated using the amortized cost valuation method. Among additional disclosure and other requirements, the amendments also will permit a money market fund, or, in certain circumstances, require a money market fund (other than a government money market fund) to impose liquidity fees on all redemptions, and permit a money market fund to limit (or gate) redemptions for up to ten business days in any 90-day period. The amendments have staggered compliance dates. The majority of these amendments will impact the MMFs beginning on October 14, 2016.
11. NEW ACCOUNTING PRONOUNCEMENT
In May 2015, the FASB issued ASU 2015-07, Fair Value Measurement (Topic 820) — Disclosures for Investments in Certain Entities That Calculate Net Asset Value per Share (or Its Equivalent) (“ASU No. 2015-07”). ASU No. 2015-07 removes the requirement to include investments in the fair value hierarchy for which the fair value is measured at NAV using the practical expedient under “Fair Value Measurements and Disclosures (Topic 820).” ASU No. 2015-07 is effective for annual reporting periods beginning after December 15, 2015, including interim periods within that reporting period, however, early adoption is permitted. ASU No. 2015-07 is required to be applied retrospectively to all periods presented beginning in the year of adoption. Management is currently assessing the potential impact that this guidance will have on the consolidated financial statements.
12. SUBSEQUENT EVENTS
The Trust has evaluated the need for additional disclosures and/or adjustments resulting from subsequent events. Based on this evaluation, no adjustments were required to the financial statements as of March 31, 2015 and no issues were noted to disclose.
CITY NATIONAL ROCHDALE FUNDS | PAGE 145
disclosure of fund expenses (Unaudited)
All mutual funds have operating expenses. As a shareholder of a Fund, your investment is affected by these ongoing costs, which include (among others) costs for portfolio management, administrative services, class-specific distribution fees, acquired fund fees and shareholder reports like this one. It is important for you to understand the impact of these costs on your investment returns.
Operating expenses such as these are deducted from the Fund’s gross income and directly reduce your final investment return. These expenses are expressed as a percentage of the Fund’s average net assets; this percentage is known as the Fund’s expense ratio.
The following examples use the expense ratio and are intended to help you understand the ongoing costs (in dollars) of investing in your Fund and to compare these costs with those of other mutual funds. The examples are based on an investment of $1,000 made at the beginning of the period shown and held for the entire period.
The table below illustrates your Fund’s costs in two ways:
Actual Fund Return. This section helps you to estimate the actual expenses that your Fund incurred over the period. The “Expenses Paid During Period” column shows the actual dollar expense cost incurred by a $1,000 investment in the Fund, and the “Ending Account Value” number is derived from deducting that expense cost from the Fund’s gross investment return.
You can use this information, together with the actual amount you invested in the Fund, to estimate the expenses you paid over that period. Simply divide your actual account value by $1,000 to arrive at a ratio (for example, an $8,600 account value divided by $1,000 = 8.6), then multiply that ratio by the number shown for your Fund under “Expenses Paid During Period.”
Hypothetical 5% Return. This section helps you compare your Fund’s costs with those of other mutual funds. It assumes that the Fund had an annual 5% return before expenses during the year, but that the expense ratio (Column 3) for the period is unchanged. This example is useful in making comparisons because the Securities and Exchange Commission requires all mutual funds to make this 5% calculation. You can assess your Fund’s comparative cost by comparing the hypothetical result for your Fund in the “Expenses Paid During Period” column with those that appear in the same charts in the shareholder reports for other funds.
NOTE: Because the return is set at 5% for comparison purposes – NOT your Fund’s actual return – the account values shown do not apply to your specific investment.
CITY NATIONAL ROCHDALE FUNDS | PAGE 146
| | | Beginning Account Value 10/01/2014 | | | Ending Account Value 03/31/2015 | | | Annualized Expense Ratios | | | Expense Paid During Period* | |
| City National Rochdale Government Money Market Fund | |
| Actual Fund Return | | | | | | | | | | | | |
| Class N | | $ | 1,000.00 | | | $ | 1,000.00 | | | | 0.09 | % | | $ | 0.45 | |
| Class S | | | 1,000.00 | | | | 1,000.00 | | | | 0.09 | % | | | 0.45 | |
| Servicing Class | | | 1,000.00 | | | | 1,000.00 | | | | 0.09 | % | | | 0.45 | |
| | | | | | | | | | | | | | | | | |
| Hypothetical 5% Return | | | | | | | | | | | | | | | | |
| Class N | | $ | 1,000.00 | | | $ | 1,024.48 | | | | 0.09 | % | | $ | 0.45 | |
| Class S | | | 1,000.00 | | | | 1,024.48 | | | | 0.09 | % | | | 0.45 | |
| Servicing Class | | | 1,000.00 | | | | 1,024.48 | | | | 0.09 | % | | | 0.45 | |
| | | | | | | | | | | | | | | | | |
| City National Rochdale Prime Money Market Fund | |
| Actual Fund Return | | | | | | | | | | | | | | | | |
| Institutional Class | | $ | 1,000.00 | | | $ | 1,000.00 | | | | 0.16 | % | | $ | 0.80 | |
| Class N | | | 1000.00 | | | | 1,000.00 | | | | 0.16 | % | | | 0.80 | |
| Class S | | | 1,000.00 | | | | 1,000.00 | | | | 0.16 | % | | | 0.80 | |
| Servicing Class | | | 1,000.00 | | | | 1,000.00 | | | | 0.16 | % | | | 0.80 | |
| | | | | | | | | | | | | | | | | |
| Hypothetical 5% Return | | | | | | | | | | | | | | | | |
| Institutional Class | | $ | 1,000.00 | | | $ | 1,024.13 | | | | 0.16 | % | | $ | 0.81 | |
| Class N | | | 1000.00 | | | | 1024.13 | | | | 0.16 | % | | | 0.81 | |
| Class S | | | 1,000.00 | | | | 1,024.13 | | | | 0.16 | % | | | 0.81 | |
| Servicing Class | | | 1,000.00 | | | | 1,024.13 | | | | 0.16 | % | | | 0.81 | |
| | | | | | | | | | | | | | | | | |
| City National Rochdale California Tax Exempt Money Market Fund | |
| Actual Fund Return | | | | | | | | | | | | | | | | |
| Class N | | $ | 1,000.00 | | | $ | 1,000.00 | | | | 0.05 | % | | $ | 0.25 | |
| Class S | | | 1,000.00 | | | | 1,000.00 | | | | 0.05 | % | | | 0.25 | |
| Servicing Class | | | 1,000.00 | | | | 1,000.00 | | | | 0.04 | % | | | 0.20 | |
| | | | | | | | | | | | | | | | | |
| Hypothetical 5% Return | | | | | | | | | | | | | | | | |
| Class N | | $ | 1,000.00 | | | $ | 1,024.68 | | | | 0.05 | % | | $ | 0.25 | |
| Class S | | | 1,000.00 | | | | 1,024.68 | | | | 0.05 | % | | | 0.25 | |
| Servicing Class | | | 1,000.00 | | | | 1,024.73 | | | | 0.04 | % | | | 0.20 | |
| |
| City National Rochdale Limited Maturity Fixed Income Fund | |
| Actual Fund Return | | | | | | | | | | | | | | | | |
| Institutional Class | | $ | 1,000.00 | | | $ | 1,003.90 | | | | 0.67 | % | | $ | 3.35 | |
| Class N | | | 1,000.00 | | | | 1,003.60 | | | | 0.92 | % | | | 4.60 | |
| | | | | | | | | | | | | | | | | |
| Hypothetical 5% Return | | | | | | | | | | | | | | | | |
| Institutional Class | | $ | 1,000.00 | | | $ | 1,021.59 | | | | 0.67 | % | | $ | 3.38 | |
| Class N | | | 1,000.00 | | | | 1,020.34 | | | | 0.92 | % | | | 4.63 | |
| | | | | | | | | | | | | | | | | |
| City National Rochdale Government Bond Fund | |
| Actual Fund Return | | | | | | | | | | | | | | | | |
| Institutional Class | | $ | 1,000.00 | | | $ | 1,010.20 | | | | 0.53 | % | | $ | 0.88 | |
| Class N | | | 1,000.00 | | | | 1,007.70 | | | | 1.03 | % | | | 5.16 | |
| Servicing Class | | | 1,000.00 | | | | 1,009.00 | | | | 0.78 | % | | | 3.91 | |
| | | | | | | | | | | | | | | | | |
| Hypothetical 5% Return | | | | | | | | | | | | | | | | |
| Institutional Class | | $ | 1,000.00 | | | $ | 1,022.29 | | | | 0.53 | % | | $ | 2.67 | |
| Class N | | | 1,000.00 | | | | 1,019.80 | | | | 1.03 | % | | | 5.19 | |
| Servicing Class | | | 1,000.00 | | | | 1,021.04 | | | | 0.78 | % | | | 3.93 | |
| | | | | | | | | | | | | | | | | |
| City National Rochdale Corporate Bond Fund | |
| Actual Fund Return | | | | | | | | | | | | | | | | |
| Class N | | $ | 1,000.00 | | | $ | 1,007.80 | | | | 1.01 | % | | $ | 5.06 | |
| Servicing Class | | | 1,000.00 | | | | 1,008.10 | | | | 0.76 | % | | | 3.80 | |
| | | | | | | | | | | | | | | | | |
| Hypothetical 5% Return | | | | | | | | | | | | | | | | |
| Class N | | $ | 1,000.00 | | | $ | 1,019.90 | | | | 1.01 | % | | $ | 5.09 | |
| Servicing Class | | | 1,000.00 | | | | 1,021.14 | | | | 0.76 | % | | | 3.83 | |
| |
| City National Rochdale California Tax Exempt Bond Fund | |
| Actual Fund Return | | | | | | | | | | | | | | | | |
| Class N | | $ | 1,000.00 | | | $ | 1,008.30 | | | | 0.88 | % | | $ | 4.41 | |
| Servicing Class | | | 1,000.00 | | | | 1,009.60 | | | | 0.63 | % | | | 3.16 | |
| | | | | | | | | | | | | | | | | |
| Hypothetical 5% Return | | | | | | | | | | | | | | | | |
| Class N | | $ | 1,000.00 | | | $ | 1,020.54 | | | | 0.88 | % | | $ | 4.43 | |
| Servicing Class | | | 1,000.00 | | | | 1,021.79 | | | | 0.63 | % | | | 3.18 | |
| | | | | | | | | | | | | | | | | |
| City National Rochdale Municipal High Income Fund | |
| Actual Fund Return | | | | | | | | | | | | | | | | |
| Class N | | $ | 1,000.00 | | | $ | 1,034.60 | | | | 1.04 | % | | $ | 5.28 | |
| Servicing Class | | | 1,000.00 | | | | 1,035.90 | | | | 0.79 | % | | | 4.01 | |
| | | | | | | | | | | | | | | | | |
| Hypothetical 5% Return | | | | | | | | | | | | | | | | |
| Class N | | $ | 1,000.00 | | | $ | 1,019.75 | | | | 1.04 | % | | $ | 5.24 | |
| Servicing Class | | | 1,000.00 | | | | 1,020.99 | | | | 0.79 | % | | | 3.98 | |
| |
| City National Rochdale High Yield Bond Fund | |
| Actual Fund Return | | | | | | | | | | | | | | | | |
| Institutional Class | | $ | 1,000.00 | | | $ | 1,006.30 | | | | 0.70 | % | | $ | 1.14 | |
| Class N | | | 1,000.00 | | | | 1,003.90 | | | | 1.20 | % | | | 6.00 | |
| Servicing Class | | | 1,000.00 | | | | 1,005.10 | | | | 0.95 | % | | | 4.75 | |
| | | | | | | | | | | | | | | | | |
| Hypothetical 5% Return | | | | | | | | | | | | | | | | |
| Institutional Class | | $ | 1,000.00 | | | $ | 1,021.44 | | | | 0.70 | % | | $ | 3.53 | |
| Class N | | | 1,000.00 | | | | 1,018.95 | | | | 1.20 | % | | | 6.04 | |
| Servicing Class | | | 1,000.00 | | | | 1,020.19 | | | | 0.95 | % | | | 4.78 | |
| * | Expenses are equal to the Fund’s annualized expense ratio multiplied by the average account value over the period, multiplied by 182/365 (to reflect the one-half year period). |
CITY NATIONAL ROCHDALE FUNDS | PAGE 147
disclosure of fund expenses (Unaudited)
| | | Beginning Account Value 10/01/2014 | | | Ending Account Value 03/31/2015 | | | Annualized Expense Ratios | | | Expense Paid During Period* | |
| City National Rochdale Intermediate Fixed Income Fund | |
| Actual Fund Return | | | | | | | | | | | | |
| Institutional Class | | $ | 1,000.00 | | | $ | 1,020.90 | | | | 0.51 | % | | $ | 0.83 | |
| Class N | | | 1,000.00 | | | | 1,018.10 | | | | 1.01 | % | | | 5.08 | |
| | | | | | | | | | | | | | | | | |
| Hypothetical 5% Return | | | | | | | | | | | | | | | | |
| Institutional Class | | $ | 1,000.00 | | | $ | 1,022.39 | | | | 0.51 | % | | $ | 2.57 | |
| Class N | | | 1,000.00 | | | | 1,019.90 | | | | 1.01 | % | | | 5.09 | |
| | | | | | | | | | | | | | | | | |
| City National Rochdale Fixed Income Opportunities Fund | |
| Actual Fund Return | | | | | | | | | | | | | | | | |
| Class N | | $ | 1,000.00 | | | $ | 989.80 | | | | 1.10 | % | | $ | 5.46 | |
| | | | | | | | | | | | | | | | | |
| Hypothetical 5% Return | | | | | | | | | | | | | | | | |
| Class N | | $ | 1,000.00 | | | $ | 1,019.45 | | | | 1.10 | % | | $ | 5.54 | |
| | | | | | | | | | | | | | | | | |
| City National Rochdale Multi-Asset Fund | |
| Actual Fund Return | | | | | | | | | | | | | | | | |
| Class N | | $ | 1,000.00 | | | $ | 1,025.20 | | | | 1.49 | % | | $ | 7.52 | |
| Servicing Class | | | 1,000.00 | | | | 1,026.50 | | | | 1.24 | % | | | 6.26 | |
| | | | | | | | | | | | | | | | | |
| Hypothetical 5% Return | | | | | | | | | | | | | | | | |
| Class N | | $ | 1,000.00 | | | $ | 1,017.50 | | | | 1.49 | % | | $ | 7.49 | |
| Servicing Class | | | 1,000.00 | | | | 1,018.75 | | | | 1.24 | % | | | 6.24 | |
| | | | | | | | | | | | | | | | | |
| City National Rochdale Dividend & Income Fund | |
| Actual Fund Return | | | | | | | | | | | | | | | | |
| Class N | | $ | 1,000.00 | | | $ | 1,049.80 | | | | 1.11 | % | | $ | 5.67 | |
| | | | | | | | | | | | | | | | | |
| Hypothetical 5% Return | | | | | | | | | | | | | | | | |
| Class N | | $ | 1,000.00 | | | $ | 1,019.40 | | | | 1.11 | % | | $ | 5.59 | |
| | | | | | | | | | | | | | | | | |
| City National Rochdale U.S. Core Equity Fund | |
| Actual Fund Return | | | | | | | | | | | | | | | | |
| Institutional Class | | $ | 1,000.00 | | | $ | 1,062.30 | | | | 0.53 | % | | $ | 0.90 | |
| Class N | | | 1,000.00 | | | | 1,059.60 | | | | 1.03 | % | | | 5.29 | |
| Servicing Class | | | 1,000.00 | | | | 1,060.70 | | | | 0.78 | % | | | 4.01 | |
| | | | | | | | | | | | | | | | | |
| Hypothetical 5% Return | | | | | | | | | | | | | | | | |
| Institutional Class | | $ | 1,000.00 | | | $ | 1,022.29 | | | | 0.53 | % | | $ | 2.67 | |
| Class N | | | 1,000.00 | | | | 1,019.80 | | | | 1.03 | % | | | 5.19 | |
| Servicing Class | | | 1,000.00 | | | | 1,021.04 | | | | 0.78 | % | | | 3.93 | |
| | | | | | | | | | | | | | | | | |
| City National Rochdale Socially Responsible Equity Fund | |
| Actual Fund Return | | | | | | | | | | | | | | | | |
| Institutional Class | | $ | 1,000.00 | | | $ | 1,014.20 | | | | 0.87 | % | | $ | 4.37 | |
| Class N | | | 1,000.00 | | | | 1,013.90 | | | | 1.11 | % | | | 5.57 | |
| | | | | | | | | | | | | | | | | |
| Hypothetical 5% Return | | | | | | | | | | | | | | | | |
| Institutional Class | | $ | 1,000.00 | | | $ | 1,020.59 | | | | 0.87 | % | | $ | 4.38 | |
| Class N | | | 1,000.00 | | | | 1,019.40 | | | | 1.11 | % | | | 5.59 | |
| | | | | | | | | | | | | | | | | |
| City National Rochdale Emerging Markets Fund | |
| Actual Fund Return | | | | | | | | | | | | | | | | |
| Class N | | $ | 1,000.00 | | | $ | 1,068.30 | | | | 1.61 | % | | $ | 8.30 | |
| | | | | | | | | | | | | | | | | |
| Hypothetical 5% Return | | | | | | | | | | | | | | | | |
| Class N | | $ | 1,000.00 | | | $ | 1,016.90 | | | | 1.61 | % | | $ | 8.10 | |
| * | Expenses are equal to the Fund’s annualized expense ratio multiplied by the average account value over the period, multiplied by 182/365 (to reflect the one-half year period). |
CITY NATIONAL ROCHDALE FUNDS | PAGE 148
board approval of advisory and sub-advisory agreements
(Unaudited)
The Board of Trustees of City National Rochdale Funds (the “Trust”) is comprised of eight Trustees, six of whom are independent of the Trust’s investment adviser and sub-advisers (the “Independent Trustees”). On May 14, 2014, the Board and the Independent Trustees approved the following sub-advisory agreements:
| • | A sub-advisory agreement between City National Rochdale, LLC (the “Adviser”) and Ashmore Investment Management Limited (“Ashmore”) with respect to the City National Rochdale Fixed Income Opportunities Fund (the “Fixed Income Opportunities Fund” or the “Fund”); and |
| • | A sub-advisory agreement between the Adviser and AllFinancial Partners II, LLC (“AllFinancial”) with respect to the Fund. |
The sub-advisory agreements listed above are collectively referred to below as the “Agreements,” and Ashmore and AllFinancial are collectively referred to below as the “Sub-Advisers.”
General Information
The following information summarizes the Board’s considerations associated with its review of the Agreements. In connection with their deliberations, the Board considered such information and factors as they believed, in light of the legal advice furnished to them and their own business judgment, to be relevant. As described below, the Board considered the nature, quality and extent of the various investment advisory services proposed to be performed by each Sub-Adviser. In considering these matters, the Independent Trustees discussed the approval of the Agreements with management and in a private session with their independent counsel at which no representatives of the Adviser or the Sub-Advisers were present.
The Board reviewed extensive materials regarding investment results of each Sub-Adviser, advisory fee information, financial information with respect to each Sub-Adviser, descriptions of various functions such as compliance monitoring and portfolio trading practices, and information about the personnel who would be providing investment management services to the Funds. In addition, the Investment Committee of the Board of Trustees met with and reviewed presentations by representatives of Ashmore and AllFinancial.
In deciding to approve the Agreements, the Board and the Independent Trustees did not identify a single factor as controlling and this summary does not describe all of the matters considered. In addition, each Board member did not necessarily attribute the same weight to each matter. However, the Board and the Independent Trustees concluded that each of the various factors referred to below favored such approval.
Ashmore Investment Management Limited
Nature, Extent and Quality of Services
In reviewing the services to be provided by Ashmore to the Fund, the Board considered a variety of matters, including the background, education and experience of Ashmore’s key portfolio management and operational personnel; its overall financial strength and stability; its resources and ability to attract, motivate and retain capable personnel to serve the Fund; and the overall general quality and depth of its organization. The Board also reviewed Ashmore’s investment philosophy and processes as well as its brokerage and trading practices, its disaster recovery and contingency planning, and its commitment and systems in place with regard to compliance with applicable laws and regulations.
The Board considered the composite performance of accounts managed by Ashmore using the same investment strategies Ashmore would use to manage its portion of the Fund. The Board observed that the annualized returns of the composite, which commenced August 2007, were higher than the returns of the JP Morgan Corporate Emerging Market Bond Index (CEMBI) Non-Investment Grade for the one-, three- and five-year and since inception periods ending December 31, 2013.
Sub-Advisory Fees, Benefits to Sub-Adviser and Economies of Scale
The Board reviewed the fees charged by Ashmore to two commingled funds that Ashmore manages using the same investment strategies it would use to manage its portion of the Fund, and noted that the asset-based fees charged by Ashmore to the commingled funds were greater than the management fees it would be charging with respect to the Fund, and that one of the commingled funds also paid a significant performance-based fee. The Board also considered the potential benefits to be received by Ashmore as a result of its relationship with the Fund generally, including sub-advisory fees paid to Ashmore and the intangible benefits of its association with the Fund and any favorable publicity arising in connection with the Fund’s performance. The Board considered that although neither the Fund’s advisory agreement nor the proposed Ashmore Agreement included fee breakpoints, the Adviser would retain no advisory fees with respect to the portion of the Fund to be managed by Ashmore
CITY NATIONAL ROCHDALE FUNDS | PAGE 149
board approval of advisory and sub-advisory agreements
(Unaudited)
and significant economies of scale were not likely to be realized by Ashmore at the Fund asset levels anticipated during the next several years of the Fund’s operations.
Conclusions
Based on their review, including their consideration of each of the factors referred to above, the Board and the Independent Trustees concluded that the terms of the proposed sub-advisory agreement, including the fees to be received by Ashmore, were fair and reasonable in light of the nature and quality of the services proposed to be provided by Ashmore to the Fund and its shareholders, and approved the sub-advisory agreement.
AllFinancial Partners II, LLC
Nature, Extent and Quality of Services
In reviewing the services to be provided by AllFinancial to the Fund, the Board considered a variety of matters, including the background, education and experience of AllFinancial’s key portfolio management and operational personnel; its overall financial strength and stability; its resources and ability to attract, motivate and retain capable personnel to serve the Fund; and the overall general quality and depth of its organization. The Board also reviewed information regarding AllFinancial’s advisory business and the advisory services it would be providing to the Fund with respect to the Fund’s investments in life insurance policies. The Board noted that AllFinancial would be recommending new life insurance policies to the Adviser for investment by the Fund, but that the Adviser would continue to make investment decisions with respect to the Fund’s investments in life insurance policies based on AllFinancial’s recommendations. The Board also reviewed information regarding AllFinancial’s commitment and systems in place with regard to compliance with applicable laws and regulations.
The Board considered the performance of the City National Rochdale Alternative Return Fund (the “Alternative Total Return Fund”), which commenced January 4, 2011, was expected to reorganize into the Fixed Income Opportunities Fund at the end of May 2014, and for which AllFinancial’s principal had provided investment recommendations. The Board noted that the Alternative Total Return Fund had outperformed the Barclay’s Intermediate Aggregate Bond Index plus 500 basis points for the one-year and since inception periods ending March 31, 2014, although the Alternative Total Return Fund had underperformed the S&P 500 Index by 13.39% and 0.71% for the same periods, respectively.
Sub-Advisory Fees, Benefits to Sub-Adviser and Economies of Scale
The Trustees considered that the Fixed Income Opportunities Fund would be AllFinancial’s only client and that therefore they did not have a basis for comparing the proposed fees to be paid to AllFinancial with respect to the portion of the Fund invested in life insurance policies with advisory fees charged by AllFinancial to other clients. The Board also considered the potential benefits to be received by AllFinancial as a result of its relationship with the Fund generally, including sub-advisory fees paid to AllFinancial and the intangible benefits of its association with the Fund and any favorable publicity arising in connection with the Fund’s performance. The Board considered that although neither the Fund’s advisory agreement with the Adviser nor the AllFinancial Agreement included fee breakpoints, the Adviser would not be retaining any portion of its advisory fee with respect to the Fund’s investment in life insurance policies and significant economies of scale were not likely to be realized by AllFinancial at the Fund asset levels anticipated during the next several years of the Fund’s operations.
Conclusions
Based on their review, including their consideration of each of the factors referred to above, the Board and the Independent Trustees concluded that the terms of the proposed sub-advisory agreement, including the fees to be received by AllFinancial, were fair and reasonable in light of the nature and quality of the services proposed to be provided by AllFinancial to the Fund and its shareholders, and approved the sub-advisory agreement.
CITY NATIONAL ROCHDALE FUNDS | PAGE 150
This page intentionally left blank.
CITY NATIONAL ROCHDALE FUNDS | PAGE 151
This page intentionally left blank.
CITY NATIONAL ROCHDALE FUNDS | PAGE 152
This page intentionally left blank.
CITY NATIONAL ROCHDALE FUNDS | PAGE 153
This page intentionally left blank.
CITY NATIONAL ROCHDALE FUNDS | PAGE 154
This page intentionally left blank.
CITY NATIONAL ROCHDALE FUNDS | PAGE 155
This page intentionally left blank.
CITY NATIONAL ROCHDALE FUNDS | PAGE 156
For more information on City National Rochdale Funds, including charges and expenses, please call 1-888-889-0799 or go to citynationalrochdalefunds.com for a free prospectus. Read it carefully before you invest or send money.
CNR-SA-004-0700
Item 2. Code of Ethics.
Not applicable for semi-annual report.
Item 3. Audit Committee Financial Expert.
Not applicable for semi-annual report.
Item 4. Principal Accountant Fees and Services.
Not applicable for semi-annual report.
Item 5. Audit Committee of Listed Registrants.
Not applicable to open-end management investment companies.
Item 6. Schedule of Investments
Not applicable.
Item 7. Disclosure of Proxy Voting Policies and Procedures for Closed-End Management Investment Companies.
Not applicable to open-end management investment companies.
Item 8. Portfolio Managers of Closed-End Management Investment Companies
Not applicable to open-end management investment companies.
Item 9. Purchases of Equity Securities by Closed-End Management Company and Affiliated Purchasers.
Not applicable to open-end management investment companies.
Item 10. Submission of Matters to a Vote of Security Holders.
None.
Item 11. Controls and Procedures.
(a) The certifying officers, whose certifications are included herewith, have evaluated the registrant’s disclosure controls and procedures within 90 days of the filing date of this report. In their opinion, based on their evaluation, the registrant’s disclosure controls and procedures are adequately designed, and are operating effectively to ensure, that information required to be disclosed by the registrant in the reports it files or submits under the Securities Exchange Act of 1934 is recorded, processed, summarized and reported within the time periods specified in the Securities and Exchange Commission’s rules and forms.
(b) There were no significant changes in the registrant’s internal control over financial reporting that occurred during the second fiscal quarter of the period covered by this report that has materially affected, or is reasonably likely to materially affect, the registrant’s internal control over financial reporting.
Items 12. Exhibits.
(a)(1) Not applicable for semi-annual report.
(a)(2) A separate certification for the principal executive officer and the principal financial officer of the registrant as required by Rule 30a-2(a) under the Investment Company Act of 1940, as amended (17 CFR 270.30a-2(a)), are filed herewith.
(b) Officer certifications as required by Rule 30a-2(b) under the Investment Company Act of 1940, as amended (17 CFR 270.30a-2(b)) also accompany this filing as an Exhibit.
SIGNATURES
Pursuant to the requirements of the securities Exchange Act of 1934 and the Investment Company Act of 1940, the registrant has duly caused this report to be signed on its behalf by the undersigned, thereunto duly authorized.
| (Registrant) | City National Rochdale Funds | |
| | | |
| By (Signature and Title)* | /s/ Garrett R. D’Alessandro | |
| Garrett R. D’Alessandro, | |
| | President and Chief Executive Officer | |
| | | |
| Date: | June 8, 2015 | |
Pursuant to the requirements of the Securities Exchange Act of 1934 and the Investment Company Act of 1940, this report has been signed below by the following persons on behalf of the registrant and in the capacities and on the dates indicated.
| By (Signature and Title)* | /s/ Garrett R. D’Alessandro | |
| Garrett R. D’Alessandro, | |
| | President and Chief Executive Officer | |
| | | |
| Date: | June 8, 2015 | |
| | | |
| By (Signature and Title)* | /s/ Eric Kleinschmidt | |
| Eric Kleinschmidt, | |
| | Treasurer | |
| Date: | June 8, 2015 | |
* Print the name and title of each signing officer under his or her signature.