bonds. During the year, the Fund reduced its holdings of Puerto Rico bonds from less than 2% of its net assets to 0%, compared to the benchmark's holdings of approximately 24%. Worsening financial distress caused further defaults for nearly all of Puerto Rico’s debt. Ensuing bond price declines in Puerto Rico debt reduced the Index's returns. As in many sectors, credit spreads tightening caused nonrated and below investment grade bonds to outperform, contributing to the Fund outperforming its benchmark during the quarter and year to date.
The fiscal year underperformance was caused by the Fund’s duration being longer than the Index's duration during the fourth quarter of 2016, as rates rose substantially during the quarter. During 2017, the Fund's duration has been approximately the same as the Index's duration.
HIGH YIELD BOND FUND – CHYIX
The Servicing Class Shares of the Fund posted a return of 1.77% for Q3, lagging the Citigroup High Yield Market Capped Index’s return of 1.91% by 14 basis points. Calendar year to date, as of September 30, 2017, the Fund is behind the benchmark’s return of 6.36% by 96 basis points with a return of 5.40%. For the fiscal year ended September 30, 2017, the Servicing Class Shares of the Fund returned 8.42%, up 4 basis points over its benchmark's return of 8.38%. The Fund underperformed its benchmark in nearly all situations because of asset class exposure and risk weights. As of September 30, 2017, the Fund has 87% exposure to high yield bonds and 13% exposure to higher quality assets, such as bank loans (7%), investment grade bonds (3%), and cash (2%). The manager has maintained a similar average credit quality of the overall portfolio over the course of the last year relative to the benchmark. Similar credit risk, with lower interest rate risk from bank loan exposure is intended to help insulate against elevated volatility that has affected credit markets over the past few years. The Fund’s approximate 7% allocation to bank loans has also been a constructive hedge against downside risk, as senior secured paper has performed relatively well during periods of market stress. Loans have underperformed high yield bonds over the past year, so when comparing attribution of returns for only the high yield bonds, the underlying performance has been slightly stronger than the benchmark. Therefore, we are pleased with the absolute performance of the strategy, and with the risk adjusted performance relative to the benchmark over the past year.
INTERMEDIATE FIXED INCOME FUND – RIMCX
The Class N Shares of the Fund posted a return of 0.19% for Q3, underperforming the Bloomberg Barclays Intermediate U.S. Government/Credit Index’s return of 0.60%. Calendar year to date, as of September 30, 2017, the Fund is underperforming its benchmark’s return of 2.34% by 9 basis points with a return of 2.25%. For the fiscal year ended September 30, 2017, the Class N Shares of the Fund returned 0.48%, outperforming its benchmark’s return of 0.23% by 25 basis points. As of the most recent quarter, the Fund continued to outpace its benchmark from a yield and total return perspective, driven by an emphasis on investing in lower quality bonds within the investment grade universe. The significant overweight to credit has been the most meaningful driver of outperformance for the fiscal year. The slight underweight duration positioning relative to the benchmark was a performance tailwind. The driving force behind the underperformance was exposure to a third-party managed mutual fund that invests in the risk reinsurance market. During September 2017, the United States was hit by both Hurricanes Harvey and Irma. As a result, this allocation lost nearly 14.1% for the month and 46 basis points of performance from the Fund.
FIXED INCOME OPPORTUNITIES FUND – RIMOX
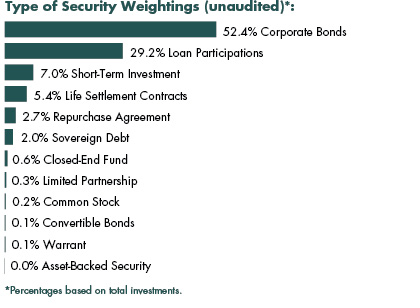
The Fund posted a return of 2.07% for Q3, outperforming all asset class specific benchmarks. Calendar year to date, as of September 30, 2017, the Fund is outperforming the Bloomberg Barclays Aggregate Index's return of 3.14% by 219 basis points with a return of 5.33%. For the fiscal year ended September 30, 2017, the Fund returned 7.99%, outperforming the Bloomberg Barclays Aggregate Index's return of 0.07% by 792 basis points. The Fund’s diversified asset class exposures have been instrumental in delivering an attractive yield profile, without assuming an inordinate amount of interest rate risk. With nearly 30% of the Fund allocated to a combination of domestic and European bank loans, the strategy has been well positioned to withstand the elevated volatility experienced in the credit markets. The
CITY NATIONAL ROCHDALE FUNDS | PAGE 5
investment adviser’s report (Unaudited) |
| September 30, 2017 |
Fixed Income Funds (continued) |
Fund’s emerging markets high yield and U.S. high yield bond allocations have been two of the strongest performers during the year. Both of these areas outperformed the more conservative segment of bank loans.
This material represents the managers’ assessment of the portfolios and market environment at a specific point in time and should not be relied upon by the reader as research or investment advice.
Performance data quoted represents past performance and does not guarantee similar future results. The investment performance and principal value of an investment will fluctuate so that an investor’s shares, when redeemed, may be worth more or less than their original cost, and current performance may be lower or higher than the performance quoted. For performance data current to the most recent month end, please call 1-888-889-0799.
Index performance returns do not reflect any management fees, transaction costs or expenses. Indexes are unmanaged and one cannot invest directly in an index.
The Government Bond Fund’s, Corporate Bond Fund’s, California Tax Exempt Bond Fund’s, Municipal High Income Fund’s, High Yield Bond Fund’s, Intermediate Fixed Income Fund’s and Fixed Income Opportunities Fund’s investment performance reflects voluntary fee waivers in effect. Absent these waivers, total return and yield would be lower. The Adviser intends to continue these arrangements at least through January 31, 2018, but there can be no assurance that City National Rochdale, LLC will continue to waive fees.
Mutual fund investing involves risk, including loss of principal. Bonds and bond funds are subject to interest rate risk and will decline in value as interest rates rise. The securities of mid-cap companies may have greater price volatility and less liquidity than the securities of larger capitalized companies. Emerging markets involve heightened risk related to the same factors as well as increased volatility and lower trading volume.
The California Tax Exempt Bond Fund invests primarily in California securities and may be more volatile and susceptible to a single adverse economic or regulatory occurrence affecting those obligations than a fund investing in obligations of a number of states.
The credit quality breakdown depicts the credit quality ratings of the Fund’s portfolio securities that are rated by one or both of two major nationally recognized statistical rating organizations (“NRSROs”). The two NRSROs currently utilized for this purpose are Standard & Poor’s (S&P) and Moody’s. When a bond is rated by S&P that rating is utilized. If it is not rated by S&P, the Moody’s rating is utilized. When a security is rated by neither, it is classified as “Not Rated”. For bonds, these credit quality ratings are shown without regard to gradations within a given rating category. For example, securities rated “AA-” or “AA+” have been included in the “AA” rated category. Long-term ratings are measured on a scale that generally ranges from AAA (highest) to D (lowest).
Duration is a measure of a bond's sensitivity to interest rate changes. The higher the bond's duration, the greater its sensitivity to the change.
CITY NATIONAL ROCHDALE FUNDS | PAGE 6
fund overview (Unaudited) |
| September 30, 2017 |
| City National Rochdale Government Bond Fund |
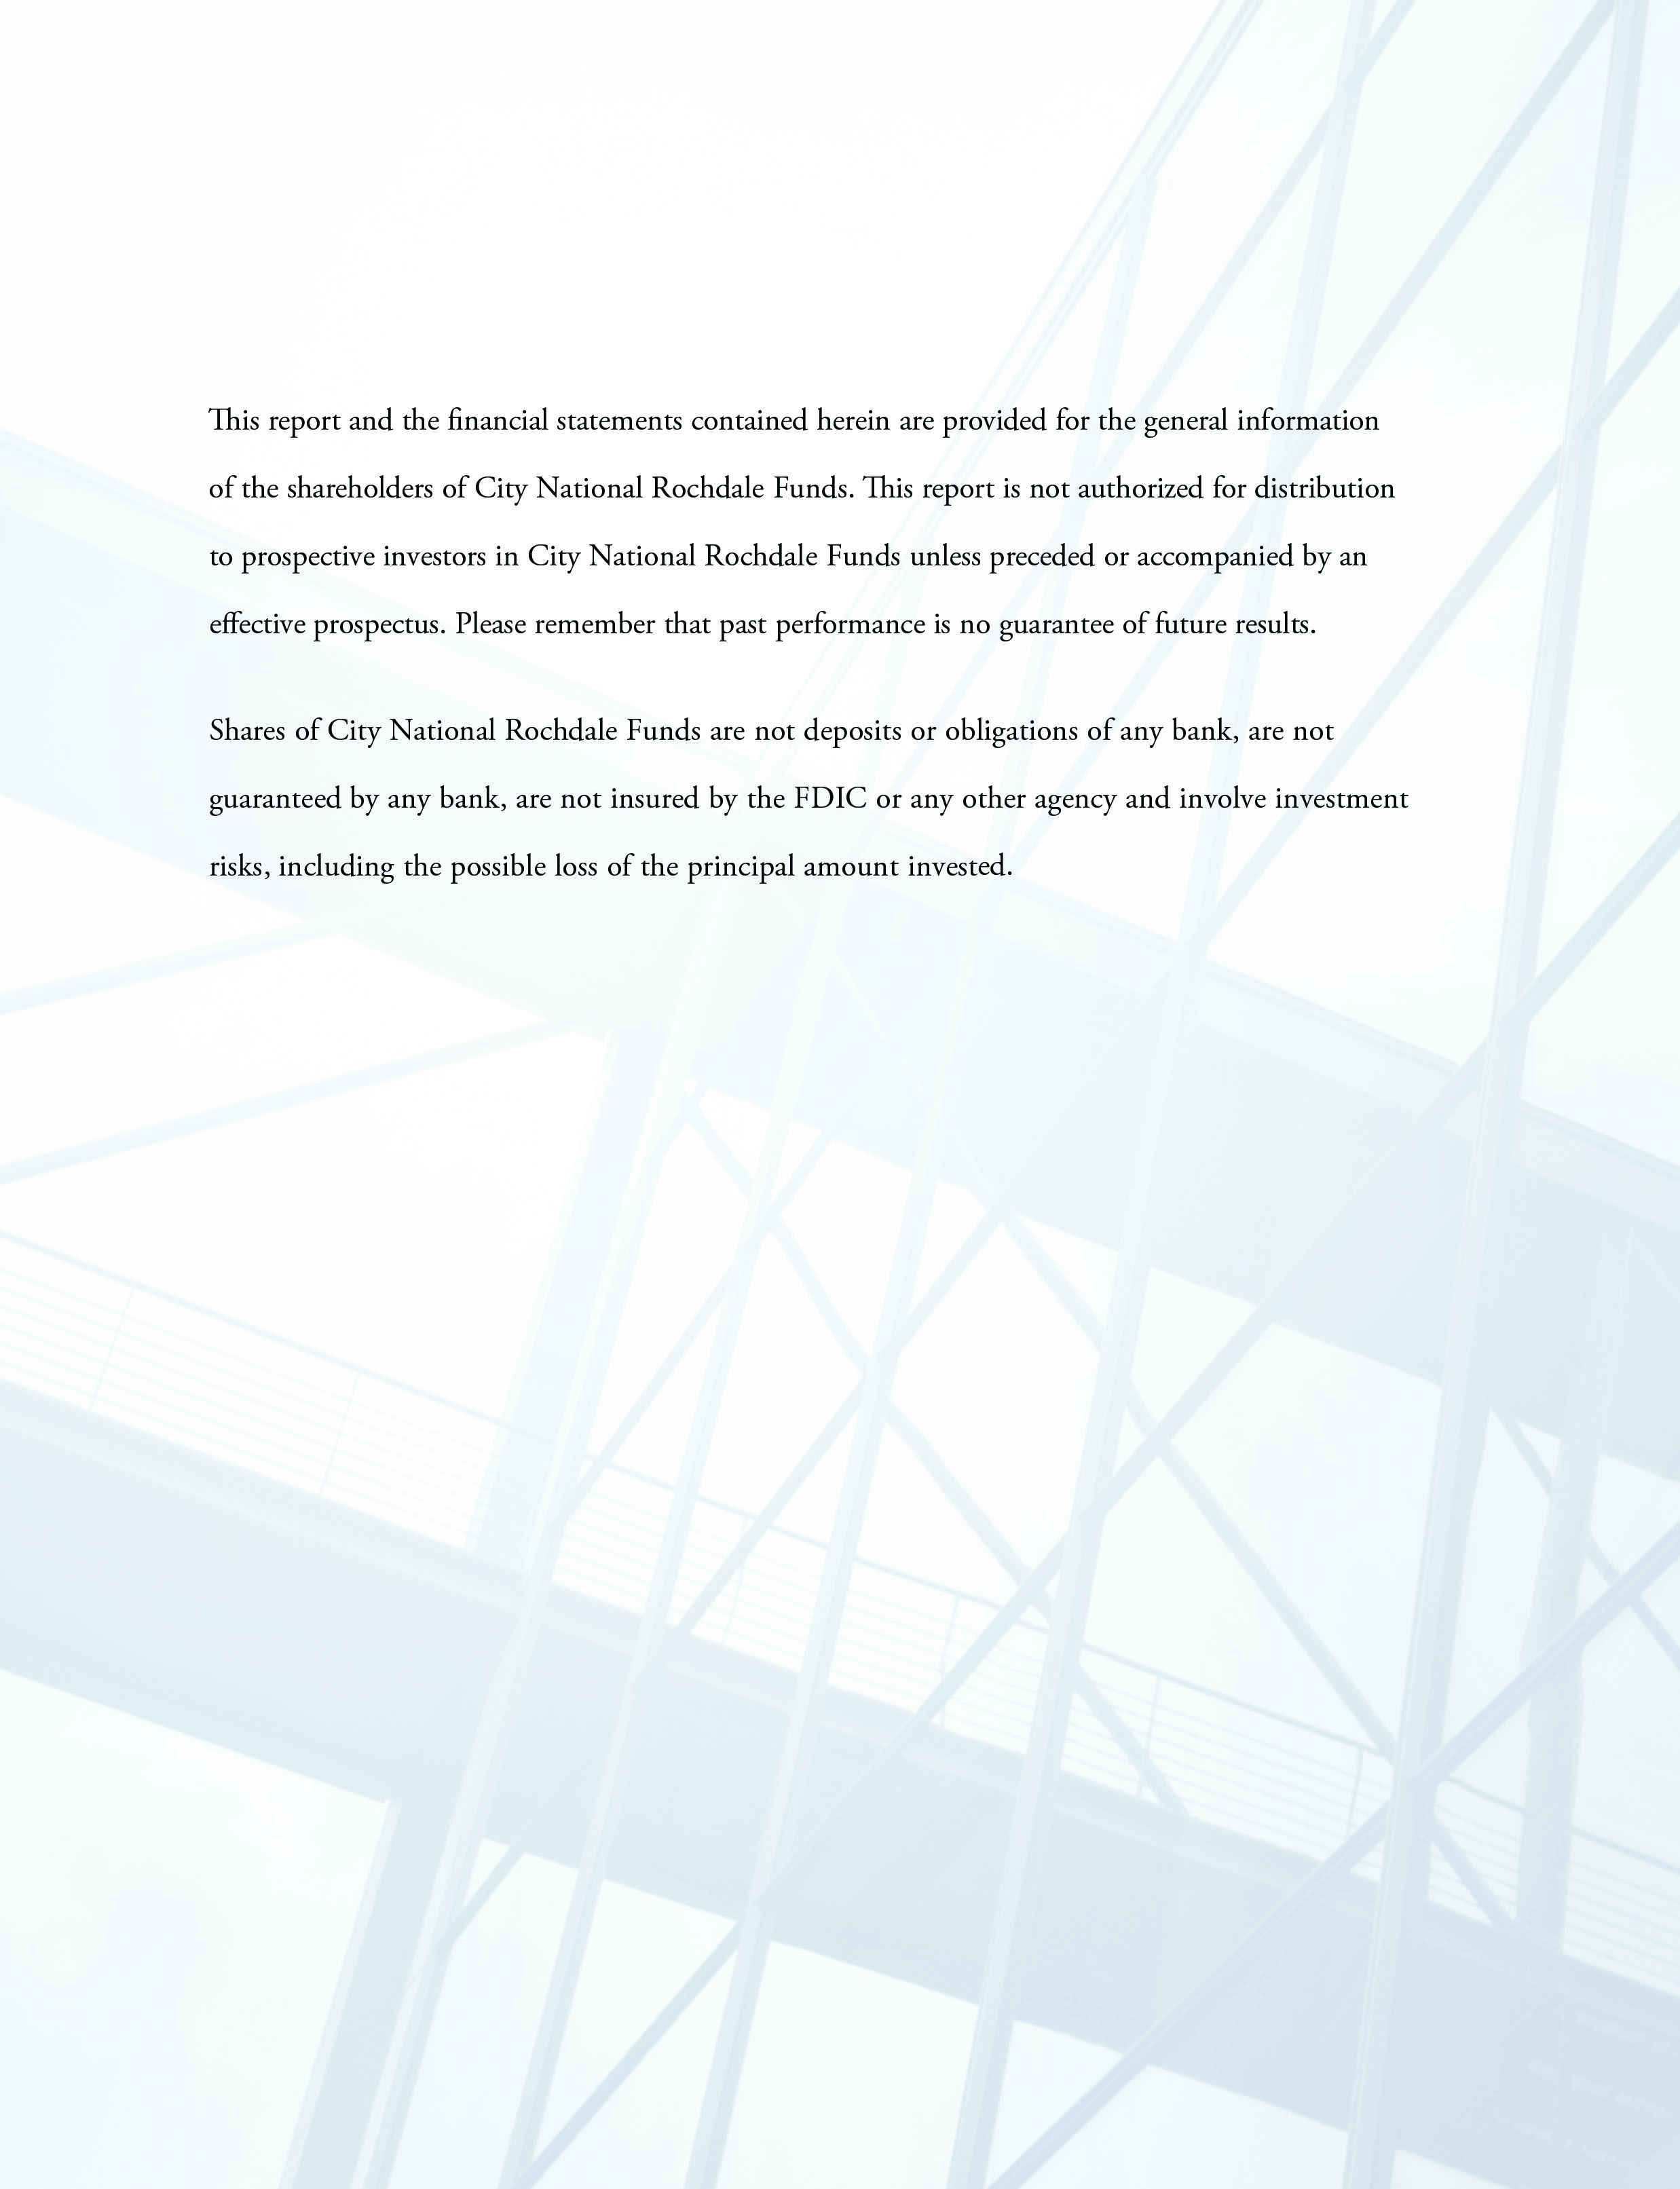
The Fund seeks to provide current income by investing primarily in securities either issued or guaranteed by the U.S. Government or its agencies or instrumentalities.
Comparison of Change in the Value of a $10,000 Investment in the City National Rochdale Government Bond Fund, Servicing Class Shares, versus the Bloomberg Barclays U.S. 1-5 Year Government Bond Index(1)
| (1) | The performance in the above graph does not reflect the deduction of taxes the shareholder will pay on Fund distributions or the redemptions of Fund shares. Investment performance reflects fee waivers in effect. In the absence of such waivers, total return would be reduced. |
| Past performance is no indication of future performance. |
| The Fund’s comparative benchmark does not include the annual operating expenses incurred by the Fund. Please note that one cannot invest directly in an unmanaged index. |
| AVERAGE ANNUAL TOTAL RETURNS |
| Shares | Ticker Symbol | 1-Year Return | 3-Year Return | 5-Year Return | 10-Year Return |
Servicing Class*^ | CNBIX | -0.34% | 0.57% | 0.19% | 1.82% |
Institutional Class(1)^^† | CNIGX | -0.18% | 0.82% | 0.43% | 1.96% |
| Class N | CGBAX | -0.68% | 0.28% | -0.09% | 1.55% |
| Bloomberg Barclays U.S. 1-5 Year Government Bond Index | n/a | -0.06% | 1.17% | 0.83% | 2.38% |
| * | The graph is based on only Servicing Class Shares; performance for Institutional Class and Class N Shares would be different due to differences in fee structures. |
| (1) | Commenced operations on February 1, 2012. |
| ^ | The Fund’s Servicing Class Shares are available only to fiduciary, advisory, agency, custodial and other similar accounts maintained at City National Bank and certain retirement plan platforms. |
| ^^ | The Fund’s Institutional Class Shares are available only to fiduciary, advisory, agency, custodial and other similar accounts maintained at City National Bank which meet the Fund’s minimum initial investment requirement, and certain tax-deferred retirement plans (including 401(k) plans, employer-sponsored 403(b) plans, 457 plans, profit sharing and money purchase pension plans, defined benefit plans and non-qualified deferred compensation plans) held in plan level or omnibus accounts. |
| † | Institutional Class Shares’ performance for the period of October 1, 2007, to February 1, 2012, is that of the Servicing Class Shares. |
| TOP TEN HOLDINGS |
| % OF PORTFOLIO |
| U.S. Treasury Note | |
| 1.375%, 12/15/19 | 6.5% |
| U.S. Treasury Note | |
| 2.125%, 12/31/21 | 6.0% |
| U.S. Treasury Note | |
| 1.500%, 01/31/22 | 5.5% |
| U.S. Treasury Note | |
| 2.000%, 11/30/20 | 5.1% |
| U.S. Treasury Note | |
| 1.375%, 02/15/20 | 5.0% |
| FFCB | |
| 1.426%, 09/20/19 | 5.0% |
| FHLMC, Ser K708, Cl A2 | |
| 2.130%, 01/25/19 | 5.0% |
| FNMA | |
| 1.250%, 08/17/21 | 5.0% |
| U.S. Treasury Note | |
| 2.375%, 12/31/20 | 4.7% |
| FNMA | |
| 1.750%, 06/20/19 | 4.6% |
CITY NATIONAL ROCHDALE FUNDS | PAGE 7
fund overview (Unaudited) |
| September 30, 2017 |
| City National Rochdale Corporate Bond Fund |
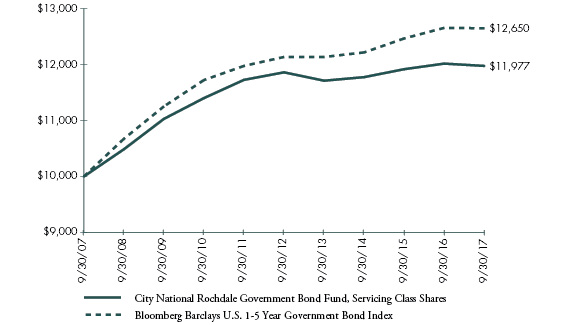
The Fund seeks to provide current income by investing in a diversified portfolio of fixed income securities, primarily investment grade corporate bonds issued by domestic and international companies denominated in U.S. dollars.
Comparison of Change in the Value of a $10,000 Investment in the City National Rochdale Corporate Bond Fund, Servicing Class Shares, versus the Bloomberg Barclays 1-5 Year U.S. Corporate A3 or Higher, 2% Issuer Constrained Index(1)
| (1) | The performance in the above graph does not reflect the deduction of taxes the shareholder will pay on Fund distributions or the redemptions of Fund shares. Investment performance reflects fee waivers in effect. In the absence of such waivers, total return would be reduced. |
| Past performance is no indication of future performance. |
| The Fund’s comparative benchmark does not include the annual operating expenses incurred by the Fund. Please note that one cannot invest directly in an unmanaged index. |
| AVERAGE ANNUAL TOTAL RETURNS |
| Shares | Ticker Symbol | 1-Year Return | 3-Year Return | 5-Year Return | 10-Year Return |
Servicing Class*^ | CNCIX | 0.84% | 1.30% | 1.31% | 3.09% |
| Class N | CCBAX | 0.68% | 1.06% | 1.06% | 2.85% |
| Bloomberg Barclays 1-5 Year U.S. Corporate A3 or Higher, 2% Issuer Constrained Index | n/a | 1.35% | 2.13% | 1.81% | 3.50% |
| * | The graph is based on only Servicing Class Shares; performance for Class N Shares would be different due to differences in fee structures. |
| ^ | The Fund’s Servicing Class Shares are available only to fiduciary, advisory, agency, custodial and other similar accounts maintained at City National Bank and certain retirement plan platforms. |
| TOP TEN HOLDINGS |
| % OF PORTFOLIO |
| Total Capital International | |
| 2.875%, 02/17/22 | 3.0% |
| NextGear Floorplan Master Owner Trust, Ser 2015-2A, Cl A | |
| 2.380%, 10/15/20 | 2.9% |
| Apple | |
| 3.450%, 05/06/24 | 2.3% |
| Stone Ridge Reinsurance Risk Premium Interval Fund | 2.2% |
| Costco Wholesale | |
| 2.150%, 05/18/21 | 2.2% |
| Hewlett Packard Enterprise 3.041% | |
| 10/05/17 | 2.2% |
| Standard Chartered, MTN | |
| 1.700%, 04/17/18 | 2.2% |
| Daimler Finance North America | |
| 2.250%, 07/31/19 | 2.1% |
| America Movil | |
| 5.000%, 03/30/20 | 2.0% |
| Prologis | |
| 4.250%, 08/15/23 | 2.0% |
| BOND CREDIT QUALITY |
| | |
CREDIT RATINGS(1) | % OF NET ASSETS |
| AAA | 5.3% |
| AA | 10.5% |
| A | 42.2% |
| BBB | 34.4% |
| B | 1.0% |
| NR | 0.4% |
| Registered Investment Company | 2.2% |
| Short-Term Investments and Other Net Assets | 3.3% |
| (1) | Credit quality is based on ratings from Standard & Poor’s, a division of The McGraw-Hill Companies, Inc. (“S&P”). Where S&P ratings are not available, credit quality is based on ratings from Moody’s Investor Services, Inc. (“Moody’s”). S&P and Moody’s ratings have been selected fo several reasons, including the access to information and materials provided by S&P and Moody’s, as well as the Fund’s consideration of industry practice. The Not Rated category, if applicable, consists of securities that have not been rated by S&P or Moody’s. |
CITY NATIONAL ROCHDALE FUNDS | PAGE 8
fund overview (Unaudited) |
| September 30, 2017 |
| City National Rochdale California Tax Exempt Bond Fund |
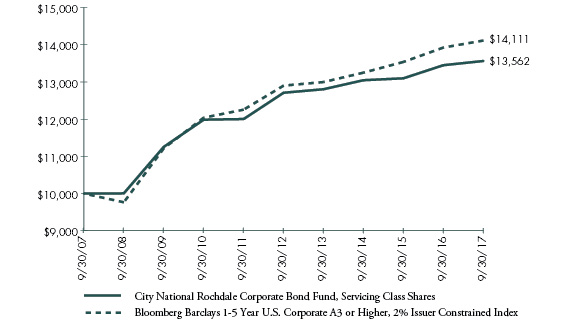
The Fund seeks to provide current income exempt from federal and California state income tax by investing primarily in California municipal bonds and notes.
Comparison of Change in the Value of a $10,000 Investment in the City National Rochdale California Tax Exempt Bond Fund, Servicing Class Shares, versus the Bloomberg Barclays Intermediate-Short California Municipal Bond Index(1)
| (1) | The performance in the above graph does not reflect the deduction of taxes the shareholder will pay on Fund distributions or the redemptions of Fund shares. Investment performance reflects fee waivers in effect. In the absence of such waivers, total return would be reduced. |
| Past performance is no indication of future performance. |
| The Fund’s comparative benchmark does not include the annual operating expenses incurred by the Fund. Please note that one cannot invest directly in an unmanaged index. |
| AVERAGE ANNUAL TOTAL RETURNS |
| Shares | Ticker Symbol | 1-Year Return | 3-Year Return | 5-Year Return | 10-Year Return |
Servicing Class*^ | CNTIX | 0.31% | 1.44% | 1.54% | 2.91% |
| Class N | CCTEX | 0.05% | 1.18% | 1.27% | 2.64% |
| Bloomberg Barclays Intermediate-Short California Municipal Bond Index | n/a | 0.83% | 1.81% | 2.01% | 3.58% |
| * | The graph is based on only Servicing Class Shares; performance for Class N Shares would be different due to differences in fee structures. |
| ^ | The Fund’s Servicing Class Shares are available only to fiduciary, advisory, agency, custodial and other similar accounts maintained at City National Bank. |
| TOP TEN HOLDINGS |
| % OF PORTFOLIO |
California Infrastructure & Economic Development Bank, Pacific Gas & Electric Project, Ser B, RB,
Union Bank N.A. Callable 09/29/17 @ 100 | |
| 0.890%, 11/01/26 | 2.8% |
| Long Beach, Unified School District, Election of 2008, Ser S, GO Pre-Refunded @ 100 | |
| 5.250%, 08/01/19 | 2.4% |
| California State, Health Facilities Financing Authority, RB | |
| 0.930%, 10/10/17 | 2.2% |
| University of California, Ser AT, RB | |
| 1.400%, 05/15/46 | 2.2% |
| California State, Public Works Board, RB | |
| 5.000%, 09/01/25 | 2.0% |
| California State, GO | |
| 1.692%, 12/01/29 | 1.7% |
| New York City, Water & Sewer System, RB Callable 09/29/17 @ 100 | |
| 0.980%, 06/15/48 | 1.5% |
| California Statewide, Communities Development Authority, Kaiser Permanente, Ser A, RB | |
| 5.000%, 04/01/19 | 1.5% |
| Long Beach, Unified School District, GO | |
| 5.000%, 08/01/26 | 1.4% |
| San Mateo County, Joint Powers Financing Authority, Maple Street Correctional Center, RB Callable 06/15/24 @ 100 | |
| 5.000%, 06/15/26 | 1.4% |
CITY NATIONAL ROCHDALE FUNDS | PAGE 9
fund overview (Unaudited) |
| September 30, 2017 |
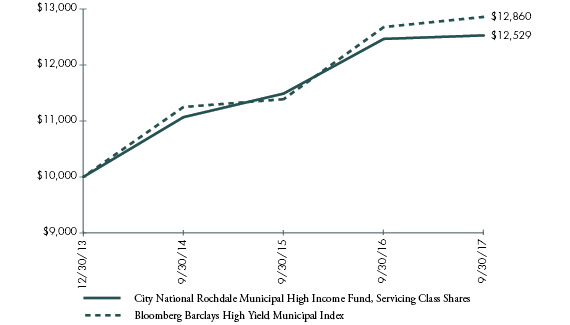
| City National Rochdale Municipal High Income Fund |
The Fund seeks to provide a high level of current income that is not subject to federal income tax.
Comparison of Change in the Value of a $10,000 Investment in the City National Rochdale Municipal High Income Fund, Servicing Class Shares, versus the Bloomberg Barclays High Yield Municipal Index(1)
| (1) | The performance in the above graph does not reflect the deduction of taxes the shareholder will pay on Fund distributions or the redemptions of Fund shares. Investment performance reflects fee waivers in effect. In the absence of such waivers, total return would be reduced. Effective January 31, 2016, the Adviser discontinued the voluntary fee waivers for the Fund. |
| Past performance is no indication of future performance. |
| The Fund’s comparative benchmark does not include the annual operating expenses incurred by the Fund. Please note that one cannot invest directly in an unmanaged index. |
| AVERAGE ANNUAL TOTAL RETURNS |
| Shares | Ticker Symbol | 1-Year Return | 3-Year Return | Inception to Date |
Servicing Class*(1)^ | CNRMX | 0.50% | 4.22% | 6.19% |
Class N(1) | CNRNX | 0.16% | 3.96% | 5.91% |
| Bloomberg Barclays High Yield Municipal Index | n/a | 1.43% | 4.56% | 6.93% |
| * | The graph is based on only Servicing Class Shares; performance for Class N Shares would be different due to differences in fee structures. |
| (1) | Commenced operations on December 30, 2013. |
| ^ | The Fund’s Servicing Class Shares are available only to fiduciary, advisory, agency, custodial and other similar accounts maintained at City National Bank and certain retirement plan platforms. |
| TOP TEN HOLDINGS* |
| % OF PORTFOLIO |
| Tobacco Settlement Financing, Ser 1A, RB Callable 10/16/17 @ 100 | |
| 5.000%, 06/01/41 | 1.0% |
| Illinois State, Finance Authority, Ser A University of Chicago, RB Callable 10/01/25 @ 100 | |
| 5.000%, 10/01/40 | 1.0% |
| Fayette County, Hospital Authority, Piedmont Healthcare Project, RB Callable 07/01/26 @ 100 | |
| 5.000%, 07/01/46 | 0.9% |
| New York State, Liberty Development, World Trade Center RB Callable 11/15/24 @ 100 | |
| 5.000%, 11/15/44 | 0.9% |
| Tarrant County, Cultural Education Facilities Finance, C.C. Young Memorial Home Project, RB Callable 02/15/27 @ 100 | |
| 6.375%, 02/15/48 | 0.9% |
| Jefferson County, Sewer Revenue, Ser D, RB Callable 10/01/23 @ 105 | |
| 6.000%, 10/01/42 | 0.9% |
| New York City, Transitional Finance Authority, Building Aid Revenue, Ser S-1 Callable 01/15/26 @ 100 | |
| 4.000%, 07/15/45 | 0.9% |
| Chicago, Ser A, GO Callable 01/01/27 @ 100 | |
| 6.000%, 01/01/38 | 0.9% |
| Nassau County, Tobacco Settlement, RB Callable 10/30/17 @ 100 | |
| 5.125%, 06/01/46 | 0.8% |
| Salt Verde Financial, Gas Revenue, RB | |
| 5.000%, 12/01/37 | 0.8% |
| * | Excludes Cash Equivalents |
CITY NATIONAL ROCHDALE FUNDS | PAGE 10
fund overview (Unaudited) |
| September 30, 2017 |
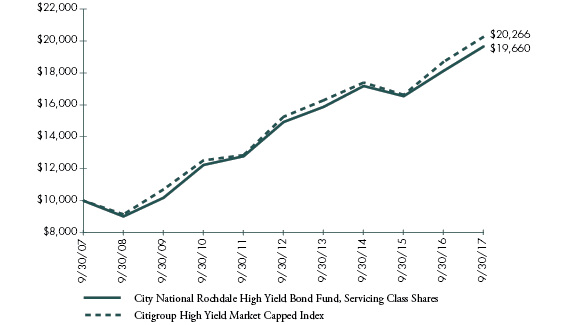
| City National Rochdale High Yield Bond Fund |
The Fund seeks to maximize total return by investing primarily in fixed income securities rated below investment grade including corporate bonds and debentures, convertible and preferred securities, zero coupon obligations and debt securities that are issued by U.S. and foreign governments.
Comparison of Change in the Value of a $10,000 Investment in the City National Rochdale High Yield Bond Fund, Servicing Class Shares, versus the Citigroup High Yield Market Capped Index(1)
| (1) | The performance in the above graph does not reflect the deduction of taxes the shareholder will pay on Fund distributions or the redemptions of Fund shares. Investment performance reflects fee waivers in effect. In the absence of such waivers, total return would be reduced. Effective January 31, 2016, the Adviser discontinued the voluntary fee waivers for the Fund. |
| Past performance is no indication of future performance. |
| The Fund’s comparative benchmark does not include the annual operating expenses incurred by the Fund. Please note that one cannot invest directly in an unmanaged index. |
| AVERAGE ANNUAL TOTAL RETURNS |
| Shares | Ticker Symbol | 1-Year Return | 3-Year Return | 5-Year Return | 10-Year Return |
Servicing Class*^ | CHYIX | 8.42% | 4.60% | 5.66% | 6.99% |
Institutional Class(1)^^† | CNIHX | 8.82% | 4.89% | 5.92% | 7.16% |
| Class N | CHBAX | 8.28% | 4.41% | 5.42% | 6.72% |
| Citigroup High Yield Market Capped Index | n/a | 8.38% | 5.23% | 5.85% | 7.32% |
| * | The graph is based on only Servicing Class Shares; performance for Institutional and Class N Shares would be different due to differences in fee structures. |
| (1) | Commenced operations on February 2, 2012. |
| ^ | The Fund’s Servicing Class Shares are available only to fiduciary, advisory, agency, custodial and other similar accounts maintained at City National Bank and certain retirement plan platforms. |
| ^^ | The Fund’s Institutional Class Shares are available only to fiduciary, advisory, agency, custodial and other similar accounts maintained at City National Bank which meet the Fund’s minimum initial investment requirement, and certain tax-deferred retirement plans (including 401(k) plans, employer-sponsored 403(b) plans, 457 plans, profit sharing and money purchase pension plans, defined benefit plans and non-qualified deferred compensation plans) held in plan level or omnibus accounts. |
| † | Institutional Class Shares’ performance for the period from October 1, 2007, to February 2, 2012, is that of the Servicing Class Shares. |
| TOP TEN HOLDINGS* |
| % OF PORTFOLIO |
| Epicor Software | |
| 9.250%, 05/21/23 | 2.1% |
| Vector Group | |
| 6.125%, 02/01/25 | 1.9% |
| MDC Partners | |
| 6.500%, 05/01/24 | 1.5% |
| Terraform Global Operating | |
| 9.750%, 08/15/22 | 1.5% |
| SFR Group | |
| 7.375%, 05/01/26 | 1.4% |
| CCO Holdings | |
| 5.125%, 05/01/27 | 1.4% |
| LBC Tank Terminals Holding Netherlands | |
| 6.875%, 05/15/23 | 1.3% |
| Grinding Media | |
| 7.375%, 12/15/23 | 1.3% |
| Eldorado | |
| 6.125%, 12/15/20 | 1.3% |
| EIG Investors | |
| 10.875%, 02/01/24 | 1.3% |
| * | Excludes Cash Equivalents |
CITY NATIONAL ROCHDALE FUNDS | PAGE 11
fund overview (Unaudited) |
| September 30, 2017 |
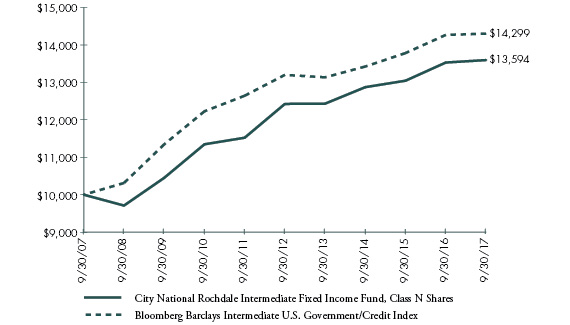
| City National Rochdale Intermediate Fixed Income Fund |
The Fund seeks current income and, to the extent consistent with this goal, capital appreciation, by investing primarily in fixed income securities.
Comparison of Change in the Value of a $10,000 Investment in the City National Rochdale Intermediate Fixed Income Fund, Class N Shares, versus the Bloomberg Barclays Intermediate U.S. Government/Credit Index(1)
| (1) | The performance in the above graph does not reflect the deduction of taxes the shareholder will pay on Fund distributions or the redemptions of Fund shares. Investment performance reflects fee waivers in effect. In the absence of such waivers, total return would be reduced. |
| Past performance is no indication of future performance. |
| The Fund’s comparative benchmark does not include the annual operating expenses incurred by the Fund. Please note that one cannot invest directly in an unmanaged index. |
| AVERAGE ANNUAL TOTAL RETURNS |
| Shares | Ticker Symbol | 1-Year Return | 3-Year Return | 5-Year Return | 10-Year Return |
Class N*(1) | RIMCX | 0.48% | 1.84% | 1.82% | 3.12% |
Institutional Class(2)^ | CNRIX | 1.02% | 2.35% | 2.20% | 3.31% |
| Bloomberg Barclays Intermediate U.S. Government/Credit Index | n/a | 0.23% | 2.13% | 1.61% | 3.64% |
| * | The graph is based on only Class N Shares; the performance for Institutional Class Shares would be different due to differences in fee structures. |
| (1) | The predecessor to the City National Rochdale Intermediate Fixed Income Fund (the “Predecessor Fund”) commenced operations on December 31, 1999. On March 29, 2013, the Predecessor Fund was reorganized into the Fund. The performance results for the Class N Shares of the Fund for the period October 1, 2007, to March 29, 2013, reflect the performance of the Predecessor Fund’s Shares. |
| (2) | Commenced operations on December 20, 2013. The performance results for Institutional Class Shares of the Fund for the period of October 1, 2007, to March 28, 2013, reflect the performance of the Predecessor Fund’s shares. The performance results for the Institutional Class Shares of the Fund for the period March 29, 2013, to December 19, 2013, reflect the performance of the Class N Shares. |
| ^ | The Fund’s Institutional Class shares are available only to fiduciary, advisory, agency, custodial and other similar accounts maintained at City National Bank which meet the minimum initial investment requirement of $1,000,000 and certain tax deferred retirement plans (including 401(k) plans, employer sponsored 403(b) plans, 457 plans, profit sharing and money purchase pension plans, defined benefit plans and non-qualified deferred compensation plans) held in plan level or omnibus accounts. |
| TOP TEN HOLDINGS |
| % OF PORTFOLIO |
| NextGear Floorplan Master Owner Trust, Ser 2015-2A, Cl A | |
| 2.380%, 10/15/20 | 3.0% |
| Stone Ridge Reinsurance Risk Premium Interval Fund | 2.8% |
| Svenska Handelsbanken, MTN | |
| 5.125%, 03/30/20 | 2.5% |
| Rio Tinto Finance USA | |
| 3.750%, 06/15/25 | 2.5% |
| FNMA, Pool AL5866 | |
| 2.730%, 08/01/22 | 2.3% |
| U.S. Treasury Inflation Indexed Bonds | |
| 0.625% 01/15/26 | 2.3% |
| Apple | |
| 2.450%, 08/04/26 | 2.2% |
| Bank of Nova Scotia | |
| 2.450% 03/22/21 | 2.2% |
| Morgan Stanley, MTN | |
| 3.750%, 02/25/23 | 2.1% |
| HSBC Holdings | |
| 3.400%, 03/08/21 | 2.1% |
CITY NATIONAL ROCHDALE FUNDS | PAGE 12
fund overview (Unaudited) |
| September 30, 2017 |
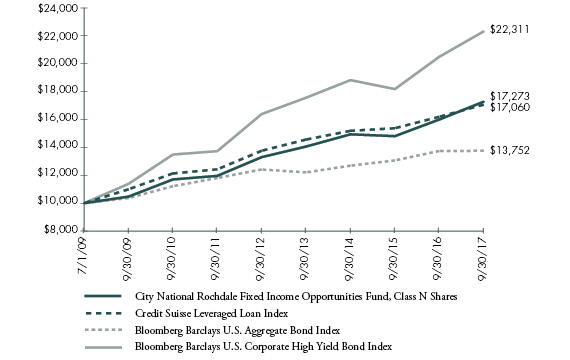
| City National Rochdale Fixed Income Opportunities Fund |
The Fund seeks a high level of current income by investing primarily in fixed income securities.
Comparison of Change in the Value of a $10,000 Investment in the City National Rochdale Fixed Income Opportunities Fund, Class N Shares, versus the Credit Suisse Leveraged Loan Index, the Bloomberg Barclays U.S. Aggregate Bond Index and the Bloomberg Barclays U.S. Corporate High Yield Bond Index(1)
| (1) | The performance in the above graph does not reflect the deduction of taxes the shareholder will pay on Fund distributions or the redemptions of Fund shares. Investment performance reflects fee waivers in effect. In the absence of such waivers, total return would be reduced. |
| Past performance is no indication of future performance. |
| The Fund’s comparative benchmarks do not include the annual operating expenses incurred by the Fund. Please note that one cannot invest directly in an unmanaged index. |
| AVERAGE ANNUAL TOTAL RETURNS |
| Shares | Ticker Symbol | 1-Year Return | 3-Year Return | 5-Year Return | Inception to Date |
Class N(1) | RIMOX | 7.99% | 4.96% | 5.37% | 6.85% |
| Credit Suisse Leveraged Loan Index | n/a | 5.36% | 3.95% | 4.40% | 6.68% |
| Bloomberg Barclays U.S. Aggregate Bond Index | n/a | 0.07% | 2.71% | 2.06% | 3.93% |
| Bloomberg Barclays U.S. Corporate High Yield Bond Index | n/a | 8.88% | 5.83% | 6.36% | 10.21% |
| (1) | The predecessor to the City National Rochdale Fixed Income Opportunities Fund (the “Predecessor Fund”) commenced operations on July 1, 2009. On March 29, 2013, the Predecessor Fund was reorganized into the Fund. The performance results for the Class N Shares of the Fund for the period July 1, 2009, to March 29, 2013, reflect the performance of the Predecessor Fund’s Shares. |
| TOP TEN HOLDINGS* |
| % OF PORTFOLIO |
| DTEK Finance | |
| 10.750%, 12/31/24 | 1.2% |
| EP PetroEcuador via Noble Sovereign Funding I | |
| 6.961%, 09/24/19 | 1.0% |
| Petroleos de Venezuela | |
| 8.500%, 10/27/20 | 1.0% |
| Kazkommertsbank JSC | |
| 5.500%, 12/21/22 | 1.0% |
| Digicel | |
| 6.000%, 04/15/21 | 0.9% |
| Petrobras Global Finance | |
| 6.875%, 01/20/40 | 0.9% |
| Altice Financing | |
| 7.500%, 05/15/26 | 0.8% |
| Digicel Group | |
| 8.250%, 09/30/20 | 0.8% |
| Energy Resources | |
| 2.838%, 09/30/22 | 0.8% |
| Goldman Sachs Group, MTN | |
| 2.415%,11/15/18 | 0.7% |
| * | Excludes Cash Equivalents |
CITY NATIONAL ROCHDALE FUNDS | PAGE 13
investment adviser’s report (Unaudited) |
| September 30, 2017 |
| Equity Funds |
DIVIDEND & INCOME FUND – RIMHX
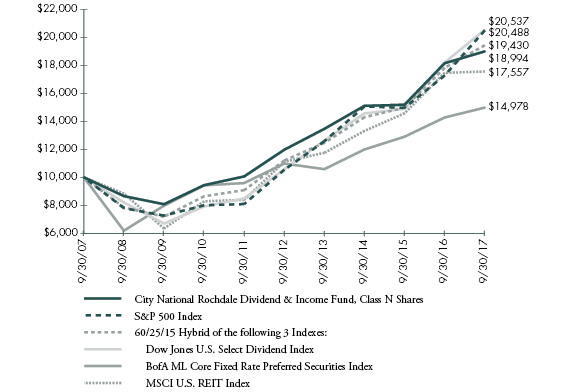
The Fund posted a return of 0.15% for Q3, underperforming the blended benchmark’s (Dow Jones U.S. Selected Dividend Index: 60%; BofA ML Core Fixed Rate Preferred Securities Index: 25%; MSCI U.S. REIT Index: 15%) return of 1.70%. Calendar year to date, as of September 30, 2017, the Fund delivered a return of 4.25%, lagging the blended benchmark’s 8.26% return. For the fiscal year ended September 30, 2017, the Class N Shares of the Fund generated a 4.66% return, underperforming the benchmark’s return of 9.03%.
Coming off a very strong 2016 (and a very strong 2014 in the recent past), we found the post-Trump market to be difficult for our type valued-oriented names in terms of outperformance, as the certain cyclical and growth-oriented sectors of the market (including within our benchmark) rapidly moved upward. Specifically, roughly 2% of the Fund's underperformance (about half overall) was due to an underweight in low dividend, highly cyclical equities in the Industrial and Materials space. Another roughly 185 basis points was due to the Fund being underweight in Utilities relative to the benchmark. Finally, the Fund's overweight position in Consumer Staples hurt the Fund by roughly 50 basis points, as the sector was weak during the year. Going forward, we have confidence in the stability of the dividends paid by our companies and according to our research, we believe the growth of those dividends paid by our companies may be in the 3-8% range. Thus we feel that the Fund's strategy can accrue value relative to the benchmark, especially as the rapid upward move in cyclical, higher beta stocks slows down.
U.S. Core Equity Fund – CNRUX
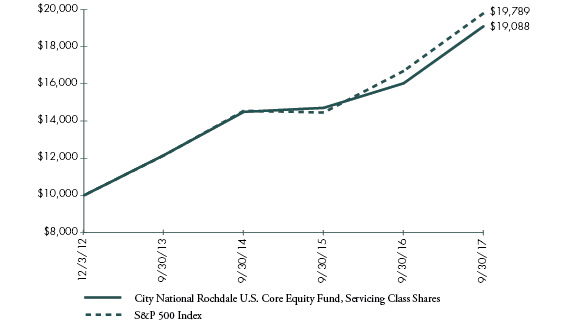
For the fiscal year ended September 30, 2017, the Institutional Class Shares of the Fund returned 19.40%, versus 18.61% for the S&P 500 Index, an outperformance of 79 basis points. Stock selection was the primary reason for the outperformance representing 64% of the excess returns. At the sector level, Consumer Discretionary outperformed by 178 basis points, Health Care by 63 basis points, and Information Technology by 50 basis points. The Financial and Industrial sectors detracted performance by 58 basis points and 59 basis points, respectively.
On a year to date basis, as of September 30, 2017, the Institutional Share Class posted a return of 17.18%, 294 basis points above the S&P 500 Index’s return of 14.24%. Stock selection was strong for the period, representing 72% of the excess returns. Year to date, the best performing industries were Software and Services, contributing 207 basis points and Consumer Durables and Apparel contributing 70 basis points. The industries that detracted the most year to date were Technology Hardware (-50 basis points) and Insurance (-44 basis points), due to negative contributions from stock selection.
While we have lowered the risk profile of the portfolio as valuations in equity markets continue to rise we are maintaining our focus on high quality, visible earnings companies.
EMERGING MARKETS FUND – RIMIX
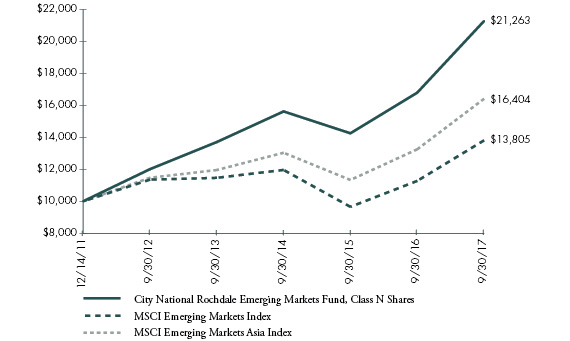
The Class N Shares of the Fund posted returns of 9.41% for Q3, outperforming the MSCI Emerging Markets Index and the MSCI Emerging Markets Asia Index by 152 basis points and 239 basis points, respectively. Calendar year to date, as of September 30, 2017, the Class N Shares of the Fund returned 35.91%, outperforming the MSCI Emerging Markets Index and the MSCI Emerging Markets Asia Index by 813 basis points and 409 basis points, respectively. For the fiscal year ended September 30, 2017, the Class N Shares of the Fund had a total return of 26.66%, outperforming the MSCI Emerging Markets Index by 420 basis points and the MSCI Emerging Markets Asia Index by 284 basis points. In September, the Fund's outperformance relative to the MSCI Emerging Markets Index is attributable to stock selection and currency effects. The stock selection outperformance came from continued gains in the Fund's top two Chinese Consumer Technology positions, which reported better than expected earnings in the quarter. Year to date, these top two positions in which the Fund is overweight, remain the top performers within the Fund. While currency outperformed in the month of September due to weakness in the South African Rand and South Korean Won, two currencies which the Fund has little to no exposure to, year to date currency has been the biggest detractor of relative performance. By country, China/Hong Kong, where the Fund remains overweight, was the best performing market both for the
CITY NATIONAL ROCHDALE FUNDS | PAGE 14
month of September and year to date. During September, the Fund also saw contribution versus the benchmark from weakness in South Africa, a market the Fund has no exposure to.
This material represents the managers’ assessment of the portfolios and market environment at a specific point in time and should not be relied upon by the reader as research or investment advice.
Performance data quoted represents past performance and does not guarantee similar future results. The investment performance and principal value of an investment will fluctuate so that an investor’s shares, when redeemed, may be worth more or less than their original cost, and current performance may be lower or higher than the performance quoted. For performance data current to the most recent month end, please call 1-888-889-0799.
Index performance returns do not reflect any management fees, transaction costs or expenses. Indexes are unmanaged and one cannot invest directly in an index.
The Dividend & Income Fund’s, U.S. Core Equity Fund’s and Emerging Markets Fund’s investment performance reflects voluntary fee waivers in effect. Absent these waivers, total return and yield would be lower. The Adviser intends to continue these arrangements at least through January 31, 2018 but there can be no assurance that City National Rochdale, LLC will continue to waive fees.
Mutual fund investing involves risk including loss of principal. Bonds and bond funds are subject to interest rate risk and will decline in value as interest rates rise. The securities of mid-cap companies may have greater price volatility and less liquidity than the securities of larger capitalized companies. Emerging markets involve heightened risk related to the same factors as well as increased volatility and lower trading volume.
Beta is a measure of the volatility, or systematic risk, of a security or a portfolio in comparison to the market as a whole. A Company may reduce or eliminate its dividend, causing losses to the fund.
CITY NATIONAL ROCHDALE FUNDS | PAGE 15
fund overview (Unaudited) |
| September 30, 2017 |
| City National Rochdale Dividend & Income Fund |
The Fund seeks to provide significant income and, as a secondary focus, long-term capital appreciation, by investing primarily in income-generating securities, principally comprised of dividend-paying equity securities.
Comparison of Change in the Value of a $10,000 Investment in the City National Rochdale Dividend & Income Fund, Class N Shares, versus the S&P 500 Index and the 60/25/15 Hybrid of the following 3 Indexes: Dow Jones U.S. Select Dividend Index, BofA ML Core Fixed Rate Preferred Securities Index and MSCI U.S. REIT Index(1)
| (1) | The performance in the above graph does not reflect the deduction of taxes the shareholder will pay on Fund distributions or the redemptions of Fund shares. Investment performance reflects fee waivers in effect. In the absence of such waivers, total return would be reduced. Effective January 31, 2016, the Adviser discontinued the voluntary fee waivers for the Fund. |
| Past performance is no indication of future performance. |
| The Fund’s comparative benchmarks do not include the annual operating expenses incurred by the Fund. Please note that one cannot invest directly in an unmanaged index. |
| AVERAGE ANNUAL TOTAL RETURNS |
| Shares | Ticker Symbol | 1-Year Return | 3-Year Return | 5-Year Return | 10-Year Return |
Class N(1) | RIMHX | 4.66% | 7.94% | 9.68% | 6.63% |
| S&P 500 Index | n/a | 18.61% | 10.81% | 14.22% | 7.44% |
| 60/25/15 Hybrid of the following 3 Indexes: | n/a | 9.03% | 10.78% | 11.66% | 6.87% |
| Dow Jones U.S. Select Dividend Index | n/a | 12.84% | 12.14% | 14.21% | 7.46% |
| BofA ML Core Fixed Rate Preferred Securities Index | n/a | 4.94% | 7.70% | 6.40% | 4.12% |
| MSCI U.S. REIT Index | n/a | 0.54% | 9.67% | 9.58% | 5.79% |
| (1) | The predecessor to the City National Rochdale Dividend & Income Fund (the “Predecessor Fund”) commenced operations on June 1, 1999. On March 29, 2013, the Predecessor Fund was reorganized into the Fund. The performance results for the Class N Shares of the Fund for the period October 1, 2007, to March 29, 2013, reflect the performance of the Predecessor Fund’s Shares. |
| TOP TEN HOLDINGS |
| % OF PORTFOLIO |
| Lockheed Martin | 3.7% |
| Altria Group | 2.9% |
| Philip Morris International | 2.7% |
| McDonald's | 2.4% |
| Verizon Communications | 2.3% |
| Lamar Advertising | 2.3% |
| Johnson & Johnson | 2.3% |
| Hasbro | 2.3% |
| General Mills | 2.3% |
| Duke Energy | 2.3% |
CITY NATIONAL ROCHDALE FUNDS | PAGE 16
fund overview (Unaudited) |
| September 30, 2017 |
| City National Rochdale U.S. Core Equity Fund |
The Fund seeks to provide long-term capital appreciation by investing primarily in common stock of large and middle capitalization corporations domiciled in the United States.
Comparison of Change in the Value of a $10,000 Investment in the City National Rochdale U.S. Core Equity Fund, Servicing Class Shares, versus the S&P 500 Index(1)
| (1) | The performance in the above graph does not reflect the deduction of taxes the shareholder will pay on Fund distributions or the redemptions of Fund shares. Investment performance reflects fee waivers in effect. In the absence of such waivers, total return would be reduced. Effective January 31, 2016, the Adviser discontinued the voluntary fee waivers for the Fund. |
| Past performance is no indication of future performance. |
| The Fund’s comparative benchmark does not include the annual operating expenses incurred by the Fund. Please note that one cannot invest directly in an unmanaged index. |
| AVERAGE ANNUAL TOTAL RETURNS |
| Shares | Ticker Symbol | 1-Year Return | 3-Year Return | Inception to Date |
Servicing Class*(1)^ | CNRVX | 19.14% | 9.63% | 14.34% |
Institutional Class(1)^^ | CNRUX | 19.40% | 9.91% | 14.79% |
Class N(1) | CNRWX | 18.81% | 9.35% | 14.04% |
| S&P 500 Index | n/a | 18.61% | 10.81% | 15.19% |
| * | The graph is based on only Servicing Class Shares; performance for Institutional and Class N Shares would be different due to differences in fee structures. |
| (1) | Commenced operations on December 3, 2012. |
| ^ | The Fund’s Servicing Class shares are available only to fiduciary, advisory, agency, custodial and other similar accounts maintained at City National Bank and certain retirement plan platforms. |
| ^^ | The Fund’s Institutional Class shares are available only to fiduciary, advisory, agency, custodial and other similar accounts maintained at City National Bank which meet the minimum initial investment requirements, and certain tax-deferred retirement plans (including 401(k) plans, employer-sponsored 403(b) plans, 457 plans, profit sharing and money purchase pension plans, defined benefit plans and non-qualified deferred compensation plans) held in plan level or omnibus accounts. |
| TOP TEN HOLDINGS |
| % OF PORTFOLIO |
| Visa | 3.6% |
| Mastercard | 3.4% |
| Alphabet | 3.3% |
| UnitedHealth Group | 2.9% |
| JPMorgan Chase | 2.9% |
| Home Depot | 2.8% |
| PG&E | 2.7% |
| Facebook | 2.7% |
| Microsoft | 2.6% |
| Apple | 2.4% |
CITY NATIONAL ROCHDALE FUNDS | PAGE 17
fund overview (Unaudited) |
| September 30, 2017 |
| City National Rochdale Emerging Markets Fund |
The Fund seeks to provide long-term capital appreciation by investing primarily in the equity securities of companies that are operating principally in emerging market countries.
Comparison of Change in the Value of a $10,000 Investment in the City National Rochdale Emerging Markets Fund, Class N shares versus the MSCI Emerging Markets Index and the MSCI Emerging Markets Asia Index(1)
| (1) | The performance in the above graph does not reflect the deduction of taxes the shareholder will pay on Fund distributions or the redemptions of Fund shares. Investment performance reflects fee waivers in effect. In the absence of such waivers, total return would be reduced. Effective January 31, 2016, the Adviser discontinued the voluntary fee waivers for the Fund. |
| Past performance is no indication of future performance. |
| The Fund’s comparative benchmarks do not include the annual operating expenses incurred by the Fund. Please note that one cannot invest directly in an unmanaged index. |
| AVERAGE ANNUAL TOTAL RETURNS |
| Shares | Ticker Symbol | 1-Year Return | 3-Year Return | 5-Year Return | Inception to Date |
Class N*(1) | RIMIX | 26.66% | 10.84% | 12.11% | 13.90% |
Class Y(2)† | CNRYX | 26.95% | 10.96% | 12.18% | 13.97% |
| MSCI Emerging Markets Index | n/a | 22.46% | 4.90% | 3.99% | 5.72% |
| MSCI Emerging Markets Asia Index | n/a | 23.82% | 7.97% | 7.42% | 8.91% |
| * | The graph is based on only Class N Shares; performance for Class Y Shares would be different due to differences in fee structures. |
| (1) | Shares of the predecessor to the City National Rochdale Emerging Markets Fund (the “Predecessor Fund”) commenced operations on December 14, 2011. On March 29, 2013, the Predecessor Fund was reorganized into the Fund. The performance results for the Class N Shares of the Fund for the period December 14, 2011, to March 29, 2013, reflect the performance of the Predecessor Fund’s Shares. |
| (2) | Commenced operations on June 1, 2016. |
| † | Class Y Shares’ performance for the period from December 14, 2011 to June 1, 2016 is that of the Class N Shares. |
| TOP TEN HOLDINGS* |
| % OF PORTFOLIO |
| Tencent Holdings | 5.5% |
| Sunny Optical Technology Group | 5.3% |
| Alibaba Group Holding | 3.8% |
| AAC Technologies Holdings | 3.8% |
| Galaxy Entertainment Group | 2.7% |
| Great Wall Motor | 2.4% |
| Ping An Insurance Group of China | 2.3% |
| New Oriental Education & Technology Group | 2.2% |
| Hangzhou Hikvision Digital | 1.6% |
| Kotak Mahindra Bank | 1.6% |
| * | Excludes Cash Equivalents |
CITY NATIONAL ROCHDALE FUNDS | PAGE 18
| schedule of investments |
| September 30, 2017 |
| City National Rochdale Government Money Market Fund |
| Description | | Face Amount (000) | | | Value (000) | |
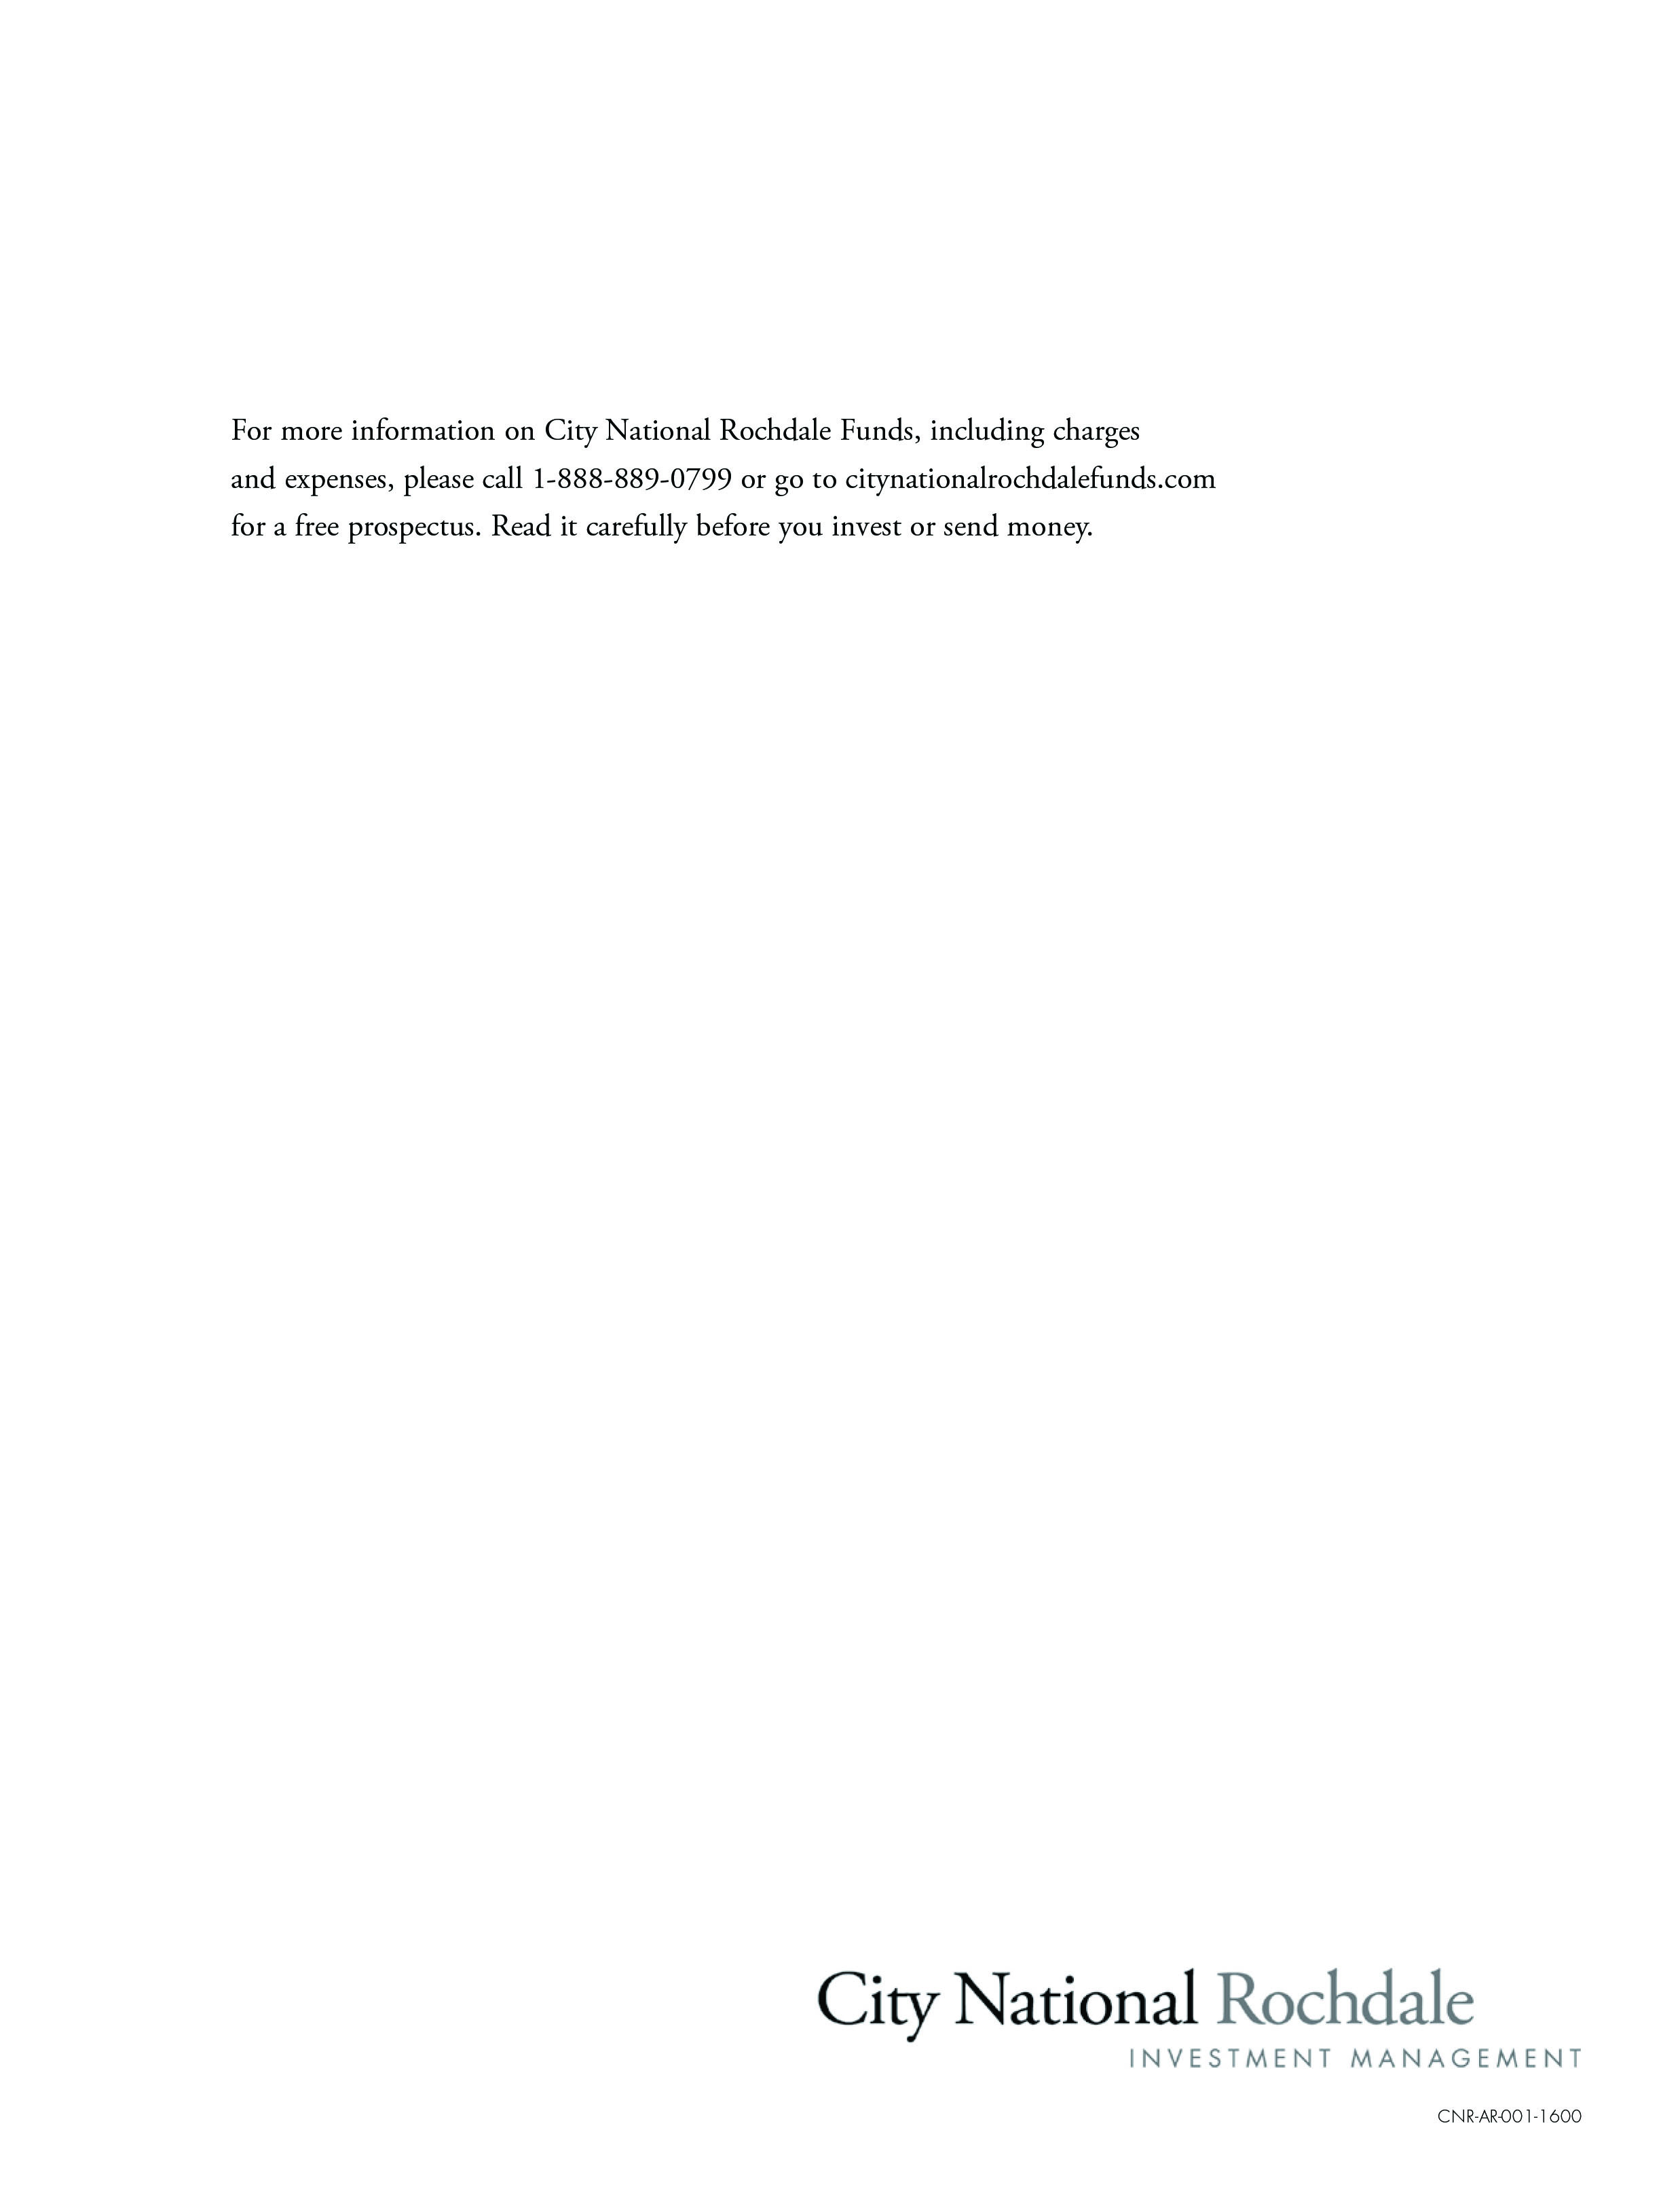
| U.S. Government Agency Obligations [74.8%] | |
| FFCB | | | | | | |
| 1.135%, VAR US Federal Funds Effective Rate+-0.025%, 10/01/17 | | $ | 50,000 | | | $ | 49,996 | |
| 1.155%, VAR ICE LIBOR USD 1 Month+-0.080%, 10/09/17 | | | 50,000 | | | | 49,997 | |
| 1.325%, VAR ICE LIBOR USD 1 Month+0.090%, 10/29/17 | | | 50,000 | | | | 49,999 | |
| 1.287%, VAR ICE LIBOR USD 1 Month+0.055%, 06/08/18 | | | 50,000 | | | | 49,997 | |
| FHLB | | | | | | | | |
| 1.275%, VAR ICE LIBOR USD 1 Month+0.040%, 10/01/17 | | | 50,000 | | | | 50,000 | |
| 1.245%, VAR ICE LIBOR USD 1 Month+0.010%, 10/01/17 | | | 75,000 | | | | 74,999 | |
| 1.337%, VAR ICE LIBOR USD 1 Month+0.100%, 10/19/17 | | | 50,000 | | | | 50,000 | |
| 1.042%, VAR ICE LIBOR USD 3 Month+-0.265%, 10/20/17 | | | 50,000 | | | | 50,000 | |
| 1.198%, VAR ICE LIBOR USD 1 Month+-0.040%, 10/26/17 | | | 50,000 | | | | 50,000 | |
| 1.102%, VAR ICE LIBOR USD 1 Month+-0.135%, 10/27/17 | | | 50,000 | | | | 50,000 | |
| 1.122%, VAR ICE LIBOR USD 3 Month+-0.190%, 11/08/17 | | | 50,000 | | | | 50,000 | |
| 1.051%, VAR ICE LIBOR USD 3 Month+-0.260%, 11/09/17 | | | 50,000 | | | | 50,000 | |
| 0.750%, 11/16/17 | | | 40,220 | | | | 40,216 | |
| 1.147%, VAR ICE LIBOR USD 3 Month+-0.170%, 11/18/17 | | | 25,000 | | | | 25,002 | |
| 1.116%, VAR ICE LIBOR USD 3 Month+-0.200%, 11/21/17 | | | 50,000 | | | | 50,000 | |
| 1.099%, VAR ICE LIBOR USD 3 Month+-0.230%, 12/26/17 | | | 50,000 | | | | 50,000 | |
| FHLB DN | | | | | | | | |
| 1.027%, 10/03/17(A) | | | 50,000 | | | | 49,997 | |
| 1.022%, 10/04/17(A) | | | 50,000 | | | | 49,996 | |
| 1.036%, 10/11/17(A) | | | 335,700 | | | | 335,604 | |
| 1.000%, 10/12/17(A) | | | 32,400 | | | | 32,390 | |
| 1.051%, 10/18/17(A) | | | 84,000 | | | | 83,958 | |
| 1.021%, 10/25/17(A) | | | 50,000 | | | | 49,966 | |
| 1.028%, 10/27/17(A) | | | 50,000 | | | | 49,963 | |
| 1.077%, 11/01/17(A) | | | 100,000 | | | | 99,908 | |
| 1.032%, 11/03/17(A) | | | 47,000 | | | | 46,956 | |
| 1.056%, 11/08/17(A) | | | 100,000 | | | | 99,889 | |
| 1.053%, 11/10/17(A) | | | 24,000 | | | | 23,972 | |
| 1.052%, 11/15/17(A) | | | 130,563 | | | | 130,392 | |
| 1.040%, 11/17/17(A) | | | 82,700 | | | | 82,588 | |
| 1.040%, 11/22/17(A) | | | 100,000 | | | | 99,850 | |
| 1.037%, 11/24/17(A) | | | 79,000 | | | | 78,877 | |
| 1.035%, 11/29/17(A) | | | 50,000 | | | | 49,915 | |
| 1.044%, 12/01/17(A) | | | 100,000 | | | | 99,824 | |
| 1.048%, 12/08/17(A) | | | 100,000 | | | | 99,803 | |
| 1.048%, 12/13/17(A) | | | 18,000 | | | | 17,962 | |
| 1.052%, 12/20/17(A) | | | 50,000 | | | | 49,883 | |
| 1.048%, 12/22/17(A) | | | 50,000 | | | | 49,881 | |
| 1.053%, 12/27/17(A) | | | 50,000 | | | | 49,873 | |
| 1.147%, 01/31/18(A) | | | 64,000 | | | | 63,753 | |
| 1.140%, 02/02/18(A) | | | 120,100 | | | | 119,631 | |
| 1.155%, 02/07/18(A) | | | 50,000 | | | | 49,794 | |
| 1.147%, 02/09/18(A) | | | 50,000 | | | | 49,793 | |
| 1.137%, 02/14/18(A) | | | 50,000 | | | | 49,787 | |
| 1.132%, 02/21/18(A) | | | 100,000 | | | | 99,553 | |
| 1.128%, 02/23/18(A) | | | 50,000 | | | | 49,774 | |
| 1.142%, 03/09/18(A) | | | 64,000 | | | | 63,679 | |
| 1.147%, 03/14/18(A) | | | 8,000 | | | | 7,958 | |
| 1.185%, 03/23/18(A) | | | 50,000 | | | | 49,717 | |
| 1.182%, 03/28/18(A) | | | 50,000 | | | | 49,709 | |
| | | | | | | | | |
| Total U.S. Government Agency Obligations | |
| (Cost $3,174,801) | | | | 3,174,801 | |
| | | | | | | | | |
| Municipal Bonds [4.2%] | |
| California [1.0%] | |
| California Statewide, Communities Development Authority, Fairway Family Apartments Project, Ser PP, RB, FNMA, AMT | | | | | | | | |
| 0.990%, 10/05/17(B)(C)(D) | | | 8,000 | | | | 8,000 | |
See accompanying notes to financial statements.
CITY NATIONAL ROCHDALE FUNDS | PAGE 19
| schedule of investments |
| September 30, 2017 |
City National Rochdale Government Money Market Fund (continued) |
| Description | | Face Amount (000) | | | Value (000) | |
| Los Angeles, Community Redevelopment Agency, Hollywood and Vine Apartments Project, Ser A, RB, FNMA, AMT | | | | | | |
| 0.940%, 10/05/17(B)(C)(D) | | $ | 23,910 | | | $ | 23,910 | |
| Sacramento County, Housing Authority, Ashford Heights Apartments Project, Ser H, RB, FNMA, AMT | | | | | | | | |
| 0.990%, 10/05/17(B)(C)(D) | | | 9,000 | | | | 9,000 | |
| | | | | | | | | |
| Total California | | | | 40,910 | |
| | | | | | | | | |
| New York [2.2%] | |
| New York State, Housing Development Authority, 26th Street Development Project, Ser A, RB, FHLMC | | | | | | | | |
| 0.990%, 10/05/17(B)(C) | | | 13,500 | | | | 13,500 | |
| New York State, Housing Development Authority, 26th Street Development Project, Ser A, RB, FHLMC, AMT | | | | | | | | |
| 1.050%, 10/05/17(B)(C) | | | 9,350 | | | | 9,350 | |
| New York State, Housing Finance Agency, 360 West 43rd Street Project, Ser A, RB, FNMA, AMT | | | | | | | | |
| 0.950%, 10/04/17(B)(C)(D) | | | 13,800 | | | | 13,800 | |
| New York State, Housing Finance Agency, 360 West 43rd Street Project, Ser A, RB, FNMA, AMT | | | | | | | | |
| 0.950%, 10/04/17(B)(C)(D) | | | 23,800 | | | | 23,800 | |
| New York State, Housing Finance Agency, East 84th Street Project, Ser A, RB, FNMA, AMT | | | | | | | | |
| 0.990%, 10/04/17(B)(C)(D) | | | 15,000 | | | | 15,000 | |
| New York State, Housing Finance Agency, West 38th Street Project, Ser A, RB, FNMA, AMT | | | | | | | | |
| 0.960%, 10/04/17(B)(C)(D) | | | 20,000 | | | | 20,000 | |
| | | | | | | | | |
| Total New York | | | | 95,450 | |
| | | | | | | | | |
| Texas [0.6%] | |
| Houston, Housing Finance, Regency Park Apartments Project, RB, FNMA, AMT | | | | | | | | |
| 0.980%, 10/04/17(B)(C)(D) | | | 13,095 | | | | 13,095 | |
| Texas State, Department of Housing & Community Affairs, Idlewilde Apartments Project, RB, FNMA, AMT | | | | | | | | |
| 0.990%, 10/15/17(B)(C)(D) | | | 12,990 | | | | 12,990 | |
| | | | | | | | | |
| Total Texas | | | | 26,085 | |
| | | | | | | | | |
| Washington [0.4%] | |
| Washington State, Housing Finance Commission, Vintage Spokane Project, Ser A, RB, FNMA, AMT | | | | | | | | |
| 0.990%, 10/05/17(B)(C)(D) | | | 16,295 | | | | 16,295 | |
| | | | | | | | | |
| Total Municipal Bonds | |
| (Cost $178,740) | | | | 178,740 | |
| | | | | | | | | |
| Repurchase Agreements [20.0%] | |
| Barclays (E) | | | | | | | | |
| 1.050%, dated 09/29/17, repurchased on 10/02/17, repurchase price $22,001,925 (collateralized by various U.S. Government obligations, par values ranging from $9,800 to $12,057,400, 1.125% - 3.125%, 03/31/18 to 06/30/23; with a total market value of $22,440,087) | | | 22,000 | | | | 22,000 | |
| Goldman Sachs (E) | | | | | | | | |
| 1.020%, dated 09/29/17, repurchased on 10/02/17, repurchase price $125,010,625 (collateralized by various U.S. Government obligations, par values ranging from $1,430,000 - $75,220,000, 0.875% - 3.240%, 08/31/18 to 04/26/41; with a total market value of $127,500,021) | | | 125,000 | | | | 125,000 | |
| Wells Fargo (E) | | | | | | | | |
| 1.040%, dated 09/29/17, repurchased on 10/02/17, repurchase price $700,060,667 (collateralized by various U.S. Government obligations, par values ranging from $170,562 to $557,858,508, 3.500% - 4.500%, 09/01/32 to 09/01/47; with a total market value of $714,000,000) | | | 700,000 | | | | 700,000 | |
| | | | | | | | | |
| Total Repurchase Agreements | |
| (Cost $847,000) | | | | 847,000 | |
See accompanying notes to financial statements.
CITY NATIONAL ROCHDALE FUNDS | PAGE 20
| schedule of investments |
| September 30, 2017 |
City National Rochdale Government Money Market Fund (concluded) |
| Description | | Shares | | | Value (000) | |
| Short-Term Investment [1.1%] | |
| Morgan Stanley Institutional Liquidity Funds - Government Portfolio, 0.850%** | | | 44,069,110 | | | $ | 44,069 | |
| | | | | | | | | |
| Total Short-Term Investment | |
| (Cost $44,069) | | | | 44,069 | |
| | | | | | | | | |
| Total Investments [100.1%] | |
| (Cost $4,244,610) | | | $ | 4,244,610 | |
Percentages are based on Net Assets of $4,242,213 (000).
| ** | The rate reported is the 7-day effective yield as of September 30, 2017. |
| (A) | Zero coupon security. The rate reported is the effective yield at time of purchase. |
| (B) | Put and Demand Feature — The date reported is the next reset or put date. |
| (C) | Variable or floating rate security, the interest rate of which adjusts periodically based on prevailing interest rates. |
| (D) | Securities are held in conjunction with a letter of credit from a major bank or financial institution. |
| (E) | Tri-Party Repurchase Agreement. |
AMT — Alternative Minimum Tax (subject to)
DN — Discount Note
FFCB — Federal Farm Credit Bank
FHLB — Federal Home Loan Bank
FHLMC — Federal Home Loan Mortgage Corporation
FNMA — Federal National Mortgage Association
ICE — Intercontinental Exchange
LIBOR — London Interbank Offered Rates
RB — Revenue Bond
Ser — Series
USD — United States Dollar
VAR — Variable
The following is a list of the inputs used as of September 30, 2017, in valuing the Fund’s investments carried at value (000):
| Investments in Securities | | Level 1 | | | Level 2 | | | Level 3 | | | Total | |
| U.S. Government Agency Obligations | | $ | — | | | $ | 3,174,801 | | | $ | — | | | $ | 3,174,801 | |
| Municipal Bonds | | | — | | | | 178,740 | | | | — | | | | 178,740 | |
| Repurchase Agreements | | | — | | | | 847,000 | | | | — | | | | 847,000 | |
| Short-Term Investment | | | 44,069 | | | | — | | | | — | | | | 44,069 | |
| Total Investments in Securities | | $ | 44,069 | | | $ | 4,200,541 | | | $ | — | | | $ | 4,244,610 | |
For the year ended September 30, 2017, there have been no transfers between any of the fair value hierarchy levels. Transfers between Levels are recognized at period end.
Amounts designated as “—” are either $0 or have been rounded to $0.
For more information on valuation inputs, see Note 2 — Significant Accounting Policies in the Notes to Financial Statements.
See accompanying notes to financial statements.
CITY NATIONAL ROCHDALE FUNDS | PAGE 21
| schedule of investments |
| September 30, 2017 |
| City National Rochdale Government Bond Fund |
| Description | | Face Amount (000) | | | Value (000) | |
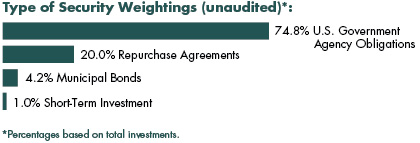
| U.S. Treasury Obligations [61.8%] | |
| U.S. Treasury Inflation Indexed Bonds | | | | | | |
| 0.125%, 04/15/20 | | $ | 3,021 | | | $ | 3,036 | |
| U.S. Treasury Notes | | | | | | | | |
| 2.375%, 12/31/20 | | | 4,500 | | | | 4,598 | |
| 2.125%, 01/31/21 | | | 4,340 | | | | 4,400 | |
| 2.125%, 12/31/21 | | | 5,825 | | | | 5,891 | |
| 2.000%, 11/30/20 | | | 5,000 | | | | 5,051 | |
| 1.875%, 05/31/22 | | | 2,500 | | | | 2,498 | |
| 1.875%, 08/31/24 | | | 2,805 | | | | 2,755 | |
| 1.625%, 06/30/20 | | | 2,800 | | | | 2,802 | |
| 1.500%, 01/31/22 | | | 5,500 | | | | 5,418 | |
| 1.375%, 12/15/19 | | | 6,440 | | | | 6,420 | |
| 1.375%, 02/15/20 | | | 5,000 | | | | 4,980 | |
| 1.375%, 04/30/20 | | | 750 | | | | 746 | |
| 1.375%, 10/31/20 | | | 4,000 | | | | 3,967 | |
| 1.375%, 09/30/23 | | | 1,290 | | | | 1,240 | |
| 1.250%, 12/15/18 | | | 3,500 | | | | 3,494 | |
| 1.123%, VAR US Treasury 3 Month Bill Money Market Yield+0.070%, 04/30/19 | | | 3,700 | | | | 3,702 | |
| | | | | | | | | |
| Total U.S. Treasury Obligations | |
| (Cost $61,049) | | | | 60,998 | |
| | | | | | | | | |
| U.S. Government Agency Obligations [21.3%] | |
| FFCB | | | | | | | | |
| 1.426%, VAR ICE LIBOR USD 1 Month+0.190%, 09/20/19 | | | 4,900 | | | | 4,923 | |
| FHLB | | | | | | | | |
| 1.375%, 09/13/19 | | | 2,795 | | | | 2,787 | |
| FNMA | | | | | | | | |
| 1.875%, 02/19/19 | | | 3,825 | | | | 3,846 | |
| 1.750%, 06/20/19 | | | 4,525 | | | | 4,545 | |
| 1.250%, 08/17/21 | | | 5,000 | | | | 4,893 | |
| | | | | | | | | |
| Total U.S. Government Agency Obligations | |
| (Cost $21,098) | | | | 20,994 | |
| Description | | Face Amount (000) /Shares | | | Value (000) | |
| U.S. Government Mortgage-Backed Obligations [15.4%] | |
| FHLMC, Ser K708, Cl A2 | | | | | | |
| 2.130%, 01/25/19 | | $ | 4,884 | | | $ | 4,904 | |
| FHLMC REMIC, Ser 2011-3874, Cl JA | | | | | | | | |
| 3.000%, 04/15/25 | | | 841 | | | | 847 | |
| FHLMC REMIC, Ser 2011-3877, Cl ND | | | | | | | | |
| 3.000%, 02/15/25 | | | 141 | | | | 142 | |
| FNMA, Pool AL5866 | | | | | | | | |
| 2.730%, 08/01/22 | | | 2,344 | | | | 2,393 | |
| FNMA, Pool AS4877 | | | | | | | | |
| 3.000%, 04/01/30 | | | 2,105 | | | | 2,167 | |
| FNMA, Pool FN0004 | | | | | | | | |
| 3.619%, 12/01/20 | | | 4,296 | | | | 4,490 | |
| FNMA ARM, Pool 766620 | | | | | | | | |
| 3.351%, VAR ICE LIBOR USD 12 Month+1.648%, 03/01/34 | | | 104 | | | | 109 | |
| GNMA, Pool 329656 | | | | | | | | |
| 8.000%, 08/15/22 | | | 3 | | | | 3 | |
| GNMA, Pool 376533 | | | | | | | | |
| 7.500%, 06/15/24 | | | 1 | | | | 1 | |
| GNMA, Pool 398660 | | | | | | | | |
| 7.500%, 05/15/26 | | | 1 | | | | 1 | |
| GNMA, Pool 497411 | | | | | | | | |
| 6.000%, 01/15/29 | | | 3 | | | | 4 | |
| GNMA, Pool 584992 | | | | | | | | |
| 7.500%, 04/15/32 | | | 9 | | | | 9 | |
| GNMA ARM, Pool G2 81318 | | | | | | | | |
| 2.625%, VAR US Treas Yield Curve Rate T Note Constant Mat 1 Yr+1.500%, 04/20/35 | | | 141 | | | | 147 | |
| GNMA ARM, Pool G2 81447 | | | | | | | | |
| 2.125%, VAR US Treas Yield Curve Rate T Note Constant Mat 1 Yr+1.500%, 08/20/35 | | | 34 | | | | 35 | |
| | | | | | | | | |
| Total U.S. Government Mortgage-Backed Obligations | |
| (Cost $15,296) | | | | 15,252 | |
| | | | | | | | | |
| Short-Term Investment [1.1%] | |
| SEI Daily Income Trust Government Fund, Cl F, 0.840%** | | | 1,047,015 | | | | 1,047 | |
| | | | | | | | | |
| Total Short-Term Investment | |
| (Cost $1,047) | | | | 1,047 | |
| | | | | | | | | |
| Total Investments [99.6%] | |
| (Cost $98,490) | | | $ | 98,291 | |
Percentages are based on Net Assets of $98,642 (000).
See accompanying notes to financial statements.
CITY NATIONAL ROCHDALE FUNDS | PAGE 22
| schedule of investments |
| September 30, 2017 |
City National Rochdale Government Bond Fund (concluded) |
| ** | The rate reported is the 7-day effective yield as of September 30, 2017. |
ARM — Adjustable Rate Mortgage
Cl — Class
FFCB — Federal Farm Credit Bank
FHLB — Federal Home Loan Bank
FHLMC — Federal Home Loan Mortgage Corporation
FNMA — Federal National Mortgage Association
GNMA — Government National Mortgage Association
ICE — Intercontinental Exchange
LIBOR — London Interbank Offered Rates
REMIC — Real Estate Mortgage Investment Conduit
Ser — Series
USD — United States Dollar
VAR — Variable
The following is a list of the inputs used as of September 30, 2017, in valuing the Fund’s investments carried at value (000):
| Investments in Securities | | Level 1 | | | Level 2 | | | Level 3 | | | Total | |
| U.S. Treasury Obligations | | $ | — | | | $ | 60,998 | | | $ | — | | | $ | 60,998 | |
| U.S. Government Agency Obligations | | | — | | | | 20,994 | | | | — | | | | 20,994 | |
| U.S. Government Mortgage-Backed Obligations | | | — | | | | 15,252 | | | | — | | | | 15,252 | |
| Short-Term Investment | | | 1,047 | | | | — | | | | — | | | | 1,047 | |
| Total Investments in Securities | | $ | 1,047 | | | $ | 97,244 | | | $ | — | | | $ | 98,291 | |
For the year ended September 30, 2017, there have been no transfers between any of the fair value hierarchy levels. Transfers between Levels are recognized at period end.
The following is a summary of the transactions with affiliates for the year ended September 30, 2017 (000):
| | | City National Rochdale Government
Money Market Fund,
Institutional Class | |
| Beginning balance as of 9/30/16 | | $ | 855 | |
| Purchases at Cost | | | 18,405 | |
| Proceeds from Sales | | | (19,260 | ) |
| Unrealized Gain (Loss) | | | — | |
| Realized Gain (Loss) | | | — | |
| Ending balance as of 9/30/17 | | $ | — | |
| Dividend Income | | $ | — | |
Amounts designated as “—” are either $0 or have been rounded to $0.
For more information on valuation inputs, see Note 2 — Significant Accounting Policies in the Notes to Financial Statements.
See accompanying notes to financial statements.
CITY NATIONAL ROCHDALE FUNDS | PAGE 23
| schedule of investments |
| September 30, 2017 |
| City National Rochdale Corporate Bond Fund |
| Description | | Face Amount (000) | | | Value (000) | |
| Corporate Bonds [87.5%] | |
| Auto-Med and Heavy Duty Trks [1.9%] | |
| PACCAR Financial, MTN | | | | | | |
| 1.750%, 08/14/18 | | $ | 2,600 | | | $ | 2,606 | |
| | | | | | | | | |
| Automotive [9.7%] | |
| American Honda Finance, MTN | | | | | | | | |
| 1.700%, 09/09/21 | | | 2,500 | | | | 2,452 | |
| Daimler Finance North America | | | | | | | | |
| 2.250%, 07/31/19(A) | | | 2,900 | | | | 2,913 | |
| Ford Motor Credit | | | | | | | | |
| 2.551%, 10/05/18 | | | 2,000 | | | | 2,013 | |
| 2.375%, 01/16/18 | | | 1,000 | | | | 1,002 | |
| General Motors Financial | | | | | | | | |
| 5.250%, 03/01/26 | | | 1,250 | | | | 1,357 | |
| Hyundai Capital America, MTN | | | | | | | | |
| 2.325%, VAR ICE LIBOR USD 3 Month+1.000%, 09/18/20(A) | | | 1,000 | | | | 1,000 | |
| Toyota Motor Credit, MTN | | | | | | | | |
| 1.200%, 04/06/18 | | | 2,500 | | | | 2,497 | |
| | | | | | | | | |
| Total Automotive | | | | 13,234 | |
| | | | | | | | | |
| Banks [12.9%] | |
| Bank of Montreal, MTN | | | | | | | | |
| 1.947%, VAR ICE LIBOR USD 3 Month+0.630%, 09/11/22 | | | 1,200 | | | | 1,201 | |
| Bank of Nova Scotia | | | | | | | | |
| 2.450%, 03/22/21 | | | 2,500 | | | | 2,515 | |
| Capital One | | | | | | | | |
| 2.350%, 08/17/18 | | | 500 | | | | 502 | |
| 1.850%, 09/13/19 | | | 1,500 | | | | 1,490 | |
| National Australia Bank | | | | | | | | |
| 4.375%, 12/10/20(A) | | | 751 | | | | 798 | |
| Nordea Bank, MTN | | | | | | | | |
| 2.375%, 04/04/19(A) | | | 1,000 | | | | 1,007 | |
| PNC Bank | | | | | | | | |
| 2.700%, 11/01/22 | | | 2,500 | | | | 2,519 | |
| Standard Chartered, MTN | | | | | | | | |
| 1.700%, 04/17/18(A) | | | 3,000 | | | | 2,996 | |
| Sumitomo Mitsui Financial Group | | | | | | | | |
| 2.846%, 01/11/22 | | | 2,500 | | | | 2,523 | |
| Svenska Handelsbanken | | | | | | | | |
| 1.677%, VAR ICE LIBOR USD 3 Month+0.360%, 09/08/20 | | | 2,000 | | | | 2,004 | |
| Westpac Banking | | | | | | | | |
| 4.875%, 11/19/19 | | | 65 | | | | 69 | |
| | | | | | | | | |
| Total Banks | | | | 17,624 | |
| | | | | | | | | |
| Broadcasting & Cable [2.8%] | |
| CBS | | | | | | | | |
| 4.300%, 02/15/21 | | | 1,400 | | | | 1,481 | |
| Comcast Cable Communications Holdings | | | | | | | | |
| 9.455%, 11/15/22 | | | 1,800 | | | | 2,393 | |
| | | | | | | | | |
| Total Broadcasting & Cable | | | | 3,874 | |
| | | | | | | | | |
| Computer System Design & Services [4.5%] | |
| Apple | | | | | | | | |
| 3.450%, 05/06/24 | | | 3,000 | | | | 3,146 | |
| Hewlett Packard Enterprise | | | | | | | | |
| 3.041%, VAR ICE LIBOR USD 3 Month+1.740%, 10/05/17 | | | 3,000 | | | | 3,000 | |
| | | | | | | | | |
| Total Computer System Design & Services | | | | 6,146 | |
| | | | | | | | | |
| Computers-Memory Devices [0.7%] | |
| NetApp | | | | | | | | |
| 2.000%, 12/15/17 | | | 1,000 | | | | 1,000 | |
| | | | | | | | | |
| Diagnostic Equipment [0.5%] | |
| Danaher | | | | | | | | |
| 1.650%, 09/15/18 | | | 700 | | | | 701 | |
See accompanying notes to financial statements.
CITY NATIONAL ROCHDALE FUNDS | PAGE 24
| schedule of investments |
| September 30, 2017 |
City National Rochdale Corporate Bond Fund (continued) |
| Description | | Face Amount (000) | | | Value (000) | |
| Drugs [0.7%] | |
| AbbVie | | | | | | |
| 2.500%, 05/14/20 | | $ | 1,000 | | | $ | 1,012 | |
| | | | | | | | | |
| Electric Utilities [2.7%] | |
| American Electric Power | | | | | | | | |
| 1.650%, 12/15/17 | | | 1,000 | | | | 1,000 | |
| Exelon Generation | | | | | | | | |
| 6.200%, 10/01/17 | | | 1,200 | | | | 1,200 | |
| 3.400%, 03/15/22 | | | 1,500 | | | | 1,536 | |
| | | | | | | | | |
| Total Electric Utilities | | | | 3,736 | |
| | | | | | | | | |
| Electric-Distribution [0.8%] | |
| Commonwealth Edison | | | | | | | | |
| 6.950%, 07/15/18 | | | 1,000 | | | | 1,041 | |
| | | | | | | | | |
| Food, Beverage & Tobacco [3.1%] | |
| Anheuser-Busch InBev Finance | | | | | | | | |
| 2.571%, VAR ICE LIBOR USD 3 Month+1.260%, 02/01/21 | | | 2,000 | | | | 2,067 | |
| Kraft Heinz Foods | | | | | | | | |
| 2.000%, 07/02/18 | | | 1,000 | | | | 1,002 | |
| Molson Coors Brewing | | | | | | | | |
| 1.450%, 07/15/19 | | | 1,250 | | | | 1,237 | |
| | | | | | | | | |
| Total Food, Beverage & Tobacco | | | | 4,306 | |
| | | | | | | | | |
| Food-Confectionery [0.2%] | |
| JM Smucker | | | | | | | | |
| 2.500%, 03/15/20 | | | 250 | | | | 252 | |
| | | | | | | | | |
| Insurance [1.5%] | |
| Berkshire Hathaway | | | | | | | | |
| 2.100%, 08/14/19 | | | 2,000 | | | | 2,019 | |
| | | | | | | | | |
| Investment Bank/Broker-Dealer [13.1%] | |
| Citigroup | | | | | | | | |
| 2.746%, VAR ICE LIBOR USD 3 Month+1.430%, 09/01/23 | | | 1,000 | | | | 1,026 | |
| Credit Suisse Group Funding Guernsey | | | | | | | | |
| 3.450%, 04/16/21 | | | 1,250 | | | | 1,283 | |
| Deutsche Bank, MTN | | | | | | | | |
| 2.850%, 05/10/19 | | | 1,450 | | | | 1,464 | |
| Goldman Sachs Group | | | | | | | | |
| 2.625%, 01/31/19 | | | 500 | | | | 504 | |
| 2.485%, VAR ICE LIBOR USD 3 Month+1.170%, 11/15/21 | | | 2,500 | | | | 2,534 | |
| HSBC Holdings | | | | | | | | |
| 3.400%, 03/08/21 | | | 2,500 | | | | 2,578 | |
| Jefferies Group | | | | | | | | |
| 5.125%, 01/20/23 | | | 1,300 | | | | 1,420 | |
| JPMorgan Chase | | | | | | | | |
| 6.300%, 04/23/19 | | | 2,000 | | | | 2,134 | |
| 6.000%, 01/15/18 | | | 405 | | | | 410 | |
| Macquarie Group | | | | | | | | |
| 6.000%, 01/14/20(A) | | | 2,000 | | | | 2,161 | |
| Morgan Stanley, MTN | | | | | | | | |
| 5.950%, 12/28/17 | | | 465 | | | | 470 | |
| 3.750%, 02/25/23 | | | 2,000 | | | | 2,088 | |
| | | | | | | | | |
Total Investment Bank/Broker-Dealer | | | | 18,072 | |
| | | | | | | | | |
| Medical Labs and Testing Srv [1.1%] | |
| Laboratory Corp of America Holdings | | | | | | | | |
| 2.625%, 02/01/20 | | | 1,500 | | | | 1,516 | |
| | |
| Medical Products & Services [1.9%] | |
| Gilead Sciences | | | | | | | | |
| 3.700%, 04/01/24 | | | 2,500 | | | | 2,640 | |
| | | | | | | | | |
| Medical-HMO [1.1%] | |
| UnitedHealth Group | | | | | | | | |
| 1.625%, 03/15/19 | | | 1,500 | | | | 1,497 | |
| | | | | | | | | |
| Motorcycle/Motor Scooter [1.9%] | |
| Harley-Davidson Funding | | | | | | | | |
| 6.800%, 06/15/18(A) | | | 2,500 | | | | 2,589 | |
| | | | | | | | | |
| Multi-line Insurance [2.9%] | |
| Genworth Holdings | | | | | | | | |
| 7.700%, 06/15/20 | | | 1,400 | | | | 1,405 | |
| MetLife | | | | | | | | |
| 4.750%, 02/08/21 | | | 2,400 | | | | 2,597 | |
| | | | | | | | | |
| Total Multi-line Insurance | | | | 4,002 | |
| | | | | | | | | |
| Petroleum & Fuel Products [7.1%] | |
| Korea National Oil, MTN | | | | | | | | |
| 2.750%, 01/23/19(A) | | | 1,500 | | | | 1,506 | |
| Shell International Finance BV | | | | | | | | |
| 4.300%, 09/22/19 | | | 125 | | | | 131 | |
| 3.400%, 08/12/23 | | | 2,500 | | | | 2,621 | |
| Sunoco Logistics Partners Operations | | | | | | | | |
| 4.650%, 02/15/22 | | | 1,300 | | | | 1,382 | |
See accompanying notes to financial statements.
CITY NATIONAL ROCHDALE FUNDS | PAGE 25
| schedule of investments |
| September 30, 2017 |
City National Rochdale Corporate Bond Fund (continued) |
| Description | | Face Amount (000) | | | Value (000) | |
| Total Capital International | | | | | | |
| 2.875%, 02/17/22 | | $ | 4,000 | | | $ | 4,085 | |
| | | | | | | | | |
| Total Petroleum & Fuel Products | | | | 9,725 | |
| | | | | | | | | |
| Real Estate [2.0%] | |
| Prologis | | | | | | | | |
| 4.250%, 08/15/23 | | | 2,500 | | | | 2,716 | |
| | | | | | | | | |
| Real Estate Investment Trusts [4.0%] | |
| HCP | | | | | | | | |
| 3.150%, 08/01/22 | | | 1,000 | | | | 1,012 | |
| Kimco Realty | | | | | | | | |
| 6.875%, 10/01/19 | | | 1,080 | | | | 1,176 | |
| Simon Property Group | | | | | | | | |
| 2.500%, 09/01/20 | | | 2,000 | | | | 2,024 | |
| Welltower | | | | | | | | |
| 3.750%, 03/15/23 | | | 1,250 | | | | 1,301 | |
| | | | | | | | | |
| Total Real Estate Investment Trusts | | | | 5,513 | |
| | | | | | | | | |
| Regional Authority [1.5%] | |
| Province of Ontario Canada | | | | | | | | |
| 4.400%, 04/14/20 | | | 2,000 | | | | 2,122 | |
| | | | | | | | | |
| Retail [3.3%] | |
| AutoZone | | | | | | | | |
| 4.000%, 11/15/20 | | | 1,400 | | | | 1,467 | |
| Costco Wholesale | | | | | | | | |
| 2.150%, 05/18/21 | | | 3,000 | | | | 3,009 | |
| | | | | | | | | |
| Total Retail | | | | 4,476 | |
| | | | | | | | | |
| Telephones & Telecommunications [4.7%] | |
| America Movil | | | | | | | | |
| 5.000%, 03/30/20 | | | 2,600 | | | | 2,781 | |
| AT&T | | | | | | | | |
| 3.600%, 02/17/23 | | | 2,000 | | | | 2,058 | |
| Verizon Communications | | | | | | | | |
| 3.125%, 03/16/22 | | | 1,500 | | | | 1,537 | |
| | | | | | | | | |
| Total Telephones & Telecommunications | | | | 6,376 | |
| | | | | | | | | |
| Trucking & Leasing [0.9%] | |
| Penske Truck Leasing | | | | | | | | |
| 4.875%, 07/11/22(A) | | | 1,100 | | | | 1,198 | |
| | | | | | | | | |
| Total Corporate Bonds | |
| (Cost $118,711) | | | | 119,993 | |
| Description | | Face Amount (000) /Shares | | | Value (000) | |
| Asset-Backed Securities [4.4%] | |
| Ford Credit Floorplan Master Owner Trust A, Ser 2016-3, Cl A1 | | | | | | |
| 1.550%, 07/15/21 | | $ | 2,000 | | | $ | 1,990 | |
| NextGear Floorplan Master Owner Trust, Ser 2015-2A, Cl A | | | | | | | | |
| 2.380%, 10/15/20(A) | | | 4,000 | | | | 4,014 | |
| | | | | | | | | |
| Total Asset-Backed Securities | |
| (Cost $6,020) | | | | 6,004 | |
| | | | | | | | | |
| Closed-End Fund [2.2%] | |
| Stone Ridge Reinsurance Risk Premium Interval Fund(B) | | | 338,592 | | | | 3,054 | |
| | | | | | | | | |
| Total Closed-End Fund | |
| (Cost $3,449) | | | | 3,054 | |
| | | | | | | | | |
| Municipal Bonds [1.9%] | |
| California [1.0%] | |
| State of California, GO | | | | | | | | |
| 6.200%, 03/01/19 | | | 1,300 | | | | 1,381 | |
| | | | | | | | | |
| New York [0.9%] | |
| New York State, Urban Development, RB | | | | | | | | |
| 2.790%, 03/15/21 | | | 1,205 | | | | 1,233 | |
| | | | | | | | | |
| Total Municipal Bonds | |
| (Cost $2,609) | | | | 2,614 | |
| | | | | | | | | |
| Repurchase Agreement [2.2%] | |
| Barclays (C) | | | | | | | | |
| 1.050%, dated 09/29/17, repurchased on 10/02/17, repurchase price $3,000,263 (collateralized by various U.S. Government obligations, par values ranging from $1,261,200 - $1,446,400, 0.875% - 4.500%, 09/15/19 to 02/15/36; with a total market value of $3,060,002) | | | 3,000 | | | | 3,000 | |
| | | | | | | | | |
| Total Repurchase Agreement | |
| (Cost $3,000) | | | | 3,000 | |
See accompanying notes to financial statements.
CITY NATIONAL ROCHDALE FUNDS | PAGE 26
| schedule of investments |
| September 30, 2017 |
City National Rochdale Corporate Bond Fund (concluded) |
| Description | | Shares | | | Value (000) | |
| Short-Term Investment [1.1%] | |
| SEI Daily Income Trust Government Fund, Cl F, 0.840%** | | | 1,432,053 | | | $ | 1,432 | |
| | | | | | | | | |
| Total Short-Term Investment | |
| (Cost $1,432) | | | | 1,432 | |
| | | | | | | | | |
| Total Investments [99.3%] | |
| (Cost $135,221) | | | $ | 136,097 | |
Percentages are based on Net Assets of $137,103 (000).
| ** | The rate reported is the 7-day effective yield as of September 30, 2017. |
| (A) | Security exempt from registration under Rule 144A of the Securities Act of 1933. These securities may be resold in transactions exempt from registration normally to qualified institutions. On September 30, 2017, the value of these securities amounted to $20,182 (000), representing 14.7% of the net assets of the Fund. |
| (B) | Security is considered illiquid. The total market value of such security as of September 30, 2017, was $3,054 (000) and represented 2.2% of the net assets of the Fund. |
| (C) | Tri-Party Repurchase Agreement. |
Cl — Class
GO — General Obligation
ICE — Intercontinental Exchange
LIBOR — London Interbank Offered Rates
MTN — Medium Term Note
RB — Revenue Bond
Ser — Series
USD — United States Dollar
VAR — Variable
The following is a list of the inputs used as of September 30, 2017, in valuing the Fund’s investments carried at value (000):
| Investments in Securities | | Level 1 | | | Level 2 | | | Level 3 | | | Total | |
| Corporate Bonds | | $ | — | | | $ | 119,993 | | | $ | — | | | $ | 119,993 | |
| Asset-Backed Securities | | | — | | | | 6,004 | | | | — | | | | 6,004 | |
| Closed-End Fund | | | 3,054 | | | | — | | | | — | | | | 3,054 | |
| Municipal Bonds | | | — | | | | 2,614 | | | | — | | | | 2,614 | |
| Repurchase Agreement | | | — | | | | 3,000 | | | | — | | | | 3,000 | |
| Short-Term Investment | | | 1,432 | | | | — | | | | — | | | | 1,432 | |
| Total Investments in Securities | | $ | 4,486 | | | $ | 131,611 | | | $ | — | | | $ | 136,097 | |
For the year ended September 30, 2017, there have been no transfers between any of the fair value hierarchy levels. Transfers between Levels are recognized at period end.
The following is a summary of the transactions with affiliates for the year ended September 30, 2017 (000):
| | | City National Rochdale Government
Money Market Fund,
Institutional Class | |
| Beginning balance as of 9/30/16 | | $ | 808 | |
| Purchases at Cost | | | 16,349 | |
| Proceeds from Sales | | | (17,157 | ) |
| Ending balance as of 9/30/17 | | $ | — | |
| Dividend Income | | $ | 1 | |
Amounts designated as “—“ are $0 or have been rounded to $0.
For information on valuation inputs, see Note 2 — Significant Accounting Policies in the Notes to Financial Statements.
See accompanying notes to financial statements.
CITY NATIONAL ROCHDALE FUNDS | PAGE 27
| schedule of investments |
| September 30, 2017 |
| City National Rochdale California Tax Exempt Bond Fund |
| Description | | Face Amount (000) | | | Value (000) | |
| Municipal Bonds [99.8%] | |
| California [96.9%] | |
| Bay Area, Water Supply & Conservation Agency, Ser A, RB | | | | | | |
| Callable 04/01/23 @ 100 | | | | | | |
| 5.000%, 10/01/23 | | $ | 600 | | | $ | 709 | |
| Brea, Redevelopment Agency Successor, Redevelopment Project AB, TA | | | | | | | | |
| 5.000%, 08/01/20 | | | 500 | | | | 553 | |
| Brea, Redevelopment Agency Successor, Redevelopment Project AB, TA | | | | | | | | |
| Callable 08/01/23 @ 100 | | | | | | | | |
| 5.000%, 08/01/25 | | | 500 | | | | 584 | |
| California Infrastructure & Economic Development Bank, Pacific Gas & Electric Project, Ser B, RB, Union Bank N.A. | | | | | | | | |
| Callable 09/29/17 @ 100 | | | | | | | | |
| 0.850%, 11/01/26(A) (B) | | | 2,500 | | | | 2,500 | |
| California State University, Ser A, RB | | | | | | | | |
| 5.000%, 11/01/24 | | | 900 | | | | 1,104 | |
| California State University, Ser A, RB | | | | | | | | |
| Callable 05/01/26 @ 100 | | | | | | | | |
| 5.000%, 11/01/27 | | | 240 | | | | 296 | |
| California State, Department of Water Resources, Ser F-3, RB | | | | | | | | |
| Pre-Refunded @ 100 | | | | | | | | |
| 4.375%, 05/01/18(C) | | | 200 | | | | 204 | |
| California State, Educational Facilities Authority, Chapman University, RB | | | | | | | | |
| Callable 04/01/25 @ 100 | | | | | | | | |
| 5.000%, 04/01/26 | | | 100 | | | | 119 | |
| California State, Educational Facilities Authority, Chapman University, RB | | | | | | | | |
| Callable 04/01/25 @ 100 | | | | | | | | |
| 5.000%, 04/01/27 | | | 100 | | | | 119 | |
| California State, GO | | | | | | | | |
| 5.250%, 09/01/22 | | | 1,000 | | | | 1,182 | |
| California State, GO | | | | | | | | |
| 5.000%, 11/01/19 | | | 1,000 | | | | 1,082 | |
| California State, GO | | | | | | | | |
| 5.000%, 09/01/20 | | | 1,000 | | | | 1,112 | |
| California State, GO | | | | | | | | |
| 5.000%, 12/01/21 | | | 1,000 | | | | 1,151 | |
| California State, GO | | | | | | | | |
| Callable 11/01/20 @ 100 | | | | | | | | |
| 5.000%, 11/01/22 | | | 1,025 | | | | 1,143 | |
| California State, GO | | | | | | | | |
| 5.000%, 11/01/24 | | | 1,000 | | | | 1,216 | |
| California State, GO | | | | | | | | |
| 5.000%, 08/01/26 | | | 1,000 | | | | 1,238 | |
| California State, GO | | | | | | | | |
| Callable 12/01/23 @ 100 | | | | | | | | |
| 5.000%, 12/01/26 | | | 1,000 | | | | 1,191 | |
| California State, GO | | | | | | | | |
| Callable 11/01/23 @ 100 | | | | | | | | |
| 5.000%, 11/01/27 | | | 500 | | | | 593 | |
| California State, GO | | | | | | | | |
| 4.000%, 02/01/19 | | | 1,000 | | | | 1,040 | |
| California State, GO | | | | | | | | |
| Callable 06/01/19 @ 100 | | | | | | | | |
| 3.000%, 12/01/32(A) | | | 1,000 | | | | 1,034 | |
| California State, GO | | | | | | | | |
| Callable 06/01/18 @ 100 | | | | | | | | |
| 1.692%, 12/01/29(A) | | | 1,500 | | | | 1,505 | |
| California State, Health Facilities Financing Authority, City of Hope, Ser A, RB | | | | | | | | |
| 5.000%, 11/15/17 | | | 375 | | | | 377 | |
| California State, Health Facilities Financing Authority, RB | | | | | | | | |
| 0.930%, 10/10/17 | | | 2,000 | | | | 2,000 | |
| California State, Health Facilities Financing Authority, St. Joseph Health System, Ser B, RB | | | | | | | | |
| 5.000%, 07/01/43(A) | | | 875 | | | | 876 | |
See accompanying notes to financial statements.
CITY NATIONAL ROCHDALE FUNDS | PAGE 28
| schedule of investments |
| September 30, 2017 |
City National Rochdale California Tax Exempt Bond Fund (continued) |
| Description | | Face Amount (000) | | | Value (000) | |
| California State, Health Facilities Financing Authority, St. Joseph Health System, Ser D, RB | | | | | | |
| 5.000%, 07/01/43(A) | | $ | 975 | | | $ | 1,080 | |
| California State, Health Facilities Financing Authority, Sutter Health, Ser A, RB | | | | | | | | |
| 5.500%, 08/15/18 | | | 125 | | | | 130 | |
| California State, Public Works Board, Department of Corrections and Rehab Project, Ser A, RB | | | | | | | | |
| 5.000%, 09/01/22 | | | 1,000 | | | | 1,167 | |
| California State, Public Works Board, Department of Corrections-State Prisons, Ser A, RB, AMBAC | | | | | | | | |
| 5.000%, 12/01/19 | | | 555 | | | | 581 | |
| California State, Public Works Board, Judicial Council, Ser B, RB | | | | | | | | |
| 5.000%, 10/01/23 | | | 475 | | | | 566 | |
| California State, Public Works Board, RB | | | | | | | | |
| 5.000%, 09/01/25 | | | 1,500 | | | | 1,829 | |
| California State, Public Works Board, Ser B, RB | | | | | | | | |
| 5.000%, 10/01/25 | | | 225 | | | | 275 | |
| California State, Public Works Board, Ser C, RB | | | | | | | | |
| Callable 03/01/27 @ 100 | | | | | | | | |
| 5.000%, 03/01/28 | | | 500 | | | | 609 | |
| California State, Public Works Board, Various Capital Projects, Ser G-1, RB | | | | | | | | |
| Pre-Refunded @ 100 | | | | | | | | |
| 5.250%, 10/01/19(C) | | | 250 | | | | 271 | |
| California Statewide, Communities Development Authority, Cottage Health System, RB | | | | | | | | |
| Callable 11/01/24 @ 100 | | | | | | | | |
| 5.000%, 11/01/25 | | | 350 | | | | 413 | |
| California Statewide, Communities Development Authority, Kaiser Permanente, Ser A, RB | | | | | | | | |
| 5.000%, 04/01/19 | | | 1,235 | | | | 1,309 | |
| California Statewide, Communities Development Authority, Sutter Health, Ser A, RB | | | | | | | | |
| 5.000%, 08/15/18 | | | 220 | | | | 228 | |
| Central Basin Municipal Water District, Ser A, RB, AGM | | | | | | | | |
| Callable 08/01/26 @ 100 | | | | | | | | |
| 5.000%, 08/01/28 | | | 885 | | | | 1,069 | |
| Chula Vista, Elementary School District, School Building Project, Ser A, COP, AGM | | | | | | | | |
| 5.000%, 09/01/22 | | | 1,000 | | | | 1,170 | |
| Chula Vista, Police Facility Project, COP | | | | | | | | |
| 5.000%, 10/01/21 | | | 360 | | | | 411 | |
| Contra Costa, Transportation Authority, Ser A, RB | | | | | | | | |
| 5.000%, 03/01/27 | | | 420 | | | | 528 | |
| East Bay, Municipal Utility District, Water System Revenue, Ser A, RB | | | | | | | | |
| Callable 06/01/25 @ 100 | | | | | | | | |
| 5.000%, 06/01/29 | | | 850 | | | | 1,032 | |
| El Dorado, Irrigation District, Ser A, RB, AGM | | | | | | | | |
| 4.500%, 03/01/19 | | | 500 | | | | 525 | |
| Gilroy, Public Facilities Financing Authority, RB | | | | | | | | |
| 5.000%, 11/01/21 | | | 940 | | | | 1,078 | |
| Golden State Tobacco Securitization, Ser A, RB | | | | | | | | |
| 5.000%, 06/01/19 | | | 1,000 | | | | 1,067 | |
| Hemet, Unified School District, GO, AGM | | | | | | | | |
| 4.000%, 08/01/24 | | | 500 | | | | 569 | |
| Inglewood, Redevelopment Agency Successor Agency, Sub-Ser, TA, BAM | | | | | | | | |
| 5.000%, 05/01/23 | | | 500 | | | | 592 | |
| JPM Chase Putters, Ser 2015-ZF0159, GO | | | | | | | | |
| 1.090%, 08/01/22(A) (D) (E) | | | 1,000 | | | | 1,000 | |
| JPM Chase Putters, Ser 2015-ZF0183, RB | | | | | | | | |
| 1.090%, 12/01/22(A) (D) (E) | | | 1,000 | | | | 1,000 | |
| JPM Chase Putters, Ser 2015-ZF0184, RB | | | | | | | | |
| 1.040%, 12/01/22(A) (D) (E) | | | 1,000 | | | | 1,000 | |
| JPM Chase Putters, Ser 2015-ZF0184, RB | | | | | | | | |
| 0.950%, 02/01/23(A) (D) (E) | | | 1,000 | | | | 1,000 | |
| Jurupa, Unified School District, GO, AGM | | | | | | | | |
| 5.000%, 08/01/22 | | | 1,000 | | | | 1,166 | |
| Long Beach, Harbor Revenue, Ser A, RB, AMT | | | | | | | | |
| 5.000%, 05/15/27 | | | 500 | | | | 614 | |
See accompanying notes to financial statements.
CITY NATIONAL ROCHDALE FUNDS | PAGE 29
| schedule of investments |
| September 30, 2017 |
City National Rochdale California Tax Exempt Bond Fund (continued) |
| Description | | Face Amount (000) | | | Value (000) | |
| Long Beach, Harbor Revenue, Ser C, RB | | | | | | |
| 4.000%, 11/15/18 | | $ | 500 | | | $ | 517 | |
| Long Beach, Unified School District, Election of 2008, Ser S, GO | | | | | | | | |
| Pre-Refunded @ 100 | | | | | | | | |
| 5.250%, 08/01/19(C) | | | 2,010 | | | | 2,167 | |
| Long Beach, Unified School District, GO | | | | | | | | |
| 5.000%, 08/01/26 | | | 1,000 | | | | 1,253 | |
| Los Angeles California Wastewater System Revenue, Sub-Ser C, RB | | | | | | | | |
| 1.350%, 06/01/18 | | | 615 | | | | 614 | |
| Los Angeles County, Disney Parking Hall Project, COP | | | | | | | | |
| 5.000%, 09/01/22 | | | 500 | | | | 585 | |
| Los Angeles County, Metropolitan Transportation Authority, Ser A, RB | | | | | | | | |
| Callable 07/01/25 @ 100 | | | | | | | | |
| 5.000%, 07/01/26 | | | 500 | | | | 612 | |
| Los Angeles, Department of Water, Ser A, RB | | | | | | | | |
| Callable 01/01/27 @ 100 | | | | | | | | |
| 5.000%, 07/01/30 | | | 1,000 | | | | 1,221 | |
| Los Angeles, Department of Airports, Ser C, RB | | | | | | | | |
| 5.000%, 05/15/25 | | | 550 | | | | 673 | |
| Los Angeles, Department of Water & Power, Power System Project, Ser A, RB | | | | | | | | |
| 5.000%, 07/01/19 | | | 500 | | | | 535 | |
| Los Angeles, Department of Water & Power, Power System Project, Ser C, RB | | | | | | | | |
| 5.000%, 07/01/23 | | | 500 | | | | 598 | |
| Los Angeles, Municipal Improvement Authority, Capital Equipment, Ser A, RB | | | | | | | | |
| 4.000%, 11/01/19 | | | 575 | | | | 610 | |
| Los Angeles, Sanitation Districts Financing Authority, Ser A, RB | | | | | | | | |
| Callable 10/01/25 @ 100 | | | | | | | | |
| 5.000%, 10/01/28 | | | 500 | | | | 607 | |
| Los Angeles, Ser A, GO, ETM | | | | | | | | |
| 5.000%, 09/01/21 | | | 270 | | | | 310 | |
| Los Angeles, Unified School District, Headquarters Building Project, Ser A, COP | | | | | | | | |
| 5.000%, 10/01/20 | | | 1,000 | | | | 1,115 | |
| Los Angeles, Unified School District, Ser A, GO | | | | | | | | |
| 5.000%, 07/01/18 | | | 350 | | | | 361 | |
| Merced, Irrigation District, Ser A, RB, AGM | | | | | | | | |
| 5.000%, 10/01/20 | | | 500 | | | | 555 | |
| North City, West School Facilities Financing Authority, Sub-Ser A, SPL Tax, AGM | | | | | | | | |
| 5.000%, 09/01/20 | | | 1,000 | | | | 1,112 | |
| Northern California, Power Agency, Hydroelectric Project Number 1, Ser C, RB, AGC | | | | | | | | |
| Callable 07/01/18 @ 100 | | | | | | | | |
| 5.000%, 07/01/20 | | | 500 | | | | 514 | |
| Orange County, Redevelopment Agency Successor Agency, TA, AGM | | | | | | | | |
| 5.000%, 09/01/23 | | | 320 | | | | 380 | |
| Petaluma, Joint Unified High School District, Election of 2014, Ser A, GO | | | | | | | | |
| 4.000%, 08/01/18 | | | 595 | | | | 610 | |
| Port of Oakland, Ser B, RB, NATL | | | | | | | | |
| Callable 11/01/17 @ 100 | | | | | | | | |
| 5.000%, 11/01/23 | | | 500 | | | | 502 | |
| Redding, Electric System Revenue, RB | | | | | | | | |
| 5.000%, 06/01/24 | | | 600 | | | | 722 | |
| Redding, Electric System Revenue, RB | | | | | | | | |
| 5.000%, 06/01/25 | | | 250 | | | | 305 | |
| Riverside County, RB | | | | | | | | |
| 2.000%, 06/29/18 | | | 1,000 | | | | 1,009 | |
| Riverside County, Transportation Commission, Ser A, RB | | | | | | | | |
| Callable 06/01/23 @ 100 | | | | | | | | |
| 5.250%, 06/01/28 | | | 500 | | | | 597 | |
| Riverside, Public Financing Authority, Ser A, RB | | | | | | | | |
| 5.000%, 11/01/21 | | | 1,000 | | | | 1,144 | |
| Roseville, Finance Authority, RB | | | | | | | | |
| 4.000%, 02/01/18 | | | 500 | | | | 505 | |
| Sacramento County, Sanitation District Financing Authority, Sewer Revenue, Ser A, RB | | | | | | | | |
| 5.000%, 12/01/20 | | | 500 | | | | 560 | |
| Sacramento, Area Flood Control Agency, Ser A, SAB, NATL | | | | | | | | |
| Pre-Refunded @ 100 | | | | | | | | |
| 5.000%, 10/01/17(C) | | | 400 | | | | 400 | |
See accompanying notes to financial statements.
CITY NATIONAL ROCHDALE FUNDS | PAGE 30
| schedule of investments |
| September 30, 2017 |
City National Rochdale California Tax Exempt Bond Fund (continued) |
| Description | | Face Amount (000) | | | Value (000) | |
| Sacramento, Financing Authority, EPA Building Project, Ser A, RB | | | | | | |
| 4.000%, 05/01/18 | | $ | 850 | | | $ | 865 | |
| San Diego, Public Facilities Financing Authority, Sewer Revenue, RB | | | | | | | | |
| 5.000%, 05/15/25 | | | 1,000 | | | | 1,237 | |
| San Francisco City & County, Open Space Fund, Various Park Projects, RB, NATL | | | | | | | | |
| Callable 10/30/17 @ 100 | | | | | | | | |
| 3.750%, 07/01/18 | | | 500 | | | | 501 | |
| San Francisco City & County, Public Utilities Commission, Wastewater Revenue, Ser A, RB | | | | | | | | |
| Callable 10/01/25 @ 100 | | | | | | | | |
| 5.000%, 10/01/27 | | | 1,000 | | | | 1,215 | |
| San Francisco City & County, Public Utilities Commission, Water Revenue, Ser A, RB | | | | | | | | |
| 5.000%, 11/01/20 | | | 250 | | | | 280 | |
| San Francisco City & County, Public Utilities Commission, Water Revenue, Sub-Ser, RB | | | | | | | | |
| Callable 11/01/26 @ 100 | | | | | | | | |
| 5.000%, 11/01/29 | | | 680 | | | | 838 | |
| San Francisco City & County, Redevelopment Agency, Redevelopment Projects, Ser B, TA, NATL | | | | | | | | |
| Callable 10/30/17 @ 100 | | | | | | | | |
| 5.250%, 08/01/18 | | | 345 | | | | 345 | |
| San Francisco, State Building Authority, RB | | | | | | | | |
| 4.000%, 12/01/20 | | | 1,000 | | | | 1,091 | |
| San Jose, International Airport, Ser A, RB, AMT | | | | | | | | |
| 5.000%, 03/01/24 | | | 500 | | | | 589 | |
| San Leandro, Unified School District, GO, BAM | | | | | | | | |
| 5.000%, 08/01/24 | | | 325 | | | | 393 | |
| San Mateo County, Joint Powers Financing Authority, Maple Street Correctional Center, RB | | | | | | | | |
| Callable 06/15/24 @ 100 | | | | | | | | |
| 5.000%, 06/15/26 | | | 1,035 | | | | 1,244 | |
| San Mateo County, Transportation Authority, Ser A, RB, NATL, ETM | | | | | | | | |
| 5.250%, 06/01/19 | | | 755 | | | | 808 | |
| San Pablo County, Redevelopment Agency, Ser A, TA, AGM | | | | | | | | |
| 5.000%, 06/15/21 | | | 480 | | | | 542 | |
| Santa Clara County, Financing Authority, Lease Revenue Capital Project, Ser A, RB | | | | | | | | |
| 5.000%, 02/01/20 | | | 500 | | | | 546 | |
| Santa Cruz County, Redevelopment Agency, TA, BAM | | | | | | | | |
| 5.000%, 09/01/19 | | | 640 | | | | 689 | |
| Tahoe-Truckee, Unified School District, Ser B, GO | | | | | | | | |
| Callable 08/01/26 @ 100 | | | | | | | | |
| 5.000%, 08/01/27 | | | 200 | | | | 247 | |
| Tahoe-Truckee, Unified School District, Ser B, GO | | | | | | | | |
| Callable 08/01/26 @ 100 | | | | | | | | |
| 5.000%, 08/01/28 | | | 200 | | | | 245 | |
| Turlock, Irrigation District, Ser 2014, RB | | | | | | | | |
| 5.000%, 01/01/19 | | | 200 | | | | 210 | |
| Tustin, Unified School District, SPL Tax, BAM | | | | | | | | |
| 5.000%, 09/01/24 | | | 500 | | | | 595 | |
| University of California, Regents Medical Center Pooled Revenue, Ser J, RB | | | | | | | | |
| Callable 05/15/23 @ 100 | | | | | | | | |
| 5.000%, 05/15/26 | | | 605 | | | | 701 | |
| University of California, Ser AT, RB | | | | | | | | |
| Callable 11/15/20 @ 100 | | | | | | | | |
| 1.400%, 05/15/46(A) | | | 2,000 | | | | 1,999 | |
| University of California, Limited Project Revenue, Ser E, RB | | | | | | | | |
| Callable 05/15/20 @ 100 | | | | | | | | |
| 5.000%, 05/15/22 | | | 500 | | | | 552 | |
| University of California, Limited Project Revenue, Ser G, RB | | | | | | | | |
| Callable 05/15/22 @ 100 | | | | | | | | |
| 5.000%, 05/15/26 | | | 500 | | | | 579 | |
| University of California, Ser M, RB | | | | | | | | |
| Callable 05/15/27 @ 100 | | | | | | | | |
| 5.000%, 05/15/29 | | | 1,000 | | | | 1,237 | |
| Ventura County, Community College District, GO | | | | | | | | |
| Callable 08/01/21 @ 100 | | | | | | | | |
| 5.000%, 08/01/24 | | | 385 | | | | 438 | |
See accompanying notes to financial statements.
CITY NATIONAL ROCHDALE FUNDS | PAGE 31
| schedule of investments |
| September 30, 2017 |
City National Rochdale California Tax Exempt Bond Fund (continued) |
| Description | | Face Amount (000)/Shares | | | Value (000) | |
| Ventura County, Public Financing Authority, Ser A, RB | | | | | | |
| 5.000%, 11/01/19 | | $ | 500 | | | $ | 541 | |
| Ventura County, Public Financing Authority, Ser A, RB | | | | | | | | |
| 4.000%, 11/01/18 | | | 500 | | | | 517 | |
| Ventura County, Public Financing Authority, Ser B, RB | | | | | | | | |
| 5.000%, 11/01/18 | | | 500 | | | | 522 | |
| Walnut, Energy Center Authority, RB | | | | | | | | |
| 5.000%, 01/01/19 | | | 300 | | | | 315 | |
| Westlands, Water District, Ser A, RB, AGM | | | | | | | | |
| Callable 09/01/26 @ 100 | | | | | | | | |
| 5.000%, 09/01/27 | | | 1,000 | | | | 1,225 | |
| | | | | | | | | |
| Total California | | | | 87,006 | |
| | | | | | | | | |
| New York [1.5%] | |
| New York City, Water & Sewer System, RB | | | | | | | | |
| Callable 09/29/17 @ 100 | | | | | | | | |
| 0.980%, 06/15/48(A) | | | 1,365 | | | | 1,365 | |
| | | | | | | | | |
| Virginia [1.4%] | |
| Virginia State, Public Building Authority, Ser A, RB | | | | | | | | |
| 5.000%, 08/01/24 | | | 1,000 | | | | 1,211 | |
| | | | | | | | | |
| Total Municipal Bonds | |
| (Cost $88,002) | | | | 89,582 | |
| | | | | | | | | |
| Affiliated Registered Investment Company [0.6%] | |
| City National Rochdale Municipal High Income Fund, Cl N‡ | | | 49,297 | | | | 531 | |
| | | | | | | | | |
| Total Affiliated Registered Investment Company | |
| (Cost $524) | | | | 531 | |
| Description | | Shares | | | Value (000) | |
| Short-Term Investment [0.6%] | |
| SEI Daily Income Trust Government Fund, Cl F, 0.840%** | | | 547,963 | | | $ | 548 | |
| | | | | | | | | |
| Total Short-Term Investment | |
| (Cost $548) | | | | 548 | |
| | | | | | | | | |
| Total Investments [101.0%] | |
| (Cost $89,074) | | | $ | 90,661 | |
Percentages are based on Net Assets of $89,779 (000).
| ** | The rate reported is the 7-day effective yield as of September 30, 2017. |
| ‡ | Investment in Affiliate. |
| (A) | Variable or floating rate security, the interest rate of which adjusts periodically based on prevailing interest rates. |
| (B) | Securities are held in conjunction with a letter of credit from a major bank or financial institution. |
| (C) | Pre-Refunded Security — The maturity date shown is the pre-refunded date. |
| (D) | Represents an investment in a tender option bond residual interest certificate purchased in a secondary market transaction. The interest rate shown bears an inverse relationship to the interest rate on a tender option bond floating rate certificate. The interest rate disclosed reflects the rate in effect on September 30, 2017. |
| (E) | Security exempt from registration under Rule 144A of the Securities Act of 1933. These securities may be resold in transactions exempt from registration normally to qualified institutions. On September 30, 2017, the value of these securities amounted to $4,000 (000), representing 4.5% of the net assets of the Fund. |
AGC — American Guarantee Corporation
AGM — Assured Guarantee Municipal
AMBAC — American Municipal Bond Assurance Company
AMT — Alternative Minimum Tax (subject to)
BAM — Build America Mutual
Cl — Class
COP — Certificate of Participation
EPA — Environmental Protection Agency
ETM — Escrowed to Maturity
GO — General Obligation
NATL — National Public Finance Guarantee Corporation
RB — Revenue Bond
SAB — Special Assessment Board
Ser — Series
SPL Tax — Special Tax
TA — Tax Allocation
See accompanying notes to financial statements.
CITY NATIONAL ROCHDALE FUNDS | PAGE 32
| schedule of investments |
| September 30, 2017 |
City National Rochdale California Tax Exempt Bond Fund (concluded) |
The following is a list of the inputs used as of September 30, 2017, in valuing the Fund’s investments carried at value (000):
| Investments in Securities | | Level 1 | | | Level 2 | | | Level 3 | | | Total | |
| Municipal Bonds | | $ | — | | | $ | 89,582 | | | $ | — | | | $ | 89,582 | |
| Affiliated Registered Investment Company | | | 531 | | | | — | | | | — | | | | 531 | |
| Short-Term Investment | | | 548 | | | | — | | | | — | | | | 548 | |
| Total Investments in Securities | | $ | 1,079 | | | $ | 89,582 | | | $ | — | | | $ | 90,661 | |
For the year ended September 30, 2017, there have been no transfers between any of the fair value hierarchy levels. Transfers between Levels are recognized at period end.
The following is a summary of the transactions with affiliates for the year ended September 30, 2017 (000):
| | | City National Rochdale
Municipal High Income Fund, Class N | | | City National Rochdale Government Money Market Fund,
Class I | |
| Beginning balance as of 9/30/16 | | $ | 2,312 | | | $ | 1,331 | |
| Purchases at Cost | | | 1,250 | | | | 50,202 | |
| Proceeds from Sales | | | (2,928 | ) | | | (51,533 | ) |
| Unrealized Gain (Loss) | | | (55 | ) | | | — | |
| Realized Gain (Loss) | | | (48 | ) | | | — | |
| Ending balance as of 9/30/17 | | $ | 531 | | | $ | — | |
| Dividend Income | | $ | 33 | | | $ | 1 | |
Amounts designated as “—“ are either $0 or have been rounded to $0.
For more information on valuation inputs, see Note 2 — Significant Accounting Policies in the Notes to Financial Statements.
See accompanying notes to financial statements.
CITY NATIONAL ROCHDALE FUNDS | PAGE 33
| schedule of investments |
| September 30, 2017 |
| City National Rochdale Municipal High Income Fund |
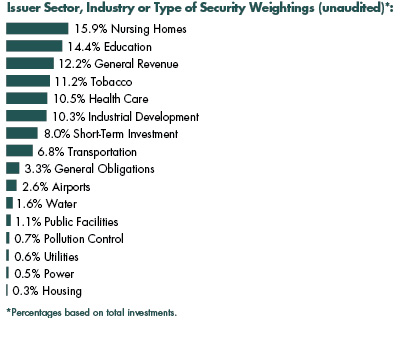
| Description | | Face Amount (000) | | | Value (000) | |
| Municipal Bonds [91.3%] | |
| Alabama [1.5%] | |
| Cullman County, Health Care Authority, Cullman Regional Medical Center Project, Ser A, RB | | | | | | |
| Callable 02/01/19 @ 100 | | | | | | |
| 7.000%, 02/01/36 | | $ | 4,315 | | | $ | 4,496 | |
| Jefferson County, Sewer Revenue, Ser D, RB | | | | | | | | |
| Callable 10/01/23 @ 105 | | | | | | | | |
| 6.000%, 10/01/42 | | | 9,000 | | | | 10,556 | |
| Jefferson County, Sewer Revenue, Sub-Ser, RB | | | | | | | | |
| Callable 10/01/23 @ 105 | | | | | | | | |
| 0.815%, 10/01/46(A) | | | 2,500 | | | | 2,070 | |
| | | | | | | | | |
| Total Alabama | | | | 17,122 | |
| | | | | | | | | |
| Alaska [0.5%] | |
| Northern Tobacco Securitization, Ser A, RB | | | | | | | | |
| Callable 10/16/17 @ 100 | | | | | | | | |
| 5.000%, 06/01/46 | | | 6,000 | | | | 5,831 | |
| | | | | | | | | |
| Arizona [1.9%] | |
| Glendale, Industrial Development Authority, Glencroft Retirement Community RB | | | | | | | | |
| Callable 11/15/26 @ 100 | | | | | | | | |
| 5.250%, 11/15/46 | | | 1,000 | | | | 991 | |
| Glendale, Industrial Development Authority, Glencroft Retirement Community RB | | | | | | | | |
| Callable 11/15/26 @ 100 | | | | | | | | |
| 5.250%, 11/15/51 | | | 1,500 | | | | 1,474 | |
| Glendale, Industrial Development Authority, Glencroft Retirement Community RB | | | | | | | | |
| Callable 11/15/26 @ 100 | | | | | | | | |
| 5.000%, 11/15/36 | | | 600 | | | | 592 | |
| Glendale, Industrial Development Authority, Glencroft Retirement Community RB | | | | | | | | |
| 4.250%, 11/15/26 | | | 485 | | | | 482 | |
| Phoenix, Industrial Development Authority, Legacy Traditional School Projects, RB | | | | | | | | |
| Callable 07/01/25 @ 100 | | | | | | | | |
| 5.000%, 07/01/45(B) | | | 3,300 | | | | 3,300 | |
| Phoenix, Industrial Development Authority, Legacy Traditional School Projects RB | | | | | | | | |
| 5.750%, 07/01/24(B) | | | 1,400 | | | | 1,531 | |
| Pima County, Industrial Development Authority, Noah Webster School Project, RB | | | | | | | | |
| Callable 12/15/23 @ 100 | | | | | | | | |
| 7.000%, 12/15/43 | | | 1,500 | | | | 1,662 | |
| Salt Verde Financial, Gas Revenue, RB | | | | | | | | |
| 5.000%, 12/01/37 | | | 8,000 | | | | 9,738 | |
| Yavapai County, Industrial Development Authority, Ser A, RB | | | | | | | | |
| Callable 03/01/25 @ 100 | | | | | | | | |
| 5.000%, 09/01/34(B) | | | 2,015 | | | | 2,060 | |
| | | | | | | | | |
| Total Arizona | | | | 21,830 | |
| | | | | | | | | |
| California [8.2%] | |
| Adelanto, Public Utility Authority, Utility System Project, Ser A, RB | | | | | | | | |
| Callable 07/01/19 @ 100 | | | | | | | | |
| 6.750%, 07/01/39 | | | 6,500 | | | | 6,983 | |
See accompanying notes to financial statements.
CITY NATIONAL ROCHDALE FUNDS | PAGE 34
| schedule of investments |
| September 30, 2017 |
City National Rochdale Municipal High Income Fund (continued) |
| Description | | Face Amount (000) | | | Value (000) | |
| California State, KIPP LA Project School Finance Authority, Ser A | | | | | | |
| Callable 07/01/27 @ 100 | | | | | | |
| 5.000%, 07/01/47(B) | | $ | 500 | | | $ | 563 | |
| California State, GO | | | | | | | | |
| Callable 12/01/23 @ 100 | | | | | | | | |
| 5.000%, 12/01/31 | | | 1,500 | | | | 1,753 | |
| California State, Municipal Finance Authority, Windsor Mobile Country Club RB | | | | | | | | |
| Callable 11/15/27 @ 100 | | | | | | | | |
| 4.000%, 11/15/37 | | | 200 | | | | 210 | |
| California State, Municipal Finance Authority, Windsor Mobile Country Club RB | | | | | | | | |
| Callable 11/15/27 @ 100 | | | | | | | | |
| 3.250%, 11/15/32 | | | 625 | | | | 613 | |
| California State, Municipal Finance Authority, Baptist University, Ser A, RB | | | | | | | | |
| Callable 11/01/25 @ 100 | | | | | | | | |
| 5.500%, 11/01/45(B) | | | 4,000 | | | | 4,419 | |
| California State, Pollution Control Financing Authority, Calplant I Project RB, AMT | | | | | | | | |
| Callable 07/01/27 @ 100 | | | | | | | | |
| 8.000%, 07/01/39(B) | | | 5,000 | | | | 5,519 | |
| California State, Pollution Control Financing Authority, San Diego Water Project, RB | | | | | | | | |
| Callable 10/30/17 @ 100 | | | | | | | | |
| 5.000%, 11/21/45(B) | | | 2,000 | | | | 2,010 | |
| California State, Public Works Board, Department of Corrections and Rehab Project, Ser A, RB | | | | | | | | |
| Callable 09/01/24 @ 100 | | | | | | | | |
| 5.000%, 09/01/31 | | | 5,000 | | | | 5,851 | |
| California State, Public Works Board, Various Capital Projects, Ser A, RB | | | | | | | | |
| Callable 04/01/22 @ 100 | | | | | | | | |
| 5.000%, 04/01/37 | | | 1,000 | | | | 1,125 | |
| California State, School Finance Authority, View Park Elementary & Middle School Project, Ser A, RB | | | | | | | | |
| Callable 10/01/24 @ 100 | | | | | | | | |
| 6.000%, 10/01/49 | | | 1,120 | | | | 1,209 | |
| California State, School Finance Authority, View Park Elementary & Middle School Project, Ser A, RB | | | | | | | | |
| Callable 10/01/24 @ 100 | | | | | | | | |
| 5.875%, 10/01/44 | | | 1,000 | | | | 1,091 | |
| California State, School Finance Authority, View Park Elementary & Middle School Project, Ser A, RB | | | | | | | | |
| Callable 10/01/24 @ 100 | | | | | | | | |
| 5.625%, 10/01/34 | | | 575 | | | | 625 | |
| California Statewide, Communities Development Authority, RB | | | | | | | | |
| Callable 06/01/25 @ 100 | | | | | | | | |
| 7.000%, 06/01/45 | | | 3,155 | | | | 2,642 | |
| California Statewide, Financing Authority, Ser C, RB | | | | | | | | |
| Callable 10/16/17 @ 8 | | | | | | | | |
| 12.268%, 06/01/55(C) | | | 50,000 | | | | 2,272 | |
| Folsom Ranch Financing Authority, SPL Tax | | | | | | | | |
| Callable 09/01/27 @ 100 | | | | | | | | |
| 5.000%, 09/01/37 | | | 1,435 | | | | 1,545 | |
| Folsom Ranch Financing Authority, SPL Tax | | | | | | | | |
| Callable 09/01/27 @ 100 | | | | | | | | |
| 5.000%, 09/01/47 | | | 2,000 | | | | 2,142 | |
| Fontana City, Community Facilities District No. 80, SPL Tax | | | | | | | | |
| Callable 09/01/27 @ 100 | | | | | | | | |
| 5.000%, 09/01/46 | | | 755 | | | | 830 | |
| Golden State Tobacco Securitization, Golden State Tobacco Settlement, Ser A-1, RB | | | | | | | | |
| Callable 10/16/17 @ 100 | | | | | | | | |
| 5.125%, 06/01/47 | | | 7,280 | | | | 7,165 | |
| Golden State Tobacco Securitization, RB | | | | | | | | |
| Callable 10/16/17 @ 100 | | | | | | | | |
| 5.750%, 06/01/47 | | | 9,230 | | | | 9,250 | |
| Inland Empire Tobacco Securitization Authority, RB | | | | | | | | |
| Callable 10/16/17 @ 30 | | | | | | | | |
| 6.876%, 06/01/36(C) | | | 25,000 | | | | 7,243 | |
| Lake Elsinore, Public Financing Authority, SAB | | | | | | | | |
| Callable 09/01/25 @ 100 | | | | | | | | |
| 5.000%, 09/01/35 | | | 2,650 | | | | 2,957 | |
See accompanying notes to financial statements.
CITY NATIONAL ROCHDALE FUNDS | PAGE 35
| schedule of investments |
| September 30, 2017 |
City National Rochdale Municipal High Income Fund (continued) |
| Description | | Face Amount (000) | | | Value (000) | |
| M-S-R Energy Authority, Ser C, RB | | | | | | |
| 7.000%, 11/01/34 | | $ | 2,500 | | | $ | 3,589 | |
| Northern California, Gas Authority No. 1, Ser B, RB | | | | | | | | |
| 1.590%, 07/01/27(D) | | | 5,000 | | | | 4,860 | |
| Northern California, Tobacco Securitization Authority, Ser A-1 | | | | | | | | |
| Callable 10/16/17 @ 100 | | | | | | | | |
| 5.375%, 06/01/38 | | | 4,650 | | | | 4,650 | |
| Palomar Pomerado, Health Care District, COP | | | | | | | | |
| Callable 11/01/20 @ 100 | | | | | | | | |
| 6.000%, 11/01/30 | | | 3,920 | | | | 4,281 | |
| San Buenaventura, Community Memorial Health System Project, RB | | | | | | | | |
| Callable 12/01/21 @ 100 | | | | | | | | |
| 7.500%, 12/01/41 | | | 1,000 | | | | 1,165 | |
| San Buenaventura, Community Memorial Health System Project, RB | | | | | | | | |
| Callable 12/01/21 @ 100 | | | | | | | | |
| 7.000%, 12/01/26 | | | 1,000 | | | | 1,161 | |
| San Mateo, Community Facilities District, SAB | | | | | | | | |
| Callable 09/01/22 @ 100 | | | | | | | | |
| 5.500%, 09/01/44 | | | 1,000 | | | | 1,090 | |
| Southern California, Public Power Authority, Ser A, RB | | | | | | | | |
| 2.348%, 11/01/38(D) | | | 2,500 | | | | 2,176 | |
| Southern California, Tobacco Securitization Authority, Ser A-1, RB | | | | | | | | |
| Callable 10/16/17 @ 100 | | | | | | | | |
| 5.000%, 06/01/37 | | | 3,000 | | | | 3,008 | |
| West Hills, Community College District, Ser B, GO, AGM | | | | | | | | |
| Callable 08/01/31 @ 100 | | | | | | | | |
| 0.679%, 08/01/38(A) | | | 2,250 | | | | 2,041 | |
| | | | | | | | | |
| Total California | | | | 96,038 | |
| | | | | | | | | |
| Colorado [6.3%] | |
| Arkansas State, River Power Authority, Colorado Improvement Project, RB | | | | | | | | |
| Callable 10/01/20 @ 100 | | | | | | | | |
| 6.125%, 10/01/40 | | | 2,500 | | | | 2,685 | |
| Arkansas State, River Power Authority, Colorado Improvement Project, RB | | | | | | | | |
| Callable 10/01/18 @ 100 | | | | | | | | |
| 6.000%, 10/01/40 | | | 2,895 | | | | 2,946 | |
| Base Village Metropolitan District No. 2, Ser A, GO | | | | | | | | |
| Callable 12/01/21 @ 103 | | | | | | | | |
| 5.750%, 12/01/46 | | | 1,500 | | | | 1,571 | |
| Belleview Station Metropolitan District No. 2, GO | | | | | | | | |
| Callable 12/01/21 @ 103 | | | | | | | | |
| 5.125%, 12/01/46 | | | 3,375 | | | | 3,453 | |
| Belleview Station Metropolitan District No. 2, GO | | | | | | | | |
| Callable 12/01/21 @ 103 | | | | | | | | |
| 5.000%, 12/01/36 | | | 1,500 | | | | 1,537 | |
| Big Dry Creek Metropolitan District, Ser A, GO | | | | | | | | |
| Callable 12/01/22 @ 103 | | | | | | | | |
| 5.750%, 12/01/47 | | | 2,910 | | | | 2,944 | |
| Canyons Metropolitan District No. 5, Ser A, GO | | | | | | | | |
| Callable 12/01/22 @ 103 | | | | | | | | |
| 6.125%, 12/01/47 | | | 1,000 | | | | 1,014 | |
| Canyons Metropolitan District No. 5, Ser A, GO | | | | | | | | |
| Callable 12/01/22 @ 103 | | | | | | | | |
| 6.000%, 12/01/37 | | | 2,000 | | | | 2,028 | |
| Castle Oaks Metropolitan District No. 3, GO | | | | | | | | |
| Callable 12/01/20 @ 103 | | | | | | | | |
| 6.250%, 12/01/44 | | | 2,860 | | | | 3,047 | |
| Castle Oaks Metropolitan District No. 3, GO | | | | | | | | |
| Callable 12/01/20 @ 103 | | | | | | | | |
| 5.500%, 12/01/45 | | | 2,345 | | | | 2,372 | |
| Clear Creek Station Metropolitan District No. 2, Ser A | | | | | | | | |
| Callable 12/01/22 @ 103 | | | | | | | | |
| 5.000%, 12/01/47 | | | 1,000 | | | | 1,019 | |
| Colorado State, Educational & Cultural Facilities Authority, Aspen Ridge School Project, RB | | | | | | | | |
| Callable 07/01/25 @ 100 | | | | | | | | |
| 5.250%, 07/01/46(B) | | | 1,930 | | | | 1,968 | |
See accompanying notes to financial statements.
CITY NATIONAL ROCHDALE FUNDS | PAGE 36
| schedule of investments |
| September 30, 2017 |
City National Rochdale Municipal High Income Fund (continued) |
| Description | | Face Amount (000) | | | Value (000) | |
| Colorado State, Educational & Cultural Facilities Authority, Aspen Ridge School Project, RB | | | | | | |
| Callable 07/01/25 @ 100 | | | | | | |
| 5.000%, 07/01/36(B) | | $ | 915 | | | $ | 933 | |
| Colorado State, Educational & Cultural Facilities Authority, Charter School Preparatory School Project, RB | | | | | | | | |
| Callable 04/01/25 @ 100 | | | | | | | | |
| 5.250%, 04/01/45(B) | | | 2,655 | | | | 2,662 | |
| Colorado State, Educational & Cultural Facilities Authority, Charter School Preparatory School Project, RB | | | | | | | | |
| Callable 04/01/25 @ 100 | | | | | | | | |
| 5.125%, 04/01/35(B) | | | 1,515 | | | | 1,519 | |
| Colorado State, Health Facilities Authority, Sunny Vista Living Center, Ser A, RB | | | | | | | | |
| Callable 12/01/25 @ 100 | | | | | | | | |
| 6.125%, 12/01/45(B) | | | 1,000 | | | | 1,055 | |
| Colorado State, High Performance Transportation Enterprise, U.S. 36 & I-25 Managed Lanes Project, RB, AMT | | | | | | | | |
| Callable 01/01/23 @ 100 | | | | | | | | |
| 5.750%, 01/01/44 | | | 2,000 | | | | 2,248 | |
| Colorado State, Public Energy Authority, RB | | | | | | | | |
| 6.500%, 11/15/38 | | | 6,000 | | | | 8,469 | |
| Denver City & County, United Airlines Project, Ser A, RB, AMT | | | | | | | | |
| 5.250%, 10/01/32 | | | 1,000 | | | | 1,003 | |
| Denver County, Health & Hospital Authority, Ser A | | | | | | | | |
| Callable 12/01/27 @ 100 | | | | | | | | |
| 4.000%, 12/01/35(B) | | | 1,835 | | | | 1,798 | |
| Denver County, Health & Hospital Authority, Ser A | | | | | | | | |
| Callable 12/01/27 @ 100 | | | | | | | | |
| 4.000%, 12/01/36(B) | | | 2,305 | | | | 2,236 | |
| Erie Highlands Metropolitan District No. 1, GO | | | | | | | | |
| Callable 12/01/20 @ 103 | | | | | | | | |
| 5.750%, 12/01/45 | | | 2,000 | | | | 2,041 | |
| Flatiron Meadows Metropolitan District, GO | | | | | | | | |
| Callable 12/01/21 @ 103 | | | | | | | | |
| 5.125%, 12/01/46 | | | 2,000 | | | | 1,977 | |
| Great Western Park Metropolitan District No. 2, Ser A, GO | | | | | | | | |
| Callable 12/01/21 @ 100 | | | | | | | | |
| 5.000%, 12/01/46 | | | 1,825 | | | | 1,811 | |
| Green Gables Metropolitan District No. 1, Ser A, GO | | | | | | | | |
| Callable 12/01/21 @ 103 | | | | | | | | |
| 5.300%, 12/01/46 | | | 1,250 | | | | 1,264 | |
| Lewis Pointe Metropolitan District, Ser A, GO | | | | | | | | |
| Callable 12/01/20 @ 100 | | | | | | | | |
| 6.000%, 12/01/44 | | | 2,590 | | | | 2,613 | |
| Leyden Rock Metropolitan District No. 10, Ser A, GO | | | | | | | | |
| Callable 12/01/21 @ 103 | | | | | | | | |
| 5.000%, 12/01/45 | | | 1,250 | | | | 1,271 | |
| Leyden Rock Metropolitan District No. 10, Ser A, GO | | | | | | | | |
| Callable 12/01/21 @ 103 | | | | | | | | |
| 4.375%, 12/01/33 | | | 1,500 | | | | 1,489 | |
| Overlook Metropolitan District, GO | | | | | | | | |
| Callable 12/01/21 @ 103 | | | | | | | | |
| 5.500%, 12/01/46 | | | 1,230 | | | | 1,199 | |
| Regional Transportation District, Denver Transportation Partners Project, RB | | | | | | | | |
| Callable 07/15/20 @ 100 | | | | | | | | |
| 6.000%, 01/15/41 | | | 1,000 | | | | 1,100 | |
| Sierra Ridge Metropolitan District No. 2, Ser A, GO | | | | | | | | |
| Callable 12/01/21 @ 103 | | | | | | | | |
| 5.500%, 12/01/46 | | | 1,500 | | | | 1,544 | |
| Solaris Metropolitan District No. 3, Ser A, GO | | | | | | | | |
| 5.000%, 12/01/36 | | | 700 | | | | 732 | |
| Solaris Metropolitan District No. 3, Ser A, GO | | | | | | | | |
| Callable 12/01/21 @ 103 | | | | | | | | |
| 5.000%, 12/01/46 | | | 2,530 | | | | 2,622 | |
| Southglenn Metropolitan District, GO | | | | | | | | |
| Callable 12/01/21 @ 103 | | | | | | | | |
| 5.000%, 12/01/46 | | | 3,675 | | | | 3,712 | |
| Southglenn Metropolitan District, GO | | | | | | | | |
| Callable 12/01/21 @ 103 | | | | | | | | |
| 3.500%, 12/01/26 | | | 1,000 | | | | 963 | |
See accompanying notes to financial statements.
CITY NATIONAL ROCHDALE FUNDS | PAGE 37
| schedule of investments |
| September 30, 2017 |
City National Rochdale Municipal High Income Fund (continued) |
| Description | | Face Amount (000) | | | Value (000) | |
| Water Valley Metropolitan District No. 01, GO | | | | | | |
| Callable 12/01/26 @ 100 | | | | | | |
| 5.250%, 12/01/40 | | $ | 300 | | | $ | 319 | |
| Water Valley Metropolitan District No. 01, GO | | | | | | | | |
| Callable 12/01/26 @ 100 | | | | | | | | |
| 5.000%, 12/01/35 | | | 100 | | | | 104 | |
| Water Valley Metropolitan District No. 01, GO | | | | | | | | |
| Callable 12/01/26 @ 100 | | | | | | | | |
| 4.000%, 12/01/33 | | | 375 | | | | 364 | |
| Water Valley Metropolitan District No. 02, GO | | | | | | | | |
| Callable 12/01/26 @ 100 | | | | | | | | |
| 5.250%, 12/01/40 | | | 575 | | | | 619 | |
| Water Valley Metropolitan District No. 02, GO | | | | | | | | |
| Callable 12/01/26 @ 100 | | | | | | | | |
| 4.000%, 12/01/33 | | | 250 | | | | 240 | |
| | | | | | | | | |
| Total Colorado | | | | 74,491 | |
| | | | | | | | | |
| Connecticut [0.4%] | |
| JPMorgan Chase, Ser 2016-XM0449, RB | | | | | | | | |
| Callable 06/01/26 @ 100 | | | | | | | | |
| 11.980%, 12/01/45(B)(D) (F) | | | 3,335 | | | | 4,600 | |
| | | | | | | | | |
| Delaware [0.2%] | |
| Delaware State, Economic Development Authority, Indian River Power Project, RB | | | | | | | | |
| Callable 10/01/20 @ 100 | | | | | | | | |
| 5.375%, 10/01/45 | | | 2,000 | | | | 2,084 | |
| | | | | | | | | |
| District of Columbia [0.2%] | |
| Metropolitan Washington, Airports Authority, Dulles Toll Road Revenue, Ser B, RB | | | | | | | | |
| Callable 10/01/28 @ 100 | | | | | | | | |
| 6.500%, 10/01/44(A) | | | 2,000 | | | | 2,387 | |
| | | | | | | | | |
| Florida [5.2%] | |
| Alachua County, Health Facilities Authority, East Ridge Retirement Village Project, RB | | | | | | | | |
| Callable 11/15/24 @ 100 | | | | | | | | |
| 6.250%, 11/15/44 | | | 1,000 | | | | 1,092 | |
| Alachua County, Health Facilities Authority, East Ridge Retirement Village Project, RB | | | | | | | | |
| Callable 11/15/24 @ 100 | | | | | | | | |
| 6.000%, 11/15/34 | | | 2,500 | | | | 2,720 | |
| Brevard County, Industrial Development Authority, TUFF Florida Tech Project, RB | | | | | | | | |
| Callable 11/01/19 @ 100 | | | | | | | | |
| 6.750%, 11/01/39 | | | 960 | | | | 1,007 | |
| Capital Trust Agency, Silver Creek St. Augustine, RB | | | | | | | | |
| Callable 10/30/17 @ 100 | | | | | | | | |
| 9.750%, 01/01/35(A)(D) (G) | | | 815 | | | | 762 | |
| Capital Trust Agency, Silver Creek St. Augustine, RB | | | | | | | | |
| Callable 10/30/17 @ 100 | | | | | | | | |
| 5.750%, 01/01/50(G) | | | 945 | | | | 849 | |
| Capital Trust Agency, Silver Creek St. Augustine, Ser A, RB | | | | | | | | |
| Callable 01/01/21 @ 103 | | | | | | | | |
| 8.250%, 01/01/44(G) | | | 3,390 | | | | 2,778 | |
| Capital Trust Agency, Silver Creek St. Augustine, Ser A, RB | | | | | | | | |
| Callable 01/01/21 @ 103 | | | | | | | | |
| 8.250%, 01/01/49(G) | | | 1,000 | | | | 819 | |
| Florida State, Development Finance, Renaissance Charter School Project, RB | | | | | | | | |
| Callable 06/15/25 @ 100 | | | | | | | | |
| 6.125%, 06/15/46(B) | | | 4,930 | | | | 5,190 | |
| Florida State, Development Finance, Renaissance Charter School Project, Ser A, RB | | | | | | | | |
| Callable 06/15/22 @ 100 | | | | | | | | |
| 6.125%, 06/15/43 | | | 1,000 | | | | 1,056 | |
| Florida State, Development Finance, Renaissance Charter School Project, Ser A, RB | | | | | | | | |
| Callable 06/15/24 @ 100 | | | | | | | | |
| 6.125%, 06/15/44 | | | 3,000 | | | | 3,162 | |
| Florida State, Development Finance, Renaissance Charter School Project, Ser A, RB | | | | | | | | |
| Callable 06/15/24 @ 100 | | | | | | | | |
| 6.000%, 06/15/34 | | | 2,110 | | | | 2,253 | |
See accompanying notes to financial statements.
CITY NATIONAL ROCHDALE FUNDS | PAGE 38
| schedule of investments |
| September 30, 2017 |
City National Rochdale Municipal High Income Fund (continued) |
| Description | | Face Amount (000) | | | Value (000) | |
| Florida State, Development Finance, Tuscan Isle Senior Living Community Project, Ser A, RB | | | | | | |
| Callable 06/01/22 @ 103 | | | | | | |
| 7.000%, 06/01/35(B) | | $ | 1,350 | | | $ | 1,096 | |
| Florida State, Development Finance, Tuscan Isle Senior Living Community Project, Ser A, RB | | | | | | | | |
| Callable 06/01/22 @ 103 | | | | | | | | |
| 7.000%, 06/01/45(B) | | | 3,000 | | | | 2,436 | |
| Florida State, Village Community Development District No. 10, SAB | | | | | | | | |
| Callable 05/01/23 @ 100 | | | | | | | | |
| 6.000%, 05/01/44 | | | 970 | | | | 1,142 | |
| Lakewood Ranch Stewardship District, SAB | | | | | | | | |
| Callable 05/01/27 @ 100 | | | | | | | | |
| 5.250%, 05/01/37 | | | 1,815 | | | | 1,933 | |
| Miami-Dade County, Industrial Development Authority, Pinecrest Academy Project, RB | | | | | | | | |
| Callable 09/15/24 @ 100 | | | | | | | | |
| 5.250%, 09/15/44 | | | 4,300 | | | | 4,607 | |
| Miami-Dade County, Industrial Development Authority, Youth CO-OP Charter Schools Project, Ser A, RB | | | | | | | | |
| Callable 09/15/25 @ 100 | | | | | | | | |
| 5.750%, 09/15/35(B) | | | 1,605 | | | | 1,638 | |
| Mid-Bay Bridge Authority, Ser A, RB | | | | | | | | |
| Pre-Refunded @ 100 | | | | | | | | |
| 7.250%, 10/01/21(E) | | | 5,200 | | | | 6,375 | |
| Mid-Bay Bridge Authority, Ser A, RB | | | | | | | | |
| Callable 10/01/25 @ 100 | | | | | | | | |
| 5.000%, 10/01/35 | | | 5,000 | | | | 5,623 | |
| Osceola County, Poinciana Parkway Project, Ser A, RB | | | | | | | | |
| Callable 10/01/24 @ 100 | | | | | | | | |
| 5.375%, 10/01/47 | | | 5,000 | | | | 5,419 | |
| Palm Beach County, Health Facilities Authority, Sinai Residences Project, Ser A, RB | | | | | | | | |
| Callable 06/01/22 @ 102 | | | | | | | | |
| 7.500%, 06/01/49 | | | 2,000 | | | | 2,438 | |
| Palm Beach County, Health Facilities Authority, Sinai Residences Project, Ser A, RB | | | | | | | | |
| Callable 06/01/22 @ 102 | | | | | | | | |
| 7.250%, 06/01/34 | | | 500 | | | | 609 | |
| Saint Johns County, Industrial Development Authority, Presbyterian Retirement Project, Ser A, RB | | | | | | | | |
| Pre-Refunded @ 100 | | | | | | | | |
| 6.000%, 08/01/20(E) | | | 3,000 | | | | 3,397 | |
| Village Community Development District No. 12, SAB | | | | | | | | |
| Callable 05/01/26 @ 100 | | | | | | | | |
| 3.875%, 05/01/47 | | | 3,000 | | | | 2,890 | |
| | | | | | | | | |
| Total Florida | | | | 61,291 | |
| | | | | | | | | |
| Georgia [1.7%] | |
| Atlanta, Department of Aviation, Ser A, RB | | | | | | | | |
| Callable 01/01/24 @ 100 | | | | | | | | |
| 5.000%, 01/01/31 | | | 2,500 | | | | 2,933 | |
| DeKalb County, Hospital Authority, Dekalb Medical Center Project, RB | | | | | | | | |
| Callable 09/01/20 @ 100 | | | | | | | | |
| 6.125%, 09/01/40 | | | 1,000 | | | | 1,089 | |
| Fayette County, Hospital Authority, Piedmont Healthcare Project, RB | | | | | | | | |
| Callable 07/01/26 @ 100 | | | | | | | | |
| 5.000%, 07/01/46 | | | 10,000 | | | | 11,145 | |
| Greene County, Development Authority, GLEN-I Project, Ser A, RB | | | | | | | | |
| Callable 01/01/25 @ 100 | | | | | | | | |
| 7.250%, 01/01/46(B) | | | 3,400 | | | | 3,432 | |
| Savannah, Economic Development Authority, Marshes Skidaway Island Project, RB | | | | | | | | |
| Callable 01/01/24 @ 100 | | | | | | | | |
| 7.250%, 01/01/49 | | | 810 | | | | 928 | |
| | | | | | | | | |
| Total Georgia | | | | 19,527 | |
See accompanying notes to financial statements.
CITY NATIONAL ROCHDALE FUNDS | PAGE 39
| schedule of investments |
| September 30, 2017 |
City National Rochdale Municipal High Income Fund (continued) |
| Description | | Face Amount (000) | | | Value (000) | |
| Hawaii [0.7%] | |
| Hawaii State, Department of Budget & Finance, 15 Craigside Project, Ser A, RB | | | | | | |
| Pre-Refunded @ 100 | | | | | | |
| 8.750%, 11/15/19(E) | | $ | 2,255 | | | $ | 2,565 | |
| Hawaii State, Department of Budget & Finance, Hawaiian Election Project AMT | | | | | | | | |
| Callable 03/01/27 @ 100 | | | | | | | | |
| 4.000%, 03/01/37 | | | 5,115 | | | | 5,294 | |
| | | | | | | | | |
| Total Hawaii | | | | 7,859 | |
| | | | | | | | | |
| Illinois [8.3%] | |
| Bridgeview Village, Cook County, Ser A, GO | | | | | | | | |
| Callable 12/01/25 @ 100 | | | | | | | | |
| 5.750%, 12/01/35 | | | 2,000 | | | | 1,874 | |
| Bridgeview Village, Ser A, GO | | | | | | | | |
| Callable 06/01/24 @ 100 | | | | | | | | |
| 5.500%, 12/01/43 | | | 4,880 | | | | 4,428 | |
| Chicago Board of Education, Ser B | | | | | | | | |
| Callable 12/01/27 @ 100 | | | | | | | | |
| 7.000%, 12/01/42(B) | | | 5,000 | | | | 6,015 | |
| Chicago Board of Education, Ser C | | | | | | | | |
| Callable 12/01/18 @ 100 | | | | | | | | |
| 5.000%, 12/01/21 | | | 1,000 | | | | 1,005 | |
| Chicago, Midway International Airport, Ser B, RB | | | | | | | | |
| Callable 01/01/23 @ 100 | | | | | | | | |
| 5.000%, 01/01/35 | | | 2,000 | | | | 2,250 | |
| Chicago, Midway International Airport, Ser B, RB | | | | | | | | |
| Callable 01/01/24 @ 100 | | | | | | | | |
| 5.000%, 01/01/35 | | | 3,000 | | | | 3,372 | |
| Chicago, Ser A, GO | | | | | | | | |
| Callable 01/01/27 @ 100 | | | | | | | | |
| 6.000%, 01/01/38 | | | 9,000 | | | | 10,424 | |
| Chicago, Waterworks Revenue, Ser A-1, RB | | | | | | | | |
| Callable 11/01/26 @ 100 | | | | | | | | |
| 5.000%, 11/01/28 | | | 1,000 | | | | 1,162 | |
| Chicago, Waterworks Revenue, Ser A-1, RB | | | | | | | | |
| Callable 11/01/26 @ 100 | | | | | | | | |
| 5.000%, 11/01/30 | | | 1,025 | | | | 1,178 | |
| Cook County, Ser A, GO | | | | | | | | |
| Callable 11/15/26 @ 100 | | | | | | | | |
| 5.000%, 11/15/30 | | | 2,050 | | | | 2,361 | |
| Illinois State, Finance Authority, Admiral at Lake Project, Ser A, RB | | | | | | | | |
| Callable 05/15/20 @ 100 | | | | | | | | |
| 8.000%, 05/15/40 | | | 4,000 | | | | 4,428 | |
| Illinois State, Finance Authority, Admiral at Lake Project, Ser A, RB | | | | | | | | |
| Callable 05/15/20 @ 100 | | | | | | | | |
| 8.000%, 05/15/46 | | | 1,825 | | | | 2,016 | |
| Illinois State, Finance Authority, Lutheran Home and Services Project, RB | | | | | | | | |
| Callable 05/15/22 @ 100 | | | | | | | | |
| 5.625%, 05/15/42 | | | 5,000 | | | | 5,223 | |
| Illinois State, Finance Authority, RB | | | | | | | | |
| Callable 09/01/26 @ 100 | | | | | | | | |
| 4.000%, 09/01/41 | | | 6,640 | | | | 6,480 | |
| Illinois State, Finance Authority, Roosevelt University Project, RB | | | | | | | | |
| Callable 10/01/19 @ 100 | | | | | | | | |
| 6.500%, 04/01/39 | | | 3,445 | | | | 3,683 | |
| Illinois State, Finance Authority, Roosevelt University Project, RB | | | | | | | | |
| Callable 10/01/19 @ 100 | | | | | | | | |
| 6.250%, 04/01/29 | | | 1,000 | | | | 1,074 | |
| Illinois State, Finance Authority, Ser A University of Chicago, RB | | | | | | | | |
| Callable 10/01/25 @ 100 | | | | | | | | |
| 5.000%, 10/01/40 | | | 10,000 | | | | 11,194 | |
| Illinois State, Finance Authority, Presence Health Network, Ser C, RB | | | | | | | | |
| Callable 02/15/27 @ 100 | | | | | | | | |
| 5.000%, 02/15/41 | | | 1,000 | | | | 1,105 | |
| Illinois State, Finance Authority, Presence Health Network, Ser C, RB | | | | | | | | |
| Callable 02/15/27 @ 100 | | | | | | | | |
| 5.000%, 02/15/36 | | | 4,535 | | | | 5,028 | |
| Illinois State, Finance Authority Columbia College Chicago, Ser S, RB | | | | | | | | |
| Callable 12/01/25 @ 100 | | | | | | | | |
| 4.125%, 12/01/30 | | | 1,505 | | | | 1,527 | |
| Illinois State, GO | | | | | | | | |
| Callable 05/01/24 @ 100 | | | | | | | | |
| 5.000%, 05/01/27 | | | 1,500 | | | | 1,611 | |
See accompanying notes to financial statements.
CITY NATIONAL ROCHDALE FUNDS | PAGE 40
| schedule of investments |
| September 30, 2017 |
City National Rochdale Municipal High Income Fund (continued) |
| Description | | Face Amount (000) | | | Value (000) | |
| Illinois State, Housing Development Authority, Stonebridge Gurnee Project, Ser A, RB | | | | | | |
| Callable 01/01/26 @ 100 | | | | | | |
| 5.600%, 01/01/56(B) | | $ | 2,500 | | | $ | 2,333 | |
| Illinois State, Housing Development Authority, Stonebridge Gurnee Project, Ser A, RB | | | | | | | | |
| Callable 01/01/26 @ 100 | | | | | | | | |
| 5.450%, 01/01/46(B) | | | 2,500 | | | | 2,330 | |
| Illinois State, Ser A, GO | | | | | | | | |
| Callable 01/01/22 @ 100 | | | | | | | | |
| 4.000%, 01/01/23 | | | 3,000 | | | | 3,116 | |
| Metropolitan Pier & Exposition Authority, Ser A, RB, NATL | | | | | | | | |
| 4.675%, 12/15/32(C) | | | 5,000 | | | | 2,763 | |
| Southern Illinois University, Ser B, RB | | | | | | | | |
| Callable 10/01/22 @ 100 | | | | | | | | |
| 5.000%, 04/01/26 | | | 2,105 | | | | 2,234 | |
| Southwestern Illinois, Development Authority, Collinsville Project, RB | | | | | | | | |
| Callable 10/30/17 @ 100 | | | | | | | | |
| 5.350%, 03/01/31 | | | 75 | | | | 56 | |
| University of Illinois, Ser B, COP | | | | | | | | |
| Callable 10/01/26 @ 100 | | | | | | | | |
| 5.000%, 10/01/27 | | | 1,500 | | | | 1,707 | |
| Village of Hodgkins, Redevelopement Project Area No. 4 | | | | | | | | |
| Callable 01/01/27 @ 100 | | | | | | | | |
| 5.625%, 01/01/37 | | | 5,200 | | | | 5,231 | |
| | | | | | | | | |
| Total Illinois | | | | 97,208 | |
| | | | | | | | | |
| Indiana [2.0%] | |
| Allen County, Storypoint Fort Wayne Project, RB | | | | | | | | |
| Callable 01/15/24 @ 104 | | | | | | | | |
| 6.875%, 01/15/52(B) | | | 1,265 | | | | 1,333 | |
| Carmel City, Barrington Carmel Project, Ser A, RB | | | | | | | | |
| Callable 11/15/22 @ 100 | | | | | | | | |
| 7.125%, 11/15/47 | | | 3,000 | | | | 3,251 | |
| Carmel City, Barrington Carmel Project, Ser A, RB | | | | | | | | |
| Callable 11/15/22 @ 100 | | | | | | | | |
| 7.000%, 11/15/32 | | | 1,650 | | | | 1,806 | |
| Chesterton Town, Storypoint Chesterton Project Ser A-1, RB | | | | | | | | |
| Callable 01/15/24 @ 104 | | | | | | | | |
| 6.375%, 01/15/51(B) | | | 2,100 | | | | 2,127 | |
| Indiana Finance Authority, Republic Service Project AMT | | | | | | | | |
| 1.150%, 05/01/34(D) | | | 3,000 | | | | 2,999 | |
| Indiana Finance Authority, Republic Service Project AMT | | | | | | | | |
| 1.150%, 12/01/37(D) | | | 2,500 | | | | 2,499 | |
| Indianapolis, Ritter Affordable Assisted Living Project, RB | | | | | | | | |
| Callable 12/01/22 @ 102 | | | | | | | | |
| 6.900%, 12/01/33 | | | 4,000 | | | | 3,920 | |
| Lafayette City, Glasswater Creek Project, RB | | | | | | | | |
| Callable 07/01/26 @ 101 | | | | | | | | |
| 5.800%, 01/01/37 | | | 3,310 | | | | 3,359 | |
| Terre Haute, Westminster Village Project, RB | | | | | | | | |
| Callable 08/01/22 @ 100 | | | | | | | | |
| 6.000%, 08/01/39 | | | 2,355 | | | | 2,365 | |
| | | | | | | | | |
| Total Indiana | | | | 23,659 | |
| | | | | | | | | |
| Iowa [0.8%] | |
| Iowa State, Finance Authority, Ser B, RB | | | | | | | | |
| Callable 06/01/25 @ 100 | | | | | | | | |
| 5.000%, 06/01/36 | | | 2,000 | | | | 2,112 | |
| Iowa State, Tobacco Settlement Authority, Ser C, RB | | | | | | | | |
| Callable 10/30/17 @ 100 | | | | | | | | |
| 5.375%, 06/01/38 | | | 4,500 | | | | 4,500 | |
| Iowa State, Tobacco Settlement Authority, Ser C | | | | | | | | |
| Callable 10/30/17 @ 100 | | | | | | | | |
| 5.625%, 06/01/46 | | | 1,665 | | | | 1,672 | |
| Iowa State, Tobacco Settlement Authority, Ser C | | | | | | | | |
| Callable 10/30/17 @ 100 | | | | | | | | |
| 5.500%, 06/01/42 | | | 1,180 | | | | 1,185 | |
| | | | | | | | | |
| Total Iowa | | | | 9,469 | |
See accompanying notes to financial statements.
CITY NATIONAL ROCHDALE FUNDS | PAGE 41
| schedule of investments |
| September 30, 2017 |
City National Rochdale Municipal High Income Fund (continued) |
| Description | | Face Amount (000) | | | Value (000) | |
| Kansas [0.7%] | |
| Arkansas City, Public Building Commission, South Central Regional Medical Center, RB | | | | | | |
| Callable 09/01/19 @ 100 | | | | | | |
| 7.000%, 09/01/29 | | $ | 2,550 | | | $ | 2,690 | |
| Wichita, Ser II-A, RB | | | | | | | | |
| Callable 12/01/26 @ 100 | | | | | | | | |
| 5.375%, 12/01/46 | | | 2,500 | | | | 2,663 | |
| Wichita, Ser II-A, RB | | | | | | | | |
| Callable 12/01/26 @ 100 | | | | | | | | |
| 5.250%, 12/01/36 | | | 500 | | | | 534 | |
| Wyandotte County-Kansas City Unified Government, RB | | | | | | | | |
| Callable 09/01/25 @ 100 | | | | | | | | |
| 5.750%, 09/01/32 | | | 2,000 | | | | 2,019 | |
| | | | | | | | | |
| Total Kansas | | | | 7,906 | |
| | | | | | | | | |
| Kentucky [2.0%] | |
| Kentucky State, Economic Development Finance Authority, Owensboro Medical Health System Project, Ser A, RB | | | | | | | | |
| Pre-Refunded @ 100 | | | | | | | | |
| 6.500%, 06/01/20(E) | | | 2,960 | | | | 3,373 | |
| Kentucky State, Economic Development Finance Authority, Owensboro Medical Health System Project, Ser A, RB | | | | | | | | |
| Pre-Refunded @ 100 | | | | | | | | |
| 6.375%, 06/01/20(E) | | | 1,000 | | | | 1,136 | |
| Kentucky State, Economic Development Finance Authority, Masonic Home Independent Living, RB | | | | | | | | |
| Callable 05/15/26 @ 100 | | | | | | | | |
| 5.000%, 05/15/36 | | | 1,250 | | | | 1,304 | |
| Kentucky State, Economic Development Finance Authority, Masonic Home Independent Living, RB | | | | | | | | |
| Callable 05/15/26 @ 100 | | | | | | | | |
| 5.000%, 05/15/46 | | | 4,500 | | | | 4,630 | |
| Kentucky State, Economic Development Finance Authority, Masonic Home Independent Living, RB | | | | | | | | |
| Callable 05/15/26 @ 100 | | | | | | | | |
| 5.000%, 05/15/51 | | | 4,000 | | | | 4,101 | |
| Kentucky State, Public Transportation Infrastructure Authority, Downtown Crossing Project, Ser A, RB | | | | | | | | |
| Callable 07/01/23 @ 100 | | | | | | | | |
| 5.750%, 07/01/49 | | | 5,650 | | | | 6,322 | |
| Louisville & Jefferson County, Louisville Gas and Electric Company Project, RB | | | | | | | | |
| 1.500%, 10/01/33(D) | | | 3,000 | | | | 3,010 | |
| | | | | | | | | |
| Total Kentucky | | | | 23,876 | |
| | | | | | | | | |
| Louisiana [1.1%] | |
| Juban Crossing, Economic Development District, General Infrastructure Project, Ser C, RB | | | | | | | | |
| Callable 03/15/25 @ 100 | | | | | | | | |
| 7.000%, 09/15/44(B) | | | 5,665 | | | | 5,922 | |
| Louisiana State, Local Government Environmental Facilities & Community Development Authority, Ser S, RB | | | | | | | | |
| Callable 06/01/25 @ 100 | | | | | | | | |
| 5.625%, 06/01/45 | | | 2,000 | | | | 2,053 | |
| Louisiana State, Public Facilities Authority, Loyola University Project, RB | | | | | | | | |
| Callable 10/01/21 @ 100 | | | | | | | | |
| 5.000%, 10/01/41 | | | 5,000 | | | | 5,239 | |
| Louisiana State, Public Facilities Authority, Pellets Project, RB, AMT | | | | | | | | |
| Callable 07/01/23 @ 100 | | | | | | | | |
| 10.500%, 07/01/39(G) | | | 1,435 | | | | 14 | |
| Louisiana State, Public Facilities Authority, Pellets Project, RB, AMT | | | | | | | | |
| 7.000%, 07/01/24(B) (G) | | | 1,319 | | | | 13 | |
| Louisiana State, Public Facilities Authority, Pellets Project, Ser A, RB, AMT | | | | | | | | |
| Callable 07/01/24 @ 100 | | | | | | | | |
| 8.375%, 07/01/39(G) | | | 3,474 | | | | 35 | |
| | | | | | | | | |
| Total Louisiana | | | | 13,276 | |
| | | | | | | | | |
| Maryland [1.3%] | |
| Baltimore, Harbor Point Project, RB | | | | | | | | |
| Callable 06/01/26 @ 100 | | | | | | | | |
| 5.000%, 06/01/36 | | | 1,000 | | | | 1,033 | |
See accompanying notes to financial statements.
CITY NATIONAL ROCHDALE FUNDS | PAGE 42
| schedule of investments |
| September 30, 2017 |
City National Rochdale Municipal High Income Fund (continued) |
| Description | | Face Amount (000) | | | Value (000) | |
| Howard County, Annapolis Junction Town Center Project, TA | | | | | | |
| Callable 02/15/24 @ 100 | | | | | | |
| 6.100%, 02/15/44 | | $ | 1,425 | | | $ | 1,470 | |
| Howard County, Annapolis Junction Town Center Project, TA | | | | | | | | |
| Callable 02/15/24 @ 100 | | | | | | | | |
| 5.800%, 02/15/34 | | | 725 | | | | 746 | |
| Maryland State, Economic Development, RB | | | | | | | | |
| Callable 09/01/20 @ 100 | | | | | | | | |
| 5.750%, 09/01/25 | | | 3,000 | | | | 3,090 | |
| Rockville City, Ingleside at King Farm Project, RB | | | | | | | | |
| Callable 11/01/24 @ 103 | | | | | | | | |
| 5.000%, 11/01/42 | | | 1,205 | | | | 1,311 | |
| Rockville City, Ingleside at King Farm Project, RB | | | | | | | | |
| Callable 11/01/24 @ 103 | | | | | | | | |
| 5.000%, 11/01/47 | | | 1,500 | | | | 1,623 | |
| Westminster, Luther Village Millers Grant Project, RB | | | | | | | | |
| Callable 07/01/24 @ 100 | | | | | | | | |
| 6.250%, 07/01/44 | | | 3,780 | | | | 4,086 | |
| Westminster, Luther Village Millers Grant Project, RB | | | | | | | | |
| Callable 07/01/24 @ 100 | | | | | | | | |
| 6.125%, 07/01/39 | | | 750 | | | | 802 | |
| Westminster, Luther Village Millers Grant Project, RB | | | | | | | | |
| Callable 07/01/24 @ 100 | | | | | | | | |
| 6.000%, 07/01/34 | | | 1,205 | | | | 1,289 | |
| | | | | | | | | |
| Total Maryland | | | | 15,450 | |
| | | | | | | | | |
| Massachusetts [0.7%] | |
| Massachusetts State, Development Finance Agency, Ser A, RB | | | | | | | | |
| Callable 10/01/26 @ 100 | | | | | | | | |
| 5.000%, 10/01/36 | | | 2,305 | | | | 2,614 | |
| Massachusetts State, Development Finance Agency, Ser A, RB | | | | | | | | |
| Callable 10/01/26 @ 100 | | | | | | | | |
| 4.000%, 10/01/46 | | | 6,120 | | | | 6,203 | |
| | | | | | | | | |
| Total Massachusetts | | | | 8,817 | |
| | | | | | | | | |
| Michigan [1.9%] | |
| Calhoun County, Hospital Finance Authority, Oaklawn Hospital, RB | | | | | | | | |
| Callable 02/15/27 @ 100 | | | | | | | | |
| 5.000%, 02/15/47 | | | 3,000 | | | | 3,158 | |
| Michigan State, Finance Authority, Old Redford School Project, Ser A, RB | | | | | | | | |
| Callable 12/01/20 @ 100 | | | | | | | | |
| 6.500%, 12/01/40 | | | 3,745 | | | | 3,803 | |
| Michigan State, Finance Authority, RB | | | | | | | | |
| Callable 02/01/20 @ 101 | | | | | | | | |
| 5.750%, 02/01/33 | | | 4,000 | | | | 4,082 | |
| Michigan State, Finance Authority, RB | | | | | | | | |
| Callable 11/15/25 @ 100 | | | | | | | | |
| 5.250%, 11/15/35 | | | 2,340 | | | | 2,453 | |
| Michigan State, Public Educational Facilities Authority, Old Redford Project, Ser A, RB | | | | | | | | |
| Callable 10/30/17 @ 100 | | | | | | | | |
| 5.875%, 12/01/30 | | | 2,000 | | | | 2,000 | |
| Michigan State, Tobacco Settlement Finance Authority, Ser A, RB | | | | | | | | |
| Callable 10/16/17 @ 100 | | | | | | | | |
| 5.125%, 06/01/22 | | | 2,860 | | | | 2,855 | |
| Michigan State, Tobacco Settlement Finance Authority, Turbo Project, Ser A, RB | | | | | | | | |
| Callable 06/01/18 @ 100 | | | | | | | | |
| 6.875%, 06/01/42 | | | 2,000 | | | | 2,053 | |
| Michigan State, Tobacco Settlement Finance Authority, Ser A | | | | | | | | |
| Callable 10/16/17 @ 100 | | | | | | | | |
| 6.000%, 06/01/34 | | | 2,000 | | | | 1,998 | |
| | | | | | | | | |
| Total Michigan | | | | 22,402 | |
| | | | | | | | | |
| Minnesota [0.5%] | |
| Anoka, Housing Revenue Authority, Homestead Project, RB | | | | | | | | |
| Callable 11/01/24 @ 103 | | | | | | | | |
| 4.750%, 11/01/35 | | | 4,000 | | | | 4,080 | |
| Dakota County, Community Development Agency, RB | | | | | | | | |
| Callable 08/01/22 @ 100 | | | | | | | | |
| 5.000%, 08/01/51(B) | | | 1,250 | | | | 1,258 | |
See accompanying notes to financial statements.
CITY NATIONAL ROCHDALE FUNDS | PAGE 43
| schedule of investments |
| September 30, 2017 |
City National Rochdale Municipal High Income Fund (continued) |
| Description | | Face Amount (000) | | | Value (000) | |
| Saint Paul Park, Presbyterian Homes Bloomington Project, RB | | | | | | |
| Callable 09/01/24 @ 100 | | | | | | |
| 5.000%, 09/01/42 | | $ | 1,000 | | | $ | 1,047 | |
| | | | | | | | | |
| Total Minnesota | | | | 6,385 | |
| | | | | | | | | |
| Missouri [3.6%] | |
| Blue Springs, Improvement Adams Farm Project, Ser A, SPL Tax | | | | | | | | |
| Callable 06/01/24 @ 100 | | | | | | | | |
| 5.250%, 06/01/39 | | | 3,400 | | | | 3,447 | |
| Branson, Industrial Development Authority, Branson Shoppes Redevelopment, RB | | | | | | | | |
| Callable 11/01/25 @ 100 | | | | | | | | |
| 3.900%, 11/01/29 | | | 1,150 | | | | 1,156 | |
| Hanley, Eager Road Transportation Development District, Ser A, SAB | | | | | | | | |
| Callable 03/01/21 @ 100 | | | | | | | | |
| 4.000%, 03/01/42 | | | 1,000 | | | | 956 | |
| Hanley, Eager Road Transportation Development District, Ser A, SAB | | | | | | | | |
| Callable 03/01/21 @ 100 | | | | | | | | |
| 3.625%, 03/01/33 | | | 500 | | | | 474 | |
| Hanley, Eager Road Transportation Development District, Ser A, SAB | | | | | | | | |
| Callable 03/01/21 @ 100 | | | | | | | | |
| 3.000%, 03/01/26 | | | 500 | | | | 481 | |
| Kansas City, Industrial Development Authority, Ser A, RB | | | | | | | | |
| Callable 04/01/26 @ 100 | | | | | | | | |
| 5.000%, 04/01/36(B) | | | 1,000 | | | | 973 | |
| Kansas City, Industrial Development Authority, Ser A, RB | | | | | | | | |
| Callable 04/01/26 @ 100 | | | | | | | | |
| 5.000%, 04/01/46(B) | | | 1,150 | | | | 1,085 | |
| Kirkwood, Industrial Development Authority, Aberdeen Heights Project, Ser A, RB | | | | | | | | |
| Pre-Refunded @ 100 | | | | | | | | |
| 8.250%, 05/15/20(E) | | | 3,000 | | | | 3,543 | |
| Kirkwood, Industrial Development Authority, Aberdeen Heights Project, Ser A, RB | | | | | | | | |
| Callable 05/15/27 @ 100 | | | | | | | | |
| 5.250%, 05/15/37 | | | 1,000 | | | | 1,059 | |
| Kirkwood, Industrial Development Authority, Aberdeen Heights Project, Ser A, RB | | | | | | | | |
| Callable 05/15/27 @ 100 | | | | | | | | |
| 5.250%, 05/15/42 | | | 1,000 | | | | 1,054 | |
| Kirkwood, Industrial Development Authority, Aberdeen Heights Project, Ser A, RB | | | | | | | | |
| Callable 05/15/27 @ 100 | | | | | | | | |
| 5.250%, 05/15/50 | | | 3,000 | | | | 3,143 | |
| Lees Summit, Industrial Development Authority, John Knox Village, Ser A, RB | | | | | | | | |
| Callable 08/15/24 @ 102 | | | | | | | | |
| 5.000%, 08/15/46 | | | 4,500 | | | | 4,710 | |
| Lees Summit, Industrial Development Authority, John Knox Village, Ser A, RB | | | | | | | | |
| Callable 08/15/24 @ 102 | | | | | | | | |
| 5.000%, 08/15/51 | | | 5,000 | | | | 5,214 | |
| Poplar Bluff, Ser A, SPL Tax | | | | | | | | |
| Callable 11/01/23 @ 100 | | | | | | | | |
| 5.125%, 11/01/35(B) | | | 5,000 | | | | 4,950 | |
| St. Joseph, Industrial Development Authority, Living Community Saint Joseph Project, RB | | | | | | | | |
| Callable 10/30/17 @ 100 | | | | | | | | |
| 7.000%, 08/15/32 | | | 975 | | | | 975 | |
| St. Louis County, Industrial Development Authority, RB | | | | | | | | |
| Callable 09/01/24 @ 100 | | | | | | | | |
| 5.250%, 09/01/45(B) | | | 3,000 | | | | 3,009 | |
| St. Louis County, Industrial Development Authority, RB | | | | | | | | |
| Callable 09/01/24 @ 100 | | | | | | | | |
| 5.000%, 09/01/38(B) | | | 2,000 | | | | 2,012 | |
| St. Louis County, Industrial Development Authority, RB | | | | | | | | |
| Callable 11/15/25 @ 100 | | | | | | | | |
| 5.000%, 11/15/41 | | | 1,250 | | | | 1,257 | |
| St. Louis County, Industrial Development Authority, RB | | | | | | | | |
| Callable 11/15/25 @ 100 | | | | | | | | |
| 5.000%, 11/15/46 | | | 1,500 | | | | 1,501 | |
See accompanying notes to financial statements.
CITY NATIONAL ROCHDALE FUNDS | PAGE 44
| schedule of investments |
| September 30, 2017 |
City National Rochdale Municipal High Income Fund (continued) |
| Description | | Face Amount (000) | | | Value (000) | |
| St. Louis County, Industrial Development Authority, RB | | | | | | |
| Callable 11/15/25 @ 100 | | | | | | |
| 4.000%, 11/15/36 | | $ | 1,250 | | | $ | 1,140 | |
| | | | | | | | | |
| Total Missouri | | | | 42,139 | |
| | | | | | | | | |
| Nebraska [0.6%] | |
| Central Plains Energy Project, Project No. 3, RB | | | | | | | | |
| Callable 09/01/22 @ 100 | | | | | | | | |
| 5.250%, 09/01/37 | | | 1,000 | | | | 1,108 | |
| Central Plains Energy Project, Project No. 3, RB | | | | | | | | |
| Callable 09/01/22 @ 100 | | | | | | | | |
| 5.000%, 09/01/42 | | | 5,500 | | | | 6,001 | |
| | | | | | | | | |
| Total Nebraska | | | | 7,109 | |
| | | | | | | | | |
| Nevada [0.8%] | |
| Clark County, Department of Aviation, Sub-Ser A-2, RB | | | | | | | | |
| Callable 07/01/24 @ 100 | | | | | | | | |
| 5.000%, 07/01/35 | | | 3,000 | | | | 3,407 | |
| Las Vegas, RB | | | | | | | | |
| Callable 06/15/21 @ 100 | | | | | | | | |
| 4.375%, 06/15/35(B) | | | 3,500 | | | | 3,249 | |
| Las Vegas, Special Improvement District No. 812, SAB | | | | | | | | |
| Callable 12/01/25 @ 100 | | | | | | | | |
| 5.000%, 12/01/35 | | | 1,000 | | | | 1,027 | |
| Nevada State, Department of Business & Industry, Ser A, RB | | | | | | | | |
| Callable 12/15/25 @ 100 | | | | | | | | |
| 5.000%, 12/15/35(B) | | | 1,595 | | | | 1,650 | |
| | | | | | | | | |
| Total Nevada | | | | 9,333 | |
| | | | | | | | | |
| New Jersey [1.5%] | |
| New Jersey State, Economic Development Authority, Continental Airlines Project, RB, AMT | | | | | | | | |
| Callable 08/20/22 @ 101 | | | | | | | | |
| 5.250%, 09/15/29 | | | 2,850 | | | | 3,115 | |
| South Jersey Port, Ser S, RB | | | | | | | | |
| Callable 01/01/26 @ 100 | | | | | | | | |
| 5.000%, 01/01/39 | | | 750 | | | | 754 | |
| Tobacco Settlement Financing, Ser 1A | | | | | | | | |
| Callable 10/16/17 @ 100 | | | | | | | | |
| 5.000%, 06/01/29 | | | 2,000 | | | | 2,003 | |
| Tobacco Settlement Financing, Ser 1A, RB | | | | | | | | |
| Callable 10/16/17 @ 100 | | | | | | | | |
| 5.000%, 06/01/41 | | | 12,000 | | | | 11,627 | |
| | | | | | | | | |
| Total New Jersey | | | | 17,499 | |
| | | | | | | | | |
| New Mexico [0.3%] | |
| New Mexico State, Hospital Equipment Loan Council, RB | | | | | | | | |
| Callable 07/01/22 @ 100 | | | | | | | | |
| 5.500%, 07/01/42 | | | 3,110 | | | | 3,367 | |
| | | | | | | | | |
| New York [7.2%] | |
| Brooklyn Arena, Barclays Center Local Development, Ser A, RB | | | | | | | | |
| Callable 01/15/27 @ 100 | | | | | | | | |
| 5.000%, 07/15/30 | | | 1,500 | | | | 1,745 | |
| Brooklyn Arena, Barclays Center Local Development, Ser A, RB | | | | | | | | |
| Callable 01/15/27 @ 100 | | | | | | | | |
| 5.000%, 07/15/42 | | | 5,000 | | | | 5,636 | |
| Metropolitan Transportation Authority, Ser A-1, RB | | | | | | | | |
| Callable 05/15/25 @ 100 | | | | | | | | |
| 5.000%, 11/15/45 | | | 5,000 | | | | 5,687 | |
| Nassau County, Industrial Development Agency, Ser A, RB | | | | | | | | |
| Callable 01/01/25 @ 101 | | | | | | | | |
| 6.700%, 01/01/49 | | | 4,789 | | | | 4,839 | |
| Nassau County, Industrial Development Agency, Ser C, RB | | | | | | | | |
| Callable 01/01/18 @ 100 | | | | | | | | |
| 2.000%, 01/01/49 | | | 1,728 | | | | 294 | |
| Nassau County, Tobacco Settlement, RB | | | | | | | | |
| Callable 10/30/17 @ 100 | | | | | | | | |
| 5.125%, 06/01/46 | | | 10,120 | | | | 9,985 | |
| New York City, Transitional Finance Authority, Building Aid Revenue, Ser S-1 | | | | | | | | |
| Callable 01/15/26 @ 100 | | | | | | | | |
| 4.000%, 07/15/45 | | | 10,000 | | | | 10,511 | |
See accompanying notes to financial statements.
CITY NATIONAL ROCHDALE FUNDS | PAGE 45
| schedule of investments |
| September 30, 2017 |
City National Rochdale Municipal High Income Fund (continued) |
| Description | | Face Amount (000) | | | Value (000) | |
| New York Counties, Tobacco Trust IV, Ser A, RB | | | | | | |
| Callable 10/16/17 @ 100 | | | | | | |
| 5.000%, 06/01/45 | | $ | 5,800 | | | $ | 5,524 | |
| New York State, Liberty Development, Goldman Sachs Headquarters, RB | | | | | | | | |
| 5.250%, 10/01/35 | | | 3,000 | | | | 3,836 | |
| New York State, Liberty Development, World Trade Center, RB | | | | | | | | |
| Callable 11/15/24 @ 100 | | | | | | | | |
| 5.375%, 11/15/40(B) | | | 2,500 | | | | 2,785 | |
| New York State, Liberty Development, World Trade Center, RB | | | | | | | | |
| Callable 11/15/24 @ 100 | | | | | | | | |
| 5.000%, 11/15/44(B) | | | 10,000 | | | | 10,878 | |
| New York State, Transportation Development, RB, AMT | | | | | | | | |
| Callable 08/01/21 @ 100 | | | | | | | | |
| 5.000%, 08/01/26 | | | 5,500 | | | | 5,905 | |
| New York State, Transportation Development, RB, AMT | | | | | | | | |
| Callable 07/01/24 @ 100 | | | | | | | | |
| 5.000%, 07/01/34 | | | 1,000 | | | | 1,111 | |
| New York State, Transportation Development, RB, AMT | | | | | | | | |
| Callable 07/01/24 @ 100 | | | | | | | | |
| 5.000%, 07/01/41 | | | 1,500 | | | | 1,650 | |
| Niagara, Tobacco Asset Securitization, RB | | | | | | | | |
| Callable 05/15/24 @ 100 | | | | | | | | |
| 5.250%, 05/15/34 | | | 1,000 | | | | 1,131 | |
| Niagara, Tobacco Asset Securitization, RB | | | | | | | | |
| Callable 05/15/24 @ 100 | | | | | | | | |
| 5.250%, 05/15/40 | | | 1,000 | | | | 1,125 | |
| TSASC, Ser B, RB | | | | | | | | |
| Callable 06/01/27 @ 100 | | | | | | | | |
| 5.000%, 06/01/48 | | | 5,000 | | | | 5,069 | |
| Westchester, Tobacco Asset Securitization, Sub-Ser C, RB | | | | | | | | |
| Callable 06/01/27 @ 100 | | | | | | | | |
| 5.125%, 06/01/51 | | | 7,000 | | | | 6,972 | |
| | | | | | | | | |
| Total New York | | | | 84,683 | |
| | | | | | | | | |
| North Carolina [0.2%] | |
| North Carolina State, Department of Transportation, I-77 Hot Lanes Project, RB, AMT | | | | | | | | |
| Callable 06/30/25 @ 100 | | | | | | | | |
| 5.000%, 12/31/37 | | | 1,405 | | | | 1,525 | |
| North Carolina State, Medical Care Commission, United Church Homes and Services, RB | | | | | | | | |
| Callable 09/01/24 @ 100 | | | | | | | | |
| 5.000%, 09/01/37 | | | 1,155 | | | | 1,199 | |
| | | | | | | | | |
| Total North Carolina | | | | 2,724 | |
| | | | | | | | | |
| North Dakota [0.4%] | |
| Burleigh County, Education Facilities, University of Mary Project, RB | | | | | | | | |
| Callable 04/15/26 @ 100 | | | | | | | | |
| 5.200%, 04/15/46 | | | 2,000 | | | | 2,022 | |
| Mandan, Park Facilities, Ser A, RB | | | | | | | | |
| Callable 09/01/24 @ 100 | | | | | | | | |
| 3.250%, 09/01/41 | | | 2,450 | | | | 2,205 | |
| | | | | | | | | |
| Total North Dakota | | | | 4,227 | |
| | | | | | | | | |
| Ohio [4.2%] | |
| Buckeye, Tobacco Settlement Financing Authority, Ser A-2, RB | | | | | | | | |
| Callable 10/16/17 @ 100 | | | | | | | | |
| 6.500%, 06/01/47 | | | 3,000 | | | | 3,003 | |
| Buckeye, Tobacco Settlement Financing Authority, Ser A-2, RB | | | | | | | | |
| Callable 10/16/17 @ 100 | | | | | | | | |
| 5.875%, 06/01/30 | | | 5,000 | | | | 4,850 | |
| Buckeye, Tobacco Settlement Financing Authority, Ser A-2, RB | | | | | | | | |
| Callable 10/16/17 @ 100 | | | | | | | | |
| 5.875%, 06/01/47 | | | 7,000 | | | | 6,683 | |
| Buckeye, Tobacco Settlement Financing Authority, Ser A-2, RB | | | | | | | | |
| Callable 10/16/17 @ 100 | | | | | | | | |
| 5.750%, 06/01/34 | | | 3,090 | | | | 2,979 | |
See accompanying notes to financial statements.
CITY NATIONAL ROCHDALE FUNDS | PAGE 46
| schedule of investments |
| September 30, 2017 |
City National Rochdale Municipal High Income Fund (continued) |
| Description | | Face Amount (000) | | | Value (000) | |
| Buckeye, Tobacco Settlement Financing Authority, Ser A-2, RB | | | | | | |
| Callable 10/16/17 @ 100 | | | | | | |
| 5.125%, 06/01/24 | | $ | 3,000 | | | $ | 2,842 | |
| Butler County Port Authority, Storypoint Fairfield Project, RB | | | | | | | | |
| Callable 01/15/24 @ 104 | | | | | | | | |
| 6.375%, 01/15/43(B) | | | 500 | | | | 517 | |
| Cuyahoga County, Hospital Revenue, Metrohealth System, RB | | | | | | | | |
| Callable 02/15/27 @ 100 | | | | | | | | |
| 5.250%, 02/15/47 | | | 3,800 | | | | 4,109 | |
| Muskingum County, Hospital Facilities Authority, Genesis Healthcare Systems Project, RB | | | | | | | | |
| Callable 02/15/23 @ 100 | | | | | | | | |
| 5.000%, 02/15/33 | | | 2,240 | | | | 2,376 | |
| Muskingum County, Hospital Facilities Authority, Genesis Healthcare Systems Project, RB | | | | | | | | |
| Callable 02/15/23 @ 100 | | | | | | | | |
| 5.000%, 02/15/44 | | | 1,000 | | | | 1,041 | |
| Muskingum County, Hospital Facilities Authority, Genesis Healthcare Systems Project, RB | | | | | | | | |
| Callable 02/15/23 @ 100 | | | | | | | | |
| 5.000%, 02/15/48 | | | 3,390 | | | | 3,524 | |
| Ohio State, Air Quality Development Authority, Ohio Valley Electric Project, Ser E, RB | | | | | | | | |
| 5.625%, 10/01/19 | | | 3,350 | | | | 3,471 | |
| Ohio State, Water Development Authority, FirstEnergy Nuclear Generation Project, Ser B, RB | | | | | | | | |
| 4.375%, 06/01/33(D) | | | 3,500 | | | | 3,447 | |
| Southeastern Ohio, Port Authority, Memorial Health System Project, RB | | | | | | | | |
| Callable 12/01/22 @ 100 | | | | | | | | |
| 6.000%, 12/01/42 | | | 7,000 | | | | 7,694 | |
| Toledo-Lucas County, Port Authority, Storypoint Waterville Project, RB | | | | | | | | |
| Callable 01/15/24 @ 104 | | | | | | | | |
| 6.375%, 01/15/51(B) | | | 2,500 | | | | 2,532 | |
| | | | | | | | | |
| Total Ohio | | | | 49,068 | |
| Oklahoma [1.3%] | |
| Oklahoma County, Finance Authority, Ser A, RB | | | | | | | | |
| Callable 04/01/22 @ 100 | | | | | | | | |
| 5.125%, 04/01/42 | | | 4,000 | | | | 3,784 | |
| Oklahoma State, Development Finance Authority, RB | | | | | | | | |
| Callable 01/01/22 @ 100 | | | | | | | | |
| 6.000%, 01/01/32 | | | 3,030 | | | | 3,162 | |
| Payne County, Economic Development Authority, RB | | | | | | | | |
| Callable 11/01/26 @ 100 | | | | | | | | |
| 6.875%, 11/01/46 | | | 5,775 | | | | 5,574 | |
| Payne County, Economic Development Authority, RB | | | | | | | | |
| Callable 11/01/26 @ 100 | | | | | | | | |
| 6.625%, 11/01/36 | | | 2,500 | | | | 2,420 | |
| | | | | | | | | |
| Total Oklahoma | | | | 14,940 | |
| | | | | | | | | |
| Pennsylvania [2.7%] | |
| Beaver County, Industrial Development Authority, Ser B, RB | | | | | | | | |
| 4.250%, 10/01/47(D) | | | 1,320 | | | | 1,305 | |
| Delaware County, Industrial Development Authority, Covanta Project, Ser A, RB | | | | | | | | |
| Callable 07/01/20 @ 100 | | | | | | | | |
| 5.000%, 07/01/43 | | | 2,500 | | | | 2,520 | |
| Montgomery County Higher Education & Health Authority, Philadelphia Presbyterian Hospital, RB | | | | | | | | |
| Callable 12/01/24 @ 103 | | | | | | | | |
| 4.000%, 12/01/48 | | | 2,500 | | | | 2,443 | |
| Pennsylvania State, Economic Development Financing Authority, Ser A-RE, RB | | | | | | | | |
| Callable 09/01/25 @ 100 | | | | | | | | |
| 6.400%, 12/01/38 | | | 3,000 | | | | 3,069 | |
| Pennsylvania State, Turnpike Commission, Ser A, RB | | | | | | | | |
| Callable 12/01/24 @ 100 | | | | | | | | |
| 5.000%, 12/01/33 | | | 1,500 | | | | 1,723 | |
| Pennsylvania State, Turnpike Commission, Sub-Ser A, RB | | | | | | | | |
| Callable 12/01/26 @ 100 | | | | | | | | |
| 5.500%, 12/01/42 | | | 5,000 | | | | 5,894 | |
| Pennsylvania State, Turnpike Commission, Sub-Ser E, RB | | | | | | | | |
| Callable 12/01/27 @ 100 | | | | | | | | |
| 6.375%, 12/01/17(A) | | | 2,000 | | | | 2,483 | |
See accompanying notes to financial statements.
CITY NATIONAL ROCHDALE FUNDS | PAGE 47
| schedule of investments |
| September 30, 2017 |
City National Rochdale Municipal High Income Fund (continued) |
| Description | | Face Amount (000) | | | Value (000) | |
| Philadelphia, Authority for Industrial Development, Mariana Bracetti Academy, RB | | | | | | |
| Callable 12/15/21 @ 100 | | | | | | |
| 7.150%, 12/15/36 | | $ | 2,280 | | | $ | 2,480 | |
| Philadelphia, Authority for Industrial Development, RB | | | | | | | | |
| Callable 12/15/21 @ 100 | | | | | | | | |
| 7.625%, 12/15/41 | | | 1,000 | | | | 1,105 | |
| Philadelphia, Hospitals & Higher Education Facilities Authority, Temple University Health Systems Project, Ser A, RB | | | | | | | | |
| Callable 07/01/22 @ 100 | | | | | | | | |
| 5.625%, 07/01/42 | | | 3,000 | | | | 3,285 | |
| Pottsville, Hospital Authority, RB | | | | | | | | |
| Pre-Refunded @ 100 | | | | | | | | |
| 5.250%, 07/01/18(B) (E) | | | 2,020 | | | | 2,143 | |
| Pottsville, Hospital Authority, Schuykill Health System Project, RB | | | | | | | | |
| Pre-Refunded @ 100 | | | | | | | | |
| 6.500%, 07/01/24(E) | | | 3,000 | | | | 3,929 | |
| | | | | | | | | |
| Total Pennsylvania | | | | 32,379 | |
| | | | | | | | | |
| Rhode Island [0.2%] | |
| Tobacco Settlement Financing, Ser B, RB | | | | | | | | |
| Callable 10/16/17 @ 12 | | | | | | | | |
| 8.663%, 06/01/52(C) | | | 26,270 | | | | 2,317 | |
| | | | | | | | | |
| South Carolina [1.3%] | |
| South Carolina State, Jobs-Economic Development Authority, Episcopal of Still Hopes, RB | | | | | | | | |
| Callable 04/01/25 @ 102 | | | | | | | | |
| 5.000%, 04/01/47 | | | 2,000 | | | | 2,089 | |
| South Carolina State, Jobs-Economic Development Authority, Episcopal of Still Hopes, RB | | | | | | | | |
| Callable 04/01/25 @ 102 | | | | | | | | |
| 5.000%, 04/01/52 | | | 2,550 | | | | 2,650 | |
| South Carolina State, Jobs-Economic Development Authority, The Woodlands at Furman, RB | | | | | | | | |
| Callable 11/15/24 @ 103 | | | | | | | | |
| 5.250%, 11/15/47 | | | 5,000 | | | | 5,273 | |
| South Carolina State, Jobs-Economic Development Authority, The Woodlands at Furman, RB | | | | | | | | |
| Callable 11/15/24 @ 103 | | | | | | | | |
| 5.250%, 11/15/52 | | | 5,405 | | | | 5,677 | |
| | | | | | | | | |
| Total South Carolina | | | | 15,689 | |
| | | | | | | | | |
| Tennessee [0.7%] | |
| Chattanooga, Health Educational & Housing Facility Board, RB | | | | | | | | |
| Callable 10/01/25 @ 100 | | | | | | | | |
| 5.000%, 10/01/35 | | | 1,000 | | | | 1,105 | |
| Johnson City, Health & Educational Facilities Board, Mountain States Health Alliance Project, RB | | | | | | | | |
| Callable 07/01/20 @ 100 | | | | | | | | |
| 6.000%, 07/01/38 | | | 2,000 | | | | 2,156 | |
| Shelby County, Health Educational & Housing Facilities Board, Ser A, RB | | | | | | | | |
| Callable 09/01/23 @ 100 | | | | | | | | |
| 5.500%, 09/01/47 | | | 1,000 | | | | 1,034 | |
| Shelby County, Health Educational & Housing Facilities Board, Ser A, RB | | | | | | | | |
| Callable 09/01/26 @ 100 | | | | | | | | |
| 5.000%, 09/01/31 | | | 2,750 | | | | 2,974 | |
| Shelby County, Health Educational & Housing Facilities Board, Ser A, RB | | | | | | | | |
| Callable 09/01/26 @ 100 | | | | | | | | |
| 5.000%, 09/01/37 | | | 1,145 | | | | 1,166 | |
| | | | | | | | | |
| Total Tennessee | | | | 8,435 | |
| | | | | | | | | |
| Texas [10.3%] | |
| Arlington, Higher Education Finance, Universal Academy Project, Ser A, RB | | | | | | | | |
| Callable 03/01/24 @ 100 | | | | | | | | |
| 7.125%, 03/01/44 | | | 2,300 | | | | 2,399 | |
| Arlington, Higher Education Finance, Universal Academy Project, Ser A, RB | | | | | | | | |
| Callable 03/01/24 @ 100 | | | | | | | | |
| 7.000%, 03/01/34 | | | 400 | | | | 419 | |
See accompanying notes to financial statements.
CITY NATIONAL ROCHDALE FUNDS | PAGE 48
| schedule of investments |
| September 30, 2017 |
City National Rochdale Municipal High Income Fund (continued) |
| Description | | Face Amount (000) | | | Value (000) | |
| Bexar County, Health Facilities Development, Army Retirement Residence Project, RB | | | | | | |
| Pre-Refunded @ 100 | | | | | | |
| 6.200%, 07/01/20(E) | | $ | 3,250 | | | $ | 3,690 | |
| Celina, Lakes at Mustang Ranch Public Improvement District Phase 1 Project, SAB | | | | | | | | |
| Callable 09/01/20 @ 103 | | | | | | | | |
| 5.875%, 09/01/40 | | | 600 | | | | 591 | |
| Celina, Lakes at Mustang Ranch Public Improvement District Phase 1 Project, SAB | | | | | | | | |
| Callable 09/01/20 @ 103 | | | | | | | | |
| 5.500%, 09/01/32 | | | 250 | | | | 247 | |
| Celina, Lakes at Mustang Ranch Public Improvement District Phase 1 Project, SAB | | | | | | | | |
| Callable 09/01/20 @ 103 | | | | | | | | |
| 5.375%, 09/01/28 | | | 400 | | | | 396 | |
| Celina, Sutton Fields II Public Improvement Project, SAB | | | | | | | | |
| Callable 03/01/23 @ 103 | | | | | | | | |
| 7.250%, 09/01/45 | | | 500 | | | | 499 | |
| Central Texas, Regional Mobility Authority, Sub-Ser, RB | | | | | | | | |
| Callable 01/01/23 @ 100 | | | | | | | | |
| 5.000%, 01/01/33 | | | 1,000 | | | | 1,109 | |
| Central Texas, Regional Mobility Authority, Sub-Ser, RB | | | | | | | | |
| Callable 01/01/23 @ 100 | | | | | | | | |
| 5.000%, 01/01/42 | | | 1,000 | | | | 1,102 | |
| Grand Parkway Transportation, Toll Revenue, Sub-Ser B, RB | | | | | | | | |
| Callable 10/01/23 @ 100 | | | | | | | | |
| 5.000%, 04/01/53 | | | 2,000 | | | | 2,270 | |
| Hackberry City, Public Improvement District No. 3, SAB | | | | | | | | |
| Pre-Refunded @ 100 | | | | | | | | |
| 7.000%, 09/01/19(E) | | | 475 | | | | 542 | |
| Hackberry City, Public Improvement District No. 3, SAB | | | | | | | | |
| Pre-Refunded @ 100 | | | | | | | | |
| 6.750%, 09/01/19(E) | | | 500 | | | | 568 | |
| Hackberry City, Public Improvement District No. 3, SAB | | | | | | | | |
| Pre-Refunded @ 100 | | | | | | | | |
| 6.750%, 09/01/19(E) | | | 525 | | | | 596 | |
| Hackberry City, Public Improvement District No. 3, SAB | | | | | | | | |
| Pre-Refunded @ 100 | | | | | | | | |
| 6.625%, 09/01/19(E) | | | 450 | | | | 510 | |
| Houston, Airport System Revenue, United Airlines Project, RB, AMT | | | | | | | | |
| Callable 07/01/24 @ 100 | | | | | | | | |
| 5.000%, 07/01/29 | | | 3,000 | | | | 3,278 | |
| Houston, Higher Education Finance, Ser A, RB | | | | | | | | |
| Pre-Refunded @ 100 | | | | | | | | |
| 6.875%, 05/15/21(E) | | | 5,300 | | | | 6,338 | |
| Leander, Oak Creek Public Improvement District, SAB | | | | | | | | |
| Callable 09/01/19 @ 103 | | | | | | | | |
| 5.875%, 09/01/44 | | | 500 | | | | 495 | |
| Leander, Oak Creek Public Improvement District, SAB | | | | | | | | |
| Callable 09/01/19 @ 103 | | | | | | | | |
| 5.750%, 09/01/38 | | | 500 | | | | 495 | |
| McLendon-Chisholm, Sonoma Public Improvement District Project, SAB | | | | | | | | |
| Callable 09/15/20 @ 103 | | | | | | | | |
| 5.500%, 09/15/40 | | | 375 | | | | 368 | |
| McLendon-Chisholm, Sonoma Public Improvement District Project, SAB | | | | | | | | |
| Callable 09/15/20 @ 103 | | | | | | | | |
| 5.125%, 09/15/28 | | | 500 | | | | 502 | |
| McLendon-Chishom, Sonoma Public Improvement District Project, SAB | | | | | | | | |
| Callable 09/15/20 @ 103 | | | | | | | | |
| 5.375%, 09/15/35 | | | 400 | | | | 398 | |
| Mission, Economic Development, RB, AMT | | | | | | | | |
| Callable 10/01/18 @ 103 | | | | | | | | |
| 5.750%, 10/01/31(B) | | | 2,000 | | | | 2,098 | |
| New Hope, Cultural Education Facilities Finance, RB | | | | | | | | |
| Callable 08/15/21 @ 100 | | | | | | | | |
| 5.500%, 08/15/46 | | | 1,000 | | | | 1,011 | |
| New Hope, Cultural Education Facilities Finance, RB | | | | | | | | |
| Callable 11/15/26 @ 100 | | | | | | | | |
| 5.500%, 11/15/46 | | | 1,000 | | | | 1,007 | |
| New Hope, Cultural Education Facilities Finance, RB | | | | | | | | |
| Callable 08/15/21 @ 100 | | | | | | | | |
| 5.500%, 08/15/51 | | | 2,500 | | | | 2,524 | |
See accompanying notes to financial statements.
CITY NATIONAL ROCHDALE FUNDS | PAGE 49
| schedule of investments |
| September 30, 2017 |
City National Rochdale Municipal High Income Fund (continued) |
| Description | | Face Amount (000) | | | Value (000) | |
| New Hope, Cultural Education Facilities Finance, RB | | | | | | |
| Callable 11/15/26 @ 100 | | | | | | |
| 5.500%, 11/15/52 | | $ | 1,150 | | | $ | 1,153 | |
| New Hope, Cultural Education Facilities Finance, RB | | | | | | | | |
| Callable 11/15/26 @ 100 | | | | | | | | |
| 5.375%, 11/15/36 | | | 500 | | | | 504 | |
| New Hope, Cultural Education Facilities Finance, RB | | | | | | | | |
| 5.000%, 11/15/26 | | | 400 | | | | 408 | |
| New Hope, Cultural Education Facilities Finance, RB | | | | | | | | |
| Callable 07/01/24 @ 102 | | | | | | | | |
| 5.000%, 07/01/36 | | | 1,250 | | | | 1,286 | |
| New Hope, Cultural Education Facilities Finance, RB | | | | | | | | |
| Callable 07/01/24 @ 102 | | | | | | | | |
| 5.000%, 07/01/46 | | | 6,445 | | | | 6,527 | |
| New Hope, Cultural Education Facilities Finance, RB | | | | | | | | |
| 5.000%, 08/15/46 | | | 3,000 | | | | 2,982 | |
| New Hope, Cultural Education Facilities Finance, Ser A, RB | | | | | | | | |
| Callable 08/15/21 @ 100 | | | | | | | | |
| 5.000%, 08/15/36(B) | | | 4,000 | | | | 4,051 | |
| New Hope, Cultural Education Facilities Finance, Ser S, RB | | | | | | | | |
| Callable 08/15/21 @ 100 | | | | | | | | |
| 5.125%, 08/15/47(B) | | | 1,500 | | | | 1,509 | |
| Newark, Higher Education Finance, Ser A, RB | | | | | | | | |
| Callable 08/15/25 @ 100 | | | | | | | | |
| 5.750%, 08/15/45(B) | | | 1,700 | | | | 1,717 | |
| Newark, Higher Education Finance, Ser A, RB | | | | | | | | |
| Callable 08/15/25 @ 100 | | | | | | | | |
| 5.500%, 08/15/35(B) | | | 900 | | | | 919 | |
| North Texas, Tollway Authority, Convertible Capital Appreciation Project, Ser C, RB | | | | | | | | |
| Callable 09/01/31 @ 100 | | | | | | | | |
| 0.549%, 09/01/43(A) | | | 5,000 | | | | 5,332 | |
| North Texas, Tollway Authority, Ser A, RB | | | | | | | | |
| Callable 01/01/26 @ 100 | | | | | | | | |
| 5.000%, 01/01/39 | | | 1,500 | | | | 1,716 | |
| Sanger, Industrial Development Authority, Texas Pellets Project, Ser B, RB, AMT | | | | | | | | |
| Callable 07/01/22 @ 100 | | | | | | | | |
| 8.000%, 07/01/38(G) | | | 4,950 | | | | 1,139 | |
| Tarrant County, Cultural Education Facilities Finance, Buckner Retirement Services, RB | | | | | | | | |
| Callable 11/15/27 @ 100 | | | | | | | | |
| 5.000%, 11/15/37 | | | 1,000 | | | | 1,139 | |
| Tarrant County, Cultural Education Facilities Finance, Buckner Retirement Services, RB | | | | | | | | |
| Callable 11/15/27 @ 100 | | | | | | | | |
| 5.000%, 11/15/46 | | | 1,000 | | | | 1,124 | |
| Tarrant County, Cultural Education Facilities Finance, Buckingham Senior Living Community Project, RB | | | | | | | | |
| Callable 11/15/25 @ 100 | | | | | | | | |
| 5.500%, 11/15/45 | | | 5,315 | | | | 5,581 | |
| Tarrant County, Cultural Education Facilities Finance, Buckingham Senior Living Community Project, RB | | | | | | | | |
| Callable 10/30/17 @ 100 | | | | | | | | |
| 4.500%, 11/15/21 | | | 5,000 | | | | 5,000 | |
| Tarrant County, Cultural Education Facilities Finance, Buckingham Senior Living Community Project, Ser Senior LIVING, RB | | | | | | | | |
| Callable 11/15/17 @ 100 | | | | | | | | |
| 5.750%, 11/15/37 | | | 6,000 | | | | 6,007 | |
| Tarrant County, Cultural Education Facilities Finance, Buckner Senior Living Yentana Project, Ser Senior LIVING, RB | | | | | | | | |
| Callable 05/15/27 @ 100 | | | | | | | | |
| 6.750%, 11/15/47 | | | 2,000 | | | | 2,175 | |
| Tarrant County, Cultural Education Facilities Finance, Buckner Senior Living Yentana Project, Ser Senior LIVING, RB | | | | | | | | |
| Callable 05/15/27 @ 100 | | | | | | | | |
| 6.750%, 11/15/52 | | | 2,100 | | | | 2,276 | |
| Tarrant County, Cultural Education Facilities Finance, Buckner Senior Living Yentana Project, Ser Senior LIVING, RB | | | | | | | | |
| Callable 05/15/27 @ 100 | | | | | | | | |
| 6.625%, 11/15/37 | | | 2,500 | | | | 2,729 | |
See accompanying notes to financial statements.
CITY NATIONAL ROCHDALE FUNDS | PAGE 50
| schedule of investments |
| September 30, 2017 |
City National Rochdale Municipal High Income Fund (continued) |
| Description | | Face Amount (000) | | | Value (000) | |
| Tarrant County, Cultural Education Facilities Finance, C.C. Young Memorial Home Project, RB | | | | | | |
| Callable 02/15/27 @ 100 | | | | | | |
| 6.375%, 02/15/48 | | $ | 10,000 | | | $ | 10,693 | |
| Tarrant County, Cultural Education Facilities Finance, Northwest Senior Housing Edgemere Project, RB | | | | | | | | |
| Callable 05/15/27 @ 100 | | | | | | | | |
| 5.250%, 11/15/47 | | | 6,500 | | | | 6,892 | |
| Tarrant County, Cultural Education Facilities Finance, Trinity Basin Preparatory Project, Ser A, RB | | | | | | | | |
| Pre-Refunded @ 100 | | | | | | | | |
| 7.300%, 06/01/19(E) | | | 565 | | | | 617 | |
| Texas State, Private Activity Bond Surface Transportation, LBJ Infrastructure Project, RB | | | | | | | | |
| Callable 06/30/20 @ 100 | | | | | | | | |
| 7.000%, 06/30/40 | | | 5,165 | | | | 5,837 | |
| Texas State, Private Activity Bond Surface Transportation, NTE Mobility Project, RB | | | | | | | | |
| Callable 12/31/19 @ 100 | | | | | | | | |
| 6.875%, 12/31/39 | | | 5,350 | | | | 5,944 | |
| Texas State, Private Activity Bond Surface Transportation, SH 288 Toll Lanes Project, RB, AMT | | | | | | | | |
| Callable 12/31/25 @ 100 | | | | | | | | |
| 5.000%, 12/31/40 | | | 1,745 | | | | 1,932 | |
| Texas State, Private Activity Bond Surface Transportation, SH 288 Toll Lanes Project, RB, AMT | | | | | | | | |
| Callable 12/31/25 @ 100 | | | | | | | | |
| 5.000%, 12/31/45 | | | 1,000 | | | | 1,101 | |
| | | | | | | | | |
| Total Texas | | | | 121,742 | |
| | | | | | | | | |
| Virgin Islands [0.3%] | |
| Virgin Islands, Public Finance Authority, RB | | | | | | | | |
| Callable 10/01/20 @ 100 | | | | | | | | |
| 5.000%, 10/01/25 | | | 3,155 | | | | 2,280 | |
| Virgin Islands, Public Finance Authority, Sub-Ser, RB | | | | | | | | |
| Callable 10/01/19 @ 100 | | | | | | | | |
| 5.000%, 10/01/22 | | | 2,000 | | | | 1,375 | |
| | | | | | | | | |
| Total Virgin Islands | | | | 3,655 | |
| Virginia [1.4%] | |
| Cherry Hill, Community Development Authority, SAB | | | | | | | | |
| Callable 03/01/25 @ 100 | | | | | | | | |
| 5.400%, 03/01/45(B) | | | 2,000 | | | | 2,029 | |
| Cherry Hill, Community Development Authority, SAB | | | | | | | | |
| Callable 03/01/25 @ 100 | | | | | | | | |
| 5.150%, 03/01/35(B) | | | 1,000 | | | | 1,015 | |
| James City County, Economic Development Authority, United Methodist Home Project, Ser A, RB | | | | | | | | |
| Callable 06/01/23 @ 100 | | | | | | | | |
| 6.000%, 06/01/43 | | | 4,675 | | | | 4,609 | |
| Lower Magnolia Green, Community Development Authority, SAB | | | | | | | | |
| Callable 03/01/25 @ 100 | | | | | | | | |
| 5.000%, 03/01/45(B) | | | 4,030 | | | | 4,092 | |
| Tobacco Settlement Financing, Ser B1, RB | | | | | | | | |
| Callable 10/16/17 @ 100 | | | | | | | | |
| 5.000%, 06/01/47 | | | 4,310 | | | | 4,161 | |
| Virginia State, Small Business Financing Authority, Elizabeth River Project, RB, AMT | | | | | | | | |
| Callable 07/01/22 @ 100 | | | | | | | | |
| 6.000%, 01/01/37 | | | 820 | | | | 930 | |
| | | | | | | | | |
| Total Virginia | | | | 16,836 | |
| | | | | | | | | |
| Washington [0.6%] | |
| Washington State, Housing Finance Commission, Presbyterian Retirement Communities Northwest Projects, RB | | | | | | | | |
| Callable 01/01/25 @ 102 | | | | | | | | |
| 5.000%, 01/01/46(B) | | | 4,215 | | | | 4,438 | |
| Washington State, Housing Finance Commission, Rockwood Retirement Community Project, RB | | | | | | | | |
| Callable 01/01/24 @ 100 | | | | | | | | |
| 7.500%, 01/01/49(B) | | | 2,000 | | | | 2,351 | |
| | | | | | | | | |
| Total Washington | | | | 6,789 | |
See accompanying notes to financial statements.
CITY NATIONAL ROCHDALE FUNDS | PAGE 51
| schedule of investments |
| September 30, 2017 |
City National Rochdale Municipal High Income Fund (continued) |
| Description | | Face Amount (000) | | | Value (000) | |
| West Virginia [0.1%] | |
| West Virginia State, Economic Development Authority, RB, AMT | | | | | | |
| 2.875%, 12/15/26 | | $ | 1,825 | | | $ | 1,789 | |
| | | | | | | | | |
| Wisconsin [5.6%] | |
| Public Finance Authority, Airport Facilities, Senior Trips Obligation Group Project, Ser B, RB, AMT | | | | | | | | |
| Callable 07/01/22 @ 100 | | | | | | | | |
| 5.000%, 07/01/42 | | | 1,000 | | | | 1,070 | |
| Public Finance Authority, Coral Academy Project, RB | | | | | | | | |
| Callable 07/01/24 @ 100 | | | | | | | | |
| 5.625%, 07/01/44 | | | 3,500 | | | | 3,780 | |
| Public Finance Authority, Coral Academy Project, RB | | | | | | | | |
| Callable 07/01/24 @ 100 | | | | | | | | |
| 5.375%, 07/01/34 | | | 2,000 | | | | 2,197 | |
| Public Finance Authority, Las Ventanas Retirement Community Project, RB | | | | | | | | |
| Callable 10/01/20 @ 102 | | | | | | | | |
| 7.000%, 10/01/42 | | | 5,400 | | | | 5,429 | |
| Public Finance Authority, RB | | | | | | | | |
| Callable 11/01/26 @ 100 | | | | | | | | |
| 6.850%, 11/01/46(B) | | | 3,000 | | | | 3,079 | |
| Public Finance Authority, RB | | | | | | | | |
| Callable 04/01/25 @ 100 | | | | | | | | |
| 5.875%, 04/01/45 | | | 6,000 | | | | 6,572 | |
| Public Finance Authority, RB | | | | | | | | |
| Callable 03/01/25 @ 100 | | | | | | | | |
| 5.500%, 03/01/45(B) | | | 3,460 | | | | 3,601 | |
| Public Finance Authority, RB | | | | | | | | |
| Callable 03/01/25 @ 100 | | | | | | | | |
| 5.250%, 03/01/35(B) | | | 1,250 | | | | 1,302 | |
| Public Finance Authority, RB | | | | | | | | |
| Callable 06/01/26 @ 100 | | | | | | | | |
| 5.125%, 06/01/48(B) | | | 2,000 | | | | 2,019 | |
| Public Finance Authority, RB | | | | | | | | |
| Callable 02/01/26 @ 100 | | | | | | | | |
| 5.000%, 02/01/36(B) | | | 3,000 | | | | 2,885 | |
| Public Finance Authority, RB | | | | | | | | |
| Callable 06/01/26 @ 100 | | | | | | | | |
| 5.000%, 06/01/36(B) | | | 1,500 | | | | 1,513 | |
| Public Finance Authority, RB | | | | | | | | |
| Callable 09/01/24 @ 100 | | | | | | | | |
| 5.000%, 09/01/38(B) | | | 1,580 | | | | 1,616 | |
| Public Finance Authority, RB | | | | | | | | |
| Callable 06/01/26 @ 100 | | | | | | | | |
| 4.625%, 06/01/36(B) | | | 4,100 | | | | 3,976 | |
| Public Finance Authority, RB, AMT | | | | | | | | |
| Callable 08/01/26 @ 100 | | | | | | | | |
| 4.000%, 08/01/35 | | | 3,000 | | | | 2,921 | |
| Public Finance Authority, Ser A, RB | | | | | | | | |
| Callable 06/15/25 @ 100 | | | | | | | | |
| 5.500%, 06/15/35(B) | | | 3,000 | | | | 3,033 | |
| Public Finance Authority, Ser A, RB | | | | | | | | |
| Callable 06/15/25 @ 100 | | | | | | | | |
| 5.500%, 06/15/45(B) | | | 4,280 | | | | 4,290 | |
| Public Finance Authority, Ser C, RB, AMT | | | | | | | | |
| 5.000%, 07/01/22 | | | 1,415 | | | | 1,537 | |
| Public Finance Authority, Ser E, RB, AMT | | | | | | | | |
| Callable 07/01/22 @ 100 | | | | | | | | |
| 5.000%, 07/01/23 | | | 4,655 | | | | 5,098 | |
| Wisconsin State, Health & Educational Facilities Authority, RB | | | | | | | | |
| Callable 10/01/22 @ 102 | | | | | | | | |
| 5.500%, 10/01/49 | | | 2,500 | | | | 2,667 | |
| Wisconsin State, Health & Educational Facilities Authority, RB | | | | | | | | |
| Callable 12/01/22 @ 102 | | | | | | | | |
| 5.250%, 12/01/49 | | | 5,000 | | | | 5,309 | |
| Wisconsin State, Health & Educational Facilities Authority, Ser B, RB | | | | | | | | |
| Callable 09/15/22 @ 100 | | | | | | | | |
| 5.000%, 09/15/37 | | | 650 | | | | 692 | |
| Wisconsin State, Health & Educational Facilities Authority, Ser B, RB | | | | | | | | |
| Callable 09/15/22 @ 100 | | | | | | | | |
| 5.000%, 09/15/45 | | | 1,000 | | | | 1,058 | |
| | | | | | | | | |
| Total Wisconsin | | | | 65,644 | |
| | | | | | | | | |
| American Samoa [0.3%] | |
| American Samoa, Economic Development Authority, Ser A, RB | | | | | | | | |
| Callable 09/01/25 @ 100 | | | | | | | | |
| 6.625%, 09/01/35 | | | 3,000 | | | | 2,996 | |
See accompanying notes to financial statements.
CITY NATIONAL ROCHDALE FUNDS | PAGE 52
| schedule of investments |
| September 30, 2017 |
City National Rochdale Municipal High Income Fund (continued) |
| Description | | Face Amount (000) | | | Value (000) | |
| Guam [1.0%] | |
| Territory of Guam, Government Waterworks Authority, RB | | | | | | |
| Callable 07/01/20 @ 100 | | | | | | |
| 5.625%, 07/01/40 | | $ | 2,000 | | | $ | 2,123 | |
| Territory of Guam, Ser A, GO | | | | | | | | |
| Pre-Refunded @ 100 | | | | | | | | |
| 7.000%, 11/15/19(E) | | | 6,000 | | | | 6,735 | |
| Territory of Guam, Ser A, RB | | | | | | | | |
| Callable 12/01/26 @ 100 | | | | | | | | |
| 5.000%, 12/01/34 | | | 2,500 | | | | 2,778 | |
| | | | | | | | | |
| Total Guam | | | | 11,636 | |
| | | | | | | | | |
| Puerto Rico [0.6%] | |
| Children’s Trust Fund | | | | | | | | |
| Callable 10/30/17 @ 100 | | | | | | | | |
| 5.625%, 05/15/43 | | | 2,000 | | | | 2,002 | |
| Children’s Trust Fund, RB | | | | | | | | |
| Callable 10/30/17 @ 100 | | | | | | | | |
| 5.375%, 05/15/33 | | | 2,060 | | | | 2,062 | |
| Children’s Trust Fund, Ser A, RB | | | | | | | | |
| Callable 10/30/17 @ 13 | | | | | | | | |
| 8.663%, 05/15/50(C) | | | 25,000 | | | | 2,814 | |
| | | | | | | | | |
| Total Puerto Rico | | | | 6,878 | |
| | | | | | | | | |
| Total Municipal Bonds | |
| (Cost $1,045,053) | | | | 1,073,382 | |
| Description | | Shares | | | Value (000) | |
| Short-Term Investment [7.9%] | |
| SEI Daily Income Trust Government Fund, Cl F, 0.840%** | | | 93,036,740 | | | $ | 93,037 | |
| | | | | | | | | |
| Total Short-Term Investment | |
| (Cost $93,037) | | | | 93,037 | |
| | | | | | | | | |
| Total Investments [99.2%] | |
| (Cost $1,138,090) | | | $ | 1,166,419 | |
Percentages are based on Net Assets of $1,176,017 (000).
| ** | The rate reported is the 7-day effective yield as of September 30, 2017. |
| (A) | Step Bond — The rate reported is the rate in effect on September 30, 2017. The coupon on a step bond changes on a specific date. |
| (B) | Security exempt from registration under Rule 144A of the Securities Act of 1933. These securities may be resold in transactions exempt from registration normally to qualified institutions. On September 30, 2017, the value of these securities amounted to $158,612 (000), representing 13.5% of the net assets of the Fund. |
| (C) | Zero coupon security. The rate reported is the effective yield at time of purchase. |
| (D) | Variable or floating rate security, the interest rate of which adjusts periodically based on prevailing interest rates. |
| (E) | Pre-Refunded Security — The maturity date shown is the pre-refunded date. |
| (F) | Represents an investment in a tender option bond residual interest certificate purchased in a secondary market transaction. The interest rate shown bears an inverse relationship to the interest rate on a tender option bond floating rate certificate. The interest rate disclosed reflects the rate in effect on September 30, 2017. |
| (G) | In default on interest payments. Rate shown represents the last coupon rate prior to default. |
See accompanying notes to financial statements.
CITY NATIONAL ROCHDALE FUNDS | PAGE 53
| schedule of investments |
| September 30, 2017 |
City National Rochdale Municipal High Income Fund (concluded) |
AGM — Assured Guarantee Municipal
AMT — Alternative Minimum Tax (subject to)
Cl — Class
COP — Certificate of Participation
GO — General Obligation
NATL — National Public Finance Guarantee Corporation
RB — Revenue Bond
SAB — Special Assessment Board
Ser — Series
SPL Tax — Special Tax
TA — Tax Allocation
The following is a list of the inputs used as of September 30, 2017, is valuing the Fund’s investments and other financial instruments carried at value (000):
| Investments in Securities | | Level 1 | | | Level 2 | | | Level 3 | | | Total | |
| Municipal Bonds | | $ | — | | | $ | 1,073,382 | | | $ | — | | | $ | 1,073,382 | |
| Short-Term Investment | | | 93,037 | | | | — | | | | — | | | | 93,037 | |
| Total Investments in Securities | | $ | 93,037 | | | $ | 1,073,382 | | | $ | — | | | $ | 1,166,419 | |
For the year ended September 30, 2017, there have been no transfers between any of the fair value hierarchy levels. Transfers between Levels are recognized at period end.
The following is a summary of the transactions with affiliates for the year ended September 30, 2017 (000):
| | | City National Rochdale Government Money Market Fund,
Institutional Class | |
| Beginning balance as of 9/30/16 | | $ | 18,397 | |
| Purchases at Cost | | | 168,252 | |
| Proceeds from Sales | | | (186,649 | ) |
| Unrealized Gain (Loss) | | | — | |
| Realized Gain (Loss) | | | — | |
| Ending balance as of 9/30/17 | | $ | — | |
| Dividend Income | | $ | 15 | |
Amounts designated as “—“ are either $0 or have been rounded to $0.
For more information on valuation inputs, see Note 2 — Significant Accounting Policies in the Notes to Financial Statements.
See accompanying notes to financial statements.
CITY NATIONAL ROCHDALE FUNDS | PAGE 54
| schedule of investments |
| September 30, 2017 |
| City National Rochdale High Yield Bond Fund |
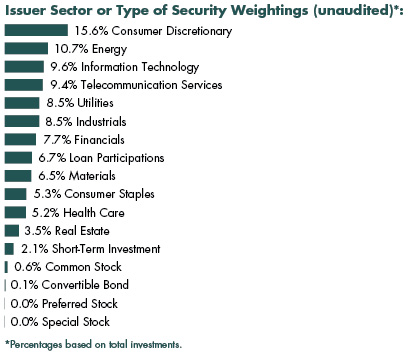
| Description | | Face Amount (000) | | | Value (000) | |
| Corporate Bonds [89.4%] | |
| Advertising Agencies [1.5%] | |
| MDC Partners | | | | | | |
| 6.500%, 05/01/24(A) | | $ | 1,125 | | | $ | 1,133 | |
| | | | | | | | | |
| Aerospace & Defense [0.6%] | |
| StandardAero Aviation Holdings | | | | | | | | |
| 10.000%, 07/15/23(A) | | | 420 | | | | 465 | |
| | | | | | | | | |
| Auto/Trk Prts and Equip-Repl [0.1%] | |
| Allison Transmission | | | | | | | | |
| 4.750%, 10/01/27(A) | | | 75 | | | | 76 | |
| | | | | | | | | |
| Automotive [1.2%] | |
| Midas Intermediate Holdco II | | | | | | | | |
| 7.875%, 10/01/22(A) | | | 650 | | | | 658 | |
| Tesla | | | | | | | | |
| 5.300%, 08/15/25(A) | | | 250 | | | | 244 | |
| | | | | | | | | |
| Total Automotive | | | | 902 | |
| | | | | | | | | |
| Autoparts [0.5%] | |
| Delphi Jersey Holdings | | | | | | | | |
| 5.000%, 10/01/25(A) | | | 350 | | | | 356 | |
| | | | | | | | | |
| Banks [1.0%] | |
| Capital One Financial | | | | | | | | |
| 3.750%, 07/28/26 | | | 250 | | | | 248 | |
| Compass Bank | | | | | | | | |
| 3.875%, 04/10/25 | | | 300 | | | | 299 | |
| PNC Financial Services Group | | | | | | | | |
| 5.000%, VAR ICE LIBOR USD 3 Month+3.300%, 12/29/49 | | | 200 | | | | 210 | |
| | | | | | | | | |
| Total Banks | | | | 757 | |
| | | | | | | | | |
| Batteries/Battery Sys [0.1%] | |
| EnerSys | | | | | | | | |
| 5.000%, 04/30/23(A) | | | 100 | | | | 104 | |
| | | | | | | | | |
| Broadcasting & Cable [9.4%] | |
| AMC Networks | | | | | | | | |
| 4.750%, 08/01/25 | | | 125 | | | | 126 | |
| Anixter | | | | | | | | |
| 5.500%, 03/01/23 | | | 450 | | | | 489 | |
| CCO Holdings | | | | | | | | |
| 5.125%, 05/01/27(A) | | | 1,000 | | | | 1,014 | |
| 5.000%, 02/01/28(A) | | | 400 | | | | 399 | |
| Charter Communications Operating | | | | | | | | |
| 4.200%, 03/15/28(A) | | | 200 | | | | 202 | |
| Comcast | | | | | | | | |
| 3.200%, 07/15/36 | | | 250 | | | | 235 | |
| CSC Holdings | | | | | | | | |
| 6.750%, 11/15/21 | | | 200 | | | | 221 | |
| 5.500%, 04/15/27(A) | | | 175 | | | | 182 | |
| 5.250%, 06/01/24 | | | 150 | | | | 152 | |
| DISH DBS | | | | | | | | |
| 7.750%, 07/01/26 | | | 500 | | | | 574 | |
| 5.875%, 07/15/22 | | | 450 | | | | 478 | |
| 5.875%, 11/15/24 | | | 300 | | | | 314 | |
| Midcontinent Communications | | | | | | | | |
| 6.875%, 08/15/23(A) | | | 300 | | | | 323 | |
| SFR Group | | | | | | | | |
| 7.375%, 05/01/26(A) | | | 950 | | | | 1,026 | |
| 6.250%, 05/15/24(A) | | | 200 | | | | 211 | |
| UPCB Finance IV | | | | | | | | |
| 5.375%, 01/15/25(A) | | | 200 | | | | 208 | |
| Videotron | | | | | | | | |
| 5.125%, 04/15/27(A) | | | 150 | | | | 156 | |
| Virgin Media Secured Finance | | | | | | | | |
| 5.000%, 04/15/27(A) | | | 350 | | | | 482 | |
| Ziggo Secured Finance | | | | | | | | |
| 5.500%, 01/15/27(A) | | | 150 | | | | 154 | |
| | | | | | | | | |
| Total Broadcasting & Cable | | | | 6,946 | |
| | | | | | | | | |
| Building & Construction [3.3%] | |
| CalAtlantic Group | | | | | | | | |
| 5.000%, 06/15/27 | | | 125 | | | | 126 | |
See accompanying notes to financial statements.
CITY NATIONAL ROCHDALE FUNDS | PAGE 55
| schedule of investments |
| September 30, 2017 |
City National Rochdale High Yield Bond Fund (continued) |
| Description | | Face Amount (000) | | | Value (000) | |
| Grinding Media | | | | | | |
| 7.375%, 12/15/23(A) | | $ | 900 | | | $ | 976 | |
| Novelis | | | | | | | | |
| 6.250%, 08/15/24(A) | | | 375 | | | | 391 | |
| 5.875%, 09/30/26(A) | | | 450 | | | | 457 | |
| Standard Industries | | | | | | | | |
| 5.000%, 02/15/27(A) | | | 100 | | | | 104 | |
| Summit Materials | | | | | | | | |
| 8.500%, 04/15/22 | | | 350 | | | | 394 | |
| | | | | | | | | |
| Total Building & Construction | | | | 2,448 | |
| | | | | | | | | |
| Building-Heavy Construct [0.5%] | |
| Tutor Perini | | | | | | | | |
| 6.875%, 05/01/25(A) | | | 325 | | | | 353 | |
| | | | | | | | | |
| Chemicals [1.1%] | |
| GCP Applied Technologies | | | | | | | | |
| 9.500%, 02/01/23(A) | | | 350 | | | | 395 | |
| PQ | | | | | | | | |
| 6.750%, 11/15/22(A) | | | 200 | | | | 217 | |
| Valvoline | | | | | | | | |
| 4.375%, 08/15/25(A) | | | 175 | | | | 178 | |
| | | | | | | | | |
| Total Chemicals | | | | 790 | |
| | | | | | | | | |
| Coal Mining [0.6%] | |
| CONSOL Energy | | | | | | | | |
| 8.000%, 04/01/23 | | | 400 | | | | 425 | |
| | | | | | | | | |
| Commercial Serv-Finance [0.9%] | |
| CDK Global | | | | | | | | |
| 4.875%, 06/01/27(A) | | | 100 | | | | 103 | |
| WEX | | | | | | | | |
| 4.750%, 02/01/23(A) | | | 550 | | | | 564 | |
| | | | | | | | | |
| Total Commercial Serv-Finance | | | | 667 | |
| | | | | | | | | |
| Commercial Services [0.8%] | |
| Nielsen Luxembourg SARL | | | | | | | | |
| 5.000%, 02/01/25(A) | | | 225 | | | | 234 | |
| ServiceMaster | | | | | | | | |
| 5.125%, 11/15/24(A) | | | 325 | | | | 334 | |
| | | | | | | | | |
| Total Commercial Services | | | | 568 | |
| | | | | | | | | |
| Communication & Media [0.2%] | |
| EW Scripps | | | | | | | | |
| 5.125%, 05/15/25(A) | | | 125 | | | | 127 | |
| | | | | | | | | |
| Computer Graphics [2.1%] | |
| Epicor Software | | | | | | | | |
| 9.250%, 05/21/23(A) (B) | | | 1,600 | | | | 1,563 | |
| | | | | | | | | |
| Computer System Design & Services [0.6%] | |
| NCR | | | | | | | | |
| 6.375%, 12/15/23 | | | 400 | | | | 427 | |
| | | | | | | | | |
| Consumer Products & Services [0.7%] | |
| Central Garden & Pet | | | | | | | | |
| 6.125%, 11/15/23 | | | 300 | | | | 319 | |
| WMG Acquisition | | | | | | | | |
| 5.000%, 08/01/23(A) | | | 200 | | | | 207 | |
| | | | | | | | | |
| Total Consumer Products & Services | | | | 526 | |
| | | | | | | | | |
| Containers & Packaging [0.5%] | |
| BWAY Holding | | | | | | | | |
| 5.500%, 04/15/24(A) | | | 200 | | | | 209 | |
| Multi-Color | | | | | | | | |
| 4.875%, 11/01/25(A) | | | 60 | | | | 61 | |
| Reynolds Group Issuer | | | | | | | | |
| 6.875%, 02/15/21 | | | 130 | | | | 133 | |
| | | | | | | | | |
| Total Containers & Packaging | | | | 403 | |
| | | | | | | | | |
| Data Processing/Mgmt [0.7%] | |
| First Data | | | | | | | | |
| 7.000%, 12/01/23(A) | | | 200 | | | | 213 | |
| 5.750%, 01/15/24(A) | | | 300 | | | | 314 | |
| | | | | | | | | |
| Total Data Processing/Mgmt | | | | 527 | |
| | | | | | | | | |
| Distribution/Wholesale [0.2%] | |
| Avantor | | | | | | | | |
| 6.000%, 10/01/24(A) | | | 150 | | | | 154 | |
| | | | | | | | | |
| Diversified Operations [0.7%] | |
| Actuant | | | | | | | | |
| 5.625%, 06/15/22 | | | 75 | | | | 77 | |
| Amsted Industries | | | | | | | | |
| 5.375%, 09/15/24(A) | | | 450 | | | | 473 | |
| | | | | | | | | |
| Total Diversified Operations | | | | 550 | |
| | | | | | | | | |
| Drugs [1.7%] | |
| Endo Dac | | | | | | | | |
| 5.875%, 10/15/24(A) | | | 200 | | | | 209 | |
See accompanying notes to financial statements.
CITY NATIONAL ROCHDALE FUNDS | PAGE 56
| schedule of investments |
| September 30, 2017 |
City National Rochdale High Yield Bond Fund (continued) |
| Description | | Face Amount (000) | | | Value (000) | |
| Valeant Pharmaceuticals International | | | | | | |
| 7.000%, 03/15/24(A) | | $ | 800 | | | $ | 854 | |
| 6.500%, 03/15/22(A) | | | 200 | | | | 212 | |
| | | | | | | | | |
| Total Drugs | | | | 1,275 | |
| | | | | | | | | |
| Educational Software [1.2%] | |
| Ascend Learning | | | | | | | | |
| 6.875%, 08/01/25(A) | | | 75 | | | | 79 | |
| Cengage Learning | | | | | | | | |
| 9.500%, 06/15/24(A) | | | 925 | | | | 805 | |
| | | | | | | | | |
| Total Educational Software | | | | 884 | |
| | | | | | | | | |
| Electric Utilities [2.6%] | |
| AES | | | | | | | | |
| 6.000%, 05/15/26 | | | 650 | | | | 700 | |
| 5.125%, 09/01/27 | | | 100 | | | | 102 | |
| Terraform Global Operating | | | | | | | | |
| 9.750%, 08/15/22(A) | | | 1,000 | | | | 1,110 | |
| | | | | | | | | |
| Total Electric Utilities | | | | 1,912 | |
| | | | | | | | | |
| Energy & Power [1.2%] | |
| Pattern Energy Group | | | | | | | | |
| 5.875%, 02/01/24(A) | | | 250 | | | | 264 | |
| TerraForm Power Operating | | | | | | | | |
| 6.375%, 02/01/23(A) (C) | | | 450 | | | | 468 | |
| 6.125%, 06/15/25(A) (C) | | | 125 | | | | 133 | |
| | | | | | | | | |
| Total Energy & Power | | | | 865 | |
| | | | | | | | | |
| Enterprise Software/Serv [1.2%] | |
| Infor US | | | | | | | | |
| 6.500%, 05/15/22 | | | 650 | | | | 674 | |
| Oracle | | | | | | | | |
| 3.850%, 07/15/36 | | | 200 | | | | 207 | |
| | | | | | | | | |
| Total Enterprise Software/Serv | | | | 881 | |
| | | | | | | | | |
| Entertainment & Gaming [1.8%] | |
| AMC Entertainment Holdings | | | | | | | | |
| 6.125%, 05/15/27 | | | 375 | | | | 370 | |
| 5.875%, 11/15/26 | | | 75 | | | | 74 | |
| Buffalo Thunder Development Authority | | | | | | | | |
| 11.000%, 12/09/22(A) (B) | | | 35 | | | | 13 | |
| 9.375%, 11/15/29(A) (B) (D) | | | 16 | | | | — | |
| Seminole Hard Rock Entertainment | | | | | | | | |
| 5.875%, 05/15/21(A) | | | 450 | | | | 455 | |
| Wynn Las Vegas | | | | | | | | |
| 5.500%, 03/01/25(A) | | | 375 | | | | 391 | |
| | | | �� | | | | | |
| Total Entertainment & Gaming | | | | 1,303 | |
| | | | | | | | | |
| Financial Services [5.2%] | |
| FBM Finance | | | | | | | | |
| 8.250%, 08/15/21(A) | | | 800 | | | | 856 | |
| Icahn Enterprises | | | | | | | | |
| 5.875%, 02/01/22 | | | 650 | | | | 669 | |
| Jefferies Finance | | | | | | | | |
| 7.500%, 04/15/21(A) | | | 350 | | | | 362 | |
| 7.375%, 04/01/20(A) | | | 495 | | | | 510 | |
| 7.250%, 08/15/24(A) | | | 300 | | | | 301 | |
| 6.875%, 04/15/22(A) | | | 200 | | | | 201 | |
| Jefferies LoanCore | | | | | | | | |
| 6.875%, 06/01/20(A) | | | 450 | | | | 465 | |
| NewStar Financial | | | | | | | | |
| 7.250%, 05/01/20(A) | | | 450 | | | | 464 | |
| | | | | | | | | |
| Total Financial Services | | | | 3,828 | |
| | | | | | | | | |
| Food, Beverage & Tobacco [2.4%] | |
| Beverages & More | | | | | | | | |
| 11.500%, 06/15/22(A) | | | 200 | | | | 187 | |
| FAGE International | | | | | | | | |
| 5.625%, 08/15/26(A) | | | 200 | | | | 208 | |
| Vector Group | | | | | | | | |
| 6.125%, 02/01/25(A) | | | 1,350 | | | | 1,397 | |
| | | | | | | | | |
| Total Food, Beverage & Tobacco | | | | 1,792 | |
| | | | | | | | | |
| Food-Flour and Grain [0.6%] | |
| Post Holdings | | | | | | | | |
| 5.500%, 03/01/25(A) | | | 450 | | | | 467 | |
| | | | | | | | | |
| Food-Wholesale/Distrib [0.5%] | |
| KeHE Distributors | | | | | | | | |
| 7.625%, 08/15/21(A) | | | 370 | | | | 372 | |
| | | | | | | | | |
| Gas-Distribution [1.9%] | |
| AmeriGas Partners | | | | | | | | |
| 5.750%, 05/20/27 | | | 275 | | | | 281 | |
| 5.500%, 05/20/25 | | | 100 | | | | 103 | |
| LBC Tank Terminals Holding Netherlands | | | | | | | | |
| 6.875%, 05/15/23(A) | | | 950 | | | | 997 | |
| | | | | | | | | |
| Total Gas-Distribution | | | | 1,381 | |
See accompanying notes to financial statements.
CITY NATIONAL ROCHDALE FUNDS | PAGE 57
| schedule of investments |
| September 30, 2017 |
City National Rochdale High Yield Bond Fund (continued) |
| Description | | Face Amount (000) | | | Value (000) | |
| Gold Mining [1.7%] | |
| Eldorado | | | | | | |
| 6.125%, 12/15/20(A) | | $ | 950 | | | $ | 965 | |
| Yamana | | | | | | | | |
| 4.950%, 07/15/24 | | | 300 | | | | 308 | |
| | | | | | | | | |
| Total Gold Mining | | | | 1,273 | |
| | | | | | | | | |
| Hotels and Motels [0.6%] | |
| Interval Acquisition | | | | | | | | |
| 5.625%, 04/15/23 | | | 150 | | | | 155 | |
| TVL Finance | | | | | | | | |
| 8.500%, 05/15/23(A) | | | 180 | | | | 266 | |
| | | | | | | | | |
| Total Hotels and Motels | | | | 421 | |
| | | | | | | | | |
| Human Resources [0.3%] | |
| AMN Healthcare | | | | | | | | |
| 5.125%, 10/01/24(A) | | | 200 | | | | 207 | |
| | | | | | | | | |
| Insurance [1.0%] | |
| American Equity Investment Life Holding | | | | | | | | |
| 5.000%, 06/15/27 | | | 275 | | | | 285 | |
| Fidelity & Guaranty Life Holdings | | | | | | | | |
| 6.375%, 04/01/21(A) | | | 150 | | | | 154 | |
| USIS Merger Sub | | | | | | | | |
| 6.875%, 05/01/25(A) | | | 300 | | | | 306 | |
| | | | | | | | | |
| Total Insurance | | | | 745 | |
| | | | | | | | | |
| Internet Connectiv Svcs [0.8%] | |
| Zayo Group | | | | | | | | |
| 6.375%, 05/15/25 | | | 300 | | | | 323 | |
| 5.750%, 01/15/27(A) | | | 250 | | | | 265 | |
| | | | | | | | | |
| Total Internet Connectiv Svcs | | | | 588 | |
| | | | | | | | | |
| Investment Bank/Broker-Dealer [0.2%] | |
| NFP | | | | | | | | |
| 6.875%, 07/15/25(A) | | | 125 | | | | 127 | |
| | | | | | | | | |
| Machinery-General Indust [0.1%] | |
| Tennant | | | | | | | | |
| 5.625%, 05/01/25(A) | | | 100 | | | | 104 | |
| | | | | | | | | |
| Marine Services [1.1%] | |
| Great Lakes Dredge & Dock | | | | | | | | |
| 8.000%, 05/15/22 | | | 750 | | | | 778 | |
| | | | | | | | | |
| Medical Products & Services [2.9%] | |
| Acadia Healthcare | | | | | | | | |
| 6.500%, 03/01/24 | | | 200 | | | | 215 | |
| 5.625%, 02/15/23 | | | 250 | | | | 262 | |
| Halyard Health | | | | | | | | |
| 6.250%, 10/15/22 | | | 400 | | | | 417 | |
| HCA | | | | | | | | |
| 5.500%, 06/15/47 | | | 200 | | | | 207 | |
| Hill-Rom Holdings | | | | | | | | |
| 5.000%, 02/15/25(A) | | | 160 | | | | 166 | |
| Tenet Healthcare | | | | | | | | |
| 7.500%, 01/01/22(A) | | | 335 | | | | 355 | |
| 5.125%, 05/01/25(A) | | | 200 | | | | 197 | |
| 4.625%, 07/15/24(A) | | | 350 | | | | 347 | |
| | | | | | | | | |
| Total Medical Products & Services | | | | 2,166 | |
| | | | | | | | | |
| Metals & Mining [2.1%] | |
| Alcoa Nederland Holding | | | | | | | | |
| 7.000%, 09/30/26(A) | | | 200 | | | | 226 | |
| 6.750%, 09/30/24(A) | | | 800 | | | | 886 | |
| Constellium | | | | | | | | |
| 7.875%, 04/01/21(A) | | | 300 | | | | 318 | |
| Kaiser Aluminum | | | | | | | | |
| 5.875%, 05/15/24(A) | | | 100 | | | | 107 | |
| New Day Aluminum | | | | | | | | |
| 10.000%, 10/25/20(B) | | | 6 | | | | 6 | |
| | | | | | | | | |
| Total Metals & Mining | | | | 1,543 | |
| | | | | | | | | |
| Oil-Field Services [0.8%] | |
| Exterran Energy Solutions | | | | | | | | |
| 8.125%, 05/01/25(A) | | | 475 | | | | 492 | |
| Trinidad Drilling | | | | | | | | |
| 6.625%, 02/15/25(A) | | | 125 | | | | 117 | |
| | | | | | | | | |
| Total Oil-Field Services | | | | 609 | |
| | | | | | | | | |
| Paper & Related Products [0.3%] | |
| Clearwater Paper | | | | | | | | |
| 5.375%, 02/01/25(A) | | | 225 | | | | 224 | |
| | | | | | | | | |
| Petroleum & Fuel Products [9.9%] | |
| Alta Mesa Holdings | | | | | | | | |
| 7.875%, 12/15/24(A) | | | 400 | | | | 432 | |
| American Midstream Partners | | | | | | | | |
| 8.500%, 12/15/21(A) | | | 825 | | | | 852 | |
| Antero Resources | | | | | | | | |
| 5.625%, 06/01/23 | | | 350 | | | | 365 | |
| 5.125%, 12/01/22 | | | 350 | | | | 358 | |
See accompanying notes to financial statements.
CITY NATIONAL ROCHDALE FUNDS | PAGE 58
| schedule of investments |
| September 30, 2017 |
City National Rochdale High Yield Bond Fund (continued) |
| Description | | Face Amount (000) | | | Value (000) | |
| Callon Petroleum | | | | | | |
| 6.125%, 10/01/24 | | $ | 150 | | | $ | 155 | |
| Cheniere Corpus Christi Holdings | | | | | | | | |
| 7.000%, 06/30/24 | | | 100 | | | | 114 | |
| 5.125%, 06/30/27(A) | | | 150 | | | | 154 | |
| Comstock Resources | | | | | | | | |
| 10.000% cash/12.250% PIK, 03/15/20 | | | 400 | | | | 398 | |
| Covey Park Energy | | | | | | | | |
| 7.500%, 05/15/25(A) | | | 345 | | | | 357 | |
| Crestwood Midstream Partners | | | | | | | | |
| 6.250%, 04/01/23 | | | 150 | | | | 155 | |
| 5.750%, 04/01/25 | | | 150 | | | | 153 | |
| EP Energy | | | | | | | | |
| 8.000%, 02/15/25(A) | | | 250 | | | | 195 | |
| 6.375%, 06/15/23 | | | 400 | | | | 246 | |
| Gibson Energy | | | | | | | | |
| 5.250%, 07/15/24(A) | | | 450 | | | | 360 | |
| Legacy Reserves | | | | | | | | |
| 8.000%, 12/01/20 | | | 760 | | | | 524 | |
| 6.625%, 12/01/21 | | | 600 | | | | 379 | |
| Murphy Oil | | | | | | | | |
| 5.750%, 08/15/25 | | | 75 | | | | 77 | |
| NGPL PipeCo | | | | | | | | |
| 4.875%, 08/15/27(A) | | | 200 | | | | 210 | |
| PDC Energy | | | | | | | | |
| 7.750%, 10/15/22 | | | 75 | | | | 78 | |
| QEP Resources | | | | | | | | |
| 6.875%, 03/01/21 | | | 50 | | | | 53 | |
| 5.375%, 10/01/22 | | | 200 | | | | 196 | |
| 5.250%, 05/01/23 | | | 400 | | | | 389 | |
| Summit Midstream Holdings | | | | | | | | |
| 5.750%, 04/15/25 | | | 300 | | | | 305 | |
| Unit | | | | | | | | |
| 6.625%, 05/15/21 | | | 850 | | | | 852 | |
| | | | | | | | | |
| Total Petroleum & Fuel Products | | | | 7,357 | |
| | | | | | | | | |
| Publishing-Books [1.1%] | |
| McGraw-Hill Global Education Holdings | | | | | | | | |
| 7.875%, 05/15/24(A) | | | 850 | | | | 838 | |
| | | | | | | | | |
| Radio [1.1%] | |
| Sirius XM Radio | | | | | | | | |
| 5.375%, 07/15/26(A) | | | 400 | | | | 421 | |
| 5.000%, 08/01/27(A) | | | 200 | | | | 204 | |
| 3.875%, 08/01/22(A) | | | 200 | | | | 205 | |
| | | | | | | | | |
| Total Radio | | | | 830 | |
| | | | | | | | | |
| Real Estate [1.3%] | |
| Kennedy-Wilson | | | | | | | | |
| 5.875%, 04/01/24 | | | 905 | | | | 932 | |
| | | | | | | | | |
| Real Estate Investment Trusts [2.2%] | |
| CyrusOne | | | | | | | | |
| 5.000%, 03/15/24(A) | | | 200 | | | | 211 | |
| GEO Group | | | | | | | | |
| 6.000%, 04/15/26 | | | 400 | | | | 421 | |
| 5.875%, 10/15/24 | | | 200 | | | | 209 | |
| Hospitality Properties Trust | | | | | | | | |
| 4.500%, 03/15/25(A) | | | 550 | | | | 565 | |
| iStar | | | | | | | | |
| 5.250%, 09/15/22 | | | 60 | | | | 61 | |
| 4.625%, 09/15/20 | | | 65 | | | | 66 | |
| SBA Communications | | | | | | | | |
| 4.000%, 10/01/22(A) | | | 75 | | | | 75 | |
| | | | | | | | | |
| Total Real Estate Investment Trusts | | | | 1,608 | |
| | | | | | | | | |
| Real Estate Oper/Develop [0.6%] | |
| Greystar Real Estate Partners | | | | | | | | |
| 8.250%, 12/01/22(A) | | | 400 | | | | 427 | |
| | | | | | | | | |
| Regional Authority [0.0%] | |
| Mashantucket Western Pequot Tribe | | | | | | | | |
| 6.500% cash/6.500% PIK, 07/01/36(B) | | | 93 | | | | — | |
| | | | | | | | | |
| Retail [5.1%] | |
| Albertsons | | | | | | | | |
| 6.625%, 06/15/24 | | | 25 | | | | 23 | |
| 5.750%, 03/15/25 | | | 300 | | | | 264 | |
| Carrols Restaurant | | | | | | | | |
| 8.000%, 05/01/22 | | | 200 | | | | 213 | |
| Carrols Restaurant Group | | | | | | | | |
| 8.000%, 05/01/22(A) | | | 150 | | | | 159 | |
| Cumberland Farms | | | | | | | | |
| 6.750%, 05/01/25(A) | | | 300 | | | | 319 | |
| Ferrellgas | | | | | | | | |
| 6.750%, 01/15/22 | | | 500 | | | | 485 | |
| 6.750%, 06/15/23 | | | 700 | | | | 676 | |
| 6.500%, 05/01/21 | | | 100 | | | | 97 | |
| L Brands | | | | | | | | |
| 6.750%, 07/01/36 | | | 300 | | | | 290 | |
| Lithia Motors | | | | | | | | |
| 5.250%, 08/01/25(A) | | | 200 | | | | 208 | |
| Nathan’s Famous | | | | | | | | |
| 10.000%, 03/15/20(A) | | | 425 | | | | 444 | |
| PetSmart | | | | | | | | |
| 5.875%, 06/01/25(A) | | | 200 | | | | 175 | |
See accompanying notes to financial statements.
CITY NATIONAL ROCHDALE FUNDS | PAGE 59
| schedule of investments |
| September 30, 2017 |
City National Rochdale High Yield Bond Fund (continued) |
| Description | | Face Amount (000) | | | Value (000) | |
| Reliance Intermediate Holdings | | | | | | |
| 6.500%, 04/01/23(A) | | $ | 400 | | | $ | 425 | |
| | | | | | | | | |
| Total Retail | | | | 3,778 | |
| | | | | | | | | |
| Security Brokers & Dealers [0.6%] | |
| Citigroup | | | | | | | | |
| 6.300%, VAR ICE LIBOR USD 3 Month+3.423%, 12/29/49 | | | 400 | | | | 434 | |
| | | | | | | | | |
| Semi-Conductors [1.4%] | |
| Micron Technology | | | | | | | | |
| 7.500%, 09/15/23 | | | 385 | | | | 428 | |
| 5.250%, 08/01/23(A) | | | 550 | | | | 574 | |
| | | | | | | | | |
| Total Semi-Conductors | | | | 1,002 | |
| | | | | | | | | |
| Steel & Steel Works [0.5%] | |
| Big River Steel | | | | | | | | |
| 7.250%, 09/01/25(A) | | | 200 | | | | 212 | |
| Commercial Metals | | | | | | | | |
| 5.375%, 07/15/27 | | | 125 | | | | 131 | |
| | | | | | | | | |
| Total Steel & Steel Works | | | | 343 | |
| | | | | | | | | |
| Telephones & Telecommunications [2.3%] | |
| Altice US Finance I | | | | | | | | |
| 5.375%, 07/15/23(A) | | | 350 | | | | 370 | |
| CSC Holdings | | | | | | | | |
| 6.625%, 10/15/25(A) | | | 200 | | | | 219 | |
| Inmarsat Finance | | | | | | | | |
| 4.875%, 05/15/22(A) | | | 550 | | | | 561 | |
| Nokia | | | | | | | | |
| 4.375%, 06/12/27 | | | 200 | | | | 206 | |
| Virgin Media Finance | | | | | | | | |
| 6.375%, 04/15/23(A) | | | 350 | | | | 366 | |
| | | | | | | | | |
| Total Telephones & Telecommunications | | | | 1,722 | |
| | | | | | | | | |
| Transportation & Logistics [0.1%] | |
| Wabash National | | | | | | | | |
| 5.500%, 10/01/25(A) | | | 90 | | | | 92 | |
| | | | | | | | | |
| Transportation Services [1.1%] | |
| HRG Group | | | | | | | | |
| 7.875%, 07/15/19 | | | 504 | | | | 514 | |
| Sabre GLBL | | | | | | | | |
| 5.250%, 11/15/23(A) | | | 300 | | | | 308 | |
| | | | | | | | | |
| Total Transportation Services | | | | 822 | |
| | | | | | | | | |
| Utility [1.1%] | |
| Suburban Propane Partners | | | | | | | | |
| 5.875%, 03/01/27 | | | 250 | | | | 248 | |
| 5.750%, 03/01/25 | | | 250 | | | | 247 | |
| 5.500%, 06/01/24 | | | 350 | | | | 352 | |
| | | | | | | | | |
| Total Utility | | | | 847 | |
| | | | | | | | | |
| Waste Disposal [0.1%] | |
| Wrangler Buyer | | | | | | | | |
| 6.000%, 10/01/25(A) | | | 60 | | | | 61 | |
| | | | | | | | | |
| Web Hosting/Design [1.4%] | |
| EIG Investors | | | | | | | | |
| 10.875%, 02/01/24 | | | 850 | | | | 935 | |
| VeriSign | | | | | | | | |
| 4.750%, 07/15/27 | | | 100 | | | | 103 | |
| | | | | | | | | |
| Total Web Hosting/Design | | | | 1,038 | |
| | | | | | | | | |
| Total Corporate Bonds | |
| (Cost $65,037) | | | | 66,143 | |
| | | | | | | | | |
| Loan Participations [6.6%] | |
| Automotive [0.7%] | |
| Mavis Tire Supply, Term Loan | | | | | | | | |
| 6.485%, 11/02/20(B) | | | 538 | | | | 533 | |
| | | | | | | | | |
| Communications [0.7%] | |
| TIBCO Software, Term Loan B, 1st Lien | | | | | | | | |
| 4.740%, 12/04/20 | | | 536 | | | | 538 | |
| | | | | | | | | |
| Computers & Electronics [0.5%] | |
| Advanced Computer, Term Loan, 1st Lien | | | | | | | | |
| 10.815%, 01/31/23 | | | 400 | | | | 370 | |
| | | | | | | | | |
| Energy [0.5%] | |
| Invenergy Thermal, Term Loan, 1st Lien | | | | | | | | |
| 6.833%, 10/19/22(B) | | | 413 | | | | 392 | |
| | | | | | | | | |
| Financial [0.3%] | |
| Acrisure, Term Loan, 1st Lien | | | | | | | | |
| 6.272%, 11/22/23(F) (G) | | | 193 | | | | 195 | |
| | | | | | | | | |
| Healthcare [0.1%] | |
| Surgery Center Holdings, Term Loan B | | | | | | | | |
| 4.490%, 06/20/24(F) (G) | | | 100 | | | | 99 | |
See accompanying notes to financial statements.
CITY NATIONAL ROCHDALE FUNDS | PAGE 60
| schedule of investments |
| September 30, 2017 |
City National Rochdale High Yield Bond Fund (continued) |
| Description | | Face Amount (000) | | | Value (000) | |
| Information Technology [0.9%] | |
| CCC Information, Term Loan, 1st Lien | | | | | | |
| 4.240%, 04/29/24(F) (G) | | $ | 349 | | | $ | 348 | |
| Project Alpha Intermediate Holding, Term Loan B | | | | | | | | |
| 4.810%, 04/19/24(G) | | | 295 | | | | 287 | |
| | | | | | | | | |
| Total Information Technology | | | | 635 | |
| | | | | | | | | |
| Oil & Gas [0.8%] | |
| Cactus Wellhead, Term Loan, 1st Lien | | | | | | | | |
| 7.317%, 07/31/20 | | | 339 | | | | 329 | |
| Moss Creek, Term Loan, 1st Lien | | | | | | | | |
| 9.500%, 03/29/22(B) | | | 272 | | | | 269 | |
| | | | | | | | | |
| Total Oil & Gas | | | | 598 | |
| | | | | | | | | |
| Retail [1.4%] | |
| Authentic Brands, Term Loan, 1st Lien | | | | | | | | |
| 4.833%, 09/26/24 | | | 125 | | | | 125 | |
| Belk, Term Loan, 1st Lien | | | | | | | | |
| 6.054%, 12/12/22 | | | 228 | | | | 191 | |
| Blue Nile, Term Loan, 1st Lien | | | | | | | | |
| 7.833%, 01/20/23(B) (F) | | | 173 | | | | 172 | |
| Hardware Holdings, Term Loan B | | | | | | | | |
| 7.833%, 03/30/20(B) | | | 333 | | | | 323 | |
| Sears Roebuck Acceptance, Term Loan B | | | | | | | | |
| 5.735%, 06/30/18 | | | 224 | | | | 221 | |
| | | | | | | | | |
| Total Retail | | | | 1,032 | |
| | | | | | | | | |
| Specialty Apparel Stores [0.7%] | |
| Boot Barn, Term Loan, 1st Lien | | | | | | | | |
| 5.833%, 06/24/21(B) | | | 513 | | | | 492 | |
| | | | | | | | | |
| Total Loan Participations | |
| (Cost $4,899) | | | | 4,884 | |
| Description | | Shares/ Face Amount (000) | | | Value (000) | |
| Common Stock [0.6%] | |
| Electronic Equipment & Instruments [0.0%] | |
| CUI * (B) (H) (I) | | | — | | | $ | 8 | |
| | | | | | | | | |
| Metals & Mining [0.0%] | |
| Mirabela Nickel * (B) (H) (I) | | | 2,465,571 | | | | — | |
| | | | | | | | | |
| Miscellaneous Manufacturing [0.0%] | |
| CEVA Group * (B) (I) | | | 22 | | | | 9 | |
| | | | | | | | | |
| Oil, Gas & Consumable Fuels [0.6%] | |
| Approach Resources * | | | 5,520 | | | | 14 | |
| SandRidge Energy * | | | 16,758 | | | | 337 | |
| Titan Energy * (B) | | | 11,458 | | | | 51 | |
| | | | | | | | | |
| Total Oil, Gas & Consumable Fuels | | | | 402 | |
| | | | | | | | | |
| Petroleum & Fuel Products [0.0%] | |
| MWO * | | | 130 | | | | 13 | |
| | | | | | | | | |
| Total Common Stock | |
| (Cost $1,149) | | | | 432 | |
| | | | | | | | | |
| Convertible Bond [0.1%] | |
| Metals & Mining [0.1%] | |
| Mirabela Nickel | | | | | | | | |
| 9.500% cash/9.500% PIK, 06/24/19(A) (B) (D) (I) | | $ | 653 | | | | 59 | |
| | | | | | | | | |
| Total Convertible Bond | |
| (Cost $653) | | | | 59 | |
| | | | | | | | | |
| Preferred Stock [0.0%] | |
| Miscellaneous Manufacturing [0.0%] | |
| CEVA Group, Ser A2 * (B) | | | 49 | | | | 19 | |
| | | | | | | | | |
| Total Preferred Stock | |
| (Cost $44) | | | | 19 | |
| | | | | | | | | |
| Special Stock [0.0%] | |
| Broadcasting & Cable [0.0%] | |
| Adelphia Recovery Trust (H) (I) | | | 8,500 | | | | — | |
| | | | | | | | | |
| Total Special Stock | |
| (Cost $9) | | | | — | |
See accompanying notes to financial statements.
CITY NATIONAL ROCHDALE FUNDS | PAGE 61
| schedule of investments |
| September 30, 2017 |
City National Rochdale High Yield Bond Fund (continued) |
| Description | | Shares | | | Value (000) | |
| Short-Term Investment [2.1%] | |
| SEI Daily Income Trust Government Fund, Cl F, 0.840%** | | | 1,557,324 | | | $ | 1,557 | |
| | | | | | | | | |
| Total Short-Term Investment | |
| (Cost $1,557) | | | | 1,557 | |
| | | | | | | | | |
| Total Investments [98.8%] | |
| (Cost $73,348) | | | $ | 73,094 | |
Percentages are based on Net Assets of $73,947 (000).
| * | Non-income producing security. |
| ** | The rate reported is the 7-day effective yield as of September 30, 2017. |
| (A) | Security exempt from registration under Rule 144A of the Securities Act of 1933. These securities may be resold in transactions exempt from registration normally to qualified institutions. On September 30, 2017, the value of these securities amounted to $42,687 (000), representing 57.7% of the net assets of the Fund. |
| (B) | Security is considered illiquid. The total market value of such security as of September 30, 2017, was $3,909 (000) and represented 5.3% of the net assets of the Fund. |
| (C) | Step Bond — The rate reported is the rate in effect on September 30, 2017. The coupon on a step bond changes on a specific date. |
| (D) | In default on interest payments. Rate shown represents the last coupon rate prior to default. |
| (E) | Unfunded bank loan. Interest rate not available. |
| (G) | Variable or floating rate security, the interest rate of which adjusts periodically based on changes in current interest rates and prepayments on the underlying pool of assets. |
| (H) | Security fair valued using methods determined in good faith by the Fair Value Committee designated by the Board of Trustees. The total market value of such security as of September 30, 2017, was $8 (000) and represented 0.0% of the net assets of the Fund. |
| (I) | Level 3 security in accordance with fair value hierarchy. |
CAD — Canadian Dollar
Cl — Class
GBP — British Pound Sterling
ICE — Intercontinental Exchange
LIBOR — London Interbank Offered Rates
PIK — Payment in-kind
Ser — Series
USD — United States Dollar
VAR — Variable
A list of the open forward foreign currency contracts held by the Fund at September 30, 2017, is as follows:
| Counterparty | Settlement Date | Currency to
Deliver
(000) | | Currency to
Receive
(000) | | | Unrealized
Appreciation (Depreciation) (000) | |
| JPMorgan Chase Bank | 10/12/17 | CAD | | | 453 | | USD | | | 373 | | | $ | 10 | |
| Robert W. Baird | 10/12/17 | GBP | | | 583 | | USD | | | 769 | | | | (13 | ) |
| | | | | | | | | | | | | | $ | (3 | ) |
The following is a list of the inputs used as of September 30, 2017, in valuing the Fund’s investments carried at value (000):
| Investments in Securities | | Level 1 | | | Level 2 | | | Level 3(1) | | | Total | |
| Corporate Bonds | | $ | — | | | $ | 66,143 | | | $ | — | | | $ | 66,143 | |
| Loan Participations | | | — | | | | 4,884 | | | | — | | | | 4,884 | |
| Common Stock | | | 415 | | | | — | | | | 17 | | | | 432 | |
| Convertible Bond | | | — | | | | — | | | | 59 | | | | 59 | |
| Preferred Stock | | | — | | | | 19 | | | | — | | | | 19 | |
| Special Stock | | | — | | | | — | | | | — | | | | — | |
| Short-Term Investment | | | 1,557 | | | | — | | | | — | | | | 1,557 | |
| Total Investments in Securities | | $ | 1,972 | | | $ | 71,046 | | | $ | 76 | | | $ | 73,094 | |
| Other Financial Instruments | | Level 1 | | | Level 2 | | | Level 3 | | | Total | |
| Forwards Contracts* | | | | | | | | | | | | |
| Unrealized Appreciation | | $ | — | | | $ | 10 | | | $ | — | | | $ | 10 | |
| Unrealized Depreciation | | | — | | | | (13 | ) | | | — | | | | (13 | ) |
| Total Securities Sold Short | | $ | — | | | $ | (3 | ) | | $ | — | | | $ | (3 | ) |
| * | Forwards contracts are valued at the unrealized appreciation (depreciation) on the instrument. |
| (1) | Of the $76 (000) of Level 3 securities as of September 30, 2017, $8 (000) in common stock are valued via third party pricing vendors and broker quotes. If significant, the disclosure of the unobservable inputs is required for those Level 3 securities that are not valued by third party pricing vendors or broker quotes. |
See accompanying notes to financial statements.
CITY NATIONAL ROCHDALE FUNDS | PAGE 62
| schedule of investments |
| September 30, 2017 |
City National Rochdale High Yield Bond Fund (concluded) |
The following is a reconciliation of investments in which significant unobservable inputs (Level 3) were used in determining value as of September 30, 2017:
| | | Investments in
Corporate Bonds
(000) | | | Investments in
Common Stock
(000) | | | Investments in
Convertible Bond
(000) | |
| Beginning balance as of 10/1/16 | | $ | 332 | | | $ | 16 | | | $ | 183 | |
| Accrued discounts/ premiums | | | 3 | | | | — | | | | — | |
| Realized gain/(loss) | | | — | | | | — | | | | — | |
| Change in unrealized appreciation/(depreciation) | | | 108 | | | | 1 | | | | (124 | ) |
| Purchases | | | 492 | | | | — | | | | — | |
| Sales/paydowns | | | — | | | | — | | | | — | |
| Transfers into Level 3 | | | — | | | | — | | | | — | |
| Transfers out of Level 3 | | | (935 | ) | | | — | | | | — | |
| Ending balance as of 9/30/17 | | | — | | | | 17 | | | | 59 | |
| Changes in unrealized gains/(losses) included in earnings related to securities still held at reporting date | | $ | — | | | $ | 1 | | | $ | (124 | ) |
| | | Total
(000) | |
| Beginning balance as of 10/1/16 | | $ | 531 | |
| Accrued discounts/ premiums | | | 3 | |
| Realized gain/(loss) | | | — | |
| Change in unrealized appreciation/(depreciation) | | | (15 | ) |
| Purchases | | | 492 | |
| Sales/paydowns | | | — | |
| Transfers into Level 3 | | | — | |
| Transfers out of Level 3 | | | (935 | ) |
| Ending balance as of 9/30/17 | | $ | 76 | |
| Changes in unrealized gains/(losses) included in earnings related to securities still held at reporting date | | $ | (123 | ) |
For the year ended September 30, 2017, there were transfers between Level 2 and Level 3 assets and liabilities.
The transfers between fair value hierarchy levels were due to changes in the availability of observable inputs to determine fair value. Transfers between Levels are recognized at period end.
The following is a summary of the transactions with affiliates for the year ended September 30, 2017:
| | | City National Rochdale Government Money Market Fund,
Class I
(000) | |
| Beginning balance as of 10/1/16 | | $ | 1,133 | |
| Purchases at Cost | | | 11,881 | |
| Proceeds from Sales | | | (13,014 | ) |
| Unrealized Gain (Loss) | | | — | |
| Realized Gain (Loss) | | | — | |
| Ending balance as of 9/30/17 | | $ | — | |
| Dividend Income | | $ | — | |
Amounts designated as “—“ are either $0 or have been rounded to $0.
For more information on valuation inputs, see Note 2 — Significant Accounting Policies in the Notes to Financial Statements.
See accompanying notes to financial statements.
CITY NATIONAL ROCHDALE FUNDS | PAGE 63
| schedule of investments |
| September 30, 2017 |
| City National Rochdale Intermediate Fixed Income Fund |
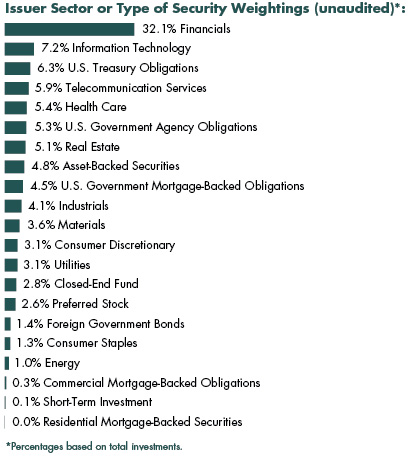
| Description | | Face Amount (000) | | | Value (000) | |
| Corporate Bonds [71.4%] | |
| Consumer Discretionary [3.1%] | |
| AutoZone | | | | | | |
| 3.700%, 04/15/22 | | $ | 250 | | | $ | 260 | |
| 2.500%, 04/15/21 | | | 1,000 | | | | 1,000 | |
| Gap | | | | | | | | |
| 5.950%, 04/12/21 | | | 495 | | | | 537 | |
| General Motors Financial | | | | | | | | |
| 4.350%, 01/17/27 | | | 2,500 | | | | 2,569 | |
| Harley-Davidson Financial Services, MTN | | | | | | | | |
| 1.550%, 11/17/17(A) | | | 725 | | | | 725 | |
| Home Depot | | | | | | | | |
| 2.625%, 06/01/22 | | | 1,000 | | | | 1,016 | |
| Hyundai Capital America | | | | | | | | |
| 2.600%, 03/19/20(A) | | | 1,000 | | | | 1,000 | |
| Tupperware Brands | | | | | | | | |
| 4.750%, 06/01/21 | | | 500 | | | | 528 | |
| | | | | | | | | |
| Total Consumer Discretionary | | | | 7,635 | |
| | | | | | | | | |
| Consumer Staples [1.3%] | |
| Bunge Finance | | | | | | | | |
| 8.500%, 06/15/19 | | | 105 | | | | 116 | |
| Campbell Soup | | | | | | | | |
| 8.875%, 05/01/21 | | | 350 | | | | 423 | |
| CVS Health | | | | | | | | |
| 3.500%, 07/20/22 | | | 2,000 | | | | 2,081 | |
| Kraft Heinz Foods | | | | | | | | |
| 3.500%, 07/15/22 | | | 500 | | | | 517 | |
| | | | | | | | | |
| Total Consumer Staples | | | | 3,137 | |
| | | | | | | | | |
| Energy [1.0%] | |
| DCP Midstream Operating | | | | | | | | |
| 9.750%, 03/15/19(A) | | | 114 | | | | 125 | |
| Ecopetrol | | | | | | | | |
| 7.625%, 07/23/19 | | | 250 | | | | 274 | |
| Energy Transfer | | | | | | | | |
| 9.700%, 03/15/19 | | | 330 | | | | 365 | |
| 9.000%, 04/15/19 | | | 189 | | | | 208 | |
| 3.600%, 02/01/23 | | | 200 | | | | 203 | |
| Enterprise Products Operating | | | | | | | | |
| 6.500%, 01/31/19 | | | 140 | | | | 148 | |
| Kinder Morgan Energy Partners | | | | | | | | |
| 5.300%, 09/15/20 | | | 125 | | | | 135 | |
| Panhandle Eastern Pipe Line | | | | | | | | |
| 7.000%, 06/15/18 | | | 396 | | | | 409 | |
| Puget Energy | | | | | | | | |
| 6.000%, 09/01/21 | | | 500 | | | | 560 | |
| | | | | | | | | |
| Total Energy | | | | 2,427 | |
| | | | | | | | | |
| Financials [31.8%] | |
| Alleghany | | | | | | | | |
| 5.625%, 09/15/20 | | | 270 | | | | 293 | |
| American Express | | | | | | | | |
| 1.905%, VAR ICE LIBOR USD 3 Month+0.590%, 05/22/18 | | | 3,000 | | | | 3,008 | |
| Axis Specialty Finance | | | | | | | | |
| 5.875%, 06/01/20 | | | 250 | | | | 271 | |
| Bank of America, MTN | | | | | | | | |
| 2.205%, VAR ICE LIBOR USD 3 Month+0.870%, 04/01/19 | | | 5,000 | | | | 5,045 | |
| Bank of Montreal, MTN | | | | | | | | |
| 1.947%, VAR ICE LIBOR USD 3 Month+0.630%, 09/11/22 | | | 4,070 | | | | 4,073 | |
| 1.450%, 04/09/18 | | | 340 | | | | 340 | |
| Bank of Nova Scotia | | | | | | | | |
| 2.450%, 03/22/21 | | | 5,330 | | | | 5,363 | |
| Barclays | | | | | | | | |
| 4.375%, 01/12/26 | | | 1,500 | | | | 1,566 | |
| Bear Stearns | | | | | | | | |
| 7.250%, 02/01/18 | | | 275 | | | | 280 | |
See accompanying notes to financial statements.
CITY NATIONAL ROCHDALE FUNDS | PAGE 64
| schedule of investments |
| September 30, 2017 |
City National Rochdale Intermediate Fixed Income Fund (continued) |
| Description | | Face Amount (000) | | | Value (000) | |
| Capital One Financial | | | | | | |
| 4.200%, 10/29/25 | | $ | 1,000 | | | $ | 1,028 | |
| 1.500%, 03/22/18 | | | 475 | | | | 475 | |
| Chubb INA Holdings | | | | | | | | |
| 5.800%, 03/15/18 | | | 300 | | | | 306 | |
| Citigroup | | | | | | | | |
| 4.500%, 01/14/22 | | | 2,000 | | | | 2,151 | |
| CNA Financial | | | | | | | | |
| 6.950%, 01/15/18 | | | 1,076 | | | | 1,091 | |
| Commonwealth Bank of Australia, MTN | | | | | | | | |
| 5.000%, 10/15/19(A) | | | 150 | | | | 159 | |
| Commonwealth Bank of Australia NY, MTN | | | | | | | | |
| 2.550%, 03/15/21 | | | 5,000 | | | | 5,033 | |
| Credit Suisse Group Funding Guernsey | | | | | | | | |
| 4.550%, 04/17/26 | | | 2,500 | | | | 2,680 | |
| Credit Suisse NY, MTN | | | | | | | | |
| 5.300%, 08/13/19 | | | 150 | | | | 159 | |
| Deutsche Bank, MTN | | | | | | | | |
| 2.850%, 05/10/19 | | | 2,985 | | | | 3,015 | |
| ERAC USA Finance | | | | | | | | |
| 3.300%, 10/15/22(A) | | | 250 | | | | 256 | |
| Goldman Sachs Group | | | | | | | | |
| 6.150%, 04/01/18 | | | 150 | | | | 153 | |
| Goldman Sachs Group, MTN | | | | | | | | |
| 6.000%, 06/15/20 | | | 500 | | | | 549 | |
| HSBC Holdings | | | | | | | | |
| 3.400%, 03/08/21 | | | 5,000 | | | | 5,156 | |
| Jefferies Group | | | | | | | | |
| 5.125%, 01/20/23 | | | 2,700 | | | | 2,949 | |
| JPMorgan Chase | | | | | | | | |
| 4.950%, 03/25/20 | | | 100 | | | | 107 | |
| 4.250%, 10/15/20 | | | 150 | | | | 159 | |
| 3.125%, 01/23/25 | | | 4,700 | | | | 4,734 | |
| Lehman Brothers Holdings, MTN | | | | | | | | |
| 7.000%, 09/28/37(B) | | | 400 | | | | 25 | |
| Macquarie Bank, MTN | | | | | | | | |
| 2.600%, 06/24/19(A) | | | 4,200 | | | | 4,233 | |
| Marsh & McLennan, MTN | | | | | | | | |
| 2.550%, 10/15/18 | | | 100 | | | | 101 | |
| Metropolitan Life Global Funding I | | | | | | | | |
| 3.875%, 04/11/22(A) | | | 125 | | | | 133 | |
| Morgan Stanley, MTN | | | | | | | | |
| 3.750%, 02/25/23 | | | 5,000 | | | | 5,221 | |
| MUFG Americas Holdings | | | | | | | | |
| 2.250%, 02/10/20 | | | 2,000 | | | | 2,004 | |
| NASDAQ OMX Group | | | | | | | | |
| 5.550%, 01/15/20 | | | 1,249 | | | | 1,342 | |
| National Rural Utilities Cooperative Finance | | | | | | | | |
| 10.375%, 11/01/18 | | | 125 | | | | 136 | |
| 6.550%, 11/01/18 | | | 300 | | | | 315 | |
| Principal Financial Group | | | | | | | | |
| 3.300%, 09/15/22 | | | 200 | | | | 205 | |
| Protective Life | | | | | | | | |
| 6.400%, 01/15/18 | | | 250 | | | | 253 | |
| Prudential Financial, MTN | | | | | | | | |
| 5.375%, 06/21/20 | | | 145 | | | | 158 | |
| Sumitomo Mitsui Financial Group | | | | | | | | |
| 2.846%, 01/11/22 | | | 3,910 | | | | 3,946 | |
| Svenska Handelsbanken, MTN | | | | | | | | |
| 5.125%, 03/30/20(A) | | | 5,800 | | | | 6,227 | |
| TD Ameritrade Holding | | | | | | | | |
| 5.600%, 12/01/19 | | | 290 | | | | 312 | |
| Toronto-Dominion Bank, MTN | | | | | | | | |
| 1.872%, VAR ICE LIBOR USD 3 Month+0.560%, 11/05/19 | | | 3,100 | | | | 3,120 | |
| Wilmington Trust | | | | | | | | |
| 8.500%, 04/02/18 | | | 315 | | | | 325 | |
| | | | | | | | | |
| Total Financials | | | | 78,455 | |
| | | | | | | | | |
| Health Care [5.4%] | |
| Abbott Laboratories | | | | | | | | |
| 3.400%, 11/30/23 | | | 3,075 | | | | 3,171 | |
| AbbVie | | | | | | | | |
| 2.850%, 05/14/23 | | | 2,500 | | | | 2,519 | |
| Gilead Sciences | | | | | | | | |
| 2.950%, 03/01/27 | | | 5,000 | | | | 4,957 | |
| Laboratory Corp of America Holdings | | | | | | | | |
| 3.200%, 02/01/22 | | | 2,530 | | | | 2,589 | |
| | | | | | | | | |
| Total Health Care | | | | 13,236 | |
| | | | | | | | | |
| Industrials [4.0%] | |
| Carlisle | | | | | | | | |
| 3.750%, 11/15/22 | | | 250 | | | | 255 | |
| Eaton | | | | | | | | |
| 8.875%, 06/15/19 | | | 125 | | | | 138 | |
| GATX | | | | | | | | |
| 6.000%, 02/15/18 | | | 170 | | | | 172 | |
| IDEX | | | | | | | | |
| 4.200%, 12/15/21 | | | 250 | | | | 260 | |
| John Deere Capital, MTN | | | | | | | | |
| 2.800%, 09/08/27 | | | 5,000 | | | | 4,916 | |
| PACCAR Financial, MTN | | | | | | | | |
| 1.750%, 08/14/18 | | | 3,000 | | | | 3,007 | |
See accompanying notes to financial statements.
CITY NATIONAL ROCHDALE FUNDS | PAGE 65
| schedule of investments |
| September 30, 2017 |
City National Rochdale Intermediate Fixed Income Fund (continued) |
| Description | | Face Amount (000) | | | Value (000) | |
| Penske Truck Leasing | | | | | | |
| 4.875%, 07/11/22(A) | | $ | 200 | | | $ | 218 | |
| 4.250%, 01/17/23(A) | | | 300 | | | | 320 | |
| Republic Services | | | | | | | | |
| 3.550%, 06/01/22 | | | 250 | | | | 261 | |
| Roper Technologies | | | | | | | | |
| 3.125%, 11/15/22 | | | 200 | | | | 202 | |
| 1.850%, 11/15/17 | | | 250 | | | | 250 | |
| | | | | | | | | |
| Total Industrials | | | | 9,999 | |
| | | | | | | | | |
| Information Technology [7.2%] | |
| Apple | | | | | | | | |
| 2.450%, 08/04/26 | | | 5,700 | | | | 5,500 | |
| Fiserv | | | | | | | | |
| 3.500%, 10/01/22 | | | 250 | | | | 259 | |
| 2.700%, 06/01/20 | | | 2,000 | | | | 2,023 | |
| KLA-Tencor | | | | | | | | |
| 4.650%, 11/01/24 | | | 2,500 | | | | 2,708 | |
| Oracle | | | | | | | | |
| 2.500%, 05/15/22 | | | 5,000 | | | | 5,073 | |
| Western Union | | | | | | | | |
| 5.253%, 04/01/20 | | | 2,000 | | | | 2,134 | |
| | | | | | | | | |
| Total Information Technology | | | | 17,697 | |
| | | | | | | | | |
| Materials [3.6%] | |
| Airgas | | | | | | | | |
| 2.900%, 11/15/22 | | | 250 | | | | 254 | |
| Avery Dennison | | | | | | | | |
| 5.375%, 04/15/20 | | | 405 | | | | 431 | |
| Glencore Funding | | | | | | | | |
| 2.664%, VAR ICE LIBOR USD 3 Month+1.360%, 07/15/17(A) | | | 2,000 | | | | 2,020 | |
| Rio Tinto Finance USA | | | | | | | | |
| 3.750%, 06/15/25 | | | 5,780 | | | | 6,094 | |
| | | | | | | | | |
| Total Materials | | | | 8,799 | |
| | | | | | | | | |
| REITs [5.0%] | |
| American Tower | | | | | | | | |
| 4.000%, 06/01/25 | | | 1,800 | | | | 1,861 | |
| Boston Properties | | | | | | | | |
| 5.875%, 10/15/19 | | | 140 | | | | 150 | |
| Common Wealth | | | | | | | | |
| 5.875%, 09/15/20 | | | 105 | | | | 112 | |
| DDR | | | | | | | | |
| 4.625%, 07/15/22 | | | 250 | | | | 265 | |
| HCP | | | | | | | | |
| 4.000%, 06/01/25 | | | 2,770 | | | | 2,857 | |
| Highwoods Realty | | | | | | | | |
| 3.625%, 01/15/23 | | | 200 | | | | 203 | |
| National Retail Properties | | | | | | | | |
| 6.875%, 10/15/17 | | | 300 | | | | 300 | |
| 3.800%, 10/15/22 | | | 350 | | | | 364 | |
| Prologis | | | | | | | | |
| 3.350%, 02/01/21 | | | 2,200 | | | | 2,278 | |
| Realty Income | | | | | | | | |
| 3.250%, 10/15/22 | | | 200 | | | | 205 | |
| Regency Centers | | | | | | | | |
| 3.750%, 11/15/22 | | | 250 | | | | 258 | |
| Senior Housing Properties Trust | | | | | | | | |
| 6.750%, 12/15/21 | | | 500 | | | | 559 | |
| Washington | | | | | | | | |
| 3.950%, 10/15/22 | | | 250 | | | | 258 | |
| Welltower | | | | | | | | |
| 4.950%, 01/15/21 | | | 155 | | | | 166 | |
| 3.750%, 03/15/23 | | | 2,500 | | | | 2,602 | |
| | | | | | | | | |
| Total REITs | | | | 12,438 | |
| | | | | | | | | |
| Telecommunication Services [5.9%] | |
| America Movil | | | | | | | | |
| 3.125%, 07/16/22 | | | 4,000 | | | | 4,100 | |
| AT&T | | | | | | | | |
| 5.600%, 05/15/18 | | | 310 | | | | 317 | |
| 3.600%, 02/17/23 | | | 5,000 | | | | 5,144 | |
| Deutsche Telekom International Finance | | | | | | | | |
| 6.000%, 07/08/19 | | | 50 | | | | 54 | |
| Verizon Communications | | | | | | | | |
| 4.600%, 04/01/21 | | | 4,100 | | | | 4,427 | |
| 2.321%, VAR ICE LIBOR USD 3 Month+1.000%, 03/16/22 | | | 500 | | | | 507 | |
| | | | | | | | | |
| Total Telecommunication Services | | | | 14,549 | |
| | | | | | | | | |
| Utilities [3.1%] | |
| British Transco Finance | | | | | | | | |
| 6.625%, 06/01/18 | | | 128 | | | | 132 | |
| Entergy Mississippi | | | | | | | | |
| 6.640%, 07/01/19 | | | 540 | | | | 580 | |
| Entergy Texas | | | | | | | | |
| 7.125%, 02/01/19 | | | 190 | | | | 202 | |
| Exelon Generation | | | | | | | | |
| 6.200%, 10/01/17 | | | 2,125 | | | | 2,125 | |
| 3.400%, 03/15/22 | | | 2,500 | | | | 2,561 | |
| Korea Electric Power | | | | | | | | |
| 6.750%, 08/01/27 | | | 75 | | | | 96 | |
See accompanying notes to financial statements.
CITY NATIONAL ROCHDALE FUNDS | PAGE 66
| schedule of investments |
| September 30, 2017 |
City National Rochdale Intermediate Fixed Income Fund (continued) |
| Description | | Face Amount (000) | | | Value (000) | |
| National Fuel Gas | | | | | | |
| 4.900%, 12/01/21 | | $ | 500 | | | $ | 530 | |
| Puget Energy | | | | | | | | |
| 5.625%, 07/15/22 | | | 250 | | | | 279 | |
| Southwestern Electric Power | | | | | | | | |
| 5.875%, 03/01/18 | | | 581 | | | | 591 | |
| 3.550%, 02/15/22 | | | 500 | | | | 518 | |
| | | | | | | | | |
| Total Utilities | | | | 7,614 | |
| | | | | | | | | |
| Total Corporate Bonds | |
| (Cost $172,479) | | | | 175,986 | |
| | | | | | | | | |
| U.S. Treasury Obligations [6.2%] | |
| U.S. Treasury Inflation Indexed Bonds | | | | | | | | |
| 0.625%, 01/15/26 | | | 5,476 | | | | 5,550 | |
| U.S. Treasury Notes | | | | | | | | |
| 2.625%, 11/15/20 | | | 425 | | | | 437 | |
| 2.250%, 11/15/24 | | | 3,000 | | | | 3,015 | |
| 1.625%, 10/31/23 | | | 4,000 | | | | 3,900 | |
| 1.250%, 04/30/19 | | | 1,675 | | | | 1,670 | |
| 0.875%, 07/31/19 | | | 815 | | | | 806 | |
| | | | | | | | | |
| Total U.S. Treasury Obligations | |
| (Cost $15,533) | | | | 15,378 | |
| | | | | | | | | |
| U.S. Government Agency Obligations [5.3%] | |
| FHLMC | | | | | | | | |
| 1.750%, 05/30/19 | | | 3,000 | | | | 3,013 | |
| FNMA | | | | | | | | |
| 1.875%, 12/28/20 | | | 5,000 | | | | 5,026 | |
| 1.625%, 11/27/18 | | | 5,000 | | | | 5,006 | |
| | | | | | | | | |
| Total U.S. Government Agency Obligations | |
| (Cost $13,018) | | | | 13,045 | |
| | | | | | | | | |
| Asset-Backed Securities [4.8%] | |
| Bayview Financial Acquisition Trust, Ser 2007-A, Cl 1A2 | | | | | | | | |
| 6.205%, 05/28/37(C) | | | 51 | | | | 53 | |
| BT SPE (Acquired 07/06/11, Acquisition Cost $1,102,589) | | | | | | | | |
| 9.250%, 12/31/49(D) (E) (F) (G) | | | 454 | | | | 34 | |
| Carmax Auto Owner Trust, Ser 2014-2, Cl A3 | | | | | | | | |
| 0.980%, 01/15/19 | | | 145 | | | | 145 | |
| Cityscape Home Equity Loan Trust, Ser 1997-C, Cl A4 | | | | | | | | |
| 7.000%, 07/25/28(B) (C) (F) | | | 5 | | | | 4 | |
| Ford Credit Floorplan Master Owner Trust A, Ser 2016-3, Cl A1 | | | | | | | | |
| 1.550%, 07/15/21 | | | 4,000 | | | | 3,979 | |
| GMACM Mortgage Loan Trust, Ser 2004-GH1, Cl A6 | | | | | | | | |
| 4.810%, 07/25/35(C) | | | 2 | | | | 2 | |
| NextGear Floorplan Master Owner Trust, Ser 2015-2A, Cl A | | | | | | | | |
| 2.380%, 10/15/20(A) | | | 7,490 | | | | 7,517 | |
| | | | | | | | | |
| Total Asset-Backed Securities | |
| (Cost $12,183) | | | | 11,734 | |
| | | | | | | | | |
| U.S. Government Mortgage-Backed Obligations [4.5%] | |
| FHLMC, Pool 1B2677 | | | | | | | | |
| 3.505%, VAR ICE LIBOR USD 12 Month+1.900%, 01/01/35 | | | 4 | | | | 4 | |
| FHLMC, Pool 1B2683 | �� | | | | | | | |
| 3.466%, VAR ICE LIBOR USD 12 Month+1.894%, 01/01/35 | | | 2 | | | | 3 | |
| FHLMC, Pool 1B2692 | | | | | | | | |
| 3.268%, VAR ICE LIBOR USD 12 Month+1.763%, 12/01/34 | | | 7 | | | | 7 | |
| FHLMC, Pool A93505 | | | | | | | | |
| 4.500%, 08/01/40 | | | 23 | | | | 25 | |
| FHLMC, Pool A93996 | | | | | | | | |
| 4.500%, 09/01/40 | | | 35 | | | | 38 | |
| FHLMC, Pool C03490 | | | | | | | | |
| 4.500%, 08/01/40 | | | 181 | | | | 195 | |
| FHLMC, Pool C09015 | | | | | | | | |
| 3.000%, 10/01/42 | | | 170 | | | | 171 | |
| FHLMC, Pool E01280 | | | | | | | | |
| 5.000%, 12/01/17 | | | — | | | | — | |
| FHLMC, Pool G02940 | | | | | | | | |
| 5.500%, 05/01/37 | | | 5 | | | | 5 | |
| FHLMC, Pool G04222 | | | | | | | | |
| 5.500%, 04/01/38 | | | 9 | | | | 11 | |
| FHLMC, Pool G04913 | | | | | | | | |
| 5.000%, 03/01/38 | | | 37 | | | | 41 | |
| FHLMC, Pool G08003 | | | | | | | | |
| 6.000%, 07/01/34 | | | 11 | | | | 13 | |
| FHLMC, Pool G11880 | | | | | | | | |
| 5.000%, 12/01/20 | | | 5 | | | | 5 | |
| FHLMC, Pool G18124 | | | | | | | | |
| 6.000%, 06/01/21 | | | 4 | | | | 5 | |
See accompanying notes to financial statements.
CITY NATIONAL ROCHDALE FUNDS | PAGE 67
| schedule of investments |
| September 30, 2017 |
City National Rochdale Intermediate Fixed Income Fund (continued) |
| Description | | Face Amount (000) | | | Value (000) | |
| FHLMC, Pool J19197 | | | | | | |
| 3.000%, 05/01/27 | | $ | 98 | | | $ | 101 | |
| FHLMC, Pool Q08998 | | | | | | | | |
| 3.500%, 06/01/42 | | | 126 | | | | 130 | |
| FHLMC, Pool Q10378 | | | | | | | | |
| 3.000%, 08/01/42 | | | 159 | | | | 160 | |
| FHLMC, Ser 2004-2804, Cl VC | | | | | | | | |
| 5.000%, 07/15/21 | | | 22 | | | | 22 | |
| FHLMC, Ser 2011-3958, Cl VA | | | | | | | | |
| 4.000%, 06/15/26 | | | 1,566 | | | | 1,592 | |
| FHLMC, Ser K708, Cl A2 | | | | | | | | |
| 2.130%, 01/25/19 | | | 293 | | | | 294 | |
| FHLMC Multifamily Structured Pass-Through Certificates, Ser K003, Cl A4 | | | | | | | | |
| 5.053%, 01/25/19 | | | 150 | | | | 155 | |
| FHLMC Multifamily Structured Pass-Through Certificates, Ser K704, Cl A2 | | | | | | | | |
| 2.412%, 08/25/18 | | | 388 | | | | 389 | |
| FHLMC Multifamily Structured Pass-Through Certificates, Ser K705, Cl A2 | | | | | | | | |
| 2.303%, 09/25/18 | | | 200 | | | | 201 | |
| FNMA, Pool 252570 | | | | | | | | |
| 6.500%, 07/01/29 | | | 3 | | | | 4 | |
| FNMA, Pool 253183 | | | | | | | | |
| 7.500%, 04/01/30 | | | 1 | | | | 1 | |
| FNMA, Pool 253398 | | | | | | | | |
| 8.000%, 08/01/30 | | | 1 | | | | 1 | |
| FNMA, Pool 254685 | | | | | | | | |
| 5.000%, 04/01/18 | | | 1 | | | | 1 | |
| FNMA, Pool 254949 | | | | | | | | |
| 5.000%, 11/01/33 | | | 8 | | | | 9 | |
| FNMA, Pool 255814 | | | | | | | | |
| 5.500%, 08/01/35 | | | 13 | | | | 14 | |
| FNMA, Pool 303168 | | | | | | | | |
| 9.500%, 02/01/25 | | | 1 | | | | 1 | |
| FNMA, Pool 725424 | | | | | | | | |
| 5.500%, 04/01/34 | | | 12 | | | | 14 | |
| FNMA, Pool 735060 | | | | | | | | |
| 6.000%, 11/01/34 | | | 8 | | | | 9 | |
| FNMA, Pool 735228 | | | | | | | | |
| 5.500%, 02/01/35 | | | 6 | | | | 7 | |
| FNMA, Pool 735230 | | | | | | | | |
| 5.500%, 02/01/35 | | | 16 | | | | 18 | |
| FNMA, Pool 745275 | | | | | | | | |
| 5.000%, 02/01/36 | | | 62 | | | | 68 | |
| Description | | Face Amount (000) /Shares | | | Value (000) | |
| FNMA, Pool 745418 | | | | | | |
| 5.500%, 04/01/36 | | $ | 70 | | | $ | 78 | |
| FNMA, Pool 827223 | | | | | | | | |
| 3.215%, VAR ICE LIBOR USD 12 Month+1.465%, 04/01/35 | | | 25 | | | | 26 | |
| FNMA, Pool 844809 | | | | | | | | |
| 5.000%, 11/01/35 | | | 26 | | | | 28 | |
| FNMA, Pool AD0454 | | | | | | | | |
| 5.000%, 11/01/21 | | | 7 | | | | 7 | |
| FNMA, Pool AD8522 | | | | | | | | |
| 4.000%, 08/01/40 | | | 26 | | | | 28 | |
| FNMA, Pool AE0828 | | | | | | | | |
| 3.500%, 02/01/41 | | | 230 | | | | 239 | |
| FNMA, Pool AH0621 | | | | | | | | |
| 3.500%, 01/01/41 | | | 51 | | | | 53 | |
| FNMA, Pool AJ1407 | | | | | | | | |
| 4.000%, 09/01/41 | | | 42 | | | | 44 | |
| FNMA, Pool AJ7689 | | | | | | | | |
| 4.000%, 12/01/41 | | | 142 | | | | 150 | |
| FNMA, Pool AK0971 | | | | | | | | |
| 3.000%, 02/01/27 | | | 90 | | | | 93 | |
| FNMA, Pool AL5866 | | | | | | | | |
| 2.730%, 08/01/22 | | | 5,615 | | | | 5,732 | |
| FNMA, Pool AO2970 | | | | | | | | |
| 3.000%, 05/01/42 | | | 151 | | | | 152 | |
| FNMA, Pool AO4137 | | | | | | | | |
| 3.500%, 06/01/42 | | | 129 | | | | 134 | |
| FNMA, Pool MA1277 | | | | | | | | |
| 2.500%, 12/01/27 | | | 90 | | | | 91 | |
| GNMA, Pool G2 4696 | | | | | | | | |
| 4.500%, 05/20/40 | | | 79 | | | | 84 | |
| GNMA, Pool G2 4747 | | | | | | | | |
| 5.000%, 07/20/40 | | | 30 | | | | 33 | |
| GNMA, Pool G2 4923 | | | | | | | | |
| 4.500%, 01/20/41 | | | 47 | | | | 51 | |
| GNMA, Pool G2 MA0155 | | | | | | | | |
| 4.000%, 06/20/42 | | | 114 | | | | 122 | |
| GNMA, Pool G2 MA0392 | | | | | | | | |
| 3.500%, 09/20/42 | | | 142 | | | | 148 | |
| | | | | | | | | |
| Total U.S. Government Mortgage-Backed Obligations | |
| (Cost $10,929) | | | | 11,007 | |
| | | | | | | | | |
| Closed-End Fund [2.8%] | |
| Stone Ridge Reinsurance Risk Premium Interval Fund(F) | | | 761,754 | | | | 6,871 | |
| | | | | | | | | |
| Total Closed-End Fund | |
| (Cost $7,749) | | | | 6,871 | |
See accompanying notes to financial statements.
CITY NATIONAL ROCHDALE FUNDS | PAGE 68
| schedule of investments |
| September 30, 2017 |
City National Rochdale Intermediate Fixed Income Fund (continued) |
| Description | | Shares/ Face Amount (000) | | | Value (000) | |
| Preferred Stock [2.6%] | |
| Financials [1.1%] | |
| BB&T, 5.625% | | | 10,000 | | | $ | 253 | |
| Citigroup, 5.800% | | | 10,000 | | | | 258 | |
| Goldman Sachs Group, 5.950% | | | 25,000 | | | | 638 | |
| HSBC Holdings, 8.000% | | | 30,000 | | | | 809 | |
| JPMorgan Chase, 5.500% | | | 20,000 | | | | 507 | |
| Prudential Financial, 5.750% | | | 10,000 | | | | 256 | |
| | | | | | | | | |
| Total Financials | | | | 2,721 | |
| | | | | | | | | |
| Industrials [0.3%] | |
| Pitney Bowes, 6.700% | | | 10,000 | | | | 255 | |
| Stanley Black & Decker, 5.750% | | | 20,000 | | | | 509 | |
| | | | | | | | | |
| Total Industrials | | | | 764 | |
| | | | | | | | | |
| REITs [0.9%] | |
| Kimco Realty, 5.500% | | | 10,000 | | | | 253 | |
| Senior Housing Properties Trust, 5.625% | | | 52,500 | | | | 1,333 | |
| Vornado Realty Trust, 5.700% | | | 20,000 | | | | 504 | |
| | | | | | | | | |
| Total REITs | | | | 2,090 | |
| | | | | | | | | |
| Telecommunication Services [0.3%] | |
| Telephone & Data Systems, 5.875% | | | 30,000 | | | | 750 | |
| | | | | | | | | |
| Total Preferred Stock | |
| (Cost $6,160) | | | | 6,325 | |
| | | | | | | | | |
| Foreign Government Bonds [1.3%] | |
| Hashemite Kingdom of Jordan Government AID Bond | | | | | | | | |
| 2.578%, 06/30/22 | | $ | 3,000 | | | | 3,073 | |
| Mexico Government International Bond, MTN | | | | | | | | |
| 5.125%, 01/15/20 | | | 100 | | | | 107 | |
| Province of Quebec Canada, MTN | | | | | | | | |
| 7.380%, 04/09/26(C) | | | 100 | | | | 130 | |
| | | | | | | | | |
| Total Foreign Government Bonds | |
| (Cost $3,221) | | | | 3,310 | |
| | | | | | | | | |
| Commercial Mortgage-Backed Obligations [0.3%] | |
| Commercial Mortgage Trust, Ser 2012-CR2, Cl A4 | | | | | | | | |
| 3.147%, 08/15/45 | | | 125 | | | | 129 | |
| | | | | | | |
| Description | | Face Amount (000) /Shares | | | Value (000) | |
| GS Mortgage Securities II, Ser GCJ9, Cl A3 | | | | | | | | |
| 2.773%, 11/10/45 | | $ | 275 | | | $ | 278 | |
| JPMorgan Chase Commercial Mortgage Securities Trust, Ser 2013-LC11, Cl A5 | | | | | | | | |
| 2.960%, 04/15/46 | | | 150 | | | | 152 | |
| Morgan Stanley Bank of America Merrill Lynch Trust, Ser C6, Cl A4 | | | | | | | | |
| 2.858%, 11/15/45 | | | 275 | | | | 280 | |
| | | | | | | | | |
| Total Commercial Mortgage-Backed Obligations | |
| (Cost $836) | | | | 839 | |
| | | | | | | | | |
| Residential Mortgage-Backed Securities [0.0%] | |
| RAAC, Ser 2004-SP1, Cl AI4 | | | | | | | | |
| 5.285%, 08/25/27(H) | | | — | | | | — | |
| Residential Accredit Loans, Ser 2004-QS6, Cl A1 | | | | | | | | |
| 5.000%, 05/25/19 | | | 3 | | | | 3 | |
| Residential Asset Mortgage Products, Ser 2002-RS3, Cl AI5 | | | | | | | | |
| 5.572%, 06/25/32(H) | | | 19 | | | | 19 | |
| WaMu Mortgage Pass-Through Certificates Trust, Ser 2004-CB2, Cl 5A | | | | | | | | |
| 5.000%, 07/25/19 | | | 10 | | | | 10 | |
| | | | | | | | | |
| Total Residential Mortgage-Backed Securities | |
| (Cost $32) | | | | 32 | |
| | | | | | | | | |
| Short-Term Investment [0.1%] | |
| SEI Daily Income Trust Government Fund, Cl F, 0.840%** | | | 205,075 | | | | 205 | |
| | | | | | | | | |
| Total Short-Term Investment | |
| (Cost $205) | | | | 205 | |
| | | | | | | | | |
| Total Investments [99.3%] | |
| (Cost $242,345) | | | $ | 244,732 | |
Percentages are based on Net Assets of $246,480 (000).
| ** | The rate reported is the 7-day effective yield as of September 30, 2017. |
| (A) | Security exempt from registration under Rule 144A of the Securities Act of 1933. These securities may be resold in transactions exempt from registration normally to qualified institutions. On September 30, 2017, the value of these securities amounted to $22,933 (000), representing 9.3% of the net assets of the Fund. |
| (B) | In default on interest payments. Rate shown represents the last coupon rate prior to default. |
See accompanying notes to financial statements.
CITY NATIONAL ROCHDALE FUNDS | PAGE 69
| schedule of investments |
| September 30, 2017 |
City National Rochdale Intermediate Fixed Income Fund (continued) |
| (C) | Step Bond — The rate reported is the rate in effect on September 30, 2017. The coupon on a step bond changes on a specific date. |
| (D) | Security fair valued using methods determined in good faith by the Fair Value Committee designated by the Board of Trustees. The total market value of such security as of September 30, 2017, was $34 (000) and represented 0.0% of the net assets of the Fund. |
| (E) | Level 3 security in accordance with fair value hierarchy. |
| (F) | Security is considered illiquid. The total market value of such security as of September 30, 2017, was $6,909 (000) and represented 2.8% of the net assets of the Fund. |
| (G) | Security is considered restricted. The total market value of such security as of September 30, 2017, was $34 (000) and represented 0.0% of the net assets of the Fund. |
| (H) | Variable or floating rate security, the interest rate of which adjusts periodically based on changes in current interest rates and prepayments on the underlying pool of assets. |
AID — Agency for International Development
Cl — Class
FHLMC — Federal Home Loan Mortgage Corporation
FNMA — Federal National Mortgage Association
GNMA — Government National Mortgage Association
ICE — Intercontinental Exchange
LIBOR — London Interbank Offered Rates
MTN — Medium Term Note
NY — New York
REIT — Real Estate Investment Trust
Ser — Series
SPE — Special Purpose Entity
VAR — Variable
USD — U.S. Dollar
The following is a list of the inputs used as of September 30, 2017, in valuing the Fund’s investments carried at value (000):
| Investments in Securities | | Level 1 | | | Level 2 | | | Level 3 | | | Total | |
| Corporate Bonds | | $ | — | | | $ | 175,986 | | | $ | — | | | $ | 175,986 | |
| U.S. Treasury Obligations | | | — | | | | 15,378 | | | | — | | | | 15,378 | |
| U.S. Government Agency Obligations | | | — | | | | 13,045 | | | | — | | | | 13,045 | |
| Asset-Backed Securities | | | — | | | | 11,700 | | | | 34 | | | | 11,734 | |
| U.S. Government Mortgage-Backed Obligations | | | — | | | | 11,007 | | | | — | | | | 11,007 | |
| Closed-End Fund | | | 6,871 | | | | — | | | | — | | | | 6,871 | |
| Preferred Stock | | | 6,325 | | | | — | | | | — | | | | 6,325 | |
| Foreign Government Bonds | | | — | | | | 3,310 | | | | — | | | | 3,310 | |
| Commercial Mortgage-Backed Obligations | | | — | | | | 839 | | | | — | | | | 839 | |
| Residential Mortgage-Backed Securities | | | — | | | | 32 | | | | — | | | | 32 | |
| Short-Term Investment | | | 205 | | | | — | | | | — | | | | 205 | |
| Total Investments in Securities | | $ | 13,401 | | | $ | 231,297 | | | $ | 34 | | | $ | 244,732 | |
The following is a reconciliation of investments in which significant unobservable inputs (Level 3) were used in determining value as of September 30, 2017:
| | | Investments in Asset-Backed Securities
(000) | |
| Beginning balance as of 10/1/16 | | $ | 135 | |
| Accrued discounts/premiums | | | — | |
| Realized gain/(loss) | | | — | |
| Change in unrealized appreciation/(depreciation) | | | (42 | ) |
| Purchases | | | — | |
| Sales/paydowns | | | (59 | ) |
| Transfers into Level 3 | | | — | |
| Transfers out of Level 3 | | | — | |
| Ending balance as of 9/30/17 | | $ | 34 | |
| Changes in unrealized gains/(losses) included in earnings related to securities still held at reporting date | | $ | (42 | ) |
The following table summarizes the quantitative inputs and assumptions used for items categorized as material Level 3 investments as of September 30, 2017. The disclosures below also include qualitative information on the sensitivity of the fair value measurements to changes in the significant unobservable inputs.
| | Fair Value at
September 30, 2017
(000) | Valuation Techniques | |
| BT SPE | $34 | Discounted Cash Flow Model based on actual collection level and experienced defaults | |
| | | | |
| | | Observable Inputs | |
| | | Cumulated Collections | |
| | | Cumulated Defaults | |
| | | Annualized Default | |
| | | Cumulated Default | |
| | | Pace of Collection | |
| | | Interest Rates | |
| | | | |
| | | Unobservable Inputs | Range |
| | | Projected Default Rates | 5%-12% |
| | | Projected Collection Rates | 90%-100% |
| | | Expected Discount Rates | 7%-9.25% |
The unobservable inputs used to determine fair value of recurring Level 3 assets may have similar or diverging impacts on valuation. Significant increases and decreases in these inputs in isolation and the interrelationships between them could result in significantly higher or lower fair value measurements.
For the year ended September 30, 2017, there have been no transfers between any of the fair value hierarchy levels. Transfers between Levels are recognized at period end.
See accompanying notes to financial statements.
CITY NATIONAL ROCHDALE FUNDS | PAGE 70
| schedule of investments |
| September 30, 2017 |
City National Rochdale Intermediate Fixed Income Fund (concluded) |
The following is a summary of the transactions with affiliates for the year ended September 30, 2017:
| | | City National Rochdale Government Money Market Fund,
Class I
(000) | |
| Beginning balance as of 10/1/16 | | $ | 1,106 | |
| Purchases at Cost | | | 18,018 | |
| Proceeds from Sales | | | (19,124 | ) |
| Unrealized Gain (Loss) | | | — | |
| Realized Gain (Loss) | | | — | |
| Ending balance as of 9/30/17 | | $ | — | |
| Dividend Income | | $ | 1 | |
Amounts designated as “—“ are either $0 or have been rounded to $0.
For more information on valuation inputs, see Note 2 — Significant Accounting Policies in the Notes to Financial Statements.
See accompanying notes to financial statements.
CITY NATIONAL ROCHDALE FUNDS | PAGE 71
| consolidated schedule of investments |
| September 30, 2017 |
| City National Rochdale Fixed Income Opportunities Fund |
| Description | | Face Amount (000)(1) | | | Value (000) | |
| Corporate Bonds [52.4%] | |
| Advertising Sales [0.0%] | |
| Clear Channel International | | | | | | |
| 8.750%, 12/15/20(A) | | $ | 200 | | | $ | 210 | |
| Outfront Media Capital | | | | | | | | |
| 5.875%, 03/15/25 | | | 675 | | | | 707 | |
| 5.625%, 02/15/24 | | | 350 | | | | 365 | |
| | | | | | | | | |
| Total Advertising Sales | | | | 1,282 | |
| | | | | | | | | |
| Aerospace & Defense [0.2%] | |
| TransDigm | | | | | | | | |
| 6.500%, 07/15/24 | | | 1,000 | | | | 1,032 | |
| 6.500%, 05/15/25 | | | 1,825 | | | | 1,880 | |
| 6.375%, 06/15/26 | | | 425 | | | | 435 | |
| 6.000%, 07/15/22 | | | 950 | | | | 986 | |
| 5.500%, 10/15/20 | | | 350 | | | | 355 | |
| | | | | | | | | |
| Total Aerospace & Defense | | | | 4,688 | |
| | | | | | | | | |
| Airlines [0.7%] | |
| EA Partners I | | | | | | | | |
| 6.875%, 09/28/20 | | | 4,150 | | | | 3,600 | |
| EA Partners II | | | | | | | | |
| 6.750%, 06/01/21 | | | 1,000 | | | | 851 | |
| Gol LuxCo | | | | | | | | |
| 8.875%, 01/24/22 | | | 9,090 | | | | 9,092 | |
| SriLankan Airlines | | | | | | | | |
| 5.300%, 06/27/19 | | | 4,850 | | | | 4,915 | |
| | | | | | | | | |
| Total Airlines | | | | 18,458 | |
| Description | | Face Amount (000)(1) | | | Value (000) | |
| Apparel/Textiles [0.1%] | |
| Hanesbrands | | | | | | |
| 4.875%, 05/15/26(A) | | $ | 1,050 | | | $ | 1,091 | |
| SMCP Group SAS | | | | | | | | |
| 5.875%, 05/01/23 | | EUR | 270 | | | | 347 | |
| | | | | | | | | |
| Total Apparel/Textiles | | | | 1,438 | |
| | | | | | | | | |
| Applications Software [0.1%] | |
| Nuance Communications | | | | | | | | |
| 6.000%, 07/01/24 | | | 775 | | | | 839 | |
| 5.625%, 12/15/26(A) | | | 1,275 | | | | 1,351 | |
| 5.375%, 08/15/20(A) | | | 383 | | | | 390 | |
| | | | | | | | | |
| Total Applications Software | | | | 2,580 | |
| | | | | | | | | |
| Auction House/Art Dealer [0.0%] | |
| KAR Auction Services | | | | | | | | |
| 5.125%, 06/01/25(A) | | | 925 | | | | 962 | |
| Ritchie Bros Auctioneers | | | | | | | | |
| 5.375%, 01/15/25(A) | | | 350 | | | | 370 | |
| | | | | | | | | |
| Total Auction House/Art Dealer | | | | 1,332 | |
| | | | | | | | | |
| Auto Rent & Lease [0.3%] | |
| Avis Budget Car Rental | | | | | | | | |
| 6.375%, 04/01/24(A) | | | 1,425 | | | | 1,485 | |
| 5.250%, 03/15/25(A) | | | 275 | | | | 275 | |
| Hertz | | | | | | | | |
| 7.625%, 06/01/22(A) | | | 725 | | | | 748 | |
| 6.250%, 10/15/22 | | | 800 | | | | 760 | |
| 5.500%, 10/15/24(A) | | | 750 | | | | 675 | |
| United Rentals North America | | | | | | | | |
| 5.875%, 09/15/26 | | | 575 | | | | 624 | |
| 5.750%, 11/15/24 | | | 175 | | | | 186 | |
| 5.500%, 07/15/25 | | | 150 | | | | 161 | |
| 5.500%, 05/15/27 | | | 900 | | | | 960 | |
| 4.875%, 01/15/28 | | | 600 | | | | 603 | |
| 4.625%, 07/15/23 | | | 325 | | | | 339 | |
| | | | | | | | | |
| Total Auto Rent & Lease | | | | 6,816 | |
| | | | | | | | | |
| Auto/Trk Prts and Equip-Repl [0.0%] | |
| Allison Transmission | | | | | | | | |
| 5.000%, 10/01/24(A) | | | 550 | | | | 571 | |
| JB Poindexter | | | | | | | | |
| 9.000%, 04/01/22(A) | | | 675 | | | | 705 | |
| | | | | | | | | |
| Total Auto/Trk Prts and Equip-Repl | | | | 1,276 | |
See accompanying notes to financial statements.
CITY NATIONAL ROCHDALE FUNDS | PAGE 72
| consolidated schedule of investments |
| September 30, 2017 |
City National Rochdale Fixed Income Opportunities Fund (continued) |
| Description | | Face Amount (000)(1) | | | Value (000) | |
| Automotive [0.4%] | |
| General Motors Financial | | | | | | |
| 2.643%, VAR ICE LIBOR USD 3 Month+1.310% 06/30/22 | | $ | 10,000 | | | $ | 10,081 | |
| | | | | | | | | |
| Autoparts [0.3%] | |
| Adient Global Holdings | | | | | | | | |
| 4.875%, 08/15/26(A) | | | 1,300 | | | | 1,329 | |
| American Axle & Manufacturing | | | | | | | | |
| 6.625%, 10/15/22 | | | 375 | | | | 387 | |
| 6.500%, 04/01/27(A) | | | 1,275 | | | | 1,286 | |
| IHO Verwaltungs GmbH | | | | | | | | |
| 4.750%, 09/15/26(A) | | | 1,875 | | | | 1,910 | |
| 4.500%, cash/0% PIK 09/15/23(A) | | | 275 | | | | 280 | |
| Schaeffler Finance | | | | | | | | |
| 4.750%, 05/15/23(A) | | | 125 | | | | 129 | |
| Tenneco | | | | | | | | |
| 5.375%, 12/15/24 | | | 175 | | | | 184 | |
| 5.000%, 07/15/26 | | | 200 | | | | 205 | |
| TI Group Automotive Systems | | | | | | | | |
| 8.750%, 07/15/23(A) | | | 1,175 | | | | 1,246 | |
| Tupy Overseas | | | | | | | | |
| 6.625%, 07/17/24 | | | 65 | | | | 68 | |
| ZF North America Capital | | | | | | | | |
| 4.750%, 04/29/25(A) | | | 375 | | | | 396 | |
| | | | | | | | | |
| Total Autoparts | | | | 7,420 | |
| | | | | | | | | |
| Banks [4.5%] | |
| Access Bank, MTN | | | | | | | | |
| 10.500%, 10/19/21 | | | 3,733 | | | | 4,123 | |
| African Bank, MTN | | | | | | | | |
| 8.125%, 10/19/20 | | | 5,433 | | | | 5,691 | |
| Akbank Turk, MTN | | | | | | | | |
| 5.125%, 03/31/25 | | | 6,365 | | | | 6,293 | |
| Alternatifbank | | | | | | | | |
| 8.750%, VAR USD Swap Semi 30/360 5 Year Curr+7.833% 04/16/26 | | | 171 | | | | 179 | |
| Australia & New Zealand Banking Group, MTN | | | | | | | | |
| 2.306%, VAR ICE LIBOR USD 3 Month+0.990% 06/01/21(A) | | | 10,000 | | | | 10,154 | |
| Banco de Bogota | | | | | | | | |
| 6.250%, 05/12/26 | | | 1,860 | | | | 2,036 | |
| Banco do Brasil | | | | | | | | |
| 8.500%, VAR US Treas Yield Curve Rate T Note Const Mat 10 Yr+7.782% 10/29/49 | | | 4,170 | | | | 4,566 | |
| Bank Nadra via NDR Finance | | | | | | | | |
| 8.250%, 07/31/18(B) (D) | | | 721 | | | | 22 | |
| Credit Bank of Moscow Via CBOM Finance | | | | | | | | |
| 7.500%, VAR USD Swap Semi 30/360 5 Year Curr+5.416% 10/05/27 | | | 1,850 | | | | 1,591 | |
| 5.875%, 11/07/21 | | | 3,290 | | | | 3,329 | |
| FBN Finance | | | | | | | | |
| 8.250%, 08/07/20 | | | 9,693 | | | | 9,441 | |
| First Bank of Nigeria Via FBN Finance | | | | | | | | |
| 8.000%, VAR USSW2+6.488% 07/23/21 | | | 8,688 | | | | 8,156 | |
| ForteBank JSC | | | | | | | | |
| 11.750%, 12/15/24 | | | 2,775 | | | | 3,056 | |
| Kazkommertsbank JSC | | | | | | | | |
| 5.500%, 12/21/22 | | | 26,860 | | | | 26,462 | |
| National Savings Bank | | | | | | | | |
| 8.875%, 09/18/18 | | | 20 | | | | 21 | |
| Renaissance Credit Via Renaissance Consumer Funding | | | | | | | | |
| 13.500%, 06/21/18 | | | 2,624 | | | | 2,690 | |
| 13.500%, 05/22/19 | | | 2,475 | | | | 2,475 | |
| State Savings Bank of Ukraine Via SSB | | | | | | | | |
| 9.375, 03/10/23 (C) | | | 10,200 | | | | 10,827 | |
| Tinkoff Credit Systems Via TCS Finance | | | | | | | | |
| 9.250%, VAR US Treas Yield Curve Rate T Note Const Mat 5 Yr+7.592% 12/31/49 | | | 4,855 | | | | 5,015 | |
| Turkiye Is Bankasi | | | | | | | | |
| 6.000%, 10/24/22 | | | 9,840 | | | | 9,953 | |
| 3.875%, 11/07/17 | | | 1,290 | | | | 1,291 | |
| United Bank for Africa | | | | | | | | |
| 7.750%, 06/08/22 | | | 6,000 | | | | 5,970 | |
| | | | | | | | | |
| Total Banks | | | | 123,341 | |
| | | | | | | | | |
| Beauty Products [0.1%] | |
| First Quality Finance | | | | | | | | |
| 5.000%, 07/01/25(A) | | | 300 | | | | 309 | |
| 4.625%, 05/15/21(A) | | | 2,100 | | | | 2,122 | |
| | | | | | | | | |
| Total Beauty Products | | | | 2,431 | |
| | | | | | | | | |
| Broadcasting & Cable [3.0%] | |
| Altice Financing | | | | | | | | |
| 7.500%, 05/15/26 | | | 20,535 | | | | 22,640 | |
See accompanying notes to financial statements.
CITY NATIONAL ROCHDALE FUNDS | PAGE 73
| consolidated schedule of investments |
| September 30, 2017 |
City National Rochdale Fixed Income Opportunities Fund (continued) |
| Description | | Face Amount (000)(1) | | | Value (000) | |
| Altice Finco, MTN | | | | | | |
| 7.625%, 02/15/25 | | $ | 4,775 | | | $ | 5,056 | |
| Altice US Finance I | | | | | | | | |
| 5.500%, 05/15/26(A) | | | 775 | | | | 817 | |
| AMC Networks | | | | | | | | |
| 5.000%, 04/01/24 | | | 1,400 | | | | 1,445 | |
| 4.750%, 12/15/22 | | | 325 | | | | 334 | |
| 4.750%, 08/01/25 | | | 175 | | | | 177 | |
| Anixter | | | | | | | | |
| 5.625%, 05/01/19 | | | 275 | | | | 288 | |
| 5.500%, 03/01/23 | | | 900 | | | | 979 | |
| Belden | | | | | | | | |
| 5.250%, 07/15/24(A) | | | 1,125 | | | | 1,173 | |
| Cablevision Systems | | | | | | | | |
| 5.875%, 09/15/22 | | | 925 | | | | 957 | |
| CCO Holdings | | | | | | | | |
| 5.875%, 04/01/24(A) | | | 325 | | | | 345 | |
| 5.875%, 05/01/27(A) | | | 600 | | | | 628 | |
| 5.750%, 09/01/23 | | | 525 | | | | 545 | |
| 5.750%, 01/15/24 | | | 425 | | | | 441 | |
| 5.750%, 02/15/26(A) | | | 300 | | | | 315 | |
| 5.500%, 05/01/26(A) | | | 875 | | | | 907 | |
| 5.375%, 05/01/25(A) | | | 250 | | | | 259 | |
| 5.250%, 09/30/22 | | | 925 | | | | 953 | |
| 5.125%, 02/15/23 | | | 1,275 | | | | 1,316 | |
| 5.125%, 05/01/27(A) | | | 1,100 | | | | 1,115 | |
| 5.000%, 02/01/28(A) | | | 1,300 | | | | 1,296 | |
| Cequel Communications Holdings I | | | | | | | | |
| 5.125%, 12/15/21(A) | | | 1,250 | | | | 1,272 | |
| Clear Channel Worldwide Holdings | | | | | | | | |
| 6.500%, 11/15/22 | | | 1,550 | | | | 1,597 | |
| CSC Holdings | | | | | | | | |
| 5.500%, 04/15/27(A) | | | 1,550 | | | | 1,612 | |
| 5.250%, 06/01/24 | | | 575 | | | | 581 | |
| DISH DBS | | | | | | | | |
| 7.750%, 07/01/26 | | | 200 | | | | 230 | |
| 5.875%, 07/15/22 | | | 2,425 | | | | 2,577 | |
| 5.875%, 11/15/24 | | | 600 | | | | 629 | |
| 5.000%, 03/15/23 | | | 675 | | | | 690 | |
| Gray Television | | | | | | | | |
| 5.875%, 07/15/26(A) | | | 1,275 | | | | 1,313 | |
| 5.125%, 10/15/24(A) | | | 450 | | | | 452 | |
| iHeartCommunications | | | | | | | | |
| 9.000%, 03/01/21 | | | 1,150 | | | | 816 | |
| LIN Television | | | | | | | | |
| 5.875%, 11/15/22 | | | 650 | | | | 678 | |
| Myriad International Holdings | | | | | | | | |
| 4.850%, 07/06/27 | | | 5,955 | | | | 6,172 | |
| Nexstar Broadcasting | | | | | | | | |
| 6.125%, 02/15/22(A) | | | 875 | | | | 912 | |
| 5.625%, 08/01/24(A) | | | 1,600 | | | | 1,656 | |
| SFR Group | | | | | | | | |
| 7.375%, 05/01/26(A) | | | 2,325 | | | | 2,511 | |
| 6.250%, 05/15/24(A) | | | 575 | | | | 607 | |
| 6.000%, 05/15/22(A) | | | 450 | | | | 470 | |
| Sinclair Television Group | | | | | | | | |
| 5.875%, 03/15/26(A) | | | 1,050 | | | | 1,071 | |
| 5.625%, 08/01/24(A) | | | 1,275 | | | | 1,308 | |
| 5.125%, 02/15/27(A) | | | 500 | | | | 486 | |
| Tribune Media | | | | | | | | |
| 5.875%, 07/15/22 | | | 1,950 | | | | 2,028 | |
| Unitymedia Hessen GmbH & KG | | | | | | | | |
| 5.500%, 01/15/23(A) | | | 473 | | | | 488 | |
| Unitymedia KabelBW GmbH | | | | | | | | |
| 6.125%, 01/15/25(A) | | | 1,850 | | | | 1,973 | |
| Virgin Media Finance | | | | | | | | |
| 6.375%, 04/15/23(A) | | | 675 | | | | 705 | |
| 6.000%, 10/15/24(A) | | | 200 | | | | 210 | |
| 5.750%, 01/15/25(A) | | | 500 | | | | 518 | |
| Virgin Media Secured Finance | | | | | | | | |
| 5.500%, 08/15/26(A) | | | 400 | | | | 422 | |
| 5.250%, 01/15/26(A) | | | 2,250 | | | | 2,343 | |
| VTR Finance | | | | | | | | |
| 6.875%, 01/15/24 | | | 1,335 | | | | 1,417 | |
| Ziggo Bond Finance | | | | | | | | |
| 6.000%, 01/15/27(A) | | | 925 | | | | 957 | |
| 5.875%, 01/15/25(A) | | | 275 | | | | 287 | |
| Ziggo Secured Finance | | | | | | | | |
| 5.500%, 01/15/27(A) | | | 1,325 | | | | 1,358 | |
| | | | | | | | | |
| Total Broadcasting & Cable | | | | 82,332 | |
| | | | | | | | | |
| Building & Construction [0.5%] | |
| Allegion US Holding | | | | | | | | |
| 5.750%, 10/01/21 | | | 550 | | | | 566 | |
| China Shanshui Cement Group | | | | | | | | |
| 7.500%, 03/10/20(D) | | | 4,323 | | | | 3,372 | |
| Masonite International | | | | | | | | |
| 5.625%, 03/15/23(A) | | | 875 | | | | 916 | |
| NCI Building Systems | | | | | | | | |
| 8.250%, 01/15/23(A) | | | 700 | | | | 751 | |
| Ply Gem Industries | | | | | | | | |
| 6.500%, 02/01/22 | | | 650 | | | | 677 | |
| Standard Industries | | | | | | | | |
| 6.000%, 10/15/25(A) | | | 950 | | | | 1,036 | |
| 5.000%, 02/15/27(A) | | | 1,775 | | | | 1,850 | |
See accompanying notes to financial statements.
CITY NATIONAL ROCHDALE FUNDS | PAGE 74
| consolidated schedule of investments |
| September 30, 2017 |
City National Rochdale Fixed Income Opportunities Fund (continued) |
| Description | | Face Amount (000)(1) | | | Value (000) | |
| USG | | | | | | |
| 5.500%, 03/01/25(A) | | $ | 400 | | | $ | 428 | |
| 4.875%, 06/01/27(A) | | | 850 | | | | 887 | |
| Yuksel Insaat | | | | | | | | |
| 9.500%, 11/10/15(B) (D) | | | 11,809 | | | | 2,067 | |
| | | | | | | | | |
| Total Building & Construction | | | | 12,550 | |
| | | | | | | | | |
| Building & Construction Supplies [0.1%] | |
| Signode Industrial Group Lux | | | | | | | | |
| 6.375%, 05/01/22(A) | | | 2,675 | | | | 2,775 | |
| | | | | | | | | |
| Building-Heavy Construct [0.3%] | |
| Andrade Gutierrez International | | | | | | | | |
| 4.000%, 04/30/18 | | | 6,825 | | | | 6,468 | |
| Odebrecht Offshore Drilling Finance | | | | | | | | |
| 6.750%, 10/01/22(B) | | | 7,856 | | | | 2,808 | |
| | | | | | | | | |
| Total Building-Heavy Construct | | | | 9,276 | |
| | | | | | | | | |
| Business Services [0.3%] | |
| Acwa Power Management And Investments One | | | | | | | | |
| 5.950%, 12/15/39 | | | 6,145 | | | | 6,346 | |
| Gartner | | | | | | | | |
| 5.125%, 04/01/25(A) | | | 525 | | | | 554 | |
| | | | | | | | | |
| Total Business Services | | | | 6,900 | |
| | | | | | | | | |
| Cable & Satellite [0.1%] | |
| United Group | | | | | | | | |
| 4.375%, 07/01/22 | | EUR | 1,700 | | | | 2,059 | |
| | | | | | | | | |
| Casinos & Gaming [0.1%] | |
| CRC Escrow Issuer LLC | | | | | | | | |
| 5.250%, 10/15/25 | | | 2,175 | | | | 2,175 | |
| | | | | | | | | |
| Chemicals [0.7%] | |
| Alpha 3 | | | | | | | | |
| 6.250%, 02/01/25(A) | | | 1,475 | | | | 1,501 | |
| Eco Services Operations | | | | | | | | |
| 8.500%, 11/01/22(A) | | | 800 | | | | 834 | |
| Hexion | | | | | | | | |
| 6.625%, 04/15/20 | | | 1,900 | | | | 1,701 | |
| Huntsman International | | | | | | | | |
| 5.125%, 11/15/22 | | | 250 | | | | 269 | |
| 4.875%, 11/15/20 | | | 375 | | | | 397 | |
| Mexichem SAB de CV | | | | | | | | |
| 6.750%, 09/19/42 | | | 1,160 | | | | 1,314 | |
| OCP | | | | | | | | |
| 6.875%, 04/25/44 | | | 3,050 | | | | 3,431 | |
| Perstorp Holding | | | | | | | | |
| 7.625%, VAR Euribor 3 Month+7.625% 06/30/21 | | EUR | 500 | | | | 601 | |
| Platform Specialty Products | | | | | | | | |
| 10.375%, 05/01/21(A) | | | 325 | | | | 354 | |
| 6.500%, 02/01/22(A) | | | 3,250 | | | | 3,368 | |
| PQ | | | | | | | | |
| 6.750%, 11/15/22(A) | | | 875 | | | | 947 | |
| Rock International Investment | | | | | | | | |
| 6.625%, 03/27/20 | | | 2,500 | | | | 2,400 | |
| Valvoline | | | | | | | | |
| 5.500%, 07/15/24(A) | | | 200 | | | | 213 | |
| Versum Materials | | | | | | | | |
| 5.500%, 09/30/24(A) | | | 425 | | | | 450 | |
| | | | | | | | | |
| Total Chemicals | | | | 17,780 | |
| | | | | | | | | |
| Circuit Boards [0.0%] | |
| TTM Technologies | | | | | | | | |
| 5.625%, 10/01/25(A) | | | 750 | | | | 759 | |
| | | | | | | | | |
| Coal Mining [2.3%] | |
| Alliance Resource Operating Partners | | | | | | | | |
| 7.500%, 05/01/25(A) | | | 1,075 | | | | 1,115 | |
| DTEK Finance | | | | | | | | |
| 10.750%, 12/31/24 | | | 34,186 | | | | 34,021 | |
| Energy Resources | | | | | | | | |
| 2.838%, cash+PIK on avg mthly TSIPPCAE Index 09/30/22 | | | 21,934 | | | | 21,989 | |
| 2.838%, cash+PIK on avg mthly TSIPPCAE Index 12/31/49 | | | 10,267 | | | | 4,928 | |
| New World Resources | | | | | | | | |
| 8.000%, 04/07/20(B) (D) | | EUR | 1,101 | | | | 20 | |
| Peabody Energy | | | | | | | | |
| 6.375%, 03/31/25(A) | | | 950 | | | | 976 | |
| 6.000%, 03/31/22(A) | | | 175 | | | | 181 | |
| | | | | | | | | |
| Total Coal Mining | | | | 63,230 | |
| | | | | | | | | |
| Commercial Services [0.2%] | |
| Acosta | | | | | | | | |
| 7.750%, 10/01/22(A) | | | 1,775 | | | | 1,278 | |
| Live Nation Entertainment | | | | | | | | |
| 4.875%, 11/01/24(A) | | | 350 | | | | 362 | |
| Nielsen Luxembourg SARL | | | | | | | | |
| 5.000%, 02/01/25(A) | | | 1,575 | | | | 1,640 | |
See accompanying notes to financial statements.
CITY NATIONAL ROCHDALE FUNDS | PAGE 75
| consolidated schedule of investments |
| September 30, 2017 |
City National Rochdale Fixed Income Opportunities Fund (continued) |
| Description | | Face Amount (000)(1) | | | Value (000) | |
| ServiceMaster | | | | | | |
| 5.125%, 11/15/24(A) | | $ | 1,000 | | | $ | 1,028 | |
| | | | | | | | | |
| Total Commercial Services | | | | 4,308 | |
| | | | | | | | | |
| Communication & Media [0.0%] | |
| EW Scripps | | | | | | | | |
| 5.125%, 05/15/25(A) | | | 250 | | | | 255 | |
| | | | | | | | | |
| Computer Graphics [0.1%] | |
| Southern Graphics | | | | | | | | |
| 8.375%, 10/15/20(A) | | | 1,375 | | | | 1,394 | |
| | | | | | | | | |
| Computer Software [0.1%] | |
| Informatica | | | | | | | | |
| 7.125%, 07/15/23(A) | | | 1,850 | | | | 1,859 | |
| SS&C Technologies Holdings | | | | | | | | |
| 5.875%, 07/15/23 | | | 900 | | | | 950 | |
| | | | | | | | | |
| Total Computer Software | | | | 2,809 | |
| | | | | | | | | |
| Computer System Design & Services [0.2%] | |
| Dell International | | | | | | | | |
| 7.125%, 06/15/24(A) | | | 2,050 | | | | 2,265 | |
| 5.875%, 06/15/21(A) | | | 250 | | | | 261 | |
| NCR | | | | | | | | |
| 6.375%, 12/15/23 | | | 625 | | | | 667 | |
| 5.875%, 12/15/21 | | | 400 | | | | 413 | |
| 5.000%, 07/15/22 | | | 975 | | | | 997 | |
| 4.625%, 02/15/21 | | | 300 | | | | 305 | |
| Riverbed Technology | | | | | | | | |
| 8.875%, 03/01/23(A) | | | 1,725 | | | | 1,643 | |
| | | | | | | | | |
| Total Computer System Design & Services | | | | 6,551 | |
| | | | | | | | | |
| Consumer Products & Services [0.3%] | |
| EMI Music Publishing Group North America Holdings | | | | | | | | |
| 7.625%, 06/15/24(A) | | | 1,375 | | | | 1,530 | |
| Prestige Brands | | | | | | | | |
| 6.375%, 03/01/24(A) | | | 1,450 | | | | 1,559 | |
| 5.375%, 12/15/21(A) | | | 1,675 | | | | 1,725 | |
| Scotts Miracle-Gro | | | | | | | | |
| 5.250%, 12/15/26 | | | 75 | | | | 79 | |
| ServiceMaster | | | | | | | | |
| 7.450%, 08/15/27 | | | 225 | | | | 246 | |
| 7.100%, 03/01/18 | | | 475 | | | | 482 | |
| Spectrum Brands | | | | | | | | |
| 6.125%, 12/15/24 | | | 575 | | | | 616 | |
| 5.750%, 07/15/25 | | | 800 | | | | 852 | |
| WMG Acquisition | | | | | | | | |
| 5.000%, 08/01/23(A) | | | 150 | | | | 155 | |
| 4.875%, 11/01/24(A) | | | 250 | | | | 257 | |
| | | | | | | | | |
| Total Consumer Products & Services | | | | 7,501 | |
| | | | | | | | | |
| Containers & Packaging [1.0%] | |
| ARD Finance | | | | | | | | |
| 7.125%, cash/0% PIK 09/15/23 | | | 1,600 | | | | 1,712 | |
| Ardagh Packaging Finance | | | | | | | | |
| 7.250%, 05/15/24(A) | | | 2,550 | | | | 2,797 | |
| 6.000%, 06/30/21(A) | | | 800 | | | | 822 | |
| 6.000%, 02/15/25(A) | | | 675 | | | | 715 | |
| 4.625%, 05/15/23(A) | | | 350 | | | | 360 | |
| Berry Global | | | | | | | | |
| 6.000%, 10/15/22 | | | 400 | | | | 425 | |
| 5.500%, 05/15/22 | | | 2,075 | | | | 2,166 | |
| 5.125%, 07/15/23 | | | 725 | | | | 758 | |
| BWAY Holding | | | | | | | | |
| 7.250%, 04/15/25(A) | | | 3,050 | | | | 3,142 | |
| 5.500%, 04/15/24(A) | | | 1,350 | | | | 1,411 | |
| Crown Americas | | | | | | | | |
| 4.250%, 09/30/26 | | | 225 | | | | 227 | |
| Flex Acquisition | | | | | | | | |
| 6.875%, 01/15/25(A) | | | 2,825 | | | | 2,933 | |
| Guala Closures | | | | | | | | |
| 4.750%, VAR Euribor 3 Month+4.750% 11/15/21 | | EUR | 160 | | | | 190 | |
| Multi-Color | | | | | | | | |
| 4.875%, 11/01/25(A) | | | 375 | | | | 379 | |
| Owens-Brockway Glass Container | | | | | | | | |
| 6.375%, 08/15/25(A) | | | 550 | | | | 622 | |
| 5.375%, 01/15/25(A) | | | 950 | | | | 1,020 | |
| 5.000%, 01/15/22(A) | | | 125 | | | | 132 | |
| Pactiv | | | | | | | | |
| 7.950%, 12/15/25 | | | 200 | | | | 225 | |
| Reynolds Group Issuer | | | | | | | | |
| 7.000%, 07/15/24(A) | | | 2,050 | | | | 2,183 | |
| 5.750%, 10/15/20 | | | 1,650 | | | | 1,679 | |
| Sealed Air | | | | | | | | |
| 5.500%, 09/15/25(A) | | | 700 | | | | 770 | |
| 5.125%, 12/01/24(A) | | | 850 | | | | 915 | |
| 4.875%, 12/01/22(A) | | | 475 | | | | 505 | |
| | | | | | | | | |
| Total Containers & Packaging | | | | 26,088 | |
See accompanying notes to financial statements.
CITY NATIONAL ROCHDALE FUNDS | PAGE 76
| consolidated schedule of investments |
| September 30, 2017 |
City National Rochdale Fixed Income Opportunities Fund (continued) |
| Description | | Face Amount (000)(1) | | | Value (000) | |
| Data Processing/Mgmt [0.2%] | |
| First Data | | | | | | |
| 7.000%, 12/01/23(A) | | $ | 1,425 | | | $ | 1,521 | |
| 5.750%, 01/15/24(A) | | | 3,050 | | | | 3,191 | |
| 5.375%, 08/15/23(A) | | | 1,300 | | | | 1,360 | |
| | | | | | | | | |
| Total Data Processing/Mgmt | | | | 6,072 | |
| | | | | | | | | |
| Decision Support Software [0.0%] | |
| MSCI | | | | | | | | |
| 5.750%, 08/15/25(A) | | | 525 | | | | 573 | |
| 5.250%, 11/15/24(A) | | | 275 | | | | 293 | |
| 4.750%, 08/01/26(A) | | | 150 | | | | 158 | |
| | | | | | | | | |
| Total Decision Support Software | | | | 1,024 | |
| | | | | | | | | |
| Dental Supplies and Equip [0.1%] | |
| IDH Finance | | | | | | | | |
| 6.280%, VAR ICE LIBOR GBP 3 Month+6.000% 08/15/22 | | GBP | 1,500 | | | | 1,884 | |
| | | | | | | | | |
| Diagnostic Equipment [0.2%] | |
| Ortho-Clinical Diagnostics | | | | | | | | |
| 6.625%, 05/15/22(A) | | | 4,400 | | | | 4,312 | |
| | | | | | | | | |
| Dialysis Centers [0.0%] | |
| DaVita | | | | | | | | |
| 5.750%, 08/15/22 | | | 400 | | | | 410 | |
| | | | | | | | | |
| Diamonds/Precious Stones [0.1%] | |
| Petra Diamonds US Treasury | | | | | | | | |
| 7.250%, 05/01/22 | | | 3,000 | | | | 3,060 | |
| | | | | | | | | |
| Disposable Medical Prod [0.1%] | |
| Sterigenics-Nordion Holdings | | | | | | | | |
| 6.500%, 05/15/23(A) | | | 2,300 | | | | 2,392 | |
| | | | | | | | | |
| Distribution/Wholesale [0.1%] | |
| American Builders & Contractors Supply | | | | | | | | |
| 5.750%, 12/15/23(A) | | | 200 | | | | 213 | |
| 5.625%, 04/15/21(A) | | | 358 | | | | 366 | |
| Avantor | | | | | | | | |
| 9.000%, 10/01/25(A) | | | 1,200 | | | | 1,228 | |
| 6.000%, 10/01/24(A) | | | 525 | | | | 538 | |
| Beacon Roofing Supply | | | | | | | | |
| 6.375%, 10/01/23 | | | 425 | | | | 453 | |
| HD Supply | | | | | | | | |
| 5.750%, 04/15/24(A) | | | 900 | | | | 963 | |
| Performance Food Group | | | | | | | | |
| 5.500%, 06/01/24(A) | | | 200 | | | | 206 | |
| | | | | | | | | |
| Total Distribution/Wholesale | | | | 3,967 | |
| | | | | | | | | |
| Diversified Minerals [0.2%] | |
| Teck Resources | | | | | | | | |
| 8.500%, 06/01/24(A) | | | 725 | | | | 832 | |
| 6.250%, 07/15/41 | | | 100 | | | | 113 | |
| 6.125%, 10/01/35 | | | 1,100 | | | | 1,232 | |
| 6.000%, 08/15/40 | | | 350 | | | | 380 | |
| VM Holding | | | | | | | | |
| 5.375%, 05/04/27 | | | 3,305 | | | | 3,478 | |
| | | | | | | | | |
| Total Diversified Minerals | | | | 6,035 | |
| | | | | | | | | |
| Diversified Operations [0.1%] | |
| Colfax | | | | | | | | |
| 3.250%, 05/15/25 | | EUR | 280 | | | | 342 | |
| Koppers | | | | | | | | |
| 6.000%, 02/15/25(A) | | | 975 | | | | 1,048 | |
| | | | | | | | | |
| Total Diversified Operations | | | | 1,390 | |
| | | | | | | | | |
| Drugs [0.4%] | |
| Endo Dac | | | | | | | | |
| 6.000%, 07/15/23(A) | | | 700 | | | | 578 | |
| 6.000%, 02/01/25(A) | | | 2,325 | | | | 1,883 | |
| Valeant Pharmaceuticals International | | | | | | | | |
| 7.500%, 07/15/21(A) | | | 900 | | | | 898 | |
| 7.250%, 07/15/22(A) | | | 600 | | | | 585 | |
| 7.000%, 03/15/24(A) | | | 525 | | | | 560 | |
| 6.500%, 03/15/22(A) | | | 175 | | | | 185 | |
| 6.125%, 04/15/25(A) | | | 3,075 | | | | 2,694 | |
| 5.875%, 05/15/23(A) | | | 2,025 | | | | 1,790 | |
| 5.625%, 12/01/21(A) | | | 700 | | | | 655 | |
| 5.500%, 03/01/23(A) | | | 750 | | | | 658 | |
| | | | | | | | | |
| Total Drugs | | | | 10,486 | |
| | | | | | | | | |
| E-Commerce/Services [0.1%] | |
| Match Group | | | | | | | | |
| 6.750%, 12/15/22 | | | 1,475 | | | | 1,523 | |
| 6.375%, 06/01/24 | | | 450 | | | | 490 | |
| | | | | | | | | |
| Total E-Commerce/Services | | | | 2,013 | |
| | | | | | | | | |
| Electric Utilities [1.2%] | |
| Calpine | | | | | | | | |
| 5.875%, 01/15/24(A) | | | 550 | | | | 568 | |
| 5.750%, 01/15/25 | | | 2,225 | | | | 2,100 | |
See accompanying notes to financial statements.
CITY NATIONAL ROCHDALE FUNDS | PAGE 77
| consolidated schedule of investments |
| September 30, 2017 |
City National Rochdale Fixed Income Opportunities Fund (continued) |
| Description | | Face Amount (000)(1) | | | Value (000) | |
| Capex | | | | | | |
| 6.875%, 05/15/24 | | $ | 3,000 | | | $ | 3,085 | |
| Eskom Holdings SOC | | | | | | | | |
| 7.125%, 02/11/25 | | | 9,295 | | | | 9,628 | |
| Genneia | | | | | | | | |
| 8.750%, 01/20/22 | | | 4,174 | | | | 4,562 | |
| NRG Energy | | | | | | | | |
| 7.250%, 05/15/26 | | | 650 | | | | 697 | |
| 6.625%, 03/15/23 | | | 1,175 | | | | 1,215 | |
| 6.625%, 01/15/27 | | | 625 | | | | 655 | |
| 6.250%, 05/01/24 | | | 1,575 | | | | 1,638 | |
| Orazul Energy Egenor S en C por A | | | | | | | | |
| 5.625%, 04/28/27 | | | 3,100 | | | | 3,035 | |
| Pampa Energia | | | | | | | | |
| 7.500%, 01/24/27 | | | 100 | | | | 109 | |
| Stoneway Capital | | | | | | | | |
| 10.000%, 03/01/27 | | | 5,000 | | | | 5,370 | |
| | | | | | | | | |
| Total Electric Utilities | | | | 32,662 | |
| | | | | | | | | |
| Electrical Products [0.1%] | |
| WESCO Distribution | | | | | | | | |
| 5.375%, 12/15/21 | | | 1,650 | | | | 1,704 | |
| 5.375%, 06/15/24 | | | 500 | | | | 527 | |
| | | | | | | | | |
| Total Electrical Products | | | | 2,231 | |
| | | | | | | | | |
| Energy & Power [0.2%] | |
| Enviva Partners | | | | | | | | |
| 8.500%, 11/01/21 | | | 1,650 | | | | 1,757 | |
| TerraForm Power Operating | | | | | | | | |
| 6.375%, 02/01/23(A) (C) | | | 1,775 | | | | 1,846 | |
| 6.125%, 06/15/25(A) (C) | | | 700 | | | | 746 | |
| | | | | | | | | |
| Total Energy & Power | | | | 4,349 | |
| | | | | | | | | |
| Engineering/R and D Services [0.0%] | |
| Engility | | | | | | | | |
| 8.875%, 09/01/24 | | | 1,075 | | | | 1,180 | |
| | | | | | | | | |
| Enterprise Software/Serv [0.4%] | |
| BCP Singapore VI Cayman Financing | | | | | | | | |
| 8.000%, 04/15/21 | | | 105 | | | | 103 | |
| BMC Software Finance | | | | | | | | |
| 8.125%, 07/15/21(A) | | | 2,225 | | | | 2,278 | |
| Infor Software Parent | | | | | | | | |
| 7.125%, cash/0% PIK 05/01/21(A) | | | 2,450 | | | | 2,493 | |
| Infor US | | | | | | | | |
| 6.500%, 05/15/22 | | | 2,925 | | | | 3,033 | |
| RP Crown Parent | | | | | | | | |
| 7.375%, 10/15/24(A) | | | 1,850 | | | | 1,894 | |
| Sophia | | | | | | | | |
| 9.000%, 09/30/23(A) | | | 1,600 | | | | 1,658 | |
| | | | | | | | | |
| Total Enterprise Software/Serv | | | | 11,459 | |
| | | | | | | | | |
| Entertainment & Gaming [0.7%] | |
| AMC Entertainment Holdings | | | | | | | | |
| 6.125%, 05/15/27 | | | 650 | | | | 642 | |
| 5.875%, 11/15/26 | | | 325 | | | | 320 | |
| Boyd Gaming | | | | | | | | |
| 6.875%, 05/15/23 | | | 1,225 | | | | 1,310 | |
| 6.375%, 04/01/26 | | | 500 | | | | 546 | |
| Chester Downs & Marina | | | | | | | | |
| 9.250%, 02/01/20(A) | | | 1,300 | | | | 1,316 | |
| Eldorado Resorts | | | | | | | | |
| 6.000%, 04/01/25 | | | 1,175 | | | | 1,234 | |
| MGM Resorts International | | | | | | | | |
| 7.750%, 03/15/22 | | | 1,275 | | | | 1,489 | |
| 6.750%, 10/01/20 | | | 250 | | | | 276 | |
| 6.000%, 03/15/23 | | | 600 | | | | 661 | |
| 4.625%, 09/01/26 | | | 250 | | | | 253 | |
| Mohegan Gaming & Entertainment | | | | | | | | |
| 7.875%, 10/15/24(A) | | | 1,425 | | | | 1,514 | |
| Penn National Gaming | | | | | | | | |
| 5.625%, 01/15/27(A) | | | 800 | | | | 830 | |
| Pinnacle Entertainment | | | | | | | | |
| 5.625%, 05/01/24 | | | 1,450 | | | | 1,483 | |
| Regal Entertainment Group | | | | | | | | |
| 5.750%, 02/01/25 | | | 650 | | | | 658 | |
| Rivers Pittsburgh Borrower | | | | | | | | |
| 6.125%, 08/15/21(A) | | | 1,325 | | | | 1,339 | |
| Seminole Hard Rock Entertainment | | | | | | | | |
| 5.875%, 05/15/21(A) | | | 2,000 | | | | 2,020 | |
| Seminole Indian Tribe of Florida | | | | | | | | |
| 7.804%, 10/01/20(A) | | | 370 | | | | 374 | |
| Station Casinos | | | | | | | | |
| 7.500%, 03/01/21 | | | 725 | | | | 752 | |
| 5.000%, 10/01/25(A) | | | 925 | | | | 927 | |
| Sugarhouse HSP Gaming Prop Mezz | | | | | | | | |
| 5.875%, 05/15/25(A) | | | 850 | | | | 835 | |
| Wynn Las Vegas | | | | | | | | |
| 5.250%, 05/15/27(A) | | | 525 | | | | 535 | |
| | | | | | | | | |
| Total Entertainment & Gaming | | | | 19,314 | |
See accompanying notes to financial statements.
CITY NATIONAL ROCHDALE FUNDS | PAGE 78
| consolidated schedule of investments |
| September 30, 2017 |
City National Rochdale Fixed Income Opportunities Fund (continued) |
| Description | | Face Amount (000)(1) | | | Value (000) | |
| Export/Import Bank [0.3%] | |
| Ukreximbank Via Biz Finance | | | | | | |
| 9.750%, 01/22/25 | | $ | 2,000 | | | $ | 2,149 | |
| 9.625%, 04/27/22 | | | 6,435 | | | | 6,890 | |
| | | | | | | | | |
| Total Export/Import Bank | | | | 9,039 | |
| | | | | | | | | |
| Financial Services [1.0%] | |
| Ally Financial | | | | | | | | |
| 5.750%, 11/20/25 | | | 1,975 | | | | 2,141 | |
| 5.125%, 09/30/24 | | | 450 | | | | 487 | |
| 4.750%, 09/10/18 | | | 475 | | | | 486 | |
| 4.625%, 03/30/25 | | | 1,025 | | | | 1,075 | |
| 4.125%, 03/30/20 | | | 425 | | | | 438 | |
| Amigo Luxembourg | | | | | | | | |
| 7.625%, 01/15/24 | | GBP | 450 | | | | 628 | |
| Astana-Finance JSC | | | | | | | | |
| 0.000%, 12/22/24(E) | | | 147 | | | | — | |
| Cabot Financial Luxembourg II | | | | | | | | |
| 5.875%, VAR Euribor 3 Month+5.875% 11/15/21 | | EUR | 1,000 | | | | 1,233 | |
| Dana Financing Luxembourg Sarl | | | | | | | | |
| 6.500%, 06/01/26(A) | | | 1,250 | | | | 1,350 | |
| 5.750%, 04/15/25(A) | | | 300 | | | | 316 | |
| Louvre Bidco SAS | | | | | | | | |
| 4.250%, 09/30/24 | | EUR | 200 | | | | 238 | |
| Navient | | | | | | | | |
| 7.250%, 09/25/23 | | | 525 | | | | 570 | |
| 6.750%, 06/25/25 | | | 225 | | | | 234 | |
| 5.875%, 10/25/24 | | | 1,800 | | | | 1,827 | |
| Navient, MTN | | | | | | | | |
| 6.125%, 03/25/24 | | | 975 | | | | 1,005 | |
| 5.500%, 01/25/23 | | | 175 | | | | 177 | |
| Promontoria MCS SAS | | | | | | | | |
| 5.750%, VAR Euribor 3 Month+5.750% 09/30/21 | | EUR | 100 | | | | 126 | |
| Quicken Loans | | | | | | | | |
| 5.750%, 05/01/25(A) | | | 2,825 | | | | 2,966 | |
| Russian Standard | | | | | | | | |
| 13.000%, cash/0% PIK 10/27/22 | | | 18,005 | | | | 6,266 | |
| Tempo Acquisition | | | | | | | | |
| 6.750%, 06/01/25(A) | | | 1,400 | | | | 1,414 | |
| Unifin Financiera SOFOM ENR | | | | | | | | |
| 7.250%, 09/27/23 | | | 3,500 | | �� | | 3,649 | |
| | | | | | | | | |
| Total Financial Services | | | | 26,626 | |
| | | | | | | | | |
| Firearms and Ammunition [0.0%] | |
| FGI Operating | | | | | | | | |
| 7.875%, 05/01/20(D) | | | 1,250 | | | | 813 | |
| | | | | | | | | |
| Food, Beverage & Tobacco [2.1%] | |
| ARAMARK | | | | | | | | |
| 5.125%, 01/15/24 | | | 1,075 | | | | 1,141 | |
| CEDC Finance International | | | | | | | | |
| 10.000%, 12/31/22(A) | | | 5,000 | | | | 4,831 | |
| ESAL GmbH | | | | | | | | |
| 6.250%, 02/05/23 | | | 3,250 | | | | 3,150 | |
| Galapagos | | | | | | | | |
| 4.421%, VAR Euribor 3 Month+4.750% 06/15/21 | | EUR | 1,888 | | | | 2,174 | |
| Hearthside Group Holdings | | | | | | | | |
| 6.500%, 05/01/22(A) | | | 1,250 | | | | 1,278 | |
| JBS Investments GmbH | | | | | | | | |
| 7.750%, 10/28/20 | | | 143 | | | | 146 | |
| 7.250%, 04/03/24 | | | 6,500 | | | | 6,492 | |
| Lamb Weston Holdings | | | | | | | | |
| 4.875%, 11/01/26(A) | | | 700 | | | | 735 | |
| MARB BondCo | | | | | | | | |
| 7.000%, 03/15/24 | | | 4,795 | | | | 4,723 | |
| Marfrig Holdings Europe | | | | | | | | |
| 8.000%, 06/08/23 | | | 14,620 | | | | 15,126 | |
| MHP | | | | | | | | |
| 8.250%, 04/02/20 | | | 3,765 | | | | 4,062 | |
| 7.750%, 05/10/24 | | | 1,110 | | | | 1,195 | |
| Minerva Luxembourg | | | | | | | | |
| 6.500%, 09/20/26 | | | 2,800 | | | | 2,829 | |
| Nova Austral | | | | | | | | |
| 8.250%, 05/26/21(A) | | | 8,500 | | | | 8,711 | |
| Pinnacle Foods Finance | | | | | | | | |
| 5.875%, 01/15/24 | | | 450 | | | | 477 | |
| | | | | | | | | |
| Total Food, Beverage & Tobacco | | | | 57,070 | |
| | | | | | | | | |
| Food-Catering [0.0%] | |
| Aramark Services | | | | | | | | |
| 5.000%, 04/01/25(A) | | | 750 | | | | 798 | |
| | | | | | | | | |
| Food-Flour and Grain [0.1%] | |
| Post Holdings | | | | | | | | |
| 6.000%, 12/15/22(A) | | | 150 | | | | 157 | |
| 5.750%, 03/01/27(A) | | | 1,000 | | | | 1,030 | |
| 5.500%, 03/01/25(A) | | | 500 | | | | 519 | |
| 5.000%, 08/15/26(A) | | | 2,125 | | | | 2,119 | |
| | | | | | | | | |
| Total Food-Flour and Grain | | | | 3,825 | |
See accompanying notes to financial statements.
CITY NATIONAL ROCHDALE FUNDS | PAGE 79
| consolidated schedule of investments |
| September 30, 2017 |
City National Rochdale Fixed Income Opportunities Fund (continued) |
| Description | | Face Amount (000)(1) | | | Value (000) | |
| Food-Wholesale/Distrib [0.1%] | |
| US Foods | | | | | | |
| 5.875%, 06/15/24(A) | | $ | 1,700 | | | $ | 1,781 | |
| | | | | | | | | |
| Gas-Distribution [0.1%] | |
| AmeriGas Partners | | | | | | | | |
| 5.875%, 08/20/26 | | | 1,075 | | | | 1,118 | |
| 5.750%, 05/20/27 | | | 925 | | | | 946 | |
| 5.625%, 05/20/24 | | | 400 | | | | 421 | |
| 5.500%, 05/20/25 | | | 675 | | | | 694 | |
| | | | | | | | | |
| Total Gas-Distribution | | | | 3,179 | |
| | | | | | | | | |
| Hazardous Waste Disposal [0.0%] | |
| Tervita Escrow | | | | | | | | |
| 7.625%, 12/01/21(A) | | | 1,150 | | | | 1,164 | |
| | | | | | | | | |
| Health Care [0.1%] | |
| Envision Healthcare | | | | | | | | |
| 5.125%, 07/01/22(A) | | | 1,400 | | | | 1,452 | |
| | | | | | | | | |
| Home Decoration Products [0.1%] | |
| RSI Home Products | | | | | | | | |
| 6.500%, 03/15/23(A) | | | 1,875 | | | | 1,969 | |
| | | | | | | | | |
| Hotels and Motels [0.0%] | |
| Grupo Posadas | | | | | | | | |
| 7.875%, 06/30/22 | | | 163 | | | | 174 | |
| Hilton Domestic Operating | | | | | | | | |
| 4.250%, 09/01/24 | | | 550 | | | | 561 | |
| Hilton Worldwide Finance | | | | | | | | |
| 4.625%, 04/01/25 | | | 475 | | | | 489 | |
| | | | | | | | | |
| Total Hotels and Motels | | | | 1,224 | |
| | | | | | | | | |
| Human Resources [0.1%] | |
| Team Health Holdings | | | | | | | | |
| 6.375%, 02/01/25(A) | | | 3,050 | | | | 2,890 | |
| | | | | | | | | |
| Industrial [0.3%] | |
| Reward International Investment | | | | | | | | |
| 7.250%, 01/25/20 | | | 7,470 | | | | 7,058 | |
| Saderea, MTN | | | | | | | | |
| 12.500%, 11/30/26 | | | 392 | | | | 426 | |
| | | | | | | | | |
| Total Industrial | | | | 7,484 | |
| | | | | | | | | |
| Insurance [0.3%] | |
| Ardonagh Midco 3 | | | | | | | | |
| 8.625%, 07/15/23(A) | | | 1,375 | | | | 1,447 | |
| AssuredPartners | | | | | | | | |
| 7.000%, 08/15/25(A) | | | 1,400 | | | | 1,434 | |
| Hub Holdings | | | | | | | | |
| 8.125%, cash/0% PIK 07/15/19(A) | | | 1,525 | | | | 1,529 | |
| HUB International | | | | | | | | |
| 7.875%, 10/01/21(A) | | | 2,600 | | | | 2,707 | |
| USIS Merger Sub | | | | | | | | |
| 6.875%, 05/01/25(A) | | | 1,800 | | | | 1,834 | |
| | | | | | | | | |
| Total Insurance | | | | 8,951 | |
| | | | | | | | | |
| Internet Connectiv Svcs [0.1%] | |
| United Group | | | | | | | | |
| 4.875%, 07/01/24 | | EUR | 1,900 | | | | 2,301 | |
| | | | | | | | | |
| Internet Security [0.0%] | |
| Symantec | | | | | | | | |
| 5.000%, 04/15/25(A) | | | 725 | | | | 758 | |
| | | | | | | | | |
| Investment Bank/Broker-Dealer [0.1%] | |
| BCD Acquisition | | | | | | | | |
| 9.625%, 09/15/23(A) | | | 1,100 | | | | 1,210 | |
| NFP | | | | | | | | |
| 6.875%, 07/15/25(A) | | | 1,525 | | | | 1,548 | |
| | | | | | | | | |
| Total Investment Bank/Broker-Dealer | | | | 2,758 | |
| | | | | | | | | |
| Machinery-General Indust [0.0%] | |
| JPW Industries Holding | | | | | | | | |
| 9.000%, 10/01/24(A) | | | 700 | | | | 718 | |
| Zebra Technologies | | | | | | | | |
| 7.250%, 10/15/22 | | | 552 | | | | 584 | |
| | | | | | | | | |
| Total Machinery-General Indust | | | | 1,302 | |
| | | | | | | | | |
| Media - Non-Cable [0.0%] | |
| Intelsat Jackson Holdings | | | | | | | | |
| 7.250%, 10/15/20 | | | 500 | | | | 481 | |
| | | | | | | | | |
| Medical Information Sys [0.0%] | |
| Quintiles IMS | | | | | | | | |
| 5.000%, 10/15/26(A) | | | 975 | | | | 1,034 | |
| | | | | | | | | |
| Medical Labs and Testing Srv [0.1%] | |
| Eagle Holding II | | | | | | | | |
| 7.625%, cash/0% PIK 05/15/22(A) | | | 775 | | | | 804 | |
| West Street Merger Sub | | | | | | | | |
| 6.375%, 09/01/25(A) | | | 1,025 | | | | 1,020 | |
| | | | | | | | | |
| Total Medical Labs and Testing Srv | | | | 1,824 | |
See accompanying notes to financial statements.
CITY NATIONAL ROCHDALE FUNDS | PAGE 80
| consolidated schedule of investments |
| September 30, 2017 |
City National Rochdale Fixed Income Opportunities Fund (continued) |
| Description | | Face Amount (000)(1) | | | Value (000) | |
| Medical Products & Services [1.3%] | |
| Acadia Healthcare | | | | | | |
| 6.500%, 03/01/24 | | $ | 2,325 | | | $ | 2,496 | |
| CHS | | | | | | | | |
| 6.875%, 02/01/22 | | | 1,875 | | | | 1,472 | |
| 6.250%, 03/31/23 | | | 1,025 | | | | 1,007 | |
| 5.125%, 08/01/21 | | | 500 | | | | 494 | |
| Envision Healthcare | | | | | | | | |
| 6.250%, 12/01/24(A) | | | 1,000 | | | | 1,073 | |
| HCA | | | | | | | | |
| 7.500%, 02/15/22 | | | 1,225 | | | | 1,405 | |
| 6.500%, 02/15/20 | | | 300 | | | | 327 | |
| 5.875%, 05/01/23 | | | 825 | | | | 897 | |
| 5.875%, 02/15/26 | | | 1,000 | | | | 1,074 | |
| 5.375%, 02/01/25 | | | 2,250 | | | | 2,371 | |
| 5.250%, 04/15/25 | | | 2,025 | | | | 2,190 | |
| 5.000%, 03/15/24 | | | 1,875 | | | | 1,997 | |
| 4.500%, 02/15/27 | | | 250 | | | | 256 | |
| HCA Healthcare | | | | | | | | |
| 6.250%, 02/15/21 | | | 550 | | | | 595 | |
| IASIS Healthcare | | | | | | | | |
| 8.375%, 05/15/19 | | | 1,350 | | | | 1,355 | |
| LifePoint Health | | | | | | | | |
| 5.875%, 12/01/23 | | | 325 | | | | 343 | |
| LifePoint Hospitals | | | | | | | | |
| 5.500%, 12/01/21 | | | 875 | | | | 904 | |
| Mallinckrodt International Finance | | | | | | | | |
| 5.625%, 10/15/23(A) | | | 725 | | | | 677 | |
| 5.500%, 04/15/25(A) | | | 2,500 | | | | 2,256 | |
| 4.750%, 04/15/23 | | | 975 | | | | 831 | |
| Nidda Healthcare Holding | | | | | | | | |
| 3.500%, 09/30/24 | | EUR | 600 | | | | 717 | |
| SP Finco | | | | | | | | |
| 6.750%, 07/01/25(A) | | | 1,700 | | | | 1,598 | |
| Sterigenics-Nordion Topco | | | | | | | | |
| 8.125%, cash/0% PIK 11/01/21(A) | | | 1,750 | | | | 1,785 | |
| Teleflex | | | | | | | | |
| 5.250%, 06/15/24 | | | 450 | | | | 476 | |
| 4.875%, 06/01/26 | | | 675 | | | | 700 | |
| Tenet Healthcare | | | | | | | | |
| 8.125%, 04/01/22 | | | 300 | | | | 305 | |
| 7.500%, 01/01/22(A) | | | 325 | | | | 344 | |
| 7.000%, 08/01/25(A) | | | 350 | | | | 329 | |
| 6.750%, 06/15/23 | | | 2,150 | | | | 2,064 | |
| 5.125%, 05/01/25(A) | | | 1,225 | | | | 1,208 | |
| 4.625%, 07/15/24(A) | | | 575 | | | | 570 | |
| 4.500%, 04/01/21 | | | 700 | | | | 714 | |
| 4.375%, 10/01/21 | | | 300 | | | | 304 | |
| | | | | | | | | |
| Total Medical Products & Services | | | | 35,134 | |
| | | | | | | | | |
| Medical-HMO [0.1%] | |
| MPH Acquisition Holdings | | | | | | | | |
| 7.125%, 06/01/24(A) | | | 3,575 | | | | 3,843 | |
| | | | | | | | | |
| Medical-Outptnt/Home Med [0.0%] | |
| Envision Healthcare | | | | | | | | |
| 5.625%, 07/15/22 | | | 950 | | | | 990 | |
| | | | | | | | | |
| Medical-Whsle Drug Dist [0.1%] | |
| Vizient | | | | | | | | |
| 10.375%, 03/01/24(A) | | | 1,600 | | | | 1,838 | |
| | | | | | | | | |
| Metal-Copper [0.4%] | |
| First Quantum Minerals | | | | | | | | |
| 7.500%, 04/01/25 | | | 1,000 | | | | 1,023 | |
| 7.250%, 04/01/23(A) | | | 1,000 | | | | 1,030 | |
| 7.250%, 04/01/23 | | | 1,000 | | | | 1,030 | |
| Freeport-McMoRan | | | | | | | | |
| 5.400%, 11/14/34 | | | 2,300 | | | | 2,196 | |
| 3.875%, 03/15/23 | | | 1,825 | | | | 1,798 | |
| Southern Copper | | | | | | | | |
| 7.500%, 07/27/35 | | | 2,675 | | | | 3,489 | |
| | | | | | | | | |
| Total Metal-Copper | | | | 10,566 | |
| | | | | | | | | |
| Metal-Iron [1.4%] | |
| Koks OAO Via Koks Finance DAC | | | | | | | | |
| 7.500%, 05/04/22 | | | 5,100 | | | | 5,480 | |
| Samarco Mineracao | | | | | | | | |
| 5.750%, 10/24/23(B) | | | 12,900 | | | | 7,805 | |
| 4.125%, 11/01/22(B) | | | 8,200 | | | | 5,002 | |
| Vale Overseas | | | | | | | | |
| 6.875%, 11/21/36 | | | 6,481 | | | | 7,453 | |
| 6.875%, 11/10/39 | | | 10,745 | | | | 12,316 | |
| | | | | | | | | |
| Total Metal-Iron | | | | 38,056 | |
| | | | | | | | | |
| Metals & Mining [0.5%] | |
| Hudbay Minerals | | | | | | | | |
| 7.625%, 01/15/25(A) | | | 750 | | | | 812 | |
| 7.250%, 01/15/23(A) | | | 325 | | | | 346 | |
| TiZir | | | | | | | | |
| 9.500%, 07/19/22(A) | | | 9,100 | | | | 9,393 | |
See accompanying notes to financial statements.
CITY NATIONAL ROCHDALE FUNDS | PAGE 81
| consolidated schedule of investments |
| September 30, 2017 |
City National Rochdale Fixed Income Opportunities Fund (continued) |
| Description | | Face Amount (000)(1) | | | Value (000) | |
| Vedanta Resources | | | | | | |
| 8.250%, 06/07/21 | | $ | 3,500 | | | $ | 3,920 | |
| | | | | | | | | |
| Total Metals & Mining | | | | 14,471 | |
| | | | | | | | | |
| Miscellaneous Business Services [0.0%] | |
| GW Honos Security | | | | | | | | |
| 8.750%, 05/15/25(A) | | | 650 | | | | 693 | |
| | |
| Miscellaneous Manufacturing [0.2%] | |
| Grupo KUO De | | | | | | | | |
| 6.250%, 12/04/22 | | | 32 | | | | 33 | |
| Magnesita Finance | | | | | | | | |
| 8.625%, 04/29/49 | | | 4,043 | | | | 4,027 | |
| Sistema via Sistema International Funding | | | | | | | | |
| 6.950%, 05/17/19 | | | 1,000 | | | | 985 | |
| | | | | | | | | |
| Total Miscellaneous Manufacturing | | | | 5,045 | |
| | | | | | | | | |
| Office Automation and Equip [0.1%] | |
| CDW | | | | | | | | |
| 5.500%, 12/01/24 | | | 1,125 | | | | 1,253 | |
| 5.000%, 09/01/25 | | | 350 | | | | 367 | |
| | | | | | | | | |
| Total Office Automation and Equip | | | | 1,620 | |
| | | | | | | | | |
| Oil-Field Services [0.3%] | |
| Borets Finance | | | | | | | | |
| 7.625%, 09/26/18 | | | 2,220 | | | | 2,304 | |
| Oro Negro Drilling Pte | | | | | | | | |
| 7.500%, 01/24/19(A) | | | 2,677 | | | | 1,526 | |
| SESI | | | | | | | | |
| 7.750%, 09/15/24(A) | | | 1,000 | | | | 1,035 | |
| Weatherford International | | | | | | | | |
| 9.875%, 02/15/24(A) | | | 200 | | | | 220 | |
| 8.250%, 06/15/23 | | | 1,075 | | | | 1,107 | |
| 7.000%, 03/15/38 | | | 775 | | | | 690 | |
| 6.800%, 06/15/37 | | | 225 | | | | 195 | |
| Western Refining Logistics | | | | | | | | |
| 7.500%, 02/15/23 | | | 1,125 | | | | 1,204 | |
| | | | | | | | | |
| Total Oil-Field Services | | | | 8,281 | |
| | | | | | | | | |
| Oil-US Royalty Trusts [0.1%] | |
| Rio Oil Finance Trust, Ser 2014-3 | | | | | | | | |
| 9.750%, 01/06/27 | | | 2,724 | | | | 2,847 | |
| | | | | | | | | |
| Paper & Related Products [0.1%] | |
| Clearwater Paper | | | | | | | | |
| 5.375%, 02/01/25(A) | | | 2,300 | | | | 2,289 | |
| | |
| Petrochemicals [0.1%] | |
| Braskem America Finance | | | | | | | | |
| 7.125%, 07/22/41 | | | 2,590 | | | | 2,953 | |
| | | | | | | | | |
| Petroleum & Fuel Products [9.6%] | |
| Andeavor | | | | | | | | |
| 5.375%, 10/01/22 | | | 375 | | | | 386 | |
| Andeavor Logistics | | | | | | | | |
| 6.375%, 05/01/24 | | | 200 | | | | 217 | |
| 6.250%, 10/15/22 | | | 975 | | | | 1,037 | |
| 6.125%, 10/15/21 | | | 475 | | | | 490 | |
| 5.875%, 10/01/20 | | | 875 | | | | 890 | |
| 5.500%, 10/15/19 | | | 50 | | | | 53 | |
| 5.250%, 01/15/25 | | | 700 | | | | 750 | |
| Antero Midstream Partners | | | | | | | | |
| 5.375%, 09/15/24 | | | 1,300 | | | | 1,345 | |
| Antero Resources | | | | | | | | |
| 5.625%, 06/01/23 | | | 325 | | | | 339 | |
| 5.375%, 11/01/21 | | | 475 | | | | 488 | |
| 5.125%, 12/01/22 | | | 350 | | | | 358 | |
| 5.000%, 03/01/25 | | | 1,075 | | | | 1,091 | |
| Ascent Resources Utica Holdings | | | | | | | | |
| 10.000%, 04/01/22(A) | | | 1,000 | | | | 1,073 | |
| Callon Petroleum | | | | | | | | |
| 6.125%, 10/01/24 | | | 1,155 | | | | 1,195 | |
| Carrizo Oil & Gas | | | | | | | | |
| 8.250%, 07/15/25 | | | 325 | | | | 353 | |
| 7.500%, 09/15/20 | | | 675 | | | | 689 | |
| 6.250%, 04/15/23 | | | 675 | | | | 685 | |
| Cheniere Corpus Christi Holdings | | | | | | | | |
| 7.000%, 06/30/24 | | | 750 | | | | 855 | |
| 5.875%, 03/31/25 | | | 1,050 | | | | 1,130 | |
| 5.125%, 06/30/27(A) | | | 475 | | | | 489 | |
| Cheniere Energy Partners | | | | | | | | |
| 5.250%, 10/01/25(A) | | | 1,850 | | | | 1,892 | |
| Chesapeake Energy | | | | | | | | |
| 8.000%, 12/15/22(A) | | | 715 | | | | 770 | |
| 8.000%, 01/15/25(A) | | | 350 | | | | 354 | |
| 8.000%, 06/15/27(A) | | | 1,025 | | | | 1,015 | |
| 5.750%, 03/15/23 | | | 500 | | | | 461 | |
| 5.375%, 06/15/21 | | | 375 | | | | 357 | |
| 4.875%, 04/15/22 | | | 100 | | | | 93 | |
| Continental Resources | | | | | | | | |
| 4.500%, 04/15/23 | | | 900 | | | | 902 | |
See accompanying notes to financial statements.
CITY NATIONAL ROCHDALE FUNDS | PAGE 82
| consolidated schedule of investments |
| September 30, 2017 |
City National Rochdale Fixed Income Opportunities Fund (continued) |
| Description | | Face Amount (000)(1) | | | Value (000) | |
| CrownRock | | | | | | |
| 7.750%, 02/15/23(A) | | $ | 225 | | | $ | 240 | |
| 7.125%, 04/15/21(A) | | | 350 | | | | 361 | |
| CVR Refining | | | | | | | | |
| 6.500%, 11/01/22 | | | 2,000 | | | | 2,040 | |
| Dana Gas Sukuk | | | | | | | | |
| 9.000%, 10/31/17(A) | | | 2,120 | | | | 1,672 | |
| Diamondback Energy | | | | | | | | |
| 4.750%, 11/01/24 | | | 350 | | | | 357 | |
| DNO | | | | | | | | |
| 8.750%, 06/18/20(A) | | | 1,400 | | | | 1,400 | |
| Energy Transfer | | | | | | | | |
| 5.500%, 04/15/23 | | | 200 | | | | 206 | |
| Energy Transfer Equity | | | | | | | | |
| 5.875%, 01/15/24 | | | 1,975 | | | | 2,121 | |
| 5.500%, 06/01/27 | | | 175 | | | | 184 | |
| EP Energy | | | | | | | | |
| 8.000%, 11/29/24(A) | | | 800 | | | | 808 | |
| 6.375%, 06/15/23 | | | 200 | | | | 123 | |
| EP PetroEcuador via Noble Sovereign Funding I | | | | | | | | |
| 6.961%, VAR ICE LIBOR USD 3 Month+5.630% 09/24/19 | | | 28,523 | | | | 28,665 | |
| Gazprom OAO Via Gaz Capital, MTN | | | | | | | | |
| 8.625%, 04/28/34 | | | 9,150 | | | | 12,438 | |
| Genel Energy Finance | | | | | | | | |
| 7.500%, 05/14/19(A) | | | 1,400 | | | | 1,344 | |
| General Exploration Partners | | | | | | | | |
| 11.500%, cash/0% PIK 11/13/18(A) | | | 10,796 | | | | 10,256 | |
| Georgian Oil and Gas JSC | | | | | | | | |
| 6.750%, 04/26/21 | | | 600 | | | | 637 | |
| Gulfport Energy | | | | | | | | |
| 6.625%, 05/01/23 | | | 550 | | | | 557 | |
| 6.375%, 05/15/25 | | | 675 | | | | 683 | |
| 6.000%, 10/15/24 | | | 300 | | | | 302 | |
| Holly Energy Partners | | | | | | | | |
| 6.000%, 08/01/24(A) | | | 1,625 | | | | 1,704 | |
| Laredo Petroleum | | | | | | | | |
| 7.375%, 05/01/22 | | | 775 | | | | 802 | |
| 6.250%, 03/15/23 | | | 200 | | | | 206 | |
| 5.625%, 01/15/22 | | | 375 | | | | 378 | |
| Latina Offshore | | | | | | | | |
| 8.875%, 07/03/18(A) | | | 3,000 | | | | 2,310 | |
| NGPL PipeCo | | | | | | | | |
| 4.875%, 08/15/27(A) | | | 100 | | | | 105 | |
| 4.375%, 08/15/22(A) | | | 50 | | | | 52 | |
| Nostrum Oil & Gas Finance | | | | | | | | |
| 8.000%, 07/25/22 | | | 5,050 | | | | 5,274 | |
| NuStar Logistics | | | | | | | | |
| 5.625%, 04/28/27 | | | 1,200 | | | | 1,266 | |
| Oasis Petroleum | | | | | | | | |
| 6.875%, 03/15/22 | | | 650 | | | | 661 | |
| 6.875%, 01/15/23 | | | 175 | | | | 178 | |
| 6.500%, 11/01/21 | | | 450 | | | | 459 | |
| Odebrecht Drilling Norbe VIII | | | | | | | | |
| 6.350%, 06/30/21(B) | | | 10,879 | | | | 7,044 | |
| Offshore Drilling Holding | | | | | | | | |
| 8.375%, 09/20/20 | | | 10,550 | | | | 4,326 | |
| Oilflow SPV 1 DAC | | | | | | | | |
| 12.000%, 01/13/22 | | | 2,950 | | | | 3,095 | |
| 12.000%, 01/13/22(A) | | | 9,245 | | | | 9,700 | |
| Parsley Energy | | | | | | | | |
| 6.250%, 06/01/24(A) | | | 150 | | | | 158 | |
| 5.375%, 01/15/25(A) | | | 275 | | | | 281 | |
| 5.250%, 08/15/25(A) | | | 275 | | | | 279 | |
| PDC Energy | | | | | | | | |
| 7.750%, 10/15/22 | | | 175 | | | | 182 | |
| 6.125%, 09/15/24 | | | 450 | | | | 470 | |
| Petroamazonas EP | | | | | | | | |
| 4.625%, 02/16/20 | | | 7,000 | | | | 6,703 | |
| Petrobras Global Finance | | | | | | | | |
| 8.750%, 05/23/26 | | | 4,740 | | | | 5,696 | |
| 8.375%, 12/10/18 | | | 3,000 | | | | 3,197 | |
| 7.875%, 03/15/19 | | | 140 | | | | 150 | |
| 6.875%, 01/20/40 | | | 23,055 | | | | 23,343 | |
| 6.850%, 06/05/15(L) | | | 5,783 | | | | 5,537 | |
| 6.125%, 01/17/22 | | | 3,500 | | | | 3,763 | |
| Petroleos de Venezuela | | | | | | | | |
| 9.750%, 05/17/35 | | | 11,459 | | | | 3,925 | |
| 8.500%, 11/02/17 | | | 435 | | | | 409 | |
| 8.500%, 10/27/20 | | | 32,710 | | | | 27,231 | |
| Precision Drilling | | | | | | | | |
| 7.750%, 12/15/23 | | | 625 | | | | 638 | |
| 6.500%, 12/15/21 | | | 225 | | | | 228 | |
| Puma International Financing | | | | | | | | |
| 6.750%, 02/01/21 | | | 7,050 | | | | 7,262 | |
| QEP Resources | | | | | | | | |
| 6.875%, 03/01/21 | | | 400 | | | | 421 | |
| 5.250%, 05/01/23 | | | 550 | | | | 535 | |
| QGOG Atlantic | | | | | | | | |
| 5.250%, 07/30/18 | | | 1,615 | | | | 1,591 | |
| QGOG Constellation | | | | | | | | |
| 9.500%, 11/09/24 | | | 20,670 | | | | 15,916 | |
| Range Resources | | | | | | | | |
| 5.000%, 03/15/23(A) | | | 475 | | | | 471 | |
| 4.875%, 05/15/25 | | | 772 | | | | 760 | |
| Rice Energy | | | | | | | | |
| 6.250%, 05/01/22 | | | 900 | | | | 941 | |
See accompanying notes to financial statements.
CITY NATIONAL ROCHDALE FUNDS | PAGE 83
| consolidated schedule of investments |
| September 30, 2017 |
City National Rochdale Fixed Income Opportunities Fund (continued) |
| Description | | Face Amount (000)(1) | | | Value (000) | |
| RSP Permian | | | | | | |
| 6.625%, 10/01/22 | | $ | 625 | | | $ | 656 | |
| 5.250%, 01/15/25(A) | | | 425 | | | | 431 | |
| Seven Energy Finance | | | | | | | | |
| 10.250%, cash/0% PIK 10/11/21(B) (D) | | | 11,685 | | | | 3,973 | |
| SM Energy | | | | | | | | |
| 6.750%, 09/15/26 | | | 300 | | | | 300 | |
| 6.500%, 01/01/23 | | | 400 | | | | 403 | |
| 5.625%, 06/01/25 | | | 250 | | | | 238 | |
| 5.000%, 01/15/24 | | | 175 | | | | 165 | |
| Southwestern Energy | | | | | | | | |
| 7.750%, 10/01/27 | | | 1,025 | | | | 1,063 | |
| 7.500%, 04/01/26 | | | 175 | | | | 182 | |
| 4.100%, 03/15/22 | | | 850 | | | | 817 | |
| Summit Midstream Holdings | | | | | | | | |
| 5.750%, 04/15/25 | | | 1,275 | | | | 1,294 | |
| 5.500%, 08/15/22 | | | 1,600 | | | | 1,608 | |
| Targa Resources Partners | | | | | | | | |
| 5.375%, 02/01/27 | | | 1,075 | | | | 1,119 | |
| 5.250%, 05/01/23 | | | 500 | | | | 510 | |
| 5.125%, 02/01/25 | | | 475 | | | | 489 | |
| Tupras Turkiye Petrol Rafinerileri | | | | | | | | |
| 4.125%, 05/02/18 | | | 3,000 | | | | 3,018 | |
| Ultra Resources | | | | | | | | |
| 7.125%, 04/15/25(A) | | | 750 | | | | 758 | |
| 6.875%, 04/15/22(A) | | | 225 | | | | 230 | |
| Whiting Petroleum | | | | | | | | |
| 6.250%, 04/01/23 | | | 1,025 | | | | 1,008 | |
| Williams | | | | | | | | |
| 4.550%, 06/24/24 | | | 900 | | | | 932 | |
| Williams Partners | | | | | | | | |
| 4.875%, 03/15/24 | | | 450 | | | | 471 | |
| WPX Energy | | | | | | | | |
| 8.250%, 08/01/23 | | | 275 | | | | 308 | |
| 7.500%, 08/01/20 | | | 51 | | | | 55 | |
| 6.000%, 01/15/22 | | | 300 | | | | 310 | |
| 5.250%, 09/15/24 | | | 625 | | | | 627 | |
| YPF | | | | | | | | |
| 8.500%, 07/28/25 | | | 3,950 | | | | 4,552 | |
| 6.950%, 07/21/27 | | | 4,000 | | | | 4,250 | |
| Zhaikmunai LLP | | | | | | | | |
| 7.125%, 11/13/19 | | | 1,390 | | | | 1,413 | |
| 6.375%, 02/14/19 | | | 1,550 | | | | 1,558 | |
| | | | | | | | | |
| Total Petroleum & Fuel Products | | | | 264,536 | |
| | | | | | | | | |
| Phys Practice Mgmnt [0.0%] | |
| MEDNAX | | | | | | | | |
| 5.250%, 12/01/23(A) | | | 200 | | | | 210 | |
| | |
| Platinum [0.2%] | |
| Stillwater Mining | | | | | | | | |
| 7.125%, 06/27/25 | | | 4,000 | | | | 4,120 | |
| 6.125%, 06/27/22 | | | 1,500 | | | | 1,523 | |
| | | | | | | | | |
| Total Platinum | | | | 5,643 | |
| | | | | | | | | |
| Precious Metals [0.0%] | |
| Coeur Mining | | | | | | | | |
| 5.875%, 06/01/24 | | | 925 | | | | 925 | |
| | |
| Printing & Publishing [0.1%] | |
| Multi-Color | | | | | | | | |
| 6.125%, 12/01/22(A) | | | 1,550 | | | | 1,626 | |
| Nielsen Finance | | | | | | | | |
| 5.000%, 04/15/22(A) | | | 1,700 | | | | 1,761 | |
| | | | | | | | | |
| Total Printing & Publishing | | | | 3,387 | |
| | | | | | | | | |
| Publishing-Newspapers [0.1%] | |
| TEGNA | | | | | | | | |
| 6.375%, 10/15/23 | | | 1,125 | | | | 1,196 | |
| 5.500%, 09/15/24(A) | | | 300 | | | | 316 | |
| | | | | | | | | |
| Total Publishing-Newspapers | | | | 1,512 | |
| | | | | | | | | |
| Quarrying [0.0%] | |
| Compass Minerals International | | | | | | | | |
| 4.875%, 07/15/24(A) | | | 1,200 | | | | 1,179 | |
| | | | | | | | | |
| Radio [0.3%] | |
| CBS Radio | | | | | | | | |
| 7.250%, 11/01/24(A) | | | 650 | | | | 694 | |
| Sirius XM Radio | | | | | | | | |
| 6.000%, 07/15/24(A) | | | 975 | | | | 1,049 | |
| 5.375%, 04/15/25(A) | | | 1,400 | | | | 1,477 | |
| 5.375%, 07/15/26(A) | | | 575 | | | | 605 | |
| 5.000%, 08/01/27(A) | | | 75 | | | | 77 | |
| 4.625%, 05/15/23(A) | | | 1,250 | | | | 1,284 | |
| Urban One | | | | | | | | |
| 9.250%, 02/15/20(A) | | | 900 | | | | 853 | |
| 7.375%, 04/15/22(A) | | | 1,150 | | | | 1,150 | |
| | | | | | | | | |
| Total Radio | | | | 7,189 | |
| | | | | | | | | |
| Real Estate Investment Trusts [0.1%] | |
| GLP Capital | | | | | | | | |
| 5.375%, 04/15/26 | | | 400 | | | | 436 | |
| Iron Mountain | | | | | | | | |
| 5.750%, 08/15/24 | | | 475 | | | | 490 | |
See accompanying notes to financial statements.
CITY NATIONAL ROCHDALE FUNDS | PAGE 84
| consolidated schedule of investments |
| September 30, 2017 |
City National Rochdale Fixed Income Opportunities Fund (continued) |
| Description | | Face Amount (000)(1) | | | Value (000) | |
| Lamar Media | | | | | | |
| 5.875%, 02/01/22 | | $ | 525 | | | $ | 541 | |
| 5.750%, 02/01/26 | | | 100 | | | | 108 | |
| 5.375%, 01/15/24 | | | 450 | | | | 474 | |
| MGM Growth Properties Operating Partnership | | | | | | | | |
| 5.625%, 05/01/24 | | | 425 | | | | 461 | |
| RHP Hotel Properties | | | | | | | | |
| 5.000%, 04/15/23 | | | 150 | | | | 155 | |
| | | | | | | | | |
| Total Real Estate Investment Trusts | | | | 2,665 | |
| | | | | | | | | |
| Real Estate Oper/Develop [1.0%] | |
| APL Realty Holdings Pte | | | | | | | | |
| 5.950%, 06/02/24 | | | 3,000 | | | | 2,993 | |
| BR Properties | | | | | | | | |
| 9.000%, 10/29/49 | | | 1,000 | | | | 1,015 | |
| Central China Real Estate | | | | | | | | |
| 8.750%, 01/23/21 | | | 1,280 | | | | 1,375 | |
| China Evergrande Group | | | | | | | | |
| 7.500%, 06/28/23 | | | 5,115 | | | | 5,080 | |
| China SCE Property Holdings | | | | | | | | |
| 10.000%, 07/02/20 | | | 1,000 | | | | 1,088 | |
| Ezdan Sukuk | | | | | | | | |
| 4.375%, 05/18/21 | | | 2,850 | | | | 2,703 | |
| Global Prime Capital Pte | | | | | | | | |
| 5.500%, 10/18/23 | | | 5,000 | | | | 5,041 | |
| Kaisa Group Holdings | | | | | | | | |
| 8.500%, 06/30/22 | | | 3,445 | | | | 3,458 | |
| Sunac China Holdings | | | | | | | | |
| 7.950%, 08/08/22 | | | 5,800 | | | | 5,791 | |
| | | | | | | | | |
| Total Real Estate Oper/Develop | | | | 28,544 | |
| | | | | | | | | |
| Regional Authority [0.0%] | |
| Rio Oil Finance Trust, Ser 2014-1 | | | | | | | | |
| 9.250%, 07/06/24 | | | 181 | | | | 188 | |
| | | | | | | | | |
| Research and Development [0.1%] | |
| Jaguar Holding II | | | | | | | | |
| 6.375%, 08/01/23(A) | | | 3,575 | | | | 3,740 | |
| | | | | | | | | |
| Resorts/Theme Parks [0.1%] | |
| Cedar Fair | | | | | | | | |
| 5.375%, 04/15/27(A) | | | 400 | | | | 420 | |
| Six Flags Entertainment | | | | | | | | |
| 5.500%, 04/15/27(A) | | | 2,450 | | | | 2,511 | |
| 4.875%, 07/31/24(A) | | | 550 | | | | 560 | |
| | | | | | | | | |
| Total Resorts/Theme Parks | | | | 3,491 | |
| | |
| Retail [0.9%] | |
| 1011778 BC ULC | | | | | | | | |
| 6.000%, 04/01/22(A) | | | 1,114 | | | | 1,149 | |
| 5.000%, 10/15/25(A) | | | 2,100 | | | | 2,126 | |
| 4.250%, 05/15/24(A) | | | 525 | | | | 527 | |
| Albertsons | | | | | | | | |
| 6.625%, 06/15/24 | | | 900 | | | | 840 | |
| 5.750%, 03/15/25 | | | 1,600 | | | | 1,408 | |
| Ferrellgas | | | | | | | | |
| 6.750%, 01/15/22 | | | 1,175 | | | | 1,140 | |
| 6.750%, 06/15/23 | | | 1,100 | | | | 1,061 | |
| 6.500%, 05/01/21 | | | 675 | | | | 655 | |
| Hillman Group | | | | | | | | |
| 6.375%, 07/15/22(A) | | | 1,950 | | | | 1,940 | |
| Iceland Bondco | | | | | | | | |
| 4.545%, VAR ICE LIBOR GBP 3 Month+4.250% 07/15/20 | | GBP | 247 | | | | 330 | |
| KFC Holding | | | | | | | | |
| 5.250%, 06/01/26(A) | | | 625 | | | | 662 | |
| 5.000%, 06/01/24(A) | | | 325 | | | | 342 | |
| 4.750%, 06/01/27(A) | | | 625 | | | | 644 | |
| Michaels Stores | | | | | | | | |
| 5.875%, 12/15/20(A) | | | 1,500 | | | | 1,534 | |
| New Look Secured Issuer | | | | | | | | |
| 4.500%, VAR Euribor 3 Month+4.500% 07/01/22 | | EUR | 2,000 | | | | 1,525 | |
| Party City Holdings | | | | | | | | |
| 6.125%, 08/15/23(A) | | | 1,650 | | | | 1,716 | |
| PetSmart | | | | | | | | |
| 8.875%, 06/01/25(A) | | | 675 | | | | 537 | |
| 7.125%, 03/15/23(A) | | | 2,550 | | | | 1,988 | |
| Rite Aid | | | | | | | | |
| 6.125%, 04/01/23(A) | | | 1,050 | | | | 1,020 | |
| Sally Holdings | | | | | | | | |
| 5.625%, 12/01/25 | | | 1,050 | | | | 1,076 | |
| Suburban Propane Partners | | | | | | | | |
| 5.875%, 03/01/27 | | | 450 | | | | 445 | |
| | | | | | | | | |
| Total Retail | | | | 22,665 | |
| | | | | | | | | |
| Rubber & Plastic [0.1%] | |
| Goodyear Tire & Rubber | | | | | | | | |
| 5.125%, 11/15/23 | | | 250 | | | | 261 | |
| 5.000%, 05/31/26 | | | 675 | | | | 704 | |
| 4.875%, 03/15/27 | | | 575 | | | | 592 | |
| | | | | | | | | |
| Total Rubber & Plastic | | | | 1,557 | |
See accompanying notes to financial statements.
CITY NATIONAL ROCHDALE FUNDS | PAGE 85
| consolidated schedule of investments |
| September 30, 2017 |
City National Rochdale Fixed Income Opportunities Fund (continued) |
| Description | | Face Amount (000)(1) | | | Value (000) | |
| Rubber/Plastic Products [0.1%] | |
| Gates Global | | | | | | |
| 6.000%, 07/15/22(A) | | $ | 2,625 | | | $ | 2,697 | |
| | | | | | | | | |
| Security Brokers & Dealers [2.2%] | |
| Bank of America | | | | | | | | |
| 2.313%, VAR ICE LIBOR USD 3 Month+1.000% 04/24/23 | | | 10,000 | | | | 10,086 | |
| Goldman Sachs Group, MTN | | | | | | | | |
| 2.415%, VAR ICE LIBOR USD 3 Month+1.100% 11/15/18 | | | 20,000 | | | | 20,185 | |
| JPMorgan Chase | | | | | | | | |
| 2.214%, VAR ICE LIBOR USD 3 Month+0.900% 04/25/23 | | | 10,000 | | | | 10,071 | |
| Morgan Stanley | | | | | | | | |
| 2.109%, VAR ICE LIBOR USD 3 Month+0.800% 02/14/20 | | | 10,000 | | | | 10,051 | |
| UBS Group Funding Switzerland | | | | | | | | |
| 2.841%, VAR ICE LIBOR USD 3 Month+1.530% 02/01/22(A) | | | 10,000 | | | | 10,306 | |
| | | | | | | | | |
| Total Security Brokers & Dealers | | | | 60,699 | |
| | | | | | | | | |
| Semi-Conductors [0.2%] | |
| Entegris | | | | | | | | |
| 6.000%, 04/01/22(A) | | | 1,300 | | | | 1,359 | |
| Micron Technology | | | | | | | | |
| 5.250%, 08/01/23(A) | | | 275 | | | | 287 | |
| 5.250%, 01/15/24(A) | | | 175 | | | | 184 | |
| Sensata Technologies | | | | | | | | |
| 5.000%, 10/01/25(A) | | | 300 | | | | 316 | |
| Sensata Technologies UK Financing | | | | | | | | |
| 6.250%, 02/15/26(A) | | | 225 | | | | 246 | |
| Tunghsu Venus Holdings | | | | | | | | |
| 7.000%, 06/12/20 | | | 3,635 | | | | 3,453 | |
| | | | | | | | | |
| Total Semi-Conductors | | | | 5,845 | |
| | | | | | | | | |
| Software & Services [0.1%] | |
| Rackspace Hosting | | | | | | | | |
| 8.625%, 11/15/24(A) | | | 2,250 | | | | 2,401 | |
| | | | | | | | | |
| Steel & Steel Works [0.5%] | |
| ArcelorMittal | | | | | | | | |
| 6.125%, 06/01/25 | | | 250 | | | | 287 | |
| CSN Resources | | | | | | | | |
| 6.500%, 07/21/20 | | | 2,000 | | | | 1,760 | |
| Ferrexpo Finance | | | | | | | | |
| 10.375%, 04/07/19 | | | 2,588 | | | | 2,749 | |
| Metinvest | | | | | | | | |
| 9.373%, cash/0% PIK 12/31/21 | | | 7,265 | | | | 7,353 | |
| Steel Dynamics | | | | | | | | |
| 5.500%, 10/01/24 | | | 900 | | | | 963 | |
| 5.250%, 04/15/23 | | | 125 | | | | 130 | |
| 5.125%, 10/01/21 | | | 225 | | | | 232 | |
| 5.000%, 12/15/26 | | | 225 | | | | 240 | |
| | | | | | | | | |
| Total Steel & Steel Works | | | | 13,714 | |
| | | | | | | | | |
| Telecommunication Equip [0.5%] | |
| CommScope | | | | | | | | |
| 5.500%, 06/15/24(A) | | | 300 | | | | 314 | |
| CommScope Technologies | | | | | | | | |
| 6.000%, 06/15/25(A) | | | 950 | | | | 1,016 | |
| 5.000%, 03/15/27(A) | | | 125 | | | | 125 | |
| HTA Group | | | | | | | | |
| 9.125%, 03/08/22 | | | 10,925 | | | | 11,487 | |
| | | | | | | | | |
| Total Telecommunication Equip | | | | 12,942 | |
| | | | | | | | | |
| Telephones & Telecommunications [4.8%] | |
| Altice | | | | | | | | |
| 7.750%, 05/15/22(A) | | | 850 | | | | 902 | |
| 7.625%, 02/15/25(A) | | | 1,500 | | | | 1,618 | |
| Altice US Finance I | | | | | | | | |
| 5.375%, 07/15/23(A) | | | 575 | | | | 608 | |
| AT&T | | | | | | | | |
| 2.254%, VAR ICE LIBOR USD 3 Month+0.950% 07/15/21 | | | 10,000 | | | | 10,126 | |
| Banglalink Digital Communications | | | | | | | | |
| 8.625%, 05/06/19 | | | 1,200 | | | | 1,252 | |
| Bulgarian Telecommunications EAD, MTN | | | | | | | | |
| 6.625%, 11/15/18 | | EUR | 1,358 | | | | 1,615 | |
| Cequel Communications Holdings I | | | | | | | | |
| 7.750%, 07/15/25(A) | | | 1,000 | | | | 1,105 | |
| Comcel Trust | | | | | | | | |
| 6.875%, 02/06/24 | | | 2,975 | | | | 3,170 | |
| CSC Holdings | | | | | | | | |
| 10.875%, 10/15/25(A) | | | 375 | | | | 464 | |
| 10.125%, 01/15/23(A) | | | 825 | | | | 952 | |
| 6.625%, 10/15/25(A) | | | 625 | | | | 684 | |
See accompanying notes to financial statements.
CITY NATIONAL ROCHDALE FUNDS | PAGE 86
| consolidated schedule of investments |
| September 30, 2017 |
City National Rochdale Fixed Income Opportunities Fund (continued) |
| Description | | Face Amount (000)(1) | | | Value (000) | |
| Digicel | | | | | | |
| 6.000%, 04/15/21 | | $ | 24,415 | | | | 23,833 | |
| Digicel Group | | | | | | | | |
| 8.250%, 09/30/20 | | | 22,880 | | | | 22,437 | |
| 8.250%, 09/30/20(A) | | | 1,075 | | | | 1,050 | |
| 7.125%, 04/01/22 | | | 14,055 | | | | 12,732 | |
| GTH Finance | | | | | | | | |
| 7.250%, 04/26/23 | | | 9,655 | | | | 10,953 | |
| Intelsat Jackson Holdings | | | | | | | | |
| 9.750%, 07/15/25(A) | | | 525 | | | | 530 | |
| 8.000%, 02/15/24(A) | | | 875 | | | | 941 | |
| 7.500%, 04/01/21 | | | 1,475 | | | | 1,398 | |
| 5.500%, 08/01/23 | | | 1,625 | | | | 1,377 | |
| Liquid Telecommunications Financing | | | | | | | | |
| 8.500%, 07/13/22 | | | 7,000 | | | | 7,373 | |
| Matterhorn Telecom, MTN | | | | | | | | |
| 3.250%, VAR Euribor 3 Month+3.250% 02/01/23 | | EUR | 905 | | | | 1,070 | |
| Mauritius Investment | | | | | | | | |
| 5.373%, 02/13/22 | | | 14 | | | | 15 | |
| Sable International Finance | | | | | | | | |
| 6.875%, 08/01/22 | | | 10,525 | | | | 11,367 | |
| Sixsigma Networks Mexico | | | | | | | | |
| 8.250%, 11/07/21 | | | 63 | | | | 65 | |
| Sprint | | | | | | | | |
| 7.875%, 09/15/23 | | | 3,300 | | | | 3,828 | |
| 7.625%, 02/15/25 | | | 600 | | | | 688 | |
| 7.125%, 06/15/24 | | | 500 | | | | 562 | |
| Sprint Capital | | | | | | | | |
| 6.875%, 11/15/28 | | | 1,800 | | | | 2,016 | |
| Sprint Communications | | | | | | | | |
| 6.000%, 11/15/22 | | | 1,700 | | | | 1,820 | |
| T-Mobile USA | | | | | | | | |
| 6.836%, 04/28/23 | | | 1,500 | | | | 1,584 | |
| 6.625%, 04/01/23 | | | 1,450 | | | | 1,526 | |
| 6.500%, 01/15/24 | | | 700 | | | | 746 | |
| 6.500%, 01/15/26 | | | 400 | | | | 442 | |
| 6.375%, 03/01/25 | | | 575 | | | | 619 | |
| 6.125%, 01/15/22 | | | 275 | | | | 286 | |
| 6.000%, 04/15/24 | | | 550 | | | | 584 | |
| | | | | | | | | |
| Total Telephones & Telecommunications | | | | 132,338 | |
| | | | | | | | | |
| Textile-Home Furnishings [0.0%] | |
| Springs Industries | | | | | | | | |
| 6.250%, 06/01/21 | | | 627 | | | | 647 | |
| | | | | | | | | |
| Textile-Products [0.3%] | |
| Golden Legacy Pte. Ltd. | | | | | | | | |
| 8.250%, 06/07/21 | | | 4,655 | | | | 5,084 | |
| 6.875%, 03/27/24 | | | 2,000 | | | | 2,033 | |
| Grupo Kaltex | | | | | | | | |
| 8.875%, 04/11/22 | | | 140 | | | | 131 | |
| | | | | | | | | |
| Total Textile-Products | | | | 7,248 | |
| | | | | | | | | |
| Transactional Software [0.1%] | |
| Solera | | | | | | | | |
| 10.500%, 03/01/24(A) | | | 2,250 | | | | 2,562 | |
| | | | | | | | | |
| Transportation & Logistics [0.1%] | |
| DP World, MTN | | | | | | | | |
| 6.850%, 07/02/37 | | | 2,860 | | | | 3,530 | |
| | | | | | | | | |
| Transportation Services [0.9%] | |
| Air Medical Group Holdings | | | | | | | | |
| 6.375%, 05/15/23(A) | | | 1,800 | | | | 1,732 | |
| Alfa | | | | | | | | |
| 6.875%, 03/25/44 | | | 3,055 | | | | 3,460 | |
| Brunswick Rail Finance | | | | | | | | |
| 6.500%, 11/01/17 | | | 2,450 | | | | 2,074 | |
| Far East Capital | | | | | | | | |
| 8.750%, 05/02/20(B) | | | 5,200 | | | | 4,108 | |
| 8.000%, 05/02/18(B) | | | 5,500 | | | | 4,346 | |
| Global Liman Isletmeleri | | | | | | | | |
| 8.125%, 11/14/21 | | | 5,250 | | | | 5,436 | |
| Nielsen Luxembourg SaRL | | | | | | | | |
| 5.500%, 10/01/21(A) | | | 250 | | | | 257 | |
| Sabre GLBL | | | | | | | | |
| 5.375%, 04/15/23(A) | | | 900 | | | | 933 | |
| Ukraine Railways via Shortline | | | | | | | | |
| 9.875%, 09/15/21 | | | 3,000 | | | | 3,171 | |
| | | | | | | | | |
| Total Transportation Services | | | | 25,517 | |
| | | | | | | | | |
| Transport-Equip and Leasng [0.1%] | |
| Park Aerospace Holdings | | | | | | | | |
| 5.500%, 02/15/24(A) | | | 2,925 | | | | 3,071 | |
| 5.250%, 08/15/22(A) | | | 250 | | | | 260 | |
| 4.500%, 03/15/23(A) | | | 250 | | | | 250 | |
| | | | | | | | | |
| Total Transport-Equip and Leasng | | | | 3,581 | |
| | | | | | | | | |
| Utility [0.1%] | |
| Suburban Propane Partners | | | | | | | | |
| 5.750%, 03/01/25 | | | 850 | | | | 841 | |
| 5.500%, 06/01/24 | | | 1,550 | | | | 1,558 | |
| | | | | | | | | |
| Total Utility | | | | 2,399 | |
See accompanying notes to financial statements.
CITY NATIONAL ROCHDALE FUNDS | PAGE 87
| consolidated schedule of investments |
| September 30, 2017 |
City National Rochdale Fixed Income Opportunities Fund (continued) |
| Description | | Face Amount (000)(1) | | | Value (000) | |
| Waste Disposal [0.0%] | |
| Wrangler Buyer | | | | | | |
| 6.000%, 10/01/25(A) | | $ | 125 | | | $ | 127 | |
| | | | | | | | | |
| Water Treatment Systems [0.0%] | |
| CD&R Waterworks Merger Sub | | | | | | | | |
| 6.125%, 08/15/25(A) | | | 550 | | | | 564 | |
| | | | | | | | | |
| Web Hosting/Design [0.0%] | |
| VeriSign | | | | | | | | |
| 5.250%, 04/01/25 | | | 525 | | | | 567 | |
| 4.750%, 07/15/27 | | | 250 | | | | 257 | |
| | | | | | | | | |
| Total Web Hosting/Design | | | | 824 | |
| | | | | | | | | |
| Total Corporate Bonds | |
| (Cost $1,396,232) | | | | 1,436,540 | |
| | | | | | | | | |
| Loan Participations [29.2%] | |
| Aerospace [0.6%] | |
| Aerojet Rocketdyne Holdings, Term Loan | | | | | | | | |
| 3.235%, 06/17/21 | | | 750 | | | | 743 | |
| Air Canada, Term Loan B (2017) | | | | | | | | |
| 3.568%, 10/06/23 | | | 1,260 | | | | 1,265 | |
| American Airlines, Class B Term Loan | | | | | | | | |
| 3.734%, 12/14/23 | | | 305 | | | | 305 | |
| American Airlines, Term Loan B | | | | | | | | |
| 3.735%, 04/28/23(F) | | | 635 | | | | 637 | |
| American Airlines, Term Loan B (2017) | | | | | | | | |
| 4.813%, 10/10/21 | | | 495 | | | | 495 | |
| Dae Aviation Holdings, Term Loan | | | | | | | | |
| 0.000%, 07/07/22(F) (G) | | | 1,175 | | | | 1,183 | |
| Dae Aviation Holdings, Term Loan B | | | | | | | | |
| 4.985%, 07/07/22 | | | 1,236 | | | | 1,245 | |
| Engility, Term Loan B-1 | | | | | | | | |
| 3.985%, 08/12/20 | | | 1,206 | | | | 1,213 | |
| Engility, Term Loan B-2 | | | | | | | | |
| 6.500%, 08/14/23(G) | | | 1,395 | | | | 1,410 | |
| Sequa, Term Loan B | | | | | | | | |
| 6.814%, 10/26/21(G) | | | 783 | | | | 788 | |
| Sequa, Term Loan, 2nd Lien | | | | | | | | |
| 10.314%, 04/26/22(G) | | | 185 | | | | 189 | |
| TransDigm, Term Loan D | | | | | | | | |
| 4.333%, 06/04/21(G) | | | 1,962 | | | | 1,966 | |
| TransDigm, Term Loan F | | | | | | | | |
| 4.235%, 06/09/23(G) | | | 2,275 | | | | 2,281 | |
| TransDigm, Term Loan G | | | | | | | | |
| 4.235%, 08/16/24 | | | 753 | | | | 754 | |
| WP CPP Holdings, Term Loan B-3 | | | | | | | | |
| 4.811%, 12/28/19 | | | 834 | | | | 812 | |
| | | | | | | | | |
| Total Aerospace | | | | 15,286 | |
| | | | | | | | | |
| Automotive [0.6%] | |
| Apcoa, Term Loan, 1st Lien | | | | | | | | |
| 4.250%, 03/08/24 | | | 2,000 | | | | 2,387 | |
| Car Trawler, Term Loan | | | | | | | | |
| 3.750%, 04/30/21 | | EUR | 2,723 | | | | 3,187 | |
| Cooper, Term Loan | | | | | | | | |
| 3.500%, 01/30/23 | | EUR | 1,000 | | | | 1,190 | |
| Oasis Holdings, Term Loan | | | | | | | | |
| 2.500%, 11/19/20(F) | | | 10,386 | | | | 8,828 | |
| | | | | | | | | |
| Total Automotive | | | | 15,592 | |
| | | | | | | | | |
| Broadcasting [0.4%] | |
| CBS Radio, Term Loan B | | | | | | | | |
| 4.737%, 10/17/23 | | | 588 | | | | 592 | |
| CBS Radio, Term Loan B (2017) | | | | | | | | |
| 2.750%, 03/02/24(F) | | | 750 | | | | 751 | |
| Cumulus Media, Term Loan B | | | | | | | | |
| 4.490%, 12/23/20(G) | | | 466 | | | | 388 | |
| Entercom Radio LLC, Term Loan B | | | | | | | | |
| 4.737%, 11/01/23 | | | 458 | | | | 459 | |
| IHeart Communications, Term Loan E | | | | | | | | |
| 8.833%, 07/30/19 | | | 2,143 | | | | 1,651 | |
| Mission / Nexstar Broadcasting, Term Loan B2 - Mission | | | | | | | | |
| 3.732%, 01/17/24(G) | | | 53 | | | | 53 | |
| Mission / Nexstar Broadcasting, Term Loan B2 - Nexstar | | | | | | | | |
| 3.737%, 01/17/24(G) | | | 417 | | | | 418 | |
| Quincy Newspapers, Term Loan B | | | | | | | | |
| 4.490%, 11/02/22 | | | 416 | | | | 417 | |
| TFM Group, Term Loan | | | | | | | | |
| 3.500%, 10/16/23 | | EUR | 1,000 | | | | 1,189 | |
| Tribune Media, Term Loan B | | | | | | | | |
| 4.235%, 12/27/20 | | | 100 | | | | 100 | |
| Tribune Media, Term Loan C | | | | | | | | |
| 4.235%, 01/27/24(G) | | | 1,249 | | | | 1,250 | |
See accompanying notes to financial statements.
CITY NATIONAL ROCHDALE FUNDS | PAGE 88
| consolidated schedule of investments |
| September 30, 2017 |
City National Rochdale Fixed Income Opportunities Fund (continued) |
| Description | | Face Amount (000)(1) | | | Value (000) | |
| Univision Comm (fka Umbrella), 2017 Replacement Term Loan | | | | | | |
| 3.985%, 03/15/24(G) | | $ | 4,424 | | | $ | 4,382 | |
| | | | | | | | | |
| Total Broadcasting | | | | 11,650 | |
| | | | | | | | | |
| Broadcasting & Cable [0.1%] | |
| Virgin Media, Term Loan J, 1st Lien | | | | | | | | |
| 3.752%, 01/30/26 | | GBP | 1,500 | | | | 2,016 | |
| | | | | | | | | |
| Cable/Wireless Video [1.8%] | |
| Altice Financing, New Refi Term Loan | | | | | | | | |
| 3.485%, 07/28/25 | | | 2,677 | | | | 2,663 | |
| Altice Financing, Term Loan B (2017) | | | | | | | | |
| 4.054%, 06/22/25 | | | 1,167 | | | | 1,168 | |
| Atlantic Broadband, Term Loan | | | | | | | | |
| 2.375%, 08/11/24 | | | 1,300 | | | | 1,291 | |
| Cable & Wireless Communications PLC (Sable), Term Loan B-3 | | | | | | | | |
| 4.735%, 01/31/25(G) | | | 3,415 | | | | 3,377 | |
| Cable One, Term Loan B | | | | | | | | |
| 3.570%, 04/12/24 | | | 224 | | | | 226 | |
| Charter Comm Operating, LLC, Term Loan E-1 | | | | | | | | |
| 3.240%, 07/01/20 | | | 1,733 | | | | 1,739 | |
| Charter Comm Operating, LLC, Term Loan H-1 | | | | | | | | |
| 3.240%, 01/15/22(G) | | | 1,873 | | | | 1,877 | |
| Charter Comm Operating, LLC, Term Loan I-1 | | | | | | | | |
| 3.490%, 01/15/24(G) | | | 2,121 | | | | 2,129 | |
| CSC Holdings, Term Loan B (2017) | | | | | | | | |
| 3.484%, 07/15/25(G) | | | 1,471 | | | | 1,462 | |
| Intelsat Jackson Holdings, Term Loan B2 | | | | | | | | |
| 4.071%, 06/30/19(G) | | | 3,220 | | | | 3,208 | |
| Liberty Cablevision of Puerto Rico, Term Loan, 1st Lien | | | | | | | | |
| 4.804%, 01/07/22 | | | 2,610 | | | | 2,427 | |
| Liberty Cablevision of Puerto Rico, Term Loan, 2nd Lien - 2014 | | | | | | | | |
| 8.054%, 07/07/23 | | | 112 | | | | 110 | |
| M7 Group, Term Loan | | | | | | | | |
| 4.250%, 06/17/21 | | | 899 | | | | 1,069 | |
| MCC Iowa (Broadband), Term Loan H | | | | | | | | |
| 3.700%, 01/29/21 | | | 1,250 | | | | 1,258 | |
| Mediacom LLC, Term Loan K | | | | | | | | |
| 3.450%, 02/19/24 | | | 1,134 | | | | 1,135 | |
| Quebecor Media, Term Loan B | | | | | | | | |
| 3.565%, 08/17/20 | | | 2,089 | | | | 2,094 | |
| Radiate Hold, Term Loan B | | | | | | | | |
| 4.235%, 02/01/24(G) | | | 1,129 | | | | 1,113 | |
| Tele Columbus, Term Loan | | | | | | | | |
| 3.250%, 10/15/24 | | EUR | 2,000 | | | | 2,376 | |
| Telenet Financing, Term Loan AI | | | | | | | | |
| 3.984%, 06/30/25(G) | | | 470 | | | | 471 | |
| Unitymedia, Term Loan B (2017) | | | | | | | | |
| 3.487%, 09/08/25(F) | | | 1,765 | | | | 1,759 | |
| UPC Financing, Term Loan AP | | | | | | | | |
| 3.984%, 04/15/25(G) | | | 2,210 | | | | 2,216 | |
| WideOpenWest Finance LLC, Term Loan B (2017) | | | | | | | | |
| 4.484%, 08/18/23(G) | | | 2,590 | | | | 2,584 | |
| Ziggo, Term Loan E | | | | | | | | |
| 3.734%, 04/15/25(G) | | | 7,800 | | | | 7,793 | |
| 3.000%, 04/15/25 | | EUR | 3,000 | | | | 3,565 | |
| | | | | | | | | |
| Total Cable/Wireless Video | | | | 49,110 | |
| | | | | | | | | |
| Chemicals [1.7%] | |
| Albaugh, LLC, Initial Term Loan | | | | | | | | |
| 6.235%, 05/31/21 | | | 401 | | | | 404 | |
| Allnex, Term Loan B-1 | | | | | | | | |
| 3.250%, 06/02/23 | | EUR | 1,485 | | | | 1,759 | |
| Alpha 3, Term Loan B-1 | | | | | | | | |
| 4.333%, 01/31/24(G) | | | 379 | | | | 380 | |
| Ashland, Term Loan B | | | | | | | | |
| 3.319%, 05/25/24 | | | 145 | | | | 145 | |
| ASP Chromaflo Intermediate Holdings, Term Loan B-1 | | | | | | | | |
| 5.235%, 11/20/23(G) | | | 731 | | | | 734 | |
| ASP Chromaflo Intermediate Holdings, Term Loan B-2 | | | | | | | | |
| 5.239%, 11/20/23(G) | | | 951 | | | | 955 | |
| Axalta Coating Systems US Holdings, Term Loan B (2017) | | | | | | | | |
| 3.333%, 06/30/24 | | | 658 | | | | 661 | |
| Colouroz Investment 2, LLC, Initial Term B-2 Loan, 1st Lien | | | | | | | | |
| 4.057%, 09/07/21 | | | 2,497 | | | | 2,428 | |
See accompanying notes to financial statements.
CITY NATIONAL ROCHDALE FUNDS | PAGE 89
| consolidated schedule of investments |
| September 30, 2017 |
City National Rochdale Fixed Income Opportunities Fund (continued) |
| Description | | Face Amount (000)(1) | | | Value (000) | |
| Constantia Flexibles, 1st Lien | | | | | | |
| 4.296%, 04/30/22(G) | | $ | 629 | | | $ | 626 | |
| Constantia Flexibles, Initial Term Loan | | | | | | | | |
| 4.296%, 04/30/22(G) | | | 123 | | | | 122 | |
| Emerald Performance Materials, LLC, Initial Term Loan, 1st Lien | | | | | | | | |
| 4.735%, 07/30/21(G) | | | 118 | | | | 119 | |
| Emerald Performance Materials, LLC, Term Loan, 2nd Lien | | | | | | | | |
| 8.985%, 08/01/22 | | | 1,945 | | | | 1,940 | |
| Ferro, Term Loan B | | | | | | | | |
| 3.735%, 02/13/24(G) | | | 786 | | | | 789 | |
| Flint Group SA, Term Loan C | | | | | | | | |
| 4.057%, 09/03/21 | | | 413 | | | | 401 | |
| Gemini HDPE LLC, Term Loan B | | | | | | | | |
| 4.172%, 08/06/21 | | | 1,640 | | | | 1,648 | |
| Ineos Group Holdings PLC, Term Loan B (2024) | | | | | | | | |
| 3.985%, 02/10/24(G) | | | 1,896 | | | | 1,908 | |
| Ineos Group Holdings PLC, Term Loan B 2022 | | | | | | | | |
| 3.985%, 03/31/22(G) | | | 5,473 | | | | 5,509 | |
| Ineos Group, Term Loan | | | | | | | | |
| 3.250%, 03/31/22 | | | 1,950 | | | | 2,316 | |
| Ineos Styrolution Group GmbH, Term Loan B (2017) | | | | | | | | |
| 4.083%, 03/30/24 | | | 1,236 | | | | 1,247 | |
| Kraton Polymers, Term Loan B (2017) | | | | | | | | |
| 4.235%, 01/06/22(G) | | | 163 | | | | 165 | |
| MacDermid (Platform), Term Loan B-5 | | | | | | | | |
| 4.735%, 06/07/20 | | | 450 | | | | 452 | |
| MacDermid (Platform), Term Loan B-6 | | | | | | | | |
| 4.239%, 06/07/23 | | | 573 | | | | 576 | |
| MacDermid (Platform), Term Loan B-7 | | | | | | | | |
| 2.500%, 06/07/20 | | | 460 | | | | 461 | |
| MacDermid, Term Loan C, 1st Lien | | | | | | | | |
| 0.000%, 06/07/20 | | EUR | 2,241 | | | | 2,661 | |
| Minerals Technologies, Fixed Term Loan B-2 | | | | | | | | |
| 4.750%, 05/07/21 | | | 3,495 | | | | 3,539 | |
| Minerals Technologies, Term Loan B (2017) | | | | | | | | |
| 3.490%, 02/14/24 | | | 2,245 | | | | 2,256 | |
| NEP, Term Loan, 1st Lien | | | | | | | | |
| 3.750%, 01/04/24 | | | 1,489 | | | | 1,773 | |
| New Arclin US Holdings, Term Loan B | | | | | | | | |
| 5.583%, 02/10/24 | | | 219 | | | | 221 | |
| Oxea, Term Loan B | | | | | | | | |
| 0.000%, 10/12/24 | | EUR | 540 | | | | 541 | |
| Oxea, Term Loan, 1st Lien | | | | | | | | |
| 0.000%, 09/27/24 | | EUR | 1,500 | | | | 1,773 | |
| Parex Group, Term Loan B, 1st Lien | | | | | | | | |
| 3.500%, 03/07/24 | | EUR | 1,500 | | | | 1,780 | |
| Perstorp, Term Loan | | | | | | | | |
| 0.297%, 12/27/21 | | EUR | 1,098 | | | | 1,337 | |
| Platform Specialty Products, 1st Lien | | | | | | | | |
| 4.250%, 06/07/20 | | | 230 | | | | 272 | |
| Royal Adhesives and Sealants LLC, Term Loan B | | | | | | | | |
| 4.583%, 06/20/22(G) | | | 622 | | | | 623 | |
| Royal Adhesives and Sealants LLC, Term Loan, 2nd Lien | | | | | | | | |
| 8.833%, 06/19/23(G) | | | 552 | | | | 550 | |
| Sapec, Term Loan B, 1st Lien | | | | | | | | |
| 4.750%, 12/15/23(D) | | EUR | 2,500 | | | | 2,940 | |
| Trinseo Materials Operating S.C.A (fka Styron), Term Loan B (2017) | | | | | | | | |
| 3.735%, 08/17/24(F) (G) | | | 785 | | | | 789 | |
| Tronox, Blocked Dollar Term Loan | | | | | | | | |
| 3.000%, 09/22/24(G) | | | 153 | | | | 153 | |
| Tronox, Initial Dollar Term Loan | | | | | | | | |
| 3.000%, 09/22/24(G) | | | 352 | | | | 354 | |
| Univar, Term Loan B2 | | | | | | | | |
| 3.985%, 07/01/22(G) | | | 238 | | | | 239 | |
| Venator, Term Loan B | | | | | | | | |
| 4.312%, 06/29/24(F) | | | 510 | | | | 512 | |
| | | | | | | | | |
| Total Chemicals | | | | 48,058 | |
| | | | | | | | | |
| Consumer Durables [0.1%] | |
| American Bath Group, Replacement Term Loan | | | | | | | | |
| 6.583%, 09/30/23 | | | 1,200 | | | | 1,202 | |
| WKI Holdings, Term Loan B (2017) | | | | | | | | |
| 5.311%, 05/01/24 | | | 444 | | | | 444 | |
| | | | | | | | | |
| Total Consumer Durables | | | | 1,646 | |
See accompanying notes to financial statements.
CITY NATIONAL ROCHDALE FUNDS | PAGE 90
| consolidated schedule of investments |
| September 30, 2017 |
City National Rochdale Fixed Income Opportunities Fund (continued) |
| Description | | Face Amount (000)(1) | | | Value (000) | |
| Consumer Non-Durables [0.3%] | |
| Coty, Term Loan B (Galleria) | | | | | | |
| 4.250%, 09/29/23(G) | | $ | 525 | | | $ | 523 | |
| Eastman Kodak, Exit Term Loan | | | | | | | | |
| 7.507%, 09/03/19(G) | | | 820 | | | | 807 | |
| NBTY (Nature’s Bounty), Term Loan | | | | | | | | |
| 4.738%, 09/11/24 | | | 395 | | | | 390 | |
| Parfums Holdings, Term Loan B | | | | | | | | |
| 6.083%, 06/29/24(F) | | | 324 | | | | 327 | |
| PHS Group Limited, Term Loan | | | | | | | | |
| 6.250%, 11/15/21 | | GBP | 1,697 | | | | 2,293 | |
| Prestige Brands, Term Loan B-4 | | | | | | | | |
| 3.985%, 01/20/24(G) | | | 850 | | | | 853 | |
| Varsity Brands (Hercules Achievement), Term Loan B | | | | | | | | |
| 4.732%, 12/10/21(G) | | | 1,961 | | | | 1,974 | |
| | | | | | | | | |
| Total Consumer Non-Durables | | | | 7,167 | |
| | | | | | | | | |
| Containers & Packaging [0.1%] | |
| Faerch, Term Loan B, 1st Lien | | | | | | | | |
| 0.000%, 07/24/24 | | | 2,500 | | | | 2,955 | |
| | | | | | | | | |
| Diversified Media [1.1%] | |
| ALM Media, LLC, Term Loan B | | | | | | | | |
| 5.833%, 07/31/20(D) | | | 204 | | | | 184 | |
| Audiotonix Term Loan, 1st Lien | | | | | | | | |
| 5.924%, 03/22/24 | | | 1,223 | | | | 1,217 | |
| Creative Artist Agency LLC, Term Loan B (2024) | | | | �� | | | | |
| 4.734%, 02/13/24 | | | 1,060 | | | | 1,063 | |
| Deluxe Entertainment Services Group, Term Loan | | | | | | | | |
| 6.811%, 02/28/20 | | | 1,942 | | | | 1,949 | |
| DHX Media, Term Loan B | | | | | | | | |
| 4.985%, 12/29/23(F) | | | 509 | | | | 507 | |
| Donnelley Financial Solutions, Term Loan B | | | | | | | | |
| 4.480%, 09/29/23 | | | 254 | | | | 255 | |
| Formula One (Alpha Topco), Term Loan B | | | | | | | | |
| 4.235%, 02/24/24(G) | | | 840 | | | | 845 | |
| Harland Clarke Holdings, Term Loan B-5 | | | | | | | | |
| 7.333%, 12/31/21 | | | 2,550 | | | | 2,563 | |
| Harland Clarke Holdings, Term Loan B-6 | | | | | | | | |
| 6.833%, 02/09/22(G) | | | 9,955 | | | | 9,999 | |
| Learfield Communications, Term Loan | | | | | | | | |
| 4.490%, 12/01/23(G) | | | 248 | | | | 249 | |
| Lions Gate Entertainment, Term Loan B | | | | | | | | |
| 4.235%, 12/08/23 | | | 1,450 | | | | 1,461 | |
| McGraw-Hill Global Education Holdings LLC, Term Loan - 2022 | | | | | | | | |
| 5.235%, 05/04/22(G) | | | 522 | | | | 512 | |
| MediArena Acquisition (Endemol), Term Loan, 1st Lien | | | | | | | | |
| 7.049%, 08/13/21 | | | 1,446 | | | | 1,392 | |
| Merrill Communications LLC, Term Loan - 2022 | | | | | | | | |
| 6.561%, 06/01/22 | | | 1,139 | | | | 1,144 | |
| Micro Holdings (Internet Brands), Term Loan (2017) | | | | | | | | |
| 4.820%, 08/16/24 | | | 1,148 | | | | 1,141 | |
| Micro Holdings (Internet Brands), Term Loan, 2nd Lien | | | | | | | | |
| 8.820%, 08/16/25 | | | 145 | | | | 144 | |
| Nielsen Finance LLC, Term Loan B-4 | | | | | | | | |
| 6.976%, 10/04/23 | | | 594 | | | | 594 | |
| Rovi Solutions, Term Loan B | | | | | | | | |
| 3.740%, 07/02/21 | | | 559 | | | | 560 | |
| WME IMG Holdings LLC, Initial Term Loan | | | | | | | | |
| 4.490%, 05/06/21(G) | | | 2,707 | | | | 2,721 | |
| WME IMG Holdings LLC, Term Loan, 2nd Lien | | | | | | | | |
| 8.490%, 05/06/22 | | | 2,427 | | | | 2,451 | |
| | | | | | | | | |
| Total Diversified Media | | | | 30,951 | |
| | | | | | | | | |
| Energy [1.4%] | |
| Alon USA, MLP Term Loan | | | | | | | | |
| 9.250%, 11/26/18 | | | 537 | | | | 539 | |
| Azure Midstream Holdings LLC, Term Loan B | | | | | | | | |
| 7.735%, 11/15/18 | | | 1,377 | | | | 1,265 | |
| BCP Renaissance Parent LLC, Term Loan B | | | | | | | | |
| 0.000%, 10/30/24(G) | | | 430 | | | | 434 | |
| Biogroup, Term Loan | | | | | | | | |
| 3.500%, 06/14/24 | | EUR | 767 | | | | 907 | |
| Biogroup, Term Loan B, 1st Lien | | | | | | | | |
| 3.500%, 06/14/24 | | EUR | 233 | | | | 277 | |
| California Resources, Term Loan | | | | | | | | |
| 11.609%, 12/31/21(G) | | | 790 | | | | 841 | |
See accompanying notes to financial statements.
CITY NATIONAL ROCHDALE FUNDS | PAGE 91
| consolidated schedule of investments |
| September 30, 2017 |
City National Rochdale Fixed Income Opportunities Fund (continued) |
| Description | | Face Amount (000)(1) | | | Value (000) | |
| Chesapeake Energy, Term Loan | | | | | | |
| 8.814%, 08/23/21(G) | | $ | 2,930 | | | $ | 3,154 | |
| Chief Exploration & Development LLC, Term Loan, 2nd Lien | | | | | | | | |
| 7.959%, 05/16/21(G) | | | 1,315 | | | | 1,284 | |
| CITGO Petroleum, Term Loan B 2015 | | | | | | | | |
| 9.647%, 05/12/18 | | | 3,724 | | | | 3,752 | |
| Crestwood, Term Loan B-1 | | | | | | | | |
| 9.234%, 06/19/19(F) | | | 1,242 | | | | 1,235 | |
| Eagleclaw, Term Loan B | | | | | | | | |
| 5.447%, 06/22/24(G) | | | 1,127 | | | | 1,135 | |
| EMG Utica, Term Loan | | | | | | | | |
| 5.197%, 03/27/20 | | | 1,847 | | | | 1,858 | |
| Energy Transfer Equity LP, Term Loan B (2017) | | | | | | | | |
| 4.726%, 01/31/24(G) | | | 6,605 | | | | 6,634 | |
| Euro Garages, Term Loan | | | | | | | | |
| 6.311%, 01/31/23 | | GBP | 2,000 | | | | 2,696 | |
| Frac Tech International, Term Loan B - 2014 | | | | | | | | |
| 5.985%, 04/16/21(G) | | | 2,351 | | | | 2,194 | |
| Gavilan Resources, Term Loan, 2nd Lien | | | | | | | | |
| 7.726%, 02/24/24(G) | | | 1,370 | | | | 1,322 | |
| Hi-Crush Partners, Term Loan B | | | | | | | | |
| 5.083%, 04/28/21 | | | 840 | | | | 822 | |
| KCA Deutag, Term Loan | | | | | | | | |
| 7.065%, 05/15/20(G) | | | 1,268 | | | | 1,221 | |
| Motor Fuel Group, Term Loan | | | | | | | | |
| 4.871%, 07/18/22 | | GBP | 2,000 | | | | 2,714 | |
| New World Resources, Term Loan | | | | | | | | |
| 0.000%, 10/07/17(D) | | | 233 | | | | — | |
| Paradigm, Term Loan C | | | | | | | | |
| 4.840%, 07/30/19 | | | 136 | | | | 101 | |
| Philadelphia Energy Solutions, Term Loan | | | | | | | | |
| 6.333%, 04/04/18(G) | | | 285 | | | | 230 | |
| Sheridan Production Partners, Term Loan II-A | | | | | | | | |
| 4.820%, 12/16/20(D) | | | 76 | | | | 64 | |
| Sheridan Production Partners, Term Loan II-M | | | | | | | | |
| 4.820%, 12/16/20(D) | | | 28 | | | | 24 | |
| Sheridan Production Partners, Term Loan II-SIP | | | | | | | | |
| 4.820%, 12/16/20(D) | | | 544 | | | | 459 | |
| Techem, Tem Loan B, 1st Lien | | | | | | | | |
| 0.000%, 07/26/24(F) | | EUR | 1,500 | | | | 1,781 | |
| Traverse Midstream, Term Loan B | | | | | | | | |
| 0.000%, 09/21/24(F) (G) | | | 755 | | | | 764 | |
| Ultra Resources, Term Loan B | | | | | | | | |
| 4.309%, 04/12/24 | | | 720 | | | | 718 | |
| | | | | | | | | |
| Total Energy | | | | 38,425 | |
| | | | | | | | | |
| Financial [2.7%] | |
| Accelya, International Term Loan, 1st Lien | | | | | | | | |
| 5.687%, 03/29/24 | | | 2,000 | | | | 1,990 | |
| Altisource, Term Loan B | | | | | | | | |
| 4.739%, 12/09/20(G) | | | 707 | | | | 655 | |
| Aretec Group, Exit Term Loan | | | | | | | | |
| 8.000%, 11/23/20 | | | 814 | | | | 814 | |
| Aretec Group, Term Loan, 2nd Lien | | | | | | | | |
| 2.000%, 05/23/21 | | | 1,677 | | | | 1,669 | |
| Aruba Investments, Term Loan, 1st Lien | | | | | | | | |
| 4.250%, 02/02/22 | | EUR | 978 | | | | 1,158 | |
| Asurion, LLC (fka Asurion), Replacement B-4 Term Loan (2017) | | | | | | | | |
| 3.985%, 08/04/22(G) | | | 2,561 | | | | 2,567 | |
| Asurion, LLC (fka Asurion), Replacement B-5 Term Loan | | | | | | | | |
| 4.235%, 11/03/23(G) | | | 3,985 | | | | 4,002 | |
| Asurion, LLC (fka Asurion), Term Loan, 2nd Lien (2017) | | | | | | | | |
| 7.235%, 08/04/25(G) | | | 5,185 | | | | 5,299 | |
| Avolon, Term Loan B-1 | | | | | | | | |
| 3.486%, 09/16/20 | | | 234 | | | | 235 | |
| Avolon, Term Loan B-2 | | | | | | | | |
| 3.986%, 03/20/22(G) | | | 1,576 | | | | 1,579 | |
| Dubai World, Term Loan | | | | | | | | |
| 3.000%, 09/30/18 | | | 14,490 | | | | 13,209 | |
| 4.750%, 09/30/18 | | | 17,616 | | | | 16,075 | |
| EVO Payments International, Term Loan B | | | | | | | | |
| 6.240%, 12/08/23 | | | 652 | | | | 659 | |
| Fortress Investment, Term Loan B | | | | | | | | |
| 2.750%, 06/09/22(G) | | | 1,140 | | | | 1,151 | |
| Freedom Mortgage, Term Loan B | | | | | | | | |
| 6.956%, 02/17/22(F) | | | 995 | | | | 1,011 | |
| Infinitas, Term Loan | | | | | | | | |
| 3.750%, 05/03/24 | | EUR | 2,000 | | | | 2,346 | |
| iStar Financial, Term Loan B | | | | | | | | |
| 4.237%, 10/01/21(G) | | | 2,725 | | | | 2,735 | |
See accompanying notes to financial statements.
CITY NATIONAL ROCHDALE FUNDS | PAGE 92
| consolidated schedule of investments |
| September 30, 2017 |
City National Rochdale Fixed Income Opportunities Fund (continued) |
| Description | | Face Amount (000)(1) | | | Value (000) | |
| Jane Street Group, LLC, Term Loan B | | | | | | |
| 5.735%, 08/25/22 | | $ | 360 | | | $ | 363 | |
| Jefferies Finance LLC, Term Loan B | | | | | | | | |
| 4.313%, 08/03/24(G) | | | 275 | | | | 275 | |
| LPL Holdings, Term Loan B (2017) | | | | | | | | |
| 3.576%, 03/11/24 | | | 250 | | | | 249 | |
| Mortgage Contracting Services, Term Loan AP | | | | | | | | |
| 6.056%, 05/12/24 | | | 589 | | | | 594 | |
| Ocwen Financial, Term Loan | | | | | | | | |
| 6.231%, 12/07/20 | | | 1,308 | | | | 1,304 | |
| Optimal Payments Ltd., Term Loan | | | | | | | | |
| 3.750%, 01/22/21 | | EUR | 2,000 | | | | 2,364 | |
| Russell Investments, Term Loan B | | | | | | | | |
| 5.485%, 06/01/23 | | | 848 | | | | 859 | |
| Tackle, Term Loan B, 1st Lien | | | | | | | | |
| 3.500%, 08/08/22 | | EUR | 2,000 | | | | 2,349 | |
| Tempo Acquisition LLC, Term Loan B | | | | | | | | |
| 4.235%, 05/12/24(G) | | | 1,776 | | | | 1,776 | |
| USI Holdings, Term Loan B | | | | | | | | |
| 4.314%, 05/16/24(G) | | | 505 | | | | 503 | |
| Victory Capital Management, Term Loan B (2017) | | | | | | | | |
| 6.583%, 10/29/21 | | | 699 | | | | 711 | |
| Virtu Financial LLC (aka VFH), Term Loan | | | | | | | | |
| 5.061%, 12/30/21 | | | 921 | | | | 930 | |
| Vistra Group, Ltd., Term Loan | | | | | | | | |
| 4.000%, 07/21/22 | | | 980 | | | | 1,165 | |
| Walter Investment Management, Term Loan B | | | | | | | | |
| 4.985%, 12/18/20(G) | | | 2,495 | | | | 2,284 | |
| | | | | | | | | |
| Total Financial | | | | 72,880 | |
| | | | | | | | | |
| Food and Drug [0.4%] | |
| Albertsons, LLC, 2017-1 Term Loan B-4 | | | | | | | | |
| 3.985%, 08/25/21(G) | | | 652 | | | | 628 | |
| Albertsons, LLC, 2017-1 Term Loan B-6 | | | | | | | | |
| 4.317%, 06/22/23(G) | | | 2,274 | | | | 2,183 | |
| Refresco, Term Loan B, 1st Lien | | | | | | | | |
| 0.000%, 09/27/24 | | GBP | 1,000 | | | | 1,352 | |
| 0.000%, 09/26/24 | | EUR | 1,500 | | | | 1,789 | |
| Rite Aid, Term Loan, 2nd Lien - Tranche 1 | | | | | | | | |
| 5.990%, 08/21/20 | | | 1,085 | | | | 1,092 | |
| Rite Aid, Term Loan, 2nd Lien - Tranche 2 | | | | | | | | |
| 5.115%, 06/21/21 | | | 440 | | | | 442 | |
| Solina Group, Term Loan | | | | | | | | |
| 4.750%, 12/16/22 | | EUR | 2,000 | | | | 2,380 | |
| Supervalu, Delay Draw Term Loan | | | | | | | | |
| 4.735%, 06/08/24 | | | 209 | | | | 200 | |
| Supervalu, Term Loan B | | | | | | | | |
| 4.735%, 06/08/24 | | | 349 | | | | 333 | |
| | | | | | | | | |
| Total Food and Drug | | | | 10,399 | |
| | | | | | | | | |
| Food/Tobacco [0.6%] | |
| Amplify Snack Brands, Term Loan B | | | | | | | | |
| 6.740%, 09/02/23(G) | | | 1,075 | | | | 1,062 | |
| Burger King (1011778 B.C. / New Red), Term Loan B-3 | | | | | | | | |
| 3.485%, 02/17/24(G) | | | 4,498 | | | | 4,491 | |
| Campbell Soup Europe, Term Loan B, 1st Lien | | | | | | | | |
| 3.750%, 12/08/23 | | | 2,000 | | | | 2,373 | |
| Deoleo, S.A. (Deoleo USA), Initial Term Loan | | | | | | | | |
| 4.500%, 06/02/21 | | EUR | 3,000 | | | | 2,504 | |
| Golden Nugget (fka Landry’s), Term Loan B | | | | | | | | |
| 4.488%, 10/04/23(G) | | | 464 | | | | 466 | |
| Jacobs Douwe Egberts, Term Loan | | | | | | | | |
| 2.750%, 07/01/22 | | | 265 | | | | 316 | |
| JBS USA LLC, Term Loan B (2017) | | | | | | | | |
| 3.804%, 10/30/22(G) | | | 2,060 | | | | 2,034 | |
| Milk Specialties, Term Loan | | | | | | | | |
| 5.333%, 08/16/23 | | | 1,015 | | | | 1,021 | |
| NPC International, Term Loan B | | | | | | | | |
| 4.738%, 04/03/24 | | | 319 | | | | 322 | |
| NPC International, Term Loan, 2nd Lien | | | | | | | | |
| 8.738%, 04/03/25 | | | 115 | | | | 117 | |
| Post Holdings, Term Loan B | | | | | | | | |
| 3.490%, 05/17/24(G) | | | 1,541 | | | | 1,544 | |
| US Foods, Term Loan B | | | | | | | | |
| 3.985%, 06/27/23(G) | | | 1,402 | | | | 1,410 | |
| | | | | | | | | |
| Total Food/Tobacco | | | | 17,660 | |
See accompanying notes to financial statements.
CITY NATIONAL ROCHDALE FUNDS | PAGE 93
| consolidated schedule of investments |
| September 30, 2017 |
City National Rochdale Fixed Income Opportunities Fund (continued) |
| Description | | Face Amount (000)(1) | | | Value (000) | |
| Forest Prod/Containers [0.7%] | |
| Albea, Cov-Lite, 1st Lien | | | | | | |
| 4.000%, 04/10/24 | | EUR | 1,500 | | | $ | 1,786 | |
| Anchor Glass Container, Term Loan | | | | | | | |
| 4.067%, 12/07/23 | | $ | 464 | | | | 465 | |
| Anchor Glass Container, Term Loan, 2nd Lien | | | | | | | | |
| 3.700%, 12/07/24 | | | 230 | | | | 232 | |
| Berry Plastics, Term Loan K | | | | | | | | |
| 3.485%, 02/08/20(G) | | | 688 | | | | 690 | |
| BWAY Holding, Term Loan B | | | | | | | | |
| 4.481%, 04/03/24(G) | | | 1,631 | | | | 1,635 | |
| Caraustar Industries, Term Loan B (2017) | | | | | | | | |
| 6.833%, 03/09/22 | | | 1,453 | | | | 1,452 | |
| Dummen Orange, Cov-Lite, Term Loan B, 1st Lien | | | | | | | | |
| 3.500%, 05/18/24 | | | 3,000 | | | | 3,520 | |
| Flex Acquisition (Novolex), Initial Term Loan | | | | | | | | |
| 5.000%, 12/29/23(G) | | | 239 | | | | 240 | |
| IVC, Term Loan B, 1st Lien | | | | | | | | |
| 3.750%, 01/26/24 | | | 1,500 | | | | 1,786 | |
| ProAmpac, Term Loan B | | | | | | | | |
| 5.179%, 11/18/23 | | | 905 | | | | 913 | |
| Reynolds Group Holdings, Incremental US Term Loan | | | | | | | | |
| 4.235%, 02/05/23(G) | | | 1,912 | | | | 1,919 | |
| Signode Industrial Group US, Term Loan B | | | | | | | | |
| 4.083%, 05/01/21(G) | | | 1,634 | | | | 1,638 | |
| Verallia, Term Loan | | | | | | | | |
| 3.000%, 10/22/22 | | | 2,000 | | | | 2,365 | |
| | | | | | | | | |
| Total Forest Prod/Containers | | | | 18,641 | |
| | | | | | | | | |
| Gaming/Leisure [2.2%] | |
| Amaya, Initial Term Loan B-3 | | | | | | | | |
| 4.833%, 08/01/21 | | | 1,493 | | | | 1,496 | |
| Apple Leisure Group (Casablanca), Term Loan | | | | | | | | |
| 6.061%, 03/31/24 | | | 572 | | | | 571 | |
| Aristocrat (Video Gaming Tech), Term Loan B | | | | | | | | |
| 0.000%, 10/31/24 | | | 290 | | | | 290 | |
| Belmond Interfin Ltd., Term Loan B | | | | | | | | |
| 3.985%, 07/03/24(F) (G) | | | 763 | | | | 764 | |
| Boyd Gaming, Term Loan B (2017) | | | | | | | | |
| 3.694%, 09/15/23(G) | | | 551 | | | | 553 | |
| Caesars Entertainment, Term Loan | | | | | | | | |
| 4.735%, 10/11/20 | | | 3,581 | | | | 3,586 | |
| Caesars Entertainment, Term Loan B | | | | | | | | |
| 0.000%, 04/04/24(F) | | | 520 | | | | 520 | |
| Caesars Entertainment, Term Loan B-5 | | | | | | | | |
| 1.500%, 10/31/17(F) | | | 2,550 | | | | 3,003 | |
| Caesars Entertainment, Term Loan B-6 Extended | | | | | | | | |
| 1.500%, 03/01/18(F) (G) | | | 6,176 | | | | 7,492 | |
| Caesars Entertainment, Term Loan B7 | | | | | | | | |
| 1.500%, 03/01/18(F) | | | 2,180 | | | | 2,794 | |
| CityCenter Holdings, Term Loan B | | | | | | | | |
| 3.735%, 04/14/24(G) | | | 299 | | | | 300 | |
| ClubCorp Club Operations, Term Loan B | | | | | | | | |
| 4.588%, 09/15/24(G) | | | 250 | | | | 248 | |
| Diamond Resorts, Term Loan B | | | | | | | | |
| 7.235%, 09/02/23 | | | 2,718 | | | | 2,726 | |
| Eldorado Resorts, Term Loan B | | | | | | | | |
| 3.563%, 03/16/24 | | | 1,012 | | | | 1,011 | |
| ESH Hospitality, Term Loan B | | | | | | | | |
| 3.735%, 08/20/23(G) | | | 1,485 | | | | 1,490 | |
| Four Seasons Holdings, Term Loan (12/13) | | | | | | | | |
| 3.735%, 11/30/23 | | | 1,231 | | | | 1,239 | |
| Gateway Casinos & Entertainment, Term Loan B-1 | | | | | | | | |
| 5.083%, 02/22/23(G) | | | 234 | | | | 236 | |
| Global Cash Access, Term Loan B (2017) | | | | | | | | |
| 5.735%, 05/08/24 | | | 1,810 | | | | 1,826 | |
| GLP Capital LP (Gaming & Leisure), Term Loan, Incremental Tranche A-1 | | | | | | | | |
| 4.550%, 04/29/21 | | | 4,955 | | | | 4,887 | |
| Golden Entertainment, Term Loan B | | | | | | | | |
| 0.000%, 08/15/24 | | | 465 | | | | 462 | |
| Greektown Holdings, Term Loan B | | | | | | | | |
| 4.235%, 04/25/24 | | | 998 | | | | 997 | |
| Hilton Worldwide Finance, LLC, Term Loan B-2 | | | | | | | | |
| 3.237%, 10/25/23 | | | 8,676 | | | | 8,710 | |
| La Quinta Intermediate Holdings, Term Loan B | | | | | | | | |
| 4.054%, 04/14/21 | | | 340 | | | | 341 | |
See accompanying notes to financial statements.
CITY NATIONAL ROCHDALE FUNDS | PAGE 94
| consolidated schedule of investments |
| September 30, 2017 |
City National Rochdale Fixed Income Opportunities Fund (continued) |
| Description | | Face Amount (000)(1) | | | Value (000) | |
| Las Vegas Sands, Term Loan B (2017) | | | | | | |
| 3.235%, 03/29/24(G) | | $ | 1,849 | | | $ | 1,856 | |
| MGM Growth Properties, Term Loan B | | | | | | | | |
| 3.485%, 04/25/23(G) | | | 1,074 | | | | 1,077 | |
| MGM Resorts, Term Loan A | | | | | | | | |
| 3.485%, 04/23/21 | | | 698 | | | | 698 | |
| Mohegan Tribal Gaming, Term Loan B (2016) | | | | | | | | |
| 5.235%, 10/13/23(G) | | | 1,102 | | | | 1,112 | |
| Penn National Gaming, Term Loan B | | | | | | | | |
| 3.735%, 01/12/24(G) | | | 234 | | | | 235 | |
| Playa Resorts Holding, Term Loan B (2017) | | | | | | | | |
| 4.320%, 04/24/24(G) | | | 519 | | | | 515 | |
| Playcore, Delay Draw Term Loan | | | | | | | | |
| 0.000%, 09/19/24 | | | 26 | | | | 26 | |
| Playcore, Term Loan B | | | | | | | | |
| 0.000%, 09/18/24 | | | 189 | | | | 190 | |
| Premier Lotteries, Term Loan B, 1st Lien | | | | | | | | |
| 0.000%, 06/26/24 | | | 2,500 | | | | 2,966 | |
| Richmond Bidco, Term Loan | | | | | | | | |
| 4.500%, 03/04/24 | | EUR | 1,500 | | | | 2,010 | |
| Scientific Games, Term Loan B-4 | | | | | | | | |
| 4.522%, 08/14/24(G) | | | 1,335 | | | | 1,336 | |
| Sky Bet, Term Loan B, 1st Lien | | | | | | | | |
| 4.585%, 07/26/24 | | | 2,000 | | | | 2,694 | |
| Station Casinos, Term Loan B | | | | | | | | |
| 3.740%, 06/08/23(G) | | | 598 | | | | 598 | |
| UFC Holdings (Buyer), Term Loan B - 2023 | | | | | | | | |
| 4.490%, 08/18/23(G) | | | 505 | | | | 507 | |
| | | | | | | | | |
| Total Gaming/Leisure | | | | 61,362 | |
| | | | | | | | | |
| Healthcare [3.0%] | |
| Apollo 5 GmbH, Facility B (Dragenopharm), 1st Lien | | | | | | | | |
| 5.000%, 09/29/20 | | | 2,000 | | | | 2,126 | |
| Ardent Legacy Holdings, Term Loan B | | | | | | | | |
| 6.833%, 08/04/21 | | | 1,174 | | | | 1,176 | |
| CDRH (Healogics), Term Loan B | | | | | | | | |
| 5.570%, 07/01/21 | | | 320 | | | | 259 | |
| Cerba Healthcare, Term Loan, 1st Lien | | | | | | | | |
| 3.000%, 03/21/24 | | | 1,000 | | | | 1,177 | |
| Change Healthcare Holdings, Term Loan B | | | | | | | | |
| 3.985%, 03/01/24(G) | | | 5,312 | | | | 5,323 | |
| Coherent Holding, Term Loan | | | | | | | | |
| 4.250%, 08/01/23 | | EUR | 1,532 | | | | 1,828 | |
| Cole-Parmer, Term Loan B | | | | | | | | |
| 5.340%, 03/17/24 | | | 388 | | | | 391 | |
| Community Health Systems, Term Loan G | | | | | | | | |
| 4.067%, 12/25/19 | | | 1,103 | | | | 1,096 | |
| Community Health Systems, Term Loan H | | | | | | | | |
| 4.317%, 01/15/21(F) | | | 4,157 | | | | 4,127 | |
| Concordia Healthcare, Initial Dollar Term Loan | | | | | | | | |
| 5.484%, 10/21/21 | | | 1,947 | | | | 1,503 | |
| ConvaTec Healthcare, Term Loan B | | | | | | | | |
| 3.583%, 10/25/23 | | | 584 | | | | 585 | |
| Diaverum, Term Loan | | | | | | | | |
| 8.000%, 05/24/24 | | EUR | 1,500 | | | | 1,744 | |
| 3.250%, 05/24/24 | | EUR | 1,500 | | | | 1,766 | |
| Envision Healthcare (EMS), Term Loan B | | | | | | | | |
| 4.240%, 12/01/23(G) | | | 85 | | | | 85 | |
| Etypharm, Term Loan, 1st Lien | | | | | | | | |
| 5.057%, 07/21/23 | | GBP | 1,000 | | | | 1,349 | |
| Explorer Holdings, Term Loan B | | | | | | | | |
| 5.061%, 05/02/23 | | | 465 | | | | 467 | |
| Gesundheits, Term Loan | | | | | | | | |
| 4.000%, 07/25/21 | | EUR | 1,000 | | | | 1,158 | |
| Greatbatch, Ltd., Term Loan A | | | | | | | | |
| 4.480%, 10/27/21 | | | 384 | | | | 384 | |
| Greatbatch, Ltd., Term Loan B (2017) | | | | | | | | |
| 4.740%, 10/27/22 | | | 1,533 | | | | 1,541 | |
| Grifols, Term Loan B (2017) | | | | | | | | |
| 3.447%, 01/24/25(G) | | | 3,279 | | | | 3,284 | |
| Halyard Health, Term Loan | | | | | | | | |
| 3.985%, 11/01/21 | | | 765 | | | | 771 | |
| HCA, Term Loan B-8 | | | | | | | | |
| 3.485%, 02/15/24 | | | 2,769 | | | | 2,782 | |
| HCA, Term Loan B-9 | | | | | | | | |
| 3.235%, 03/18/23(G) | | | 1,866 | | | | 1,872 | |
| HRA, Term Loan, 1st Lien | | | | | | | | |
| 0.000%, 07/31/24 | | | 2,000 | | | | 2,363 | |
| INC Research, Term Loan A | | | | | | | | |
| 2.985%, 08/01/22 | | | 1,080 | | | | 1,083 | |
| INC Research, Term Loan B (2017) | | | | | | | | |
| 3.485%, 06/28/24(F) | | | 800 | | | | 802 | |
See accompanying notes to financial statements.
CITY NATIONAL ROCHDALE FUNDS | PAGE 95
| consolidated schedule of investments |
| September 30, 2017 |
City National Rochdale Fixed Income Opportunities Fund (continued) |
| Description | | Face Amount (000)(1) | | | Value (000) | |
| Indivior Finance S.Ã r.l., Term Loan B | | | | | | |
| 7.320%, 12/19/19(G) | | $ | 1,611 | | | $ | 1,615 | |
| Innoviva, Term Loan B | | | | | | | | |
| 5.817%, 08/14/22 | | | 525 | | | | 529 | |
| Kindred Healthcare, Term Loan B | | | | | | | | |
| 4.813%, 04/09/21 | | | 558 | | | | 559 | |
| Lannett, Term Loan A | | | | | | | | |
| 5.985%, 11/25/20 | | | 1,982 | | | | 1,957 | |
| MultiPlan, Term Loan B | | | | | | | | |
| 4.333%, 06/07/23(G) | | | 3,776 | | | | 3,803 | |
| Novacap, Term Loan | | | | | | | | |
| 3.500%, 04/28/23 | | | 2,499 | | | | 2,973 | |
| Parexel International, Term Loan B | | | | | | | | |
| 3.000%, 09/27/24(F) (G) | | | 470 | | | | 473 | |
| Pharmaceutical Product Development, Term Loan B (2017) | | | | | | | | |
| 4.083%, 08/18/22(G) | | | 256 | | | | 257 | |
| PharMerica, Term Loan B | | | | | | | | |
| 0.000%, 09/26/24(G) | | | 180 | | | | 181 | |
| PharMerica, Term Loan, 2nd Lien | | | | | | | | |
| 0.000%, 09/26/25(G) | | | 145 | | | | 145 | |
| Quintiles IMS, Term Loan B-1 | | | | | | | | |
| 3.333%, 03/03/24 | | | 390 | | | | 392 | |
| Quintiles IMS, Term Loan B-2 | | | | | | | | |
| 3.321%, 01/15/25(G) | | | 435 | | | | 437 | |
| Royalty Pharma (aka RPI), Term Loan A-3 | | | | | | | | |
| 3.083%, 10/14/21 | | | 217 | | | | 217 | |
| Royalty Pharma (aka RPI), Term Loan B-6 | | | | | | | | |
| 3.333%, 03/23/23(G) | | | 3,765 | | | | 3,774 | |
| Siemens Audiology, Term Loan | | | | | | | | |
| 3.500%, 01/17/22 | | | 975 | | | | 1,164 | |
| Stada/Nidda, Term Loan, 1st Lien | | | | | | | | |
| 0.000%, 09/20/24 | | EUR | 3,500 | | | | 4,147 | |
| 0.000%, 09/20/24 | | GBP | 1,000 | | | | 1,346 | |
| Sunrise Medical, Cov-lite, Term Loan | | | | | | | | |
| 4.500%, 07/05/22 | | EUR | 303 | | | | 358 | |
| Sunrise Medical, Term Loan B, 1st Lien | | | | | | | | |
| 5.000%, 07/05/22 | | EUR | 2,197 | | | | 2,598 | |
| Surgery Center Holdings, Term Loan B | | | | | | | | |
| 4.490%, 06/20/24(G) | | | 730 | | | | 724 | |
| Team Health, Term Loan | | | | | | | | |
| 3.985%, 01/12/24(G) | | | 617 | | | | 605 | |
| Unilabs, Term Loan | | | | | | | | |
| 3.000%, 04/19/24 | | | 2,500 | | | | 2,932 | |
| Unither, Term Loan B, 1st Lien | | | | | | | | |
| 4.000%, 02/01/24 | | EUR | 1,500 | | | | 1,788 | |
| Valeant Pharmaceuticals International, Series F-1 Tranche B Term Loan | | | | | | | | |
| 5.990%, 04/01/22(G) | | | 4,545 | | | | 4,625 | |
| Vedici Group, Term Loan | | | | | | | | |
| 3.750%, 10/31/22 | | EUR | 2,000 | | | | 2,383 | |
| | | | | | | | | |
| Total Healthcare | | | | 81,024 | |
| | | | | | | | | |
| Housing [0.5%] | |
| ABC Supply, Term Loan B-1 | | | | | | | | |
| 3.735%, 10/31/23(G) | | | 1,254 | | | | 1,258 | |
| Canam Construction, Term Loan B | | | | | | | | |
| 6.799%, 06/29/24(F) | | | 524 | | | | 524 | |
| Capital Automotive LP, Term Loan B (2017) | | | | | | | | |
| 4.240%, 03/21/24 | | | 2,323 | | | | 2,334 | |
| Capital Automotive LP, Term Loan, 2nd Lien (2017) | | | | | | | | |
| 7.240%, 03/21/25(G) | | | 4,263 | | | | 4,311 | |
| DTZ US Borrower LLC, 2015-1 Additional Term Loan, 1st Lien | | | | | | | | |
| 4.567%, 11/04/21(G) | | | 2,655 | | | | 2,660 | |
| PulteGroup, Term Loan | | | | | | | | |
| 3.750%, 04/11/23 | | | 1,500 | | | | 1,786 | |
| Quikrete Holdings, Term Loan B | | | | | | | | |
| 3.985%, 11/15/23 | | | 362 | | | | 362 | |
| | | | | | | | | |
| Total Housing | | | | 13,235 | |
| | | | | | | | | |
| Industrials [0.2%] | |
| Delachaux, Term Loan | | | | | | | | |
| 5.250%, 09/25/21 | | GBP | 360 | | | | 483 | �� |
| IVC, Term Loan B, 1st Lien | | | | | | | | |
| 4.500%, 01/25/24 | | | 1,000 | | | | 1,340 | |
| Socotec, Term Loan, 1st Lien | | | | | | | | |
| 3.750%, 07/20/24 | | | 1,000 | | | | 1,186 | |
| 4.500%, 07/20/24 | | | 1,000 | | | | 1,341 | |
| Xella, Term Loan B, 1st Lien | | | | | | | | |
| 4.000%, 02/02/24 | | | 1,000 | | | | 1,184 | |
| | | | | | | | | |
| Total Industrials | | | | 5,534 | |
See accompanying notes to financial statements.
CITY NATIONAL ROCHDALE FUNDS | PAGE 96
| consolidated schedule of investments |
| September 30, 2017 |
City National Rochdale Fixed Income Opportunities Fund (continued) |
| Description | | Face Amount (000)(1) | | | Value (000) | |
| Information Technology [2.6%] | |
| Almonde, Term Loan B | | | | | | |
| 4.817%, 04/28/24(G) | | $ | 890 | | | $ | 894 | |
| Almonde, Term Loan, 2nd Lien | | | | | | | | |
| 8.567%, 04/28/25(G) | | | 375 | | | | 381 | |
| Applied Systems, Term Loan | | | | | | | | |
| 4.574%, 09/14/24(G) | | | 145 | | | | 146 | |
| Aricent Technologies, Term Loan | | | | | | | | |
| 5.737%, 04/14/21(G) | | | 567 | | | | 567 | |
| Arris Group, Term Loan A | | | | | | | | |
| 2.985%, 06/18/20 | | | 273 | | | | 272 | |
| Arris Group, Term Loan B (2017) | | | | | | | | |
| 3.735%, 04/26/24 | | | 1,049 | | | | 1,053 | |
| Avaya, Term Loan B-6 | | | | | | | | |
| 6.814%, 03/31/18 | | | 873 | | | | 734 | |
| Avaya, Term Loan B-7 | | | | | | | | |
| 6.564%, 04/30/20 | | | 2,031 | | | | 1,716 | |
| Blackboard, Term Loan B-4 | | | | | | | | |
| 6.304%, 06/30/21 | | | 901 | | | | 865 | |
| Cavium, Term Loan B (2017) | | | | | | | | |
| 3.487%, 08/16/22 | | | 637 | | | | 639 | |
| CCC Information, Term Loan B | | | | | | | | |
| 4.240%, 04/24/24(F) (G) | | | 594 | | | | 592 | |
| Cologix, Term Loan B | | | | | | | | |
| 4.456%, 03/20/24 | | | 388 | | | | 388 | |
| Cologix, Term Loan, 2nd Lien | | | | | | | | |
| 8.237%, 03/20/25 | | | 100 | | | | 101 | |
| CompuCom Systems, Term Loan B | | | | | | | | |
| 4.485%, 05/09/20 | | | 79 | | | | 69 | |
| Computer Sciences Government Services, Term Loan B | | | | | | | | |
| 3.333%, 11/30/23 | | | 516 | | | | 517 | |
| Compuware, Term Loan B-3 | | | | | | | | |
| 5.490%, 12/15/21 | | | 404 | | | | 408 | |
| Cortes NP Acquisition (Vertiv), Term Loan B (2017) | | | | | | | | |
| 5.239%, 11/30/23(G) | | | 1,176 | | | | 1,184 | |
| Dell, Term Loan A2 | | | | | | | | |
| 3.490%, 09/07/21(G) | | | 3,258 | | | | 3,260 | |
| Dell, Term Loan A3 | | | | | | | | |
| 3.200%, 12/31/18(G) | | | 2,355 | | | | 2,354 | |
| Dell, Term Loan B (2017) | | | | | | | | |
| 3.740%, 09/07/23(G) | | | 4,775 | | | | 4,790 | |
| Digicert, Term Loan B-2 | | | | | | | | |
| 0.000%, 09/20/24 | | | 290 | | | | 293 | |
| Digicert, Term Loan, 2nd Lien | | | | | | | | |
| 0.000%, 09/20/25 | | | 365 | | | | 368 | |
| EAB Avatar Purchaser, Term Loan B | | | | | | | | |
| 0.000%, 12/15/24 | | | 580 | | | | 577 | |
| ECI Software Solutions, Term Loan B | | | | | | | | |
| 0.000%, 09/29/24 | | | 290 | | | | 290 | |
| EIG Investors, Term Loan B (2017) | | | | | | | | |
| 5.236%, 02/09/23(G) | | | 574 | | | | 579 | |
| Equinix, Term Loan | | | | | | | | |
| 5.276%, 01/05/24 | | | 2,488 | | | | 2,949 | |
| Gartner, Term Loan A | | | | | | | | |
| 3.235%, 03/16/22 | | | 712 | | | | 714 | |
| Gartner, Term Loan B | | | | | | | | |
| 3.235%, 03/16/24 | | | 677 | | | | 682 | |
| Globallogic Holdings, Term Loan B | | | | | | | | |
| 5.833%, 06/20/22 | | | 443 | | | | 444 | |
| Help/Systems, Term Loan B | | | | | | | | |
| 5.833%, 10/08/21 | | | 343 | | | | 344 | |
| IFS, Term Loan | | | | | | | | |
| 0.000%, 07/25/24 | | EUR | 2,000 | | | | 2,374 | |
| Infor US, Term Loan, 1st Lien | | | | | | | | |
| 3.750%, 02/01/22 | | | 1,990 | | | | 2,361 | |
| Inovalon Holdings, Term Loan | | | | | | | | |
| 2.485%, 09/19/19 | | | 2,593 | | | | 2,554 | |
| Internap, Term Loan B | | | | | | | | |
| 8.240%, 04/03/22(G) | | | 299 | | | | 302 | |
| ION Trading Technologies S.A.R.L., Tranche B-1 Euro Term Loan | | | | | | | | |
| 4.000%, 06/10/21 | | | 1,613 | | | | 1,922 | |
| IPC, Term Loan B-1 | | | | | | | | |
| 5.820%, 08/06/21 | | | 1,023 | | | | 972 | |
| JDA Software Group, (RP Crown), Term Loan B | | | | | | | | |
| 4.735%, 10/12/23 | | | 283 | | | | 284 | |
| LANDesk Software, Term Loan B | | | | | | | | |
| 5.490%, 01/20/24(G) | | | 473 | | | | 460 | |
| Leidos (Abacus Innovations), Term Loan B | | | | | | | | |
| 3.250%, 08/16/23 | | | 566 | | | | 569 | |
| LGC Science Holdings, Term Loan | | | | | | | | |
| 3.750%, 03/08/23 | | EUR | 1,285 | | | | 1,531 | |
| Lionbridge Technologies, Term Loan B | | | | | | | | |
| 6.735%, 02/06/24 | | | 313 | | | | 312 | |
| MaxLinear, Term Loan B | | | | | | | | |
| 3.737%, 04/13/24 | | | 371 | | | | 372 | |
See accompanying notes to financial statements.
CITY NATIONAL ROCHDALE FUNDS | PAGE 97
| consolidated schedule of investments |
| September 30, 2017 |
City National Rochdale Fixed Income Opportunities Fund (continued) |
| Description | | Face Amount (000)(1) | | | Value (000) | |
| McAfee, Term Loan B | | | | | | |
| 0.000%, 09/29/24 | | $ | 1,295 | | | $ | 1,301 | |
| Micro Focus, MA Finance, Term Loan | | | | | | | | |
| 3.987%, 04/21/24(G) | | | 202 | | | | 202 | |
| Micro Focus, Seattle Spin, Term Loan | | | | | | | | |
| 3.987%, 04/21/24(G) | | | 1,363 | | | | 1,365 | |
| Oberthur, Cov-Lite, Term Loan B-1, 1st Lien | | | | | | | | |
| 4.000%, 12/14/23 | | EUR | 765 | | | | 887 | |
| Oberthur, Cov-Lite, Term Loan B-2, 1st Lien | | | | | | | | |
| 3.750%, 12/14/23 | | EUR | 1,235 | | | | 1,432 | |
| On Semiconductor, Term Loan | | | | | | | | |
| 3.049%, 01/02/18 | | | 231 | | | | 231 | |
| Peak 10, Term Loan | | | | | | | | |
| 4.811%, 08/01/24 | | | 1,000 | | | | 1,000 | |
| Peak 10, Term Loan, 2nd Lien | | | | | | | | |
| 8.561%, 08/01/25 | | | 180 | | | | 181 | |
| Presidio, Term Loan B | | | | | | | | |
| 4.549%, 02/02/22 | | | 887 | | | | 893 | |
| Project Leopard Holdings (Kofax), Term Loan B | | | | | | | | |
| 6.833%, 06/21/23(F) | | | 245 | | | | 248 | |
| Quest Software (Seahawk), Term Loan B | | | | | | | | |
| 7.235%, 10/31/22 | | | 243 | | | | 246 | |
| Rackspace Hosting, Term Loan B (2017) | | | | | | | | |
| 4.311%, 11/03/23 | | | 786 | | | | 783 | |
| RAET, Term Loan | | | | | | | | |
| 4.250%, 07/01/21 | | | 1,500 | | | | 1,784 | |
| Redtop, Term Loan, 1st Lien | | | | | | | | |
| 4.000%, 12/03/20 | | EUR | 1,000 | | | | 1,182 | |
| Salient CRGT, Term Loan B | | | | | | | | |
| 6.985%, 02/27/22 | | | 749 | | | | 752 | |
| Sirius Computer Solutions (SCS), Term Loan B | | | | | | | | |
| 5.485%, 10/30/22 | | | 454 | | | | 457 | |
| SolarWinds, Term Loan | | | | | | | | |
| 4.735%, 02/05/23(G) | | | 425 | | | | 426 | |
| Solera, LLC (Solera Finance), Euro Term Loan, 1st Lien | | | | | | | | |
| 3.750%, 03/03/23 | | | 1,970 | | | | 2,350 | |
| Solera, Term Loan B | | | | | | | | |
| 4.485%, 03/03/23(G) | | | 2,038 | | | | 2,043 | |
| Southern Graphics, Term Loan - 2013 | | | | | | | | |
| 4.485%, 10/17/19 | | | 200 | | | | 201 | |
| SS&C Technologies, Term Loan B-1 (new) | | | | | | | | |
| 3.485%, 07/08/22(G) | | | 1,563 | | | | 1,569 | |
| SS&C Technologies, Term Loan B-2 (new) | | | | | | | | |
| 3.485%, 07/08/22(G) | | | 83 | | | | 83 | |
| Symantec, Term Loan A-1 | | | | | | | | |
| 3.474%, 05/10/19(F) | | | 260 | | | | 259 | |
| Symantec, Term Loan A-2 | | | | | | | | |
| 2.760%, 08/01/19(F) | | | 330 | | | | 329 | |
| Symantec, Term Loan A-3 | | | | | | | | |
| 8.546%, 08/01/19(F) | | | 670 | | | | 666 | |
| Symantec, Term Loan A-5 | | | | | | | | |
| 4.546%, 08/01/21 | | | 1,600 | | | | 1,594 | |
| Syncsort (Starfish Hold, LLC), Term Loan B | | | | | | | | |
| 6.314%, 08/14/24 | | | 290 | | | | 284 | |
| TierPoint, Term Loan B | | | | | | | | |
| 4.985%, 04/28/24 | | | 294 | | | | 296 | |
| TTM Technologies, Term Loan B (2017) | | | | | | | | |
| 0.000%, 09/15/24 | | | 290 | | | | 291 | |
| Vertafore (VF Holding), Term Loan (2016) | | | | | | | | |
| 4.485%, 06/30/23(G) | | | 1,143 | | | | 1,147 | |
| Webhelp, Term Loan | | | | | | | | |
| 4.250%, 03/16/23 | | | 1,000 | | | | 1,190 | |
| Webhelp, Term Loan B, 1st Lien | | | | | | | | |
| 4.250%, 12/31/49 | | | 1,500 | | | | 2,013 | |
| Western Digital, Term Loan A | | | | | | | | |
| 2.985%, 04/29/21 | | | 988 | | | | 991 | |
| Western Digital, Term Loan B-2 | | | | | | | | |
| 3.985%, 04/29/23(G) | | | 861 | | | | 866 | |
| | | | | | | | | |
| Total Information Technology | | | | 71,725 | |
| | | | | | | | | |
| Manufacturing [0.6%] | |
| Big River Steel LLC, Term Loan B | | | | | | | | |
| 6.333%, 08/23/23(G) | | | 720 | | | | 727 | |
| Brand Energy & Infrastructure, Term Loan B | | | | | | | | |
| 5.564%, 06/16/24(F) (G) | | | 653 | | | | 656 | |
| Bright Bidco, Term Loan B | | | | | | | | |
| 5.833%, 07/01/24(F) | | | 1,421 | | | | 1,433 | |
| Columbus Mckinnon, Term Loan B | | | | | | | | |
| 4.296%, 01/20/24(G) | | | 346 | | | | 347 | |
| DRB-HICOM Berhad, Term Loan, 1st Lien | | | | | | | | |
| 3.563%, 01/22/21(D) | | | 4,900 | | | | 4,435 | |
See accompanying notes to financial statements.
CITY NATIONAL ROCHDALE FUNDS | PAGE 98
| consolidated schedule of investments |
| September 30, 2017 |
City National Rochdale Fixed Income Opportunities Fund (continued) |
| Description | | Face Amount (000)(1) | | | Value (000) | |
| Dynacast International LLC, Term Loan B-1 | | | | | | |
| 4.583%, 01/28/22(G) | | $ | 808 | | | $ | 812 | |
| Gates Global LLC, Term Loan B (2017) | | | | | | | | |
| 4.583%, 03/30/24 | | | 1,410 | | | | 1,415 | |
| Keurig Green Mountain, Term Loan A | | | | | | | | |
| 2.750%, 03/03/21 | | | 2,212 | | | | 2,205 | |
| Manitowoc (Welbilt), Term Loan B | | | | | | | | |
| 3.985%, 03/03/23 | | | 819 | | | | 824 | |
| Milacron, Term Loan B (2017) | | | | | | | | |
| 4.235%, 09/28/23 | | | 313 | | | | 314 | |
| Ravago Holdings America, Term Loan B (2016) | | | | | | | | |
| 4.490%, 07/13/23(G) | | | 444 | | | | 446 | |
| Sebia, Term Loan, 1st Lien | | | | | | | | |
| 0.000%, 09/22/25 | | | 1,000 | | | | 1,191 | |
| TecoStar Holdings, Term Loan B | | | | | | | | |
| 5.061%, 04/24/24(G) | | | 444 | | | | 446 | |
| Unifrax I LLC, Term Loan B | | | | | | | | |
| 5.083%, 04/04/24 | | | 559 | | | | 561 | |
| | | | | | | | | |
| Total Manufacturing | | | | 15,812 | |
| | | | | | | | | |
| Metals/Minerals [0.6%] | |
| Atkore International, Term Loan (2016) | | | | | | | | |
| 4.340%, 12/15/23 | | | 1,697 | | | | 1,706 | |
| Atlas Iron Limited, Term Loan | | | | | | | | |
| 8.580%, 05/06/21(G) | | | 54 | | | | 51 | |
| Blackhawk Mining, Term Loan B | | | | | | | | |
| 10.780%, 02/14/22 | | | 1,560 | | | | 1,428 | |
| Contura Energy, Term Loan B | | | | | | | | |
| 6.280%, 03/13/24(G) | | | 1,358 | | | | 1,336 | |
| Coronado Coal LLC, Term Loan B | | | | | | | | |
| 8.333%, 06/06/23 | | | 414 | | | | 416 | |
| Fairmount Minerals, Ltd., Extended Term Loan | | | | | | | | |
| 3.500%, 09/05/19 | | | 678 | | | | 667 | |
| Fairmount Minerals, Ltd., New Term Loan B-2 | | | | | | | | |
| 4.735%, 09/05/19(G) | | | 629 | | | | 622 | |
| Foresight Energy LLC, Term Loan B | | | | | | | | |
| 7.083%, 03/16/22(G) | | | 1,164 | | | | 1,086 | |
| Global Brass and Copper, Term Loan B | | | | | | | | |
| 4.500%, 07/18/23 | | | 337 | | | | 340 | |
| Metinvest, Term Loan, 1st Lien | | | | | | | | |
| 5.388%, 06/30/21(D) | | | 5,886 | | | | 4,782 | |
| Peabody Energy, Exit Term Loan | | | | | | | | |
| 4.735%, 02/08/22(G) | | | 685 | | | | 688 | |
| SLV, Term Loan B, 1st Lien | | | | | | | | |
| 4.250%, 12/13/23 | | | 1,000 | | | | 1,130 | |
| TMS International, Term Loan B (2017) | | | | | | | | |
| 4.309%, 08/09/24 | | | 500 | | | | 500 | |
| US Silica, Add-On Term Loan | | | | | | | | |
| 4.875%, 07/23/20 | | | 840 | | | | 842 | |
| US Silica, Term Loan B | | | | | | | | |
| 4.375%, 07/23/20 | | | 717 | | | | 718 | |
| Zekelman Industries (fka JMC Steel), Term Loan B | | | | | | | | |
| 4.823%, 06/14/21(G) | | | 657 | | | | 660 | |
| | | | | | | | | |
| Total Metals/Minerals | | | | 16,972 | |
| | | | | | | | | |
| Publishing [0.1%] | |
| Springer Science and Business Media, Term Loan | | | | | | | | |
| 3.750%, 08/14/20 | | | 1,980 | | | | 2,348 | |
| | | | | | | | | |
| Real Estate [0.1%] | |
| Flamingo LUX II, Senior Facility Term Loan B, 1st Lien | | | | | | | | |
| 4.250%, 07/28/23 | | | 1,482 | | | | 1,760 | |
| | | | | | | | | |
| Retail [1.0%] | |
| Abercrombie & Fitch Management, Term Loan B | | | | | | | | |
| 4.990%, 08/07/21 | | | 1,068 | | | | 1,052 | |
| Action Netherland, Term Loan B, 1st Lien | | | | | | | | |
| 4.250%, 02/25/22 | | | 1,000 | | | | 1,193 | |
| AS Adventure, Term Loan | | | | | | | | |
| 5.617%, 04/12/22 | | | 1,000 | | | | 1,313 | |
| AS Adventure, Term Loan B | | | | | | | | |
| 5.000%, 04/01/22 | | EUR | 2,000 | | | | 2,327 | |
| Ascena Retail Group, Tranche B Term Loan | | | | | | | | |
| 5.750%, 08/21/22(G) | | | 910 | | | | 739 | |
| Bass Pro Group, Term Loan B | | | | | | | | |
| 6.296%, 12/16/23 | | | 1,585 | | | | 1,491 | |
| Belk, Term Loan | | | | | | | | |
| 6.054%, 12/12/22 | | | 790 | | | | 661 | |
| CWGS Group, LLC, Term Loan B - 2023 | | | | | | | | |
| 4.981%, 11/08/23 | | | 1,345 | | | | 1,350 | |
See accompanying notes to financial statements.
CITY NATIONAL ROCHDALE FUNDS | PAGE 99
| consolidated schedule of investments |
| September 30, 2017 |
City National Rochdale Fixed Income Opportunities Fund (continued) |
| Description | | Face Amount (000)(1) | | | Value (000) | |
| Dollar Tree, Fixed Term Loan B-2 | | | | | | |
| 4.309%, 07/06/22 | | $ | 4,210 | | | $ | 4,263 | |
| Hudson’s Bay, Term Loan B - 2022 | | | | | | | | |
| 4.522%, 09/30/22 | | | 2,355 | | | | 2,284 | |
| J Crew Group, Term Loan B - Consenting Lenders | | | | | | | | |
| 4.516%, 03/05/21(G) | | | 833 | | | | 502 | |
| JC Penney, Term Loan B | | | | | | | | |
| 5.568%, 06/23/23(G) | | | 1,455 | | | | 1,413 | |
| Men’s Wearhouse, Term Loan B | | | | | | | | |
| 4.813%, 06/18/21 | | | 405 | | | | 395 | |
| Men’s Wearhouse, Term Loan B1 (Fixed) | | | | | | | | |
| 5.000%, 06/18/21 | | | 915 | | | | 877 | |
| MRH, Term Loan | | | | | | | | |
| 3.000%, 12/14/23 | | | 1,000 | | | | 1,184 | |
| Petsmart (fka Argos Merger), Term Loan B | | | | | | | | |
| 4.240%, 03/10/22(G) | | | 439 | | | | 370 | |
| Sears Roebuck Acceptance, Term Loan | | | | | | | | |
| 8.732%, 07/20/20 | | | 742 | | | | 747 | |
| Sears Roebuck Acceptance, Term Loan B | | | | | | | | |
| 5.735%, 06/30/18 | | | 271 | | | | 267 | |
| Toys R Us Property, Initial Term Loan | | | | | | | | |
| 6.235%, 08/21/19 | | | 3,267 | | | | 3,069 | |
| Toys R Us-Delaware, Term Loan B-2 | | | | | | | | |
| 5.250%, 05/25/18 | | | 1,536 | | | | 656 | |
| Toys R Us-Delaware, Term Loan B-3 | | | | | | | | |
| 5.250%, 05/25/18 | | | 89 | | | | 38 | |
| Toys R Us-Delaware, Term Loan B4 | | | | | | | | |
| 10.067%, 04/24/20 | | | 1,035 | | | | 614 | |
| | | | | | | | | |
| Total Retail | | | | 26,805 | |
| | | | | | | | | |
| Service [2.2%] | |
| AHT Cooling, Term Loan | | | | | | | | |
| 4.271%, 11/19/20 | | EUR | 976 | | | | 1,160 | |
| AI Avocado, Term Loan | | | | | | | | |
| 4.250%, 09/17/21 | | EUR | 1,000 | | | | 1,184 | |
| 4.250%, 10/08/21 | | EUR | 1,000 | | | | 1,184 | |
| American Teleconferencing Services, Term Loan B | | | | | | | | |
| 3.049%, 12/08/21 | | | 273 | | | | 262 | |
| Ascend Learning LLC, Term Loan B | | | | | | | | |
| 4.485%, 06/29/24(G) | | | 365 | | | | 366 | |
| Busy Bees Nurseries Ltd., Term Loan | | | | | | | | |
| 5.000%, 04/29/22 | | GBP | 1,000 | | | | 1,344 | |
| Callcredit Information Group, Term Loan, 1st Lien | | | | | | | | |
| 4.500%, 02/12/21 | | GBP | 2,644 | | | | 3,540 | |
| Diebold, Term Loan B (2017) | | | | | | | | |
| 4.480%, 11/06/23(G) | | | 378 | | | | 378 | |
| DigitalGlobe, Term Loan | | | | | | | | |
| 3.985%, 01/15/24(G) | | | 402 | | | | 402 | |
| Dorna Sports, Term Loan | | | | | | | | |
| 3.250%, 04/12/24 | | | 1,883 | | | | 2,229 | |
| Engineered Machinery Holdings, Delayed Draw Term Loan | | | | | | | | |
| 4.583%, 07/25/24 | | | 32 | | | | 32 | |
| Engineered Machinery Holdings, Term Loan B | | | | | | | | |
| 4.556%, 07/25/24 | | | 243 | | | | 243 | |
| Environmental Resources, Term Loan | | | | | | | | |
| 8.296%, 05/09/22 | | | 1,000 | | | | 924 | |
| 5.296%, 05/14/21(G) | | | 3,471 | | | | 3,430 | |
| Evertec Group, LLC, Term Loan A | | | | | | | | |
| 3.509%, 04/17/18 | | | 31 | | | | 31 | |
| Exela, Term Loan B | | | | | | | | |
| 8.804%, 06/30/23(F) | | | 635 | | | | 628 | |
| First Data, 2022D New Dollar Term Loan | | | | | | | | |
| 3.487%, 07/10/22 | | | 6,874 | | | | 6,884 | |
| First Data, Term Loan B (2017) | | | | | | | | |
| 3.737%, 04/21/24(G) | | | 3,864 | | | | 3,875 | |
| FleetCor Technologies, Term Loan B (2017) | | | | | | | | |
| 3.235%, 08/02/24 | | | 720 | | | | 722 | |
| Genesys, Term Loan | | | | | | | | |
| 3.750%, 12/01/23 | | | 1,985 | | | | 2,365 | |
| GFL Environmental, Term Loan B | | | | | | | | |
| 4.083%, 09/29/23 | | | 401 | | | | 402 | |
| Global Payments, Existing Term Loan | | | | | | | | |
| 2.985%, 05/02/22 | | | 1,170 | | | | 1,172 | |
| Hotelbeds Group, Term Loan | | | | | | | | |
| 6.250%, 05/31/23 | | | 1,985 | | | | 2,369 | |
| Inmar, Term Loan B | | | | | | | | |
| 4.772%, 04/25/24 | | | 594 | | | | 593 | |
| Inmar, Term Loan, 2nd Lien | | | | | | | | |
| 9.272%, 04/25/25 | | | 150 | | | | 150 | |
See accompanying notes to financial statements.
CITY NATIONAL ROCHDALE FUNDS | PAGE 100
| consolidated schedule of investments |
| September 30, 2017 |
City National Rochdale Fixed Income Opportunities Fund (continued) |
| Description | | Face Amount (000)(1) | | | Value (000) | |
| iQor US, Term Loan B | | | | | | |
| 6.299%, 04/01/21 | | $ | 1,657 | | | $ | 1,639 | |
| KinderCare (KUEHG), Term Loan, 2nd Lien | | | | | | | | |
| 9.522%, 08/16/25 | | | 145 | | | | 144 | |
| Laureate Education, Term Loan B (2017) | | | | | | | | |
| 5.735%, 04/26/24 | | | 627 | | | | 629 | |
| LS Deco LLC (Leighton), Term Loan B | | | | | | | | |
| 4.833%, 05/21/22 | | | 269 | | | | 271 | |
| North American Bancard (NAB), Term Loan B | | | | | | | | |
| 4.833%, 06/15/24(G) | | | 145 | | | | 145 | |
| PrePaid Legal Services, Term Loan, 2nd Lien | | | | | | | | |
| 10.250%, 07/01/20(F) | | | 125 | | | | 125 | |
| Prime Security Services, Term Loan B-1 | | | | | | | | |
| 3.985%, 05/02/22 | | | 871 | | | | 878 | |
| Prosol, Cov-Lite Term Loan, 1st Lien | | | | | | | | |
| 4.000%, 04/21/24 | | | 2,000 | | | | 2,374 | |
| QA Group, Term Loan | | | | | | | | |
| 5.276%, 07/26/24 | | | 3,000 | | | | 3,970 | |
| Redbox Automated Retail, Term Loan | | | | | | | | |
| 8.735%, 09/27/21 | | | 414 | | | | 416 | |
| Sedgwick, 2016 Replacement Term Loan | | | | | | | | |
| 4.583%, 03/01/21(G) | | | 119 | | | | 119 | |
| Sedgwick, Term Loan, 1st Lien | | | | | | | | |
| 3.985%, 03/01/21 | | | 1,456 | | | | 1,458 | |
| Sedgwick, Term Loan, 2nd Lien | | | | | | | | |
| 6.985%, 02/28/22 | | | 825 | | | | 831 | |
| Sedgwick, Term Loan, 2nd Lien - Add-On | | | | | | | | |
| 7.067%, 02/28/22 | | | 925 | | | | 932 | |
| Spin Hold (Coinmach), Term Loan B-1 | | | | | | | | |
| 5.014%, 11/14/22 | | | 469 | | | | 471 | |
| St. George’s University Scholastic Services, Term Loan B | | | | | | | | |
| 5.566%, 07/06/22 | | | 239 | | | | 240 | |
| Sutherland Global Services, Initial Cayman Term Loan | | | | | | | | |
| 6.708%, 04/23/21 | | | 402 | | | | 385 | |
| Sutherland Global Services, Initial US Term Loan | | | | | | | | |
| 6.671%, 04/23/21 | | | 1,728 | | | | 1,653 | |
| TKC Holdings, Term Loan B | | | | | | | | |
| 5.522%, 02/01/23 | | | 468 | | | | 472 | |
| TKC Holdings, Term Loan, 2nd Lien | | | | | | | | |
| 9.272%, 02/01/24 | | | 115 | | | | 116 | |
| TransUnion LLC, Term Loan B-3 | | | | | | | | |
| 3.235%, 04/09/23(G) | | | 553 | | | | 552 | |
| Travelport, Term Loan D | | | | | | | | |
| 4.061%, 09/02/21 | | | 2,432 | | | | 2,428 | |
| TriMark USA, Delay Draw Term Loan | | | | | | | | |
| 0.000%, 09/15/24(F) | | | 6 | | | | 6 | |
| TriMark USA, Term Loan | | | | | | | | |
| 0.000%, 09/15/24 | | | 139 | | | | 140 | |
| USIC Holdings, Term Loan B (2017) | | | | | | | | |
| 5.004%, 12/08/23 | | | 283 | | | | 285 | |
| Vantiv, Incremental Term Loan | | | | | | | | |
| 0.000%, 08/07/24(F) | | | 605 | | | | 605 | |
| Vantiv, Term Loan B-1 | | | | | | | | |
| 0.000%, 01/15/25(F) | | | 190 | | | | 190 | |
| Vivid Seats LLC, Term Loan B (2017) | | | | | | | | |
| 5.235%, 06/27/24(G) | | | 324 | | | | 323 | |
| Waste Industries, Term Loan B | | | | | | | | |
| 0.000%, 09/25/24(G) | | | 250 | | | | 251 | |
| Weight Watchers International, Term Loan B-2 | | | | | | | | |
| 4.550%, 04/02/20(G) | | | 1,741 | | | | 1,717 | |
| Xerox Business Services (Conduent), Term Loan B | | | | | | | | |
| 5.235%, 12/07/23(G) | | | 824 | | | | 827 | |
| | | | | | | | | |
| Total Service | | | | 60,461 | |
| | | | | | | | | |
| Sovereign [0.2%] | |
| Arab Republic of Egypt, Term Loan | | | | | | | | |
| 1.884%, 01/04/21(D) (H) | | CHF | 1,879 | | | | 1,795 | |
| Republic of Angola, Term Loan | | | | | | | | |
| 7.683%, 12/06/20(D) | | | 5,688 | | | | 5,090 | |
| | | | | | | | | |
| Total Sovereign | | | | 6,885 | |
| | | | | | | | | |
| Telecommunications [1.1%] | |
| Alorica, Term Loan B (2017) | | | | | | | | |
| 4.985%, 06/30/22 | | | 121 | | | | 121 | |
| CenturyLink, Term Loan B | | | | | | | | |
| 2.750%, 01/15/25(G) | | | 5,065 | | | | 4,905 | |
| Colorado Buyer, Term Loan B | | | | | | | | |
| 4.310%, 03/15/24(G) | | | 389 | | | | 390 | |
See accompanying notes to financial statements.
CITY NATIONAL ROCHDALE FUNDS | PAGE 101
| consolidated schedule of investments |
| September 30, 2017 |
City National Rochdale Fixed Income Opportunities Fund (continued) |
| Description | | Face Amount (000)(1) | | | Value (000) | |
| Colorado Buyer, Term Loan, 2nd Lien | | | | | | |
| 8.560%, 03/15/25(G) | | $ | 295 | | | $ | 299 | |
| ConvergeOne Holdings, Term Loan B | | | | | | | | |
| 6.090%, 06/15/24 | | | 439 | | | | 439 | |
| Eircom, Term Loan, 1st Lien | | | | | | | | |
| 3.250%, 03/08/24 | | | 2,500 | | | | 2,965 | |
| Hargray Communications Group, Term Loan B | | | | | | | | |
| 4.235%, 05/16/24 | | | 384 | | | | 385 | |
| Interoute, Tem Loan B, 1st Lien | | | | | | | | |
| 0.000%, 09/29/23 | | | 2,000 | | | | 2,364 | |
| Level 3 Communications, Term Loan B (2017) | | | | | | | | |
| 3.486%, 02/22/24(G) | | | 7,105 | | | | 7,099 | |
| Neustar, Term Loan B-2 | | | | | | | | |
| 3.750%, 08/08/24(F) | | | 740 | | | | 745 | |
| Neustar, Term Loan, 2nd Lien | | | | | | | | |
| 9.312%, 08/08/25(F) | | | 295 | | | | 298 | |
| Numericable U.S. LLC (SFR), Term Loan B-10 | | | | | | | | |
| 4.561%, 01/14/25(G) | | | 2,529 | | | | 2,536 | |
| Numericable U.S. LLC (SFR), Term Loan B-11 | | | | | | | | |
| 3.000%, 06/22/25 | | | 2,494 | | | | 2,956 | |
| 4.061%, 07/31/25(G) | | | 2,753 | | | | 2,739 | |
| PlusServer, Term Loan, 1st Lien | | | | | | | | |
| 0.000%, 09/13/24 | | | 1,000 | | | | 1,182 | |
| WestCorp, Term Loan B12 | | | | | | | | |
| 3.735%, 06/17/23(G) | | | 153 | | | | 153 | |
| WestCorp, Term Loan B14 | | | | | | | | |
| 3.735%, 06/17/21 | | | 559 | | | | 559 | |
| Zayo Group LLC , Term Loan B-2 (Refi) | | | | | | | | |
| 3.487%, 01/19/24(G) | | | 1,300 | | | | 1,301 | |
| | | | | | | | | |
| Total Telecommunications | | | | 31,436 | |
| | | | | | | | | |
| Textile & Apparel Mfg. [0.0%] | |
| Vivarte, Term Loan, 1st Lien | | | | | | | | |
| 4.000%, 10/29/19 | | EUR | 1,148 | | | | 1,180 | |
| | | | | | | | | |
| Transportation [0.9%] | |
| American Axle & Manufacturing, Term Loan | | | | | | | | |
| 3.490%, 03/10/24 | | | 1,725 | | | | 1,720 | |
| Caliber Collision (CH Hold), Term Loan B | | | | | | | | |
| 4.235%, 02/01/24(G) | | | 668 | | | | 673 | |
| Ceva, Term Loan | | | | | | | | |
| 3.000%, 06/30/21 | | EUR | 1,000 | | | | 1,183 | |
| Commercial Barge Line, Term Loan B 2022 | | | | | | | | |
| 9.985%, 11/12/20(D) | | | 513 | | | | 405 | |
| Daseke, Term Loan B | | | | | | | | |
| 6.735%, 02/03/24 | | | 343 | | | | 347 | |
| DryDocks World, Term Loan A, 1st Lien | | | | | | | | |
| 5.216%, 10/18/17(D) | | | 6,915 | | | | 6,578 | |
| 0.100%, 10/18/27(D) | | | 11,050 | | | | 2,486 | |
| Federal-Mogul, Term Loan C | | | | | | | | |
| 9.250%, 04/15/21(F) | | | 2,804 | | | | 2,819 | |
| Harvey Gulf Int’l Marine, Term Loan A | | | | | | | | |
| 7.500%, 06/18/18(D) | | | 1,384 | | | | 577 | |
| Harvey Gulf Int’l Marine, Term Loan B | | | | | | | | |
| 7.750%, 06/18/20(D) | | | 800 | | | | 273 | |
| International Seaways, Term Loan B | | | | | | | | |
| 6.740%, 06/22/22(G) | | | 475 | | | | 465 | |
| K&N Parent, Initial Term Loan | | | | | | | | |
| 5.985%, 10/20/23 | | | 243 | | | | 242 | |
| K&N Parent, Term Loan, 2nd Lien | | | | | | | | |
| 9.989%, 10/19/24 | | | 165 | | | | 162 | |
| Navios Maritime Midstream Partners LP, Term Loan | | | | | | | | |
| 5.830%, 06/18/20 | | | 464 | | | | 460 | |
| Navios Maritime Partners LP, Term Loan B (2017) | | | | | | | | |
| 6.320%, 09/03/20(G) | | | 1,205 | | | | 1,198 | |
| Navistar, Term Loan B (2017) | | | | | | | | |
| 5.240%, 08/07/20 | | | 826 | | | | 830 | |
| OSG Bulk Ships, Initial Term Loan | | | | | | | | |
| 5.570%, 08/05/19 | | | 829 | | | | 787 | |
| Sage Automotive Holdings (Clearlake), Term Loan - 2022 | | | | | | | | |
| 6.235%, 11/08/22 | | | 764 | | | | 770 | |
| Superior Industries, Term Loan B | | | | | | | | |
| 5.736%, 03/22/24 | | | 813 | | | | 801 | |
| Tower Auto Holdings, Term Loan B (2024) | | | | | | | | |
| 4.000%, 03/07/24 | | | 1,074 | | | | 1,076 | |
| Wabash National, Term Loan B-3 | | | | | | | | |
| 3.990%, 03/18/22 | | | 899 | | | | 900 | |
| | | | | | | | | |
| Total Transportation | | | | 24,752 | |
See accompanying notes to financial statements.
CITY NATIONAL ROCHDALE FUNDS | PAGE 102
| consolidated schedule of investments |
| September 30, 2017 |
City National Rochdale Fixed Income Opportunities Fund (continued) |
| Description | | Face Amount (000)(1) | | | Value (000) | |
| Utility [1.1%] | |
| AES, Term Loan B (2017) | | | | | | |
| 3.317%, 05/24/22 | | $ | 731 | | | $ | 732 | |
| Aria Energy Operating LLC, Term Loan B | | | | | | | | |
| 5.735%, 05/27/22 | | | 347 | | | | 348 | |
| Atlantic Power, Term Loan | | | | | | | | |
| 5.485%, 04/13/23 | | | 383 | | | | 386 | |
| Bronco Midstream Funding, LLC, Term Loan B | | | | | | | | |
| 5.316%, 08/17/20 | | | 2,110 | | | | 2,126 | |
| Calpine, Bridge Facility Term Loan | | | | | | | | |
| 2.990%, 11/30/17(F) | | | 108 | | | | 108 | |
| Calpine, Construction Term Loan B1 (2020) | | | | | | | | |
| 3.490%, 05/03/20 | | | 79 | | | | 79 | |
| Calpine, Term Loan B-5 | | | | | | | | |
| 4.090%, 01/15/24(G) | | | 791 | | | | 789 | |
| Calpine, Term Loan B-6 | | | | | | | | |
| 3.900%, 01/15/23 | | | 375 | | | | 374 | |
| Calpine, Term Loan B-7 | | | | | | | | |
| 4.090%, 05/17/23 | | | 474 | | | | 473 | |
| Calpine, Term Loan B-8 | | | | | | | | |
| 2.990%, 12/26/19 | | | 189 | | | | 189 | |
| Dynegy, Tranche C-1 Term Loan | | | | | | | | |
| 4.485%, 02/07/24(G) | | | 2,469 | | | | 2,479 | |
| Eastern Power, LLC (TPF II), Term Loan | | | | | | | | |
| 4.985%, 10/02/23 | | | 1,292 | | | | 1,298 | |
| Empire Generating, LLC, Term Loan B | | | | | | | | |
| 5.570%, 03/14/21(G) | | | 1,747 | | | | 1,616 | |
| Empire Generating, LLC, Term Loan C | | | | | | | | |
| 5.570%, 03/14/21(G) | | | 173 | | | | 160 | |
| HD Supply Waterworks, Initial Term Loan | | | | | | | | |
| 4.455%, 07/21/24(G) | | | 225 | | | | 225 | |
| Helix Gen Funding, LLC, Term Loan B | | | | | | | | |
| 5.083%, 06/02/24 | | | 295 | | | | 298 | |
| Longview Power, Term Loan B | | | | | | | | |
| 7.240%, 04/13/21 | | | 1,569 | | | | 961 | |
| Morrison Utility, Term Loan B, 1st Lien | | | | | | | | |
| 5.000%, 09/13/23 | | | 3,000 | | | | 4,020 | |
| MRP Generation Holdings, LLC (TPF), Term Loan B (2016) | | | | | | | | |
| 8.333%, 10/18/22 | | | 1,604 | | | | 1,500 | |
| Description | | Face Amount (000)(1)/
Acquisition Cost (000) | | | Value (000) | |
| NRG Energy, Term Loan B | | | | | | |
| 3.583%, 06/30/23 | | $ | 4,720 | | | $ | 4,722 | |
| Power Buyer, LLC, Term Loan | | | | | | | | |
| 4.583%, 05/06/20 | | | 1,009 | | | | 1,006 | |
| Power Buyer, LLC, Term Loan, 2nd Lien | | | | | | | | |
| 8.583%, 11/06/20 | | | 190 | | | | 189 | |
| Summit Midstream Partners, Term Loan B | | | | | | | | |
| 7.235%, 05/16/22(G) | | | 2,045 | | | | 2,070 | |
| Talen Energy Supply, Term Loan B-1 | | | | | | | | |
| 5.235%, 07/06/23 | | | 398 | | | | 387 | |
| Talen Energy Supply, Term Loan B-2 | | | | | | | | |
| 5.239%, 04/13/24 | | | 989 | | | | 963 | |
| Vistra Operations LLC, 2016 Incremental Term Loan | | | | | | | | |
| 3.984%, 12/14/23(G) | | | 610 | | | | 612 | |
| Vistra Operations LLC, Term Loan | | | | | | | | |
| 3.985%, 08/04/23(G) | | | 2,372 | | | | 2,375 | |
| Vistra Operations LLC, Term Loan C | | | | | | | | |
| 3.982%, 08/04/23(G) | | | 545 | | | | 546 | |
| Viva Alamo LLC, Term Loan B | | | | | | | | |
| 5.567%, 02/22/21 | | | 269 | | | | 256 | |
| | | | | | | | | |
| Total Utility | | | | 31,287 | |
| | | | | | | | | |
| Wireless Communications [0.2%] | |
| Sprint Communications, Term Loan B | | | | | | | | |
| 3.750%, 01/31/24(G) | | | 6,492 | | | | 6,496 | |
| | | | | | | | | |
| Total Loan Participations | |
| (Cost $797,856) | | | | 801,510 | |
| | | | | | | | | |
| Life Settlement Contracts (D) (H) (I) (J) [5.4%] | |
| American General Life #460L | | | | | | | | |
| Acquired 05/30/2014* | | | 303 | | | | 574 | |
| American General Life #508L | | | | | | | | |
| Acquired 05/30/2014* | | | 2,595 | | | | 2,694 | |
| American General Life #542L | | | | | | | | |
| Acquired 07/30/2015* | | | 83 | | | | 300 | |
| American General Life #634L | | | | | | | | |
| Acquired 05/30/2014* | | | 530 | | | | 2,486 | |
| American General Life #906L | | | | | | | | |
| Acquired 07/30/2015* | | | 479 | | | | 2,602 | |
| American General Life #964L | | | | | | | | |
| Acquired 07/30/2015* | | | 1,459 | | | | 1,847 | |
See accompanying notes to financial statements.
CITY NATIONAL ROCHDALE FUNDS | PAGE 103
| consolidated schedule of investments |
| September 30, 2017 |
City National Rochdale Fixed Income Opportunities Fund (continued) |
| Description | | Acquisition Cost (000) | | | Value (000) | |
| AXA Equitable Life #0474 | | | | | | |
| Acquired 11/04/2013* | | $ | 7,290 | | | $ | 10,221 | |
| AXA Equitable Life #1616 | | | | | | | | |
| Acquired 05/30/2014* | | | 3,254 | | | | 3,815 | |
| AXA Equitable Life #1898 | | | | | | | | |
| Acquired 11/04/2013* | | | 441 | | | | 548 | |
| AXA Equitable Life #7233 | | | | | | | | |
| Acquired 11/04/2013* | | | 395 | | | | 1,755 | |
| AXA Equitable Life #7578 | | | | | | | | |
| Acquired 11/04/2013* | | | 2,104 | | | | 3,820 | |
| AXA Equitable Life #7857 | | | | | | | | |
| Acquired 11/04/2013* | | | 2,297 | | | | 2,328 | |
| AXA Equitable Life #8538 | | | | | | | | |
| Acquired 11/04/2013* | | | 1,333 | | | | 1,599 | |
| AXA Equitable Life #9345 | | | | | | | | |
| Acquired 11/04/2013* | | | 143 | | | | — | |
| Genworth Life and Annuity #6473 | | | | | | | | |
| Acquired 10/19/2016* | | | 740 | | | | 1,220 | |
| Guardian Insurance #0346 | | | | | | | | |
| Acquired 11/04/2013* | | | 646 | | | | 3,048 | |
| Hartford Life #4700 | | | | | | | | |
| Acquired 11/24/2015* | | | 81 | | | | 99 | |
| Hartford Life #7522 | | | | | | | | |
| Acquired 11/24/2015* | | | 805 | | | | 2,217 | |
| ING Reliastar #1234 | | | | | | | | |
| Acquired 12/05/2013* | | | 1,067 | | | | 4,236 | |
| ING Reliastar #1649 | | | | | | | | |
| Acquired 12/05/2013* | | | 61 | | | | 1,813 | |
| ING Reliastar #3394 | | | | | | | | |
| Acquired 05/30/2014* | | | 3,687 | | | | 4,275 | |
| ING Reliastar #4842 | | | | | | | | |
| Acquired 11/20/2013* | | | 921 | | | | 3,920 | |
| ING Reliastar #776H | | | | | | | | |
| Acquired 05/30/2014* | | | 1,518 | | | | 1,952 | |
| John Hancock #0430 | | | | | | | | |
| Acquired 05/30/2014* | | | 2,418 | | | | 3,455 | |
| John Hancock #0801 | | | | | | | | |
| Acquired 05/30/2014* | | | 1,564 | | | | 2,075 | |
| John Hancock #1929 | | | | | | | | |
| Acquired 05/30/2014* | | | 3,812 | | | | 3,941 | |
| John Hancock #5072 | | | | | | | | |
| Acquired 05/30/2014* | | | 1,409 | | | | 3,204 | |
| John Hancock #5080 | | | | | | | | |
| Acquired 11/19/2013* | | | 313 | | | | 3,177 | |
| John Hancock #5885 | | | | | | | | |
| Acquired 05/30/2014* | | | 894 | | | | 1,514 | |
| John Hancock #6686 | | | | | | | | |
| Acquired 05/30/2014* | | | 3,035 | | | | 3,180 | |
| John Hancock #6912 | | | | | | | | |
| Acquired 05/30/2014* | | | 1,065 | | | | 1,701 | |
| Lincoln National #0019 | | | | | | | | |
| Acquired 09/18/2015* | | | 2,460 | | | | 5,433 | |
| Lincoln National #4654 | | | | | | | | |
| Acquired 05/30/2014* | | | 721 | | | | 725 | |
| Lincoln National #4754 | | | | | | | | |
| Acquired 09/18/2015* | | | 610 | | | | 3,282 | |
| Lincoln National #4754 | | | | | | | | |
| Acquired 09/18/2015* | | | 1,029 | | | | 4,104 | |
| Lincoln National #5658 | | | | | | | | |
| Acquired 09/18/2015* | | | 329 | | | | 1,224 | |
| Lincoln National #7099 | | | | | | | | |
| Acquired 09/18/2015* | | | 1,254 | | | | 2,896 | |
| Lincoln National #8558 | | | | | | | | |
| Acquired 09/18/2015* | | | 1,659 | | | | 3,925 | |
| Mass Mutual #1849 | | | | | | | | |
| Acquired 11/05/2013* | | | 2,926 | | | | 4,899 | |
| Mass Mutual #5167 | | | | | | | | |
| Acquired 05/30/2014* | | | 63 | | | | 1,357 | |
| Mass Mutual #5681 | | | | | | | | |
| Acquired 11/05/2013* | | | 288 | | | | 2,320 | |
| Mass Mutual #5864 | | | | | | | | |
| Acquired 05/30/2014* | | | 4,668 | | | | 803 | |
| Mass Mutual #6620 | | | | | | | | |
| Acquired 11/05/2013* | | | 222 | | | | 831 | |
| Met Life #8MLU | | | | | | | | |
| Acquired 05/30/2014* | | | 1,413 | | | | 2,183 | |
| Pacific Life #7850 | | | | | | | | |
| Acquired 05/30/2014* | | | 550 | | | | 915 | |
| Penn Life #8183 | | | | | | | | |
| Acquired 10/18/2016* | | | 46 | | | | 101 | |
| Penn Mutual #3106 | | | | | | | | |
| Acquired 05/30/2014* | | | 1,294 | | | | 1,510 | |
| Phoenix Life #5555 | | | | | | | | |
| Acquired 05/30/2014* | | | 3,946 | | | | 5,322 | |
| Phoenix Life #5715 | | | | | | | | |
| Acquired 10/18/2016* | | | 570 | | | | 1,833 | |
| Phoenix Life #6157 | | | | | | | | |
| Acquired 10/18/2016* | | | 569 | | | | 1,873 | |
| Phoenix Life #6161 | | | | | | | | |
| Acquired 05/30/2014* | | | 3,472 | | | | 8,098 | |
| Phoenix Life #8499 | | | | | | | | |
| Acquired 05/30/2014* | | | 756 | | | | 1,058 | |
| Phoenix Life #8509 | | | | | | | | |
| Acquired 05/30/2014* | | | 761 | | | | 1,058 | |
| Principal Financial #6653 | | | | | | | | |
| Acquired 10/30/2013* | | | 306 | | | | 1,584 | |
| Prudential #5978 | | | | | | | | |
| Acquired 10/02/2015* | | | 372 | | | | 1,442 | |
| Security Mutual Life #5380 | | | | | | | | |
| Acquired 10/30/2013* | | | 410 | | | | 570 | |
See accompanying notes to financial statements.
CITY NATIONAL ROCHDALE FUNDS | PAGE 104
| consolidated schedule of investments |
| September 30, 2017 |
City National Rochdale Fixed Income Opportunities Fund (continued) |
| Description | | Acquisition Cost (000)/
Face Amount (000)(1) | | | Value (000) | |
| Transamerica #1708 | | | | | | |
| Acquired 10/28/2013* | | $ | 957 | | | $ | 2,971 | |
| Transamerica #3426 | | | | | | | | |
| Acquired 11/12/2013* | | | 274 | | | | 568 | |
| Transamerica #8205 | | | | | | | | |
| Acquired 10/28/2013* | | | 714 | | | | 1,828 | |
| Union Central Life #4500 | | | | | | | | |
| Acquired 10/30/2013* | | | 790 | | | | 3,799 | |
| | | | | | | | | |
| Total Life Settlement Contracts | |
| (Cost $80,172) | | | | 148,128 | |
| | | | | | | | | |
| Sovereign Debt [2.0%] | |
| 1MDB Global Investments | | | | | | | | |
| 4.400%, 03/09/23 | | | 1,000 | | | | 951 | |
| AES | | | | | | | | |
| 7.750%, 02/02/24 | | | 3,000 | | | | 3,215 | |
| Argentina Paris Club | | | | | | | | |
| 3.000%, 05/30/21(D) | | | 5,984 | | | | 5,623 | |
| Argentine Republic Government International Bond | | | | | | | | |
| 10.250%, 02/06/03(B) (D) | | EUR | 12 | | | | 16 | |
| 10.000%, 12/07/04(B) (D) | | EUR | 1,244 | | | | 1,618 | |
| 10.000%, 01/07/05(B) (D) | | EUR | 132 | | | | 139 | |
| 10.000%, 02/22/07(B) (D) | | EUR | 25 | | | | 26 | |
| 9.500%, 03/04/04(B) (D) | | EUR | 27 | | | | 35 | |
| 9.000%, 11/19/08(B) (D) | | EUR | 15 | | | | 20 | |
| 8.750%, 02/04/03(B) (D) | | EUR | 30 | | | | 32 | |
| 8.500%, 02/23/05(B) (D) | | EUR | 630 | | | | 735 | |
| 8.500%, 07/30/10(B) (D) | | EUR | 34 | | | | 35 | |
| 8.125%, 10/04/04(B) (D) | | EUR | 119 | | | | 146 | |
| 8.125%, 04/21/08(B) (D) | | EUR | 85 | | | | 89 | |
| 8.000%, 02/25/02(B) (D) | | EUR | 2,033 | | | | 1,563 | |
| 8.000%, 02/26/08(B) (D) | | EUR | 114 | | | | 147 | |
| 8.000%, 10/30/09(B) (D) | | EUR | 366 | | | | 476 | |
| 7.820%, 12/31/33(B) (D) | | EUR | 7,618 | | | | 9,986 | |
| 7.625%, 08/11/07(B) (D) | | EUR | 13 | | | | 14 | |
| 7.500%, 05/23/02(B) (D) | | EUR | 52 | | | | 40 | |
| 7.125%, 06/10/02(B) (D) | | EUR | 97 | | | | 102 | |
| 7.000%, 03/18/04(B) (D) | | EUR | 141 | | | | 166 | |
| 5.870%, 03/31/23(B) (D) | | EUR | 28 | | | | 40 | |
| 0.000%, 07/22/03(B) (D) | | EUR | 66 | | | | 51 | |
| 0.000%, 12/22/04(B) (D) | | EUR | 29 | | | | 31 | |
| Bosnia & Herzegovina Government International Bond | | | | | | | | |
| 0.500%, VAR ICE LIBOR EUR 6M+0.813% 12/22/17 | | EUR | 380 | | | | 444 | |
| City of Cordoba, Argentina | | | | | | | | |
| 7.875%, 09/29/24 | | | 3,500 | | | | 3,668 | |
| | | | | | | | | |
| Description | | Face Amount (000)(1)/Shares | | | Value (000) | |
| Egyptian Paris Club | | | | | | | | |
| 5.056%, 01/01/21(D) (H) | | $ | 7 | | | $ | 5 | |
| Ghana Government International Bond | | | | | | | | |
| 8.500%, 10/04/17 | | | 100 | | | | 100 | |
| Ivory Coast Government International Bond | | | | | | | | |
| 5.750%, 12/31/32 | | | 57 | | | | 56 | |
| Province of Salta, Argentina | | | | | | | | |
| 9.500%, 03/16/22 | | | 1,512 | | | | 1,618 | |
| Provincia de Entre Rios, Argentina | | | | | | | | |
| 8.750%, 02/08/25 | | | 4,000 | | | | 4,160 | |
| Provincia de Neuquen, Argentina | | | | | | | | |
| 7.500%, 04/27/25 | | | 1,000 | | | | 1,043 | |
| Republic of Azerbaijan International Bond | | | | | | | | |
| 3.500%, 09/01/32 | | | 5,619 | | | | 4,875 | |
| Republic of Belarus International Bond | | | | | | | | |
| 8.950%, 01/26/18 | | | 5,100 | | | | 5,192 | |
| Ukraine Government International Bond | | | | | | | | |
| 7.375%, 09/25/32 | | | 7,500 | | | | 7,303 | |
| 0.000%, 05/31/40(G) | | | 2,000 | | | | 1,077 | |
| | | | | | | | | |
| Total Sovereign Debt | |
| (Cost $54,806) | | | | 54,837 | |
| | | | | | | | | |
| Closed-End Fund [0.6%] | |
| Stone Ridge Reinsurance Risk Premium Interval Fund(D) | | | 1,699,627 | | | | 15,331 | |
| | | | | | | | | |
| Total Closed-End Fund | |
| (Cost $17,257) | | | | 15,331 | |
| | | | | | | | | |
| Limited Partnership [0.3%] | |
| Financial Services [0.3%] | |
| Cartesian LP * (D) (H) (I) | | | 1 | | | | 7,815 | |
| | | | | | | | | |
| Total Limited Partnership | |
| (Cost $10,000) | | | | 7,815 | |
| | | | | | | | | |
| Common Stock [0.2%] | |
| Energy [0.0%] | |
| Templar Energy, Cl A * | | | 105,419 | | | | 276 | |
| | | | | | | | | |
| Financial [0.0%] | |
| Aretec Group * | | | 3,419 | | | | 103 | |
See accompanying notes to financial statements.
CITY NATIONAL ROCHDALE FUNDS | PAGE 105
| consolidated schedule of investments |
| September 30, 2017 |
City National Rochdale Fixed Income Opportunities Fund (continued) |
| Description | | Shares/ Face Amount (000)(1)/
Number of Warrants | | | Value (000) | |
| Metals & Mining [0.0%] | |
| New World Resources, Cl A * (D) | | | 44,276,198 | | | $ | 89 | |
| | | | | | | | | |
| Oil, Gas & Consumable Fuels [0.2%] | |
| Gulf Keystone Petroleum * | | | 2,879,160 | | | | 3,704 | |
| | | | | | | | | |
| Services [0.0%] | |
| A’Ayan Leasing * (D) | | | 1,169,438 | | | | 122 | |
| Astana Finance * | | | 208,618 | | | | — | |
| | | | | | | | | |
| Total Services | | | | 122 | |
| | | | | | | | | |
| Total Common Stock | |
| (Cost $6,055) | | | | 4,294 | |
| | | | | | | | | |
| Convertible Bonds [0.2%] | |
| Coal Mining [0.0%] | |
| New World Resources | | | | | | | | |
| 4.000%, 10/07/20(B) (D) | | EUR | 380 | | | | — | |
| | | | | | | | | |
| Medical Products & Services [0.0%] | |
| Bio City Development | | | | | | | | |
| 8.000%, 07/06/18(B) (D) | | | 1,000 | | | | 200 | |
| | | | | | | | | |
| Metal-Iron [0.0%] | |
| London Mining Jersey | | | | | | | | |
| 12.000%, 04/30/19(B) (D) | | | 1,500 | | | | 15 | |
| | | | | | | | | |
| Petroleum & Fuel Products [0.2%] | |
| Dana Gas Sukuk | | | | | | | | |
| 9.000%, 10/31/17(B) | | | 4,642 | | | | 3,661 | |
| 7.000%, 10/31/17 | | | 450 | | | | 365 | |
| | | | | | | | | |
| Total Petroleum & Fuel Products | | | | 4,026 | |
| | | | | | | | | |
| Total Convertible Bonds | |
| (Cost $7,400) | | | | 4,241 | |
| | | | | | | | | |
| Warrant [0.1%] | |
| Central Bank of Nigeria, | | | | | | | | |
| Expires 11/15/20, Strike Price $0.0001*(D) | | | 36,000 | | | | 2,673 | |
| | | | | | | | | |
| Total Warrant | |
| (Cost $5,425) | | | | 2,673 | |
| | | | | | | | | |
| Description | | Face Amount (000)(1)/Shares | | | Value (000) | |
| Asset-Backed Security [0.0%] | |
| BT SPE (Acquired 07/06/11, Acquisition Cost $10,781,378) | | | | | | | | |
| 9.250%, 06/06/16(D) (H) (I) (J) | | $ | 4,438 | | | $ | 328 | |
| | | | | | | | | |
| Total Asset-Backed Security | |
| (Cost $4,438) | | | | 328 | |
| | | | | | | | | |
| Repurchase Agreement [2.7%] | |
| Barclays(K) | | | | | | | | |
| 1.050%, dated 09/29/17, repurchased on 10/02/17, repurchase price $75,006,563 (collateralized by various U.S. Government obligations, par values ranging from $100 ‒ $19,844,200, 0.000% ‒ 6.625%, 01/02/18 ‒ 02/15/36; with a total market value $76,500,000) | | | 75,000 | | | | 75,000 | |
| | | | | | | | | |
| Total Repurchase Agreement | |
| (Cost $75,000) | | | | 75,000 | |
| | | | | | | | | |
| Short-Term Investment [7.0%] | |
| SEI Daily Income Trust Government Fund, Cl F, 0.840%** | | | 192,698,140 | | | | 192,698 | |
| | | | | | | | | |
| Total Short-Term Investment | |
| (Cost $192,698) | | | | 192,698 | |
| | | | | | | | | |
| Total Investments [100.1%] | |
| (Cost $2,647,339) | | | $ | 2,743,395 | |
Percentages are based on Net Assets of $2,740,248 (000).
| * | Non-income producing security. |
| ** | The rate reported is the 7-day effective yield as of September 30, 2017. |
| (1) | In U.S. dollars unless otherwise indicated. |
| (A) | Security exempt from registration under Rule 144A of the Securities Act of 1933. These securities may be resold in transactions exempt from registration normally to qualified institutions. On September 30, 2017, the value of these securities amounted to $358,544 (000), representing 13.1% of the net assets of the Fund. |
| (B) | In default on interest payments. Rate shown represents the last coupon rate prior to default. |
| (C) | Step Bond — The rate reported is the rate in effect on September 30, 2017. The coupon on a step bond changes on a specific date. |
| (D) | Security is considered illiquid. The total market value of such securities as of September 30, 2017, was $236,195 (000) and represented 8.6% of the net assets of the Fund. |
See accompanying notes to financial statements.
CITY NATIONAL ROCHDALE FUNDS | PAGE 106
| consolidated schedule of investments |
| September 30, 2017 |
City National Rochdale Fixed Income Opportunities Fund (continued) |
| (E) | Zero coupon security. The rate reported is the effective yield at time of purchase. |
| (G) | Variable or floating rate security, the interest rate of which adjusts periodically based on changes in current interest rates and prepayments on the underlying pool of assets. |
| (H) | Level 3 security in accordance with fair value hierarchy. |
| (I) | Security fair valued using methods determined in good faith by the Fair Value Committee designated by the Board of Trustees. The total market value of such securities as of September 30, 2017, was $156,271 (000) and represented 5.7% of the net assets of the Fund. |
| (J) | Security is considered restricted. The total market value of such securities as of September 30, 2017, was $148,456 (000) and represented 5.4% of the net assets of the Fund. |
| (K) | Tri-Party Repurchase Agreement. |
| (L) | Maturity date is 06/05/2115. |
CHF — Swiss Franc
Cl — Class
EUR — Euro
Euribor — Euro Interbank Offered Rates
GBP — British Pound Sterling
ICE — Intercontinental Exchange
LIBOR — London Interbank Offered Rates
LLC — Limited Liability Corporation
LLP — Limited Liability Partnership
LP — Limited Partnership
MLP — Master Limited Partnership
MTN — Medium Term Note
PIK — Payment in-kind
PLC — Public Limited Company
Pte. Ltd. — Private Limited
SA — Special Assessment
SAB — Special Assessment Board
Ser — Series
SPE — Special Purpose Entity
USD — United States Dollar
VAR — Variable
A list of the open forward foreign currency contracts held by the Fund at September 30, 2017, is as follows:
| Counterparty | Settlement Date | Currency to
Deliver
(000) | | Currency to
Receive
(000) | | | Unrealized
Appreciation
(Depreciation)
(000) | |
| U.S. Bank | 11/30/17 | GBP | | | 1,640 | | USD | | | 2,208 | | | $ | 6 | |
| U.S. Bank | 10/10/17 | GBP | | | 28,350 | | USD | | | 37,095 | | | | (906 | ) |
| U.S. Bank | 10/10/17 | EUR | | | 127,960 | | USD | | | 153,795 | | | | 2,476 | |
| U.S. Bank | 10/10/17 - 11/30/17 | EUR | | | 19,600 | | USD | | | 23,148 | | | | (83 | ) |
| U.S. Bank | 05/31/18 | CHF | | | 6,000 | | USD | | | 6,325 | | | | 21 | |
| U.S. Bank | 03/29/18 | CHF | | | 1,500 | | USD | | | 1,565 | | | | (4 | ) |
| | | | | | | | | | | | | | $ | 1,510 | |
The following is a list of the inputs used as of September 30, 2017, in valuing the Fund’s investments and other financial instruments carried at value (000):
| Investments in Securities | | Level 1 | | | Level 2 | | | Level 3(1) | | | Total | |
| Corporate Bonds | | $ | — | | | $ | 1,436,540 | | | $ | — | | | $ | 1,436,540 | |
| Loan Participations | | | — | | | | 799,715 | | | | 1,795 | | | | 801,510 | |
| Life Settlement Contracts | | | — | | | | — | | | | 148,128 | | | | 148,128 | |
| Sovereign Debt | | | — | | | | 54,832 | | | | 5 | | | | 54,837 | |
| Closed-End Fund | | | 15,331 | | | | — | | | | — | | | | 15,331 | |
| Limited Partnership | | | — | | | | — | | | | 7,815 | | | | 7,815 | |
| Common Stock | | | 3,826 | | | | 468 | | | | — | | | | 4,294 | |
| Convertible Bonds | | | — | | | | 4,241 | | | | — | | | | 4,241 | |
| Warrant | | | 2,673 | | | | — | | | | — | | | | 2,673 | |
| Asset-Backed Security | | | — | | | | — | | | | 328 | | | | 328 | |
| Repurchase Agreement | | | — | | | | 75,000 | | | | — | | | | 75,000 | |
| Short-Term Investment | | | 192,698 | | | | — | | | | — | | | | 192,698 | |
| Total Investments in Securities | | $ | 214,528 | | | $ | 2,370,796 | | | $ | 158,071 | | | $ | 2,743,395 | |
| Other Financial Instruments | | Level 1 | | | Level 2 | | | Level 3 | | | Total | |
| Forwards Contracts* | | | | | | | | | | | | |
| Unrealized Appreciation | | $ | — | | | $ | 2,503 | | | $ | — | | | $ | 2,503 | |
| Unrealized Depreciation | | | — | | | | (993 | ) | | | — | | | | (993 | ) |
| Total Other Financial Instruments | | $ | — | | | $ | 1,510 | | | $ | — | | | $ | 1,510 | |
| * | Forwards contracts are valued at the unrealized appreciation/(depreciation) on the instrument. |
| (1) | Of the $158,071 (000) in Level 3 securities as of September 30, 2017, $156,271 (000) or 98.9% are not valued via third party pricing vendors and broker quotes. If significant, the disclosure of the unobservable inputs and the interrelationships and sensitivity between these inputs is required for those Level 3 securities that are not valued by third party vendors or broker quotes. |
The following is a reconciliation of investments in which significant unobservable inputs (Level 3) were used in determining value as of September 30, 2017:
| | | Investments in Loan Participations
(000) | | | Investments in Life Settlement Contracts
(000) | | | Investments in Sovereign Debt
(000) | |
| Beginning balance as of 10/1/16 | | $ | 2,185 | | | $ | 152,481 | | | $ | 10 | |
| Accrued discounts/ premiums | | | 89 | | | | — | | | | — | |
| Realized gain/(loss) | | | 49 | | | | 13,923 | | | | 1 | |
| Change in unrealized appreciation/(depreciation) | | | (50 | ) | | | 5,469 | | | | (2 | ) |
| Purchases | | | — | | | | 1,925 | | | | — | |
| Sales/paydowns | | | (478 | ) | | | (25,670 | ) | | | (4 | ) |
| Transfers into Level 3 | | | — | | | | — | | | | — | |
| Transfers out of Level 3 | | | — | | | | — | | | | — | |
| Ending balance as of 9/30/17 | | $ | 1,795 | | | $ | 148,128 | | | $ | 5 | |
| Changes in unrealized gains/(losses) included in earnings related to securities still held at reporting date | | $ | (50 | ) | | $ | 5,469 | | | $ | (2 | ) |
See accompanying notes to financial statements.
CITY NATIONAL ROCHDALE FUNDS | PAGE 107
| consolidated schedule of investments |
| September 30, 2017 |
City National Rochdale Fixed Income Opportunities Fund (concluded) |
| | | Investments in Limited Partnership
(000) | | | Investments in Asset-Backed Securities
(000) | | | Total
(000) | |
| Beginning balance as of 10/1/16 | | $ | — | | | $ | 1,316 | | | $ | 155,992 | |
| Accrued discounts/ premiums | | | — | | | | — | | | | 89 | |
| Realized gain/(loss) | | | — | | | | — | | | | 13,973 | |
| Change in unrealized appreciation/(depreciation) | | | — | | | | (407 | ) | | | 5,010 | |
| Purchases | | | — | | | | — | | | | 1,925 | |
| Sales/paydowns | | | — | | | | (581 | ) | | | (26,733 | ) |
| Transfers into Level 3 | | | 7,815 | | | | — | | | | 7,815 | |
| Transfers out of Level 3 | | | — | | | | — | | | | — | |
| Ending balance as of 9/30/17 | | $ | 7,815 | | | $ | 328 | | | $ | 158,071 | |
| Changes in unrealized gains/(losses) included in earnings related to securities still held at reporting date | | $ | — | | | $ | (407 | ) | | $ | 5,110 | |
The following table summarizes the quantitative inputs and assumptions used for items categorized as material Level 3 investments as of September 30, 2017. The disclosures below also include qualitative information on the sensitivity of the fair value measurements to changes in the significant unobservable inputs.
| | Fair Value at
September 30, 2017
(000) | Valuation Techniques | |
| BT SPE | $328 | Discounted Cash Flow Model | |
| | | based on actual collection level and experienced defaults | |
| | | | |
| | | Observable Inputs | |
| | | Cumulated Collections | |
| | | Cumulated Defaults | |
| | | Annualized Default Rate | |
| | | Cumulated Default Rate | |
| | | Pace of Collection | |
| | | Pace of Defaults | |
| | | Interest Rates | |
| | | | |
| | | Unobservable Inputs | Range |
| | | Projected Default Rates | 5%-12% |
| | | Projected Collection Rates | 90%-100% |
| | | Expected Discount Rates | 9.25% |
| | | | |
| | | Valuation Techniques | |
| Life Settlement Contracts | 148,128 | Discounted Cash Flow Model | |
| | | | |
| | | Observable Inputs | |
| | | Maturity Value | |
| | | | |
| | | Unobservable Inputs | Range |
| | | Discount Rate | 13.5% |
| | | Expected Maturity (months) | 6-130 months |
| | | | |
| | | Valuation Techniques | |
| Limited Partnership | 7,815 | Fair value based on estimates of insured losses and disposition of industry loss warranties | |
| | | | |
| | | Observable Inputs | |
| | | Previous month's Net Asset Value | |
| | | | |
| | | Unobservable Inputs | Range |
| | | Projected insured losses from hurricanes provided by management | 30% |
The unobservable inputs used to determine fair value of recurring Level 3 assets may have similar or diverging impacts on valuation. Significant increases and decreases in these inputs in isolation and the interrelationships between them could result in significantly higher or lower fair value measurements. Increases in projected collection rates in isolation would result in a higher fair value measurement, while increases in expected discount rates, projected default rates, and maturities of life settlement contracts, in isolation, would result in a lower fair value measurement.
For the year ended September 30, 2017, there were transfers between Level 2 and Level 3 assets and liabilities. Transfers between Levels are recognized at period end.
The transfers between fair values hierarchy levels were due to changes in the availability of observable inputs to determine fair value.
The following is a summary of the transactions with affiliates for the year ended September 30, 2017:
| | | City National Rochdale Government Money Market Fund,
Class I
(000) | |
| Beginning balance as of 10/1/16 | | $ | 8,930 | |
| Purchases at Cost | | | 7,846 | |
| Proceeds from Sales | | | (16,776 | ) |
| Unrealized Gain/(Loss) | | | — | |
| Realized Gain/(Loss) | | | — | |
| Ending balance as of 9/30/17 | | $ | — | |
| Dividend Income | | $ | — | |
At September 30, 2017, the Fund had the following investments in life settlement contracts:
| Year | | Number of Contracts | | | Fair Value
(000) | | | Face Value
(Death Benefits)
(000) | |
| 2018 | | | 2 | | | $ | 9,120 | | | $ | 12,000 | |
| 2019 | | | 6 | | | | 14,403 | | | | 21,824 | |
| 2020 | | | 10 | | | | 41,066 | | | | 77,508 | |
| 2021 | | | 15 | | | | 36,513 | | | | 88,000 | |
| 2022 | | | 10 | | | | 21,208 | | | | 61,000 | |
| Thereafter | | | 17 | | | | 25,818 | | | | 101,872 | |
| | | | 60 | | | $ | 148,128 | | | $ | 362,204 | |
For the year ended September 30, 2017, the net change to fair value on life settlement contracts, net of premiums paid and continuing costs disclosed in the Fund’s Consolidated Statement of Operations, as part of the unrealized appreciation/(depreciation) on investments, consisted of a net positive change to fair value on life settlement contracts of $1,497,475, offset by $19,664,536 in premiums paid and continuing costs associated with its investment in the policies. For the year ended September 30, 2017, the Fund realized gains of $13,923,133 on matured life settlements, which are disclosed in the Consolidated Statement of Operations, as part of the realized gain/(loss) on investments.
Amounts designated as “—“ are either $0 or have been rounded to $0.
For more information on valuation inputs, see Note 2 — Significant Accounting Policies in the Notes to Financial Statements.
See accompanying notes to financial statements.
CITY NATIONAL ROCHDALE FUNDS | PAGE 108
| schedule of investments |
| September 30, 2017 |
| City National Rochdale Dividend & Income Fund |
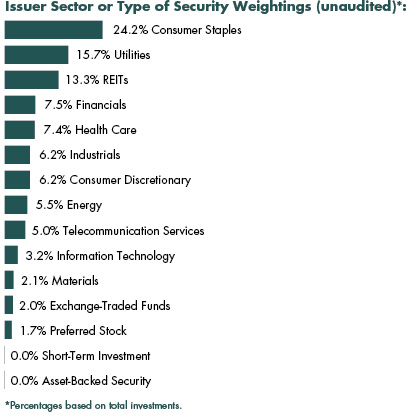
| Description | | Shares | | | Value (000) | |
| Common Stock [96.3%] | |
| Consumer Discretionary [6.2%] | |
| Cedar Fair (A) | | | 28,000 | | | $ | 1,795 | |
| Hasbro | | | 58,800 | | | | 5,743 | |
| McDonald’s | | | 38,800 | | | | 6,079 | |
| Six Flags Entertainment | | | 32,500 | | | | 1,981 | |
| | | | | | | | | |
| Total Consumer Discretionary | | | | 15,598 | |
| | | | | | | | | |
| Consumer Staples [24.2%] | |
| Altria Group | | | 114,750 | | | | 7,277 | |
| B&G Foods | | | 141,800 | | | | 4,516 | |
| British American Tobacco ADR | | | 8,559 | | | | 535 | |
| Clorox | | | 37,700 | | | | 4,973 | |
| Coca-Cola | | | 75,372 | | | | 3,393 | |
| Dr. Pepper Snapple Group | | | 61,400 | | | | 5,432 | |
| General Mills | | | 110,780 | | | | 5,734 | |
| Hershey | | | 25,400 | | | | 2,773 | |
| Imperial Brands ADR | | | 46,304 | | | | 2,004 | |
| Kellogg | | | 47,000 | | | | 2,931 | |
| Kimberly-Clark | | | 19,000 | | | | 2,236 | |
| Mondelez International, Cl A | | | 25,000 | | | | 1,017 | |
| Philip Morris International | | | 61,700 | | | | 6,849 | |
| Procter & Gamble | | | 45,949 | | | | 4,180 | |
| Sysco | | | 38,800 | | | | 2,093 | |
| Unilever ADR | | | 22,200 | | | | 1,287 | |
| Vector Group | | | 198,979 | | | | 4,073 | |
| | | | | | | | | |
| Total Consumer Staples | | | | 61,303 | |
| | | | | | | | | |
| Energy [5.5%] | |
| Buckeye Partners (A) | | | 12,400 | | | | 707 | |
| Chevron | | | 36,183 | | | | 4,252 | |
| Enterprise Products Partners (A) | | | 87,984 | | | | 2,294 | |
| ExxonMobil | | | 25,838 | | | | 2,118 | |
| Occidental Petroleum | | | 25,500 | | | | 1,637 | |
| ONEOK | | | 18,500 | | | | 1,025 | |
| TransCanada | | | 37,128 | | | | 1,835 | |
| | | | | | | | | |
| Total Energy | | | | 13,868 | |
| | | | | | | | | |
| Financials [7.5%] | |
| Ares Capital | | | 91,000 | | | | 1,492 | |
| Arthur J Gallagher | | | 13,200 | | | | 812 | |
| BB&T | | | 64,600 | | | | 3,032 | |
| Cincinnati Financial | | | 60,650 | | | | 4,644 | |
| Compass Diversified Holdings (A) | | | 153,000 | | | | 2,716 | |
| JPMorgan Chase | | | 33,400 | | | | 3,190 | |
| People’s United Financial | | | 30,000 | | | | 544 | |
| Umpqua Holdings | | | 71,000 | | | | 1,385 | |
| United Bankshares | | | 33,500 | | | | 1,245 | |
| | | | | | | | | |
| Total Financials | | | | 19,060 | |
| | | | | | | | | |
| Health Care [7.4%] | |
| Bristol-Myers Squibb | | | 54,200 | | | | 3,455 | |
| GlaxoSmithKline ADR | | | 67,800 | | | | 2,752 | |
| Johnson & Johnson | | | 44,300 | | | | 5,759 | |
| Merck | | | 73,150 | | | | 4,684 | |
| Pfizer | | | 56,944 | | | | 2,033 | |
| | | | | | | | | |
| Total Health Care | | | | 18,683 | |
| | | | | | | | | |
| Industrials [6.2%] | |
| Eaton | | | 41,300 | | | | 3,172 | |
| General Dynamics | | | 15,300 | | | | 3,145 | |
| Lockheed Martin | | | 30,117 | | | | 9,345 | |
| | | | | | | | | |
| Total Industrials | | | | 15,662 | |
| | | | | | | | | |
| Information Technology [3.2%] | |
| Intel | | | 134,500 | | | | 5,122 | |
| Paychex | | | 52,000 | | | | 3,118 | |
| | | | | | | | | |
| Total Information Technology | | | | 8,240 | |
See accompanying notes to financial statements.
CITY NATIONAL ROCHDALE FUNDS | PAGE 109
| schedule of investments |
| September 30, 2017 |
City National Rochdale Dividend & Income Fund (continued) |
| Description | | Shares | | | Value (000) | |
| Materials [2.1%] | |
| DowDuPont | | | 58,597 | | | $ | 4,056 | |
| Sonoco Products | | | 24,000 | | | | 1,211 | |
| | | | | | | | | |
| Total Materials | | | | 5,267 | |
| | | | | | | | | |
| REITs [13.3%] | |
| EPR Properties | | | 34,500 | | | | 2,406 | |
| Government Properties Income Trust | | | 35,000 | | | | 657 | |
| Gramercy Property Trust | | | 46,999 | | | | 1,422 | |
| Healthcare Trust of America, Cl A | | | 79,500 | | | | 2,369 | |
| Lamar Advertising, Cl A | | | 84,800 | | | | 5,811 | |
| Liberty Property Trust | | | 83,985 | | | | 3,449 | |
| Life Storage | | | 10,036 | | | | 821 | |
| Mid-America Apartment Communities | | | 26,500 | | | | 2,832 | |
| National Retail Properties | | | 59,500 | | | | 2,479 | |
| National Storage Affiliates Trust | | | 50,000 | | | | 1,212 | |
| Select Income | | | 35,500 | | | | 832 | |
| Simon Property Group | | | 10,000 | | | | 1,610 | |
| Tanger Factory Outlet Centers | | | 27,984 | | | | 683 | |
| Ventas | | | 40,232 | | | | 2,620 | |
| Welltower | | | 32,262 | | | | 2,267 | |
| Weyerhaeuser | | | 38,400 | | | | 1,307 | |
| WP Carey | | | 12,000 | | | | 809 | |
| | | | | | | | | |
| Total REITs | | | | 33,586 | |
| | | | | | | | | |
| Telecommunication Services [5.0%] | |
| AT&T | | | 98,500 | | | | 3,858 | |
| Consolidated Communications Holdings | | | 150,900 | | | | 2,879 | |
| Verizon Communications | | | 119,167 | | | | 5,898 | |
| | | | | | | | | |
| Total Telecommunication Services | | | | 12,635 | |
| | | | | | | | | |
| Utilities [15.7%] | |
| American Electric Power | | | 34,900 | | | | 2,451 | |
| AmeriGas Partners (A) | | | 28,200 | | | | 1,268 | |
| Avangrid | | | 59,000 | | | | 2,798 | |
| Brookfield Infrastructure Partners | | | 67,600 | | | | 2,916 | |
| Dominion Energy | | | 24,000 | | | | 1,846 | |
| DTE Energy | | | 15,000 | | | | 1,610 | |
| Duke Energy | | | 68,006 | | | | 5,707 | |
| Entergy | | | 13,700 | | | | 1,046 | |
| Eversource Energy | | | 39,242 | | | | 2,372 | |
| OGE Energy | | | 33,600 | | | | 1,211 | |
| Pattern Energy Group, Cl A | | | 22,000 | | | | 530 | |
| Pinnacle West Capital | | | 30,135 | | | | 2,548 | |
| PPL | | | 34,500 | | | | 1,309 | |
| SCANA | | | 44,100 | | | | 2,139 | |
| Sempra Energy | | | 9,000 | | | | 1,027 | |
| Vectren | | | 56,000 | | | | 3,683 | |
| WEC Energy Group | | | 38,050 | | | | 2,389 | |
| Xcel Energy | | | 62,100 | | | | 2,939 | |
| | | | | | | | | |
| Total Utilities | | | | 39,789 | |
| | | | | | | | | |
| Total Common Stock | |
| (Cost $185,630) | | | | 243,691 | |
| | | | | | | | | |
| Exchange-Traded Funds [2.0%] | |
| iShares US Preferred Stock ETF | | | 27,300 | | | | 1,059 | |
| PowerShares Preferred Portfolio | | | 269,500 | | | | 4,051 | |
| | | | | | | | | |
| Total Exchange-Traded Funds | |
| (Cost $5,027) | | | | 5,110 | |
| | | | | | | | | |
| Preferred Stock [1.7%] | |
| Financials [0.7%] | |
| AmTrust Financial Services, 7.500% | | | 10,000 | | | | 260 | |
| Bank of America, 6.500% | | | 10,000 | | | | 269 | |
| Capital One Financial, 6.700% | | | 10,000 | | | | 272 | |
| JPMorgan Chase, 6.125% | | | 10,000 | | | | 268 | |
| Wells Fargo, 6.000% | | | 20,000 | | | | 524 | |
| Wells Fargo Real Estate Investment, 6.375% | | | 10,000 | | | | 264 | |
| | | | | | | | | |
| Total Financials | | | | 1,857 | |
| | | | | | | | | |
| REITs [0.6%] | |
| Digital Realty Trust, 5.250% | | | 10,000 | | | | 251 | |
| National Retail Properties, 5.200% | | | 10,000 | | | | 251 | |
| PS Business Parks, 5.200% | | | 10,000 | | | | 253 | |
| Public Storage, 5.050% | | | 30,000 | | | | 770 | |
| | | | | | | | | |
| Total REITs | | | | 1,525 | |
| | | | | | | | | |
| Telecommunication Services [0.2%] | |
| Qwest, 7.000% | | | 10,000 | | | | 269 | |
| Verizon Communications, 5.900% | | | 10,000 | | | | 272 | |
| | | | | | | | | |
| Total Telecommunication Services | | | | 541 | |
See accompanying notes to financial statements.
CITY NATIONAL ROCHDALE FUNDS | PAGE 110
| schedule of investments |
| September 30, 2017 |
City National Rochdale Dividend & Income Fund (continued) |
| Description | | Shares/Face Amount (000) | | | Value (000) | |
| Utilities [0.2%] | |
| Dominion Energy, 5.250% | | | 5,000 | | | $ | 129 | |
| Southern, 6.250% | | | 10,000 | | | | 274 | |
| | | | | | | | | |
| Total Utilities | | | | 403 | |
| | | | | | | | | |
| Total Preferred Stock | |
| (Cost $4,125) | | | | 4,326 | |
| | | | | | | | | |
| Asset-Backed Security [0.0%] | |
| BT SPE (Acquired 07/06/11, Acquisition Cost $551,294) | | | | | | | | |
| 9.250%, 06/06/16(B) (C) (D) | | $ | 227 | | | | 17 | |
| | | | | | | | | |
| Total Asset-Backed Security | |
| (Cost $227) | | | | 17 | |
| | | | | | | | | |
| Short-Term Investment [0.0%] | |
| SEI Daily Income Trust Government Fund, Cl F, 0.840%** | | | 194 | | | | — | |
| | | | | | | | | |
| Total Short-Term Investment | |
| (Cost $0) | | | | — | |
| | | | | | | | | |
| Total Investments [100.0%] | |
| (Cost $195,009) | | | $ | 253,144 | |
Percentages are based on Net Assets of $253,209 (000).
| ** | The rate reported is the 7-day effective yield as of September 30, 2017. |
| (A) | Security is a Master Limited Partnership. At September 30, 2017, such securities amounted to $8,780 (000), or 3.5% of the net assets of the Fund. |
| (B) | Security fair valued using methods determined in good faith by the Fair Value Committee designated by the Board of Trustees. The total market value of such security as of September 30, 2017, was $17 (000) and represented 0.0% of the net assets of the Fund. |
| (C) | Security is considered illiquid. The total market value of such security as of September 30, 2017, was $17 (000) and represented 0.0% of the net assets of the Fund. |
| (D) | Level 3 security in accordance with fair value hierarchy. |
ADR — American Depositary Receipt
Cl — Class
ETF — Exchange-Traded Fund
REIT — Real Estate Investment Trust
SPE — Special Purpose Entity
The following is a list of the inputs used as of September 30, 2017, in valuing the Fund’s investments carried at value (000):
| Investments in Securities | | Level 1 | | | Level 2 | | | Level 3 | | | Total | |
| Common Stock | | $ | 243,691 | | | $ | — | | | $ | — | | | $ | 243,691 | |
| Exchange-Traded Funds | | | 5,110 | | | | — | | | | — | | | | 5,110 | |
| Preferred Stock | | | 4,326 | | | | — | | | | — | | | | 4,326 | |
| Asset-Backed Security | | | — | | | | — | | | | 17 | | | | 17 | |
| Short-Term Investment | | | — | | | | — | | | | — | | | | — | |
| Total Investments in Securities | | $ | 253,127 | | | $ | — | | | $ | 17 | | | $ | 253,144 | |
The following is a reconciliation of investments in which significant unobservable inputs (Level 3) were used in determining value as of September 30, 2017:
| | | Investments in Asset-Backed Security
(000) | |
| Beginning balance as of 10/1/16 | | $ | 67 | |
| Accrued discounts/premiums | | | — | |
| Realized gain/(loss) | | | — | |
| Change in unrealized appreciation/(depreciation) | | | (21 | ) |
| Purchases | | | — | |
| Sales/paydowns | | | (29 | ) |
| Transfers into Level 3 | | | — | |
| Transfers out of Level 3 | | | — | |
| Ending balance as of 9/30/17 | | $ | 17 | |
| Changes in unrealized gains/(losses) included in earnings related to securities still held at reporting date | | $ | (21 | ) |
The following table summarizes the quantitative inputs and assumptions used for items categorized as material Level 3 investments as of September 30, 2017. The disclosures below also include qualitative information on the sensitivity of the fair value measurements to changes in the significant unobservable inputs.
| | Fair Value at September 30, 2017
(000) | Valuation Techniques | |
| BT SPE | $ 17 | Discounted Cash Flow Model based on actual collection level and experienced defaults | |
| | | | |
| | | Observable Inputs | |
| | | Cumulated Collections | |
| | | Cumulated Defaults | |
| | | Annualized Default Rate | |
| | | Cumulated Default Rate | |
| | | Pace of Collection | |
| | | Pace of Defaults | |
| | | Interest Rates | |
| | | | |
| | | Unobservable Inputs | Range |
| | | Projected Default Rates | 5%-12% |
| | | Projected Collection Rates | 90%-100% |
| | | Expected Discount Rates | 7%-9.25% |
The unobservable inputs used to determine fair value of recurring Level 3 assets may have similar or diverging impacts on valuation. Significant increases and decreases in these inputs in isolation and the interrelationships between them could result in significantly higher or lower fair value measurements.
See accompanying notes to financial statements.
CITY NATIONAL ROCHDALE FUNDS | PAGE 111
| schedule of investments |
| September 30, 2017 |
City National Rochdale Dividend & Income Fund (concluded) |
For the year ended September 30, 2017, there have been no transfers between any of the fair value hierarchy levels. Transfers between Levels are recognized at period end.
The following is a summary of the transactions with affiliates for the year ended September 30, 2017:
| | | City National Rochdale Government Money Market Fund,
Class I
(000) | |
| Beginning balance as of 10/1/16 | | $ | 3,417 | |
| Purchases at Cost | | | 18,275 | |
| Proceeds from Sales | | | (21,692 | ) |
| Unrealized Gain (Loss) | | | — | |
| Realized Gain (Loss) | | | — | |
| Ending balance as of 9/30/17 | | $ | — | |
| Dividend Income | | $ | 2 | |
Amounts designated as “—“ are either $0 or have been rounded to $0.
For more information on valuation inputs, see Note 2 — Significant Accounting Policies in the Notes to Financial Statements.
See accompanying notes to financial statements.
CITY NATIONAL ROCHDALE FUNDS | PAGE 112
| schedule of investments |
| September 30, 2017 |
| City National Rochdale U.S. Core Equity Fund |
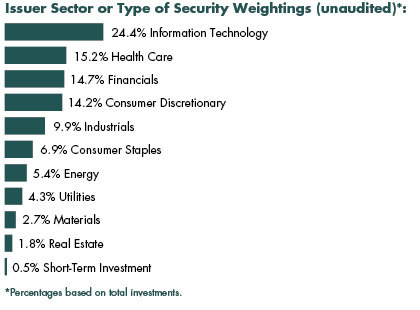
| Description | | Shares | | | Value (000) | |
| Common Stock [99.5%] | |
| Aerospace & Defense [2.4%] | |
| Northrop Grumman | | | 12,100 | | | $ | 3,481 | |
| Raytheon | | | 15,000 | | | | 2,799 | |
| | | | | | | | | |
| Total Aerospace & Defense | | | | 6,280 | |
| | | | | | | | | |
| Auto Components [1.7%] | |
| Magna International | | | 80,800 | | | | 4,313 | |
| | | | | | | | | |
| Banks [4.8%] | |
| Bank of America | | | 104,000 | | | | 2,635 | |
| PNC Financial Services Group | | | 38,000 | | | | 5,121 | |
| SunTrust Banks | | | 76,000 | | | | 4,543 | |
| | | | | | | | | |
| Total Banks | | | | 12,299 | |
| | | | | | | | | |
| Beverages [2.1%] | |
| PepsiCo | | | 48,000 | | | | 5,348 | |
| | | | | | | | | |
| Biotechnology [2.0%] | |
| Celgene * | | | 36,100 | | | | 5,264 | |
| | | | | | | | | |
| Building Products [0.6%] | |
| Lennox International | | | 8,800 | | | | 1,575 | |
| | | | | | | | | |
| Capital Markets [3.2%] | |
| BlackRock, Cl A | | | 6,100 | | | | 2,727 | |
| CME Group, Cl A | | | 40,900 | | | | 5,549 | |
| | | | | | | | | |
| Total Capital Markets | | | | 8,276 | |
| | | | | | | | | |
| Chemicals [2.7%] | |
| DowDuPont | | | 36,000 | | | | 2,492 | |
| Ecolab | | | 18,900 | | | | 2,431 | |
| Westlake Chemical | | | 25,000 | | | | 2,077 | |
| | | | | | | | | |
| Total Chemicals | | | | 7,000 | |
| | | | | | | | | |
| Commercial Banks [4.7%] | |
| JPMorgan Chase | | | 77,100 | | | | 7,364 | |
| US Bancorp | | | 90,000 | | | | 4,823 | |
| | | | | | | | | |
| Total Commercial Banks | | | | 12,187 | |
| | | | | | | | | |
| Commercial Services & Supplies [2.0%] | |
| Cintas | | | 35,000 | | | | 5,050 | |
| | | | | | | | | |
| Diversified Financial Services [1.9%] | |
| Berkshire Hathaway, Cl B * | | | 27,000 | | | | 4,950 | |
| | | | | | | | | |
| Electric Utilities [2.7%] | |
| PG&E | | | 102,800 | | | | 7,000 | |
| | | | | | | | | |
| Electronic Equipment [1.1%] | |
| Amphenol, Cl A | | | 33,000 | | | | 2,793 | |
| | | | | | | | | |
| Energy Equipment & Services [1.0%] | |
| Halliburton | | | 58,000 | | | | 2,670 | |
| | | | | | | | | |
| Food & Staples Retailing [3.1%] | |
| Costco Wholesale | | | 22,800 | | | | 3,746 | |
| Wal-Mart Stores | | | 54,300 | | | | 4,243 | |
| | | | | | | | | |
| Total Food & Staples Retailing | | | | 7,989 | |
| | | | | | | | | |
| Health Care Equipment & Supplies [2.6%] | |
| Danaher | | | 28,000 | | | | 2,402 | |
| Edwards Lifesciences * | | | 38,000 | | | | 4,154 | |
| | | | | | | | | |
| Total Health Care Equipment & Supplies | | | | 6,556 | |
| | | | | | | | | |
| Health Care Providers & Services [2.9%] | |
| UnitedHealth Group | | | 38,600 | | | | 7,560 | |
| | | | | | | | | |
| Hotels, Restaurants & Leisure [3.1%] | |
| McDonald’s | | | 32,800 | | | | 5,139 | |
| Starbucks | | | 51,500 | | | | 2,766 | |
| | | | | | | | | |
| Total Hotels, Restaurants & Leisure | | | | 7,905 | |
| | | | | | | | | |
| Household Durables [2.0%] | |
| PulteGroup | | | 190,000 | | | | 5,193 | |
See accompanying notes to financial statements.
CITY NATIONAL ROCHDALE FUNDS | PAGE 113
| schedule of investments |
| September 30, 2017 |
City National Rochdale U.S. Core Equity Fund (continued) |
| Description | | Shares | | | Value (000) | |
| Household Products [1.7%] | |
| Colgate-Palmolive | | | 61,700 | | | $ | 4,495 | |
| | | | | | | | | |
| Industrial Conglomerates [2.6%] | |
| 3M | | | 15,100 | | | | 3,169 | |
| Honeywell International | | | 24,800 | | | | 3,515 | |
| | | | | | | | | |
| Total Industrial Conglomerates | | | | 6,684 | |
| | | | | | | | | |
| Internet Software & Services [6.6%] | |
| Alphabet, Cl A * | | | 8,600 | | | | 8,374 | |
| Alphabet, Cl C * | | | 1,800 | | | | 1,727 | |
| Facebook, Cl A * | | | 40,600 | | | | 6,937 | |
| | | | | | | | | |
| Total Internet Software & Services | | | | 17,038 | |
| | | | | | | | | |
| IT Services [7.0%] | |
| Mastercard, Cl A | | | 62,200 | | | | 8,783 | |
| Visa, Cl A | | | 87,000 | | | | 9,156 | |
| | | | | | | | | |
| Total IT Services | | | | 17,939 | |
| | | | | | | | | |
| Life Sciences Tools & Services [2.2%] | |
| Thermo Fisher Scientific | | | 29,200 | | | | 5,525 | |
| | | | | | | | | |
| Machinery [1.0%] | |
| Ingersoll-Rand | | | 28,000 | | | | 2,497 | |
| | | | | | | | | |
| Media [4.7%] | |
| Comcast, Cl A | | | 153,200 | | | | 5,895 | |
| Time Warner | | | 26,600 | | | | 2,725 | |
| Walt Disney | | | 34,000 | | | | 3,352 | |
| | | | | | | | | |
| Total Media | | | | 11,972 | |
| | | | | | | | | |
| Oil, Gas & Consumable Fuels [4.3%] | |
| Cabot Oil & Gas | | | 95,000 | | | | 2,541 | |
| Chevron | | | 26,600 | | | | 3,126 | |
| Concho Resources * | | | 20,000 | | | | 2,634 | |
| ExxonMobil | | | 35,000 | | | | 2,869 | |
| | | | | | | | | |
| Total Oil, Gas & Consumable Fuels | | | | 11,170 | |
| | | | | | | | | |
| Pharmaceuticals [5.6%] | |
| Eli Lilly | | | 48,000 | | | | 4,106 | |
| Johnson & Johnson | | | 42,000 | | | | 5,460 | |
| Zoetis, Cl A | | | 74,000 | | | | 4,718 | |
| | | | | | | | | |
| Total Pharmaceuticals | | | | 14,284 | |
| | | | | | | | | |
| Real Estate Investment Trusts [1.8%] | |
| Essex Property Trust | | | 18,000 | | | | 4,573 | |
| | | | | | | | | |
| Road & Rail [1.3%] | |
| Union Pacific | | | 28,500 | | | | 3,305 | |
| | | | | | | | | |
| Semiconductors & Semiconductor Equipment [2.8%] | |
| NXP Semiconductors * | | | 52,300 | | | | 5,915 | |
| Texas Instruments | | | 15,000 | | | | 1,344 | |
| | | | | | | | | |
| Total Semiconductors & Semiconductor Equipment | | | | 7,259 | |
| | | | | | | | | |
| Software [4.5%] | |
| Adobe Systems * | | | 32,600 | | | | 4,863 | |
| Microsoft | | | 90,900 | | | | 6,771 | |
| | | | | | | | | |
| Total Software | | | | 11,634 | |
| | | | | | | | | |
| Specialty Retail [2.8%] | |
| Home Depot | | | 43,500 | | | | 7,115 | |
| | | | | | | | | |
| Technology Hardware, Storage & Peripherals [2.4%] | |
| Apple | | | 40,300 | | | | 6,211 | |
| | | | | | | | | |
| Water Utilities [1.6%] | |
| American Water Works | | | 51,500 | | | | 4,167 | |
| | | | | | | | | |
| Total Common Stock | |
| (Cost $181,081) | | | | 256,076 | |
| | | | | | | | | |
| Short-Term Investment [0.4%] | |
| SEI Daily Income Trust Government Fund, Cl F, 0.840%** | | | 1,150,459 | | | | 1,150 | |
| | | | | | | | | |
| Total Short-Term Investment | |
| (Cost $1,150) | | | | 1,150 | |
| | | | | | | | | |
| Total Investments [99.9%] | |
| (Cost $182,231) | | | $ | 257,226 | |
Percentages are based on Net Assets of $257,475 (000).
| * | Non-income producing security. |
| ** | The rate reported is the 7-day effective yield as of September 30, 2017. |
Cl — Class
As of September 30, 2017, all of the Fund’s investments are Level 1, in accordance with the authoritative guidance on fair value measurements and disclosure under U.S. GAAP.
See accompanying notes to financial statements.
CITY NATIONAL ROCHDALE FUNDS | PAGE 114
| schedule of investments |
| September 30, 2017 |
City National Rochdale U.S. Core Equity Fund (concluded) |
For the year ended September 30, 2017, there have been no transfers between any of the fair value hierarchy levels. Transfers between Levels are recognized at period end.
The following is a summary of the transactions with affiliates for the year ended September 30, 2017:
| | | City National Rochdale Government Money Market Fund,
Class I
(000) | |
| Beginning balance as of 10/1/16 | | $ | 2,542 | |
| Purchases at Cost | | | 12,851 | |
| Proceeds from Sales | | | (15,393 | ) |
| Unrealized Gain (Loss) | | | — | |
| Realized Gain (Loss) | | | — | |
| Ending balance as of 9/30/17 | | $ | — | |
| Dividend Income | | $ | 1 | |
Amounts designated as “—“ are either $0 or have been rounded to $0.
For more information on valuation inputs, see Note 2 — Significant Accounting Policies in the Notes to Financial Statements.
See accompanying notes to financial statements.
CITY NATIONAL ROCHDALE FUNDS | PAGE 115
| consolidated schedule of investments |
| September 30, 2017 |
| City National Rochdale Emerging Markets Fund |
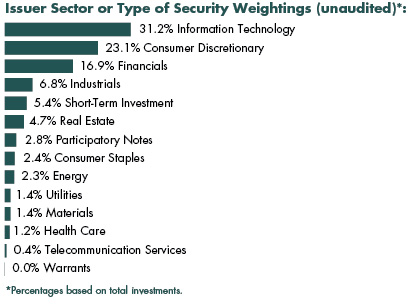
| Description | | Shares | | | Value (000) | |
| Common Stock [88.1%] | |
| China [37.1%] | |
| AAC Technologies Holdings | | | 3,491,200 | | | $ | 58,637 | |
| Alibaba Group Holding ADR * | | | 348,219 | | | | 60,141 | |
| ANTA Sports Products | | | 4,243,000 | | | | 17,843 | |
| Baidu ADR * | | | 65,400 | | | | 16,199 | |
| Bloomage BioTechnology | | | 5,592,500 | | | | 11,168 | |
| China Medical System Holdings | | | 9,949,000 | | | | 17,372 | |
| China Overseas Land & Investment | | | 4,369,000 | | | | 14,206 | |
| China Railway Group, Cl H | | | 17,876,000 | | | | 14,783 | |
| China State Construction International Holdings | | | 12,472,091 | | | | 18,169 | |
| Ctrip.com International ADR * | | | 256,500 | | | | 13,528 | |
| Great Wall Motor, Cl H (A) | | | 30,646,500 | | | | 37,663 | |
| Minth Group | | | 4,370,000 | | | | 22,880 | |
| New Oriental Education & Technology Group ADR | | | 391,500 | | | | 34,554 | |
| Ping An Insurance Group of China, Cl H | | | 4,625,000 | | | | 35,495 | |
| Sunny Optical Technology Group | | | 5,202,132 | | | | 82,711 | |
| Tencent Holdings | | | 2,011,600 | | | | 86,576 | |
| Zhejiang Expressway, Cl H | | | 12,607,000 | | | | 15,671 | |
| ZTE, Cl H | | | 6,566,824 | | | | 21,479 | |
| | | | | | | | | |
| Total China | | | | 579,075 | |
| | | | | | | | | |
| Hong Kong [8.1%] | |
| Chow Tai Fook Jewellery Group | | | 1,523,400 | | | | 1,827 | |
| Galaxy Entertainment Group | | | 6,078,000 | | | | 42,794 | |
| Man Wah Holdings | | | 26,458,400 | | | | 23,709 | |
| MTR | | | 2,629,327 | | | | 15,349 | |
| NagaCorp | | | 25,402,063 | | | | 15,414 | |
| Skyworth Digital Holdings | | | 21,425,285 | | | | 10,944 | |
| Tongda Group Holdings | | | 59,500,000 | | | | 15,919 | |
| | | | | | | | | |
| Total Hong Kong | | | | 125,956 | |
| | | | | | | | | |
| India [16.9%] | |
| Bharat Petroleum (B) | | | 1,954,760 | | | | 14,104 | |
| CESC (B) | | | 1,407,688 | | | | 21,266 | |
| Crompton Greaves Consumer Electricals (B) | | | 3,259,392 | | | | 10,421 | |
| Emami (B) | | | 496,740 | | | | 8,321 | |
| HDFC Bank (B) | | | 360,293 | | | | 10,019 | |
| HDFC Bank ADR (B) | | | 239,000 | | | | 23,032 | |
| Housing Development Finance (B) | | | 755,772 | | | | 20,157 | |
| ICICI Bank (B) | | | 2,121,764 | | | | 8,985 | |
| ICICI Bank ADR (B) | | | 1,664,775 | | | | 14,251 | |
| ICICI Lombard General Insurance *(B) (C) | | | 915,458 | | | | 9,533 | |
| ICICI Prudential Life Insurance (B) (C) | | | 1,601,144 | | | | 9,530 | |
| Indian Oil (B) | | | 1,713,000 | | | | 10,503 | |
| ITC (B) | | | 4,428,234 | | | | 17,511 | |
| Kotak Mahindra Bank (B) | | | 1,597,940 | | | | 24,518 | |
| SBI Life Insurance *(B) (C) | | | 885,576 | | | | 9,491 | |
| Tata Motors, Cl A (B) | | | 1,482,833 | | | | 5,046 | |
| Tata Motors ADR *(B) | | | 388,670 | | | | 12,154 | |
| Tech Mahindra (B) | | | 2,637,336 | | | | 18,486 | |
| Zee Entertainment Enterprises (B) | | | 2,030,000 | | | | 16,164 | |
| | | | | | | | | |
| Total India | | | | 263,492 | |
| | | | | | | | | |
| Indonesia [5.4%] | |
| Bank Mandiri Persero | | | 23,108,600 | | | | 11,538 | |
| Ciputra Development | | | 150,218,059 | | | | 13,328 | |
| Jasa Marga Persero | | | 16,795,543 | | | | 6,983 | |
| Lippo Karawaci | | | 178,078,261 | | | | 9,585 | |
| Mitra Adiperkasa | | | 21,327,600 | | | | 11,084 | |
| MNC Kapital Indonesia * (A) (D) (E) | | | 89,799,800 | | | | 7,851 | |
| Sarana Menara Nusantara | | | 15,367,300 | | | | 5,100 | |
| Surya Citra Media | | | 62,420,000 | | | | 10,149 | |
| United Tractors | | | 4,075,000 | | | | 9,682 | |
| | | | | | | | | |
| Total Indonesia | | | | 85,300 | |
| | | | | | | | | |
| Malaysia [3.4%] | |
| Inari Amertron | | | 40,314,879 | | | | 24,251 | |
| My EG Services | | | 29,721,900 | | | | 14,430 | |
| Padini Holdings | | | 13,839,300 | | | | 14,912 | |
| | | | | | | | | |
| Total Malaysia | | | | 53,593 | |
See accompanying notes to financial statements.
CITY NATIONAL ROCHDALE FUNDS | PAGE 116
| consolidated schedule of investments |
| September 30, 2017 |
City National Rochdale Emerging Markets Fund (continued) |
| Description | | Shares | | | Value (000) | |
| Philippines [6.8%] | |
| Ayala | | | 628,210 | | | $ | 11,996 | |
| BDO Unibank | | | 5,940,860 | | | | 15,285 | |
| GT Capital Holdings | | | 612,760 | | | | 14,004 | |
| JG Summit Holdings | | | 5,601,680 | | | | 8,270 | |
| Jollibee Foods | | | 1,895,500 | | | | 9,097 | |
| Megaworld | | | 151,872,826 | | | | 15,636 | |
| Security Bank | | | 2,888,930 | | | | 13,830 | |
| SM Prime Holdings | | | 26,860,875 | | | | 18,216 | |
| | | | | | | | | |
| Total Philippines | | | | 106,334 | |
| | | | | | | | | |
| South Korea [3.4%] | |
| Cosmax | | | 93,177 | | | | 10,332 | |
| Innocean Worldwide | | | 243,943 | | | | 14,249 | |
| NAVER | | | 13,150 | | | | 8,553 | |
| Samsung Electronics | | | 2,175 | | | | 4,869 | |
| Samsung Life Insurance | | | 148,100 | | | | 14,612 | |
| | | | | | | | | |
| Total South Korea | | | | 52,615 | |
| | | | | | | | | |
| Taiwan [2.8%] | |
| Airtac International Group | | | 1,610,488 | | | | 22,200 | |
| General Interface Solution Holding | | | 2,106,000 | | | | 20,939 | |
| | | | | | | | | |
| Total Taiwan | | | | 43,139 | |
| | | | | | | | | |
| Thailand [2.8%] | |
| KCE Electronics | | | 6,037,500 | | | | 18,103 | |
| Minor International | | | 12,350,305 | | | | 15,091 | |
| Minor International NVDR | | | 1,096,700 | | | | 1,340 | |
| Siam Cement | | | 648,000 | | | | 9,754 | |
| | | | | | | | | |
| Total Thailand | | | | 44,288 | |
| | | | | | | | | |
| United States [1.4%] | |
| Cognizant Technology Solutions, Cl A | | | 224,000 | | | | 16,249 | |
| Videocon d2h ADR * | | | 658,724 | | | | 5,863 | |
| | | | | | | | | |
| Total United States | | | | 22,112 | |
| | | | | | | | | |
| Total Common Stock | |
| (Cost $951,168) | | | | 1,375,904 | |
| | | | | | | | | |
| Participatory Notes [2.7%] | |
| Boci Financial - Credit Suisse # * | | | 3,247,990 | | | | 14,761 | |
| Hangzhou Hikvision Digital, | | | | | | | | |
| Expires 06/22/18 * | | | 5,340,226 | | | | 25,725 | |
| Description | | Shares/Number of Warrants | | | Value (000) | |
| Hangzhou Hikvision Digital Technology - Credit Suisse # * | | | 196,770 | | | $ | 948 | |
| Hangzhou Hikvision Digital-A - Credit Suisse, | | | | | | | | |
| Expires 09/27/21 * | | | 65,000 | | | | 313 | |
| | | | | | | | | |
| Total Participatory Notes | |
| (Cost $34,310) | | | | 41,747 | |
| | | | | | | | | |
| Warrants [0.0%] | |
| Inari Amertron, | | | | | | | | |
| Expires 02/17/20, Strike Price 1.60 (MYR)* | | | 1,117,403 | | | | 455 | |
| Minor International, | | | | | | | | |
| Expires 12/31/29, Strike Price 40 (THB)* | | | 355,427 | | | | 33 | |
| | | | | | | | | |
| Total Warrants | |
| (Cost $—) | | | | 488 | |
| | | | | | | | | |
| Short-Term Investment [5.2%] | |
| SEI Daily Income Trust Government Fund, Cl F, 0.840%** | | | 81,121,352 | | | | 81,121 | |
| | | | | | | | | |
| Total Short-Term Investment | |
| (Cost $81,121) | | | | 81,121 | |
| | | | | | | | | |
| Total Investments [96.0%] | |
| (Cost $1,066,599) | | | $ | 1,499,260 | |
Percentages are based on Net Assets of $1,562,732 (000).
| * | Non-income producing security. |
| ** | The rate reported is the 7-day effective yield as of September 30, 2017. |
| # | Expiration date not available. |
| (A) | Security fair valued using methods determined in good faith by the Fair Value Committee designated by the Board of Trustees. The total market value of such security as of September 30, 2017, was $45,514 (000) and represented 2.9% of the net assets of the Fund. |
| (B) | Securities held through a Mauritius Subsidiary. |
| (C) | Security exempt from registration under Rule 144A of the Securities Act of 1933. These securities may be resold in transactions exempt from registration normally to qualified institutions. On September 30, 2017, the value of these securities amounted to $28,569 (000), representing 1.8% of the net assets of the Fund. |
| (D) | Level 3 security in accordance with fair value hierarchy. |
| (E) | Security is considered illiquid. The total market value of such security as of September 30, 2017, was $7,851 (000) and represented 0.5% of the net assets of the Fund. |
See accompanying notes to financial statements.
CITY NATIONAL ROCHDALE FUNDS | PAGE 117
| consolidated schedule of investments |
| September 30, 2017 |
City National Rochdale Emerging Markets Fund (concluded) |
ADR — American Depositary Receipt
Cl — Class
MYR — Malaysian Ringgit
NVDR — Non Voting Depositary Receipt
THB — Thai Baht
The following is a list of the inputs used as of September 30, 2017, in valuing the Fund’s investments carried at value (000):
| Investments in Securities | | Level 1 | | | Level 2 | | | Level 3 | | | Total | |
| Common Stock | | $ | 1,368,053 | | | $ | — | | | $ | 7,851 | | | $ | 1,375,904 | |
| Participatory Notes | | | — | | | | 41,747 | | | | — | | | | 41,747 | |
| Warrants | | | — | | | | 488 | | | | — | | | | 488 | |
| Short-Term Investment | | | 81,121 | | | | — | | | | — | | | | 81,121 | |
| Total Investments in Securities | | $ | 1,449,174 | | | $ | 42,235 | | | $ | 7,851 | | | $ | 1,499,260 | |
The following is a reconciliation of investments in which significant unobservable inputs (Level 3) were used in determining value as of September 30, 2017:
| | | Investments in Common Stock
(000) | |
| Beginning balance as of 10/1/16 | | $ | 8,360 | |
| Accrued discounts/premiums | | | — | |
| Realized gain/(loss) | | | — | |
| Change in unrealized appreciation/(depreciation) | | | (509 | ) |
| Purchases | | | — | |
| Sales/paydowns | | | — | |
| Transfers into Level 3 | | | — | |
| Transfers out of Level 3 | | | — | |
| Ending balance as of 9/30/17 | | $ | 7,851 | |
| Changes in unrealized gains/(losses) included in earnings related to securities still held at reporting date | | $ | (509 | ) |
The following table summarizes the quantitative inputs and assumptions used for items categorized as material Level 3 investments that are not valued via one or more broker quotes as of September 30, 2017. The disclosures below also include qualitative information on the sensitivity of the fair value measurements to changes in the significant unobservable inputs.
| | Fair Value at September 30, 2017
(000) | Valuation Techniques | |
| Common Stock | $7,851 | Discounted from the Last Traded Price | |
| | | | |
| | | Observable Inputs | |
| | | Last Traded Price | |
| | | | |
| | | Unobservable Inputs | Discount Range |
| | | Discount Rate | 25% |
The unobservable inputs used to determine fair value of recurring Level 3 assets may have similar or diverging impacts on valuation. Significant increases and decreases in these inputs in isolation and the interrelationships between them could result in significantly higher or lower fair value measurements.
For the year ended September 30, 2017, there have been no transfers between any of the fair value hierarchy levels. Transfers between Levels are recognized at period end.
The following is a summary of the transactions with affiliates for the year ended September 30, 2017:
| | | City National Rochdale Government Money Market Fund,
Class I
(000) | |
| Beginning balance as of 10/1/16 | | $ | 24,145 | |
| Purchases at Cost | | | 99,908 | |
| Proceeds from Sales | | | (124,053 | ) |
| Unrealized Gain (Loss) | | | — | |
| Realized Gain (Loss) | | | — | |
| Ending balance as of 9/30/17 | | $ | — | |
| Dividend Income | | $ | 16 | |
Amounts designated as “—“ are either $0 or have been rounded to $0.
For more information on valuation inputs, see Note 2 — Significant Accounting Policies in the Notes to Financial Statements.
See accompanying notes to financial statements.
CITY NATIONAL ROCHDALE FUNDS | PAGE 118
| statements of assets and liabilities (000) |
| September 30, 2017 |
| | | City National Rochdale Government Money Market Fund | | | City National Rochdale Government Bond Fund | | | City National Rochdale Corporate Bond Fund | | | City National Rochdale California Tax Exempt Bond Fund | |
| ASSETS: | | | | | | | | | | | | |
| Cost of securities (including affiliated investments and repurchase agreements) | | $ | 4,244,610 | | | $ | 98,490 | | | $ | 135,221 | | | $ | 89,074 | |
| Investments in securities, at value | | $ | 3,397,610 | | | $ | 98,291 | | | $ | 133,097 | | | $ | 90,130 | |
| Affiliated investments, at value | | | — | | | | — | | | | — | | | | 531 | |
| Repurchase agreements, at value | | | 847,000 | | | | — | | | | 3,000 | | | | — | |
| Cash | | | — | | | | 9 | | | | — | | | | — | |
| Dividend and interest receivable | | | 1,006 | | | | 316 | | | | 1,013 | | | | 904 | |
| Receivable for capital shares sold | | | — | | | | 167 | | | | 315 | | | | 192 | |
| Prepaid expenses | | | 83 | | | | 3 | | | | 2 | | | | 1 | |
| Total Assets | | $ | 4,245,699 | | | $ | 98,786 | | | $ | 137,427 | | | $ | 91,758 | |
| | | | | | | | | | | | | | | | | |
| LIABILITIES: | | | | | | | | | | | | | | | | |
| Payable for income distributions | | | 442 | | | | 28 | | | | 168 | | | | 77 | |
| Payable for capital shares redeemed | | | — | | | | 49 | | | | 38 | | | | 2 | |
| Payable for investment securities purchased | | | — | | | | — | | | | — | | | | 1,830 | |
| Investment advisory fees payable | | | 1,679 | | | | 20 | | | | 29 | | | | 2 | |
| Shareholder servicing and distribution fees payable | | | 965 | | | | 13 | | | | 29 | | | | 31 | |
| Administrative fees payable | | | 74 | | | | 15 | | | | 15 | | | | 14 | |
| Accrued expenses | | | 326 | | | | 19 | | | | 45 | | | | 23 | |
| Total Liabilities | | | 3,486 | | | | 144 | | | | 324 | | | | 1,979 | |
| Net Assets | | $ | 4,242,213 | | | $ | 98,642 | | | $ | 137,103 | | | $ | 89,779 | |
| | | | | | | | | | | | | | | | | |
| Net Assets: | | | | | | | | | | | | | | | | |
| Paid-in Capital (unlimited authorization — $0.01 par value) | | $ | 4,242,206 | | | $ | 98,752 | | | $ | 137,433 | | | $ | 88,472 | |
| Undistributed net investment income | | | — | | | | 29 | | | | 4 | | | | 4 | |
| Accumulated net realized gain (loss) on investments | | | 7 | | | | 60 | | | | (1,210 | ) | | | (284 | ) |
| Net unrealized appreciation (depreciation) on investments | | | — | | | | (199 | ) | | | 876 | | | | 1,587 | |
| Net Assets | | $ | 4,242,213 | | | $ | 98,642 | | | $ | 137,103 | | | $ | 89,779 | |
| | | | | | | | | | | | | | | | | |
| Institutional Class Shares: | | | | | | | | | | | | | | | | |
| Net Assets ($Dollars) | | $ | — | | | $ | 39,987,981 | | | $ | — | | | $ | — | |
| Total shares outstanding at end of year | | | — | | | | 3,815,466 | | | | — | | | | — | |
| Net asset value, offering and redemption price per share | | | | | | | | | | | | | | | | |
| (net assets ÷ shares outstanding) | | $ | — | | | $ | 10.48 | | | $ | — | | | $ | — | |
| | | | | | | | | | | | | | | | | |
| Class N Shares: | | | | | | | | | | | | | | | | |
| Net Assets ($Dollars) | | $ | 1,099,004,904 | | | $ | 1,743,137 | | | $ | 5,625,681 | | | $ | 9,344,074 | |
| Total shares outstanding at end of year | | | 1,098,997,133 | | | | 166,114 | | | | 539,427 | | | | 877,867 | |
| Net asset value, offering and redemption price per share | | | | | | | | | | | | | | | | |
| (net assets ÷ shares outstanding) | | $ | 1.00 | | | $ | 10.49 | | | $ | 10.43 | | | $ | 10.64 | |
| | | | | | | | | | | | | | | | | |
| Class S Shares: | | | | | | | | | | | | | | | | |
| Net Assets ($Dollars) | | $ | 841,246,244 | | | $ | — | | | $ | — | | | $ | — | |
| Total shares outstanding at end of year | | | 841,246,141 | | | | — | | | | — | | | | — | |
| Net asset value, offering and redemption price per share | | | | | | | | | | | | | | | | |
| (net assets ÷ shares outstanding) | | $ | 1.00 | | | $ | — | | | $ | — | | | $ | — | |
| | | | | | | | | | | | | | | | | |
| Servicing Class Shares: | | | | | | | | | | | | | | | | |
| Net Assets ($Dollars) | | $ | 2,301,961,847 | | | $ | 56,910,810 | | | $ | 131,476,933 | | | $ | 80,435,169 | |
| Total shares outstanding at end of year | | | 2,301,962,858 | | | | 5,432,338 | | | | 12,628,331 | | | | 7,580,940 | |
| Net asset value, offering and redemption price per share | | | | | | | | | | | | | | | | |
| (net assets ÷ shares outstanding) | | $ | 1.00 | | | $ | 10.48 | | | $ | 10.41 | | | $ | 10.61 | |
Amounts designated as “—” are either $0 or have been rounded to $0.
See accompanying notes to financial statements.
CITY NATIONAL ROCHDALE FUNDS | PAGE 119
statements of assets and liabilities (000)/
consolidated statement of assets and liabilities (000) |
| September 30, 2017 |
| | | City National Rochdale Municipal High Income Fund | | | City National Rochdale High Yield Bond Fund | | | City National Rochdale Intermediate Fixed Income Fund | | | City National Rochdale Fixed Income Opportunities Fund | |
| ASSETS: | | | | | | | | | | | | |
| Cost of securities (including repurchase agreements) | | $ | 1,138,090 | | | $ | 73,348 | | | $ | 242,345 | | | $ | 2,647,339 | |
| Investments in securities, at value | | $ | 1,166,419 | | | $ | 73,094 | | | $ | 244,732 | | | $ | 2,668,395 | |
| Repurchase agreements, at value | | | — | | | | — | | | | — | | | | 75,000 | |
| Cash | | | — | | | | 2 | | | | — | | | | 3,735 | |
| Foreign currency | | | — | | | | — | | | | — | | | | 1,705 | (1) |
| Dividend and interest receivable | | | 16,130 | | | | 1,292 | | | | 1,729 | | | | 31,268 | |
| Foreign tax reclaim receivable | | | — | | | | 2 | | | | — | | | | 312 | |
| Receivable for capital shares sold | | | 2,295 | | | | 220 | | | | 264 | | | | 5,583 | |
| Receivable for investment securities sold | | | — | | | | 264 | | | | — | | | | 19,551 | |
| Unrealized gain on forward foreign currency contracts | | | — | | | | 10 | | | | — | | | | 2,503 | |
| Prepaid expenses | | | 18 | | | | 1 | | | | 6 | | | | 42 | |
| Total Assets | | $ | 1,184,862 | | | $ | 74,885 | | | $ | 246,731 | | | $ | 2,808,094 | |
| | | | | | | | | | | | | | | | | |
| LIABILITIES: | | | | | | | | | | | | | | | | |
| Payable for investment securities purchased | | | 5,289 | | | | 728 | | | | — | | | | 63,904 | |
| Payable for income distributions | | | 2,131 | | | | 81 | | | | — | | | | — | |
| Payable for capital shares redeemed | | | 416 | | | | 29 | | | | 25 | | | | 331 | |
| Unrealized loss on forward foreign currency contracts | | | — | | | | 13 | | | | — | | | | 993 | |
| Investment advisory fees payable | | | 482 | | | | 36 | | | | 77 | | | | 1,075 | |
| Shareholder servicing and distribution fees payable | | | 387 | | | | 10 | | | | 100 | | | | 1,120 | |
| Administrative fees payable | | | 28 | | | | 14 | | | | 17 | | | | 48 | |
| Accrued expenses | | | 112 | | | | 27 | | | | 32 | | | | 375 | |
| Total Liabilities | | $ | 8,845 | | | $ | 938 | | | $ | 251 | | | $ | 67,846 | |
| Net Assets | | $ | 1,176,017 | | | $ | 73,947 | | | $ | 246,480 | | | $ | 2,740,248 | |
| | | | | | | | | | | | | | | | | |
| NET ASSETS: | | | | | | | | | | | | | | | | |
| Paid-in Capital (unlimited authorization — $0.01 par value) | | $ | 1,167,397 | | | $ | 79,105 | | | $ | 244,391 | | | $ | 2,784,305 | |
| Undistributed (Distributions in excess of) net investment income | | | 1,697 | | | | 69 | | | | 94 | | | | (76,057 | ) |
| Accumulated net realized gain (loss) on investments | | | (21,406 | ) | | | (4,971 | ) | | | (392 | ) | | | 6,092 | |
| Net unrealized appreciation (depreciation) on: | | | | | | | | | | | | | | | | |
| Investments | | | 28,329 | | | | (254 | ) | | | 2,387 | | | | 24,430 | |
| Forward foreign currency contracts, foreign currencies and translation of other assets and liabilities denominated in foreign currencies | | | — | | | | (2 | ) | | | — | | | | 1,478 | |
| Net Assets | | $ | 1,176,017 | | | $ | 73,947 | | | $ | 246,480 | | | $ | 2,740,248 | |
| | | | | | | | | | | | | | | | | |
| Institutional Class Shares: | | | | | | | | | | | | | | | | |
| Net Assets ($Dollars) | | $ | — | | | $ | 40,698,117 | | | $ | 4,589,126 | | | $ | — | |
| Total shares outstanding at end of year | | | — | | | | 5,050,529 | | | | 175,307 | | | | — | |
| Net asset value, offering and redemption price per share | | | | | | | | | | | | | | | | |
| (net assets ÷ shares outstanding) | | $ | — | | | $ | 8.06 | | | $ | 26.18 | | | $ | — | |
| | | | | | | | | | | | | | | | | |
| Class N Shares: | | | | | | | | | | | | | | | | |
| Net Assets ($Dollars) | | $ | 686,922,118 | | | $ | 16,705,260 | | | $ | 241,890,688 | | | $ | 2,740,248,090 | |
| Total shares outstanding at end of year | | | 63,836,890 | | | | 2,073,159 | | | | 9,243,249 | | | | 106,165,938 | |
| Net asset value, offering and redemption price per share | | | | | | | | | | | | | | | | |
| (net assets ÷ shares outstanding) | | $ | 10.76 | | | $ | 8.06 | | | $ | 26.17 | | | $ | 25.81 | |
| | | | | | | | | | | | | | | | | |
| Servicing Class Shares: | | | | | | | | | | | | | | | | |
| Net Assets ($Dollars) | | $ | 489,094,508 | | | $ | 16,543,683 | | | $ | — | | | $ | — | |
| Total shares outstanding at end of year | | | 45,432,297 | | | | 2,054,078 | | | | — | | | | — | |
| Net asset value, offering and redemption price per share | | | | | | | | | | | | | | | | |
| (net assets ÷ shares outstanding) | | $ | 10.77 | | | $ | 8.05 | | | $ | — | | | $ | — | |
Amounts designated as “—” are either $0 or have been rounded to $0.
| (1) | Cost of foreign currency $1,705 (000). |
See accompanying notes to financial statements.
CITY NATIONAL ROCHDALE FUNDS | PAGE 120
statements of assets and liabilities (000)/
consolidated statement of assets and liabilities (000) |
| September 30, 2017 |
| | | City National Rochdale Dividend & Income Fund | | | City National Rochdale U.S. Core Equity Fund | | | City National Rochdale Emerging Markets Fund | |
| ASSETS: | | | | | | | | | |
| Cost of securities | | $ | 195,009 | | | $ | 182,231 | | | $ | 1,066,599 | |
| Investments in securities, at value | | $ | 253,144 | | | $ | 257,226 | | | $ | 1,499,260 | |
| Cash | | | 18 | | | | — | | | | — | |
| Foreign currency | | | — | | | | — | | | | 71,786 | (1) |
| Dividend and interest receivable | | | 648 | | | | 192 | | | | 1,682 | |
| Receivable for investment securities sold | | | — | | | | — | | | | 1,700 | |
| Foreign tax reclaim receivable | | | 15 | | | | 2 | | | | 11 | |
| Receivable for capital shares sold | | | 262 | | | | 338 | | | | 5,123 | |
| Prepaid expenses | | | 4 | | | | 4 | | | | 20 | |
| Total Assets | | | 254,091 | | | | 257,762 | | | | 1,579,582 | |
| | | | | | | | | | | | | |
| LIABILITIES: | | | | | | | | | | | | |
| Payable for investment securities purchased | | | — | | | | — | | | | 14,147 | |
| Payable for capital shares redeemed | | | 229 | | | | 80 | | | | 439 | |
| Investment advisory fees payable | | | 142 | | | | 84 | | | | 1,287 | |
| Shareholder servicing and distribution fees payable | | | 104 | | | | 78 | | | | 712 | |
| Administrative fees payable | | | 16 | | | | 17 | | | | 34 | |
| Line of credit | | | 363 | | | | — | | | | — | |
| Accrued foreign capital gains tax on appreciated securities | | | — | | | | — | | | | 10 | |
| Accrued expenses | | | 28 | | | | 28 | | | | 221 | |
| Total Liabilities | | | 882 | | | | 287 | | | | 16,850 | |
| Net Assets | | $ | 253,209 | | | $ | 257,475 | | | $ | 1,562,732 | |
| | | | | | | | | | | | | |
| NET ASSETS: | | | | | | | | | | | | |
| Paid-in Capital (unlimited authorization — $0.01 par value) | | $ | 185,522 | | | $ | 181,667 | | | $ | 1,116,029 | |
| Undistributed (Distributions in excess of) net investment income | | | (14 | ) | | | 68 | | | | (1,814 | ) |
| Accumulated net realized gain (loss) on investments and foreign currency | | | 9,566 | | | | 745 | | | | 15,836 | |
| Net unrealized appreciation (depreciation) on: | | | | | | | | | | | | |
| Investments | | | 58,135 | | | | 74,995 | | | | 432,661 | |
| Forward foreign currency contracts, foreign currencies and translation of other assets and liabilities denominated in foreign currencies | | | — | | | | — | | | | 30 | |
| Accumulated foreign capital gains tax on appreciated securities | | | — | | | | — | | | | (10 | ) |
| Net Assets | | $ | 253,209 | | | $ | 257,475 | | | $ | 1,562,732 | |
| | | | | | | | | | | | | |
| Institutional Class Shares: | | | | | | | | | | | | |
| Net Assets ($Dollars) | | $ | — | | | $ | 16,835 | | | $ | — | |
| Total shares outstanding at end of year | | | — | | | | 1,063 | | | | — | |
| Net asset value, offering and redemption price per share | | | | | | | | | | | | |
| (net assets ÷ shares outstanding) | | $ | — | | | $ | 15.83 | * | | $ | — | |
| | | | | | | | | | | | | |
| Class N Shares: | | | | | | | | | | | | |
| Net Assets ($Dollars) | | $ | 253,209,211 | | | $ | 127,086,287 | | | $ | 175,874,776 | |
| Total shares outstanding at end of year | | | 6,268,170 | | | | 8,112,975 | | | | 3,338,344 | |
| Net asset value, offering and redemption price per share | | | | | | | | | | | | |
| (net assets ÷ shares outstanding) | | $ | 40.40 | | | $ | 15.66 | | | $ | 52.68 | |
| | | | | | | | | | | | | |
| Servicing Class Shares: | | | | | | | | | | | | |
| Net Assets ($Dollars) | | $ | — | | | $ | 130,372,100 | | | $ | — | |
| Total shares outstanding at end of year | | | — | | | | 8,310,579 | | | | — | |
| Net asset value, offering and redemption price per share | | | | | | | | | | | | |
| (net assets ÷ shares outstanding) | | $ | — | | | $ | 15.69 | | | $ | — | |
| | | | | | | | | | | | | |
| Class Y Shares: | | | | | | | | | | | | |
| Net Assets ($Dollars) | | $ | — | | | $ | — | | | $ | 1,386,857,679 | |
| Total shares outstanding at end of year | | | — | | | | — | | | | 26,262,975 | |
| Net asset value, offering and redemption price per share | | | | | | | | | | | | |
| (net assets ÷ shares outstanding) | | $ | — | | | $ | — | | | $ | 52.81 | |
Amounts designated as “—” are either $0 or have been rounded to $0.
| (1) | Cost of foreign currency $74,827 (000). |
| * | Net assets divided by total share outstanding do not calculate to the stated net asset value because net assets and total shares outstanding amounts are shown rounded. |
See accompanying notes to financial statements.
CITY NATIONAL ROCHDALE FUNDS | PAGE 121
| statements of operations (000) |
| For the year ended September 30, 2017 |
| | | City National Rochdale Government Money Market Fund | | | City National Rochdale Government Bond Fund | | | City National Rochdale Corporate Bond Fund | | | City National Rochdale California Tax Exempt Bond Fund | |
INVESTMENT INCOME: | | | | | | | | | | | | |
| Dividend Income | | $ | — | | | $ | 6 | | | $ | 208 | | | $ | 4 | |
| Dividend Income from Affiliated Investments | | | — | | | | — | | | | 1 | | | | 34 | |
| Interest Income | | | 35,397 | | | | 1,914 | | | | 3,153 | | | | 1,837 | |
| Foreign Taxes Withheld | | | — | | | | — | | | | (2 | ) | | | — | |
| Total Investment Income | | | 35,397 | | | | 1,920 | | | | 3,360 | | | | 1,875 | |
| | | | | | | | | | | | | | | | | |
| EXPENSES: | | | | | | | | | | | | | | | | |
| Investment Advisory Fees | | | 13,294 | | | | 568 | | | | 527 | | | | 254 | |
Shareholder Servicing Fees — Class N(1) | | | 16,738 | | | | 9 | | | | 25 | | | | 44 | |
Shareholder Servicing Fees — Class S(1) | | | 6,927 | | | | — | | | | — | | | | — | |
| Shareholder Servicing Fees — Servicing Class | | | 2,866 | | | | 193 | | | | 317 | | | | 213 | |
| Administration Fees | | | 969 | | | | 180 | | | | 180 | | | | 174 | |
| Transfer Agent Fees | | | 387 | | | | 10 | | | | 10 | | | | 7 | |
| Trustee Fees | | | 178 | | | | 32 | | | | 32 | | | | 31 | |
| Professional Fees | | | 336 | | | | 20 | | | | 21 | | | | 18 | |
| Custody Fees | | | 207 | | | | 6 | | | | 12 | | | | 4 | |
| Registration Fees | | | 262 | | | | 7 | | | | 6 | | | | 5 | |
| Printing Fees | | | 105 | | | | 3 | | | | 3 | | | | 2 | |
| Insurance and Other Expenses | | | 242 | | | | 11 | | | | 37 | | | | 21 | |
| Total Expenses | | | 42,511 | | | | 1,039 | | | | 1,170 | | | | 773 | |
Recovery of Investment Advisory Fees Previously Waived(2) | | | 5,520 | | | | — | | | | — | | | | — | |
| Less, Waivers and/or Reimbursements of: | | | | | | | | | | | | | | | | |
| Investment Advisory Fees | | | — | | | | (136 | ) | | | (156 | ) | | | (158 | ) |
Shareholder Servicing Fees — Class N(1) | | | (11,716 | ) | | | — | | | | — | | | | — | |
Shareholder Servicing Fees — Class S(1) | | | (5,226 | ) | | | — | | | | — | | | | — | |
| Shareholder Servicing Fees — Servicing Class | | | (619 | ) | | | — | | | | — | | | | — | |
| Net Expenses | | | 30,470 | | | | 903 | | | | 1,014 | | | | 615 | |
| | | | | | | | | | | | | | | | | |
| Net Investment Income | | | 4,927 | | | | 1,017 | | | | 2,346 | | | | 1,260 | |
| Net Realized Gain (Loss): | | | | | | | | | | | | | | | | |
| Investments | | | 7 | | | | 170 | | | | 117 | | | | (237 | ) |
| Affiliated Investments | | | — | | | | — | | | | — | | | | (48 | ) |
| Net Change in Unrealized Appreciation (Depreciation) on: | | | | | | | | | | | | | | | | |
| Investments | | | — | | | | (1,758 | ) | | | (1,287 | ) | | | (756 | ) |
| Affiliated Investments | | | — | | | | — | | | | — | | | | (55 | ) |
| Net Increase (Decrease) in Net Assets Resulting from Operations | | $ | 4,934 | | | $ | (571 | ) | | $ | 1,176 | | | $ | 164 | |
| (1) | Includes class specific distribution expenses. |
| (2) | See Note 4 for advisory fees recovered. |
Amounts designated as “—” are either $0 or have been rounded to $0.
See accompanying notes to financial statements.
CITY NATIONAL ROCHDALE FUNDS | PAGE 122
statements of operations (000)/
consolidated statement of operations (000) |
| For the year ended September 30, 2017 |
| | | City National Rochdale Municipal High Income Fund | | | City National Rochdale High Yield Bond Fund | | | City National Rochdale Intermediate Fixed Income Fund | | | City National Rochdale Fixed Income Opportunities Fund | |
INVESTMENT INCOME: | | | | | | | | | | | | |
| Dividend Income | | $ | 249 | | | $ | 9 | | | $ | 765 | | | $ | 2,206 | |
| Dividend Income from Affiliated Investments | | | 15 | | | | — | | | | 1 | | | | — | |
| Interest Income | | | 51,415 | | | | 4,834 | | | | 6,762 | | | | 147,446 | |
| Less: Foreign Taxes Withheld | | | — | | | | — | | | | (3 | ) | | | (39 | ) |
| Total Investment Income | | | 51,679 | | | | 4,843 | | | | 7,525 | | | | 149,613 | |
| | | | | | | | | | | | | | | | | |
| EXPENSES: | | | | | | | | | | | | | | | | |
| Investment Advisory Fees | | | 5,406 | | | | 452 | | | | 1,016 | | | | 12,179 | |
Shareholder Servicing Fees — Class N(1) | | | 3,168 | | | | 89 | | | | 1,246 | | | | 12,179 | |
| Shareholder Servicing Fees — Servicing Class | | | 1,119 | | | | 43 | | | | — | | | | — | |
| Administration Fees | | | 331 | | | | 171 | | | | 199 | | | | 622 | |
| Transfer Agent Fees | | | 81 | | | | 6 | | | | 19 | | | | 183 | |
| Trustee Fees | | | 60 | | | | 31 | | | | 36 | | | | 109 | |
| Professional Fees | | | 82 | | | | 17 | | | | 28 | | | | 278 | |
| Custody Fees | | | 42 | | | | 12 | | | | 10 | | | | 482 | |
| Registration Fees | | | 47 | | | | 4 | | | | 11 | | | | 107 | |
| Printing Fees | | | 24 | | | | 2 | | | | 5 | | | | 57 | |
| Insurance and Other Expenses | | | 150 | | | | 32 | | | | 30 | | | | 325 | |
| Total Expenses | | | 10,510 | | | | 859 | | | | 2,600 | | | | 26,521 | |
Recovery of Investment Advisory Fees Previously Waived(2) | | | — | | | | — | | | | — | | | | 222 | |
| Less, Waivers of: | | | | | | | | | | | | | | | | |
| Investment Advisory Fees | | | — | | | | — | | | | (59 | ) | | | — | |
| Net Expenses | | | 10,510 | | | | 859 | | | | 2,541 | | | | 26,743 | |
| | | | | | | | | | | | | | | | | |
| Net Investment Income | | | 41,169 | | | | 3,984 | | | | 4,984 | | | | 122,870 | |
| Net Realized Gain (Loss) from: | | | | | | | | | | | | | | | | |
| Securities Transactions | | | (14,443 | ) | | | 595 | | | | 787 | | | | 51,518 | |
| Purchased Options | | | — | | | | — | | | | — | | | | (1 | ) |
| Forward Foreign Currency Contracts | | | — | | | | 64 | | | | — | | | | (5,586 | ) |
| Foreign Currency Transactions | | | — | | | | (105 | ) | | | — | | | | (9,877 | ) |
| Net Change in Unrealized Appreciation (Depreciation) on: | | | | | | | | | | | | | | | | |
| Investments | | | (21,106 | ) | | | 1,715 | | | | (4,620 | ) | | | 26,066 | |
| Purchased Options | | | — | | | | — | | | | — | | | | 1 | |
| Forward Foreign Currency Contracts | | | — | | | | (10 | ) | | | — | | | | 1,620 | |
| Foreign Currency Translations | | | — | | | | 1 | | | | — | | | | (65 | ) |
| Net Increase in Net Assets Resulting from Operations | | $ | 5,620 | | | $ | 6,244 | | | $ | 1,151 | | | $ | 186,546 | |
| (1) | Includes class specific distribution expenses. |
| (2) | See Note 4 for advisory fees recovered. |
Amounts designated as “—” are either $0 or have been rounded to $0.
See accompanying notes to financial statements.
CITY NATIONAL ROCHDALE FUNDS | PAGE 123
statements of operations (000)/
consolidated statement of operations (000) |
| For the year ended September 30, 2017 |
| | | City National Rochdale Dividend & Income Fund | | | City National Rochdale U.S. Core Equity Fund | | | City National Rochdale Emerging Markets Fund | |
INVESTMENT INCOME: | | | | | | | | | |
| Dividend Income | | $ | 8,462 | | | $ | 4,070 | | | $ | 18,981 | |
| Dividend Income from Affiliated Investments | | | 2 | | | | 1 | | | | 16 | |
| Interest Income | | | 17 | | | | 7 | | | | 26 | |
| Less: Foreign Taxes Withheld | | | (6 | ) | | | (13 | ) | | | (809 | ) |
| Total Investment Income | | | 8,475 | | | | 4,065 | | | | 18,214 | |
| | | | | | | | | | | | | |
| EXPENSES: | | | | | | | | | | | | |
| Investment Advisory Fees | | | 1,225 | | | | 940 | | | | 12,161 | |
Shareholder Servicing Fees — Class N(1) | | | 1,225 | | | | 583 | | | | 638 | |
Shareholder Servicing Fees — Servicing Class(1) | | | — | | | | 296 | | | | — | |
Shareholder Servicing Fees — Class Y(1) | | | — | | | | — | | | | 2,721 | |
| Administration Fees | | | 198 | | | | 196 | | | | 353 | |
| Transfer Agent Fees | | | 18 | | | | 18 | | | | 92 | |
| Trustee Fees | | | 36 | | | | 35 | | | | 63 | |
| Professional Fees | | | 28 | | | | 27 | | | | 103 | |
| Custody Fees | | | 10 | | | | 10 | | | | 484 | |
| Registration Fees | | | 11 | | | | 10 | | | | 45 | |
| Printing Fees | | | 6 | | | | 5 | | | | 30 | |
| Insurance and Other Expenses | | | 14 | | | | 12 | | | | 190 | |
| Total Expenses | | | 2,771 | | | | 2,132 | | | | 16,880 | |
| Net Expenses | | | 2,771 | | | | 2,132 | | | | 16,880 | |
| | | | | | | | | | | | | |
| Net Investment Income | | | 5,704 | | | | 1,933 | | | | 1,334 | |
| Net Realized Gain (Loss) from: | | | | | | | | | | | | |
| Securities Transactions | | | 7,992 | | | | 1,991 | | | | 40,766 | |
| Foreign Currency Transactions | | | — | | | | — | | | | (1,112 | ) |
| Net Change in Unrealized Appreciation (Depreciation) on: | | | | | | | | | | | | |
| Investments | | | (2,636 | ) | | | 37,144 | | | | 273,424 | |
| Foreign Currency Translations | | | — | | | | — | | | | (139 | ) |
| Foreign Capital Gains Tax | | | — | | | | — | | | | (10 | ) |
| Net Increase in Net Assets Resulting from Operations | | $ | 11,060 | | | $ | 41,068 | | | $ | 314,263 | |
| (1) | Includes class specific distribution expenses. |
Amounts designated as “—” are either $0 or have been rounded to $0.
See accompanying notes to financial statements.
CITY NATIONAL ROCHDALE FUNDS | PAGE 124
This page intentionally left blank.
CITY NATIONAL ROCHDALE FUNDS | PAGE 125
| statements of changes in net assets (000) |
| For the years ended September 30, |
| | | City National Rochdale Government Money Market Fund | | | City National Rochdale Government Bond Fund | |
| | | 2017 | | | 2016 | | | 2017 | | | 2016 | |
| OPERATIONS: | | | | | | | | | | | | |
| Net Investment Income | | $ | 4,927 | | | $ | 896 | | | $ | 1,017 | | | $ | 1,032 | |
| Net Realized Gain (Loss) from Security Transactions | | | 7 | | | | — | | | | 170 | | | | 255 | |
| Net Change in Unrealized Appreciation (Depreciation) on Investments and Affiliated Investments | | | — | | | | — | | | | (1,758 | ) | | | 111 | |
| Net Increase (Decrease) in Net Assets Resulting from Operations | | | 4,934 | | | | 896 | | | | (571 | ) | | | 1,398 | |
| | | | | | | | | | | | | | | | | |
| DIVIDENDS AND DISTRIBUTIONS FROM: | | | | | | | | | | | | | | | | |
| Net Investment Income: | | | | | | | | | | | | | | | | |
| Institutional Class | | | — | | | | — | | | | (518 | ) | | | (553 | ) |
| Class N | | | (1,583 | ) | | | (649 | ) | | | (9 | ) | | | (6 | ) |
| Class S | | | (555 | ) | | | (154 | ) | | | — | | | | — | |
| Servicing Class | | | (2,789 | ) | | | (94 | ) | | | (571 | ) | | | (556 | ) |
| Realized Capital Gains: | | | | | | | | | | | | | | | | |
| Institutional Class | | | — | | | | — | | | | (42 | ) | | | — | |
| Class N | | | — | | | | — | | | | (1 | ) | | | — | |
| Servicing Class | | | — | | | | — | | | | (52 | ) | | | — | |
| Total Dividends and Distributions | | | (4,927 | ) | | | (897 | ) | | | (1,193 | ) | | | (1,115 | ) |
| | | | | | | | | | | | | | | | | |
CAPITAL SHARE TRANSACTIONS:(1) | | | | | | | | | | | | | | | | |
| Institutional Class: | | | | | | | | | | | | | | | | |
| Shares Issued | | | — | | | | — | | | | 7,014 | | | | 15,023 | |
| Shares Issued in Lieu of Dividends and Distributions | | | — | | | | — | | | | 557 | | | | 553 | |
| Shares Redeemed | | | — | | | | — | | | | (32,811 | ) | | | (7,967 | ) |
| Increase (Decrease) in Net Assets from Institutional Class Share Transactions | | | — | | | | — | | | | (25,240 | ) | | | 7,609 | |
| | | | | | | | | | | | | | | | | |
| Class N: | | | | | | | | | | | | | | | | |
| Shares Issued | | | 4,345,705 | | | | 5,798,518 | | | | 1,013 | | | | 245 | |
| Shares Issued in Lieu of Dividends and Distributions | | | 1,332 | | | | 550 | | | | 6 | | | | 3 | |
| Shares Redeemed | | | (7,118,824 | ) | | | (4,887,064 | ) | | | (711 | ) | | | (690 | ) |
| Increase (Decrease) in Net Assets from Class N Share Transactions | | | (2,771,787 | ) | | | 912,004 | | | | 308 | | | | (442 | ) |
| | | | | | | | | | | | | | | | | |
| Class S: | | | | | | | | | | | | | | | | |
| Shares Issued | | | 2,288,322 | | | | 2,017,973 | | | | — | | | | — | |
| Shares Issued in Lieu of Dividends and Distributions | | | — | | | | — | | | | — | | | | — | |
| Shares Redeemed | | | (2,330,002 | ) | | | (1,803,230 | ) | | | — | | | | — | |
| Increase (Decrease) in Net Assets from Class S Share Transactions | | | (41,680 | ) | | | 214,743 | | | | — | | | | — | |
| | | | | | | | | | | | | | | | | |
| Servicing Class: | | | | | | | | | | | | | | | | |
| Shares Issued | | | 4,547,446 | | | | 2,473,708 | | | | 18,242 | | | | 20,079 | |
| Shares Issued in Lieu of Dividends and Distributions | | | 1,557 | | | | 3 | | | | 254 | | | | 272 | |
| Shares Redeemed | | | (3,229,008 | ) | | | (1,800,335 | ) | | | (43,816 | ) | | | (27,963 | ) |
| Increase (Decrease) in Net Assets from Servicing Class Share Transactions | | | 1,319,995 | | | | 673,376 | �� | | | (25,320 | ) | | | (7,612 | ) |
| | | | | | | | | | | | | | | | | |
| Net Increase (Decrease) in Net Assets from Share Transactions | | | (1,493,472 | ) | | | 1,800,123 | | | | (50,252 | ) | | | (445 | ) |
| Total Increase (Decrease) in Net Assets | | | (1,493,465 | ) | | | 1,800,122 | | | | (52,016 | ) | | | (162 | ) |
| | | | | | | | | | | | | | | | | |
| NET ASSETS: | | | | | | | | | | | | | | | | |
| Beginning of Year | | | 5,735,678 | | | | 3,935,556 | | | | 150,658 | | | | 150,820 | |
| End of Year | | $ | 4,242,213 | | | $ | 5,735,678 | | | $ | 98,642 | | | $ | 150,658 | |
| Undistributed net investment income | | $ | — | | | $ | — | | | $ | 29 | | | $ | — | |
| (1) | See Note 8 for shares issued and redeemed. |
Amounts designated as “—” are either $0 or have been rounded to $0.
See accompanying notes to financial statements.
CITY NATIONAL ROCHDALE FUNDS | PAGE 126
City National Rochdale Corporate Bond Fund | | | City National Rochdale California Tax Exempt Bond Fund | | | City National Rochdale Municipal High Income Fund | |
| 2017 | | | 2016 | | | 2017 | | | 2016 | | | 2017 | | | 2016 | |
| | | | | | | | | | | | | | | | | |
| $ | 2,346 | | | $ | 2,271 | | | $ | 1,260 | | | $ | 1,330 | | | $ | 41,169 | | | $ | 32,575 | |
| | 117 | | | | (1,132 | ) | | | (285 | ) | | | 591 | | | | (14,443 | ) | | | (7,503 | ) |
| | (1,287 | ) | | | 2,206 | | | | (811 | ) | | | 434 | | | | (21,106 | ) | | | 41,554 | |
| | 1,176 | | | | 3,345 | | | | 164 | | | | 2,355 | | | | 5,620 | | | | 66,626 | |
| | | | | | | | | | | | | | | | | | | | | | | |
| | | | | | | | | | | | | | | | | | | | | | | |
| | | | | | | | | | | | | | | | | | | | | | | |
| | — | | | | — | | | | — | | | | — | | | | — | | | | — | |
| | (76 | ) | | | (59 | ) | | | (97 | ) | | | (121 | ) | | | (22,943 | ) | | | (17,013 | ) |
| | — | | | | — | | | | — | | | | — | | | | — | | | | — | |
| | (2,271 | ) | | | (2,212 | ) | | | (1,164 | ) | | | (1,207 | ) | | | (17,313 | ) | | | (14,761 | ) |
| | | | | | | | | | | | | | | | | | | | | | | |
| | — | | | | — | | | | — | | | | — | | | | — | | | | — | |
| | — | | | | (10 | ) | | | (47 | ) | | | (4 | ) | | | — | | | | (88 | ) |
| | — | | | | (300 | ) | | | (540 | ) | | | (32 | ) | | | — | | | | (73 | ) |
| | (2,347 | ) | | | (2,581 | ) | | | (1,848 | ) | | | (1,364 | ) | | | (40,256 | ) | | | (31,935 | ) |
| | | | | | | | | | | | | | | | | | | | | | | |
| | | | | | | | | | | | | | | | | | | | | | | |
| | | | | | | | | | | | | | | | | | | | | | | |
| | — | | | | — | | | | — | | | | — | | | | — | | | | — | |
| | — | | | | — | | | | — | | | | — | | | | — | | | | — | |
| | — | | | | — | | | | — | | | | — | | | | — | | | | — | |
| | — | | | | — | | | | — | | | | — | | | | — | | | | — | |
| | | | | | | | | | | | | | | | | | | | | | | |
| | | | | | | | | | | | | | | | | | | | | | | |
| | 2,779 | | | | 1,049 | | | | 5,211 | | | | 7,217 | | | | 272,975 | | | | 251,922 | |
| | 47 | | | | 47 | | | | 87 | | | | 60 | | | | 13,377 | | | | 10,334 | |
| | (950 | ) | | | (1,738 | ) | | | (3,295 | ) | | | (11,347 | ) | | | (174,843 | ) | | | (68,453 | ) |
| | 1,876 | | | | (642 | ) | | | 2,003 | | | | (4,070 | ) | | | 111,509 | | | | 193,803 | |
| | | | | | | | | | | | | | | | | | | | | | | |
| | | | | | | | | | | | | | | | | | | | | | | |
| | — | | | | — | | | | — | | | | — | | | | — | | | | — | |
| | — | | | | — | | | | — | | | | — | | | | — | | | | — | |
| | — | | | | — | | | | — | | | | — | | | | — | | | | — | |
| | — | | | | — | | | | — | | | | — | | | | — | | | | — | |
| | | | | | | | | | | | | | | | | | | | | | | |
| | | | | | | | | | | | | | | | | | | | | | | |
| | 34,383 | | | | 28,449 | | | | 24,846 | | | | 26,329 | | | | 161,767 | | | | 141,729 | |
| | 226 | | | | 192 | | | | 245 | | | | 108 | | | | 2,061 | | | | 1,137 | |
| | (26,711 | ) | | | (36,068 | ) | | | (33,769 | ) | | | (23,113 | ) | | | (103,735 | ) | | | (31,971 | ) |
| | 7,898 | | | | (7,427 | ) | | | (8,678 | ) | | | 3,324 | | | | 60,093 | | | | 110,895 | |
| | | | | | | | | | | | | | | | | | | | | | | |
| | 9,774 | | | | (8,069 | ) | | | (6,675 | ) | | | (746 | ) | | | 171,602 | | | | 304,698 | |
| | 8,603 | | | | (7,305 | ) | | | (8,359 | ) | | | 245 | | | | 136,966 | | | | 339,389 | |
| | | | | | | | | | | | | | | | | | | | | | | |
| | | | | | | | | | | | | | | | | | | | | | | |
| | 128,500 | | | | 135,805 | | | | 98,138 | | | | 97,893 | | | | 1,039,051 | | | | 699,662 | |
| $ | 137,103 | | | $ | 128,500 | | | $ | 89,779 | | | $ | 98,138 | | | $ | 1,176,017 | | | $ | 1,039,051 | |
| $ | 4 | | | $ | 1 | | | $ | 4 | | | $ | 5 | | | $ | 1,697 | | | $ | 1,095 | |
See accompanying notes to financial statements.
CITY NATIONAL ROCHDALE FUNDS | PAGE 127
statements of changes in net assets/
consolidated statement of changes in net assets (000) |
| For the years ended September 30, |
| | | City National Rochdale High Yield Bond Fund | | | City National Rochdale Intermediate Fixed Income Fund | |
| | | 2017 | | | 2016 | | | 2017 | | | 2016 | |
| OPERATIONS: | | | | | | | | | | | | |
| Net Investment Income | | $ | 3,984 | | | $ | 4,754 | | | $ | 4,984 | | | $ | 5,187 | |
| Net Realized Gain (Loss) from: | | | | | | | | | | | | | | | | |
| Security Transactions and Purchased Options | | | 595 | | | | (5,252 | ) | | | 787 | | | | (771 | ) |
| Foreign Currency Transactions | | | (41 | ) | | | 81 | | | | — | | | | — | |
| Net Change in Unrealized Appreciation (Depreciation) on: | | | | | | | | | | | | | | | | |
| Investments, Affiliated Investments and Purchased Options | | | 1,715 | | | | 7,095 | | | | (4,620 | ) | | | 5,455 | |
| Foreign Currency Translations | | | (9 | ) | | | 1 | | | | — | | | | — | |
| Foreign Capital Gains Tax | | | — | | | | — | | | | — | | | | — | |
| Net Increase in Net Assets Resulting from Operations | | | 6,244 | | | | 6,679 | | | | 1,151 | | | | 9,871 | |
| | | | | | | | | | | | | | | | | |
| DIVIDENDS AND DISTRIBUTIONS FROM: | | | | | | | | | | | | | | | | |
| Net Investment Income: | | | | | | | | | | | | | | | | |
| Institutional Class | | | (2,085 | ) | | | (2,453 | ) | | | (109 | ) | | | (229 | ) |
| Class N | | | (841 | ) | | | (1,193 | ) | | | (4,851 | ) | | | (4,999 | ) |
| Servicing Class | | | (866 | ) | | | (1,362 | ) | | | — | | | | — | |
| Class Y | | | — | | | | — | | | | — | | | | — | |
| Realized Capital Gains: | | | | | | | | | | | | | | | | |
| Institutional Class | | | — | | | | — | | | | — | | | | — | |
| Class N | | | — | | | | — | | | | — | | | | — | |
| Servicing Class | | | — | | | | — | | | | — | | | | — | |
| Class Y | | | — | | | | — | | | | — | | | | — | |
| Return of Capital: | | | | | | | | | | | | | | | | |
| Class N | | | — | | | | — | | | | — | | | | — | |
| Total Dividends and Distributions | | | (3,792 | ) | | | (5,008 | ) | | | (4,960 | ) | | | (5,228 | ) |
| | | | | | | | | | | | | | | | | |
CAPITAL SHARE TRANSACTIONS:(1) | | | | | | | | | | | | | | | | |
| Institutional Class: | | | | | | | | | | | | | | | | |
| Shares Issued | | | 6,135 | | | | 5,639 | | | | 549 | | | | 4,239 | |
| Shares Issued in Lieu of Dividends and Distributions | | | 2,071 | | | | 2,367 | | | | 56 | | | | 177 | |
| Shares Redeemed | | | (9,514 | ) | | | (6,783 | ) | | | (3,145 | ) | | | (12,885 | ) |
| Increase (Decrease) in Net Assets from Institutional Class Share Transactions | | | (1,308 | ) | | | 1,223 | | | | (2,540 | ) | | | (8,469 | ) |
| | | | | | | | | | | | | | | | | |
| Class N: | | | | | | | | | | | | | | | | |
| Shares Issued | | | 3,545 | | | | 6,488 | | | | 46,407 | | | | 62,311 | |
| Shares Issued in Lieu of Dividends and Distributions | | | 436 | | | | 600 | | | | 4,533 | | | | 4,709 | |
| Shares Redeemed | | | (6,360 | ) | | | (10,001 | ) | | | (58,443 | ) | | | (73,449 | ) |
| Increase (Decrease) in Net Assets from Class N Share Transactions | | | (2,379 | ) | | | (2,913 | ) | | | (7,503 | ) | | | (6,429 | ) |
| | | | | | | | | | | | | | | | | |
| Servicing Class: | | | | | | | | | | | | | | | | |
| Shares Issued | | | 4,197 | | | | 15,267 | | | | — | | | | — | |
| Shares Issued in Lieu of Dividends and Distributions | | | 232 | | | | 363 | | | | — | | | | — | |
| Shares Redeemed | | | (7,082 | ) | | | (24,287 | ) | | | — | | | | — | |
| Increase (Decrease) in Net Assets from Servicing Class Share Transactions | | | (2,653 | ) | | | (8,657 | ) | | | — | | | | — | |
| | | | | | | | | | | | | | | | | |
| Class Y: | | | | | | | | | | | | | | | | |
| Shares Issued | | | — | | | | — | | | | — | | | | — | |
| Shares Issued in Lieu of Dividends and Distributions | | | — | | | | — | | | | — | | | | — | |
| Shares Redeemed | | | — | | | | — | | | | — | | | | — | |
| Increase (Decrease) in Net Assets from Class Y Share Transactions | | | — | | | | — | | | | — | | | | — | |
| Net Increase (Decrease) in Net Assets from Share Transactions | | | (6,340 | ) | | | (10,347 | ) | | | (10,043 | ) | | | (14,898 | ) |
| Total Increase (Decrease) in Net Assets | | | (3,888 | ) | | | (8,676 | ) | | | (13,852 | ) | | | (10,255 | ) |
| | | | | | | | | | | | | | | | | |
| NET ASSETS: | | | | | | | | | | | | | | | | |
| Beginning of Year | | | 77,835 | | | | 86,511 | | | | 260,332 | | | | 270,587 | |
| End of Year | | $ | 73,947 | | | $ | 77,835 | | | $ | 246,480 | | | $ | 260,332 | |
| Undistributed (distribution in excess of) net investment income | | $ | 69 | | | $ | (67 | ) | | $ | 94 | | | $ | 52 | |
| (1) | See Note 8 for shares issued and redeemed. |
| (2) | Class Y commenced operations on June 1, 2016. |
| (3) | Includes transfer from Class N to Class Y of $692,420 (000). |
Amounts designated as “—” are either $0 or have been rounded to $0.
See accompanying notes to financial statements.
CITY NATIONAL ROCHDALE FUNDS | PAGE 128
City National Rochdale Fixed Income Opportunities Fund | | | City National Rochdale Dividend & Income Fund | | | City National Rochdale U.S. Core Equity Fund | | | City National Rochdale Emerging Markets Fund (2) | |
| 2017 | | | 2016 | | | 2017 | | | 2016 | | | 2017 | | | 2016 | | | 2017 | | | 2016 | |
| | | | | | | | | | | | | | | | | | | | | | | |
| $ | 122,870 | | | $ | 94,069 | | | $ | 5,704 | | | $ | 5,245 | | | $ | 1,933 | | | $ | 1,522 | | | $ | 1,334 | | | $ | 2,049 | |
| | | | | | | | | | | | | | | | | | | | | | | | | | | | | | | |
| | 51,517 | | | | (42,394 | ) | | | 7,992 | | | | 824 | | | | 1,991 | | | | 8,913 | | | | 40,766 | | | | (15,955 | ) |
| | (15,463 | ) | | | 5,529 | | | | — | | | | — | | | | — | | | | — | | | | (1,112 | ) | | | (1,573 | ) |
| | | | | | | | | | | | | | | | | | | | | | | | | | | | | | | |
| | 26,067 | | | | 96,056 | | | | (2,636 | ) | | | 30,072 | | | | 37,144 | | | | 7,967 | | | | 273,424 | | | | 149,893 | |
| | 1,555 | | | | (478 | ) | | | — | | | | — | | | | — | | | | — | | | | (139 | ) | | | 766 | |
| | — | | | | — | | | | — | | | | — | | | | — | | | | — | | | | (10 | ) | | | — | |
| | 186,546 | | | | 152,782 | | | | 11,060 | | | | 36,141 | | | | 41,068 | | | | 18,402 | | | | 314,263 | | | | 135,180 | |
| | | | | | | | | | | | | | | | | | | | | | | | | | | | | | | |
| | | | | | | | | | | | | | | | | | | | | | | | | | | | | | | |
| | | | | | | | | | | | | | | | | | | | | | | | | | | | | | | |
| | — | | | | — | | | | — | | | | — | | | | — | | | | — | | | | — | | | | — | |
| | (145,340 | ) | | | (131,462 | ) | | | (6,846 | ) | | | (5,466 | ) | | | (810 | ) | | | (636 | ) | | | (178 | ) | | | (228 | ) |
| | — | | | | — | | | | — | | | | — | | | | (1,099 | ) | | | (923 | ) | | | — | | | | — | |
| | — | | | | — | | | | — | | | | — | | | | — | | | | — | | | | (2,287 | ) | | | — | |
| | | | | | | | | | | | | | | | | | | | | | | | | | | | | | | |
| | — | | | | — | | | | — | | | | — | | | | (1 | ) | | | — | | | | — | | | | — | |
| | — | | | | — | | | | — | | | | (164 | ) | | | (4,736 | ) | | | (710 | ) | | | — | | | | — | |
| | — | | | | — | | | | — | | | | — | | | | (4,806 | ) | | | (739 | ) | | | — | | | | — | |
| | — | | | | — | | | | — | | | | — | | | | — | | | | — | | | | — | | | | — | |
| | | | | | | | | | | | | | | | | | | | | | | | | | | | | | | |
| | — | | | | — | | | | — | | | | (823 | ) | | | — | | | | — | | | | — | | | | — | |
| | (145,340 | ) | | | (131,462 | ) | | | (6,846 | ) | | | (6,453 | ) | | | (11,452 | ) | | | (3,008 | ) | | | (2,465 | ) | | | (228 | ) |
| | | | | | | | | | | | | | | | | | | | | | | | | | | | | | | |
| | | | | | | | | | | | | | | | | | | | | | | | | | | | | | | |
| | | | | | | | | | | | | | | | | | | | | | | | | | | | | | | |
| | — | | | | — | | | | — | | | | — | | | | — | | | | — | | | | — | | | | — | |
| | — | | | | — | | | | — | | | | — | | | | 1 | | | | — | | | | — | | | | — | |
| | — | | | | — | | | | — | | | | — | | | | — | | | | (7,205 | ) | | | — | | | | — | |
| | — | | | | — | | | | — | | | | — | | | | 1 | | | | (7,205 | ) | | | — | | | | — | |
| | | | | | | | | | | | | | | | | | | | | | | | | | | | | | | |
| | | | | | | | | | | | | | | | | | | | | | | | | | | | | | | |
| | 810,702 | | | | 813,637 | | | | 70,855 | | | | 73,266 | | | | 17,564 | | | | 16,276 | | | | 139,570 | | | | 360,912 | |
| | 107,788 | | | | 97,392 | | | | 4,498 | | | | 4,329 | | | | 4,871 | | | | 1,151 | | | | 155 | | | | 162 | |
| | (382,028 | ) | | | (411,723 | ) | | | (63,315 | ) | | | (58,011 | ) | | | (18,854 | ) | | | (18,823 | ) | | | (107,632 | ) | | | (1,043,367 | )(3) |
| | 536,462 | | | | 499,306 | | | | 12,038 | | | | 19,584 | | | | 3,581 | | | | (1,396 | ) | | | 32,093 | | | | (682,293 | ) |
| | | | | | | | | | | | | | | | | | | | | | | | | | | | | | | |
| | | | | | | | | | | | | | | | | | | | | | | | | | | | | | | |
| | — | | | | — | | | | — | | | | — | | | | 27,687 | | | | 23,794 | | | | — | | | | — | |
| | — | | | | — | | | | — | | | | — | | | | 303 | | | | 41 | | | | — | | | | — | |
| | — | | | | — | | | | — | | | | — | | | | (23,547 | ) | | | (24,637 | ) | | | — | | | | — | |
| | — | | | | — | | | | — | | | | — | | | | 4,443 | | | | (802 | ) | | | — | | | | — | |
| | | | | | | | | | | | | | | | | | | | | | | | | | | | | | | |
| | | | | | | | | | | | | | | | | | | | | | | | | | | | | | | |
| | — | | | | — | | | | — | | | | — | | | | — | | | | — | | | | 370,807 | | | | 874,121 | (3) |
| | — | | | | — | | | | — | | | | — | | | | — | | | | — | | | | 1,673 | | | | — | |
| | — | | | | — | | | | — | | | | — | | | | — | | | | — | | | | (146,903 | ) | | | (17,698 | ) |
| | — | | | | — | | | | — | | | | — | | | | — | | | | — | | | | 225,577 | | | | 856,423 | |
| | 536,462 | | | | 499,306 | | | | 12,038 | | | | 19,584 | | | | 8,025 | | | | (9,403 | ) | | | 257,670 | | | | 174,130 | |
| | 577,668 | | | | 520,626 | | | | 16,252 | | | | 49,272 | | | | 37,641 | | | | 5,991 | | | | 569,468 | | | | 309,082 | |
| | | | | | | | | | | | | | | | | | | | | | | | | | | | | | | |
| | | | | | | | | | | | | | | | | | | | | | | | | | | | | | | |
| | 2,162,580 | | | | 1,641,954 | | | | 236,957 | | | | 187,685 | | | | 219,834 | | | | 213,843 | | | | 993,264 | | | | 684,182 | |
| $ | 2,740,248 | | | $ | 2,162,580 | | | $ | 253,209 | | | $ | 236,957 | | | $ | 257,475 | | | $ | 219,834 | | | $ | 1,562,732 | | | $ | 993,264 | |
| $ | (76,057 | ) | | $ | (39,650 | ) | | $ | (14 | ) | | $ | (12 | ) | | $ | 68 | | | $ | 34 | | | $ | (1,814 | ) | | $ | 419 | |
See accompanying notes to financial statements.
CITY NATIONAL ROCHDALE FUNDS | PAGE 129
| consolidated statement of cash flows (000) |
| For the year ended September 30, 2017 |
| | | City National
Rochdale
Fixed Income
Opportunities Fund | |
| Cash Flows from Operating Activities: | | | |
| Net increase in net assets from operations | | $ | 186,546 | |
| Adjustments to reconcile net increase in net assets resulting from operations to net cash used in operating activities: | | | | |
| Purchase of investment securities | | | (5,168,589 | ) |
| Proceeds from disposition of investment securities | | | 4,702,103 | |
| Amortization (accretion of market discount) | | | (15,514 | ) |
| Premium payments | | | (19,664 | ) |
| Net realized gain on investments | | | (51,517 | ) |
| Net change in unrealized appreciation on investments | | | (26,067 | ) |
| Net change in unrealized appreciation on currency | | | (9,051 | ) |
| | | | | |
| Changes in assets: | | | | |
| Dividend and interest receivable | | | (3,153 | ) |
| Foreign tax reclaim receivable | | | (90 | ) |
| Receivable for investment securities sold | | | 37,896 | |
| Unrealized gain on forward foreign currency contracts | | | (2,397 | ) |
| Prepaid expenses | | | (5 | ) |
| | | | | |
| Changes in liabilities: | | | | |
| Payable for investment securities purchased | | | (28,743 | ) |
| Unrealized loss on forward foreign currency contracts | | | 777 | |
| Investment advisory fees payable | | | 243 | |
| Shareholder servicing and distribution fees payable | | | 241 | |
| Administrative fees payable | | | 9 | |
| Accrued expenses | | | (40 | ) |
| Net cash used in operating activities | | | (397,015 | ) |
| | | | | |
| Cash Flows from Financing Activities: | | | | |
| Proceeds from shares issued | | | 809,885 | |
| Cost of shares redeemed | | | (382,015 | ) |
| Distributions | | | (37,552 | ) |
| Net cash provided by financing activities | | | 390,318 | |
| Net change in cash | | | (6,697 | ) |
| Cash at beginning of year | | | 12,137 | |
| Cash at end of year | | $ | 5,440 | |
| | | | | |
| NON-Cash Financing Activities: | | | | |
| Reinvestments of dividends and distributions | | $ | 107,788 | |
See accompanying notes to financial statements.
CITY NATIONAL ROCHDALE FUNDS | PAGE 130
This page intentionally left blank.
CITY NATIONAL ROCHDALE FUNDS | PAGE 131
| financial highlights |
For a Share Outstanding Throughout Each Period
For the year or period ended September 30, |
| | | Net Asset Value Beginning of Period | | | Net Investment Income† | | | Net Realized and Unrealized Gains (Losses) on Securities† | | | Dividends from Net Investment Income | | | Distributions from Realized Capital Gains | | | Net Asset Value End of Period | | Total Return‡ | | | Net Assets
End of Period (000) | | Ratio of Expenses to Average Net Assets(1)(2) | | Ratio of Net Investment Income to Average Net Assets(1)(2) | | Ratio of
Expenses to Average Net Assets (Excluding Waivers & Recovered Fees)(1) | | Portfolio Turnover Rate | |
| City National Rochdale Government Money Market Fund | |
| Class N (commenced operations on June 21, 1999) | |
| 2017 | | $ | 1.00 | | | $ | 0.001 | | | $ | 0.000 | * | | $ | (0.001 | ) | | $ | — | | | $ | 1.00 | | | 0.06 | % | | $ | 1,099,005 | | | 0.60 | % | | 0.05 | % | | 0.86 | % | | — | % |
| 2016 | | | 1.00 | | | | 0.000 | * | | | 0.000 | * | | | (0.000 | )* | | | — | | | | 1.00 | | | 0.02 | | | | 3,870,786 | | | 0.30 | | | 0.02 | | | 0.86 | | | — | |
| 2015 | | | 1.00 | | | | 0.000 | * | | | 0.000 | * | | | (0.000 | )* | | | — | | | | 1.00 | | | 0.01 | | | | 2,958,782 | | | 0.10 | | | 0.01 | | | 0.87 | | | — | |
| 2014 | | | 1.00 | | | | 0.000 | * | | | 0.000 | * | | | (0.000 | )* | | | — | | | | 1.00 | | | 0.01 | | | | 3,174,351 | | | 0.08 | | | 0.01 | | | 0.88 | | | — | |
| 2013 | | | 1.00 | | | | 0.000 | * | | | 0.000 | * | | | (0.000 | )* | | | — | | | | 1.00 | | | 0.01 | | | | 3,040,396 | | | 0.13 | | | 0.01 | | | 0.97 | | | — | |
| Class S (commenced operations on October 6, 1999) | |
| 2017 | | $ | 1.00 | | | $ | 0.001 | | | $ | 0.000 | * | | $ | (0.001 | ) | | $ | — | | | $ | 1.00 | | | 0.06 | % | | $ | 841,246 | | | 0.67 | % | | 0.06 | % | | 1.06 | % | | — | % |
| 2016 | | | 1.00 | | | | 0.000 | * | | | 0.000 | * | | | (0.000 | )* | | | — | | | | 1.00 | | | 0.02 | | | | 882,925 | | | 0.31 | | | 0.02 | | | 1.06 | | | — | |
| 2015 | | | 1.00 | | | | 0.000 | * | | | 0.000 | * | | | (0.000 | )* | | | — | | | | 1.00 | | | 0.01 | | | | 668,183 | | | 0.10 | | | 0.01 | | | 1.07 | | | — | |
| 2014 | | | 1.00 | | | | 0.000 | * | | | 0.000 | * | | | (0.000 | )* | | | — | | | | 1.00 | | | 0.01 | | | | 705,932 | | | 0.08 | | | 0.01 | | | 1.08 | | | — | |
| 2013 | | | 1.00 | | | | 0.000 | * | | | 0.000 | * | | | (0.000 | )* | | | — | | | | 1.00 | | | 0.01 | | | | 475,151 | | | 0.12 | | | 0.01 | | | 1.11 | | | — | |
Servicing Class (commenced operations on April 3, 2000)^^ | |
| 2017 | | $ | 1.00 | | | $ | 0.002 | | | $ | 0.000 | * | | $ | (0.002 | ) | | $ | — | | | $ | 1.00 | | | 0.17 | % | | $ | 2,301,962 | | | 0.53 | % | | 0.24 | % | | 0.56 | % | | — | % |
| 2016 | | | 1.00 | | | | 0.000 | * | | | 0.000 | * | | | (0.000 | )* | | | — | | | | 1.00 | | | 0.02 | | | | 981,967 | | | 0.31 | | | 0.02 | | | 0.56 | | | — | |
| 2015 | | | 1.00 | | | | 0.000 | * | | | 0.000 | * | | | (0.000 | )* | | | — | | | | 1.00 | | | 0.01 | | | | 308,591 | | | 0.10 | | | 0.01 | | | 0.57 | | | — | |
| 2014 | | | 1.00 | | | | 0.000 | * | | | 0.000 | * | | | (0.000 | )* | | | — | | | | 1.00 | | | 0.01 | | | | 211,958 | | | 0.08 | | | 0.01 | | | 0.58 | | | — | |
| 2013 | | | 1.00 | | | | 0.000 | * | | | 0.000 | * | | | (0.000 | )* | | | — | | | | 1.00 | | | 0.01 | | | | 128,423 | | | 0.12 | | | 0.01 | | | 0.61 | | | — | |
| City National Rochdale Government Bond Fund | |
| Institutional Class (commenced operations on February 1, 2012) | |
| 2017 | | $ | 10.61 | | | $ | 0.10 | | | $ | (0.12 | ) | | $ | (0.10 | ) | | $ | (0.01 | ) | | $ | 10.48 | | | (0.18 | )% | | $ | 39,988 | | | 0.53 | % | | 0.90 | % | | 0.63 | % | | 55 | % |
| 2016 | | | 10.59 | | | | 0.09 | | | | 0.02 | | | | (0.09 | ) | | | — | | | | 10.61 | | | 1.09 | | | | 66,021 | | | 0.53 | | | 0.84 | | | 0.58 | | | 37 | |
| 2015 | | | 10.49 | | | | 0.06 | | | | 0.10 | | | | (0.06 | ) | | | — | | | | 10.59 | | | 1.55 | | | | 58,301 | | | 0.53 | | | 0.59 | | | 0.57 | | | 37 | |
| 2014 | | | 10.47 | | | | 0.06 | | | | 0.02 | | | | (0.06 | ) | | | — | | | | 10.49 | | | 0.80 | | | | 56,722 | | | 0.53 | | | 0.59 | | | 0.57 | | | 59 | |
| 2013 | | | 10.73 | | | | 0.11 | | | | (0.23 | ) | | | (0.14 | ) | | | — | | | | 10.47 | | | (1.11 | ) | | | 56,351 | | | 0.54 | | | 1.03 | | | 0.52 | | | 28 | |
| Class N (commenced operations on April 13, 2000) | |
| 2017 | | $ | 10.62 | | | $ | 0.05 | | | $ | (0.12 | ) | | $ | (0.05 | ) | | $ | (0.01 | ) | | $ | 10.49 | | | (0.68 | )% | | $ | 1,743 | | | 1.03 | % | | 0.43 | % | | 1.13 | % | | 55 | % |
| 2016 | | | 10.60 | | | | 0.03 | | | | 0.03 | | | | (0.04 | ) | | | — | | | | 10.62 | | | 0.58 | | | | 1,453 | | | 1.03 | | | 0.33 | | | 1.08 | | | 37 | |
| 2015 | | | 10.51 | | | | 0.01 | | | | 0.09 | | | | (0.01 | ) | | | — | | | | 10.60 | | | 0.95 | | | | 1,895 | | | 1.03 | | | 0.08 | | | 1.07 | | | 37 | |
| 2014 | | | 10.49 | | | | 0.01 | | | | 0.02 | | | | (0.01 | ) | | | — | | | | 10.51 | | | 0.29 | | | | 2,027 | | | 1.03 | | | 0.10 | | | 1.07 | | | 59 | |
| 2013 | | | 10.75 | | | | 0.04 | | | | (0.21 | ) | | | (0.09 | ) | | | — | | | | 10.49 | | | (1.60 | ) | | | 2,505 | | | 1.03 | | | 0.38 | | | 1.02 | | | 28 | |
| Servicing Class (commenced operations on January 14, 2000) | |
| 2017 | | $ | 10.60 | | | $ | 0.07 | | | $ | (0.10 | ) | | $ | (0.08 | ) | | $ | (0.01 | ) | | $ | 10.48 | | | (0.34 | )% | | $ | 56,911 | | | 0.78 | % | | 0.68 | % | | 0.88 | % | | 55 | % |
| 2016 | | | 10.58 | | | | 0.06 | | | | 0.03 | | | | (0.07 | ) | | | — | | | | 10.60 | | | 0.84 | | | | 83,184 | | | 0.78 | | | 0.59 | | | 0.83 | | | 37 | |
| 2015 | | | 10.49 | | | | 0.04 | | | | 0.09 | | | | (0.04 | ) | | | — | | | | 10.58 | | | 1.21 | | | | 90,624 | | | 0.78 | | | 0.33 | | | 0.82 | | | 37 | |
| 2014 | | | 10.47 | | | | 0.04 | | | | 0.02 | | | | (0.04 | ) | | | — | | | | 10.49 | | | 0.54 | | | | 113,485 | | | 0.78 | | | 0.34 | | | 0.82 | | | 59 | |
| 2013 | | | 10.72 | | | | 0.07 | | | | (0.20 | ) | | | (0.12 | ) | | | — | | | | 10.47 | | | (1.26 | ) | | | 114,953 | | | 0.79 | | | 0.62 | | | 0.77 | | | 28 | |
| City National Rochdale Corporate Bond Fund | |
| Class N (commenced operations on April 13, 2000) | |
| 2017 | | $ | 10.52 | | | $ | 0.16 | | | $ | (0.09 | ) | | $ | (0.16 | ) | | $ | — | | | $ | 10.43 | | | 0.68 | % | | $ | 5,626 | | | 1.01 | % | | 1.53 | % | | 1.13 | % | | 26 | % |
| 2016 | | | 10.45 | | | | 0.16 | | | | 0.08 | | | | (0.15 | ) | | | (0.02 | ) | | | 10.52 | | | 2.39 | | | | 3,783 | | | 1.01 | | | 1.52 | | | 1.09 | | | 30 | |
| 2015 | | | 10.67 | | | | 0.15 | | | | (0.14 | ) | | | (0.15 | ) | | | (0.08 | ) | | | 10.45 | | | 0.14 | | | | 4,411 | | | 1.01 | | | 1.42 | | | 1.07 | | | 32 | |
| 2014 | | | 10.71 | | | | 0.14 | | | | 0.03 | | | | (0.14 | ) | | | (0.07 | ) | | | 10.67 | | | 1.64 | | | | 4,008 | | | 1.01 | | | 1.32 | | | 1.07 | | | 37 | |
| 2013 | | | 10.91 | | | | 0.16 | | | | (0.10 | ) | | | (0.17 | ) | | | (0.09 | ) | | | 10.71 | | | 0.49 | | | | 3,100 | | | 1.00 | | | 1.51 | | | 1.00 | | | 29 | |
| Servicing Class (commenced operations on January 14, 2000) | |
| 2017 | | $ | 10.51 | | | $ | 0.19 | | | $ | (0.10 | ) | | $ | (0.19 | ) | | $ | — | | | $ | 10.41 | | | 0.84 | % | | $ | 131,477 | | | 0.76 | % | | 1.79 | % | | 0.88 | % | | 26 | % |
| 2016 | | | 10.44 | | | | 0.18 | | | | 0.09 | | | | (0.18 | ) | | | (0.02 | ) | | | 10.51 | | | 2.69 | | | | 124,717 | | | 0.76 | | | 1.75 | | | 0.84 | | | 30 | |
| 2015 | | | 10.66 | | | | 0.18 | | | | (0.14 | ) | | | (0.18 | ) | | | (0.08 | ) | | | 10.44 | | | 0.39 | | | | 131,394 | | | 0.76 | | | 1.67 | | | 0.82 | | | 32 | |
| 2014 | | | 10.70 | | | | 0.17 | | | | 0.03 | | | | (0.17 | ) | | | (0.07 | ) | | | 10.66 | | | 1.89 | | | | 142,766 | | | 0.76 | | | 1.57 | | | 0.82 | | | 37 | |
| 2013 | | | 10.90 | | | | 0.19 | | | | (0.11 | ) | | | (0.19 | ) | | | (0.09 | ) | | | 10.70 | | | 0.75 | | | | 135,184 | | | 0.75 | | | 1.77 | | | 0.75 | | | 29 | |
| * | Amount represents less than $0.001. |
| † | Per share calculations are based on Average Shares outstanding throughout the period. |
| ‡ | Returns are for the period indicated and have not been annualized. Fee waivers are in effect; if they had not been in effect, performance would have been lower. Returns shown do not reflect the deduction of taxes that a shareholder would pay on fund distributions or the redemption of fund shares. |
| ^^ | Effective November 28, 2012, Institutional Class Shares were redesignated as Servicing Class Shares. This share class name change had no impact on the Fund’s operations or investment policy. |
| (1) | Annualized for periods less than one year. |
| (2) | Ratio includes waivers and previously waived investment advisory fees recovered. The impact of the recovered fees may cause a higher net expense ratio. |
Amounts designated as “—” are either $0 or have been rounded to $0.
See accompanying notes to financial statements.
CITY NATIONAL ROCHDALE FUNDS | PAGE 132
| | | Net Asset Value Beginning of Period | | | Net Investment Income† | | | Net Realized and Unrealized Gains (Losses) on Securities† | | | Dividends from Net Investment Income | | | Distributions from Realized Capital Gains | | | Net Asset Value End of Period | | Total Return‡ | | | Net Assets End of Period (000) | | Ratio of Expenses to Average Net Assets(1)(2) | | Ratio of Net Investment Income to Average Net Assets(1)(2) | | Ratio of Expenses to Average Net Assets (Excluding Waivers & Recovered Fees)(1) | | Portfolio Turnover Rate | |
| City National Rochdale California Tax Exempt Bond Fund | |
| Class N (commenced operations on April 13, 2000) | |
| 2017 | | $ | 10.82 | | | $ | 0.12 | | | $ | (0.12 | ) | | $ | (0.12 | ) | | $ | (0.06 | ) | | $ | 10.64 | | | 0.05 | % | | $ | 9,344 | | | 0.88 | % | | 1.11 | % | | 1.05 | % | | 45 | % |
| 2016 | | | 10.71 | | | | 0.12 | | | | 0.11 | | | | (0.12 | ) | | —^ ^ | | | | 10.82 | | | 2.20 | | | | 7,444 | | | 0.88 | | | 1.14 | | | 0.99 | | | 25 | |
| 2015 | | | 10.74 | | | | 0.12 | | | | 0.02 | | | | (0.12 | ) | | | (0.05 | ) | | | 10.71 | | | 1.30 | | | | 11,386 | | | 0.88 | | | 1.10 | | | 1.00 | | | 10 | |
| 2014 | | | 10.54 | | | | 0.13 | | | | 0.22 | | | | (0.13 | ) | | | (0.02 | ) | | | 10.74 | | | 3.31 | | | | 10,955 | | | 0.88 | | | 1.17 | | | 1.02 | | | 36 | |
| 2013 | | | 10.86 | | | | 0.18 | | | | (0.22 | ) | | | (0.18 | ) | | | (0.10 | ) | | | 10.54 | | | (0.45 | ) | | | 8,197 | | | 0.87 | | | 1.64 | | | 0.86 | | | 34 | |
| Servicing Class (commenced operations on January 14, 2000) | |
| 2017 | | $ | 10.79 | | | $ | 0.14 | | | $ | (0.12 | ) | | $ | (0.14 | ) | | $ | (0.06 | ) | | $ | 10.61 | | | 0.31 | % | | $ | 80,435 | | | 0.63 | % | | 1.36 | % | | 0.80 | % | | 45 | % |
| 2016 | | | 10.68 | | | | 0.15 | | | | 0.11 | | | | (0.15 | ) | | —^ ^ | | | | 10.79 | | | 2.48 | | | | 90,694 | | | 0.63 | | | 1.39 | | | 0.74 | | | 25 | |
| 2015 | | | 10.71 | | | | 0.14 | | | | 0.03 | | | | (0.15 | ) | | | (0.05 | ) | | | 10.68 | | | 1.56 | | | | 86,507 | | | 0.63 | | | 1.36 | | | 0.75 | | | 10 | |
| 2014 | | | 10.51 | | | | 0.15 | | | | 0.22 | | | | (0.15 | ) | | | (0.02 | ) | | | 10.71 | | | 3.58 | | | | 70,698 | | | 0.63 | | | 1.43 | | | 0.77 | | | 36 | |
| 2013 | | | 10.83 | | | | 0.20 | | | | (0.22 | ) | | | (0.20 | ) | | | (0.10 | ) | | | 10.51 | | | (0.20 | ) | | | 59,149 | | | 0.62 | | | 1.91 | | | 0.62 | | | 34 | |
| City National Rochdale Municipal High Income Fund | |
| Class N (commenced operations on December 30, 2013) | |
| 2017 | | $ | 11.14 | | | $ | 0.38 | | | $ | (0.38 | ) | | $ | (0.38 | ) | | $ | — | | | $ | 10.76 | | | 0.16 | % | | $ | 686,922 | | | 1.07 | % | | 3.62 | % | | 1.07 | % | | 50 | % |
| 2016 | | | 10.67 | | | | 0.41 | | | | 0.46 | | | | (0.40 | ) | | —^ ^ | | | | 11.14 | | | 8.34 | | | | 595,221 | | | 1.04 | | | 3.76 | | | 1.04 | | | 28 | |
| 2015 | | | 10.71 | | | | 0.41 | | | | (0.04 | ) | | | (0.41 | ) | | | — | | | | 10.67 | | | 3.55 | | | | 382,461 | | | 1.04 | | | 3.85 | | | 1.03 | | | 2 | |
| 2014 | | | 10.00 | | | | 0.32 | | | | 0.71 | | | | (0.32 | ) | | | — | | | | 10.71 | | | 10.38 | | | | 201,200 | | | 1.08 | | | 4.02 | | | 1.08 | | | 1 | |
| Servicing Class (commenced operations on December 30, 2013) | |
| 2017 | | $ | 11.14 | | | $ | 0.41 | | | $ | (0.37 | ) | | $ | (0.41 | ) | | $ | — | | | $ | 10.77 | | | 0.50 | % | | $ | 489,095 | | | 0.83 | % | | 3.87 | % | | 0.83 | % | | 50 | % |
| 2016 | | | 10.68 | | | | 0.44 | | | | 0.45 | | | | (0.43 | ) | | —^ ^ | | | | 11.14 | | | 8.50 | | | | 443,830 | | | 0.79 | | | 4.01 | | | 0.79 | | | 28 | |
| 2015 | | | 10.72 | | | | 0.44 | | | | (0.04 | ) | | | (0.44 | ) | | | — | | | | 10.68 | | | 3.81 | | | | 317,201 | | | 0.79 | | | 4.10 | | | 0.79 | | | 2 | |
| 2014 | | | 10.00 | | | | 0.34 | | | | 0.72 | | | | (0.34 | ) | | | — | | | | 10.72 | | | 10.68 | | | | 220,851 | | | 0.83 | | | 4.27 | | | 0.84 | | | 1 | |
| City National Rochdale High Yield Bond Fund | |
| Institutional Class (commenced operations on February 2, 2012) | |
| 2017 | | $ | 7.80 | | | $ | 0.43 | | | $ | 0.24 | | | $ | (0.41 | ) | | $ | — | | | $ | 8.06 | | | 8.82 | % | | $ | 40,698 | | | 0.96 | % | | 5.46 | % | | 0.96 | % | | 59 | % |
| 2016 | | | 7.58 | | | | 0.47 | | | | 0.24 | | | | (0.49 | ) | | | — | | | | 7.80 | | | 9.88 | | | | 40,701 | | | 0.83 | | | 6.39 | | | 0.89 | | | 69 | |
| 2015 | | | 8.76 | | | | 0.49 | | | | (0.77 | ) | | | (0.49 | ) | | | (0.41 | ) | | | 7.58 | | | (3.47 | ) | | | 38,274 | | | 0.70 | | | 5.94 | | | 0.83 | | | 77 | |
| 2014 | | | 8.59 | | | | 0.53 | | | | 0.19 | | | | (0.53 | ) | | | (0.02 | ) | | | 8.76 | | | 8.49 | | | | 40,639 | | | 0.70 | | | 5.98 | | | 0.78 | | | 59 | |
| 2013 | | | 8.64 | | | | 0.60 | | | | (0.05 | ) | | | (0.60 | ) | | | — | | | | 8.59 | | | 6.49 | | | | 39,219 | | | 0.75 | | | 6.87 | | | 0.75 | | | 56 | |
| Class N (commenced operations on January 14, 2000) | |
| 2017 | | $ | 7.80 | | | $ | 0.39 | | | $ | 0.24 | | | $ | (0.37 | ) | | $ | — | | | $ | 8.06 | | | 8.28 | % | | $ | 16,705 | | | 1.46 | % | | 4.95 | % | | 1.46 | % | | 59 | % |
| 2016 | | | 7.58 | | | | 0.45 | | | | 0.23 | | | | (0.46 | ) | | | — | | | | 7.80 | | | 9.44 | | | | 18,513 | | | 1.23 | | | 6.02 | | | 1.30 | | | 69 | |
| 2015 | | | 8.76 | | | | 0.44 | | | | (0.76 | ) | | | (0.45 | ) | | | (0.41 | ) | | | 7.58 | | | (3.94 | ) | | | 21,063 | | | 1.20 | | | 5.43 | | | 1.33 | | | 77 | |
| 2014 | | | 8.59 | | | | 0.49 | | | | 0.18 | | | | (0.48 | ) | | | (0.02 | ) | | | 8.76 | | | 7.95 | | | | 26,166 | | | 1.20 | | | 5.49 | | | 1.28 | | | 59 | |
| 2013 | | | 8.64 | | | | 0.56 | | | | (0.05 | ) | | | (0.56 | ) | | | — | | | | 8.59 | | | 5.95 | | | | 34,371 | | | 1.27 | | | 6.37 | | | 1.26 | | | 56 | |
| Servicing Class (commenced operations on January 14, 2000) | |
| 2017 | | $ | 7.80 | | | $ | 0.41 | | | $ | 0.23 | | | $ | (0.39 | ) | | $ | — | | | $ | 8.05 | | | 8.42 | % | | $ | 16,544 | | | 1.21 | % | | 5.21 | % | | 1.21 | % | | 59 | % |
| 2016 | | | 7.58 | | | | 0.46 | | | | 0.23 | | | | (0.47 | ) | | | — | | | | 7.80 | | | 9.61 | | | | 18,621 | | | 1.07 | | | 6.16 | | | 1.14 | | | 69 | |
| 2015 | | | 8.76 | | | | 0.47 | | | | (0.77 | ) | | | (0.47 | ) | | | (0.41 | ) | | | 7.58 | | | (3.71 | ) | | | 27,174 | | | 0.95 | | | 5.67 | | | 1.08 | | | 77 | |
| 2014 | | | 8.59 | | | | 0.51 | | | | 0.19 | | | | (0.51 | ) | | | (0.02 | ) | | | 8.76 | | | 8.22 | | | | 43,974 | | | 0.95 | | | 5.83 | | | 1.02 | | | 59 | |
| 2013 | | | 8.63 | | | | 0.58 | | | | (0.04 | ) | | | (0.58 | ) | | | — | | | | 8.59 | | | 6.35 | | | | 88,949 | | | 0.99 | | | 6.58 | | | 0.99 | | | 56 | |
| City National Rochdale Intermediate Fixed Income Fund | |
| Institutional Class (commenced operations on December 20, 2013) | |
| 2017 | | $ | 26.56 | | | $ | 0.64 | | | $ | (0.38 | ) | | $ | (0.64 | ) | | $ | — | | | $ | 26.18 | | | 1.02 | % | | $ | 4,589 | | | 0.51 | % | | 2.43 | % | | 0.53 | % | | 20 | % |
| 2016 | | | 26.12 | | | | 0.63 | | | | 0.45 | | | | (0.64 | ) | | | — | | | | 26.56 | | | 4.20 | | | | 7,249 | | | 0.51 | | | 2.38 | | | 0.51 | | | 25 | |
| 2015 | | | 26.23 | | | | 0.60 | | | | (0.11 | ) | | | (0.60 | ) | | | — | | | | 26.12 | | | 1.87 | | | | 15,574 | | | 0.51 | | | 2.29 | | | 0.53 | | | 21 | |
| 2014 | | | 25.89 | | | | 0.53 | | | | 0.33 | | | | (0.52 | ) | | | — | | | | 26.23 | | | 3.35 | | | | 8,784 | | | 0.51 | | | 2.57 | | | 0.52 | | | 28 | |
| Class N (commenced operations on December 31, 1999) | |
| 2017 | | $ | 26.56 | | | $ | 0.51 | | | $ | (0.39 | ) | | $ | (0.51 | ) | | $ | — | | | $ | 26.17 | | | 0.48 | % | | $ | 241,891 | | | 1.01 | % | | 1.95 | % | | 1.03 | % | | 20 | % |
| 2016 | | | 26.11 | | | | 0.50 | | | | 0.46 | | | | (0.51 | ) | | | — | | | | 26.56 | | | 3.72 | | | | 253,083 | | | 1.01 | | | 1.90 | | | 1.01 | | | 25 | |
| 2015 | | | 26.23 | | | | 0.47 | | | | (0.12 | ) | | | (0.47 | ) | | | — | | | | 26.11 | | | 1.34 | | | | 255,013 | | | 1.01 | | | 1.79 | | | 1.03 | | | 21 | |
| 2014 | | | 25.89 | | | | 0.57 | | | | 0.34 | | | | (0.57 | ) | | | — | | | | 26.23 | | | 3.54 | | | | 204,264 | | | 1.01 | | | 2.17 | | | 1.04 | | | 28 | |
| 2013* | | | 26.76 | | | | 0.60 | | | | (0.85 | ) | | | (0.62 | ) | | | — | | | | 25.89 | | | (0.96 | ) | | | 155,740 | | | 1.02 | | | 3.04 | | | 1.04 | | | 21 | |
| 2012 | | | 25.68 | | | | 0.95 | | | | 1.08 | | | | (0.95 | ) | | | — | | | | 26.76 | | | 7.99 | | | | 130,359 | | | 1.13 | | | 3.59 | | | 1.12 | | | 26 | |
| * | For the nine months ended September 30, 2013, and the year or period ended December 31. Effective March 29, 2013, Rochdale Investment Trust’s Rochdale Intermediate Fixed Income Portfolio (the “Predecessor Fund”) was merged into City National Rochdale Funds’ City National Rochdale Intermediate Fixed Income Fund. Information presented for the period prior to March 29, 2013, is that of the respective Predecessor Fund, which had a December 31 fiscal year end. |
| † | Per share calculations are based on Average Shares outstanding throughout the period. |
| ‡ | Returns are for the period indicated and have not been annualized. Fee waivers are in effect; if they had not been in effect, performance would have been lower. Returns shown do not reflect the deduction of taxes that a shareholder would pay on fund distributions or the redemption of fund shares. |
| ^^ | Amount represents less than $0.01. |
| (1) | Annualized for periods less than one year. |
| (2) | Ratio includes waivers and previously waived investment advisory fees recovered. The impact of the recovered fees may cause a higher net expense ratio. |
Amounts designated as “—” are either $0 or have been rounded to $0.
See accompanying notes to financial statements.
CITY NATIONAL ROCHDALE FUNDS | PAGE 133
| financial highlights/consolidated financial highlights |
For a Share Outstanding Throughout Each Period
For the year or period ended September 30, |
| | | | Net Asset Value Beginning of Period | | Net Investment Income† | | Net Realized and Unrealized Gains (Losses) on Securities† | | Redemption Fees† | | Dividends from Net Investment Income | | | Distributions from Realized Capital Gains | | | Distributions from Return of Capital | | | Net Asset Value End of Period | | Total Return‡ | | | Net Assets End of Period (000) | | Ratio of Expenses to Average Net Assets(1)(2) | | Ratio of Net Investment Income to Average Net Assets(1)(2) | | Ratio of Expenses to Average Net Assets (Excluding Waivers & Recovered Fees)(1) | | Portfolio Turnover Rate | |
| City National Rochdale Fixed Income Opportunities Fund | |
| Class N (commenced operations on July 1, 2009) | |
| 2017 | | | $ | 25.36 | | $ | 1.30 | | $ | 0.67 | | $ | — | | $ | (1.52 | ) | | $ | — | | | $ | — | | | $ | 25.81 | | | 7.99 | % | | $ | 2,740,248 | | | 1.10 | %(6) | | 5.04 | % | | 1.09 | %(6) | | 140 | % |
| 2016 | | | | 25.22 | | | 1.28 | | | 0.65 | | | — | | | (1.79 | ) | | | — | | | | — | | | | 25.36 | | | 8.04 | | | | 2,162,580 | | | 1.10 | (5) | | 5.15 | | | 1.10 | (5) | | 124 | |
| 2015 | | | | 27.19 | | | 1.34 | | | (1.59 | ) | | — | | | (1.60 | ) | | | (0.12 | ) | | | — | | | | 25.22 | | | (0.88 | ) | | | 1,641,954 | | | 1.10 | (4) | | 5.08 | | | 1.12 | (4) | | 73 | |
| 2014 | | | | 26.83 | | | 1.28 | | | 0.38 | | | — | | | (1.17 | ) | | | (0.13 | ) | | | — | | | | 27.19 | | | 6.20 | | | | 1,391,497 | | | 1.11 | (3) | | 4.65 | | | 1.12 | (3) | | 82 | |
| 2013 | * | | | 27.20 | | | 1.28 | | | (0.43 | ) | | — | | | (1.22 | ) | | —^ | | | | — | | | | 26.83 | | | 3.16 | | | | 924,444 | | | 1.08 | | | 6.24 | | | 1.11 | | | 52 | |
| 2012 | | | | 26.16 | | | 1.70 | | | 1.04 | | | — | | | (1.64 | ) | | | (0.06 | ) | | | — | | | | 27.20 | | | 10.70 | | | | 654,095 | | | 1.12 | | | 6.29 | | | 1.12 | | | 41 | |
| City National Rochdale Dividend & Income Fund | |
| Class N (commenced operations on June 1, 1999) | |
| 2017 | | | $ | 39.68 | | $ | 0.94 | | $ | 0.90 | | $ | — | | $ | (1.12 | ) | | $ | — | | | $ | — | | | $ | 40.40 | | | 4.66 | % | | $ | 253,209 | | | 1.13 | % | | 2.33 | % | | 1.13 | % | | 15 | % |
| 2016 | | | | 34.22 | | | 0.94 | | | 5.67 | | | — | | | (0.97 | ) | | | (0.03 | ) | | | (0.15 | ) | | | 39.68 | | | 19.50 | | | | 236,957 | | | 1.11 | | | 2.49 | | | 1.12 | | | 5 | |
| 2015 | | | | 35.08 | | | 0.94 | | | (0.72 | ) | | — | | | (1.08 | ) | | | — | | | | — | | | | 34.22 | | | 0.53 | | | | 187,685 | | | 1.11 | | | 2.60 | | | 1.13 | | | 13 | |
| 2014 | | | | 32.25 | | | 0.95 | | | 2.96 | | | — | | | (1.08 | ) | | | — | | | | — | | | | 35.08 | | | 12.20 | | | | 172,917 | | | 1.09 | | | 2.74 | | | 1.14 | | | 16 | |
| 2013 | * | | | 29.07 | | | 0.62 | | | 3.37 | | | — | | | (0.54 | ) | | | — | | | | (0.27 | ) | | | 32.25 | | | 13.74 | | | | 155,807 | | | 1.16 | | | 2.55 | | | 1.19 | | | 17 | |
| 2012 | | | | 28.06 | | | 0.92 | | | 1.17 | | | — | | | (0.92 | ) | | | — | | | | (0.16 | ) | | | 29.07 | | | 7.49 | | | | 116,138 | | | 1.38 | | | 3.18 | | | 1.37 | | | 13 | |
| City National Rochdale U.S. Core Equity Fund | |
| Institutional Class (commenced operations on December 3, 2012) | |
| 2017 | | | $ | 14.00 | | $ | 0.17 | | $ | 2.43 | | $ | — | | $ | (0.17 | ) | | $ | (0.60 | ) | | $ | — | | | $ | 15.83 | | | 19.40 | % | | $ | 17 | | | 0.53 | % | | 1.19 | % | | 0.53 | % | | 25 | % |
| 2016 | | | | 13.04 | | | 0.13 | | | 1.07 | | | — | | | (0.15 | ) | | | (0.09 | ) | | | — | | | | 14.00 | | | 9.25 | | | | 14 | | | 0.52 | | | 0.93 | | | 0.52 | | | 31 | |
| 2015 | | | | 14.21 | | | 0.11 | | | 0.13 | | | — | | | (0.10 | ) | | | (1.31 | ) | | | — | | | | 13.04 | | | 1.79 | | | | 6,870 | | | 0.52 | | | 0.79 | | | 0.52 | | | 32 | |
| 2014 | | | | 12.13 | | | 0.08 | | | 2.30 | | | — | | | (0.08 | ) | | | (0.22 | ) | | | — | | | | 14.21 | | | 19.86 | | | | 6,759 | | | 0.53 | | | 0.59 | | | 0.53 | | | 60 | |
| 2013 | | | | 10.00 | | | 0.14 | | | 2.08 | | | — | | | (0.09 | ) | | | — | | | | — | | | | 12.13 | | | 22.23 | | | | — | | 0.00^ | | | 1.57 | | 0.00^ | | | 32 | |
| Class N (commenced operations on December 3, 2012) | |
| 2017 | | | $ | 13.86 | | $ | 0.10 | | $ | 2.40 | | $ | — | | $ | (0.10 | ) | | $ | (0.60 | ) | | $ | — | | | $ | 15.66 | | | 18.81 | % | | $ | 127,086 | | | 1.03 | % | | 0.70 | % | | 1.03 | % | | 25 | % |
| 2016 | | | | 12.92 | | | 0.08 | | | 1.03 | | | — | | | (0.08 | ) | | | (0.09 | ) | | | — | | | | 13.86 | | | 8.63 | | | | 108,807 | | | 1.02 | | | 0.58 | | | 1.02 | | | 31 | |
| 2015 | | | | 14.09 | | | 0.04 | | | 0.14 | | | — | | | (0.04 | ) | | | (1.31 | ) | | | — | | | | 12.92 | | | 1.31 | | | | 102,753 | | | 1.02 | | | 0.29 | | | 1.02 | | | 32 | |
| 2014 | | | | 12.08 | | | 0.01 | | | 2.23 | | | — | | | (0.01 | ) | | | (0.22 | ) | | | — | | | | 14.09 | | | 18.80 | | | | 97,205 | | | 1.03 | | | 0.09 | | | 1.04 | | | 60 | |
| 2013 | | | | 10.00 | | | 0.05 | | | 2.08 | | | — | | | (0.05 | ) | | | — | | | | — | | | | 12.08 | | | 21.33 | | | | 66,145 | | | 0.99 | | | 0.52 | | | 0.99 | | | 32 | |
| Servicing Class (commenced operations on December 3, 2012) | |
| 2017 | | | $ | 13.88 | | $ | 0.14 | | $ | 2.40 | | $ | — | | $ | (0.13 | ) | | $ | (0.60 | ) | | $ | — | | | $ | 15.69 | | | 19.14 | % | | $ | 130,372 | | | 0.78 | % | | 0.95 | % | | 0.78 | % | | 25 | % |
| 2016 | | | | 12.93 | | | 0.11 | | | 1.04 | | | — | | | (0.11 | ) | | | (0.09 | ) | | | — | | | | 13.88 | | | 8.97 | | | | 111,013 | | | 0.77 | | | 0.83 | | | 0.77 | | | 31 | |
| 2015 | | | | 14.11 | | | 0.07 | | | 0.13 | | | — | | | (0.07 | ) | | | (1.31 | ) | | | — | | | | 12.93 | | | 1.48 | | | | 104,220 | | | 0.77 | | | 0.54 | | | 0.77 | | | 32 | |
| 2014 | | | | 12.09 | | | 0.05 | | | 2.24 | | | — | | | (0.05 | ) | | | (0.22 | ) | | | — | | | | 14.11 | | | 19.15 | | | | 103,246 | | | 0.78 | | | 0.34 | | | 0.79 | | | 60 | |
| 2013 | | | | 10.00 | | | 0.07 | | | 2.08 | | | — | | | (0.06 | ) | | | — | | | | — | | | | 12.09 | | | 21.60 | | | | 68,919 | | | 0.74 | | | 0.73 | | | 0.74 | | | 32 | |
| City National Rochdale Emerging Markets Fund | |
| Class N (commenced operations on December 14, 2011) | |
| 2017 | | | $ | 41.67 | | $ | (0.05 | ) | $ | 11.13 | | $ | — | | $ | (0.07 | ) | | $ | — | | | $ | — | | | $ | 52.68 | | | 26.66 | % | | $ | 175,875 | | | 1.61 | % | | (0.12 | )% | | 1.61 | % | | 24 | % |
| 2016 | | | | 35.38 | | | 0.04 | | | 6.26 | | | — | | | (0.01 | ) | | | — | | | | — | | | | 41.67 | | | 17.81 | | | | 112,388 | | | 1.61 | | | 0.11 | | | 1.62 | | | 15 | †† |
| 2015 | | | | 38.90 | | | 0.09 | | | (3.48 | ) | | — | | | (0.13 | ) | | | — | | | | — | | | | 35.38 | | | (8.74 | ) | | | 684,182 | | | 1.61 | | | 0.21 | | | 1.65 | | | 34 | |
| 2014 | | | | 34.24 | | | 0.22 | | | 4.55 | | | — | | | (0.11 | ) | | | — | | | | — | | | | 38.90 | | | 13.96 | | | | 582,490 | | | 1.61 | | | 0.58 | | | 1.64 | | | 42 | |
| 2013 | * | | | 32.31 | | | 0.33 | | | 1.60 | | | — | | | — | | | | — | | | | — | | | | 34.24 | | | 5.97 | | | | 294,040 | | | 1.62 | | | 1.31 | | | 1.69 | | | 25 | |
| 2012 | | | | 25.28 | | | 0.04 | | | 7.00 | | | 0.01 | | | — | | | | — | | | | (0.02 | ) | | | 32.31 | | | 27.87 | | | | 136,838 | | | 1.97 | | | 0.15 | | | 1.94 | | | 69 | |
| Class Y (commenced operations on June 1, 2016) | |
| 2017 | | | $ | 41.71 | | $ | 0.06 | | $ | 11.14 | �� | $ | — | | $ | (0.10 | ) | | $ | — | | | $ | — | | | $ | 52.81 | | | 26.95 | % | | $ | 1,386,857 | | | 1.36 | % | | 0.14 | % | | 1.36 | % | | 24 | % |
| 2016 | | | | 38.33 | | | 0.10 | | | 3.28 | | | — | | | — | | | | — | | | | — | | | | 41.71 | | | 8.82 | | | | 880,876 | | | 1.37 | | | 0.74 | | | 1.37 | | | 15 | †† |
| * | For the nine months ended September 30, 2013, and the year or period ended December 31. Effective March 29, 2013, Rochdale Investment Trust’s Fixed Income Opportunities Portfolio, Rochdale Investment Trust’s Rochdale Dividend & Income Portfolio, and Rochdale Emerging Markets Portfolio (each a “Predecessor Fund”) were merged into City National Rochdale Funds’ City National Rochdale Fixed Income Opportunities Fund, City National Rochdale Funds’ City National Rochdale Dividend & Income Fund, and City National Rochdale Emerging Markets Fund, respectively. Information presented for the period prior to March 29, 2013, is that of the respective Predecessor Fund, which had a December 31 fiscal year end. |
| † | Per share calculations are based on Average Shares outstanding throughout the period. |
| †† | Portfolio turnover rate is presented at the Fund level. |
| ‡ | Returns are for the period indicated and have not been annualized. Fee waivers are in effect; if they had not been in effect, performance would have been lower. Returns shown do not reflect the deduction of taxes that a shareholder would pay on fund distributions or the redemption of fund shares. |
| ^ | Amount represents less than $0.01 per share. |
| (1) | Annualized for periods less than one year. |
| (2) | Ratio includes waivers and previously waived investment advisory fees recovered. The impact of the recovered fees may cause a higher net expense ratio. |
| (3) | The expense ratio includes acquired fund fee expenses from the investment in the Subsidiary. Had this expense been excluded, the ratios would have been 1.09% and 1.10%, respectively. |
| (4) | The expense ratio includes acquired fund fee expenses from the investment in the Subsidiary. Had this expense been excluded, the ratios would have been 1.09% and 1.11%, respectively. |
| (5) | The expense ratio includes acquired fund fee expenses from the investment in the Subsidiary. Had this expense been excluded, the ratios would have been 1.09% and 1.09%, respectively. |
| (6) | The expense ratio includes acquired fund fee expenses from the investment in the Subsidiary. Had this expense been excluded, the ratios would have been 1.09% and 1.08%, respectively. |
Amounts designated as “—” are either $0 or have been rounded to $0.
See accompanying notes to financial statements.
CITY NATIONAL ROCHDALE FUNDS | PAGE 134
notes to financial statements/
consolidated notes to financial statements |
| September 30, 2017 |
City National Rochdale Funds, a Delaware statutory trust (the “Trust”), is registered under the Investment Company Act of 1940, as amended ( the “1940 Act”), as an open-end management investment company currently offering the following 11 series (each a “Fund” and collectively, the “Funds”): City National Rochdale Government Money Market Fund (“Government Money Market Fund”); City National Rochdale Government Bond Fund (“Government Bond Fund”), City National Rochdale Corporate Bond Fund (“Corporate Bond Fund”), City National Rochdale California Tax Exempt Bond Fund (“California Tax Exempt Bond Fund”), City National Rochdale Municipal High Income Fund (“Municipal High Income Fund”), City National Rochdale High Yield Bond Fund (“High Yield Bond Fund”), City National Rochdale Intermediate Fixed Income Fund (“Intermediate Fixed Income Fund”), and City National Rochdale Fixed Income Opportunities Fund (“Fixed Income Opportunities Fund”) (collectively, the “Fixed Income Funds”); and City National Rochdale Dividend & Income Fund (“Dividend & Income Fund”), City National Rochdale U.S. Core Equity Fund (“U.S. Core Equity Fund”), and City National Rochdale Emerging Markets Fund (“Emerging Markets Fund”) (collectively, the “Equity Funds”).
On June 1, 2016, a new Class Y of the Emerging Markets Fund opened.
The City National Rochdale California Tax Exempt Money Market Fund was liquidated on October 3, 2016.
The assets of each Fund are segregated, and a shareholder’s interest is limited to the Fund in which shares are held. Each Fund is diversified with the exception of the California Tax Exempt Bond Fund and the Emerging Markets Fund, which are non-diversified.
2. | SIGNIFICANT ACCOUNTING POLICIES: |
The following is a summary of significant accounting policies followed by the Funds.
Use of Estimates – The Funds are investment companies that conform with accounting principles generally accepted in the United States of America (“GAAP”). Therefore the Funds follow the accounting and reporting guidance for investment companies. The preparation of financial statements in conformity with GAAP requires management to make estimates and assumptions that affect the reported amounts of assets and liabilities and disclosure of contingent assets and liabilities at the date of the financial statements and the reported amounts of increases and decreases in net assets from operations during the reporting period. Actual results could differ from those estimates.
Security Valuation – Securities listed on a securities exchange, market or automated quotation system for which quotations are readily available (except for securities traded on NASDAQ) are valued at the last quoted sale price on the primary exchange or market (foreign or domestic) on which they are traded, or, if there is no such reported sale, at the most recent quoted bid price. For securities traded on NASDAQ, the NASDAQ Official Closing Price is used. If available, debt securities are priced based upon valuations provided by independent, third-party pricing agents. Such values generally reflect the last reported sales price if the security is actively traded. The third-party pricing agents may also value debt securities at an evaluated bid price by employing methodologies that utilize actual market transactions, broker-supplied valuations, or other methodologies designed to identify the market value for such securities. Debt obligations with remaining maturities of sixty days or less may be valued at their amortized cost, if the Funds’ Fair Value Committee concludes it approximates market value after taking into account factors such as credit, liquidity and interest rate conditions as well as issuer specific factors. Investments in underlying registered investment companies are valued at their respective daily net assets in accordance with pricing procedures approved by their respective boards. The prices for foreign securities are reported in local currency and converted to U.S. dollars using currency exchange rates. Prices for most securities held by the Funds are provided daily by recognized independent pricing agents. If a security price cannot be obtained from an independent, third-party pricing agent, the Funds seek to obtain a bid price from one or more independent brokers.
Securities for which market prices are not “readily available” are valued in accordance with Fair Value Procedures established by the Trust’s Board of Trustees. The Funds’ Fair Value Procedures are implemented through a Fair Value Committee (the “Committee”) designated by the Trust’s Board of Trustees. Some of the more common reasons that may necessitate that a security be valued using Fair Value Procedures include: the security’s trading has been halted or suspended; the security has been de-listed from a national exchange; the security’s primary trading market is temporarily closed at a time when under normal conditions it would be open; for international securities, market events occur after the close of the foreign markets that make closing prices not representative of fair value; or the security’s primary pricing source is not able or willing to provide a price. When a security is valued in accordance with the Fair Value
CITY NATIONAL ROCHDALE FUNDS | PAGE 135
notes to financial statements/
consolidated notes to financial statements |
| September 30, 2017 |
Procedures, the Committee will determine the value after taking into consideration relevant information reasonably available to the Committee.
Beginning January 1, 2017, investments in life settlement policies (“Policies”) are valued using a probabilistic method, for an actuarially derived valuation approach, in order to determine the fair value of each Policy. Previously, the Policies were valued using a deterministic method. The change in methodology resulted in approximately $22.5 million decrease to the fair value. The Fair Value Procedures recognize that the Policies are illiquid and that no market currently exists for the Policies. Under the probabilistic method, two life expectancies are obtained from established life expectancy providers on the insured(s) of the Policy and an actuarial table is used to determine the probability of survival in each year going forward for the insured(s) for each of the two life expectancies. The probabilities associated with each life expectancy are then utilized along with the premiums due and the death benefit of the Policy for each year of the Policy to determine expected cash flows. These cash flows are then discounted at a rate that accounts for the risk associated with the Policy and various other factors. The valuations from each life expectancy are then typically averaged to obtain the desired market valuation for the investor. Life settlement policies are included in Level 3 of the fair value hierarchy.
In accordance with GAAP, the objective of a fair value measurement is to determine the price that would be received to sell an asset or paid to transfer a liability in an orderly transaction between market participants at the measurement date (an exit price). The fair value hierarchy gives the highest priority to quoted prices (unadjusted) in active markets for identical assets or liabilities (Level 1) and the lowest priority to unobservable inputs (Level 3). The three levels of the fair value hierarchy are described below:
| | ● | Level 1 — Unadjusted quoted prices in active markets for identical, unrestricted assets or liabilities that the Funds have the ability to access at the measurement date; |
| | ● | Level 2 — Quoted prices in inactive markets, or inputs that are observable (either directly or indirectly) for substantially the full term of the asset or liability; and |
| | ● | Level 3 — Prices, inputs or exotic modeling techniques which are both significant to the fair value measurement and unobservable (supported by little or no market activity). |
Investments are classified within the level of the lowest significant input considered in determining fair value. Investments classified within Level 3, the fair value measurement of which considers several inputs, may include Level 1 or Level 2 inputs as components of the overall fair value measurement.
For the year ended September 30, 2017, the Funds’ fair valuation methodology for Policies changed from a discounted cash flow model, which used a “deterministic method” for valuing the Policies, to the probabilistic method described above. None of the Funds’ other fair valuation methodologies changed during the period. For more details on the investment classifications, refer to the Schedules of Investments/Consolidated Schedule of Investments.
Security Transactions and Related Income – Security transactions are accounted for on the trade date of the security purchase or sale. Costs used in determining net realized capital gains and losses on the sale of securities are those of the specific securities sold. Interest income is recognized on an accrual basis and dividend income is recognized on the ex-dividend date. Purchase discounts and premiums on securities held by the Funds are accreted and amortized to maturity using the scientific method, which approximates the effective interest method over the holding period of a security, except for the Government Money Market Fund, which use a straight line basis which is not materially different from the scientific method.
Repurchase Agreements – Securities pledged as collateral for repurchase agreements are held by BNY Mellon until maturity of the repurchase agreements. Provisions of the agreements and procedures adopted by the investment adviser require that the market value of the collateral, including accrued interest thereon, is sufficient in the event of default by the counterparty. The Funds also invest in tri-party repurchase agreements. Securities held as collateral for tri-party repurchase agreements are maintained by the broker’s custodian bank in a segregated account until maturity of the repurchase agreements. Provisions of the agreements require that the market value of the collateral, including accrued interest thereon, is sufficient in the event of default. If the counterparty defaults and the value of the collateral declines or if the counterparty enters into an insolvency proceeding, realization of the collateral by a Fund may be delayed or limited.
TBA Transactions – The Funds may engage in “to be announced” (“TBA”) security transactions. Such transactions involve a commitment by a Fund to purchase or sell securities for a predetermined price or yield, with payment and delivery taking place beyond the customary settlement period. The Funds
CITY NATIONAL ROCHDALE FUNDS | PAGE 136
record TBA securities on the trade date and maintain security positions such that sufficient liquid assets will be available to make payments for the securities purchased.
Expense Allocation – Common expenses incurred by the Funds are allocated among the Funds (i) based upon relative average daily net assets, (ii) as incurred on a specific identification basis, (iii) equally, or (iv) a combination of the above, depending on the nature of the expenditure.
Classes – Class-specific expenses are borne by that class. Income, non class-specific expenses, and realized and unrealized gains/losses are allocated to the respective class on the basis of relative net asset value each day.
Dividends and Distributions to Shareholders – Dividends from net investment income are declared daily and paid to shareholders monthly for the Government Money Market Fund and Fixed Income Funds except for the Intermediate Fixed Income Fund and Fixed Income Opportunities Fund. Dividends from net investment income are declared and paid quarterly for the Intermediate Fixed Income Fund, Fixed Income Opportunities Fund and Equity Funds, except for the Emerging Markets Fund. Dividends from net investment income are declared and paid annually for the Emerging Markets Fund. Distributions from net realized capital gains are distributed to shareholders at least annually.
Foreign Currency – Values of investments denominated in foreign currencies are converted into U.S. dollars using the spot market rate of exchange at the time of valuation. Purchases and sales of investments and dividend and interest income are translated into U.S. dollars using the spot market rate of exchange prevailing on the respective dates of such translations. The gain or loss upon the sale of a security resulting from changes in foreign exchange rates is included with the net realized and unrealized gain or loss from investments, as appropriate. Foreign securities and currency transactions may involve certain considerations and risks not typically associated with those of domestic origin.
Forward Foreign Currency Contracts – A forward foreign currency contract is an agreement between two parties to buy or sell a currency at a set price on a future date. Forward contracts are marked to market daily and the change in market value is recorded as an unrealized gain (loss) on forward foreign currency contracts in the Statements of Assets and Liabilities/Consolidated Statement of Assets and Liabilities. When a contract is closed, a Fund records a realized gain or loss equal to the difference between the value of the contract at the time it was opened and the value at the time it was closed, which is included within realized gain (loss) on foreign currency transactions in the Statements of Operations/Consolidated Statement of Operations. A Fund could be at risk if the counterparties are unable to meet the terms of the contracts or if the value of the currency changes unfavorably.
To reduce counterparty risk with respect to over-the-counter (“OTC”) transactions, the High Yield Bond Fund and the Fixed Income Opportunities Fund have entered into master netting arrangements, established within the High Yield Bond Fund’s and the Fixed Income Opportunities Fund’s International Swaps and Derivatives Association, Inc. (“ISDA”) master agreements, which allow the High Yield Bond Fund and the Fixed Income Opportunities Fund to make (or to have an entitlement to receive) a single net payment in the event of default (close-out netting) for outstanding payables and receivables with respect to certain OTC positions in forward foreign currency contracts for each individual counterparty. In addition, the High Yield Bond Fund and the Fixed Income Opportunities Fund may require that certain counterparties post cash and/or securities in collateral accounts to cover their net payment obligations for those derivative contracts subject to ISDA master agreements. If the counterparty fails to perform under these contracts and agreements, the cash and/or securities will be made available to the High Yield Bond Fund and/or the Fixed Income Opportunities Fund.
For financial reporting purposes, the High Yield Bond Fund and the Fixed Income Opportunities Fund do not offset derivative assets and derivative liabilities that are subject to netting arrangements in the Statements of Assets and Liabilities/Consolidated Statement of Assets and Liabilities. Bankruptcy or insolvency laws of a particular jurisdiction may impose restrictions on or prohibitions against the right of offset in bankruptcy, insolvency or other events.
Collateral terms are contract specific for OTC derivatives. For derivatives traded under an ISDA master agreement, the collateral requirements are typically calculated by netting the mark to market amount of each transaction under such agreement and comparing that amount to the value of any collateral currently pledged by the High Yield Bond Fund and the Fixed Income Opportunities Fund, or the counterparty.
For financial reporting purposes, cash collateral that has been pledged to cover obligations of the High Yield Bond Fund and the Fixed Income Opportunities Fund, if any, is reported separately on the Statements of Assets and Liabilities/Consolidated Statement of Assets and Liabilities as cash pledged as collateral. Non-cash collateral pledged by the High Yield
CITY NATIONAL ROCHDALE FUNDS | PAGE 137
notes to financial statements/
consolidated notes to financial statements |
| September 30, 2017 |
Bond Fund and the Fixed Income Opportunities Fund, if any, is noted in the Schedule of Investments/Consolidated Schedule of Investments. Generally, the amount of collateral due from or to a party must exceed a minimum transfer amount threshold before a transfer has to be made. To the extent amounts due to the High Yield Bond Fund and the Fixed Income Opportunities Fund from the Funds' counterparties are not fully collateralized, contractually or otherwise, the High Yield Bond Fund and the Fixed Income Opportunities Fund bear the risk of loss from counterparty nonperformance.
The following tables present, by derivative type, the High Yield Bond Fund’s and the Fixed Income Opportunities Fund’s OTC derivative assets and liabilities net of the related collateral posted for the benefit of the High Yield Bond Fund and the Fixed Income Opportunities Fund at September 30, 2017 (000):
| Derivative Type | | Derivative Assets Subject to a Netting Agreement or Similar Arrangement | | | Derivative Available for Offset | | | Collateral Received | | | Net Amount | |
| High Yield Bond Fund | |
| JP Morgan Chase Bank | | | | | | | | | | | | |
| Forward Foreign Currency Contracts | | $ | 10 | | | $ | — | | | $ | — | | | $ | 10 | |
| Fixed Income Opportunities Fund | |
| U.S. Bank | | | | | | | | | | | | | | | | |
| Forward Foreign Currency Contracts | | | 2,503 | | | | (993 | ) | | | — | | | | 1,510 | |
| Derivative Type | | Derivative Liabilities Subject to a Netting Agreement or Similar Arrangement | | | Derivative Available for Offset | | | Collateral Pledged | | | Net Amount | |
| High Yield Bond Fund | |
| Robert W. Baird | | | | | | | | | | | | |
| Forward Foreign Currency Contracts | | $ | (13 | ) | | $ | — | | | $ | — | | | $ | (13 | ) |
| Fixed Income Opportunities Fund | |
| U.S. Bank | | | | | | | | | | | | | | | | |
| Forward Foreign Currency Contracts | | | (993 | ) | | | 993 | | | | — | | | | — | |
Futures Contracts – To the extent consistent with their investment objective and strategies, certain Funds may use futures contracts for tactical hedging purposes as well as to enhance the Funds’ returns. Initial margin deposits of cash or securities are made upon entering into futures contracts. The contracts are marked to market daily and the resulting changes in value are accounted for as unrealized gains or losses. Variation margin payments are paid or received, depending upon whether unrealized gains or losses are incurred. When a contract is closed, a Fund records a realized gain or loss equal to the difference between the proceeds from (or cost of) the closing transaction and the amount invested in the contract.
Risks of entering into futures contracts include the possibility that there will be an imperfect price correlation between the futures contract and the underlying securities. Second, it is possible that a lack of liquidity for futures contracts could exist in the secondary market, resulting in an inability to close a position prior to its maturity date. Third, futures contracts involve the risk that a Fund could lose more than the original margin deposit required to initiate a futures transaction.
Finally, the risk exists that losses could exceed amounts disclosed on the Statements of Assets and Liabilities or Consolidated Statement of Assets and Liabilities. As of September 30, 2017, there were no open futures contracts.
Options Contracts – A Fund may also purchase put and call options. Purchasing call options tends to increase a Fund’s exposure to the underlying instrument. Purchasing put options tends to decrease a Fund’s exposure to the underlying instrument. When purchasing an option, a Fund will pay a premium which is included on the Fund’s Statement of Assets and Liabilities and subsequently marked to market to reflect the current value of the option. Premiums paid for purchasing options which expire are treated as realized losses. Certain options may be purchased with premiums to be determined on a future date. The premiums for these options are based upon implied volatility parameters at specified terms. The risk associated with purchasing put and call options is limited to the premium paid. Premiums paid for purchasing options which are exercised or closed are added to the amounts paid or offset against the proceeds on the underlying investment transaction to determine the unrealized gain or loss.
The net realized gain or loss on options contracts is reflected in the Statement of Operations and the net unrealized gains/(losses) are included as a component of the net change in unrealized appreciation/(depreciation) on options contracts in the Statement of Operations. Realized and changes in unrealized gains or losses on options contracts during the period as
CITY NATIONAL ROCHDALE FUNDS | PAGE 138
disclosed in the Statements of Operations, serve as indicators of the volume of derivative activity for a Fund. As of September 30, 2017, there were no open options contracts.
Restricted Securities – Restricted securities include securities that have not been registered under the Securities Act of 1933, as amended, and securities that are subject to restrictions on resale.
A Fund may invest in restricted securities that are consistent with the Fund’s investment objective and investment strategies. A Fund will not invest in a restricted security if, immediately after and as a result of the investment in such security, more than 15% (5% in the case of the Government Money Market Fund) of the Fund’s net assets would be invested in illiquid securities. In some cases, the issuer of restricted securities has agreed to register such securities for resale, at the issuer’s expense either upon demand by a Fund or in connection with another registered offering of the securities. Investments in restricted securities are valued at fair value as determined in good faith in accordance with procedures adopted by the Board of Trustees. It is possible that the estimated value may differ significantly from the amount that might ultimately be realized in the near term, and the difference could be material.
Master Limited Partnerships – Entities commonly referred to as “MLPs” are generally organized under state law as limited partnerships or limited liability companies. The Dividend & Income Fund may, as a non-principal investment strategy, invest in MLPs receiving partnership taxation treatment under the Internal Revenue Code of 1986, interests or “units” of which are traded on securities exchanges like shares of corporate stock. To qualify as an MLP for U.S. Federal income tax purposes, an entity must receive at least 90% of its income from qualifying sources such as interest, dividends, real estate rents, gains from the sale or disposition of real property, income and gains from certain mineral or natural resources activities, income and gains from the transportation or storage of certain fuels, and, in certain circumstances, income and gains from commodities or futures, forwards and options with respect to commodities, and gains from the sale or other disposition of a capital asset held for the production of such income. Mineral or natural resources activities include exploration, development, production, mining, processing, refining, marketing and transportation (including pipelines), of oil and gas, minerals, geothermal energy, fertilizer, timber or industrial source carbon dioxide. An MLP consists of a general partner and limited partners (or in the case of MLPs organized as limited liability companies, a managing member and members). The general partner or managing member typically controls the operations and management of the MLP and has an ownership stake in the partnership. The limited partners or members, through their ownership of limited partner or member interests, provide capital to the entity, are intended to have no role in the operation and management of the entity, and receive cash distributions. The MLPs themselves generally do not pay U.S. Federal income taxes. Thus, unlike investors in corporate securities, direct MLP investors are generally not subject to double taxation (i.e., corporate level tax and tax on corporate dividends). Currently, most MLPs operate in the energy, natural resources or real estate sectors.
Investments in Irish Subsidiary – The Fixed Income Opportunities Fund may invest up to 15% of its net assets in life insurance policies and interests related thereto purchased through life settlement transactions. The Fund may invest in life insurance policies and related interests directly or through a wholly-owned subsidiary of the Fund under the laws of Ireland (the “Subsidiary”).
The principal purpose of investment in the Subsidiary is to allow the Fixed Income Opportunities Fund to gain exposure to life insurance policies within the limitations of the federal tax law requirements applicable to regulated investment companies. The Subsidiary is a company organized under the laws of Ireland and is overseen by its own board of directors. Although the Subsidiary has its own board of directors, the Subsidiary is wholly-owned and controlled by the Fund. The Subsidiary is not an investment company registered under the 1940 Act and is not subject to all of the investor protections of the 1940 Act.
Information regarding the Fixed Income Opportunities Fund and the Subsidiary has been consolidated in the Consolidated Schedule of Investments, Consolidated Statement of Assets and Liabilities, Consolidated Statement of Operations, Consolidated Statement of Changes in Net Assets and Consolidated Statement of Cash Flows.
The Subsidiary commenced operations on October 3, 2013. The net assets of the Subsidiary at September 30, 2017, were $160,003,996, which represented 5.8% of the net assets of the Fixed Income Opportunities Fund.
Investments in Mauritius Subsidiary – To the extent that the Emerging Markets Fund seeks to invest in the securities of Indian companies, it currently intends to do so by investing in shares of a wholly-owned collective investment vehicle (the “Mauritius Subsidiary”) registered with and regulated by the Mauritius Financial Services Commission that is also managed by City National Rochdale. The Mauritius Subsidiary was formed to allow the Fund’s investments in Indian companies to benefit from a favorable tax treaty between Mauritius and India. In order to do so, the Mauritius Subsidiary will seek to maintain residency in Mauritius.
CITY NATIONAL ROCHDALE FUNDS | PAGE 139
notes to financial statements/
consolidated notes to financial statements |
| September 30, 2017 |
Due to the recent amendment of the tax treaty between India and Mauritius, the capital gains tax exemption on shares of Indian companies will be phased out over a two-year period that began on April 1, 2017, and ends on March 31, 2019. Shares of Indian companies acquired after April 1, 2017, will be subject to a reduced capital gains tax until March 31, 2019, and shares will be taxed at India’s full tax rate thereafter. There is no guarantee that the tax treaty will not be amended further.
Investments in Affiliated Securities – The Fixed Income Funds and Equity Funds may invest excess cash in the Government Money Market Fund and Municipal High Income Fund.
3. | ADMINISTRATION, TRANSFER AGENT, DISTRIBUTION AND SHAREHOLDER SERVICES AGREEMENTS: |
Pursuant to an Amended and Restated Administration Agreement dated January 1, 2013, as amended (the “Agreement”), SEI Investments Global Funds Services (the “Administrator”), a wholly owned subsidiary of SEI Investments Company, acts as the Trust’s administrator. Under the terms of the Agreement, the Administrator is entitled to receive an annual fee based on the average daily net assets of the Trust and subject to a minimum annual fee.
The Trust has adopted a Rule 12b-1 Distribution Plan (“the Plan”) with respect to Class N and Class S Shares that allows each Fund to pay distribution and servicing fees. Pursuant to the Plan, SEI Investments Distribution Co. (the “Distributor”) may receive a distribution fee, computed daily and paid monthly, at the annual rate of 0.50% of the average daily net assets of the Class S Shares and 0.30% of the average daily net assets of the Class N Shares of the Government Money Market Fund and 0.25% of the Class N Shares of the Fixed Income Funds and Equity Funds, which may be used by the Distributor to provide compensation for sales support and distribution-related activities. Pursuant to a Distribution Coordination Agreement, the entirety of the fees received by the Distributor pursuant to the Distribution Plan is transmitted to RIM Securities LLC (“RIM Securities”) as Sub-Distribution Coordinator. RIM Securities then reallows those fees to broker-dealers and service providers, including City National Rochdale and other affiliates, for payments for distribution services of the type identified in the Distribution Plan, and retains any undistributed balance of fees received from the Distributor.
US Bancorp Fund Services, LLC (the “Transfer Agent”) serves as transfer agent for the Trust and provides services at an annual rate of $20,000 per share class for all Funds plus other transaction based fees and out-of-pocket expenses.
The Trust has entered into Shareholder Servicing Agreements that permit payment of compensation to City National Bank (“CNB”) and its affiliates (including City National Rochdale), which provide certain shareholder support for their customers who own Class N, Class S, or Servicing Class Shares, as applicable. In consideration for such services, a shareholder servicing fee is charged at the annual rate of up to 0.25% of the average daily net assets of the relevant class of each Fund.
The Board has adopted, on behalf of Class Y shares of the Emerging Markets Fund, a Shareholder Service Plan (the “Service Plan”) under which City National Rochdale will provide, or arrange for others (such as banks, trust companies, broker-dealers and other financial intermediaries (each, a “Service Organization”)) to provide, certain specified non-distribution shareholder servicing functions for Class Y shares of the Emerging Markets Fund owned by its respective customers, including but not limited to (a) establishing and maintaining accounts and records relating to customers who invest in the Class; (b) aggregating and processing orders involving Class Y shares; (c) processing dividend and other distribution payments from the Class on behalf of customers; (d) preparing tax reports or forms on behalf of customers; (e) forwarding communications from the Fund; (f) providing subaccounting with respect to Class Y shares of the Fund or the information to the Fund necessary for subaccounting; (g) providing customers with a service that invests the assets of their accounts in Class Y shares of the Fund pursuant to specific or pre-authorized instructions; and (h) providing such other similar services as the Adviser may reasonably request to the extent it or a Service Organization is permitted to do so under applicable statutes, rules or regulations. The Class Y shares of the Emerging Markets Fund will pay the City National Rochdale or Service Organizations, as applicable, at an annual rate of up to 0.25% of the average daily net assets of Class Y shares owned by its respective customers, payable monthly.
CNB and City National Rochdale have agreed to voluntarily waive portions of their shareholder servicing fees with respect to certain Funds. For the year ended September 30, 2017, CNB and City National Rochdale received $23,445,372 in shareholder servicing fees from the Trust.
Certain officers of the Trust are also officers or employees of City National Rochdale, CNB or the Administrator. Such officers are paid no fees by the Trust for serving as officers of the Trust.
CITY NATIONAL ROCHDALE FUNDS | PAGE 140
4. | INVESTMENT ADVISORY FEES AND OTHER AGREEMENTS: |
Under the terms of the current investment management agreements, City National Rochdale receives an annual fee equal to a percentage of the average daily net assets of each Fund, as follows:
| Fund | Fee |
| Government Money Market Fund | 0.26% |
| Government Bond Fund | 0.43 |
| Corporate Bond Fund | 0.40 |
| California Tax Exempt Bond Fund | 0.27 |
| Municipal High Income Fund | 0.50 |
| High Yield Bond Fund | 0.60 |
| Intermediate Fixed Income Fund | 0.40 |
| Fixed Income Opportunities Fund | 0.50 |
| Dividend & Income Fund | 0.50 |
| U.S. Core Equity Fund | 0.40 |
| Emerging Markets Fund | 1.00 |
Guggenheim Partners Investment Management, LLC (“Guggenheim”) acts as the investment sub-adviser with respect to the High Yield Bond Fund.
Alcentra LTD, All Financial Partners II LLC, Ashmore Investment Management Limited, Federated Investment Management Company, GML Capital LLP and Seix Investment Advisors LLC act as the investment sub-advisers with respect to the Fixed Income Opportunities Fund.
Sub-adviser fees are paid by City National Rochdale.
City National Rochdale has voluntarily agreed to limit its fees or reimburse expenses to the extent necessary to keep operating expenses at or below certain percentages of certain of the Funds’ respective average daily net assets. The voluntary expense limitations (expressed as percentages of the average daily net assets) are as follows:
| | Government Money Market Fund | Government Bond Fund | Corporate Bond Fund |
| Institutional Class | n/a | 0.53% | n/a |
| Class N | 0.93% | 1.03% | 1.01% |
| Class S | 1.13% | n/a | n/a |
| Servicing Class | 0.63% | 0.78% | 0.76% |
| | California Tax Exempt Bond Fund | Intermediate Fixed Income Fund | Fixed Income Opportunities Fund |
| Institutional Class | n/a | 0.51% | n/a |
| Class N | 0.88% | 1.01% | 1.09% |
| Servicing Class | 0.63% | n/a | n/a |
Effective January 31, 2016, the Adviser discontinued the voluntary fee waivers for the Municipal High Income Fund, High Yield Bond Fund, Dividend & Income Fund, U.S. Core Equity Fund, and Emerging Markets Fund.
Any fee reductions or expense reimbursements may be repaid by a Fund to City National Rochdale, within three years after occurrence if such repayments can be achieved within the Fund’s expense limit in effect at the time such expenses were incurred and if certain other conditions are satisfied.
As of September 30, 2017, fees which were previously waived by City National Rochdale which may be subject to possible future reimbursement were as follows:
| Fund | Potential Amount of Recovery
(000) | Expiration |
| Government Money Market Fund | $ 3,066 | 2018 |
| | 345 | 2019 |
| Government Bond Fund | 74 | 2018 |
| | 79 | 2019 |
| | 136 | 2020 |
| Corporate Bond Fund | 89 | 2018 |
| | 109 | 2019 |
| | 156 | 2020 |
| California Tax Exempt Bond Fund | 109 | 2018 |
| | 105 | 2019 |
| | 158 | 2020 |
| Intermediate Fixed Income Fund | 43 | 2018 |
| | 8 | 2019 |
| | 59 | 2020 |
| Fixed Income Opportunities Fund | 248 | 2018 |
| Dividend & Income Fund | 44 | 2018 |
| | 12 | 2019 |
| Emerging Markets Fund | 291 | 2018 |
| | 47 | 2019 |
During the year ended September 30, 2017, the Adviser recovered $5,520 (000) and $222 (000) in previously waived fees for the Government Money Market Fund and Fixed Income Opportunities Fund, respectively.
City National Rochdale and CNB have voluntarily agreed to further waive and reduce their fees and/or reimburse certain expenses of the Government Money Market Fund in order to maintain a one-day net income yield (yield floor) of not less than
CITY NATIONAL ROCHDALE FUNDS | PAGE 141
notes to financial statements/
consolidated notes to financial statements |
| September 30, 2017 |
0.01% of the Fund’s average daily net assets. The following table shows waivers, with respect to such yield floor, by class for the year ended September 30, 2017:
| | | Shareholder Servicing Fee Waiver
(000) | |
| Government Money Market Fund | |
| Class N | | $ | 11,716 | (1) |
| Class S | | | 5,226 | (1) |
| Servicing Class | | | 619 | |
| (1) | Includes class specific distribution expenses. |
5. | INVESTMENT TRANSACTIONS: |
The cost of security purchases and proceeds from the sale and maturities of securities, other than temporary investments in short-term securities for the year ended September 30, 2017, were as follows for the Fixed Income Funds and Equity Funds:
| | | Purchases | | | Sales and Maturities | |
| Fund | | U.S. Gov’t (000) | | | Other
(000) | | | U.S. Gov’t (000) | | | Other
(000) | |
| Government Bond Fund | | $ | 63,984 | | | $ | — | | | $ | 104,592 | | | $ | 300 | |
| Corporate Bond Fund | | | — | | | | 36,475 | | | | 3 | | | | 30,613 | |
| California Tax Exempt Bond Fund | | | — | | | | 36,234 | | | | — | | | | 42,921 | |
| Municipal High Income Fund | | | — | | | | 579,683 | | | | — | | | | 481,513 | |
| High Yield Bond Fund | | | — | | | | 37,508 | † | | | — | | | | 40,550 | † |
| Intermediate Fixed Income Fund | | | 11,367 | | | | 35,843 | | | | 6,774 | | | | 50,341 | |
| Fixed Income Opportunities Fund | | | 31,489 | | | | 2,196,788 | ‡ | | | 33,285 | | | | 1,974,471 | ‡ |
| Dividend & Income Fund | | | — | | | | 55,884 | | | | — | | | | 35,526 | |
| U.S. Core Equity | | | — | | | | 61,379 | | | | — | | | | 58,408 | |
| Emerging Markets Fund | | | — | | | | 466,380 | | | | — | | | | 261,966 | |
| † | Includes 17a-7 related party transactions of $1,453 (000) and $1,703 (000), respectively. |
| ‡ | Includes 17a-7 related party transactions of $13,060 (000) and $1,853 (000), respectively. |
The Funds may purchase or sell investment securities in transactions with affiliated entities under procedures adopted by the Board of Trustees, pursuant to the 1940 Act. These transactions are effected at market rates without incurring broker commissions.
6. | FEDERAL TAX INFORMATION: |
Each Fund intends to qualify or continue to qualify as a regulated investment company for U.S. Federal income tax purposes and distribute all of its taxable income and net capital gains. Accordingly, no provisions for U.S. Federal income taxes are required.
Management has analyzed the Funds’ tax positions taken on U.S. Federal income tax returns for all open tax years and has concluded that as of September 30, 2017, no provision for income tax would be required in the Funds’ financial statements. The Funds’ U.S. Federal and state income and U.S. Federal excise tax returns for tax years for which the applicable statutes of limitations have not expired are subject to examination by the Internal Revenue Service and state departments of revenue.
The Funds may be subject to taxes imposed by countries in which they invest, with respect to their investments in issuers existing or operating in such countries. Such taxes are generally based on income earned. The Funds accrue such taxes when the related income is earned.
The timing and characterization of certain income and capital gains distributions are determined annually in accordance with U.S. Federal tax regulations, which may differ from accounting principles generally accepted in the United States of America. As a result, net investment income/(loss) and net realized gain/(loss) on investment transactions for a reporting period may differ significantly from distributions during such period. These book/tax differences may be temporary or permanent. To the extent these differences are permanent in nature, they are charged or credited to undistributed net investment income/(loss), accumulated net realized gain/(loss), or paid-in capital, as appropriate, in the period that the differences arise.
Accordingly, the following permanent differences, primarily attributable to foreign currency transactions, REIT adjustments, investments in partnerships, realized gains/(losses) on paydowns, default bonds, non-deductible excise tax paid, PFIC adjustments, expired capital loss carryforward, reclass of distribution, return of capital distribution received and market discount adjustment, were reclassified to/from the following accounts as of September 30, 2017:
| | | Increase (Decrease) Undistributed Net Investments Income (Loss) (000) | | | Increase (Decrease) Accumulated Net Realized Gain (Loss) (000) | | | Increase (Decrease) Paid-in Capital
(000) | |
| Government Bond Fund | | $ | 110 | | | $ | (110 | ) | | $ | — | |
| Corporate Bond Fund | | | 4 | | | | — | | | | (4 | ) |
| Municpal High Income Fund | | | (311 | ) | | | 311 | | | | — | |
| High Yield Bond Fund | | | (56 | ) | | | 56 | | | | — | |
| Intermediate Fixed Income Fund | | | 18 | | | | 2,099 | | | | (2,117 | ) |
| Fixed Income Opportunities Fund | | | (13,937 | ) | | | 13,937 | | | | — | |
| Dividend & Income Fund | | | 1,140 | | | | (1,135 | ) | | | (5 | ) |
| U.S. Core Equity Fund | | | 10 | | | | (10 | ) | | | — | |
| Emerging Markets Fund | | | (1,102 | ) | | | 1,102 | | | | — | |
Amounts designated as “—” are either $0 or have been rounded to $0.
CITY NATIONAL ROCHDALE FUNDS | PAGE 142
The tax character of dividends and distributions declared during the years ended September 30, 2017, and September 30, 2016, unless otherwise indicated were as follows:
| Fund | | Tax Exempt Income
(000) | | | Ordinary Income
(000) | | | Long-Term Capital Gain (000) | | | Return of Capital
(000) | | | Total
(000) | |
| Government Money Market Fund | |
| 2017 | | $ | — | | | $ | 4,927 | | | $ | — | | | $ | — | | | $ | 4,927 | |
| 2016 | | | — | | | | 897 | | | | — | | | | — | | | | 897 | |
| Government Bond Fund | |
| 2017 | | $ | — | | | $ | 1,098 | | | $ | 95 | | | $ | — | | | $ | 1,193 | |
| 2016 | | | — | | | | 1,115 | | | | — | | | | — | | | | 1,115 | |
| Corporate Bond Fund | |
| 2017 | | $ | — | | | $ | 2,347 | | | $ | — | | | $ | — | | | $ | 2,347 | |
| 2016 | | | — | | | | 2,271 | | | | 310 | | | | — | | | | 2,581 | |
| California Tax Exempt Bond Fund | |
| 2017 | | $ | 1,261 | | | $ | 151 | | | $ | 436 | | | $ | — | | | $ | 1,848 | |
| 2016 | | | 1,328 | | | | — | | | | 36 | | | | — | | | | 1,364 | |
| Municipal High Income Fund | |
| 2017 | | $ | 39,585 | | | $ | 671 | | | $ | — | | | $ | — | | | $ | 40,256 | |
| 2016 | | | 31,625 | | | | 261 | | | | 49 | | | | — | | | | 31,935 | |
| High Yield Bond Fund | |
| 2017 | | $ | — | | | $ | 3,792 | | | $ | — | | | $ | — | | | $ | 3,792 | |
| 2016 | | | — | | | | 5,008 | | | | — | | | | — | | | | 5,008 | |
| Intermediate Fixed Income Fund | |
| 2017 | | $ | — | | | $ | 4,960 | | | $ | — | | | $ | — | | | $ | 4,960 | |
| 2016 | | | — | | | | 5,228 | | | | — | | | | — | | | | 5,228 | |
| Fixed Income Opportunities Fund | |
| 2017 | | $ | — | | | $ | 145,340 | | | $ | — | | | $ | — | | | $ | 145,340 | |
| 2016 | | | — | | | | 131,462 | | | | — | | | | — | | | | 131,462 | |
| Dividend & Income Fund | |
| 2017 | | $ | — | | | $ | 5,052 | | | $ | 1,794 | | | $ | — | | | $ | 6,846 | |
| 2016 | | | — | | | | 5,018 | | | | 612 | | | | 823 | | | | 6,453 | |
| U.S. Core Equity Fund | |
| 2017 | | $ | — | | | $ | 1,909 | | | $ | 9,543 | | | $ | — | | | $ | 11,452 | |
| 2016 | | | — | | | | 1,581 | | | | 1,427 | | | | — | | | | 3,008 | |
| Emerging Markets Fund | |
| 2017 | | $ | — | | | $ | 2,465 | | | $ | — | | | $ | — | | | $ | 2,465 | |
| 2016 | | | — | | | | 228 | | | | — | | | | — | | | | 228 | |
As of September 30, 2017, the components of Distributable Earnings/(Accumulated Losses) on a tax basis were as follows:
| Fund | | Undistributed Tax-Exempt Income
(000) | | | Undistributed Ordinary Income
(000) | | | Undistributed Long-Term Capital Gain
(000) | | | Capital Loss Carryforwards
(000) | | | Post-October Losses
(000) | | | Unrealized Appreciation (Depreciation)
(000) | | | Other Temporary Differences
(000) | | | Total Distributable Earnings (Accumulated Losses)
(000) | |
| Government Money Market Fund | | $ | — | | | $ | 1,345 | | | $ | — | | | $ | — | | | $ | — | | | $ | — | | | $ | (1,338 | ) | | $ | 7 | |
| Government Bond Fund | | | — | | | | 94 | | | | 60 | | | | — | | | | — | | | | (199 | ) | | | (65 | ) | | | (110 | ) |
| Corporate Bond Fund | | | — | | | | 195 | | | | — | | | | (1,210 | ) | | | — | | | | 876 | | | | (191 | ) | | | (330 | ) |
| California Tax Exempt Bond Fund | | | 100 | | | | — | | | | — | | | | (123 | ) | | | (161 | ) | | | 1,587 | | | | (96 | ) | | | 1,307 | |
| Municipal High Income Fund | | | 3,497 | | | | — | | | | — | | | | (7,924 | ) | | | (13,257 | ) | | | 29,805 | | | | (3,501 | ) | | | 8,620 | |
| High Yield Bond Fund | | | — | | | | 363 | | | | — | | | | (4,936 | ) | | | — | | | | (289 | ) | | | (296 | ) | | | (5,158 | ) |
| Intermediate Fixed Income Fund | | | — | | | | 103 | | | | — | | | | (392 | ) | | | — | | | | 2,380 | | | | (2 | ) | | | 2,089 | |
| Fixed Income Opportunities Fund | | | — | | | | 7,694 | | | | — | | | | (44,910 | ) | | | — | | | | (6,841 | ) | | | — | | | | (44,057 | ) |
| Dividend & Income Fund | | | — | | | | — | | | | 7,344 | | | | — | | | | — | | | | 60,358 | | | | (15 | ) | | | 67,687 | |
| U.S. Core Equity Fund | | | — | | | | 67 | | | | 1,195 | | | | — | | | | (434 | ) | | | 74,980 | | | | — | | | | 75,808 | |
| Emerging Markets Fund | | | — | | | | 4,328 | | | | 15,956 | | | | — | | | | — | | | | 426,421 | | | | (2 | ) | | | 446,703 | |
CITY NATIONAL ROCHDALE FUNDS | PAGE 143
notes to financial statements/
consolidated notes to financial statements |
| September 30, 2017 |
Post-October losses represent losses realized on investments and foreign currency transactions from November 1, 2016, through September 30, 2017, that, in accordance with U.S. Federal income tax regulations, the Funds have elected to defer and treat as having arisen in the following fiscal year.
Under the Regulated Investment Company Modernization Act of 2010, the Funds will be permitted to carry forward capital losses incurred in taxable years beginning after December 22, 2010, for an unlimited period. However, any losses incurred during those future taxable years will be required to be utilized prior to the losses incurred in pre-enactment taxable years. As a result of this ordering rule, pre-enactment capital loss carryforwards may be more likely to expire unused. Additionally, post-enactment capital losses that are carried forward will retain their character as either short-term or long-term capital losses rather than being considered all short-term as under previous law. Losses carried forward under these new provisions are as follows:
| Fund | | Short-Term Loss
(000) | | | Long-Term Loss
(000) | | | Total
(000) | |
| Corporate Bond Fund | | $ | — | | | $ | (1,210 | ) | | $ | (1,210 | ) |
| California Tax Exempt Bond Fund | | | (123 | ) | | | — | | | | (123 | ) |
| Municipal High Income Fund | | | (1,358 | ) | | | (6,566 | ) | | | (7,924 | ) |
| High Yield Bond Fund | | | — | | | | (4,936 | ) | | | (4,936 | ) |
| Intermediate Fixed Income Fund | | | — | | | | (392 | ) | | | (392 | ) |
| Fixed Income Opportunities Fund | | | — | | | | (44,910 | ) | | | (44,910 | ) |
During the year ended September 30, 2017, the following Funds utilized capital loss carryforwards to offset capital gains amounting to:
| Fund | | Amount
(000) | |
| Municipal High Income Fund | | $ | 521 | |
| High Yield Bond Fund | | | 150 | |
| Fixed Income Opportunities Fund | | | 26,744 | |
| Emerging Markets Fund | | | 6,801 | |
The aggregate gross unrealized appreciation on investments, the aggregate gross unrealized depreciation on investments and the net unrealized appreciation/(depreciation) for tax purposes as of September 30, 2017, for each of the Fixed Income Funds' and Equity Funds' investments were as follows:
| Fund | | Federal Tax Cost
(000) | | | Aggregate Gross Unrealized Appreciation (000) | | | Aggregate Gross Unrealized Depreciation (000) | | | Net Unrealized Appreciation (Depreciation) (000) | |
| Government Bond Fund | | $ | 98,490 | | | $ | 169 | | | $ | (368 | ) | | $ | (199 | ) |
| Corporate Bond Fund | | | 135,221 | | | | 1,516 | | | | (640 | ) | | | 876 | |
| California Tax Exempt Bond Fund | | | 89,074 | | | | 1,764 | | | | (177 | ) | | | 1,587 | |
| Municipal High Income Fund | | | 1,136,614 | | | | 49,414 | | | | (19,609 | ) | | | 29,805 | |
| High Yield Bond Fund | | | 73,381 | | | | 2,386 | | | | (2,673 | ) | | | (287 | ) |
| Intermediate Fixed Income Fund | | | 242,352 | | | | 4,559 | | | | (2,179 | ) | | | 2,380 | |
| Fixed Income Opportunities Fund | | | 2,654,760 | | | | 155,237 | | | | (65,047 | ) | | | 90,190 | |
| Dividend & Income Fund | | | 192,786 | | | | 61,647 | | | | (1,289 | ) | | | 60,358 | |
| U.S. Core Equity Fund | | | 182,246 | | | | 75,085 | | | | (105 | ) | | | 74,980 | |
| Emerging Markets Fund | | | 1,072,859 | | | | 458,822 | | | | (32,392 | ) | | | 426,430 | |
At September 30, 2017, the Government Money Market Fund’s cost of securities for U.S. Federal income tax purposes approximates the cost disclosed in the Schedule of Investments.
In the normal course of business, the Funds enter into contracts that provide general indemnifications. The Funds’ maximum exposure under these arrangements is dependent on future claims that may be made against the Funds and, therefore, cannot be established; however, based on experience, the risk of loss from such claims is considered remote.
The Intermediate Fixed Income Fund, the Fixed Income Opportunities Fund, the Dividend & Income Fund and the Emerging Markets Fund may invest in exchange-traded notes (“ETNs”), each as a non-principal investment strategy. ETNs are unsecured debt obligations of investment banks which are traded on exchanges and the returns of which are linked to the performance of market indexes. In addition to trading ETNs on exchanges, investors may redeem ETNs directly with the issuer on a weekly basis, typically in a minimum amount of 50,000 units, or hold the ETNs until maturity. ETNs are riskier than ordinary unsecured debt securities and have no principal protection. The Funds will generally invest in ETNs which are linked to commodities indexes. A Fund’s investment in an ETN may be influenced by many unpredictable factors, including highly volatile commodities prices, changes in supply
CITY NATIONAL ROCHDALE FUNDS | PAGE 144
and demand relationships, weather, agriculture, trade, changes in interest rates, and monetary and other governmental policies, action and inaction. Investing in ETNs is not equivalent to investing directly in index components or the relevant index itself. Because ETNs are debt securities, they possess credit risk; if the issuer has financial difficulties or goes bankrupt, the investor may not receive the return expected.
The Municipal High Income Fund, High Yield Bond Fund, Intermediate Fixed Income Fund and Fixed Income Opportunities Fund may invest in lower-rated corporate bonds, known as high yield bonds. High yield bonds involve greater risks of default, downgrade, or price declines and are more volatile than investment grade securities. Issuers of high yield bonds may be more susceptible than other issuers to economic downturns and investors are subject to a greater risk that the issuer may not be able to pay interest or dividends and ultimately to repay the principal upon maturity. Discontinuation of these payments could have a substantial adverse effect on the market value of the security.
The Intermediate Fixed Income Fund and Fixed Income Opportunities Fund may invest in asset-backed and mortgage-backed securities. As a general rule, prepayments of the principal of the loans underlying mortgage-backed or other pass-through securities increase during a period of falling interest rates and decrease during a period of rising interest rates. In periods of declining interest rates, as a result of prepayments a Fund may be required to reinvest its assets in securities with lower interest rates. In periods of increasing interest rates, the securities subject to prepayment risk held by a Fund may exhibit price characteristics of longer-term debt securities.
The Intermediate Fixed Income Fund and Fixed Income Opportunities Fund may invest in bank loans. Bank loans are not traded on an exchange and purchasers and sellers of bank loans generally rely on market makers, typically the administrative agent under a bank loan, to effect private sales transactions. As a result, bank loans may have relatively less liquidity than other types of fixed income assets, and a Fund may be more likely to incur losses on the sale of bank loans than on other, more liquid, investments.
The Fixed Income Opportunities Fund may invest in beneficial interests in individual life insurance policies. A Policy owner transfers his or her Policy at a discount to its face value (the amount that is payable upon the death of the insured) in return for an immediate cash settlement. The ultimate purchaser of the Policy (in this case, the Fund) is responsible for premiums payable on the Policy and is entitled to receive the full face value from the insurance company upon the death of the insured. If the Fund is unable to make premium payments on a Policy, the Policy will lapse and the Fund will lose its ownership interest in the Policy. There is currently no established secondary market for Policies, and the Policies are not considered liquid investments by the Fund. If the Fund must sell Policies to meet redemption requests or other cash needs, the Fund may be forced to sell at a loss. The longer the insured lives, the lower the Fund’s rate of return on the Policy. The underwriter’s estimate of the insured’s life expectancy may be incorrect. An insurance company may be unable or may refuse to pay benefits on a Policy. In addition, market quotations will not be readily available for the Policies and the Policies will be priced using a fair value methodology adopted by the Trust’s Board of Trustees. The sales price the Fund could receive for a Policy may differ from the Trust’s valuation of the Policy. A Policy is a liability of the issuing life insurance company, and if the life insurance company goes out of business, sufficient funds may not be available to pay that liability.
California Tax Exempt Bond Fund – Specific Risks
The ability of issuers to pay interest on, and repay the principal of, California municipal securities may be affected by economic and political developments in the State of California.
Certain securities are backed by letters of credit from various financial institutions and financial guaranty assurance agencies. These letters of credit enhance the credit quality of the individual securities; however, if any of the financial institutions’ or financial guaranty assurance agencies’ credit quality should deteriorate, it could cause the individual security’s credit quality to change. Additionally, if the Fund concentrates its letters of credit in any one financial institution, the risk of credit quality deterioration increases.
The Fund invests in Certificates of Participation in a municipal obligation, which are subject to annual appropriation risk.
Emerging Markets Fund – Specific Risks
Foreign investments tend to be more volatile than domestic securities, and are subject to risks that are not typically associated with domestic securities (e.g., changes in currency rates and exchange control regulations, future political and economic developments and the possibility of seizure or nationalization of companies, or the imposition of withholding taxes on income). There may be less government supervision of foreign markets. As a result, foreign issuers may not be subject to the uniform accounting, auditing, and financial reporting standards and practices applicable to domestic issuers, and there may be less publicly available information about foreign issuers.
CITY NATIONAL ROCHDALE FUNDS | PAGE 145
notes to financial statements/
consolidated notes to financial statements |
| September 30, 2017 |
As long as the Emerging Markets Fund holds a foreign security, its value will be affected by the value of the local currency relative to the U.S. dollar. The value of a foreign currency may decline in relation to the U.S. dollar while the Fund holds securities denominated in such currency. Currency exchange rates can be volatile and can be affected by, among other factors, the general economics of a country or the actions of the United States or foreign governments or central banks. U.S. dollar-denominated securities of foreign issuers may also be affected by currency risk, as the value of these securities may also be affected by changes in the issuer’s local currency.
Risks associated with foreign investments may be intensified in the case of investments in emerging market countries, the political, legal and economic systems of which are less developed and less stable than those of more developed nations. Emerging markets may have relatively unstable governments, immature economic structures, national policies restricting investments by foreigners, social instability, and different and/or developing legal systems. In some countries, there is the risk that the government may take over the assets or operations of a company or that the government may impose withholding and other taxes or limits on the removal of the Emerging Market Fund’s assets from that country. In addition, the economies of emerging markets may be predominantly based on only a few industries, may be highly vulnerable to changes in local or global trade conditions, and may suffer from extreme and volatile debt burdens or inflation rates. Such investments are often less liquid and/or more volatile than securities issued by companies located in developed nations. Emerging market securities are also subject to the risk that the securities may not be sold at the quoted market price within a reasonable period of time.
A more complete description of risks is included in the Funds’ prospectus and statement of additional information.
8. | CAPITAL SHARES ISSUED AND REDEEMED: |
Capital share activity for the year ended September 30, 2017, and the year ended September 30, 2016, were as follows (000):
| | | Government Money Market Fund | | | Government Bond Fund | | | Corporate Bond Fund | |
| | | 2017 | | | 2016 | | | 2017 | | | 2016 | | | 2017 | | | 2016 | |
| CAPITAL SHARES ISSUED AND REDEEMED: | | | | | | | | | | | | | | | | |
| Institutional Class: | | | | | | | | | | | | | | | | | | |
| Shares issued | | | — | | | | — | | | | 668 | | | | 1,418 | | | | — | | | | — | |
| Shares issued in lieu of dividends and distributions | | | — | | | | — | | | | 53 | | | | 52 | | | | — | | | | — | |
| Shares redeemed | | | — | | | | — | | | | (3,130 | ) | | | (753 | ) | | | — | | | | — | |
| Net Institutional Class transactions | | | — | | | | — | | | | (2,409 | ) | | | 717 | | | | — | | | | — | |
| Class N: | | | | | | | | | | | | | | | | | | | | | | | | |
| Shares issued | | | 4,345,705 | | | | 5,798,519 | | | | 96 | | | | 23 | | | | 267 | | | | 100 | |
| Shares issued in lieu of dividends and distributions | | | 1,332 | | | | 550 | | | | 1 | | | | — | | | | 4 | | | | 4 | |
| Shares redeemed | | | (7,118,824 | ) | | | (4,887,064 | ) | | | (68 | ) | | | (65 | ) | | | (91 | ) | | | (167 | ) |
| Net Class N transactions | | | (2,771,787 | ) | | | 912,005 | | | | 29 | | | | (42 | ) | | | 180 | | | | (63 | ) |
| Class S: | | | | | | | | | | | | | | | | | | | | | | | | |
| Shares issued | | | 2,288,322 | | | | 2,017,973 | | | | — | | | | — | | | | — | | | | — | |
| Shares issued in lieu of dividends and distribtuions | | | — | | | | — | | | | — | | | | — | | | | — | | | | — | |
| Shares redeemed | | | (2,330,002 | ) | | | (1,803,230 | ) | | | — | | | | — | | | | — | | | | — | |
| Net Class S transactions | | | (41,680 | ) | | | 214,743 | | | | — | | | | — | | | | — | | | | — | |
| Servicing Class: | | | | | | | | | | | | | | | | | | | | | | | | |
| Shares issued | | | 4,547,445 | | | | 2,473,708 | | | | 1,738 | | | | 1,899 | | | | 3,301 | | | | 2,733 | |
| Shares issued in lieu of dividends and distributions | | | 1,557 | | | | 3 | | | | 24 | | | | 26 | | | | 22 | | | | 18 | |
| Shares redeemed | | | (3,229,008 | ) | | | (1,800,335 | ) | | | (4,176 | ) | | | (2,642 | ) | | | (2,566 | ) | | | (3,466 | ) |
| Net Servicing Class transactions | | | 1,319,994 | | | | 673,376 | | | | (2,414 | ) | | | (717 | ) | | | 757 | | | | (715 | ) |
CITY NATIONAL ROCHDALE FUNDS | PAGE 146
| | | California Tax Exempt Bond Fund | | | Municipal High Income Fund | |
| | | 2017 | | | 2016 | | | 2017 | | | 2016 | |
| CAPITAL SHARES ISSUED AND REDEEMED: | | | | | | | | | | | | |
| Class N: | | | | | | | | | | | | |
| Shares issued | | | 493 | | | | 668 | | | | 25,835 | | | | 22,941 | |
| Shares issued in lieu of dividends and distributions | | | 8 | | | | 6 | | | | 1,265 | | | | 943 | |
| Shares redeemed | | | (311 | ) | | | (1,049 | ) | | | (16,699 | ) | | | (6,281 | ) |
| Net Class N transactions | | | 190 | | | | (375 | ) | | | 10,401 | | | | 17,603 | |
| Servicing Class: | | | | | | | | | | | | | | | | |
| Shares issued | | | 2,351 | | | | 2,445 | | | | 15,348 | | | | 12,941 | |
| Shares issued in lieu of dividends and distributions | | | 23 | | | | 10 | | | | 195 | | | | 103 | |
| Shares redeemed | | | (3,199 | ) | | | (2,150 | ) | | | (9,938 | ) | | | (2,923 | ) |
| Net Servicing Class transactions | | | (825 | ) | | | 305 | | | | 5,605 | | | | 10,121 | |
| | | High Yield Bond Fund | | | Intermediate Fixed Income Fund | | | Fixed Income Opportunities Fund | |
| | | 2017 | | | 2016 | | | 2017 | | | 2016 | | | 2017 | | | 2016 | |
| CAPITAL SHARES ISSUED AND REDEEMED: | | | | | | | | | | |
| Institutional Class: | | | | | | | | | | | | | | | | | | |
| Shares issued | | | 772 | | | | 759 | | | | 21 | | | | 161 | | | | — | | | | — | |
| Shares issued in lieu of dividends and distributions | | | 260 | | | | 319 | | | | 2 | | | | 7 | | | | — | | | | — | |
| Shares redeemed | | | (1,196 | ) | | | (910 | ) | | | (120 | ) | | | (491 | ) | | | — | | | | — | |
| Net Institutional Class transactions | | | (164 | ) | | | 168 | | | | (97 | ) | | | (323 | ) | | | — | | | | — | |
| Class N: | | | | | | | | | | | | | | | | | | | | | | | | |
| Shares issued | | | 444 | | | | 880 | | | | 1,770 | | | | 2,371 | | | | 31,530 | | | | 32,737 | |
| Shares issued in lieu of dividends and distributions | | | 55 | | | | 81 | | | | 174 | | | | 180 | | | | 4,227 | | | | 3,950 | |
| Shares redeemed | | | (798 | ) | | | (1,368 | ) | | | (2,230 | ) | | | (2,787 | ) | | | (14,867 | ) | | | (16,515 | ) |
| Net Class N transactions | | | (299 | ) | | | (407 | ) | | | (286 | ) | | | (236 | ) | | | 20,890 | | | | 20,172 | |
| Servicing Class: | | | | | | | | | | | | | | | | | | | | | | | | |
| Shares issued | | | 528 | | | | 2,051 | | | | — | | | | — | | | | — | | | | — | |
| Shares issued in lieu of dividends and distributions | | | 29 | | | | 49 | | | | — | | | | — | | | | — | | | | — | |
| Shares redeemed | | | (890 | ) | | | (3,298 | ) | | | — | | | | — | | | | — | | | | — | |
| Net Servicing Class transactions | | | (333 | ) | | | (1,198 | ) | | | — | | | | — | | | | — | | | | — | |
CITY NATIONAL ROCHDALE FUNDS | PAGE 147
notes to financial statements/
consolidated notes to financial statements |
| September 30, 2017 |
| | | Dividend & Income Fund | | | U.S. Core Equity Fund | | | Emerging Markets Fund (1) | |
| | | 2017 | | | 2016 | | | 2017 | | | 2016 | | | 2017 | | | 2016 | |
| CAPITAL SHARES ISSUED AND REDEEMED: | | | | | | | | | | |
| Institutional Class: | | | | | | | | | | | | | | | | | | |
| Shares issued | | | — | | | | — | | | | — | | | | — | | | | — | | | | — | |
| Shares issued in lieu of dividends and distributions | | | — | | | | — | | | | — | | | | — | | | | — | | | | — | |
| Shares redeemed | | | — | | | | — | | | | — | | | | (526 | ) | | | — | | | | — | |
| Net Institutional Class transactions | | | — | | | | — | | | | — | | | | (526 | ) | | | — | | | | — | |
| Class N: | | | | | | | | | | | | | | | | | | | | | | | | |
| Shares issued | | | 1,762 | | | | 1,906 | | | | 1,221 | | | | 1,225 | | | | 3,093 | | | | 9,641 | |
| Shares issued in lieu of dividends and distributions | | | 111 | | | | 114 | | | | 355 | | | | 85 | | | | 4 | | | | 4 | |
| Shares redeemed | | | (1,577 | ) | | | (1,532 | ) | | | (1,312 | ) | | | (1,416 | ) | | | (2,456 | ) | | | (26,285 | )(2) |
| Net Class N transactions | | | 296 | | | | 488 | | | | 264 | | | | (106 | ) | | | 641 | | | | (16,640 | ) |
| Servicing Class: | | | | | | | | | | | | | | | | | | | | | | | | |
| Shares issued | | | — | | | | — | | | | 1,929 | | | | 1,778 | | | | — | | | | — | |
| Shares issued in lieu of dividends and distributions | | | — | | | | — | | | | 22 | | | | 3 | | | | — | | | | — | |
| Shares redeemed | | | — | | | | — | | | | (1,638 | ) | | | (1,841 | ) | | | — | | | | — | |
| Net Servicing Class transactions | | | — | | | | — | | | | 313 | | | | (60 | ) | | | — | | | | — | |
| Class Y: | | | | | | | | | | | | | | | | | | | | | | | | |
| Shares issued | | | — | | | | — | | | | — | | | | — | | | | 8,286 | | | | 21,547 | (2) |
| Shares issued in lieu of dividends and distributions | | | — | | | | — | | | | — | | | | — | | | | 44 | | | | — | |
| Shares redeemed | | | — | | | | — | | | | — | | | | — | | | | (3,186 | ) | | | (428 | ) |
| Net Class Y transactions | | | — | | | | — | | | | — | | | | — | | | | 5,144 | | | | 21,119 | |
| (1) | Class Y commenced operations on June 1, 2016. |
| (2) | Includes transfers of 17,188 (000) Shares from Class N into 17,183 (000) Shares of Class Y. |
The Funds, except for the Government Money Market Fund, have an unsecured Loan Agreement (“LOC”) with U.S. Bank N.A. Under the terms of the LOC, borrowings for an individual Fund were limited to either the lesser of 10% of the Fund’s net assets or an explicit amount on the LOC. Interest is charged to a Fund based on its borrowings at prime rate minus 0.50%.
Borrowing activity under the LOC for the year ended September 30, 2017, was as follows:
| Fund | | Maximum Amount of Line of Credit
(000) | | | Interest Expense (000) | | | Average Rate | | | Average Borrowings (000) | | | Maximum Amount Outstanding (000) | |
| Dividend & Income Fund | | $ | 50,000 | | | $ | — | | | | 3.75 | % | | $ | 385 | | | $ | 428 | |
In October 2016, the Commission released its final rule on Investment Company Reporting Modernization (the “Rule”). The Rule, which introduces two new regulatory reporting forms for investment companies – Form N-PORT and Form N-CEN – also contains amendments to Regulation S-X, which impact the form and content of financial statements, particularly with respect to the disclosure of derivative investments. Management is still evaluating the impact of the Rule, but they believe that many of the Regulation S-X amendments are consistent with the Funds’ current financial statement presentation and they expect that the Funds will be in compliance with the Rule’s Regulation S-X amendments by the August 1, 2017, compliance date.
The Trust has evaluated the need for additional disclosures and/or adjustments resulting from subsequent events. Based on this evaluation, no adjustments were required to the financial statements as of September 30, 2017, and no issues were noted to disclose.
CITY NATIONAL ROCHDALE FUNDS | PAGE 148
| report of independent registered public accounting firm |
| |
To the Shareholders and Board of Trustees
of City National Rochdale Funds
We have audited the accompanying statements of assets and liabilities of Government Money Market Fund, Government Bond Fund, Corporate Bond Fund, California Tax Exempt Bond Fund, Municipal High Income Fund, High Yield Bond Fund, Intermediate Fixed Income Fund, Fixed Income Opportunities Fund (consolidated), Dividend & Income Fund, U.S. Core Equity Fund, and Emerging Markets Fund (consolidated), each a series of shares of beneficial interest in City National Rochdale Funds (the “Funds”), including the schedules of investments, as of September 30, 2017, and the related statements of operations and cash flows (for Fixed Income Opportunities Fund only) for the year then ended, the statements of changes in net assets for each of the years in the two-year period then ended and the financial highlights for each of the years in the three-year period then ended (consolidated for Fixed Income Opportunities Fund and Emerging Markets Fund). These financial statements and financial highlights are the responsibility of the Funds' management. Our responsibility is to express an opinion on these financial statements and financial highlights based on our audits. The financial highlights (consolidated for Fixed Income Opportunities and Emerging Markets Fund) for each of the years or periods presented through September 30, 2014 for each of the Funds were audited by other auditors, whose reports dated November 28, 2014 and March 31, 2013 expressed an unqualified opinion on those financial highlights.
We conducted our audits in accordance with the standards of the Public Company Accounting Oversight Board (United States). Those standards require that we plan and perform the audits to obtain reasonable assurance about whether the financial statements and financial highlights are free of material misstatement. An audit includes examining, on a test basis, evidence supporting the amounts and disclosures in the financial statements. Our procedures included confirmation of securities owned as of September 30, 2017 by correspondence with the custodian, brokers, and other counterparties, or by other appropriate auditing procedures. An audit also includes assessing the accounting principles used and significant estimates made by management, as well as evaluating the overall financial statement presentation. We believe that our audits provide a reasonable basis for our opinion.
In our opinion, the financial statements and financial highlights (consolidated where noted) referred to above present fairly, in all material respects, the financial position of each of the Funds comprising the City National Rochdale Funds as of September 30, 2017, and the results of their operations and cash flows (for Fixed Income Opportunities Fund only) for the year then ended, the changes in their net assets for each of the years in the two-year period then ended and their financial highlights for each of the years in the three-year period then ended, in conformity with accounting principles generally accepted in the United States of America.
Philadelphia, Pennsylvania
November 28, 2017
CITY NATIONAL ROCHDALE FUNDS | PAGE 149
trustees and officers (Unaudited) |
| September 30, 2017 |
The Trustees and officers of the Trust, their principal occupations during the past five years, and their affiliations, if any, with City National Rochdale, the investment manager to the Funds, are set forth below. The persons listed below may have held other positions with their employers named below during the relevant periods. Certain officers of the Trust also serve as officers to one or more other mutual funds for which SEI Investments or its affiliates act as investment manager, administrator or distributor. Andrew S. Clare (the “Interested Trustee”) is an “interested person” of the Trust, as defined in the 1940 Act. Each Trustee other than Mr. Clare may be referred to in this SAI as an “Independent Trustee” and collectively as the “Independent Trustees.” The Trust’s Statement of Additional Information (“SAI”) includes additional information about the Trustees and Officers. The SAI may be obtained without charge by calling 1-888-889-0799.
Name,
Address,
and Age | Position with the Trust | Term of Office(1) and Length of Time Served | Principal Occupation
for the Past Five Years | Number of Portfolios in Fund Complex(2) Overseen by Trustee | Other Directorships Held by Trustee For the Past Five Years |
| INDEPENDENT TRUSTEES |
Daniel A. Hanwacker City National Rochdale Funds 400 N. Roxbury Drive Beverly Hills, California 90210 Age: 65 | Trustee | Since 2013 | CEO and President, Hanwacker Associates, Inc. (asset management consulting and executive search services) (2001-present). Managing Director - Asset Management, Putnam Lovell Securities (2000-2001). Co-Founding Partner, Constellation Financial Management, Co., LLC (1995-2000). | 16 | Rochdale Investment Trust (2011- 2013) |
Jon C. Hunt City National Rochdale Funds 400 N. Roxbury Drive Beverly Hills, California 90210 Age: 65 | Trustee | Since 2013 | Retired (March 2013-present). Consultant to Management, Convergent Capital Management, LLC (“CCM”) (July 2012-March 2013). Managing Director and Chief Operating Officer, CCM (1998-June 2012). | 16 | Nuveen Commodities Asset Management, member of Independent Committee (February 2012 - present); Advisor’s Inner Circle Fund III (February 2014 – present); Winton Series Trust and Winton Diversified Opportunities Fund, Lead Independent Trustee (January 2015 - present) |
Vernon C. Kozlen City National Rochdale Funds 400 N. Roxbury Drive Beverly Hills, California 90210 Age: 74 | Trustee Chairman | Since 2007 �� Since 2016 | Retired (2007-present). President and Chief Executive Officer, City National Rochdale Funds (2000-2007). Executive Vice President and Director of Asset Management Development, CNB (1996-2007). Director, Reed, Conner & Birdwell LLC (2000-2007), and Convergent Capital Management, LLC (2003-2007). Chairman of the Board, City National Asset Management, Inc. (2001-2005). Chairman of the Board, City National Securities, Inc. (1999-2005). Director, City National Asset Management, Inc. (2001-2006), and City National Securities, Inc. (1999-2006). | 16 | Windermere Jupiter Fund, LLC, CMS/Ironwood Multi-Strategy Fund LLC, CMS/Barlow Long-Short Equity Fund, LLC (3) |
CITY NATIONAL ROCHDALE FUNDS | PAGE 150
Name,
Address,
and Age | Position with the Trust | Term of Office(1) and Length of Time Served | Principal Occupation
for the Past Five Years | Number of Portfolios in Fund Complex(2) Overseen by Trustee | Other Directorships Held by Trustee For the Past Five Years |
| INDEPENDENT TRUSTEES (Continued) |
Jay C. Nadel City National Rochdale Funds 400 N. Roxbury Drive Beverly Hills, California 90210 Age: 58 | Trustee | Since 2013 | Financial Services Consultant (2005-present). Executive Vice President, Bank of New York Broker-Dealer and Member of the Operating Committee (2002-2004). Weiss, Peck & Greer, Partner, Managing Director and Chair of the Operations Committee (1986-2001). | 16 | Lapolla Industries, Inc. (2007 – present); Rochdale Investment Trust (2011-2013) |
James R. Wolford City National Rochdale Funds 400 N. Roxbury Drive Beverly Hills, California 90210 Age: 63 | Trustee | Since 1999 | Chief Executive Officer of Corinthian Development Company (December 2013-present). President, Chief Operating Officer and Chief Financial Officer, Thompson National Properties (March 2011-December 2013). Chief Financial Officer, Pacific Office Properties, a real estate investment trust (April 2010-March 2011). Chief Financial Officer, Bixby Land Company, a real estate company (2004-March 2010). Regional Financial Officer, AIMCO, a real estate investment trust (2004). Chief Financial Officer, DBM Group, a direct mail marketing company (2001-2004). Senior Vice President and Chief Operating Officer, Forecast Commercial Real Estate Service, Inc. (2000-2001). Senior Vice President and Chief Financial Officer, Bixby Ranch Company (1985-2000). | 16 | None |
| INTERESTED TRUSTEE |
Andrew S. Clare (4) City National Rochdale Funds 400 N. Roxbury Drive Beverly Hills, California 90210 Age: 71 | Trustee | Since 2013 | Attorney and partner, Loeb & Loeb LLP, a law firm (1972-present). | 16 | None |
| (1) | The Trustees serve for terms of office as follows: |
| Name of Trustee | End of Term of Office |
| Vernon C. Kozlen | December 31, 2018* |
| James Wolford | March 29, 2023 |
| Andrew S. Clare | December 31, 2020* |
| Daniel A. Hanwacker | March 29, 2023 |
| Jon C. Hunt | March 29, 2023 |
| Jay C. Nadel | March 29, 2023 |
| | * | Subject to extension by the Board for up to two years. |
| (2) | “Fund complex” is defined as two or more registered investment companies that hold themselves out to investors as related companies or have a common investment adviser or affiliated investment advisers and in this case includes the following registered closed-end funds: City National Rochdale High Yield Alternative Strategies Master Fund LLC, City National Rochdale High Yield Alternative Strategies Fund LLC, City National Rochdale High Yield Alternative Strategies Fund TEI LLC, City National Rochdale Structured Claims Fixed Income Fund LLC and City National Rochdale International Trade Fixed Income Fund. |
| (3) | Convergent Wealth Advisors, LLC, which is under common control with CNB, serves as investment adviser to Windermere Jupiter Fund, LLC, CMS/Ironwood Multi-Strategy Fund, LLC and CMS/Barlow Long-Short Equity Fund, LLC, each of which is a private investment fund. |
| (4) | Mr. Clare is an “interested person” of the Trust, as defined in the 1940 Act, by virtue of the provision of significant legal services by him and his law firm to CNB. |
CITY NATIONAL ROCHDALE FUNDS | PAGE 151
trustees and officers (Unaudited) (Continued) |
| September 30, 2017 |
Name,
Address,
and Age | Position
with the Trust | Term of Office(1) and Length of Time Served | Principal Occupation
for the Past Five Years |
| OFFICERS |
Garrett R. D’Alessandro City National Rochdale, LLC 400 N. Roxbury Drive Beverly Hills, California 90210 Age: 60 | President and Chief Executive Officer | Since 2013 | Chief Executive Officer, City National Rochdale (1986-present); Chief Investment Officer, City National Rochdale (April 2016-present). |
Eric Kleinschmidt SEI Investments One Freedom Valley Drive Oaks, Pennsylvania 19456 Age: 49 | Treasurer | Since 2005 | Director of Fund Accounting, SEI Investments Company (2004-present). Manager of Fund Accounting, SEI Investments (1999-2004). |
F. Michael Gozzillo City National Rochdale, LLC 400 N. Roxbury Drive Beverly Hills, California 90210 Age: 52 | Vice President; Chief Compliance Officer (“CCO”); Anti-Money Laundering Officer & Identity Theft Program Officer | Since 2013 | Senior Vice President & Chief Compliance Officer, City National Rochdale (2012-present). CCO, Symphonic Financial Advisers LLC (2013 to Present). CCO, City National Rochdale High Yield Alternative Strategies Master Fund LLC, City National Rochdale High Yield Alternative Strategies Fund LLC, City National Rochdale High Yield Alternative Strategies Fund TEI LLC, City National Rochdale Structured Claims Fixed Income Fund LLC and City National Rochdale International Trade Fixed Income Fund (2013-present). Director & Compliance Officer, TIAA-CREF (2008-2012). CCO, TIAA-CREF Life Insurance Co. Separate Accounts (2009-2012). |
Lisa Whittaker SEI Investments One Freedom Valley Drive Oaks, Pennsylvania 19456 Age: 38 | Vice President and Assistant Secretary | Since 2012 | Attorney, SEI Investments Company (2012-present). Associate Counsel, The Glenmede Trust Company (2011-2012). Associate, Drinker Biddle & Reath LLP (2006-2011). |
Mitchell Cepler City National Rochdale, LLC 400 N. Roxbury Drive Beverly Hills, California 90210 Age: 34 | Vice President and Assistant Treasurer | Since 2015 | Group Finance Manager, City National Rochdale (2011-present). Manager, Financial Planning and Analysis, ESP Technologies Corporation (2008-2011). |
Kurt Hawkesworth City National Rochdale, LLC 400 N. Roxbury Drive Beverly Hills, California 90210 Age: 46 | Vice President and Secretary | Since 2013 | Chief Operating Officer, City National Rochdale (2003-present). |
Anthony Sozio City National Rochdale, LLC 400 N. Roxbury Drive Beverly Hills, California 90210 Age: 46 | Vice President and Assistant Secretary | Since 2013 | Assistant Vice President of Registered Fund Operations, City National Rochdale (1998-present). |
| (1) | Each officer serves until removed by the Board or the principal executive officer of the Trust, or until such officer resigns. |
CITY NATIONAL ROCHDALE FUNDS | PAGE 152
notice to shareholders (Unaudited) |
| September 30, 2017 |
For shareholders that do not have a September 30, 2017, taxable year end, this notice is for informational purposes only. For shareholders with a September 30, 2017, taxable year end, please consult your tax advisor as to the pertinence of this notice.
For California income tax purposes, for the fiscal year ended September 30, 2017, each of the California Tax Exempt Bond Fund and Municipal High Income Fund is designating 98.18% and 9.07%, respectively, of its distributions paid from net investment income as exempt-interest dividends under Section 17145 of the California Revenue and Taxation Code.
For Federal income tax purposes, for the fiscal year ended September 30, 2017, each Fund is designating the following items with regard to distributions paid during the year:
| | (A)
Long Term Capital Gain Distributions | (B)
Return of Capital | (C)
Ordinary Income Distributions | (D)
Tax Exempt Interest | (E)
Total Distributions | (F)
Dividends Qualifying for Corporate Dividends Rec. Deduction (1) | (G)
Qualifying Dividend Income (2) | (H)
U.S. Government Interest (3) | (I)
Interest Related Dividends (4) | (J)
Qualified Short-Term Capital Gain Dividends (5) | (K)
Foreign
Tax
Credit |
| Government Money Market Fund | 0.00% | 0.00% | 100.00% | 0.00% | 100.00% | 0.00% | 0.00% | 89.79% | 99.81% | 0.00% | 0.00% |
| Government Bond Fund | 7.79% | 0.00% | 92.21% | 0.00% | 100.00% | 0.00% | 0.00% | 58.37% | 99.80% | 0.00% | 0.00% |
| Corporate Bond Fund | 0.00% | 0.00% | 100.00% | 0.00% | 100.00% | 0.00% | 0.00% | 0.00% | 85.30% | 0.00% | 0.00% |
| California Tax Exempt Bond Fund | 23.50% | 0.00% | 8.12% | 68.38% | 100.00% | 0.00% | 0.00% | 0.00% | 0.00% | 100.00% | 0.00% |
| Municipal High Income Fund | 0.00% | 0.00% | 1.69% | 98.31% | 100.00% | 0.00% | 0.00% | 0.00% | 0.00% | 0.00% | 0.00% |
| High Yield Bond Fund | 0.00% | 0.00% | 100.00% | 0.00% | 100.00% | 0.00% | 0.00% | 0.00% | 99.80% | 0.00% | 0.00% |
| Intermediate Fixed Income Fund | 0.00% | 0.00% | 100.00% | 0.00% | 100.00% | 8.96% | 10.15% | 3.97% | 84.18% | 0.00% | 0.00% |
| Fixed Income Opportunities Fund | 0.00% | 0.00% | 100.00% | 0.00% | 100.00% | 26.74% | 26.74% | 0.01% | 84.15% | 0.00% | 0.00% |
| Dividend & Income Fund | 26.20% | 0.00% | 73.80% | 0.00% | 100.00% | 100.00% | 100.00% | 0.00% | 1.62% | 0.00% | 0.00% |
| U.S. Core Equity Fund | 83.33% | 0.00% | 16.67% | 0.00% | 100.00% | 100.00% | 100.00% | 0.00% | 0.00% | 0.00% | 0.00% |
Emerging Markets Fund (6) | 0.00% | 0.00% | 100.00% | 0.00% | 100.00% | 0.00% | 100.00% | 0.00% | 0.00% | 0.00% | 10.45% |
| (1) | “Dividends Received Deduction” represent dividends which qualify for the corporate dividends received deduction. |
| (2) | “Qualifying Dividend Income” represent qualifying dividends as created by the Jobs and Growth Tax Relief Reconciliation Act of 2003. The Fund intends to designate the maximum amount permitted by law. |
| (3) | “U.S. Government Interest” represent the amount of interest that was derived from direct U.S. Government obligations and distributed during the fiscal year. This amount is reflected as a percentage of ordinary income. Generally, interest from direct U.S. Government obligations is exempt from state income tax. However, for shareholders who are residents of California, Connecticut or New York, the statutory threshold requirements were not satisfied to permit exemption of these amounts from state income. |
| (4) | “Interest Related Dividends” represent qualifying interest that is exempt from U.S. withholding tax when paid to foreign investors as created by the American Jobs Creation Act of 2004. |
| (5) | “Short-Term Capital Gain Dividends” represent qualifying short-term capital gain that is exempt from U.S. withholding tax when paid to foreign investors as created by the American Jobs Creation Act of 2004. |
| (6) | The Fund intends to pass through a foreign tax credit to shareholders. For the fiscal year ended September 30, 2017, the total amount of foreign source income was $19,023,212. The total amount of foreign tax to be paid is $287,625. Your allocable share of foreign tax credit will be reported on Form 1099-DIV. |
Items (A), (B), (C), (D), (E) and (K) are based on the percentage of each fund’s total distribution.
Items (F) and (G) are based on the percentage of “Ordinary Income Distributions.”
Item (H) is based on the percentage of gross income of each Fund.
Item (I) is based on the percentage of net investment income distributions.
Item (J) is based on the percentage of short-term capital gain distributions.
CITY NATIONAL ROCHDALE FUNDS | PAGE 153
disclosure of fund expenses (Unaudited) |
| |
All mutual funds have operating expenses. As a shareholder of a Fund, your investment is affected by these ongoing costs, which include (among others) costs for portfolio management, administrative services, class-specific distribution fees, acquired fund fees and shareholder reports like this one. It is important for you to understand the impact of these costs on your investment returns.
Operating expenses such as these are deducted from a Fund’s gross income and directly reduce your final investment return. These expenses are expressed as a percentage of the Fund’s average net assets; this percentage is known as the Fund’s expense ratio.
The following examples use the expense ratio and are intended to help you understand the ongoing costs (in dollars) of investing in your Fund and to compare these costs with those of other mutual funds. The examples are based on an investment of $1,000 made at the beginning of the period shown and held for the entire period (April 1, 2017 to September 30, 2017).
The table below illustrates your Fund’s costs in two ways:
Actual Fund Return. This section helps you to estimate the actual expenses that your Fund incurred over the period. The “Expenses Paid During Period” column shows the actual dollar expense cost incurred by a $1,000 investment in each Fund, and the “Ending Account Value” number is derived from deducting that expense cost from each Fund’s gross investment return.
You can use this information, together with the actual amount you invested in a Fund, to estimate the expenses you paid over that period. Simply divide your actual account value by $1,000 to arrive at a ratio (for example, an $8,600 account value divided by $1,000 = 8.6), then multiply that ratio by the number shown for your Fund under “Expenses Paid During Period.”
Hypothetical 5% Return. This section helps you compare your Fund’s costs with those of other mutual funds. It assumes that each Fund had an annual 5% return before expenses during the year, but that the expense ratio (Column 3) for the period is unchanged. This example is useful in making comparisons because the Securities and Exchange Commission requires all mutual funds to make this 5% calculation. You can assess your Fund’s comparative cost by comparing the hypothetical result for your Fund in the “Expenses Paid During Period” column with those that appear in the same charts in the shareholder reports for other funds.
NOTE: Because the return is set at 5% for comparison purposes – NOT your Fund’s actual return – the account values shown do not apply to your specific investment.
CITY NATIONAL ROCHDALE FUNDS | PAGE 154
| | Beginning Account Value 4/01/2017 | Ending Account Value 9/30/2017 | Annualized Expense Ratios | Expense Paid During Period* |
| City National Rochdale Government Money Market Fund |
| Actual Fund Return | | | | |
| Class N | $ 1,000.00 | $ 1,000.40 | 1.42% | $ 7.12 |
| Class S | 1,000.00 | 1,000.40 | 0.86% | 4.31 |
| Servicing Class | 1,000.00 | 1,001.40 | 0.33% | 1.66 |
| | | | | |
| Hypothetical 5% Return | | | | |
| Class N | $ 1,000.00 | $ 1,017.95 | 1.42% | $ 7.18 |
| Class S | 1,000.00 | 1,020.76 | 0.86% | 4.36 |
| Servicing Class | 1,000.00 | 1,023.41 | 0.33% | 1.67 |
| | | | | |
| City National Rochdale Government Bond Fund |
| Actual Fund Return | | | | |
| Institutional Class | $ 1,000.00 | $ 1,005.10 | 0.53% | $ 2.66 |
| Class N | 1,000.00 | 1,002.60 | 1.03% | 5.17 |
| Servicing Class | 1,000.00 | 1,002.90 | 0.78% | 3.92 |
| | | | | |
| Hypothetical 5% Return | | | | |
| Institutional Class | $ 1,000.00 | $ 1,022.41 | 0.53% | $ 2.69 |
| Class N | 1,000.00 | 1,019.90 | 1.03% | 5.22 |
| Servicing Class | 1,000.00 | 1,021.16 | 0.78% | 3.95 |
| | | | | |
| City National Rochdale Corporate Bond Fund |
| Actual Fund Return | | | | |
| Class N | $ 1,000.00 | $ 1,008.90 | 1.01% | $ 5.09 |
| Servicing Class | 1,000.00 | 1,010.20 | 0.76% | 3.83 |
| | | | | |
| Hypothetical 5% Return | | | | |
| Class N | $ 1,000.00 | $ 1,020.00 | 1.01% | $ 5.11 |
| Servicing Class | 1,000.00 | 1,021.26 | 0.76% | 3.85 |
| |
| City National Rochdale California Tax Exempt Bond Fund |
| Actual Fund Return | | | | |
| Class N | $ 1,000.00 | $ 1,015.20 | 0.88% | $ 4.45 |
| Servicing Class | 1,000.00 | 1,016.50 | 0.63% | 3.18 |
| | | | | |
| Hypothetical 5% Return | | | | |
| Class N | $ 1,000.00 | $ 1,020.66 | 0.88% | $ 4.46 |
| Servicing Class | 1,000.00 | 1,021.91 | 0.63% | 3.19 |
| | | | | |
| City National Rochdale Municipal High Income Fund |
| Actual Fund Return | | | | |
| Class N | $ 1,000.00 | $ 1,044.10 | 1.08% | $ 5.53 |
| Servicing Class | 1,000.00 | 1,045.30 | 0.83% | 4.26 |
| | | | | |
| Hypothetical 5% Return | | | | |
| Class N | $ 1,000.00 | $ 1,019.65 | 1.08% | $ 5.47 |
| Servicing Class | 1,000.00 | 1,020.91 | 0.83% | 4.20 |
| |
| City National Rochdale High Yield Bond Fund |
| Actual Fund Return | | | | |
| Institutional Class | $ 1,000.00 | $ 1,038.10 | 0.97% | $ 4.98 |
| Class N | 1,000.00 | 1,035.50 | 1.47% | 7.50 |
| Servicing Class | 1,000.00 | 1,035.70 | 1.22% | 6.24 |
| | | | | |
| Hypothetical 5% Return | | | | |
| Institutional Class | $ 1,000.00 | $ 1,020.19 | 0.97% | $ 4.93 |
| Class N | 1,000.00 | 1,017.70 | 1.47% | 7.44 |
| Servicing Class | 1,000.00 | 1,018.94 | 1.22% | 6.19 |
| | | | | |
| City National Rochdale Intermediate Fixed Income Fund |
| Actual Fund Return | | | | |
| Institutional Class | $ 1,000.00 | $ 1,014.50 | 0.51% | $ 2.58 |
| Class N | 1,000.00 | 1,011.90 | 1.01% | 5.09 |
| | | | | |
| Hypothetical 5% Return | | | | |
| Institutional Class | $ 1,000.00 | $ 1,022.51 | 0.51% | $ 2.59 |
| Class N | 1,000.00 | 1,020.00 | 1.01% | 5.12 |
| | | | | |
| City National Rochdale Fixed Income Opportunities Fund |
| Actual Fund Return | | | | |
| Class N | $ 1,000.00 | $ 1,037.70 | 1.09% | $ 5.57 |
| | | | | |
| Hypothetical 5% Return | | | | |
| Class N | $ 1,000.00 | $ 1,019.60 | 1.09% | $ 5.52 |
| * | Expenses are equal to the Fund’s annualized expense ratio multiplied by the average account value over the period, multiplied by 183/365 (to reflect the one-half year period). |
CITY NATIONAL ROCHDALE FUNDS | PAGE 155
disclosure of fund expenses (Unaudited) (Continued) |
| |
| | Beginning Account Value 4/01/2017 | Ending Account Value 9/30/2017 | Annualized Expense Ratios | Expense Paid During Period* |
| City National Rochdale Dividend & Income Fund |
| Actual Fund Return | | | | |
| Class N | $ 1,000.00 | $ 1,004.60 | 1.13% | $ 5.66 |
| | | | | |
| Hypothetical 5% Return | | | | |
| Class N | $ 1,000.00 | $ 1,019.42 | 1.13% | $ 5.71 |
| | | | | |
| City National Rochdale U.S. Core Equity Fund |
| Actual Fund Return | | | | |
| Institutional Class | $ 1,000.00 | $ 1,100.10 | 0.53% | $ 2.75 |
| Class N | 1,000.00 | 1,097.00 | 1.03% | 5.41 |
| Servicing Class | 1,000.00 | 1,098.20 | 0.78% | 4.10 |
| | | | | |
| Hypothetical 5% Return | | | | |
| Institutional Class | $ 1,000.00 | $ 1,022.45 | 0.53% | $ 2.65 |
| Class N | 1,000.00 | 1,019.91 | 1.03% | 5.21 |
| Servicing Class | 1,000.00 | 1,021.16 | 0.78% | 3.95 |
| | | | | |
| City National Rochdale Emerging Markets Fund |
| Actual Fund Return | | | | |
| Class N | $ 1,000.00 | $ 1,183.90 | 1.62% | $ 8.85 |
| Class Y | $ 1,000.00 | $ 1,185.20 | 1.37% | 7.48 |
| | | | | |
| Hypothetical 5% Return | | | | |
| Class N | $ 1,000.00 | $ 1,016.96 | 1.62% | $ 8.17 |
| Class Y | $ 1,000.00 | $ 1,018.22 | 1.37% | 6.91 |
| * | Expenses are equal to the Fund’s annualized expense ratio multiplied by the average account value over the period, multiplied by 183/365 (to reflect the one-half year period). |
CITY NATIONAL ROCHDALE FUNDS | PAGE 156
| board approval of advisory and sub-advisory agreements |
| (Unaudited) |
The Board of Trustees of City National Rochdale Funds (the “Trust”) is comprised of six Trustees, five of whom are Independent Trustees (i.e., not “interested persons” of the Trust as defined in the Investment Company Act of 1940, as amended). During the six months ended September 30, 2017, the Board and the Independent Trustees approved renewal of the following advisory and sub-advisory agreements:
| | ● | The advisory agreement between City National Rochdale, LLC (the “Adviser”) and the Trust, on behalf of the City National Rochdale Government Money Market Fund (“Government Money Market Fund”), City National Rochdale Government Bond Fund (“Government Bond Fund”), City National Rochdale Corporate Bond Fund (“Corporate Bond Fund”), City National Rochdale California Tax Exempt Bond Fund (“California Tax Exempt Bond Fund”), City National Rochdale Municipal High Income Fund (“Municipal High Income Fund”), City National Rochdale High Yield Bond Fund (“High Yield Bond Fund”), City National Rochdale Intermediate Fixed Income Fund (“Intermediate Fixed Income Fund”), City National Rochdale Fixed Income Opportunities Fund (“Fixed Income Opportunities Fund”), City National Rochdale Dividend & Income Fund (“Dividend & Income Fund”), City National Rochdale U.S. Core Equity Fund (“U.S. Core Equity Fund”), and City National Rochdale Emerging Markets Fund (“Emerging Markets Fund”) (each a “Fund” and collectively, the “Funds”); |
| | ● | The sub-advisory agreement between the Adviser and Guggenheim Partners Investment Management, LLC (“Guggenheim”), with respect to the High Yield Bond Fund; |
| | ● | The sub-advisory agreement between the Adviser and Seix Investment Advisors LLC (“Seix”), with respect to the Fixed Income Opportunities Fund; |
| | ● | The sub-advisory agreement between the Adviser and Federated Investment Management Company (“Federated”), with respect to the Fixed Income Opportunities Fund; |
| | ● | The sub-advisory agreement between the Adviser and GML Capital LLP (“GML”), with respect to the Fixed Income Opportunities Fund; |
| | ● | The sub-advisory agreement between the Adviser and Alcentra Limited (“Alcentra”), with respect to the Fixed Income Opportunities Fund; |
| | ● | The sub-advisory agreement between the Adviser and Ashmore Investment Management Limited (“Ashmore”), with respect to the Fixed Income Opportunities Fund; |
| | ● | The sub-advisory agreement between the Adviser and AllFinancial Partners II, LLC (“AllFinancial”), with respect to the Fixed Income Opportunities Fund; |
| | ● | The advisory agreement between the Adviser and Rochdale Emerging Markets (Mauritius) (the “Mauritius Subsidiary”), a wholly-owned subsidiary of the Emerging Markets Fund; and |
| | ● | The advisory agreement between the Adviser and City National Rochdale Fixed Income Opportunities (Ireland) Limited (the “Irish Subsidiary”), a wholly-owned subsidiary of the Fixed Income Opportunities Fund. |
The advisory and sub-advisory agreements listed above are collectively referred to below as the “Agreements.” Guggenheim, Seix, Federated, GML, Alcentra, Ashmore, and AllFinancial are collectively referred to below as the “Sub-Advisers,” and the Mauritius Subsidiary and the Irish Subsidiary are collectively referred to below as the “Subsidiaries.”
The Board also approved amendments to the sub-advisory agreements with Federated, Ashmore and Seix with respect to the Fixed Income Opportunities Fund, each of which provided for reductions of fees payable by the Adviser to the Sub-Adviser, as applicable. The amendment to the Ashmore sub-advisory agreement also included an expansion of its mandate with respect the Fixed Income Opportunities Fund to include investments in emerging market local currency bonds.
General Information
The following information summarizes the Board’s considerations associated with its review of the Agreements. In connection with their deliberations, the Board considered such information and factors as they believed, in light of the legal advice furnished to them and their own business judgment, to be relevant. The Agreements were considered separately for each Fund and Subsidiary, although the Board took into account the common interests of the Funds and the Subsidiaries in its review. As described below, the Board considered the nature, quality and extent of the various investment advisory and administrative services performed by the Adviser and each Sub-Adviser. In considering these matters, the Independent Trustees discussed the approval of the Agreements with management and in private sessions with their independent counsel at which no representatives of the Adviser or the Sub-Advisers were present.
CITY NATIONAL ROCHDALE FUNDS | PAGE 157
| board approval of advisory and sub-advisory agreements |
| (Unaudited) (Continued) |
The Board reviewed extensive materials regarding investment results of the Adviser and each Sub-Adviser with respect to the Funds (or portions of the Funds) and the Subsidiaries they manage, advisory fee and expense comparisons, financial information with respect to each firm, descriptions of various functions such as compliance monitoring and portfolio trading practices, and information about the personnel providing investment management and administrative services to the Funds and the Subsidiaries. The Board also took into account information they received at past meetings of the Board and its committees with respect to these matters.
In deciding to approve the Agreements, the Board and the Independent Trustees did not identify a single factor as controlling and this summary does not describe all of the matters considered. In addition, each Board member did not necessarily attribute the same weight to each matter. However, the Board and the Independent Trustees concluded that each of the various factors referred to below favored such approval.
CITY NATIONAL ROCHDALE, LLC
Nature, Extent and Quality of Services
In reviewing the services provided by the Adviser to the Funds and the Subsidiaries, the Board considered a variety of matters, including the overall quality and depth of the Adviser’s organization, its overall financial strength and stability, its commitment to compliance with applicable laws and regulations and the systems in place to ensure compliance with those requirements, its portfolio trading and soft dollar practices, and its disaster recovery and contingency planning practices. The Board also considered the experience, capability and integrity of the Adviser’s senior management, the background, education and experience of the Adviser’s personnel, and its efforts to retain, attract and motivate capable personnel to serve the Funds and the Subsidiaries. The Board found all of these matters to be satisfactory.
The Board assessed the performance of each Fund compared with the returns of its respective benchmark index or indexes and the averages of the funds included in its respective peer group category selected by Lipper, Inc. (each, a “Lipper Universe”), and for the Government Money Market Fund, an iMoneyNet, Inc. index. They reviewed these matters for the one-, three-, five-, ten- and 15-year and since inception periods ended June 30, 2017, as applicable. In addition, the Board reviewed the performance of each Fund compared to the performance of a select group of comparable funds determined by the Adviser to have investment objectives similar to that of the Fund. With respect to the performance results of the Funds, the Trustees noted that the meeting materials indicated as follows:
| | ● | The Government Money Market Fund (Servicing Class) underperformed the average returns of the funds in the Lipper Institutional U.S. Government Money Market Objective group (by 0.20% or less), and the iMoneyNet, Inc. Government Institutional group (by 0.22% or less) for the one-, three-, five-, ten- and 15-year and since inception periods. |
| | ● | The Government Bond Fund (Institutional Class) outperformed the Lipper Short/Intermediate U.S. Government Objective group, but trailed the Bloomberg Barclays U.S. 1-5 Year Government Bond Index (by 0.38% or less), for the three- and five-year periods. The Fund underperformed the Bloomberg Barclays Index (by 0.45% or less), and the Lipper Universe average returns (by 0.39% or less) for the one-, ten- and 15-year and since inception periods. The Board considered the Adviser’s explanation that the Fund’s underperformance compared to its Lipper Universe was primarily due to longer maturity profiles and greater allocations to mortgage-backed securities by the Fund’s peers. |
| | ● | The Corporate Bond Fund (Servicing Class) outperformed the Lipper Short/Intermediate Investment-Grade Objective group and the Bloomberg Barclays U.S. Corp 1-5 A3+, 2% Issuer Constrained Index for the one-year period, and outperformed the average return of the funds in the Lipper Universe, but underperformed the Barclays Index (by 0.42% or less), for the five-, ten- and 15-year and since inception periods. The Fund underperformed the Bloomberg Barclays Index (by 0.73%) and the Lipper Universe average (by 0.19%) for the three-year period. The Board noted the Adviser’s explanation that the Fund’s near-term outperformance was primarily attributable to the Fund’s conservative duration positioning which, in the previous year, contributed to the then near-term underperformance. The Board also considered several structural differences between the Fund, the benchmark, and Lipper peer group funds. |
| | ● | The California Tax Exempt Bond Fund (Servicing Class) outperformed the average returns of the funds in the Lipper CA Short/Intermediate Municipal Debt Objective group, but underperformed the Bloomberg Barclays CA Intermediate-Short Municipal Index (by 0.68% or less) for the one-, three-, five-, ten- and 15-year and since inception |
CITY NATIONAL ROCHDALE FUNDS | PAGE 158
periods. The Board considered the Adviser’s explanation that although the Fund was outperforming its peers, it was underperforming its index primarily due to the size of the Fund and the low interest rate environment.
| | ● | The Municipal High Income Fund (Servicing Class) underperformed the average returns of the funds in the Lipper High Yield Municipal Classification group (by 0.98% or less), and the Bloomberg Barclays High Yield Municipal Index (by 2.36% or less) for the one- and three-year and since inception periods. The Board noted that the Adviser was satisfied with the performance of the new portfolio management team, and considered the positive effect of the Fund’s relative overweight in tobacco-related holdings and below investment grade securities during the second half of the year. |
| | ● | The High Yield Bond Fund (Institutional Class) outperformed the average returns of the funds in the Lipper High Yield Bond Funds Objective group for the one-, three-, five-, ten- and 15-year and since inception periods. The Fund outperformed the Citigroup High-Yield Market Capped Index for the one- and five-year and since inception periods, but underperformed the Citigroup Index (by 0.72% or less) for the three-, ten- and 15-year periods. The Board considered the Adviser’s explanation that much of the Fund’s underperformance as compared to its benchmark was due to the higher credit quality of the Fund’s portfolio securities. |
| | ● | The Intermediate Fixed Income Fund (Institutional Class) outperformed the Bloomberg Barclays U.S. Intermediate Government/Credit Bond Index and the Lipper Core Bond Funds Classification group for the one-, three- and five-year periods. The Fund underperformed the Lipper Universe averages (by 0.65% or less) and the Bloomberg Barclays Index (by 0.38% or less) for the ten- and 15-year and since inception periods. |
| | ● | The Fixed Income Opportunities Fund (Class N) outperformed the average returns of the funds in the Lipper High Yield Bond Funds Classification group, the Bloomberg Barclays U.S. Aggregate Bond Index, and the Credit Suisse Leveraged Loan Index, but underperformed the Bloomberg Barclays U.S. Corporate High Yield Index (by 0.45%) for the three-year period. The Fund outperformed the Bloomberg Barclays U.S. Aggregate Bond Index, but underperformed the Credit Suisse Index (by 3.48% or less), the Lipper Universe average return (by 2.25% or less), and the Bloomberg Barclays U.S. Corporate High Yield Index (by 3.48% or less) for the one- and five-year and since inception periods. The Board noted that the Fund is a blended fund with several sleeves managed by the Adviser and different sub-advisers according to various investment mandates, that it was therefore difficult to compare the Fund to a broad-based securities index, and that many of the Fund’s secondary benchmarks were benchmarks applicable only to certain sleeves of the Fund. |
| | ● | The Dividend & Income Fund (Class N) outperformed the average returns of the funds in the Lipper Equity Income Funds Classification group, but underperformed the S&P 500 Index (by 2.35%) and the Blended Index (a customized index composed of 60% Dow Jones U.S. Select Dividend Index, 25% Bank of America ML Core Fixed Rate Preferred Securities Index and 15% MSCI U.S. REIT Index) (by 2.09%), for the three-year period. The Fund outperformed the Lipper Universe average return and the Blended Index, but underperformed the S&P 500 Index return (by 0.57%), for the ten-year period. For the one-, five- and 15-year periods, the Fund underperformed the Blended Index (by 5.71% or less), the Lipper Universe (by 10.91% or less), and the S&P 500 Index (by 15.6% or less). The Fund outperformed the S&P 500 Index but trailed the Lipper Universe average returns (by 0.41%) and the Blended Index (by 2.77%) for the since inception period. The Board noted the Adviser’s observation that most of the Fund’s underperformance compared to the Blended Index was due to weak performance over the one-year period ending June 30, 2017, and that, as of the prior year, the Fund had performed well. The Board also noted that the Fund had been ranked in the five-star category by Morningstar, Inc. for the ten-year period as of June 30, 2017, and is a four-star fund in the Large Value Category overall. |
| | ● | The U.S. Core Equity Fund (Institutional Class) outperformed the average returns of the funds in the Lipper Large Cap Core Funds Classification group and the S&P 500 Index, but underperformed the Lipper Large Cap Growth Funds Classification group (by 1.57%), for the one-year period. The Fund outperformed the Lipper Large Cap Core Universe, but underperformed the S&P 500 Index (by 0.84% or less) and the Lipper Large Cap Growth Universe (by 0.85% or less) for the three-year and since inception periods. |
| | ● | The Emerging Markets Fund (Class N) outperformed the MSCI Emerging Markets Index, the average returns of the funds in the Lipper Emerging Markets Funds Classification group and the MSCI Emerging Markets Asia Index for |
CITY NATIONAL ROCHDALE FUNDS | PAGE 159
| board approval of advisory and sub-advisory agreements |
| (Unaudited) (Continued) |
the three- and five-year and since inception periods. For the one-year period, the Fund outperformed the Lipper Universe but slightly underperformed the MSCI Emerging Markets Index (by 0.22%), and underperformed the MSCI Emerging Markets Asia Index (by 4.33%).
The Board concluded that the Adviser continues to provide high quality management and oversight services to the Funds, the Mauritius Subsidiary, and the Irish Subsidiary. The Board noted that the investment results of the Funds over the long term were generally competitive; that the Adviser had given reasonable explanations for the performance of those Funds that had underperformed relative to their benchmarks; that the results for the Government Money Market Fund compared to its peer group were acceptable given the special services and investment focuses of the Fund and the unusual market conditions applicable to the money market fund industry in recent years; and that consideration of returns of market indexes needed to take into account that indexes do not reflect the expenses of operating mutual funds.
Advisory Fees and Fund Expenses
The Board then reviewed information regarding the advisory fees (both before and after waivers) charged by the Adviser to each Fund, and the total expenses (net of fee waivers) for the last fiscal year of the Institutional Class, Servicing Class, and Class N shares of each Fund (as percentages of their respective average annual net assets), as applicable (“Total Expense Ratios”), compared to those of the funds included in its respective Lipper Universe and peer group identified by the Adviser (each, a “Peer Group”), as applicable.
The Board observed that the meeting materials indicated as follows with respect to the Funds’ investment advisory fees (net of fee waivers):
| | ● | The net advisory fees paid by the Government Money Market Fund, Municipal High Income Fund, High Yield Bond Fund, Intermediate Fixed Income Fund, and Emerging Markets Fund were above their Lipper Universe averages and Peer Group averages. |
| | ● | The net advisory fees paid by the Government Bond Fund, Corporate Bond Fund, California Tax Exempt Bond Fund, Dividend & Income Fund, and U.S. Core Equity Fund were below their Peer Group and Lipper Universe averages. |
| | ● | The net advisory fee paid by the Fixed Income Opportunities Fund was below its Peer Group average but above its Lipper Universe average. |
The Board noted that the Adviser does not manage investment portfolios for other registered investment companies, pension funds, or institutional accounts that have similar investment objectives and policies as the Funds, so it did not have a basis to compare the Funds’ advisory fees with advisory fees charged by the Adviser to other such clients.
The Board observed that the meeting materials indicated as follows with respect to the Total Expense Ratios of each Fund (net of fee waivers):
| | ● | The Total Expense Ratios of the Institutional Class of the California Tax-Exempt Bond Fund, Corporate Bond Fund, Government Bond Fund, Municipal High Income Fund, Fixed Income Opportunities Fund, and Emerging Markets Fund; the Class N, Servicing Class and Institutional Class of the U.S. Core Equity Fund; and the Class N and Institutional Class of the Dividend & Income Fund were below both their respective Peer Group and Lipper Universe averages. |
| | ● | The Total Expense Ratios of the Servicing Class of the Government Bond Fund, California Tax Exempt Bond Fund, Emerging Markets Fund, and Municipal High Income Fund; and the Institutional Class of the Government Money Market Fund, High Yield Bond Fund, and Intermediate Fixed Income Fund were below their respective Lipper Universe averages but above their respective Peer Group averages. |
| | ● | The Total Expense Ratio of the Servicing Class of the Corporate Bond Fund was below its Peer Group average but above its Lipper Universe average. |
| | ● | The Total Expense Ratios of the Servicing Class of the Government Money Market Fund and High Yield Bond Fund; and the Class N of the Government Money Market Fund, Government Bond Fund, Corporate Bond Fund, California Tax Exempt Bond Fund, Municipal High Income Fund, High Yield Bond Fund, Intermediate Fixed Income Fund, Fixed Income Opportunities Fund, and Emerging Markets Fund were above their respective Peer Group and Lipper Universe averages. However, the Total Expense Ratios for the Government Bond Fund (Institutional Class), Corporate Bond Fund (Servicing Class), California Tax Exempt Bond Fund (Servicing Class), Municipal High Income Fund (Servicing Class), High Yield Bond Fund (Institutional Class), Intermediate Fixed Income Fund (Institutional Class), Fixed Income Opportunities Fund (Class N), and Emerging Markets Fund (Class N) were in the middle 60% of funds in their Lipper Universes. |
CITY NATIONAL ROCHDALE FUNDS | PAGE 160
The Board concluded that the advisory fees charged by the Adviser were fair and reasonable in relation to the value of services provided, and the total expenses of each Fund continued to be reasonable in light of the services provided, noting the different expense structure and arrangements for shareholder services and distribution of the various classes of the Funds. The Board noted that the Government Money Market Fund offered unique features which created substantial demands on the Adviser’s portfolio management staff. The Board also noted that the Adviser was recouping previously waived advisory fees from the Government Money Market Fund and that its affiliates had begun to collect shareholder servicing fees again after years of waiving those fees in order to maintain yields at certain levels.
Profitability, Benefits to the Adviser and Economies of Scale
The Board next considered information prepared by the Adviser relating to its costs and profits, as well as the benefits received by the Adviser and its affiliates as a result of its relationship with the Funds (other than the investment advisory fees paid to the Adviser), including fees paid to City National Bank (“CNB”), City National Securities, Inc., the Adviser, and RIM Securities, LLC for providing certain shareholder servicing, distribution and sub-distribution services to the Trust, benefits to CNB’s brokerage and wealth management business as a result of the availability of the Funds to its customers, and any research received from broker-dealers that execute transactions on behalf of the Funds. The Board determined that the profitability to the Adviser of its relationship with the Funds was reasonable. The Board also concluded that although there were no advisory fee breakpoints, significant economies of scale were not available until the asset levels of the Funds were materially higher than their current levels.
Conclusion
The Board and the Independent Trustees concluded that, based on the various factors they had reviewed, the compensation payable to the Adviser under the advisory agreements was fair and reasonable in light of the nature and quality of the services it provides to the Funds, the Mauritius Subsidiary, and the Irish Subsidiary, and that renewal of the advisory agreements would be in the best interests of each Fund, the Mauritius Subsidiary, and the Irish Subsidiary and their respective shareholders.
SUB-ADVISERS
Nature, Extent and Quality of Services
In reviewing the services provided by each Sub-Adviser, the Board considered a variety of matters, including the overall quality and depth of each Sub-Adviser’s organization and each Sub-Adviser’s overall financial strength and stability. The Board also considered, among other things, the investment operations and staff of each Sub-Adviser, its commitment to compliance with applicable laws and regulations and the Trust’s compliance policies and procedures, its portfolio trading and soft dollar practices and its disaster recovery and contingency planning practices. In addition, the Board considered the background, education and experience of each Sub-Adviser’s key portfolio management and operational personnel, and each Sub-Adviser’s efforts to retain, attract and motivate capable personnel to serve the relevant Fund. The Board found all of these matters to be satisfactory.
Investment Performance
The Board reviewed information provided in the meeting materials setting forth the performance of the portion of the Fixed Income Opportunities Fund managed by each of its Sub-Advisers compared with applicable benchmarks for various periods ended June 30, 2017. The Board noted that since Guggenheim sub-advises the entire High Yield Bond Fund, the performance of Guggenheim had already been reviewed as a part of the review of the performance of the High Yield Bond Fund generally. The Board made the following additional observations in reviewing the performance of the following Sub-Advisers of the Fixed Income Opportunities Fund:
| | ● | The annualized returns for the portion of the Fund managed by Federated were above the returns of the Bloomberg Barclays U.S. Corporate High Yield Index for the three- and five-year periods, but below the return of the Barclays Index (by 0.57%) for the one-year period. |
| | ● | The annualized returns for the portion of the Fund managed by Seix were above the return of the Credit Suisse Institutional Leveraged Loan Index for the three-year period, but below the return of the Credit Suisse Index (by 0.80% or less) for the one- and five-year periods. |
| | ● | The annualized returns for the portion of the Fund managed by Alcentra were below the returns of the Credit Suisse Institutional Western Europe Leveraged Loan Index (by 0.76% or less) for the one- and three-year periods. |
| | ● | The annualized returns for the portion of the Fund managed by GML were above the returns of the JP Morgan CEMBI Broad High Yield Index for the one-year period, but slightly below the JP Morgan Index (by 0.21% or less) for the three- and five-year periods. |
CITY NATIONAL ROCHDALE FUNDS | PAGE 161
| board approval of advisory and sub-advisory agreements |
| (Unaudited) (Continued) |
| | ● | The annualized returns for the portion of the Fund managed by Ashmore were above the returns of the JP Morgan CEMBI Broad High Yield Index for the one-year period, but below the JP Morgan Index (by 0.58%) for the three-year period. |
The Board noted that, while not all of the Sub-Advisers outperformed their respective benchmarks for the periods under evaluation, the Adviser had reviewed their performance relative to current market conditions, with an understanding of each Sub-Adviser’s style and philosophy, and was satisfied with the performance of each Sub-Adviser.
The Board considered the investment results of the Funds to be generally competitive, and determined that each of Guggenheim, Seix, Federated, GML, Alcentra, Ashmore and AllFinancial continued to provide high quality sub-advisory services to the applicable Funds.
Sub-Advisory Fees and Fund Expenses
The Board reviewed information included in the meeting materials regarding the sub-advisory fees charged by each Sub-Adviser, and observed that the fees were generally low compared to the fees charged by the Sub-Advisers to their other institutional clients and noted that although certain Sub-Advisers charged lower fees to other mutual funds advised by the Sub-Advisers, those funds were significantly larger than the relevant Fund. The Trustees noted that the Adviser pays all sub-advisory fees out of its advisory fee. The Board considered that Ashmore, Seix and Federated had recently agreed to lower their fee rates, and that the Adviser had indicated that any net fee retained by the Adviser in connection with the decreased sub-advisory fees would be rebated to Fund shareholders investing in the Fixed Income Opportunities Fund through the Adviser’s managed accounts.
Benefits to Sub-Advisers and Economies of Scale
The Board also evaluated the financial information prepared by each Sub-Adviser. The Board considered that none of the Sub-Advisers or their affiliates receive benefits (other than the sub-advisory fees) as a result of their relationship with the Funds, except the intangible benefits of their association with the Funds generally, any favorable publicity arising in connection with the Funds’ performance, and any research received from broker-dealers that execute transactions on behalf of the Funds. The Board also considered that the asset levels of most of the Funds were relatively small and were currently not likely to lead to significant economies of scale.
Conclusion
Based on their review, including their consideration of each of the factors referred to above, the Board and the Independent Trustees concluded that the compensation payable to each Sub-Adviser pursuant to its respective sub-advisory agreement was fair and reasonable in light of the nature and quality of the services being provided by each Sub-Adviser to the respective Fund and its shareholders, and it would be in the best interests of each of the Funds and their respective shareholders to renew the sub-advisory agreements with each of Guggenheim, Seix, Federated, GML, Alcentra, Ashmore and AllFinancial.
AMENDMENTS TO SUB-ADVISORY AGREEMENTS
In connection with the proposed amendments to the Federated, Ashmore and Seix sub-advisory agreements, each of which provided for reduction of the applicable sub-advisory fee, the Board reviewed the performance of the relevant Sub-Adviser’s current portfolio. The Board noted the Adviser’s representation that there would be no change to the quality or quantity of services provided to the Fund by the Adviser or the relevant Sub-Adviser in connection with the proposed amendments to the sub-advisory agreements, and that any net fee retained by the Adviser in connection with the decreased sub-advisory fees would be rebated to Fund shareholders investing in the Fund through separately managed accounts.
With respect to the proposed amendment to the Ashmore sub-advisory agreement, which would also expand Ashmore’s mandate to include investments in emerging market local currency bonds, the Board considered information regarding Ashmore’s management of such investments, including performance of a Luxembourg registered fund managed by Ashmore using the same strategies it would use to manage the new emerging market local currency bond portion of the Fund. The Board observed that the Luxembourg fund outperformed its benchmark, the JP Morgan GBI-EM GD Index, for recent one-, three- and five-year and since inception periods.
Conclusion
Based on their review, including their consideration of each of the factors referred to above, the Board and the Independent Trustees concluded that the compensation payable to each Sub-Adviser pursuant to the amendment to its respective sub-advisory agreement was fair and reasonable and in the best interest of the Fixed Income Opportunities Fund and its shareholders to approve the amendments to the sub-advisory agreement with each of Federated, Seix and Ashmore.
CITY NATIONAL ROCHDALE FUNDS | PAGE 162
This page intentionally left blank.
CITY NATIONAL ROCHDALE FUNDS | PAGE 163
This page intentionally left blank.
CITY NATIONAL ROCHDALE FUNDS | PAGE 164
The registrant has adopted a code of ethics that applies to the registrant’s principal executive officer, principal financial officer and principal accounting officer.
| Item 3. | Audit Committee Financial Expert. |
(a)(1) The registrant’s board of trustees has determined that the registrant has at least one audit committee financial expert serving on the audit committee.
(a)(2) The audit committee financial expert is James R. Wolford. Mr. Wolford is independent as defined in Form N-CSR Item 3(a)(2).
| Item 4. | Principal Accountant Fees and Services. |
Fees billed by BBD LLP Related to the Trust
BBD LLP billed the Trust aggregate fees for services rendered to the Trust for the last two fiscal years as follows:
| | 2017 | 2016 |
| | | All fees and services to the Trust that were pre-approved | All fees and services to service affiliates that were pre-approved | All other fees and services to service affiliates that did not require pre-approval | All fees and services to the Trust that were pre-approved | All fees and services to service affiliates that were pre-approved | All other fees and services to service affiliates that did not require pre-approval |
| (a) | Audit Fees(1) | $224,000 | N/A | N/A | $214,000 | N/A | N/A |
| (b) | Audit-Related Fees | N/A | N/A | N/A | N/A | N/A | N/A |
| (c) | Tax Fees | N/A | N/A | N/A | N/A | N/A | N/A |
| (d) | All Other Fees | N/A | N/A | N/A | N/A | N/A | N/A |
Notes:
| (1) | Audit fees include amounts related to the audit of the registrant’s annual financial statements and services normally provided by the accountant in connection with statutory and regulatory filings. |
| (e)(2) | Percentage of fees billed applicable to non-audit services pursuant to waiver of pre-approval requirement were as follows: |
| | 2017 | 2016 |
| Audit-Related Fees | N/A | N/A |
| Tax Fees | N/A | N/A |
| All Other Fees | N/A | N/A |
| (g) | The aggregate non-audit fees and services billed by BBD LLP for the last two fiscal years were $0 and $0 for 2017 and 2016, respectively. |
| Item 5. | Audit Committee of Listed Registrants. |
Not applicable.
| Item 6. | Schedule of Investments |
Not applicable.
| Item 7. | Disclosure of Proxy Voting Policies and Procedures for Closed-End Management Investment Companies. |
Not applicable to open-end management investment companies.
| Item 8. | Portfolio Managers of Closed-End Management Investment Companies |
Not applicable
| Item 9. | Purchases of Equity Securities by Closed-End Management Company and Affiliated Purchasers. |
Not applicable to open-end management investment companies.
| Item 10. | Submission of Matters to a Vote of Security Holders. |
There have been no changes to the procedures by which shareholders may recommend nominees to the registrant’s Board of Trustees during the period covered by this report.
| Item 11. | Controls and Procedures. |
(a) The certifying officers, whose certifications are included herewith, have evaluated the registrant’s disclosure controls and procedures within 90 days of the filing date of this report. In their opinion, based on their evaluation, the registrant’s disclosure controls and procedures are adequately designed, and are operating effectively to ensure, that information required to be disclosed by the registrant in the reports it files or submits under the Securities Exchange Act of 1934 is recorded, processed, summarized and reported within the time periods specified in the Securities and Exchange Commission’s rules and forms.
(b) There were no significant changes in the registrant’s internal control over financial reporting that occurred during the registrant’s last fiscal half-year that has materially affected, or is reasonably likely to materially affect, the registrant’s internal control over financial reporting.
(a)(1) Code of Ethics attached hereto.
(a)(2) A separate certification for the principal executive officer and the principal financial officer of the registrant as required by Rule 30a-2(a) under the Investment Company Act of 1940, as amended (17 CFR 270.30a-2(a)), are filed herewith.
(b) Officer certifications as required by Rule 30a-2(b) under the Investment Company Act of 1940, as amended (17 CFR 270.30a-2(b)) also accompany this filing as an Exhibit.
SIGNATURES
Pursuant to the requirements of the securities Exchange Act of 1934 and the Investment Company Act of 1940, the registrant has duly caused this report to be signed on its behalf by the undersigned, thereunto duly authorized.
| (Registrant) | City National Rochdale Funds | |
| | | |
| By (Signature and Title) | /s/ Garrett R. D’Alessandro | |
| | Garrett R. D’Alessandro, | |
| | President & Chief Executive Officer | |
Date: December 8, 2017
Pursuant to the requirements of the Securities Exchange Act of 1934 and the Investment Company Act of 1940, this report has been signed below by the following persons on behalf of the registrant and in the capacities and on the dates indicated.
| By (Signature and Title) | /s/ Garrett R. D’Alessandro | |
| | Garrett R. D’Alessandro, | |
| | President & Chief Executive Officer | |
| | | |
| Date: December 8, 2017 | | |
| | | |
| By (Signature and Title) | /s/ Eric Kleinschmidt | |
| | Eric Kleinschmidt, | |
| | Treasurer | |
| | | |
| Date: December 8, 2017 | | |