Washington, D.C. 20549
William J. Souza, Esq.
Item 1. Reports to Stockholders.
TABLE OF CONTENTS
| | City National Rochdale Funds Annual Report |
| | |
2 | Letter to Our Shareholders |
4 | Fixed Income and Blended Funds Investment Adviser’s Report |
7 | Fixed Income and Blended Funds Overview |
15 | Equity Funds Investment Adviser’s Report |
17 | Equity Funds Overview |
21 | Schedule of Investments/Consolidated Schedule of Investments |
124 | Statements of Assets and Liabilities/Consolidated Statement of Assets and Liabilities |
128 | Statements of Operations/Consolidated Statement of Operations |
132 | Statements of Changes in Net Assets/Consolidated Statement of Changes in Net Assets |
138 | Consolidated Statement of Cash Flows |
140 | Financial Highlights/Consolidated Financial Highlights |
145 | Notes to Financial Statements/Consolidated Notes to Financial Statements |
162 | Report of Independent Registered Public Accounting Firm |
163 | Trustees and Officers |
166 | Notice to Shareholders |
168 | Disclosure of Fund Expenses |
171 | Board Approval of Advisory and Sub-Advisory Agreements |
The Funds file their complete schedules of portfolio holdings with the Securities and Exchange Commission (the “Commission”) for the first and third quarters of each fiscal year on Form N-Q within 60 days after the end of the period. The Funds’ Form N-Q filings are available on the Commission’s website at http://www.sec.gov, and may be reviewed and copied at the Commission’s Public Reference Room in Washington, DC. Information on the operation of the Public Reference Room may be obtained by calling 1-800-SEC-0330. The most current Form N-Q filing is also available on the Funds’ website at www.citynationalrochdalefunds.com and without charge, upon request, by calling 1-888-889-0799.
A description of the policies and procedures that the Funds use to determine how to vote proxies relating to the Funds’ portfolio securities, and information on how the Funds voted proxies relating to portfolio securities during the most recent 12-month period ending June 30 is available (1) without charge, upon request, by calling 1-888-889-0799, (2) on the Funds’ website at www.citynationalrochdalefunds.com, and (3) on the Commission’s website at www.sec.gov.
CITY NATIONAL ROCHDALE FUNDS | PAGE 1
letter to our shareholders |
September 30, 2015 |
Dear Shareholders,
This annual report covers the one-year period ended September 30, 2015. Heading towards the end of the calendar year, risk assets have delivered a wide range of performance outcomes. Though U.S. equity performance stands in stark contrast to the double digit returns garnered at this time last year, relative to other equity markets around the world, domestic investors generally still remain ahead of the pack. Volatility levels within both equity and fixed income markets have increased throughout the year, as anxiety surrounding U.S. interest rate policy, global central bank activity, and Chinese GDP trends have weighed on investor psychology. Commodity markets have been among the hardest hit, as Oil’s approximate 50% freefall over the course of the last 12 months has pressured business models and export-oriented economies alike.
Within fixed income markets, credit quality positioning was of key importance throughout the year, particularly during the most recent quarter. Energy companies have been under significant pressure, as $40 - $50 Oil (per barrel) has dramatically changed profitability projections across the sector. Spread widening was the most acute for high yield issuers within the Exploration & Production space, but bonds across all industries were not immune from the sell-off that took hold during August and September. The BofaML U.S. High Yield Master II Index declined 4.9% during the third quarter (“Q3”), with CCC rated credits bearing the brunt of the damage. Investment grade exposure held up well, however, as evidenced by the 1.2% return posted by the Barclays Aggregate Index during the quarter. Over the last 12 months, investment grade bonds have outpaced high yield bonds by over 500 basis points (“bps”). Though volatility can be painful in the short to intermediate term, it can also create attractive purchase opportunities for astute investors with the ability to distinguish between price and intrinsic value.
Equity investors have experienced mixed results over the course of the last year, depending on how they have been positioned from both geographic and style standpoints. International markets have been challenged, particularly within emerging market economies, where China’s decision to devalue its currency in mid-August was met with rapid sell orders around the world. Triggered by this development, the MSCI Emerging Markets Index plunged almost 18% during Q3. Uncertainty surrounding the potential implications of a U.S. interest rate hike on emerging market borrowers, both corporate and sovereign, further magnified investor anxiety during the late summer months. The spillover effect to U.S. markets elicited a 6.4% decline for the S&P 500 Index during the quarter as well. Though more recently it has been a bit of a wild ride, there are also some bright spots worth mentioning. Domestic investors with an eye towards growth have fared reasonably well, outshining their value-oriented peers. Healthcare, Consumer Discretionary, and Information Technology stocks in particular have been among the strongest contributors in this regard, supporting a 3.2% return for the Russell 1000 Growth Index on a trailing 12-month basis.
Coming into 2015, we expected to face choppy seas amidst a backdrop of shifting global economic currents and uncertain monetary policy developments around the world. Our unwavering focus on risk management and downside protection continues to serve us well, as capital preservation will always be of paramount importance within all of the investment strategies that we manage. As always, we thank you for your trust and confidence in our abilities to continue to serve you well through your investment in the City National Rochdale Funds.
Sincerely,

Bruce Simon
Chief Investment Officer
City National Rochdale Funds
Index returns are for illustrative purposes only and do not represent actual Fund performance. Index performance returns do not reflect any management fees, transaction costs or expenses. Indexes are unmanaged and one cannot invest directly in an index.
CITY NATIONAL ROCHDALE FUNDS | PAGE 2
Past performance is no guarantee of future results. Certain shareholders may be subject to the Alternative Minimum Tax (AMT). Federal income tax rules apply to any capital gain distributions.
This information must be preceded or accompanied by a current prospectus. Please read the prospectus carefully before investing.
City National Rochdale Funds do not generally accept investments by non-U.S. persons and may not be available in all states.
BofaML U.S. High Yield Master II Index measures the performance of U.S. dollar denominated below investment grade corporate debt publicly issued in the U.S. domestic market. Qualifying securities must have a below investment grade rating (based on an average of Moody’s, S&P, and Fitch) and an investment grade rated country of risk (based on an average of Moody’s, S&P and Fitch foreign currency long term sovereign debt ratings).
Barclays Aggregate Index is an index generally representing fixed-rate, investment-grade government bonds, corporate debt securities, mortgage-backed securities, and asset-backed securities with minimum maturity dates of at least one year.
MSCI Emerging Markets Index is a free float-adjusted market capitalization index that is designed to measure equity market performance in the global emerging markets. With over 800 constituents, the index covers approximately 85% of the free float-adjusted market capitalization in each country.
The S&P 500 Index is a stock market index based on the market capitalizations of 500 large companies having common stock listed on the NYSE or NASDAQ.
Russell 1000 Growth Index measures the performance of the large-cap growth segment of the U.S. equity universe. It includes those Russell 1000 companies with higher price-to-book ratios and higher forecasted growth values.
CITY NATIONAL ROCHDALE FUNDS | PAGE 3
investment adviser’s report (Unaudited) |
September 30, 2015 |
Fixed Income and Blended Funds |
Government Bond Fund – CNBIX
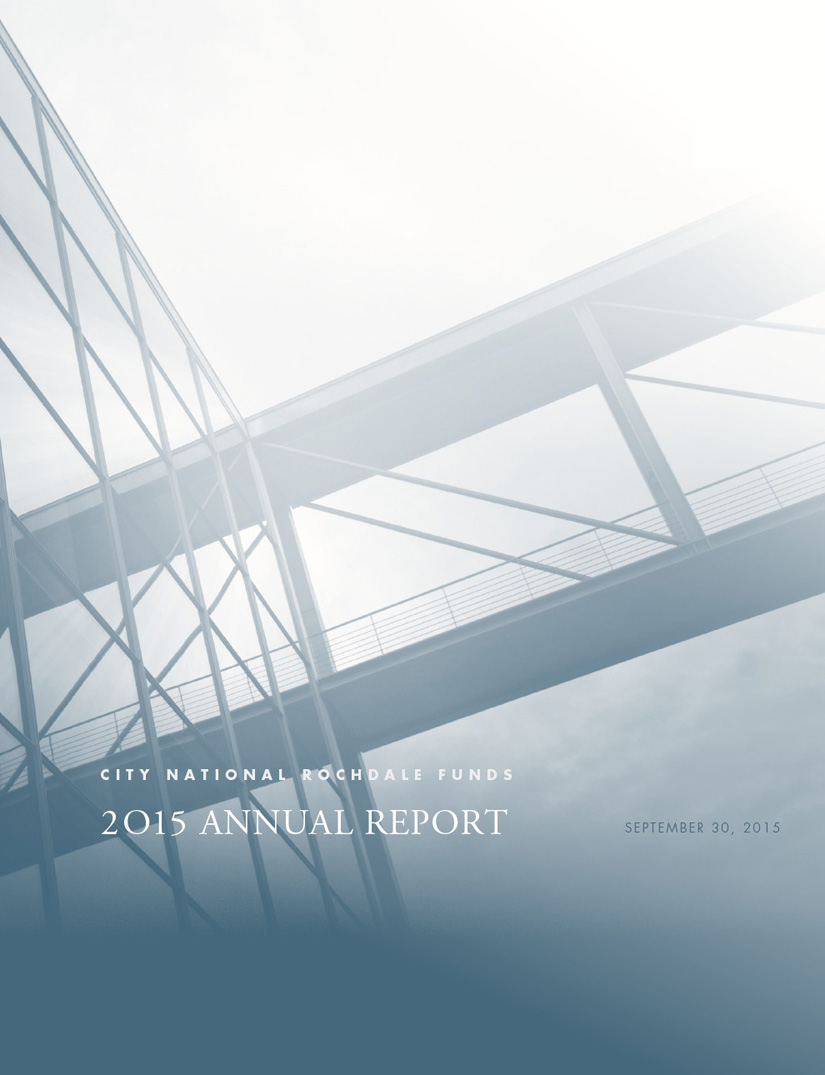
The Servicing Class Shares of the Fund posted a return of 0.50% for Q3, which underperformed the Barclays U.S. 1-5 Year Government Bond Index’s 0.68% return. Calendar year to date, as of September 30, 2015, the Fund is lagging the benchmark’s return of 1.59% by 64 basis points with a return of 0.95%. For the fiscal year ended September 30, 2015, the Servicing Class Shares of the Fund has returned 1.21% and the benchmark has delivered a return of 2.05%.
As of the most recent quarter, the portfolio maintained its short duration positioning relative to the benchmark in anticipation of an eventual rise in interest rates. This proved to be a headwind during the quarter, as longer duration assets outperformed shorter duration positions as interest rates rallied. The yield enhancement garnered from the Fund’s overweight to Agency bullet bonds was additive to performance. The Fund also increased its allocation to 3-6 year maturity buckets to take advantage of the current steepness in the yield curve.
Corporate Bond Fund – CNCIX
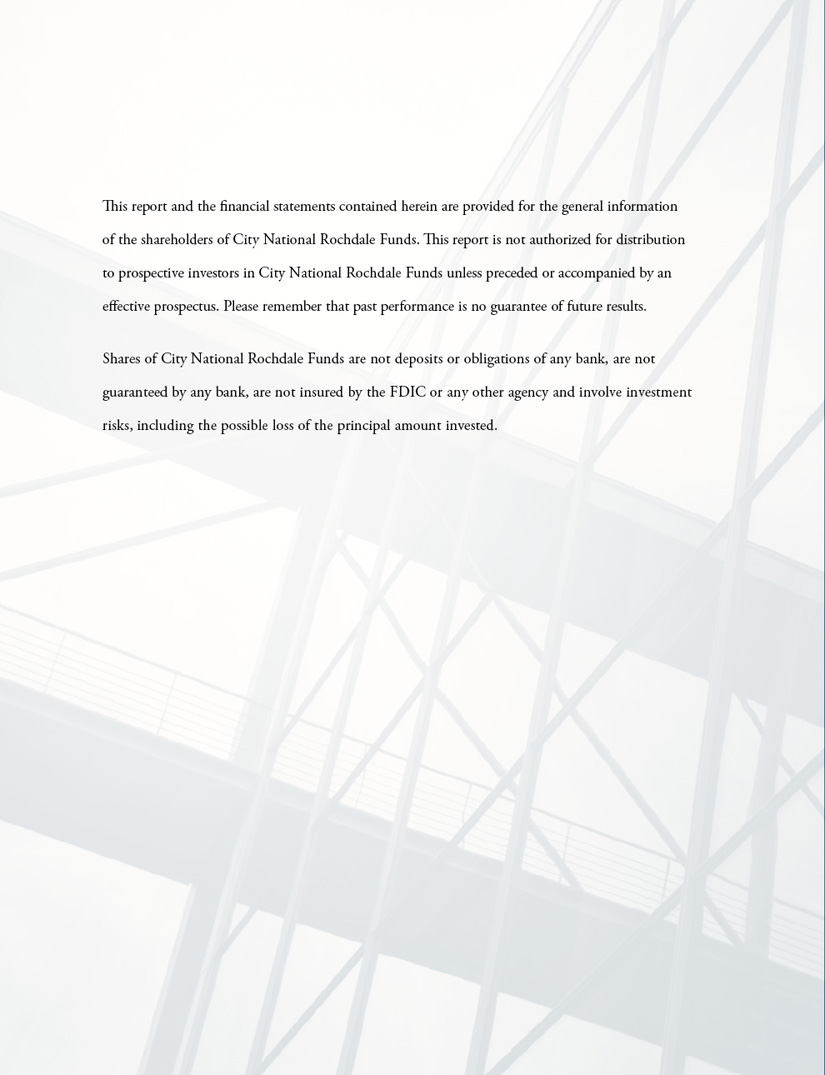
The Servicing Class Shares of the Fund posted a return of -0.07% for Q3, underperforming the Barclays 1-5 Year A3 or Higher U.S. Corporate Index’s return of 0.72%. Calendar year to date, as of September 30, 2015, the Fund is underperforming the benchmark by 1.09% (0.58% for the Fund vs. 1.67% for the Benchmark). For the fiscal year ended September 30, 2015, the Servicing Class Shares of the Fund has underperformed the benchmark’s return by 1.79% (0.39% for the Fund vs. 2.18% for the benchmark).
As of the most recent quarter, the Fund continued to outpace the benchmark from a yield perspective, driven by an emphasis on investing in lower quality bonds within the investment grade universe. Sector allocation was additive to relative performance as bonds within the Financial sector outperformed bonds within the Industrial sector. Issuer selection within the Energy and Metals & Mining sectors accompanied by slightly underweight duration relative to the benchmark was a performance headwind.
California Tax Exempt Bond Fund - CNTIX
The Servicing Class Shares of the Fund posted a return of 1.00% for Q3, underperforming the Barclays Intermediate-Short California Municipal Bond Index return of 1.23% but outperforming the Lipper peer group return of 0.71%. Calendar year to date, as of September 30, 2015, the Fund is lagging the benchmark’s return of 1.70% by 51 basis points with a return of 1.19% but again outperforming the Lipper peer group return of 0.49%. For the fiscal year ended September 30, 2015, the 1.56% return for the Servicing Class Shares of the Fund has underperformed the benchmark return of 2.08% while outperforming the Lipper return of 0.68%.
Contributions to performance during the fiscal year include duration shifts, an overweight to lower investment grade credit quality and a sharp underweight to pre-refunded bonds. In anticipation of the Federal Reserve (Fed) raising short-term rates by summer 2015, we reduced duration from neutral to short the benchmark only to return to neutral in the third quarter as the economic fundamentals moved back to the negative side. We also migrated toward a mild barbell structure in anticipation of a flattening yield curve. The focus on lower investment grade credits served the Fund well as the fundamental health of California’s economy and the fiscal health of the issuers continued to improve during the year. A heavy wave of refundings in the market in the first half of 2015 led to underperformance in the sector. We benefited from our sharp underweight to refunded debt. Detractors to performance included the continuing low nominal rate environment, cash drag from new subscriptions in a low supply environment and an underweight to California state debt relative to the index.
Municipal High Income Bond Fund – CNRMX
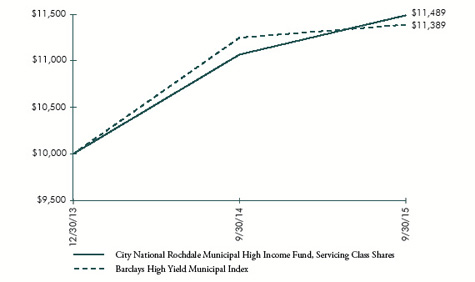
The Servicing Class Shares of the Fund posted a return of 1.43% for Q3, underperforming the Barclays High Yield Muni Index’s return of 1.99% by 56 basis points. Calendar year to date, as of September 30, 2015, the Fund is ahead of the benchmark’s return of 0.03% by 173 basis points with a return of 1.76%. For the fiscal year ended September 30, 2015, the Servicing Class Shares of the Fund returned 3.81%, outpacing the benchmark’s return of 1.24% by 257 basis points.
CITY NATIONAL ROCHDALE FUNDS | PAGE 4
The Fund outperformed the benchmark in three out of the four quarters during the last year. One of the primary areas of attention within the High Yield Muni space over the last 12 months has been Puerto Rico, which has grown to over a 25% weighting within the benchmark. Our Fund has generally maintained less than 5% exposure to these credits, which has been a meaningful contributor to both absolute and relative performance. Focusing on higher quality bonds, often mis-rated by the market, and a concerted effort to minimize relative interest rate risk within the portfolio have provided constructive support for the Fund’s outperformance.
High Yield Bond Fund – CHYIX
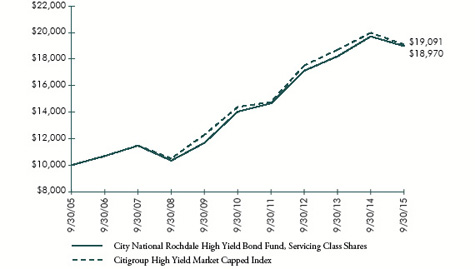
The Servicing Class Shares of the Fund posted a return of -5.03% for Q3, outperforming the Citigroup High Yield Market Capped Index’s return of -5.52% by 49 basis points. Calendar year to date, as of September 30, 2015, the Fund is ahead of the benchmark’s return of -3.11% by 152 basis points with a return of -1.59%. For the fiscal year ended September 30, 2015, the Servicing Class Shares of the Fund returned -3.71%, outpacing the benchmark’s return of -4.41% by 70 basis points.
The Fund outperformed the benchmark in three out of four quarters during the last year. Much of this is attributable to positive security selection, and avoiding or underweighting sectors with questionable creditworthiness. The manager has upgraded the credit quality of the overall portfolio over the course of the last year, which has helped to insulate against elevated volatility that has punctuated credit markets as of late. The Fund’s approximate 8% allocation to bank loans has also been a constructive hedge against downside risk, as senior secured paper has performed relatively well during periods of market stress. Though the portfolio’s Energy exposure has hindered performance, the manager has been able to take advantage of mispriced bonds that have sold off along with the rest of the sector.
Intermediate Fixed Income Fund – RIMCX
The Class N Shares of the Fund posted a return of 0.31% for Q3, lagging the Barclays Intermediate U.S. Government/Credit Index’s return of 0.95%. Calendar year to date, as of September 30, 2015, the Fund is underperforming the benchmark’s return of 1.77% by 95 basis points with a return of 0.82%. For the fiscal year ended September 30, 2015, the Class N Shares of the Fund returned 1.34%, underperforming the benchmark’s return of 2.68% by 134 basis points.
As of the most recent quarter, the Fund continued to outpace the benchmark from a yield perspective, driven by an emphasis on investing in lower quality bonds within the investment grade universe. The significant overweight to corporate credit has been the most meaningful driver of underperformance over the last year. Corporate sector allocation was additive to relative performance as bonds within the Financial sector outperformed bonds within the Industrial sector. Issuer selection within the Energy and Metals & Mining sectors accompanied by slightly underweight duration relative to the benchmark was a performance headwind.
Fixed Income Opportunities Fund – RIMOX
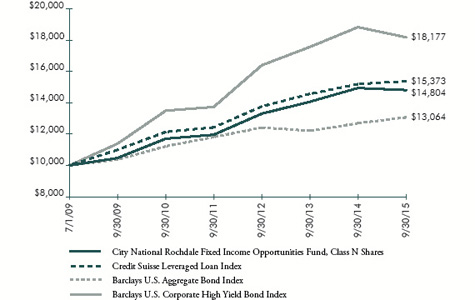
The Fund posted a return of -2.60% for Q3, underperforming the Credit Suisse Leveraged Loan Index’s return of -1.22% by 138 basis points. Calendar year to date, as of September 30, 2015, the Fund is outperforming the benchmark’s return of 1.61% by 46 basis points with a return of 2.07%. For the fiscal year ended September 30, 2015, the Fund has returned -0.88%, trailing the benchmark’s return of 1.22% by 210 basis points.
The Fund’s diversified asset class exposures have been instrumental in delivering an attractive yield profile, without assuming an inordinate amount of interest rate risk. With just over 30% of the Fund allocated to a combination of domestic and European bank loans, the strategy has been well positioned to withstand the elevated volatility experienced in credit markets as of late. The Fund’s emerging markets high yield bond allocation, although pressured in Q3, has been additive to performance during 2015. The domestic high yield segment of the Fund has sidestepped many of the problem areas within the Energy sector over the course of the last year, and generally maintains a higher quality portfolio compared to broad market indices.
CITY NATIONAL ROCHDALE FUNDS | PAGE 5
investment adviser’s report (Unaudited) |
September 30, 2015 |
Fixed Income and Blended Funds (continued) |
Multi-Asset Fund – CNIIX
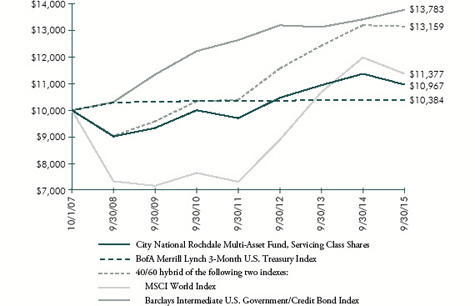
The Servicing Class Shares of the Fund posted a -4.09% return in Q3, underperforming the BofA Merrill Lynch 3-Month U.S. Treasury Bill Index of 0.01%. Calendar year to date, as of September 30, 2015, the Fund has delivered -4.83% return relative to 0.02% for the benchmark. For the fiscal year ended September 30, 2015, the Servicing Class Shares of the Fund returned -3.59% compared to a 0.02% return for the benchmark.
The bulk of the Fund’s underperformance came in Q3 of 2015. As of the most recent quarter, approximately 45% of the Fund was invested in fixed income, 35% in equities, 3% in real estate investment trusts and the remaining 17% in cash. Emerging markets and European equities exposure was a performance headwind during the most recent quarter. On the positive side, an allocation to longer duration treasuries, equities in the Utilities sector, and cash helped boost performance.
This material represents the managers’ assessment of the portfolios and market environment at a specific point in time and should not be relied upon by the reader as research or investment advice.
Performance data quoted represents past performance and does not guarantee similar future results. The investment performance and principal value of an investment will fluctuate so that an investor’s shares, when redeemed, may be worth more or less than their original cost, and current performance may be lower or higher than the performance quoted. For performance data current to the most recent month end, please call 1-888-889-0799.
Index performance returns do not reflect any management fees, transaction costs or expenses. Indexes are unmanaged and one cannot invest directly in an index.
The Government Bond Fund’s, Corporate Bond Fund’s, California Tax Exempt Bond Fund’s, Municipal High Income Fund’s, High Yield Bond Fund’s, Intermediate Fixed Income Fund’s, Multi-Asset Fund’s, and Fixed Income Opportunities Fund’s investment performance reflects voluntary fee waivers in effect. Absent these waivers, total return and yield would be lower. The Adviser intends to continue these arrangements at least through January 31, 2016, but there can be no assurance that City National Rochdale, LLC will continue to waive fees. After January 31, 2016, City National Rochdale, LLC intends to discontinue the voluntary fee waivers for the Municipal High Income Fund and High Yield Bond.
Mutual fund investing involves risk, including loss of principal. Bonds and bond funds are subject to interest rate risk and will decline in value as interest rates rise. The securities of mid-cap companies may have greater price volatility and less liquidity than the securities of larger capitalized companies. Emerging markets involve heightened risk related to the same factors as well as increased volatility and lower trading volume.
The California Tax Exempt Bond Fund invests primarily in California securities and may be more volatile and susceptible to a single adverse economic or regulatory occurrence affecting those obligations than a fund investing in obligations of a number of states.
The credit quality breakdown depicts the credit quality ratings of the Fund’s portfolio securities that are rated by one or both of two major nationally recognized statistical rating organizations (“NRSROs”). The two NRSROs currently utilized for this purpose are Standard & Poor’s (S&P) and Moody’s. When a bond is rated by S&P that rating is utilized. If it is not rated by S&P, the Moody’s rating is utilized. When a security is rated by neither, it is classified as “Not Rated”. For bonds, these credit quality ratings are shown without regard to gradations within a given rating category. For example, securities rated “AA-” or “AA+” have been included in the “AA” rated category. Long-term ratings are measured on a scale that generally ranges from AAA (highest) to D (lowest).
CITY NATIONAL ROCHDALE FUNDS | PAGE 6
fund overview (Unaudited) |
September 30, 2015 |
City National Rochdale Government Bond Fund |
The Fund seeks to provide current income (as the primary component of a total return intermediate duration strategy) by investing primarily in securities either issued or guaranteed by the U.S. Government or its agencies or instrumentalities.
Comparison of Change in the Value of a $10,000 Investment in the City National Rochdale Government Bond Fund, Servicing Class Shares, versus the Barclays U.S. 1-5 Year Government Bond Index(1)
(1) | The performance in the above graph does not reflect the deduction of taxes the shareholder will pay on Fund distributions or the redemptions of Fund shares. Investment performance reflects fee waivers in effect. In the absence of such waivers, total return would be reduced. |
Past performance is no indication of future performance.
The Fund’s comparative benchmark does not include the annual operating expenses incurred by the Fund. Please note that one cannot invest directly in an unmanaged index.
AVERAGE ANNUAL TOTAL RETURNS |
Shares | Ticker
Symbol | 1-Year
Return | 3-Year
Return | 5-Year
Return | 10-Year Return |
Servicing Class*(1)^ | CNBIX | 1.21% | 0.16% | 0.89% | 2.56% |
Institutional Class(2)^^† | CNIGX | 1.55% | 0.41% | 1.09% | 2.67% |
Class N(3) | CGBAX | 0.95% | -0.12% | 0.64% | 2.30% |
Barclays U.S. 1-5 Year Government Bond Index | n/a | 2.05% | 0.90% | 1.24% | 3.19% |
* | The graph is based on only Servicing Class Shares; performance for Institutional Class and Class N Shares would be different due to differences in fee structures. |
(1) | Commenced operations on January 14, 2000. |
(2) | Commenced operations on February 1, 2012. |
(3) | Commenced operations on April 13, 2000. |
^ | The Fund’s Servicing Class Shares are available only to fiduciary, advisory, agency, custodial and other similar accounts maintained at City National Bank and certain retirement plan platforms. |
^^ | The Fund’s Institutional Class Shares are available only to fiduciary, advisory, agency, custodial and other similar accounts maintained at City National Bank which meet the Fund’s minimum initial investment requirement, and certain tax-deferred retirement plans (including 401(k) plans, employer-sponsored 403(b) plans, 457 plans, profit sharing and money purchase pension plans, defined benefit plans and non-qualified deferred compensation plans) held in plan level or omnibus accounts. |
† | Institutional Class Shares’ performance for the period of January 14, 2000, to February 1, 2012, is that of the Servicing Class Shares. |
Top Ten Holdings |
% OF PORTFOLIO |
Tennessee Valley Authority, Ser E | |
6.250%, 12/15/17 | 5.9% |
Illinois Municipal Electric Agency, Ser A, NATL Pre-Refunded @ 100 | |
5.125%, 02/01/17 | 5.6% |
FNMA | |
1.000%, 10/16/17 | 4.0% |
FNMA | |
5.000%, 02/13/17 | 3.7% |
FNMA | |
0.875%, 02/08/18 | 3.7% |
U.S. Treasury Bonds | |
2.195%, 11/15/21 | 3.7% |
FNMA | |
2.430%, 10/09/19 | 3.6% |
FNMA | |
3.619%, 12/01/20 | 3.5% |
FNMA | |
4.875%, 12/15/16 | 3.5% |
U.S. Treasury Notes | |
2.875, 03/31/18 | 3.5% |
CITY NATIONAL ROCHDALE FUNDS | PAGE 7
fund overview (Unaudited) |
September 30, 2015 |
City National Rochdale Corporate Bond Fund |
The Fund seeks to provide current income (as the primary component of a total return intermediate duration strategy) by investing in a diversified portfolio of fixed income securities, primarily investment grade corporate bonds issued by domestic and international companies denominated in U.S. dollars.
Comparison of Change in the Value of a $10,000 Investment in the City National Rochdale Corporate Bond Fund, Servicing Class Shares, versus the Barclays 1-5 Year U.S. Corporate A3 or Higher, 2% Issuer Constrained Index(1)
(1) | The performance in the above graph does not reflect the deduction of taxes the shareholder will pay on Fund distributions or the redemptions of Fund shares. Investment performance reflects fee waivers in effect. In the absence of such waivers, total return would be reduced. |
Past performance is no indication of future performance.
The Fund’s comparative benchmark does not include the annual operating expenses incurred by the Fund. Please note that one cannot invest directly in an unmanaged index.
AVERAGE ANNUAL TOTAL RETURNS |
Shares | Ticker
Symbol | 1-Year
Return | 3-Year
Return | 5-Year
Return | 10-Year
Return |
Servicing Class*(1)^ | CNCIX | 0.39% | 1.01% | 1.79% | 3.52% |
Class N(2) | CCBAX | 0.14% | 0.76% | 1.54% | 3.27% |
Barclays 1-5 Year U.S. Corporate A3 or Higher, 2% Issuer Constrained Index | n/a | 2.18% | 1.62% | 2.37% | 4.00% |
* | The graph is based on only Servicing Class Shares; performance for Class N Shares would be different due to differences in fee structures. |
(1) | Commenced operations on January 14, 2000. |
(2) | Commenced operations on April 13, 2000. |
^ | The Fund’s Servicing Class Shares are available only to fiduciary, advisory, agency, custodial and other similar accounts maintained at City National Bank and certain retirement plan platforms. |
Top Ten Holdings |
% OF PORTFOLIO |
Florida State, Hurricane Catastrophe Fund | |
Finance, Ser A, RB | |
2.107%, 07/01/18 | 3.1% |
Toyota Motor Credit, MTN | |
2.050%, 01/12/17 | 3.0% |
Total Capital International | |
2.875%, 02/17/22 | 2.9% |
Lowe’s | |
6.100%, 09/15/17 | 2.4% |
Stone Ridge Reinsurance Risk Premium Interval Fund | 2.3% |
Fifth Third Bank | |
1.150%, 11/18/16 | 2.3% |
Nissan Auto Lease Trust 2015-A, Ser 2015-A, Cl A3 | |
1.400%, 06/15/18 | 2.2% |
Hewlett Packard Enterprise | |
2.060%, 10/05/17 | 2.2% |
Standard Chartered, MTN | |
1.700%, 04/17/18 | 2.2% |
VW Credit, MTN | |
1.875%, 10/13/16 | 2.2% |
BOND CREDIT QUALITY |
CREDIT RATINGS(1) | % OF NET ASSETS |
AAA | 2.2% |
AA | 21.1% |
A | 36.1% |
BBB | 33.0% |
BB | 3.2% |
NR | 1.5% |
Registered Investment Company | 2.3% |
Short-Term Investments and Other Net Assets | 2.1% |
(1) | Credit quality is based on ratings from Standard & Poor’s, a division of The McGraw-Hill Companies, Inc. (“S&P”). When S&P ratings are not available, credit quality is based on ratings from Moody’s Investor Services, Inc. (“Moody’s”). S&P and Moody’s ratings have been selected fo several reasons, including the access to information and materials provided by S&P and Moody’s, as well as the Fund’s consideration of industry practice. The Not Rated category, if applicable, consists of securities that have not been rated by S&P or Moody’s. |
CITY NATIONAL ROCHDALE FUNDS | PAGE 8
fund overview (Unaudited) |
September 30, 2015 |
City National Rochdale California Tax Exempt Bond Fund |
The Fund seeks to provide current income exempt from federal and California state income tax (as the primary component of a total return strategy) by investing primarily in California municipal bonds and notes.
Comparison of Change in the Value of a $10,000 Investment in the City National Rochdale California Tax Exempt Bond Fund, Servicing Class Shares, versus the Barclays Intermediate-Short California Municipal Index(1)

(1) | The performance in the above graph does not reflect the deduction of taxes the shareholder will pay on Fund distributions or the redemptions of Fund shares. Investment performance reflects fee waivers in effect. In the absence of such waivers, total return would be reduced. |
Past performance is no indication of future performance.
The Fund’s comparative benchmark does not include the annual operating expenses incurred by the Fund. Please note that one cannot invest directly in an unmanaged index.
AVERAGE ANNUAL TOTAL RETURNS |
Shares | Ticker
Symbol | 1-Year
Return | 3-Year
Return | 5-Year
Return | 10-Year Return |
Servicing Class*(1)^ | CNTIX | 1.56% | 1.63% | 2.48% | 3.25% |
Class N(2) | CCTEX | 1.30% | 1.37% | 2.21% | 2.99% |
Barclays Intermediate-Short California Municipal Index | n/a | 2.08% | 2.23% | 2.96% | 3.94% |
* | The graph is based on only Servicing Class Shares; performance for Class N Shares would be different due to differences in fee structures. |
(1) | Commenced operations on January 14, 2000. |
(2) | Commenced operations on April 13, 2000. |
^ | The Fund’s Servicing Class Shares are available only to fiduciary, advisory, agency, custodial and other similar accounts maintained at City National Bank. |
Top Ten Holdings* |
% OF PORTFOLIO |
Fairfield County, Redevelopment Agency, TA | |
4.000%, 08/01/17 | 2.9% |
Los Angeles, Unified School District, Ser B, GO, AMBAC Callable 07/01/17 @ 100 | |
5.000%, 07/01/19 | 2.2% |
California Statewide, Communities Development Authority, Kaiser Permanente, Ser B, RB
Callable 02/01/17 @ 100 | |
0.970%, 04/01/52 | 2.0% |
Riverside County, Public Safety Communication, Ser A, COP, AMBAC | |
5.000%, 11/01/17 | 1.8% |
Southern California, Public Power Authority, Subordinated Southern Transmission Project, Ser A, RB | |
5.000%, 07/01/17 | 1.5% |
California State, GO | |
5.000%, 09/01/21 | 1.5% |
California Statewide, Communities Development Authority, Kaiser Permanente, Ser A, RB | |
5.000%, 04/01/19 | 1.4% |
San Diego, Public Facilities Financing Authority Sewer Revenue, RB | |
5.000%, 05/15/25 | 1.3% |
Southern California, Public Power Authority, Linden Wind Energy Project, Ser A, RB
Callable 07/01/20 @ 100 | |
5.000%, 07/01/27 | 1.3% |
California State, GO | |
5.250%, 09/01/22 | 1.2% |
* | Excludes Cash Equivalents |
CITY NATIONAL ROCHDALE FUNDS | PAGE 9
fund overview (Unaudited) |
September 30, 2015 |
City National Rochdale Municipal High Income Fund |
The Fund seeks to provide a high level of current income that is not subject to federal income tax.
Comparison of Change in the Value of a $10,000 Investment in the City National Rochdale Municipal High Income Fund, Servicing Class Shares, versus the Barclays High Yield Municipal Index(1)
(1) | The performance in the above graph does not reflect the deduction of taxes the shareholder will pay on Fund distributions or the redemptions of Fund shares. Investment performance reflects fee waivers in effect. In the absence of such waivers, total return would be reduced. |
Past performance is no indication of future performance.
The Fund’s comparative benchmark does not include the annual operating expenses incurred by the Fund. Please note that one cannot invest directly in an unmanaged index.
AVERAGE ANNUAL TOTAL RETURNS |
Shares | Ticker Symbol | 1-Year
Return | Inception
to Date |
Servicing Class*(1)^ | CNRMX | 3.81% | 8.24% |
Class N(1) | CNRNX | 3.55% | 7.92% |
Barclays High Yield Municipal Index | n/a | 1.24% | 7.71% |
* | The graph is based on only Servicing Class Shares; performance for Class N Shares would be different due to differences in fee structures. |
(1) | Commenced operations on December 30, 2013. |
^ | The Fund’s Servicing Class Shares are available only to fiduciary, advisory, agency, custodial and other similar accounts maintained at City National Bank and certain retirement plan platforms. |
Top Ten Holdings* |
% OF PORTFOLIO |
New York State, Liberty Development, RB
Callable 11/15/24 @ 100 | |
5.000%, 11/15/44 | 1.4% |
Southeastern Ohio, Port Authority, Memorial Health System Project, RB
Callable 12/01/22 @ 100 | |
6.000%, 12/01/42 | 1.1% |
Puerto Rico, Commonwealth, Ser A, GO
Callable 07/01/20 @ 100 | |
8.000%, 07/01/35 | 1.1% |
Territory of Guam, Ser A, GO
Pre-Refunded @ 100 | |
7.000%, 11/15/39 | 1.1% |
Authority, Utility System Project, Ser A, RB
Callable 07/01/19 @ 100 | |
6.750%, 07/01/39 | 1.0% |
Mid-Bay Bridge Authority, Ser A, RB
Pre-Refunded @ 100 | |
7.250%, 10/01/34 | 1.0% |
Houston, Higher Education Finance, Ser A, RB
Pre-Refunded @ 100 | |
6.875%, 05/15/41 | 1.0% |
Illinois State, Finance Authority, Three Crowns Park Plaza Project, Ser A, RB
Callable 02/15/16 @ 100 | |
5.875%, 02/15/38 | 1.0% |
Delaware State, Economic Development Authority, Indian River Power Project, RB
Callable 10/01/20 @ 100 | |
5.375%, 10/01/45 | 1.0% |
Texas State, Private Activity Bond Surface Transportation Corp.,
NTE Mobility Project, RB
Callable 12/31/19 @ 100 | |
6.875%, 12/31/39 | 0.9% |
* | Excludes Cash Equivalents |
CITY NATIONAL ROCHDALE FUNDS | PAGE 10
fund overview (Unaudited) |
September 30, 2015 |
City National Rochdale High Yield Bond Fund |
The Fund seeks to maximize total return by investing primarily in fixed income securities rated below investment grade including corporate bonds and debentures, convertible and preferred securities, zero coupon obligations and debt securities that are issued by U.S. and foreign governments.
Comparison of Change in the Value of a $10,000 Investment in the City National Rochdale High Yield Bond Fund, Servicing Class Shares, versus the Citigroup High Yield Market Capped Index(1)
(1) | The performance in the above graph does not reflect the deduction of taxes the shareholder will pay on Fund distributions or the redemptions of Fund shares. Investment performance reflects fee waivers in effect. In the absence of such waivers, total return would be reduced. |
Past performance is no indication of future performance.
The Fund’s comparative benchmark does not include the annual operating expenses incurred by the Fund. Please note that one cannot invest directly in an unmanaged index.
AVERAGE ANNUAL TOTAL RETURNS |
Shares | Ticker
Symbol | 1-Year
Return | 3-Year
Return | 5-Year
Return | 10-Year
Return |
Servicing Class*(1)^ | CHYIX | -3.71% | 3.49% | 6.21% | 6.61% |
Institutional Class(2)^^† | CNIHX | -3.47% | 3.70% | 6.41% | 6.71% |
Class N(1) | CHBAX | -3.94% | 3.19% | 5.93% | 6.31% |
Citigroup High Yield Market Capped Index | n/a | -4.41% | 2.91% | 5.83% | 6.68% |
* | The graph is based on only Servicing Class Shares; performance for Institutional and Class N Shares would be different due to differences in fee structures. |
(1) | Commenced operations on January 14, 2000. |
(2) | Commenced operations on February 2, 2012. |
^ | The Fund’s Servicing Class Shares are available only to fiduciary, advisory, agency, custodial and other similar accounts maintained at City National Bank and certain retirement plan platforms. |
^^ | The Fund’s Institutional Class Shares are available only to fiduciary, advisory, agency, custodial and other similar accounts maintained at City National Bank which meet the Fund’s minimum initial investment requirement, and certain tax-deferred retirement plans (including 401(k) plans, employer-sponsored 403(b) plans, 457 plans, profit sharing and money purchase pension plans, defined benefit plans and non-qualified deferred compensation plans) held in plan level or omnibus accounts. |
† | Institutional Class Shares’ performance for the period from January 14, 2000, to February 2, 2012, is that of the Servicing Class Shares. |
Top Ten Holdings |
% OF PORTFOLIO |
Central Garden and Pet | |
8.250%, 03/01/18 | 2.3% |
Epicor Software | |
9.250%, 05/21/23 | 1.8% |
MDC Partners | |
6.750%, 04/01/20 | 1.7% |
Vector Group | |
7.750%, 02/15/21 | 1.7% |
Opal Acquisition | |
8.875%, 12/15/21 | 1.6% |
McGraw-Hill Global Education Holdings | |
9.750%, 04/01/21 | 1.5% |
ContourGlobal Power Holdings | |
7.125%, 06/01/19 | 1.4% |
Icahn Enterprises | |
5.875%, 02/01/22 | 1.3% |
Open Text | |
5.625%, 01/15/23 | 1.3% |
Ironshore Holdings US | |
8.500%, 05/15/20 | 1.3% |
CITY NATIONAL ROCHDALE FUNDS | PAGE 11
fund overview (Unaudited) |
September 30, 2015 |
City National Rochdale Intermediate Fixed Income Fund |
The Fund seeks current income and, to the extent consistent with this goal, capital appreciation, by investing primarily in fixed income securities.
Comparison of Change in the Value of a $10,000 Investment in the City National Rochdale Intermediate Fixed Income Fund, Class N Shares, versus the Barclays Intermediate U.S. Government/Credit Index(1)

(1) | The performance in the above graph does not reflect the deduction of taxes the shareholder will pay on Fund distributions or the redemptions of Fund shares. Investment performance reflects fee waivers in effect. In the absence of such waivers, total return would be reduced. |
Past performance is no indication of future performance.
The Fund’s comparative benchmark does not include the annual operating expenses incurred by the Fund. Please note that one cannot invest directly in an unmanaged index.
AVERAGE ANNUAL TOTAL RETURNS |
Shares | Ticker
Symbol | 1-Year
Return | 3-Year
Return | 5-Year
Return | 10-Year
Return |
Class N*(1) | RIMCX | 1.34% | 1.63% | 2.83% | 3.52% |
Institutional Class(2) | CNRIX | 1.87% | 1.94% | 3.01% | 3.61% |
Barclays Intermediate U.S. Government/Credit Index | n/a | 2.68% | 1.45% | 2.42% | 4.17% |
* | The graph is based on only Class N Shares; the performance for Institutional Class Shares would be different due to differences in fee structures. |
(1) | The predecessor to the City National Rochdale Intermediate Fixed Income Fund (the “Predecessor Fund”) commenced operations on December 31, 1999. On March 29, 2013, the Predecessor Fund was reorganized into the Fund. The performance results for the Class N Shares of the Fund for the period December 31, 1999, to March 29, 2013, reflect the performance of the Predecessor Fund’s Shares. |
(2) | Commenced operations on December 20, 2013. The performance results for Institutional Class Shares of the Fund for the period of December 31, 1999, to March 28, 2013, reflect the performance of the Predecessor Fund’s shares. The performance results for the Institutional Class Shares of the Fund for the period March 29, 2013, to December 19, 2013, reflect the performance of the Class N Shares. |
^ | The Fund’s Institutional Class shares are available only to fiduciary, advisory, agency, custodial and other similar accounts maintained at City National Bank which meet the minimum initial investment requirement of $1,000,000 and certain tax deferred retirement plans (including 401(k) plans, employer sponsored 403(b) plans, 457 plans, profit sharing and money purchase pension plans, defined benefit plans and non-qualified deferred compensation plans) held in plan level or omnibus accounts. |
Top Ten Holdings |
% OF PORTFOLIO |
Apple | |
0.561%, 02/07/20 | 2.7% |
Svenska Handelsbanken, MTN | |
5.125%, 03/30/20 | 2.4% |
FNMA | |
1.625%, 11/27/18 | 2.3% |
Rio Tinto Finance USA | |
3.750%, 06/15/25 | 2.1% |
Carmax Auto Owner Trust, Ser 2014-2, Cl A3 | |
0.980%, 01/15/19 | 2.0% |
Stone Ridge Reinsurance Risk Premium Interval Fund | 1.9% |
Morgan Stanley | |
3.750%, 02/25/23 | 1.9% |
State Street | |
2.550%, 08/18/20 | 1.9% |
Oracle | |
2.500%, 05/15/22 | 1.8% |
FNMA | |
5.000%, 03/15/16 | 1.8% |
CITY NATIONAL ROCHDALE FUNDS | PAGE 12
fund overview (Unaudited) |
September 30, 2015 |
City National Rochdale Fixed Income Opportunities Fund |
The Fund seeks a high level of current income by investing primarily in fixed income securities.
Comparison of Change in the Value of a $10,000 Investment in the City National Rochdale Fixed Income Opportunities Fund, Class N Shares, versus the Credit Suisse Leveraged Loan Index, the Barclays U.S. Aggregate Bond Index and the Barclays U.S. Corporate High Yield Bond Index(1)
(1) | The performance in the above graph does not reflect the deduction of taxes the shareholder will pay on Fund distributions or the redemptions of Fund shares. Investment performance reflects fee waivers in effect. In the absence of such waivers, total return would be reduced. |
Past performance is no indication of future performance.
The Fund’s comparative benchmarks do not include the annual operating expenses incurred by the Fund. Please note that one cannot invest directly in an unmanaged index.
AVERAGE ANNUAL TOTAL RETURNS |
Shares | Ticker
Symbol | 1-Year
Return | 3-Year
Return | 5-Year
Return | Inception
to Date |
Class N(1) | RIMOX | -0.88% | 3.64% | 4.82% | 6.48% |
Credit Suisse Leveraged Loan Index | n/a | 1.22% | 3.77% | 4.84% | 7.12% |
Barclays U.S. Aggregate Bond Index | n/a | 2.94% | 1.71% | 3.10% | 4.37% |
Barclays U.S. Corporate High Yield Bond Index | n/a | -3.43% | 3.51% | 6.15% | 10.03% |
(1) | The predecessor to the City National Rochdale Fixed Income Opportunities Fund (the “Predecessor Fund”) commenced operations on July 1, 2009. On March 29, 2013, the Predecessor Fund was reorganized into the Fund. The performance results for the Class N Shares of the Fund for the period July 1, 2009, to March 29, 2013, reflect the performance of the Predecessor Fund’s Shares. |
Top Ten Holdings* |
% OF PORTFOLIO |
Stone Ridge Reinsurance Risk Premium Interval Fund | 1.0% |
AXA Equitable Life #0474, | |
Acquired 11/04/2013 | 0.7% |
Digicel Group | |
8.2500%, 09/30/20 | 0.6% |
Dubai World | |
4.250%, 09/30/22 | 0.6% |
Dubai Holding Commercial Operations, MTN | |
6.000%, 02/01/17 | 0.4% |
Republic of Angola | |
6.600%, 12/06/20 | 0.4% |
Fortescue Metals Group (FMG), Cov-Lite Term Loan | |
3.750%, 06/30/19 | 0.4% |
Hilton Worldwide Finance, LLC., Term Loan B-1 | |
3.500%, 10/26/20 | 0.4% |
IHeart Communications, Term Loan D Extended | |
6.944%, 01/30/19 | 0.4% |
Dubai World | |
2.000%, 09/30/18 | 0.4% |
* | Excludes Cash Equivalents |
CITY NATIONAL ROCHDALE FUNDS | PAGE 13
fund overview (Unaudited) |
September 30, 2015 |
City National Rochdale Multi-Asset Fund |
The Fund seeks to generate a positive total return in excess of inflation in a manner consistent with capital preservation in all market environments by investing all or a principal portion of its assets in other mutual funds or exchange-traded funds.
Comparison of Change in the Value of a $10,000 Investment in the City National Rochdale Multi-Asset Fund, Servicing Class Shares, versus the BofA Merrill Lynch 3-Month U.S. Treasury Index and a 40/60 hybrid of the following two indexes: the MSCI World Index and Barclays Intermediate U.S. Government/Credit Bond Index(1)
(1) | The performance in the above graph does not reflect the deduction of taxes the shareholder will pay on Fund distributions or the redemptions of Fund shares. Investment performance reflects fee waivers in effect. In the absence of such waivers, total return would be reduced. |
Past performance is no indication of future performance.
The Fund’s comparative benchmarks do not include the annual operating expenses incurred by the Fund. Please note that one cannot invest directly in an unmanaged index.
AVERAGE ANNUAL TOTAL RETURNS |
Shares | Ticker Symbol | 1-Year Return | 3-Year Return | 5-Year Return | Inception to Date |
Servicing Class*(1)^ | CNIIX | -3.59% | 1.55% | 1.86% | 1.16% |
Class N(1) | CNIAX | -3.84% | 1.29% | 1.62% | 0.91% |
BofA Merrill Lynch U.S. 3-Month U.S. Treasury Index | n/a | 0.02% | 0.06% | 0.08% | 0.47% |
40/60 hybrid of the following two indexes: | n/a | -0.34% | 4.37% | 4.94% | 3.49% |
MSCI World Index (net) | n/a | -5.09% | 8.58% | 8.29% | 1.63% |
Barclays Intermediate U.S. Government/Credit Bond Index | n/a | 2.68% | 1.45% | 2.42% | 4.09% |
* | The graph is based on only Servicing Class Shares; performance for Class N Shares would be different due to differences in fee structures. |
(1) | Commenced operations on October 1, 2007. |
^ | The Fund’s Servicing Class Shares are available only to fiduciary, advisory, agency, custodial and other similar accounts maintained at City National Bank and certain retirement plan platforms. |
Top Ten Holdings* |
% OF PORTFOLIO |
iShares 7-10 Year Treasury Bond ETF | 16.7% |
Vanguard Short-Term Bond Index Fund | 8.2% |
iShares Russell 3000 Index Fund | 5.5% |
iShares S&P MidCap 400 Index Fund | 4.6% |
Ashmore Emerging Markets Corporate Debt Fund | 4.5% |
SPDR S&P Dividend | 4.5% |
iShares MSCI World ETF | 3.9% |
DoubleLine Total Return Bond Fund | 3.6% |
Voya Global Real Estate Fund | 3.5% |
Oppenheimer Senior Floating Rate Fund | 3.4% |
* | Excludes Cash Equivalents |
CITY NATIONAL ROCHDALE FUNDS | PAGE 14
investment adviser’s report (Unaudited) |
September 30, 2015 |
Equity Funds |
Dividend & Income Fund - RIMHX
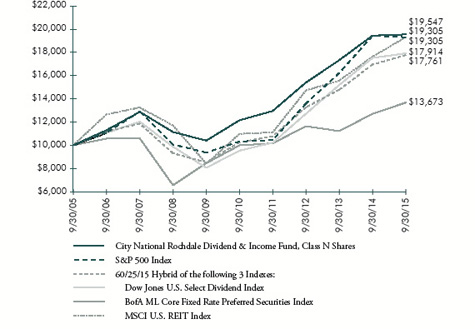
The Fund posted a return of -1.63% for Q3, underperforming the blended benchmark’s (Dow Jones U.S. Selected Dividend Index: 60%; BofA Merrill Lynch Core Fixed Rate Preferred Securities Index: 25%; MSCI U.S. REIT Index: 15%) return of -0.45% by 118 basis points. Calendar year to date, as of September 30, 2015, the Fund delivered a return of -4.08%, lagging the blended benchmark’s -2.97% return by 111 basis points. For the fiscal year ended September 30, 2015, the Class N shares of the Fund generated a 0.53% return, underperforming the benchmark’s return of 4.78% by 425 basis points.
During the most recent quarter, the Fund’s exposure to Consumer Staples stocks helped insulate performance against the periods of elevated market volatility. Companies in the portfolio continued to perform well operationally and provided solid guidance, offering confidence in forward looking dividend growth potential. The Fund’s exposure to the pipeline Master Limited Partnership (MLP) segment was a headwind during Q3 and year-to-date 2015, as many of these securities declined heavily following weak energy markets. In addition, the positive performance of preferred stocks, up 4.38% in the year-to-date period and up 2.32% in the quarter, had a strong positive impact on the blended benchmark and hurt the Fund’s relative performance.
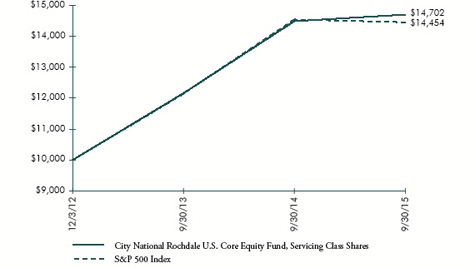
U.S. Core Equity Fund – CNRUX
The Institutional Class Shares of the Fund posted a return of -6.12% for Q3, outpacing the S&P 500 Index’s return of -6.44% by 32 basis points. Calendar year to date, as of September 30, 2015, the Fund delivered a return of -1.69%, 360 basis points ahead of the S&P 500 Index’s return of -5.29%. For the fiscal year ended September 30, 2015, the Institutional Class Shares of the Fund has returned 1.79%, versus -0.61% for the S&P 500 Index.
In terms of performance attribution, the Fund has generally remained positioned with domestic, defensive stocks with highly visible earnings and growth and mid cap tilts. Returns outpaced the benchmark in three of the last four quarters. Information Technology (+173 bps), Health Care (+80 bps) and Consumer Staples (+62 bps) were the top contributing sectors for the year. During the most recent quarter, performance was pressured by Financial stocks which tend to be more reliant on rising rate environment and overweight in Industrial stocks due to cyclical exposure with global growth concerns from China. As of the end of Q3, the Fund was overweight Consumer Discretionary, Industrials, and Utilities sectors, and underweight Materials, Financials, and Consumer Staples.
Socially Responsible Equity Fund – AHSRX
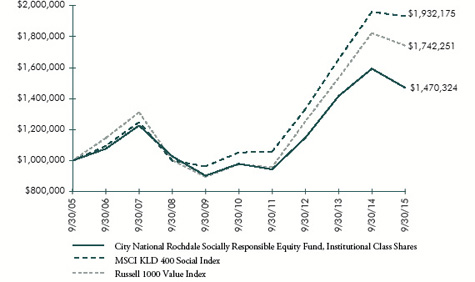
The Institutional Class Shares of the Fund posted a return of -10.02% for Q3, trailing the MSCI KLD 400 Social Index’s return of -6.31%. Calendar year to date, as of September 30, 2015, the Fund delivered a return of -10.2%, lagging the benchmark’s -6.00% return by 420 basis points. For the fiscal year ended September 30, 2015, the Institutional Class Shares of the Fund returned -7.70% versus -1.40% for the MSCI KLD 400 Social Index (net).
Much of the Fund’s underperformance is due to a significant overweight to the Energy sector, which has declined almost 33% within the benchmark over the last 12 months. The strategy generally maintains more of a value orientation than the benchmark, which can cause increased style variability when measuring relative performance. A significant underweight to Consumer Discretionary stocks has also been a material headwind, as this has been the benchmark’s best performing sector over the course of the last year.
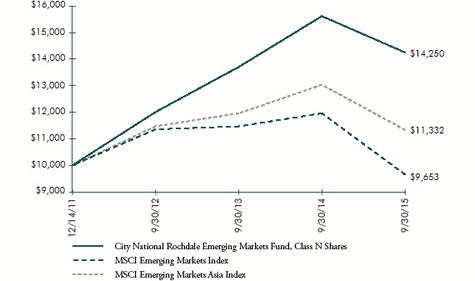
EMERGING MARKETS FUND – RIMIX
The Fund posted negative returns of -13.90% for Q3 though, outperforming the MSCI Emerging Markets Index and the MSCI Emerging Markets Asia Index returns of 17.90% and -17.01%, respectively. During the current calendar year through September 30, the fund returned -9.93%, compared with -15.47% and -12.81% for the MSCI Emerging Markets Index and the MSCI Emerging Markets Asia Index, respectively. For the fiscal year ended September 30, 2015, the Fund outperformed its benchmarks, with a total return of -8.74%, compared to a -19.28% return for the MSCI Emerging Markets Index (net) and -13.05% for the MSCI Emerging Markets Asia Index (net).
CITY NATIONAL ROCHDALE FUNDS | PAGE 15
investment adviser’s report (Unaudited) |
September 30, 2015 |
Equity Funds (continued) |
Emerging markets experienced increased volatility in the past year over Fed rate hike concerns and with the uncertainties over economic slowdown in China. The Fund’s disciplined investment strategy based on bottom up stock picking and its bias on domestic consumption themes remained intact. The relative resilience in the region’s consumption growth and the Fund’s quality of stock selection are underscored by the attractive downside capture ratios of 53.48% and 74.83% compared against the MSCI Emerging Markets Index and the MSCI Emerging Markets Asia Index, respectively.
Following the significant rally in China equities at the start of the second quarter of this calendar year, the Fund’s cash holdings were raised and the cash was subsequently deployed through the Q3 2015 market correction period. Thus, with the active management of cash balances, cash was the primary performance attribution factor in Q3 2015. The Fund’s relative underweight positions in Financials and Information technology helped, while sharp stock-specific corrections in a few of the Fund’s larger consumer space holdings detracted from performance during the quarter. The Fund’s exposure in all the countries, except Indonesia, contributed positively; while not being in South Korea hurt performance. The manager’s long term outlook and investment thesis remain unaltered.
This material represents the managers’ assessment of the portfolios and market environment at a specific point in time and should not be relied upon by the reader as research or investment advice.
Performance data quoted represents past performance and does not guarantee similar future results. The investment performance and principal value of an investment will fluctuate so that an investor’s shares, when redeemed, may be worth more or less than their original cost, and current performance may be lower or higher than the performance quoted. For performance data current to the most recent month end, please call 1-888-889-0799.
Index performance returns do not reflect any management fees, transaction costs or expenses. Indexes are unmanaged and one cannot invest directly in an index.
The Dividend and Income Fund’s, U.S. Core Equity Fund’s, Socially Responsible Equity Fund’s, and Emerging Markets Fund’s investment performance reflects voluntary fee waivers in effect. Absent these waivers, total return and yield would be lower. The Adviser intends to continue these arrangements at least through January 31, 2016 but there can be no assurance that City National Rochdale, LLC will continue to waive fees. After January 31, 2016, City National Rochdale, LLC intends to discontinue the voluntary fee waivers for the Dividend & Income Fund, U.S. Core Equity Fund and Emerging Markets Fund.
The Socially Responsible Equity Fund’s investment performance reflects contractual fee waivers in effect. Absent these waivers, total return and yield would be lower. Waivers are in effect until January 31, 2016.
Mutual fund investing involves risk including lose of principal. Bonds and bond funds are subject to interest rate risk and will decline in value as interest rates rise. The securities of mid-cap companies may have greater price volatility and less liquidity than the securities of larger capitalized companies. Emerging markets involve heightened risk related to the same factors as well as increased volatility and lower trading volume.
CITY NATIONAL ROCHDALE FUNDS | PAGE 16
fund overview (Unaudited) |
September 30, 2015 |
City National Rochdale Dividend & Income Fund |
The Fund seeks to provide significant income and, as a secondary focus, long-term capital appreciation, by investing primarily in income-generating securities, principally comprised of dividend-paying equity securities.
Comparison of Change in the Value of a $10,000 Investment in the City National Rochdale Dividend & Income Fund, versus the S&P 500 Index and the 60/25/15 Hybrid of the following 3 Indexes: Dow Jones U.S. Select Dividend Index, BofA ML Core Fixed Rate Preferred Securities Index and MSCI U.S. REIT Index(1)
(1) | The performance in the above graph does not reflect the deduction of taxes the shareholder will pay on Fund distributions or the redemptions of Fund shares. Investment performance reflects fee waivers in effect. In the absence of such waivers, total return would be reduced. |
Past performance is no indication of future performance.
The Fund’s comparative benchmarks do not include the annual operating expenses incurred by the Fund. Please note that one cannot invest directly in an unmanaged index.
AVERAGE ANNUAL TOTAL RETURNS |
Shares | Ticker
Symbol | 1-Year
Return | 3-Year
Return | 5-Year
Return | 10-Year
Return |
Class N(1) | RIMHX | 0.53% | 8.26% | 9.97% | 6.93% |
S&P 500 Index | n/a | -0.61% | 12.40% | 13.34% | 6.80% |
60/25/15 Hybrid of the following 3 Indexes: | n/a | 4.78% | 10.18% | 11.61% | 5.91% |
Dow Jones U.S. Select Dividend Index | n/a | 2.24% | 12.10% | 13.45% | 6.00% |
BofA ML Core Fixed Rate Preferred Securities Index | n/a | 7.60% | 5.51% | 6.48% | 3.18% |
MSCI U.S. REIT Index | n/a | 9.47% | 9.45% | 11.95% | 6.80% |
(1) | The predecessor to the City National Rochdale Dividend & Income Fund (the “Predecessor Fund”) commenced operations on June 1, 1999. On March 29, 2013, the Predecessor Fund was reorganized into the Fund. The performance results for the Class N Shares of the Fund for the period December 31, 1999, to March 29, 2013, reflect the performance of the Predecessor Fund’s Shares. |
Top Ten Holdings |
% OF PORTFOLIO |
Duke Energy | 2.3% |
Dr Pepper Snapple Group | 2.2% |
Philip Morris International | 2.2% |
Eli Lilly | 2.2% |
Lockheed Martin | 2.1% |
PowerShares Preferred Portfolio | 2.1% |
B&G Foods | 2.0% |
General Mills | 2.0% |
Clorox | 2.0% |
Lamar Advertising | 1.9% |
CITY NATIONAL ROCHDALE FUNDS | PAGE 17
fund overview (Unaudited) |
September 30, 2015 |
City National Rochdale U.S. Core Equity Fund |
The Fund seeks to provide long-term capital appreciation by investing primarily in common stock of large and middle capitalization corporations domiciled in the United States.
Comparison of Change in the Value of a $10,000 Investment in the City National Rochdale U.S. Core Equity Fund, Servicing Class Shares, versus the S&P 500 Index(1)
(1) | The performance in the above graph does not reflect the deduction of taxes the shareholder will pay on Fund distributions or the redemptions of Fund shares. Investment performance reflects fee waivers in effect. In the absence of such waivers, total return would be reduced. |
Past performance is no indication of future performance.
The Fund’s comparative benchmark does not include the annual operating expenses incurred by the Fund. Please note that one cannot invest directly in an unmanaged index.
AVERAGE ANNUAL TOTAL RETURNS |
Shares | Ticker
Symbol | 1-Year Return | Inception to Date |
Servicing Class*(1)^ | CNRVX | 1.48% | 14.62% |
Institutional Class(1)^^ | CNRUX | 1.79% | 15.19% |
Class N(1) | CNRWX | 1.31% | 14.34% |
S&P 500 Index | n/a | -0.61% | 13.93% |
* | The graph is based on only Servicing Class Shares; performance for Institutional and Class N Shares would be different due to differences in fee structures. |
(1) | Commenced operations on December 3, 2012. |
^ | The Fund’s Servicing Class shares are available only to fiduciary, advisory, agency, custodial and other similar accounts maintained at City National Bank and certain retirement plan platforms. |
^^ | The Fund’s Institutional Class shares are available only to fiduciary, advisory, agency, custodial and other similar accounts maintained at City National Bank which meet the minimum initial investment requirements, and certain tax-deferred retirement plans (including 401(k) plans, employer-sponsored 403(b) plans, 457 plans, profit sharing and money purchase pension plans, defined benefit plans and non-qualified deferred compensation plans) held in plan level or omnibus accounts. |
Top Ten Holdings |
% OF PORTFOLIO |
Apple | 3.6% |
CVS Health | 3.1% |
Visa | 3.0% |
Gilead Sciences | 2.9% |
Comcast | 2.9% |
Charles Schwab | 2.9% |
MasterCard | 2.8% |
PG&E | 2.6% |
Google, Cl A | 2.5% |
Home Depot | 2.5% |
CITY NATIONAL ROCHDALE FUNDS | PAGE 18
fund overview (Unaudited) |
September 30, 2015 |
City National Rochdale Socially Responsible Equity Fund |
The Fund seeks to provide long-term capital growth by investing primarily in common stocks of U.S. issuers that meet certain socially responsible criteria.
Comparison of Change in the Value of a $1,000,000 Investment in the City National Rochdale Socially Responsible Equity Fund, Institutional Class Shares, versus the MSCI KLD 400 Social Index and the Russell 1000 Value Index(1)
(1) | The performance in the above graph does not reflect the deduction of taxes the shareholder will pay on Fund distributions or the redemptions of Fund shares. Investment performance reflects fee waivers in effect. In the absence of such waivers, total return would be reduced. |
Past performance is no indication of future performance.
The Fund’s comparative benchmarks do not include the annual operating expenses incurred by the Fund. Please note that one cannot invest directly in an unmanaged index.
AVERAGE ANNUAL TOTAL RETURNS |
Shares | Ticker
Symbol | 1-Year
Return | 3-Year
Return | 5-Year
Return | 10-Year
Return |
Institutional Class*(1)^ | AHSRX | -7.70% | 8.59% | 8.46% | 3.93% |
Class N(2) | AHRAX | -7.86% | 8.34% | 8.21% | 3.67% |
MSCI KLD 400 Social Index (net) | n/a | -1.40% | 13.21% | 12.91% | 6.81% |
Russell 1000 Value Index | n/a | -4.42% | 11.59% | 12.29% | 5.71% |
* | The graph is based on only Institutional Class Shares; performance for Class N Shares would be different due to differences in fee structures. |
(1) | Class I Shares of the predecessor to the Institutional Class shares of the Socially Responsible Equity Fund (the “Predecessor Fund”) commenced operations on January 3, 2005. On September 30, 2005, the Predecessor Fund reorganized into the Fund. The performance results for Institutional Class Shares of the Fund for the period of January 3, 2005, to September 29, 2005, reflect the performance of the Predecessor Fund’s Class I Shares. |
(2) | Class A Shares of the Predecessor Fund, the predecessor to the Class N Shares of the Fund, commenced operations on August 12, 2005. On September 30, 2005, the Predecessor Fund reorganized into the Fund. The performance results for Class N Shares of the Fund for the period of August 12, 2005, to September 29, 2005, reflect the performance of the Predecessor Fund’s Class A Shares. The performance results for Class N Shares of the Fund for the period of January 3, 2005, to August 12, 2005, reflect the performance of the Predecessor Fund’s Class I Shares. The performance of the Predecessor Fund’s Class I Shares has not been adjusted to reflect the higher Rule 12b-1 fees and expenses applicable to the Fund’s Class N Shares. If it had, the performance of the Fund’s Class N Shares would have been lower than that shown. |
^ | The Fund’s Institutional Class shares are available only to investors that meet the minimum initial investment requirements, and certain tax-deferred retirement plans (including 401(k) plans, employer-sponsored 403(b) plans, 457 plans, profit sharing and money purchase pension plans, defined benefit plans and non-qualified deferred compensation plans) held in plan level or omnibus accounts. |
Top Ten Holdings* |
% OF PORTFOLIO |
Verizon Communications | 3.3% |
American International Group | 3.1% |
Symetra Financial | 2.9% |
Bank of America | 2.9% |
MetLife | 2.8% |
Eaton | 2.7% |
HCC Insurance Holdings | 2.7% |
Cisco Systems | 2.6% |
TE Connectivity | 2.5% |
IBM | 2.5% |
* | Excludes Cash Equivalent |
CITY NATIONAL ROCHDALE FUNDS | PAGE 19
fund overview (Unaudited) |
September 30, 2015 |
City National Rochdale Emerging Markets Fund |
The Fund seeks to provide long-term capital appreciation by investing primarily in the equity securities of companies that are operating principally in emerging market countries.
Comparison of Change in the Value of a $10,000 Investment in the City National Rochdale Emerging Markets Fund, Class N shares, versus the MSCI Emerging Markets Index and the MSCI Emerging Markets Asia Index(1)
(1) | The performance in the above graph does not reflect the deduction of taxes the shareholder will pay on Fund distributions or the redemptions of Fund shares. Investment performance reflects fee waivers in effect. In the absence of such waivers, total return would be reduced. |
Past performance is no indication of future performance.
The Fund’s comparative benchmarks do not include the annual operating expenses incurred by the Fund. Please note that one cannot invest directly in an unmanaged index.
AVERAGE ANNUAL TOTAL RETURNS |
Shares | Ticker
Symbol | 1-Year
Return | 3-Year
Return | Inception
to Date |
Class N(1) | RIMIX | -8.74% | 5.87% | 9.78% |
MSCI Emerging Markets Index (net) | n/a | -19.28% | -5.27% | -0.92% |
MSCI Emerging Markets Asia Index (net) | n/a | -13.05% | -0.40% | 3.35% |
(1) | Shares of the predecessor to the City National Rochdale Emerging Markets Fund (the “Predecessor Fund”) commenced operations on December 14, 2011. On March 29, 2013, the Predecessor Fund was reorganized into the Fund. The performance results for the Class N Shares of the Fund for the period December 14, 2011, to March 29, 2013, reflect the performance of the Predecessor Fund’s Shares. |
Top Ten Holdings* |
% OF PORTFOLIO |
Tencent Holdings | 4.0% |
Sunny Optical Technology Group | 2.7% |
NagaCorp | 2.4% |
ANTA Sports Products | 2.3% |
Great Wall Motor | 2.3% |
AAC Technologies Holdings | 2.2% |
HDFC Bank | 2.1% |
Cognizant Technology Solutions | 2.0% |
Ping An Insurance Group of China | 1.9% |
ZTE | 1.9% |
* | Excludes Cash Equivalent |
CITY NATIONAL ROCHDALE FUNDS | PAGE 20
schedule of investments |
September 30, 2015 |
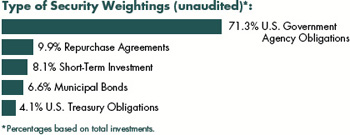
City National Rochdale Government Money Market Fund |
Description | | Face Amount (000) | | | Value (000) | |
U.S. Government Agency Obligations [71.3%] | |
FAMC DN | | | | | | |
0.090%, 10/02/15(A) | | $ | 49,000 | | | $ | 49,000 | |
0.200%, 12/01/15(A) | | | 38,016 | | | | 38,003 | |
0.200%, 12/10/15(A) | | | 16,000 | | | | 15,994 | |
0.195%, 12/15/15(A) | | | 60,000 | | | | 59,975 | |
0.170%, 01/06/16(A) | | | 50,000 | | | | 49,977 | |
FFCB | | | | | | | | |
0.165%, 10/06/15(B) | | | 80,000 | | | | 80,014 | |
0.153%, 10/11/15(B) | | | 58,000 | | | | 57,997 | |
0.157%, 10/15/15(B) | | | 50,000 | | | | 49,996 | |
0.145%, 10/16/15(B) | | | 50,000 | | | | 49,997 | |
0.278%, 10/19/15(B) | | | 50,000 | | | | 50,031 | |
FHLB | | | | | | | | |
0.169%, 10/02/15(B) | | | 50,000 | | | | 50,000 | |
0.151%, 10/13/15(B) | | | 50,000 | | | | 50,000 | |
0.172%, 10/15/15(B) | | | 20,000 | | | | 20,000 | |
0.170%, 10/16/15 | | | 50,000 | | | | 50,000 | |
0.158%, 10/18/15(B) | | | 50,000 | | | | 50,000 | |
0.174%, 10/25/15(B) | | | 65,000 | | | | 65,002 | |
0.190%, 11/17/15 | | | 50,000 | | | | 49,998 | |
0.154%, 12/02/15(A) | | | 143,700 | | | | 143,662 | |
0.165%, 01/13/16(A) | | | 100,000 | | | | 99,952 | |
0.270%, 02/05/16 | | | 37,700 | | | | 37,693 | |
FHLB DN | | | | | | | | |
0.122%, 10/07/15(A) | | | 136,988 | | | | 136,985 | |
0.156%, 10/09/15 | | | 40,000 | | | | 39,999 | |
0.095%, 10/14/15(A) | | | 21,600 | | | | 21,599 | |
0.125%, 10/16/15(A) | | | 50,000 | | | | 49,997 | |
0.080%, 10/21/15(A) | | | 118,645 | | | | 118,639 | |
0.012%, 10/28/15(A) | | | 20,200 | | | | 20,198 | |
0.020%, 11/02/15(A) | | | 14,000 | | | | 13,999 | |
0.170%, 11/03/15(A) | | | 100,000 | | | | 99,984 | |
0.153%, 11/04/15(A) | | | 158,322 | | | | 158,299 | |
0.166%, 11/06/15(A) | | | 75,000 | | | | 74,988 | |
0.138%, 11/13/15(A) | | | 163,500 | | | | 163,473 | |
0.180%, 11/16/15(A) | | | 54,600 | | | | 54,587 | |
0.133%, 11/18/15(A) | | | 161,000 | | | | 160,972 | |
0.100%, 11/20/15(A) | | | 100,000 | | | | 99,986 | |
0.185%, 11/25/15(A) | | | 80,000 | | | | 79,977 | |
0.192%, 11/27/15 | | | 50,000 | | | | 49,985 | |
0.172%, 12/04/15 | | | 23,493 | | | | 23,486 | |
0.100%, 12/08/15(A) | | | 9,300 | | | | 9,298 | |
0.215%, 12/11/15(A) | | | 55,600 | | | | 55,577 | |
0.175%, 12/18/15 | | | 62,000 | | | | 61,977 | |
0.280%, 02/12/16(A) | | | 40,000 | | | | 39,958 | |
0.300%, 02/17/16(A) | | | 30,000 | | | | 29,965 | |
FHLMC | | | | | | | | |
0.165%, 10/16/15(B) | | | 50,000 | | | | 50,000 | |
FNMA | | | | | | | | |
4.375%, 10/15/15 | | | 14,000 | | | | 14,023 | |
0.375%, 12/21/15 | | | 24,115 | | | | 24,127 | |
0.500%, 03/30/16 | | | 35,203 | | | | 35,228 | |
| | | | | | | | | |
Total U.S. Government Agency Obligations | | | | | | | | |
(Cost $2,804,597) | | | | 2,804,597 | |
| | | | | | | | | |
Municipal Bonds [6.6%] | |
California [1.7%] | |
ABAG Finance Authority for Nonprofit, Miramar Apartments Project, Ser A, RB, FNMA, AMT | | | | | | | | |
0.020%, 10/01/15(B) (D) | | | 14,800 | | | | 14,800 | |
Anaheim, Housing Authority, Sea Wind Apartments Project, Ser C, RB, FNMA, AMT | | | | | | | | |
0.030%, 10/01/15(B) (D) | | | 6,300 | | | | 6,300 | |
California Statewide, Communities Development Authority, Fairway Family Apartments Project, Ser PP, RB, FNMA, AMT | | | | | | | | |
0.020%, 10/01/15(B) (D) | | | 8,000 | | | | 8,000 | |
Los Angeles, Community Redevelopment Agency, Hollywood and Vine Apartments Project, Ser A, RB, FNMA, AMT | | | | | | | | |
0.020%, 10/01/15(B) (D) | | | 28,450 | | | | 28,450 | |
Sacramento County, Housing Authority, Ashford Heights Apartments Project, Ser H, RB, FNMA, AMT | | | | | | | | |
0.030%, 10/01/15(B) (D) | | | 9,000 | | | | 9,000 | |
| | | | | | | | | |
Total California | | | | 66,550 | |
| | | | | | | | | |
Florida [0.1%] | |
Duval County, Housing Finance Authority, Camri Green Apartments Project, RB, FNMA, AMT | | | | | | | | |
0.040%, 10/01/15(B) (D) | | | 6,400 | | | | 6,400 | |
See accompanying notes to financial statements.
CITY NATIONAL ROCHDALE FUNDS | PAGE 21
schedule of investments |
September 30, 2015 |
City National Rochdale Government Money Market Fund (continued) |
Description | | Face Amount (000) | | | Value (000) | |
New York [3.7%] | |
New York State, Housing Development Authority, 26th Street Development Project, Ser A, RB, FHLMC | | | | | | |
0.010%, 10/01/15(B) (D) | | $ | 13,500 | | | $ | 13,500 | |
New York State, Housing Development Authority, 26th Street Development Project, Ser A, RB, FHLMC, AMT | | | | | | | | |
0.010%, 10/01/15(B) (D) | | | 9,350 | | | | 9,350 | |
New York State, Housing Finance Agency, 345 East 94th Street Project, Ser A, RB, FHLMC, AMT | | | | | | | | |
0.020%, 10/07/15(B) (D) | | | 13,300 | | | | 13,300 | |
New York State, Housing Finance Agency, 360 West 43rd Street Project, Ser A, RB, FNMA, AMT | | | | | | | | |
0.020%, 10/07/15(B) (D) | | | 18,100 | | | | 18,100 | |
New York State, Housing Finance Agency, 360 West 43rd Street Project, Ser A, RB, FNMA, AMT | | | | | | | | |
0.020%, 10/07/15(B) (D) | | | 23,800 | | | | 23,800 | |
New York State, Housing Finance Agency, 750 6th Avenue Project, Ser A, RB, FNMA, AMT | | | | | | | | |
0.020%, 10/07/15(B) (D) | | | 7,500 | | | | 7,500 | |
New York State, Housing Finance Agency, East 84th Street Project, Ser A, RB, FNMA, AMT | | | | | | | | |
0.020%, 10/07/15(B) (D) | | | 15,000 | | | | 15,000 | |
New York State, Housing Finance Agency, Victory Housing Project, Ser 2004-A, RB, FHLMC, AMT | | | | | | | | |
0.020%, 10/07/15(B) (D) | | | 25,500 | | | | 25,500 | |
New York State, Housing Finance Agency, West 38th Street Project, Ser A, RB, FNMA, AMT | | | | | | | | |
0.020%, 10/07/15(B) (D) | | | 20,000 | | | | 20,000 | |
| | | | | | | | | |
Total New York | | | | 146,050 | |
| | | | | | | | | |
Texas [0.7%] | |
Houston, Housing Finance, Regency Park Apartments Project, RB, FNMA, AMT | | | | | | | | |
0.040%, 10/07/15(B) (D) | | | 13,395 | | | | 13,395 | |
Texas State, Department of Housing & Community Affairs, Idlewilde Apartments Project, RB, FNMA, AMT | | | | | | | | |
0.040%, 10/01/15(B) (D) | | | 13,390 | | | | 13,390 | |
| | | | | | | | | |
Total Texas | | | | 26,785 | |
| | | | | | | | | |
Washington [0.4%] | |
Washington State, Housing Finance Commission, Vintage Spokane Project, Ser A, RB, FNMA, AMT | | | | | | | | |
0.030%, 10/01/15(B) (D) | | | 16,295 | | | | 16,295 | |
| | | | | | | | | |
Total Municipal Bonds | |
(Cost $262,080) | | | | 262,080 | |
| | | | | | | | | |
U.S. Treasury Obligations [4.1%] | |
U.S. Treasury Notes | | | | | | | | |
0.084%, 10/06/15(B) | | | 130,000 | | | | 130,004 | |
0.060%, 10/06/15(B) | | | 30,000 | | | | 29,999 | |
| | | | | | | | | |
Total U.S. Treasury Obligations | |
(Cost $160,003) | | | | 160,003 | |
| | | | | | | | | |
Repurchase Agreements [9.9%] | |
Barclays (C) | | | | | | | | |
0.100%, dated 09/30/15, repurchased on 10/01/15, repurchase price $47,000,131 (collateralized by various U.S. Government obligations, par values ranging from $8 to $37,200,000, 0.625% - 9.000%, 10/01/15 to 02/15/25; with a total market value $47,813,143) | | | 47,000 | | | | 47,000 | |
Wells Fargo (C) | | | | | | | | |
0.140%, dated 09/30/15, repurchased on 10/01/15, repurchase price $343,001,334 (collateralized by various U.S. Government obligations, par values ranging from $1,000 to $163,000,000, 3.500% - 6.000%, 09/20/29 to 09/20/45; with a total market value $348,903,291) | | | 343,000 | | | | 343,000 | |
| | | | | | | | | |
Total Repurchase Agreements | |
(Cost $390,000) | | | | 390,000 | |
See accompanying notes to financial statements.
CITY NATIONAL ROCHDALE FUNDS | PAGE 22
schedule of investments |
September 30, 2015 |
City National Rochdale Government Money Market Fund (concluded) |
Description | | Shares | | | Value (000) | |
Short-Term Investment [8.1%] | |
Morgan Stanley Institutional Liquidity Funds - Government Portfolio, 0.050%** | | | 318,950,180 | | | $ | 318,950 | |
| | | | | | | | | |
Total Short-Term Investment | |
(Cost $318,950) | | | | 318,950 | |
| | | | | | | | | |
Total Investments [100.0%] | |
(Cost $3,935,630) | | | $ | 3,935,630 | |
Percentages are based on Net Assets of $3,935,556 (000).
** | The rate reported is the 7-day effective yield as of September 30, 2015. |
(A) | Zero coupon security. The rate reported is the effective yield at time of purchase. |
(B) | Floating Rate Security — The rate reported is the rate in effect on September 30, 2015. |
(C) | Tri-Party Repurchase Agreement. |
(D) | Put and Demand Feature — The date reported is the next reset or put date. |
ABAG — Association of Bay Area Governments
AMT — Alternative Minimum Tax (subject to)
DN — Discount Note
FAMC — Federal Agriculture Mortgage Corporation
FFCB — Federal Farm Credit Bank
FHLB — Federal Home Loan Bank
FHLMC — Federal Home Loan Mortgage Corporation
FNMA — Federal National Mortgage Association
RB — Revenue Bond
Ser — Series
The following is a list of the level of inputs used as of September 30, 2015 in valuing the Fund’s investments carried at value (000):
Investments in Securities | | Level 1 | | | Level 2 | | | Level 3 | | | Total | |
U.S. Government Agency Obligations | | $ | — | | | $ | 2,804,597 | | | $ | — | | | $ | 2,804,597 | |
Municipal Bonds | | | — | | | | 262,080 | | | | — | | | | 262,080 | |
U.S. Treasury Obligations | | | — | | | | 160,003 | | | | — | | | | 160,003 | |
Repurchase Agreements | | | — | | | | 390,000 | | | | — | | | | 390,000 | |
Short-Term Investment | | | 318,950 | | | | — | | | | — | | | | 318,950 | |
Total Investments in Securities | | $ | 318,950 | | | $ | 3,616,680 | | | $ | — | | | $ | 3,935,630 | |
For the year ended September 30, 2015, there have been no transfers between any of the fair value hierarchy levels. Transfers between levels are recognized at period end.
For more information on valuation inputs, see Note 2 — Significant Accounting Policies in the Notes to Financial Statements.
See accompanying notes to financial statements.
CITY NATIONAL ROCHDALE FUNDS | PAGE 23
schedule of investments |
September 30, 2015 |
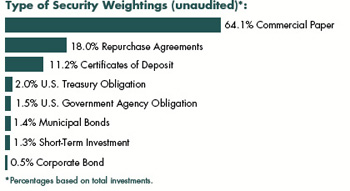
City National Rochdale Prime Money Market Fund |
Description | | Face Amount (000) | | | Value (000) | |
Commercial Paper [64.1%] | |
Banks [25.4%] | |
ANZ New Zealand International (A) (B) | | | | | | |
0.390%, 01/05/16 | | $ | 30,000 | | | $ | 29,969 | |
Bank of Nova Scotia (A) (B) | | | | | | | | |
0.230%, 10/26/15 | | | 30,000 | | | | 29,995 | |
Bank of Tokyo-Mitsubishi UFJ NY (B) | | | | | | | | |
0.190%, 10/23/15 | | | 30,000 | | | | 29,997 | |
Barclays Bank (B) | | | | | | | | |
0.330%, 11/27/15 | | | 30,000 | | | | 29,984 | |
BNP Paribas Fortis (B) | | | | | | | | |
0.270%, 11/06/15 | | | 20,000 | | | | 19,995 | |
Macquarie Bank (A) (B) | | | | | | | | |
0.390%, 10/16/15 | | | 30,000 | | | | 29,995 | |
National Australia Bank (A) (B) | | | | | | | | |
0.260%, 10/13/15 | | | 10,000 | | | | 9,999 | |
0.150%, 10/26/15 | | | 20,000 | | | | 19,998 | |
Standard Chartered Bank (A) (B) | | | | | | | | |
0.300%, 12/01/15 | | | 30,000 | | | | 29,985 | |
Sumitomo Mitsui Banking (A) (B) | | | | | | | | |
0.300%, 11/12/15 | | | 30,000 | | | | 29,989 | |
| | | | | | | | | |
Total Banks | | | | 259,906 | |
| | | | | | | | | |
Consumer Staples [2.9%] | |
Wal-Mart Stores (A) (B) | | | | | | | | |
0.120%, 10/23/15 | | | 30,000 | | | | 29,998 | |
| | | | | | | | | |
Financial Services [22.2%] | |
Allianz Finance (A) (B) | | | | | | | | |
0.300%, 11/02/15 | | | 20,200 | | | | 20,194 | |
ASB Finance (A) (B) | | | | | | | | |
0.280%, 10/01/15 | | | 20,000 | | | | 20,000 | |
AXA Financial (A) (B) | | | | | | | | |
0.220%, 10/08/15 | | | 30,000 | | | | 29,999 | |
Caisse Centrale Desjardins (A) (B) | | | | | | | | |
0.220%, 11/23/15 | | | 30,000 | | | | 29,990 | |
Collateralized Commercial Paper (B) | | | | | | | | |
0.450%, 02/01/16 | | | 15,000 | | | | 14,977 | |
0.520%, 03/07/16 | | | 15,000 | | | | 14,966 | |
General Electric Capital (B) | | | | | | | | |
0.380%, 11/10/15 | | | 10,000 | | | | 9,996 | |
John Deere Financial Canada ULC (A) (B) | | | | | | | | |
0.190%, 10/13/15 | | | 27,250 | | | | 27,248 | |
National Securities Clearing (A) (B) | | | | | | | | |
0.100%, 10/05/15 | | | 30,000 | | | | 30,000 | |
Toyota Motor Credit (B) | | | | | | | | |
0.170%, 10/15/15 | | | 30,000 | | | | 29,998 | |
| | | | | | | | | |
Total Financial Services | | | | 227,368 | |
| | | | | | | | | |
Foreign Agency Obligation [2.9%] | |
Korea Development Bank NY (B) | | | | | | | | |
0.270%, 12/03/15 | | | 30,000 | | | | 29,986 | |
| | | | | | | | | |
Medical - HMO [2.9%] | |
UnitedHealth Group (A) (B) | | | | | | | | |
0.220%, 10/01/15 | | | 30,000 | | | | 30,000 | |
| | | | | | | | | |
Pharmaceuticals [5.9%] | |
Abbott Laboratories (A) (B) | | | | | | | | |
0.150%, 10/20/15 | | | 30,000 | | | | 29,998 | |
AstraZeneca (A) (B) | | | | | | | | |
0.190%, 10/19/15 | | | 30,000 | | | | 29,997 | |
| | | | | | | | | |
Total Pharmaceuticals | | | | 59,995 | |
| | | | | | | | | |
University [1.9%] | |
University of California | | | | | | | | |
0.110%, 10/08/15(B) | | | 19,000 | | | | 18,999 | |
| | | | | | | | | |
Total Commercial Paper | |
(Cost $656,252) | | | | 656,252 | |
| | | | | | | | | |
Certificates of Deposit [11.2%] | |
Banco Del Estado De Chile | | | | | | | | |
0.490%, 03/02/16 | | | 30,000 | | | | 30,000 | |
Bank of America | | | | | | | | |
0.330%, 12/01/15 | | | 30,000 | | | | 30,000 | |
Mizuho Bank | | | | | | | | |
0.270%, 10/05/15 | | | 30,000 | | | | 30,000 | |
See accompanying notes to financial statements.
CITY NATIONAL ROCHDALE FUNDS | PAGE 24
schedule of investments |
September 30, 2015 |
City National Rochdale Prime Money Market Fund (continued) |
Description | | Face Amount (000) | | | Value (000) | |
National Bank of Canada NY | | | | | | |
0.416%, 10/13/15 | | $ | 5,000 | | | $ | 4,999 | |
Norinchukin Bank | | | | | | | | |
0.260%, 10/05/15 | | | 20,000 | | | | 20,000 | |
| | | | | | | | | |
Total Certificates of Deposit | |
(Cost $114,999) | | | | 114,999 | |
| | | | | | | | | |
U.S. Treasury Obligation [1.9%] | |
U.S. Treasury Note | | | | | | | | |
0.500%, 06/30/16 | | | 20,000 | | | | 20,025 | |
| | | | | | | | | |
Total U.S. Treasury Obligation | |
(Cost $20,025) | | | | 20,025 | |
| | | | | | | | | |
Municipal Bond [1.5%] | |
California [1.5%] | |
Southern California, Metropolitan Water District, Ser B-3, RB | | | | | | | | |
0.010%, 10/01/15(C) | | | 15,000 | | | | 15,000 | |
| | | | | | | | | |
Total Municipal Bond | |
(Cost $15,000) | | | | 15,000 | |
| | | | | | | | | |
U.S. Government Agency Obligation [1.5%] | |
FFCB | | | | | | | | |
0.155%, 10/06/15(C) | | | 15,000 | | | | 15,002 | |
| | | | | | | | | |
Total U.S. Government Agency Obligation | | | | | | | | |
(Cost $15,002) | | | | 15,002 | |
| | | | | | | | | |
Corporate Bond [0.5%] | |
Financial Services [0.5%] | |
General Electric Capital, MTN | | | | | | | | |
0.512%, 11/11/15 | | | 5,000 | | | | 5,004 | |
| | | | | | | | | |
Total Corporate Bond | |
(Cost $5,004) | | | | 5,004 | |
Description | | Face Amount (000)/Shares | | | Value (000) | |
Repurchase Agreements [18.1%] | |
Barclays (D) | | | | | | |
0.100%, dated 09/30/15, repurchased on 10/01/15, repurchase price $3,000,008 (collateralized by various U.S. Government Agency obligations, par values ranging from $39,300 to $2,412,800, 0.000% - 1.000%, 12/10/15 to 06/30/19; with a total market value of $3,059,968) | | $ | 3,000 | | | $ | 3,000 | |
Goldman Sachs (D) | | | | | | | | |
0.110%, dated 09/30/15, repurchased on 10/01/15, repurchase price $125,000,382 (collateralized by various U.S. Government Agency obligations, par values ranging from $5,000 to $74,800,000, 0.178% - 1.840%, 10/09/15 to 04/08/20; with a total market value of $127,111,534) | | | 125,000 | | | | 125,000 | |
Wells Fargo (D) | | | | | | | | |
0.140%, dated 09/30/15, repurchased on 10/01/15, repurchase price $57,000,222 (collateralized by various U.S. Government Agency obligations, par values ranging from $7,760,858 to $47,000,000, 3.500% - 4.000%, 07/01/45 to 10/01/45; with a total market value of $57,999,930) | | | 57,000 | | | | 57,000 | |
| | | | | | | | | |
Total Repurchase Agreements | |
(Cost $185,000) | | | | 185,000 | |
| | | | | | | | | |
Short-Term Investment [1.2%] | |
SEI Daily Income Trust, Prime Obligation Fund, Cl A, 0.030%** | | | 12,826,661 | | | | 12,827 | |
| | | | | | | | | |
Total Short-Term Investment | |
(Cost $12,827) | | | | 12,827 | |
| | | | | | | | | |
Total Investments [100.0%] | |
(Cost $1,024,109) | | | $ | 1,024,109 | |
Percentages are based on Net Assets of $1,023,952 (000).
See accompanying notes to financial statements.
CITY NATIONAL ROCHDALE FUNDS | PAGE 25
schedule of investments |
September 30, 2015 |
City National Rochdale Prime Money Market Fund (concluded) |
** | The rate reported is the 7-day effective yield as of September 30, 2015. |
(A) | Security exempt from registration under Rule 144A of the Securities Act of 1933. These securities may be resold in transactions exempt from registration normally to qualified institutions. On September 30, 2015, the value of these securities amounted to $457,354 (000), representing 44.7% of the net assets of the Fund. |
(B) | Zero coupon security. The rate reported is the effective yield at time of purchase. |
(C) | Floating Rate Security — The rate reported is the rate in effect on September 30, 2015. |
(D) | Tri-Party Repurchase Agreement. |
Cl — Class
FFCB — Federal Farm Credit Bank
MTN — Medium Term Note
NY — New York
RB — Revenue Bond
Ser — Series
The following is a list of the inputs used as of September 30, 2015 in valuing the Fund’s investments carried at value (000):
Investments in Securities | | Level 1 | | | Level 2 | | | Level 3 | | | Total | |
Commercial Paper | | $ | — | | | $ | 656,252 | | | $ | — | | | $ | 656,252 | |
Certificates of Deposit | | | — | | | | 114,999 | | | | — | | | | 114,999 | |
U.S. Treasury Obligation | | | — | | | | 20,025 | | | | — | | | | 20,025 | |
Municipal Bond | | | — | | | | 15,000 | | | | — | | | | 15,000 | |
U.S. Government Agency Obligation | | | — | | | | 15,002 | | | | — | | | | 15,002 | |
Corporate Bond | | | — | | | | 5,004 | | | | — | | | | 5,004 | |
Repurchase Agreements | | | — | | | | 185,000 | | | | — | | | | 185,000 | |
Short-Term Investment | | | 12,827 | | | | — | | | | — | | | | 12,827 | |
Total Investments in Securities | | $ | 12,827 | | | $ | 1,011,282 | | | $ | — | | | $ | 1,024,109 | |
For the year ended September 30, 2015, there have been no transfers between any of the fair value hierarchy levels. Transfers between Levels are recognized at period end.
For more information on valuation inputs, see Note 2 — Significant Accounting Policies in the Notes to Financial Statements.
See accompanying notes to financial statements.
CITY NATIONAL ROCHDALE FUNDS | PAGE 26
schedule of investments |
September 30, 2015 |
City National Rochdale California Tax Exempt Money Market Fund |
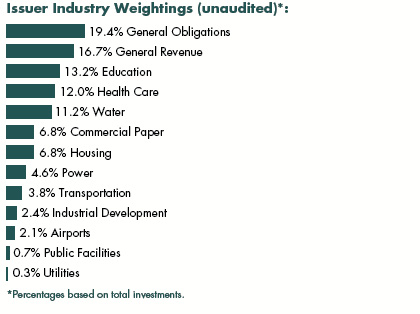
Description | | Face Amount (000) | | | Value (000) | |
Municipal Bonds [85.4%] | |
Arizona [0.9%] | |
Maricopa County, Industrial Development Authority, Ser A, RB, FNMA, AMT | | | | | | |
0.040%, 10/01/15(A) (B) | | $ | 7,715 | | | $ | 7,715 | |
| | | | | | | | | |
California [78.5%] | |
Abag, Finance Authority for Nonprofit, Ser C, RB | | | | | | | | |
0.010%, 10/07/15(A) (B) (C) | | | 1,300 | | | | 1,300 | |
Alameda County Joint Powers Authority, Ser 2927Z, RB, AGM | | | | | | | | |
0.010%, 10/01/15(B) (D) | | | 3,490 | | | | 3,490 | |
Bay Area Toll Authority, RB | | | | | | | | |
0.010%, 10/01/15(A) (B) (C) | | | 4,975 | | | | 4,975 | |
Bay Area Toll Authority, Ser A-2, RB | | | | | | | | |
0.010%, 10/01/15(A) (B) (C) | | | 6,000 | | | | 6,000 | |
Bay Area Toll Authority, Ser C-1, RB | | | | | | | | |
0.010%, 10/01/15(A) (B) (C) | | | 6,700 | | | | 6,700 | |
Bay Area Toll Authority, Ser C-2, RB | | | | | | | | |
0.010%, 10/01/15(A) (B) (C) | | | 9,000 | | | | 9,000 | |
Bay Area Toll Authority, Ser E-1, RB | | | | | | | | |
0.060%, 10/01/15(A) (B) | | | 1,900 | | | | 1,900 | |
Bay Area Toll Authority, Ser F, RB | | | | | | | | |
Pre-Refunded @ 100 | | | | | | | | |
5.000%, 04/01/16(E) | | | 890 | | | | 911 | |
Bay Area Toll Authority, Ser F, RB | | | | | | | | |
Pre-Refunded @ 100 | | | | | | | | |
5.000%, 04/01/16(E) | | | 605 | | | | 619 | |
Bay Area Toll Authority, Ser F, RB | | | | | | | | |
Pre-Refunded @ 100 | | | | | | | | |
5.000%, 04/01/16(E) | | | 550 | | | | 563 | |
Bay Area Toll Authority, Ser F, RB | | | | | | | | |
Pre-Refunded @ 100 | | | | | | | | |
5.000%, 04/01/22(E) | | | 115 | | | | 118 | |
Big Bear Lake California, Southwest Gas Corporation Project, Ser A, RB, AMT | | | | | | | | |
0.020%, 10/07/15(A) (B) (C) | | | 16,000 | | | | 16,000 | |
California State, Economic Recovery Project, Ser A, GO | | | | | | | | |
Pre-Refunded @ 100 | | | | | | | | |
5.000%, 07/01/22(E) | | | 1,655 | | | | 1,714 | |
California State, Educational Facilities Authority, Stanford University Project, Ser L-4, RB | | | | | | | | |
0.010%, 10/07/15(B) | | | 1,075 | | | | 1,075 | |
California State, Educational Facilities Authority, Stanford University Project, Ser L-5, RB | | | | | | | | |
0.010%, 10/07/15(A) (B) | | | 100 | | | | 100 | |
California State, Educational Facilities Authority, Stanford University Project, Ser L-6, RB | | | | | | | | |
0.010%, 10/07/15(A) (B) | | | 400 | | | | 400 | |
California State, Educational Facilities Authority, Stanford University Project, Ser L-7, RB | | | | | | | | |
0.010%, 10/07/15(A) (B) | | | 1,200 | | | | 1,200 | |
California State, GO | | | | | | | | |
4.000%, 02/01/16 | | | 10,500 | | | | 10,637 | |
California State, Health Facilities Financing Authority, Adventis Health System Project, Ser A, RB | | | | | | | | |
0.010%, 10/01/15(A) (B) (C) | | | 8,600 | | | | 8,600 | |
California State, Health Facilities Financing Authority, Adventis Health System Project, Ser B, RB | | | | | | | | |
0.010%, 10/01/15(A) (B) (C) | | | 2,680 | | | | 2,680 | |
See accompanying notes to financial statements.
CITY NATIONAL ROCHDALE FUNDS | PAGE 27
schedule of investments |
September 30, 2015 |
City National Rochdale California Tax Exempt Money Market Fund (continued) |
Description | | Face Amount (000) | | | Value (000) | |
California State, Health Facilities Financing Authority, Catholic Health Care Project, Ser H, RB | | | | | | |
0.010%, 10/07/15(A) (B) (C) | | $ | 3,500 | | | $ | 3,500 | |
California State, Health Facilities Financing Authority, Catholic Healthcare Project, Ser C, RB, NATL | | | | | | | | |
0.130%, 10/07/15(A) (B) (C) | | | 2,100 | | | | 2,100 | |
California State, Health Facilities Financing Authority, Catholic Healthcare Project, Ser H, RB | | | | | | | | |
0.010%, 10/07/15(A) (B) (C) | | | 800 | | | | 800 | |
California State, Health Facilities Financing Authority, Catholic Healthcare Project, Ser K, RB | | | | | | | | |
0.010%, 10/07/15(A) (B) (C) | | | 5,000 | | | | 5,000 | |
California State, Health Facilities Financing Authority, Health Facility Catholic Project, Ser I, RB | | | | | | | | |
0.010%, 10/07/15(A) (B) (C) | | | 100 | | | | 100 | |
California State, Health Facilities Financing Authority, Kaiser Permanente Project, Ser C, RB | | | | | | | | |
0.010%, 10/07/15(A) (B) | | | 7,700 | | | | 7,700 | |
California State, Health Facilities Financing Authority, Ser B, RB | | | | | | | | |
0.010%, 10/01/15(A) (B) (C) | | | 600 | | | | 600 | |
California State, Health Facilities Financing Authority, Ser B, RB | | | | | | | | |
0.010%, 10/07/15(A) (B) (C) | | | 1,960 | | | | 1,960 | |
California State, Health Facilities Financing Authority, St. Joseph Health System Project, Ser B, RB | | | | | | | | |
0.010%, 10/01/15(A) (B) (C) | | | 3,700 | | | | 3,700 | |
California State, Health Facilities Financing Authority, St. Joseph Health System Project, Ser C, RB | | | | | | | | |
0.010%, 10/01/15(B) (C) | | | 100 | | | | 100 | |
California State, Health Facilities Financing Authority, Stanford Hospital Project, Ser B-1, RB | | | | | | | | |
0.010%, 10/07/15(A) (B) | | | 10,000 | | | | 10,000 | |
California State, Infrastructure & Economic Development Bank, RB | | | | | | | | |
0.060%, 10/01/15(A) (B) (C) | | | 6,245 | | | | 6,245 | |
California State, Infrastructure & Economic Development Bank, Museum of Nautral History Foundation Project, Ser A, RB | | | | | | | | |
0.010%, 10/01/15(A) (B) (C) | | | 630 | | | | 630 | |
California State, Infrastructure & Economic Development Bank, Ser A-1, RB | | | | | | | | |
4.000%, 10/01/15 | | | 1,400 | | | | 1,400 | |
California State, Kindergarten Project, GO | | | | | | | | |
0.010%, 10/01/15(A) (B) (C) | | | 7,900 | | | | 7,900 | |
California State, Kindergarten Project, Ser A-1, GO | | | | | | | | |
0.010%, 10/01/15(A) (B) (C) | | | 3,100 | | | | 3,100 | |
California State, Kindergarten Project, Ser A-2, GO | | | | | | | | |
0.010%, 10/01/15(A) (B) (C) | | | 10,545 | | | | 10,545 | |
California State, Kindergarten Project, Ser A-3, GO | | | | | | | | |
0.010%, 10/01/15(A) (B) (C) | | | 1,000 | | | | 1,000 | |
California State, Kindergarten Project, Ser A5, GO | | | | | | | | |
0.010%, 10/01/15(A) (B) (C) | | | 4,000 | | | | 4,000 | |
California State, Kindergarten Project, Ser B-1, GO | | | | | | | | |
0.010%, 10/01/15(A) (B) (C) | | | 4,100 | | | | 4,100 | |
California State, Kindergarten Project, Ser B-2, GO | | | | | | | | |
0.010%, 10/01/15(A) (B) (C) | | | 1,835 | | | | 1,835 | |
California State, Kindergarten Project, Ser B-3, GO | | | | | | | | |
0.010%, 10/01/15(A) (B) (C) | | | 1,055 | | | | 1,055 | |
California State, Kindergarten Project, Ser B-4, GO | | | | | | | | |
0.010%, 10/01/15(A) (B) (C) | | | 700 | | | | 700 | |
California State, Kindergarten Project, Ser B-5, GO | | | | | | | | |
0.010%, 10/01/15(A) (B) (C) | | | 500 | | | | 500 | |
California State, Kindergarten Project, Ser B-6, GO | | | | | | | | |
0.010%, 10/01/15(A) (B) (C) | | | 500 | | | | 500 | |
California State, Municipal Finance Authority, Cheveron USA Recovery Zone Project, Ser B-5, RB | | | | | | | | |
0.010%, 10/07/15(A) (B) (C) | | | 21,000 | | | | 21,000 | |
See accompanying notes to financial statements.
CITY NATIONAL ROCHDALE FUNDS | PAGE 28
schedule of investments |
September 30, 2015 |
City National Rochdale California Tax Exempt Money Market Fund (continued) |
Description | | Face Amount (000) | | | Value (000) | |
California State, Municipal Finance Authority, Chevron USA Recovery Zone Project, RB | | | | | | |
0.010%, 10/01/15(A) (B) | | $ | 400 | | | $ | 400 | |
California State, Municipal Finance Authority, Chevron USA Recovery Zone Project, Ser B, RB | | | | | | | | |
0.010%, 10/01/15(A) (B) | | | 950 | | | | 950 | |
California State, Public Works Board, Ser F, RB, ETM | | | | | | | | |
4.000%, 10/01/15 | | | 100 | | | | 100 | |
California State, Public Works Board, Ser J, RB | | | | | | | | |
Pre-Refunded @ 100 | | | | | | | | |
5.000%, 01/01/17(E) | | | 100 | | | | 101 | |
California State, Public Works Board, University of California Projects, Ser L, RB, NATL | | | | | | | | |
Pre-Refunded @ 100 | | | | | | | | |
5.250%, 11/01/15(E) | | | 1,000 | | | | 1,004 | |
California State, Ser 2813, GO | | | | | | | | |
0.080%, 10/01/15(A) (B) (D) | | | 8,000 | | | | 8,000 | |
California State, Ser A-2, GO | | | | | | | | |
0.010%, 10/01/15(A) (B) (C) | | | 400 | | | | 400 | |
California State, Ser B-1, GO | | | | | | | | |
0.010%, 10/07/15(A) (B) (C) | | | 21,000 | | | | 21,000 | |
California State, Ser B-4, GO | | | | | | | | |
0.010%, 10/07/15(A) (B) (C) | | | 1,500 | | | | 1,500 | |
California State, Ser C-1, GO | | | | | | | | |
0.010%, 10/01/15(A) (B) (C) | | | 250 | | | | 250 | |
California State, University, Ser C, RB, NATL | | | | | | | | |
Pre-Refunded @ 100 | | | | | | | | |
5.000%, 11/01/15(E) | | | 155 | | | | 156 | |
California State, University, Ser C, RB, NATL | | | | | | | | |
Pre-Refunded @ 100 | | | | | | | | |
5.000%, 11/01/15(E) | | | 660 | | | | 663 | |
California State, University, Ser C, RB, NATL | | | | | | | | |
Pre-Refunded @ 100 | | | | | | | | |
5.000%, 11/01/15(E) | | | 265 | | | | 266 | |
California State, University, Ser C, RB, NATL | | | | | | | | |
Pre-Refunded @ 100 | | | | | | | | |
5.000%, 11/01/15(E) | | | 250 | | | | 251 | |
California Statewide, Communities Development Authority, John Muir Health Project, Ser A, RB | | | | | | | | |
0.010%, 10/01/15(A) (B) (C) | | | 2,075 | | | | 2,075 | |
California Statewide, Communities Development Authority, John Muir Health Project, Ser C, RB | | | | | | | | |
0.010%, 10/01/15(A) (B) (C) | | | 600 | | | | 600 | |
California Statewide, Communities Development Authority, Kaiser Permanente Project, Ser B, RB | | | | | | | | |
0.010%, 10/07/15(A) (B) | | | 7,100 | | | | 7,100 | |
California Statewide, Communities Development Authority, Kaiser Permanente Project, Ser D, RB | | | | | | | | |
0.010%, 10/07/15(A) (B) | | | 18,000 | | | | 18,000 | |
California Statewide, Communities Development Authority, RB, AMT | | | | | | | | |
0.080%, 10/07/15(A) (B) (C) | | | 150 | | | | 150 | |
California Statewide, Communities Development Authority, Ser A, RB | | | | | | | | |
0.010%, 10/07/15(B) (C) | | | 100 | | | | 100 | |
California Statewide, Communities Development Authority, Ser A, RB, AMT | | | | | | | | |
0.080%, 10/07/15(A) (B) (C) | | | 535 | | | | 535 | |
California Statewide, Communities Development Authority, Ser S, RB, AMT | | | | | | | | |
0.030%, 10/01/15(A) (B) (C) | | | 1,500 | | | | 1,500 | |
Contra Costa, Water District, Ser B, RB, ETM | | | | | | | | |
5.000%, 10/01/15 | | | 1,300 | | | | 1,300 | |
Contra County, Housing & Finance Authority, Multi-Family Housing Project, Ser B, RB | | | | | | | | |
0.070%, 10/07/15 | | | 9,900 | | | | 9,900 | |
County of Santa Cruz California, GO | | | | | | | | |
2.000%, 06/30/16 | | | 5,000 | | | | 5,063 | |
County of Ventura California, GO | | | | | | | | |
2.000%, 07/01/16 | | | 15,000 | | | | 15,193 | |
East Bay, Municipal Utility District Water System Revenue, Ser A-2, RB | | | | | | | | |
0.010%, 10/07/15(A) (B) | | | 2,990 | | | | 2,990 | |
See accompanying notes to financial statements.
CITY NATIONAL ROCHDALE FUNDS | PAGE 29
schedule of investments |
September 30, 2015 |
City National Rochdale California Tax Exempt Money Market Fund (continued) |
Description | | Face Amount (000) | | | Value (000) | |
East Bay, Municipal Utility District Water System Revenue, Ser A-4, RB | | | | | | |
0.010%, 10/07/15(A) (B) | | $ | 100 | | | $ | 100 | |
East Bay, Municipal Utility District Water System Revenue, Ser B, RB | | | | | | | | |
5.000%, 06/01/16 | | | 135 | | | | 139 | |
East Bay, Municipal Utility District, Ser A-3, RB | | | | | | | | |
0.010%, 10/07/15(A) (B) | | | 150 | | | | 150 | |
Eastern Municipal Water District, Ser A, RB | | | | | | | | |
0.060%, 10/01/15(A) (B) | | | 7,500 | | | | 7,500 | |
Eastern Municipal Water District, Ser C, COP | | | | | | | | |
0.010%, 10/07/15(A) (B) | | | 8,475 | | | | 8,475 | |
Elsinore Valley, Municipal Water District, Ser A, COP | | | | | | | | |
0.030%, 10/07/15(A) (B) (C) | | | 3,040 | | | | 3,040 | |
Elsinore Valley, Municipal Water District, Ser B, COP | | | | | | | | |
0.030%, 10/07/15(A) (B) (C) | | | 9,000 | | | | 9,000 | |
Hayward, Unified School District, GO | | | | | | | | |
Pre-Refunded @ 100 | | | | | | | | |
5.000%, 08/01/33(E) | | | 225 | | | | 234 | |
Irvine Ranch, Water District, SAB | | | | | | | | |
0.010%, 10/01/15(A) (B) (C) | | | 5,800 | | | | 5,800 | |
Irvine Ranch, Water District, Ser A, SAB | | | | | | | | |
0.010%, 10/01/15(A) (B) (C) | | | 1,635 | | | | 1,635 | |
Irvine Ranch, Water District, Ser B, SAB | | | | | | | | |
0.010%, 10/01/15(A) (B) (C) | | | 9,145 | | | | 9,145 | |
Irvine, Unified School District, SPL Tax | | | | | | | | |
0.010%, 10/01/15(A) (B) (C) | | | 500 | | | | 500 | |
Irvine, Unified School District, SPL Tax | | | | | | | | |
0.010%, 10/01/15(A) (B) (C) | | | 4,710 | | | | 4,710 | |
Irvine, Unified School District, Ser A, SPL Tax | | | | | | | | |
0.010%, 10/01/15(A) (B) (C) | | | 200 | | | | 200 | |
Irvine, Unified School District, Ser B, SPL Tax | | | | | | | | |
0.010%, 10/07/15(A) (B) (C) | | | 5,220 | | | | 5,220 | |
JPMorgan Chase Putters, Ser 3365, RB | | | | | | | | |
0.030%, 10/01/15(B) (D) (G) | | | 7,730 | | | | 7,730 | |
JPMorgan Chase Putters, Ser 3962, RB | | | | | | | | |
0.030%, 10/01/15(B) (D) (G) | | | 4,345 | | | | 4,345 | |
JPMorgan Chase Putters, Ser 3969, RB | | | | | | | | |
0.030%, 10/01/15(B) (D) (G) | | | 5,000 | | | | 5,000 | |
JPM Chase Putters, Ser 2015-ZF0159, GO | | | | | | | | |
0.030%, 10/01/15(B) (D) (G) | | | 7,500 | | | | 7,500 | |
JPM Chase Putters, Ser 2015-ZF0162, RB | | | | | | | | |
0.030%, 10/01/15(B) (D) (G) | | | 1,625 | | | | 1,625 | |
JPM Chase Putters, Ser 2015-ZF0177, RB | | | | | | | | |
0.030%, 10/01/15(B) (D) (G) | | | 1,410 | | | | 1,410 | |
JPM Chase Putters, Ser 2015-ZF0178, RB | | | | | | | | |
0.030%, 10/01/15(B) (D) (G) | | | 500 | | | | 500 | |
JPM Chase Putters, Ser 2015-ZF0179, GO | | | | | | | | |
0.030%, 10/01/15(B) (D) (G) | | | 3,050 | | | | 3,050 | |
JPM Chase Putters, Ser 2015-ZF0181, RB | | | | | | | | |
0.030%, 10/01/15(B) (D) (G) | | | 6,750 | | | | 6,750 | |
JPM Chase Putters, Ser 2015-ZF0182, RB | | | | | | | | |
0.030%, 10/01/15(B) (D) (G) | | | 3,000 | | | | 3,000 | |
JPM Chase Putters, Ser 2015-ZF0187, RB | | | | | | | | |
0.030%, 10/01/15(B) (D) (G) | | | 4,605 | | | | 4,605 | |
JPM Chase Putters, Ser 2015-ZF0188, RB | | | | | | | | |
0.030%, 10/01/15(B) (D) (G) | | | 1,385 | | | | 1,385 | |
JPM Chase Putters, Ser 2015-ZF0243, RB | | | | | | | | |
0.030%, 10/01/15(B) (D) (G) | | | 2,920 | | | | 2,920 | |
JPM Chase Putters, Ser 2015-ZF0250, GO | | | | | | | | |
0.050%, 10/01/15(B) (D) (G) | | | 5,410 | | | | 5,410 | |
See accompanying notes to financial statements.
CITY NATIONAL ROCHDALE FUNDS | PAGE 30
schedule of investments |
September 30, 2015 |
City National Rochdale California Tax Exempt Money Market Fund (continued) |
Description | | Face Amount (000) | | | Value (000) | |
JPM Chase Putters, Ser ZF0190, RB | | | | | | |
0.030%, 10/01/15(B) (D) (G) | | $ | 1,835 | | | $ | 1,835 | |
Kern, Community College District, GO, AGM | | | | | | | | |
Pre-Refunded @ 100 | | | | | | | | |
5.000%, 11/01/15(E) | | | 400 | | | | 402 | |
Livermore, Ser A, COP | | | | | | | | |
0.010%, 10/01/15(A) (B) (C) | | | 3,000 | | | | 3,000 | |
Livermore, Ser B, COP | | | | | | | | |
0.010%, 10/01/15(A) (B) (C) | | | 6,410 | | | | 6,410 | |
Los Angeles County, TRAN | | | | | | | | |
5.000%, 06/30/16 | | | 10,075 | | | | 10,428 | |
Los Angeles, Department of Water & Power, Ser A-1, RB | | | | | | | | |
0.010%, 10/01/15(A) (B) | | | 12,100 | | | | 12,100 | |
Los Angeles, Department of Water & Power, Ser B-4, RB | | | | | | | | |
0.010%, 10/01/15(A) (B) | | | 6,400 | | | | 6,400 | |
Los Angeles, Housing and Finance Authority, Multi-Family Housing Project, Various Loans to Lender Program, Ser A, RB, AMT | | | | | | | | |
0.030%, 10/01/15(A) (B) (C) | | | 2,359 | | | | 2,359 | |
Los Angeles, Unified School District, Ser A, GO, NATL | | | | | | | | |
Pre-Refunded @ 100 | | | | | | | | |
5.000%, 07/01/18(E) | | | 435 | | | | 450 | |
Los Angeles, Unified School District, Ser F, GO, FGIC | | | | | | | | |
Pre-Refunded @ 100 | | | | | | | | |
5.000%, 07/01/19(E) | | | 100 | | | | 103 | |
Los Angeles, Unified School District, Ser F, GO, FGIC | | | | | | | | |
Pre-Refunded @ 100 | | | | | | | | |
5.000%, 07/01/30(E) | | | 2,300 | | | | 2,382 | |
Los Angeles, Unified School District, Ser S, GO, FGIC | | | | | | | | |
Pre-Refunded @ 100 | | | | | | | | |
5.000%, 07/01/18(E) | | | 100 | | | | 103 | |
Los Angeles, Wastewater System Revenue, Ser B, RB | | | | | | | | |
4.000%, 06/01/16 | | | 160 | | | | 164 | |
Los Angeles, Water & Power Resource Authority, Ser B-6, RB | | | | | | | | |
0.010%, 10/01/15(A) (B) | | | 15,200 | | | | 15,200 | |
Los Gatos-Saratoga, Joint High School District, GO | | | | | | | | |
2.000%, 12/01/15 | | | 4,740 | | | | 4,754 | |
Metropolitan Water District of Southern California, Ser A-1, RB | | | | | | | | |
0.040%, 10/01/15(A) (B) | | | 15,000 | | | | 15,000 | |
Metropolitan Water District of Southern California, Ser A-2, RB | | | | | | | | |
0.070%, 10/01/15(A) (B) | | | 7,500 | | | | 7,500 | |
Metropolitan Water District of Southern California, Ser A-3, RB | | | | | | | | |
0.040%, 10/01/15(B) | | | 11,000 | | | | 11,000 | |
Metropolitan Water District of Southern California, Ser B, RB | | | | | | | | |
4.000%, 07/01/16 | | | 200 | | | | 205 | |
Metropolitan Water District of Southern California, Ser B, RB | | | | | | | | |
4.000%, 07/01/16 | | | 200 | | | | 205 | |
Metropolitan Water District of Southern California, Ser B, RB | | | | | | | | |
4.000%, 07/01/16 | | | 175 | | | | 180 | |
Metropolitan Water District of Southern California, Ser C, RB | | | | | | | | |
4.000%, 10/01/15 | | | 125 | | | | 125 | |
Metropolitan Water District of Southern California, Ser C, RB | | | | | | | | |
5.000%, 07/01/16 | | | 275 | | | | 285 | |
Metropolitan Water District of Southern California, Ser D, RB | | | | | | | | |
0.010%, 10/01/15(A) (B) | | | 6,100 | | | | 6,100 | |
Monrovia, Unified School District, Ser A, GO, AGM | | | | | | | | |
Pre-Refunded @ 100 | | | | | | | | |
5.000%, 08/01/31(E) | | | 500 | | | | 519 | |
Monterey Peninsula, Water Management District, COP | | | | | | | | |
0.030%, 10/01/15(A) (B) (C) | | | 5,467 | | | | 5,467 | |
Orange County, Fire Authority, GO | | | | | | | | |
2.000%, 06/30/16 | | | 7,000 | | | | 7,088 | |
Orange County, Municipal Improvement Authority, SAB | | | | | | | | |
0.010%, 10/07/15(A) (B) (C) | | | 7,213 | | | | 7,213 | |
Orange County, Water District Authority, Ser A, COP | | | | | | | | |
0.010%, 10/07/15(A) (B) (C) | | | 25,050 | | | | 25,050 | |
See accompanying notes to financial statements.
CITY NATIONAL ROCHDALE FUNDS | PAGE 31
schedule of investments |
September 30, 2015 |
City National Rochdale California Tax Exempt Money Market Fund (continued) |
Description | | Face Amount (000) | | | Value (000) | |
Pasadena, Unified School District, GO, AGM | | | | | | |
Pre-Refunded @ 102 | | | | | | |
5.000%, 11/01/15(E) | | $ | 500 | | | $ | 512 | |
Pasadena, Unified School District, GO, AGM | | | | | | | | |
Pre-Refunded @ 102 | | | | | | | | |
5.000%, 11/01/15(E) | | | 910 | | | | 932 | |
Pasadena, Unified School District, GO, AGM | | | | | | | | |
Pre-Refunded @ 102 | | | | | | | | |
5.000%, 11/01/15(E) | | | 300 | | | | 307 | |
Redondo Beach, Unified School District, Ser A, GO | | | | | | | | |
Pre-Refunded @ 102 | | | | | | | | |
5.125%, 08/01/37(E) | | | 150 | | | | 159 | |
Riverside County, RB, TRAN | | | | | | | | |
2.000%, 06/30/16 | | | 6,000 | | | | 6,076 | |
Sacramento County, Sanitation Districts Financing Authority, RB, NATL | | | | | | | | |
Pre-Refunded @ 100 | | | | | | | | |
4.750%, 12/01/15(E) | | | 250 | | | | 252 | |
Sacramento County, Sanitation Districts Financing Authority, RB, NATL | | | | | | | | |
Pre-Refunded @ 100 | | | | | | | | |
5.000%, 12/01/29(E) | | | 650 | | | | 671 | |
Sacramento, Municipal Utility District, Sub-Ser L, RB | | | | | | | | |
0.010%, 10/01/15(A) (B) (C) | | | 2,685 | | | | 2,685 | |
San Bernardino County, Ser A, GO | | | | | | | | |
2.000%, 06/30/16 | | | 7,000 | | | | 7,090 | |
San Bernardino, Community College District, Ser C, GO, AGM | | | | | | | | |
Pre-Refunded @ 100 | | | | | | | | |
5.000%, 08/01/27(E) | | | 125 | | | | 130 | |
San Diego County California, TRAN | | | | | | | | |
2.000%, 06/30/16 | | | 1,500 | | | | 1,520 | |
San Diego County, Regional Transportation Commission, Ser A, RB | | | | | | | | |
5.000%, 04/01/16 | | | 1,000 | | | | 1,024 | |
San Diego County, Regional Transportation Commission, Ser B, RB | | | | | | | | |
0.010%, 10/01/15(A) (B) | | | 280 | | | | 280 | |
San Diego County, Regional Transportation Commission, Ser C, RB | | | | | | | | |
0.010%, 10/01/15(A) (B) | | | 100 | | | | 100 | |
San Diego County, Regional Transportation Commission, Ser D, RB | | | | | | | | |
0.010%, 10/01/15(A) (B) | | | 12,540 | | | | 12,540 | |
San Francisco City & County, Airports Comm-San Francisco International Airport, Ser 36B-RMKT, RB | | | | | | | | |
0.010%, 10/07/15(A) (B) (C) | | | 600 | | | | 600 | |
San Francisco City & County, Airports Comm-San Francisco International Airport, Ser 37C-RMKT, RB | | | | | | | | |
0.010%, 10/07/15(A) (B) (C) | | | 17,000 | | | | 17,000 | |
San Francisco City & County, Public Utilities Commission Water Revenue, Ser B, RB, XLCA | | | | | | | | |
5.000%, 11/01/15 | | | 500 | | | | 502 | |
San Francisco City & County, Redevelopment Agency, Ser C, RB, AMT | | | | | | | | |
0.080%, 10/07/15(A) (B) (C) | | | 800 | | | | 800 | |
San Francisco City & County, Ser B, RB | | | | | | | | |
0.060%, 10/01/15(B) (C) | | | 3,475 | | | | 3,475 | |
San Francisco, Public Utilities Commission Water Revenue, Ser A, RB, AGM | | | | | | | | |
Pre-Refunded @ 100 | | | | | | | | |
4.750%, 05/01/16(E) | | | 12,485 | | | | 12,807 | |
San Francisco, Public Utilities Commission Water Revenue, Ser A, RB, AGM | | | | | | | | |
Pre-Refunded @ 100 | | | | | | | | |
4.500%, 05/01/16(E) | | | 150 | | | | 154 | |
San Francisco, Public Utilities Commission Water Revenue, Ser A, RB, AGM | | | | | | | | |
Pre-Refunded @ 100 | | | | | | | | |
5.000%, 11/01/19(E) | | | 100 | | | | 103 | |
San Francisco, Public Utilities Commission Water Revenue, Ser A, RB, AGM | | | | | | | | |
Pre-Refunded @ 100 | | | | | | | | |
5.000%, 11/01/23(E) | | | 200 | | | | 205 | |
San Mateo, Joint Powers Financing Authority, Public Safety Project, Ser A, RB | | | | | | | | |
0.030%, 10/01/15(A) (B) (C) | | | 5,000 | | | | 5,000 | |
See accompanying notes to financial statements.
CITY NATIONAL ROCHDALE FUNDS | PAGE 32
schedule of investments |
September 30, 2015 |
City National Rochdale California Tax Exempt Money Market Fund (continued) |
Description | | Face Amount (000) | | | Value (000) | |
San Ramon Valley Unified School District, GO, NATL | | | | | | |
Pre-Refunded @ 100 | | | | | | |
5.000%, 08/01/25(E) | | $ | 100 | | | $ | 104 | |
Santa Clara Valley, Transportation Authority, Ser A, RB | | | | | | | | |
0.010%, 10/01/15(A) (B) | | | 7,600 | | | | 7,600 | |
Santa Clara Valley, Transportation Authority, Ser C, RB | | | | | | | | |
0.010%, 10/01/15(A) (B) | | | 540 | | | | 540 | |
Santa Clara Valley, Transportation Authority, Ser C, RB | | | | | | | | |
0.010%, 10/01/15(A) (B) | | | 7,300 | | | | 7,300 | |
Santa Clara Valley, Transportation Authority, Ser D, RB | | | | | | | | |
0.010%, 10/01/15(A) (B) | | | 10,000 | | | | 10,000 | |
South San Francisco Unified School District, Ser C, GO, ETM | | | | | | | | |
0.400%, 06/01/16(F) | | | 150 | | | | 150 | |
Southern California, Metropolitan Water District, Ser B-3, RB | | | | | | | | |
0.010%, 10/01/15(A) (B) | | | 1,600 | | | | 1,600 | |
Southern California, Public Power Authority, Magnolia Power Project, Ser A-1, RB | | | | | | | | |
0.010%, 10/07/15(A) (B) (C) | | | 11,045 | | | | 11,045 | |
Southern California, Public Power Authority, Ser A-2, RB | | | | | | | | |
0.010%, 10/07/15(A) (B) (C) | | | 100 | | | | 100 | |
State of California, Department of Water Resources, Ser AJ, RB | | | | | | | | |
5.000%, 12/01/15 | | | 1,150 | | | | 1,159 | |
Tamalpais Unified High School District, GO, NATL | | | | | | | | |
Pre-Refunded @ 100 | | | | | | | | |
5.000%, 08/01/29(E) | | | 450 | | | | 468 | |
University of California, Ser AF, RB | | | | | | | | |
5.000%, 05/15/16 | | | 1,000 | | | | 1,029 | |
University of California, Ser Z-1, RB | | | | | | | | |
0.120%, 10/01/15(A) (B) | | | 20,875 | | | | 20,875 | |
Ventura County, Public Financing Authority, Ser 2015-ZF2065, RB | | | | | | | | |
0.060%, 10/01/15(A) (B) (D) | | | 5,630 | | | | 5,630 | |
Ventura County, Public Financing Authority, Ser 2015-ZF2066, RB | | | | | | | | |
0.060%, 10/01/15(A) (B) (D) | | | 5,685 | | | | 5,685 | |
West Covina, Public Financing Authority, Golf Course Project, Ser B, RB | | | | | | | | |
0.020%, 10/07/15(A) (B) (C) | | | 800 | | | | 800 | |
West Covina, Public Financing Authority, Ser A, RB | | | | | | | | |
0.020%, 10/07/15(A) (B) (C) | | | 300 | | | | 300 | |
West Valley-Mission Community College District, Ser A, GO, AGM | | | | | | | | |
Pre-Refunded @ 100 | | | | | | | | |
5.000%, 08/01/26(E) | | | 1,265 | | | | 1,315 | |
| | | | | | | | | |
Total California | | | | 691,328 | |
| | | | | | | | | |
Connecticut [0.0%] | |
Hartford City, GO, AMBAC | | | | | | | | |
Pre-Refunded @ 100 | | | | | | | | |
5.000%, 07/15/18(E) | | | 100 | | | | 104 | |
| | | | | | | | | |
Iowa [0.2%] | |
Iowa State, Finance Authority, Ser C, RB, GNMA/FNMA, AMT | | | | | | | | |
0.020%, 10/01/15(A) (B) | | | 1,200 | | | | 1,200 | |
| | | | | | | | | |
New York [0.9%] | |
New York City, Refunding Project, Ser I-6, GO | | | | | | | | |
0.010%, 10/01/15(A) (B) (C) | | | 785 | | | | 785 | |
New York State, Dormitory Authority, Ser D, RB | | | | | | | | |
Pre-Refunded @ 100 | | | | | | | | |
5.000%, 03/15/19(E) | | | 100 | | | | 104 | |
New York State, Housing Finance Agency, Ser B, RB | | | | | | | | |
0.110%, 10/07/15(A) (B) (C) | | | 7,000 | | | | 7,000 | |
| | | | | | | | | |
Total New York | | | | 7,889 | |
| | | | | | | | | |
Texas [0.1%] | |
JPMorgan Chase Putters, Ser 4302Z, RB | | | | | | | | |
0.130%, 10/01/15(B) (D) | | | 600 | | | | 600 | |
Lower Neches Valley, Industrial Development Authority, Exxon Mobil Project, RB | | | | | | | | |
0.010%, 10/01/15(A) (B) | | | 300 | | | | 300 | |
See accompanying notes to financial statements.
CITY NATIONAL ROCHDALE FUNDS | PAGE 33
schedule of investments |
September 30, 2015 |
City National Rochdale California Tax Exempt Money Market Fund (continued) |
Description | | Face Amount (000) | | | Value (000) | |
North Texas, Tollway Authority, Ser F, RB Pre-Refunded @ 100 | | | | | | |
6.125%, 01/01/31(E) | | $ | 250 | | | $ | 254 | |
| | | | | | | | | |
Total Texas | | | | 1,154 | |
| | | | | | | | | |
Utah [1.3%] | |
Utah Housing, Ser A-1, RB, AMT | | | | | | | | |
0.030%, 10/07/15(A) (B) | | | 3,810 | | | | 3,810 | |
Utah Housing, Ser B, RB, AMT | | | | | | | | |
0.030%, 10/07/15(A) (B) | | | 3,380 | | | | 3,380 | |
Utah Housing, Ser G-2, RB, AMT | | | | | | | | |
0.080%, 10/07/15(A) (B) | | | 4,300 | | | | 4,300 | |
| | | | | | | | | |
Total Utah | | | | 11,490 | |
| | | | | | | | | |
Virginia [0.1%] | |
King George County, Industrial Development Authority, Ser A, RB | | | | | | | | |
0.020%, 10/01/15 | | | 500 | | | | 500 | |
| | | | | | | | | |
Washington [2.4%] | |
JPMorgan Chase Putters, Ser 5002, RB | | | | | | | | |
0.020%, 10/01/15(B) (D) | | | 9,195 | | | | 9,195 | |
Washington State, Health Care Facilities Authority, Ser D-R, RB | | | | | | | | |
0.010%, 10/01/15(A) (B) (C) | | | 6,180 | | | | 6,180 | |
Washington State, Housing Finance Commission, Eagles Lending Apartments Project, Ser A, RB, FNMA, AMT | | | | | | | | |
0.040%, 10/01/15(A) (B) | | | 6,065 | | | | 6,065 | |
| | | | | | | | | |
Total Washington | | | | 21,440 | |
| | | | | | | | | |
Wyoming [1.0%] | |
Wyoming Community Development Authority, Ser 11, RB, AMT | | | | | | | | |
0.060%, 10/01/15(A) (B) | | | 6,000 | | | | 6,000 | |
Wyoming Community Development Authority, Ser 6, RB, AMT | | | | | | | | |
0.060%, 10/01/15(A) (B) | | | 3,000 | | | | 3,000 | |
| | | | | | | | | |
Total Wyoming | | | | 9,000 | |
| | | | | | | | | |
Total Municipal Bonds | |
(Cost $751,820) | | | | 751,820 | |
| | | | | | | | | |
Commercial Paper [10.4%] | |
California [10.4%] | |
California State, Educational Facilities Authority | | | | | | | | |
0.200%, 03/30/16 | | | 25,000 | | | | 25,000 | |
California State, Health Facilities Financing Authority, Stanford Hospital Project, Ser B-2, RB | | | | | | | | |
0.140%, 12/03/15 | | | 18,550 | | | | 18,550 | |
California State, University, Ser A, RB | | | | | | | | |
0.090%, 10/05/15 | | | 16,035 | | | | 16,035 | |
San Diego County, Water Authority | | | | | | | | |
0.010%, 10/05/15 | | | 15,000 | | | | 15,000 | |
San Francisco City & County, Public Utilities Commission, Ser A-6 | | | | | | | | |
0.030%, 10/19/15 | | | 15,000 | | | | 15,000 | |
San Francisco, Public Utilities Commission Water Revenue | | | | | | | | |
0.040%, 12/09/15 | | | 2,000 | | | | 2,000 | |
| | | | | | | | | |
Total California | | | | 91,585 | |
| | | | | | | | | |
Total Commercial Paper | |
(Cost $91,585) | | | | 91,585 | |
| | | | | | | | | |
Total Investments [95.8%] | |
(Cost $843,405) | | | $ | 843,405 | |
Percentages are based on Net Assets of $880,539 (000).
See accompanying notes to financial statements.
CITY NATIONAL ROCHDALE FUNDS | PAGE 34
schedule of investments |
September 30, 2015 |
City National Rochdale California Tax Exempt Money Market Fund (concluded) |
(A) | Put and Demand Feature — The date reported is the next reset or put date. |
(B) | Floating Rate Security — The rate reported is the rate in effect on September 30, 2015. |
(C) | Securities are held in conjunction with a letter of credit from a major bank or financial institution. |
(D) | Security exempt from registration under Rule 144A of the Securities Act of 1933. These securities may be resold in transactions exempt from registration normally to qualified institutions. On September 30, 2015, the value of these securities amounted to $89,665 (000), representing 10.2% of the net assets of the Fund. |
(E) | Pre-Refunded Security — The maturity date shown is the pre-refunded date. |
(F) | Zero coupon security. The rate reported is the effective yield at time of purchase. |
(G) | Represents an investment in a tender option bond residual interest certificate purchased in a secondary market transaction. The interest rate shown bears an inverse relationship to the interest rate on a tender option bond floating rate certificate. The interest rate disclosed reflects the rate in effect on September 30, 2015. |
AGM — Assured Guarantee Municipal
AMBAC — American Municipal Bond Assurance Company
AMT — Alternative Minimum Tax (subject to)
COP — Certificate of Participation
ETM — Escrowed to Maturity
FGIC — Financial Guaranty Insurance Company
FNMA — Federal National Mortgage Association
GNMA — Government National Mortgage Association
GO — General Obligation
NATL — National Public Finance Guarantee Corporation
RB — Revenue Bond
SAB — Special Assessment Board
Ser — Series
SPL Tax — Special Tax
TRAN — Tax and Revenue Anticipation Note
XLCA — XL Capital Assurance Inc.
As of September 30, 2015, all of the Fund’s investments are Level 2 in accordance with authoritative guidance on fair value measurements and disclosure under U.S. GAAP.
For the year ended September 30, 2015, there have been no transfers between any of the fair value hierarchy levels. Transfers between Levels are recognized at period end.
For more information on valuation inputs, see Note 2 — Significant Accounting Policies in the Notes to Financial Statements.
See accompanying notes to financial statements.
CITY NATIONAL ROCHDALE FUNDS | PAGE 35
schedule of investments |
September 30, 2015 |
City National Rochdale Government Bond Fund |
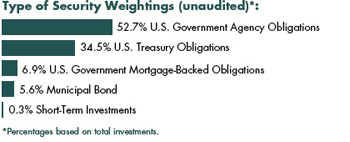
Description | | Face Amount (000) | | | Value (000) | |
U.S. Government Agency Obligations [52.8%] | |
FFCB | | | | | | |
0.295%, 01/26/15(A) | | $ | 5,000 | | | $ | 5,007 | |
FFCB | | | | | | | | |
0.290%, 01/21/16 | | | 5,250 | | | | 5,252 | |
FHLB | | | | | | | | |
1.150%, 07/25/18 | | | 1,520 | | | | 1,520 | |
FHLMC, MTN | | | | | | | | |
1.500%, 01/30/16(B) | | | 5,000 | | | | 5,002 | |
1.250%, 05/12/17 | | | 2,350 | | | | 2,375 | |
1.000%, 09/29/17 | | | 4,130 | | | | 4,155 | |
FNMA | | | | | | | | |
5.000%, 02/13/17 | | | 5,200 | | | | 5,515 | |
4.875%, 12/15/16 | | | 5,000 | | | | 5,283 | |
2.430%, 10/09/19(B) | | | 5,805 | | | | 5,391 | |
1.875%, 02/19/19 | | | 445 | | | | 455 | |
1.750%, 06/20/19 | | | 4,525 | | | | 4,614 | |
1.625%, 11/27/18 | | | 5,000 | | | | 5,089 | |
1.625%, 01/21/20 | | | 5,000 | | | | 5,052 | |
1.000%, 10/16/17 | | | 6,000 | | | | 6,001 | |
0.875%, 02/08/18 | | | 5,500 | | | | 5,508 | |
0.875%, 05/21/18 | | | 4,500 | | | | 4,498 | |
Tennessee Valley Authority, Ser E | | | | | | | | |
6.250%, 12/15/17 | | | 8,000 | | | | 8,930 | |
| | | | | | | | | |
Total U.S. Government Agency Obligations | | | | | | | | |
(Cost $78,932) | | | | 79,647 | |
| | | | | | | | | |
U.S. Treasury Obligations [34.6%] | |
U.S. Treasury Bonds | | | | | | | | |
2.195%, 11/15/21(B) | | | 6,100 | | | | 5,505 | |
U.S. Treasury Notes | | | | | | | | |
3.250%, 03/31/17 | | | 2,000 | | | | 2,082 | |
3.000%, 02/28/17 | | | 2,415 | | | | 2,500 | |
2.875%, 03/31/18 | | | 5,000 | | | | 5,256 | |
2.750%, 02/28/18 | | | 5,000 | | | | 5,235 | |
2.000%, 11/30/20 | | | 5,000 | | | | 5,136 | |
1.750%, 10/31/18 | | | 3,500 | | | | 3,584 | |
1.500%, 12/31/18 | | | 4,550 | | | | 4,620 | |
1.375%, 06/30/18 | | | 3,400 | | | | 3,446 | |
1.375%, 09/30/18 | | | 5,000 | | | | 5,065 | |
1.375%, 04/30/20 | | | 5,000 | | | | 5,014 | |
1.125%, 12/31/19 | | | 4,700 | | | | 4,673 | |
| | | | | | | | | |
Total U.S. Treasury Obligations | |
(Cost $51,473) | | | | 52,116 | |
| | | | | | | | | |
Municipal Bond [5.6%] | |
Illinois [5.6%] | |
Illinois Municipal Electric Agency, Ser A, NATL | | | | | | | | |
Pre-Refunded @ 100 | | | | | | | | |
5.125%, 02/01/17(C) | | | 8,000 | | | | 8,490 | |
| | | | | | | | | |
Total Municipal Bond | |
(Cost $8,469) | | | | 8,490 | |
| | | | | | | | | |
U.S. Government Mortgage-Backed Obligations [6.9%] | |
FHLMC REMIC, Ser 2011-3877, Cl ND, | | | | | | | | |
3.000%, 02/15/25 | | | 1,012 | | | | 1,038 | |
FNMA, Pool FN0004 | | | | | | | | |
3.619%, 12/01/20 | | | 4,963 | | | | 5,347 | |
FNMA, Ser 2010-123, Cl HA, | | | | | | | | |
2.500%, 03/25/24 | | | 3,289 | | | | 3,357 | |
FNMA ARM, Pool 766620 | | | | | | | | |
2.289%, 01/01/15(A) | | | 144 | | | | 154 | |
FNMA REMIC, Ser 2011-144, Cl CE, | | | | | | | | |
1.250%, 06/25/35 | | | 269 | | | | 269 | |
GNMA, Pool 329656 | | | | | | | | |
8.000%, 08/15/22 | | | 4 | | | | 4 | |
GNMA, Pool 376533 | | | | | | | | |
7.500%, 06/15/24 | | | 1 | | | | 1 | |
GNMA, Pool 398660 | | | | | | | | |
7.500%, 05/15/26 | | | 2 | | | | 2 | |
GNMA, Pool 497411 | | | | | | | | |
6.000%, 01/15/29 | | | 4 | | | | 5 | |
GNMA, Pool 571376 | | | | | | | | |
7.000%, 12/15/16 | | | 1 | | | | 1 | |
GNMA, Pool 584992 | | | | | | | | |
7.500%, 04/15/32 | | | 27 | | | | 30 | |
GNMA ARM, Pool G2 81318 | | | | | | | | |
1.750%, 01/01/15(A) | | | 222 | | | | 229 | |
GNMA ARM, Pool G2 81447 | | | | | | | | |
1.625%, 01/01/15(A) | | | 47 | | | | 49 | |
| | | | | | | | | |
Total U.S. Government Mortgage-Backed Obligations | | | | | |
(Cost $10,417) | | | | 10,486 | |
See accompanying notes to financial statements.
CITY NATIONAL ROCHDALE FUNDS | PAGE 36
schedule of investments |
September 30, 2015 |
City National Rochdale Government Bond Fund (concluded) |
Description | | Shares | | | Value (000) | |
Short-Term Investments [0.3%] | |
City National Rochdale Government Money Market Fund, Institutional Class, 0.010%**‡ | | | 199,557 | | | $ | 199 | |
SEI Daily Income Trust Government Fund, Cl A, 0.030%** | | | 199,542 | | | | 199 | |
| | | | | | | | | |
Total Short-Term Investments | |
(Cost $398) | | | | 398 | |
| | | | | | | | | |
Total Investments [100.2%] | |
(Cost $149,689) | | | | 151,137 | |
Percentages are based on Net Assets of $150,820 (000).
** | The rate reported is the 7-day effective yield as of September 30, 2015. |
‡ | Investment in Affiliate. |
(A) | Floating Rate Security — The rate reported is the rate in effect on September 30, 2015. |
(B) | Zero coupon security. The rate reported is the effective yield at time of purchase. |
(C) | Pre-Refunded Security — The maturity date shown is the pre-refunded date. |
ARM — Adjustable Rate Mortgage
Cl — Class
FFCB — Federal Farm Credit Bank
FHLB — Federal Home Loan Bank
FHLMC — Federal Home Loan Mortgage Corporation
FNMA — Federal National Mortgage Association
GNMA — Government National Mortgage Association
MTN — Medium Term Note
NATL — National Public Finance Guarantee Corporation
REMIC — Real Estate Mortgage Investment Conduit
Ser — Series
The following is a list of the inputs used as of September 30, 2015 in valuing the Fund’s investments carried at value (000):
Investments in Securities | | Level 1 | | | Level 2 | | | Level 3 | | | Total | |
U.S. Government Agency Obligations | | $ | — | | | $ | 79,647 | | | $ | — | | | $ | 79,647 | |
U.S. Treasury Obligations | | | — | | | | 52,116 | | | | — | | | | 52,116 | |
Municipal Bond | | | | | | | 8,490 | | | | — | | | | 8,490 | |
U.S. Government Mortgage-Backed Obligations | | | — | | | | 10,486 | | | | — | | | | 10,486 | |
Short-Term Investments | | | 398 | | | | — | | | | — | | | | 398 | |
Total Investments in Securities | | $ | 398 | | | $ | 150,739 | | | $ | — | | | $ | 151,137 | |
For the period ended September 30, 2015, there have been no transfers between any of the fair value hierarchy levels. Transfers between Levels are recognized at period end.
For more information on valuation inputs, see Note 2 — Significant Accounting Policies in the Notes to Financial Statements.
See accompanying notes to financial statements.
CITY NATIONAL ROCHDALE FUNDS | PAGE 37
schedule of investments |
September 30, 2015 |
City National Rochdale Corporate Bond Fund |
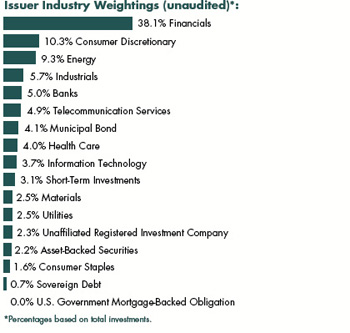
Description | | Face Amount (000) | | | Value (000) | |
Corporate Bonds [89.6%] | |
Auto-Med and Heavy Duty Trks [0.7%] | |
PACCAR Financial, MTN | | | | | | |
1.750%, 08/14/18 | | $ | 1,000 | | | $ | 1,005 | |
| | | | | | | | | |
Banks [14.1%] | |
Bank of America, MTN | | | | | | | | |
6.400%, 08/28/17 | | | 400 | | | | 434 | |
Barclays Bank, MTN | | | | | | | | |
0.254%, 01/10/14(A) | | | 1,950 | | | | 1,923 | |
Capital One | | | | | | | | |
2.350%, 08/17/18 | | | 500 | | | | 501 | |
Citigroup | | | | | | | | |
5.500%, 02/15/17 | | | 1,250 | | | | 1,316 | |
Fifth Third Bank | | | | | | | | |
1.150%, 11/18/16 | | | 3,060 | | | | 3,061 | |
JPMorgan Chase | | | | | | | | |
6.300%, 04/23/19 | | | 2,000 | | | | 2,274 | |
6.000%, 01/15/18 | | | 405 | | | | 443 | |
National Australia Bank, MTN | | | | | | | | |
2.750%, 03/09/17 | | | 480 | | | | 492 | |
Nordea Bank | | | | | | | | |
2.375%, 04/04/19(B) | | | 1,000 | | | | 1,012 | |
Standard Chartered, MTN | | | | | | | | |
1.700%, 04/17/18(B) | | | 3,000 | | | | 2,978 | |
UBS, MTN | | | | | | | | |
5.875%, 12/20/17 | | | 2,000 | | | | 2,178 | |
Wells Fargo Bank | | | | | | | | |
5.750%, 05/16/16 | | | 2,400 | | | | 2,475 | |
| | | | | | | | | |
Total Banks | | | | 19,087 | |
| | | | | | | | | |
Broadcasting & Cable [1.1%] | |
CBS | | | | | | | | |
4.300%, 02/15/21 | | | 1,400 | | | | 1,489 | |
| | | | | | | | | |
Computer System Design & Services [2.2%] | |
Hewlett Packard Enterprise | | | | | | | | |
2.060%, 10/05/17(A) (B) | | | 3,000 | | | | 3,000 | |
| | | | | | | | | |
Computers-Memory Devices [0.7%] | |
NetApp | | | | | | | | |
2.000%, 12/15/17 | | | 1,000 | | | | 1,001 | |
| | | | | | | | | |
Diagnostic Equipment [0.5%] | |
Danaher | | | | | | | | |
1.650%, 09/15/18 | | | 700 | | | | 704 | |
| | | | | | | | | |
Diversified Minerals [1.5%] | |
BHP Billiton | | | | | | | | |
5.250%, 12/15/15 | | | 27 | | | | 27 | |
Teck Resources | | | | | | | | |
3.150%, 01/15/17 | | | 1,250 | | | | 1,177 | |
2.500%, 02/01/18 | | | 1,000 | | | | 809 | |
| | | | | | | | | |
Total Diversified Minerals | | | | 2,013 | |
| | | | | | | | | |
Diversified Operations [2.6%] | |
Glencore Funding | | | | | | | | |
1.700%, 05/27/16(B) | | | 1,500 | | | | 1,425 | |
Siemens Finc | | | | | | | | |
5.750%, 10/17/16(B) | | | 2,000 | | | | 2,097 | |
| | | | | | | | | |
Total Diversified Operations | | | | 3,522 | |
| | | | | | | | | |
Drugs [1.9%] | |
AbbVie | | | | | | | | |
2.500%, 05/14/20 | | | 1,000 | | | | 995 | |
Wyeth | | | | | | | | |
5.500%, 02/15/16 | | | 1,500 | | | | 1,527 | |
| | | | | | | | | |
Total Drugs | | | | 2,522 | |
| | | | | | | | | |
Electric Utilities [2.5%] | |
American Electric Power | | | | | | | | |
1.650%, 12/15/17 | | | 1,000 | | | | 997 | |
Commonwealth Edison | | | | | | | | |
6.950%, 07/15/18 | | | 1,000 | | | | 1,121 | |
See accompanying notes to financial statements.
CITY NATIONAL ROCHDALE FUNDS | PAGE 38
schedule of investments |
September 30, 2015 |
City National Rochdale Corporate Bond Fund (continued) |
Description | | Face Amount (000) | | | Value (000) | |
Exelon Generation | | | | | | |
6.200%, 10/01/17 | | $ | 1,200 | | | $ | 1,302 | |
| | | | | | | | | |
Total Electric Utilities | | | | 3,420 | |
| | | | | | | | | |
Financial Services [17.6%] | |
American Honda Finance | | | | | | | | |
1.600%, 02/16/18(B) | | | 1,900 | | | | 1,903 | |
Countrywide Financial | | | | | | | | |
6.250%, 05/15/16 | | | 1,200 | | | | 1,234 | |
Daimler Finance North America | | | | | | | | |
2.250%, 07/31/19(B) | | | 2,900 | | | | 2,823 | |
Ford Motor Credit | | | | | | | | |
8.000%, 12/15/16 | | | 1,000 | | | | 1,075 | |
2.375%, 01/16/18 | | | 1,000 | | | | 1,001 | |
General Electric Capital, MTN | | | | | | | | |
5.300%, 02/11/21 | | | 2,500 | | | | 2,875 | |
Harley Davidson Funding | | | | | | | | |
6.800%, 06/15/18(B) | | | 2,500 | | | | 2,827 | |
Harley-Davidson Financial Services, MTN | | | | | | | | |
3.875%, 03/15/16(B) | | | 1,000 | | | | 1,013 | |
Nissan Motor Acceptance, MTN | | | | | | | | |
1.950%, 09/12/17(B) | | | 1,000 | | | | 1,012 | |
Toyota Motor Credit, MTN | | | | | | | | |
2.050%, 01/12/17 | | | 4,000 | | | | 4,059 | |
VW Credit, MTN | | | | | | | | |
1.875%, 10/13/16 | | | 3,000 | | | | 2,960 | |
Western Union | | | | | | | | |
5.930%, 10/01/16 | | | 1,000 | | | | 1,044 | |
| | | | | | | | | |
Total Financial Services | | | | 23,826 | |
| | | | | | | | | |
Food, Beverage & Tobacco [0.7%] | |
Kraft Heinz Foods | | | | | | | | |
2.000%, 07/02/18(B) | | | 1,000 | | | | 1,001 | |
| | | | | | | | | |
Food-Confectionery [0.2%] | |
JM Smucker | | | | | | | | |
2.500%, 03/15/20(B) | | | 250 | | | | 251 | |
| | | | | | | | | |
Home Decoration Products [0.7%] | |
Newell Rubbermaid | | | | | | | | |
2.875%, 12/01/19 | | | 1,000 | | | | 1,009 | |
| | | | | | | | | |
Insurance [4.5%] | |
Berkshire Hathaway | | | | | | | | |
2.100%, 08/14/19 | | | 2,000 | | | | 2,035 | |
Genworth Financial | | | | | | | | |
7.700%, 06/15/20 | | | 1,400 | | | | 1,414 | |
Metropolitan Life Global Funding I, MTN | | | | | | | | |
1.875%, 06/22/18(B) | | | 2,700 | | | | 2,718 | |
| | | | | | | | | |
Total Insurance | | | | 6,167 | |
| | | | | | | | | |
Investment Banker/Broker Dealer [8.4%] | |
Deutsche Bank | | | | | | | | |
1.400%, 02/13/17 | | | 2,500 | | | | 2,495 | |
Goldman Sachs Group | | | | | | | | |
5.625%, 01/15/17 | | | 1,700 | | | | 1,785 | |
2.625%, 01/31/19 | | | 500 | | | | 506 | |
Jefferies Group | | | | | | | | |
8.500%, 07/15/19 | | | 1,530 | | | | 1,812 | |
Macquarie Group | | | | | | | | |
6.000%, 01/14/20(B) | | | 2,000 | | | | 2,244 | |
Morgan Stanley | | | | | | | | |
3.750%, 02/25/23 | | | 2,000 | | | | 2,049 | |
Morgan Stanley, MTN | | | | | | | | |
5.950%, 12/28/17 | | | 465 | | | | 507 | |
| | | | | | | | | |
Total Investment Banker/Broker Dealer | | | | 11,398 | |
| | | | | | | | | |
Medical Labs and Testing Srv [1.1%] | |
Laboratory Corp of America Holdings | | | | | | | | |
2.625%, 02/01/20 | | | 1,500 | | | | 1,504 | |
| | | | | | | | | |
Medical-HMO [1.1%] | |
UnitedHealth Group | | | | | | | | |
1.625%, 03/15/19 | | | 1,500 | | | | 1,490 | |
| | | | | | | | | |
Petroleum & Fuel Products [10.1%] | |
BP Capital Markets | | | | | | | | |
1.375%, 05/10/18 | | | 2,800 | | | | 2,780 | |
Freeport-McMoran Oil & Gas | | | | | | | | |
6.125%, 06/15/19 | | | 1,300 | | | | 1,209 | |
Kinder Morgan Energy Partners | | | | | | | | |
6.000%, 02/01/17 | | | 1,000 | | | | 1,046 | |
Korea National Oil | | | | | | | | |
2.875%, 11/09/15(B) | | | 1,000 | | | | 1,002 | |
Korea National Oil, MTN | | | | | | | | |
2.750%, 01/23/19(B) | | | 1,500 | | | | 1,520 | |
Sunoco Logistics Partners Operations | | | | | | | | |
4.650%, 02/15/22 | | | 1,300 | | | | 1,271 | |
Total Capital International | | | | | | | | |
2.875%, 02/17/22 | | | 4,000 | | | | 3,986 | |
Transocean | | | | | | | | |
6.500%, 11/15/20 | | | 1,250 | | | | 956 | |
| | | | | | | | | |
Total Petroleum & Fuel Products | | | | 13,770 | |
See accompanying notes to financial statements.
CITY NATIONAL ROCHDALE FUNDS | PAGE 39
schedule of investments |
September 30, 2015 |
City National Rochdale Corporate Bond Fund (continued) |
Description | | Face Amount (000) | | | Value (000) | |
Real Estate Investment Trusts [5.0%] | |
American Tower | | | | | | |
7.250%, 05/15/19 | | $ | 1,200 | | | $ | 1,387 | |
HCP | | | | | | | | |
5.625%, 05/01/17 | | | 1,000 | | | | 1,061 | |
Kimco Realty | | | | | | | | |
6.875%, 10/01/19 | | | 1,080 | | | | 1,262 | |
Simon Property Group | | | | | | | | |
2.500%, 09/01/20 | | | 2,000 | | | | 2,020 | |
Welltower | | | | | | | | |
4.700%, 09/15/17 | | | 1,000 | | | | 1,054 | |
| | | | | | | | | |
Total Real Estate Investment Trusts | | | | 6,784 | |
| | | | | | | | | |
Regional Authority [1.6%] | |
Province of Ontario Canada | | | | | | | | |
4.400%, 04/14/20 | | | 2,000 | | | | 2,229 | |
| | | | | | | | | |
Retail [4.3%] | |
AutoZone | | | | | | | | |
4.000%, 11/15/20 | | | 1,400 | | | | 1,487 | |
CVS Health | | | | | | | | |
2.800%, 07/20/20 | | | 1,000 | | | | 1,016 | |
Lowe’s | | | | | | | | |
6.100%, 09/15/17 | | | 3,000 | | | | 3,280 | |
| | | | | | | | | |
Total Retail | | | | 5,783 | |
| | | | | | | | | |
Telephones & Telecommunications [5.0%] | |
America Movil | | | | | | | | |
5.000%, 03/30/20 | | | 2,600 | | | | 2,840 | |
AT&T | | | | | | | | |
3.000%, 06/30/22 | | | 3,000 | | | | 2,927 | |
Telefonica Emisiones SAU | | | | | | | | |
6.421%, 06/20/16 | | | 1,000 | | | | 1,036 | |
| | | | | | | | | |
Total Telephones & Telecommunications | | | | 6,803 | |
| | | | | | | | | |
Trucking & Leasing [1.5%] | |
Penske Truck Leasing | | | | | | | | |
4.875%, 07/11/22(B) | | | 1,100 | | | | 1,169 | |
3.750%, 05/11/17(B) | | | 750 | | | | 772 | |
| | | | | | | | | |
Total Trucking & Leasing | | | | 1,941 | |
| | | | | | | | | |
Total Corporate Bonds | |
(Cost $121,958) | | | | 121,719 | |
Description | | Face Amount (000)/Shares | | | Value (000) | |
Municipal Bonds [4.2%] | |
California [1.1%] | |
State of California | | | | | | |
6.200%, 03/01/19 | | $ | 1,300 | | | $ | 1,493 | |
| | | | | | | | | |
Florida [3.1%] | |
Florida State, Hurricane Catastrophe Fund Finance, Ser A, RB | | | | | | | | |
2.107%, 07/01/18 | | | 4,130 | | | | 4,167 | |
| | | | | | | | | |
Total Municipal Bonds | |
(Cost $5,602) | | | | 5,660 | |
| | | | | | | | | |
Closed-End Fund [2.3%] | |
Stone Ridge Reinsurance Risk Premium Interval Fund(C) | | | 294,118 | | | | 3,120 | |
| | | | | | | | | |
Total Closed-End Fund | |
(Cost $3,000) | | | | 3,120 | |
| | | | | | | | | |
Asset-Backed Security [2.2%] | |
Nissan Auto Lease Trust 2015-A, Ser 2015-A, Cl A3 | | | | | | | | |
1.400%, 06/15/18 | | | 3,000 | | | | 3,016 | |
| | | | | | | | | |
Total Asset-Backed Security | |
(Cost $2,999) | | | | 3,016 | |
| | | | | | | | | |
U.S. Government Mortgage-Backed Obligation [0.0%] | |
FNMA REMIC, Ser 2002-56, Cl MC | | | | | | | | |
5.500%, 09/25/17 | | | 28 | | | | 29 | |
| | | | | | | | | |
Total U.S. Government Mortgage-Backed Obligation | | | | | |
(Cost $28) | | | | 29 | |
| | | | | | | | | |
Short-Term Investments [3.2%] | |
City National Rochdale Prime Money Market Fund, Institutional Class, 0.010%**† | | | 2,142,809 | | | | 2,143 | |
SEI Daily Income Trust, Prime Obligation Fund, Cl A, 0.030%** | | | 2,142,809 | | | | 2,143 | |
| | | | | | | | | |
Total Short-Term Investments | |
(Cost $4,286) | | | | 4,286 | |
| | | | | | | | | |
Total Investments [101.5%] | |
(Cost $137,873) | | | $ | 137,830 | |
See accompanying notes to financial statements.
CITY NATIONAL ROCHDALE FUNDS | PAGE 40
schedule of investments |
September 30, 2015 |
City National Rochdale Corporate Bond Fund (concluded) |
Percentages are based on Net Assets of $135,805 (000).
** | The rate reported is the 7-day effective yield as of September 30, 2015. |
‡ | Investment in Affiliate. |
(A) | Floating Rate Security — The rate reported is the rate in effect on September 30, 2015. |
(B) | Security exempt from registration under Rule 144A of the Securities Act of 1933. These securities may be resold in transactions exempt from registration normally to qualified institutions. On September 30, 2015, the value of these securities amounted to $30,767 (000), representing 22.7% of the net assets of the Fund. |
(C) | Security is considered illiquid. The total value of such security as of September 30, 2015, was $3,120 (000) and represented 2.3% of the net assets of the Fund. |
Cl — Class
FNMA — Federal National Mortgage Association
MTN — Medium Term Note
RB — Revenue Bond
REMIC — Real Estate Mortgage Investment Conduit
Ser — Series
The following is a list of the inputs used as of September 30, 2015 in valuing the Fund’s investments carried at value (000):
Investments in Securities | | Level 1 | | | Level 2 | | | Level 3 | | | Total | |
Corporate Bonds | | $ | — | | | $ | 121,719 | | | $ | — | | | $ | 121,719 | |
Municipal Bonds | | | — | | | | 5,660 | | | | — | | | | 5,660 | |
Closed-End Fund | | | 3,120 | | | | — | | | | — | | | | 3,120 | |
Asset-Backed Security | | | — | | | | 3,016 | | | | — | | | | 3,016 | |
U.S. Government Mortgage-Backed Obligation | | | — | | | | 29 | | | | — | | | | 29 | |
Short-Term Investments | | | 4,286 | | | | — | | | | — | | | | 4,286 | |
Total Investments in Securities | | $ | 7,406 | | | $ | 130,424 | | | $ | — | | | $ | 137,830 | |
For the period ended September 30, 2015, there have been no transfers between any of the fair value hierarchy levels. Transfers between Levels are recognized at period end.
For more information on valuation inputs, see Note 2 — Significant Accounting Policies in the Notes to Financial Statements.
See accompanying notes to financial statements.
CITY NATIONAL ROCHDALE FUNDS | PAGE 41
schedule of investments |
September 30, 2015 |
City National Rochdale California Tax Exempt Bond Fund |
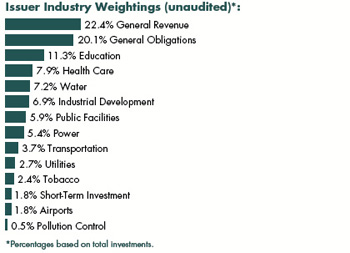
Description | | Face Amount (000) | | | Value (000) | |
Municipal Bonds [97.1%] | |
California [94.5%] | |
Abag, Finance Authority for Nonprofit, Sharp Healthcare, Ser A, RB | | | | | | |
Callable 08/01/21 @ 100 | | | | | | |
6.000%, 08/01/30 | | $ | 1,000 | | | $ | 1,216 | |
Bay Area Toll Authority, Ser C, RB | | | | | | | | |
Callable 10/01/18 @ 100 | | | | | | | | |
1.875%, 04/01/47(A) | | | 1,200 | | | | 1,221 | |
Bay Area Toll Authority, Ser D, RB | | | | | | | | |
Callable 10/01/19 @ 100 | | | | | | | | |
1.875%, 04/01/34(A) | | | 750 | | | | 763 | |
Beverly Hills, Community Facilities District, Ser 2002-A, SPL Tax | | | | | | | | |
4.000%, 09/01/22 | | | 250 | | | | 272 | |
Brea, Redevelopment Agency Successor, Redevelopment Project AB, SPL Tax | | | | | | | | |
Callable 08/01/23 @ 100 | | | | | | | | |
5.000%, 08/01/25 | | | 500 | | | | 595 | |
Brea, Redevelopment Agency Successor, Redevelopment Project AB, TA | | | | | | | | |
5.000%, 08/01/20 | | | 500 | | | | 580 | |
California State, Department of Water Resources, Ser F-3, RB | | | | | | | | |
Callable 05/01/18 @ 100 | | | | | | | | |
4.375%, 05/01/20 | | | 200 | | | | 218 | |
California State, Educational Facilities Authority, Chapman University, RB | | | | | | | | |
Callable 04/01/25 @ 100 | | | | | | | | |
5.000%, 04/01/26 | | | 100 | | | | 119 | |
California State, Educational Facilities Authority, Chapman University, RB | | | | | | | | |
Callable 04/01/25 @ 100 | | | | | | | | |
5.000%, 04/01/27 | | | 100 | | | | 118 | |
California State, GO | | | | | | | | |
4.000%, 02/01/18 | | | 1,000 | | | | 1,076 | |
California State, GO | | | | | | | | |
4.000%, 03/01/18 | | | 1,000 | | | | 1,079 | |
California State, GO | | | | | | | | |
3.000%, 03/01/18 | | | 1,000 | | | | 1,055 | |
California State, GO | | | | | | | | |
4.000%, 02/01/19 | | | 1,000 | | | | 1,101 | |
California State, GO | | | | | | | | |
5.000%, 11/01/19 | | | 1,000 | | | | 1,155 | |
California State, GO | | | | | | | | |
5.000%, 09/01/20 | | | 1,000 | | | | 1,174 | |
California State, GO | | | | | | | | |
5.000%, 09/01/21 | | | 1,200 | | | | 1,434 | |
California State, GO | | | | | | | | |
5.000%, 12/01/21 | | | 1,000 | | | | 1,201 | |
California State, GO | | | | | | | | |
5.250%, 09/01/22 | | | 1,000 | | | | 1,223 | |
California State, GO | | | | | | | | |
Callable 11/01/20 @ 100 | | | | | | | | |
5.000%, 11/01/22 | | | 1,025 | | | | 1,195 | |
California State, GO | | | | | | | | |
Callable 12/01/23 @ 100 | | | | | | | | |
5.000%, 12/01/26 | | | 1,000 | | | | 1,207 | |
California State, GO | | | | | | | | |
Callable 11/01/23 @ 100 | | | | | | | | |
5.000%, 11/01/27 | | | 500 | | | | 598 | |
California State, GO | | | | | | | | |
Callable 06/01/19 @ 100 | | | | | | | | |
3.000%, 12/01/32(A) | | | 1,000 | | | | 1,067 | |
California State, GO | | | | | | | | |
Callable 04/01/18 @ 100 | | | | | | | | |
5.125%, 04/01/33 | | | 1,050 | | | | 1,142 | |
California State, Health Facilities Financing Authority, Catholic Healthcare, Ser A, RB | | | | | | | | |
Callable 03/01/21 @ 100 | | | | | | | | |
5.250%, 03/01/22 | | | 265 | | | | 311 | |
See accompanying notes to financial statements.
CITY NATIONAL ROCHDALE FUNDS | PAGE 42
schedule of investments |
September 30, 2015 |
City National Rochdale California Tax Exempt Bond Fund (continued) |
Description | | Face Amount (000) | | | Value (000) | |
California State, Health Facilities Financing Authority, Cedars-Sinai Medical Center, RB | | | | | | |
5.000%, 08/15/17 | | $ | 750 | | | $ | 813 | |
California State, Health Facilities Financing Authority, City of Hope, Ser A, RB | | | | | | | | |
5.000%, 11/15/17 | | | 375 | | | | 408 | |
California State, Health Facilities Financing Authority, Insured Marshall Medical Center, RB, CA MTG INS | | | | | | | | |
Callable 11/01/24 @ 100 | | | | | | | | |
5.000%, 11/01/29 | | | 250 | | | | 292 | |
California State, Health Facilities Financing Authority, Memorial Health Services Corp, Ser A, RB | | | | | | | | |
5.000%, 10/01/15 | | | 450 | | | | 450 | |
California State, Health Facilities Financing Authority, St. Joseph Health System, Ser B, RB | | | | | | | | |
5.000%, 07/01/43(A) | | | 875 | | | | 950 | |
California State, Health Facilities Financing Authority, St. Joseph Health System, Ser D, RB | | | | | | | | |
5.000%, 07/01/43(A) | | | 975 | | | | 1,141 | |
California State, Health Facilities Financing Authority, Sutter Health, Ser A, RB | | | | | | | | |
5.500%, 08/15/17 | | | 500 | | | | 545 | |
California State, Health Facilities Financing Authority, Sutter Health, Ser A, RB | | | | | | | | |
5.500%, 08/15/18 | | | 125 | | | | 142 | |
California State, Public Works Board, Department of Corrections and Rehab Project, Ser A, RB | | | | | | | | |
4.000%, 09/01/17 | | | 500 | | | | 532 | |
California State, Public Works Board, Department of Corrections and Rehab Project, Ser A, RB | | | | | | | | |
5.000%, 09/01/22 | | | 1,000 | | | | 1,198 | |
California State, Public Works Board, Department of Corrections-State Prisons, Ser A, RB, AMBAC | | | | | | | | |
5.000%, 12/01/19 | | | 755 | | | | 828 | |
California State, Public Works Board, Judicial Council, Ser B, RB | | | | | | | | |
5.000%, 10/01/23 | | | 475 | | | | 575 | |
California State, Public Works Board, State Prisons, Ser C, RB | | | | | | | | |
5.000%, 10/01/16 | | | 1,000 | | | | 1,046 | |
California State, Public Works Board, Various Capital Projects, Ser A, RB | | | | | | | | |
4.000%, 04/01/17 | | | 500 | | | | 526 | |
California State, Public Works Board, Various Capital Projects, Ser G-1, RB | | | | | | | | |
Callable 10/01/19 @ 100 | | | | | | | | |
5.250%, 10/01/23 | | | 250 | | | | 287 | |
California State, Ser E, GO | | | | | | | | |
Callable 06/01/18 @ 100 | | | | | | | | |
0.965%, 12/01/29(A) | | | 1,000 | | | | 1,013 | |
California Statewide, Communities Development Authority, Cottage Health System, RB | | | | | | | | |
Callable 11/01/24 @ 100 | | | | | | | | |
5.000%, 11/01/25 | | | 350 | | | | 421 | |
California Statewide, Communities Development Authority, RB | | | | | | | | |
1.375%, 04/01/28(A) | | | 500 | | | | 502 | |
California Statewide, Communities Development Authority, Kaiser Permanente, Ser A, RB | | | | | | | | |
5.000%, 04/01/19 | | | 1,200 | | | | 1,364 | |
California Statewide, Communities Development Authority, Kaiser Permanente, Ser B, RB | | | | | | | | |
Callable 02/01/17 @ 100 | | | | | | | | |
0.970%, 04/01/52(A) | | | 2,000 | | | | 2,006 | |
California Statewide, Communities Development Authority, Sutter Health, Ser A, RB | | | | | | | | |
5.000%, 08/15/18 | | | 200 | | | | 224 | |
Carlsbad, Public Financing Authority, Municipal Golf Course Project, Ser A, RB, AMBAC | | | | | | | | |
4.500%, 09/01/16 | | | 350 | | | | 364 | |
Chula Vista, Elementary School District, School Building Project, Ser A, COP, AGM | | | | | | | | |
5.000%, 09/01/22 | | | 1,000 | | | | 1,181 | |
See accompanying notes to financial statements.
CITY NATIONAL ROCHDALE FUNDS | PAGE 43
schedule of investments |
September 30, 2015 |
City National Rochdale California Tax Exempt Bond Fund (continued) |
Description | | Face Amount (000) | | | Value (000) | |
Chula Vista, Police Facility Project, COP | | | | | | |
5.000%, 10/01/21 | | $ | 360 | | | $ | 425 | |
El Dorado, Irrigation District, Ser A, RB, AGM | | | | | | | | |
4.500%, 03/01/19 | | | 500 | | | | 557 | |
Elk Grove, Finance Authority, SPL Tax | | | | | | | | |
3.000%, 09/01/18 | | | 480 | | | | 504 | |
Encinitas, Unified School District, GO, NATL | | | | | | | | |
0.796%, 08/01/17(B) | | | 500 | | | | 494 | |
Fairfield County, Redevelopment Agency, TA | | | | | | | | |
4.000%, 08/01/17 | | | 2,630 | | | | 2,790 | |
Gilroy, Public Facilities Financing Authority, RB | | | | | | | | |
5.000%, 11/01/21 | | | 940 | | | | 1,110 | |
Golden State Tobacco Securitization, Ser A, RB | | | | | | | | |
5.000%, 06/01/19 | | | 1,000 | | | | 1,137 | |
Golden State Tobacco Securitization, Ser A, RB | | | | | | | | |
Callable 06/01/23 @ 100 | | | | | | | | |
5.000%, 06/01/30 | | | 1,075 | | | | 1,210 | |
Hemet, Unified School District, GO, AGM | | | | | | | | |
4.000%, 08/01/24 | | | 500 | | | | 568 | |
Irvine Unified School District, SPL Tax, BAM | | | | | | | | |
Callable 03/01/25 @ 100 | | | | | | | | |
5.000%, 09/01/30 | | | 250 | | | | 295 | |
JPM Chase Putters, Ser 2015-ZF0183, RB | | | | | | | | |
0.270%, 12/01/22(A) (D) (E) | | | 1,000 | | | | 1,000 | |
Jurupa, Unified School District, GO, AGM | | | | | | | | |
5.000%, 08/01/22 | | | 1,000 | | | | 1,198 | |
Long Beach, Harbor Revenue, Ser C, RB | | | | | | | | |
4.000%, 11/15/18 | | | 500 | | | | 550 | |
Los Angeles County, Disney Parking Hall Project, COP | | | | | | | | |
5.000%, 09/01/22 | | | 500 | | | | 600 | |
Los Angeles, California Wastewater System Revenue, Ser B, RB | | | | | | | | |
Callable 06/01/22 @ 100 | | | | | | | | |
5.000%, 06/01/31 | | | 1,000 | | | | 1,152 | |
Los Angeles, Community College District, Election of 2001, Ser E-1, GO, | | | | | | | | |
Pre-Refunded @ 100 | | | | | | | | |
5.000%, 08/01/27(C) | | | 400 | | | | 448 | |
Los Angeles, Department of Airports, Senior International Governmental, Ser C, RB | | | | | | | | |
4.000%, 05/15/17 | | | 545 | | | | 576 | |
Los Angeles, Department of Airports, Ser C, RB | | | | | | | | |
5.000%, 05/15/25 | | | 550 | | | | 676 | |
Los Angeles, Department of Water & Power System, Ser A, RB | | | | | | | | |
5.000%, 07/01/19 | | | 500 | | | | 574 | |
Los Angeles, Department of Water & Power System, Ser C, RB | | | | | | | | |
5.000%, 07/01/23 | | | 500 | | | | 614 | |
Los Angeles, Municipal Improvement Authority, Capital Equipment, Ser A, RB | | | | | | | | |
4.000%, 11/01/19 | | | 575 | | | | 636 | |
Los Angeles, Municipal Improvement Authority, Ser C, RB | | | | | | | | |
4.000%, 09/01/16 | | | 500 | | | | 516 | |
Los Angeles, Sanitation Districts Financing Authority, Ser A, RB | | | | | | | | |
Callable 10/01/25 @ 100 | | | | | | | | |
5.000%, 10/01/28 | | | 500 | | | | 600 | |
Los Angeles, Ser A, GO | | | | | | | | |
5.000%, 09/01/21 | | | 240 | | | | 289 | |
Los Angeles, Unified School District, Election of 2005, Ser E, GO, AGM, | | | | | | | | |
Pre-Refunded @ 100 | | | | | | | | |
5.000%, 07/01/19(C) | | | 500 | | | | 538 | |
Los Angeles, Unified School District, Headquarters Building Project, Ser A, COP | | | | | | | | |
5.000%, 10/01/20 | | | 1,000 | | | | 1,170 | |
Los Angeles, Unified School District, Ser A, GO | | | | | | | | |
5.000%, 07/01/18 | | | 350 | | | | 390 | |
Los Angeles, Unified School District, Ser B, GO, AMBAC | | | | | | | | |
Callable 07/01/17 @ 100 | | | | | | | | |
5.000%, 07/01/19 | | | 2,000 | | | | 2,152 | |
Merced, Irrigation District, Ser A, RB, AGM | | | | | | | | |
5.000%, 10/01/20 | | | 500 | | | | 583 | |
See accompanying notes to financial statements.
CITY NATIONAL ROCHDALE FUNDS | PAGE 44
schedule of investments |
September 30, 2015 |
City National Rochdale California Tax Exempt Bond Fund (continued) |
Description | | Face Amount (000) | | | Value (000) | |
Modesto, Irrigation District, Ser A, RB | | | | | | |
5.000%, 07/01/17 | | $ | 1,000 | | | $ | 1,074 | |
Northern California, Power Agency, Hydroelectric Project Number 1, Ser C, RB, ASSURED GTY | | | | | | | | |
Callable 07/01/18 @ 100 | | | | | | | | |
5.000%, 07/01/20 | | | 500 | | | | 554 | |
Oakland-Alameda County, Coliseum Authority, Ser A, RB | | | | | | | | |
5.000%, 02/01/20 | | | 820 | | | | 937 | |
Orange County, Public Financing Authority, RB, NATL | | | | | | | | |
5.000%, 07/01/17 | | | 1,050 | | | | 1,131 | |
Orange County, Redevelopment Agency Successor Agency, TA, AGM | | | | | | | | |
5.000%, 09/01/23 | | | 320 | | | | 380 | |
Orange County, Sanitation District, Ser A, COP | | | | | | | | |
3.000%, 02/01/17 | | | 500 | | | | 517 | |
Petaluma, Joint Unified High School District, Election of 2014, Ser A, GO | | | | | | | | |
4.000%, 08/01/18 | | | 595 | | | | 646 | |
Port of Oakland, Ser B, RB, NATL | | | | | | | | |
Callable 11/01/17 @ 100 | | | | | | | | |
5.000%, 11/01/23 | | | 500 | | | | 541 | |
Port of Oakland, Transportation Airport & Marina Revenue, Ser C, RB, NATL | | | | | | | | |
5.000%, 11/01/15 | | | 450 | | | | 452 | |
Riverside County, Public Safety Communication, Ser A, COP, AMBAC | | | | | | | | |
5.000%, 11/01/17 | | | 1,600 | | | | 1,726 | |
Riverside County, Transportation Commission, Ser A, RB | | | | | | | | |
Callable 06/01/23 @ 100 | | | | | | | | |
5.250%, 06/01/28 | | | 500 | | | | 607 | |
Riverside, Public Financing Authority, Ser A, RB | | | | | | | | |
5.000%, 11/01/21 | | | 1,000 | | | | 1,167 | |
Roseville, Finance Authority, RB | | | | | | | | |
4.000%, 02/01/18 | | | 500 | | | | 536 | |
Sacramento County, Sanitation District Financing Authority, Sewer Revenue, Ser A, RB | | | | | | | | |
5.000%, 12/01/20 | | | 500 | | | | 591 | |
Sacramento, Area Flood Control Agency, SAB, BAM | | | | | | | | |
Callable 10/01/24 @ 100 | | | | | | | | |
5.000%, 10/01/30 | | | 250 | | | | 286 | |
Sacramento, Area Flood Control Agency, Ser A, SAB, NATL | | | | | | | | |
Callable 10/01/17 @ 100 | | | | | | | | |
5.000%, 10/01/21 | | | 400 | | | | 433 | |
Sacramento, Financing Authority, EPA Building Project, Ser A, RB | | | | | | | | |
4.000%, 05/01/18 | | | 850 | | | | 917 | |
San Diego, Public Facilities Financing Authority Sewer Revenue, RB | | | | | | | | |
5.000%, 05/15/25 | | | 1,000 | | | | 1,251 | |
San Francisco City & County, Airports Commission, Ser B, RB | | | | | | | | |
5.000%, 05/01/17 | | | 495 | | | | 530 | |
San Francisco City & County, Multiple Capital Improvement Projects, Ser B, COP | | | | | | | | |
Callable 04/01/19 @ 100 | | | | | | | | |
5.000%, 04/01/22 | | | 735 | | | | 826 | |
San Francisco City & County, Open Space Fund, Various Park Projects, RB, NATL | | | | | | | | |
Callable 11/02/15 @ 100 | | | | | | | | |
3.750%, 07/01/18 | | | 500 | | | | 501 | |
San Francisco City & County, Public Utilities Commission Water Revenue, Ser A, RB | | | | | | | | |
5.000%, 11/01/20 | | | 250 | | | | 295 | |
San Francisco City & County, Redevelopment Agency, Redevelopment Projects, Ser B, TA | | | | | | | | |
5.000%, 08/01/17 | | | 540 | | | | 576 | |
San Francisco City & County, Redevelopment Agency, Redevelopment Projects, Ser B, TA, NATL | | | | | | | | |
Callable 11/02/15 @ 100 | | | | | | | | |
5.250%, 08/01/18 | | | 600 | | | | 601 | |
San Luis Obispo County, Financing Authority, Ser A, RB, BAM | | | | | | | | |
Callable 09/01/25 @ 100 | | | | | | | | |
5.000%, 09/01/30 | | | 500 | | | | 583 | |
San Marcos, Public Facilities Authority, Ser A, SPL Tax | | | | | | | | |
5.000%, 09/01/19 | | | 330 | | | | 376 | |
See accompanying notes to financial statements.
CITY NATIONAL ROCHDALE FUNDS | PAGE 45
schedule of investments |
September 30, 2015 |
City National Rochdale California Tax Exempt Bond Fund (continued) |
Description | | Face Amount (000) | | | Value (000) | |
San Mateo County, Joint Powers Financing Authority, Maple Street Project, RB | | | | | | |
3.000%, 06/15/17 | | $ | 1,000 | | | $ | 1,042 | |
San Mateo County, Transportation Authority, Ser A, RB, NATL, ETM | | | | | | | | |
5.250%, 06/01/19 | | | 755 | | | | 871 | |
San Pablo County, Redevelopment Agency, Ser A, TA, AGM | | | | | | | | |
5.000%, 06/15/21 | | | 480 | | | | 560 | |
Santa Clara County, Financing Authority, Lease Revenue Capital Project, Ser A, RB | | | | | | | | |
5.000%, 02/01/20 | | | 500 | | | | 576 | |
Santa Cruz County Redevelopment Agency, Ser A, SPL TAX, AGM | | | | | | | | |
Callable 09/01/25 @ 100 | | | | | | | | |
5.000%, 09/01/28 | | | 480 | | | | 568 | |
Santa Cruz County, Redevelopment Agency, TA, BAM | | | | | | | | |
5.000%, 09/01/19 | | | 640 | | | | 729 | |
Santa Rosa, Wastewater Revenue, Ser A, RB | | | | | | | | |
4.000%, 09/01/17 | | | 415 | | | | 442 | |
Southern California, Metropolitan Water District, Ser G-4, RB | | | | | | | | |
Callable 07/01/19 @ 100 | | | | | | | | |
3.000%, 07/01/37(A) | | | 1,000 | | | | 1,066 | |
Southern California, Public Power Authority, Linden Wind Energy Project, Ser A, RB | | | | | | | | |
Callable 07/01/20 @ 100 | | | | | | | | |
5.000%, 07/01/27 | | | 1,065 | | | | 1,235 | |
Southern California, Public Power Authority, Subordinated Southern Transmission Project, Ser A, RB | | | | | | | | |
5.000%, 07/01/17 | | | 1,375 | | | | 1,482 | |
Turlock, Irrigation District, RB | | | | | | | | |
5.000%, 01/01/19 | | | 200 | | | | 225 | |
Turlock, Irrigation District, Ser A, RB | | | | | | | | |
5.000%, 01/01/17 | | | 575 | | | | 606 | |
Tustin, Unified School District, SPL TAX, BAM | | | | | | | | |
5.000%, 09/01/24 | | | 500 | | | | 601 | |
University of California, Regents Medical Center Pooled Revenue, Ser J, RB | | | | | | | | |
Callable 05/15/23 @ 100 | | | | | | | | |
5.000%, 05/15/26 | | | 500 | | | | 597 | |
University of California, Revenues Limited Project, Ser E, RB | | | | | | | | |
Callable 05/15/20 @ 100 | | | | | | | | |
5.000%, 05/15/22 | | | 500 | | | | 581 | |
Ventura County, Public Financing Authority, Ser A, RB | | | | | | | | |
4.000%, 11/01/18 | | | 500 | | | | 546 | |
Ventura County, Public Financing Authority, Ser A, RB | | | | | | | | |
5.000%, 11/01/19 | | | 500 | | | | 575 | |
Ventura County, Public Financing Authority, Ser B, RB | | | | | | | | |
5.000%, 11/01/18 | | | 500 | | | | 561 | |
Walnut, Energy Center Authority, RB | | | | | | | | |
5.000%, 01/01/19 | | | 300 | | | | 339 | |
| | | | | | | | | |
Total California | | | | 92,516 | |
| | | | | | | | | |
Connecticut [2.1%] | |
Connecticut State, Ser A, GO | | | | | | | | |
Callable 10/19/15 @ 100 | | | | | | | | |
1.370%, 03/01/19(A) | | | 1,000 | | | | 1,000 | |
Connecticut State, Ser D, GO | | | | | | | | |
0.900%, 08/15/19(A) | | | 1,000 | | | | 1,001 | |
| | | | | | | | | |
Total Connecticut | | | | 2,001 | |
| | | | | | | | | |
Guam [0.5%] | |
Territory of Guam, Ser A, RB | | | | | | | | |
5.000%, 01/01/17 | | | 500 | | | | 525 | |
| | | | | | | | | |
Total Municipal Bonds | |
(Cost $93,078) | | | | 95,042 | |
See accompanying notes to financial statements.
CITY NATIONAL ROCHDALE FUNDS | PAGE 46
schedule of investments |
September 30, 2015 |
City National Rochdale California Tax Exempt Bond Fund (concluded) |
Description | | Shares | | | Value (000) | |
Short-Term Investment [1.8%] | |
City National Rochdale California Tax Exempt Money Market Fund, Institutional Class, 0.010%** ‡ | | | 1,735,823 | | | $ | 1,736 | |
| | | | | | | | | |
Total Short-Term Investment | |
(Cost $1,736) | | | | 1,736 | |
| | | | | | | | | |
Total Investments [98.9%] | |
(Cost $94,814) | | | $ | 96,778 | |
Percentages are based on Net Assets of $97,893 (000).
** | The rate reported is the 7-day effective yield as of September 30, 2015. |
‡ | Investment in Affiliate. |
(A) | Floating Rate Security — The rate reported is the rate in effect on September 30, 2015. |
(B) | Zero coupon security. The rate reported is the effective yield at time of purchase. |
(C) | Pre-Refunded Security — The maturity date shown is the pre-refunded date. |
(D) | Security exempt from registration under Rule 144A of the Securities Act of 1933. These securities may be resold in transactions exempt from registration normally to qualified institutions. On September 30, 2015, the value of these securities amounted to $1,000 (000), representing 1.0% of the net assets of the Fund. |
(E) | Represents an investment in a tender option bond residual interest certificate purchased in a secondary market transaction. The interest rate shown bears an inverse relationship to the interest rate on a tender option bond floating rate certificate. The interest rate disclosed reflects the rate in effect on September 30, 2015. |
AGM — Assured Guarantee Municipal
AMBAC — American Municipal Bond Assurance Company
ASSURED GTY— Assured Guaranty Ltd.
BAM — Build America Mutual Assurance Company
CA MTG INS — Cal-Mortgage Loan Insurance Division
COP — Certificate of Participation
EPA — Environmental Protection Agency
ETM — Escrowed to Maturity
GO — General Obligation
NATL — National Public Finance Guarantee Corporation
RB — Revenue Bond
SAB — Special Assessment Board
Ser — Series
SPL Tax — Special Tax
TA — Tax Allocation
The following is a list of the inputs used as of September 30, 2015 in valuing the Fund’s investments carried at value (000):
Investments in Securities | | Level 1 | | | Level 2 | | | Level 3 | | | Total | |
Municipal Bonds | | $ | — | | | $ | 95,042 | | | $ | — | | | $ | 95,042 | |
Short-Term Investment | | | 1,736 | | | | — | | | | — | | | | 1,736 | |
Total Investments in Securities | | $ | 1,736 | | | $ | 95,042 | | | $ | — | | | $ | 96,778 | |
For the year ended September 30, 2015, there have been no transfers between any of the fair value hierarchy levels. Transfers between Levels are recognized at period end.
For more information on valuation inputs, see Note 2 — Significant Accounting Policies in the Notes to Financial Statements.
See accompanying notes to financial statements.
CITY NATIONAL ROCHDALE FUNDS | PAGE 47
schedule of investments |
September 30, 2015 |
City National Rochdale Municipal High Income Fund |
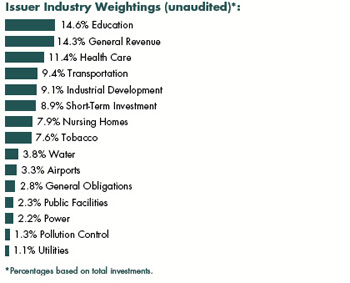
Description | | Face Amount (000) | | | Value (000) | |
Municipal Bonds [90.2%] | |
Alabama [2.8%] | |
Birmingham, Water Works Board, Ser A, RB | | | | | | |
Callable 01/01/25 @ 100 | | | | | | |
5.000%, 01/01/42 | | $ | 5,000 | | | $ | 5,529 | |
Cullman County, Health Care Authority, Cullman Regional Medical Center Project, Ser A, RB | | | | | | | | |
Callable 02/01/19 @ 100 | | | | | | | | |
7.000%, 02/01/36 | | | 4,315 | | | | 4,623 | |
Jefferson County, Sewer Revenue, Ser D, RB | | | | | | | | |
Callable 10/01/23 @ 105 | | | | | | | | |
6.000%, 10/01/42 | | | 4,000 | | | | 4,467 | |
Jefferson County, Sewer Revenue, Ser D, RB | | | | | | | | |
Callable 10/01/23 @ 105 | | | | | | | | |
6.500%, 10/01/53 | | | 4,000 | | | | 4,572 | |
| | | | | | | | | |
Total Alabama | | | | 19,191 | |
| | | | | | | | | |
Alaska [0.7%] | |
Northern Tobacco Securitization, Ser A, RB | | | | | | | | |
Callable 10/19/15 @ 100 | | | | | | | | |
5.000%, 06/01/46 | | | 6,000 | | | | 4,731 | |
| | | | | | | | | |
American Samoa [0.7%] | |
American Samoa Economic Development Authority, Ser A, RB | | | | | | | | |
Callable 09/01/25 @ 100 | | | | | | | | |
6.625%, 09/01/35 | | | 5,000 | | | | 4,996 | |
| | | | | | | | | |
Arizona [1.0%] | |
Phoenix, Industrial Development Authority, Legacy Traditional School Projects, RB | | | | | | | | |
Callable 07/01/25 @ 100 | | | | | | | | |
5.000%, 07/01/45(A) | | | 3,300 | | | | 3,078 | |
Pima County, Industrial Development Authority, Noah Webster School Project, RB | | | | | | | | |
Callable 12/15/23 @ 100 | | | | | | | | |
7.000%, 12/15/43 | | | 1,500 | | | | 1,663 | |
Yavapai County Industrial Development Authority, Ser A, RB | | | | | | | | |
Callable 03/01/25 @ 100 | | | | | | | | |
5.000%, 09/01/34(A) | | | 2,015 | | | | 1,993 | |
| | | | | | | | | |
Total Arizona | | | | 6,734 | |
| | | | | | | | | |
California [10.9%] | |
Adelanto, Public Utility Authority, Utility System Project, Ser A, RB | | | | | | | | |
Callable 07/01/19 @ 100 | | | | | | | | |
6.750%, 07/01/39 | | | 6,500 | | | | 7,275 | |
California State, GO | | | | | | | | |
Callable 12/01/23 @ 100 | | | | | | | | |
5.000%, 12/01/31 | | | 1,500 | | | | 1,749 | |
California State, Municipal Finance Authority, Ser A, RB | | | | | | | | |
Callable 11/01/25 @ 100 | | | | | | | | |
5.500%, 11/01/45(A) | | | 4,000 | | | | 4,006 | |
California State, Pollution Control Financing Authority, San Diego Water Project, RB | | | | | | | | |
Callable 07/01/17 @ 100 | | | | | | | | |
5.000%, 11/21/45(A) | | | 2,000 | | | | 2,059 | |
California State, Public Works Board, Department of Corrections and Rehab Project, Ser A, RB | | | | | | | | |
Callable 09/01/24 @ 100 | | | | | | | | |
5.000%, 09/01/31 | | | 5,000 | | | | 5,810 | |
See accompanying notes to financial statements.
CITY NATIONAL ROCHDALE FUNDS | PAGE 48
schedule of investments |
September 30, 2015 |
City National Rochdale Municipal High Income Fund (continued) |
Description | | Face Amount (000) | | | Value (000) | |
California State, Public Works Board, Various Capital Projects, Ser A, RB | | | | | | |
Callable 04/01/22 @ 100 | | | | | | |
5.000%, 04/01/37 | | $ | 1,000 | | | $ | 1,113 | |
California State, School Finance Authority, View Park Elementary & Middle School Project, Ser A, RB | | | | | | | | |
Callable 10/01/24 @ 100 | | | | | | | | |
5.625%, 10/01/34 | | | 575 | | | | 577 | |
California State, School Finance Authority, View Park Elementary & Middle School Project, Ser A, RB | | | | | | | | |
Callable 10/01/24 @ 100 | | | | | | | | |
5.875%, 10/01/44 | | | 1,000 | | | | 1,004 | |
California State, School Finance Authority, View Park Elementary & Middle School Project, Ser A, RB | | | | | | | | |
Callable 10/01/24 @ 100 | | | | | | | | |
6.000%, 10/01/49 | | | 720 | | | | 722 | |
California Statewide Communities Development Authority, RB | | | | | | | | |
Callable 06/01/25 @ 100 | | | | | | | | |
7.000%, 06/01/45 | | | 3,155 | | | | 2,993 | |
Golden State Tobacco Securitization, Golden State Tobacco Settlement, Ser A, RB | | | | | | | | |
Callable 06/01/25 @ 100 | | | | | | | | |
5.000%, 06/01/35 | | | 5,000 | | | | 5,610 | |
Golden State Tobacco Securitization, Golden State Tobacco Settlement, Ser A-1, RB | | | | | | | | |
Callable 06/01/17 @ 100 | | | | | | | | |
4.500%, 06/01/27 | | | 4,655 | | | | 4,463 | |
Golden State Tobacco Securitization, Golden State Tobacco Settlement, Ser A-1, RB | | | | | | | | |
Callable 06/01/17 @ 100 | | | | | | | | |
5.750%, 06/01/47 | | | 5,000 | | | | 4,444 | |
Golden State Tobacco Securitization, Golden State Tobacco Settlement, Ser A-1, RB | | | | | | | | |
Callable 06/01/17 @ 100 | | | | | | | | |
5.125%, 06/01/47 | | | 7,280 | | | | 5,976 | |
Inland Empire Tobacco Securitization Authority, Ser A, RB | | | | | | | | |
Callable 06/01/17 @ 100 | | | | | | | | |
4.625%, 06/01/21 | | | 4,795 | | | | 4,721 | |
Lake Elsinore, Public Financing Authority, SAB | | | | | | | | |
Callable 09/01/25 @ 100 | | | | | | | | |
5.000%, 09/01/35 | | | 2,650 | | | | 2,835 | |
M-S-R Energy Authority, Ser C, RB | | | | | | | | |
7.000%, 11/01/34 | | | 2,500 | | | | 3,440 | |
Palomar Pomerado Health Care District, COP | | | | | | | | |
Callable 11/01/20 @ 100 | | | | | | | | |
6.000%, 11/01/30 | | | 3,920 | | | | 4,213 | |
San Buenaventura, Community Memorial Health System Project, RB | | | | | | | | |
Callable 12/01/21 @ 100 | | | | | | | | |
7.000%, 12/01/26 | | | 1,000 | | | | 1,195 | |
San Buenaventura, Community Memorial Health System Project, RB | | | | | | | | |
Callable 12/01/21 @ 100 | | | | | | | | |
7.500%, 12/01/41 | | | 1,000 | | | | 1,209 | |
San Mateo, Community Facilities District, SAB | | | | | | | | |
Callable 09/01/22 @ 100 | | | | | | | | |
5.500%, 09/01/44 | | | 1,000 | | | | 1,097 | |
San Mateo, Foster City School District, GO | | | | | | | | |
Callable 08/01/31 @ 100 | | | | | | | | |
0.000%, 08/01/42(B) | | | 6,000 | | | | 4,455 | |
Southern California, Tobacco Securitization Authority, Ser A-1, RB | | | | | | | | |
Callable 10/19/15 @ 100 | | | | | | | | |
5.000%, 06/01/37 | | | 3,000 | | | | 2,622 | |
Southern California, Tobacco Securitization Authority, Ser A1-SNR, RB | | | | | | | | |
Callable 10/19/15 @ 100 | | | | | | | | |
5.125%, 06/01/46 | | | 3,000 | | | | 2,542 | |
| | | | | | | | | |
Total California | | | | 76,130 | |
| | | | | | | | | |
Colorado [4.5%] | |
Arkansas State, River Power Authority, Colorado Improvement Project, RB | | | | | | | | |
Callable 10/01/20 @ 100 | | | | | | | | |
6.125%, 10/01/40 | | | 2,500 | | | | 2,674 | |
See accompanying notes to financial statements.
CITY NATIONAL ROCHDALE FUNDS | PAGE 49
schedule of investments |
September 30, 2015 |
City National Rochdale Municipal High Income Fund (continued) |
Description | | Face Amount (000) | | | Value (000) | |
Arkansas State, River Power Authority, Colorado Improvement Project, RB | | | | | | |
Callable 10/01/18 @ 100 | | | | | | |
6.000%, 10/01/40 | | $ | 2,965 | | | $ | 3,130 | |
Castle Oaks Metropolitan District No. 3, GO | | | | | | | | |
Callable 12/01/20 @ 103 | | | | | | | | |
6.250%, 12/01/44 | | | 2,860 | | | | 2,774 | |
Colorado State, Educational & Cultural Facilities Authority, Charter School Preparatory School Project, RB | | | | | | | | |
Callable 04/01/25 @ 100 | | | | | | | | |
5.125%, 04/01/35(A) | | | 1,515 | | | | 1,442 | |
Colorado State, Educational & Cultural Facilities Authority, Charter School Preparatory School Project, RB | | | | | | | | |
Callable 04/01/25 @ 100 | | | | | | | | |
5.250%, 04/01/45(A) | | | 2,655 | | | | 2,503 | |
Colorado State, Educational & Cultural Facilities Authority, Charter School Project, RB | | | | | | | | |
Callable 07/01/25 @ 100 | | | | | | | | |
5.000%, 07/01/36(A) | | | 915 | | | | 900 | |
Colorado State, Educational & Cultural Facilities Authority, Charter School Project, RB | | | | | | | | |
Callable 07/01/25 @ 100 | | | | | | | | |
5.250%, 07/01/46(A) | | | 1,930 | | | | 1,892 | |
Colorado State, Educational & Cultural Facilities Authority, Charter School Skyview Project, RB | | | | | | | | |
Callable 07/01/24 @ 100 | | | | | | | | |
5.375%, 07/01/44(A) | | | 1,350 | | | | 1,392 | |
Colorado State, Educational & Cultural Facilities Authority, Charter School Skyview Project, RB | | | | | | | | |
Callable 07/01/24 @ 100 | | | | | | | | |
5.500%, 07/01/49(A) | | | 1,600 | | | | 1,647 | |
Colorado State, High Performance Transportation Enterprise, U.S. 36 & I-25 Managed Lanes Project, RB, AMT | | | | | | | | |
Callable 01/01/23 @ 100 | | | | | | | | |
5.750%, 01/01/44 | | | 2,000 | | | | 2,114 | |
Colorado State, Public Energy Authority, RB | | | | | | | | |
6.500%, 11/15/38 | | | 4,000 | | | | 5,245 | |
Denver City & County, United Airlines Project, Ser A, RB, AMT | | | | | | | | |
Callable 10/01/17 @ 100 | | | | | | | | |
5.250%, 10/01/32 | | | 1,000 | | | | 1,031 | |
Lewis Pointe Metropolitan District, Ser A, GO | | | | | | | | |
Callable 12/01/20 @ 100 | | | | | | | | |
6.000%, 12/01/44 | | | 2,590 | | | | 2,562 | |
Regional Transportation District, Denver Transportation Partners Project, RB | | | | | | | | |
Callable 07/15/20 @ 100 | | | | | | | | |
6.000%, 01/15/41 | | | 1,000 | | | | 1,120 | |
Wildgrass County, Metropolitan District, GO | | | | | | | | |
Pre-Refunded @ 100 | | | | | | | | |
6.200%, 12/01/34(C) | | | 1,000 | | | | 1,060 | |
| | | | | | | | | |
Total Colorado | | | | 31,486 | |
| | | | | | | | | |
Delaware [1.0%] | |
Delaware State, Economic Development Authority, Indian River Power Project, RB | | | | | | | | |
Callable 10/01/20 @ 100 | | | | | | | | |
5.375%, 10/01/45 | | | 6,500 | | | | 6,725 | |
| | | | | | | | | |
District of Columbia [0.3%] | |
Metropolitan Washington, Airports Authority, Dulles Toll Road Revenue, Ser B, RB | | | | | | | | |
Callable 10/01/28 @ 100 | | | | | | | | |
0.000%, 10/01/44(B) | | | 2,000 | | | | 2,091 | |
| | | | | | | | | |
Florida [6.9%] | |
Alachua County, Health Facilities Authority, East Ridge Retirement Village Project, RB | | | | | | | | |
Callable 11/15/24 @ 100 | | | | | | | | |
6.000%, 11/15/34 | | | 2,500 | | | | 2,668 | |
Alachua County, Health Facilities Authority, East Ridge Retirement Village Project, RB | | | | | | | | |
Callable 11/15/24 @ 100 | | | | | | | | |
6.250%, 11/15/44 | | | 1,000 | | | | 1,078 | |
See accompanying notes to financial statements.
CITY NATIONAL ROCHDALE FUNDS | PAGE 50
schedule of investments |
September 30, 2015 |
City National Rochdale Municipal High Income Fund (continued) |
Description | | Face Amount (000) | | | Value (000) | |
Brevard County, Industrial Development Authority, TUFF Florida Tech Project, RB | | | | | | |
Callable 11/01/19 @ 100 | | | | | | |
6.750%, 11/01/39 | | $ | 745 | | | $ | 809 | |
Capital Trust Agency, Silver Creek Street Project, Ser A, RB | | | | | | | | |
Callable 01/01/21 @ 103 | | | | | | | | |
8.250%, 01/01/44 | | | 3,390 | | | | 3,127 | |
Capital Trust Agency, Silver Creek Street Project, Ser A, RB | | | | | | | | |
Callable 01/01/21 @ 103 | | | | | | | | |
8.250%, 01/01/49 | | | 1,000 | | | | 910 | |
Florida State, Development Finance Corp., Renaissance Charter School Project, Ser A, RB | | | | | | | | |
Callable 06/15/22 @ 100 | | | | | | | | |
6.125%, 06/15/43 | | | 1,000 | | | | 1,037 | |
Florida State, Development Finance, Renaissance Charter School Project, Ser A, RB | | | | | | | | |
Callable 06/15/24 @ 100 | | | | | | | | |
6.000%, 06/15/34 | | | 2,110 | | | | 2,061 | |
Florida State, Development Finance, Renaissance Charter School Project, Ser A, RB | | | | | | | | |
Callable 06/15/24 @ 100 | | | | | | | | |
6.125%, 06/15/44 | | | 3,000 | | | | 2,907 | |
Florida State, Development Finance, Tuscan Isle Senior Living Community Project, Ser A, RB | | | | | | | | |
Callable 06/01/22 @ 103 | | | | | | | | |
7.000%, 06/01/35(A) | | | 1,350 | | | | 1,399 | |
Florida State, Development Finance, Tuscan Isle Senior Living Community Project, Ser A, RB | | | | | | | | |
Callable 06/01/22 @ 103 | | | | | | | | |
7.000%, 06/01/45(A) | | | 3,000 | | | | 3,056 | |
Florida State, Village Community Development District No. 10, SAB | | | | | | | | |
Callable 05/01/23 @ 100 | | | | | | | | |
6.000%, 05/01/44 | | | 1,000 | | | | 1,146 | |
Miami-Dade County, Industrial Development Authority, Pinecrest Academy Project, RB | | | | | | | | |
Callable 09/15/24 @ 100 | | | | | | | | |
5.250%, 09/15/44 | | | 2,500 | | | | 2,570 | |
Miami-Dade County, Industrial Development Authority, Youth CO-OP Charter Schools Project, Ser A, RB | | | | | | | | |
Callable 09/15/25 @ 100 | | | | | | | | |
5.750%, 09/15/35(A) | | | 1,605 | | | | 1,581 | |
Mid-Bay Bridge Authority, Ser A, RB | | | | | | | | |
Pre-Refunded @ 100 | | | | | | | | |
7.250%, 10/01/34(C) | | | 5,200 | | | | 6,906 | |
Mid-Bay Bridge Authority, Ser A, RB | | | | | | | | |
Callable 10/01/25 @ 100 | | | | | | | | |
5.000%, 10/01/35 | | | 5,000 | | | | 5,460 | |
Osceola County, Poinciana Parkway Project, Ser A, RB | | | | | | | | |
Callable 10/01/24 @ 100 | | | | | | | | |
5.375%, 10/01/47 | | | 5,000 | | | | 5,332 | |
Palm Beach County, Health Facilities Authority, Sinai Residences Project, Ser A, RB | | | | | | | | |
Callable 06/01/22 @ 102 | | | | | | | | |
7.250%, 06/01/34 | | | 500 | | | | 574 | |
Palm Beach County, Health Facilities Authority, Sinai Residences Project, Ser A, RB | | | | | | | | |
Callable 06/01/22 @ 102 | | | | | | | | |
7.500%, 06/01/49 | | | 2,000 | | | | 2,304 | |
Saint Johns County, Industrial Development Authority, Presbyterian Retirement Project, Ser A, RB | | | | | | | | |
Callable 08/01/20 @ 100 | | | | | | | | |
6.000%, 08/01/45 | | | 3,000 | | | | 3,326 | |
| | | | | | | | | |
Total Florida | | | | 48,251 | |
| | | | | | | | | |
Georgia [1.2%] | |
Atlanta, Department of Aviation, Ser A, RB | | | | | | | | |
Callable 01/01/24 @ 100 | | | | | | | | |
5.000%, 01/01/31 | | | 2,500 | | | | 2,849 | |
DeKalb County, Hospital Authority, Dekalb Medical Center Project, RB | | | | | | | | |
Callable 09/01/20 @ 100 | | | | | | | | |
6.125%, 09/01/40 | | | 1,000 | | | | 1,084 | |
Greene County, Development Authority, GLEN-I, LLC Project, Ser A, RB | | | | | | | | |
Callable 01/01/25 @ 100 | | | | | | | | |
7.250%, 01/01/46(A) | | | 3,400 | | | | 3,395 | |
See accompanying notes to financial statements.
CITY NATIONAL ROCHDALE FUNDS | PAGE 51
schedule of investments |
September 30, 2015 |
City National Rochdale Municipal High Income Fund (continued) |
Description | | Face Amount (000) | | | Value (000) | |
Savannah, Economic Development Authority, Marshes Skidaway Island Project, RB | | | | | | |
Callable 01/01/24 @ 100 | | | | | | |
7.250%, 01/01/49 | | $ | 810 | | | $ | 905 | |
| | | | | | | | | |
Total Georgia | | | | 8,233 | |
| | | | | | | | | |
Guam [1.4%] | |
Territory of Guam, Government Waterworks Authority, RB | | | | | | | | |
Callable 07/01/20 @ 100 | | | | | | | | |
5.625%, 07/01/40 | | | 2,000 | | | | 2,212 | |
Territory of Guam, Ser A, GO | | | | | | | | |
Pre-Refunded @ 100 | | | | | | | | |
7.000%, 11/15/39(C) | | | 6,000 | | | | 7,424 | |
| | | | | | | | | |
Total Guam | | | | 9,636 | |
| | | | | | | | | |
Hawaii [0.4%] | |
Hawaii State, Department of Budget & Finance, 15 Craigside Project, Ser A, RB | | | | | | | | |
Callable 11/15/19 @ 100 | | | | | | | | |
8.750%, 11/15/29 | | | 2,450 | | | | 3,089 | |
| | | | | | | | | |
Illinois [5.4%] | |
Bridgeview Village, Ser A, GO | | | | | | | | |
Callable 06/01/24 @ 100 | | | | | | | | |
5.500%, 12/01/43 | | | 4,880 | | | | 4,588 | |
Chicago, Midway International Airport, Ser B, RB | | | | | | | | |
Callable 01/01/23 @ 100 | | | | | | | | |
5.000%, 01/01/35 | | | 2,000 | | | | 2,181 | |
Chicago, Midway International Airport, Ser B, RB | | | | | | | | |
Callable 01/01/24 @ 100 | | | | | | | | |
5.000%, 01/01/35 | | | 3,000 | | | | 3,304 | |
Chicago, Refunding Project, Ser A, GO, AGM | | | | | | | | |
Callable 01/01/24 @ 100 | | | | | | | | |
5.250%, 01/01/31 | | | 1,000 | | | | 1,032 | |
Illinois State, Finance Authority, Admiral at Lake Project, Ser A, RB | | | | | | | | |
Callable 05/15/20 @ 100 | | | | | | | | |
8.000%, 05/15/40 | | | 4,000 | | | | 4,621 | |
Illinois State, Finance Authority, Admiral at Lake Project, Ser A, RB | | | | | | | | |
Callable 05/15/20 @ 100 | | | | | | | | |
8.000%, 05/15/46 | | | 2,825 | | | | 3,248 | |
Illinois State, Finance Authority, Lutheran Home and Services Project, RB | | | | | | | | |
Callable 05/15/22 @ 100 | | | | | | | | |
5.625%, 05/15/42 | | | 5,000 | | | | 5,171 | |
Illinois State, Finance Authority, Roosevelt University Project, RB | | | | | | | | |
Callable 10/01/19 @ 100 | | | | | | | | |
6.250%, 04/01/29 | | | 1,000 | | | | 1,079 | |
Illinois State, Finance Authority, Roosevelt University Project, RB | | | | | | | | |
Callable 10/01/19 @ 100 | | | | | | | | |
6.500%, 04/01/39 | | | 3,445 | | | | 3,721 | |
Illinois State, Finance Authority, Three Crowns Park Plaza Project, Ser A, RB | | | | | | | | |
Callable 02/15/16 @ 100 | | | | | | | | |
5.875%, 02/15/38 | | | 6,750 | | | | 6,775 | |
Southwestern Illinois, Development Authority, Collinsville Project, RB | | | | | | | | |
Callable 03/01/16 @ 100 | | | | | | | | |
5.350%, 03/01/31 | | | 170 | | | | 132 | |
Village of Bridgeview, Cook County, Ser A, GO | | | | | | | | |
Callable 12/01/25 @ 100 | | | | | | | | |
5.750%, 12/01/35 | | | 2,000 | | | | 2,014 | |
| | | | | | | | | |
Total Illinois | | | | 37,866 | |
| | | | | | | | | |
Indiana [1.8%] | |
Carmel City, Barrington Carmel Project, Ser A, RB | | | | | | | | |
Callable 11/15/22 @ 100 | | | | | | | | |
7.000%, 11/15/32 | | | 1,650 | | | | 1,858 | |
Carmel City, Barrington Carmel Project, Ser A, RB | | | | | | | | |
Callable 11/15/22 @ 100 | | | | | | | | |
7.125%, 11/15/47 | | | 3,000 | | | | 3,345 | |
Indiana State, Finance Authority, Ohio Valley Electric Corporation Project, Ser A, RB | | | | | | | | |
Callable 06/01/22 @ 100 | | | | | | | | |
5.000%, 06/01/39 | | | 1,000 | | | | 1,038 | |
Indianapolis, Ritter Affordable Assisted Living Project, RB | | | | | | | | |
Callable 12/01/22 @ 102 | | | | | | | | |
6.900%, 12/01/33 | | | 4,000 | | | | 4,057 | |
See accompanying notes to financial statements.
CITY NATIONAL ROCHDALE FUNDS | PAGE 52
schedule of investments |
September 30, 2015 |
City National Rochdale Municipal High Income Fund (continued) |
Description | | Face Amount (000) | | | Value (000) | |
Terre Haute, Westminster Village Project, RB | | | | | | |
Callable 08/01/22 @ 100 | | | | | | |
6.000%, 08/01/39 | | $ | 2,355 | | | $ | 2,311 | |
| | | | | | | | | |
Total Indiana | | | | 12,609 | |
| | | | | | | | | |
Iowa [0.3%] | |
Iowa State, Finance Authority, Ser B, RB | | | | | | | | |
Callable 06/01/25 @ 100 | | | | | | | | |
5.000%, 06/01/36 | | | 2,000 | | | | 1,927 | |
| | | | | | | | | |
Kansas [0.7%] | |
Arkansas City, Public Building Commission, South Central Regional Medical Center, RB | | | | | | | | |
Callable 09/01/19 @ 100 | | | | | | | | |
7.000%, 09/01/29 | | | 2,550 | | | | 2,541 | |
Wyandotte County-Kansas City Unified Government, RB | | | | | | | | |
Callable 09/01/25 @ 100 | | | | | | | | |
5.750%, 09/01/32 | | | 2,000 | | | | 1,985 | |
| | | | | | | | | |
Total Kansas | | | | 4,526 | |
| | | | | | | | | |
Kentucky [1.5%] | |
Kentucky State, Economic Development Finance Authority, Owensboro Medical Health System Project, Ser A, RB | | | | | | | | |
Callable 06/01/20 @ 100 | | | | | | | | |
6.375%, 06/01/40 | | | 1,000 | | | | 1,125 | |
Kentucky State, Economic Development Finance Authority, Owensboro Medical Health System Project, Ser A, RB | | | | | | | | |
Callable 06/01/20 @ 100 | | | | | | | | |
6.500%, 03/01/45 | | | 2,960 | | | | 3,338 | |
Kentucky State, Public Transportation Infrastructure Authority, Downtown Crossing Project, Ser A, RB | | | | | | | | |
Callable 07/01/23 @ 100 | | | | | | | | |
5.750%, 07/01/49 | | | 5,650 | | | | 6,243 | |
| | | | | | | | | |
Total Kentucky | | | | 10,706 | |
| | | | | | | | | |
Louisiana [2.4%] | |
Juban Crossing Economic Development District, General Infrastructure Project, Ser C, RB | | | | | | | | |
Callable 03/15/25 @ 100 | | | | | | | | |
7.000%, 09/15/44(A) | | | 5,665 | | | | 5,663 | |
Louisiana State, Local Government Environmental Facilities & Community Development Authority, Ser S, RB | | | | | | | | |
Callable 06/01/25 @ 100 | | | | | | | | |
5.625%, 06/01/45 | | | 2,000 | | | | 1,963 | |
Louisiana State, Public Facilities Authority, Pellets Inc. Project, RB, AMT | | | | | | | | |
7.000%, 07/01/24(A) | | | 2,000 | | | | 1,988 | |
Louisiana State, Public Facilities Authority, Pellets Inc. Project, RB, AMT | | | | | | | | |
Callable 07/01/23 @ 100 | | | | | | | | |
10.500%, 07/01/39 | | | 2,000 | | | | 2,209 | |
Louisiana State, Public Facilities Authority, Pellets Inc. Project, Ser A, RB, AMT | | | | | | | | |
Callable 07/01/24 @ 100 | | | | | | | | |
8.375%, 07/01/39 | | | 5,000 | | | | 5,112 | |
| | | | | | | | | |
Total Louisiana | | | | 16,935 | |
| | | | | | | | | |
Maryland [1.6%] | |
Howard County, Annapolis Junction Town Center Project, TA | | | | | | | | |
Callable 02/15/24 @ 100 | | | | | | | | |
5.800%, 02/15/34 | | | 725 | | | | 755 | |
Howard County, Annapolis Junction Town Center Project, TA | | | | | | | | |
Callable 02/15/24 @ 100 | | | | | | | | |
6.100%, 02/15/44 | | | 1,425 | | | | 1,483 | |
Maryland State, Economic Development, RB | | | | | | | | |
Callable 09/01/20 @ 100 | | | | | | | | |
5.750%, 09/01/25 | | | 3,000 | | | | 3,064 | |
Westminster, Luther Village Millers Grant Inc. Project, RB | | | | | | | | |
Callable 07/01/24 @ 100 | | | | | | | | |
6.000%, 07/01/34 | | | 1,205 | | | | 1,269 | |
Westminster, Luther Village Millers Grant Inc. Project, RB | | | | | | | | |
Callable 07/01/24 @ 100 | | | | | | | | |
6.125%, 07/01/39 | | | 750 | | | | 790 | |
See accompanying notes to financial statements.
CITY NATIONAL ROCHDALE FUNDS | PAGE 53
schedule of investments |
September 30, 2015 |
City National Rochdale Municipal High Income Fund (continued) |
Description | | Face Amount (000) | | | Value (000) | |
Westminster, Luther Village Millers Grant Inc. Project, RB | | | | | | |
Callable 07/01/24 @ 100 | | | | | | |
6.250%, 07/01/44 | | $ | 3,780 | | | $ | 4,001 | |
| | | | | | | | | |
Total Maryland | | | | 11,362 | |
| | | | | | | | | |
Massachusetts [0.7%] | |
Massachusetts, Port Authority, Ser B, RB, AMBAC, AMT | | | | | | | | |
0.379%, 01/01/31(D) | | | 6,000 | | | | 5,091 | |
| | | | | | | | | |
Michigan [2.7%] | |
Kent, Hospital Finance Authority, Metropolitan Hospital Project, Ser A, RB | | | | | | | | |
Callable 11/02/15 @ 100 | | | | | | | | |
6.000%, 07/01/35 | | | 4,805 | | | | 4,816 | |
Kent, Hospital Finance Authority, Ser A, RB | | | | | | | | |
Callable 11/02/15 @ 100 | | | | | | | | |
6.250%, 07/01/40 | | | 1,500 | | | | 1,504 | |
Michigan State, Finance Authority, RB | | | | | | | | |
Callable 11/15/25 @ 100 | | | | | | | | |
5.250%, 11/15/35 | | | 2,340 | | | | 2,383 | |
Michigan State, Finance Authority, Old Redford School Project, Ser A, RB | | | | | | | | |
Callable 12/01/20 @ 100 | | | | | | | | |
6.500%, 12/01/40 | | | 3,745 | | | | 3,771 | |
Michigan State, Public Educational Facilities Authority, Old Redford Project, Ser A, RB | | | | | | | | |
Callable 12/01/15 @ 100 | | | | | | | | |
5.875%, 12/01/30 | | | 2,000 | | | | 1,999 | |
Michigan State, Tobacco Settlement Finance Authority, Ser A, RB | | | | | | | | |
Callable 06/01/17 @ 100 | | | | | | | | |
5.125%, 06/01/22 | | | 2,935 | | | | 2,620 | |
Michigan State, Tobacco Settlement Finance Authority, Turbo Project, Ser A, RB | | | | | | | | |
Callable 06/01/18 @ 100 | | | | | | | | |
6.875%, 06/01/42 | | | 2,000 | | | | 1,967 | |
| | | | | | | | | |
Total Michigan | | | | 19,060 | |
| | | | | | | | | |
Missouri [2.9%] | |
Blue Springs, Improvement Adams Farm Project, Ser A, SPL Tax | | | | | | | | |
Callable 06/01/24 @ 100 | | | | | | | | |
5.250%, 06/01/39 | | | 3,400 | | | | 3,368 | |
Kirkwood, Industrial Development Authority, Aberdeen Heights Project, Ser A, RB | | | | | | | | |
Callable 05/15/20 @ 100 | | | | | | | | |
8.250%, 05/15/45 | | | 3,000 | | | | 3,384 | |
Poplar Bluff Missouri, Ser A, SPL Tax | | | | | | | | |
Callable 11/01/23 @ 100 | | | | | | | | |
5.125%, 11/01/35(A) | | | 5,000 | | | | 4,994 | |
Saint Joseph, Industrial Development Authority, Living Community Saint Joseph Project, RB | | | | | | | | |
Callable 11/02/15 @ 100 | | | | | | | | |
7.000%, 08/15/32 | | | 1,000 | | | | 1,000 | |
Saint Louis County, Lambert Airport Project, SAB | | | | | | | | |
Pre-Refunded @ 105 | | | | | | | | |
9.000%, 11/01/31(C) | | | 2,500 | | | | 2,854 | |
St. Louis County, Industrial Development Authority, RB | | | | | | | | |
Callable 09/01/24 @ 100 | | | | | | | | |
5.000%, 09/01/38(A) | | | 2,000 | | | | 1,994 | |
St. Louis County, Industrial Development Authority, RB | | | | | | | | |
Callable 09/01/24 @ 100 | | | | | | | | |
5.250%, 09/01/45(A) | | | 3,000 | | | | 2,986 | |
| | | | | | | | | |
Total Missouri | | | | 20,580 | |
| | | | | | | | | |
Nebraska [1.0%] | |
Central Plains Energy Project, Project No. 3, RB | | | | | | | | |
Callable 09/01/22 @ 100 | | | | | | | | |
5.250%, 09/01/37 | | | 1,000 | | | | 1,098 | |
Central Plains Energy Project, Project No. 3, RB | | | | | | | | |
Callable 09/01/22 @ 100 | | | | | | | | |
5.000%, 09/01/42 | | | 5,500 | | | | 5,849 | |
| | | | | | | | | |
Total Nebraska | | | | 6,947 | |
See accompanying notes to financial statements.
CITY NATIONAL ROCHDALE FUNDS | PAGE 54
schedule of investments |
September 30, 2015 |
City National Rochdale Municipal High Income Fund (continued) |
Description | | Face Amount (000) | | | Value (000) | |
Nevada [0.7%] | |
Clark County, Department of Aviation, Ser A-2, RB | | | | | | |
Callable 07/01/24 @ 100 | | | | | | |
5.000%, 07/01/35 | | $ | 3,000 | | | $ | 3,346 | |
State of Nevada Department of Business & Industry, Ser A, RB | | | | | | | | |
Callable 12/15/25 @ 100 | | | | | | | | |
5.000%, 12/15/35(A) | | | 1,595 | | | | 1,551 | |
| | | | | | | | | |
Total Nevada | | | | 4,897 | |
| | | | | | | | | |
New Jersey [1.7%] | |
New Jersey State, Economic Development Authority, Continental Airlines Project, RB, AMT | | | | | | | | |
Callable 08/20/22 @ 101 | | | | | | | | |
5.250%, 09/15/29 | | | 1,000 | | | | 1,078 | |
New Jersey State, Economic Development Authority, School Facilities Construction, Ser UU, RB | | | | | | | | |
Callable 06/15/24 @ 100 | | | | | | | | |
5.000%, 06/15/40 | | | 5,000 | | | | 5,066 | |
Tobacco Settlement Financing, Ser 1A, RB | | | | | | | | |
Callable 06/01/17 @ 100 | | | | | | | | |
5.000%, 06/01/41 | | | 7,500 | | | | 5,886 | |
| | | | | | | | | |
Total New Jersey | | | | 12,030 | |
| | | | | | | | | |
New York [3.9%] | |
Metropolitan Transportation Authority, Ser A-1, RB | | | | | | | | |
Callable 05/15/25 @ 100 | | | | | | | | |
5.000%, 11/15/45 | | | 5,000 | | | | 5,551 | |
Nassau County, Industrial Development Agency, Ser A, RB | | | | | | | | |
Callable 01/01/25 @ 101 | | | | | | | | |
6.700%, 01/01/49 | | | 4,789 | | | | 4,680 | |
Nassau County, Industrial Development Agency, Ser C, RB | | | | | | | | |
Callable 01/01/18 @ 100 | | | | | | | | |
2.000%, 01/01/49 | | | 1,728 | | | | 207 | |
New York City, Industrial Development Agency, American Airlines JFK International Airport Project, RB, AMT | | | | | | | | |
Callable 08/01/16 @ 101 | | | | | | | | |
7.750%, 08/01/31(D) | | | 4,000 | | | | 4,223 | |
New York State, Liberty Development, RB | | | | | | | | |
Callable 11/15/24 @ 100 | | | | | | | | |
5.000%, 11/15/44(A) | | | 10,000 | | | | 10,087 | |
Niagara, Tobacco Asset Securitization, RB | | | | | | | | |
Callable 05/15/24 @ 100 | | | | | | | | |
5.250%, 05/15/34 | | | 1,000 | | | | 1,119 | |
Niagara, Tobacco Asset Securitization, RB | | | | | | | | |
Callable 05/15/24 @ 100 | | | | | | | | |
5.250%, 05/15/40 | | | 1,000 | | | | 1,110 | |
| | | | | | | | | |
Total New York | | | | 26,977 | |
| | | | | | | | | |
North Carolina [0.2%] | |
North Carolina State, Medical Care Commission, RB | | | | | | | | |
Callable 09/01/24 @ 100 | | | | | | | | |
5.000%, 09/01/37 | | | 1,655 | | | | 1,651 | |
| | | | | | | | | |
Ohio [3.1%] | |
Muskingum County, Hospital Facilities Authority, Genesis Healthcare System Project, RB | | | | | | | | |
Callable 02/15/23 @ 100 | | | | | | | | |
5.000%, 02/15/33 | | | 1,000 | | | | 1,041 | |
Muskingum County, Hospital Facilities Authority, Genesis Healthcare Systems Project, RB | | | | | | | | |
Callable 02/15/23 @ 100 | | | | | | | | |
5.000%, 02/15/44 | | | 1,000 | | | | 1,023 | |
Muskingum County, Hospital Facilities Authority, Genesis Healthcare Systems Project, RB | | | | | | | | |
Callable 02/15/23 @ 100 | | | | | | | | |
5.000%, 02/15/48 | | | 3,000 | | | | 3,055 | |
Ohio State, Air Quality Development Authority, Pollution Control Firstenergy Project, Ser B, RB | | | | | | | | |
3.625%, 12/01/33(D) | | | 1,000 | | | | 1,013 | |
See accompanying notes to financial statements.
CITY NATIONAL ROCHDALE FUNDS | PAGE 55
schedule of investments |
September 30, 2015 |
City National Rochdale Municipal High Income Fund (continued) |
Description | | Face Amount (000) | | | Value (000) | |
Ohio State, Air Quality Development Authority, Pollution Control Firstenergy Project, Ser S, RB | | | | | | |
3.625%, 10/01/33(D) | | $ | 1,000 | | | $ | 1,012 | |
Ohio State, Air Quality Development Authority, Ser E, RB | | | | | | | | |
5.625%, 10/01/19 | | | 3,350 | | | | 3,718 | |
Ohio State, Water Development Authority, Pollution Control Firstenergy Project, Ser S, RB | | | | | | | | |
3.625%, 10/01/33(D) | | | 1,500 | | | | 1,518 | |
Southeastern Ohio, Port Authority, Memorial Health System Project, RB | | | | | | | | |
Callable 12/01/22 @ 100 | | | | | | | | |
6.000%, 12/01/42 | | | 7,000 | | | | 7,521 | |
Toledo-Lucas County Port Authority, SAB | | | | | | | | |
Callable 11/02/15 @ 101 | | | | | | | | |
5.375%, 12/01/35 | | | 2,005 | | | | 2,013 | |
| | | | | | | | | |
Total Ohio | | | | 21,914 | |
| | | | | | | | | |
Pennsylvania [3.7%] | |
Beaver County, Industrial Development Authority, Ser B, RB | | | | | | | | |
3.500%, 12/01/35(D) | | | 5,000 | | | | 5,036 | |
Delaware County, Industrial Development Authority, Chester Community Charter School Project, Ser A, RB | | | | | | | | |
Callable 08/15/20 @ 100 | | | | | | | | |
6.125%, 08/15/40 | | | 4,730 | | | | 4,822 | |
Delaware County, Industrial Development Authority, Covanta Project, Ser A, RB | | | | | | | | |
Callable 07/01/20 @ 100 | | | | | | | | |
5.000%, 07/01/43 | | | 2,500 | | | | 2,485 | |
Pennsylvania State, Economic Development Financing Authority, Ser A-RE, RB | | | | | | | | |
Callable 09/01/25 @ 100 | | | | | | | | |
6.400%, 12/01/38 | | | 3,000 | | | | 3,118 | |
Pennsylvania State, Turnpike Commission, Ser A, RB | | | | | | | | |
Callable 12/01/24 @ 100 | | | | | | | | |
5.000%, 12/01/33 | | | 1,500 | | | | 1,694 | |
Pennsylvania State, Turnpike Commission, Sub-Ser E, RB | | | | | | | | |
Callable 12/01/27 @ 100 | | | | | | | | |
0.000%, 12/01/38(B) | | | 2,000 | | | | 2,230 | |
Philadelphia, Authority for Industrial Development, Mariana Bracetti Academy, RB | | | | | | | | |
Callable 12/15/21 @ 100 | | | | | | | | |
7.150%, 12/15/36 | | | 165 | | | | 180 | |
Philadelphia, Hospitals & Higher Education Facilities Authority, Temple University Health Systems Project, Ser A, RB | | | | | | | | |
Callable 07/01/22 @ 100 | | | | | | | | |
5.625%, 07/01/42 | | | 3,000 | | | | 3,153 | |
Pottsville, Hospital Authority, Schuykill Health System Project, RB | | | | | | | | |
Callable 07/01/24 @ 100 | | | | | | | | |
6.500%, 07/01/28 | | | 3,000 | | | | 3,236 | |
| | | | | | | | | |
Total Pennsylvania | | | | 25,954 | |
| | | | | | | | | |
Rhode Island [0.7%] | |
Tobacco Settlement Financing, Ser A, RB | | | | | | | | |
Callable 06/01/25 @ 100 | | | | | | | | |
5.000%, 06/01/35 | | | 2,500 | | | | 2,589 | |
Tobacco Settlement Financing, Ser A, RB | | | | | | | | |
Callable 06/01/25 @ 100 | | | | | | | | |
5.000%, 06/01/40 | | | 2,250 | | | | 2,286 | |
| | | | | | | | | |
Total Rhode Island | | | | 4,875 | |
| | | | | | | | | |
South Carolina [0.8%] | |
South Carolina State, Public Service Authority, Ser E, RB | | | | | | | | |
Callable 12/01/23 @ 100 | | | | | | | | |
5.500%, 12/01/53 | | | 5,000 | | | | 5,554 | |
| | | | | | | | | |
Tennessee [0.3%] | |
Johnson City, Health & Educational Facilities Board, Mountain States Health Alliance Project, RB | | | | | | | | |
Callable 07/01/20 @ 100 | | | | | | | | |
6.000%, 07/01/38 | | | 2,000 | | | | 2,241 | |
| | | | | | | | | |
Texas [10.2%] | |
Arlington, Higher Education Finance Corp., Universal Academy Project, Ser A, RB | | | | | | | | |
Callable 03/01/24 @ 100 | | | | | | | | |
7.000%, 03/01/34 | | | 400 | | | | 413 | |
See accompanying notes to financial statements.
CITY NATIONAL ROCHDALE FUNDS | PAGE 56
schedule of investments |
September 30, 2015 |
City National Rochdale Municipal High Income Fund (continued) |
Description | | Face Amount (000) | | | Value (000) | |
Arlington, Higher Education Finance Corp., Universal Academy Project, Ser A, RB | | | | | | |
Callable 03/01/24 @ 100 | | | | | | |
7.125%, 03/01/44 | | $ | 2,300 | | | $ | 2,401 | |
Bexar County, Health Facilities Development Corp., Army Retirement Residence Project, RB | | | | | | | | |
Callable 07/01/20 @ 100 | | | | | | | | |
6.200%, 07/01/45 | | | 3,250 | | | | 3,515 | |
Celina, Lakes at Mustang Ranch Public Improvement District Phase 1 Project, SAB | | | | | | | | |
5.375%, 09/01/28 | | | 400 | | | | 387 | |
Celina, Lakes at Mustang Ranch Public Improvement District Phase 1 Project, SAB | | | | | | | | |
5.500%, 09/01/32 | | | 250 | | | | 241 | |
Celina, Lakes at Mustang Ranch Public Improvement District Phase 1 Project, SAB | | | | | | | | |
5.875%, 09/01/40 | | | 600 | | | | 574 | |
Central Texas, Regional Mobility Authority, RB | | | | | | | | |
Callable 01/01/23 @ 100 | | | | | | | | |
5.000%, 01/01/33 | | | 1,000 | | | | 1,075 | |
Central Texas, Regional Mobility Authority, RB | | | | | | | | |
Callable 01/01/23 @ 100 | | | | | | | | |
5.000%, 01/01/42 | | | 1,000 | | | | 1,056 | |
Grand Parkway Transportation, Toll Revenue, Ser B, RB | | | | | | | | |
Callable 10/01/23 @ 100 | | | | | | | | |
5.000%, 04/01/53 | | | 2,000 | | | | 2,178 | |
Hackberry City, Public Improvement District No. 3, SAB | | | | | | | | |
Callable 09/01/19 @ 103 | | | | | | | | |
6.750%, 09/01/28 | | | 500 | | | | 522 | |
Hackberry City, Public Improvement District No. 3, SAB | | | | | | | | |
Callable 09/01/19 @ 103 | | | | | | | | |
7.000%, 09/01/33 | | | 475 | | | | 508 | |
Hackberry City, Public Improvement District No. 3, SAB | | | | | | | | |
Callable 09/01/19 @ 103 | | | | | | | | |
6.625%, 09/01/37 | | | 450 | | | | 470 | |
Hackberry City, Public Improvement District No. 3, SAB | | | | | | | | |
Callable 09/01/19 @ 103 | | | | | | | | |
6.750%, 09/01/44 | | | 525 | | | | 547 | |
Houston, Airport System Revenue, United Airlines Project, RB, AMT | | | | | | | | |
Callable 07/01/24 @ 100 | | | | | | | | |
5.000%, 07/01/29 | | | 3,000 | | | | 3,163 | |
Houston, Higher Education Finance, Ser A, RB | | | | | | | | |
Pre-Refunded @ 100 | | | | | | | | |
6.875%, 05/15/41(C) | | | 5,300 | | | | 6,861 | |
Leander, Oak Creek Public Improvement District, SAB | | | | | | | | |
Callable 09/01/19 @ 103 | | | | | | | | |
5.750%, 09/01/38 | | | 500 | | | | 491 | |
Leander, Oak Creek Public Improvement District, SAB | | | | | | | | |
Callable 09/01/19 @ 103 | | | | | | | | |
5.875%, 09/01/44 | | | 500 | | | | 490 | |
Lubbock, Health Facilities Development, First Mortgage - Carillon Project, Ser A, RB | | | | | | | | |
Callable 07/01/16 @ 101 | | | | | | | | |
6.500%, 07/01/26 | | | 430 | | | | 438 | |
Lubbock, Health Facilities Development, First Mortgage - Carillon Project, Ser A, RB | | | | | | | | |
Callable 07/01/16 @ 101 | | | | | | | | |
6.625%, 07/01/36 | | | 255 | | | | 259 | |
McLendon-Chisholm, Sonoma Public Improvement District Project, SAB | | | | | | | | |
Callable 09/15/20 @ 103 | | | | | | | | |
5.125%, 09/15/28 | | | 500 | | | | 488 | |
McLendon-Chisholm, Sonoma Public Improvement District Project, SAB | | | | | | | | |
Callable 09/15/20 @ 103 | | | | | | | | |
5.500%, 09/15/40 | | | 375 | | | | 362 | |
McLendon-Chishom, Sonoma Public Improvement District Project, SAB | | | | | | | | |
Callable 09/15/20 @ 103 | | | | | | | | |
5.375%, 09/15/35 | | | 400 | | | | 388 | |
North Texas State, Thruway Authority, Convertible Capital Appreciation Project, Ser C, RB | | | | | | | | |
Callable 09/01/31 @ 100 | | | | | | | | |
7.000%, 09/01/43(B) | | | 5,000 | | | | 4,526 | |
See accompanying notes to financial statements.
CITY NATIONAL ROCHDALE FUNDS | PAGE 57
schedule of investments |
September 30, 2015 |
City National Rochdale Municipal High Income Fund (continued) |
Description | | Face Amount (000) | | | Value (000) | |
Red River, Health Facilities Development, MRC Crossings Project, Ser B, RB | | | | | | |
Callable 11/02/15 @ 100 | | | | | | |
5.000%, 11/15/19 | | $ | 1,075 | | | $ | 1,077 | |
Sanger, Industrial Development Authority, Pellets Project, Ser B, RB, AMT | | | | | | | | |
Callable 07/01/22 @ 100 | | | | | | | | |
8.000%, 07/01/38 | | | 4,950 | | | | 5,338 | |
Tarrant County Cultural Education Facilities Finance, Buckingham Senior Living Community Project, RB | | | | | | | | |
Callable 11/15/25 @ 100 | | | | | | | | |
5.500%, 11/15/45 | | | 4,100 | | | | 4,100 | |
Tarrant County Cultural Education Facilities Finance, RB | | | | | | | | |
Callable 05/15/17 @ 100 | | | | | | | | |
4.500%, 11/15/21 | | | 3,500 | | | | 3,498 | |
Tarrant County, Cultural Education Facilities Finance, Buckingham Senior Living Community Project, RB | | | | | | | | |
Callable 11/15/17 @ 100 | | | | | | | | |
5.750%, 11/15/37 | | | 6,000 | | | | 6,098 | |
Tarrant County, Cultural Education Facilities Finance, Trinity Basin Preparatory Project, Ser A, RB | | | | | | | | |
Pre-Refunded @ 100 | | | | | | | | |
7.300%, 06/01/29(C) | | | 600 | | | | 715 | |
Texas State, Municipal Gas Acquisition & Supply I, Ser Senior D, RB | | | | | | | | |
6.250%, 12/15/26 | | | 3,575 | | | | 4,306 | |
Texas State, Municipal Gas Acquisition & Supply III, RB | | | | | | | | |
5.000%, 12/15/32 | | | 2,500 | | | | 2,685 | |
Texas State, Private Activity Bond Surface Transportation Corp., LBJ Infrastructure Project, RB | | | | | | | | |
Callable 06/30/20 @ 100 | | | | | | | | |
7.000%, 06/30/40 | | | 5,165 | | | | 6,121 | |
Texas State, Private Activity Bond Surface Transportation Corp., NTE Mobility Project, RB | | | | | | | | |
Callable 12/31/19 @ 100 | | | | | | | | |
6.875%, 12/31/39 | | | 5,350 | | | | 6,257 | |
| | | | | | | | | |
Total Texas | | | | 71,548 | |
| | | | | | | | | |
Virginia [2.4%] | |
Cherry Hill, Community Development Authority, SAB | | | | | | | | |
Callable 03/01/25 @ 100 | | | | | | | | |
5.150%, 03/01/35(A) | | | 1,000 | | | | 1,001 | |
Cherry Hill, Community Development Authority, SAB | | | | | | | | |
Callable 03/01/25 @ 100 | | | | | | | | |
5.400%, 03/01/45(A) | | | 2,000 | | | | 2,022 | |
James City County, Economic Development Authority, United Methodist Home Project, Ser A, RB | | | | | | | | |
Callable 06/01/23 @ 100 | | | | | | | | |
6.000%, 06/01/43 | | | 4,690 | | | | 4,362 | |
Lower Magnolia Green Community Development Authority, SAB | | | | | | | | |
Callable 03/01/25 @ 100 | | | | | | | | |
5.000%, 03/01/45(A) | | | 4,135 | | | | 4,017 | |
Virginia State, College Building Authority, Marymount University Project, Ser A, RB | | | | | | | | |
Callable 07/01/25 @ 100 | | | | | | | | |
5.000%, 07/01/35(A) | | | 1,200 | | | | 1,257 | |
Virginia State, College Building Authority, Marymount University Project, Ser A, RB | | | | | | | | |
Callable 07/01/25 @ 100 | | | | | | | | |
5.000%, 07/01/45(A) | | | 3,110 | | | | 3,114 | |
Virginia State, Small Business Financing Authority, Elizabeth River Project, RB, AMT | | | | | | | | |
Callable 07/01/22 @ 100 | | | | | | | | |
6.000%, 01/01/37 | | | 1,000 | | | | 1,139 | |
| | | | | | | | | |
Total Virginia | | | | 16,912 | |
| | | | | | | | | |
Washington [0.6%] | |
Washington State, Housing Finance Commission, Rockwood Retirement Community Project, RB | | | | | | | | |
Callable 10/22/15 @ 100 | | | | | | | | |
5.375%, 01/01/20(A) | | | 2,000 | | | | 2,003 | |
Washington State, Housing Finance Commission, Rockwood Retirement Community Project, RB | | | | | | | | |
Callable 01/01/24 @ 100 | | | | | | | | |
7.500%, 01/01/49(A) | | | 2,000 | | | | 2,265 | |
| | | | | | | | | |
Total Washington | | | | 4,268 | |
See accompanying notes to financial statements.
CITY NATIONAL ROCHDALE FUNDS | PAGE 58
schedule of investments |
September 30, 2015 |
City National Rochdale Municipal High Income Fund (continued) |
Description | | Face Amount (000) | | | Value (000) | |
Wisconsin [5.4%] | |
Public Finance Authority, Airport Facilities, Senior Trips Obligation Group Project, RB, AMT | | | | | | |
Callable 07/01/22 @ 100 | | | | | | |
5.000%, 07/01/42 | | $ | 1,000 | | | $ | 1,033 | |
Public Finance Authority, Coral Academy Project, RB | | | | | | | | |
Callable 07/01/24 @ 100 | | | | | | | | |
5.375%, 07/01/34 | | | 2,000 | | | | 2,038 | |
Public Finance Authority, Coral Academy Project, RB | | | | | | | | |
Callable 07/01/24 @ 100 | | | | | | | | |
5.625%, 07/01/44 | | | 3,500 | | | | 3,593 | |
Public Finance Authority, RB | | | | | | | | |
Callable 09/01/24 @ 100 | | | | | | | | |
5.000%, 09/01/30(A) | | | 800 | | | | 805 | |
Public Finance Authority, RB | | | | | | | | |
Callable 03/01/25 @ 100 | | | | | | | | |
5.250%, 03/01/35(A) | | | 1,250 | | | | 1,238 | |
Public Finance Authority, RB | | | | | | | | |
Callable 09/01/24 @ 100 | | | | | | | | |
5.000%, 09/01/38(A) | | | 1,580 | | | | 1,540 | |
Public Finance Authority, RB | | | | | | | | |
Callable 03/01/25 @ 100 | | | | | | | | |
5.500%, 03/01/45(A) | | | 3,460 | | | | 3,420 | |
Public Finance Authority, RB | | | | | | | | |
Callable 04/01/25 @ 100 | | | | | | | | |
5.875%, 04/01/45 | | | 3,000 | | | | 3,102 | |
Public Finance Authority, Las Ventanas Retirement Community Project, RB | | | | | | | | |
Callable 10/01/20 @ 102 | | | | | | | | |
7.000%, 10/01/42 | | | 5,400 | | | | 5,382 | |
Public Finance Authority, Ser A, RB | | | | | | | | |
Callable 06/15/25 @ 100 | | | | | | | | |
5.500%, 06/15/35(A) | | | 3,000 | | | | 2,905 | |
Public Finance Authority, Ser A, RB | | | | | | | | |
Callable 06/15/25 @ 100 | | | | | | | | |
5.500%, 06/15/45(A) | | | 4,280 | | | | 4,041 | |
Wisconsin State, Health & Educational Facilities Authority, RB | | | | | | | | |
Callable 10/01/22 @ 102 | | | | | | | | |
5.500%, 10/01/49 | | | 2,500 | | | | 2,496 | |
Wisconsin State, Health & Educational Facilities Authority, RB | | | | | | | | |
Callable 12/01/22 @ 102 | | | | | | | | |
5.250%, 12/01/49 | | | 6,000 | | | | 6,015 | |
| | | | | | | | | |
Total Wisconsin | | | | 37,608 | |
| | | | | | | | | |
Puerto Rico [3.7%] | |
Puerto Rico, Commonwealth, Aqueduct & Sewer Authority, Ser A, RB | | | | | | | | |
Callable 07/01/22 @ 100 | | | | | | | | |
5.250%, 07/01/24 | | | 2,590 | | | | 1,829 | |
Puerto Rico, Commonwealth, Aqueduct & Sewer Authority, Ser A, RB | | | | | | | | |
Callable 07/01/22 @ 100 | | | | | | | | |
5.250%, 07/01/42 | | | 840 | | | | 569 | |
Puerto Rico, Commonwealth, Aqueduct & Sewer Authority, Ser Senior A, RB | | | | | | | | |
Callable 07/01/18 @ 100 | | | | | | | | |
6.000%, 07/01/38 | | | 4,000 | | | | 2,785 | |
Puerto Rico, Commonwealth, Aqueduct & Sewer Authority, Ser Senior A, RB | | | | | | | | |
Callable 07/01/18 @ 100 | | | | | | | | |
6.000%, 07/01/44 | | | 3,000 | | | | 2,078 | |
Puerto Rico, Commonwealth, Ser A, GO | | | | | | | | |
Callable 07/01/20 @ 100 | | | | | | | | |
8.000%, 07/01/35 | | | 10,000 | | | | 7,500 | |
Puerto Rico, Electric Power Authority, Ser A, RB | | | | | | | | |
Callable 07/01/23 @ 100 | | | | | | | | |
7.000%, 07/01/33 | | | 1,440 | | | | 929 | |
Puerto Rico, Electric Power Authority, Ser A, RB | | | | | | | | |
Callable 07/01/23 @ 100 | | | | | | | | |
7.000%, 07/01/40 | | | 1,000 | | | | 645 | |
Puerto Rico, Electric Power Authority, Ser A, RB | | | | | | | | |
Callable 07/01/22 @ 100 | | | | | | | | |
5.000%, 07/01/42 | | | 1,310 | | | | 845 | |
Puerto Rico, Electric Power Authority, Ser WW, RB | | | | | | | | |
Callable 07/01/18 @ 100 | | | | | | | | |
5.500%, 07/01/38 | | | 1,060 | | | | 684 | |
Puerto Rico, Electric Power Authority, Ser XX, RB | | | | | | | | |
Callable 07/01/20 @ 100 | | | | | | | | |
5.750%, 07/01/36 | | | 940 | | | | 606 | |
See accompanying notes to financial statements.
CITY NATIONAL ROCHDALE FUNDS | PAGE 59
schedule of investments |
September 30, 2015 |
City National Rochdale Municipal High Income Fund (concluded) |
Description | | Face Amount (000)/Shares | | | Value (000) | |
Puerto Rico, Sales Tax Financing, Sub-Ser A, RB | | | | | | |
Callable 02/01/20 @ 100 | | | | | | |
5.375%, 08/01/39 | | $ | 7,000 | | | $ | 2,949 | |
Puerto Rico, Sales Tax Financing, Sub-Ser A, RB | | | | | | | | |
Callable 08/01/19 @ 100 | | | | | | | | |
6.000%, 08/01/42 | | | 3,500 | | | | 1,479 | |
Puerto Rico, Sales Tax Financing, Sub-Ser A, RB | | | | | | | | |
Callable 08/01/19 @ 100 | | | | | | | | |
6.500%, 08/01/44 | | | 1,250 | | | | 534 | |
Puerto Rico, Sales Tax Financing, Sub-Ser C, RB | | | | | | | | |
5.250%, 08/01/40 | | | 3,000 | | | | 1,875 | |
Puerto Rico, Sales Tax Financing, Sub-Ser C, RB | | | | | | | | |
Callable 08/01/20 @ 100 | | | | | | | | |
5.250%, 08/01/41 | | | 1,000 | | | | 421 | |
| | | | | | | | | |
Total Puerto Rico | | | | 25,728 | |
| | | | | | | | | |
Total Municipal Bonds | |
(Cost $623,120) | | | | 631,059 | |
| | | | | | | | | |
Short-Term Investments [8.8%] | |
City National Rochdale Government Money Market Fund, Institutional Class, 0.010%** ‡ | | | 33,108,254 | | | | 33,108 | |
SEI Daily Income Trust Government Fund, Cl A, 0.010%** | | | 28,172,329 | | | | 28,173 | |
| | | | | | | | | |
Total Short-Term Investments | |
(Cost $61,281) | | | | 61,281 | |
| | | | | | | | | |
Total Investments [99.0%] | |
(Cost $684,401) | | | $ | 692,340 | |
Percentages are based on Net Assets of $699,662 (000).
‡ | Investment in Affiliate. |
** | The rate reported is the 7-day effective yield as of September 30, 2015. |
(A) | Security exempt from registration under Rule 144A of the Securities Act of 1933. These securities may be resold in transactions exempt from registration normally to qualified institutions. On September 30, 2015, the value of these securities amounted to $89,234 (000), representing 12.8% of the net assets of the Fund. |
(B) | Step Bond — The rate reported is the rate in effect on September 30, 2015. The coupon on a step bond changes on a specific date. |
(C) | Pre-Refunded Security — The maturity date shown is the pre-refunded date. |
(D) | Floating Rate Security — The rate reported is the rate in effect on September 30, 2015. |
AGM — Assured Guarantee Municipal
AMBAC — American Municipal Bond Assurance Company
AMT — Alternative Minimum Tax (subject to)
COP — Certificate of Participation
GO — General Obligation
RB — Revenue Bond
SAB — Special Assessment Board
Ser — Series
SPL Tax — Special Tax
TA — Tax Allocation
A list of open futures contracts held by the Fund at September 30, 2015, is as follows:
Type of Contract | | Number of Contracts Short | | Expiration Date | | Unrealized (Depreciation) ($ Thousands) | |
U.S. Long Treasury Bond | | | (89) | | Dec-2015 | | $ | (58 | ) |
For the year ended September 30, 2015, the total amount of all open futures contracts, as presented in the table above, are representative of the volume of activity for this derivative type during the year.
The following is a list of the inputs used as of September 30, 2015 is valuing the Fund’s investments and other financial instruments carried at value (000):
Investments in Securities | | Level 1 | | | Level 2 | | | Level 3 | | | Total | |
Municipal Bonds | | $ | — | | | $ | 631,059 | | | $ | — | | | $ | 631,059 | |
Short-Term Investments | | | 61,281 | | | | — | | | | — | | | | 61,281 | |
Total Investments in Securities | | $ | 61,281 | | | $ | 631,059 | | | $ | — | | | $ | 692,340 | |
Other Financial Instruments | | Level 1 | | | Level 2 | | | Level 3 | | | Total | |
Futures Contracts* Depreciation | | $ | (58 | ) | | $ | — | | | $ | — | | | $ | (58 | ) |
* | Futures contracts are valued at the unrealized depreciation on the instrument. |
For the year ended September 30, 2015, there have been no transfers between any of the fair value hierarchy levels. Transfers between Levels are recognized at period end.
For more information on valuation inputs, see Note 2 — Significant Accounting Policies in the Notes to Financial Statements.
See accompanying notes to financial statements.
CITY NATIONAL ROCHDALE FUNDS | PAGE 60
schedule of investments |
September 30, 2015 |
City National Rochdale High Yield Bond Fund |
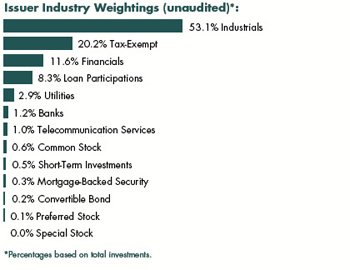
Description | | Face Amount (000) | | | Value (000) | |
Corporate Bonds [89.3%] | |
Advertising Agencies [1.7%] | |
MDC Partners | | | | | | |
6.750%, 04/01/20(A) | | $ | 1,450 | | | $ | 1,432 | |
| | | | | | | | | |
Aerospace & Defense [1.4%] | |
LMI Aerospace | | | | | | | | |
7.375%, 07/15/19 | | | 400 | | | | 386 | |
Orbital ATK | | | | | | | | |
5.500%, 10/01/23(A) | | | 450 | | | | 451 | |
StandardAero Aviation Holdings | | | | | | | | |
10.000%, 07/15/23(A) | | | 400 | | | | 396 | |
| | | | | | | | | |
Total Aerospace & Defense | | | | 1,233 | |
| | | | | | | | | |
Air Transportation [0.7%] | |
CEVA Group | | | | | | | | |
7.000%, 03/01/21(A) | | | 725 | | | | 642 | |
| | | | | | | | | |
Airlines [0.1%] | |
Continental Airlines, Ser 2009-2, Cl B | | | | | | | | |
9.250%, 05/10/17 | | | 87 | | | | 94 | |
| | | | | | | | | |
Automotive [0.8%] | |
Midas Intermediate Holdco II | | | | | | | | |
7.875%, 10/01/22(A) | | | 675 | | | | 658 | |
| | | | | | | | | |
Banks [0.3%] | |
Compass Bank | | | | | | | | |
3.875%, 04/10/25 | | | 300 | | | | 280 | |
| | | | | | | | | |
Broadcasting & Cable [3.8%] | |
Anixter | | | | | | | | |
5.500%, 03/01/23(A) | | | 450 | | | | 443 | |
CCO Holdings | | | | | | | | |
5.125%, 05/01/23(A) | | | 450 | | | | 415 | |
CSC Holdings | | | | | | | | |
5.250%, 06/01/24 | | | 200 | | | | 158 | |
DISH DBS | | | | | | | | |
5.875%, 07/15/22 | | | 650 | | | | 575 | |
5.875%, 11/15/24 | | | 100 | | | | 85 | |
Midcontinent Communications & Midcontinent Finance | | | | | | | | |
6.875%, 08/15/23(A) | | | 250 | | | | 249 | |
Sirius XM Radio | | | | | | | | |
5.375%, 04/15/25(A) | | | 400 | | | | 383 | |
Unitymedia GmbH | | | | | | | | |
6.125%, 01/15/25(A) | | | 200 | | | | 197 | |
Unitymedia Hessen GmbH & KG | | | | | | | | |
5.000%, 01/15/25(A) | | | 400 | | | | 376 | |
Univision Communications | | | | | | | | |
5.125%, 02/15/25(A) | | | 400 | | | | 375 | |
| | | | | | | | | |
Total Broadcasting & Cable | | | | 3,256 | |
| | | | | | | | | |
Building & Construction [1.1%] | |
Building Materials Corp of America | | | | | | | | |
6.000%, 10/15/25(A) | | | 250 | | | | 252 | |
Dycom Investments | | | | | | | | |
7.125%, 01/15/21 | | | 300 | | | | 316 | |
Reliance Intermediate Holdings | | | | | | | | |
6.500%, 04/01/23(A) | | | 400 | | | | 400 | |
| | | | | | | | | |
Total Building & Construction | | | | 968 | |
| | | | | | | | | |
Business Services [0.8%] | |
FTI Consulting | | | | | | | | |
6.000%, 11/15/22 | | | 700 | | | | 725 | |
| | | | | | | | | |
Coal Mining [0.9%] | |
CONSOL Energy | | | | | | | | |
8.000%, 04/01/23(A) | | | 700 | | | | 500 | |
5.875%, 04/15/22 | | | 450 | | | | 303 | |
| | | | | | | | | |
Total Coal Mining | | | | 803 | |
| | | | | | | | | |
Commercial Serv-Finance [0.5%] | |
WEX | | | | | | | | |
4.750%, 02/01/23(A) | | | 450 | | | | 430 | |
See accompanying notes to financial statements.
CITY NATIONAL ROCHDALE FUNDS | PAGE 61
schedule of investments |
September 30, 2015 |
City National Rochdale High Yield Bond Fund (continued) |
Description | | Face Amount (000) | | | Value (000) | |
Commercial Services [0.1%] | |
Iron Mountain | | | | | | |
6.000%, 10/01/20(A) | | $ | 100 | | | $ | 101 | |
| | | | | | | | | |
Computer Graphics [1.8%] | |
Epicor Software | | | | | | | | |
9.250%, 05/21/23 | | | 1,600 | | | | 1,552 | |
| | | | | | | | | |
Computer System Design & Services [1.7%] | |
Brocade Communications Systems | | | | | | | | |
4.625%, 01/15/23 | | | 450 | | | | 434 | |
NCR | | | | | | | | |
6.375%, 12/15/23 | | | 400 | | | | 392 | |
5.875%, 12/15/21 | | | 650 | | | | 637 | |
| | | | | | | | | |
Total Computer System Design & Services | | | | 1,463 | |
| | | | | | | | | |
Consumer Products & Services [4.3%] | |
Central Garden and Pet | | | | | | | | |
8.250%, 03/01/18 | | | 1,955 | | | | 1,982 | |
Spectrum Brands | | | | | | | | |
5.750%, 07/15/25(A) | | | 200 | | | | 204 | |
Tempur Sealy International | | | | | | | | |
5.625%, 10/15/23(A) | | | 75 | | | | 75 | |
WMG Acquisition | | | | | | | | |
6.750%, 04/15/22(A) | | | 450 | | | | 423 | |
6.000%, 01/15/21(A) | | | 993 | | | | 993 | |
| | | | | | | | | |
Total Consumer Products & Services | | | | 3,677 | |
| | | | | | | | | |
Containers & Packaging [1.2%] | |
Berry Plastics Escrow | | | | | | | | |
6.000%, 10/15/22(A) | | | 150 | | | | 150 | |
Novelis | | | | | | | | |
8.750%, 12/15/20 | | | 400 | | | | 385 | |
Reynolds Group Issuer | | | | | | | | |
7.875%, 08/15/19 | | | 500 | | | | 520 | |
| | | | | | | | | |
Total Containers & Packaging | | | | 1,055 | |
| | | | | | | | | |
Data Processing/Mgmt [1.1%] | |
Audatex North America | | | | | | | | |
6.125%, 11/01/23(A) | | | 200 | | | | 201 | |
6.000%, 06/15/21(A) | | | 300 | | | | 300 | |
First Data | | | | | | | | |
8.750%, 01/15/22(A) (B) | | | 460 | | | | 481 | |
| | | | | | | | | |
Total Data Processing/Mgmt | | | | 982 | |
| | | | | | | | | |
Distribution/Wholesale [0.4%] | |
VWR Funding | | | | | | | | |
4.625%, 04/15/22(A) | | | 300 | | | | 316 | |
| | | | | | | | | |
Diversified Operations [1.0%] | |
Actuant | | | | | | | | |
5.625%, 06/15/22 | | | 300 | | | | 299 | |
Amsted Industries | | | | | | | | |
5.375%, 09/15/24(A) | | | 250 | | | | 243 | |
5.000%, 03/15/22(A) | | | 350 | | | | 345 | |
| | | | | | | | | |
Total Diversified Operations | | | | 887 | |
| | | | | | | | | |
Drugs [1.4%] | |
Valeant Pharmaceuticals International | | | | | | | | |
5.500%, 03/01/23(A) | | | 250 | | | | 237 | |
5.375%, 03/15/20(A) | | | 1,000 | | | | 972 | |
| | | | | | | | | |
Total Drugs | | | | 1,209 | |
| | | | | | | | | |
E-Commerce/Services [0.3%] | |
IAC | | | | | | | | |
4.750%, 12/15/22 | | | 250 | | | | 230 | |
| | | | | | | | | |
Electric Utilities [1.8%] | |
AES | | | | | | | | |
7.375%, 07/01/21 | | | 750 | | | | 778 | |
3.283%, 12/01/15(C) | | | 350 | | | | 333 | |
Terraform Global Operating | | | | | | | | |
9.750%, 08/15/22(A) | | | 500 | | | | 401 | |
| | | | | | | | | |
Total Electric Utilities | | | | 1,512 | |
| | | | | | | | | |
Energy & Power [1.9%] | |
ContourGlobal Power Holdings | | | | | | | | |
7.125%, 06/01/19(A) | | | 1,250 | | | | 1,253 | |
TerraForm Power Operating | | | | | | | | |
6.125%, 06/15/25(A) | | | 125 | | | | 108 | |
5.875%, 02/01/23(A) | | | 350 | | | | 309 | |
| | | | | | | | | |
Total Energy & Power | | | | 1,670 | |
| | | | | | | | | |
Engines-Internal Combust [1.0%] | |
Briggs & Stratton | | | | | | | | |
6.875%, 12/15/20 | | | 800 | | | | 864 | |
| | | | | | | | | |
Enterprise Software/Serv [2.7%] | |
Information US | | | | | | | | |
6.500%, 05/15/22(A) | | | 1,000 | | | | 917 | |
5.750%, 08/15/20(A) | | | 300 | | | | 299 | |
See accompanying notes to financial statements.
CITY NATIONAL ROCHDALE FUNDS | PAGE 62
schedule of investments |
September 30, 2015 |
City National Rochdale High Yield Bond Fund (continued) |
Description | | Face Amount (000) | | | Value (000) | |
Open Text | | | | | | |
5.625%, 01/15/23(A) | | $ | 1,150 | | | $ | 1,141 | |
| | | | | | | | | |
Total Enterprise Software/Serv | | | | 2,357 | |
| | | | | | | | | |
Entertainment & Gaming [1.4%] | |
Buffalo Thunder Development Authority | | | | | | | | |
11.000%, 12/09/22(A) (F) | | | 35 | | | | 24 | |
0.000%, 11/15/29(A) (D) (F) | | | 16 | | | | — | |
Mashantucket Western Pequot Tribe | | | | | | | | |
6.500%, 07/01/36 (F) | | | 85 | | | | 1 | |
Seminole Hard Rock Entertainment | | | | | | | | |
5.875%, 05/15/21(A) | | | 250 | | | | 246 | |
Wynn Las Vegas | | | | | | | | |
5.500%, 03/01/25(A) | | | 1,100 | | | | 943 | |
| | | | | | | | | |
Total Entertainment & Gaming | | | | 1,214 | |
| | | | | | | | | |
Financial Services [5.0%] | |
Credit Acceptance | | | | | | | | |
6.125%, 02/15/21 | | | 450 | | | | 443 | |
Icahn Enterprises | | | | | | | | |
5.875%, 02/01/22 | | | 1,150 | | | | 1,157 | |
Jefferies Finance | | | | | | | | |
7.500%, 04/15/21(A) | | | 1,000 | | | | 935 | |
7.375%, 04/01/20(A) | | | 495 | | | | 477 | |
Jefferies LoanCore | | | | | | | | |
6.875%, 06/01/20(A) | | | 450 | | | | 430 | |
NewStar Financial | | | | | | | | |
7.250%, 05/01/20(A) | | | 300 | | | | 299 | |
Oxford Finance | | | | | | | | |
7.250%, 01/15/18(A) | | | 450 | | | | 459 | |
Quicken Loans | | | | | | | | |
5.750%, 05/01/25(A) | | | 150 | | | | 141 | |
| | | | | | | | | |
Total Financial Services | | | | 4,341 | |
| | | | | | | | | |
Food, Beverage & Tobacco [3.1%] | |
Bumble Bee Holdings | | | | | | | | |
9.000%, 12/15/17(A) | | | 923 | | | | 942 | |
Darling Ingredients | | | | | | | | |
5.375%, 01/15/22 | | | 300 | | | | 294 | |
Le-Nature’s | | | | | | | | |
9.000%, 06/15/13(A) (D) (F) | | | 150 | | | | — | |
Vector Group | | | | | | | | |
7.750%, 02/15/21 | | | 1,350 | | | | 1,427 | |
| | | | | | | | | |
Total Food, Beverage & Tobacco | | | | 2,663 | |
| | | | | | | | | |
Food-Wholesale/Distrib [0.6%] | |
KeHE Distributors | | | | | | | | |
7.625%, 08/15/21(A) | | | 450 | | | | 472 | |
| | | | | | | | | |
Gas-Distribution [1.1%] | |
LBC Tank Terminals Holding Netherlands | | | | | | | | |
6.875%, 05/15/23(A) | | | 950 | | | | 986 | |
| | | | | | | | | |
Gold Mining [0.8%] | |
Eldorado | | | | | | | | |
6.125%, 12/15/20(A) | | | 800 | | | | 696 | |
| | | | | | | | | |
Hotels and Motels [0.2%] | |
Interval Acquisition | | | | | | | | |
5.625%, 04/15/23(A) | | | 200 | | | | 197 | |
| | | | | | | | | |
Industrial [1.2%] | |
Unifrax I | | | | | | | | |
7.500%, 02/15/19(A) | | | 1,025 | | | | 1,004 | |
| | | | | | | | | |
Insurance [2.6%] | |
American Equity Investment Life Holding | | | | | | | | |
6.625%, 07/15/21 | | | 1,050 | | | | 1,102 | |
Ironshore Holdings US | | | | | | | | |
8.500%, 05/15/20(A) | | | 950 | | | | 1,116 | |
| | | | | | | | | |
Total Insurance | | | | 2,218 | |
| | | | | | | | | |
Internet Connectiv Svcs [0.9%] | |
Cogent Communications Group | | | | | | | | |
5.375%, 03/01/22(A) | | | 300 | | | | 290 | |
Zayo Group | | | | | | | | |
6.375%, 05/15/25(A) | | | 550 | | | | 528 | |
| | | | | | | | | |
Total Internet Connectiv Svcs | | | | 818 | |
| | | | | | | | | |
Internet Infrastr Sftwr [0.2%] | |
TIBCO Software | | | | | | | | |
11.375%, 12/01/21(A) | | | 150 | | | | 150 | |
| | | | | | | | | |
Investment Banker/Broker Dealer [1.0%] | |
Ares Finance II | | | | | | | | |
5.250%, 09/01/25(A) | | | 350 | | | | 356 | |
National Financial Partners | | | | | | | | |
9.000%, 07/15/21(A) | | | 500 | | | | 482 | |
| | | | | | | | | |
Total Investment Banker/Broker Dealer | | | | 838 | |
See accompanying notes to financial statements.
CITY NATIONAL ROCHDALE FUNDS | PAGE 63
schedule of investments |
September 30, 2015 |
City National Rochdale High Yield Bond Fund (continued) |
Description | | Face Amount (000) | | | Value (000) | |
Investment Banks [1.4%] | |
Citigroup | | | | | | |
6.300%, 12/29/49(C) | | $ | 400 | | | $ | 385 | |
Royal Bank of Scotland Group | | | | | | | | |
1.213%, 12/30/15(C) | | | 800 | | | | 800 | |
| | | | | | | | | |
Total Investment Banks | | | | 1,185 | |
| | | | | | | | | |
Machinery [0.8%] | |
CNH Industrial Capital | | | | | | | | |
3.875%, 07/16/18(A) | | | 250 | | | | 245 | |
Tempel Steel | | | | | | | | |
12.000%, 08/15/16(A) | | | 500 | | | | 454 | |
| | | | | | | | | |
Total Machinery | | | | 699 | |
| | | | | | | | | |
Medical Products & Services [1.6%] | |
Halyard Health | | | | | | | | |
6.250%, 10/15/22 | | | 400 | | | | 408 | |
Tenet Healthcare | | | | | | | | |
3.786%, 12/15/15(A) (C) | | | 1,000 | | | | 993 | |
| | | | | | | | | |
Total Medical Products & Services | | | | 1,401 | |
| | | | | | | | | |
Metals & Mining [0.2%] | |
Kaiser Aluminum | | | | | | | | |
8.250%, 06/01/20 | | | 170 | | | | 181 | |
| | | | | | | | | |
Miscellaneous Business Services [0.7%] | |
ADT | | | | | | | | |
6.250%, 10/15/21 | | | 400 | | | | 412 | |
3.500%, 07/15/22 | | | 200 | | | | 177 | |
| | | | | | | | | |
Total Miscellaneous Business Services | | | | 589 | |
| | | | | | | | | |
Oil-Field Services [1.1%] | |
Exterran Holdings | | | | | | | | |
7.250%, 12/01/18 | | | 550 | | | | 539 | |
FTS International | | | | | | | | |
7.783%, 12/01/15(A) (C) | | | 550 | | | | 407 | |
| | | | | | | | | |
Total Oil-Field Services | | | | 946 | |
| | | | | | | | | |
Oil-US Royalty Trusts [0.2%] | |
IronGate Energy Services | | | | | | | | |
11.000%, 07/01/18(A) (F) | | | 275 | | | | 175 | |
| | | | | | | | | |
Paper & Related Products [1.9%] | |
Cascades | | | | | | | | |
5.750%, 07/15/23(A) | | | 200 | | | | 191 | |
Opal Acquisition | | | | | | | | |
8.875%, 12/15/21(A) | | | 1,500 | | | | 1,412 | |
| | | | | | | | | |
Total Paper & Related Products | | | | 1,603 | |
| | | | | | | | | |
Petrochemicals [0.9%] | |
TPC Group | | | | | | | | |
8.750%, 12/15/20(A) | | | 895 | | | | 765 | |
| | | | | | | | | |
Petroleum & Fuel Products [9.5%] | |
Antero Resources | | | | | | | | |
5.625%, 06/01/23(A) | | | 350 | | | | 307 | |
5.125%, 12/01/22 | | | 350 | | | | 301 | |
Antero Resources Finance | | | | | | | | |
5.375%, 11/01/21 | | | 50 | | | | 44 | |
Atlas Energy Holdings Operating | | | | | | | | |
9.250%, 08/15/21(F) | | | 725 | | | | 305 | |
7.750%, 01/15/21(F) | | | 975 | | | | 409 | |
BreitBurn Energy Partners | | | | | | | | |
7.875%, 04/15/22 | | | 1,100 | | | | 393 | |
Comstock Resources | | | | | | | | |
10.000%, 03/15/20(A) | | | 750 | | | | 521 | |
Crestwood Midstream Partners | | | | | | | | |
6.125%, 03/01/22 | | | 550 | | | | 476 | |
EP Energy | | | | | | | | |
9.375%, 05/01/20 | | | 500 | | | | 430 | |
6.375%, 06/15/23 | | | 400 | | | | 295 | |
FTS International | | | | | | | | |
6.250%, 05/01/22 | | | 450 | | | | 140 | |
Gibson Energy | | | | | | | | |
6.750%, 07/15/21(A) | | | 300 | | | | 288 | |
Legacy Reserves | | | | | | | | |
8.000%, 12/01/20 | | | 760 | | | | 547 | |
6.625%, 12/01/21 | | | 750 | | | | 510 | |
Milagro Oil & Gas | | | | | | | | |
10.500%, 05/15/16(D) (F) | | | 400 | | | | 120 | |
Precision Drilling | | | | | | | | |
6.625%, 11/15/20 | | | 475 | | | | 414 | |
QEP Resources | | | | | | | | |
5.250%, 05/01/23 | | | 300 | | | | 251 | |
Sabine Pass Liquefaction | | | | | | | | |
5.625%, 04/15/23 | | | 950 | | | | 843 | |
SandRidge Energy | | | | | | | | |
8.750%, 06/01/20(A) | | | 400 | | | | 243 | |
8.125%, 10/15/22 | | | 850 | | | | 183 | |
Ultra Petroleum | | | | | | | | |
5.750%, 12/15/18(A) | | | 700 | | | | 504 | |
See accompanying notes to financial statements.
CITY NATIONAL ROCHDALE FUNDS | PAGE 64
schedule of investments |
September 30, 2015 |
City National Rochdale High Yield Bond Fund (continued) |
Description | | Face Amount (000) | | | Value (000) | |
Unit | | | | | | |
6.625%, 05/15/21 | | $ | 850 | | | $ | 697 | |
| | | | | | | | | |
Total Petroleum & Fuel Products | | | | 8,221 | |
| | | | | | | | | |
Publishing-Books [1.5%] | |
McGraw-Hill Global Education Holdings | | | | | | | | |
9.750%, 04/01/21 | | | 1,150 | | | | 1,256 | |
| | | | | | | | | |
Real Estate [1.0%] | |
Kennedy-Wilson | | | | | | | | |
5.875%, 04/01/24 | | | 850 | | | | 831 | |
| | | | | | | | | |
Real Estate Investment Trusts [1.3%] | |
Corrections Corp of America | | | | | | | | |
5.000%, 10/15/22 | | | 250 | | | | 250 | |
DuPont Fabros Technology | | | | | | | | |
5.625%, 06/15/23 | | | 350 | | | | 352 | |
Hospitality Properties Trust | | | | | | | | |
4.500%, 03/15/25 | | | 550 | | | | 539 | |
| | | | | | | | | |
Total Real Estate Investment Trusts | | | | 1,141 | |
| | | | | | | | | |
Real Estate Oper/Develop [0.2%] | |
Greystar Real Estate Partners | | | | | | | | |
8.250%, 12/01/22(A) | | | 200 | | | | 209 | |
| | | | | | | | | |
Research and Development [0.2%] | |
Jaguar Holding II | | | | | | | | |
6.375%, 08/01/23(A) | | | 200 | | | | 194 | |
| | | | | | | | | |
Retail [5.4%] | |
AmeriGas Finance | | | | | | | | |
7.000%, 05/20/22 | | | 1,010 | | | | 1,035 | |
Brunswick | | | | | | | | |
4.625%, 05/15/21(A) | | | 550 | | | | 546 | |
Carrols Restaurant | | | | | | | | |
8.000%, 05/01/22 | | | 200 | | | | 211 | |
Checkers Drive-In Restaurants | | | | | | | | |
11.000%, 12/01/17(A) | | | 650 | | | | 691 | |
Ferrellgas | | | | | | | | |
6.750%, 01/15/22 | | | 300 | | | | 279 | |
6.750%, 06/15/23(A) | | | 600 | | | | 546 | |
6.500%, 05/01/21 | | | 50 | | | | 47 | |
Men’s Wearhouse | | | | | | | | |
7.000%, 07/01/22 | | | 300 | | | | 309 | |
Nathan’s Famous | | | | | | | | |
10.000%, 03/15/20(A) (F) | | | 250 | | | | 262 | |
NPC International | | | | | | | | |
10.500%, 01/15/20 | | | 225 | | | | 234 | |
Petco Animal Supplies | | | | | | | | |
9.250%, 12/01/18(A) | | | 300 | | | | 304 | |
PF Chang’s China Bistro | | | | | | | | |
10.250%, 06/30/20(A) | | | 285 | | | | 277 | |
| | | | | | | | | |
Total Retail | | | | 4,741 | |
| | | | | | | | | |
Security Brokers & Dealers [1.1%] | |
Citigroup | | | | | | | | |
5.950%, 10/24/15(C) | | | 200 | | | | 188 | |
Goldman Sachs Group | | | | | | | | |
5.375%, 10/23/15(C) | | | 300 | | | | 293 | |
JPMorgan Chase | | | | | | | | |
5.300%, 10/21/15(C) | | | 500 | | | | 491 | |
| | | | | | | | | |
Total Security Brokers & Dealers | | | | 972 | |
| | | | | | | | | |
Semi-Conductors [1.5%] | |
Applied Materials | | | | | | | | |
3.900%, 10/01/25 | | | 250 | | | | 249 | |
Micron Technology | | | | | | | | |
5.250%, 08/01/23(A) | | | 1,150 | | | | 1,058 | |
| | | | | | | | | |
Total Semi-Conductors | | | | 1,307 | |
| | | | | | | | | |
Telecommunication Equip [1.3%] | |
Avaya | | | | | | | | |
7.000%, 04/01/19(A) | | | 850 | | | | 674 | |
CommScope Technologies Finance | | | | | | | | |
6.000%, 06/15/25(A) | | | 500 | | | | 480 | |
| | | | | | | | | |
Total Telecommunication Equip | | | | 1,154 | |
| | | | | | | | | |
Telephones & Telecommunications [4.6%] | |
Altice US Finance I | | | | | | | | |
5.375%, 07/15/23(A) | | | 350 | | | | 336 | |
CenturyLink | | | | | | | | |
5.625%, 04/01/25(A) | | | 350 | | | | 278 | |
Interoute Finco | | | | | | | | |
7.375%, 10/15/20(A) | | | 500 | | | | 494 | |
Level 3 Financing | | | | | | | | |
5.375%, 05/01/25(A) | | | 850 | | | | 797 | |
Neptune Finco | | | | | | | | |
6.625%, 10/15/25(A) | | | 300 | | | | 302 | |
Sirius XM Canada Holdings | | | | | | | | |
5.625%, 04/23/21(A) | | | 600 | | | | 447 | |
Sprint | | | | | | | | |
7.625%, 02/15/25 | | | 250 | | | | 194 | |
Sprint Communications | | | | | | | | |
9.000%, 11/15/18(A) | | | 400 | | | | 420 | |
See accompanying notes to financial statements.
CITY NATIONAL ROCHDALE FUNDS | PAGE 65
schedule of investments |
September 30, 2015 |
City National Rochdale High Yield Bond Fund (continued) |
Description | | Face Amount (000) | | | Value (000) | |
UPCB Finance IV | | | | | | |
5.375%, 01/15/25(A) | | $ | 300 | | | $ | 276 | |
Virgin Media Secured Finance | | | | | | | | |
5.250%, 01/15/26(A) | | | 500 | | | | 460 | |
| | | | | | | | | |
Total Telephones & Telecommunications | | | | 4,004 | |
| | | | | | | | | |
Transportation Services [1.2%] | |
HRG Group | | | | | | | | |
7.875%, 07/15/19 | | | 604 | | | | 627 | |
7.875%, 07/15/19(A) | | | 150 | | | | 155 | |
Moto Finance | | | | | | | | |
6.375%, 09/01/20(A) | | | 150 | | | | 229 | |
| | | | | | | | | |
Total Transportation Services | | | | 1,011 | |
| | | | | | | | | |
Utility [0.8%] | |
Suburban Propane Partners | | | | | | | | |
5.750%, 03/01/25 | | | 250 | | | | 237 | |
5.500%, 06/01/24 | | | 450 | | | | 416 | |
| | | | | | | | | |
Total Utility | | | | 653 | |
| | | | | | | | | |
Total Corporate Bonds | |
(Cost $85,191) | | | | 77,231 | |
| | | | | | | | | |
Loan Participations [8.2%] | |
Aerospace [0.2%] | |
TransDigm Inc., Term Loan E | | | | | | | | |
3.500%, 05/13/22 | | | 199 | | | | 196 | |
| | | | | | | | | |
Automotive [0.6%] | |
Mavis Tire Supply, Term Loan | | | | | | | | |
6.250%, 11/02/20(F) | | | 550 | | | | 542 | |
| | | | | | | | | |
Communications [1.1%] | |
Numericable, Cov-Lite Term Loan B-5 | | | | | | | | |
4.000%, 07/27/22 | | | 400 | | | | 392 | |
Tibco Software, First Lien Term Loan | | | | | | | | |
6.500%, 11/25/20(F) | | | 547 | | | | 542 | |
| | | | | | | | | |
Total Communications | | | | 934 | |
| | | | | | | | | |
Computers & Electronics [1.0%] | |
Advanced Computer, Second Lien Term Loan | | | | | | | | |
10.500%, 01/31/23 | | | 400 | | | | 384 | |
Epicor Software, First Lien Term Loan | | | | | | | | |
4.750%, 06/01/22 | | | 499 | | | | 495 | |
| | | | | | | | | |
Total Computers & Electronics | | | | 879 | |
| | | | | | | | | |
Financial Services [0.5%] | |
AlixPartners, First Lien Term Loan | | | | | | | | |
4.500%, 07/22/22 | | | 450 | | | | 448 | |
Lincoln Finance | | | | | | | | |
0.000%, 12/31/15(E) (G) | | | 1,000 | | | | — | |
| | | | | | | | | |
Total Financial Services | | | | 448 | |
| | | | | | | | | |
Information Technology [0.2%] | |
Avaya, First Lien Term Loan B-7 | | | | | | | | |
6.250%, 05/29/20 | | | 194 | | | | 151 | |
| | | | | | | | | |
Manufacturing [0.3%] | |
Pelican Products, Term Loan | | | | | | | | |
9.250%, 04/09/21 | | | 250 | | | | 248 | |
| | | | | | | | | |
Metals & Mining [0.3%] | |
Noranda Aluminum, Term Loan | | | | | | | | |
5.750%, 02/24/19 | | | 396 | | | | 267 | |
| | | | | | | | | |
Oil & Gas [0.4%] | |
Cactus Wellhead, First Lien Term Loan | | | | | | | | |
7.000%, 07/31/20 | | | 347 | | | | 260 | |
Frac Tech International, Term Loan B | | | | | | | | |
5.750%, 04/16/21 | | | 165 | | | | 50 | |
| | | | | | | | | |
Total Oil & Gas | | | | 310 | |
| | | | | | | | | |
Professional & Business Services [0.2%] | |
Intertrust Group, Second Lien Term Loan | | | | | | | | |
8.000%, 04/15/22 | | | 200 | | | | 200 | |
| | | | | | | | | |
Restaurants [0.6%] | |
Jack’s Family Restaurants, Cov-Lite Term Loan | | | | | | | | |
5.750%, 06/24/22(F) | | | 550 | | | | 542 | |
| | | | | | | | | |
Retail [0.5%] | |
Hardware Holdings, Term Loan B | | | | | | | | |
6.750%, 03/30/20(F) | | | 396 | | | | 386 | |
See accompanying notes to financial statements.
CITY NATIONAL ROCHDALE FUNDS | PAGE 66
schedule of investments |
September 30, 2015 |
City National Rochdale High Yield Bond Fund (continued) |
Description | | Face Amount (000)/Shares | | | Value (000) | |
Specialty Apparel Stores [0.6%] | |
Boot Barn, First Lien Term Loan | | | | | | |
5.500%, 06/24/21(F) | | $ | 549 | | | $ | 543 | |
| | | | | | | | | |
Telecommunications [1.2%] | |
Sky Bet, Cov-Lite First Lien Term Loan | | | | | | | | |
6.500%, 02/25/22 | | | 650 | | | | 983 | |
| | | | | | | | | |
Transportation [0.5%] | |
CEVA Group, First Lien Term Loan | | | | | | | | |
6.500%, 03/19/21 | | | 186 | | | | 166 | |
Navistar, Tranche B Term Loan | | | | | | | | |
7.000%, 08/17/17 | | | 300 | | | | 293 | |
| | | | | | | | | |
Total Transportation | | | | 459 | |
| | | | | | | | | |
Total Loan Participations | |
(Cost $7,434) | | | | 7,088 | |
| | | | | | | | | |
Common Stock [0.6%] | |
Electronic Equipment & Instruments [0.0%] | |
CUI *(G) | | | — | | | | 8 | |
| | | | | | | | | |
Metals & Mining [0.2%] | |
Mirabela Nickel *(G) | | | 2,465,571 | | | | 144 | |
| | | | | | | | | |
Miscellaneous Manufacturing [0.0%] | |
CEVA Group * | | | 22 | | | | 14 | |
| | | | | | | | | |
Printing & Publishing [0.4%] | |
Houghton Mifflin Harcourt * | | | 16,866 | | | | 342 | |
| | | | | | | | | |
Total Common Stock | |
(Cost $853) | | | | 508 | |
| | | | | | | | | |
Mortgage-Backed Security [0.3%] | |
SRERS Funding, Ser 2011-RS, Cl A1B1 | | | | | | | | |
0.430%, 10/09/15(A) (C) | | | 259 | | | | 249 | |
| | | | | | | | | |
Total Mortgage-Backed Security | |
(Cost $228) | | | | 249 | |
| | | | | | | | | |
Convertible Bond [0.2%] | |
Metals & Mining [0.2%] | |
Mirabela Nickel | | | | | | | | |
9.500%, 06/24/19(A) (F) (G) | | | 595 | | | | 184 | |
| | | | | | | | | |
Total Convertible Bond | |
(Cost $595) | | | | 184 | |
| | | | | | | | | |
Preferred Stock [0.0%] | |
Miscellaneous Manufacturing [0.0%] | |
CEVA Group 7.000% * | | | 49 | | | | 30 | |
| | | | | | | | | |
Total Preferred Stock | |
(Cost $44) | | | | 30 | |
| | | | | | | | | |
Special Stock [0.0%] | |
Broadcasting & Cable [0.0%] | |
Adelphia Recovery Trust *(F) (G) | | | 8,500 | | | | — | |
| | | | | | | | | |
Total Special Stock | |
(Cost $9) | | | | — | |
| | | | | | | | | |
Short-Term Investments [0.5%] | |
City National Rochdale Prime Money Market Fund, Institutional Class, 0.010%** ‡ | | | 239,494 | | | | 240 | |
SEI Daily Income Trust, Prime Obligation Fund, Cl A, 0.030%** | | | 181,146 | | | | 181 | |
| | | | | | | | | |
Total Short-Term Investments | |
(Cost $421) | | | | 421 | |
| | | | | | | | | |
Total Investments [99.1%] | |
(Cost $94,775) | | | $ | 85,711 | |
Percentages are based on Net Assets of $86,511 (000).
‡ | Investment in Affiliate. |
* | Non-income producing security. |
** | The rate reported is the 7-day effective yield as of September 30, 2015. |
(A) | Security exempt from registration under Rule 144A of the Securities Act of 1933. These securities may be resold in transactions exempt from registration normally to qualified institutions. On September 30, 2015, the value of these securities amounted to $44,614 (000), representing 51.6% of the net assets of the Fund. |
(C) | Floating Rate Security — The rate reported is the rate in effect on September 30, 2015. |
(D) | In default on interest payments. Rate shown represents the last coupon rate prior to default. |
See accompanying notes to financial statements.
CITY NATIONAL ROCHDALE FUNDS | PAGE 67
schedule of investments |
September 30, 2015 |
City National Rochdale High Yield Bond Fund (concluded) |
(E) | Unfunded bank loan. Interest rate not available. |
(F) | Security is considered illiquid. The total value of such securities as of September 30, 2015, was $3,493 (000) and represented 4.0% of net assets of the Fund. |
(G) | Security fair valued using methods determined in good faith by the Fair Value Committee designated by the Board of Trustees. The total market value of such securities as of September 30, 2015, was $336 (000) and represented 0.4% of net assets of the Fund. |
Cl — Class
Ser — Series
Amounts designated as “—” are either $0 or have been rounded to $0.
A list of the open forward foreign currency contracts held by the Fund at September 30, 2015, is as follows:
Settlement Date | Currency to Deliver (000) | Currency to Receive (000) | | Unrealized Appreciation (Depreciation) (000) | |
10/7/15 | USD | AUD 144 | | $ | 1 | |
10/7/15 | GBP | USD 1,221 | | | 6 | |
10/7/15 | AUD | USD 142 | | | (2 | ) |
10/7/15 | CAD | USD 451 | | | 2 | |
10/7/15 | EUR | USD 329 | | | (1 | ) |
| | | | | $ | 6 | |
A list of the counterparties for the outstanding forward foreign currency contracts held by the Fund at September 30, 2015, is as follows:
Counterparty | | Currency to Deliver (000) | | | Currency to Receive (000) | | | Unrealized Appreciation (000) | |
Bank of America | | $ | (2,281 | ) | | $ | 2,287 | | | $ | 6 | |
For the period ended September 30, 2015, the total amount of all open forward foreign currency contracts, as presented in the table above, are representative of the volume of activity for this derivative type during the period.
The following is a list of the inputs used as of September 30, 2015 in valuing the Fund’s investments carried at value (000):
Investments in Securities | | Level 1 | | | Level 2 | | | Level 3(1) | | | Total | |
Corporate Bonds | | $ | — | | | $ | 77,231 | | | $ | — | | | $ | 77,231 | |
Loan Participations | | | — | | | | 7,088 | | | | — | | | | 7,088 | |
Common Stock | | | 342 | | | | 14 | | | | 152 | | | | 508 | |
Mortgage-Backed Security | | | — | | | | 249 | | | | — | | | | 249 | |
Convertible Bond | | | — | | | | — | | | | 184 | | | | 184 | |
Preferred Stock | | | — | | | | 30 | | | | — | | | | 30 | |
Special Stock | | | — | | | | — | | | | — | | | | — | |
Short-Term Investments | | | 421 | | | | — | | | | — | | | | 421 | |
Total Investments in Securities | | $ | 763 | | | $ | 84,612 | | | $ | 336 | | | $ | 85,711 | |
Other Financial Instruments | | Level 1 | | | Level 2 | | | Level 3 | | | Total | |
Forwards Contracts* | | | | | | | | | | | | |
Unrealized Appreciation | | $ | — | | | $ | 9 | | | $ | — | | | $ | 9 | |
Unrealized Depreciation | | | — | | | | (3 | ) | | | — | | | | (3 | ) |
Total Other Financial Instruments | | $ | — | | | $ | 6 | | | $ | — | | | $ | 6 | |
* | Forwards contracts are valued at the unrealized appreciation (depreciation) on the instrument. |
(1) | Of the $336 (000) Level 3 securities as of September 30, 2015, all are not valued via third party pricing vendors and broker quotes. If significant, the disclosure of the unobservable input and the interrelationships and sensitivity between these inputs are required for those Level 3 securities that are not valued by third party pricing vendors or broker quotes. |
The following is a reconciliation of investments in which significant unobservable inputs (Level 3) were used in determining value (000) as of September 30, 2015:
| | | Investments in
Corporate Bonds
(000) | | | Investments in
Common Stock
(000) | | | Investments
in Convertible
Bonds
(000) | |
Beginning balance as of October 1, 2014 | | $ | 5 | | | $ | 13 | | | $ | 542 | |
Accrued discounts/ premiums | | | — | | | | — | | | | — | |
Realized gain/(loss) | | | — | | | | — | | | | — | |
Change in unrealized appreciation/(depreciation) | | | 45 | | | | (5 | ) | | | (410 | ) |
Purchases | | | — | | | | — | | | | 52 | |
Sales/paydowns | | | (50 | ) | | | — | | | | — | |
Transfers into Level 3 | | | — | | | | 144 | | | | — | |
Transfers out of Level 3 | | | — | | | | — | | | | — | |
Ending balance as of September 30, 2015 | | $ | — | | | $ | 152 | | | $ | 184 | |
Changes in unrealized gains/(losses) included in earnings related to securities still held at reporting date | | $ | — | | | $ | (5 | ) | | $ | (410 | ) |
| | | Total
(000) | |
Beginning balance as of October 1, 2014 | | $ | 560 | |
Accrued discounts/ premiums | | | — | |
Realized gain/(loss) | | | — | |
Change in unrealized appreciation/(depreciation) | | | (370 | ) |
Purchases | | | 52 | |
Sales/paydowns | | | (50 | ) |
Transfers into Level 3 | | | 144 | |
Transfers out of Level 3 | | | — | |
Ending balance as of September 30, 2015 | | $ | 336 | |
Changes in unrealized gains/(losses) included in earnings related to securities still held at reporting date | | $ | (415 | ) |
For the year ended September 30, 2015, there have been transfers between Level 2 and Level 3 assets and liabilities.
The transfers between fair values hierarchy levels were due to changes in the availability of observable inputs to determine fair value. Transfers between Levels are recognized at period end.
For more information on valuation inputs, see Note 2 — Significant Accounting Policies in the Notes to Financial Statements.
See accompanying notes to financial statements.
CITY NATIONAL ROCHDALE FUNDS | PAGE 68
schedule of investments |
September 30, 2015 |
City National Rochdale Intermediate Fixed Income Fund |
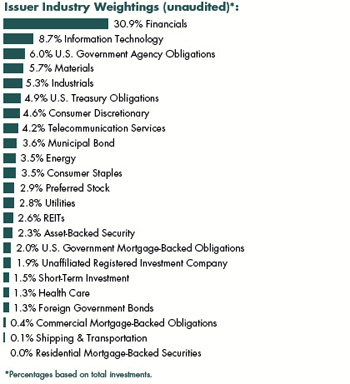
Description | | Face Amount (000) | | | Value (000) | |
Corporate Bonds [72.7%] | |
Consumer Discretionary [4.6%] | |
AutoZone | | | | | | |
3.700%, 04/15/22 | | $ | 250 | | | $ | 257 | |
2.500%, 04/15/21 | | | 1,000 | | | | 991 | |
Best Buy | | | | | | | | |
3.750%, 03/15/16 | | | 300 | | | | 302 | |
CBS | | | | | | | | |
3.375%, 03/01/22 | | | 175 | | | | 174 | |
Comcast | | | | | | | | |
3.125%, 07/15/22 | | | 200 | | | | 203 | |
Expedia | | | | | | | | |
5.950%, 08/15/20 | | | 250 | | | | 277 | |
Gap | | | | | | | | |
5.950%, 04/12/21 | | | 495 | | | | 536 | |
Harley-Davidson Financial Services, MTN | | | | | | | | |
1.550%, 11/17/17(A) | | | 3,725 | | | | 3,715 | |
Home Depot | | | | | | | | |
2.625%, 06/01/22 | | | 1,000 | | | | 1,000 | |
Hyundai Capital America | | | | | | | | |
2.600%, 03/19/20(A) | | | 1,000 | | | | 997 | |
Johnson Controls | | | | | | | | |
5.500%, 01/15/16 | | | 100 | | | | 101 | |
Newell Rubbermaid | | | | | | | | |
2.875%, 12/01/19 | | | 2,000 | | | | 2,018 | |
Scripps Networks Interactive | | | | | | | | |
2.700%, 12/15/16 | | | 1,000 | | | | 1,015 | |
Time Warner Cable | | | | | | | | |
4.125%, 02/15/21 | | | 165 | | | | 170 | |
Toys R Us Property II | | | | | | | | |
8.500%, 12/01/17 | | | 1 | | | | 1 | |
Tupperware Brands | | | | | | | | |
4.750%, 06/01/21 | | | 500 | | | | 523 | |
Viacom | | | | | | | | |
6.250%, 04/30/16 | | | 49 | | | | 50 | |
Yum! Brands | | | | | | | | |
6.250%, 03/15/18 | | | 30 | | | | 33 | |
| | | | | | | | | |
Total Consumer Discretionary | | | | 12,363 | |
| | | | | | | | | |
Consumer Staples [3.5%] | |
Avon Products | | | | | | | | |
6.500%, 03/01/19 | | | 250 | | | | 215 | |
Bunge Finance | | | | | | | | |
8.500%, 06/15/19 | | | 105 | | | | 125 | |
5.900%, 04/01/17 | | | 100 | | | | 106 | |
Campbell Soup | | | | | | | | |
8.875%, 05/01/21 | | | 350 | | | | 454 | |
ConAgra Foods | | | | | | | | |
4.950%, 08/15/20 | | | 410 | | | | 448 | |
1.900%, 01/25/18 | | | 200 | | | | 199 | |
CVS Health | | | | | | | | |
3.500%, 07/20/22 | | | 2,000 | | | | 2,066 | |
Dr Pepper Snapple Group | | | | | | | | |
2.900%, 01/15/16 | | | 2,200 | | | | 2,213 | |
JM Smucker | | | | | | | | |
3.000%, 03/15/22(A) | | | 500 | | | | 498 | |
Kraft Heinz Foods | | | | | | | | |
3.500%, 07/15/22(A) | | | 500 | | | | 511 | |
PepsiCo | | | | | | | | |
3.100%, 07/17/22 | | | 2,620 | | | | 2,683 | |
| | | | | | | | | |
Total Consumer Staples | | | | 9,518 | |
| | | | | | | | | |
Energy [3.5%] | |
Boardwalk Pipelines | | | | | | | | |
5.875%, 11/15/16 | | | 146 | | | | 151 | |
5.750%, 09/15/19 | | | 175 | | | | 185 | |
5.500%, 02/01/17 | | | 221 | | | | 227 | |
BP Capital Markets | | | | | | | | |
3.125%, 10/01/15 | | | 145 | | | | 145 | |
Buckeye Partners | | | | | | | | |
6.050%, 01/15/18 | | | 155 | | | | 163 | |
ConocoPhillips | | | | | | | | |
5.750%, 02/01/19 | | | 290 | | | | 326 | |
See accompanying notes to financial statements.
CITY NATIONAL ROCHDALE FUNDS | PAGE 69
schedule of investments |
September 30, 2015 |
City National Rochdale Intermediate Fixed Income Fund (continued) |
Description | | Face Amount (000) | | | Value (000) | |
DCP Midstream | | | | | | |
9.750%, 03/15/19(A) | | $ | 114 | | | $ | 128 | |
DCP Midstream Operating | | | | | | | | |
3.250%, 10/01/15 | | | 120 | | | | 120 | |
Duke Capital | | | | | | | | |
6.750%, 07/15/18 | | | 745 | | | | 824 | |
Ecopetrol | | | | | | | | |
7.625%, 07/23/19 | | | 250 | | | | 274 | |
Enbridge Energy Partners | | | | | | | | |
5.875%, 12/15/16 | | | 191 | | | | 200 | |
Energy Transfer Partners | | | | | | | | |
9.700%, 03/15/19 | | | 330 | | | | 394 | |
9.000%, 04/15/19 | | | 189 | | | | 222 | |
6.125%, 02/15/17 | | | 426 | | | | 448 | |
3.600%, 02/01/23 | | | 200 | | | | 180 | |
Enterprise Products Operating | | | | | | | | |
6.500%, 01/31/19 | | | 140 | | | | 157 | |
EOG Resources | | | | | | | | |
5.625%, 06/01/19 | | | 290 | | | | 327 | |
FMC Technologies | | | | | | | | |
3.450%, 10/01/22 | | | 200 | | | | 187 | |
Freeport-McMoran Oil & Gas | | | | | | | | |
6.125%, 06/15/19 | | | 1,309 | | | | 1,217 | |
Husky Energy | | | | | | | | |
3.950%, 04/15/22 | | | 150 | | | | 145 | |
Kinder Morgan Energy Partners | | | | | | | | |
5.300%, 09/15/20 | | | 125 | | | | 133 | |
Marathon Oil | | | | | | | | |
6.000%, 10/01/17 | | | 150 | | | | 161 | |
ONEOK Partners | | | | | | | | |
2.000%, 10/01/17 | | | 155 | | | | 154 | |
Panhandle Eastern Pipe Line | | | | | | | | |
7.000%, 06/15/18 | | | 396 | | | | 442 | |
Petrofac | | | | | | | | |
3.400%, 10/10/18(A) | | | 125 | | | | 123 | |
Plains All American Pipeline | | | | | | | | |
5.875%, 08/15/16 | | | 205 | | | | 213 | |
PPL Energy Supply | | | | | | | | |
6.200%, 05/15/16 | | | 105 | | | | 106 | |
Puget Energy | | | | | | | | |
6.000%, 09/01/21 | | | 500 | | | | 575 | |
Rowan | | | | | | | | |
4.875%, 06/01/22 | | | 200 | | | | 149 | |
Sabine Pass LNG | | | | | | | | |
7.500%, 11/30/16 | | | 100 | | | | 102 | |
Spectra Energy Capital | | | | | | | | |
6.200%, 04/15/18 | | | 135 | | | | 146 | |
Transocean | | | | | | | | |
7.375%, 04/15/18 | | | 494 | | | | 469 | |
6.000%, 03/15/18 | | | 500 | | | | 458 | |
Williams Partners | | | | | | | | |
3.350%, 08/15/22 | | | 200 | | | | 180 | |
| | | | | | | | | |
Total Energy | | | | 9,431 | |
| | | | | | | | | |
Financials [30.7%] | |
ACE INA Holdings | | | | | | | | |
5.800%, 03/15/18 | | | 300 | | | | 330 | |
Alleghany | | | | | | | | |
5.625%, 09/15/20 | | | 270 | | | | 303 | |
American Express | | | | | | | | |
0.919%, 05/22/18(B) | | | 3,000 | | | | 2,996 | |
American Express Credit, MTN | | | | | | | | |
2.800%, 09/19/16 | | | 175 | | | | 178 | |
American Tower | | | | | | | | |
4.000%, 06/01/25 | | | 1,800 | | | | 1,758 | |
Associates Corp of North America | | | | | | | | |
6.950%, 11/01/18 | | | 150 | | | | 171 | |
Axis Specialty Finance | | | | | | | | |
5.875%, 06/01/20 | | | 250 | | | | 283 | |
Bank of America | | | | | | | | |
5.700%, 05/02/17 | | | 950 | | | | 1,003 | |
5.420%, 03/15/17 | | | 42 | | | | 44 | |
Bank of America, MTN | | | | | | | | |
5.650%, 05/01/18 | | | 145 | | | | 158 | |
Bank of Montreal, MTN | | | | | | | | |
1.450%, 04/09/18 | | | 340 | | | | 338 | |
Barclays Bank | | | | | | | | |
5.125%, 01/08/20 | | | 100 | | | | 112 | |
BB&T, MTN | | | | | | | | |
1.600%, 08/15/17 | | | 355 | | | | 357 | |
Bear Stearns | | | | | | | | |
7.250%, 02/01/18 | | | 275 | | | | 308 | |
5.550%, 01/22/17 | | | 468 | | | | 492 | |
Capital One Financial | | | | | | | | |
1.500%, 03/22/18 | | | 475 | | | | 468 | |
Citigroup | | | | | | | | |
6.125%, 05/15/18 | | | 140 | | | | 155 | |
4.500%, 01/14/22 | | | 2,000 | | | | 2,163 | |
CNA Financial | | | | | | | | |
6.950%, 01/15/18 | | | 1,076 | | | | 1,192 | |
Commonwealth Bank of Australia, MTN | | | | | | | | |
5.000%, 10/15/19(A) | | | 150 | | | | 166 | |
Countrywide Financial, MTN | | | | | | | | |
6.000%, 08/26/20(C) | | | 313 | | | | 312 | |
Credit Suisse NY, MTN | | | | | | | | |
5.300%, 08/13/19 | | | 150 | | | | 167 | |
Daimler Finance North America | | | | | | | | |
1.875%, 01/11/18(A) | | | 4,200 | | | | 4,173 | |
See accompanying notes to financial statements.
CITY NATIONAL ROCHDALE FUNDS | PAGE 70
schedule of investments |
September 30, 2015 |
City National Rochdale Intermediate Fixed Income Fund (continued) |
Description | | Face Amount (000) | | | Value (000) | |
Discover Bank | | | | | | |
3.100%, 06/04/20 | | $ | 1,000 | | | $ | 1,010 | |
ERAC USA Finance | | | | | | | | |
3.300%, 10/15/22(A) | | | 250 | | | | 250 | |
Ford Motor Credit | | | | | | | | |
4.250%, 02/03/17 | | | 2,000 | | | | 2,067 | |
1.700%, 05/09/16 | | | 1,000 | | | | 1,003 | |
Goldman Sachs Group | | | | | | | | |
6.250%, 09/01/17 | | | 550 | | | | 598 | |
6.150%, 04/01/18 | | | 150 | | | | 165 | |
5.625%, 01/15/17 | | | 700 | | | | 735 | |
5.350%, 01/15/16 | | | 250 | | | | 253 | |
Goldman Sachs Group, MTN | | | | | | | | |
6.000%, 06/15/20 | | | 500 | | | | 575 | |
HCP | | | | | | | | |
4.000%, 06/01/25 | | | 2,770 | | | | 2,714 | |
HSBC Finance | | | | | | | | |
6.676%, 01/15/21 | | | 83 | | | | 97 | |
ING Bank | | | | | | | | |
3.750%, 03/07/17(A) | | | 200 | | | | 206 | |
Jefferies Group | | | | | | | | |
8.500%, 07/15/19 | | | 1,000 | | | | 1,184 | |
5.500%, 03/15/16 | | | 1,000 | | | | 1,017 | |
JPMorgan Chase | | | | | | | | |
4.950%, 03/25/20 | | | 100 | | | | 110 | |
4.250%, 10/15/20 | | | 150 | | | | 161 | |
3.125%, 01/23/25 | | | 4,700 | | | | 4,536 | |
Lehman Brothers Holdings, MTN | | | | | | | | |
7.000%, 09/28/37(D) | | | 400 | | | | 41 | |
Macquarie Bank, MTN | | | | | | | | |
2.600%, 06/24/19(A) | | | 4,200 | | | | 4,223 | |
Marsh & McLennan, MTN | | | | | | | | |
2.550%, 10/15/18 | | | 100 | | | | 102 | |
MetLife | | | | | | | | |
6.817%, 08/15/18 | | | 3,500 | | | | 3,987 | |
Metropolitan Life Global Funding I | | | | | | | | |
3.875%, 04/11/22(A) | | | 125 | | | | 130 | |
Moody’s | | | | | | | | |
5.500%, 09/01/20 | | | 800 | | | | 904 | |
Morgan Stanley | | | | | | | | |
3.750%, 02/25/23 | | | 5,000 | | | | 5,121 | |
MUFG Americas Holdings | | | | | | | | |
2.250%, 02/10/20 | | | 2,000 | | | | 1,993 | |
NASDAQ OMX Group | | | | | | | | |
5.550%, 01/15/20 | | | 1,249 | | | | 1,375 | |
National Bank of Canada, MTN | | | | | | | | |
1.450%, 11/07/17 | | | 750 | | | | 749 | |
National Rural Utilities Cooperative Finance | | | | | | | | |
10.375%, 11/01/18 | | | 125 | | | | 156 | |
6.550%, 11/01/18 | | | 300 | | | | 343 | |
Navient, MTN | | | | | | | | |
5.000%, 06/15/18 | | | 2 | | | | 2 | |
Penske Truck Leasing | | | | | | | | |
3.750%, 05/11/17(A) | | | 3,000 | | | | 3,090 | |
Principal Financial Group | | | | | | | | |
8.875%, 05/15/19 | | | 130 | | | | 159 | |
3.300%, 09/15/22 | | | 200 | | | | 200 | |
Protective Life | | | | | | | | |
6.400%, 01/15/18 | | | 250 | | | | 275 | |
Prudential Financial, MTN | | | | | | | | |
5.375%, 06/21/20 | | | 145 | | | | 163 | |
Silicon Valley Bank | | | | | | | | |
6.050%, 06/01/17 | | | 355 | | | | 377 | |
Simon Property Group | | | | | | | | |
10.350%, 04/01/19 | | | 3,500 | | | | 4,401 | |
State Street | | | | | | | | |
2.550%, 08/18/20 | | | 5,000 | | | | 5,066 | |
SunTrust Banks | | | | | | | | |
6.000%, 09/11/17 | | | 254 | | | | 275 | |
Svenska Handelsbanken, MTN | | | | | | | | |
5.125%, 03/30/20(A) | | | 5,800 | | | | 6,514 | |
TD Ameritrade Holding | | | | | | | | |
5.600%, 12/01/19 | | | 290 | | | | 332 | |
Toronto-Dominion Bank, MTN | | | | | | | | |
0.864%, 11/05/19(B) | | | 3,100 | | | | 3,095 | |
Toyota Motor Credit, MTN | | | | | | | | |
2.000%, 09/15/16 | | | 100 | | | | 101 | |
UBS, MTN | | | | | | | | |
7.375%, 06/15/17 | | | 388 | | | | 422 | |
US Bank | | | | | | | | |
2.125%, 10/28/19 | | | 4,500 | | | | 4,533 | |
Volkswagen International Finance | | | | | | | | |
2.375%, 03/22/17(A) | | | 125 | | | | 123 | |
Wells Fargo Bank | | | | | | | | |
5.750%, 05/16/16 | | | 100 | | | | 103 | |
Wilmington Trust | | | | | | | | |
8.500%, 04/02/18 | | | 315 | | | | 362 | |
| | | | | | | | | |
Total Financials | | | | 83,025 | |
| | | | | | | | | |
Health Care [1.3%] | |
Actavis | | | | | | | | |
3.250%, 10/01/22 | | | 500 | | | | 488 | |
Laboratory Corp of America Holdings | | | | | | | | |
3.200%, 02/01/22 | | | 2,530 | | | | 2,518 | |
See accompanying notes to financial statements.
CITY NATIONAL ROCHDALE FUNDS | PAGE 71
schedule of investments |
September 30, 2015 |
City National Rochdale Intermediate Fixed Income Fund (continued) |
Description | | Face Amount (000) | | | Value (000) | |
UnitedHealth Group | | | | | | |
4.700%, 02/15/21 | | $ | 200 | | | $ | 223 | |
1.625%, 03/15/19 | | | 250 | | | | 248 | |
| | | | | | | | | |
Total Health Care | | | | 3,477 | |
| | | | | | | | | |
Industrials [5.3%] | |
Carlisle | | | | | | | | |
3.750%, 11/15/22 | | | 250 | | | | 250 | |
CNH America | | | | | | | | |
7.250%, 01/15/16 | | | 388 | | | | 392 | |
Eaton | | | | | | | | |
8.875%, 06/15/19 | | | 125 | | | | 152 | |
Embraer Overseas | | | | | | | | |
5.696%, 09/16/23(A) | | | 520 | | | | 515 | |
GATX | | | | | | | | |
6.000%, 02/15/18 | | | 170 | | | | 185 | |
General Electric Capital, MTN | | | | | | | | |
6.000%, 08/07/19 | | | 410 | | | | 474 | |
5.625%, 09/15/17 | | | 300 | | | | 327 | |
5.300%, 02/11/21 | | | 3,500 | | | | 4,026 | |
4.375%, 09/16/20 | | | 150 | | | | 166 | |
IDEX | | | | | | | | |
4.200%, 12/15/21 | | | 250 | | | | 264 | |
Joy Global | | | | | | | | |
6.000%, 11/15/16 | | | 500 | | | | 515 | |
Lennox International | | | | | | | | |
4.900%, 05/15/17 | | | 250 | | | | 261 | |
NuStar Logistics | | | | | | | | |
8.150%, 04/15/18 | | | 250 | | | | 267 | |
4.800%, 09/01/20 | | | 200 | | | | 191 | |
Owens Corning | | | | | | | | |
6.500%, 12/01/16 | | | 36 | | | | 38 | |
PACCAR Financial, MTN | | | | | | | | |
1.750%, 08/14/18 | | | 4,000 | | | | 4,020 | |
Penske Truck Leasing | | | | | | | | |
4.875%, 07/11/22(A) | | | 200 | | | | 213 | |
4.250%, 01/17/23(A) | | | 300 | | | | 306 | |
3.375%, 03/15/18(A) | | | 250 | | | | 257 | |
2.500%, 03/15/16(A) | | | 500 | | | | 503 | |
Republic Services | | | | | | | | |
3.550%, 06/01/22 | | | 250 | | | | 256 | |
Roper Industries | | | | | | | | |
3.125%, 11/15/22 | | | 200 | | | | 197 | |
1.850%, 11/15/17 | | | 250 | | | | 251 | |
Xylem | | | | | | | | |
3.550%, 09/20/16 | | | 200 | | | | 204 | |
| | | | | | | | | |
Total Industrials | | | | 14,230 | |
| | | | | | | | | |
Information Technology [8.6%] | |
Apple | | | | | | | | |
0.561%, 02/07/20(B) | | | 7,238 | | | | 7,191 | |
Arrow Electronics | | | | | | | | |
6.875%, 06/01/18 | | | 400 | | | | 438 | |
Avnet | | | | | | | | |
6.625%, 09/15/16 | | | 128 | | | | 134 | |
Fiserv | | | | | | | | |
3.500%, 10/01/22 | | | 250 | | | | 253 | |
2.700%, 06/01/20 | | | 2,000 | | | | 2,016 | |
KLA-Tencor | | | | | | | | |
4.650%, 11/01/24 | | | 2,500 | | | | 2,498 | |
Lexmark International | | | | | | | | |
5.125%, 03/15/20 | | | 2,250 | | | | 2,350 | |
Nokia | | | | | | | | |
5.375%, 05/15/19 | | | 950 | | | | 1,000 | |
Oracle | | | | | | | | |
2.500%, 05/15/22 | | | 5,000 | | | | 4,927 | |
Texas Instruments | | | | | | | | |
1.650%, 08/03/19 | | | 295 | | | | 294 | |
Western Union | | | | | | | | |
5.253%, 04/01/20 | | | 2,000 | | | | 2,194 | |
| | | | | | | | | |
Total Information Technology | | | | 23,295 | |
| | | | | | | | | |
Materials [5.6%] | |
Airgas | | | | | | | | |
2.900%, 11/15/22 | | | 250 | | | | 240 | |
AngloGold Ashanti Holdings | | | | | | | | |
5.375%, 04/15/20 | | | 1,317 | | | | 1,240 | |
ArcelorMittal | | | | | | | | |
10.600%, 06/01/19 | | | 200 | | | | 216 | |
6.125%, 06/01/18 | | | 800 | | | | 784 | |
Avery Dennison | | | | | | | | |
5.375%, 04/15/20 | | | 405 | | | | 445 | |
Cabot | | | | | | | | |
5.000%, 10/01/16 | | | 300 | | | | 311 | |
Glencore Canada | | | | | | | | |
6.000%, 10/15/15 | | | 1,192 | | | | 1,192 | |
5.500%, 06/15/17 | | | 1,010 | | | | 943 | |
Glencore Funding | | | | | | | | |
1.700%, 05/27/16(A) | | | 1,500 | | | | 1,425 | |
1.649%, 01/15/19(A) (B) | | | 2,000 | | | | 1,635 | |
Kinross | | | | | | | | |
5.125%, 09/01/21 | | | 303 | | | | 264 | |
Rio Tinto Finance USA | | | | | | | | |
6.500%, 07/15/18 | | | 100 | | | | 111 | |
3.750%, 06/15/25 | | | 5,780 | | | | 5,638 | |
Vale Overseas | | | | | | | | |
5.625%, 09/15/19 | | | 505 | | | | 507 | |
See accompanying notes to financial statements.
CITY NATIONAL ROCHDALE FUNDS | PAGE 72
schedule of investments |
September 30, 2015 |
City National Rochdale Intermediate Fixed Income Fund (continued) |
Description | | Face Amount (000) | | | Value (000) | |
Worthington Industries | | | | | | |
6.500%, 04/15/20 | | $ | 250 | | | $ | 284 | |
| | | | | | | | | |
Total Materials | | | | 15,235 | |
| | | | | | | | | |
REITs [2.5%] | |
BioMed Realty | | | | | | | | |
3.850%, 04/15/16 | | | 500 | | | | 505 | |
Boston Properties | | | | | | | | |
5.875%, 10/15/19 | | | 140 | | | | 159 | |
Common Wealth REIT | | | | | | | | |
5.875%, 09/15/20 | | | 105 | | | | 115 | |
DDR | | | | | | | | |
4.625%, 07/15/22 | | | 250 | | | | 262 | |
Equity One | | | | | | | | |
3.750%, 11/15/22 | | | 250 | | | | 245 | |
Highwoods Realty | | | | | | | | |
3.625%, 01/15/23 | | | 200 | | | | 201 | |
HRPT Properties Trust | | | | | | | | |
6.650%, 01/15/18 | | | 300 | | | | 322 | |
Liberty Property, MTN | | | | | | | | |
7.500%, 01/15/18 | | | 177 | | | | 197 | |
National Retail Properties | | | | | | | | |
6.875%, 10/15/17 | | | 300 | | | | 329 | |
3.800%, 10/15/22 | | | 350 | | | | 355 | |
Prologis | | | | | | | | |
6.875%, 03/15/20 | | | 101 | | | | 114 | |
3.350%, 02/01/21 | | | 2,200 | | | | 2,230 | |
Realty Income | | | | | | | | |
5.950%, 09/15/16 | | | 129 | | | | 134 | |
3.250%, 10/15/22 | | | 200 | | | | 195 | |
Senior Housing Properties Trust | | | | | | | | |
6.750%, 12/15/21 | | | 500 | | | | 573 | |
4.300%, 01/15/16 | | | 500 | | | | 501 | |
Washington Real Estate Investment Trust | | | | | | | | |
3.950%, 10/15/22 | | | 250 | | | | 252 | |
Welltower | | | | | | | | |
4.950%, 01/15/21 | | | 155 | | | | 169 | |
| | | | | | | | | |
Total REITs | | | | 6,858 | |
| | | | | | | | | |
Shipping & Transportation [0.1%] | |
Federal Express 1998 Pass-Through Trust | | | | | | | | |
7.020%, 01/15/16 | | | 197 | | | | 199 | |
| | | | | | | | | |
Telecommunication Services [4.2%] | |
America Movil | | | | | | | | |
3.125%, 07/16/22 | | | 4,000 | | | | 3,884 | |
AT&T | | | | | | | | |
5.600%, 05/15/18 | | | 310 | | | | 339 | |
CenturyLink | | | | | | | | |
6.450%, 06/15/21 | | | 355 | | | | 325 | |
5.800%, 03/15/22 | | | 250 | | | | 214 | |
COX Communications | | | | | | | | |
7.250%, 11/15/15 | | | 231 | | | | 233 | |
COX Communications, MTN | | | | | | | | |
6.850%, 01/15/18 | | | 224 | | | | 243 | |
Deutsche Telekom International Finance BV | | | | | | | | |
6.000%, 07/08/19 | | | 50 | | | | 57 | |
Qwest | | | | | | | | |
6.500%, 06/01/17 | | | 100 | | | | 107 | |
Telefonica Emisiones SAU | | | | | | | | |
6.421%, 06/20/16 | | | 275 | | | | 285 | |
6.221%, 07/03/17 | | | 286 | | | | 309 | |
5.462%, 02/16/21 | | | 115 | | | | 128 | |
5.134%, 04/27/20 | | | 300 | | | | 331 | |
3.992%, 02/16/16 | | | 500 | | | | 505 | |
Verizon Communications | | | | | | | | |
4.600%, 04/01/21 | | | 4,100 | | | | 4,422 | |
| | | | | | | | | |
Total Telecommunication Services | | | | 11,382 | |
| | | | | | | | | |
Utilities [2.8%] | |
AmeriGas Partners | | | | | | | | |
6.500%, 05/20/21 | | | 477 | | | | 479 | |
Arizona Public Service | | | | | | | | |
6.250%, 08/01/16 | | | 44 | | | | 46 | |
British Transco Finance | | | | | | | | |
6.625%, 06/01/18 | | | 128 | | | | 145 | |
Cleveland Electric Illuminating | | | | | | | | |
7.880%, 11/01/17 | | | 10 | | | | 11 | |
5.700%, 04/01/17 | | | 6 | | | | 6 | |
Entergy Mississippi | | | | | | | | |
6.640%, 07/01/19 | | | 540 | | | | 628 | |
Entergy Texas | | | | | | | | |
7.125%, 02/01/19 | | | 190 | | | | 220 | |
Exelon Generation | | | | | | | | |
6.200%, 10/01/17 | | | 2,125 | | | | 2,305 | |
Jersey Central Power & Light | | | | | | | | |
5.625%, 05/01/16 | | | 265 | | | | 271 | |
Korea Electric Power | | | | | | | | |
6.750%, 08/01/27 | | | 75 | | | | 95 | |
National Fuel Gas | | | | | | | | |
4.900%, 12/01/21 | | | 500 | | | | 526 | |
Nisource Capital Markets, MTN | | | | | | | | |
7.860%, 03/27/17 | | | 163 | | | | 175 | |
See accompanying notes to financial statements.
CITY NATIONAL ROCHDALE FUNDS | PAGE 73
schedule of investments |
September 30, 2015 |
City National Rochdale Intermediate Fixed Income Fund (continued) |
Description | | Face Amount (000) | | | Value (000) | |
Northern Indiana Public Service, MTN | | | | | | |
7.590%, 06/12/17 | | $ | 440 | | | $ | 476 | |
ONEOK | | | | | | | | |
4.250%, 02/01/22 | | | 294 | | | | 254 | |
Pennsylvania Electric | | | | | | | | |
6.625%, 04/01/19 | | | 15 | | | | 17 | |
PPL Energy Supply | | | | | | | | |
5.700%, 10/15/15 | | | 75 | | | | 75 | |
Puget Energy | | | | | | | | |
5.625%, 07/15/22 | | | 250 | | | | 281 | |
Puget Sound Energy, MTN | | | | | | | | |
6.740%, 06/15/18 | | | 57 | | | | 63 | |
Southwestern Electric Power | | | | | | | | |
5.875%, 03/01/18 | | | 581 | | | | 638 | |
3.550%, 02/15/22 | | | 500 | | | | 510 | |
Southwestern Public Service | | | | | | | | |
8.750%, 12/01/18 | | | 250 | | | | 301 | |
Xcel Energy | | | | | | | | |
5.613%, 04/01/17 | | | 10 | | | | 11 | |
| | | | | | | | | |
Total Utilities | | | | 7,533 | |
| | | | | | | | | |
Total Corporate Bonds | |
(Cost $195,762) | | | | 196,546 | |
| | | | | | | | | |
U.S. Government Agency Obligations [6.0%] | |
FHLMC | | | | | | | | |
1.750%, 05/30/19 | | | 3,000 | | | | 3,061 | |
1.000%, 09/29/17 | | | 660 | | | | 664 | |
FNMA | | | | | | | | |
5.000%, 03/15/16 | | | 4,700 | | | | 4,802 | |
1.875%, 09/18/18 | | | 150 | | | | 154 | |
1.625%, 11/27/18 | | | 6,000 | | | | 6,107 | |
1.375%, 11/15/16 | | | 460 | | | | 464 | |
1.125%, 04/27/17 | | | 470 | | | | 474 | |
0.875%, 05/21/18 | | | 350 | | | | 350 | |
| | | | | | | | | |
Total U.S. Government Agency Obligations | |
(Cost $15,863) | | | | 16,076 | |
| | | | | | | | | |
U.S. Treasury Obligations [4.8%] | |
U.S. Treasury Notes | | | | | | | | |
2.750%, 02/15/19 | | | 845 | | | | 892 | |
2.625%, 11/15/20 | | | 425 | | | | 449 | |
2.375%, 07/31/17 | | | 1,010 | | | | 1,043 | |
2.250%, 11/15/24 | | | 4,500 | | | | 4,584 | |
2.000%, 02/15/25 | | | 2,300 | | | | 2,291 | |
1.750%, 10/31/18 | | | 610 | | | | 625 | |
1.250%, 04/30/19 | | | 2,375 | | | | 2,388 | |
Description | | Face Amount (000)/Shares | | | Value (000) | |
0.875%, 07/31/19 | | $ | 815 | | | $ | 806 | |
| | | | | | | | | |
Total U.S. Treasury Obligations | |
(Cost $13,023) | | | | 13,078 | |
| | | | | | | | | |
Municipal Bonds [3.5%] | |
California [0.6%] | |
State of California Department of Water Resources Power Supply Revenue, Ser L | | | | | | | | |
Callable 05/01/20 @ 100 | | | | | | | | |
5.000%, 05/01/21 | | | 1,315 | | | | 1,525 | |
| | | | | | | | | |
Florida [1.4%] | |
Florida State, Hurricane Catastrophe Fund Finance, Ser A, RB | | | | | | | | |
2.107%, 07/01/18 | | | 3,870 | | | | 3,905 | |
| | | | | | | | | |
Illinois [1.5%] | |
Illinois Municipal Electric Agency, Ser A, NATL | | | | | | | | |
Pre-Refunded @ 100 | | | | | | | | |
5.125%, 02/01/17(E) | | | 3,865 | | | | 4,102 | |
| | | | | | | | | |
Total Municipal Bonds | |
(Cost $9,465) | | | | 9,532 | |
| | | | | | | | | |
Preferred Stock [2.9%] | |
Financials [1.0%] | |
BB&T 5.625% | | | 10,000 | | | | 248 | |
Citigroup 5.800% | | | 10,000 | | | | 249 | |
Goldman Sachs Group 5.950% | | | 25,000 | | | | 624 | |
HSBC Holdings 8.000% | | | 30,000 | | | | 765 | |
JPMorgan Chase 5.500% | | | 20,000 | | | | 483 | |
Prudential Financial 5.750% | | | 10,000 | | | | 252 | |
| | | | | | | | | |
Total Financials | | | | 2,621 | |
| | | | | | | | | |
Industrials [0.3%] | |
Pitney Bowes 6.700% | | | 10,000 | | | | 261 | |
Stanley Black & Decker 5.750% | | | 20,000 | | | | 510 | |
| | | | | | | | | |
Total Industrials | | | | 771 | |
| | | | | | | | | |
REITs [1.2%] | |
Digital Realty Trust 6.625% | | | 10,000 | | | | 253 | |
Kimco Realty 5.500% | | | 10,000 | | | | 242 | |
National Retail Properties 6.625% | | | 20,000 | | | | 507 | |
Realty Income 6.625% | | | 20,000 | | | | 514 | |
Senior Housing Properties Trust 5.625% | | | 52,500 | | | | 1,288 | |
See accompanying notes to financial statements.
CITY NATIONAL ROCHDALE FUNDS | PAGE 74
schedule of investments |
September 30, 2015 |
City National Rochdale Intermediate Fixed Income Fund (continued) |
Description | | Shares/Face Amount (000) | | | Value (000) | |
Vornado Realty Trust 5.700% | | | 20,000 | | | $ | 483 | |
| | | | | | | | | |
Total REITs | | | | 3,287 | |
| | | | | | | | | |
Telecommunication Services [0.2%] | |
Telephone & Data Systems 5.875% | | | 30,000 | | | | 719 | |
| | | | | | | | | |
Utilities [0.2%] | |
SCE Trust I 5.625% | | | 20,000 | | | | 490 | |
| | | | | | | | | |
Total Preferred Stock | |
(Cost $7,904) | | | | 7,888 | |
| | | | | | | | | |
Asset-Backed Securities [2.2%] | |
Bayview Financial Acquisition Trust, Ser 2007-A, Cl 1A2 | | | | | | | | |
6.205%, 05/28/37 | | $ | 91 | | | | 95 | |
BT SPE (Acquired 07/06/11, Acquisition Cost $1,102,589) | | | | | | | | |
9.250%, 06/06/16 (F)(G)(H) | | | 625 | | | | 560 | |
Carmax Auto Owner Trust, Ser 2014-2, Cl A3 | | | | | | | | |
0.980%, 01/15/19 | | | 5,350 | | | | 5,351 | |
Cityscape Home Equity Loan Trust Series, Ser 1997-C, Cl A4 | | | | | | | | |
7.000%, 07/25/28 (D) | | | 5 | | | | — | |
Conseco Financial, Ser 1997-7, Cl A6 | | | | | | | | |
6.760%, 07/15/28 | | | 16 | | | | 16 | |
Contimortgage Home Equity Loan Trust, Ser 1997-2, Cl A9 | | | | | | | | |
7.090%, 04/15/28 | | | – | | | | — | |
GMACM Mortgage Loan Trust, Ser 2004-GH1, Cl A6 | | | | | | | | |
4.810%, 07/25/35 | | | 13 | | | | 13 | |
| | | | | | | | | |
Total Asset-Backed Securities | |
(Cost $6,099) | | | | 6,035 | |
| | | | | | | | | |
U.S. Government Mortgage-Backed Obligations [2.0%] | |
FHLMC, Pool 1B2677 | | | | | | | | |
2.416%, 01/01/35(B) | | | 6 | | | | 6 | |
FHLMC, Pool 1B2683 | | | | | | | | |
2.436%, 01/01/35(B) | | | 4 | | | | 4 | |
FHLMC, Pool 1B2692 | | | | | | | | |
2.364%, 12/01/34(B) | | | 11 | | | | 12 | |
FHLMC, Pool A93505 | | | | | | | | |
4.500%, 08/01/40 | | | 39 | | | | 42 | |
FHLMC, Pool A93996 | | | | | | | | |
4.500%, 09/01/40 | | | 58 | | | | 63 | |
Description | | Face Amount (000) | | | Value (000) | |
FHLMC, Pool C03490 | | | | | | |
4.500%, 08/01/40 | | $ | 303 | | | $ | 329 | |
FHLMC, Pool C09015 | | | | | | | | |
3.000%, 10/01/42 | | | 218 | | | | 222 | |
FHLMC, Pool C20300 | | | | | | | | |
6.500%, 01/01/29 | | | 4 | | | | 4 | |
FHLMC, Pool E01280 | | | | | | | | |
5.000%, 12/01/17 | | | 2 | | | | 3 | |
FHLMC, Pool G02940 | | | | | | | | |
5.500%, 05/01/37 | | | 10 | | | | 11 | |
FHLMC, Pool G04222 | | | | | | | | |
5.500%, 04/01/38 | | | 17 | | | | 19 | |
FHLMC, Pool G04913 | | | | | | | | |
5.000%, 03/01/38 | | | 66 | | | | 72 | |
FHLMC, Pool G08003 | | | | | | | | |
6.000%, 07/01/34 | | | 17 | | | | 20 | |
FHLMC, Pool G11431 | | | | | | | | |
6.000%, 08/01/18 | | | 1 | | | | 1 | |
FHLMC, Pool G11880 | | | | | | | | |
5.000%, 12/01/20 | | | 12 | | | | 13 | |
FHLMC, Pool G18124 | | | | | | | | |
6.000%, 06/01/21 | | | 9 | | | | 10 | |
FHLMC, Pool J19197 | | | | | | | | |
3.000%, 05/01/27 | | | 150 | | | | 156 | |
FHLMC, Pool Q08998 | | | | | | | | |
3.500%, 06/01/42 | | | 180 | | | | 188 | |
FHLMC, Pool Q10378 | | | | | | | | |
3.000%, 08/01/42 | | | 209 | | | | 212 | |
FHLMC, Ser 2004-2804, Cl VC, Pool FHR 2804 VC | | | | | | | | |
5.000%, 07/15/21 | | | 87 | | | | 92 | |
FHLMC Multifamily Structured Pass Through Certificates, Ser K003, Cl A4 | | | | | | | | |
5.053%, 01/25/19 | | | 150 | | | | 166 | |
FHLMC Multifamily Structured Pass Through Certificates, Ser K704, Cl A2 | | | | | | | | |
2.412%, 08/25/18 | | | 400 | | | | 411 | |
FHLMC Multifamily Structured Pass Through Certificates, Ser K705, Cl A2 | | | | | | | | |
2.303%, 09/25/18 | | | 200 | | | | 205 | |
FHLMC Multifamily Structured Pass Through Certificates, Ser K708, Cl A2 | | | | | | | | |
2.130%, 01/25/19 | | | 300 | | | | 307 | |
FNMA, Pool 252570 | | | | | | | | |
6.500%, 07/01/29 | | | 5 | | | | 6 | |
FNMA, Pool 253183 | | | | | | | | |
7.500%, 04/01/30 | | | 1 | | | | 1 | |
See accompanying notes to financial statements.
CITY NATIONAL ROCHDALE FUNDS | PAGE 75
schedule of investments |
September 30, 2015 |
City National Rochdale Intermediate Fixed Income Fund (continued) |
Description | | Face Amount (000) | | | Value (000) | |
FNMA, Pool 253398 | | | | | | |
8.000%, 08/01/30 | | $ | 2 | | | $ | 2 | |
FNMA, Pool 254545 | | | | | | | | |
5.000%, 12/01/17 | | | 6 | | | | 7 | |
FNMA, Pool 254685 | | | | | | | | |
5.000%, 04/01/18 | | | 6 | | | | 6 | |
FNMA, Pool 254949 | | | | | | | | |
5.000%, 11/01/33 | | | 13 | | | | 14 | |
FNMA, Pool 255814 | | | | | | | | |
5.500%, 08/01/35 | | | 22 | | | | 25 | |
FNMA, Pool 303168 | | | | | | | | |
9.500%, 02/01/25 | | | 2 | | | | 2 | |
FNMA, Pool 725424 | | | | | | | | |
5.500%, 04/01/34 | | | 20 | | | | 22 | |
FNMA, Pool 735060 | | | | | | | | |
6.000%, 11/01/34 | | | 13 | | | | 14 | |
FNMA, Pool 735228 | | | | | | | | |
5.500%, 02/01/35 | | | 11 | | | | 12 | |
FNMA, Pool 735230 | | | | | | | | |
5.500%, 02/01/35 | | | 26 | | | | 30 | |
FNMA, Pool 745275 | | | | | | | | |
5.000%, 02/01/36 | | | 106 | | | | 116 | |
FNMA, Pool 745418 | | | | | | | | |
5.500%, 04/01/36 | | | 121 | | | | 136 | |
FNMA, Pool 827223 | | | | | | | | |
2.090%, 04/01/35(B) | | | 55 | | | | 58 | |
FNMA, Pool 844809 | | | | | | | | |
5.000%, 11/01/35 | | | 49 | | | | 55 | |
FNMA, Pool AD0454 | | | | | | | | |
5.000%, 11/01/21 | | | 24 | | | | 25 | |
FNMA, Pool AD8522 | | | | | | | | |
4.000%, 08/01/40 | | | 43 | | | | 46 | |
FNMA, Pool AE0828 | | | | | | | | |
3.500%, 02/01/41 | | | 329 | | | | 345 | |
FNMA, Pool AH0621 | | | | | | | | |
3.500%, 01/01/41 | | | 79 | | | | 83 | |
FNMA, Pool AJ1407 | | | | | | | | |
4.000%, 09/01/41 | | | 68 | | | | 73 | |
FNMA, Pool AJ7689 | | | | | | | | |
4.000%, 12/01/41 | | | 225 | | | | 240 | |
FNMA, Pool AK0971 | | | | | | | | |
3.000%, 02/01/27 | | | 141 | | | | 148 | |
FNMA, Pool AO2970 | | | | | | | | |
3.000%, 05/01/42 | | | 199 | | | | 202 | |
FNMA, Pool AO4137 | | | | | | | | |
3.500%, 06/01/42 | | | 194 | | | | 203 | |
FNMA, Pool MA1277 | | | | | | | | |
2.500%, 12/01/27 | | | 133 | | | | 137 | |
FNMA REMIC Trust, Ser 2004-W6, Cl 1A6 | | | | | | | | |
5.500%, 07/25/34 | | | 42 | | | | 42 | |
Description | | Face Amount (000)/Shares | | | Value (000) | |
GNMA, Pool 780315 | | | | | | |
9.500%, 12/15/17 | | $ | 1 | | | $ | 1 | |
GNMA, Pool G2 4696 | | | | | | | | |
4.500%, 05/20/40 | | | 141 | | | | 153 | |
GNMA, Pool G2 4747 | | | | | | | | |
5.000%, 07/20/40 | | | 54 | | | | 60 | |
GNMA, Pool G2 4923 | | | | | | | | |
4.500%, 01/20/41 | | | 79 | | | | 86 | |
GNMA, Pool G2 MA0155 | | | | | | | | |
4.000%, 06/20/42 | | | 190 | | | | 204 | |
GNMA, Pool G2 MA0392 | | | | | | | | |
3.500%, 09/20/42 | | | 215 | | | | 226 | |
| | | | | | | | | |
Total U.S. Government Mortgage-Backed Obligations | | | | | |
(Cost $5,151) | | | | 5,348 | |
| | | | | | | | | |
Closed-End Fund [1.9%] | |
Stone Ridge Reinsurance Risk Premium Interval Fund(F) | | | 490,196 | | | | 5,201 | |
| | | | | | | | | |
Total Closed-End Fund | |
(Cost $5,000) | | | | 5,201 | |
| | | | | | | | | |
Foreign Government Bonds [1.3%] | |
Hashemite Kingdom of Jordan Government AID Bond | | | | | | | | |
2.578%, 06/30/22 | | | 3,000 | | | | 3,100 | |
Mexico Government International Bond, MTN | | | | | | | | |
5.125%, 01/15/20 | | | 100 | | | | 110 | |
Province of Newfoundland and Labrador Canada | | | | | | | | |
7.320%, 10/13/23 | | | 100 | | | | 126 | |
Province of Quebec Canada, MTN | | | | | | | | |
7.380%, 04/09/26(C) | | | 100 | | | | 132 | |
| | | | | | | | | |
Total Foreign Government Bonds | |
(Cost $3,353) | | | | 3,468 | |
| | | | | | | | | |
Commercial Mortgage-Backed Obligations [0.4%] | |
Commercial Mortgage Trust, Ser 2012-CR2, Cl A4 | | | | | | | | |
3.147%, 08/15/45 | | | 125 | | | | 129 | |
GS Mortgage Securities II, Ser GCJ9, Cl A3 | | | | | | | | |
2.773%, 11/10/45 | | | 275 | | | | 277 | |
JP Morgan Chase Commercial Mortgage Securities Trust, Ser 2013-LC11, Cl A5 | | | | | | | | |
2.960%, 04/15/46 | | | 150 | | | | 152 | |
See accompanying notes to financial statements.
CITY NATIONAL ROCHDALE FUNDS | PAGE 76
schedule of investments |
September 30, 2015 |
City National Rochdale Intermediate Fixed Income Fund (continued) |
Description | | Face Amount (000) | | | Value (000) | |
Morgan Stanley Bank of America Merrill Lynch Trust, Ser C6, Cl A4 | | | | | | |
2.858%, 11/15/45 | | $ | 275 | | | $ | 278 | |
NCUA Guaranteed Notes Trust, Ser 2010-C1, Cl A2 | | | | | | | | |
2.900%, 10/29/20 | | | 190 | | | | 191 | |
NCUA Guaranteed Notes Trust, Ser 2010-R1, Cl 2A | | | | | | | | |
1.840%, 10/07/20 | | | 8 | | | | 8 | |
| | | | | | | | | |
Total Commercial Mortgage-Backed Obligations | | | | | |
(Cost $1,035) | | | | 1,035 | |
| | | | | | | | | |
Residential Mortgage-Backed Securities [0.0%] | |
Banc of America Alternative Loan Trust, Ser 2004-2, Cl 5A1 | | | | | | | | |
5.500%, 03/25/19 | | | 17 | | | | 18 | |
RAAC, Ser 2004-SP1, Cl AI4 | | | | | | | | |
5.285%, 08/25/27(B) | | | 2 | | | | 2 | |
Residential Accredit Loans, Ser 2004-QS5, Cl A5 | | | | | | | | |
4.750%, 04/25/34 | | | 5 | | | | 5 | |
Residential Accredit Loans, Ser 2004-QS6, Cl A1 | | | | | | | | |
5.000%, 05/25/19 | | | 10 | | | | 10 | |
Residential Asset Mortgage Products, Ser 2002-RS3, Cl AI5 | | | | | | | | |
5.572%, 06/25/32(B) | | | 28 | | | | 27 | |
WaMu Mortgage Pass-Through Certificates Series Trust, Ser 2004-CB2, Cl 5A | | | | | | | | |
5.000%, 07/25/19 | | | 28 | | | | 29 | |
| | | | | | | | | |
Total Residential Mortgage-Backed Securities | | | | | | | | |
(Cost $91) | | | | 91 | |
Description | | Shares | | | Value (000) | |
Short-Term Investments [1.5%] | |
City National Rochdale Government Money Market Fund, Institutional Class, 0.010%**‡ | | | 2,030,440 | | | $ | 2,031 | |
SEI Daily Income Trust Government Fund, Cl A, 0.030%** | | | 2,030,440 | | | | 2,030 | |
| | | | | | | | | |
Total Short-Term Investments | |
(Cost $4,061) | | | | 4,061 | |
| | | | | | | | | |
Total Investments [99.2%] | |
(Cost $266,807) | | | $ | 268,359 | |
Percentages are based on Net Assets of $270,587 (000).
** | The rate reported is the 7-day effective yield as of September 30, 2015. |
‡ | Investment in Affiliate. |
(A) | Security exempt from registration under Rule 144A of the Securities Act of 1933. These securities may be resold in transactions exempt from registration normally to qualified institutions. On September 30, 2015, the value of these securities amounted to $29,701 (000), representing 11.0% of the net assets of the Fund. |
(B) | Floating Rate Security — The rate reported is the rate in effect on September 30, 2015. |
(C) | Step Bond — The rate reported is the rate in effect on September 30, 2015. The coupon on a step bond changes on a specific date. |
(D) | In default on interest payments. Rate shown represents the last coupon rate prior to default. |
(E) | Pre-Refunded Security — The maturity date shown is the pre-refunded date. |
(F) | Security is considered illiquid. The total market value of such security as of September 30, 2015 was $5,761 (000) and represented 2.1% of net assets of the Fund. |
(G) | Security fair valued using methods determined in good faith by the Fair Value Committee designated by the Board of Trustees. The total market value of such security as of September 30, 2015 was $560 (000) and represented 0.2% of net assets of the Fund. |
(H) | Security is considered restricted. The total market value of such security as of September 30, 2015 was $560 (000) and represented 0.2% of net assets of the Fund. |
See accompanying notes to financial statements.
CITY NATIONAL ROCHDALE FUNDS | PAGE 77
schedule of investments |
September 30, 2015 |
City National Rochdale Intermediate Fixed Income Fund (concluded) |
Cl — Class
FHLMC — Federal Home Loan Mortgage Corporation
FNMA — Federal National Mortgage Association
GNMA — Government National Mortgage Association
MTN — Medium Term Note
NATL — National Public Finance Guarantee Corporation
NCUA — National Credit Union Administration
NY — New York
RB — Revenue Bond
REIT — Real Estate Investment Trust
REMIC — Real Estate Mortgage Investment Conduit
Ser — Series
SPE — Special Purpose Entity
Amounts designated as “—” are either $0 or have been rounded to $0.
The following is a list of the inputs used as of September 30, 2015 in valuing the Fund’s investments carried at value (000):
Investments in Securities | | Level 1 | | | Level 2 | | | Level 3 | | | Total | |
Corporate Bonds | | $ | — | | | $ | 196,546 | | | $ | — | | | $ | 196,546 | |
U.S. Government Agency Obligations | | | — | | | | 16,076 | | | | — | | | | 16,076 | |
U.S. Treasury Obligations | | | — | | | | 13,078 | | | | — | | | | 13,078 | |
Municipal Bonds | | | — | | | | 9,532 | | | | — | | | | 9,532 | |
Preferred Stock | | | 7,888 | | | | — | | | | — | | | | 7,888 | |
Asset-Backed Securities | | | — | | | | 5,475 | | | | 560 | | | | 6,035 | |
U.S. Government Mortgage-Backed Obligations | | | — | | | | 5,348 | | | | — | | | | 5,348 | |
Closed-End Fund | | | 5,201 | | | | — | | | | — | | | | 5,201 | |
Foreign Government Bonds | | | — | | | | 3,468 | | | | — | | | | 3,468 | |
Commercial Mortgage-Backed Obligations | | | — | | | | 1,035 | | | | — | | | | 1,035 | |
Residential Mortgage-Backed Securities | | | — | | | | 91 | | | | — | | | | 91 | |
Short-Term Investments | | | 4,061 | | | | — | | | | — | | | | 4,061 | |
Total Investments in Securities | | $ | 17,150 | | | $ | 250,649 | | | $ | 560 | | | $ | 268,359 | |
The following is a reconciliation of investments in which significant unobservable inputs (Level 3) were used in determining value (000) as of September 30, 2015:
| | | Investments in
Asset-Backed
Securities | |
Beginning balance as of October 1, 2014 | | $ | 807 | |
Accrued discounts/premiums | | | — | |
Realized gain/(loss) | | | — | |
Change in unrealized appreciation/(depreciation) | | | (16 | ) |
Purchases | | | — | |
Sales/paydowns | | | (231 | ) |
Transfers into Level 3 | | | — | |
Transfers out of Level 3 | | | — | |
Ending balance as of September 30, 2015 | | $ | 560 | |
Changes in unrealized gains/(losses) included in earnings related to securities still held at reporting date | | $ | (16 | ) |
The following table summarizes the quantitative inputs and assumptions used for items categorized as Level 3 investments as of September 30, 2015. The disclosures below also include qualitative information on the sensitivity of the fair value measurements to changes in the significant unobservable inputs.
| | Fair Value at
September 30,
2015 (000) | Valuation Techniques | |
BT SPE | $560 | Discounted Cash Flow Model based on actual collection level and experienced defaults | |
| | | | |
| | | Observable Inputs | |
| | | Cumulated Collections | |
| | | Cumulated Defaults | |
| | | Annualized Default Rate | |
| | | Cumulated Default Rate | |
| | | Pace of Collection Pace of Defaults | |
| | | Interest Rates | |
| | | | |
| | | Unobservable Inputs | Range |
| | | Projected Default Rates | 5%-12% |
| | | Projected Collection Rates | 90%-100% |
| | | Expected Discount Rates | 7%-9.25% |
The unobservable inputs used to determine fair value of recurring Level 3 assets may have similar or diverging impacts on valuation. Significant increased and decreased in these inputs in isolation and interrelationships between those inputs could result in significantly higher or lower fair value measurement.
For the period ended September 30, 2015, there have been no transfers between Level 1 and Level 2 assets and liabilities. For the period ended September 30, 2015, there have been no transfers between Level 2 and Level 3 assets and liabilities. Transfers between Levels are recognized at period end.
For more information on valuation inputs, see Note 2 — Significant Accounting Policies in the Notes to Financial Statements.
See accompanying notes to financial statements.
CITY NATIONAL ROCHDALE FUNDS | PAGE 78
consolidated schedule of investments |
September 30, 2015 |
City National Rochdale Fixed Income Opportunities Fund |
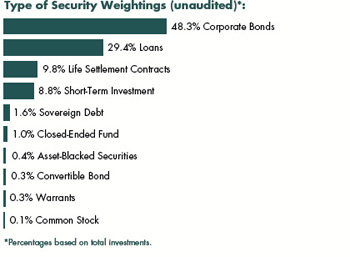
Description | | Face Amount (000) | | | Value (000) | |
Corporate Bonds [47.4%] | |
Advertising Sales [0.2%] | |
Lamar Media | | | | | | |
5.875%, 02/01/22 | | $ | 525 | | | $ | 546 | |
5.375%, 01/15/24 | | | 475 | | | | 480 | |
5.000%, 05/01/23 | | | 450 | | | | 443 | |
Outfront Media Capital | | | | | | | | |
5.875%, 03/15/25 | | | 675 | | | | 687 | |
5.625%, 02/15/24 | | | 275 | | | | 279 | |
5.625%, 02/15/24(A) | | | 325 | | | | 329 | |
5.250%, 02/15/22 | | | 300 | | | | 300 | |
| | | | | | | | | |
Total Advertising Sales | | | | 3,064 | |
| | | | | | | | | |
Aerospace & Defense [0.2%] | |
Accudyne Industries Borrower | | | | | | | | |
7.750%, 12/15/20(A) | | | 900 | | | | 781 | |
KLX | | | | | | | | |
5.875%, 12/01/22(A) | | | 600 | | | | 584 | |
TransDigm | | | | | | | | |
7.500%, 07/15/21 | | | 100 | | | | 104 | |
6.500%, 07/15/24 | | | 875 | | | | 822 | |
6.500%, 05/15/25(A) | | | 425 | | | | 399 | |
6.000%, 07/15/22 | | | 950 | | | | 886 | |
5.500%, 10/15/20 | | | 350 | | | | 334 | |
| | | | | | | | | |
Total Aerospace & Defense | | | | 3,910 | |
| | | | | | | | | |
Agricultural [0.1%] | |
Avangardco Investments Public | | | | | | | | |
10.000%, 10/29/15 | | | 1,250 | | | | 532 | |
Mriya Agro Holding | | | | | | | | |
9.450%, 04/19/18(B) | | | 1,195 | | | | 179 | |
UKRLANDFARMING | | | | | | | | |
10.875%, 03/26/18 | | | 2,760 | | | | 1,160 | |
| | | | | | | | | |
Total Agricultural | | | | 1,871 | |
| | | | | | | | | |
Airlines [0.2%] | |
Avianca Holdings | | | | | | | | |
8.375%, 05/10/20 | | | 1,300 | | | | 1,099 | |
SriLankan Airlines | | | | | | | | |
5.300%, 06/27/19 | | | 1,500 | | | | 1,444 | |
| | | | | | | | | |
Total Airlines | | | | 2,543 | |
| | | | | | | | | |
Airport Develop/Maint [0.1%] | |
Aeropuertos Dominicanos Siglo XXI | | | | | | | | |
9.750%, 11/13/19 | | | 1,840 | | | | 1,822 | |
| | | | | | | | | |
Applications Software [0.1%] | |
Emdeon | | | | | | | | |
11.000%, 12/31/19 | | | 525 | | | | 559 | |
6.000%, 02/15/21(A) | | | 500 | | | | 483 | |
Nuance Communications | | | | | | | | |
5.375%, 08/15/20(A) | | | 900 | | | | 898 | |
| | | | | | | | | |
Total Applications Software | | | | 1,940 | |
| | | | | | | | | |
Auto Rent & Lease [0.3%] | |
CAR | | | | | | | | |
6.125%, 02/04/20 | | | 2,000 | | | | 1,980 | |
6.000%, 02/11/21 | | | 200 | | | | 191 | |
Hertz | | | | | | | | |
6.750%, 04/15/19 | | | 575 | | | | 585 | |
6.250%, 10/15/22 | | | 1,025 | | | | 1,027 | |
United Rentals North America | | | | | | | | |
6.125%, 06/15/23 | | | 575 | | | | 573 | |
5.750%, 11/15/24 | | | 175 | | | | 168 | |
5.500%, 07/15/25 | | | 1,200 | | | | 1,122 | |
4.625%, 07/15/23 | | | 325 | | | | 315 | |
| | | | | | | | | |
Total Auto Rent & Lease | | | | 5,961 | |
| | | | | | | | | |
Auto/Trk Prts and Equip-Repl [0.2%] | |
JB Poindexter | | | | | | | | |
9.000%, 04/01/22(A) | | | 725 | | | | 763 | |
UCI International | | | | | | | | |
8.625%, 02/15/19(G) (I) | | | 1,275 | | | | 1,020 | |
| | | | | | | | | |
Total Auto/Trk Prts and Equip-Repl | | | | 1,783 | |
See accompanying notes to financial statements.
CITY NATIONAL ROCHDALE FUNDS | PAGE 79
consolidated schedule of investments |
September 30, 2015 |
City National Rochdale Fixed Income Opportunities Fund (continued) |
Description | | Face Amount (000) | | | Value (000) | |
Automotive [0.0%] | |
General Motors | | | | | | |
4.000%, 04/01/25 | | $ | 700 | | | $ | 664 | |
| | | | | | | | | |
Autoparts [0.8%] | |
Affinia Group | | | | | | | | |
7.750%, 05/01/21 | | | 1,325 | | | | 1,391 | |
American Axle & Manufacturing | | | | | | | | |
7.750%, 11/15/19 | | | 600 | | | | 660 | |
6.625%, 10/15/22 | | | 675 | | | | 678 | |
6.250%, 03/15/21 | | | 275 | | | | 274 | |
International Automotive Components Group | | | | | | | | |
9.125%, 06/01/18(A) | | | 900 | | | | 914 | |
Lear | | | | | | | | |
5.250%, 01/15/25 | | | 200 | | | | 196 | |
4.750%, 01/15/23 | | | 1,400 | | | | 1,372 | |
Metalsa | | | | | | | | |
4.900%, 04/24/23 | | | 1,000 | | | | 860 | |
MPG Holdco I | | | | | | | | |
7.375%, 10/15/22 | | | 1,000 | | | | 1,040 | |
Nexteer Automotive Group | | | | | | | | |
5.875%, 11/15/21 | | | 1,000 | | | | 975 | |
Omega US Sub | | | | | | | | |
8.750%, 07/15/23(A) | | | 550 | | | | 486 | |
Schaeffler Finance BV | | | | | | | | |
4.750%, 05/15/21(A) | | | 625 | | | | 616 | |
4.750%, 05/15/23(A) | | | 800 | | | | 772 | |
Schaeffler Finance BV, MTN | | | | | | | | |
4.250%, 05/15/21(A) | | | 375 | | | | 360 | |
Schaeffler Holding Finance BV | | | | | | | | |
6.875%, 08/15/18(A) (F) | | | 850 | | | | 877 | |
6.750%, 11/15/22(A) (F) | | | 575 | | | | 618 | |
Stackpole International Intermediate | | | | | | | | |
7.750%, 10/15/21(A) | | | 950 | | | | 1,033 | |
Tenneco | | | | | | | | |
5.375%, 12/15/24 | | | 625 | | | | 641 | |
ZF North America Capital | | | | | | | | |
4.750%, 04/29/25(A) | | | 750 | | | | 687 | |
| | | | | | | | | |
Total Autoparts | | | | 14,450 | |
| | | | | | | | | |
Banks [4.9%] | |
Access Bank, MTN | | | | | | | | |
9.250%, 06/24/21(D) | | | 3,695 | | | | 3,113 | |
African Bank, MTN | | | | | | | | |
8.125%, 02/24/17 | | | 1,329 | | | | 1,124 | |
Agricola Senior Trust | | | | | | | | |
6.750%, 06/18/20 | | | 2,000 | | | | 1,982 | |
AK BARS Bank Via AK BARS Luxembourg | | | | | | | | |
8.000%, 08/06/18 | | | 3,250 | | | | 3,257 | |
Banco BMG | | | | | | | | |
9.950%, 11/05/19 | | | 950 | | | | 845 | |
8.000%, 04/15/18 | | | 1,000 | | | | 925 | |
Banco do Brasil | | | | | | | | |
9.250%, 10/29/49(D) | | | 500 | | | | 300 | |
8.500%, 10/29/49(D) | | | 2,500 | | | | 2,012 | |
Bank of Ceylon | | | | | | | | |
6.875%, 05/03/17 | | | 500 | | | | 513 | |
Bank of Georgia JSC, MTN | | | | | | | | |
7.750%, 07/05/17 | | | 2,200 | | | | 2,264 | |
Bank of Moscow Via Kuznetski Capital | | | | | | | | |
0.000%, 11/25/15(D) (E) | | | 2,500 | | | | 2,501 | |
BMCE Bank | | | | | | | | |
6.250%, 11/27/18 | | | 500 | | | | 516 | |
CIT Group | | | | | | | | |
5.250%, 03/15/18 | | | 875 | | | | 899 | |
5.000%, 05/15/17 | | | 625 | | | | 641 | |
5.000%, 08/01/23 | | | 1,175 | | | | 1,168 | |
Commercial Bank Privatbank JSC Via Standard Bank | | | | | | | | |
5.799%, 02/09/16(D) | | | 370 | | | | 210 | |
Credit Bank of Moscow Via CBOM Finance | | | | | | | | |
8.700%, 11/13/18 | | | 1,685 | | | | 1,513 | |
7.700%, 02/01/18 | | | 1,540 | | | | 1,516 | |
Development Bank of Mongolia, MTN | | | | | | | | |
5.750%, 03/21/17 | | | 940 | | | | 888 | |
Eastern and Southern African Trade and Development Bank, MTN | | | | | | | | |
6.375%, 12/06/18 | | | 3,200 | | | | 3,236 | |
FBN Finance | | | | | | | | |
8.250%, 08/07/20 | | | 2,590 | | | | 2,041 | |
FBN Finance BV | | | | | | | | |
8.000%, 07/23/21(D) | | | 4,828 | | | | 3,645 | |
Finansbank | | | | | | | | |
6.250%, 04/30/19 | | | 2,000 | | | | 2,004 | |
ForteBank JSC | | | | | | | | |
11.750%, 12/15/24 | | | 2,230 | | | | 2,130 | |
Gazprombank Via GBP Eurobond Finance | | | | | | | | |
7.496%, 12/28/23(D) | | | 1,000 | | | | 840 | |
Halyk Savings Bank of Kazakhstan JSC | | | | | | | | |
7.250%, 05/03/17 | | | 1,000 | | | | 1,012 | |
7.250%, 01/28/21 | | | 1,625 | | | | 1,652 | |
See accompanying notes to financial statements.
CITY NATIONAL ROCHDALE FUNDS | PAGE 80
consolidated schedule of investments |
September 30, 2015 |
City National Rochdale Fixed Income Opportunities Fund (continued) |
Description | | Face Amount (000) | | | Value (000) | |
ICBC Standard Bank, MTN | | | | | | |
8.125%, 12/02/19 | | $ | 3,064 | | | $ | 3,279 | |
International Bank of Azerbaijan | | | | | | �� | | |
5.625%, 06/11/19 | | | 2,900 | | | | 2,588 | |
International Bank of Azerbaijan Via Rubrika Finance, MTN | | | | | | | | |
7.200%, 10/31/16 | | | 500 | | | | 493 | |
Kaspi Bank JSC | | | | | | | | |
9.875%, 10/28/16 | | | 2,305 | | | | 2,317 | |
Kazkommertsbank | | | | | | | | |
8.500%, 05/11/18 | | | 2,280 | | | | 2,155 | |
Kazkommertsbank JSC | | | | | | | | |
6.765%, 07/27/16(D) (E) | | | 4,000 | | | | 3,770 | |
5.500%, 12/21/22 | | | 4,448 | | | | 3,211 | |
Kazkommertsbank JSC, MTN | | | | | | | | |
8.000%, 11/03/15 | | | 1,940 | | | | 1,918 | |
7.500%, 11/29/16 | | | 2,205 | | | | 2,027 | |
6.875%, 02/13/17 | | | 2,410 | | | | 2,500 | |
National Savings Bank | | | | | | | | |
8.875%, 09/18/18 | | | 1,800 | | | | 1,908 | |
NDR Finance | | | | | | | | |
8.000%, 06/22/17(D) (G) (I) | | | 721 | | | | 51 | |
Oschadbank Via SSB #1 | | | | | | | | |
0.000%, 03/10/23(E) | | | 5,250 | | | | 4,528 | |
0.000%, 03/20/25(E) | | | 530 | | | | 451 | |
Privatbank CJSC Via UK SPV Credit Finance, MTN | | | | | | | | |
10.250%, 01/15/16 | | | 300 | | | | 213 | |
Renaissance Capital Via Renaissance Consumer Funding | | | | | | | | |
13.500%, 06/21/18 | | | 1,624 | | | | 1,364 | |
Russian Standard Bank Via Russian Standard Finance, MTN | | | | | | | | |
10.750%, 04/10/18 | | | 1,380 | | | | 386 | |
Sberbank of Russia Via SB Capital | | | | | | | | |
5.500%, 02/26/24(B) | | | 2,000 | | | | 1,695 | |
Trade & Development Bank of Mongolia, MTN | | | | | | | | |
9.375%, 05/19/20 | | | 1,750 | | | | 1,706 | |
VTB Bank Via VTB Capital | | | | | | | | |
6.950%, 10/17/22 | | | 1,000 | | | | 880 | |
| | | | | | | | | |
Total Banks | | | | 80,187 | |
| | | | | | | | | |
Batteries/Battery Sys [0.0%] | |
EnerSys | | | | | | | | |
5.000%, 04/30/23(A) | | | 450 | | | | 436 | |
| | | | | | | | | |
Broadcasting & Cable [1.7%] | |
AMC Networks | | | | | | | | |
7.750%, 07/15/21 | | | 600 | | | | 635 | |
4.750%, 12/15/22 | | | 325 | | | | 306 | |
Anixter | | | | | | | | |
5.625%, 05/01/19 | | | 600 | | | | 629 | |
5.500%, 03/01/23(A) | | | 350 | | | | 345 | |
5.125%, 10/01/21 | | | 300 | | | | 298 | |
Belden | | | | | | | | |
5.500%, 09/01/22(A) | | | 1,050 | | | | 1,016 | |
5.250%, 07/15/24(A) | | | 550 | | | | 509 | |
CCO Holdings | | | | | | | | |
7.375%, 06/01/20 | | | 300 | | | | 312 | |
6.625%, 01/31/22 | | | 650 | | | | 655 | |
5.875%, 05/01/27(A) | | | 200 | | | | 185 | |
5.750%, 09/01/23 | | | 525 | | | | 503 | |
5.750%, 01/15/24 | | | 425 | | | | 406 | |
5.375%, 05/01/25(A) | | | 250 | | | | 228 | |
5.250%, 03/15/21 | | | 675 | | | | 665 | |
5.125%, 02/15/23 | | | 500 | | | | 461 | |
Cequel Communications Holdings I | | | | | | | | |
6.375%, 09/15/20(A) | | | 225 | | | | 212 | |
5.125%, 12/15/21(A) | | | 750 | | | | 660 | |
Clear Channel Communications | | | | | | | | |
9.000%, 03/01/21 | | | 1,150 | | | | 966 | |
Clear Channel Worldwide Holdings | | | | | | | | |
6.500%, 11/15/22 | | | 2,000 | | | | 2,007 | |
Columbus International | | | | | | | | |
7.375%, 03/30/21 | | | 3,410 | | | | 3,529 | |
DISH DBS | | | | | | | | |
5.875%, 07/15/22 | | | 2,425 | | | | 2,146 | |
5.000%, 03/15/23 | | | 100 | | | | 84 | |
Gray Television | | | | | | | | |
7.500%, 10/01/20 | | | 1,150 | | | | 1,179 | |
LIN Television | | | | | | | | |
6.375%, 01/15/21 | | | 175 | | | | 182 | |
5.875%, 11/15/22(A) | | | 650 | | | | 645 | |
Nexstar Broadcasting | | | | | | | | |
6.125%, 02/15/22(A) | | | 875 | | | | 864 | |
Numericable Group | | | | | | | | |
6.250%, 05/15/24(A) | | | 575 | | | | 554 | |
6.000%, 05/15/22(A) | | | 800 | | | | 771 | |
Sinclair Television Group | | | | | | | | |
5.625%, 08/01/24(A) | | | 1,775 | | | | 1,613 | |
Tribune Media | | | | | | | | |
5.875%, 07/15/22(A) | | | 1,250 | | | | 1,213 | |
Unitymedia Hessen GmbH & KG | | | | | | | | |
5.500%, 01/15/23(A) | | | 525 | | | | 524 | |
See accompanying notes to financial statements.
CITY NATIONAL ROCHDALE FUNDS | PAGE 81
consolidated schedule of investments |
September 30, 2015 |
City National Rochdale Fixed Income Opportunities Fund (continued) |
Description | | Face Amount (000) | | | Value (000) | |
Unitymedia KabelBW GmbH | | | | | | |
6.125%, 01/15/25(A) | | $ | 1,325 | | | $ | 1,308 | |
VTR Finance BV | | | | | | | | |
6.875%, 01/15/24 | | | 2,610 | | | | 2,369 | |
Ziggo Bond Finance BV | | | | | | | | |
5.875%, 01/15/25(A) | | | 275 | | | | 252 | |
| | | | | | | | | |
Total Broadcasting & Cable | | | | 28,231 | |
| | | | | | | | | |
Building & Construction [2.0%] | |
Allegion US Holding | | | | | | | | |
5.750%, 10/01/21 | | | 550 | | | | 564 | |
Building Materials Corp of America | | | | | | | | |
6.000%, 10/15/25(A) | | | 425 | | | | 429 | |
Cemex | | | | | | | | |
7.250%, 01/15/21 | | | 765 | | | | 763 | |
6.500%, 12/10/19 | | | 2,155 | | | | 2,139 | |
5.875%, 03/25/19 | | | 970 | | | | 946 | |
CEMEX Espana | | | | | | | | |
9.875%, 04/30/19 | | | 1,590 | | | | 1,709 | |
Cemex Finance | | | | | | | | |
9.375%, 10/12/22 | | | 4,885 | | | | 5,196 | |
China Shanshui Cement Group | | | | | | | | |
7.500%, 03/10/20 | | | 3,450 | | | | 3,053 | |
CPG Merger Sub | | | | | | | | |
8.000%, 10/01/21(A) | | | 375 | | | | 378 | |
Dry Mix Solutions Investissements SAS | | | | | | | | |
4.212%, 06/15/21(D) | | | 3,000 | | | | 3,148 | |
Elementia | | | | | | | | |
5.500%, 01/15/25 | | | 300 | | | | 282 | |
Grupo Cementos de Chihuahua | | | | | | | | |
8.125%, 02/08/20 | | | 915 | | | | 950 | |
Kerneos Corporate SAS | | | | | | | | |
4.717%, 03/01/21(D) | | | 2,000 | | | | 2,215 | |
Masonite International | | | | | | | | |
5.625%, 03/15/23(A) | | | 500 | | | | 510 | |
NCI Building Systems | | | | | | | | |
8.250%, 01/15/23(A) | | | 800 | | | | 838 | |
Nortek | | | | | | | | |
8.500%, 04/15/21 | | | 1,350 | | | | 1,417 | |
Saderea, MTN | | | | | | | | |
12.500%, 11/30/26(G) (I) | | | 2,938 | | | | 2,577 | |
USG | | | | | | | | |
7.875%, 03/30/20(A) | | | 250 | | | | 263 | |
5.875%, 11/01/21(A) | | | 650 | | | | 674 | |
5.500%, 03/01/25(A) | | | 400 | | | | 399 | |
West China Cement | | | | | | | | |
6.500%, 09/11/19 | | | 2,000 | | | | 1,950 | |
Wise Metals Intermediate Holdings | | | | | | | | |
9.750%, 06/15/19(A) | | | 525 | | | | 505 | |
Yuksel Insaat | | | | | | | | |
9.500%, 11/10/15 | | | 1,465 | | | | 718 | |
| | | | | | | | | |
Total Building & Construction | | | | 31,623 | |
| | | | | | | | | |
Building & Construction Supplies [0.1%] | |
Signode Industrial Group Lux | | | | | | | | |
6.375%, 05/01/22(A) | | | 1,750 | | | | 1,654 | |
| | | | | | | | | |
Building-Heavy Construct [0.3%] | |
Empresas ICA | | | | | | | | |
8.900%, 02/04/21 | | | 2,209 | | | | 1,110 | |
8.875%, 05/29/24 | | | 3,620 | | | | 1,584 | |
Pratama Agung Pte | | | | | | | | |
6.250%, 02/24/20 | | | 2,500 | | | | 2,364 | |
| | | | | | | | | |
Total Building-Heavy Construct | | | | 5,058 | |
| | | | | | | | | |
Business Services [0.0%] | |
CoreLogic | | | | | | | | |
7.250%, 06/01/21 | | | 675 | | | | 705 | |
| | | | | | | | | |
Chemicals [0.5%] | |
Ashland | | | | | | | | |
4.750%, 08/15/22 | | | 950 | | | | 890 | |
Axiall | | | | | | | | |
4.875%, 05/15/23 | | | 100 | | | | 84 | |
Celanese US Holdings | | | | | | | | |
4.625%, 11/15/22 | | | 375 | | | | 353 | |
Eagle Spinco | | | | | | | | |
4.625%, 02/15/21 | | | 175 | | | | 148 | |
Eco Services Operations | | | | | | | | |
8.500%, 11/01/22(A) | | | 475 | | | | 423 | |
Hexion US Finance | | | | | | | | |
8.875%, 02/01/18 | | | 1,625 | | | | 1,300 | |
Huntsman International | | | | | | | | |
5.125%, 11/15/22(A) | | | 475 | | | | 407 | |
4.875%, 11/15/20 | | | 900 | | | | 782 | |
Ineos Finance | | | | | | | | |
4.000%, 05/01/23 | | | 1,000 | | | | 1,022 | |
Novacap International SAS, MTN | | | | | | | | |
4.977%, 05/01/19(D) | | | 1,000 | | | | 1,109 | |
Platform Specialty | | | | | | | | |
6.500%, 02/01/22 | | | 1,625 | | | | 1,398 | |
See accompanying notes to financial statements.
CITY NATIONAL ROCHDALE FUNDS | PAGE 82
consolidated schedule of investments |
September 30, 2015 |
City National Rochdale Fixed Income Opportunities Fund (continued) |
Description | | Face Amount (000) | | | Value (000) | |
WR Grace & -Conn | | | | | | |
5.625%, 10/01/24(A) | | $ | 325 | | | $ | 319 | |
5.125%, 10/01/21(A) | | | 225 | | | | 222 | |
| | | | | | | | | |
Total Chemicals | | | | 8,457 | |
| | | | | | | | | |
Coal Mining [0.5%] | |
Berau Coal Energy | | | | | | | | |
7.250%, 03/13/17 | | | 3,935 | | | | 1,377 | |
Indo Energy Finance II BV | | | | | | | | |
6.375%, 01/24/23 | | | 3,815 | | | | 1,602 | |
Mongolian Mining, MTN | | | | | | | | |
8.875%, 03/29/17 | | | 12,398 | | | | 4,959 | |
New World Resources | | | | | | | | |
8.000%, 04/07/20 | | | 897 | | | | 552 | |
| | | | | | | | | |
Total Coal Mining | | | | 8,490 | |
| | | | | | | | | |
Coatings/Paint [0.1%] | |
US Coatings Acquisition | | | | | | | | |
7.375%, 05/01/21(A) | | | 1,300 | | | | 1,370 | |
| | | | | | | | | |
Commercial Serv-Finance [0.3%] | |
Igloo Holdings | | | | | | | | |
8.250%, 12/15/17(A) (F) | | | 975 | | | | 980 | |
Interactive Data | | | | | | | | |
5.875%, 04/15/19(A) | | | 1,350 | | | | 1,346 | |
TMF Group Holding BV | | | | | | | | |
5.342%, 12/01/18(D) | | | 1,000 | | | | 1,124 | |
| | | | | | | | | |
Total Commercial Serv-Finance | | | | 3,450 | |
| | | | | | | | | |
Commercial Services [0.3%] | |
Allegion | | | | | | | | |
5.875%, 09/15/23 | | | 175 | | | | 179 | |
Anna Merger Sub | | | | | | | | |
7.750%, 10/01/22(A) | | | 2,050 | | | | 1,940 | |
BC Luxco 1 | | | | | | | | |
7.375%, 01/29/20 | | | 2,470 | | | | 2,322 | |
Iron Mountain | | | | | | | | |
6.000%, 10/01/20(A) | | | 125 | | | | 126 | |
5.750%, 08/15/24 | | | 725 | | | | 700 | |
| | | | | | | | | |
Total Commercial Services | | | | 5,267 | |
| | | | | | | | | |
Communication & Media [0.0%] | |
Ottawa Holdings Pte | | | | | | | | |
5.875%, 05/16/18 | | | 1,500 | | | | 623 | |
| | | | | | | | | |
Computer Graphics [0.1%] | |
Southern Graphics | | | | | | | | |
8.375%, 10/15/20(A) | | | 1,375 | | | | 1,375 | |
| | | | | | | | | |
Computer Software [0.1%] | |
Italics Merger Sub | | | | | | | | |
7.125%, 07/15/23(A) | | | 1,175 | | | | 1,122 | |
SS&C Technologies Holdings | | | | | | | | |
5.875%, 07/15/23(A) | | | 800 | | | | 814 | |
| | | | | | | | | |
Total Computer Software | | | | 1,936 | |
| | | | | | | | | |
Computer System Design & Services [0.3%] | |
Compiler Finance Sub | | | | | | | | |
7.000%, 05/01/21(A) | | | 800 | | | | 480 | |
IHS | | | | | | | | |
5.000%, 11/01/22 | | | 550 | | | | 529 | |
NCR | | | | | | | | |
6.375%, 12/15/23 | | | 350 | | | | 343 | |
5.875%, 12/15/21 | | | 400 | | | | 392 | |
5.000%, 07/15/22 | | | 800 | | | | 758 | |
4.625%, 02/15/21 | | | 250 | | | | 239 | |
SunGard Data Systems | | | | | | | | |
6.625%, 11/01/19 | | | 1,800 | | | | 1,859 | |
| | | | | | | | | |
Total Computer System Design & Services | | | | 4,600 | |
| | | | | | | | | |
Consumer Products & Services [0.5%] | |
First Quality Finance | | | | | | | | |
4.625%, 05/15/21(A) | | | 1,200 | | | | 1,116 | |
Prestige Brands | | | | | | | | |
8.125%, 02/01/20 | | | 475 | | | | 497 | |
5.375%, 12/15/21(A) | | | 1,125 | | | | 1,097 | |
Serta Simmons Holdings | | | | | | | | |
8.125%, 10/01/20(A) | | | 1,950 | | | | 2,045 | |
ServiceMaster | | | | | | | | |
7.450%, 08/15/27 | | | 225 | | | | 226 | |
7.100%, 03/01/18 | | | 475 | | | | 480 | |
Spectrum Brands | | | | | | | | |
6.125%, 12/15/24(A) | | | 575 | | | | 592 | |
5.750%, 07/15/25(A) | | | 800 | | | | 816 | |
Tempur Sealy International | | | | | | | | |
5.625%, 10/15/23(A) | | | 475 | | | | 477 | |
| | | | | | | | | |
Total Consumer Products & Services | | | | 7,346 | |
| | | | | | | | | |
Containers & Packaging [1.1%] | |
Ardagh Packaging Finance | | | | | | | | |
9.125%, 10/15/20(A) | | | 2,200 | | | | 2,294 | |
6.750%, 01/31/21(A) | | | 200 | | | | 200 | |
6.000%, 06/30/21(A) | | | 175 | | | | 167 | |
See accompanying notes to financial statements.
CITY NATIONAL ROCHDALE FUNDS | PAGE 83
consolidated schedule of investments |
September 30, 2015 |
City National Rochdale Fixed Income Opportunities Fund (continued) |
Description | | Face Amount (000) | | | Value (000) | |
Ball | | | | | | |
5.250%, 07/01/25 | | $ | 1,225 | | | $ | 1,207 | |
4.000%, 11/15/23 | | | 825 | | | | 771 | |
Berry Plastics | | | | | | | | |
5.500%, 05/15/22 | | | 2,075 | | | | 2,018 | |
5.125%, 07/15/23 | | | 575 | | | | 542 | |
Berry Plastics Escrow | | | | | | | | |
6.000%, 10/15/22(A) | | | 400 | | | | 401 | |
BWAY Holding | | | | | | | | |
9.125%, 08/15/21(A) | | | 1,550 | | | | 1,496 | |
Crown Americas | | | | | | | | |
4.500%, 01/15/23 | | | 1,300 | | | | 1,274 | |
Graphic Packaging International | | | | | | | | |
4.875%, 11/15/22 | | | 350 | | | | 349 | |
4.750%, 04/15/21 | | | 200 | | | | 198 | |
Owens-Brockway Glass Container | | | | | | | | |
6.375%, 08/15/25(A) | | | 425 | | | | 429 | |
5.875%, 08/15/23(A) | | | 375 | | | | 377 | |
5.375%, 01/15/25(A) | | | 950 | | | | 912 | |
5.000%, 01/15/22(A) | | | 125 | | | | 119 | |
Pactiv | | | | | | | | |
7.950%, 12/15/25 | | | 200 | | | | 190 | |
Reynolds Group Issuer | | | | | | | | |
9.875%, 08/15/19 | | | 350 | | | | 362 | |
8.250%, 02/15/21 | | | 1,025 | | | | 1,022 | |
5.750%, 10/15/20 | | | 1,350 | | | | 1,364 | |
Sealed Air | | | | | | | | |
6.500%, 12/01/20(A) | | | 725 | | | | 794 | |
5.250%, 04/01/23(A) | | | 50 | | | | 50 | |
5.125%, 12/01/24(A) | | | 850 | | | | 833 | |
4.875%, 12/01/22(A) | | | 725 | | | | 717 | |
| | | | | | | | | |
Total Containers & Packaging | | | | 18,086 | |
| | | | | | | | | |
Data Processing/Mgmt [0.4%] | |
Audatex North America | | | | | | | | |
6.125%, 11/01/23(A) | | | 1,025 | | | | 1,030 | |
6.000%, 06/15/21(A) | | | 1,175 | | | | 1,177 | |
First Data | | | | | | | | |
8.750%, 01/15/22(A) (F) | | | 3,225 | | | | 3,370 | |
8.250%, 01/15/21(A) | | | 150 | | | | 156 | |
5.375%, 08/15/23 | | | 1,300 | | | | 1,287 | |
| | | | | | | | | |
Total Data Processing/Mgmt | | | | 7,020 | |
| | | | | | | | | |
Decision Support Software [0.1%] | |
MSCI | | | | | | | | |
5.750%, 08/15/25(A) | | | 525 | | | | 529 | |
MSCI | | | | | | | | |
5.250%, 11/15/24(A) | | | 275 | | | | 278 | |
| | | | | | | | | |
Total Decision Support Software | | | | 807 | |
| | | | | | | | | |
Dental Supplies and Equip [0.3%] | |
IDH Finance | | | | | | | | |
5.586%, 12/01/18(D) | | | 3,000 | | | | 4,504 | |
| | | | | | | | | |
Diagnostic Equipment [0.1%] | |
Crimson Merger Sub | | | | | | | | |
6.625%, 05/15/22(A) | | | 2,350 | | | | 2,021 | |
| | | | | | | | | |
Dialysis Centers [0.0%] | |
DaVita HealthCare Partners | | | | | | | | |
5.750%, 08/15/22 | | | 875 | | | | 910 | |
5.125%, 07/15/24 | | | 175 | | | | 172 | |
5.000%, 05/01/25 | | | 350 | | | | 336 | |
| | | | | | | | | |
Total Dialysis Centers | | | | 1,418 | |
| | | | | | | | | |
Diamonds/Precious Stones [0.1%] | |
Petra Diamonds US Treasury | | | | | | | | |
8.250%, 05/31/20 | | | 2,500 | | | | 2,353 | |
| | | | | | | | | |
Disposable Medical Prod [0.1%] | |
Sterigenics-Nordion Holdings | | | | | | | | |
6.500%, 05/15/23(A) | | | 1,325 | | | | 1,315 | |
| | | | | | | | | |
Distribution/Wholesale [0.2%] | |
American Builders & Contractors Supply | | | | | | | | |
5.625%, 04/15/21(A) | | | 900 | | | | 882 | |
Beacon Roofing Supply | | | | | | | | |
6.375%, 10/01/23(A) | | | 300 | | | | 301 | |
DH Services Luxembourg Sarl | | | | | | | | |
7.750%, 12/15/20(A) | | | 1,350 | | | | 1,363 | |
HD Supply | | | | | | | | |
7.500%, 07/15/20 | | | 325 | | | | 338 | |
5.250%, 12/15/21(A) | | | 575 | | | | 578 | |
| | | | | | | | | |
Total Distribution/Wholesale | | | | 3,462 | |
| | | | | | | | | |
Drugs [0.5%] | |
Endo | | | | | | | | |
6.000%, 07/15/23(A) | | | 725 | | | | 716 | |
Endo Finance | | | | | | | | |
6.000%, 02/01/25(A) | | | 1,375 | | | | 1,335 | |
Grifols Worldwide Operations | | | | | | | | |
5.250%, 04/01/22 | | | 1,250 | | | | 1,237 | |
See accompanying notes to financial statements.
CITY NATIONAL ROCHDALE FUNDS | PAGE 84
consolidated schedule of investments |
September 30, 2015 |
City National Rochdale Fixed Income Opportunities Fund (continued) |
Description | | Face Amount (000) | | | Value (000) | |
Quintiles Transnational | | | | | | |
4.875%, 05/15/23(A) | | $ | 375 | | | $ | 371 | |
Valeant Pharmaceuticals International | | | | | | | | |
5.625%, 12/01/21(A) | | | 425 | | | | 404 | |
5.500%, 03/01/23(A) | | | 100 | | | | 95 | |
VPII Escrow | | | | | | | | |
7.500%, 07/15/21(A) | | | 1,400 | | | | 1,442 | |
VRX Escrow | | | | | | | | |
6.125%, 04/15/25(A) | | | 2,050 | | | | 1,953 | |
5.875%, 05/15/23(A) | | | 1,300 | | | | 1,242 | |
5.375%, 03/15/20(A) | | | 100 | | | | 97 | |
| | | | | | | | | |
Total Drugs | | | | 8,892 | |
| | | | | | | | | |
E-Commerce/Services [0.1%] | |
IAC | | | | | | | | |
4.750%, 12/15/22 | | | 1,250 | | | | 1,147 | |
| | | | | | | | | |
Educational Software [0.0%] | |
Blackboard | | | | | | | | |
7.750%, 11/15/19(A) | | | 650 | | | | 546 | |
| | | | | | | | | |
Electric Utilities [0.5%] | |
Calpine | | | | | | | | |
5.875%, 01/15/24(A) | | | 550 | | | | 566 | |
5.750%, 01/15/25 | | | 1,150 | | | | 1,075 | |
Eskom Holdings SOC | | | | | | | | |
5.750%, 01/26/21 | | | 2,500 | | | | 2,348 | |
NRG Energy | | | | | | | | |
6.625%, 03/15/23 | | | 400 | | | | 368 | |
6.250%, 05/01/24 | | | 500 | | | | 441 | |
Star Energy Geothermal Wayang Windu | | | | | | | | |
6.125%, 03/27/20 | | | 4,100 | | | | 3,752 | |
| | | | | | | | | |
Total Electric Utilities | | | | 8,550 | |
| | | | | | | | | |
Electrical Products [0.1%] | |
WESCO Distribution | | | | | | | | |
5.375%, 12/15/21 | | | 1,600 | | | | 1,530 | |
| | | | | | | | | |
Energy [0.2%] | |
CGG | | | | | | | | |
6.875%, 01/15/22 | | | 375 | | | | 208 | |
ContourGlobal Power Holdings | | | | | | | | |
7.125%, 06/01/19 | | | 3,150 | | | | 3,158 | |
Viridian Group | | | | | | | | |
7.500%, 03/01/20 | | | 500 | | | | 542 | |
| | | | | | | | | |
Total Energy | | | | 3,908 | |
Energy & Power [0.2%] | |
Greenko Dutch BV | | | | | | | | |
8.000%, 08/01/19 | | | 3,000 | | | | 3,063 | |
TerraForm Power Operating | | | | | | | | |
6.125%, 06/15/25(A) | | | 450 | | | | 389 | |
5.875%, 02/01/23(A) | | | 525 | | | | 464 | |
| | | | | | | | | |
Total Energy & Power | | | | 3,916 | |
| | | | | | | | | |
Engineering/R and D Services [0.1%] | |
Abengoa, MTN | | | | | | | | |
8.500%, 03/31/16 | | | 1,000 | | | | 951 | |
| | | | | | | | | |
Enterprise Software/Serv [0.4%] | |
BMC Software Finance | | | | | | | | |
8.125%, 07/15/21(A) | | | 875 | | | | 707 | |
Boxer Parent | | | | | | | | |
9.000%, 10/15/19(A) (F) | | | 1,200 | | | | 852 | |
Ensemble S Merger Sub | | | | | | | | |
9.000%, 09/30/23(A) | | | 1,125 | | | | 1,088 | |
Infor Software Parent | | | | | | | | |
7.125%, 05/01/21(A) | | | 1,775 | | | | 1,562 | |
Infor US | | | | | | | | |
6.500%, 05/15/22(A) | | | 2,175 | | | | 1,996 | |
Information US | | | | | | | | |
5.750%, 08/15/20(A) | | | 225 | | | | 224 | |
Open Text | | | | | | | | |
5.625%, 01/15/23(A) | | | 500 | | | | 496 | |
| | | | | | | | | |
Total Enterprise Software/Serv | | | | 6,925 | |
| | | | | | | | | |
Entertainment & Gaming [1.1%] | |
Affinity Gaming | | | | | | | | |
9.000%, 05/15/18 | | | 375 | | | | 373 | |
Ameristar Casinos | | | | | | | | |
7.500%, 04/15/21 | | | 600 | | | | 626 | |
Boyd Gaming | | | | | | | | |
6.875%, 05/15/23 | | | 750 | | | | 761 | |
Chester Downs & Marina | | | | | | | | |
9.250%, 02/01/20(A) | | | 700 | | | | 527 | |
Cinemark USA | | | | | | | | |
7.375%, 06/15/21 | | | 200 | | | | 209 | |
5.125%, 12/15/22 | | | 300 | | | | 294 | |
GLP Capital | | | | | | | | |
5.375%, 11/01/23 | | | 500 | | | | 507 | |
4.875%, 11/01/20 | | | 450 | | | | 456 | |
MGM Resorts International | | | | | | | | |
7.750%, 03/15/22 | | | 1,400 | | | | 1,491 | |
6.750%, 10/01/20 | | | 250 | | | | 258 | |
6.000%, 03/15/23 | | | 375 | | | | 364 | |
5.250%, 03/31/20 | | | 350 | | | | 345 | |
See accompanying notes to financial statements.
CITY NATIONAL ROCHDALE FUNDS | PAGE 85
consolidated schedule of investments |
September 30, 2015 |
City National Rochdale Fixed Income Opportunities Fund (continued) |
Description | | Face Amount (000) | | | Value (000) | |
Mohegan Tribal Gaming Authority | | | | | | |
9.750%, 09/01/21 | | $ | 750 | | | $ | 763 | |
Penn National Gaming | | | | | | | | |
5.875%, 11/01/21 | | | 1,525 | | | | 1,538 | |
Pinnacle Entertainment | | | | | | | | |
7.750%, 04/01/22 | | | 525 | | | | 575 | |
6.375%, 08/01/21 | | | 400 | | | | 423 | |
Regal Entertainment Group | | | | | | | | |
5.750%, 03/15/22 | | | 500 | | | | 491 | |
5.750%, 02/01/25 | | | 375 | | | | 354 | |
Seminole Hard Rock Entertainment | | | | | | | | |
5.875%, 05/15/21(A) | | | 1,700 | | | | 1,675 | |
Seminole Indian Tribe of Florida | | | | | | | | |
7.804%, 10/01/20(A) | | | 555 | | | | 589 | |
Station Casinos | | | | | | | | |
7.500%, 03/01/21 | | | 1,200 | | | | 1,248 | |
Studio City Finance | | | | | | | | |
8.500%, 12/01/20 | | | 2,000 | | | | 1,850 | |
| | | | | | | | | |
Total Entertainment & Gaming | | | | 15,717 | |
| | | | | | | | | |
E-Services/Consulting [0.1%] | |
TES Finance | | | | | | | | |
6.750%, 07/15/20 | | | 1,000 | | | | 1,414 | |
| | | | | | | | | |
Export/Import Bank [0.3%] | |
Ukreximbank Via Biz Finance | | | | | | | | |
9.625%, 04/27/22 | | | 4,819 | | | | 4,221 | |
| | | | | | | | | |
Financial Services [1.2%] | |
AerCap Ireland Capital | | | | | | | | |
4.625%, 07/01/22 | | | 250 | | | | 249 | |
4.500%, 05/15/21 | | | 800 | | | | 799 | |
Ally Financial | | | | | | | | |
5.125%, 09/30/24 | | | 450 | | | | 444 | |
4.750%, 09/10/18 | | | 1,150 | | | | 1,172 | |
4.625%, 05/19/22 | | | 100 | | | | 98 | |
4.625%, 03/30/25 | | | 1,300 | | | | 1,229 | |
4.125%, 03/30/20 | | | 425 | | | | 420 | |
4.125%, 02/13/22 | | | 400 | | | | 385 | |
2.750%, 01/30/17 | | | 1,150 | | | | 1,141 | |
Arrow Global Finance | | | | | | | | |
5.217%, 11/01/21(D) | | | 1,000 | | | | 1,122 | |
Astana Finance JSC | | | | | | | | |
0.000%, 12/22/24(F) (G) (I) | | | 147 | | | | 4 | |
Credito Real | | | | | | | | |
7.500%, 03/13/19 | | | 2,500 | | | | 2,468 | |
International Lease Finance | | | | | | | | |
5.875%, 08/15/22 | | | 1,025 | | | | 1,092 | |
4.625%, 04/15/21 | | | 1,500 | | | | 1,508 | |
Koks Finance | | | | | | | | |
10.750%, 12/28/18 | | | 2,353 | | | | 2,075 | |
Lock | | | | | | | | |
5.500%, 08/15/20(D) | | | 2,000 | | | | 2,240 | |
Quicken Loans | | | | | | | | |
5.750%, 05/01/25(A) | | | 1,575 | | | | 1,479 | |
| | | | | | | | | |
Total Financial Services | | | | 17,925 | |
| | | | | | | | | |
Firearms and Ammunition [0.0%] | |
FGI Operating Company | | | | | | | | |
7.875%, 05/01/20 | | | 925 | | | | 703 | |
| | | | | | | | | |
Food, Beverage & Tobacco [2.0%] | |
ARAMARK | | | | | | | | |
5.750%, 03/15/20 | | | 1,475 | | | | 1,533 | |
Boparan Finance | | | | | | | | |
5.500%, 07/15/21 | | | 1,000 | | | | 1,324 | |
Boparan Finance, MTN | | | | | | | | |
4.375%, 07/15/21 | | | 1,000 | | | | 981 | |
CEDC Finance International | | | | | | | | |
10.000%, 04/30/18(E) | | | 2,005 | | | | 1,729 | |
CFG Investment SAC | | | | | | | | |
9.750%, 07/30/19 | | | 1,020 | | | | 612 | |
Dean Foods | | | | | | | | |
6.500%, 03/15/23(A) | | | 950 | | | | 964 | |
Galapagos | | | | | | | | |
4.712%, 06/15/21(D) | | | 3,000 | | | | 3,151 | |
Hearthside Group Holdings | | | | | | | | |
6.500%, 05/01/22(A) | | | 1,525 | | | | 1,411 | |
JBS Investments GmbH | | | | | | | | |
7.750%, 10/28/20 | | | 750 | | | | 769 | |
Marfrig Holding Europe BV | | | | | | | | |
8.375%, 05/09/18 | | | 2,305 | | | | 2,149 | |
6.875%, 06/24/19 | | | 2,550 | | | | 2,155 | |
Marfrig Overseas | | | | | | | | |
9.500%, 05/04/20 | | | 4,604 | | | | 4,466 | |
MHP | | | | | | | | |
8.250%, 04/02/20 | | | 6,115 | | | | 5,145 | |
Minerva Luxembourg | | | | | | | | |
8.750%, 12/29/49(D) | | | 2,000 | | | | 1,760 | |
Pinnacle Foods Finance | | | | | | | | |
4.875%, 05/01/21 | | | 1,675 | | | | 1,646 | |
Smithfield Foods | | | | | | | | |
6.625%, 08/15/22 | | | 850 | | | | 896 | |
Sun Merger Sub | | | | | | | | |
5.875%, 08/01/21(A) | | | 600 | | | | 615 | |
| | | | | | | | | |
Total Food, Beverage & Tobacco | | | | 31,306 | |
See accompanying notes to financial statements.
CITY NATIONAL ROCHDALE FUNDS | PAGE 86
consolidated schedule of investments |
September 30, 2015 |
City National Rochdale Fixed Income Opportunities Fund (continued) |
Description | | Face Amount (000) | | | Value (000) | |
Food-Canned [0.0%] | |
TreeHouse Foods | | | | | | |
4.875%, 03/15/22 | | $ | 100 | | | $ | 96 | |
| | | | | | | | | |
Food-Flour and Grain [0.1%] | |
Post Holdings | | | | | | | | |
8.000%, 07/15/25(A) | | | 750 | | | | 773 | |
7.750%, 03/15/24(A) | | | 375 | | | | 384 | |
| | | | | | | | | |
Total Food-Flour and Grain | | | | 1,157 | |
| | | | | | | | | |
Food-Wholesale/Distrib [0.1%] | |
US Foods | | | | | | | | |
8.500%, 06/30/19 | | | 2,225 | | | | 2,303 | |
| | | | | | | | | |
Gaming [0.0%] | |
Rivers Pittsburgh Borrower | | | | | | | | |
9.500%, 06/15/19(A) | | | 717 | | | | 746 | |
| | | | | | | | | |
Gold Mining [0.1%] | |
Polyus International | | | | | | | | |
5.625%, 04/29/20 | | | 1,620 | | | | 1,529 | |
| | | | | | | | | |
Health Care [0.1%] | |
Envision Healthcare | | | | | | | | |
5.125%, 07/01/22(A) | | | 1,100 | | | | 1,097 | |
| | | | | | | | | |
Home Decoration Products [0.1%] | |
RSI Home Products | | | | | | | | |
6.500%, 03/15/23(A) | | | 1,125 | | | | 1,125 | |
| | | | | | | | | |
Hotels and Motels [0.0%] | |
Grupo Posadas | | | | | | | | |
7.875%, 06/30/22 | | | 500 | | | | 451 | |
Hilton Worldwide Finance | | | | | | | | |
5.625%, 10/15/21 | | | 700 | | | | 723 | |
| | | | | | | | | |
Total Hotels and Motels | | | | 1,174 | |
| | | | | | | | | |
Industrial [0.0%] | |
Unifrax I | | | | | | | | |
7.500%, 02/15/19(A) | | | 950 | | | | 931 | |
| | | | | | | | | |
Insurance [0.2%] | |
Hockey Merger Sub 2 | | | | | | | | |
7.875%, 10/01/21(A) | | | 1,450 | | | | 1,385 | |
Hub Holdings | | | | | | | | |
8.125%, 07/15/19(A) (F) | | | 1,050 | | | | 1,013 | |
| | | | | | | | | |
Total Insurance | | | | 2,398 | |
| | | | | | | | | |
Internet Connectiv Svcs [0.1%] | |
Adria Bidco BV | | | | | | | | |
7.875%, 11/15/20 | | | 1,000 | | | | 1,145 | |
| | | | | | | | | |
Internet Security [0.2%] | |
Blue Coat Holdings | | | | | | | | |
8.375%, 06/01/23(A) | | | 1,200 | | | | 1,197 | |
VeriSign | | | | | | | | |
5.250%, 04/01/25 | | | 525 | | | | 521 | |
4.625%, 05/01/23 | | | 825 | | | | 802 | |
| | | | | | | | | |
Total Internet Security | | | | 2,520 | |
| | | | | | | | | |
Investment Banker/Broker Dealer [0.0%] | |
First Investment Finance BV | | | | | | | | |
11.625%, 03/29/16(E) (G) (I) | | | 200 | | | | 197 | |
Neuberger Berman Group | | | | | | | | |
5.875%, 03/15/22(A) | | | 300 | | | | 318 | |
| | | | | | | | | |
Total Investment Banker/Broker Dealer | | | | 515 | |
| | | | | | | | | |
Investment Companies [0.1%] | |
Sagicor Finance 2015 | | | | | | | | |
8.875%, 08/11/22(A) | | | 805 | | | | 859 | |
| | | | | | | | | |
Mach Tools and Rel Products [0.0%] | |
Milacron | | | | | | | | |
7.750%, 02/15/21(A) | | | 525 | | | | 535 | |
| | | | | | | | | |
Machinery-General Indust [0.2%] | |
ATS Automation Tooling Systems | | | | | | | | |
6.500%, 06/15/23(A) | | | 500 | | | | 501 | |
Gardner Denver | | | | | | | | |
6.875%, 08/15/21(A) | | | 1,075 | | | | 949 | |
Zebra Technologies | | | | | | | | |
7.250%, 10/15/22(A) | | | 1,325 | | | | 1,411 | |
| | | | | | | | | |
Total Machinery-General Indust | | | | 2,861 | |
| | | | | | | | | |
Manufacturing [0.0%] | |
Cleaver-Brooks | | | | | | | | |
8.750%, 12/15/19(A) | | | 825 | | | | 780 | |
| | | | | | | | | |
Medical Labs and Testing Srv [0.2%] | |
Ephios Bondco | | | | | | | | |
5.059%, 07/01/22(D) | | | 2,000 | | | | 2,212 | |
5.000%, 07/01/22(D) | | | 1,000 | | | | 1,116 | |
| | | | | | | | | |
Total Medical Labs and Testing Srv | | | | 3,328 | |
See accompanying notes to financial statements.
CITY NATIONAL ROCHDALE FUNDS | PAGE 87
consolidated schedule of investments |
September 30, 2015 |
City National Rochdale Fixed Income Opportunities Fund (continued) |
Description | | Face Amount (000) | | | Value (000) | |
Medical Products & Services [1.3%] | |
AMAG Pharmaceuticals | | | | | | |
7.875%, 09/01/23(A) | | $ | 250 | | | $ | 239 | |
Care UK Health & Social Care | | | | | | | | |
5.584%, 07/15/19(D) | | | 679 | | | | 947 | |
CHS | | | | | | | | |
6.875%, 02/01/22 | | | 2,025 | | | | 2,068 | |
5.125%, 08/01/21 | | | 450 | | | | 458 | |
HCA | | | | | | | | |
7.500%, 02/15/22 | | | 1,625 | | | | 1,836 | |
6.500%, 02/15/20 | | | 450 | | | | 491 | |
5.875%, 05/01/23 | | | 825 | | | | 856 | |
5.375%, 02/01/25 | | | 1,650 | | | | 1,633 | |
5.250%, 04/15/25 | | | 725 | | | | 740 | |
5.000%, 03/15/24 | | | 1,875 | | | | 1,880 | |
HCA Holdings | | | | | | | | |
6.250%, 02/15/21 | | | 550 | | | | 586 | |
Hill-Rom Holdings | | | | | | | | |
5.750%, 09/01/23(A) | | | 375 | | | | 376 | |
IASIS Healthcare | | | | | | | | |
8.375%, 05/15/19 | | | 1,200 | | | | 1,235 | |
LifePoint Hospitals | | | | | | | | |
5.500%, 12/01/21 | | | 1,025 | | | | 1,035 | |
Mallinckrodt International Finance | | | | | | | | |
5.625%, 10/15/23(A) | | | 350 | | | | 319 | |
5.500%, 04/15/25(A) | | | 300 | | | | 267 | |
4.875%, 04/15/20(A) | | | 175 | | | | 167 | |
4.750%, 04/15/23 | | | 850 | | | | 735 | |
Teleflex | | | | | | | | |
5.250%, 06/15/24 | | | 450 | | | | 452 | |
Tenet Healthcare | | | | | | | | |
8.125%, 04/01/22 | | | 1,425 | | | | 1,515 | |
6.750%, 06/15/23 | | | 650 | | | | 645 | |
4.500%, 04/01/21 | | | 850 | | | | 837 | |
4.375%, 10/01/21 | | | 925 | | | | 902 | |
| | | | | | | | | |
Total Medical Products & Services | | | | 20,219 | |
| | | | | | | | | |
Medical-HMO [0.1%] | |
MPH Acquisition Holdings | | | | | | | | |
6.625%, 04/01/22(A) | | | 1,900 | | | | 1,900 | |
| | | | | | | | | |
Medical-Outptnt/Home Med [0.1%] | |
Amsurg | | | | | | | | |
5.625%, 11/30/20 | | | 300 | | | | 304 | |
5.625%, 07/15/22 | | | 1,075 | | | | 1,074 | |
| | | | | | | | | |
Total Medical-Outptnt/Home Med | | | | 1,378 | |
| | | | | | | | | |
Metal-Copper [0.2%] | |
First Quantum Minerals | | | | | | | | |
7.250%, 10/15/19 | | | 3,800 | | | | 2,584 | |
| | | | | | | | | |
Metal-Iron [0.1%] | |
Koks OAO Via Koks Finance | | | | | | | | |
7.750%, 06/23/16 | | | 200 | | | | 190 | |
Metalloinvest Finance | | | | | | | | |
5.625%, 04/17/20 | | | 1,835 | | | | 1,727 | |
| | | | | | | | | |
Total Metal-Iron | | | | 1,917 | |
| | | | | | | | | |
Metals & Mining [0.4%] | |
Consolidated Minerals | | | | | | | | |
8.000%, 05/15/20 | | | 2,000 | | | | 1,400 | |
TiZir | | | | | | | | |
9.000%, 09/28/17(G) (I) | | | 3,800 | | | | 2,584 | |
Vedanta Resources | | | | | | | | |
8.250%, 06/07/21 | | | 1,265 | | | | 886 | |
7.125%, 05/31/23 | | | 1,670 | | | | 1,031 | |
| | | | | | | | | |
Total Metals & Mining | | | | 5,901 | |
| | | | | | | | | |
Mining Other [0.1%] | |
Uranium One Investments | | | | | | | | |
6.250%, 12/13/18 | | | 2,150 | | | | 1,975 | |
| | | | | | | | | |
Miscellaneous Business Services [0.1%] | |
Garda World Security | | | | | | | | |
7.250%, 11/15/21(A) | | | 1,425 | | | | 1,300 | |
| | | | | | | | | |
Total Miscellaneous Business Services | | | | 1,300 | |
| | | | | | | | | |
Miscellaneous Manufacturing [0.5%] | |
MAF Global Securities | | | | | | | | |
7.125%, 10/29/49(D) | | | 2,025 | | | | 2,091 | |
Natsionalnaya Kompaniya Kazakhstan Engineering AO | | | | | | | | |
4.550%, 12/03/16 | | | 1,100 | | | | 1,039 | |
Sistema via Sistema International Funding | | | | | | | | |
6.950%, 05/17/19 | | | 2,525 | | | | 2,458 | |
TMK OAO Via TMK Capital | | | | | | | | |
7.750%, 01/27/18 | | | 1,330 | | | | 1,297 | |
6.750%, 04/03/20 | | | 1,900 | | | | 1,661 | |
| | | | | | | | | |
Total Miscellaneous Manufacturing | | | | 8,546 | |
| | | | | | | | | |
MRI/Medical Diag Imaging [0.1%] | |
Surgical Care Affiliates | | | | | | | | |
6.000%, 04/01/23(A) | | | 1,050 | | | | 1,040 | |
See accompanying notes to financial statements.
CITY NATIONAL ROCHDALE FUNDS | PAGE 88
consolidated schedule of investments |
September 30, 2015 |
City National Rochdale Fixed Income Opportunities Fund (continued) |
Description | | Face Amount (000) | | | Value (000) | |
Office Automation and Equip [0.1%] | |
CDW | | | | | | |
6.000%, 08/15/22 | | $ | 1,125 | | | $ | 1,176 | |
5.500%, 12/01/24 | | | 1,125 | | | | 1,125 | |
| | | | | | | | | |
Total Office Automation and Equip | | | | 2,301 | |
| | | | | | | | | |
Oil-Field Services [0.4%] | |
Borets Finance | | | | | | | | |
7.625%, 09/26/18 | | | 700 | | | | 564 | |
Hiland Partners | | | | | | | | |
5.500%, 05/15/22(A) | | | 375 | | | | 366 | |
Sea Trucks Group | | | | | | | | |
9.000%, 03/26/18(A) | | | 8,295 | | | | 5,525 | |
Western Refining Logistics | | | | | | | | |
7.500%, 02/15/23 | | | 725 | | | | 720 | |
| | | | | | | | | |
Total Oil-Field Services | | | | 7,175 | |
| | | | | | | | | |
Paper & Related Products [0.2%] | |
Argos Merger Sub | | | | | | | | |
7.125%, 03/15/23(A) | | | 1,900 | | | | 1,921 | |
Clearwater Paper | | | | | | | | |
5.375%, 02/01/25(A) | | | 1,300 | | | | 1,235 | |
| | | | | | | | | |
Total Paper & Related Products | | | | 3,156 | |
| | | | | | | | | |
Petrochemicals [0.1%] | |
Braskem Finance | | | | | | | | |
7.375%, 10/29/49 | | | 500 | | | | 346 | |
7.250%, 06/05/18 | | | 400 | | | | 395 | |
7.000%, 05/07/20 | | | 1,500 | | | | 1,402 | |
| | | | | | | | | |
Total Petrochemicals | | | | 2,143 | |
| | | | | | | | | |
Petroleum & Fuel Products [6.3%] | |
Access Midstream Partners | | | | | | | | |
4.875%, 03/15/24 | | | 825 | | | | 739 | |
Antero Resources | | | | | | | | |
5.625%, 06/01/23(A) | | | 200 | | | | 175 | |
5.125%, 12/01/22 | | | 350 | | | | 301 | |
Antero Resources Finance | | | | | | | | |
6.000%, 12/01/20 | | | 650 | | | | 601 | |
5.375%, 11/01/21 | | | 475 | | | | 418 | |
Approach Resources | | | | | | | | |
7.000%, 06/15/21 | | | 875 | | | | 525 | |
Blue Racer Midstream | | | | | | | | |
6.125%, 11/15/22(A) | | | 725 | | | | 689 | |
BreitBurn Energy Partners | | | | | | | | |
7.875%, 04/15/22 | | | 350 | | | | 125 | |
California Resources | | | | | | | | |
6.000%, 11/15/24 | | | 1,250 | | | | 745 | |
5.500%, 09/15/21 | | | 175 | | | | 107 | |
Carrizo Oil & Gas | | | | | | | | |
7.500%, 09/15/20 | | | 775 | | | | 725 | |
6.250%, 04/15/23 | | | 350 | | | | 305 | |
Chaparral Energy | | | | | | | | |
9.875%, 10/01/20(G) (I) | | | 75 | | | | 24 | |
7.625%, 11/15/22 | | | 400 | | | | 118 | |
Chesapeake Energy | | | | | | | | |
6.875%, 11/15/20 | | | 525 | | | | 386 | |
5.750%, 03/15/23 | | | 650 | | | | 424 | |
5.375%, 06/15/21 | | | 500 | | | | 332 | |
China Oil & Gas Group | | | | | | | | |
5.250%, 04/25/18 | | | 2,877 | | | | 2,692 | |
Crestwood Midstream Partners | | | | | | | | |
6.250%, 04/01/23(A) | | | 875 | | | | 744 | |
6.125%, 03/01/22 | | | 250 | | | | 216 | |
6.000%, 12/15/20 | | | 425 | | | | 381 | |
CrownRock | | | | | | | | |
7.750%, 02/15/23(A) | | | 225 | | | | 220 | |
CVR Refining | | | | | | | | |
6.500%, 11/01/22 | | | 600 | | | | 581 | |
DNO | | | | | | | | |
8.750%, 06/18/20(A) | | | 1,000 | | | | 777 | |
Energy Transfer Equity | | | | | | | | |
5.875%, 01/15/24 | | | 2,625 | | | | 2,364 | |
Energy XXI Gulf Coast | | | | | | | | |
7.500%, 12/15/21 | | | 650 | | | | 84 | |
6.875%, 03/15/24 | | | 100 | | | | 17 | |
EP Energy | | | | | | | | |
9.375%, 05/01/20 | | | 675 | | | | 580 | |
7.750%, 09/01/22 | | | 150 | | | | 120 | |
6.375%, 06/15/23 | | | 350 | | | | 258 | |
EP PetroEcuador via Noble Sovereign Funding I | | | | | | | | |
5.957%, 09/24/19(D) | | | 2,526 | | | | 1,914 | |
FTS International | | | | | | | | |
6.250%, 05/01/22(G) (I) | | | 625 | | | | 194 | |
Genel Energy Finance | | | | | | | | |
7.500%, 05/14/19(A) | | | 1,600 | | | | 1,312 | |
Georgian Oil and Gas | | | | | | | | |
6.875%, 05/16/17 | | | 4,900 | | | | 4,900 | |
Gulf Keystone Petroleum | | | | | | | | |
13.000%, 04/18/17(G) (I) | | | 4,200 | | | | 2,688 | |
Gulfport Energy | | | | | | | | |
7.750%, 11/01/20 | | | 650 | | | | 639 | |
6.625%, 05/01/23(A) | | | 300 | | | | 276 | |
Halcon Resources | | | | | | | | |
8.625%, 02/01/20(A) | | | 425 | | | | 353 | |
See accompanying notes to financial statements.
CITY NATIONAL ROCHDALE FUNDS | PAGE 89
consolidated schedule of investments |
September 30, 2015 |
City National Rochdale Fixed Income Opportunities Fund (continued) |
Description | | Face Amount (000) | | | Value (000) | |
Holly Energy Partners | | | | | | |
6.500%, 03/01/20 | | $ | 900 | | | $ | 855 | |
InterOil Exploration and Production | | | | | | | | |
6.000%, 01/22/20(G) (I) | | | 2,415 | | | | 725 | |
Kinder Morgan | | | | | | | | |
5.625%, 11/15/23(A) | | | 1,200 | | | | 1,177 | |
Laredo Petroleum | | | | | | | | |
7.375%, 05/01/22 | | | 425 | | | | 411 | |
6.250%, 03/15/23 | | | 200 | | | | 182 | |
5.625%, 01/15/22 | | | 300 | | | | 268 | |
Legacy Reserves | | | | | | | | |
6.625%, 12/01/21(G) (I) | | | 950 | | | | 646 | |
Linn Energy | | | | | | | | |
7.750%, 02/01/21 | | | 250 | | | | 57 | |
6.500%, 05/15/19 | | | 275 | | | | 76 | |
6.500%, 09/15/21 | | | 275 | | | | 57 | |
6.250%, 11/01/19 | | | 425 | | | | 108 | |
Lone Pine Resources Canada | | | | | | | | |
0.000%, 02/15/17(G) (I) | | | 75 | | | | — | |
MarkWest Energy Partners | | | | | | | | |
4.875%, 12/01/24 | | | 700 | | | | 640 | |
4.875%, 06/01/25 | | | 875 | | | | 805 | |
Metro Exploration Holding | | | | | | | | |
11.500%, 02/14/16(E) (G) (I) | | | 3,943 | | | | 237 | |
MIE Holdings | | | | | | | | |
7.500%, 04/25/19 | | | 3,400 | | | | 1,564 | |
MIE Holdings, MTN | | | | | | | | |
6.875%, 02/06/18 | | | 760 | | | | 380 | |
Millennium Offshore Services Superholdings | | | | | | | | |
9.500%, 02/15/18 | | | 1,200 | | | | 1,035 | |
Northern Oil and Gas | | | | | | | | |
8.000%, 06/01/20 | | | 1,275 | | | | 948 | |
Nostrum Oil & Gas Finance BV | | | | | | | | |
6.375%, 02/14/19 | | | 3,845 | | | | 3,076 | |
Oasis Petroleum | | | | | | | | |
6.875%, 03/15/22 | | | 150 | | | | 119 | |
6.875%, 01/15/23 | | | 225 | | | | 174 | |
6.500%, 11/01/21 | | | 850 | | | | 672 | |
Odebrecht Drilling Norbe VIII | | | | | | | | |
6.350%, 06/30/21 | | | 2,989 | | | | 1,054 | |
Pacific Rubiales Energy | | | | | | | | |
7.250%, 12/12/21 | | | 5,835 | | | | 2,101 | |
5.625%, 01/19/25 | | | 10,756 | | | | 3,761 | |
5.375%, 01/26/19 | | | 1,535 | | | | 568 | |
5.125%, 03/28/23 | | | 2,750 | | | | 969 | |
PDC Energy | | | | | | | | |
7.750%, 10/15/22 | | | 200 | | | | 199 | |
Petrobras Global Finance BV | | | | | | | | |
7.875%, 03/15/19 | | | 1,201 | | | | 991 | |
6.875%, 01/20/40 | | | 5,295 | | | | 3,442 | |
6.850%, 06/05/15 | | | 580 | | | | 370 | |
6.250%, 03/17/24 | | | 4,002 | | | | 2,913 | |
5.625%, 05/20/43 | | | 1,060 | | | | 649 | |
5.375%, 01/27/21 | | | 2,928 | | | | 2,136 | |
Petrobras International Finance | | | | | | | | |
5.875%, 03/01/18 | | | 500 | | | | 413 | |
5.750%, 01/20/20 | | | 1,077 | | | | 806 | |
Petroleos de Venezuela | | | | | | | | |
9.750%, 05/17/35 | | | 6,600 | | | | 2,393 | |
8.500%, 11/02/17 | | | 8,136 | | | | 5,431 | |
5.125%, 10/28/16 | | | 3,670 | | | | 2,514 | |
5.000%, 10/28/15 | | | 734 | | | | 728 | |
Puma International Financing | | | | | | | | |
6.750%, 02/01/21 | | | 3,020 | | | | 2,990 | |
QGOG Atlantic | | | | | | | | |
5.250%, 07/30/18 | | | 1,401 | | | | 910 | |
QGOG Constellation | | | | | | | | |
6.250%, 11/09/19 | | | 3,925 | | | | 1,707 | |
Range Resources | | | | | | | | |
5.000%, 03/15/23 | | | 475 | | | | 420 | |
4.875%, 05/15/25(A) | | | 772 | | | | 688 | |
Regency Energy Partners | | | | | | | | |
5.875%, 03/01/22 | | | 400 | | | | 410 | |
5.500%, 04/15/23 | | | 200 | | | | 194 | |
5.000%, 10/01/22 | | | 150 | | | | 146 | |
4.500%, 11/01/23 | | | 350 | | | | 324 | |
Rice Energy | | | | | | | | |
7.250%, 05/01/23(A) | | | 200 | | | | 188 | |
6.250%, 05/01/22 | | | 775 | | | | 691 | |
Rose Rock Midstream | | | | | | | | |
5.625%, 07/15/22 | | | 1,300 | | | | 1,144 | |
5.625%, 11/15/23(A) | | | 425 | | | | 370 | |
Rosneft Oil via Rosneft International Finance | | | | | | | | |
4.199%, 03/06/22 | | | 1,595 | | | | 1,353 | |
RSP Permian | | | | | | | | |
6.625%, 10/01/22 | | | 525 | | | | 504 | |
6.625%, 10/01/22(A) | | | 100 | | | | 96 | |
Sabine Pass Liquefaction | | | | | | | | |
6.250%, 03/15/22 | | | 1,050 | | | | 977 | |
5.625%, 02/01/21 | | | 1,225 | | | | 1,136 | |
5.625%, 04/15/23 | | | 175 | | | | 155 | |
5.625%, 03/01/25(A) | | | 625 | | | | 551 | |
SandRidge Energy | | | | | | | | |
8.125%, 10/15/22 | | | 975 | | | | 210 | |
7.500%, 03/15/21 | | | 75 | | | | 17 | |
Seven Energy | | | | | | | | |
10.250%, 10/11/21 | | | 3,600 | | | | 2,341 | |
Sibur Securities | | | | | | | | |
3.914%, 01/31/18 | | | 1,010 | | | | 972 | |
See accompanying notes to financial statements.
CITY NATIONAL ROCHDALE FUNDS | PAGE 90
consolidated schedule of investments |
September 30, 2015 |
City National Rochdale Fixed Income Opportunities Fund (continued) |
Description | | Face Amount (000) | | | Value (000) | |
SM Energy | | | | | | |
6.500%, 01/01/23 | | $ | 100 | | | $ | 93 | |
5.625%, 06/01/25 | | | 375 | | | | 323 | |
5.000%, 01/15/24 | | | 350 | | | | 296 | |
Summit Midstream Holdings | | | | | | | | |
7.500%, 07/01/21 | | | 200 | | | | 192 | |
5.500%, 08/15/22 | | | 1,050 | | | | 903 | |
Targa Resources Partners | | | | | | | | |
5.250%, 05/01/23 | | | 825 | | | | 732 | |
5.000%, 01/15/18(A) | | | 250 | | | | 238 | |
4.250%, 11/15/23 | | | 250 | | | | 208 | |
Tesoro Logistics | | | | | | | | |
6.250%, 10/15/22(A) | | | 125 | | | | 122 | |
6.125%, 10/15/21 | | | 225 | | | | 221 | |
5.875%, 10/01/20 | | | 924 | | | | 896 | |
5.500%, 10/15/19(A) | | | 50 | | | | 49 | |
5.125%, 04/01/24 | | | 600 | | | | 588 | |
W&T Offshore | | | | | | | | |
8.500%, 06/15/19 | | | 725 | | | | 323 | |
Whiting Petroleum | | | | | | | | |
6.250%, 04/01/23 | | | 1,225 | | | | 1,060 | |
Yingde Gases Investment | | | | | | | | |
8.125%, 04/22/18 | | | 1,645 | | | | 1,365 | |
Zhaikmunai LLP | | | | | | | | |
7.125%, 11/13/19 | | | 3,393 | | | | 2,714 | |
| | | | | | | | | |
Total Petroleum & Fuel Products | | | | 102,516 | |
| | | | | | | | | |
Printing & Publishing [0.4%] | |
Expo Event Transco | | | | | | | | |
9.000%, 06/15/21(A) | | | 1,175 | | | | 1,175 | |
Multi-Color | | | | | | | | |
6.125%, 12/01/22(A) | | | 1,075 | | | | 1,099 | |
Mustang Merger | | | | | | | | |
8.500%, 08/15/21(A) | | | 850 | | | | 882 | |
Nielsen Finance | | | | | | | | |
5.000%, 04/15/22(A) | | | 1,700 | | | | 1,647 | |
4.500%, 10/01/20 | | | 625 | | | | 627 | |
Time | | | | | | | | |
5.750%, 04/15/22(A) | | | 700 | | | | 654 | |
| | | | | | | | | |
Total Printing & Publishing | | | | 6,084 | |
| | | | | | | | | |
Publishing-Newspapers [0.1%] | |
Gannett | | | | | | | | |
6.375%, 10/15/23 | | | 1,125 | | | | 1,181 | |
5.500%, 09/15/24(A) | | | 50 | | | | 48 | |
5.125%, 10/15/19 | | | 175 | | | | 178 | |
4.875%, 09/15/21(A) | | | 50 | | | | 49 | |
| | | | | | | | | |
Total Publishing-Newspapers | | | | 1,456 | |
| | | | | | | | | |
Radio [0.4%] | |
Cumulus Media Holdings | | | | | | | | |
7.750%, 05/01/19 | | | 500 | | | | 359 | |
Entercom Radio | | | | | | | | |
10.500%, 12/01/19 | | | 600 | | | | 628 | |
Radio One | | | | | | | | |
9.250%, 02/15/20(A) | | | 900 | | | | 770 | |
7.375%, 04/15/22(A) | | | 975 | | | | 907 | |
Sirius XM Holdings | | | | | | | | |
4.625%, 05/15/23(A) | | | 1,425 | | | | 1,332 | |
Sirius XM Radio | | | | | | | | |
6.000%, 07/15/24(A) | | | 975 | | | | 980 | |
5.375%, 04/15/25(A) | | | 650 | | | | 622 | |
Townsquare Media | | | | | | | | |
6.500%, 04/01/23(A) | | | 750 | | | | 668 | |
| | | | | | | | | |
Total Radio | | | | 6,266 | |
| | | | | | | | | |
Real Estate Investment Trusts [0.0%] | |
ESH Hospitality | | | | | | | | |
5.250%, 05/01/25(A) | | | 300 | | | | 295 | |
RHP Hotel Properties | | | | | | | | |
5.000%, 04/15/23 | | | 150 | | | | 149 | |
| | | | | | | | | |
Total Real Estate Investment Trusts | | | | 444 | |
| | | | | | | | | |
Real Estate Oper/Develop [2.0%] | |
Agile Property Holdings | | | | | | | | |
9.875%, 03/20/17 | | | 850 | | | | 871 | |
8.875%, 04/28/17 | | | 830 | | | | 834 | |
Central China Real Estate | | | | | | | | |
8.000%, 01/28/20 | | | 775 | | | | 729 | |
China SCE Property Holdings | | | | | | | | |
11.500%, 11/14/17 | | | 2,520 | | | | 2,630 | |
CIFI Holdings Group | | | | | | | | |
12.250%, 04/15/18 | | | 892 | | | | 963 | |
Global Prime Capital Pte | | | | | | | | |
6.750%, 04/27/20 | | | 2,000 | | | | 1,885 | |
Jababeka International BV | | | | | | | | |
7.500%, 09/24/19 | | | 2,500 | | | | 2,194 | |
Kaisa Group Holdings | | | | | | | | |
10.250%, 01/08/20(B) | | | 1,575 | | | | 756 | |
9.000%, 06/06/19(B) | | | 700 | | | | 336 | |
8.875%, 03/19/18(B) | | | 3,220 | | | | 1,546 | |
KWG Property Holding | | | | | | | | |
8.975%, 01/14/19 | | | 1,600 | | | | 1,640 | |
Logan Property Holdings | | | | | | | | |
11.250%, 06/04/19 | | | 375 | | | | 387 | |
Pakuwon Prima Pte | | | | | | | | |
7.125%, 07/02/19 | | | 2,000 | | | | 1,898 | |
See accompanying notes to financial statements.
CITY NATIONAL ROCHDALE FUNDS | PAGE 91
consolidated schedule of investments |
September 30, 2015 |
City National Rochdale Fixed Income Opportunities Fund (continued) |
Description | | Face Amount (000) | | | Value (000) | |
Sunac China Holdings | | | | | | |
9.375%, 04/05/18 | | $ | 2,840 | | | $ | 2,918 | |
Times Property Holdings | | | | | | | | |
12.625%, 03/21/19 | | | 1,570 | | | | 1,662 | |
Trillion Chance | | | | | | | | |
8.500%, 01/10/19 | | | 1,795 | | | | 1,732 | |
Vingroup JSC | | | | | | | | |
11.625%, 05/07/18 | | | 4,025 | | | | 4,239 | |
VLL International | | | | | | | | |
7.375%, 06/18/22 | | | 2,500 | | | | 2,550 | |
Yuzhou Properties | | | | | | | | |
8.750%, 10/04/18 | | | 880 | | | | 873 | |
8.625%, 01/24/19 | | | 2,490 | | | | 2,446 | |
| | | | | | | | | |
Total Real Estate Oper/Develop | | | | 33,089 | |
| | | | | | | | | |
Research and Development [0.1%] | |
Jaguar Holding II | | | | | | | | |
6.375%, 08/01/23(A) | | | 2,200 | | | | 2,139 | |
| | | | | | | | | |
Resorts/Theme Parks [0.2%] | |
Cedar Fair | | | | | | | | |
5.250%, 03/15/21 | | | 1,300 | | | | 1,316 | |
Six Flags Entertainment | | | | | | | | |
5.250%, 01/15/21(A) | | | 1,325 | | | | 1,325 | |
| | | | | | | | | |
Total Resorts/Theme Parks | | | | 2,641 | |
| | | | | | | | | |
Retail [1.3%] | |
BKW | | | | | | | | |
6.000%, 04/01/22(A) | | | 2,275 | | | | 2,309 | |
Burger King | | | | | | | | |
4.625%, 01/15/22(A) | | | 450 | | | | 440 | |
Family Tree Escrow | | | | | | | | |
5.750%, 03/01/23(A) | | | 425 | | | | 441 | |
Ferrellgas | | | | | | | | |
6.750%, 01/15/22 | | | 725 | | | | 674 | |
6.750%, 06/15/23(A) | | | 425 | | | | 387 | |
6.500%, 05/01/21 | | | 675 | | | | 631 | |
Grupo Famsa | | | | | | | | |
7.250%, 06/01/20 | | | 3,000 | | | | 2,633 | |
Hillman Group | | | | | | | | |
6.375%, 07/15/22(A) | | | 1,050 | | | | 966 | |
Jo-Ann Stores | | | | | | | | |
8.125%, 03/15/19(A) | | | 100 | | | | 92 | |
Jo-Ann Stores Holdings | | | | | | | | |
9.750%, 10/15/19(A) (F) (G) (I) | | | 525 | | | | 420 | |
L Brands | | | | | | | | |
5.625%, 10/15/23 | | | 700 | | | | 744 | |
Limited Brands | | | | | | | | |
5.625%, 02/15/22 | | | 350 | | | | 370 | |
Michaels Stores | | | | | | | | |
5.875%, 12/15/20(A) | | | 1,500 | | | | 1,564 | |
Neiman Marcus Group | | | | | | | | |
8.750%, 10/15/21(A) (F) | | | 900 | | | | 927 | |
8.000%, 10/15/21(A) | | | 50 | | | | 51 | |
New Look Secured Issuer | | | | | | | | |
4.500%, 07/01/22(D) | | | 2,000 | | | | 2,168 | |
NPC International | | | | | | | | |
10.500%, 01/15/20 | | | 1,025 | | | | 1,066 | |
Party City Holdings | | | | | | | | |
6.125%, 08/15/23(A) | | | 700 | | | | 705 | |
Petco Animal Supplies | | | | | | | | |
9.250%, 12/01/18(A) | | | 1,150 | | | | 1,167 | |
Petco Holdings | | | | | | | | |
8.500%, 10/15/17(A) (F) | | | 600 | | | | 605 | |
Rite Aid | | | | | | | | |
6.125%, 04/01/23(A) | | | 1,050 | | | | 1,042 | |
Sally Holdings | | | | | | | | |
6.875%, 11/15/19 | | | 725 | | | | 752 | |
Stonegate Pub Financing | | | | | | | | |
5.334%, 04/15/19(D) | | | 1,000 | | | | 1,513 | |
Stretford 79 | | | | | | | | |
4.834%, 07/15/20(D) | | | 1,000 | | | | 1,233 | |
Vista Outdoor | | | | | | | | |
5.875%, 10/01/23(A) | | | 525 | | | | 533 | |
| | | | | | | | | |
Total Retail | | | | 23,433 | |
| | | | | | | | | |
Rubber/Plastic Products [0.1%] | |
Gates Global | | | | | | | | |
6.000%, 07/15/22(A) | | | 1,525 | | | | 1,228 | |
| | | | | | | | | |
Semicon Compo-Intg Circu [0.0%] | |
NXP BV | | | | | | | | |
5.750%, 03/15/23(A) | | | 200 | | | | 208 | |
| | | | | | | | | |
Semi-Conductors [0.2%] | |
Advanced Micro Devices | | | | | | | | |
7.500%, 08/15/22 | | | 325 | | | | 208 | |
7.000%, 07/01/24 | | | 850 | | | | 527 | |
Entegris | | | | | | | | |
6.000%, 04/01/22(A) | | | 1,300 | | | | 1,320 | |
Freescale Semiconductor | | | | | | | | |
6.000%, 01/15/22(A) | | | 450 | | | | 470 | |
Micron Technology | | | | | | | | |
5.250%, 08/01/23(A) | | | 575 | | | | 529 | |
5.250%, 01/15/24(A) | | | 400 | | | | 367 | |
See accompanying notes to financial statements.
CITY NATIONAL ROCHDALE FUNDS | PAGE 92
consolidated schedule of investments |
September 30, 2015 |
City National Rochdale Fixed Income Opportunities Fund (continued) |
Description | | Face Amount (000) | | | Value (000) | |
Sensata Technologies BV | | | | | | |
5.625%, 11/01/24(A) | | $ | 425 | | | $ | 424 | |
5.000%, 10/01/25(A) | | | 500 | | | | 469 | |
| | | | | | | | | |
Total Semi-Conductors | | | | 4,314 | |
| | | | | | | | | |
Special Purpose Banks [0.0%] | |
Vnesheconombank Via VEB Finance | | | | | | | | |
6.025%, 07/05/22 | | | 790 | | | | 744 | |
| | | | | | | | | |
Steel & Steel Works [0.5%] | |
ArcelorMittal | | | | | | | | |
6.125%, 06/01/25 | | | 600 | | | | 486 | |
Evraz Group | | | | | | | | |
9.500%, 04/24/18 | | | 1,000 | | | | 1,046 | |
Ferrexpo Finance | | | | | | | | |
10.375%, 04/07/19 | | | 1,873 | | | | 1,218 | |
Gerdau Trade | | | | | | | | |
4.750%, 04/15/23 | | | 250 | | | | 199 | |
Metinvest BV | | | | | | | | |
10.250%, 01/31/16 | | | 3,887 | | | | 2,586 | |
Metinvest BV, MTN | | | | | | | | |
10.500%, 11/28/17 | | | 1,560 | | | | 920 | |
8.750%, 02/14/18 | | | 3,519 | | | | 1,986 | |
Steel Dynamics | | | | | | | | |
6.375%, 08/15/22 | | | 300 | | | | 295 | |
5.500%, 10/01/24 | | | 500 | | | | 459 | |
5.250%, 04/15/23 | | | 125 | | | | 114 | |
5.125%, 10/01/21 | | | 225 | | | | 213 | |
| | | | | | | | | |
Total Steel & Steel Works | | | | 9,522 | |
| | | | | | | | | |
Sugar [0.1%] | |
Cosan Luxembourg | | | | | | | | |
5.000%, 03/14/23 | | | 2,000 | | | | 1,500 | |
| | | | | | | | | |
Technology [0.1%] | |
Sophia Holding Finance | | | | | | | | |
9.625%, 12/01/18(A) (F) | | | 225 | | | | 230 | |
Truven Health Analytics | | | | | | | | |
10.625%, 06/01/20 | | | 1,025 | | | | 1,071 | |
| | | | | | | | | |
Total Technology | | | | 1,301 | |
| | | | | | | | | |
Telecommunication Equip [0.2%] | |
CommScope | | | | | | | | |
5.500%, 06/15/24(A) | | | 525 | | | | 501 | |
CommScope Holding | | | | | | | | |
6.625%, 06/01/20(A) (F) | | | 1,200 | | | | 1,230 | |
CommScope Technologies Finance | | | | | | | | |
6.000%, 06/15/25(A) | | | 500 | | | | 480 | |
| | | | | | | | | |
Total Telecommunication Equip | | | | 2,211 | |
| | | | | | | | | |
Telephones & Telecommunications [4.8%] | |
Altice | | | | | | | | |
7.750%, 05/15/22(A) | | | 1,400 | | | | 1,274 | |
7.625%, 02/15/25(A) | | | 725 | | | | 634 | |
Altice Financing | | | | | | | | |
6.625%, 02/15/23 | | | 200 | | | | 192 | |
6.625%, 02/15/23(A) | | | 150 | | | | 144 | |
Altice US Finance I | | | | | | | | |
5.375%, 07/15/23(A) | | | 575 | | | | 552 | |
Altice US Finance II | | | | | | | | |
7.750%, 07/15/25(A) | | | 1,000 | | | | 885 | |
Banglalink Digital Communications | | | | | | | | |
8.625%, 05/06/19 | | | 4,430 | | | | 4,408 | |
Bite Finance International BV, MTN | | | | | | | | |
7.476%, 02/15/18(D) | | | 1,810 | | | | 1,987 | |
Colombia Telecomunicaciones ESP | | | | | | | | |
8.500%, 12/29/49(D) | | | 2,500 | | | | 2,331 | |
Comcel Trust | | | | | | | | |
6.875%, 02/06/24 | | | 3,005 | | | | 2,968 | |
Digicel | | | | | | | | |
7.000%, 02/15/20(A) | | | 325 | | | | 321 | |
6.000%, 04/15/21 | | | 4,310 | | | | 3,933 | |
6.000%, 04/15/21(A) | | | 175 | | | | 160 | |
Digicel Group | | | | | | | | |
8.250%, 09/30/20 | | | 12,865 | | | | 11,952 | |
8.250%, 09/30/20(A) | | | 1,375 | | | | 1,272 | |
7.125%, 04/01/22 | | | 2,980 | | | | 2,570 | |
Intelsat Jackson Holdings | | | | | | | | |
5.500%, 08/01/23 | | | 1,350 | | | | 1,114 | |
6.625%, 12/15/22 | | | 1,375 | | | | 1,086 | |
Intelsat Luxembourg | | | | | | | | |
8.125%, 06/01/23 | | | 600 | | | | 390 | |
7.750%, 06/01/21 | | | 825 | | | | 544 | |
Level 3 Communications | | | | | | | | |
5.750%, 12/01/22 | | | 750 | | | | 736 | |
Level 3 Financing | | | | | | | | |
7.000%, 06/01/20 | | | 500 | | | | 517 | |
5.375%, 05/01/25(A) | | | 1,200 | | | | 1,125 | |
See accompanying notes to financial statements.
CITY NATIONAL ROCHDALE FUNDS | PAGE 93
consolidated schedule of investments |
September 30, 2015 |
City National Rochdale Fixed Income Opportunities Fund (continued) |
Description | | Face Amount (000) | | | Value (000) | |
Matterhorn Telecom | | | | | | |
3.727%, 05/01/22(D) | | $ | 1,500 | | | $ | 1,555 | |
MetroPCS Wireless | | | | | | | | |
6.625%, 11/15/20 | | | 600 | | | | 610 | |
Millicom International Cellular | | | | | | | | |
6.625%, 10/15/21 | | | 2,895 | | | | 2,863 | |
6.000%, 03/15/25 | | | 1,765 | | | | 1,593 | |
4.750%, 05/22/20 | | | 890 | | | | 850 | |
Neptune Finco | | | | | | | | |
10.875%, 10/15/25(A) | | | 1,575 | | | | 1,591 | |
10.125%, 01/15/23(A) | | | 625 | | | | 632 | |
6.625%, 10/15/25(A) | | | 625 | | | | 628 | |
Oi | | | | | | | | |
5.750%, 02/10/22 | | | 1,960 | | | | 911 | |
Reliance Communications | | | | | | | | |
6.500%, 11/06/20 | | | 2,000 | | | | 2,008 | |
Sable International Finance | | | | | | | | |
6.875%, 08/01/22 | | | 2,290 | | | | 2,319 | |
Sixsigma Networks Mexico | | | | | | | | |
8.250%, 11/07/21 | | | 2,500 | | | | 2,347 | |
Sprint | | | | | | | | |
7.875%, 09/15/23 | | | 1,725 | | | | 1,396 | |
7.125%, 06/15/24 | | | 350 | | | | 269 | |
Sprint Capital | | | | | | | | |
6.875%, 11/15/28 | | | 1,850 | | | | 1,327 | |
Sprint Nextel | | | | | | | | |
7.000%, 03/01/20(A) | | | 600 | | | | 600 | |
6.000%, 11/15/22 | | | 1,100 | | | | 828 | |
Syniverse Holdings | | | | | | | | |
9.125%, 01/15/19 | | | 1,150 | | | | 978 | |
T-Mobile USA | | | | | | | | |
6.836%, 04/28/23 | | | 925 | | | | 916 | |
6.731%, 04/28/22 | | | 125 | | | | 125 | |
6.633%, 04/28/21 | | | 125 | | | | 125 | |
6.625%, 04/01/23 | | | 1,450 | | | | 1,436 | |
6.500%, 01/15/24 | | | 875 | | | | 848 | |
6.125%, 01/15/22 | | | 275 | | | | 265 | |
Vimpel Communications Via VIP Finance Ireland | | | | | | | | |
9.125%, 04/30/18 | | | 700 | | | | 754 | |
7.748%, 02/02/21 | | | 2,334 | | | | 2,382 | |
VimpelCom Holdings BV | | | | | | | | |
7.504%, 03/01/22 | | | 2,673 | | | | 2,680 | |
5.200%, 02/13/19 | | | 670 | | | | 655 | |
Virgin Media Finance | | | | | | | | |
6.375%, 04/15/23(A) | | | 675 | | | | 672 | |
Virgin Media Secured Finance | | | | | | | | |
5.250%, 01/15/26(A) | | | 2,250 | | | | 2,070 | |
Vivacom, MTN | | | | | | | | |
6.625%, 11/15/18 | | | 2,573 | | | | 2,767 | |
| | | | | | | | | |
Total Telephones & Telecommunications | | | | 80,095 | |
| | | | | | | | | |
Textile-Apparel [0.0%] | |
Texhong Textile Group | | | | | | | | |
7.625%, 01/19/16 | | | 500 | | | | 503 | |
| | | | | | | | | |
Textile-Home Furnishings [0.1%] | |
Springs Industries | | | | | | | | |
6.250%, 06/01/21 | | | 850 | | | | 842 | |
| | | | | | | | | |
Textile-Products [0.2%] | |
Golden Legacy PTE | | | | | | | | |
9.000%, 04/24/19 | | | 3,270 | | | | 2,910 | |
| | | | | | | | | |
Transportation Services [1.8%] | |
Air Medical Merger Sub | | | | | | | | |
6.375%, 05/15/23(A) | | | 1,125 | | | | 1,021 | |
Brunswick Rail Finance | | | | | | | | |
6.500%, 11/01/17 | | | 1,685 | | | | 674 | |
DTEK Finance | | | | | | | | |
10.375%, 03/28/18 | | | 1,756 | | | | 764 | |
7.875%, 04/04/18 | | | 5,491 | | | | 2,170 | |
Dubai Holding Commercial Operations, MTN | | | | | | | | |
6.000%, 02/01/17 | | | 4,600 | | | | 6,941 | |
Equiniti Newco 2 | | | | | | | | |
6.338%, 12/15/18(D) | | | 2,000 | | | | 3,014 | |
Equiniti Newco 2, MTN | | | | | | | | |
7.125%, 12/15/18 | | | 500 | | | | 772 | |
Far East Capital | | | | | | | | |
8.750%, 05/02/20 | | | 1,690 | | | | 984 | |
8.000%, 05/02/18 | | | 1,880 | | | | 1,108 | |
Favor Sea | | | | | | | | |
11.750%, 02/04/19 | | | 1,810 | | | | 1,484 | |
Georgian Railway JSC | | | | | | | | |
7.750%, 07/11/22 | | | 1,785 | | | | 1,796 | |
Grupo KUO De | | | | | | | | |
6.250%, 12/04/22 | | | 52 | | | | 51 | |
Kazakhstan Temir Zholy Finance BV | | | | | | | | |
6.375%, 10/06/20 | | | 2,425 | | | | 2,283 | |
Nielsen Luxembourg SaRL | | | | | | | | |
5.500%, 10/01/21(A) | | | 250 | | | | 248 | |
Noble Group | | | | | | | | |
6.000%, 06/24/49(D) | | | 2,411 | | | | 1,194 | |
Sabre GLBL | | | | | | | | |
5.375%, 04/15/23(A) | | | 900 | | | | 887 | |
See accompanying notes to financial statements.
CITY NATIONAL ROCHDALE FUNDS | PAGE 94
consolidated schedule of investments |
September 30, 2015 |
City National Rochdale Fixed Income Opportunities Fund (continued) |
Description | | Face Amount (000) | | | Value (000) | |
SCF Capital | | | | | | |
5.375%, 10/27/17 | | $ | 500 | | | $ | 486 | |
Topaz Marine | | | | | | | | |
8.625%, 11/01/18 | | | 600 | | | | 530 | |
Travelex Financing | | | | | | | | |
6.582%, 08/01/18(D) | | | 1,000 | | | | 1,505 | |
| | | | | | | | | |
Total Transportation Services | | | | 27,912 | |
| | | | | | | | | |
Transport-Equip and Leasing [0.0%] | |
Jurassic Holdings III | | | | | | | | |
6.875%, 02/15/21(A) | | | 500 | | | | 351 | |
| | | | | | | | | |
Utility [0.1%] | |
Suburban Propane Partners | | | | | | | | |
7.375%, 08/01/21 | | | 275 | | | | 287 | |
5.750%, 03/01/25 | | | 350 | | | | 332 | |
5.500%, 06/01/24 | | | 1,125 | | | | 1,040 | |
| | | | | | | | | |
Total Utility | | | | 1,659 | |
| | | | | | | | | |
X-Ray Equipment [0.0%] | |
Hologic | | | | | | | | |
5.250%, 07/15/22(A) | | | 475 | | | | 480 | |
| | | | | | | | | |
Total Corporate Bonds | |
(Cost $878,270) | | | | 777,935 | |
| | | | | | | | | |
Loan Participations [28.9%] | |
Aerospace [0.7%] | |
Air Canada, Term Loan | | | | | | | | |
4.000%, 09/26/19 | | | 1,412 | | | | 1,408 | |
AM General Corporation, Term Loan B - 2013 | | | | | | | | |
10.250%, 03/22/18(G) (I) | | | 348 | | | | 287 | |
American Airlines Inc, 2015 Term Loans | | | | | | | | |
3.500%, 06/27/20 | | | 1,420 | | | | 1,405 | |
BE Aerospace Inc, Term Loan B | | | | | | | | |
4.000%, 11/19/21 | | | 493 | | | | 492 | |
Dae Aviation Holdings, Term Loan B | | | | | | | | |
5.250%, 06/24/22 | | | 150 | | | | 150 | |
LM U.S. (Landmark Aviation), Second Lien | | | | | | | | |
8.250%, 10/26/20(H) | | | 2,000 | | | | 1,985 | |
Tasc Inc, Second Lien | | | | | | | | |
12.000%, 05/23/21 | | | 360 | | | | 363 | |
Tasc Inc, Term Loan | | | | | | | | |
6.500%, 05/23/20 | | | 680 | | | | 680 | |
TransDigm Inc., Term Loan C | | | | | | | | |
3.750%, 02/28/20 | | | 1,091 | | | | 1,076 | |
TransDigm Inc., Term Loan D | | | | | | | | |
3.750%, 06/04/21 | | | 1,694 | | | | 1,672 | |
TransDigm Inc., Term Loan E | | | | | | | | |
3.500%, 05/13/22 | | | 1,125 | | | | 1,106 | |
US Airways Group Inc, Term Loan B-1 | | | | | | | | |
3.500%, 05/23/19 | | | 1,132 | | | | 1,127 | |
WP CPP Holdings, Second Lien | | | | | | | | |
8.750%, 04/30/21 | | | 22 | | | | 22 | |
WP CPP Holdings, Term B-3 Loan | | | | | | | | |
4.500%, 12/28/19 | | | 169 | | | | 166 | |
Wyle Services Corporation, Term Loan B | | | | | | | | |
5.000%, 05/21/21 | | | 188 | | | | 187 | |
| | | | | | | | | |
Total Aerospace | | | | 12,126 | |
| | | | | | | | | |
Automotive [0.4%] | |
Car Trawler, Term Loan | | | | | | | | |
4.250%, 04/30/21(G) | | | 3,000 | | | | 3,352 | |
Oasis Holdings | | | | | | | | |
4.683%, 11/19/20 | | | 4,580 | | | | 2,359 | |
| | | | | | | | | |
Total Automotive | | | | 5,711 | |
| | | | | | | | | |
Broadcasting [0.9%] | |
Cumulus Media, Term Loan B | | | | | | | | |
4.250%, 12/23/20 | | | 1,351 | | | | 1,128 | |
Gray Television, Inc., Term Loan B | | | | | | | | |
3.750%, 06/13/21(G) | | | 1,589 | | | | 1,583 | |
IHeart Communications, Term Loan D Extended | | | | | | | | |
6.944%, 01/30/19(G) | | | 7,773 | | | | 6,432 | |
IHeart Communications, Term Loan E | | | | | | | | |
7.670%, 07/30/19 | | | 2,443 | | | | 2,034 | |
Media General Inc, Term Loan B | | | | | | | | |
4.000%, 07/31/20 | | | 568 | | | | 563 | |
Sinclair Broadcasting Group, Term Loan B - 2011 | | | | | | | | |
3.000%, 10/28/16 | | | 91 | | | | 90 | |
Univision Comm (fka Umbrella), Replacement First-Lien Term Loans | | | | | | | | |
4.000%, 03/01/20 | | | 2,242 | | | | 2,226 | |
See accompanying notes to financial statements.
CITY NATIONAL ROCHDALE FUNDS | PAGE 95
consolidated schedule of investments |
September 30, 2015 |
City National Rochdale Fixed Income Opportunities Fund (continued) |
Description | | Face Amount (000) | | | Value (000) | |
Univision Comm (fka Umbrella), TL C-3 (2013 Inc. Term Loans) | | | | | | |
4.000%, 03/01/20 | | $ | 1,322 | | | $ | 1,313 | |
| | | | | | | | | |
Total Broadcasting | | | | 15,369 | |
| | | | | | | | | |
Cable/Wireless Video [2.5%] | |
Altice Financing | | | | | | | | |
4.500%, 07/15/22 | | | 2,000 | | | | 2,220 | |
Altice Financing, Term Loan B | | | | | | | | |
5.500%, 07/02/19 | | | 3,753 | | | | 3,745 | |
Altice Financing, Term Loan B 2022 | | | | | | | | |
5.250%, 01/28/22 | | | 229 | | | | 228 | |
Cablevision Systems Corp, Term Loan B - 2013 | | | | | | | | |
2.672%, 04/17/20 | | | 948 | | | | 941 | |
Cequel Communications LLC, Lien 1 | | | | | | | | |
3.500%, 12/14/22 | | | 1,122 | | | | 1,105 | |
Charter Comm Operating, LLC, Term Loan A1 | | | | | | | | |
2.160%, 04/22/18 | | | 433 | | | | 429 | |
Charter Comm Operating, LLC, Term Loan E | | | | | | | | |
3.000%, 04/10/20 | | | 1,901 | | | | 1,876 | |
Charter Comm Operating, LLC, Term Loan H | | | | | | | | |
3.250%, 07/23/21 | | | 510 | | | | 507 | |
Charter Comm Operating, LLC, Term Loan I | | | | | | | | |
3.500%, 01/23/23 | | | 1,945 | | | | 1,933 | |
CSC Holdings Inc., Term Loan B | | | | | | | | |
5.000%, 09/23/22(H) | | | 1,120 | | | | 1,113 | |
Eircom | | | | | | | | |
4.500%, 05/31/22 | | | 3,002 | | | | 3,302 | |
Intelsat Jackson Holdings, Term Loan B2 | | | | | | | | |
3.750%, 06/30/19 | | | 1,743 | | | | 1,694 | |
Liberty Cablevision of Puerto Rico, First Lien Term Loan | | | | | | | | |
4.500%, 12/24/21 | | | 2,190 | | | | 2,120 | |
Liberty Cablevision of Puerto Rico, Second Lien - 2014 | | | | | | | | |
7.750%, 06/26/23 | | | 215 | | | | 210 | |
M7 Group | | | | | | | | |
4.250%, 06/17/21 | | | 995 | | | | 1,109 | |
MCC Iowa (Broadband), Term Loan G | | | | | | | | |
4.000%, 01/20/20 | | | 252 | | | | 251 | |
MCC Iowa (Broadband), Term Loan H | | | | | | | | |
3.250%, 01/22/21 | | | 1,277 | | | | 1,253 | |
MCC Iowa (Broadband), Term Loan J | | | | | | | | |
3.750%, 06/18/21 | | | 79 | | | | 79 | |
Quebecor Media, Term Loan B | | | | | | | | |
3.250%, 08/17/20 | | | 1,574 | | | | 1,530 | |
Serbia Broadband (Telemach), Term Loan | | | | | | | | |
8.278%, 06/19/19 | | | 3,135 | | | | 3,529 | |
Tele Columbus | | | | | | | | |
6.000%, 01/21/21 | | | 1,000 | | | | 1,110 | |
UPC Financing, Term Loan AH | | | | | | | | |
3.250%, 06/10/21 | | | 860 | | | | 843 | |
Virgin Media Invst Hlds Ltd, Term Loan F | | | | | | | | |
3.500%, 06/07/23 | | | 2,420 | | | | 2,382 | |
Ziggo B.V., Term Loan B1 | | | | | | | | |
3.500%, 01/15/22 | | | 2,589 | | | | 2,538 | |
Ziggo B.V., Term Loan B2 | | | | | | | | |
3.500%, 01/15/22 | | | 1,668 | | | | 1,636 | |
Ziggo B.V., Term Loan B3 | | | | | | | | |
3.500%, 01/15/22 | | | 2,743 | | | | 2,690 | |
| | | | | | | | | |
Total Cable/Wireless Video | | | | 40,373 | |
| | | | | | | | | |
Chemicals [1.2%] | |
Axalta Coating Systems US Holdings, Term Loan B - 2014 | | | | | | | | |
3.750%, 02/01/20 | | | 317 | | | | 314 | |
Chemours Co LLC, Term Loan B | | | | | | | | |
3.750%, 05/12/22 | | | 603 | | | | 528 | |
Constantia Flexibles Cov-Lite, 1st Lien | | | | | | | | |
4.750%, 04/30/22 | | | 162 | | | | 163 | |
4.750%, 04/30/22 | | | 833 | | | | 835 | |
Flint Group SA, Term Loan B-2 | | | | | | | | |
4.750%, 09/03/21 | | | 2,555 | | | | 2,510 | |
Flint Group SA, Term Loan C | | | | | | | | |
4.750%, 09/03/21 | | | 422 | | | | 416 | |
Gemini HDPE LLC, Term Loan B | | | | | | | | |
4.750%, 07/24/21 | | | 574 | | | | 566 | |
Huntsman International LLC, Term Loan C | | | | | | | | |
2.460%, 06/30/16 | | | 332 | | | | 329 | |
Ineos Finance PLC, Term Loan | | | | | | | | |
4.000%, 12/15/20 | | | 995 | | | | 1,073 | |
See accompanying notes to financial statements.
CITY NATIONAL ROCHDALE FUNDS | PAGE 96
consolidated schedule of investments |
September 30, 2015 |
City National Rochdale Fixed Income Opportunities Fund (continued) |
Description | | Face Amount (000) | | | Value (000) | |
Ineos Group Holdings PLC, Dollar Term Loans - 2020 | | | | | | |
3.750%, 12/15/20 | | $ | 3,230 | | | $ | 3,125 | |
Ineos Group Holdings PLC, Term Loan - 2022 | | | | | | | | |
4.250%, 03/11/22 | | | 269 | | | | 260 | |
Klockner Pentaplast | | | | | | | | |
5.000%, 04/22/20 | | | 1,058 | | | | 1,186 | |
5.000%, 04/28/20 | | | 937 | | | | 1,049 | |
MacDermid Holdings, LLC, Tranche B Term Loan | | | | | | | | |
4.500%, 06/05/20 | | | 342 | | | | 331 | |
Minerals Technologies Inc., Term Loan B-1 | | | | | | | | |
3.750%, 05/09/21 | | | 1,210 | | | | 1,201 | |
Minerals Technologies Inc., Term Loan B-2 | | | | | | | | |
4.750%, 05/09/21 | | | 195 | | | | 195 | |
Perstorp Holding AB, Facility A (Mezzanine) | | | | | | | | |
14.000%, 12/27/17 | | | 2,152 | | | | 2,385 | |
Polymer Group inc, Term Loan B | | | | | | | | |
5.250%, 12/19/19 | | | 2,133 | | | | 2,131 | |
Styrolution, Term Loan B-1 | | | | | | | | |
6.500%, 11/07/19 | | | 1,112 | | | | 1,105 | |
Trinseo Materials Operating S.C.A (fka Styron), Term Loan B | | | | | | | | |
4.250%, 11/05/21 | | | 249 | | | | 247 | |
Univar, Term Loan B | | | | | | | | |
4.250%, 06/24/22 | | | 490 | | | | 480 | |
| | | | | | | | | |
Total Chemicals | | | | 20,429 | |
| | | | | | | | | |
Consumer Non-Durables [0.4%] | |
Eastman Kodak Company, Exit Term Loan | | | | | | | | |
7.250%, 09/03/19 | | | 332 | | | | 318 | |
Jarden Corporation, Tranche B-1 Term Loan | | | | | | | | |
2.903%, 09/30/20 | | | 254 | | | | 254 | |
Kate Spade & Company, Term Loan B | | | | | | | | |
4.000%, 04/09/21 | | | 267 | | | | 265 | |
Libbey Glass Inc., Term Loan B | | | | | | | | |
3.750%, 04/09/21 | | | 247 | | | | 246 | |
Party City Holdings Inc., Term Loan B - new | | | | | | | | |
4.250%, 08/19/22 | | | 470 | | | | 469 | |
PHS, Lien 1 | | | | | | | | |
5.529%, 04/17/20 | | | 2,000 | | | | 2,901 | |
Spectrum Brands Inc, Term Loan | | | | | | | | |
3.750%, 06/23/22 | | | 457 | | | | 458 | |
Varsity Brands (Hercules Achievement), Term Loan B | | | | | | | | |
5.000%, 12/10/21 | | | 1,047 | | | | 1,049 | |
| | | | | | | | | |
Total Consumer Non-Durables | | | | 5,960 | |
| | | | | | | | | |
Diversified Media [1.5%] | |
Affinion Group Inc., Term Loan B | | | | | | | | |
6.750%, 10/08/16 | | | 314 | | | | 294 | |
ALM Media, LLC, Term Loan B | | | | | | | | |
5.500%, 07/29/20 | | | 215 | | | | 208 | |
Block Communication, Incremental Term Loan B | | | | | | | | |
4.000%, 11/07/21 | | | 178 | | | | 178 | |
Bureau Van Dijk | | | | | | | | |
5.216%, 09/17/21(G) | | | 1,000 | | | | 1,508 | |
Deluxe Entertainment Services Group, Term Loan | | | | | | | | |
6.500%, 02/28/20 | | | 573 | | | | 532 | |
Eden Bidco Limited (Top Right Group), Term Loan B | | | | | | | | |
6.000%, 04/13/22 | | | 389 | | | | 387 | |
Emerald Expositions Holding, Inc., Term Loan B | | | | | | | | |
4.750%, 06/17/20 | | | 281 | | | | 279 | |
EMI Music Publishing Limited, Term Loan | | | | | | | | |
4.000%, 08/14/22 | | | 210 | | | | 209 | |
Harland Clarke Holdings, Cov-Lite Term Loan B-4 | | | | | | | | |
6.000%, 08/04/19 | | | 3,667 | | | | 3,651 | |
Harland Clarke Holdings, Term Loan B3 | | | | | | | | |
7.000%, 05/22/18 | | | 4,830 | | | | 4,812 | |
Harland Clarke Holdings, Tranche B-2 TL | | | | | | | | |
5.510%, 06/30/17 | | | 156 | | | | 155 | |
Houghton Mifflin Harcourt Publishers Inc., Term Loan B | | | | | | | | |
4.000%, 05/28/21 | | | 195 | | | | 192 | |
Learfield Communications, 2014 Replacement Term Loan | | | | | | | | |
4.500%, 10/09/20 | | | 167 | | | | 167 | |
Lions Gate Entertainment, Second Lien | | | | | | | | |
5.000%, 03/17/22 | | | 740 | | | | 741 | |
Live Nation, Term Loan B | | | | | | | | |
3.500%, 08/17/20 | | | 519 | | | | 517 | |
See accompanying notes to financial statements.
CITY NATIONAL ROCHDALE FUNDS | PAGE 97
consolidated schedule of investments |
September 30, 2015 |
City National Rochdale Fixed Income Opportunities Fund (continued) |
Description | | Face Amount (000) | | | Value (000) | |
McGraw-Hill, Term Loan | | | | | | |
4.750%, 03/22/19 | | $ | 194 | | | $ | 194 | |
MediArena Acquisition (Endemol), First Lien Term Loan | | | | | | | | |
6.750%, 08/11/21 | | | 506 | | | | 488 | |
Merrill Communications LLC, Term Loan - 2022 | | | | | | | | |
6.250%, 05/27/22 | | | 477 | | | | 474 | |
Regal Cinemas, Term Loan | | | | | | | | |
3.750%, 04/01/22 | | | 469 | | | | 469 | |
Rovi Solutions Corporation, Term Loan B | | | | | | | | |
3.750%, 07/02/21 | | | 410 | | | | 400 | |
Tribune Media Company, Term Loan B | | | | | | | | |
3.750%, 12/28/20 | | | 1,945 | | | | 1,927 | |
TWCC Hld Corp-Weather Channel, Term Loan B - extended | | | | | | | | |
5.750%, 02/11/20 | | | 703 | | | | 698 | |
Village Roadshow Limited, Ultimates Facility Tranche A-2 | | | | | | | | |
4.750%, 11/21/17 | | | 697 | | | | 690 | |
Warner Music Group Corp., Term Loan - 2013 | | | | | | | | |
3.750%, 07/01/20 | �� | | 1,019 | | | | 998 | |
WME IMG Holdings LLC, Second Lien | | | | | | | | |
8.250%, 05/06/22 | | | 360 | | | | 341 | |
WME IMG Holdings LLC, Term Loan B | | | | | | | | |
5.250%, 05/06/21 | | | 3,279 | | | | 3,258 | |
| | | | | | | | | |
Total Diversified Media | | | | 23,767 | |
| | | | | | | | | |
Energy [1.3%] | |
Alon USA Inc, MLP Term Loan | | | | | | | | |
9.250%, 11/26/18 | | | 549 | | | | 543 | |
Azure Midstream Holdings LLC, Term Loan B | | | | | | | | |
7.500%, 11/15/18 | | | 190 | | | | 162 | |
Chief Exploration & Development LLC, Second Lien | | | | | | | | |
7.500%, 05/16/21(G) (I) | | | 415 | | | | 341 | |
CITGO Petroleum Corp., Term Loan B | | | | | | | | |
4.500%, 07/23/21 | | | 356 | | | | 353 | |
CITGO Petroleum Corp., Term Loan B 2015 | | | | | | | | |
9.500%, 05/09/18 | | | 2,406 | | | | 2,365 | |
CJ Holding Company, Term Loan B1 | | | | | | | | |
6.500%, 03/24/20 | | | 359 | | | | 248 | |
Drillships Financing Holding Inc., Term Loan B1 | | | | | | | | |
6.000%, 03/31/21 | | | 1,851 | | | | 1,084 | |
EMG Utica, Term Loan | | | | | | | | |
4.750%, 03/27/20(G) | | | 640 | | | | 605 | |
Energy Transfer Equity LP, Term Loan B | | | | | | | | |
3.250%, 12/02/19 | | | 4,555 | | | | 4,387 | |
EP Energy (aka Everest Acquisition), Term Loan B-3 | | | | | | | | |
3.500%, 05/24/18 | | | 644 | | | | 598 | |
Frac Tech International, Term Loan B - 2014 | | | | | | | | |
5.750%, 04/16/21 | | | 641 | | | | 194 | |
Glenn Pool Oil , Term Loan | | | | | | | | |
4.500%, 05/02/16 | | | 242 | | | | 241 | |
Harvey Gulf Int’l Marine, Term Loan B | | | | | | | | |
6.750%, 06/18/20 | | | 1,120 | | | | 722 | |
KCA Deutag, Term Loan | | | | | | | | |
6.250%, 05/15/20 | | | 262 | | | | 208 | |
MEG Energy Corp, Term Loan B - 2013 | | | | | | | | |
3.750%, 03/31/20 | | | 150 | | | | 140 | |
Motor Fuel | | | | | | | | |
6.000%, 08/05/22 | | | 2,000 | | | | 2,998 | |
New World Resources | | | | | | | | |
8.500%, 10/07/16(G) (I) | | | 300 | | | | 335 | |
Obsidian Natural Gas Trust | | | | | | | | |
7.000%, 11/02/15 | | | 84 | | | | 84 | |
Osum Production Corp., Term Loan B | | | | | | | | |
6.500%, 07/31/20(G) (I) | | | 1,136 | | | | 920 | |
Pacific Drilling, Term Loan B | | | | | | | | |
4.500%, 05/18/18 | | | 245 | | | | 145 | |
Paradigm, Term C Loan | | | | | | | | |
4.750%, 07/24/19 | | | 183 | | | | 165 | |
Petroleum Geo-Services, Term Loan B | | | | | | | | |
3.250%, 03/19/21(G) (I) | | | 281 | | | | 208 | |
Philadelphia Energy Solutions, Term Loan | | | | | | | | |
6.250%, 04/04/18 | | | 356 | | | | 352 | |
Seadrill Operating LP, Term Loan B | | | | | | | | |
4.000%, 02/21/21 | | | 1,184 | | | | 714 | |
Sheridan Production Partners, Term Loan II-A | | | | | | | | |
4.250%, 12/16/20(G) (I) | | | 37 | | | | 28 | |
See accompanying notes to financial statements.
CITY NATIONAL ROCHDALE FUNDS | PAGE 98
consolidated schedule of investments |
September 30, 2015 |
City National Rochdale Fixed Income Opportunities Fund (continued) |
Description | | Face Amount (000) | | | Value (000) | |
Sheridan Production Partners, Term Loan II-M | | | | | | |
4.250%, 12/16/20(G) (I) | | $ | 14 | | | $ | 10 | |
Sheridan Production Partners, Term Loan II-SIP | | | | | | | | |
4.250%, 12/16/20(G) (I) | | | 267 | | | | 198 | |
Southcross Holdings Borrower LP, Term Loan B | | | | | | | | |
6.000%, 07/29/21 | | | 178 | | | | 129 | |
Stonewall Gas Gathering LLC, Loan | | | | | | | | |
8.750%, 01/28/22 | | | 527 | | | | 523 | |
Templar Energy LLC, Second Lien - 2014 | | | | | | | | |
8.500%, 11/25/20 | | | 4,345 | | | | 1,919 | |
Vantage Drilling Co (Offshore), Term Loan | | | | | | | | |
5.000%, 10/25/17(G) (I) | | | 507 | | | | 164 | |
Vantage Drilling Co (Offshore), Term Loan B (2013) | | | | | | | | |
5.750%, 03/28/19(G) (I) | | | 491 | | | | 155 | |
Veresen Midstream LP, Initial Term Loan | | | | | | | | |
5.250%, 02/25/22 | | | 129 | | | | 128 | |
Western Refining, Term Loan B | | | | | | | | |
4.250%, 11/12/20 | | | 355 | | | | 353 | |
| | | | | | | | | |
Total Energy | | | | 21,719 | |
| | | | | | | | | |
Financial [1.8%] | |
Alliant Holdings Inc., Term Loan B - new | | | | | | | | |
4.500%, 08/12/22 | | | 509 | | | | 501 | |
American Capital Holdings, Inc., Term Loan B - 2017 | | | | | | | | |
3.500%, 08/22/17 | | | 377 | | | | 375 | |
Aruba Investments, First Lien | | | | | | | | |
4.250%, 02/02/22 | | | 998 | | | | 1,111 | |
Clipper Acquisitions (aka TCW), Initial Term Loan | | | | | | | | |
3.000%, 02/06/20 | | | 219 | | | | 215 | |
Compass Investors Inc. (USI), Term Loan | | | | | | | | |
4.250%, 12/27/19 | | | 345 | | | | 341 | |
Delos, Term Loan B | | | | | | | | |
3.500%, 03/06/21 | | | 370 | | | | 369 | |
Dubai World | | | | | | | | |
4.250%, 09/30/22(G) (I) | | | 11,260 | | | | 9,374 | |
2.000%, 09/30/18 | | | 7,191 | | | | 5,861 | |
Duff & Phelps Corporation, Second Lien | | | | | | | | |
9.500%, 08/13/21 | | | 160 | | | | 158 | |
Foncia Groupe, Term Loan D | | | | | | | | |
4.250%, 06/01/18 | | | 2,000 | | | | 2,234 | |
4.250%, 03/24/21 | | | 1,000 | | | | 1,119 | |
Grosvenor Capital Management Holdings LLP, Cov-Lite Term Loan | | | | | | | | |
3.750%, 01/04/21 | | | 236 | | | | 233 | |
Hub International Holdings, Initial Term Loan | | | | | | | | |
4.000%, 10/02/20 | | | 348 | | | | 339 | |
Hyperion Insurance Group Ltd, Term Loan B | | | | | | | | |
5.500%, 04/29/22 | | | 244 | | | | 244 | |
Ineos U.S. Finance LLC, 1st Lien | | | | | | | | |
4.250%, 03/11/22 | | | 995 | | | | 1,075 | |
Ion Trading Technologies, Lien 1 | | | | | | | | |
4.500%, 06/10/21 | | | 1,800 | | | | 2,013 | |
iStar Financial Inc., Term Loan A-2 - 2012 | | | | | | | | |
7.000%, 03/19/17 | | | 127 | | | | 129 | |
Optimal Payments Ltd. | | | | | | | | |
4.000%, 01/22/21 | | | 2,000 | | | | 2,225 | |
RCS Capital Corporation, Term Loan | | | | | | | | |
6.500%, 04/29/19 | | | 484 | | | | 447 | |
Starwood Property Trust, Inc., Term Loan | | | | | | | | |
3.500%, 04/17/20 | | | 355 | | | | 349 | |
Victory Capital Management, Term Loan B | | | | | | | | |
7.000%, 10/31/21 | | | 271 | | | | 263 | |
Vistra Group, Ltd. | | | | | | | | |
3.750%, 07/21/22(H) | | | 1,000 | | | | 1,118 | |
| | | | | | | | | |
Total Financial | | | | 30,093 | |
| | | | | | | | | |
Food and Drug [0.4%] | |
Albertsons, LLC, Term Loan B-2 | | | | | | | | |
5.375%, 03/21/19 | | | 2,580 | | | | 2,578 | |
Albertsons, LLC, Term Loan B-3 | | | | | | | | |
4.000%, 08/09/19 | | | 312 | | | | 312 | |
Albertsons, LLC, Term Loan B-4 | | | | | | | | |
5.500%, 08/25/21 | | | 124 | | | | 124 | |
Hostess Brands, LLC, Second Lien | | | | | | | | |
8.500%, 07/28/23 | | | 210 | | | | 210 | |
Hostess Brands, LLC, Term Loan | | | | | | | | |
4.500%, 07/29/22 | | | 615 | | | | 615 | |
See accompanying notes to financial statements.
CITY NATIONAL ROCHDALE FUNDS | PAGE 99
consolidated schedule of investments |
September 30, 2015 |
City National Rochdale Fixed Income Opportunities Fund (continued) |
Description | | Face Amount (000) | | | Value (000) | |
New Albertsons’s, Inc., Term Loan | | | | | | |
4.750%, 06/27/21 | | $ | 545 | | | $ | 543 | |
Rite Aid Corporation, Second Lien - Tranche 1 Term Loans | | | | | | | | |
5.750%, 07/07/20 | | | 1,085 | | | | 1,096 | |
Rite Aid Corporation, Second Lien - Tranche 2 Term Loans | | | | | | | | |
4.875%, 06/21/21 | | | 440 | | | | 440 | |
Supervalu Inc., Term Loan B - 2013 | | | | | | | | |
4.500%, 03/21/19 | | | 1,303 | | | | 1,304 | |
| | | | | | | | | |
Total Food and Drug | | | | 7,222 | |
| | | | | | | | | |
Food/Tobacco [0.7%] | |
Agrokor | | | | | | | | |
9.000%, 06/04/18 | | | 3,500 | | | | 3,904 | |
Burger King (1011778 B.C. / New Red), Term Loan B 2015 | | | | | | | | |
3.750%, 12/10/21 | | | 1,837 | | | | 1,827 | |
Deoleo, Term Loan | | | | | | | | |
4.500%, 06/02/21 | | | 3,000 | | | | 2,958 | |
JBS USA LLC, Term Loan | | | | | | | | |
1.500%, 08/18/22 | | | 390 | | | | 390 | |
JBS USA LLC, Term Loan B-2 | | | | | | | | |
3.750%, 09/18/20 | | | 289 | | | | 287 | |
Landry’s Inc., Term Loan B | | | | | | | | |
4.000%, 04/19/18 | | | 558 | | | | 558 | |
Post Holdings Inc, Term Loan B | | | | | | | | |
3.750%, 06/02/21 | | | 225 | | | | 225 | |
United Biscuits | | | | | | | | |
4.817%, 12/10/21 | | | 1,000 | | | | 1,510 | |
| | | | | | | | | |
Total Food/Tobacco | | | | 11,659 | |
| | | | | | | | | |
Forest Prod/Containers [0.7%] | |
Ardagh Holdings USA Inc., Incremental Term Loan B | | | | | | | | |
4.000%, 12/17/19 | | | 985 | | | | 980 | |
Berry Plastics Corp., Term Loan D | | | | | | | | |
3.500%, 02/08/20 | | | 2,833 | | | | 2,804 | |
Berry Plastics Corp., Term Loan F | | | | | | | | |
4.000%, 09/16/22(H) | | | 395 | | | | 394 | |
Caraustar Industries, Inc., Term Loan B | | | | | | | | |
7.500%, 05/01/19 | | | 140 | | | | 139 | |
CD&R Millennium LLC (Mauser), Second Lien | | | | | | | | |
8.750%, 07/31/22 | | | 150 | | | | 148 | |
Oak Tea Inc. | | | | | | | | |
3.500%, 07/02/21(G) | | | 1,945 | | | | 2,173 | |
Owens-Brockway Glass Container Inc., Term Loan B | | | | | | | | |
3.500%, 08/14/22 | | | 209 | | | | 210 | |
Reynolds Group Holdings, Term Loan B - 2013 | | | | | | | | |
4.000%, 12/01/18 | | | 1,856 | | | | 1,855 | |
SIG Combibloc (Onex Wizard), Term Loan B | | | | | | | | |
4.250%, 03/11/22 | | | 214 | | | | 213 | |
Verallia, Lien 1 | | | | | | | | |
4.000%, 07/22/22(H) | | | 2,000 | | | | 2,237 | |
| | | | | | | | | |
Total Forest Prod/Containers | | | | 11,153 | |
| | | | | | | | | |
Gaming/Leisure [2.0%] | |
Amaya, First Lien Term Loan | | | | | | | | |
5.000%, 08/01/21 | | | 814 | | | | 800 | |
Belmond Interfin Ltd., Term Loan | | | | | | | | |
4.000%, 03/19/21 | | | 394 | | | | 390 | |
Boyd Gaming Corp, Term Loan B | | | | | | | | |
4.000%, 08/14/20 | | | 177 | | | | 177 | |
Caesars Entertainment Op Co Inc, Prop Co Term Loan | | | | | | | | |
7.000%, 10/11/20 | | | 1,395 | | | | 1,297 | |
Caesars Entertainment Op Co Inc, Term Loan B-4 | | | | | | | | |
10.500%, 10/31/16(B) | | | 116 | | | | 108 | |
Caesars Entertainment Op Co Inc, Term Loan B-6 Extended | | | | | | | | |
9.500%, 01/28/18(B) | | | 4,097 | | | | 3,780 | |
Caesars Entertainment Op Co Inc, Term Loan B7 | | | | | | | | |
9.750%, 03/01/17(B) | | | 751 | | | | 676 | |
CCM Merger (Motor City), Term Loan B - new | | | | | | | | |
4.500%, 08/06/21 | | | 1,620 | | | | 1,615 | |
Clubcorp Club Operations, Term Loan | | | | | | | | |
4.250%, 07/24/20 | | | 270 | | | | 270 | |
Diamond Resorts Corp, Cov-Lite Term Loan | | | | | | | | |
5.500%, 05/09/21 | | | 1,398 | | | | 1,393 | |
Four Seasons Holdings Inc., Second Lien | | | | | | | | |
6.250%, 12/27/20 | | | 150 | | | | 149 | |
Four Seasons Holdings Inc., Term Loan (12/13) | | | | | | | | |
3.500%, 06/27/20 | | | 927 | | | | 919 | |
See accompanying notes to financial statements.
CITY NATIONAL ROCHDALE FUNDS | PAGE 100
consolidated schedule of investments |
September 30, 2015 |
City National Rochdale Fixed Income Opportunities Fund (continued) |
Description | | Face Amount (000) | | | Value (000) | |
Gala Group Finance Ltd., First Lien | | | | | | |
5.508%, 05/25/18 | | $ | 2,410 | | | $ | 3,639 | |
Global Cash Access, Term Loan B | | | | | | | | |
6.250%, 11/25/20 | | | 399 | | | | 398 | |
Hilton Worldwide Finance, LLC., Term Loan B-1 | | | | | | | | |
3.500%, 10/26/20 | | | 6,481 | | | | 6,459 | |
La Quinta Intermediate Holdings, Term Loan B | | | | | | | | |
4.000%, 04/14/21 | | | 549 | | | | 544 | |
LTF Merger Sub, Inc. (Lifetime Fitness), Term Loan | | | | | | | | |
4.250%, 06/03/22 | | | 579 | | | | 576 | |
Mohegan Tribal Gaming, Term Loan B | | | | | | | | |
5.500%, 11/19/19 | | | 221 | | | | 220 | |
NCL Corp Ltd, Term Loan B | | | | | | | | |
4.000%, 11/05/21 | | | 174 | | | | 173 | |
Nordic Cinema | | | | | | | | |
4.000%, 06/10/22 | | | 2,000 | | | | 2,221 | |
Parques, Term Loan | | | | | | | | |
5.000%, 03/26/19 | | | 3,000 | | | | 3,338 | |
Playa Resorts Holding, Term Loan B | | | | | | | | |
4.000%, 08/09/19 | | | 186 | | | | 185 | |
Scientific Games Inc., Term Loan B | | | | | | | | |
4.250%, 10/18/20 | | | 149 | | | | 147 | |
4.250%, 10/18/20 | | | 895 | | | | 882 | |
4.250%, 10/18/20 | | | 1,510 | | | | 1,489 | |
Shingle Springs Tribal, Term Loan B | | | | | | | | |
6.250%, 08/29/19 | | | 132 | | | | 133 | |
| | | | | | | | | |
Total Gaming/Leisure | | | | 31,978 | |
| | | | | | | | | |
Healthcare [3.0%] | |
Aenova | | | | | | | | |
5.000%, 09/29/20 | | | 2,000 | | | | 2,213 | |
Air Medical Group Holdings, Inc., Term Loan B | | | | | | | | |
4.500%, 04/28/22 | | | 998 | | | | 984 | |
Alere Inc., Term Loan A | | | | | | | | |
3.200%, 06/11/20 | | | 385 | | | | 383 | |
Allscripts Healthcare Solutions Inc, Term Loan A1 | | | | | | | | |
2.920%, 06/28/18 | | | 406 | | | | 405 | |
Amdipharm Mercury Ltd. | | | | | | | | |
5.250%, 11/07/19 | | | 2,000 | | | | 3,019 | |
Ardent Legacy Holdings, Term Loan B | | | | | | | | |
7.750%, 08/04/21 | | | 255 | | | | 255 | |
Catalent Pharma, Term Loan | | | | | | | | |
4.250%, 05/07/21 | | | 988 | | | | 1,105 | |
CDRH (Healogics), Term Loan B | | | | | | | | |
5.240%, 07/01/21 | | | 356 | | | | 354 | |
Community Health Systems, Inc., Term Loan A - 2019 | | | | | | | | |
2.608%, 01/25/19 | | | 3,500 | | | | 3,471 | |
Community Health Systems, Inc., Term Loan F | | | | | | | | |
3.425%, 01/25/18 | | | 2,488 | | | | 2,483 | |
Community Health Systems, Inc., Term Loan G | | | | | | | | |
3.750%, 12/31/19 | | | 818 | | | | 816 | |
Community Health Systems, Inc., Term Loan H | | | | | | | | |
4.000%, 01/27/21 | | | 1,307 | | | | 1,306 | |
ConvaTec Healthcare, First Lien | | | | | | | | |
4.250%, 12/22/16 | | | 2,993 | | | | 3,347 | |
ConvaTec Healthcare, Term Loan B | | | | | | | | |
4.250%, 12/30/16 | | | 539 | | | | 537 | |
DPX Holdings B.V., Term Loan B | | | | | | | | |
4.250%, 03/11/21 | | | 1,768 | | | | 1,733 | |
Emdeon Inc, Term Loan B-2 | | | | | | | | |
3.750%, 11/02/18 | | | 359 | | | | 357 | |
Endo Pharmaceutical, Term Loan B | | | | | | | | |
3.750%, 06/24/22 | | | 2,005 | | | | 1,997 | |
Genoa-QoL Acquisitions Corp, Second Lien | | | | | | | | |
8.750%, 04/21/23 | | | 55 | | | | 55 | |
Gesundheits | | | | | | | | |
4.750%, 07/25/21(G) | | | 1,000 | | | | 1,114 | |
Grifols, Inc, Term Loan B | | | | | | | | |
3.194%, 02/27/21 | | | 1,782 | | | | 1,781 | |
Halyard Health, Inc., Term Loan B | | | | | | | | |
4.000%, 10/01/21 | | | 317 | | | | 317 | |
Iasis Healthcare Corporation, Term Loan B - 2013 | | | | | | | | |
4.500%, 05/03/18 | | | 260 | | | | 260 | |
IMS Healthcare, Term Loan B - 2021 | | | | | | | | |
3.500%, 03/17/21 | | | 170 | | | | 169 | |
Indivior Finance S.� r.l., Term Loan B | | | | | | | | |
7.000%, 12/19/19 | | | 517 | | | | 486 | |
See accompanying notes to financial statements.
CITY NATIONAL ROCHDALE FUNDS | PAGE 101
consolidated schedule of investments |
September 30, 2015 |
City National Rochdale Fixed Income Opportunities Fund (continued) |
Description | | Face Amount (000) | | | Value (000) | |
inVentiv Health, Inc., Term B-4 Loan | | | | | | |
7.750%, 05/15/18 | | $ | 475 | | | $ | 475 | |
Kindred Healthcare Inc., Term Loan B | | | | | | | | |
4.250%, 04/09/21 | | | 461 | | | | 459 | |
Kinetic Concepts, Term Loan E-1 | | | | | | | | |
4.500%, 05/04/18 | | | 258 | | | | 257 | |
LGC Science Holdings, Term Loan | | | | | | | | |
3.889%, 03/12/21(G) | | | 3,000 | | | | 3,333 | |
MultiPlan Inc, Term Loan | | | | | | | | |
3.750%, 03/31/21(D) | | | 1,011 | | | | 998 | |
P2 Lower Acq. (Progressive), Term Loan | | | | | | | | |
5.500%, 10/22/20 | | | 1,458 | | | | 1,460 | |
Regional Care (aka RCHP, Inc.), Second Lien | | | | | | | | |
10.500%, 10/23/19 | | | 95 | | | | 95 | |
Regional Care (aka RCHP, Inc.), Term B-2 Loan | | | | | | | | |
6.000%, 04/23/19 | | | 965 | | | | 953 | |
Royalty Pharma (aka RPI), Term Loan B-4 | | | | | | | | |
3.500%, 11/09/20 | | | 1,492 | | | | 1,485 | |
Siemens Audiology, Lien 1 | | | | | | | | |
4.250%, 01/17/22 | | | 998 | | | | 1,115 | |
Sunrise Medical, Cov-lite Term Loan | | | | | | | | |
5.000%, 07/05/22 | | | 303 | | | | 334 | |
Sunrise Medical, Lien 1 Term Loan B | | | | | | | | |
5.000%, 07/05/22 | | | 2,197 | | | | 2,421 | |
Valeant Pharmaceuticals International, Series C-2 TLB | | | | | | | | |
3.500%, 12/11/19 | | | 756 | | | | 743 | |
Valeant Pharmaceuticals International, Series D-2 TLB | | | | | | | | |
3.500%, 02/13/19 | | | 309 | | | | 304 | |
Valeant Pharmaceuticals International, Series E Tranche B Term Loan | | | | | | | | |
3.500%, 06/26/20 | | | 3,706 | | | | 3,646 | |
Valeant Pharmaceuticals International, Series F-1 Tranche B Term Loan | | | | | | | | |
4.000%, 04/01/22 | | | 2,866 | | | | 2,833 | |
| | | | | | | | | |
Total Healthcare | | | | 49,858 | |
| | | | | | | | | |
Housing [0.3%] | |
ABC Supply Company, Term Loan B | | | | | | | | |
3.500%, 04/16/20 | | | 820 | | | | 812 | |
Continental Building Products LLC, First Lien Term Loan | | | | | | | | |
4.000%, 08/28/20 | | | 274 | | | | 273 | |
DTZ US Borrower LLC, Incremental Term Loan | | | | | | | | |
4.250%, 11/04/21 | | | 3,016 | | | | 2,981 | |
QUIKRETE Holdings, Inc., First Lien Term Loan | | | | | | | | |
4.000%, 09/28/20 | | | 269 | | | | 267 | |
Realogy Corporation, New Term Loan B | | | | | | | | |
3.750%, 03/05/20 | | | 312 | | | | 311 | |
| | | | | | | | | |
Total Housing | | | | 4,644 | |
| | | | | | | | | |
Industrials [0.1%] | |
Delachaux | | | | | | | | |
5.250%, 09/25/21(G) | | | 500 | | | | 754 | |
Interpipe Ukraine | | | | | | | | |
8.300%, 03/06/16(G) (I) | | | 3,821 | | | | 1,137 | |
| | | | | | | | | |
Total Industrials | | | | 1,891 | |
| | | | | | | | | |
Information Technology [2.1%] | |
Aricent Technologies, Term Loan | | | | | | | | |
5.500%, 04/14/21 | | | 425 | | | | 421 | |
Arris Group, Inc., Term Loan B 2015 | | | | | | | | |
3.250%, 04/17/20 | | | 574 | | | | 572 | |
Avago Technologies Finance, Term Loan B | | | | | | | | |
3.750%, 05/06/21 | | | 1,865 | | | | 1,862 | |
Avaya Inc., Term B-6 Loans | | | | | | | | |
6.500%, 03/31/18 | | | 908 | | | | 788 | |
Avaya Inc., Term Loan B-7 | | | | | | | | |
6.250%, 05/29/20 | | | 2,579 | | | | 2,015 | |
Blackboard Inc, Term Loan B3 | | | | | | | | |
4.750%, 10/04/18 | | | 881 | | | | 875 | |
CDW LLC, Term Loan | | | | | | | | |
3.250%, 04/29/20 | | | 1,178 | | | | 1,167 | |
CompuCom Systems, Inc., Term Loan B | | | | | | | | |
4.250%, 05/07/20 | | | 136 | | | | 109 | |
Dell Inc, Term Loan B-2 | | | | | | | | |
4.500%, 04/29/20 | | | 2,792 | | | | 2,776 | |
Dell Inc, Term Loan C | | | | | | | | |
3.750%, 10/29/18 | | | 576 | | | | 575 | |
See accompanying notes to financial statements.
CITY NATIONAL ROCHDALE FUNDS | PAGE 102
consolidated schedule of investments |
September 30, 2015 |
City National Rochdale Fixed Income Opportunities Fund (continued) |
Description | | Face Amount (000) | | | Value (000) | |
eResearch Technology, Inc., Term Loan | | | | | | |
5.500%, 05/06/22 | | $ | 289 | | | $ | 288 | |
Fidji Luxembourg (BC3) S.Ã r.l., Term Loan | | | | | | | | |
6.250%, 12/24/20 | | | 170 | | | | 169 | |
Freescale Semiconductor, Tranche B4 Term Loan | | | | | | | | |
4.250%, 02/28/20 | | | 2,607 | | | | 2,603 | |
Infor (US) , Term Loan B-3 | | | | | | | | |
3.750%, 06/03/20 | | | 186 | | | | 180 | |
Infor (US), Term Loan B-5 | | | | | | | | |
3.750%, 06/03/20 | | | 881 | | | | 851 | |
Informatica, Term Loan | | | | | | | | |
4.500%, 06/03/22 | | | 1,000 | | | | 1,116 | |
Internap Network Services, Term Loan | | | | | | | | |
6.000%, 11/26/19 | | | 285 | | | | 283 | |
iParadigms Holdings LLC, First Lien Term Loan | | | | | | | | |
5.000%, 07/23/21 | | | 252 | | | | 249 | |
IPC Corp., Term B-1 Loans | | | | | | | | |
5.500%, 08/06/21 | | | 279 | | | | 275 | |
Mitel Networks Corporation, Term Loan B 2015 | | | | | | | | |
5.000%, 04/29/22 | | | 658 | | | | 653 | |
Nuance Communications, Term Loan | | | | | | | | |
2.920%, 08/07/19 | | | 186 | | | | 184 | |
On Semiconductor Corp, Term Loan | | | | | | | | |
1.980%, 01/02/18(G) (I) | | | 447 | | | | 436 | |
Presidio, Inc., Term Loan - 2022 | | | | | | | | |
5.250%, 02/02/22 | | | 592 | | | | 590 | |
RAET B.V. | | | | | | | | |
4.250%, 07/01/21 | | | 1,500 | | | | 1,672 | |
Riverbed Technology, Inc., Term Loan B | | | | | | | | |
6.000%, 04/24/22 | | | 677 | | | | 677 | |
Scout24 Holdings | | | | | | | | |
4.250%, 12/12/20 | | | 1,785 | | | | 1,992 | |
Sophia LP, Term B Loan | | | | | | | | |
4.750%, 09/16/22(H) | | | 350 | | | | 349 | |
Southern Graphics Inc., Term Loan - 2013 | | | | | | | | |
4.250%, 10/17/19 | | | 204 | | | | 201 | |
SS&C Technologies, Term Loan B-1 (2022) | | | | | | | | |
4.000%, 07/08/22 | | | 2,020 | | | | 2,021 | |
SS&C Technologies, Term Loan B-2 (2022) | | | | | | | | |
4.000%, 07/08/22 | | | 320 | | | | 320 | |
Technicolor, Term Loan | | | | | | | | |
5.500%, 07/11/20 | | | 3,753 | | | | 3,725 | |
The Active Network, Inc., First Lien Term Loan | | | | | | | | |
5.500%, 11/13/20 | | | 108 | | | | 107 | |
TransUnion LLC, Term Loan B-2 | | | | | | | | |
3.500%, 04/09/21 | | | 438 | | | | 433 | |
Vertafore, Inc., Term Loan - 2013 | | | | | | | | |
4.250%, 10/03/19 | | | 784 | | | | 782 | |
Zebra Technologies Corp, Term Loan B | | | | | | | | |
4.750%, 09/30/21(G) | | | 3,373 | | | | 3,388 | |
| | | | | | | | | |
Total Information Technology | | | | 34,704 | |
| | | | | | | | | |
Manufacturing [0.3%] | |
Doosan Infracore, Term Loan B | | | | | | | | |
4.500%, 05/28/21 | | | 351 | | | | 351 | |
Generac Power Systems Inc, Term Loan B | | | | | | | | |
3.250%, 06/22/18 | | | 170 | | | | 164 | |
LTI Boyd Corporation, Second Lien | | | | | | | | |
10.250%, 04/17/23 | | | 500 | | | | 487 | |
Mirror Bidco Corp. (Dematic), Cov-Lite Term Loan | | | | | | | | |
4.250%, 12/28/19 | | | 292 | | | | 291 | |
Otter Products, LLC, Term Loan B | | | | | | | | |
5.750%, 06/03/20 | | | 340 | | | | 331 | |
Signode Industrial Group US Inc., Term Loan B | | | | | | | | |
3.750%, 05/01/21 | | | 1,254 | | | | 1,243 | |
TTM Technologies, Term Loan | | | | | | | | |
6.000%, 05/07/21 | | | 535 | | | | 498 | |
Utex Industries, First Lien Term Loan | | | | | | | | |
5.000%, 05/14/21 | | | 1,124 | | | | 965 | |
| | | | | | | | | |
Total Manufacturing | | | | 4,330 | |
| | | | | | | | | |
Metals/Minerals [0.5%] | |
Atkore International, Inc., Term Loan | | | | | | | | |
4.500%, 04/09/21 | | | 356 | | | | 339 | |
Atlas Iron Limited, Term Loan | | | | | | | | |
8.750%, 12/10/17(G) (I) | | | 116 | | | | 39 | |
Dynacast International LLC, Term Loan B-1 | | | | | | | | |
4.500%, 01/28/22 | | | 363 | | | | 361 | |
See accompanying notes to financial statements.
CITY NATIONAL ROCHDALE FUNDS | PAGE 103
consolidated schedule of investments |
September 30, 2015 |
City National Rochdale Fixed Income Opportunities Fund (continued) |
Description | | Face Amount (000) | | | Value (000) | |
Fortescue Metals Group (FMG), Cov-Lite Term Loan | | | | | | |
3.750%, 06/30/19 | | $ | 7,943 | | | $ | 6,478 | |
Novelis Inc., Incremental Term Loan | | | | | | | | |
4.000%, 06/02/22 | | | 1,486 | | | | 1,460 | |
| | | | | | | | | |
Total Metals/Minerals | | | | 8,677 | |
| | | | | | | | | |
Retail [1.8%] | |
Abercrombie & Fitch Management Co., Term Loan B | | | | | | | | |
4.750%, 07/30/21 | | | 993 | | | | 973 | |
AS Adventure | | | | | | | | |
5.883%, 04/12/22 | | | 1,000 | | | | 1,490 | |
AS Adventure, Term Loan B | | | | | | | | |
5.000%, 04/01/22 | | | 2,000 | | | | 2,218 | |
BJ’s Wholesale Club Inc, Second Lien Term Loan | | | | | | | | |
8.500%, 03/26/20 | | | 535 | | | | 529 | |
Capital Automotive LP, Second Lien | | | | | | | | |
6.000%, 04/30/20(G) | | | 1,530 | | | | 1,536 | |
Capital Automotive LP, Term Loan - 2013 | | | | | | | | |
4.000%, 04/10/19 | | | 1,915 | | | | 1,910 | |
CWGS Group, LLC, Term Loan | | | | | | | | |
5.750%, 02/20/20 | | | 939 | | | | 937 | |
Dollar Tree Inc, Term Loan B-1 | | | | | | | | |
3.500%, 07/06/22 | | | 2,735 | | | | 2,735 | |
Dollar Tree Inc, Term Loan B-2 | | | | | | | | |
4.250%, 03/09/22 | | | 1,365 | | | | 1,365 | |
HMK Intermediate Hldg (Sleepys), Term Loan | | | | | | | | |
5.000%, 03/30/19 | | | 323 | | | | 322 | |
Hudson’s Bay Company, Term Loan B - 2022 | | | | | | | | |
4.750%, 08/12/22(H) | | | 2,305 | | | | 2,312 | |
J Crew Group Inc, Term Loan B | | | | | | | | |
4.000%, 03/05/21 | | | 809 | | | | 625 | |
JC Penney, Prop Co Term Loan | | | | | | | | |
6.000%, 05/21/18 | | | 3,457 | | | | 3,433 | |
Jo-Ann Stores, Inc., Initial Loans | | | | | | | | |
4.000%, 03/16/18 | | | 597 | | | | 587 | |
Michaels Stores, Term Loan B | | | | | | | | |
3.750%, 01/28/20 | | | 352 | | | | 351 | |
Neiman Marcus (fka Mariposa), New Term Loan | | | | | | | | |
4.250%, 10/25/20 | | | 762 | | | | 744 | |
Petco Animal Supplies Inc, Term Loan B - 2013 | | | | | | | | |
4.000%, 11/24/17 | | | 369 | | | | 369 | |
Petsmart (fka Argos Merger), Term Loan B-1 | | | | | | | | |
4.250%, 03/10/22 | | | 1,706 | | | | 1,701 | |
Sears Roebuck Acceptance Corp., Term Loan B | | | | | | | | |
5.500%, 06/30/18(G) | | | 2,181 | | | | 2,142 | |
Staples Inc, Term Loan B | | | | | | | | |
2.750%, 04/23/21(H) | | | 600 | | | | 597 | |
Toys R Us Property Company, Initial Term Loan | | | | | | | | |
6.000%, 08/21/19 | | | 1,328 | | | | 1,208 | |
Toys R Us-Delaware, Inc., FILO CAD Term Loan | | | | | | | | |
8.250%, 10/09/19 | | | 125 | | | | 124 | |
Toys R Us-Delaware, Inc., FILO US Term Loan | | | | | | | | |
8.250%, 10/09/19 | | | 155 | | | | 154 | |
Toys R Us-Delaware, Inc., Term Loan B-3 | | | | | | | | |
5.250%, 05/25/18 | | | 33 | | | | 25 | |
Toys R Us-Delaware, Inc., Term Loan B4 | | | | | | | | |
9.750%, 04/09/20 | | | 1,328 | | | | 1,164 | |
| | | | | | | | | |
Total Retail | | | | 29,551 | |
| | | | | | | | | |
Service [2.8%] | |
4L Technologies Inc., Term Loan B | | | | | | | | |
5.500%, 05/08/20 | | | 64 | | | | 61 | |
Advanced Disposal Services, Term Loan B-2 | | | | | | | | |
3.750%, 10/09/19 | | | 1,085 | | | | 1,068 | |
AHT Cooling | | | | | | | | |
4.271%, 11/19/20 | | | 1,000 | | | | 1,087 | |
AI Avocado BV | | | | | | | | |
4.000%, 10/08/21 | | | 1,000 | | | | 1,115 | |
Asurion Corporation, Incremental Term Loan B-2 | | | | | | | | |
4.250%, 07/08/20 | | | 1,251 | | | | 1,170 | |
Asurion Corporation, Incremental Tranche B-1 | | | | | | | | |
5.000%, 05/24/19 | | | 1,810 | | | | 1,724 | |
Asurion Corporation, Second Lien | | | | | | | | |
8.500%, 03/03/21 | | | 2,295 | | | | 2,056 | |
Asurion Corporation, Term Loan B-4 | | | | | | | | |
5.000%, 07/29/22 | | | 2,683 | | | | 2,531 | |
See accompanying notes to financial statements.
CITY NATIONAL ROCHDALE FUNDS | PAGE 104
consolidated schedule of investments |
September 30, 2015 |
City National Rochdale Fixed Income Opportunities Fund (continued) |
Description | | Face Amount (000) | | | Value (000) | |
Busy Bees Nurseries Ltd., Term Loan | | | | | | |
4.750%, 04/29/22 | | $ | 1,000 | | | $ | 1,512 | |
Callcredit Information Group, 1st Lien | | | | | | | | |
5.181%, 02/12/21(G) | | | 3,000 | | | | 4,453 | |
Digital River, Inc., Term Loan | | | | | | | | |
7.500%, 02/13/21 | | | 303 | | | | 302 | |
DigitalGlobe Inc, Term Loan B | | | | | | | | |
3.750%, 01/31/20 | | | 442 | | | | 439 | |
Dorna Sports, Term Loan | | | | | | | | |
4.172%, 04/30/21(G) | | | 1,949 | | | | 2,168 | |
Environmental Resources, Term Loan | | | | | | | | |
8.000%, 05/09/22 | | | 2,000 | | | | 1,985 | |
5.000%, 05/07/21 | | | 2,000 | | | | 1,985 | |
Evertec Group, LLC, Term Loan A | | | | | | | | |
2.700%, 04/17/18 | | | 533 | | | | 507 | |
Evertec Group, LLC, Term Loan B | | | | | | | | |
3.500%, 04/17/20 | | | 91 | | | | 88 | |
First Data Corporation, 2018 New Dollar Term Loan | | | | | | | | |
3.687%, 03/23/18 | | | 4,965 | | | | 4,920 | |
First Data Corporation, 2018B Second New Term Loan | | | | | | | | |
3.687%, 09/24/18 | | | 805 | | | | 797 | |
First Data Corporation, 2021 Extended Dollar Term Loan | | | | | | | | |
4.187%, 03/24/21 | | | 1,745 | | | | 1,741 | |
First Data Corporation, New 2022 Dollar Term Loan | | | | | | | | |
3.950%, 06/24/22 | | | 220 | | | | 219 | |
Interactive Data Corporation, Term Loan B - 2014 | | | | | | | | |
4.750%, 05/02/21 | | | 1,457 | | | | 1,451 | |
iQor US Inc., Term Loan B | | | | | | | | |
6.000%, 04/01/21(G) (I) | | | 1,045 | | | | 846 | |
LS Deco LLC (Leighton), Term Loan B | | | | | | | | |
5.500%, 05/21/22 | | | 171 | | | | 171 | |
Nets Holdings, Term Loan | | | | | | | | |
4.250%, 05/04/21 | | | 3,000 | | | | 3,337 | |
PODS LLC, Term Loan B | | | | | | | | |
5.250%, 01/28/22 | | | 184 | | | | 182 | |
PrePaid Legal Services, Inc., Term Loan B | | | | | | | | |
6.250%, 07/01/19(G) | | | 135 | | | | 135 | |
Redtop Acquisitions Limited, First Lien Term Loan | | | | | | | | |
4.500%, 12/03/20 | | | 215 | | | | 216 | |
Redtop Acquisitions Limited, Second Lien | | | | | | | | |
8.250%, 06/03/21 | | | 187 | | | | 186 | |
Securitas Direct, Term Loan | | | | | | | | |
3.681%, 08/30/19(G) | | | 3,000 | | | | 3,428 | |
Sedgwick, Inc., First Lien Term Loan | | | | | | | | |
3.750%, 03/01/21 | | | 1,486 | | | | 1,462 | |
Sedgwick, Inc., Second Lien | | | | | | | | |
6.750%, 02/28/22 | | | 760 | | | | 712 | |
Spin Holdco (Coinmach), Term Loan B | | | | | | | | |
4.250%, 11/14/19 | | | 108 | | | | 106 | |
STG-Fairway Acq. - First Advantage, Term Loan B - new | | | | | | | | |
6.250%, 06/29/22 | | | 1,724 | | | | 1,717 | |
| | | | | | | | | |
Total Service | | | | 45,877 | |
| | | | | | | | | |
Sovereign [0.6%] | |
Arab Republic of Egypt | | | | | | | | |
1.884%, 01/04/21(G) (I) | | | 2,790 | | | | 2,528 | |
Republic of Angola | | | | | | | | |
6.600%, 12/06/20 | | | 7,000 | | | | 6,922 | |
| | | | | | | | | |
Total Sovereign | | | | 9,450 | |
| | | | | | | | | |
Telecommunications [1.3%] | |
Cincinnati Bell Inc., Term Loan B - 2013 | | | | | | | | |
4.000%, 09/10/20 | | | 1,032 | | | | 1,028 | |
Frontier Communications, Term Loan A | | | | | | | | |
3.050%, 10/14/16 | | | 3,054 | | | | 3,023 | |
Integra Telecom, Term Loan B - new | | | | | | | | |
5.250%, 08/14/20 | | | 427 | | | | 424 | |
Level 3 Communications, Term Loan B-3 -2019 | | | | | | | | |
4.000%, 08/01/19 | | | 735 | | | | 734 | |
Level 3 Communications, Term loan B-4 - 2020 | | | | | | | | |
4.000%, 01/15/20 | | | 3,665 | | | | 3,651 | |
LTS Buyer LLC (Light Tower), Term Loan | | | | | | | | |
4.000%, 04/13/20 | | | 1,104 | | | | 1,082 | |
Numericable U.S. LLC, Term Loan B-1 | | | | | | | | |
4.500%, 05/21/20 | | | 2,685 | | | | 2,666 | |
See accompanying notes to financial statements.
CITY NATIONAL ROCHDALE FUNDS | PAGE 105
consolidated schedule of investments |
September 30, 2015 |
City National Rochdale Fixed Income Opportunities Fund (continued) |
Description | | Face Amount (000) | | | Value (000) | |
Numericable U.S. LLC, Term Loan B-2 | | | | | | |
4.500%, 05/21/20 | | $ | 2,323 | | | $ | 2,307 | |
Numericable U.S. LLC, Term Loan B-5 | | | | | | | | |
4.000%, 07/27/22 | | | 360 | | | | 353 | |
Sky Bet, Cov-Lite First Lien Term Loan | | | | | | | | |
6.083%, 02/25/22 | | | 1,000 | | | | 1,513 | |
Telenet Communications | | | | | | | | |
3.500%, 05/01/23 | | | 2,000 | | | | 2,186 | |
Telx Group, Term Loan B (2014) | | | | | | | | |
4.500%, 04/09/20 | | | 563 | | | | 561 | |
Zayo Group LLC, Term Loan B - 2012 | | | | | | | | |
4.000%, 07/02/19 | | | 2,398 | | | | 2,381 | |
| | | | | | | | | |
Total Telecommunications | | | | 21,909 | |
| | | | | | | | | |
Textile & Apparel Mfg. [0.1%] | |
Vivarte, BOND | | | | | | | | |
4.000%, 10/29/19 | | | 1,000 | | | | 1,179 | |
| | | | | | | | | |
Transportation [0.5%] | |
Allison Transmission Inc, Term Loan B3 (2013) | | | | | | | | |
3.500%, 08/23/19 | | | 1,631 | | | | 1,629 | |
Chrysler Automotive, 2014 Term Loan B | | | | | | | | |
3.250%, 12/31/18 | | | 1,478 | | | | 1,463 | |
Chrysler Group | | | | | | | | |
4.250%, 05/24/17(G) | | | 871 | | | | 866 | |
Commercial Barge Line Company, Term Loan B | | | | | | | | |
7.500%, 09/22/19 | | | 1 | | | | 1 | |
7.500%, 09/22/19 | | | 292 | | | | 286 | |
CS Intermedia Holdco 2 LLC, Term Loan | | | | | | | | |
4.000%, 04/04/21 | | | 281 | | | | 279 | |
FleetPride, Term Loan B | | | | | | | | |
5.250%, 11/15/19 | | | 209 | | | | 201 | |
Gruden Acquisition, Inc. (Quality Distribution), Term Loan | | | | | | | | |
5.750%, 07/29/22 | | | 310 | | | | 305 | |
MPG Holdco (Metaldyne), Term Loan B | | | | | | | | |
3.750%, 10/20/21 | | | 354 | | | | 351 | |
Navios Maritime Midstream Partners LP, Term Loan | | | | | | | | |
5.500%, 06/15/20 | | | 145 | | | | 143 | |
Navios Maritime Partners LP, Term Loan B | | | | | | | | |
5.250%, 06/27/18 | | | 332 | | | | 329 | |
Schaeffler Finance BV, Term Loan E | | | | | | | | |
3.750%, 05/15/20 | | | 1,035 | | | | 1,034 | |
Tower Auto Holdings, Term Loan B - 2020 | | | | | | | | |
4.000%, 04/23/20 | | | 208 | | | | 203 | |
Travelport, Term Loan B | | | | | | | | |
5.750%, 09/02/21 | | | 377 | | | | 375 | |
Visteon Corporation, Term Loan B | | | | | | | | |
3.500%, 04/09/21 | | | 312 | | | | 310 | |
Wabash National Corporation, Term Loan B | | | | | | | | |
4.250%, 03/16/22 | | | 323 | | | | 324 | |
| | | | | | | | | |
Total Transportation | | | | 8,099 | |
| | | | | | | | | |
Utility [0.7%] | |
Bronco Midstream Funding, LLC, Term Loan B | | | | | | | | |
5.000%, 08/15/20 | | | 1,043 | | | | 970 | |
Calpine, Construction TL B1 (2020) | | | | | | | | |
3.000%, 05/03/20 | | | 147 | | | | 143 | |
Calpine, Construction TL B2 (2022) | | | | | | | | |
3.250%, 01/31/22 | | | 1,080 | | | | 1,051 | |
Calpine, Term Loan B3 | | | | | | | | |
4.000%, 09/27/19 | | | 1,549 | | | | 1,544 | |
Calpine, Term Loan B4 | | | | | | | | |
4.000%, 10/31/20 | | | 828 | | | | 825 | |
Calpine, Term Loan B5 | | | | | | | | |
3.500%, 05/20/22 | | | 883 | | | | 868 | |
Empire Generating Co, LLC, Term Loan B | | | | | | | | |
5.250%, 03/12/21 | | | 1,498 | | | | 1,401 | |
Empire Generating Co, LLC, Term Loan C | | | | | | | | |
5.250%, 03/12/21 | | | 110 | | | | 103 | |
Green Energy Partners / Stonewall LLC, Term Loan B-1 | | | | | | | | |
6.500%, 11/12/21 | | | 205 | | | | 201 | |
La Frontera Generation LLC, Term Loan B | | | | | | | | |
4.500%, 09/30/20 | | | 1,448 | | | | 1,279 | |
Longview Power | | | | | | | | |
6.000%, 04/13/20 | | | 1,496 | | | | 1,469 | |
See accompanying notes to financial statements.
CITY NATIONAL ROCHDALE FUNDS | PAGE 106
consolidated schedule of investments |
September 30, 2015 |
City National Rochdale Fixed Income Opportunities Fund (continued) |
Description | | Face Amount (000)/
Acquisition Cost (000) | | | Value (000) | |
Panda Temple Power II, LLC, Term Loan | | | | | | |
7.250%, 04/03/19 | | $ | 150 | | | $ | 133 | |
Power Buyer, LLC, Second Lien | | | | | | | | |
8.250%, 11/06/20 | | | 180 | | | | 171 | |
Power Buyer, LLC, Term Loan | | | | | | | | |
4.250%, 05/06/20 | | | 547 | | | | 540 | |
Terra-Gen Finance Company, LLC, Term Loan B | | | | | | | | |
5.250%, 11/26/21 | | | 172 | | | | 167 | |
TPF Generation Holdings, Term Loan B - 2013 | | | | | | | | |
4.750%, 12/31/17 | | | 910 | | | | 854 | |
Viva Alamo LLC, Term Loan B | | | | | | | | |
5.250%, 02/22/21(G) (I) | | | 275 | | | | 228 | |
| | | | | | | | | |
Total Utility | | | | 11,947 | |
| | | | | | | | | |
Wireless Communications [0.3%] | |
Aircell Business Aviation Services LLC (GOGO), Term Loan - B-2 | | | | | | | | |
7.500%, 03/21/18 | | | 226 | | | | 227 | |
Aircell Business Aviation Services LLC (GOGO), Term Loan B | | | | | | | | |
11.250%, 06/21/17 | | | 1,928 | | | | 1,996 | |
Crown Castle Int’l, Extended Increm Tranche B2 | | | | | | | | |
3.000%, 01/31/21 | | | 1,413 | | | | 1,407 | |
nTelos, Term Loan B | | | | | | | | |
5.750%, 11/09/19 | | | 923 | | | | 920 | |
Syniverse Technologies, Inc., Old Term Loan B - Initial Term Loans | | | | | | | | |
4.000%, 04/23/19 | | | 65 | | | | 58 | |
Syniverse Technologies, Inc., Tranche B Term Loan | | | | | | | | |
4.000%, 04/23/19 | | | 297 | | | | 270 | |
| | | | | | | | | |
Total Wireless Communications | | | | 4,878 | |
| | | | | | | | | |
Total Loan Participations | |
(Cost $499,522) | | | | 474,553 | |
| | | | | | | | | |
Life Settlement Contracts (G)(I)(J) [9.7%] | |
American General Life #460L, | | | | | | | | |
Acquired 05/30/2014* | | | 303 | | | | 425 | |
American General Life #508L, | | | | | | | | |
Acquired 05/30/2014* | | | 2,595 | | | | 2,808 | |
American General Life #542L, | | | | | | | | |
Acquired 07/30/2015* | | | 83 | | | | 132 | |
Description | | Acquisition Cost (000) | | | Value (000) | |
American General Life #634L, | | | | | | |
Acquired 05/30/2014* | | $ | 530 | | | $ | 880 | |
American General Life #906L, | | | | | | | | |
Acquired 07/30/2015* | | | 479 | | | | 2,638 | |
American General Life #964L, | | | | | | | | |
Acquired 07/30/2015* | | | 1,459 | | | | 1,526 | |
AXA Equitable Life #0474, | | | | | | | | |
Acquired 11/04/2013* | | | 7,290 | | | | 12,271 | |
AXA Equitable Life #0932, | | | | | | | | |
Acquired 11/04/2013* | | | 1,014 | | | | 4,360 | |
AXA Equitable Life #1600, | | | | | | | | |
Acquired 05/30/2014* | | | 1,436 | | | | 1,812 | |
AXA Equitable Life #1616, | | | | | | | | |
Acquired 05/30/2014* | | | 3,254 | | | | 3,879 | |
AXA Equitable Life #1898, | | | | | | | | |
Acquired 11/04/2013* | | | 441 | | | | 333 | |
AXA Equitable Life #4496, | | | | | | | | |
Acquired 11/04/2013* | | | 115 | | | | 756 | |
AXA Equitable Life #7233, | | | | | | | | |
Acquired 11/04/2013* | | | 395 | | | | 1,370 | |
AXA Equitable Life #7578, | | | | | | | | |
Acquired 11/04/2013* | | | 2,104 | | | | 3,154 | |
AXA Equitable Life #7857, | | | | | | | | |
Acquired 11/04/2013* | | | 2,297 | | | | 4,888 | |
AXA Equitable Life #8538, | | | | | | | | |
Acquired 11/04/2013* | | | 1,333 | | | | 2,723 | |
AXA Equitable Life #9345, | | | | | | | | |
Acquired 11/04/2013* | | | 143 | | | | 540 | |
Guardian Insurance #0346, | | | | | | | | |
Acquired 11/04/2013* | | | 646 | | | | 3,014 | |
ING Reliastar #3394, | | | | | | | | |
Acquired 05/30/2014* | | | 3,687 | | | | 4,282 | |
ING Reliastar #1234, | | | | | | | | |
Acquired 12/05/2013* | | | 1,067 | | | | 3,557 | |
ING Reliastar #1649, | | | | | | | | |
Acquired 12/05/2013* | | | 61 | | | | 1,380 | |
ING Reliastar #4842, | | | | | | | | |
Acquired 11/20/2013* | | | 921 | | | | 3,983 | |
ING Reliastar #776H, | | | | | | | | |
Acquired 05/30/2014* | | | 1,518 | | | | 1,826 | |
John Hancock #0430, | | | | | | | | |
Acquired 05/30/2014* | | | 2,418 | | | | 3,476 | |
John Hancock #0801, | | | | | | | | |
Acquired 05/30/2014* | | | 1,564 | | | | 2,237 | |
John Hancock #1929, | | | | | | | | |
Acquired 05/30/2014* | | | 3,812 | | | | 5,147 | |
John Hancock #2223, | | | | | | | | |
Acquired 11/19/2013* | | | 1,279 | | | | 3,077 | |
John Hancock #5072, | | | | | | | | |
Acquired 05/30/2014* | | | 1,409 | | | | 1,821 | |
See accompanying notes to financial statements.
CITY NATIONAL ROCHDALE FUNDS | PAGE 107
consolidated schedule of investments |
September 30, 2015 |
City National Rochdale Fixed Income Opportunities Fund (continued) |
Description | | Acquisition Cost (000) | | | Value (000) | |
John Hancock #5080, | | | | | | |
Acquired 11/19/2013* | | $ | 313 | | | $ | 1,916 | |
John Hancock #5885, | | | | | | | | |
Acquired 05/30/2014* | | | 894 | | | | 980 | |
John Hancock #6686, | | | | | | | | |
Acquired 05/30/2014* | | | 3,035 | | | | 2,726 | |
John Hancock #6912, | | | | | | | | |
Acquired 05/30/2014* | | | 1,065 | | | | 1,314 | |
Lincoln National #9330, | | | | | | | | |
Acquired 05/30/2014* | | | 5,482 | | | | 4,316 | |
Lincoln National #0019, | | | | | | | | |
Acquired 09/18/2015* | | | 2,460 | | | | 4,126 | |
Lincoln National #4654, | | | | | | | | |
Acquired 05/30/2014* | | | 721 | | | | 697 | |
Lincoln National #5456 | | | | | | | | |
Acquired 09/18/2015* | | | 1,029 | | | | 3,206 | |
Lincoln National #4754, | | | | | | | | |
Acquired 09/18/2015* | | | 610 | | | | 2,404 | |
Lincoln National #5255, | | | | | | | | |
Acquired 09/18/2015* | | | 287 | | | | 319 | |
Lincoln National #5658, | | | | | | | | |
Acquired 09/18/2015* | | | 329 | | | | 1,004 | |
Lincoln National #7099, | | | | | | | | |
Acquired 09/18/2015* | | | 1,254 | | | | 2,852 | |
Lincoln National #8558, | | | | | | | | |
Acquired 09/18/2015* | | | 1,659 | | | | 3,523 | |
Lincoln National #9239, | | | | | | | | |
Acquired 05/30/2014* | | | 2,181 | | | | 2,598 | |
Mass Mutual #1849, | | | | | | | | |
Acquired 11/05/2013* | | | 2,926 | | | | 4,163 | |
Mass Mutual #5167, | | | | | | | | |
Acquired 05/30/2014* | | | 63 | | | | 924 | |
Mass Mutual #5681, | | | | | | | | |
Acquired 11/05/2013* | | | 288 | | | | 1,472 | |
Mass Mutual #5864, | | | | | | | | |
Acquired 05/30/2014* | | | 4,668 | | | | 4,888 | |
Mass Mutual #6620, | | | | | | | | |
Acquired 11/05/2013* | | | 222 | | | | 1,599 | |
Met Life #8MLU, | | | | | | | | |
Acquired 05/30/2014* | | | 1,413 | | | | 4,319 | |
NY Life Insurance #5673, | | | | | | | | |
Acquired 05/30/2014* | | | 3,334 | | | | 4,559 | |
Pacific Life #7850, | | | | | | | | |
Acquired 05/30/2014* | | | 550 | | | | 631 | |
Penn Mutual #3106, | | | | | | | | |
Acquired 05/30/2014* | | | 1,294 | | | | 1,418 | |
Phoenix Life #5555, | | | | | | | | |
Acquired 05/30/2014* | | | 3,946 | | | | 5,465 | |
Phoenix Life #6161, | | | | | | | | |
Acquired 05/30/2014* | | | 3,472 | | | | 5,577 | |
Description | | Acquisition Cost (000)/
Face Amount (000) | | | Value (000) | |
Phoenix Life #8499, | | | | | | |
Acquired 05/30/2014* | | $ | 756 | | | $ | 545 | |
Phoenix Life #8509, | | | | | | | | |
Acquired 05/30/2014* | | | 761 | | | | 545 | |
Principal Financial #6653, | | | | | | | | |
Acquired 10/30/2013* | | | 306 | | | | 860 | |
Security Mutual Life #5380, | | | | | | | | |
Acquired 10/30/2013* | | | 410 | | | | 1,107 | |
Transamerica #1708, | | | | | | | | |
Acquired 10/28/2013* | | | 957 | | | | 3,447 | |
Transamerica #3426, | | | | | | | | |
Acquired 11/12/2013* | | | 275 | | | | 684 | |
Transamerica #8205, | | | | | | | | |
Acquired 10/28/2013* | | | 714 | | | | 1,391 | |
U.S. Life Insurance #46NL, | | | | | | | | |
Acquired 07/30/2015* | | | 879 | | | | 1,504 | |
Union Central Life #4500, | | | | | | | | |
Acquired 10/30/2013* | | | 790 | | | | 3,940 | |
| | | | | | | | | |
Total Life Settlement Contracts | |
(Cost $92,996) | | | | 159,314 | |
| | | | | | | | | |
Sovereign Debt [1.5%] | |
Bosnia & Herzegovina Government International Bond | | | | | | | | |
0.875%, 12/11/17(D) | | | 1,678 | | | | 1,694 | |
City of Buenos Aires Argentina, MTN | | | | | | | | |
8.950%, 02/19/21 | | | 200 | | | | 206 | |
Egyptian Paris Club | | | | | | | | |
2.779%, 01/01/21(G) (I) | | | 112 | | | | 105 | |
Islamic Republic of Pakistan | | | | | | | | |
7.250%, 04/15/19 | | | 2,500 | | | | 2,563 | |
Ivory Coast Government International Bond | | | | | | | | |
5.750%, 12/31/32 | | | 1,000 | | | | 866 | |
Kenya Government International Bond | | | | | | | | |
5.875%, 06/24/19 | | | 1,677 | | | | 1,608 | |
Mozambique EMATUM Finance 2020 BV | | | | | | | | |
6.305%, 09/11/20 | | | 1,915 | | | | 1,637 | |
Provincia de Buenos Aires | | | | | | | | |
11.750%, 10/05/15 | | | 3,950 | | | | 3,950 | |
10.875%, 01/26/21 | | | 2,750 | | | | 2,681 | |
9.250%, 04/15/17 | | | 227 | | | | 228 | |
Republic of Argentina | | | | | | | | |
7.000%, 10/03/15 | | | 3,000 | | | | 3,087 | |
See accompanying notes to financial statements.
CITY NATIONAL ROCHDALE FUNDS | PAGE 108
consolidated schedule of investments |
September 30, 2015 |
City National Rochdale Fixed Income Opportunities Fund (continued) |
Description | Face Amount (000)/
Shares/Number of Warrants | | Value (000) | |
Senegal Government International Bond | | | | |
8.750%, 05/13/21 | | $ | 1,500 | | | $ | 1,565 | |
Ukraine Government International Bond | | | | | | | | |
6.875%, 12/01/15 | | | 2,750 | | | | 2,227 | |
United Republic of Tanzania | | | | | | | | |
6.538%, 03/09/20(D) | | | 2,690 | | | | 2,549 | |
| | | | | | | | | |
Total Sovereign Debt | |
(Cost $25,933) | | | | 24,966 | |
| | | | | | | | | |
Closed-End Fund [1.0%] | |
Stone Ridge Reinsurance Risk Premium Interval Fund(G) | | | 1,476,378 | | | | 15,664 | |
| | | | | | | | | |
Total Closed-End Fund | |
(Cost $15,000) | | | | 15,664 | |
| | | | | | | | | |
Asset-Backed Securities [0.3%] | |
BT SPE (Acquired 07/06/11, Acquisition Cost $10,781,378) | | | | | | | | |
9.250%, 06/06/16(G) (I) (J) | | | 6,112 | | | | 5,469 | |
Sealane Trade Finance, Ser 2011-1X, Cl A | | | | | | | | |
2.314%, 02/12/16(D) (G) (I) | | | 93 | | | | 81 | |
Start CLO, Ser 2011-7A, Cl A | | | | | | | | |
2.332%, 06/09/16(A) (D) (G) (I) | | | 122 | | | | 114 | |
| | | | | | | | | |
Total Asset-Backed Securities | |
(Cost $6,328) | | | | 5,664 | |
| | | | | | | | | |
Warrants [0.3%] | |
Central Bank of Nigeria, | | | | | | | | |
Expires 11/15/20* | | | 34,250 | | | | 4,675 | |
Gulf Keystone Petro, | | | | | | | | |
Expires 04/18/17* | | | 661,000 | | | | 13 | |
| | | | | | | | | |
Total Warrants | |
(Cost $6,033) | | | | 4,688 | |
| | | | | | | | | |
Convertible Bonds [0.3%] | |
Coal Mining [0.0%] | |
Enercoal Resources Pte | | | | | | | | |
9.250%, 04/07/18(B) | | | 200 | | | | 30 | |
New World Resources | | | | | | | | |
4.000%, 10/07/20 | | | 326 | | | | 37 | |
| | | | | | | | | |
Total Coal Mining | | | | 67 | |
| | | | | |
Description | Face Amount (000)/Shares | | Value (000) | |
Food, Beverage & Tobacco [0.1%] | |
CEDC Finance International | | | | | | | | |
10.000%, 04/30/18(B) (G) (I) | | $ | 1,599 | | | $ | 783 | |
| | | | | | | | | |
Medical Products & Services [0.0%] | |
Bio City Development B.V | | | | | | | | |
8.000%, 07/06/18 | | | 1,000 | | | | 510 | |
| | | | | | | | | |
Metal-Iron [0.0%] | |
London Mining Jersey | | | | | | | | |
12.000%, 02/15/16(B) (G) (I) | | | 1,500 | | | | 77 | |
| | | | | | | | | |
Miscellaneous Business Services [0.2%] | |
DP World | | | | | | | | |
1.750%, 06/19/24 | | | 3,000 | | | | 3,274 | |
| | | | | | | | | |
Petroleum & Fuel Products [0.0%] | |
Gulf Keystone Petroleum | | | | | | | | |
6.250%, 10/18/17 | | | 1,000 | | | | 401 | |
| | | | | | | | | |
Total Convertible Bonds | |
(Cost $7,967) | | | | 5,112 | |
| | | | | | | | | |
Common Stock [0.1%] | |
Energy [0.0%] | |
Aventine Renewable Energy Holdings *(G) (I) | | | 3,836 | | | | 32 | |
Lone Pine Resource *(G) (I) | | | 9,355 | | | | — | |
Lone Pine Resource A *(G) (I) (J) | | | 9,355 | | | | 11 | |
| | | | | | | | | |
Total Energy | | | | 43 | |
| | | | | | | | | |
Metals & Mining [0.1%] | |
New World Resources, Cl A * | | | 44,276,198 | | | | 301 | |
Petropavlovsk | | | 4,522,345 | | | | 404 | |
| | | | | | | | | |
Total Metals & Mining | | | | 705 | |
| | | | | | | | | |
Petroleum & Fuel Products [0.0%] | |
InterOil Exploration and Production * | | | 460,225 | | | | 88 | |
See accompanying notes to financial statements.
CITY NATIONAL ROCHDALE FUNDS | PAGE 109
consolidated schedule of investments |
September 30, 2015 |
City National Rochdale Fixed Income Opportunities Fund (continued) |
Description | | Shares | | | Value (000) | |
Services [0.0%] | |
A’Ayan Leasing * | | | 1,169,438 | | | $ | 128 | |
Astana Finance * | | | 208,618 | | | | — | |
| | | | | | | | | |
Total Services | | | | 128 | |
| | | | | | | | | |
Total Common Stock | |
(Cost $2,102) | | | | 964 | |
| | | | | | | | | |
Short-Term Investments [8.6%] | |
City National Rochdale Government Money Market Fund, Institutional Class, 0.010%**‡ | | | 59,033 | | | | 59 | |
SEI Daily Income Trust Government Fund, Cl A, 0.030%** | | | 141,221,661 | | | | 141,322 | |
| | | | | | | | | |
Total Short-Term Investments | |
(Cost $141,381) | | | | 141,381 | |
| | | | | | | | | |
Total Investments [98.1%] | |
(Cost $1,675,532) | | | $ | 1,610,241 | |
Percentages are based on Net Assets of $1,641,954 (000).
‡ | Investment in Affiliate. |
* | Non-income producing security. |
** | The rate reported is the 7-day effective yield as of September 30, 2015. |
(A) | Security exempt from registration under Rule 144A of the Securities Act of 1933. These securities may be resold in transactions exempt from registration normally to qualified institutions. On September 30, 2015, the value of these securities amounted to $176,288 (000), representing 10.7% of the net assets of the Fund. |
(B) | In default on interest payments. Rate shown represents the last coupon rate prior to default. |
(C) | Floating Rate Security — The rate reported is the rate in effect on September 30, 2015. |
(D) | Rate shown is the effective yield at time of purchase. |
(E) | Step Bond — The rate reported is the rate in effect on September 30, 2015. The coupon on a step bond changes on a specific date. |
(G) | Security is considered illiquid. The total market value of such securities as of September 30, 2015 was $209,976 (000) and represented 12.8% of net assets of the Fund. |
(I) | Security is considered restricted. The total market value of such securities as of September 30, 2015 was $209,976 (000) and represented 12.8% of Net Assets of the Fund. |
(J) | Security fair valued using methods determined in good faith by the Fair Value Committee designated by the Board of Trustees. The total market value of such securities as of September 30, 2015 was $164,794 (000) and represented 10.0% of net assets of the Fund. |
CHF — Swiss Franc
Cl — Class
EUR — Euro
GBP — British Pound Sterling
LLC — Limited Liability Corporation
LLP — Limited Liability Partnerships
LP — Limited Partnership
MLP — Master Limited Partnership
MTN — Medium Term Note
NY — New York
PLC — Public Limited Company
Ser — Series
SPE — Special Purpose Entity
USD — United States Dollar
Amounts designated as “—” are either $0 or have been rounded to $0.
A list of the open forward foreign currency contracts held by the Fund at September 30, 2015, is as follows:
Maturity Date | Currency to
Deliver
(000) | | Currency to
Receive
(000) | | | Unrealized
Appreciation
(Depreciation)
(000) | |
10/23/15-11/27/15 | GBP | | | 33,889 | | USD | | | 51,382 | | | $ | 131 | |
10/23/15-12/1/15 | EUR | | | 105,350 | | USD | | | 118,078 | | | | 253 | |
1/15/16 | CHF | | | 2,440 | | USD | | | 2,590 | | | | 75 | |
| | | | | | | | | | | | | $ | 459 | |
A list of the counterparties for the outstanding forward foreign currency contracts held by the Fund at September 30, 2015, is as follows:
Counterparty | | Currency to
Deliver
(000) | | | Currency to
Receive
(000) | | | Unrealized
Appreciation
(000) | |
U.S. Bank | | $ | (171,591 | ) | | $ | 172,050 | | | $ | 459 | |
For the period ended September 30, 2015, the total amount of all open forward foreign currency contracts, as presented in the table above, are representative of the volume of activity for this derivative type during the period.
See accompanying notes to financial statements.
CITY NATIONAL ROCHDALE FUNDS | PAGE 110
consolidated schedule of investments |
September 30, 2015 |
City National Rochdale Fixed Income Opportunities Fund (continued) |
The following is a list of the inputs used as of September 30, 2015 in valuing the Fund’s investments carried at value (000):
Investments in Securities | | Level 1 | | | Level 2 | | | Level 3(1) | | | Total | |
Corporate Bonds | | $ | — | | | $ | 777,935 | | | $ | — | | | $ | 777,935 | |
Loan Participations | | | — | | | | 472,025 | | | | 2,528 | | | | 474,553 | |
Life Settlement Contracts | | | — | | | | — | | | | 159,314 | | | | 159,314 | |
Sovereign Debt | | | — | | | | 24,861 | | | | 105 | | | | 24,966 | |
Closed-End Fund | | | 15,664 | | | | — | | | | — | | | | 15,664 | |
Asset-Backed Securities | | | — | | | | 195 | | | | 5,469 | | | | 5,664 | |
Convertible Bonds | | | — | | | | 5,112 | | | | — | | | | 5,112 | |
Warrants | | | 4,675 | | | | 13 | | | | — | | | | 4,688 | |
Common Stock | | | 620 | | | | 333 | | | | 11 | | | | 964 | |
Short-Term Investments | | | 141,381 | | | | — | | | | — | | | | 141,381 | |
Total Investments in Securities | | $ | 162,340 | | | $ | 1,280,474 | | | $ | 167,427 | | | $ | 1,610,241 | |
Other Financial Instruments | | Level 1 | | | Level 2 | | | Level 3 | | | Total | |
Forwards Contracts* | | | | | | | | | | | | |
Unrealized Appreciation | | $ | — | | | $ | 459 | | | $ | — | | | $ | 459 | |
* | Forwards contracts are valued at the unrealized appreciation (depreciation) on the instrument. |
(1) | Of the $167,427 (000) in Level 3 securities as of September 30, 2015, $164,794 (000) or 98.4% are not valued via third party pricing vendors and broker quotes. If significant, the disclosure of the unobservable inputs and the interrelationships and sensitivity between these inputs is required for those Level 3 securities that are not valued by third party vendors or broker quotes. |
The following is a reconciliation of investments in which significant unobservable inputs (Level 3) were used in determining value (000) as of September 30, 2015:
| | | Investments
in Loan
Participations | | | Investments in
Life Settlement
Contracts | | | Investments in
Sovereign Debt | |
Beginning balance as of October 1, 2014 | | $ | 6,000 | | | $ | 130,798 | | | $ | 179 | |
Accrued discounts/ premiums | | | 117 | | | | — | | | | 5 | |
Realized gain/(loss) | | | (617 | ) | | | 22,396 | | | | 17 | |
Change in unrealized appreciation/(depreciation) | | | 291 | | | | 30,306 | | | | — | |
Purchases | | | — | | | | 10,527 | | | | — | |
Sales/paydowns | | | (3,263 | ) | | | (34,713 | ) | | | (96 | ) |
Transfers into Level 3 | | | — | | | | — | | | | — | |
Transfers out of Level 3 | | | — | | | | — | | | | — | |
Ending balance as of September 30, 2015 | | $ | 2,528 | | | $ | 159,314 | | | $ | 105 | |
Changes in unrealized gains/(losses) included in earnings related to securities still held at reporting date | | $ | (36 | ) | | $ | 30,306 | | | $ | — | |
| | | Investments in
Asset-Backed
Securities | | | Investments in
Corporate Bonds | |
Beginning balance as of October 1, 2014 | | $ | 7,886 | | | $ | 165 | |
Accrued discounts/ premiums | | | — | | | | — | |
Realized gain/(loss) | | | — | | | | 19 | |
Change in unrealized appreciation/(depreciation) | | | (156 | ) | | | (7 | ) |
Purchases | | | — | | | | — | |
Sales/paydowns | | | (2,261 | ) | | | (177 | ) |
Transfers into Level 3 | | | — | | | | — | |
Transfers out of Level 3 | | | — | | | | — | |
Ending balance as of September 30, 2015 | | $ | 5,469 | | | $ | — | |
Changes in unrealized gains/(losses) included in earnings related to securities still held at reporting date | | $ | (156 | ) | | $ | — | |
| | | Investments in
Common Stock | | | Total | |
Beginning balance as of October 1, 2014 | | $ | 18 | | | $ | 145,046 | |
Accrued discounts/ premiums | | | — | | | | 122 | |
Realized gain/(loss) | | | — | | | | 21,815 | |
Change in unrealized appreciation/(depreciation) | | | (7 | ) | | | 30,427 | |
Purchases | | | — | | | | 10,527 | |
Sales/paydowns | | | — | | | | (40,510 | ) |
Transfers into Level 3 | | | — | | | | — | |
Transfers out of Level 3 | | | — | | | | — | |
Ending balance as of September 30, 2015 | | $ | 11 | | | $ | 167,427 | |
Changes in unrealized gains/(losses) included in earnings related to securities still held at reporting date | | $ | (7 | ) | | $ | 30,107 | |
See accompanying notes to financial statements.
CITY NATIONAL ROCHDALE FUNDS | PAGE 111
consolidated schedule of investments |
September 30, 2015 |
City National Rochdale Fixed Income Opportunities Fund (concluded) |
The following table summarizes the quantitative inputs and assumptions used for items categorized as material Level 3 investments as of September 30, 2015. The disclosures below also include qualitative information on the sensitivity of the fair value measurements to changes in the significant unobservable inputs.
| | Fair Value at
September 30, 2015 (000) | Valuation Techniques | |
BT SPE | $5,469 | Discounted Cash Flow Model based on actual collection level and experienced defaults | |
| | | | |
| | | Observable Inputs | |
| | | Accumulated Collections | |
| | | Accumulated Defaults | |
| | | Annualized Default Rate | |
| | | Accumulated Default Rate | |
| | | Pace of Collection Pace of Defaults | |
| | | Interest Rates | |
| | | | |
| | | Unobservable Inputs | Range |
| | | Projected Default Rates | 5%-12% |
| | | Projected Collection Rates | 90%-100% |
| | | Expected Discount Rates | 9.25% |
| | | | |
| | | Valuation Techniques | |
Life Settlement Contracts | 159,314 | Discounted Cash Flow Model | |
| | | Observable Inputs | |
| | | Maturity Value | |
| | | | |
| | | Unobservable Inputs | Range |
| | | Discount Rate | 14% |
| | | Expected Maturity (months) | 2-112 Months |
The unobservable inputs used to determine fair value of recurring Level 3 assets may have similar or diverging impacts on valuation. Significant increases and decreases in these inputs in isolation and interrelationships between those inputs could result in significantly higher or lower fair value measurement. Increases in projected collection rates in isolation would result in a higher fair value measurement, while increases in expected discount rates, projected default rates, and maturities of life settlement contracts, in isolation, would result in a lower fair value measurement.
For the year ended September 30, 2015, there have been no transfers between Levels of assets and liabilities.
For more information on valuation inputs, see Note 2 — Significant Accounting Policies in the Notes to Financial Statements.
At September 30, 2015, the Fund had the following investments in life settlement contracts:
Year | | Number
of
Contracts | | | Fair
Value
(000) | | | Face Value (Death Benefits) (000) | |
2016 | | | 8 | | | $ | 34,606 | | | $ | 36,357 | |
2017 | | | 4 | | | | 7,066 | | | | 10,066 | |
2018 | | | 8 | | | | 31,528 | | | | 56,750 | |
2019 | | | 10 | | | | 36,512 | | | | 79,875 | |
2020 | | | 11 | | | | 17,960 | | | | 62,500 | |
Thereafter | | | 21 | | | | 31,642 | | | | 138,000 | |
| | | | 62 | | | $ | 159,314 | | | $ | 383,548 | |
For the year ended September 30, 2015, the net change to fair value on life settlement contracts, net of premiums paid and continuing costs disclosed in the Fund’s Consolidated Statement of Operations, as part of the unrealized appreciation (depreciation) on investments, consisted of a net positive change to fair value on life settlement contracts of $30,305,686, offset by $20,832,231 in premiums paid and continuing costs associated with its investment in the Policies. For the year ended September 30, 2015, the Fund realized gains of $22,395,662 on matured life settlements, which are disclosed in the Consolidated Statement of Operations, as part of the realized loss on investments.
See accompanying notes to financial statements.
CITY NATIONAL ROCHDALE FUNDS | PAGE 112
schedule of investments |
September 30, 2015 |
City National Rochdale Multi-Asset Fund |
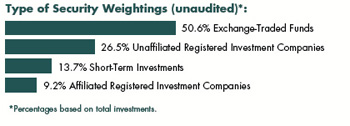
Description | | Shares | | | Value (000) | |
Exchange Traded Funds [48.9%] | |
Financial Select Sector SPDR | | | 22,680 | | | $ | 514 | |
iShares 7-10 Year Treasury Bond ETF | | | 31,780 | | | | 3,428 | |
iShares MSCI World ETF | | | 12,035 | | | | 803 | |
iShares Russell 3000 Index Fund | | | 9,870 | | | | 1,124 | |
iShares S&P MidCap 400 Index Fund | | | 6,865 | | | | 938 | |
SPDR S&P 500 | | | 3,053 | | | | 585 | |
SPDR S&P Dividend | | | 12,712 | | | | 917 | |
SPDR S&P Telecom ETF | | | 6,015 | | | | 318 | |
Technology Select Sector SPDR | | | 7,330 | | | | 290 | |
Utilities Select Sector SPDR Fund | | | 16,070 | | | | 696 | |
Vanguard FTSE Developed Markets ETF | | | 11,415 | | | | 407 | |
| | | | | | | | | |
Total Exchange Traded Funds | |
(Cost $9,881) | | | | 10,020 | |
| | | | | | | | | |
Unaffiliated Registered Investment Companies [25.6%] | |
Ashmore Emerging Markets Corporate Debt Fund | | | 118,498 | | | | 921 | |
DoubleLine Total Return Bond Fund | | | 68,222 | | | | 746 | |
Oppenheimer Senior Floating Rate Fund | | | 89,396 | | | | 705 | |
Vanguard Short-Term Bond Index Fund | | | 160,226 | | | | 1,689 | |
Voya Global Real Estate Fund | | | 38,090 | | | | 727 | |
WisdomTree Europe Hedged Equity Fund | | | 8,305 | | | | 454 | |
| | | | | | | | | |
Total Unaffiliated Registered Investment Companies | |
(Cost $5,361) | | | | 5,242 | |
| | | | | | | | | |
Affiliated Registered Investment Companies [8.9%] | |
City National Rochdale Corporate Bond Fund, Servicing Class | | | 124,539 | | | | 1,300 | |
City National Rochdale High Yield Bond Fund, Institutional Class | | | 70,053 | | | | 531 | |
| | | | | | | | | |
Total Affiliated Registered Investment Companies | |
(Cost $1,962) | | | | 1,831 | |
| | | | | | | | | |
Short-Term Investments [13.3%] | |
City National Rochdale Prime Money Market Fund, Institutional Class, 0.010%**‡ | | | 1,356,828 | | | | 1,357 | |
SEI Daily Income Trust, Prime Obligation Fund, Cl A, 0.030%** | | | 1,356,828 | | | | 1,357 | |
| | | | | | | | | |
Total Short-Term Investments | |
(Cost $2,714) | | | | 2,714 | |
| | | | | | | | | |
Total Investments [96.7%] | |
(Cost $19,918) | | | $ | 19,807 | |
Percentages are based on Net Assets of $20,484 (000).
** | The rate reported is the 7-day effective yield as of September 30, 2015. |
‡ | Investment in Affiliate. |
Cl — Class
ETF — Exchange Traded Fund
FTSE — Financial Times and Stock Exchange
MSCI — Morgan Stanley Capital International
S&P — Standard & Poor’s
SPDR — Standard & Poor’s Depositary Receipts
As of September 30, 2015, all of the Fund’s investments are Level 1, in accordance with the authoritative guidance on fair value measurements and disclosure under U.S. GAAP.
For the year ended September 30, 2015, there have been no transfers between any of the fair value hierarchy levels. Transfers between Levels are recognized at period end.
For more information on valuation inputs, see Note 2 — Significant Accounting Policies in the Notes to Financial Statements.
See accompanying notes to financial statements.
CITY NATIONAL ROCHDALE FUNDS | PAGE 113
schedule of investments |
September 30, 2015 |
City National Rochdale Dividend & Income Fund |

Description | | Shares | | | Value (000) | |
Common Stock [94.7%] | |
Consumer Discretionary [3.4%] | |
Cedar Fair | | | 14,000 | | | $ | 737 | |
Hasbro | | | 20,000 | | | | 1,443 | |
McDonald’s | | | 33,800 | | | | 3,330 | |
Six Flags Entertainment | | | 18,000 | | | | 824 | |
| | | | | | | | | |
Total Consumer Discretionary | | | | 6,334 | |
| | | | | | | | | |
Consumer Staples [26.1%](A) | |
Altria Group | | | 64,250 | | | | 3,495 | |
B&G Foods | | | 102,900 | | | | 3,751 | |
Campbell Soup | | | 15,000 | | | | 760 | |
Clorox | | | 32,100 | | | | 3,708 | |
Coca-Cola | | | 8,000 | | | | 321 | |
ConAgra Foods | | | 27,800 | | | | 1,126 | |
Dr Pepper Snapple Group | | | 52,900 | | | | 4,182 | |
General Mills | | | 66,680 | | | | 3,743 | |
Hershey | | | 24,400 | | | | 2,242 | |
Imperial Tobacco Group ADR | | | 23,152 | | | | 2,396 | |
Kellogg | | | 40,500 | | | | 2,695 | |
Kimberly-Clark | | | 18,200 | | | | 1,985 | |
PepsiCo | | | 8,000 | | | | 754 | |
Philip Morris International | | | 52,600 | | | | 4,173 | |
Procter & Gamble | | | 39,149 | | | | 2,816 | |
Reynolds American | | | 36,272 | | | | 1,606 | |
Sysco | | | 31,600 | | | | 1,232 | |
Unilever ADR | | | 22,200 | | | | 905 | |
Universal | | | 38,592 | | | | 1,913 | |
Vector Group | | | 146,243 | | | | 3,307 | |
Wal-Mart Stores | | | 29,200 | | | | 1,893 | |
| | | | | | | | | |
Total Consumer Staples | | | | 49,003 | |
| | | | | | | | | |
Energy [8.1%] | |
Buckeye Partners | | | 12,400 | | | | 735 | |
Chevron | | | 30,683 | | | | 2,420 | |
ConocoPhillips | | | 27,500 | | | | 1,319 | |
Enbridge Energy Partners | | | 15,000 | | | | 371 | |
Energy Transfer Partners | | | 3,700 | | | | 152 | |
Enterprise Products Partners | | | 72,584 | | | | 1,807 | |
Exxon Mobil | | | 25,838 | | | | 1,921 | |
Kinder Morgan | | | 33,500 | | | | 927 | |
NuStar Energy | | | 11,250 | | | | 504 | |
Occidental Petroleum | | | 25,500 | | | | 1,687 | |
ONEOK | | | 18,500 | | | | 596 | |
Plains All American Pipeline | | | 60,725 | | | | 1,845 | |
Spectra Energy | | | 4,753 | | | | 125 | |
TransCanada | | | 25,928 | | | | 819 | |
| | | | | | | | | |
Total Energy | | | | 15,228 | |
| | | | | | | | | |
Financials [5.7%] | |
Arthur J Gallagher | | | 13,200 | | | | 545 | |
BB&T | | | 44,000 | | | | 1,566 | |
Cincinnati Financial | | | 51,700 | | | | 2,781 | |
Compass Diversified Holdings | | | 52,000 | | | | 838 | |
JPMorgan Chase | | | 32,000 | | | | 1,951 | |
Mercury General | | | 15,000 | | | | 758 | |
NBT Bancorp | | | 25,935 | | | | 699 | |
People’s United Financial | | | 30,000 | | | | 472 | |
US Bancorp | | | 10,000 | | | | 410 | |
Welltower | | | 11,612 | | | | 786 | |
| | | | | | | | | |
Total Financials | | | | 10,806 | |
| | | | | | | | | |
Health Care [7.8%] | |
Bristol-Myers Squibb | | | 52,000 | | | | 3,078 | |
Eli Lilly | | | 48,400 | | | | 4,051 | |
GlaxoSmithKline ADR | | | 32,000 | | | | 1,230 | |
Johnson & Johnson | | | 38,200 | | | | 3,566 | |
Merck | | | 28,150 | | | | 1,390 | |
Pfizer | | | 41,944 | | | | 1,318 | |
| | | | | | | | | |
Total Health Care | | | | 14,633 | |
See accompanying notes to financial statements.
CITY NATIONAL ROCHDALE FUNDS | PAGE 114
schedule of investments |
September 30, 2015 |
City National Rochdale Dividend & Income Fund (continued) |
Description | | Shares | | | Value (000) | |
Industrials [4.6%] | |
3M | | | 1,000 | | | $ | 142 | |
Eaton | | | 39,700 | | | | 2,036 | |
General Dynamics | | | 14,500 | | | | 2,000 | |
General Electric | | | 20,000 | | | | 504 | |
Lockheed Martin | | | 19,200 | | | | 3,981 | |
| | | | | | | | | |
Total Industrials | | | | 8,663 | |
| | | | | | | | | |
Information Technology [0.9%] | |
Paychex | | | 20,000 | | | | 953 | |
Seagate Technology | | | 15,000 | | | | 672 | |
| | | | | | | | | |
Total Information Technology | | | | 1,625 | |
| | | | | | | | | |
Materials [2.0%] | |
Dow Chemical | | | 19,000 | | | | 805 | |
EI du Pont de Nemours | | | 32,700 | | | | 1,576 | |
Olin | | | 28,000 | | | | 471 | |
Sonoco Products | | | 24,000 | | | | 906 | |
| | | | | | | | | |
Total Materials | | | | 3,758 | |
| | | | | | | | | |
REITs [12.6%] | |
Apartment Investment & Management, Cl A | | | 17,229 | | | | 638 | |
Camden Property Trust | | | 8,914 | | | | 659 | |
Care Capital Properties | | | 9,658 | | | | 318 | |
Communications Sales & Leasing | | | 27,225 | | | | 487 | |
EPR Properties | | | 33,200 | | | | 1,712 | |
Government Properties Income Trust | | | 35,000 | | | | 560 | |
Health Care Property Investors | | | 33,546 | | | | 1,250 | |
Healthcare Realty Trust | | | 17,000 | | | | 422 | |
Healthcare Trust of America, Cl A | | | 20,000 | | | | 490 | |
Home Properties | | | 45,000 | | | | 3,364 | |
Liberty Property Trust | | | 17,385 | | | | 548 | |
Mid-America Apartment Communities | | | 12,000 | | | | 982 | |
National Health Investors | | | 20,000 | | | | 1,150 | |
National Retail Properties, Cl REIT | | | 48,500 | | | | 1,759 | |
National Storage Affiliates Trust | | | 50,000 | | | | 678 | |
Plum Creek Timber | | | 24,000 | | | | 948 | |
Public Storage | | | 10,000 | | | | 254 | |
QTS Realty Trust, Cl A * | | | 8,000 | | | | 350 | |
Select Income REIT | | | 62,000 | | | | 1,179 | |
Simon Property Group | | | 10,000 | | | | 1,837 | |
Sovran Self Storage | | | 10,036 | | | | 946 | |
Tanger Factory Outlet Centers | | | 27,984 | | | | 923 | |
Ventas | | | 38,632 | | | | 2,166 | |
| | | | | | | | | |
Total REITs | | | | 23,620 | |
| | | | | | | | | |
Shipping & Transportation [0.6%] | |
Fly Leasing ADR | | | 87,370 | | | | 1,153 | |
| | | | | | | | | |
Telecommunication Services [6.3%] | |
AT&T | | | 84,500 | | | | 2,753 | |
Consolidated Communications Holdings | | | 125,400 | | | | 2,416 | |
Lamar Advertising, Cl A | | | 70,000 | | | | 3,653 | |
Verizon Communications | | | 68,067 | | | | 2,962 | |
| | | | | | | | | |
Total Telecommunication Services | | | | 11,784 | |
| | | | | | | | | |
Utilities [16.6%] | |
AGL Resources | | | 19,000 | | | | 1,160 | |
American Electric Power | | | 33,500 | | | | 1,905 | |
AmeriGas Partners | | | 28,200 | | | | 1,171 | |
Atmos Energy | | | 15,000 | | | | 873 | |
Avista | | | 30,000 | | | | 998 | |
Brookfield Infrastructure Partners, Cl Miscellaneous | | | 36,000 | | | | 1,324 | |
Dominion Resources | | | 24,000 | | | | 1,689 | |
DTE Energy | | | 15,000 | | | | 1,206 | |
Duke Energy | | | 59,006 | | | | 4,245 | |
Entergy | | | 13,700 | | | | 892 | |
Eversource Energy | | | 37,492 | | | | 1,898 | |
Ferrellgas Partners | | | 7,300 | | | | 144 | |
FirstEnergy | | | 38,000 | | | | 1,190 | |
NiSource | | | 20,000 | | | | 371 | |
Northwest Natural Gas | | | 8,396 | | | | 385 | |
OGE Energy | | | 33,600 | | | | 919 | |
Pinnacle West Capital | | | 28,885 | | | | 1,852 | |
Portland General Electric | | | 12,000 | | | | 443 | |
PPL | | | 20,000 | | | | 658 | |
SCANA | | | 38,000 | | | | 2,138 | |
Sempra Energy | | | 9,000 | | | | 870 | |
Suburban Propane Partners | | | 11,200 | | | | 368 | |
UIL Holdings | | | 14,000 | | | | 704 | |
United Utilities Group ADR | | | 17,318 | | | | 483 | |
WEC Energy Group | | | 36,500 | | | | 1,906 | |
Xcel Energy | | | 40,000 | | | | 1,416 | |
| | | | | | | | | |
Total Utilities | | | | 31,208 | |
| | | | | | | | | |
Total Common Stock | |
(Cost $147,126) | | | | 177,815 | |
See accompanying notes to financial statements.
CITY NATIONAL ROCHDALE FUNDS | PAGE 115
schedule of investments |
September 30, 2015 |
City National Rochdale Dividend & Income Fund (continued) |
Description | | Shares/Face Amount (000) | | | Value (000) | |
Exchange Traded Funds [2.5%] | |
iShares US Preferred Stock ETF | | | 19,500 | | | $ | 753 | |
PowerShares Preferred Portfolio | | | 269,500 | | | | 3,929 | |
| | | | | | | | | |
Total Exchange Traded Funds | |
(Cost $4,725) | | | | 4,682 | |
| | | | | | | | | |
Preferred Stock [1.6%] | |
Financials [0.8%] | |
AmTrust Financial Services 7.500% | | | 10,000 | | | | 251 | |
Bank of America 6.500% | | | 10,000 | | | | 255 | |
Capital One Financial 6.700% | | | 10,000 | | | | 265 | |
JPMorgan Chase 6.125% | | | 10,000 | | | | 251 | |
Wells Fargo 6.000% | | | 10,000 | | | | 254 | |
Wells Fargo Real Estate Investment 6.375% | | | 10,000 | | | | 256 | |
| | | | | | | | | |
Total Financials | | | | 1,532 | |
| | | | | | | | | |
REITs [0.5%] | |
Equity Commonwealth 7.250% | | | 10,000 | | | | 255 | |
First Potomac Realty Trust 7.750% | | | 10,000 | | | | 255 | |
National Retail Properties 6.625% | | | 10,000 | | | | 253 | |
Public Storage 6.500% | | | 10,000 | | | | 252 | |
| | | | | | | | | |
Total REITs | | | | 1,015 | |
| | | | | | | | | |
Telecommunication Services [0.3%] | |
Qwest 7.375% | | | 10,000 | | | | 255 | |
Verizon Communications 5.900% | | | 10,000 | | | | 260 | |
| | | | | | | | | |
Total Telecommunication Services | | | | 515 | |
| | | | | | | | | |
Total Preferred Stock | |
(Cost $2,977) | | | | 3,062 | |
| | | | | | | | | |
Asset-Backed Security [0.2%] | |
BT SPE (Acquired 07/06/11, Acquisition Cost $551,294) | | | | | | | | |
9.250%, 06/06/16(B)(C) | | $ | 313 | | | | 280 | |
| | | | | | | | | |
Total Asset-Backed Security | |
(Cost $312) | | | | 280 | |
Description | | Shares | | | Value (000) | |
Short-Term Investments [0.4%] | |
City National Rochdale Government Money Market Fund, Institutional Class, 0.010%**‡ | | | 455,644 | | | $ | 455 | |
SEI Daily Income Trust Government Fund, Cl A, 0.030%** | | | 205,644 | | | | 206 | |
| | | | | | | | | |
Total Short-Term Investments | |
(Cost $661) | | | | 661 | |
| | | | | | | | | |
Total Investments [99.4%] | |
(Cost $155,801) | | | $ | 186,500 | |
Percentages are based on Net Assets of $187,685 (000).
* | Non-income producing security. |
** | The rate reported is the 7-day effective yield as of September 30, 2015. |
‡ | Investment in Affiliate. |
(A) | The Fund uses more specific categories in following its investment limitations on investment concentrations. Broad industry sectors are used for financial reporting purposes. |
(B) | Security is considered illiquid. The total market value of such security as of September 30, 2015 was $280 (000) and represented 0.1% of net assets of the Fund. |
(C) | Security fair valued using methods determined in good faith by the Fair Value Committee designated by the Board of Trustees. The total market value of such securities as of September 30, 2015 was $280 (000) and represented 0.1% of net assets of the Fund. |
ADR — American Depositary Receipt
Cl — Class
ETF — Exchange Traded Fund
REIT — Real Estate Investment Trust
SPE — Special Purpose Entity
The following is a list of the inputs used as of September 30, 2015 in valuing the Fund’s investments carried at value (000):
Investments in Securities | | Level 1 | | | Level 2 | | | Level 3 | | | Total | |
Common Stock | | $ | 177,815 | | | $ | — | | | $ | — | | | $ | 177,815 | |
Exchange Traded Funds | | | 4,682 | | | | — | | | | — | | | | 4,682 | |
Preferred Stock | | | 3,062 | | | | — | | | | — | | | | 3,062 | |
Asset-Backed Security | | | — | | | | — | | | | 280 | | | | 280 | |
Short-Term Investments | | | 661 | | | | — | | | | — | | | | 661 | |
Total Investments in Securities | | $ | 186,220 | | | $ | — | | | $ | 280 | | | $ | 186,500 | |
See accompanying notes to financial statements.
CITY NATIONAL ROCHDALE FUNDS | PAGE 116
schedule of investments |
September 30, 2015 |
City National Rochdale Dividend & Income Fund (concluded) |
The following is a reconciliation of investments in which significant unobservable inputs (Level 3) were used in determining value (000) as of September 30, 2015:
| | | Investments in
Asset-Backed
Security | |
Beginning balance as of October 1, 2014 | | $ | 403 | |
Accrued discounts/premiums | | | — | |
Realized gain/(loss) | | | — | |
Change in unrealized appreciation/(depreciation) | | | (8 | ) |
Purchases | | | — | |
Sales/paydowns | | | (115 | ) |
Transfers into Level 3 | | | — | |
Transfers out of Level 3 | | | — | |
Ending balance as of September 30, 2015 | | $ | 280 | |
Changes in unrealized gains/(losses) included in earnings related to securities still held at reporting date | | $ | (8 | ) |
The following table summarizes the quantitative inputs and assumptions used for items categorized as material Level 3 investments as of September 30, 2015. The disclosures below also include qualitative information on the sensitivity of the fair value measurements to changes in the significant unobservable inputs.
| | Fair Value at
September 30,
2015 (000) | Valuation Technique | |
BT SPE | $280 | Discounted Cash Flow Model based on actual collection level and experienced defaults | |
| | | | |
| | | Observable Inputs | |
| | | Accumulated Collections | |
| | | Accumulated Defaults | |
| | | Annualized Default Rate | |
| | | Accumulated Default Rate | |
| | | Pace of Collection Pace of Defaults | |
| | | Interest Rates | |
| | | | |
| | | Unobservable Inputs | Range |
| | | Projected Default Rates | 5%-12% |
| | | Projected Collection Rates | 90%-100% |
| | | Expected Discount Rates | 9.25% |
The unobservable inputs used to determine fair value of recurring Level 3 assets may have similar or diverging impacts on valuation. Significant increased and decreased in these inputs in isolation and interrelationships between those inputs could result in significantly higher or lower fair value measurement.
For the period ended September 30, 2015, the transfers into Level 1 were due to changes in the availability of observable inputs to determine fair value. Transfers between Levels are recognized at period end.
For more information on valuation inputs, see Note 2 — Significant Accounting Policies in the Notes to Financial Statements.
See accompanying notes to financial statements.
CITY NATIONAL ROCHDALE FUNDS | PAGE 117
schedule of investments |
September 30, 2015 |
City National Rochdale U.S. Core Equity Fund |
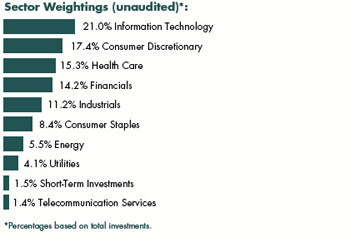
Description | | Shares | | | Value (000) | |
Common Stock [97.2%] | |
Aerospace & Defense [7.0%] | |
Boeing | | | 20,900 | | | $ | 2,737 | |
Hexcel | | | 71,800 | | | | 3,221 | |
Honeywell International | | | 43,100 | | | | 4,081 | |
Textron | | | 131,700 | | | | 4,957 | |
| | | | | | | | | |
Total Aerospace & Defense | | | | 14,996 | |
| | | | | | | | | |
Auto Components [1.3%] | |
Magna International | | | 57,800 | | | | 2,775 | |
| | | | | | | | | |
Biotechnology [5.3%] | |
Celgene * | | | 46,700 | | | | 5,052 | |
Gilead Sciences | | | 63,400 | | | | 6,225 | |
| | | | | | | | | |
Total Biotechnology | | | | 11,277 | |
| | | | | | | | | |
Capital Markets [4.1%] | |
Affiliated Managers Group * | | | 14,900 | | | | 2,548 | |
Charles Schwab | | | 215,000 | | | | 6,140 | |
| | | | | | | | | |
Total Capital Markets | | | | 8,688 | |
| | | | | | | | | |
Commercial Banks [3.6%] | |
BankUnited | | | 98,500 | | | | 3,521 | |
Wells Fargo | | | 79,800 | | | | 4,098 | |
| | | | | | | | | |
Total Commercial Banks | | | | 7,619 | |
| | | | | | | | | |
Computer Software [1.5%] | |
Microsoft | | | 72,600 | | | | 3,213 | |
| | | | | | | | | |
Computers & Peripherals [3.6%] | |
Apple | | | 69,500 | | | | 7,666 | |
| | | | | | | | | |
Diversified Financial Services [2.3%] | |
JPMorgan Chase | | | 79,800 | | | | 4,866 | |
| | | | | | | | | |
Diversified Telecommunication Services [1.4%] | |
Verizon Communications | | | 67,400 | | | | 2,933 | |
| | | | | | | | | |
Energy Equipment & Services [1.4%] | |
Schlumberger | | | 43,400 | | | | 2,993 | |
| | | | | | | | | |
Food & Staples Retailing [5.5%] | |
Costco Wholesale | | | 34,300 | | | | 4,959 | |
CVS Health | | | 69,800 | | | | 6,734 | |
| | | | | | | | | |
Total Food & Staples Retailing | | | | 11,693 | |
| | | | | | | | | |
Food Products [2.8%] | |
Tyson Foods, Cl A | | | 104,700 | | | | 4,512 | |
WhiteWave Foods, Cl A * | | | 39,400 | | | | 1,582 | |
| | | | | | | | | |
Total Food Products | | | | 6,094 | |
| | | | | | | | | |
Health Care Equipment & Supplies [2.2%] | |
Edwards Lifesciences * | | | 33,800 | | | | 4,805 | |
| | | | | | | | | |
Health Care Providers & Services [2.7%] | |
HCA Holdings * | | | 41,000 | | | | 3,172 | |
UnitedHealth Group | | | 23,400 | | | | 2,714 | |
| | | | | | | | | |
Total Health Care Providers & Services | | | | 5,886 | |
| | | | | | | | | |
Health Care Technology [1.2%] | |
Cerner * | | | 41,500 | | | | 2,488 | |
| | | | | | | | | |
Hotels, Restaurants & Leisure [1.8%] | |
Starbucks | | | 69,500 | | | | 3,950 | |
| | | | | | | | | |
Household Durables [1.7%] | |
PulteGroup | | | 198,800 | | | | 3,751 | |
| | | | | | | | | |
Insurance [4.1%] | |
American International Group | | | 82,500 | | | | 4,688 | |
Prudential Financial | | | 52,700 | | | | 4,016 | |
| | | | | | | | | |
Total Insurance | | | | 8,704 | |
See accompanying notes to financial statements.
CITY NATIONAL ROCHDALE FUNDS | PAGE 118
schedule of investments |
September 30, 2015 |
City National Rochdale U.S. Core Equity Fund (concluded) |
Description | | Shares | | | Value (000) | |
Internet Software & Services [5.8%] | |
Facebook, Cl A * | | | 53,000 | | | $ | 4,765 | |
Google, Cl A * | | | 12,310 | | | | 7,738 | |
| | | | | | | | | |
Total Internet Software & Services | | | | 12,503 | |
| | | | | | | | | |
IT Services [5.8%] | |
MasterCard, Cl A | | | 66,600 | | | | 6,002 | |
Visa, Cl A | | | 91,200 | | | | 6,353 | |
| | | | | | | | | |
Total IT Services | | | | 12,355 | |
| | | | | | | | | |
Leisure Equipment & Products [1.4%] | |
Polaris Industries | | | 24,600 | | | | 2,949 | |
| | | | | | | | | |
Life Sciences Tools & Services [1.8%] | |
Thermo Fisher Scientific | | | 31,400 | | | | 3,840 | |
| | | | | | | | | |
Machinery [2.0%] | |
Wabtec | | | 48,200 | | | | 4,244 | |
| | | | | | | | | |
Media [6.7%] | |
Comcast, Cl A | | | 108,900 | | | | 6,194 | |
Lions Gate Entertainment | | | 89,600 | | | | 3,297 | |
Walt Disney | | | 46,600 | | | | 4,763 | |
| | | | | | | | | |
Total Media | | | | 14,254 | |
| | | | | | | | | |
Multi-Utilities [2.6%] | |
PG&E | | | 106,800 | | | | 5,639 | |
| | | | | | | | | |
Oil, Gas & Consumable Fuels [4.0%] | |
Chevron | | | 28,400 | | | | 2,240 | |
EOG Resources | | | 29,500 | | | | 2,148 | |
Exxon Mobil | | | 57,200 | | | | 4,253 | |
| | | | | | | | | |
Total Oil, Gas & Consumable Fuels | | | | 8,641 | |
| | | | | | | | | |
Pharmaceuticals [1.9%] | |
Eli Lilly | | | 48,200 | | | | 4,034 | |
| | | | | | | | | |
Road & Rail [2.1%] | |
Union Pacific | | | 49,800 | | | | 4,403 | |
| | | | | | | | | |
Semiconductors & Semiconductor Equipment [2.2%] | |
NXP Semiconductor * | | | 53,900 | | | | 4,693 | |
| | | | | | | | | |
Software [1.8%] | |
Adobe Systems * | | | 47,700 | | | | 3,922 | |
| | | | | | | | | |
Specialty Retail [4.2%] | |
Home Depot | | | 45,500 | | | | 5,255 | |
Lowe’s | | | 53,000 | | | | 3,653 | |
| | | | | | | | | |
Total Specialty Retail | | | | 8,908 | |
| | | | | | | | | |
Water Utilities [1.4%] | |
American Water Works | | | 54,700 | | | | 3,013 | |
| | | | | | | | | |
Total Common Stock | |
(Cost $177,911) | | | | 207,795 | |
| | | | | | | | | |
Short-Term Investments [1.4%] | |
City National Rochdale Prime Money Market Fund, Institutional Class, 0.010%**‡ | | | 1,554,962 | | | | 1,555 | |
SEI Daily Income Trust, Prime Obligation Fund, Cl A, 0.030%** | | | 1,556,961 | | | | 1,557 | |
| | | | | | | | | |
Total Short-Term Investments | |
(Cost $3,112) | | | | 3,112 | |
| | | | | | | | | |
Total Investments [98.6%] | |
(Cost $181,023) | | | $ | 210,907 | |
Percentages are based on Net Assets of $213,843 (000).
* | Non-income producing security. |
** | The rate reported is the 7-day effective yield as of September 30, 2015. |
‡ | Investment in Affiliate. |
Cl — Class
As of September 30, 2015, all of the Fund’s investments are Level 1, in accordance with the authoritative guidance on fair value measurements and disclosure under U.S. GAAP.
For the year ended September 30, 2015, there have been no transfers between any of the fair value hierarchy levels. Transfers between Levels are recognized at period end.
For more information on valuation inputs, see Note 2 — Significant Accounting Policies in the Notes to Financial Statements.
See accompanying notes to financial statements.
CITY NATIONAL ROCHDALE FUNDS | PAGE 119
schedule of investments |
September 30, 2015 |
City National Rochdale Socially Responsible Equity Fund |
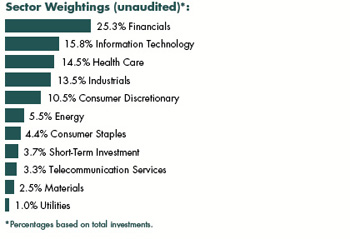
Description | | Shares | | | Value (000) | |
Common Stock [96.8%] | |
Automotive [4.6%] | |
Ford Motor | | | 478,000 | | | $ | 6,487 | |
Johnson Controls | | | 131,700 | | | | 5,447 | |
| | | | | | | | | |
Total Automotive | | | | 11,934 | |
| | | | | | | | | |
Banks [3.9%] | |
Bank of America | | | 478,700 | | | | 7,458 | |
M&T Bank | | | 22,000 | | | | 2,683 | |
| | | | | | | | | |
Total Banks | | | | 10,141 | |
| | | | | | | | | |
Biotechnology [2.9%] | |
Baxalta | | | 118,200 | | | | 3,725 | |
Gilead Sciences | | | 39,200 | | | | 3,849 | |
| | | | | | | | | |
Total Biotechnology | | | | 7,574 | |
| | | | | | | | | |
Building & Construction [2.3%] | |
USG * | | | 224,000 | | | | 5,963 | |
| | | | | | | | | |
Chemicals [2.5%] | |
Albemarle | | | 55,000 | | | | 2,426 | |
Chemours | | | 272,400 | | | | 1,762 | |
Innophos Holdings | | | 57,000 | | | | 2,259 | |
| | | | | | | | | |
Total Chemicals | | | | 6,447 | |
| | | | | | | | | |
Commercial Banks [2.3%] | |
BB&T | | | 168,300 | | | | 5,991 | |
| | | | | | | | | |
Communication & Media [2.4%] | |
Starz * | | | 169,000 | | | | 6,310 | |
| | | | | | | | | |
Communications Equipment [2.0%] | |
Qualcomm | | | 96,000 | | | | 5,158 | |
| | | | | | | | | |
Computer Software [4.3%] | |
Microsoft | | | 142,200 | | | | 6,294 | |
Oracle | | | 140,100 | | | | 5,060 | |
| | | | | | | | | |
Total Computer Software | | | | 11,354 | |
| | | | | | | | | |
Drugs [1.9%] | |
AbbVie | | | 89,300 | | | | 4,859 | |
| | | | | | | | | |
Electronic Equipment & Instruments [7.0%] | |
Cisco Systems | | | 254,800 | | | | 6,689 | |
Corning | | | 301,300 | | | | 5,158 | |
TE Connectivity | | | 110,000 | | | | 6,588 | |
| | | | | | | | | |
Total Electronic Equipment & Instruments | | | | 18,435 | |
| | | | | | | | | |
Energy Equipment & Services [1.4%] | |
National Oilwell Varco | | | 95,300 | | | | 3,588 | |
| | | | | | | | | |
Financial Services [2.0%] | |
American Express | | | 70,700 | | | | 5,241 | |
| | | | | | | | | |
Food, Beverage & Tobacco [2.4%] | |
PepsiCo | | | 67,500 | | | | 6,365 | |
| | | | | | | | | |
Health Care Products & Services [5.9%] | |
Cardinal Health | | | 31,600 | | | | 2,427 | |
DaVita HealthCare Partners * | | | 89,700 | | | | 6,488 | |
Express Scripts Holding * | | | 80,000 | | | | 6,477 | |
| | | | | | | | | |
Total Health Care Products & Services | | | | 15,392 | |
| | | | | | | | | |
Household Furniture & Fixtures [1.4%] | |
Stanley Black & Decker | | | 37,700 | | | | 3,656 | |
| | | | | | | | | |
Household Products [2.0%] | |
Procter & Gamble | | | 73,200 | | | | 5,266 | |
| | | | | | | | | |
Independent Power Producers & Energy Trader [1.0%] | |
Calpine * | | | 179,900 | | | | 2,626 | |
| | | | | | | | | |
Industrial Products & Services [7.0%] | |
Eaton | | | 136,800 | | | | 7,018 | |
Republic Services, Cl A | | | 159,400 | | | | 6,567 | |
Tyco International | | | 139,675 | | | | 4,673 | |
| | | | | | | | | |
Total Industrial Products & Services | | | | 18,258 | |
See accompanying notes to financial statements.
CITY NATIONAL ROCHDALE FUNDS | PAGE 120
schedule of investments |
September 30, 2015 |
City National Rochdale Socially Responsible Equity Fund (concluded) |
Description | | Shares | | | Value (000) | |
Information Technology [2.5%] | |
IBM | | | 45,400 | | | $ | 6,582 | |
| | | | | | | | | |
Insurance [14.1%] | |
American International Group | | | 141,600 | | | | 8,046 | |
Berkshire Hathaway, Cl B * | | | 35,600 | | | | 4,642 | |
Genworth Financial, Cl A * | | | 508,700 | | | | 2,350 | |
HCC Insurance Holdings | | | 89,600 | | | | 6,941 | |
MetLife | | | 152,500 | | | | 7,191 | |
Symetra Financial | | | 243,100 | | | | 7,692 | |
| | | | | | | | | |
Total Insurance | | | | 36,862 | |
| | | | | | | | | |
Medical Products & Services [3.9%] | |
Baxter International | | | 155,200 | | | | 5,098 | |
Becton Dickinson | | | 39,400 | | | | 5,227 | |
| | | | | | | | | |
Total Medical Products & Services | | | | 10,325 | |
| | | | | | | | | |
Petroleum & Fuel Products [4.2%] | |
ConocoPhillips | | | 73,000 | | | | 3,501 | |
Devon Energy | | | 147,000 | | | | 5,452 | |
Phillips 66 | | | 26,400 | | | | 2,029 | |
| | | | | | | | | |
Total Petroleum & Fuel Products | | | | 10,982 | |
| | | | | | | | | |
Real Estate Management & Development [3.1%] | |
Brookfield Asset Management, Cl A | | | 142,350 | | | | 4,475 | |
Kennedy-Wilson Holdings | | | 168,900 | | | | 3,745 | |
| | | | | | | | | |
Total Real Estate Management & Development | | | | 8,220 | |
| | | | | | | | | |
Retail [3.6%] | |
AutoNation * | | | 91,000 | | | | 5,295 | |
Target | | | 52,000 | | | | 4,090 | |
| | | | | | | | | |
Total Retail | | | | 9,385 | |
| | | | | | | | | |
Specialty Finance [1.9%] | |
Air Lease, Cl A | | | 162,700 | | | | 5,031 | |
| | | | | | | | | |
Telephone & Telecommunications [3.3%] | |
Verizon Communications | | | 198,000 | | | | 8,615 | |
| | | | | | | | | |
Transportation Infrastructure [1.0%] | |
Wesco Aircraft Holdings * | | | 206,000 | | | | 2,513 | |
| | | | | | | | | |
Total Common Stock | |
(Cost $267,726) | | | | 253,073 | |
| | | | | | | | | |
Short-Term Investment [3.7%] | |
AIM STIT-Government TaxAdvantage Portfolio, 0.020%** | | | 9,755,692 | | | | 9,756 | |
| | | | | | | | | |
Total Short-Term Investment | |
(Cost $9,756) | | | | 9,756 | |
| | | | | | | | | |
Total Investments [100.5%] | |
(Cost $277,482) | | | $ | 262,829 | |
Percentages are based on Net Assets of $261,424 (000).
* | Non-income producing security. |
** | The rate reported is the 7-day effective yield as of September 30, 2015. |
Cl — Class
As of September 30, 2015, all of the Fund’s investments are Level 1 in accordance with authoritative guidance on fair value measurements and disclosure under U.S. GAAP.
For the year ended September 30, 2015, there have been no transfers between any of the fair value hierarchy levels. Transfers between Levels are recognized at period end.
For more information on valuation inputs, see Note 2 — Significant Accounting Policies in the Notes to Financial Statements.
See accompanying notes to financial statements.
CITY NATIONAL ROCHDALE FUNDS | PAGE 121
consolidated schedule of investments |
September 30, 2015 |
City National Rochdale Emerging Markets Fund |
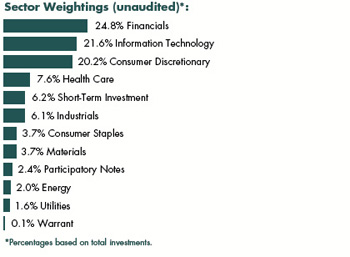
Description | | Shares | | | Value (000) | |
Common Stock [88.0%] | |
China [29.7%] | |
AAC Technologies Holdings | | | 2,456,200 | | | $ | 15,292 | |
Alibaba Group Holding ADR * | | | 125,519 | | | | 7,402 | |
ANTA Sports Products | | | 6,150,000 | | | | 15,871 | |
Baidu ADR * | | | 60,500 | | | | 8,313 | |
China Medical System Holdings | | | 7,223,000 | | | | 8,267 | |
China Pioneer Pharma Holdings | | | 14,755,000 | | | | 6,359 | |
China Railway Group, Cl H | | | 7,272,000 | | | | 6,596 | |
China State Construction International Holdings | | | 4,287,091 | | | | 6,129 | |
CIMC Enric Holdings | | | 11,242,000 | | | | 6,412 | |
Fufeng Group | | | 15,762,000 | | | | 6,386 | |
Great Wall Motor, Cl H | | | 14,116,500 | | | | 15,592 | |
Man Wah Holdings | | | 9,403,200 | | | | 9,148 | |
New Oriental Education & Technology Group ADR | | | 366,500 | | | | 7,407 | |
Ping An Insurance Group of China, Cl H | | | 2,645,000 | | | | 13,088 | |
Sunac China Holdings | | | 11,898,000 | | | | 6,202 | |
Sunny Optical Technology Group | | | 9,160,132 | | | | 18,178 | |
Tencent Holdings | | | 1,628,100 | | | | 27,163 | |
Zhejiang Expressway, Cl H | | | 6,054,000 | | | | 6,570 | |
ZTE, Cl H | | | 5,706,024 | | | | 12,988 | |
| | | | | | | | | |
Total China | | | | 203,363 | |
| | | | | | | | | |
Hong Kong [8.4%] | |
Bloomage BioTechnology | | | 6,922,500 | | | | 10,468 | |
Galaxy Entertainment Group | | | 2,472,000 | | | | 6,283 | |
Minth Group | | | 3,000,000 | | | | 5,350 | |
MTR | | | 1,695,739 | | | | 7,352 | |
NagaCorp | | | 27,372,063 | | | | 16,388 | |
Skyworth Digital Holdings | | | 16,948,814 | | | | 11,416 | |
| | | | | | | | | |
Total Hong Kong | | | | 57,257 | |
| | | | | | | | | |
India [24.4%] | |
Amtek Auto(A) | | | 2,436,433 | | | | 1,629 | |
Bharat Petroleum(A) | | | 477,920 | | | | 6,194 | |
CESC(A) | | | 1,374,602 | | | | 10,824 | |
Coal India(A) | | | 1,416,958 | | | | 7,072 | |
Crompton Greaves(A) | | | 2,822,928 | | | | 7,343 | |
Dr. Reddy’s Laboratories ADR | | | 167,200 | | | | 10,686 | |
Emami(A) | | | 681,022 | | | | 11,958 | |
HDFC Bank(A) | | | 353,793 | | | | 6,926 | |
HDFC Bank ADR | | | 239,000 | | | | 14,600 | |
Housing Development Finance(A) | | | 432,415 | | | | 7,989 | |
ICICI Bank ADR | | | 846,027 | | | | 7,090 | |
Infosys ADR | | | 200,000 | | | | 3,818 | |
ITC(A) | | | 1,675,823 | | | | 8,394 | |
Kaveri Seed(A) | | | 625,531 | | | | 4,040 | |
Kotak Mahindra Bank(A) | | | 1,026,940 | | | | 10,140 | |
Mindtree(A) | | | 456,968 | | | | 10,543 | |
Sun Pharmaceutical Industries * (A) | | | 680,355 | | | | 9,001 | |
Taro Pharmaceutical Industries * (A) | | | 69,669 | | | | 9,955 | |
Tata Motors, Cl A(A) | | | 1,326,174 | | | | 4,373 | |
Tata Motors ADR * | | | 260,954 | | | | 5,872 | |
Tech Mahindra(A) | | | 1,032,336 | | | | 8,766 | |
| | | | | | | | | |
Total India | | | | 167,213 | |
| | | | | | | | | |
Indonesia [6.0%] | |
Bank Mandiri Persero | | | 11,554,300 | | | | 6,250 | |
Ciputra Development | | | 65,004,198 | | | | 3,616 | |
Kalbe Farma | | | 41,503,100 | | | | 3,895 | |
Lippo Karawaci | | | 87,737,461 | | | | 6,768 | |
Mitra Adiperkasa * | | | 18,996,500 | | | | 3,890 | |
MNC Kapital Indonesia | | | 89,800,000 | | | | 10,237 | |
Surya Citra Media | | | 33,593,500 | | | | 6,283 | |
| | | | | | | | | |
Total Indonesia | | | | 40,939 | |
| | | | | | | | | |
Malaysia [3.3%] | |
Inari Amertron | | | 10,957,911 | | | | 8,451 | |
My EG Services | | | 10,907,300 | | | | 6,972 | |
Nirvana Asia | | | 28,415,000 | | | | 6,966 | |
| | | | | | | | | |
Total Malaysia | | | | 22,389 | |
See accompanying notes to financial statements.
CITY NATIONAL ROCHDALE FUNDS | PAGE 122
consolidated schedule of investments |
September 30, 2015 |
City National Rochdale Emerging Markets Fund (concluded) |
Description | | Shares | | | Value (000) | |
Philippines [8.4%] | |
GT Capital Holdings | | | 454,850 | | | $ | 12,310 | |
Jollibee Foods | | | 1,826,410 | | | | 7,534 | |
Megaworld | | | 124,813,526 | | | | 11,670 | |
Metropolitan Bank & Trust | | | 4,413,094 | | | | 7,705 | |
Security Bank | | | 2,398,330 | | | | 7,040 | |
SM Prime Holdings | | | 25,310,875 | | | | 11,182 | |
| | | | | | | | | |
Total Philippines | | | | 57,441 | |
| | | | | | | | | |
Singapore [0.3%] | |
Raffles Medical Group | | | 581,689 | | | | 1,848 | |
| | | | | | | | | |
Thailand [5.5%] | |
KCE Electronics - Foreign | | | 354,100 | | | | 546 | |
Krung Thai Bank - Foreign | | | 18,127,850 | | | | 8,541 | |
Land & Houses NVDR | | | 28,171,284 | | | | 6,248 | |
LPN Development NVDR | | | 8,254,701 | | | | 3,866 | |
LPN Development | | | 3,220,000 | | | | 1,508 | |
LPN Development - Foreign | | | 987,700 | | | | 463 | |
Minor International - Foreign | | | 10,050,305 | | | | 7,961 | |
Minor International NVDR | | | 1,096,700 | | | | 869 | |
Siam Cement - Foreign | | | 580,100 | | | | 7,448 | |
| | | | | | | | | |
Total Thailand | | | | 37,450 | |
| | | | | | | | | |
United States [2.0%] | |
Cognizant Technology Solutions, Cl A * | | | 224,000 | | | | 14,025 | |
| | | | | | | | | |
Total Common Stock | |
(Cost $588,612) | | | | 601,925 | |
| | | | | | | | | |
Participatory Notes [2.3%] | | | | | |
Boci Financial,# * | | | 3,452,638 | | | | 9,118 | |
Hanghou Hikvision Digital Technology# * | | | 958,643 | | | | 4,899 | |
Hikvision Digital Technology,* | | | | | | | | |
Expires 06/14/16 | | | 291,400 | | | | 1,488 | |
| | | | | | | | | |
Total Participatory Notes | | | | | |
(Cost $19,748) | | | | 15,505 | |
Description | | Number of Warrants/Shares | | | Value (000) | |
Warrants [0.0%] | | | | |
Inari Amertron, | | | | | | |
Expires 02/17/20* | | | 893,923 | | | $ | 274 | |
Minor International, | | | | | | | | |
Expires 11/3/17* | | | 400,127 | | | | — | |
| | | | | | | | | |
Total Warrants | | | | | |
(Cost $—) | | | | 274 | |
| | | | | | | | | |
Short-Term Investments [6.0%] | |
City National Rochdale Government Money Market Fund, Institutional Class, 0.010%** ‡ | | | 20,187,019 | | | | 20,187 | |
SEI Daily Income Trust Government Fund, Cl A, 0.010%** | | | 20,712,038 | | | | 20,712 | |
| | | | | | | | | |
Total Short-Term Investments | |
(Cost $40,899) | | | | 40,899 | |
| | | | | | | | | |
Total Investments [96.3%] | | | | | |
(Cost $649,259) | | | $ | 658,603 | |
Percentages are based on Net Assets of $684,182 (000).
* | Non-income producing security. |
** | The rate reported is the 7-day effective yield as of September 30, 2015. |
‡ | Investment in Affiliate. |
# | Expiration Date not available. |
(A) | Securities held through a Mauritius Subsidiary (See Note 2). |
ADR — American Depositary Receipt
Cl — Class
NVDR — Non Voting Depository Receipt
Amounts designated as “—” are $0 or have been rounded to $0.
As of September 30, 2015, all of the Fund’s investments are Level 1 in accordance with authoritative guidance on fair value measurements and disclosure under U.S. GAAP.
For the year ended September 30, 2015, there have been no transfers between any of the fair value hierarchy levels. Transfers between Levels are recognized at period end.
For more information on valuation inputs, see Note 2 — Significant Accounting Policies in the Notes to Financial Statements.
See accompanying notes to financial statements.
CITY NATIONAL ROCHDALE FUNDS | PAGE 123
statements of assets and liabilities (000) |
September 30, 2015 |
| | | City National
Rochdale
Government Money
Market Fund | | | City National
Rochdale Prime
Money Market Fund | | | City National
Rochdale California
Tax Exempt Money
Market Fund | |
ASSETS: | | | | | | | | | |
Cost of securities (including repurchase agreements) | | $ | 3,935,630 | | | $ | 1,024,109 | | | $ | 843,405 | |
Investments in securities, at value | | $ | 3,545,630 | | | $ | 839,109 | | | $ | 843,405 | |
Affiliated investments, at value | | | — | | | | — | | | | — | |
Repurchase agreements, at value | | | 390,000 | | | | 185,000 | | | | — | |
Cash | | | — | | | | — | | | | 34,790 | |
Dividend and interest receivable | | | 486 | | | | 95 | | | | 1,132 | |
Receivable for investment securities sold | | | — | | | | — | | | | 2,155 | |
Receivable for reimbursement of legal fees (Note 4) | | | — | | | | — | | | | 25 | |
Receivable for reimbursement of transfer agent fees (Note 4) | | | — | | | | — | | | | 1 | |
Prepaid expenses | | | 136 | | | | 36 | | | | 31 | |
Total Assets | | | 3,936,252 | | | | 1,024,240 | | | | 881,539 | |
| | | | | | | | | | | | | |
LIABILITIES: | | | | | | | | | | | | |
Payable for income distributions | | | 12 | | | | 5 | | | | 3 | |
Payable for investment securities purchased | | | — | | | | — | | | | 855 | |
Investment advisory fees payable | | | 233 | | | | 147 | | | | 19 | |
Administrative fees payable | | | 48 | | | | 18 | | | | 16 | |
Accrued expenses | | | 403 | | | | 118 | | | | 107 | |
Total Liabilities | | | 696 | | | | 288 | | | | 1,000 | |
Net Assets | | $ | 3,935,556 | | | $ | 1,023,952 | | | $ | 880,539 | |
| | | | | | | | | | | | | |
Net Assets: | | | | | | | | | | | | |
Paid-in Capital (unlimited authorization — $0.01 par value) | | $ | 3,935,555 | | | $ | 1,023,963 | | | $ | 880,507 | |
Undistributed (Distributions in excess of) net investment income | | | 1 | | | | — | | | | (4 | ) |
Accumulated net realized gain (loss) on investments | | | — | | | | (11 | ) | | | 36 | |
Net Assets | | $ | 3,935,556 | | | $ | 1,023,952 | | | $ | 880,539 | |
| | | | | | | | | | | | | |
Institutional Class Shares: | | | | | | | | | | | | |
Net Assets ($Dollars) | | $ | — | | | $ | 68,005,340 | | | $ | — | |
Total shares outstanding at end of year | | | — | | | | 68,005,155 | | | | — | |
Net asset value, offering and redemption price per share | | | | | | | | | | | | |
(net assets ÷ shares outstanding) | | $ | — | | | $ | 1.00 | | | $ | — | |
| | | | | | | | | | | | | |
Class N Shares: | | | | | | | | | | | | |
Net Assets ($Dollars) | | $ | 2,958,782,440 | | | $ | 291,290,915 | | | $ | 594,314,753 | |
Total shares outstanding at end of year | | | 2,958,779,064 | | | | 291,352,144 | | | | 594,293,772 | |
Net asset value, offering and redemption price per share | | | | | | | | | | | | |
(net assets ÷ shares outstanding) | | $ | 1.00 | | | $ | 1.00 | | | $ | 1.00 | |
| | | | | | | | | | | | | |
Class S Shares: | | | | | | | | | | | | |
Net Assets ($Dollars) | | $ | 668,182,548 | | | $ | 258,809,012 | | | $ | 60,397,408 | |
Total shares outstanding at end of year | | | 668,183,245 | | | | 258,773,951 | | | | 60,390,794 | |
Net asset value, offering and redemption price per share | | | | | | | | | | | | |
(net assets ÷ shares outstanding) | | $ | 1.00 | | | $ | 1.00 | | | $ | 1.00 | |
| | | | | | | | | | | | | |
Servicing Class Shares: | | | | | | | | | | | | |
Net Assets ($Dollars) | | $ | 308,590,844 | | | $ | 405,846,719 | | | $ | 225,826,523 | |
Total shares outstanding at end of year | | | 308,592,049 | | | | 405,925,026 | | | | 225,822,897 | |
Net asset value, offering and redemption price per share | | | | | | | | | | | | |
(net assets ÷ shares outstanding) | | $ | 1.00 | | | $ | 1.00 | | | $ | 1.00 | |
Amounts designated as “—” are either $0 or have been rounded to $0.
See accompanying notes to financial statements.
CITY NATIONAL ROCHDALE FUNDS | PAGE 124
statements of assets and liabilities (000) |
September 30, 2015 |
| | | City National
Rochdale
Government
Bond Fund | | | City National
Rochdale Corporate
Bond Fund | | | City National
Rochdale California
Tax Exempt
Bond Fund | | | City National
Rochdale Municipal
High Income Fund | |
ASSETS: | | | | | | | | | | | | |
Cost of securities (including affiliated investments) | | $ | 149,689 | | | $ | 137,873 | | | $ | 94,814 | | | $ | 684,401 | |
Investments in securities, at value | | $ | 150,938 | | | $ | 135,687 | | | $ | 95,042 | | | $ | 659,232 | |
Affiliated investments, at value | | | 199 | | | | 2,143 | | | | 1,736 | | | | 33,108 | |
Dividend and interest receivable | | | 642 | | | | 1,190 | | | | 1,001 | | | | 10,360 | |
Foreign tax reclaim receivable | | | — | | | | 5 | | | | — | | | | — | |
Receivable for investment securities sold | | | — | | | | — | | | | — | | | | 16 | |
Cash | | | — | | | | — | | | | — | | | | — | |
Receivable for capital shares sold | | | 154 | | | | 61 | | | | 300 | | | | 1,038 | |
Cash pledged as collateral for future contacts | | | — | | | | — | | | | — | | | | 303 | |
Receivable for variation margin | | | — | | | | — | | | | — | | | | 50 | |
Prepaid expenses | | | 6 | | | | 5 | | | | 3 | | | | 20 | |
Total Assets | | | 151,939 | | | | 139,091 | | | | 98,082 | | | | 704,127 | |
| | | | | | | | | | | | | | | | | |
LIABILITIES: | | | | | | | | | | | | | | | | |
Payable for income distributions | | | 19 | | | | 167 | | | | 98 | | | | 1,500 | |
Payable for capital shares redeemed | | | 987 | | | | 6 | | | | 8 | | | | 194 | |
Payable for investment securities purchased | | | — | | | | 3,000 | | | | — | | | | 1,985 | |
Investment advisory fees payable | | | 50 | | | | 40 | | | | 13 | | | | 255 | |
Shareholder servicing and distribution fees payable | | | 20 | | | | 28 | | | | 31 | | | | 416 | |
Administrative fees payable | | | 11 | | | | 11 | | | | 10 | | | | 18 | |
Accrued expenses | | | 32 | | | | 34 | | | | 29 | | | | 97 | |
Total Liabilities | | | 1,119 | | | | 3,286 | | | | 189 | | | | 4,465 | |
Net Assets | | $ | 150,820 | | | $ | 135,805 | | | $ | 97,893 | | | $ | 699,662 | |
| | | | | | | | | | | | | | | | | |
NET ASSETS: | | | | | | | | | | | | | | | | |
Paid-in Capital (unlimited authorization — $0.01 par value) | | $ | 149,449 | | | $ | 135,732 | | | $ | 95,893 | | | $ | 691,097 | |
Undistributed net investment income | | | 4 | | | | 1 | | | | 3 | | | | 523 | |
Accumulated net realized gain (loss) on investments | | | (81 | ) | | | 115 | | | | 33 | | | | 161 | |
Net unrealized appreciation (depreciation) on investments | | | 1,448 | | | | (43 | ) | | | 1,964 | | | | 7,939 | |
Net unrealized depreciation on futures contracts | | | — | | | | — | | | | — | | | | (58 | ) |
Net Assets | | $ | 150,820 | | | $ | 135,805 | | | $ | 97,893 | | | $ | 699,662 | |
| | | | | | | | | | | | | | | | | |
Institutional Class Shares: | | | | | | | | | | | | | | | | |
Net Assets ($Dollars) | | $ | 58,301,307 | | | $ | — | | | $ | — | | | $ | — | |
Total shares outstanding at end of year | | | 5,506,866 | | | | — | | | | — | | | | — | |
Net asset value, offering and redemption price per share | | | | | | | | | | | | | | | | |
(net assets ÷ shares outstanding) | | $ | 10.59 | | | $ | — | | | $ | — | | | $ | — | |
| | | | | | | | | | | | | | | | | |
Class N Shares: | | | | | | | | | | | | | | | | |
Net Assets ($Dollars) | | $ | 1,894,740 | | | $ | 4,411,228 | | | $ | 11,385,997 | | | $ | 382,461,126 | |
Total shares outstanding at end of year | | | 178,692 | | | | 422,037 | | | | 1,063,171 | | | | 35,833,045 | |
Net asset value, offering and redemption price per share | | | | | | | | | | | | | | | | |
(net assets ÷ shares outstanding) | | $ | 10.60 | | | $ | 10.45 | | | $ | 10.71 | | | $ | 10.67 | |
| | | | | | | | | | | | | | | | | |
Servicing Class Shares: | | | | | | | | | | | | | | | | |
Net Assets ($Dollars) | | $ | 90,623,874 | | | $ | 131,393,942 | | | $ | 86,507,477 | | | $ | 317,201,171 | |
Total shares outstanding at end of year | | | 8,562,948 | | | | 12,585,926 | | | | 8,100,649 | | | | 29,705,902 | |
Net asset value, offering and redemption price per share | | | | | | | | | | | | | | | | |
(net assets ÷ shares outstanding) | | $ | 10.58 | | | $ | 10.44 | | | $ | 10.68 | | | $ | 10.68 | |
Amounts designated as “—” are either $0 or have been rounded to $0.
See accompanying notes to financial statements.
CITY NATIONAL ROCHDALE FUNDS | PAGE 125
statements of assets and liabilities/
consolidated statement of assets and liabilities (000) |
September 30, 2015 |
| | | City National
Rochdale High
Yield Bond Fund | | | City National
Rochdale
Intermediate Fixed
Income Fund | | | City National
Rochdale
Fixed Income
Opportunities Fund | | | City National
Rochdale Multi-
Asset Fund | |
ASSETS: | | | | | | | | | | | | |
Cost of securities (including affiliated investments) | | $ | 94,775 | | | $ | 266,807 | | | $ | 1,675,532 | | | $ | 19,918 | |
Investments in securities, at value | | $ | 85,471 | | | $ | 266,328 | | | $ | 1,610,182 | | | $ | 16,619 | |
Affiliated investments, at value | | | 240 | | | | 2,031 | | | | 59 | | | | 3,188 | |
Cash | | | 54 | | | | — | | | | 3,086 | | | | — | |
Foreign Currency(1) | | | 13 | | | | — | | | | 2,796 | | | | — | |
Dividend and interest receivable | | | 1,615 | | | | 2,280 | | | | 22,112 | | | | 27 | |
Foreign tax reclaim receivable | | | 3 | | | | — | | | | 81 | | | | — | |
Receivable for capital shares sold | | | 62 | | | | 413 | | | | 2,514 | | | | — | |
Receivable for investment securities sold | | | 785 | | | | — | | | | 28,751 | | | | 688 | |
Unrealized gain on forward foreign currency contracts | | | 9 | | | | — | | | | 462 | | | | — | |
Prepaid expenses | | | 4 | | | | 8 | | | | 50 | | | | 1 | |
Total Assets | | | 88,256 | | | | 271,060 | | | | 1,670,093 | | | | 20,523 | |
| | | | | | | | | | | | | | | | | |
LIABILITIES: | | | | | | | | | | | | | | | | |
Payable for income distributions | | | 167 | | | | — | | | | — | | | | — | |
Payable for capital shares redeemed | | | 208 | | | | 212 | | | | 528 | | | | — | |
Payable for investment securities purchased | | | 1,255 | | | | — | | | | 25,514 | | | | — | |
Unrealized loss on forward foreign currency contracts | | | 3 | | | | — | | | | 3 | | | | — | |
Investment advisory fees payable | | | 38 | | | | 91 | | | | 673 | | | | 3 | |
Shareholder servicing and distribution fees payable | | | 31 | | | | 105 | | | | 684 | | | | 4 | |
Administrative fees payable | | | 10 | | | | 12 | | | | 31 | | | | 9 | |
Accrued expenses | | | 33 | | | | 53 | | | | 706 | | | | 23 | |
Total Liabilities | | | 1,745 | | | | 473 | | | | 28,139 | | | | 39 | |
Net Assets | | $ | 86,511 | | | $ | 270,587 | | | $ | 1,641,954 | | | $ | 20,484 | |
| | | | | | | | | | | | | | | | | |
NET ASSETS: | | | | | | | | | | | | | | | | |
Paid-in Capital (unlimited authorization — $0.01 par value) | | | 95,792 | | | | 271,449 | | | | 1,748,537 | | | | 21,357 | |
Undistributed (Distributions in excess of) net investment income | | | 54 | | | | 67 | | | | (3,287 | ) | | | 11 | |
Accumulated net realized (loss) on investments and foreign currency | | | (277 | ) | | | (2,481 | ) | | | (6,004 | ) | | | (773 | ) |
Net unrealized appreciation (depreciation) on: | | | | | | | | | | | | | | | | |
Investments | | | (9,064 | ) | | | 1,552 | | | | (97,693 | ) | | | (111 | ) |
Forward foreign currency contracts, foreign currencies and translation of other assets and liabilities denominated in foreign currencies | | | 6 | | | | — | | | | 401 | | | | — | |
Net Assets | | $ | 86,511 | | | $ | 270,587 | | | $ | 1,641,954 | | | $ | 20,484 | |
| | | | | | | | | | | | | | | | | |
Institutional Class Shares: | | | | | | | | | | | | | | | | |
Net Assets ($Dollars) | | $ | 38,273,843 | | | $ | 15,573,928 | | | $ | — | | | $ | — | |
Total shares outstanding at end of year | | | 5,047,375 | | | | 596,278 | | | | — | | | | — | |
Net asset value, offering and redemption price per share | | | | | | | | | | | | | | | | |
(net assets ÷ shares outstanding) | | $ | 7.58 | | | $ | 26.12 | | | $ | — | | | $ | — | |
| | | | | | | | | | | | | | | | | |
Class N Shares: | | | | | | | | | | | | | | | | |
Net Assets ($Dollars) | | $ | 21,063,452 | | | $ | 255,013,103 | | | $ | 1,641,953,977 | | | $ | 16,079,779 | |
Total shares outstanding at end of year | | | 2,778,756 | | | | 9,765,382 | | | | 65,105,191 | | | | 1,534,880 | |
Net asset value, offering and redemption price per share | | | | | | | | | | | | | | | | |
(net assets ÷ shares outstanding) | | $ | 7.58 | | | $ | 26.11 | | | $ | 25.22 | | | $ | 10.48 | |
| | | | | | | | | | | | | | | | | |
Servicing Class Shares: | | | | | | | | | | | | | | | | |
Net Assets ($Dollars) | | $ | 27,173,568 | | | $ | — | | | $ | — | | | $ | 4,404,395 | |
Total shares outstanding at end of year | | | 3,584,820 | | | | — | | | | — | | | | 420,036 | |
Net asset value, offering and redemption price per share | | | | | | | | | | | | | | | | |
(net assets ÷ shares outstanding) | | $ | 7.58 | | | $ | — | | | $ | — | | | $ | 10.49 | |
Amounts designated as “—” are either $0 or have been rounded to $0.
(1) | Cost of foreign currency $13 (000) and $2,796 (000), respectively. |
See accompanying notes to financial statements.
CITY NATIONAL ROCHDALE FUNDS | PAGE 126
statements of assets and liabilities/
consolidated statement of assets and liabilities (000) |
September 30, 2015 |
| | | City National
Rochdale Dividend
& Income Fund | | | City National
Rochdale U.S.
Core Equity Fund | | | City National
Rochdale Socially
Responsible
Equity Fund | | | City National
Rochdale Emerging
Markets Fund | |
ASSETS: | | | | | | | | | | | | |
Cost of securities (including affiliated investments) | | $ | 155,801 | | | $ | 181,023 | | | $ | 277,482 | | | $ | 649,259 | |
Investments in securities, at value | | $ | 186,045 | | | $ | 209,352 | | | $ | 262,829 | | | $ | 638,416 | |
Affiliated investments, at value | | | 455 | | | | 1,555 | | | | — | | | | 20,187 | |
Cash | | | 39 | | | | — | | | | 14 | | | | — | |
Foreign Currency(1) | | | — | | | | — | | | | — | | | | 24,071 | |
Dividend and interest receivable | | | 475 | | | | 159 | | | | 168 | | | | 1,011 | |
Receivable for investment securities sold | | | 1,652 | | | | 2,898 | | | | — | | | | — | |
Foreign tax reclaim receivable | | | 4 | | | | — | | | | 4 | | | | 10 | |
Receivable for capital shares sold | | | 167 | | | | 112 | | | | 277 | | | | 2,386 | |
Prepaid expenses | | | 6 | | | | 8 | | | | 9 | | | | 24 | |
Total Assets | | | 188,843 | | | | 214,084 | | | | 263,301 | | | | 686,105 | |
| | | | | | | | | | | | | | | | | |
LIABILITIES: | | | | | | | | | | | | | | | | |
Payable for capital shares redeemed | | | 158 | | | | 16 | | | | 22 | | | | 680 | |
Payable for investment securities purchased | | | 801 | | | | — | | | | 1,625 | | | | 277 | |
Investment advisory fees payable | | | 75 | | | | 72 | | | | 163 | | | | 486 | |
Shareholder servicing and distribution fees payable | | | 77 | | | | 103 | | | | 9 | | | | 278 | |
Administrative fees payable | | | 11 | | | | 12 | | | | 11 | | | | 18 | |
Accrued expenses | | | 36 | | | | 38 | | | | 47 | | | | 184 | |
Total Liabilities | | | 1,158 | | | | 241 | | | | 1,877 | | | | 1,923 | |
Net Assets | | $ | 187,685 | | | $ | 213,843 | | | $ | 261,424 | | | $ | 684,182 | |
| | | | | | | | | | | | | | | | | |
NET ASSETS: | | | | | | | | | | | | | | | | |
Paid-in Capital (unlimited authorization — $0.01 par value) | | $ | 154,733 | | | $ | 183,045 | | | $ | 274,213 | | | $ | 684,229 | |
Undistributed (Distributions in excess of) net investment income | | | (5 | ) | | | 88 | | | | 77 | | | | 171 | |
Accumulated net realized gain (loss) on investments and foreign currency | | | 2,258 | | | | 826 | | | | 1,787 | | | | (8,965 | ) |
Net unrealized appreciation (depreciation) on: | | | | | | | | | | | | | | | | |
Investments | | | 30,699 | | | | 29,884 | | | | (14,653 | ) | | | 9,344 | |
Foreign currencies and translation of other assets and liabilities denominated in foreign currencies | | | — | | | | — | | | | — | | | | (597 | ) |
Net Assets | | $ | 187,685 | | | $ | 213,843 | | | $ | 261,424 | | | $ | 684,182 | |
| | | | | | | | | | | | | | | | | |
Institutional Class Shares: | | | | | | | | | | | | | | | | |
Net Assets ($Dollars) | | $ | — | | | $ | 6,870,442 | | | $ | 238,379,305 | | | $ | — | |
Total shares outstanding at end of year | | | — | | | | 526,935 | | | | 23,418,941 | | | | — | |
Net asset value, offering and redemption price per share | | | | | | | | | | | | | | | | |
(net assets ÷ shares outstanding) | | $ | — | | | $ | 13.04 | | | $ | 10.18 | | | $ | — | |
| | | | | | | | | | | | | | | | | |
Class N Shares: | | | | | | | | | | | | | | | | |
Net Assets ($Dollars) | | $ | 187,684,670 | | | $ | 102,752,748 | | | $ | 23,044,621 | | | $ | 684,181,674 | |
Total shares outstanding at end of year | | | 5,484,369 | | | | 7,954,955 | | | | 2,269,039 | | | | 19,337,304 | |
Net asset value, offering and redemption price per share | | | | | | | | | | | | | | | | |
(net assets ÷ shares outstanding) | | $ | 34.22 | | | $ | 12.92 | | | $ | 10.16 | | | $ | 35.38 | |
| | | | | | | | | | | | | | | | | |
Servicing Class Shares: | | | | | | | | | | | | | | | | |
Net Assets ($Dollars) | | $ | — | | | $ | 104,219,535 | | | $ | — | | | $ | — | |
Total shares outstanding at end of year | | | — | | | | 8,058,325 | | | | — | | | | — | |
Net asset value, offering and redemption price per share | | | | | | | | | | | | | | | | |
(net assets ÷ shares outstanding) | | $ | — | | | $ | 12.93 | | | $ | — | | | $ | — | |
Amounts designated as “—” are either $0 or have been rounded to $0.
(1) | Cost of foreign currency $24,666 (000). |
See accompanying notes to financial statements.
CITY NATIONAL ROCHDALE FUNDS | PAGE 127
statements of operations (000) |
For the year ended September 30, 2015 |
| | | City National
Rochdale
Government Money
Market Fund | | | City National
Rochdale Prime
Money Market Fund | | | City National
Rochdale California Tax Exempt Money
Market Fund | |
INCOME: | | | | | | | | | |
Interest Income | | $ | 4,399 | | | $ | 1,990 | | | $ | 604 | |
Total Investment Income | | | 4,399 | | | | 1,990 | | | | 604 | |
| | | | | | | | | | | | | |
EXPENSES: | | | | | | | | | | | | |
Investment Advisory Fees | | | 10,321 | | | | 2,630 | | | | 2,470 | |
Shareholder Servicing Fees — Class N(1) | | | 16,545 | | | | 1,802 | | | | 3,398 | |
Shareholder Servicing Fees — Class S(1) | | | 5,268 | | | | 1,894 | | | | 592 | |
Shareholder Servicing Fees — Servicing Class | | | 647 | | | | 1,014 | | | | 545 | |
Administration Fees | | | 755 | | | | 277 | | | | 254 | |
Transfer Agent Fees | | | 410 | | | | 104 | | | | 94 | |
Trustee Fees | | | 177 | | | | 64 | | | | 59 | |
Professional Fees | | | 330 | | | | 92 | | | | 85 | |
Custody Fees | | | 159 | | | | 40 | | | | 24 | |
Registration Fees | | | 207 | | | | 56 | | | | 49 | |
Printing Fees | | | 159 | | | | 40 | | | | 36 | |
Insurance and Other Expenses | | | 240 | | | | 66 | | | | 77 | |
Total Expenses | | | 35,218 | | | | 8,079 | | | | 7,683 | |
Less, Waivers and/or Reimbursements of: | | | | | | | | | | | | |
Investment Advisory Fees | | | (8,586 | ) | | | (1,422 | ) | | | (2,470 | ) |
Shareholder Servicing Fees — Class N(1) | | | (16,545 | ) | | | (1,802 | ) | | | (3,398 | ) |
Shareholder Servicing Fees — Class S(1) | | | (5,268 | ) | | | (1,894 | ) | | | (592 | ) |
Shareholder Servicing Fees — Servicing Class | | | (647 | ) | | | (1,014 | ) | | | (545 | ) |
Administration Fees | | | (170 | ) | | | (62 | ) | | | (127 | ) |
Transfer Agent Fees | | | — | | | | — | | | | (10 | ) |
Legal Fees | | | — | | | | — | | | | (25 | ) |
Net Expenses | | | 4,002 | | | | 1,885 | | | | 516 | |
| | | | | | | | | | | | | |
Net Investment Income | | | 397 | | | | 105 | | | | 88 | |
Net Realized Gain from Securities Transactions | | | — | | | | — | | | | 36 | |
Net Increase in Net Assets Resulting from Operations | | $ | 397 | | | $ | 105 | | | $ | 124 | |
(1) | Includes class specific distribution expenses. |
Amounts designated as “—” are either $0 or have been rounded to $0.
See accompanying notes to financial statements.
CITY NATIONAL ROCHDALE FUNDS | PAGE 128
statements of operations (000) |
For the year ended September 30, 2015 |
| | | City National
Rochdale
Government
Bond Fund | | | City National
Rochdale Corporate
Bond Fund | | | City National
Rochdale California
Tax Exempt
Bond Fund | | | City National
Rochdale Municipal High Income Fund (2) | |
INCOME: | | | | | | | | | | | | |
Dividend Income | | $ | — | | | $ | — | | | $ | — | | | $ | — | |
Dividend Income from Affiliated Investments | | | — | | | | — | | | | — | | | | 4 | |
Interest Income | | | 1,843 | | | | 3,456 | | | | 1,823 | | | | 28,086 | |
Total Investment Income | | | 1,843 | | | | 3,456 | | | | 1,823 | | | | 28,090 | |
| | | | | | | | | | | | | | | | | |
EXPENSES: | | | | | | | | | | | | | | | | |
Investment Advisory Fees | | | 713 | | | | 568 | | | | 248 | | | | 2,552 | |
Shareholder Servicing Fees — Class N(1) | | | 10 | | | | 22 | | | | 57 | | | | 1,474 | |
Shareholder Servicing Fees — Servicing Class | | | 262 | | | | 344 | | | | 201 | | | | 681 | |
Administration Fees | | | 131 | | | | 128 | | | | 119 | | | | 197 | |
Transfer Agent Fees | | | 16 | �� | | | 14 | | | | 10 | | | | 62 | |
Trustee Fees | | | 30 | | | | 30 | | | | 28 | | | | 45 | |
Professional Fees | | | 27 | | | | 26 | | | | 23 | | | | 67 | |
Custody Fees | | | 7 | | | | 12 | | | | 4 | | | | 22 | |
Registration Fees | | | 9 | | | | 7 | | | | 5 | | | | 33 | |
Printing Fees | | | 6 | | | | 6 | | | | 4 | | | | 25 | |
Offering Costs | | | — | | | | — | | | | — | | | | 7 | |
Insurance and Other Expenses | | | 13 | | | | 24 | | | | 17 | | | | 23 | |
Total Expenses | | | 1,224 | | | | 1,181 | | | | 716 | | | | 5,188 | |
Recovery of Investment Advisory Fees Previously Waived(2) | | | — | | | | — | | | | — | | | | 13 | |
Less, Waivers of: | | | | | | | | | | | | | | | | |
Investment Advisory Fees | | | (74 | ) | | | (89 | ) | | | (109 | ) | | | — | |
Net Expenses | | | 1,150 | | | | 1,092 | | | | 607 | | | | 5,201 | |
| | | | | | | | | | | | | | | | | |
Net Investment Income | | | 693 | | | | 2,364 | | | | 1,216 | | | | 22,889 | |
Net Realized Gain from Securities Transactions | | | 124 | | | | 115 | | | | 129 | | | | 162 | |
Net Change in Unrealized Appreciation (Depreciation) on: | | | | | | | | | | | | | | | | |
Investments | | | 1,373 | | | | (1,927 | ) | | | 6 | | | | (4,922 | ) |
Futures Contracts | | | — | | | | — | | | | — | | | | (58 | ) |
Net Increase in Net Assets Resulting from Operations | | $ | 2,190 | | | $ | 552 | | | $ | 1,351 | | | $ | 18,071 | |
(1) | Includes class specific distribution expenses. |
(2) | See Note 4 for advisory fees recovered. |
Amounts designated as “—” are either $0 or have been rounded to $0.
See accompanying notes to financial statements.
CITY NATIONAL ROCHDALE FUNDS | PAGE 129
statements of operations/
consolidated statement of operations (000) |
For the year ended September 30, 2015 |
| | | City National
Rochdale High
Yield Bond Fund | | | City National
Rochdale
Intermediate Fixed
Income Fund | | | City National
Rochdale
Fixed Income
Opportunities Fund | | | City National
Rochdale Multi-
Asset Fund | |
INCOME: | | | | | | | | | | | | |
Dividend Income | | $ | 61 | | | $ | 449 | | | $ | — | | | $ | 517 | |
Dividend Income from Affiliated Investments | | | — | | | | — | | | | — | | | | 78 | |
Interest Income | | | 6,539 | | | | 6,411 | | | | 93,635 | | | | — | |
Less: Foreign Taxes Withheld | | | — | | | | (1 | ) | | | (62 | ) | | | — | |
Total Investment Income | | | 6,600 | | | | 6,859 | | | | 93,573 | | | | 595 | |
| | | | | | | | | | | | | | | | | |
EXPENSES: | | | | | | | | | | | | | | | | |
Investment Advisory Fees | | | 598 | | | | 980 | | | | 7,571 | | | | 115 | |
Shareholder Servicing Fees — Class N(1) | | | 118 | | | | 1,177 | | | | 7,571 | | | | 88 | |
Shareholder Servicing Fees — Servicing Class(1) | | | 90 | | | | — | | | | — | | | | 13 | |
Administration Fees | | | 121 | | | | 145 | | | | 427 | | | | 108 | |
Transfer Agent Fees | | | 9 | | | | 25 | | | | 156 | | | | 2 | |
Trustee Fees | | | 28 | | | | 33 | | | | 96 | | | | 25 | |
Professional Fees | | | 22 | | | | 34 | | | | 236 | | | | 17 | |
Custody Fees | | | 9 | | | | 10 | | | | 535 | | | | 3 | |
Registration Fees | | | 6 | | | | 15 | | | | 102 | | | | 2 | |
Printing Fees | | | 4 | | | | 10 | | | | 60 | | | | 1 | |
Interest Expense | | | — | | | | — | | | | 22 | | | | — | |
Insurance and Other Expenses | | | 28 | | | | 40 | | | | 174 | | | | 2 | |
Total Expenses | | | 1,033 | | | | 2,469 | | | | 16,950 | | | | 376 | |
Less, Waiver of: | | | | | | | | | | | | | | | | |
Investment Advisory Fees | | | (128 | ) | | | (43 | ) | | | (248 | ) | | | (44 | ) |
Net Expenses | | | 905 | | | | 2,426 | | | | 16,702 | | | | 332 | |
| | | | | | | | | | | | | | | | | |
Net Investment Income | | | 5,695 | | | | 4,433 | | | | 76,871 | | | | 263 | |
Net Realized Gain (Loss) from: | | | | | | | | | | | | | | | | |
Securities Transactions | | | (271 | ) | | | 792 | | | | (7,681 | ) | | | (242 | ) |
Affiliated Investments | | | — | | | | — | | | | — | | | | (153 | ) |
Distributions of Realized Gains from Investment Company Shares | | | — | | | | — | | | | — | | | | 85 | |
Forward Foreign Currency Contracts | | | — | | | | — | | | | 5,455 | | | | — | |
Foreign Currency Transactions | | | 72 | | | | — | | | | 2,835 | | | | — | |
Net Change in Unrealized Appreciation (Depreciation) on: | | | | | | | | | | | | | | | | |
Investments | | | (9,010 | ) | | | (2,189 | ) | | | (90,387 | ) | | | (649 | ) |
Affiliated Investments | | | — | | | | — | | | | — | | | | (48 | ) |
Forward Foreign Currency Contracts | | | — | | | | — | | | | (1,588 | ) | | | — | |
Foreign Currency Translations | | | 6 | | | | — | | | | (207 | ) | | | — | |
Net Increase (Decrease) in Net Assets Resulting from Operations | | $ | (3,508 | ) | | $ | 3,036 | | | $ | (14,702 | ) | | $ | (744 | ) |
(1) | Includes class specific distribution expenses. |
(2) | See Note 4 for advisory fees recovered. |
Amounts designated as “—” are either $0 or have been rounded to $0.
See accompanying notes to financial statements.
CITY NATIONAL ROCHDALE FUNDS | PAGE 130
statements of operations/
consolidated statement of operations (000) |
For the year ended September 30, 2015 |
| | | City National
Rochdale Dividend
& Income Fund | | | City National
Rochdale U.S.
Core Equity Fund | | | City National
Rochdale Socially
Responsible
Equity Fund | | | City National
Rochdale Emerging
Markets Fund | |
INCOME: | | | | | | | | | | | | |
Dividend Income | | $ | 7,123 | | | $ | 2,903 | | | $ | 5,553 | | | $ | 13,381 | |
Interest Income | | | 36 | | | | 1 | | | | 11 | | | | — | |
Less: Foreign Taxes Withheld | | | (8 | ) | | | (10 | ) | | | (8 | ) | | | (647 | ) |
Total Investment Income | | | 7,151 | | | | 2,894 | | | | 5,556 | | | | 12,734 | |
| | | | | | | | | | | | | | | | | |
EXPENSES: | | | | | | | | | | | | | | | | |
Investment Advisory Fees | | | 963 | | | | 880 | | | | 1,973 | | | | 6,979 | |
Shareholder Servicing Fees — Class N(1) | | | 963 | | | | 523 | | | | 132 | | | | — | |
Shareholder Servicing Fees — Servicing Class | | | — | | | | 271 | | | | — | | | | 3,490 | |
Administration Fees | | | 136 | | | | 140 | | | | 145 | | | | 219 | |
Transfer Agent Fees | | | 19 | | | | 21 | | | | 29 | | | | 72 | |
Trustee Fees | | | 31 | | | | 32 | | | | 34 | | | | 50 | |
Professional Fees | | | 29 | | | | 30 | | | | 39 | | | | 78 | |
Custody Fees | | | 12 | | | | 11 | | | | 10 | | | | 425 | |
Registration Fees | | | 10 | | | | 11 | | | | 26 | | | | 46 | |
Printing Fees | | | 7 | | | | 8 | | | | 11 | | | | 28 | |
Interest Expense | | | 1 | | | | — | | | | — | | | | — | |
Insurance and Other Expenses | | | 12 | | | | 12 | | | | 12 | | | | 140 | |
Total Expenses | | | 2,183 | | | | 1,939 | | | | 2,411 | | | | 11,527 | |
Recovery of Investment Advisory Fees Previously Waived(2) | | | — | | | | 8 | | | | 60 | | | | — | |
Less, Waiver of: | | | | | | | | | | | | | | | | |
Investment Advisory Fees | | | (44 | ) | | | — | | | | — | | | | (291 | ) |
Shareholder Servicing Fees — Class N | | | — | | | | — | | | | (66 | ) | | | — | |
Net Expenses | | | 2,139 | | | | 1,947 | | | | 2,405 | | | | 11,236 | |
| | | | | | | | | | | | | | | | | |
Net Investment Income | | | 5,012 | | | | 947 | | | | 3,151 | | | | 1,498 | |
Net Realized Gain (Loss) from: | | | | | | | | | | | | | | | | |
Securities Transactions | | | 5,580 | | | | 1,411 | | | | 2,738 | | | | (7,454 | ) |
Foreign Currency Transactions | | | — | | | | — | | | | — | | | | (1,325 | ) |
Net Change in Unrealized Appreciation (Depreciation) on: | | | | | | | | | | | | | | | | |
Investments | | | (10,600 | ) | | | 242 | | | | (28,300 | ) | | | (71,965 | ) |
Foreign Currency Translations | | | — | | | | — | | | | — | | | | (270 | ) |
Net Increase (Decrease) in Net Assets Resulting from Operations | | $ | (8 | ) | | $ | 2,600 | | | $ | (22,411 | ) | | $ | (79,516 | ) |
(1) | Includes class specific distribution expenses. |
(2) | See Note 4 for advisory fees recovered. |
Amounts designated as “—” are either $0 or have been rounded to $0.
See accompanying notes to financial statements.
CITY NATIONAL ROCHDALE FUNDS | PAGE 131
statements of changes in net assets (000) |
For the year ended September 30, |
| | | City National Rochdale Government Money Market Fund | | | City National Rochdale Prime Money Market Fund | |
| | 2015 | | | 2014 | | | 2015 | | | 2014 | |
OPERATIONS: | | | | | | | | | | | | |
Net Investment Income | | $ | 397 | | | $ | 378 | | | $ | 105 | | | $ | 120 | |
Net Realized Gain (Loss) from Security Transactions | | | — | | | | 2 | | | | — | | | | 4 | |
Net Change in Unrealized Appreciation (Depreciation) on Investments | | | — | | | | — | | | | — | | | | — | |
Net Increase in Net Assets Resulting from Operations | | | 397 | | | | 380 | | | | 105 | | | | 124 | |
| | | | | | | | | | | | | | | | | |
DIVIDENDS AND DISTRIBUTIONS FROM: | | | | | | | | | | | | | | | | |
Net Investment Income: | | | | | | | | | | | | | | | | |
Institutional Class | | | — | | | | — | | | | (6 | ) | | | (4 | ) |
Class N | | | (301 | ) | | | (300 | ) | | | (33 | ) | | | (36 | ) |
Class S | | | (70 | ) | | | (61 | ) | | | (25 | ) | | | (23 | ) |
Servicing Class | | | (26 | ) | | | (17 | ) | | | (41 | ) | | | (57 | ) |
Realized Capital Gains: | | | | | | | | | | | | | | | | |
Institutional Class | | | — | | | | — | | | | — | | | | — | |
Class N | | | — | | | | — | | | | — | | | | — | |
Servicing Class | | | — | | | | — | | | | — | | | | — | |
Total Dividends and Distributions | | | (397 | ) | | | (378 | ) | | | (105 | ) | | | (120 | ) |
| | | | | | | | | | | | | | | | | |
CAPITAL SHARE TRANSACTIONS:(1) | | | | | | | | | | | | | | | | |
Institutional Class: | | | | | | | | | | | | | | | | |
Shares Issued | | | — | | | | — | | | | 103,267 | | | | 177,330 | |
Shares Issued in Lieu of Dividends and Distributions | | | — | | | | — | | | | 5 | | | | — | |
Shares Redeemed | | | — | | | | — | | | | (89,242 | ) | | | (134,563 | ) |
Increase in Net Assets from Institutional Class Share Transactions | | | — | | | | — | | | | 14,030 | | | | 42,767 | |
| | | | | | | | | | | | | | | | | |
Class N: | | | | | | | | | | | | | | | | |
Shares Issued | | | 3,753,981 | | | | 4,544,028 | | | | 701,569 | | | | 712,240 | |
Shares Issued in Lieu of Dividends and Distributions | | | 252 | | | | 249 | | | | 23 | | | | 24 | |
Shares Redeemed | | | (3,969,801 | ) | | | (4,410,324 | ) | | | (743,764 | ) | | | (803,775 | ) |
Increase (Decrease) in Net Assets from Class N Share Transactions | | | (215,568 | ) | | | 133,953 | | | | (42,172 | ) | | | (91,511 | ) |
| | | | | | | | | | | | | | | | | |
Class S: | | | | | | | | | | | | | | | | |
Shares Issued | | | 1,307,608 | | | | 1,522,771 | | | | 1,030,737 | | | | 869,219 | |
Shares Issued in Lieu of Dividends and Distributions | | | — | | | | — | | | | — | | | | — | |
Shares Redeemed | | | (1,345,358 | ) | | | (1,291,990 | ) | | | (970,164 | ) | | | (878,235 | ) |
Increase (Decrease) in Net Assets from Class S Share Transactions | | | (37,750 | ) | | | 230,781 | | | | 60,573 | | | | (9,016 | ) |
| | | | | | | | | | | | | | | | | |
Servicing Class: | | | | | | | | | | | | | | | | |
Shares Issued | | | 1,454,606 | | | | 1,008,445 | | | | 1,141,621 | | | | 1,057,487 | |
Shares Issued in Lieu of Dividends and Distributions | | | — | | | | — | | | | 11 | | | | 9 | |
Shares Redeemed | | | (1,357,973 | ) | | | (924,910 | ) | | | (1,199,419 | ) | | | (1,207,309 | ) |
Increase (Decrease) in Net Assets from Servicing Class Share Transactions | | | 96,633 | | | | 83,535 | | | | (57,787 | ) | | | (149,813 | ) |
| | | | | | | | | | | | | | | | | |
Net Increase (Decrease) in Net Assets from Share Transactions | | | (156,685 | ) | | | 448,269 | | | | (25,356 | ) | | | (207,573 | ) |
Total Increase (Decrease) in Net Assets | | | (156,685 | ) | | | 448,271 | | | | (25,356 | ) | | | (207,569 | ) |
| | | | | | | | | | | | | | | | | |
NET ASSETS: | | | | | | | | | | | | | | | | |
Beginning of Year | | | 4,092,241 | | | | 3,643,970 | | | | 1,049,308 | | | | 1,256,877 | |
End of Year | | $ | 3,935,556 | | | $ | 4,092,241 | | | $ | 1,023,952 | | | $ | 1,049,308 | |
Undistributed (Distributions in excess of) net investment income | | $ | 1 | | | $ | — | | | $ | — | | | $ | — | |
(1) | See Note 8 for shares issued and redeemed. |
Amounts designated as “—” are either $0 or have been rounded to $0.
CITY NATIONAL ROCHDALE FUNDS | PAGE 132
City National Rochdale California Tax Exempt Money Market Fund | | | City National Rochdale Government Bond Fund | | | City National Rochdale Corporate Bond Fund | |
2015 | | | 2014 | | | 2015 | | | 2014 | | | 2015 | | | 2014 | |
| | | | | | | | | | | | | | | | |
$ | 88 | | | $ | 96 | | | $ | 693 | | | $ | 738 | | | $ | 2,364 | | | $ | 2,226 | |
| | 36 | | | | (2 | ) | | | 124 | | | | 1,551 | | | | 115 | | | | 1,186 | |
| | — | | | | — | | | | 1,373 | | | | (1,205 | ) | | | (1,927 | ) | | | (775 | ) |
| | 124 | | | | 94 | | | | 2,190 | | | | 1,084 | | | | 552 | | | | 2,637 | |
| | | | | | | | | | | | | | | | | | | | | | | |
| | | | | | | | | | | | | | | | | | | | | | | |
| | | | | | | | | | | | | | | | | | | | | | | |
| | — | | | | — | | | | (352 | ) | | | (402 | ) | | | — | | | | — | |
| | (62 | ) | | | (69 | ) | | | (2 | ) | | | (2 | ) | | | (63 | ) | | | (44 | ) |
| | (8 | ) | | | (7 | ) | | | — | | | | — | | | | — | | | | — | |
| | (22 | ) | | | (20 | ) | | | (354 | ) | | | (346 | ) | | | (2,301 | ) | | | (2,181 | ) |
| | | | | | | | | | | | | | | | | | | | | | | |
| | — | | | | — | | | | — | | | | — | | | | — | | | | — | |
| | — | | | | — | | | | — | | | | — | | | | (35 | ) | | | (20 | ) |
| | — | | | | — | | | | — | | | | — | | | | (1,106 | ) | | | (914 | ) |
| | (92 | ) | | | (96 | ) | | | (708 | ) | | | (750 | ) | | | (3,505 | ) | | | (3,159 | ) |
| | | | | | | | | | | | | | | | | | | | | | | |
| | | | | | | | | | | | | | | | | | | | | | | |
| | | | | | | | | | | | | | | | | | | | | | | |
| | — | | | | — | | | | 10,393 | | | | 9,605 | | | | — | | | | — | |
| | — | | | | — | | | | 347 | | | | 338 | | | | — | | | | — | |
| | — | | | | — | | | | (9,674 | ) | | | (9,682 | ) | | | — | | | | — | |
| | — | | | | — | | | | 1,066 | | | | 261 | | | | — | | | | — | |
| | | | | | | | | | | | | | | | | | | | | | | |
| | | | | | | | | | | | | | | | | | | | | | | |
| | 686,601 | | | | 988,104 | | | | 310 | | | | 385 | | | | 1,983 | | | | 1,625 | |
| | 61 | | | | 67 | | | | 1 | | | | 1 | | | | 62 | | | | 47 | |
| | (715,932 | ) | | | (1,037,816 | ) | | | (461 | ) | | | (871 | ) | | | (1,546 | ) | | | (750 | ) |
| | (29,270 | ) | | | (49,645 | ) | | | (150 | ) | | | (485 | ) | | | 499 | | | | 922 | |
| | | | | | | | | | | | | | | | | | | | | | | |
| | | | | | | | | | | | | | | | | | | | | | | |
| | 453,783 | | | | 372,122 | | | | — | | | | — | | | | — | | | | — | |
| | — | | | | — | | | | — | | | | — | | | | — | | | | — | |
| | (474,800 | ) | | | (370,022 | ) | | | — | | | | — | | | | — | | | | — | |
| | (21,017 | ) | | | 2,100 | | | | — | | | | — | | | | — | | | | — | |
| | | | | | | | | | | | | | | | | | | | | | | |
| | | | | | | | | | | | | | | | | | | | | | | |
| | 816,681 | | | | 698,593 | | | | 19,490 | | | | 28,483 | | | | 26,686 | | | | 43,257 | |
| | — | | | | — | | | | 176 | | | | 193 | | | | 260 | | | | 241 | |
| | (792,229 | ) | | | (662,963 | ) | | | (43,478 | ) | | | (30,360 | ) | | | (35,461 | ) | | | (35,408 | ) |
| | 24,452 | | | | 35,630 | | | | (23,812 | ) | | | (1,684 | ) | | | (8,515 | ) | | | 8,090 | |
| | | | | | | | | | | | | | | | | | | | | | | |
| | (25,835 | ) | | | (11,915 | ) | | | (22,896 | ) | | | (1,908 | ) | | | (8,016 | ) | | | 9,012 | |
| | (25,803 | ) | | | (11,917 | ) | | | (21,414 | ) | | | (1,574 | ) | | | (10,969 | ) | | | 8,490 | |
| | | | | | | | | | | | | | | | | | | | | | | |
| | | | | | | | | | | | | | | | | | | | | | | |
| | 906,342 | | | | 918,259 | | | | 172,234 | | | | 173,808 | | | | 146,774 | | | | 138,284 | |
$ | 880,539 | | | $ | 906,342 | | | $ | 150,820 | | | $ | 172,234 | | | $ | 135,805 | | | $ | 146,774 | |
$ | (4 | ) | | $ | — | | | $ | 4 | | | $ | 2 | | | $ | 1 | | | $ | 1 | |
CITY NATIONAL ROCHDALE FUNDS | PAGE 133
statements of changes in net assets/
consolidated statements of changes in net assets (000) |
For the year or period ended September 30, |
| | | City National Rochdale California Tax Exempt Bond Fund | | | City National Rochdale Municipal High Income Fund | |
| | 2015 | | | 2014 | | | 2015 | | | 2014(4) | |
OPERATIONS: | | | | | | | | | | | | |
Net Investment Income | | $ | 1,216 | | | $ | 1,008 | | | $ | 22,889 | | | $ | 7,598 | |
Net Realized Gain (Loss) from: | | | | | | | | | | | | | | | | |
Security Transactions and Affiliated Investments | | | 129 | | | | 461 | | | | 162 | | | | 74 | |
Distributions of Realized Gains from Investment Company Shares | | | — | | | | — | | | | — | | | | — | |
Foreign Currency Transactions | | | — | | | | — | | | | — | | | | — | |
Net Change in Unrealized Appreciation (Depreciation) on: | | | | | | | | | | | | | | | | |
Investments, Affiliated Investments and Futures Contracts | | | 6 | | | | 1,052 | | | | (4,980 | ) | | | 12,861 | |
Foreign Currency Translations | | | — | | | | — | | | | — | | | | — | |
Net Increase (Decrease) in Net Assets Resulting from Operations | | | 1,351 | | | | 2,521 | | | | 18,071 | | | | 20,533 | |
| | | | | | | | | | | | | | | | | |
DIVIDENDS AND DISTRIBUTIONS FROM: | | | | | | | | | | | | | | | | |
Net Investment Income: | | | | | | | | | | | | | | | | |
Institutional Class | | | — | | | | — | | | | — | | | | — | |
Class N | | | (126 | ) | | | (115 | ) | | | (11,345 | ) | | | (3,407 | ) |
Servicing Class | | | (1,090 | ) | | | (893 | ) | | | (11,151 | ) | | | (4,062 | ) |
Realized Capital Gains: | | | | | | | | | | | | | | | | |
Institutional Class | | | — | | | | — | | | | — | | | | — | |
Class N | | | (52 | ) | | | (17 | ) | | | (36 | ) | | | — | |
Servicing Class | | | (355 | ) | | | (110 | ) | | | (38 | ) | | | — | |
Total Dividends and Distributions | | | (1,623 | ) | | | (1,135 | ) | | | (22,570 | ) | | | (7,469 | ) |
| | | | | | | | | | | | | | | | | |
CAPITAL SHARE TRANSACTIONS:(1) | | | | | | | | | | | | | | | | |
Institutional Class: | | | | | | | | | | | | | | | | |
Shares Issued | | | — | | | | — | | | | — | | | | — | |
Shares Issued from Merger(3) | | | — | | | | — | | | | — | | | | — | |
Shares Issued in Lieu of Dividends and Distributions | | | — | | | | — | | | | — | | | | — | |
Shares Redeemed | | | — | | | | — | | | | — | | | | — | |
Increase (Decrease) in Net Assets from Institutional Class Share Transactions | | | — | | | | — | | | | — | | | | — | |
| | | | | | | | | | | | | | | | | |
Class N: | | | | | | | | | | | | | | | | |
Shares Issued | | | 4,360 | | | | 4,384 | | | | 214,782 | | | | 212,375 | |
Shares Issued from Merger(3) | | | — | | | | — | | | | — | | | | — | |
Shares Issued in Lieu of Dividends and Distributions | | | 111 | | | | 75 | | | | 7,366 | | | | 2,227 | |
Shares Redeemed | | | (4,001 | ) | | | (1,893 | ) | | | (38,116 | ) | | | (19,319 | ) |
Increase (Decrease) in Net Assets from Class N Share Transactions | | | 470 | | | | 2,566 | | | | 184,032 | | | | 195,283 | |
| | | | | | | | | | | | | | | | | |
Servicing Class: | | | | | | | | | | | | | | | | |
Shares Issued | | | 33,934 | | | | 26,391 | | | | 134,840 | | | | 220,241 | |
Shares Issued in Lieu of Dividends and Distributions | | | 115 | | | | 97 | | | | 563 | | | | 74 | |
Shares Redeemed | | | (18,007 | ) | | | (16,133 | ) | | | (37,325 | ) | | | (6,611 | ) |
Increase (Decrease) in Net Assets from Servicing Class Share Transactions | | | 16,042 | | | | 10,355 | | | | 98,078 | | | | 213,704 | |
Net Increase (Decrease) in Net Assets from Share Transactions | | | 16,512 | | | | 12,921 | | | | 282,110 | | | | 408,987 | |
Total Increase (Decrease) in Net Assets | | | 16,240 | | | | 14,307 | | | | 277,611 | | | | 422,051 | |
| | | | | | | | | | | | | | | | | |
NET ASSETS: | | | | | | | | | | | | | | | | |
Beginning of Year/Period | | | 81,653 | | | | 67,346 | | | | 422,051 | | | | — | |
End of Year/Period | | $ | 97,893 | | | $ | 81,653 | | | $ | 699,662 | | | $ | 422,051 | |
Undistributed (distribution in excess of) net investment income | | $ | 3 | | | $ | — | | | $ | 523 | | | $ | 130 | |
(1) | See Note 8 for shares issued and redeemed. |
(2) | Institutional Class ceased operations on January 31, 2014. |
(4) | Fund commenced operations on December 30, 2013. |
Amounts designated as “—” are either $0 or have been rounded to $0.
See accompanying notes to financial statements.
CITY NATIONAL ROCHDALE FUNDS | PAGE 134
City National Rochdale High Yield Bond Fund | | | City National Rochdale Intermediate Fixed Income Fund | | | City National Rochdale Fixed Income Opportunities Fund | | | City National Rochdale Multi-Asset Fund (2) | |
2015 | | | 2014 | | | 2015 | | | 2014 | | | 2015 | | | 2014 | | | 2015 | | | 2014 | |
| | | | | | | | | | | | | | | | | | | | | | |
$ | 5,695 | | | $ | 7,711 | | | $ | 4,433 | | | $ | 4,535 | | | $ | 76,871 | | | $ | 56,680 | | | $ | 263 | | | $ | 199 | |
| | | | | | | | | | | | | | | | | | | | | | | | | | | | | | | |
| | (271 | ) | | | 5,028 | | | | 792 | | | | (123 | ) | | | (7,681 | ) | | | 4,871 | | | | (395 | ) | | | 1,226 | |
| | — | | | | — | | | | — | | | | — | | | | — | | | | — | | | | 85 | | | | 38 | |
| | 72 | | | | — | | | | — | | | | — | | | | 8,290 | | | | 5,476 | | | | — | | | | — | |
| | | | | | | | | | | | | | | | | | | | | | | | | | | | | | | |
| | (9,010 | ) | | | (1,148 | ) | | | (2,189 | ) | | | 2,982 | | | | (90,387 | ) | | | (2,897 | ) | | | (697 | ) | | | (275 | ) |
| | 6 | | | | — | | | | — | | | | — | | | | (1,795 | ) | | | 2,649 | | | | — | | | | — | |
| | (3,508 | ) | | | 11,591 | | | | 3,036 | | | | 7,394 | | | | (14,702 | ) | | | 66,779 | | | | (744 | ) | | | 1,188 | |
| | | | | | | | | | | | | | | | | | | | | | | | | | | | | | | |
| | | | | | | | | | | | | | | | | | | | | | | | | | | | | | | |
| | | | | | | | | | | | | | | | | | | | | | | | | | | | | | | |
| | (2,379 | ) | | | (2,421 | ) | | | (244 | ) | | | (611 | ) | | | — | | | | — | | | | — | | | | (28 | ) |
| | (1,278 | ) | | | (1,899 | ) | | | (4,288 | ) | | | (3,973 | ) | | | (93,437 | ) | | | (54,067 | ) | | | (177 | ) | | | (149 | ) |
| | (2,049 | ) | | | (3,386 | ) | | | — | | | | — | | | | — | | | | — | | | | (75 | ) | | | (57 | ) |
| | | | | | | | | | | | | | | | | | | | | | | | | | | | | | | |
| | (1,868 | ) | | | (90 | ) | | | — | | | | — | | | | — | | | | — | | | | — | | | | — | |
| | (1,142 | ) | | | (83 | ) | | | — | | | | — | | | | (6,421 | ) | | | (5,256 | ) | | | — | | | | — | |
| | (1,982 | ) | | | (208 | ) | | | — | | | | — | | | | — | | | | — | | | | — | | | | — | |
| | (10,698 | ) | | | (8,087 | ) | | | (4,532 | ) | | | (4,584 | ) | | | (99,858 | ) | | | (59,323 | ) | | | (252 | ) | | | (234 | ) |
| | | | | | | | | | | | | | | | | | | | | | | | | | | | | | | |
| | | | | | | | | | | | | | | | | | | | | | | | | | | | | | | |
| | | | | | | | | | | | | | | | | | | | | | | | | | | | | | | |
| | 5,782 | | | | 7,321 | | | | 6,668 | | | | 1,175 | | | | — | | | | — | | | | — | | | | 783 | |
| | — | | | | — | | | | — | | | | 44,899 | | | | — | | | | — | | | | — | | | | — | |
| | 4,041 | | | | 2,362 | | | | 232 | | | | 648 | | | | — | | | | — | | | | — | | | | 27 | |
| | (6,571 | ) | | | (9,031 | ) | | | (39 | ) | | | (38,696 | ) | | | — | | | | — | | | | — | | | | (7,291 | ) |
| | 3,252 | | | | 652 | | | | 6,861 | | | | 8,026 | | | | — | | | | — | | | | — | | | | (6,481 | ) |
| | | | | | | | | | | | | | | | | | | | | | | | | | | | | | | |
| | | | | | | | | | | | | | | | | | | | | | | | | | | | | | | |
| | 5,469 | | | | 4,360 | | | | 95,123 | | | | 98,095 | | | | 664,124 | | | | 629,065 | | | | 1,700 | | | | 650 | |
| | — | | | | — | | | | — | | | | — | | | | — | | | | 58,518 | | | | — | | | | — | |
| | 1,309 | | | | 1,220 | | | | 3,268 | | | | 2,343 | | | | 62,724 | | | | 32,489 | | | | 129 | | | | 105 | |
| | (8,540 | ) | | | (14,526 | ) | | | (46,217 | ) | | | (53,966 | ) | | | (361,831 | ) | | | (260,475 | ) | | | (3,712 | ) | | | (4,588 | ) |
| | (1,762 | ) | | | (8,946 | ) | | | 52,174 | | | | 46,472 | | | | 365,017 | | | | 459,597 | | | | (1,883 | ) | | | (3,833 | ) |
| | | | | | | | | | | | | | | | | | | | | | | | | | | | | | | |
| | | | | | | | | | | | | | | | | | | | | | | | | | | | | | | |
| | 9,056 | | | | 26,803 | | | | — | | | | — | | | | — | | | | — | | | | 2,142 | | | | 1,149 | |
| | 742 | | | | 557 | | | | — | | | | — | | | | — | | | | — | | | | 53 | | | | 33 | |
| | (21,350 | ) | | | (74,330 | ) | | | — | | | | — | | | | — | | | | — | | | | (3,637 | ) | | | (228 | ) |
| | (11,552 | ) | | | (46,970 | ) | | | — | | | | — | | | | — | | | | — | | | | (1,442 | ) | | | 954 | |
| | (10,062 | ) | | | (55,264 | ) | | | 59,035 | | | | 54,498 | | | | 365,017 | | | | 459,597 | | | | (3,325 | ) | | | (9,360 | ) |
| | (24,268 | ) | | | (51,760 | ) | | | 57,539 | | | | 57,308 | | | | 250,457 | | | | 467,053 | | | | (4,321 | ) | | | (8,406 | ) |
| | | | | | | | | | | | | | | | | | | | | | | | | | | | | | | |
| | | | | | | | | | | | | | | | | | | | | | | | | | | | | | | |
| | 110,779 | | | | 162,539 | | | | 213,048 | | | | 155,740 | | | | 1,391,497 | | | | 924,444 | | | | 24,805 | | | | 33,211 | |
$ | 86,511 | | | $ | 110,779 | | | $ | 270,587 | | | $ | 213,048 | | | $ | 1,641,954 | | | $ | 1,391,497 | | | $ | 20,484 | | | $ | 24,805 | |
$ | 54 | | | $ | 6 | | | $ | 67 | | | $ | 63 | | | $ | (3,287 | ) | | $ | 6,957 | | | $ | 11 | | | $ | — | |
Amounts designated as “—” are either $0 or have been rounded to $0.
See accompanying notes to financial statements.
CITY NATIONAL ROCHDALE FUNDS | PAGE 135
statements of changes in net assets/
consolidated statements of changes in net assets (000) |
For the year ended September 30, |
| | | City National Rochdale
Dividend & Income Fund | |
| | 2015 | | | 2014 | |
OPERATIONS: | | | | | | |
Net Investment Income | | $ | 5,012 | | | $ | 4,785 | |
Net Realized Gain (Loss) from: | | | | | | | | |
Security Transactions | | | 5,580 | | | | 5,858 | |
Foreign Currency Transactions | | | — | | | | — | |
Net Change in Unrealized Appreciation (Depreciation) on: | | | | | | | | |
Investments | | | (10,600 | ) | | | 9,234 | |
Foreign Currency Translations | | | — | | | | — | |
Net Increase (Decrease) in Net Assets Resulting from Operations | | | (8 | ) | | | 19,877 | |
| | | | | | | | | |
DIVIDENDS AND DISTRIBUTIONS FROM: | | | | | | | | |
Net Investment Income: | | | | | | | | |
Institutional Class | | | — | | | | — | |
Class N | | | (5,817 | ) | | | (5,449 | ) |
Servicing Class | | | — | | | | — | |
Realized Capital Gains: | | | | | | | | |
Institutional Class | | | — | | | | — | |
Class N | | | — | | | | — | |
Servicing Class | | | — | | | | — | |
Total Dividends and Distributions | | | (5,817 | ) | | | (5,449 | ) |
| | | | | | | | | |
CAPITAL SHARE TRANSACTIONS:(1) | | | | | | | | |
Institutional Class: | | | | | | | | |
Shares Issued | | | — | | | | — | |
Shares Issued from Merger(2) | | | — | | | | — | |
Shares Issued in Lieu of Dividends and Distributions | | | — | | | | — | |
Shares Redeemed | | | — | | | | — | |
Increase in Net Assets from Institutional Class Share Transactions | | | — | | | | — | |
| | | | | | | | | |
Class N: | | | | | | | | |
Shares Issued | | | 66,145 | | | | 68,568 | |
Shares Issued from Merger(2) | | | — | | | | — | |
Shares Issued in Lieu of Dividends and Distributions | | | 3,602 | | | | 3,535 | |
Shares Redeemed | | | (49,154 | ) | | | (69,421 | ) |
Increase (Decrease) in Net Assets from Class N Share Transactions | | | 20,593 | | | | 2,682 | |
| | | | | | | | | |
Servicing Class: | | | | | | | | |
Shares Issued | | | — | | | | — | |
Shares Issued in Lieu of Dividends and Distributions | | | — | | | | — | |
Shares Redeemed | | | — | | | | — | |
Increase in Net Assets from Servicing Class Share Transactions | | | — | | | | — | |
Net Increase in Net Assets from Share Transactions | | | 20,593 | | | | 2,682 | |
Total Increase in Net Assets | | | 14,768 | | | | 17,110 | |
| | | | | | | | | |
NET ASSETS: | | | | | | | | |
Beginning of Year | | | 172,917 | | | | 155,807 | |
End of Year | | $ | 187,685 | | | $ | 172,917 | |
Undistributed (Distributions in excess of) net investment income | | $ | (5 | ) | | $ | (4 | ) |
(1) | See Note 8 for shares issued and redeemed. |
Amounts designated as “—” are either $0 or have been rounded to $0.
See accompanying notes to financial statements.
CITY NATIONAL ROCHDALE FUNDS | PAGE 136
City National Rochdale U.S. Core Equity Fund | | | City National Rochdale Socially Responsible Equity Fund | | | City National Rochdale Emerging Markets Fund | |
2015 | | | 2014 | | | 2015 | | | 2014 | | | 2015 | | | 2014 | |
| | | | | | | | | | | | | | | | |
$ | 947 | | | $ | 468 | | | $ | 3,151 | | | $ | 1,396 | | | $ | 1,498 | | | $ | 2,603 | |
| | | | | | | | | | | | | | | | | | | | | | | |
| | 1,411 | | | | 19,801 | | | | 2,738 | | | | 6,101 | | | | (7,454 | ) | | | (405 | ) |
| | — | | | | — | | | | — | | | | — | | | | (1,325 | ) | | | (579 | ) |
| | | | | | | | | | | | | | | | | | | | | | | |
| | 242 | | | | 10,820 | | | | (28,300 | ) | | | (169 | ) | | | (71,965 | ) | | | 53,480 | |
| | — | | | | — | | | | — | | | | — | | | | (270 | ) | | | (330 | ) |
| | 2,600 | | | | 31,089 | | | | (22,411 | ) | | | 7,328 | | | | (79,516 | ) | | | 54,769 | |
| | | | | | | | | | | | | | | | | | | | | | | |
| | | | | | | | | | | | | | | | | | | | | | | |
| | | | | | | | | | | | | | | | | | | | | | | |
| | (53 | ) | | | (82 | ) | | | (2,845 | ) | | | (939 | ) | | | — | | | | — | |
| | (278 | ) | | | (82 | ) | | | (241 | ) | | | (461 | ) | | | (2,025 | ) | | | (1,072 | ) |
| | (542 | ) | | | (306 | ) | | | — | | | | — | | | | — | | | | — | |
| | | | | | | | | | | | | | | | | | | | | | | |
| | (621 | ) | | | — | | | | (5,652 | ) | | | (7,405 | ) | | | — | | | | — | |
| | (9,079 | ) | | | (1,261 | ) | | | (672 | ) | | | (5,241 | ) | | | — | | | | — | |
| | (10,078 | ) | | | (1,354 | ) | | | — | | | | — | | | | — | | | | — | |
| | (20,651 | ) | | | (3,085 | ) | | | (9,410 | ) | | | (14,046 | ) | | | (2,025 | ) | | | (1,072 | ) |
| | | | | | | | | | | | | | | | | | | | | | | |
| | | | | | | | | | | | | | | | | | | | | | | |
| | | | | | | | | | | | | | | | | | | | | | | |
| | — | | | | 1,318 | | | | 112,429 | | | | 131,401 | | | | — | | | | — | |
| | — | | | | 50,817 | | | | — | | | | — | | | | — | | | | — | |
| | 674 | | | | 81 | | | | 8,463 | | | | 8,341 | | | | — | | | | — | |
| | (8 | ) | | | (47,918 | ) | | | (26,406 | ) | | | (7,405 | ) | | | — | | | | — | |
| | 666 | | | | 4,298 | | | | 94,486 | | | | 132,337 | | | | — | | | | — | |
| | | | | | | | | | | | | | | | | | | | | | | |
| | | | | | | | | | | | | | | | | | | | | | | |
| | 19,775 | | | | 27,776 | | | | 4,092 | | | | 11,122 | | | | 357,980 | | | | 295,842 | |
| | — | | | | 2,752 | | | | — | | | | — | | | | — | | | | — | |
| | 8,212 | | | | 1,216 | | | | 904 | | | | 5,563 | | | | 1,003 | | | | 530 | |
| | (14,129 | ) | | | (13,106 | ) | | | (5,830 | ) | | | (19,455 | ) | | | (175,750 | ) | | | (61,619 | ) |
| | 13,858 | | | | 18,638 | | | | (834 | ) | | | (2,770 | ) | | | 183,233 | | | | 234,753 | |
| | | | | | | | | | | | | | | | | | | | | | | |
| | | | | | | | | | | | | | | | | | | | | | | |
| | 35,806 | | | | 38,171 | | | | — | | | | — | | | | — | | | | — | |
| | 64 | | | | 11 | | | | — | | | | — | | | | — | | | | — | |
| | (25,710 | ) | | | (16,976 | ) | | | — | | | | — | | | | — | | | | — | |
| | 10,160 | | | | 21,206 | | | | — | | | | — | | | | — | | | | — | |
| | 24,684 | | | | 44,142 | | | | 93,652 | | | | 129,567 | | | | 183,233 | | | | 234,753 | |
| | 6,633 | | | | 72,146 | | | | 61,831 | | | | 122,849 | | | | 101,692 | | | | 288,450 | |
| | | | | | | | | | | | | | | | | | | | | | | |
| | | | | | | | | | | | | | | | | | | | | | | |
| | 207,210 | | | | 135,064 | | | | 199,593 | | | | 76,744 | | | | 582,490 | | | | 294,040 | |
$ | 213,843 | | | $ | 207,210 | | | $ | 261,424 | | | $ | 199,593 | | | $ | 684,182 | | | $ | 582,490 | |
$ | 88 | | | $ | — | | | $ | 77 | | | $ | — | | | $ | 171 | | | $ | 2,023 | |
Amounts designated as “—” are either $0 or have been rounded to $0.
See accompanying notes to financial statements.
CITY NATIONAL ROCHDALE FUNDS | PAGE 137
consolidated statement of cash flows (000) |
For the year ended September 30, 2015 |
| | | City National
Rochdale
Fixed Income
Opportunities Fund | |
Cash Flows from Operating Activities: | | | |
Net decrease in net assets from operations | | $ | (14,702 | ) |
Adjustments to reconcile net decrease in net assets resulting from operations to net cash used in operating activities: | | | | |
Purchase of investment securities | | | (2,184,181 | ) |
Proceeds from disposition of investment securities | | | 1,882,310 | |
Amortization (accretion of market discount) | | | (5,785 | ) |
Premium payments | | | (20,832 | ) |
Net realized loss on investments | | | 7,681 | |
Net change in unrealized depreciation on investments | | �� | 90,387 | |
| | | | | |
Changes in assets: | | | | |
Receivable for investment securities sold | | | (15,233 | ) |
Dividends and interest receivable | | | (4,237 | ) |
Unrealized gain on forward currency contracts | | | 1,670 | |
Prepaid expenses | | | (28 | ) |
Foreign tax reclaim receivable | | | (81 | ) |
| | | | | |
Changes in liabilities: | | | | |
Payable for investment securities purchased | | | (12,862 | ) |
Due to custodian | | | (1,198 | ) |
Unrealized loss on forward foreign currency contracts | | | (82 | ) |
Investment advisory fees payable | | | 209 | |
Shareholder servicing and distribution fees payable | | | 109 | |
Administrative fees payable | | | 4 | |
Accrued expense payable | | | 208 | |
Net Cash Used in Operating Activities | | | (276,643 | ) |
| | | | | |
Cash Flows from Financing Activities: | | | | |
Proceeds from shares issued | | | 667,307 | |
Cost of shares redeemed | | | (361,664 | ) |
Distributions | | | (37,134 | ) |
Net cash provided by financing activities | | | 268,509 | |
Net change in cash | | | (8,134 | ) |
Cash at beginning of year | | | 14,016 | |
Cash at end of year | | $ | 5,882 | |
| | | | | |
Non-Cash Financing Activities: | | | | |
Reinvestments of dividends and distributions | | $ | 62,724 | |
See accompanying notes to financial statements.
CITY NATIONAL ROCHDALE FUNDS | PAGE 138
This page intentionally left blank.
financial highlights |
For a Share Outstanding Throughout Each Period
For the year or period ended September 30, |
| | Net Asset Value Beginning of Period | | | Net Investment Income† | | | Dividends from Net Investment Income | | | Net Asset Value End of Period | | | Total Return‡ | | | Net Assets End of Period (000) | | | Ratio of Expenses to Average Net Assets(1)(2) | | | Ratio of Net Investment Income to Average Net Assets(1)(2) | | | Ratio of Expenses to Average Net Assets (Excluding Waivers & Recovered Fees)(1) | |
City National Rochdale Government Money Market Fund | |
Class N (commenced operations on June 21, 1999) | |
2015 | | $ | 1.00 | | | $0.000^ | | | $(0.000)^ | | | $ | 1.00 | | | | 0.01 | % | | $ | 2,958,782 | | | | 0.10 | % | | | 0.01 | % | | | 0.87 | % |
2014 | | | 1.00 | | | 0.000^ | | | (0.000)^ | | | | 1.00 | | | | 0.01 | | | | 3,174,351 | | | | 0.08 | | | | 0.01 | | | | 0.88 | |
2013 | | | 1.00 | | | 0.000^ | | | (0.000)^ | | | | 1.00 | | | | 0.01 | | | | 3,040,396 | | | | 0.13 | | | | 0.01 | | | | 0.97 | |
2012 | | | 1.00 | | | 0.000^ | | | (0.000)^ | | | | 1.00 | | | | 0.00 | | | | 2,808,068 | | | | 0.14 | | | | 0.01 | | | | 1.11 | |
2011 | | | 1.00 | | | 0.000^ | | | (0.000)^ | | | | 1.00 | | | | 0.02 | | | | 2,926,120 | | | | 0.14 | | | | 0.02 | | | | 1.11 | |
Class S (commenced operations on October 6, 1999) | |
2015 | | $ | 1.00 | | | $0.000^ | | | $(0.000)^ | | | $ | 1.00 | | | | 0.01 | % | | $ | 668,183 | | | | 0.10 | % | | | 0.01 | % | | | 1.07 | % |
2014 | | | 1.00 | | | 0.000^ | | | (0.000)^ | | | | 1.00 | | | | 0.01 | | | | 705,932 | | | | 0.08 | | | | 0.01 | | | | 1.08 | |
2013 | | | 1.00 | | | 0.000^ | | | (0.000)^ | | | | 1.00 | | | | 0.01 | | | | 475,151 | | | | 0.12 | | | | 0.01 | | | | 1.11 | |
2012 | | | 1.00 | | | 0.000^ | | | (0.000)^ | | | | 1.00 | | | | 0.00 | | | | 288,922 | | | | 0.14 | | | | 0.01 | | | | 1.11 | |
2011 | | | 1.00 | | | 0.000^ | | | (0.000)^ | | | | 1.00 | | | | 0.01 | | | | 291,194 | | | | 0.15 | | | | 0.01 | | | | 1.11 | |
Servicing Class (commenced operations on April 3, 2000)^^ | |
2015 | | $ | 1.00 | | | $0.000^ | | | $(0.000)^ | | | $ | 1.00 | | | | 0.01 | % | | $ | 308,591 | | | | 0.10 | % | | | 0.01 | % | | | 0.57 | % |
2014 | | | 1.00 | | | 0.000^ | | | (0.000)^ | | | | 1.00 | | | | 0.01 | | | | 211,958 | | | | 0.08 | | | | 0.01 | | | | 0.58 | |
2013 | | | 1.00 | | | 0.000^ | | | (0.000)^ | | | | 1.00 | | | | 0.01 | | | | 128,423 | | | | 0.12 | | | | 0.01 | | | | 0.61 | |
2012 | | | 1.00 | | | 0.000^ | | | (0.000)^ | | | | 1.00 | | | | 0.00 | | | | 96,452 | | | | 0.14 | | | | 0.01 | | | | 0.61 | |
2011 | | | 1.00 | | | 0.000^ | | | (0.000)^ | | | | 1.00 | | | | 0.02 | | | | 51,705 | | | | 0.14 | | | | 0.03 | | | | 0.61 | |
City National Rochdale Prime Money Market Fund | |
Institutional Class (commenced operations on December 19, 2012) | |
2015 | | $ | 1.00 | | | $0.000^ | | | $(0.000)^ | | | $ | 1.00 | | | | 0.01 | % | | $ | 68,005 | | | | 0.18 | % | | | 0.01 | % | | | 0.32 | % |
2014 | | | 1.00 | | | 0.000^ | | | (0.000)^ | | | | 1.00 | | | | 0.01 | | | | 53,975 | | | | 0.15 | | | | 0.01 | | | | 0.33 | |
2013 | | | 1.00 | | | 0.000^ | | | (0.000)^ | | | | 1.00 | | | | 0.02 | | | | 11,207 | | | | 0.18 | | | | 0.02 | | | | 0.35 | |
Class N (commenced operations on October 18, 1999) | |
2015 | | $ | 1.00 | | | $0.000^ | | | $(0.000)^ | | | $ | 1.00 | | | | 0.01 | % | | $ | 291,291 | | | | 0.18 | % | | | 0.01 | % | | | 0.87 | % |
2014 | | | 1.00 | | | 0.000^ | | | (0.000)^ | | | | 1.00 | | | | 0.01 | | | | 333,463 | | | | 0.15 | | | | 0.01 | | | | 0.88 | |
2013 | | | 1.00 | | | 0.000^ | | | (0.000)^ | | | | 1.00 | | | | 0.02 | | | | 424,972 | | | | 0.20 | | | | 0.02 | | | | 0.96 | |
2012 | | | 1.00 | | | 0.000^ | | | (0.000)^ | | | | 1.00 | | | | 0.00 | | | | 394,036 | | | | 0.24 | | | | 0.01 | | | | 1.10 | |
2011 | | | 1.00 | | | 0.000^ | | | (0.000)^ | | | | 1.00 | | | | 0.03 | | | | 450,282 | | | | 0.25 | | | | 0.03 | | | | 1.10 | |
Class S (commenced operations on October 26, 1999) | |
2015 | | $ | 1.00 | | | $0.000^ | | | $(0.000)^ | | | $ | 1.00 | | | | 0.01 | % | | $ | 258,809 | | | | 0.18 | % | | | 0.01 | % | | | 1.07 | % |
2014 | | | 1.00 | | | 0.000^ | | | (0.000)^ | | | | 1.00 | | | | 0.01 | | | | 198,237 | | | | 0.15 | | | | 0.01 | | | | 1.08 | |
2013 | | | 1.00 | | | 0.000^ | | | (0.000)^ | | | | 1.00 | | | | 0.01 | | | | 207,252 | | | | 0.21 | | | | 0.01 | | | | 1.09 | |
2012 | | | 1.00 | | | 0.000^ | | | (0.000)^ | | | | 1.00 | | | | 0.00 | | | | 256,060 | | | | 0.24 | | | | 0.01 | | | | 1.10 | |
2011 | | | 1.00 | | | 0.000^ | | | 0.000^ | | | | 1.00 | | | | 0.02 | | | | 265,116 | | | | 0.27 | | | | 0.01 | | | | 1.10 | |
Servicing Class (commenced operations on March 23, 1998)^^ | |
2015 | | $ | 1.00 | | | $0.000^ | | | $(0.000)^ | | | $ | 1.00 | | | | 0.01 | % | | $ | 405,847 | | | | 0.18 | % | | | 0.01 | % | | | 0.57 | % |
2014 | | | 1.00 | | | 0.000^ | | | (0.000)^ | | | | 1.00 | | | | 0.01 | | | | 463,633 | | | | 0.15 | | | | 0.01 | | | | 0.58 | |
2013 | | | 1.00 | | | 0.000^ | | | (0.000)^ | | | | 1.00 | | | | 0.02 | | | | 613,445 | | | | 0.19 | | | | 0.02 | | | | 0.59 | |
2012 | | | 1.00 | | | 0.000^ | | | (0.000)^ | | | | 1.00 | | | | 0.00 | | | | 506,728 | | | | 0.23 | | | | 0.02 | | | | 0.60 | |
2011 | | | 1.00 | | | | 0.001 | | | | (0.001 | ) | | | 1.00 | | | | 0.06 | | | | 630,250 | | | | 0.22 | | | | 0.05 | | | | 0.60 | |
City National Rochdale California Tax Exempt Money Market Fund | |
Class N (commenced operations on June 21, 1999) | |
2015 | | $ | 1.00 | | | $0.000^ | | | $(0.000)^ | | | $ | 1.00 | | | | 0.01 | % | | $ | 594,315 | | | | 0.06 | % | | | 0.01 | % | | | 0.89 | % |
2014 | | | 1.00 | | | 0.000^ | | | (0.000)^ | | | | 1.00 | | | | 0.01 | | | | 623,561 | | | | 0.05 | | | | 0.01 | | | | 0.90 | |
2013 | | | 1.00 | | | 0.000^ | | | (0.000)^ | | | | 1.00 | | | | 0.01 | | | | 673,208 | | | | 0.11 | | | | 0.01 | | | | 0.97 | |
2012 | | | 1.00 | | | 0.000^ | | | (0.000)^ | | | | 1.00 | | | | 0.00 | | | | 666,532 | | | | 0.12 | | | | 0.01 | | | | 1.11 | |
2011 | | | 1.00 | | | 0.000^ | | | (0.000)^ | | | | 1.00 | | | | 0.02 | | | | 628,163 | | | | 0.17 | | | | 0.02 | | | | 1.12 | |
Class S (commenced operations on November 12, 1999) | |
2015 | | $ | 1.00 | | | $0.000^ | | | $(0.000)^ | | | $ | 1.00 | | | | 0.01 | % | | $ | 60,397 | | | | 0.06 | % | | | 0.01 | % | | | 1.09 | % |
2014 | | | 1.00 | | | 0.000^ | | | (0.000)^ | | | | 1.00 | | | | 0.01 | | | | 81,412 | | | | 0.05 | | | | 0.01 | | | | 1.10 | |
2013 | | | 1.00 | | | 0.000^ | | | (0.000)^ | | | | 1.00 | | | | 0.01 | | | | 79,312 | | | | 0.11 | | | | 0.01 | | | | 1.11 | |
2012 | | | 1.00 | | | 0.000^ | | | (0.000)^ | | | | 1.00 | | | | 0.00 | | | | 99,970 | | | | 0.12 | | | | 0.01 | | | | 1.11 | |
2011 | | | 1.00 | | | 0.000^ | | | (0.000)^ | | | | 1.00 | | | | 0.01 | | | | 78,221 | | | | 0.17 | | | | 0.01 | | | | 1.12 | |
Servicing Class (commenced operations on April 3, 2000)^^ | |
2015 | | $ | 1.00 | | | $0.000^ | | | $(0.000)^ | | | $ | 1.00 | | | | 0.01 | % | | $ | 225,827 | | | | 0.06 | % | | | 0.01 | % | | | 0.59 | % |
2014 | | | 1.00 | | | 0.000^ | | | (0.000)^ | | | | 1.00 | | | | 0.01 | | | | 201,369 | | | | 0.05 | | | | 0.01 | | | | 0.60 | |
2013 | | | 1.00 | | | 0.000^ | | | (0.000)^ | | | | 1.00 | | | | 0.01 | | | | 165,740 | | | | 0.10 | | | | 0.01 | | | | 0.61 | |
2012 | | | 1.00 | | | 0.000^ | | | (0.000)^ | | | | 1.00 | | | | 0.00 | | | | 137,665 | | | | 0.12 | | | | 0.01 | | | | 0.61 | |
2011 | | | 1.00 | | | 0.000^ | | | (0.000)^ | | | | 1.00 | | | | 0.02 | | | | 169,932 | | | | 0.16 | | | | 0.02 | | | | 0.62 | |
† | Per share calculations are based on Average Shares outstanding throughout the period. |
‡ | Returns are for the period indicated and have not been annualized. Fee waivers are in effect; if they had not been in effect, performance would have been lower. Returns shown do not reflect the deduction of taxes that a shareholder would pay on fund distributions or the redemption of fund shares. |
^ | Amount represents less than $0.001. |
^^ | Effective November 28, 2012, Institutional Class Shares were redesignated as Servicing Class Shares. This share class name change had no impact on the Fund’s operations or investment policy. |
(1) | Annualized for periods less than one year. |
(2) | Ratio includes waivers and previously waived investment advisory fees recovered. The impact of the recovered fees may cause a higher net expense ratio. |
See accompanying notes to financial statements.
CITY NATIONAL ROCHDALE FUNDS | PAGE 140
| | Net Asset Value Beginning of Period | | | Net Investment Income† | | | Net Realized and Unrealized Gains (Losses) on Securities† | | | Dividends from Net Investment Income | | | Distributions from Realized Capital Gains | | | Net Asset Value End of Period | | | Total Return‡ | | | Net Assets End of Period (000) | | | Ratio of Expenses to Average Net Assets(1)(2) | | | Ratio of Net Investment Income to Average Net Assets(1)(2) | | | Ratio of Expenses to Average Net Assets (Excluding Waivers & Recovered Fees)(1) | | | Portfolio Turnover Rate | |
City National Rochdale Government Bond Fund | |
Institutional Class (commenced operations on February 1, 2012) | |
2015 | | $ | 10.49 | | | $ | 0.06 | | | $ | 0.10 | | | $ | (0.06 | ) | | $ | — | | | $ | 10.59 | | | | 1.55 | % | | $ | 58,301 | | | | 0.53 | % | | | 0.59 | % | | | 0.57 | % | | | 37 | % |
2014 | | | 10.47 | | | | 0.06 | | | | 0.02 | | | | (0.06 | ) | | | — | | | | 10.49 | | | | 0.80 | | | | 56,722 | | | | 0.53 | | | | 0.59 | | | | 0.57 | | | | 59 | |
2013 | | | 10.73 | | | | 0.11 | | | | (0.23 | ) | | | (0.14 | ) | | | — | | | | 10.47 | | | | (1.11 | ) | | | 56,351 | | | | 0.54 | | | | 1.03 | | | | 0.52 | | | | 28 | |
2012 | | | 10.75 | | | | 0.05 | | | | 0.04 | | | | (0.11 | ) | | | — | | | | 10.73 | | | | 0.01 | | | | 55,502 | | | | 0.55 | | | | 0.96 | | | | 0.53 | | | | 55 | |
Class N (commenced operations on April 13, 2000) | |
2015 | | $ | 10.51 | | | $ | 0.01 | | | $ | 0.09 | | | $ | (0.01 | ) | | $ | — | | | $ | 10.60 | | | | 0.95 | % | | $ | 1,895 | | | | 1.03 | % | | | 0.08 | % | | | 1.07 | % | | | 37 | % |
2014 | | | 10.49 | | | | 0.01 | | | | 0.02 | | | | (0.01 | ) | | | — | | | | 10.51 | | | | 0.29 | | | | 2,027 | | | | 1.03 | | | | 0.10 | | | | 1.07 | | | | 59 | |
2013 | | | 10.75 | | | | 0.04 | | | | (0.21 | ) | | | (0.09 | ) | | | — | | | | 10.49 | | | | (1.60 | ) | | | 2,505 | | | | 1.03 | | | | 0.38 | | | | 1.02 | | | | 28 | |
2012 | | | 10.77 | | | | 0.06 | | | | 0.05 | | | | (0.12 | ) | | | (0.01 | ) | | | 10.75 | | | | 0.01 | | | | 2,970 | | | | 1.03 | | | | 0.56 | | | | 1.03 | | | | 55 | |
2011 | | | 10.68 | | | | 0.12 | | | | 0.15 | | | | (0.18 | ) | | | — | | | | 10.77 | | | | 2.60 | | | | 2,940 | | | | 0.95 | | | | 1.17 | | | | 1.03 | | | | 86 | |
Servicing Class (commenced operations on January 14, 2000)^ | |
2015 | | $ | 10.49 | | | $ | 0.04 | | | $ | 0.09 | | | $ | (0.04 | ) | | $ | — | | | $ | 10.58 | | | | 1.21 | % | | $ | 90,624 | | | | 0.78 | % | | | 0.33 | % | | | 0.82 | % | | | 37 | % |
2014 | | | 10.47 | | | | 0.04 | | | | 0.02 | | | | (0.04 | ) | | | — | | | | 10.49 | | | | 0.54 | | | | 113,485 | | | | 0.78 | | | | 0.34 | | | | 0.82 | | | | 59 | |
2013 | | | 10.72 | | | | 0.07 | | | | (0.20 | ) | | | (0.12 | ) | | | — | | | | 10.47 | | | | (1.26 | ) | | | 114,953 | | | | 0.79 | | | | 0.62 | | | | 0.77 | | | | 28 | |
2012 | | | 10.75 | | | | 0.09 | | | | 0.03 | | | | (0.14 | ) | | | (0.01 | ) | | | 10.72 | | | | 0.01 | | | | 124,121 | | | | 0.77 | | | | 0.83 | | | | 0.78 | | | | 55 | |
2011 | | | 10.66 | | | | 0.15 | | | | 0.15 | | | | (0.21 | ) | | | — | | | | 10.75 | | | | 2.86 | | | | 175,866 | | | | 0.70 | | | | 1.40 | | | | 0.78 | | | | 86 | |
City National Rochdale Corporate Bond Fund | |
Class N (commenced operations on April 13, 2000) | |
2015 | | $ | 10.67 | | | $ | 0.15 | | | $ | (0.14 | ) | | $ | (0.15 | ) | | $ | (0.08 | ) | | $ | 10.45 | | | | 0.14 | % | | $ | 4,411 | | | | 1.01 | % | | | 1.42 | % | | | 1.07 | % | | | 32 | % |
2014 | | | 10.71 | | | | 0.14 | | | | 0.03 | | | | (0.14 | ) | | | (0.07 | ) | | | 10.67 | | | | 1.64 | | | | 4,008 | | | | 1.01 | | | | 1.32 | | | | 1.07 | | | | 37 | |
2013 | | | 10.91 | | | | 0.16 | | | | (0.10 | ) | | | (0.17 | ) | | | (0.09 | ) | | | 10.71 | | | | 0.49 | | | | 3,100 | | | | 1.00 | | | | 1.51 | | | | 1.00 | | | | 29 | |
2012 | | | 10.59 | | | | 0.22 | | | | 0.37 | | | | (0.22 | ) | | | (0.05 | ) | | | 10.91 | | | | 0.06 | | | | 2,535 | | | | 1.00 | | | | 2.05 | | | | 1.00 | | | | 31 | |
2011 | | | 10.89 | | | | 0.29 | | | | (0.30 | ) | | | (0.29 | ) | | | — | | | | 10.59 | | | | (0.10 | ) | | | 2,481 | | | | 1.00 | | | | 2.69 | | | | 1.00 | | | | 40 | |
Servicing Class (commenced operations on January 14, 2000)^ | |
2015 | | $ | 10.66 | | | $ | 0.18 | | | $ | (0.14 | ) | | $ | (0.18 | ) | | $ | (0.08 | ) | | $ | 10.44 | | | | 0.39 | % | | $ | 131,394 | | | | 0.76 | % | | | 1.67 | % | | | 0.82 | % | | | 32 | % |
2014 | | | 10.70 | | | | 0.17 | | | | 0.03 | | | | (0.17 | ) | | | (0.07 | ) | | | 10.66 | | | | 1.89 | | | | 142,766 | | | | 0.76 | | | | 1.57 | | | | 0.82 | | | | 37 | |
2013 | | | 10.90 | | | | 0.19 | | | | (0.11 | ) | | | (0.19 | ) | | | (0.09 | ) | | | 10.70 | | | | 0.75 | | | | 135,184 | | | | 0.75 | | | | 1.77 | | | | 0.75 | | | | 29 | |
2012 | | | 10.58 | | | | 0.25 | | | | 0.37 | | | | (0.25 | ) | | | (0.05 | ) | | | 10.90 | | | | 0.06 | | | | 133,787 | | | | 0.75 | | | | 2.30 | | | | 0.75 | | | | 31 | |
2011 | | | 10.88 | | | | 0.32 | | | | (0.30 | ) | | | (0.32 | ) | | | — | | | | 10.58 | | | | 0.15 | | | | 111,563 | | | | 0.75 | | | | 2.94 | | | | 0.75 | | | | 40 | |
City National Rochdale California Tax Exempt Bond Fund | |
Class N (commenced operations on April 13, 2000) | |
2015 | | $ | 10.74 | | | $ | 0.12 | | | $ | 0.02 | | | $ | (0.12 | ) | | $ | (0.05 | ) | | $ | 10.71 | | | | 1.30 | % | | $ | 11,386 | | | | 0.88 | % | | | 1.10 | % | | | 1.00 | % | | | 10 | % |
2014 | | | 10.54 | | | | 0.13 | | | | 0.22 | | | | (0.13 | ) | | | (0.02 | ) | | | 10.74 | | | | 3.31 | | | | 10,955 | | | | 0.88 | | | | 1.17 | | | | 1.02 | | | | 36 | |
2013 | | | 10.86 | | | | 0.18 | | | | (0.22 | ) | | | (0.18 | ) | | | (0.10 | ) | | | 10.54 | | | | (0.45 | ) | | | 8,197 | | | | 0.87 | | | | 1.64 | | | | 0.86 | | | | 34 | |
2012 | | | 10.70 | | | | 0.22 | | | | 0.23 | | | | (0.22 | ) | | | (0.07 | ) | | | 10.86 | | | | 4.32 | | | | 6,093 | | | | 0.83 | | | | 2.07 | | | | 0.86 | | | | 27 | |
2011 | | | 10.73 | | | | 0.26 | | | | 0.01 | | | | (0.26 | ) | | | (0.04 | ) | | | 10.70 | | | | 2.65 | | | | 4,563 | | | | 0.75 | | | | 2.46 | | | | 0.87 | | | | 26 | |
Servicing Class (commenced operations on January 14, 2000)^ | |
2015 | | $ | 10.71 | | | $ | 0.14 | | | $ | 0.03 | | | $ | (0.15 | ) | | $ | (0.05 | ) | | $ | 10.68 | | | | 1.56 | % | | $ | 86,507 | | | | 0.63 | % | | | 1.36 | % | | | 0.75 | % | | | 10 | % |
2014 | | | 10.51 | | | | 0.15 | | | | 0.22 | | | | (0.15 | ) | | | (0.02 | ) | | | 10.71 | | | | 3.58 | | | | 70,698 | | | | 0.63 | | | | 1.43 | | | | 0.77 | | | | 36 | |
2013 | | | 10.83 | | | | 0.20 | | | | (0.22 | ) | | | (0.20 | ) | | | (0.10 | ) | | | 10.51 | | | | (0.20 | ) | | | 59,149 | | | | 0.62 | | | | 1.91 | | | | 0.62 | | | | 34 | |
2012 | | | 10.67 | | | | 0.25 | | | | 0.23 | | | | (0.25 | ) | | | (0.07 | ) | | | 10.83 | | | | 4.59 | | | | 51,840 | | | | 0.58 | | | | 2.34 | | | | 0.61 | | | | 27 | |
2011 | | | 10.70 | | | | 0.29 | | | | 0.01 | | | | (0.29 | ) | | | (0.04 | ) | | | 10.67 | | | | 2.92 | | | | 53,464 | | | | 0.50 | | | | 2.73 | | | | 0.62 | | | | 26 | |
† | Per share calculations are based on Average Shares outstanding throughout the period. |
‡ | Returns are for the period indicated and have not been annualized. Fee waivers are in effect; if they had not been in effect, performance would have been lower. Returns shown do not reflect the deduction of taxes that a shareholder would pay on fund distributions or the redemption of fund shares. |
^ | Effective December 19, 2011, Institutional Class Shares were redesignated as Servicing Class Shares. This share class name change had no impact on the Fund’s operations or investment policy. |
(1) | Annualized for periods less than one year. |
(2) | Ratio includes waivers and previously waived investment advisory fees recovered. The impact of the recovered fees may cause a higher net expense ratio. |
Amounts designated as “—” are either $0 or have been rounded to $0.
See accompanying notes to financial statements.
CITY NATIONAL ROCHDALE FUNDS | PAGE 141
financial highlights/consolidated financial highlights |
For a Share Outstanding Throughout Each Period
For the year or period ended September 30, |
| | | Net Asset Value Beginning of Period | | | Net Investment Income† | | | Net Realized and Unrealized Gains (Losses) on Securities† | | | Dividends from Net Investment Income | | | Distributions from Realized Capital Gains | | | Net Asset Value End of Period | | | Total Return‡ | | | Net Assets End of Period (000) | | | Ratio of Expenses to Average Net Assets(1)(2) | | | Ratio of Net Investment Income to Average Net Assets(1)(2) | | | Ratio of Expenses to Average Net Assets (Excluding Waivers & Recovered Fees)(1) | | | Portfolio Turnover Rate | |
City National Rochdale Municipal High Income Fund | |
Class N (commenced operations on December 30, 2013) | |
2015 | | | $ | 10.71 | | | $ | 0.41 | | | $ | (0.04 | ) | | $ | (0.41 | ) | | $ —^ | | | $ | 10.67 | | | | 3.55 | % | | $ | 382,461 | | | | 1.04 | % | | | 3.85 | % | | | 1.03 | % | | | 2 | % |
2014 | | | | 10.00 | | | | 0.32 | | | | 0.71 | | | | (0.32 | ) | | | — | | | | 10.71 | | | | 10.38 | | | | 201,200 | | | | 1.08 | | | | 4.02 | | | | 1.08 | | | | 1 | |
Servicing Class (commenced operations on December 30, 2013) | |
2015 | | | $ | 10.72 | | | $ | 0.44 | | | $ | (0.04 | ) | | $ | (0.44 | ) | | $ —^ | | | $ | 10.68 | | | | 3.81 | % | | $ | 317,201 | | | | 0.79 | % | | | 4.10 | % | | | 0.79 | % | | | 2 | % |
2014 | | | | 10.00 | | | | 0.34 | | | | 0.72 | | | | (0.34 | ) | | | — | | | | 10.72 | | | | 10.68 | | | | 220,851 | | | | 0.83 | | | | 4.27 | | | | 0.84 | | | | 1 | |
City National Rochdale High Yield Bond Fund | |
Institutional Class (commenced operations on February 2, 2012) | |
2015 | | | $ | 8.76 | | | $ | 0.49 | | | $ | (0.77 | ) | | $ | (0.49 | ) | | $ | (0.41 | ) | | $ | 7.58 | | | | (3.47 | )% | | $ | 38,274 | | | | 0.70 | % | | | 5.94 | % | | | 0.83 | % | | | 77 | % |
2014 | | | | 8.59 | | | | 0.53 | | | | 0.19 | | | | (0.53 | ) | | | (0.02 | ) | | | 8.76 | | | | 8.49 | | | | 40,639 | | | | 0.70 | | | | 5.98 | | | | 0.78 | | | | 59 | |
2013 | | | | 8.64 | | | | 0.60 | | | | (0.05 | ) | | | (0.60 | ) | | | — | | | | 8.59 | | | | 6.49 | | | | 39,219 | | | | 0.75 | | | | 6.87 | | | | 0.75 | | | | 56 | |
2012 | | | | 8.39 | | | | 0.43 | | | | 0.26 | | | | (0.44 | ) | | | — | | | | 8.64 | | | | 8.39 | | | | 40,891 | | | | 0.85 | | | | 7.66 | | | | 0.85 | | | | 41 | |
Class N (commenced operations on January 14, 2000) | |
2015 | | | $ | 8.76 | | | $ | 0.44 | | | $ | (0.76 | ) | | $ | (0.45 | ) | | $ | (0.41 | ) | | $ | 7.58 | | | | (3.94 | )% | | $ | 21,063 | | | | 1.20 | % | | | 5.43 | % | | | 1.33 | % | | | 77 | % |
2014 | | | | 8.59 | | | | 0.49 | | | | 0.18 | | | | (0.48 | ) | | | (0.02 | ) | | | 8.76 | | | | 7.95 | | | | 26,166 | | | | 1.20 | | | | 5.49 | | | | 1.28 | | | | 59 | |
2013 | | | | 8.64 | | | | 0.56 | | | | (0.05 | ) | | | (0.56 | ) | | | — | | | | 8.59 | | | | 5.95 | | | | 34,371 | | | | 1.27 | | | | 6.37 | | | | 1.26 | | | | 56 | |
2012 | | | | 7.98 | | | | 0.62 | | | | 0.66 | | | | (0.62 | ) | | | — | | | | 8.64 | | | | 16.56 | | | | 38,629 | | | | 1.38 | | | | 7.43 | | | | 1.39 | | | | 41 | |
2011 | | | | 8.31 | | | | 0.69 | | | | (0.33 | ) | | | (0.69 | ) | | | — | | | | 7.98 | | | | 4.14 | | | | 28,672 | | | | 1.30 | | | | 8.12 | | | | 1.40 | | | | 56 | |
Servicing Class (commenced operations on January 14, 2000)^ | |
2015 | | | $ | 8.76 | | | $ | 0.47 | | | $ | (0.77 | ) | | $ | (0.47 | ) | | $ | (0.41 | ) | | $ | 7.58 | | | | (3.71 | )% | | $ | 27,174 | | | | 0.95 | % | | | 5.67 | % | | | 1.08 | % | | | 77 | % |
2014 | | | | 8.59 | | | | 0.51 | | | | 0.19 | | | | (0.51 | ) | | | (0.02 | ) | | | 8.76 | | | | 8.22 | | | | 43,974 | | | | 0.95 | | | | 5.83 | | | | 1.02 | | | | 59 | |
2013 | | | | 8.63 | | | | 0.58 | | | | (0.04 | ) | | | (0.58 | ) | | | — | | | | 8.59 | | | | 6.35 | | | | 88,949 | | | | 0.99 | | | | 6.58 | | | | 0.99 | | | | 56 | |
2012 | | | | 7.98 | | | | 0.65 | | | | 0.65 | | | | (0.65 | ) | | | — | | | | 8.63 | | | | 16.77 | | | | 74,245 | | | | 1.08 | | | | 7.76 | | | | 1.09 | | | | 41 | |
2011 | | | | 8.31 | | | | 0.72 | | | | (0.33 | ) | | | (0.72 | ) | | | — | | | | 7.98 | | | | 4.45 | | | | 65,829 | | | | 1.00 | | | | 8.43 | | | | 1.10 | | | | 56 | |
City National Rochdale Intermediate Fixed Income Fund | |
Institutional Class (commenced operations on December 20, 2013) | |
2015 | | | $ | 26.23 | | | $ | 0.60 | | | $ | (0.11 | ) | | $ | (0.60 | ) | | $ | — | | | $ | 26.12 | | | | 1.87 | % | | $ | 15,574 | | | | 0.51 | % | | | 2.29 | % | | | 0.53 | % | | | 21 | % |
2014 | | | | 25.89 | | | | 0.53 | | | | 0.33 | | | | (0.52 | ) | | | — | | | | 26.23 | | | | 3.35 | | | | 8,784 | | | | 0.51 | | | | 2.57 | | | | 0.52 | | | | 28 | |
Class N (commenced operations on December 31, 1999) | |
2015 | | | $ | 26.23 | | | $ | 0.47 | | | $ | (0.12 | ) | | $ | (0.47 | ) | | $ | — | | | $ | 26.11 | | | | 1.34 | % | | $ | 255,013 | | | | 1.01 | % | | | 1.79 | % | | | 1.03 | % | | | 21 | % |
2014 | | | | 25.89 | | | | 0.57 | | | | 0.34 | | | | (0.57 | ) | | | — | | | | 26.23 | | | | 3.54 | | | | 204,264 | | | | 1.01 | | | | 2.17 | | | | 1.04 | | | | 28 | |
| | 2013 | * | | | 26.76 | | | | 0.60 | | | | (0.85 | ) | | | (0.62 | ) | | | — | | | | 25.89 | | | | (0.96 | ) | | | 155,740 | | | | 1.02 | | | | 3.04 | | | | 1.04 | | | | 21 | |
| | 2012 | | | | 25.68 | | | | 0.95 | | | | 1.08 | | | | (0.95 | ) | | | — | | | | 26.76 | | | | 7.99 | | | | 130,359 | | | | 1.13 | | | | 3.59 | | | | 1.12 | | | | 26 | |
| | 2011 | | | | 25.89 | | | | 0.97 | | | | (0.23 | ) | | | (0.95 | ) | | | — | | | | 25.68 | | | | 2.88 | | | | 107,957 | | | | 1.15 | | | | 3.74 | | | | 1.15 | | | | 58 | |
| | 2010 | | | | 25.11 | | | | 0.95 | | | | 0.79 | | | | (0.96 | ) | | | — | | | | 25.89 | | | | 7.01 | | | | 75,900 | | | | 1.15 | | | | 3.79 | | | | 1.12 | | | | 52 | |
City National Rochdale Fixed Income Opportunities Fund | |
Class N (commenced operations on July 1, 2009) | |
| | 2015 | | | $ | 27.19 | | | $ | 1.34 | | | $ | (1.59 | ) | | $ | (1.60 | ) | | $ | (0.12 | ) | | $ | 25.22 | | | | (0.88 | )% | | $ | 1,641,954 | | | | 1.10 | %(4) | | | 5.08 | % | | | 1.12 | %(4) | | | 73 | % |
| | 2014 | | | | 26.83 | | | | 1.28 | | | | 0.38 | | | | (1.17 | ) | | | (0.13 | ) | | | 27.19 | | | | 6.20 | | | | 1,391,497 | | | | 1.11 | (3) | | | 4.65 | | | | 1.12 | (3) | | | 82 | |
| | 2013 | * | | | 27.20 | | | | 1.28 | | | | (0.43 | ) | | | (1.22 | ) | | —^^ | | | | 26.83 | | | | 3.16 | | | | 924,444 | | | | 1.08 | | | | 6.24 | | | | 1.11 | | | | 52 | |
| | 2012 | | | | 26.16 | | | | 1.70 | | | | 1.04 | | | | (1.64 | ) | | | (0.06 | ) | | | 27.20 | | | | 10.70 | | | | 654,095 | | | | 1.12 | | | | 6.29 | | | | 1.12 | | | | 41 | |
| | 2011 | | | | 27.34 | | | | 1.58 | | | | (1.02 | ) | | | (1.45 | ) | | | (0.29 | ) | | | 26.16 | | | | 2.04 | | | | 497,684 | | | | 1.16 | | | | 5.80 | | | | 1.16 | | | | 60 | |
| | 2010 | | | | 26.56 | | | | 1.79 | | | | 1.07 | | | | (1.79 | ) | | | (0.29 | ) | | | 27.34 | | | | 11.10 | | | | 257,900 | | | | 1.18 | | | | 6.60 | | | | 1.18 | | | | 62 | |
* | For the nine months ended September 30, 2013, and the year or period ended December 31. Effective March 29, 2013, Rochdale Investment Trust’s Rochdale Intermediate Fixed Income Portfolio and Rochdale Fixed Income Opportunities Portfolio (each a “Predecessor Fund”) were merged into City National Rochdale Funds’ City National Rochdale Intermediate Fixed Income Fund and City National Rochdale Fixed Income Opportunities Fund, respectively. Information presented for the period prior to March 29, 2013, is that of the respective Predecessor Fund, which had a December 31 fiscal year end. |
† | Per share calculations are based on Average Shares outstanding throughout the period. |
‡ | Returns are for the period indicated and have not been annualized. Fee waivers are in effect; if they had not been in effect, performance would have been lower. Returns shown do not reflect the deduction of taxes that a shareholder would pay on fund distributions or the redemption of fund shares. |
^ | Effective December 19, 2011, Institutional Class Shares were redesignated as Servicing Class Shares. This share class name change had no impact on the Fund’s operations or investment policy. |
^^ | Amount represents less than $0.01 per share. |
(1) | Annualized for periods less than one year. |
(2) | Ratio includes waivers and previously waived investment advisory fees recovered. The impact of the recovered fees may cause a higher net expense ratio. |
(3) | The expense ratio includes acquired fund fee expenses from the investment in the Subsidiary. Had this expense been excluded, the ratios would have been 1.09% and 1.10%, respectively. |
(4) | The expense ratio includes acquired fund fee expenses from the investment in the Subsidiary. Had this expense been excluded, the ratios would have been 1.09% and 1.11%, respectively. |
Amounts designated as “—” are either $0 or have been rounded to $0.
See accompanying notes to financial statements.
CITY NATIONAL ROCHDALE FUNDS | PAGE 142
| | | Net Asset Value Beginning of Period | | | Net Investment Income† | | | Net Realized and Unrealized Gains (Losses) on Securities† | | | Redemption Fees | | | Dividends from Net Investment Income | | | Distributions from Realized Capital Gains | | | Distributions from Return of Capital | | | Net Asset Value End of Period | | | Total Return‡ | | | Net Assets End of Period (000) | | | Ratio of Expenses to
Average Net Assets(1)(2) | | | Ratio of Net Investment Income to Average Net Assets(1)(2) | | | Ratio of Expenses to Average Net Assets (Excluding Waivers & Recovered Fees)(1) | | | Portfolio Turnover Rate | |
City National Rochdale Multi-Asset Fund | |
Class N (commenced operations on October 1, 2007) | |
2015 | | | $ | 11.01 | | | $ | 0.12 | | | $ | (0.54 | ) | | $ | — | | | $ | (0.11 | ) | | $ | — | | | $ | — | | | $ | 10.48 | | | | (3.84 | )% | | $ | 16,080 | | | | 1.50 | % | | | 1.09 | % | | | 1.69 | % | | | 67 | % |
2014 | | | | 10.70 | | | | 0.07 | | | | 0.32 | | | | — | | | | (0.08 | ) | | | — | | | | — | | | | 11.01 | | | | 3.67 | | | | 18,760 | | | | 1.49 | | | | 0.63 | | | | 1.53 | | | | 75 | |
2013 | | | | 10.44 | | | | 0.15 | | | | 0.29 | | | | — | | | | (0.18 | ) | | | — | | | | — | | | | 10.70 | | | | 4.25 | | | | 21,966 | | | | 1.09 | | | | 1.45 | | | | 1.10 | | | | 56 | |
2012 | | | | 9.88 | | | | 0.18 | | | | 0.57 | | | | — | | | | (0.19 | ) | | | — | | | | — | | | | 10.44 | | | | 7.61 | | | | 25,001 | | | | 1.09 | | | | 1.72 | | | | 1.10 | | | | 89 | |
2011 | | | | 10.36 | | | | 0.17 | | | | (0.48 | ) | | | — | | | | (0.17 | ) | | | — | | | | — | | | | 9.88 | | | | (3.11 | ) | | | 26,377 | | | | 1.09 | | | | 1.57 | | | | 1.10 | | | | 67 | |
Servicing Class (commenced operations on October 1, 2007)^^ | |
2015 | | | $ | 11.02 | | | $ | 0.15 | | | $ | (0.54 | ) | | $ | — | | | $ | (0.14 | ) | | $ | — | | | $ | — | | | $ | 10.49 | | | | (3.59 | )% | | $ | 4,404 | | | | 1.25 | % | | | 1.35 | % | | | 1.43 | % | | | 67 | % |
2014 | | | | 10.71 | | | | 0.10 | | | | 0.32 | | | | — | | | | (0.11 | ) | | | — | | | | — | | | | 11.02 | | | | 3.94 | | | | 6,045 | | | | 1.24 | | | | 0.87 | | | | 1.29 | | | | 75 | |
2013 | | | | 10.45 | | | | 0.18 | | | | 0.29 | | | | — | | | | (0.21 | ) | | | — | | | | — | | | | 10.71 | | | | 4.51 | | | | 4,938 | | | | 0.84 | | | | 1.70 | | | | 0.84 | | | | 56 | |
2012 | | | | 9.88 | | | | 0.20 | | | | 0.57 | | | | — | | | | (0.20 | ) | | | — | | | | — | | | | 10.45 | | | | 7.89 | | | | 7,230 | | | | 0.84 | | | | 1.99 | | | | 0.84 | | | | 89 | |
2011 | | | | 10.37 | | | | 0.19 | | | | (0.48 | ) | | | — | | | | (0.20 | ) | | | — | | | | — | | | | 9.88 | | | | (2.97 | ) | | | 19,084 | | | | 0.84 | | | | 1.76 | | | | 0.85 | | | | 67 | |
City National Rochdale Dividend & Income Fund | |
Class N (commenced operations on June 1, 1999) | |
2015 | | | $ | 35.08 | | | $ | 0.94 | | | $ | (0.72 | ) | | $ | — | | | $ | (1.08 | ) | | $ | — | | | $ | — | | | $ | 34.22 | | | | 0.53 | % | | $ | 187,685 | | | | 1.11 | % | | | 2.60 | % | | | 1.13 | % | | | 13 | % |
2014 | | | | 32.25 | | | | 0.95 | | | | 2.96 | | | | — | | | | (1.08 | ) | | | — | | | | — | | | | 35.08 | | | | 12.20 | | | | 172,917 | | | | 1.09 | | | | 2.74 | | | | 1.14 | | | | 16 | |
| | 2013 | * | | | 29.07 | | | | 0.62 | | | | 3.37 | | | | — | | | | (0.54 | ) | | | — | | | | (0.27 | ) | | | 32.25 | | | | 13.74 | | | | 155,807 | | | | 1.16 | | | | 2.55 | | | | 1.19 | | | | 17 | |
| | 2012 | | | | 28.06 | | | | 0.92 | | | | 1.17 | | | | — | | | | (0.92 | ) | | | — | | | | (0.16 | ) | | | 29.07 | | | | 7.49 | | | | 116,138 | | | | 1.38 | | | | 3.18 | | | | 1.37 | | | | 13 | |
| | 2011 | | | | 26.73 | | | | 0.90 | | | | 1.46 | | | | 0.01 | | | | (0.88 | ) | | | — | | | | (0.16 | ) | | | 28.06 | | | | 9.02 | | | | 107,012 | | | | 1.40 | | | | 3.27 | | | | 1.40 | | | | 21 | |
| | 2010 | | | | 23.71 | | | | 0.82 | | | | 3.24 | | | | — | | | | (0.81 | ) | | | — | | | | (0.23 | ) | | | 26.73 | | | | 17.48 | | | | 70,800 | | | | 1.35 | | | | 3.29 | | | | 1.35 | | | | 16 | |
City National Rochdale U.S. Core Equity Fund | |
Institutional Class (commenced operations on December 3, 2012) | |
| | 2015 | | | $ | 14.21 | | | $ | 0.11 | | | $ | 0.13 | | | $ | — | | | $ | (0.10 | ) | | $ | (1.31 | ) | | $ | — | | | $ | 13.04 | | | | 1.79 | % | | $ | 6,870 | | | | 0.52 | % | | | 0.79 | % | | | 0.52 | % | | | 32 | % |
| | 2014 | | | | 12.13 | | | | 0.08 | | | | 2.30 | | | | — | | | | (0.08 | ) | | | (0.22 | ) | | | — | | | | 14.21 | | | | 19.86 | | | | 6,759 | | | | 0.53 | | | | 0.59 | | | | 0.53 | | | | 60 | |
| | 2013 | | | | 10.00 | | | | 0.14 | | | | 2.08 | | | | — | | | | (0.09 | ) | | | — | | | | — | | | | 12.13 | | | | 22.23 | | | | — | | | | 0.00 | (3) | | | 1.57 | | | | 0.00 | (3) | | | 32 | |
Class N (commenced operations on December 3, 2012) | |
| | 2015 | | | $ | 14.09 | | | $ | 0.04 | | | $ | 0.14 | | | $ | — | | | $ | (0.04 | ) | | $ | (1.31 | ) | | $ | — | | | $ | 12.92 | | | | 1.31 | % | | $ | 102,753 | | | | 1.02 | % | | | 0.29 | % | | | 1.02 | % | | | 32 | % |
| | 2014 | | | | 12.08 | | | | 0.01 | | | | 2.23 | | | | — | | | | (0.01 | ) | | | (0.22 | ) | | | — | | | | 14.09 | | | | 18.80 | | | | 97,205 | | | | 1.03 | | | | 0.09 | | | | 1.04 | | | | 60 | |
| | 2013 | | | | 10.00 | | | | 0.05 | | | | 2.08 | | | | — | | | | (0.05 | ) | | | — | | | | — | | | | 12.08 | | | | 21.33 | | | | 66,145 | | | | 0.99 | | | | 0.52 | | | | 0.99 | | | | 32 | |
Servicing Class (commenced operations on December 3, 2012) | |
| | 2015 | | | $ | 14.11 | | | $ | 0.07 | | | $ | 0.13 | | | $ | — | | | $ | (0.07 | ) | | $ | (1.31 | ) | | $ | — | | | $ | 12.93 | | | | 1.48 | % | | $ | 104,220 | | | | 0.77 | % | | | 0.54 | % | | | 0.77 | % | | | 32 | % |
| | 2014 | | | | 12.09 | | | | 0.05 | | | | 2.24 | | | | — | | | | (0.05 | ) | | | (0.22 | ) | | | — | | | | 14.11 | | | | 19.15 | | | | 103,246 | | | | 0.78 | | | | 0.34 | | | | 0.79 | | | | 60 | |
| | 2013 | | | | 10.00 | | | | 0.07 | | | | 2.08 | | | | — | | | | (0.06 | ) | | | — | | | | — | | | | 12.09 | | | | 21.60 | | | | 68,919 | | | | 0.74 | | | | 0.73 | | | | 0.74 | | | | 32 | |
* | For the nine months ended September 30, 2013, and the year or period ended December 31. Effective March 29, 2013, the Rochdale Investment Trust’s Rochdale Dividend & Income Portfolio (the “Predecessor Fund”) was merged into City National Rochdale Funds’ City National Rochdale Dividend & Income Fund. Information presented for the period prior to March 29, 2013, is that of the Predecessor Fund, which had a December 31 fiscal year end. |
† | Per share calculations are based on Average Shares outstanding throughout the period. |
‡ | Returns are for the period indicated and have not been annualized. Fee waivers are in effect; if they had not been in effect, performance would have been lower. Returns shown do not reflect the deduction of taxes that a shareholder would pay on fund distributions or the redemption of fund shares. |
^ | Amount represents less than $0.01 per share. |
^^ | Effective December 19, 2011, Institutional Class Shares were redesignated as Servicing Class Shares. This share class name change had no impact on the Fund’s operations or investment policy. |
(1) | Annualized for periods less than one year. |
(2) | Ratio includes waivers and previously waived investment advisory fees recovered. The impact of the recovered fees may cause a higher net expense ratio. |
(3) | Amount represents less than 0.01%. |
Amounts designated as “—” are either $0 or have been rounded to $0.
See accompanying notes to financial statements.
CITY NATIONAL ROCHDALE FUNDS | PAGE 143
financial highlights/consolidated financial highlights |
For a Share Outstanding Throughout Each Period
For the year or period ended September 30, |
| | Net Asset
Value
Beginning
of Period | | | Net
Investment
Income
(Loss)† | | | Net
Realized
and
Unrealized
Gains
(Losses) on
Securities† | | | Redemption
Fees | | | Dividends
from Net
Investment
Income | | | Distributions
from
Realized
Capital Gains | | | Distributions
from Return
of Capital | | | Net Asset
Value End
of Period | | | Total
Return‡ | | | Net Assets
End of
Period
(000) | | | Ratio of
Expenses
to
Average
Net
Assets(1)(2) | | | Ratio
of Net
Investment
Income
(Loss) to
Average
Net
Assets(1)(2) | | | Ratio of
Expenses
to Average
Net Assets
(Excluding
Waivers &
Recovered
Fees)(1) | | | Portfolio
Turnover
Rate | |
City National Rochdale Socially Responsible Equity Fund | |
Institutional Class (commenced operations on January 3, 2005) | |
2015 | | $ | 11.45 | | | $ | 0.14 | | | $ | (0.99 | ) | | $ | — | | | $ | (0.13 | ) | | $ | (0.29 | ) | | $ | — | | | $ | 10.18 | | | | (7.70 | )% | | $ | 238,379 | | | | 0.89 | % | | | 1.22 | % | | | 0.87 | % | | | 29 | % |
2014 | | | 12.28 | | | | 0.19 | | | | 1.18 | | | | — | | | | (0.18 | ) | | | (2.02 | ) | | | — | | | | 11.45 | | | | 12.46 | | | | 172,830 | | | | 0.89 | | | | 1.62 | | | | 0.96 | | | | 34 | |
2013 | | | 10.06 | | | | 0.12 | | | | 2.22 | | | | — | | | | (0.12 | ) | | | — | | | | — | | | | 12.28 | | | | 23.38 | | | | 45,357 | | | | 0.87 | | | | 1.10 | | | | 0.87 | | | | 42 | |
2012 | | | 8.38 | | | | 0.13 | | | | 1.68 | | | | — | | | | (0.13 | ) | | | — | | | | — | | | | 10.06 | | | | 21.63 | | | | 80,109 | | | | 0.90 | | | | 1.37 | | | | 0.90 | | | | 38 | |
2011 | | | 8.81 | | | | 0.12 | | | | (0.43 | ) | | | — | | | | (0.12 | ) | | | — | | | | — | | | | 8.38 | | | | (3.67 | ) | | | 62,193 | | | | 0.88 | | | | 1.27 | | | | 0.89 | | | | 22 | |
Class N (commenced operations on August 12, 2005) | |
2015 | | $ | 11.42 | | | $ | 0.11 | | | $ | (0.98 | ) | | $ | — | | | $ | (0.10 | ) | | $ | (0.29 | ) | | $ | — | | | $ | 10.16 | | | | (7.86 | )% | | $ | 23,045 | | | | 1.14 | % | | | 0.99 | % | | | 1.37 | % | | | 29 | % |
2014 | | | 12.26 | | | | 0.18 | | | | 1.15 | | | | — | | | | (0.15 | ) | | | (2.02 | ) | | | — | | | | 11.42 | | | | 12.11 | | | | 26,763 | | | | 1.14 | | | | 1.55 | | | | 1.46 | | | | 34 | |
2013 | | | 10.04 | | | | 0.09 | | | | 2.22 | | | | — | | | | (0.09 | ) | | | — | | | | — | | | | 12.26 | | | | 23.12 | | | | 31,387 | | | | 1.13 | | | | 0.81 | | | | 1.38 | | | | 42 | |
2012 | | | 8.37 | | | | 0.11 | | | | 1.67 | | | | — | | | | (0.11 | ) | | | — | | | | — | | | | 10.04 | | | | 21.28 | | | | 25,631 | | | | 1.15 | | | | 1.13 | | | | 1.40 | | | | 38 | |
2011 | | | 8.79 | | | | 0.10 | | | | (0.42 | ) | | | — | | | | (0.10 | ) | | | — | | | | — | | | | 8.37 | | | | (3.80 | ) | | | 3,132 | | | | 1.13 | | | | 1.05 | | | | 1.39 | | | | 22 | |
City National Rochdale Emerging Markets Fund | |
Class N (commenced operations on December 14, 2011) | |
2015 | | $ | 38.90 | | | $ | 0.09 | | | $ | (3.48 | ) | | $ | — | | | $ | (0.13 | ) | | $ | — | | | $ | — | | | $ | 35.38 | | | | (8.74 | )% | | $ | 684,182 | | | | 1.61 | % | | | 0.21 | % | | | 1.65 | % | | | 34 | % |
2014 | | | 34.24 | | | | 0.22 | | | | 4.55 | | | | — | | | | (0.11 | ) | | | — | | | | — | | | | 38.90 | | | | 13.96 | | | | 582,490 | | | | 1.61 | | | | 0.58 | | | | 1.64 | | | | 42 | |
2013* | | | 32.31 | | | | 0.33 | | | | 1.60 | | | | — | | | | — | | | | — | | | | — | | | | 34.24 | | | | 5.97 | | | | 294,040 | | | | 1.62 | | | | 1.31 | | | | 1.69 | | | | 25 | |
2012 | | | 25.28 | | | | 0.04 | | | | 7.00 | | | | 0.01 | | | | — | | | | — | | | | (0.02 | ) | | | 32.31 | | | | 27.87 | | | | 136,838 | | | | 1.97 | | | | 0.15 | | | | 1.94 | | | | 69 | |
2011 | | | 25.00 | | | | (0.02 | )(3) | | | 0.30 | | | —^ | | | | — | | | | — | | | | — | | | | 25.28 | | | | 1.12 | | | | 5,934 | | | | 2.25 | | | | (2.15 | ) | | | 9.74 | | | | 6 | |
* | For the nine months ended September 30, 2013, and the year or period ended December 31. Effective March 29, 2013, the Rochdale Investment Trust’s Rochdale Emerging Markets Portfolio (the “Predecessor Fund”) was merged into City National Rochdale Funds’ City National Rochdale Emerging Markets Fund. Information presented for the period prior to March 29, 2013, is that of the Predecessor Fund, which had a December 31 fiscal year end. |
† | Per share calculations are based on Average Shares outstanding throughout the period. |
‡ | Returns are for the period indicated and have not been annualized. Fee waivers are in effect; if they had not been in effect, performance would have been lower. Returns shown do not reflect the deduction of taxes that a shareholder would pay on fund distributions or the redemption of fund shares. |
^ | Amount represents less than $0.01 per share. |
(1) | Annualized for periods less than one year. |
(2) | Ratio includes waivers and previously waived investment advisory fees recovered. The impact of the recovered fees may cause a higher net expense ratio. |
(3) | Net investment loss per share is calculated using ending balances prior to consideration of adjustments for permanent book and tax differences. |
Amounts designated as “—” are either $0 or have been rounded to $0.
See accompanying notes to financial statements.
CITY NATIONAL ROCHDALE FUNDS | PAGE 144
notes to financial statements/
consolidated notes to financial statements |
September 30, 2015 |
City National Rochdale Funds, a Delaware statutory trust (the “Trust”), is registered under the Investment Company Act of 1940, as amended (the “1940 Act”), as an open-end management investment company currently offering the following 15 series (each a “Fund” and collectively, the “Funds”): City National Rochdale Government Money Market Fund (“Government Money Market Fund”), City National Rochdale Prime Money Market Fund (“Prime Money Market Fund”), and City National Rochdale California Tax Exempt Money Market Fund (“California Money Market Fund”) (collectively, the “Money Market Funds”); City National Rochdale Government Bond Fund (“Government Bond Fund”), City National Rochdale Corporate Bond Fund (“Corporate Bond Fund”), City National Rochdale California Tax Exempt Bond Fund (“California Tax Exempt Bond Fund”), City National Rochdale Municipal High Income Fund (“Municipal High Income Fund”), City National Rochdale High Yield Bond Fund (“High Yield Bond Fund”), City National Rochdale Intermediate Fixed Income Fund (“Intermediate Fixed Income Fund”), and City National Rochdale Fixed Income Opportunities Fund (“Fixed Income Opportunities Fund”) (collectively, the “Fixed Income Funds”); City National Rochdale Multi-Asset Fund (“Multi-Asset Fund”); City National Rochdale Dividend & Income Fund (“Dividend & Income Fund”), City National Rochdale U.S. Core Equity Fund (“U.S. Core Equity Fund”), City National Rochdale Socially Responsible Equity Fund (“Socially Responsible Equity Fund”), and City National Rochdale Emerging Markets Fund (“Emerging Markets Fund”) (collectively, the “Equity Funds”).
On May 30, 2014, the Board of Trustees of the Trust approved the reorganization of City National Rochdale Alternative Total Return Fund LLC, an affiliate of City National Rochdale, LLC (“City National Rochdale”) into the Fixed Income Opportunities Fund. The reorganization was effective as of the close of business on May 30, 2014.
The Municipal High Income Fund commenced operations on December 30, 2013.
On December 20, 2013, a new Institutional Class of the Intermediate Fixed Income Fund opened.
On January 31, 2014, the Institutional Class of the Multi-Asset Fund closed.
On September 15, 2015, the Limited Maturity Fund Fixed Income Fund Closed.
The assets of each Fund are segregated, and a shareholder’s interest is limited to the Fund in which shares are held. Each Fund is diversified with the exception of the California Tax Exempt Bond Fund and the Emerging Markets Fund, which are non-diversified.
2. | SIGNIFICANT ACCOUNTING POLICIES: |
The following is a summary of significant accounting policies followed by the Funds.
Use of Estimates – The Funds are investment companies that conform with accounting principles generally accepted in the United States of America (“GAAP”). Therefore the Funds follow the accounting and reporting guidance for investment companies. The preparation of financial statements in conformity with GAAP requires management to make estimates and assumptions that affect the reported amounts of assets and liabilities and disclosure of contingent assets and liabilities at the date of the financial statements and the reported amounts of increases and decreases in net assets from operations during the reporting period. Actual results could differ from those estimates.
Security Valuation – Securities listed on a securities exchange, market or automated quotation system for which quotations are readily available (except for securities traded on NASDAQ) are valued at the last quoted sale price on the primary exchange or market (foreign or domestic) on which they are traded, or, if there is no such reported sale, at the most recent quoted bid price. For securities traded on NASDAQ, the NASDAQ Official Closing Price is used. If available, debt securities are priced based upon valuations provided by independent, third-party pricing agents. Such values generally reflect the last reported sales price if the security is actively traded. The third-party pricing agents may also value debt securities at an evaluated bid price by employing methodologies that utilize actual market transactions, broker-supplied valuations, or other methodologies designed to identify the market value for such securities. Debt obligations with remaining maturities of sixty days or less may be valued at their amortized cost, if the Funds’ Fair Value Committee concludes it approximates market value after taking into account factors such as credit, liquidity and interest rate conditions as well as issuer specific factors. Investments in underlying registered investment companies are valued at their respective daily net assets in accordance with pricing procedures approved by their respective boards. The prices for foreign securities are reported in local currency and converted to U.S. dollars using currency exchange rates. Prices for most securities held by the Funds are provided daily by recognized independent pricing agents. If a security
CITY NATIONAL ROCHDALE FUNDS | PAGE 145
notes to financial statements/
consolidated notes to financial statements |
September 30, 2015 |
price cannot be obtained from an independent, third-party pricing agent, the Funds seek to obtain a bid price from one or more independent brokers.
Securities for which market prices are not “readily available” are valued in accordance with Fair Value Procedures established by the Trust’s Board of Trustees. The Funds’ Fair Value Procedures are implemented through a Fair Value Committee (the “Committee”) designated by the Trust’s Board of Trustees. Some of the more common reasons that may necessitate that a security be valued using Fair Value Procedures include: the security’s trading has been halted or suspended; the security has been de-listed from a national exchange; the security’s primary trading market is temporarily closed at a time when under normal conditions it would be open; for international securities, market events occur after the close of the foreign markets that make closing prices not representative of fair value; or the security’s primary pricing source is not able or willing to provide a price. When a security is valued in accordance with the Fair Value Procedures, the Committee will determine the value after taking into consideration relevant information reasonably available to the Committee.
Investments in life settlement policies (“Policies”) are valued using the fair value method of accounting. The Fair Value Procedures recognize that the Policies are illiquid and that no market currently exists for the Policies. Under the fair value method, the Fixed Income Opportunities Fund recognizes the initial investment in its Policies at the transaction price. In subsequent periods, the Fund re-measures the investment in its Policies at fair value daily and recognizes changes in fair value in earnings, less Policy premiums paid and continuing costs, plus proceeds from Policy maturities in the period in which the changes occur. Due to the inherent uncertainty of this method of valuation, the estimated values may differ significantly from the value that would have been used had a ready market value for the investment existed, and the difference could be material. Life settlement contracts are included in Level 3 of the fair value hierarchy.
In accordance with GAAP, the objective of a fair value measurement is to determine the price that would be received to sell an asset or paid to transfer a liability in an orderly transaction between market participants at the measurement date (an exit price). The fair value hierarchy gives the highest priority to quoted prices (unadjusted) in active markets for identical assets or liabilities (Level 1) and the lowest priority to unobservable inputs (Level 3). The three levels of the fair value hierarchy are described below:
| | ● | Level 1 — Unadjusted quoted prices in active markets for identical, unrestricted assets or liabilities that the Funds have the ability to access at the measurement date; |
| | ● | Level 2 — Quoted prices in inactive markets, or inputs that are observable (either directly or indirectly) for substantially the full term of the asset or liability; and |
| | ● | Level 3 — Prices, inputs or exotic modeling techniques which are both significant to the fair value measurement and unobservable (supported by little or no market activity). |
Investments are classified within the level of the lowest significant input considered in determining fair value. Investments classified within Level 3, the fair value measurement of which considers several inputs, may include Level 1 or Level 2 inputs as components of the overall fair value measurement.
For the year ended September 30, 2015, there have been no changes to the Funds’ fair valuation methodologies. For more details of the investment classification, refer to the Schedules of Investments/Consolidated Schedule of Investments.
Security Transactions and Related Income – Security transactions are accounted for on the trade date of the security purchase or sale. Costs used in determining net realized capital gains and losses on the sale of securities are those of the specific securities sold. Interest income is recognized on an accrual basis and dividend income is recognized on the ex-dividend date. Purchase discounts and premiums on securities held by the Funds are accreted and amortized to maturity using the scientific method, which approximates the effective interest method over the holding period of a security, except for the Money Market Funds, which use a straight line basis which is not materially different from the scientific method.
Repurchase Agreements – Securities pledged as collateral for repurchase agreements are held by each Fund’s custodian bank, U.S. Bank, N.A., until maturity of the repurchase agreements. Provisions of the agreements and procedures adopted by the investment adviser require that the market value of the collateral, including accrued interest thereon, is sufficient in the event of default by the counterparty. The Funds also invest in tri-party repurchase agreements. Securities held as collateral for tri-party repurchase agreements are maintained by the broker’s custodian bank in a segregated account until maturity of the repurchase agreement. Provisions of the agreements require that the market value of the collateral, including accrued interest thereon, is sufficient in the event of default. If the counterparty defaults and
CITY NATIONAL ROCHDALE FUNDS | PAGE 146
the value of the collateral declines or if the counterparty enters into an insolvency proceeding, realization of the collateral by the Fund may be delayed or limited.
TBA Transactions – The Funds may engage in “to be announced” (“TBA”) security transactions. Such transactions involve a commitment by a Fund to purchase or sell securities for a predetermined price or yield, with payment and delivery taking place beyond the customary settlement period. The Funds record TBA securities on the trade date and maintain security positions such that sufficient liquid assets will be available to make payments for the securities purchased.
Expense Allocation – Common expenses incurred by the Funds are allocated among the Funds (i) based upon relative average daily net assets, (ii) as incurred on a specific identification basis, (iii) equally among the Funds, or (iv) a combination of the above, depending on the nature of the expenditure.
Classes – Class-specific expenses are borne by that class. Income, non class-specific expenses, and realized and unrealized gains/losses are allocated to the respective class on the basis of relative net asset value each day.
Dividends and Distributions to Shareholders – Dividends from net investment income are declared daily and paid to shareholders monthly for the Money Market Funds and Fixed Income Funds except for the Intermediate Fixed Income Fund, Fixed Income Opportunities Fund and Dividend & Income Fund. Dividends from net investment income are declared and paid quarterly for the Intermediate Fixed Income Fund, Fixed Income Opportunities Fund, Dividend & Income Fund, Multi-Asset Fund and Equity Funds except for the Emerging Markets Fund. Dividends from net investment income are declared and paid annually for the Emerging Markets Fund. Distributions from net realized capital gains are distributed to shareholders at least annually.
Foreign Currency – Values of investments denominated in foreign currencies are converted into U.S. dollars using the spot market rate of exchange at the time of valuation. Purchases and sales of investments and dividend and interest income are translated into U.S. dollars using the spot market rate of exchange prevailing on the respective dates of such translations. The gain or loss upon the sale of a security resulting from changes in foreign exchange rates is included with net realized and unrealized gain or loss from investments, as appropriate. Foreign securities and currency transactions may involve certain considerations and risks not typically associated with those of domestic origin.
Forward Foreign Currency Contracts – A forward foreign currency contract is an agreement between two parties to buy or sell a currency at a set price on a future date. Forward contracts are marked to market daily and the change in market value is recorded as an unrealized gain (loss) on forward foreign currency contracts in the Statements of Assets and Liabilities/Consolidated Statements of Assets and Liabilities. When a contract is closed, a Fund records a realized gain or loss equal to the difference between the value of the contract at the time it was opened and the value at the time it was closed, which is included within realized gain (loss) on foreign currency transactions in the Statements of Operations/Consolidated Statement of Operations. A Fund could be at risk if the counterparties are unable to meet the terms of the contracts or if the value of the currency changes unfavorably.
To reduce counterparty risk with respect to over-the-counter (“OTC”) transactions, the High Yield Bond Fund and the Fixed Income Opportunities Fund have entered into master netting arrangements, established within the High Yield Bond Fund’s and the Fixed Income Opportunities Fund’s International Swap and Derivatives Association, Inc. (“ISDA”) master agreements, which allows the High Yield Bond Fund and the Fixed Income Opportunities Fund to make (or to have an entitlement to receive) a single net payment in the event of default (close-out netting) for outstanding payables and receivables with respect to certain OTC positions in forward foreign currency contracts for each individual counterparty. In addition, the High Yield Bond Fund and the Fixed Income Opportunities Fund may require that certain counterparties post cash and/or securities in collateral accounts to cover their net payment obligations for those derivative contracts subject to ISDA master agreements. If the counterparty fails to perform under these contracts and agreements, the cash and/or securities will be made available to the High Yield Bond Fund and the Fixed Income Opportunities Fund.
For financial reporting purposes, the High Yield Bond Fund and the Fixed Income Opportunities Fund do not offset derivative assets and derivative liabilities that are subject to netting arrangements in the Statement of Assets and Liabilities/Consolidated Statement of Assets and Liabilities. Bankruptcy or insolvency laws of a particular jurisdiction may impose restrictions on or prohibitions against the right of offset in bankruptcy, insolvency or other events.
Collateral terms are contract specific for OTC derivatives. For derivatives traded under an ISDA master agreement, the collateral requirements are typically calculated by netting the mark to market amount of each transaction under such
CITY NATIONAL ROCHDALE FUNDS | PAGE 147
notes to financial statements/
consolidated notes to financial statements |
September 30, 2015 |
agreement and comparing that amount to the value of any collateral currently pledged by the High Yield Bond Fund and the Fixed Income Opportunities Fund or the counterparty.
For financial reporting purposes, cash collateral that has been pledged to cover obligations of the High Yield Bond Fund and the Fixed Income Opportunities Fund, if any, is reported separately on the Statement of Assets and Liabilities/Consolidated Statement of Assets and Liabilities as cash pledged as collateral. Non-cash collateral pledged by the High Yield Bond Fund and the Fixed Income Opportunities Fund, if any, is noted in the Schedule of Investments/Consolidated Schedule of Investments. Generally, the amount of collateral due from or to a party must exceed a minimum transfer amount threshold before a transfer has to be made. To the extent amounts due to the High Yield Bond Fund and the Fixed Income Opportunities Fund from its counterparties are not fully collateralized, contractually or otherwise, the High Yield Bond Fund and the Fixed Income Opportunities Fund bear the risk of loss from counterparty nonperformance.
The following tables present, by derivative type, the High Yield Bond Fund’s and the Fixed Income Opportunities Fund’s OTC derivative assets and liabilities net of the related collateral posted for the benefit of the High Yield Bond Fund and the Fixed Income Opportunities Fund at September 30, 2015 (000):
Derivative Type | | Derivative
Assets
Subject to
a Netting
Agreement
or Similar
Arrangement | | | Derivative
Available
for Offset | | | Collateral
Received | | | Net Amount | |
High Yield Bond Fund | |
Forward Foreign Currency Contracts | | $ | 9 | | | $ | (3 | ) | | $ | — | | | $ | 6 | |
Fixed Income Opportunities Fund | |
Forward Foreign Currency Contracts | | | 462 | | | | — | | | | — | | | | 462 | |
Derivative Type | | Derivative
Liabilities
Subject to
a Netting
Agreement
or Similar
Arrangement | | | Derivative
Available
for Offset | | | Collateral
Pledged | | | Net Amount | |
High Yield Bond Fund | |
Forward Foreign Currency Contracts | | $ | 3 | | | $ | (3 | ) | | $ | — | | | $ | — | |
Fixed Income Opportunities Fund | |
Forward Foreign Currency Contracts | | | 3 | | | | (3 | ) | | | — | | | | — | |
Futures Contracts — To the extent consistent with their Investment Objective and Strategies, certain Funds may use futures contracts for tactical hedging purposes as well as to enhance the Funds’ returns. Initial margin deposits of cash or securities are made upon entering into futures contracts. The contracts are marked to market daily and the resulting changes in value are accounted for as unrealized gains and losses. Variation margin payments are paid or received, depending upon whether unrealized gains or losses are incurred. When a contract is closed, the Fund records a realized gain or loss equal to the difference between the proceeds from (or cost of) the closing transaction and the amount invested in the contract.
Risks of entering into futures contracts include the possibility that there will be an imperfect price correlation between the futures and the underlying securities. Second, it is possible that a lack of liquidity for futures contracts could exist in the secondary market, resulting in an inability to close a position prior to its maturity date. Third, the futures contract involves the risk that the Fund could lose more than the original margin deposit required to initiate a futures transaction.
Finally, the risk exists that losses could exceed amounts disclosed on the Statements of Assets and Liabilities or Consolidated Statements of Assets and Liabilities. Refer to each Fund’s Schedule of Investments or Consolidated Schedule of Investments for details regarding open futures contracts as of September 30, 2015, if applicable.
Restricted Securities – Restricted securities include securities that have not been registered under the Securities Act of 1933, as amended, and securities that are subject to restrictions on resale.
A Fund may invest in restricted securities that are consistent with the Fund’s investment objective and investment strategies. A Fund will not invest in a restricted security if, immediately after and as a result of the investment in such security, more than 15% (5% in the case of the Money Market Funds) of the Fund’s net assets would be invested in illiquid securities. In some cases, the issuer of restricted securities has agreed to register such securities for resale, at the issuer’s expense either upon demand by the Fund or in connection with another registered offering of the securities. Investments in restricted securities are valued at fair value as determined in good faith in accordance with procedures adopted by the Board of Trustees. It is possible that the estimated value may differ significantly from the amount that might ultimately be realized in the near term, and the difference could be material.
CITY NATIONAL ROCHDALE FUNDS | PAGE 148
Master Limited Partnerships – Entities commonly referred to as “MLPs” are generally organized under state law as limited partnerships or limited liability companies. The City National Rochdale Dividend & Income Fund may, as a non-principal investment strategy, invest in MLPs receiving partnership taxation treatment under the Internal Revenue Code of 1986, interests or “units” of which are traded on securities exchanges like shares of corporate stock. To qualify as an MLP for U.S. federal income tax purposes, an entity must receive at least 90% of its income from qualifying sources such as interest, dividends, real estate rents, gain from the sale or disposition of real property, income and gain from certain mineral or natural resources activities, income and gain from the transportation or storage of certain fuels, and, in certain circumstances, income and gain from commodities or futures, forwards and options with respect to commodities, and gain from the sale or other disposition of a capital asset held for the production of such income. Mineral or natural resources activities include exploration, development, production, mining, processing, refining, marketing and transportation (including pipelines), of oil and gas, minerals, geothermal energy, fertilizer, timber or industrial source carbon dioxide. An MLP consists of a general partner and limited partners (or in the case of MLPs organized as limited liability companies, a managing member and members). The general partner or managing member typically controls the operations and management of the MLP and has an ownership stake in the partnership. The limited partners or members, through their ownership of limited partner or member interests, provide capital to the entity, are intended to have no role in the operation and management of the entity and receive cash distributions. The MLPs themselves generally do not pay U.S. federal income taxes. Thus, unlike investors in corporate securities, direct MLP investors are generally not subject to double taxation (i.e., corporate level tax and tax on corporate dividends). Currently, most MLPs operate in the energy, natural resources or real estate sectors.
Investments in Irish Subsidiary – The Fixed Income Opportunities Fund may invest up to 15% of its net assets in life insurance policies and interests related thereto purchased through life settlement transactions. The Fund may invest in life insurance policies and related interests directly or through a wholly-owned subsidiary of the Fund under the laws of Ireland (the “Subsidiary”).
The principal purpose of investment in the Subsidiary is to allow the Fixed Income Opportunities Fund to gain exposure to life insurance policies within the limitations of the federal tax law requirements applicable to regulated investment companies. The Subsidiary is a company organized under the laws of Ireland and is overseen by its own board of directors. Although the Subsidiary has its own board of directors, the Subsidiary is wholly-owned and controlled by the Fund. The Subsidiary is not an investment company registered under the 1940 Act and is not subject to all of the investor protections of the 1940 Act.
Information regarding the Fixed Income Opportunities Fund and the Subsidiary has been consolidated in the Consolidated Schedule of Investments, Consolidated Statement of Assets and Liabilities, Consolidated Statement of Operations, Consolidated Statement of Changes in Net Assets and Consolidated Statement of Cash Flows.
The Subsidiary commenced operations on October 3, 2013. The net assets of the Subsidiary at September 30, 2015, were $179,776,620, which represented 10.9% of the net assets of the Fixed Income Opportunities Fund.
Investments in Mauritius Subsidiary – To the extent that the Emerging Markets Fund seeks to invest in the securities of Indian companies, it currently intends to do so by investing in shares of a wholly-owned collective investment vehicle (the “Mauritius Subsidiary”) registered with and regulated by the Mauritius Financial Services Commission that is also managed by City National Rochdale. The Mauritius Subsidiary was formed to allow the Fund’s investments in Indian companies to benefit from a favorable tax treaty between Mauritius and India. In order to do so, the Mauritius Subsidiary will seek to maintain residency in Mauritius.
Investment in Affiliated Security – The Funds may invest excess cash in the Money Market Funds. The Multi-Asset Fund also invests in other series of the Trust.
Deferred Offering Costs – Offering costs, including costs of printing initial prospectuses and legal and registration fees, are amortized over twelve months from inception of a Fund. As of September 30, 2015, deferred offering costs for the Municipal High Income Fund have been fully amortized.
3. | ADMINISTRATION, TRANSFER AGENT, DISTRIBUTION AND SHAREHOLDER SERVICES AGREEMENTS: |
Pursuant to an Amended and Restated Administration Agreement dated January 1, 2013, as amended (the “Agreement”), SEI Investments Global Funds Services (the “Administrator”), a wholly owned subsidiary of SEI Investments Company, acts as the Trust’s administrator. Under the terms of
CITY NATIONAL ROCHDALE FUNDS | PAGE 149
notes to financial statements/
consolidated notes to financial statements |
September 30, 2015 |
the Agreement, the Administrator is entitled to receive an annual fee based on the average daily net assets of the Trust and subject to a minimum annual fee.
The Trust has adopted a Rule 12b-1 Distribution Plan (“the Plan”) with respect to Class N and Class S Shares that allows each Fund to pay distribution and servicing fees. Pursuant to the Plan, SEI Investments Distribution Co. (the “Distributor”) may receive a distribution fee, computed daily and paid monthly, at the annual rate of 0.50% of the average daily net assets of the Class S Shares and 0.30% of the average daily net assets of the Class N Shares of the Money Market Funds and 0.25% of the Class N Shares of the Fixed Income Funds, Multi-Asset Fund and Equity Funds, which may be used by the Distributor to provide compensation for sales support and distribution-related activities.
US Bancorp Fund Services, LLC (the “Transfer Agent”) serves as transfer agent for the Trust and provides services at an annual rate of $20,000 per share class for all Funds plus other transaction based fees and out-of-pocket expenses.
The Trust has entered into Shareholder Servicing Agreements that permit payment of compensation to City National Bank (“CNB”) and its affiliates (including City National Rochdale), which provide certain shareholder support for their customers who own Class N, Class S or Servicing Class Shares, as applicable. In consideration for such services, a shareholder servicing fee is charged at the annual rate of up to 0.25% of average daily net assets of the relevant class of each Fund. CNB and City National Rochdale have agreed to voluntarily waive portions of their shareholder servicing fees with respect to certain Funds. For the year ended September 30, 2015, CNB and City National Rochdale received $9,782,869 in shareholder servicing fees from the Trust.
Certain officers of the Trust are also officers or employees of City National Rochdale, City National Bank or the Administrator. Such officers are paid no fees by the Trust for serving as officers of the Trust.
4. | INVESTMENT ADVISORY FEES AND OTHER AGREEMENTS: |
Under the terms of the current investment management agreements, City National Rochdale receives an annual fee equal to a percentage of the average daily net assets of each Fund, as follows:
Fund | Fee |
Government Money Market Fund | 0.26% |
Prime Money Market Fund | 0.25 |
California Tax Exempt Money Market Fund | 0.27 |
Government Bond Fund | 0.43 |
Corporate Bond Fund | 0.40 |
California Tax Exempt Bond Fund | 0.27 |
Municipal High Income Fund | 0.45 |
High Yield Bond Fund | 0.60 |
Intermediate Fixed Income Fund | 0.40 |
Fixed Income Opportunities Fund | 0.50 |
Multi-Asset Fund | 0.50 |
Dividend & Income Fund | 0.50 |
U.S. Core Equity Fund | 0.40 |
Socially Responsible Equity Fund | 0.75 |
Emerging Markets Fund | 1.00 |
Guggenheim Partners Investment Management, LLC (“Guggenheim”) acts as the investment sub-adviser with respect to the High Yield Bond Fund.
Alcentra LTD, All Financial Partners II LLC, Ashmore Investment Management Limited, Federated Investment Management Corp., GML Capital LLP and Seix Investment Advisors LLC act as the investment sub-advisers with respect to the Fixed Income Opportunities Fund.
SKBA Capital Management, LLC acts as the investment sub-adviser with respect to the Socially Responsible Equity Fund.
Waddell & Reed Investment Management Company acts as the investment sub-adviser with respect to the Municipal High Income Fund.
Sub-adviser fees are paid by City National Rochdale.
City National Rochdale has voluntarily agreed to limit its fees or reimburse expenses to the extent necessary to keep operating expenses at or below certain percentages of certain of the Funds’ respective average daily net assets. With respect to the Socially Responsible Equity Fund, voluntary limits are in addition to the contractual expense limitations described in the fee table in each Fund’s prospectus. The voluntary expense limitations (expressed as percentages of average daily net assets) are as follows:
| Government
Money
Market Fund | Prime Money
Market Fund | California
Tax Exempt
Money
Market Fund |
Institutional Class | n/a | 0.38% | n/a |
Class N | 0.93% | 0.93% | 0.85% |
Class S | 1.13% | 1.13% | 1.05% |
Servicing Class | 0.63% | 0.63% | 0.55% |
CITY NATIONAL ROCHDALE FUNDS | PAGE 150
| Government
Bond Fund | Corporate
Bond Fund | California
Tax Exempt
Bond Fund | Municipal
High Income
Fund |
Institutional Class | 0.53% | n/a | n/a | n/a |
Class N | 1.03% | 1.01% | 0.88% | 1.15% |
Servicing Class | 0.78% | 0.76% | 0.63% | 0.90% |
| High Yield
Bond Fund | Intermediate
Fixed Income
Fund | Fixed Income
Opportunities
Fund | Multi-Asset
Fund |
Institutional Class | 0.70% | 0.51% | n/a | n/a |
Class N | 1.20% | 1.01% | 1.09% | 1.49% |
Servicing Class | 0.95% | n/a | n/a | 1.24% |
| Dividend &
Income Fund | U.S. Core
Equity Fund | Socially
Responsible
Equity Fund | Emerging
Markets Fund |
Institutional Class | n/a | 0.55% | 0.89% | n/a |
Class N | 1.11% | 1.05% | 1.14% | 1.61% |
Servicing Class | n/a | 0.80% | n/a | n/a |
The contractual limitations for the Socially Responsible Equity Fund are as follows:
| Socially
Responsible
Equity Fund |
Institutional Class | 1.25% |
Class N | 1.50% |
Any fee reductions or expense reimbursements may be repaid by a Fund to City National Rochdale, within three years after occurrence if such repayments can be achieved within the Fund’s expense limit in effect at the time such expenses were incurred and if certain other conditions are satisfied.
As of September 30, 2015, fees which were previously waived by City National Rochdale which may be subject to possible future reimbursement were as follows:
Fund | | Potential Amount
of Recovery (000) | | | Expiration | |
Government Money Market Fund | | $ | 7,131 | | | | 2016 | |
| | | | 9,264 | | | | 2017 | |
| | | | 8,586 | | | | 2018 | |
Prime Money Market Fund | | | 1,741 | | | | 2016 | |
| | | | 2,095 | | | | 2017 | |
| | | | 1,422 | | | | 2018 | |
California Tax Exempt Money Market Fund | | | 2,275 | | | | 2016 | |
| | | | 2,592 | | | | 2017 | |
| | | | 2,470 | | | | 2018 | |
Government Bond Fund | | | 5 | | | | 2016 | |
| | | | 67 | | | | 2017 | |
| | | | 74 | | | | 2018 | |
Corporate Bond Fund | | | 83 | | | | 2017 | |
| | | | 89 | | | | 2018 | |
California Tax Exempt Bond Fund | | | 3 | | | | 2016 | |
| | | | 99 | | | | 2017 | |
| | | | 109 | | | | 2018 | |
High Yield Bond Fund | | | 6 | | | | 2016 | |
| | | | 101 | | | | 2017 | |
| | | | 128 | | | | 2018 | |
Intermediate Fixed Income Fund | | | 16 | | | | 2016 | |
| | | | 59 | | | | 2017 | |
| | | | 43 | | | | 2018 | |
Fixed Income Opportunities Fund | | | 42 | | | | 2016 | |
| | | | 263 | | | | 2017 | |
| | | | 248 | | | | 2018 | |
Multi-Asset Fund | | | 11 | | | | 2017 | |
| | | | 44 | | | | 2018 | |
Dividend & Income Fund | | | 23 | | | | 2016 | |
| | | | 90 | | | | 2017 | |
| | | | 44 | | | | 2018 | |
Emerging Markets Fund | | | 115 | | | | 2016 | |
| | | | 145 | | | | 2017 | |
| | | | 291 | | | | 2018 | |
City National Rochdale, CNB, the Administrator, the transfer agent and the Funds’ legal counsel have voluntarily agreed to further waive and reduce their fees and/or reimburse certain expenses of the Money Market Funds in order to maintain a one-day net income yield (yield floor) of each Fund of not less than 0.01% of the Fund’s average daily net assets. The following table shows waivers, with respect to such yield floor, by class for the year ended September 30, 2015:
| | Shareholder
Servicing
Fee Waiver | | | Investment
Advisory
Fee Waiver | | | Administration
Fee Waiver | | | Transfer
Agent Fee
Waiver | | | Legal Fee
Waiver | |
Government Money Market Fund | | | | | | | |
Class N | | $ | 14,741 | (1) | | $ | 6,507 | | | $ | 129 | | | $ | — | | | $ | — | |
Class S | | | 4,846 | (1) | | | 1,521 | | | | 30 | | | | — | | | | — | |
Servicing Class | | | 647 | | | | 558 | | | | 11 | | | | — | | | | — | |
| | | | | | | | | | | | | | | | | | | | | |
Prime Money Market Fund | | | | | | | | | |
Institutional Class | | $ | — | | | $ | 89 | | | $ | 4 | | | $ | — | | | $ | — | |
Class N | | | 1,606 | (1) | | | 449 | | | | 19 | | | | — | | | | — | |
Class S | | | 1,743 | (1) | | | 337 | | | | 15 | | | | — | | | | — | |
Servicing Class | | | 1,014 | | | | 547 | | | | 24 | | | | — | | | | — | |
| | | | | | | | | | | | | | | | | | | | | |
California Tax Exempt Money Market Fund | | | | | | | | | |
Class N | | $ | 2,965 | (1) | | $ | 1,414 | (1) | | $ | 75 | | | $ | 6 | | | $ | 17 | |
Class S | | | 537 | (1) | | | 180 | (1) | | | 9 | | | | 1 | | | | 2 | |
Servicing Class | | | 545 | | | | 498 | (1) | | | 25 | | | | 3 | | | | 6 | |
(1) | Includes class specific distribution expenses. |
CITY NATIONAL ROCHDALE FUNDS | PAGE 151
notes to financial statements/
consolidated notes to financial statements |
September 30, 2015 |
5. | INVESTMENT TRANSACTIONS: |
The cost of security purchases and proceeds from the sale and maturities of securities, other than temporary investments in short-term securities for the year ended September 30, 2015, were as follows for the Fixed Income Funds, Multi-Asset Fund and Equity Funds:
| | | Purchases | | | Sales and Maturities | |
Fund | | U.S. Gov’t
(000) | | | Other
(000) | | | U.S. Gov’t
(000) | | | Other
(000) | |
Government Bond Fund | | $ | 45,453 | | | $ | 8,603 | | | $ | 8,603 | | | $ | 3,076 | |
Corporate Bond Fund | | | — | | | | 43,487 | | | | 40 | | | | 50,239 | |
California Tax Exempt Bond Fund | | | — | | | | 26,931 | | | | — | | | | 8,236 | |
Municipal High Income Fund | | | — | | | | 281,984 | | | | — | | | | 9,080 | |
High Yield Bond Fund | | | — | | | | 65,999 | | | | — | | | | 71,207 | |
Intermediate Fixed Income Fund | | | 6,892 | | | | 96,173 | | | | 4,251 | | | | 42,100 | |
Fixed Income Opportunities Fund | | | 3,191 | | | | 808,475 | | | | 3,201 | | | | 616,538 | |
Multi-Asset Fund | | | — | | | | 14,735 | * | | | — | | | | 20,884 | * |
Dividend & Income Fund | | | — | | | | 43,962 | | | | — | | | | 24,175 | |
U.S. Core Equity | | | — | | | | 71,454 | | | | — | | | | 67,227 | |
Socially Responsible Equity Fund | | | — | | | | 167,392 | | | | — | | | | 71,822 | |
Emerging Markets Fund | | | — | | | | 378,503 | | | | — | | | | 214,811 | |
* | Includes $753 (000) and $4,161 (000) of purchases and sales, respectively, of affiliated registered investment companies. |
The Funds may purchase or sell investment securities in transactions with affiliated entities under procedures adopted by the Board, pursuant to the 1940 Act. These transactions are effected at market rates without incurring broker commissions.
The following is a summary of the transactions with affiliates for the Multi-Asset Fund for the year ended September 30, 2015:
| | Limited
Maturity
Fixed Income
Fund,
Institutional
Class | | | Government
Bond Fund,
Institutional
Class | | | Corporate
Bond Fund,
Servicing
Class | |
Beginning balance as of October 1, 2014 | | $ | 1,213 | | | $ | 1,145 | | | $ | 1,588 | |
Purchases at Cost | | | 64 | | | | 55 | | | | 82 | |
Proceeds from Sales | | | (1,274 | ) | | | (1,205 | ) | | | (340 | ) |
Realized Gain (Loss) | | | (8 | ) | | | (18 | ) | | | (6 | ) |
Unrealized Gain (Loss) | | | 5 | | | | 23 | | | | (24 | ) |
Ending balance as of September 30, 2015 | | $ | — | | | $ | — | | | $ | 1,300 | |
| | High Yield
Bond Fund,
Institutional
Class | | | Emerging
Markets
Fund,
Institutional
Class | |
Beginning balance as of October 1, 2014 | | $ | 745 | | | $ | 736 | |
Purchases at Cost | | | 36 | | | | 516 | |
Proceeds from Sales | | | (186 | ) | | | (1,143 | ) |
Realized Gain (Loss) | | | 15 | | | | (136 | ) |
Unrealized Gain (Loss) | | | (79 | ) | | | 27 | |
Ending balance as of September 30, 2015 | | $ | 531 | | | $ | — | |
The Funds may also invest in the affiliated Money Market Funds to manage excess cash or to serve as margin or collateral for derivative positions.
The following is a summary of the transactions with affiliates for the year ended September 30, 2015:
| | Purchases
at Cost
(000) | | | Proceeds
from Sales
(000) | | | Value
9/30/2015
(000) | | | Dividend
Income
(000) | |
Government Money Market Fund | |
Government Bond Fund | | $ | 22,055 | | | $ | (24,227 | ) | | $ | 199 | | | $ | — | |
Municipal High Income Fund | | | 112,509 | | | | (110,098 | ) | | | 33,108 | | | | 4 | |
Intermediate Fixed Income Fund | | | 43,862 | | | | (46,007 | ) | | | 2,031 | | | | — | |
Fixed Income Opportunities Fund | | | 9,098 | | | | (9,039 | ) | | | 59 | | | | — | |
Dividend & Income Fund | | | 21,331 | | | | (21,470 | ) | | | 455 | | | | — | |
Emerging Markets Fund | | | 110,918 | | | | (110,520 | ) | | | 20,187 | | | | 2 | |
Prime Money Market Fund | |
Corporate Bond Fund | | | 24,376 | | | | (24,455 | ) | | | 2,143 | | | | — | |
High Yield Bond Fund | | | 33,600 | | | | (34,216 | ) | | | 240 | | | | — | |
Multi-Asset Fund | | | 5,321 | | | | (4,209 | ) | | | 1,357 | | | | 1 | |
U.S. Core Equity Fund | | | 28,462 | | | | (29,371 | ) | | | 1,555 | | | | — | |
California Tax Exempt Money Market Fund | |
California Tax Exempt Bond Fund | | | 34,471 | | | | (35,614 | ) | | | 1,736 | | | | — | |
6. | FEDERAL TAX INFORMATION: |
Each Fund intends to qualify or continue to qualify as a regulated investment company for Federal income tax purposes and distribute all of its taxable income and net capital gains. Accordingly, no provisions for Federal income taxes are required.
Management has analyzed the Funds’ tax position taken on Federal income tax returns for all open tax years and has concluded that as of September 30, 2015, no provision for income tax would be required in the Funds’ financial statements. The Funds’ Federal and state income and Federal excise tax
CITY NATIONAL ROCHDALE FUNDS | PAGE 152
returns for tax years for which the applicable statutes of limitations have not expired are subject to examination by the Internal Revenue Service and state departments of revenue.
The Funds may be subject to taxes imposed by countries in which they invest, with respect to their investments in issuers existing or operating in such countries. Such taxes are generally based on income earned. The Funds accrue such taxes when the related income is earned.
The timing and characterization of certain income and capital gains distributions are determined annually in accordance with Federal tax regulations, which may differ from accounting principles generally accepted in the United States of America. As a result, net investment income (loss) and net realized gain (loss) on investment transactions for a reporting period may differ significantly from distributions during such period. These book/tax differences may be temporary or permanent. To the extent these differences are permanent in nature, they are charged or credited to undistributed net investment income (loss), accumulated net realized gain (loss), or paid-in capital, as appropriate, in the period that the differences arise.
Accordingly, the following permanent differences, primarily attributable to foreign currency transactions, a permanent ROC for investment in tax exempt investments in a taxable fund, REIT adjustments, investments in partnerships, realized gains (losses) on paydowns, net operating losses, return of capital distributions, distributions in excess of net investment income, investments in Passive Foreign Investment Companies and timing of distributions, were reclassified to/from the following accounts as of September 30, 2015:
| | Increase
(Decrease)
Undistributed
Net Investments
Income (Loss)
(000) | | | Increase
(Decrease)
Accumulated
Net Realized
Gain (Loss)
(000) | | | Increase
(Decrease) Paid-
in Capital
(000) | |
Government Money Market | | $ | 1 | | | $ | (1 | ) | | $ | — | |
Government Bond Fund | | | 17 | | | | (17 | ) | | | — | |
California Tax Exempt Bond Fund | | | 3 | | | | (3 | ) | | | — | |
High Yield Bond Fund | | | 59 | | | | (59 | ) | | | — | |
Intermediate Fixed Income Fund | | | 103 | | | | (103 | ) | | | — | |
Fixed Income Opportunities Fund | | | 6,322 | | | | (6,322 | ) | | | — | |
Dividend & Income Fund | | | 804 | | | | (555 | ) | | | (249 | ) |
U.S. Core Equity Fund | | | 14 | | | | (14 | ) | | | — | |
Socially Responsible Equity Fund | | | 12 | | | | (12 | ) | | | — | |
Emerging Markets Fund | | | (1,325 | ) | | | 1,325 | | | | — | |
Amounts designated as “—” are either $0 or have been rounded to $0.
The tax character of dividends and distributions declared during the years ended September 30, 2015 and September 30, 2014 unless otherwise indicated were as follows:
Fund | | Tax
Exempt
Income
(000) | | | Ordinary
Income
(000) | | | Long-Term
Capital
Gain
(000) | | | Return of
Capital
(000) | | | Total
(000) | |
Government Money Market Fund | |
2015 | | $ | — | | | $ | 397 | | | $ | — | | | $ | — | | | $ | 397 | |
2014 | | | — | | | | 378 | | | | — | | | | — | | | | 378 | |
Prime Money Market Fund | |
2015 | | | — | | | | 105 | | | | — | | | | — | | | | 105 | |
2014 | | | — | | | | 120 | | | | — | | | | — | | | | 120 | |
California Tax Exempt Money Market Fund | |
2015 | | | 90 | | | | 2 | | | | — | | | | — | | | | 92 | |
2014 | | | 96 | | | | — | | | | — | | | | — | | | | 96 | |
Government Bond Fund | |
2015 | | | — | | | | 708 | | | | — | | | | — | | | | 708 | |
2014 | | | — | | | | 750 | | | | — | | | | — | | | | 750 | |
Corporate Bond Fund | |
2015 | | | — | | | | 2,423 | | | | 1,082 | | | | — | | | | 3,505 | |
2014 | | | — | | | | 2,225 | | | | 934 | | | | — | | | | 3,159 | |
California Tax Exempt Bond Fund | |
2015 | | | 1,216 | | | | 121 | | | | 286 | | | | — | | | | 1,623 | |
2014 | | | 1,008 | | | | — | | | | 127 | | | | — | | | | 1,135 | |
Municipal High Income Fund | |
2015 | | | 22,487 | | | | 83 | | | | — | | | | — | | | | 22,570 | |
2014^^ | | | 7,464 | | | | 5 | | | | — | | | | — | | | | 7,469 | |
High Yield Bond Fund | |
2015 | | | — | | | | 6,630 | | | | 4,068 | | | | — | | | | 10,698 | |
2014 | | | — | | | | 7,732 | | | | 355 | | | | — | | | | 8,087 | |
Intermediate Fixed Income Fund | |
2015 | | | — | | | | 4,532 | | | | — | | | | — | | | | 4,532 | |
2014 | | | — | | | | 4,584 | | | | — | | | | — | | | | 4,584 | |
Fixed Income Opportunities Fund | |
2015 | | | — | | | | 97,143 | | | | 2,715 | | | | — | | | | 99,858 | |
2014 | | | — | | | | 54,067 | | | | 5,256 | | | | — | | | | 59,323 | |
Multi-Asset Fund | |
2015 | | | — | | | | 252 | | | | — | | | | — | | | | 252 | |
2014 | | | — | | | | 234 | | | | — | | | | — | | | | 234 | |
Dividend & Income Fund | |
2015 | | | — | | | | 4,363 | | | | 1,454 | | | | — | | | | 5,817 | |
2014 | | | — | | | | 5,449 | | | | — | | | | — | | | | 5,449 | |
U.S. Core Equity Fund | |
2015 | | | — | | | | 2,073 | | | | 18,578 | | | | — | | | | 20,651 | |
2014 | | | — | | | | 3,085 | | | | — | | | | — | | | | 3,085 | |
Socially Responsible Equity Fund | |
2015 | | | — | | | | 3,086 | | | | 6,324 | | | | — | | | | 9,410 | |
2014 | | | — | | | | 1,409 | | | | 12,637 | | | | — | | | | 14,046 | |
Emerging Markets Fund | |
2015 | | | — | | | | 2,025 | | | | — | | | | — | | | | 2,025 | |
2014 | | | — | | | | 1,072 | | | | — | | | | — | | | | 1,072 | |
^^ | For the period December 30, 2013 (commencement of operations) through September 30, 2014. |
CITY NATIONAL ROCHDALE FUNDS | PAGE 153
notes to financial statements/
consolidated notes to financial statements |
September 30, 2015 |
As of September 30, 2015, the components of Distributable Earnings/(Accumulated Losses) on a tax basis were as follows:
Fund | | Undistributed
Tax-Exempt
Income
(000) | | | Undistributed
Ordinary
Income
(000) | | | Undistributed
Long-Term
Capital Gain
(000) | | | Capital Loss
Carryforwards
(000) | | | Post-October
Losses
(000) | | | Unrealized
Appreciation
(Depreciation)
(000) | | | Other
Temporary
Differences
(000) | | | Total
Distributable
Earnings
(Accumulated
Losses)
(000) | |
Government Money Market Fund | | $ | — | | | $ | 34 | | | $ | — | | | $ | — | | | $ | — | | | $ | — | | | $ | (33 | ) | | $ | 1 | |
Prime Money Market Fund | | | — | | | | 9 | | | | — | | | | (12 | ) | | | — | | | | — | | | | (8 | ) | | | (11 | ) |
California Tax Exempt Money Market Fund | | | 5 | | | | 34 | | | | — | | | | — | | | | — | | | | — | | | | (7 | ) | | | 32 | |
Government Bond Fund | | | — | | | | 78 | | | | — | | | | (81 | ) | | | — | | | | 1,448 | | | | (74 | ) | | | 1,371 | |
Corporate Bond Fund | | | — | | | | 180 | | | | 115 | | | | — | | | | — | | | | (43 | ) | | | (179 | ) | | | 73 | |
California Tax Exempt Bond Fund | | | 113 | | | | — | | | | 33 | | | | — | | | | — | | | | 1,964 | | | | (110 | ) | | | 2,000 | |
Municipal High Income Fund | | | 2,337 | | | | 88 | | | | 16 | | | | — | | | | — | | | | 8,457 | | | | (2,333 | ) | | | 8,565 | |
High Yield Bond Fund | | | — | | | | 503 | | | | — | | | | (13 | ) | | | (263 | ) | | | (9,058 | ) | | | (450 | ) | | | (9,281 | ) |
Intermediate Fixed Income Fund | | | — | | | | 76 | | | | — | | | | (2,481 | ) | | | — | | | | 1,552 | | | | (9 | ) | | | (862 | ) |
Fixed Income Opportunities Fund | | | — | | | | 15,637 | | | | — | | | | (789 | ) | | | (24,124 | ) | | | (96,769 | ) | | | (538 | ) | | | (106,583 | ) |
Multi-Asset Fund | | | — | | | | 11 | | | | — | | | | (74 | ) | | | (631 | ) | | | (178 | ) | | | (1 | ) | | | (873 | ) |
Dividend & Income Fund | | | — | | | | — | | | | — | | | | — | | | | — | | | | 32,958 | | | | (6 | ) | | | 32,952 | |
U.S. Core Equity Fund | | | — | | | | 88 | | | | 855 | | | | — | | | | — | | | | 29,855 | | | | — | | | | 30,798 | |
Socially Responsible Equity Fund | | | — | | | | 76 | | | | 1,788 | | | | — | | | | — | | | | (14,653 | ) | | | — | | | | (12,789 | ) |
Emerging Markets Fund | | | — | | | | 227 | | | | — | | | | (2,121 | ) | | | (5,735 | ) | | | 7,582 | | | | — | | | | (47 | ) |
For tax purposes, the losses in the Funds generated prior to the Regulated Investment Company Modernization Act of 2010 can be carried forward for a maximum of eight years to offset any future net realized capital gains. As of September 30, 2015, the breakdown of capital loss carryforwards was as follows:
| | | Expiring September 30, | |
Fund | | | 2015
(000) | | | | 2017 (000) | | | | 2018
(000) | | | | 2019 (000) | | | Total
(000) | |
Multi-Asset Fund | | $ | — | | | $ | (74 | ) | | $ | — | | | $ | — | | | $ | (74 | ) |
| | | Expiring December 31, | | |
Fund | | | 2016
(000) | | | | 2017 (000) | | | | 2018
(000) | | | Total
(000) | | |
Intermediate Fixed Income Fund | | $ | — | | | $ | (192 | ) | | $ | (2,240 | ) | | $ | (2,432 | ) | |
Post-October losses represent losses realized on investments and foreign currency transactions from November 1, 2014, through September 30, 2015, that, in accordance with Federal income tax regulations, the Funds have elected to defer and treat as having arisen in the following fiscal year.
CITY NATIONAL ROCHDALE FUNDS | PAGE 154
Under the Regulated Investment Company Modernization Act of 2010, the Funds will be permitted to carry forward capital losses incurred in taxable years beginning after December 22, 2010 for an unlimited period. However, any losses incurred during those future taxable years will be required to be utilized prior to the losses incurred in pre-enactment taxable years. As a result of this ordering rule, pre-enactment capital loss carryforwards may be more likely to expire unused. Additionally, post-enactment capital losses that are carried forward will retain their character as either short-term or long-term capital losses rather than being considered all short-term as under previous law. Losses carried forward under these new provisions are as follows:
Fund | | Short-Term Loss (000) | | | Long-Term Loss (000) | | | Total (000)* | |
Prime Money Market Fund | | $ | (12 | ) | | $ | — | | | $ | (12 | ) |
Government Bond Fund | | | (81 | ) | | | — | | | | (81 | ) |
Intermediate Fixed Income Fund | | | (49 | ) | | | — | | | | (49 | ) |
Fixed Income Opportunities Fund | | | (765 | ) | | | (24 | ) | | | (789 | ) |
Emerging Markets Fund | | | (1,305 | ) | | | (816 | ) | | | (2,121 | ) |
High Yield Bond Fund | | | — | | | | (13 | ) | | | (13 | ) |
* | This table should be used in conjunction with the capital loss carryforwards table. |
During the year ended September 30, 2015, the following Funds utilized capital loss carryforwards to offset capital gains amounting to:
Fund | | Amount
(000) | |
California Tax Exempt Money Market Fund | | $ | 2 | |
Government Bond Fund | | | 107 | |
Intermediate Fixed Income Fund | | | 343 | |
Multi-Asset Fund | | | 386 | |
Dividend & Income Fund | | | 4,416 | |
The aggregate gross unrealized appreciation on securities, the aggregate gross unrealized depreciation on securities and the net unrealized appreciation/ (depreciation) for tax purposes as of September 30, 2015, for each of the Fixed Income Funds, Multi-Asset Fund and Equity Funds were as follows:
Fund | | Federal Tax
Cost
(000) | | | Aggregate
Gross
Unrealized
Appreciation
(000) | | | Aggregate
Gross
Unrealized
Depreciation
(000) | | | Net
Unrealized
Appreciation
(Depreciation)
(000) | |
Government Bond Fund | | $ | 149,689 | | | $ | 1,460 | | | $ | (12 | ) | | $ | 1,448 | |
Corporate Bond Fund | | | 137,873 | | | | 1,552 | | | | (1,595 | ) | | | (43 | ) |
California Tax Exempt Bond Fund | | | 94,814 | | | | 2,052 | | | | (88 | ) | | | 1,964 | |
Municipal High Income Fund | | | 683,883 | | | | 20,885 | | | | (12,428 | ) | | | 8,457 | |
High Yield Bond Fund | | | 94,775 | | | | 462 | | | | (9,526 | ) | | | (9,064 | ) |
Intermediate Fixed Income Fund | | | 266,807 | | | | 4,185 | | | | (2,633 | ) | | | 1,552 | |
Fixed Income Opportunities Fund | | | 1,679,021 | | | | 75,386 | | | | (144,166 | ) | | | (68,780 | ) |
Multi-Asset Fund | | | 19,985 | | | | 453 | | | | (631 | ) | | | (178 | ) |
Dividend & Income Fund | | | 153,542 | | | | 36,473 | | | | (3,515 | ) | | | 32,958 | |
U.S. Core Equity Fund | | | 181,052 | | | | 32,709 | | | | (2,854 | ) | | | 29,855 | |
Socially Responsible Equity Fund | | | 277,482 | | | | 12,831 | | | | (27,484 | ) | | | (14,653 | ) |
Emerging Markets Fund | | | 650,424 | | | | 78,833 | | | | (70,654 | ) | | | 8,179 | |
At September 30, 2015, the Money Market Funds’ cost of securities for Federal income tax purposes approximates the cost disclosed in the Schedule of Investments.
In the normal course of business, the Funds enter into contracts that provide general indemnifications. The Funds’ maximum exposure under these arrangements is dependent on future claims that may be made against the Funds and, therefore, cannot be established; however, based on experience, the risk of loss from such claims is considered remote.
The Multi-Asset Fund may invest in exchange-traded notes (“ETNs”) as a non-principal investment strategy. ETNs are unsecured debt obligations of investment banks which are traded on exchanges and the returns of which are linked to the performance of market indexes. In addition to trading ETNs on exchanges, investors may redeem ETNs directly with the issuer on a weekly basis, typically in a minimum amount of 50,000 units, or hold the ETNs until maturity. ETNs are riskier than ordinary unsecured debt securities and have no principal protection. The Fund will generally invest in ETNs which are linked to commodities indexes. The Fund’s investment in an ETN may be influenced by many unpredictable factors, including highly volatile commodities prices, changes in supply and demand relationships, weather, agriculture, trade, changes in interest rates, and monetary and other governmental policies, action and inaction. Investing in ETNs is not equivalent to investing directly in index components or the relevant index
CITY NATIONAL ROCHDALE FUNDS | PAGE 155
notes to financial statements/
consolidated notes to financial statements |
September 30, 2015 |
itself. Because ETNs are debt securities, they possess credit risk; if the issuer has financial difficulties or goes bankrupt, the investor may not receive the return it was promised.
The Municipal High Income Fund, High Yield Bond Fund, Intermediate Fixed Income Fund, Fixed Income Opportunities Fund and Multi-Asset Fund may invest in lower-rated corporate bonds, known as high yield bonds. High yield bonds involve greater risks of default, downgrade, or price declines and are more volatile than investment grade securities. Issuers of high yield bonds may be more susceptible than other issuers to economic downturns and are subject to a greater risk that the issuer may not be able to pay interest or dividends and ultimately to repay principal upon maturity. Discontinuation of these payments could have a substantial adverse effect on the market value of the security.
The Intermediate Fixed Income Fund and Fixed Income Opportunities Fund may invest in asset-backed and mortgage-backed securities. As a general rule, prepayments of the principal of the loans underlying mortgage-backed or other pass-through securities increase during a period of falling interest rates and decrease during a period of rising interest rates. In periods of declining interest rates, as a result of prepayments a Fund may be required to reinvest its assets in securities with lower interest rates. In periods of increasing interest rates, the securities subject to prepayment risk held by a Fund may exhibit price characteristics of longer-term debt securities.
The Intermediate Fixed Income Fund and Fixed Income Opportunities Fund may invest in bank loans. Bank loans are not traded on an exchange and purchasers and sellers of bank loans generally rely on market makers, typically the administrative agent under a bank loan, to effect private sales transactions. As a result, bank loans may have relatively less liquidity than other types of fixed income assets, and a Fund may be more likely to incur losses on the sale of bank loans than on other, more liquid, investments.
The Fixed Income Opportunities Fund may invest in beneficial interests in individual life insurance policies (“Policies”). A Policy owner transfers his or her Policy at a discount to its face value (the amount that is payable upon the death of the insured) in return for an immediate cash settlement. The ultimate purchaser of the Policy (in this case, the Fund) is responsible for premiums payable on the Policy and is entitled to receive the full face value from the insurance company upon the death of the insured. If the Fund is unable to make premium payments on a Policy, the Policy will lapse and the Fund will lose its ownership interest in the Policy. There is currently no established secondary market for Policies, and the Policies are not considered liquid investments by the Fund. If the Fund must sell Policies to meet redemption requests or other cash needs, the Fund may be forced to sell at a loss. The longer the insured lives, the lower the Fund’s rate of return on the Policy. The underwriter’s estimate of the insured’s life expectancy may be incorrect. An insurance company may be unable or refuse to pay benefits on a Policy. In addition, market quotations will not be readily available for the Policies and the Policies will be priced using a fair value methodology adopted by the Trust’s Board. The sales price the Fund could receive for a Policy may differ from the Trust’s valuation of the Policy. A Policy is a liability of the issuing life insurance company, and if the life insurance company goes out of business, sufficient funds may not be available to pay that liability.
California Tax Exempt Funds – Specific Risks
The ability of issuers to pay interest on, and repay principal of, California municipal securities may be affected by economic and political developments in the State of California.
Certain securities are backed by letters of credit from various financial institutions and financial guaranty assurance agencies. These letters of credit enhance the credit quality of the individual securities; however, if any of the financial institutions’ or financial guaranty assurance agencies’ credit quality should deteriorate, it could cause the individual security’s credit quality to change. Additionally, if any of the Funds concentrate their letters of credit in any one financial institution, the risk of credit quality deterioration increases.
The Funds invest in Certificates of Participation in a municipal obligation, which are subject to annual appropriation risk.
Emerging Markets Fund – Specific Risks
Foreign investments tend to be more volatile than domestic securities, and are subject to risks that are not typically associated with domestic securities (e.g., changes in currency rates and exchange control regulations, future political and economic developments and the possibility of seizure or nationalization of companies, or the imposition of withholding taxes on income). There may be less government supervision of foreign markets. As a result, foreign issuers may not be subject to the uniform accounting, auditing, and financial reporting standards and practices applicable to domestic issuers, and there may be less publicly available information about foreign issuers.
As long as the Emerging Markets Fund holds a foreign security, its value will be affected by the value of the local currency relative to the U.S. dollar. The value of a foreign currency may decline in relation to the U.S. dollar while the Fund holds securities
CITY NATIONAL ROCHDALE FUNDS | PAGE 156
denominated in such currency. Currency exchange rates can be volatile and can be affected by, among other factors, the general economics of a country or the actions of the U.S. or foreign governments or central banks. U.S. dollar-denominated securities of foreign issuers may also be affected by currency risk, as the value of these securities may also be affected by changes in the issuer’s local currency.
Risks associated with foreign investments may be intensified in the case of investments in emerging market countries, the political, legal and economic systems of which are less developed and less stable than those of more developed nations. Emerging markets may have relatively unstable governments, immature economic structures, national policies restricting investments by foreigners, social instability, and different and/or developing legal systems. In some countries, there is the risk that the government may take over the assets or operations of a company or that the government may impose withholding and other taxes or limits on the removal of the Emerging Market Fund’s assets from that country. In addition, the economies of emerging markets may be predominantly based on only a few industries, may be highly vulnerable to changes in local or global trade conditions, and may suffer from extreme and volatile debt burdens or inflation rates. Such investments are often less liquid and/or more volatile than securities issued by companies located in developed nations. Emerging market securities are also subject to the risk that the securities may not be sold at the quoted market price within a reasonable period of time
8. | CAPITAL SHARES ISSUED AND REDEEMED: |
Capital share activity for the year ended September 30, 2015, and the year or period ended September 30, 2014, were as follows (000):
| | | Government Money
Market Fund | | | Prime Money
Market Fund | | | California Tax Exempt
Money Market Fund | |
| | | 2015 | | | 2014 | | | 2015 | | | 2014 | | | 2015 | | | 2014 | |
CAPITAL SHARES ISSUED AND REDEEMED: | | | | | | | | | | | | | | | | |
Institutional Class: | | | | | | | | | | | | | | | | | | |
Shares issued | | | — | | | | — | | | | 103,267 | | | | 177,330 | | | | — | | | | — | |
Shares issued in Lieu of Dividends and Distributions | | | — | | | | — | | | | 5 | | | | — | | | | — | | | | — | |
Shares redeemed | | | — | | | | — | | | | (89,241 | ) | | | (134,563 | ) | | | — | | | | — | |
Net Institutional Class transactions | | | — | | | | — | | | | 14,031 | | | | 42,767 | | | | — | | | | — | |
Class N: | | | | | | | | | | | | | | | | | | | | | | | | |
Shares issued | | | 3,753,980 | | | | 4,544,028 | | | | 701,569 | | | | 712,240 | | | | 686,601 | | | | 988,104 | |
Shares issued in Lieu of Dividends and Distributions | | | 252 | | | | 249 | | | | 23 | | | | 24 | | | | 61 | | | | 67 | |
Shares redeemed | | | (3,969,801 | ) | | | (4,410,324 | ) | | | (743,764 | ) | | | (803,775 | ) | | | (715,932 | ) | | | (1,037,816 | ) |
Net Class N transactions | | | (215,569 | ) | | | 133,953 | | | | (42,172 | ) | | | (91,511 | ) | | | (29,270 | ) | | | (49,645 | ) |
Class S: | | | | | | | | | | | | | | | | | | | | | | | | |
Shares issued | | | 1,307,608 | | | | 1,522,771 | | | | 1,030,736 | | | | 869,219 | | | | 453,783 | | | | 372,122 | |
Shares issued in Lieu of Dividends and Distributions | | | — | | | | — | | | | — | | | | — | | | | — | | | | — | |
Shares redeemed | | | (1,345,358 | ) | | | (1,291,990 | ) | | | (970,164 | ) | | | (878,235 | ) | | | (474,800 | ) | | | (370,022 | ) |
Net Class S transactions | | | (37,750 | ) | | | 230,781 | | | | 60,572 | | | | (9,016 | ) | | | (21,017 | ) | | | 2,100 | |
Servicing Class: | | | | | | | | | | | | | | | | | | | | | | | | |
Shares issued | | | 1,454,606 | | | | 1,008,445 | | | | 1,141,621 | | | | 1,057,487 | | | | 816,680 | | | | 698,593 | |
Shares issued in Lieu of Dividends and Distributions | | | — | | | | — | | | | 11 | | | | 9 | | | | — | | | | — | |
Shares redeemed | | | (1,357,973 | ) | | | (924,910 | ) | | | (1,199,419 | ) | | | (1,207,309 | ) | | | (792,228 | ) | | | (662,963 | ) |
Net Servicing Class transactions | | | 96,633 | | | | 83,535 | | | | (57,787 | ) | | | (149,813 | ) | | | 24,452 | | | | 35,630 | |
CITY NATIONAL ROCHDALE FUNDS | PAGE 157
notes to financial statements/
consolidated notes to financial statements |
September 30, 2015 |
| | | Government Bond Fund | | | Corporate Bond Fund | | | California Tax Exempt Bond Fund | |
| | | 2015 | | | 2014 | | | 2015 | | | 2014 | | | 2015 | | | 2014 | |
CAPITAL SHARES ISSUED AND REDEEMED: | | | | | | | | | | | | | | | | | | |
Institutional Class: | | | | | | | | | | | | | | | | | | |
Shares issued | | | 985 | | | | 550 | | | | — | | | | — | | | | — | | | | — | |
Shares issued in Lieu of Dividends and Distributions | | | 33 | | | | 14 | | | | — | | | | — | | | | — | | | | — | |
Shares redeemed | | | (917 | ) | | | (322 | ) | | | — | | | | — | | | | — | | | | — | |
Net Institutional Class transactions | | | 101 | | | | 242 | | | | — | | | | — | | | | — | | | | — | |
Class N: | | | | | | | | | | | | | | | | | | | | | | | | |
Shares issued | | | 29 | | | | 12 | | | | 187 | | | | 128 | | | | 407 | | | | 241 | |
Shares issued in Lieu of Dividends and Distributions | | | — | | | | — | | | | 6 | | | | 4 | | | | 10 | | | | 7 | |
Shares redeemed | | | (43 | ) | | | (30 | ) | | | (146 | ) | | | (88 | ) | | | (374 | ) | | | (164 | ) |
Net Class N transactions | | | (14 | ) | | | (18 | ) | | | 47 | | | | 44 | | | | 43 | | | | 84 | |
Servicing Class: | | | | | | | | | | | | | | | | | | | | | | | | |
Shares issued | | | 1,849 | | | | 1,126 | | | | 2,527 | | | | 1,617 | | | | 3,179 | | | | 1,874 | |
Shares issued in Lieu of Dividends and Distributions | | | 17 | | | | 7 | | | | 25 | | | | 19 | | | | 11 | | | | 7 | |
Shares redeemed | | | (4,123 | ) | | | (1,563 | ) | | | (3,358 | ) | | | (1,846 | ) | | | (1,687 | ) | | | (718 | ) |
Net Servicing Class transactions | | | (2,257 | ) | | | (430 | ) | | | (806 | ) | | | (210 | ) | | | 1,503 | | | | 1,163 | |
| | | Municipal High Income Fund | | | High Yield Bond Fund | | | Intermediate Fixed Income Fund (1) | | | Fixed Income Opportunities Fund | |
| | | 2015 | | | 2014 | | | 2015 | | | 2014 | | | 2015 | | | 2014 | | | 2015 | | | 2014 | |
CAPITAL SHARES ISSUED AND REDEEMED: | | | | | | | | | | | | | | | | |
Institutional Class: | | | | | | | | | | | | | | | | | | | | | | | | |
Shares issued | | | — | | | | — | | | | 707 | | | | 831 | | | | 254 | | | | 45 | | | | — | | | | — | |
Shares issued from Merger(2) | | | — | | | | — | | | | — | | | | — | | | | — | | | | 1,734 | | | | — | | | | — | |
Shares issued in Lieu of Dividends and Distributions | | | — | | | | — | | | | 501 | | | | 267 | | | | 9 | | | | 25 | | | | — | | | | — | |
Shares redeemed | | | — | | | | — | | | | (800 | ) | | | (1,023 | ) | | | (2 | ) | | | (1,469 | ) | | | — | | | | — | |
Net Institutional Class transactions | | | — | | | | — | | | | 408 | | | | 75 | | | | 261 | | | | 335 | | | | — | | | | — | |
Class N: | | | | | | | | | | | | | | | | | | | | | | | | | | | | | | | | |
Shares issued | | | 19,914 | | | | 20,399 | | | | 668 | | | | 494 | | | | 3,610 | | | | 3,739 | | | | 25,240 | | | | 22,889 | |
Shares issued from Merger(2) | | | — | | | | — | | | | — | | | | — | | | | — | | | | — | | | | — | | | | 2,105 | |
Shares issued in Lieu of Dividends and Distributions | | | 685 | | | | 211 | | | | 163 | | | | 138 | | | | 124 | | | | 89 | | | | 2,433 | | | | 1,185 | |
Shares redeemed | | | (3,548 | ) | | | (1,828 | ) | | | (1,040 | ) | | | (1,645 | ) | | | (1,755 | ) | | | (2,058 | ) | | | (13,754 | ) | | | (9,450 | ) |
Net Class N transactions | | | 17,051 | | | | 18,782 | | | | (209 | ) | | | (1,013 | ) | | | 1,979 | | | | 1,770 | | | | 13,919 | | | | 16,729 | |
Servicing Class: | | | | | | | | | | | | | | | | | | | | | | | | | | | | | | | | |
Shares issued | | | 12,508 | | | | 21,234 | | | | 1,101 | | | | 3,068 | | | | — | | | | — | | | | — | | | | — | |
Shares issued in Lieu of Dividends and Distributions | | | 52 | | | | 7 | | | | 92 | | | | 63 | | | | — | | | | — | | | | — | | | | — | |
Shares redeemed | | | (3,463 | ) | | | (633 | ) | | | (2,629 | ) | | | (8,462 | ) | | | — | | | | — | | | | — | | | | — | |
Net Servicing Class transactions | | | 9,097 | | | | 20,608 | | | | (1,436 | ) | | | (5,331 | ) | | | — | | | | — | | | | — | | | | — | |
(1) | Institutional Class commenced operations on December 20, 2013. |
(2) | See Note 9 in Notes to Financial Statements. |
CITY NATIONAL ROCHDALE FUNDS | PAGE 158
| | | Multi-Asset Fund (1) | | | Dividend & Income Fund | | | U.S. Core Equity Fund | |
| | | 2015 | | | 2014 | | | 2015 | | | 2014 | | | 2015 | | | 2014 | |
CAPITAL SHARES ISSUED AND REDEEMED: | | | | | | | | | | | | | | | | |
Institutional Class: | | | | | | | | | | | | | | | | | | |
Shares issued | | | — | | | | 71 | | | | — | | | | — | | | | — | | | | 100 | |
Shares issued from Merger(2) | | | — | | | | — | | | | — | | | | — | | | | — | | | | 3,795 | |
Shares issued in Lieu of Dividends and Distributions | | | — | | | | 3 | | | | — | | | | — | | | | 52 | | | | 6 | |
Shares redeemed | | | — | | | | (664 | ) | | | — | | | | — | | | | (1 | ) | | | (3,425 | ) |
Net Institutional Class transactions | | | — | | | | (590 | ) | | | — | | | | — | | | | 51 | | | | 476 | |
Class N: | | | | | | | | | | | | | | | | | | | | | | | | |
Shares issued | | | 153 | | | | 59 | | | | 1,823 | | | | 2,007 | | | | 1,450 | | | | 2,093 | |
Shares issued from Merger(2) | | | — | | | | — | | | | — | | | | — | | | | — | | | | 207 | |
Shares issued in Lieu of Dividends and Distributions | | | 12 | | | | 10 | | | | 100 | | | | 102 | | | | 640 | | | | 97 | |
Shares redeemed | | | (334 | ) | | | (418 | ) | | | (1,369 | ) | | | (2,010 | ) | | | (1,032 | ) | | | (977 | ) |
Net Class N transactions | | | (169 | ) | | | (349 | ) | | | 554 | | | | 99 | | | | 1,058 | | | | 1,420 | |
Servicing Class: | | | | | | | | | | | | | | | | | | | | | | | | |
Shares issued | | | 191 | | | | 105 | | | | — | | | | — | | | | 2,617 | | | | 2,881 | |
Shares issued in Lieu of Dividends and Distributions | | | 5 | | | | 3 | | | | — | | | | — | | | | 4 | | | | 1 | |
Shares redeemed | | | (324 | ) | | | (21 | ) | | | — | | | | — | | | | (1,882 | ) | | | (1,265 | ) |
Net Servicing Class transactions | | | (128 | ) | | | 87 | | | | — | | | | — | | | | 739 | | | | 1,617 | |
| | | Socially Responsible Equity Fund | | | Emerging Markets Fund | |
| | | 2015 | | | 2014 | | | 2015 | | | 2014 | |
CAPITAL SHARES ISSUED AND REDEEMED: | | | | | | | | | | | | |
Institutional Class: | | | | | | | | | | | | |
Shares issued | | | 9,898 | | | | 11,271 | | | | — | | | | — | |
Shares issued in Lieu of Dividends and Distributions | | | 767 | | | | 768 | | | | — | | | | — | |
Shares redeemed | | | (2,343 | ) | | | (635 | ) | | | — | | | | — | |
Net Institutional Class transactions | | | 8,322 | | | | 11,404 | | | | — | | | | — | |
Class N: | | | | | | | | | | | | | | | | |
Shares issued | | | 363 | | | | 968 | | | | 8,896 | | | | 8,011 | |
Shares issued in Lieu of Dividends and Distributions | | | 82 | | | | 514 | | | | 25 | | | | 15 | |
Shares redeemed | | | (519 | ) | | | (1,699 | ) | | | (4,558 | ) | | | (1,641 | ) |
Net Class N transactions | | | (74 | ) | | | (217 | ) | | | 4,363 | | | | 6,385 | |
(1) | Institutional Class ceased operations on January 31, 2014. |
(2) | See Note 9 in Notes to Financial Statements. |
CITY NATIONAL ROCHDALE FUNDS | PAGE 159
notes to financial statements/
consolidated notes to financial statements |
September 30, 2015 |
Intermediate Fixed Income Fund:
On December 20, 2013, the assets of the City National Rochdale Full Maturity Fixed Income Fund (the “Full Maturity Fixed Income Fund”) were reorganized into the Intermediate Fixed Income Fund. In this reorganization, 4,352,128 shares of the Full Maturity Fixed Income Fund were exchanged for 1,734,179 shares of the Intermediate Fixed Income Fund in a tax-free exchange.
The value of the Full Maturity Fixed Income Fund on December 20, 2013 was $44,899,004. Upon the business combination of such Funds on December 20, 2013, the value of the Full Maturity Fixed Income Fund, which included accumulated realized losses of $124,817 and unrealized loss of $238,709, combined with the value of the Intermediate Fixed Income Fund was $209,405,691.
Assuming the reorganization had been completed on October 1, 2013, the beginning of the fiscal year end, the Intermediate Fixed Income Fund’s pro-forma net investment income, net gain/(loss) on investments and net increase in net assets from operations, for the year ended September 30, 2014, would have been $4,836,013, $2,902,040 and $7,738,053, respectively. Because the combined investment portfolios have been managed as a single integrated portfolio since the reorganization was completed, it is not practicable to separate the amounts of revenue and earnings of the Full Maturity Fixed Income Fund that have been included in the Intermediate Fixed Income Fund’s Statement of Operations since December 20, 2013. Because the Intermediate Fixed Income Fund and Full Maturity Fixed Income Fund sold and redeemed shares throughout the period, it is not practicable to provide pro-forma information on a per-share basis.
U.S. Core Equity Fund:
On March 21, 2014, the assets of the City National Rochdale Diversified Equity Fund (the “Diversified Equity Fund”) were reorganized into the U.S. Core Equity Fund. In this reorganization, 3,019,691 shares of the Diversified Equity Fund were exchanged for 207,167 Class N shares and 3,794,815 Institutional Class shares of the U.S. Core Equity Fund in a taxable exchange.
The value of the Diversified Equity Fund on March 21, 2014 was $53,568,331. Upon the business combination of such Funds on March 21, 2014, the value of the Diversified Equity Fund, which included accumulated realized losses of $451,745 and distributions in excess of net investment income of $210, combined with the value of the U.S. Core Equity Fund was $223,593,114.
Assuming the reorganization had been completed on October 1, 2013, the beginning of the fiscal year end, the U.S. Core Equity Fund’s pro-forma net investment income, net gain/(loss) on investments and net increase in net assets from operations for the year ended September 30, 2014, would have been $1,073,823, $35,415,034 and $36,488,858, respectively. Because the combined investment portfolios have been managed as a single integrated portfolio since the reorganization was completed, it is not practicable to separate the amounts of revenue and earnings of the Diversified Equity Fund that have been included in the U.S. Core Equity Fund’s Statement of Operations since March 21, 2014. Because the U.S. Core Equity Fund and Diversified Equity Fund sold and redeemed shares throughout the period, it is not practicable to provide pro-forma information on a per-share basis
Fixed Income Opportunities Fund:
On May 30, 2014, the assets of City National Rochdale Alternative Total Return Fund LLC were reorganized into the Fixed Income Opportunities Fund. In this reorganization, the total net assets of City National Rochdale Alternative Total Return Fund LLC were exchanged for 2,104,921 shares of the Fixed Income Opportunities Fund in a taxable exchange.
The value of City National Rochdale Alternative Total Return Fund LLC on May 30, 2014 was $58,518,275. Upon the business combination of such Funds on May 30, 2014, the value of City National Rochdale Alternative Total Return Fund LLC, which included realized gains of $49,195,270 and distributions in excess of net investment income of $28,972,614, combined with the value of the Fixed Income Opportunities Fund was $1,349,061,955.
Assuming the reorganization had been completed on October 1, 2013, the beginning of the fiscal year end, the Fixed Income Opportunities Fund’s pro-forma net investment income, net gain/(loss) on investments and net increase in net assets from operations for the year ended September 30, 2014, would have been $57,319,270, $8,564,090 and $65,883,360, respectively. The only investments acquired as part of the reorganization were life settlement contracts. Since the date of reorganization there were no realized gains with respect to the merged assets and the net change in unrealized loss amounted to $2,969,202. Because the Fixed Income Opportunities Fund and City National Rochdale Alternative Total Return Fund LLC sold and redeemed shares throughout the period, it is not practicable to provide pro-forma information on a per-share basis.
10. LINE OF CREDIT
The Funds, except for the Money Market Funds, have an unsecured Loan Agreement (“LOC”) with U.S. Bank N.A. Under the terms of the LOC, borrowings for an individual Fund were limited to either the lesser of 10% of the Fund’s net assets or an explicit amount on the LOC. Interest is charged to a Fund based on its borrowings at prime rate minus 0.50%.
CITY NATIONAL ROCHDALE FUNDS | PAGE 160
Borrowing activity under the LOC for the year ended September 30, 2015, was as follows:
Fund | | Maximum Amount of Line of Credit (000) | | | Interest Expense (000) | | | Average Rate | | | Average Borrowings (000) | | | Maximum Amount Outstanding (000) | |
City National Rochdale Fixed Income Opportunities Fund | | $ | 50,000 | | | $ | 22 | | | | 2.75 | % | | $ | 4,515 | | | $ | 20,000 | |
Dividend & Income Fund | | $ | 50,000 | | | $ | 1 | | | | 2.75 | % | | $ | 79 | | | $ | 945 | |
Average borrowing activity was calculated using the number of days for amounts outstanding in the Fixed Income Opportunities Fund and Dividend & Income Fund.
On July 23, 2014, the Securities and Exchange Commission voted to amend the rules under the Investment Company Act of 1940, as amended, which currently govern the operations of the Money Market Funds (the “MMFs”). The most significant change resulting from these amendments is a requirement that certain types of money market funds transact fund shares based on a market-based NAV. Other types of money market funds may continue to transact fund shares at an NAV calculated using the amortized cost valuation method. Among additional disclosure and other requirements, the amendments also will permit a money market fund, or, in certain circumstances, require a money market fund (other than a government money market fund) to impose liquidity fees on all redemptions, and permit a money market fund to limit (or gate) redemptions for up to ten business days in any 90-day period. The amendments have staggered compliance dates. The majority of these amendments will impact the MMFs beginning on October 14, 2016.
12. | CHANGE OF INDEPENDENT REGISTERED PUBLIC ACCOUNTING FIRM |
The Trust has selected BBD, LLP (“BBD”) to serve as the Funds’ independent registered public accounting firm for the Funds’ fiscal year ended September 30, 2015. The decision to select BBD was recommended by the Trust’s Audit Committee on August 27, 2015, and was approved by the Board of Trustees on August 27, 2015. During the Trust’s fiscal year ended September 30, 2015, nor the Trust, nor anyone on its behalf, consulted with BBD on items which: (i) concerned the application of accounting principles to a specified transaction, either completed or proposed, or the type of audit opinion that might be rendered on the Trust’s financial statements; or (ii) concerned the subject of a disagreement (as defined in paragraph(a)(1)(iv) in Item 304 of Regulation S-K). The selection of BBD does not reflect any disagreements with or dissatisfaction by the Trust or the Board of Trustees with the performance of the Trust’s prior independent registered public accounting firm, KPMG LLP (“KPMG”). KPMG’s report on the Trust’s financial statement for the fiscal years ended September 30, 2013 and September 30, 2014, contained no adverse opinion or disclaimer of opinion, nor was it qualified or modified as to uncertainty, audit scope, or accounting principles. During the Trust’s fiscal years ended 2013 and 2014 (i) there were no disagreements with KPMG on any matter of accounting principles or practices, financial statement disclosure, or auditing scope or procedure, which disagreements, if not resolved to the satisfaction of KPMG, would have caused them to make reference to the subject matter of the disagreements in connection with its reports on the Trust’s financial statements for such years; and (ii) there were no “reportable events” of the kind described in Item 304(a)(1)(v) of Regulation S-K.
On November 2, 2015, Royal Bank of Canada completed its acquisition of City National Corporation. City National Rochdale, LLC, the investment adviser to the City National Rochdale Funds, is a subsidiary of City National Bank. City National Rochdale, LLC and City National Bank are wholly-owned subsidiaries of RBC USA Holdco Corporation, which is a wholly-owned indirect subsidiary of Royal Bank of Canada.
On November 20, 2015, approximately 86% of the shares of the City National Rochdale Socially Responsible Equity Fund was redeemed.
A special meeting of shareholders of the City National Rochdale Socially Responsible Equity Fund is scheduled for December 7, 2015 to seek approval of a proposed reorganization of the Fund into a newly formed series of Forum Funds II. This proposed reorganization will result in a change in the investment adviser to the City National Rochdale Socially Responsible Equity Fund from City National Rochdale, LLC to SKBA Capital Management, LLC, currently the sub-adviser to the Fund, and no change to the Fund’s investment objective or strategies.
Effective January 31, 2016, the Adviser intends to discontinue the voluntary fee waivers for the City National Rochdale Municipal High Income Fund, City National Rochdale High Yield Bond Fund, City National Rochdale U.S. Core Equity Fund, City National Rochdale Dividend & Income Fund, and City National Rochdale Emerging Markets Fund.
The Trust has evaluated the need for additional disclosures and/or adjustments resulting from subsequent events. Based on this evaluation, no adjustments were required to the financial statements as of September 30, 2015 and no issues were noted to disclose.
CITY NATIONAL ROCHDALE FUNDS | PAGE 161
report of independent registered public accounting firm |
|
To the Shareholders and Board of Trustees
of City National Rochdale Funds
We have audited the accompanying statements of assets and liabilities of Government Money Market Fund, Prime Money Market Fund, California Tax Exempt Money Market Fund, Government Bond Fund, Corporate Bond Fund, California Tax Exempt Bond Fund, Municipal High Income Fund, High Yield Bond Fund, Intermediate Fixed Income Fund, Fixed Income Opportunities Fund (consolidated), Multi-Asset Fund, Dividend & Income Fund, U.S. Core Equity Fund, Socially Responsible Equity Fund and Emerging Markets Fund (consolidated) (the “Funds”), each a series of shares of beneficial interest in the City National Rochdale Funds, including the schedules of investments, as of September 30, 2015, and the related statements of operations, changes in net assets, and consolidated cash flows (for Fixed Income Opportunities only) and the financial highlights for the year then ended (consolidated for Fixed Income Opportunities and Emerging Markets Fund). These financial statements and financial highlights are the responsibility of the Funds’ management. Our responsibility is to express an opinion on these financial statements and financial highlights based on our audits. The statements of changes in net assets and the financial highlights (consolidated for Fixed Income Opportunities and Emerging Markets Fund) for each of the years or periods presented through September 30, 2014 for each of the Funds were audited by other auditors, whose reports dated November 28, 2014 and March 31, 2013 expressed an unqualified opinion on those financial statements and financial highlights.
We conducted our audits in accordance with the standards of the Public Company Accounting Oversight Board (United States). Those standards require that we plan and perform the audits to obtain reasonable assurance about whether the financial statements and financial highlights are free of material misstatement. An audit includes examining, on a test basis, evidence supporting the amounts and disclosures in the financial statements. Our procedures included confirmation of securities owned as of September 30, 2015 by correspondence with the custodian and brokers, or by other appropriate auditing procedures. An audit also includes assessing the accounting principles used and significant estimates made by management, as well as evaluating the overall financial statement presentation. We believe that our audits provide a reasonable basis for our opinion.
In our opinion, the financial statements and financial highlights (consolidated where noted) referred to above present fairly, in all material respects, the financial position of each of the Funds comprising the City National Rochdale Funds as of September 30, 2015, and the results of their operations and cash flows, the changes in their net assets and their financial highlights for the year then ended, in conformity with accounting principles generally accepted in the United States of America.
Philadelphia, Pennsylvania
November 30, 2015
CITY NATIONAL ROCHDALE FUNDS | PAGE 162
trustees and officers (Unaudited) |
September 30, 2015 |
Information pertaining to the Trustees and Officers of the Trust is set forth below as of September 30, 2015. Trustees who are not deemed to be “interested persons” of the Trust as defined in the Investment Company Act of 1940 are referred to as “Independent Trustees.” The Trust’s Statement of Additional Information (“SAI”) includes additional information about the Trustees and Officers. The SAI may be obtained without charge by calling 1-888-889-0799.
Name,
Address,
and Age | Position
with the
Trust | Term of
Office(1) and
Length of
Time Served | Principal Occupation
for the Past Five Years | Number of
Portfolios in Fund Complex(2)
Overseen by
Trustee | Other
Directorships
Held by Trustee |
INDEPENDENT TRUSTEES |
Irwin G. Barnet City National Rochdale Funds 400 N. Roxbury Drive Beverly Hills, California 90210 Age: 77 | Trustee | Since 1999 | Retired (May 2014-present). Attorney and of counsel, Reed Smith LLP, a law firm (2009-April 2014). Partner, Reed Smith LLP (2003-2008). Attorney and principal, Crosby, Heafey, Roach & May P.C., a law firm (2000-2002). Attorney and principal, Sanders, Barnet, Goldman, Simons & Mosk, a law firm (1980-2000). | 20 | None |
Daniel A. Hanwacker City National Rochdale Funds 400 N. Roxbury Drive Beverly Hills, California 90210 Age: 63 | Trustee | Since 2013 | CEO and President, Hanwacker Associates, Inc. (asset management consulting and executive search services) (2001-present). Managing Director - Asset Management, Putnam Lovell Securities (2000-2001). Co-Founding Partner, Constellation Financial Management, Co., LLC (1995-2000). | 20 | Rochdale Investment Trust (2011-2013) |
Jon C. Hunt City National Rochdale Funds 400 N. Roxbury Drive Beverly Hills, California 90210 Age: 63 | Trustee | Since 2013 | Retired (March 2013 to present). Consultant to Management, Convergent Capital Management, LLC (“CCM”) (July 2012-March 2013). Managing Director and Chief Operating Officer, CCM (1998-June 2012). | 20 | Nuveen Commodities Asset Management, member of Independent Committee (February 2012-present); Advisor’s Inner Circle Fund III (February 2014-present); O’Connor EQUUS (May 2014-present); Winton Series Trust and Winton Diversified Opportunities Fund, Lead Independent Trustee (January 2015-present) |
Vernon C. Kozlen City National Rochdale Funds 400 N. Roxbury Drive Beverly Hills, California 90210 Age: 72 | Trustee | Since 2007 | Retired (2007-present). President and Chief Executive Officer, City National Rochdale Funds (2000-2007). Executive Vice President and Director of Asset Management Development, CNB (1996-2007). Director, Reed, Conner & Birdwell LLC (2000-2007), and Convergent Capital Management, LLC (2003-2007). Chairman of the Board, City National Asset Management, Inc. (2001-2005). Chairman of the Board, City National Securities, Inc. (1999-2005). Director, City National Asset Management, Inc. (2001-2006), and City National Securities, Inc. (1999-2006). | 20 | Windermere Jupiter Fund, LLC, CMS/Ironwood Multi-Strategy Fund LLC, CMS/Barlow Long-Short Equity Fund, LLC (3) |
CITY NATIONAL ROCHDALE FUNDS | PAGE 163
trustees and officers (Unaudited) (Continued) |
September 30, 2015 |
Name,
Address,
and Age | Position
with the
Trust | Term of
Office(1) and
Length of
Time Served | Principal Occupation
for the Past Five Years | Number of
Portfolios in Fund Complex(2)
Overseen by
Trustee | Other
Directorships
Held by Trustee |
INDEPENDENT TRUSTEES (Continued) |
Jay C. Nadel City National Rochdale Funds 400 N. Roxbury Drive Beverly Hills, California 90210 Age: 56 | Trustee | Since 2013 | Financial Services Consultant (2005-present). Executive Vice President, Bank of New York Broker-Dealer and Member of the Operating Committee (2002-2004). Weiss, Peck & Greer, Partner, Managing Director and Chair of the Operations Committee (1986-2001). | 20 | Lapolla Industries, Inc. (2007-present); Rochdale Investment Trust (2011-2013) |
James Wolford City National Rochdale Funds 400 N. Roxbury Drive Beverly Hills, California 90210 Age: 61 | Trustee | Since 1999 | Chief Executive Officer of Corinthian Development Company (December 2013-present). President, Chief Operating Officer and Chief Financial Officer, Thompson National Properties (March 2011-December 2013). Chief Financial Officer, Pacific Office Properties, a real estate investment trust (April 2010-March 2011). Chief Financial Officer, Bixby Land Company, a real estate company (2004-March 2010). Regional Financial Officer, AIMCO, a real estate investment trust (2004). Chief Financial Officer, DBM Group, a direct mail marketing company (2001-2004). Senior Vice President and Chief Operating Officer, Forecast Commercial Real Estate Service, Inc. (2000-2001). Senior Vice President and Chief Financial Officer, Bixby Ranch Company (1985-2000). | 20 | None |
INTERESTED TRUSTEES |
Andrew S. Clare (4) City National Rochdale Funds 400 N. Roxbury Drive Beverly Hills, California 90210 Age: 69 | Trustee | Since 2013 | Attorney and partner, Loeb & Loeb LLP, a law firm (1972-present). | 20 | None |
(1) | The Trustees serve for terms of office as follows: |
Name of Trustee | End of Term of Office |
Irwin G. Barnet | December 31, 2015 |
Vernon C. Kozlen | December 31, 2018* |
James Wolford | March 29, 2023 |
Andrew S. Clare | December 31, 2020* |
Daniel A. Hanwacker | March 29, 2023 |
Jon C. Hunt | March 29, 2023 |
Jay C. Nadel | March 29, 2023 |
| | * | Subject to extension by the Board for up to two years. |
(2) | “Fund complex” is defined as two or more registered investment companies that hold themselves out to investors as related companies or have a common investment adviser or affiliated investment advisers and in this case includes the following registered closed-end funds: City National Rochdale High Yield Alternative Strategies Master Fund LLC, City National Rochdale High Yield Alternative Strategies Fund LLC, City National Rochdale High Yield Alternative Strategies Fund TEI LLC, City National Rochdale Structured Claims Fixed Income Fund LLC and City National Rochdale International Trade Fixed Income Fund. |
(3) | Convergent Wealth Advisors, LLC, which is under common control with CNB, serves as investment adviser to Windermere Jupiter Fund, LLC, CMS/Ironwood Multi-Strategy Fund, LLC and CMS/Barlow Long-Short Equity Fund, LLC, each of which is a private investment fund. |
(4) | Mr. Clare is an “interested person” of the Trust, as defined in the 1940 Act, by virtue of the provision of significant legal services by him and his law firm to CNB. |
CITY NATIONAL ROCHDALE FUNDS | PAGE 164
Name
Address,
and Age | Position
with the
Trust | Term of
Office(1) and
Length of
Time Served | Principal Occupation
for the Past Five Years |
OFFICERS |
Garrett R. D’Alessandro City National Rochdale, LLC 400 N. Roxbury Drive Beverly Hills, California 90210 Age: 57 | President and Chief Executive Officer | Since 2013 | Chief Executive Officer, City National Rochdale (1986-present). |
Eric Kleinschmidt SEI Investments One Freedom Valley Drive Oaks, Pennsylvania 19456 Age: 47 | Treasurer | Since 2005 | Director of Fund Accounting, SEI Investments Company (2004-present). Manager of Fund Accounting, SEI Investments (1999-2004). |
F. Michael Gozzillo City National Rochdale, LLC 400 N. Roxbury Drive Beverly Hills, California 90210 Age: 50 | Vice President; Chief Compliance Officer (“CCO”); Anti-Money Laundering Officer & Identity Theft Program Officer | Since 2013 | Senior Vice President & Chief Compliance Officer, City National Rochdale (2012-present). CCO, Symphonic Financial Advisers LLC (2013-Present). CCO, City National Rochdale High Yield Alternative Strategies Master Fund LLC, City National Rochdale High Yield Alternative Strategies Fund LLC, City National Rochdale High Yield Alternative Strategies Fund TEI LLC, City National Rochdale Structured Claims Fixed Income Fund LLC and City National Rochdale International Trade Fixed Income Fund (2013-present). Director & Compliance Officer, TIAA-CREF (2008-2012). CCO, TIAA-CREF Life Insurance Co. Separate Accounts (2009-2012). |
Lisa Whittaker SEI Investments One Freedom Valley Drive Oaks, Pennsylvania 19456 Age: 36 | Vice President and Assistant Secretary | Since 2012 | Attorney, SEI Investments Company (2012-present). Associate Counsel, The Glenmede Trust Company (2011-2012). Associate, Drinker Biddle & Reath LLP (2006-2011). |
Greg Francoeur City National Rochdale, LLC 400 N. Roxbury Drive Beverly Hills, California 90210 Age: 44 | Vice President and Assistant Treasurer | Since 2015 | Segment Finance Manager, City National Corporation Wealth Management Segment (2009-present). Chief Financial Officer, Convergent Capital Management, (2003-2009). |
Mitchell Cepler City National Rochdale, LLC 400 N. Roxbury Drive Beverly Hills, California 90210 Age: 32 | Vice President and Assistant Treasurer | Since 2015 | Group Finance Manager, City National Rochdale (2011-present). Manager, Financial Planning and Analysis, ESP Technologies Corporation (2008-2011). |
Kurt Hawkesworth City National Rochdale, LLC 400 N. Roxbury Drive Beverly Hills, California 90210 Age: 44 | Vice President and Secretary | Since 2013 | Chief Operating Officer, City National Rochdale (2003-present). |
Anthony Sozio City National Rochdale, LLC 400 N. Roxbury Drive Beverly Hills, California 90210 Age: 44 | Vice President and Assistant Secretary | Since 2013 | Assistant Vice President of Registered Fund Operations, City National Rochdale (1998-present). |
(1) | Each officer serves until removed by the Board or the principal executive officer of the Trust, or until such officer resigns. |
CITY NATIONAL ROCHDALE FUNDS | PAGE 165
notice to shareholders (Unaudited) |
September 30, 2015 |
For shareholders that do not have a September 30, 2015, taxable year end, this notice is for informational purposes only. For shareholders with a September 30, 2015, taxable year end, please consult your tax advisor as to the pertinence of this notice.
For California income tax purposes, for the fiscal year ended September 30, 2015, each of the California Tax Exempt Bond Fund, California Tax Exempt Money Market Fund and Municipal High Income Fund is designating 92.41%, 91.17% and 10.94%, respectively, of its distributions paid from net investment income as exempt-interest dividends under Section 17145 of the California Revenue and Taxation Code.
For Federal income tax purposes, for the fiscal year ended September 30, 2015, each Fund is designating the following items with regard to distributions paid during the year:
| (A)
Long Term Capital Gain Distributions | (B)
Return of Capital | (C)
Ordinary Income Distributions | (D)
Tax Exempt Interest | (E)
Total Distributions | (F)
Dividends Qualifying for Corporate Dividends
Rec. Deduction (1) | (G)
Qualifying Dividend Income (2) | (H)
U.S. Government Interest (3) | (I)
Interest Related Dividends (4) | (J)
Qualified Short-Term Capital Gain Dividends (5) |
Government Money Market Fund | 0.00% | 0.00% | 100.00% | 0.00% | 100.00% | 0.00% | 0.00% | 78.26% | 99.51% | 100.00% |
Prime Money Market Fund | 0.00% | 0.00% | 100.00% | 0.00% | 100.00% | 0.00% | 0.00% | 2.32% | 99.52% | 0.00% |
California Tax Exempt Money Market Fund | 0.00% | 0.00% | 1.67% | 98.33% | 100.00% | 0.00% | 0.00% | 0.00% | 100.00% | 0.00% |
Limited Maturity Fixed Income | 0.00% | 0.00% | 100.00% | 0.00% | 100.00% | 0.00% | 0.00% | 0.00% | 88.37% | 0.00% |
Government Bond Fund | 0.00% | 0.00% | 100.00% | 0.00% | 100.00% | 0.00% | 0.00% | 60.32% | 100.00% | 0.00% |
Corporate Bond Fund | 30.74% | 0.00% | 69.26% | 0.00% | 100.00% | 0.00% | 0.00% | 0.00% | 98.84% | 100.00% |
California Tax Exempt Bond Fund | 17.95% | 0.00% | 7.79% | 74.26% | 100.00% | 0.00% | 0.00% | 0.00% | 0.00% | 100.00% |
Municipal High Income Fund | 0.00% | 0.00% | 0.39% | 99.61% | 100.00% | 0.00% | 0.00% | 0.00% | 0.00% | 100.00% |
High Yield Bond Fund | 37.97% | 0.00% | 62.03% | 0.00% | 100.00% | 0.00% | 0.00% | 0.00% | 98.21% | 100.00% |
Intermediate Fixed Income Fund | 0.00% | 0.00% | 100.00% | 0.00% | 100.00% | 6.36% | 4.08% | 2.62% | 93.09% | 0.00% |
Fixed Income Opportunities Fund | 2.72% | 0.00% | 97.28% | 0.00% | 100.00% | 15.16% | 15.25% | 0.01% | 64.13% | 100.00% |
Multi-Asset Fund | 0.00% | 0.00% | 100.00% | 0.00% | 100.00% | 56.09% | 62.14% | 0.00% | 0.00% | 0.00% |
Dividend & Income Fund | 25.40% | 0.00% | 74.60% | 0.00% | 100.00% | 100.00% | 100.00% | 0.00% | 0.00% | 0.00% |
U.S. Core Equity Fund | 89.96% | 0.00% | 10.04% | 0.00% | 100.00% | 96.64% | 96.20% | 0.00% | 0.00% | 100.00% |
Socially Responsible Equity Fund | 67.20% | 0.00% | 32.80% | 0.00% | 100.00% | 100.00% | 100.00% | 0.00% | 0.00% | 0.00% |
Emerging Markets Fund (6) | 0.00% | 0.00% | 100.00% | 0.00% | 100.00% | 0.00% | 100.00% | 0.00% | 0.00% | 0.00% |
CITY NATIONAL ROCHDALE FUNDS | PAGE 166
(1) | “Dividends Received Deduction” represent dividends which qualify for the corporate dividends received deduction. |
(2) | “Qualifying Dividend Income” represent qualifying dividends as created by the Jobs and Growth Tax Relief Reconciliation Act of 2003. The Fund intends to designate the maximum amount permitted by law. |
(3) | “U.S. Government Interest” represent the amount of interest that was derived from direct U.S. Government obligations and distributed during the fiscal year. This amount is reflected as a percentage of ordinary income. Generally, interest from direct U.S. Government obligations is exempt from state income tax. However, for shareholders who are residents of California, Connecticut or New York, the statutory threshold requirements were not satisfied to permit exemption of these amounts from state income. |
(4) | “Interest Related Dividends” represent qualifying interest that is exempt from U.S. withholding tax when paid to foreign investors as created by the American Jobs Creation Act of 2004. |
(5) | “Short-Term Capital Gain Dividends” represent qualifying short-term capital gain that is exempt from U.S. withholding tax when paid to foreign investors as created by the American Jobs Creation Act of 2004. |
(6) | The Fund intends to pass through a foreign tax credit to shareholders. For the fiscal year ended September 30, 2015, the total amount of foreign source income was $13,085,658. The total amount of foreign tax to be paid is $357,429. Your allocable share of foreign tax credit will be reported on Form 1099-DIV. |
Items (A), (B), (C), (D) and (E) are based on the percentage of each fund’s total distribution.
Items (F) and (G) are based on the percentage of “Ordinary Income Distributions.”
Item (H) is based on the percentage of gross income of each Fund.
Item (I) is based on the percentage of net investment income distributions.
Item (J) is based on the percentage of short-term capital gain distributions.
CITY NATIONAL ROCHDALE FUNDS | PAGE 167
disclosure of fund expenses (Unaudited) |
|
All mutual funds have operating expenses. As a shareholder of a Fund, your investment is affected by these ongoing costs, which include (among others) costs for portfolio management, administrative services, class-specific distribution fees, acquired fund fees and shareholder reports like this one. It is important for you to understand the impact of these costs on your investment returns.
Operating expenses such as these are deducted from the Fund’s gross income and directly reduce your final investment return. These expenses are expressed as a percentage of the Fund’s average net assets; this percentage is known as the Fund’s expense ratio.
The following examples use the expense ratio and are intended to help you understand the ongoing costs (in dollars) of investing in your Fund and to compare these costs with those of other mutual funds. The examples are based on an investment of $1,000 made at the beginning of the period shown and held for the entire period (April 1, 2015, to September 30, 2015).
The table below illustrates your Fund’s costs in two ways:
Actual Fund Return. This section helps you to estimate the actual expenses that your Fund incurred over the period. The “Expenses Paid During Period” column shows the actual dollar expense cost incurred by a $1,000 investment in the Fund, and the “Ending Account Value” number is derived from deducting that expense cost from the Fund’s gross investment return.
You can use this information, together with the actual amount you invested in the Fund, to estimate the expenses you paid over that period. Simply divide your actual account value by $1,000 to arrive at a ratio (for example, an $8,600 account value divided by $1,000 = 8.6), then multiply that ratio by the number shown for your Fund under “Expenses Paid During Period.”
Hypothetical 5% Return. This section helps you compare your Fund’s costs with those of other mutual funds. It assumes that the Fund had an annual 5% return before expenses during the year, but that the expense ratio (Column 3) for the period is unchanged. This example is useful in making comparisons because the Securities and Exchange Commission requires all mutual funds to make this 5% calculation. You can assess your Fund’s comparative cost by comparing the hypothetical result for your Fund in the “Expenses Paid During Period” column with those that appear in the same charts in the shareholder reports for other funds.
NOTE: Because the return is set at 5% for comparison purposes – NOT your Fund’s actual return – the account values shown do not apply to your specific investment.
CITY NATIONAL ROCHDALE FUNDS | PAGE 168
| | Beginning Account Value 4/01/2015 | Ending Account Value 9/30/2015 | Annualized Expense Ratios | Expense Paid During Period* |
City National Rochdale Government Money Market Fund |
Actual Fund Return | | | | |
Class N | $ 1,000.00 | $ 1,000.10 | 0.11% | $ 0.55 |
Class S | 1,000.00 | 1,000.10 | 0.11% | 0.55 |
Servicing Class | 1,000.00 | 1,000.10 | 0.12% | 0.60 |
| | | | | |
Hypothetical 5% Return | | | | |
Class N | $ 1,000.00 | $ 1,024.52 | 0.11% | $ 0.56 |
Class S | 1,000.00 | 1,024.52 | 0.11% | 0.56 |
Servicing Class | 1,000.00 | 1,024.47 | 0.12% | 0.61 |
| | | | | |
City National Rochdale Prime Money Market Fund |
Actual Fund Return | | | | |
Institutional Class | $ 1,000.00 | $ 1,000.10 | 0.20% | $ 1.00 |
Class N | 1,000.00 | 1,000.10 | 0.20% | 1.00 |
Class S | 1,000.00 | 1,000.10 | 0.20% | 1.00 |
Servicing Class | 1,000.00 | 1,000.10 | 0.20% | 1.00 |
| | | | | |
Hypothetical 5% Return | | | | |
Institutional Class | $ 1,000.00 | $ 1,024.07 | 0.20% | $ 1.01 |
Class N | 1,000.00 | 1,024.07 | 0.20% | 1.01 |
Class S | 1,000.00 | 1,024.07 | 0.20% | 1.01 |
Servicing Class | 1,000.00 | 1,024.07 | 0.20% | 1.01 |
| | | | | |
City National Rochdale California Tax Exempt Money Market Fund |
Actual Fund Return | | | | |
Class N | $ 1,000.00 | $ 1,000.10 | 0.10% | $ 0.50 |
Class S | 1,000.00 | 1,000.10 | 0.07% | 0.35 |
Servicing Class | 1,000.00 | 1,000.10 | 0.07% | 0.35 |
| | | | | |
Hypothetical 5% Return | | | | |
Class N | $ 1,000.00 | $ 1,024.57 | 0.10% | $ 0.51 |
Class S | 1,000.00 | 1,024.72 | 0.07% | 0.36 |
Servicing Class | 1,000.00 | 1,024.72 | 0.07% | 0.36 |
| |
City National Rochdale Government Bond Fund |
Actual Fund Return | | | | |
Institutional Class | $ 1,000.00 | $ 1,005.30 | 0.54% | $ 0.89 |
Class N | 1,000.00 | 1,001.80 | 1.00% | 5.02 |
Servicing Class | 1,000.00 | 1,003.10 | 0.74% | 3.72 |
| | | | | |
Hypothetical 5% Return | | | | |
Institutional Class | $ 1,000.00 | $ 1,022.36 | 0.54% | $ 2.74 |
Class N | 1,000.00 | 1,020.05 | 1.00% | 5.06 |
Servicing Class | 1,000.00 | 1,021.36 | 0.74% | 3.75 |
| | | | | |
City National Rochdale Corporate Bond Fund |
Actual Fund Return | | | | |
Class N | $ 1,000.00 | $ 993.60 | 1.03% | $ 5.15 |
Servicing Class | 1,000.00 | 995.80 | 0.75% | 3.75 |
| | | | | |
Hypothetical 5% Return | | | | |
Class N | $ 1,000.00 | $ 1,019.90 | 1.03% | $ 5.22 |
Servicing Class | 1,000.00 | 1,021.31 | 0.75% | 3.80 |
| |
City National Rochdale California Tax Exempt Bond Fund |
Actual Fund Return | | | | |
Class N | $ 1,000.00 | $ 1,004.60 | 0.88% | $ 4.42 |
Servicing Class | 1,000.00 | 1,005.90 | 0.63% | 3.17 |
| | | | | |
Hypothetical 5% Return | | | | |
Class N | $ 1,000.00 | $ 1,020.66 | 0.88% | $ 4.46 |
Servicing Class | 1,000.00 | 1,021.91 | 0.63% | 3.19 |
| | | | | |
City National Rochdale Municipal High Income Fund |
Actual Fund Return | | | | |
Class N | $ 1,000.00 | $ 1,000.80 | 1.04% | $ 5.22 |
Servicing Class | 1,000.00 | 1,002.10 | 0.79% | 3.96 |
| | | | | |
Hypothetical 5% Return | | | | |
Class N | $ 1,000.00 | $ 1,019.85 | 1.04% | $ 5.27 |
Servicing Class | 1,000.00 | 1,021.11 | 0.79% | 4.00 |
| |
City National Rochdale High Yield Bond Fund |
Actual Fund Return | | | | |
Institutional Class | $ 1,000.00 | $ 959.20 | 0.70% | $ 1.11 |
Class N | 1,000.00 | 956.80 | 1.20% | 5.89 |
Servicing Class | 1,000.00 | 958.00 | 0.95% | 4.66 |
| | | | | |
Hypothetical 5% Return | | | | |
Institutional Class | $ 1,000.00 | $ 1,021.56 | 0.70% | $ 3.55 |
Class N | 1,000.00 | 1,019.05 | 1.20% | 6.07 |
Servicing Class | 1,000.00 | 1,020.31 | 0.95% | 4.81 |
* | Expenses are equal to the Fund’s annualized expense ratio multiplied by the average account value over the period, multiplied by 182/365 (to reflect the one-half year period). |
CITY NATIONAL ROCHDALE FUNDS | PAGE 169
disclosure of fund expenses (Unaudited) (Continued) |
|
| | Beginning Account Value 4/01/2015 | Ending Account Value 9/30/2015 | Annualized Expense Ratios | Expense Paid During Period* |
City National Rochdale Intermediate Fixed Income Fund |
Actual Fund Return | | | | |
Institutional Class | $ 1,000.00 | $ 997.80 | 0.55% | $ 0.89 |
Class N | $ 1,000.00 | $ 995.30 | 1.07% | $ 5.35 |
| | | | | |
Hypothetical 5% Return | | | | |
Institutional Class | $ 1,000.00 | $ 1,022.31 | 0.55% | $ 2.79 |
Class N | $ 1,000.00 | $ 1,019.70 | 1.07% | $ 5.42 |
| | | | | |
City National Rochdale Fixed Income Opportunities Fund |
Actual Fund Return | | | | |
Class N | $ 1,000.00 | $ 1,001.40 | 1.09% | $ 5.47 |
| | | | | |
Hypothetical 5% Return | | | | |
Class N | $ 1,000.00 | $ 1,019.60 | 1.09% | $ 5.52 |
| | | | | |
City National Rochdale Multi-Asset Fund |
Actual Fund Return | | | | |
Class N | $ 1,000.00 | $ 937.90 | 1.50% | $ 7.29 |
Servicing Class | 1,000.00 | 939.20 | 1.25% | 6.08 |
| | | | | |
Hypothetical 5% Return | | | | |
Class N | $ 1,000.00 | $ 1,017.55 | 1.50% | $ 7.59 |
Servicing Class | 1,000.00 | 1,018.80 | 1.25% | 6.33 |
| | | | | |
City National Rochdale Dividend & Income Fund |
Actual Fund Return | | | | |
Class N | $ 1,000.00 | $ 957.60 | 1.13% | $ 5.55 |
| | | | | |
Hypothetical 5% Return | | | | |
Class N | $ 1,000.00 | $ 1,019.40 | 1.13% | $ 5.72 |
| | | | | |
City National Rochdale U.S. Core Equity Fund |
Actual Fund Return | | | | |
Institutional Class | $ 1,000.00 | $ 958.20 | 0.54% | $ 0.87 |
Class N | 1,000.00 | 956.20 | 1.06% | 5.20 |
Servicing Class | 1,000.00 | 956.70 | 0.78% | 3.83 |
| | | | | |
Hypothetical 5% Return | | | | |
Institutional Class | $ 1,000.00 | $ 1,022.36 | 0.54% | $ 2.74 |
Class N | 1,000.00 | 1,019.75 | 1.06% | 5.37 |
Servicing Class | 1,000.00 | 1,021.16 | 0.78% | 3.95 |
| | | | | |
City National Rochdale Socially Responsible Equity Fund |
Actual Fund Return | | | | |
Institutional Class | $ 1,000.00 | $ 910.00 | 0.91% | $ 4.36 |
Class N | 1,000.00 | 908.70 | 1.16% | 5.55 |
| | | | | |
Hypothetical 5% Return | | | | |
Institutional Class | $ 1,000.00 | $ 1,020.51 | 0.91% | $ 4.61 |
Class N | 1,000.00 | 1,019.25 | 1.16% | 5.87 |
| | | | | |
City National Rochdale Emerging Markets Fund |
Actual Fund Return | | | | |
Class N | $ 1,000.00 | $ 854.20 | 1.61% | $ 7.48 |
| | | | | |
Hypothetical 5% Return | | | | |
Class N | $ 1,000.00 | $ 1,017.00 | 1.61% | $ 8.14 |
* | Expenses are equal to the Fund’s annualized expense ratio multiplied by the average account value over the period, multiplied by 183/365 (to reflect the one-half year period). |
CITY NATIONAL ROCHDALE FUNDS | PAGE 170
board approval of advisory and sub-advisory agreements |
(Unaudited) |
The Board of Trustees of City National Rochdale Funds (the “Trust”) is comprised of seven Trustees, six of whom are not “interested persons” of the Trust as defined in the Investment Company Act of 1940, as amended (the “Independent Trustees”). During the six months ended September 30, 2015, the Board and the Independent Trustees approved the following advisory agreement and sub-advisory agreements:
| | ● | The advisory agreement between the Trust, on behalf of each of its series (each a “Fund” and collectively the “Funds”), and City National Rochdale, LLC (the “Adviser”); |
| | ● | The sub-advisory agreement between the Adviser and Guggenheim Partners Investment Management, LLC (“Guggenheim”) with respect to the High Yield Bond Fund; |
| | ● | The sub-advisory agreement between the Adviser and Waddell & Reed Investment Management Company (“Waddell”) with respect to the Municipal High Income Fund; |
| | ● | The sub-advisory agreement between the Adviser and SKBA Capital Management, LLC (“SKBA”) with respect to the Socially Responsible Equity Fund; |
| | ● | The sub-advisory agreement between the Adviser and Seix Investment Advisors LLC (“Seix”) with respect to the Fixed Income Opportunities Fund; |
| | ● | The sub-advisory agreement between the Adviser and Federated Investment Management Company (“Federated”) with respect to the Fixed Income Opportunities Fund; |
| | ● | The sub-advisory agreement between the Adviser and GML Capital LLP (“GML Capital”) with respect to the Fixed Income Opportunities Fund; |
| | ● | The sub-advisory agreement between the Adviser and Alcentra Limited (“Alcentra”) with respect to the Fixed Income Opportunities Fund; |
| | ● | The sub-advisory agreement between the Adviser and Ashmore Investment Management Limited (“Ashmore”) with respect to the Fixed Income Opportunities Fund; and |
| | ● | The sub-advisory agreement between the Adviser and AllFinancial Partners II, LLC (“AllFinancial”) with respect to the Fixed Income Opportunities Fund. |
The advisory and sub-advisory agreements listed above are collectively referred to below as the “Agreements” and Guggenheim, Waddell, SKBA, Seix, Federated, GML, Alcentra, Ashmore and AllFinancial are collectively referred to below as the “Sub-Advisers.”
General Information
The following information summarizes the Board’s considerations associated with its review of the Agreements. In connection with their deliberations, the Board considered such information and factors as they believed, in light of the legal advice furnished to them and their own business judgment, to be relevant. The Agreements were considered separately for each Fund, although the Board took into account the common interests of the Funds in its review. As described below, the Board considered the nature, quality and extent of the various investment advisory and administrative services performed by the Adviser and each Sub-Adviser. In considering these matters, the Independent Trustees discussed the approval of the Agreements with management and in private sessions with their independent counsel at which no representatives of the Adviser or the Sub-Advisers were present.
The Board reviewed extensive materials regarding investment results of the Adviser and each Sub-Adviser with respect to the Funds (or portions of the Funds) they manage, advisory fee and expense comparisons, financial information with respect to each firm, descriptions of various functions such as compliance monitoring and portfolio trading practices, and information about the personnel providing investment management and administrative services to the Funds. They also took into account information they received at past meetings of the Board and its committees with respect to these matters.
In deciding to approve the Agreements, the Board and the Independent Trustees did not identify a single factor as controlling and this summary does not describe all of the matters considered. In addition, each Board member did not necessarily attribute the same weight to each matter. However, the Board and the Independent Trustees concluded that each of the various factors referred to below favored such approval.
CITY NATIONAL ROCHDALE FUNDS | PAGE 171
board approval of advisory and sub-advisory agreements |
(Unaudited) (Continued) |
CITY NATIONAL ROCHDALE, LLC
Nature, Extent and Quality of Services
In reviewing the services provided by the Adviser to the Funds, the Board considered a variety of matters, including the background, education and experience of its key portfolio management and operational personnel; its overall financial strength and stability; its resources and efforts to retain, attract and motivate capable personnel to serve the Funds; and the overall general quality and depth of its organization. The Board also took into account the experience, capability and integrity of the Adviser’s senior management; its investment philosophy and processes, including sub-adviser oversight processes; its brokerage, trading and soft dollar practices; its disaster recovery and contingency planning; and its commitment and systems in place with regard to compliance with applicable laws and regulations. The Board found all of these matters to be satisfactory.
The Board assessed the performance of each Fund compared with its respective benchmark index or indexes and the average of all funds in its respective peer group category (each a “universe”) selected by Lipper, Inc. (and iMoneyNet, Inc.for the money market funds only) for the one-, three-, five-, ten- and 15-year and since inception periods ended June 30, 2015, as applicable. In addition, the Board reviewed the performance of each Fund compared to the performance of a select group of comparable funds determined by the Adviser to have investment objectives similar to that of the Fund.
The Board’s observations with respect to the annualized total returns of the Funds were as follows:
| | ● | The annualized total returns of the Government Money Market Fund (Servicing Class) are the same as the Lipper Institutional U.S. Government Money Market Objective and iMoneyNet, Inc. Government Institutional averages for the one-, three- and five-year periods ended June 30, 2015. For the ten-year and since inception periods, the Fund trailed the Lipper universe average (by 0.16% or less) and iMoneyNet (by 0.05% or less). The Board noted that the Fund was not able to participate in the Federal Reserve’s Reverse Repo Facility due to size constraints, which contributed to the Fund’s lower realized yields compared to those of its larger peers. |
| | ● | The Prime Money Market Fund (Institutional Class) underperformed the Lipper Institutional Money Market Objective universe average and iMoneyNet, Inc. Prime Institutional average (in each case by 0.02% or less) for the one-, three-, and five-year periods ending June 30, 2015. For the ten-year and since inception periods, the Fund underperformed the Lipper Institutional Money Market Objective (by 0.21% or less) and the iMoneyNet, Inc. Prime Institutional average (by 0.19% or less). The Board noted that the Fund was not able to participate in the Federal Reserve’s Reverse Repo Facility due to size constraints, which contributed to the Fund’s lower realized yields compared to those of its larger peers. |
| | ● | The annualized total returns of the California Tax Exempt Money Market Fund (Servicing Class) were the same as or below the Lipper CA Tax-Exempt Money Market Funds Objective universe average (by 0.04% or less) and below the iMoneyNet State Specific Institutional-CA universe average (by 0.12% or less) for the one-, three-, five- and ten-year and since inception periods ending June 30, 2015. |
| | ● | For the one-, three-, five-, ten- and 15-year and since inception periods ending June 30, 2015, the Limited Maturity Fixed Income Fund (Institutional Class) underperformed the Barclays 1-3 Year US Government/Credit Index (by 0.70% or less) and the Lipper Short Investment-Grade Debt Funds Classification universe average (by 0.76% or less). The Board noted that it had recently approved a Plan of Liquidation for the Fund, which was expected to be fully liquidated on or about September 15, 2015. |
| | ● | For the one- and five-year period ending June 30, 2015, the Government Bond Fund (Institutional Class) outperformed the Lipper Short/Intermediate U.S. Government Objective universe average, but trailed the Barclays 1-5 Year Government Bond Index (by 0.48% or less). For the three- and ten-year and since inception periods ending June 30, 2015, the Fund underperformed the Barclays 1-5 Year Government Bond Index (by 0.52% or less) and the Lipper Short/Intermediate US Government Objective universe average (by 0.33% or less). |
| | ● | The Corporate Bond Fund (Servicing Class) underperformed the Barclays US Corp 1-5 A3+, 2% Issuer Constrained Index (by 1.13% or less) and the Lipper Short/Intermediate Investment-Grade Objective universe average (by 0.39% or less) over the one- and five-year periods. The Fund outperformed the Lipper universe average, but underperformed the Barclays Index (by 0.42% or less) over the three- and ten-year and since inception periods. |
CITY NATIONAL ROCHDALE FUNDS | PAGE 172
| | ● | The California Tax Exempt Bond Fund (Servicing Class) outperformed the Lipper CA Short/Intermediate Municipal Debt Objective universe average but underperformed the Barclays CA Intermediate-Short Municipal Index (by 0.68% or less) over the one-, three-, five- and ten-year and since inception periods ending June 30, 2015. |
| | ● | For the one-year period ending June 30, 2015, the Municipal High Income Fund (Servicing Class) outperformed the Lipper High Yield Municipal Classification universe average and the Barclays High Yield Municipal Index. The Fund outperformed the Barclays Index, but underperformed the Lipper universe average (by 0.91%) for the period since its inception on December 30, 2013. |
| | ● | The High Yield Bond Fund (Institutional Class) outperformed the Citigroup High-Yield Market Capped Index and the Lipper High Yield Bond Funds Objective universe averages over the one-, three-, five- and ten-year and since inception periods ending June 30, 2015. |
| | ● | For the one-year period ending June 30, 2015, the Intermediate Fixed Income Fund (Institutional Class) underperformed the Barclays Intermediate U.S. Government/Credit Index (by 0.35%) but outperformed the Lipper Core Bond Funds Classification universe average. For the three-year period, the Fund outperformed the Lipper universe average and the Barclays Index. For the five-year period, the Fund outperformed the Barclays Index, but underperformed the Lipper universe average (by 0.01%). For the ten-year and since inception periods, the Fund underperformed the Lipper universe average (by 0.48% or less) and the Barclays Index (by 0.46% or less). The Board considered the Adviser’s explanation that Fund’s near-term underperformance was due to the Fund’s overweight in corporate debt compared to government debt, and the Adviser’s belief that strong corporate fundamentals continued to justify the Fund’s overweight allocation to corporate debt. |
| | ● | For the one-year period ending June 30, 2015, the Fixed Income Opportunities Fund (Class N) outperformed the Lipper High Yield Bond Funds Classification universe average and the Barclays U.S. Corporate High Yield Index, but underperformed the Credit Suisse Leveraged Loan Index (by 1.02%) and the Barclays U.S. Aggregate Index (by 0.73%). For the three-year period, the Fund outperformed the Credit Suisse Index and the Barclays U.S. Aggregate Index but underperformed the Lipper universe average (by 0.28%), and the Barclays U.S. High Yield Index (by 1.12%). For the period since its inception on July 1, 2009, the Fund outperformed the Barclays U.S. Aggregate Index, but underperformed the Lipper universe average (by 0.75%) and Barclays High Yield Index (by 4.16%) on an annualized basis. The Board considered that the Fund is a blended fund with several portfolios managed by different sub-advisers according to differing investment mandates and that it was therefore difficult to compare the Fund to a broad-based securities index and to other funds. |
| | ● | The Multi-Asset Fund (Servicing Class) underperformed the Lipper Absolute Returns Funds Classification universe average (by 1.60%), the BofA Merrill Lynch 3-Month US Treasury Bill Index (by 1.62%) and the Blended Index (a customized index composed of 60% in the Barclays Capital Intermediate Government/Credit Index and 40% in the MSCI World Index) (by 3.28%) over the one-year period ending June 30, 2015. For the three- and five-year and since inception periods the Fund outperformed the Lipper universe average and the BofA Merrill Lynch Index, but underperformed the Blended Index (by 2.90% or less). |
| | ● | For the one-, three- and five-year periods ending June 30, 2015, the Dividend & Income Fund (Class N) underperformed the Lipper Equity Income Funds Classification universe average (by 3.68% or less), the S&P 500 Index (by 7.36% or less) and the Blended Index (a customized index composed of 60% in the Dow Jones U.S. Select Dividend Index, 25% in the Bank of America ML Core Fixed Rate Preferred Securities Index and 15% in the MSCI U.S. REIT Index) (by 2.52% or less). For the ten-year period, the Fund outperformed the Lipper universe average and the Blended Index, but underperformed the S&P 500 Index (by 0.69%). For the period since inception, the Fund outperformed the S&P 500 Index, but underperformed the Lipper universe average (by 0.74%) and the Blended Index (by 2.88%). The Board also considered that the Fund had a relatively low risk rating in Morningstar, Inc.’s Large Value fund category. |
| | ● | The U.S. Core Equity Fund (Institutional Class) outperformed the S&P 500 Index but underperformed the Lipper Large Cap Core Funds Classification universe average (by 0.28%) over the one-year period ending June 30, 2015. The Fund outperformed the Lipper universe average and the S&P 500 Index since its inception on December 3, 2012. |
CITY NATIONAL ROCHDALE FUNDS | PAGE 173
board approval of advisory and sub-advisory agreements |
(Unaudited) (Continued) |
| | ● | The Socially Responsible Equity Fund (Institutional Class) underperformed the MSCI KLD 400 Social Index (by 6.40% or less), the Lipper Multi-Cap Value Funds Classification universe average (by 2.92% or less), and the Russell 1000 Value Index (by 4.57% or less) over the one-, three- and five-year, and since inception periods ending June 30, 2015. The Board noted that the Adviser was in negotiations with SKBA to reorganize the Fund into a fund managed by SKBA outside of the Trust. |
| | ● | The Emerging Markets Fund (Class N) outperformed the MSCI Emerging Markets Index, the Lipper Emerging Markets Funds Classification universe average and the MSCI Emerging Markets Asia Index over the one- and three-year periods and since inception period ending June 30, 2015. |
The Board concluded that the Adviser continues to provide satisfactory management and oversight services to the Funds. The Board members noted that the investment results of the Funds over the long term were generally competitive; that the Adviser had reasonable explanations for the performance of those Funds that had underperformed relative to their benchmarks; that the results for the Money Market Funds compared to their peer groups were acceptable given the special services and investment focuses of those Funds and the unusual market conditions applicable to the money market fund industry in recent years; and that consideration of returns of market indexes needed to take into account that indexes do not reflect the expenses of operating mutual funds.
Advisory Fees and Fund Expenses
The Board reviewed information regarding the advisory fees (both before and after waivers) charged by the Adviser to the Funds, and the total expenses (net of fee waivers) of each Fund (as percentages of their respective average annual net assets) compared to those of the funds included in the relevant Lipper universes and peer groups selected by the Adviser (“Peer Groups”).
The Board observed as follows with respect to the investment advisory fees (net of fee waivers) paid by the Funds:
| | ● | The net advisory fees paid by the Government Money Market Fund, California Tax Exempt Money Market Fund and the High Yield Bond Fund were below their Lipper universe averages but above their Peer Group averages. |
| | ● | The net advisory fees paid by the Prime Money Market Fund, Corporate Bond Fund, Intermediate Fixed Income Fund, and Socially Responsible Equity Fund were above their Lipper universe averages and Peer Group averages, but were within the middle 60% range for the relevant Lipper universes. |
| | ● | The net advisory fees paid by the Limited Maturity Fixed Income Fund, Municipal High Income Fund, California Tax Exempt Bond Fund, Fixed Income Opportunities Fund, Multi-Asset Fund, Dividend & Income Fund, and U.S. Core Equity Fund were below their Peer Group and Lipper universe averages. |
| | ● | The net advisory fee paid by the Emerging Markets Fund was below its Peer Group average but above its Lipper universe average. |
| | ● | The net advisory fee paid by the Government Bond Fund was the same as its Peer Group average and slightly above its Lipper universe average. |
The Board noted that the Adviser does not manage investment portfolios for other registered investment companies, pension funds, or institutional accounts that have similar investment objectives and policies as the Funds except as follows, so in most cases it did not have a basis to compare the Funds’ advisory fees with advisory fees charged by the Adviser to other clients. The Board observed that the Adviser manages the City National Rochdale International Trade Fixed Income Fund, a closed-end fund that is managed using the same strategies and sub-adviser, GML, as those used to manage a portion of the Fixed Income Opportunities Fund, for a fee greater than that charged to the Fixed Income Opportunities Fund.
The Board’s observations with respect to the total expenses of the lowest-expense class of each Fund (net of fee waivers) were as follows:
| | ● | The total expense ratios of the Servicing Class of the California Tax Exempt Money Market Fund, Corporate Bond Fund, California Tax Exempt Bond Fund and Municipal High Income Fund; the Institutional Class of the Government Bond Fund, High Yield Bond Fund, U.S. Core Equity Fund and Socially Responsible Equity Fund; and Class N of the Dividend & Income Fund were below both the relevant Peer Group and Lipper universe averages. |
CITY NATIONAL ROCHDALE FUNDS | PAGE 174
| | ● | The total expense ratios of the Institutional Class of the Limited Maturity Fixed Income Fund and Intermediate Fixed Income Fund were below their respective Lipper Universe averages but above their respective Peer Group averages. |
| | ● | The total expense ratios of the Servicing Class of the Multi-Asset Fund and Class N of the Emerging Markets Fund were below their respective Peer Group averages but above their respective Lipper Universe averages. |
| | ● | The total expense ratios of the Servicing Class of the Government Money Market Fund, the Institutional Class of the Prime Money Market Fund and Class N of the Fixed Income Opportunities Fund were above their respective Peer Group and Lipper universe averages but were in the middle 60% of funds in their Lipper universes. |
The Board concluded that the advisory fees charged by the Adviser continued to be fair and reasonable, and the total expenses of each Fund continued to be reasonable.
Profitability, Benefits to Advisers and Economies of Scale
The Board considered information prepared by the Adviser relating to its costs and profits with respect to the Funds. The Board also considered the benefits received by the Adviser and its affiliates as a result of its relationship with the Funds (other than investment advisory fees paid to the Adviser), including fees paid to affiliates of the Adviser such as City National Bank, City National Securities, Inc. and RIM Securities, LLC for providing certain shareholder servicing and sub-distribution services to the Trust; benefits to City National Bank’s brokerage and wealth management businesses as a result of the availability of the Funds to its customers; research services made available to the Adviser by broker-dealers that provide execution services to the Funds; and the intangible benefits to the Adviser and its affiliates of their association with the Funds generally and any favorable publicity arising in connection with the Funds’ performance. The Board concluded that although there were no advisory fee breakpoints, in the current economic environment significant economies of scale were not available with respect to the money market Funds and were not likely to be realized with respect to the other Funds until the asset levels of those Funds were significantly higher than their current levels.
Conclusions
Based on their review, including their consideration of each of the factors referred to above, the Board and the Independent Trustees concluded that the compensation payable to the Adviser with respect to each of the Funds pursuant to its advisory agreement with the Trust is fair and reasonable in light of the nature and quality of the services being provided by it to the Funds and their shareholders, and that renewal of the agreement was in the best interest of the Funds and their shareholders.
SUB-ADVISERS
Nature, Extent and Quality of Services
In reviewing the services provided by each Sub-Adviser, the Board considered a variety of matters, including the background, education and experience of the Sub-Adviser’s key portfolio management and operational personnel; its overall financial strength and stability; its resources and related efforts to retain, attract and motivate capable personnel to serve the relevant Funds; and the overall general quality and depth of its organization. The Board also reviewed each Sub-Adviser’s investment philosophy and processes as well as its brokerage and trading practices, its disaster recovery and contingency planning, and its commitment and systems in place with regard to compliance with applicable laws and regulations. The Board found all of these matters to be satisfactory.
Investment Performance
The Board’s observations regarding the performance of the High Yield Bond Fund, Municipal High Income Fund, Fixed Income Opportunities Fund and Socially Responsible Equity Fund are described above. In addition, the Board assessed the performance of the portion of the Fixed Income Opportunities Fund managed by each of Seix, Federated, GML, Alcentra, and Ashmore, compared with the Sub-Adviser’s respective benchmark for various periods ended June 30, 2015. The Board made the following additional observations in reviewing the annualized total returns of those Sub-Advisers:
| | ● | The annualized returns for Federated’s portion of the Fixed Income Opportunities Fund were above the returns of the Barclays U.S. Corporate High Yield 2% Issuer Capped Index for the one- and three-year periods. |
| | ● | The annualized returns for Seix’s portion of the Fixed Income Opportunities Fund were below the returns of the Credit Suisse Leveraged Loan Index (by 0.53% or less) for the one- and three-year periods. |
| | ● | The annualized returns for GML Capital’s portion of the Fixed Income Opportunities Fund were below the returns of the JP Morgan CEMBI Broad Diversified Index (by 3.16% or less) for the one- and three-year periods. The |
CITY NATIONAL ROCHDALE FUNDS | PAGE 175
board approval of advisory and sub-advisory agreements |
(Unaudited) (Continued) |
Board considered GML Capital’s explanation that in 2014, declining U.S. Treasury yields, among other factors, contributed to the portfolio’s underperformance relative to the Index, and that for a recent year-to-date period the portfolio had underperformed the Index primarily due to the portfolio’s substantial underweight to Russian exposure relative to the Index.
| | ● | The annualized return for Ashmore’s portion of the Fixed Income Opportunities Fund was below the return of the JP Morgan CEMBI Broad High Yield Diversified Index (by 2.29%) for the one-year period. |
In considering AllFinancial’s performance, the Board noted that AllFinancial operates in an asset class (life settlement policies) for which indices and peer comparisons are not available, but that AllFinancial continues to meet the Adviser’s expectations regarding its ability to oversee and manage those assets.
The Board considered the Adviser’s view that the investment performance of the Fund or Fund portfolio managed by each Sub-Adviser was satisfactory. The Board concluded that each Sub-Adviser continued to provide satisfactory services to the Funds.
Advisory Fees and Fund Expenses
The Board reviewed information regarding the advisory fees charged by each Sub-Adviser and observed that the fees charged by each Sub-Adviser were generally equal to or lower than the fees it charged to its other advisory or sub-advisory clients to manage comparable funds. The Trustees also noted that the Adviser pays all sub-advisory fees out of its advisory fees. The Board noted that Guggenheim’s sub-advisory fee with respect to the High Yield Bond Fund was higher than its fees with respect to another mutual fund for which it serves as sub-adviser, but also noted that the other fund was significantly larger than the Fund (with assets in excess of $1 billion). Additionally, the Board considered that Guggenheim had indicated that it would consider adding additional breakpoints to the sub-advisory fee structure should the assets of the High Yield Bond Fund grow to over $300 million. The Board also observed that Seix’s sub-advisory fee with respect to the Fixed Income Opportunities Fund was higher than the fee it charged to another mutual fund for which it served as sub-adviser using a similar strategy, but noted that the other fund was significantly larger than the Fund (with assets over $6.5 billion) and was a part of a larger mutual fund complex for which Seix serves as sub-adviser. Additionally, the Board considered that Seix indicated that the lower sub-advisory fee for the other mutual fund it manages using a similar strategy reflected the economies of scale of the other fund and the group of funds of which it is a part.
Benefits to Sub-Advisers
The Board considered the benefits received by each Sub-Adviser and its affiliates as a result of its relationship with the Funds (other than the sub-advisory fees paid to the Sub-Adviser), including any research services made available to the Sub-Adviser by broker-dealers providing execution services to the relevant Fund, the intangible benefits of the Sub-Adviser’s association with the Funds generally and any favorable publicity arising in connection with the Funds’ performance.
Conclusions
Based on their review, including their consideration of each of the factors referred to above, the Board and the Independent Trustees concluded that the compensation payable to each Sub-Adviser pursuant to its respective sub-advisory agreement is fair and reasonable in light of the nature and quality of the services being provided by each Sub-Adviser to the respective Fund and its shareholders, and that renewal of each sub-advisory agreement was in the best interest of the Funds and their shareholders.
CITY NATIONAL ROCHDALE FUNDS | PAGE 176

Item 2. Code of Ethics.
The registrant has adopted a code of ethics that applies to the registrant’s principal executive officer, principal financial officer and principal accounting officer.
Item 3. Audit Committee Financial Expert.
(a)(1) The registrant’s board of trustees has determined that the registrant has at least one audit committee financial expert serving on the audit committee.
(a)(2) The audit committee financial expert is James R. Wolford. Mr. Wolford is independent as defined in Form N-CSR Item 3(a)(2).
Item 5. Audit Committee of Listed Registrants.
Not applicable to open-end management investment companies.
Not applicable.
Item 7. Disclosure of Proxy Voting Policies and Procedures for Closed-End Management Investment Companies.
Not applicable to open-end management investment companies.
Not applicable. Effective for closed-end management investment companies for fiscal years ending on or after December 31, 2005
Item 9. Purchases of Equity Securities by Closed-End Management Company and Affiliated Purchasers.
Not applicable to open-end management investment companies.
Item 10. Submission of Matters to a Vote of Security Holders.
There have been no changes to the procedures by which shareholders may recommend nominees to the registrant’s Board of Trustees during the period covered by this report.
Item 11. Controls and Procedures.
(a) The certifying officers, whose certifications are included herewith, have evaluated the registrant’s disclosure controls and procedures within 90 days of the filing date of this report. In their opinion, based on their evaluation, the registrant’s disclosure controls and procedures are adequately designed, and are operating effectively to ensure, that information required to be disclosed by the registrant in the reports it files or submits under the Securities Exchange Act of 1934 is recorded, processed, summarized and reported within the time periods specified in the Securities and Exchange Commission’s rules and forms.
(b) There were no significant changes in the registrant’s internal control over financial reporting that occurred during the registrant’s last fiscal half-year that has materially affected, or is reasonably likely to materially affect, the registrant’s internal control over financial reporting.
Items 12. Exhibits.
(a)(1) Code of Ethics attached hereto.
(a)(2) A separate certification for the principal executive officer and the principal financial officer of the registrant as required by Rule 30a-2(a) under the Investment Company Act of 1940, as amended (17 CFR 270.30a-2(a)), are filed herewith.
(b) Officer certifications as required by Rule 30a-2(b) under the Investment Company Act of 1940, as amended (17 CFR 270.30a-2(b)) also accompany this filing as an Exhibit.
Pursuant to the requirements of the securities Exchange Act of 1934 and the Investment Company Act of 1940, the registrant has duly caused this report to be signed on its behalf by the undersigned, thereunto duly authorized.
Pursuant to the requirements of the Securities Exchange Act of 1934 and the Investment Company Act of 1940, this report has been signed below by the following persons on behalf of the registrant and in the capacities and on the dates indicated.