UNITED STATES
SECURITIES AND EXCHANGE COMMISSION
Washington, D.C. 20549
________
FORM N-CSR
________
CERTIFIED SHAREHOLDER REPORT OF REGISTERED MANAGEMENT
INVESTMENT COMPANIES
Investment Company Act file number 811-07923
City National Rochdale Funds
(Exact name of registrant as specified in charter)
________
400 North Roxbury Drive
Beverly Hills, CA 90210
(Address of principal executive offices) (Zip code)
Michael Carbone
400 North Roxbury Drive
Beverly Hills, CA 90210
(Name and address of agent for service)
Registrant’s telephone number, including area code: 1-888-889-0799
Date of fiscal year end: September 30, 2021
Date of reporting period: September 30, 2021
Item 1. Reports to Stockholders.
A copy of the report transmitted to stockholders pursuant to Rule 30e-1 under the Investment Company Act or 1940, as amended (the “Act”) (17 CFR § 270.30e-1) is attached hereto.
TABLE OF CONTENTS
| | City National Rochdale Funds Annual Report |
| | |
2 | Letter to Our Shareholders |
4 | Fixed Income Funds Investment Adviser’s Report |
7 | Fixed Income Funds Overview |
14 | Equity Funds Investment Adviser’s Report |
15 | Equity Funds Overview |
17 | Schedule of Investments/Consolidated Schedule of Investments |
145 | Statements of Assets and Liabilities/Consolidated Statement of Assets and Liabilities |
149 | Statements of Operations/Consolidated Statement of Operations |
152 | Statements of Changes in Net Assets/Consolidated Statements of Changes in Net Assets |
156 | Consolidated Statement of Cash Flows |
158 | Financial Highlights/Consolidated Financial Highlights |
161 | Notes to Financial Statements/Consolidated Notes to Financial Statements |
176 | Report of Independent Registered Public Accounting Firm |
178 | Trustees and Officers |
181 | Notice to Shareholders |
182 | Disclosure of Fund Expenses |
184 | Board Approval of Advisory and Sub-Advisory Agreements |
191 | Liquidity Risk Management Program |
The Funds file their complete schedules of portfolio holdings with the Securities and Exchange Commission (the “Commission”) for the first and third quarters of each fiscal year as an exhibit to their reports on Form N-PORT, and for reporting periods ended prior to March 31, 2019, on Form N-Q. The Funds’ Form N-PORT and Form N-Q filings are available on the Commission’s website at http://www.sec.gov. The most current Form N-PORT filing is also available on the Funds’ website at www.citynationalrochdalefunds.com and without charge, upon request, by calling 1-888-889-0799.
A description of the policies and procedures that the Funds use to determine how to vote proxies relating to the Funds’ portfolio securities, and information on how the Funds voted proxies relating to portfolio securities during the most recent 12-month period ended June 30 is available (1) without charge, upon request, by calling 1-888-889-0799, (2) on the Funds’ website at www.citynationalrochdalefunds.com, and (3) on the Commission’s website at www.sec.gov.
CITY NATIONAL ROCHDALE FUNDS | PAGE 1
letter to our shareholders (Unaudited) |
September 30, 2021 |
Dear Shareholders,
This annual report covers the one-year period ended September 30, 2021.
After an unusually long period of complacency, volatility has returned to the equity markets. Concerns over the Federal Reserve (the “Fed”) tapering its bond purchases, the U.S. debt ceiling, inflation pressures, slowing economic and earnings growth projections, and China’s property market have provided the catalyst for the S&P 500 Index’s first 5% decline in nearly a year. We do not believe any of these issues pose a significant threat to the long-term outlook, but market sentiment could remain vulnerable in the near term.
The U.S. economy experienced robust growth in the first half of the year, averaging around 6.5%. Such growth propelled the economy past the previous peak in output and set it on a steeper trajectory than during the last economic expansion.
Although Q2 2021 was expected to be the peak in growth for the current expansion, largely due to the end of the federal stimulus checks to U.S. households, the slowdown in Q3 was more severe than anticipated. This slowdown was blamed solely on the rise in cases of the Delta variant of COVID-19 in July, August, and early September. The rise in Delta variant cases caused a significant downshift in consumer spending, with the hospitality sector seeing the most significant decreases. Also, the supply of goods has been curtailed as the manufacturing sector continues to be plagued by shortages of materials. Vehicle production is especially challenged by the limited availability of semiconductors, which has led to fewer sales.
The Fed is looking past these issues and plans to reduce some of the stimulus it is providing because it believes the economy is strong enough. In November, the Fed announced the reduction in its bond-buying program. Since May 2020, the Fed has been buying $120 billion in government bonds each month to help push down longer-term interest rates and add liquidity to the market. While this move may be considered to be more of a gradual tapering of monetary policy, since the Fed is stopping purchases of additional bonds onto its balance sheet, more tightening may be possible into 2022. For instance, based on the “dot plot” of expectations for interest rates, the Federal Open Market Committee (the “FOMC”) indicated that it could begin raising interest rates as soon as 2022. The Fed’s balance sheet currently stands at $8.5 trillion, which is approximately twice the size it was two years ago.
Unlike the 2013 taper tantrum, when the 10-year U.S. Treasury yield jumped approximately 100 basis points, this time the Fed prepared the markets for the termination of bond purchases. Since December of 2020, the Fed has been considering the conditions needed to begin tapering. In April 2021, the Fed indicated that the FOMC would begin discussions about tapering, and the FOMC spoke about tapering during its summer meetings.
With the combination of its large balance sheet and the low level of the federal funds rate, the Fed still provides a very high level of stimulus to the economy. Moreover, the Fed has made it abundantly clear to the markets of its plans to stay accommodative. Before tightening monetary policy, the Fed indicated that inflation must be above 2.0% for a sustained period, and there must be maximum employment.
While inflation has been high due to temporary disruptions (e.g., supply challenges from reopening), we expect this to ease in the second half of 2022 (e.g., the travel and automobile industries have seen a slowdown in price increases). However, while inflation has risen and is comfortably in the range, we foresee elements of inflation as transitory and feel that the Fed will be comfortable with current levels. In terms of the labor market, businesses have continued to struggle to find workers and, as a result, they have increased wages to attract potential workers. It appears that the mismatch in the skills and location of workers will take time to correct itself, but we do not believe that this will alter the Fed’s plan to taper its bond purchases in the near future.
Still, for now, investors have more questions than answers, and this uncertainty does raise the prospect of further volatility in the coming months and a potential market correction. Corrections, though, are often healthy events, that help to eliminate excesses that have built up after an extended period of market optimism and set a firmer foundation for future gains. We think this bull market still has a lot of room to run and that the combination of sustained economic expansion, robust earnings growth and ongoing monetary policy support
CITY NATIONAL ROCHDALE FUNDS | PAGE 2
will ultimately remain a tailwind for stock prices. Given this, investors may want to use any market corrections in the near future as an opportunity to add to core positions.
As always, we thank you for your trust and confidence in our abilities to continue to serve you well through your investment in the City National Rochdale Funds.
Sincerely,

Thomas A. Galvin
President and Chief Executive Officer
City National Rochdale Funds
Past performance is no guarantee of future results. Certain shareholders may be subject to the Alternative Minimum Tax (AMT). Federal income tax rules apply to any capital gain distributions.
This information must be preceded or accompanied by a current prospectus. Please read the prospectus carefully before investing.
City National Rochdale Funds do not generally accept investments by non-U.S. persons and may not be available in all states.
Bloomberg U.S. 1-5 Year Government Bond Index is an index of all investment grade bonds with maturities of more than one year and less than five years. The index is a market value weighted performance benchmark.
Bloomberg 1-5 Year U.S. Corporate A3 or Higher, 2% Issuer Constrained Index includes U.S. dollar-denominated, investment-grade, fixed-rate, taxable securities issued by industrial, utility, and financial companies, with maturities between one and five years.
S&P Municipal Yield Index is an unmanaged index which measures the performance of high-yield and investment-grade municipal bonds with weights determined by credit rating.
The S&P 500 Index is a market capitalization value weighted composite index of 500 large capitalization
U.S. companies and reflects the reinvestment of dividends.
Bloomberg U.S. Aggregate Bond Index is a broad-based flagship benchmark that measures the investment grade, U.S. dollar-denominated, fixed-rate taxable bond market.
Bloomberg Intermediate U.S. Government/Credit Index consists of publicly issued, U.S. dollar-denominated U.S. Government, agency, or investment grade corporate fixed income securities with maturities from one to ten years. The comparative market index is not directly investable and is not adjusted to reflect expenses that the Commission requires to be reflected in the fund’s performance.
Bloomberg Intermediate-Short California Municipal Bond Index measures the performance of California municipal bonds.
Intercontinental Exchange Bank of America Merrill Lynch 0-1 Year Emerging Markets Corporate Plus Index tracks the performance of emerging markets non-sovereign debt publicly issued.
Bloomberg Global Aggregate Index is a flagship measure of global investment grade debt from twenty-four local currency markets. This multi-currency benchmark includes treasury, government-related, corporate and securitized fixed-rate bonds from both developed and emerging market issuers.
CITY NATIONAL ROCHDALE FUNDS | PAGE 3
investment adviser’s report (Unaudited) |
September 30, 2021 |
Fixed Income Funds |
Government Bond Fund – CNBIX
The Servicing Class Shares of the Fund, for the fiscal year ended September 30, 2021, underperformed the Bloomberg U.S. 1-5 Year Government Bond Index by 59 basis points (-1.02% for the Fund versus -0.43% for the benchmark). Calendar year to date, as of September 30, 2021, the Fund returned -0.97% versus the benchmark return of -0.44%. The Fund posted a return of -0.19% in Q3 2021, which underperformed the benchmark’s 0.03% return. As of September 30, 2021, the Fund’s duration positioning was slightly short, versus the benchmark. Government agency positions continue to augment portfolio yield. Additionally, tactical positioning along steeper positions in the yield curve may meaningfully contribute to total return though the end of the year.
CORPORATE BOND FUND – CNCIX
The Servicing Class Shares of the Fund, for the fiscal year ended September 30, 2021, underperformed the Bloomberg 1-5 Year U.S. Corporate A3 or Higher, 2% Issuer Constrained Index by 20 basis points (0.42% for the Fund versus 0.62% for the benchmark). Calendar year to date, as of September 30, 2021, the Fund returned -0.42% versus the benchmark return of -0.08%. The Fund posted a return of -0.08% in Q3 2021, which slightly underperformed the benchmark’s 0.03% return. During the third quarter, the strategy exited taxable municipal securities and added to U.S. Treasury security exposures while moving to an overall neutral to the benchmark posture for both duration and sector positioning. The Fund is constructive on investment grade corporate debt. The Fund expects continued volatility to create attractive tactical opportunities for the remainder of 2021.
CALIFORNIA TAX EXEMPT BOND FUND – CNTIX
The Servicing Class Shares of the Fund posted a return of -0.30% for Q3 2021, which underperformed the Bloomberg Intermediate-Short California Municipal Bond Index’s return of -0.02%. Calendar year to date, as of September 30, 2021, the Fund returned -0.65% versus the benchmark return of -0.09%. For the fiscal year ended September 30, 2021, the Fund returned -0.27%, which underperformed its benchmark return of 0.56%. The Fund’s underperformance for the third quarter was primarily due to credit quality. The BBB sector benefitted from tightening spreads. The addition of US Treasuries was additive. The Fund maintains a neutral duration versus the benchmark with additional appetite for lower rated bonds as the credit environment remains healthy.
MUNICIPAL HIGH INCOME BOND FUND – CNRMX
The Servicing Class Shares of the Fund posted a return of -0.15% for Q3 2021, which underperformed the S&P Municipal Yield Index’s return of -0.12%. Calendar year to date, as of September 30, 2021, the Fund returned 3.99% versus the benchmark return of 5.03%. For the fiscal year ended September 30, 2021, the Fund returned 7.77%, which underperformed its benchmark return of 9.43%. In the high yield municipal bond market, returns turned negative for Q3 2021, following U.S. Treasuries and the general municipal credit market. Modest outflows from the municipal credit market caused credit spreads to widen. The Fund’s performance in the third quarter of 2021, versus its category peers was positive, due in part to being somewhat short duration and cautious in new issue credit and structures. The Fund was slightly short duration versus the index, but lower relative credit quality caused moderate underperformance. Municipal credit remains attractive, with default rates rising in certain sectors such as senior living, but remaining low overall. Security selection is critical, as certain sectors, such as residential development are more likely to recover than others. As the recovery takes shape, we have been adding selectively to credit in the areas that will benefit most from the improving economy, such as single and multi-family development, while remaining cautious in others, such as life care.
INTERMEDIATE FIXED INCOME FUND – RIMCX
The Class N Shares of the Fund posted a return of -0.33% for Q3 2021, which underperformed the Bloomberg Intermediate U.S. Government Credit Index return of 0.02%. Calendar year to date, as of September 30, 2021, the Fund returned -1.30% versus the benchmark return of -0.87%. For the fiscal year ended September 30, 2021, the fund returned -0.20%, which outperformed the benchmark’s return of -0.40%. The Fund has transitioned from being materially overweight corporate credit and underweight U.S. Treasury securities, with a barbell duration posture, to one that is neutral to the benchmark across most factors. Looking ahead, the Fund
CITY NATIONAL ROCHDALE FUNDS | PAGE 4
will continue to maintain a neutral corporate credit and government securities positioning relative to the benchmark, and will look to tactically trade around interest rate and/or credit spread volatility.
FIXED INCOME OPPORTUNITIES FUND – RIMOX
The Fund posted a return of 0.48% for Q3 2021, which outperformed the Bloomberg U.S. Aggregate Bond Index return of 0.11%. Calendar year to date, as of September 30, 2021, the Fund returned 3.99% versus the Bloomberg U.S. Aggregate Bond Index return of -0.11%. For the fiscal year ended September 30, 2021, the Fund returned 10.14%, which outperformed the Bloomberg U.S. Aggregate Bond Index return of -0.90%. Emerging markets high yield debt had a rough third quarter, as it was negatively impacted by the issues in the Chinese property sector. The Fund’s portfolio managers, however, largely avoided the most troubled credit. The Fund’s structured credit allocation was the top performer, as collateralized loan obligations have benefited from an expanding economy, improving credit quality, and above market yields. U.S. high yield debt was stable during the one-year period. We have been pleased with the Fund’s outperformance in 2021 and the catch-up with the Fund’s trailing periods on a relative basis.
CNR Short Term EM Debt Fund – CNRGX
The Fund posted a return of 0.78% for Q3 2021, which outperformed the ICE BofAML 0-1 Year Emerging Markets Corporate Plus Index return of -1.09%. Calendar year to date, as of September 30, 2021, the Fund returned 8.42% versus the benchmark return of -1.30%. For the fiscal year ended September 30, 2021, the Fund returned 16.42%, which outperformed its benchmark return of 0.68%. The Fund commenced operations in May 2019, and is invested in very high conviction, short-term emerging market bonds. The original thesis of the Fund’s strategy was that the short-term nature of these investments were not held as widely due to the fact that most emerging market high yield corporate benchmarks did not have maturities of less than one year. Because of this unique aspect within emerging market fixed income, our view was that in normal market environments this would present a compelling opportunity. The emerging market debt universe continues to experience exceptionally high levels of volatility, which is partly related to the general economic slowdown across the globe. The liquidation of the Fund is scheduled for mid-November 2021, and the Fund is positioned to meet performance expectations.
This material represents the investment adviser’s assessment of the portfolios and market environment at a specific point in time and should not be relied upon by the reader as research or investment advice.
Performance data quoted represents past performance and does not guarantee similar future results. The investment performance and principal value of an investment will fluctuate so that an investor’s shares, when redeemed, may be worth more or less than their original cost, and current performance may be lower or higher than the performance quoted. For performance data current to the most recent month end, please call 1-888-889-0799.
Index performance returns do not reflect any management fees, transaction costs or expenses. Indexes are unmanaged and one cannot invest directly in an index.
Mutual fund investing involves risk, including loss of principal. Bonds and bond funds are subject to interest rate risk and will decline in value as interest rates rise. High yield bonds involve greater risks of default or downgrade and are more volatile than investment grade securities, due to the speculative nature of their investments.
The California Tax Exempt Bond Fund invests primarily in California securities and may be more volatile and susceptible to a single adverse economic or regulatory occurrence affecting those obligations than a fund investing in obligations of a number of states.
The credit quality breakdown depicts the credit quality ratings of the Fund’s portfolio securities that are rated by one or both of two major nationally recognized statistical rating organizations (“NRSROs”). The two NRSROs currently utilized for this purpose are Standard & Poor’s (S&P) and Moody’s. When a bond is rated by S&P that rating is utilized. If it is not rated by S&P, the Moody’s rating is utilized. When a security is rated by neither, it is classified as “Not Rated”. For bonds, these credit quality ratings are shown without regard to gradations within a given rating category. For example, securities rated “AA-” or “AA+” have
CITY NATIONAL ROCHDALE FUNDS | PAGE 5
investment adviser’s report (Unaudited) |
September 30, 2021 |
Fixed Income Funds (continued) |
been included in the “AA” rated category. Long term ratings are measured on a scale that generally ranges from AAA (highest) to D (lowest).
Duration is a measure of a bond’s sensitivity to interest rate changes. The higher the bond’s duration, the greater its sensitivity to the change.
CITY NATIONAL ROCHDALE FUNDS | PAGE 6
fund overview (Unaudited) |
September 30, 2021 |
City National Rochdale Government Bond Fund |
The Fund seeks to provide current income (as the primary component of a total return intermediate duration strategy) by investing primarily in U.S. Government securities.
Comparison of Change in the Value of a $10,000 Investment in the City National Rochdale Government Bond Fund, Servicing Class Shares, versus the Bloomberg U.S. 1-5 Year Government Bond Index(1)

(1) | The performance in the above graph does not reflect the deduction of taxes the shareholder will pay on Fund distributions or the redemptions of Fund shares. Investment performance reflects fee waivers in effect. In the absence of such waivers, total return would be reduced. |
| Past performance is no indication of future performance. |
| The Fund’s comparative benchmark does not include the annual operating expenses incurred by the Fund. Please note that one cannot invest directly in an unmanaged index. |
AVERAGE ANNUAL TOTAL RETURNS |
Shares | Ticker
Symbol | 1-Year
Return | 3-Year
Return | 5-Year
Return | 10-Year
Return |
Servicing Class*^ | CNBIX | -1.02% | 2.45% | 1.19% | 0.84% |
Class N | CGBAX | -1.27% | 2.22% | 0.94% | 0.59% |
Bloomberg U.S. 1-5 Year Government Bond Index | n/a | -0.43% | 3.28% | 1.82% | 1.46% |
* | The graph is based on only Servicing Class Shares; performance for Class N Shares would be different due to differences in fee structures. |
^ | The Fund’s Servicing Class Shares are available only to fiduciary, advisory, agency, custodial and other similar accounts maintained at City National Bank and certain retirement plan platforms. |
TOP TEN HOLDINGS* |
% OF PORTFOLIO |
U.S. Treasury Notes, 1.875%, 08/31/24 | | | 9.7 | % |
U.S. Treasury Notes, 2.625%, 02/28/23 | | | 5.9 | % |
U.S. Treasury Notes, 2.625%, 12/31/25 | | | 5.7 | % |
FHLB, 3.375%, 09/08/23 | | | 5.6 | % |
FNMA, 2.500%, 02/05/24 | | | 5.1 | % |
FNMA, 2.625%, 09/06/24 | | | 5.0 | % |
FNMA, 1.625%, 01/07/25 | | | 4.4 | % |
U.S. Treasury Notes, 2.750%, 08/31/23 | | | 4.4 | % |
U.S. Treasury Notes, 1.625%, 04/30/23 | | | 4.2 | % |
FFCB, 0.200%, 10/02/23 | | | 4.2 | % |
* | Excludes Cash Equivalents |
CITY NATIONAL ROCHDALE FUNDS | PAGE 7
fund overview (Unaudited) |
September 30, 2021 |
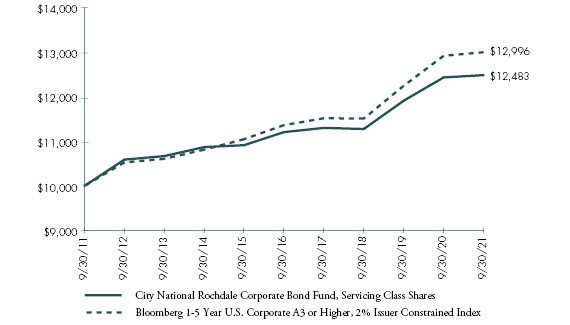
City National Rochdale Corporate Bond Fund |
The Fund seeks to provide current income (as the primary component of a total return intermediate duration strategy) by investing in a diversified portfolio of fixed income securities.
Comparison of Change in the Value of a $10,000 Investment in the City National Rochdale Corporate Bond Fund, Servicing Class Shares, versus the Bloomberg 1-5 Year U.S. Corporate A3 or Higher, 2% Issuer Constrained Index(1)
(1) | The performance in the above graph does not reflect the deduction of taxes the shareholder will pay on Fund distributions or the redemptions of Fund shares. Investment performance reflects fee waivers in effect. In the absence of such waivers, total return would be reduced. |
| Past performance is no indication of future performance. |
| The Fund’s comparative benchmark does not include the annual operating expenses incurred by the Fund. Please note that one cannot invest directly in an unmanaged index. |
AVERAGE ANNUAL TOTAL RETURNS |
Shares | Ticker
Symbol | 1-Year
Return | 3-Year
Return | 5-Year
Return | 10-Year
Return |
Servicing Class*^ | CNCIX | 0.42% | 3.45% | 2.18% | 2.24% |
Class N | CCBAX | 0.16% | 3.22% | 1.95% | 1.99% |
Bloomberg 1-5 Year U.S. Corporate A3 or Higher, 2% Issuer Constrained Index | n/a | 0.62% | 4.13% | 2.72% | 2.66% |
* | The graph is based on only Servicing Class Shares; performance for Class N Shares would be different due to differences in fee structures. |
^ | The Fund’s Servicing Class Shares are available only to fiduciary, advisory, agency, custodial and other similar accounts maintained at City National Bank and certain retirement plan platforms. |
TOP TEN HOLDINGS* |
% OF PORTFOLIO |
Apple, 3.450%, 05/06/24 | | | 3.2 | % |
City National Rochdale Fixed Income Opportunities Fund, Cl N | | | 3.2 | % |
JPMorgan Chase, 3.300%, 04/01/26 | | | 2.8 | % |
Morgan Stanley, 3.125%, 07/27/26 | | | 2.8 | % |
UnitedHealth Group, 2.875%, 03/15/23 | | | 2.7 | % |
Toyota Motor Credit, 2.250%, 10/18/23 | | | 2.7 | % |
Shell International Finance BV, 3.400%, 08/12/23 | | | 2.7 | % |
Citigroup, 1.550%, 09/01/23 | | | 2.6 | % |
General Motors Financial, 5.250%, 03/01/26 | | | 2.6 | % |
Applied Materials, 3.900%, 10/01/25 | | | 2.5 | % |
* Excludes Cash Equivalents
BOND CREDIT QUALITY |
CREDIT RATINGS(1) | | % OF NET
ASSETS | |
U.S. Government Obligations | | | 0.1 | % |
AAA | | | 1.1 | % |
AA | | | 5.0 | % |
A | | | 31.1 | % |
BBB | | | 55.3 | % |
Registered Investment Company | | | 3.2 | % |
Short-Term Investments and Other Net Assets | | | 3.5 | % |
(1) | Credit quality is based on ratings from Standard & Poor’s, a division of The McGraw-Hill Companies, Inc. (“S&P”). Where S&P ratings are not available, credit quality is based on ratings from Moody’s Investor Services, Inc. (“Moody’s”). S&P and Moody’s ratings have been selected for several reasons, including the access to information and materials provided by S&P and Moody’s, as well as the Fund’s consideration of industry practice. The Not Rated category, if applicable, consists of securities that have not been rated by S&P or Moody’s. |
CITY NATIONAL ROCHDALE FUNDS | PAGE 8
fund overview (Unaudited) |
September 30, 2021 |
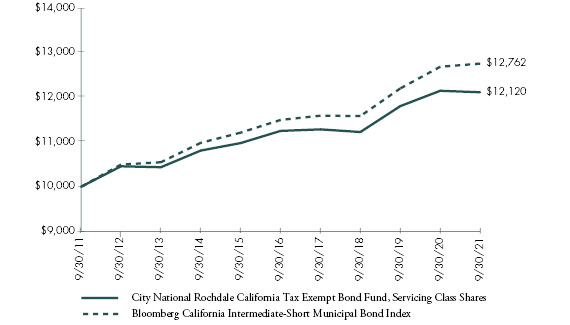
City National Rochdale California Tax Exempt Bond Fund |
The Fund seeks to provide current income exempt from federal and California state income tax (as the primary component of a total return strategy) by investing primarily in California municipal bonds.
Comparison of Change in the Value of a $10,000 Investment in the City National Rochdale California Tax Exempt Bond Fund, Servicing Class Shares, versus the Bloomberg California Intermediate-Short Municipal Bond Index(1)
(1) | The performance in the above graph does not reflect the deduction of taxes the shareholder will pay on Fund distributions or the redemptions of Fund shares. Investment performance reflects fee waivers in effect. In the absence of such waivers, total return would be reduced. |
| Past performance is no indication of future performance. |
| The Fund’s comparative benchmark does not include the annual operating expenses incurred by the Fund. Please note that one cannot invest directly in an unmanaged index. |
AVERAGE ANNUAL TOTAL RETURNS |
Shares | Ticker
Symbol | 1-Year
Return | 3-Year
Return | 5-Year
Return | 10-Year
Return |
Servicing Class*^ | CNTIX | -0.27% | 2.58% | 1.50% | 1.94% |
Class N | CCTEX | -0.43% | 2.35% | 1.25% | 1.69% |
Bloomberg California Intermediate-Short Municipal Bond Index | n/a | 0.56% | 3.28% | 2.11% | 2.47% |
* | The graph is based on only Servicing Class Shares; performance for Class N Shares would be different due to differences in fee structures. |
^ | The Fund’s Servicing Class Shares are available only to fiduciary, advisory, agency, custodial and other similar accounts maintained at City National Bank. |
TOP TEN HOLDINGS* |
% OF PORTFOLIO |
San Francisco City & County, San Francisco International Airport, RB, AMT 5.000%, 05/01/27 | | | 3.5 | % |
Chula Vista Elementary School District, RB 1.550%, 08/01/23 | | | 2.6 | % |
California State, Public Works Board, RB 5.000%, 09/01/25 | | | 2.3 | % |
State of Illinois, Ser C, GO 4.000%, 03/01/24 | | | 1.8 | % |
Los Angeles, Department of Water, Ser C, RB Callable 07/01/30 @ 100 5.000%, 07/01/32 | | | 1.7 | % |
California State, GO 5.000%, 10/01/30 | | | 1.7 | % |
Santa Clara County, Financing Authority, 5.000%, 05/01/29 | | | 1.7 | % |
Westlands, Water District, Ser A, RB, AGM Callable 09/01/26 @ 100 5.000%, 09/01/27 | | | 1.6 | % |
California State, Infrastructure & Economic Development Bank, Ser B, RB 5.000%, 07/01/23 | | | 1.6 | % |
University of California, Ser AY, RB Callable 05/15/27 @ 100 5.000%, 05/15/28 | | | 1.6 | % |
* | Excludes Cash Equivalents |
CITY NATIONAL ROCHDALE FUNDS | PAGE 9
fund overview (Unaudited) |
September 30, 2021 |
City National Rochdale Municipal High Income Fund |
The Fund seeks to provide a high level of current income that is not subject to federal income tax.
Comparison of Change in the Value of a $10,000 Investment in the City National Rochdale Municipal High Income Fund, Servicing Class Shares, versus the Bloomberg 60%LB Tax-Exempt HY/40%LB Municipal IG TR Unhedged USD Index(1) and the S&P Municipal Yield Index(1)
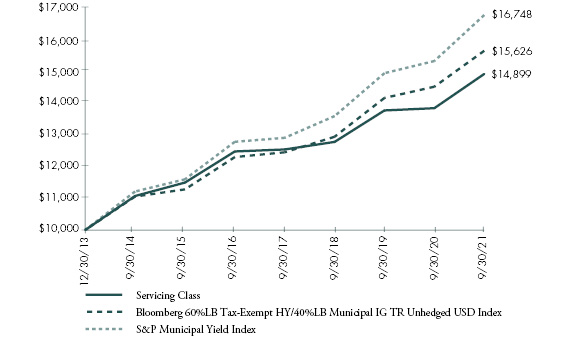
(1) | The performance in the above graph does not reflect the deduction of taxes the shareholder will pay on Fund distributions or the redemptions of Fund shares. Investment performance reflects fee waivers in effect. In the absence of such waivers, total return would be reduced. Effective January 31, 2016, the Adviser discontinued the voluntary fee waivers for the Fund. |
| Past performance is no indication of future performance. |
| The Fund’s comparative benchmark does not include the annual operating expenses incurred by the Fund. Please note that one cannot invest directly in an unmanaged index. |
AVERAGE ANNUAL TOTAL RETURNS |
Shares | Ticker
Symbol | 1-Year
Return | 3-Year
Return | 5-Year
Return | Inception
to Date |
Servicing Class*(1)^ | CNRMX | 7.77% | 5.29% | 3.63% | 5.28% |
Class N(1) | CNRNX | 7.51% | 4.99% | 3.35% | 5.01% |
Bloomberg 60%LB Tax-Exempt HY/40%LB Municipal IG TR Unhedged USD Index | n/a | 7.77% | 6.52% | 4.92% | 5.92% |
S&P Municipal Yield Index | n/a | 9.43% | 7.25% | 5.57% | 6.88% |
* | The graph is based on only Servicing Class Shares; performance for Class N Shares would be different due to differences in fee structures. |
(1) | Commenced operations on December 30, 2013. |
^ | The Fund’s Servicing Class Shares are available only to fiduciary, advisory, agency, custodial and other similar accounts maintained at City National Bank and certain retirement plan platforms. |
TOP TEN HOLDINGS* |
% OF PORTFOLIO |
Florida State, Development Finance, 7.375%, 01/01/49 | | | 1.1 | % |
Puerto Rico, Sales Tax Financing Sales Tax Revenue, 4.784%, 07/01/58 | | | 1.0 | % |
Puerto Rico, Sales Tax Financing Sales Tax Revenue, 4.500%, 07/01/34 | | | 1.0 | % |
Ohio State, Air Quality Development Authority, 5.000%. 07/01/49 | | | 0.7 | % |
Puerto Rico, Sales Tax Financing Sales Tax Revenue, 5.000%, 07/01/58 | | | 0.6 | % |
West Virginia, Tobacco Settlement Finance Authority, 4.875%, 06/01/49 | | | 0.6 | % |
Puerto Rico Commonwealth, Aqueduct & Sewer Authority, 5.250%, 07/01/42 | | | 0.6 | % |
Metropolitan Transportation Authority, 5.250%, 11/15/55 | | | 0.6 | % |
Buckeye Tobacco Settlement Financing Authority, 5.000%, 06/01/55 | | | 0.6 | % |
Tennergy, 4.000%, 12/01/51 | | | 0.6 | % |
* | Excludes Cash Equivalents |
CITY NATIONAL ROCHDALE FUNDS | PAGE 10
fund overview (Unaudited) |
September 30, 2021 |
City National Rochdale Intermediate Fixed Income Fund |
The Fund seeks current income and, to the extent consistent with this goal, capital appreciation.
Comparison of Change in the Value of a $10,000 Investment in the City National Rochdale Intermediate Fixed Income Fund, Class N Shares, versus the Bloomberg Intermediate U.S. Government/Credit Index(1)

(1) | The performance in the above graph does not reflect the deduction of taxes the shareholder will pay on Fund distributions or the redemptions of Fund shares. Investment performance reflects fee waivers in effect. In the absence of such waivers, total return would be reduced. |
| Past performance is no indication of future performance. |
| The Fund’s comparative benchmark does not include the annual operating expenses incurred by the Fund. Please note that one cannot invest directly in an unmanaged index. |
AVERAGE ANNUAL TOTAL RETURNS |
Shares | Ticker
Symbol | 1-Year
Return | 3-Year
Return | 5-Year
Return | 10-Year
Return |
Class N*(1) | RIMCX | -0.24% | 4.24% | 2.38% | 2.82% |
Institutional Class(2)^ | CNRIX | 0.27% | 4.76% | 2.89% | 3.22% |
Bloomberg Intermediate U.S. Government/Credit Index | n/a | -0.40% | 4.63% | 2.60% | 2.52% |
* | The graph is based on only Class N Shares; the performance for Institutional Class Shares would be different due to differences in fee structures. |
(1) | The predecessor to the City National Rochdale Intermediate Fixed Income Fund (the “Predecessor Fund”) commenced operations on December 31, 1999. On March 29, 2013, the Predecessor Fund was reorganized into the Fund. The performance results for the Class N Shares of the Fund for the period October 1, 2011, to March 29, 2013, reflect the performance of the Predecessor Fund’s Shares. |
(2) | Commenced operations on December 20, 2013. The performance results for Institutional Class Shares of the Fund for the period of October 1, 2011, to March 29, 2013, reflect the performance of the Predecessor Fund’s shares. The performance results for the Institutional Class Shares of the Fund for the period March 29, 2013, to December 19, 2013, reflect the performance of the Class N Shares. |
^ | The Fund’s Institutional Class shares are available only to fiduciary, advisory, agency, custodial and other similar accounts maintained at City National Bank which meet the minimum initial investment requirement of $1,000,000 and certain tax deferred retirement plans (including 401(k) plans, employer sponsored 403(b) plans, 457 plans, profit sharing and money purchase pension plans, defined benefit plans and non-qualified deferred compensation plans) held in plan level or omnibus accounts. |
TOP TEN HOLDINGS* |
% OF PORTFOLIO |
U.S. Treasury Notes, 0.125%, 12/15/23 | | | 8.9 | % |
U.S. Treasury Notes, 2.625%, 01/31/26 | | | 5.9 | % |
U.S. Treasury Notes, 0.125%, 01/15/24 | | | 5.6 | % |
U.S. Treasury Notes, 1.875%, 07/31/26 | | | 4.8 | % |
U.S. Treasury Notes, 0.875%, 11/15/30 | | | 4.8 | % |
U.S. Treasury Notes, 1.625%, 08/15/29 | | | 4.0 | % |
U.S. Treasury Notes, 1.000%, 07/31/28 | | | 3.7 | % |
Morgan Stanley, 3.750%, 02/25/23 | | | 3.2 | % |
City National Rochdale Fixed Income Opportunities Fund | | | 3.0 | % |
Credit Suisse Group Funding Guernsey, 4.550%, 04/17/26 | | | 2.9 | % |
* | Excludes Cash Equivalents |
CITY NATIONAL ROCHDALE FUNDS | PAGE 11
fund overview (Unaudited) |
September 30, 2021 |
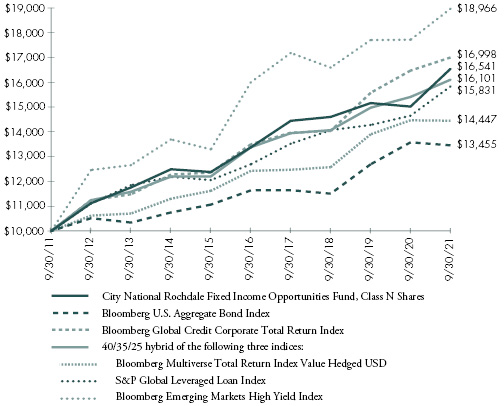
City National Rochdale Fixed Income Opportunities Fund |
The Fund seeks a high level of current income.
Comparison of Change in the Value of a $10,000 Investment in the City National Rochdale Fixed Income Opportunities Fund, Class N Shares, versus the Bloomberg U.S. Aggregate Bond Index and the Bloomberg Global Credit Corporate Total Return Index(1)
(1) | The performance in the above graph does not reflect the deduction of taxes the shareholder will pay on Fund distributions or the redemptions of Fund shares. Investment performance reflects fee waivers in effect. In the absence of such waivers, total return would be reduced. |
| Past performance is no indication of future performance. |
| The Fund’s comparative benchmarks do not include the annual operating expenses incurred by the Fund. Please note that one cannot invest directly in an unmanaged index. |
AVERAGE ANNUAL TOTAL RETURNS |
Shares | Ticker
Symbol | 1-Year
Return | 3-Year
Return | 5-Year
Return | 10-Year
Return |
Class N(1) | RIMOX | 10.14% | 4.24% | 4.34% | 5.16% |
Bloomberg U.S. Aggregate Bond Index | n/a | -0.90% | 5.36% | 2.94% | 3.01% |
Bloomberg Global Credit Corporate Total Return Index | n/a | 3.20% | 6.59% | 4.72% | 5.45% |
40/35/25 hybrid of the following three indices: | n/a | 4.51% | 4.60% | 3.78% | 4.88% |
Bloomberg Multiverse Total Return Index Value Hedged USD | n/a | -0.13% | 4.73% | 3.06% | 3.75% |
S&P Global Leveraged Loan Index | n/a | 8.05% | 4.01% | 4.52% | 4.70% |
Bloomberg Emerging Markets High Yield Index | n/a | 7.07% | 4.56% | 3.46% | 6.61% |
(1) | The predecessor to the City National Rochdale Fixed Income Opportunities Fund (the “Predecessor Fund”) commenced operations on July 1, 2009. On March 29, 2013, the Predecessor Fund was reorganized into the Fund. The performance results for the Class N Shares of the Fund for the period October 1, 2011, to March 29, 2013, reflect the performance of the Predecessor Fund’s Shares. |
TOP TEN HOLDINGS* |
% OF PORTFOLIO |
Vedanta Resources, 6.375%, 07/30/22 | | | 1.3 | % |
Andrade Gutierrez International, 9.500%, 12/30/24 | | | 1.0 | % |
Aerovias de Mexico, 7.000%, 02/05/25 | | | 0.6 | % |
Provincia de Buenos Aires, 3.900%, 09/01/37 | | | 0.6 | % |
Tecpetrol, 4.875%, 12/12/22 | | | 0.6 | % |
Provincia de Cordoba, 5.000%, 12/10/25 | | | 0.6 | % |
Instituto Costarricense de Electricidad, 6.950%, 11/10/21 | | | 0.6 | % |
Alam Sutera Realty, 6.000%, 05/02/24 | | | 0.5 | % |
DTEK Finance, 5.000%, 12/31/27 | | | 0.5 | % |
United Bank for Africa, 7.750%, 06/08/22 | | | 0.5 | % |
* | Excludes Cash Equivalents |
CITY NATIONAL ROCHDALE FUNDS | PAGE 12
fund overview (Unaudited) |
September 30, 2021 |
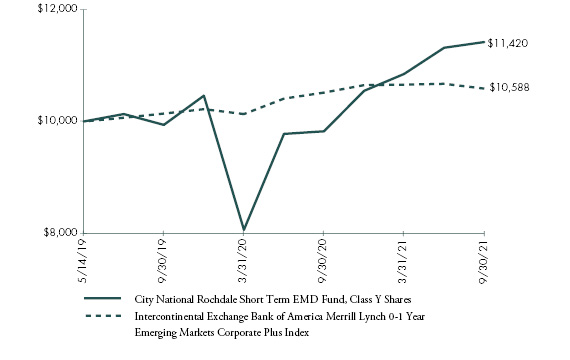
City National Rochdale Short Term Emerging Markets Debt Fund |
The Fund seeks to generate interest income and preserve capital in order to achieve positive total returns.
Comparison of Change in the Value of a $10,000 Investment in the City National Rochdale Short Term Emerging Markets Debt Fund, Class Y Shares, versus the Intercontinental Exchange Bank of America Merrill Lynch 0-1 Year Emerging Markets Corporate Plus Index(1)
(1) | The performance in the above graph does not reflect the deduction of taxes the shareholder will pay on Fund distributions or the redemptions of Fund shares. Investment performance reflects fee waivers in effect. In the absence of such waivers, total return would be reduced. |
| Past performance is no indication of future performance. |
| The Fund’s comparative benchmark does not include the annual operating expenses incurred by the Fund. Please note that one cannot invest directly in an unmanaged index. |
AVERAGE ANNUAL TOTAL RETURNS |
Shares | Ticker
Symbol | 1-Year
Return | Inception
to Date |
Class Y(1) | CNRGX | 16.24% | 5.73% |
Intercontinental Exchange Bank of America Merrill Lynch 0-1 Year Emerging Markets Corp Plus Index | n/a | 0.68% | 2.43% |
(1) | Commenced operations on May 14, 2019. |
TOP TEN HOLDINGS* |
% OF PORTFOLIO |
SEI Daily Income Trust Government Fund, 0.010% | | | 72.9 | % |
Third Pakistan International Sukuk, 5.500%, 10/13/21 | | | 4.8 | % |
Access Bank, 10.500%, 10/19/21 | | | 4.6 | % |
Namibia International Bonds, 5.500%, 11/03/21 | | | 4.5 | % |
Instituto Costarricense de Electricidad, 6.950%, 11/10/21 | | | 4.3 | % |
Turkiye Vakiflar Bankasi TAO, 5.500%, 10/27/21 | | | 4.3 | % |
Global Bank,4.500%, 10/20/21 | | | 2.7 | % |
Provincia de Buenos Aires,3.900%, 09/01/37 | | | 1.8 | % |
Andrade Gutierrez International, 11.000%, 08/20/21 | | | 0.1 | % |
Andrade Gutierrez International, 11.000%, 08/20/21 | | | 0.0 | % |
* | Excludes Cash Equivalents |
CITY NATIONAL ROCHDALE FUNDS | PAGE 13
investment adviser’s report (Unaudited) |
September 30, 2021 |
Equity Funds |
DIVIDEND & INCOME FUND – RIMHX
The Fund posted a return of -0.11% in Q3 2021, which outperformed the -0.40% return of the Fund’s blended benchmark (made up of 60% Dow Jones Select Dividend Index (DJDVP), 25% BofAML Core Fixed Rate Index, and 15% MSCI U.S. REIT Index). Year to date, the Fund’s return is 11.22% versus 17.41% for its blended benchmark. For the fiscal year ended September 30, 2021, the Fund returned 17.53%, which underperformed its blended benchmark return of 33.88%. During Q3 2021, in keeping with the Fund’s goals of implementing tighter risk controls and decreasing the defensive tilt, the Fund’s weightings were increased primarily in cyclical sectors, including energy, financials, and consumer discretionary. We also adjusted the Fund’s weightings towards more cyclical components within mostly defensive sectors, such as by adding advertising exposure to the communications services sector. As an offset to those changes, we reduced the Fund’s defensive positions in the consumer staples and health care sectors, which were overweight, as well as the Fund’s historically more defensive positions in the information technology sector. Future quarters will reflect relative performance compared to the DJ Select Dividend Index, the Fund’s new benchmark as of October 1, 2021.
U.S. Core Equity Fund – CNRVX
The Servicing Share Class of the Fund posted a return of 2.09% for Q3 2021, which outperformed the S&P 500 Index return of 0.58%. Calendar year to date, as of September 30, 2021, the Fund returned 16.24%, which outperformed its benchmark return of 15.92%. For the fiscal year ended September 30, 2021, the Fund returned 27.13%, which underperformed its benchmark return of 30.00%. We have modestly lowered our S&P 500 earnings per share forecast for Q3 and Q4 in 2021, but we increased our expectations for 2022. Stock selection for the Fund was above the benchmark by 173 basis points, while industry allocation attracted 43 basis points. Positive stock selection in pharmaceuticals, biotechnology, transportation, and diversified financials aided the Fund’s quarterly performance, which was offset by underperformance from underweighted automobiles and components, negative stock selection in telecommunications services, and underweighted media and entertainment. The Fund received a 5 rating overall from Lipper for total returns and capital preservation, a 4 rating for tax efficiency, a 3 rating for consistent return, and a 2 rating for expenses.
This material represents the investment adviser’s assessment of the portfolios and market environment at a specific point in time and should not be relied upon by the reader as research or investment advice.
Performance data quoted represents past performance and does not guarantee similar future results. The investment performance and principal value of an investment will fluctuate so that an investor’s shares, when redeemed, may be worth more or less than their original cost, and current performance may be lower or higher than the performance quoted. For performance data current to the most recent month end, please call 1-888-889-0799.
Index performance returns do not reflect any management fees, transaction costs or expenses. Indexes are unmanaged and one cannot invest directly in an index.
CITY NATIONAL ROCHDALE FUNDS | PAGE 14
fund overview (Unaudited) |
September 30, 2021 |
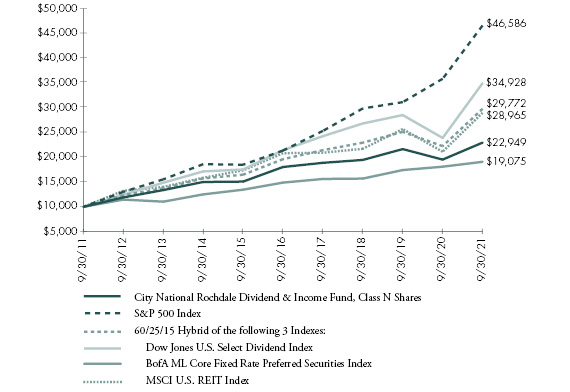
City National Rochdale Dividend & Income Fund |
The Fund seeks to provide significant income and, as a secondary focus, long-term capital appreciation.
Comparison of Change in the Value of a $10,000 Investment in the City National Rochdale Dividend & Income Fund, Class N Shares, versus the S&P 500 Index and the 60/25/15 Hybrid of the following 3 Indexes: Dow Jones U.S. Select Dividend Index, BofA ML Core Fixed Rate Preferred Securities Index and MSCI U.S. REIT Index(1)
(1) | The performance in the above graph does not reflect the deduction of taxes the shareholder will pay on Fund distributions or the redemptions of Fund shares. Investment performance reflects fee waivers in effect. In the absence of such waivers, total return would be reduced. Effective January 31, 2016, the Adviser discontinued the voluntary fee waivers for the Fund. |
| Past performance is no indication of future performance. |
| The Fund’s comparative benchmarks do not include the annual operating expenses incurred by the Fund. Please note that one cannot invest directly in an unmanaged index. |
AVERAGE ANNUAL TOTAL RETURNS |
Shares | Ticker
Symbol | 1-Year
Return | 3-Year
Return | 5-Year
Return | 10-Year
Return |
Class N(1) | RIMHX | 17.53% | 5.65% | 4.94% | 8.66% |
S&P 500 Index | n/a | 30.00% | 15.99% | 16.90% | 16.63% |
60/25/15 Hybrid of the following 3 Indexes: | n/a | 33.88% | 9.07% | 8.70% | 11.53% |
Dow Jones U.S. Select Dividend Index | n/a | 46.15% | 9.21% | 10.27% | 13.32% |
BofA ML Core Fixed Rate Preferred Securities Index | n/a | 5.43% | 6.72% | 5.09% | 6.67% |
MSCI U.S. REIT Index | n/a | 37.16% | 10.10% | 6.84% | 11.22% |
(1) | The predecessor to the City National Rochdale Dividend & Income Fund (the “Predecessor Fund”) commenced operations on June 1, 1999. On March 29, 2013, the Predecessor Fund was reorganized into the Fund. The performance results for the Class N Shares of the Fund for the period October 1, 2010, to March 29, 2013, reflect the performance of the Predecessor Fund’s Shares. |
TOP TEN HOLDINGS* |
% OF PORTFOLIO |
Lockheed Martin | | | 3.1 | % |
Prologis | | | 3.0 | % |
Paychex | | | 2.9 | % |
Fifth Third Bancorp | | | 2.9 | % |
Cincinnati Financial | | | 2.9 | % |
Mid-America Apartment Communities | | | 2.8 | % |
Cisco Systems | | | 2.8 | % |
Duke Energy | | | 2.8 | % |
Altria Group | | | 2.8 | % |
Philip Morris International | | | 2.8 | % |
* | Excludes Cash Equivalents |
CITY NATIONAL ROCHDALE FUNDS | PAGE 15
fund overview (Unaudited) |
September 30, 2021 |
City National Rochdale U.S. Core Equity Fund |
The Fund seeks to provide long-term capital appreciation.
Comparison of Change in the Value of a $10,000 Investment in the City National Rochdale U.S. Core Equity Fund, Servicing Class Shares, versus the S&P 500 Index(1)

(1) | The performance in the above graph does not reflect the deduction of taxes the shareholder will pay on Fund distributions or the redemptions of Fund shares. Investment performance reflects fee waivers in effect. In the absence of such waivers, total return would be reduced. Effective January 31, 2016, the Adviser discontinued the voluntary fee waivers for the Fund. |
| Past performance is no indication of future performance. |
| The Fund’s comparative benchmark does not include the annual operating expenses incurred by the Fund. Please note that one cannot invest directly in an unmanaged index. |
AVERAGE ANNUAL TOTAL RETURNS |
Shares | Ticker
Symbol | 1-Year
Return | 3-Year
Return | 5-Year
Return | Inception
to Date |
Servicing Class*(1)^ | CNRVX | 27.13% | 16.71% | 17.32% | 15.48% |
Institutional Class(1)^^ | CNRUX | 26.76% | 16.79% | 17.49% | 15.79% |
Class N(1) | CNRWX | 26.79% | 16.42% | 17.04% | 15.19% |
S&P 500 Index | n/a | 30.00% | 15.99% | 16.90% | 15.76% |
* | The graph is based on only Servicing Class Shares; performance for Institutional Class and Class N Shares would be different due to differences in fee structures. |
(1) | Commenced operations on December 3, 2012. |
^ | The Fund’s Servicing Class shares are available only to fiduciary, advisory, agency, custodial and other similar accounts maintained at City National Bank and certain retirement plan platforms. |
^^ | The Fund’s Institutional Class shares are available only to fiduciary, advisory, agency, custodial and other similar accounts maintained at City National Bank which meet the minimum initial investment requirements, and certain tax-deferred retirement plans (including 401(k) plans, employer-sponsored 403(b) plans, 457 plans, profit sharing and money purchase pension plans, defined benefit plans and non-qualified deferred compensation plans) held in plan level or omnibus accounts. |
TOP TEN HOLDINGS* |
% OF PORTFOLIO |
Microsoft | | | 6.6 | % |
Apple | | | 5.0 | % |
UnitedHealth Group | | | 3.6 | % |
Visa | | | 3.4 | % |
Home Depot | | | 3.1 | % |
Mastercard | | | 2.8 | % |
Accenture | | | 2.8 | % |
Adobe | | | 2.8 | % |
Alphabet | | | 2.7 | % |
JPMorgan Chase | | | 2.7 | % |
* | Excludes Cash Equivalents |
CITY NATIONAL ROCHDALE FUNDS | PAGE 16
schedule of investments |
September 30, 2021 |
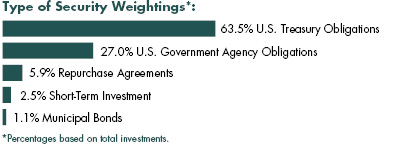
City National Rochdale Government Money Market Fund |
Description | | Face Amount (000) | | | Value (000) | |
U.S. Treasury Obligations [63.5%] |
U.S. Cash Management Bill | | | | | | | | |
0.027%, 10/05/21(A) | | $ | 100,000 | | | $ | 100,000 | |
0.042%, 10/19/21(A) | | | 150,000 | | | | 149,997 | |
0.045%, 12/28/21(A) | | | 100,000 | | | | 99,989 | |
U.S. Treasury Bills | | | | | | | | |
0.043%, 10/12/21(A) | | | 75,000 | | | | 74,999 | |
0.037%, 10/14/21(A) | | | 100,000 | | | | 99,999 | |
0.045%, 10/21/21(A) | | | 100,000 | | | | 99,997 | |
0.043%, 11/04/21(A) | | | 200,000 | | | | 199,992 | |
0.045%, 11/09/21(A) | | | 150,000 | | | | 149,993 | |
0.053%, 11/12/21(A) | | | 150,000 | | | | 149,991 | |
0.043%, 11/16/21(A) | | | 100,000 | | | | 99,994 | |
0.039%, 11/18/21(A) | | | 200,000 | | | | 199,990 | |
0.044%, 11/26/21(A) | | | 200,000 | | | | 199,986 | |
0.050%, 11/30/21(A) | | | 200,000 | | | | 199,983 | |
0.041%, 12/02/21(A) | | | 100,000 | | | | 99,993 | |
0.036%, 12/09/21(A) | | | 50,000 | | | | 49,997 | |
0.052%, 02/03/22(A) | | | 100,000 | | | | 99,982 | |
0.050%, 03/31/22(A) | | | 75,000 | | | | 74,981 | |
U.S. Treasury Notes | | | | | | | | |
2.875%, 10/15/21 | | | 50,000 | | | | 50,054 | |
2.000%, 10/31/21 | | | 100,000 | | | | 100,160 | |
2.875%, 11/15/21 | | | 50,000 | | | | 50,172 | |
1.500%, 11/30/21 | | | 50,000 | | | | 50,120 | |
1.500%, 01/31/22 | | | 50,000 | | | | 50,243 | |
2.500%, 02/15/22 | | | 50,000 | | | | 50,458 | |
2.000%, 02/15/22 | | | 50,000 | | | | 50,367 | |
0.375%, 03/31/22 | | | 175,000 | | | | 175,290 | |
1.875%, 04/30/22 | | | 100,000 | | | | 101,054 | |
0.089%, VAR US Treasury 3 Month Bill Money Market Yield + 0.049%, 01/31/23 | | | 150,000 | | | | 150,047 | |
0.074%, VAR US Treasury 3 Month Bill Money Market Yield + 0.034%, 04/30/23 | | | 50,000 | | | | 50,003 | |
| | | | | | | | | | | | | |
Total U.S. Treasury Obligations |
(Cost $3,027,831) | | | 3,027,831 | |
| | | | | | | | | | | | | |
Description | | Face Amount (000)/Shares | | | Value (000) | |
U.S. Government Agency Obligations [27.0%] |
FFCB | | | | | | | | |
0.110%, VAR US Federal Funds Effective Rate + 0.030%, 03/09/23 | | $ | 50,000 | | | $ | 50,000 | |
FHLB | | | | | | | | |
0.060%, 10/15/21 | | | 50,000 | | | | 50,000 | |
0.220%, VAR United States Secured Overnight Financing Rate + 0.170%, 11/12/21 | | | 50,000 | | | | 50,000 | |
0.030%, 12/03/21 | | | 50,000 | | | | 49,999 | |
0.110%, VAR United States Secured Overnight Financing Rate + 0.060%, 12/15/22 | | | 50,000 | | | | 50,000 | |
FHLB DN | | | | | | | | |
0.038%, 10/01/09(A) | | | 75,000 | | | | 75,000 | |
0.042%, 12/01/17(A) | | | 75,000 | | | | 74,995 | |
0.037%, 10/06/21(A) | | | 92,000 | | | | 92,000 | |
0.035%, 10/20/21(A) | | | 42,000 | | | | 41,999 | |
1.028%, 10/27/21(A) | | | 171,000 | | | | 170,995 | |
0.040%, 10/29/21(A) | | | 112,900 | | | | 112,896 | |
1.032%, 11/03/21(A) | | | 121,500 | | | | 121,496 | |
0.042%, 12/03/21(A) | | | 75,000 | | | | 74,994 | |
0.045%, 03/16/22(A) | | | 50,000 | | | | 49,990 | |
FHLMC | | | | | | | | |
0.120%, VAR United States Secured Overnight Financing Rate + 0.070%, 08/12/22 | | | 50,000 | | | | 50,000 | |
FNMA | | | | | | | | |
0.410%, VAR United States Secured Overnight Financing Rate + 0.360%, 01/20/22 | | | 50,000 | | | | 50,000 | |
0.440%, VAR United States Secured Overnight Financing Rate + 0.390%, 04/15/22 | | | 50,000 | | | | 50,000 | |
0.290%, VAR United States Secured Overnight Financing Rate + 0.240%, 05/05/22 | | | 25,000 | | | | 25,000 | |
0.250%, VAR United States Secured Overnight Financing Rate + 0.200%, 05/09/22 | | | 50,000 | | | | 50,000 | |
| | | | | | | | | | | | | |
Total U.S. Government Agency Obligations |
(Cost $1,289,364) | | | 1,289,364 | |
| | | | | | | | | | | | | |
Municipal Bonds [1.1%] |
California [0.2%] |
California State, Multi-Family Housing Agency, RB | | | | | | | | |
5.500%, 05/15/36(B) | | | 8,900 | | | | 8,900 | |
| | | | | | | | | | | | | |
See accompanying notes to financial statements.
CITY NATIONAL ROCHDALE FUNDS | PAGE 17
schedule of investments |
September 30, 2021 |
City National Rochdale Government Money Market Fund (concluded) |
Description | | Face Amount (000)/Shares | | | Value (000) | |
New York [0.9%] |
New York City, Housing Development, Ser A, RB | | | | | | | | |
0.050%, 03/15/36(B) | | $ | 22,800 | | | $ | 22,800 | |
New York State, Housing Finance Agency, Ser A, RB | | | | | | | | |
0.050%, 05/15/41(B) | | | 21,150 | | | | 21,150 | |
| | | | | | | | | | | | | |
Total New York | | | 43,950 | |
| | | | | | | | | | | | | |
Total Municipal Bonds |
(Cost $52,850) | | | 52,850 | |
| | | | | | | | | | | | | |
Short-Term Investment [2.5%] |
Morgan Stanley Institutional Liquidity Funds - Government Portfolio, 0.030%** | | | 120,343,874 | | | | 120,344 | |
| | | | | | | | | | | | | |
Total Short-Term Investment |
(Cost $120,344) | | | 120,344 | |
| | | | | | | | | | | | | |
Repurchase Agreements [5.8%] |
Barclays (C) | | | | | | | | |
0.040%, dated 09/30/21 repurchased on 10/01/21, repurchase price $70,000,078 (collateralized by various U.S. Treasury obligations, par values ranging from $84,602,300, 1.375%, 8/15/2050; with a total market value of $71,400,005) | | | 70,000 | | | | 70,000 | |
Daiwa (C) | | | | | | | | |
0.030%, dated 09/30/21 repurchased on 10/01/21, repurchase price $133,000,112 (collateralized by various U.S. Treasury obligations, par values ranging from $100,000 to $66,105,000, 0.125% - 2.75%, 9/15/2022 - 2/15/2025; with a total market value of $135,660,095) | | | 133,000 | | | | 133,000 | |
Description | | Face Amount (000) | | | Value (000) | |
Goldman Sachs (C) | | | | | | | | |
0.050%, dated 09/30/21 repurchased on 10/01/21, repurchase price $75,000,105 (collateralized by various U.S. Government obligations, par values ranging from $300 to $76,832,000, 0.000% - 2.750%, 4/21/2022 - 5/15/2049; with a total market value of $76,500,000) | | $ | 75,000 | | | $ | 75,000 | |
| | | | | | | | | | | | | |
Total Repurchase Agreements |
(Cost $278,000) | | | 278,000 | |
| | | | | | | | | | | | | |
Total Investments [99.9%] |
(Cost $4,768,389) | | $ | 4,768,389 | |
Percentages are based on net assets of $4,771,843 (000).
** | The rate reported is the 7-day effective yield as of September 30, 2021. |
(A) | Zero coupon security. The rate reported is the effective yield at time of purchase. |
(B) | Variable or floating rate security, the interest rate of which adjusts periodically based on prevailing interest rates. |
(C) | Tri-party Repurchase Agreement. |
DN — Discount Note
FFCB — Federal Farm Credit Bank
FHLB — Federal Home Loan Bank
FHLMC — Federal Home Loan Mortgage Corporation
FNMA — Federal National Mortgage Association
RB — Revenue Bond
Ser — Series
VAR — Variable
The following is a list of the inputs used as of September 30, 2021, in valuing the Fund’s investments carried at value (000):
Investments in Securities | | Level 1 | | | Level 2 | | | Level 3 | | | Total | |
U.S. Treasury Obligations | | $ | — | | | $ | 3,027,831 | | | $ | — | | | $ | 3,027,831 | |
U.S. Government Agency Obligations | | | — | | | | 1,289,364 | | | | — | | | | 1,289,364 | |
Municipal Bonds | | | — | | | | 52,850 | | | | — | | | | 52,850 | |
Short-Term Investment | | | 120,344 | | | | — | | | | — | | | | 120,344 | |
Repurchase Agreements | | | — | | | | 278,000 | | | | — | | | | 278,000 | |
Total Investments in Securities | | $ | 120,344 | | | $ | 4,648,045 | | | $ | — | | | $ | 4,768,389 | |
For the year ended September 30, 2021, there have been no transfers in or out of Level 3.
Amounts designated as “—” are either $0 or have been rounded to $0.
For more information on valuation inputs, see Note 2 — Significant Accounting Policies in the Notes to Financial Statements.
See accompanying notes to financial statements.
CITY NATIONAL ROCHDALE FUNDS | PAGE 18
schedule of investments |
September 30, 2021 |
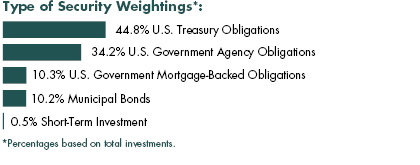
City National Rochdale Government Bond Fund |
Description | | Face Amount (000) | | | Value (000) | |
U.S. Treasury Obligations [44.7%] |
U.S. Treasury Notes | | | | | | | | |
2.875%, 09/30/23 | | $ | 350 | | | $ | 368 | |
2.750%, 07/31/23 | | | 1,175 | | | | 1,228 | |
2.750%, 08/31/23 | | | 1,255 | | | | 1,314 | |
2.750%, 08/31/25 | | | 600 | | | | 645 | |
2.625%, 02/28/23 | | | 1,700 | | | | 1,759 | |
2.625%, 12/31/25 | | | 1,600 | | | | 1,718 | |
2.375%, 04/30/26 | | | 330 | | | | 352 | |
2.000%, 11/30/22 | | | 1,000 | | | | 1,022 | |
1.875%, 08/31/24 | | | 2,805 | | | | 2,916 | |
1.750%, 07/31/24 | | | 800 | | | | 829 | |
1.625%, 04/30/23 | | | 1,225 | | | | 1,252 | |
| | | | | | | | | | | | | |
Total U.S. Treasury Obligations |
(Cost $13,086) | | | 13,403 | |
| | | | | | | | | | | | | |
U.S. Government Agency Obligations [34.0%] |
FFCB | | | | | | | | |
0.200%, 10/02/23 | | | 1,250 | | | | 1,249 | |
FHLB | | | | | | | | |
3.375%, 09/08/23 | | | 1,585 | | | | 1,681 | |
3.125%, 09/09/22 | | | 860 | | | | 884 | |
FNMA | | | | | | | | |
2.625%, 09/06/24 | | | 1,400 | | | | 1,487 | |
2.500%, 02/05/24 | | | 1,445 | | | | 1,518 | |
2.125%, 04/24/26 | | | 955 | | | | 1,005 | |
1.625%, 01/07/25 | | | 1,280 | | | | 1,323 | |
Tennessee Valley Authority | | | | | | | | |
2.875%, 09/15/24 | | | 1,000 | | | | 1,068 | |
| | | | | | | | | | | | | |
Total U.S. Government Agency Obligations |
(Cost $9,963) | | | 10,215 | |
| | | | | | | | | | | | | |
Description | | Face Amount (000) | | | Value (000) | |
U.S. Government Mortgage-Backed Obligations [10.3%] |
FHLMC, Ser 2016-4635, Cl EG, Pool FHR 4635 EG | | | | | | | | |
2.500%, 12/15/46 | | $ | 1,170 | | | $ | 1,219 | |
FNMA, Pool AL5866 | | | | | | | | |
2.425%, 08/01/22(A) | | | 1,022 | | | | 1,030 | |
FNMA, Pool AS4877 | | | | | | | | |
3.000%, 04/01/30 | | | 707 | | | | 747 | |
FNMA ARM, Pool 766620 | | | | | | | | |
1.976%, VAR ICE LIBOR USD 12 Month + 1.677%, 03/01/34 | | | 33 | | | | 33 | |
GNMA, Pool 497411 | | | | | | | | |
6.000%, 01/15/29 | | | 2 | | | | 2 | |
GNMA ARM, Pool G2 81318 | | | | | | | | |
1.875%, VAR US Treas Yield Curve Rate T Note Const Mat 1 Yr + 1.500%, 04/20/35 | | | 45 | | | | 48 | |
GNMA ARM, Pool G2 81447 | | | | | | | | |
2.250%, VAR US Treas Yield Curve Rate T Note Const Mat 1 Yr + 1.500%, 08/20/35 | | | 11 | | | | 11 | |
| | | | | | | | | | | | | |
Total U.S. Government Mortgage-Backed Obligations |
(Cost $3,020) | | | 3,090 | |
| | | | | | | | | | | | | |
Municipal Bonds [10.1%] |
California [3.6%] |
California State, GO | | | | | | | | |
3.000%, 11/01/25 | | | 1,000 | | | | 1,086 | |
| | | | | | | | | | | | | |
Florida [2.7%] |
Florida State, Board of Administration Finance, Ser A, RB | | | | | | | | |
1.258%, 07/01/25 | | | 810 | | | | 819 | |
| | | | | | | | | | | | | |
Texas [3.8%] |
Harris County, Port Authority of Houston, Ser B, GO | | | | | | | | |
2.250%, 10/01/26 | | | 1,075 | | | | 1,132 | |
| | | | | | | | | | | | | |
Total Municipal Bonds |
(Cost $3,049) | | | 3,037 | |
| | | | | | | | | | | | | |
See accompanying notes to financial statements.
CITY NATIONAL ROCHDALE FUNDS | PAGE 19
schedule of investments |
September 30, 2021 |
City National Rochdale Government Bond Fund (concluded) |
Description | | Shares | | | Value (000) | |
Short-Term Investment [0.6%] |
SEI Daily Income Trust Government Fund, Cl F, 0.010%** | | | 165,247 | | | $ | 165 | |
| | | | | | | | | | | | | |
Total Short-Term Investment |
(Cost $165) | | | 165 | |
| | | | | | | | | | | | | |
Total Investments [99.7%] |
(Cost $29,283) | | $ | 29,910 | |
Percentages are based on net assets of $29,992 (000).
** | The rate reported is the 7-day effective yield as of September 30, 2021. |
(A) | Variable or floating rate security, the interest rate of which adjusts periodically based on changes in current interest rates and prepayments on the underlying pool of assets. |
ARM — Adjustable Rate Mortgage
Cl — Class
FFCB — Federal Farm Credit Bank
FHLB — Federal Home Loan Bank
FHLMC — Federal Home Loan Mortgage Corporation
FNMA — Federal National Mortgage Association
GNMA — Government National Mortgage Association
GO — General Obligation
ICE — Intercontinental Exchange
LIBOR — London Interbank Offered Rates
RB — Revenue Bond
Ser — Series
USD — U.S. Dollar
VAR — Variable
The following is a list of the inputs used as of September 30, 2021 in valuing the Fund’s investments carried at value (000):
Investments in Securities | | Level 1 | | | Level 2 | | | Level 3 | | | Total | |
U.S. Treasury Obligations | | $ | — | | | $ | 13,403 | | | $ | — | | | $ | 13,403 | |
U.S. Government Agency Obligations | | | — | | | | 10,215 | | | | — | | | | 10,215 | |
U.S. Government Mortgage-Backed Obligations | | | — | | | | 3,090 | | | | — | | | | 3,090 | |
Municipal Bonds | | | — | | | | 3,037 | | | | — | | | | 3,037 | |
Short-Term Investment | | | 165 | | | | — | | | | — | | | | 165 | |
Total Investments in Securities | | $ | 165 | | | $ | 29,745 | | | $ | — | | | $ | 29,910 | |
For the year ended September 30, 2021, there have been no transfers in or out of Level 3.
Amounts designated as “—” are $0 or have been rounded to $0.
For more information on valuation inputs, see Note 2 -- Significant Accounting Policies in the Notes to Financial Statements.
See accompanying notes to financial statements.
CITY NATIONAL ROCHDALE FUNDS | PAGE 20
schedule of investments |
September 30, 2021 |
City National Rochdale Corporate Bond Fund |
Description | | Face Amount (000) | | | Value (000) | |
Corporate Bonds [91.5%] |
Automotive [5.3%] |
General Motors Financial | | | | | | | | |
5.250%, 03/01/26 | | $ | 2,600 | | | $ | 2,970 | |
Toyota Motor Credit, MTN | | | | | | | | |
2.250%, 10/18/23 | | | 3,000 | | | | 3,110 | |
| | | | | | | | | | | | | |
Total Automotive | | | 6,080 | |
| | | | | | | | | | | | | |
Banks [7.5%] |
BPCE | | | | | | | | |
4.000%, 04/15/24 | | | 1,800 | | | | 1,949 | |
Cooperatieve Rabobank UA | | | | | | | | |
4.375%, 08/04/25 | | | 1,500 | | | | 1,662 | |
Standard Chartered | | | | | | | | |
3.950%, 01/11/23(A) | | | 2,250 | | | | 2,332 | |
Wells Fargo, MTN | | | | | | | | |
3.300%, 09/09/24 | | | 2,500 | | | | 2,690 | |
| | | | | | | | | | | | | |
Total Banks | | | 8,633 | |
| | | | | | | | | | | | | |
Broadcasting & Cable [2.3%] |
Comcast | | | | | | | | |
3.700%, 04/15/24 | | | 2,500 | | | | 2,688 | |
| | | | | | | | | | | | | |
Chemicals [0.2%] |
Dow Chemical | | | | | | | | |
4.550%, 11/30/25 | | | 148 | | | | 166 | |
| | | | | | | | | | | | | |
Computer System Design & Services [3.2%] |
Apple | | | | | | | | |
3.450%, 05/06/24 | | | 3,450 | | | | 3,706 | |
| | | | | | | | | | | | | |
Drugs [2.3%] |
AbbVie | | | | | | | | |
2.600%, 11/21/24 | | | 2,500 | | | | 2,628 | |
| | | | | | | | | | | | | |
Electric Utilities [3.5%] |
Duke Energy | | | | | | | | |
3.150%, 08/15/27 | | | 1,575 | | | | 1,696 | |
Georgia Power | | | | | | | | |
3.250%, 04/01/26 | | | 2,200 | | | | 2,357 | |
| | | | | | | | | | | | | |
Total Electric Utilities | | | 4,053 | |
| | | | | | | | | | | | | |
Enterprise Software/Services [2.0%] |
Oracle | | | | | | | | |
2.500%, 04/01/25 | | | 2,250 | | | | 2,353 | |
| | | | | | | | | | | | | |
Fiduciary Banks [2.4%] |
State Street | | | | | | | | |
2.825%, VAR United States Secured Overnight Financing Rate + 2.690%, 03/30/23 | | | 2,750 | | | | 2,783 | |
| | | | | | | | | | | | | |
Financial Services [2.4%] |
American Express | | | | | | | | |
4.200%, 11/06/25 | | | 2,500 | | | | 2,814 | |
| | | | | | | | | | | | | |
Food, Beverage & Tobacco [4.3%] |
Anheuser-Busch | | | | | | | | |
3.650%, 02/01/26 | | | 2,250 | | �� | | 2,467 | |
General Mills | | | | | | | | |
2.600%, 10/12/22 | | | 2,450 | | | | 2,502 | |
| | | | | | | | | | | | | |
Total Food, Beverage & Tobacco | | | 4,969 | |
| | | | | | | | | | | | | |
Industrials [1.4%] |
Penske Truck Leasing LP | | | | | | | | |
3.450%, 07/01/24(A) | | | 1,500 | | | | 1,599 | |
| | | | | | | | | | | | | |
Investment Bank/Broker-Dealer [1.5%] |
Jefferies Group | | | | | | | | |
4.850%, 01/15/27 | | | 1,500 | | | | 1,738 | |
| | | | | | | | | | | | | |
Medical Labs and Testing Srv [2.4%] |
Laboratory Corp of America Holdings | | | | | | | | |
3.600%, 02/01/25 | | | 2,600 | | | | 2,797 | |
| | | | | | | | | | | | | |
See accompanying notes to financial statements.
CITY NATIONAL ROCHDALE FUNDS | PAGE 21
schedule of investments |
September 30, 2021 |
City National Rochdale Corporate Bond Fund (continued) |
Description | | Face Amount (000) | | | Value (000) | |
Medical Products & Services [4.6%] |
Abbott Laboratories | | | | | | | | |
3.875%, 09/15/25 | | $ | 2,355 | | | $ | 2,605 | |
Gilead Sciences | | | | | | | | |
3.700%, 04/01/24 | | | 2,500 | | | | 2,671 | |
| | | | | | | | | | | | | |
Total Medical Products & Services | | | 5,276 | |
| | | | | | | | | | | | | |
Medical-HMO [2.7%] |
UnitedHealth Group | | | | | | | | |
2.875%, 03/15/23 | | | 3,000 | | | | 3,111 | |
| | | | | | | | | | | | | |
Petroleum & Fuel Products [11.0%] |
Energy Transfer | | | | | | | | |
5.200%, 02/01/22 | | | 2,425 | | | | 2,434 | |
4.650%, 02/15/22 | | | 2,400 | | | | 2,436 | |
EOG Resources | | | | | | | | |
2.625%, 03/15/23 | | | 2,520 | | | | 2,588 | |
Exxon Mobil | | | | | | | | |
2.275%, 08/16/26 | | | 2,000 | | | | 2,099 | |
Shell International Finance BV | | | | | | | | |
3.400%, 08/12/23 | | | 2,900 | | | | 3,063 | |
| | | | | | | | | | | | | |
Total Petroleum & Fuel Products | | | 12,620 | |
| | | | | | | | | | | | | |
Real Estate Investment Trusts [2.4%] |
Prologis | | | | | | | | |
3.250%, 10/01/26 | | | 2,500 | | | | 2,719 | |
| | | | | | | | | | | | | |
Retail [2.1%] |
AutoZone | | | | | | | | |
3.125%, 04/21/26 | | | 2,250 | | | | 2,423 | |
| | | | | | | | | | | | | |
Security Brokers & Dealers [21.8%] |
Banco Santander | | | | | | | | |
2.746%, 05/28/25 | | | 2,600 | | | | 2,726 | |
Bank of America, MTN | | | | | | | | |
4.250%, 10/22/26 | | | 2,500 | | | | 2,813 | |
Barclays, MTN | | | | | | | | |
4.338%, VAR ICE LIBOR USD 3 Month + 1.356%, 05/16/24 | | | 2,250 | | | | 2,382 | |
Citigroup | | | | | | | | |
1.550%, VAR ICE LIBOR USD 3 Month + 1.430%, 09/01/23 | | | 3,000 | | | | 3,035 | |
Description | | Face Amount (000) | | | Value (000) | |
Credit Suisse Group | | | | | | | | |
3.574%, 01/09/23(A) | | $ | 2,500 | | | $ | 2,521 | |
Goldman Sachs Group, MTN | | | | | | | | |
3.850%, 07/08/24 | | | 2,500 | | | | 2,691 | |
JPMorgan Chase | | | | | | | | |
3.300%, 04/01/26 | | | 3,000 | | | | 3,251 | |
Morgan Stanley, MTN | | | | | | | | |
3.125%, 07/27/26 | | | 3,000 | | | | 3,237 | |
NatWest Group | | | | | | | | |
4.519%, VAR ICE LIBOR USD 3 Month + 1.550%, 06/25/24 | | | 2,300 | | | | 2,448 | |
| | | | | | | | | | | | | |
Total Security Brokers & Dealers | | | 25,104 | |
| | | | | | | | | | | | | |
Semi-Conductors [2.5%] |
Applied Materials | | | | | | | | |
3.900%, 10/01/25 | | | 2,600 | | | | 2,879 | |
| | | | | | | | | | | | | |
Telephones & Telecommunications [3.7%] |
AT&T | | | | | | | | |
3.600%, 07/15/25 | | | 1,500 | | | | 1,632 | |
Verizon Communications | | | | | | | | |
2.625%, 08/15/26 | | | 2,500 | | | | 2,646 | |
| | | | | | | | | | | | | |
Total Telephones & Telecommunications | | | 4,278 | |
| | | | | | | | | | | | | |
Total Corporate Bonds |
(Cost $103,900) | | | 105,417 | |
| | | | | | | | | | | | | |
Affiliated Registered Investment Company [3.2%] |
City National Rochdale Fixed Income Opportunities Fund, Cl N‡ | | | 157,077 | | | | 3,660 | |
| | | | | | | | | | | | | |
Total Affiliated Registered Investment Company |
(Cost $4,000) | | | 3,660 | |
| | | | | | | | | | | | | |
Asset-Backed Security [1.1%] |
Carmax Auto Owner Trust, Ser 2018-4, Cl A3 | | | | | | | | |
3.360%, 09/15/23 | | | 1,297 | | | | 1,311 | |
| | | | | | | | | | | | | |
Total Asset-Backed Security |
(Cost $1,297) | | | 1,311 | |
See accompanying notes to financial statements.
CITY NATIONAL ROCHDALE FUNDS | PAGE 22
schedule of investments |
September 30, 2021 |
City National Rochdale Corporate Bond Fund (concluded) |
Description | | Face Amount (000)/Shares | | | Value (000) | |
Closed-End Fund [0.0%] |
Stone Ridge Reinsurance Risk Premium Interval Fund* | | $ | 591 | | | $ | 22 | |
| | | | | | | | | | | | | |
Total Closed-End Fund |
(Cost $25) | | | 22 | |
| | | | | | | | | | | | | |
Short-Term Investment [3.5%] |
SEI Daily Income Trust Government Fund, Cl F, 0.010%** | | | 4,067,786 | | | | 4,068 | |
| | | | | | | | | | | | | |
Total Short-Term Investment |
(Cost $4,068) | | | 4,068 | |
| | | | | | | | | | | | | |
Total Investments [99.3%] |
(Cost $113,290) | | $ | 114,478 | |
Percentages are based on net assets of $115,268 (000).
* | Non-income producing security. |
** | The rate reported is the 7-day effective yield as of September 30, 2021. |
‡ | Investment in Affiliate. |
(A) | Security exempt from registration under Rule 144A of the Securities Act of 1933. These securities may be resold in transactions exempt from registration normally to qualified institutions. On September 30, 2021, the value of these securities amounted to $6,452 (000), representing 5.6% of the net assets of the Fund. |
Cl — Class
ICE — Intercontinental Exchange
LIBOR — London Interbank Offered Rate
LP — Limited Partnership
MTN — Medium Term Note
Ser — Series
USD — U.S. Dollar
VAR — Variable Rate
The following is a list of the inputs used as of September 30, 2021 in valuing the Fund’s investments carried at value (000):
Investments in Securities | | Level 1 | | | Level 2 | | | Level 3 | | | Total | |
Corporate Bonds | | $ | — | | | $ | 105,417 | | | $ | — | | | $ | 105,417 | |
Affiliated Registered Investment Company | | | 3,660 | | | | — | | | | — | | | | 3,660 | |
Asset-Backed Security | | | — | | | | 1,311 | | | | — | | | | 1,311 | |
Closed-End Fund | | | 22 | | | | — | | | | — | | | | 22 | |
Short-Term Investment | | | 4,068 | | | | — | | | | — | | | | 4,068 | |
Total Investments in Securities | | $ | 7,750 | | | $ | 106,728 | | | $ | — | | | $ | 114,478 | |
For the year ended September 30, 2021, there have been no transfers into or out of Level 3.
The following is a summary of the transactions with affiliates for the year ended September 30, 2021 (000):
| | | City National
Rochdale
Fixed Income
Opportunities
Fund,
Class N (000) | |
Beginning balance as of October 1, 2020 | | $ | 3,545 | |
Purchases at Cost | | | — | |
Proceeds from Sales | | | — | |
Realized Gain (Loss) | | | — | |
Unrealized Gain (Loss) | | | 115 | |
Ending balance as of September 30, 2021 | | $ | 3,660 | |
Dividend Income | | $ | 226 | |
| | | City National
Rochdale
Fixed Income
Opportunities
Fund, Class N
(Shares) | |
Beginning balance as of October 1, 2020 | | | 157,077 | |
Purchases | | | — | |
Sales | | | — | |
Ending balance as of September 30, 2021 | | | 157,077 | |
Amounts designated as “—” are $0 or have been rounded to $0.
For more information on valuation inputs, see Note 2 - Significant Accounting Policies in the Notes to Financial Statements.
See accompanying notes to financial statements.
CITY NATIONAL ROCHDALE FUNDS | PAGE 23
schedule of investments |
September 30, 2021 |
City National Rochdale California Tax Exempt Bond Fund |

Description | | Face Amount (000) | | | Value (000) | |
Municipal Bonds [97.1%] |
California [92.2%] |
Alameda County, Joint Powers Authority, RB | | | | | | | | |
Callable 12/01/26 @ 100 | | | | | | | | |
5.000%, 12/01/30 | | $ | 300 | | | $ | 362 | |
Anaheim Housing & Public Improvements Authority, Ser B, RB | | | | | | | | |
Callable 04/01/23 @ 100 | | | | | | | | |
5.000%, 10/01/27 | | | 220 | | | | 235 | |
Bay Area, Water Supply & Conservation Agency, Ser A, RB | | | | | | | | |
Callable 04/01/23 @ 100 | | | | | | | | |
5.000%, 10/01/23 | | | 645 | | | | 691 | |
Brea, Redevelopment Agency Successor, Redevelopment Project, TA | | | | | | | | |
Callable 08/01/23 @ 100 | | | | | | | | |
5.000%, 08/01/25 | | | 550 | | | | 596 | |
California County, Tobacco Securitization Agency, RB | | | | | | | | |
5.000%, 06/01/30 | | | 300 | | | | 391 | |
California State University, Ser B, RB | | | | | | | | |
1.766%, 11/01/25 | | | 1,000 | | | | 1,031 | |
California State, Department of Water Resources, Ser AX, RB | | | | | | | | |
Callable 12/01/27 @ 100 | | | | | | | | |
5.000%, 12/01/29 | | | 500 | | | | 626 | |
California State, Educational Facilities Authority, Ser A, RB | | | | | | | | |
5.000%, 04/01/25 | | | 420 | | | | 486 | |
California State, GO | | | | | | | | |
5.000%, 12/01/21 | | | 1,000 | | | | 1,008 | |
California State, GO | | | | | | | | |
5.000%, 11/01/24 | | | 1,000 | | | | 1,145 | |
California State, GO | | | | | | | | |
5.000%, 08/01/26 | | | 1,000 | | | | 1,210 | |
California State, GO | | | | | | | | |
Callable 12/01/23 @ 100 | | | | | | | | |
5.000%, 12/01/26 | | | 1,000 | | | | 1,102 | |
California State, GO | | | | | | | | |
Callable 11/01/23 @ 100 | | | | | | | | |
5.000%, 11/01/27 | | | 500 | | | | 549 | |
California State, GO | | | | | | | | |
5.000%, 10/01/30 | | | 1,000 | | | | 1,323 | |
California State, GO | | | | | | | | |
4.000%, 04/01/23 | | | 1,000 | | | | 1,057 | |
California State, GO | | | | | | | | |
Callable 04/01/31 @ 100 | | | | | | | | |
4.000%, 10/01/33 | | | 1,000 | | | | 1,223 | |
California State, Health Facilities Financing Authority, RB | | | | | | | | |
Callable 11/15/25 @ 100 | | | | | | | | |
5.000%, 11/15/26 | | | 230 | | | | 272 | |
California State, Health Facilities Financing Authority, RB | | | | | | | | |
5.000%, 11/01/27 | | | 200 | | | | 250 | |
California State, Health Facilities Financing Authority, RB | | | | | | | | |
5.000%, 10/01/39(A) | | | 1,000 | | | | 1,179 | |
California State, Health Facilities Financing Authority, RB | | | | | | | | |
4.000%, 03/01/25 | | | 100 | | | | 112 | |
California State, Health Facilities Financing Authority, Ser A, RB | | | | | | | | |
Callable 11/15/22 @ 100 | | | | | | | | |
5.000%, 11/15/25 | | | 665 | | | | 700 | |
California State, Health Facilities Financing Authority, Ser A, RB | | | | | | | | |
Callable 07/01/23 @ 100 | | | | | | | | |
5.000%, 07/01/28 | | | 1,000 | | | | 1,083 | |
California State, Health Facilities Financing Authority, Ser A, RB | | | | | | | | |
Callable 11/15/27 @ 100 | | | | | | | | |
5.000%, 11/15/30 | | | 400 | | | | 497 | |
California State, Infrastructure & Economic Development Bank, Ser B, RB | | | | | | | | |
5.000%, 07/01/23 | | | 1,150 | | | | 1,239 | |
See accompanying notes to financial statements.
CITY NATIONAL ROCHDALE FUNDS | PAGE 24
schedule of investments |
September 30, 2021 |
City National Rochdale California Tax Exempt Bond Fund (continued) |
Description | | Face Amount (000) | | | Value (000) | |
California State, Municipal Finance Authority, RB | | | | | | | | |
5.000%, 06/01/23 | | $ | 200 | | | $ | 215 | |
California State, Municipal Finance Authority, RB, BAM | | | | | | | | |
5.000%, 05/15/29 | | | 300 | | | | 380 | |
California State, Public Works Board, Department of Corrections and Rehab Project, Ser A, RB | | | | | | | | |
5.000%, 09/01/22 | | | 1,000 | | | | 1,044 | |
California State, Public Works Board, Judicial Council, Ser B, RB | | | | | | | | |
5.000%, 10/01/23 | | | 475 | | | | 520 | |
California State, Public Works Board, RB | | | | | | | | |
5.000%, 09/01/25 | | | 1,500 | | | | 1,762 | |
California State, Public Works Board, Ser B, RB | | | | | | | | |
5.000%, 10/01/25 | | | 225 | | | | 265 | |
California State, Public Works Board, Ser B, RB | | | | | | | | |
5.000%, 10/01/27 | | | 650 | | | | 810 | |
California State, Public Works Board, Ser C, RB | | | | | | | | |
Callable 03/01/27 @ 100 | | | | | | | | |
5.000%, 03/01/28 | | | 500 | | | | 612 | |
California State, Public Works Board, Ser S, RB | | | | | | | | |
Callable 04/01/27 @ 100 | | | | | | | | |
5.000%, 04/01/28 | | | 800 | | | | 982 | |
California State, Statewide Communities Development Authority, Cottage Health System, RB | | | | | | | | |
Pre-Refunded @ 100 | | | | | | | | |
5.000%, 11/01/24(B) | | | 350 | | | | 400 | |
California State, University Systemwide Revenue, Ser A, RB | | | | | | | | |
5.000%, 11/01/24 | | | 990 | | | | 1,132 | |
California State, University Systemwide Revenue, Ser A, RB | | | | | | | | |
Callable 05/01/26 @ 100 | | | | | | | | |
5.000%, 11/01/27 | | | 320 | | | | 384 | |
California State, University Systemwide Revenue, Ser B-1, RB | | | | | | | | |
Callable 05/01/26 @ 100 | | | | | | | | |
1.600%, 11/01/47(A) | | | 1,000 | | | | 1,043 | |
Chula Vista Elementary School District, RB | | | | | | | | |
1.550%, 08/01/23(C) | | | 2,025 | | | | 2,012 | |
Contra Costa, Transportation Authority, Ser A, RB | | | | | | | | |
5.000%, 03/01/27 | | | 420 | | | | 518 | |
Culver Redevelopment Agency Successor Agency, RB | | | | | | | | |
5.000%, 11/01/24 | | | 370 | | | | 422 | |
Desert Community College District, GO | | | | | | | | |
4.000%, 08/01/26 | | | 125 | | | | 145 | |
East Bay, Municipal Utility District, Water System Revenue, Ser A, RB | | | | | | | | |
Callable 06/01/25 @ 100 | | | | | | | | |
5.000%, 06/01/29 | | | 850 | | | | 990 | |
El Dorado Irrigation District, Ser A, RB | | | | | | | | |
Callable 03/01/30 @ 100 | | | | | | | | |
5.000%, 03/01/32 | | | 235 | | | | 306 | |
Fremont, Public Financing Authority, RB | | | | | | | | |
5.000%, 10/01/25 | | | 1,000 | | | | 1,176 | |
Irvine California, TA, BAM | | | | | | | | |
4.000%, 09/02/31 | | | 700 | | | | 878 | |
Jurupa, Unified School District, GO, AGM | | | | | | | | |
5.000%, 08/01/22 | | | 1,000 | | | | 1,038 | |
Long Beach, Harbor Revenue, Ser A, RB, AMT | | | | | | | | |
5.000%, 05/15/27 | | | 500 | | | | 608 | |
Long Beach, Unified School District, GO | | | | | | | | |
5.000%, 08/01/26 | | | 1,000 | | | | 1,214 | |
Los Angeles County, Disney Parking Hall Project, COP | | | | | | | | |
5.000%, 09/01/22 | | | 500 | | | | 521 | |
Los Angeles County, Metropolitan Transportation Authority, RB | | | | | | | | |
5.000%, 06/01/26 | | | 280 | | | | 338 | |
Los Angeles County, Metropolitan Transportation Authority, Ser A, RB | | | | | | | | |
Callable 07/01/25 @ 100 | | | | | | | | |
5.000%, 07/01/26 | | | 500 | | | | 586 | |
Los Angeles County, Metropolitan Transportation Authority, Ser A, RB | | | | | | | | |
5.000%, 07/01/24 | | | 510 | | | | 577 | |
See accompanying notes to financial statements.
CITY NATIONAL ROCHDALE FUNDS | PAGE 25
schedule of investments |
September 30, 2021 |
City National Rochdale California Tax Exempt Bond Fund (continued) |
Description | | Face Amount (000) | | | Value (000) | |
Los Angeles County, Public Works Financing Authority, Ser E-1, RB | | | | | | | | |
5.000%, 12/01/25 | | $ | 210 | | | $ | 249 | |
Los Angeles County, Public Works Financing Authority, Ser E-2, RB | | | | | | | | |
4.000%, 12/01/28 | | | 500 | | | | 606 | |
Los Angeles County, Redevelopment Refunding Authority Redev Agency Successor Agy, RB, AGM | | | | | | | | |
Callable 12/01/24 @ 100 | | | | | | | | |
5.250%, 12/01/26 | | | 415 | | | | 475 | |
Los Angeles, Department of Airports, Ser B, RB | | | | | | | | |
5.000%, 05/15/25 | | | 1,030 | | | | 1,199 | |
Los Angeles, Department of Airports, Ser C, RB | | | | | | | | |
5.000%, 05/15/25 | | | 660 | | | | 768 | |
Los Angeles, Department of Airports, Sub-Ser, RB | | | | | | | | |
4.000%, 05/15/24 | | | 175 | | | | 192 | |
Los Angeles, Department of Airports, Sub-Ser, RB, AMT | | | | | | | | |
Callable 05/15/26 @ 100 | | | | | | | | |
5.000%, 05/15/29 | | | 400 | | | | 474 | |
Los Angeles, Department of Water & Power, Power System Project, Ser C, RB | | | | | | | | |
5.000%, 07/01/23 | | | 580 | | | | 629 | |
Los Angeles, Department of Water & Power, Ser A, RB | | | | | | | | |
5.000%, 07/01/24 | | | 110 | | | | 124 | |
Los Angeles, Department of Water, Ser C, RB | | | | | | | | |
Callable 07/01/30 @ 100 | | | | | | | | |
5.000%, 07/01/32 | | | 1,000 | | | | 1,325 | |
Los Angeles, Sanitation Districts Financing Authority, Ser A, RB | | | | | | | | |
Callable 10/01/25 @ 100 | | | | | | | | |
5.000%, 10/01/28 | | | 525 | | | | 618 | |
Metropolitan Water District of Southern California, Sub-Ser A, RB | | | | | | | | |
5.000%, 07/01/25 | | | 230 | | | | 269 | |
Metropolitan Water District of Southern California, Sub-Ser A, RB | | | | | | | | |
5.000%, 07/01/27 | | | 500 | | | | 622 | |
Orange County, Airport Revenue, Ser A, RB | | | | | | | | |
5.000%, 07/01/23 | | | 360 | | | | 390 | |
Orange County, Airport Revenue, Ser B, RB | | | | | | | | |
5.000%, 07/01/22 | | | 500 | | | | 518 | |
Orange County, Redevelopment Agency Successor Agency, TA, AGM | | | | | | | | |
5.000%, 09/01/23 | | | 335 | | | | 365 | |
Redding, Electric System Revenue, RB | | | | | | | | |
5.000%, 06/01/24 | | | 655 | | | | 736 | |
Redding, Electric System Revenue, RB | | | | | | | | |
5.000%, 06/01/25 | | | 595 | | | | 692 | |
Riverside County, Infrastructure Financing Authority, Ser A, RB | | | | | | | | |
Callable 11/01/26 @ 100 | | | | | | | | |
4.000%, 11/01/29 | | | 500 | | | | 580 | |
Riverside County, Public Financing Authority, RB | | | | | | | | |
Callable 11/01/25 @ 100 | | | | | | | | |
5.000%, 11/01/26 | | | 145 | | | | 170 | |
Riverside County, Transportation Commission, Ser A, RB | | | | | | | | |
Pre-Refunded @ 100 | | | | | | | | |
5.250%, 06/01/23(B) | | | 500 | | | | 542 | |
Riverside, Electric System Revenue, Ser A, RB | | | | | | | | |
5.000%, 10/01/23 | | | 1,000 | | | | 1,094 | |
Sacramento County, Water Financing Authority, RB | | | | | | | | |
5.000%, 06/01/24 | | | 125 | | | | 141 | |
San Diego County, Regional Transportation Commission, Sub-Ser B, RB | | | | | | | | |
5.000%, 04/01/28 | | | 250 | | | | 318 | |
San Diego County, Regional Transportation Commission, Sub-Ser B, RB | | | | | | | | |
5.000%, 04/01/29 | | | 250 | | | | 325 | |
San Diego County, Ser A, RB | | | | | | | | |
Callable 10/15/24 @ 100 | | | | | | | | |
5.000%, 10/15/28 | | | 125 | | | | 142 | |
San Diego, Association of Governments South Bay Expressway Revenue, Ser A, RB | | | | | | | | |
Callable 07/01/27 @ 100 | | | | | | | | |
5.000%, 07/01/28 | | | 350 | | | | 427 | |
See accompanying notes to financial statements.
CITY NATIONAL ROCHDALE FUNDS | PAGE 26
schedule of investments |
September 30, 2021 |
City National Rochdale California Tax Exempt Bond Fund (continued) |
Description | | Face Amount (000) | | | Value (000) | |
San Francisco City & County, Airport Comm-San Francisco International Airport, RB, AMT | | | | | | | | |
Callable 05/01/23 @ 100 | | | | | | | | |
5.250%, 05/01/33 | | $ | 500 | | | $ | 536 | |
San Francisco City & County, Airport Comm-San Francisco International Airport, Ser E, RB, AMT | | | | | | | | |
Callable 05/01/29 @ 100 | | | | | | | | |
5.000%, 05/01/34 | | | 330 | | | | 412 | |
San Francisco City & County, Public Utilities Commission, Water Revenue, Ser A, RB | | | | | | | | |
Callable 10/01/25 @ 100 | | | | | | | | |
5.000%, 10/01/27 | | | 1,000 | | | | 1,179 | |
San Francisco City & County, Public Utilities Commission, Water Revenue, Ser A, RB | | | | | | | | |
Callable 11/01/24 @ 100 | | | | | | | | |
5.000%, 11/01/28 | | | 500 | | | | 571 | |
San Francisco City & County, San Francisco International Airport, RB, AMT | | | | | | | | |
5.000%, 05/01/27 | | | 2,200 | | | | 2,688 | |
San Joaquin Hills, Transportation Corridor Agency, RB, ETM | | | | | | | | |
1.280%, 01/01/26(C) | | | 400 | | | | 389 | |
San Jose, International Airport, Ser A, RB, AMT | | | | | | | | |
5.000%, 03/01/24 | | | 510 | | | | 566 | |
San Mateo County, Joint Powers Financing Authority, Maple Street Correctional Center, RB | | | | | | | | |
Callable 06/15/24 @ 100 | | | | | | | | |
5.000%, 06/15/26 | | | 1,035 | | | | 1,167 | |
Sanger Unified School District, Ser A, GO, BAM | | | | | | | | |
Callable 08/01/31 @ 100 | | | | | | | | |
4.000%, 08/01/33 | | | 125 | | | | 154 | |
Sanger Unified School District, Ser C, GO, BAM | | | | | | | | |
Callable 08/01/31 @ 100 | | | | | | | | |
4.000%, 08/01/33 | | | 185 | | | | 227 | |
Santa Clara County, Financing Authority, Ser A, RB | | | | | | | | |
5.000%, 05/01/29 | | | 1,000 | | | | 1,299 | |
Santa Clara County, Financing Authority, Ser A, RB | | | | | | | | |
Callable 04/01/28 @ 100 | | | | | | | | |
4.000%, 04/01/34 | | | 1,000 | | | | 1,166 | |
Santa Clara Valley, Transportation Authority, Ser B, RB | | | | | | | | |
5.000%, 06/01/26 | | | 200 | | | | 241 | |
Santa Cruz County, Redevelopment Successor Agency, Ser A, RB, BAM | | | | | | | | |
Callable 09/01/25 @ 101 | | | | | | | | |
5.000%, 09/01/26 | | | 120 | | | | 141 | |
Santaluz Community Facilities District No. 2, GO | | | | | | | | |
3.000%, 09/01/24 | | | 570 | | | | 612 | |
Silicon Valley, Ser A, RB | | | | | | | | |
Callable 09/01/23 @ 100 | | | | | | | | |
3.000%, 03/01/24 | | | 1,000 | | | | 1,051 | |
Tahoe-Truckee, Unified School District, Ser B, GO | | | | | | | | |
Callable 08/01/26 @ 100 | | | | | | | | |
5.000%, 08/01/27 | | | 200 | | | | 242 | |
Tahoe-Truckee, Unified School District, Ser B, GO | | | | | | | | |
Callable 08/01/26 @ 100 | | | | | | | | |
5.000%, 08/01/28 | | | 200 | | | | 241 | |
Tobacco Securitization Authority of Northern California, RB | | | | | | | | |
5.000%, 06/01/29 | | | 500 | | | | 640 | |
Tustin, Unified School District, SPL Tax, BAM | | | | | | | | |
5.000%, 09/01/24 | | | 525 | | | | 595 | |
University of California, Regents of the University of California Medical Center Pooled Revenue, Ser J, RB | | | | | | | | |
Pre-Refunded @ 100 | | | | | | | | |
5.000%, 05/15/23(B) | | | 605 | | | | 652 | |
University of California, Regents of the University of California Medical Center Pooled Revenue, Ser J, RB | | | | | | | | |
Callable 05/15/23 @ 100 | | | | | | | | |
5.000%, 05/15/26 | | | 110 | | | | 118 | |
University of California, Ser AY, RB | | | | | | | | |
Callable 05/15/27 @ 100 | | | | | | | | |
5.000%, 05/15/28 | | | 1,000 | | | | 1,235 | |
University of California, Ser G, RB | | | | | | | | |
Pre-Refunded @ 100 | | | | | | | | |
5.000%, 05/15/22(B) | | | 260 | | | | 268 | |
See accompanying notes to financial statements.
CITY NATIONAL ROCHDALE FUNDS | PAGE 27
schedule of investments |
September 30, 2021 |
City National Rochdale California Tax Exempt Bond Fund (continued) |
Description | | Face Amount (000) | | | Value (000) | |
Westlands, Water District, Ser A, RB, AGM | | | | | | | | |
Callable 09/01/26 @ 100 | | | | | | | | |
5.000%, 09/01/27 | | $ | 1,035 | | | $ | 1,251 | |
| | | | | | | | | | | | | |
Total California | | | 70,876 | |
| | | | | | | | | | | | | |
Georgia [0.5%] |
Georgia State, Road & Tollway Authority, RB | | | | | | | | |
Callable 06/01/30 @ 100 | | | | | | | | |
5.000%, 06/01/31 | | | 300 | | | | 391 | |
| | | | | | | | | | | | | |
Illinois [2.4%] |
Chicago Transit Authority Capital Grant Receipts Revenue, RB | | | | | | | | |
5.000%, 06/01/27 | | | 250 | | | | 306 | |
Chicago Transit Authority Capital Grant Receipts Revenue, RB | | | | | | | | |
5.000%, 06/01/29 | | | 100 | | | | 128 | |
State of Illinois, Ser C, GO | | | | | | | | |
4.000%, 03/01/24 | | | 1,250 | | | | 1,353 | |
| | | | | | | | | | | | | |
Total Illinois | | | 1,787 | |
| | | | | | | | | | | | | |
Indiana [2.0%] |
Indiana Finance Authority, Ser S, RB | | | | | | | | |
5.000%, 10/01/28 | | | 500 | | | | 636 | |
Indiana Finance Authority, Ser S, RB | | | | | | | | |
5.000%, 10/01/29 | | | 700 | | | | 909 | |
| | | | | | | | | | | | | |
Total Indiana | | | 1,545 | |
| | | | | | | | | | | | | |
Total Municipal Bonds |
(Cost $72,379) | | | 74,599 | |
| | | | | | | | | | | | | |
U.S. Treasury Obligation [1.4%] |
U.S. Treasury Bill | | | | | | | | |
0.048%, 01/20/22(C) | | | 1,100 | | | | 1,100 | |
| | | | | | | | | | | | | |
Total U.S. Treasury Obligation |
(Cost $1,099) | | | 1,100 | |
| | | | | | | | | | | | | |
Description | | Shares | | | Value (000) | |
Short-Term Investment [0.5%] |
SEI Daily Income Trust Government Fund, Cl F, 0.010%** | | | 350,543 | | | $ | 351 | |
| | | | | | | | | | | | | |
Total Short-Term Investment |
(Cost $351) | | | 351 | |
| | | | | | | | | | | | | |
Total Investments [99.0%] |
(Cost $73,829) | | $ | 76,050 | |
Percentages are based on net assets of $76,844 (000).
** | The rate reported is the 7-day effective yield as of September 30, 2021. |
(A) | Variable or floating rate security, the interest rate of which adjusts periodically based on prevailing interest rates. |
(B) | Pre-Refunded Security — The maturity date shown is the pre-refunded date. |
(C) | Zero coupon security. The rate reported is the effective yield at time of purchase. |
AGM — Assured Guarantee Municipal
AMT — Alternative Minimum Tax (subject to)
BAM — Build America Mutual
Cl — Class
COP — Certificate of Participation
ETM — Escrowed to Maturity
GO — General Obligation
RB — Revenue Bond
Ser — Series
SPL Tax — Special Tax
TA — Tax Allocation
The following is a list of the inputs used as of September 30, 2021 in valuing the Fund’s investments carried at value (000):
Investments in Securities | | Level 1 | | | Level 2 | | | Level 3 | | | Total | |
Municipal Bonds | | $ | — | | | $ | 74,599 | | | $ | — | | | $ | 74,599 | |
U.S. Treasury Obligation | | | — | | | | 1,100 | | | | — | | | | 1,100 | |
Short-Term Investment | | | 351 | | | | — | | | | — | | | | 351 | |
Total Investments in Securities | | $ | 351 | | | $ | 75,699 | | | $ | — | | | $ | 76,050 | |
For the year ended September 30, 2021, there have been no transfers in or out of Level 3.
See accompanying notes to financial statements.
CITY NATIONAL ROCHDALE FUNDS | PAGE 28
schedule of investments |
September 30, 2021 |
City National Rochdale California Tax Exempt Bond Fund (concluded) |
The following is a summary of the transactions with affiliates for the year ended September 30, 2021 (000):
| | | City National
Rochdale Municipal
High Income Fund,
Class N (000) | |
Beginning balance as of October 1, 2020 | | $ | — | |
Purchases at Cost | | | 500 | |
Proceeds from Sales | | | (500 | ) |
Realized Gain (Loss) | | | — | |
Unrealized Gain (Loss) | | | — | |
Ending balance as of September 30, 2021 | | $ | — | |
Dividend Income | | $ | 1 | |
| | | City National
Rochdale Municipal
High Income Fund,
Class N (Shares) | |
Beginning balance as of October 1, 2020 | | | — | |
Purchases | | | 45,455 | |
Sales | | | (45,455 | ) |
Ending balance as of September 30, 2021 | | | — | |
Amounts designated as “—” are either $0 or have been rounded to $0.
For more information on valuation inputs, see Note 2 -- Significant Accounting Policies in the Notes to Financial Statements.
See accompanying notes to financial statements.
CITY NATIONAL ROCHDALE FUNDS | PAGE 29
schedule of investments |
September 30, 2021 |
City National Rochdale Municipal High Income Fund |

Description | | Face Amount (000) | | | Value (000) | |
Municipal Bonds [93.3%] |
Alabama [2.1%] |
Alabama State, Southeast Gas Supply District, Ser A, RB | | | | | | | | |
Callable 03/01/24 @ 100 | | | | | | | | |
4.000%, 06/01/49(A) | | $ | 5,000 | | | $ | 5,426 | |
Black Belt Energy Gas District, Ser A-1, RB | | | | | | | | |
Callable 09/01/25 @ 100 | | | | | | | | |
4.000%, 12/01/49(A) | | | 5,000 | | | | 5,642 | |
Jefferson County, Sewer Revenue, Ser D, RB | | | | | | | | |
Callable 10/01/23 @ 105 | | | | | | | | |
6.000%, 10/01/42 | | | 9,000 | | | | 10,315 | |
Jefferson County, Sewer Revenue, Sub-Ser, RB | | | | | | | | |
Callable 10/01/23 @ 105 | | | | | | | | |
0.843%, 7.750%, 10/01/23, 10/01/46(B) | | | 2,500 | | | | 2,569 | |
Lower Alabama Gas District, Ser A, RB | | | | | | | | |
5.000%, 09/01/46 | | | 500 | | | | 711 | |
Southeast Energy Authority A Cooperative District, Ser A, RB | | | | | | | | |
Callable 07/01/28 @ 101 | | | | | | | | |
4.000%, 11/01/51(A) | | | 3,000 | | | | 3,528 | |
Southeast Energy Authority A Cooperative District, Ser B, RB | | | | | | | | |
Callable 09/01/31 @ 101 | | | | | | | | |
4.000%, 12/01/51(A) | | | 5,000 | | | | 6,057 | |
Tuscaloosa County, Industrial Development Authority, Ser A, RB | | | | | | | | |
Callable 05/01/29 @ 100 | | | | | | | | |
5.250%, 05/01/44(C) | | | 8,500 | | | | 9,831 | |
| | | | | | | | | | | | | |
Total Alabama | | | 44,079 | |
| | | | | | | | | | | | | |
Alaska [0.1%] |
Northern Arkansas, Tobacco Securitization, Ser B-2-CLASS, RB | | | | | | | | |
Callable 06/01/31 @ 31 | | | | | | | | |
3.390%, 06/01/66(D) | | | 10,000 | | | | 2,179 | |
| | | | | | | | | | | | | |
Arizona [0.8%] |
Arizona State, Industrial Development Authority, RB | | | | | | | | |
Callable 07/01/29 @ 100 | | | | | | | | |
5.000%, 01/01/54 | | | 375 | | | | 389 | |
Arizona State, Industrial Development Authority, RB | | | | | | | | |
Callable 07/15/29 @ 100 | | | | | | | | |
4.000%, 07/15/51(C) | | | 500 | | | | 543 | |
Arizona State, Industrial Development Authority, RB | | | | | | | | |
Callable 12/15/29 @ 100 | | | | | | | | |
4.000%, 12/15/51(C) | | | 650 | | | | 697 | |
Arizona State, Industrial Development Authority, RB | | | | | | | | |
Callable 07/15/29 @ 100 | | | | | | | | |
4.000%, 07/15/56(C) | | | 225 | | | | 243 | |
Arizona State, Industrial Development Authority, Ser A, RB | | | | | | | | |
Callable 07/15/28 @ 100 | | | | | | | | |
4.000%, 07/15/30(C) | | | 625 | | | | 686 | |
Arizona State, Industrial Development Authority, Ser A, RB | | | | | | | | |
Callable 07/15/28 @ 100 | | | | | | | | |
4.000%, 07/15/40(C) | | | 925 | | | | 994 | |
Arizona State, Industrial Development Authority, Ser A-SOCIAL, RB | | | | | | | | |
Callable 07/01/31 @ 100 | | | | | | | | |
4.000%, 07/01/51 | | | 750 | | | | 824 | |
Glendale, Industrial Development Authority, Glencroft Retirement Community, RB | | | | | | | | |
Callable 11/15/26 @ 100 | | | | | | | | |
5.250%, 11/15/46 | | | 1,000 | | | | 1,018 | |
See accompanying notes to financial statements.
CITY NATIONAL ROCHDALE FUNDS | PAGE 30
schedule of investments |
September 30, 2021 |
City National Rochdale Municipal High Income Fund (continued) |
Description | | Face Amount (000) | | | Value (000) | |
Glendale, Industrial Development Authority, Glencroft Retirement Community, RB | | | | | | | | |
Callable 11/15/26 @ 100 | | | | | | | | |
5.250%, 11/15/51 | | $ | 1,850 | | | $ | 1,879 | |
Glendale, Industrial Development Authority, Glencroft Retirement Community, RB | | | | | | | | |
Callable 11/15/26 @ 100 | | | | | | | | |
5.000%, 11/15/36 | | | 600 | | | | 611 | |
Phoenix, Industrial Development Authority, Legacy Traditional School Projects, RB | | | | | | | | |
5.750%, 07/01/24(C) | | | 875 | | | | 942 | |
Phoenix, Industrial Development Authority, Legacy Traditional School Projects, RB | | | | | | | | |
Callable 07/01/25 @ 100 | | | | | | | | |
5.000%, 07/01/45(C) | | | 3,300 | | | | 3,533 | |
Pima County, Industrial Development Authority, Noah Webster School Project, RB | | | | | | | | |
Callable 12/15/23 @ 100 | | | | | | | | |
7.000%, 12/15/43 | | | 1,500 | | | | 1,653 | |
Tempe, Industrial Development Authority, Mirrabella at ASU Project, Ser A, RB | | | | | | | | |
Callable 10/01/27 @ 100 | | | | | | | | |
6.125%, 10/01/52(C) | | | 1,200 | | | | 1,315 | |
Yavapai County, Industrial Development Authority, Ser A, RB | | | | | | | | |
Callable 03/01/25 @ 100 | | | | | | | | |
5.000%, 09/01/34(C) | | | 2,015 | | | | 2,196 | |
| | | | | | | | | | | | | |
Total Arizona | | | 17,523 | |
| | | | | | | | | | | | | |
Arkansas [0.4%] |
Arkansas State, Development Finance Authority, RB, AMT | | | | | | | | |
Callable 09/01/26 @ 103 | | | | | | | | |
4.500%, 09/01/49(C) | | | 8,500 | | | | 9,319 | |
| | | | | | | | | | | | | |
California [5.7%] |
California County, Tobacco Securitization Agency, Ser A, RB | | | | | | | | |
Callable 06/01/30 @ 100 | | | | | | | | |
4.000%, 06/01/49 | | | 1,000 | | | | 1,158 | |
California County, Tobacco Securitization Agency, Sub-Ser A, RB | | | | | | | | |
Callable 10/22/21 @ 21 | | | | | | | | |
7.676%, 06/01/46(D) | | | 10,000 | | | | 2,067 | |
California State, Community Development Administration, RB | | | | | | | | |
Callable 08/01/31 @ 100 | | | | | | | | |
4.000%, 08/01/56(C) | | | 750 | | | | 793 | |
California State, Community Housing Agency, Ser A, RB | | | | | | | | |
Callable 08/01/30 @ 100 | | | | | | | | |
5.000%, 08/01/50(C) | | | 4,500 | | | | 5,100 | |
California State, Community Housing Agency, Ser A, RB | | | | | | | | |
Callable 02/01/31 @ 100 | | | | | | | | |
4.000%, 02/01/56(C) | | | 5,100 | | | | 5,477 | |
California State, Community Housing Agency, Ser NITY, RB | | | | | | | | |
Callable 02/01/30 @ 100 | | | | | | | | |
5.000%, 02/01/50(C) | | | 6,875 | | | | 7,709 | |
California State, Community Housing Agency, Ser S, RB | | | | | | | | |
Callable 08/01/29 @ 100 | | | | | | | | |
5.000%, 08/01/49(C) | | | 1,500 | | | | 1,680 | |
California State, GO | | | | | | | | |
Callable 12/01/23 @ 100 | | | | | | | | |
5.000%, 12/01/31 | | | 1,500 | | | | 1,649 | |
California State, Health Facilities Financing Authority, Ser A, RB | | | | | | | | |
Callable 11/15/27 @ 100 | | | | | | | | |
4.000%, 11/15/40 | | | 5,000 | | | | 5,770 | |
California State, Municipal Finance Authority, California Baptist University, Ser A, RB | | | | | | | | |
Callable 11/01/25 @ 100 | | | | | | | | |
5.500%, 11/01/45(C) | | | 4,000 | | | | 4,565 | |
California State, Municipal Finance Authority, RB | | | | | | | | |
Callable 06/01/27 @ 100 | | | | | | | | |
5.000%, 06/01/43 | | | 3,620 | | | | 4,293 | |
California State, Municipal Finance Authority, RB, BAM | | | | | | | | |
Callable 05/15/31 @ 100 | | | | | | | | |
4.000%, 05/15/46 | | | 1,000 | | | | 1,156 | |
California State, Municipal Finance Authority, Ser A, RB | | | | | | | | |
Callable 11/01/26 @ 100 | | | | | | | | |
5.250%, 11/01/36 | | | 255 | | | | 298 | |
See accompanying notes to financial statements.
CITY NATIONAL ROCHDALE FUNDS | PAGE 31
schedule of investments |
September 30, 2021 |
City National Rochdale Municipal High Income Fund (continued) |
Description | | Face Amount (000) | | | Value (000) | |
California State, Municipal Finance Authority, Ser A, RB | | | | | | | | |
Callable 12/01/30 @ 100 | | | | | | | | |
5.000%, 12/01/46(C) | | $ | 625 | | | $ | 709 | |
California State, Municipal Finance Authority, Ser A, RB | | | | | | | | |
Callable 11/01/26 @ 100 | | | | | | | | |
5.000%, 11/01/47 | | | 1,005 | | | | 1,137 | |
California State, Municipal Finance Authority, Ser A, RB | | | | | | | | |
Callable 12/01/30 @ 100 | | | | | | | | |
5.000%, 12/01/54(C) | | | 875 | | | | 980 | |
California State, Pollution Control Financing Authority, Calplant I Project, RB, AMT | | | | | | | | |
Callable 07/01/27 @ 100 | | | | | | | | |
8.000%, 07/01/39(C) (E) | | | 5,000 | | | | 3,250 | |
California State, Pollution Control Financing Authority, RB, AMT | | | | | | | | |
7.500%, 07/01/32(C) | | | 1,275 | | | | 1,176 | |
California State, Public Works Board, Department of Corrections and Rehab Project, Ser A, RB | | | | | | | | |
Callable 09/01/24 @ 100 | | | | | | | | |
5.000%, 09/01/31 | | | 5,000 | | | | 5,645 | |
California State, Public Works Board, Various Capital Projects, Ser A, RB | | | | | | | | |
Callable 04/01/22 @ 100 | | | | | | | | |
5.000%, 04/01/37 | | | 1,000 | | | | 1,024 | |
California State, School Finance Authority, KIPP LA Project, Ser A, RB | | | | | | | | |
Callable 07/01/27 @ 100 | | | | | | | | |
5.000%, 07/01/47(C) | | | 500 | | | | 575 | |
California State, School Finance Authority, Ser A, RB | | | | | | | | |
5.000%, 07/01/30(C) | | | 70 | | | | 89 | |
California State, School Finance Authority, View Park Elementary & Middle School Project, Ser A, RB | | | | | | | | |
Callable 10/01/24 @ 100 | | | | | | | | |
6.000%, 10/01/49 | | | 1,120 | | | | 1,235 | |
California State, School Finance Authority, View Park Elementary & Middle School Project, Ser A, RB | | | | | | | | |
Callable 10/01/24 @ 100 | | | | | | | | |
5.875%, 10/01/44 | | | 1,000 | | | | 1,099 | |
California State, School Finance Authority, View Park Elementary & Middle School Project, Ser A, RB | | | | | | | | |
Callable 10/01/24 @ 100 | | | | | | | | |
5.625%, 10/01/34 | | | 575 | | | | 631 | |
California State, Statewide Communities Development Authority, RB | | | | | | | | |
Callable 06/01/28 @ 100 | | | | | | | | |
5.250%, 12/01/43(C) | | | 500 | | | | 584 | |
California State, Statewide Communities Development Authority, RB | | | | | | | | |
Callable 12/01/24 @ 100 | | | | | | | | |
5.250%, 12/01/44 | | | 5,380 | | | | 6,077 | |
California State, Statewide Communities Development Authority, RB | | | | | | | | |
Callable 06/01/28 @ 100 | | | | | | | | |
5.250%, 12/01/48(C) | | | 2,000 | | | | 2,321 | |
California State, Statewide Communities Development Authority, Ser A, RB | | | | | | | | |
Callable 06/01/26 @ 100 | | | | | | | | |
5.250%, 12/01/56(C) | | | 1,500 | | | | 1,670 | |
Central Basin, Municipal Water District, Ser A, RB | | | | | | | | |
Callable 08/01/28 @ 100 | | | | | | | | |
5.000%, 08/01/44 | | | 2,000 | | | | 2,238 | |
Dublin California, SPL Tax | | | | | | | | |
Callable 09/01/27 @ 103 | | | | | | | | |
4.000%, 09/01/45 | | | 600 | | | | 670 | |
Dublin California, SPL Tax | | | | | | | | |
Callable 09/01/27 @ 103 | | | | | | | | |
4.000%, 09/01/51 | | | 865 | | | | 963 | |
Folsom Ranch, Financing Authority, SPL Tax | | | | | | | | |
Callable 09/01/27 @ 100 | | | | | | | | |
5.000%, 09/01/37 | | | 1,435 | | | | 1,683 | |
Folsom Ranch, Financing Authority, SPL Tax | | | | | | | | |
Callable 09/01/27 @ 100 | | | | | | | | |
5.000%, 09/01/47 | | | 2,000 | | | | 2,308 | |
Foothill-Eastern Transportation Corridor Agency, Ser A, RB | | | | | | | | |
Callable 01/15/31 @ 100 | | | | | | | | |
4.000%, 01/15/46 | | | 1,500 | | | | 1,711 | |
Golden State, Tobacco Securitization, RB | | | | | | | | |
Callable 06/01/31 @ 100 | | | | | | | | |
3.115%, 06/01/38 | | | 10,000 | | | | 10,158 | |
See accompanying notes to financial statements.
CITY NATIONAL ROCHDALE FUNDS | PAGE 32
schedule of investments |
September 30, 2021 |
City National Rochdale Municipal High Income Fund (continued) |
Description | | Face Amount (000) | | | Value (000) | |
Golden State, Tobacco Securitization, Ser A-1, RB | | | | | | | | |
Callable 06/01/22 @ 100 | | | | | | | | |
5.000%, 06/01/47 | | $ | 2,000 | | | $ | 2,056 | |
Golden State, Tobacco Securitization, Ser A-1, RB | | | | | | | | |
Callable 06/01/22 @ 100 | | | | | | | | |
3.500%, 06/01/36 | | | 6,615 | | | | 6,699 | |
Inland Empire, Tobacco Securitization Authority, RB | | | | | | | | |
Callable 10/22/21 @ 39 | | | | | | | | |
9.730%, 06/01/36(D) | | | 12,500 | | | | 4,811 | |
Orange County, Community Facilities District, SPL Tax | | | | | | | | |
Callable 08/15/28 @ 100 | | | | | | | | |
5.000%, 08/15/47 | | | 1,000 | | | | 1,177 | |
Oroville City, RB | | | | | | | | |
Callable 04/01/29 @ 100 | | | | | | | | |
5.250%, 04/01/39 | | | 750 | | | | 841 | |
Oroville City, RB | | | | | | | | |
Callable 04/01/29 @ 100 | | | | | | | | |
5.250%, 04/01/49 | | | 3,000 | | | | 3,299 | |
San Buenaventura, Community Memorial Health System Project, RB | | | | | | | | |
Pre-Refunded @ 100 | | | | | | | | |
7.500%, 12/01/21(F) | | | 1,000 | | | | 1,011 | |
San Buenaventura, Community Memorial Health System Project, RB | | | | | | | | |
Pre-Refunded @ 100 | | | | | | | | |
7.000%, 12/01/21(F) | | | 1,000 | | | | 1,011 | |
San Mateo, Community Facilities District, Community Facilities District No. 2008-1-Bay, SPL Tax | | | | | | | | |
Callable 09/01/22 @ 100 | | | | | | | | |
5.500%, 09/01/44 | | | 1,000 | | | | 1,032 | |
Tobacco Securitization Authority of Northern California, RB | | | | | | | | |
Callable 12/01/30 @ 33 | | | | | | | | |
3.763%, 06/01/60(D) | | | 9,900 | | | | 2,452 | |
University of California, Ser BE, RB | | | | | | | | |
Callable 05/15/30 @ 100 | | | | | | | | |
4.000%, 05/15/40 | | | 2,500 | | | | 2,969 | |
| | | | | | | | | | | | | |
Total California | | | 117,006 | |
| | | | | | | | | | | | | |
Colorado [8.2%] |
9th Avenue Metropolitan District No. 2, GO | | | | | | | | |
Callable 12/01/23 @ 103 | | | | | | | | |
5.000%, 12/01/48 | | | 1,000 | | | | 1,067 | |
Amber Creek, Metropolitan District, Ser A, GO | | | | | | | | |
Callable 12/01/22 @ 103 | | | | | | | | |
5.125%, 12/01/47 | | | 1,041 | | | | 1,091 | |
Amber Creek, Metropolitan District, Ser A, GO | | | | | | | | |
Callable 12/01/22 @ 103 | | | | | | | | |
5.000%, 12/01/37 | | | 750 | | | | 787 | |
Banning Lewis Ranch Metropolitan District No. 8, GO | | | | | | | | |
Callable 06/01/26 @ 103 | | | | | | | | |
4.875%, 12/01/51(C) | | | 3,500 | | | | 3,411 | |
Base Village Metropolitan District No. 2, Ser A, GO | | | | | | | | |
Callable 12/01/21 @ 103 | | | | | | | | |
5.750%, 12/01/46 | | | 3,055 | | | | 3,159 | |
Baseline Metropolitan District No. 1, Ser A, GO | | | | | | | | |
Callable 12/01/24 @ 103 | | | | | | | | |
5.000%, 12/01/51 | | | 1,000 | | | | 1,065 | |
Belleview Station Metropolitan District No. 2, GO | | | | | | | | |
Callable 12/01/21 @ 103 | | | | | | | | |
5.125%, 12/01/46 | | | 3,375 | | | | 3,485 | |
Belleview Station Metropolitan District No. 2, GO | | | | | | | | |
Callable 12/01/21 @ 103 | | | | | | | | |
5.000%, 12/01/36 | | | 1,500 | | | | 1,549 | |
Big Dry Creek Metropolitan District, Ser A, GO | | | | | | | | |
Callable 12/01/22 @ 103 | | | | | | | | |
5.750%, 12/01/47 | | | 2,910 | | | | 3,073 | |
Brighton Crossing Metropolitan District No. 4, Ser A, GO | | | | | | | | |
Callable 12/01/22 @ 103 | | | | | | | | |
5.000%, 12/01/37 | | | 525 | | | | 553 | |
Brighton Crossing Metropolitan District No. 4, Ser A, GO | | | | | | | | |
Callable 12/01/22 @ 103 | | | | | | | | |
5.000%, 12/01/47 | | | 1,720 | | | | 1,806 | |
Brighton Crossing Metropolitan District No. 6, Ser A, GO | | | | | | | | |
Callable 12/01/25 @ 103 | | | | | | | | |
5.000%, 12/01/35 | | | 525 | | | | 585 | |
See accompanying notes to financial statements.
CITY NATIONAL ROCHDALE FUNDS | PAGE 33
schedule of investments |
September 30, 2021 |
City National Rochdale Municipal High Income Fund (continued) |
Description | | Face Amount (000) | | | Value (000) | |
Brighton Crossing Metropolitan District No. 6, Ser A, GO | | | | | | | | |
Callable 12/01/25 @ 103 | | | | | | | | |
5.000%, 12/01/50 | | $ | 4,180 | | | $ | 4,577 | |
Broadway Park North Metropolitan District No. 2, GO | | | | | | | | |
Callable 12/01/25 @ 103 | | | | | | | | |
5.000%, 12/01/40(C) | | | 1,100 | | | | 1,211 | |
Broadway Park North Metropolitan District No. 2, GO | | | | | | | | |
Callable 12/01/25 @ 103 | | | | | | | | |
5.000%, 12/01/49(C) | | | 1,265 | | | | 1,384 | |
Broadway Station Metropolitan District No. 2, Ser A, GO | | | | | | | | |
Callable 06/01/24 @ 103 | | | | | | | | |
5.125%, 12/01/48 | | | 1,500 | | | | 1,625 | |
Broadway Station Metropolitan District No. 2, Ser A, GO | | | | | | | | |
Callable 06/01/24 @ 103 | | | | | | | | |
5.000%, 12/01/35 | | | 730 | | | | 796 | |
Buffalo Highlands Metropolitan District, Ser A, GO | | | | | | | | |
Callable 12/01/23 @ 103 | | | | | | | | |
5.375%, 12/01/48 | | | 1,775 | | | | 1,893 | |
Canyons Metropolitan District No. 5, Ser A, GO | | | | | | | | |
Callable 12/01/22 @ 103 | | | | | | | | |
6.125%, 12/01/47 | | | 1,000 | | | | 1,049 | |
Canyons Metropolitan District No. 5, Ser A, GO | | | | | | | | |
Callable 12/01/22 @ 103 | | | | | | | | |
6.000%, 12/01/37 | | | 2,000 | | | | 2,097 | |
Chambers Highpoint Metropolitan District No. 2, GO | | | | | | | | |
Callable 09/01/26 @ 103 | | | | | | | | |
5.000%, 12/01/41 | | | 515 | | | | 545 | |
Chambers Highpoint Metropolitan District No. 2, GO | | | | | | | | |
Callable 09/01/26 @ 103 | | | | | | | | |
5.000%, 12/01/51 | | | 835 | | | | 870 | |
City & County of Denver Colorado, RB, AMT | | | | | | | | |
Callable 10/01/23 @ 100 | | | | | | | | |
5.000%, 10/01/32 | | | 2,000 | | | | 2,116 | |
Clear Creek Station, Metropolitan District No. 2, Ser A, GO | | | | | | | | |
Callable 12/01/22 @ 103 | | | | | | | | |
5.000%, 12/01/47 | | | 1,000 | | | | 1,048 | |
Colorado State, Educational & Cultural Facilities Authority, Aspen Ridge School Project, RB | | | | | | | | |
Callable 07/01/25 @ 100 | | | | | | | | |
5.250%, 07/01/46(C) | | | 1,930 | | | | 2,081 | |
Colorado State, Educational & Cultural Facilities Authority, Aspen Ridge School Project, RB | | | | | | | | |
Callable 07/01/25 @ 100 | | | | | | | | |
5.000%, 07/01/36(C) | | | 915 | | | | 991 | |
Colorado State, Educational & Cultural Facilities Authority, Charter School Preparatory School Project, RB | | | | | | | | |
Callable 04/01/25 @ 100 | | | | | | | | |
5.250%, 04/01/45(C) | | | 2,655 | | | | 2,757 | |
Colorado State, Educational & Cultural Facilities Authority, Charter School Preparatory School Project, RB | | | | | | | | |
Callable 04/01/25 @ 100 | | | | | | | | |
5.125%, 04/01/35(C) | | | 1,515 | | | | 1,586 | |
Colorado State, Educational & Cultural Facilities Authority, RB | | | | | | | | |
Callable 05/01/28 @ 103 | | | | | | | | |
4.000%, 05/01/61 | | | 500 | | | | 540 | |
Colorado State, Health Facilities Authority, Common Spirit Health, Ser A, RB | | | | | | | | |
Callable 08/01/29 @ 100 | | | | | | | | |
4.000%, 08/01/49 | | | 8,620 | | | | 9,668 | |
Colorado State, High Performance Transportation Enterprise, U.S. 36 & I-25 Managed Lanes Project, RB, AMT | | | | | | | | |
Callable 01/01/23 @ 100 | | | | | | | | |
5.750%, 01/01/44 | | | 2,000 | | | | 2,125 | |
Constitution Heights Metropolitan District, GO | | | | | | | | |
Callable 06/01/25 @ 103 | | | | | | | | |
5.000%, 12/01/49(E) | | | 1,260 | | | | 1,373 | |
Cottonwood Highlands Metropolitan District No. 1, Ser A, GO | | | | | | | | |
Callable 06/01/24 @ 103 | | | | | | | | |
5.000%, 12/01/49 | | | 1,400 | | | | 1,498 | |
Denver County, Health & Hospital Authority, Ser A, RB | | | | | | | | |
Callable 12/01/27 @ 100 | | | | | | | | |
4.000%, 12/01/35(C) | | | 1,835 | | | | 2,067 | |
See accompanying notes to financial statements.
CITY NATIONAL ROCHDALE FUNDS | PAGE 34
schedule of investments |
September 30, 2021 |
City National Rochdale Municipal High Income Fund (continued) |
Description | | Face Amount (000) | | | Value (000) | |
Denver County, Health & Hospital Authority, Ser A, RB | | | | | | | | |
Callable 12/01/27 @ 100 | | | | | | | | |
4.000%, 12/01/36(C) | | $ | 2,305 | | | $ | 2,593 | |
Denver County, Health & Hospital Authority, Ser A, RB | | | | | | | | |
Callable 12/01/29 @ 100 | | | | | | | | |
4.000%, 12/01/38 | | | 1,250 | | | | 1,435 | |
Denver County, Health & Hospital Authority, Ser A, RB | | | | | | | | |
Callable 12/01/29 @ 100 | | | | | | | | |
4.000%, 12/01/39 | | | 1,000 | | | | 1,145 | |
Denver County, Health & Hospital Authority, Ser A, RB | | | | | | | | |
Callable 12/01/29 @ 100 | | | | | | | | |
4.000%, 12/01/40 | | | 750 | | | | 857 | |
Denver, International Business Center Metropolitan District No. 1, Sub-Ser B, GO | | | | | | | | |
Callable 06/01/24 @ 103 | | | | | | | | |
6.000%, 12/01/48 | | | 2,290 | | | | 2,468 | |
Denver, International Business Center, RB | | | | | | | | |
4.000%, 12/01/48 | | | 350 | | | | 360 | |
Erie Highlands, Metropolitan District No. 1, GO, BAM | | | | | | | | |
Callable 12/01/30 @ 100 | | | | | | | | |
3.000%, 12/01/45 | | | 500 | | | | 537 | |
Erie Highlands, Metropolitan District No. 1, GO, BAM | | | | | | | | |
Callable 12/01/30 @ 100 | | | | | | | | |
2.250%, 12/01/40 | | | 900 | | | | 903 | |
Erie Highlands, Metropolitan District No. 2, Ser A, GO | | | | | | | | |
Callable 12/01/23 @ 103 | | | | | | | | |
5.250%, 12/01/48 | | | 5,725 | | | | 6,097 | |
First Creek Village Metropolitan District, Ser A, GO | | | | | | | | |
Callable 09/01/24 @ 103 | | | | | | | | |
5.000%, 12/01/39 | | | 595 | | | | 652 | |
First Creek Village Metropolitan District, Ser A, GO | | | | | | | | |
Callable 09/01/24 @ 103 | | | | | | | | |
5.000%, 08/01/49 | | | 1,085 | | | | 1,179 | |
First Creek Village Metropolitan District, Ser A, GO | | | | | | | | |
Callable 09/01/24 @ 103 | | | | | | | | |
3.000%, 12/01/29 | | | 500 | | | | 533 | |
Flatiron Meadows, Metropolitan District, GO | | | | | | | | |
Callable 12/01/21 @ 103 | | | | | | | | |
5.125%, 12/01/46 | | | 2,000 | | | | 2,065 | |
Great Western Park, Metropolitan District No. 2, Ser A, GO | | | | | | | | |
Callable 12/01/21 @ 100 | | | | | | | | |
5.000%, 12/01/46 | | | 1,825 | | | | 1,885 | |
Green Gables, Metropolitan District No. 1, Ser A, GO | | | | | | | | |
Pre-Refunded @ 100 | | | | | | | | |
5.300%, 12/01/21(F) | | | 2,500 | | | | 2,594 | |
Green Valley Ranch East Metropolitan District No. 6, Ser A, GO | | | | | | | | |
Callable 09/01/25 @ 103 | | | | | | | | |
5.875%, 12/01/50 | | | 1,195 | | | | 1,317 | |
Greenways Metropolitan District No. 1, Ser A, GO | | | | | | | | |
Callable 09/01/26 @ 103 | | | | | | | | |
4.625%, 12/01/51 | | | 1,580 | | | | 1,553 | |
Jefferson Center, Metropolitan District No. 1, Ser A-2, RB | | | | | | | | |
Callable 12/01/23 @ 103 | | | | | | | | |
4.375%, 12/01/47 | | | 750 | | | | 795 | |
Jefferson Center, Metropolitan District No. 1, Ser A-2, RB | | | | | | | | |
Callable 12/01/23 @ 103 | | | | | | | | |
4.125%, 12/01/40 | | | 575 | | | | 609 | |
Karl’s Farm Metropolitan District No. 2, Ser A, GO | | | | | | | | |
Callable 09/01/25 @ 103 | | | | | | | | |
5.625%, 12/01/50(C) | | | 1,900 | | | | 2,079 | |
Karl’s Farm Metropolitan District No. 2, Ser A, GO | | | | | | | | |
Callable 09/01/25 @ 103 | | | | | | | | |
5.375%, 12/01/40(C) | | | 645 | | | | 707 | |
Legato Community Authority, Ser A-2, RB | | | | | | | | |
Callable 06/01/26 @ 101 | | | | | | | | |
0.793%, 5.000%, 12/1/26, 12/01/51(B) | | | 7,335 | | | | 6,103 | |
Leyden Rock Metropolitan District No. 10, Ser A, GO | | | | | | | | |
Callable 12/01/21 @ 103 | | | | | | | | |
5.000%, 12/01/45 | | | 2,500 | | | | 2,594 | |
Leyden Rock Metropolitan District No. 10, Ser A, GO | | | | | | | | |
Callable 12/01/21 @ 103 | | | | | | | | |
4.375%, 12/01/33 | | | 1,500 | | | | 1,555 | |
Meadowlark Metropolitan District, Ser A-SENIOR-LIMITED, GO | | | | | | | | |
Callable 09/01/25 @ 103 | | | | | | | | |
5.125%, 12/01/50 | | | 750 | | | | 813 | |
See accompanying notes to financial statements.
CITY NATIONAL ROCHDALE FUNDS | PAGE 35
schedule of investments |
September 30, 2021 |
City National Rochdale Municipal High Income Fund (continued) |
Description | | Face Amount (000) | | | Value (000) | |
Mirabelle Metropolitan District No. 2, Ser A, GO | | | | | | | | |
Callable 03/01/25 @ 103 | | | | | | | | |
5.000%, 12/01/49 | | $ | 1,950 | | | $ | 2,099 | |
North Holly, Metropolitan District, Ser A, GO | | | | | | | | |
Callable 12/01/23 @ 103 | | | | | | | | |
5.500%, 12/01/48 | | | 1,755 | | | | 1,877 | |
Overlook Metropolitan District, GO | | | | | | | | |
Callable 12/01/21 @ 103 | | | | | | | | |
5.500%, 12/01/46 | | | 1,230 | | | | 1,277 | |
Peak Metropolitan District No. 1, Ser A, GO | | | | | | | | |
Callable 03/01/26 @ 103 | | | | | | | | |
5.000%, 12/01/51(C) | | | 1,150 | | | | 1,254 | |
Pronghorn Valley Metropolitan District, Ser A, GO | | | | | | | | |
Callable 09/01/26 @ 103 | | | | | | | | |
4.000%, 12/01/51 | | | 650 | | | | 644 | |
Rampart Range Metropolitan District No. 5, RB | | | | | | | | |
Callable 10/01/26 @ 102 | | | | | | | | |
4.000%, 12/01/51 | | | 6,000 | | | | 6,060 | |
Regional Transportation District, RB | | | | | | | | |
4.000%, 07/15/39 | | | 525 | | | | 672 | |
Reunion Metropolitan District, Ser A, RB | | | | | | | | |
Callable 06/01/26 @ 103 | | | | | | | | |
3.625%, 12/01/44 | | | 2,000 | | | | 1,942 | |
Serenity Ridge, Metropolitan District No. 2, Ser A, GO | | | | | | | | |
Callable 12/01/23 @ 103 | | | | | | | | |
5.125%, 12/01/37 | | | 550 | | | | 589 | |
Serenity Ridge, Metropolitan District No. 2, Ser A, GO | | | | | | | | |
Callable 12/01/23 @ 103 | | | | | | | | |
5.125%, 12/01/43 | | | 1,000 | | | | 1,067 | |
Sierra Ridge, Metropolitan District No. 2, Ser A, GO | | | | | | | | |
Callable 12/01/21 @ 103 | | | | | | | | |
5.500%, 12/01/46 | | | 1,500 | | | | 1,550 | |
Solaris, Metropolitan District No. 3, Ser A, GO | | | | | | | | |
5.000%, 12/01/36 | | | 700 | | | | 725 | |
Solaris, Metropolitan District No. 3, Ser A, GO | | | | | | | | |
Callable 12/01/21 @ 103 | | | | | | | | |
5.000%, 12/01/46 | | | 2,530 | | | | 2,617 | |
Southglenn, Metropolitan District, GO | | | | | | | | |
Callable 12/01/21 @ 103 | | | | | | | | |
5.000%, 12/01/46 | | | 3,675 | | | | 3,794 | |
Southglenn, Metropolitan District, GO | | | | | | | | |
Callable 12/01/21 @ 103 | | | | | | | | |
3.500%, 12/01/26 | | | 1,750 | | | | 1,806 | |
Southlands, Metropolitan District No. 1, Ser A-1, GO | | | | | | | | |
Callable 12/01/27 @ 100 | | | | | | | | |
5.000%, 12/01/37 | | | 500 | | | | 567 | |
Southlands, Metropolitan District No. 1, Ser A-1, GO | | | | | | | | |
Callable 12/01/27 @ 100 | | | | | | | | |
5.000%, 12/01/47 | | | 3,000 | | | | 3,351 | |
Stone Creek Metropolitan District, Ser A, GO | | | | | | | | |
Callable 12/01/23 @ 103 | | | | | | | | |
5.625%, 12/01/47 | | | 2,000 | | | | 2,146 | |
Trails at Crowfoot Metropolitan District No. 3, Ser ES, GO | | | | | | | | |
Callable 09/01/24 @ 103 | | | | | | | | |
5.000%, 12/01/49 | | | 3,620 | | | | 3,874 | |
Verve Metropolitan District No. 1, GO | | | | | | | | |
Callable 03/01/26 @ 103 | | | | | | | | |
5.000%, 12/01/51 | | | 5,000 | | | | 5,448 | |
Village at Dry Creek Metropolitan District No. 2, GO | | | | | | | | |
Callable 09/01/24 @ 103 | | | | | | | | |
4.375%, 12/01/44 | | | 1,870 | | | | 1,970 | |
Villas Metropolitan District, Ser A, GO | | | | | | | | |
Callable 12/01/23 @ 103 | | | | | | | | |
5.125%, 12/01/48 | | | 1,250 | | | | 1,330 | |
Water Valley, Metropolitan District No. 01, GO | | | | | | | | |
Callable 12/01/26 @ 100 | | | | | | | | |
5.250%, 12/01/40 | | | 545 | | | | 602 | |
Water Valley, Metropolitan District No. 01, GO | | | | | | | | |
Callable 12/01/26 @ 100 | | | | | | | | |
5.000%, 12/01/35 | | | 100 | | | | 110 | |
Water Valley, Metropolitan District No. 01, GO | | | | | | | | |
Callable 12/01/26 @ 100 | | | | | | | | |
4.000%, 12/01/33 | | | 375 | | | | 396 | |
Water Valley, Metropolitan District No. 02, GO | | | | | | | | |
Callable 12/01/26 @ 100 | | | | | | | | |
5.250%, 12/01/40 | | | 1,045 | | | | 1,156 | |
See accompanying notes to financial statements.
CITY NATIONAL ROCHDALE FUNDS | PAGE 36
schedule of investments |
September 30, 2021 |
City National Rochdale Municipal High Income Fund (continued) |
Description | | Face Amount (000) | | | Value (000) | |
Water Valley, Metropolitan District No. 02, GO | | | | | | | | |
Callable 12/01/26 @ 100 | | | | | | | | |
4.000%, 12/01/33 | | $ | 250 | | | $ | 263 | |
Westcreek Metropolitan District No. 2, Ser A, GO | | | | | | | | |
Callable 06/01/24 @ 103 | | | | | | | | |
5.375%, 12/01/48 | | | 1,300 | | | | 1,399 | |
Whispering Pines Metropolitan District No. 1, Ser A, GO | | | | | | | | |
Callable 12/01/22 @ 103 | | | | | | | | |
5.000%, 12/01/37 | | | 1,556 | | | | 1,637 | |
Whispering Pines Metropolitan District No. 1, Ser A, GO | | | | | | | | |
Callable 12/01/22 @ 103 | | | | | | | | |
5.000%, 12/01/47 | | | 2,500 | | | | 2,620 | |
Wild Plum Metropolitan District, Ser A, GO | | | | | | | | |
Callable 12/01/24 @ 103 | | | | | | | | |
5.000%, 12/01/49 | | | 595 | | | | 644 | |
Willow Bend Metropolitan District, Ser A, GO | | | | | | | | |
Callable 09/01/24 @ 103 | | | | | | | | |
5.000%, 12/01/39 | | | 600 | | | | 647 | |
Willow Bend Metropolitan District, Ser A, GO | | | | | | | | |
Callable 09/01/24 @ 103 | | | | | | | | |
5.000%, 12/01/49 | | | 1,000 | | | | 1,074 | |
Wyndham Hill Metropolitan District No. 2, Ser A, GO, BAM | | | | | | | | |
Callable 12/01/28 @ 100 | | | | | | | | |
4.000%, 12/01/49 | | | 1,500 | | | | 1,675 | |
| | | | | | | | | | | | | |
Total Colorado | | | 167,838 | |
| | | | | | | | | | | | | |
Connecticut [0.6%] |
Connecticut State, Health & Educational Facilities Authority, Ser A, RB | | | | | | | | |
Callable 01/01/26 @ 102 | | | | | | | | |
5.000%, 01/01/45(C) | | | 500 | | | | 556 | |
Connecticut State, Health & Educational Facilities Authority, Ser A, RB | | | | | | | | |
Callable 01/01/26 @ 102 | | | | | | | | |
5.000%, 01/01/55(C) | | | 750 | | | | 828 | |
Connecticut State, Health & Educational Facilities Authority, Ser R, RB | | | | | | | | |
Callable 07/01/27 @ 100 | | | | | | | | |
4.000%, 07/01/47 | | | 4,000 | | | | 4,429 | |
Steel Point Infrastructure Improvement District, TA | | | | | | | | |
Callable 04/01/30 @ 100 | | | | | | | | |
4.000%, 04/01/51 | | | 875 | | | | 891 | |
Tender Option Bond Trust Receipts, Ser 2016-XM0449, RB | | | | | | | | |
Callable 06/01/26 @ 100 | | | | | | | | |
13.781%, 12/01/45(A) (C) (G) | | | 3,335 | | | | 5,091 | |
| | | | | | | | | | | | | |
Total Connecticut | | | 11,795 | |
| | | | | | | | | | | | | |
Delaware [0.1%] |
Delaware State, Economic Development Authority, Ser V, RB | | | | | | | | |
Callable 10/01/25 @ 100 | | | | | | | | |
1.250%, 10/01/45(A) | | | 2,000 | | | | 2,013 | |
| | | | | | | | | | | | | |
District of Columbia [0.8%] |
District of Columbia, RB | | | | | | | | |
Callable 07/01/29 @ 100 | | | | | | | | |
4.000%, 07/01/39 | | | 730 | | | | 824 | |
District of Columbia, RB | | | | | | | | |
Callable 07/01/29 @ 100 | | | | | | | | |
4.000%, 07/01/49 | | | 2,000 | | | | 2,212 | |
Metropolitan Washington, Airports Authority Dulles Toll Road Revenue, Sub-Ser, RB | | | | | | | | |
Callable 10/01/29 @ 100 | | | | | | | | |
5.000%, 10/01/47 | | | 1,540 | | | | 1,866 | |
Metropolitan Washington, Airports Authority Dulles Toll Road Revenue, Sub-Ser, RB | | | | | | | | |
Callable 10/01/29 @ 100 | | | | | | | | |
4.000%, 10/01/36 | | | 2,060 | | | | 2,370 | |
Metropolitan Washington, Airports Authority Dulles Toll Road Revenue, Sub-Ser, RB | | | | | | | | |
Callable 10/01/29 @ 100 | | | | | | | | |
4.000%, 10/01/44 | | | 4,965 | | | | 5,602 | |
Metropolitan Washington, Airports Authority, Dulles Toll Road Revenue, Ser B, RB | | | | | | | | |
Callable 10/01/28 @ 100 | | | | | | | | |
6.500%, 10/01/44 | | | 2,000 | | | | 2,637 | |
| | | | | | | | | | | | | |
Total District of Columbia | | | 15,511 | |
| | | | | | | | | | | | | |
See accompanying notes to financial statements.
CITY NATIONAL ROCHDALE FUNDS | PAGE 37
schedule of investments |
September 30, 2021 |
City National Rochdale Municipal High Income Fund (continued) |
Description | | Face Amount (000) | | | Value (000) | |
Florida [7.8%] |
Alachua County, Health Facilities Authority, RB | | | | | | | | |
Callable 11/15/24 @ 100 | | | | | | | | |
6.375%, 11/15/49 | | $ | 5,190 | | | $ | 4,990 | |
Alachua County, Health Facilities Authority, RB | | | | | | | | |
Callable 12/01/29 @ 100 | | | | | | | | |
5.000%, 12/01/37 | | | 8,095 | | | | 10,193 | |
Capital Projects Finance Authority, Ser A-1, RB | | | | | | | | |
Callable 10/01/30 @ 100 | | | | | | | | |
5.000%, 10/01/31 | | | 500 | | | | 617 | |
Capital Projects Finance Authority, Ser A-1, RB | | | | | | | | |
Callable 10/01/30 @ 100 | | | | | | | | |
5.000%, 10/01/33 | | | 500 | | | | 613 | |
Capital Projects Finance Authority, Ser A-1, RB | | | | | | | | |
Callable 10/01/30 @ 100 | | | | | | | | |
5.000%, 10/01/34 | | | 375 | | | | 459 | |
Capital Trust Agency, RB | | | | | | | | |
Callable 01/01/29 @ 100 | | | | | | | | |
5.375%, 07/01/54(C) | | | 1,500 | | | | 1,676 | |
Capital Trust Agency, RB | | | | | | | | |
Callable 01/01/29 @ 100 | | | | | | | | |
5.125%, 07/01/39(C) | | | 1,500 | | | | 1,684 | |
Capital Trust Agency, RB | | | | | | | | |
Callable 06/15/26 @ 100 | | | | | | | | |
5.000%, 06/15/39(C) | | | 3,610 | | | | 3,934 | |
Capital Trust Agency, RB | | | | | | | | |
Callable 07/01/30 @ 100 | | | | | | | | |
5.000%, 01/01/55(C) | | | 3,000 | | | | 3,355 | |
County of Osceola Florida Transportation Revenue, Ser A-2, RB | | | | | | | | |
Callable 10/01/29 @ 49 | | | | | | | | |
3.280%, 10/01/49(D) | | | 1,325 | | | | 519 | |
Florida State, Capital Trust Agency, Silver Creek St. Augustine, Ser A, RB | | | | | | | | |
Callable 03/18/21 @ 103 | | | | | | | | |
8.250%, 01/01/44(E) | | | 3,390 | | | | 68 | |
Florida State, Capital Trust Agency, Silver Creek St. Augustine, Ser A, RB | | | | | | | | |
Callable 03/18/21 @ 103 | | | | | | | | |
8.250%, 01/01/49(E) | | | 1,000 | | | | 20 | |
Florida State, Department of Transportation Turnpike System Revenue, Ser B, RB | | | | | | | | |
Callable 07/01/29 @ 100 | | | | | | | | |
3.000%, 07/01/36 | | | 6,310 | | | | 6,942 | |
Florida State, Department of Transportation Turnpike System Revenue, Ser B, RB | | | | | | | | |
Callable 07/01/29 @ 100 | | | | | | | | |
3.000%, 07/01/37 | | | 6,050 | | | | 6,637 | |
Florida State, Development Finance, RB | | | | | | | | |
Callable 06/01/27 @ 103 | | | | | | | | |
5.250%, 06/01/50(C) | | | 750 | | | | 876 | |
Florida State, Development Finance, RB | | | | | | | | |
Callable 06/01/28 @ 103 | | | | | | | | |
5.000%, 06/01/31 | | | 275 | | | | 322 | |
Florida State, Development Finance, RB | | | | | | | | |
Callable 06/01/28 @ 103 | | | | | | | | |
5.000%, 06/01/35 | | | 200 | | | | 232 | |
Florida State, Development Finance, RB | | | | | | | | |
Callable 09/15/27 @ 100 | | | | | | | | |
5.000%, 09/15/40(C) | | | 1,045 | | | | 1,164 | |
Florida State, Development Finance, RB | | | | | | | | |
Callable 09/15/27 @ 100 | | | | | | | | |
5.000%, 09/15/50(C) | | | 1,950 | | | | 2,147 | |
Florida State, Development Finance, RB | | | | | | | | |
Callable 06/01/28 @ 103 | | | | | | | | |
5.000%, 06/01/51 | | | 1,750 | | | | 1,993 | |
Florida State, Development Finance, RB | | | | | | | | |
Callable 06/01/28 @ 103 | | | | | | | | |
4.000%, 06/01/46(C) | | | 755 | | | | 835 | |
Florida State, Development Finance, RB | | | | | | | | |
Callable 06/01/28 @ 103 | | | | | | | | |
4.000%, 06/01/55(C) | | | 1,750 | | | | 1,926 | |
Florida State, Development Finance, RB, AMT | | | | | | | | |
Callable 01/01/24 @ 107 | | | | | | | | |
7.375%, 01/01/49(C) | | | 19,875 | | | | 21,628 | |
Florida State, Development Finance, RB, AMT | | | | | | | | |
Callable 11/08/21 @ 104 | | | | | | | | |
6.500%, 01/01/49(A) (C) | | | 7,995 | | | | 8,143 | |
Florida State, Development Finance, RB, AMT | | | | | | | | |
Callable 05/01/22 @ 105 | | | | | | | | |
5.000%, 05/01/29(C) | | | 3,500 | | | | 3,744 | |
Florida State, Development Finance, RB, AMT | | | | | | | | |
Callable 06/01/24 @ 103 | | | | | | | | |
3.000%, 06/01/32 | | | 3,175 | | | | 3,325 | |
See accompanying notes to financial statements.
CITY NATIONAL ROCHDALE FUNDS | PAGE 38
schedule of investments |
September 30, 2021 |
City National Rochdale Municipal High Income Fund (continued) |
Description | | Face Amount (000) | | | Value (000) | |
Florida State, Development Finance, Renaissance Charter School Project, RB | | | | | | | | |
Callable 06/15/25 @ 100 | | | | | | | | |
6.125%, 06/15/46(C) | | $ | 4,930 | | | $ | 5,510 | |
Florida State, Development Finance, Renaissance Charter School Project, Ser A, RB | | | | | | | | |
Callable 06/15/22 @ 100 | | | | | | | | |
6.125%, 06/15/43(C) | | | 1,000 | | | | 1,021 | |
Florida State, Development Finance, Renaissance Charter School Project, Ser A, RB | | | | | | | | |
Callable 06/15/24 @ 100 | | | | | | | | |
6.125%, 06/15/44 | | | 3,000 | | | | 3,238 | |
Florida State, Development Finance, Renaissance Charter School Project, Ser A, RB | | | | | | | | |
Callable 06/15/24 @ 100 | | | | | | | | |
6.000%, 06/15/34 | | | 2,110 | | | | 2,291 | |
Florida State, Development Finance, Ser A, RB | | | | | | | | |
Callable 06/15/27 @ 100 | | | | | | | | |
5.000%, 06/15/50(C) | | | 1,000 | | | | 1,136 | |
Florida State, Development Finance, Ser A, RB | | | | | | | | |
Callable 06/15/27 @ 100 | | | | | | | | |
5.000%, 06/15/55(C) | | | 1,500 | | | | 1,699 | |
Lakewood Ranch, Stewardship District, SAB | | | | | | | | |
Callable 05/01/27 @ 100 | | | | | | | | |
5.250%, 05/01/37 | | | 1,810 | | | | 2,023 | |
Miami-Dade County, Educational Facilities Authority, Ser A, RB | | | | | | | | |
Callable 04/01/28 @ 100 | | | | | | | | |
4.000%, 04/01/53 | | | 1,500 | | | | 1,656 | |
Miami-Dade County, Industrial Development Authority, Pinecrest Academy Project, RB | | | | | | | | |
Callable 09/15/24 @ 100 | | | | | | | | |
5.250%, 09/15/44 | | | 4,550 | | | | 4,969 | |
Miami-Dade County, Industrial Development Authority, Youth CO-OP Charter Schools Project, Ser A, RB | | | | | | | | |
Callable 09/15/25 @ 100 | | | | | | | | |
5.750%, 09/15/35(C) | | | 1,605 | | | | 1,757 | |
Miami-Dade County, Water & Sewer System Revenue, Ser B, RB | | | | | | | | |
Callable 10/01/29 @ 100 | | | | | | | | |
4.000%, 10/01/49 | | | 5,000 | | | | 5,714 | |
Mid-Bay, Bridge Authority, Ser A, RB | | | | | | | | |
Pre-Refunded @ 100 | | | | | | | | |
7.250%, 10/01/21(F) | | | 5,200 | | | | 5,200 | |
Mid-Bay, Bridge Authority, Ser A, RB | | | | | | | | |
Callable 10/01/25 @ 100 | | | | | | | | |
5.000%, 10/01/29 | | | 1,660 | | | | 1,896 | |
Mid-Bay, Bridge Authority, Ser A, RB | | | | | | | | |
Callable 10/01/25 @ 100 | | | | | | | | |
5.000%, 10/01/35 | | | 5,000 | | | | 5,650 | |
Osceola County, Finance Authority, Poinciana Parkway Project, Ser A, RB | | | | | | | | |
Pre-Refunded @ 100 | | | | | | | | |
5.375%, 10/01/24(F) | | | 5,000 | | | | 5,745 | |
Osceola County, Transportation Revenue, Ser A-1, RB | | | | | | | | |
Callable 10/01/29 @ 100 | | | | | | | | |
5.000%, 10/01/44 | | | 250 | | | | 309 | |
Osceola County, Transportation Revenue, Ser A-1, RB | | | | | | | | |
Callable 10/01/29 @ 100 | | | | | | | | |
4.000%, 10/01/54 | | | 800 | | | | 907 | |
Palm Beach County, Health Facilities Authority, RB | | | | | | | | |
Callable 06/01/25 @ 103 | | | | | | | | |
5.000%, 06/01/55 | | | 2,300 | | | | 2,480 | |
Palm Beach County, Health Facilities Authority, Ser B, RB | | | | | | | | |
Callable 11/15/27 @ 103 | | | | | | | | |
5.000%, 11/15/42 | | | 500 | | | | 606 | |
Palm Beach County, Health Facilities Authority, Sinai Residences Project, Ser A, RB | | | | | | | | |
Callable 06/01/22 @ 102 | | | | | | | | |
7.500%, 06/01/49 | | | 2,000 | | | | 2,106 | |
Palm Beach County, Health Facilities Authority, Sinai Residences Project, Ser A, RB | | | | | | | | |
Callable 06/01/22 @ 102 | | | | | | | | |
7.250%, 06/01/34 | | | 500 | | | | 527 | |
State Johns County, Industrial Development Authority, RB | | | | | | | | |
Callable 12/15/27 @ 103 | | | | | | | | |
4.000%, 12/15/46 | | | 500 | | | | 545 | |
State Johns County, Industrial Development Authority, RB | | | | | | | | |
Callable 12/15/27 @ 103 | | | | | | | | |
4.000%, 12/15/50 | | | 905 | | | | 982 | |
See accompanying notes to financial statements.
CITY NATIONAL ROCHDALE FUNDS | PAGE 39
schedule of investments |
September 30, 2021 |
City National Rochdale Municipal High Income Fund (continued) |
Description | | Face Amount (000) | | | Value (000) | |
Village Community Development District No. 10, Village Community Development District No. 10, SAB | | | | | | | | |
Callable 05/01/23 @ 100 | | | | | | | | |
6.000%, 05/01/44 | | $ | 835 | | | $ | 894 | |
Village Community Development District No. 12, SAB | | | | | | | | |
Callable 05/01/28 @ 100 | | | | | | | | |
4.250%, 05/01/43(C) | | | 2,380 | | | | 2,626 | |
Village Community Development District No. 12, SAB | | | | | | | | |
Callable 05/01/28 @ 100 | | | | | | | | |
4.000%, 05/01/33(C) | | | 1,425 | | | | 1,588 | |
Village Community Development District No. 12, Village Community Development District No. 12, SAB | | | | | | | | |
Callable 05/01/26 @ 100 | | | | | | | | |
3.875%, 05/01/47 | | | 2,855 | | | | 3,018 | |
Village Community Development District No. 8, SAB, AGM | | | | | | | | |
Callable 05/01/30 @ 100 | | | | | | | | |
4.500%, 05/01/39 | | | 2,350 | | | | 2,765 | |
Village Community Development District No. 8, SAB, AGM | | | | | | | | |
Callable 05/01/30 @ 100 | | | | | | | | |
4.500%, 05/01/40 | | | 2,435 | | | | 2,859 | |
| | | | | | | | | | | | | |
Total Florida | | | 159,759 | |
| | | | | | | | | | | | | |
Georgia [2.1%] |
Atlanta, Airport Passenger Facility Charge, Sub-Ser, RB, AMT | | | | | | | | |
Callable 07/01/29 @ 100 | | | | | | | | |
4.000%, 07/01/38 | | | 2,560 | | | | 2,939 | |
Atlanta, Department of Aviation, Ser A, RB | | | | | | | | |
Callable 01/01/24 @ 100 | | | | | | | | |
5.000%, 01/01/31 | | | 2,500 | | | | 2,757 | |
Atlanta, Department of Aviation, Ser B, RB, AMT | | | | | | | | |
Callable 07/01/29 @ 100 | | | | | | | | |
4.000%, 07/01/49 | | | 3,885 | | | | 4,376 | |
Burke County, Development Authority, RB | | | | | | | | |
2.925%, 11/01/53(A) | | | 5,000 | | | | 5,296 | |
Burke County, Development Authority, RB | | | | | | | | |
Callable 05/03/31 @ 100 | | | | | | | | |
2.750%, 01/01/52 | | | 7,000 | | | | 6,996 | |
Fulton County Residential Care Facilities for the Elderly Authority, Ser A, RB | | | | | | | | |
Callable 04/01/28 @ 103 | | | | | | | | |
4.000%, 04/01/56(C) | | | 5,020 | | | | 5,213 | |
Gainesville & Hall County, Development Authority, Riverside Military Academy, RB | | | | | | | | |
Callable 03/01/27 @ 100 | | | | | | | | |
5.000%, 03/01/47 | | | 4,000 | | | | 3,915 | |
George L Smith II Congress Center Authority, RB | | | | | | | | |
Callable 01/01/31 @ 100 | | | | | | | | |
4.000%, 01/01/54 | | | 1,000 | | | | 1,132 | |
Main Street Natural Gas, Ser A, RB | | | | | | | | |
Callable 05/15/29 @ 100 | | | | | | | | |
5.000%, 05/15/43 | | | 600 | | | | 719 | |
Main Street Natural Gas, Ser A, RB | | | | | | | | |
5.000%, 05/15/49 | | | 6,000 | | | | 8,734 | |
Rockdale County, Development Authority, Pratt Paper Project, RB, AMT | | | | | | | | |
Callable 01/01/28 @ 100 | | | | | | | | |
4.000%, 01/01/38(C) | | | 1,000 | | | | 1,127 | |
Savannah, Economic Development Authority, Marshes Skidaway Island Project, RB | | | | | | | | |
Pre-Refunded @ 100 | | | | | | | | |
7.250%, 01/01/24(F) | | | 810 | | | | 932 | |
| | | | | | | | | | | | | |
Total Georgia | | | 44,136 | |
| | | | | | | | | | | | | |
Illinois [8.5%] |
Aurora, Tax Increase Revenue, Ser A, RB | | | | | | | | |
5.000%, 12/30/27 | | | 800 | | | | 841 | |
Bridgeview Village, Ser A, GO | | | | | | | | |
Callable 12/01/25 @ 100 | | | | | | | | |
5.750%, 12/01/35 | | | 2,000 | | | | 2,055 | |
Bridgeview Village, Ser A, GO | | | | | | | | |
Callable 06/01/24 @ 100 | | | | | | | | |
5.500%, 12/01/43 | | | 4,880 | | | | 4,906 | |
Chicago, Board of Education, GO | | | | | | | | |
6.138%, 12/01/39 | | | 5,000 | | | | 6,061 | |
See accompanying notes to financial statements.
CITY NATIONAL ROCHDALE FUNDS | PAGE 40
schedule of investments |
September 30, 2021 |
City National Rochdale Municipal High Income Fund (continued) |
Description | | Face Amount (000) | | | Value (000) | |
Chicago, Board of Education, Ser A, GO | | | | | | | | |
Callable 12/01/28 @ 100 | | | | | | | | |
5.000%, 12/01/34 | | $ | 1,000 | | | $ | 1,218 | |
Chicago, Board of Education, Ser A, GO | | | | | | | | |
Callable 12/01/28 @ 100 | | | | | | | | |
5.000%, 12/01/35 | | | 1,250 | | | | 1,520 | |
Chicago, Board of Education, Ser A, GO | | | | | | | | |
Callable 12/01/30 @ 100 | | | | | | | | |
5.000%, 12/01/40 | | | 2,300 | | | | 2,839 | |
Chicago, Board of Education, Ser B, GO | | | | | | | | |
Callable 12/01/27 @ 100 | | | | | | | | |
7.000%, 12/01/42(C) | | | 5,000 | | | | 6,510 | |
Chicago, Board of Education, Ser D, GO | | | | | | | | |
Callable 12/01/28 @ 100 | | | | | | | | |
5.000%, 12/01/46 | | | 2,000 | | | | 2,394 | |
Chicago, Board of Education, Ser G, GO | | | | | | | | |
Callable 12/01/27 @ 100 | | | | | | | | |
5.000%, 12/01/34 | | | 2,000 | | | | 2,388 | |
Chicago, Midway International Airport, Ser B, RB | | | | | | | | |
Callable 01/01/23 @ 100 | | | | | | | | |
5.000%, 01/01/35 | | | 2,000 | | | | 2,111 | |
Chicago, Midway International Airport, Ser B, RB | | | | | | | | |
Callable 01/01/24 @ 100 | | | | | | | | |
5.000%, 01/01/35 | | | 3,000 | | | | 3,295 | |
Chicago, Ser A, GO | | | | | | | | |
Callable 01/01/27 @ 100 | | | | | | | | |
6.000%, 01/01/38 | | | 9,000 | | | | 11,030 | |
Chicago, Ser A, GO | | | | | | | | |
Callable 01/01/29 @ 100 | | | | | | | | |
5.500%, 01/01/35 | | | 5,000 | | | | 6,237 | |
Chicago, Ser A, GO | | | | | | | | |
5.000%, 01/01/27 | | | 1,750 | | | | 2,091 | |
Chicago, Ser A, GO | | | | | | | | |
Callable 01/01/24 @ 100 | | | | | | | | |
5.000%, 01/01/30 | | | 1,000 | | | | 1,080 | |
Chicago, Ser A, GO | | | | | | | | |
Callable 01/01/29 @ 100 | | | | | | | | |
5.000%, 01/01/40 | | | 1,500 | | | | 1,799 | |
Chicago, Ser C, GO | | | | | | | | |
5.000%, 01/01/26 | | | 2,000 | | | | 2,329 | |
County of Cook Illinois, Sales Tax Revenue, Ser A, RB | | | | | | | | |
Callable 11/15/30 @ 100 | | | | | | | | |
4.000%, 11/15/39 | | | 1,000 | | | | 1,164 | |
County of Cook Illinois, Sales Tax Revenue, Ser A, RB | | | | | | | | |
Callable 11/15/30 @ 100 | | | | | | | | |
4.000%, 11/15/40 | | | 1,000 | | | | 1,160 | |
County of Cook Illinois, Ser A, GO | | | | | | | | |
Callable 11/15/26 @ 100 | | | | | | | | |
5.000%, 11/15/31 | | | 2,400 | | | | 2,851 | |
Illinois State, Finance Authority, Columbia College Chicago, Ser S, RB | | | | | | | | |
Callable 12/01/25 @ 100 | | | | | | | | |
4.125%, 12/01/30 | | | 1,505 | | | | 1,642 | |
Illinois State, Finance Authority, Presence Health Network, Ser C, RB | | | | | | | | |
Callable 02/15/27 @ 100 | | | | | | | | |
5.000%, 02/15/36 | | | 4,535 | | | | 5,425 | |
Illinois State, Finance Authority, Presence Health Network, Ser C, RB | | | | | | | | |
Callable 02/15/27 @ 100 | | | | | | | | |
5.000%, 02/15/41 | | | 1,000 | | | | 1,190 | |
Illinois State, Finance Authority, RB | | | | | | | | |
Callable 09/01/29 @ 100 | | | | | | | | |
5.000%, 09/01/38 | | | 250 | | | | 305 | |
Illinois State, Finance Authority, RB | | | | | | | | |
Callable 09/01/29 @ 100 | | | | | | | | |
5.000%, 09/01/40 | | | 250 | | | | 304 | |
Illinois State, Finance Authority, RB | | | | | | | | |
Callable 05/15/28 @ 103 | | | | | | | | |
5.000%, 05/15/41 | | | 310 | | | | 366 | |
Illinois State, Finance Authority, RB | | | | | | | | |
Callable 12/01/29 @ 100 | | | | | | | | |
5.000%, 12/01/49 | | | 5,595 | | | | 6,593 | |
Illinois State, Finance Authority, RB | | | | | | | | |
Callable 05/15/26 @ 100 | | | | | | | | |
5.000%, 05/15/50(A) | | | 1,200 | | | | 1,427 | |
Illinois State, Finance Authority, RB | | | | | | | | |
Callable 05/15/28 @ 103 | | | | | | | | |
5.000%, 05/15/51 | | | 1,000 | | | | 1,161 | |
Illinois State, Finance Authority, RB | | | | | | | | |
Callable 05/15/28 @ 103 | | | | | | | | |
5.000%, 05/15/56 | | | 515 | | | | 594 | |
See accompanying notes to financial statements.
CITY NATIONAL ROCHDALE FUNDS | PAGE 41
schedule of investments |
September 30, 2021 |
City National Rochdale Municipal High Income Fund (continued) |
Description | | Face Amount (000) | | | Value (000) | |
Illinois State, Finance Authority, RB | | | | | | | | |
Callable 04/01/31 @ 100 | | | | | | | | |
4.000%, 10/01/32 | | $ | 400 | | | $ | 457 | |
Illinois State, Finance Authority, RB | | | | | | | | |
Callable 04/01/31 @ 100 | | | | | | | | |
4.000%, 10/01/33 | | | 350 | | | | 398 | |
Illinois State, Finance Authority, RB | | | | | | | | |
Callable 09/01/29 @ 100 | | | | | | | | |
4.000%, 09/01/37 | | | 350 | | | | 397 | |
Illinois State, Finance Authority, RB | | | | | | | | |
Callable 04/01/31 @ 100 | | | | | | | | |
4.000%, 10/01/38 | | | 230 | | | | 258 | |
Illinois State, Finance Authority, RB | | | | | | | | |
Callable 09/01/29 @ 100 | | | | | | | | |
4.000%, 09/01/41 | | | 500 | | | | 561 | |
Illinois State, Finance Authority, RB | | | | | | | | |
Callable 10/01/30 @ 100 | | | | | | | | |
4.000%, 10/01/50 | | | 3,130 | | | | 3,500 | |
Illinois State, Finance Authority, RB | | | | | | | | |
Callable 10/01/30 @ 100 | | | | | | | | |
4.000%, 10/01/55 | | | 3,500 | | | | 3,896 | |
Illinois State, Finance Authority, Ser A, RB | | | | | | | | |
Callable 10/01/28 @ 101 | | | | | | | | |
6.125%, 04/01/58(C) | | | 5,000 | | | | 6,003 | |
Illinois State, Finance Authority, Ser A, RB | | | | | | | | |
Callable 11/01/26 @ 103 | | | | | | | | |
5.000%, 11/01/49 | | | 2,000 | | | | 2,205 | |
Illinois State, Finance Authority, Ser B-1, RB | | | | | | | | |
Callable 05/15/24 @ 100 | | | | | | | | |
5.000%, 05/15/50(A) | | | 1,500 | | | | 1,676 | |
Illinois State, Finance Authority, Wesleyan University, RB | | | | | | | | |
Callable 09/01/26 @ 100 | | | | | | | | |
4.000%, 09/01/41 | | | 6,640 | | | | 7,432 | |
Illinois State, GO | | | | | | | | |
Callable 05/01/24 @ 100 | | | | | | | | |
5.000%, 05/01/27 | | | 6,500 | | | | 7,174 | |
Illinois State, GO | | | | | | | | |
Callable 05/01/24 @ 100 | | | | | | | | |
5.000%, 05/01/31 | | | 5,000 | | | | 5,474 | |
Illinois State, GO | | | | | | | | |
Callable 05/01/24 @ 100 | | | | | | | | |
5.000%, 05/01/35 | | | 5,000 | | | | 5,457 | |
Illinois State, Housing Development Authority, Stonebridge Gurnee Project, Ser A, RB | | | | | | | | |
Callable 01/01/26 @ 100 | | | | | | | | |
5.600%, 01/01/56(C) | | | 5,200 | | | | 4,782 | |
Illinois State, Ser D, GO | | | | | | | | |
3.250%, 11/01/26 | | | 8,175 | | | | 9,066 | |
Milton Grove, Tax Increment Revenue, RB | | | | | | | | |
Callable 01/01/26 @ 100 | | | | | | | | |
5.000%, 01/01/39 | | | 2,000 | | | | 2,067 | |
Milton Grove, Tax Increment Revenue, RB | | | | | | | | |
Callable 01/01/26 @ 100 | | | | | | | | |
4.250%, 01/01/29 | | | 880 | | | | 904 | |
Northern Illinois University, RB, BAM | | | | | | | | |
Callable 04/01/31 @ 100 | | | | | | | | |
4.000%, 10/01/39 | | | 425 | | | | 497 | |
Northern Illinois University, RB, BAM | | | | | | | | |
Callable 04/01/31 @ 100 | | | | | | | | |
4.000%, 10/01/43 | | | 1,250 | | | | 1,447 | |
Romeoville Village, Lewis University, Ser B, RB | | | | | | | | |
Callable 04/01/25 @ 100 | | | | | | | | |
4.125%, 10/01/41 | | | 1,250 | | | | 1,326 | |
Romeoville Village, Lewis University, Ser B, RB | | | | | | | | |
Callable 04/01/25 @ 100 | | | | | | | | |
4.125%, 10/01/46 | | | 1,500 | | | | 1,583 | |
Southern Illinois University, Ser B, RB | | | | | | | | |
Callable 10/01/22 @ 100 | | | | | | | | |
5.000%, 04/01/26 | | | 2,105 | | | | 2,162 | |
Southwestern Illinois, Development Authority, Collinsville Project, RB | | | | | | | | |
Callable 11/08/21 @ 100 | | | | | | | | |
5.350%, 03/01/31 | | | 75 | | | | 46 | |
State of Illinois, Ser A, GO | | | | | | | | |
Callable 03/01/31 @ 100 | | | | | | | | |
5.000%, 03/01/46 | | | 1,750 | | | | 2,141 | |
State of Illinois, Ser A, GO | | | | | | | | |
Callable 03/01/31 @ 100 | | | | | | | | |
4.000%, 03/01/41 | | | 1,000 | | | | 1,139 | |
See accompanying notes to financial statements.
CITY NATIONAL ROCHDALE FUNDS | PAGE 42
schedule of investments |
September 30, 2021 |
City National Rochdale Municipal High Income Fund (continued) |
Description | | Face Amount (000) | | | Value (000) | |
University of Illinois, Ser B, COP | | | | | | | | |
Callable 10/01/26 @ 100 | | | | | | | | |
5.000%, 10/01/27 | | $ | 1,500 | | | $ | 1,782 | |
Upper Illinois, River Valley Development Authority, RB | | | | | | | | |
Callable 12/01/28 @ 100 | | | | | | | | |
5.000%, 12/01/43 | | | 2,000 | | | | 2,254 | |
Village of Bolingbrook, Special Service Area No. 1, SPL Tax | | | | | | | | |
Callable 03/01/28 @ 100 | | | | | | | | |
5.250%, 03/01/41 | | | 3,500 | | | | 3,696 | |
Village of Gilberts, RB | | | | | | | | |
Callable 10/22/21 @ 100 | | | | | | | | |
5.000%, 11/15/34 | | | 2,883 | | | | 3,170 | |
Village of Hodgkins, Redevelopment Project Area #4, TA | | | | | | | | |
Callable 01/01/27 @ 100 | | | | | | | | |
5.625%, 01/01/37 | | | 5,050 | | | | 5,357 | |
Village of Matteson Illinois, GO | | | | | | | | |
Callable 12/01/26 @ 100 | | | | | | | | |
6.500%, 12/01/35 | | | 975 | | | | 1,087 | |
Village of Villa Park Illinois, TA | | | | | | | | |
Callable 12/31/28 @ 100 | | | | | | | | |
0.000%, 4.5000%, 06/30/25, 12/31/38(B) | | | 1,680 | | | | 1,421 | |
| | | | | | | | | | | | | |
Total Illinois | | | 175,701 | |
| | | | | | | | | | | | | |
Indiana [1.2%] |
Anderson Indiana, RB | | | | | | | | |
Callable 01/01/27 @ 102 | | | | | | | | |
5.375%, 01/01/40 | | | 2,745 | | | | 2,866 | |
Anderson Indiana, RB | | | | | | | | |
5.000%, 01/01/25 | | | 250 | | | | 254 | |
Anderson Indiana, RB | | | | | | | | |
4.180%, 01/01/23 | | | 850 | | | | 857 | |
Indiana State, Finance Authority, RB | | | | | | | | |
1.650%, 05/01/28(A) | | | 3,000 | | | | 3,000 | |
Indiana State, Finance Authority, RB, AMT | | | | | | | | |
Callable 11/01/30 @ 100 | | | | | | | | |
6.750%, 05/01/39 | | | 1,750 | | | | 2,308 | |
Indiana State, Housing & Community Development Authority, Ser A, RB | | | | | | | | |
Callable 04/01/29 @ 102 | | | | | | | | |
5.250%, 04/01/41(C) | | | 5,750 | | | | 6,039 | |
Indianapolis, Ritter Affordable Assisted Living Project, RB | | | | | | | | |
Callable 12/01/22 @ 102 | | | | | | | | |
6.900%, 12/01/33 | | | 4,000 | | | | 3,894 | |
Lafayette City, Finance Authority, Glasswater Creek Project, RB | | | | | | | | |
Callable 07/01/26 @ 101 | | | | | | | | |
5.800%, 01/01/37 | | | 3,310 | | | | 3,491 | |
Terre Haute, Westminster Village Project, RB | | | | | | | | |
Callable 08/01/22 @ 100 | | | | | | | | |
6.000%, 08/01/39 | | | 2,355 | | | | 2,401 | |
| | | | | | | | | | | | | |
Total Indiana | | | 25,110 | |
| | | | | | | | | | | | | |
Iowa [0.8%] |
Iowa State, Finance Authority, Child Serve Project, Ser B, RB | | | | | | | | |
Callable 06/01/25 @ 100 | | | | | | | | |
5.000%, 06/01/36 | | | 2,000 | | | | 2,105 | |
Iowa State, Finance Authority, RB | | | | | | | | |
Callable 10/27/21 @ 103 | | | | | | | | |
3.125%, 12/01/22 | | | 375 | | | | 381 | |
Iowa State, Finance Authority, Ser A, RB | | | | | | | | |
Callable 05/15/27 @ 100 | | | | | | | | |
5.000%, 05/15/43 | | | 2,000 | | | | 2,301 | |
Iowa State, Tobacco Settlement Authority, Sub-Ser B, RB | | | | | | | | |
Callable 06/01/31 @ 26 | | | | | | | | |
4.010%, 06/01/65(D) | | | 61,315 | | | | 11,347 | |
| | | | | | | | | | | | | |
Total Iowa | | | 16,134 | |
| | | | | | | | | | | | | |
Kansas [0.8%] |
Kansas State, Development Finance Authority, Village Shalom Project, Ser A, RB | | | | | | | | |
Callable 11/15/23 @ 104 | | | | | | | | |
5.500%, 11/15/38 | | | 500 | | | | 514 | |
Kansas State, Development Finance Authority, Village Shalom Project, Ser A, RB | | | | | | | | |
Callable 11/15/23 @ 104 | | | | | | | | |
5.250%, 11/15/53 | | | 4,190 | | | | 4,170 | |
Manhattan Kansas, Ser A, RB | | | | | | | | |
Callable 06/01/28 @ 103 | | | | | | | | |
4.000%, 06/01/46 | | | 750 | | | | 813 | |
See accompanying notes to financial statements.
CITY NATIONAL ROCHDALE FUNDS | PAGE 43
schedule of investments |
September 30, 2021 |
City National Rochdale Municipal High Income Fund (continued) |
Description | | Face Amount (000) | | | Value (000) | |
University of Kansas, Hospital Authority, Ser A, RB | | | | | | | | |
Callable 03/01/27 @ 100 | | | | | | | | |
4.000%, 03/01/42 | | $ | 5,000 | | | $ | 5,516 | |
Wichita City, Masonic Home, Ser II-A, RB | | | | | | | | |
Callable 12/01/26 @ 100 | | | | | | | | |
5.375%, 12/01/46 | | | 1,500 | | | | 1,553 | |
Wichita City, Masonic Home, Ser II-A, RB | | | | | | | | |
Callable 12/01/26 @ 100 | | | | | | | | |
5.250%, 12/01/36 | | | 500 | | | | 522 | |
Wyandotte County, Kansas City Unified Government, RB | | | | | | | | |
Callable 09/01/25 @ 100 | | | | | | | | |
5.750%, 09/01/32 | | | 4,080 | | | | 4,128 | |
| | | | | | | | | | | | | |
Total Kansas | | | 17,216 | |
| | | | | | | | | | | | | |
Kentucky [1.3%] |
County of Trimble Kentucky, RB, AMT | | | | | | | | |
1.300%, 09/01/44(A) | | | 1,000 | | | | 998 | |
Kentucky State, Economic Development Finance Authority, Masonic Home Independent Living, RB | | | | | | | | |
Callable 05/15/26 @ 100 | | | | | | | | |
5.000%, 05/15/46 | | | 4,500 | | | | 4,734 | |
Kentucky State, Economic Development Finance Authority, RB | | | | | | | | |
1.650%, 04/01/31(A) | | | 5,500 | | | | 5,500 | |
Kentucky State, Economic Development Finance Authority, Ser A-, RB | | | | | | | | |
Callable 08/01/29 @ 100 | | | | | | | | |
5.000%, 08/01/44 | | | 1,000 | | | | 1,217 | |
Kentucky State, Public Energy Authority, Ser B, RB | | | | | | | | |
Callable 10/01/24 @ 100 | | | | | | | | |
4.000%, 01/01/49(A) | | | 2,500 | | | | 2,753 | |
Kentucky State, Public Transportation Infrastructure Authority, Downtown Crossing Project, RB | | | | | | | | |
Callable 07/01/23 @ 100 | | | | | | | | |
5.750%, 07/01/49 | | | 5,650 | | | | 6,174 | |
Kentucky State, Public Transportation Infrastructure Authority, Ser C, RB | | | | | | | | |
Callable 11/01/27 @ 100 | | | | | | | | |
4.000%, 02/01/50(A) | | | 5,000 | | | | 5,848 | |
| | | | | | | | | | | | | |
Total Kentucky | | | 27,224 | |
| | | | | | | | | | | | | |
Louisiana [0.9%] |
Juban Crossing, Economic Development District, General Infrastructure Project, Ser C, RB | | | | | | | | |
Callable 03/15/25 @ 100 | | | | | | | | |
7.000%, 09/15/44(C) | | | 5,565 | | | | 5,386 | |
Louisiana State, Public Facilities Authority, Loyola University Project, RB | | | | | | | | |
Callable 10/01/21 @ 100 | | | | | | | | |
5.000%, 10/01/41 | | | 5,000 | | | | 5,000 | |
Louisiana State, Public Facilities Authority, Pellets Project, RB, AMT | | | | | | | | |
Callable 07/01/23 @ 100 | | | | | | | | |
10.500%, 07/01/39(E) | | | 1,435 | | | | — | |
Louisiana State, Public Facilities Authority, Pellets Project, RB, AMT | | | | | | | | |
7.000%, 07/01/24(C) (E) | | | 1,319 | | | | — | |
Louisiana State, Public Facilities Authority, Pellets Project, Ser A, RB, AMT | | | | | | | | |
Callable 07/01/24 @ 100 | | | | | | | | |
8.375%, 07/01/39(E) | | | 3,474 | | | | — | |
Parish of Saint John the Baptist Louisiana, RB | | | | | | | | |
2.375%, 06/01/37(A) | | | 4,000 | | | | 4,207 | |
Parish of Saint John the Baptist Louisiana, RB | | | | | | | | |
2.100%, 06/01/37(A) | | | 3,770 | | | | 3,889 | |
| | | | | | | | | | | | | |
Total Louisiana | | | 18,482 | |
| | | | | | | | | | | | | |
Maine [0.1%] |
Maine State, Financing Authority, Casella Waste Systems Project, RB, AMT | | | | | | | | |
4.375%, 08/01/35(A) (C) | | | 1,000 | | | | 1,110 | |
| | | | | | | | | | | | | |
See accompanying notes to financial statements.
CITY NATIONAL ROCHDALE FUNDS | PAGE 44
schedule of investments |
September 30, 2021 |
City National Rochdale Municipal High Income Fund (continued) |
Description | | Face Amount (000) | | | Value (000) | |
Maryland [1.3%] |
Baltimore, Harbor Point Project, RB | | | | | | | | |
Callable 06/01/26 @ 100 | | | | | | | | |
5.000%, 06/01/36 | | $ | 1,000 | | | $ | 1,102 | |
Baltimore, RB | | | | | | | | |
Callable 06/01/29 @ 100 | | | | | | | | |
3.625%, 06/01/46(C) | | | 1,370 | | | | 1,421 | |
Baltimore, RB | | | | | | | | |
Callable 06/01/29 @ 100 | | | | | | | | |
3.500%, 06/01/39(C) | | | 650 | | | | 673 | |
Baltimore, Sub-Ser B, RB | | | | | | | | |
Callable 06/01/23 @ 100 | | | | | | | | |
3.875%, 06/01/46(C) | | | 350 | | | | 353 | |
Baltimore, Sub-Ser B, RB | | | | | | | | |
Callable 06/01/23 @ 100 | | | | | | | | |
3.700%, 06/01/39(C) | | | 200 | | | | 202 | |
Brunswick, RB | | | | | | | | |
Callable 01/01/29 @ 100 | | | | | | | | |
5.000%, 07/01/36 | | | 1,550 | | | | 1,824 | |
Brunswick, RB | | | | | | | | |
Callable 01/01/29 @ 100 | | | | | | | | |
4.000%, 07/01/29 | | | 945 | | | | 1,082 | |
Frederick County, RB | | | | | | | | |
Callable 07/01/29 @ 100 | | | | | | | | |
3.750%, 07/01/39 | | | 1,410 | | | | 1,487 | |
Frederick County, RB | | | | | | | | |
3.250%, 07/01/29 | | | 890 | | | | 939 | |
Howard County, Annapolis Junction Town Center Project, TA | | | | | | | | |
Callable 02/15/24 @ 100 | | | | | | | | |
6.100%, 02/15/44 | | | 1,425 | | | | 1,500 | |
Howard County, Annapolis Junction Town Center Project, TA | | | | | | | | |
Callable 02/15/24 @ 100 | | | | | | | | |
5.800%, 02/15/34 | | | 725 | | | | 763 | |
Howard County, Downtown Columbia Project, Ser A, TA | | | | | | | | |
Callable 02/15/26 @ 100 | | | | | | | | |
4.500%, 02/15/47(C) | | | 1,250 | | | | 1,314 | |
Howard County, Downtown Columbia Project, Ser A, TA | | | | | | | | |
Callable 02/15/26 @ 100 | | | | | | | | |
4.375%, 02/15/39(C) | | | 1,000 | | | | 1,056 | |
Maryland State, Economic Development, GO | | | | | | | | |
Callable 09/01/30 @ 100 | | | | | | | | |
4.000%, 09/01/40 | | | 875 | | | | 998 | |
Maryland State, Economic Development, GO | | | | | | | | |
Callable 09/01/30 @ 100 | | | | | | | | |
4.000%, 09/01/50 | | | 875 | | | | 984 | |
Maryland State, Health & Higher Educational Facilities Authority, RB | | | | | | | | |
Callable 06/01/31 @ 100 | | | | | | | | |
4.000%, 06/01/55 | | | 2,000 | | | | 2,248 | |
Prince George’s County, RB | | | | | | | | |
Callable 07/01/28 @ 100 | | | | | | | | |
5.250%, 07/01/48(C) | | | 2,000 | | | | 2,223 | |
Prince George’s County, RB | | | | | | | | |
Callable 07/01/28 @ 100 | | | | | | | | |
5.125%, 07/01/39(C) | | | 1,000 | | | | 1,112 | |
Westminster, Luther Village Millers Grant Project, RB | | | | | | | | |
Callable 07/01/24 @ 100 | | | | | | | | |
6.250%, 07/01/44 | | | 3,780 | | | | 4,148 | |
Westminster, Luther Village Millers Grant Project, RB | | | | | | | | |
Callable 07/01/24 @ 100 | | | | | | | | |
6.125%, 07/01/39 | | | 750 | | | | 823 | |
Westminster, Luther Village Millers Grant Project, RB | | | | | | | | |
Callable 07/01/24 @ 100 | | | | | | | | |
6.000%, 07/01/34 | | | 1,205 | | | | 1,324 | |
| | | | | | | | | | | | | |
Total Maryland | | | 27,576 | |
| | | | | | | | | | | | | |
Massachusetts [0.8%] |
Massachusetts State, Development Finance Agency, Emmanuel College, Ser A, RB | | | | | | | | |
Callable 10/01/26 @ 100 | | | | | | | | |
5.000%, 10/01/36 | | | 2,305 | | | | 2,693 | |
Massachusetts State, Development Finance Agency, Emmanuel College, Ser A, RB | | | | | | | | |
Callable 10/01/26 @ 100 | | | | | | | | |
4.000%, 10/01/46 | | | 4,120 | | | | 4,508 | |
Massachusetts State, Development Finance Agency, RB | | | | | | | | |
Callable 07/01/28 @ 103 | | | | | | | | |
5.000%, 07/01/56(C) | | | 2,500 | | | | 2,724 | |
Massachusetts State, Development Finance Agency, Ser A, RB | | | | | | | | |
Callable 10/01/26 @ 100 | | | | | | | | |
5.000%, 10/01/43 | | | 2,000 | | | | 2,309 | |
See accompanying notes to financial statements.
CITY NATIONAL ROCHDALE FUNDS | PAGE 45
schedule of investments |
September 30, 2021 |
City National Rochdale Municipal High Income Fund (continued) |
Description | | Face Amount (000) | | | Value (000) | |
Massachusetts State, Development Finance Agency, Ser A, RB | | | | | | | | |
Callable 01/01/29 @ 100 | | | | | | | | |
5.000%, 07/01/44 | | $ | 500 | | | $ | 598 | |
Massachusetts State, Development Finance Agency, Ser S, RB | | | | | | | | |
Callable 07/15/30 @ 100 | | | | | | | | |
5.000%, 07/15/46(C) | | | 750 | | | | 900 | |
Massachusetts State, Development Finance Agency, Western New England University, RB | | | | | | | | |
Callable 09/01/28 @ 100 | | | | | | | | |
5.000%, 09/01/43 | | | 2,000 | | | | 2,359 | |
| | | | | | | | | | | | | |
Total Massachusetts | | | 16,091 | |
| | | | | | | | | | | | | |
Michigan [1.4%] |
Detroit City, GO | | | | | | | | |
Callable 04/01/28 @ 100 | | | | | | | | |
5.000%, 04/01/38 | | | 625 | | | | 726 | |
Detroit Michigan, Ser A, GO | | | | | | | | |
Callable 04/01/31 @ 100 | | | | | | | | |
5.000%, 04/01/50 | | | 1,000 | | | | 1,204 | |
Kalamazoo Economic Development, RB | | | | | | | | |
Callable 08/15/28 @ 103 | | | | | | | | |
5.000%, 08/15/51(C) | | | 1,505 | | | | 1,653 | |
Kalamazoo Economic Development, RB | | | | | | | | |
Callable 05/15/27 @ 103 | | | | | | | | |
5.000%, 05/15/55 | | | 3,750 | | | | 4,203 | |
Kentwood Economic Development, Ser S, RB | | | | | | | | |
Callable 11/15/28 @ 103 | | | | | | | | |
4.000%, 11/15/45 | | | 500 | | | | 549 | |
Michigan State, Finance Authority, Hospital Presbyterian Village, RB | | | | | | | | |
Callable 11/15/25 @ 100 | | | | | | | | |
5.250%, 11/15/35 | | | 2,340 | | | | 2,532 | |
Michigan State, Finance Authority, Old Redford School Project, Ser A, RB | | | | | | | | |
Callable 11/08/21 @ 100 | | | | | | | | |
6.500%, 12/01/40 | | | 3,745 | | | | 3,750 | |
Michigan State, Finance Authority, Ser A, RB | | | | | | | | |
Callable 11/02/29 @ 100 | | | | | | | | |
5.000%, 11/15/48 | | | 6,800 | | | | 8,411 | |
Michigan State, Finance Authority, Ser A-2, RB | | | | | | | | |
Callable 12/01/30 @ 100 | | | | | | | | |
5.000%, 06/01/40 | | | 1,770 | | | | 2,253 | |
Michigan State, Public Educational Facilities Authority, Old Redford Project, Ser A, RB | | | | | | | | |
Callable 11/08/21 @ 100 | | | | | | | | |
5.875%, 12/01/30 | | | 2,000 | | | | 2,002 | |
Michigan State, Strategic Fund, RB | | | | | | | | |
Callable 08/15/28 @ 103 | | | | | | | | |
5.000%, 08/15/51(C) | | | 1,000 | | | | 1,098 | |
| | | | | | | | | | | | | |
Total Michigan | | | 28,381 | |
| | | | | | | | | | | | | |
Minnesota [0.7%] |
Anoka, Housing Revenue Authority, Homestead Project, RB | | | | | | | | |
Callable 11/01/24 @ 103 | | | | | | | | |
4.750%, 11/01/35 | | | 3,000 | | | | 3,216 | |
Bethel, Senior Housing Revenue, Lodge at Lakes at Stillwater Project, RB | | | | | | | | |
Callable 06/01/23 @ 102 | | | | | | | | |
5.250%, 06/01/58 | | | 2,840 | | | | 2,945 | |
Bethel, Senior Housing Revenue, RB | | | | | | | | |
Callable 05/01/24 @ 102 | | | | | | | | |
4.500%, 05/01/49 | | | 1,355 | | | | 1,393 | |
Duluth Economic Development Authority, RB | | | | | | | | |
Callable 07/01/26 @ 103 | | | | | | | | |
4.000%, 07/01/41 | | | 930 | | | | 1,000 | |
Minneapolis State, Riverton Community Housing Project, RB | | | | | | | | |
Callable 08/01/24 @ 102 | | | | | | | | |
5.000%, 08/01/53(C) | | | 500 | | | | 530 | |
Minneapolis State, Riverton Community Housing Project, RB | | | | | | | | |
Callable 08/01/24 @ 102 | | | | | | | | |
4.750%, 08/01/43(C) | | | 1,600 | | | | 1,687 | |
Rochester, RB | | | | | | | | |
Callable 05/15/28 @ 100 | | | | | | | | |
4.000%, 11/15/48 | | | 2,000 | | | | 2,276 | |
West Saint Paul, Walker Westwood Ridge Camp, RB | | | | | | | | |
Callable 11/01/25 @ 100 | | | | | | | | |
5.000%, 11/01/49 | | | 1,150 | | | | 1,174 | |
See accompanying notes to financial statements.
CITY NATIONAL ROCHDALE FUNDS | PAGE 46
schedule of investments |
September 30, 2021 |
City National Rochdale Municipal High Income Fund (continued) |
Description | | Face Amount (000) | | | Value (000) | |
Woodbury Minnesota, RB | | | | | | | | |
Callable 07/01/28 @ 103 | | | | | | | | |
4.000%, 07/01/56 | | $ | 1,150 | | | $ | 1,234 | |
| | | | | | | | | | | | | |
Total Minnesota | | | 15,455 | |
| | | | | | | | | | | | | |
Missouri [2.5%] |
Blue Springs, Improvement Adams Farm Project, TA | | | | | | | | |
Callable 06/01/24 @ 100 | | | | | | | | |
5.250%, 06/01/39 | | | 3,400 | | | | 3,452 | |
Cape Girardeau County Industrial Development Authority, RB | | | | | | | | |
Callable 03/01/31 @ 100 | | | | | | | | |
3.000%, 03/01/46 | | | 945 | | | | 954 | |
Hanley, Transportation Development, Eager Road Transportation Development District, Ser A, SAB | | | | | | | | |
Callable 11/08/21 @ 100 | | | | | | | | |
4.000%, 03/01/42 | | | 1,000 | | | | 1,001 | |
Hanley, Transportation Development, Eager Road Transportation Development District, Ser A, SAB | | | | | | | | |
Callable 11/08/21 @ 100 | | | | | | | | |
3.625%, 03/01/33 | | | 500 | | | | 500 | |
Hanley, Transportation Development, Eager Road Transportation Development District, Ser A, SAB | | | | | | | | |
Callable 11/08/21 @ 100 | | | | | | | | |
3.000%, 03/01/26 | | | 500 | | | | 500 | |
Health & Educational Facilities Authority of the State of Missouri, RB | | | | | | | | |
Callable 08/01/31 @ 100 | | | | | | | | |
4.000%, 08/01/36 | | | 440 | | | | 520 | |
Health & Educational Facilities Authority of the State of Missouri, RB | | | | | | | | |
Callable 08/01/31 @ 100 | | | | | | | | |
4.000%, 08/01/41 | | | 410 | | | | 478 | |
Kansas City, Industrial Development Authority, RB, AGM, AMT | | | | | | | | |
Callable 03/01/30 @ 100 | | | | | | | | |
5.000%, 03/01/57 | | | 250 | | | | 305 | |
Kansas City, Industrial Development Authority, RB, AMT | | | | | | | | |
Callable 03/01/30 @ 100 | | | | | | | | |
4.000%, 03/01/45 | | | 5,000 | | | | 5,646 | |
Kansas City, Industrial Development Authority, RB, AMT | | | | | | | | |
Callable 03/01/30 @ 100 | | | | | | | | |
4.000%, 03/01/50 | | | 4,750 | | | | 5,340 | |
Kansas City, Industrial Development Authority, Ser A, RB | | | | | | | | |
Callable 04/01/26 @ 100 | | | | | | | | |
5.000%, 04/01/36(C) | | | 2,000 | | | | 2,097 | |
Kirkwood, Industrial Development Authority, Aberdeen Heights Project, RB | | | | | | | | |
Callable 05/15/27 @ 100 | | | | | | | | |
5.250%, 05/15/37 | | | 2,000 | | | | 2,277 | |
Lees Summit, Industrial Development Authority, John Knox Village, Ser A, RB | | | | | | | | |
Callable 08/15/24 @ 102 | | | | | | | | |
5.000%, 08/15/46 | | | 2,000 | | | | 2,157 | |
Lees Summit, Industrial Development Authority, John Knox Village, Ser A, RB | | | | | | | | |
Callable 08/15/24 @ 102 | | | | | | | | |
5.000%, 08/15/51 | | | 500 | | | | 539 | |
Lees Summit, Industrial Development Authority, RB | | | | | | | | |
Callable 08/15/25 @ 103 | | | | | | | | |
5.000%, 08/15/42 | | | 2,400 | | | | 2,661 | |
Maryland Heights Missouri, GO | | | | | | | | |
Callable 11/01/29 @ 100 | | | | | | | | |
4.125%, 11/01/38 | | | 1,950 | | | | 2,075 | |
Missouri Southern State University, RB | | | | | | | | |
Callable 10/01/31 @ 100 | | | | | | | | |
4.000%, 10/01/44 | | | 3,375 | | | | 3,476 | |
Poplar Bluff, Ser A, TA | | | | | | | | |
Callable 11/01/23 @ 100 | | | | | | | | |
5.125%, 11/01/35(C) | | | 5,000 | | | | 5,063 | |
St. Louis County, Industrial Development Authority, Manchester Ballas Community, RB | | | | | | | | |
Callable 09/01/24 @ 100 | | | | | | | | |
5.250%, 09/01/45(C) | | | 3,000 | | | | 3,054 | |
St. Louis County, Industrial Development Authority, Manchester Ballas Community, RB | | | | | | | | |
Callable 09/01/24 @ 100 | | | | | | | | |
5.000%, 09/01/38(C) | | | 2,000 | | | | 2,038 | |
See accompanying notes to financial statements.
CITY NATIONAL ROCHDALE FUNDS | PAGE 47
schedule of investments |
September 30, 2021 |
City National Rochdale Municipal High Income Fund (continued) |
Description | | Face Amount (000) | | | Value (000) | |
St. Louis County, Industrial Development Authority, RB | | | | | | | | |
Callable 09/01/25 @ 103 | | | | | | | | |
5.250%, 09/01/53 | | $ | 2,000 | | | $ | 2,247 | |
St. Louis, Industrial Development Authority, Ballpark Village Development Project, RB | | | | | | | | |
Callable 11/15/26 @ 100 | | | | | | | | |
4.375%, 11/15/35 | | | 2,250 | | | | 2,261 | |
St. Louis, Industrial Development Authority, Ballpark Village Development Project, RB | | | | | | | | |
Callable 11/15/26 @ 100 | | | | | | | | |
3.875%, 11/15/29 | | | 1,315 | | | | 1,306 | |
St. Louis, Industrial Development Authority, Innovation District Project, TA | | | | | | | | |
Callable 05/15/24 @ 100 | | | | | | | | |
4.375%, 05/15/36 | | | 2,500 | | | | 2,532 | |
| | | | | | | | | | | | | |
Total Missouri | | | 52,479 | |
| | | | | | | | | | | | | |
Nebraska [0.7%] |
Central Plains Energy Project, Project No. 3, RB | | | | | | | | |
Callable 09/01/22 @ 100 | | | | | | | | |
5.250%, 09/01/37 | | | 1,000 | | | | 1,044 | |
Central Plains Energy Project, Project No. 3, RB | | | | | | | | |
Callable 09/01/22 @ 100 | | | | | | | | |
5.000%, 09/01/42 | | | 5,500 | | | | 5,732 | |
Central Plains Energy Project, Ser A, RB | | | | | | | | |
5.000%, 09/01/42 | | | 5,500 | | | | 7,899 | |
| | | | | | | | | | | | | |
Total Nebraska | | | 14,675 | |
| | | | | | | | | | | | | |
Nevada [1.0%] |
Clark County, Department of Aviation, Sub-Ser A-2, RB | | | | | | | | |
Callable 07/01/24 @ 100 | | | | | | | | |
5.000%, 07/01/35 | | | 3,000 | | | | 3,362 | |
Las Vegas, Finance Authority, RB | | | | | | | | |
Callable 10/27/21 @ 100 | | | | | | | | |
4.375%, 06/15/35(C) | | | 3,500 | | | | 3,501 | |
Las Vegas, Special Improvement District No. 611, RB | | | | | | | | |
Callable 06/01/30 @ 100 | | | | | | | | |
4.125%, 06/01/50 | | | 875 | | | | 951 | |
Las Vegas, Special Improvement District No. 612 Skye Hills, GO | | | | | | | | |
Callable 06/01/30 @ 100 | | | | | | | | |
3.750%, 06/01/42 | | | 750 | | | | 798 | |
Las Vegas, Special Improvement District No. 612 Skye Hills, GO | | | | | | | | |
Callable 06/01/30 @ 100 | | | | | | | | |
3.500%, 06/01/35 | | | 200 | | | | 214 | |
Las Vegas, Special Improvement District No. 812, SAB | | | | | | | | |
Callable 12/01/25 @ 100 | | | | | | | | |
5.000%, 12/01/35 | | | 950 | | | | 1,039 | |
Las Vegas, Special Improvement District No. 814, GO | | | | | | | | |
Callable 06/01/29 @ 100 | | | | | | | | |
4.000%, 06/01/44 | | | 750 | | | | 810 | |
Las Vegas, Special Improvement District No. 815, GO | | | | | | | | |
Callable 12/01/30 @ 100 | | | | | | | | |
4.750%, 12/01/40 | | | 750 | | | | 870 | |
Las Vegas, Special Improvement District No. 816, SPA | | | | | | | | |
Callable 06/01/31 @ 100 | | | | | | | | |
3.125%, 06/01/46 | | | 2,050 | | | | 2,081 | |
Las Vegas, Special Improvement District No. 816, SPA | | | | | | | | |
Callable 06/01/31 @ 100 | | | | | | | | |
3.125%, 06/01/51 | | | 1,425 | | | | 1,441 | |
Las Vegas, Special Improvement District No. 816, SPA | | | | | | | | |
Callable 06/01/31 @ 100 | | | | | | | | |
3.000%, 06/01/41 | | | 950 | | | | 962 | |
Nevada State, Department of Business & Industry, Green-Fulcrum Sierra Biofuels, RB, AMT | | | | | | | | |
Callable 12/15/27 @ 100 | | | | | | | | |
6.250%, 12/15/37(C) | | | 100 | | | | 105 | |
Nevada State, Department of Business & Industry, Sumerset Academy, Ser A, RB | | | | | | | | |
Callable 12/15/25 @ 100 | | | | | | | | |
5.000%, 12/15/35(C) | | | 1,595 | | | | 1,769 | |
Nevada State, Department of Business & Industry, Sumerset Academy, Ser A, RB | | | | | | | | |
Callable 12/15/25 @ 100 | | | | | | | | |
5.000%, 12/15/48(C) | | | 1,000 | | | | 1,089 | |
Sparks Nevada, Ser A, RB | | | | | | | | |
2.750%, 06/15/28(C) | | | 1,000 | | | | 1,033 | |
See accompanying notes to financial statements.
CITY NATIONAL ROCHDALE FUNDS | PAGE 48
schedule of investments |
September 30, 2021 |
City National Rochdale Municipal High Income Fund (continued) |
Description | | Face Amount (000) | | | Value (000) | |
Sparks Nevada, Ser A, RB | | | | | | | | |
2.500%, 06/15/24(C) | | $ | 725 | | | $ | 737 | |
| | | | | | | | | | | | | |
Total Nevada | | | 20,762 | |
| | | | | | | | | | | | | |
New Hampshire [0.4%] |
New Hampshire Business Finance Authority, RB | | | | | | | | |
Callable 07/01/28 @ 103 | | | | | | | | |
5.000%, 07/01/56(C) | | | 1,910 | | | | 2,069 | |
New Hampshire, Business Finance Authority, RB | | | | | | | | |
Callable 01/01/26 @ 103 | | | | | | | | |
4.000%, 01/01/41 | | | 1,000 | | | | 1,090 | |
New Hampshire, Business Finance Authority, RB | | | | | | | | |
Callable 01/01/26 @ 103 | | | | | | | | |
4.000%, 01/01/51 | | | 1,000 | | | | 1,079 | |
New Hampshire, Business Finance Authority, Ser A, RB | | | | | | | | |
Callable 07/01/25 @ 103 | | | | | | | | |
5.750%, 07/01/54(C) | | | 1,250 | | | | 1,322 | |
New Hampshire, Business Finance Authority, Ser A, RB | | | | | | | | |
Callable 07/01/25 @ 103 | | | | | | | | |
5.625%, 07/01/46(C) | | | 500 | | | | 528 | |
New Hampshire, Business Finance Authority, Ser A, RB | | | | | | | | |
Callable 07/01/25 @ 100 | | | | | | | | |
3.625%, 07/01/43(A) (C) | | | 1,000 | | | | 1,053 | |
New Hampshire, Business Finance Authority, Ser B, RB, AMT | | | | | | | | |
Callable 07/01/25 @ 100 | | | | | | | | |
3.750%, 07/01/45(A) (C) | | | 1,000 | | | | 1,058 | |
| | | | | | | | | | | | | |
Total New Hampshire | | | 8,199 | |
| | | | | | | | | | | | | |
New Jersey [2.6%] |
County of Essex New Jersey, GO | | | | | | | | |
Callable 09/01/28 @ 100 | | | | | | | | |
2.125%, 09/01/49 | | | 3,900 | | | | 3,627 | |
County of Essex New Jersey, GO | | | | | | | | |
Callable 09/01/28 @ 100 | | | | | | | | |
2.125%, 09/01/50 | | | 900 | | | | 834 | |
New Jersey State, Economic Development Authority, Port Newark Container, RB, AMT | | | | | | | | |
Callable 10/01/27 @ 100 | | | | | | | | |
5.000%, 10/01/47 | | | 6,000 | | | | 6,859 | |
New Jersey State, Economic Development Authority, RB | | | | | | | | |
Callable 11/01/29 @ 100 | | | | | | | | |
4.000%, 11/01/37 | | | 1,100 | | | | 1,268 | |
New Jersey State, Economic Development Authority, RB, AMT | | | | | | | | |
Callable 03/05/24 @ 101 | | | | | | | | |
5.625%, 11/15/30 | | | 1,000 | | | | 1,103 | |
New Jersey State, Economic Development Authority, Ser A, RB | | | | | | | | |
Callable 12/15/27 @ 100 | | | | | | | | |
5.000%, 06/15/42 | | | 1,155 | | | | 1,389 | |
New Jersey State, Economic Development Authority, Ser A, RB | | | | | | | | |
Callable 12/15/27 @ 100 | | | | | | | | |
5.000%, 06/15/47 | | | 1,230 | | | | 1,470 | |
New Jersey State, Economic Development Authority, Ser EEE, RB | | | | | | | | |
Callable 12/15/28 @ 100 | | | | | | | | |
5.000%, 06/15/43 | | | 1,000 | | | | 1,223 | |
New Jersey State, Economic Development Authority, Ser S, RB | | | | | | | | |
Callable 12/15/30 @ 100 | | | | | | | | |
4.000%, 06/15/46 | | | 500 | | | | 573 | |
New Jersey State, Economic Development Authority, Ser S, RB | | | | | | | | |
Callable 12/15/30 @ 100 | | | | | | | | |
4.000%, 06/15/50 | | | 450 | | | | 515 | |
New Jersey State, Transportation Trust Fund Authority, RB | | | | | | | | |
Callable 12/15/29 @ 100 | | | | | | | | |
4.000%, 12/15/39 | | | 1,750 | | | | 2,011 | |
New Jersey State, Transportation Trust Fund Authority, Ser AA, RB | | | | | | | | |
Callable 06/15/25 @ 100 | | | | | | | | |
5.250%, 06/15/41 | | | 5,245 | | | | 6,033 | |
New Jersey State, Transportation Trust Fund Authority, Ser AA, RB | | | | | | | | |
Callable 12/15/30 @ 100 | | | | | | | | |
4.000%, 06/15/45 | | | 5,325 | | | | 6,112 | |
New Jersey State, Transportation Trust Fund Authority, Ser AA, RB | | | | | | | | |
Callable 12/15/30 @ 100 | | | | | | | | |
4.000%, 06/15/50 | | | 1,000 | | | | 1,143 | |
See accompanying notes to financial statements.
CITY NATIONAL ROCHDALE FUNDS | PAGE 49
schedule of investments |
September 30, 2021 |
City National Rochdale Municipal High Income Fund (continued) |
Description | | Face Amount (000) | | | Value (000) | |
New Jersey State, Transportation Trust Fund Authority, Ser BB, RB | | | | | | | | |
Callable 12/15/28 @ 100 | | | | | | | | |
4.000%, 06/15/37 | | $ | 3,500 | | | $ | 3,996 | |
New Jersey State, Transportation Trust Fund Authority, Ser BB, RB | | | | | | | | |
Callable 12/15/28 @ 100 | | | | | | | | |
4.000%, 06/15/50 | | | 8,500 | | | | 9,536 | |
New Jersey State, Transportation Trust Fund Authority, Ser S, RB | | | | | | | | |
Callable 12/15/28 @ 100 | | | | | | | | |
5.000%, 06/15/46 | | | 1,000 | | | | 1,217 | |
New Jersey State, Transportation Trust Fund Authority, Ser S, RB | | | | | | | | |
Callable 12/15/28 @ 100 | | | | | | | | |
4.500%, 06/15/49 | | | 4,015 | | | | 4,706 | |
| | | | | | | | | | | | | |
Total New Jersey | | | 53,615 | |
| | | | | | | | | | | | | |
New Mexico [0.6%] |
Farmington New Mexico, RB | | | | | | | | |
1.150%, 06/01/40(A) | | | 3,500 | | | | 3,538 | |
Farmington New Mexico, RB | | | | | | | | |
1.100%, 06/01/40(A) | | | 3,000 | | | | 3,023 | |
Lower Petroglyphs, Public Improvement District, RB | | | | | | | | |
Callable 10/01/27 @ 100 | | | | | | | | |
5.000%, 10/01/33 | | | 500 | | | | 547 | |
Lower Petroglyphs, Public Improvement District, RB | | | | | | | | |
Callable 10/01/27 @ 100 | | | | | | | | |
5.000%, 10/01/38 | | | 500 | | | | 541 | |
Lower Petroglyphs, Public Improvement District, RB | | | | | | | | |
Callable 10/01/27 @ 100 | | | | | | | | |
5.000%, 10/01/48 | | | 1,750 | | | | 1,882 | |
New Mexico State, Hospital Equipment Loan Council, RB | | | | | | | | |
Callable 07/01/22 @ 100 | | | | | | | | |
5.500%, 07/01/42 | | | 3,110 | | | | 3,205 | |
| | | | | | | | | | | | | |
Total New Mexico | | | 12,736 | |
| | | | | | | | | | | | | |
New York [6.2%] |
Build NYC Resource, RB | | | | | | | | |
Callable 06/15/31 @ 100 | | | | | | | | |
4.000%, 06/15/51 | | | 480 | | | | 517 | |
Build NYC Resource, RB | | | | | | | | |
Callable 06/15/31 @ 100 | | | | | | | | |
4.000%, 06/15/56 | | | 530 | | | | 568 | |
Dutchess County, Local Development, Ser A, RB | | | | | | | | |
Callable 07/01/30 @ 100 | | | | | | | | |
5.000%, 07/01/45(C) | | | 875 | | | | 1,047 | |
Dutchess County, Local Development, Ser A, RB | | | | | | | | |
Callable 07/01/30 @ 100 | | | | | | | | |
5.000%, 07/01/51(C) | | | 875 | | | | 1,043 | |
Jefferson County, Civic Facility Development, RB | | | | | | | | |
Callable 11/01/27 @ 100 | | | | | | | | |
4.000%, 11/01/47 | | | 4,875 | | | | 5,102 | |
Metropolitan Transportation Authority, Ser C-1, RB | | | | | | | | |
Callable 05/15/30 @ 100 | | | | | | | | |
5.250%, 11/15/55 | | | 10,000 | | | | 12,145 | |
Metropolitan Washington, Transportation Authority, Ser C-1, RB | | | | | | | | |
Callable 05/15/30 @ 100 | | | | | | | | |
5.000%, 11/15/50 | | | 1,750 | | | | 2,095 | |
Metropolitan Washington, Transportation Authority, Ser C-1, RB | | | | | | | | |
Callable 05/15/30 @ 100 | | | | | | | | |
4.750%, 11/15/45 | | | 2,000 | | | | 2,345 | |
Monroe County Industrial Development, RB | | | | | | | | |
Callable 06/01/28 @ 100 | | | | | | | | |
5.000%, 06/01/50(C) | | | 1,100 | | | | 1,274 | |
Nassau County Industrial Development Agency, RB | | | | | | | | |
Callable 10/01/26 @ 107 | | | | | | | | |
5.000%, 5.250%, 09/8/41, 01/01/58(A) (B) | | | 4,358 | | | | 4,145 | |
Nassau County, Tobacco Settlement, RB | | | | | | | | |
Callable 10/22/21 @ 100 | | | | | | | | |
5.125%, 06/01/46 | | | 1,345 | | | | 1,366 | |
New York Counties, Tobacco Trust IV, Ser A, RB | | | | | | | | |
Callable 10/22/21 @ 100 | | | | | | | | |
5.000%, 06/01/45 | | | 5,800 | | | | 5,851 | |
New York State, Dormitory Authority, Ser A, RB | | | | | | | | |
Callable 09/15/30 @ 100 | | | | | | | | |
3.000%, 03/15/49 | | | 10,000 | | | | 10,478 | |
See accompanying notes to financial statements.
CITY NATIONAL ROCHDALE FUNDS | PAGE 50
schedule of investments |
September 30, 2021 |
City National Rochdale Municipal High Income Fund (continued) |
Description | | Face Amount (000) | | | Value (000) | |
New York State, Environmental Facilities, RB, AMT | | | | | | | | |
Callable 06/02/25 @ 100 | | | | | | | | |
2.750%, 09/01/50(A) | | $ | 750 | | | $ | 786 | |
New York State, Liberty Development, Bank of America Tower, RB | | | | | | | | |
Callable 03/15/29 @ 100 | | | | | | | | |
2.800%, 09/15/69 | | | 1,000 | | | | 1,016 | |
New York State, Liberty Development, World Trade Center, RB | | | | | | | | |
Callable 11/15/24 @ 100 | | | | | | | | |
5.000%, 11/15/44(C) | | | 5,000 | | | | 5,475 | |
New York State, Thruway Authority, Sub-Ser B, RB | | | | | | | | |
Callable 01/01/30 @ 100 | | | | | | | | |
4.000%, 01/01/50 | | | 5,000 | | | | 5,686 | |
New York State, Transportation Development, LaGuardia Airport Terminal B, RB, AMT | | | | | | | | |
Callable 07/01/24 @ 100 | | | | | | | | |
5.000%, 07/01/41 | | | 1,500 | | | | 1,665 | |
New York State, Transportation Development, RB | | | | | | | | |
Callable 12/01/30 @ 100 | | | | | | | | |
4.000%, 12/01/39 | | | 1,500 | | | | 1,718 | |
New York State, Transportation Development, RB | | | | | | | | |
Callable 12/01/30 @ 100 | | | | | | | | |
4.000%, 12/01/41 | | | 850 | | | | 961 | |
New York State, Transportation Development, RB, AMT | | | | | | | | |
Callable 08/01/30 @ 100 | | | | | | | | |
5.250%, 08/01/31 | | | 1,880 | | | | 2,230 | |
New York State, Transportation Development, RB, AMT | | | | | | | | |
5.000%, 01/01/22 | | | 3,420 | | | | 3,457 | |
New York State, Transportation Development, RB, AMT | | | | | | | | |
Callable 01/01/28 @ 100 | | | | | | | | |
5.000%, 01/01/36 | | | 5,000 | | | | 5,972 | |
New York State, Transportation Development, RB, AMT | | | | | | | | |
Callable 10/01/30 @ 100 | | | | | | | | |
4.375%, 10/01/45 | | | 2,750 | | | | 3,184 | |
New York State, Transportation Development, RB, AMT | | | | | | | | |
3.000%, 08/01/31 | | | 1,200 | | | | 1,284 | |
New York State, Urban Development, RB | | | | | | | | |
Callable 09/15/28 @ 100 | | | | | | | | |
4.000%, 03/15/48 | | | 7,000 | | | | 7,986 | |
New York Transportation Development, RB, AMT | | | | | | | | |
Callable 10/31/31 @ 100 | | | | | | | | |
4.000%, 04/30/53 | | | 3,000 | | | | 3,375 | |
Niagara, Area Development, Ser A, RB, AMT | | | | | | | | |
Callable 07/01/23 @ 100 | | | | | | | | |
4.750%, 11/01/42(C) | | | 4,750 | | | | 4,963 | |
Niagara, Tobacco Asset Securitization, RB | | | | | | | | |
Callable 05/15/24 @ 100 | | | | | | | | |
5.250%, 05/15/34 | | | 1,000 | | | | 1,092 | |
Niagara, Tobacco Asset Securitization, RB | | | | | | | | |
Callable 05/15/24 @ 100 | | | | | | | | |
5.250%, 05/15/40 | | | 1,000 | | | | 1,085 | |
Suffolk Tobacco Asset Securitization, Sub-Ser, RB | | | | | | | | |
Callable 06/01/31 @ 28 | | | | | | | | |
3.667%, 06/01/66(D) | | | 25,040 | | | | 4,765 | |
Suffolk, Tobacco Asset Securitization, Ser C, RB | | | | | | | | |
Callable 10/29/21 @ 100 | | | | | | | | |
6.625%, 06/01/44 | | | 1,200 | | | | 1,212 | |
TSASC, Ser A, RB | | | | | | | | |
Callable 06/01/27 @ 100 | | | | | | | | |
5.000%, 06/01/41 | | | 2,000 | | | | 2,317 | |
TSASC, Ser B, RB | | | | | | | | |
Callable 06/01/27 @ 100 | | | | | | | | |
5.000%, 06/01/48 | | | 5,750 | | | | 6,283 | |
TSASC, Sub-Ser, RB | | | | | | | | |
Callable 06/01/27 @ 100 | | | | | | | | |
5.000%, 06/01/45 | | | 1,250 | | | | 1,373 | |
Westchester, Tobacco Asset Securitization, Ser B, RB | | | | | | | | |
Callable 06/01/27 @ 100 | | | | | | | | |
5.000%, 06/01/41 | | | 2,485 | | | | 2,933 | |
Westchester, Tobacco Asset Securitization, Sub-Ser C, RB | | | | | | | | |
Callable 06/01/27 @ 100 | | | | | | | | |
5.125%, 06/01/51 | | | 7,000 | | | | 7,960 | |
| | | | | | | | | | | | | |
Total New York | | | 126,754 | |
| | | | | | | | | | | | | |
See accompanying notes to financial statements.
CITY NATIONAL ROCHDALE FUNDS | PAGE 51
schedule of investments |
September 30, 2021 |
City National Rochdale Municipal High Income Fund (continued) |
Description | | Face Amount (000) | | | Value (000) | |
North Carolina [0.5%] |
North Carolina State, Department of Transportation, I-77 Hot Lanes Project, RB, AMT | | | | | | | | |
Callable 06/30/25 @ 100 | | | | | | | | |
5.000%, 12/31/37 | | $ | 1,405 | | | $ | 1,547 | |
North Carolina State, Medical Care Commission, RB | | | | | | | | |
Callable 09/01/28 @ 103 | | | | | | | | |
4.000%, 09/01/46 | | | 525 | | | | 601 | |
North Carolina State, Medical Care Commission, Ser A, RB | | | | | | | | |
Callable 09/01/27 @ 100 | | | | | | | | |
4.000%, 09/01/50 | | | 3,750 | | | | 4,044 | |
North Carolina State, Turnpike Authority, RB | | | | | | | | |
5.000%, 02/01/24 | | | 1,000 | | | | 1,102 | |
North Carolina State, Turnpike Authority, RB | | | | | | | | |
Callable 01/01/30 @ 100 | | | | | | | | |
5.000%, 01/01/44 | | | 1,500 | | | | 1,824 | |
North Carolina State, Turnpike Authority, RB | | | | | | | | |
Callable 01/01/30 @ 100 | | | | | | | | |
5.000%, 01/01/49 | | | 500 | | | | 604 | |
| | | | | | | | | | | | | |
Total North Carolina | | | 9,722 | |
| | | | | | | | | | | | | |
North Dakota [0.6%] |
Burleigh County, Educational Facilities Revenue, Education Facilities, University of Mary Project, RB | | | | | | | | |
Callable 04/15/26 @ 100 | | | | | | | | |
5.200%, 04/15/46 | | | 2,000 | | | | 2,099 | |
County of Grand Forks North Dakota, RB, AMT | | | | | | | | |
Callable 06/15/26 @ 103 | | | | | | | | |
7.000%, 12/15/43(C) | | | 5,000 | | | | 5,024 | |
Grand Forks North Dakota, RB | | | | | | | | |
Callable 12/01/31 @ 100 | | | | | | | | |
4.000%, 12/01/51 | | | 250 | | | | 283 | |
Ward County, Ser C, RB | | | | | | | | |
Callable 06/01/28 @ 100 | | | | | | | | |
5.000%, 06/01/48 | | | 2,500 | | | | 2,888 | |
Ward County, Ser C, RB | | | | | | | | |
Callable 06/01/28 @ 100 | | | | | | | | |
5.000%, 06/01/53 | | | 1,500 | | | | 1,724 | |
| | | | | | | | | | | | | |
Total North Dakota | | | 12,018 | |
| | | | | | | | | | | | | |
Ohio [4.3%] |
Buckeye Tobacco Settlement, Financing Authority, Ser A-2-Class, RB | | | | | | | | |
Callable 06/01/30 @ 100 | | | | | | | | |
4.000%, 06/01/48 | | | 7,000 | | | | 7,784 | |
Buckeye Tobacco Settlement, Financing Authority, Ser A-2-Class, RB | | | | | | | | |
Callable 06/01/30 @ 100 | | | | | | | | |
3.000%, 06/01/48 | | | 10,630 | | | | 10,874 | |
Buckeye Tobacco Settlement, Financing Authority, Ser B-2, RB | | | | | | | | |
Callable 06/01/30 @ 100 | | | | | | | | |
5.000%, 06/01/55 | | | 10,500 | | | | 11,886 | |
Cleveland-Cuyahoga County Port Authority, TA | | | | | | | | |
Callable 12/01/29 @ 100 | | | | | | | | |
4.000%, 12/01/55(C) | | | 250 | | | | 262 | |
County of Cuyahoga Ohio, RB | | | | | | | | |
Callable 02/15/27 @ 100 | | | | | | | | |
5.000%, 02/15/57 | | | 5,000 | | | | 5,794 | |
Cuyahoga County, Hospital Revenue, Metrohealth System, RB | | | | | | | | |
Callable 02/15/27 @ 100 | | | | | | | | |
5.250%, 02/15/47 | | | 3,800 | | | | 4,486 | |
Muskingum County, Hospital Facilities Authority, Genesis Healthcare Systems Project, RB | | | | | | | | |
Callable 02/15/23 @ 100 | | | | | | | | |
5.000%, 02/15/33 | | | 1,000 | | | | 1,046 | |
Muskingum County, Hospital Facilities Authority, Genesis Healthcare Systems Project, RB | | | | | | | | |
Callable 02/15/23 @ 100 | | | | | | | | |
5.000%, 02/15/44 | | | 1,000 | | | | 1,040 | |
Muskingum County, Hospital Facilities Authority, Genesis Healthcare Systems Project, RB | | | | | | | | |
Callable 02/15/23 @ 100 | | | | | | | | |
5.000%, 02/15/48 | | | 4,000 | | | | 4,156 | |
Ohio State, Air Quality Development Authority, Pratt Paper Project, RB, AMT | | | | | | | | |
Callable 01/15/28 @ 100 | | | | | | | | |
4.500%, 01/15/48(C) | | | 3,020 | | | | 3,494 | |
See accompanying notes to financial statements.
CITY NATIONAL ROCHDALE FUNDS | PAGE 52
schedule of investments |
September 30, 2021 |
City National Rochdale Municipal High Income Fund (continued) |
Description | | Face Amount (000) | | | Value (000) | |
Ohio State, Air Quality Development Authority, Pratt Paper Project, RB, AMT | | | | | | | | |
Callable 01/15/28 @ 100 | | | | | | | | |
4.250%, 01/15/38(C) | | $ | 3,280 | | | $ | 3,747 | |
Ohio State, Air Quality Development Authority, RB, AMT | | | | | | | | |
Callable 07/01/29 @ 100 | | | | | | | | |
5.000%, 07/01/49(C) | | | 12,000 | | | | 13,781 | |
Ohio State, Housing Finance Agency, Sanctuary at Springboro Project, RB | | | | | | | | |
Callable 10/01/25 @ 101 | | | | | | | | |
5.450%, 01/01/38(C) | | | 2,500 | | | | 2,524 | |
Southeastern Ohio, Port Authority, Memorial Health System Project, RB | | | | | | | | |
Callable 12/01/22 @ 100 | | | | | | | | |
6.000%, 12/01/42 | | | 7,000 | | | | 7,262 | |
Southern Ohio Port Authority, Ser A, RB, AMT | | | | | | | | |
Callable 12/01/27 @ 103 | | | | | | | | |
7.000%, 12/01/42(C) | | | 6,000 | | | | 6,890 | |
Southern Ohio Port Authority, Ser A, RB, AMT | | | | | | | | |
Callable 12/01/27 @ 103 | | | | | | | | |
6.500%, 12/01/30(C) | | | 3,000 | | | | 3,466 | |
| | | | | | | | | | | | | |
Total Ohio | | | 88,492 | |
| | | | | | | | | | | | | |
Oklahoma [0.5%] |
Oklahoma County, Development Finance Authority, Ser B, RB | | | | | | | | |
Callable 08/15/28 @ 100 | | | | | | | | |
5.500%, 08/15/52 | | | 500 | | | | 609 | |
Oklahoma County, Finance Authority, Epworth Village Project, Ser A, RB | | | | | | | | |
Callable 04/01/22 @ 100 | | | | | | | | |
5.125%, 04/01/42 | | | 4,000 | | | | 3,560 | |
Oklahoma State, Development Finance Authority, Inverness Village Community, RB | | | | | | | | |
Callable 01/01/22 @ 100 | | | | | | | | |
6.000%, 01/01/32(E) | | | 1,278 | | | | 15 | |
Oklahoma State, Development Finance Authority, RB | | | | | | | | |
5.450%, 08/15/28 | | | 5,000 | | | | 5,646 | |
Oklahoma State, Development Finance Authority, RB | | | | | | | | |
Callable 08/01/27 @ 100 | | | | | | | | |
5.250%, 08/01/57(E) | | | 1,622 | | | | 24 | |
Payne County, Economic Development Authority, Epworth Living at the Ranch, RB | | | | | | | | |
Callable 11/01/26 @ 100 | | | | | | | | |
6.875%, 11/01/46(E) | | | 3,843 | | | | 19 | |
Payne County, Economic Development Authority, Epworth Living at the Ranch, RB | | | | | | | | |
Callable 11/01/26 @ 100 | | | | | | | | |
6.625%, 11/01/36(E) | | | 1,664 | | | | 9 | |
| | | | | | | | | | | | | |
Total Oklahoma | | | 9,882 | |
| | | | | | | | | | | | | |
Oregon [1.3%] |
Clackamas County, Hospital Facility Authority, Ser A, RB | | | | | | | | |
Callable 11/15/25 @ 102 | | | | | | | | |
5.375%, 11/15/55 | | | 875 | | | | 966 | |
Clackamas County, Hospital Facility Authority, Ser A, RB | | | | | | | | |
Callable 11/15/25 @ 102 | | | | | | | | |
5.250%, 11/15/50 | | | 1,000 | | | | 1,101 | |
Hospital Facilities Authority of Multnomah County Oregon, RB | | | | | | | | |
Callable 12/01/28 @ 103 | | | | | | | | |
4.000%, 12/01/56 | | | 9,220 | | | | 10,098 | |
Medford Hospital Facilities Authority, Ser A, RB | | | | | | | | |
Callable 08/15/30 @ 100 | | | | | | | | |
4.000%, 08/15/50 | | | 7,000 | | | | 8,026 | |
Oregon State, Business Development Commission, RB, AMT | | | | | | | | |
5.000%, 03/01/49(A) | | | 5,000 | | | | 5,093 | |
Yamhill County, Hospital Authority, Ser A, RB | | | | | | | | |
Callable 11/15/28 @ 103 | | | | | | | | |
5.000%, 11/15/51 | | | 600 | | | | 698 | |
Yamhill County, Hospital Authority, Ser A, RB | | | | | | | | |
Callable 11/15/28 @ 103 | | | | | | | | |
5.000%, 11/15/56 | | | 750 | | | | 866 | |
| | | | | | | | | | | | | |
Total Oregon | | | 26,848 | |
| | | | | | | | | | | | | |
Pennsylvania [2.7%] |
Allegheny County Airport Authority, Ser A, RB, AMT | | | | | | | | |
Callable 01/01/31 @ 100 | | | | | | | | |
4.000%, 01/01/56 | | | 2,250 | | | | 2,542 | |
See accompanying notes to financial statements.
CITY NATIONAL ROCHDALE FUNDS | PAGE 53
schedule of investments |
September 30, 2021 |
City National Rochdale Municipal High Income Fund (continued) |
Description | | Face Amount (000) | | | Value (000) | |
Allentown, Neighborhood Improvement Zone Development Authority, City Center Project, RB | | | | | | | | |
Callable 05/01/28 @ 100 | | | | | | | | |
5.000%, 05/01/33(C) | | $ | 500 | | | $ | 592 | |
Allentown, Neighborhood Improvement Zone Development Authority, City Center Project, RB | | | | | | | | |
Callable 05/01/28 @ 100 | | | | | | | | |
5.000%, 05/01/42(C) | | | 2,000 | | | | 2,350 | |
Allentown, Neighborhood Improvement Zone Development Authority, Sub-Ser, RB | | | | | | | | |
Callable 05/01/28 @ 100 | | | | | | | | |
5.375%, 05/01/42(C) | | | 3,000 | | | | 3,502 | |
Allentown, Neighborhood Improvement Zone Development Authority, Sub-Ser, RB | | | | | | | | |
Callable 05/01/28 @ 100 | | | | | | | | |
5.125%, 05/01/32(C) | | | 1,000 | | | | 1,175 | |
Chester County, Industrial Development Authority, Woodlands at Graystone Project, RB | | | | | | | | |
Callable 03/01/28 @ 100 | | | | | | | | |
5.125%, 03/01/48(C) | | | 1,000 | | | | 1,133 | |
Chester County, Industrial Development Authority, Woodlands at Graystone Project, RB | | | | | | | | |
Callable 03/01/28 @ 100 | | | | | | | | |
5.000%, 03/01/38(C) | | | 525 | | | | 597 | |
Dauphin County General Authority, RB | | | | | | | | |
Callable 10/15/28 @ 100 | | | | | | | | |
6.250%, 10/15/53(C) | | | 750 | | | | 906 | |
Dauphin County, General Authority, Harrisburg University of Science and Technology Project, RB | | | | | | | | |
Callable 10/15/27 @ 100 | | | | | | | | |
5.125%, 10/15/41(C) | | | 1,135 | | | | 1,263 | |
Dauphin County, General Authority, RB | | | | | | | | |
Callable 10/15/27 @ 100 | | | | | | | | |
5.000%, 10/15/34(C) | | | 8,470 | | | | 9,443 | |
DuBois, Hospital Authority, RB | | | | | | | | |
Callable 01/15/28 @ 100 | | | | | | | | |
4.000%, 07/15/43 | | | 2,370 | | | | 2,614 | |
Franklin County, Industrial Development Authority, RB | | | | | | | | |
Callable 12/01/25 @ 103 | | | | | | | | |
5.000%, 12/01/49 | | | 1,530 | | | | 1,637 | |
Pennsylvania State, Turnpike Commission, Convertible Capital Appreciation Project, Sub-Ser E, RB | | | | | | | | |
Callable 12/01/27 @ 100 | | | | | | | | |
6.375%, 12/01/38 | | | 2,000 | | | | 2,606 | |
Pennsylvania State, Turnpike Commission, Ser A, RB | | | | | | | | |
Callable 12/01/24 @ 100 | | | | | | | | |
5.000%, 12/01/33 | | | 1,500 | | | | 1,703 | |
Pennsylvania State, Turnpike Commission, Ser A, RB | | | | | | | | |
Callable 12/01/29 @ 100 | | | | | | | | |
5.000%, 12/01/49 | | | 2,975 | | | | 3,691 | |
Philadelphia, Authority for Industrial Development, Mariana Bracetti Academy, RB | | | | | | | | |
Pre-Refunded @ 100 | | | | | | | | |
7.625%, 12/15/21(F) | | | 1,000 | | | | 1,015 | |
Philadelphia, Authority for Industrial Development, Mariana Bracetti Academy, RB | | | | | | | | |
Pre-Refunded @ 100 | | | | | | | | |
7.150%, 12/15/21(F) | | | 2,280 | | | | 2,311 | |
Philadelphia, Authority for Industrial Development, RB | | | | | | | | |
Callable 06/15/28 @ 100 | | | | | | | | |
5.000%, 06/15/40(C) | | | 900 | | | | 1,048 | |
Philadelphia, Authority for Industrial Development, RB | | | | | | | | |
Callable 06/15/28 @ 100 | | | | | | | | |
5.000%, 06/15/50(C) | | | 1,450 | | | | 1,667 | |
Philadelphia, Hospitals & Higher Education Facilities Authority, Temple University Health Systems Project, Ser A, RB | | | | | | | | |
Callable 07/01/22 @ 100 | | | | | | | | |
5.625%, 07/01/42 | | | 3,000 | | | | 3,095 | |
Philadelphia, Ser B, GO | | | | | | | | |
Callable 08/01/29 @ 100 | | | | | | | | |
5.000%, 02/01/39 | | | 4,385 | | | | 5,428 | |
Pottsville, Hospital Authority, Schuykill Health System Project, RB | | | | | | | | |
Pre-Refunded @ 100 | | | | | | | | |
6.500%, 07/01/24(C) (F) | | | 3,000 | | | | 3,466 | |
See accompanying notes to financial statements.
CITY NATIONAL ROCHDALE FUNDS | PAGE 54
schedule of investments |
September 30, 2021 |
City National Rochdale Municipal High Income Fund (continued) |
Description | | Face Amount (000) | | | Value (000) | |
Washington County, Redevelopment Authority, TA | | | | | | | | |
Callable 01/01/28 @ 100 | | | | | | | | |
5.000%, 07/01/35 | | $ | 1,235 | | | $ | 1,342 | |
| | | | | | | | | | | | | |
Total Pennsylvania | | | 55,126 | |
| | | | | | | | | | | | | |
Rhode Island [0.2%] |
Rhode Island State, Health & Educational Building, RB | | | | | | | | |
Callable 05/15/26 @ 100 | | | | | | | | |
5.000%, 05/15/39 | | | 1,000 | | | | 1,129 | |
Rhode Island State, Tobacco Settlement Financing, Ser B, RB | | | | | | | | |
Callable 10/22/21 @ 16 | | | | | | | | |
11.028%, 06/01/52(D) | | | 21,270 | | | | 3,346 | |
| | | | | | | | | | | | | |
Total Rhode Island | | | 4,475 | |
| | | | | | | | | | | | | |
South Carolina [0.7%] |
Berkeley County, RB | | | | | | | | |
Callable 11/01/29 @ 100 | | | | | | | | |
4.375%, 11/01/49 | | | 2,500 | | | | 2,787 | |
South Carolina State, Jobs-Economic Development Authority, The Woodlands at Furman, RB | | | | | | | | |
Callable 11/15/24 @ 103 | | | | | | | | |
5.250%, 11/15/47 | | | 3,830 | | | | 4,185 | |
South Carolina State, Jobs-Economic Development Authority, The Woodlands at Furman, RB | | | | | | | | |
Callable 11/15/24 @ 103 | | | | | | | | |
5.250%, 11/15/52 | | | 5,950 | | | | 6,493 | |
| | | | | | | | | | | | | |
Total South Carolina | | | 13,465 | |
| | | | | | | | | | | | | |
Tennessee [1.3%] |
Chattanooga, Health Educational & Housing Facility Board, RB | | | | | | | | |
Callable 10/01/25 @ 100 | | | | | | | | |
5.000%, 10/01/35 | | | 1,000 | | | | 1,110 | |
Metropolitan Government, Nashville & Davidson County Health & Educational Facs Bd, Ser S, RB | | | | | | | | |
Callable 11/01/25 @ 102 | | | | | | | | |
4.000%, 11/01/55 | | | 4,750 | | | | 5,043 | |
Metropolitan Nashville Airport Authority, Sub-Ser B, RB, AMT | | | | | | | | |
Callable 07/01/30 @ 100 | | | | | | | | |
5.000%, 07/01/54 | | | 5,675 | | | | 6,906 | |
Nashville, Metropolitan Development & Housing Agency, RB | | | | | | | | |
Callable 06/01/28 @ 100 | | | | | | | | |
5.125%, 06/01/36(C) | | | 900 | | | | 1,026 | |
Nashville, Metropolitan Development & Housing Agency, RB | | | | | | | | |
4.500%, 06/01/28(C) | | | 650 | | | | 712 | |
Tennergy, Ser A, RB | | | | | | | | |
Callable 06/01/28 @ 101 | | | | | | | | |
4.000%, 12/01/51(A) | | | 10,000 | | | | 11,791 | |
| | | | | | | | | | | | | |
Total Tennessee | | | 26,588 | |
| | | | | | | | | | | | | |
Texas [6.5%] |
Alvin Independent School District, Ser B-REMK, GO | | | | | | | | |
0.450%, 02/15/36(A) | | | 2,000 | | | | 2,005 | |
Arlington, Higher Education Finance, Universal Academy Project, Ser A, RB | | | | | | | | |
Callable 03/01/24 @ 100 | | | | | | | | |
7.125%, 03/01/44 | | | 2,300 | | | | 2,513 | |
Arlington, Higher Education Finance, Universal Academy Project, Ser A, RB | | | | | | | | |
Callable 03/01/24 @ 100 | | | | | | | | |
7.000%, 03/01/34 | | | 400 | | | | 439 | |
Board of Regents of the University of Texas System, Ser B, RB | | | | | | | | |
5.000%, 08/15/49 | | | 5,500 | | | | 8,257 | |
Celina, Cambridge Crossing Public Improvement Project, SAB | | | | | | | | |
Callable 09/01/28 @ 100 | | | | | | | | |
5.250%, 09/01/47(C) | | | 500 | | | | 564 | |
Celina, Cambridge Crossing Public Improvement Project, SAB | | | | | | | | |
Callable 09/01/28 @ 100 | | | | | | | | |
5.125%, 09/01/38(C) | | | 1,500 | | | | 1,705 | |
Celina, Sutton Fields II Public Improvement Project, SAB | | | | | | | | |
Callable 03/01/23 @ 103 | | | | | | | | |
7.250%, 09/01/45 | | | 475 | | | | 498 | |
See accompanying notes to financial statements.
CITY NATIONAL ROCHDALE FUNDS | PAGE 55
schedule of investments |
September 30, 2021 |
City National Rochdale Municipal High Income Fund (continued) |
Description | | Face Amount (000) | | | Value (000) | |
Central Texas, Regional Mobility Authority, Ser B, RB | | | | | | | | |
Callable 01/01/31 @ 100 | | | | | | | | |
4.000%, 01/01/51 | | $ | 1,000 | | | $ | 1,132 | |
Central Texas, Regional Mobility Authority, Ser B-SENIOR, RB | | | | | | | | |
Callable 01/01/30 @ 100 | | | | | | | | |
5.000%, 01/01/45 | | | 750 | | | | 918 | |
Central Texas, Regional Mobility Authority, Sub-Ser, RB | | | | | | | | |
Pre-Refunded @ 100 | | | | | | | | |
5.000%, 01/01/23(F) | | | 1,000 | | | | 1,060 | |
Central Texas, Regional Mobility Authority, Sub-Ser, RB | | | | | | | | |
Pre-Refunded @ 100 | | | | | | | | |
5.000%, 01/01/23(F) | | | 1,000 | | | | 1,060 | |
Clifton, Higher Education Finance, International Leadership Project, Ser D, RB | | | | | | | | |
Callable 08/15/25 @ 100 | | | | | | | | |
6.125%, 08/15/48 | | | 4,245 | | | | 4,883 | |
Grand Parkway, Transportation, Toll Revenue, Sub-Ser B, RB | | | | | | | | |
Pre-Refunded @ 100 | | | | | | | | |
5.000%, 10/01/23(F) | | | 2,000 | | | | 2,190 | |
Gulf Coast Authority, Ser B, RB, AMT | | | | | | | | |
1.500%, 05/01/28 | | | 1,000 | | | | 999 | |
Houston Texas Airport System Revenue, RB, AMT | | | | | | | | |
Callable 07/15/29 @ 100 | | | | | | | | |
4.000%, 07/15/41 | | | 2,750 | | | | 2,925 | |
Houston, Airport System Revenue, RB, AMT | | | | | | | | |
5.000%, 07/01/27 | | | 500 | | | | 586 | |
Houston, Airport System Revenue, RB, AMT | | | | | | | | |
4.750%, 07/01/24 | | | 2,000 | | | | 2,125 | |
Houston, Airport System Revenue, Ser B-1, RB, AMT | | | | | | | | |
Callable 07/15/25 @ 100 | | | | | | | | |
5.000%, 07/15/35 | | | 3,000 | | | | 3,299 | |
Houston, Airport System Revenue, Ser C, RB, AMT | | | | | | | | |
5.000%, 07/15/27 | | | 4,500 | | | | 5,257 | |
Houston, Airport System Revenue, Sub-Ser A, RB, AMT | | | | | | | | |
Callable 07/01/30 @ 100 | | | | | | | | |
4.000%, 07/01/47 | | | 1,250 | | | | 1,414 | |
Houston, Airport System Revenue, United Airlines Project, RB, AMT | | | | | | | | |
Callable 07/01/24 @ 100 | | | | | | | | |
5.000%, 07/01/29 | | | 7,000 | | | | 7,619 | |
Lago Vista Texas, RB | | | | | | | | |
Callable 09/01/30 @ 100 | | | | | | | | |
4.875%, 09/01/50(C) | | | 275 | | | | 289 | |
Matagorda County Navigation District No. 1, RB, AMT | | | | | | | | |
0.900%, 05/01/30(A) | | | 1,750 | | | | 1,755 | |
Mission, Economic Development, RB, AMT | | | | | | | | |
Callable 10/27/21 @ 105 | | | | | | | | |
4.625%, 10/01/31(C) | | | 3,250 | | | | 3,418 | |
New Hope, Cultural Education Facilities Finance, Carillon LifeCare Community Project, RB | | | | | | | | |
Callable 07/01/24 @ 102 | | | | | | | | |
5.000%, 07/01/36 | | | 4,660 | | | | 4,829 | |
New Hope, Cultural Education Facilities Finance, E Grand Preparatory Academy, RB | | | | | | | | |
Callable 11/08/21 @ 100 | | | | | | | | |
5.500%, 08/15/46 | | | 1,000 | | | | 1,003 | |
New Hope, Cultural Education Facilities Finance, E Grand Preparatory Academy, RB | | | | | | | | |
Callable 11/08/21 @ 100 | | | | | | | | |
5.500%, 08/15/51 | | | 2,500 | | | | 2,506 | |
New Hope, Cultural Education Facilities Finance, Jubilee Academic Center Project, Ser A, RB | | | | | | | | |
Callable 11/08/21 @ 100 | | | | | | | | |
5.000%, 08/15/36(C) | | | 1,500 | | | | 1,503 | |
New Hope, Cultural Education Facilities Finance, RB | | | | | | | | |
5.000%, 08/15/46 | | | 7,000 | | | | 7,013 | |
New Hope, Cultural Education Facilities Finance, RB | | | | | | | | |
Callable 11/01/27 @ 103 | | | | | | | | |
4.000%, 11/01/55 | | | 1,000 | | | | 1,118 | |
New Hope, Cultural Education Facilities Finance, Ser A, RB | | | | | | | | |
Callable 08/15/25 @ 100 | | | | | | | | |
5.000%, 08/15/50(C) | | | 4,750 | | | | 5,155 | |
Newark, Higher Education Finance, Ser A, RB | | | | | | | | |
Callable 08/15/25 @ 100 | | | | | | | | |
5.750%, 08/15/45(C) | | | 1,700 | | | | 1,899 | |
See accompanying notes to financial statements.
CITY NATIONAL ROCHDALE FUNDS | PAGE 56
schedule of investments |
September 30, 2021 |
City National Rochdale Municipal High Income Fund (continued) |
Description | | Face Amount (000) | | | Value (000) | |
Newark, Higher Education Finance, Ser A, RB | | | | | | | | |
Callable 08/15/25 @ 100 | | | | | | | | |
5.500%, 08/15/35(C) | | $ | 900 | | | $ | 1,010 | |
North Texas, Tollway Authority, Convertible Capital Appreciation Project, Ser C, RB | | | | | | | | |
Pre-Refunded @ 100 | | | | | | | | |
0.561%, 7.000%, 09/01/23, 09/01/31(B) (F) | | | 5,000 | | | | 6,960 | |
Port Beaumont Navigation District, RB | | | | | | | | |
Callable 01/01/22 @ 103 | | | | | | | | |
6.000%, 01/01/25(C) | | | 1,525 | | | | 1,581 | |
Port Beaumont Navigation District, RB, AMT | | | | | | | | |
Callable 01/01/22 @ 103 | | | | | | | | |
4.000%, 01/01/50(C) | | | 6,330 | | | | 6,540 | |
Port Beaumont Navigation District, RB, AMT | | | | | | | | |
Callable 01/01/22 @ 103 | | | | | | | | |
3.625%, 01/01/35(C) | | | 1,000 | | | | 1,033 | |
Port Beaumont Navigation District, RB, AMT | | | | | | | | |
Callable 07/01/23 @ 103 | | | | | | | | |
3.000%, 01/01/50(C) | | | 750 | | | | 702 | |
Sanger, Industrial Development Authority, Texas Pellets Project, Ser B, RB, AMT | | | | | | | | |
Callable 07/01/22 @ 100 | | | | | | | | |
8.000%, 07/01/38(E) | | | 4,950 | | | | 1,237 | |
Tarrant County, Cultural Education Facilities Finance, Buckingham Senior Living Community Project, RB | | | | | | | | |
Callable 11/15/25 @ 100 | | | | | | | | |
5.500%, 11/15/45(E) | | | 5,315 | | | | 3,030 | |
Tarrant County, Cultural Education Facilities Finance, Buckingham Senior Living Community Project, RB | | | | | | | | |
Callable 11/08/21 @ 100 | | | | | | | | |
4.500%, 11/15/21(E) | | | 2,310 | | | | 1,317 | |
Tarrant County, Cultural Education Facilities Finance, Buckingham Senior Living Community Project, Ser Senior, RB | | | | | | | | |
Callable 11/08/21 @ 100 | | | | | | | | |
5.750%, 11/15/37(E) | | | 6,000 | | | | 3,420 | |
Tarrant County, Cultural Education Facilities Finance, Buckner Senior Living Ventana Project, Ser Senior, RB | | | | | | | | |
Callable 05/15/27 @ 100 | | | | | | | | |
6.750%, 11/15/47 | | | 1,000 | | | | 1,129 | |
Tarrant County, Cultural Education Facilities Finance, Buckner Senior Living Ventana Project, Ser Senior, RB | | | | | | | | |
Callable 05/15/27 @ 100 | | | | | | | | |
6.750%, 11/15/52 | | | 2,200 | | | | 2,473 | |
Tarrant County, Cultural Education Facilities Finance, Buckner Senior Living Ventana Project, Ser Senior, RB | | | | | | | | |
Callable 05/15/27 @ 100 | | | | | | | | |
6.625%, 11/15/37 | | | 3,500 | | | | 3,980 | |
Tarrant County, Cultural Education Facilities Finance, Northwest Senior Housing Edgemere Project, RB | | | | | | | | |
Callable 05/15/27 @ 100 | | | | | | | | |
5.250%, 11/15/47 | | | 3,720 | | | | 3,252 | |
Tarrant County, Cultural Education Facilities Finance, RB | | | | | | | | |
Callable 02/15/27 @ 100 | | | | | | | | |
6.375%, 02/15/52(E) | | | 9,000 | | | | 6,300 | |
Temple, Ser A-REV, RB | | | | | | | | |
Callable 08/01/25 @ 100 | | | | | | | | |
5.000%, 08/01/38 | | | 2,000 | | | | 2,180 | |
Texas State, Private Activity Bond Surface Transportation, RB, AMT | | | | | | | | |
Callable 06/30/29 @ 100 | | | | | | | | |
5.000%, 06/30/58 | | | 1,500 | | | | 1,793 | |
Texas State, Private Activity Bond Surface Transportation, SH 288 Toll Lanes Project, RB, AMT | | | | | | | | |
Callable 12/31/25 @ 100 | | | | | | | | |
5.000%, 12/31/45 | | | 2,635 | | | | 2,936 | |
Texas State, Transportation Commission, RB | | | | | | | | |
Callable 02/01/29 @ 73 | | | | | | | | |
4.971%, 08/01/36(D) | | | 1,000 | | | | 602 | |
| | | | | | | | | | | | | |
Total Texas | | | 133,411 | |
| | | | | | | | | | | | | |
See accompanying notes to financial statements.
CITY NATIONAL ROCHDALE FUNDS | PAGE 57
schedule of investments |
September 30, 2021 |
City National Rochdale Municipal High Income Fund (continued) |
Description | | Face Amount (000) | | | Value (000) | |
Utah [0.1%] |
Utah Charter School Finance Authority, RB | | | | | | | | |
Callable 06/15/28 @ 102 | | | | | | | | |
5.000%, 06/15/55(C) | | $ | 1,750 | | | $ | 1,964 | |
| | | | | | | | | | | | | |
Vermont [0.2%] |
Vermont Economic Development Authority, RB | | | | | | | | |
Callable 05/01/28 @ 103 | | | | | | | | |
4.000%, 05/01/45 | | | 2,850 | | | | 3,055 | |
Vermont State, Economic Development Authority, Casella Waste Systems Project, RB, AMT | | | | | | | | |
4.625%, 04/01/36(A) (C) | | | 1,000 | | | | 1,176 | |
| | | | | | | | | | | | | |
Total Vermont | | | 4,231 | |
| | | | | | | | | | | | | |
Virginia [1.2%] |
Cherry Hill, Community Development Authority, Potomac Shores Project, SAB | | | | | | | | |
Callable 03/01/25 @ 100 | | | | | | | | |
5.400%, 03/01/45(C) | | | 2,000 | | | | 2,109 | |
Cherry Hill, Community Development Authority, Potomac Shores Project, SAB | | | | | | | | |
Callable 03/01/25 @ 100 | | | | | | | | |
5.150%, 03/01/35(C) | | | 1,000 | | | | 1,055 | |
Farmville, Industrial Development Authority, RB | | | | | | | | |
Callable 01/01/29 @ 100 | | | | | | | | |
5.000%, 01/01/48 | | | 2,000 | | | | 2,352 | |
Halifax County, Industrial Development Authority, Virginia Electric & Power Project, RB | | | | | | | | |
0.450%, 12/01/41(A) | | | 1,750 | | | | 1,751 | |
James City County Economic Development Authority, Ser A, RB | | | | | | | | |
Callable 12/01/27 @ 103 | | | | | | | | |
4.000%, 12/01/50 | | | 2,985 | | | | 3,256 | |
Lower Magnolia Green, Community Development Authority, SAB | | | | | | | | |
Callable 03/01/25 @ 100 | | | | | | | | |
5.000%, 03/01/45(C) | | | 4,005 | | | | 4,166 | |
Peninsula Town Center, Community Development Authority, RB | | | | | | | | |
Callable 09/01/27 @ 100 | | | | | | | | |
5.000%, 09/01/37(C) | | | 2,750 | | | | 2,996 | |
Peninsula Town Center, Community Development Authority, RB | | | | | | | | |
Callable 09/01/27 @ 100 | | | | | | | | |
5.000%, 09/01/45(C) | | | 3,700 | | | | 4,021 | |
Virginia State, Small Business Financing Authority, Elizabeth River Project, RB, AMT | | | | | | | | |
Callable 07/01/22 @ 100 | | | | | | | | |
6.000%, 01/01/37 | | | 820 | | | | 853 | |
Wise County, Industrial Development Authority, Ser A-RE, RB | | | | | | | | |
0.750%, 10/01/40(A) | | | 2,500 | | | | 2,505 | |
| | | | | | | | | | | | | |
Total Virginia | | | 25,064 | |
| | | | | | | | | | | | | |
Washington [0.7%] |
Kalispel Tribe of Indians, Ser A, RB | | | | | | | | |
Callable 01/01/28 @ 100 | | | | | | | | |
5.250%, 01/01/38(C) | | | 400 | | | | 474 | |
Washington State, Health Care Facilities Authority, RB | | | | | | | | |
Callable 01/01/28 @ 100 | | | | | | | | |
4.000%, 07/01/42 | | | 3,500 | | | | 3,951 | |
Washington State, Housing Finance Commission, Judson Park Project, RB | | | | | | | | |
Callable 07/01/25 @ 102 | | | | | | | | |
5.000%, 07/01/38(C) | | | 325 | | | | 351 | |
Washington State, Housing Finance Commission, Judson Park Project, RB | | | | | | | | |
Callable 07/01/25 @ 102 | | | | | | | | |
5.000%, 07/01/48(C) | | | 2,400 | | | | 2,570 | |
Washington State, Housing Finance Commission, RB | | | | | | | | |
Callable 01/01/25 @ 102 | | | | | | | | |
5.000%, 01/01/51(C) | | | 4,330 | | | | 4,694 | |
Washington State, Housing Finance Commission, Rockwood Retirement Community Project, RB | | | | | | | | |
Callable 01/01/24 @ 100 | | | | | | | | |
7.500%, 01/01/49(C) | | | 2,000 | | | | 2,215 | |
| | | | | | | | | | | | | |
Total Washington | | | 14,255 | |
| | | | | | | | | | | | | |
See accompanying notes to financial statements.
CITY NATIONAL ROCHDALE FUNDS | PAGE 58
schedule of investments |
September 30, 2021 |
City National Rochdale Municipal High Income Fund (continued) |
Description | | Face Amount (000) | | | Value (000) | |
West Virginia [0.9%] |
West Virginia, Economic Development Authority, RB, AMT | | | | | | | | |
Callable 01/01/25 @ 100 | | | | | | | | |
5.000%, 07/01/45(A) | | $ | 1,190 | | | $ | 1,292 | |
West Virginia, Economic Development Authority, RB, AMT | | | | | | | | |
Callable 01/01/25 @ 100 | | | | | | | | |
4.125%, 07/01/45(A) | | | 1,650 | | | | 1,741 | |
West Virginia, Economic Development Authority, Ser S, RB | | | | | | | | |
0.625%, 12/01/38(A) | | | 2,500 | | | | 2,474 | |
West Virginia, Tobacco Settlement Finance Authority, RB | | | | | | | | |
Callable 12/01/30 @ 100 | | | | | | | | |
4.875%, 06/01/49 | | | 12,070 | | | | 12,525 | |
| | | | | | | | | | | | | |
Total West Virginia | | | 18,032 | |
| | | | | | | | | | | | | |
Wisconsin [3.8%] |
Hartford, Public Finance Authority, RB | | | | | | | | |
Callable 09/01/24 @ 100 | | | | | | | | |
5.000%, 09/01/38(C) | | | 1,580 | | | | 1,695 | |
Piedmont, Public Finance Authority, RB | | | | | | | | |
Callable 06/15/29 @ 100 | | | | | | | | |
5.000%, 06/15/49 | | | 500 | | | | 574 | |
Pine Lake, Public Finance Authority, RB | | | | | | | | |
Callable 03/01/25 @ 100 | | | | | | | | |
5.500%, 03/01/45(C) | | | 3,460 | | | | 3,807 | |
Pine Lake, Public Finance Authority, RB | | | | | | | | |
Callable 03/01/25 @ 100 | | | | | | | | |
5.250%, 03/01/35(C) | | | 1,250 | | | | 1,381 | |
Public Finance Authority, RB | | | | | | | | |
Callable 07/01/29 @ 100 | | | | | | | | |
4.000%, 07/01/61 | | | 3,750 | | | | 4,058 | |
Wisconsin State, Health & Educational Facilities Authority, Dickson Hollow Project, RB | | | | | | | | |
Callable 10/01/22 @ 102 | | | | | | | | |
5.500%, 10/01/49 | | | 2,500 | | | | 2,594 | |
Wisconsin State, Health & Educational Facilities Authority, RB | | | | | | | | |
Callable 08/15/26 @ 100 | | | | | | | | |
5.000%, 02/15/51(A) | | | 1,000 | | | | 1,191 | |
Wisconsin State, Health & Educational Facilities Authority, RB | | | | | | | | |
Callable 08/15/24 @ 100 | | | | | | | | |
5.000%, 02/15/52(A) | | | 1,500 | | | | 1,689 | |
Wisconsin State, Health & Educational Facilities Authority, RB | | | | | | | | |
Callable 04/01/27 @ 100 | | | | | | | | |
4.000%, 04/01/39 | | | 2,500 | | | | 2,784 | |
Wisconsin State, Health & Educational Facilities Authority, Woodland Hill Senior Housing Project, RB | | | | | | | | |
Callable 12/01/22 @ 102 | | | | | | | | |
5.250%, 12/01/49 | | | 5,000 | | | | 5,184 | |
Wisconsin State, Public Finance Authority, Bancroft Neurohealth Project, RB | | | | | | | | |
Callable 06/01/26 @ 100 | | | | | | | | |
5.000%, 06/01/36(C) | | | 6,125 | | | | 6,772 | |
Wisconsin State, Public Finance Authority, Bancroft Neurohealth Project, RB | | | | | | | | |
Callable 06/01/26 @ 100 | | | | | | | | |
4.625%, 06/01/36(C) | | | 3,300 | | | | 3,587 | |
Wisconsin State, Public Finance Authority, Coral Academy Project, RB | | | | | | | | |
Callable 07/01/24 @ 100 | | | | | | | | |
5.625%, 07/01/44 | | | 3,500 | | | | 3,855 | |
Wisconsin State, Public Finance Authority, Coral Academy Project, RB | | | | | | | | |
Callable 07/01/24 @ 100 | | | | | | | | |
5.375%, 07/01/34 | | | 2,000 | | | | 2,209 | |
Wisconsin State, Public Finance Authority, Cornerstone Christian Project, RB | | | | | | | | |
Callable 02/01/26 @ 100 | | | | | | | | |
5.000%, 02/01/36(C) | | | 3,000 | | | | 3,219 | |
Wisconsin State, Public Finance Authority, Las Ventanas Retirement Community Project, RB | | | | | | | | |
Callable 11/08/21 @ 101 | | | | | | | | |
7.000%, 10/01/42 | | | 5,400 | | | | 5,449 | |
See accompanying notes to financial statements.
CITY NATIONAL ROCHDALE FUNDS | PAGE 59
schedule of investments |
September 30, 2021 |
City National Rochdale Municipal High Income Fund (continued) |
Description | | Face Amount (000) | | | Value (000) | |
Wisconsin State, Public Finance Authority, National Gypsum, RB, AMT | | | | | | | | |
Callable 08/01/26 @ 100 | | | | | | | | |
4.000%, 08/01/35 | | $ | 3,000 | | | $ | 3,058 | |
Wisconsin State, Public Finance Authority, RB | | | | | | | | |
Callable 03/01/30 @ 100 | | | | | | | | |
5.250%, 03/01/45(C) | | | 1,500 | | | | 1,726 | |
Wisconsin State, Public Finance Authority, RB | | | | | | | | |
Callable 03/01/30 @ 100 | | | | | | | | |
5.250%, 03/01/55(C) | | | 2,500 | | | | 2,857 | |
Wisconsin State, Public Finance Authority, RB | | | | | | | | |
Callable 04/01/30 @ 100 | | | | | | | | |
5.000%, 04/01/40(C) | | | 1,175 | | | | 1,396 | |
Wisconsin State, Public Finance Authority, RB | | | | | | | | |
Callable 11/15/27 @ 103 | | | | | | | | |
5.000%, 11/15/41 | | | 1,000 | | | | 1,215 | |
Wisconsin State, Public Finance Authority, RB | | | | | | | | |
Callable 04/01/30 @ 100 | | | | | | | | |
5.000%, 04/01/50(C) | | | 1,675 | | | | 1,961 | |
Wisconsin State, Public Finance Authority, Roseman University Health Sciences, RB | | | | | | | | |
Callable 04/01/25 @ 100 | | | | | | | | |
5.875%, 04/01/45 | | | 6,000 | | | | 6,789 | |
Wisconsin State, Public Finance Authority, Senior Trips Obligation Group Project, Ser B, RB, AMT | | | | | | | | |
Callable 07/01/22 @ 100 | | | | | | | | |
5.000%, 07/01/42 | | | 1,000 | | | | 1,025 | |
Wisconsin State, Public Finance Authority, Ser A, RB | | | | | | | | |
Callable 06/15/25 @ 100 | | | | | | | | |
5.500%, 06/15/35(C) | | | 3,000 | | | | 3,258 | |
Wisconsin State, Public Finance Authority, Ser A, RB | | | | | | | | |
Callable 06/15/25 @ 100 | | | | | | | | |
5.500%, 06/15/45(C) | | | 4,280 | | | | 4,591 | |
Wisconsin State, Public Finance Authority, Ser C, RB, AMT | | | | | | | | |
5.000%, 07/01/22 | | | 200 | | | | 206 | |
Wisconsin State, Public Finance Authority, Ser E, RB, AMT | | | | | | | | |
Callable 07/01/22 @ 100 | | | | | | | | |
5.000%, 07/01/23 | | | 820 | | | | 841 | |
| | | | | | | | | | | | | |
Total Wisconsin | | | 78,971 | |
American Samoa [0.3%] |
American Samoa, Economic Development Authority, Ser A, RB | | | | | | | | |
Callable 09/01/25 @ 100 | | | | | | | | |
6.625%, 09/01/35 | | | 3,000 | | | | 3,497 | |
American Samoa, Economic Development Authority, Ser A, RB | | | | | | | | |
Callable 09/01/31 @ 100 | | | | | | | | |
5.000%, 09/01/38(C) | | | 1,500 | | | | 1,836 | |
| | | | | | | | | | | | | |
Total American Samoa | | | 5,333 | |
| | | | | | | | | | | | | |
Guam [0.3%] |
Territory of Guam, Ser A, RB | | | | | | | | |
Callable 12/01/26 @ 100 | | | | | | | | |
5.000%, 12/01/34 | | | 2,500 | | | | 2,898 | |
Territory of Guam, Ser A, RB | | | | | | | | |
Callable 05/01/31 @ 100 | | | | | | | | |
5.000%, 11/01/35 | | | 1,000 | | | | 1,258 | |
Territory of Guam, Ser A, RB | | | | | | | | |
Callable 05/01/31 @ 100 | | | | | | | | |
5.000%, 11/01/40 | | | 1,000 | | | | 1,236 | |
| | | | | | | | | | | | | |
Total Guam | | | 5,392 | |
| | | | | | | | | | | | | |
Puerto Rico [6.5%] |
Commonwealth of Puerto Rico, Ser A-PSA, GO | | | | | | | | |
Callable 11/08/21 @ 100 | | | | | | | | |
8.000%, 07/01/35(E) | | | 2,150 | | | | 1,854 | |
Commonwealth of Puerto Rico, Ser A-PSA, GO | | | | | | | | |
Callable 07/01/22 @ 100 | | | | | | | | |
5.750%, 07/01/28(E) | | | 1,555 | | | | 1,433 | |
Commonwealth of Puerto Rico, Ser A-PSA, GO | | | | | | | | |
Callable 11/08/21 @ 100 | | | | | | | | |
5.500%, 07/01/23(E) | | | 3,000 | | | | 2,895 | |
Commonwealth of Puerto Rico, Ser A-PSA, GO | | | | | | | | |
Callable 07/01/22 @ 100 | | | | | | | | |
5.500%, 07/01/26(E) | | | 3,200 | | | | 2,932 | |
Commonwealth of Puerto Rico, Ser A-PSA, GO | | | | | | | | |
Callable 07/01/22 @ 100 | | | | | | | | |
5.500%, 07/01/39(E) | | | 3,100 | | | | 2,844 | |
Commonwealth of Puerto Rico, Ser A-PSA, GO | | | | | | | | |
Callable 07/01/22 @ 100 | | | | | | | | |
5.125%, 07/01/37(E) | | | 2,500 | | | | 2,250 | |
See accompanying notes to financial statements.
CITY NATIONAL ROCHDALE FUNDS | PAGE 60
schedule of investments |
September 30, 2021 |
City National Rochdale Municipal High Income Fund (continued) |
Description | | Face Amount (000) | | | Value (000) | |
Commonwealth of Puerto Rico, Ser A-PSA, GO | | | | | | | | |
Callable 07/01/22 @ 100 | | | | | | | | |
5.000%, 07/01/41(E) | | $ | 5,290 | | | $ | 4,629 | |
Commonwealth of Puerto Rico, Ser C-PSA, GO | | | | | | | | |
Callable 11/08/21 @ 100 | | | | | | | | |
6.500%, 07/01/40(E) | | | 2,215 | | | | 2,099 | |
Commonwealth of Puerto Rico, Ser E-PSA, GO | | | | | | | | |
Callable 11/08/21 @ 100 | | | | | | | | |
5.625%, 07/01/33(E) | | | 2,570 | | | | 2,464 | |
Puerto Rico, Commonwealth, Aqueduct & Sewer Authority, Ser A, RB | | | | | | | | |
Callable 07/01/22 @ 100 | | | | | | | | |
5.250%, 07/01/42 | | | 12,000 | | | | 12,446 | |
Puerto Rico, Electric Power Authority, Ser 2013A-RSA-1, RB | | | | | | | | |
Callable 07/01/23 @ 100 | | | | | | | | |
6.750%, 07/01/36(E) | | | 2,605 | | | | 2,615 | |
Puerto Rico, Electric Power Authority, Ser AAA-RSA-1, RB | | | | | | | | |
Callable 11/08/21 @ 100 | | | | | | | | |
5.250%, 07/01/30(E) | | | 1,625 | | | | 1,594 | |
Puerto Rico, Electric Power Authority, Ser A-RSA-1, RB | | | | | | | | |
Callable 07/01/22 @ 100 | | | | | | | | |
5.000%, 07/01/42(E) | | | 2,000 | | | | 1,955 | |
Puerto Rico, Electric Power Authority, Ser CCC-RSA-1, RB | | | | | | | | |
Callable 11/08/21 @ 100 | | | | | | | | |
5.250%, 07/01/28(E) | | | 2,145 | | | | 2,105 | |
Puerto Rico, Electric Power Authority, Ser E-1-RSA-1, RB | | | | | | | | |
10.000%, 01/01/22(E) | | | 3,957 | | | | 4,070 | |
Puerto Rico, Electric Power Authority, Ser E-2-RSA-1, RB | | | | | | | | |
10.000%, 07/01/21(E) | | | 1,500 | | | | 1,543 | |
Puerto Rico, Electric Power Authority, Ser E-2-RSA-1, RB | | | | | | | | |
10.000%, 01/01/22(E) | | | 500 | | | | 520 | |
Puerto Rico, Electric Power Authority, Ser XX-RSA-1, RB | | | | | | | | |
Callable 11/08/21 @ 100 | | | | | | | | |
5.250%, 07/01/40(E) | | | 7,000 | | | | 6,869 | |
Puerto Rico, Highway & Transportation Authority, Ser A, RB | | | | | | | | |
Callable 11/08/21 @ 100 | | | | | | | | |
5.850%, 07/01/25 | | | 4,105 | | | | 4,023 | |
Puerto Rico, Public Buildings Authority, Ser N-PSA, RB | | | | | | | | |
Callable 11/08/21 @ 100 | | | | | | | | |
5.000%, 07/01/37(E) | | | 1,400 | | | | 1,480 | |
Puerto Rico, Public Buildings Authority, Ser P-PSA, RB | | | | | | | | |
Callable 11/08/21 @ 100 | | | | | | | | |
6.500%, 07/01/30(E) | | | 5,045 | | | | 5,531 | |
Puerto Rico, Sales Tax Financing Sales Tax Revenue, Ser A-1, RB | | | | | | | | |
Callable 07/01/28 @ 100 | | | | | | | | |
5.000%, 07/01/58 | | | 11,572 | | | | 13,126 | |
Puerto Rico, Sales Tax Financing Sales Tax Revenue, Ser A-1, RB | | | | | | | | |
Callable 07/01/28 @ 100 | | | | | | | | |
4.750%, 07/01/53 | | | 5,276 | | | | 5,904 | |
Puerto Rico, Sales Tax Financing Sales Tax Revenue, Ser A-1, RB | | | | | | | | |
Callable 07/01/25 @ 100 | | | | | | | | |
4.500%, 07/01/34 | | | 19,005 | | | | 20,854 | |
Puerto Rico, Sales Tax Financing Sales Tax Revenue, Ser A-1, RB | | | | | | | | |
4.086%, 07/01/24(D) | | | 1,791 | | | | 1,710 | |
Puerto Rico, Sales Tax Financing Sales Tax Revenue, Ser A-1, RB | | | | | | | | |
Callable 07/01/28 @ 41 | | | | | | | | |
4.786%, 07/01/46(D) | | | 7,170 | | | | 2,358 | |
Puerto Rico, Sales Tax Financing Sales Tax Revenue, Ser A-1, RB | | | | | | | | |
Callable 07/01/28 @ 30 | | | | | | | | |
5.106%, 07/01/51(D) | | | 2,946 | | | | 700 | |
Puerto Rico, Sales Tax Financing Sales Tax Revenue, Ser A-2, RB | | | | | | | | |
Callable 07/01/28 @ 100 | | | | | | | | |
4.784%, 07/01/58 | | | 19,108 | | | | 21,421 | |
Puerto Rico, Sales Tax Financing Sales Tax Revenue, Ser A-2, RB | | | | | | | | |
Callable 07/01/28 @ 100 | | | | | | | | |
4.536%, 07/01/53 | | | 31 | | | | 34 | |
| | | | | | | | | | | | | |
Total Puerto Rico | | | 134,258 | |
See accompanying notes to financial statements.
CITY NATIONAL ROCHDALE FUNDS | PAGE 61
schedule of investments |
September 30, 2021 |
City National Rochdale Municipal High Income Fund (concluded) |
Description | | Face Amount (000)/Shares | | | Value (000) | |
Virgin Islands [0.2%] |
Virgin Islands, Public Finance Authority, Ser Senior, RB | | | | | | | | |
Callable 11/08/21 @ 100 | | | | | | | | |
5.000%, 10/01/25 | | $ | 3,155 | | | $ | 3,163 | |
Virgin Islands, Public Finance Authority, Sub-Ser, RB | | | | | | | | |
Callable 11/08/21 @ 100 | | | | | | | | |
5.000%, 10/01/22 | | | 1,365 | | | | 1,361 | |
| | | | | | | | | | | | | |
Total Virgin Islands | | | 4,524 | |
| | | | | | | | | | | | | |
Total Municipal Bonds |
(Cost $1,805,906) | | | 1,920,909 | |
| | | | | | | | | | | | | |
Corporate Bonds [0.8%] |
Electric Utilities [0.1%] |
Talen Energy Supply | | | | | | | | |
6.625%, 01/15/28(C) | | | 3,000 | | | | 2,782 | |
| | | | | | | | | | | | | |
Medical Products & Services [0.4%] |
Tower Health | | | | | | | | |
4.451%, 02/01/50 | | | 9,000 | | | | 8,054 | |
| | | | | | | | | | | | | |
Steel & Steel Works [0.2%] |
United States Steel | | | | | | | | |
6.875%, 03/01/29 | | | 2,000 | | | | 2,132 | |
6.250%, 03/15/26 | | | 960 | | | | 991 | |
| | | | | | | | | | | | | |
Total Steel & Steel Works | | | 3,123 | |
| | | | | | | | | | | | | |
Waste Disposal [0.1%] |
Waste Pro USA | | | | | | | | |
5.500%, 02/15/26(C) | | | 1,500 | | | | 1,515 | |
| | | | | | | | | | | | | |
Total Corporate Bonds |
(Cost $14,582) | | | 15,474 | |
| | | | | | | | | | | | | |
Short-Term Investment [5.8%] |
SEI Daily Income Trust Government Fund, Cl F, 0.010%** | | | 119,925,721 | | | | 119,926 | |
| | | | | | | | | | | | | |
Total Short-Term Investment |
(Cost $119,926) | | | 119,926 | |
| | | | | | | | | | | | | |
Total Investments [99.9%] |
(Cost $1,940,414) | | $ | 2,056,309 | |
Percentages are based on net assets of $2,058,425 (000).
** | The rate reported is the 7-day effective yield as of September 30, 2021. |
(A) | Variable or floating rate security, the interest rate of which adjusts periodically based on prevailing interest rates. |
(B) | Step Bonds — Represents the current rate, the step rate, the step date and the final maturity date. |
(C) | Security exempt from registration under Rule 144A of the Securities Act of 1933. These securities may be resold in transactions exempt from registration normally to qualified institutions. On September 30, 2021, the value of these securities amounted to $419,097 (000), representing 20.4% of the net assets of the Fund. |
(D) | Zero coupon security. The rate reported is the effective yield at time of purchase. |
(E) | In default on interest payments. Rate shown represents the last coupon rate prior to default. |
(F) | Pre-Refunded Security — The maturity date shown is the pre-refunded date. |
(G) | Represents an investment in a tender option bond residual interest certificate purchased in a secondary market transaction. The interest rate shown bears an inverse relationship to the interest rate on a tender option bond floating rate certificate. The interest rate disclosed reflects the rate in effect on September 30, 2021. |
AGM — Assured Guarantee Municipal
AMT — Alternative Minimum Tax (subject to)
BAM — Build America Mutual
Cl — Class
COP — Certificate of Participation
GO — General Obligation
RB — Revenue Bond
SAB — Special Assessment Board
Ser — Series
SPA — Special Assessment
SPL Tax — Special Tax
TA — Tax Allocation
The following is a list of the inputs used as of September 30, 2021, in valuing the Fund’s investments and other financial instruments carried at value (000):
Investments in Securities | | Level 1 | | | Level 2 | | | Level 3 | | | Total | |
Municipal Bonds | | $ | — | | | $ | 1,920,909 | | | $ | — | | | $ | 1,920,909 | |
Corporate Bonds | | | — | | | | 15,474 | | | | — | | | | 15,474 | |
Short-Term Investment | | | 119,926 | | | | — | | | | — | | | | 119,926 | |
Total Investments in Securities | | $ | 119,926 | | | $ | 1,936,383 | | | $ | — | | | $ | 2,056,309 | |
For the year ended September 30, 2021, there have been no transfers in or out of Level 3.
Amounts designated as “—” are either $0 or have been rounded to $0.
For more information on valuation inputs, see Note 2 — Significant Accounting Policies in the Notes to Financial Statements.
See accompanying notes to financial statements.
CITY NATIONAL ROCHDALE FUNDS | PAGE 62
schedule of investments |
September 30, 2021 |
City National Rochdale Intermediate Fixed Income Fund |

Description | | Face Amount (000) | | | Value (000) | |
Corporate Bonds [50.9%] |
Communication Services [4.8%] |
America Movil | | | | | | | | |
3.625%, 04/22/29 | | $ | 2,000 | | | $ | 2,177 | |
Verizon Communications | | | | | | | | |
2.355%, 03/15/32(A) | | | 2,536 | | | | 2,506 | |
| | | | | | | | | | | | | |
Total Communication Services | | | 4,683 | |
| | | | | | | | | | | | | |
Consumer Discretionary [2.9%] |
General Motors Financial | | | | | | | | |
4.350%, 01/17/27 | | | 2,500 | | | | 2,802 | |
| | | | | | | | | | | | | |
Energy [2.1%] |
Energy Transfer | | | | | | | | |
5.950%, 12/01/25 | | | 1,800 | | | | 2,087 | |
| | | | | | | | | | | | | |
Financials [22.8%] |
Allstate | | | | | | | | |
0.762%, VAR ICE LIBOR USD 3 Month + 0.630%, 03/29/23(C) | | | 1,400 | | | | 1,411 | |
Banco Santander | | | | | | | | |
2.746%, 05/28/25 | | | 2,000 | | | | 2,097 | |
Barclays | | | | | | | | |
4.375%, 01/12/26 | | | 2,000 | | | | 2,231 | |
Capital One Financial | | | | | | | | |
4.200%, 10/29/25 | | | 1,800 | | | | 1,993 | |
Citigroup | | | | | | | | |
3.500%, 05/15/23 | | | 2,400 | | | | 2,514 | |
Credit Suisse Group Funding Guernsey | | | | | | | | |
4.550%, 04/17/26 | | | 2,500 | | | | 2,807 | |
Jefferies Group | | | | | | | | |
4.850%, 01/15/27 | | | 2,210 | | | | 2,561 | |
JPMorgan Chase | | | | | | | | |
3.125%, 01/23/25 | | | 2,200 | | | | 2,337 | |
Lehman Brothers Holdings, MTN | | | | | | | | |
7.000%, 09/28/37(B) | | | 400 | | | | 3 | |
Mitsubishi UFJ Financial Group | | | | | | | | |
0.860%, VAR ICE LIBOR USD 3 Month + 0.740%, 03/02/23(C) | | | 1,100 | | | | 1,110 | |
Morgan Stanley, MTN | | | | | | | | |
3.750%, 02/25/23 | | | 3,000 | | | | 3,137 | |
| | | | | | | | | | | | | |
Total Financials | | | 22,201 | |
| | | | | | | | | | | | | |
Health Care [3.6%] |
AbbVie | | | | | | | | |
2.850%, 05/14/23 | | | 2,500 | | | | 2,586 | |
CVS Health | | | | | | | | |
4.300%, 03/25/28 | | | 854 | | | | 971 | |
| | | | | | | | | | | | | |
Total Health Care | | | 3,557 | |
| | | | | | | | | | | | | |
Industrials [4.7%] |
John Deere Capital, MTN | | | | | | | | |
2.800%, 09/08/27 | | | 2,500 | | | | 2,690 | |
Penske Truck Leasing LP | | | | | | | | |
4.250%, 01/17/23(A) | | | 300 | | | | 314 | |
3.450%, 07/01/24(A) | | | 1,500 | | | | 1,599 | |
| | | | | | | | | | | | | |
Total Industrials | | | 4,603 | |
| | | | | | | | | | | | | |
Information Technology [2.8%] |
KLA-Tencor | | | | | | | | |
4.650%, 11/01/24 | | | 2,500 | | | | 2,757 | |
| | | | | | | | | | | | | |
Petroleum & Fuel Products [2.4%] |
Shell International Finance BV | | | | | | | | |
2.375%, 04/06/25 | | | 2,230 | | | | 2,331 | |
| | | | | | | | | | | | | |
Real Estate [2.6%] |
Prologis | | | | | | | | |
2.125%, 04/15/27(A) | | | 2,425 | | | | 2,509 | |
| | | | | | | | | | | | | |
See accompanying notes to financial statements.
CITY NATIONAL ROCHDALE FUNDS | PAGE 63
schedule of investments |
September 30, 2021 |
City National Rochdale Intermediate Fixed Income Fund (continued) |
Description | | Face Amount (000) | | | Value (000) | |
Utilities [2.3%] |
Duke Energy | | | | | | | | |
3.400%, 06/15/29 | | $ | 2,020 | | | $ | 2,181 | |
Korea Electric Power | | | | | | | | |
6.750%, 08/01/27 | | | 75 | | | | 95 | |
| | | | | | | | | | | | | |
Total Utilities | | | 2,276 | |
| | | | | | | | | | | | | |
Total Corporate Bonds |
(Cost $48,215) | | | 49,806 | |
| | | | | | | | | | | | | |
U.S. Treasury Obligations [40.6%] |
U.S. Treasury Notes | | | | | | | | |
2.625%, 01/31/26 | | | 5,350 | | | | 5,748 | |
1.875%, 07/31/26 | | | 4,500 | | | | 4,693 | |
1.625%, 11/15/22 | | | 1,500 | | | | 1,525 | |
1.625%, 08/15/29 | | | 3,800 | | | | 3,867 | |
1.000%, 07/31/28 | | | 3,650 | | | | 3,577 | |
0.875%, 11/15/30 | | | 4,950 | | | | 4,693 | |
0.250%, 11/15/23 | | | 1,500 | | | | 1,498 | |
0.125%, 12/15/23 | | | 8,750 | | | | 8,708 | |
0.125%, 01/15/24 | | | 5,450 | | | | 5,420 | |
| | | | | | | | | | | | | |
Total U.S. Treasury Obligations |
(Cost $40,098) | | | 39,729 | |
| | | | | | | | | | | | | |
U.S. Government Mortgage-Backed Obligations [3.5%] |
FHLMC, Pool 1B2677 | | | | | | | | |
2.275%, VAR ICE LIBOR USD 12 Month + 1.900%, 01/01/35 | | | 1 | | | | 1 | |
FHLMC, Pool 1B2683 | | | | | | | | |
2.309%, VAR ICE LIBOR USD 12 Month + 1.900%, 01/01/35 | | | 1 | | | | 1 | |
FHLMC, Pool 1B2692 | | | | | | | | |
2.154%, VAR ICE LIBOR USD 12 Month + 1.770%, 12/01/34 | | | 4 | | | | 4 | |
FHLMC, Pool A93505 | | | | | | | | |
4.500%, 08/01/40 | | | 8 | | | | 9 | |
FHLMC, Pool A93996 | | | | | | | | |
4.500%, 09/01/40 | | | 12 | | | | 13 | |
FHLMC, Pool C03490 | | | | | | | | |
4.500%, 08/01/40 | | | 55 | | | | 61 | |
FHLMC, Pool C09015 | | | | | | | | |
3.000%, 10/01/42 | | | 67 | | | | 72 | |
FHLMC, Pool G02940 | | | | | | | | |
5.500%, 05/01/37 | | | 2 | | | | 2 | |
FHLMC, Pool G04222 | | | | | | | | |
5.500%, 04/01/38 | | | 4 | | | | 4 | |
FHLMC, Pool G04913 | | | | | | | | |
5.000%, 03/01/38 | | | 15 | | | | 18 | |
FHLMC, Pool G08003 | | | | | | | | |
6.000%, 07/01/34 | | | 5 | | | | 6 | |
FHLMC, Pool J19197 | | | | | | | | |
3.000%, 05/01/27 | | | 30 | | | | 32 | |
FHLMC, Pool Q08998 | | | | | | | | |
3.500%, 06/01/42 | | | 42 | | | | 46 | |
FHLMC, Pool Q10378 | | | | | | | | |
3.000%, 08/01/42 | | | 60 | | | | 65 | |
FNMA, Pool 252570 | | | | | | | | |
6.500%, 07/01/29 | | | 1 | | | | 2 | |
FNMA, Pool 253183 | | | | | | | | |
7.500%, 04/01/30 | | | — | | | | — | |
FNMA, Pool 253398 | | | | | | | | |
8.000%, 08/01/30 | | | 1 | | | | 1 | |
FNMA, Pool 254949 | | | | | | | | |
5.000%, 11/01/33 | | | 3 | | | | 4 | |
FNMA, Pool 255814 | | | | | | | | |
5.500%, 08/01/35 | | | 5 | | | | 6 | |
FNMA, Pool 303168 | | | | | | | | |
9.500%, 02/01/25 | | | — | | | | — | |
FNMA, Pool 725424 | | | | | | | | |
5.500%, 04/01/34 | | | 5 | | | | 6 | |
FNMA, Pool 735060 | | | | | | | | |
6.000%, 11/01/34 | | | 4 | | | | 4 | |
FNMA, Pool 735228 | | | | | | | | |
5.500%, 02/01/35 | | | 3 | | | | 3 | |
FNMA, Pool 735230 | | | | | | | | |
5.500%, 02/01/35 | | | 7 | | | | 8 | |
FNMA, Pool 745275 | | | | | | | | |
5.000%, 02/01/36 | | | 25 | | | | 29 | |
FNMA, Pool 745418 | | | | | | | | |
5.500%, 04/01/36 | | | 28 | | | | 32 | |
FNMA, Pool 827223 | | | | | | | | |
1.715%, VAR ICE LIBOR USD 12 Month + 1.465%, 04/01/35 | | | 8 | | | | 8 | |
FNMA, Pool 844809 | | | | | | | | |
5.000%, 11/01/35 | | | 11 | | | | 12 | |
FNMA, Pool AD0454 | | | | | | | | |
5.000%, 11/01/21 | | | — | | | | — | |
FNMA, Pool AD8522 | | | | | | | | |
4.000%, 08/01/40 | | | 9 | | | | 10 | |
FNMA, Pool AE0828 | | | | | | | | |
3.500%, 02/01/41 | | | 81 | | | | 88 | |
FNMA, Pool AH0621 | | | | | | | | |
3.500%, 01/01/41 | | | 20 | | | | 22 | |
FNMA, Pool AJ1407 | | | | | | | | |
4.000%, 09/01/41 | | | 13 | | | | 14 | |
See accompanying notes to financial statements.
CITY NATIONAL ROCHDALE FUNDS | PAGE 64
schedule of investments |
September 30, 2021 |
City National Rochdale Intermediate Fixed Income Fund (continued) |
Description | | Face Amount (000)/Shares | | | Value (000) | |
FNMA, Pool AJ7689 | | | | | | | | |
4.000%, 12/01/41 | | $ | 49 | | | $ | 54 | |
FNMA, Pool AK0971 | | | | | | | | |
3.000%, 02/01/27 | | | 25 | | | | 26 | |
FNMA, Pool AL5866 | | | | | | | | |
2.425%, 08/01/22 | | | 2,448 | | | | 2,466 | |
FNMA, Pool AO2970 | | | | | | | | |
3.000%, 05/01/42 | | | 55 | | | | 59 | |
FNMA, Pool AO4137 | | | | | | | | |
3.500%, 06/01/42 | | | 46 | | | | 50 | |
FNMA, Pool MA1277 | | | | | | | | |
2.500%, 12/01/27 | | | 29 | | | | 31 | |
GNMA, Pool G2 4696 | | | | | | | | |
4.500%, 05/20/40 | | | 26 | | | | 28 | |
GNMA, Pool G2 4747 | | | | | | | | |
5.000%, 07/20/40 | | | 11 | | | | 12 | |
GNMA, Pool G2 4923 | | | | | | | | |
4.500%, 01/20/41 | | | 18 | | | | 20 | |
GNMA, Pool G2 MA0155 | | | | | | | | |
4.000%, 06/20/42 | | | 41 | | | | 46 | |
GNMA, Pool G2 MA0392 | | | | | | | | |
3.500%, 09/20/42 | | | 53 | | | | 57 | |
| | | | | | | | | | | | | |
Total U.S. Government Mortgage-Backed Obligations |
(Cost $3,344) | | | 3,432 | |
| | | | | | | | | | | | | |
Affiliated Registered Investment Company [3.0%] |
City National Rochdale Fixed Income Opportunities Fund, Cl N ‡ | | | 127,551 | | | | 2,972 | |
| | | | | | | | | | | | | |
Total Affiliated Registered Investment Company |
(Cost $2,500) | | | 2,972 | |
| | | | | | | | | | | | | |
Mortgage-Backed Obligations [0.8%] |
Commercial Mortgage Trust, Ser 2012-CR2, Cl A4 | | | | | | | | |
3.147%, 08/15/45 | | | 125 | | | | 126 | |
GMACM Mortgage Loan Trust, Ser 2004-GH1, Cl A6 | | | | | | | | |
5.310%, 07/25/35 | | | — | | | | — | |
GS Mortgage Securities II, Ser 2012-GCJ9, Cl A3 | | | | | | | | |
2.773%, 11/10/45 | | | 267 | | | | 272 | |
JPMorgan Chase Commercial Mortgage Securities Trust, Ser 2013-LC11, Cl A5 | | | | | | | | |
2.960%, 04/15/46 | | | 150 | | | | 154 | |
Morgan Stanley Bank of America Merrill Lynch Trust, Ser 2012-C6, Cl A4 | | | | | | | | |
2.858%, 11/15/45 | | | 198 | | | | 201 | |
| | | | | | | | | | | | | |
Total Mortgage-Backed Obligations |
(Cost $748) | | | 753 | |
| | | | | | | | | | | | | |
Closed-End Fund [0.1%] |
Stone Ridge Reinsurance Risk Premium Interval Fund | | | 1,330 | | | | 51 | |
| | | | | | | | | | | | | |
Total Closed-End Fund |
(Cost $56) | | | 51 | |
| | | | | | | | | | | | | |
Asset-Backed Security [0.0%] |
Cityscape Home Equity Loan Trust, Ser 1997-C, Cl A4 | | | | | | | | |
7.000%, 07/25/28 | | | 5 | | | | 3 | |
| | | | | | | | | | | | | |
Total Asset-Backed Security |
(Cost $5) | | | 3 | |
| | | | | | | | | | | | | |
Residential Mortgage-Backed Security [0.0%] |
Residential Accredit Loans, Ser 2004-QS6, Cl A1 | | | | | | | | |
5.000%, 05/25/19 | | | — | | | | — | |
| | | | | | | | | | | | | |
Total Residential Mortgage-Backed Security |
(Cost $0) | | | — | |
| | | | | | | | | | | | | |
Short-Term Investment [0.8%] |
SEI Daily Income Trust Government Fund, Cl F, 0.010%** | | | 762,415 | | | | 762 | |
| | | | | | | | | | | | | |
Total Short-Term Investment |
(Cost $762) | | | 762 | |
| | | | | | | | | | | | | |
Total Investments [99.7%] |
(Cost $95,728) | | $ | 97,508 | |
Percentages are based on net assets of $97,731 (000).
** | The rate reported is the 7-day effective yield as of September 30, 2021. |
‡ | Investment in Affiliate. |
(A) | Security exempt from registration under Rule 144A of the Securities Act of 1933. These securities may be resold in transactions exempt from registration normally to qualified institutions. On September 30, 2021, the value of these securities amounted to $4,419 (000), representing 4.5% of the net assets of the Fund. |
See accompanying notes to financial statements.
CITY NATIONAL ROCHDALE FUNDS | PAGE 65
schedule of investments |
September 30, 2021 |
City National Rochdale Intermediate Fixed Income Fund (concluded) |
(B) | In default on interest payments. Rate shown represents the last coupon rate prior to default. |
(C) | Variable or floating rate security, the interest rate of which adjusts periodically based on changes in current interest rates and prepayments on the underlying pool of assets. |
Cl — Class
FHLMC — Federal Home Loan Mortgage Corporation
FNMA — Federal National Mortgage Association
GNMA — Government National Mortgage Association
ICE — Intercontinental Exchange
LIBOR — London Interbank Offered Rates
LP — Limited Partnership
MTN — Medium Term Note
Ser — Series
USD — U.S. Dollar
VAR — Variable
The following is a list of the inputs used as of September 30, 2021, in valuing the Fund’s investments carried at value (000):
Investments in Securities | | Level 1 | | | Level 2 | | | Level 3 | | | Total | |
Corporate Bonds | | $ | — | | | $ | 49,806 | | | $ | — | | | $ | 49,806 | |
U.S. Treasury Obligations | | | — | | | | 39,729 | | | | — | | | | 39,729 | |
U.S. Government Mortgage-Backed Obligations | | | — | | | | 3,432 | | | | — | | | | 3,432 | |
Affiliated Registered Investment Company | | | 2,972 | | | | — | | | | — | | | | 2,972 | |
Mortgage-Backed Obligations | | | — | | | | 753 | | | | — | | | | 753 | |
Closed-End Fund | | | 51 | | | | — | | | | — | | | | 51 | |
Asset-Backed Security | | | — | | | | 3 | | | | — | | | | 3 | |
Residential Mortgage-Backed Security | | | — | | | | — | | | | — | | | | — | |
Short-Term Investment | | | 762 | | | | — | | | | — | | | | 762 | |
Total Investments in Securities | | $ | 3,785 | | | $ | 93,723 | | | $ | — | | | $ | 97,508 | |
For the year ended September 30, 2021, there have been no transfers in or out of Level 3.
The following is a summary of the transactions with the affiliates for the year ended September 30, 2021.
| | | City National
Rochdale
Fixed Income
Opportunities
Fund, Class
N (000) | |
Beginning balance as of October 1, 2020 | | $ | 2,879 | |
Purchases at Cost | | | — | |
Proceeds from Sales | | | — | |
Realized Gain (Loss) | | | — | |
Unrealized Gain (Loss) | | | 93 | |
Ending balance as of September 30, 2021 | | $ | 2,972 | |
Dividend Income | | $ | 183 | |
| | | City National
Rochdale
Fixed Income
Opportunities
Fund, Class
N (Shares) | |
Beginning balance as of October 1, 2020 | | | 127,551 | |
Purchases | | | — | |
Sales | | | — | |
Ending balance as of September 30, 2021 | | | 127,551 | |
Amounts designated as “—” are $0 or have been rounded to $0.
For more information on valuation inputs, see Note 2 — Significant Accounting Policies in the Notes to Financial Statements.
See accompanying notes to financial statements.
CITY NATIONAL ROCHDALE FUNDS | PAGE 66
consolidated schedule of investments |
September 30, 2021 |
City National Rochdale Fixed Income Opportunities Fund |
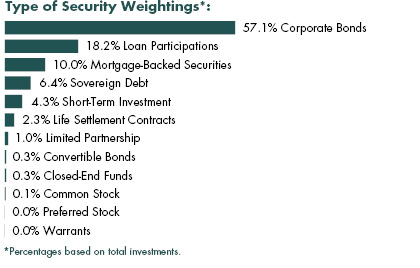
Description | | Face Amount (000)(1) | | | Value (000) | |
Corporate Bonds [56.7%] |
Aerospace / Defense [0.4%] |
Rolls-Royce | | | | | | | | |
5.750%, 10/15/27(A) | | $ | 900 | | | $ | 995 | |
TransDigm | | | | | | | | |
6.250%, 03/15/26(A) | | | 3,325 | | | | 3,479 | |
TransDigm | | | | | | | | |
6.375%, 06/15/26 | | | 800 | | | | 825 | |
TransDigm | | | | | | | | |
5.500%, 11/15/27 | | | 3,775 | | | | 3,903 | |
TransDigm | | | | | | | | |
4.875%, 05/01/29 | | | 2,725 | | | | 2,730 | |
TransDigm UK Holdings | | | | | | | | |
6.875%, 05/15/26 | | | 4,200 | | | | 4,415 | |
| | | | | | | | | | | | | |
Total Aerospace / Defense | | | 16,347 | |
| | | | | | | | | | | | | |
Agricultural [0.0%] |
Mriya Recovery Certificates | | | | | | | | |
0.000%, 12/31/49 | | EUR | 3,224 | | | | 5 | |
| | | | | | | | | | | | | |
Airlines [1.0%] |
Aerovias de Mexico | | | | | | | | |
7.000%, 02/05/25(B) | | | 32,845 | | | | 25,837 | |
American Airlines | | | | | | | | |
11.750%, 07/15/25(A) | | | 1,245 | | | | 1,541 | |
American Airlines | | | | | | | | |
5.500%, 04/20/26(A) | | | 5,315 | | | | 5,587 | |
American Airlines | | | | | | | | |
5.750%, 04/20/29(A) | | | 1,350 | | | | 1,455 | |
Avianca Holdings | | | | | | | | |
8.375%, 07/10/20(B) | | | 39 | | | | 6 | |
EA Partners I | | | | | | | | |
6.875%, 09/28/20(B) | | | 5,617 | | | | 112 | |
EA Partners II | | | | | | | | |
6.750%, 06/01/21(B) | | | 4,960 | | | | 49 | |
Gol Finance | | | | | | | | |
7.000%, 01/31/25 | | | 1,210 | | | | 1,143 | |
Gol Finance | | | | | | | | |
8.000%, 06/30/26(A) | | | 2,820 | | | | 2,834 | |
Spirit Loyalty Cayman | | | | | | | | |
8.000%, 09/20/25(A) | | | 539 | | | | 604 | |
| | | | | | | | | | | | | |
Total Airlines | | | 39,168 | |
| | | | | | | | | | | | | |
Airport Develop/Maint [0.6%] |
Delhi International Airport | | | | | | | | |
6.125%, 02/03/22 | | | 13,460 | | | | 13,521 | |
International Airport Finance | | | | | | | | |
12.000%, 03/15/33 | | | 9,597 | | | | 10,406 | |
| | | | | | | | | | | | | |
Total Airport Develop/Maint | | | 23,927 | |
| | | | | | | | | | | | | |
Applications Software [0.0%] |
Brunello Bidco | | | | | | | | |
3.750%, VAR Euribor 3 Month + 3.750%, 02/15/28 | | EUR | 1,000 | | | | 1,158 | |
| | | | | | | | | | | | | |
Auto Manufacturers [0.0%] |
Wabash National | | | | | | | | |
4.500%, 10/15/28(A) | | | 1,030 | | | | 1,029 | |
| | | | | | | | | | | | | |
Auto Rent & Lease [0.2%] |
Kapla Holding SAS | | | | | | | | |
3.250%, VAR Euribor 3 Month + 3.250%, 12/15/26 | | EUR | 300 | | | | 345 | |
Kapla Holding SAS | | | | | | | | |
3.375%, 12/15/26 | | EUR | 414 | | | | 481 | |
Movida Europe | | | | | | | | |
5.250%, 02/08/31(A) | | | 2,800 | | | | 2,721 | |
Rent-A-Center | | | | | | | | |
6.375%, 02/15/29(A) | | | 2,875 | | | | 3,101 | |
| | | | | | | | | | | | | |
Total Auto Rent & Lease | | | 6,648 | |
| | | | | | | | | | | | | |
Automotive [1.3%] |
Adient Global Holdings | | | | | | | | |
4.875%, 08/15/26(A) | | | 3,175 | | | | 3,252 | |
Adient US | | | | | | | | |
9.000%, 04/15/25(A) | | | 400 | | | | 432 | |
American Axle & Manufacturing | | | | | | | | |
6.500%, 04/01/27 | | | 850 | | | | 886 | |
Clarios Global | | | | | | | | |
6.750%, 05/15/25(A) | | | 159 | | | | 168 | |
See accompanying notes to financial statements.
CITY NATIONAL ROCHDALE FUNDS | PAGE 67
consolidated schedule of investments |
September 30, 2021 |
City National Rochdale Fixed Income Opportunities Fund (continued) |
Description | | Face Amount (000)(1) | | | Value (000) | |
Dana | | | | | | | | |
5.375%, 11/15/27 | | $ | 175 | | | $ | 184 | |
Dana | | | | | | | | |
5.625%, 06/15/28 | | | 475 | | | | 512 | |
Dana | | | | | | | | |
4.250%, 09/01/30 | | | 250 | | | | 257 | |
Dana Financing Luxembourg Sarl | | | | | | | | |
5.750%, 04/15/25(A) | | | 450 | | | | 464 | |
Dornoch Debt Merger Sub | | | | | | | | |
6.625%, 10/15/29(A) | | | 1,950 | | | | 1,950 | |
Ford Motor | | | | | | | | |
9.000%, 04/22/25 | | | 1,325 | | | | 1,592 | |
Ford Motor Credit | | | | | | | | |
3.813%, 10/12/21 | | | 950 | | | | 951 | |
Ford Motor Credit | | | | | | | | |
3.339%, 03/28/22 | | | 1,300 | | | | 1,307 | |
Ford Motor Credit | | | | | | | | |
4.250%, 09/20/22 | | | 1,000 | | | | 1,023 | |
Ford Motor Credit | | | | | | | | |
4.140%, 02/15/23 | | | 475 | | | | 487 | |
Ford Motor Credit | | | | | | | | |
3.096%, 05/04/23 | | | 850 | | | | 864 | |
Ford Motor Credit | | | | | | | | |
5.584%, 03/18/24 | | | 3,450 | | | | 3,708 | |
Ford Motor Credit | | | | | | | | |
4.063%, 11/01/24 | | | 2,200 | | | | 2,313 | |
Ford Motor Credit | | | | | | | | |
5.125%, 06/16/25 | | | 1,850 | | | | 2,010 | |
Ford Motor Credit | | | | | | | | |
3.375%, 11/13/25 | | | 2,400 | | | | 2,466 | |
Ford Motor Credit | | | | | | | | |
4.271%, 01/09/27 | | | 925 | | | | 984 | |
Ford Motor Credit | | | | | | | | |
4.125%, 08/17/27 | | | 1,700 | | | | 1,804 | |
Ford Motor Credit | | | | | | | | |
5.113%, 05/03/29 | | | 1,500 | | | | 1,676 | |
Ford Motor Credit | | | | | | | | |
4.000%, 11/13/30 | | | 2,475 | | | | 2,574 | |
Ford Motor Credit, MTN | | | | | | | | |
4.389%, 01/08/26 | | | 2,100 | | | | 2,239 | |
IAA | | | | | | | | |
5.500%, 06/15/27(A) | | | 200 | | | | 209 | |
IHO Verwaltungs GmbH | | | | | | | | |
4.750%cash/5.500% PIK, 09/15/26(A) | | | 1,325 | | | | 1,358 | |
IHO Verwaltungs GmbH | | | | | | | | |
6.000%cash/6.750% PIK, 05/15/27(A) | | | 850 | | | | 886 | |
IHO Verwaltungs GmbH | | | | | | | | |
6.375%cash/7.125% PIK, 05/15/29(A) | | | 775 | | | | 846 | |
JB Poindexter | | | | | | | | |
7.125%, 04/15/26(A) | | | 2,400 | | | | 2,526 | |
KAR Auction Services | | | | | | | | |
5.125%, 06/01/25(A) | | | 2,350 | | | | 2,376 | |
Panther BF Aggregator 2 | | | | | | | | |
6.250%, 05/15/26(A) | | | 404 | | | | 424 | |
Panther BF Aggregator 2 | | | | | | | | |
8.500%, 05/15/27(A) | | | 5,875 | | | | 6,250 | |
Real Hero Merger Sub 2 | | | | | | | | |
6.250%, 02/01/29(A) | | | 3,950 | | | | 4,100 | |
| | | | | | | | | | | | | |
Total Automotive | | | 53,078 | |
| | | | | | | | | | | | | |
Autoparts [0.0%] |
Standard Profil Automotive GmbH | | | | | | | | |
6.250%, 04/30/26 | | EUR | 491 | | | | 519 | |
| | | | | | | | | | | | | |
Banks [3.7%] |
Absa Group | | | | | | | | |
6.375%, VAR US Treas Yield Curve Rate T Note Const Mat 5 Yr + 5.411%, 11/27/69 | | | 3,175 | | | | 3,307 | |
Access Bank | | | | | | | | |
9.125%, VAR US Treas Yield Curve Rate T Note Const Mat 5 Yr + 8.070%, 07/07/70 | | | 5,500 | | | | 5,500 | |
Access Bank, MTN | | | | | | | | |
10.500%, 10/19/21 | | | 1,565 | | | | 1,569 | |
Akbank T.A.S. | | | | | | | | |
6.797%, VAR USD Swap Semi 30/360 5 Yr Curr + 4.029%, 04/27/28 | | | 3,647 | | | | 3,671 | |
Akbank T.A.S., MTN | | | | | | | | |
7.200%, VAR USD Swap Semi 30/360 5 Yr Curr + 5.026%, 03/16/27 | | | 755 | | | | 762 | |
Banco do Brasil | | | | | | | | |
6.250%, VAR US Treas Yield Curve Rate T Note Const Mat 10 Yr + 4.398%, 10/15/69 | | | 7,115 | | | | 7,118 | |
Banco Mercantil del Norte | | | | | | | | |
7.625%, VAR US Treas Yield Curve Rate T Note Const Mat 10 Yr + 5.353%, 10/06/67 | | | 2,440 | | | | 2,724 | |
See accompanying notes to financial statements.
CITY NATIONAL ROCHDALE FUNDS | PAGE 68
consolidated schedule of investments |
September 30, 2021 |
City National Rochdale Fixed Income Opportunities Fund (continued) |
Description | | Face Amount (000)(1) | | | Value (000) | |
Banco Mercantil del Norte | | | | | | | | |
6.875%, VAR US Treas Yield Curve Rate T Note Const Mat 5 Yr + 5.035%, 10/06/70 | | $ | 4,000 | | | $ | 4,102 | |
Bank Nadra Via NDR Finance | | | | | | | | |
8.250%, 06/22/17(B) | | | 631 | | | | 3 | |
BBVA Bancomer | | | | | | | | |
5.125%, VAR US Treas Yield Curve Rate T Note Const Mat 5 Yr + 2.650%, 01/18/33 | | | 4,620 | | | | 4,823 | |
CorpGroup Banking | | | | | | | | |
6.750%, 03/15/23(B) | | | 4,750 | | | | 986 | |
Credit Bank of Moscow Via CBOM Finance | | | | | | | | |
7.500%, VAR USD Swap Semi 30/360 5 Yr Curr + 5.416%, 10/05/27 | | | 12,300 | | | | 12,654 | |
Credit Bank of Moscow Via CBOM Finance | | | | | | | | |
7.625%, VAR US Treas Yield Curve Rate T Note Const Mat 5 Yr + 6.561%, 01/04/70(A) | | | 5,900 | | | | 5,876 | |
Credit Bank of Moscow Via CBOM Finance | | | | | | | | |
8.875%, VAR USD Swap Semi 30/360 5 Yr Curr + 6.942%, 08/10/70 | | | 3,340 | | | | 3,462 | |
Fidelity Bank | | | | | | | | |
10.500%, 10/16/22 | | | 14,741 | | | | 15,714 | |
Freedom Mortgage | | | | | | | | |
8.250%, 04/15/25(A) | | | 303 | | | | 309 | |
Freedom Mortgage | | | | | | | | |
7.625%, 05/01/26(A) | | | 2,893 | | | | 2,948 | |
Freedom Mortgage | | | | | | | | |
6.625%, 01/15/27(A) | | | 605 | | | | 588 | |
Global Bank | | | | | | | | |
4.500%, 10/20/21 | | | 6,000 | | | | 5,994 | |
ING Bank, MTN | | | | | | | | |
2.571%, 01/01/28 | | JPY | 391,613 | | | | 2,780 | |
Itau Unibanco Holding, MTN | | | | | | | | |
6.125%, VAR US Treas Yield Curve Rate T Note Const Mat 5 Yr + 3.981%, 06/12/70 | | | 2,440 | | | | 2,464 | |
Sovcombank Via SovCom Capital DAC | | | | | | | | |
8.000%, VAR US Treas Yield Curve Rate T Note Const Mat 5 Yr + 6.427%, 04/07/30 | | | 4,305 | | | | 4,662 | |
Turkiye Garanti Bankasi | | | | | | | | |
6.125%, VAR USD Swap Semi 30/360 5 Yr Curr + 4.220%, 05/24/27 | | | 3,885 | | | | 3,912 | |
Turkiye Is Bankasi | | | | | | | | |
7.000%, VAR USD Swap Semi 30/360 5 Yr Curr + 5.117%, 06/29/28 | | | 2,917 | | | | 2,954 | |
United Bank for Africa | | | | | | | | |
7.750%, 06/08/22 | | | 20,104 | | | | 20,606 | |
Vietnam Prosperity JSC Bank, MTN | | | | | | | | |
6.250%, 07/17/22 | | | 14,972 | | | | 15,299 | |
Yapi ve Kredi Bankasi | | | | | | | | |
7.875%, VAR US Treas Yield Curve Rate T Note Const Mat 5 Yr + 7.415%, 01/22/31 | | | 3,700 | | | | 3,816 | |
Yes Bank Ifsc Banking Unit Branch, MTN | | | | | | | | |
3.750%, 02/06/23 | | | 15,000 | | | | 14,850 | |
| | | | | | | | | | | | | |
Total Banks | | | 153,453 | |
| | | | | | | | | | | | | |
Batteries/Battery Sys [0.0%] |
Energizer Gamma Acquisition BV | | | | | | | | |
3.500%, 06/30/29 | | EUR | 300 | | | | 345 | |
| | | | | | | | | | | | | |
Beauty Products [0.1%] |
Coty | | | | | | | | |
5.000%, 04/15/26(A) | | | 1,400 | | | | 1,430 | |
Oriflame Investment Holding | | | | | | | | |
5.125%, 05/04/26 | | | 3,900 | | | | 4,007 | |
| | | | | | | | | | | | | |
Total Beauty Products | | | 5,437 | |
| | | | | | | | | | | | | |
Broadcasting & Cable [0.4%] |
Altice Financing | | | | | | | | |
5.000%, 01/15/28(A) | | | 4,000 | | | | 3,813 | |
Altice Financing | | | | | | | | |
4.250%, 08/15/29 | | EUR | 1,750 | | | | 1,973 | |
Altice Financing | | | | | | | | |
5.750%, 08/15/29(A) | | | 2,510 | | | | 2,443 | |
See accompanying notes to financial statements.
CITY NATIONAL ROCHDALE FUNDS | PAGE 69
consolidated schedule of investments |
September 30, 2021 |
City National Rochdale Fixed Income Opportunities Fund (continued) |
Description | | Face Amount (000)(1) | | | Value (000) | |
LCPR Senior Secured Financing DAC | | | | | | | | |
5.125%, 07/15/29(A) | | $ | 1,005 | | | $ | 1,038 | |
Liberty Interactive | | | | | | | | |
8.500%, 07/15/29 | | | 1,000 | | | | 1,135 | |
Liberty Interactive | | | | | | | | |
8.250%, 02/01/30 | | | 2,415 | | | | 2,687 | |
Virgin Media Vendor Financing Notes III DAC | | | | | | | | |
4.875%, 07/15/28 | | GBP | 100 | | | | 137 | |
VTR Finance | | | | | | | | |
6.375%, 07/15/28 | | | 2,623 | | | | 2,831 | |
| | | | | | | | | | | | | |
Total Broadcasting & Cable | | | 16,057 | |
| | | | | | | | | | | | | |
Building & Construction [1.0%] |
APi Group DE | | | | | | | | |
4.125%, 07/15/29(A) | | | 1,098 | | | | 1,076 | |
Ashton Woods USA | | | | | | | | |
4.625%, 04/01/30(A) | | | 2,060 | | | | 2,073 | |
Brundage-Bone Concrete Pumping Holdings | | | | | | | | |
6.000%, 02/01/26(A) | | | 1,970 | | | | 2,054 | |
Cemex | | | | | | | | |
7.375%, 06/05/27 | | | 1,170 | | | | 1,297 | |
Cemex | | | | | | | | |
5.450%, 11/19/29 | | | 2,700 | | | | 2,930 | |
Cemex | | | | | | | | |
3.875%, 07/11/31 | | | 1,720 | | | | 1,723 | |
Forestar Group | | | | | | | | |
3.850%, 05/15/26(A) | | | 2,110 | | | | 2,107 | |
HTA Group | | | | | | | | |
7.000%, 12/18/25 | | | 2,985 | | | | 3,149 | |
Installed Building Products | | | | | | | | |
5.750%, 02/01/28(A) | | | 1,130 | | | | 1,184 | |
InterCement Financial Operations BV | | | | | | | | |
5.750%, 07/17/24 | | | 6,390 | | | | 6,050 | |
LGI Homes | | | | | | | | |
4.000%, 07/15/29(A) | | | 95 | | | | 95 | |
New Home | | | | | | | | |
7.250%, 10/15/25(A) | | | 2,640 | | | | 2,778 | |
Patrick Industries | | | | | | | | |
7.500%, 10/15/27(A) | | | 925 | | | | 996 | |
Patrick Industries | | | | | | | | |
4.750%, 05/01/29(A) | | | 1,045 | | | | 1,066 | |
PCF GmbH | | | | | | | | |
4.750%, 04/15/26 | | EUR | 500 | | | | 598 | |
Shea Homes | | | | | | | | |
4.750%, 02/15/28(A) | | | 1,750 | | | | 1,800 | |
Summit Materials | | | | | | | | |
6.500%, 03/15/27(A) | | | 2,000 | | | | 2,097 | |
TRI Pointe Group | | | | | | | | |
5.875%, 06/15/24 | | | 2,100 | | | | 2,310 | |
Victoria | | | | | | | | |
3.750%, 03/15/28 | | EUR | 690 | | | | 820 | |
Victors Merger | | | | | | | | |
6.375%, 05/15/29(A) | | | 1,655 | | | | 1,585 | |
Winnebago Industries | | | | | | | | |
6.250%, 07/15/28(A) | | | 1,820 | | | | 1,956 | |
Yuksel Insaat | | | | | | | | |
9.500%, 11/10/15(B) | | | 12,655 | | | | 126 | |
| | | | | | | | | | | | | |
Total Building & Construction | | | 39,870 | |
| | | | | | | | | | | | | |
Building & Construction Supplies [0.0%] |
Allegheny Ludlum | | | | | | | | |
6.950%, 12/15/25 | | | 570 | | | | 624 | |
| | | | | | | | | | | | | |
Building Materials [0.5%] |
American Builders & Contractors Supply | | | | | | | | |
4.000%, 01/15/28(A) | | | 350 | | | | 357 | |
American Builders & Contractors Supply | | | | | | | | |
3.875%, 11/15/29(A) | | | 400 | | | | 399 | |
Cornerstone Building Brands | | | | | | | | |
6.125%, 01/15/29(A) | | | 975 | | | | 1,036 | |
CP Atlas Buyer | | | | | | | | |
7.000%, 12/01/28(A) | | | 3,275 | | | | 3,283 | |
Foundation Building Materials | | | | | | | | |
6.000%, 03/01/29(A) | | | 4,140 | | | | 4,057 | |
GYP Holdings III | | | | | | | | |
4.625%, 05/01/29(A) | | | 1,845 | | | | 1,866 | |
Interface | | | | | | | | |
5.500%, 12/01/28(A) | | | 650 | | | | 683 | |
SRS Distribution | | | | | | | | |
6.125%, 07/01/29(A) | | | 925 | | | | 953 | |
Standard Industries | | | | | | | | |
5.000%, 02/15/27(A) | | | 1,725 | | | | 1,779 | |
Standard Industries | | | | | | | | |
4.750%, 01/15/28(A) | | | 1,500 | | | | 1,556 | |
Standard Industries | | | | | | | | |
4.375%, 07/15/30(A) | | | 1,075 | | | | 1,096 | |
Standard Industries | | | | | | | | |
3.375%, 01/15/31(A) | | | 1,625 | | | | 1,547 | |
White Capital Buyer | | | | | | | | |
6.875%, 10/15/28(A) | | | 2,225 | | | | 2,347 | |
See accompanying notes to financial statements.
CITY NATIONAL ROCHDALE FUNDS | PAGE 70
consolidated schedule of investments |
September 30, 2021 |
City National Rochdale Fixed Income Opportunities Fund (continued) |
Description | | Face Amount (000)(1) | | | Value (000) | |
White Capital Parent | | | | | | | | |
8.250% PIK, 03/15/26(A) | | $ | 925 | | | $ | 955 | |
| | | | | | | | | | | | | |
Total Building Materials | | | 21,914 | |
| | | | | | | | | | | | | |
Building-Heavy Construct [1.1%] |
Andrade Gutierrez International | | | | | | | | |
11.000%, 08/20/21(B) | | | 200 | | | | 153 | |
Andrade Gutierrez International | | | | | | | | |
9.500%, 12/30/24(B) | | | 52,740 | | | | 41,101 | |
Dycom Industries | | | | | | | | |
4.500%, 04/15/29(A) | | | 1,720 | | | | 1,730 | |
Odebrecht Holdco Finance | | | | | | | | |
8.760%, 09/10/58(C) | | | 18,374 | | | | 285 | |
| | | | | | | | | | | | | |
Total Building-Heavy Construct | | | 43,269 | |
| | | | | | | | | | | | | |
Cable Satellite [1.8%] |
Cablevision Systems | | | | | | | | |
5.875%, 09/15/22 | | | 850 | | | | 880 | |
CCO Holdings | | | | | | | | |
4.000%, 03/01/23(A) | | | 1,500 | | | | 1,507 | |
CCO Holdings | | | | | | | | |
5.500%, 05/01/26(A) | | | 437 | | | | 451 | |
CCO Holdings | | | | | | | | |
5.125%, 05/01/27(A) | | | 2,675 | | | | 2,785 | |
CCO Holdings | | | | | | | | |
5.000%, 02/01/28(A) | | | 900 | | | | 938 | |
CCO Holdings | | | | | | | | |
4.750%, 03/01/30(A) | | | 2,125 | | | | 2,220 | |
CCO Holdings | | | | | | | | |
4.500%, 08/15/30(A) | | | 2,800 | | | | 2,889 | |
4.500%, 05/01/32 | | | 575 | | | | 592 | |
4.500%, 06/01/33(A) | | | 1,175 | | | | 1,196 | |
CCO Holdings | | | | | | | | |
4.250%, 02/01/31(A) | | | 2,850 | | | | 2,893 | |
4.250%, 01/15/34(A) | | | 900 | | | | 895 | |
CSC Holdings | | | | | | | | |
5.250%, 06/01/24 | | | 875 | | | | 937 | |
CSC Holdings | | | | | | | | |
5.500%, 04/15/27(A) | | | 1,550 | | | | 1,611 | |
CSC Holdings | | | | | | | | |
7.500%, 04/01/28(A) | | | 900 | | | | 973 | |
CSC Holdings | | | | | | | | |
5.750%, 01/15/30(A) | | | 3,500 | | | | 3,552 | |
CSC Holdings | | | | | | | | |
4.125%, 12/01/30(A) | | | 4,300 | | | | 4,219 | |
CSC Holdings | | | | | | | | |
4.625%, 12/01/30(A) | | | 3,785 | | | | 3,586 | |
CSC Holdings | | | | | | | | |
3.375%, 02/15/31(A) | | | 400 | | | | 372 | |
CSC Holdings | | | | | | | | |
4.500%, 11/15/31(A) | | | 975 | | | | 963 | |
DIRECTV Holdings | | | | | | | | |
5.875%, 08/15/27(A) | | | 2,676 | | | | 2,793 | |
DISH DBS | | | | | | | | |
5.875%, 11/15/24 | | | 750 | | | | 806 | |
DISH DBS | | | | | | | | |
7.750%, 07/01/26 | | | 3,915 | | | | 4,419 | |
DISH DBS | | | | | | | | |
7.375%, 07/01/28 | | | 2,765 | | | | 2,944 | |
DISH DBS | | | | | | | | |
5.125%, 06/01/29 | | | 1,400 | | | | 1,372 | |
Dolya Holdco 18 DAC | | | | | | | | |
5.000%, 07/15/28(A) | | | 1,275 | | | | 1,317 | |
Intelsat Jackson Holdings | | | | | | | | |
5.500%, 08/01/23(B) | | | 725 | | | | 404 | |
Intelsat Jackson Holdings | | | | | | | | |
8.500%, 10/15/24(A) (B) | | | 875 | | | | 499 | |
Intelsat Jackson Holdings | | | | | | | | |
9.750%, 07/15/25(A) (B) | | | 525 | | | | 285 | |
Sirius XM Radio | | | | | | | | |
3.125%, 09/01/26(A) | | | 425 | | | | 431 | |
Sirius XM Radio | | | | | | | | |
4.000%, 07/15/28(A) | | | 625 | | | | 636 | |
Sirius XM Radio | | | | | | | | |
5.500%, 07/01/29(A) | | | 2,450 | | | | 2,649 | |
Sirius XM Radio | | | | | | | | |
4.125%, 07/01/30(A) | | | 2,175 | | | | 2,185 | |
Sirius XM Radio | | | | | | | | |
3.875%, 09/01/31(A) | | | 1,425 | | | | 1,392 | |
Telenet Finance Luxembourg Notes Sarl | | | | | | | | |
5.500%, 03/01/28(A) | | | 3,000 | | | | 3,152 | |
UPC Broadband Finco BV | | | | | | | | |
4.875%, 07/15/31(A) | | | 3,300 | | | | 3,379 | |
Virgin Media Finance | | | | | | | | |
5.000%, 07/15/30(A) | | | 650 | | | | 664 | |
Virgin Media Secured Finance | | | | | | | | |
5.500%, 05/15/29(A) | | | 900 | | | | 953 | |
Virgin Media Secured Finance | | | | | | | | |
4.500%, 08/15/30(A) | | | 825 | | | | 838 | |
Vmed O2 UK Financing I | | | | | | | | |
4.250%, 01/31/31(A) | | | 1,725 | | | | 1,721 | |
See accompanying notes to financial statements.
CITY NATIONAL ROCHDALE FUNDS | PAGE 71
consolidated schedule of investments |
September 30, 2021 |
City National Rochdale Fixed Income Opportunities Fund (continued) |
Description | | Face Amount (000)(1) | | | Value (000) | |
Vmed O2 UK Financing I | | | | | | | | |
4.750%, 07/15/31(A) | | $ | 3,490 | | | $ | 3,565 | |
Ziggo Bond BV | | | | | | | | |
6.000%, 01/15/27(A) | | | 2,825 | | | | 2,920 | |
Ziggo Bond BV | | | | | | | | |
5.125%, 02/28/30(A) | | | 350 | | | | 359 | |
Ziggo BV | | | | | | | | |
5.500%, 01/15/27(A) | | | 1,325 | | | | 1,370 | |
Ziggo BV | | | | | | | | |
4.875%, 01/15/30(A) | | | 200 | | | | 205 | |
| | | | | | | | | | | | | |
Total Cable Satellite | | | 74,717 | |
| | | | | | | | | | | | | |
Chemicals [1.3%] |
Ashland | | | | | | | | |
3.375%, 09/01/31(A) | | | 575 | | | | 580 | |
Axalta Coating Systems | | | | | | | | |
4.750%, 06/15/27(A) | | | 250 | | | | 261 | |
Axalta Coating Systems | | | | | | | | |
3.375%, 02/15/29(A) | | | 775 | | | | 755 | |
Braskem Idesa SAPI | | | | | | | | |
7.450%, 11/15/29 | | | 5,050 | | | | 5,362 | |
Braskem Netherlands Finance BV | | | | | | | | |
5.875%, 01/31/50 | | | 2,210 | | | | 2,517 | |
Braskem Netherlands Finance BV | | | | | | | | |
8.500%, VAR US Treas Yield Curve Rate T Note Const Mat 5 Yr + 8.220%, 01/23/81 | | | 3,100 | | | | 3,553 | |
Compass Minerals International | | | | | | | | |
4.875%, 07/15/24(A) | | | 1,200 | | | | 1,249 | |
Compass Minerals International | | | | | | | | |
6.750%, 12/01/27(A) | | | 1,200 | | | | 1,274 | |
Element Solutions | | | | | | | | |
3.875%, 09/01/28(A) | | | 1,975 | | | | 1,995 | |
Fire BC | | | | | | | | |
4.750%, VAR Euribor 3 Month + 4.750%, 09/30/24 | | EUR | 2,341 | | | | 2,651 | |
HB Fuller | | | | | | | | |
4.250%, 10/15/28 | | | 775 | | | | 788 | |
Herens Holdco Sarl | | | | | | | | |
4.750%, 05/15/28(A) | | | 2,075 | | | | 2,085 | |
Herens Midco Sarl | | | | | | | | |
5.250%, 05/15/29 | | EUR | 500 | | | | 562 | |
Hexion | | | | | | | | |
7.875%, 07/15/27(A) | | | 2,550 | | | | 2,722 | |
Illuminate Buyer | | | | | | | | |
9.000%, 07/01/28(A) | | | 1,450 | | | | 1,599 | |
INEOS Quattro Finance 2 | | | | | | | | |
3.375%, 01/15/26(A) | | | 200 | | | | 202 | |
Koppers | | | | | | | | |
6.000%, 02/15/25(A) | | | 4,075 | | | | 4,167 | |
Olympus Water US Holding | | | | | | | | |
3.875%, 10/01/28 | | EUR | 200 | | | | 232 | |
Olympus Water US Holding | | | | | | | | |
4.250%, 10/01/28(A) | | | 1,200 | | | | 1,182 | |
Olympus Water US Holding | | | | | | | | |
5.375%, 10/01/29 | | EUR | 197 | | | | 225 | |
Olympus Water US Holding | | | | | | | | |
6.250%, 10/01/29(A) | | | 875 | | | | 867 | |
Polar US Borrower | | | | | | | | |
6.750%, 05/15/26(A) | | | 1,850 | | | | 1,862 | |
Sasol Financing USA | | | | | | | | |
4.375%, 09/18/26 | | | 1,400 | | | | 1,422 | |
Sasol Financing USA | | | | | | | | |
6.500%, 09/27/28 | | | 4,300 | | | | 4,751 | |
Sasol Financing USA | | | | | | | | |
5.500%, 03/18/31 | | | 2,600 | | | | 2,666 | |
SPCM | | | | | | | | |
3.125%, 03/15/27(A) | | | 200 | | | | 200 | |
SPCM | | | | | | | | |
3.375%, 03/15/30(A) | | | 425 | | | | 425 | |
Trinseo Materials Operating SCA | | | | | | | | |
5.125%, 04/01/29(A) | | | 190 | | | | 191 | |
Unigel Luxembourg | | | | | | | | |
8.750%, 10/01/26 | | | 4,430 | | | | 4,768 | |
WR Grace Holdings | | | | | | | | |
4.875%, 06/15/27(A) | | | 775 | | | | 796 | |
WR Grace Holdings | | | | | | | | |
5.625%, 08/15/29(A) | | | 1,125 | | | | 1,159 | |
Yingde Gases Investment | | | | | | | | |
6.250%, 01/19/23 | | | 1,065 | | | | 1,097 | |
| | | | | | | | | | | | | |
Total Chemicals | | | 54,165 | |
| | | | | | | | | | | | | |
Coal Mining [0.7%] |
DTEK Finance | | | | | | | | |
5.000%cash/0.000% PIK, 12/31/27 | | | 33,958 | | | | 20,651 | |
Eterna Capital Pte | | | | | | | | |
8.000%, 12/11/22 | | | 4,956 | | | | 2,131 | |
Mongolian Mining | | | | | | | | |
9.250%, 04/15/24 | | | 3,620 | | | | 3,255 | |
See accompanying notes to financial statements.
CITY NATIONAL ROCHDALE FUNDS | PAGE 72
consolidated schedule of investments |
September 30, 2021 |
City National Rochdale Fixed Income Opportunities Fund (continued) |
Description | | Face Amount (000)(1) | | | Value (000) | |
Mongolian Mining | | | | | | | | |
0.000%(L) | | $ | 5,787 | | | $ | 2,517 | |
New World Resources | | | | | | | | |
8.000%, 04/07/20(B) | | EUR | 1,101 | | | | 34 | |
SunCoke Energy | | | | | | | | |
4.875%, 06/30/29(A) | | | 470 | | | | 468 | |
| | | | | | | | | | | | | |
Total Coal Mining | | | 29,056 | |
| | | | | | | | | | | | | |
Commercial Serv-Finance [0.0%] |
Paysafe Finance | | | | | | | | |
3.000%, 06/15/29 | | EUR | 700 | | | | 783 | |
Sabre GLBL | | | | | | | | |
9.250%, 04/15/25(A) | | | 580 | | | | 670 | |
| | | | | | | | | | | | | |
Total Commercial Serv-Finance | | | 1,453 | |
| | | | | | | | | | | | | |
Commercial Services [0.3%] |
Legends Hospitality Holding | | | | | | | | |
5.000%, 02/01/26(A) | | | 2,256 | | | | 2,312 | |
Live Nation Entertainment | | | | | | | | |
4.875%, 11/01/24(A) | | | 1,860 | | | | 1,881 | |
Live Nation Entertainment | | | | | | | | |
5.625%, 03/15/26(A) | | | 2,480 | | | | 2,567 | |
SD International Sukuk, MTN | | | | | | | | |
6.300%, 05/09/22 | | | 13,384 | | | | 4,626 | |
| | | | | | | | | | | | | |
Total Commercial Services | | | 11,386 | |
| | | | | | | | | | | | | |
Computer Software [0.1%] |
ZoomInfo Technologies | | | | | | | | |
3.875%, 02/01/29(A) | | | 2,041 | | | | 2,041 | |
| | | | | | | | | | | | | |
Computer System Design & Services [0.0%] |
Ahead DB Holdings | | | | | | | | |
6.625%, 05/01/28(A) | | | 590 | | | | 594 | |
Austin BidCo | | | | | | | | |
7.125%, 12/15/28(A) | | | 1,005 | | | | 1,013 | |
| | | | | | | | | | | | | |
Total Computer System Design & Services | | | 1,607 | |
| | | | | | | | | | | | | |
Construction Machinery [0.2%] |
H&E Equipment Services | | | | | | | | |
3.875%, 12/15/28(A) | | | 2,700 | | | | 2,693 | |
Terex | | | | | | | | |
5.000%, 05/15/29(A) | | | 1,630 | | | | 1,689 | |
United Rentals North America | | | | | | | | |
5.500%, 05/15/27 | | | 850 | | | | 893 | |
United Rentals North America | | | | | | | | |
4.875%, 01/15/28 | | | 600 | | | | 634 | |
United Rentals North America | | | | | | | | |
5.250%, 01/15/30 | | | 325 | | | | 356 | |
United Rentals North America | | | | | | | | |
4.000%, 07/15/30 | | | 700 | | | | 726 | |
United Rentals North America | | | | | | | | |
3.875%, 02/15/31 | | | 700 | | | | 718 | |
United Rentals North America | | | | | | | | |
3.750%, 01/15/32 | | | 400 | | | | 405 | |
| | | | | | | | | | | | | |
Total Construction Machinery | | | 8,114 | |
| | | | | | | | | | | | | |
Consumer Cyclical Services [0.6%] |
Allied Universal Holdco | | | | | | | | |
6.625%, 07/15/26(A) | | | 1,575 | | | | 1,665 | |
Allied Universal Holdco | | | | | | | | |
9.750%, 07/15/27(A) | | | 5,075 | | | | 5,506 | |
Allied Universal Holdco | | | | | | | | |
6.000%, 06/01/29(A) | | | 1,100 | | | | 1,086 | |
Brink’s | | | | | | | | |
5.500%, 07/15/25(A) | | | 250 | | | | 261 | |
Garda World Security | | | | | | | | |
4.625%, 02/15/27(A) | | | 1,700 | | | | 1,700 | |
Garda World Security | | | | | | | | |
6.000%, 06/01/29(A) | | | 1,700 | | | | 1,654 | |
Go Daddy Operating | | | | | | | | |
5.250%, 12/01/27(A) | | | 1,475 | | | | 1,538 | |
GW B-CR Security | | | | | | | | |
9.500%, 11/01/27(A) | | | 4,018 | | | | 4,334 | |
Signal Parent | | | | | | | | |
6.125%, 04/01/29(A) | | | 5,037 | | | | 4,810 | |
| | | | | | | | | | | | | |
Total Consumer Cyclical Services | | | 22,554 | |
| | | | | | | | | | | | | |
Consumer Products [0.2%] |
BCPE Empire Holdings | | | | | | | | |
7.625%, 05/01/27(A) | | | 3,325 | | | | 3,308 | |
Diamond BC BV | | | | | | | | |
4.625%, 10/01/29(A) | | | 825 | | | | 837 | |
Edgewell Personal Care | | | | | | | | |
5.500%, 06/01/28(A) | | | 875 | | | | 924 | |
Edgewell Personal Care | | | | | | | | |
4.125%, 04/01/29(A) | | | 900 | | | | 900 | |
See accompanying notes to financial statements.
CITY NATIONAL ROCHDALE FUNDS | PAGE 73
consolidated schedule of investments |
September 30, 2021 |
City National Rochdale Fixed Income Opportunities Fund (continued) |
Description | | Face Amount (000)(1) | | | Value (000) | |
Energizer Holdings | | | | | | | | |
4.750%, 06/15/28(A) | | $ | 725 | | | $ | 738 | |
Energizer Holdings | | | | | | | | |
4.375%, 03/31/29(A) | | | 1,950 | | | | 1,935 | |
Prestige Brands | | | | | | | | |
5.125%, 01/15/28(A) | | | 475 | | | | 498 | |
Prestige Brands | | | | | | | | |
3.750%, 04/01/31(A) | | | 600 | | | | 579 | |
| | | | | | | | | | | | | |
Total Consumer Products | | | 9,719 | |
| | | | | | | | | | | | | |
Consumer Products & Services [0.0%] |
Tempur Sealy International | | | | | | | | |
3.875%, 10/15/31(A) | | | 365 | | | | 365 | |
| | | | | | | | | | | | | |
Containers & Packaging [0.2%] |
Graham Packaging | | | | | | | | |
7.125%, 08/15/28(A) | | | 500 | | | | 526 | |
Klabin Austria GmbH | | | | | | | | |
3.200%, 01/12/31 | | | 1,665 | | | | 1,594 | |
Klabin Austria GmbH | | | | | | | | |
7.000%, 04/03/49 | | | 4,545 | | | | 5,505 | |
| | | | | | | | | | | | | |
Total Containers & Packaging | | | 7,625 | |
| | | | | | | | | | | | | |
Diversified Manufacturing [0.2%] |
Colfax | | | | | | | | |
6.375%, 02/15/26(A) | | | 150 | | | | 157 | |
Entegris | | | | | | | | |
3.625%, 05/01/29(A) | | | 730 | | | | 745 | |
Gates Global | | | | | | | | |
6.250%, 01/15/26(A) | | | 4,450 | | | | 4,617 | |
Stevens Holding | | | | | | | | |
6.125%, 10/01/26(A) | | | 425 | | | | 459 | |
Titan Acquisition | | | | | | | | |
7.750%, 04/15/26(A) | | | 300 | | | | 306 | |
WESCO Distribution | | | | | | | | |
7.125%, 06/15/25(A) | | | 450 | | | | 481 | |
WESCO Distribution | | | | | | | | |
7.250%, 06/15/28(A) | | | 2,250 | | | | 2,492 | |
| | | | | | | | | | | | | |
Total Diversified Manufacturing | | | 9,257 | |
| | | | | | | | | | | | | |
Diversified Minerals [0.3%] |
Volcan Cia Minera SAA | | | | | | | | |
5.375%, 02/02/22 | | | 11,275 | | | | 11,298 | |
| | | | | | | | | | | | | |
Drugs [0.7%] |
Diocle Spa | | | | | | | | |
3.875%, VAR Euribor 3 Month + 3.875%, 06/30/26 | | EUR | 315 | | | | 365 | |
Teva Pharmaceutical Finance | | | | | | | | |
6.150%, 02/01/36 | | | 8,775 | | | | 9,601 | |
Teva Pharmaceutical Finance Netherlands III BV | | | | | | | | |
7.125%, 01/31/25 | | | 1,145 | | | | 1,252 | |
Teva Pharmaceutical Finance Netherlands III BV | | | | | | | | |
6.750%, 03/01/28 | | | 14,470 | | | | 16,550 | |
| | | | | | | | | | | | | |
Total Drugs | | | 27,768 | |
| | | | | | | | | | | | | |
E-Commerce/Products [0.0%] |
ANGI Group | | | | | | | | |
3.875%, 08/15/28(A) | | | 1,480 | | | | 1,473 | |
HSE Finance Sarl | | | | | | | | |
5.625%, 10/15/26 | | EUR | 300 | | | | 361 | |
| | | | | | | | | | | | | |
Total E-Commerce/Products | | | 1,834 | |
| | | | | | | | | | | | | |
E-Commerce/Services [0.1%] |
TripAdvisor | | | | | | | | |
7.000%, 07/15/25(A) | | | 1,465 | | | | 1,553 | |
Uber Technologies | | | | | | | | |
6.250%, 01/15/28(A) | | | 1,750 | | | | 1,877 | |
| | | | | | | | | | | | | |
Total E-Commerce/Services | | | 3,430 | |
| | | | | | | | | | | | | |
Educational Services [0.2%] |
Adtalem Global Education | | | | | | | | |
5.500%, 03/01/28(A) | | | 2,960 | | | | 3,003 | |
New Oriental Education & Technology Group | | | | | | | | |
2.125%, 07/02/25 | | | 2,000 | | | | 1,790 | |
| | | | | | | | | | | | | |
Total Educational Services | | | 4,793 | |
| | | | | | | | | | | | | |
Electric Utilities [1.6%] |
AES Gener | | | | | | | | |
7.125%, VAR USD Swap Semi 30/360 5 Yr Curr + 4.644%, 03/26/79 | | | 5,555 | | | | 5,905 | |
AES Panama Generation Holdings SRL | | | | | | | | |
4.375%, 05/31/30 | | | 2,240 | | | | 2,312 | |
See accompanying notes to financial statements.
CITY NATIONAL ROCHDALE FUNDS | PAGE 74
consolidated schedule of investments |
September 30, 2021 |
City National Rochdale Fixed Income Opportunities Fund (continued) |
Description | | Face Amount (000)(1) | | | Value (000) | |
Electricidad Firme de Mexico Holdings | | | | | | | | |
4.900%, 11/20/26(A) | | $ | 3,400 | | | $ | 3,397 | |
Eskom Holdings SOC | | | | | | | | |
7.125%, 02/11/25 | | | 335 | | | | 350 | |
Guacolda Energia | | | | | | | | |
4.560%, 04/30/25 | | | 4,515 | | | | 3,003 | |
Instituto Costarricense de Electricidad | | | | | | | | |
6.950%, 11/10/21 | | | 23,461 | | | | 23,473 | |
Instituto Costarricense de Electricidad | | | | | | | | |
6.750%, 10/07/31 | | | 5,000 | | | | 4,955 | |
Leeward Renewable Energy Operations | | | | | | | | |
4.250%, 07/01/29(A) | | | 810 | | | | 823 | |
Perusahaan Listrik Negara | | | | | | | | |
5.500%, 11/22/21 | | | 626 | | | | 630 | |
Perusahaan Listrik Negara, MTN | | | | | | | | |
5.250%, 05/15/47 | | | 316 | | | | 352 | |
Perusahaan Listrik Negara, MTN | | | | | | | | |
6.150%, 05/21/48 | | | 519 | | | | 642 | |
PG&E | | | | | | | | |
5.000%, 07/01/28 | | | 1,075 | | | | 1,092 | |
PG&E | | | | | | | | |
5.250%, 07/01/30 | | | 625 | | | | 639 | |
Stoneway Capital | | | | | | | | |
10.000%, 03/01/27(B) | | | 66,142 | | | | 16,867 | |
| | | | | | | | | | | | | |
Total Electric Utilities | | | 64,440 | |
| | | | | | | | | | | | | |
Electric-Distribution [0.2%] |
Comision Federal de Electricidad | | | | | | | | |
4.875%, 01/15/24 | | | 590 | | | | 638 | |
Comision Federal de Electricidad | | | | | | | | |
3.875%, 07/26/33(A) | | | 431 | | | | 425 | |
Comision Federal de Electricidad | | | | | | | | |
5.750%, 02/14/42 | | | 715 | | | | 785 | |
Energia Group NI FinanceCo | | | | | | | | |
4.750%, 09/15/24 | | GBP | 2,000 | | | | 2,718 | |
Zorlu Yenilenebilir Enerji | | | | | | | | |
9.000%, 06/01/26 | | | 5,300 | | | | 5,205 | |
| | | | | | | | | | | | | |
Total Electric-Distribution | | | 9,771 | |
| | | | | | | | | | | | | |
Energy & Power [0.5%] |
Aydem Yenilenebilir Enerji | | | | | | | | |
7.750%, 02/02/27 | | | 16,300 | | | | 15,876 | |
Greenko Solar Mauritius | | | | | | | | |
5.950%, 07/29/26 | | | 1,435 | | | | 1,522 | |
India Green Energy Holdings | | | | | | | | |
5.375%, 04/29/24 | | | 1,060 | | | | 1,103 | |
Sheridan Production Partners | | | | | | | | |
0.000%(M) | | | 11 | | | | 75 | |
| | | | | | | | | | | | | |
Total Energy & Power | | | 18,576 | |
| | | | | | | | | | | | | |
Enterprise Software/Serv [0.0%] |
Cedacri Mergeco SPA | | | | | | | | |
4.625%, VAR Euribor 3 Month + 4.625%, 05/15/28 | | EUR | 900 | | | | 1,048 | |
| | | | | | | | | | | | | |
Entertainment & Gaming [0.2%] |
Everi Holdings | | | | | | | | |
5.000%, 07/15/29(A) | | | 49 | | | | 50 | |
Gamma Bidco | | | | | | | | |
5.125%, 07/15/25 | | EUR | 800 | | | | 945 | |
NagaCorp | | | | | | | | |
7.950%, 07/06/24 | | | 8,000 | | | | 8,013 | |
| | | | | | | | | | | | | |
Total Entertainment & Gaming | | | 9,008 | |
| | | | | | | | | | | | | |
Entertainment Software [0.0%] |
Playtika Holding | | | | | | | | |
4.250%, 03/15/29(A) | | | 1,000 | | | | 1,003 | |
| | | | | | | | | | | | | |
Export/Import Bank [0.0%] |
Development Bank of Mongolia | | | | | | | | |
7.250%, 10/23/23 | | | 204 | | | | 218 | |
Export-Import Bank of India | | | | | | | | |
3.375%, 08/05/26 | | | 284 | | | | 302 | |
Export-Import Bank of India, MTN | | | | | | | | |
4.000%, 01/14/23 | | | 415 | | | | 432 | |
Export-Import Bank of India, MTN | | | | | | | | |
2.250%, 01/13/31(A) | | | 572 | | | | 532 | |
Ukreximbank Via Biz Finance | | | | | | | | |
9.625%, 04/27/22 | | | 1,000 | | | | 1,015 | |
| | | | | | | | | | | | | |
Total Export/Import Bank | | | 2,499 | |
See accompanying notes to financial statements.
CITY NATIONAL ROCHDALE FUNDS | PAGE 75
consolidated schedule of investments |
September 30, 2021 |
City National Rochdale Fixed Income Opportunities Fund (continued) |
Description | | Face Amount (000)(1) | | | Value (000) | |
Finance Companies [0.7%] |
LD Holdings Group | | | | | | | | |
6.500%, 11/01/25(A) | | $ | 980 | | | $ | 975 | |
LD Holdings Group | | | | | | | | |
6.125%, 04/01/28(A) | | | 6,625 | | | | 6,244 | |
Navient | | | | | | | | |
5.875%, 10/25/24 | | | 1,125 | | | | 1,201 | |
Navient | | | | | | | | |
6.750%, 06/25/25 | | | 725 | | | | 792 | |
6.750%, 06/15/26 | | | 200 | | | | 222 | |
Navient | | | | | | | | |
5.000%, 03/15/27 | | | 750 | | | | 771 | |
Navient | | | | | | | | |
4.875%, 03/15/28 | | | 600 | | | | 608 | |
Rocket Mortgage | | | | | | | | |
2.875%, 10/15/26(A) | | | 1,200 | | | | 1,191 | |
Rocket Mortgage | | | | | | | | |
5.250%, 01/15/28(A) | | | 1,575 | | | | 1,697 | |
Rocket Mortgage | | | | | | | | |
3.625%, 03/01/29(A) | | | 1,325 | | | | 1,350 | |
Rocket Mortgage | | | | | | | | |
3.875%, 03/01/31(A) | | | 1,925 | | | | 1,942 | |
Rocket Mortgage | | | | | | | | |
4.000%, 10/15/33(A) | | | 875 | | | | 869 | |
United Wholesale Mortgage | | | | | | | | |
5.500%, 11/15/25(A) | | | 4,570 | | | | 4,604 | |
5.500%, 04/15/29(A) | | | 5,346 | | | | 5,191 | |
| | | | | | | | | | | | | |
Total Finance Companies | | | 27,657 | |
| | | | | | | | | | | | | |
Financial Services [1.4%] |
Alliance Data Systems | | | | | | | | |
7.000%, 01/15/26(A) | | | 3,815 | | | | 4,082 | |
Encore Capital Group | | | | | | | | |
4.250%, VAR Euribor 3 Month + 4.250%, 01/15/28 | | EUR | 800 | | | | 946 | |
4.250%, 06/01/28 | | GBP | 300 | | | | 403 | |
Garfunkelux Holdco 3 | | | | | | | | |
6.750%, 11/01/25 | | EUR | 900 | | | | 1,088 | |
Garfunkelux Holdco 3 | | | | | | | | |
7.750%, 11/01/25 | | GBP | 900 | | | | 1,267 | |
Genworth Mortgage Holdings | | | | | | | | |
6.500%, 08/15/25(A) | | | 1,476 | | | | 1,611 | |
India Infoline Finance, MTN | | | | | | | | |
5.875%, 04/20/23 | | | 14,206 | | | | 13,797 | |
Jefferies Finance | | | | | | | | |
5.000%, 08/15/28(A) | | | 795 | | | | 807 | |
MGIC Investment | | | | | | | | |
5.250%, 08/15/28 | | | 1,870 | | | | 1,995 | |
Midcap Financial Issuer Trust | | | | | | | | |
6.500%, 05/01/28(A) | | | 995 | | | | 1,037 | |
Midcap Financial Issuer Trust | | | | | | | | |
5.625%, 01/15/30(A) | | | 990 | | | | 980 | |
Nationstar Mortgage Holdings | | | | | | | | |
6.000%, 01/15/27(A) | | | 6,530 | | | | 6,816 | |
Nationstar Mortgage Holdings | | | | | | | | |
5.500%, 08/15/28(A) | | | 1,960 | | | | 2,019 | |
NT Rig Holdco PTE | | | | | | | | |
1.805%, 12/20/22 | | | 2,837 | | | | 2,567 | |
NT Rig Holdco PTE | | | | | | | | |
7.500%, 12/20/22 | | | 25,338 | | | | 2,787 | |
OEC Finance | | | | | | | | |
4.375% PIK,10/25/29(C) | | | 61 | | | | 5 | |
OEC Finance | | | | | | | | |
5.250% PIK, 12/27/33 | | | 7,201 | | | | 594 | |
OEC Finance | | | | | | | | |
7.125% PIK, 12/26/46(C) | | | 6,340 | | | | 539 | |
OEC Finance | | | | | | | | |
7.500%, 03/14/70 | | | 1,068 | | | | 88 | |
Oilflow SPV 1 DAC | | | | | | | | |
12.000%, 01/13/22 | | | 1,981 | | | | 2,001 | |
OneMain Finance | | | | | | | | |
6.875%, 03/15/25 | | | 1,500 | | | | 1,686 | |
OneMain Finance | | | | | | | | |
5.375%, 11/15/29 | | | 385 | | | | 417 | |
PennyMac Financial Services | | | | | | | | |
5.375%, 10/15/25(A) | | | 1,129 | | | | 1,161 | |
PennyMac Financial Services | | | | | | | | |
4.250%, 02/15/29(A) | | | 1,675 | | | | 1,595 | |
PennyMac Financial Services | | | | | | | | |
5.750%, 09/15/31(A) | | | 195 | | | | 195 | |
PRA Group | | | | | | | | |
5.000%, 10/01/29(A) | | | 1,010 | | | | 1,011 | |
Radian Group | | | | | | | | |
6.625%, 03/15/25 | | | 3,725 | | | | 4,158 | |
Russian Standard | | | | | | | | |
13.000%, 10/27/22(B) | | | — | | | | — | |
Unifin Financiera SOFOM ENR | | | | | | | | |
7.250%, 09/27/23 | | | 2,368 | | | | 2,377 | |
| | | | | | | | | | | | | |
Total Financial Services | | | 58,029 | |
See accompanying notes to financial statements.
CITY NATIONAL ROCHDALE FUNDS | PAGE 76
consolidated schedule of investments |
September 30, 2021 |
City National Rochdale Fixed Income Opportunities Fund (continued) |
Description | | Face Amount (000)(1) | | | Value (000) | |
| | | | | | | | | | | | | |
Food & Beverage [0.6%] |
Aramark Services | | | | | | | | |
5.000%, 04/01/25(A) | | $ | 625 | | | $ | 640 | |
5.000%, 02/01/28(A) | | | 2,850 | | | | 2,928 | |
Aramark Services | | | | | | | | |
6.375%, 05/01/25(A) | | | 425 | | | | 447 | |
Kraft Heinz Foods | | | | | | | | |
4.250%, 03/01/31 | | | 1,650 | | | | 1,863 | |
Kraft Heinz Foods | | | | | | | | |
5.200%, 07/15/45 | | | 200 | | | | 251 | |
Kraft Heinz Foods | | | | | | | | |
4.375%, 06/01/46 | | | 4,400 | | | | 5,006 | |
Lamb Weston Holdings | | | | | | | | |
4.625%, 11/01/24(A) | | | 375 | | | | 382 | |
Lamb Weston Holdings | | | | | | | | |
4.875%, 11/01/26(A) | | | 1,025 | | | | 1,050 | |
4.875%, 05/15/28(A) | | | 275 | | | | 302 | |
Performance Food Group | | | | | | | | |
4.250%, 08/01/29(A) | | | 1,730 | | | | 1,734 | |
Post Holdings | | | | | | | | |
5.750%, 03/01/27(A) | | | 1,575 | | | | 1,636 | |
Post Holdings | | | | | | | | |
5.625%, 01/15/28(A) | | | 2,800 | | | | 2,942 | |
Post Holdings | | | | | | | | |
5.500%, 12/15/29(A) | | | 850 | | | | 901 | |
Post Holdings | | | | | | | | |
4.625%, 04/15/30(A) | | | 550 | | | | 554 | |
Post Holdings | | | | | | | | |
4.500%, 09/15/31(A) | | | 1,450 | | | | 1,433 | |
US Foods | | | | | | | | |
6.250%, 04/15/25(A) | | | 225 | | | | 236 | |
US Foods | | | | | | | | |
4.750%, 02/15/29(A) | | | 1,925 | | | | 1,975 | |
| | | | | | | | | | | | | |
Total Food & Beverage | | | 24,280 | |
| | | | | | | | | | | | | |
Food, Beverage & Tobacco [0.7%] |
BRF | | | | | | | | |
5.750%, 09/21/50 | | | 7,725 | | | | 7,418 | |
Frigorifico Concepcion | | | | | | | | |
7.700%, 07/21/28 | | | 10,819 | | | | 11,198 | |
MARB BondCo | | | | | | | | |
3.950%, 01/29/31 | | | 2,400 | | | | 2,296 | |
Simmons Foods | | | | | | | | |
4.625%, 03/01/29(A) | | | 1,495 | | | | 1,506 | |
Turning Point Brands | | | | | | | | |
5.625%, 02/15/26(A) | | | 1,915 | | | | 1,997 | |
Vector Group | | | | | | | | |
10.500%, 11/01/26(A) | | | 2,290 | | | | 2,410 | |
Vector Group | | | | | | | | |
5.750%, 02/01/29(A) | | | 1,925 | | | | 1,924 | |
| | | | | | | | | | | | | |
Total Food, Beverage & Tobacco | | | 28,749 | |
| | | | | | | | | | | | | |
Footwear and Related Apparel [0.0%] |
Wolverine World Wide | | | | | | | | |
4.000%, 08/15/29(A) | | | 745 | | | | 752 | |
| | | | | | | | | | | | | |
Gaming [1.0%] |
Affinity Gaming | | | | | | | | |
6.875%, 12/15/27(A) | | | 1,900 | | | | 1,995 | |
Bally’s | | | | | | | | |
6.750%, 06/01/27(A) | | | 553 | | | | 602 | |
Boyd Gaming | | | | | | | | |
8.625%, 06/01/25(A) | | | 175 | | | | 190 | |
Boyd Gaming | | | | | | | | |
4.750%, 12/01/27 | | | 1,550 | | | | 1,602 | |
4.750%, 06/15/31(A) | | | 675 | | | | 696 | |
Caesars Entertainment | | | | | | | | |
4.625%, 10/15/29(A) | | | 625 | | | | 634 | |
Caesars Resort Collection | | | | | | | | |
5.250%, 10/15/25(A) | | | 2,300 | | | | 2,331 | |
CCM Merger | | | | | | | | |
6.375%, 05/01/26(A) | | | 225 | | | | 237 | |
Colt Merger Sub | | | | | | | | |
5.750%, 07/01/25(A) | | | 475 | | | | 499 | |
Colt Merger Sub | | | | | | | | |
6.250%, 07/01/25(A) | | | 1,150 | | | | 1,211 | |
Colt Merger Sub | | | | | | | | |
8.125%, 07/01/27(A) | | | 5,074 | | | | 5,702 | |
MGM Growth Properties Operating Partnership | | | | | | | | |
5.625%, 05/01/24 | | | 425 | | | | 462 | |
MGM Growth Properties Operating Partnership | | | | | | | | |
4.625%, 06/15/25(A) | | | 400 | | | | 431 | |
MGM Growth Properties Operating Partnership | | | | | | | | |
4.500%, 09/01/26 | | | 875 | | | | 952 | |
MGM Growth Properties Operating Partnership | | | | | | | | |
3.875%, 02/15/29(A) | | | 250 | | | | 266 | |
MGM Resorts International | | | | | | | | |
6.000%, 03/15/23 | | | 500 | | | | 528 | |
MGM Resorts International | | | | | | | | |
6.750%, 05/01/25 | | | 1,075 | | | | 1,133 | |
MGM Resorts International | | | | | | | | |
4.625%, 09/01/26 | | | 192 | | | | 201 | |
See accompanying notes to financial statements.
CITY NATIONAL ROCHDALE FUNDS | PAGE 77
consolidated schedule of investments |
September 30, 2021 |
City National Rochdale Fixed Income Opportunities Fund (continued) |
Description | | Face Amount (000)(1) | | | Value (000) | |
MGM Resorts International | | | | | | | | |
5.500%, 04/15/27 | | $ | 762 | | | $ | 827 | |
MGM Resorts International | | | | | | | | |
4.750%, 10/15/28 | | | 775 | | | | 817 | |
Midwest Gaming Borrower | | | | | | | | |
4.875%, 05/01/29(A) | | | 900 | | | | 917 | |
Mohegan Gaming & Entertainment | | | | | | | | |
7.875%, 10/15/24(A) | | | 475 | | | | 499 | |
Mohegan Gaming & Entertainment | | | | | | | | |
8.000%, 02/01/26(A) | | | 3,800 | | | | 3,959 | |
Penn National Gaming | | | | | | | | |
5.625%, 01/15/27(A) | | | 250 | | | | 257 | |
Penn National Gaming | | | | | | | | |
4.125%, 07/01/29(A) | | | 1,335 | | | | 1,320 | |
Raptor Acquisition | | | | | | | | |
4.875%, 11/01/26(A) | | | 425 | | | | 434 | |
Scientific Games International | | | | | | | | |
8.625%, 07/01/25(A) | | | 1,525 | | | | 1,651 | |
Scientific Games International | | | | | | | | |
8.250%, 03/15/26(A) | | | 875 | | | | 929 | |
Scientific Games International | | | | | | | | |
7.250%, 11/15/29(A) | | | 1,175 | | | | 1,320 | |
Station Casinos | | | | | | | | |
5.000%, 10/01/25(A) | | | 1,565 | | | | 1,587 | |
Station Casinos | | | | | | | | |
4.500%, 02/15/28(A) | | | 2,450 | | | | 2,489 | |
Sugarhouse HSP Gaming Prop Mezz | | | | | | | | |
5.875%, 05/15/25(A) | | | 200 | | | | 200 | |
VICI Properties | | | | | | | | |
3.500%, 02/15/25(A) | | | 75 | | | | 76 | |
VICI Properties | | | | | | | | |
4.250%, 12/01/26(A) | | | 900 | | | | 940 | |
VICI Properties | | | | | | | | |
4.625%, 12/01/29(A) | | | 1,800 | | | | 1,935 | |
VICI Properties | | | | | | | | |
4.125%, 08/15/30(A) | | | 275 | | | | 292 | |
| | | | | | | | | | | | | |
Total Gaming | | | 40,121 | |
| | | | | | | | | | | | | |
Gold Mining [0.3%] |
Cia de Minas Buenaventura SAA | | | | | | | | |
5.500%, 07/23/26 | | | 13,210 | | | | 13,059 | |
5.500%, 07/23/26(A) | | | 200 | | | | 197 | |
| | | | | | | | | | | | | |
Total Gold Mining | | | 13,256 | |
| | | | | | | | | | | | | |
Government [0.2%] |
City of Kyiv Via Kyiv Finance, MTN | | | | | | | | |
7.500%, 12/15/22 | | | 6,025 | | | | 6,054 | |
| | | | | | | | | | | | | |
Health Insurance [0.2%] |
Centene | | | | | | | | |
4.250%, 12/15/27 | | | 1,075 | | | | 1,125 | |
Centene | | | | | | | | |
2.450%, 07/15/28 | | | 900 | | | | 905 | |
Centene | | | | | | | | |
4.625%, 12/15/29 | | | 500 | | | | 545 | |
Centene | | | | | | | | |
3.375%, 02/15/30 | | | 250 | | | | 258 | |
Centene | | | | | | | | |
3.000%, 10/15/30 | | | 1,225 | | | | 1,256 | |
Centene | | | | | | | | |
2.625%, 08/01/31 | | | 2,300 | | | | 2,284 | |
| | | | | | | | | | | | | |
Total Health Insurance | | | 6,373 | |
| | | | | | | | | | | | | |
Healthcare [1.6%] |
Acadia Healthcare | | | | | | | | |
5.500%, 07/01/28(A) | | | 875 | | | | 920 | |
Acadia Healthcare | | | | | | | | |
5.000%, 04/15/29(A) | | | 250 | | | | 260 | |
AdaptHealth | | | | | | | | |
4.625%, 08/01/29(A) | | | 1,150 | | | | 1,149 | |
AdaptHealth | | | | | | | | |
5.125%, 03/01/30(A) | | | 1,275 | | | | 1,276 | |
AHP Health Partners | | | | | | | | |
5.750%, 07/15/29(A) | | | 825 | | | | 833 | |
Avantor Funding | | | | | | | | |
4.625%, 07/15/28(A) | | | 2,550 | | | | 2,684 | |
Charles River Laboratories International | | | | | | | | |
4.250%, 05/01/28(A) | | | 100 | | | | 104 | |
Charles River Laboratories International | | | | | | | | |
3.750%, 03/15/29(A) | | | 475 | | | | 485 | |
Charles River Laboratories International | | | | | | | | |
4.000%, 03/15/31(A) | | | 475 | | | | 498 | |
See accompanying notes to financial statements.
CITY NATIONAL ROCHDALE FUNDS | PAGE 78
consolidated schedule of investments |
September 30, 2021 |
City National Rochdale Fixed Income Opportunities Fund (continued) |
Description | | Face Amount (000)(1) | | | Value (000) | |
CHS | | | | | | | | |
6.625%, 02/15/25(A) | | $ | 725 | | | $ | 758 | |
CHS | | | | | | | | |
8.000%, 03/15/26(A) | | | 1,675 | | | | 1,775 | |
8.000%, 12/15/27(A) | | | 300 | | | | 327 | |
CHS | | | | | | | | |
5.625%, 03/15/27(A) | | | 750 | | | | 785 | |
CHS | | | | | | | | |
6.000%, 01/15/29(A) | | | 250 | | | | 265 | |
CHS | | | | | | | | |
6.875%, 04/15/29(A) | | | 2,500 | | | | 2,503 | |
CHS | | | | | | | | |
6.125%, 04/01/30(A) | | | 850 | | | | 826 | |
DaVita | | | | | | | | |
4.625%, 06/01/30(A) | | | 2,520 | | | | 2,592 | |
Global Medical Response | | | | | | | | |
6.500%, 10/01/25(A) | | | 3,575 | | | | 3,696 | |
HCA | | | | | | | | |
5.875%, 05/01/23 | | | 700 | | | | 752 | |
5.875%, 02/15/26 | | | 1,350 | | | | 1,547 | |
HCA | | | | | | | | |
5.375%, 02/01/25 | | | 1,750 | | | | 1,956 | |
5.375%, 09/01/26 | | | 375 | | | | 429 | |
HCA | | | | | | | | |
3.500%, 09/01/30 | | | 3,025 | | | | 3,205 | |
IQVIA | | | | | | | | |
5.000%, 10/15/26(A) | | | 1,475 | | | | 1,512 | |
5.000%, 05/15/27(A) | | | 325 | | | | 337 | |
LifePoint Health | | | | | | | | |
6.750%, 04/15/25(A) | | | 1,250 | | | | 1,314 | |
LifePoint Health | | | | | | | | |
4.375%, 02/15/27(A) | | | 400 | | | | 398 | |
LifePoint Health | | | | | | | | |
5.375%, 01/15/29(A) | | | 850 | | | | 827 | |
MEDNAX | | | | | | | | |
6.250%, 01/15/27(A) | | | 1,125 | | | | 1,183 | |
Mozart Debt Merger Sub | | | | | | | | |
3.875%, 04/01/29(A) | | | 1,575 | | | | 1,575 | |
Mozart Debt Merger Sub | | | | | | | | |
5.250%, 10/01/29(A) | | | 2,675 | | | | 2,675 | |
MPH Acquisition Holdings | | | | | | | | |
5.500%, 09/01/28(A) | | | 1,560 | | | | 1,572 | |
MPH Acquisition Holdings | | | | | | | | |
5.750%, 11/01/28(A) | | | 5,539 | | | | 5,217 | |
RegionalCare Hospital Partners Holdings | | | | | | | | |
9.750%, 12/01/26(A) | | | 2,925 | | | | 3,090 | |
Team Health Holdings | | | | | | | | |
6.375%, 02/01/25(A) | | | 1,950 | | | | 1,871 | |
Teleflex | | | | | | | | |
4.625%, 11/15/27 | | | 125 | | | | 130 | |
Teleflex | | | | | | | | |
4.250%, 06/01/28(A) | | | 100 | | | | 104 | |
Tenet Healthcare | | | | | | | | |
6.750%, 06/15/23 | | | 950 | | | | 1,024 | |
Tenet Healthcare | | | | | | | | |
4.625%, 07/15/24 | | | 257 | | | | 261 | |
Tenet Healthcare | | | | | | | | |
4.875%, 01/01/26(A) | | | 550 | | | | 569 | |
Tenet Healthcare | | | | | | | | |
6.250%, 02/01/27(A) | | | 1,800 | | | | 1,868 | |
Tenet Healthcare | | | | | | | | |
5.125%, 11/01/27(A) | | | 2,075 | | | | 2,163 | |
Tenet Healthcare | | | | | | | | |
6.125%, 10/01/28(A) | | | 3,675 | | | | 3,858 | |
Tenet Healthcare | | | | | | | | |
4.250%, 06/01/29(A) | | | 900 | | | | 914 | |
Tenet Healthcare | | | | | | | | |
6.875%, 11/15/31 | | | 890 | | | | 1,021 | |
Vizient | | | | | | | | |
6.250%, 05/15/27(A) | | | 1,600 | | | | 1,672 | |
| | | | | | | | | | | | | |
Total Healthcare | | | 64,780 | |
| | | | | | | | | | | | | |
Home Decoration Products [0.0%] |
Newell Brands | | | | | | | | |
5.875%, 04/01/36 | | | 657 | | | | 816 | |
| | | | | | | | | | | | | |
Hotels and Motels [0.2%] |
Hilton Grand Vacations Borrower Escrow | | | | | | | | |
5.000%, 06/01/29(A) | | | 1,200 | | | | 1,224 | |
Hilton Grand Vacations Borrower Escrow | | | | | | | | |
4.875%, 07/01/31(A) | | | 824 | | | | 827 | |
Marriott Ownership Resorts | | | | | | | | |
4.750%, 01/15/28 | | | 3,935 | | | | 4,014 | |
Marriott Ownership Resorts | | | | | �� | | | |
4.500%, 06/15/29(A) | | | 815 | | | | 825 | |
Travel + Leisure | | | | | | | | |
6.625%, 07/31/26(A) | | | 600 | | | | 683 | |
Travel + Leisure | | | | | | | | |
4.625%, 03/01/30(A) | | | 955 | | | | 984 | |
| | | | | | | | | | | | | |
Total Hotels and Motels | | | 8,557 | |
| | | | | | | | | | | | | |
Human Resources [0.0%] |
House of Finance | | | | | | | | |
4.375%, 07/15/26 | | EUR | 230 | | | | 273 | |
| | | | | | | | | | | | | |
See accompanying notes to financial statements.
CITY NATIONAL ROCHDALE FUNDS | PAGE 79
consolidated schedule of investments |
September 30, 2021 |
City National Rochdale Fixed Income Opportunities Fund (continued) |
Description | | Face Amount (000)(1) | | | Value (000) | |
Independent Energy [1.8%] |
Antero Resources | | | | | | | | |
8.375%, 07/15/26(A) | | $ | 836 | | | $ | 947 | |
Antero Resources | | | | | | | | |
7.625%, 02/01/29(A) | | | 2,110 | | | | 2,359 | |
Antero Resources | | | | | | | | |
5.375%, 03/01/30(A) | | | 975 | | | | 1,027 | |
Apache | | | | | | | | |
4.625%, 11/15/25 | | | 250 | | | | 270 | |
Apache | | | | | | | | |
4.875%, 11/15/27 | | | 875 | | | | 954 | |
Ascent Resources Utica Holdings | | | | | | | | |
7.000%, 11/01/26(A) | | | 2,280 | | | | 2,357 | |
Ascent Resources Utica Holdings | | | | | | | | |
9.000%, 11/01/27(A) | | | 276 | | | | 378 | |
Ascent Resources Utica Holdings | | | | | | | | |
8.250%, 12/31/28(A) | | | 3,095 | | | | 3,374 | |
Ascent Resources Utica Holdings | | | | | | | | |
5.875%, 06/30/29(A) | | | 525 | | | | 535 | |
Berry Petroleum | | | | | | | | |
7.000%, 02/15/26(A) | | | 550 | | | | 560 | |
Callon Petroleum | | | | | | | | |
6.125%, 10/01/24 | | | 1,155 | | | | 1,135 | |
Callon Petroleum | | | | | | | | |
9.000%, 04/01/25(A) | | | 375 | | | | 406 | |
Callon Petroleum | | | | | | | | |
6.375%, 07/01/26 | | | 805 | | | | 770 | |
Callon Petroleum | | | | | | | | |
8.000%, 08/01/28(A) | | | 850 | | | | 842 | |
Carrizo Oil & Gas | | | | | | | | |
8.250%, 07/15/25 | | | 325 | | | | 318 | |
Centennial Resource Production | | | | | | | | |
5.375%, 01/15/26(A) | | | 250 | | | | 245 | |
Centennial Resource Production | | | | | | | | |
6.875%, 04/01/27(A) | | | 1,475 | | | | 1,503 | |
Chesapeake Energy | | | | | | | | |
5.500%, 02/01/26(A) | | | 2,420 | | | | 2,529 | |
Chesapeake Energy | | | | | | | | |
5.875%, 02/01/29(A) | | | 225 | | | | 240 | |
Chesapeake Energy | | | | | | | | |
7.000%, 12/31/49(D) | | | 575 | | | | 16 | |
Comstock Resources | | | | | | | | |
7.500%, 05/15/25(A) | | | 930 | | | | 967 | |
Comstock Resources | | | | | | | | |
6.750%, 03/01/29(A) | | | 2,300 | | | | 2,484 | |
Comstock Resources | | | | | | | | |
5.875%, 01/15/30(A) | | | 710 | | | | 738 | |
Continental Resources | | | | | | | | |
4.375%, 01/15/28 | | | 650 | | | | 719 | |
Continental Resources | | | | | | | | |
5.750%, 01/15/31(A) | | | 1,750 | | | | 2,112 | |
CrownRock | | | | | | | | |
5.625%, 10/15/25(A) | | | 3,370 | | | | 3,449 | |
CrownRock | | | | | | | | |
5.000%, 05/01/29(A) | | | 1,253 | | | | 1,308 | |
Endeavor Energy Resources | | | | | | | | |
6.625%, 07/15/25(A) | | | 2,445 | | | | 2,577 | |
Endeavor Energy Resources | | | | | | | | |
5.750%, 01/30/28(A) | | | 900 | | | | 947 | |
EQT Corp | | | | | | | | |
6.625%, 02/01/25 | | | 325 | | | | 372 | |
EQT Corp | | | | | | | | |
3.900%, 10/01/27 | | | 375 | | | | 406 | |
EQT Corp | | | | | | | | |
5.000%, 01/15/29 | | | 300 | | | | 338 | |
EQT Corp | | | | | | | | |
7.500%, 02/01/30 | | | 1,750 | | | | 2,252 | |
Equities | | | | | | | | |
3.125%, 05/15/26(A) | | | 750 | | | | 769 | |
Equities | | | | | | | | |
3.625%, 05/15/31(A) | | | 500 | | | | 521 | |
Oasis Petroleum | | | | | | | | |
6.375%, 06/01/26(A) | | | 300 | | | | 314 | |
Occidental Petroleum | | | | | | | | |
3.500%, 06/15/25 | | | 1,600 | | | | 1,663 | |
Occidental Petroleum | | | | | | | | |
8.000%, 07/15/25 | | | 750 | | | | 895 | |
Occidental Petroleum | | | | | | | | |
5.875%, 09/01/25 | | | 2,550 | | | | 2,858 | |
Occidental Petroleum | | | | | | | | |
5.500%, 12/01/25 | | | 1,115 | | | | 1,235 | |
Occidental Petroleum | | | | | | | | |
5.550%, 03/15/26 | | | 1,160 | | | | 1,288 | |
Occidental Petroleum | | | | | | | | |
3.200%, 08/15/26 | | | 1,275 | | | | 1,302 | |
Occidental Petroleum | | | | | | | | |
8.875%, 07/15/30 | | | 1,400 | | | | 1,902 | |
Occidental Petroleum | | | | | | | | |
6.625%, 09/01/30 | | | 1,050 | | | | 1,295 | |
Occidental Petroleum | | | | | | | | |
7.500%, 05/01/31 | | | 335 | | | | 436 | |
Occidental Petroleum | | | | | | | | |
7.875%, 09/15/31 | | | 660 | | | | 880 | |
Occidental Petroleum | | | | | | | | |
6.450%, 09/15/36 | | | 4,545 | | | | 5,718 | |
See accompanying notes to financial statements.
CITY NATIONAL ROCHDALE FUNDS | PAGE 80
consolidated schedule of investments |
September 30, 2021 |
City National Rochdale Fixed Income Opportunities Fund (continued) |
Description | | Face Amount (000)(1) | | | Value (000) | |
Occidental Petroleum | | | | | | | | |
4.300%, 08/15/39 | | $ | 1,575 | | | $ | 1,553 | |
Occidental Petroleum | | | | | | | | |
4.100%, 02/15/47 | | | 425 | | | | 404 | |
Occidental Petroleum | | | | | | | | |
4.400%, 08/15/49 | | | 175 | | | | 172 | |
PDC Energy | | | | | | | | |
6.125%, 09/15/24 | | | 775 | | | | 787 | |
PDC Energy | | | | | | | | |
5.750%, 05/15/26 | | | 1,995 | | | | 2,077 | |
Range Resources | | | | | | | | |
5.000%, 03/15/23 | | | 187 | | | | 194 | |
Range Resources | | | | | | | | |
4.875%, 05/15/25 | | | 397 | | | | 419 | |
Range Resources | | | | | | | | |
9.250%, 02/01/26 | | | 1,275 | | | | 1,390 | |
Range Resources | | | | | | | | |
8.250%, 01/15/29(A) | | | 375 | | | | 422 | |
Rockcliff Energy II | | | | | | | | |
5.500%, 10/15/29(A) | | | 800 | | | | 812 | |
SM Energy | | | | | | | | |
5.625%, 06/01/25 | | | 500 | | | | 503 | |
SM Energy | | | | | | | | |
6.750%, 09/15/26 | | | 1,075 | | | | 1,098 | |
SM Energy | | | | | | | | |
6.625%, 01/15/27 | | | 400 | | | | 410 | |
SM Energy | | | | | | | | |
6.500%, 07/15/28 | | | 1,160 | | | | 1,201 | |
Southwestern Energy | | | | | | | | |
7.750%, 10/01/27 | | | 375 | | | | 405 | |
Southwestern Energy | | | | | | | | |
8.375%, 09/15/28 | | | 375 | | | | 425 | |
Southwestern Energy | | | | | | | | |
5.375%, 03/15/30 | | | 625 | | | | 675 | |
Tap Rock Resources | | | | | | | | |
7.000%, 10/01/26(A) | | | 675 | | | | 693 | |
Ultra Resources Inc | | | | | | | | |
7.125%, 04/15/25(B) | | | 400 | | | | — | |
| | | | | | | | | | | | | |
Total Independent Energy | | | 74,150 | |
| | | | | | | | | | | | | |
Industrial - Other [0.2%] |
Booz Allen Hamilton | | | | | | | | |
3.875%, 09/01/28(A) | | | 300 | | | | 307 | |
Booz Allen Hamilton | | | | | | | | |
4.000%, 07/01/29(A) | | | 326 | | | | 335 | |
Cushman & Wakefield US Borrower | | | | | | | | |
6.750%, 05/15/28(A) | | | 725 | | | | 786 | |
Madison IAQ | | | | | | | | |
4.125%, 06/30/28(A) | | | 250 | | | | 250 | |
Madison IAQ | | | | | | | | |
5.875%, 06/30/29(A) | | | 2,625 | | | | 2,645 | |
Roller Bearing of America | | | | | | | | |
4.375%, 10/15/29(A) | | | 590 | | | | 605 | |
TK Elevator Holdco GmbH | | | | | | | | |
7.625%, 07/15/28(A) | | | 1,200 | | | | 1,278 | |
| | | | | | | | | | | | | |
Total Industrial - Other | | | 6,206 | |
| | | | | | | | | | | | | |
Industrial Services [0.2%] |
Prime Security Services Borrower | | | | | | | | |
5.250%, 04/15/24(A) | | | 2,865 | | | | 3,056 | |
Prime Security Services Borrower | | | | | | | | |
5.750%, 04/15/26(A) | | | 4,000 | | | | 4,327 | |
| | | | | | | | | | | | | |
Total Industrial Services | | | 7,383 | |
| | | | | | | | | | | | | |
Industrials [0.0%] |
Afflelou SAS | | | | | | | | |
4.250%, 05/19/26 | | EUR | 300 | | | | 357 | |
Deuce Finco | | | | | | | | |
5.500%, 06/15/27 | | GBP | 500 | | | | 681 | |
| | | | | | | | | | | | | |
Total Industrials | | | 1,038 | |
| | | | | | | | | | | | | |
Insurance - P&C [1.0%] |
Alliant Holdings Intermediate | | | | | | | | |
6.750%, 10/15/27(A) | | | 3,325 | | | | 3,441 | |
AmWINS Group | | | | | | | | |
4.875%, 06/30/29(A) | | | 2,250 | | | | 2,284 | |
Ardonagh Midco 2 | | | | | | | | |
11.500%, 01/15/27(A) | | | 2,028 | | | | 2,215 | |
AssuredPartners | | | | | | | | |
7.000%, 08/15/25(A) | | | 3,855 | | | | 3,923 | |
AssuredPartners | | | | | | | | |
5.625%, 01/15/29(A) | | | 875 | | | | 880 | |
BroadStreet Partners | | | | | | | | |
5.875%, 04/15/29(A) | | | 2,550 | | | | 2,541 | |
GTCR AP Finance | | | | | | | | |
8.000%, 05/15/27(A) | | | 2,840 | | | | 2,996 | |
HUB International | | | | | | | | |
7.000%, 05/01/26(A) | | | 9,075 | | | | 9,381 | |
NFP | | | | | | | | |
4.875%, 08/15/28(A) | | | 350 | | | | 354 | |
NFP | | | | | | | | |
6.875%, 08/15/28(A) | | | 7,677 | | | | 7,839 | |
See accompanying notes to financial statements.
CITY NATIONAL ROCHDALE FUNDS | PAGE 81
consolidated schedule of investments |
September 30, 2021 |
City National Rochdale Fixed Income Opportunities Fund (continued) |
Description | | Face Amount (000)(1) | | | Value (000) | |
USI | | | | | | | | |
6.875%, 05/01/25(A) | | $ | 4,525 | | | $ | 4,605 | |
| | | | | | | | | | | | | |
Total Insurance - P&C | | | 40,459 | |
| | | | | | | | | | | | | |
Internet Connectiv Svcs [0.1%] |
Northwest Fiber | | | | | | | | |
4.750%, 04/30/27(A) | | | 370 | | | | 375 | |
Northwest Fiber | | | | | | | | |
6.000%, 02/15/28(A) | | | 975 | | | | 970 | |
United Group | | | | | | | | |
4.875%, 07/01/24 | | EUR | 650 | | | | 762 | |
United Group BV | | | | | | | | |
4.125%, VAR Euribor 3 Month + 4.125%, 05/15/25 | | EUR | 1,500 | | | | 1,736 | |
United Group BV | | | | | | | | |
3.250%, VAR Euribor 3 Month + 3.250%, 02/15/26 | | EUR | 400 | | | | 453 | |
United Group BV | | | | | | | | |
3.625%, 02/15/28 | | EUR | 300 | | | | 335 | |
| | | | | | | | | | | | | |
Total Internet Connectiv Svcs | | | 4,631 | |
| | | | | | | | | | | | | |
Internet Telephony [0.1%] |
Cablevision Lightpath | | | | | | | | |
5.625%, 09/15/28(A) | | | 2,040 | | | | 2,047 | |
| | | | | | | | | | | | | |
Investment Companies [0.1%] |
Compass Group Diversified Holdings | | | | | | | | |
5.250%, 04/15/29(A) | | | 1,096 | | | | 1,147 | |
Hightower Holding | | | | | | | | |
6.750%, 04/15/29(A) | | | 1,947 | | | | 1,995 | |
Icahn Enterprises | | | | | | | | |
5.250%, 05/15/27 | | | 1,940 | | | | 2,017 | |
| | | | | | | | | | | | | |
Total Investment Companies | | | 5,159 | |
| | | | | | | | | | | | | |
Leisure [0.3%] |
Cedar Fair | | | | | | | | |
5.250%, 07/15/29 | | | 1,680 | | | | 1,724 | |
Royal Caribbean Cruises | | | | | | | | |
10.875%, 06/01/23(A) | | | 1,625 | | | | 1,820 | |
SeaWorld Parks & Entertainment | | | | | | | | |
8.750%, 05/01/25(A) | | | 885 | | | | 951 | |
SeaWorld Parks & Entertainment | | | | | | | | |
5.250%, 08/15/29(A) | | | 3,375 | | | | 3,448 | |
Six Flags Entertainment | | | | | | | | |
4.875%, 07/31/24(A) | | | 250 | | | | 252 | |
Six Flags Entertainment | | | | | | | | |
5.500%, 04/15/27(A) | | | 1,750 | | | | 1,807 | |
Six Flags Theme Parks | | | | | | | | |
7.000%, 07/01/25(A) | | | 200 | | | | 213 | |
Viking Cruises | | | | | | | | |
6.250%, 05/15/25(A) | | | 2,015 | | | | 2,020 | |
| | | | | | | | | | | | | |
Total Leisure | | | 12,235 | |
| | | | | | | | | | | | | |
Lodging [0.1%] |
Hilton Domestic Operating | | | | | | | | |
5.750%, 05/01/28(A) | | | 300 | | | | 323 | |
Hilton Domestic Operating | | | | | | | | |
3.750%, 05/01/29(A) | | | 925 | | | | 934 | |
Hilton Domestic Operating | | | | | | | | |
4.875%, 01/15/30 | | | 375 | | | | 402 | |
Hilton Domestic Operating | | | | | | | | |
3.625%, 02/15/32(A) | | | 975 | | | | 961 | |
RHP Hotel Properties | | | | | | | | |
4.750%, 10/15/27 | | | 1,650 | | | | 1,708 | |
Wyndham Hotels & Resorts | | | | | | | | |
4.375%, 08/15/28(A) | | | 475 | | | | 496 | |
| | | | | | | | | | | | | |
Total Lodging | | | 4,824 | |
| | | | | | | | | | | | | |
Mach Tools and Rel Products [0.0%] |
Norican | | | | | | | | |
4.500%, 05/15/23 | | EUR | 837 | | | | 956 | |
| | | | | | | | | | | | | |
Machinery [0.0%] |
Manitowoc | | | | | | | | |
9.000%, 04/01/26(A) | | | 325 | | | | 348 | |
| | | | | | | | | | | | | |
Media Entertainment [2.2%] |
AMC Networks | | | | | | | | |
5.000%, 04/01/24 | | | 1,172 | | | | 1,185 | |
AMC Networks | | | | | | | | |
4.750%, 08/01/25 | | | 450 | | | | 461 | |
AMC Networks | | | | | | | | |
4.250%, 02/15/29 | | | 1,875 | | | | 1,865 | |
Audacy Capital | | | | | | | | |
6.500%, 05/01/27(A) | | | 3,420 | | | | 3,497 | |
Audacy Capital | | | | | | | | |
6.750%, 03/31/29(A) | | | 1,350 | | | | 1,361 | |
Cumulus Media New Holdings | | | | | | | | |
6.750%, 07/01/26(A) | | | 1,648 | | | | 1,706 | |
See accompanying notes to financial statements.
CITY NATIONAL ROCHDALE FUNDS | PAGE 82
consolidated schedule of investments |
September 30, 2021 |
City National Rochdale Fixed Income Opportunities Fund (continued) |
Description | | Face Amount (000)(1) | | | Value (000) | |
Diamond Sports Group | | | | | | | | |
5.375%, 08/15/26(A) | | $ | 6,805 | | | $ | 4,491 | |
Diamond Sports Group | | | | | | | | |
6.625%, 08/15/27(A) | | | 1,850 | | | | 810 | |
Gray Television | | | | | | | | |
5.875%, 07/15/26(A) | | | 1,400 | | | | 1,445 | |
Gray Television | | | | | | | | |
7.000%, 05/15/27(A) | | | 1,300 | | | | 1,394 | |
Gray Television | | | | | | | | |
4.750%, 10/15/30(A) | | | 3,325 | | | | 3,268 | |
iHeartCommunications | | | | | | | | |
6.375%, 05/01/26 | | | 444 | | | | 468 | |
iHeartCommunications | | | | | | | | |
8.375%, 05/01/27 | | | 7,754 | | | | 8,288 | |
iHeartCommunications | | | | | | | | |
5.250%, 08/15/27(A) | | | 600 | | | | 624 | |
iHeartCommunications | | | | | | | | |
4.750%, 01/15/28(A) | | | 1,350 | | | | 1,391 | |
Lamar Media | | | | | | | | |
3.750%, 02/15/28 | | | 450 | | | | 463 | |
Lamar Media | | | | | | | | |
4.875%, 01/15/29 | | | 1,525 | | | | 1,616 | |
Match Group | | | | | | | | |
5.000%, 12/15/27(A) | | | 1,225 | | | | 1,278 | |
Match Group | | | | | | | | |
4.625%, 06/01/28(A) | | | 550 | | | | 573 | |
Match Group | | | | | | | | |
4.125%, 08/01/30(A) | | | 1,275 | | | | 1,328 | |
Match Group Holdings II | | | | | | | | |
3.625%, 10/01/31(A) | | | 800 | | | | 790 | |
Midas OpCo Holdings | | | | | | | | |
5.625%, 08/15/29(A) | | | 4,150 | | | | 4,294 | |
Nexstar Broadcasting | | | | | | | | |
5.625%, 07/15/27(A) | | | 4,325 | | | | 4,580 | |
Nexstar Broadcasting | | | | | | | | |
4.750%, 11/01/28(A) | | | 4,030 | | | | 4,181 | |
Nielsen Finance | | | | | | | | |
5.625%, 10/01/28(A) | | | 825 | | | | 855 | |
Nielsen Finance | | | | | | | | |
4.500%, 07/15/29(A) | | | 450 | | | | 440 | |
Nielsen Finance | | | | | | | | |
5.875%, 10/01/30(A) | | | 1,275 | | | | 1,342 | |
Nielsen Finance | | | | | | | | |
4.750%, 07/15/31(A) | | | 1,150 | | | | 1,119 | |
Nielsen Luxembourg SARL | | | | | | | | |
5.000%, 02/01/25(A) | | | 550 | | | | 563 | |
Outfront Media Capital | | | | | | | | |
4.250%, 01/15/29(A) | | | 975 | | | | 966 | |
Outfront Media Capital | | | | | | | | |
4.625%, 03/15/30(A) | | | 875 | | | | 877 | |
Scripps Escrow | | | | | | | | |
5.875%, 07/15/27(A) | | | 1,900 | | | | 1,950 | |
Scripps Escrow II | | | | | | | | |
3.875%, 01/15/29(A) | | | 450 | | | | 452 | |
Scripps Escrow II | | | | | | | | |
5.375%, 01/15/31(A) | | | 2,045 | | | | 2,010 | |
Sinclair Television Group | | | | | | | | |
5.875%, 03/15/26(A) | | | 1,825 | | | | 1,864 | |
Sinclair Television Group | | | | | | | | |
5.125%, 02/15/27(A) | | | 5,000 | | | | 4,962 | |
Sinclair Television Group | | | | | | | | |
5.500%, 03/01/30(A) | | | 725 | | | | 719 | |
Sinclair Television Group | | | | | | | | |
4.125%, 12/01/30(A) | | | 175 | | | | 171 | |
TEGNA | | | | | | | | |
5.500%, 09/15/24(A) | | | 42 | | | | 42 | |
TEGNA | | | | | | | | |
4.750%, 03/15/26(A) | | | 225 | | | | 235 | |
TEGNA | | | | | | | | |
4.625%, 03/15/28 | | | 2,805 | | | | 2,868 | |
TEGNA | | | | | | | | |
5.000%, 09/15/29 | | | 4,950 | | | | 5,099 | |
Terrier Media Buyer | | | | | | | | |
8.875%, 12/15/27(A) | | | 6,650 | | | | 7,032 | |
Townsquare Media | | | | | | | | |
6.875%, 02/01/26(A) | | | 500 | | | | 526 | |
Univision Communications | | | | | | | | |
9.500%, 05/01/25(A) | | | 905 | | | | 982 | |
Univision Communications | | | | | | | | |
4.500%, 05/01/29(A) | | | 1,125 | | | | 1,143 | |
Urban One | | | | | | | | |
7.375%, 02/01/28(A) | | | 1,850 | | | | 1,982 | |
WMG Acquisition | | | | | | | | |
3.875%, 07/15/30(A) | | | 375 | | | | 390 | |
| | | | | | | | | | | | | |
Total Media Entertainment | | | 89,946 | |
| | | | | | | | | | | | | |
Medical Labs and Testing Srv [0.1%] |
US Acute Care Solutions | | | | | | | | |
6.375%, 03/01/26(A) | | | 2,115 | | | | 2,239 | |
| | | | | | | | | | | | | |
Medical Products & Services [0.0%] |
Cidron Aida Finco Sarl | | | | | | | | |
6.250%, 04/01/28 | | GBP | 1,300 | | | | 1,770 | |
| | | | | | | | | | | | | |
Medical-Whsle Drug Dist [0.0%] |
180 Medical | | | | | | | | |
3.875%, 10/15/29(A) | | | 265 | | | | 265 | |
Owens & Minor | | | | | | | | |
4.500%, 03/31/29(A) | | | 1,575 | | | | 1,591 | |
| | | | | | | | | | | | | |
Total Medical-Whsle Drug Dist | | | 1,856 | |
| | | | | | | | | | | | | |
See accompanying notes to financial statements.
CITY NATIONAL ROCHDALE FUNDS | PAGE 83
consolidated schedule of investments |
September 30, 2021 |
City National Rochdale Fixed Income Opportunities Fund (continued) |
Description | | Face Amount (000)(1) | | | Value (000) | |
Metal-Copper [0.4%] |
First Quantum Minerals | | | | | | | | |
7.250%, 04/01/23 | | $ | 7,880 | | | $ | 8,028 | |
First Quantum Minerals | | | | | | | | |
6.875%, 03/01/26 | | | 6,835 | | | | 7,117 | |
6.875%, 10/15/27 | | | 3,000 | | | | 3,178 | |
| | | | | | | | | | | | | |
Total Metal-Copper | | | 18,323 | |
| | | | | | | | | | | | | |
Metal-Iron [0.4%] |
PJSC Koks via IMH Capital DAC | | | | | | | | |
5.900%, 09/23/25 | | | 2,240 | | | | 2,374 | |
Samarco Mineracao | | | | | | | | |
5.750%, 10/24/23(B) | | | 5,422 | | | | 3,796 | |
Samarco Mineracao | | | | | | | | |
5.375%, 09/26/24(B) | | | 11,800 | | | | 8,260 | |
TMS International | | | | | | | | |
6.250%, 04/15/29(A) | | | 1,155 | | | | 1,207 | |
| | | | | | | | | | | | | |
Total Metal-Iron | | | 15,637 | |
| | | | | | | | | | | | | |
Metals & Mining [1.7%] |
Cleveland-Cliffs | | | | | | | | |
4.625%, 03/01/29(A) | | | 1,800 | | | | 1,842 | |
Cleveland-Cliffs | | | | | | | | |
4.875%, 03/01/31(A) | | | 2,100 | | | | 2,168 | |
Coeur Mining | | | | | | | | |
5.125%, 02/15/29(A) | | | 1,450 | | | | 1,392 | |
Freeport-McMoRan | | | | | | | | |
5.000%, 09/01/27 | | | 475 | | | | 495 | |
Freeport-McMoRan | | | | | | | | |
4.125%, 03/01/28 | | | 150 | | | | 155 | |
Freeport-McMoRan | | | | | | | | |
4.375%, 08/01/28 | | | 775 | | | | 810 | |
Freeport-McMoRan | | | | | | | | |
5.250%, 09/01/29 | | | 400 | | | | 435 | |
Freeport-McMoRan | | | | | | | | |
4.625%, 08/01/30 | | | 2,100 | | | | 2,271 | |
Freeport-McMoRan | | | | | | | | |
5.400%, 11/14/34 | | | 875 | | | | 1,051 | |
Indonesia Asahan Aluminium Persero | | | | | | | | |
5.710%, 11/15/23 | | | 376 | | | | 411 | |
Indonesia Asahan Aluminium Persero | | | | | | | | |
5.450%, 05/15/30 | | | 251 | | | | 289 | |
Indonesia Asahan Aluminium Persero | | | | | | | | |
6.757%, 11/15/48 | | | 602 | | | | 775 | |
Indonesia Asahan Aluminium Persero | | | | | | | | |
5.800%, 05/15/50 | | | 217 | | | | 255 | �� |
Vedanta Resources | | | | | | | | |
6.375%, 07/30/22 | | | 51,256 | | | | 51,130 | |
Vedanta Resources | | | | | | | | |
6.125%, 08/09/24 | | | 1,485 | | | | 1,336 | |
Vedanta Resources Finance II | | | | | | | | |
8.000%, 04/23/23 | | | 1,260 | | | | 1,227 | |
Vedanta Resources Finance II | | | | | | | | |
8.950%, 03/11/25 | | | 4,820 | | | | 4,820 | |
| | | | | | | | | | | | | |
Total Metals & Mining | | | 70,862 | |
| | | | | | | | | | | | | |
Midstream [1.6%] |
AmeriGas Partners | | | | | | | | |
5.500%, 05/20/25 | | | 375 | | | | 414 | |
AmeriGas Partners | | | | | | | | |
5.875%, 08/20/26 | | | 1,175 | | | | 1,328 | |
AmeriGas Partners | | | | | | | | |
5.750%, 05/20/27 | | | 925 | | | | 1,045 | |
Antero Midstream Partners | | | | | | | | |
7.875%, 05/15/26(A) | | | 1,445 | | | | 1,582 | |
Antero Midstream Partners | | | | | | | | |
5.750%, 03/01/27(A) | | | 4,200 | | | | 4,339 | |
5.750%, 01/15/28(A) | | | 1,800 | | | | 1,870 | |
Antero Midstream Partners | | | | | | | | |
5.375%, 06/15/29(A) | | | 950 | | | | 981 | |
Buckeye Partners | | | | | | | | |
4.500%, 03/01/28(A) | | | 725 | | | | 736 | |
Cheniere Energy | | | | | | | | |
4.625%, 10/15/28 | | | 1,300 | | | | 1,369 | |
Cheniere Energy Partners | | | | | | | | |
5.625%, 10/01/26 | | | 100 | | | | 103 | |
Cheniere Energy Partners | | | | | | | | |
4.500%, 10/01/29 | | | 1,300 | | | | 1,391 | |
Cheniere Energy Partners | | | | | | | | |
4.000%, 03/01/31(A) | | | 1,875 | | | | 1,963 | |
CNX Midstream Partners | | | | | | | | |
6.500%, 03/15/26(A) | | | 2,975 | | | | 3,125 | |
CNX Midstream Partners | | | | | | | | |
4.750%, 04/15/30(A) | | | 1,200 | | | | 1,216 | |
DT Midstream | | | | | | | | |
4.375%, 06/15/31(A) | | | 1,325 | | | | 1,365 | |
EQM Midstream Partners | | | | | | | | |
4.500%, 01/15/29(A) | | | 600 | | | | 623 | |
EQM Midstream Partners | | | | | | | | |
4.750%, 01/15/31(A) | | | 1,450 | | | | 1,508 | |
See accompanying notes to financial statements.
CITY NATIONAL ROCHDALE FUNDS | PAGE 84
consolidated schedule of investments |
September 30, 2021 |
City National Rochdale Fixed Income Opportunities Fund (continued) |
Description | | Face Amount (000)(1) | | | Value (000) | |
EQT Midstream Partners | | | | | | | | |
4.750%, 07/15/23 | | $ | 245 | | | $ | 256 | |
EQT Midstream Partners | | | | | | | | |
6.000%, 07/01/25(A) | | | 675 | | | | 740 | |
EQT Midstream Partners | | | | | | | | |
6.500%, 07/01/27(A) | | | 3,370 | | | | 3,790 | |
6.500%, 07/15/48 | | | 1,675 | | | | 1,918 | |
EQT Midstream Partners | | | | | | | | |
5.500%, 07/15/28 | | | 2,425 | | | | 2,664 | |
Hess Midstream Operations | | | | | | | | |
5.625%, 02/15/26(A) | | | 575 | | | | 596 | |
Hess Midstream Operations | | | | | | | | |
5.125%, 06/15/28(A) | | | 825 | | | | 862 | |
Hess Midstream Operations | | | | | | | | |
4.250%, 02/15/30(A) | | | 525 | | | | 532 | |
Holly Energy Partners | | | | | | | | |
5.000%, 02/01/28(A) | | | 1,550 | | | | 1,572 | |
NuStar Logistics | | | | | | | | |
6.000%, 06/01/26 | | | 625 | | | | 675 | |
NuStar Logistics | | | | | | | | |
5.625%, 04/28/27 | | | 2,000 | | | | 2,130 | |
Oasis Midstream Partners | | | | | | | | |
8.000%, 04/01/29(A) | | | 1,125 | | | | 1,170 | |
Rattler Midstream | | | | | | | | |
5.625%, 07/15/25(A) | | | 1,350 | | | | 1,406 | |
Solaris Midstream Holdings | | | | | | | | |
7.625%, 04/01/26(A) | | | 400 | | | | 429 | |
Suburban Propane Partners | | | | | | | | |
5.875%, 03/01/27 | | | 1,775 | | | | 1,850 | |
Suburban Propane Partners | | | | | | | | |
5.000%, 06/01/31(A) | | | 1,675 | | | | 1,738 | |
Summit Midstream Holdings | | | | | | | | |
5.500%, 08/15/22 | | | 825 | | | | 820 | |
Summit Midstream Holdings | | | | | | | | |
5.750%, 04/15/25 | | | 1,725 | | | | 1,569 | |
Sunoco | | | | | | | | |
5.500%, 02/15/26 | | | 500 | | | | 510 | |
Targa Resources Partners | | | | | | | | |
5.875%, 04/15/26 | | | 825 | | | | 862 | |
Targa Resources Partners | | | | | | | | |
5.375%, 02/01/27 | | | 1,075 | | | | 1,114 | |
Targa Resources Partners | | | | | | | | |
6.500%, 07/15/27 | | | 2,050 | | | | 2,210 | |
Targa Resources Partners | | | | | | | | |
5.000%, 01/15/28 | | | 1,875 | | | | 1,969 | |
Targa Resources Partners | | | | | | | | |
5.500%, 03/01/30 | | | 1,475 | | | | 1,613 | |
Targa Resources Partners | | | | | | | | |
4.875%, 02/01/31 | | | 875 | | | | 944 | |
Targa Resources Partners | | | | | | | | |
4.000%, 01/15/32(A) | | | 375 | | | | 387 | |
TransMontaigne Partners | | | | | | | | |
6.125%, 02/15/26 | | | 700 | | | | 714 | |
Western Midstream Operating | | | | | | | | |
4.000%, 07/01/22 | | | 800 | | | | 812 | |
Western Midstream Operating | | | | | | | | |
4.650%, 07/01/26 | | | 150 | | | | 162 | |
Western Midstream Operating | | | | | | | | |
4.500%, 03/01/28 | | | 1,050 | | | | 1,126 | |
Western Midstream Operating | | | | | | | | |
4.750%, 08/15/28 | | | 200 | | | | 218 | |
Western Midstream Operating | | | | | | | | |
5.450%, 04/01/44 | | | 400 | | | | 460 | |
Western Midstream Operating | | | | | | | | |
5.300%, 03/01/48 | | | 2,350 | | | | 2,709 | |
Western Midstream Operating | | | | | | | | |
5.500%, 08/15/48 | | | 800 | | | | 936 | |
Western Midstream Operating | | | | | | | | |
6.500%, 02/01/50 | | | 900 | | | | 1,059 | |
| | | | | | | | | | | | | |
Total Midstream | | | 67,480 | |
| | | | | | | | | | | | | |
Miscellaneous Manufacturing [0.1%] |
Anolis Capital Markets PCC | | | | | | | | |
4.150%, 01/01/28 | | EUR | 1,195 | | | | 1,204 | |
Bombardier | | | | | | | | |
7.500%, 03/15/25(A) | | | 1,015 | | | | 1,037 | |
TMK OAO Via TMK Capital | | | | | | | | |
4.300%, 02/12/27 | | | 2,465 | | | | 2,497 | |
| | | | | | | | | | | | | |
Total Miscellaneous Manufacturing | | | 4,738 | |
| | | | | | | | | | | | | |
Motion Pictures and Services [0.0%] |
Allen Media | | | | | | | | |
10.500%, 02/15/28(A) | | | 608 | | | | 624 | |
| | | | | | | | | | | | | |
Non-Ferrous Metals [0.1%] |
Nacional del Cobre de Chile | | | | | | | | |
5.625%, 10/18/43 | | | 582 | | | | 757 | |
See accompanying notes to financial statements.
CITY NATIONAL ROCHDALE FUNDS | PAGE 85
consolidated schedule of investments |
September 30, 2021 |
City National Rochdale Fixed Income Opportunities Fund (continued) |
Description | | Face Amount (000)(1) | | | Value (000) | |
Nacional del Cobre de Chile | | | | | | | | |
4.875%, 11/04/44 | | $ | 256 | | | $ | 306 | |
Nacional del Cobre de Chile | | | | | | | | |
4.500%, 08/01/47 | | | 200 | | | | 231 | |
Nacional del Cobre de Chile | | | | | | | | |
4.375%, 02/05/49 | | | 339 | | | | 383 | |
Nacional del Cobre de Chile | | | | | | | | |
3.150%, 01/15/51 | | | 346 | | | | 319 | |
| | | | | | | | | | | | | |
Total Non-Ferrous Metals | | | 1,996 | |
| | | | | | | | | | | | | |
Oil Field Services [0.4%] |
Archrock Partners | | | | | | | | |
6.875%, 04/01/27(A) | | | 2,350 | | | | 2,467 | |
Archrock Partners | | | | | | | | |
6.250%, 04/01/28(A) | | | 2,575 | | | | 2,659 | |
Nabors Industries | | | | | | | | |
7.250%, 01/15/26(A) | | | 1,400 | | | | 1,362 | |
Nabors Industries | | | | | | | | |
7.500%, 01/15/28(A) | | | 600 | | | | 568 | |
Precision Drilling | | | | | | | | |
7.125%, 01/15/26(A) | | | 200 | | | | 206 | |
Precision Drilling | | | | | | | | |
6.875%, 01/15/29(A) | | | 1,555 | | | | 1,624 | |
Shelf Drilling Holdings | | | | | | | | |
8.250%, 02/15/25(A) | | | 850 | | | | 667 | |
USA Compression Partners | | | | | | | | |
6.875%, 04/01/26 | | | 3,225 | | | | 3,358 | |
6.875%, 09/01/27 | | | 1,725 | | | | 1,824 | |
| | | | | | | | | | | | | |
Total Oil Field Services | | | 14,735 | |
| | | | | | | | | | | | | |
Oil-Field Services [0.1%] |
ChampionX | | | | | | | | |
6.375%, 05/01/26 | | | 897 | | | | 935 | |
Oceaneering International | | | | | | | | |
4.650%, 11/15/24 | | | 1,165 | | | | 1,188 | |
Oceaneering International | | | | | | | | |
6.000%, 02/01/28 | | | 750 | | | | 762 | |
Transocean Phoenix 2 | | | | | | | | |
7.750%, 10/15/24(A) | | | 481 | | | | 491 | |
Transocean Proteus | | | | | | | | |
6.250%, 12/01/24(A) | | | 880 | | | | 880 | |
| | | | | | | | | | | | | |
Total Oil-Field Services | | | 4,256 | |
| | | | | | | | | | | | | |
Oli Field Services [0.0%] |
Nabors Industries | | | | | | | | |
9.000%, 02/01/25(A) | | | 1,140 | | | | 1,180 | |
| | | | | | | | | | | | | |
Packaging [1.0%] |
ARD Finance | | | | | | | | |
6.500%, 06/30/27(A) | | | 4,300 | | | | 4,563 | |
Ardagh Metal Packaging Finance USA | | | | | | | | |
4.000%, 09/01/29(A) | | | 1,600 | | | | 1,618 | |
Ardagh Packaging Finance | | | | | | | | |
5.250%, 08/15/27(A) | | | 3,375 | | | | 3,436 | |
Ball | | | | | | | | |
2.875%, 08/15/30 | | | 1,900 | | | | 1,844 | |
Berry Global Escrow | | | | | | | | |
4.875%, 07/15/26(A) | | | 900 | | | | 945 | |
Berry Global Escrow | | | | | | | | |
5.625%, 07/15/27(A) | | | 525 | | | | 555 | |
Crown Americas | | | | | | | | |
4.750%, 02/01/26 | | | 1,450 | | | | 1,494 | |
Flex Acquisition | | | | | | | | |
6.875%, 01/15/25(A) | | | 4,475 | | | | 4,531 | |
Flex Acquisition | | | | | | | | |
7.875%, 07/15/26(A) | | | 3,975 | | | | 4,154 | |
Mauser Packaging Solutions Holding | | | | | | | | |
5.500%, 04/15/24(A) | | | 1,025 | | | | 1,034 | |
Mauser Packaging Solutions Holding | | | | | | | | |
7.250%, 04/15/25(A) | | | 2,625 | | | | 2,609 | |
Owens-Brockway Glass Container | | | | | | | | |
5.375%, 01/15/25(A) | | | 975 | | | | 1,041 | |
Owens-Brockway Glass Container | | | | | | | | |
6.375%, 08/15/25(A) | | | 1,875 | | | | 2,076 | |
Owens-Brockway Glass Container | | | | | | | | |
6.625%, 05/13/27(A) | | | 675 | | | | 725 | |
Pactiv Evergreen Group Issuer | | | | | | | | |
4.000%, 10/15/27(A) | | | 1,000 | | | | 990 | |
Sealed Air | | | | | | | | |
4.875%, 12/01/22(A) | | | 1,125 | | | | 1,166 | |
Sealed Air | | | | | | | | |
5.125%, 12/01/24(A) | | | 425 | | | | 462 | |
Sealed Air | | | | | | | | |
4.000%, 12/01/27(A) | | | 1,150 | | | | 1,224 | |
Trident TPI Holdings | | | | | | | | |
9.250%, 08/01/24(A) | | | 1,600 | | | | 1,681 | |
Trident TPI Holdings | | | | | | | | |
6.625%, 11/01/25(A) | | | 1,525 | | | | 1,548 | |
See accompanying notes to financial statements.
CITY NATIONAL ROCHDALE FUNDS | PAGE 86
consolidated schedule of investments |
September 30, 2021 |
City National Rochdale Fixed Income Opportunities Fund (continued) |
Description | | Face Amount (000)(1) | | | Value (000) | |
Trivium Packaging Finance BV | | | | | | | | |
5.500%, 08/15/26(A) | | $ | 700 | | | $ | 733 | |
Trivium Packaging Finance BV | | | | | | | | |
8.500%, 08/15/27(A) | | | 2,500 | | | | 2,685 | |
| | | | | | | | | | | | | |
Total Packaging | | | 41,114 | |
| | | | | | | | | | | | | |
Paper [0.1%] |
Clearwater Paper | | | | | | | | |
5.375%, 02/01/25(A) | | | 1,775 | | | | 1,913 | |
Clearwater Paper | | | | | | | | |
4.750%, 08/15/28(A) | | | 1,000 | | | | 1,027 | |
Graphic Packaging International | | | | | | | | |
4.750%, 07/15/27(A) | | | 300 | | | | 325 | |
Graphic Packaging International | | | | | | | | |
3.500%, 03/15/28(A) | | | 600 | | | | 609 | |
3.500%, 03/01/29(A) | | | 525 | | | | 522 | |
| | | | | | | | | | | | | |
Total Paper | | | 4,396 | |
| | | | | | | | | | | | | |
Paper & Related Products [0.2%] |
Ahlstrom-Munksjo Holding 3 Oy | | | | | | | | |
3.625%, 02/04/28 | | EUR | 300 | | | | 353 | |
Fabric BC | | | | | | | | |
4.125%, VAR Euribor 3 Month + 4.125%, 08/31/26 | | EUR | 200 | | | | 233 | |
Schweitzer-Mauduit International | | | | | | | | |
6.875%, 10/01/26(A) | | | 1,763 | | | | 1,834 | |
Suzano Austria GmbH | | | | | | | | |
7.000%, 03/16/47 | | | 3,595 | | | | 4,718 | |
Sylvamo | | | | | | | | |
7.000%, 09/01/29(A) | | | 745 | | | | 762 | |
| | | | | | | | | | | | | |
Total Paper & Related Products | | | 7,900 | |
| | | | | | | | | | | | | |
Petrochemicals [0.1%] |
Braskem America Finance | | | | | | | | |
7.125%, 07/22/41 | | | 1,485 | | | | 1,921 | |
| | | | | | | | | | | | | |
Petroleum & Fuel Products [6.3%] |
California Resources | | | | | | | | |
7.125%, 02/01/26(A) | | | 2,625 | | | | 2,770 | |
Constellation Oil | | | | | | | | |
0.000%cash/10.000% PIK,11/09/24 | | | 7,950 | | | | 2,425 | |
DCP Midstream Operating | | | | | | | | |
6.450%, 11/03/36(A) | | | 275 | | | | 342 | |
DNO | | | | | | | | |
8.375%, 05/29/24(A) | | | 7,210 | | | | 7,516 | |
DNO | | | | | | | | |
7.875%, 09/09/26(A) | | | 7,600 | | | | 7,714 | |
Ecopetrol | | | | | | | | |
6.875%, 04/29/30 | | | 5,495 | | | | 6,439 | |
Empresa Nacional del Petroleo | | | | | | | | |
3.750%, 08/05/26 | | | 430 | | | | 452 | |
Empresa Nacional del Petroleo | | | | | | | | |
4.500%, 09/14/47 | | | 576 | | | | 580 | |
Ensign Drilling | | | | | | | | |
9.250%, 04/15/24(A) | | | 1,660 | | | | 1,602 | |
Frontera Energy | | | | | | | | |
7.875%, 06/21/28 | | | 3,800 | | | | 3,691 | |
Geopark | | | | | | | | |
5.500%, 01/17/27 | | | 3,410 | | | | 3,364 | |
Hilcorp Energy I | | | | | | | | |
5.750%, 10/01/25(A) | | | 500 | | | | 506 | |
Hilcorp Energy I | | | | | | | | |
6.250%, 11/01/28(A) | | | 2,371 | | | | 2,457 | |
Hilcorp Energy I | | | | | | | | |
6.000%, 02/01/31(A) | | | 1,110 | | | | 1,140 | |
HKN Energy | | | | | | | | |
11.000%, 03/06/24 | | | 4,800 | | | | 4,974 | |
HKN Energy III | | | | | | | | |
12.000%, 05/26/25(A) | | | 3,400 | | | | 3,451 | |
KazMunayGas National JSC | | | | | | | | |
5.375%, 04/24/30 | | | 589 | | | | 697 | |
KazMunayGas National JSC | | | | | | | | |
3.500%, 04/14/33 | | | 279 | | | | 288 | |
KazMunayGas National JSC | | | | | | | | |
6.375%, 10/24/48 | | | 486 | | | | 626 | |
Latina Offshore | | | | | | | | |
8.875%, 10/15/22(A) | | | 24,495 | | | | 15,248 | |
Leviathan Bond | | | | | | | | |
5.750%, 06/30/23(A) | | | 1,025 | | | | 1,069 | |
Leviathan Bond | | | | | | | | |
6.125%, 06/30/25(A) | | | 2,370 | | | | 2,576 | |
Leviathan Bond | | | | | | | | |
6.500%, 06/30/27(A) | | | 2,461 | | | | 2,711 | |
Leviathan Bond | | | | | | | | |
6.750%, 06/30/30(A) | | | 4,630 | | | | 5,141 | |
Magnolia Oil & Gas Operating | | | | | | | | |
6.000%, 08/01/26(A) | | | 2,245 | | | | 2,306 | |
See accompanying notes to financial statements.
CITY NATIONAL ROCHDALE FUNDS | PAGE 87
consolidated schedule of investments |
September 30, 2021 |
City National Rochdale Fixed Income Opportunities Fund (continued) |
Description | | Face Amount (000)(1) | | | Value (000) | |
MC Brazil Downstream Trading SARL | | | | | | | | |
7.250%, 06/30/31(A) | | $ | 5,300 | | | $ | 5,337 | |
NAK Naftogaz Ukraine via Kondor Finance | | | | | | | | |
7.375%, 07/19/22 | | | 16,568 | | | | 16,874 | |
New Fortress Energy | | | | | | | | |
6.750%, 09/15/25(A) | | | 3,190 | | | | 3,070 | |
New Fortress Energy | | | | | | | | |
6.500%, 09/30/26(A) | | | 1,995 | | | | 1,908 | |
NGD Holdings BV | | | | | | | | |
6.750%, 12/31/26 | | | 4,623 | | | | 4,492 | |
Nostrum Oil & Gas Finance BV | | | | | | | | |
7.000%, 02/16/25 | | | 25,009 | | | | 6,752 | |
Offshore Drilling Holding | | | | | | | | |
8.375%, 10/19/20 | | | 38,575 | | | | 3,117 | |
Oil and Gas Holding BSCC | | | | | | | | |
7.625%, 11/07/24 | | | 221 | | | | 243 | |
Oil and Gas Holding BSCC | | | | | | | | |
8.375%, 11/07/28 | | | 377 | | | | 436 | |
Oleoducto Central | | | | | | | | |
4.000%, 07/14/27 | | | 1,605 | | | | 1,655 | |
Oro Negro Drilling Pte | | | | | | | | |
0.000%, (B) (D) | | | 3,683 | | | | — | |
Oro Negro Drilling Pte | | | | | | | | |
7.500%, 12/31/49(A) (B) | | | 23,137 | | | | 926 | |
Patterson-UTI Energy | | | | | | | | |
5.150%, 11/15/29 | | | 840 | | | | 861 | |
Pertamina Persero | | | | | | | | |
6.000%, 05/03/42 | | | 216 | | | | 268 | |
Pertamina Persero, MTN | | | | | | | | |
6.450%, 05/30/44 | | | 200 | | | | 261 | |
Pertamina Persero, MTN | | | | | | | | |
4.175%, 01/21/50 | | | 371 | | | | 375 | |
Peru LNG Srl | | | | | | | | |
5.375%, 03/22/30 | | | 5,200 | | | | 4,202 | |
Petroamazonas EP | | | | | | | | |
4.625%, 12/06/21 | | | 281 | | | | 281 | |
Petrobras Global Finance | | | | | | | | |
6.850%, 06/05/15 | | | 17,653 | | | | 18,271 | |
Petrobras Global Finance BV | | | | | | | | |
5.500%, 06/10/51 | | | 4,640 | | | | 4,323 | |
Petroleos de Venezuela | | | | | | | | |
8.500%, 10/27/20(B) | | | 10,470 | | | | 2,958 | |
Petroleos de Venezuela | | | | | | | | |
9.750%, 05/17/35(B) | | | 8,689 | | | | 521 | |
Petroleos del Peru | | | | | | | | |
5.625%, 06/19/47 | | | 268 | | | | 268 | |
5.625%, 06/19/47(A) | | | 450 | | | | 450 | |
Petroleos Mexicanos | | | | | | | | |
6.350%, 02/12/48 | | | 577 | | | | 488 | |
Petroleos Mexicanos | | | | | | | | |
7.690%, 01/23/50 | | | 1,698 | | | | 1,608 | |
Petroleos Mexicanos | | | | | | | | |
6.950%, 01/28/60 | | | 1,602 | | | | 1,405 | |
Petroleos Mexicanos, MTN | | | | | | | | |
6.875%, 08/04/26 | | | 1,820 | | | | 1,979 | |
Petroleos Mexicanos, MTN | | | | | | | | |
6.750%, 09/21/47 | | | 1,775 | | | | 1,551 | |
Petronas Capital, MTN | | | | | | | | |
2.480%, 01/28/32 | | | 546 | | | | 544 | |
Petronas Capital, MTN | | | | | | | | |
4.550%, 04/21/50 | | | 799 | | | | 982 | |
Petronas Capital, MTN | | | | | | | | |
4.800%, 04/21/60 | | | 493 | | | | 643 | |
Petronas Capital, MTN | | | | | | | | |
3.404%, 04/28/61(A) | | | 812 | | | | 820 | |
Puma International Financing | | | | | | | | |
5.000%, 01/24/26 | | | 9,520 | | | | 9,562 | |
Qatar Petroleum | | | | | | | | |
3.125%, 07/12/41 | | | 971 | | | | 972 | |
Rockies Express Pipeline | | | | | | | | |
4.950%, 07/15/29(A) | | | 1,750 | | | | 1,820 | |
Rockies Express Pipeline | | | | | | | | |
7.500%, 07/15/38(A) | | | 740 | | | | 840 | |
ShaMaran Petroleum | | | | | | | | |
12.000%, 07/05/23(A) | | | 18,187 | | | | 18,188 | |
SierraCol Energy Andina | | | | | | | | |
6.000%, 06/15/28 | | | 3,000 | | | | 2,933 | |
Sinopec Group Overseas Development 2012 | | | | | | | | |
4.875%, 05/17/42 | | | 224 | | | | 278 | |
Sinopec Group Overseas Development 2018 | | | | | | | | |
2.700%, 05/13/30 | | | 410 | | | | 420 | |
Sinopec Group Overseas Development 2018 | | | | | | | | |
3.350%, 05/13/50 | | | 238 | | | | 244 | |
Southern Gas Corridor CJSC | | | | | | | | |
6.875%, 03/24/26 | | | 827 | | | | 977 | |
State Oil of the Azerbaijan Republic | | | | | | | | |
6.950%, 03/18/30 | | | 562 | | | | 694 | |
Tallgrass Energy Partners | | | | | | | | |
7.500%, 10/01/25(A) | | | 1,630 | | | | 1,765 | |
See accompanying notes to financial statements.
CITY NATIONAL ROCHDALE FUNDS | PAGE 88
consolidated schedule of investments |
September 30, 2021 |
City National Rochdale Fixed Income Opportunities Fund (continued) |
Description | | Face Amount (000)(1) | | | Value (000) | |
Talos Production | | | | | | | | |
12.000%, 01/15/26 | | $ | 1,110 | | | $ | 1,189 | |
Tecpetrol | | | | | | | | |
4.875%, 12/12/22 | | | 24,338 | | | | 24,277 | |
Transocean Pontus | | | | | | | | |
6.125%, 08/01/25(A) | | | 804 | | | | 804 | |
Trinidad Petroleum Holdings | | | | | | | | |
6.000%, 05/08/22 | | | 320 | | | | 321 | |
Tullow Oil | | | | | | | | |
7.000%, 03/01/25 | | | 5,800 | | | | 5,041 | |
Tullow Oil | | | | | | | | |
10.250%, 05/15/26 | | | 6,655 | | | | 6,958 | |
YPF | | | | | | | | |
2.500%, 9.00%, 1/1/2023, 01/01/23(E) | | | 2,353 | | | | 1,616 | |
YPF | | | | | | | | |
4.000%, 9.00%, 1/1/2023, 01/01/23(E) | | | 15,032 | | | | 13,308 | |
| | | | | | | | | | | | | |
Total Petroleum & Fuel Products | | | 260,161 | |
| | | | | | | | | | | | | |
Pharmaceuticals [0.9%] |
Bausch Health | | | | | | | | |
6.125%, 04/15/25(A) | | | 3,167 | | | | 3,230 | |
Bausch Health | | | | | | | | |
5.500%, 11/01/25(A) | | | 900 | | | | 914 | |
Bausch Health | | | | | | | | |
9.000%, 12/15/25(A) | | | 550 | | | | 582 | |
Bausch Health | | | | | | | | |
5.750%, 08/15/27(A) | | | 275 | | | | 288 | |
Bausch Health | | | | | | | | |
5.000%, 01/30/28(A) | | | 950 | | | | 901 | |
5.000%, 02/15/29(A) | | | 600 | | | | 559 | |
Bausch Health | | | | | | | | |
4.875%, 06/01/28(A) | | | 750 | | | | 777 | |
Bausch Health | | | | | | | | |
6.250%, 02/15/29(A) | | | 3,150 | | | | 3,117 | |
Bausch Health | | | | | | | | |
7.250%, 05/30/29(A) | | | 1,950 | | | | 1,992 | |
Bausch Health | | | | | | | | |
5.250%, 01/30/30(A) | | | 800 | | | | 746 | |
5.250%, 02/15/31(A) | | | 375 | | | | 345 | |
Bausch Health Americas | | | | | | | | |
9.250%, 04/01/26(A) | | | 750 | | | | 800 | |
Bausch Health Americas | | | | | | | | |
8.500%, 01/31/27(A) | | | 3,150 | | | | 3,378 | |
Catalent Pharma Solutions | | | | | | | | |
3.500%, 04/01/30(A) | | | 675 | | | | 675 | |
Emergent BioSolutions | | | | | | | | |
3.875%, 08/15/28(A) | | | 2,815 | | | | 2,745 | |
Endo Dac | | | | | | | | |
9.500%, 07/31/27(A) | | | 1,000 | | | | 1,002 | |
Endo Dac | | | | | | | | |
6.000%, 06/30/28(A) | | | 1,877 | | | | 1,365 | |
Endo Luxembourg Finance I Sarl | | | | | | | | |
6.125%, 04/01/29(A) | | | 625 | | | | 625 | |
Grifols Escrow Issuer | | | | | | | | |
4.750%, 10/15/28(A) | | | 450 | | | | 459 | |
HCRX Investments Holdco | | | | | | | | |
4.500%, 08/01/29(A) | | | 600 | | | | 603 | |
Jaguar Holding II | | | | | | | | |
4.625%, 06/15/25(A) | | | 1,825 | | | | 1,895 | |
Jaguar Holding II | | | | | | | | |
5.000%, 06/15/28(A) | | | 600 | | | | 646 | |
Jazz Securities DAC | | | | | | | | |
4.375%, 01/15/29(A) | | | 1,950 | | | | 2,021 | |
Mallinckrodt International Finance | | | | | | | | |
5.625%, 10/15/23(A) (B) | | | 750 | | | | 375 | |
Mallinckrodt International Finance | | | | | | | | |
5.500%, 04/15/25(A) (B) | | | 2,575 | | | | 1,291 | |
Organon | | | | | | | | |
4.125%, 04/30/28(A) | | | 425 | | | | 433 | |
Organon | | | | | | | | |
5.125%, 04/30/31(A) | | | 1,750 | | | | 1,838 | |
Par Pharmaceutical | | | | | | | | |
7.500%, 04/01/27(A) | | | 2,870 | | | | 2,924 | |
Syneos Health | | | | | | | | |
3.625%, 01/15/29(A) | | | 1,525 | | | | 1,521 | |
| | | | | | | | | | | | | |
Total Pharmaceuticals | | | 38,047 | |
| | | | | | | | | | | | | |
Printing & Publishing [0.2%] |
Advantage Sales & Marketing | | | | | | | | |
6.500%, 11/15/28(A) | | | 920 | | | | 959 | |
Cimpress | | | | | | | | |
7.000%, 06/15/26(A) | | | 4,837 | | | | 5,045 | |
Deluxe | | | | | | | | |
8.000%, 06/01/29(A) | | | 1,005 | | | | 1,050 | |
| | | | | | | | | | | | | |
Total Printing & Publishing | | | 7,054 | |
| | | | | | | | | | | | | |
See accompanying notes to financial statements.
CITY NATIONAL ROCHDALE FUNDS | PAGE 89
consolidated schedule of investments |
September 30, 2021 |
City National Rochdale Fixed Income Opportunities Fund (continued) |
Description | | Face Amount (000)(1) | | | Value (000) | |
Property/Casualty Ins [0.1%] |
Markel | | | | | | | | |
6.000%, VAR US Treas Yield Curve Rate T Note Const Mat 5 Yr + 5.662%, 12/01/69 | | $ | 1,820 | | | $ | 2,017 | |
| | | | | | | | | | | | | |
Radio [0.0%] |
Spanish Broadcasting System | | | | | | | | |
9.750%, 03/01/26(A) | | | 1,225 | | | | 1,279 | |
| | | | | | | | | | | | | |
Real Estate Investment Trusts [0.4%] |
American Finance Trust | | | | | | | | |
4.500%, 09/30/28(A) | | | 925 | | | | 925 | |
Brookfield Property REIT | | | | | | | | |
5.750%, 05/15/26(A) | | | 2,705 | | | | 2,813 | |
Brookfield Property REIT | | | | | | | | |
4.500%, 04/01/27(A) | | | 1,190 | | | | 1,177 | |
New Residential Investment | | | | | | | | |
6.250%, 10/15/25(A) | | | 4,270 | | | | 4,303 | |
Trust Fibra Uno | | | | | | | | |
6.390%, 01/15/50 | | | 2,050 | | | | 2,425 | |
Uniti Group | | | | | | | | |
7.125%, 12/15/24(A) | | | 960 | | | | 980 | |
Uniti Group | | | | | | | | |
4.750%, 04/15/28(A) | | | 1,025 | | | | 1,047 | |
Uniti Group | | | | | | | | |
6.500%, 02/15/29(A) | | | 1,990 | | | | 2,047 | |
Uniti Group | | | | | | | | |
6.000%, 01/15/30(A) | | | 1,030 | | | | 1,021 | |
XHR | | | | | | | | |
4.875%, 06/01/29(A) | | | 984 | | | | 1,011 | |
| | | | | | | | | | | | | |
Total Real Estate Investment Trusts | | | 17,749 | |
| | | | | | | | | | | | | |
Real Estate Oper/Develop [2.6%] |
Alam Sutera Realty | | | | | | | | |
6.000%cash or 6.25%PIK, 05/02/24 | | | 25,452 | | | | 21,889 | |
Alam Synergy Pte | | | | | | | | |
6.625%, 04/24/22 | | | 6,517 | | | | 6,192 | |
Arabian Centres Sukuk II | | | | | | | | |
5.625%, 10/07/26 | | | 5,400 | | | | 5,641 | |
Central China Real Estate | | | | | | | | |
7.250%, 08/13/24 | | | 3,100 | | | | 1,902 | |
CFLD Cayman Investment | | | | | | | | |
8.625%, 02/28/21(B) | | | 729 | | | | 301 | |
CFLD Cayman Investment | | | | | | | | |
8.600%, 04/08/24 | | | 10,690 | | | | 4,475 | |
China Evergrande Group | | | | | | | | |
8.250%, 03/23/22 | | | 1,950 | | | | 502 | |
China Evergrande Group | | | | | | | | |
10.000%, 04/11/23 | | | 2,390 | | | | 574 | |
China Evergrande Group | | | | | | | | |
7.500%, 06/28/23 | | | 10,000 | | | | 2,400 | |
China Evergrande Group | | | | | | | | |
9.500%, 03/29/24 | | | 2,695 | | | | 647 | |
China Evergrande Group | | | | | | | | |
8.750%, 06/28/25 | | | 5,655 | | | | 1,356 | |
Dar Al-Arkan Sukuk | | | | | | | | |
6.750%, 02/15/25 | | | 3,480 | | | | 3,674 | |
Fantasia Holdings Group | | | | | | | | |
15.000%, 12/18/21 | | | 1,920 | | | | 1,306 | |
Fantasia Holdings Group | | | | | | �� | | |
12.250%, 10/18/22 | | | 4,075 | | | | 1,355 | |
Fantasia Holdings Group | | | | | | | | |
10.875%, 01/09/23 | | | 2,555 | | | | 798 | |
Fantasia Holdings Group | | | | | | | | |
11.875%, 06/01/23 | | | 2,165 | | | | 677 | |
Haya Finance 2017 | | | | | | | | |
5.250%, 11/15/22 | | EUR | 645 | | | | 619 | |
Hong Kong Red Star Macalline Universal Home Furnishings | | | | | | | | |
3.375%, 09/21/22 | | | 12,000 | | | | 10,680 | |
Howard Hughes | | | | | | | | |
4.125%, 02/01/29(A) | | | 1,285 | | | | 1,288 | |
IRSA Propiedades Comerciales | | | | | | | | |
8.750%, 03/23/23 | | | 890 | | | | 860 | |
Kaisa Group Holdings | | | | | | | | |
8.500%, 06/30/22 | | | 4,562 | | | | 3,958 | |
Kaisa Group Holdings | | | | | | | | |
10.875%, 07/23/23 | | | 2,625 | | | | 2,182 | |
Kaisa Group Holdings | | | | | | | | |
9.375%, 06/30/24 | | | 4,682 | | | | 3,571 | |
Kaisa Group Holdings | | | | | | | | |
11.250%, 04/16/25 | | | 2,804 | | | | 2,176 | |
Kaisa Group Holdings | | | | | | | | |
11.700%, 11/11/25 | | | 2,021 | | | | 1,551 | |
Radiance Capital Investments | | | | | | | | |
8.800%, 09/17/23 | | | 6,375 | | | | 6,152 | |
Redco Properties Group, MTN | | | | | | | | |
9.900%, 02/17/24 | | | 2,905 | | | | 2,479 | |
Redsun Properties Group | | | | | | | | |
7.300%, 01/13/25 | | | 2,230 | | | | 1,841 | |
Scenery Journey | | | | | | | | |
11.500%, 10/24/22 | | | 2,310 | | | | 422 | |
See accompanying notes to financial statements.
CITY NATIONAL ROCHDALE FUNDS | PAGE 90
consolidated schedule of investments |
September 30, 2021 |
City National Rochdale Fixed Income Opportunities Fund (continued) |
Description | | Face Amount (000)(1) | | | Value (000) | |
Scenery Journey | | | | | | | | |
12.000%, 10/24/23 | | $ | 6,797 | | | $ | 1,206 | |
Sunac China Holdings | | | | | | | | |
7.500%, 02/01/24 | | | 2,085 | | | | 1,724 | |
Sunac China Holdings | | | | | | | | |
6.500%, 01/10/25 | | | 3,315 | | | | 2,685 | |
Yuzhou Group Holdings | | | | | | | | |
6.350%, 01/13/27 | | | 1,690 | | | | 1,092 | |
Zhenro Properties Group | | | | | | | | |
9.150%, 05/06/23 | | | 2,385 | | | | 2,329 | |
Zhenro Properties Group | | | | | | | | |
7.875%, 04/14/24 | | | 2,515 | | | | 2,282 | |
| | | | | | | | | | | | | |
Total Real Estate Oper/Develop | | | 102,786 | |
| | | | | | | | | | | | | |
Regional Banks-Non US [0.0%] |
Banco del Estado de Chile, MTN | | | | | | | | |
3.875%, 02/08/22 | | | 262 | | | | 264 | |
| | | | | | | | | | | | | |
Restaurants [0.3%] |
1011778 BC ULC | | | | | | | | |
3.875%, 01/15/28(A) | | | 375 | | | | 378 | |
1011778 BC ULC | | | | | | | | |
4.375%, 01/15/28(A) | | | 1,175 | | | | 1,193 | |
1011778 BC ULC | | | | | | | | |
3.500%, 02/15/29(A) | | | 400 | | | | 397 | |
1011778 BC ULC | | | | | | | | |
4.000%, 10/15/30(A) | | | 6,025 | | | | 5,965 | |
KFC Holding | | | | | | | | |
4.750%, 06/01/27(A) | | | 975 | | | | 1,018 | |
Yum! Brands | | | | | | | | |
4.750%, 01/15/30(A) | | | 925 | | | | 1,003 | |
Yum! Brands | | | | | | | | |
3.625%, 03/15/31 | | | 825 | | | | 829 | |
Yum! Brands Inc | | | | | | | | |
4.625%, 01/31/32 | | | 850 | | | | 907 | |
| | | | | | | | | | | | | |
Total Restaurants | | | 11,690 | |
| | | | | | | | | | | | | |
Retail [1.0%] |
Ambience Merger Sub | | | | | | | | |
4.875%, 07/15/28(A) | | | 285 | | | | 285 | |
Bath & Body Works | | | | | | | | |
6.950%, 03/01/33 | | | 1,008 | | | | 1,190 | |
Bath & Body Works | | | | | | | | |
6.750%, 07/01/36 | | | 985 | | | | 1,221 | |
Bloomin’ Brands | | | | | | | | |
5.125%, 04/15/29(A) | | | 1,940 | | | | 2,018 | |
Carvana | | | | | | | | |
5.625%, 10/01/25(A) | | | 4,145 | | | | 4,285 | |
eG Global Finance | | | | | | | | |
6.250%, 10/30/25 | | EUR | 1,200 | | | | 1,420 | |
Eurotorg Via Bonitron DAC | | | | | | | | |
9.000%, 10/22/25 | | | 1,535 | | | | 1,623 | |
FirstCash | | | | | | | | |
4.625%, 09/01/28(A) | | | 990 | | | | 1,027 | |
Foot Locker | | | | | | | | |
4.000%, 10/01/29(A) | | | 555 | | | | 556 | |
Future Retail | | | | | | | | |
5.600%, 01/22/25 | | | 13,000 | | | | 7,621 | |
Golden Nugget | | | | | | | | |
6.750%, 10/15/24(A) | | | 1,900 | | | | 1,903 | |
Grupo Axo SAPI | | | | | | | | |
5.750%, 06/08/26 | | | 5,300 | | | | 5,440 | |
Guitar Center | | | | | | | | |
8.500%, 01/15/26(A) | | | 1,101 | | | | 1,181 | |
Lion | | | | | | | | |
4.000%, VAR Euribor 3 Month + 4.000%, 07/01/26 | | EUR | 700 | | | | 815 | |
Nordstrom | | | | | | | | |
4.375%, 04/01/30 | | | 525 | | | | 537 | |
Park River Holdings | | | | | | | | |
5.625%, 02/01/29(A) | | | 2,020 | | | | 1,957 | |
Park River Holdings | | | | | | | | |
6.750%, 08/01/29(A) | | | 1,020 | | | | 1,023 | |
Punch Finance | | | | | | | | |
6.125%, 06/30/26 | | GBP | 300 | | | | 413 | |
QVC | | | | | | | | |
5.450%, 08/15/34 | | | 3,890 | | | | 4,134 | |
Sonic Automotive | | | | | | | | |
6.125%, 03/15/27 | | | 1,883 | | | | 1,957 | |
Victoria’s Secret | | | | | | | | |
4.625%, 07/15/29(A) | | | 1,035 | | | | 1,048 | |
| | | | | | | | | | | | | |
Total Retail | | | 41,654 | |
| | | | | | | | | | | | | |
Retailers [0.1%] |
Academy | | | | | | | | |
6.000%, 11/15/27(A) | | | 825 | | | | 891 | |
Gap | | | | | | | | |
3.625%, 10/01/29(A) | | | 300 | | | | 300 | |
Gap | | | | | | | | |
3.875%, 10/01/31(A) | | | 450 | | | | 451 | |
NMG Holding | | | | | | | | |
7.125%, 04/01/26(A) | | | 1,150 | | | | 1,220 | |
William Carter | | | | | | | | |
5.500%, 05/15/25(A) | | | 375 | | | | 394 | |
William Carter | | | | | | | | |
5.625%, 03/15/27(A) | | | 125 | | | | 130 | |
| | | | | | | | | | | | | |
Total Retailers | | | 3,386 | |
| | | | | | | | | | | | | |
See accompanying notes to financial statements.
CITY NATIONAL ROCHDALE FUNDS | PAGE 91
consolidated schedule of investments |
September 30, 2021 |
City National Rochdale Fixed Income Opportunities Fund (continued) |
Description | | Face Amount (000)(1) | | | Value (000) | |
Semi-Conductors [0.0%] |
Tunghsu Venus Holdings | | | | | | | | |
7.000%, 06/12/20(B) | | $ | 4,275 | | | $ | 1,139 | |
| | | | | | | | | | | | | |
Steel & Steel Works [0.6%] |
CSN Islands XI | | | | | | | | |
6.750%, 01/28/28 | | | 4,130 | | | | 4,405 | |
CSN Resources | | | | | | | | |
7.625%, 04/17/26 | | | 2,325 | | | | 2,468 | |
Metinvest BV | | | | | | | | |
8.500%, 04/23/26 | | | 7,873 | | | | 8,804 | |
Metinvest BV | | | | | | | | |
7.750%, 10/17/29 | | | 5,110 | | | | 5,553 | |
United States Steel | | | | | | | | |
6.250%, 03/15/26 | | | 378 | | | | 390 | |
United States Steel | | | | | | | | |
6.875%, 03/01/29 | | | 1,440 | | | | 1,535 | |
| | | | | | | | | | | | | |
Total Steel & Steel Works | | | 23,155 | |
| | | | | | | | | | | | | |
Supermarkets [0.1%] |
Albertsons | | | | | | | | |
3.500%, 02/15/23(A) | | | 300 | | | | 307 | |
3.500%, 03/15/29(A) | | | 1,025 | | | | 1,021 | |
Albertsons | | | | | | | | |
5.750%, 03/15/25 | | | 336 | | | | 343 | |
Albertsons | | | | | | | | |
3.250%, 03/15/26(A) | | | 625 | | | | 634 | |
Albertsons | | | | | | | | |
7.500%, 03/15/26(A) | | | 1,075 | | | | 1,161 | |
Albertsons | | | | | | | | |
5.875%, 02/15/28(A) | | | 950 | | | | 1,012 | |
Albertsons | | | | | | | | |
4.875%, 02/15/30(A) | | | 375 | | | | 404 | |
| | | | | | | | | | | | | |
Total Supermarkets | | | 4,882 | |
| | | | | | | | | | | | | |
Technology [1.5%] |
Ams | | | | | | | | |
7.000%, 07/31/25(A) | | | 1,175 | | | | 1,260 | |
Black Knight InfoServ | | | | | | | | |
3.625%, 09/01/28(A) | | | 1,475 | | | | 1,482 | |
Boxer Parent | | | | | | | | |
9.125%, 03/01/26(A) | | | 875 | | | | 917 | |
Cars.com | | | | | | | | |
6.375%, 11/01/28(A) | | | 1,850 | | | | 1,952 | |
CDW | | | | | | | | |
5.500%, 12/01/24 | | | 325 | | | | 358 | |
CDW | | | | | | | | |
4.250%, 04/01/28 | | | 450 | | | | 469 | |
CDW | | | | | | | | |
3.250%, 02/15/29 | | | 675 | | | | 692 | |
Clarivate Science Holdings | | | | | | | | |
3.875%, 07/01/28(A) | | | 350 | | | | 350 | |
Clarivate Science Holdings | | | | | | | | |
4.875%, 07/01/29(A) | | | 1,475 | | | | 1,479 | |
Consensus Cloud Solutions | | | | | | | | |
6.000%, 10/15/26(A) | | | 550 | | | | 565 | |
Consensus Cloud Solutions | | | | | | | | |
6.500%, 10/15/28(A) | | | 1,200 | | | | 1,245 | |
Dell International | | | | | | | | |
7.125%, 06/15/24(A) | | | 6,870 | | | | 7,025 | |
Diebold Nixdorf | | | | | | | | |
9.375%, 07/15/25(A) | | | 325 | | | | 356 | |
Dun & Bradstreet | | | | | | | | |
6.875%, 08/15/26(A) | | | 255 | | | | 268 | |
Dun & Bradstreet | | | | | | | | |
10.250%, 02/15/27(A) | | | 1,590 | | | | 1,709 | |
Elastic | | | | | | | | |
4.125%, 07/15/29(A) | | | 1,705 | | | | 1,714 | |
Gartner | | | | | | | | |
4.500%, 07/01/28(A) | | | 625 | | | | 656 | |
Gartner | | | | | | | | |
3.750%, 10/01/30(A) | | | 550 | | | | 566 | |
HealthEquity | | | | | | | | |
4.500%, 10/01/29(A) | | | 675 | | | | 687 | |
Helios Software Holdings | | | | | | | | |
4.625%, 05/01/28(A) | | | 1,750 | | | | 1,724 | |
Logan Merger Sub | | | | | | | | |
5.500%, 09/01/27(A) | | | 2,425 | | | | 2,470 | |
Millennium Escrow | | | | | | | | |
6.625%, 08/01/26(A) | | | 1,075 | | | | 1,107 | |
NCR | | | | | | | | |
5.750%, 09/01/27(A) | | | 300 | | | | 316 | |
NCR | | | | | | | | |
5.000%, 10/01/28(A) | | | 2,576 | | | | 2,632 | |
NCR | | | | | | | | |
5.125%, 04/15/29(A) | | | 3,410 | | | | 3,517 | |
NCR | | | | | | | | |
6.125%, 09/01/29(A) | | | 1,350 | | | | 1,465 | |
NCR | | | | | | | | |
5.250%, 10/01/30(A) | | | 1,800 | | | | 1,887 | |
Nuance Communications | | | | | | | | |
5.625%, 12/15/26 | | | 700 | | | | 724 | |
ON Semiconductor | | | | | | | | |
3.875%, 09/01/28(A) | | | 500 | | | | 517 | |
Open Text | | | | | | | | |
3.875%, 02/15/28(A) | | | 1,500 | | | | 1,530 | |
PTC | | | | | | | | |
3.625%, 02/15/25(A) | | | 550 | | | | 558 | |
See accompanying notes to financial statements.
CITY NATIONAL ROCHDALE FUNDS | PAGE 92
consolidated schedule of investments |
September 30, 2021 |
City National Rochdale Fixed Income Opportunities Fund (continued) |
Description | | Face Amount (000)(1) | | | Value (000) | |
PTC | | | | | | | | |
4.000%, 02/15/28(A) | | $ | 250 | | | $ | 257 | |
Qorvo | | | | | | | | |
4.375%, 10/15/29 | | | 1,000 | | | | 1,090 | |
Qorvo | | | | | | | | |
3.375%, 04/01/31(A) | | | 750 | | | | 791 | |
Rackspace Technology Global | | | | | | | | |
3.500%, 02/15/28(A) | | | 1,800 | | | | 1,737 | |
Rackspace Technology Global | | | | | | | | |
5.375%, 12/01/28(A) | | | 1,725 | | | | 1,695 | |
Rocket Software | | | | | | | | |
6.500%, 02/15/29(A) | | | 2,650 | | | | 2,623 | |
Science Applications International | | | | | | | | |
4.875%, 04/01/28(A) | | | 1,575 | | | | 1,628 | |
Seagate HDD Cayman | | | | | | | | |
3.125%, 07/15/29(A) | | | 1,575 | | | | 1,523 | |
Seagate HDD Cayman | | | | | | | | |
3.375%, 07/15/31(A) | | | 1,075 | | | | 1,046 | |
Seagate HDD Cayman | | | | | | | | |
5.750%, 12/01/34 | | | 920 | | | | 1,076 | |
Sensata Technologies | | | | | | | | |
4.375%, 02/15/30(A) | | | 225 | | | | 242 | |
Sensata Technologies | | | | | | | | |
3.750%, 02/15/31(A) | | | 425 | | | | 428 | |
Sensata Technologies BV | | | | | | | | |
4.000%, 04/15/29(A) | | | 650 | | | | 662 | |
SS&C Technologies | | | | | | | | |
5.500%, 09/30/27(A) | | | 3,100 | | | | 3,276 | |
Synaptics | | | | | | | | |
4.000%, 06/15/29(A) | | | 550 | | | | 563 | |
TTM Technologies | | | | | | | | |
4.000%, 03/01/29(A) | | | 675 | | | | 676 | |
Veritas US | | | | | | | | |
7.500%, 09/01/25(A) | | | 2,875 | | | | 2,990 | |
Viavi Solutions | | | | | | | | |
3.750%, 10/01/29(A) | | | 325 | | | | 326 | |
| | | | | | | | | | | | | |
Total Technology | | | 64,826 | |
| | | | | | | | | | | | | |
Telecommunication Equip [0.1%] |
CommScope | | | | | | | | |
8.250%, 03/01/27(A) | | | 1,800 | | | | 1,881 | |
Plantronics | | | | | | | | |
4.750%, 03/01/29(A) | | | 850 | | | | 796 | |
| | | | | | | | | | | | | |
Total Telecommunication Equip | | | 2,677 | |
| | | | | | | | | | | | | |
Telephones & Telecommunications [2.1%] |
Altice France | | | | | | | | |
7.375%, 05/01/26(A) | | | 1,425 | | | | 1,479 | |
Altice France | | | | | | | | |
8.125%, 02/01/27(A) | | | 1,440 | | | | 1,549 | |
Altice France | | | | | | | | |
4.000%, 07/15/29 | | EUR | 700 | | | | 798 | |
Altice France | | | | | | | | |
4.250%, 10/15/29 | | EUR | 700 | | | | 801 | |
Altice France Holding | | | | | | | | |
10.500%, 05/15/27(A) | | | 2,000 | | | | 2,180 | |
C&W Senior Financing DAC | | | | | | | | |
7.500%, 10/15/26(A) | | | 1,600 | | | | 1,659 | |
C&W Senior Financing DAC | | | | | | | | |
6.875%, 09/15/27 | | | 2,245 | | | | 2,363 | |
Consolidated Communications | | | | | | | | |
6.500%, 10/01/28(A) | | | 1,925 | | | | 2,091 | |
Digicel | | | | | | | | |
6.750%, 03/01/23 | | | 2,835 | | | | 2,676 | |
Digicel Group 0.5 | | | | | | | | |
10.000%, 04/01/24 | | | 3,868 | | | | 3,873 | |
Digicel Group 0.5 | | | | | | | | |
8.000%, 04/01/25 | | | 5 | | | | 4 | |
Digicel International Finance | | | | | | | | |
8.000%, 12/31/26 | | | 1 | | | | 1 | |
Frontier Communications | | | | | | | | |
5.000%, 05/01/28(A) | | | 1,935 | | | | 2,032 | |
Frontier Communications | | | | | | | | |
6.750%, 05/01/29(A) | | | 1,250 | | | | 1,317 | |
Internap Holdings LLC | | | | | | | | |
0.000%, | | | 61 | | | | 9 | |
Liquid Telecommunications Financing | | | | | | | | |
5.500%, 09/04/26 | | | 4,025 | | | | 4,175 | |
Lorca Telecom Bondco SAU | | | | | | | | |
4.000%, 09/18/27 | | EUR | 390 | | | | 454 | |
Lumen Technologies | | | | | | | | |
5.375%, 06/15/29(A) | | | 2,010 | | | | 2,040 | |
Mauritius Investments | | | | | | | | |
6.500%, 10/13/26 | | | 4,300 | | | | 4,916 | |
Maxcom Telecomunicaciones | | | | | | | | |
8.000%, 10/25/24 | | | 4,229 | | | | 2,117 | |
Maxcom Telecomunicaciones | | | | | | | | |
15.000%, 10/25/69 | | | 2,002 | | | | 302 | |
See accompanying notes to financial statements.
CITY NATIONAL ROCHDALE FUNDS | PAGE 93
consolidated schedule of investments |
September 30, 2021 |
City National Rochdale Fixed Income Opportunities Fund (continued) |
Description | | Face Amount (000)(1) | | | Value (000) | |
Millicom International Cellular | | | | | | | | |
6.250%, 03/25/29 | | $ | 1,994 | | | $ | 2,186 | |
Millicom International Cellular | | | | | | | | |
4.500%, 04/27/31 | | | 2,310 | | | | 2,419 | |
4.500%, 04/27/31(A) | | | 2,391 | | | | 2,504 | |
Network i2i | | | | | | | | |
3.975%, VAR US Treas Yield Curve Rate T Note Const Mat 5 Yr + 3.390%, 06/03/70 | | | 3,920 | | | | 3,954 | |
Oi | | | | | | | | |
10.000% cash or 8.000%cash/4.000% PIK, 07/27/25 | | | 18,520 | | | | 17,391 | |
Sixsigma Networks Mexico | | | | | | | | |
7.500%, 05/02/25 | | | 9,720 | | | | 9,453 | |
VF Ukraine PAT via VFU Funding | | | | | | | | |
6.200%, 02/11/25 | | | 4,615 | | | | 4,795 | |
Viasat | | | | | | | | |
5.625%, 09/15/25(A) | | | 1,250 | | | | 1,267 | |
Viasat | | | | | | | | |
6.500%, 07/15/28(A) | | | 2,250 | | | | 2,370 | |
VTR Comunicaciones | | | | | | | | |
5.125%, 01/15/28 | | | 636 | | | | 676 | |
VTR Comunicaciones | | | | | | | | |
4.375%, 04/15/29 | | | 741 | | | | 763 | |
Windstream Escrow | | | | | | | | |
7.750%, 08/15/28(A) | | | 1,840 | | | | 1,922 | |
| | | | | | | | | | | | | |
Total Telephones & Telecommunications | | | 86,536 | |
| | | | | | | | | | | | | |
Textile-Products [0.3%] |
Golden Legacy Pte. Ltd. | | | | | | | | |
6.875%, 03/27/24 | | | 15,640 | | | | 3,034 | |
Prime Bloom Holdings | | | | | | | | |
6.950%, 07/05/22 | | | 16,500 | | | | 3,135 | |
Sri Rejeki Isman | | | | | | | | |
7.250%, 01/16/25 | | | 25,394 | | | | 4,996 | |
| | | | | | | | | | | | | |
Total Textile-Products | | | 11,165 | |
| | | | | | | | | | | | | |
Transportation Services [0.3%] |
Alfa | | | | | | | | |
6.875%, 03/25/44 | | | 1,850 | | | | 2,463 | |
Carnival | | | | | | | | |
9.875%, 08/01/27(A) | | | 3,315 | | | | 3,826 | |
Danaos | | | | | | | | |
8.500%, 03/01/28(A) | | | 755 | | | | 834 | |
DP World Crescent, MTN | | | | | | | | |
3.875%, 07/18/29 | | | 362 | | | | 392 | |
DP World Crescent, MTN | | | | | | | | |
3.750%, 01/30/30 | | | 299 | | | | 320 | |
Empresa de Transporte de Pasajeros Metro | | | | | | | | |
4.700%, 05/07/50 | | | 615 | | | | 724 | |
Kazakhstan Temir Zholy Finance BV | | | | | | | | |
6.950%, 07/10/42 | | | 418 | | | | 575 | |
Limak Iskenderun Uluslararasi Liman Isletmeciligi | | | | | | | | |
9.500%, 07/10/36 | | | 100 | | | | 101 | |
Seaspan | | | | | | | | |
5.500%, 08/01/29(A) | | | 1,015 | | | | 1,036 | |
Stena International | | | | | | | | |
6.125%, 02/01/25(A) | | | 1,450 | | | | 1,500 | |
Watco | | | | | | | | |
6.500%, 06/15/27(A) | | | 2,000 | | | | 2,140 | |
| | | | | | | | | | | | | |
Total Transportation Services | | | 13,911 | |
| | | | | | | | | | | | | |
Utility - Electric [0.5%] |
Calpine | | | | | | | | |
5.250%, 06/01/26(A) | | | 587 | | | | 604 | |
Calpine | | | | | | | | |
4.500%, 02/15/28(A) | | | 925 | | | | 943 | |
Calpine | | | | | | | | |
5.125%, 03/15/28(A) | | | 1,375 | | | | 1,393 | |
Calpine | | | | | | | | |
4.625%, 02/01/29(A) | | | 725 | | | | 714 | |
Calpine | | | | | | | | |
5.000%, 02/01/31(A) | | | 475 | | | | 475 | |
Calpine | | | | | | | | |
3.750%, 03/01/31(A) | | | 825 | | | | 794 | |
Enviva Partners | | | | | | | | |
6.500%, 01/15/26(A) | | | 3,050 | | | | 3,155 | |
NRG Energy | | | | | | | | |
6.625%, 01/15/27 | | | 551 | | | | 571 | |
NRG Energy | | | | | | | | |
5.750%, 01/15/28 | | | 1,950 | | | | 2,074 | |
NRG Energy | | | | | | | | |
3.375%, 02/15/29(A) | | | 550 | | | | 543 | |
NRG Energy | | | | | | | | |
5.250%, 06/15/29(A) | | | 600 | | | | 638 | |
NRG Energy | | | | | | | | |
3.625%, 02/15/31(A) | | | 200 | | | | 196 | |
NRG Energy | | | | | | | | |
3.875%, 02/15/32(A) | | | 900 | | | | 887 | |
Pattern Energy Operations | | | | | | | | |
4.500%, 08/15/28(A) | | | 600 | | | | 626 | |
See accompanying notes to financial statements.
CITY NATIONAL ROCHDALE FUNDS | PAGE 94
consolidated schedule of investments |
September 30, 2021 |
City National Rochdale Fixed Income Opportunities Fund (continued) |
Description | | Face Amount (000)(1) | | | Value (000) | |
TerraForm Power Operating | | | | | | | | |
4.250%, 01/31/23(A) | | $ | 925 | | | $ | 951 | |
TerraForm Power Operating | | | | | | | | |
5.000%, 01/31/28(A) | | | 1,125 | | | | 1,209 | |
TerraForm Power Operating | | | | | | | | |
4.750%, 01/15/30(A) | | | 1,000 | | | | 1,048 | |
Vistra Operations | | | | | | | | |
5.500%, 09/01/26(A) | | | 1,800 | | | | 1,849 | |
Vistra Operations | | | | | | | | |
5.625%, 02/15/27(A) | | | 1,850 | | | | 1,915 | |
Vistra Operations | | | | | | | | |
5.000%, 07/31/27(A) | | | 725 | | | | 749 | |
Vistra Operations | | | | | | | | |
4.375%, 05/01/29(A) | | | 600 | | | | 601 | |
| | | | | | | | | | | | | |
Total Utility - Electric | | | 21,935 | |
| | | | | | | | | | | | | |
Waste Disposal [0.0%] |
GFL Environmental | | | | | | | | |
4.375%, 08/15/29(A) | | | 1,020 | | | | 1,030 | |
Verde Bidco | | | | | | | | |
4.625%, 10/01/26 | | EUR | 200 | | | | 236 | |
| | | | | | | | | | | | | |
Total Waste Disposal | | | 1,266 | |
| | | | | | | | | | | | | |
Water [0.0%] |
Agua y Saneamientos Argentinos | | | | | | | | |
6.625%, 02/01/23 | | | 3,241 | | | | 1,823 | |
| | | | | | | | | | | | | |
Wireless Communications [0.3%] |
Sprint | | | | | | | | |
7.625%, 02/15/25 | | | 4,200 | | | | 4,910 | |
7.625%, 03/01/26 | | | 800 | | | | 968 | |
Sprint Capital | | | | | | | | |
6.875%, 11/15/28 | | | 325 | | | | 416 | |
Sprint Communications | | | | | | | | |
6.000%, 11/15/22 | | | 1,525 | | | | 1,603 | |
T-Mobile USA | | | | | | | | |
4.750%, 02/01/28 | | | 325 | | | | 345 | |
T-Mobile USA | | | | | | | | |
2.625%, 02/15/29 | | | 1,175 | | | | 1,189 | |
T-Mobile USA | | | | | | | | |
3.375%, 04/15/29(A) | | | 2,025 | | | | 2,113 | |
| | | | | | | | | | | | | |
Total Wireless Communications | | | 11,544 | |
| | | | | | | | | | | | | |
X-Ray Equipment [0.0%] |
Varex Imaging | | | | | | | | |
7.875%, 10/15/27(A) | | | 113 | | | | 127 | |
| | | | | | | | | | | | | |
Total Corporate Bonds | | | | |
Cost ($2,497,395) | | | 2,331,554 | |
| | | | | | | | | | | | | |
Loan Participations [18.0%] |
Aerospace [0.4%] |
AAdvantage Loyality IP Ltd. (American Airlines, Inc.), Initial Term Loan, 1st Lien | | | | | | | | |
5.500%, VAR LIBOR + 4.750%, 04/20/28 | | | 2,355 | | | | 2,434 | |
Brown Group Holdings, LLC, Initial Term Loan, 1st Lien | | | | | | | | |
3.250%, VAR LIBOR + 2.750%, 06/07/28 | | | 656 | | | | 655 | |
Ducommun Incorporated, Term B Loan, 1st Lien | | | | | | | | |
4.085%, VAR LIBOR + 4.000%, 11/21/25 | | | 2,023 | | | | 2,013 | |
Dynasty Acquisition Co., Inc., 2020 Term B-1 Loan, 1st Lien | | | | | | | | |
3.632%, VAR LIBOR + 3.500%, 04/06/26 | | | 917 | | | | 896 | |
Dynasty Acquisition Co., Inc., 2020 Term B-2 Loan, 1st Lien | | | | | | | | |
3.632%, VAR LIBOR + 3.500%, 04/06/26 | | | 493 | | | | 482 | |
KKR Apple Bidco, LLC, Term Loan, 1st Lien | | | | | | | | |
3.500%, 07/14/28 | | | 665 | | | | 664 | |
MB Aerospace Holdings II Corp., Initial Term Loan, 1st Lien | | | | | | | | |
4.500%, VAR LIBOR + 3.500%, 01/22/25 | | | 674 | | | | 627 | |
Mileage Plus Holdings LLC (Mileage Plus Intellectual Property Assets, Ltd.), Initial Term Loan, 1st Lien | | | | | | | | |
6.250%, VAR LIBOR + 5.250%, 06/21/27 | | | 1,105 | | | | 1,174 | |
SkyMiles IP Ltd. (Delta Air Lines, Inc.), Initial Term Loan, 1st Lien | | | | | | | | |
4.750%, VAR LIBOR + 3.750%, 10/20/27 | | | 2,560 | | | | 2,721 | |
See accompanying notes to financial statements.
CITY NATIONAL ROCHDALE FUNDS | PAGE 95
consolidated schedule of investments |
September 30, 2021 |
City National Rochdale Fixed Income Opportunities Fund (continued) |
Description | | Face Amount (000)(1) | | | Value (000) | |
Spirit Aerosystems, Inc. (fka Mid-Western Aircraft Systems, Inc and Onex Wind Finance LP.), Initial Term Loan, 1st Lien | | | | | | | | |
6.000%, VAR LIBOR + 5.250%, 01/15/25 | | $ | 846 | | | $ | 848 | |
TransDigm Inc., Tranche F Refinancing Term Loan, 1st Lien | | | | | | | | |
2.334%, VAR LIBOR + 2.250%, 12/09/25 | | | 1,285 | | | | 1,269 | |
United AirLines, Inc., Class B Term Loan, 1st Lien | | | | | | | | |
4.500%, VAR LIBOR + 3.750%, 04/21/28 | | | 1,197 | | | | 1,204 | |
WP CPP Holdings, Term B Loan | | | | | | | | |
4.750%, VAR LIBOR + 3.750%, 04/30/25 | | | 1,290 | | | | 1,253 | |
| | | | | | | | | | | | | |
Total Aerospace | | | | | | | 16,240 | |
| | | | | | | | | | | | | |
Automotive [0.3%] |
Abra Auto Body, Term Loan, 1st Lien | | | | | | | | |
3.085%, 02/05/26 | | | 916 | | | | 908 | |
Adient US LLC, Term B-1 Loan, 1st Lien | | | | | | | | |
3.584%, VAR LIBOR + 3.500%, 04/10/28 | | | 1,121 | | | | 1,120 | |
Autokiniton US Holdings (L&W), Term Loan, 1st Lien | | | | | | | | |
5.000%, 04/06/28(F) | | | 1,430 | | | | 1,429 | |
Belron Group S.A., Dollar Third Incremental Loan, 1st Lien | | | | | | | | |
3.250%, VAR LIBOR + 2.750%, 03/31/28 | | | 2 | | | | 2 | |
Clarios Global LP, Term Loan, 1st Lien | | | | | | | | |
3.250%, 04/30/26 | | | 2,900 | | | | 3,326 | |
Dealer Tire, LLC, Term B-1 Loan, 1st Lien | | | | | | | | |
4.334%, VAR LIBOR + 4.250%, 12/12/25 | | | 493 | | | | 492 | |
ENC Parent Corporation, Delayed Draw Term Loan, 1st Lien | | | | | | | | |
0.000%, VAR UNFND 0.000%, 08/19/28(G) | | | 63 | | | | 63 | |
ENC Parent Corporation, Initial Term Loan, 1st Lien | | | | | | | | |
5.000%, VAR LIBOR + 4.250%, 08/19/28 | | | 712 | | | | 706 | |
ILPEA Parent Inc., Term Loan, 1st Lien | | | | | | | | |
5.250%, VAR LIBOR + 4.500%, 06/22/28 | | | 574 | | | | 572 | |
PAI Holdco, Inc., Term B Loan, 1st Lien | | | | | | | | |
4.250%, VAR LIBOR + 3.500%, 10/28/27 | | | 603 | | | | 604 | |
RC Buyer, Inc., Initial Term Loan, 2nd Lien | | | | | | | | |
7.500%, VAR LIBOR + 6.750%, 07/30/29 | | | 250 | | | | 249 | |
Rough Country, LLC, Term Loan, 1st Lien | | | | | | | | |
4.250%, 07/26/28 | | | 500 | | | | 499 | |
RVR Dealership Holdings, LLC, Term Loan, 1st Lien | | | | | | | | |
4.750%, VAR LIBOR + 4.000%, 02/08/28 | | | 1,108 | | | | 1,105 | |
TI Automotive, Term Loan, 1st Lien | | | | | | | | |
3.397%, 12/16/26 | | | 479 | | | | 479 | |
Wheel Pros, Inc., Initial Term Loan, 1st Lien | | | | | | | | |
5.250%, VAR LIBOR + 4.500%, 05/11/28 | | | 560 | | | | 559 | |
| | | | | | | | | | | | | |
Total Automotive | | | | | | | 12,113 | |
| | | | | | | | | | | | | |
Broadcasting [0.2%] |
Diamond Sports Group, LLC, Term Loan, 1st Lien | | | | | | | | |
3.340%, VAR LIBOR + 3.250%, 08/24/26 | | | 1,965 | | | | 1,219 | |
DIRECTV Financing, LLC, Closing Date Term Loan, 1st Lien | | | | | | | | |
5.750%, VAR LIBOR + 5.000%, 08/02/27 | | | 2,200 | | | | 2,201 | |
Gogo Intermediate Holdings LLC, Initial Term Loan, 1st Lien | | | | | | | | |
4.500%, VAR LIBOR + 3.750%, 04/30/28 | | | 524 | | | | 524 | |
IHeartcommunications, Inc., Term Loan | | | | | | | | |
3.750%, 05/01/26 | | | 1,164 | | | | 1,163 | |
See accompanying notes to financial statements.
CITY NATIONAL ROCHDALE FUNDS | PAGE 96
consolidated schedule of investments |
September 30, 2021 |
City National Rochdale Fixed Income Opportunities Fund (continued) |
Description | | Face Amount (000)(1) | | | Value (000) | |
LCPR Loan Financing LLC, 2021 Additional Term Loan, 1st Lien | | | | | | | | |
3.834%, VAR LIBOR + 3.750%, 10/16/28 | | $ | 825 | | | $ | 825 | |
Mission Broadcasting, Term Loan B, 1st Lien | | | | | | | | |
2.586%, 05/26/28 | | | 1 | | | | 1 | |
Sinclair Broadcasting Group Term Loan B-2 | | | | | | | | |
2.400%, 01/31/24 | | | 973 | | | | 961 | |
Univision Communications, Inc., Replacement Converted Term Loan, 1st Lien | | | | | | | | |
4.000%, 03/15/26 | | | 1,406 | | | | 1,404 | |
| | | | | | | | | | | | | |
Total Broadcasting | | | | | | | 8,298 | |
| | | | | | | | | | | | | |
Broadcasting and Entertainment [0.1%] |
Dorna Sports, S.L., B2 (EUR) Term Loan Facility, 1st Lien | | | | | | | | |
3.250%, VAR Euribor + 3.250%, 04/12/24 | | EUR | 1,000 | | | | 1,147 | |
Stage Entertainment B.V., Facility B2, 1st Lien | | | | | | | | |
3.250%, VAR Euribor + 3.250%, 06/02/26 | | | 1,000 | | | | 1,102 | |
| | | | | | | | | | | | | |
Total Broadcasting and Entertainment | | | 2,249 | |
| | | | | | | | | | | | | |
Building & Development [0.1%] |
LSF10 XL Bidco S.C.A., Facility B4, 1st Lien | | | | | | | | |
4.250%, VAR Euribor + 4.250%, 04/12/28 | | | 2,889 | | | | 3,349 | |
LSF11 Skyscraper Holdco Sarl, Term Loan, 1st Lien | | | | | | | | |
3.500%, 09/29/27 | | | 1,500 | | | | 1,730 | |
| | | | | | | | | | | | | |
Total Building & Development | | | 5,079 | |
| | | | | | | | | | | | | |
Business Equipment and Services [0.5%] |
Civica Term Loan | | | | | | | | |
4.832%, 10/10/24(F) | | GBP | 2,000 | | | | 2,681 | |
Colour Bidco (NGA UK) Term Loan B | | | | | | | | |
5.608%, VAR LIBOR + 5.250%, 11/22/24 | | GBP | 1,542 | | | | 1,994 | |
Exact Software Term Loan B | | | | | | | | |
3.250%, 04/10/26 | | EUR | 1,000 | | | | 1,146 | |
First Names Group Term Loan B (EUR) | | | | | | | | |
3.750%, VAR Euribor + 3.750%, 03/07/25 | | EUR | 2,000 | | | | 2,317 | |
PlusServer Covenant-Lite Term Loan | | | | | | | | |
3.750%, VAR Euribor + 3.750%, 09/13/24 | | EUR | 1,000 | | | | 647 | |
Proxiserve (aka Persea) Term Loan | | | | | | | | |
3.750%, 02/27/26 | | EUR | 1,000 | | | | 1,158 | |
QA Term Loan | | | | | | | | |
4.818%, VAR LIBOR + 4.750%, 07/26/24 | | GBP | 3,000 | | | | 3,968 | |
Trescal Term Loan B | | | | | | | | |
3.000%, 03/14/25(F) | | EUR | 1,000 | | | | 1,136 | |
Universidad Europea Facility B | | | | | | | | |
3.500%, 02/25/26 | | EUR | 2,000 | | | | 2,274 | |
Verisure Holding AB (publ), Facility B (EUR), 1st Lien | | | | | | | | |
3.250%, VAR Euribor + 3.250%, 03/27/28 | | | 1,000 | | | | 1,151 | |
ZPG (aka Zoopla) Term Loan B | | | | | | | | |
4.799%, 06/06/25 | | GBP | 2,000 | | | | 2,680 | |
| | | | | | | | | | | | | |
Total Business Equipment and Services | | | 21,152 | |
| | | | | | | | | | | | | |
Cable & Satellite Television [0.1%] |
Technicolor S.A., Tranche 1 Loan, 1st Lien | | | | | | | | |
3.000%, VAR Euribor + 3.000%, 12/31/24 | | | 1,127 | | | | 1,249 | |
UPC Broadband Holding B.V., Facility AY, 1st Lien | | | | | | | | |
3.000%, VAR Euribor + 3.000%, 01/31/29 | | | 1,500 | | | | 1,725 | |
Virgin Media Ireland Limited, Facility B1, 1st Lien | | | | | | | | |
3.500%, VAR Euribor + 3.500%, 07/15/29 | | | 1,500 | | | | 1,730 | |
| | | | | | | | | | | | | |
Total Cable & Satellite Television | | | 4,704 | |
| | | | | | | | | | | | | |
Cable/Wireless Video [0.5%] |
Altice Financing S.A., October 2017 USD Term Loan, 1st Lien | | | | | | | | |
2.900%, VAR LIBOR + 2.750%, 01/31/26 | | | 2,127 | | | | 2,088 | |
See accompanying notes to financial statements.
CITY NATIONAL ROCHDALE FUNDS | PAGE 97
consolidated schedule of investments |
September 30, 2021 |
City National Rochdale Fixed Income Opportunities Fund (continued) |
Description | | Face Amount (000)(1) | | | Value (000) | |
Altice Financing Term Loan B (2017) | | | | | | | | |
2.876%, VAR LIBOR + 2.750%, 07/15/25 | | $ | 2,176 | | | $ | 2,139 | |
Cablevision Lightpath LLC, Initial Term Loan, 1st Lien | | | | | | | | |
3.750%, VAR LIBOR + 3.250%, 11/30/27 | | | 968 | | | | 969 | |
Charter Communications Operating, LLC, Term B-2 Loan, 1st Lien | | | | | | | | |
1.840%, VAR LIBOR + 1.750%, 02/01/27 | | | 2,940 | | | | 2,921 | |
Coral-US Co-Borrower LLC, Term B-5 Loan, 1st Lien | | | | | | | | |
2.334%, VAR LIBOR + 2.250%, 01/31/28 | | | 1,000 | | | | 986 | |
CSC Holdings, LLC, March 2017 Refinancing Term Loan, 1st Lien | | | | | | | | |
2.334%, VAR LIBOR + 2.250%, 07/17/25 | | | 2,605 | | | | 2,566 | |
Intelsat Jackson Holdings S.A., Tranche B-3 Term Loan, 1st Lien | | | | | | | | |
8.000%, VAR Prime Rate by Country + 4.750%, 11/27/23 | | | 4,440 | | | | 4,489 | |
Radiate Holdco, LLC, Term B Loan, 1st Lien | | | | | | | | |
4.250%, VAR LIBOR + 3.500%, 09/25/26 | | | 2,042 | | | | 2,039 | |
Virgin Media Bristol LLC, N Facility, 1st Lien | | | | | | | | |
2.584%, VAR LIBOR + 2.500%, 01/31/28 | | | 2,526 | | | | 2,508 | |
WideOpenWest Finance, LLC, Eighth Amendment Term B Loan, 1st Lien | | | | | | | | |
4.250%, VAR LIBOR + 3.250%, 08/18/23 | | | 347 | | | | 347 | |
Ziggo Financing Partnership, Term Loan I Facility, 1st Lien | | | | | | | | |
2.584%, VAR LIBOR + 2.500%, 04/30/28 | | | 1,460 | | | | 1,448 | |
| | | | | | | | | | | | | |
Total Cable/Wireless Video | | | 22,500 | |
| | | | | | | | | | | | | |
Cargo Transport [0.0%] |
Boluda Towage, S.L., Facility B1, 1st Lien | | | | | | | | |
3.500%, VAR Euribor + 3.500%, 09/26/26 | | EUR | 1,000 | | | $ | 1,155 | |
| | | | | | | | | | | | | |
Chemicals [0.6%] |
Alpha BV, Term Loan, 1st Lien | | | | | | | | |
3.000%, 03/05/28 | | | 1,545 | | | | 1,543 | |
AOC/Aliancys, Term Loan, 1st Lien | | | | | | | | |
0.000%, 09/30/28(G) | | | 550 | | | | 547 | |
Aruba Investments, Term Loan, 1st Lien | | | | | | | | |
4.000%, 10/28/27 | | | 998 | | | | 1,158 | |
4.750%, 11/24/27(F) | | | 833 | | | | 834 | |
Consolidated Energy Limited Term Loan B | | | | | | | | |
2.657%, VAR LIBOR + 2.500%, 05/07/25 | | | 1,840 | | | | 1,807 | |
INEOS Enterprises Holdings Limited, Refinancing Tranche B Dollar Term Loan, 1st Lien | | | | | | | | |
4.500%, VAR LIBOR + 3.500%, 08/28/26 | | | 1,457 | | | | 1,459 | |
Ineos Group Holdings PLC Term Loan B | | | | | | | | |
2.085%, VAR LIBOR + 2.000%, 04/01/24 | | | 4,120 | | | | 4,092 | |
INEOS Styrolution Group GmbH, 2026 Tranche B Dollar Term Loan, 1st Lien | | | | | | | | |
3.250%, VAR LIBOR + 2.750%, 01/29/26 | | | 785 | | | | 785 | |
Lonza Group, Term Loan B, 1st Lien | | | | | | | | |
4.750%, 04/28/28 | | | 770 | | | | 772 | |
Minerals Technologies Inc. Term Loan B (2017) | | | | | | | | |
3.000%, VAR LIBOR + 2.250%, 02/14/24 | | | 1,737 | | | | 1,737 | |
Momentive Performance Term Loan B | | | | | | | | |
3.340%, 05/15/24 | | | 2,337 | | | | 2,332 | |
New Arclin U.S. Holding Corp., Replacement Term Loan (2021), 1st Lien | | | | | | | | |
5.000%, VAR LIBOR + 4.000%, 02/19/26 | | | 486 | | | | 486 | |
See accompanying notes to financial statements.
CITY NATIONAL ROCHDALE FUNDS | PAGE 98
consolidated schedule of investments |
September 30, 2021 |
City National Rochdale Fixed Income Opportunities Fund (continued) |
Description | | Face Amount (000)(1) | | | Value (000) | |
Nouryon Finance B.V., Initial Dollar Term Loan, 1st Lien | | | | | | | | |
2.832%, VAR LIBOR + 2.750%, 10/01/25 | | $ | 1,721 | | | $ | 1,709 | |
PQ Corp, Term Loan B, 1st Lien | | | | | | | | |
3.250%, 05/26/28 | | | 680 | | | | 680 | |
Ravago, Term Loan B, 1st Lien | | | | | | | | |
2.650%, 02/18/28 | | | 1,766 | | | | 1,757 | |
Sparta U.S. Holdco LLC, Initial Term Loan, 1st Lien | | | | | | | | |
4.250%, VAR LIBOR + 3.500%, 08/02/28 | | | 495 | | | | 496 | |
Styrolution, Term Loan, 1st Lien | | | | | | | | |
2.085%, 01/22/27 | | | 813 | | | | 801 | |
Trinseo, Term Loan B-2, 1st Lien | | | | | | | | |
2.585%, 03/17/28 | | | 765 | | | | 762 | |
Tronox Finance, Term Loan B, 1st Lien | | | | | | | | |
2.335%, 03/02/28 | | | 1,129 | | | | 1,124 | |
Vantage Specialty Chemicals, Inc., Closing Date Term Loan, 1st Lien | | | | | | | | |
4.500%, VAR LIBOR + 3.500%, 10/28/24 | | | 613 | | | | 600 | |
Vantage Specialty Chemicals, Inc., Initial Loan, 2nd Lien | | | | | | | | |
9.250%, VAR LIBOR + 8.250%, 10/20/25 | | | 790 | | | | 764 | |
| | | | | | | | | | | | | |
Total Chemicals | | | | | | | 26,245 | |
| | | | | | | | | | | | | |
Chemicals & plastics [0.1%] |
Colouroz Investment 1 GMBH, Initial Term C Loan, 1st Lien | | | | | | | | |
4.250%, VAR PIK Interest + 0.750%, 09/21/23 | | | 400 | | | | 400 | |
INEOS Styrolution Group GmbH, 2026 Tranche B Euro Term Loan, 1st Lien | | | | | | | | |
2.750%, VAR Euribor + 2.750%, 01/21/26 | | | 1,500 | | | | 1,724 | |
| | | | | | | | | | | | | |
Total Chemicals & plastics | | | 2,124 | |
| | | | | | | | | | | | | |
Chemicals, Plastics and Rubber [0.2%] |
Colouroz Investment 1 GMBH, Initial Euro Term Loan, 1st Lien | | | | | | | | |
5.000%, VAR PIK Interest + 0.750%, 09/21/23 | | | 994 | | | | 1,152 | |
Colouroz Investment 2, LLC, Initial Term B-2 Loan, 1st Lien | | | | | | | | |
5.250%, VAR PIK Interest + 0.750%, 09/21/23 | | | 2,417 | | | | 2,417 | |
INEOS Enterprises Holdings Limited, Refinancing Tranche B Euro Term Loan, 1st Lien | | | | | | | | |
3.250%, VAR Euribor + 3.250%, 08/28/26 | | | 1,000 | | | | 1,157 | |
Novacap Facility B | | | | | | | | |
3.250%, 04/28/23(F) | | EUR | 2,180 | | | | 2,514 | |
Novacap Facility B3 | | | | | | | | |
3.250%, 06/22/23 | | EUR | 319 | | | | 368 | |
Specialty Chemicals International B.V., Facility B-1, 1st Lien | | | | | | | | |
4.000%, 03/04/27 | | | 1,500 | | | | 1,736 | |
| | | | | | | | | | | | | |
Total Chemicals, Plastics and Rubber | | | 9,344 | |
| | | | | | | | | | | | | |
Communication Services [0.0%] |
Tele Columbus, Term Loan, 1st Lien | | | | | | | | |
3.500%, 10/15/24 | | | 1,099 | | | | 1,261 | |
| | | | | | | | | | | | | |
Consumer Discretionary [0.2%] |
Eagle Bidco Limited, Term Loan, 1st Lien | | | | | | | | |
4.806%, 03/10/28 | | | 1,500 | | | | 2,015 | |
Galileo Global Education, Term Loan, 1st Lien | | | | | | | | |
3.750%, 07/09/28 | | | 1,000 | | | | 1,159 | |
IVC, Term Loan, 1st Lien | | | | | | | | |
4.583%, 02/13/26 | | | 1,000 | | | | 1,348 | |
Nord Anglia, Term Loan, 1st Lien | | | | | | | | |
3.250%, 08/30/24 | | | 1,500 | | | | 1,703 | |
Polaris Newco LLC, Term Loan, 1st Lien | | | | | | | | |
4.000%, 06/02/28 | | | 2,000 | | | | 2,315 | |
| | | | | | | | | | | | | |
Total Consumer Discretionary | | | 8,540 | |
| | | | | | | | | | | | | |
See accompanying notes to financial statements.
CITY NATIONAL ROCHDALE FUNDS | PAGE 99
consolidated schedule of investments |
September 30, 2021 |
City National Rochdale Fixed Income Opportunities Fund (continued) |
Description | | Face Amount (000)(1) | | | Value (000) | |
Consumer Durables [0.1%] |
Justrite (Safety Products) Delay Draw | | | | | | | | |
4.585%, 06/28/26 | | $ | 47 | | | $ | 45 | |
Justrite (Safety Products) Term Loan B | | | | | | | | |
4.585%, 06/28/26 | | | 873 | | | | 831 | |
Weber-Stephen Products LLC, Initial Term B Loan, 1st Lien | | | | | | | | |
4.000%, VAR LIBOR + 3.250%, 10/20/27 | | | 585 | | | | 586 | |
White Cap Buyer, LLC, Initial Closing Date Term Loan, 1st Lien | | | | | | | | |
4.500%, VAR LIBOR + 4.000%, 10/19/27 | | | 827 | | | | 828 | |
| | | | | | | | | | | | | |
Total Consumer Durables | | | | | | | 2,290 | |
| | | | | | | | | | | | | |
Consumer NonDurables [0.1%] |
ABG Intermediate Holdings 2 LLC, 2021 Refinancing Term Loan, 1st Lien | | | | | | | | |
4.000%, VAR LIBOR + 3.250%, 09/27/24 | | | 961 | | | | 959 | |
ABG Intermediate Holdings 2 LLC, Amendment No. 5 Incremental Term Loan, 1st Lien | | | | | | | | |
6.250%, VAR LIBOR + 5.250%, 09/27/24 | | | 1,153 | | | | 1,153 | |
Conair Holdings LLC, Initial Term Loan, 1st Lien | | | | | | | | |
4.250%, VAR LIBOR + 3.750%, 05/17/28 | | | 895 | | | | 896 | |
Coty Inc., Term B USD Loan, 1st Lien | | | | | | | | |
2.333%, VAR LIBOR + 2.250%, 04/07/25 | | | 865 | | | | 849 | |
Diamond (BC) B.V., Amendment No. 3 Refinancing Term Loan, 1st Lien | | | | | | | | |
3.500%, VAR LIBOR + 3.000%, 09/29/28 | | | 690 | | | | 691 | |
Guadarrama Proyectors Educativos SL, Term Loan, 1st Lien | | | | | | | | |
4.000%, 07/10/26 | | | 936 | | | | 1,084 | |
New Trojan Parent, Inc., Initial Term Loan, 1st Lien | | | | | | | | |
3.750%, VAR LIBOR + 3.250%, 01/06/28 | | | 605 | | | | 603 | |
| | | | | | | | | | | | | |
Total Consumer NonDurables | | | 6,235 | |
| | | | | | | | | | | | | |
Consumer Staples [0.1%] |
Signature Foods, Term Loan, 1st Lien | | | | | | | | |
3.500%, 01/29/28 | | | 1,000 | | | | 1,152 | |
United Petfood, Term Loan, 1st Lien | | | | | | | | |
3.250%, 03/19/28 | | | 1,000 | | | | 1,150 | |
| | | | | | | | | | | | | |
Total Consumer Staples | | | | | | | 2,302 | |
| | | | | | | | | | | | | |
Containers & glass products [0.1%] |
Kleopatra Finco S.a r.l., Facility B (EUR), 1st Lien | | | | | | | | |
4.750%, VAR Euribor + 4.750%, 02/04/26 | | | 1,000 | | | | 1,146 | |
Weener Plastics Group Term Loan B | | | | | | | | |
3.750%, VAR Euribor + 3.750%, 06/20/25 | | EUR | 1,500 | | | | 1,734 | |
| | | | | | | | | | | | | |
Total Containers & glass products | | | 2,880 | |
| | | | | | | | | | | | | |
Diversified Media [0.5%] |
Adevinta ASA, Facility B2, 1st Lien | | | | | | | | |
3.750%, VAR LIBOR + 3.000%, 06/26/28 | | | 2 | | | | 2 | |
Applovin Corporation, Initial Term Loan, 1st Lien | | | | | | | | |
3.334%, VAR LIBOR + 3.250%, 08/15/25 | | | 904 | | | | 903 | |
Arches Buyer Inc., Refinancing Term Loan, 1st Lien | | | | | | | | |
3.750%, VAR LIBOR + 3.250%, 12/06/27 | | | 846 | | | | 841 | |
Constant Contact, Inc., Initial Term Loan, 1st Lien | | | | | | | | |
4.750%, VAR LIBOR + 4.000%, 02/10/28 | | | 1,135 | | | | 1,132 | |
Deluxe Entertainment Services Group Inc. | | | | | | | | |
0.000%, (G) | | | 19 | | | | — | |
See accompanying notes to financial statements.
CITY NATIONAL ROCHDALE FUNDS | PAGE 100
consolidated schedule of investments |
September 30, 2021 |
City National Rochdale Fixed Income Opportunities Fund (continued) |
Description | | Face Amount (000)(1) | | | Value (000) | |
Digital Media Solutions, LLC, Initial Term Loan, 1st Lien | | | | | | | | |
5.750%, VAR LIBOR + 5.000%, 05/25/26 | | $ | 585 | | | $ | 582 | |
E.W. Scripps Company, The, Tranche B-2 Term Loan, 1st Lien | | | | | | | | |
3.313%, VAR LIBOR + 2.563%, 05/01/26 | | | 645 | | | | 643 | |
Harland Clarke, Term Loan, 1st Lien | | | | | | | | |
8.750%, 06/16/26 | | | 1,265 | | | | 1,183 | |
Indy US Bidco, LLC, Tranche B-1 Term Loan, 1st Lien | | | | | | | | |
4.084%, VAR LIBOR + 4.000%, 03/06/28 | | | 998 | | | | 999 | |
Lions Gate Capital Holdings LLC, Term B Loan, 1st Lien | | | | | | | | |
2.334%, VAR LIBOR + 2.250%, 03/24/25 | | | 975 | | | | 966 | |
Lions Gate Capital Holdings LLC, Term Loan | | | | | | | | |
0.221%, 03/22/23 | | | 875 | | | | 868 | |
McGraw-Hill Education, Inc., Initial Term Loan, 1st Lien | | | | | | | | |
5.250%, 07/28/28 | | | 825 | | | | 827 | |
Melita, Term Loan | | | | | | | | |
3.500%, 07/30/26 | | | 1,000 | | | | 1,149 | |
Meredith Corporation, Tranche B-3 Term Loan, 1st Lien | | | | | | | | |
5.250%, VAR LIBOR + 4.250%, 01/31/25 | | | 1,980 | | | | 2,020 | |
MH Sub I, LLC (Micro Holding Corp.), 2020 June New Term Loan, 1st Lien | | | | | | | | |
4.750%, VAR LIBOR + 3.750%, 09/13/24 | | | 1,403 | | | | 1,406 | |
MH Sub I, LLC (Micro Holding Corp.), Amendment No. 2 Initial Term Loan, 1st Lien | | | | | | | | |
3.584%, VAR LIBOR + 3.500%, 09/13/24 | | | 2,275 | | | | 2,267 | |
RR Donnelley & Sons Co Term Loan B | | | | | | | | |
5.085%, VAR LIBOR + 5.000%, 01/15/24 | | | 351 | | | | 349 | |
Trader Interactive, LLC, Initial Term Loan, 1st Lien | | | | | | | | |
4.500%, VAR LIBOR + 4.000%, 07/28/28 | | | 500 | | | | 499 | |
William Morris Endeavor Entertainment, LLC (IMG Worldwide Holdings, LLC), Term B-1 Loan, 1st Lien | | | | | | | | |
2.840%, VAR LIBOR + 2.750%, 05/18/25 | | | 4,526 | | | | 4,429 | |
| | | | | | | | | | | | | |
Total Diversified Media | | | | | | | 21,065 | |
| | | | | | | | | | | | | |
Diversified/Conglomerate Service [0.0%] |
Inspired Finco Holdings Limited, Facility B2, 1st Lien | | | | | | | | |
3.250%, VAR Euribor + 3.250%, 05/28/26 | | EUR | 1,000 | | | | 1,145 | |
| | | | | | | | | | | | | |
Drugs [0.1%] |
HRA Term Loan | | | | | | | | |
3.500%, VAR Euribor + 3.500%, 07/31/24 | | EUR | 2,000 | | | | 2,302 | |
| | | | | | | | | | | | | |
Ecological [0.1%] |
Sapphire Bidco B.V., Facility B, 1st Lien | | | | | | | | |
3.250%, VAR Euribor + 3.250%, 05/05/25 | | EUR | 2,000 | | | | 2,292 | |
| | | | | | | | | | | | | |
Electronics [0.1%] |
MA Financeco., LLC, Euro Tranche B-1 Term Loan, 1st Lien | | | | | | | | |
4.500%, VAR Euribor + 4.500%, 05/29/25 | | | 1,950 | | | | 2,273 | |
| | | | | | | | | | | | | |
Electronics/electrical [0.1%] |
ION Trading Finance Limited, Initial Euro Term Loan (2021), 1st Lien | | | | | | | | |
4.250%, VAR Euribor + 4.250%, 04/01/28 | | | 4,000 | | | | 4,637 | |
| | | | | | | | | | | | | |
Energy [0.2%] |
Arclight, Term Loan B, 1st Lien | | | | | | | | |
4.750%, 04/13/28 | | | 710 | | | | 712 | |
See accompanying notes to financial statements.
CITY NATIONAL ROCHDALE FUNDS | PAGE 101
consolidated schedule of investments |
September 30, 2021 |
City National Rochdale Fixed Income Opportunities Fund (continued) |
Description | | Face Amount (000)(1) | | | Value (000) | |
BCP Raptor II, LLC, Initial Term Loan, 1st Lien | | | | | | | | |
4.835%, VAR LIBOR + 4.750%, 10/22/25 | | $ | 1,324 | | | $ | 1,308 | |
BlackBrush Oil & Gas, L.P., Closing Date Commitment (Term Loan), 1st Lien | | | | | | | | |
6.000%, VAR LIBOR + 5.000%, 09/03/25 | | | 430 | | | | 430 | |
ChampionX Holding Inc., Term Loan, 1st Lien | | | | | | | | |
6.000%, VAR LIBOR + 5.000%, 06/03/27 | | | 1,492 | | | | 1,514 | |
DT Midstream, Term Loan, 1st Lien | | | | | | | | |
2.500%, 05/25/28 | | | 1 | | | | 1 | |
Eagleclaw (BCP Raptor) Term Loan B | | | | | | | | |
5.250%, VAR LIBOR + 4.250%, 06/24/24 | | | 974 | | | | 970 | |
Generation Bridge, Term Loan B, 1st Lien | | | | | | | | |
0.000%, 08/06/28(G) | | | 544 | | | | 545 | |
Generation Bridge, Term Loan C, 1st Lien | | | | | | | | |
0.000%, 08/06/28(G) | | | 11 | | | | 11 | |
Lower Cadence Holdings LLC, Initial Term Loan, 1st Lien | | | | | | | | |
4.084%, VAR LIBOR + 4.000%, 05/22/26 | | | 1,408 | | | | 1,407 | |
Traverse Midstream Partners LLC, Advance, 1st Lien | | | | | | | | |
6.500%, VAR LIBOR + 5.500%, 09/27/24 | | | 984 | | | | 984 | |
| | | | | | | | | | | | | |
Total Energy | | | | | | | 7,882 | |
| | | | | | | | | | | | | |
Entertainment & Leisure [0.0%] |
PortAventra World, Term Loan, 1st Lien | | | | | | | | |
3.500%, 06/13/24 | | | 1,000 | | | | 1,121 | |
| | | | | | | | | | | | | |
Finance (Including Structured Products) [0.1%] |
IFCO Management GmbH, Facility B1A, 1st Lien | | | | | | | | |
3.250%, VAR Euribor + 3.250%, 05/29/26 | | | 2,500 | | | | 2,879 | |
Peer Holding III B.V., Facility B, 1st Lien | | | | | | | | |
3.000%, 03/07/25 | | EUR | 1,000 | | | | 1,151 | |
| | | | | | | | | | | | | |
Total Finance (Including Structured Products) | | | 4,030 | |
| | | | | | | | | | | | | |
Financial [1.2%] |
Acrisure, LLC, 2020 Term Loan, 1st Lien | | | | | | | | |
3.632%, VAR LIBOR + 3.500%, 02/15/27 | | | 597 | | | | 591 | |
Altisource Term Loan B (2018) | | | | | | | | |
5.000%, 03/29/24(F) | | | 537 | | | | 446 | |
Amwins Group Inc, Term Loan B, 1st Lien | | | | | | | | |
3.000%, 02/19/28 | | | 908 | | | | 902 | |
Apollo Commercial Real Estate Term Loan B | | | | | | | | |
2.839%, 05/15/26(F) | | | 1,193 | | | | 1,172 | |
Aretec Group, Inc. (fka RCS Capital Corporation), Initial Term Loan, 1st Lien | | | | | | | | |
4.334%, VAR LIBOR + 4.250%, 10/01/25 | | | 2,293 | | | | 2,284 | |
Asurion, LLC, New B-3 Term Loan, 2nd Lien | | | | | | | | |
5.335%, VAR LIBOR + 5.250%, 01/31/28 | | | 2,170 | | | | 2,162 | |
Asurion, LLC, New B-4 Term Loan, 2nd Lien | | | | | | | | |
5.331%, VAR LIBOR + 5.250%, 01/20/29 | | | 1,585 | | | | 1,577 | |
Asurion, LLC, New B-8 Term Loan, 1st Lien | | | | | | | | |
3.334%, VAR LIBOR + 3.250%, 12/23/26 | | | 1,393 | | | | 1,372 | |
Asurion, LLC, New B-9 Term Loan, 1st Lien | | | | | | | | |
3.334%, VAR LIBOR + 3.250%, 07/31/27 | | | 1,097 | | | | 1,081 | |
Broadstreet Partners, Inc., Initial Term Loan (2020), 1st Lien | | | | | | | | |
3.084%, VAR LIBOR + 3.000%, 01/27/27 | | | 985 | | | | 973 | |
CCP Lux Holding, Term Loan, 1st Lien | | | | | | | | |
4.250%, 01/10/25 | | | 1,920 | | | | 2,227 | |
See accompanying notes to financial statements.
CITY NATIONAL ROCHDALE FUNDS | PAGE 102
consolidated schedule of investments |
September 30, 2021 |
City National Rochdale Fixed Income Opportunities Fund (continued) |
Description | | Face Amount (000)(1) | | | Value (000) | |
Citadel Securities LP, 2021 Term Loan, 1st Lien | | | | | | | | |
2.584%, VAR LIBOR + 2.500%, 02/02/28 | | $ | 2,189 | | | $ | 2,168 | |
Ditech Holding Corporation (fka Walter Investment Management Corp.), Tranche B Term Loan, 1st Lien | | | | | | | | |
10.250%, VAR Prime Rate by Country + 7.000%, 06/30/22 | | | 408 | | | | 80 | |
Dlg Acquisitions Limited | | | | | | | | |
3.500%, 05/15/26 | | EUR | 1,000 | | | | 1,155 | |
DRW Holdings, LLC, Initial Term Loan, 1st Lien | | | | | | | | |
3.834%, VAR LIBOR + 3.750%, 03/01/28 | | | 1,565 | | | | 1,558 | |
EVO Payments International, Term B Loan | | | | | | | | |
3.340%, VAR LIBOR + 3.250%, 12/22/23 | | | 1,311 | | | | 1,308 | |
First Eagle Holdings, Inc., Refinancing Term Loan | | | | | | | | |
2.647%, 02/01/27 | | | 803 | | | | 794 | |
Freshworld Holding III, Term Loan, 1st Lien | | | | | | | | |
3.500%, 10/02/26 | | | 1,000 | | | | 1,154 | |
Hestia Holdings, LLC, Term Loan, 1st Lien | | | | | | | | |
4.000%, 06/18/27 | | | 3,000 | | | | 3,484 | |
HighTower Holding, LLC, Delayed Draw Term Loan, 1st Lien | | | | | | | | |
4.000%, VAR UNFND + 4.000%, 04/21/28 | | | 142 | | | | 142 | |
HighTower Holding, LLC, Initial Term Loan, 1st Lien | | | | | | | | |
4.750%, VAR LIBOR + 4.000%, 04/21/28 | | | 568 | | | | 567 | |
Hudson River Trading LLC, Term Loan, 1st Lien | | | | | | | | |
3.084%, VAR LIBOR + 3.000%, 03/20/28 | | | 430 | | | | 427 | |
Infinitas Learn Cov-Lite Lien1 | | | | | | | | |
4.250%, 05/03/24 | | EUR | 2,890 | | | | 3,356 | |
0.000%, 07/21/28(G) | | | 1,000 | | | | 1,159 | |
Jane Street Group, LLC, Dollar Term Loan, 1st Lien | | | | | | | | |
2.834%, VAR LIBOR + 2.750%, 01/26/28 | | | 1,801 | | | | 1,782 | |
Japan Paris Club, Term Loan, 1st Lien | | | | | | | | |
0.000%, 01/10/28(G) | | JPY | 216,667 | | | | 1,480 | |
KREF Holdings X LLC, Initial Term Loan, 1st Lien | | | | | | | | |
5.750%, VAR LIBOR + 4.750%, 09/01/27(D) | | | 447 | | | | 447 | |
Mariner Wealth Advisors, Cov-Lite Delayed Term Loan, 1st Lien | | | | | | | | |
0.000%, 08/18/28(G) | | | 73 | | | | 73 | |
Mariner Wealth Advisors, LLC, Initial Term Loan, 1st Lien | | | | | | | | |
3.750%, VAR LIBOR + 3.250%, 08/18/28 | | | 512 | | | | 509 | |
Mistral Holdco SAS, Term Loan, 1st Lien | | | | | | | | |
4.250%, 12/16/27 | | | 1,000 | | | | 1,158 | |
Nexus Buyer LLC, Term Loan, 1st Lien | | | | | | | | |
3.836%, VAR LIBOR + 3.750%, 11/09/26 | | | 2,393 | | | | 2,392 | |
Nobian Finance BV, Term Loan, 1st Lien | | | | | | | | |
3.750%, 06/25/26 | | | 1,500 | | | | 1,732 | |
Orion Advisor Solutions, Inc., 2021 Refinancing Term Loan, 1st Lien | | | | | | | | |
4.500%, VAR LIBOR + 3.750%, 09/24/27 | | | 1,786 | | | | 1,786 | |
Russell Investment, Term Loan, 1st Lien | | | | | | | | |
4.500%, 06/02/25 | | | 1,517 | | | | 1,519 | |
Starwood Property Mortgage, L.L.C., Term B-2 Loan, 1st Lien | | | | | | | | |
4.250%, VAR LIBOR + 3.500%, 07/26/26 | | | 498 | | | | 499 | |
Superannuation and Investments, Term Loan, 1st Lien | | | | | | | | |
0.000%, 09/24/28(G) | | | 780 | | | | 775 | |
Taurus Midco Ltd., Term Loan, 1st Lien | | | | | | | | |
3.500%, 09/29/24 | | | 645 | | | | 737 | |
3.500%, 09/29/24 | | | 165 | | | | 189 | |
3.500%, 09/29/24 | | | 385 | | | | 440 | |
3.500%, 09/29/24 | | | 305 | | | | 349 | |
See accompanying notes to financial statements.
CITY NATIONAL ROCHDALE FUNDS | PAGE 103
consolidated schedule of investments |
September 30, 2021 |
City National Rochdale Fixed Income Opportunities Fund (continued) |
Description | | Face Amount (000)(1) | | | Value (000) | |
VFH Parent LLC, Initial Term Loan, 1st Lien | | | | | | | | |
3.082%, VAR LIBOR + 3.000%, 03/01/26 | | $ | 1,081 | | | $ | 1,079 | |
Vistra, Term Loan | | | | | | | | |
3.750%, 10/27/25 | | | 953 | | | | 1,104 | |
Zebra Buyer LLC, Term Loan, 1st Lien | | | | | | | | |
0.000%, 04/21/28(G) | | | 370 | | | | 371 | |
| | | | | | | | | | | | | |
Total Financial | | | | | | | 50,560 | |
| | | | | | | | | | | | | |
Financial intermediaries [0.1%] |
AI Sirona (Luxembourg) Acquisition S.a r.l., Additional Facility B1 (EUR), 1st Lien | | | | | | | | |
3.500%, VAR Euribor + 3.500%, 09/29/25 | | | 2,000 | | | | 2,305 | |
Winterfell Financing S.a r.l., Facility B, 1st Lien | | | | | | | | |
3.500%, VAR Euribor + 3.500%, 02/18/28 | | | 3,000 | | | | 3,445 | |
| | | | | | | | | | | | | |
Total Financial intermediaries | | | 5,750 | |
| | | | | | | | | | | | | |
Financials [0.2%] |
AVS Holding, Term Loan, 1st Lien | | | | | | | | |
3.750%, 09/10/26 | | | 1,000 | | | | 1,156 | |
LSFX Flavum, Term Loan B, 1st Lien | | | | | | | | |
4.500%, 02/28/28 | | | 1,000 | | | | 1,159 | |
Paradocs Holding Sarl, Term Loan, 1st Lien | | | | | | | | |
3.500%, 02/17/28 | | | 1,000 | | | | 1,157 | |
S4 Capital Lux, Term Loan, 1st Lien | | | | | | | | |
3.750%, 07/31/28 | | | 1,000 | | | | 1,161 | |
Sandy Bidco BV, Term Loan, 1st Lien | | | | | | | | |
0.000%, 09/15/28(G) | | | 1,000 | | | | 1,158 | |
Stada Add-on, Term Loan, 1st Lien | | | | | | | | |
0.000%, 08/21/26(G) | | | 1,000 | | | | 1,143 | |
Summer Bidco, Term Loan, 1st Lien | | | | | | | | |
4.250%, 12/04/26 | | | 1,000 | | | | 1,163 | |
Waterlogic Group Holdings Limited, Term Loan, 1st Lien | | | | | | | | |
0.000%, 08/04/28(G) | | | 1,000 | | | | 1,158 | |
| | | | | | | | | | | | | |
Total Financials | | | | | | | 9,255 | |
| | | | | | | | | | | | | |
Food and Drug [0.0%] |
United Natural Foods Term Loan B | | | | | | | | |
3.584%, VAR LIBOR + 3.500%, 10/22/25 | | | 815 | | | | 814 | |
| | | | | | | | | | | | | |
Food service [0.1%] |
Pax Midco Spain, S.L.U., Facility B, 1st Lien | | | | | | | | |
4.750%, VAR Euribor + 4.750%, 06/07/26 | | EUR | 1,000 | | | | 1,057 | |
WSH Term Loan | | | | | | | | |
5.113%, 02/27/26 | | GBP | 1,000 | | | | 1,320 | |
WSH Term Loan 2nd Lien | | | | | | | | |
8.863%, 03/01/27 | | GBP | 1,000 | | | | 1,300 | |
| | | | | | | | | | | | | |
Total Food service | | | | | | | 3,677 | |
| | | | | | | | | | | | | |
Food/Tobacco [0.2%] |
Evergreen Acqco 1 LP, Initial Term Loan, 1st Lien | | | | | | | | |
6.500%, VAR LIBOR + 5.750%, 04/26/28 | | | 830 | | | | 837 | |
IRB Holding Corp., Fourth Amendment Incremental Term Loan, 1st Lien | | | | | | | | |
4.250%, VAR LIBOR + 3.250%, 12/15/27 | | | 796 | | | | 797 | |
K-Mac, Term Loan, 2nd Lien | | | | | | | | |
7.250%, 06/22/29 | | | 170 | | | | 170 | |
MIC Glen LLC, Initial Term Loan, 1st Lien | | | | | | | | |
4.000%, VAR LIBOR + 3.500%, 07/21/28 | | | 505 | | | | 502 | |
Milk Specialties, Term Loan, 1st Lien | | | | | | | | |
5.000%, 08/16/25 | | | 840 | | | | 839 | |
Quirch Foods Holdings, LLC, Initial Term Loan, 1st Lien | | | | | | | | |
5.750%, VAR LIBOR + 4.750%, 10/27/27 | | | 997 | | | | 1,001 | |
See accompanying notes to financial statements.
CITY NATIONAL ROCHDALE FUNDS | PAGE 104
consolidated schedule of investments |
September 30, 2021 |
City National Rochdale Fixed Income Opportunities Fund (continued) |
Description | | Face Amount (000)(1) | | | Value (000) | |
Sycamore/Sanderson Farms, Term Loan B, 1st Lien | | | | | | | | |
0.000%, 09/24/28(G) | | $ | 975 | | | $ | 971 | |
Triton Water Holdings, Inc., Initial Term Loan, 1st Lien | | | | | | | | |
4.000%, VAR LIBOR + 3.500%, 03/31/28 | | | 1,185 | | | | 1,183 | |
Whole Earth, Term Loan B, 1st Lien | | | | | | | | |
5.500%, 02/02/28 | | | 1,522 | | | | 1,511 | |
Woof Holdings, Inc., Initial Term Loan, 1st Lien | | | | | | | | |
4.500%, VAR LIBOR + 3.750%, 12/21/27 | | | 1,234 | | | | 1,235 | |
| | | | | | | | | | | | | |
Total Food/Tobacco | | | | | | | 9,046 | |
| | | | | | | | | | | | | |
Forest Prod/Containers [0.3%] |
Anchor Packaging, LLC, Initial Term Loan, 1st Lien | | | | | | | | |
4.084%, VAR LIBOR + 4.000%, 07/18/26 | | | 888 | | | | 887 | |
Berlin Packaging L.L.C., Tranche B-4 Initial Term Loan, 1st Lien | | | | | | | | |
3.750%, VAR LIBOR + 3.250%, 03/11/28 | | | 1,137 | | | | 1,127 | |
Berlin Packaging L.L.C., Tranche B-5 Term Loan, 1st Lien | | | | | | | | |
4.250%, VAR LIBOR + 3.750%, 03/11/28 | | | 500 | | | | 499 | |
Geon Performance Solutions, LLC, Initial Term Loan, 1st Lien | | | | | | | | |
5.500%, VAR LIBOR + 4.750%, 08/18/28 | | | 750 | | | | 755 | |
Graham Packaging Company Inc., Initial Term Loan (2021), 1st Lien | | | | | | | | |
3.750%, VAR LIBOR + 3.000%, 08/04/27 | | | 1,901 | | | | 1,899 | |
Kleopatra Finco S.a r.l., Facility B (USD), 1st Lien | | | | | | | | |
5.250%, VAR LIBOR + 4.750%, 02/12/26 | | | 698 | | | | 700 | |
Logoplaste, Term Loan, 1st Lien | | | | | | | | |
4.385%, 04/21/28 | | | 795 | | | | 792 | |
Pactiv Evergreen Inc., Tranche B-2 U.S. Term Loan, 1st Lien | | | | | | | | |
3.335%, VAR LIBOR + 3.250%, 02/05/26 | | | 1,388 | | | | 1,378 | |
Pregis TopCo LLC, Initial Term Loan, 1st Lien | | | | | | | | |
4.084%, VAR LIBOR + 4.000%, 07/31/26 | | | 1,965 | | | | 1,967 | |
Schweitzer-Mauduit International, Inc., Term B Loan, 1st Lien | | | | | | | | |
4.500%, VAR LIBOR + 3.750%, 02/09/28 | | | 1,280 | | | | 1,278 | |
Spa Holdings 3 Oy, Facility B (USD), 1st Lien | | | | | | | | |
4.750%, VAR LIBOR + 4.000%, 02/04/28 | | | 662 | | | | 662 | |
Sylvamo, Term Loan B, 1st Lien | | | | | | | | |
5.000%, 08/18/28 | | | 815 | | | | 812 | |
Tricorbraun Holdings, Inc., Closing Date Initial Term Loan, 1st Lien | | | | | | | | |
3.750%, VAR LIBOR + 3.250%, 03/03/28 | | | 864 | | | | 859 | |
Tricorbraun Holdings, Inc., Delayed Draw Term Loan, 1st Lien | | | | | | | | |
3.750%, VAR LIBOR + 3.250%, 03/03/28 | | | 195 | | | | 193 | |
| | | | | | | | | | | | | |
Total Forest Prod/Containers | | | 13,808 | |
| | | | | | | | | | | | | |
Forest products [0.0%] |
Spa Holdings 3 Oy, Facility B (EUR), 1st Lien | | | | | | | | |
3.750%, VAR Euribor + 3.750%, 02/04/28 | | | 1,000 | | | | 1,158 | |
| | | | | | | | | | | | | |
Gaming/Leisure [0.4%] |
Aimbridge Acquisition Co., Inc., 2021 Term Loan, 1st Lien | | | | | | | | |
5.500%, VAR LIBOR + 4.750%, 02/02/26 | | | 576 | | | | 571 | |
Caesars Resort Collection, LLC, Term B Loan, 1st Lien | | | | | | | | |
2.834%, VAR LIBOR + 2.750%, 12/23/24 | | | 4,746 | | | | 4,715 | |
Entain PLC, Term Loan B, 1st Lien | | | | | | | | |
0.044%, 03/29/27 | | | 570 | | | | 569 | |
See accompanying notes to financial statements.
CITY NATIONAL ROCHDALE FUNDS | PAGE 105
consolidated schedule of investments |
September 30, 2021 |
City National Rochdale Fixed Income Opportunities Fund (continued) |
Description | | Face Amount (000)(1) | | | Value (000) | |
Enterprise Development Authority, Term B Loan, 1st Lien | | | | | | | | |
5.000%, VAR LIBOR + 4.250%, 02/28/28(D) | | $ | 478 | | | $ | 478 | |
Flutter Entertainment plc, USD Term Loan, 1st Lien | | | | | | | | |
2.382%, VAR LIBOR + 2.250%, 07/21/26 | | | 1,075 | | | | 1,071 | |
Global Cash Access Term Loan B (2021) | | | | | | | | |
3.000%, 06/30/28 | | | 635 | | | | 633 | |
Golden Nugget (fka Landry’s), Term Loan B | | | | | | | | |
3.250%, VAR LIBOR + 3.250%, 10/04/23 | | | 945 | | | | 940 | |
Herschend Entertainment Company, LLC, Initial Term Loan (2021), 1st Lien | | | | | | | | |
4.250%, VAR LIBOR + 3.750%, 08/27/28 | | | 335 | | | | 334 | |
Hilton Grand Vacations Borrower LLC, Initial Term Loan, 1st Lien | | | | | | | | |
3.500%, VAR LIBOR + 3.000%, 08/02/28 | | | 805 | | | | 807 | |
Jack Ohio Finance, Term Loan, 1st Lien | | | | | | | | |
0.000%, 09/29/28(G) | | | 485 | | | | 487 | |
Marriott Ownership Resorts, Inc., 2019 Refinancing Term Loan, 1st Lien | | | | | | | | |
1.835%, VAR LIBOR + 1.750%, 08/29/25 | | | 685 | | | | 672 | |
Playa Resorts Holding Term Loan B (2017) | | | | | | | | |
3.750%, VAR LIBOR + 2.750%, 04/29/24 | | | 1,225 | | | | 1,197 | |
Playtika Holding Corp., Term B-1 Loan, 1st Lien | | | | | | | | |
2.834%, VAR LIBOR + 2.750%, 03/13/28 | | | 1,147 | | | | 1,146 | |
Scientific Games International, Inc., Initial Term B-5 Loan, 1st Lien | | | | | | | | |
2.834%, VAR LIBOR + 2.750%, 08/14/24 | | | 1,818 | | | | 1,809 | |
Twin River/Ballys, Term Loan B, 1st Lien | | | | | | | | |
0.000%, 08/06/28(G) | | | 635 | | | | 635 | |
| | | | | | | | | | | | | |
Total Gaming/Leisure | | | | | | | 16,064 | |
| | | | | | | | | | | | | |
Healthcare [1.8%] |
Aenova, Term Loan | | | | | | | | |
4.500%, 03/06/26 | | | 1,500 | | | | 1,744 | |
Agiliti Health, Inc., Amendment No. 2 Term Loan, 1st Lien | | | | | | | | |
3.500%, VAR LIBOR + 2.750%, 01/04/26 | | | 1,276 | | | | 1,270 | |
Amneal Pharmaceuticals LLC, Initial Term Loan, 1st Lien | | | | | | | | |
3.625%, VAR LIBOR + 3.500%, 05/04/25 | | | 2,384 | | | | 2,349 | |
Ardent Health, Term Loan B, 1st Lien | | | | | | | | |
4.000%, 08/24/28 | | | 1,700 | | | | 1,704 | |
ASP Navigate Acquisition Corp., Initial Term Loan, 1st Lien | | | | | | | | |
5.500%, VAR LIBOR + 4.500%, 10/06/27 | | | 1,159 | | | | 1,148 | |
athenahealth, Inc., Term B-1 Loan, 1st Lien | | | | | | | | |
4.377%, VAR LIBOR + 4.250%, 02/11/26 | | | 1,272 | | | | 1,274 | |
Auris Luxembourg III S.a r.l., Facility B1A, 1st Lien | | | | | | | | |
4.000%, VAR Euribor + 4.000%, 07/24/25 | | EUR | 3,000 | | | | 3,465 | |
Bella Holding Company, LLC, Initial Term Loan, 1st Lien | | | | | | | | |
4.500%, VAR LIBOR + 3.750%, 05/10/28 | | | 980 | | | | 978 | |
CAB, Facility B, 1st Lien | | | | | | | | |
3.500%, VAR Euribor + 3.500%, 01/28/28 | | | 2,500 | | | | 2,880 | |
Cano Health, LLC, Initial Term Loan, 1st Lien | | | | | | | | |
5.250%, VAR LIBOR + 4.500%, 11/23/27 | | | 916 | | | | 916 | |
Change Healthcare Holdings, Inc. (fka Emdeon Inc.), Closing Date Term Loan, 1st Lien | | | | | | | | |
3.500%, VAR LIBOR + 2.500%, 03/01/24 | | | 1,014 | | | | 1,012 | |
CHG Healthcare Services, Inc., Initial Term Loan, 1st Lien | | | | | | | | |
4.000%, VAR LIBOR + 3.500%, 09/29/28 | | | 610 | | | | 611 | |
See accompanying notes to financial statements.
CITY NATIONAL ROCHDALE FUNDS | PAGE 106
consolidated schedule of investments |
September 30, 2021 |
City National Rochdale Fixed Income Opportunities Fund (continued) |
Description | | Face Amount (000)(1) | | | Value (000) | |
Chrome Bidco, Facility B, 1st Lien | | | | | | | | |
3.750%, VAR Euribor + 3.750%, 05/24/28 | | $ | 2,500 | | | $ | 2,894 | |
Diaverum Holding S.a.r.l. (fka Velox Bidco S.a.r.l.), Facility B | | | | | | | | |
3.250%, VAR Euribor + 3.250%, 05/24/24 | | EUR | 1,500 | | | | 1,719 | |
Diaverum Holding S.a.r.l. (fka Velox Bidco S.a.r.l.), Second Lien Facility | | | | | | | | �� |
8.000%, VAR Euribor + 8.000%, 05/24/24 | | EUR | 1,500 | | | | 1,742 | |
Elsan SAS , Facility B5, 1st Lien | | | | | | | | |
3.500%, VAR Euribor + 3.500%, 06/16/28 | | | 3,000 | | | | 3,469 | |
Envision Healthcare Corporation, Initial Term Loan, 1st Lien | | | | | | | | |
3.834%, VAR LIBOR + 3.750%, 10/10/25 | | | 830 | | | | 736 | |
Envision Healthcare Corporation, Term Loan | | | | | | | | |
0.000%, 10/10/25(G) | | | 836 | | | | 703 | |
Financiere Verdi I SAS, 1st Lien | | | | | | | | |
4.550%, 03/31/28 | | | 2,000 | | | | 2,678 | |
Gainwell Acquisition Corp., Term B Loan, 1st Lien | | | | | | | | |
4.750%, VAR LIBOR + 4.000%, 10/01/27 | | | 1,667 | | | | 1,669 | |
Gesundheits GmbH Term Loan | | | | | | | | |
4.000%, 07/30/26 | | EUR | 2,000 | | | | 2,309 | |
Healthcare Royalty, Term Loan, 1st Lien | | | | | | | | |
2.250%, 07/14/28 | | | 495 | | | | 493 | |
Homevi Inc., Term Loan, 1st Lien | | | | | | | | |
4.000%, 10/31/26 | | | 1,000 | | | | 1,161 | |
Hunter Holdco 3 Limited, Initial Dollar Term Loan, 1st Lien | | | | | | | | |
4.750%, VAR LIBOR + 4.250%, 08/19/28 | | | 850 | | | | 853 | |
Icon Public Limited Company, Lux Term Loan, 1st Lien | | | | | | | | |
3.000%, VAR LIBOR + 2.500%, 07/03/28 | | | 1,198 | | | | 1,202 | |
Icon Public Limited Company, U.S. Term Loan, 1st Lien | | | | | | | | |
3.000%, VAR LIBOR + 2.500%, 07/03/28 | | | 298 | | | | 299 | |
ImageFirst Holdings, LLC, Delayed Draw Tranche A Term Loan, 1st Lien | | | | | | | | |
5.250%, VAR LIBOR + 4.500%, 04/27/28 | | | 98 | | | | 98 | |
ImageFirst Holdings, LLC, Initial Term Loan, 1st Lien | | | | | | | | |
5.250%, VAR LIBOR + 4.500%, 04/27/28 | | | 432 | | | | 431 | |
Indivior, Term Loan B, 1st Lien | | | | | | | | |
5.500%, 06/26/26 | | | 790 | | | | 784 | |
Insulet Corporation, Term Loan B, 1st Lien | | | | | | | | |
3.750%, 05/04/28 | | | 615 | | | | 616 | |
Invent Farma, Term Loan, 1st Lien | | | | | | | | |
3.500%, 02/12/28 | | | 1,000 | | | | 1,154 | |
4.250%, 10/29/27 | | | 634 | | | | 736 | |
4.250%, 12/15/27 | | | 366 | | | | 425 | |
Kindred Healthcare Inc., Term B Loan | | | | | | | | |
4.625%, VAR LIBOR + 4.500%, 07/02/25 | | | 1,733 | | | | 1,733 | |
LifePoint Health, Inc. (Regional Care) Term B Loan | | | | | | | | |
3.834%, 11/16/25 | | | 1,665 | | | | 1,662 | |
Mamba Purchaser, Term Loan, 1st Lien | | | | | | | | |
0.000%, 09/29/28(G) | | | 490 | | | | 490 | |
MDVIP/Mamba Purchaser, 2nd Lien Cov-Lite Term Loan, 1st Lien | | | | | | | | |
0.000%, 09/29/29(G) | | | 160 | | | | 160 | |
Mediq BV, Term Loan, 1st Lien | | | | | | | | |
3.500%, 03/03/28 | | | 2,000 | | | | 2,309 | |
Midwest Physician Administrative Services, LLC, Initial Term Loan, 1st Lien | | | | | | | | |
3.750%, VAR LIBOR + 3.000%, 03/12/28 | | | 758 | | | | 753 | |
Mozart Debt Merger, Term Loan, 1st Lien | | | | | | | | |
0.000%, 09/30/28(D) (G) | | | 1,070 | | | | 1,065 | |
See accompanying notes to financial statements.
CITY NATIONAL ROCHDALE FUNDS | PAGE 107
consolidated schedule of investments |
September 30, 2021 |
City National Rochdale Fixed Income Opportunities Fund (continued) |
Description | | Face Amount (000)(1) | | | Value (000) | |
MPH Acquisition Holdings, LLC, Initial Term Loan, 1st Lien | | | | | | | | |
4.750%, 09/01/28 | | $ | 1,285 | | | $ | 1,270 | |
National Mentor Holdings, Inc., Delayed Draw Term Loan, 1st Lien | | | | | | | | |
3.750%, VAR UNFND + 3.750%, 03/02/28 | | | 28 | | | | 27 | |
National Mentor Holdings, Inc., Initial Term C Loan, 1st Lien | | | | | | | | |
4.500%, VAR LIBOR + 3.750%, 03/02/28 | | | 19 | | | | 19 | |
National Mentor Holdings, Inc., Initial Term Loan, 1st Lien | | | | | | | | |
4.500%, VAR LIBOR + 3.750%, 03/02/28 | | | 592 | | | | 592 | |
Onex TSG Intermediate Corp, Term Loan, 1st Lien | | | | | | | | |
5.500%, 02/28/28 | | | 221 | | | | 222 | |
Option Care Health, Inc., Term B Loan, 1st Lien | | | | | | | | |
3.834%, VAR LIBOR + 3.750%, 08/06/26 | | | 965 | | | | 965 | |
Organon & Co., Dollar Term Loan, 1st Lien | | | | | | | | |
3.500%, VAR LIBOR + 3.000%, 06/02/28 | | | 985 | | | | 987 | |
Ortho-Clinical Diagnostics, Inc., 2020 Incremental Euro Term Loan, 1st Lien | | | | | | | | |
3.500%, VAR Euribor + 3.500%, 06/30/25 | | | 1,903 | | | | 2,204 | |
Packaging Coordinators Midco, Inc., Term B Loan, 1st Lien | | | | | | | | |
4.250%, VAR LIBOR + 3.500%, 11/30/27 | | | 1,162 | | | | 1,163 | |
Parexel International Corporation, Initial Term Loan, 1st Lien | | | | | | | | |
2.834%, VAR LIBOR + 2.750%, 09/27/24 | | | 611 | | | | 610 | |
Parexel International Corporation, Term Loan, 1st Lien | | | | | | | | |
0.000%, 08/11/28(G) | | | 750 | | | | 750 | |
PetIQ, Term Loan, 1st Lien | | | | | | | | |
4.750%, 04/07/28 | | | 1,045 | | | | 1,037 | |
Pluto Acquisition I, Inc., 2021 Term Loan, 1st Lien | | | | | | | | |
4.121%, VAR LIBOR + 4.000%, 06/22/26 | | | 680 | | | | 679 | |
Project Ruby Ultimate Parent Corp., Closing Date Term Loan, 1st Lien | | | | | | | | |
4.000%, VAR LIBOR + 3.250%, 03/10/28 | | | 738 | | | | 737 | |
Prophylaxis B.V., Term Loan | | | | | | | | |
0.500%, 06/30/25 | | | 238 | | | | 413 | |
Prophylaxis, Term Loan | | | | | | | | |
4.500%, 06/30/25 | | | 590 | | | | 673 | |
RXB Holdings, Inc., Initial Term Loan, 1st Lien | | | | | | | | |
5.250%, VAR LIBOR + 4.500%, 12/20/27 | | | 1,075 | | | | 1,079 | |
SCP Eye Care, Term Loan, 1st Lien | | | | | | | | |
5.250%, 03/15/28 | | | 643 | | | | 643 | |
0.000%, 03/15/28(G) | | | 112 | | | | 111 | |
Signify Health, LLC , Initial Term Loan, 1st Lien | | | | | | | | |
3.750%, VAR LIBOR + 3.250%, 06/22/28 | | | 615 | | | | 612 | |
Sotera Health Holdings, LLC, Term Loan, 1st Lien | | | | | | | | |
3.250%, 12/11/26(F) | | | 1,045 | | | | 1,041 | |
Surgery Center Holdings, Inc., 2021 New Term Loan, 1st Lien | | | | | | | | |
4.500%, VAR LIBOR + 3.750%, 08/31/26 | | | 1,052 | | | | 1,053 | |
Synlab Bondco PLC, Term Facility 2, 1st Lien | | | | | | | | |
3.250%, VAR Euribor + 2.500%, 07/01/26 | | | — | | | | — | |
TakeCare Bidco SAS, Term Loan, 1st Lien | | | | | | | | |
4.000%, 05/26/28 | | | 1,000 | | | | 1,161 | |
Theramex, Term Loan, 1st Lien | | | | | | | | |
4.000%, 01/31/25 | | | 1,000 | | | | 1,155 | |
Vivalto Sante, Term Loan, 1st Lien | | | | | | | | |
0.000%, 07/21/28(G) | | | 1,500 | | | | 1,740 | |
| | | | | | | | | | | | | |
Total Healthcare | | | | | | | 74,637 | |
| | | | | | | | | | | | | |
See accompanying notes to financial statements.
CITY NATIONAL ROCHDALE FUNDS | PAGE 108
consolidated schedule of investments |
September 30, 2021 |
City National Rochdale Fixed Income Opportunities Fund (continued) |
Description | | Face Amount (000)(1) | | | Value (000) | |
Healthcare, Education and Childcare [0.2%] |
Cidron Ollopa Holding B.V., Facility B, 1st Lien | | | | | | | | |
3.500%, VAR Euribor + 3.250%, 04/16/25 | | EUR | 2,437 | | | $ | 2,803 | |
Financiere Mendel, Facility B, 1st Lien | | | | | | | | |
4.500%, VAR Euribor + 4.500%, 03/27/26 | | EUR | 2,000 | | | | 2,327 | |
Nidda Healthcare Holding GmbH, Facility F (EUR), 1st Lien | | | | | | | | |
3.500%, VAR Euribor + 3.500%, 08/21/26 | | | 1,500 | | | | 1,714 | |
Nidda Healthcare Holding GmbH, Facility F (GBP), 1st Lien | | | | | | | | |
4.560%, VAR LIBOR + 4.500%, 08/21/26 | | | 1,000 | | | | 1,337 | |
| | | | | | | | | | | | | |
Total Healthcare, Education and Childcare | | | 8,181 | |
| | | | | | | | | | | | | |
Housing [0.4%] |
84 Lumber, Term Loan B, 1st Lien | | | | | | | | |
3.750%, 11/13/26 | | | 995 | | | | 996 | |
ACProducts Holdings, Inc., Initial Term Loan, 1st Lien | | | | | | | | |
4.750%, VAR LIBOR + 4.250%, 05/17/28 | | | 1,147 | | | | 1,144 | |
Advanced Drainage Systems, Inc., Initial Term Loan, 1st Lien | | | | | | | | |
2.375%, VAR LIBOR + 2.250%, 07/31/26 | | | 3 | | | | 2 | |
DTZ Cushman & Wakefield | | | | | | | | |
2.835%, 08/21/25 | | | 2,171 | | | | 2,149 | |
Empire Today, Term Loan, 1st Lien | | | | | | | | |
5.750%, 04/03/28(F) | | | 610 | | | | 605 | |
Foundation Building Materials, Inc., Initial Term Loan, 1st Lien | | | | | | | | |
3.750%, VAR LIBOR + 3.250%, 01/31/28 | | | 1,130 | | | | 1,122 | |
GGP (Brookfield Residential Property) Term Loan B | | | | | | | | |
2.585%, VAR LIBOR + 2.500%, 08/27/25 | | | 3,272 | | | | 3,230 | |
HD Supply Waterworks, Term Loan B, 1st Lien | | | | | | | | |
2.586%, 07/27/28 | | | 1,375 | | | | 1,368 | |
Hunter Fan Company, Initial Term Loan, 1st Lien | | | | | | | | |
5.750%, VAR LIBOR + 5.000%, 05/08/28 | | | 735 | | | | 734 | |
IPS/CP Iris, Cov-Lite Term Loan, 1st Lien | | | | | | | | |
0.000%, 09/21/28(G) | | | 571 | | | | 570 | |
IPS/CP Iris, Delayed Term Loan, 1st Lien | | | | | | | | |
0.000%, 09/21/28(G) | | | 114 | | | | 114 | |
LBM Acquisition, LLC, Initial Term Loan, 1st Lien | | | | | | | | |
4.500%, VAR LIBOR + 3.750%, 12/17/27 | | | 1,200 | | | | 1,188 | |
Mannington Mills, Inc., Tranche B-1 Loan, 1st Lien | | | | | | | | |
3.882%, VAR LIBOR + 3.750%, 08/06/26 | | | 1,300 | | | | 1,295 | |
Osmose Utilities Services, Inc., Initial Term Loan, 1st Lien | | | | | | | | |
3.750%, VAR LIBOR + 3.250%, 06/23/28 | | | 1,020 | | | | 1,016 | |
Quikrete Holding, Term Loan B, 1st Lien | | | | | | | | |
0.000%, 02/21/28(G) | | | 740 | | | | 737 | |
Standard Industies, Term Loan, 1st Lien | | | | | | | | |
2.500%, 08/06/28 | | | 995 | | | | 996 | |
The Hillman Group, Inc., Term Loan B, 1st Lien | | | | | | | | |
3.250%, 07/14/28 | | | 550 | | | | 549 | |
The Hillman Group, Inc., Term Loan, 1st Lien | | | | | | | | |
3.250%, 07/14/28 | | | 132 | | | | 131 | |
VC GB Holdings I Corp, Initial Term Loan, 1st Lien | | | | | | | | |
4.000%, VAR LIBOR + 3.500%, 07/21/28 | | | 335 | | | | 335 | |
VC GB Holdings I Corp, Initial Term Loan, 2nd Lien | | | | | | | | |
7.250%, VAR LIBOR + 6.750%, 07/23/29 | | | 250 | | | | 251 | |
| | | | | | | | | | | | | |
Total Housing | | | | | | | 18,532 | |
| | | | | | | | | | | | | |
See accompanying notes to financial statements.
CITY NATIONAL ROCHDALE FUNDS | PAGE 109
consolidated schedule of investments |
September 30, 2021 |
City National Rochdale Fixed Income Opportunities Fund (continued) |
Description | | Face Amount (000)(1) | | | Value (000) | |
Industrial Equipment [0.1%] |
ADB Safegate, Cov-Lite, 1st Lien | | | | | | | | |
3.500%, 10/03/24(F) | | EUR | 1,000 | | | $ | 1,106 | |
Ahlsell, Term Loan, 1st Lien | | | | | | | | |
3.500%, 02/16/26 | | | 2,000 | | | | 2,301 | |
Engineered Machinery Holdings, Inc., Incremental Amendment No. 4 Term Loan, 1st Lien | | | | | | | | |
3.750%, VAR Euribor + 3.750%, 05/21/28 | | | 1,000 | | | | 1,156 | |
Flender, Term Loan, 1st Lien | | | | | | | | |
3.750%, 01/21/28 | | | 1,000 | | | | 1,153 | |
| | | | | | | | | | | | | |
Total Industrial Equipment | | | 5,716 | |
| | | | | | | | | | | | | |
Industrial Services [0.0%] |
Assystem Technologies, Term Loan, 1st Lien | | | | | | | | |
4.250%, 09/27/24 | | | 1,000 | | | | 1,120 | |
| | | | | | | | | | | | | |
Industrials [0.3%] |
Boels, Term Loan | | | | | | | | |
3.250%, 02/06/27 | | | 3,000 | | | | 3,464 | |
Circet, Term Loan, 1st Lien | | | | | | | | |
0.000%, 07/09/28(G) | | | 1,500 | | | | 1,734 | |
Holding Socotec, Term Loan, 1st Lien | | | | | | | | |
3.750%, 05/05/28 | | | 1,500 | | | | 1,740 | |
Oberthur Technologies SA, Term Loan, 1st Lien | | | | | | | | |
4.500%, 01/09/26 | | | 3,500 | | | | 4,064 | |
Optimus Bidco SAS, Term Loan, 1st Lien | | | | | | | | |
3.750%, 09/29/25 | | | 1,000 | | | | 1,150 | |
| | | | | | | | | | | | | |
Total Industrials | | | | | | | 12,152 | |
| | | | | | | | | | | | | |
Information Technology [1.8%] |
Allegro MicroSystems, Inc., Initial Term Loan, 1st Lien | | | | | | | | |
4.250%, VAR LIBOR + 3.750%, 09/30/27 | | | 98 | | | | 97 | |
Apttus Corporation, Initial Term Loan, 1st Lien | | | | | | | | |
5.000%, VAR LIBOR + 4.250%, 05/08/28 | | | 845 | | | | 848 | |
AQA Acquisition Holding, Inc., Initial Term Loan, 1st Lien | | | | | | | | |
4.750%, VAR LIBOR + 4.250%, 03/03/28 | | | 828 | | | | 831 | |
Aspect Software, Term Loan, 1st Lien | | | | | | | | |
6.000%, 05/03/28 | | | 600 | | | | 589 | |
Aspect Software, Term Loan, 2nd Lien | | | | | | | | |
9.750%, 05/03/29 | | | 175 | | | | 174 | |
Avaya Inc., Tranche B-1 Term Loan, 1st Lien | | | | | | | | |
4.334%, VAR LIBOR + 4.250%, 12/15/27 | | | 728 | | | | 729 | |
Barracuda Networks, Inc., 2020 Term Loan, 1st Lien | | | | | | | | |
4.500%, VAR LIBOR + 3.750%, 02/12/25 | | | 1,176 | | | | 1,179 | |
Brave Parent Holdings, Inc., Initial Term Loan, 1st Lien | | | | | | | | |
4.084%, VAR LIBOR + 4.000%, 04/18/25 | | | 908 | | | | 907 | |
Brooks Automation, Term Loan B, 1st Lien | | | | | | | | |
2.710%, 10/04/24(F) | | | 1,000 | | | | 992 | |
Buzz Finco L.L.C., Initial Term Loan, 1st Lien | | | | | | | | |
2.835%, VAR LIBOR + 2.750%, 01/29/27 | | | 2 | | | | 2 | |
Castle US Holding Corporation, Initial Dollar Term Loan, 1st Lien | | | | | | | | |
3.882%, VAR LIBOR + 3.750%, 01/29/27 | | | 249 | | | | 247 | |
CCC Intelligent Solutions Inc., Initial Term Loan, 1st Lien | | | | | | | | |
3.000%, VAR LIBOR + 2.500%, 09/21/28 | | | 765 | | | | 764 | |
Cision US, Incremental Term Loan B, 1st Lien | | | | | | | | |
4.750%, 01/29/27 | | | 848 | | | | 851 | |
Cloudera, Inc., Term Loan, 1st Lien | | | | | | | | |
3.250%, VAR LIBOR + 2.500%, 12/22/27 | | | 841 | | | | 840 | |
CommerceHub, Inc., Initial Term Loan, 1st Lien | | | | | | | | |
4.750%, VAR LIBOR + 4.000%, 12/29/27(D) | | | 1,000 | | | | 1,000 | |
See accompanying notes to financial statements.
CITY NATIONAL ROCHDALE FUNDS | PAGE 110
consolidated schedule of investments |
September 30, 2021 |
City National Rochdale Fixed Income Opportunities Fund (continued) |
Description | | Face Amount (000)(1) | | | Value (000) | |
ConnectWise, LLC, Initial Term Loan, 1st Lien | | | | | | | | |
4.000%, VAR LIBOR + 3.500%, 09/29/28 | | $ | 1,055 | | | $ | 1,052 | |
ConvergeOne Holdings, Corp., Initial Term Loan | | | | | | | | |
5.084%, VAR LIBOR + 5.000%, 01/04/26 | | | 1,595 | | | | 1,585 | |
CoreLogic, Inc. (fka First American Corporation, The), Initial Term Loan, 1st Lien | | | | | | | | |
4.000%, VAR LIBOR + 3.500%, 06/02/28 | | | 1,660 | | | | 1,658 | |
Cornerstone OnDemand, Inc., 2021 Refinancing Term Loan, 1st Lien | | | | | | | | |
3.334%, VAR LIBOR + 3.250%, 04/22/27 | | | 4 | | | | 4 | |
Cornerstone OnDemand, Inc., Term Loan, 1st Lien | | | | | | | | |
0.000%, 09/21/28(G) | | | 730 | | | | 728 | |
Creation Technologies, Term Loan, 1st Lien | | | | | | | | |
0.000%, 09/14/28(G) | | | 845 | | | | 839 | |
DCert Buyer, Inc., First Amendment Refinancing Loan, 2nd Lien | | | | | | | | |
7.084%, VAR LIBOR + 7.000%, 02/19/29 | | | 1,175 | | | | 1,184 | |
DCert Buyer, Inc., Initial Term Loan, 1st Lien | | | | | | | | |
4.084%, VAR LIBOR + 4.000%, 10/16/26 | | | 398 | | | | 398 | |
Dell International L.L.C. (EMC Corporation), Refinancing Term B-2 Loan, 1st Lien | | | | | | | | |
2.000%, VAR LIBOR + 1.750%, 09/19/25 | | | 3,038 | | | | 3,036 | |
E2open, Term Loan B, 1st Lien | | | | | | | | |
4.000%, 02/04/28 | | | 1,072 | | | | 1,072 | |
Endurance International Group Holdings, Inc., Initial Term Loan, 1st Lien | | | | | | | | |
4.250%, VAR LIBOR + 3.500%, 02/10/28 | | | 950 | | | | 944 | |
Ensono, Term Loan, 1st Lien | | | | | | | | |
4.750%, 05/26/28 | | | 635 | | | | 636 | |
Gigamon Inc., Initial Term Loan, 1st Lien | | | | | | | | |
4.500%, VAR LIBOR + 3.750%, 12/19/24 | | | 1,395 | | | | 1,395 | |
Greeneden U.S. Holdings I, LLC, Initial Dollar Term Loan (2020), 1st Lien | | | | | | | | |
4.750%, VAR LIBOR + 4.000%, 12/01/27 | | | 1,612 | | | | 1,617 | |
Idera, Inc., Term B-1 Loan, 1st Lien | | | | | | | | |
4.500%, VAR LIBOR + 3.750%, 03/02/28 | | | 564 | | | | 563 | |
Informatica, Term Loan, 1st Lien | | | | | | | | |
3.250%, 02/14/27 | | | 988 | | | | 1,136 | |
Ivanti Software, Inc., First Amendment Term Loan, 1st Lien | | | | | | | | |
4.750%, VAR LIBOR + 4.000%, 12/01/27 | | | 319 | | | | 319 | |
Ivanti Software, Inc., Initial Term Loan, 1st Lien | | | | | | | | |
5.750%, VAR LIBOR + 4.750%, 12/01/27 | | | 1,107 | | | | 1,109 | |
LendingTree, Cov-Lite Term Loan B, 1st Lien | | | | | | | | |
0.000%, 08/25/28(G) | | | 300 | | | | 300 | |
LI Group Holdings, Inc., 2021 Term Loan, 1st Lien | | | | | | | | |
4.250%, VAR LIBOR + 3.500%, 03/11/28 | | | 746 | | | | 749 | |
Liftoff Mobile, Inc., Initial Term Loan Retired 09/30/2021, 1st Lien | | | | | | | | |
4.250%, VAR LIBOR + 3.500%, 03/17/28 | | | 866 | | | | 864 | |
LogMeIn, Inc., Initial Term Loan, 1st Lien | | | | | | | | |
4.833%, VAR LIBOR + 4.750%, 08/31/27 | | | 2,145 | | | | 2,143 | |
MA Financeco., LLC, Tranche B-3 Term Loan, 1st Lien | | | | | | | | |
2.834%, VAR LIBOR + 2.750%, 06/21/24 | | | 198 | | | | 196 | |
Magenta Buyer LLC, Initial Term Loan, 1st Lien | | | | | | | | |
5.750%, VAR LIBOR + 5.000%, 07/27/28 | | | 1,780 | | | | 1,779 | |
Magnite, Inc., Initial Term Loan, 1st Lien | | | | | | | | |
5.750%, VAR LIBOR + 5.000%, 04/28/28 | | | 535 | | | | 534 | |
See accompanying notes to financial statements.
CITY NATIONAL ROCHDALE FUNDS | PAGE 111
consolidated schedule of investments |
September 30, 2021 |
City National Rochdale Fixed Income Opportunities Fund (continued) |
Description | | Face Amount (000)(1) | | | Value (000) | |
Marcel LUX IV S.a.r.l., Original Facility, 1st Lien | | | | | | | | |
4.750%, VAR LIBOR + 4.000%, 12/31/27 | | $ | 313 | | | $ | 312 | |
Mavenir Systems, Inc., Initial Term Loan, 1st Lien | | | | | | | | |
5.250%, VAR LIBOR + 4.750%, 08/18/28 | | | 1,600 | | | | 1,598 | |
Maverick Bidco Inc., Closing Date Initial Term Loan, 1st Lien | | | | | | | | |
4.500%, VAR LIBOR + 3.750%, 05/18/28 | | | 615 | | | | 614 | |
MaxLinear, Cov-Lite Term Loan B, 1st Lien | | | | | | | | |
2.750%, 06/16/28 | | | 471 | | | | 469 | |
McAfee, LLC, Term B USD Loan, 1st Lien | | | | | | | | |
3.837%, VAR LIBOR + 3.750%, 09/30/24 | | | 929 | | | | 929 | |
Mermaid Bidco Inc., Additional Term Facility (USD), 1st Lien | | | | | | | | |
4.500%, VAR LIBOR + 3.750%, 12/22/27 | | | 1,207 | | | | 1,204 | |
N-able International Holdings II, LLC, Term Loan, 1st Lien | | | | | | | | |
3.500%, VAR LIBOR + 3.000%, 07/19/28 | | | 485 | | | | 484 | |
Perforce Software, Inc., New Term Loan, 1st Lien | | | | | | | | |
3.834%, VAR LIBOR + 3.750%, 07/01/26 | | | 2,112 | | | | 2,094 | |
Planview Parent, Inc., Closing Date Term Loan, 1st Lien | | | | | | | | |
4.750%, VAR LIBOR + 4.000%, 12/17/27 | | | 731 | | | | 732 | |
Polaris Newco, LLC, Dollar Term Loan, 1st Lien | | | | | | | | |
4.500%, VAR LIBOR + 4.000%, 06/02/28 | | | 800 | | | | 801 | |
Project Sky, Term Loan B, 1st Lien | | | | | | | | |
0.000%, 08/10/28(G) | | | 750 | | | | 749 | |
Project Sky, Term Loan, 1st Lien | | | | | | | | |
0.000%, 08/10/29(G) | | | 400 | | | | 398 | |
Proofpoint, Inc., Initial Term Loan, 1st Lien | | | | | | | | |
3.750%, VAR LIBOR + 3.250%, 08/31/28 | | | 860 | | | | 855 | |
Quest Software US Holdings Inc., Initial Term Loan, 1st Lien | | | | | | | | |
4.379%, VAR LIBOR + 4.250%, 05/16/25 | | | 520 | | | | 519 | |
Rackspace Technology Global, Inc., 2021 Term B Loan, 1st Lien | | | | | | | | |
3.500%, VAR LIBOR + 2.750%, 02/15/28 | | | 1,945 | | | | 1,930 | |
RealPage, Inc., Initial Term Loan, 1st Lien | | | | | | | | |
3.750%, VAR LIBOR + 3.250%, 04/24/28 | | | 1,315 | | | | 1,310 | |
Red Planet Borrower, LLC, Initial Term Loan, 1st Lien | | | | | | | | |
4.250%, VAR LIBOR + 3.750%, 10/02/28 | | | 830 | | | | 827 | |
Redstone HoldCo 2 LP, Initial Loan, 2nd Lien | | | | | | | | |
8.500%, VAR LIBOR + 7.750%, 04/27/29 | | | 510 | | | | 496 | |
Redstone HoldCo LP, Initial Loan, 1st Lien | | | | | | | | |
5.500%, 04/27/28 | | | 600 | | | | 589 | |
Renaissance Holding Corp., Initial Term Loan, 1st Lien | | | | | | | | |
3.334%, VAR LIBOR + 3.250%, 05/30/25 | | | 746 | | | | 739 | |
Royal Caribbean Cruises, Term Loan, 1st Lien | | | | | | | | |
9.000%, 07/27/29 | | | 110 | | | | 110 | |
Sabre GLBL Inc., 2021 Other Term B-1 Loan, 1st Lien | | | | | | | | |
4.000%, VAR LIBOR + 3.500%, 12/17/27 | | | 322 | | | | 320 | |
Sabre GLBL Inc., 2021 Other Term B-2 Loan, 1st Lien | | | | | | | | |
4.000%, VAR LIBOR + 3.500%, 12/17/27 | | | 513 | | | | 510 | |
SCS Holdings I Inc. (Sirius Computer Solutions, Inc.), Tranche B Term Loan, 1st Lien | | | | | | | | |
3.584%, VAR LIBOR + 3.500%, 07/01/26 | | | 1,078 | | | | 1,076 | |
Seattle SpinCo, Inc., Initial Term Loan, 1st Lien | | | | | | | | |
2.834%, VAR LIBOR + 2.750%, 06/21/24 | | | 1,338 | | | | 1,323 | |
See accompanying notes to financial statements.
CITY NATIONAL ROCHDALE FUNDS | PAGE 112
consolidated schedule of investments |
September 30, 2021 |
City National Rochdale Fixed Income Opportunities Fund (continued) |
Description | | Face Amount (000)(1) | | | Value (000) | |
Sitel Worldwide, Cov-Lite Term Loan, 1st Lien | | | | | | | | |
0.071%, 07/28/28 | | $ | 1,335 | | | $ | 1,337 | |
Skillsoft Finance II, Inc., Initial Term Loan, 1st Lien | | | | | | | | |
5.500%, VAR LIBOR + 4.750%, 07/14/28 | | | 420 | | | | 421 | |
SolarWinds Holdings, Inc., 2018 Refinancing Term Loan, 1st Lien | | | | | | | | |
2.834%, VAR LIBOR + 2.750%, 02/05/24 | | | 1,443 | | | | 1,427 | |
Sovos Compliance, LLC, First Lien Delayed Draw Term Loan, 1st Lien | | | | | | | | |
0.000%, VAR UNFND 0.000%, 08/11/28(G) | | | 73 | | | | 73 | |
Sovos Compliance, LLC, Initial Term Loan, 1st Lien | | | | | | | | |
5.000%, VAR LIBOR + 4.500%, 08/11/28 | | | 422 | | | | 424 | |
Surf Holdings S.a r.l., Dollar Tranche Term Loan, 1st Lien | | | | | | | | |
3.616%, VAR LIBOR + 3.500%, 03/05/27 | | | 1,698 | | | | 1,687 | |
Symplr Software, Inc., Initial Term Loan, 1st Lien | | | | | | | | |
5.250%, VAR LIBOR + 4.500%, 12/22/27 | | | 733 | | | | 735 | |
Taboola,Inc., Tranche B Term Loan, 1st Lien | | | | | | | | |
4.500%, 09/01/28 | | | 865 | | | | 859 | |
Tekni-Plex, Inc., Term Loan, 1st Lien | | | | | | | | |
0.000%, 07/29/28(G) | | | 58 | | | | 58 | |
Tenable, Term Loan B, 1st Lien | | | | | | | | |
3.250%, 06/28/28 | | | 535 | | | | 534 | |
ThoughtWorks, Inc., Incremental Term Loan, 1st Lien | | | | | | | | |
3.500%, VAR LIBOR + 3.000%, 03/24/28 | | | 613 | | | | 613 | |
TIBCO Software Inc., Term B-3 Loan, 1st Lien | | | | | | | | |
3.840%, VAR LIBOR + 3.750%, 06/30/26 | | | 737 | | | | 731 | |
Trident TPI Holdings, Inc., Tranche B-3 Initial Term Loan, 1st Lien | | | | | | | | |
4.500%, VAR LIBOR + 4.000%, 09/15/28 | | | 407 | | | | 408 | |
UKG Inc., 2021 Incremental Term Loan, 1st Lien | | | | | | | | |
4.000%, VAR LIBOR + 3.250%, 05/04/26 | | | 569 | | | | 570 | |
UKG Inc., Initial Term Loan, 1st Lien | | | | | | | | |
3.834%, VAR LIBOR + 3.750%, 05/04/26 | | | 839 | | | | 841 | |
Ultra Clean Holdings, Term Loan, 1st Lien | | | | | | | | |
3.835%, 08/27/25 | | | 1,823 | | | | 1,825 | |
Valkyr Purchaser, LLC, Initial Term Loan, 1st Lien | | | | | | | | |
4.750%, VAR LIBOR + 4.000%, 11/05/27 | | | 998 | | | | 994 | |
Virtusa Corporation, Closing Date Term Loan, 1st Lien | | | | | | | | |
5.000%, VAR LIBOR + 4.250%, 02/11/28 | | | 1,279 | | | | 1,280 | |
Vision Solutions, Inc. (Precisely Software Incorporated), Initial Term Loan, 1st Lien | | | | | | | | |
5.000%, VAR LIBOR + 4.250%, 04/24/28 | | | 1,160 | | | | 1,157 | |
Voyage Australia Pty Limited, Initial U.S. Term Loan, 1st Lien | | | | | | | | |
4.000%, VAR LIBOR + 3.500%, 07/20/28 | | | 550 | | | | 549 | |
Xperi Holding Corporation, Initial Term B Loan, 1st Lien | | | | | | | | |
3.584%, VAR LIBOR + 3.500%, 06/08/28 | | | 1,370 | | | | 1,366 | |
| | | | | | | | | | | | | |
Total Information Technology | | | 74,767 | |
| | | | | | | | | | | | | |
Insurance Services [0.0%] |
Siaci Saint Honore, Term Loan, 1st Lien | | | | | | | | |
0.000%, 07/21/28(G) | | | 1,500 | | | | 1,736 | |
| | | | | | | | | | | | | |
Land Transportation [0.1%] |
Daseke, Term Loan B, 1st Lien | | | | | | | | |
4.750%, 03/03/28 | | | 1,895 | | | | 1,893 | |
See accompanying notes to financial statements.
CITY NATIONAL ROCHDALE FUNDS | PAGE 113
consolidated schedule of investments |
September 30, 2021 |
City National Rochdale Fixed Income Opportunities Fund (continued) |
Description | | Face Amount (000)(1) | | | Value (000) | |
LaserShip, Inc., Initial Loan, 2nd Lien | | | | | | | | |
8.250%, VAR LIBOR + 7.500%, 05/07/29 | | $ | 645 | | | $ | 645 | |
LaserShip, Inc., Initial Term Loan, 1st Lien | | | | | | | | |
5.250%, VAR LIBOR + 4.500%, 05/07/28 | | | 1,100 | | | | 1,101 | |
Savage Enterprises, Cov-Lite Term Loan B, 1st Lien | | | | | | | | |
3.750%, 08/11/28 | | | 1,416 | | | | 1,414 | |
Transplace Holdings. Inc. Term Loan B | | | | | | | | |
4.750%, VAR LIBOR + 3.750%, 09/29/24 | | | 579 | | | | 578 | |
| | | | | | | | | | | | | |
Total Land Transportation | | | | | | | 5,631 | |
| | | | | | | | | | | | | |
Leisure Goods/Activities/Movies [0.3%] |
Homair Vacances, Facility B1, 1st Lien | | | | | | | | |
4.827%, VAR LIBOR + 4.750%, 07/19/24 | | | 1,500 | | | | 2,008 | |
Piolin II S.a.r.l., Facility B, 1st Lien | | | | | | | | |
3.750%, VAR Euribor + 3.750%, 09/16/26 | | EUR | 3,000 | | | | 3,319 | |
Premier Lotteries Cov-Lite Term Loan B | | | | | | | | |
3.000%, 06/26/24(F) | | EUR | 2,413 | | | | 2,755 | |
Stiga Facility B | | | | | | | | |
4.250%, 08/30/24 | | EUR | 2,584 | | | | 2,926 | |
| | | | | | | | | | | | | |
Total Leisure Goods/Activities/Movies | | | 11,008 | |
| | | | | | | | | | | | | |
Lodging & Casinos [0.2%] |
Compass III Limited, Incremental Facility, 1st Lien | | | | | | | | |
4.000%, VAR Euribor + 4.000%, 05/09/25 | | EUR | 2,000 | | | | 2,315 | |
Flutter Entertainment plc, Euro Term Loan, 1st Lien | | | | | | | | |
2.500%, VAR Euribor + 2.500%, 07/21/26 | | EUR | 1,193 | | | | 1,381 | |
IGT Holding IV AB, Facility B1(A), 1st Lien | | | | | | | | |
3.500%, VAR Euribor + 3.500%, 03/23/28 | | | 1,641 | | | | 1,888 | |
Vacalians Term Loan B | | | | | | | | |
4.000%, VAR Euribor + 4.000%, 10/30/25 | | EUR | 662 | | | | 732 | |
| | | | | | | | | | | | | |
Total Lodging & Casinos | | | | | | | 6,316 | |
| | | | | | | | | | | | | |
Manufacturing [0.6%] |
Alliance Laundry Systems LLC, Initial Term B Loan, 1st Lien | | | | | | | | |
4.250%, VAR LIBOR + 3.500%, 10/08/27 | | | 388 | | | | 388 | |
Alpha Bidco, Term Loan, 1st Lien | | | | | | | | |
3.750%, 07/30/25 | | | 3,000 | | | | 3,456 | |
American Traffice, Term Loan B, 1st Lien | | | | | | | | |
3.417%, 03/24/28 | | | 892 | | | | 890 | |
American Trailer World Corp., Initial Term Loan, 1st Lien | | | | | | | | |
4.500%, VAR LIBOR + 3.750%, 03/03/28 | | | 1,085 | | | | 1,079 | |
Apex Group Treasury Limited, USD Term Loan, 1st Lien | | | | | | | | |
4.250%, VAR LIBOR + 3.750%, 07/27/28 | | | 500 | | | | 499 | |
Apex Group, Term Loan, 1st Lien | | | | | | | | |
4.000%, 07/23/28 | | | 1,000 | | | | 1,159 | |
Canada Goose, Term Loan, 1st Lien | | | | | | | | |
4.250%, 10/07/27 | | | 928 | | | | 929 | |
Cimpress plc, Tranche B-1 Term Loan, 1st Lien | | | | | | | | |
4.000%, VAR LIBOR + 3.500%, 05/17/28 | | | — | | | | 1 | |
Clark Equipment, Term Loan, 1st Lien | | | | | | | | |
2.397%, 05/18/24 | | | 2 | | | | 2 | |
Delachaux, Term Loan, 1st Lien | | | | | | | | |
3.750%, 04/16/26 | | | 2,955 | | | | 3,419 | |
Gates Global, Term Loan, 1st Lien | | | | | | | | |
3.250%, 03/31/27(F) | | | 542 | | | | 541 | |
Grinding Media Inc., Term Loan B, 1st Lien | | | | | | | | |
0.000%, 09/21/28(G) | | | 690 | | | | 691 | |
See accompanying notes to financial statements.
CITY NATIONAL ROCHDALE FUNDS | PAGE 114
consolidated schedule of investments |
September 30, 2021 |
City National Rochdale Fixed Income Opportunities Fund (continued) |
Description | | Face Amount (000)(1) | | | Value (000) | |
Hyperion Materials & Technologies, Inc., Initial Term Loan, 1st Lien | | | | | | | | |
5.000%, VAR LIBOR + 4.500%, 08/30/28 | | $ | 370 | | | $ | 371 | |
Labeyrie, Term Loan, 1st Lien | | | | | | | | |
0.000%, 12/31/49(G) | | | 1,000 | | | | 1,158 | |
Lumileds (Bright Bidco) Term Loan B (2018) | | | | | | | | |
4.500%, VAR LIBOR + 3.500%, 06/30/24 | | | 964 | | | | 765 | |
Madison IAQ LLC, Initial Term Loan, 1st Lien | | | | | | | | |
3.750%, VAR LIBOR + 3.250%, 06/21/28 | | | 1,000 | | | | 998 | |
Ozark Holdings LLC, 2020 Refinancing Term Loan, 1st Lien | | | | | | | | |
4.250%, VAR LIBOR + 4.000%, 12/10/27 | | | 715 | | | | 715 | |
Plaskolite PPC Intermediate II LLC, 2021-1 Refinancing Term Loan, 1st Lien | | | | | | | | |
4.750%, VAR LIBOR + 4.000%, 12/15/25 | | | 524 | | | | 524 | |
Rexnord-Zurn Holdings, Term Loan B, 1st Lien | | | | | | | | |
0.000%, 09/15/28(G) | | | 495 | | | | 495 | |
Schur Flexibles, Term Loan, 1st Lien | | | | | | | | |
0.000%, 09/15/28(G) | | | 1,000 | | | | 1,156 | |
Tenneco Inc, Term Loan B | | | | | | | | |
3.085%, VAR LIBOR + 3.000%, 10/01/25 | | | 1,877 | | | | 1,858 | |
Tiger Acquisition, LLC, Initial Term Loan, 1st Lien | | | | | | | | |
3.750%, VAR LIBOR + 3.250%, 06/01/28 | | | 445 | | | | 443 | |
Truck Hero, Inc., Initial Term Loan, 1st Lien | | | | | | | | |
4.000%, VAR LIBOR + 3.250%, 01/31/28 | | | 808 | | | | 806 | |
ZF Invest, Senior Facility B, 1st Lien | | | | | | | | |
4.000%, VAR Euribor + 4.000%, 07/12/28 | | | 2,000 | | | | 2,318 | |
| | | | | | | | | | | | | |
Total Manufacturing | | | | | | | 24,661 | |
| | | | | | | | | | | | | |
Materials [0.1%] |
Ineos Group Holdings Ltd, Term Loan, 1st Lien | | | | | | | | |
3.250%, 10/23/27 | | | 995 | | | | 1,153 | |
Kersia, Term Loan, 1st Lien | | | | | | | | |
4.000%, 11/25/27 | | | 1,000 | | | | 1,161 | |
| | | | | | | | | | | | | |
Total Materials | | | | | | | 2,314 | |
| | | | | | | | | | | | | |
Media [0.1%] |
Springer Nature Deutschland, Term Loan, 1st Lien | | | | | | | | |
3.250%, 08/14/26 | | | 3,319 | | | | 3,829 | |
| | | | | | | | | | | | | |
Metals/Minerals [0.1%] |
Atkore International, Inc., Term Loan B, 1st Lien | | | | | | | | |
2.500%, 05/18/28 | | | 1,035 | | | | 1,031 | |
Consol Energy Inc. Term Loan B | | | | | | | | |
4.600%, 10/31/22(F) | | | 1,336 | | | | 1,279 | |
Oxbow Carbon LLC, Tranche B Term Loan, 1st Lien | | | | | | | | |
5.000%, VAR LIBOR + 4.250%, 10/13/25 | | | 1,203 | | | | 1,205 | |
| | | | | | | | | | | | | |
Total Metals/Minerals | | | | | | | 3,515 | |
| | | | | | | | | | | | | |
Mining [0.1%] |
Samarco Mineracao, 1st Lien | | | | | | | | |
5.192%, 11/01/22 | | | 5,000 | | | | 3,000 | |
| | | | | | | | | | | | | |
Mining, Steel, Iron and Nonprecious Metals [0.0%] |
NWR Holdings B.V., Super Senior Term Facility, 1st Lien | | | | | | | | |
14.500%, 12/31/49 | | EUR | 407 | | | | — | |
| | | | | | | | | | | | | |
Other [0.1%] |
AL AS Adventure, Term Loan, 1st Lien | | | | | | | | |
5.000%, 04/01/22 | | | 2,228 | | | | 2,349 | |
Tackle Sarl, Term Loan, 1st Lien | | | | | | | | |
4.000%, 05/05/28 | | | 1,500 | | | | 1,734 | |
| | | | | | | | | | | | | |
Total Other | | | | | | | 4,083 | |
| | | | | | | | | | | | | |
See accompanying notes to financial statements.
CITY NATIONAL ROCHDALE FUNDS | PAGE 115
consolidated schedule of investments |
September 30, 2021 |
City National Rochdale Fixed Income Opportunities Fund (continued) |
Description | | Face Amount (000)(1) | | | Value (000) | |
Pharmaceuticals [0.1%] |
Antigua Bidco Ltd, Term Loan, 1st Lien | | | | | | | | |
4.000%, 08/07/26 | | $ | 917 | | | $ | 1,063 | |
Cheplapharm Arzneimittel GmbH | | | | | | | | |
3.500%, 07/14/25 | | | 1,000 | | | | 1,153 | |
| | | | | | | | | | | | | |
Total Pharmaceuticals | | | | | | | 2,216 | |
| | | | | | | | | | | | | |
Publishing [0.1%] |
Axel Springer Se Lien1 | | | | | | | | |
5.000%, 10/30/26 | | EUR | 1,500 | | | | 1,739 | |
LABL, Inc., Euro Term B Loan, 1st Lien | | | | | | | | |
4.250%, VAR Euribor + 4.250%, 07/01/26 | | | 2,000 | | | | 2,320 | |
| | | | | | | | | | | | | |
Total Publishing | | | | | | | 4,059 | |
| | | | | | | | | | | | | |
Real Estate [0.1%] |
BME Group Holding BV, Term Loan, 1st Lien | | | | | | | | |
4.250%, 10/30/26 | | | 1,500 | | | | 1,738 | |
Foncia, Term Loan, 1st Lien | | | | | | | | |
3.500%, 03/17/28 | | | 2,000 | | | | 2,298 | |
| | | | | | | | | | | | | |
Total Real Estate | | | | | | | 4,036 | |
| | | | | | | | | | | | | |
Refining [0.1%] |
Karpower, Term Loan | | | | | | | | |
8.751%, 11/16/23 | | | 2,786 | | | | 2,758 | |
| | | | | | | | | | | | | |
Retail [0.3%] |
Academy, LTD., Initial Term Loan (2021), 1st Lien | | | | | | | | |
4.500%, VAR LIBOR + 3.750%, 11/05/27 | | | 838 | | | | 839 | |
Ascena Retail Group, Inc. (Anntaylor Retail, Inc.), Tranche B Term Loan, 1st Lien | | | | | | | | |
5.250%, VAR LIBOR + 4.500%, 08/21/22 | | | 248 | | | | 6 | |
Belk,Inc., First-Out Loan, 1st Lien | | | | | | | | |
8.500%, VAR LIBOR + 7.500%, 07/31/25 | | | 1,635 | | | | 1,635 | |
Belk,Inc., Second-Out Loan, 1st Lien | | | | | | | | |
5.000%, VAR FIXED 0.000%, 07/31/25 | | | 602 | | | | 462 | |
BK LC Lux SPV S.a r.l., Facility B (USD), 1st Lien | | | | | | | | |
4.250%, VAR LIBOR + 3.750%, 04/28/28 | | | 885 | | | | 883 | |
Burlington Coat Factory, Term Loan B, 1st Lien | | | | | | | | |
2.090%, 11/15/24 | | | 1 | | | | 1 | |
CWGS Group, LLC, Initial Term Loan, 1st Lien | | | | | | | | |
3.250%, VAR LIBOR + 2.500%, 06/03/28 | | | 1,244 | | | | 1,237 | |
DEI Sales, Inc., Initial Term Loan, 1st Lien | | | | | | | | |
6.250%, VAR LIBOR + 5.500%, 04/28/28(D) | | | 900 | | | | 891 | |
Great Outdoors Group, LLC, Term B-1 Loan, 1st Lien | | | | | | | | |
5.000%, VAR LIBOR + 4.250%, 03/06/28 | | | 917 | | | | 920 | |
J.C. Penney Corporation, Inc. , Loan (2016), 1st Lien | | | | | | | | |
5.250%, VAR LIBOR + 4.250%, 06/23/23(B) (D) | | | 794 | | | | 4 | |
Jo-Ann Stores, LLC, Term Loan B, 1st Lien | | | | | | | | |
5.500%, 06/30/28 | | | 940 | | | | 913 | |
Penney Borrower LLC, Initial Loan, 1st Lien | | | | | | | | |
9.500%, VAR LIBOR + 8.500%, 12/07/26 | | | 26 | | | | 26 | |
Petco Health and Wellness Company, Inc., Initial Term Loan, 1st Lien | | | | | | | | |
4.000%, VAR LIBOR + 3.250%, 03/03/28 | | | 1,596 | | | | 1,595 | |
Rent-A-Center, Inc., Initial Term Loan (2021), 1st Lien | | | | | | | | |
3.750%, VAR LIBOR + 3.250%, 02/17/28 | | | 948 | | | | 950 | |
Rising Tide Holdings, Inc., Initial Term Loan, 1st Lien | | | | | | | | |
5.500%, VAR LIBOR + 4.750%, 06/01/28 | | | 430 | | | | 432 | |
See accompanying notes to financial statements.
CITY NATIONAL ROCHDALE FUNDS | PAGE 116
consolidated schedule of investments |
September 30, 2021 |
City National Rochdale Fixed Income Opportunities Fund (continued) |
Description | | Face Amount (000)(1) | | | Value (000) | |
Rising Tide Holdings, Inc., Initial Term Loan, 2nd Lien | | | | | | | | |
9.000%, VAR LIBOR + 8.250%, 06/01/29 | | $ | 345 | | | $ | 346 | |
Tory Burch LLC, Initial Term B Loan, 1st Lien | | | | | | | | |
4.000%, VAR LIBOR + 3.500%, 04/16/28 | | | 580 | | | | 581 | |
| | | | | | | | | | | | | |
Total Retail | | | | | | | 11,721 | |
| | | | | | | | | | | | | |
Retail Stores [0.1%] |
Obol France 3 SAS, Amended Facility B, 1st Lien | | | | | | | | |
3.500%, VAR Euribor + 3.500%, 04/11/23 | | EUR | 1,468 | | | | 1,646 | |
THG Operations Holdings Limited, Facility B, 1st Lien | | | | | | | | |
4.500%, VAR Euribor + 4.500%, 12/10/26 | | EUR | 2,000 | | | | 2,318 | |
Toys ‘R’ Us Property Company I, LLC, Term Loan | | | | | | | | |
0.000%, 03/20/22(G) | | | 9 | | | | 209 | |
| | | | | | | | | | | | | |
Total Retail Stores | | | | | | | 4,173 | |
| | | | | | | | | | | | | |
Retailers (except food & drug) [0.1%] |
CD&R Firefly Bidco Limited, Facility B1, 1st Lien | | | | | | | | |
4.906%, VAR SONIA + 4.750%, 06/23/25 | | GBP | 2,000 | | | | 2,677 | |
| | | | | | | | | | | | | |
Retailers (other than food/drug) [0.1%] |
Cd&R Firefly Bidco Ltd Lien1 | | | | | | | | |
3.750%, 06/23/25 | | EUR | 500 | | | | 578 | |
Euro Garage Limited (EG Group) (GBP) Term Loan B | | | | | | | | |
4.832%, VAR LIBOR + 4.750%, 02/07/25 | | GBP | 1,940 | | | | 2,598 | |
Peer Holding Iii B.V | | | | | | | | |
3.500%, 11/27/26 | | EUR | 2,000 | | | | 2,313 | |
| | | | | | | | | | | | | |
Total Retailers (other than food/drug) | | | 5,489 | |
| | | | | | | | | | | | | |
Service [1.4%] |
Addison Group Term Loan B | | | | | | | | |
4.835%, 04/10/26 | | | 370 | | | | 368 | |
Adtalem Global, Term Loan B, 1st Lien | | | | | | | | |
5.250%, 08/12/28 | | | 2,645 | | | | 2,646 | |
AlixPartners, Term Loan B, 1st Lien | | | | | | | | |
3.250%, 02/04/28 | | | 643 | | | | 641 | |
American Public Education, Term Loan B, 1st Lien | | | | | | | | |
6.250%, 03/29/27 | | | 590 | | | | 589 | |
American Residential Services L.L.C., Closing Date Term Loan, 1st Lien | | | | | | | | |
4.250%, VAR LIBOR + 3.500%, 10/15/27 | | | 657 | | | | 656 | |
APX Group, Inc., Initial Term Loan, 1st Lien | | | | | | | | |
4.000%, VAR LIBOR + 3.500%, 07/10/28 | | | 1,420 | | | | 1,415 | |
Array Tech, Inc., Initial Term Loan, 1st Lien | | | | | | | | |
3.750%, VAR LIBOR + 3.250%, 10/14/27 | | | 427 | | | | 426 | |
Ascend Learning LLC Term Loan B | | | | | | | | |
4.000%, VAR LIBOR + 3.000%, 07/12/24 | | | 975 | | | | 974 | |
Ascend Learning, LLC, Amendment No. 2 Incremental Term Loan, 1st Lien | | | | | | | | |
4.750%, VAR LIBOR + 3.750%, 07/12/24 | | | 988 | | | | 988 | |
Belfor Holdings Inc., Initial Term Loan, 1st Lien | | | | | | | | |
4.085%, VAR LIBOR + 4.000%, 02/13/26 | | | 1,266 | | | | 1,269 | |
Camelot U.S. Acquisition 1 Co., Amendment No. 2 Incremental Term Loan, 1st Lien | | | | | | | | |
4.000%, VAR LIBOR + 3.000%, 10/30/26 | | | 841 | | | | 843 | |
Conservice, Term Loan B, 1st Lien | | | | | | | | |
4.357%, 05/13/27 | | | 943 | | | | 943 | |
Consilio, Term Loan B, 1st Lien | | | | | | | | |
4.500%, 04/30/28 | | | 728 | | | | 723 | |
See accompanying notes to financial statements.
CITY NATIONAL ROCHDALE FUNDS | PAGE 117
consolidated schedule of investments |
September 30, 2021 |
City National Rochdale Fixed Income Opportunities Fund (continued) |
Description | | Face Amount (000)(1) | | | Value (000) | |
Convergint, Delayed Term Loan, 1st Lien | | | | | | | | |
0.000%, 03/18/28(G) | | $ | 101 | | | $ | 102 | |
Convergint, Term Loan, 1st Lien | | | | | | | | |
4.500%, 03/18/28 | | | 484 | | | | 485 | |
Evertec Group, LLC Term Loan B (2018) | | | | | | | | |
3.585%, VAR LIBOR + 3.500%, 11/20/24 | | | 982 | | | | 982 | |
Exela Term Loan B (2018) | | | | | | | | |
7.500%, VAR LIBOR + 6.500%, 07/12/23 | | | 540 | | | | 415 | |
First Student Bidco Inc., Initial Term B Loan, 1st Lien | | | | | | | | |
3.500%, VAR LIBOR + 3.000%, 07/21/28 | | | 939 | | | | 933 | |
First Student Bidco Inc., Initial Term C Loan, 1st Lien | | | | | | | | |
3.500%, VAR LIBOR + 3.000%, 07/21/28 | | | 346 | | | | 344 | |
Foundational Education Group, Inc., Initial Term Loan, 1st Lien | | | | | | | | |
4.750%, VAR LIBOR + 4.250%, 08/31/28 | | | 535 | | | | 532 | |
Foundational Education Group, Inc., Initial Term Loan, 2nd Lien | | | | | | | | |
7.000%, VAR LIBOR + 6.500%, 08/31/29 | | | 170 | | | | 170 | |
GFL Environmental, Term Loan, 1st Lien | | | | | | | | |
3.500%, 05/30/25(F) | | | 801 | | | | 802 | |
Gopher Resource, Term Loan B, 1st Lien | | | | | | | | |
4.250%, 03/06/25 | | | 489 | | | | 450 | |
Grab Holdings, Inc., Initial Term Loan, 1st Lien | | | | | | | | |
5.500%, VAR LIBOR + 4.500%, 01/29/26 | | | 893 | | | | 900 | |
Guidehouse LLP, Initial Term Loan, 1st Lien | | | | | | | | |
4.084%, VAR LIBOR + 4.000%, 05/01/25 | | | 2,335 | | | | 2,337 | |
Harsco, Term Loan, 1st Lien | | | | | | | | |
2.750%, 03/05/28 | | | 670 | | | | 668 | |
Lakeshore Learning Materials, Term Loan, 1st Lien | | | | | | | | |
0.000%, 09/29/28(G) | | | 490 | | | | 489 | |
Maximus, Term Loan B, 1st Lien | | | | | | | | |
2.500%, 05/12/28 | | | 530 | | | | 529 | |
MHI Holdings, LLC, Initial Term Loan, 1st Lien | | | | | | | | |
5.084%, VAR LIBOR + 5.000%, 09/21/26 | | | 2,303 | | | | 2,312 | |
National Intergovernmental Purchasing Alliance, Term Loan B | | | | | | | | |
3.647%, VAR LIBOR + 3.500%, 05/19/25 | | | 1,443 | | | | 1,431 | |
Oravel Stays, Term Loan B, 1st Lien | | | | | | | | |
9.000%, 06/05/26 | | | 340 | | | | 357 | |
Pacific Architects Inc, Term Loan, 1st Lien | | | | | | | | |
5.250%, 10/19/27(F) | | | 1,393 | | | | 1,390 | |
Packers Holdings, LLC, Initial Term Loan, 1st Lien | | | | | | | | |
4.000%, VAR LIBOR + 3.250%, 03/09/28 | | | 723 | | | | 719 | |
Paysafe Fungible, Term Loan, 1st Lien | | | | | | | | |
0.000%, 06/28/28(G) | | | 1,000 | | | | 1,138 | |
Paysafe Holdings, Term Loan B-1, 1st Lien | | | | | | | | |
3.250%, 06/09/28 | | | 1,145 | | | | 1,132 | |
Peraton Corp., Term B Loan, 1st Lien | | | | | | | | |
4.500%, VAR LIBOR + 3.750%, 02/01/28 | | | 1,541 | | | | 1,541 | |
Pitney Bowes, Term Loan B, 1st Lien | | | | | | | | |
4.090%, 03/12/28 | | | 454 | | | | 454 | |
Pivotal Payments, Term Loan, 1st Lien | | | | | | | | |
3.000%, 09/29/25 | | | 575 | | | | 577 | |
PODS, LLC, Initial Term Loan, 1st Lien | | | | | | | | |
3.750%, VAR LIBOR + 3.000%, 03/31/28 | | | 726 | | | | 726 | |
Prime Security Services Borrower, LLC, 2021 Refinancing Term B-1 Loan, 1st Lien | | | | | | | | |
3.500%, VAR LIBOR + 2.750%, 09/23/26 | | | 1,866 | | | | 1,864 | |
Priority Holdings, LLC, Initial Term Loan, 1st Lien | | | | | | | | |
6.750%, VAR LIBOR + 5.750%, 04/27/27 | | | 1,140 | | | | 1,136 | |
See accompanying notes to financial statements.
CITY NATIONAL ROCHDALE FUNDS | PAGE 118
consolidated schedule of investments |
September 30, 2021 |
City National Rochdale Fixed Income Opportunities Fund (continued) |
Description | | Face Amount (000)(1) | | | Value (000) | |
Red Ventures, Term Loan B, 1st Lien | | | | | | | | |
4.250%, 11/08/24 | | $ | 617 | | | $ | 615 | |
Refficiency Holdings LLC, Initial DDTL, 1st Lien | | | | | | | | |
4.000%, VAR UNFND + 4.000%, 12/16/27 | | | 154 | | | | 154 | |
Refficiency Holdings LLC, Initial Term Loan, 1st Lien | | | | | | | | |
4.750%, VAR LIBOR + 4.000%, 12/16/27 | | | 797 | | | | 796 | |
Shutterfly, LLC, 2021 Refinancing Term B Loan, 1st Lien | | | | | | | | |
5.750%, VAR LIBOR + 5.000%, 09/25/26 | | | 665 | | | | 665 | |
Signal Parent, Inc., Initial Term Loan, 1st Lien | | | | | | | | |
4.250%, VAR LIBOR + 3.500%, 03/25/28 | | | 960 | | | | 948 | |
Socotec, Term Loan, 1st Lien | | | | | | | | |
5.000%, 05/05/28 | | | 695 | | | | 694 | |
Spin Holdco Inc., Initial Term Loan, 1st Lien | | | | | | | | |
4.750%, VAR LIBOR + 4.000%, 03/04/28 | | | 853 | | | | 855 | |
St. George’s University Scholastic Services LLC, Term Loan B, 1st Lien | | | | | | | | |
0.000%, 06/29/28(G) | | | 630 | | | | 629 | |
St. George’s University Scholastic Services LLC, Term Loan, 1st Lien | | | | | | | | |
3.340%, VAR LIBOR + 3.250%, 07/17/25 | | | 465 | | | | 463 | |
Summer (BC) Bidco B LLC, Additional Facility B2 (USD), 1st Lien | | | | | | | | |
5.250%, VAR LIBOR + 4.500%, 12/04/26 | | | 800 | | | | 800 | |
Titan Acquisitionco New Zealand Limited, 2020 Refinancing Term Loan, 1st Lien | | | | | | | | |
4.132%, VAR LIBOR + 4.000%, 05/01/26 | | | 336 | | | | 335 | |
Travelport Finance (Luxembourg) S.a r.l., Initial Term Loan (Priority), 1st Lien | | | | | | | | |
2.500%, VAR LIBOR + 1.500%, 02/28/25 | | | 1,016 | | | | 1,053 | |
Travelport Finance (Luxembourg) S.a r.l., Term Loan, 1st Lien | | | | | | | | |
0.898%, 05/29/26 | | | 707 | | | | 606 | |
United Talent, Term Loan B, 1st Lien | | | | | | | | |
4.750%, 07/07/28 | | | 335 | | | | 332 | |
Ventia (LS Deco LLC Leighton) Term Loan B | | | | | | | | |
5.000%, VAR LIBOR + 3.500%, 05/21/22 | | | 3,388 | | | | 3,400 | |
Webhelp, Term Loan, 1st Lien | | | | | | | | |
0.000%, 07/28/28(G) | | | 2,000 | | | | 2,313 | |
0.000%, 07/28/28(G) | | | 910 | | | | 907 | |
Weld North Education, Cov-Lite Term Loan, 1st Lien | | | | | | | | |
0.000%, 12/21/27(G) | | | 557 | | | | 557 | |
WIN Waste Innovations Holdings Inc., Initial Term Loan, 1st Lien | | | | | | | | |
3.250%, VAR LIBOR + 2.750%, 03/24/28 | | | 1,595 | | | | 1,593 | |
WW International, Inc., Initial Term Loan, 1st Lien | | | | | | | | |
4.000%, VAR LIBOR + 3.500%, 04/13/28 | | | 984 | | | | 983 | |
| | | | | | | | | | | | | |
Total Service | | | | | | | 56,094 | |
| | | | | | | | | | | | | |
Shipping [0.0%] |
PS Logistics LLC Term Loan | | | | | | | | |
6.750%, VAR LIBOR + 4.750%, 03/06/25 | | | 764 | | | | 763 | |
Worldwide Express/GlobalTranz, Term Loan, 2nd Lien | | | | | | | | |
7.750%, 07/26/29 | | | 350 | | | | 346 | |
WWEX UNI TopCo Holdings, LLC, Initial Term Loan, 1st Lien | | | | | | | | |
5.000%, VAR LIBOR + 4.250%, 07/26/28 | | | 380 | | | | 381 | |
| | | | | | | | | | | | | |
Total Shipping | | | | | | | 1,490 | |
| | | | | | | | | | | | | |
Software & Service [0.1%] |
Dedalus, Term Loan, 1st Lien | | | | | | | | |
3.750%, 05/04/27 | | | 2,500 | | | | 2,891 | |
See accompanying notes to financial statements.
CITY NATIONAL ROCHDALE FUNDS | PAGE 119
consolidated schedule of investments |
September 30, 2021 |
City National Rochdale Fixed Income Opportunities Fund (continued) |
Description | | Face Amount (000)(1) | | | Value (000) | |
Inovie Group, Term Loan, 1st Lien | | | | | | | | |
3.750%, 03/03/28 | | $ | 1,000 | | | $ | 1,158 | |
| | | | | | | | | | | | | |
Total Software & Service | | | | | | | 4,049 | |
| | | | | | | | | | | | | |
Surface transport [0.1%] |
Silk Bidco AS, Facility B, 1st Lien | | | | | | | | |
4.000%, VAR Euribor + 4.000%, 02/24/25 | | EUR | 2,500 | | | | 2,734 | |
| | | | | | | | | | | | | |
Technology [0.4%] |
Bock Capital Bidco BV, Term Loan, 1st Lien | | | | | | | | |
4.000%, 04/28/28 | | | 2,000 | | | | 2,320 | |
Gfk SE, Term Loan B-1, 1st Lien | | | | | | | | |
3.750%, 04/21/28 | | | 1,500 | | | | 1,740 | |
Helios Software Hold, Term Loan, 1st Lien | | | | | | | | |
3.750%, 03/05/28 | | | 1,322 | | | | 1,529 | |
Mermaid Bidco, Term Loan, 1st Lien | | | | | | | | |
3.750%, 12/22/27 | | | 1,000 | | | | 1,159 | |
Paysafe Holdings, Term Loan, 1st Lien | | | | | | | | |
3.000%, 06/09/28 | | | 1,000 | | | | 1,138 | |
Philips DA, Term Loan, 1st Lien | | | | | | | | |
0.000%, 06/09/28(G) | | | 1,500 | | | | 1,734 | |
Sitel Group, Term Loan, 1st Lien | | | | | | | | |
0.000%, 07/28/28(G) | | | 2,500 | | | | 2,896 | |
Technicolor, Term Loan, 1st Lien | | | | | | | | |
12.235%, 06/03/24 | | | 796 | | | | 842 | |
6.000%, 06/03/24 | | | 538 | | | | 660 | |
6.000%, 06/03/24 | | | 621 | | | | 768 | |
| | | | | | | | | | | | | |
Total Technology | | | | | | | 14,786 | |
| | | | | | | | | | | | | |
Telecommunications [0.7%] |
Altice France S.A. (Ypso France SAS), EUR TLB-11 Term Loan, 1st Lien | | | | | | | | |
3.000%, VAR Euribor + 3.000%, 07/31/25 | | EUR | 2,394 | | | | 2,715 | |
Circet Group Circet (Odyssey Investissement) | | | | | | | | |
3.250%, 04/28/25 | | EUR | 2,000 | | | | 2,311 | |
Connect Finco Sarl, Amendment No. 1 Refinancing Term Loan, 1st Lien | | | | | | | | |
4.500%, VAR LIBOR + 3.500%, 12/11/26 | | | 2,044 | | | | 2,045 | |
Consolidated Communications, Inc., Term Loan B-1 | | | | | | | | |
4.250%, 10/02/27 | | | 785 | | | | 786 | |
Frontier Communications Holdings, LLC, TLB, 1st Lien | | | | | | | | |
4.500%, VAR LIBOR + 3.750%, 05/01/28 | | | 599 | | | | 597 | |
Greeneden U.S. Holdings I, LLC, Initial Euro Term Loan (2020), 1st Lien | | | | | | | | |
4.250%, VAR Euribor + 4.250%, 10/08/27 | | | 995 | | | | 1,156 | |
Level 3 Financing, Inc., Tranche B 2027 Term Loan, 1st Lien | | | | | | | | |
1.834%, VAR LIBOR + 1.750%, 03/01/27 | | | 859 | | | | 848 | |
Lorca Holdco Limited, Facility B, 1st Lien | | | | | | | | |
4.250%, VAR Euribor + 4.250%, 09/17/27 | | | 2,500 | | | | 2,898 | |
Lumen Technologies Inc., Term B Loan, 1st Lien | | | | | | | | |
2.335%, VAR LIBOR + 2.250%, 03/15/27 | | | 1,550 | | | | 1,532 | |
MetroNet Systems Holdings, LLC, 2021 Term Loan, 1st Lien | | | | | | | | |
4.500%, VAR LIBOR + 3.750%, 06/02/28 | | | 606 | | | | 606 | |
Neustar Term Loan B-4 | | | | | | | | |
4.500%, VAR LIBOR + 3.500%, 08/08/24 | | | 1,526 | | | | 1,526 | |
Neustar Term Loan B-5 | | | | | | | | |
5.500%, 08/08/24 | | | 288 | | | | 287 | |
Numericable U.S. LLC (SFR) Term Loan B-13 | | | | | | | | |
4.125%, VAR LIBOR + 4.000%, 08/14/26 | | | 2,231 | | | | 2,221 | |
Numericable U.S. LLC, USD TLB-[12] Term Loan, 1st Lien | | | | | | | | |
3.814%, VAR LIBOR + 3.688%, 01/31/26 | | | 2,352 | | | | 2,330 | |
See accompanying notes to financial statements.
CITY NATIONAL ROCHDALE FUNDS | PAGE 120
consolidated schedule of investments |
September 30, 2021 |
City National Rochdale Fixed Income Opportunities Fund (continued) |
Description | | Face Amount (000)(1) | | | Value (000) | |
Numericable U.S. LLC, USD TLB-11 Term Loan, 1st Lien | | | | | | | | |
2.879%, VAR LIBOR + 2.750%, 07/31/25 | | $ | 742 | | | $ | 729 | |
Windstream Services II, LLC, Initial Term Loan, 1st Lien | | | | | | | | |
7.250%, VAR LIBOR + 6.250%, 09/21/27 | | | 1,156 | | | | 1,160 | |
Xplornet, Term Loan, 1st Lien | | | | | | | | |
0.000%, 09/30/28(G) | | | 810 | | | | 809 | |
Zacapa (Ufinet), Term Loan B | | | | | | | | |
4.632%, VAR LIBOR + 4.500%, 07/02/25 | | | 1,740 | | | | 1,748 | |
Ziggo B.V., Term Loan H Facility, 1st Lien | | | | | | | | |
3.000%, VAR Euribor + 3.000%, 01/31/29 | | EUR | 3,000 | | | | 3,435 | |
| | | | | | | | | | | | | |
Total Telecommunications | | | | | | | 29,739 | |
| | | | | | | | | | | | | |
Transportation [0.1%] |
Dexko Global, Term Loan B, 1st Lien | | | | | | | | |
0.000%, 09/22/28(G) | | | 752 | | | | 751 | |
Dexko Global, Term Loan, 1st Lien | | | | | | | | |
0.000%, 09/22/28(G) | | | 904 | | | | 1,045 | |
0.000%, 09/22/28(G) | | | 143 | | | | 143 | |
0.000%, 09/22/28(G) | | | 96 | | | | 111 | |
Pilot Travel Centers, LLC, Initial Tranche B Term Loan, 1st Lien | | | | | | | | |
0.102%, 08/04/28 | | | 1,285 | | | | 1,280 | |
Superior Industries, Closing Date Term Loan | | | | | | | | |
4.085%, VAR LIBOR + 4.000%, 05/22/24 | | | 909 | | | | 904 | |
Wabash National, Term Loan B, 1st Lien | | | | | | | | |
4.000%, 09/17/27 | | | 798 | | | | 797 | |
| | | | | | | | | | | | | |
Total Transportation | | | | | | | 5,031 | |
| | | | | | | | | | | | | |
Utility [0.4%] |
Calpine Term Loan B-9 | | | | | | | | |
2.090%, VAR LIBOR + 2.000%, 04/05/26 | | | 1,183 | | | | 1,169 | |
Centuri Group, Term Loan B, 1st Lien | | | | | | | | |
3.000%, 08/27/28 | | | 535 | | | | 534 | |
Eastern Power, LLC (Eastern Covert Midco, LLC), Term Loan, 1st Lien | | | | | | | | |
4.750%, VAR LIBOR + 3.750%, 10/02/25 | | | 1,703 | | | | 1,512 | |
GGP (Brookfield Residential Property) Term Loan, 1st Lien | | | | | | | | |
3.250%, 08/01/25(F) | | | 2,031 | | | | 2,015 | |
Granite Generation LLC, Term Loan, 1st Lien | | | | | | | | |
4.750%, VAR LIBOR + 3.750%, 11/09/26 | | | 2,751 | | | | 2,700 | |
Invenergy Thermal Operating I LLC, Term Loan B | | | | | | | | |
3.084%, VAR LIBOR + 3.000%, 08/28/25 | | | 884 | | | | 870 | |
Longview Power LLC, Term Loan | | | | | | | | |
11.500%, 04/14/25 | | | 436 | | | | 438 | |
MGroup Term Loan B | | | | | | | | |
4.824%, 07/25/25 | | GBP | 2,700 | | | | 3,529 | |
Talen Energy Supply Term Loan B (2019) | | | | | | | | |
3.835%, 06/26/26 | | | 2,365 | | | | 2,201 | |
| | | | | | | | | | | | | |
Total Utility | | | | | | | 14,968 | |
| | | | | | | | | | | | | |
Wireless Communications [0.1%] |
CCI Buyer, Inc., Initial Term Loan, 1st Lien | | | | | | | | |
4.500%, VAR LIBOR + 3.750%, 12/17/27 | | | 998 | | | | 1,000 | |
Crown Subsea Communications Holding, Inc. , Initial Term Loan, 1st Lien | | | | | | | | |
5.750%, VAR LIBOR + 5.000%, 04/27/27 | | | 721 | | | | 725 | |
Iridium Satellite LLC, Term B-2 Loan, 1st Lien | | | | | | | | |
3.250%, VAR LIBOR + 2.500%, 11/04/26 | | | 757 | | | | 757 | |
Orbcomm Inc., Closing Date Term Loan, 1st Lien | | | | | | | | |
5.000%, VAR LIBOR + 4.250%, 09/01/28 | | | 300 | | | | 300 | |
| | | | | | | | | | | | | |
Total Wireless Communications | | | 2,782 | |
| | | | | | | | | | | | | |
Total Loan Participations | | | | |
(Cost $745,382) | | | | | | | 741,590 | |
| | | | | | | | | | | | | |
See accompanying notes to financial statements.
CITY NATIONAL ROCHDALE FUNDS | PAGE 121
consolidated schedule of investments |
September 30, 2021 |
City National Rochdale Fixed Income Opportunities Fund (continued) |
Description | | Face Amount (000)(1) | | | Value (000) | |
Mortgage-Backed Securities [10.0%] |
522 Funding CLO, Ser 2021-7A, Cl E | | | | | | | | |
6.420%, VAR ICE LIBOR USD 3 Month + 6.220%, 04/23/34(A) | | $ | 1,700 | | | $ | 1,663 | |
Anchorage Capital Europe CLO DAC, Ser 2021-4X, Cl E | | | | | | | | |
5.710%, VAR Euribor 3 Month + 5.710%, 04/25/34 | | EUR | 1,000 | | | | 1,138 | |
Arbour CLO VII DAC, Ser 2020-7X, Cl E | | | | | | | | |
6.400%, VAR Euribor 3 Month + 6.400%, 03/15/33 | | EUR | 3,500 | | | | 4,041 | |
Ares European CLO VIII DAC, Ser 2019-8X, Cl ER | | | | | | | | |
6.320%, VAR Euribor 3 Month + 6.320%, 04/17/32 | | EUR | 1,500 | | | | 1,736 | |
Ares European CLO XIII BV, Ser 2020-13X, Cl E | | | | | | | | |
6.350%, VAR Euribor 3 Month + 6.350%, 07/20/32 | | EUR | 3,250 | | | | 3,757 | |
Armada Euro CLO I DAC, Ser 2021-1X, Cl ER | | | | | | | | |
6.090%, VAR Euribor 3 Month + 6.090%, 10/24/33 | | EUR | 850 | | | | 980 | |
Armada Euro CLO II DAC, Ser 2018-2X, Cl E | | | | | | | | |
4.820%, VAR Euribor 3 Month + 4.820%, 11/15/31 | | EUR | 1,500 | | | | 1,669 | |
Armada Euro CLO II DAC, Ser 2018-2X, Cl F | | | | | | | | |
6.450%, VAR Euribor 3 Month + 6.450%, 11/15/31 | | EUR | 1,000 | | | | 1,044 | |
Armada Euro CLO V DAC, Ser 2021-5X, Cl D | | | | | | | | |
3.130%, VAR Euribor 3 Month + 3.130%, 07/28/34 | | EUR | 900 | | | | 1,040 | |
Aurium CLO II DAC, Ser 2021-2X, Cl ERR | | | | | | | | |
6.080%, VAR Euribor 3 Month + 6.080%, 06/22/34 | | EUR | 2,055 | | | | 2,345 | |
Aurium CLO VII DAC, Ser 2021-7X, Cl E | | | | | | | | |
5.860%, VAR Euribor 3 Month + 5.860%, 05/15/34 | | EUR | 2,125 | | | | 2,428 | |
BABSN, Ser 2018-IA, Cl ER | | | | | | | | |
5.634%, VAR ICE LIBOR USD 3 Month + 5.500%, 01/20/31(A) | | | 2,000 | | | | 1,846 | |
Bain Capital Euro CLO DAC, Ser 2018-1X, Cl E | | | | | | | | |
4.970%, VAR Euribor 3 Month + 4.970%, 04/20/32 | | EUR | 1,690 | | | | 1,746 | |
Barings CLO 2019-III, Ser 2021-3A, Cl ER | | | | | | | | |
6.834%, VAR ICE LIBOR USD 3 Month + 6.700%, 04/20/31(A) | | | 1,500 | | | | 1,496 | |
Barings Euro CLO BV, Ser 2018-1X, Cl C | | | | | | | | |
1.500%, VAR Euribor 3 Month + 1.500%, 04/15/31 | | EUR | 1,100 | | | | 1,250 | |
Barings Euro CLO BV, Ser 2018-1X, Cl E | | | | | | | | |
4.120%, VAR Euribor 3 Month + 4.120%, 04/15/31 | | EUR | 4,275 | | | | 4,573 | |
Barings Euro CLO BV, Ser 2018-2X, Cl E | | | | | | | | |
5.050%, VAR Euribor 3 Month + 5.050%, 10/15/31 | | EUR | 3,000 | | | | 3,359 | |
Barings Euro CLO BV, Ser 2018-3X, Cl E | | | | | | | | |
5.790%, VAR Euribor 3 Month + 5.790%, 07/27/31 | | EUR | 2,900 | | | | 3,282 | |
Barings Euro CLO DAC, Ser 2020-2X, Cl E | | | | | | | | |
6.500%, VAR Euribor 3 Month + 6.500%, 07/24/32 | | EUR | 2,475 | | | | 2,832 | |
Battalion CL XVIII, Ser 2020-18A, Cl E | | | | | | | | |
8.066%, VAR ICE LIBOR USD 3 Month + 7.940%, 10/15/32(A) (D) | | | 2,000 | | | | 1,995 | |
See accompanying notes to financial statements.
CITY NATIONAL ROCHDALE FUNDS | PAGE 122
consolidated schedule of investments |
September 30, 2021 |
City National Rochdale Fixed Income Opportunities Fund (continued) |
Description | | Face Amount (000)(1) | | | Value (000) | |
Battalion CLO X, Ser 2021-10A, Cl DR2 | | | | | | | | |
6.735%, VAR ICE LIBOR USD 3 Month + 6.610%, 01/25/35(A) | | $ | 2,750 | | | $ | 2,743 | |
Battalion Clo XIV, Ser 2019-14A, Cl E | | | | | | | | |
6.814%, VAR ICE LIBOR USD 3 Month + 6.680%, 04/20/32(A) | | | 3,450 | | | | 3,443 | |
Birch Grove CLO 2, Ser 2021-2A, Cl E | | | | | | | | |
7.064%, VAR ICE LIBOR USD 3 Month + 6.950%, 10/19/34(A) | | | 1,750 | | | | 1,715 | |
Black Diamond CLO, Ser 2017-1A, Cl C | | | | | | | | |
4.075%, VAR ICE LIBOR USD 3 Month + 3.950%, 04/24/29(A) | | | 3,000 | | | | 2,949 | |
Black Diamond CLO DAC, Ser 2015-1X, Cl F | | | | | | | | |
6.500%, VAR Euribor 3 Month + 6.500%, 10/03/29 | | EUR | 1,220 | | | | 1,324 | |
Black Diamond CLO DAC, Ser 2018-1X, Cl DR | | | | | | | | |
2.650%, VAR Euribor 3 Month + 2.650%, 10/03/29 | | EUR | 5,000 | | | | 5,784 | |
Black Diamond CLO DAC, Ser 2019-1X, Cl D | | | | | | | | |
4.100%, VAR Euribor 3 Month + 4.100%, 05/15/32 | | EUR | 3,000 | | | | 3,396 | |
Blackrock European CLO DAC, Ser 2018-1X, Cl ER | | | | | | | | |
4.420%, VAR Euribor 3 Month + 4.420%, 03/15/31 | | EUR | 3,000 | | | | 3,274 | |
Blackrock European CLO DAC, Ser 2018-1X, Cl FR | | | | | | | | |
6.600%, VAR Euribor 3 Month + 6.600%, 03/15/31 | | EUR | 1,750 | | | | 1,913 | |
Blackrock European Clo III Designated Activity, Ser 2021-3X, Cl ER | | | | | | | | |
6.130%, VAR Euribor 3 Month + 6.130%, 07/19/35 | | EUR | 3,000 | | | | 3,397 | |
Blackrock European CLO IX DAC, Ser 2019-9X, Cl F | | | | | | | | |
8.920%, VAR Euribor 3 Month + 8.920%, 12/15/32 | | EUR | 1,250 | | | | 1,419 | |
Bosphorus CLO IV DAC, Ser 2018-4X, Cl E | | | | | | | | |
4.630%, VAR Euribor 3 Month + 4.630%, 12/15/30 | | EUR | 2,000 | | | | 2,233 | |
Bosphorus CLO VI DAC, Ser 2021-6X, Cl E | | | | | | | | |
5.800%, VAR Euribor 3 Month + 5.800%, 05/25/34 | | EUR | 2,500 | | | | 2,840 | |
Cairn CLO VIII BV, Ser 2017-8X, Cl E | | | | | | | | |
5.050%, VAR Euribor 3 Month + 5.050%, 10/30/30 | | EUR | 2,000 | | | | 2,231 | |
Cairn CLO XI DAC, Ser 2019-11X, Cl E | | | | | | | | |
6.770%, VAR Euribor 3 Month + 6.770%, 07/15/35 | | EUR | 5,850 | | | | 6,769 | |
Carlyle Euro CLO DAC, Ser 2017-3X, Cl D | | | | | | | | |
4.580%, VAR Euribor 3 Month + 4.580%, 01/15/31 | | EUR | 2,000 | | | | 2,167 | |
Carlyle Euro CLO DAC, Ser 2021-2X, Cl CR | | | | | | | | |
3.500%, VAR Euribor 3 Month + 3.500%, 08/15/32 | | EUR | 1,300 | | | | 1,505 | |
Carlyle Global Market Strategies CLO, Ser 2018-4RA, Cl C | | | | | | | | |
3.026%, VAR ICE LIBOR USD 3 Month + 2.900%, 07/15/30(A) | | | 1,800 | | | | 1,705 | |
Carlyle Global Market Strategies Euro CLO, Ser 2020-1X, Cl DR | | | | | | | | |
5.500%, VAR Euribor 3 Month + 5.500%, 01/16/33 | | EUR | 2,000 | | | | 2,230 | |
Carlyle Global Market Strategies Euro CLO DAC, Ser 2018-1X, Cl ER | | | | | | | | |
4.930%, VAR Euribor 3 Month + 4.930%, 07/15/31 | | EUR | 3,300 | | | | 3,695 | |
See accompanying notes to financial statements.
CITY NATIONAL ROCHDALE FUNDS | PAGE 123
consolidated schedule of investments |
September 30, 2021 |
City National Rochdale Fixed Income Opportunities Fund (continued) |
Description | | Face Amount (000)(1) | | | Value (000) | |
Carlyle Global Market Strategies Euro CLO DAC, Ser 2018-3X, Cl DR | | | | | | | | |
4.580%, VAR Euribor 3 Month + 4.580%, 01/25/32 | | EUR | 2,400 | | | $ | 2,659 | |
Catamaran CLO, Ser 2018-1A, Cl E | | | | | | | | |
6.495%, VAR ICE LIBOR USD 3 Month + 6.370%, 10/25/31(A) | | | 3,500 | | | | 3,272 | |
CIFC European Funding CLO IV DAC, Ser 2021-4X, Cl D | | | | | | | | |
3.100%, VAR Euribor 3 Month + 3.100%, 08/18/35 | | EUR | 1,300 | | | | 1,503 | |
Cifc Funding, Ser 2018-4RA, Cl D | | | | | | | | |
5.834%, VAR ICE LIBOR USD 3 Month + 5.700%, 10/17/30(A) | | | 2,200 | | | | 2,139 | |
Crestline Denali CLO XIV, Ser 2018-1A, Cl DR | | | | | | | | |
3.488%, VAR ICE LIBOR USD 3 Month + 3.350%, 10/23/31(A) | | | 2,000 | | | | 1,934 | |
Crestline Denali CLO XVII, Ser 2018-1A, Cl D | | | | | | | | |
3.376%, VAR ICE LIBOR USD 3 Month + 3.250%, 10/15/31(A) | | | 2,250 | | | | 2,186 | |
CRNPT, Ser 2018-4A, Cl D | | | | | | | | |
2.884%, VAR ICE LIBOR USD 3 Month + 2.750%, 04/20/31(A) | | | 3,000 | | | | 2,926 | |
Crown Point CLO 8, Ser 2019-8A, Cl E | | | | | | | | |
7.234%, VAR ICE LIBOR USD 3 Month + 7.100%, 10/20/32(A) | | | 4,000 | | | | 3,967 | |
Crown Point CLO 9, Ser 2021-9A, Cl DR | | | | | | | | |
3.882%, VAR ICE LIBOR USD 3 Month + 3.750%, 07/14/34(A) | | | 2,000 | | | | 1,997 | |
Crown Point CLO 9, Ser 2021-9A, Cl ER | | | | | | | | |
6.892%, VAR ICE LIBOR USD 3 Month + 6.760%, 07/14/34(A) | | | 2,375 | | | | 2,298 | |
CVC Cordatus Loan Fund IV, Ser 2021-4X, Cl ERRR | | | | | | | | |
5.860%, VAR Euribor 3 Month + 5.860%, 02/22/34 | | EUR | 1,200 | | | | 1,397 | |
CVC Cordatus Loan Fund IV, Ser 2021-4X, Cl FRRR | | | | | | | | |
8.060%, VAR Euribor 3 Month + 8.060%, 02/22/34 | | EUR | 615 | | | | 697 | |
CVC Cordatus Loan Fund XVI DAC, Ser 2019-16X, Cl E | | | | | | | | |
6.700%, VAR Euribor 3 Month + 6.700%, 06/17/32 | | EUR | 1,000 | | | | 1,156 | |
Dryden 29 Euro CLO 2013 BV, Ser 2018-29X, Cl ERR | | | | | | | | |
4.750%, VAR Euribor 3 Month + 4.750%, 07/15/32 | | EUR | 911 | | | | 1,024 | |
Dryden 32 Euro CLO 2014 BV, Ser 2018-32X, Cl FR | | | | | | | | |
7.270%, VAR Euribor 3 Month + 7.270%, 08/15/31 | | EUR | 1,250 | | | | 1,385 | |
Dryden 35 EURO CLO 2014 BV, Ser 2020-35X, Cl ER | | | | | | | | |
6.330%, VAR Euribor 3 Month + 6.330%, 01/17/33 | | EUR | 4,200 | | | | 4,840 | |
Dryden 48 Euro CLO 2016 BV, Ser 2019-48X, Cl ER | | | | | | | | |
6.670%, VAR Euribor 3 Month + 6.670%, 10/15/32 | | EUR | 2,640 | | | | 3,051 | |
Dryden 56 Euro CLO 2017 BV, Ser 2017-56X, Cl E | | | �� | | | | | |
4.720%, VAR Euribor 3 Month + 4.720%, 01/15/32 | | EUR | 3,225 | | | | 3,625 | |
Dryden 73 Euro CLO 2019 BV, Ser 2019-73X, Cl E | | | | | | | | |
6.820%, VAR Euribor 3 Month + 6.820%, 01/15/34 | | EUR | 2,000 | | | | 2,305 | |
See accompanying notes to financial statements.
CITY NATIONAL ROCHDALE FUNDS | PAGE 124
consolidated schedule of investments |
September 30, 2021 |
City National Rochdale Fixed Income Opportunities Fund (continued) |
Description | | Face Amount (000)(1) | | | Value (000) | |
Elevation CLO, Ser 2019-1A, Cl D1R2 | | | | | | | | |
7.775%, VAR ICE LIBOR USD 3 Month + 7.650%, 08/15/32(A) | | $ | 2,210 | | | $ | 2,214 | |
Euro-Galaxy III CLO DAC, Ser 2021-3X, Cl FRRR | | | | | | | | |
7.980%, VAR Euribor 3 Month + 7.980%, 04/24/34 | | EUR | 500 | | | | 566 | |
Euro-Galaxy IV CLO BV, Ser 2021-4X, Cl DRR | | | | | | | | |
3.050%, VAR Euribor 3 Month + 3.050%, 07/30/34 | | EUR | 1,120 | | | | 1,294 | |
Euro-Galaxy IV CLO BV, Ser 2021-4X, Cl ERR | | | | | | | | |
6.070%, VAR Euribor 3 Month + 6.070%, 07/30/34 | | EUR | 2,250 | | | | 2,544 | |
Euro-Galaxy V CLO BV, Ser 2021-5X, Cl ERR | | | | | | | | |
5.820%, VAR Euribor 3 Month + 5.820%, 02/15/34 | | EUR | 1,350 | | | | 1,541 | |
Euro-Galaxy VII CLO DAC, Ser 2021-7X, Cl ER | | | | | | | | |
6.200%, VAR Euribor 3 Month + 6.200%, 07/25/35 | | EUR | 3,000 | | | | 3,397 | |
GoldenTree Loan Management EUR CLO 3 DAC, Ser 2019-3X, Cl E | | | | | | | | |
5.910%, VAR Euribor 3 Month + 5.910%, 01/20/32 | | EUR | 3,550 | | | | 4,103 | |
Greywolf CLO II, Ser 2021-1A, Cl DRR | | | | | | | | |
7.176%, VAR ICE LIBOR USD 3 Month + 7.050%, 04/15/34(A) | | | 3,000 | | | | 2,969 | |
Greywolf CLO III, Ser 2020-3RA, Cl DR | | | | | | | | |
7.058%, VAR ICE LIBOR USD 3 Month + 6.920%, 04/15/33(A) | | | 5,000 | | | | 4,998 | |
Halsey Point CLO I, Ser 2019-1A, Cl E | | | | | | | | |
7.834%, VAR ICE LIBOR USD 3 Month + 7.700%, 01/20/33(A) | | | 2,000 | | | | 2,005 | |
HalseyPoint CLO 3, Ser 2020-3A, Cl E | | | | | | | | |
8.469%, VAR ICE LIBOR USD 3 Month + 8.340%, 11/30/32(A) | | | 1,500 | | | | 1,508 | |
Harvest CLO IX DAC, Ser 2017-9X, Cl ER | | | | | | | | |
5.120%, VAR Euribor 3 Month + 5.120%, 02/15/30 | | EUR | 1,000 | | | | 1,107 | |
Harvest CLO VIII DAC, Ser 2018-8X, Cl DRR | | | | | | | | |
2.550%, VAR Euribor 3 Month + 2.550%, 01/15/31 | | EUR | 1,800 | | | | 2,042 | |
Harvest CLO XIV DAC, Ser 2015-14X, Cl F | | | | | | | | |
6.300%, VAR Euribor 3 Month + 6.300%, 11/18/29 | | EUR | 3,250 | | | | 3,625 | |
Harvest CLO XVI DAC, Ser 2018-16X, Cl ER | | | | | | | | |
5.570%, VAR Euribor 3 Month + 5.570%, 10/15/31 | | EUR | 3,000 | | | | 3,331 | |
Harvest CLO XXII DAC, Ser 2019-22X, Cl E | | | | | | | | |
6.110%, VAR Euribor 3 Month + 6.110%, 01/15/32 | | EUR | 1,500 | | | | 1,692 | |
Harvest CLO XXIII DAC, Ser 2020-23X, Cl F | | | | | | | | |
8.310%, VAR Euribor 3 Month + 8.310%, 10/20/32 | | EUR | 1,500 | | | | 1,694 | |
Hayfin Emerald CLO IV DAC, Ser 2021-4X, Cl DR | | | | | | | | |
3.450%, VAR Euribor 3 Month + 3.450%, 10/15/34 | | EUR | 1,855 | | | | 2,147 | |
Holland Park CLO DAC, Ser 2019-1X, Cl DRR | | | | | | | | |
7.030%, VAR Euribor 3 Month + 7.030%, 11/14/32 | | EUR | 2,300 | | | | 2,663 | |
ICG Euro CLO DAC, Ser 2021-1X, Cl E | | | | | | | | |
6.460%, VAR Euribor 3 Month + 6.460%, 10/15/34 | | EUR | 2,000 | | | | 2,269 | |
See accompanying notes to financial statements.
CITY NATIONAL ROCHDALE FUNDS | PAGE 125
consolidated schedule of investments |
September 30, 2021 |
City National Rochdale Fixed Income Opportunities Fund (continued) |
Description | | Face Amount (000)(1) | | | Value (000) | |
ICG Euro CLO DAC, Ser 2021-1X, Cl F | | | | | | | | |
8.820%, VAR Euribor 3 Month + 8.820%, 10/15/34 | | EUR | 1,000 | | | $ | 1,118 | |
Jamestown CLO XIV, Ser 2019-14A, Cl D | | | | | | | | |
7.174%, VAR ICE LIBOR USD 3 Month + 7.040%, 10/20/32(A) | | | 3,600 | | | | 3,591 | |
Jamestown CLO XVI, Ser 2021-16A, Cl D | | | | | | | | |
3.775%, VAR ICE LIBOR USD 3 Month + 3.650%, 07/25/34(A) | | | 2,000 | | | | 1,997 | |
Jamestown CLO XVI, Ser 2021-16A, Cl E | | | | | | | | |
7.285%, VAR ICE LIBOR USD 3 Month + 7.160%, 07/25/34(A) | | | 1,000 | | | | 980 | |
KKR CLO 14, Ser 2018-14, Cl ER | | | | | | | | |
6.276%, VAR ICE LIBOR USD 3 Month + 6.150%, 07/15/31(A) | | | 2,000 | | | | 1,944 | |
KKR CLO 26, Ser 2021-26, Cl ER | | | | | | | | |
0.000%, 10/15/34(A) (F) | | | 3,000 | | | | 2,961 | |
KVK CLO, Ser 2021-1A, Cl ER2 | | | | | | | | |
0.000%, 10/15/34(A) (F) | | | 2,000 | | | | 1,975 | |
KVK CLO, Ser 2021-1A, Cl FR2 | | | | | | | | |
0.000%, 10/15/34(A) (F) | | | 1,000 | | | | 900 | |
Laurelin DAC, Ser 2018-1X, Cl ER | | | | | | | | |
5.430%, VAR Euribor 3 Month + 5.430%, 10/20/31 | | EUR | 5,000 | | | | 5,539 | |
LCM 33, Ser 2021-33A, Cl D | | | | | | | | |
3.312%, VAR ICE LIBOR USD 3 Month + 3.200%, 07/20/34(A) | | | 1,625 | | | | 1,620 | |
Madison Park Euro Funding VII BV, Ser 2018-7X, Cl ER | | | | | | | | |
4.700%, VAR Euribor 3 Month + 4.700%, 05/25/31 | | EUR | 1,150 | | | | 1,285 | |
Madison Park Euro Funding VIII DAC, Ser 2019-8X, Cl ER | | | | | | | | |
7.150%, VAR Euribor 3 Month + 7.150%, 04/15/32 | | EUR | 2,500 | | | | 2,888 | |
Madison Park Euro Funding XI DAC, Ser 2018-11X, Cl D | | | | | | | | |
2.800%, VAR Euribor 3 Month + 2.800%, 02/15/31 | | EUR | 3,000 | | | | 3,456 | |
Madison Park Euro Funding XI DAC, Ser 2018-11X, Cl E | | | | | | | | |
4.860%, VAR Euribor 3 Month + 4.860%, 02/15/31 | | EUR | 3,650 | | | | 4,043 | |
Madison Park Euro Funding XII DAC, Ser 2018-12X, Cl E | | | | | | | | |
5.200%, VAR Euribor 3 Month + 5.200%, 10/15/31 | | EUR | 3,000 | | | | 3,433 | |
Madison Park Euro Funding XII DAC, Ser 2018-12X, Cl EN | | | | | | | | |
5.200%, VAR Euribor 3 Month + 5.200%, 10/15/31 | | EUR | 151 | | | | 173 | |
Madison Park Funding XI, Ser 2017-11A, Cl ER | | | | | | | | |
6.588%, VAR ICE LIBOR USD 3 Month + 6.450%, 07/23/29(A) | | | 3,500 | | | | 3,481 | |
Madison Park Funding XXXII, Ser 2021-32A, Cl ER | | | | | | | | |
6.338%, VAR ICE LIBOR USD 3 Month + 6.200%, 01/22/31(A) | | | 3,000 | | | | 2,992 | |
Man GLG Euro CLO I DAC, Ser 2018-1X, Cl ERR | | | | | | | | |
4.850%, VAR Euribor 3 Month + 4.850%, 10/15/30 | | EUR | 1,500 | | | | 1,554 | |
Man GLG Euro CLO II DAC, Ser 2016-2X, Cl F | | | | | | | | |
8.750%, VAR Euribor 3 Month + 8.750%, 01/15/30 | | EUR | 2,000 | | | | 2,150 | |
See accompanying notes to financial statements.
CITY NATIONAL ROCHDALE FUNDS | PAGE 126
consolidated schedule of investments |
September 30, 2021 |
City National Rochdale Fixed Income Opportunities Fund (continued) |
Description | | Face Amount (000)(1) | | | Value (000) | |
Man GLG Euro CLO V DAC, Ser 2018-5X, Cl E | | | | | | | | |
5.860%, VAR Euribor 3 Month + 5.860%, 12/15/31 | | EUR | 900 | | | $ | 1,008 | |
Man GLG Euro CLO VI DAC, Ser 2020-6X, Cl E | | | | | | | | |
5.390%, VAR Euribor 3 Month + 5.390%, 10/15/32 | | EUR | 1,300 | | | | 1,419 | |
Marble Point CLO XII, Ser 2018-1A, Cl D | | | | | | | | |
3.126%, VAR ICE LIBOR USD 3 Month + 3.000%, 07/16/31(A) | | | 5,000 | | | | 4,757 | |
MidOcean Credit CLO III, Ser 2018-3A, Cl DR | | | | | | | | |
3.394%, VAR ICE LIBOR USD 3 Month + 3.260%, 04/21/31(A) | | | 1,500 | | | | 1,403 | |
Midocean Credit CLO IX, Ser 2018-9A, Cl E | | | | | | | | |
6.184%, VAR ICE LIBOR USD 3 Month + 6.050%, 07/20/31(A) | | | 1,000 | | | | 957 | |
Mountain View CLO, Ser 2018-9A, Cl CR | | | | | | | | |
3.246%, VAR ICE LIBOR USD 3 Month + 3.120%, 07/15/31(A) | | | 2,500 | | | | 2,412 | |
Northwoods Capital 20, Ser 2021-20A, Cl ER | | | | | | | | |
7.975%, VAR ICE LIBOR USD 3 Month + 7.850%, 01/25/32(A) | | | 2,438 | | | | 2,421 | |
Northwoods Capital 21 Euro DAC, Ser 2021-21X, Cl DR | | | | | | | | |
3.250%, VAR Euribor 3 Month + 3.250%, 07/22/34 | | EUR | 1,375 | | | | 1,587 | |
Northwoods Capital 21 Euro DAC, Ser 2021-21X, Cl ER | | | | | | | | |
6.060%, VAR Euribor 3 Month + 6.060%, 07/22/34 | | EUR | 2,300 | | | | 2,651 | |
Northwoods Capital 21 Euro DAC, Ser 2021-21X, Cl FR | | | | | | | | |
8.630%, VAR Euribor 3 Month + 8.630%, 07/22/34 | | EUR | 3,230 | | | | 3,604 | |
Northwoods Capital 22, Ser 2020-22A, Cl E | | | | | | | | |
8.940%, VAR ICE LIBOR USD 3 Month + 8.820%, 09/01/31(A) | | | 5,000 | | | | 5,049 | |
Northwoods Capital 25, Ser 2021-25A, Cl D | | | | | | | | |
3.874%, VAR ICE LIBOR USD 3 Month + 3.750%, 07/20/34(A) | | | 2,000 | | | | 1,997 | |
Northwoods Capital 25, Ser 2021-25A, Cl E | | | | | | | | |
7.264%, VAR ICE LIBOR USD 3 Month + 7.140%, 07/20/34(A) | | | 2,000 | | | | 1,916 | |
Northwoods Capital XV, Ser 2021-15A, Cl ER | | | | | | | | |
7.762%, VAR ICE LIBOR USD 3 Month + 7.640%, 06/20/34(A) | | | 2,000 | | | | 1,936 | |
Oak Hill European Credit Partners IV Designated Activity, Ser 2018-4X, Cl DR | | | | | | | | |
2.500%, VAR Euribor 3 Month + 2.500%, 01/20/32 | | EUR | 3,000 | | | | 3,428 | |
OAK Hill European Credit Partners V Designated Activity, Ser 2017-5X, Cl E | | | | | | | | |
6.200%, VAR Euribor 3 Month + 6.200%, 02/21/30 | | EUR | 1,500 | | | | 1,720 | |
OAK Hill European Credit Partners V Designated Activity, Ser 2017-5X, Cl F | | | | | | | | |
7.300%, VAR Euribor 3 Month + 7.300%, 02/21/30 | | EUR | 1,100 | | | | 1,237 | |
OAK Hill European Credit Partners VIII DAC, Ser 2021-8X, Cl D | | | | | | | | |
3.500%, VAR Euribor 3 Month + 3.500%, 04/18/35 | | EUR | 960 | | | | 1,118 | |
OAK Hill European Credit Partners VIII DAC, Ser 2021-8X, Cl E | | | | | | | | |
5.670%, VAR Euribor 3 Month + 5.670%, 04/18/35 | | EUR | 4,455 | | | | 5,048 | |
See accompanying notes to financial statements.
CITY NATIONAL ROCHDALE FUNDS | PAGE 127
consolidated schedule of investments |
September 30, 2021 |
City National Rochdale Fixed Income Opportunities Fund (continued) |
Description | | Face Amount (000)(1) | | | Value (000) | |
Ocean Trails CLO 8, Ser 2021-8A, Cl DR | | | | | | | | |
3.881%, VAR ICE LIBOR USD 3 Month + 3.750%, 07/15/34(A) | | $ | 2,000 | | | $ | 1,997 | |
Ocean Trails CLO 8, Ser 2021-8A, Cl ER | | | | | | | | |
7.581%, VAR ICE LIBOR USD 3 Month + 7.450%, 07/15/34(A) | | | 1,000 | | | | 978 | |
Ocean Trails CLO VII, Ser 2019-7A, Cl E | | | | | | | | |
7.014%, VAR ICE LIBOR USD 3 Month + 6.880%, 04/17/30(A) | | | 3,000 | | | | 2,932 | |
OZLM IX, Ser 2018-9A, Cl CRR | | | | | | | | |
3.384%, VAR ICE LIBOR USD 3 Month + 3.250%, 10/20/31(A) | | | 1,500 | | | | 1,498 | |
OZLM IX, Ser 2018-9A, Cl DRR | | | | | | | | |
6.254%, VAR ICE LIBOR USD 3 Month + 6.120%, 10/20/31(A) | | | 2,000 | | | | 1,865 | |
OZLM VI, Ser 2018-6A, Cl DS | | | | | | | | |
6.184%, VAR ICE LIBOR USD 3 Month + 6.050%, 04/17/31(A) | | | 3,550 | | | | 3,243 | |
OZLM XI, Ser 2017-11A, Cl DR | | | | | | | | |
7.129%, VAR ICE LIBOR USD 3 Month + 7.000%, 10/30/30(A) | | | 3,000 | | | | 2,898 | |
OZLM XXII, Ser 2018-22A, Cl D | | | | | | | | |
5.434%, VAR ICE LIBOR USD 3 Month + 5.300%, 01/17/31(A) | | | 1,800 | | | | 1,611 | |
OZLM XXIV, Ser 2019-24A, Cl D | | | | | | | | |
7.184%, VAR ICE LIBOR USD 3 Month + 7.050%, 07/20/32(A) | | | 4,000 | | | | 3,898 | |
Palmer Square European Loan Funding DAC, Ser 2020-1X, Cl F | | | | | | | | |
7.700%, VAR Euribor 3 Month + 7.700%, 01/15/30 | | EUR | 3,200 | | | | 3,372 | |
Parallel, Ser 2018-1A, Cl C | | | | | | | | |
2.934%, VAR ICE LIBOR USD 3 Month + 2.800%, 04/20/31(A) | | | 2,000 | | | | 1,901 | |
Parallel, Ser 2018-1A, Cl D | | | | | | | | |
5.384%, VAR ICE LIBOR USD 3 Month + 5.250%, 04/20/31(A) | | | 1,250 | | | | 1,073 | |
Pikes Peak CLO 5, Ser 2020-5A, Cl E | | | | | | | | |
6.834%, VAR ICE LIBOR USD 3 Month + 6.700%, 04/20/33(A) | | | 2,500 | | | | 2,506 | |
Purple Finance CLO 2 DAC, Ser 2019-2X, Cl E | | | | | | | | |
6.400%, VAR Euribor 3 Month + 6.400%, 04/20/32 | | EUR | 1,000 | | | | 1,119 | |
Regatta XIV Funding, Ser 2018-3A, Cl E | | | | | | | | |
6.075%, VAR ICE LIBOR USD 3 Month + 5.950%, 10/25/31(A) | | | 3,600 | | | | 3,518 | |
Regatta XV Funding, Ser 2018-4A, Cl D | | | | | | | | |
6.625%, VAR ICE LIBOR USD 3 Month + 6.500%, 10/25/31(A) | | | 1,750 | | | | 1,734 | |
Rockford Tower Europe CLO DAC, Ser 2019-1X, Cl E | | | | | | | | |
6.030%, VAR Euribor 3 Month + 6.030%, 01/20/33 | | EUR | 2,000 | | | | 2,311 | |
Sculptor European Clo II DAC, Ser 2021-2X, Cl DR | | | | | | | | |
3.600%, VAR Euribor 3 Month + 3.600%, 04/15/34 | | EUR | 1,000 | | | | 1,157 | |
Sculptor European Clo II DAC, Ser 2021-2X, Cl ER | | | | | | | | |
5.890%, VAR Euribor 3 Month + 5.890%, 04/15/34 | | EUR | 1,100 | | | | 1,250 | |
Sculptor European CLO VI DAC, Ser 2021-6X, Cl DR | | | | | | | | |
3.400%, VAR Euribor 3 Month + 3.400%, 10/15/34 | | EUR | 1,350 | | | | 1,564 | |
Sculptor European CLO VII DAC, Ser 2020-7X, Cl D | | | | | | | | |
4.500%, VAR Euribor 3 Month + 4.500%, 01/15/34 | | EUR | 1,025 | | | | 1,195 | |
See accompanying notes to financial statements.
CITY NATIONAL ROCHDALE FUNDS | PAGE 128
consolidated schedule of investments |
September 30, 2021 |
City National Rochdale Fixed Income Opportunities Fund (continued) |
Description | | Face Amount (000)(1) | | | Value (000) | |
Sculptor European CLO VII DAC, Ser 2020-7X, Cl F | | | | | | | | |
8.380%, VAR Euribor 3 Month + 8.380%, 01/15/34 | | EUR | 255 | | | $ | 293 | |
Sculptor European CLO VIII DAC, Ser 2021-8X, Cl E | | | | | | | | |
6.170%, VAR Euribor 3 Month + 6.170%, 07/17/34 | | EUR | 2,500 | | | | 2,827 | |
Sorrento Park CLO DAC, Ser 2014-1X, Cl E | | | | | | | | |
5.697%, 11/16/27(F) | | EUR | 3,000 | | | | 3,354 | |
Sound Point CLO V-R, Ser 2018-1RA, Cl D | | | | | | | | |
3.234%, VAR ICE LIBOR USD 3 Month + 3.100%, 07/18/31(A) | | | 1,000 | | | | 966 | |
Sound Point CLO XXIII, Ser 2021-2A, Cl ER | | | | | | | | |
6.618%, VAR ICE LIBOR USD 3 Month + 6.470%, 07/15/34(A) | | | 3,500 | | | | 3,423 | |
Sound Point CLO XXIV, Ser 2019-3A, Cl E | | | | | | | | |
7.435%, VAR ICE LIBOR USD 3 Month + 7.310%, 10/25/32(A) | | | 3,000 | | | | 3,015 | |
Sound Point CLO XXVII, Ser 2020-2A, Cl E | | | | | | | | |
7.365%, VAR ICE LIBOR USD 3 Month + 7.240%, 10/25/31(A) | | | 3,000 | | | | 3,014 | |
St. Paul’s CLO III-R DAC, Ser 2018-3RX, Cl ER | | | | | | | | |
4.430%, VAR Euribor 3 Month + 4.430%, 01/15/32 | | EUR | 5,650 | | | | 5,826 | |
St. Paul’s CLO V, Ser 2017-5X, Cl ER | | | | | | | | |
5.150%, VAR Euribor 3 Month + 5.150%, 02/20/30 | | EUR | 1,500 | | | | 1,734 | |
St. Paul’s CLO VII DAC, Ser 2021-7X, Cl ERR | | | | | | | | |
6.120%, VAR Euribor 3 Month + 6.120%, 07/18/34 | | EUR | 4,000 | | | | 4,530 | |
St. Paul’s CLO VIII DAC, Ser 2017-8X, Cl E | | | | | | | | |
4.600%, VAR Euribor 3 Month + 4.600%, 01/17/30 | | EUR | 2,800 | | | | 2,961 | |
St. Paul’s CLO X DAC, Ser 2021-10X, Cl ER | | | | | | | | |
6.360%, VAR Euribor 3 Month + 6.360%, 04/22/35 | | EUR | 2,000 | | | | 2,277 | |
Toro European CLO 2 DAC, Ser 2021-2X, Cl DRR | | | | | | | | |
3.550%, VAR Euribor 3 Month + 3.550%, 07/25/34 | | EUR | 2,000 | | | | 2,312 | |
Toro European CLO 2 DAC, Ser 2021-2X, Cl ERR | | | | | | | | |
6.470%, VAR Euribor 3 Month + 6.470%, 07/25/34 | | EUR | 2,000 | | | | 2,264 | |
Toro European CLO 3 DAC, Ser 2021-3X, Cl ERR | | | | | | | | |
6.300%, VAR Euribor 3 Month + 6.300%, 07/15/34 | | EUR | 2,000 | | | | 2,276 | |
Toro European CLO 6 DAC, Ser 2019-6X, Cl E | | | | | | | | |
6.490%, VAR Euribor 3 Month + 6.490%, 01/12/32 | | EUR | 1,207 | | | | 1,336 | |
Toro European CLO 6 DAC, Ser 2021-6X, Cl DR | | | | | | | | |
3.500%, VAR Euribor 3 Month + 3.500%, 01/12/32 | | EUR | 1,030 | | | | 1,191 | |
Tralee CLO V, Ser 2018-5A, Cl D | | | | | | | | |
3.334%, VAR ICE LIBOR USD 3 Month + 3.200%, 10/20/28(A) | | | 3,000 | | | | 2,937 | |
Trimaran Cavu, Ser 2019-1A, Cl E | | | | | | | | |
7.174%, VAR ICE LIBOR USD 3 Month + 7.040%, 07/20/32(A) | | | 1,800 | | | | 1,784 | |
Trimaran Cavu, Ser 2019-2A, Cl D | | | | | | | | |
7.084%, VAR ICE LIBOR USD 3 Month + 6.950%, 11/26/32(A) | | | 1,750 | | | | 1,714 | |
Trimaran Cavu, Ser 2021-1A, Cl E | | | | | | | | |
6.638%, VAR ICE LIBOR USD 3 Month + 6.500%, 04/23/32(A) | | | 4,000 | | | | 3,990 | |
See accompanying notes to financial statements.
CITY NATIONAL ROCHDALE FUNDS | PAGE 129
consolidated schedule of investments |
September 30, 2021 |
City National Rochdale Fixed Income Opportunities Fund (continued) |
Description | | Face Amount (000)(1) | | | Value (000) | |
Vesey Park CLO DAC, Ser 2020-1X, Cl D | | | | | | | | |
7.160%, VAR Euribor 3 Month + 7.160%, 11/16/32 | | EUR | 2,000 | | | $ | 2,329 | |
VIBR, Ser 2018-8A, Cl D | | | | | | | | |
5.884%, VAR ICE LIBOR USD 3 Month + 5.750%, 01/20/31(A) | | | 2,000 | | | | 1,816 | |
Vibrant CLO XIII, Ser 2021-13A, Cl D | | | | | | | | |
7.159%, VAR ICE LIBOR USD 3 Month + 7.060%, 07/15/34(A) | | | 4,000 | | | | 3,950 | |
Voya CLO, Ser 2018-3A, Cl DR | | | | | | | | |
6.034%, VAR ICE LIBOR USD 3 Month + 5.900%, 10/18/31(A) | | | 2,500 | | | | 2,419 | |
Voya CLO, Ser 2021-1A, Cl D | | | | | | | | |
3.261%, VAR ICE LIBOR USD 3 Month + 3.150%, 07/15/34(A) | | | 1,150 | | | | 1,148 | |
Voya Euro CLO II DAC, Ser 2021-2X, Cl DR | | | | | | | | |
3.200%, VAR Euribor 3 Month + 3.200%, 07/15/35 | | EUR | 1,350 | | | | 1,560 | |
Voya Euro CLO IV DAC, Ser 2020-4X, Cl E | | | | | | | | |
6.650%, VAR Euribor 3 Month + 6.650%, 01/15/34 | | EUR | 690 | | | | 805 | |
Voya Euro CLO IV DAC, Ser 2020-4X, Cl F | | | | | | | | |
8.530%, VAR Euribor 3 Month + 8.530%, 01/15/34 | | EUR | 305 | | | | 349 | |
Voya Euro CLO V DAC, Ser 2021-5X, Cl D | | | | | | | | |
3.100%, VAR Euribor 3 Month + 3.100%, 04/15/35 | | EUR | 1,100 | | | | 1,273 | |
Wellfleet CLO, Ser 2021-2A, Cl D | | | | | | | | |
0.000%, 07/15/34(A) (F) | | | 2,000 | | | | 1,997 | |
Wellfleet CLO, Ser 2021-2A, Cl E | | | | | | | | |
0.000%, 07/15/34(A) (F) | | | 1,000 | | | | 993 | |
York CLO-5, Ser 2018-1A, Cl E | | | | | | | | |
6.148%, VAR ICE LIBOR USD 3 Month + 6.010%, 10/22/31(A) | | | 2,500 | | | | 2,464 | |
Zais CLO 5, Ser 2016-2A, Cl B | | | | | | | | |
3.426%, VAR ICE LIBOR USD 3 Month + 3.300%, 10/15/28(A) | | | 4,500 | | | | 4,444 | |
| | | | | | | | | | | | | |
Total Mortgage-Backed Securities | | | | |
Cost ($400,917) | | | 409,961 | |
| | | | | | | | | | | | | |
Sovereign Debt [6.3%] |
Abu Dhabi Government International Bond, MTN | | | | | | | | |
3.875%, 04/16/50 | | | 791 | | | | 906 | |
3.125%, 09/30/49 | | | 797 | | | | 802 | |
Angolan Government International Bond | | | | | | | | |
9.375%, 05/08/48 | | | 1,084 | | | | 1,122 | |
9.125%, 11/26/49 | | | 744 | | | | 759 | |
8.250%, 05/09/28 | | | 518 | | | | 538 | |
8.000%, 11/26/29 | | | 239 | | | | 245 | |
Argentina Paris Club | | | | | | | | |
2.910%, 05/30/21 | | CHF | 2,244 | | | | 1,565 | |
Argentine Republic Government International Bond | | | | | | | | |
2.500%, 3.50%, 7/9/2022, 07/09/22(E) | | | 2,233 | | | | 825 | |
2.000%, 3.88%, 7/9/2022, 07/09/22(E) | | | 8,283 | | | | 3,216 | |
1.125%, 1.50%, 7/9/2022, 07/09/22(E) | | | 5,227 | | | | 1,711 | |
1.000%, 07/09/29 | | | 1,910 | | | | 733 | |
0.500%, 0.75%, 7/9/2023, 07/09/23(E) | | | 6,291 | | | | 2,312 | |
0.500%, 07/09/29 | | EUR | — | | | | — | |
Bahrain Government International Bond | | | | | | | | |
7.500%, 09/20/47 | | | 453 | | | | 468 | |
Brazilian Government International Bond | | | | | | | | |
8.250%, 01/20/34 | | | 374 | | | | 497 | |
7.125%, 01/20/37 | | | 330 | | | | 398 | |
6.000%, 04/07/26 | | | 274 | | | | 315 | |
5.625%, 01/07/41 | | | 246 | | | | 250 | |
5.625%, 02/21/47 | | | 360 | | | | 360 | |
5.000%, 01/27/45 | | | 550 | | | | 515 | |
4.625%, 01/13/28 | | | 393 | | | | 414 | |
Chile Government International Bond | | | | | | | | |
3.500%, 01/25/50 | | | 506 | | | | 506 | |
3.240%, 02/06/28 | | | 203 | | | | 216 | |
3.100%, 05/07/41 | | | 621 | | | | 600 | |
3.100%, 01/22/61 | | | 260 | | | | 235 | |
See accompanying notes to financial statements.
CITY NATIONAL ROCHDALE FUNDS | PAGE 130
consolidated schedule of investments |
September 30, 2021 |
City National Rochdale Fixed Income Opportunities Fund (continued) |
Description | | Face Amount (000)(1) | | | Value (000) | |
Colombia Government International Bond | | | | | | | | |
8.125%, 05/21/24 | | $ | 588 | | | $ | 680 | |
7.375%, 09/18/37 | | | 437 | | | | 537 | |
6.125%, 01/18/41 | | | 728 | | | | 802 | |
5.625%, 02/26/44 | | | 756 | | | | 790 | |
4.125%, 05/15/51 | | | 501 | | | | 433 | |
3.875%, 04/25/27 | | | 697 | | | | 723 | |
Cordoba City | | | | | | | | |
2.125%, 09/29/27 | | | 8,546 | | | | 5,427 | |
Costa Rica Government International Bond | | | | | | | | |
6.125%, 02/19/31 | | | 449 | | | | 462 | |
5.625%, 04/30/43 | | | 368 | | | | 328 | |
Croatia Government International Bond | | | | | | | | |
6.000%, 01/26/24 | | | 1,058 | | | | 1,182 | |
Development Bank of Kazakhstan JSC | | | | | | | | |
4.125%, 12/10/22 | | | 766 | | | | 794 | |
Dominican Republic International Bond | | | | | | | | |
7.450%, 04/30/44 | | | 504 | | | | 602 | |
6.875%, 01/29/26 | | | 1,084 | | | | 1,255 | |
6.850%, 01/27/45 | | | 989 | | | | 1,106 | |
6.500%, 02/15/48 | | | 280 | | | | 300 | |
6.400%, 06/05/49 | | | 274 | | | | 291 | |
6.000%, 07/19/28 | | | 259 | | | | 293 | |
5.875%, 01/30/60 | | | 3,029 | | | | 2,972 | |
5.500%, 01/27/25 | | | 425 | | | | 465 | |
5.300%, 01/21/41(A) | | | 604 | | | | 599 | |
4.875%, 09/23/32 | | | 1,698 | | | | 1,736 | |
Ecuador Government International Bond | | | | | | | | |
5.000%, 5.50%, 7/31/2021, 07/31/22(A) (E) | | | 1,939 | | | | 1,634 | |
1.000%, 2.50%, 7/31/2021, 07/31/22(A) (E) | | | 10,347 | | | | 6,868 | |
0.500%, 1.50%, 7/31/2021, 07/31/22(A) (E) | | | 2,737 | | | | 1,599 | |
Egypt Government International Bond, MTN | | | | | | | | |
8.875%, 05/29/50 | | | 1,787 | | | | 1,775 | |
8.750%, 09/30/51(A) | | | 14,500 | | | | 14,145 | |
8.700%, 03/01/49 | | | 411 | | | | 400 | |
8.500%, 01/31/47 | | | 1,318 | | | | 1,277 | |
7.903%, 02/21/48 | | | 1,314 | | | | 1,204 | |
7.625%, 05/29/32 | | | 493 | | | | 493 | |
7.600%, 03/01/29 | | | 496 | | | | 515 | |
7.300%, 09/30/33 | | | 1,000 | | | | 971 | |
6.588%, 02/21/28 | | | 314 | | | | 316 | |
5.875%, 02/16/31 | | | 658 | | | | 607 | |
5.800%, 09/30/27 | | | 5,000 | | | | 4,909 | |
El Salvador Government International Bond | | | | | | | | |
9.500%, 07/15/52 | | | 343 | | | | 269 | |
8.625%, 02/28/29 | | | 565 | | | | 435 | |
8.250%, 04/10/32 | | | 216 | | | | 162 | |
7.650%, 06/15/35 | | | 167 | | | | 121 | |
7.625%, 02/01/41 | | | 680 | | | | 483 | |
7.125%, 01/20/50 | | | 375 | | | | 259 | |
Gabon Government International Bond | | | | | | | | |
6.625%, 02/06/31 | | | 745 | | | | 736 | |
6.375%, 12/12/24 | | | 403 | | | | 430 | |
Ghana Government International Bond | | | | | | | | |
8.950%, 03/26/51 | | | 777 | | | | 710 | |
8.875%, 05/07/42 | | | 655 | | | | 611 | |
8.625%, 04/07/34 | | | 578 | | | | 551 | |
8.125%, 03/26/32 | | | 401 | | | | 381 | |
7.625%, 05/16/29 | | | 447 | | | | 426 | |
Guatemala Government Bond | | | | | | | | |
6.125%, 06/01/50 | | | 489 | | | | 566 | |
Hungary Government International Bond | | | | | | | | |
5.375%, 03/25/24 | | | 758 | | | | 842 | |
3.125%, 09/21/51(A) | | | 284 | | | | 280 | |
2.125%, 09/22/31(A) | | | 260 | | | | 257 | |
Indonesia Government International Bond, MTN | | | | | | | | |
8.500%, 10/12/35 | | | 353 | | | | 553 | |
7.750%, 01/17/38 | | | 504 | | | | 751 | |
6.625%, 02/17/37 | | | 365 | | | | 499 | |
5.950%, 01/08/46 | | | 341 | | | | 462 | |
5.250%, 01/17/42 | | | 447 | | | | 545 | |
5.250%, 01/08/47 | | | 289 | | | | 361 | |
5.125%, 01/15/45 | | | 908 | | | | 1,101 | |
4.750%, 07/18/47 | | | 474 | | | | 557 | |
Iraq International Bond | | | | | | | | |
6.752%, 03/09/23 | | | 12,103 | | | | 12,284 | |
5.800%, 01/15/28 | | | 267 | | | | 259 | |
Ivory Coast Government International Bond | | | | | | | | |
6.875%, 10/17/40 | | EUR | 732 | | | | 908 | |
5.875%, 10/17/31 | | EUR | 558 | | | | 676 | |
4.875%, 01/30/32 | | EUR | 499 | | | | 565 | |
See accompanying notes to financial statements.
CITY NATIONAL ROCHDALE FUNDS | PAGE 131
consolidated schedule of investments |
September 30, 2021 |
City National Rochdale Fixed Income Opportunities Fund (continued) |
Description | | Face Amount (000)(1) | | | Value (000) | |
Jamaica Government International Bond | | | | | | | | |
7.875%, 07/28/45 | | $ | 296 | | | $ | 412 | |
Kazakhstan Government International Bond, MTN | | | | | | | | |
6.500%, 07/21/45 | | | 736 | | | | 1,066 | |
Lebanon Government International Bond, MTN | | | | | | | | |
8.250%, 04/12/21(B) | | | 2,657 | | | | 462 | |
7.250%, 03/23/37(B) | | | 1 | | | | — | |
7.050%, 11/02/35(B) | | | 157 | | | | 27 | |
7.000%, 03/23/32(B) | | | 898 | | | | 152 | |
6.850%, 03/23/27(B) | | | 1,262 | | | | 213 | |
6.600%, 11/27/26(B) | | | 624 | | | | 106 | |
6.375%, 10/31/21(B) | | | 1,502 | | | | 252 | |
6.150%, 06/19/20(B) | | | 1,760 | | | | 295 | |
6.100%, 10/04/22(B) | | | 3,210 | | | | 543 | |
6.000%, 01/27/23(B) | | | 448 | | | | 76 | |
5.800%, 04/14/20(B) | | | 928 | | | | 155 | |
Mexico Government International Bond | | | | | | | | |
6.050%, 01/11/40 | | | 276 | | | | 338 | |
5.750%, 10/12/10 | | | 550 | | | | 627 | |
5.550%, 01/21/45 | | | 455 | | | | 533 | |
4.750%, 03/08/44 | | | 198 | | | | 212 | |
3.771%, 05/24/61 | | | 1,581 | | | | 1,407 | |
3.750%, 04/19/71 | | | 1,054 | | | | 913 | |
2.659%, 05/24/31 | | | 452 | | | | 437 | |
Mongolia Government International Bond | | | | | | | | |
5.625%, 05/01/23 | | | 216 | | | | 227 | |
4.450%, 07/07/31 | | | 200 | | | | 195 | |
Morocco Government International Bond | | | | | | | | |
5.500%, 12/11/42 | | | 265 | | | | 300 | |
4.250%, 12/11/22 | | | 538 | | | | 557 | |
Nigeria Government International Bond, MTN | | | | | | | | |
9.248%, 01/21/49 | | | 313 | | | | 341 | |
8.250%, 09/28/51(A) | | | 4,984 | | | | 5,020 | |
7.696%, 02/23/38 | | | 445 | | | | 441 | |
7.625%, 11/28/47 | | | 523 | | | | 506 | |
7.375%, 09/28/33(A) | | | 660 | | | | 667 | |
6.500%, 11/28/27 | | | 305 | | | | 317 | |
Oman Government International Bond | | | | | | | | |
7.000%, 01/25/51 | | | 296 | | | | 301 | |
6.750%, 10/28/27 | | | 431 | | | | 480 | |
6.750%, 01/17/48 | | | 723 | | | | 718 | |
6.500%, 03/08/47 | | | 1,409 | | | | 1,370 | |
6.250%, 01/25/31 | | | 205 | | | | 220 | |
6.000%, 08/01/29 | | | 462 | | | | 487 | |
4.750%, 06/15/26 | | | 296 | | | | 304 | |
Pakistan Government International Bond, MTN | | | | | | | | |
8.875%, 04/08/51 | | | 515 | | | | 520 | |
8.250%, 04/15/24 | | | 1,050 | | | | 1,124 | |
8.250%, 09/30/25 | | | 378 | | | | 411 | |
7.375%, 04/08/31(A) | | | 1,164 | | | | 1,164 | |
6.875%, 12/05/27 | | | 766 | | | | 772 | |
Pakistan Water & Power Development Authority | | | | | | | | |
7.500%, 06/04/31 | | | 336 | | | | 334 | |
Panama Government International Bond | | | | | | | | |
9.375%, 04/01/29 | | | 356 | | | | 520 | |
8.875%, 09/30/27 | | | 375 | | | | 512 | |
7.125%, 01/29/26 | | | 110 | | | | 135 | |
6.700%, 01/26/36 | | | 516 | | | | 688 | |
4.500%, 05/15/47 | | | 344 | | | | 376 | |
4.300%, 04/29/53 | | | 550 | | | | 584 | |
4.000%, 09/22/24 | | | 265 | | | | 285 | |
Paraguay Government International Bond | | | | | | | | |
5.400%, 03/30/50 | | | 210 | | | | 242 | |
4.700%, 03/27/27 | | | 291 | | | | 324 | |
Perusahaan Penerbit SBSN Indonesia III | | | | | | | | |
4.550%, 03/29/26 | | | 620 | | | | 702 | |
Peruvian Government International Bond | | | | | | | | |
8.750%, 11/21/33 | | | 987 | | | | 1,526 | |
7.350%, 07/21/25 | | | 770 | | | | 932 | |
5.625%, 11/18/50 | | | 567 | | | | 773 | |
3.230%, 07/28/21 | | | 355 | | | | 295 | |
2.780%, 12/01/60 | | | 703 | | | | 595 | |
Philippine Government International Bond | | | | | | | | |
10.625%, 03/16/25 | | | 367 | | | | 484 | |
9.500%, 02/02/30 | | | 595 | | | | 923 | |
7.750%, 01/14/31 | | | 376 | | | | 542 | |
6.375%, 10/23/34 | | | 435 | | | | 602 | |
3.950%, 01/20/40 | | | 553 | | | | 604 | |
2.950%, 05/05/45 | | | 290 | | | | 277 | |
Province of Salta | | | | | | | | |
9.500%, 03/16/22 | | | 10 | | | | 10 | |
Province of Santa Fe | | | | | | | | |
7.000%, 03/23/23 | | | 14,000 | | | | 12,950 | |
See accompanying notes to financial statements.
CITY NATIONAL ROCHDALE FUNDS | PAGE 132
consolidated schedule of investments |
September 30, 2021 |
City National Rochdale Fixed Income Opportunities Fund (continued) |
Description | | Face Amount (000)(1) | | | Value (000) | |
Provincia de Buenos Aires, MTN | | | | | | | | |
3.900%, 5.25%, 9/1/2022, 09/01/37(E) | | $ | 55,082 | | | $ | 24,511 | |
3.500%, 4.50%, 9/1/2022, 09/01/22(E) | | | 2,679 | | | | 1,072 | |
Provincia de Cordoba | | | | | | | | |
5.000%, 12/10/25 | | | 31,476 | | | | 23,793 | |
Provincia de Entre Rios | | | | | | | | |
5.000%, 08/08/28 | | | 18,700 | | | | 13,090 | |
Qatar Government International Bond | | | | | | | | |
5.103%, 04/23/48 | | | 518 | | | | 689 | |
4.817%, 03/14/49 | | | 1,327 | | | | 1,710 | |
4.400%, 04/16/50 | | | 288 | | | | 352 | |
3.250%, 06/02/26 | | | 952 | | | | 1,029 | |
Republic of Belarus International Bond | | | | | | | | |
7.625%, 06/29/27 | | | 298 | | | | 295 | |
6.200%, 02/28/30 | | | 242 | | | | 214 | |
Republic of Kenya Government International Bond | | | | | | | | |
8.000%, 05/22/32 | | | 350 | | | | 388 | |
6.300%, 01/23/34 | | | 366 | | | | 362 | |
Republic of South Africa Government International Bond | | | | | | | | |
5.875%, 05/30/22 | | | 267 | | | | 276 | |
5.875%, 06/22/30 | | | 259 | | | | 287 | |
5.750%, 09/30/49 | | | 341 | | | | 326 | |
5.650%, 09/27/47 | | | 660 | | | | 629 | |
5.000%, 10/12/46 | | | 342 | | | | 304 | |
4.300%, 10/12/28 | | | 925 | | | | 932 | |
Romanian Government International Bond, MTN | | | | | | | | |
6.750%, 02/07/22 | | | 342 | | | | 349 | |
6.125%, 01/22/44 | | | 118 | | | | 155 | |
4.375%, 08/22/23 | | | 1,026 | | | | 1,096 | |
4.000%, 02/14/51 | | | 1,098 | | | | 1,098 | |
3.624%, 05/26/30 | | EUR | 310 | | | | 405 | |
3.375%, 01/28/50 | | EUR | 753 | | | | 860 | |
3.000%, 02/14/31 | | | 182 | | | | 186 | |
Russian Foreign Bond - Eurobond | | | | | | | | |
5.250%, 06/23/47 | | | 1,000 | | | | 1,269 | |
4.375%, 03/21/29 | | | 800 | | | | 908 | |
4.250%, 06/23/27 | | | 400 | | | | 446 | |
Saudi Government International Bond, MTN | | | | | | | | |
5.250%, 01/16/50 | | | 825 | | | | 1,069 | |
5.000%, 04/17/49 | | | 910 | | | | 1,136 | |
4.625%, 10/04/47 | | | 323 | | | | 380 | |
4.500%, 04/22/60 | | | 462 | | | | 553 | |
3.750%, 01/21/55 | | | 813 | | | | 851 | |
3.450%, 02/02/61(A) | | | 527 | | | | 519 | |
Sri Lanka Government International Bond | | | | | | | | |
7.850%, 03/14/29 | | | 760 | | | | 468 | |
7.550%, 03/28/30 | | | 424 | | | | 260 | |
5.750%, 01/18/22 | | | 1,200 | | | | 1,074 | |
Third Pakistan International Sukuk | | | | | | | | |
5.625%, 12/05/22 | | | 604 | | | | 619 | |
Turkey Government International Bond | | | | | | | | |
6.875%, 03/17/36 | | | 212 | | | | 206 | |
6.500%, 09/20/33 | | | 491 | | | | 472 | |
6.350%, 08/10/24 | | | 361 | | | | 374 | |
6.125%, 10/24/28 | | | 305 | | | | 302 | |
6.000%, 03/25/27 | | | 247 | | | | 247 | |
6.000%, 01/14/41 | | | 301 | | | | 262 | |
5.875%, 06/26/31 | | | 746 | | | | 702 | |
5.750%, 03/22/24 | | | 566 | | | | 580 | |
5.750%, 05/11/47 | | | 1,043 | | | | 867 | |
5.600%, 11/14/24 | | | 255 | | | | 259 | |
4.875%, 04/16/43 | | | 788 | | | | 615 | |
3.250%, 03/23/23 | | | 323 | | | | 322 | |
Ukraine Government International Bond | | | | | | | | |
9.750%, 11/01/28 | | | 581 | | | | 683 | |
7.750%, 09/01/23 | | | 730 | | | | 782 | |
7.750%, 09/01/24 | | | 325 | | | | 353 | |
7.750%, 09/01/25 | | | 659 | | | | 717 | |
7.750%, 09/01/26 | | | 625 | | | | 680 | |
7.375%, 09/25/32 | | | 2,143 | | | | 2,199 | |
7.253%, 03/15/33 | | | 755 | | | | 767 | |
6.876%, 05/21/29 | | | 561 | | | | 570 | |
1.258%, VAR N/A 0.000%, 05/31/40 | | | 2,000 | | | | 2,182 | |
Uruguay Government International Bond | | | | | | | | |
7.875%, 01/15/33 | | | 494 | | | | 731 | |
7.625%, 03/21/36 | | | 527 | | | | 790 | |
5.100%, 06/18/50 | | | 541 | | | | 690 | |
4.975%, 04/20/55 | | | 908 | | | | 1,138 | |
4.125%, 11/20/45 | | | 448 | | | | 526 | |
Vertical US Newco | | | | | | | | |
5.250%, 07/15/27(A) | | | 1,400 | | | | 1,471 | |
Vietnam Government International Bond | | | | | | | | |
4.800%, 11/19/24 | | | 578 | | | | 641 | |
See accompanying notes to financial statements.
CITY NATIONAL ROCHDALE FUNDS | PAGE 133
consolidated schedule of investments |
September 30, 2021 |
City National Rochdale Fixed Income Opportunities Fund (continued) |
Description | | Face Amount (000)(1) | | | Value (000) | |
Zambia Government International Bond | | | | | | | | |
8.970%, 07/30/27 | | $ | 835 | | | $ | 648 | |
| | | | | | | | | | | | | |
Total Sovereign Debt | | | | |
Cost ($274,915) | | | 259,657 | |
| | | | | | | | | | | | | |
Life Settlement Contracts [2.3%](D)(H)(I)* |
American General Life #508L, Acquired 05/30/2014 | | | 2,595 | | | | 2,272 | |
American General Life #542L, Acquired 07/30/2015 | | | 83 | | | | 340 | |
American General Life #906L, Acquired 07/30/2015 | | | 479 | | | | 3,084 | |
AXA Equitable Life #0474, Acquired 11/04/2013 | | | 7,290 | | | | 8,009 | |
AXA Equitable Life #1616, Acquired 05/30/2014 | | | 3,254 | | | | 3,324 | |
AXA Equitable Life #1898, Acquired 11/04/2013 | | | 441 | | | | 1,055 | |
AXA Equitable Life #7233, Acquired 11/04/2013 | | | 395 | | | | 2,163 | |
AXA Equitable Life #7578, Acquired 11/04/2013 | | | 2,104 | | | | 3,972 | |
AXA Equitable Life #7857, Acquired 11/04/2013 | | | 2,297 | | | | 1,145 | |
AXA Equitable Life #8538, Acquired 11/04/2013 | | | 1,333 | | | | 1,995 | |
Guardian Insurance #0346, Acquired 11/04/2013 | | | 646 | | | | 2,014 | |
Hartford Life #4700, Acquired 11/24/2015 | | | 81 | | | | 239 | |
ING Reliastar #1234, Acquired 12/05/2013 | | | 1,067 | | | | 5,150 | |
ING Reliastar #3394, Acquired 05/30/2014 | | | 3,687 | | | | 6,434 | |
ING Reliastar #4842, Acquired 11/20/2013 | | | 921 | | | | 2,810 | |
ING Reliastar #776H, Acquired 05/30/2014 | | | 1,518 | | | | 1,342 | |
John Hancock #0430, Acquired 05/30/2014 | | | 2,418 | | | | 3,970 | |
John Hancock #1929, Acquired 05/30/2014 | | | 3,812 | | | | 3,257 | |
John Hancock #5072, Acquired 05/30/2014 | | | 1,409 | | | | 4,079 | |
John Hancock #5080, Acquired 11/19/2013 | | | 313 | | | | 4,077 | |
John Hancock #5885, Acquired 05/30/2014 | | | 894 | | | | 2,104 | |
John Hancock #6686, Acquired 05/30/2014 | | | 3,035 | | | | 2,723 | |
Lincoln National #4754, Acquired 09/17/2015 | | | 610 | | | | 3,909 | |
Lincoln National #5658, Acquired 09/17/2015 | | | 329 | | | | 1,508 | |
Lincoln National #7099, Acquired 09/17/2015 | | | 1,254 | | | | 3,496 | |
Lincoln National #8558, Acquired 09/17/2015 | | | 1,659 | | | | 2,236 | |
Mass Mutual #5167, Acquired 05/30/2014 | | | 63 | | | | 1,957 | |
Mass Mutual #5681, Acquired 11/05/2013 | | | 288 | | | | 2,742 | |
Met Life #8MLU, Acquired 05/20/2014 | | | 1,413 | | | | 839 | |
Penn Life #8183, Acquired 10/18/2016 | | | 46 | | | | 138 | |
Penn Mutual #3106, Acquired 05/30/2014 | | | 1,294 | | | | 1,202 | |
Phoenix Life #5715, Acquired 10/18/2016 | | | 570 | | | | 2,717 | |
Phoenix Life #6157, Acquired 10/18/2016 | | | 569 | | | | 2,704 | |
Phoenix Life #8499, Acquired 05/30/2014 | | | 756 | | | | 1,545 | |
Phoenix Life #8509, Acquired 05/30/2014 | | | 761 | | | | 1,545 | |
Principal Financial #6653, Acquired 10/30/2013 | | | 306 | | | | — | |
Security Mutual Life #5380, Acquired 10/28/2013 | | | 410 | | | | — | |
Transamerica #1708, Acquired 10/28/2013 | | | 957 | | | | 1,023 | |
Transamerica #8205, Acquired 10/28/2013 | | | 714 | | | | 618 | |
| | | | | | | | | | | | | |
Total Life Settlement Contracts | | | | |
(Cost $52,071) | | | | | | | 93,737 | |
| | | | | | | | | | | | | |
Common Stock [0.1%] |
Agricultural [0.0%] |
Mriya Farming PLC * | | | 2,903 | | | | — | |
| | | | | | | | | | | | | |
Chemicals [0.0%] |
Hexion Holdings, Cl B * | | | 19,802 | | | | 436 | |
| | | | | | | | | | | | | |
See accompanying notes to financial statements.
CITY NATIONAL ROCHDALE FUNDS | PAGE 134
consolidated schedule of investments |
September 30, 2021 |
City National Rochdale Fixed Income Opportunities Fund (continued) |
Description | | Face Amount (000)(1) | | | Value (000) | |
Consumer Cyclical [0.0%] |
TruKid * | | $ | 232 | | | $ | 579 | |
| | | | | | | | | | | | | |
Diversified Minerals [0.0%] |
New World Resources, Cl A * | | | 44,276,198 | | | | — | |
| | | | | | | | | | | | | |
Energy [0.0%] |
BlackBrush Oil & Gas, L.P. | | | 39,375 | | | | — | |
| | | | | | | | | | | | | |
Energy Equipment & Services [0.1%] |
FTS International, Cl A * | | | 26,754 | | | | 658 | |
| | | | | | | | | | | | | |
Financials [0.0%] |
Propco Certificates * (D) | | | 3,788 | | | | 75 | |
| | | | | | | | | | | | | |
Total Financials | | | | | | | 75 | |
| | | | | | | | | | | | | |
Health Care [0.0%] |
Novartex | | | 180,000 | | | | 27 | |
| | | | | | | | | | | | | |
Total Health Care | | | | | | | 27 | |
| | | | | | | | | | | | | |
Manufacturing [0.0%] |
Vivarte | | | 6,000 | | | | 1 | |
| | | | | | | | | | | | | |
Media Entertainment [0.1%] |
iHeartMedia * | | | 12,136 | | | | 304 | |
| | | | | | | | | | | | | |
Total Media Entertainment | | | 304 | |
| | | | | | | | | | | | | |
Oil Field Services [0.0%] |
Superior Energy | | | 30,620 | | | | 1,347 | |
| | | | | | | | | | | | | |
Oil, Gas & Consumable Fuels [0.0%] |
Summit Midstream Partners * | | | 11,456 | | | | 407 | |
| | | | | | | | | | | | | |
Retail [0.0%] |
Qurate Retail | | | 900 | | | | 97 | |
| | | | | | | | | | | | | |
Retailers [0.0%] |
Belk, Inc. | | | 81 | | | | 1 | |
Penney Borrower LLC * (D) | | | 505 | | | | 5 | |
| | | | | | | | | | | | | |
Total Retailers | | | | | | | 6 | |
Services [0.0%] |
A’ayan Leasing & Investment KSCP * | | | 1,169,438 | | | | 453 | |
Wayne Services Legacy * | | | 257 | | | | — | |
| | | | | | | | | | | | | |
Total Services | | | | | | | 453 | |
| | | | | | | | | | | | | |
Technology [0.0%] |
AS ADV Shares | | | 127,800 | | | | — | |
| | | | | | | | | | | | | |
Total Technology | | | | | | | — | |
| |
Utilities [0.0%] |
Longview Power LLC | | | 64,904 | | | | 179 | |
| | | | | | | | | | | | | |
Total Common Stock | | | | |
(Cost $6,066) | | | | | | | 4,569 | |
| | | | | | | | | | | | | |
Convertible Bonds [0.3%] |
Broadcasting & Cable [0.0%] |
Liberty Interactive CV to 1.000 | | | | | | | | |
4.000%, 11/15/29 | | | 1,448 | | | | 1,129 | |
| | | | | | | | | | | | | |
Cable Satellite [0.0%] |
DISH Network CV to 15.343 | | | | | | | | |
3.375%, 08/15/26 | | | 1,030 | | | | 1,071 | |
| | | | | | | | | | | | | |
Coal Mining [0.0%] |
New World Resources CV to 1.000 | | | | | | | | |
4.000%cash or 8.000% PIK, 10/07/20(B) | | EUR | 380 | | | | 11 | |
| | | | | | | | | | | | | |
Internet Content-Entmnt [0.0%] |
Twitter CV to 7.691 | | | | | | | | |
2.002%, 03/15/26(A) | | | 683 | | | | 634 | |
| | | | | | | | | | | | | |
Telephones & Telecommunications [0.1%] |
Digicel Group 0.5 CV to 1.000 | | | | | | | | |
7.000%, 10/01/70 | | | 1,776 | | | | 1,460 | |
| | | | | | | | | | | | | |
Textile-Products [0.2%] |
Sasa Polyester Sanayi CV to 25,587.769 | | | | | | | | |
3.250%, 06/30/26 | | EUR | 7,900 | | | | 8,893 | |
| | | | | | | | | | | | | |
Total Convertible Bonds | | | | |
Cost ($13,016) | | | 13,198 | |
See accompanying notes to financial statements.
CITY NATIONAL ROCHDALE FUNDS | PAGE 135
consolidated schedule of investments |
September 30, 2021 |
City National Rochdale Fixed Income Opportunities Fund (continued) |
Description | | Face Amount (000)(1) | | | Value (000) | |
Limited Partnership [1.0%] |
Cartesian LP* | | $ | 10,000 | | | $ | 12,234 | |
Golub Capital (O) | | | 16,875,000 | | | | 16,875 | |
Oberland Capital Healthcare Solutions LP (O) | | | 5,268,289 | | | | 5,023 | |
Primary Wave Music IP LP (O) | | | 8,491,843 | | | | 8,049 | |
| | | | | | | | | | | | | |
Total Limited Partnership | | | | |
(Cost $40,636) | | | | | | | 42,181 | |
| | | | | | | | | | | | | |
Warrants [0.0%] |
Chesapeake Energy, | | | | | | | | |
Expires 02/12/26* (J) | | | 8,485 | | | | 281 | |
Prophylaxis *(J)(K) | | | — | | | | — | |
Toys ‘R’ Us/Hill Street | | | | | | | | |
Expires 06/21/22* (J) | | | 14,795 | | | | 7 | |
| | | | | | | | | | | | | |
Total Warrants | | | | |
(Cost $223) | | | | | | | 288 | |
| | | | | | | | | | | | | |
Preferred Stock [0.0%] |
[0.0%] |
Blackbrush Oil & Gas, LP (N) | | | 1,270 | | | | 547 | |
| | | | | | | | | | | | | |
Total Preferred Stock | | | | |
(Cost $367) | | | | | | | 547 | |
| | | | | | | | | | | | | |
Closed-End Funds [0.3%] |
Cliffwater Corporate Lending Fund | | | 942,507 | | | | 10,028 | |
Stone Ridge Reinsurance Risk Premium Interval Fund | | | 2,968 | | | | 114 | |
| | | | | | | | | | | | | |
Total Closed-End Funds | | | | |
(Cost $10,124) | | | | | | | 10,142 | |
| | | | | | | | | | | | | |
Short-Term Investment [4.2%] |
SEI Daily Income Trust Government Fund, Cl F, 0.010%** | | | 174,578,599 | | | | 174,579 | |
| | | | | | | | | | | | | |
Total Short-Term Investment | | | | |
(Cost $174,579) | | | | | | | 174,579 | |
| | | | | | | | | | | | | |
Total Investments [99.3%] |
(Cost $4,215,691) | | | | | | | 4,082,003 | |
Percentages are based on net assets of $4,111,912 (000).
* Non-income producing security.
** | The rate reported is the 7-day effective yield as of September 30, 2021. |
(1) | U.S. Dollars unless otherwise indicated. |
(A) | Security exempt from registration under Rule 144A of the Securities Act of 1933. These securities may be resold in transactions exempt from registration normally to qualified institutions. On September 30, 2021, the value of these securities amounted to $1,206,515 (000), representing 29.3% of the net assets of the Fund. |
(B) | In default on interest payments. Rate shown represents the last coupon rate prior to default. |
(C) | Zero coupon security. The rate reported is the effective yield at time of purchase. |
(D) | Level 3 security in accordance with fair value hierarchy. |
(E) | Step Bond — The rate reported is the rate in effect on September 30, 2021. The coupon on a step bond changes on a specific date. |
(F) | Variable or floating rate security, the interest rate of which adjusts periodically based on changes in current interest rates and prepayments on the underlying pool of assets. |
(G) | Unsettled bank loan, Interest rate not available. |
(H) | Security is considered illiquid. The total market value of such security as of September 30, 2021 was $93,737 (000) and represented 2.3% of the net assets of the Fund. |
(I) | Security is considered restricted. The total market value of such securities as of September 30, 2021 was $93,737 (000) and represented 2.3% the net assets of the Fund. Please see restricted table below for further details. |
(J) | Strike Price is unavailable. |
(K) | Expiration date is unavailable. |
(L) | Perpetual security with no stated maturity date. |
(M) | Maturity date is unavailable. |
(N) | There is currently not rate available. |
(O) Unfunded Commitments as of September 30, 2021:
Security | | Value | | | Unfunded
Commitments | | | Redemption
Frequency | | | Redemption
Notice
(Days) | |
Golub Capital BDC 3, Inc | | $ | 16,875,000 | | | $ | 58,125,000 | | | | None | | | | None | |
Oberland Capital Healthcare Solutions Offshore LP | | | 1,782,074 | | | | 17,715,097 | | | | None | | | | None | |
Oberland Capital Healthcare Solutions Co-Invest Offshore LP | | | 3,241,091 | | | | 16,681,250 | | | | None | | | | None | |
Primary Wave Music IP Fund 3, LP | | | 41,508,157 | | | | 41,508,157 | | | | None | | | | None | |
Total | | $ | 63,406,322 | | | $ | 134,029,504 | | | | | | | | | |
CHF — Swiss Franc
Cl — Class
CLO — Collateralized Loan Obligation
CV — Convertible Security
DAC — Designated Activity Company
EUR — Euro
Euribor — Euro Interbank Offered Rate
GBP — British Pound Sterling
JPY — Japanese Yen
ICE — Intercontinental Exchange
JSC — Joint Stock Company
LIBOR — London Interbank Offered Rates
LLC — Limited Liability Company
See accompanying notes to financial statements.
CITY NATIONAL ROCHDALE FUNDS | PAGE 136
consolidated schedule of investments |
September 30, 2021 |
City National Rochdale Fixed Income Opportunities Fund (continued) |
LLP — Limited Liability Partnership
LP — Limited Partnership
LTD — Limited
MTN — Medium Term Note
PIK — Paid-in Kind
PLC — Public Limited Company
REIT — Real Estate Investment Trust
SA — Special Assessment
Ser — Series
ULC — Unlimited Liability Company
USD — U.S. Dollar
VAR — Variable
At September 30, 2021, the following life settlement contracts are considered restricted securities. The acquisition dates of these investments, the enforceable right to acquire these securities, along with their cost and values at September 30, 2021, were as follows:
| | Face Amount
(000) | | | Acquisition
Date | | | Right to
Acquire Date | |
American General Life #508L | | $ | 2,595 | | | | 5/30/2014 | | | | 5/30/2014 | |
American General Life #542L | | | 83 | | | | 7/30/2015 | | | | 7/30/2015 | |
American General Life #906L | | | 479 | | | | 7/30/2015 | | | | 7/30/2015 | |
AXA Equitable Life #0474 | | | 7,290 | | | | 11/4/2013 | | | | 11/4/2013 | |
AXA Equitable Life #1616 | | | 3,254 | | | | 5/30/2014 | | | | 5/30/2014 | |
AXA Equitable Life #1898 | | | 441 | | | | 11/4/2013 | | | | 11/4/2013 | |
AXA Equitable Life #7233 | | | 395 | | | | 11/4/2013 | | | | 11/4/2013 | |
AXA Equitable Life #7578 | | | 2,104 | | | | 11/4/2013 | | | | 11/4/2013 | |
AXA Equitable Life #7857 | | | 2,297 | | | | 11/4/2013 | | | | 11/4/2013 | |
AXA Equitable Life #8538 | | | 1,333 | | | | 11/4/2013 | | | | 11/4/2013 | |
Guardian Insurance #0346 | | | 646 | | | | 11/4/2013 | | | | 11/4/2013 | |
Hartford Life #4700 | | | 81 | | | | 11/24/2015 | | | | 11/24/2015 | |
ING Reliastar #1234 | | | 1,067 | | | | 12/5/2013 | | | | 12/5/2013 | |
ING Reliastar #3394 | | | 3,687 | | | | 5/30/2014 | | | | 5/30/2014 | |
ING Reliastar #4842 | | | 921 | | | | 11/20/2013 | | | | 11/20/2013 | |
ING Reliastar #776H | | | 1,518 | | | | 5/30/2014 | | | | 5/30/2014 | |
John Hancock #0430 | | | 2,418 | | | | 5/30/2014 | | | | 5/30/2014 | |
John Hancock #1929 | | | 3,812 | | | | 5/30/2014 | | | | 5/30/2014 | |
John Hancock #5072 | | | 1,409 | | | | 5/30/2014 | | | | 5/30/2014 | |
John Hancock #5080 | | | 313 | | | | 11/19/2013 | | | | 11/19/2013 | |
John Hancock #5885 | | | 894 | | | | 5/30/2014 | | | | 5/30/2014 | |
John Hancock #6686 | | | 3,035 | | | | 5/30/2014 | | | | 5/30/2014 | |
Lincoln National #4754 | | | 610 | | | | 9/17/2015 | | | | 9/17/2015 | |
Lincoln National #5658 | | | 329 | | | | 9/17/2015 | | | | 9/17/2015 | |
Lincoln National #7099 | | | 1,254 | | | | 9/17/2015 | | | | 9/17/2015 | |
Lincoln National #8558 | | | 1,659 | | | | 9/17/2015 | | | | 9/17/2015 | |
Mass Mutual #5167 | | | 63 | | | | 5/30/2014 | | | | 5/30/2014 | |
Mass Mutual #5681 | | | 288 | | | | 11/5/2013 | | | | 11/5/2013 | |
Met Life #8MLU | | | 1,413 | | | | 5/20/2014 | | | | 5/20/2014 | |
Penn Life #8183 | | | 46 | | | | 10/18/2016 | | | | 10/18/2016 | |
Penn Mutual #3106 | | | 1,294 | | | | 5/30/2014 | | | | 5/30/2014 | |
Phoenix Life #5715 | | | 570 | | | | 10/18/2016 | | | | 10/18/2016 | |
Phoenix Life #6157 | | | 569 | | | | 10/18/2016 | | | | 10/18/2016 | |
Phoenix Life #8499 | | | 756 | | | | 5/30/2014 | | | | 5/30/2014 | |
Phoenix Life #8509 | | | 761 | | | | 5/30/2014 | | | | 5/30/2014 | |
Principal Financial #6653 | | | 306 | | | | 10/30/2013 | | | | 10/30/2013 | |
Security Mutual Life #5380 | | | 410 | | | | 10/28/2013 | | | | 10/28/2013 | |
Transamerica #1708 | | | 957 | | | | 10/28/2013 | | | | 10/28/2013 | |
Transamerica #8205 | | | 714 | | | | 10/28/2013 | | | | 10/28/2013 | |
| | | Cost (000) | | | Market Value
(000) | | | % of Net Assets | |
American General Life #508L | | $ | 2,595 | | | $ | 2,272 | | | | 0.1 | % |
American General Life #542L | | | 83 | | | | 340 | | | | 0.0 | % |
American General Life #906L | | | 479 | | | | 3,084 | | | | 0.1 | % |
AXA Equitable Life #0474 | | | 7,290 | | | | 8,009 | | | | 0.2 | % |
AXA Equitable Life #1616 | | | 3,254 | | | | 3,324 | | | | 0.1 | % |
AXA Equitable Life #1898 | | | 441 | | | | 1,055 | | | | 0.0 | % |
AXA Equitable Life #7233 | | | 395 | | | | 2,163 | | | | 0.1 | % |
AXA Equitable Life #7578 | | | 2,104 | | | | 3,972 | | | | 0.1 | % |
AXA Equitable Life #7857 | | | 2,297 | | | | 1,145 | | | | 0.0 | % |
AXA Equitable Life #8538 | | | 1,333 | | | | 1,995 | | | | 0.0 | % |
Guardian Insurance #0346 | | | 646 | | | | 2,014 | | | | 0.0 | % |
Hartford Life #4700 | | | 81 | | | | 239 | | | | 0.0 | % |
ING Reliastar #1234 | | | 1,067 | | | | 5,150 | | | | 0.1 | % |
ING Reliastar #3394 | | | 3,687 | | | | 6,434 | | | | 0.2 | % |
ING Reliastar #4842 | | | 921 | | | | 2,810 | | | | 0.1 | % |
ING Reliastar #776H | | | 1,518 | | | | 1,342 | | | | 0.0 | % |
John Hancock #0430 | | | 2,418 | | | | 3,970 | | | | 0.1 | % |
John Hancock #1929 | | | 3,812 | | | | 3,257 | | | | 0.1 | % |
John Hancock #5072 | | | 1,409 | | | | 4,079 | | | | 0.1 | % |
John Hancock #5080 | | | 313 | | | | 4,077 | | | | 0.1 | % |
John Hancock #5885 | | | 894 | | | | 2,104 | | | | 0.1 | % |
John Hancock #6686 | | | 3,035 | | | | 2,723 | | | | 0.1 | % |
Lincoln National #4754 | | | 610 | | | | 3,909 | | | | 0.1 | % |
Lincoln National #5658 | | | 329 | | | | 1,508 | | | | 0.0 | % |
Lincoln National #7099 | | | 1,254 | | | | 3,496 | | | | 0.1 | % |
Lincoln National #8558 | | | 1,659 | | | | 2,236 | | | | 0.1 | % |
Mass Mutual #5167 | | | 63 | | | | 1,957 | | | | 0.0 | % |
Mass Mutual #5681 | | | 288 | | | | 2,742 | | | | 0.1 | % |
Met Life #8MLU | | | 1,413 | | | | 839 | | | | 0.0 | % |
Penn Life #8183 | | | 46 | | | | 138 | | | | 0.0 | % |
Penn Mutual #3106 | | | 1,294 | | | | 1,202 | | | | 0.0 | % |
Phoenix Life #5715 | | | 570 | | | | 2,717 | | | | 0.1 | % |
Phoenix Life #6157 | | | 569 | | | | 2,704 | | | | 0.1 | % |
Phoenix Life #8499 | | | 756 | | | | 1,545 | | | | 0.0 | % |
Phoenix Life #8509 | | | 761 | | | | 1,545 | | | | 0.0 | % |
Principal Financial #6653 | | | 306 | | | | 0 | | | | 0.0 | % |
Security Mutual Life #5380 | | | 410 | | | | 0 | | | | 0.0 | % |
Transamerica #1708 | | | 957 | | | | 1,023 | | | | 0.0 | % |
Transamerica #8205 | | | 714 | | | | 618 | | | | 0.0 | % |
| | $ | 52,071 | | | $ | 93,737 | | | | 2.3 | % |
A list of the open forward foreign currency contracts held by the Fund at September 30, 2021, is as follows:
Counterparty | Settlement
Date | Currency to
Deliver
(Thousands) | Currency to
Receive
(Thousands) | | Unrealized
Appreciation
(Depreciation)
(Thousands) | |
U.S. Bank | 12/22/21 | CHF | | | 1,450 | | USD | | | 1,572 | | | $ | 13 | |
U.S. Bank | 12/22/21 | EUR | | | 8,800 | | USD | | | 10,341 | | | | 129 | |
U.S. Bank | 12/22/21 | JPY | | | 480,000 | | USD | | | 4,393 | | | | 77 | |
U.S. Bank | 10/13/21 | USD | | | 1,366 | | GBP | | | 1,000 | | | | (19 | ) |
U.S. Bank | 10/13/21 | GBP | | | 29,600 | | USD | | | 40,958 | | | | 1,075 | |
U.S. Bank | 10/13/21 - 10/18/21 | EUR | | | 450,546 | | USD | | | 533,256 | | | | 11,253 | |
U.S. Bank | 10/18/21 | EUR | | | 1,800 | | USD | | | 2,084 | | | | (2 | ) |
| | | | | | | | | | | | | | $ | 12,526 | |
See accompanying notes to financial statements.
CITY NATIONAL ROCHDALE FUNDS | PAGE 137
consolidated schedule of investments |
September 30, 2021 |
City National Rochdale Fixed Income Opportunities Fund (continued) |
The following is a list of the inputs used as of September 30, 2021 in valuing the Fund’s investments and other financial instruments carried at value (000):
Investments in Securities | | Level 1 | | | Level 2 | | | Level 3(1) | | | Total | |
Corporate Bonds | | $ | — | | | $ | 2,331,538 | | | $ | 16 | | | $ | 2,331,554 | |
Loan Participations | | | — | | | | 737,705 | | | | 3,885 | | | | 741,590 | |
Mortgage-Backed Securities | | | — | | | | 407,966 | | | | 1,995 | | | | 409,961 | |
Sovereign Debt | | | — | | | | 259,657 | | | | — | | | | 259,657 | |
Life Settlement Contracts | | | — | | | | — | | | | 93,737 | | | | 93,737 | |
Common Stock | | | 2,528 | | | | 1,961 | | | | 80 | | | | 4,569 | |
Convertible Bonds | | | — | | | | 13,198 | | | | — | | | | 13,198 | |
Limited Partnership(a) | | | — | | | | — | | | | — | | | | 42,181 | |
Warrants | | | — | | | | 288 | | | | — | | | | 288 | |
Preferred Stock | | | — | | | | 547 | | | | — | | | | 547 | |
Closed-End Funds | | | 10,142 | | | | — | | | | — | | | | 10,142 | |
Short-Term Investment | | | 174,579 | | | | — | | | | — | | | | 174,579 | |
Total Investments in Securities | | $ | 187,249 | | | $ | 3,752,860 | | | $ | 99,713 | | | $ | 4,082,003 | |
Other Financial Instruments | | Level 1 | | | Level 2 | | | Level 3 | | | Total | |
Forwards Contracts* | | | | | | | | | | | | | | | | |
Unrealized Appreciation | | $ | — | | | $ | 12,547 | | | $ | — | | | $ | 12,547 | |
Unrealized Depreciation | | | — | | | | (21 | ) | | | — | | | | (21 | ) |
Total Other Financial Instruments | | $ | — | | | $ | 12,526 | | | $ | — | | | $ | 12,526 | |
(a) In accordance with Subtopic 820-10, certain investments that are measured at fair value using the net asset value per share (or its equivalent) practical expedient have not been classified in the fair value hierarchy. The fair value amounts presented in this table are intended to permit reconciliation of the fair value hierarchy to the amounts presented in the Schedule of Investments.
* Forwards contracts are valued at the unrealized appreciation (depreciation) on the instrument.
(1) Of the $99,713 (000) in Level 3 securities as of September 30, 2021, $93,737 (000) or 94.0% are not valued via third party pricing vendors and broker quotes. If significant, the disclosure of the unobservable inputs and the interrelationships and sensitivity between these inputs is required for those Level 3 securities that are not valued by third party vendors or broker quotes.
The following is a reconciliation of investments in which significant unobservable inputs (Level 3) were used in determining value as of September 30, 2021:
| | | Investments in
Corporate Bonds | | | Investments
in Loan
Participations | | | Investments in
Mortgage-Backed
Securities | |
Beginning balance as of October 1, 2020 | | $ | 2 | | | $ | 2,180 | | | $ | — | |
Accrued discounts/ premiums | | | (10 | ) | | | — | | | | — | |
Realized gain/(loss) | | | (11 | ) | | | 4 | | | | — | |
Change in unrealized appreciation/(depreciation) | | | 20 | | | | (31 | ) | | | — | |
Purchases | | | — | | | | — | | | | — | |
Sales/paydowns | | | (1 | ) | | | (2,153 | ) | | | — | |
Transfers into Level 3 | | | 16 | | | | 3,885 | | | | 1,995 | |
Transfers out of Level 3 | | | — | | | | — | | | | — | |
Ending balance as of September 30, 2021 | | $ | 16 | | | $ | 3,885 | | | $ | 1,995 | |
Changes in unrealized gains/(losses) included in earnings related to securities still held at reporting date | | $ | 16 | | | $ | (779 | ) | | $ | 35 | |
| | | Investments in
Sovereign Debt | | | Investments in
Life Settlement
Contracts | | | Investments in
Common Stock | |
Beginning balance as of October 1, 2020 | | $ | 2 | | | $ | 128,281 | | | $ | — | |
Accrued discounts/ premiums | | | — | | | | — | | | | — | |
Realized gain/(loss) | | | — | | | | 15,773 | | | | — | |
Change in unrealized appreciation/(depreciation) | | | — | | | | 10,760 | | | | — | |
Purchases | | | — | | | | — | | | | — | |
Sales/paydowns | | | (2 | ) | | | (61,077 | ) | | | — | |
Transfers into Level 3 | | | — | | | | — | | | | 80 | |
Transfers out of Level 3 | | | — | | | | — | | | | — | |
Ending balance as of September 30, 2021 | | $ | — | | | $ | 93,737 | | | $ | 80 | |
Changes in unrealized gains/(losses) included in earnings related to securities still held at reporting date | | $ | — | | | $ | (17,916 | ) | | $ | 12 | |
See accompanying notes to financial statements.
CITY NATIONAL ROCHDALE FUNDS | PAGE 138
consolidated schedule of investments |
September 30, 2021 |
City National Rochdale Fixed Income Opportunities Fund (concluded) |
| | | Investments
in Warrants | | | Total | |
Beginning balance as of October 1, 2020 | | $ | 2,241 | | | $ | 132,706 | |
Accrued discounts/ premiums | | | — | | | | (10 | ) |
Realized gain/(loss) | | | (7,007 | ) | | | 8,759 | |
Change in unrealized appreciation/(depreciation) | | | 4,766 | | | | 15,515 | |
Purchases | | | — | | | | — | |
Sales/paydowns | | | — | | | | (63,233 | ) |
Transfers into Level 3 | | | — | | | | 5,976 | |
Transfers out of Level 3 | | | — | | | | — | |
Ending balance as of September 30, 2021 | | $ | — | | | $ | 99,713 | |
Changes in unrealized gains/(losses) included in earnings related to securities still held at reporting date | | $ | — | | | $ | (18,632 | ) |
Amounts designated as “—” are either $0 or have been rounded to $0.
For more information on valuation inputs, see Note 2 — Significant Accounting Policies in the Notes to Financial Statements.
The following table summarizes the quantitative inputs and assumptions used for items categorized as material Level 3 investments as of September 30, 2021. The disclosures below also include qualitative information on the sensitivity of the fair value measurements to changes in the significant unobservable inputs.
| | Fair Value at
September 30,
2021
(000) | Valuation Techniques | |
Life
Settlement Contracts | $93,737 | Discounted Cash Flow Model | |
| | | | |
| | | Observable Inputs | |
| | | Maturity Value | |
| | | | |
| | | Unobservable Inputs | Range |
| | | Discount Rate | 13.29% |
| | | Expected Maturity (months) | 20-127 months |
The unobservable inputs used to determine fair value of recurring Level 3 assets may have similar or diverging impacts on valuation. Significant increases and decreases in these inputs in isolation and the interrelationships between them could result in significantly higher or lower fair value measurements. Increases in projected collection rates in isolation would result in a higher fair value measurement, while increases in expected discount rates, projected default rates, and maturities of life settlement contracts, in isolation, would result in a lower fair value measurement.
For the year ended September 30, 2021, there were transfers of $5,976 into Level 3. Transfers between Levels are recognized at year end.
At September 30, 2021, the Fund had the following investments in life settlement contracts:
Projected Year
of Maturity | | Number of
Contracts | | | Fair Value
(000) | | | Face Value
(Death Benefits)
(000) | |
2023 | | | 3 | | | $ | 14,842 | | | $ | 23,500 | |
2024 | | | 9 | | | | 23,281 | | | | 46,750 | |
2025 | | | 9 | | | | 26,009 | | | | 70,500 | |
2026 | | | 10 | | | | 18,243 | | | | 66,000 | |
Thereafter | | | 8 | | | | 11,362 | | | | 44,598 | |
| | | | 39 | | | $ | 93,737 | | | $ | 251,348 | |
For the year ended September 30, 2021, the net change to fair value on life settlement contracts, net of premiums paid and continuing costs disclosed in the Fund’s Consolidated Statement of Operations, as part of the unrealized appreciation/(depreciation) on investments, consisted of a net positive change to fair value on life settlement contracts of $10,759,855, offset by $22,169,652 in premiums paid and continuing costs associated with its investment in the policies. For the year ended September 30, 2021, the Fund realized gains of $15,773,452 on matured life settlement contracts, which are disclosed in the Consolidated Statement of Operations, as part of the realized gain/(loss) on investments.
See accompanying notes to financial statements.
CITY NATIONAL ROCHDALE FUNDS | PAGE 139
schedule of investments |
September 30, 2021 |
City National Rochdale Short Term Emerging Markets Debt Fund |
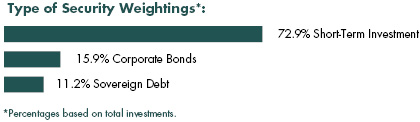
Description | | Face Amount (000)/Shares | | | Value (000) | |
Corporate Bonds [15.9%] |
Banks [11.5%] |
Access Bank, MTN | | | | | | | | |
10.500%, 10/19/21 | | $ | 9,895 | | | $ | 9,918 | |
Global Bank | | | | | | | | |
4.500%, 10/20/21 | | | 5,810 | | | | 5,804 | |
Turkiye Vakiflar Bankasi TAO, MTN | | | | | | | | |
5.500%, 10/27/21 | | | 9,300 | | | | 9,306 | |
| | | | | | | | | | | | | |
Total Banks | | | 25,028 | |
| | | | | | | | | | | | | |
Building-Heavy Construct [0.1%] |
Andrade Gutierrez International | | | | | | | | |
11.000%, 08/20/21(A) | | | 201 | | | | 153 | |
11.000%, 08/20/21(A) (B) | | | 1 | | | | 1 | |
| | | | | | | | | | | | | |
Total Building-Heavy Construct | | | 154 | |
| | | | | | | | | | | | | |
Electric Utilities [4.3%] |
Instituto Costarricense de Electricidad | | | | | | | | |
6.950%, 11/10/21 | | | 9,390 | | | | 9,395 | |
| | | | | | | | | | | | | |
Total Corporate Bonds |
(Cost $34,683) | | | 34,577 | |
| | | | | | | | | | | | | |
Sovereign Debt [11.2%] |
Namibia International Bonds | | | | | | | | |
5.500%, 11/03/21 | | | 9,800 | | | | 9,824 | |
Provincia de Buenos Aires, MTN | | | | | | | | |
5.250%, 09/01/37 | | | 9,000 | | | | 4,005 | |
Third Pakistan International Sukuk | | | | | | | | |
5.500%, 10/13/21 | | | 10,394 | | | | 10,388 | |
| | | | | | | | | | | | | |
Total Sovereign Debt |
(Cost $23,930) | | | 24,217 | |
| | | | | | | | | | | | | |
Description | | Shares | | | Value (000) | |
Short-Term Investment‡ [73.0%] |
SEI Daily Income Trust Government Fund, Cl F, 0.010%** | | | 158,228,866 | | | $ | 158,229 | |
| | | | | | | | | | | | | |
Total Short-Term Investment |
(Cost $158,229) | | $ | 158,229 | |
| | | | | | | | | | | | | |
Total Investments [100.1%] |
(Cost $216,842) | | $ | 217,023 | |
Percentages are based on net assets of $216,687 (000).
** The rate reported is the 7-day effective yield as of September 30, 2021.
‡ | The Fund’s investment objective is to provide interest income and capital preservation in order to achieve positive returns. Refer to the Fund’s previous annual report at: https://www.citynationalrochdalefunds.com/fund_reports |
(A) | In default on interest payments. Rate shown represents the last coupon rate prior to default. |
(B) | Security exempt from registration under Rule 144A of the Securities Act of 1933. This security may be resold in transactions exempt from registration normally to qualified institutions. On September 30, 2021, the value of this security amounted to $1 (000), representing 0.0% of the net assets of the Fund. |
Cl — Class
MTN — Medium Term Note
The following is a list of the inputs used as of September 30, 2021, in valuing the Fund’s investments and other financial instruments carried at value (000):
Investments in Securities | | Level 1 | | | Level 2 | | | Level 3 | | | Total | |
Corporate Bonds | | $ | — | | | $ | 34,577 | | | $ | — | | | $ | 34,577 | |
Sovereign Debt | | | — | | | | 24,217 | | | | — | | | | 24,217 | |
Short-Term Investment | | | 158,229 | | | | — | | | | — | | | | 158,229 | |
Total Investments in Securities | | $ | 158,229 | | | $ | 58,794 | | | $ | — | | | $ | 217,023 | |
For the year ended September 30, 2021, there have been no transfers in or out of Level 3.
Amounts designated as “—” are either $0 or have been rounded to $0.
For more information on valuation inputs, see Note 2 — Significant Accounting Policies in the Notes to Financial Statements.
See accompanying notes to financial statements.
CITY NATIONAL ROCHDALE FUNDS | PAGE 140
schedule of investments |
September 30, 2021 |
City National Rochdale Dividend & Income Fund |
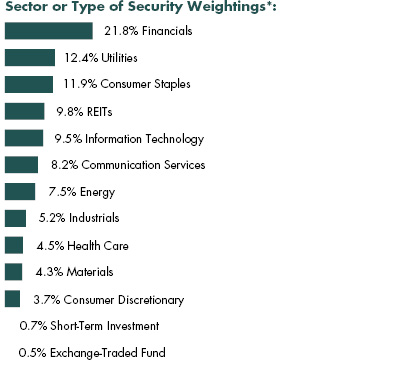
Description | | Shares | | | Value (000) | |
Common Stock [98.2%] |
Communication Services [8.1%] |
AT&T | | | 188,500 | | | $ | 5,092 | |
BCE | | | 70,000 | | | | 3,504 | |
Interpublic Group of | | | 114,500 | | | | 4,199 | |
Verizon Communications | | | 119,167 | | | | 6,436 | |
| | | | | | | | | | | | | |
Total Communication Services | | | 19,231 | |
| | | | | | | | | | | | | |
Consumer Discretionary [3.7%] |
Genuine Parts | | | 20,300 | | | | 2,461 | |
Hanesbrands | | | 130,600 | | | | 2,241 | |
Newell Brands | | | 181,100 | | | | 4,009 | |
| | | | | | | | | | | | | |
Total Consumer Discretionary | | | 8,711 | |
| | | | | | | | | | | | | |
Consumer Staples [11.8%] |
Altria Group | | | 144,550 | | | | 6,580 | |
Coca-Cola | | | 81,772 | | | | 4,291 | |
General Mills | | | 72,780 | | | | 4,354 | |
Philip Morris International | | | 69,300 | | | | 6,569 | |
Procter & Gamble | | | 44,700 | | | | 6,249 | |
| | | | | | | | | | | | | |
Total Consumer Staples | | | 28,043 | |
| | | | | | | | | | | | | |
Energy [7.5%] |
Chevron | | | 44,500 | | | | 4,514 | |
ConocoPhillips | | | 51,000 | | | | 3,456 | |
Marathon Petroleum | | | 76,000 | | | | 4,698 | |
Williams | | | 196,900 | | | | 5,108 | |
| | | | | | | | | | | | | |
Total Energy | | | 17,776 | |
| | | | | | | | | | | | | |
Financials [21.7%] |
Ares Capital | | | 253,400 | | | | 5,152 | |
Arthur J Gallagher | | | 29,400 | | | | 4,370 | |
Cincinnati Financial | | | 60,650 | | | | 6,928 | |
Citizens Financial Group | | | 105,500 | | | | 4,956 | |
Compass Diversified Holdings (A) | | | 140,000 | | | | 3,944 | |
Fifth Third Bancorp | | | 163,400 | | | | 6,935 | |
First Horizon | | | 232,400 | | | | 3,786 | |
Hartford Financial Services Group | | | 69,700 | | | | 4,896 | |
KeyCorp | | | 212,800 | | | | 4,601 | |
MetLife | | | 97,000 | | | | 5,988 | |
| | | | | | | | | | | | | |
Total Financials | | | 51,556 | |
| | | | | | | | | | | | | |
Health Care [4.5%] |
Merck | | | 73,150 | | | | 5,495 | |
Pfizer | | | 119,444 | | | | 5,137 | |
| | | | | | | | | | | | | |
Total Health Care | | | 10,632 | |
| | | | | | | | | | | | | |
Industrials [5.2%] |
Emerson Electric | | | 52,000 | | | | 4,898 | |
Lockheed Martin | | | 21,200 | | | | 7,316 | |
| | | | | | | | | | | | | |
Total Industrials | | | 12,214 | |
| | | | | | | | | | | | | |
Information Technology [9.4%] |
Cisco Systems | | | 122,000 | | | | 6,640 | |
Intel | | | 45,100 | | | | 2,403 | |
Paychex | | | 62,150 | | | | 6,989 | |
Qualcomm | | | 48,700 | | | | 6,281 | |
| | | | | | | | | | | | | |
Total Information Technology | | | 22,313 | |
| | | | | | | | | | | | | |
Materials [4.2%] |
International Paper | | | 89,500 | | | | 5,005 | |
Sonoco Products | | | 84,650 | | | | 5,043 | |
| | | | | | | | | | | | | |
Total Materials | | | 10,048 | |
| | | | | | | | | | | | | |
See accompanying notes to financial statements.
CITY NATIONAL ROCHDALE FUNDS | PAGE 141
schedule of investments |
September 30, 2021 |
City National Rochdale Dividend & Income Fund (concluded) |
Description | | Shares | | | Value (000) | |
REITs [9.8%] |
Crown Castle International | | | 25,600 | | | $ | 4,437 | |
Mid-America Apartment Communities | | | 36,000 | | | | 6,723 | |
National Retail Properties | | | 115,200 | | | | 4,975 | |
Prologis | | | 56,689 | | | | 7,111 | |
| | | | | | | | | | | | | |
Total REITs | | | 23,246 | |
| | | | | | | | | | | | | |
Utilities [12.3%] |
American Electric Power | | | 34,900 | | | | 2,833 | |
Avangrid | | | 67,600 | | | | 3,285 | |
Dominion Energy | | | 47,300 | | | | 3,454 | |
Duke Energy | | | 68,006 | | | | 6,637 | |
Entergy | | | 47,800 | | | | 4,747 | |
Eversource Energy | | | 44,542 | | | | 3,642 | |
NextEra Energy Partners | | | 30,700 | | | | 2,313 | |
Sempra Energy | | | 18,200 | | | | 2,302 | |
| | | | | | | | | | | | | |
Total Utilities | | | 29,213 | |
| | | | | | | | | | | | | |
Total Common Stock |
(Cost $177,638) | | | 232,983 | |
| | | | | | | | | | | | | |
Exchange-Traded Fund [0.6%] |
Invesco Preferred ETF | | | 85,000 | | | | 1,277 | |
| | | | | | | | | | | | | |
Total Exchange-Traded Fund |
(Cost $1,263) | | | 1,277 | |
| | | | | | | | | | | | | |
Short-Term Investment [0.7%] |
SEI Daily Income Trust Government Fund, Cl F, 0.010%** | | | 1,681,800 | | | | 1,682 | |
| | | | | | | | | | | | | |
Total Short-Term Investment |
(Cost $1,682) | | | 1,682 | |
| | | | | | | | | | | | | |
Total Investments [99.5%] |
(Cost $180,583) | | | 235,942 | |
Percentages are based on net assets of $237,219 (000).
** | The rate reported is the 7-day effective yield as of September 30, 2021. |
(A) | Security is a Master Limited Partnership. At September 30, 2021, such securities amounted to $3,944 (000), or 1.7% of the net assets of the Fund. |
Cl — Class
ETF — Exchange-Traded Fund
REIT — Real Estate Investment Trust
As of September 30, 2021, all of the Fund’s investments are Level 1, in accordance with the authoritative guidance on fair value measurements and disclosure under U.S. GAAP.
For the year ended September 30, 2021, there have been no transfers in or out of Level 3.
For more information on valuation inputs, see Note 2 -- Significant Accounting Policies in the Notes to Financial Statements.
See accompanying notes to financial statements.
CITY NATIONAL ROCHDALE FUNDS | PAGE 142
schedule of investments |
September 30, 2021 |
City National Rochdale U.S. Core Equity Fund |
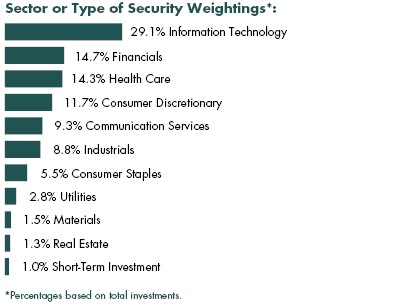
Description | | Shares | | | Value (000) | |
Common Stock [99.1%] |
Aerospace & Defense [1.6%] |
L3Harris Technologies | | | 10,000 | | | $ | 2,202 | |
Northrop Grumman | | | 12,000 | | | | 4,322 | |
| | | | | | | | | | | | | |
Total Aerospace & Defense | | | 6,524 | |
| | | | | | | | | | | | | |
Beverages [1.8%] |
PepsiCo | | | 49,000 | | | | 7,370 | |
| | | | | | | | | | | | | |
Capital Markets [5.1%] |
Blackstone, Cl A (A) | | | 87,000 | | | | 10,121 | |
CME Group, Cl A | | | 36,000 | | | | 6,962 | |
S&P Global | | | 10,000 | | | | 4,249 | |
| | | | | | | | | | | | | |
Total Capital Markets | | | 21,332 | |
| | | | | | | | | | | | | |
Chemicals [1.5%] |
Sherwin-Williams | | | 23,100 | | | | 6,462 | |
| | | | | | | | | | | | | |
Commercial Banks [2.7%] |
JPMorgan Chase | | | 68,000 | | | | 11,131 | |
| | | | | | | | | | | | | |
Commercial Services & Supplies [2.5%] |
Cintas | | | 27,000 | | | | 10,278 | |
| | | | | | | | | | | | | |
Consumer Finance [3.0%] |
Ally Financial | | | 165,000 | | | | 8,423 | |
Synchrony Financial | | | 86,000 | | | | 4,204 | |
| | | | | | | | | | | | | |
Total Consumer Finance | | | 12,627 | |
| | | | | | | | | | | | | |
Diversified Financial Services [1.8%] |
Berkshire Hathaway, Cl B * | | | 27,000 | | | | 7,369 | |
| | | | | | | | | | | | | |
Electric Utilities [1.5%] |
NextEra Energy | | | 80,000 | | | | 6,282 | |
| | | | | | | | | | | | | |
Food & Staples Retailing [3.8%] |
Costco Wholesale | | | 21,000 | | | | 9,436 | |
Walmart | | | 46,000 | | | | 6,412 | |
| | | | | | | | | | | | | |
Total Food & Staples Retailing | | | 15,848 | |
| | | | | | | | | | | | | |
Health Care Equipment & Supplies [3.3%] |
Danaher | | | 18,000 | | | | 5,480 | |
Edwards Lifesciences * | | | 75,000 | | | | 8,491 | |
| | | | | | | | | | | | | |
Total Health Care Equipment & Supplies | | | 13,971 | |
| | | | | | | | | | | | | |
Health Care Providers & Services [4.6%] |
HCA Healthcare | | | 18,000 | | | | 4,369 | |
UnitedHealth Group | | | 38,000 | | | | 14,848 | |
| | | | | | | | | | | | | |
Total Health Care Providers & Services | | | 19,217 | |
| | | | | | | | | | | | | |
Hotels, Restaurants & Leisure [5.3%] |
Expedia Group * | | | 28,000 | | | | 4,589 | |
McDonald’s | | | 33,000 | | | | 7,956 | |
Starbucks | | | 86,000 | | | | 9,487 | |
| | | | | | | | | | | | | |
Total Hotels, Restaurants & Leisure | | | 22,032 | |
| | | | | | | | | | | | | |
Industrial Conglomerates [0.7%] |
Roper Technologies | | | 7,000 | | | | 3,123 | |
| | | | | | | | | | | | | |
Insurance [2.2%] |
Aon, Cl A | | | 32,000 | | | | 9,145 | |
| | | | | | | | | | | | | |
Interactive Media & Services [4.0%] |
Alphabet, Cl A * | | | 4,200 | | | | 11,229 | |
Facebook, Cl A * | | | 16,000 | | | | 5,430 | |
| | | | | | | | | | | | | |
Total Interactive Media & Services | | | 16,659 | |
| | | | | | | | | | | | | |
Internet & Catalog Retail [2.4%] |
Amazon.Com * | | | 3,100 | | | | 10,184 | |
| | | | | | | | | | | | | |
See accompanying notes to financial statements.
CITY NATIONAL ROCHDALE FUNDS | PAGE 143
schedule of investments |
September 30, 2021 |
City National Rochdale U.S. Core Equity Fund (concluded) |
Description | | Shares | | | Value (000) | |
IT Services [8.9%] |
Accenture, Cl A | | | 36,000 | | | $ | 11,517 | |
Mastercard, Cl A | | | 34,000 | | | | 11,821 | |
Visa, Cl A | | | 63,000 | | | | 14,033 | |
| | | | | | | | | | | | | |
Total IT Services | | | 37,371 | |
| | | | | | | | | | | | | |
Life Sciences Tools & Services [4.5%] |
Charles River Laboratories International * | | | 22,000 | | | | 9,079 | |
Thermo Fisher Scientific | | | 17,000 | | | | 9,712 | |
| | | | | | | | | | | | | |
Total Life Sciences Tools & Services | | | 18,791 | |
| | | | | | | | | | | | | |
Machinery [1.8%] |
Trane Technologies | | | 44,000 | | | | 7,597 | |
| | | | | | | | | | | | | |
Media [1.7%] |
Comcast, Cl A | | | 126,000 | | | | 7,047 | |
| | | | | | | | | | | | | |
Pharmaceuticals [1.9%] |
Zoetis, Cl A | | | 40,000 | | | | 7,766 | |
| | | | | | | | | | | | | |
Professional Services [1.0%] |
TransUnion | | | 39,000 | | | | 4,380 | |
| | | | | | | | | | | | | |
Real Estate Investment Trusts [1.3%] |
Equinix | | | 7,000 | | | | 5,531 | |
| | | | | | | | | | | | | |
Road & Rail [1.2%] |
Old Dominion Freight Line | | | 17,000 | | | | 4,862 | |
| | | | | | | | | | | | | |
Semiconductors & Semiconductor Equipment [5.8%] |
Applied Materials | | | 64,000 | | | | 8,239 | |
ASML Holding, Cl G | | | 11,000 | | | | 8,196 | |
NXP Semiconductors | | | 41,000 | | | | 8,030 | |
| | | | | | | | | | | | | |
Total Semiconductors & Semiconductor Equipment | | | 24,465 | |
| | | | | | | | | | | | | |
Software [9.3%] |
Adobe * | | | 20,000 | | | | 11,514 | |
Microsoft | | | 98,000 | | | | 27,628 | |
| | | | | | | | | | | | | |
Total Software | | | 39,142 | |
| | | | | | | | | | | | | |
Specialty Retail [4.0%] |
Home Depot | | | 40,000 | | | | 13,130 | |
TJX | | | 54,000 | | | | 3,563 | |
| | | | | | | | | | | | | |
Total Specialty Retail | | | 16,693 | |
| | | | | | | | | | | | | |
Technology Hardware, Storage & Peripherals [5.0%] |
Apple | | | 148,000 | | | | 20,942 | |
| | | | | | | | | | | | | |
Telephones & Telecommunications [1.9%] |
Walt Disney * | | | 48,000 | | | | 8,120 | |
| | | | | | | | | | | | | |
Water Utilities [1.3%] |
American Water Works | | | 32,000 | | | | 5,409 | |
| | | | | | | | | | | | | |
Wireless Telecommunication Services [1.7%] |
T-Mobile US * | | | 55,000 | | | | 7,027 | |
| | | | | | | | | | | | | |
Total Common Stock |
(Cost $186,121) | | | 414,697 | |
| | | | | | | | | | | | | |
Short-Term Investment [1.0%] |
SEI Daily Income Trust Government Fund, Cl F, 0.010%** | | | 4,373,682 | | | | 4,374 | |
| | | | | | | | | | | | | |
Total Short-Term Investment |
(Cost $4,374) | | | 4,374 | |
| | | | | | | | | | | | | |
Total Investments [100.1%] |
(Cost $190,495) | | $ | 419,071 | |
Percentages are based on net assets of $418,650 (000).
* Non-income producing security.
** | The rate reported is the 7-day effective yield as of September 30, 2021. |
(A) | Security is a Master Limited Partnership. At September 30, 2021, such securities amounted to $10,121 (000), or 2.4% of the net assets of the Fund. |
Cl — Class
As of September 30, 2021, all of the Fund’s investments are Level 1, in accordance with the authoritative guidance on fair value measurements and disclosure under U.S. GAAP.
For the year ended September 30, 2021, there have been no transfers in or out of Level 3.
Amounts designated as “—” are either $0 or have been rounded to $0.
For more information on valuation inputs, see Note 2 -- Significant Accounting Policies in the Notes to Financial Statements.
See accompanying notes to financial statements.
CITY NATIONAL ROCHDALE FUNDS | PAGE 144
Statements of Assets and Liabilities/Consolidated Statement of Assets and Liabilities
statements of assets and liabilities (000) |
September 30, 2021 |
| | | City National
Rochdale
Government Money
Market Fund | | | City National
Rochdale
Government
Bond Fund | | | City National
Rochdale Corporate
Bond Fund | | | City National
Rochdale California
Tax Exempt
Bond Fund | |
ASSETS: | | | | | | | | | | | | | | | | |
Cost of securities (including affiliated investments and repurchase agreements) | | $ | 4,768,389 | | | $ | 29,283 | | | $ | 113,290 | | | $ | 73,829 | |
Investments in securities, at value | | $ | 4,490,389 | | | $ | 29,910 | | | $ | 110,818 | | | $ | 76,050 | |
Repurchase agreements, at value | | | 278,000 | | | | — | | | | — | | | | — | |
Affiliated Investments, at value | | | — | | | | — | | | | 3,660 | | | | — | |
Dividend and interest receivable | | | 3,700 | | | | 113 | | | | 920 | | | | 904 | |
Receivable for capital shares sold | | | — | | | | 3 | | | | 11 | | | | 33 | |
Foreign tax reclaim receivable | | | — | | | | — | | | | 9 | | | | — | |
Receivable due from investment adviser | | | — | | | | 18 | | | | — | | | | 11 | |
Prepaid expenses | | | 1,213 | | | | — | | | | 1 | | | | 1 | |
Total Assets | | $ | 4,773,302 | | | $ | 30,044 | | | $ | 115,419 | | | $ | 76,999 | |
| | | | | | | | | | | | | | | | | |
LIABILITIES: | | | | | | | | | | | | | | | | |
Payable for income distributions | | $ | 41 | | | $ | 15 | | | $ | 78 | | | $ | 54 | |
Payable for capital shares redeemed | | | — | | | | — | | | | — | | | | 38 | |
Investment advisory fees payable | | | 161 | | | | — | | | | 13 | | | | — | |
Shareholder servicing and distribution fees payable | | | 1,007 | | | | 6 | | | | 24 | | | | 26 | |
Administrative fees payable | | | 75 | | | | 16 | | | | 17 | | | | 16 | |
Audit expense payable | | | — | | | | 13 | | | | 13 | | | | 13 | |
Accrued expenses | | | 175 | | | | 2 | | | | 6 | | | | 8 | |
Total Liabilities | | $ | 1,459 | | | $ | 52 | | | $ | 151 | | | $ | 155 | |
Net Assets | | $ | 4,771,843 | | | $ | 29,992 | | | $ | 115,268 | | | $ | 76,844 | |
| | | | | | | | | | | | | | | | | |
NET ASSETS: | | | | | | | | | | | | | | | | |
Paid-in Capital (unlimited authorization — $0.01 par value) | | $ | 4,771,829 | | | $ | 29,908 | | | $ | 112,488 | | | $ | 74,604 | |
Total distributable earnings | | | 14 | | | | 84 | | | | 2,780 | | | | 2,240 | |
Net Assets | | $ | 4,771,843 | | | $ | 29,992 | | | $ | 115,268 | | | $ | 76,844 | |
| | | | | | | | | | | | | | | | | |
Class N Shares: | | | | | | | | | | | | | | | | |
Net Assets | | $ | 642,240 | | | $ | 2,823 | | | $ | 12,837 | | | $ | 7,050 | |
Total shares outstanding at end of year | | | 642,230 | | | | 264 | | | | 1,201 | | | | 653 | |
Net asset value, offering and redemption price per share (net assets ÷ shares outstanding) | | $ | 1.00 | | | $ | 10.71 | * | | $ | 10.69 | | | $ | 10.80 | |
| | | | | | | | | | | | | | | | | |
Class S Shares: | | | | | | | | | | | | | | | | |
Net Assets | | $ | 689,506 | | | $ | — | | | $ | — | | | $ | — | |
Total shares outstanding at end of year | | | 689,497 | | | | — | | | | — | | | | — | |
Net asset value, offering and redemption price per share (net assets ÷ shares outstanding) | | $ | 1.00 | | | $ | — | | | $ | — | | | $ | — | |
| | | | | | | | | | | | | | | | | |
Servicing Class Shares: | | | | | | | | | | | | | | | | |
Net Assets | | $ | 3,440,097 | | | $ | 27,169 | | | $ | 102,431 | | | $ | 69,794 | |
Total shares outstanding at end of year | | | 3,440,106 | | | | 2,540 | | | | 9,598 | | | | 6,485 | |
Net asset value, offering and redemption price per share (net assets ÷ shares outstanding) | | $ | 1.00 | | | $ | 10.69 | * | | $ | 10.67 | | | $ | 10.76 | |
* | NAV per share as of September 30, 2021 does not calculate to the stated NAV per share due to rounding of net assets and shares. |
Amounts designated as “—” are either $0 or have been rounded to $0.
See accompanying notes to financial statements.
CITY NATIONAL ROCHDALE FUNDS | PAGE 145
statements of assets and liabilities (000)/
consolidated statement of assets and liabilities (000) |
September 30, 2021 |
| | | City National
Rochdale Municipal
High Income Fund | | | City National
Rochdale
Intermediate Fixed
Income Fund | | | City National
Rochdale
Fixed Income
Opportunities Fund
(Consolidated) | | | City National
Rochdale Short
Term Emerging
Markets Debt Fund | |
ASSETS: | | | | | | | | | | | | | | | | |
Cost of securities (including affiliated investments and repurchase agreements) | | $ | 1,940,414 | | | $ | 95,728 | | | $ | 4,215,691 | | | $ | 216,842 | |
Investments in securities, at value | | $ | 2,056,309 | | | $ | 94,536 | | | $ | 4,082,003 | | | $ | 217,023 | |
Affilliated investments, at value | | | — | | | | 2,972 | | | | — | | | | — | |
Cash | | | — | | | | — | | | | 2,357 | | | | — | |
Foreign currency(1) | | | — | | | | — | | | | 5,221 | | | | — | |
Dividend and interest receivable | | | 23,277 | | | | 532 | | | | 45,502 | | | | 1,545 | |
Foreign tax reclaim receivable | | | — | | | | 24 | | | | 402 | | | | — | |
Receivable for capital shares sold | | | 5,441 | | | | 72 | | | | 13,719 | | | | — | |
Receivable for investment securities sold | | | 520 | | | | — | | | | 73,853 | | | | — | |
Unrealized gain on forward foreign currency contracts | | | — | | | | — | | | | 12,547 | | | | — | |
Prepaid expenses | | | 20 | | | | 1 | | | | 43 | | | | 3 | |
Total Assets | | $ | 2,085,567 | | | $ | 98,137 | | | $ | 4,235,647 | | | $ | 218,571 | |
| | | | | | | | | | | | | | | | | |
LIABILITIES: | | | | | | | | | | | | | | | | |
Payable for investment securities purchased | | $ | 20,454 | | | $ | — | | | $ | 117,174 | | | $ | 1,486 | |
Payable for income distributions | | | 2,894 | | | | — | | | | — | | | | 116 | |
Payable for capital shares redeemed | | | 2,053 | | | | 326 | | | | 2,022 | | | | 75 | |
Unrealized loss on forward foreign currency contracts | | | — | | | | — | | | | 21 | | | | — | |
Investment advisory fees payable | | | 843 | | | | 6 | | | | 2,165 | | | | 116 | |
Shareholder servicing and distribution fees payable | | | 680 | | | | 39 | | | | 1,701 | | | | 45 | |
Administrative fees payable | | | 68 | | | | 16 | | | | 66 | | | | 18 | |
Accrued expenses | | | 150 | | | | 19 | | | | 586 | | | | 28 | |
Total Liabilities | | $ | 27,142 | | | $ | 406 | | | $ | 123,735 | | | $ | 1,884 | |
Net Assets | | $ | 2,058,425 | | | $ | 97,731 | | | $ | 4,111,912 | | | $ | 216,687 | |
| | | | | | | | | | | | | | | | | |
NET ASSETS: | | | | | | | | | | | | | | | | |
Paid-in Capital (unlimited authorization — $0.01 par value) | | $ | 1,999,339 | | | $ | 93,171 | | | $ | 4,508,993 | | | $ | 231,838 | |
Total distributable earnings/(loss) | | | 59,086 | | | | 4,560 | | | | (397,081 | ) | | | (15,151 | ) |
Net Assets | | $ | 2,058,425 | | | $ | 97,731 | | | $ | 4,111,912 | | | $ | 216,687 | |
| | | | | | | | | | | | | | | | | |
Institutional Class Shares: | | | | | | | | | | | | | | | | |
Net Assets | | $ | — | | | $ | 3,247 | | | $ | — | | | $ | — | |
Total shares outstanding at end of year | | | — | | | | 119 | | | | — | | | | — | |
Net asset value, offering and redemption price per share (net assets ÷ shares outstanding) | | $ | — | | | $ | 27.20 | * | | $ | — | | | $ | — | |
| | | | | | | | | | | | | | | | | |
Class N Shares: | | | | | | | | | | | | | | | | |
Net Assets | | $ | 1,235,195 | | | $ | 94,484 | | | $ | 4,111,912 | | | $ | — | |
Total shares outstanding at end of year | | | 111,588 | | | | 3,472 | | | | 175,809 | | | | — | |
Net asset value, offering and redemption price per share (net assets ÷ shares outstanding) | | $ | 11.07 | | | $ | 27.21 | | | $ | 23.39 | | | $ | — | |
| | | | | | | | | | | | | | | | | |
Servicing Class Shares: | | | | | | | | | | | | | | | | |
Net Assets | | $ | 823,230 | | | $ | — | | | $ | — | | | $ | — | |
Total shares outstanding at end of year | | | 74,329 | | | | — | | | | — | | | | — | |
Net asset value, offering and redemption price per share (net assets ÷ shares outstanding) | | $ | 11.08 | | | $ | — | | | $ | — | | | $ | — | |
| | | | | | | | | | | | | | | | | |
Class Y Shares: | | | | | | | | | | | | | | | | |
Net Assets | | $ | — | | | $ | — | | | $ | — | | | $ | 216,687 | |
Total shares outstanding at end of year | | | — | | | | — | | | | — | | | | 26,950 | |
Net asset value, offering and redemption price per share (net assets ÷ shares outstanding) | | $ | — | | | $ | — | | | $ | — | | | $ | 8.04 | |
(1) | Cost of foreign currency $5,249 (000). |
* NAV per share as of September 30, 2021 does not calculate to the stated NAV per share due to rounding of net assets and shares.
Amounts designated as “—” are either $0 or have been rounded to $0.
See accompanying notes to financial statements.
CITY NATIONAL ROCHDALE FUNDS | PAGE 146
statements of assets and liabilities (000) |
September 30, 2021 |
| | | City National
Rochdale Dividend
& Income Fund | | | City National
Rochdale U.S.
Core Equity Fund | |
ASSETS: | | | | | | | | |
Cost of securities | | $ | 180,583 | | | $ | 190,495 | |
Investments in securities, at value | | $ | 235,942 | | | $ | 419,071 | |
Cash | | | — | | | | 20 | |
Receivable for investment securities sold | | | 965 | | | | — | |
Dividend and interest receivable | | | 532 | | | | 28 | |
Receivable for capital shares sold | | | 122 | | | | 185 | |
Foreign tax reclaim receivable | | | 45 | | | | 20 | |
Prepaid expenses | | | 3 | | | | 4 | |
Total Assets | | $ | 237,609 | | | $ | 419,328 | |
| | | | | | | | | |
LIABILITIES: | | | | | | | | |
Payable for capital shares redeemed | | $ | 109 | | | $ | 345 | |
Investment advisory fees payable | | | 101 | | | | 145 | |
Shareholder servicing and distribution fees payable | | | 101 | | | | 140 | |
Payable to custodian | | | 38 | | | | — | |
Administrative fees payable | | | 18 | | | | 21 | |
Accrued expenses | | | 23 | | | | 27 | |
Total Liabilities | | $ | 390 | | | $ | 678 | |
Net Assets | | $ | 237,219 | | | $ | 418,650 | |
| | | | | | | | | |
NET ASSETS: | | | | | | | | |
Paid-in Capital (unlimited authorization — $0.01 par value) | | $ | 166,501 | | | $ | 171,815 | |
Total distributable earnings | | | 70,718 | | | | 246,835 | |
Net Assets | | $ | 237,219 | | | $ | 418,650 | |
| | | | | | | | | |
See accompanying notes to financial statements.
CITY NATIONAL ROCHDALE FUNDS | PAGE 147
statements of assets and liabilities (000) |
September 30, 2021 |
| | | City National
Rochdale Dividend
& Income Fund | | | City National
Rochdale U.S.
Core Equity Fund | |
Institutional Class Shares: | | | | | | | | |
Net Assets | | $ | — | | | $ | 148 | |
Total shares outstanding at end of year | | | — | | | | 6 | |
Net asset value, offering and redemption price per share (net assets ÷ shares outstanding) | | $ | — | | | $ | 26.49 | * |
| | | | | | | | | |
Class N Shares: | | | | | | | | |
Net Assets | | $ | 237,219 | | | $ | 230,767 | |
Total shares outstanding at end of year | | | 5,846 | | | | 8,791 | |
Net asset value, offering and redemption price per share (net assets ÷ shares outstanding) | | $ | 40.58 | | | $ | 26.25 | |
| | | | | | | | | |
Servicing Class Shares: | | | | | | | | |
Net Assets | | $ | — | | | $ | 187,735 | |
Total shares outstanding at end of year | | | — | | | | 7,129 | |
Net asset value, offering and redemption price per share (net assets ÷ shares outstanding) | | $ | — | | | $ | 26.33 | |
* | NAV per share as of September 30, 2021 does not calculate to the stated NAV per share due to rounding of net assets and shares. |
Amounts designated as “—” are either $0 or have been rounded to $0.
See accompanying notes to financial statements.
CITY NATIONAL ROCHDALE FUNDS | PAGE 148
Statements of Operations/Consolidated Statement of Operations
statements of operations (000) |
For the year ended September 30, 2021 |
| | | City National
Rochdale
Government Money
Market Fund | | | City National
Rochdale
Government
Bond Fund | | | City National
Rochdale Corporate
Bond Fund | | | City National
Rochdale California
Tax Exempt
Bond Fund | |
INVESTMENT INCOME: | | | | | | | | | | | | | | | | |
Dividend Income | | $ | — | | | $ | — | | | $ | 4 | | | $ | — | |
Dividend Income from Affiliated Investments | | | — | | | | — | | | | 226 | | | | 1 | |
Interest Income | | | 3,755 | | | | 553 | | | | 2,461 | | | | 1,385 | |
Total Investment Income | | | 3,755 | | | | 553 | | | | 2,691 | | | | 1,386 | |
| | | | | | | | | | | | | | | | | |
EXPENSES: | | | | | | | | | | | | | | | | |
Investment Advisory Fees | | | 12,014 | | | | 152 | | | | 506 | | | | 213 | |
Shareholder Servicing Fees — Class N(1) | | | 2,782 | | | | 14 | | | | 63 | | | | 36 | |
Shareholder Servicing Fees — Class S(1) | | | 4,772 | | | | — | | | | — | | | | — | |
Shareholder Servicing Fees — Servicing Class | | | 8,582 | | | | 81 | | | | 285 | | | | 179 | |
Administration Fees | | | 889 | | | | 186 | | | | 201 | | | | 193 | |
Transfer Agent Fees | | | 240 | | | | 1 | | | | 6 | | | | 4 | |
Trustee Fees | | | 168 | | | | 35 | | | | 38 | | | | 36 | |
Professional Fees | | | 374 | | | | 16 | | | | 23 | | | | 19 | |
Custody Fees | | | 172 | | | | 1 | | | | 5 | | | | 3 | |
Registration Fees | | | 241 | | | | 2 | | | | 5 | | | | 3 | |
Printing Fees | | | 110 | | | | 1 | | | | 3 | | | | 2 | |
Insurance and Other Expenses | | | 344 | | | | 16 | | | | 26 | | | | 28 | |
Total Expenses | | | 30,688 | | | | 505 | | | | 1,161 | | | | 716 | |
Less, Waivers of: | | | | | | | | | | | | | | | | |
Investment Advisory Fees | | | (10,166 | ) | | | (152 | ) | | | (168 | ) | | | (202 | ) |
Shareholder Servicing Fees — Class N(1) | | | (2,782 | ) | | | — | | | | — | | | | — | |
Shareholder Servicing Fees — Class S(1) | | | (4,772 | ) | | | — | | | | — | | | | — | |
Shareholder Servicing Fees — Servicing Class | | | (8,582 | ) | | | — | | | | — | | | | — | |
Reimbursement of Expenses from Investment Advisor | | | (1,254 | ) | | | (71 | ) | | | — | | | | — | |
Net Expenses | | | 3,132 | | | | 282 | | | | 993 | | | | 514 | |
| | | | | | | | | | | | | | | | | |
Net Investment Income | | | 623 | | | | 271 | | | | 1,698 | | | | 872 | |
Net Realized Gain: | | | | | | | | | | | | | | | | |
Investments | | | — | | | | 238 | | | | 2,380 | | | | 20 | |
Net Change in Unrealized Appreciation (Depreciation) on: | | | | | | | | | | | | | | | | |
Investments | | | — | | | | (851 | ) | | | (3,545 | ) | | | (1,072 | ) |
Net Increase (Decrease) in Net Assets Resulting from Operations | | $ | 623 | | | $ | (342 | ) | | $ | 533 | | | $ | (180 | ) |
(1) | Includes class specific distribution expenses. |
Amounts designated as “—” are either $0 or have been rounded to $0.
See accompanying notes to financial statements.
CITY NATIONAL ROCHDALE FUNDS | PAGE 149
statements of operations (000)/
consolidated statement of operations (000) |
For the year ended September 30, 2021 |
| | | City National
Rochdale Municipal
High Income Fund | | | City National
Rochdale
Intermediate Fixed
Income Fund | | | City National
Rochdale
Fixed Income
Opportunities Fund
(Consolidated) | | | City National
Rochdale Short
Term Emerging
Markets Debt Fund | |
INVESTMENT INCOME: | | | | | | | | | | | | | | | | |
Dividend Income | | $ | 8 | | | $ | 8 | | | $ | 1,521 | | | $ | 6 | |
Dividend Income from Affiliated Investments | | | — | | | | 183 | | | | — | | | | — | |
Interest Income | | | 76,417 | | | | 2,085 | | | | 247,779 | | | | 17,258 | |
Total Investment Income | | | 76,425 | | | | 2,276 | | | | 249,300 | | | | 17,264 | |
| | | | | | | | | | | | | | | | | |
EXPENSES: | | | | | | | | | | | | | | | | |
Investment Advisory Fees | | | 9,318 | | | | 420 | | | | 19,983 | | | | 1,196 | |
Shareholder Servicing Fees — Class N(1) | | | 5,753 | | | | 488 | | | | 19,983 | | | | — | |
Shareholder Servicing Fees — Servicing Class | | | 1,783 | | | | — | | | | — | | | | — | |
Shareholder Servicing Fees — Class Y | | | — | | | | — | | | | — | | | | 598 | |
Administration Fees | | | 497 | | | | 197 | | | | 877 | | | | 218 | |
Transfer Agent Fees | | | 97 | | | | 5 | | | | 205 | | | | 12 | |
Trustee Fees | | | 88 | | | | 37 | | | | 181 | | | | 41 | |
Professional Fees | | | 162 | | | | 22 | | | | 420 | | | | 33 | |
Custody Fees | | | 69 | | | | 3 | | | | 670 | | | | 36 | |
Registration Fees | | | 86 | | | | 4 | | | | 158 | | | | 11 | |
Printing Fees | | �� | 44 | | | | 2 | | | | 89 | | | | 5 | |
Insurance and Other Expenses | | | 305 | | | | 28 | | | | 836 | | | | 44 | |
Reimbursement of Waiver to Investment Advisor | | | — | | | | — | | | | 517 | | | | 48 | |
Total Expenses | | | 18,202 | | | | 1,206 | | | | 43,919 | | | | 2,242 | |
Less, Waivers of: | | | | | | | | | | | | | | | | |
Investment Advisory Fees | | | — | | | | (183 | ) | | | (47 | ) | | | — | |
Net Expenses | | | 18,202 | | | | 1,023 | | | | 43,872 | | | | 2,242 | |
| | | | | | | | | | | | | | | | | |
Net Investment Income | | | 58,223 | | | | 1,253 | | | | 205,428 | | | | 15,022 | |
Net Realized Gain (Loss) from: | | | | | | | | | | | | | | | | |
Securities Transactions | | | 1,234 | | | | 2,795 | | | | 48,437 | | | | (10,817 | ) |
Forward Foreign Currency Contracts | | | — | | | | — | | | | 4,628 | | | | (1 | ) |
Foreign Currency Transactions | | | — | | | | — | | | | (1,989 | ) | | | (108 | ) |
Net Change in Unrealized Appreciation (Depreciation) on: | | | | | | | | | | | | | | | | |
Investments | | | 71,957 | | | | (4,367 | ) | | | 115,623 | | | | 33,783 | |
Affiliated Investments | | | | | | | 93 | | | | — | | | | — | |
Forward Foreign Currency Contracts | | | — | | | | — | | | | 7,786 | | | | (16 | ) |
Foreign Currency Translations | | | — | | | | — | | | | 293 | | | | (1 | ) |
Net Increase (Decrease) in Net Assets Resulting from Operations | | $ | 131,414 | | | $ | (226 | ) | | $ | 380,206 | | | $ | 37,862 | |
(1) | Includes class specific distribution expenses. |
Amounts designated as “—” are either $0 or have been rounded to $0.
See accompanying notes to financial statements.
CITY NATIONAL ROCHDALE FUNDS | PAGE 150
statements of operations (000) |
For the year ended September 30, 2021 |
| | | City National
Rochdale Dividend
& Income Fund | | | City National
Rochdale U.S.
Core Equity Fund | |
INVESTMENT INCOME: | | | | | | | | |
Dividend Income | | $ | 8,235 | | | $ | 4,190 | |
Interest Income | | | — | | | | 1 | |
Less: Foreign Taxes Withheld | | | (17 | ) | | | (12 | ) |
Total Investment Income | | | 8,218 | | | | 4,179 | |
| | | | | | | | | |
EXPENSES: | | | | | | | | |
Investment Advisory Fees | | | 1,210 | | | | 1,549 | |
Shareholder Servicing Fees — Class N(1) | | | 1,210 | | | | 1,025 | |
Shareholder Servicing Fees — Servicing Class | | | — | | | | 444 | |
Administration Fees | | | 219 | | | | 241 | |
Trustee Fees | | | 41 | | | | 45 | |
Professional Fees | | | 33 | | | | 44 | |
Transfer Agent Fees | | | 13 | | | | 20 | |
Custody Fees | | | 9 | | | | 14 | |
Registration Fees | | | 9 | | | | 13 | |
Printing Fees | | | 6 | | | | 9 | |
Insurance and Other Expenses | | | 30 | | | | 38 | |
Total Expenses | | | 2,780 | | | | 3,442 | |
| | | | | | | | | |
Net Investment Income | | | 5,438 | | | | 737 | |
Net Realized Gain from: | | | | | | | | |
Securities Transactions | | | 24,925 | | | | 19,407 | |
Net Change in Unrealized Appreciation (Depreciation) on: | | | | | | | | |
Investments | | | 8,552 | | | | 69,709 | |
Net Increase in Net Assets Resulting from Operations | | $ | 38,915 | | | $ | 89,853 | |
(1) | Includes class specific distribution expenses. |
Amounts designated as “—” are either $0 or have been rounded to $0.
See accompanying notes to financial statements.
CITY NATIONAL ROCHDALE FUNDS | PAGE 151
Statements of Changes in Net Assets/Consolidated Statements of Changes in Net Assets
statements of changes in net assets (000) |
For the years ended September 30, |
| | | City National
Rochdale
Government
Money
Market Fund | | | City National
Rochdale
Government
Bond Fund | |
| | 2021 | | | 2020 | | | 2021 | | | 2020 | |
OPERATIONS: |
Net Investment Income | | $ | 623 | | | $ | 15,014 | | | $ | 271 | | | $ | 429 | |
Net Realized Gain (Loss) from Security Transactions | | | — | | | | — | | | | 238 | | | | 114 | |
Net Change in Unrealized Appreciation (Depreciation) on Investments and Affiliated Investments | | | — | | | | — | | | | (851 | ) | | | 1,157 | |
Net Increase (Decrease) in Net Assets Resulting from Operations | | | 623 | | | | 15,014 | | | | (342 | ) | | | 1,700 | |
| | | | | | | | | | | | | | | | | |
DISTRIBUTIONS: |
Class N | | | (53 | ) | | | (1,077 | ) | | | (17 | ) | | | (24 | ) |
Class S | | | (70 | ) | | | (1,124 | ) | | | — | | | | — | |
Servicing Class | | | (513 | ) | | | (12,791 | ) | | | (269 | ) | | | (434 | ) |
Total Distributions | | | (636 | ) | | | (14,992 | ) | | | (286 | ) | | | (458 | ) |
| | | | | | | | | | | | | | | | | |
CAPITAL SHARE TRANSACTIONS:(1) |
Institutional Class: | | | | | | | | | | | | | | | | |
Shares Issued | | | — | | | | — | | | | — | | | | 11 | |
Shares Redeemed | | | — | | | | — | | | | — | | | | (13 | ) |
Decrease in Net Assets from Institutional Class Share Transactions | | | — | | | | — | | | | — | | | | (2 | ) |
| | | | | | | | | | | | | | | | | |
Class N: | | | | | | | | | | | | | | | | |
Shares Issued | | | 689,637 | | | | 920,464 | | | | 389 | | | | 271 | |
Shares Issued in Lieu of Dividends and Distributions | | | 47 | | | | 1,077 | | | | 14 | | | | 20 | |
Shares Redeemed | | | (571,006 | ) | | | (618,068 | ) | | | (418 | ) | | | (313 | ) |
Increase (Decrease) in Net Assets from Class N Share Transactions | | | 118,678 | | | | 303,473 | | | | (15 | ) | | | (22 | ) |
| | | | | | | | | | | | | | | | | |
Class S: | | | | | | | | | | | | | | | | |
Shares Issued | | | 2,796,788 | | | | 1,321,522 | | | | — | | | | — | |
Shares Issued in Lieu of Dividends and Distributions | | | — | | | | — | | | | — | | | | — | |
Shares Redeemed | | | (2,528,435 | ) | | | (1,186,148 | ) | | | — | | | | — | |
Increase (Decrease) in Net Assets from Class S Share Transactions | | | 268,353 | | | | 135,374 | | | | — | | | | — | |
| | | | | | | | | | | | | | | | | |
Servicing Class: | | | | | | | | | | | | | | | | |
Shares Issued | | | 6,485,965 | | | | 7,218,391 | | | | 3,117 | | | | 4,277 | |
Shares Issued in Lieu of Dividends and Distributions | | | 351 | | | | 10,485 | | | | 34 | | | | 54 | |
Shares Redeemed | | | (6,262,298 | ) | | | (6,049,690 | ) | | | (12,552 | ) | | | (9,016 | ) |
Increase (Decrease) in Net Assets from Servicing Class Share Transactions | | | 224,018 | | | | 1,179,186 | | | | (9,401 | ) | | | (4,685 | ) |
| | | | | | | | | | | | | | | | | |
Net Increase (Decrease) in Net Assets from Share Transactions | | | 611,049 | | | | 1,618,033 | | | | (9,416 | ) | | | (4,709 | ) |
Total Increase (Decrease) in Net Assets | | | 611,036 | | | | 1,618,055 | | | | (10,044 | ) | | | (3,467 | ) |
| | | | | | | | | | | | | | | | | |
NET ASSETS: |
Beginning of Year | | | 4,160,807 | | | | 2,542,752 | | | | 40,036 | | | | 43,503 | |
End of Year | | $ | 4,771,843 | | | $ | 4,160,807 | | | $ | 29,992 | | | $ | 40,036 | |
(1) | See Note 9 for shares issued and redeemed. |
Amounts designated as “—” are either $0 or have been rounded to $0.
See accompanying notes to financial statements.
CITY NATIONAL ROCHDALE FUNDS | PAGE 152
| | City National
Rochdale
Corporate
Bond Fund | | | City National
Rochdale
California
Tax Exempt
Bond Fund | | | City National
Rochdale
Municipal
High Income
Fund | |
| | 2021 | | | 2020 | | | 2021 | | | 2020 | | | 2021 | | | 2020 | |
| | | | | | | | | | | | | | | | | | | | | | | | |
| | $ | 1,698 | | | $ | 2,525 | | | $ | 872 | | | $ | 1,108 | | | $ | 58,223 | | | $ | 52,834 | |
| | | 2,380 | | | | 873 | | | | 20 | | | | 427 | | | | 1,234 | | | | (38,887 | ) |
| | | (3,545 | ) | | | 2,143 | | | | (1,072 | ) | | | 673 | | | | 71,957 | | | | (9,731 | ) |
| | | 533 | | | | 5,541 | | | | (180 | ) | | | 2,208 | | | | 131,414 | | | | 4,216 | |
| | | | | | | | | | | | | | | | | | | | | | | | |
| | | | | | | | | | | | | | | | | | | | | | | | |
| | | (137 | ) | | | (172 | ) | | | (75 | ) | | | (88 | ) | | | (34,401 | ) | | | (32,117 | ) |
| | | — | | | | — | | | | — | | | | — | | | | — | | | | — | |
| | | (1,542 | ) | | | (2,376 | ) | | | (931 | ) | | | (1,021 | ) | | | (22,993 | ) | | | (20,716 | ) |
| | | (1,679 | ) | | | (2,548 | ) | | | (1,006 | ) | | | (1,109 | ) | | | (57,394 | ) | | | (52,833 | ) |
| | | | | | | | | | | | | | | | | | | | | | | | |
| | | | | | | | | | | | | | | | | | | | | | | | |
| | | | | | | | | | | | | | | | | | | | | | | | |
| | | — | | | | — | | | | — | | | | — | | | | — | | | | — | |
| | | — | | | | — | | | | — | | | | — | | | | — | | | | — | |
| | | — | | | | — | | | | — | | | | — | | | | — | | | | — | |
| | | | | | | | | | | | | | | | | | | | | | | | |
| | | | | | | | | | | | | | | | | | | | | | | | |
| | | 3,169 | | | | 3,821 | | | | 2,926 | | | | 1,075 | | | | 358,867 | | | | 332,651 | |
| | | 112 | | | | 146 | | | | 41 | | | | 50 | | | | 20,386 | | | | 19,769 | |
| | | (2,157 | ) | | | (1,330 | ) | | | (3,223 | ) | | | (1,996 | ) | | | (244,531 | ) | | | (163,321 | ) |
| | | 1,124 | | | | 2,637 | | | | (256 | ) | | | (871 | ) | | | 134,722 | | | | 189,099 | |
| | | | | | | | | | | | | | | | | | | | | | | | |
| | | | | | | | | | | | | | | | | | | | | | | | |
| | | — | | | | 18,867 | | | | — | | | | — | | | | — | | | | — | |
| | | — | | | | 251 | | | | — | | | | — | | | | — | | | | — | |
| | | — | | | | (24,751 | ) | | | — | | | | — | | | | — | | | | — | |
| | | — | | | | (5,633 | ) | | | — | | | | — | | | | — | | | | — | |
| | | | | | | | | | | | | | | | | | | | | | | | |
| | | | | | | | | | | | | | | | | | | | | | | | |
| | | 19,057 | | | | — | | | | 16,371 | | | | 15,197 | | | | 305,006 | | | | 148,790 | |
| | | 161 | | | | — | | | | 137 | | | | 164 | | | | 4,151 | | | | 2,539 | |
| | | (37,582 | ) | | | — | | | | (16,574 | ) | | | (22,467 | ) | | | (122,110 | ) | | | (94,095 | ) |
| | | (18,364 | ) | | | — | | | | (66 | ) | | | (7,106 | ) | | | 187,047 | | | | 57,234 | |
| | | | | | | | | | | | | | | | | | | | | | | | |
| | | (17,240 | ) | | | (2,996 | ) | | | (322 | ) | | | (7,977 | ) | | | 321,769 | | | | 246,333 | |
| | | (18,386 | ) | | | (3 | ) | | | (1,508 | ) | | | (6,878 | ) | | | 395,789 | | | | 197,716 | |
| | | | | | | | | | | | | | | | | | | | | | | | |
| | | | | | | | | | | | | | | | | | | | | | | | |
| | | 133,654 | | | | 133,657 | | | | 78,352 | | | | 85,230 | | | | 1,662,636 | | | | 1,464,920 | |
| | $ | 115,268 | | | $ | 133,654 | | | $ | 76,844 | | | $ | 78,352 | | | $ | 2,058,425 | | | $ | 1,662,636 | |
See accompanying notes to financial statements.
CITY NATIONAL ROCHDALE FUNDS | PAGE 153
statements of changes in net assets (000)/
consolidated statement of changes in net assets (000) |
For the years ended September 30, |
| | | City National
Rochdale
Intermediate
Fixed Income
Fund | | | City National
Rochdale
Fixed Income
Opportunities
Fund
(Consolidated) | |
| | 2021 | | | 2020 | | | 2021 | | | 2020 | |
OPERATIONS: | | | | | | | | | | | | | | | | |
Net Investment Income | | $ | 1,253 | | | $ | 2,071 | | | $ | 205,428 | | | $ | 237,259 | |
Net Realized Gain (Loss) from: | | | | | | | | | | | | | | | | |
Security Transactions | | | 2,795 | | | | 2,437 | | | | 48,437 | | | | (92,760 | ) |
Foreign Currency Transactions | | | — | | | | — | | | | 2,639 | | | | (39,113 | ) |
Net Change in Unrealized Appreciation (Depreciation) on: | | | | | | | | | | | | | | | | |
Investments and Affiliated Investments | | | (4,274 | ) | | | 1,986 | | | | 115,623 | | | | (185,067 | ) |
Forward Foreign Currency Contracts and Foreign Currency Translations | | | — | | | | — | | | | 8,079 | | | | 631 | |
Net Increase (Decrease) in Net Assets Resulting from Operations | | | (226 | ) | | | 6,494 | | | | 380,206 | | | | (79,050 | ) |
| | | | | | | | | | | | | | | | | |
DISTRIBUTIONS: | | | | | | | | | | | | | | | | |
Institutional Class | | | (1,075 | ) | | | (121 | ) | | | — | | | | — | |
Class N | | | (139 | ) | | | (1,938 | ) | | | (246,026 | ) | | | (211,921 | ) |
Servicing Class | | | — | | | | — | | | | — | | | | — | |
Class Y | | | — | | | | — | | | | — | | | | — | |
Return of Capital: | | | | | | | | | | | | | | | | |
Class N | | | — | | | | — | | | | — | | | | — | |
Servicing Class | | | — | | | | — | | | | — | | | | — | |
Class Y | | | — | | | | — | | | | — | | | | — | |
Total Distributions | | | (1,214 | ) | | | (2,059 | ) | | | (246,026 | ) | | | (211,921 | ) |
| | | | | | | | | | | | | | | | | |
CAPITAL SHARE TRANSACTIONS:(1) | | | | | | | | | | | | | | | | |
Institutional Class: | | | | | | | | | | | | | | | | |
Shares Issued | | | 13,980 | | | | 2,333 | | | | — | | | | — | |
Shares Issued in Lieu of Dividends and Distributions | | | 44 | | | | 50 | | | | — | | | | — | |
Shares Redeemed | | | (16,106 | ) | | | (1,332 | ) | | | — | | | | — | |
Increase (Decrease) in Net Assets from Institutional Class Share Transactions | | | (2,082 | ) | | | 1,051 | | | | — | | | | — | |
| | | | | | | | | | | | | | | | | |
Class N: | | | | | | | | | | | | | | | | |
Shares Issued | | | 29,374 | | | | 25,669 | | | | 1,229,740 | | | | 1,621,835 | |
Shares Issued in Lieu of Dividends and Distributions | | | 1,002 | | | | 1,894 | | | | 181,607 | | | | 162,832 | |
Shares Redeemed | | | (34,427 | ) | | | (46,759 | ) | | | (1,172,716 | ) | | | (1,170,706 | ) |
Increase (Decrease) in Net Assets from Class N Share Transactions | | | (4,051 | ) | | | (19,196 | ) | | | 238,631 | | | | 613,961 | |
| | | | | | | | | | | | | | | | | |
Servicing Class: | | | | | | | | | | | | | | | | |
Shares Issued | | | — | | | | — | | | | — | | | | — | |
Shares Issued in Lieu of Dividends and Distributions | | | — | | | | — | | | | — | | | | — | |
Shares Redeemed | | | — | | | | — | | | | — | | | | — | |
Decrease in Net Assets from Servicing Class Share Transactions | | | — | | | | — | | | | — | | | | — | |
| | | | | | | | | | | | | | | | | |
Class Y: | | | | | | | | | | | | | | | | |
Shares Issued | | | — | | | | — | | | | — | | | | — | |
Shares Issued in Lieu of Dividends and Distributions | | | — | | | | — | | | | — | | | | — | |
Redemption Fees | | | — | | | | — | | | | — | | | | — | |
Shares Redeemed | | | — | | | | — | | | | — | | | | — | |
Increase (Decrease) in Net Assets from Class Y Share Transactions | | | — | | | | — | | | | — | | | | — | |
Net Increase (Decrease) in Net Assets from Share Transactions | | | (6,133 | ) | | | (18,145 | ) | | | 238,631 | | | | 613,961 | |
Total Increase (Decrease) in Net Assets | | | (7,573 | ) | | | (13,710 | ) | | | 372,811 | | | | 322,990 | |
| | | | | | | | | | | | | | | | | |
NET ASSETS: | | | | | | | | | | | | | | | | |
Beginning of Year | | | 105,304 | | | | 119,014 | | | | 3,739,101 | | | | 3,416,111 | |
End of Year | | $ | 97,731 | | | $ | 105,304 | | | $ | 4,111,912 | | | $ | 3,739,101 | |
(1) | See Note 9 for shares issued and redeemed. |
Amounts designated as “—” are either $0 or have been rounded to $0.
See accompanying notes to financial statements.
CITY NATIONAL ROCHDALE FUNDS | PAGE 154
| | City National
Rochdale Short
Term Emerging
Markets
Debt Fund | | | City National
Rochdale
Dividend &
Income Fund | | | City National
Rochdale
U.S. Core
Equity Fund | |
| | 2021 | | | 2020 | | | 2021 | | | 2020 | | | 2021 | | | 2020 | |
| | | | | | | | | | | | | | | | | | | | | | | | |
| | $ | 15,022 | | | $ | 26,591 | | | $ | 5,438 | | | $ | 4,496 | | | $ | 737 | | | $ | 1,224 | |
| | | | | | | | | | | | | | | | | | | | | | | | |
| | | (10,817 | ) | | | (4,122 | ) | | | 24,925 | | | | (9,768 | ) | | | 19,407 | | | | (1,138 | ) |
| | | (109 | ) | | | (838 | ) | | | — | | | | — | | | | — | | | | — | |
| | | | | | | | | | | | | | | | | | | | | | | | |
| | | 33,783 | | | | (27,702 | ) | | | 8,552 | | | | (20,233 | ) | | | 69,709 | | | | 32,839 | |
| | | (17 | ) | | | (46 | ) | | | — | | | | — | | | | — | | | | — | |
| | | 37,862 | | | | (6,117 | ) | | | 38,915 | | | | (25,505 | ) | | | 89,853 | | | | 32,925 | |
| | | | | | | | | | | | | | | | | | | | | | | | |
| | | | | | | | | | | | | | | | | | | | | | | | |
| | | — | | | | — | | | | — | | | | — | | | | (19 | ) | | | (22 | ) |
| | | — | | | | — | | | | (6,821 | ) | | | (6,933 | ) | | | (235 | ) | | | (4,592 | ) |
| | | — | | | | — | | | | — | | | | — | | | | (482 | ) | | | (4,920 | ) |
| | | (14,878 | ) | | | (26,735 | ) | | | — | | | | — | | | | — | | | | — | |
| | | | | | | | | | | | | | | | | | | | | | | | |
| | | — | | | | — | | | | — | | | | (2,077 | ) | | | — | | | | (10 | ) |
| | | — | | | | — | | | | — | | | | — | | | | — | | | | (16 | ) |
| | | (37,652 | ) | | | (3,741 | ) | | | — | | | | — | | | | — | | | | — | |
| | | (52,530 | ) | | | (30,476 | ) | | | (6,821 | ) | | | (9,010 | ) | | | (736 | ) | | | (9,560 | ) |
| | | | | | | | | | | | | | | | | | | | | | | | |
| | | | | | | | | | | | | | | | | | | | | | | | |
| | | | | | | | | | | | | | | | | | | | | | | | |
| | | — | | | | — | | | | — | | | | — | | | | 114 | | | | 5,254 | |
| | | — | | | | — | | | | — | | | | — | | | | 2 | | | | 17 | |
| | | — | | | | — | | | | — | | | | — | | | | (6,945 | ) | | | (550 | ) |
| | | — | | | | — | | | | — | | | | — | | | | (6,829 | ) | | | 4,721 | |
| | | | | | | | | | | | | | | | | | | | | | | | |
| | | | | | | | | | | | | | | | | | | | | | | | |
| | | — | | | | — | | | | 49,077 | | | | 58,381 | | | | 45,556 | | | | 35,598 | |
| | | — | | | | — | | | | 4,428 | | | | 5,846 | | | | 175 | | | | 4,013 | |
| | | — | | | | — | | | | (70,477 | ) | | | (54,769 | ) | | | (32,730 | ) | | | (37,715 | ) |
| | | — | | | | — | | | | (16,972 | ) | | | 9,458 | | | | 13,001 | | | | 1,896 | |
| | | | | | | | | | | | | | | | | | | | | | | | |
| | | | | | | | | | | | | | | | | | | | | | | | |
| | | — | | | | — | | | | — | | | | — | | | | 26,624 | | | | 19,982 | |
| | | — | | | | — | | | | — | | | | — | | | | 44 | | | | 370 | |
| | | — | | | | — | | | | — | | | | — | | | | (35,698 | ) | | | (40,980 | ) |
| | | — | | | | — | | | | — | | | | — | | | | (9,030 | ) | | | (20,628 | ) |
| | | | | | | | | | | | | | | | | | | | | | | | |
| | | | | | | | | | | | | | | | | | | | | | | | |
| | | 12 | | | | 83,486 | | | | — | | | | — | | | | — | | | | — | |
| | | 31,442 | | | | 17,969 | | | | — | | | | — | | | | — | | | | — | |
| | | (8 | ) | | | 8 | | | | — | | | | — | | | | — | | | | — | |
| | | (57,489 | ) | | | (28,584 | ) | | | — | | | | — | | | | — | | | | — | |
| | | (26,043 | ) | | | 72,879 | | | | — | | | | — | | | | — | | | | — | |
| | | (26,043 | ) | | | 72,879 | | | | (16,972 | ) | | | 9,458 | | | | (2,858 | ) | | | (14,011 | ) |
| | | (40,711 | ) | | | 36,286 | | | | 15,122 | | | | (25,057 | ) | | | 86,259 | | | | 9,354 | |
| | | | | | | | | | | | | | | | | | | | | | | | |
| | | | | | | | | | | | | | | | | | | | | | | | |
| | | 257,398 | | | | 221,112 | | | | 222,097 | | | | 247,154 | | | | 332,391 | | | | 323,037 | |
| | $ | 216,687 | | | $ | 257,398 | | | $ | 237,219 | | | $ | 222,097 | | | $ | 418,650 | | | $ | 332,391 | |
See accompanying notes to financial statements.
CITY NATIONAL ROCHDALE FUNDS | PAGE 155
Consolidated Statement of Cash Flows
consolidated statement of cash flows (000) |
For the year ended September 30, 2021 |
| | | City National
Rochdale
Fixed Income
Opportunities Fund | |
CASH FLOWS FROM OPERATING ACTIVITIES: | | | | |
Net increase in net assets from operations | | $ | 380,206 | |
Adjustments to reconcile net increase in net assets resulting from operations to net cash provided by operating activities: | | | | |
Purchase of investment securities | | | (7,834,310 | ) |
Proceeds from disposition of investment securities | | | 7,749,777 | |
Amortization (accretion of market discount) | | | (42,624 | ) |
Premium payments | | | (22,170 | ) |
Net realized gain on investments and foreign currency transactions | | | (45,896 | ) |
Net change in unrealized appreciation on investments, forward foreign currency contracts and foreign currency translations | | | (123,702 | ) |
| | | | | |
Changes in assets: | | | | |
Dividend and interest receivable | | | (1,256 | ) |
Reclaim receivable | | | (60 | ) |
Receivable for investment securities sold | | | (33,649 | ) |
Unrealized gain on forward foreign currency contracts | | | (6,918 | ) |
Prepaid expenses | | | 13 | |
| | | | | |
Changes in liabilities: | | | | |
Payable for investment securities purchased | | | 1,018 | |
Unrealized loss on forward foreign currency contracts | | | (868 | ) |
Investment advisory fees payable | | | 631 | |
Shareholder servicing and distribution fees payable | | | 111 | |
Administrative fees payable | | | 1 | |
Accrued expenses | | | 96 | |
Net Cash Provided by Operating Activities | | | 20,400 | |
| | | | | |
CASH FLOWS USED IN FINANCING ACTIVITIES: | | | | |
Proceeds from shares issued | | | 1,408,717 | |
Cost of shares redeemed | | | (1,188,905 | ) |
Distributions | | | (246,026 | ) |
Net cash used in financing activities | | | (26,214 | ) |
Net change in cash | | | (5,814 | ) |
Cash at beginning of year | | | 13,392 | |
Cash at end of year | | $ | 7,578 | |
| | | | | |
NON-CASH FINANCING ACTIVITIES: | | | | |
Reinvestments of dividends and distributions | | $ | 181,607 | |
The following table provides a reconciliation of cash and foreign currency reported on the statement of assets and liabilities to the total of such amounts shown in this statement of cash flows.
Balance at the end of the year | | | | |
Cash | | $ | 2,357 | |
Foreign Currency | | | 5,221 | |
Total Cash and Foreign Currency | | $ | 7,578 | |
See accompanying notes to financial statements.
CITY NATIONAL ROCHDALE FUNDS | PAGE 156
This page intentionally left blank.
CITY NATIONAL ROCHDALE FUNDS | PAGE 157
Financial Highlights/Consolidated Financial Highlights
financial highlights/consolidated financial highlights |
For a Share Outstanding Throughout Each Period
For the year ended September 30, |
| Net Asset
Value
Beginning
of Year | Net
Investment
Income† | Net
Realized and
Unrealized
Gains
(Losses) on
Securities | Dividends
from Net
Investment
Income | Distributions
from Realized
Capital Gains | Net Asset
Value End
of Year | Total
Return‡ | Net Assets End
of Year (000) | Ratio of
Expenses to
Average Net
Assets(1) | Ratio of Net
Investment
Income to
Average Net
Assets(1) | Ratio of Expenses
to Average Net
Assets (Excluding
Waivers &
Recovered Fees) | Portfolio
Turnover
Rate |
City National Rochdale Government Money Market Fund |
Class N (commenced operations on June 21, 1999) |
2021 | $ 1.00 | $ 0.000* | $ 0.000* | $ (0.000)* | $ — | $ 1.00 | 0.01% | $ 642,240 | 0.07% | 0.01% | 0.87% | —% |
2020 | 1.00 | 0.003 | 0.001 | (0.004) | — | 1.00 | 0.42 | 523,559 | 0.38 | 0.27 | 0.88 | — |
2019 | 1.00 | 0.016 | 0.000* | (0.016) | — | 1.00 | 1.58 | 220,083 | 0.76 | 1.55 | 0.87 | — |
2018 | 1.00 | 0.007 | 0.000* | (0.007) | — | 1.00 | 0.71 | 994,591 | 0.88 | 0.69 | 0.86 | — |
2017 | 1.00 | 0.001 | 0.000* | (0.001) | — | 1.00 | 0.06 | 1,099,005 | 0.60 | 0.05 | 0.86 | — |
Class S (commenced operations on October 6, 1999) |
2021 | $ 1.00 | $ 0.000* | $ 0.000* | $ (0.000)* | $ — | $ 1.00 | 0.01% | $ 689,506 | 0.07% | 0.01% | 1.02% | —% |
2020 | 1.00 | 0.003 | 0.000* | (0.003) | — | 1.00 | 0.35 | 421,153 | 0.50 | 0.31 | 1.03 | — |
2019 | 1.00 | 0.014 | 0.000* | (0.014) | — | 1.00 | 1.43 | 285,778 | 0.91 | 1.43 | 1.02 | — |
2018 | 1.00 | 0.006 | 0.000* | (0.006) | — | 1.00 | 0.62 | 1,070,474 | 0.95 | 0.64 | 1.03 | — |
2017 | 1.00 | 0.001 | 0.000* | (0.001) | — | 1.00 | 0.06 | 841,246 | 0.67 | 0.06 | 1.06 | — |
Servicing Class (commenced operations on April 3, 2000)^^ |
2021 | $ 1.00 | $ 0.000* | $ 0.000* | $ (0.000)* | $ — | $ 1.00 | 0.02% | $ 3,440,097 | 0.07% | 0.01% | 0.57% | —% |
2020 | 1.00 | 0.005 | 0.001 | (0.006) | — | 1.00 | 0.57 | 3,216,095 | 0.31 | 0.46 | 0.57 | — |
2019 | 1.00 | 0.019 | 0.000* | (0.019) | — | 1.00 | 1.89 | 2,036,891 | 0.46 | 1.87 | 0.57 | — |
2018 | 1.00 | 0.011 | 0.000* | (0.011) | — | 1.00 | 1.11 | 2,942,980 | 0.46 | 1.12 | 0.56 | — |
2017 | 1.00 | 0.002 | 0.000* | (0.002) | — | 1.00 | 0.17 | 2,301,962 | 0.53 | 0.24 | 0.56 | — |
City National Rochdale Government Bond Fund |
Class N (commenced operations on April 13, 2000) |
2021 | $ 10.91 | $ 0.05 | $ (0.19) | $ (0.06) | $ — | $ 10.71 | (1.27)% | $ 2,823 | 1.03% | 0.53% | 1.67% | 14% |
2020 | 10.59 | 0.08 | 0.33 | (0.09) | — | 10.91 | 3.90 | 2,890 | 1.03 | 0.78 | 1.50 | 25 |
2019 | 10.27 | 0.09 | 0.33 | (0.10) | — | 10.59 | 4.12 | 2,827 | 1.03 | 0.87 | 1.35 | 60 |
2018 | 10.49 | 0.07 | (0.19) | (0.09) | (0.01) | 10.27 | (1.21) | 1,984 | 1.03 | 0.72 | 1.25 | 14 |
2017 | 10.62 | 0.05 | (0.12) | (0.05) | (0.01) | 10.49 | (0.68) | 1,743 | 1.03 | 0.43 | 1.13 | 55 |
Servicing Class (commenced operations on January 14, 2000) |
2021 | $ 10.89 | $ 0.08 | $ (0.19) | $ (0.09) | $ — | $ 10.69 | (1.02)% | $ 27,169 | 0.78% | 0.79% | 1.41% | 14% |
2020 | 10.57 | 0.11 | 0.33 | (0.12) | — | 10.89 | 4.17 | 37,146 | 0.78 | 1.04 | 1.24 | 25 |
2019 | 10.26 | 0.11 | 0.33 | (0.13) | — | 10.57 | 4.28 | 40,675 | 0.78 | 1.10 | 1.11 | 60 |
2018 | 10.48 | 0.10 | (0.20) | (0.11) | (0.01) | 10.26 | (0.98) | 53,746 | 0.78 | 0.97 | 1.00 | 14 |
2017 | 10.60 | 0.07 | (0.10) | (0.08) | (0.01) | 10.48 | (0.34) | 56,911 | 0.78 | 0.68 | 0.88 | 55 |
City National Rochdale Corporate Bond Fund |
Class N (commenced operations on April 13, 2000) |
2021 | $ 10.79 | $ 0.12 | $ (0.10) | $ (0.12) | $ — | $ 10.69 | 0.16% | $ 12,837 | 1.01% | 1.11% | 1.14% | 59% |
2020 | 10.53 | 0.18 | 0.26 | (0.18) | — | 10.79 | 4.21 | 11,827 | 1.01 | 1.66 | 1.12 | 35 |
2019 | 10.20 | 0.21 | 0.33 | (0.21) | — | 10.53 | 5.36 | 8,947 | 1.01 | 2.04 | 1.06 | 21 |
2018 | 10.43 | 0.18 | (0.24) | (0.17) | — | 10.20 | (0.55) | 7,065 | 1.01 | 1.72 | 1.12 | 29 |
2017 | 10.52 | 0.16 | (0.09) | (0.16) | — | 10.43 | 0.68 | 5,626 | 1.01 | 1.53 | 1.13 | 26 |
Servicing Class (commenced operations on January 14, 2000) |
2021 | $ 10.77 | $ 0.15 | $ (0.11) | $ (0.14) | $ — | $ 10.67 | 0.42% | $ 102,431 | 0.76% | 1.37% | 0.89% | 59% |
2020 | 10.52 | 0.20 | 0.26 | (0.21) | — | 10.77 | 4.38 | 121,827 | 0.76 | 1.93 | 0.87 | 35 |
2019 | 10.19 | 0.24 | 0.33 | (0.24) | — | 10.52 | 5.63 | 124,710 | 0.76 | 2.30 | 0.81 | 21 |
2018 | 10.41 | 0.20 | (0.22) | (0.20) | — | 10.19 | (0.22) | 132,532 | 0.76 | 1.95 | 0.87 | 29 |
2017 | 10.51 | 0.19 | (0.10) | (0.19) | — | 10.41 | 0.84 | 131,477 | 0.76 | 1.79 | 0.88 | 26 |
* | Amount represents less than $0.001. |
† | Per share calculations are based on Average Shares outstanding throughout the period. |
‡ | Returns are for the period indicated and have not been annualized. Fee waivers are in effect; if they had not been in effect, performance would have been lower. Returns shown do not reflect the deduction of taxes that a shareholder would pay on fund distributions or the redemption of fund shares. |
^^ | Effective November 28, 2012, Institutional Class Shares were redesignated as Servicing Class Shares. This share class name change had no impact on the Fund’s operations or investment policy. |
(1) | Ratio includes waivers and previously waived investment advisory fees recovered. The impact of the recovered fees may cause a higher net expense ratio. |
Amounts designated as “—” are either $0 or have been rounded to $0.
See accompanying notes to financial statements.
CITY NATIONAL ROCHDALE FUNDS | PAGE 158
| Net Asset
Value
Beginning
of Year | Net
Investment
Income† | Net
Realized and
Unrealized
Gains
(Losses) on
Securities | Dividends
from Net
Investment
Income | Distributions
from Realized
Capital Gains | Net Asset
Value End
of Year | Total
Return‡ | Net Assets
End of
Year (000) | Ratio of
Expenses
to Average
Net Assets | Ratio of Net
Investment
Income to
Average Net
Assets | Ratio of Expenses
to Average Net
Assets (Excluding
Waivers &
Recovered Fees) | Portfolio
Turnover
Rate |
City National Rochdale California Tax Exempt Bond Fund |
Class N (commenced operations on April 13, 2000) |
2021 | $ 10.96 | $ 0.10 | $ (0.14) | $ (0.10) | $ (0.02) | $ 10.80 | (0.43)% | $ 7,050 | 0.88% | 0.87% | 1.13% | 33% |
2020 | 10.80 | 0.12 | 0.16 | (0.12) | — | 10.96 | 2.65 | 7,417 | 0.88 | 1.14 | 1.10 | 23 |
2019 | 10.43 | 0.14 | 0.37 | (0.14) | — | 10.80 | 4.90 | 8,185 | 0.88 | 1.29 | 1.06 | 24 |
2018 | 10.64 | 0.13 | (0.21) | (0.13) | — | 10.43 | (0.78) | 7,760 | 0.88 | 1.21 | 1.08 | 26 |
2017 | 10.82 | 0.12 | (0.12) | (0.12) | (0.06) | 10.64 | 0.05 | 9,344 | 0.88 | 1.11 | 1.05 | 45 |
Servicing Class (commenced operations on January 14, 2000) |
2021 | $ 10.93 | $ 0.12 | $ (0.15) | $ (0.12) | $ (0.02) | $ 10.76 | (0.27)% | $ 69,794 | 0.63% | 1.13% | 0.89% | 33% |
2020 | 10.77 | 0.15 | 0.16 | (0.15) | — | 10.93 | 2.91 | 70,935 | 0.63 | 1.40 | 0.86 | 23 |
2019 | 10.40 | 0.16 | 0.37 | (0.16) | — | 10.77 | 5.17 | 77,045 | 0.63 | 1.55 | 0.81 | 24 |
2018 | 10.61 | 0.15 | (0.21) | (0.15) | — | 10.40 | (0.53) | 78,830 | 0.63 | 1.46 | 0.83 | 26 |
2017 | 10.79 | 0.14 | (0.12) | (0.14) | (0.06) | 10.61 | 0.31 | 80,435 | 0.63 | 1.36 | 0.80 | 45 |
City National Rochdale Municipal High Income Fund |
Class N (commenced operations on December 30, 2013) |
2021 | $ 10.61 | $ 0.33 | $ 0.46 | $ (0.33) | $ — | $ 11.07 | 7.51% | $ 1,235,195 | 1.07% | 3.03% | 1.07% | 15% |
2020 | 10.95 | 0.35 | (0.34) | (0.35) | — | 10.61 | 0.17 | 1,053,948 | 1.08 | 3.33 | 1.08 | 45 |
2019 | 10.57 | 0.38 | 0.39 | (0.39) | — | 10.95 | 7.47 | 894,519 | 1.08 | 3.60 | 1.08 | 33 |
2018 | 10.76 | 0.40 | (0.22) | (0.37) | — | 10.57 | 1.73 | 754,819 | 1.07 | 3.76 | 1.07 | 24 |
2017 | 11.14 | 0.38 | (0.38) | (0.38) | — | 10.76 | 0.16 | 686,922 | 1.07 | 3.62 | 1.07 | 50 |
Servicing Class (commenced operations on December 30, 2013) |
2021 | $ 10.62 | $ 0.36 | $ 0.46 | $ (0.36) | $ — | $ 11.08 | 7.77% | $ 823,230 | 0.82% | 3.27% | 0.82% | 15% |
2020 | 10.95 | 0.38 | (0.33) | (0.38) | — | 10.62 | 0.52 | 608,688 | 0.83 | 3.58 | 0.83 | 45 |
2019 | 10.57 | 0.41 | 0.39 | (0.42) | — | 10.95 | 7.74 | 570,401 | 0.83 | 3.85 | 0.83 | 33 |
2018 | 10.77 | 0.43 | (0.23) | (0.40) | — | 10.57 | 1.89 | 511,454 | 0.82 | 4.01 | 0.82 | 24 |
2017 | 11.14 | 0.41 | (0.37) | (0.41) | — | 10.77 | 0.50 | 489,095 | 0.83 | 3.87 | 0.83 | 50 |
City National Rochdale Intermediate Fixed Income Fund |
Institutional Class (commenced operations on December 20, 2013) |
2021 | $ 27.57 | $ 0.46 | $ (0.38) | $ (0.38) | $ (0.07) | $ 27.20 | 0.27% | $ 3,247 | 0.51% | 1.68% | 0.67% | 74% |
2020 | 26.52 | 0.62 | 1.06 | (0.63) | — | 27.57 | 6.45 | 5,609 | 0.51 | 2.31 | 0.66 | 49 |
2019 | 25.33 | 0.68 | 1.24 | (0.73) | — | 26.52 | 7.66 | 4,359 | 0.51 | 2.61 | 0.58 | 35 |
2018 | 26.18 | 0.63 | (0.81) | (0.67) | — | 25.33 | (0.70) | 4,528 | 0.51 | 2.45 | 0.55 | 30 |
2017 | 26.56 | 0.64 | (0.38) | (0.64) | — | 26.18 | 1.02 | 4,589 | 0.51 | 2.43 | 0.53 | 2 |
Class N (commenced operations on December 31, 1999) |
2021 | $ 27.58 | $ 0.32 | $ (0.38) | $ (0.24) | $ (0.07) | $ 27.21 | (0.24)% | $ 94,484 | 1.01% | 1.15% | 1.18% | 74% |
2020 | 26.52 | 0.49 | 1.07 | (0.50) | — | 27.58 | 5.95 | 99,695 | 1.01 | 1.83 | 1.15 | 49 |
2019 | 25.33 | 0.55 | 1.23 | (0.59) | — | 26.52 | 7.11 | 114,655 | 1.01 | 2.13 | 1.08 | 35 |
2018 | 26.17 | 0.50 | (0.81) | (0.53) | — | 25.33 | (1.18) | 179,392 | 1.01 | 1.95 | 1.05 | 30 |
2017 | 26.56 | 0.51 | (0.39) | (0.51) | — | 26.17 | 0.48 | 241,891 | 1.01 | 1.95 | 1.03 | 2 |
City National Rochdale Fixed Income Opportunities Fund (Consolidated) |
Class N (commenced operations on July 1, 2009) |
2021 | $ 22.57 | $ 1.21 | $ 1.04 | $ (1.43) | $ — | $ 23.39 | 10.14% | $ 4,111,912 | 1.10% | 5.14% | 1.10% | 117% |
2020 | 24.22 | 1.53 | (1.83) | (1.35) | — | 22.57 | (0.94) | 3,739,101 | 1.10(4) | 6.66 | 1.11(4) | 143 |
2019 | 24.72 | 1.36 | (0.45) | (1.41) | — | 24.22 | 3.83 | 3,416,111 | 1.09(4) | 5.53 | 1.10(4) | 180 |
2018 | 25.81 | 1.19 | (0.92) | (1.36) | — | 24.72 | 1.09 | 3,002,607 | 1.09(3) | 4.65 | 1.09(3) | 162 |
2017 | 25.36 | 1.30 | 0.67 | (1.52) | — | 25.81 | 7.99 | 2,740,248 | 1.10(1)(2) | 5.04 | 1.09(2) | 140 |
† | Per share calculations are based on Average Shares outstanding throughout the year. |
‡ | Returns are for the year indicated and have not been annualized. Fee waivers are in effect; if they had not been in effect, performance would have been lower. Returns shown do not reflect the deduction of taxes that a shareholder would pay on fund distributions or the redemption of fund shares. |
(1) | Ratio includes waivers and previously waived investment advisory fees recovered. The impact of the recovered fees may cause a higher net expense ratio. |
(2) | The expense ratio includes acquired fund fee expenses from the investment in the Subsidiary. Had this expense been excluded, the ratios would have been 1.09% and 1.08%, respectively. |
(3) | The expense ratio includes acquired fund fee expenses from the investment in the Subsidiary. Had this expense been excluded, the ratios would have been 1.09% and 1.09%, respectively. |
(4) | The expense ratio includes acquired fund fee expenses from the investment in the Subsidiary. Had this expense been excluded, the ratios would have been 1.09% and 1.09%, respectively. |
Amounts designated as “—” are either $0 or have been rounded to $0.
See accompanying notes to financial statements.
CITY NATIONAL ROCHDALE FUNDS | PAGE 159
financial highlights |
For a Share Outstanding Throughout Each Period
For the year ended September 30, |
| Net Asset
Value
Beginning
of Period | Net
Investment
Income† | Net
Realized
and
Unrealized
Gains
(Losses) on
Securities† | Dividends
from Net
Investment
Income | Distributions
from
Realized
Capital Gains | Redemption
Fees | Distributions
from
Return of
Capital | Net Asset
Value End
of Period | Total
Return‡ | Net Assets
End of
Period (000) | Ratio of
Expenses
to
Average
Net
Assets(1)(2) | Ratio
of Net
Investment
Income to
Average
Net
Assets(1)(2) | Ratio of
Expenses
to Average
Net Assets
(Excluding
Waivers &
Recovered
Fees)(1) | Portfolio
Turnover
Rate |
City National Rochdale Short Term Emerging Markets Debt Fund |
Class Y (commenced operations on May 15, 2019) |
2021 | $ 8.55 | $ 0.52 | $ 0.76 | $ (0.51) | $ — | $ — | $ (1.28) | $ 8.04 | 16.24% | $ 216,687 | 0.94% | 6.27% | 0.94% | 26% |
2020 | 9.71 | 0.91 | (1.03) | (0.87) | (0.04) | —(3) | (0.13) | 8.55 | (1.16) | 257,398 | 0.92 | 10.00 | 0.93 | 129 |
2019 | 10.00 | 0.24 | (0.30) | (0.23) | — | — | — | 9.71 | (0.61) | 221,112 | 0.98 | 6.41 | 1.01 | 121 |
City National Rochdale Dividend & Income Fund |
Class N (commenced operations on June 1, 1999) |
2021 | $ 35.52 | $ 0.88 | $ 5.30 | $ (1.12) | $ — | $ — | $ — | $ 40.58 | 17.53% | $ 237,219 | 1.15% | 2.25% | 1.15% | 30% |
2020 | 41.01 | 0.73 | (4.73) | (0.79) | (0.36) | — | (0.34) | 35.52 | (9.80) | 222,097 | 1.15 | 1.95 | 1.15 | 20 |
2019 | 39.32 | 0.93 | 3.18 | (1.12) | (1.30) | — | — | 41.01 | 11.25 | 247,154 | 1.14 | 2.40 | 1.14 | 3 |
2018 | 40.40 | 1.10 | 0.12 | (1.12) | (1.18) | — | — | 39.32 | 3.10 | 239,439 | 1.14 | 2.79 | 1.14 | 10 |
2017 | 39.68 | 0.94 | 0.90 | (1.12) | — | — | — | 40.40 | 4.66 | 253,209 | 1.13 | 2.33 | 1.13 | 15 |
City National Rochdale U.S. Core Equity Fund |
Institutional Class (commenced operations on December 3, 2012) |
2021 | $ 20.99 | $ 0.15 | $ 5.45 | $ (0.10) | $ — | $ — | $ — | $ 26.49 | 26.76% | $ 148 | 0.51% | 0.62% | 0.51% | 13% |
2020 | 19.32 | 0.10 | 2.21 | (0.14) | (0.50) | — | —^ | 20.99 | 12.20 | 5,633 | 0.56 | 0.52 | 0.56 | 14 |
2019 | 18.21 | 0.20 | 1.79 | (0.19) | (0.69) | — | — | 19.32 | 12.01 | 443 | 0.52 | 1.07 | 0.52 | 22 |
2018 | 15.83 | 0.17 | 2.60 | (0.18) | (0.21) | — | — | 18.21 | 17.71 | 34 | 0.52 | 0.97 | 0.52 | 18 |
2017 | 14.00 | 0.17 | 2.43 | (0.17) | (0.60) | — | — | 15.83 | 19.40 | 17 | 0.53 | 1.19 | 0.53 | 25 |
Class N (commenced operations on December 3, 2012) |
2021 | $ 20.73 | $ 0.02 | $ 5.53 | $ (0.03) | $ — | $ — | $ — | $ 26.25 | 26.79% | $ 230,767 | 1.01% | 0.07% | 1.01% | 13% |
2020 | 19.10 | 0.05 | 2.14 | (0.06) | (0.50) | — | —^ | 20.73 | 11.64 | 171,355 | 1.04 | 0.26 | 1.04 | 14 |
2019 | 18.01 | 0.10 | 1.78 | (0.10) | (0.69) | — | — | 19.10 | 11.49 | 157,700 | 1.02 | 0.57 | 1.02 | 22 |
2018 | 15.66 | 0.09 | 2.56 | (0.09) | (0.21) | — | — | 18.01 | 17.12 | 146,533 | 1.02 | 0.51 | 1.02 | 18 |
2017 | 13.86 | 0.10 | 2.40 | (0.10) | (0.60) | — | — | 15.66 | 18.81 | 127,086 | 1.03 | 0.70 | 1.03 | 25 |
Servicing Class (commenced operations on December 3, 2012) |
2021 | $ 20.77 | $ 0.08 | $ 5.54 | $ (0.06) | $ — | $ — | $ — | $ 26.33 | 27.13% | $ 187,735 | 0.76% | 0.32% | 0.76% | 13% |
2020 | 19.13 | 0.10 | 2.14 | (0.10) | (0.50) | — | —^ | 20.77 | 11.91 | 155,403 | 0.78 | 0.52 | 0.78 | 14 |
2019 | 18.04 | 0.15 | 1.77 | (0.14) | (0.69) | — | — | 19.13 | 11.74 | 164,894 | 0.77 | 0.83 | 0.77 | 22 |
2018 | 15.69 | 0.13 | 2.56 | (0.13) | (0.21) | — | — | 18.04 | 17.38 | 154,589 | 0.77 | 0.76 | 0.77 | 18 |
2017 | 13.88 | 0.14 | 2.40 | (0.13) | (0.60) | — | — | 15.69 | 19.14 | 130,372 | 0.78 | 0.95 | 0.78 | 25 |
† | Per share calculations are based on Average Shares outstanding throughout the period. |
‡ | Returns are for the period indicated and have not been annualized. Fee waivers are in effect; if they had not been in effect, performance would have been lower. Returns shown do not reflect the deduction of taxes that a shareholder would pay on fund distributions or the redemption of fund shares. |
^ | Amount represents less than $0.01 per share. |
(1) | Annualized for periods less than one year. |
(2) | Ratio includes waivers and previously waived investment advisory fees recovered. The impact of the recovered fees may cause a higher net expense ratio. |
(3) | See Note 2 for Redemption Fees. |
Amounts designated as “—” are either $0 or have been rounded to $0.
See accompanying notes to financial statements.
CITY NATIONAL ROCHDALE FUNDS | PAGE 160
notes to financial statements/
consolidated notes to financial statements |
September 30, 2021 |
City National Rochdale Funds, a Delaware statutory trust (the “Trust”), is registered under the Investment Company Act of 1940, as amended (the “1940 Act”), as an open-end management investment company currently offering the following 10 series (each a “Fund” and collectively, the “Funds”): City National Rochdale Government Money Market Fund (“Government Money Market Fund”); City National Rochdale Government Bond Fund (“Government Bond Fund”), City National Rochdale Corporate Bond Fund (“Corporate Bond Fund”), City National Rochdale California Tax Exempt Bond Fund (“California Tax Exempt Bond Fund”), City National Rochdale Municipal High Income Fund (“Municipal High Income Fund”), City National Rochdale Intermediate Fixed Income Fund (“Intermediate Fixed Income Fund”), City National Rochdale Fixed Income Opportunities Fund (“Fixed Income Opportunities Fund”) and City National Rochdale Short Term Emerging Markets Debt Fund (“Short Term Emerging Markets Debt Fund”) (collectively, the “Fixed Income Funds”); and City National Rochdale Dividend & Income Fund (“Dividend & Income Fund”) and City National Rochdale U.S. Core Equity Fund (“U.S. Core Equity Fund”) (collectively, the “Equity Funds”).
The investment objective of the Government Money Market Fund is to preserve your principal and maintain a high degree of liquidity while providing current income. The investment objective of the Government Bond Fund and Corporate Bond Fund is to provide current income as a primary part of a total return intermediate duration strategy. The investment objective of the California Tax Exempt Bond Fund is to provide current income exempt from federal and California state income tax. The investment objective of the Municipal High Income Fund is to provide a high level of current income that is not subject to federal income tax. The investment objective of the Intermediate Fixed Income Fund is to provide current income and capital appreciation. The investment objective of the Fixed Income Opportunities Fund is to provide a high level of current income. The investment objective of the Short Term Emerging Markets Debt Fund is to provide interest income and capital preservation in order to achieve positive total returns. The investment objective of the Dividend & Income Fund is to provide significant income and a secondary focus on long-term capital appreciation. The investment objective of the U.S. Core Equity Fund is to provide long-term capital appreciation.
The Trust is registered to offer: Class N shares of the Funds except for Short Term Emerging Markets Debt Fund; Servicing Class shares of the Funds except for Intermediate Fixed Income Fund, Fixed Income Opportunities Fund, Short Term Emerging Markets Debt Fund and Dividend & Income Fund; Institutional Class shares of Intermediate Fixed Income and U.S. Core Equity Fund; Class S shares of the Government Money Market Fund; Class Y shares of the Short Term Emerging Markets Debt Fund.
The assets of each Fund are segregated, and a shareholder’s interest is limited to the Fund in which shares are held. Each Fund is diversified with the exception of the California Tax Exempt Bond Fund, which is non-diversified.
2. | SIGNIFICANT ACCOUNTING POLICIES: |
The following is a summary of significant accounting policies followed by the Funds.
Use of Estimates – The Funds are investment companies that conform with accounting principles generally accepted in the United States of America (“GAAP”). Therefore the Funds follow the accounting and reporting guidance for investment companies. The preparation of financial statements in conformity with GAAP requires management to make estimates and assumptions that affect the reported amounts of assets and liabilities and disclosure of contingent assets and liabilities at the date of the financial statements and the reported amounts of increases and decreases in net assets from operations during the reporting period. Actual results could differ from those estimates.
Security Valuation – Securities listed on a securities exchange, market or automated quotation system for which quotations are readily available (except for securities traded on NASDAQ) are valued at the last quoted sale price on the primary exchange or market (foreign or domestic) on which they are traded, or, if there is no such reported sale, at the most recent quoted bid price. For securities traded on NASDAQ, the NASDAQ Official Closing Price is used. If available, debt securities are priced based upon valuations provided by independent, third-party pricing agents. Such values generally reflect the last reported sales price if the security is actively traded. The third-party pricing agents may also value debt securities at an evaluated bid price by employing methodologies that utilize actual market transactions, broker-supplied valuations, or other methodologies designed to identify the market value for such securities. Debt obligations with remaining maturities of sixty days or less may be valued at their amortized cost, if the Funds’ Fair Value Committee concludes it approximates market value after taking into account factors such as credit, liquidity and interest rate conditions as well as issuer specific factors. Investments in underlying registered investment companies are valued at their respective daily net assets in accordance with pricing procedures approved by their respective boards. The prices for foreign securities are reported in local
CITY NATIONAL ROCHDALE FUNDS | PAGE 161
notes to financial statements/
consolidated notes to financial statements |
September 30, 2021 |
currency and converted to U.S. Dollars using currency exchange rates. Prices for most securities held by the Funds are provided daily by recognized independent pricing agents. If a security price cannot be obtained from an independent, third-party pricing agent, the Funds seek to obtain a bid price from one or more independent brokers.
Securities for which market prices are not “readily available” are valued in accordance with the Fair Value Procedures established by the Trust’s Board of Trustees. The Funds’ Fair Value Procedures are implemented through a Fair Value Committee (the “Committee”) designated by the Trust’s Board of Trustees. Some of the more common reasons that may necessitate that a security be valued using the Fair Value Procedures include: the security’s trading has been halted or suspended; the security has been de-listed from a national exchange; the security’s primary trading market is temporarily closed at a time when, under normal conditions, it would be open; for international securities, market events that occur after the close of the foreign markets that make closing prices not representative of fair value; or the security’s primary pricing source is not able or willing to provide a price. When a security is valued in accordance with the Fair Value Procedures, the Committee will determine the value after taking into consideration relevant information reasonably available to the Committee.
Investments in life settlement policies (“Policies”) are valued using a probabilistic method, for an actuarially derived valuation approach, in order to determine the fair value of each Policy. The Fair Value Procedures recognize that the Policies are illiquid and that no market currently exists for the Policies. Under the probabilistic method, two life expectancies are obtained from established life expectancy providers on the insured(s) of the Policy and an actuarial table is used to determine the probability of survival in each year going forward for the insured(s) for each of the two life expectancies. The probabilities associated with each life expectancy are then utilized, along with the premiums due and the death benefit of the Policy for each year of the Policy, to determine expected cash flows. These cash flows are then discounted at a rate that accounts for the risks associated with the Policy and various other factors. The valuations from each life expectancy are then typically averaged to obtain the desired market valuation for the investor. Life settlement policies are included in Level 3 of the fair value hierarchy.
In accordance with GAAP, the objective of a fair value measurement is to determine the price that would be received to sell an asset or paid to transfer a liability, in an orderly transaction between market participants at the measurement date (an exit price). The fair value hierarchy gives the highest priority to quoted prices (unadjusted) in active markets for identical assets or liabilities (Level 1) and the lowest priority to unobservable inputs (Level 3). The three levels of the fair value hierarchy are described below:
| | ● | Level 1 — Unadjusted quoted prices in active markets for identical, unrestricted assets or liabilities that the Funds have the ability to access at the measurement date; |
| | ● | Level 2 — Quoted prices in inactive markets, or inputs that are observable (either directly or indirectly) for substantially the full term of the asset or liability; and |
| | ● | Level 3 — Prices, inputs or exotic modeling techniques which are both significant to the fair value measurement and unobservable (supported by little or no market activity). |
Investments are classified within the level of the lowest significant input considered in determining fair value. Investments classified within Level 3, the fair value measurement of which considers several inputs, may include Level 1 or Level 2 inputs as components of the overall fair value measurement.
For the year ended September 30, 2021, there have been no changes to the Funds’ fair value methodologies. For more details on the investment classifications, refer to the Schedules of Investments/Consolidated Schedule of Investments.
Security Transactions and Related Income – Security transactions are accounted for on the trade date of the security purchase or sale. Costs used in determining the net realized capital gains or losses on the sale of securities are those of the specific securities sold. Interest income is recognized on an accrual basis and dividend income is recognized on the ex-dividend date. Purchase discounts and premiums on securities held by the Funds are accreted and amortized to maturity using the scientific method, which approximates the effective interest method over the holding period of a security, except for the Government Money Market Fund, which uses a straight line basis which is not materially different from the scientific method.
Repurchase Agreements – Securities pledged as collateral for repurchase agreements are held by BNY Mellon until maturity of the repurchase agreements. Provisions of the agreements and procedures adopted by the investment adviser require that the market value of the collateral, including accrued interest thereon, is sufficient in the event of default by the counterparty. The Funds also invest in tri-party repurchase agreements. Securities held as collateral for tri-party repurchase agreements are maintained by the broker’s custodian bank in a segregated account until maturity of the repurchase agreements. Provisions
CITY NATIONAL ROCHDALE FUNDS | PAGE 162
of the agreements require that the market value of the collateral, including accrued interest thereon, is sufficient in the event of default. If the counterparty defaults and the value of the collateral declines or if the counterparty enters into an insolvency proceeding, realization of the collateral by a Fund may be delayed or limited.
TBA Transactions – The Funds may engage in “to be announced” (“TBA”) security transactions. Such transactions involve a commitment by a Fund to purchase or sell securities for a predetermined price or yield, with payment and delivery taking place beyond the customary settlement period. The Funds record TBA securities on the trade date and maintain security positions such that sufficient liquid assets will be available to make payments for the securities purchased.
Expense Allocation – Common expenses incurred by the Funds are allocated among the Funds (i) based upon relative average daily net assets, (ii) as incurred on a specific identification basis, (iii) equally, or (iv) based upon a combination of the above, depending on the nature of the expenditure.
Classes – Class-specific expenses are borne by that class. Income, non class-specific expenses, and realized and unrealized gains/losses are allocated to the respective class on the basis of relative net asset value each day.
Dividends and Distributions to Shareholders – Dividends from net investment income are declared daily and paid to shareholders monthly for the Government Money Market Fund and Fixed Income Funds, except for the Intermediate Fixed Income Fund and Fixed Income Opportunities Fund. Dividends from net investment income are declared and paid quarterly for the Intermediate Fixed Income Fund, Fixed Income Opportunities Fund and Equity Funds. Distributions from net realized capital gains are distributed to shareholders at least annually. Dividends and distributions are recorded on the ex-dividend date.
Foreign Currency – Values of investments denominated in foreign currencies are converted into U.S. Dollars using the spot market rate of exchange at the time of valuation. Purchases and sales of investments and dividend and interest income are translated into U.S. Dollars using the spot market rate of exchange prevailing on the respective dates of such transactions. The Funds do not isolate the portion of gains and losses on investments that is due to changes in the foreign exchange rates from that which is due to changes in market prices of investments. Foreign securities and currency transactions may involve certain considerations and risks not typically associated with those of domestic origin.
Forward Foreign Currency Contracts – A forward foreign currency contract is an agreement between two parties to buy or sell a currency at a set price on a future date. Forward contracts are marked to market daily and the change in market value is recorded as an unrealized gain/(loss) on forward foreign currency contracts in the Statements of Assets and Liabilities/Consolidated Statement of Assets and Liabilities. When a contract is closed, a Fund records a realized gain or loss equal to the difference between the value of the contract at the time it was opened and the value at the time it was closed, which is included within the realized gain/(loss) on foreign currency transactions in the Statements of Operations/Consolidated Statement of Operations. A Fund could be at risk if the counterparties are unable to meet the terms of the contracts or if the value of the currency changes unfavorably.
To reduce counterparty risk with respect to over-the-counter (“OTC”) transactions, the Fixed Income Opportunities Fund and the Short Term Emerging Markets Debt Fund have entered into master netting arrangements, established within the Fixed Income Opportunities Fund’s and the Short Term Emerging Markets Debt Fund’s International Swaps and Derivatives Association, Inc. (“ISDA”) master agreements, which allow the Fixed Income Opportunities Fund and the Short Term Emerging Markets Debt Fund to make (or to have an entitlement to receive) a single net payment in the event of default (close-out netting) for outstanding payables and receivables with respect to certain OTC positions in forward foreign currency contracts for each individual counterparty. In addition, the Fixed Income Opportunities Fund and the Short Term Emerging Markets Debt Fund may require that certain counterparties post cash and/or securities in collateral accounts to cover their net payment obligations for those derivative contracts subject to ISDA master agreements. If the counterparty fails to perform under these agreements, the cash and/or securities will be made available to the Fixed Income Opportunities Fund and/or the Short Term Emerging Markets Debt Fund.
For financial reporting purposes, the Fixed Income Opportunities Fund and the Short Term Emerging Markets Debt Fund do not offset derivative assets and derivative liabilities that are subject to netting arrangements in the Statements of Assets and Liabilities/Consolidated Statement of Assets and Liabilities.
Bankruptcy or insolvency laws of a particular jurisdiction may impose restrictions on or prohibitions against the right of offset in bankruptcy, insolvency or other events.
CITY NATIONAL ROCHDALE FUNDS | PAGE 163
notes to financial statements/
consolidated notes to financial statements |
September 30, 2021 |
Collateral terms are contract specific for OTC derivatives. For derivatives traded under an ISDA master agreement, the collateral requirements are typically calculated by netting the marked to market amount of each transaction under such agreement and comparing that amount to the value of any collateral currently pledged by the Fixed Income Opportunities Fund and the Short Term Emerging Markets Debt Fund, or the counterparty.
For financial reporting purposes, cash collateral that has been pledged to cover obligations of the Fixed Income Opportunities Fund and the Short Term Emerging Markets Debt Fund, if any, is reported separately on the Statements of Assets and Liabilities/Consolidated Statement of Assets and Liabilities as cash pledged as collateral. Non-cash collateral pledged by the Fixed Income Opportunities Fund and the Short Term Emerging Markets Debt Fund, if any, is noted in the Schedules of Investments/Consolidated Schedule of Investments. Generally, the amount of collateral due from or to a party must exceed a minimum transfer amount threshold before a transfer has to be made. To the extent the amounts due to the Fixed Income Opportunities Fund and the Short Term Emerging Markets Debt Fund from the Funds’ counterparties are not fully collateralized, contractually or otherwise, the Fixed Income Opportunities Fund and the Short Term Emerging Markets Debt Fund bear the risk of loss from counterparty nonperformance.
Futures Contracts – To the extent consistent with their investment objective and strategies, certain Funds may use futures contracts for tactical hedging purposes as well as to enhance the Funds’ returns. Initial margin deposits of cash or securities are made upon entering into futures contracts. The contracts are marked to market daily and the resulting changes in value are accounted for as unrealized gains or losses. Variation margin payments are paid or received, depending upon whether unrealized gains or losses are incurred. When a contract is closed, a Fund records a realized gain or loss equal to the difference between the proceeds from (or cost of) the closing transaction and the amount invested in the contract.
Risks of entering into futures contracts include the possibility that there will be an imperfect price correlation between the futures contract and the underlying securities. Second, it is possible that a lack of liquidity for futures contracts could exist in the secondary market, resulting in an inability to close a position prior to its maturity date. Third, futures contracts involve the risk that a Fund could lose more than the original margin deposit required to initiate a futures transaction.
Finally, the risk exists that losses could exceed amounts disclosed on the Statements of Assets and Liabilities/Consolidated Statement of Assets and Liabilities. As of September 30, 2021, there were no open futures contracts.
Swap Agreements – A Fund may invest in swap agreements as a non-principal investment strategy. A swap is a financial instrument that typically involves the exchange of cash flows between two parties on specified dates (settlement dates), where the cash flows are based on agreed-upon measures such as prices, interest rates or indices. The nominal amount on which these cash flows are calculated is called the notional amount. Swaps are individually negotiated and structured to include exposure to a variety of different types of investments or market factors, such as interest rates, foreign currency rates, mortgage securities, corporate borrowing rates, security prices, indices or inflation rates.
Swap agreements may increase or decrease the overall volatility of the investments of a Fund and its share price. The performance of swap agreements may be affected by a change in the specific interest rate, currency, or other factors that determine the payments due to and from a Fund. If a swap agreement calls for payments by a Fund, the Fund must be prepared to make such payments when due. In addition, if the counterparty’s creditworthiness declines, the value of a swap agreement would be likely to decline, potentially resulting in losses.
Generally, a swap agreement has a fixed maturity date that is agreed upon by the parties. The agreement can be terminated before the maturity date only under limited circumstances, such as default by one of the parties or insolvency, among others, and can be transferred by a party only with the prior written consent of the other party. A Fund may be able to eliminate its exposure under a swap agreement either by assignment or by other disposition, or by entering into an offsetting swap agreement with the same party or a similarly creditworthy party. If the counterparty is unable to meet its obligations under the contract, declares bankruptcy, defaults or becomes insolvent, a Fund may not be able to recover the money it expected to receive under the contract.
A swap agreement can be a form of leverage, which can magnify a Fund’s gains or losses. In order to reduce the risk associated with leveraging, a Fund will cover its current obligations under swap agreements according to guidelines established by the SEC. If a Fund enters into a swap agreement on a net basis, it will segregate assets with a daily value at least equal to the excess, if any, of the Fund’s accrued obligations under the swap agreement over the accrued amount the Fund is entitled to receive under the agreement. If a Fund enters into a swap agreement on other
CITY NATIONAL ROCHDALE FUNDS | PAGE 164
than a net basis, it will segregate assets with a value equal to the full amount of the Fund’s accrued obligations under the agreement.
Options Contracts – A Fund may also purchase put and call options. Purchasing call options tends to increase a Fund’s exposure to the underlying instrument. Purchasing put options tends to decrease a Fund’s exposure to the underlying instrument. When purchasing an option, a Fund will pay a premium which is included on the Fund’s Statement of Assets and Liabilities/Consolidated Statement of Assets and Liabilities and subsequently marked to market to reflect the current value of the option. Premiums paid for purchasing options which expire are treated as realized losses. Certain options may be purchased with premiums to be determined on a future date. The premiums for these options are based upon implied volatility parameters at specified terms. The risk associated with purchasing put and call options is limited to the premium paid. Premiums paid for purchasing options which are exercised or closed are added to the amounts paid or offset against the proceeds on the underlying investment transaction to determine the realized gain or loss.
The net realized gain or loss on options contracts is reflected in the Statements of Operations/Consolidated Statement of Operations and the net unrealized gains/(losses) are included as a component of the net change in unrealized appreciation/(depreciation) on options contracts in the Statements of Operations/Consolidated Statement of Operations. Realized and changes in unrealized gains or losses on options contracts during the period as disclosed in the Statements of Operations/Consolidated Statement of Operations, serve as indicators of the volume of derivative activity for a Fund. As of September 30, 2021 and for the year then ended, there were no open options contracts.
Restricted Securities – Restricted securities include securities that have not been registered under the Securities Act of 1933, as amended, and securities that are subject to restrictions on resale.
A Fund may invest in restricted securities that are consistent with the Fund’s investment objective and investment strategies. While restricted securities are generally presumed to be illiquid, it may be determined that a particular restricted security is liquid. In some cases, the issuer of restricted securities has agreed to register such securities for resale, at the issuer’s expense either upon demand by a Fund or in connection with another registered offering of the securities. Investments in restricted securities are valued at fair value as determined in good faith in accordance with procedures adopted by the Board of Trustees. It is possible that the estimated value may differ significantly from the amount that might ultimately be realized in the near term, and the difference could be material.
Master Limited Partnerships – Entities commonly referred to as “MLPs” are generally organized under state law as limited partnerships or limited liability companies. The Dividend & Income Fund may, as a non-principal investment strategy, invest in MLPs receiving partnership taxation treatment under the Internal Revenue Code of 1986, interests or “units” of which are traded on securities exchanges like shares of corporate stock. To qualify as an MLP for U.S. Federal income tax purposes, an entity must receive at least 90% of its income from qualifying sources such as interest, dividends, real estate rents, gains from the sale or disposition of real property, income and gains from certain mineral or natural resources activities, income and gains from the transportation or storage of certain fuels, and, in certain circumstances, income and gains from commodities or futures, forwards and options with respect to commodities, and gains from the sale or other disposition of a capital asset held for the production of such income. Mineral or natural resources activities include exploration, development, production, mining, processing, refining, marketing and transportation (including pipelines) of oil and gas, minerals, geothermal energy, fertilizer, timber or industrial source carbon dioxide. An MLP consists of a general partner and limited partners (or in the case of MLPs organized as limited liability companies, a managing member and members). The general partner or managing member typically controls the operations and management of the MLP and has an ownership stake in the partnership. The limited partners or members, through their ownership of limited partner or member interests, provide capital to the entity, are intended to have no role in the operation and management of the entity, and receive cash distributions. The MLPs themselves generally do not pay U.S. Federal income taxes. Thus, unlike investors in corporate securities, direct MLP investors are generally not subject to double taxation (i.e., corporate level tax and tax on corporate dividends). Currently, most MLPs operate in the energy, natural resources or real estate sectors.
Investments in Irish Subsidiary – The Fixed Income Opportunities Fund may invest up to 15% of its net assets in life insurance policies and interests related thereto purchased through life settlement transactions. The Fund may invest in life insurance policies and related interests directly or through a wholly-owned subsidiary of the Fund under the laws of Ireland (the “Subsidiary”).
CITY NATIONAL ROCHDALE FUNDS | PAGE 165
notes to financial statements/
consolidated notes to financial statements |
September 30, 2021 |
The principal purpose of investment in the Subsidiary is to allow the Fixed Income Opportunities Fund to gain exposure to life insurance policies within the limitations of the federal tax law requirements applicable to regulated investment companies. The Subsidiary is a company organized under the laws of Ireland and is overseen by its own board of directors. Although the Subsidiary has its own board of directors, the Subsidiary is wholly-owned and controlled by the Fund. The Subsidiary is not an investment company registered under the 1940 Act and is not subject to all of the investor protections of the 1940 Act.
Information regarding the Fixed Income Opportunities Fund and the Subsidiary has been consolidated in the Consolidated Schedule of Investments, Consolidated Statement of Assets and Liabilities, Consolidated Statement of Operations, Consolidated Statements of Changes in Net Assets, Consolidated Statement of Cash Flows and Consolidated Financial Highlights.
The Subsidiary commenced operations on October 3, 2013. The net assets of the Subsidiary at September 30, 2021, were $177,818,875, which represented 4.3% of the net assets of the Fixed Income Opportunities Fund.
Investments in Affiliated Securities – The Fixed Income Funds and Equity Funds may invest excess cash in the Government Money Market Fund, the Municipal High Income Fund and / or the Fixed Income Opportunities Fund.
Redemption Fees – The Short Term Emerging Markets Debt Fund retains a redemption fee of 2.00% on redemptions of capital shares held for less than 90 days. For the year ended September 30, 2021, there were no redemption fees retained by the Fund. Any such fees would be retained by the Fund for the benefit of the remaining shareholders and would be recorded as additions to fund capital.
3. | DERIVATIVE TRANSACTIONS |
The following tables include only Funds that had exposure to more than one type of risk from derivatives held throughout the year. For Funds that held derivatives throughout the year with exposure to only one type of risk, additional information can be found on the Schedule of Investments/Consolidated Schedule of Investments and the Statements of Operations/Consolidated Statement of Operations.
The following table discloses the volume of the Fixed Income Opportunities Fund’s and Short Term Emerging Markets Debt Fund’s forward foreign currency contracts activity during the year ended September 30, 2021 (000):
Fixed Income Opportunities Fund | | | |
Forwards: | | | | |
Average Notional Balance Long | | $ | 4,447 | |
Average Notional Balance Short | | | 511,466 | |
Ending Notional Balance Long | | | 1,347 | |
Ending Notional Balance Short | | | 580,059 | |
Short Term Emerging Markets Debt Fund | | | |
Forwards: | | | | |
Average Notional Balance Long | | $ | 655 | |
Average Notional Balance Short | | | 3,387 | |
The following tables present, by derivative type, the Fixed Income Opportunities Fund’s OTC derivative assets and liabilities net of the related collateral posted for the benefit of the Fixed Income Opportunities Fund at September 30, 2021 (000):
Derivative Type | | Derivative
Assets
Subject to
a Netting
Agreement
or Similar
Arrangement | | | Derivative
Available
for Offset | | | Collateral
Received | | | Net Amount | |
Fixed Income Opportunities Fund |
Forward Foreign Currency Contracts | | | | | | | | | | | | | | | | |
U.S. Bank | | $ | 12,547 | | | $ | (21 | ) | | $ | — | | | $ | 12,526 | |
Derivative Type | | Derivative
Liabilities
Subject to
a Netting
Agreement
or Similar
Arrangement | | | Derivative
Available
for Offset | | | Collateral
Pledged | | | Net Amount | |
Fixed Income Opportunities Fund |
Forward Foreign Currency Contracts | | | | | | | | | | | | | | | | |
U.S. Bank | | $ | (21 | ) | | $ | 21 | | | $ | — | | | $ | — | |
4. | ADMINISTRATION, TRANSFER AGENT, DISTRIBUTION AND SHAREHOLDER SERVICES AGREEMENTS: |
Pursuant to an Amended and Restated Administration Agreement dated January 1, 2013, as amended (the “Agreement”), SEI Investments Global Funds Services (the “Administrator”), a wholly owned subsidiary of SEI Investments Company, acts as the Trust’s administrator. Under the terms of the Agreement, the Administrator is entitled to receive an annual fee based on the average daily net assets of the Trust, subject to a minimum annual fee.
CITY NATIONAL ROCHDALE FUNDS | PAGE 166
The Trust has adopted a Rule 12b-1 Distribution Plan (“the Plan”) with respect to Class N and Class S Shares that allows each Fund to pay distribution fees. Pursuant to the Plan, SEI Investments Distribution Co. (the “Distributor”) may receive a distribution fee, computed daily and paid monthly, at the annual rate of 0.50% of the average daily net assets of the Class S Shares and 0.30% of the average daily net assets of the Class N Shares of the Government Money Market Fund and 0.25% of the Class N Shares of the Fixed Income Funds and Equity Funds, which may be used by the Distributor to provide compensation for sales support and distribution-related activities. Pursuant to a Distribution Coordination Agreement, the entirety of the fees received by the Distributor pursuant to the Plan is transmitted to CNR Securities, LLC (“CNR Securities”) as Sub-Distribution Coordinator. CNR Securities then reallows those fees to broker-dealers and service providers, including City National Rochdale, LLC (“City National Rochdale” or the “Adviser”) and other affiliates, for payments for distribution services of the type identified in the Plan, and retains any undistributed balance of fees received from the Distributor.
The Government Money Market Fund has contractually agreed to limit the distribution fee payable by Class S shares of the Fund to 0.45% through January 31, 2022. Anytime prior to January 31, 2022, the arrangement may be terminated without penalty by the Fund’s Board of Trustees.
U.S. Bank Global Fund Services (the “Transfer Agent”) serves as transfer agent for the Trust and provides services at an annual rate of $20,000 per share class for all Funds plus other transaction based fees and out-of-pocket expenses.
The Trust has entered into a Shareholder Services Agreement that permits payment of compensation to City National Bank (“CNB”), its affiliates (including City National Rochdale) and others, which provide certain specified shareholder services to shareholders of all classes of each Fund, except for the Class Y shares of the Short Term Emerging Markets Debt Fund and Institutional Class shares. As compensation for the provision of such services, each Fund will pay CNB a fee of 0.25% of the average daily net assets of the applicable classes on an annual basis, payable monthly.
The Board has adopted, on behalf of Class Y shares of the Short Term Emerging Markets Debt Fund, a Shareholder Service Plan (the “Service Plan”) under which the Adviser will provide, or arrange for others (such as banks, trust companies, broker-dealers and other financial intermediaries (each, a “Service Organization”)) to provide, certain specified non-distribution shareholder servicing functions for Class Y shares of the Short Term Emerging Markets Debt Fund owned by its respective customers. The Class Y shares of the Short Term Emerging Markets Debt Fund will pay the Adviser or Service Organizations, as applicable, at an annual rate of up to 0.25% of the average daily net assets of Class Y shares owned by its respective customers, payable monthly.
CNB and City National Rochdale have agreed to voluntarily waive portions of their shareholder servicing fees with respect to certain Funds. For the year ended September 30, 2021, CNB and City National Rochdale received $11,818,018 in shareholder servicing fees from the Trust.
Certain officers of the Trust are also officers or employees of City National Rochdale, CNB or the Administrator. Such officers are paid no fees by the Trust for serving as officers of the Trust.
5. | INVESTMENT ADVISORY FEES AND OTHER AGREEMENTS: |
Under the terms of the current investment management agreements, City National Rochdale receives an annual fee equal to a percentage of the average daily net assets of each Fund, as follows:
Fund | Fee |
Government Money Market Fund | 0.26% |
Government Bond Fund | 0.43 |
Corporate Bond Fund | 0.40 |
California Tax Exempt Bond Fund | 0.27 |
Municipal High Income Fund | 0.50 |
Intermediate Fixed Income Fund | 0.40 |
Fixed Income Opportunities Fund | 0.50 |
Short Term Emerging Markets Debt Fund | 0.50 |
Dividend & Income Fund | 0.50 |
U.S. Core Equity Fund | 0.40 |
City National Rochdale has contractually agreed to waive the management fee for the Government Money Market Fund such that the fee charged is 0.15% through January 31, 2022. Anytime prior to January 31, 2022, the arrangement may be terminated without penalty (a) by the Fund’s Board of Trustees, or (b) by the Adviser effective no earlier than January 31, 2022, upon at least 60 days’ prior written notice. Management fees waived by the Adviser pursuant to this arrangement will not be eligible for reimbursement by the Fund to the Adviser.
City National Rochdale has contractually agreed to waive its fees and/or pay for the operating expenses of the Short Term Emerging Markets Debt Fund to ensure total fund operating expenses do not exceed 1.00% of the average daily net assets of Class Y shares.
Alcentra LTD, Alcentra NY, LLC, AllFinancial Partners II LLC, Ashmore Investment Management Limited, Federated Investment Management Company, GML Capital LLP and Seix Investment Advisors LLC act as the investment sub-advisers with respect to the Fixed Income Opportunities Fund.
CITY NATIONAL ROCHDALE FUNDS | PAGE 167
notes to financial statements/
consolidated notes to financial statements |
September 30, 2021 |
GML Capital LLP acts as the investment sub-adviser with respect to the Short Term Emerging Markets Debt Fund.
Sub-adviser fees are paid by City National Rochdale.
City National Rochdale has voluntarily agreed to limit its fees or reimburse expenses to the extent necessary to keep operating expenses at or below certain percentages of certain of the Funds’ respective average daily net assets. The voluntary expense limitations (expressed as percentages of the average daily net assets) are as follows:
| Government
Bond Fund | Corporate
Bond Fund |
Institutional Class | n/a | n/a |
Class N | 1.03% | 1.01% |
Class S | n/a | n/a |
Servicing Class | 0.78% | 0.76% |
| California
Tax Exempt
Bond Fund | Intermediate
Fixed Income
Fund | Fixed Income
Opportunities
Fund |
Institutional Class | n/a | 0.51% | n/a |
Class N | 0.88% | 1.01% | 1.09% |
Servicing Class | 0.63% | n/a | n/a |
Any fee reductions or expense reimbursements may be repaid by a Fund to City National Rochdale, within three years after occurrence if such repayments can be achieved within the Fund’s expense limit in effect at the time such expenses were incurred and if certain other conditions are satisfied.
As of September 30, 2021, fees which were previously waived by City National Rochdale which may be subject to possible future reimbursement were as follows:
Fund | | Potential Amount of
Recovery
(000) | | | Expiration | |
Government Bond Fund | | $ | 161 | | | | 2022 | |
| | | | 196 | | | | 2023 | |
| | | | 223 | | | | 2024 | |
Corporate Bond Fund | | | 75 | | | | 2022 | |
| | | | 144 | | | | 2023 | |
| | | | 168 | | | | 2024 | |
California Tax Exempt Bond Fund | | | 150 | | | | 2022 | |
| | | | 181 | | | | 2023 | |
| | | | 202 | | | | 2024 | |
Intermediate Fixed Income Fund | | | 113 | | | | 2022 | |
| | | | 160 | | | | 2023 | |
| | | | 183 | | | | 2024 | |
Fixed Income Opportunities Fund | | | 19 | | | | 2024 | |
During the year ended September 30, 2021, City National Rochdale did not recover previously waived fees for the Dividend & Income Fund.
6. | INVESTMENT TRANSACTIONS: |
The cost of security purchases and proceeds from the sale and maturities of securities, other than temporary investments in short-term securities for the year ended September 30, 2021, were as follows for the Fixed Income Funds and Equity Funds:
| | | Purchases | | | Sales and Maturities | |
Fund | | U.S. Gov’t
(000) | | | Other
(000) | | | U.S. Gov’t
(000) | | | Other
(000) | |
Government Bond Fund | | $ | 3,335 | | | $ | 1,705 | | | $ | 13,235 | | | $ | 1,008 | |
Corporate Bond Fund | | | — | | | | 65,354 | | | | — | | | | 73,090 | |
California Tax Exempt Bond Fund | | | 1,368 | | | | 24,767 | | | | 1,369 | | | | 23,454 | |
Municipal High Income Fund | | | — | | | | 554,634 | | | | — | | | | 253,303 | |
Intermediate Fixed Income Fund | | | 54,615 | | | | 17,998 | | | | 22,543 | | | | 48,645 | |
Fixed Income Opportunities Fund | | | — | | | | 3,662,015 | | | | — | | | | 3,434,187 | |
Short Term Emerging Markets Debt Fund | | | — | | | | 28,708 | | | | — | | | | 181,389 | |
Dividend & Income Fund | | | — | | | | 69,792 | | | | — | | | | 72,409 | |
U.S. Core Equity | | | — | | | | 60,553 | | | | — | | | | 47,049 | |
The Funds may purchase or sell investment securities in transactions with affiliated entities under procedures adopted by the Board of Trustees, pursuant to the 1940 Act. These transactions are effected at market rates without incurring broker commissions.
7. | FEDERAL TAX INFORMATION: |
Each Fund intends to qualify or continue to qualify as a regulated investment company for U.S. Federal income tax purposes and distribute all of its taxable income and net capital gains. Accordingly, no provisions for U.S. Federal income taxes are required.
Management has analyzed the Funds’ tax positions taken on U.S. Federal income tax returns for all open tax years and has concluded that as of September 30, 2021, no provision for income tax would be required in the Funds’ financial statements. The Funds’ U.S. Federal and state income and U.S. Federal excise tax returns for tax years for which the applicable statutes of limitations have not expired are subject to examination by the Internal Revenue Service and state departments of revenue.
The Funds may be subject to taxes imposed by countries in which they invest, with respect to their investments in issuers existing or operating in such countries. Such taxes are generally based on income earned. The Funds accrue such taxes when the related income is earned.
The timing and characterization of certain income and capital gains distributions are determined annually in accordance with U.S. Federal tax regulations, which may differ from accounting
CITY NATIONAL ROCHDALE FUNDS | PAGE 168
principles generally accepted in the United States of America. As a result, net investment income/(loss) and net realized gain/(loss) on investment transactions for a reporting period may differ significantly from distributions during such period. These book/tax differences may be temporary or permanent. To the extent these differences are permanent in nature, they are charged or credited to distributable earnings or paid-in capital, as appropriate, in the period that the differences arise.
The permanent differences primarily consist of gains and losses on paydowns of mortgage and asset-backed securities for tax purposes, reclassification of long term capital gain distribution on REITs, distribution reclassification, defaulted bond basis adjustments, market discount basis adjustments, investments in swaps and foreign currency translations. The permanent difference that is credited or charged to Paid-in Capital and Distributable Earnings as of September 30, 2021 is primarily related to excise tax paid and partnership adjustment:
| | Distributable
Earnings (Loss)
(000) | | | Paid-in Capital
(000) | |
Corporate Bond Fund | | $ | 2 | | | $ | (2 | ) |
Intermediate Fixed Income Fund | | | 1 | | | | (1 | ) |
Dividend & Income Fund | | | 47 | | | | (47 | ) |
U.S. Core Equity Fund | | | 3 | | | | (3 | ) |
The tax character of dividends and distributions declared during the years ended September 30, 2021, and September 30, 2020, unless otherwise indicated were as follows:
Fund | | Tax Exempt
Income
(000) | | | Ordinary
Income
(000) | | | Long-Term
Capital
Gain
(000) | | | Return of
Capital
(000) | | | Total
(000) | |
Government Money Market Fund |
2021 | | $ | — | | | $ | 636 | | | $ | — | | | $ | — | | | $ | 636 | |
2020 | | | — | | | | 14,992 | | | | — | | | | — | | | | 14,992 | |
Government Bond Fund |
2021 | | $ | — | | | $ | 286 | | | $ | — | | | $ | — | | | $ | 286 | |
2020 | | | — | | | | 458 | | | | — | | | | — | | | | 458 | |
Corporate Bond Fund |
2021 | | $ | — | | | $ | 1,679 | | | $ | — | | | $ | — | | | $ | 1,679 | |
2020 | | | — | | | | 2,548 | | | | — | | | | — | | | | 2,548 | |
California Tax Exempt Bond Fund |
2021 | | $ | 834 | | | $ | 38 | | | $ | 134 | | | $ | — | | | $ | 1,006 | |
2020 | | | 1,064 | | | | 45 | | | | — | | | | — | | | | 1,109 | |
Municipal High Income Fund |
2021 | | $ | 56,118 | | | $ | 1,276 | | | $ | — | | | $ | — | | | $ | 57,394 | |
2020 | | | 52,096 | | | | 737 | | | | — | | | | — | | | | 52,833 | |
Intermediate Fixed Income Fund |
2021 | | $ | — | | | $ | 948 | | | $ | 266 | | | $ | — | | | $ | 1,214 | |
2020 | | | — | | | | 2,059 | | | | — | | | | — | | | | 2,059 | |
Fixed Income Opportunities Fund |
2021 | | $ | — | | | $ | 246,026 | | | $ | — | | | $ | — | | | $ | 246,026 | |
2020 | | | — | | | | 211,921 | | | | — | | | | — | | | | 211,921 | |
Short Term Emerging Markets Debt Fund |
2021 | | $ | — | | | $ | 14,878 | | | $ | — | | | $ | 37,652 | | | $ | 52,530 | |
2020 | | | — | | | | 26,735 | | | | — | | | | 3,741 | | | | 30,476 | |
Dividend & Income Fund |
2021 | | $ | — | | | $ | 4,902 | | | $ | 1,919 | | | $ | — | | | $ | 6,821 | |
2020 | | | — | | | | 4,753 | | | | 2,180 | | | | 2,077 | | | | 9,010 | |
U.S. Core Equity Fund |
2021 | | $ | — | | | $ | 736 | | | $ | — | | | $ | — | | | $ | 736 | |
2020 | | | — | | | | 1,257 | | | | 8,277 | | | | 26 | | | | 9,560 | |
CITY NATIONAL ROCHDALE FUNDS | PAGE 169
notes to financial statements/
consolidated notes to financial statements |
September 30, 2021 |
As of September 30, 2021, the components of Distributable Earnings/(Accumulated Losses) on a tax basis were as follows:
Fund | | Undistributed
Tax-Exempt
Income
(000) | | | Undistributed
Ordinary
Income
(000) | | | Undistributed
Long-Term
Capital Gain
(000) | | | Capital Loss
Carryforwards
(000) | | | Post-October
Losses
(000) | | | Unrealized
Appreciation
(Depreciation)
(000) | | | Other
Temporary
Differences
(000)* | | | Total
Distributable
Earnings
(Accumulated
Losses)
(000) | |
Government Money Market Fund | | $ | — | | | $ | 52 | | | $ | — | | | $ | — | | | $ | — | | | $ | — | | | $ | (38 | ) | | $ | 14 | |
Government Bond Fund | | | — | | | | 18 | | | | — | | | | (546 | ) | | | — | | | | 627 | | | | (15 | ) | | | 84 | |
Corporate Bond Fund | | | — | | | | 310 | | | | 1,372 | | | | — | | | | — | | | | 1,181 | | | | (83 | ) | | | 2,780 | |
California Tax Exempt Bond Fund | | | 64 | | | | — | | | | 20 | | | | — | | | | — | | | | 2,221 | | | | (65 | ) | | | 2,240 | |
Municipal High Income Fund | | | 4,758 | | | | — | | | | — | | | | (55,218 | ) | | | — | | | | 114,391 | | | | (4,845 | ) | | | 59,086 | |
Intermediate Fixed Income Fund | | | — | | | | 371 | | | | 2,440 | | | | — | | | | — | | | | 1,753 | | | | (4 | ) | | | 4,560 | |
Fixed Income Opportunities Fund | | | — | | | | 52,357 | | | | — | | | | (60,013 | ) | | | (42,190 | ) | | | (347,239 | ) | | | 4 | | | | (397,081 | ) |
Short Term Emerging Markets Debt Fund | | | — | | | | — | | | | — | | | | (2,140 | ) | | | (12,948 | ) | | | (63 | ) | | | — | | | | (15,151 | ) |
Dividend & Income Fund | | | — | | | | — | | | | 14,905 | | | | — | | | | — | | | | 55,806 | | | | 7 | | | | 70,718 | |
U.S. Core Equity Fund | | | — | | | | 12 | | | | 18,246 | | | | — | | | | — | | | | 228,576 | | | | 1 | | | | 246,835 | |
* | Other temporary differences primarily consist of dividend payable. |
Post-October losses represent losses realized on investments and foreign currency transactions from November 1, 2020, through September 30, 2021, that, in accordance with U.S. Federal income tax regulations, the Funds have elected to defer and treat as having arisen in the following fiscal year.
The Funds have capital losses carried forward as follows:
Fund | | Short-Term Loss
(000) | | | Long-Term Loss
(000) | | | Total
(000) | |
Government Bond Fund | | $ | 39 | | | $ | 507 | | | $ | 546 | |
Municipal High Income Fund | | | 33,999 | | | | 21,219 | | | | 55,218 | |
Fixed Income Opportunities Fund | | | — | | | | 60,013 | | | | 60,013 | |
Short Term Emerging Markets Debt Fund | | | 154 | | | | 1,986 | | | | 2,140 | |
During the year ended September 30, 2021, the following Funds utilized capital loss carryforwards to offset capital gains amounting to:
Fund | | Amount
(000) | |
Government Bond Fund | | $ | 222 | |
Corporate Bond Fund | | | 848 | |
Intermediate Fixed Income Fund | | | 90 | |
Dividend & Income Fund | | | 180 | |
The aggregate gross unrealized appreciation on investments, the aggregate gross unrealized depreciation on investments and the net unrealized appreciation/(depreciation) for tax purposes as of September 30, 2021, for each of the Fixed Income Funds’ and Equity Funds’ investments were as follows:
Fund | | Federal Tax
Cost
(000) | | | Aggregate
Gross
Unrealized
Appreciation
(000) | | | Aggregate
Gross
Unrealized
Depreciation
(000) | | | Net
Unrealized
Appreciation
(Depreciation)
(000) | |
Government Bond Fund | | $ | 29,283 | | | $ | 686 | | | $ | (59 | ) | | $ | 627 | |
Corporate Bond Fund | | | 113,297 | | | | 1,873 | | | | (692 | ) | | | 1,181 | |
California Tax Exempt Bond Fund | | | 73,829 | | | | 2,407 | | | | (186 | ) | | | 2,221 | |
Municipal High Income Fund | | | 1,941,918 | | | | 154,467 | | | | (40,076 | ) | | | 114,391 | |
Intermediate Fixed Income Fund | | | 95,755 | | | | 2,619 | | | | (866 | ) | | | 1,753 | |
Fixed Income Opportunities Fund | | | 4,429,434 | | | | 137,093 | | | | (484,332 | ) | | | (347,239 | ) |
Short Term Emerging Markets Debt Fund | | | 217,086 | | | | 304 | | | | (367 | ) | | | (63 | ) |
Dividend & Income Fund | | | 180,134 | | | | 59,119 | | | | (3,313 | ) | | | 55,806 | |
U.S. Core Equity Fund | | | 190,495 | | | | 228,649 | | | | (73 | ) | | | 228,576 | |
At September 30, 2021, the Government Money Market Fund’s cost of securities for U.S. Federal income tax purposes approximates the cost disclosed in the Schedule of Investments.
In the normal course of business, the Funds enter into contracts that provide general indemnifications. The Funds’ maximum exposure under these arrangements is dependent on future claims
CITY NATIONAL ROCHDALE FUNDS | PAGE 170
that may be made against the Funds and, therefore, cannot be established; however, based on experience, the risk of loss from such claims is considered remote.
The Intermediate Fixed Income Fund, the Fixed Income Opportunities Fund and the Dividend & Income Fund may invest in exchange-traded notes (“ETNs”), each as a non-principal investment strategy. ETNs are unsecured debt obligations of investment banks which are traded on exchanges and the returns of which are linked to the performance of market indexes. In addition to trading ETNs on exchanges, investors may redeem ETNs directly with the issuer on a weekly basis, typically in a minimum amount of 50,000 units, or hold the ETNs until maturity. ETNs are riskier than ordinary unsecured debt securities and have no principal protection. The Funds will generally invest in ETNs which are linked to commodities indexes. A Fund’s investment in an ETN may be influenced by many unpredictable factors, including highly volatile commodities prices, changes in supply and demand relationships, weather, agriculture, trade, changes in interest rates, and monetary and other governmental policies, action and inaction. Investing in ETNs is not equivalent to investing directly in index components or the relevant index itself. Because ETNs are debt securities, they possess credit risk; if the issuer has financial difficulties or goes bankrupt, the investor may not receive the return expected and may suffer a loss.
The Municipal High Income Fund, Intermediate Fixed Income Fund, Fixed Income Opportunities Fund and Short Term Emerging Markets Debt Fund may invest in lower-rated corporate bonds, known as high yield bonds. High yield bonds involve greater risks of default, downgrade, or price declines and are more volatile than investment grade securities. Issuers of high yield bonds may be more susceptible than other issuers to economic downturns and investors are subject to a greater risk that the issuer may not be able to pay interest or dividends, or repay the principal upon maturity. Discontinuation of these payments could have a substantial adverse effect on the market value of the security.
The Intermediate Fixed Income Fund and Fixed Income Opportunities Fund may invest in asset-backed and mortgage-backed securities. As a general rule, prepayments of the principal of the loans underlying mortgage-backed or other pass-through securities increase during a period of falling interest rates and decrease during a period of rising interest rates. In periods of declining interest rates, as a result of prepayments a Fund may be required to reinvest its assets in securities with lower interest rates. In periods of increasing interest rates, the securities subject to prepayment risk held by a Fund may exhibit price characteristics of longer-term debt securities.
The Intermediate Fixed Income Fund and Fixed Income Opportunities Fund may invest in bank loans. Bank loans are not traded on an exchange and purchasers and sellers of bank loans generally rely on market makers, typically the administrative agent under a bank loan, to effect private sales transactions. As a result, bank loans may have relatively less liquidity than other types of fixed income assets, and a Fund may be more likely to incur losses on the sale of bank loans than on other, more liquid, investments.
The Fixed Income Opportunities Fund may invest in beneficial interests in individual life insurance Policies. A Policy owner transfers his or her Policy at a discount to its face value (the amount that is payable upon the death of the insured) in return for an immediate cash settlement. The ultimate purchaser of the Policy (in this case, the Fund) is responsible for premiums payable on the Policy and is entitled to receive the full face value from the insurance company upon the death of the insured. If the Fund is unable to make premium payments on a Policy, the Policy will lapse and the Fund will lose its ownership interest in the Policy. There is currently no established secondary market for Policies, and the Policies are not considered liquid investments by the Fund. If the Fund must sell Policies to meet redemption requests or for other cash needs, the Fund may be forced to sell at a loss. The longer the insured lives, the lower the Fund’s rate of return on the Policy. The underwriter’s estimate of the insured’s life expectancy may be incorrect. An insurance company may be unable or may refuse to pay benefits on a Policy. In addition, market quotations will not be readily available for the Policies and the Policies will be priced using a fair value methodology adopted by the Trust’s Board of Trustees. The sales price the Fund could receive for a Policy may differ from the Trust’s valuation of the Policy. A Policy is a liability of the issuing life insurance company, and if the life insurance company goes out of business, sufficient funds may not be available to pay that liability.
California Tax Exempt Bond Fund – Specific Risks
The ability of issuers to pay interest on, and repay the principal of, California municipal securities may be affected by economic and political developments in the State of California.
Certain securities are backed by letters of credit from various financial institutions and financial guaranty assurance agencies. These letters of credit enhance the credit quality of the individual securities; however, if any of the financial institutions’ or financial guaranty assurance agencies’ credit quality should
CITY NATIONAL ROCHDALE FUNDS | PAGE 171
notes to financial statements/
consolidated notes to financial statements |
September 30, 2021 |
deteriorate, it could cause the individual security’s credit quality to change. Additionally, if the Fund concentrates its letters of credit in any one financial institution, the risk of credit quality deterioration increases.
Short Term Emerging Markets Debt Fund – Specific Risks
Foreign investments tend to be more volatile than domestic securities, and are subject to risks that are not typically associated with domestic securities (e.g., changes in currency rates and exchange control regulations, future political and economic developments and the possibility of seizure or nationalization of companies, or the imposition of withholding taxes on income). There may be less government supervision of foreign markets. As a result, foreign issuers may not be subject to the uniform accounting, auditing, and financial reporting standards and practices applicable to domestic issuers, and there may be less publicly available information about foreign issuers.
As long as the Short Term Emerging Markets Debt Fund holds a foreign security, its value will be affected by the value of the local currency relative to the U.S. dollar. The value of a foreign currency may decline in relation to the U.S. dollar while the Fund holds securities denominated in such currency. Currency exchange rates can be volatile and can be affected by, among other factors, the general economics of a country or the actions of the United States or foreign governments or central banks. U.S. dollar-denominated securities of foreign issuers may also be affected by currency risk, as the value of these securities may also be affected by changes in the issuer’s local currency.
Risks associated with foreign investments may be intensified in the case of investments in emerging market countries, the political, legal and economic systems of which are less developed and less stable than those of more developed nations. Emerging markets may have relatively unstable governments, immature economic structures, national policies restricting investments by foreigners, social instability, and different and/or developing legal systems. In some countries, there is the risk that the government may take over the assets or operations of a company or that the government may impose withholding and other taxes or limits on the removal of the Short Term Emerging Markets Debt Fund’s assets from that country. In addition, the economies of emerging markets may be predominantly based on only a few industries, may be highly vulnerable to changes in local or global trade conditions, and may suffer from extreme and volatile debt burdens or inflation rates. Such investments are often less liquid and/or more volatile than securities issued by companies located in developed nations. Emerging market securities are also subject to the risk that the securities may not be sold at the quoted market price within a reasonable period of time.
A more complete description of risks is included in the Funds’ prospectus and statement of additional information.
CITY NATIONAL ROCHDALE FUNDS | PAGE 172
9. | CAPITAL SHARES ISSUED AND REDEEMED: |
Capital share activity for the year ended September 30, 2021, and the year ended September 30, 2020, was as follows (000):
| | | Government Money Market Fund | | | | Government Bond Fund | | | | Corporate Bond Fund | |
| | | 2021 | | | 2020 | | | | 2021 | | | 2020 | | | | 2021 | | | 2020 | |
CAPITAL SHARES ISSUED AND REDEEMED: | | | | | | | | | | | | | | | | | | | | | | |
Institutional Class: | | | | | | | | | | | | | | | | | | | | | | | | | | |
Shares issued | | | — | | | | — | | | | | — | | | | 1 | | | | | — | | | | — | |
Shares issued in lieu of dividends and distributions | | | — | | | | — | | | | | — | (a) | | | — | (a) | | | | — | | | | — | |
Shares redeemed | | | — | | | | — | | | | | — | | | | (1 | ) | | | | — | | | | — | |
Net Institutional Class transactions | | | — | | | | — | | | | | — | | | | — | | | | | — | | | | — | |
Class N: | | | | | | | | | | | | | | | | | | | | | | | | | | |
Shares issued | | | 689,637 | | | | 920,464 | | | | | 37 | | | | 25 | | | | | 295 | | | | 359 | |
Shares issued in lieu of dividends and distributions | | | 47 | | | | 1,077 | | | | | 1 | | | | 2 | | | | | 10 | | | | 14 | |
Shares redeemed | | | (571,006 | ) | | | (618,068 | ) | | | | (39 | ) | | | (29 | ) | | | | (201 | ) | | | (126 | ) |
Net Class N transactions | | | 118,678 | | | | 303,473 | | | | | (1 | ) | | | (2 | ) | | | | 104 | | | | 247 | |
Class S: | | | | | | | | | | | | | | | | | | | | | | | | | | |
Shares issued | | | 2,796,788 | | | | 1,321,522 | | | | | — | | | | — | | | | | — | | | | — | |
Shares issued in lieu of dividends and distributions | | | — | | | | — | | | | | — | | | | — | | | | | — | | | | — | |
Shares redeemed | | | (2,528,435 | ) | | | (1,186,148 | ) | | | | — | | | | — | | | | | — | | | | — | |
Net Class S transactions | | | 268,353 | | | | 135,374 | | | | | — | | | | — | | | | | — | | | | — | |
Servicing Class: | | | | | | | | | | | | | | | | | | | | | | | | | | |
Shares issued | | | 6,485,965 | | | | 7,218,391 | | | | | 288 | | | | 399 | | | | | 1,770 | | | | 1,780 | |
Shares issued in lieu of dividends and distributions | | | 351 | | | | 10,485 | | | | | 3 | | | | 5 | | | | | 15 | | | | 24 | |
Shares redeemed | | | (6,262,298 | ) | | | (6,049,690 | ) | | | | (1,163 | ) | | | (839 | ) | | | | (3,500 | ) | | | (2,350 | ) |
Net Servicing Class transactions | | | 224,018 | | | | 1,179,186 | | | | | (872 | ) | | | (435 | ) | | | | (1,715 | ) | | | (546 | ) |
| | | California Tax Exempt Bond Fund | | | | Municipal High
Income Fund | |
| | | 2021 | | | 2020 | | | | 2021 | | | 2020 | |
CAPITAL SHARES ISSUED AND REDEEMED: | | | | | | | | | | | | | | | | | |
Class N: | | | | | | | | | | | | | | | | | |
Shares issued | | | 268 | | | | 99 | | | | | 32,665 | | | | 31,405 | |
Shares issued in lieu of dividends and distributions | | | 4 | | | | 5 | | | | | 1,859 | | | | 1,862 | |
Shares redeemed | | | (296 | ) | | | (185 | ) | | | | (22,278 | ) | | | (15,632 | ) |
Net Class N transactions | | | (24 | ) | | | (81 | ) | | | | 12,246 | | | | 17,635 | |
Servicing Class: | | | | | | | | | | | | | | | | | |
Shares issued | | | 1,504 | | | | 1,400 | | | | | 27,704 | | | | 14,008 | |
Shares issued in lieu of dividends and distributions | | | 13 | | | | 15 | | | | | 376 | | | | 239 | |
Shares redeemed | | | (1,525 | ) | | | (2,078 | ) | | | | (11,092 | ) | | | (8,981 | ) |
Net Servicing Class transactions | | | (8 | ) | | | (663 | ) | | | | 16,988 | | | | 5,266 | |
CITY NATIONAL ROCHDALE FUNDS | PAGE 173
notes to financial statements/
consolidated notes to financial statements |
September 30, 2021 |
| | | Intermediate Fixed Income Fund | | | | Fixed Income Opportunities Fund | | | | Short Term Emerging Markets Debt Fund | |
| | | 2021 | | | 2020 | | | | 2021 | | | 2020 | | | | 2021 | | | 2020 | |
CAPITAL SHARES ISSUED AND REDEEMED: | | | | | | | | | | | | | |
Institutional Class: | | | | | | | | | | | | | | | | | | | | | | | | | | |
Shares issued | | | 506 | | | | 86 | | | | | — | | | | — | | | | | — | | | | — | |
Shares issued in lieu of dividends and distributions | | | 2 | | | | 2 | | | | | — | | | | — | | | | | — | | | | — | |
Shares redeemed | | | (592 | ) | | | (49 | ) | | | | — | | | | — | | | | | — | | | | — | |
Net Institutional Class transactions | | | (84 | ) | | | 39 | | | | | — | | | | — | | | | | — | | | | — | |
Class N: | | | | | | | | | | | | | | | | | | | | | | | | | | |
Shares issued | | | 1,074 | | | | 955 | | | | | 52,367 | | | | 70,559 | | | | | — | | | | — | |
Shares issued in lieu of dividends and distributions | | | 36 | | | | 71 | | | | | 7,773 | | | | 7,451 | | | | | — | | | | — | |
Shares redeemed | | | (1,253 | ) | | | (1,734 | ) | | | | (49,980 | ) | | | (53,434 | ) | | | | — | | | | — | |
Net Class N transactions | | | (143 | ) | | | (708 | ) | | | | 10,160 | | | | 24,576 | | | | | — | | | | — | |
Class Y: | | | | | | | | | | | | | | | | | | | | | | | | | | |
Shares issued | | | — | | | | — | | | | | — | | | | — | | | | | 2 | | | | 8,472 | |
Shares issued in lieu of dividends and distributions | | | — | | | | — | | | | | — | | | | — | | | | | 3,990 | | | | 2,019 | |
Shares redeemed | | | — | | | | — | | | | | — | | | | — | | | | | (7,156 | ) | | | (3,142 | ) |
Net Class Y transactions | | | — | | | | — | | | | | — | | | | — | | | | | (3,164 | ) | | | 7,349 | |
| | | Dividend & Income Fund | | | | U.S. Core Equity Fund | |
| | | 2021 | | | 2020 | | | | 2021 | | | 2020 | |
CAPITAL SHARES ISSUED AND REDEEMED: |
Institutional Class: | | | | | | | | | | | | | | | | | |
Shares issued | | | — | | | | — | | | | | 6 | | | | 274 | |
Shares issued in lieu of dividends and distributions | | | — | | | | — | | | | | — | (a) | | | 1 | |
Shares redeemed | | | — | | | | — | | | | | (268 | ) | | | (30 | ) |
Net Institutional Class transactions | | | — | | | | — | | | | | (262 | ) | | | 245 | |
Class N: | | | | | | | | | | | | | | | | | |
Shares issued | | | 1,281 | | | | 1,572 | | | | | 1,878 | | | | 1,869 | |
Shares issued in lieu of dividends and distributions | | | 113 | | | | 161 | | | | | 8 | | | | 206 | |
Shares redeemed | | | (1,800 | ) | | | (1,507 | ) | | | | (1,362 | ) | | | (2,066 | ) |
Net Class N transactions | | | (406 | ) | | | 226 | | | | | 524 | | | | 9 | |
Servicing Class: | | | | | | | | | | | | | | | | | |
Shares issued | | | — | | | | — | | | | | 1,125 | | | | 1,037 | |
Shares issued in lieu of dividends and distributions | | | — | | | | — | | | | | 2 | | | | 19 | |
Shares redeemed | | | — | | | | — | | | | | (1,479 | ) | | | (2,195 | ) |
Net Servicing Class transactions | | | — | | | | — | | | | | (352 | ) | | | (1,139 | ) |
CITY NATIONAL ROCHDALE FUNDS | PAGE 174
The Funds, except for the Government Money Market Fund, have an unsecured Loan Agreement (“LOC”) with U.S. Bank N.A. Under the terms of the LOC, borrowings for an individual Fund are limited to either the lesser of 10% of the Fund’s net assets or an explicit amount on the LOC. Interest is charged to a Fund based on its borrowings at prime rate minus 0.50%.
Borrowing activity under the LOC for the year ended September 30, 2021, was as follows:
Fund | | Maximum
Amount
of Line of
Credit
(000) | | | Interest
Expense
(000) | | | Average
Rate | | | Average
Borrowings
(000) | | | Maximum
Amount
Outstanding
(000) | |
Fixed Income Opportunities Fund | | $ | 200,000 | | | $ | 98 | | | | 2.75 | % | | $ | 18,654 | | | $ | 39,999 | |
Dividend & Income Fund | | | 200,000 | | | | 4 | | | | 2.75 | | | | 1,052 | | | | 4,546 | |
11. OTHER MATTERS
The outbreak of a novel strain of coronavirus (COVID-19) and subsequent global pandemic began significantly impacting the U.S. and global markets and economies in early 2020. There is significant uncertainty with respect to the breadth and duration of business disruptions related to COVID-19, as well as its long-term impact on the U.S. and global markets and economies. The operational and financial performance of the issuers of securities in which the Funds invest depends on future developments, including the duration and spread of the outbreak, and such developments may negatively affect the value of the Funds’ investments and could lead to losses. The ultimate impact of COVID-19 on the financial performance of the Funds’ investments is not reasonably estimable at this time. Management continues to monitor and evaluate this situation.
In July 2017, the Financial Conduct Authority, the United Kingdom’s financial regulatory body, announced that after 2021 it will cease its active encouragement of banks to provide the quotations needed to sustain LIBOR. In March 2021, the administrator of LIBOR announced a delay in the phase out of the majority of U.S. Dollar LIBOR publications until June 30, 2023, with the remainder of LIBOR publications to still end on December 31, 2021. Various financial industry groups have begun planning for the transition, whether through market wide protocols, fallback contractual provisions, bespoke negotiations or amendments or otherwise, but there are obstacles to converting certain securities and transactions to a new benchmark. Transition planning is at an early stage, and neither the effect of the transition process nor its ultimate success can yet be known. The transition process might lead to increased volatility and illiquidity in markets for instruments whose terms currently include LIBOR. It could also lead to a reduction in the value of some LIBOR-based investments and reduce the effectiveness of new hedges placed against existing LIBOR-based investments. While some LIBOR-based instruments may contemplate a scenario where LIBOR is no longer available by providing for an alternative rate-setting methodology and/or increased costs for certain LIBOR-related instruments or financing transactions, not all may have such provisions and there may be significant uncertainty regarding the effectiveness of any such alternative methodologies, resulting in prolonged adverse market conditions for a Fund. Because the usefulness of LIBOR as a benchmark could deteriorate during the transition period, these effects could occur prior to the completion of the applicable phase out. There also remains uncertainty and risk regarding the willingness and ability of issuers to include enhanced provisions in new and existing contracts or instruments. All of the aforementioned may adversely affect a Fund’s performance or NAV.
The Trust has evaluated the need for additional disclosures and/or adjustments resulting from subsequent events. Based on this evaluation, see the below disclosure to the financial statements as of September 30, 2021:
Effective October 1, 2021, City National Rochdale Dividend & Income Fund changed its name to City National Rochdale Equity Income Fund. The Fund’s primary benchmark changed and certain non-material changes were made to the Fund’s investment program. Refer to the prospectus for further details.
The Short Term Emerging Markets Debt Fund liquidated on November 17, 2021.
CITY NATIONAL ROCHDALE FUNDS | PAGE 175
report of independent registered public accounting firm |
|
To the Shareholders and the Board of Trustees
of City National Rochdale Funds
Opinion on the Financial Statements
We have audited the accompanying statements of assets and liabilities of City National Rochdale Government Money Market Fund, City National Rochdale Government Bond Fund, City National Rochdale Corporate Bond Fund, City National Rochdale California Tax Exempt Bond Fund, City National Rochdale Municipal High Income Fund, City National Rochdale Intermediate Fixed Income Fund, City National Rochdale Fixed Income Opportunities Fund (consolidated), City National Rochdale Dividend & Income Fund and City National Rochdale U.S. Core Equity Fund, each a series of shares of beneficial interest in City National Rochdale Funds, (inclusive of the City National Rochdale Short Term Emerging Markets Debt Fund referred to as the “Funds”), including the schedules of investments, as of September 30, 2021, and the related statements of operations and cash flows (for City National Rochdale Fixed Income Opportunities Fund only) for the year then ended, the statements of changes in net assets for each of the years in the two-year period then ended, the financial highlights the years in the five-year period then ended (consolidated for City National Rochdale Fixed Income Opportunities Fund), and the related notes. We have also audited the accompanying statement of assets and liabilities of City National Rochdale Short Term Emerging Markets Debt Fund, a series of shares of beneficial interest in City National Rochdale Funds, including the schedule of investments, as of September 30, 2021 and the related statements of operations for the year then ended, the changes in net assets for each of the years in the two-year period then ended and the financial highlights for each of the years in the two-year period then ended and for the period May 15, 2019 (commencement of operations) through September 30, 2019 and the related notes. The above statements are collectively referred to as the “financial statements”.
In our opinion, the financial statements (consolidated where noted) referred to above present fairly, in all material respects, the financial position of the Funds as of September 30, 2021, and the results of their operations and cash flows (for City National Rochdale Fixed Income Opportunities Fund only), the changes in their net assets and their financial highlights for each of the periods noted above, in conformity with accounting principles generally accepted in the United States of America.
Basis for Opinion
These financial statements are the responsibility of the Funds’ management. Our responsibility is to express an opinion on the Funds’ financial statements based on our audits. We are a public accounting firm registered with the Public Company Accounting Oversight Board (United States) (“PCAOB”) and are required to be independent with respect to the Funds in accordance with the U.S. federal securities law and the applicable rules and regulations of the Securities and Exchange Commission and the PCAOB.
We conducted our audits in accordance with the standards of the PCAOB. Those standards require that we plan and perform the audits to obtain reasonable assurance about whether the financial statements are free of material misstatement, whether due to error or fraud. The Funds are not required to have, nor were we engaged to perform, an audit of their internal control over financial reporting. As part of our audits we are required to obtain an understanding of internal control over financial reporting but not for the purpose of expressing an opinion on the effectiveness of the Funds’ internal control over financial reporting. Accordingly, we express no such opinion.
CITY NATIONAL ROCHDALE FUNDS | PAGE 176
Our audits included performing procedures to assess the risk of material misstatement of the financial statements, whether due to error or fraud, and performing procedures that respond to those risks. Such procedures included examining, on a test basis, evidence regarding the amounts and disclosures in the financial statements. Our procedures included confirmation of securities owned as of September 30, 2021 by correspondence with the custodian, broker, insurance companies, and by other appropriate auditing procedures where replies were not received. Our audits also included evaluating the accounting principles used and significant estimates made by management, as well as evaluating the overall presentation of the financial statements. We believe that our audits provide a reasonable basis for our opinion.

BBD, LLP
We have served as the auditor of one or more of the Funds in the City National Rochdale Funds since 2015.
Philadelphia, Pennsylvania
November 29, 2021
CITY NATIONAL ROCHDALE FUNDS | PAGE 177
trustees and officers (Unaudited) |
September 30, 2021 |
The Trustees and officers of the Trust, their principal occupations during the past five years, and their affiliations, if any, with City National Rochdale, the investment adviser to the Trust, are set forth below. The persons listed below may have held other positions with their employers named below during the relevant periods. Certain officers of the Trust also serve as officers to one or more other mutual funds for which SEI Investments or its affiliates act as investment adviser, administrator or distributor. Andrew S. Clare (the “Interested Trustee”) is an “interested person” of the Trust, as defined in the 1940 Act. Each Trustee other than Mr. Clare may be referred to in this SAI as an “Independent Trustee” and collectively as the “Independent Trustees.” There is no stated term of office for the Trustees. However, the Board has adopted a policy setting a retirement date for Trustees of December 31 of the year in which each Trustee reaches age 75. Exceptions to the retirement age may be made by the Board in individual cases for a period of up to two years, in the discretion of the Board. The business address for each Trustee is c/o City National Rochdale Funds, 400 North Roxbury Drive, Beverly Hills, California 90210, unless otherwise noted. The business address for each officer of the Trust is c/o City National Rochdale LLC, 400 North Roxbury Drive, Beverly Hills, California 90210, unless otherwise noted. The Trust’s Statement of Additional Information (“SAI”) includes additional information about the Trustees and Officers. The SAI may be obtained without charge by calling 1-888-889-0799.
Name and
Year of Birth | Position(s) Held with the Trust | Length of Time Served | Principal Occupation(s) During the Past 5 Years | Number of Portfolios in Fund Complex(1) Overseen by Trustee | Other Directorships Held by Trustee |
INDEPENDENT TRUSTEES: |
Daniel A. Hanwacker Year of Birth: 1951 | Trustee | Since 2013 | CEO and President, Hanwacker Associates, Inc. (asset management consulting and executive search services) (2001-present). Managing Director - Asset Management, Putnam Lovell Securities (2000- 2001). Co-Founding Partner, Constellation Financial Management Co., LLC (1995-2000). | 11 | None |
Jon C. Hunt Year of Birth: 1951 | Trustee | Since 2013 | Retired (2013-present). Consultant to Management, Convergent Capital Management, LLC (“CCM”) (2012-2013). Managing Director and Chief Operating Officer, CCM (1998-2012). | 11 | Advisor’s Inner Circle Fund III (2014-present); Gallery Trust (2016-present); Schroder Series Trust and Schroder Global Series Trust, Lead Independent Trustee (2017-present) |
Julie C. Miller Year of Birth: 1957 | Trustee | Since May 2020 | Certified Public Accountant(CPA) and Partner, Holthouse, Carlin & Van Trigt LLP (accounting firm) (2006 – present). | 11 | None |
Jay C. Nadel Year of Birth: 1951 | Trustee Chairman | Since 2013 Since 2019 | Financial Services Consultant (2005-present). Executive Vice President, Bank of New York Broker-Dealer and Member of the Operating Committee (2002-2004). Weiss, Peck & Greer, Partner, Managing Director and Chair of the Operations Committee (1986-2001). | 11 | Advisor’s Inner Circle Fund III (2016-present); Gallery Trust (2016-present); Schroder Series Trust and Schroder Global Series Trust, Independent Trustee (2017-present) |
CITY NATIONAL ROCHDALE FUNDS | PAGE 178
Name and
Year of Birth | Position(s) Held with the Trust | Length of Time Served | Principal Occupation(s) During the Past 5 Years | Number of Portfolios in Fund Complex(1) Overseen by Trustee | Other Directorships Held by Trustee |
INDEPENDENT TRUSTEES (Continued) |
James R. Wolford Year of Birth: 1954 | Trustee | Since 1999 | Chief Executive Officer of Corinthian Development Company (2013-present). President, Chief Operating Officer and Chief Financial Officer, Thompson National Properties (2011-2013). Chief Financial Officer, Pacific Office Properties, a real estate investment trust (2010-2011). Chief Financial Officer, Bixby Land Company, a real estate company (2004- 2010). Regional Financial Officer, AIMCO, a real estate investment trust (2004). Chief Financial Officer, DBM Group, a direct mail marketing company (2001- 2004). Senior Vice President and Chief Operating Officer, Forecast Commercial Real Estate Service, Inc. (2000-2001). Senior Vice President and Chief Financial Officer, Bixby Ranch Company (1985- 2000). | 11 | None |
INTERESTED TRUSTEE: |
Andrew S. Clare Year of Birth: 1945 | Trustee | Since 2013 | Attorney and partner, Loeb & Loeb LLP, a law firm (1972-present). | 11 | None |
(1) | “Fund complex” is defined as two or more registered investment companies that hold themselves out to investors as related companies or have a common investment adviser or affiliated investment advisers and in this case includes the series of City National Rochdale Funds and the following registered closed-end funds: City National Rochdale High Yield Alternative Strategies Master Fund LLC, City National Rochdale High Yield Alternative Strategies Fund TEI LLC, City National Rochdale High Yield Alternative Strategies Fund LLC, City National Rochdale Select Strategies Fund and City National Rochdale Strategic Credit Fund. |
(2) | Mr. Clare is an “interested person” of the Fund, as defined in the 1940 Act, by virtue of the provision of significant legal services by him and his law firm to CNB. |
CITY NATIONAL ROCHDALE FUNDS | PAGE 179
trustees and officers (Unaudited) (Continued) |
September 30, 2021 |
Name and
Year of Birth | Position(s)
Held with
the Trust | Term of
Office(1) and
Length of
Time Served | Principal Occupation(s)
During Past 5 Years |
OFFICERS: |
Thomas A. Galvin
Year of Birth: 1955 | President and Chief Executive Officer | Since 2021 | Chief Investment Officer and Senior Managing Director, U.S. Equity Research, City National Rochdale (2020-present); Managing Director, U.S. Equity Research, City National Rochdale (2012-present). |
Andrew Metzger
SEI Investments
One Freedom Valley Drive
Oaks, Pennsylvania 19456
Year of Birth: 1980 | Treasurer (Principal Financial and Accounting Officer and Controller) | Since 2021 | Director of Fund Accounting, SEI Investments Company (2020-present). Senior Director, Embark Consulting, LLC (2019-2020). Senior Manager, PricewaterhouseCoopers LLP (2002-2019). Treasurer (Principal Financial and Accounting Officer and Controller), City National Rochdale Funds, City National Rochdale Select Strategies Fund (the “Select Strategies Fund”) and City National Rochdale Strategic Credit Fund (the “Strategic Credit Fund”) (April 2021-present). |
Michael Carbone
Year of Birth: 1975 | Chief Compliance Officer (“CCO”) and Anti-Money Laundering Officer (“AML Officer”) | Since 2021 | Senior Vice President and Chief Compliance Officer, City National Bank (2020-present); CCO and AML Officer, City National Rochdale Funds, Select Strategies Fund, Strategic Credit Fund and City National Rochdale High Yield Alternative Strategies Master Fund LLC (the “Master Fund”), City National Rochdale High Yield Alternative Strategies Fund LLC (the “High Yield Feeder Fund”), City National Rochdale High Yield Alternative Strategies Fund TEI LLC (the “High Yield Feeder Fund TEI” and together with the Master Fund and the High Yield Feeder Fund, the “High Yield Funds”) (September 15, 2021 - Present); Director of Compliance, Citizens Bank, N.A. (2017-2020); Head of Enterprise Risk Management and Director of Compliance, Santander Bank, N.A. (2011-2017). |
Mitchell Cepler
Year of Birth: 1982 | Vice President and Assistant Treasurer | Since 2015 | Group Finance Manager, City National Rochdale (2011-present); Vice President and Assistant Treasurer, City National Rochdale Funds (2015-present), Select Strategies Fund (2016-present), and Strategic Credit Fund (2018-present); Treasurer and Chief Financial Officer, High Yield Funds (2016-present). |
Anthony Sozio
Year of Birth: 1971 | Vice President and Secretary | Since 2013 | Assistant Vice President of Registered Fund Operations, City National Rochdale (1998-present); Vice President, City National Rochdale Funds (2013-present), Select Strategies Fund (2016-present), and Strategic Credit Fund (2018-present); Secretary, City National Rochdale Funds (2019-present), Select Strategies Fund (2020-present), Strategic Credit Fund (2020-present), and High Yield Funds (2020-present); Assistant Secretary, City National Rochdale Funds (2013-2019), High Yield Funds (2013-2020), Select Strategies Fund (2016-2020), and Strategic Credit Fund (2018-2020). |
Matthew M. Maher
SEI Investments
One Freedom Valley Drive
Oaks, Pennsylvania 19456
Year of Birth: 1975 | Assistant Secretary | Since 2019 | Counsel, SEI Investments Company (2018-present); Assistant Secretary, City National Rochdale Funds, Select Strategies Fund, and Strategic Credit Fund (2019-present); Attorney, Blank Rome LLP (2015-2018); Assistant Counsel and Vice President, Bank of New York Mellon (2013-2014); Attorney, Dilworth Paxson LLP (2006-2013). |
(1) | Each officer serves until removed by the Board or the principal executive officer of the Fund, or until such officer resign. |
CITY NATIONAL ROCHDALE FUNDS | PAGE 180
notice to shareholders (Unaudited) |
September 30, 2021 |
For shareholders that do not have a September 30, 2021, taxable year end, this notice is for informational purposes only. For shareholders with a September 30, 2021, taxable year end, please consult your tax advisor as to the pertinence of this notice.
For California income tax purposes, for the fiscal year ended September 30, 2021, each of the California Tax Exempt Bond Fund and Municipal High Income Fund is designating 97.20% and 5.78%, respectively, of its distributions paid from net investment income as exempt-interest dividends under Section 17145 of the California Revenue and Taxation Code.
For Federal income tax purposes, for the fiscal year ended September 30, 2021, each Fund is designating the following items with regard to distributions paid during the year:
| | (A)
Long Term
Capital Gain
Distributions | (B)
Return of
Capital | (C)
Ordinary
Income
Distributions | (D)
Tax Exempt
Interest | (E)
Total
Distributions | (F)
Dividends
Qualifying
for Corporate
Dividends
Rec.
Deduction (1) | (G)
Qualifying
Dividend
Income (2) | (H)
U.S.
Government
Interest (3) | (I)
Interest
Related
Dividends (4) | (J)
Qualified
Short-Term
Capital Gain
Dividends (5) | (K)
Foreign Tax
Credit |
Government Money Market Fund(3) | 0.00% | 0.00% | 100.00% | 0.00% | 100.00% | 0.00% | 0.00% | 63.38% | 100.00% | 100.00% | 0.00% |
Government Bond Fund | 0.00% | 0.00% | 100.00% | 0.00% | 100.00% | 0.00% | 0.00% | 59.80% | 89.02% | 0.00% | 0.00% |
Corporate Bond Fund(3) | 0.00% | 0.00% | 100.00% | 0.00% | 100.00% | 0.00% | 0.00% | 0.00% | 83.62% | 0.00% | 0.00% |
California Tax Exempt Bond Fund(3) | 13.04% | 0.00% | 3.72% | 83.24% | 100.00% | 0.00% | 0.00% | 0.00% | 0.00% | 0.00% | 0.00% |
Municipal High Income Fund(3) | 0.00% | 0.00% | 2.25% | 97.75% | 100.00% | 0.00% | 0.00% | 0.00% | 0.00% | 0.00% | 0.00% |
Intermediate Fixed Income Fund(3) | 21.94% | 0.00% | 78.06% | 0.00% | 100.00% | 0.00% | 0.00% | 6.46% | 91.21% | 0.00% | 0.00% |
Fixed Income Opportunities Fund(3) | 0.00% | 0.00% | 100.00% | 0.00% | 100.00% | 5.53% | 5.53% | 0.00% | 94.16% | 0.00% | 0.00% |
Short Term Emerging Markets Debt Fund(3) | 0.00% | 71.68% | 28.32% | 0.00% | 100.00% | 0.00% | 0.00% | 0.00% | 100.00% | 0.00% | 0.00% |
Dividend & Income Fund(3) | 28.15% | 0.00% | 71.85% | 0.00% | 100.00% | 100.00% | 100.00% | 0.00% | 0.00% | 0.00% | 0.00% |
U.S. Core Equity Fund(3) | 0.00% | 0.00% | 100.00% | 0.00% | 100.00% | 100.00% | 100.00% | 0.00% | 0.00% | 0.00% | 0.00% |
(1) | “Dividends Received Deduction” represent dividends which qualify for the corporate dividends received deduction. |
(2) | “Qualifying Dividend Income” represent qualifying dividends as created by the Jobs and Growth Tax Relief Reconciliation Act of 2003. The Fund intends to designate the maximum amount permitted by law. |
(3) | “U.S. Government Interest” represent the amount of interest that was derived from direct U.S. Government obligations and distributed during the fiscal year. This amount is reflected as a percentage of ordinary income. Generally, interest from direct U.S. Government obligations is exempt from state income tax. However, for shareholders who are residents of California, Connecticut or New York, the statutory threshold requirements were not satisfied to permit exemption of these amounts from state income. |
(4) | “Interest Related Dividends” represent qualifying interest that is exempt from U.S. withholding tax when paid to foreign investors as created by the American Jobs Creation Act of 2004. |
(5) | “Short-Term Capital Gain Dividends” represent qualifying short-term capital gain that is exempt from U.S. withholding tax when paid to foreign investors as created by the American Jobs Creation Act of 2004. |
Items (A), (B), (C), (D), (E) and (K) are based on the percentage of each fund’s total distribution.
Items (F) and (G) are based on the percentage of “Ordinary Income Distributions.”
Item (H) is based on the percentage of gross income of each Fund.
Item (I) is based on the percentage of net investment income distributions.
Item (J) is based on the percentage of short-term capital gain distributions.
CITY NATIONAL ROCHDALE FUNDS | PAGE 181
disclosure of fund expenses (Unaudited) |
|
All mutual funds have operating expenses. As a shareholder of a Fund, your investment is affected by these ongoing costs, which include (among others) costs for portfolio management, administrative services, class-specific distribution fees, acquired fund fees and shareholder reports like this one. It is important for you to understand the impact of these costs on your investment returns.
Operating expenses such as these are deducted from a Fund’s gross income and directly reduce your final investment return. These expenses are expressed as a percentage of the Fund’s average net assets; this percentage is known as the Fund’s expense ratio.
The following examples use the expense ratio and are intended to help you understand the ongoing costs (in dollars) of investing in a Fund and to compare these costs with those of other mutual funds. The examples are based on an investment of $1,000 made at the beginning of the period shown and held for the entire period (April 1, 2021 through September 30, 2021).
The table below illustrates each Fund’s costs in two ways:
Actual Fund Return. This section helps you to estimate the actual expenses that each Fund incurred over the period. The “Expenses Paid During Period” column shows the actual dollar expense cost incurred by a $1,000 investment in each Fund, and the “Ending Account Value” number is derived from deducting that expense cost from each Fund’s gross investment return.
You can use this information, together with the actual amount you invested in a Fund, to estimate the expenses you paid over that period. Simply divide your actual account value by $1,000 to arrive at a ratio (for example, an $8,600 account value divided by $1,000 = 8.6), then multiply that ratio by the number shown for the Fund under “Expenses Paid During Period.”
Hypothetical 5% Return. This section helps you compare each Fund’s costs with those of other mutual funds. It assumes that each Fund had an annual 5% return before expenses during the year, but that the expense ratio (Column 3) for the period is unchanged. This example is useful in making comparisons because the Securities and Exchange Commission requires all mutual funds to make this 5% calculation. You can assess each Fund’s comparative cost by comparing the hypothetical result for each Fund in the “Expenses Paid During Period” column with those that appear in the same charts in the shareholder reports for other funds.
NOTE: Because the return is set at 5% for comparison purposes - NOT each Fund’s actual return - the account values shown do not apply to your specific investment.
CITY NATIONAL ROCHDALE FUNDS | PAGE 182
| | | Beginning
Account
Value
4/1/2021 | | | Ending
Account
Value
9/30/2021 | | | Annualized
Expense
Ratios | | | Expense
Paid During
Period* | |
City National Rochdale Government Money Market Fund |
Actual Fund Return | | | | | | | | | | | | | | | | |
Class N | | $ | 1,000.00 | | | $ | 1,000.10 | | | | 0.07 | % | | $ | 0.35 | |
Class S | | | 1,000.00 | | | | 1,000.10 | | | | 0.07 | % | | | 0.35 | |
Servicing Class | | | 1,000.00 | | | | 1,000.10 | | | | 0.07 | % | | | 0.35 | |
| | | | | | | | | | | | | | | | | |
Hypothetical 5% Return | | | | | | | | | | | | | | | | |
Class N | | $ | 1,000.00 | | | $ | 1,024.72 | | | | 0.07 | % | | $ | 0.36 | |
Class S | | | 1,000.00 | | | | 1,024.72 | | | | 0.07 | % | | | 0.36 | |
Servicing Class | | | 1,000.00 | | | | 1,024.72 | | | | 0.07 | % | | | 0.36 | |
| | | | | | | | | | | | | | | | | |
City National Rochdale Government Bond Fund |
Actual Fund Return | | | | | | | | | | | | | | | | |
Institutional Class | | | | | | | | | | | | | | | | |
Class N | | $ | 1,000.00 | | | $ | 997.00 | | | | 1.03 | % | | $ | 5.16 | |
Servicing Class | | | 1,000.00 | | | | 998.3 | | | | 0.78 | % | | | 3.91 | |
| | | | | | | | | | | | | | | | | |
Hypothetical 5% Return | | | | | | | | | | | | | | | | |
Institutional Class | | | | | | | | | | | | | | | | |
Class N | | $ | 1,000.00 | | | $ | 1,019.90 | | | | 1.03 | % | | $ | 5.22 | |
Servicing Class | | | 1,000.00 | | | | 1,021.16 | | | | 0.78 | % | | | 3.95 | |
| | | | | | | | | | | | | | | | | |
City National Rochdale Corporate Bond Fund |
Actual Fund Return | | | | | | | | | | | | | | | | |
Class N | | $ | 1,000.00 | | | $ | 1,004.30 | | | | 1.01 | % | | $ | 5.07 | |
Servicing Class | | | 1,000.00 | | | | 1,005.50 | | | | 0.76 | % | | | 3.82 | |
| | | | | | | | | | | | | | | | | |
Hypothetical 5% Return | | | | | | | | | | | | | | | | |
Class N | | $ | 1,000.00 | | | $ | 1,020.00 | | | | 1.01 | % | | $ | 5.11 | |
Servicing Class | | | 1,000.00 | | | | 1,021.26 | | | | 0.76 | % | | | 3.85 | |
| |
City National Rochdale California Tax Exempt Bond Fund |
Actual Fund Return | | | | | | | | | | | | | | | | |
Class N | | $ | 1,000.00 | | | $ | 1,001.30 | | | | 0.88 | % | | $ | 4.41 | |
Servicing Class | | | 1,000.00 | | | | 1,001.70 | | | | 0.63 | % | | | 3.16 | |
| | | | | | | | | | | | | | | | | |
Hypothetical 5% Return | | | | | | | | | | | | | | | | |
Class N | | $ | 1,000.00 | | | $ | 1,020.66 | | | | 0.88 | % | | $ | 4.46 | |
Servicing Class | | | 1,000.00 | | | | 1,021.91 | | | | 0.63 | % | | | 3.19 | |
| | | | | | | | | | | | | | | | | |
City National Rochdale Municipal High Income Fund |
Actual Fund Return | | | | | | | | | | | | | | | | |
Class N | | $ | 1,000.00 | | | $ | 1,028.70 | | | | 1.07 | % | | $ | 5.44 | |
Servicing Class | | | 1,000.00 | | | | 1,030.90 | | | | 0.82 | % | | | 4.17 | |
| | | | | | | | | | | | | | | | | |
Hypothetical 5% Return | | | | | | | | | | | | | | | | |
Class N | | $ | 1,000.00 | | | $ | 1,019.70 | | | | 1.07 | % | | $ | 5.42 | |
Servicing Class | | | 1,000.00 | | | | 1,020.96 | | | | 0.82 | % | | | 4.15 | |
| |
City National Rochdale Intermediate Fixed Income Fund |
Actual Fund Return | | | | | | | | | | | | | | | | |
Institutional Class | | $ | 1,000.00 | | | $ | 1,010.20 | | | | 0.50 | % | | $ | 2.52 | |
Class N | | | 1,000.00 | | | | 1,007.60 | | | | 1.01 | % | | | 5.08 | |
| | | | | | | | | | | | | | | | | |
Hypothetical 5% Return | | | | | | | | | | | | | | | | |
Institutional Class | | $ | 1,000.00 | | | $ | 1,022.56 | | | | 0.50 | % | | $ | 2.54 | |
Class N | | | 1,000.00 | | | | 1,020.00 | | | | 1.01 | % | | | 5.11 | |
| | | | | | | | | | | | | | | | | |
City National Rochdale Fixed Income Opportunities Fund |
Actual Fund Return | | | | | | | | | | | | | | | | |
Class N | | $ | 1,000.00 | | | $ | 1,030.00 | | | | 1.08 | % | | $ | 5.50 | |
| | | | | | | | | | | | | | | | | |
Hypothetical 5% Return | | | | | | | | | | | | | | | | |
Class N | | $ | 1,000.00 | | | $ | 1,019.65 | | | | 1.08 | % | | $ | 5.47 | |
| | | | | | | | | | | | | | | | | |
City National Rochdale Short Term Emerging Markets Debt Fund |
Actual Fund Return | | | | | | | | | | | | | | | | |
Class Y | | $ | 1,000.00 | | | $ | 1,052.50 | | | | 0.92 | % | | $ | 4.73 | |
| | | | | | | | | | | | | | | | | |
Hypothetical 5% Return | | | | | | | | | | | | | | | | |
Class Y | | $ | 1,000.00 | | | $ | 1,020.46 | | | | 0.92 | % | | $ | 4.66 | |
| | | | | | | | | | | | | | | | | |
City National Rochdale Dividend & Income Fund |
Actual Fund Return | | | | | | | | | | | | | | | | |
Class N | | $ | 1,000.00 | | | $ | 1,038.30 | | | | 1.15 | % | | $ | 5.88 | |
| | | | | | | | | | | | | | | | | |
Hypothetical 5% Return | | | | | | | | | | | | | | | | |
Class N | | $ | 1,000.00 | | | $ | 1,019.30 | | | | 1.15 | % | | $ | 5.82 | |
| | | | | | | | | | | | | | | | | |
City National Rochdale U.S. Core Equity Fund |
Actual Fund Return | | | | | | | | | | | | | | | | |
Institutional Class | | $ | 1,000.00 | | | $ | 1,114.40 | | | | 0.50 | % | | $ | 2.65 | |
Class N | | | 1,000.00 | | | | 1,117.50 | | | | 1.01 | % | | | 5.36 | |
Servicing Class | | | 1,000.00 | | | | 1,118.90 | | | | 0.76 | % | | | 4.04 | |
| | | | | | | | | | | | | | | | | |
Hypothetical 5% Return | | | | | | | | | | | | | | | | |
Institutional Class | | $ | 1,000.00 | | | $ | 1,022.56 | | | | 0.50 | % | | $ | 2.54 | |
Class N | | | 1,000.00 | | | | 1,020.00 | | | | 1.01 | % | | | 5.11 | |
Servicing Class | | | 1,000.00 | | | | 1,021.26 | | | | 0.76 | % | | | 3.85 | |
* | Expenses are equal to the Fund’s annualized expense ratio multiplied by the average account value over the period, multiplied by 183/365 (to reflect the one-half year period). |
CITY NATIONAL ROCHDALE FUNDS | PAGE 183
board approval of advisory and sub-advisory agreements (Unaudited) |
|
The Board of Trustees of City National Rochdale Funds (the “Trust”) is comprised of six Trustees, five of whom are Independent Trustees (i.e., not “interested persons” of the Trust as defined in the Investment Company Act of 1940, as amended). At meetings held on April 1, 2021, and May 13, 2021, the Board and the Independent Trustees considered, and at the May 13, 2021, meeting, the Board and the Independent Trustees approved, the renewal of the following advisory and sub-advisory agreements:
| | ● | The advisory agreement between City National Rochdale, LLC (the “Adviser”) and the Trust, on behalf of the City National Rochdale Government Money Market Fund (the “Government Money Market Fund”), City National Rochdale Government Bond Fund (the “Government Bond Fund”), City National Rochdale Corporate Bond Fund (the “Corporate Bond Fund”), City National Rochdale California Tax Exempt Bond Fund (the “California Tax Exempt Bond Fund”), City National Rochdale Municipal High Income Fund (the “Municipal High Income Fund”), City National Rochdale Intermediate Fixed Income Fund (the “Intermediate Fixed Income Fund”), City National Rochdale Fixed Income Opportunities Fund (the “Fixed Income Opportunities Fund”), City National Rochdale Short Term Emerging Markets Debt Fund (the “Short Term EM Debt Fund”), City National Rochdale Dividend & Income Fund (which changed its name to City National Rochdale Equity Income Fund effective October 1, 2021) (the “Dividend & Income Fund”), and City National Rochdale U.S. Core Equity Fund (the “U.S. Core Equity Fund”) (each a “Fund” and collectively, the “Funds”); |
| | ● | The advisory agreement between the Adviser and City National Rochdale Fixed Income Opportunities (Ireland) Limited (the “Irish Subsidiary”), a wholly-owned subsidiary of the Fixed Income Opportunities Fund; |
| | ● | The sub-advisory agreement between the Adviser and Alcentra Limited (“Alcentra”), with respect to the Fixed Income Opportunities Fund; |
| | ● | The sub-advisory agreement among the Adviser, Alcentra and Alcentra NY, LLC (“Alcentra NY”), with respect to the Fixed Income Opportunities Fund; |
| | ● | The sub-advisory agreement between the Adviser and AllFinancial Partners II, LLC (“AllFinancial”), with respect to the Fixed Income Opportunities Fund; |
| | ● | The sub-advisory agreement between the Adviser and Ashmore Investment Management Limited (“Ashmore”), with respect to the Fixed Income Opportunities Fund; |
| | ● | The sub-advisory agreement between the Adviser and Federated Investment Management Company (“Federated”), with respect to the Fixed Income Opportunities Fund; |
| | ● | The sub-advisory agreements between the Adviser and GML Capital LLP (“GML”), with respect to the Fixed Income Opportunities Fund and the Short Term EM Debt Fund; and |
| | ● | The sub-advisory agreement between the Adviser and Seix Investment Advisors LLC (“Seix”), with respect to the Fixed Income Opportunities Fund. |
The advisory and sub-advisory agreements listed above are collectively referred to below as the “Agreements.” Alcentra, Alcentra NY, AllFinancial, Ashmore, Federated, GML, and Seix are collectively referred to below as the “Sub-Advisers.”
The Board acknowledged that in accordance with exemptive relief granted by the U.S. Securities and Exchange Commission, due to unforeseen emergency circumstances related to the COVID-19 pandemic, the May 13, 2021, meeting was held by videoconference, and that as required by the relief, the Board would ratify the renewal of the Agreements at its next in-person meeting.
General Information
The following information summarizes the Board’s considerations associated with its review of the Agreements. In connection with their deliberations, the Board considered such information and factors as they believed, in light of the legal advice furnished to them and their own business judgment, to be relevant. The Agreements were considered separately for each Fund and the Irish Subsidiary, although the Board took into account the common interests of the Funds and the Irish Subsidiary in its review. As described below, the Board considered the nature, quality and extent of the various services performed by the Adviser and each Sub-Adviser. In considering these matters, the Independent Trustees discussed the renewal of the Agreements with management and in private sessions with their independent counsel at which no representatives of the Adviser or the Sub-Advisers were present.
The Board reviewed extensive materials regarding investment results of the Adviser and each Sub-Adviser with respect to the Funds (or portions of the Funds) and the Irish Subsidiary they manage, advisory fee and expense comparisons, financial
CITY NATIONAL ROCHDALE FUNDS | PAGE 184
information with respect to the Adviser and each Sub-Adviser, descriptions of various functions such as compliance monitoring and portfolio trading practices, and information about the personnel providing various services to the Funds and the Irish Subsidiary. The Board also took into account information they received at past meetings of the Board and its committees with respect to these matters.
In deciding to renew the Agreements, the Board and the Independent Trustees did not identify a single factor as controlling and this summary does not describe all of the matters considered. In addition, each Board member did not necessarily attribute the same weight to each matter. However, the Board and the Independent Trustees concluded that each of the various factors referred to below favored such renewal.
CITY NATIONAL ROCHDALE, LLC
Nature, Extent and Quality of Services
In reviewing the services provided by the Adviser to the Funds and the Irish Subsidiary, the Board considered a variety of matters, including the overall quality and depth of the Adviser’s organization, its overall financial strength and stability, its commitment to compliance with applicable laws and regulations and the systems in place to ensure compliance with those requirements, its portfolio trading and soft dollar practices, and its disaster recovery and contingency planning practices. The Board also considered the experience, capability and integrity of the Adviser’s senior management, the background, education and experience of the Adviser’s personnel, and its efforts to retain, attract and motivate capable personnel to serve the Funds and the Irish Subsidiary. With respect to Funds that are sub-advised, the Board considered the process the Adviser utilizes to select the Sub-Advisers and proactively oversee the Sub-Advisers with respect to various investment, valuation and compliance matters. The Board found all of these matters to be satisfactory.
Investment Performance
The Board assessed the performance of each Fund compared with the returns of its respective benchmark index or indexes and the averages of the funds included in its respective fund universe selected by Lipper, Inc. (each, a “Lipper Universe”), for the one-, three-, five-, ten- and 15-year and since inception periods ended December 31, 2020, as applicable. In addition, the Board reviewed the performance of each Fund compared to the average returns of certain peer group funds in the Fund’s Lipper Universe selected by the Funds’ administrator based on the Fund’s total net assets, for the same periods. With respect to the performance results of the Funds, the Trustees noted that the meeting materials indicated as follows:
| | ● | The Government Money Market Fund (Servicing Class) underperformed the average returns of the funds in the Lipper Institutional U.S. Government Money Market Objective Universe (by 0.17% or less) for the one-, three-, five-, ten- and 15-year and since inception periods. The Trustees noted the Adviser’s explanation that following the Federal Reserve’s lowering of the target range of the Federal Funds Rate to near zero in March 2020, the Fund’s net yield experienced a significant decline shortly thereafter. The Trustees also considered the Adviser’s explanation that the Fund has employed U.S. agency floating rate notes and increased the Fund’s weighted average maturity since that time, which has enhanced the Fund’s gross yield. |
| | ● | The Government Bond Fund (Servicing Class) underperformed the Lipper Short/Intermediate U.S. Government Objective Universe average returns (by 0.39% or less) and the Bloomberg U.S. 1-5 Year Government Bond Index returns (by 0.74% or less) for the one-, three-, five-, ten- and 15-year and since inception periods. The Trustees considered the Adviser’s assertion that the Fund produced solid returns as compared to its peers, and that the Fund trailed the average return of its Lipper Universe by only two basis points in 2020. The Trustees also considered the Adviser’s explanation that the Fund’s underperformance against its benchmark was due to the difference in yield, and that the Adviser took steps to augment the portfolio yield during 2020 by incorporating U.S. agency and U.S. municipal securities into the Fund’s portfolio. |
| | ● | The Corporate Bond Fund (Servicing Class) underperformed the average returns of the Lipper Short/Intermediate Investment-Grade Objective Universe for the one-, three-, five-, and ten-year periods (by 0.33% or less), and its performance was generally in line with the Lipper Universe average returns for the 15-year and since inception periods. The Fund trailed the Bloomberg U.S. Corp 1-5 A3+, 2% Issuer Constrained Index returns (by 0.65% or less) for the one-, three-, five-, ten- and 15-year and since inception periods. The Trustees considered the Adviser’s explanation that the Fund’s recent underperformance relative to the Bloomberg U.S. Corp 1-5 A3+, 2% Issuer Constrained Index was primarily attributable to the Fund’s structural mismatch to the Index, and that the Index maintains 42% of its exposure to the banking industry as compared to the Fund, which is capped at 25% exposure |
CITY NATIONAL ROCHDALE FUNDS | PAGE 185
board approval of advisory and sub-advisory agreements (Unaudited) (Continued) |
|
to the banking industry. The Trustees noted the Adviser’s observation that the banking industry was a top performer for the Index during 2020, and that the Fund was negatively impacted by its limited exposure to the banking industry relative to the Index. The Trustees also considered the Adviser’s belief that the Fund’s move to a neutral-to-benchmark positioning in order to take advantage of rising interest rates, lower credit spreads, and rich asset prices would allow the Fund to take advantage of any near- to intermediate-term volatility.
| | ● | The California Tax Exempt Bond Fund (Servicing Class) consistently outperformed the average returns of the funds in the Lipper CA Short/Intermediate Municipal Debt Objective Universe for the one-, three-, five-, ten-, and 15-year and since inception periods, but underperformed the Bloomberg CA Intermediate-Short Municipal Index returns (by 0.98% or less) during the same periods. The Trustees noted the Adviser’s explanation that the Fund’s underperformance relative to the Bloomberg CA Intermediate-Short Municipal Index was largely a result of the post-financial crisis low yield environment, which severely constrained the Fund’s opportunities for returns above its expense ratio. The Trustees also considered the Adviser’s assertion that the Fund was positioned defensively at the start of the pandemic in 2020 in response to late-cycle factors and was able to take advantage of the volatility leading up to, and in the weeks following, the Federal Reserve’s emergency response in late March. |
| | ● | The Municipal High Income Fund (Servicing Class) underperformed the average returns of the funds in the Lipper High Yield Municipal Classification Universe (by 0.66% or less), and the S&P Municipal Yield Index returns (by 2.81% or less) for the one-, three-, and five-year and since inception periods. The Trustees considered the Adviser’s explanation that the underperformance for the one-year period was due to the Fund’s relatively cautious investments in bonds on the higher quality end of the high yield municipal bond sector as credit spreads and credit quality remained unattractive, as well as the Fund’s somewhat shorter duration relative to the S&P 500 Municipal Yield Index during the year. The Trustees also considered the Adviser’s belief that although credit spreads remained tight, the forecasted economic recovery in 2021 should allow the Fund to be positioned more aggressively than in 2020, and should permit an improvement in performance while allowing the Fund to maintain its income focus. |
| | ● | The Short Term EM Debt Fund (Class Y) underperformed the ICE BofAML 0-1 Year Emerging Markets Corp Plus Index returns (by 3.39% or less) and the average returns of the funds in the Lipper Emerging Markets Hard Currency Debt Classification Universe (by 4.89% or less) for the one-year and since inception periods. The Trustees considered the Adviser’s observation that the Fund outperformed the ICE BofAML 0-1 Year Emerging Markets Corporate Plus Index since the market low in March 2020, and the Adviser’s explanation that the recent outperformance was largely due to the Fund’s focus on higher yielding below investment grade debt, which generated a significant return over higher rated issuances. The Trustees also noted the Adviser’s assertion that the Fund performed in line with expectations as of the end of 2020, despite the severe volatility caused by the COVID-19 pandemic, and that the Fund is positioned to experience strong returns as it winds down. |
| | ● | The Intermediate Fixed Income Fund (Institutional Class) outperformed the Bloomberg Intermediate U.S. Government/Credit Bond Index returns for the one-, three-, five- and ten-year periods, but underperformed the Index returns (by 0.21% or less) for the fifteen-year and since inception periods. The Fund underperformed the average returns of the funds in the Lipper Core Bond Funds Classification Universe (by 0.76% or less) for the one-, three-, five-, ten- and 15-year and since inception periods. The Trustees considered the Adviser’s belief that the Fund will be able to take advantage of near- to intermediate-term volatility by tactically moving the Fund toward a neutral-to-benchmark positioning as interest rates move higher and credit spreads become lower. |
| | ● | The Fixed Income Opportunities Fund (Class N) outperformed the Bloomberg U.S. Aggregate Bond Index returns for the five- and ten-year and since inception periods, but underperformed the Index returns (by 4.97% or less) for the one- and three-year periods. The Fund underperformed the Lipper Global High Yield Funds Classification Universe average returns (by 2.13% or less) and the Blended Index (a hybrid index composed of 40% Bloomberg Multiverse Total Return Index Value Hedged USD, 35% S&P Global Leveraged Loan Index, and 25% Bloomberg Emerging Markets High Yield Index) returns (by 2.99% or less) for the one-, three-, five-, and ten-year and since inception periods. The Trustees noted the Adviser’s explanation that the Fund’s underperformance for the one-year period relative to the Bloomberg U.S. Aggregate Bond Index was largely due to the sudden drop in interest rates, |
CITY NATIONAL ROCHDALE FUNDS | PAGE 186
the broader economic shock brought on by the COVID-19 pandemic, and the challenges in global and emerging markets. The Trustees also considered the Adviser’s report that the Fund ended the year with a positive return of 2.5%, and that the Fund’s outperformance since March 2020 has meaningfully improved its long-term performance.
| | ● | The Dividend & Income Fund (Class N) underperformed the Blended Index (a customized index composed of 60% Dow Jones U.S. Select Dividend Index, 25% Bank of America ML Core Fixed Rate Preferred Securities Index and 15% MSCI U.S. REIT Index) returns (by 5.45% or less), the Lipper Equity Income Funds Classification Universe average returns (by 11.76% or less), and the S&P 500 Index returns (by 25.73% or less) for the one, three-, five-, ten- and 15-year and since inception periods. The Trustees considered the Adviser’s explanation that the Fund’s underperformance for the one-year period was due to stock selection and the Adviser’s defensive capital preservation efforts. The Trustees also considered the Adviser’s discussion of the impact of certain lower quality, more speculative positions that detracted from the Fund’s performance, ongoing changes to stock selection and sector tilts, and the Adviser’s commitment to continued analysis and monitoring of the Fund’s positions. The Trustees also considered the Adviser’s observation that the Fund has met or exceeded its targeted total return of 6-10% for the ten- and 15-year periods. |
| | ● | The U.S. Core Equity Fund (Institutional Class) outperformed the average returns of the funds in the Lipper Large Cap Core Funds Classification Universe for the three- and five-year and since inception periods, and the returns of the S&P 500 Index for the three-year and since inception periods. The Fund underperformed the Lipper Universe average return (by 1.84%) for the one-year period, and the S&P 500 Index returns (by 3.56% or less) for the one- and five-year periods. The Trustees considered the Adviser’s explanation that the Fund’s underperformance for the one-year period was largely due to the Fund’s increased cash position in response to the COVID-19 pandemic. The Trustees also observed that the Fund outperformed the average return of the Lipper Large Cap Core Funds Classification Universe and the return of the S&P 500 Index for the since inception period. |
The Board concluded that the Adviser continued to provide high quality management and oversight services to the Funds and the Irish Subsidiary. The Board noted that the investment results of the Funds over the long term were generally competitive; that the Adviser had given reasonable explanations for the performance of those Funds that had underperformed relative to their benchmarks and had explained the impact of market conditions on the performance of the Funds; that the Adviser had taken actions in response to the COVID-19 pandemic; that the results for the Government Money Market Fund compared to its peer group were acceptable given the special services and investment focuses of the Fund; and that consideration of returns of market indexes needed to take into account that indexes do not reflect the expenses of operating mutual funds.
Advisory Fees and Fund Expenses
The Board then reviewed information regarding the advisory fees (both before and after waivers) charged by the Adviser to each Fund, and the total expenses (net of fee waivers) for the last fiscal year of a share class of each Fund (as percentages of their respective average annual net assets), as applicable (“Total Expense Ratios”), compared to those of the funds included in its respective Lipper Universe and peer group selected by the Trust’s administrator (each, a “Peer Group”), as applicable.
The Board observed that the meeting materials indicated as follows with respect to the Funds’ investment advisory fees (gross of fee waivers):
| | ● | The gross advisory fees paid by the Government Money Market Fund, Government Bond Fund, California Tax Exempt Bond Fund, Intermediate Fixed Income Fund, Fixed Income Opportunities Fund, Short Term EM Debt Fund, Dividend & Income Fund, and U.S. Core Equity Fund were below their respective Peer Group and Lipper Universe averages. |
| | ● | The gross advisory fees paid by the Corporate Bond Fund and Municipal High Income Fund were below their respective Lipper Universe averages, but above their respective Peer Group averages. |
The Board noted that with the exception of the strategies listed below, the Adviser does not manage investment portfolios for other registered investment companies, pension funds, or institutional accounts that have similar investment objectives and policies as the Funds, so it did not have a basis to compare certain Funds’ advisory fees with advisory fees charged by the Adviser to other comparable client accounts. The Board also noted that the Adviser manages discretionary client account assets in the Core Equity, High Dividend, and California Tax Exempt strategies in accordance with investment policies similar to those of the U.S. Core Equity Fund, Dividend & Income Fund, and California Tax Exempt Bond Fund, respectively. The
CITY NATIONAL ROCHDALE FUNDS | PAGE 187
board approval of advisory and sub-advisory agreements (Unaudited) (Continued) |
|
Trustees reviewed the Adviser’s fee schedules and concluded that the advisory fees charged to the U.S. Core Equity Fund, Dividend & Income Fund, and California Tax Exempt Bond Fund were generally in the range of, and in some instances lower than, the fees that the Adviser charged to manage client accounts using similar strategies as those used by those Funds. The Trustees considered the Adviser’s explanation that the fees published in its fee schedules are applicable to each client’s entire account, regardless of the strategies used to manage the assets in the account, and that such fees are subject to negotiation. The Trustees also noted that management of mutual fund assets requires compliance with certain requirements under the 1940 Act that do not apply to separate accounts that the Adviser manages. The Trustees also considered that except with respect to the Municipal High Income Fund, any net advisory fees retained by the Adviser with respect to the Funds, after the payment of any sub-advisory fees, are rebated to shareholders investing in the Funds through separate accounts managed by the Adviser, and that with respect to the Municipal High Income Fund, the Adviser rebates half of the Adviser’s net advisory fee to shareholders investing in the Fund through separate accounts managed by the Adviser.
The Board observed that the meeting materials indicated as follows with respect to the Total Expense Ratios of each Fund (net of fee waivers):
| | ● | The Total Expense Ratios of the Institutional Class of the Intermediate Fixed Income Fund and U.S. Core Equity Fund, and the Servicing Class of the Government Bond Fund and U.S. Core Equity Fund were below both their respective Peer Group and Lipper Universe averages. |
| | ● | The Total Expense Ratios of the Servicing Class of the Government Money Market Fund and Municipal High Income Fund were below their respective Lipper Universe averages, but above their respective Peer Group averages. |
| | ● | The Total Expense Ratios of Class N of the Government Bond Fund, Fixed Income Opportunities Fund, Dividend & Income Fund, and U.S. Core Equity Fund; the Servicing Class of the California Tax Exempt Bond Fund; and Class Y of the Short Term EM Debt Fund were below their respective Peer Group averages, but above their respective Lipper Universe averages. |
| | ● | The Total Expense Ratios of Class N of the Government Money Market Fund, Corporate Bond Fund, California Tax Exempt Bond Fund, Municipal High Income Fund, and Intermediate Fixed Income Fund; and the Servicing Class of the Corporate Bond Fund were above both their respective Peer Group and Lipper Universe averages. |
The Board concluded that the advisory fees charged by the Adviser were fair and reasonable in relation to the value of services provided, and the total expenses of each Fund continued to be reasonable in light of the services provided, noting the different expense structure and arrangements for shareholder services and distribution of the various classes of the Funds.
Profitability, Benefits to the Adviser and Economies of Scale
The Board next considered information prepared by the Adviser relating to its costs and profits with respect to the Funds for the year ended December 31, 2020. The Board also considered the benefits received by the Adviser and its affiliates as a result of the Adviser’s relationship with the Funds (other than the investment advisory fees paid to the Adviser), including fees paid to the Adviser, City National Bank (“CNB”), City National Securities, Inc., and CNR Securities, LLC for providing certain shareholder servicing and/or sub-distribution services to the Funds and/or their shareholders; benefits to CNB’s brokerage and wealth management business as a result of the availability of the Funds to its customers; and any research received from broker-dealers that execute transactions on behalf of the Funds. The Trustees recognized the competitiveness of the registered fund industry and the importance of an investment adviser’s long-term profitability, including for maintaining management stability and accountability. The Board recognized the difficulty in evaluating an investment adviser’s profitability with respect to the funds it manages in the context of an adviser with multiple lines of business, and noted that other profitability methodologies might also be reasonable. The Board observed that the Adviser had not realized a profit with respect to the Government Bond Fund and California Tax Exempt Bond Fund, and concluded that the profit of the Adviser from its relationship with the remaining Funds was reasonable.
The Board also considered potential economies of scale realized by the Adviser as the Funds grow and how any such economies are shared with the Funds, reviewing information prepared by the Adviser relating to the Trust’s assets, as well as the assets of each Fund. The Board considered the Adviser’s explanation that it shares any economies of scale achieved with Fund shareholders through means other than breakpoints, such as expense caps and fee waivers, and the investments that the Adviser made in its business over the past year, including devoting resources to innovation. Based on this explanation, the Board concluded that although there were no advisory fee breakpoints, the existing
CITY NATIONAL ROCHDALE FUNDS | PAGE 188
fee structure of each Fund reflected an appropriate sharing of any efficiencies or economies of scale to date and noted that it will have the opportunity to periodically reexamine the appropriateness of the advisory fees payable to the Adviser in light of any economies of scale experienced in the future.
Conclusion
The Board and the Independent Trustees concluded that, based on the various factors they had reviewed, the compensation payable to the Adviser under the advisory agreements was fair and reasonable in light of the nature and quality of the services the Adviser provided to the Funds and the Irish Subsidiary, and that renewal of the advisory agreements would be in the best interests of each Fund, the Irish Subsidiary, and their respective shareholders.
SUB-ADVISERS
Nature, Extent and Quality of Services
In reviewing the services provided by each Sub-Adviser, the Board considered a variety of matters, including the overall quality and depth of each Sub-Adviser’s organization and its overall financial strength and stability. The Board also considered, among other things, the investment operations and staff of each Sub-Adviser, its commitment to compliance with applicable laws and regulations and the Trust’s compliance policies and procedures, its portfolio trading and soft dollar practices, and its disaster recovery and contingency planning practices. In addition, the Board considered the background, education and experience of each Sub-Adviser’s key portfolio management and operational personnel, and each Sub-Adviser’s efforts to retain, attract and motivate capable personnel to serve the Fund(s) to which it provides services. The Board found all of these matters to be satisfactory.
Investment Performance
The Board reviewed information provided in the meeting materials setting forth the performance of the portion of the Fixed Income Opportunities Fund sub-advised by each Sub-Adviser compared with applicable benchmarks for various periods ended December 31, 2020. The Board made the following additional observations in reviewing the performance of the following Sub-Advisers of the Fixed Income Opportunities Fund:
| | ● | The annualized returns for the portion of the Fund managed by Federated were above the returns of the Bloomberg U.S. Corporate High Yield Index for the one- and three-year periods, but slightly below the return of the Index (by 0.04%) for the five-year period. |
| | ● | The annualized returns for the portion of the Fund managed by Seix were below the returns of the Credit Suisse Institutional Loan Index (by 0.73% or less) for the one-, three-, and five-year periods. |
| | ● | The annualized returns for the portion of the Fund managed by Alcentra (for European leveraged loans) were above the returns of the Credit Suisse Institutional Western Europe Leveraged Loan Index for the one-, three-, and five-year periods. The annualized returns for the portion of the Fund managed by Alcentra (for U.S./European structured credit) were below the returns of the Palmer Square CLO Debt Index (by 1.01% or less) for the one- and three-year periods. |
| | ● | The annualized returns for a portion of the Fund managed by GML were below the returns of the JP Morgan CEMBI Diversified High Yield Index (by 17.48% or less) for the one-, three-, and five-year periods. The total return for the short-term emerging markets portion of the Fund managed by GML was above the ICE BofAML 0-1 Year Emerging Markets Plus Index returns for the one- and three-year periods. |
| | ● | The annualized returns for the portion of the Fund managed by Ashmore were above the return of the 60% JP Morgan CEMBI BD/40% JPM EMBI Index for the five-year period, but below the returns of the Index (by 0.44% or less) for the one- and three-year periods. |
The Board also considered and reviewed information related to the services AllFinancial provides in respect of life settlement policies held by the Fixed Income Opportunities Fund.
The Board noted that because GML sub-advises the entire Short Term EM Debt Fund, the performance of GML had already been reviewed and discussed as part of the review of the performance of the Short Term EM Debt Fund generally.
The Board noted that, while not all of the Sub-Advisers outperformed their respective benchmarks for the periods under evaluation, in each case the Adviser reviewed the Sub-Adviser’s performance relative to current market conditions and with an understanding of the Sub-Adviser’s style and philosophy. The Board considered the investment results of the Fixed Income Opportunities Fund to be generally competitive, and determined that each of Alcentra, Alcentra NY, AllFinancial, Ashmore, Federated, GML, and Seix continued to provide high quality sub-advisory services to the Fixed Income Opportunities Fund.
CITY NATIONAL ROCHDALE FUNDS | PAGE 189
board approval of advisory and sub-advisory agreements (Unaudited) (Continued) |
|
Sub-Advisory Fees and Fund Expenses
The Board reviewed information included in the meeting materials regarding the sub-advisory fees charged by each Sub-Adviser, and observed that the fees charged by each Sub-Adviser to the Short Term EM Debt Fund and the Fixed Income Opportunities Fund were generally equal to or lower than the fees it charged to its other advisory or sub-advisory clients, as applicable, to manage comparable mutual funds, private funds, and separate accounts. The Board noted that although certain Sub-Advisers charged lower fees to other mutual funds advised by the Sub-Advisers, those funds were significantly larger than the relevant Fund. The Trustees noted that the Adviser pays all sub-advisory fees out of its advisory fees. The Board also noted that the Adviser evaluates each Sub-Adviser’s fees relative to those of its respective asset class peer groups in an effort to ensure that they are reasonable and appropriate in light of the services provided. In addition, the Board considered the different advisory and sub-advisory fee splits of the sub-advised Funds, and noted the Adviser’s beliefs that the fees paid to the Sub-Advisers are priced at competitive levels, and that the overall advisory fees, gross advisory fees and sub-advisory fees are fair and reasonable in light of the services provided to the Funds by the Adviser and the Sub-Advisers, as applicable.
Benefits to Sub-Advisers and Economies of Scale
The Board also considered the benefits received by each Sub-Adviser and its affiliates as a result of its relationship with the Fund(s) to which it provides services (other than the sub-advisory fee paid to the Sub-Adviser), including any research services provided by broker-dealers providing execution services to the Fund(s), the intangible benefits of the Sub-Adviser’s association with the Fund(s) generally and any favorable publicity arising in connection with the Funds’ performance. The Board also considered that the current asset levels of the Funds were not likely to lead to significant economies of scale.
Conclusion
Based on their review, including their consideration of each of the factors referred to above, the Board and the Independent Trustees concluded that the compensation payable to each Sub-Adviser pursuant to its respective sub-advisory agreement was fair and reasonable in light of the nature and quality of the services provided by each Sub-Adviser to the Fund(s) to which it provides services, and that it would be in the best interests of the Fund(s) and its shareholders to renew the sub-advisory agreements with each of Alcentra, Alcentra NY, AllFinancial, Ashmore, Federated, GML, and Seix.
CITY NATIONAL ROCHDALE FUNDS | PAGE 190
liquidity risk management program (Unaudited) |
|
The Securities and Exchange Commission adopted Rule 22e-4 under the Investment Company Act of 1940, as amended (the “Liquidity Rule”), which requires open-end investment companies to adopt a written liquidity risk management program that is reasonably designed to assess and manage a fund’s liquidity risk. A fund’s “liquidity risk” is the risk that the fund could not meet requests to redeem shares issued by the fund without significant dilution of the remaining investors’ interests in the fund.
The series of City National Rochdale Funds (the “Trust”), excluding the City National Rochdale Government Money Market Fund (for purposes of this section only, the “Funds”), have adopted and implemented a liquidity risk management program pursuant to the Liquidity Rule (the “Program”). The Board of Trustees of the Trust (the “Board”) has appointed City National Rochdale, LLC, the Funds’ investment adviser (“City National Rochdale”), as the Program administrator for the Funds. City National Rochdale established a Liquidity Risk Management Committee to manage the Program for the Funds. The Committee’s responsibilities include oversight of the liquidity risk management process, reporting to the Board, and reviewing the Program’s effectiveness. As part of its responsibilities as the Program administrator, City National Rochdale has retained a third party to perform certain functions, including providing market data and liquidity classifications for the Funds’ investments.
At a Board meeting held on May 13, 2021, City National Rochdale provided a written report (the “Report”) to the Board addressing the operation, adequacy, and effectiveness of the Program, including any material changes to the Program, for the period from April 1, 2020, through March 31, 2021 (the “Reporting Period”). The Report concluded that the Program was adequately implemented and operated effectively during the Reporting Period. There were no material changes to the Program during the Reporting Period.
There can be no assurance that the Program will achieve its objectives in the future. Please refer to your Fund’s prospectus and statement of additional information for more information regarding the Fund’s exposure to liquidity risk, and the other principal risks to which an investment in the Fund may be subject.
CITY NATIONAL ROCHDALE FUNDS | PAGE 191
This page intentionally left blank.
CITY NATIONAL ROCHDALE FUNDS | PAGE 192


CNR-AR-001-2000
Item 2. Code of Ethics.
The registrant has adopted a code of ethics that applies to the registrant’s principal executive officer, principal financial officer and principal accounting officer.
Item 3. Audit Committee Financial Expert.
(a)(1) The registrant’s board of trustees has determined that the registrant has at least one audit committee financial expert serving on the audit committee.
(a)(2) The audit committee financial expert is James R. Wolford. Mr. Wolford is independent as defined in Form N-CSR Item 3(a)(2).
Item 4. Principal Accountant Fees and Services.
Fees billed by BBD LLP Related to the Trust
BBD LLP billed the Trust aggregate fees for services rendered to the Trust for the last two fiscal years as follows:
| | 2021 | 2020 |
| | | All fees and services to the Trust that were pre-approved | All fees and services to service affiliates that were pre-approved | All other fees and services to service affiliates that did not require pre-approval | All fees and services to the Trust that were pre-approved | All fees and services to service affiliates that were pre-approved | All other fees and services to service affiliates that did not require pre-approval |
| (a) | Audit Fees(1) | $213,500 | N/A | N/A | $213,500 | N/A | N/A |
| (b) | Audit-Related Fees | N/A | N/A | N/A | N/A | N/A | N/A |
| (c) | Tax Fees | N/A | N/A | N/A | N/A | N/A | N/A |
| (d) | All Other Fees | N/A | N/A | N/A | N/A | N/A | N/A |
Notes:
| (1) | Audit fees include amounts related to the audit of the registrant’s annual financial statements and services normally provided by the accountant in connection with statutory and regulatory filings. |
| (e)(2) | Percentage of fees billed applicable to non-audit services pursuant to waiver of pre-approval requirement were as follows: |
| | 2021 | 2020 |
Audit-Related Fees | N/A | N/A |
| Tax Fees | N/A | N/A |
All Other Fees | N/A | N/A |
| (g) | The aggregate non-audit fees and services billed by BBD LLP for the last two fiscal years were $0 and $0 for 2021 and 2020, respectively. |
Item 5. Audit Committee of Listed Registrants.
Not applicable to unlisted registrants.
Item 6. Schedule of Investments
Schedule of Investments is included as part of the Report to Shareholders filed under Item 1 of this form.
Item 7. Disclosure of Proxy Voting Policies and Procedures for Closed-End Management Investment Companies.
Not applicable to open-end management investment companies.
Item 8. Portfolio Managers of Closed-End Management Investment Companies
Not applicable to open-end management investment companies.
Item 9. Purchases of Equity Securities by Closed-End Management Company and Affiliated Purchasers.
Not applicable to open-end management investment companies.
Item 10. Submission of Matters to a Vote of Security Holders.
There have been no changes to the procedures by which shareholders may recommend nominees to the registrant’s Board of Trustees during the period covered by this report.
Item 11. Controls and Procedures.
(a) The Registrant’s principal executive and principal financial officers, or persons performing similar functions, have concluded that the Registrant’s disclosure controls and procedures (as defined in Rule 30a-3(c) under the Act (17 CFR 270.30a-3(c))) as of a date within 90 days of the filing date of the report, are effective based on the evaluation of these controls and procedures required by Rule 30a-3(b) under the Act (17 CFR 270.30a-3(b)) and Rules 13a-15(b) or 15d-15(b) under the Exchange Act (17 CFR 240.13a-15(b) or 240.15d-15(b)).
(b) There has been no change in the Registrant’s internal control over financial reporting (as defined in Rule 30a-3(d) under the Act (17 CFR 270.30a-3(d)) that occurred during the period covered by this report that has materially affected, or is reasonably likely to materially affect, the Registrant’s internal control over financial reporting.
Items 12. Exhibits.
(a)(1) Code of Ethics attached hereto.
(a)(2) A separate certification for the principal executive officer and the principal financial officer of the registrant as required by Rule 30a-2(a) under the Investment Company Act of 1940, as amended (17 CFR 270.30a-2(a)), are filed herewith.
(b) Officer certifications as required by Rule 30a-2(b) under the Investment Company Act of 1940, as amended (17 CFR 270.30a-2(b)) also accompany this filing as an Exhibit.
SIGNATURES
Pursuant to the requirements of the securities Exchange Act of 1934 and the Investment Company Act of 1940, the registrant has duly caused this report to be signed on its behalf by the undersigned, thereunto duly authorized.
| (Registrant) | City National Rochdale Funds | |
| | | |
| By (Signature and Title) | /s/ Thomas A. Galvin | |
| | Thomas A. Galvin, | |
| | President and Chief Executive Officer | |
Date: December 8, 2021
Pursuant to the requirements of the Securities Exchange Act of 1934 and the Investment Company Act of 1940, this report has been signed below by the following persons on behalf of the registrant and in the capacities and on the dates indicated.
| By (Signature and Title) | /s/ Thomas A. Galvin | |
| | Thomas A. Galvin, | |
| | President and Chief Executive Officer | |
| | | |
| Date: December 8, 2021 |
| | | |
| By (Signature and Title) | /s/ Andrew Metzger | |
| | Andrew Metzger, Treasurer (Principal Financial and | |
| | Accounting Officer and Controller) | |
| | | |
| Date: December 8, 2021 |