UNITED STATES
SECURITIES AND EXCHANGE COMMISSION
Washington, D.C. 20549
________
FORM N-CSR
________
CERTIFIED SHAREHOLDER REPORT OF REGISTERED MANAGEMENT
INVESTMENT COMPANIES
Investment Company Act file number 811-07923
City National Rochdale Funds
(Exact name of registrant as specified in charter)
400 Park Avenue
New York, New York 10022
(Address of principal executive offices) (Zip code)
Rochelle Levy
400 Park Avenue
New York, New York 10022
(Name and address of agent for service)
Registrant’s telephone number, including area code: 1-888-889-0799
Date of fiscal year end: September 30, 2024
Date of reporting period: September 30, 2024
Item 1. Reports to Stockholders.
(a) A copy of the report transmitted to stockholders pursuant to Rule 30e-1 under the Investment Company Act of 1940 (the “Act”), as amended (17 CFR § 270.30e-1) is attached hereto.
City National Rochdale Funds
City National Rochdale Government Money Market Fund
Annual Shareholder Report - September 30, 2024
This annual shareholder report contains important information about Class N Shares of the City National Rochdale Government Money Market Fund (the "Fund") for the period from October 1, 2023 to September 30, 2024. You can find additional information about the Fund at https://www.citynationalrochdalefunds.com/dashboard. You can also request this information by contacting us at 1-888-889-0799.
What were the Fund costs for the last year?
(based on a hypothetical $10,000 investment)
| Fund Name | Costs of a $10,000 investment | Costs paid as a percentage of a $10,000 investment |
|---|
| City National Rochdale Government Money Market Fund, Class N Shares | $65 | 0.63% |
Key Fund Statistics as of September 30, 2024
| Total Net Assets (000's) | Number of Holdings | Total Advisory Fees Paid (000's) | Portfolio Turnover Rate |
|---|
| $7,870,331 | 39 | $2,950 | 0% |
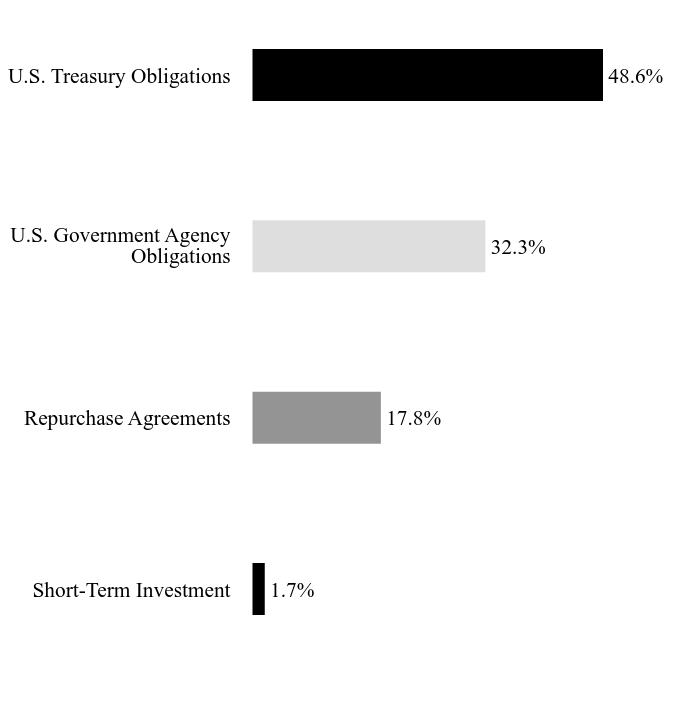
What did the Fund invest in?
Asset/Sector WeightingsFootnote Reference*
| Value | Value |
|---|
| Short-Term Investment | 1.7% |
| Repurchase Agreements | 17.8% |
| U.S. Government Agency Obligations | 32.3% |
| U.S. Treasury Obligations | 48.6% |
| Footnote | Description |
Footnote* | Percentages are calculated based on total net assets. |
| Holding Name | | | Percentage of Total Net AssetsFootnote Reference(A) |
|---|
| Goldman Sachs | | | 8.9% |
| United States Treasury Bill, 5.11%, 10/29/2024 | | | 5.1% |
| FHLB DN | | | 5.0% |
| FHLB DN | | | 4.4% |
| United States Treasury Bill, 4.71%, 11/19/2024 | | | 4.4% |
| FHLB DN | | | 4.1% |
| United States Treasury Bill, 5.31%, 10/3/2024 | | | 3.8% |
| United States Treasury Bill, 5.15%, 10/22/2024 | | | 3.8% |
| United States Treasury Bill, 4.98%, 11/5/2024 | | | 3.8% |
| FHLB DN | | | 3.8% |
| Footnote | Description |
Footnote(A) | Short-Term Investments are not shown in the top ten chart. |
There were no material changes during the reporting period.
Changes in and Disagreements with Accountants
There were no changes in or disagreements with accountants during the reporting period.
For additional information about the Fund, including its prospectus, financial information, holdings, and proxy voting information, call or visit:
Rule 30e-1 of the Investment Company Act of 1940 permits funds to transmit only one copy of a proxy statement, annual report or semi-annual report to shareholders (who need not be related) with the same residential, commercial or electronic address, provided that the shareholders have consented in writing and the reports are addressed either to each shareholder individually or to the shareholders as a group. This process is known as “householding” and is designed to reduce the duplicate copies of materials that shareholders receive and to lower printing and mailing costs for funds. Once implemented, if you would like to discontinue householding for your accounts, please call toll-free at 1-888-889-0799 to request individual copies of these documents. Once the Fund receives notice to stop householding, we will begin sending individual copies 30 days after receiving your request.
City National Rochdale Funds
City National Rochdale Government Money Market Fund / Class N Shares - CNGXX
Annual Shareholder Report - September 30, 2024
CNR-AR-TSR-2024-6
City National Rochdale Funds
City National Rochdale Government Money Market Fund
Annual Shareholder Report - September 30, 2024
This annual shareholder report contains important information about Class S Shares of the City National Rochdale Government Money Market Fund (the "Fund") for the period from October 1, 2023 to September 30, 2024. You can find additional information about the Fund at https://www.citynationalrochdalefunds.com/dashboard. You can also request this information by contacting us at 1-888-889-0799.
What were the Fund costs for the last year?
(based on a hypothetical $10,000 investment)
| Fund Name | Costs of a $10,000 investment | Costs paid as a percentage of a $10,000 investment |
|---|
| City National Rochdale Government Money Market Fund, Class S Shares | $81 | 0.79% |
Key Fund Statistics as of September 30, 2024
| Total Net Assets (000's) | Number of Holdings | Total Advisory Fees Paid (000's) | Portfolio Turnover Rate |
|---|
| $7,870,331 | 39 | $2,950 | 0% |
What did the Fund invest in?
Asset/Sector WeightingsFootnote Reference*
| Value | Value |
|---|
| Short-Term Investment | 1.7% |
| Repurchase Agreements | 17.8% |
| U.S. Government Agency Obligations | 32.3% |
| U.S. Treasury Obligations | 48.6% |
| Footnote | Description |
Footnote* | Percentages are calculated based on total net assets. |
| Holding Name | | | Percentage of Total Net AssetsFootnote Reference(A) |
|---|
| Goldman Sachs | | | 8.9% |
| United States Treasury Bill, 5.11%, 10/29/2024 | | | 5.1% |
| FHLB DN | | | 5.0% |
| FHLB DN | | | 4.4% |
| United States Treasury Bill, 4.71%, 11/19/2024 | | | 4.4% |
| FHLB DN | | | 4.1% |
| United States Treasury Bill, 5.31%, 10/3/2024 | | | 3.8% |
| United States Treasury Bill, 5.15%, 10/22/2024 | | | 3.8% |
| United States Treasury Bill, 4.98%, 11/5/2024 | | | 3.8% |
| FHLB DN | | | 3.8% |
| Footnote | Description |
Footnote(A) | Short-Term Investments are not shown in the top ten chart. |
There were no material changes during the reporting period.
Changes in and Disagreements with Accountants
There were no changes in or disagreements with accountants during the reporting period.
For additional information about the Fund, including its prospectus, financial information, holdings, and proxy voting information, call or visit:
Rule 30e-1 of the Investment Company Act of 1940 permits funds to transmit only one copy of a proxy statement, annual report or semi-annual report to shareholders (who need not be related) with the same residential, commercial or electronic address, provided that the shareholders have consented in writing and the reports are addressed either to each shareholder individually or to the shareholders as a group. This process is known as “householding” and is designed to reduce the duplicate copies of materials that shareholders receive and to lower printing and mailing costs for funds. Once implemented, if you would like to discontinue householding for your accounts, please call toll-free at 1-888-889-0799 to request individual copies of these documents. Once the Fund receives notice to stop householding, we will begin sending individual copies 30 days after receiving your request.
City National Rochdale Funds
City National Rochdale Government Money Market Fund / Class S Shares - CNFXX
Annual Shareholder Report - September 30, 2024
CNR-AR-TSR-2024-7
City National Rochdale Funds
City National Rochdale Government Money Market Fund
Servicing Class Shares - CNIXX
Annual Shareholder Report - September 30, 2024
This annual shareholder report contains important information about Servicing Class Shares of the City National Rochdale Government Money Market Fund (the "Fund") for the period from October 1, 2023 to September 30, 2024. You can find additional information about the Fund at https://www.citynationalrochdalefunds.com/dashboard. You can also request this information by contacting us at 1-888-889-0799.
What were the Fund costs for the last year?
(based on a hypothetical $10,000 investment)
| Fund Name | Costs of a $10,000 investment | Costs paid as a percentage of a $10,000 investment |
|---|
| City National Rochdale Government Money Market Fund, Servicing Class Shares | $35 | 0.34% |
Key Fund Statistics as of September 30, 2024
| Total Net Assets (000's) | Number of Holdings | Total Advisory Fees Paid (000's) | Portfolio Turnover Rate |
|---|
| $7,870,331 | 39 | $2,950 | 0% |
What did the Fund invest in?
Asset/Sector WeightingsFootnote Reference*
| Value | Value |
|---|
| Short-Term Investment | 1.7% |
| Repurchase Agreements | 17.8% |
| U.S. Government Agency Obligations | 32.3% |
| U.S. Treasury Obligations | 48.6% |
| Footnote | Description |
Footnote* | Percentages are calculated based on total net assets. |
| Holding Name | | | Percentage of Total Net AssetsFootnote Reference(A) |
|---|
| Goldman Sachs | | | 8.9% |
| United States Treasury Bill, 5.11%, 10/29/2024 | | | 5.1% |
| FHLB DN | | | 5.0% |
| FHLB DN | | | 4.4% |
| United States Treasury Bill, 4.71%, 11/19/2024 | | | 4.4% |
| FHLB DN | | | 4.1% |
| United States Treasury Bill, 5.31%, 10/3/2024 | | | 3.8% |
| United States Treasury Bill, 5.15%, 10/22/2024 | | | 3.8% |
| United States Treasury Bill, 4.98%, 11/5/2024 | | | 3.8% |
| FHLB DN | | | 3.8% |
| Footnote | Description |
Footnote(A) | Short-Term Investments are not shown in the top ten chart. |
There were no material changes during the reporting period.
Changes in and Disagreements with Accountants
There were no changes in or disagreements with accountants during the reporting period.
For additional information about the Fund, including its prospectus, financial information, holdings, and proxy voting information, call or visit:
Rule 30e-1 of the Investment Company Act of 1940 permits funds to transmit only one copy of a proxy statement, annual report or semi-annual report to shareholders (who need not be related) with the same residential, commercial or electronic address, provided that the shareholders have consented in writing and the reports are addressed either to each shareholder individually or to the shareholders as a group. This process is known as “householding” and is designed to reduce the duplicate copies of materials that shareholders receive and to lower printing and mailing costs for funds. Once implemented, if you would like to discontinue householding for your accounts, please call toll-free at 1-888-889-0799 to request individual copies of these documents. Once the Fund receives notice to stop householding, we will begin sending individual copies 30 days after receiving your request.
City National Rochdale Funds
City National Rochdale Government Money Market Fund / Servicing Class Shares - CNIXX
Annual Shareholder Report - September 30, 2024
CNR-AR-TSR-2024-5
City National Rochdale Funds
City National Rochdale Municipal High Income Fund
Annual Shareholder Report - September 30, 2024
This annual shareholder report contains important information about Class N Shares of the City National Rochdale Municipal High Income Fund (the "Fund") for the period from October 1, 2023 to September 30, 2024. You can find additional information about the Fund at https://www.citynationalrochdalefunds.com/dashboard. You can also request this information by contacting us at 1-888-889-0799.
What were the Fund costs for the last year?
(based on a hypothetical $10,000 investment)
| Fund Name | Costs of a $10,000 investment | Costs paid as a percentage of a $10,000 investment |
|---|
| City National Rochdale Municipal High Income Fund, Class N | $118 | 1.10% |
How did the Fund perform in the last year?
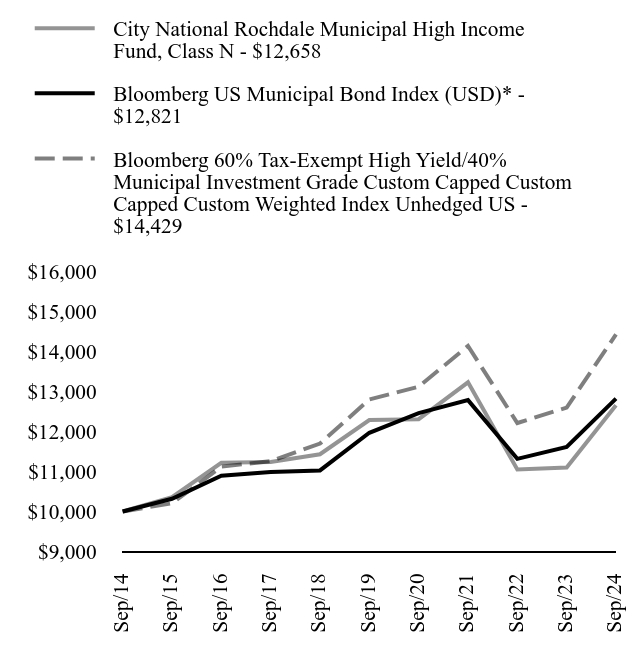
The N Class shares of the Fund posted a return of 3.37% for Q3 2024 versus the Bloomberg 60% Tax-Exempt High Yield/40% Municipal Investment Grade Custom Capped Custom Weighted Index Unhedged US return of 3.08%. Calendar year-to-date, as of September 30, 2024, the Fund returned 6.93% versus the Index return of 5.63%. For the fiscal year ending September 30, 2024, the Fund returned 14.04%, which underperformed its benchmark return of 14.53%.
High Yield municipal bonds have outperformed their Investment Grade counterparts in part due to strong technical data such as investor demand, as witnessed by positive fund flows, and lack of high yield supply. The Fund's effective duration has remained in line with its benchmark, if not slightly below throughout the year. The Fund has continued to reduce exposure to more speculative non-rated bonds and has added higher quality bonds. Fundamentally, high yield municipal credit quality remains strong, with weaknesses in only a couple of discrete sectors, such as small private universities and the industrial development sector. The portfolio management team utilizes a bottom’s-up fundamental research process, which includes site visits and meeting with management.
How did the Fund perform during the last 10 years?
Total Return Based on $10,000 Investment
Average Annual Total Returns as of September 30, 2024
| Fund/Index Name | 1 Year | 5 Years | 10 Years |
|---|
| City National Rochdale Municipal High Income Fund, Class N | 14.04% | 0.60% | 2.39% |
| Bloomberg US Municipal Bond Index (USD)* | 10.37% | 1.39% | 2.52% |
| Bloomberg 60% Tax-Exempt High Yield/40% Municipal Investment Grade Custom Capped Custom Capped Custom Weighted Index Unhedged US | 14.53% | 2.42% | 3.73% |
| City National Rochdale Municipal High Income Fund, Class N - $12658 | Bloomberg US Municipal Bond Index (USD)* - $12821 | Bloomberg 60% Tax-Exempt High Yield/40% Municipal Investment Grade Custom Capped Custom Capped Custom Weighted Index Unhedged US - $14429 |
|---|
| Sep/14 | $10000 | $10000 | $10000 |
| Sep/15 | $10355 | $10316 | $10203 |
| Sep/16 | $11218 | $10892 | $11121 |
| Sep/17 | $11237 | $10987 | $11257 |
| Sep/18 | $11431 | $11025 | $11698 |
| Sep/19 | $12286 | $11968 | $12801 |
| Sep/20 | $12307 | $12458 | $13120 |
| Sep/21 | $13231 | $12785 | $14140 |
| Sep/22 | $11052 | $11315 | $12212 |
| Sep/23 | $11100 | $11616 | $12598 |
| Sep/24 | $12658 | $12821 | $14429 |
The line graph represents historical performance of a hypothetical investment of $10,000 in the Fund during the last 10 years. Returns shown are total returns, which assume the reinvestment of dividends and capital gains. The table and graph presented above do not reflect the deduction of taxes a shareholder would pay on Fund distributions or the redemption of Fund Shares. Past performance is not indicative of future performance.Call 1-888-889-0799 or visit https://www.citynationalrochdalefunds.com/dashboard for current month-end performance.
Footnote Reference*As of September 2024, pursuant to the new regulatory requirements, this index has been added to represent the broad-based securities market index.
Key Fund Statistics as of September 30, 2024
| Total Net Assets (000's) | Number of Holdings | Total Advisory Fees Paid (000's) | Portfolio Turnover Rate |
|---|
| $840,961 | 422 | $4,658 | 18% |
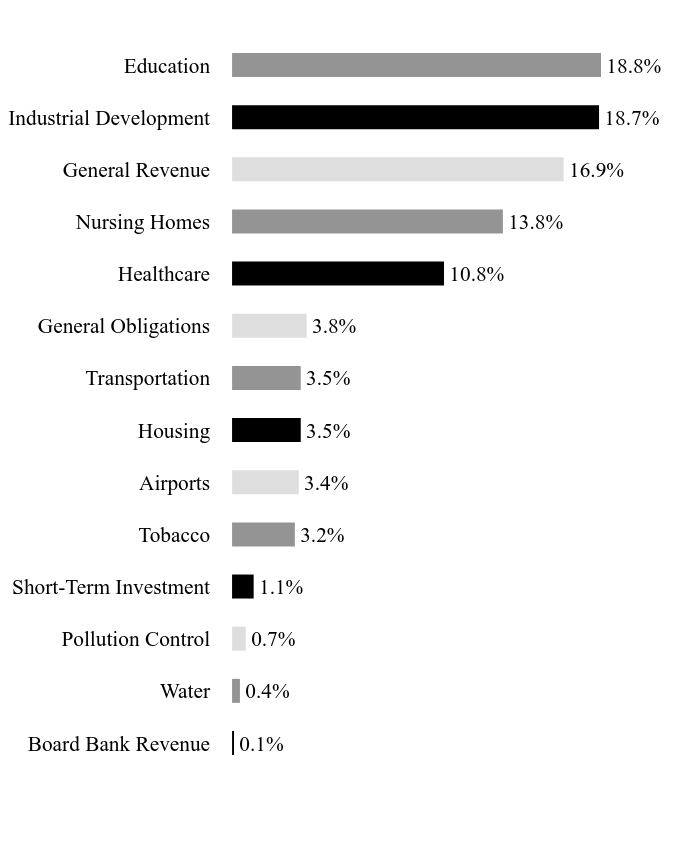
What did the Fund invest in?
Asset/Sector WeightingsFootnote Reference*
| Value | Value |
|---|
| Board Bank Revenue | 0.1% |
| Water | 0.4% |
| Pollution Control | 0.7% |
| Short-Term Investment | 1.1% |
| Tobacco | 3.2% |
| Airports | 3.4% |
| Housing | 3.5% |
| Transportation | 3.5% |
| General Obligations | 3.8% |
| Healthcare | 10.8% |
| Nursing Homes | 13.8% |
| General Revenue | 16.9% |
| Industrial Development | 18.7% |
| Education | 18.8% |
| Footnote | Description |
Footnote* | Percentages are calculated based on total net assets. |
| Holding Name | Coupon Rate | Maturity Date | Percentage of Total Net AssetsFootnote Reference(A) |
|---|
| Puerto Rico, Sales Tax Financing, Sales Tax Revenue, Ser A-1 | 4.500% | 07/01/34 | 1.2% |
| Westchester, Tobacco Asset Securitization, Sub-Ser C | 5.125% | 06/01/51 | 0.8% |
| Chicago, O'Hare International Airport, Ser A, AMT | 5.000% | 01/01/48 | 0.8% |
| North Texas, Tollway Authority, Convertible Capital Appreciation Project, Ser C | 7.000% | 09/01/31 | 0.7% |
| Puerto Rico, Sales Tax Financing, Sales Tax Revenue, Ser A-2 | 4.784% | 07/01/58 | 0.7% |
| Legato Community Authority, Ser A-2 | 0.000% | 12/01/51 | 0.7% |
| Sierra Vista, Industrial Development Authority | 5.750% | 06/15/53 | 0.7% |
| New York State, Dormitory Authority, Ser A | 5.000% | 03/15/54 | 0.7% |
| California State, Community Choice Financing Authority | 3.000% | 02/01/57 | 0.6% |
| Juban Crossing, Economic Development District, General Infrastructure Project, Ser C | 7.000% | 09/15/44 | 0.6% |
| Footnote | Description |
Footnote(A) | Short-Term Investments are not shown in the top ten chart. |
There were no material changes during the reporting period.
Changes in and Disagreements with Accountants
There were no changes in or disagreements with accountants during the reporting period.
For additional information about the Fund, including its prospectus, financial information, holdings, and proxy voting information, call or visit:
Rule 30e-1 of the Investment Company Act of 1940 permits funds to transmit only one copy of a proxy statement, annual report or semi-annual report to shareholders (who need not be related) with the same residential, commercial or electronic address, provided that the shareholders have consented in writing and the reports are addressed either to each shareholder individually or to the shareholders as a group. This process is known as “householding” and is designed to reduce the duplicate copies of materials that shareholders receive and to lower printing and mailing costs for funds. Once implemented, if you would like to discontinue householding for your accounts, please call toll-free at 1-888-889-0799 to request individual copies of these documents. Once the Fund receives notice to stop householding, we will begin sending individual copies 30 days after receiving your request.
City National Rochdale Funds
City National Rochdale Municipal High Income Fund / Class N - CNRNX
Annual Shareholder Report - September 30, 2024
CNR-AR-TSR-2024-2
City National Rochdale Funds
City National Rochdale Municipal High Income Fund
Annual Shareholder Report - September 30, 2024
This annual shareholder report contains important information about Servicing Class Shares of the City National Rochdale Municipal High Income Fund (the "Fund") for the period from October 1, 2023 to September 30, 2024. You can find additional information about the Fund at https://www.citynationalrochdalefunds.com/dashboard. You can also request this information by contacting us at 1-888-889-0799.
What were the Fund costs for the last year?
(based on a hypothetical $10,000 investment)
| Fund Name | Costs of a $10,000 investment | Costs paid as a percentage of a $10,000 investment |
|---|
| City National Rochdale Municipal High Income Fund, Servicing Class | $91 | 0.85% |
How did the Fund perform in the last year?
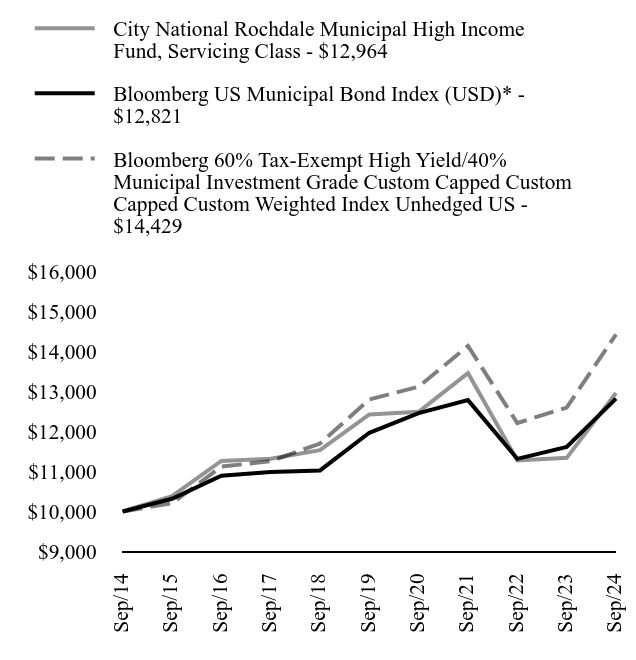
Bloomberg 60% Tax-Exempt High Yield/40% MunicipalInvestment Grade Custom Capped Custom Capped CustomWeighted Index Unhedged USThe Servicing Class shares of the Fund posted a return of 3.45% for Q3 2024 versus the Bloomberg 60% Tax-Exempt High Yield/40% Municipal Investment Grade Custom Capped Custom Weighted Index Unhedged US return of 3.08%. Calendar year-to-date, as of September 30, 2024, the Fund returned 7.01% versus the Index return of 5.63%. For the fiscal year ending September 30, 2024, the Fund returned 14.32%, which underperformed its benchmark return of 14.53%.
High Yield municipal bonds have outperformed their Investment Grade counterparts in part due to strong technical data such as investor demand, as witnessed by positive fund flows, and lack of high yield supply. The Fund's effective duration has remained in line with its benchmark, if not slightly below throughout the year. The Fund has continued to reduce exposure to more speculative non-rated bonds and has added higher quality bonds. Fundamentally, high yield municipal credit quality remains strong, with weaknesses in only a couple of discrete sectors, such as small private universities and the industrial development sector. The portfolio management team utilizes a bottom’s-up fundamental research process, which includes site visits and meeting with management.
How did the Fund perform during the last 10 years?
Total Return Based on $10,000 Investment
Average Annual Total Returns as of September 30, 2024
| Fund/Index Name | 1 Year | 5 Years | 10 Years |
|---|
| City National Rochdale Municipal High Income Fund, Servicing Class | 14.32% | 0.85% | 2.63% |
| Bloomberg US Municipal Bond Index (USD)* | 10.37% | 1.39% | 2.52% |
| Bloomberg 60% Tax-Exempt High Yield/40% Municipal Investment Grade Custom Capped Custom Capped Custom Weighted Index Unhedged US | 14.53% | 2.42% | 3.73% |
| City National Rochdale Municipal High Income Fund, Servicing Class - $12964 | Bloomberg US Municipal Bond Index (USD)* - $12821 | Bloomberg 60% Tax-Exempt High Yield/40% Municipal Investment Grade Custom Capped Custom Capped Custom Weighted Index Unhedged US - $14429 |
|---|
| Sep/14 | $10000 | $10000 | $10000 |
| Sep/15 | $10381 | $10316 | $10203 |
| Sep/16 | $11263 | $10892 | $11121 |
| Sep/17 | $11320 | $10987 | $11257 |
| Sep/18 | $11534 | $11025 | $11698 |
| Sep/19 | $12427 | $11968 | $12801 |
| Sep/20 | $12491 | $12458 | $13120 |
| Sep/21 | $13461 | $12785 | $14140 |
| Sep/22 | $11275 | $11315 | $12212 |
| Sep/23 | $11340 | $11616 | $12598 |
| Sep/24 | $12964 | $12821 | $14429 |
The line graph represents historical performance of a hypothetical investment of $10,000 in the Fund during the last 10 years. Returns shown are total returns, which assume the reinvestment of dividends and capital gains. The table and graph presented above do not reflect the deduction of taxes a shareholder would pay on Fund distributions or the redemption of Fund Shares. Past performance is not indicative of future performance.Call 1-888-889-0799 or visit https://www.citynationalrochdalefunds.com/dashboard for current month-end performance.
Footnote Reference*As of September 2024, pursuant to the new regulatory requirements, this index has been added to represent the broad-based securities market index.
Key Fund Statistics as of September 30, 2024
| Total Net Assets (000's) | Number of Holdings | Total Advisory Fees Paid (000's) | Portfolio Turnover Rate |
|---|
| $840,961 | 422 | $4,658 | 18% |
What did the Fund invest in?
Asset/Sector WeightingsFootnote Reference*
| Value | Value |
|---|
| Board Bank Revenue | 0.1% |
| Water | 0.4% |
| Pollution Control | 0.7% |
| Short-Term Investment | 1.1% |
| Tobacco | 3.2% |
| Airports | 3.4% |
| Housing | 3.5% |
| Transportation | 3.5% |
| General Obligations | 3.8% |
| Healthcare | 10.8% |
| Nursing Homes | 13.8% |
| General Revenue | 16.9% |
| Industrial Development | 18.7% |
| Education | 18.8% |
| Footnote | Description |
Footnote* | Percentages are calculated based on total net assets. |
| Holding Name | Coupon Rate | Maturity Date | Percentage of Total Net AssetsFootnote Reference(A) |
|---|
| Puerto Rico, Sales Tax Financing, Sales Tax Revenue, Ser A-1 | 4.500% | 07/01/34 | 1.2% |
| Westchester, Tobacco Asset Securitization, Sub-Ser C | 5.125% | 06/01/51 | 0.8% |
| Chicago, O'Hare International Airport, Ser A, AMT | 5.000% | 01/01/48 | 0.8% |
| North Texas, Tollway Authority, Convertible Capital Appreciation Project, Ser C | 7.000% | 09/01/31 | 0.7% |
| Puerto Rico, Sales Tax Financing, Sales Tax Revenue, Ser A-2 | 4.784% | 07/01/58 | 0.7% |
| Legato Community Authority, Ser A-2 | 0.000% | 12/01/51 | 0.7% |
| Sierra Vista, Industrial Development Authority | 5.750% | 06/15/53 | 0.7% |
| New York State, Dormitory Authority, Ser A | 5.000% | 03/15/54 | 0.7% |
| California State, Community Choice Financing Authority | 3.000% | 02/01/57 | 0.6% |
| Juban Crossing, Economic Development District, General Infrastructure Project, Ser C | 7.000% | 09/15/44 | 0.6% |
| Footnote | Description |
Footnote(A) | Short-Term Investments are not shown in the top ten chart. |
There were no material changes during the reporting period.
Changes in and Disagreements with Accountants
There were no changes in or disagreements with accountants during the reporting period.
For additional information about the Fund, including its prospectus, financial information, holdings, and proxy voting information, call or visit:
Rule 30e-1 of the Investment Company Act of 1940 permits funds to transmit only one copy of a proxy statement, annual report or semi-annual report to shareholders (who need not be related) with the same residential, commercial or electronic address, provided that the shareholders have consented in writing and the reports are addressed either to each shareholder individually or to the shareholders as a group. This process is known as “householding” and is designed to reduce the duplicate copies of materials that shareholders receive and to lower printing and mailing costs for funds. Once implemented, if you would like to discontinue householding for your accounts, please call toll-free at 1-888-889-0799 to request individual copies of these documents. Once the Fund receives notice to stop householding, we will begin sending individual copies 30 days after receiving your request.
City National Rochdale Funds
City National Rochdale Municipal High Income Fund / Servicing Class - CNRMX
Annual Shareholder Report - September 30, 2024
CNR-AR-TSR-2024-1
City National Rochdale Funds
City National Rochdale Fixed Income Opportunities Fund
Annual Shareholder Report - September 30, 2024
This annual shareholder report contains important information about Class N Shares of the City National Rochdale Fixed Income Opportunities Fund (the "Fund") for the period from October 1, 2023 to September 30, 2024. You can find additional information about the Fund at https://www.citynationalrochdalefunds.com/dashboard. You can also request this information by contacting us at 1-888-889-0799.
What were the Fund costs for the last year?
(based on a hypothetical $10,000 investment)
| Fund Name | Costs of a $10,000 investment | Costs paid as a percentage of a $10,000 investment |
|---|
| City National Rochdale Fixed Income Opportunities Fund, Class N Shares | $120 | 1.14% |
How did the Fund perform in the last year?
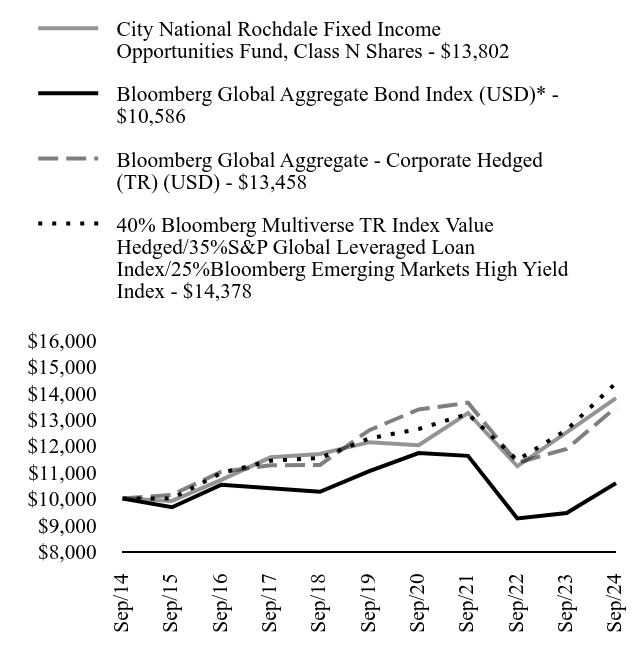
The Fund’s Class N shares posted a return of 2.24% for Q3 2024, which underperformed the blended benchmark (40% Bloomberg Multiverse Total Return Index Value Hedged USD, 35% S&P Global Leveraged Loan Index, 25% Bloomberg Emerging Markets High Yield Index) return of 4.45%. Calendar year to date, as of September 30, 2024, the Fund returned 6.52% versus the blended benchmark return of 7.48%. For the fiscal year ended September 30, 2024, the Fund returned 10.32%, which underperformed the blended benchmark return of 14.07%.
Opportunistic income had a reasonable start to the year 2024, but had a challenging Q3 on a relative basis. For Q3, the Fund’s underlying managers performed reasonably well, but the Fund slightly lagged in U.S. High Yield and Emerging Markets High Yield Corporate Debt. This was offset by relative performance in CLOs and U.S. Leveraged Loans for the quarter. The lag was more driven by significantly strong returns in the investment grade markets, which is present in the blended benchmark, and strong overall performance of the U.S. High Yield Bond market for the quarter. In terms of outlook, our manager discussions have included positioning the Fund’s portfolio on the conservative side with ideas such as shortening duration and taking advantage of rating agency mismatches where possible.
How did the Fund perform during the last 10 years?
Total Return Based on $10,000 Investment
Average Annual Total Returns as of September 30, 2024
| Fund/Index Name | 1 Year | 5 Years | 10 Years |
|---|
| City National Rochdale Fixed Income Opportunities Fund, Class N Shares | 10.32% | 2.60% | 3.27% |
| Bloomberg Global Aggregate Bond Index (USD)* | 11.99% | -0.83% | 0.57% |
| Bloomberg Global Aggregate - Corporate Hedged (TR) (USD) | 13.26% | 1.34% | 3.01% |
| 40% Bloomberg Multiverse TR Index Value Hedged/35%S&P Global Leveraged Loan Index/25%Bloomberg Emerging Markets High Yield Index | 14.07% | 3.20% | 3.70% |
| City National Rochdale Fixed Income Opportunities Fund, Class N Shares - $13802 | Bloomberg Global Aggregate Bond Index (USD)* - $10586 | Bloomberg Global Aggregate - Corporate Hedged (TR) (USD) - $13458 | 40% Bloomberg Multiverse TR Index Value Hedged/35%S&P Global Leveraged Loan Index/25%Bloomberg Emerging Markets High Yield Index - $14378 |
|---|
| Sep/14 | $10000 | $10000 | $10000 | $10000 |
| Sep/15 | $9912 | $9674 | $10145 | $10008 |
| Sep/16 | $10709 | $10528 | $11016 | $10970 |
| Sep/17 | $11564 | $10396 | $11264 | $11437 |
| Sep/18 | $11690 | $10259 | $11274 | $11539 |
| Sep/19 | $12138 | $11038 | $12593 | $12281 |
| Sep/20 | $12024 | $11726 | $13374 | $12636 |
| Sep/21 | $13243 | $11620 | $13631 | $13206 |
| Sep/22 | $11226 | $9246 | $11359 | $11456 |
| Sep/23 | $12510 | $9453 | $11883 | $12604 |
| Sep/24 | $13802 | $10586 | $13458 | $14378 |
The line graph represents historical performance of a hypothetical investment of $10,000 in the Fund during the last 10 years. Returns shown are total returns, which assume the reinvestment of dividends and capital gains. The table and graph presented above do not reflect the deduction of taxes a shareholder would pay on Fund distributions or the redemption of Fund Shares. Past performance is not indicative of future performance.Call 1-888-889-0799 or visit https://www.citynationalrochdalefunds.com/dashboard for current month-end performance.
Footnote Reference*As of September 2024, pursuant to the new regulatory requirements, this index has been added to represent the broad-based securities market index.
Key Fund Statistics as of September 30, 2024
| Total Net Assets (000's) | Number of Holdings | Total Advisory Fees Paid (000's) | Portfolio Turnover Rate |
|---|
| $1,884,920 | 1,252 | $9,981 | 34% |
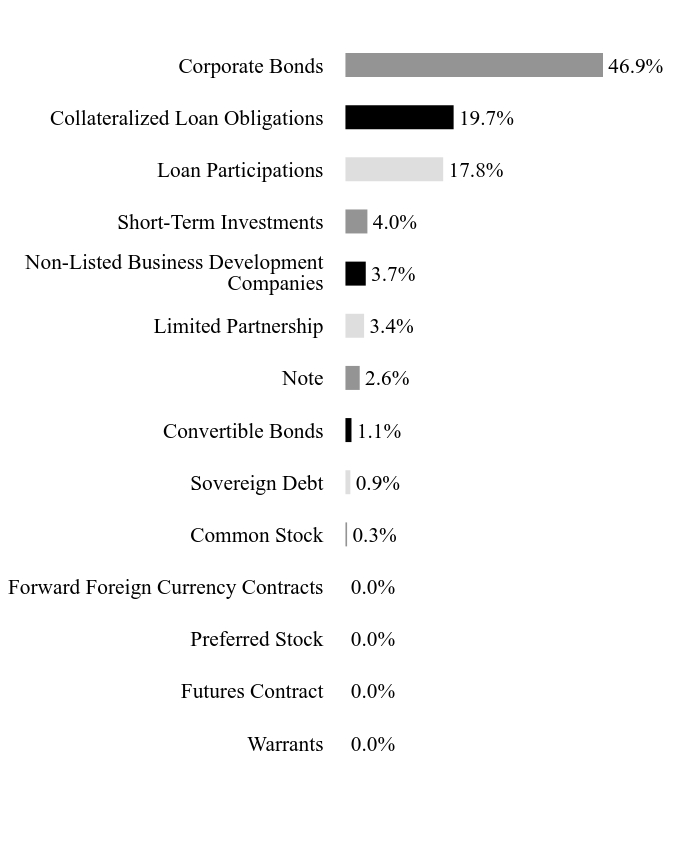
What did the Fund invest in?
Asset/Sector WeightingsFootnote Reference*
| Value | Value |
|---|
| Warrants | 0.0% |
| Futures Contract | 0.0% |
| Preferred Stock | 0.0% |
| Forward Foreign Currency Contracts | 0.0% |
| Common Stock | 0.3% |
| Sovereign Debt | 0.9% |
| Convertible Bonds | 1.1% |
| Note | 2.6% |
| Limited Partnership | 3.4% |
| Non-Listed Business Development Companies | 3.7% |
| Short-Term Investments | 4.0% |
| Loan Participations | 17.8% |
| Collateralized Loan Obligations | 19.7% |
| Corporate Bonds | 46.9% |
| Footnote | Description |
Footnote* | Percentages are calculated based on total net assets. |
| Holding Name | Coupon Rate | Maturity Date | Percentage of Total Net AssetsFootnote Reference(A) |
|---|
| Golub Capital BDC 4 | 0.000% | — | 3.1% |
| Primary Wave Music IP Fund LP | 0.000% | — | 2.8% |
| City National Rochdale FIOF Investments (Ireland) Limited | 0.000% | — | 2.6% |
| Armada Euro CLO III DAC, Ser 2024-3A, Cl ARR | 0.000% | 10/15/37 | 0.8% |
| Rockford Tower Europe CLO DAC, Ser 2019-1X, Cl A, EUR003M + 0.920% | 4.608% | 01/20/33 | 0.8% |
| Fair Oaks Loan Funding III DAC, Ser 2021-3X, Cl AR, EUR003M + 1.000% | 4.685% | 10/15/34 | 0.6% |
| TCW Direct Lending LLC | 0.000% | — | 0.6% |
| Pikes Peak CLO 14, Ser 2023-14A, Cl A1, TSFR3M + 1.950% | 7.232% | 04/20/36 | 0.6% |
| PARK BLUE CLO, Ser 2023-3A, Cl A1, TSFR3M + 2.000% | 7.282% | 04/20/36 | 0.5% |
| Sandstone Peak III, Ser 2024-1A, Cl A1, TSFR3M + 1.630% | 6.966% | 04/25/37 | 0.5% |
| Footnote | Description |
Footnote(A) | Short-Term Investments are not shown in the top ten chart. |
There were no material changes during the reporting period.
Changes in and Disagreements with Accountants
There were no changes in or disagreements with accountants during the reporting period.
For additional information about the Fund, including its prospectus, financial information, holdings, and proxy voting information, call or visit:
Rule 30e-1 of the Investment Company Act of 1940 permits funds to transmit only one copy of a proxy statement, annual report or semi-annual report to shareholders (who need not be related) with the same residential, commercial or electronic address, provided that the shareholders have consented in writing and the reports are addressed either to each shareholder individually or to the shareholders as a group. This process is known as “householding” and is designed to reduce the duplicate copies of materials that shareholders receive and to lower printing and mailing costs for funds. Once implemented, if you would like to discontinue householding for your accounts, please call toll-free at 1-888-889-0799 to request individual copies of these documents. Once the Fund receives notice to stop householding, we will begin sending individual copies 30 days after receiving your request.
City National Rochdale Funds
City National Rochdale Fixed Income Opportunities Fund / Class N Shares - RIMOX
Annual Shareholder Report - September 30, 2024
CNR-AR-TSR-2024-4
City National Rochdale Funds
City National Rochdale Equity Income Fund
Annual Shareholder Report - September 30, 2024
This annual shareholder report contains important information about Class N Shares of the City National Rochdale Equity Income Fund (the "Fund") for the period from October 1, 2023 to September 30, 2024. You can find additional information about the Fund at https://www.citynationalrochdalefunds.com/dashboard. You can also request this information by contacting us at 1-888-889-0799.
What were the Fund costs for the last year?
(based on a hypothetical $10,000 investment)
| Fund Name | Costs of a $10,000 investment | Costs paid as a percentage of a $10,000 investment |
|---|
| City National Rochdale Equity Income Fund, Class N Shares | $155 | 1.35% |
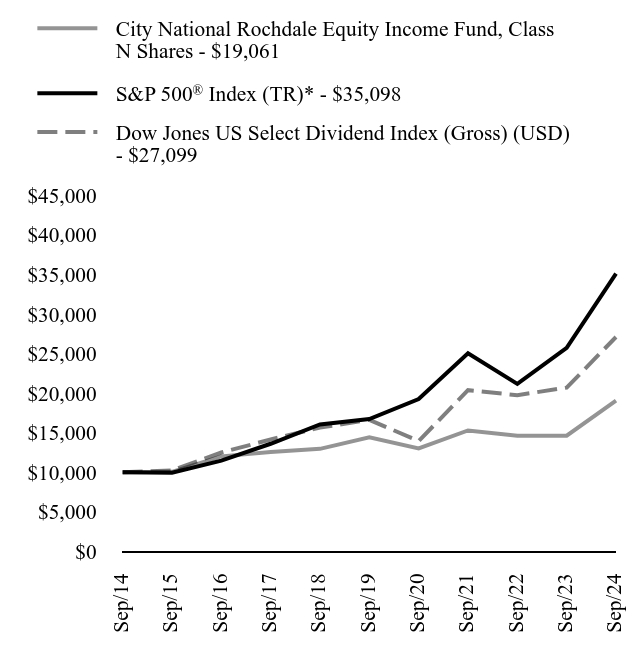
How did the Fund perform in the last year?
The Fund’s Class N shares posted a net return of +12.94% in Q3 2024, which slightly underperformed the Dow Jones U.S. Select Dividend Index’s return of +13.13%. Year to date, the Fund’s return is +20.88% versus +18.82% for its benchmark. For the fiscal year ended September 30, 2024, the Fund returned net +30.37%, which modestly underperformed the benchmark return of +30.90%.
Generally, the Fund’s portfolio is relatively balanced between cyclical and defensive sectors, close to neutral but with modest defensive, aligned with an improving macro outlook amidst ongoing risks. YTD returns have benefited from avoidance of multiple dividend cuts in its benchmark. Stock selection continues to focus on quality companies that should outperform over the course of the cycle, although recent trades have added some more cyclical names for both alpha and risk reduction purposes. We expect that our emphasis on quality will lead to superior returns over the entire course of the market cycle. Stock selection remains biased towards dividend growth over yield given the inflationary backdrop and benefits of compounding. We continue to closely monitor the Fund’s holdings and we believe that they are executing well amidst a challenging environment.
How did the Fund perform during the last 10 years?
Total Return Based on $10,000 Investment
Average Annual Total Returns as of September 30, 2024
| Fund/Index Name | 1 Year | 5 Years | 10 Years |
|---|
| City National Rochdale Equity Income Fund, Class N Shares | 30.37% | 5.74% | 6.66% |
S&P 500® Index (TR)* | 36.35% | 15.98% | 13.38% |
| Dow Jones US Select Dividend Index (Gross) (USD) | 30.90% | 10.25% | 10.48% |
| City National Rochdale Equity Income Fund, Class N Shares - $19061 | S&P 500® Index (TR)* - $35098 | Dow Jones US Select Dividend Index (Gross) (USD) - $27099 |
|---|
| Sep/14 | $10000 | $10000 | $10000 |
| Sep/15 | $10053 | $9939 | $10224 |
| Sep/16 | $12014 | $11472 | $12497 |
| Sep/17 | $12575 | $13607 | $14148 |
| Sep/18 | $12964 | $16044 | $15645 |
| Sep/19 | $14422 | $16727 | $16633 |
| Sep/20 | $13009 | $19260 | $13941 |
| Sep/21 | $15290 | $25040 | $20376 |
| Sep/22 | $14616 | $21165 | $19744 |
| Sep/23 | $14621 | $25741 | $20701 |
| Sep/24 | $19061 | $35098 | $27099 |
The line graph represents historical performance of a hypothetical investment of $10,000 in the Fund during the last 10 years. Returns shown are total returns, which assume the reinvestment of dividends and capital gains. The table and graph presented above do not reflect the deduction of taxes a shareholder would pay on Fund distributions or the redemption of Fund Shares. Past performance is not indicative of future performance.Call 1-888-889-0799 or visit https://www.citynationalrochdalefunds.com/dashboard for current month-end performance.
Footnote Reference*As of September 2024, pursuant to the new regulatory requirements, this index has been added to represent the broad-based securities market index.
Key Fund Statistics as of September 30, 2024
| Total Net Assets (000's) | Number of Holdings | Total Advisory Fees Paid (000's) | Portfolio Turnover Rate |
|---|
| $147,619 | 59 | $762 | 34% |
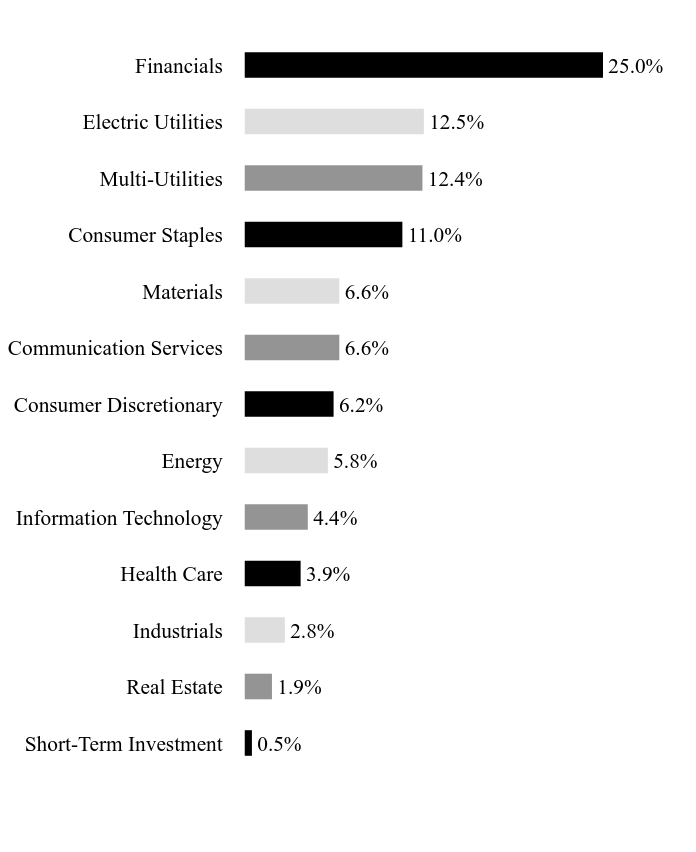
What did the Fund invest in?
Asset/Sector WeightingsFootnote Reference*
| Value | Value |
|---|
| Short-Term Investment | 0.5% |
| Real Estate | 1.9% |
| Industrials | 2.8% |
| Health Care | 3.9% |
| Information Technology | 4.4% |
| Energy | 5.8% |
| Consumer Discretionary | 6.2% |
| Communication Services | 6.6% |
| Materials | 6.6% |
| Consumer Staples | 11.0% |
| Multi-Utilities | 12.4% |
| Electric Utilities | 12.5% |
| Financials | 25.0% |
| Footnote | Description |
Footnote* | Percentages are calculated based on total net assets. |
| Holding Name | | | Percentage of Total Net AssetsFootnote Reference(A) |
|---|
| Altria Group | | | 3.0% |
| International Paper | | | 2.9% |
| Williams | | | 2.9% |
| Regions Financial | | | 2.8% |
| Fifth Third Bancorp | | | 2.8% |
| Entergy | | | 2.7% |
| Citizens Financial Group | | | 2.7% |
| American Electric Power | | | 2.7% |
| Duke Energy | | | 2.6% |
| AT&T | | | 2.6% |
| Footnote | Description |
Footnote(A) | Short-Term Investments are not shown in the top ten chart. |
There were no material changes during the reporting period.
Changes in and Disagreements with Accountants
There were no changes in or disagreements with accountants during the reporting period.
For additional information about the Fund, including its prospectus, financial information, holdings, and proxy voting information, call or visit:
Rule 30e-1 of the Investment Company Act of 1940 permits funds to transmit only one copy of a proxy statement, annual report or semi-annual report to shareholders (who need not be related) with the same residential, commercial or electronic address, provided that the shareholders have consented in writing and the reports are addressed either to each shareholder individually or to the shareholders as a group. This process is known as “householding” and is designed to reduce the duplicate copies of materials that shareholders receive and to lower printing and mailing costs for funds. Once implemented, if you would like to discontinue householding for your accounts, please call toll-free at 1-888-889-0799 to request individual copies of these documents. Once the Fund receives notice to stop householding, we will begin sending individual copies 30 days after receiving your request.
City National Rochdale Funds
City National Rochdale Equity Income Fund / Class N Shares - RIMHX
Annual Shareholder Report - September 30, 2024
CNR-AR-TSR-2024-3
City National Rochdale Funds
City National Rochdale U.S. Core Equity Fund
Institutional Class Shares - CNRUX
Annual Shareholder Report - September 30, 2024
This annual shareholder report contains important information about Institutional Class Shares of the City National Rochdale U.S. Core Equity Fund (the "Fund") for the period from October 1, 2023 to September 30, 2024. You can find additional information about the Fund at https://www.citynationalrochdalefunds.com/dashboard. You can also request this information by contacting us at 1-888-889-0799.
What were the Fund costs for the last year?
(based on a hypothetical $10,000 investment)
| Fund Name | Costs of a $10,000 investment | Costs paid as a percentage of a $10,000 investment |
|---|
| City National Rochdale U.S. Core Equity Fund, Institutional Class Shares | $66 | 0.57% |
How did the Fund perform in the last year?
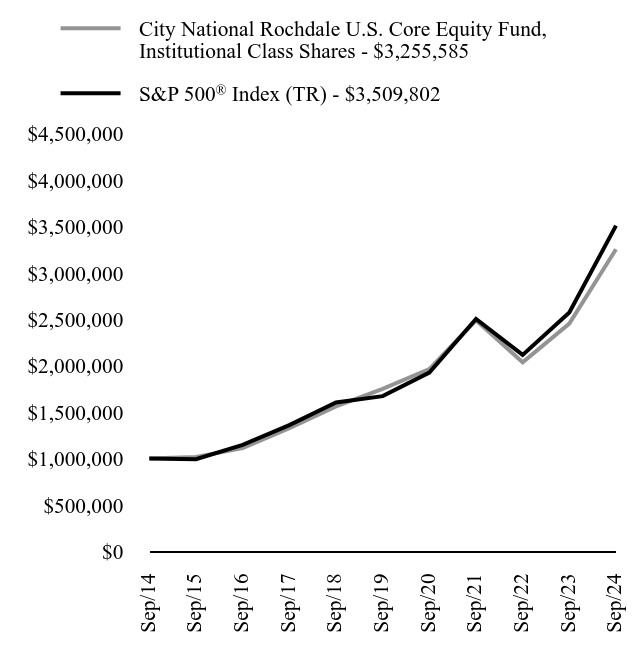
The Institutional Class shares of the Fund posted a return of 4.43% for Q3 2024, which underperformed the S&P 500 Index return of 5.89%. Calendar year to date, as of September 30, 2024, the Fund returned 18.77%, which underperformed its benchmark return of 22.08%. For the fiscal year ended September 30, 2024, the Fund returned 32.69%, which underperformed its benchmark return of 36.35%.
During 3Q, we continued to anticipate that a resilient economy would support the broadening of equity market participation later this year. Fed monetary policy easing, AI investment by major tech companies, and fading election uncertainty, all bode for the market. We made slight adjustments by increasing exposure to Financials and Energy, while reducing positions in Industrials, Consumer Staples and Healthcare. This shift reflected our favorable views in the cyclical industries and low-P/E segment of the market. We remain focused on our secular growth themes and large-cap high-quality companies with strong fundamentals.
How did the Fund perform during the last 10 years?
Total Return Based on $1,000,000 Investment
Average Annual Total Returns as of September 30, 2024
| Fund/Index Name | 1 Year | 5 Years | 10 Years |
|---|
| City National Rochdale U.S. Core Equity Fund, Institutional Class Shares | 32.69% | 13.21% | 12.53% |
S&P 500® Index (TR) | 36.35% | 15.98% | 13.38% |
| City National Rochdale U.S. Core Equity Fund, Institutional Class Shares - $3255585 | S&P 500® Index (TR) - $3509802 |
|---|
| Sep/14 | $1000000 | $1000000 |
| Sep/15 | $1017879 | $993855 |
| Sep/16 | $1112024 | $1147211 |
| Sep/17 | $1327789 | $1360699 |
| Sep/18 | $1562915 | $1604406 |
| Sep/19 | $1750652 | $1672655 |
| Sep/20 | $1964180 | $1926047 |
| Sep/21 | $2489864 | $2503956 |
| Sep/22 | $2037251 | $2116543 |
| Sep/23 | $2453540 | $2574083 |
| Sep/24 | $3255585 | $3509802 |
The line graph represents historical performance of a hypothetical investment of $1,000,000 in the Fund during the last 10 years. Returns shown are total returns, which assume the reinvestment of dividends and capital gains. The table and graph presented above do not reflect the deduction of taxes a shareholder would pay on Fund distributions or the redemption of Fund shares. Past performance is not indicative of future performance.Call 1-888-889-0799 or visit https://www.citynationalrochdalefunds.com/dashboard for current month-end performance.
Key Fund Statistics as of September 30, 2024
| Total Net Assets (000's) | Number of Holdings | Total Advisory Fees Paid (000's) | Portfolio Turnover Rate |
|---|
| $412,442 | 55 | $1,542 | 20% |
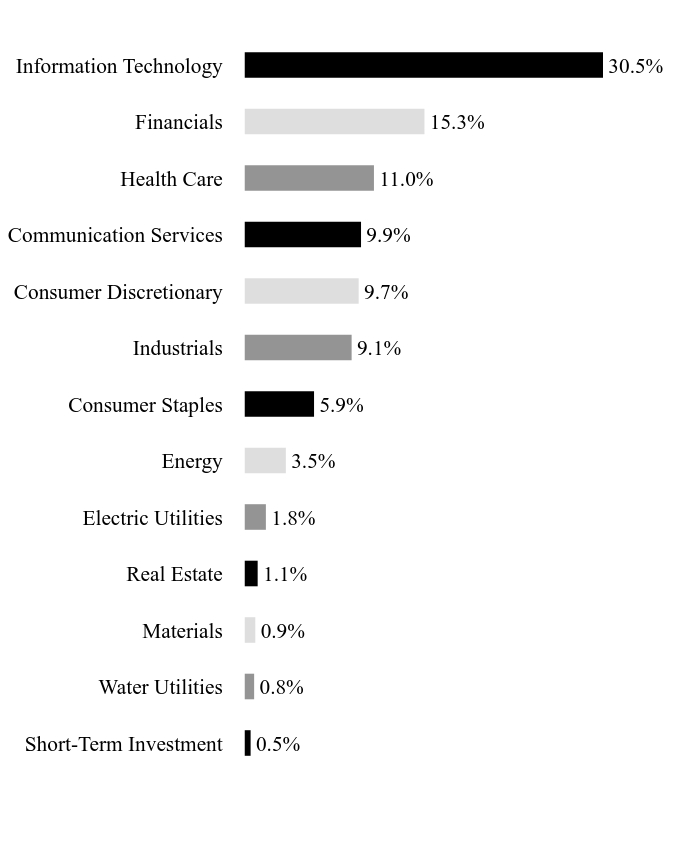
What did the Fund invest in?
Asset/Sector WeightingsFootnote Reference*
| Value | Value |
|---|
| Short-Term Investment | 0.5% |
| Water Utilities | 0.8% |
| Materials | 0.9% |
| Real Estate | 1.1% |
| Electric Utilities | 1.8% |
| Energy | 3.5% |
| Consumer Staples | 5.9% |
| Industrials | 9.1% |
| Consumer Discretionary | 9.7% |
| Communication Services | 9.9% |
| Health Care | 11.0% |
| Financials | 15.3% |
| Information Technology | 30.5% |
| Footnote | Description |
Footnote* | Percentages are calculated based on total net assets. |
| Holding Name | | | Percentage of Total Net AssetsFootnote Reference(A) |
|---|
| Microsoft | | | 7.6% |
| NVIDIA | | | 6.3% |
| Apple | | | 6.1% |
| Alphabet, Cl A | | | 4.5% |
| Amazon.Com | | | 3.8% |
| UnitedHealth Group | | | 2.7% |
| JPMorgan Chase | | | 2.7% |
| Trane Technologies | | | 2.6% |
| Costco Wholesale | | | 2.3% |
| Home Depot | | | 2.2% |
| Footnote | Description |
Footnote(A) | Short-Term Investments are not shown in the top ten chart. |
There were no material changes during the reporting period.
Changes in and Disagreements with Accountants
There were no changes in or disagreements with accountants during the reporting period.
For additional information about the Fund, including its prospectus, financial information, holdings, and proxy voting information, call or visit:
Rule 30e-1 of the Investment Company Act of 1940 permits funds to transmit only one copy of a proxy statement, annual report or semi-annual report to shareholders (who need not be related) with the same residential, commercial or electronic address, provided that the shareholders have consented in writing and the reports are addressed either to each shareholder individually or to the shareholders as a group. This process is known as “householding” and is designed to reduce the duplicate copies of materials that shareholders receive and to lower printing and mailing costs for funds. Once implemented, if you would like to discontinue householding for your accounts, please call toll-free at 1-888-889-0799 to request individual copies of these documents. Once the Fund receives notice to stop householding, we will begin sending individual copies 30 days after receiving your request.
City National Rochdale Funds
City National Rochdale U.S. Core Equity Fund / Institutional Class Shares - CNRUX
Annual Shareholder Report - September 30, 2024
CNR-AR-TSR-2024-8
City National Rochdale Funds
City National Rochdale U.S. Core Equity Fund
Annual Shareholder Report - September 30, 2024
This annual shareholder report contains important information about Class N Shares of the City National Rochdale U.S. Core Equity Fund (the "Fund") for the period from October 1, 2023 to September 30, 2024. You can find additional information about the Fund at https://www.citynationalrochdalefunds.com/dashboard. You can also request this information by contacting us at 1-888-889-0799.
What were the Fund costs for the last year?
(based on a hypothetical $10,000 investment)
| Fund Name | Costs of a $10,000 investment | Costs paid as a percentage of a $10,000 investment |
|---|
| City National Rochdale U.S. Core Equity Fund, Class N Shares | $124 | 1.07% |
How did the Fund perform in the last year?
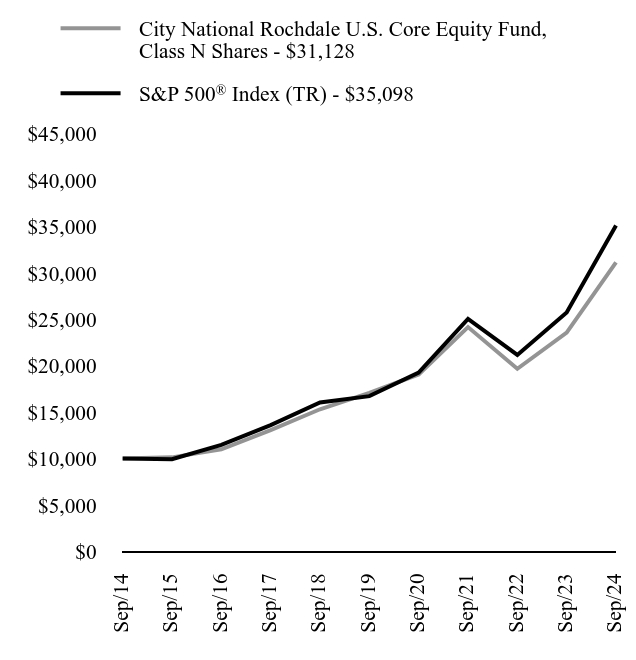
The N Class shares of the Fund posted a return of 4.30% for Q3 2024, which underperformed the S&P 500 Index return of 5.89%. Calendar year to date, as of September 30, 2024, the Fund returned 18.28%, which underperformed its benchmark return of 22.08%. For the fiscal year ended September 30, 2024, the Fund returned 32.03%, which underperformed its benchmark return of 36.35%.
During 3Q, we continued to anticipate that a resilient economy would support the broadening of equity market participation later this year. Fed monetary policy easing, AI investment by major tech companies, and fading election uncertainty, all bode for the market. We made slight adjustments by increasing exposure to Financials and Energy, while reducing positions in Industrials, Consumer Staples and Healthcare. This shift reflected our favorable views in the cyclical industries and low-P/E segment of the market. We remain focused on our secular growth themes and large-cap high-quality companies with strong fundamentals.
How did the Fund perform during the last 10 years?
Total Return Based on $10,000 Investment
Average Annual Total Returns as of September 30, 2024
| Fund/Index Name | 1 Year | 5 Years | 10 Years |
|---|
| City National Rochdale U.S. Core Equity Fund, Class N Shares | 32.03% | 12.76% | 12.03% |
S&P 500® Index (TR) | 36.35% | 15.98% | 13.38% |
| City National Rochdale U.S. Core Equity Fund, Class N Shares - $31128 | S&P 500® Index (TR) - $35098 |
|---|
| Sep/14 | $10000 | $10000 |
| Sep/15 | $10131 | $9939 |
| Sep/16 | $11006 | $11472 |
| Sep/17 | $13076 | $13607 |
| Sep/18 | $15315 | $16044 |
| Sep/19 | $17075 | $16727 |
| Sep/20 | $19062 | $19260 |
| Sep/21 | $24168 | $25040 |
| Sep/22 | $19671 | $21165 |
| Sep/23 | $23576 | $25741 |
| Sep/24 | $31128 | $35098 |
The line graph represents historical performance of a hypothetical investment of $10,000 in the Fund during the last 10 years. Returns shown are total returns, which assume the reinvestment of dividends and capital gains. The table and graph presented above do not reflect the deduction of taxes a shareholder would pay on Fund distributions or the redemption of Fund shares. Past performance is not indicative of future performance.Call 1-888-889-0799 or visit https://www.citynationalrochdalefunds.com/dashboard for current month-end performance.
Key Fund Statistics as of September 30, 2024
| Total Net Assets (000's) | Number of Holdings | Total Advisory Fees Paid (000's) | Portfolio Turnover Rate |
|---|
| $412,442 | 55 | $1,542 | 20% |
What did the Fund invest in?
Asset/Sector WeightingsFootnote Reference*
| Value | Value |
|---|
| Short-Term Investment | 0.5% |
| Water Utilities | 0.8% |
| Materials | 0.9% |
| Real Estate | 1.1% |
| Electric Utilities | 1.8% |
| Energy | 3.5% |
| Consumer Staples | 5.9% |
| Industrials | 9.1% |
| Consumer Discretionary | 9.7% |
| Communication Services | 9.9% |
| Health Care | 11.0% |
| Financials | 15.3% |
| Information Technology | 30.5% |
| Footnote | Description |
Footnote* | Percentages are calculated based on total net assets. |
| Holding Name | | | Percentage of Total Net AssetsFootnote Reference(A) |
|---|
| Microsoft | | | 7.6% |
| NVIDIA | | | 6.3% |
| Apple | | | 6.1% |
| Alphabet, Cl A | | | 4.5% |
| Amazon.Com | | | 3.8% |
| UnitedHealth Group | | | 2.7% |
| JPMorgan Chase | | | 2.7% |
| Trane Technologies | | | 2.6% |
| Costco Wholesale | | | 2.3% |
| Home Depot | | | 2.2% |
| Footnote | Description |
Footnote(A) | Short-Term Investments are not shown in the top ten chart. |
There were no material changes during the reporting period.
Changes in and Disagreements with Accountants
There were no changes in or disagreements with accountants during the reporting period.
For additional information about the Fund, including its prospectus, financial information, holdings, and proxy voting information, call or visit:
Rule 30e-1 of the Investment Company Act of 1940 permits funds to transmit only one copy of a proxy statement, annual report or semi-annual report to shareholders (who need not be related) with the same residential, commercial or electronic address, provided that the shareholders have consented in writing and the reports are addressed either to each shareholder individually or to the shareholders as a group. This process is known as “householding” and is designed to reduce the duplicate copies of materials that shareholders receive and to lower printing and mailing costs for funds. Once implemented, if you would like to discontinue householding for your accounts, please call toll-free at 1-888-889-0799 to request individual copies of these documents. Once the Fund receives notice to stop householding, we will begin sending individual copies 30 days after receiving your request.
City National Rochdale Funds
City National Rochdale U.S. Core Equity Fund / Class N Shares - CNRWX
Annual Shareholder Report - September 30, 2024
CNR-AR-TSR-2024-9
City National Rochdale Funds
City National Rochdale U.S. Core Equity Fund
Servicing Class Shares - CNRVX
Annual Shareholder Report - September 30, 2024
This annual shareholder report contains important information about Servicing Class Shares of the City National Rochdale U.S. Core Equity Fund (the "Fund") for the period from October 1, 2023 to September 30, 2024. You can find additional information about the Fund at https://www.citynationalrochdalefunds.com/dashboard. You can also request this information by contacting us at 1-888-889-0799.
What were the Fund costs for the last year?
(based on a hypothetical $10,000 investment)
| Fund Name | Costs of a $10,000 investment | Costs paid as a percentage of a $10,000 investment |
|---|
| City National Rochdale U.S. Core Equity Fund, Servicing Class Shares | $95 | 0.82% |
How did the Fund perform in the last year?
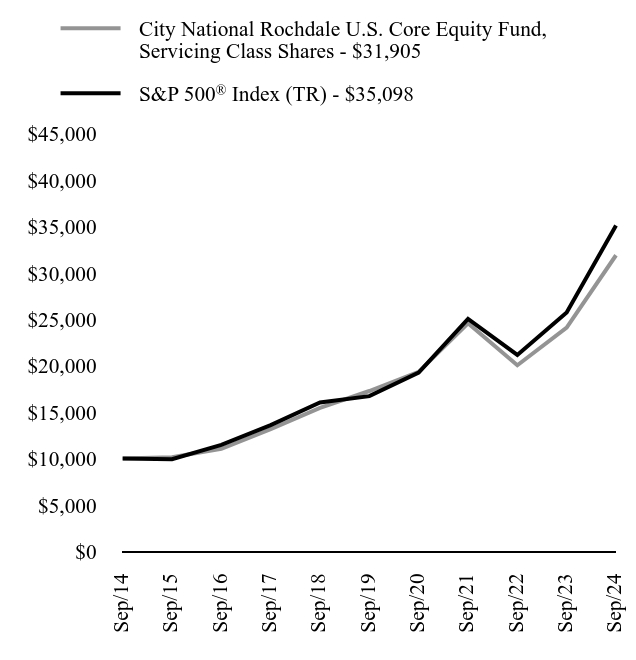
The Servicing Class shares of the Fund posted a return of 4.36% for Q3 2024, which underperformed the S&P 500 Index return of 5.89%. Calendar year to date, as of September 30, 2024, the Fund returned 18.57%, which underperformed its benchmark return of 22.08%. For the fiscal year ended September 30, 2024, the Fund returned 32.38%, which underperformed its benchmark return of 36.35%.
During 3Q, we continued to anticipate that a resilient economy would support the broadening of equity market participation later this year. Fed monetary policy easing, AI investment by major tech companies, and fading election uncertainty, all bode for the market. We made slight adjustments by increasing exposure to Financials and Energy, while reducing positions in Industrials, Consumer Staples and Healthcare. This shift reflected our favorable views in the cyclical industries and low-P/E segment of the market. We remain focused on our secular growth themes and large-cap high-quality companies with strong fundamentals.
How did the Fund perform during the last 10 years?
Total Return Based on $10,000 Investment
Average Annual Total Returns as of September 30, 2024
| Fund/Index Name | 1 Year | 5 Years | 10 Years |
|---|
| City National Rochdale U.S. Core Equity Fund, Servicing Class Shares | 32.38% | 13.05% | 12.30% |
S&P 500® Index (TR) | 36.35% | 15.98% | 13.38% |
| City National Rochdale U.S. Core Equity Fund, Servicing Class Shares - $31905 | S&P 500® Index (TR) - $35098 |
|---|
| Sep/14 | $10000 | $10000 |
| Sep/15 | $10148 | $9939 |
| Sep/16 | $11059 | $11472 |
| Sep/17 | $13175 | $13607 |
| Sep/18 | $15465 | $16044 |
| Sep/19 | $17280 | $16727 |
| Sep/20 | $19338 | $19260 |
| Sep/21 | $24583 | $25040 |
| Sep/22 | $20054 | $21165 |
| Sep/23 | $24101 | $25741 |
| Sep/24 | $31905 | $35098 |
The line graph represents historical performance of a hypothetical investment of $10,000 in the Fund during the last 10 years. Returns shown are total returns, which assume the reinvestment of dividends and capital gains. The table and graph presented above do not reflect the deduction of taxes a shareholder would pay on Fund distributions or the redemption of Fund shares. Past performance is not indicative of future performance.Call 1-888-889-0799 or visit https://www.citynationalrochdalefunds.com/dashboard for current month-end performance.
Key Fund Statistics as of September 30, 2024
| Total Net Assets (000's) | Number of Holdings | Total Advisory Fees Paid (000's) | Portfolio Turnover Rate |
|---|
| $412,442 | 55 | $1,542 | 20% |
What did the Fund invest in?
Asset/Sector WeightingsFootnote Reference*
| Value | Value |
|---|
| Short-Term Investment | 0.5% |
| Water Utilities | 0.8% |
| Materials | 0.9% |
| Real Estate | 1.1% |
| Electric Utilities | 1.8% |
| Energy | 3.5% |
| Consumer Staples | 5.9% |
| Industrials | 9.1% |
| Consumer Discretionary | 9.7% |
| Communication Services | 9.9% |
| Health Care | 11.0% |
| Financials | 15.3% |
| Information Technology | 30.5% |
| Footnote | Description |
Footnote* | Percentages are calculated based on total net assets. |
| Holding Name | | | Percentage of Total Net AssetsFootnote Reference(A) |
|---|
| Microsoft | | | 7.6% |
| NVIDIA | | | 6.3% |
| Apple | | | 6.1% |
| Alphabet, Cl A | | | 4.5% |
| Amazon.Com | | | 3.8% |
| UnitedHealth Group | | | 2.7% |
| JPMorgan Chase | | | 2.7% |
| Trane Technologies | | | 2.6% |
| Costco Wholesale | | | 2.3% |
| Home Depot | | | 2.2% |
| Footnote | Description |
Footnote(A) | Short-Term Investments are not shown in the top ten chart. |
There were no material changes during the reporting period.
Changes in and Disagreements with Accountants
There were no changes in or disagreements with accountants during the reporting period.
For additional information about the Fund, including its prospectus, financial information, holdings, and proxy voting information, call or visit:
Rule 30e-1 of the Investment Company Act of 1940 permits funds to transmit only one copy of a proxy statement, annual report or semi-annual report to shareholders (who need not be related) with the same residential, commercial or electronic address, provided that the shareholders have consented in writing and the reports are addressed either to each shareholder individually or to the shareholders as a group. This process is known as “householding” and is designed to reduce the duplicate copies of materials that shareholders receive and to lower printing and mailing costs for funds. Once implemented, if you would like to discontinue householding for your accounts, please call toll-free at 1-888-889-0799 to request individual copies of these documents. Once the Fund receives notice to stop householding, we will begin sending individual copies 30 days after receiving your request.
City National Rochdale Funds
City National Rochdale U.S. Core Equity Fund / Servicing Class Shares - CNRVX
Annual Shareholder Report - September 30, 2024
CNR-AR-TSR-2024-10
(b) Not applicable.
Item 2. Code of Ethics.
The City National Rochdale Funds (the “Registrant” or “Trust”) has adopted a code of ethics that applies to the Registrant’s principal executive officer, principal financial officer controller or principal accounting officer, and any person who performs a similar function. There have been no amendments to or waivers granted with respect to this code of ethics during the period covered by this report.
Item 3. Audit Committee Financial Expert.
(a)(1) The Registrant’s Board of Trustees has determined that the Registrant has at least one audit committee financial expert serving on the audit committee.
(a)(2) The audit committee financial expert is James R. Wolford. Mr. Wolford is independent as defined in Form N-CSR Item 3(a)(2).
Item 4. Principal Accountant Fees and Services.
Fees billed by Cohen & Company, LTD (“Cohen”) Related to the Trust
Cohen billed the Trust aggregate fees for services rendered to the Trust for the last two fiscal years as follows:
| | 2024 | 2023 |
| | | All fees and services to the Trust that were pre-approved | All fees and services to service affiliates that were pre-approved | All other fees and services to service affiliates that did not require pre-approval | All fees and services to the Trust that were pre-approved | All fees and services to service affiliates that were pre-approved | All other fees and services to service affiliates that did not require pre-approval |
| (a) | Audit Fees(1) | $191,500 | N/A | N/A | $179,000 | N/A | N/A |
| (b) | Audit-Related Fees | N/A | N/A | N/A | N/A | N/A | N/A |
| (c) | Tax Fees | N/A | N/A | N/A | N/A | N/A | N/A |
| (d) | All Other Fees | N/A | N/A | N/A | N/A | N/A | N/A |
Notes:
| (1) | Audit fees include amounts related to the audit of the Registrant’s annual financial statements and services normally provided by the accountant in connection with statutory and regulatory filings. |
(e)(1) Not Applicable
| (e)(2) | Percentage of fees billed applicable to non-audit services pursuant to waiver of pre-approval requirement were as follows: |
| | 2024 | 2023 |
Audit-Related Fees | N/A | N/A |
| Tax Fees | N/A | N/A |
All Other Fees | N/A | N/A |
(f) Not Applicable
| (g) | The aggregate non-audit fees and services billed by Cohen for the last two fiscal years were $0 and $0 for 2024 and 2023, respectively. |
(h) Not Applicable
| (i) | Not Applicable. The Registrant has not retained, for the preparation of the audit report on the financial statements included in the Form N-CSR, a registered public accounting firm that has a branch or office that is located in a foreign jurisdiction and that the Public Company Accounting Oversight Board (the “PCAOB”) has determined that the PCAOB is unable to inspect or investigate completely because of a position taken by an authority in the foreign jurisdiction. |
(j) Not Applicable. The Registrant is not a “foreign issuer,” as defined in 17 CFR § 240.3b-4.
Item 5. Audit Committee of Listed Registrants.
Not applicable to unlisted registrants.
Item 6. Investments
(a) The Schedule of Investments is included as part of the Financial Statements and Other Information filed under Item 7 of this form.
(b) Not applicable.
Item 7. Financial Statements and Financial Highlights for Open-End Management Investment Companies.
Financial statements and financial highlights are filed herein.
TABLE OF CONTENTS
| | City National Rochdale Funds Annual Financials and Other Information |
| | Financial Statements (Form N-CSR Item 7) |
2 | Schedules of Investments |
77 | Statements of Assets and Liabilities |
79 | Statements of Operations |
81 | Statements of Changes in Net Assets |
84 | Statement of Cash Flows |
86 | Financial Highlights |
88 | Notes to Financial Statements |
99 | Report of Independent Registered Public Accounting Firm |
100 | Notice to Shareholders |
101 | Board Approval of Advisory and Sub-Advisory Agreements (Form N-CSR Item 11)(Unaudited) |
CITY NATIONAL ROCHDALE FUNDS | PAGE 1
schedule of investments |
September 30, 2024 |
City National Rochdale Government Money Market Fund |
Description | | Face Amount (000) | | | Value (000) | |
U.S. Treasury Obligations [48.6%] |
United States Treasury Bill | | | | | | | | |
5.306%, 10/03/24(A) | | $ | 300,000 | | | $ | 299,913 | |
5.212%, 10/08/24(A) | | | 100,000 | | | | 99,899 | |
5.100%, 10/17/24(A) | | | 200,000 | | | | 199,550 | |
5.152%, 10/22/24(A) | | | 300,000 | | | | 299,105 | |
5.106%, 10/29/24(A) | | | 400,000 | | | | 398,424 | |
4.981%, 11/05/24(A) | | | 300,000 | | | | 298,557 | |
5.091%, 11/07/24(A) | | | 200,000 | | | | 198,965 | |
4.855%, 11/12/24(A) | | | 100,000 | | | | 99,438 | |
5.066%, 11/14/24(A) | | | 100,000 | | | | 99,388 | |
4.709%, 11/19/24(A) | | | 350,000 | | | | 347,773 | |
5.069%, 11/21/24(A) | | | 100,000 | | | | 99,290 | |
5.034%, 11/29/24(A) | | | 200,000 | | | | 198,370 | |
5.002%, 12/05/24(A) | | | 100,000 | | | | 99,108 | |
4.995%, 12/10/24(A) | | | 100,000 | | | | 99,043 | |
4.937%, 12/12/24(A) | | | 200,000 | | | | 198,050 | |
4.714%, 12/19/24(A) | | | 300,000 | | | | 296,933 | |
4.977%, 12/24/24(A) | | | 300,000 | | | | 296,570 | |
4.744%, 01/14/25(A) | | | 100,000 | | | | 98,637 | |
4.526%, 03/20/25(A) | | | 100,000 | | | | 97,910 | |
| | | | | | | | | | | | | |
Total U.S. Treasury Obligations |
(Cost $3,824,923) | | | 3,824,923 | |
| | | | | | | | | | | | | |
U.S. Government Agency Obligations [32.3%] |
Federal Farm Credit Bank (FFCB) [3.2%] |
FFCB | | | | | | | | |
4.970%, FEDL01 + 0.140%, 11/14/24(B) | | | 100,000 | | | | 100,000 | |
5.000%, FEDL01 + 0.170%, 01/06/25(B) | | | 50,000 | | | | 50,000 | |
5.090%, SOFR + 0.040%, 04/15/25(B) | | | 100,000 | | | | 100,000 | |
| | | | | | | | | | | | | |
Federal Home Loan Bank (FHLB) [29.1%] |
FHLB DN | | | | | | | | |
5.314%, 10/02/24(A) | | | 250,000 | | | | 249,964 | |
5.232%, 10/09/24(A) | | | 50,000 | | | | 49,942 | |
4.695%, 10/25/24(A) | | | 350,000 | | | | 348,909 | |
4.707%, 11/15/24(A) | | | 120,000 | | | | 119,299 | |
4.648%, 11/20/24(A) | | | 300,000 | | | | 298,077 | |
5.040%, 11/27/24(A) | | | 200,000 | | | | 198,424 | |
5.061%, 11/29/24(A) | | | 65,000 | | | | 64,467 | |
4.921%, 12/11/24(A) | | | 400,000 | | | | 396,165 | |
4.605%, 12/20/24(A) | | | 323,550 | | | | 320,275 | |
4.567%, 12/26/24(A) | | | 250,000 | | | | 247,304 | |
| | | | | | | | | | | | | |
Total U.S. Government Agency Obligations |
(Cost $2,542,826) | | | 2,542,826 | |
| | | | | | | | | | | | | |
Description | | Shares/Face Amount (000) | | | Value (000) | |
Short-Term Investment [1.7%] |
Morgan Stanley Institutional Liquidity Funds - Government Portfolio, Institutional Select, 4.780%** | | | 131,116,889 | | | $ | 131,117 | |
| | | | | | | | | | | | | |
Total Short-Term Investment |
(Cost $131,117) | | | 131,117 | |
| | | | | | | | | | | | | |
Repurchase Agreements [17.8%] |
Barclays (C) | | | | | | | | |
4.830%, dated 09/19/24, repurchased on 11/08/24, repurchase price $201,346,066 (collateralized by various U.S. Treasury obligations, par values ranging from $24,283,200-$50,000,000, 0.750%-3.875%, 01/31/2028-05/15/2043; with a total market value of $204,000,047) | | $ | 200,000 | | | | 200,000 | |
Barclays (C) | | | | | | | | |
4.750%, dated 09/30/24, repurchased on 10/01/24, repurchase price $50,006,619 (collateralized by various U.S. Treasury obligations, par values ranging from $25,828,600-$27,104,900, 0.000%-0.500%, 10/03/2024-05/31/2027; with a total market value of $51,000,046) | | | 50,000 | | | | 50,000 | |
Barclays MBS (C) | | | | | | | | |
4.800%, dated 09/30/24, repurchased on 10/01/24, repurchase price $100,013,377 (collateralized by various U.S. Treasury obligations, par values ranging from $1,000-$69,778,000, 0.000%-9.500%, 11/01/2024-12/15/2066; with a total market value of $102,000,012) | | | 100,000 | | | | 100,000 | |
Daiwa (C) | | | | | | | | |
4.780%, dated 09/30/24, repurchased on 10/01/24, repurchase price $152,020,415 (collateralized by various U.S. Treasury obligations, par values ranging from $100-$38,934,868, 0.000%-7.830%, 11/15/2024-09/01/2054; with a total market value of $156,317,313) | | | 152,000 | | | | 152,000 | |
See accompanying notes to financial statements.
CITY NATIONAL ROCHDALE FUNDS | PAGE 2
schedule of investments |
September 30, 2024 |
City National Rochdale Government Money Market Fund (concluded) |
Description | | Face Amount (000) | | | Value (000) | |
Daiwa MBS (C) | | | | | | | | |
4.800%, dated 09/30/24, repurchased on 10/01/24, repurchase price $200,026,919 (collateralized by various U.S. Treasury obligations, par values ranging from $100-$51,780,239, 1.250%-7.000%, 11/15/2025-10/01/2054; with a total market value of $205,258,298) | | $ | 200,000 | | | $ | 200,000 | |
Goldman Sachs (C) | | | | | | | | |
4.750%, dated 09/30/24, repurchased on 10/01/24, repurchase price $700,092,664 (collateralized by various U.S. Treasury obligations, par values ranging from $1,585,100-$714,017,900, 0.250%-3.500%, 10/31/2025-09/30/2026; with a total market value of $714,000,052) | | | 700,000 | | | | 700,000 | |
| | | | | | | | | | | | | |
Total Repurchase Agreements |
(Cost $1,402,000) | | | 1,402,000 | |
| | | | | | | | | | | | | |
Total Investments [100.4%] |
(Cost $7,900,866) | | $ | 7,900,866 | |
| | | | | | | | | | | | | |
Percentages are based on net assets of $7,870,331 (000).
** | The rate reported is the 7-day effective yield as of September 30, 2024. |
(A) | Interest rate represents the security’s effective yield at the time of purchase. |
(B) | Variable or floating rate security. The rate shown is the effective interest rate as of period end. The rates for certain securities are not based on published reference rates and spreads and are either determined by the issuer or agent based on current market conditions; by using a formula based on the rates of underlying loans; or by adjusting periodically based on prevailing interest rates. |
(C) | Tri-party Repurchase Agreement. |
DN — Discount Note
FEDL01 — Federal Funds Effective Rate
FFCB — Federal Farm Credit Bank
FHLB — Federal Home Loan Bank
SOFR — Secured Overnight Financing Rate
The following is a summary of the inputs used as of September 30, 2024, in valuing the Fund’s investments carried at value (000):
Investments in Securities | | Level 1 | | | Level 2 | | | Level 3 | | | Total | |
U.S. Treasury Obligations | | $ | — | | | $ | 3,824,923 | | | $ | — | | | $ | 3,824,923 | |
U.S. Government Agency Obligations | | | — | | | | 2,542,826 | | | | — | | | | 2,542,826 | |
Short-Term Investment | | | 131,117 | | | | — | | | | — | | | | 131,117 | |
Repurchase Agreements | | | — | | | | 1,402,000 | | | | — | | | | 1,402,000 | |
Total Investments in Securities | | $ | 131,117 | | | $ | 7,769,749 | | | $ | — | | | $ | 7,900,866 | |
Amounts designated as “—” are either $0 or have been rounded to $0.
For more information on valuation inputs, see Note 2 — Significant Accounting Policies in the Notes to Financial Statements.
See accompanying notes to financial statements.
CITY NATIONAL ROCHDALE FUNDS | PAGE 3
schedule of investments |
September 30, 2024 |
City National Rochdale Municipal High Income Fund |
Description | | Face Amount (000) | | | Value (000) | |
Municipal Bonds [97.6%] |
Alabama [1.4%] |
Energy Southeast A Cooperative District, Ser B, RB | | | | | | | | |
Callable 03/01/32 @ 100 | | | | | | | | |
5.250%, 07/01/54(A) | | $ | 1,000 | | | $ | 1,107 | |
Energy Southeast A Cooperative District, Ser B-1, RB | | | | | | | | |
Callable 08/01/31 @ 100 | | | | | | | | |
5.750%, 04/01/54(A) | | | 1,000 | | | | 1,136 | |
Hoover Industrial Development Board, RB, AMT | | | | | | | | |
Callable 10/01/29 @ 100 | | | | | | | | |
5.750%, 10/01/49 | | | 4,750 | | | | 5,009 | |
Mobile County, Industrial Development Authority, RB, AMT | | | | | | | | |
Callable 06/20/34 @ 100 | | | | | | | | |
5.000%, 06/01/54 | | | 1,000 | | | | 1,038 | |
Tuscaloosa County, Industrial Development Authority, Ser A, RB | | | | | | | | |
Callable 05/01/29 @ 100 | | | | | | | | |
5.250%, 05/01/44(B) | | | 3,000 | | | | 3,076 | |
| | | | | | | | | | | | | |
Total Alabama | | | 11,366 | |
| | | | | | | | | | | | | |
Alaska [0.3%] |
Northern Tobacco Securitization, Ser A-CLASS, RB | | | | | | | | |
Callable 06/01/31 @ 100 | | | | | | | | |
4.000%, 06/01/50 | | | 2,500 | | | | 2,324 | |
| | | | | | | | | | | | | |
Arizona [1.8%] |
Arizona State, Industrial Development Authority, RB | | | | | | | | |
Callable 07/01/28 @ 100 | | | | | | | | |
5.000%, 07/01/43(B) | | | 310 | | | | 313 | |
Arizona State, Industrial Development Authority, RB | | | | | | | | |
Callable 07/01/29 @ 100 | | | | | | | | |
5.000%, 01/01/54 | | | 375 | | | | 234 | |
Arizona State, Industrial Development Authority, RB | | | | | | | | |
Callable 07/15/29 @ 100 | | | | | | | | |
4.000%, 07/15/56(B) | | | 225 | | | | 186 | |
Maricopa County, Industrial Development Authority, RB | | | | | | | | |
Callable 07/01/30 @ 100 | | | | | | | | |
6.250%, 07/01/53(B) | | | 1,400 | | | | 1,446 | |
Phoenix, Civic Improvement, Ser A, RB | | | | | | | | |
Callable 07/01/25 @ 100 | | | | | | | | |
5.000%, 07/01/45 | | $ | 250 | | | $ | 252 | |
Phoenix, Industrial Development Authority, Legacy Traditional School Projects, RB | | | | | | | | |
Callable 07/01/25 @ 100 | | | | | | | | |
5.000%, 07/01/45(B) | | | 3,300 | | | | 3,310 | |
Pima County, Industrial Development Authority, Noah Webster School Project, RB | | | | | | | | |
Callable 11/04/24 @ 100 | | | | | | | | |
7.000%, 12/15/43 | | | 1,500 | | | | 1,502 | |
Sierra Vista, Industrial Development Authority, RB | | | | | | | | |
Callable 06/15/30 @ 100 | | | | | | | | |
5.750%, 06/15/53(B) | | | 5,400 | | | | 5,675 | |
Sierra Vista, Industrial Development Authority, RB | | | | | | | | |
Callable 06/15/31 @ 100 | | | | | | | | |
5.000%, 06/15/54(B) | | | 700 | | | | 706 | |
Tempe, Industrial Development Authority, Mirrabella at ASU Project, Ser A, RB | | | | | | | | |
Callable 10/01/27 @ 100 | | | | | | | | |
6.125%, 10/01/52(B) | | | 1,200 | | | | 746 | |
| | | | | | | | | | | | | |
Total Arizona | | | 14,370 | |
| | | | | | | | | | | | | |
Arkansas [0.6%] |
Arkansas State, Development Finance Authority, RB, AMT | | | | | | | | |
Callable 09/01/26 @ 103 | | | | | | | | |
4.500%, 09/01/49(B) | | | 4,750 | | | | 4,715 | |
| | | | | | | | | | | | | |
California [6.9%] |
California County, Tobacco Securitization Agency, Sub-Ser A, RB | | | | | | | | |
Callable 10/18/24 @ 25 | | | | | | | | |
0.000%, 06/01/46(C) | | | 10,000 | | | | 2,502 | |
California State, Community Choice Financing Authority, RB | | | | | | | | |
Callable 08/01/32 @ 100 | | | | | | | | |
3.000%, 02/01/57(B) | | | 7,500 | | | | 5,417 | |
See accompanying notes to financial statements.
CITY NATIONAL ROCHDALE FUNDS | PAGE 4
schedule of investments |
September 30, 2024 |
City National Rochdale Municipal High Income Fund (continued) |
Description | | Face Amount (000) | | | Value (000) | |
California State, Community Choice Financing Authority, Ser B-1-GREEN, RB | | | | | | | | |
Callable 05/01/31 @ 101 | | | | | | | | |
4.000%, 02/01/52(A) | | $ | 3,750 | | | $ | 3,867 | |
California State, Community Housing Agency, RB | | | | | | | | |
Callable 08/01/31 @ 100 | | | | | | | | |
4.000%, 02/01/56(B) | | | 3,000 | | | | 2,611 | |
California State, Infrastructure & Economic Development Bank, RB, AMT | | | | | | | | |
Callable 10/15/24 @ 103 | | | | | | | | |
8.000%, 01/01/50(A)(B) | | | 3,000 | | | | 3,090 | |
California State, Municipal Finance Authority, California Baptist University, Ser A, RB | | | | | | | | |
Callable 11/01/25 @ 100 | | | | | | | | |
5.500%, 11/01/45(B) | | | 4,000 | | | | 4,044 | |
California State, Municipal Finance Authority, RB | | | | | | | | |
Callable 09/01/29 @ 103 | | | | | | | | |
5.000%, 09/01/52 | | | 875 | | | | 915 | |
California State, Municipal Finance Authority, RB | | | | | | | | |
Callable 11/01/31 @ 100 | | | | | | | | |
4.000%, 11/01/36(B) | | | 2,370 | | | | 2,293 | |
California State, Municipal Finance Authority, Ser A, RB, AGM | | | | | | | | |
Callable 11/01/32 @ 100 | | | | | | | | |
5.250%, 11/01/52 | | | 1,000 | | | | 1,084 | |
California State, Municipal Finance Authority, Ser D, RB | | | | | | | | |
Callable 09/01/29 @ 103 | | | | | | | | |
6.000%, 09/01/42 | | | 2,000 | | | | 2,184 | |
California State, Pollution Control Financing Authority, RB, AMT | | | | | | | | |
7.500%, 07/01/32(B) (D) | | | 1,275 | | | | 17 | |
California State, Pollution Control Financing Authority, RB, AMT | | | | | | | | |
Callable 07/01/33 @ 100 | | | | | | | | |
5.000%, 07/01/34(B) | | | 1,000 | | | | 1,122 | |
California State, School Finance Authority, RB | | | | | | | | |
Callable 08/01/32 @ 100 | | | | | | | | |
5.375%, 08/01/42(B) | | | 50 | | | | 54 | |
California State, School Finance Authority, View Park Elementary & Middle School Project, Ser A, RB | | | | | | | | |
Callable 11/04/24 @ 100 | | | | | | | | |
6.000%, 10/01/49 | | $ | 1,120 | | | $ | 1,121 | |
California State, School Finance Authority, View Park Elementary & Middle School Project, Ser A, RB | | | | | | | | |
Callable 11/04/24 @ 100 | | | | | | | | |
5.875%, 10/01/44 | | | 1,000 | | | | 1,000 | |
California State, School Finance Authority, View Park Elementary & Middle School Project, Ser A, RB | | | | | | | | |
Callable 11/04/24 @ 100 | | | | | | | | |
5.625%, 10/01/34 | | | 575 | | | | 575 | |
California State, Statewide Communities Development Authority, RB | | | | | | | | |
Callable 06/01/28 @ 100 | | | | | | | | |
5.500%, 12/01/58(B) | | | 1,500 | | | | 1,553 | |
California State, Statewide Communities Development Authority, RB | | | | | | | | |
Callable 06/01/28 @ 100 | | | | | | | | |
5.250%, 12/01/43(B) | | | 500 | | | | 520 | |
California State, Statewide Communities Development Authority, RB | | | | | | | | |
Callable 12/01/24 @ 100 | | | | | | | | |
5.250%, 12/01/44 | | | 4,000 | | | | 4,000 | |
City & County of San Francisco California Community Facilities District No. 2016-1, SPL Tax | | | | | | | | |
Callable 09/01/28 @ 103 | | | | | | | | |
4.000%, 09/01/42(B) | | | 2,250 | | | | 2,182 | |
City & County of San Francisco California Infrastructure & Revitalization Fing Dist No. 1, SPL Tax | | | | | | | | |
Callable 09/01/32 @ 100 | | | | | | | | |
5.000%, 09/01/52(B) | | | 1,320 | | | | 1,339 | |
City & County of San Francisco California, San Francisco International Airport, RB, AMT | | | | | | | | |
Callable 05/01/34 @ 100 | | | | | | | | |
5.250%, 05/01/49 | | | 2,500 | | | | 2,740 | |
See accompanying notes to financial statements.
CITY NATIONAL ROCHDALE FUNDS | PAGE 5
schedule of investments |
September 30, 2024 |
City National Rochdale Municipal High Income Fund (continued) |
Description | | Face Amount (000) | | | Value (000) | |
CMFA Special Finance Agency VII, RB | | | | | | | | |
Callable 08/01/31 @ 100 | | | | | | | | |
3.000%, 08/01/56(B) | | $ | 5,500 | | | $ | 4,024 | |
CSCDA Community Improvement Authority, RB | | | | | | | | |
Callable 05/01/32 @ 100 | | | | | | | | |
3.250%, 05/01/57(B) | | | 3,430 | | | | 2,503 | |
CSCDA Community Improvement Authority, RB | | | | | | | | |
Callable 06/01/31 @ 100 | | | | | | | | |
3.000%, 06/01/47(B) | | | 3,840 | | | | 2,803 | |
Orange County Community Facilities District, Ser A, SPL Tax | | | | | | | | |
Callable 08/15/29 @ 103 | | | | | | | | |
5.000%, 08/15/52 | | | 3,200 | | | | 3,349 | |
Tejon Ranch Public Facilities Finance Authority, SPL Tax | | | | | | | | |
Callable 09/01/34 @ 100 | | | | | | | | |
5.000%, 09/01/54 | | | 1,000 | | | | 1,053 | |
| | | | | | | | | | | | | |
Total California | | | 57,962 | |
| | | | | | | | | | | | | |
Colorado [10.7%] |
9th Avenue Metropolitan District No. 2, GO | | | | | | | | |
Callable 11/04/24 @ 103 | | | | | | | | |
5.000%, 12/01/48 | | | 1,000 | | | | 966 | |
Amber Creek, Metropolitan District, Ser A, GO | | | | | | | | |
Callable 11/04/24 @ 102 | | | | | | | | |
5.125%, 12/01/47 | | | 1,041 | | | | 957 | |
Amber Creek, Metropolitan District, Ser A, GO | | | | | | | | |
Callable 11/04/24 @ 102 | | | | | | | | |
5.000%, 12/01/37 | | | 684 | | | | 648 | |
Banning Lewis Ranch Metropolitan District No. 8, GO | | | | | | | | |
Callable 06/01/26 @ 103 | | | | | | | | |
4.875%, 12/01/51(B) | | | 3,500 | | | | 2,922 | |
Broadway Station Metropolitan District No. 2, Ser A, GO | | | | | | | | |
Callable 11/04/24 @ 103 | | | | | | | | |
5.000%, 12/01/35 | | | 729 | | | | 629 | |
Broadway Station Metropolitan District No. 3, GO | | | | | | | | |
Callable 11/04/24 @ 103 | | | | | | | | |
5.000%, 12/01/49 | | | 1,500 | | | | 1,233 | |
Buffalo Highlands Metropolitan District, Ser A, GO | | | | | | | | |
Callable 10/23/24 @ 103 | | | | | | | | |
5.375%, 12/01/48 | | $ | 1,775 | | | $ | 1,782 | |
Canyons Metropolitan District No. 5, Ser A, GO | | | | | | | | |
Callable 11/04/24 @ 102 | | | | | | | | |
6.125%, 12/01/47 | | | 1,000 | | | | 1,005 | |
Canyons Metropolitan District No. 5, Ser A, GO | | | | | | | | |
Callable 11/04/24 @ 102 | | | | | | | | |
6.000%, 12/01/37 | | | 2,000 | | | | 2,007 | |
Chambers Highpoint Metropolitan District No. 2, GO | | | | | | | | |
Callable 09/01/26 @ 103 | | | | | | | | |
5.000%, 12/01/41 | | | 515 | | | | 485 | |
Chambers Highpoint Metropolitan District No. 2, GO | | | | | | | | |
Callable 09/01/26 @ 103 | | | | | | | | |
5.000%, 12/01/51 | | | 1,505 | | | | 1,363 | |
Colorado State, Educational & Cultural Facilities Authority, Aspen Ridge School Project, RB | | | | | | | | |
Callable 07/01/25 @ 100 | | | | | | | | |
5.250%, 07/01/46(B) | | | 1,930 | | | | 1,936 | |
Colorado State, Educational & Cultural Facilities Authority, Aspen Ridge School Project, RB | | | | | | | | |
Callable 07/01/25 @ 100 | | | | | | | | |
5.000%, 07/01/36(B) | | | 1,415 | | | | 1,421 | |
Colorado State, Educational & Cultural Facilities Authority, Charter School Preparatory School Project, RB | | | | | | | | |
Pre-Refunded @ 100 | | | | | | | | |
5.250%, 04/01/25(B) (E) | | | 2,655 | | | | 2,679 | |
Colorado State, Educational & Cultural Facilities Authority, Charter School Preparatory School Project, RB | | | | | | | | |
Pre-Refunded @ 100 | | | | | | | | |
5.125%, 04/01/25(B) (E) | | | 1,515 | | | | 1,528 | |
Colorado State, Health Facilities Authority, RB | | | | | | | | |
Callable 05/15/28 @ 100 | | | | | | | | |
5.000%, 11/15/48 | | | 2,800 | | | | 2,897 | |
Colorado State, Health Facilities Authority, RB | | | | | | | | |
Callable 11/15/31 @ 100 | | | | | | | | |
4.000%, 11/15/50 | | | 1,950 | | | | 1,908 | |
See accompanying notes to financial statements.
CITY NATIONAL ROCHDALE FUNDS | PAGE 6
schedule of investments |
September 30, 2024 |
City National Rochdale Municipal High Income Fund (continued) |
Description | | Face Amount (000) | | | Value (000) | |
Colorado State, Health Facilities Authority, Ser A, RB | | | | | | | | |
Callable 05/15/28 @ 103 | | | | | | | | |
5.000%, 05/15/35 | | $ | 1,170 | | | $ | 1,006 | |
Colorado State, Health Facilities Authority, Ser A, RB | | | | | | | | |
Callable 05/15/28 @ 103 | | | | | | | | |
5.000%, 05/15/49 | | | 3,000 | | | | 2,137 | |
Colorado State, Health Facilities Authority, Ser A, RB | | | | | | | | |
Callable 05/15/28 @ 103 | | | | | | | | |
5.000%, 05/15/58 | | | 4,750 | | | | 3,202 | |
Colorado State, Health Facilities Authority, Ser A-, RB | | | | | | | | |
Callable 08/01/29 @ 100 | | | | | | | | |
4.000%, 08/01/44 | | | 4,155 | | | | 4,040 | |
Colorado State, High Performance Transportation Enterprise, U.S. 36 & I-25 Managed Lanes Project, RB, AMT | | | | | | | | |
Callable 11/04/24 @ 100 | | | | | | | | |
5.750%, 01/01/44 | | | 2,000 | | | | 2,005 | |
Constitution Heights Metropolitan District, GO | | | | | | | | |
Callable 06/01/25 @ 103 | | | | | | | | |
5.000%, 12/01/49 | | | 1,260 | | | | 1,244 | |
Cottonwood Highlands Metropolitan District No. 1, Ser A, GO | | | | | | | | |
Callable 10/23/24 @ 103 | | | | | | | | |
5.000%, 12/01/49 | | | 1,398 | | | | 1,407 | |
Denver, International Business Center Metropolitan District No. 1, Ser A, RB | | | | | | | | |
Callable 10/23/24 @ 100 | | | | | | | | |
4.000%, 12/01/48 | | | 850 | | | | 726 | |
Erie Highlands, Metropolitan District No. 1, GO, BAM | | | | | | | | |
Callable 12/01/30 @ 100 | | | | | | | | |
2.250%, 12/01/40 | | | 900 | | | | 687 | |
First Creek Village Metropolitan District, Ser A, GO | | | | | | | | |
Callable 10/23/24 @ 103 | | | | | | | | |
3.000%, 12/01/29 | | | 500 | | | | 483 | |
Four Corners Business Improvement District, GO | | | | | | | | |
Callable 09/01/27 @ 103 | | | | | | | | |
6.000%, 12/01/52 | | | 1,130 | | | | 1,167 | |
Green Valley Ranch East Metropolitan District No. 6, Ser A, GO | | | | | | | | |
Callable 09/01/25 @ 103 | | | | | | | | |
5.875%, 12/01/50 | | $ | 1,195 | | | $ | 1,210 | |
Greenways Metropolitan District No. 1, Ser A, GO | | | | | | | | |
Callable 09/01/26 @ 103 | | | | | | | | |
4.625%, 12/01/51 | | | 3,685 | | | | 2,747 | |
Jefferson Center, Metropolitan District No. 1, Ser A-2, RB | | | | | | | | |
Callable 11/04/24 @ 103 | | | | | | | | |
4.375%, 12/01/47 | | | 250 | | | | 238 | |
Jefferson Center, Metropolitan District No. 1, Ser A-2, RB | | | | | | | | |
Callable 11/04/24 @ 103 | | | | | | | | |
4.125%, 12/01/40 | | | 575 | | | | 543 | |
Karl’s Farm Metropolitan District No. 2, Ser A, GO | | | | | | | | |
Callable 09/01/25 @ 103 | | | | | | | | |
5.625%, 12/01/50(B) | | | 1,900 | | | | 1,892 | |
Karl’s Farm Metropolitan District No. 2, Ser A, GO | | | | | | | | |
Callable 09/01/25 @ 103 | | | | | | | | |
5.375%, 12/01/40(B) | | | 645 | | | | 643 | |
Lanterns Metropolitan District No. 3, Sub-Ser A-1, GO | | | | | | | | |
Callable 12/01/28 @ 103 | | | | | | | | |
7.250%, 12/01/53 | | | 2,300 | | | | 2,458 | |
Legato Community Authority, Ser A-1, RB | | | | | | | | |
Callable 06/01/26 @ 103 | | | | | | | | |
5.000%, 12/01/51 | | | 1,025 | | | | 927 | |
Legato Community Authority, Ser A-2, RB | | | | | | | | |
Callable 06/01/26 @ 101 | | | | | | | | |
0.000%, 12/01/51(F) | | | 7,335 | | | | 5,739 | |
Mirabelle Metropolitan District No. 2, Ser A, GO | | | | | | | | |
Callable 03/01/25 @ 103 | | | | | | | | |
5.000%, 12/01/49 | | | 1,950 | | | | 1,966 | |
North Holly, Metropolitan District, Ser A, GO | | | | | | | | |
Callable 10/23/24 @ 103 | | | | | | | | |
5.500%, 12/01/48 | | | 1,755 | | | | 1,766 | |
North Range Metropolitan District No. 3, Ser A, GO | | | | | | | | |
Callable 12/01/25 @ 103 | | | | | | | | |
5.250%, 12/01/50 | | | 3,000 | | | | 3,045 | |
See accompanying notes to financial statements.
CITY NATIONAL ROCHDALE FUNDS | PAGE 7
schedule of investments |
September 30, 2024 |
City National Rochdale Municipal High Income Fund (continued) |
Description | | Face Amount (000) | | | Value (000) | |
Poudre Heights Valley Metropolitan District, Ser A, GO | | | | | | | | |
Callable 09/01/29 @ 103 | | | | | | | | |
5.500%, 12/01/54(B) | | $ | 975 | | | $ | 978 | |
Rampart Range Metropolitan District No. 5, RB | | | | | | | | |
Callable 10/01/26 @ 102 | | | | | | | | |
4.000%, 12/01/51 | | | 3,725 | | | | 3,195 | |
Regional Transportation District, RB | | | | | | | | |
4.000%, 07/15/40 | | | 500 | | | | 504 | |
Senac South Metropolitan District No. 1, Ser A, GO | | | | | | | | |
Callable 12/01/26 @ 103 | | | | | | | | |
5.250%, 12/01/51 | | | 5,000 | | | | 4,622 | |
Southglenn, Metropolitan District, GO | | | | | | | | |
Callable 11/04/24 @ 101 | | | | | | | | |
5.000%, 12/01/46 | | | 1,558 | | | | 1,518 | |
Spring Hill, Metropolitan District No. 3, Ser A, GO | | | | | | | | |
Callable 12/01/27 @ 103 | | | | | | | | |
6.750%, 12/01/52(B) | | | 500 | | | | 519 | |
Sterling Ranch Community Authority Board, RB | | | | | | | | |
Callable 06/01/29 @ 103 | | | | | | | | |
6.500%, 12/01/54 | | | 1,000 | | | | 1,054 | |
Verve Metropolitan District No. 1, GO | | | | | | | | |
Callable 03/01/26 @ 103 | | | | | | | | |
5.000%, 12/01/51 | | | 2,000 | | | | 1,633 | |
Village at Dry Creek Metropolitan District No. 2, GO | | | | | | | | |
Callable 11/04/24 @ 103 | | | | | | | | |
4.375%, 12/01/44 | | | 945 | | | | 943 | |
Villas Metropolitan District, Ser A, GO | | | | | | | | |
Callable 11/04/24 @ 103 | | | | | | | | |
5.125%, 12/01/48 | | | 1,233 | | | | 1,261 | |
Water Valley, Metropolitan District No. 02, GO | | | | | | | | |
Callable 12/01/26 @ 100 | | | | | | | | |
4.000%, 12/01/33 | | | 250 | | | | 238 | |
Westcreek Metropolitan District No. 2, Ser A, GO | | | | | | | | |
Callable 10/23/24 @ 103 | | | | | | | | |
5.375%, 12/01/48 | | | 1,300 | | | | 1,309 | |
Wild Plum Metropolitan District, Ser A, GO | | | | | | | | |
Pre-Refunded @ 100 | | | | | | | | |
5.000%, 12/01/24(E) | | | 595 | | | | 614 | |
Wyndham Hill Metropolitan District No. 2, Ser A, GO, BAM | | | | | | | | |
Callable 12/01/28 @ 100 | | | | | | | | |
4.000%, 12/01/49 | | $ | 1,500 | | | $ | 1,454 | |
| | | | | | | | | | | | | |
Total Colorado | | | 87,486 | |
| | | | | | | | | | | | | |
District of Columbia [0.6%] |
District of Columbia, Ser A, GO | | | | | | | | |
Callable 04/15/29 @ 100 | | | | | | | | |
4.000%, 10/15/39 | | | 5,000 | | | | 5,094 | |
| | | | | | | | | | | | | |
Florida [6.9%] |
Alachua County, Health Facilities Authority, RB | | | | | | | | |
Callable 11/15/24 @ 100 | | | | | | | | |
6.375%, 11/15/49(D) | | | 5,190 | | | | 3,475 | |
Capital Trust Agency, Pineapple Cove Classical Academy, RB | | | | | | | | |
Callable 01/01/29 @ 100 | | | | | | | | |
5.375%, 07/01/54(B) | | | 1,500 | | | | 1,474 | |
Capital Trust Agency, Pineapple Cove Classical Academy, RB | | | | | | | | |
Callable 01/01/29 @ 100 | | | | | | | | |
5.125%, 07/01/39(B) | | | 1,500 | | | | 1,510 | |
Capital Trust Agency, RB | | | | | | | | |
Callable 06/15/26 @ 100 | | | | | | | | |
4.000%, 06/15/41(B) | | | 2,250 | | | | 1,979 | |
Capital Trust Agency, Renaissance Charter School Project, RB | | | | | | | | |
Callable 06/15/26 @ 100 | | | | | | | | |
5.000%, 06/15/39(B) | | | 3,610 | | | | 3,615 | |
Capital Trust Agency, Renaissance Charter School Project, RB | | | | | | | | |
Callable 06/15/26 @ 100 | | | | | | | | |
5.000%, 06/15/49(B) | | | 2,750 | | | | 2,707 | |
Charlotte County, Industrial Development Authority, RB, AMT | | | | | | | | |
Callable 10/01/27 @ 100 | | | | | | | | |
5.000%, 10/01/49(B) | | | 1,915 | | | | 1,930 | |
Charlotte County, Industrial Development Authority, RB, AMT | | | | | | | | |
Callable 10/01/31 @ 100 | | | | | | | | |
4.000%, 10/01/41(B) | | | 905 | | | | 845 | |
See accompanying notes to financial statements.
CITY NATIONAL ROCHDALE FUNDS | PAGE 8
schedule of investments |
September 30, 2024 |
City National Rochdale Municipal High Income Fund (continued) |
Description | | Face Amount (000) | | | Value (000) | |
County of Monroe Florida Airport Revenue, Ser 202, RB, AMT | | | | | | | | |
Callable 10/01/32 @ 100 | | | | | | | | |
5.000%, 10/01/52 | | $ | 750 | | | $ | 767 | |
Florida State, Development Finance, RB, AMT | | | | | | | | |
Callable 11/04/24 @ 103 | | | | | | | | |
8.250%, 07/01/57(A)(B) | | | 3,000 | | | | 3,090 | |
Florida State, Development Finance, RB | | | | | | | | |
Callable 06/15/32 @ 100 | | | | | | | | |
5.750%, 06/15/47 | | | 2,750 | | | | 2,931 | |
Florida State, Development Finance, RB | | | | | | | | |
Callable 06/01/27 @ 103 | | | | | | | | |
5.250%, 06/01/50(B) | | | 100 | | | | 100 | |
Florida State, Development Finance, RB | | | | | | | | |
Callable 06/01/28 @ 103 | | | | | | | | |
5.000%, 06/01/35(B) | | | 200 | | | | 209 | |
Florida State, Development Finance, RB | | | | | | | | |
Callable 09/15/27 @ 100 | | | | | | | | |
5.000%, 09/15/40(B) | | | 1,045 | | | | 1,024 | |
Florida State, Development Finance, RB | | | | | | | | |
Callable 09/15/27 @ 100 | | | | | | | | |
5.000%, 09/15/50(B) | | | 1,950 | | | | 1,818 | |
Florida State, Development Finance, RB | | | | | | | | |
Callable 06/01/28 @ 103 | | | | | | | | |
4.000%, 06/01/46(B) | | | 300 | | | | 248 | |
Florida State, Development Finance, RB, AMT | | | | | | | | |
Callable 04/02/26 @ 100 | | | | | | | | |
6.125%, 07/01/32(A)(B) | | | 2,970 | | | | 3,052 | |
Florida State, Development Finance, RB, AMT | | | | | | | | |
5.250%, 08/01/29(B) | | | 1,375 | | | | 1,434 | |
Florida State, Development Finance, RB, AMT | | | | | | | | |
Callable 11/04/24 @ 103 | | | | | | | | |
5.000%, 05/01/29(B) | | | 3,500 | | | | 3,575 | |
Florida State, Development Finance, Renaissance Charter School Project, RB | | | | | | | | |
Callable 06/15/25 @ 100 | | | | | | | | |
6.125%, 06/15/46(B) | | | 4,930 | | | | 4,965 | |
Florida State, Development Finance, Renaissance Charter School Project, Ser A, RB | | | | | | | | |
Callable 11/04/24 @ 100 | | | | | | | | |
6.125%, 06/15/44(B) | | $ | 3,000 | | | $ | 3,002 | |
Florida State, Development Finance, Renaissance Charter School Project, Ser A, RB | | | | | | | | |
Callable 11/04/24 @ 100 | | | | | | | | |
6.000%, 06/15/34(B) | | | 2,110 | | | | 2,113 | |
Lakewood Ranch, Stewardship District, SAB | | | | | | | | |
Callable 05/01/27 @ 100 | | | | | | | | |
5.250%, 05/01/37 | | | 1,810 | | | | 1,853 | |
Lakewood Ranch, Stewardship District, SPA | | | | | | | | |
Callable 05/01/33 @ 100 | | | | | | | | |
6.125%, 05/01/43 | | | 1,000 | | | | 1,077 | |
Lakewood Ranch, Stewardship District, SPA | | | | | | | | |
5.450%, 05/01/33 | | | 500 | | | | 532 | |
Miami-Dade County, Industrial Development Authority, Pinecrest Academy Project, RB | | | | | | | | |
Callable 11/04/24 @ 100 | | | | | | | | |
5.250%, 09/15/44 | | | 2,500 | | | | 2,500 | |
Miami-Dade County, Industrial Development Authority, Youth CO-OP Charter Schools Project, Ser A, RB | | | | | | | | |
Callable 09/15/25 @ 100 | | | | | | | | |
5.750%, 09/15/35(B) | | | 1,605 | | | | 1,616 | |
Palm Beach County Educational Facilities Authority, RB | | | | | | | | |
Callable 04/01/34 @ 100 | | | | | | | | |
5.250%, 10/01/53 | | | 845 | | | | 884 | |
Palm Beach County, Health Facilities Authority, RB | | | | | | | | |
Callable 06/01/25 @ 103 | | | | | | | | |
5.000%, 06/01/55 | | | 145 | | | | 146 | |
Village Community Development District No. 14, SAB | | | | | | | | |
Callable 05/01/30 @ 100 | | | | | | | | |
5.375%, 05/01/42 | | | 2,475 | | | | 2,615 | |
Village Community Development District No. 15, SAB | | | | | | | | |
Callable 05/01/32 @ 100 | | | | | | | | |
4.800%, 05/01/55(B) | | | 1,000 | | | | 1,013 | |
See accompanying notes to financial statements.
CITY NATIONAL ROCHDALE FUNDS | PAGE 9
schedule of investments |
September 30, 2024 |
City National Rochdale Municipal High Income Fund (continued) |
Description | | Face Amount (000) | | | Value (000) | |
Village Community Development District No. 15, SAB | | | | | | | | |
Callable 05/01/32 @ 100 | | | | | | | | |
4.550%, 05/01/44(B) | | $ | 1,000 | | | $ | 1,015 | |
| | | | | | | | | | | | | |
Total Florida | | | 59,114 | |
| | | | | | | | | | | | | |
Georgia [0.8%] |
Atlanta, Airport Passenger Facility Charge, Sub-Ser, RB, AMT | | | | | | | | |
Callable 07/01/29 @ 100 | | | | | | | | |
4.000%, 07/01/38 | | | 4,000 | | | | 4,019 | |
Gainesville & Hall County, Development Authority, Riverside Military Academy, RB | | | | | | | | |
Callable 03/01/27 @ 100 | | | | | | | | |
5.000%, 03/01/47 | | | 4,000 | | | | 2,863 | |
| | | | | | | | | | | | | |
Total Georgia | | | 6,882 | |
| | | | | | | | | | | | | |
Idaho [0.3%] |
Idaho Falls Auditorium District, RB | | | | | | | | |
Callable 05/15/26 @ 102 | | | | | | | | |
5.250%, 05/15/51(B) | | | 2,250 | | | | 2,274 | |
| | | | | | | | | | | | | |
Illinois [10.2%] |
Aurora, Tax Increase Revenue, Ser A, RB | | | | | | | | |
5.000%, 12/30/27 | | | 500 | | | | 501 | |
Bridgeview Village, Ser A, GO | | | | | | | | |
Callable 12/01/25 @ 100 | | | | | | | | |
5.750%, 12/01/35 | | | 2,000 | | | | 2,018 | |
Chicago, Board of Education, Ser B, GO | | | | | | | | |
Callable 12/01/27 @ 100 | | | | | | | | |
7.000%, 12/01/42(B) | | | 2,500 | | | | 2,718 | |
Chicago, O’Hare International Airport, Ser A, RB, AMT | | | | | | | | |
Callable 01/01/29 @ 100 | | | | | | | | |
5.000%, 01/01/48 | | | 6,300 | | | | 6,470 | |
Chicago, Ser A, GO | | | | | | | | |
Callable 01/01/27 @ 100 | | | | | | | | |
6.000%, 01/01/38 | | | 5,000 | | | | 5,225 | |
Illinois State, Finance Authority, Presence Health Network, Ser C, RB | | | | | | | | |
Callable 02/15/27 @ 100 | | | | | | | | |
5.000%, 02/15/36 | | | 1,935 | | | | 2,022 | |
Illinois State, Finance Authority, Presence Health Network, Ser C, RB | | | | | | | | |
Callable 02/15/27 @ 100 | | | | | | | | |
5.000%, 02/15/41 | | $ | 1,000 | | | $ | 1,030 | |
Illinois State, Finance Authority, RB | | | | | | | | |
Callable 11/15/29 @ 103 | | | | | | | | |
6.500%, 05/15/42 | | | 1,000 | | | | 1,093 | |
Illinois State, Finance Authority, RB | | | | | | | | |
Callable 11/15/29 @ 103 | | | | | | | | |
6.500%, 05/15/47 | | | 1,000 | | | | 1,081 | |
Illinois State, Finance Authority, RB | | | | | | | | |
Callable 01/01/30 @ 102 | | | | | | | | |
6.375%, 01/01/48(B) | | | 4,260 | | | | 4,422 | |
Illinois State, Finance Authority, RB | | | | | | | | |
Callable 09/01/32 @ 100 | | | | | | | | |
5.000%, 03/01/52 | | | 830 | | | | 807 | |
Illinois State, Finance Authority, RB | | | | | | | | |
Callable 04/01/31 @ 100 | | | | | | | | |
4.000%, 10/01/32 | | | 400 | | | | 356 | |
Illinois State, Finance Authority, RB | | | | | | | | |
Callable 04/01/31 @ 100 | | | | | | | | |
4.000%, 10/01/33 | | | 350 | | | | 311 | |
Illinois State, Finance Authority, RB | | | | | | | | |
Callable 04/01/31 @ 100 | | | | | | | | |
4.000%, 10/01/38 | | | 230 | | | | 190 | |
Illinois State, Finance Authority, RB | | | | | | | | |
Callable 10/01/30 @ 100 | | | | | | | | |
4.000%, 10/01/40 | | | 4,250 | | | | 4,122 | |
Illinois State, Finance Authority, RB, AMT | | | | | | | | |
Callable 06/01/33 @ 100 | | | | | | | | |
7.375%, 09/01/42(A)(B) | | | 1,500 | | | | 1,772 | |
Illinois State, Finance Authority, RB, AMT | | | | | | | | |
Callable 06/03/30 @ 100 | | | | | | | | |
7.250%, 09/01/52(A)(B) | | | 1,500 | | | | 1,692 | |
Illinois State, Finance Authority, Ser A, RB | | | | | | | | |
Callable 10/01/28 @ 101 | | | | | | | | |
6.000%, 04/01/38(B) | | | 2,130 | | | | 2,166 | |
Illinois State, Finance Authority, Ser A, RB | | | | | | | | |
Callable 05/15/25 @ 100 | | | | | | | | |
5.000%, 11/15/38 | | | 1,010 | | | | 1,018 | |
See accompanying notes to financial statements.
CITY NATIONAL ROCHDALE FUNDS | PAGE 10
schedule of investments |
September 30, 2024 |
City National Rochdale Municipal High Income Fund (continued) |
Description | | Face Amount (000) | | | Value (000) | |
Illinois State, Finance Authority, Ser A, RB | | | | | | | | |
Callable 11/01/26 @ 103 | | | | | | | | |
5.000%, 11/01/49 | | $ | 2,000 | | | $ | 1,311 | |
Illinois State, Finance Authority, Ser S, RB | | | | | | | | |
Callable 12/01/25 @ 100 | | | | | | | | |
5.000%, 12/01/37 | | | 2,425 | | | | 2,427 | |
Illinois State, Finance Authority, Wesleyan University, RB | | | | | | | | |
Callable 09/01/26 @ 100 | | | | | | | | |
4.000%, 09/01/41 | | | 5,140 | | | | 4,982 | |
Illinois State, GO | | | | | | | | |
Callable 01/14/25 @ 100 | | | | | | | | |
5.000%, 05/01/27 | | | 5,000 | | | | 5,022 | |
Illinois State, GO | | | | | | | | |
Callable 01/14/25 @ 100 | | | | | | | | |
5.000%, 05/01/31 | | | 5,000 | | | | 5,022 | |
Illinois State, GO | | | | | | | | |
Callable 01/14/25 @ 100 | | | | | | | | |
5.000%, 05/01/35 | | | 5,000 | | | | 5,022 | |
Illinois State, Housing Development Authority, Stonebridge Gurnee Project, Ser A, RB | | | | | | | | |
Callable 01/01/26 @ 100 | | | | | | | | |
5.600%, 01/01/56(B) | | | 5,200 | | | | 3,925 | |
Morton Grove, Tax Increment Revenue, RB | | | | | | | | |
Callable 01/01/26 @ 100 | | | | | | | | |
5.000%, 01/01/39 | | | 2,000 | | | | 1,955 | |
Morton Grove, Tax Increment Revenue, RB | | | | | | | | |
Callable 01/01/26 @ 100 | | | | | | | | |
4.250%, 01/01/29 | | | 675 | | | | 667 | |
Southwestern Illinois, Development Authority, Collinsville Project, RB | | | | | | | | |
Callable 11/04/24 @ 100 | | | | | | | | |
5.350%, 03/01/31 | | | 75 | | | | 55 | |
Upper Illinois River Valley Development Authority, RB | | | | | | | | |
Callable 12/01/28 @ 100 | | | | | | | | |
5.000%, 12/01/48 | | | 2,000 | | | | 2,013 | |
Village of Bolingbrook, Special Service Area No. 1, SPL Tax | | | | | | | | |
Callable 03/01/28 @ 100 | | | | | | | | |
5.250%, 03/01/41 | | | 4,500 | | | | 4,575 | |
Village of Gilberts, RB | | | | | | | | |
Callable 10/18/24 @ 100 | | | | | | | | |
5.000%, 11/15/34 | | | 2,155 | | | | 2,135 | |
Village of Hodgkins, Redevelopment Project Area #4, TA | | | | | | | | |
Callable 01/01/27 @ 100 | | | | | | | | |
5.625%, 01/01/37 | | $ | 4,510 | | | $ | 4,538 | |
Village of Lincolnwood Il, Ser A, RB | | | | | | | | |
Callable 11/10/26 @ 100 | | | | | | | | |
4.820%, 01/01/41(B) | | | 415 | | | | 411 | |
Village of Matteson Illinois, GO | | | | | | | | |
Callable 12/01/26 @ 100 | | | | | | | | |
6.500%, 12/01/35 | | | 750 | | | | 780 | |
Village of Villa Park Illinois, TA | | | | | | | | |
Callable 12/31/28 @ 100 | | | | | | | | |
0.000%, 12/31/38(F) | | | 1,680 | | | | 1,414 | |
| | | | | | | | | | | | | |
Total Illinois | | | 85,268 | |
| | | | | | | | | | | | | |
Indiana [1.8%] |
Anderson Indiana, RB | | | | | | | | |
Callable 01/01/27 @ 102 | | | | | | | | |
5.375%, 01/01/40(B) | | | 2,745 | | | | 2,358 | |
Anderson Indiana, RB | | | | | | | | |
5.000%, 01/01/25 | | | 100 | | | | 100 | |
Indiana State, Finance Authority, RB, AMT | | | | | | | | |
Callable 11/01/30 @ 100 | | | | | | | | |
6.750%, 05/01/39 | | | 1,750 | | | | 2,031 | |
Indiana State, Housing & Community Development Authority, Ser A, RB | | | | | | | | |
Callable 04/01/29 @ 102 | | | | | | | | |
5.250%, 04/01/41(B) | | | 5,750 | | | | 4,920 | |
Indianapolis Local Public Improvement Bond Bank, RB | | | | | | | | |
Callable 03/01/33 @ 100 | | | | | | | | |
6.000%, 03/01/53 | | | 600 | | | | 667 | |
Lafayette City, Finance Authority, Glasswater Creek Project, RB | | | | | | | | |
Callable 07/01/26 @ 101 | | | | | | | | |
5.800%, 01/01/37 | | | 3,310 | | | | 3,329 | |
Terre Haute, Westminster Village Project, RB | | | | | | | | |
Callable 11/04/24 @ 100 | | | | | | | | |
6.000%, 08/01/39 | | | 2,355 | | | | 2,004 | |
| | | | | | | | | | | | | |
Total Indiana | | | 15,409 | |
| | | | | | | | | | | | | |
See accompanying notes to financial statements.
CITY NATIONAL ROCHDALE FUNDS | PAGE 11
schedule of investments |
September 30, 2024 |
City National Rochdale Municipal High Income Fund (continued) |
Description | | Face Amount (000) | | | Value (000) | |
Iowa [0.2%] |
Iowa State, Finance Authority, Child Serve Project, Ser B, RB | | | | | | | | |
Callable 06/01/25 @ 100 | | | | | | | | |
5.000%, 06/01/36 | | $ | 2,000 | | | $ | 2,006 | |
| | | | | | | | | | | | | |
Kansas [0.8%] |
University of Kansas Hospital Authority, RB | | | | | | | | |
Pre-Refunded @ 100 | | | | | | | | |
4.000%, 03/01/27(E) | | | 1,330 | | | | 1,376 | |
University of Kansas Hospital Authority, RB | | | | | | | | |
Callable 03/01/27 @ 100 | | | | | | | | |
4.000%, 03/01/42 | | | 1,170 | | | | 1,158 | |
Wyandotte County, Kansas City Unified Government, RB | | | | | | | | |
Callable 09/01/25 @ 100 | | | | | | | | |
5.750%, 09/01/32 | | | 4,080 | | | | 3,871 | |
| | | | | | | | | | | | | |
Total Kansas | | | 6,405 | |
| | | | | | | | | | | | | |
Kentucky [1.2%] |
Kentucky State, Economic Development Finance Authority, Masonic Home Independent Living, RB | | | | | | | | |
Callable 05/15/26 @ 100 | | | | | | | | |
5.000%, 05/15/46 | | | 4,500 | | | | 3,827 | |
Kentucky State, Economic Development Finance Authority, Ser A-, RB | | | | | | | | |
Callable 08/01/29 @ 100 | | | | | | | | |
5.000%, 08/01/44 | | | 1,000 | | | | 1,043 | |
Louisville, Ser A, RB | | | | | | | | |
Callable 05/15/32 @ 100 | | | | | | | | |
5.000%, 05/15/52 | | | 5,000 | | | | 5,222 | |
| | | | | | | | | | | | | |
Total Kentucky | | | 10,092 | |
| | | | | | | | | | | | | |
Louisiana [0.6%] |
Juban Crossing, Economic Development District, General Infrastructure Project, Ser C, RB | | | | | | | | |
Callable 03/15/25 @ 100 | | | | | | | | |
7.000%, 09/15/44(B) | | | 5,350 | | | | 5,358 | |
Louisiana State, Public Facilities Authority, Pellets Project, RB, AMT | | | | | | | | |
Callable 11/04/24 @ 100 | | | | | | | | |
10.500%, 07/01/39(D) | | | 1,435 | | | | — | |
Louisiana State, Public Facilities Authority, Pellets Project, RB, AMT | | | | | | | | |
7.000%, 07/01/24(B) (D) | | $ | 1,319 | | | $ | — | |
Louisiana State, Public Facilities Authority, Pellets Project, Ser A, RB, AMT | | | | | | | | |
Callable 11/04/24 @ 100 | | | | | | | | |
8.375%, 07/01/39(D) | | | 3,474 | | | | — | |
| | | | | | | | | | | | | |
Total Louisiana | | | 5,358 | |
| | | | | | | | | | | | | |
Maryland [2.2%] |
Baltimore, Harbor Point Project, RB | | | | | | | | |
Callable 06/01/26 @ 100 | | | | | | | | |
5.000%, 06/01/36 | | | 1,000 | | | | 1,009 | |
Baltimore, RB | | | | | | | | |
Callable 06/01/29 @ 100 | | | | | | | | |
3.625%, 06/01/46(B) | | | 1,370 | | | | 1,183 | |
Baltimore, Sub-Ser, RB | | | | | | | | |
Callable 06/01/31 @ 100 | | | | | | | | |
5.000%, 06/01/51 | | | 800 | | | | 810 | |
Brunswick, RB | | | | | | | | |
Callable 01/01/29 @ 100 | | | | | | | | |
5.000%, 07/01/36 | | | 1,550 | | | | 1,589 | |
Brunswick, RB | | | | | | | | |
Callable 01/01/29 @ 100 | | | | | | | | |
4.000%, 07/01/29 | | | 945 | | | | 947 | |
Frederick County, RB | | | | | | | | |
Callable 07/01/29 @ 100 | | | | | | | | |
3.750%, 07/01/39 | | | 1,410 | | | | 1,308 | |
Howard County, Downtown Columbia Project, Ser A, TA | | | | | | | | |
Callable 02/15/26 @ 100 | | | | | | | | |
4.500%, 02/15/47(B) | | | 1,250 | | | | 1,214 | |
Howard County, Downtown Columbia Project, Ser A, TA | | | | | | | | |
Callable 02/15/26 @ 100 | | | | | | | | |
4.375%, 02/15/39(B) | | | 1,000 | | | | 990 | |
Maryland State, Economic Development, GO | | | | | | | | |
Callable 09/01/30 @ 100 | | | | | | | | |
4.000%, 09/01/40 | | | 875 | | | | 832 | |
Maryland State, Economic Development, GO | | | | | | | | |
Callable 09/01/30 @ 100 | | | | | | | | |
4.000%, 09/01/50 | | | 875 | | | | 773 | |
Prince George’s County, RB | | | | | | | | |
Callable 07/01/28 @ 100 | | | | | | | | |
5.250%, 07/01/48(B) | | | 2,000 | | | | 2,033 | |
See accompanying notes to financial statements.
CITY NATIONAL ROCHDALE FUNDS | PAGE 12
schedule of investments |
September 30, 2024 |
City National Rochdale Municipal High Income Fund (continued) |
Description | | Face Amount (000) | | | Value (000) | |
Prince George’s County, RB | | | | | | | | |
Callable 07/01/28 @ 100 | | | | | | | | |
5.125%, 07/01/39(B) | | $ | 1,000 | | | $ | 1,016 | |
Westminster, Luther Village Millers Grant Project, RB | | | | | | | | |
Callable 11/04/24 @ 100 | | | | | | | | |
6.250%, 07/01/44 | | | 1,780 | | | | 1,781 | |
Westminster, Luther Village Millers Grant Project, RB | | | | | | | | |
Callable 11/04/24 @ 100 | | | | | | | | |
6.125%, 07/01/39 | | | 750 | | | | 750 | |
Westminster, Luther Village Millers Grant Project, RB | | | | | | | | |
Callable 11/04/24 @ 100 | | | | | | | | |
6.000%, 07/01/34 | | | 1,205 | | | | 1,206 | |
| | | | | | | | | | | | | |
Total Maryland | | | 17,441 | |
| | | | | | | | | | | | | |
Massachusetts [1.0%] |
Massachusetts State, Development Finance Agency, RB | | | | | | | | |
Callable 07/01/28 @ 103 | | | | | | | | |
5.000%, 07/01/51(B) | | | 3,500 | | | | 3,057 | |
Massachusetts State, Development Finance Agency, RB | | | | | | | | |
Callable 07/01/28 @ 103 | | | | | | | | |
5.000%, 07/01/56(B) | | | 910 | | | | 782 | |
Massachusetts State, Development Finance Agency, Ser A, RB | | | | | | | | |
Callable 10/01/26 @ 100 | | | | | | | | |
5.000%, 10/01/43 | | | 4,905 | | | | 4,944 | |
| | | | | | | | | | | | | |
Total Massachusetts | | | 8,783 | |
| | | | | | | | | | | | | |
Michigan [2.5%] |
Detroit City, GO | | | | | | | | |
Callable 04/01/28 @ 100 | | | | | | | | |
5.000%, 04/01/38 | | | 625 | | | | 652 | |
Kalamazoo Economic Development, RB | | | | | | | | |
Callable 05/15/26 @ 103 | | | | | | | | |
5.000%, 05/15/37 | | | 2,450 | | | | 2,474 | |
Kalamazoo Economic Development, RB | | | | | | | | |
Callable 05/15/26 @ 103 | | | | | | | | |
5.000%, 05/15/42 | | | 1,300 | | | | 1,283 | |
Kalamazoo Economic Development, RB | | | | | | | | |
Callable 08/15/28 @ 103 | | | | | | | | |
5.000%, 08/15/51(B) | | | 1,505 | | | | 1,275 | |
Michigan State, Finance Authority, Old Redford School Project, Ser A, RB | | | | | | | | |
Callable 11/04/24 @ 100 | | | | | | | | |
6.500%, 12/01/40 | | $ | 3,745 | | | $ | 3,745 | |
Michigan State, Hospital Finance Authority, Ser Senior CR, RB | | | | | | | | |
Callable 05/15/30 @ 100 | | | | | | | | |
5.000%, 11/15/47 | | | 4,000 | | | | 4,219 | |
Michigan State, Public Educational Facilities Authority, Old Redford Project, Ser A, RB | | | | | | | | |
Callable 11/04/24 @ 100 | | | | | | | | |
5.875%, 12/01/30 | | | 1,795 | | | | 1,795 | |
Michigan State, Strategic Fund, RB | | | | | | | | |
Callable 08/15/28 @ 103 | | | | | | | | |
5.000%, 08/15/41(B) | | | 895 | | | | 818 | |
Michigan State, Tobacco Settlement Finance Authority, Ser C, RB | | | | | | | | |
Callable 06/01/33 @ 11 | | | | | | | | |
0.000%, 06/01/58(C) | | | 3,000 | | | | 94 | |
Michigan State, Trunk Line Revenue, RB | | | | | | | | |
Callable 11/15/30 @ 100 | | | | | | | | |
4.000%, 11/15/39 | | | 5,000 | | | | 5,151 | |
| | | | | | | | | | | | | |
Total Michigan | | | 21,506 | |
| | | | | | | | | | | | | |
Minnesota [1.3%] |
Anoka, Housing Revenue Authority, Homestead Project, RB | | | | | | | | |
Callable 11/04/24 @ 103 | | | | | | | | |
4.750%, 11/01/35 | | | 3,000 | | | | 2,898 | |
Bethel, Senior Housing Revenue, Lodge at Lakes at Stillwater Project, RB | | | | | | | | |
Callable 11/04/24 @ 101 | | | | | | | | |
5.250%, 06/01/58 | | | 2,840 | | | | 2,574 | |
Duluth Economic Development Authority, RB | | | | | | | | |
Callable 07/01/26 @ 103 | | | | | | | | |
4.000%, 07/01/41 | | | 1,860 | | | | 1,601 | |
Minneapolis State, Riverton Community Housing Project, RB | | | | | | | | |
Callable 11/04/24 @ 102 | | | | | | | | |
5.000%, 08/01/53(B) | | | 500 | | | | 501 | |
See accompanying notes to financial statements.
CITY NATIONAL ROCHDALE FUNDS | PAGE 13
schedule of investments |
September 30, 2024 |
City National Rochdale Municipal High Income Fund (continued) |
Description | | Face Amount (000) | | | Value (000) | |
Minneapolis State, Riverton Community Housing Project, RB | | | | | | | | |
Callable 11/04/24 @ 102 | | | | | | | | |
4.750%, 08/01/43(B) | | $ | 1,600 | | | $ | 1,574 | |
Minneapolis-St. Paul, Metropolitan Airports Commission, Sub-Ser, RB, AMT | | | | | | | | |
Callable 01/01/34 @ 100 | | | | | | | | |
5.250%, 01/01/49 | | | 1,500 | | | | 1,636 | |
| | | | | | | | | | | | | |
Total Minnesota | | | 10,784 | |
| | | | | | | | | | | | | |
Missouri [2.7%] |
Hanley, Transportation Development, Eager Road Transportation Development District, Ser A, SAB | | | | | | | | |
Callable 11/04/24 @ 100 | | | | | | | | |
4.000%, 03/01/42 | | | 1,000 | | | | 868 | |
Hanley, Transportation Development, Eager Road Transportation Development District, Ser A, SAB | | | | | | | | |
Callable 11/04/24 @ 100 | | | | | | | | |
3.625%, 03/01/33 | | | 500 | | | | 456 | |
Hanley, Transportation Development, Eager Road Transportation Development District, Ser A, SAB | | | | | | | | |
Callable 11/04/24 @ 100 | | | | | | | | |
3.000%, 03/01/26 | | | 195 | | | | 191 | |
Kansas City, Industrial Development Authority, Ser A, RB | | | | | | | | |
Callable 04/01/26 @ 100 | | | | | | | | |
5.000%, 04/01/36(B) | | | 2,000 | | | | 2,000 | |
Kirkwood, Industrial Development Authority, RB | | | | | | | | |
Callable 05/15/27 @ 100 | | | | | | | | |
5.250%, 05/15/30 | | | 2,515 | | | | 2,531 | |
Lees Summit, Industrial Development Authority, John Knox Village, Ser A, RB | | | | | | | | |
Callable 10/23/24 @ 102 | | | | | | | | |
5.000%, 08/15/46 | | | 2,000 | | | | 1,915 | |
Lees Summit, Industrial Development Authority, RB | | | | | | | | |
Callable 08/15/25 @ 103 | | | | | | | | |
5.000%, 08/15/42 | | | 2,400 | | | | 2,391 | |
St. Louis, Industrial Development Authority, Ballpark Village Development Project, RB | | | | | | | | |
Callable 11/15/26 @ 100 | | | | | | | | |
4.375%, 11/15/35 | | $ | 2,250 | | | $ | 2,080 | |
St. Louis, Industrial Development Authority, Ballpark Village Development Project, RB | | | | | | | | |
Callable 11/15/26 @ 100 | | | | | | | | |
3.875%, 11/15/29(D) | | | 1,035 | | | | 984 | |
St. Louis, Industrial Development Authority, Innovation District Project, TA | | | | | | | | |
Callable 11/04/24 @ 100 | | | | | | | | |
4.375%, 05/15/36 | | | 2,175 | | | | 2,147 | |
St. Louis, Industrial Development Authority, RB | | | | | | | | |
Callable 09/01/25 @ 103 | | | | | | | | |
5.250%, 09/01/53 | | | 2,000 | | | | 2,026 | |
St. Louis, Industrial Development Authority, RB | | | | | | | | |
Callable 05/15/29 @ 100 | | | | | | | | |
5.000%, 05/15/41 | | | 3,250 | | | | 3,305 | |
University City, Industrial Development Authority, Ser A, RB | | | | | | | | |
Callable 06/15/33 @ 100 | | | | | | | | |
4.875%, 06/15/36 | | | 1,775 | | | | 1,826 | |
| | | | | | | | | | | | | |
Total Missouri | | | 22,720 | |
| | | | | | | | | | | | | |
Nevada [1.7%] |
Henderson Local Improvement Districts, SAB | | | | | | | | |
Callable 09/01/31 @ 100 | | | | | | | | |
4.000%, 09/01/51 | | | 245 | | | | 219 | |
Henderson Local Improvement Districts, SAB | | | | | | | | |
Callable 09/01/31 @ 100 | | | | | | | | |
3.500%, 09/01/45 | | | 695 | | | | 577 | |
Henderson Local Improvement Districts, SPA | | | | | | | | |
Callable 03/01/33 @ 100 | | | | | | | | |
5.000%, 03/01/43 | | | 930 | | | | 937 | |
Las Vegas, Special Improvement District No. 611, RB | | | | | | | | |
Callable 06/01/30 @ 100 | | | | | | | | |
4.125%, 06/01/50 | | | 855 | | | | 774 | |
See accompanying notes to financial statements.
CITY NATIONAL ROCHDALE FUNDS | PAGE 14
schedule of investments |
September 30, 2024 |
City National Rochdale Municipal High Income Fund (continued) |
Description | | Face Amount (000) | | | Value (000) | |
Las Vegas, Special Improvement District No. 612 Skye Hills, GO | | | | | | | | |
Callable 06/01/30 @ 100 | | | | | | | | |
3.500%, 06/01/35 | | $ | 195 | | | $ | 178 | |
Las Vegas, Special Improvement District No. 613, SPA | | | | | | | | |
Callable 12/01/34 @ 100 | | | | | | | | |
5.500%, 12/01/53 | | | 500 | | | | 520 | |
Las Vegas, Special Improvement District No. 613, SPA | | | | | | | | |
Callable 12/01/34 @ 100 | | | | | | | | |
5.250%, 12/01/47 | | | 500 | | | | 520 | |
Las Vegas, Special Improvement District No. 613, SPA | | | | | | | | |
Callable 12/01/34 @ 100 | | | | | | | | |
5.000%, 12/01/39 | | | 375 | | | | 390 | |
Las Vegas, Special Improvement District No. 812, Special Improvement District No. 812, SAB | | | | | | | | |
Callable 12/01/25 @ 100 | | | | | | | | |
5.000%, 12/01/35 | | | 870 | | | | 875 | |
Las Vegas, Special Improvement District No. 814, GO | | | | | | | | |
Callable 06/01/29 @ 100 | | | | | | | | |
4.000%, 06/01/44 | | | 690 | | | | 608 | |
Las Vegas, Special Improvement District No. 815, GO | | | | | | | | |
Callable 12/01/30 @ 100 | | | | | | | | |
4.750%, 12/01/40 | | | 730 | | | | 732 | |
Las Vegas, Special Improvement District No. 816, SPA | | | | | | | | |
Callable 06/01/31 @ 100 | | | | | | | | |
3.125%, 06/01/51 | | | 1,060 | | | | 786 | |
Las Vegas, Special Improvement District No. 816, SPA | | | | | | | | |
Callable 06/01/31 @ 100 | | | | | | | | |
3.000%, 06/01/41 | | | 950 | | | | 767 | |
Las Vegas, Special Improvement District No. 817 Summerlin Village 29, SPA | | | | | | | | |
Callable 06/01/33 @ 100 | | | | | | | | |
6.000%, 06/01/48 | | | 250 | | | | 265 | |
Nevada State, Department of Business & Industry, Green-Fulcrum Sierra Biofuels, RB, AMT | | | | | | | | |
Callable 12/15/27 @ 100 | | | | | | | | |
6.250%, 12/15/37(B) (D) | | | 96 | | | | 7 | |
Nevada State, Department of Business & Industry, Ser A, RB | | | | | | | | |
Callable 12/15/25 @ 100 | | | | | | | | |
5.000%, 12/15/38(B) | | $ | 1,000 | | | $ | 1,006 | |
Nevada State, Department of Business & Industry, Sumerset Academy, Ser A, RB | | | | | | | | |
Callable 12/15/25 @ 100 | | | | | | | | |
5.000%, 12/15/35(B) | | | 1,595 | | | | 1,608 | |
Reno Nevada, Sub-Ser, RB | | | | | | | | |
Callable 07/01/38 @ 31 | | | | | | | | |
0.000%, 07/01/58(B)(C) | | | 13,500 | | | | 1,984 | |
State of Nevada Department of Business & Industry, RB, AMT | | | | | | | | |
Callable 10/15/24 @ 103 | | | | | | | | |
8.125%, 01/01/50(A) | | | 2,000 | | | | 2,060 | |
| | | | | | | | | | | | | |
Total Nevada | | | 14,813 | |
| | | | | | | | | | | | | |
New Hampshire [0.8%] |
New Hampshire, Business Finance Authority, Ser A, RB | | | | | | | | |
Callable 07/01/25 @ 103 | | | | | | | | |
5.750%, 07/01/54(B) | | | 1,250 | | | | 1,260 | |
New Hampshire, Business Finance Authority, Ser A, RB | | | | | | | | |
Callable 07/01/25 @ 103 | | | | | | | | |
5.625%, 07/01/46(B) | | | 500 | | | | 504 | |
New Hampshire, Business Finance Authority, Ser B, RB, AMT | | | | | | | | |
Callable 07/01/25 @ 100 | | | | | | | | |
3.750%, 07/01/45(A)(B) | | | 5,615 | | | | 4,851 | |
| | | | | | | | | | | | | |
Total New Hampshire | | | 6,615 | |
| | | | | | | | | | | | | |
New Jersey [2.2%] |
New Jersey State, Economic Development Authority, Continental Airlines Project, RB, AMT | | | | | | | | |
Callable 11/04/24 @ 100 | | | | | | | | |
5.250%, 09/15/29 | | | 645 | | | | 646 | |
New Jersey State, Economic Development Authority, RB | | | | | | | | |
Pre-Refunded @ 100 | | | | | | | | |
5.000%, 12/15/28(E) | | | 370 | | | | 409 | |
New Jersey State, Economic Development Authority, RB | | | | | | | | |
Callable 11/01/29 @ 100 | | | | | | | | |
4.000%, 11/01/37 | | | 1,100 | | | | 1,119 | |
See accompanying notes to financial statements.
CITY NATIONAL ROCHDALE FUNDS | PAGE 15
schedule of investments |
September 30, 2024 |
City National Rochdale Municipal High Income Fund (continued) |
Description | | Face Amount (000) | | | Value (000) | |
New Jersey State, Economic Development Authority, RB, AMT | | | | | | | | |
Callable 11/04/24 @ 101 | | | | | | | | |
5.625%, 11/15/30 | | $ | 1,000 | | | $ | 1,007 | |
New Jersey State, Economic Development Authority, Ser A, RB | | | | | | | | |
Callable 12/15/27 @ 100 | | | | | | | | |
5.000%, 06/15/42 | | | 1,155 | | | | 1,195 | |
New Jersey State, Economic Development Authority, Ser A, RB | | | | | | | | |
Callable 12/15/27 @ 100 | | | | | | | | |
5.000%, 06/15/47 | | | 1,230 | | | | 1,266 | |
New Jersey State, Transportation Trust Fund Authority, Ser AA, RB | | | | | | | | |
Callable 06/15/25 @ 100 | | | | | | | | |
5.250%, 06/15/41 | | | 4,245 | | | | 4,291 | |
New Jersey State, Transportation Trust Fund Authority, Ser BB, RB | | | | | | | | |
Callable 12/15/28 @ 100 | | | | | | | | |
4.000%, 06/15/37 | | | 3,500 | | | | 3,569 | |
New Jersey State, Transportation Trust Fund Authority, Ser S, RB | | | | | | | | |
Callable 12/15/28 @ 100 | | | | | | | | |
5.000%, 06/15/46 | | | 1,000 | | | | 1,044 | |
New Jersey State, Transportation Trust Fund Authority, Ser S, RB | | | | | | | | |
Callable 12/15/28 @ 100 | | | | | | | | |
4.500%, 06/15/49 | | | 4,015 | | | | 4,088 | |
| | | | | | | | | | | | | |
Total New Jersey | | | 18,634 | |
| | | | | | | | | | | | | |
New Mexico [0.3%] |
Lower Petroglyphs, Public Improvement District, RB | | | | | | | | |
Callable 10/01/27 @ 100 | | | | | | | | |
5.000%, 10/01/33 | | | 500 | | | | 502 | |
Lower Petroglyphs, Public Improvement District, RB | | | | | | | | |
Callable 10/01/27 @ 100 | | | | | | | | |
5.000%, 10/01/38 | | | 500 | | | | 501 | |
Lower Petroglyphs, Public Improvement District, RB | | | | | | | | |
Callable 10/01/27 @ 100 | | | | | | | | |
5.000%, 10/01/48 | | | 1,750 | | | | 1,755 | |
| | | | | | | | | | | | | |
Total New Mexico | | | 2,758 | |
New York [5.8%] |
Metropolitan Transportation Authority, Ser A-1, RB | | | | | | | | |
Callable 05/15/31 @ 100 | | | | | | | | |
4.000%, 11/15/49 | | $ | 3,000 | | | $ | 2,923 | |
Metropolitan Transportation Authority, Ser C-1, RB | | | | | | | | |
Callable 05/15/30 @ 100 | | | | | | | | |
4.750%, 11/15/45 | | | 2,000 | | | | 2,073 | |
Metropolitan Transportation Authority, Ser D1, RB | | | | | | | | |
Callable 11/15/30 @ 100 | | | | | | | | |
5.000%, 11/15/44 | | | 2,450 | | | | 2,603 | |
Nassau County, Industrial Development Agency, RB | | | | | | | | |
Callable 10/01/26 @ 107 | | | | | | | | |
5.000%, 01/01/58(A) (D) | | | 4,358 | | | | 1,305 | |
New York City Housing Development, RB, Housing Urban Development Section 8 | | | | | | | | |
Callable 08/01/31 @ 100 | | | | | | | | |
4.800%, 02/01/53 | | | 1,000 | | | | 1,020 | |
New York City Housing Development, RB, Housing Urban Development Section 8 | | | | | | | | |
Callable 08/01/31 @ 100 | | | | | | | | |
4.600%, 08/01/48 | | | 3,000 | | | | 3,040 | |
New York City Housing Development, RB, Housing Urban Development Section 8 | | | | | | | | |
Callable 08/01/31 @ 100 | | | | | | | | |
4.450%, 08/01/43 | | | 2,000 | | | | 2,030 | |
New York State, Dormitory Authority, Ser A, RB | | | | | | | | |
Callable 09/15/34 @ 100 | | | | | | | | |
5.000%, 03/15/54 | | | 5,000 | | | | 5,473 | |
New York State, Liberty Development, Bank of America Tower, RB | | | | | | | | |
Callable 03/15/29 @ 100 | | | | | | | | |
2.800%, 09/15/69 | | | 1,000 | | | | 922 | |
New York State, Transportation Development, American Airlines, RB, AMT | | | | | | | | |
Callable 10/23/24 @ 100 | | | | | | | | |
5.000%, 08/01/26 | | | 1,045 | | | | 1,047 | |
New York State, Transportation Development, Delta Airlines, RB, AMT | | | | | | | | |
Callable 04/01/31 @ 100 | | | | | | | | |
6.000%, 04/01/35 | | | 1,500 | | | | 1,696 | |
See accompanying notes to financial statements.
CITY NATIONAL ROCHDALE FUNDS | PAGE 16
schedule of investments |
September 30, 2024 |
City National Rochdale Municipal High Income Fund (continued) |
Description | | Face Amount (000) | | | Value (000) | |
New York State, Transportation Development, Delta Airlines, RB, AMT | | | | | | | | |
Callable 01/01/28 @ 100 | | | | | | | | |
5.000%, 01/01/36 | | $ | 5,000 | | | $ | 5,148 | |
New York State, Transportation Development, Delta Airlines, RB, AMT | | | | | | | | |
Callable 10/01/30 @ 100 | | | | | | | | |
5.000%, 10/01/40 | | | 800 | | | | 830 | |
New York State, Transportation Development, JFK International Airport, RB, AMT | | | | | | | | |
Callable 06/30/31 @ 100 | | | | | | | | |
6.000%, 06/30/54 | | | 2,000 | | | | 2,186 | |
New York State, Transportation Development, JFK International Airport, RB, AMT | | | | | | | | |
Callable 08/01/30 @ 100 | | | | | | | | |
5.250%, 08/01/31 | | | 1,410 | | | | 1,509 | |
Oneida Indian Nation of New York, Ser B, RB | | | | | | | | |
Callable 09/01/31 @ 102 | | | | | | | | |
6.000%, 09/01/43(B) | | | 1,000 | | | | 1,111 | |
Onondaga Civic Development, RB | | | | | | | | |
Callable 08/01/34 @ 100 | | | | | | | | |
5.375%, 08/01/54 | | | 1,250 | | | | 1,295 | |
Port Authority of New York & New Jersey, Ser 221, RB, AMT | | | | | | | | |
Callable 07/15/30 @ 100 | | | | | | | | |
4.000%, 07/15/50 | | | 2,000 | | | | 1,940 | |
Suffolk Regional Off-Track Betting, RB | | | | | | | | |
Callable 06/01/29 @ 100 | | | | | | | | |
6.000%, 12/01/53 | | | 1,000 | | | | 1,054 | |
Westchester, Tobacco Asset Securitization, Ser B, RB | | | | | | | | |
Callable 06/01/27 @ 100 | | | | | | | | |
5.000%, 06/01/41 | | | 2,485 | | | | 2,540 | |
Westchester, Tobacco Asset Securitization, Sub-Ser C, RB | | | | | | | | |
Callable 06/01/27 @ 100 | | | | | | | | |
5.125%, 06/01/51 | | | 7,000 | | | | 6,941 | |
| | | | | | | | | | | | | |
Total New York | | | 48,686 | |
North Carolina [0.0%] |
North Carolina State, Medical Care Commission, Ser A, RB | | | | | | | | |
Callable 09/01/27 @ 100 | | | | | | | | |
4.000%, 09/01/50 | | $ | 250 | | | $ | 212 | |
| | | | | | | | | | | | | |
North Dakota [0.1%] |
Burleigh County, Educational Facilities Revenue, Education Facilities, University of Mary Project, RB | | | | | | | | |
Callable 04/15/26 @ 100 | | | | | | | | |
5.200%, 04/15/46 | | | 1,100 | | | | 1,101 | |
County of Grand Forks North Dakota, RB, AMT | | | | | | | | |
Callable 06/15/26 @ 103 | | | | | | | | |
7.000%, 12/15/43(B) (D) | | | 5,000 | | | | — | |
| | | | | | | | | | | | | |
Total North Dakota | | | 1,101 | |
| | | | | | | | | | | | | |
Ohio [2.2%] |
Buckeye Tobacco Settlement, Financing Authority, Ser A-2-Class, RB | | | | | | | | |
Callable 06/01/30 @ 100 | | | | | | | | |
4.000%, 06/01/48 | | | 3,500 | | | | 3,266 | |
Buckeye Tobacco Settlement, Financing Authority, Ser B-2, RB | | | | | | | | |
Callable 06/01/30 @ 100 | | | | | | | | |
5.000%, 06/01/55 | | | 2,000 | | | | 1,881 | |
County of Cuyahoga Ohio, RB | | | | | | | | |
Callable 02/15/27 @ 100 | | | | | | | | |
5.500%, 02/15/52 | | | 3,800 | | | | 3,889 | |
County of Cuyahoga Ohio, RB | | | | | | | | |
Callable 02/15/27 @ 100 | | | | | | | | |
5.000%, 02/15/57 | | | 3,000 | | | | 3,030 | |
County of Hamilton Ohio, RB | | | | | | | | |
Callable 01/01/30 @ 103 | | | | | | | | |
5.750%, 01/01/53 | | | 500 | | | | 532 | |
Muskingum County, Hospital Facilities Authority, Genesis Healthcare Systems Project, RB | | | | | | | | |
Callable 11/04/24 @ 100 | | | | | | | | |
5.000%, 02/15/48 | | | 250 | | | | 249 | |
Ohio State, Air Quality Development Authority, Pratt Paper Project, RB, AMT | | | | | | | | |
Callable 01/15/28 @ 100 | | | | | | | | |
4.250%, 01/15/38(B) | | | 3,555 | | | | 3,589 | |
See accompanying notes to financial statements.
CITY NATIONAL ROCHDALE FUNDS | PAGE 17
schedule of investments |
September 30, 2024 |
City National Rochdale Municipal High Income Fund (continued) |
Description | | Face Amount (000) | | | Value (000) | |
Ohio State, Housing Finance Agency, Sanctuary at Springboro Project, RB | | | | | | | | |
Callable 10/01/25 @ 101 | | | | | | | | |
5.450%, 01/01/38(B) | | $ | 2,500 | | | $ | 2,105 | |
| | | | | | | | | | | | | |
Total Ohio | | | 18,541 | |
| | | | | | | | | | | | | |
Oklahoma [0.8%] |
Oklahoma County, Finance Authority, RB | | | | | | | | |
2.000%, 12/01/47 | | | 718 | | | | 41 | |
Oklahoma County, Finance Authority, Ser B, RB | | | | | | | | |
Callable 01/01/30 @ 104 | | | | | | | | |
5.875%, 12/01/47 | | | 3,490 | | | | 2,766 | |
Oklahoma State, Development Finance Authority, Ser B, RB | | | | | | | | |
Callable 08/15/28 @ 100 | | | | | | | | |
5.250%, 08/15/48 | | | 4,000 | | | | 4,105 | |
Payne County, Economic Development Authority, Epworth Living at the Ranch, RB | | | | | | | | |
Callable 11/01/26 @ 100 | | | | | | | | |
6.875%, 11/01/46(D) | | | 3,843 | | | | 8 | |
Payne County, Economic Development Authority, Epworth Living at the Ranch, RB | | | | | | | | |
Callable 11/01/26 @ 100 | | | | | | | | |
6.625%, 11/01/36(D) | | | 1,664 | | | | 3 | |
| | | | | | | | | | | | | |
Total Oklahoma | | | 6,923 | |
| | | | | | | | | | | | | |
Oregon [0.6%] |
Clackamas County, Hospital Facility Authority, Ser A, RB | | | | | | | | |
Callable 11/15/25 @ 102 | | | | | | | | |
5.375%, 11/15/55 | | | 875 | | | | 882 | |
Hospital Facilities Authority of Multnomah County Oregon, RB | | | | | | | | |
Callable 12/01/28 @ 103 | | | | | | | | |
4.000%, 12/01/36 | | | 1,180 | | | | 1,097 | |
Hospital Facilities Authority of Multnomah County Oregon, RB | | | | | | | | |
Callable 12/01/28 @ 103 | | | | | | | | |
4.000%, 12/01/51 | | | 2,000 | | | | 1,584 | |
Port of Portland Oregon Airport Revenue, Ser 28, RB, AMT | | | | | | | | |
Callable 07/01/32 @ 100 | | | | | | | | |
4.000%, 07/01/47 | | $ | 2,000 | | | $ | 1,943 | |
| | | | | | | | | | | | | |
Total Oregon | | | 5,506 | |
| | | | | | | | | | | | | |
Pennsylvania [3.1%] |
Allegheny County, Airport Authority, Ser A, RB, AMT | | | | | | | | |
Callable 01/01/31 @ 100 | | | | | | | | |
5.000%, 01/01/56 | | | 2,000 | | | | 2,075 | |
Allentown, Neighborhood Improvement Zone Development Authority, City Center Project, RB | | | | | | | | |
Callable 05/01/27 @ 100 | | | | | | | | |
5.000%, 05/01/42(B) | | | 1,750 | | | | 1,760 | |
Allentown, Neighborhood Improvement Zone Development Authority, Sub-Ser, RB | | | | | | | | |
Callable 05/01/28 @ 100 | | | | | | | | |
5.125%, 05/01/32(B) | | | 1,500 | | | | 1,534 | |
Berks County Municipal Authority, RB | | | | | | | | |
Callable 10/23/24 @ 100 | | | | | | | | |
5.000%, 06/30/39 | | | 4,778 | | | | 4,730 | |
Berks County Municipal Authority, RB | | | | | | | | |
Callable 10/23/24 @ 86 | | | | | | | | |
0.000%, 11/15/29(F) | | | 2,387 | | | | 1,522 | |
Chester County, Health and Education Facilities Authority, Ser S, RB | | | | | | | | |
Callable 12/01/25 @ 100 | | | | | | | | |
5.250%, 12/01/45 | | | 1,400 | | | | 987 | |
Chester County, Industrial Development Authority, Woodlands at Graystone Project, RB | | | | | | | | |
Callable 03/01/28 @ 100 | | | | | | | | |
5.125%, 03/01/48(B) | | | 600 | | | | 594 | |
Dauphin County, General Authority, Harrisburg University of Science and Technology Project, RB | | | | | | | | |
Callable 10/15/27 @ 100 | | | | | | | | |
5.125%, 10/15/41(B) | | | 1,135 | | | | 852 | |
Dauphin County, General Authority, RB | | | | | | | | |
Callable 10/15/27 @ 100 | | | | | | | | |
5.000%, 10/15/34(B) | | | 3,310 | | | | 2,773 | |
See accompanying notes to financial statements.
CITY NATIONAL ROCHDALE FUNDS | PAGE 18
schedule of investments |
September 30, 2024 |
City National Rochdale Municipal High Income Fund (continued) |
Description | | Face Amount (000) | | | Value (000) | |
Franklin County, Industrial Development Authority, RB | | | | | | | | |
Callable 12/01/25 @ 103 | | | | | | | | |
5.000%, 12/01/49 | | $ | 780 | | | $ | 756 | |
Franklin County, Industrial Development Authority, RB | | | | | | | | |
Callable 12/01/25 @ 103 | | | | | | | | |
5.000%, 12/01/54 | | | 1,000 | | | | 952 | |
Geisinger Authority, RB | | | | | | | | |
Callable 02/15/27 @ 100 | | | | | | | | |
4.000%, 02/15/47 | | | 5,000 | | | | 4,913 | |
Pennsylvania State, Economic Development Financing Authority, RB, AMT | | | | | | | | |
Callable 12/31/32 @ 100 | | | | | | | | |
5.750%, 06/30/48 | | | 625 | | | | 697 | |
Washington County, Redevelopment Authority, TA | | | | | | | | |
Callable 01/01/28 @ 100 | | | | | | | | |
5.000%, 07/01/35 | | | 1,235 | | | | 1,243 | |
| | | | | | | | | | | | | |
Total Pennsylvania | | | 25,388 | |
| | | | | | | | | | | | | |
Rhode Island [0.5%] |
Rhode Island State, Health & Educational Building, RB | | | | | | | | |
Callable 05/15/26 @ 100 | | | | | | | | |
5.000%, 05/15/39 | | | 1,000 | | | | 1,013 | |
Rhode Island State, Tobacco Settlement Financing, Ser B, RB | | | | | | | | |
Callable 10/18/24 @ 19 | | | | | | | | |
0.000%, 06/01/52(C) | | | 21,270 | | | | 3,683 | |
| | | | | | | | | | | | | |
Total Rhode Island | | | 4,696 | |
| | | | | | | | | | | | | |
South Carolina [0.3%] |
Berkeley County, RB | | | | | | | | |
Callable 11/01/29 @ 100 | | | | | | | | |
4.375%, 11/01/49 | | | 2,500 | | | | 2,296 | |
Berkeley County, SPA | | | | | | | | |
Callable 11/01/29 @ 100 | | | | | | | | |
4.000%, 11/01/30 | | | 425 | | | | 419 | |
| | | | | | | | | | | | | |
Total South Carolina | | | 2,715 | |
| | | | | | | | | | | | | |
Tennessee [0.7%] |
Metropolitan Government Nashville & Davidson County Health & Educational Facs Bd, Ser S, RB | | | | | | | | |
Callable 11/01/25 @ 102 | | | | | | | | |
4.000%, 11/01/45 | | $ | 5,000 | | | $ | 4,423 | |
Nashville, Metropolitan Development & Housing Agency, RB | | | | | | | | |
Callable 06/01/28 @ 100 | | | | | | | | |
5.125%, 06/01/36(B) | | | 900 | | | | 922 | |
Nashville, Metropolitan Development & Housing Agency, RB | | | | | | | | |
4.500%, 06/01/28(B) | | | 400 | | | | 407 | |
| | | | | | | | | | | | | |
Total Tennessee | | | 5,752 | |
| | | | | | | | | | | | | |
Texas [8.8%] |
Arlington, Higher Education Finance, RB, PSF-GTD | | | | | | | | |
Callable 08/15/34 @ 100 | | | | | | | | |
4.125%, 08/15/54 | | | 1,000 | | | | 979 | |
Arlington, Higher Education Finance, Universal Academy Project, Ser A, RB | | | | | | | | |
Callable 11/04/24 @ 100 | | | | | | | | |
7.125%, 03/01/44 | | | 2,300 | | | | 2,301 | |
Arlington, Higher Education Finance, Universal Academy Project, Ser A, RB | | | | | | | | |
Callable 11/04/24 @ 100 | | | | | | | | |
7.000%, 03/01/34 | | | 400 | | | | 400 | |
Celina, Cambridge Crossing Public Improvement Project, SAB | | | | | | | | |
Callable 09/01/28 @ 100 | | | | | | | | |
5.250%, 09/01/47(B) | | | 500 | | | | 506 | |
Celina, Cambridge Crossing Public Improvement Project, SAB | | | | | | | | |
Callable 09/01/28 @ 100 | | | | | | | | |
5.125%, 09/01/38(B) | | | 1,500 | | | | 1,520 | |
Clifton, Higher Education Finance, International Leadership Project, Ser D, RB | | | | | | | | |
Callable 08/15/25 @ 100 | | | | | | | | |
6.125%, 08/15/48 | | | 4,245 | | | | 4,318 | |
Gulf Coast Authority, Ser B, RB, AMT | | | | | | | | |
1.500%, 05/01/28 | | | 1,000 | | | | 915 | |
See accompanying notes to financial statements.
CITY NATIONAL ROCHDALE FUNDS | PAGE 19
schedule of investments |
September 30, 2024 |
City National Rochdale Municipal High Income Fund (continued) |
Description | | Face Amount (000) | | | Value (000) | |
Horizon Regional Municipal Utility District, GO, BAM | | | | | | | | |
Callable 08/01/30 @ 100 | | | | | | | | |
4.000%, 02/01/54 | | $ | 1,000 | | | $ | 965 | |
Houston, Airport System Revenue, RB, AMT | | | | | | | | |
Callable 07/01/29 @ 100 | | | | | | | | |
4.000%, 07/01/41 | | | 2,500 | | | | 2,457 | |
Houston, Airport System Revenue, RB, AMT | | | | | | | | |
Callable 07/15/29 @ 100 | | | | | | | | |
4.000%, 07/15/41 | | | 2,530 | | | | 2,486 | |
Houston, Airport System Revenue, Ser B-1, RB, AMT | | | | | | | | |
Callable 07/15/25 @ 100 | | | | | | | | |
5.000%, 07/15/35 | | | 3,000 | | | | 3,014 | |
Lago Vista Texas, RB | | | | | | | | |
Callable 09/01/30 @ 100 | | | | | | | | |
4.875%, 09/01/50(B) | | | 275 | | | | 262 | |
Matagorda County Navigation District No. 1, RB, AMBAC, AMT | | | | | | | | |
5.125%, 11/01/28 | | | 1,500 | | | | 1,574 | |
New Hope, Cultural Education Facilities Finance, Carillon LifeCare Community Project, RB | | | | | | | | |
Callable 11/04/24 @ 102 | | | | | | | | |
5.000%, 07/01/36 | | | 3,410 | | | | 3,390 | |
New Hope, Cultural Education Facilities Finance, Carillon LifeCare Community Project, RB | | | | | | | | |
Callable 11/04/24 @ 102 | | | | | | | | |
5.000%, 07/01/46 | | | 1,250 | | | | 1,157 | |
New Hope, Cultural Education Facilities Finance, RB | | | | | | | | |
7.500%, 11/15/36 | | | 3,385 | | | | 2,901 | |
New Hope, Cultural Education Facilities Finance, RB | | | | | | | | |
7.500%, 11/15/37 | | | 545 | | | | 454 | |
New Hope, Cultural Education Facilities Finance, RB | | | | | | | | |
Callable 08/15/31 @ 100 | | | | | | | | |
4.000%, 08/15/51(B) | | | 4,385 | | | | 3,786 | |
New Hope, Cultural Education Facilities Finance, RB | | | | | | | | |
Callable 11/15/26 @ 105 | | | | | | | | |
2.000%, 11/15/61(A) | | | 14,308 | | | | 5,314 | |
New Hope, Cultural Education Facilities Finance, Ser A, RB | | | | | | | | |
Callable 08/15/25 @ 100 | | | | | | | | |
5.000%, 08/15/40(B) | | | 4,750 | | | | 4,757 | |
Newark Higher Education Finance, Ser A, RB, PSF-GTD | | | | | | | | |
Callable 08/15/34 @ 100 | | | | | | | | |
4.375%, 08/15/59 | | $ | 1,000 | | | $ | 1,001 | |
Newark, Higher Education Finance, Ser A, RB | | | | | | | | |
Callable 08/15/25 @ 100 | | | | | | | | |
5.750%, 08/15/45(B) | | | 1,700 | | | | 1,717 | |
Newark, Higher Education Finance, Ser A, RB | | | | | | | | |
Callable 08/15/25 @ 100 | | | | | | | | |
5.500%, 08/15/35(B) | | | 900 | | | | 911 | |
North Texas, Tollway Authority, Convertible Capital Appreciation Project, Ser C, RB | | | | | | | | |
Pre-Refunded @ 100 | | | | | | | | |
7.000%, 09/01/31(E) | | | 5,000 | | | | 6,200 | |
Port of Beaumont Navigation District, RB | | | | | | | | |
10.000%, 07/01/26(B) | | | 3,000 | | | | 3,094 | |
Port of Beaumont Navigation District, RB, AMT | | | | | | | | |
Callable 01/01/32 @ 104 | | | | | | | | |
5.250%, 01/01/54(B) | | | 250 | | | | 261 | |
Port of Beaumont Navigation District, RB, AMT | | | | | | | | |
Callable 11/04/24 @ 102 | | | | | | | | |
2.875%, 01/01/41(B) | | | 250 | | | | 204 | |
Port of Beaumont Navigation District, RB, AMT | | | | | | | | |
Callable 11/04/24 @ 102 | | | | | | | | |
2.750%, 01/01/36(B) | | | 1,000 | | | | 859 | |
Sanger, Industrial Development Authority, Texas Pellets Project, Ser B, RB, AMT | | | | | | | | |
8.000%, 07/01/38(D) | | | 4,950 | | | | — | |
Tarrant County Cultural Education Facilities Finance, Ser A, RB | | | | | | | | |
Callable 05/15/25 @ 100 | | | | | | | | |
5.000%, 11/15/52 | | | 3,750 | | | | 3,770 | |
Tarrant County, Cultural Education Facilities Finance, Northwest Senior Housing Edgemere Project, RB | | | | | | | | |
Callable 05/15/27 @ 100 | | | | | | | | |
5.250%, 11/15/47(D) | | | 2,983 | | | | 81 | |
Tarrant County, Cultural Education Facilities Finance, RB | | | | | | | | |
Callable 02/15/27 @ 100 | | | | | | | | |
6.375%, 02/15/52(D) | | | 9,000 | | | | 4,950 | |
See accompanying notes to financial statements.
CITY NATIONAL ROCHDALE FUNDS | PAGE 20
schedule of investments |
September 30, 2024 |
City National Rochdale Municipal High Income Fund (continued) |
Description | | Face Amount (000) | | | Value (000) | |
Temple, Ser A-REV, RB | | | | | | | | |
Callable 08/01/25 @ 100 | | | | | | | | |
5.000%, 08/01/38 | | $ | 2,000 | | | $ | 2,003 | |
Texas State, Department of Housing & Community Affairs, Ser A, RB, GNMA | | | | | | | | |
Callable 09/01/27 @ 100 | | | | | | | | |
4.250%, 09/01/43 | | | 1,880 | | | | 1,885 | |
Texas State, Private Activity Bond Surface Transportation, RB, AMT | | | | | | | | |
Callable 06/30/29 @ 100 | | | | | | | | |
5.000%, 06/30/58 | | | 5,000 | | | | 5,118 | |
Texas State, Transportation Commission, RB | | | | | | | | |
Callable 02/01/29 @ 73 | | | | | | | | |
0.000%, 08/01/36(C) | | | 1,000 | | | | 609 | |
| | | | | | | | | | | | | |
Total Texas | | | 76,119 | |
| | | | | | | | | | | | | |
Utah [0.9%] |
Downtown East Streetcar Sewer Public Infrastructure District, Ser A, GO | | | | | | | | |
Callable 09/01/27 @ 103 | | | | | | | | |
6.000%, 03/01/53(B) | | | 2,000 | | | | 2,003 | |
Downtown East Streetcar Sewer Public Infrastructure District, Ser A, GO | | | | | | | | |
Callable 09/01/27 @ 103 | | | | | | | | |
5.750%, 03/01/42(B) | | | 500 | | | | 503 | |
Salt Lake City Utah Airport Revenue, Ser A, RB, AMT | | | | | | | | |
Callable 07/01/33 @ 100 | | | | | | | | |
5.250%, 07/01/48 | | | 750 | | | | 816 | |
Salt Lake City Utah Airport Revenue, Ser A, RB, AMT | | | | | | | | |
Callable 07/01/31 @ 100 | | | | | | | | |
5.000%, 07/01/51 | | | 2,000 | | | | 2,088 | |
Utah Charter School Finance Authority, RB | | | | | | | | |
Callable 06/15/28 @ 102 | | | | | | | | |
5.000%, 06/15/55(B) | | | 1,750 | | | | 1,686 | |
Wood Ranch Public Infrastructure District, SPA | | | | | | | | |
Callable 09/01/29 @ 103 | | | | | | | | |
5.625%, 12/01/53(B) | | | 1,000 | | | | 1,038 | |
| | | | | | | | | | | | | |
Total Utah | | | 8,134 | |
| | | | | | | | | | | | | |
Virginia [0.7%] |
Virginia Beach Development Authority, RB | | | | | | | | |
Callable 09/01/30 @ 103 | | | | | | | | |
7.000%, 09/01/53 | | $ | 3,000 | | | $ | 3,492 | |
West Falls Community Development Authority, Ser A, RB | | | | | | | | |
Callable 09/01/32 @ 100 | | | | | | | | |
5.375%, 09/01/52(B) | | | 2,125 | | | | 2,188 | |
| | | | | | | | | | | | | |
Total Virginia | | | 5,680 | |
| | | | | | | | | | | | | |
Washington [1.0%] |
Kalispel Tribe of Indians, Ser A, RB | | | | | | | | |
Callable 01/01/28 @ 100 | | | | | | | | |
5.250%, 01/01/38(B) | | | 400 | | | | 415 | |
Washington State, Health Care Facilities Authority, Ser A-, RB | | | | | | | | |
Callable 08/01/29 @ 100 | | | | | | | | |
4.000%, 08/01/44 | | | 2,715 | | | | 2,640 | |
Washington State, Housing Finance Commission, Judson Park Project, RB | | | | | | | | |
Callable 07/01/25 @ 102 | | | | | | | | |
5.000%, 07/01/48(B) | | | 1,650 | | | | 1,549 | |
Washington State, Housing Finance Commission, Ser A, RB | | | | | | | | |
Callable 07/01/26 @ 103 | | | | | | | | |
5.000%, 01/01/55(B) | | | 4,000 | | | | 3,613 | |
| | | | | | | | | | | | | |
Total Washington | | | 8,217 | |
| | | | | | | | | | | | | |
West Virginia [0.4%] |
South Charleston West Virginia, RB | | | | | | | | |
Callable 06/01/31 @ 100 | | | | | | | | |
4.250%, 06/01/42(B) | | | 2,620 | | | | 2,112 | |
West Virginia, Economic Development Authority, RB, AMT | | | | | | | | |
Callable 01/01/25 @ 100 | | | | | | | | |
5.000%, 07/01/45(A) | | | 1,190 | | | | 1,193 | |
| | | | | | | | | | | | | |
Total West Virginia | | | 3,305 | |
| | | | | | | | | | | | | |
See accompanying notes to financial statements.
CITY NATIONAL ROCHDALE FUNDS | PAGE 21
schedule of investments |
September 30, 2024 |
City National Rochdale Municipal High Income Fund (continued) |
Description | | Face Amount (000) | | | Value (000) | |
Wisconsin [7.9%] |
Hartford, Public Finance Authority, RB | | | | | | | | |
Callable 11/04/24 @ 100 | | | | | | | | |
5.000%, 09/01/38(B) | | $ | 1,580 | | | $ | 1,581 | |
Pine Lake, Public Finance Authority, RB | | | | | | | | |
Callable 03/01/25 @ 100 | | | | | | | | |
5.500%, 03/01/45(B) | | | 3,460 | | | | 3,472 | |
Pine Lake, Public Finance Authority, RB | | | | | | | | |
Callable 03/01/25 @ 100 | | | | | | | | |
5.250%, 03/01/35(B) | | | 1,250 | | | | 1,256 | |
Public Finance Authority, RB | | | | | | | | |
Pre-Refunded @ 100 | | | | | | | | |
5.000%, 04/01/30(B) (E) | | | 100 | | | | 112 | |
Public Finance Authority, RB | | | | | | | | |
Callable 04/01/30 @ 100 | | | | | | | | |
5.000%, 04/01/40(B) | | | 1,175 | | | | 1,222 | |
Public Finance Authority, RB | | | | | | | | |
Callable 06/01/29 @ 103 | | | | | | | | |
5.000%, 06/01/41(B) | | | 500 | | | | 513 | |
Public Finance Authority, RB | | | | | | | | |
Callable 04/01/30 @ 100 | | | | | | | | |
5.000%, 04/01/50(B) | | | 1,575 | | | | 1,605 | |
Public Finance Authority, RB | | | | | | | | |
Callable 02/01/32 @ 100 | | | | | | | | |
5.000%, 02/01/62 | | | 2,500 | | | | 2,568 | |
Public Finance Authority, RB | | | | | | | | |
Pre-Refunded @ 100 | | | | | | | | |
4.000%, 04/01/32(B) (E) | | | 50 | | | | 55 | |
Public Finance Authority, RB | | | | | | | | |
Pre-Refunded @ 100 | | | | | | | | |
4.000%, 04/01/32(B) (E) | | | 60 | | | | 65 | |
Public Finance Authority, RB | | | | | | | | |
Callable 07/01/29 @ 100 | | | | | | | | |
4.000%, 07/01/51 | | | 1,750 | | | | 1,493 | |
Public Finance Authority, RB | | | | | | | | |
Callable 06/01/27 @ 103 | | | | | | | | |
4.000%, 06/01/56(B) | | | 3,000 | | | | 2,419 | |
Public Finance Authority, RB, AMT | | | | | | | | |
Callable 09/30/31 @ 100 | | | | | | | | |
4.000%, 09/30/51 | | | 600 | | | | 532 | |
Public Finance Authority, RB, AMT | | | | | | | | |
Callable 09/30/31 @ 100 | | | | | | | | |
4.000%, 03/31/56 | | | 3,290 | | | | 2,867 | |
Public Finance Authority, Ser A, RB | | | | | | | | |
Callable 10/01/32 @ 100 | | | | | | | | |
5.000%, 10/01/52 | | | 5,000 | | | | 5,352 | |
University of Wisconsin Hospitals & Clinics, RB | | | | | | | | |
Callable 10/01/31 @ 100 | | | | | | | | |
4.000%, 04/01/51 | | $ | 2,995 | | | $ | 2,910 | |
Wisconsin State, Health & Educational Facilities Authority, RB | | | | | | | | |
Callable 10/01/32 @ 102 | | | | | | | | |
6.000%, 10/01/44 | | | 1,300 | | | | 1,379 | |
Wisconsin State, Health & Educational Facilities Authority, RB | | | | | | | | |
Callable 01/01/27 @ 103 | | | | | | | | |
4.000%, 01/01/47 | | | 540 | | | | 481 | |
Wisconsin State, Health & Educational Facilities Authority, RB | | | | | | | | |
Callable 01/01/27 @ 103 | | | | | | | | |
4.000%, 01/01/57 | | | 2,400 | | | | 2,024 | |
Wisconsin State, Health & Educational Facilities Authority, Woodland Hill Senior Housing Project, RB | | | | | | | | |
Callable 11/04/24 @ 101 | | | | | | | | |
5.250%, 12/01/49 | | | 4,000 | | | | 3,771 | |
Wisconsin State, Public Finance Authority, Bancroft Neurohealth Project, RB | | | | | | | | |
Callable 06/01/26 @ 100 | | | | | | | | |
5.000%, 06/01/36(B) | | | 4,625 | | | | 4,649 | |
Wisconsin State, Public Finance Authority, Bancroft Neurohealth Project, RB | | | | | | | | |
Callable 06/01/26 @ 100 | | | | | | | | |
4.625%, 06/01/36(B) | | | 3,300 | | | | 3,308 | |
Wisconsin State, Public Finance Authority, Coral Academy Project, RB | | | | | | | | |
Callable 11/04/24 @ 100 | | | | | | | | |
5.625%, 07/01/44 | | | 3,500 | | | | 3,503 | |
Wisconsin State, Public Finance Authority, Coral Academy Project, RB | | | | | | | | |
Callable 11/04/24 @ 100 | | | | | | | | |
5.375%, 07/01/34 | | | 2,000 | | | | 2,003 | |
Wisconsin State, Public Finance Authority, Cornerstone Christian Project, RB | | | | | | | | |
Callable 02/01/26 @ 100 | | | | | | | | |
5.000%, 02/01/36(B) | | | 3,000 | | | | 3,004 | |
Wisconsin State, Public Finance Authority, RB | | | | | | | | |
Callable 03/01/30 @ 100 | | | | | | | | |
5.250%, 03/01/45(B) | | | 3,165 | | | | 3,176 | |
See accompanying notes to financial statements.
CITY NATIONAL ROCHDALE FUNDS | PAGE 22
schedule of investments |
September 30, 2024 |
City National Rochdale Municipal High Income Fund (continued) |
Description | | Face Amount (000) | | | Value (000) | |
Wisconsin State, Public Finance Authority, RB | | | | | | | | |
Callable 03/01/30 @ 100 | | | | | | | | |
5.250%, 03/01/55(B) | | $ | 835 | | | $ | 812 | |
Wisconsin State, Public Finance Authority, Roseman University Health Sciences, RB | | | | | | | | |
Callable 04/01/25 @ 100 | | | | | | | | |
5.875%, 04/01/45 | | | 3,000 | | | | 3,024 | |
Wisconsin State, Public Finance Authority, Ser A, RB | | | | | | | | |
Callable 06/15/25 @ 100 | | | | | | | | |
5.500%, 06/15/35(B) | | | 3,000 | | | | 3,035 | |
Wisconsin State, Public Finance Authority, Ser A, RB | | | | | | | | |
Callable 06/15/25 @ 100 | | | | | | | | |
5.500%, 06/15/45(B) | | | 4,280 | | | | 4,315 | |
| | | | | | | | | | | | | |
Total Wisconsin | | | 66,506 | |
| | | | | | | | | | | | | |
American Samoa [0.4%] |
American Samoa, Economic Development Authority, Ser A, RB | | | | | | | | |
Callable 09/01/25 @ 100 | | | | | | | | |
6.625%, 09/01/35 | | | 3,000 | | | | 3,070 | |
| | | | | | | | | | | | | |
Puerto Rico [3.6%] |
Children’s Trust Fund, RB | | | | | | | | |
Callable 11/04/24 @ 100 | | | | | | | | |
5.625%, 05/15/43 | | | 2,000 | | | | 2,026 | |
Children’s Trust Fund, Ser A, RB | | | | | | | | |
Callable 11/04/24 @ 9 | | | | | | | | |
0.000%, 05/15/57(C) | | | 25,000 | | | | 1,731 | |
Commonwealth of Puerto Rico, Sub-Ser Senior, GO | | | | | | | | |
0.000%, 11/01/51(A) | | | 6,575 | | | | 4,298 | |
Puerto Rico, Sales Tax Financing, Sales Tax Revenue, Ser A-1, RB | | | | | | | | |
Callable 07/01/28 @ 100 | | | | | | | | |
5.000%, 07/01/58 | | | 5,167 | | | | 5,218 | |
Puerto Rico, Sales Tax Financing, Sales Tax Revenue, Ser A-1, RB | | | | | | | | |
Callable 07/01/28 @ 100 | | | | | | | | |
4.750%, 07/01/53 | | | 876 | | | | 878 | |
Description | | Face Amount (000)/Shares | | | Value (000) | |
Puerto Rico, Sales Tax Financing, Sales Tax Revenue, Ser A-1, RB | | | | | | | | |
Callable 07/01/25 @ 100 | | | | | | | | |
4.500%, 07/01/34 | | $ | 10,005 | | | $ | 10,023 | |
Puerto Rico, Sales Tax Financing, Sales Tax Revenue, Ser A-2, RB | | | | | | | | |
Callable 07/01/28 @ 100 | | | | | | | | |
4.784%, 07/01/58 | | | 5,771 | | | | 5,784 | |
Puerto Rico, Sales Tax Financing, Sales Tax Revenue, Ser A-2, RB | | | | | | | | |
Callable 07/01/28 @ 100 | | | | | | | | |
4.536%, 07/01/53 | | | 31 | | | | 31 | |
| | | | | | | | | | | | | |
Total Puerto Rico | | | 29,989 | |
| | | | | | | | | | | | | |
Total Municipal Bonds |
(Cost $841,278) | | | 820,719 | |
| | | | | | | | | | | | | |
Short-Term Investment [1.1%] |
SEI Daily Income Trust Government Fund, Cl Institutional, 4.890%** | | | 9,221,446 | | | | 9,221 | |
| | | | | | | | | | | | | |
Total Short-Term Investment |
(Cost $9,221) | | | 9,221 | |
| | | | | | | | | | | | | |
Total Investments [98.7%] |
(Cost $850,499) | | $ | 829,940 | |
| | | | | | | | | | | | | |
Percentages are based on net assets of $840,961 (000).
** | The rate reported is the 7-day effective yield as of September 30, 2024. |
(A) | Variable or floating rate security. The rate shown is the effective interest rate as of period end. The rates for certain securities are not based on published reference rates and spreads and are either determined by the issuer or agent based on current market conditions; by using a formula based on the rates of underlying loans; or by adjusting periodically based on prevailing interest rates. |
(B) | Security exempt from registration under Rule 144A of the Securities Act of 1933. These securities may be resold in transactions exempt from registration normally to qualified institutions. On September 30, 2024, the value of these securities amounted to $253,506 (000), representing 30.1% of the net assets of the Fund. |
(D) | In default on interest payments. Rate shown represents the last coupon rate prior to default. |
(E) | Pre-Refunded Security — The maturity date shown is the pre-refunded date. |
(F) | Step coupon security. Coupon rate will either increase (step-up bond) or decrease (step-down bond) at regular intervals until maturity. Interest rate shown reflects the rate currently in effect. |
See accompanying notes to financial statements.
CITY NATIONAL ROCHDALE FUNDS | PAGE 23
schedule of investments |
September 30, 2024 |
City National Rochdale Municipal High Income Fund (concluded) |
AGM — Assured Guarantee Municipal
AMBAC — American Municipal Bond Assurance Company
AMT — Alternative Minimum Tax (subject to)
BAM — Build America Mutual
Cl — Class
GNMA — Government National Mortgage Association
GO — General Obligation
PSF-GTD — Public School Fund Guaranteed
RB — Revenue Bond
SAB — Special Assessment Board
Ser — Series
SPA — Special Assessment
SPL Tax — Special Tax
TA — Tax Allocation
The following is a list of the inputs used as of September 30, 2024, in valuing the Fund’s investments and other financial instruments carried at value (000):
Investments in Securities | | Level 1 | | | Level 2 | | | Level 3 | | | Total | |
Municipal Bonds | | $ | — | | | $ | 820,719 | | | $ | — | | | $ | 820,719 | |
Short-Term Investment | | | 9,221 | | | | — | | | | — | | | | 9,221 | |
Total Investments in Securities | | $ | 9,221 | | | $ | 820,719 | | | $ | — | | | $ | 829,940 | |
Amounts designated as “—” are either $0 or have been rounded to $0.
For information on valuation inputs, see Note 2 — Significant Accounting Policies in the Notes to Financial Statements.
See accompanying notes to financial statements.
CITY NATIONAL ROCHDALE FUNDS | PAGE 24
schedule of investments |
September 30, 2024 |
City National Rochdale Fixed Income Opportunities Fund |
Description | | Face Amount (000)(1) | | | Value (000) | |
Corporate Bonds [47.1%] |
Aerospace / Defense [0.3%] |
Spirit AeroSystems | | | | | | | | |
9.375%, 11/30/29(A) | | $ | 527 | | | $ | 571 | |
Spirit AeroSystems | | | | | | | | |
9.750%, 11/15/30(A) | | | 703 | | | | 784 | |
TransDigm | | | | | | | | |
6.750%, 08/15/28(A) | | | 275 | | | | 283 | |
TransDigm | | | | | | | | |
6.375%, 03/01/29(A) | | | 450 | | | | 465 | |
TransDigm | | | | | | | | |
6.875%, 12/15/30(A) | | | 1,700 | | | | 1,780 | |
TransDigm | | | | | | | | |
6.625%, 03/01/32(A) | | | 975 | | | | 1,016 | |
| | | | | | | | | | | | | |
Total Aerospace / Defense | | | 4,899 | |
| | | | | | | | | | | | | |
Agricultural [0.2%] |
Kernel Holding | | | | | | | | |
6.750%, 10/27/27 | | | 4,875 | | | | 3,905 | |
| | | | | | | | | | | | | |
Air Transportation [0.0%] |
SGL Group ApS | | | | | | | | |
8.438%, EUR003M + 4.750%, 04/22/30(B) | | EUR | 400 | | | | 446 | |
| | | | | | | | | | | | | |
Airlines [0.2%] |
Allegiant Travel | | | | | | | | |
7.250%, 08/15/27(A) | | | 1,065 | | | | 1,051 | |
American Airlines | | | | | | | | |
5.500%, 04/20/26(A) | | | 1,945 | | | | 1,943 | |
| | | | | | | | | | | | | |
Total Airlines | | | 2,994 | |
| | | | | | | | | | | | | |
Airport Develop/Maint [0.8%] |
Aeropuertos Dominicanos Siglo XXI | | | | | | | | |
7.000%, 06/30/34(A) | | | 1,990 | | | | 2,084 | |
GMR Hyderabad International Airport | | | | | | | | |
4.750%, 02/02/26 | | | 3,800 | | | | 3,752 | |
Kingston Airport Revenue Finance | | | | | | | | |
6.750%, 12/15/36(A) | | | 1,660 | | | | 1,721 | |
TAV Havalimanlari Holding | | | | | | | | |
8.500%, 12/07/28 | | | 7,175 | | | | 7,537 | |
| | | | | | | | | | | | | |
Total Airport Develop/Maint | | | 15,094 | |
| | | | | | | | | | | | | |
Appliances [0.0%] |
Versuni Group BV | | | | | | | | |
3.125%, 06/15/28 | | EUR | 850 | | | $ | 898 | |
| | | | | | | | | | | | | |
Applications Software [0.1%] |
Concentrix | | | | | | | | |
6.850%, 08/02/33 | | | 1,855 | | | | 1,920 | |
| | | | | | | | | | | | | |
Auto Rent & Lease [0.1%] |
Kapla Holding SAS | | | | | | | | |
6.981%, EUR003M + 3.500%, 07/31/30(B) | | EUR | 750 | | | | 838 | |
Upbound Group | | | | | | | | |
6.375%, 02/15/29(A) | | | 1,330 | | | | 1,287 | |
| | | | | | | | | | | | | |
Total Auto Rent & Lease | | | 2,125 | |
| | | | | | | | | | | | | |
Automotive [0.8%] |
Adient Global Holdings | | | | | | | | |
4.875%, 08/15/26(A) | | | 1,125 | | | | 1,115 | |
Dornoch Debt Merger Sub | | | | | | | | |
6.625%, 10/15/29(A) | | | 950 | | | | 836 | |
Ford Motor Credit | | | | | | | | |
4.063%, 11/01/24 | | | 2,200 | | | | 2,197 | |
Ford Motor Credit | | | | | | | | |
5.125%, 06/16/25 | | | 1,150 | | | | 1,150 | |
Ford Otomotiv Sanayi | | | | | | | | |
7.125%, 04/25/29(A) | | | 3,680 | | | | 3,805 | |
IHO Verwaltungs GmbH | | | | | | | | |
4.750%cash/5.500% PIK, 09/15/26(A) | | | 800 | | | | 784 | |
IHO Verwaltungs GmbH | | | | | | | | |
6.000%cash/6.750% PIK, 05/15/27(A) | | | 1,025 | | | | 1,007 | |
JB Poindexter | | | | | | | | |
8.750%, 12/15/31(A) | | | 400 | | | | 423 | |
Panther BF Aggregator 2 | | | | | | | | |
8.500%, 05/15/27(A) | | | 2,000 | | | | 2,006 | |
Real Hero Merger Sub 2 | | | | | | | | |
6.250%, 02/01/29(A) | | | 900 | | | | 782 | |
Standard Profil Automotive GmbH | | | | | | | | |
6.250%, 04/30/26 | | EUR | 968 | | | | 831 | |
ZF North America Capital | | | | | | | | |
6.875%, 04/14/28(A) | | | 500 | | | | 508 | |
ZF North America Capital | | | | | | | | |
7.125%, 04/14/30(A) | | | 325 | | | | 337 | |
ZF North America Capital | | | | | | | | |
6.750%, 04/23/30(A) | | | 125 | | | | 126 | |
| | | | | | | | | | | | | |
Total Automotive | | | 15,907 | |
See accompanying notes to financial statements.
CITY NATIONAL ROCHDALE FUNDS | PAGE 25
schedule of investments |
September 30, 2024 |
City National Rochdale Fixed Income Opportunities Fund (continued) |
Description | | Face Amount (000)(1) | | | Value (000) | |
Autoparts [0.2%] |
American Axle & Manufacturing | | | | | | | | |
6.875%, 07/01/28 | | $ | 520 | | | $ | 519 | |
Grupo Antolin-Irausa | | | | | | | | |
3.500%, 04/30/28 | | EUR | 750 | | | | 635 | |
Metalsa Sapi De Cv | | | | | | | | |
3.750%, 05/04/31 | | | 553 | | | | 463 | |
3.750%, 05/04/31(A) | | | 1,805 | | | | 1,512 | |
| | | | | | | | | | | | | |
Total Autoparts | | | 3,129 | |
| | | | | | | | | | | | | |
Banking [0.0%] |
Ally Financial | | | | | | | | |
5.750%, 11/20/25 | | | 475 | | | | 478 | |
| | | | | | | | | | | | | |
Banks [4.7%] |
Akbank | | | | | | | | |
9.369%, H15T5Y + 5.270%, 06/14/73(A) (B) | | | 9,480 | | | | 9,820 | |
Banca Transilvania, MTN | | | | | | | | |
8.875%, EUAMDB01 + 5.580%, 04/27/27(B) | | EUR | 2,882 | | | | 3,394 | |
Banco Davivienda | | | | | | | | |
6.650%, H15T10Y + 5.097%, 10/22/72(A) (B) | | | 5,350 | | | | 4,589 | |
Banco de Bogota | | | | | | | | |
6.250%, 05/12/26 | | | 2,350 | | | | 2,363 | |
Banco de Credito e Inversiones | | | | | | | | |
7.500%, H15T5Y + 3.767%, 09/12/70(A) (B) | | | 3,700 | | | | 3,762 | |
Banco General | | | | | | | | |
5.250%, H15T10Y + 3.665%, 11/07/72(B) | | | 4,695 | | | | 4,305 | |
Banco Mercantil del Norte | | | | | | | | |
7.625%, H15T10Y + 5.353%, 10/06/67(B) | | | 6,165 | | | | 6,211 | |
Bancolombia | | | | | | | | |
4.625%, H15T5Y + 2.944%, 12/18/29(B) | | | 4,115 | | | | 4,073 | |
Bancolombia | | | | | | | | |
8.625%, H15T5Y + 4.320%, 12/24/34(B) | | | 2,010 | | | | 2,135 | |
Bank Hapoalim | | | | | | | | |
3.255%, H15T5Y + 2.155%, 01/21/32(A) (B) | | | 5,547 | | | | 5,142 | |
Bank Nadra Via NDR Finance | | | | | | | | |
8.250%, 06/22/17(C) | | $ | 631 | | | $ | 3 | |
Bank Negara Indonesia Persero | | | | | | | | |
4.300%, H15T5Y + 3.466%, 03/24/73(B) | | | 5,200 | | | | 4,982 | |
Bank of Georgia JSC | | | | | | | | |
9.500%, USISSO05 + 5.618%, 10/16/72(A) (B) | | | 3,800 | | | | 3,719 | |
BBVA Bancomer | | | | | | | | |
5.125%, H15T5Y + 2.650%, 01/18/33(B) | | | 2,605 | | | | 2,478 | |
BBVA Bancomer | | | | | | | | |
8.125%, H15T5Y + 4.214%, 01/08/39(B) | | | 4,900 | | | | 5,192 | |
Freedom Mortgage | | | | | | | | |
7.625%, 05/01/26(A) | | | 850 | | | | 857 | |
Freedom Mortgage | | | | | | | | |
12.000%, 10/01/28(A) | | | 775 | | | | 847 | |
HDFC Bank | | | | | | | | |
3.700%, H15T5Y + 2.925%, 02/25/73(B) | | | 3,000 | | | | 2,860 | |
ING Bank, MTN | | | | | | | | |
2.571%, 01/01/28(E) | | JPY | 210,917 | | | | 1,167 | |
Ipoteka-Bank ATIB | | | | | | | | |
5.500%, 11/19/25 | | | 5,425 | | | | 5,304 | |
Jscb Agrobank | | | | | | | | |
9.250%, 10/02/29(A) | | | 1,660 | | | | 1,665 | |
NBK Tier 1 Financing 2 | | | | | | | | |
4.500%, CMTUSD6Y + 2.832%, 05/27/73(B) | | | 2,785 | | | | 2,735 | |
Sovcombank Via SovCom Capital DAC | | | | | | | | |
7.600%, H15T5Y + 6.362%, 02/17/73(B)(C)(E) | | | 3,615 | | | | — | |
Turkiye Garanti Bankasi | | | | | | | | |
8.375%, H15T5Y + 4.090%, 02/28/34(A) (B) | | | 6,100 | | | | 6,259 | |
Yapi ve Kredi Bankasi, MTN | | | | | | | | |
9.250%, 10/16/28 | | | 575 | | | | 630 | |
9.250%, 10/16/28(A) | | | 3,950 | | | | 4,326 | |
| | | | | | | | | | | | | |
Total Banks | | | 88,818 | |
| | | | | | | | | | | | | |
Broadcasting & Cable [0.8%] |
Cable One | | | | | | | | |
4.000%, 11/15/30(A) | | | 3,870 | | | | 3,085 | |
CCO Holdings | | | | | | | | |
7.375%, 03/01/31(A) | | | 1,879 | | | | 1,925 | |
See accompanying notes to financial statements.
CITY NATIONAL ROCHDALE FUNDS | PAGE 26
schedule of investments |
September 30, 2024 |
City National Rochdale Fixed Income Opportunities Fund (continued) |
Description | | Face Amount (000)(1) | | | Value (000) | |
Charter Communications Operating | | | | | | | | |
6.484%, 10/23/45 | | $ | 2,005 | | | $ | 1,934 | |
CSC Holdings | | | | | | | | |
11.250%, 05/15/28(A) | | | 1,405 | | | | 1,356 | |
Gray Television | | | | | | | | |
10.500%, 07/15/29(A) | | | 570 | | | | 595 | |
LCPR Senior Secured Financing DAC | | | | | | | | |
6.750%, 10/15/27 | | | 4,900 | | | | 4,483 | |
6.750%, 10/15/27(A) | | | 1,085 | | | | 993 | |
LCPR Senior Secured Financing DAC | | | | | | | | |
5.125%, 07/15/29(A) | | | 985 | | | | 805 | |
Time Warner Cable | | | | | | | | |
5.875%, 11/15/40 | | | 530 | | | | 479 | |
| | | | | | | | | | | | | |
Total Broadcasting & Cable | | | 15,655 | |
| | | | | | | | | | | | | |
Building & Construction [1.2%] |
Allegheny Ludlum | | | | | | | | |
6.950%, 12/15/25 | | | 470 | | | | 479 | |
Assemblin Caverion Group | | | | | | | | |
7.195%, EUR003M + 3.500%, 07/01/31(B) | | EUR | 700 | | | | 777 | |
Brundage-Bone Concrete Pumping Holdings | | | | | | | | |
6.000%, 02/01/26(A) | | | 1,560 | | | | 1,555 | |
Builders FirstSource | | | | | | | | |
4.250%, 02/01/32(A) | | | 535 | | | | 495 | |
Cemex | | | | | | | | |
9.125%, H15T5Y + 5.157%, 06/14/73(A) (B) | | | 1,880 | | | | 2,050 | |
Dream Finders Homes | | | | | | | | |
8.250%, 08/15/28(A) | | | 1,006 | | | | 1,063 | |
Forestar Group | | | | | | | | |
5.000%, 03/01/28(A) | | | 818 | | | | 797 | |
Knife River | | | | | | | | |
7.750%, 05/01/31(A) | | | 1,255 | | | | 1,334 | |
LGI Homes | | | | | | | | |
8.750%, 12/15/28(A) | | | 490 | | | | 525 | |
New Home | | | | | | | | |
9.250%, 10/01/29(A) | | | 1,050 | | | | 1,105 | |
Patrick Industries | | | | | | | | |
7.500%, 10/15/27(A) | | | 1,245 | | | | 1,247 | |
Sisecam UK | | | | | | | | |
8.250%, 05/02/29(A) | | | 3,720 | | | | 3,843 | |
Smyrna Ready Mix Concrete | | | | | | | | |
6.000%, 11/01/28(A) | | | 490 | | | | 492 | |
Smyrna Ready Mix Concrete | | | | | | | | |
8.875%, 11/15/31(A) | | $ | 1,225 | | | $ | 1,321 | |
Summit Materials | | | | | | | | |
6.500%, 03/15/27(A) | | | 1,450 | | | | 1,452 | |
West China Cement | | | | | | | | |
4.950%, 07/08/26 | | | 3,360 | | | | 2,587 | |
Winnebago Industries | | | | | | | | |
6.250%, 07/15/28(A) | | | 440 | | | | 440 | |
Yuksel Insaat | | | | | | | | |
9.500%, 11/10/15(C) | | | 12,655 | | | | 127 | |
| | | | | | | | | | | | | |
Total Building & Construction | | | 21,689 | |
| | | | | | | | | | | | | |
Building Materials [0.6%] |
American Builders & Contractors Supply | | | | | | | | |
4.000%, 01/15/28(A) | | | 350 | | | | 337 | |
American Builders & Contractors Supply | | | | | | | | |
3.875%, 11/15/29(A) | | | 400 | | | | 375 | |
Camelot Return Merger Sub | | | | | | | | |
8.750%, 08/01/28(A) | | | 740 | | | | 749 | |
CP Atlas Buyer | | | | | | | | |
7.000%, 12/01/28(A) | | | 850 | | | | 787 | |
Foundation Building Materials | | | | | | | | |
6.000%, 03/01/29(A) | | | 2,082 | | | | 1,838 | |
GYP Holdings III | | | | | | | | |
4.625%, 05/01/29(A) | | | 975 | | | | 933 | |
Interface | | | | | | | | |
5.500%, 12/01/28(A) | | | 825 | | | | 805 | |
Masterbrand | | | | | | | | |
7.000%, 07/15/32(A) | | | 955 | | | | 1,001 | |
Miter Brands Acquisition Holdco | | | | | | | | |
6.750%, 04/01/32(A) | | | 475 | | | | 493 | |
Standard Building Solutions | | | | | | | | |
6.500%, 08/15/32(A) | | | 150 | | | | 155 | |
Standard Industries | | | | | | | | |
5.000%, 02/15/27(A) | | | 600 | | | | 595 | |
Standard Industries | | | | | | | | |
4.750%, 01/15/28(A) | | | 1,150 | | | | 1,127 | |
Standard Industries | | | | | | | | |
4.375%, 07/15/30(A) | | | 530 | | | | 501 | |
White Capital Buyer | | | | | | | | |
6.875%, 10/15/28(A) | | | 725 | | | | 732 | |
See accompanying notes to financial statements.
CITY NATIONAL ROCHDALE FUNDS | PAGE 27
schedule of investments |
September 30, 2024 |
City National Rochdale Fixed Income Opportunities Fund (continued) |
Description | | Face Amount (000)(1) | | | Value (000) | |
White Capital Parent | | | | | | | | |
8.250%cash/9.000% PIK, 03/15/26(A) | | $ | 425 | | | $ | 425 | |
| | | | | | | | | | | | | |
Total Building Materials | | | 10,853 | |
| | | | | | | | | | | | | |
Building-Heavy Construct [0.5%] |
Arcosa | | | | | | | | |
6.875%, 08/15/32(A) | | | 290 | | | | 304 | |
HTA Group | | | | | | | | |
7.500%, 06/04/29(A) | | | 4,370 | | | | 4,436 | |
Odebrecht Holdco Finance | | | | | | | | |
0.000%, 09/10/58(D) | | | 13,874 | | | | 50 | |
Sitios Latinoamerica | | | | | | | | |
5.375%, 04/04/32(A) | | | 5,320 | | | | 5,144 | |
| | | | | | | | | | | | | |
Total Building-Heavy Construct | | | 9,934 | |
| | | | | | | | | | | | | |
Cable Satellite [1.0%] |
CCO Holdings | | | | | | | | |
5.125%, 05/01/27(A) | | | 1,600 | | | | 1,575 | |
CCO Holdings | | | | | | | | |
5.000%, 02/01/28(A) | | | 1,200 | | | | 1,167 | |
CCO Holdings | | | | | | | | |
4.750%, 03/01/30(A) | | | 535 | | | | 492 | |
CCO Holdings | | | | | | | | |
4.500%, 08/15/30(A) | | | 550 | | | | 498 | |
CCO Holdings | | | | | | | | |
4.250%, 01/15/34(A) | | | 900 | | | | 740 | |
CSC Holdings | | | | | | | | |
5.500%, 04/15/27(A) | | | 750 | | | | 660 | |
CSC Holdings | | | | | | | | |
5.750%, 01/15/30(A) | | | 1,350 | | | | 699 | |
CSC Holdings | | | | | | | | |
4.125%, 12/01/30(A) | | | 400 | | | | 291 | |
CSC Holdings | | | | | | | | |
3.375%, 02/15/31(A) | | | 400 | | | | 284 | |
CSC Holdings | | | | | | | | |
4.500%, 11/15/31(A) | | | 675 | | | | 491 | |
DIRECTV Holdings | | | | | | | | |
5.875%, 08/15/27(A) | | | 981 | | | | 964 | |
DISH DBS | | | | | | | | |
7.375%, 07/01/28 | | | 500 | | | | 376 | |
DISH DBS | | | | | | | | |
5.125%, 06/01/29 | | | 675 | | | | 453 | |
Sirius XM Radio | | | | | | | | |
4.000%, 07/15/28(A) | | | 1,740 | | | | 1,642 | |
Sirius XM Radio | | | | | | | | |
5.500%, 07/01/29(A) | | | 1,475 | | | | 1,441 | |
Sirius XM Radio | | | | | | | | |
3.875%, 09/01/31(A) | | | 575 | | | | 501 | |
Sunrise FinCo I BV | | | | | | | | |
4.875%, 07/15/31(A) | | $ | 975 | | | $ | 919 | |
Telenet Finance Luxembourg Notes Sarl | | | | | | | | |
5.500%, 03/01/28(A) | | | 1,400 | | | | 1,358 | |
Virgin Media Finance | | | | | | | | |
5.000%, 07/15/30(A) | | | 825 | | | | 725 | |
Virgin Media Secured Finance | | | | | | | | |
5.500%, 05/15/29(A) | | | 1,425 | | | | 1,366 | |
Virgin Media Secured Finance | | | | | | | | |
4.500%, 08/15/30(A) | | | 825 | | | | 734 | |
Vmed O2 UK Financing I | | | | | | | | |
4.750%, 07/15/31(A) | | | 1,330 | | | | 1,184 | |
Ziggo Bond BV | | | | | | | | |
6.000%, 01/15/27(A) | | | 700 | | | | 700 | |
Ziggo Bond BV | | | | | | | | |
5.125%, 02/28/30(A) | | | 225 | | | | 207 | |
| | | | | | | | | | | | | |
Total Cable Satellite | | | 19,467 | |
| | | | | | | | | | | | | |
Chemicals [1.6%] |
Axalta Coating Systems | | | | | | | | |
4.750%, 06/15/27(A) | | | 700 | | | | 694 | |
Axalta Coating Systems | | | | | | | | |
3.375%, 02/15/29(A) | | | 375 | | | | 351 | |
Braskem Idesa SAPI | | | | | | | | |
7.450%, 11/15/29 | | | 4,468 | | | | 3,872 | |
Braskem Idesa SAPI | | | | | | | | |
6.990%, 02/20/32 | | | 3,750 | | | | 2,955 | |
Braskem Netherlands Finance BV | | | | | | | | |
8.500%, 01/12/31(A) | | | 2,530 | | | | 2,690 | |
Braskem Netherlands Finance BV | | | | | | | | |
7.250%, 02/13/33(A) | | | 2,325 | | | | 2,299 | |
Consolidated Energy Finance | | | | | | | | |
12.000%, 02/15/31(A) | | | 520 | | | | 523 | |
Element Solutions | | | | | | | | |
3.875%, 09/01/28(A) | | | 700 | | | | 668 | |
HB Fuller | | | | | | | | |
4.250%, 10/15/28 | | | 775 | | | | 743 | |
Herens Holdco Sarl | | | | | | | | |
4.750%, 05/15/28(A) | | | 1,075 | | | | 938 | |
Illuminate Buyer | | | | | | | | |
9.000%, 07/01/28(A) | | | 425 | | | | 430 | |
INEOS Finance | | | | | | | | |
6.750%, 05/15/28(A) | | | 2,235 | | | | 2,258 | |
INEOS Quattro Finance 2 | | | | | | | | |
9.625%, 03/15/29(A) | | | 470 | | | | 503 | |
See accompanying notes to financial statements.
CITY NATIONAL ROCHDALE FUNDS | PAGE 28
schedule of investments |
September 30, 2024 |
City National Rochdale Fixed Income Opportunities Fund (continued) |
Description | | Face Amount (000)(1) | | | Value (000) | |
Italmatch Chemicals | | | | | | | | |
8.845%, EUR003M + 5.500%, 02/06/28(B) | | EUR | 937 | | | $ | 1,054 | |
LSF11 A5 HoldCo | | | | | | | | |
6.625%, 10/15/29(A) | | | 975 | | | | 948 | |
OCP | | | | | | | | |
7.500%, 05/02/54(A) | | | 3,850 | | | | 4,186 | |
Olympus Water US Holding | | | | | | | | |
7.125%, 10/01/27(A) | | | 375 | | | | 383 | |
Olympus Water US Holding | | | | | | | | |
9.750%, 11/15/28(A) | | | 325 | | | | 347 | |
Olympus Water US Holding | | | | | | | | |
6.250%, 10/01/29(A) | | | 875 | | | | 847 | |
Olympus Water US Holding | | | | | | | | |
7.250%, 06/15/31(A) | | | 300 | | | | 312 | |
Sasol Financing USA | | | | | | | | |
6.500%, 09/27/28 | | | 2,300 | | | | 2,280 | |
SNF Group | | | | | | | | |
3.375%, 03/15/30(A) | | | 275 | | | | 248 | |
WR Grace Holdings | | | | | | | | |
4.875%, 06/15/27(A) | | | 425 | | | | 419 | |
WR Grace Holdings | | | | | | | | |
5.625%, 08/15/29(A) | | | 225 | | | | 211 | |
| | | | | | | | | | | | | |
Total Chemicals | | | 30,159 | |
| | | | | | | | | | | | | |
Coal Mining [0.1%] |
Coronado Finance Pty | | | | | | | | |
9.250%, 10/01/29(A) | | | 497 | | | | 510 | |
New World Resources | | | | | | | | |
8.000%, 04/07/20(C) | | EUR | 1,101 | | | | 2 | |
Warrior Met Coal | | | | | | | | |
7.875%, 12/01/28(A) | | | 1,097 | | | | 1,135 | |
| | | | | | | | | | | | | |
Total Coal Mining | | | 1,647 | |
| | | | | | | | | | | | | |
Commercial Serv-Finance [0.1%] |
Sabre GLBL | | | | | | | | |
8.625%, 06/01/27(A) | | | 1,324 | | | | 1,298 | |
Shift4 Payments | | | | | | | | |
6.750%, 08/15/32(A) | | | 148 | | | | 155 | |
| | | | | | | | | | | | | |
Total Commercial Serv-Finance | | | 1,453 | |
| | | | | | | | | | | | | |
Commercial Services [0.1%] |
Arena Luxembourg Finance Sarl | | | | | | | | |
6.276%, EUR003M + 3.000%, 02/01/27(B) | | EUR | 200 | | | $ | 224 | |
Bidvest Group UK | | | | | | | | |
3.625%, 09/23/26 | | | 2,575 | | | | 2,502 | |
SD International Sukuk, MTN | | | | | | | | |
6.300%, 05/09/22(C) | | | 13,384 | | | | — | |
| | | | | | | | | | | | | |
Total Commercial Services | | | 2,726 | |
| | | | | | | | | | | | | |
Communication & Media [0.3%] |
Globo Comunicacao e Participacoes | | | | | | | | |
5.500%, 01/14/32 | | | 1,505 | | | | 1,409 | |
5.500%, 01/14/32(A) | | | 5,140 | | | | 4,810 | |
| | | | | | | | | | | | | |
Total Communication & Media | | | 6,219 | |
| | | | | | | | | | | | | |
Computer System Design & Services [0.3%] |
Magnum Holdings | | | | | | | | |
5.375%, 10/31/26(A) | | | 4,900 | | | | 4,826 | |
| | | | | | | | | | | | | |
Computers-Memory Devices [0.1%] |
Seagate HDD Cayman | | | | | | | | |
8.250%, 12/15/29 | | | 911 | | | | 990 | |
| | | | | | | | | | | | | |
Construction Machinery [0.1%] |
Terex | | | | | | | | |
5.000%, 05/15/29(A) | | | 680 | | | | 663 | |
United Rentals North America | | | | | | | | |
5.500%, 05/15/27 | | | 424 | | | | 424 | |
United Rentals North America | | | | | | | | |
4.875%, 01/15/28 | | | 600 | | | | 596 | |
| | | | | | | | | | | | | |
Total Construction Machinery | | | 1,683 | |
| | | | | | | | | | | | | |
Consumer Cyclical Services [0.5%] |
Allied Universal Holdco | | | | | | | | |
9.750%, 07/15/27(A) | | | 475 | | | | 476 | |
Allied Universal Holdco | | | | | | | | |
6.000%, 06/01/29(A) | | | 1,375 | | | | 1,230 | |
Allied Universal Holdco | | | | | | | | |
7.875%, 02/15/31(A) | | | 425 | | | | 434 | |
Brink’s | | | | | | | | |
6.500%, 06/15/29(A) | | | 350 | | | | 362 | |
Brink’s | | | | | | | | |
6.750%, 06/15/32(A) | | | 350 | | | | 365 | |
See accompanying notes to financial statements.
CITY NATIONAL ROCHDALE FUNDS | PAGE 29
schedule of investments |
September 30, 2024 |
City National Rochdale Fixed Income Opportunities Fund (continued) |
Description | | Face Amount (000)(1) | | | Value (000) | |
Cars.com | | | | | | | | |
6.375%, 11/01/28(A) | | $ | 850 | | | $ | 853 | |
Dun & Bradstreet | | | | | | | | |
5.000%, 12/15/29(A) | | | 625 | | | | 623 | |
Garda World Security | | | | | | | | |
6.000%, 06/01/29(A) | | | 1,250 | | | | 1,195 | |
Go Daddy Operating | | | | | | | | |
5.250%, 12/01/27(A) | | | 725 | | | | 722 | |
GW B-CR Security | | | | | | | | |
9.500%, 11/01/27(A) | | | 918 | | | | 919 | |
Match Group | | | | | | | | |
5.000%, 12/15/27(A) | | | 1,000 | | | | 989 | |
Match Group | | | | | | | | |
4.625%, 06/01/28(A) | | | 250 | | | | 243 | |
| | | | | | | | | | | | | |
Total Consumer Cyclical Services | | | 8,411 | |
| | | | | | | | | | | | | |
Consumer Products [0.2%] |
BCPE Empire Holdings | | | | | | | | |
7.625%, 05/01/27(A) | | | 1,500 | | | | 1,505 | |
Edgewell Personal Care | | | | | | | | |
5.500%, 06/01/28(A) | | | 725 | | | | 724 | |
Edgewell Personal Care | | | | | | | | |
4.125%, 04/01/29(A) | | | 200 | | | | 189 | |
Energizer Holdings | | | | | | | | |
6.500%, 12/31/27(A) | | | 750 | | | | 762 | |
Energizer Holdings | | | | | | | | |
4.375%, 03/31/29(A) | | | 850 | | | | 805 | |
| | | | | | | | | | | | | |
Total Consumer Products | | | 3,985 | |
| | | | | | | | | | | | | |
Consumer Products & Services [0.1%] |
Kronos Acquisition Holdings | | | | | | | | |
8.250%, 06/30/31(A) | | | 525 | | | | 525 | |
Kronos Acquisition Holdings | | | | | | | | |
10.750%, 06/30/32(A) | | | 525 | | | | 499 | |
| | | | | | | | | | | | | |
Total Consumer Products & Services | | | 1,024 | |
| | | | | | | | | | | | | |
Containers & Packaging [0.0%] |
Graham Packaging | | | | | | | | |
7.125%, 08/15/28(A) | | | 660 | | | | 655 | |
| | | | | | | | | | | | | |
Dialysis Centers [0.1%] |
DaVita | | | | | | | | |
6.875%, 09/01/32(A) | | | 980 | | | | 1,012 | |
| | | | | | | | | | | | | |
Distribution/Wholesale [0.1%] |
Azelis Finance | | | | | | | | |
4.750%, 09/25/29 | | EUR | 240 | | | $ | 272 | |
Windsor Holdings III | | | | | | | | |
8.500%, 06/15/30(A) | | | 875 | | | | 936 | |
| | | | | | | | | | | | | |
Total Distribution/Wholesale | | | 1,208 | |
| | | | | | | | | | | | | |
Diversified Manufacturing [0.2%] |
EMRLD Borrower | | | | | | | | |
6.625%, 12/15/30(A) | | | 1,500 | | | | 1,547 | |
Gates | | | | | | | | |
6.875%, 07/01/29(A) | | | 350 | | | | 362 | |
WESCO Distribution | | | | | | | | |
7.250%, 06/15/28(A) | | | 800 | | | | 819 | |
WESCO Distribution | | | | | | | | |
6.375%, 03/15/29(A) | | | 100 | | | | 104 | |
WESCO Distribution | | | | | | | | |
6.625%, 03/15/32(A) | | | 150 | | | | 156 | |
| | | | | | | | | | | | | |
Total Diversified Manufacturing | | | 2,988 | |
| | | | | | | | | | | | | |
Drugs [0.4%] |
Neopharmed Gentili SPA | | | | | | | | |
7.935%, EUR003M + 4.250%, 04/08/30(B) | | EUR | 400 | | | | 449 | |
Organon | | | | | | | | |
2.875%, 04/30/28 | | EUR | 1,000 | | | | 1,068 | |
Teva Pharmaceutical Finance Netherlands III BV | | | | | | | | |
8.125%, 09/15/31 | | | 4,550 | | | | 5,216 | |
| | | | | | | | | | | | | |
Total Drugs | | | 6,733 | |
| | | | | | | | | | | | | |
E-Commerce/Products [0.0%] |
ANGI Group | | | | | | | | |
3.875%, 08/15/28(A) | | | 685 | | | | 628 | |
Wayfair | | | | | | | | |
7.250%, 10/31/29(A) | | | 36 | | | | 37 | |
| | | | | | | | | | | | | |
Total E-Commerce/Products | | | 665 | |
| | | | | | | | | | | | | |
E-Commerce/Services [0.1%] |
Uber Technologies | | | | | | | | |
7.500%, 09/15/27(A) | | | 2,258 | | | | 2,303 | |
| | | | | | | | | | | | | |
Electric Utilities [1.8%] |
Adani Renewable Energy RJ, MTN | | | | | | | | |
4.625%, 10/15/39 | | | 5,003 | | | | 4,283 | |
See accompanying notes to financial statements.
CITY NATIONAL ROCHDALE FUNDS | PAGE 30
schedule of investments |
September 30, 2024 |
City National Rochdale Fixed Income Opportunities Fund (continued) |
Description | | Face Amount (000)(1) | | | Value (000) | |
AES Andes | | | | | | | | |
8.150%, H15T5Y + 3.835%, 06/10/55(A) (B) | | $ | 1,540 | | | $ | 1,589 | |
Cikarang Listrindo | | | | | | | | |
4.950%, 09/14/26 | | | 2,700 | | | | 2,658 | |
FirstEnergy | | | | | | | | |
2.050%, 03/01/25 | | | 174 | | | | 171 | |
Greenko Power II | | | | | | | | |
4.300%, 12/13/28 | | | 625 | | | | 587 | |
Lightning Power | | | | | | | | |
7.250%, 08/15/32(A) | | | 1,360 | | | | 1,428 | |
Mercury Chile Holdco | | | | | | | | |
6.500%, 01/24/27(A) | | | 6,830 | | | | 6,782 | |
Minejesa Capital BV | | | | | | | | |
5.625%, 08/10/37(A) | | | 5,300 | | | | 5,100 | |
Mong Duong Finance Holdings BV | | | | | | | | |
5.125%, 05/07/29 | | | 5,093 | | | | 4,943 | |
Pike | | | | | | | | |
8.625%, 01/31/31(A) | | | 545 | | | | 583 | |
Star Energy Geothermal Wayang Windu | | | | | | | | |
6.750%, 04/24/33 | | | 4,835 | | | | 4,937 | |
Vistra | | | | | | | | |
8.000%, H15T5Y + 6.930%, 04/15/73(A) (B) | | | 1,130 | | | | 1,184 | |
| | | | | | | | | | | | | |
Total Electric Utilities | | | 34,245 | |
| | | | | | | | | | | | | |
Energy & Power [0.2%] |
Continuum Energy Aura Pte | | | | | | | | |
9.500%, 02/24/27(A) | | | 2,440 | | | | 2,559 | |
Greenko Solar Mauritius | | | | | | | | |
5.950%, 07/29/26 | | | 1,900 | | | | 1,895 | |
| | | | | | | | | | | | | |
Total Energy & Power | | | 4,454 | |
| | | | | | | | | | | | | |
Entertainment & Gaming [1.0%] |
IGT Lottery Holdings BV | | | | | | | | |
4.250%, 03/15/30 | | EUR | 430 | | | | 483 | |
Lottomatica | | | | | | | | |
7.505%, EUR003M + 4.000%, 12/15/30(B) | | EUR | 400 | | | | 449 | |
Lottomatica | | | | | | | | |
6.755%, EUR003M + 3.250%, 06/01/31(B) | | EUR | 200 | | | | 224 | |
Melco Resorts Finance | | | | | | | | |
4.875%, 06/06/25 | | | 2,340 | | | | 2,319 | |
Melco Resorts Finance | | | | | | | | |
5.250%, 04/26/26 | | $ | 4,600 | | | $ | 4,514 | |
MGM China Holdings | | | | | | | | |
5.250%, 06/18/25 | | | 2,700 | | | | 2,685 | |
MGM China Holdings | | | | | | | | |
7.125%, 06/26/31(A) | | | 2,070 | | | | 2,130 | |
Studio City Finance | | | | | | | | |
6.500%, 01/15/28 | | | 4,000 | | | | 3,912 | |
Wynn Macau | | | | | | | | |
5.625%, 08/26/28 | | | 900 | | | | 875 | |
Wynn Macau | | | | | | | | |
5.125%, 12/15/29 | | | 2,100 | | | | 1,972 | |
| | | | | | | | | | | | | |
Total Entertainment & Gaming | | | 19,563 | |
| | | | | | | | | | | | | |
Finance [0.1%] |
Garfunkelux Holdco 3 | | | | | | | | |
6.750%, 11/01/25 | | EUR | 450 | | | | 337 | |
Garfunkelux Holdco 3 | | | | | | | | |
7.750%, 11/01/25 | | GBP | 700 | | | | 625 | |
| | | | | | | | | | | | | |
Total Finance | | | 962 | |
| | | | | | | | | | | | | |
Finance Companies [0.6%] |
Boost Newco Borrower | | | | | | | | |
7.500%, 01/15/31(A) | | | 2,165 | | | | 2,323 | |
Macquarie Airfinance Holdings | | | | | | | | |
6.400%, 03/26/29(A) | | | 75 | | | | 78 | |
Macquarie Airfinance Holdings | | | | | | | | |
8.125%, 03/30/29(A) | | | 835 | | | | 885 | |
Macquarie Airfinance Holdings | | | | | | | | |
6.500%, 03/26/31(A) | | | 75 | | | | 79 | |
Navient | | | | | | | | |
6.750%, 06/25/25 | | | 375 | | | | 377 | |
Navient | | | | | | | | |
5.000%, 03/15/27 | | | 750 | | | | 744 | |
Rocket Mortgage | | | | | | | | |
3.625%, 03/01/29(A) | | | 350 | | | | 329 | |
Rocket Mortgage | | | | | | | | |
3.875%, 03/01/31(A) | | | 950 | | | | 873 | |
Rocket Mortgage | | | | | | | | |
4.000%, 10/15/33(A) | | | 575 | | | | 514 | |
United Wholesale Mortgage | | | | | | | | |
5.500%, 11/15/25(A) | | | 1,935 | | | | 1,931 | |
5.500%, 04/15/29(A) | | | 3,228 | | | | 3,144 | |
| | | | | | | | | | | | | |
Total Finance Companies | | | 11,277 | |
See accompanying notes to financial statements.
CITY NATIONAL ROCHDALE FUNDS | PAGE 31
schedule of investments |
September 30, 2024 |
City National Rochdale Fixed Income Opportunities Fund (continued) |
Description | | Face Amount (000)(1) | | | Value (000) | |
Financial Services [1.5%] |
ASG Finance Designated Activity | | | | | | | | |
9.750%, 05/15/29(A) | | $ | 6,040 | | | $ | 6,043 | |
Bread Financial Holdings | | | | | | | | |
9.750%, 03/15/29(A) | | | 710 | | | | 751 | |
Castlelake Aviation Finance DAC | | | | | | | | |
5.000%, 04/15/27(A) | | | 650 | | | | 652 | |
CSN Inova Ventures | | | | | | | | |
6.750%, 01/28/28(A) | | | 2,680 | | | | 2,590 | |
Enact Holdings | | | | | | | | |
6.250%, 05/28/29 | | | 1,910 | | | | 1,984 | |
Encore Capital Group | | | | | | | | |
4.250%, 06/01/28 | | GBP | 1,000 | | | | 1,226 | |
Encore Capital Group | | | | | | | | |
9.250%, 04/01/29(A) | | | 1,185 | | | | 1,275 | |
Enova International | | | | | | | | |
9.125%, 08/01/29(A) | | | 490 | | | | 503 | |
Freedom Mortgage Holdings | | | | | | | | |
9.250%, 02/01/29(A) | | | 754 | | | | 784 | |
GGAM Finance | | | | | | | | |
8.000%, 02/15/27(A) | | | 990 | | | | 1,034 | |
Iqera Group SAS | | | | | | | | |
10.042%, EUR003M + 6.500%, 02/15/27(B) | | EUR | 900 | | | | 624 | |
Macquarie Airfinance Holdings | | | | | | | | |
8.375%, 05/01/28(A) | | | 560 | | | | 589 | |
Muangthai Capital | | | | | | | | |
6.875%, 09/30/28 | | | 2,260 | | | | 2,275 | |
Nationstar Mortgage Holdings | | | | | | | | |
6.000%, 01/15/27(A) | | | 495 | | | | 495 | |
Nationstar Mortgage Holdings | | | | | | | | |
6.500%, 08/01/29(A) | | | 440 | | | | 447 | |
Nationstar Mortgage Holdings | | | | | | | | |
5.750%, 11/15/31(A) | | | 900 | | | | 882 | |
Nationstar Mortgage Holdings | | | | | | | | |
7.125%, 02/01/32(A) | | | 287 | | | | 300 | |
OEC Finance | | | | | | | | |
7.500%, 03/14/73(C) | | | 38 | | | | 1 | |
OneMain Finance | | | | | | | | |
9.000%, 01/15/29 | | | 1,435 | | | | 1,521 | |
PennyMac Financial Services | | | | | | | | |
5.375%, 10/15/25(A) | | | 785 | | | | 783 | |
PennyMac Financial Services | | | | | | | | |
7.875%, 12/15/29(A) | | $ | 450 | | | $ | 480 | |
PRA Group | | | | | | | | |
5.000%, 10/01/29(A) | | | 540 | | | | 497 | |
PRA Group | | | | | | | | |
8.875%, 01/31/30(A) | | | 470 | | | | 489 | |
Sobha Sukuk | | | | | | | | |
8.750%, 07/17/28 | | | 2,457 | | | | 2,523 | |
| | | | | | | | | | | | | |
Total Financial Services | | | 28,748 | |
| | | | | | | | | | | | | |
Food & Beverage [0.2%] |
BellRing Brands | | | | | | | | |
7.000%, 03/15/30(A) | | | 925 | | | | 968 | |
Performance Food Group | | | | | | | | |
4.250%, 08/01/29(A) | | | 925 | | | | 880 | |
Performance Food Group | | | | | | | | |
6.125%, 09/15/32(A) | | | 50 | | | | 51 | |
Post Holdings | | | | | | | | |
5.625%, 01/15/28(A) | | | 254 | | | | 256 | |
Post Holdings | | | | | | | | |
6.250%, 02/15/32(A) | | | 250 | | | | 257 | |
6.250%, 10/15/34(A) | | | 175 | | | | 176 | |
Post Holdings | | | | | | | | |
6.375%, 03/01/33(A) | | | 550 | | | | 557 | |
US Foods | | | | | | | | |
6.875%, 09/15/28(A) | | | 375 | | | | 391 | |
US Foods | | | | | | | | |
4.750%, 02/15/29(A) | | | 675 | | | | 658 | |
US Foods | | | | | | | | |
5.750%, 04/15/33(A) | | | 75 | | | | 75 | |
| | | | | | | | | | | | | |
Total Food & Beverage | | | 4,269 | |
| | | | | | | | | | | | | |
Food, Beverage & Tobacco [1.1%] |
Agrosuper | | | | | | | | |
4.600%, 01/20/32(A) | | | 5,235 | | | | 4,825 | |
BRF | | | | | | | | |
4.875%, 01/24/30 | | | 2,885 | | | | 2,787 | |
Coca-Cola Icecek | | | | | | | | |
50.500%, 04/28/25 | | TRY | 101,100 | | | | 2,956 | |
Health & Happiness H&H International Holdings | | | | | | | | |
13.500%, 06/26/26 | | | 1,400 | | | | 1,486 | |
Minerva Luxembourg | | | | | | | | |
4.375%, 03/18/31(A) | | | 4,475 | | | | 3,975 | |
Simmons Foods | | | | | | | | |
4.625%, 03/01/29(A) | | | 855 | | | | 810 | |
Turning Point Brands | | | | | | | | |
5.625%, 02/15/26(A) | | | 1,915 | | | | 1,909 | |
See accompanying notes to financial statements.
CITY NATIONAL ROCHDALE FUNDS | PAGE 32
schedule of investments |
September 30, 2024 |
City National Rochdale Fixed Income Opportunities Fund (continued) |
Description | | Face Amount (000)(1) | | | Value (000) | |
Vector Group | | | | | | | | |
5.750%, 02/01/29(A) | | $ | 1,955 | | | $ | 1,982 | |
| | | | | | | | | | | | | |
Total Food, Beverage & Tobacco | | | 20,730 | |
| | | | | | | | | | | | | |
Gaming [0.8%] |
Affinity Interactive | | | | | | | | |
6.875%, 12/15/27(A) | | | 350 | | | | 301 | |
Boyd Gaming | | | | | | | | |
4.750%, 12/01/27 | | | 875 | | | | 865 | |
Caesars Entertainment | | | | | | | | |
4.625%, 10/15/29(A) | | | 300 | | | | 285 | |
Caesars Entertainment | | | | | | | | |
7.000%, 02/15/30(A) | | | 150 | | | | 157 | |
Caesars Entertainment | | | | | | | | |
6.500%, 02/15/32(A) | | | 425 | | | | 440 | |
Churchill Downs | | | | | | | | |
5.750%, 04/01/30(A) | | | 75 | | | | 75 | |
Churchill Downs | | | | | | | | |
6.750%, 05/01/31(A) | | | 910 | | | | 940 | |
Colt Merger Sub | | | | | | | | |
8.125%, 07/01/27(A) | | | 2,335 | | | | 2,383 | |
Light & Wonder International | | | | | | | | |
7.250%, 11/15/29(A) | | | 125 | | | | 129 | |
Light & Wonder International | | | | | | | | |
7.500%, 09/01/31(A) | | | 625 | | | | 656 | |
MGM Resorts International | | | | | | | | |
6.125%, 09/15/29 | | | 300 | | | | 304 | |
MGM Resorts International | | | | | | | | |
6.500%, 04/15/32 | | | 625 | | | | 637 | |
Midwest Gaming Borrower | | | | | | | | |
4.875%, 05/01/29(A) | | | 775 | | | | 743 | |
Mohegan Tribal Gaming Authority | | | | | | | | |
8.000%, 02/01/26(A) | | | 850 | | | | 841 | |
Ontario Gaming GTA | | | | | | | | |
8.000%, 08/01/30(A) | | | 1,000 | | | | 1,040 | |
Penn Entertainment | | | | | | | | |
5.625%, 01/15/27(A) | | | 830 | | | | 822 | |
Penn Entertainment | | | | | | | | |
4.125%, 07/01/29(A) | | | 300 | | | | 273 | |
Scientific Games Holdings | | | | | | | | |
6.625%, 03/01/30(A) | | | 650 | | | | 645 | |
Station Casinos | | | | | | | | |
4.500%, 02/15/28(A) | | | 1,990 | | | | 1,921 | |
Station Casinos | | | | | | | | |
4.625%, 12/01/31(A) | | | 860 | | | | 798 | |
Wynn Resorts Finance | | | | | | | | |
7.125%, 02/15/31(A) | | $ | 475 | | | $ | 512 | |
Wynn Resorts Finance | | | | | | | | |
6.250%, 03/15/33(A) | | | 200 | | | | 203 | |
| | | | | | | | | | | | | |
Total Gaming | | | 14,970 | |
| | | | | | | | | | | | | |
Gas-Distribution [0.0%] |
AmeriGas Partners | | | | | | | | |
9.375%, 06/01/28(A) | | | 405 | | | | 425 | |
| | | | | | | | | | | | | |
Gold Mining [0.6%] |
Aris Mining | | | | | | | | |
6.875%, 08/09/26 | | | 5,956 | | | | 5,933 | |
Cia de Minas Buenaventura SAA | | | | | | | | |
5.500%, 07/23/26 | | | 5,175 | | | | 5,107 | |
| | | | | | | | | | | | | |
Total Gold Mining | | | 11,040 | |
| | | | | | | | | | | | | |
Healthcare [0.5%] |
Avantor Funding | | | | | | | | |
4.625%, 07/15/28(A) | | | 875 | | | | 855 | |
CHS | | | | | | | | |
5.625%, 03/15/27(A) | | | 650 | | | | 639 | |
CHS | | | | | | | | |
6.000%, 01/15/29(A) | | | 250 | | | | 243 | |
CHS | | | | | | | | |
6.875%, 04/15/29(A) | | | 725 | | | | 660 | |
Concentra Escrow Issuer | | | | | | | | |
6.875%, 07/15/32(A) | | | 150 | | | | 157 | |
Embecta | | | | | | | | |
6.750%, 02/15/30(A) | | | 550 | | | | 521 | |
IQVIA | | | | | | | | |
5.000%, 10/15/26(A) | | | 1,075 | | | | 1,072 | |
Medline Borrower | | | | | | | | |
6.250%, 04/01/29(A) | | | 525 | | | | 541 | |
Medline Borrower | | | | | | | | |
5.250%, 10/01/29(A) | | | 2,100 | | | | 2,058 | |
Neogen Food Safety | | | | | | | | |
8.625%, 07/20/30(A) | | | 400 | | | | 443 | |
Tenet Healthcare | | | | | | | | |
5.125%, 11/01/27 | | | 1,225 | | | | 1,221 | |
Tenet Healthcare | | | | | | | | |
6.125%, 10/01/28 | | | 1,354 | | | | 1,363 | |
Tenet Healthcare | | | | | | | | |
6.750%, 05/15/31 | | | 450 | | | | 469 | |
| | | | | | | | | | | | | |
Total Healthcare | | | 10,242 | |
| | | | | | | | | | | | | |
See accompanying notes to financial statements.
CITY NATIONAL ROCHDALE FUNDS | PAGE 33
schedule of investments |
September 30, 2024 |
City National Rochdale Fixed Income Opportunities Fund (continued) |
Description | | Face Amount (000)(1) | | | Value (000) | |
Homebuilders/Materials/Construction [0.0%] |
PCF GmbH | | | | | | | | |
4.750%, 04/15/29 | | EUR | 253 | | | $ | 242 | |
Victoria | | | | | | | | |
3.750%, 03/15/28 | | EUR | 500 | | | | 418 | |
| | | | | | | | | | | | | |
Total Homebuilders/Materials/Construction | | | 660 | |
| | | | | | | | | | | | | |
Hotels and Motels [0.1%] |
Hilton Grand Vacations Borrower Escrow | | | | | | | | |
6.625%, 01/15/32(A) | | | 495 | | | | 501 | |
Marriott Ownership Resorts | | | | | | | | |
4.750%, 01/15/28 | | | 1,045 | | | | 1,004 | |
Travel + Leisure | | | | | | | | |
6.625%, 07/31/26(A) | | | 938 | | | | 956 | |
| | | | | | | | | | | | | |
Total Hotels and Motels | | | 2,461 | |
| | | | | | | | | | | | | |
Independent Energy [0.6%] |
Aethon United BR | | | | | | | | |
7.500%, 10/01/29(A) | | | 350 | | | | 355 | |
Antero Resources | | | | | | | | |
7.625%, 02/01/29(A) | | | 159 | | | | 164 | |
Ascent Resources Utica Holdings | | | | | | | | |
7.000%, 11/01/26(A) | | | 1,135 | | | | 1,136 | |
Ascent Resources Utica Holdings | | | | | | | | |
9.000%, 11/01/27(A) | | | 375 | | | | 448 | |
Ascent Resources Utica Holdings | | | | | | | | |
8.250%, 12/31/28(A) | | | 1,685 | | | | 1,726 | |
Chord Energy | | | | | | | | |
6.375%, 06/01/26(A) | | | 500 | | | | 501 | |
Civitas Resources | | | | | | | | |
8.375%, 07/01/28(A) | | | 1,315 | | | | 1,367 | |
Civitas Resources | | | | | | | | |
8.625%, 11/01/30(A) | | | 225 | | | | 238 | |
Civitas Resources | | | | | | | | |
8.750%, 07/01/31(A) | | | 1,050 | | | | 1,112 | |
Comstock Resources | | | | | | | | |
6.750%, 03/01/29(A) | | | 825 | | | | 805 | |
Expand Energy | | | | | | | | |
7.000%, 10/01/24(C) (E) | | | 575 | | | | 11 | |
Matador Resources | | | | | | | | |
6.500%, 04/15/32(A) | | | 450 | | | | 450 | |
Matador Resources | | | | | | | | |
6.250%, 04/15/33(A) | | | 100 | | | | 98 | |
Permian Resources Operating | | | | | | | | |
5.375%, 01/15/26(A) | | $ | 350 | | | $ | 349 | |
Permian Resources Operating | | | | | | | | |
6.250%, 02/01/33(A) | | | 175 | | | | 177 | |
Range Resources | | | | | | | | |
8.250%, 01/15/29 | | | 500 | | | | 518 | |
Sitio Royalties Operating Partnership | | | | | | | | |
7.875%, 11/01/28(A) | | | 300 | | | | 314 | |
SM Energy | | | | | | | | |
6.750%, 09/15/26 | | | 625 | | | | 625 | |
6.750%, 08/01/29(A) | | | 100 | | | | 100 | |
SM Energy | | | | | | | | |
7.000%, 08/01/32(A) | | | 100 | | | | 100 | |
Southwestern Energy | | | | | | | | |
8.375%, 09/15/28 | | | 375 | | | | 386 | |
Southwestern Energy | | | | | | | | |
5.375%, 03/15/30 | | | 300 | | | | 299 | |
TGNR Intermediate Holdings | | | | | | | | |
5.500%, 10/15/29(A) | | | 350 | | | | 333 | |
| | | | | | | | | | | | | |
Total Independent Energy | | | 11,612 | |
| | | | | | | | | | | | | |
Industrial [0.0%] |
Mangrove Luxco III Sarl | | | | | | | | |
8.674%, EUR003M + 5.000%, 07/15/29(B) | | EUR | 100 | | | | 111 | |
| | | | | | | | | | | | | |
Industrial - Other [0.2%] |
Artera Services | | | | | | | | |
8.500%, 02/15/31(A) | | | 325 | | | | 322 | |
Hillenbrand | | | | | | | | |
6.250%, 02/15/29 | | | 725 | | | | 738 | |
Madison IAQ | | | | | | | | |
5.875%, 06/30/29(A) | | | 1,525 | | | | 1,485 | |
Rand Parent | | | | | | | | |
8.500%, 02/15/30(A) | | | 510 | | | | 520 | |
SPX FLOW | | | | | | | | |
8.750%, 04/01/30(A) | | | 900 | | | | 944 | |
| | | | | | | | | | | | | |
Total Industrial - Other | | | 4,009 | |
| | | | | | | | | | | | | |
Insurance [0.1%] |
Howden UK Refinance | | | | | | | | |
8.125%, 02/15/32(A) | | | 1,560 | | | | 1,604 | |
| | | | | | | | | | | | | |
Insurance - P&C [1.1%] |
Acrisure | | | | | | | | |
7.500%, 11/06/30(A) | | | 970 | | | | 998 | |
See accompanying notes to financial statements.
CITY NATIONAL ROCHDALE FUNDS | PAGE 34
schedule of investments |
September 30, 2024 |
City National Rochdale Fixed Income Opportunities Fund (continued) |
Description | | Face Amount (000)(1) | | | Value (000) | |
Alliant Holdings Intermediate | | | | | | | | |
6.750%, 10/15/27(A) | | $ | 680 | | | $ | 678 | |
Alliant Holdings Intermediate | | | | | | | | |
5.875%, 11/01/29(A) | | | 175 | | | | 168 | |
Alliant Holdings Intermediate | | | | | | | | |
7.000%, 01/15/31(A) | | | 725 | | | | 745 | |
Alliant Holdings Intermediate | | | | | | | | |
7.375%, 10/01/32(A) | | | 350 | | | | 355 | |
AmWINS Group | | | | | | | | |
4.875%, 06/30/29(A) | | | 1,225 | | | | 1,175 | |
Ardonagh Finco | | | | | | | | |
7.750%, 02/15/31(A) | | | 250 | | | | 259 | |
Ardonagh Group Finance | | | | | | | | |
8.875%, 02/15/32(A) | | | 1,750 | | | | 1,810 | |
AssuredPartners | | | | | | | | |
5.625%, 01/15/29(A) | | | 775 | | | | 746 | |
AssuredPartners | | | | | | | | |
7.500%, 02/15/32(A) | | | 275 | | | | 283 | |
Baldwin Insurance Group Holdings | | | | | | | | |
7.125%, 05/15/31(A) | | | 2,655 | | | | 2,794 | |
BroadStreet Partners | | | | | | | | |
5.875%, 04/15/29(A) | | | 1,450 | | | | 1,386 | |
GTCR AP Finance | | | | | | | | |
8.000%, 05/15/27(A) | | | 450 | | | | 450 | |
HUB International | | | | | | | | |
5.625%, 12/01/29(A) | | | 1,075 | | | | 1,054 | |
HUB International | | | | | | | | |
7.250%, 06/15/30(A) | | | 1,200 | | | | 1,251 | |
HUB International | | | | | | | | |
7.375%, 01/31/32(A) | | | 900 | | | | 929 | |
Jones Deslauriers Insurance Management | | | | | | | | |
8.500%, 03/15/30(A) | | | 875 | | | | 937 | |
Jones Deslauriers Insurance Management | | | | | | | | |
10.500%, 12/15/30(A) | | | 600 | | | | 652 | |
Panther Escrow Issuer | | | | | | | | |
7.125%, 06/01/31(A) | | | 1,125 | | | | 1,180 | |
Ryan Specialty | | | | | | | | |
4.375%, 02/01/30(A) | | | 300 | | | | 289 | |
Ryan Specialty | | | | | | | | |
5.875%, 08/01/32(A) | | | 250 | | | | 255 | |
USI | | | | | | | | |
7.500%, 01/15/32(A) | | | 1,375 | | | | 1,424 | |
| | | | | | | | | | | | | |
Total Insurance - P&C | | | 19,818 | |
| | | | | | | | | | | | | |
Internet Connectiv Svcs [0.1%] |
United Group BV | | | | | | | | |
7.792%, EUR003M + 4.250%, 02/01/29(B) | | EUR | 500 | | | $ | 555 | |
7.792%, EUR003M + 4.250%, 02/15/31(B) | | EUR | 1,880 | | | | 2,092 | |
| | | | | | | | | | | | | |
Total Internet Connectiv Svcs | | | 2,647 | |
| | | | | | | | | | | | | |
Investment Bank/Broker-Dealer [0.1%] |
Aretec Group | | | | | | | | |
10.000%, 08/15/30(A) | | | 935 | | | | 995 | |
VFH Parent | | | | | | | | |
7.500%, 06/15/31(A) | | | 885 | | | | 927 | |
| | | | | | | | | |
Total Investment Bank/Broker-Dealer | | | | | | | 1,922 | |
| | | | | | | | | | | | | |
Investment Companies [0.1%] |
Hightower Holding | | | | | | | | |
6.750%, 04/15/29(A) | | | 1,107 | | | | 1,061 | |
| | | | | | | | | | | | | |
Leisure [0.6%] |
Carnival | | | | | | | | |
6.000%, 05/01/29(A) | | | 325 | | | | 329 | |
Carnival | | | | | | | | |
7.000%, 08/15/29(A) | | | 175 | | | | 186 | |
Carnival | | | | | | | | |
10.500%, 06/01/30(A) | | | 2,131 | | | | 2,314 | |
NCL | | | | | | | | |
5.875%, 03/15/26(A) | | | 1,100 | | | | 1,101 | |
5.875%, 02/15/27(A) | | | 1,580 | | | | 1,586 | |
NCL | | | | | | | | |
8.125%, 01/15/29(A) | | | 250 | | | | 267 | |
NCL | | | | | | | | |
7.750%, 02/15/29(A) | | | 125 | | | | 134 | |
NCL Finance | | | | | | | | |
6.125%, 03/15/28(A) | | | 200 | | | | 204 | |
Royal Caribbean Cruises | | | | | | | | |
5.500%, 08/31/26(A) | | | 350 | | | | 353 | |
Royal Caribbean Cruises | | | | | | | | |
5.375%, 07/15/27(A) | | | 525 | | | | 530 | |
Royal Caribbean Cruises | | | | | | | | |
5.625%, 09/30/31(A) | | | 100 | | | | 102 | |
Royal Caribbean Cruises | | | | | | | | |
6.250%, 03/15/32(A) | | | 275 | | | | 285 | |
Royal Caribbean Cruises | | | | | | | | |
6.000%, 02/01/33(A) | | | 175 | | | | 179 | |
SeaWorld Parks & Entertainment | | | | | | | | |
5.250%, 08/15/29(A) | | | 900 | | | | 878 | |
See accompanying notes to financial statements.
CITY NATIONAL ROCHDALE FUNDS | PAGE 35
schedule of investments |
September 30, 2024 |
City National Rochdale Fixed Income Opportunities Fund (continued) |
Description | | Face Amount (000)(1) | | | Value (000) | |
Six Flags Entertainment | | | | | | | | |
7.250%, 05/15/31(A) | | $ | 875 | | | $ | 906 | |
Viking Cruises | | | | | | | | |
6.250%, 05/15/25(A) | | | 1,690 | | | | 1,688 | |
VOC Escrow | | | | | | | | |
5.000%, 02/15/28(A) | | | 1,005 | | | | 994 | |
| | | | | | | | | | | | | |
Total Leisure | | | 12,036 | |
| | | | | | | | | | | | | |
Lodging [0.1%] |
Hilton Domestic Operating | | | | | | | | |
5.750%, 05/01/28(A) | | | 525 | | | | 527 | |
Hilton Domestic Operating | | | | | | | | |
3.750%, 05/01/29(A) | | | 375 | | | | 356 | |
Hilton Domestic Operating | | | | | | | | |
5.875%, 03/15/33(A) | | | 300 | | | | 306 | |
RHP Hotel Properties | | | | | | | | |
6.500%, 04/01/32(A) | | | 425 | | | | 439 | |
Wyndham Hotels & Resorts | | | | | | | | |
4.375%, 08/15/28(A) | | | 375 | | | | 362 | |
| | | | | | | | | | | | | |
Total Lodging | | | 1,990 | |
| | | | | | | | | | | | | |
Machinery [0.0%] |
Dynamo Newco II GmbH | | | | | | | | |
6.250%, 10/15/31 | | EUR | 150 | | | | 168 | |
Manitowoc | | | | | | | | |
9.250%, 10/01/31(A) | | | 720 | | | | 738 | |
| | | | | | | | | | | | | |
Total Machinery | | | 906 | |
| | | | | | | | | | | | | |
Machinery-Pumps [0.0%] |
CEME | | | | | | | | |
7.779%, EUR003M + 4.500%, 09/30/31(B) | | EUR | 200 | | | | 219 | |
| | | | | | | | | | | | | |
Marine Services [0.1%] |
DP World Salaam | | | | | | | | |
6.000%, H15T5Y + 5.750%, 01/01/73(B) | | | 2,250 | | | | 2,247 | |
| | | | | | | | | | | | | |
Media Entertainment [0.4%] |
Audacy Capital | | | | | | | | |
6.500%, 05/01/27(A) (C) | | | 2,050 | | | | 41 | |
Audacy Capital | | | | | | | | |
6.750%, 03/31/29(A) (C) | | | 1,350 | | | | 27 | |
CMG Media | | | | | | | | |
8.875%, 12/15/27(A) | | | 600 | | | | 351 | |
Gray Television | | | | | | | | |
5.375%, 11/15/31(A) | | $ | 350 | | | $ | 220 | |
Lamar Media | | | | | | | | |
4.875%, 01/15/29 | | | 1,000 | | | | 988 | |
Nexstar Broadcasting | | | | | | | | |
5.625%, 07/15/27(A) | | | 375 | | | | 372 | |
Outfront Media Capital | | | | | | | | |
4.625%, 03/15/30(A) | | | 925 | | | | 879 | |
ROBLOX | | | | | | | | |
3.875%, 05/01/30(A) | | | 600 | | | | 557 | |
Sinclair Television Group | | | | | | | | |
5.500%, 03/01/30(A) | | | 725 | | | | 520 | |
Sinclair Television Group | | | | | | | | |
4.125%, 12/01/30(A) | | | 895 | | | | 694 | |
Stagwell Global | | | | | | | | |
5.625%, 08/15/29(A) | | | 1,550 | | | | 1,504 | |
TEGNA | | | | | | | | |
5.000%, 09/15/29 | | | 350 | | | | 333 | |
Univision Communications | | | | | | | | |
8.000%, 08/15/28(A) | | | 200 | | | | 205 | |
Univision Communications | | | | | | | | |
4.500%, 05/01/29(A) | | | 300 | | | | 269 | |
Univision Communications | | | | | | | | |
7.375%, 06/30/30(A) | | | 625 | | | | 608 | |
Urban One | | | | | | | | |
7.375%, 02/01/28(A) | | | 100 | | | | 72 | |
| | | | | | | | | | | | | |
Total Media Entertainment | | | 7,640 | |
| | | | | | | | | | | | | |
Medical Labs and Testing Srv [0.1%] |
Star Parent | | | | | | | | |
9.000%, 10/01/30(A) | | | 1,510 | | | | 1,621 | |
| | | | | | | | | | | | | |
Medical Products & Services [0.2%] |
LifePoint Health | | | | | | | | |
11.000%, 10/15/30(A) | | | 470 | | | | 530 | |
Perrigo Finance Unlimited | | | | | | | | |
3.900%, 12/15/24 | | | 1,110 | | | | 1,106 | |
RAY Financing | | | | | | | | |
6.500%, 07/15/31 | | EUR | 300 | | | | 343 | |
RAY Financing | | | | | | | | |
7.435%, EUR003M + 3.750%, 07/15/31(B) | | EUR | 400 | | | | 448 | |
Tenet Healthcare | | | | | | | | |
6.125%, 06/15/30 | | | 490 | | | | 498 | |
| | | | | | | | | | | | | |
Total Medical Products & Services | | | 2,925 | |
| | | | | | | | | | | | | |
Metal-Copper [0.1%] |
First Quantum Minerals | | | | | | | | |
6.875%, 10/15/27(A) | | | 520 | | | | 514 | |
See accompanying notes to financial statements.
CITY NATIONAL ROCHDALE FUNDS | PAGE 36
schedule of investments |
September 30, 2024 |
City National Rochdale Fixed Income Opportunities Fund (continued) |
Description | | Face Amount (000)(1) | | | Value (000) | |
First Quantum Minerals | | | | | | | | |
9.375%, 03/01/29(A) | | $ | 1,365 | | | $ | 1,447 | |
| | | | | | | | | | | | | |
Total Metal-Copper | | | 1,961 | |
| | | | | | | | | | | | | |
Metal-Iron [0.4%] |
Mineral Resources | | | | | | | | |
8.125%, 05/01/27(A) | | | 960 | | | | 969 | |
Mineral Resources | | | | | | | | |
9.250%, 10/01/28(A) | | | 560 | | | | 595 | |
Samarco Mineracao | | | | | | | | |
9.000% PIK, 06/30/31 | | | 4,050 | | | | 3,795 | |
TMS International | | | | | | | | |
6.250%, 04/15/29(A) | | | 1,240 | | | | 1,181 | |
| | | | | | | | | | | | | |
Total Metal-Iron | | | 6,540 | |
| | | | | | | | | | | | | |
Metals & Mining [0.4%] |
Alcoa Nederland Holding BV | | | | | | | | |
7.125%, 03/15/31(A) | | | 565 | | | | 602 | |
Arsenal AIC Parent | | | | | | | | |
8.000%, 10/01/30(A) | | | 535 | | | | 574 | |
Cleveland-Cliffs | | | | | | | | |
4.625%, 03/01/29(A) | | | 875 | | | | 827 | |
Cleveland-Cliffs | | | | | | | | |
7.000%, 03/15/32(A) | | | 950 | | | | 958 | |
Coeur Mining | | | | | | | | |
5.125%, 02/15/29(A) | | | 650 | | | | 631 | |
Vedanta Resources Finance II | | | | | | | | |
13.875%, 12/09/28 | | | 2,029 | | | | 2,031 | |
Vedanta Resources Finance II | | | | | | | | |
10.875%, 09/17/29(A) | | | 2,320 | | | | 2,351 | |
| | | | | | | | | | | | | |
Total Metals & Mining | | | 7,974 | |
| | | | | | | | | | | | | |
Midstream [0.6%] |
Antero Midstream Partners | | | | | | | | |
5.750%, 03/01/27(A) | | | 2,025 | | | | 2,024 | |
Blue Racer Midstream | | | | | | | | |
7.000%, 07/15/29(A) | | | 150 | | | | 156 | |
Blue Racer Midstream | | | | | | | | |
7.250%, 07/15/32(A) | | | 200 | | | | 210 | |
CNX Midstream Partners | | | | | | | | |
4.750%, 04/15/30(A) | | | 875 | | | | 818 | |
DT Midstream | | | | | | | | |
4.375%, 06/15/31(A) | | | 950 | | | | 899 | |
EQM Midstream Partners | | | | | | | | |
6.375%, 04/01/29(A) | | $ | 275 | | | $ | 284 | |
EQT Midstream Partners | | | | | | | | |
6.500%, 07/01/27(A) | | | 500 | | | | 515 | |
EQT Midstream Partners | | | | | | | | |
5.500%, 07/15/28 | | | 1,500 | | | | 1,520 | |
Hess Midstream Operations | | | | | | | | |
5.125%, 06/15/28(A) | | | 825 | | | | 816 | |
Northriver Midstream Finance | | | | | | | | |
6.750%, 07/15/32(A) | | | 575 | | | | 593 | |
Solaris Midstream Holdings | | | | | | | | |
7.625%, 04/01/26(A) | | | 725 | | | | 730 | |
Suburban Propane Partners | | | | | | | | |
5.875%, 03/01/27 | | | 750 | | | | 749 | |
Suburban Propane Partners | | | | | | | | |
5.000%, 06/01/31(A) | | | 375 | | | | 349 | |
Targa Resources Partners | | | | | | | | |
6.500%, 07/15/27 | | | 850 | | | | 861 | |
| | | | | | | | | | | | | |
Total Midstream | | | 10,524 | |
| | | | | | | | | | | | | |
Miscellaneous Manufacturing [0.0%] |
Anolis Capital Markets PCC | | | | | | | | |
4.150%, 01/01/28(E) | | EUR | 644 | | | | 623 | |
| | | | | | | | | | | | | |
Motion Pictures and Services [0.1%] |
Warnermedia Holdings | | | | | | | | |
4.279%, 03/15/32 | | | 1,105 | | | | 985 | |
| | | | | | | | | | | | | |
Non-Ferrous Metals [0.2%] |
Minsur | | | | | | | | |
4.500%, 10/28/31 | | | 3,200 | | | | 2,949 | |
| | | | | | | | | | | | | |
Oil Field Services [0.4%] |
Archrock Partners | | | | | | | | |
6.875%, 04/01/27(A) | | | 1,300 | | | | 1,304 | |
Kodiak Gas Services | | | | | | | | |
7.250%, 02/15/29(A) | | | 525 | | | | 543 | |
Nabors Industries | | | | | | | | |
7.375%, 05/15/27(A) | | | 1,030 | | | | 1,032 | |
Nabors Industries | | | | | | | | |
9.125%, 01/31/30(A) | | | 485 | | | | 500 | |
Nabors Industries | | | | | | | | |
8.875%, 08/15/31(A) | | | 225 | | | | 215 | |
ORO SG Pte | | | | | | | | |
12.000%, 12/20/25(C)(E) | | | 9,119 | | | | 9 | |
Precision Drilling | | | | | | | | |
7.125%, 01/15/26(A) | | | 362 | | | | 362 | |
See accompanying notes to financial statements.
CITY NATIONAL ROCHDALE FUNDS | PAGE 37
schedule of investments |
September 30, 2024 |
City National Rochdale Fixed Income Opportunities Fund (continued) |
Description | | Face Amount (000)(1) | | | Value (000) | |
Precision Drilling | | | | | | | | |
6.875%, 01/15/29(A) | | $ | 505 | | | $ | 503 | |
Transocean Titan Financing | | | | | | | | |
8.375%, 02/01/28(A) | | | 952 | | | | 981 | |
USA Compression Partners | | | | | | | | |
7.125%, 03/15/29(A) | | | 1,225 | | | | 1,262 | |
| | | | | | | | | | | | | |
Total Oil Field Services | | | 6,711 | |
| | | | | | | | | | | | | |
Oil-Field Services [0.0%] |
OEG Finance | | | | | | | | |
7.250%, 09/27/29 | | EUR | 150 | | | | 170 | |
| | | | | | | | | | | | | |
Packaging [0.5%] |
ARD Finance | | | | | | | | |
6.500% PIK, 06/30/27(A) | | | 1,282 | | | | 288 | |
Ardagh Metal Packaging Finance USA | | | | | | | | |
4.000%, 09/01/29(A) | | | 975 | | | | 868 | |
Ardagh Packaging Finance | | | | | | | | |
5.250%, 08/15/27(A) | | | 1,550 | | | | 1,156 | |
Ball | | | | | | | | |
6.000%, 06/15/29 | | | 675 | | | | 698 | |
Clydesdale Acquisition Holdings | | | | | | | | |
6.875%, 01/15/30(A) | | | 275 | | | | 280 | |
Clydesdale Acquisition Holdings | | | | | | | | |
8.750%, 04/15/30(A) | | | 1,850 | | | | 1,887 | |
Mauser Packaging Solutions Holding | | | | | | | | |
7.875%, 04/15/27(A) | | | 450 | | | | 464 | |
Mauser Packaging Solutions Holding | | | | | | | | |
9.250%, 04/15/27(A) | | | 375 | | | | 385 | |
OI European Group BV | | | | | | | | |
4.750%, 02/15/30(A) | | | 925 | | | | 875 | |
Owens-Brockway Glass Container | | | | | | | | |
7.375%, 06/01/32(A) | | | 300 | | | | 307 | |
Sealed Air | | | | | | | | |
7.250%, 02/15/31(A) | | | 550 | | | | 582 | |
Sealed Air | | | | | | | | |
6.500%, 07/15/32(A) | | | 450 | | | | 464 | |
Trivium Packaging Finance BV | | | | | | | | |
8.500%, 08/15/27(A) | | | 1,400 | | | | 1,402 | |
| | | | | | | | | | | | | |
Total Packaging | | | 9,656 | |
| | | | | | | | | | | | | |
Paper [0.1%] |
Clearwater Paper | | | | | | | | |
4.750%, 08/15/28(A) | | $ | 500 | | | $ | 471 | |
Graphic Packaging International | | | | | | | | |
4.750%, 07/15/27(A) | | | 300 | | | | 296 | |
Graphic Packaging International | | | | | | | | |
3.500%, 03/15/28(A) | | | 300 | | | | 286 | |
| | | | | | | | | | | | | |
Total Paper | | | 1,053 | |
| | | | | | | | | | | | | |
Paper & Related Products [0.3%] |
Domtar | | | | | | | | |
6.750%, 10/01/28(A) | | | 265 | | | | 242 | |
LD Celulose International GmbH | | | | | | | | |
7.950%, 01/26/32(A) | | | 3,720 | | | | 3,819 | |
Mativ Holdings | | | | | | | | |
6.875%, 10/01/26(A) | | | 1,875 | | | | 1,874 | |
| | | | | | | | | | | | | |
Total Paper & Related Products | | | 5,935 | |
| | | | | | | | | | | | | |
Petroleum & Fuel Products [5.6%] |
California Resources | | | | | | | | |
8.250%, 06/15/29(A) | | | 955 | | | | 974 | |
CITGO Petroleum | | | | | | | | |
7.000%, 06/15/25(A) | | | 530 | | | | 530 | |
Cosan Overseas | | | | | | | | |
8.250%, 02/05/73 | | | 3,275 | | | | 3,354 | |
Ecopetrol | | | | | | | | |
4.625%, 11/02/31 | | | 7,550 | | | | 6,484 | |
Ecopetrol | | | | | | | | |
8.875%, 01/13/33 | | | 1,230 | | | | 1,319 | |
Ecopetrol | | | | | | | | |
8.375%, 01/19/36 | | | 1,080 | | | | 1,104 | |
Ecopetrol | | | | | | | | |
5.875%, 05/28/45 | | | 4,500 | | | | 3,377 | |
Energean Israel Finance | | | | | | | | |
5.375%, 03/30/28(A) | | | 4,183 | | | | 3,761 | |
Energy Transfer | | | | | | | | |
7.125%, H15T5Y + 2.829%, 10/01/54(B) | | | 945 | | | | 967 | |
Geopark | | | | | | | | |
5.500%, 01/17/27 | | | 7,780 | | | | 7,414 | |
Global Partners | | | | | | | | |
8.250%, 01/15/32(A) | | | 515 | | | | 534 | |
Gulfport Energy | | | | | | | | |
6.750%, 09/01/29(A) | | | 350 | | | | 355 | |
Hilcorp Energy I | | | | | | | | |
8.375%, 11/01/33(A) | | | 2,024 | | | | 2,182 | |
See accompanying notes to financial statements.
CITY NATIONAL ROCHDALE FUNDS | PAGE 38
schedule of investments |
September 30, 2024 |
City National Rochdale Fixed Income Opportunities Fund (continued) |
Description | | Face Amount (000)(1) | | | Value (000) | |
Kosmos Energy | | | | | | | | |
7.500%, 03/01/28 | | $ | 405 | | | $ | 392 | |
Kosmos Energy | | | | | | | | |
8.750%, 10/01/31(A) | | | 9,870 | | | | 9,727 | |
Leviathan Bond | | | | | | | | |
6.125%, 06/30/25(A) | | | 1,750 | | | | 1,720 | |
Leviathan Bond | | | | | | | | |
6.500%, 06/30/27(A) | | | 3,611 | | | | 3,418 | |
Magnolia Oil & Gas Operating | | | | | | | | |
6.000%, 08/01/26(A) | | | 3,585 | | | | 3,566 | |
Medco Bell Pte | | | | | | | | |
6.375%, 01/30/27 | | | 3,285 | | | | 3,271 | |
Medco Maple Tree Pte | | | | | | | | |
8.960%, 04/27/29(A) | | | 2,800 | | | | 2,954 | |
New Fortress Energy | | | | | | | | |
6.750%, 09/15/25(A) | | | 1,086 | | | | 1,042 | |
New Fortress Energy | | | | | | | | |
6.500%, 09/30/26(A) | | | 610 | | | | 513 | |
Noble Finance II | | | | | | | | |
8.000%, 04/15/30(A) | | | 1,085 | | | | 1,119 | |
Oro Negro Drilling Pte | | | | | | | | |
0.000%, * (D) (E) | | | 3,683 | | | | — | |
Oro Negro Drilling Pte | | | | | | | | |
7.500%, 01/24/24(A) (C) | | | 23,137 | | | | 23 | |
PBF Holding | | | | | | | | |
6.000%, 02/15/28 | | | 985 | | | | 972 | |
Petroleos de Venezuela | | | | | | | | |
8.500%, 10/27/20(C) | | | 10,470 | | | | 9,580 | |
Petroleos de Venezuela | | | | | | | | |
9.750%, 05/17/35(C) | | | 8,689 | | | | 934 | |
Petroleos del Peru | | | | | | | | |
4.750%, 06/19/32 | | | 2,900 | | | | 2,282 | |
Petroleos del Peru | | | | | | | | |
5.625%, 06/19/47 | | | 1,125 | | | | 767 | |
Petroleos Mexicanos | | | | | | | | |
5.950%, 01/28/31 | | | 6,340 | | | | 5,505 | |
Petroleos Mexicanos | | | | | | | | |
10.000%, 02/07/33 | | | 1,820 | | | | 1,928 | |
Prairie Acquiror | | | | | | | | |
9.000%, 08/01/29(A) | | | 785 | | | | 810 | |
Rockies Express Pipeline | | | | | | | | |
3.600%, 05/15/25(A) | | | 825 | | | | 811 | |
Rockies Express Pipeline | | | | | | | | |
7.500%, 07/15/38(A) | | | 1,073 | | | | 1,115 | |
Seadrill Finance | | | | | | | | |
8.375%, 08/01/30(A) | | | 650 | | | | 678 | |
Tallgrass Energy Partners | | | | | | | | |
7.500%, 10/01/25(A) | | | 1,500 | | | | 1,500 | |
Tallgrass Energy Partners | | | | | | | | |
7.375%, 02/15/29(A) | | | 545 | | | | 552 | |
Talos Production | | | | | | | | |
9.000%, 02/01/29(A) | | $ | 300 | | | $ | 309 | |
Talos Production | | | | | | | | |
9.375%, 02/01/31(A) | | | 630 | | | | 648 | |
Tengizchevroil Finance International | | | | | | | | |
3.250%, 08/15/30 | | | 3,350 | | | | 2,910 | |
Transocean | | | | | | | | |
8.750%, 02/15/30(A) | | | 531 | | | | 554 | |
Transocean Aquila | | | | | | | | |
8.000%, 09/30/28(A) | | | 1,110 | | | | 1,137 | |
Tullow Oil | | | | | | | | |
7.000%, 03/01/25 | | | 2,500 | | | | 2,372 | |
Valaris | | | | | | | | |
8.375%, 04/30/30(A) | | | 1,129 | | | | 1,163 | |
Venture Global Calcasieu Pass | | | | | | | | |
6.250%, 01/15/30(A) | | | 955 | | | | 1,001 | |
Venture Global LNG | | | | | | | | |
9.500%, 02/01/29(A) | | | 1,015 | | | | 1,140 | |
Vital Energy | | | | | | | | |
7.750%, 07/31/29(A) | | | 500 | | | | 497 | |
YPF | | | | | | | | |
9.000%, 02/12/26(F) | | | 1,638 | | | | 1,663 | |
YPF | | | | | | | | |
6.950%, 07/21/27 | | | 4,610 | | | | 4,485 | |
| | | | | | | | | | | | | |
Total Petroleum & Fuel Products | | | 105,413 | |
| | | | | | | | | | | | | |
Pharmaceuticals [0.3%] |
Bausch Health | | | | | | | | |
5.000%, 02/15/29(A) | | | 300 | | | | 173 | |
Bausch Health | | | | | | | | |
7.250%, 05/30/29(A) | | | 925 | | | | 566 | |
Cidron Aida Finco Sarl | | | | | | | | |
5.000%, 04/01/28 | | EUR | 1,000 | | | | 1,081 | |
Emergent BioSolutions | | | | | | | | |
3.875%, 08/15/28(A) | | | 495 | | | | 377 | |
Grifols | | | | | | | | |
4.750%, 10/15/28(A) | | | 1,100 | | | | 1,031 | |
Organon | | | | | | | | |
5.125%, 04/30/31(A) | | | 900 | | | | 849 | |
Organon | | | | | | | | |
6.750%, 05/15/34(A) | | | 1,295 | | | | 1,335 | |
| | | | | | | | | | | | | |
Total Pharmaceuticals | | | 5,412 | |
| | | | | | | | | | | | | |
Precious Metals [0.0%] |
Hecla Mining | | | | | | | | |
7.250%, 02/15/28 | | | 333 | | | | 340 | |
| | | | | | | | | | | | | |
See accompanying notes to financial statements.
CITY NATIONAL ROCHDALE FUNDS | PAGE 39
schedule of investments |
September 30, 2024 |
City National Rochdale Fixed Income Opportunities Fund (continued) |
Description | | Face Amount (000)(1) | | | Value (000) | |
Printing & Publishing [0.0%] |
Cimpress | | | | | | | | |
7.375%, 09/15/32(A) | | $ | 500 | | | $ | 506 | |
| | | | | | | | | | | | | |
Real Estate [0.3%] |
Emeria SASU | | | | | | | | |
7.750%, 03/31/28 | | EUR | 1,850 | | | | 1,968 | |
PCPD Capital | | | | | | | | |
5.125%, 06/18/26 | | | 5,000 | | | | 4,502 | |
| | | | | | | | | | | | | |
Total Real Estate | | | 6,470 | |
| | | | | | | | | | | | | |
Real Estate Investment Trusts [0.2%] |
Brookfield Property REIT | | | | | | | | |
5.750%, 05/15/26(A) | | | 2,029 | | | | 2,020 | |
Necessity Retail REIT | | | | | | | | |
4.500%, 09/30/28(A) | | | 1,020 | | | | 957 | |
| | | | | | | | | | | | | |
Total Real Estate Investment Trusts | | | 2,977 | |
| | | | | | | | | | | | | |
Real Estate Oper/Develop [0.9%] |
Country Garden Holdings | | | | | | | | |
5.125%, 01/17/25(C) | | | 2,600 | | | | 162 | |
Howard Hughes | | | | | | | | |
5.375%, 08/01/28(A) | | | 1,980 | | | | 1,951 | |
Kaisa Group Holdings | | | | | | | | |
11.700%, 11/11/25(C) | | | 2,021 | | | | 64 | |
MAF Global Securities | | | | | | | | |
6.375%, H15T5Y + 3.539%, 09/20/73(B) | | | 5,175 | | | | 5,177 | |
NWD Finance BVI | | | | | | | | |
5.250%, H15T5Y + 7.889%, 12/22/72(B) | | | 3,400 | | | | 2,841 | |
Pakuwon Jati | | | | | | | | |
4.875%, 04/29/28 | | | 5,600 | | | | 5,382 | |
Vanke Real Estate Hong Kong, MTN | | | | | | | | |
3.975%, 11/09/27 | | | 1,424 | | | | 954 | |
| | | | | | | | | | | | | |
Total Real Estate Oper/Develop | | | 16,531 | |
| | | | | | | | | | | | | |
Regional Banks-Non US [0.2%] |
Emirates NBD Bank PJSC | | | | | | | | |
6.125%, CMTUSD6Y + 3.656%, 09/20/73(B) | | | 4,500 | | | | 4,491 | |
| | | | | | | | | | | | | |
Restaurants [0.2%] |
1011778 BC ULC | | | | | | | | |
6.125%, 06/15/29(A) | | | 225 | | | | 232 | |
1011778 BC ULC | | | | | | | | |
5.625%, 09/15/29(A) | | | 175 | | | | 178 | |
1011778 BC ULC | | | | | | | | |
4.000%, 10/15/30(A) | | $ | 2,025 | | | $ | 1,867 | |
KFC Holding | | | | | | | | |
4.750%, 06/01/27(A) | | | 975 | | | | 969 | |
| | | | | | | | | | | | | |
Total Restaurants | | | 3,246 | |
| | | | | | | | | | | | | |
Retail [1.1%] |
Arcos Dorados BV | | | | | | | | |
6.125%, 05/27/29 | | | 2,400 | | | | 2,440 | |
Asbury Automotive Group | | | | | | | | |
4.750%, 03/01/30 | | | 230 | | | | 220 | |
Bath & Body Works | | | | | | | | |
6.750%, 07/01/36 | | | 1,120 | | | | 1,154 | |
BlueLinx Holdings | | | | | | | | |
6.000%, 11/15/29(A) | | | 1,140 | | | | 1,093 | |
Carvana | | | | | | | | |
13.000% PIK, 06/01/30(A) | | | 953 | | | | 1,037 | |
Fertitta Entertainment | | | | | | | | |
6.750%, 01/15/30(A) | | | 1,240 | | | | 1,155 | |
FirstCash | | | | | | | | |
5.625%, 01/01/30(A) | | | 1,089 | | | | 1,079 | |
FirstCash | | | | | | | | |
6.875%, 03/01/32(A) | | | 2,086 | | | | 2,147 | |
Foot Locker | | | | | | | | |
4.000%, 10/01/29(A) | | | 975 | | | | 850 | |
Future Retail | | | | | | | | |
5.600%, 01/22/25(C) | | | 16,200 | | | | 16 | |
Lithia Motors | | | | | | | | |
4.375%, 01/15/31(A) | | | 535 | | | | 498 | |
Macy’s Retail Holdings | | | | | | | | |
6.125%, 03/15/32(A) | | | 316 | | | | 307 | |
Macy’s Retail Holdings | | | | | | | | |
5.125%, 01/15/42 | | | 485 | | | | 373 | |
QVC | | | | | | | | |
4.450%, 02/15/25 | | | 567 | | | | 564 | |
QVC | | | | | | | | |
6.875%, 04/15/29(A) | | | 897 | | | | 745 | |
QVC | | | | | | | | |
5.450%, 08/15/34 | | | 2,155 | | | | 1,392 | |
Vivo Energy Investments BV | | | | | | | | |
5.125%, 09/24/27 | | | 5,225 | | | | 5,077 | |
Walgreens Boots Alliance | | | | | | | | |
8.125%, 08/15/29 | | | 680 | | | | 679 | |
Walgreens Boots Alliance | | | | | | | | |
4.500%, 11/18/34 | | | 250 | | | | 194 | |
| | | | | | | | | | | | | |
Total Retail | | | 21,020 | |
| | | | | | | | | | | | | |
See accompanying notes to financial statements.
CITY NATIONAL ROCHDALE FUNDS | PAGE 40
schedule of investments |
September 30, 2024 |
City National Rochdale Fixed Income Opportunities Fund (continued) |
Description | | Face Amount (000)(1) | | | Value (000) | |
Retailers [0.4%] |
Academy | | | | | | | | |
6.000%, 11/15/27(A) | | $ | 1,690 | | | $ | 1,694 | |
Asbury Automotive Group | | | | | | | | |
4.625%, 11/15/29(A) | | | 600 | | | | 572 | |
Asbury Automotive Group | | | | | | | | |
5.000%, 02/15/32(A) | | | 1,395 | | | | 1,324 | |
Gap | | | | | | | | |
3.625%, 10/01/29(A) | | | 225 | | | | 203 | |
Gap | | | | | | | | |
3.875%, 10/01/31(A) | | | 250 | | | | 219 | |
Group 1 Automotive | | | | | | | | |
6.375%, 01/15/30(A) | | | 855 | | | | 869 | |
LCM Investments Holdings II | | | | | | | | |
4.875%, 05/01/29(A) | | | 100 | | | | 96 | |
LCM Investments Holdings II | | | | | | | | |
8.250%, 08/01/31(A) | | | 775 | | | | 823 | |
Velocity Vehicle Group | | | | | | | | |
8.000%, 06/01/29(A) | | | 1,335 | | | | 1,389 | |
William Carter | | | | | | | | |
5.625%, 03/15/27(A) | | | 400 | | | | 399 | |
| | | | | | | | | | | | | |
Total Retailers | | | 7,588 | |
| | | | | | | | | | | | | |
Semi-Conductors [0.0%] |
Tunghsu Venus Holdings | | | | | | | | |
7.000%, 06/12/20(C) | | | 4,275 | | | | 43 | |
| | | | | | | | | | | | | |
Steel & Steel Works [0.5%] |
CAP | | | | | | | | |
3.900%, 04/27/31 | | | 4,510 | | | | 3,687 | |
CSN Islands XI | | | | | | | | |
6.750%, 01/28/28 | | | 800 | | | | 773 | |
CSN Resources | | | | | | | | |
4.625%, 06/10/31(A) | | | 5,175 | | | | 4,202 | |
| | | | | | | | | | | | | |
Total Steel & Steel Works | | | 8,662 | |
| | | | | | | | | | | | | |
Supermarkets [0.1%] |
Albertsons | | | | | | | | |
7.500%, 03/15/26(A) | | | 775 | | | | 782 | |
Albertsons | | | | | | | | |
6.500%, 02/15/28(A) | | | 200 | | | | 203 | |
| | | | | | | | | | | | | |
Total Supermarkets | | | 985 | |
| | | | | | | | | | | | | |
Technology [1.8%] |
Amentum Holdings | | | | | | | | |
7.250%, 08/01/32(A) | | | 1,325 | | | | 1,383 | |
AthenaHealth Group | | | | | | | | |
6.500%, 02/15/30(A) | | $ | 2,265 | | | $ | 2,176 | |
Capstone Borrower | | | | | | | | |
8.000%, 06/15/30(A) | | | 625 | | | | 662 | |
Central Parent | | | | | | | | |
7.250%, 06/15/29(A) | | | 975 | | | | 997 | |
Clarivate Science Holdings | | | | | | | | |
4.875%, 07/01/29(A) | | | 1,125 | | | | 1,082 | |
Cloud Software Group | | | | | | | | |
6.500%, 03/31/29(A) | | | 2,565 | | | | 2,548 | |
Cloud Software Group | | | | | | | | |
9.000%, 09/30/29(A) | | | 1,970 | | | | 2,002 | |
Cloud Software Group | | | | | | | | |
8.250%, 06/30/32(A) | | | 150 | | | | 157 | |
Coherent | | | | | | | | |
5.000%, 12/15/29(A) | | | 1,050 | | | | 1,027 | |
Consensus Cloud Solutions | | | | | | | | |
6.000%, 10/15/26(A) | | | 525 | | | | 522 | |
Consensus Cloud Solutions | | | | | | | | |
6.500%, 10/15/28(A) | | | 625 | | | | 625 | |
Elastic | | | | | | | | |
4.125%, 07/15/29(A) | | | 950 | | | | 887 | |
Entegris Escrow | | | | | | | | |
4.750%, 04/15/29(A) | | | 350 | | | | 345 | |
Entegris Escrow | | | | | | | | |
5.950%, 06/15/30(A) | | | 1,175 | | | | 1,197 | |
Fortress Intermediate 3 | | | | | | | | |
7.500%, 06/01/31(A) | | | 275 | | | | 290 | |
GoTo Group | | | | | | | | |
5.500%, 05/01/28(A) | | | 712 | | | | 355 | |
HealthEquity | | | | | | | | |
4.500%, 10/01/29(A) | | | 1,225 | | | | 1,184 | |
Insight Enterprises | | | | | | | | |
6.625%, 05/15/32(A) | | | 200 | | | | 209 | |
Iron Mountain | | | | | | | | |
7.000%, 02/15/29(A) | | | 1,225 | | | | 1,277 | |
McAfee | | | | | | | | |
7.375%, 02/15/30(A) | | | 1,975 | | | | 1,926 | |
Millennium Escrow | | | | | | | | |
6.625%, 08/01/26(A) | | | 825 | | | | 519 | |
NCR Atleos | | | | | | | | |
9.500%, 04/01/29(A) | | | 300 | | | | 330 | |
NCR Voyix | | | | | | | | |
5.125%, 04/15/29(A) | | | 1,200 | | | | 1,174 | |
NCR Voyix | | | | | | | | |
5.250%, 10/01/30(A) | | | 225 | | | | 220 | |
Open Text | | | | | | | | |
3.875%, 02/15/28(A) | | | 1,125 | | | | 1,074 | |
Rocket Software | | | | | | | | |
6.500%, 02/15/29(A) | | | 1,450 | | | | 1,378 | |
See accompanying notes to financial statements.
CITY NATIONAL ROCHDALE FUNDS | PAGE 41
schedule of investments |
September 30, 2024 |
City National Rochdale Fixed Income Opportunities Fund (continued) |
Description | | Face Amount (000)(1) | | | Value (000) | |
Seagate HDD Cayman | | | | | | | | |
9.625%, 12/01/32 | | $ | 826 | | | $ | 959 | |
Sensata Technologies BV | | | | | | | | |
4.000%, 04/15/29(A) | | | 600 | | | | 572 | |
Sensata Technologies BV | | | | | | | | |
5.875%, 09/01/30(A) | | | 275 | | | | 276 | |
SS&C Technologies | | | | | | | | |
5.500%, 09/30/27(A) | | | 1,550 | | | | 1,550 | |
Synaptics | | | | | | | | |
4.000%, 06/15/29(A) | | | 400 | | | | 379 | |
TTM Technologies | | | | | | | | |
4.000%, 03/01/29(A) | | | 625 | | | | 592 | |
UKG | | | | | | | | |
6.875%, 02/01/31(A) | | | 1,175 | | | | 1,214 | |
Viavi Solutions | | | | | | | | |
3.750%, 10/01/29(A) | | | 325 | | | | 295 | |
Zebra Technologies | | | | | | | | |
6.500%, 06/01/32(A) | | | 200 | | | | 209 | |
ZipRecruiter | | | | | | | | |
5.000%, 01/15/30(A) | | | 1,450 | | | | 1,313 | |
| | | | | | | | | | | | | |
Total Technology | | | 32,905 | |
| | | | | | | | | | | | | |
Technology, Electronics, Software & IT [0.0%] |
Cedacri Mergeco SPA | | | | | | | | |
8.167%, EUR003M + 4.625%, 05/15/28(B) | | EUR | 390 | | | | 433 | |
| | | | | | | | | | | | | |
Telecommunications [0.1%] |
Altice France | | | | | | | | |
8.125%, 02/01/27(A) | | | 1,060 | | | | 867 | |
Altice France | | | | | | | | |
3.375%, 01/15/28 | | EUR | 100 | | | | 79 | |
Altice France | | | | | | | | |
4.000%, 07/15/29 | | EUR | 700 | | | | 545 | |
Altice France Holding | | | | | | | | |
4.000%, 02/15/28 | | EUR | 475 | | | | 140 | |
| | | | | | | | | | | | | |
Total Telecommunications | | | 1,631 | |
| | | | | | | | | | | | | |
Telephones & Telecommunications [2.3%] |
Axian Telecom | | | | | | | | |
7.375%, 02/16/27 | | | 1,600 | | | | 1,601 | |
7.375%, 02/16/27(A) | | | 8,545 | | | | 8,549 | |
C&W Senior Financing DAC | | | | | | | | |
6.875%, 09/15/27 | | | 7,725 | | | | 7,698 | |
CT Trust | | | | | | | | |
5.125%, 02/03/32(A) | | | 3,195 | | | | 2,930 | |
Digicel | | | | | | | | |
6.750%, 03/01/23(A) (C) | | $ | 4,800 | | | $ | 96 | |
Eutelsat | | | | | | | | |
1.500%, 10/13/28 | | EUR | 300 | | | | 265 | |
Frontier Communications Holdings | | | | | | | | |
5.875%, 10/15/27(A) | | | 965 | | | | 969 | |
Iliad Holding SASU | | | | | | | | |
6.500%, 10/15/26(A) | | | 1,037 | | | | 1,049 | |
Iliad Holding SASU | | | | | | | | |
8.500%, 04/15/31(A) | | | 1,025 | | | | 1,102 | |
Liberty Costa Rica Senior Secured Finance | | | | | | | | |
10.875%, 01/15/31(A) | | | 2,400 | | | | 2,629 | |
Millicom International Cellular | | | | | | | | |
4.500%, 04/27/31 | | | 3,485 | | | | 3,142 | |
Network i2i | | | | | | | | |
5.650%, H15T5Y + 4.274%, 04/15/73(B) | | | 2,700 | | | | 2,694 | |
Sable International Finance | | | | | | | | |
7.125%, 10/15/32(A) | | | 2,200 | | | | 2,207 | |
Telecom Argentina | | | | | | | | |
8.000%, 07/18/26 | | | 5,090 | | | | 5,112 | |
Telecom Argentina | | | | | | | | |
9.500%, 07/18/31(A) | | | 2,275 | | | | 2,351 | |
Vmed O2 UK Financing I | | | | | | | | |
3.250%, 01/31/31 | | EUR | 400 | | | | 412 | |
Vmed O2 UK Financing I | | | | | | | | |
7.750%, 04/15/32(A) | | | 525 | | | | 539 | |
| | | | | | | | | | | | | |
Total Telephones & Telecommunications | | | 43,345 | |
| | | | | | | | | | | | | |
Textile-Products [0.0%] |
Golden Legacy Pte. Ltd. | | | | | | | | |
6.875%, 03/27/24(C)(E) | | | 15,640 | | | | 313 | |
Prime Bloom Holdings | | | | | | | | |
6.950%, 07/05/22(C) | | | 16,500 | | | | 247 | |
| | | | | | | | | | | | | |
Total Textile-Products | | | 560 | |
| | | | | | | | | | | | | |
Transportation Services [1.2%] |
Adani International Container Terminal Pvt | | | | | | | | |
3.000%, 02/16/31 | | | 4,816 | | | | 4,265 | |
Georgian Railway JSC | | | | | | | | |
4.000%, 06/17/28 | | | 4,050 | | | | 3,665 | |
JSW Infrastructure | | | | | | | | |
4.950%, 01/21/29(A) | | | 2,000 | | | | 1,943 | |
JSW Infrastructure, MTN | | | | | | | | |
4.950%, 01/21/29 | | | 665 | | | | 646 | |
See accompanying notes to financial statements.
CITY NATIONAL ROCHDALE FUNDS | PAGE 42
schedule of investments |
September 30, 2024 |
City National Rochdale Fixed Income Opportunities Fund (continued) |
Description | | Face Amount (000)(1) | | | Value (000) | |
Mersin Uluslararasi Liman Isletmeciligi | | | | | | | | |
8.250%, 11/15/28 | | $ | 975 | | | $ | 1,016 | |
8.250%, 11/15/28(A) | | | 4,930 | | | | 5,137 | |
Rumo Luxembourg Sarl | | | | | | | | |
4.200%, 01/18/32 | | | 2,945 | | | | 2,621 | |
Sabre GLBL | | | | | | | | |
11.250%, 12/15/27(A) | | | 885 | | | | 918 | |
Stena International | | | | | | | | |
7.250%, 01/15/31(A) | | | 200 | | | | 210 | |
Viking Cruises | | | | | | | | |
9.125%, 07/15/31(A) | | | 1,096 | | | | 1,202 | |
Watco | | | | | | | | |
7.125%, 08/01/32(A) | | | 350 | | | | 365 | |
| | | | | | | | | | | | | |
Total Transportation Services | | | 21,988 | |
| | | | | | | | | | | | | |
Transport-Equip and Leasng [0.1%] |
Fortress Transportation and Infrastructure Investors | | | | | | | | |
7.875%, 12/01/30(A) | | | 975 | | | | 1,050 | |
Fortress Transportation and Infrastructure Investors | | | | | | | | |
7.000%, 05/01/31(A) | | | 165 | | | | 174 | |
| | | | | | | | | | | | | |
Total Transport-Equip and Leasng | | | 1,224 | |
| | | | | | | | | | | | | |
Utility - Electric [0.4%] |
Calpine | | | | | | | | |
4.500%, 02/15/28(A) | | | 925 | | | | 903 | |
Calpine | | | | | | | | |
5.125%, 03/15/28(A) | | | 325 | | | | 320 | |
NextEra Energy Operating Partners | | | | | | | | |
4.500%, 09/15/27(A) | | | 225 | | | | 220 | |
NextEra Energy Operating Partners | | | | | | | | |
7.250%, 01/15/29(A) | | | 500 | | | | 527 | |
NRG Energy | | | | | | | | |
5.750%, 01/15/28 | | | 1,000 | | | | 1,008 | |
TerraForm Power Operating | | | | | | | | |
5.000%, 01/31/28(A) | | | 1,125 | | | | 1,113 | |
TransAlta | | | | | | | | |
7.750%, 11/15/29 | | | 100 | | | | 106 | |
Vistra Operations | | | | | | | | |
5.500%, 09/01/26(A) | | | 1,000 | | | | 1,000 | |
Vistra Operations | | | | | | | | |
5.625%, 02/15/27(A) | | | 325 | | | | 324 | |
Vistra Operations | | | | | | | | |
7.750%, 10/15/31(A) | | $ | 1,545 | | | $ | 1,663 | |
| | | | | | | | | | | | | |
Total Utility - Electric | | | 7,184 | |
| | | | | | | | | | | | | |
Water [0.1%] |
Aegea Finance Sarl | | | | | | | | |
6.750%, 05/20/29(A) | | | 2,450 | | | | 2,496 | |
| | | | | | | | | | | | | |
Total Corporate Bonds | | | | |
Cost ($986,207) | | | 883,843 | |
| | | | | | | | | | | | | |
Collateralized Loan Obligations [19.8%] |
Non-Agency Mortgage Backed Obligation [19.8%] |
522 Funding CLO, Ser 2021-7A, Cl E | | | | | | | | |
11.765%, TSFR3M + 6.482%, 04/23/34(A) (B) | | | 1,700 | | | | 1,624 | |
Adagio IX EUR CLO DAC, Ser 2021-A, Cl E | | | | | | | | |
9.501%, EUR003M + 6.020%, 09/15/34(A) (B) | | EUR | 2,000 | | | | 2,156 | |
Adagio IX EUR CLO DAC, Ser 2021-X, Cl E | | | | | | | | |
9.501%, EUR003M + 6.020%, 09/15/34(B) | | EUR | 1,000 | | | | 1,078 | |
Adagio V CLO DAC, Ser 2018-X, Cl ER | | | | | | | | |
8.835%, EUR003M + 5.150%, 10/15/31(B) | | EUR | 1,000 | | | | 1,073 | |
Anchorage Capital Europe CLO DAC, Ser 2021-4X, Cl E | | | | | | | | |
9.395%, EUR003M + 5.710%, 04/25/34(B) | | EUR | 1,000 | | | | 1,108 | |
Aqueduct European CLO DAC, Ser 2024-7X, Cl FR | | | | | | | | |
11.891%, EUR003M + 8.410%, 08/15/37(B) | | EUR | 2,000 | | | | 2,108 | |
Arbour CLO III DAC, Ser 2021-3X, Cl ERR | | | | | | | | |
9.575%, EUR003M + 5.890%, 07/15/34(B) | | EUR | 1,250 | | | | 1,347 | |
ARBOUR CLO IX DAC, Ser 2021-9X, Cl E | | | | | | | | |
9.475%, EUR003M + 5.790%, 04/15/34(B) | | EUR | 1,300 | | | | 1,393 | |
ARBOUR CLO VIII DAC, Ser 2021-8X, Cl FR | | | | | | | | |
12.335%, EUR003M + 8.650%, 10/15/34(B) | | EUR | 3,500 | | | | 3,747 | |
See accompanying notes to financial statements.
CITY NATIONAL ROCHDALE FUNDS | PAGE 43
schedule of investments |
September 30, 2024 |
City National Rochdale Fixed Income Opportunities Fund (continued) |
Description | | Face Amount (000)(1) | | | Value (000) | |
Armada Euro CLO III DAC, Ser 2024-3A, Cl ARR | | | | | | | | |
%, 10/15/37(A) (B) | | EUR | 14,000 | | | $ | 15,600 | |
Bain Capital Euro CLO DAC, Ser 2021-2X, Cl E | | | | | | | | |
9.882%, EUR003M + 6.220%, 07/17/34(B) | | EUR | 1,000 | | | | 1,060 | |
Barings Euro CLO DAC, Ser 2021-2X, Cl E | | | | | | | | |
9.855%, EUR003M + 6.170%, 10/15/34(B) | | EUR | 2,374 | | | | 2,462 | |
Barings Euro CLO DAC, Ser 2022-1X, Cl ERR | | | | | | | | |
10.545%, EUR003M + 6.860%, 07/25/35(B) | | EUR | 1,220 | | | | 1,331 | |
Barings Euro CLO DAC, Ser 2022-3X, Cl D | | | | | | | | |
7.286%, EUR003M + 3.600%, 07/27/34(B) | | EUR | 1,000 | | | | 1,089 | |
Battalion CLO XIV, Ser 2021-14A, Cl ER | | | | | | | | |
12.404%, TSFR3M + 7.122%, 01/20/35(A) (B) | | | 3,500 | | | | 3,189 | |
Birch Grove CLO 3, Ser 2021-3A, Cl E | | | | | | | | |
12.521%, TSFR3M + 7.242%, 01/19/35(A) (B) | | | 4,000 | | | | 3,932 | |
Blackrock European CLO III DAC, Ser 2021-3X, Cl ER | | | | | | | | |
9.808%, EUR003M + 6.130%, 07/19/35(B) | | EUR | 3,750 | | | | 4,148 | |
Blackrock European CLO IX DAC, Ser 2019-9X, Cl F | | | | | | | | |
12.401%, EUR003M + 8.920%, 12/15/32(B) | | EUR | 1,250 | | | | 1,344 | |
Bluemountain Euro CLO DAC, Ser 2021-2X, Cl D | | | | | | | | |
6.785%, EUR003M + 3.100%, 10/15/35(B) | | EUR | 1,150 | | | | 1,287 | |
Bosphorus CLO VI DAC, Ser 2021-6X, Cl E | | | | | | | | |
9.341%, EUR003M + 5.800%, 05/25/34(B) | | EUR | 2,500 | | | | 2,712 | |
Bridgepoint CLO 2 DAC, Ser 2021-2X, Cl A | | | | | | | | |
4.585%, EUR003M + 0.900%, 04/15/35(B) | | EUR | 5,400 | | | | 5,992 | |
BSL CLO 3, Ser 2021-3A, Cl E | | | | | | | | |
12.494%, TSFR3M + 7.212%, 10/20/34(A) (B) | | $ | 2,000 | | | $ | 1,988 | |
Cairn CLO XI DAC, Ser 2019-11X, Cl E | | | | | | | | |
10.455%, EUR003M + 6.770%, 07/15/32(B) | | EUR | 5,850 | | | | 6,517 | |
Cairn CLO XII DAC, Ser 2021-12X, Cl AR | | | | | | | | |
4.675%, EUR003M + 0.990%, 07/15/34(B) | | EUR | 3,400 | | | | 3,783 | |
Cairn CLO XIII DAC, Ser 2021-13X, Cl E | | | | | | | | |
9.808%, EUR003M + 6.120%, 10/20/33(B) | | EUR | 1,000 | | | | 1,097 | |
Cairn CLO XIV DAC, Ser 2021-14X, Cl A | | | | | | | | |
4.686%, EUR003M + 1.000%, 10/29/34(B) | | EUR | 2,000 | | | | 2,220 | |
Cairn CLO XIV DAC, Ser 2021-14X, Cl E | | | | | | | | |
9.796%, EUR003M + 6.110%, 10/29/34(B) | | EUR | 1,000 | | | | 1,101 | |
Capital Four CLO I DAC, Ser 2019-1X, Cl E | | | | | | | | |
10.155%, EUR003M + 6.470%, 01/15/33(B) | | EUR | 1,500 | | | | 1,668 | |
Carlyle Euro CLO DAC, Ser 2021-1X, Cl DR | | | | | | | | |
10.155%, EUR003M + 6.470%, 07/15/34(B) | | EUR | 1,650 | | | | 1,816 | |
Carlyle Euro CLO DAC, Ser 2022-3X, Cl C | | | | | | | | |
7.042%, EUR003M + 3.500%, 02/15/36(B) | | EUR | 1,350 | | | | 1,460 | |
Carlyle Euro CLO DAC, Ser 2022-3X, Cl D | | | | | | | | |
10.002%, EUR003M + 6.460%, 02/15/36(B) | | EUR | 2,700 | | | | 2,935 | |
Carlyle Global Market Strategies Euro CLO DAC, Ser 2018-3X, Cl DR | | | | | | | | |
8.265%, EUR003M + 4.580%, 01/25/32(B) | | EUR | 2,400 | | | | 2,590 | |
Carlyle Global Market Strategies Euro CLO DAC, Ser 2020-1X, Cl DR | | | | | | | | |
9.164%, EUR003M + 5.500%, 01/16/33(B) | | EUR | 2,000 | | | | 2,168 | |
See accompanying notes to financial statements.
CITY NATIONAL ROCHDALE FUNDS | PAGE 44
schedule of investments |
September 30, 2024 |
City National Rochdale Fixed Income Opportunities Fund (continued) |
Description | | Face Amount (000)(1) | | | Value (000) | |
Carlyle Global Market Strategies Euro CLO DAC, Ser 2022-2X, Cl DRR | | | | | | | | |
10.227%, EUR003M + 6.650%, 11/10/35(B) | | EUR | 1,450 | | | $ | 1,591 | |
Cathedral Lake VI, Ser 2021-6A, Cl E | | | | | | | | |
12.756%, TSFR3M + 7.472%, 04/25/34(A) (B) | | | 1,000 | | | | 918 | |
Cathedral Lake VIII, Ser 2021-8A, Cl E | | | | | | | | |
13.035%, TSFR3M + 7.752%, 01/20/35(A) (B) | | | 2,000 | | | | 1,960 | |
CQS US CLO, Ser 2021-1A, Cl DJ | | | | | | | | |
10.524%, TSFR3M + 5.242%, 01/20/35(A) (B) | | | 300 | | | | 289 | |
Crown Point CLO 10, Ser 2021-10A, Cl E | | | | | | | | |
12.394%, TSFR3M + 7.112%, 07/20/34(A) (B) | | | 3,500 | | | | 3,437 | |
CVC Cordatus Loan Fund IV, Ser 2021-4X, Cl FRRR | | | | | | | | |
11.598%, EUR003M + 8.060%, 02/22/34(B) | | EUR | 615 | | | | 683 | |
CVC Cordatus Loan Fund XVI DAC, Ser 2019-16X, Cl E | | | | | | | | |
10.172%, EUR003M + 6.700%, 06/17/32(B) | | EUR | 1,000 | | | | 1,111 | |
CVC Cordatus Loan Fund XX DAC, Ser 2021-20X, Cl E | | | | | | | | |
9.065%, EUR003M + 5.610%, 06/22/34(B) | | EUR | 1,000 | | | | 1,115 | |
CVC Cordatus Loan Fund XXI DAC, Ser 2021-21X, Cl F | | | | | | | | |
12.155%, EUR003M + 8.700%, 09/22/34(B) | | EUR | 1,300 | | | | 1,421 | |
CVC Cordatus Loan Fund XXII DAC, Ser 2021-22X, Cl F | | | | | | | | |
12.261%, EUR003M + 8.780%, 12/15/34(B) | | EUR | 1,700 | | | | 1,873 | |
Diameter Capital Clo 2, Ser 2021-2A, Cl D | | | | | | | | |
11.623%, TSFR3M + 6.322%, 10/15/36(A) (B) | | | 2,200 | | | | 2,212 | |
Diameter Capital CLO 3, Ser 2022-3A, Cl D | | | | | | | | |
12.101%, TSFR3M + 6.800%, 04/15/37(A) (B) | | $ | 2,600 | | | $ | 2,605 | |
Diameter Capital CLO 5, Ser 2023-5A, Cl D | | | | | | | | |
12.871%, TSFR3M + 7.570%, 10/15/36(A) (B) | | | 2,000 | | | | 2,037 | |
Dryden 29 Euro CLO 2013 BV, Ser 2018-29X, Cl ERR | | | | | | | | |
8.435%, EUR003M + 4.750%, 07/15/32(B) | | EUR | 911 | | | | 989 | |
Dryden 35 EURO CLO 2014 BV, Ser 2020-35X, Cl ER | | | | | | | | |
9.992%, EUR003M + 6.330%, 01/17/33(B) | | EUR | 4,200 | | | | 4,595 | |
Dryden 66 Euro CLO 2018 DAC, Ser 2018-66X, Cl E | | | | | | | | |
9.084%, EUR003M + 5.410%, 01/18/32(B) | | EUR | 1,200 | | | | 1,291 | |
Dryden 69 Euro CLO 2018 DAC, Ser 2021-69X, Cl ER | | | | | | | | |
10.044%, EUR003M + 6.370%, 10/18/34(B) | | EUR | 4,700 | | | | 5,047 | |
Dryden 88 Euro CLO 2020 DAC, Ser 2021-88X, Cl E | | | | | | | | |
9.698%, EUR003M + 6.010%, 07/20/34(B) | | EUR | 1,700 | | | | 1,840 | |
Dryden 91 Euro CLO 2021 DAC, Ser 2022-91X, Cl E | | | | | | | | |
10.734%, EUR003M + 7.060%, 04/18/35(B) | | EUR | 1,000 | | | | 1,114 | |
Dunedin Park CLO DAC, Ser 2021-1X, Cl FR | | | | | | | | |
12.490%, EUR003M + 8.930%, 11/20/34(B) | | EUR | 3,500 | | | | 3,811 | |
Euro-Galaxy III CLO DAC, Ser 2021-3X, Cl FRRR | | | | | | | | |
11.685%, EUR003M + 7.980%, 04/24/34(B) | | EUR | 500 | | | | 543 | |
Euro-Galaxy V CLO DAC, Ser 2021-5X, Cl ERR | | | | | | | | |
9.362%, EUR003M + 5.820%, 02/15/34(B) | | EUR | 1,350 | | | | 1,446 | |
See accompanying notes to financial statements.
CITY NATIONAL ROCHDALE FUNDS | PAGE 45
schedule of investments |
September 30, 2024 |
City National Rochdale Fixed Income Opportunities Fund (continued) |
Description | | Face Amount (000)(1) | | | Value (000) | |
Fair Oaks Loan Funding II DAC, Ser 2021-2X, Cl AR | | | | | | | | |
4.565%, EUR003M + 0.880%, 04/15/34(B) | | EUR | 3,500 | | | $ | 3,882 | |
Fair Oaks Loan Funding III DAC, Ser 2021-3X, Cl AR | | | | | | | | |
4.685%, EUR003M + 1.000%, 10/15/34(B) | | EUR | 10,000 | | | | 11,116 | |
Fidelity Grand Harbour CLO DAC, Ser 2019-1X, Cl E | | | | | | | | |
9.491%, EUR003M + 6.010%, 03/15/32(B) | | EUR | 1,000 | | | | 1,102 | |
Fidelity Grand Harbour CLO DAC, Ser 2024-1A, Cl AR | | | | | | | | |
5.185%, EUR003M + 1.500%, 04/15/37(A) (B) | | EUR | 5,000 | | | | 5,601 | |
Franklin Park Place CLO I, Ser 2022-1A, Cl E | | | | | | | | |
12.801%, TSFR3M + 7.500%, 04/14/35(A) (B) | | | 3,160 | | | | 3,049 | |
Greywolf CLO II, Ser 2021-1A, Cl DRR | | | | | | | | |
12.611%, TSFR3M + 7.310%, 04/15/34(A) (B) | | | 3,000 | | | | 2,913 | |
Greywolf CLO III, Ser 2020-3RA, Cl DR | | | | | | | | |
12.462%, TSFR3M + 7.180%, 04/15/33(A) (B) | | | 5,000 | | | | 4,976 | |
Guggenheim CLO, Ser 2023-2A, Cl E | | | | | | | | |
14.541%, TSFR3M + 9.240%, 01/15/35(A) (B) | | | 3,000 | | | | 3,036 | |
Halseypoint CLO 7, Ser 2023-7A, Cl A | | | | | | | | |
7.532%, TSFR3M + 2.250%, 07/20/36(A) (B) | | | 8,000 | | | | 8,073 | |
Harriman Park CLO, Ser 2021-1A, Cl ER | | | | | | | | |
11.944%, TSFR3M + 6.662%, 04/20/34(A) (B) | | | 1,300 | | | | 1,294 | |
Harvest CLO IX DAC, Ser 2017-9X, Cl ER | | | | | | | | |
8.662%, EUR003M + 5.120%, 02/15/30(B) | | EUR | 1,000 | | | | 1,110 | |
Harvest CLO XXII DAC, Ser 2019-22X, Cl E | | | | | | | | |
9.795%, EUR003M + 6.110%, 01/15/32(B) | | EUR | 1,500 | | | $ | 1,666 | |
Harvest CLO XXIII DAC, Ser 2020-23X, Cl F | | | | | | | | |
11.998%, EUR003M + 8.310%, 10/20/32(B) | | EUR | 1,500 | | | | 1,637 | |
Harvest CLO XXIV DAC, Ser 2021-24X, Cl AR | | | | | | | | |
4.725%, EUR003M + 1.040%, 07/15/34(B) | | EUR | 5,000 | | | | 5,554 | |
Hayfin Emerald CLO IV DAC, Ser 2021-4X, Cl DR | | | | | | | | |
7.135%, EUR003M + 3.450%, 10/15/34(B) | | EUR | 2,255 | | | | 2,337 | |
Hayfin Emerald CLO VIII DAC, Ser 2021-8X, Cl D | | | | | | | | |
7.162%, EUR003M + 3.500%, 01/17/35(B) | | EUR | 1,550 | | | | 1,645 | |
Hayfin US XV, Ser 2024-15A, Cl A1 | | | | | | | | |
6.977%, TSFR3M + 1.640%, 04/28/37(A) (B) | | | 1,500 | | | | 1,499 | |
Henley CLO III DAC, Ser 2021-3X, Cl ER | | | | | | | | |
9.975%, EUR003M + 6.290%, 12/25/35(B) | | EUR | 1,050 | | | | 1,158 | |
Henley CLO IV DAC, Ser 2021-4X, Cl A | | | | | | | | |
4.585%, EUR003M + 0.900%, 04/25/34(B) | | EUR | 2,500 | | | | 2,779 | |
ICG Euro CLO DAC, Ser 2021-1X, Cl E | | | | | | | | |
10.145%, EUR003M + 6.460%, 10/15/34(B) | | EUR | 2,000 | | | | 2,211 | |
ICG Euro CLO DAC, Ser 2021-1X, Cl F | | | | | | | | |
12.505%, EUR003M + 8.820%, 10/15/34(B) | | EUR | 1,000 | | | | 1,063 | |
Invesco Euro CLO IV DAC, Ser 2020-4X, Cl A | | | | | | | | |
4.615%, EUR003M + 0.930%, 04/15/33(B) | | EUR | 3,700 | | | | 4,106 | |
Jamestown CLO XVII, Ser 2021-17A, Cl E | | | | | | | | |
12.636%, TSFR3M + 7.352%, 01/25/35(A) (B) | | | 4,000 | | | | 3,830 | |
See accompanying notes to financial statements.
CITY NATIONAL ROCHDALE FUNDS | PAGE 46
schedule of investments |
September 30, 2024 |
City National Rochdale Fixed Income Opportunities Fund (continued) |
Description | | Face Amount (000)(1) | | | Value (000) | |
KKR CLO 14, Ser 2018-14, Cl ER | | | | | | | | |
11.713%, TSFR3M + 6.412%, 07/15/31(A) (B) | | $ | 4,600 | | | $ | 4,579 | |
Logiclane I CLO DAC, Ser 2022-1X, Cl A | | | | | | | | |
4.655%, EUR003M + 0.970%, 03/15/35(B) | | EUR | 5,000 | | | | 5,541 | |
Madison Park Euro Funding XII DAC, Ser 2018-12X, Cl EN | | | | | | | | |
8.885%, EUR003M + 5.200%, 10/15/31(B) | | EUR | 151 | | | | 167 | |
Madison Park Euro Funding XIV DAC, Ser 2021-14X, Cl FR | | | | | | | | |
12.505%, EUR003M + 8.820%, 07/15/32(B) | | EUR | 1,770 | | | | 1,939 | |
Madison Park Euro Funding XVI DAC, Ser 2021-16X, Cl E | | | | | | | | |
9.705%, EUR003M + 6.020%, 05/25/34(B) | | EUR | 1,000 | | | | 1,098 | |
Madison Park Euro Funding XX DAC, Ser 2024-20A, Cl AR | | | | | | | | |
5.155%, EUR003M + 1.470%, 04/15/38(A) (B) | | EUR | 5,000 | | | | 5,582 | |
Man GLG Euro CLO V DAC, Ser 2018-5X, Cl E | | | | | | | | |
9.341%, EUR003M + 5.860%, 12/15/31(B) | | EUR | 900 | | | | 979 | |
Man GLG Euro CLO VI DAC, Ser 2020-6X, Cl E | | | | | | | | |
9.075%, EUR003M + 5.390%, 10/15/32(B) | | EUR | 1,300 | | | | 1,416 | |
Marble Point CLO XX, Ser 2021-1A, Cl E | | | | | | | | |
12.655%, TSFR3M + 7.372%, 04/23/34(A) (B) | | | 1,000 | | | | 996 | |
Marble Point CLO XXII, Ser 2021-2A, Cl A | | | | | | | | |
6.746%, TSFR3M + 1.462%, 07/25/34(A) (B) | | | 1,500 | | | | 1,500 | |
MidOcean Credit CLO X, Ser 2021-10A, Cl ER | | | | | | | | |
12.705%, TSFR3M + 7.422%, 10/23/34(A) (B) | | | 3,000 | | | | 2,823 | |
Milford Park CLO, Ser 2022-1A, Cl F | | | | | | | | |
14.602%, TSFR3M + 9.320%, 07/20/35(A) (B) | | $ | 1,000 | | | $ | 990 | |
Mountain View Clo XV, Ser 2024-2A, Cl A1R | | | | | | | | |
6.971%, TSFR3M + 1.670%, 07/15/37(A) (B) | | | 4,500 | | | | 4,506 | |
North Westerly V Leveraged Loan Strategies CLO DAC, Ser 2021-X, Cl FR | | | | | | | | |
11.588%, EUR003M + 7.900%, 07/20/34(B) | | EUR | 2,000 | | | | 2,071 | |
Northwoods Capital 20, Ser 2021-20A, Cl ER | | | | | | | | |
13.396%, TSFR3M + 8.112%, 01/25/32(A) (B) | | | 2,438 | | | | 2,397 | |
Northwoods Capital 21 Euro DAC, Ser 2021-21X, Cl DR | | | | | | | | |
6.938%, EUR003M + 3.250%, 07/22/34(B) | | EUR | 1,375 | | | | 1,495 | |
Northwoods Capital 21 Euro DAC, Ser 2021-21X, Cl ER | | | | | | | | |
9.748%, EUR003M + 6.060%, 07/22/34(B) | | EUR | 2,300 | | | | 2,455 | |
Northwoods Capital 21 Euro DAC, Ser 2021-21X, Cl FR | | | | | | | | |
12.318%, EUR003M + 8.630%, 07/22/34(B) | | EUR | 3,230 | | | | 3,124 | |
Northwoods Capital 25, Ser 2021-25A, Cl E | | | | | | | | |
12.684%, TSFR3M + 7.402%, 07/20/34(A) (B) | | | 2,000 | | | | 1,934 | |
Northwoods Capital 27, Ser 2021-27A, Cl E | | | | | | | | |
12.587%, TSFR3M + 7.302%, 10/17/34(A) (B) | | | 1,150 | | | | 1,072 | |
OAK Hill European Credit Partners V DAC, Ser 2021-5X, Cl DR | | | | | | | | |
7.288%, EUR003M + 3.600%, 01/21/35(B) | | EUR | 1,350 | | | | 1,508 | |
See accompanying notes to financial statements.
CITY NATIONAL ROCHDALE FUNDS | PAGE 47
schedule of investments |
September 30, 2024 |
City National Rochdale Fixed Income Opportunities Fund (continued) |
Description | | Face Amount (000)(1) | | | Value (000) | |
OAK Hill European Credit Partners V DAC, Ser 2021-5X, Cl ER | | | | | | | | |
10.058%, EUR003M + 6.370%, 01/21/35(B) | | EUR | 1,000 | | | $ | 1,109 | |
Oaktree CLO, Ser 2023-1A, Cl A1 | | | | | | | | |
7.201%, TSFR3M + 1.900%, 04/15/36(A) (B) | | | 5,000 | | | | 5,006 | |
OZLM XXIV, Ser 2019-24A, Cl D | | | | | | | | |
12.594%, TSFR3M + 7.312%, 07/20/32(A) (B) | | | 4,000 | | | | 3,716 | |
Palmer Square Loan Funding, Ser 2024-3A, Cl DR | | | | | | | | |
11.201%, TSFR3M + 5.900%, 04/15/31(A) (B) | | | 1,600 | | | | 1,611 | |
PARK BLUE CLO, Ser 2023-3A, Cl A1 | | | | | | | | |
7.282%, TSFR3M + 2.000%, 04/20/36(A) (B) | | | 10,000 | | | | 10,087 | |
Pikes Peak CLO 14, Ser 2023-14A, Cl A1 | | | | | | | | |
7.232%, TSFR3M + 1.950%, 04/20/36(A) (B) | | | 10,900 | | | | 10,918 | |
Pikes Peak CLO 5, Ser 2024-5A, Cl ER | | | | | | | | |
%, 10/20/37(A) (B) | | | 1,000 | | | | 1,000 | |
Purple Finance CLO 2 DAC, Ser 2019-2X, Cl E | | | | | | | | |
10.088%, EUR003M + 6.400%, 04/20/32(B) | | EUR | 2,000 | | | | 2,233 | |
Rockford Tower Europe CLO DAC, Ser 2019-1X, Cl A | | | | | | | | |
4.608%, EUR003M + 0.920%, 01/20/33(B) | | EUR | 13,970 | | | | 15,539 | |
Rockford Tower Europe CLO DAC, Ser 2021-2X, Cl D | | | | | | | | |
7.155%, EUR003M + 3.450%, 01/24/35(B) | | EUR | 1,350 | | | | 1,505 | |
Rockford Tower Europe CLO DAC, Ser 2021-2X, Cl E | | | | | | | | |
9.925%, EUR003M + 6.220%, 01/24/35(B) | | EUR | 2,500 | | | | 2,764 | |
Rockford Tower Europe CLO DAC, Ser 2021-2X, Cl F | | | | | | | | |
12.605%, EUR003M + 8.900%, 01/24/35(B) | | EUR | 1,000 | | | $ | 1,075 | |
Sandstone Peak III, Ser 2024-1A, Cl A1 | | | | | | | | |
6.966%, TSFR3M + 1.630%, 04/25/37(A) (B) | | | 10,000 | | | | 9,996 | |
Sculptor CLO XXIX, Ser 2021-29A, Cl D2 | | | | | | | | |
10.414%, TSFR3M + 5.132%, 10/22/34(A) (B) | | | 1,010 | | | | 1,001 | |
Sculptor CLO XXVI, Ser 2021-26A, Cl E | | | | | | | | |
12.794%, TSFR3M + 7.512%, 07/20/34(A) (B) | | | 1,800 | | | | 1,792 | |
Sculptor European CLO II DAC, Ser 2021-2X, Cl DR | | | | | | | | |
7.285%, EUR003M + 3.600%, 04/15/34(B) | | EUR | 1,000 | | | | 1,116 | |
Sculptor European CLO II DAC, Ser 2021-2X, Cl ER | | | | | | | | |
9.575%, EUR003M + 5.890%, 04/15/34(B) | | EUR | 1,100 | | | | 1,202 | |
Sculptor European CLO VI DAC, Ser 2021-6X, Cl DR | | | | | | | | |
7.085%, EUR003M + 3.400%, 10/15/34(B) | | EUR | 1,350 | | | | 1,485 | |
Sculptor European CLO VII DAC, Ser 2020-7X, Cl F | | | | | | | | |
12.065%, EUR003M + 8.380%, 01/15/34(B) | | EUR | 255 | | | | 275 | |
Sculptor European CLO VIII DAC, Ser 2021-8X, Cl E | | | | | | | | |
9.832%, EUR003M + 6.170%, 07/17/34(B) | | EUR | 1,000 | | | | 1,118 | |
Segovia European CLO DAC, Ser 2022-3X, Cl ER | | | | | | | | |
10.045%, EUR003M + 6.360%, 01/25/35(B) | | EUR | 1,000 | | | | 1,104 | |
St. Paul’s CLO VI DAC, Ser 2021-6X, Cl ERR | | | | | | | | |
9.860%, EUR003M + 6.300%, 05/20/34(B) | | EUR | 1,000 | | | | 1,104 | |
See accompanying notes to financial statements.
CITY NATIONAL ROCHDALE FUNDS | PAGE 48
schedule of investments |
September 30, 2024 |
City National Rochdale Fixed Income Opportunities Fund (continued) |
Description | | Face Amount (000)(1) | | | Value (000) | |
St. Paul’s CLO VII DAC, Ser 2021-7X, Cl ERR | | | | | | | | |
9.794%, EUR003M + 6.120%, 07/18/34(B) | | EUR | 4,000 | | | $ | 4,326 | |
St. Paul’s CLO VIII DAC, Ser 2017-8X, Cl E | | | | | | | | |
8.262%, EUR003M + 4.600%, 07/17/30(B) | | EUR | 2,800 | | | | 3,076 | |
St. Paul’s CLO X DAC, Ser 2021-10X, Cl DR | | | | | | | | |
7.438%, EUR003M + 3.750%, 04/22/35(B) | | EUR | 250 | | | | 278 | |
St. Paul’s CLO X DAC, Ser 2021-10X, Cl ER | | | | | | | | |
10.048%, EUR003M + 6.360%, 04/22/35(B) | | EUR | 2,360 | | | | 2,577 | |
St. Paul’s CLO XII DAC, Ser 2020-12X, Cl E | | | | | | | | |
9.005%, EUR003M + 5.320%, 04/15/33(B) | | EUR | 1,710 | | | | 1,870 | |
Sycamore Tree CLO, Ser 2024-3A, Cl A1R | | | | | | | | |
6.932%, TSFR3M + 1.650%, 04/20/37(A) (B) | | | 7,500 | | | | 7,498 | |
TCW CLO, Ser 2021-1A, Cl E | | | | | | | | |
11.364%, TSFR3M + 6.082%, 03/18/34(A) (B) | | | 2,300 | | | | 2,172 | |
Tikehau CLO II BV, Ser 2021-2X, Cl ER | | | | | | | | |
9.790%, EUR003M + 6.320%, 09/07/35(B) | | EUR | 1,000 | | | | 1,113 | |
Tikehau CLO VI DAC, Ser 2021-6X, Cl E | | | | | | | | |
10.005%, EUR003M + 6.320%, 01/15/35(B) | | EUR | 1,100 | | | | 1,211 | |
Toro European CLO 2 DAC, Ser 2021-2X, Cl ERR | | | | | | | | |
10.155%, EUR003M + 6.470%, 07/25/34(B) | | EUR | 2,000 | | | | 2,140 | |
Toro European CLO 3 DAC, Ser 2021-3X, Cl ERR | | | | | | | | |
9.985%, EUR003M + 6.300%, 07/15/34(B) | | EUR | 3,500 | | | | 3,813 | |
Toro European CLO 6 DAC, Ser 2019-6X, Cl E | | | | | | | | |
10.194%, EUR003M + 6.490%, 01/12/32(B) | | EUR | 1,207 | | | | 1,325 | |
Toro European CLO 7 DAC, Ser 2020-7X, Cl E | | | | | | | | |
10.702%, EUR003M + 7.160%, 02/15/34(B) | | EUR | 2,634 | | | $ | 2,886 | |
Trimaran Cavu, Ser 2019-1A, Cl E | | | | | | | | |
12.584%, TSFR3M + 7.302%, 07/20/32(A) (B) | | | 1,800 | | | | 1,799 | |
Trimaran Cavu, Ser 2019-2A, Cl D | | | | | | | | |
12.491%, TSFR3M + 7.212%, 11/26/32(A) (B) | | | 1,750 | | | | 1,744 | |
Trimaran Cavu, Ser 2021-3A, Cl E | | | | | | | | |
12.911%, TSFR3M + 7.632%, 01/18/35(A) (B) | | | 2,000 | | | | 2,023 | |
| | | | | | | | | | | | | |
Total Collateralized Loan Obligations | | | | |
Cost ($363,065) | | | 371,467 | |
| | | | | | | | | | | | | |
Loan Participations [17.9%] |
Aerospace and defense [0.0%] |
HDI Aerosapce, Term Loan, 1st Lien | | | | | | | | |
0.000%, 09/19/31(G) | | | 640 | | | | 634 | |
TransDigm Inc., Tranche L Term Loan, 1st Lien | | | | | | | | |
7.320%, CME Term SOFR + 2.500%, 01/19/32(B) | | | 260 | | | | 259 | |
| | | | | | | | | | | | | |
Total Aerospace and defense | | | | | | | 893 | |
| | | | | | | | | | | | | |
Aerospace and Defense [0.4%] |
Cobham Ultra SeniorCo S.a r.l., Facility B (USD), 1st Lien | | | | | | | | |
9.245%, CME Term SOFR + 3.750%, 08/03/29(B) | | | 1,670 | | | | 1,596 | |
KBR, Term Loan B, 1st Lien | | | | | | | | |
7.247%, 01/19/31 | | | 1,062 | | | | 1,061 | |
Peraton Corp., Term B Loan, 1st Lien | | | | | | | | |
8.695%, CME Term SOFR + 3.750%, 02/01/28(B) | | | 1,744 | | | | 1,674 | |
See accompanying notes to financial statements.
CITY NATIONAL ROCHDALE FUNDS | PAGE 49
schedule of investments |
September 30, 2024 |
City National Rochdale Fixed Income Opportunities Fund (continued) |
Description | | Face Amount (000)(1) | | | Value (000) | |
Peraton Corp., Term B-1 Loan, 2nd Lien | | | | | | | | |
12.971%, CME Term SOFR + 7.750%, 02/01/29(B) | | $ | 333 | | | $ | 312 | |
Spirit Aerosystems, Inc. (fka Mid-Western Aircraft Systems, Inc and Onex Wind Finance LP.), 2022 Refinancing Term Loan | | | | | | | | |
8.514%, CME Term SOFR + 4.500%, 04/01/28(B) | | | 1,222 | | | | 898 | |
Spirit Aerosystems, Inc., 2022 Refinancing Term Loan, 1st Lien | | | | | | | | |
9.752%, CME Term SOFR + 4.250%, 11/08/27(B) | | | 715 | | | | 720 | |
TransDigm Inc., Tranche K Term Loan, 1st Lien | | | | | | | | |
7.354%, CME Term SOFR + 2.750%, 03/22/30(B) | | | 933 | | | | 932 | |
| | | | | | | | | | | | | |
Total Aerospace and Defense | | | | | | | 7,193 | |
| | | | | | | | | | | | | |
Automobile [0.1%] |
Clarios Global LP, Amendment No. 5 Euro Term Loan, 1st Lien | | | | | | | | |
6.378%, Euribor + 3.000%, 07/16/31(B) | | | 1,177 | | | | 1,306 | |
CWGS Group, LLC, Initial Term Loan, 1st Lien | | | | | | | | |
7.892%, CME Term SOFR + 2.500%, 06/03/28(B) | | | 802 | | | | 767 | |
| | | | | | | | | | | | | |
Total Automobile | | | | | | | 2,073 | |
| | | | | | | | | | | | | |
Banking [0.1%] |
Nexus Buyer LLC, Amendment No. 7 Refinancing Term Loan, 1st Lien | | | | | | | | |
8.845%, CME Term SOFR + 4.000%, 07/31/31(B) | | | 1,118 | | | | 1,107 | |
| | | | | | | | | | | | | |
Beverage, Food and Tobacco [0.1%] |
Froneri International Limited, Facility B1, 1st Lien | | | | | | | | |
5.715%, Euribor + 2.625%, 01/29/27(B) | | $ | 1,000 | | | $ | 1,112 | |
Peralta Inversiones Globales, S.L.U., Facility B, 1st Lien | | | | | | | | |
7.676%, Euribor + 4.000%, 07/18/31(B) | | | 1,000 | | | | 1,114 | |
| | | | | | | | | | | | | |
Total Beverage, Food and Tobacco | | | | | | | 2,226 | |
| | | | | | | | | | | | | |
Broadcasting and Entertainment [0.8%] |
Allen Media, LLC, Initial Term Loan (2021), 1st Lien | | | | | | | | |
10.254%, CME Term SOFR + 5.500%, 02/10/27(B) | | | 637 | | | | 412 | |
Altice Financing S.A., 2022 Refinancing Dollar Commitments, 1st Lien | | | | | | | | |
10.301%, CME Term SOFR + 5.000%, 10/31/27(B) | | | 1,790 | | | | 1,623 | |
Altice Financing, Term Loan, 1st Lien | | | | | | | | |
8.685%, 10/31/27 | | | 993 | | | | 981 | |
Altice France S.A., EUR TLB-[14] Loan, 1st Lien | | | | | | | | |
9.185%, EURIBOR + 5.500%, 08/15/28(B) | | | 980 | | | | 819 | |
Altice France S.A., USD TLB-[14] Loan, 1st Lien | | | | | | | | |
10.801%, CME Term SOFR + 5.500%, 08/15/28(B) | | | 1,932 | | | | 1,443 | |
Charter Communications Operating, LLC, Term B-4 Loan, 1st Lien | | | | | | | | |
7.332%, 12/07/30 | | | 1,164 | | | | 1,154 | |
CSC Holdings, LLC, September 2019 Initial Term Loan, 1st Lien | | | | | | | | |
7.173%, Syn LIBOR + 2.500%, 04/15/27(B) | | | 124 | | | | 113 | |
DIRECTV Financing, LLC, 2024 Refinancing Term B Loan, 1st Lien | | | | | | | | |
10.210%, CME Term SOFR + 5.250%, 08/02/29(B) | | | 629 | | | | 618 | |
See accompanying notes to financial statements.
CITY NATIONAL ROCHDALE FUNDS | PAGE 50
schedule of investments |
September 30, 2024 |
City National Rochdale Fixed Income Opportunities Fund (continued) |
Description | | Face Amount (000)(1) | | | Value (000) | |
Gray Television, Cov-Lite Term Loan D, 1st Lien | | | | | | | | |
8.315%, 12/01/28 | | $ | 1,980 | | | $ | 1,822 | |
Sinclair Television Group, Inc., Tranche B-2b Term Loan, 1st Lien | | | | | | | | |
8.014%, CME Term SOFR + 2.500%, 09/30/26(B) | | | 119 | | | | 115 | |
Univision Communications Inc., 2021 Replacement Converted First-Lien Term Loan, 1st Lien | | | | | | | | |
8.210%, CME Term SOFR + 3.250%, 03/15/26(B) | | | 315 | | | | 314 | |
Univision Communications Inc., Tem Loan, 1st Lien | | | | | | | | |
8.861%, 01/31/29 | | | 625 | | | | 610 | |
Virgin Media Bristol LLC, Facility Q, 1st Lien | | | | | | | | |
8.461%, CME Term SOFR + 3.250%, 01/31/29(B) | | | 1,825 | | | | 1,744 | |
Virgin Media Bristol LLC, Facility Y, 1st Lien | | | | | | | | |
8.656%, CME Term SOFR + 3.250%, 03/31/31(B) | | | 200 | | | | 191 | |
Virgin Media Ireland Limited, Facility B1, 1st Lien | | | | | | | | |
7.161%, EURIBOR + 3.500%, 07/15/29(B) | | | 2,000 | | | | 2,206 | |
Ziggo Financing Partnership, Term Loan I Facility, 1st Lien | | | | | | | | |
7.711%, LIBOR + 2.500%, 04/30/28(B) | | | 1,030 | | | | 1,005 | |
| | | | | | | | | | | | | |
Total Broadcasting and Entertainment | | | | | | | 15,170 | |
| | | | | | | | | | | | | |
Buildings and Real Estate [0.5%] |
APi Group DE, Inc., Repriced 2021 Incremental Term Loan (2024), 1st Lien | | | | | | | | |
6.845%, CME Term SOFR + 2.000%, 01/03/29(B) | | | 405 | | | | 405 | |
Crown Subsea Communications Holding, Inc., 2024 Term Loan, 1st Lien | | | | | | | | |
9.252%, CME Term SOFR + 4.000%, 01/30/31(B) | | $ | 1,100 | | | $ | 1,105 | |
Delachaux Group, Facility B, 1st Lien | | | | | | | | |
7.386%, Euribor + 3.750%, 04/16/29(B) | | | 922 | | | | 1,028 | |
Forest City Enterprises, L.P., Replacement Term Loan, 1st Lien | | | | | | | | |
8.460%, CME Term SOFR + 3.500%, 12/08/25(B) | | | 1,160 | | | | 1,121 | |
Mannington Mills, Inc., Tranche B-1 Loan, 1st Lien | | | | | | | | |
9.346%, CME Term SOFR + 3.750%, 08/06/26(B) | | | 864 | | | | 851 | |
Oscar AcquisitionCo, LLC, Term B Loan, 1st Lien | | | | | | | | |
8.854%, CME Term SOFR + 4.250%, 04/29/29(B) | | | 1,282 | | | | 1,265 | |
Pique Bidco, S.L.U., Facility B3, 1st Lien | | | | | | | | |
7.128%, Euribor + 3.750%, 12/18/30(B) | | | 1,000 | | | | 1,113 | |
Platea (BC) Bidco AB, DDTL Facility, 1st Lien | | | | | | | | |
7.845%, Euribor + 4.500%, 04/03/31(B) | | | 167 | | | | 186 | |
Platea (BC) Bidco AB, Facility B, 1st Lien | | | | | | | | |
7.845%, Euribor + 4.500%, 04/03/31(B) | | | 833 | | | | 930 | |
Smyrna Ready Mix Concrete, LLC, 2023 Refinancing Term Loan, 1st Lien | | | | | | | | |
8.354%, CME Term SOFR + 3.500%, 04/02/29(B) | | | 409 | | | | 411 | |
See accompanying notes to financial statements.
CITY NATIONAL ROCHDALE FUNDS | PAGE 51
schedule of investments |
September 30, 2024 |
City National Rochdale Fixed Income Opportunities Fund (continued) |
Description | | Face Amount (000)(1) | | | Value (000) | |
Trulite Holding Corp., Initial Term Loans, 1st Lien | | | | | | | | |
11.247%, CME Term SOFR + 6.000%, 03/01/30(B) | | $ | 1,048 | | | $ | 1,012 | |
| | | | | | | | | | | | | |
Total Buildings and Real Estate | | | | | | | 9,427 | |
| | | | | | | | | | | | | |
Business Equipment & Services [0.0%] |
Emerald X, Inc., Initial Term Loan | | | | | | | | |
10.347%, 06/02/26(B) | | | 594 | | | | 595 | |
| | | | | | | | | | | | | |
Cargo Transport [0.4%] |
Boluda Towage, S.L.U., Facility B3, 1st Lien | | | | | | | | |
7.255%, Euribor + 3.750%, 01/31/30(B) | | | 1,000 | | | | 1,116 | |
Dynasty Acquisition Co., Inc., 2024 Specified Refinancing Term B-1 Loan, 1st Lien | | | | | | | | |
8.345%, CME Term SOFR + 3.500%, 08/24/28(B) | | | 1,036 | | | | 1,036 | |
Dynasty Acquisition Co., Inc., 2024 Specified Refinancing Term B-2 Loan, 1st Lien | | | | | | | | |
8.345%, CME Term SOFR + 3.500%, 08/24/28(B) | | | 400 | | | | 400 | |
GN Loanco, LLC, Term B Loan, 1st Lien | | | | | | | | |
9.752%, CME Term SOFR + 4.500%, 12/19/30(B) | | | 753 | | | | 747 | |
LaserShip, Inc., Initial Loan, 2nd Lien | | | | | | | | |
12.365%, CME Term SOFR + 7.500%, 05/07/29(B) | | | 645 | | | | 259 | |
Radar Bidco SARL, Facility B (EUR), 1st Lien | | | | | | | | |
7.955%, Euribor + 4.250%, 04/04/31(B) | | | 1,000 | | | | 1,114 | |
Rand Parent, LLC, Term B Loan, 1st Lien | | | | | | | | |
8.354%, CME Term SOFR + 3.750%, 03/17/30(B) | | | 1,342 | | | | 1,343 | |
Winterfell Financing S.a r.l., Facility B | | | | | | | | |
6.982%, EURIBOR + 3.425%, 05/04/28(B) | | EUR | 1,000 | | | $ | 1,055 | |
| | | | | | | | | | | | | |
Total Cargo Transport | | | | | | | 7,070 | |
| | | | | | | | | | | | | |
Chemicals, Plastics and Rubber [0.9%] |
ARC Falcon I Inc., Initial Term Loan, 1st Lien | | | | | | | | |
8.847%, LIBOR + 3.750%, 09/22/28(B) | | | 1,948 | | | | 1,945 | |
Chemours Company, The, Tranche B-3 US$ Term Loan, 1st Lien | | | | | | | | |
8.345%, CME Term SOFR + 3.500%, 08/18/28(B) | | | 449 | | | | 448 | |
Flint Group Packaging Inks North America Holdings LLC, Facility B (USD), 1st Lien | | | | | | | | |
9.795%, CME Term SOFR + 4.250%, 12/31/26(B) | | | 638 | | | | 606 | |
Flint Group, Term Loan | | | | | | | | |
5.677%, 12/31/27 | | | 340 | | | | 298 | |
Granite FR Bidco, Term Loan, 1st Lien | | | | | | | | |
8.455%, 10/17/28 | | | 1,000 | | | | 1,107 | |
Herens Holdco S.a r.l., Facility B (EUR), 1st Lien | | | | | | | | |
7.270%, Euribor + 3.925%, 07/03/28(B) | | | 1,000 | | | | 1,052 | |
Hexion Holdings Corporation, Initial Term Loan, 1st Lien | | | | | | | | |
9.771%, CME Term SOFR + 4.500%, 03/15/29(B) | | | 838 | | | | 831 | |
Hexion Holdings Corporation, Initial Term Loan, 2nd Lien | | | | | | | | |
12.383%, CME Term SOFR + 7.438%, 03/15/30(B) | | | 860 | | | | 769 | |
ILPEA Parent Inc., Term Loan, 1st Lien | | | | | | | | |
8.850%, CME Term SOFR + 4.000%, 06/22/28(B) | | | 342 | | | | 342 | |
See accompanying notes to financial statements.
CITY NATIONAL ROCHDALE FUNDS | PAGE 52
schedule of investments |
September 30, 2024 |
City National Rochdale Fixed Income Opportunities Fund (continued) |
Description | | Face Amount (000)(1) | | | Value (000) | |
INEOS Enterprises Holdings US Finco LLC, 2030 Tranche B Euro Term Loan, 1st Lien | | | | | | | | |
7.505%, Euribor + 4.000%, 07/08/30(B) | | $ | 1,000 | | | $ | 1,118 | |
Ineos Quattro Holdings UK Limited, 2029 Tranche B Dollar Term Loan, 1st Lien | | | | | | | | |
9.195%, CME Term SOFR + 4.250%, 04/02/29(B) | | | 519 | | | | 518 | |
Ineos US Finance LLC, 2030 Dollar Term Loan, 1st Lien | | | | | | | | |
8.095%, CME Term SOFR + 3.250%, 02/18/30(B) | | | 795 | | | | 794 | |
Ineos US Finance LLC, 2031 Dollar Term Loan, 1st Lien | | | | | | | | |
8.595%, CME Term SOFR + 3.750%, 02/07/31(B) | | | 1,495 | | | | 1,495 | |
Ineos US Finance LLC, 2031-II Euro Term Loan, 1st Lien | | | | | | | | |
6.878%, Euribor + 3.500%, 06/23/31(B) | | | 1,000 | | | | 1,108 | |
Sirona Bidco, Term Loan, 1st Lien | | | | | | | | |
7.988%, 10/20/28 | | | 2,000 | | | | 2,000 | |
Trinseo Materials Operating S.C.A., 2021 Incremental Term Loan, 1st Lien | | | | | | | | |
7.819%, CME Term SOFR + 2.500%, 05/03/28(B) | | | 742 | | | | 585 | |
Tronox Finance LLC, 2024 Other Term Loan, 1st Lien | | | | | | | | |
7.354%, CME Term SOFR + 2.750%, 04/04/29(B) | | | 718 | | | | 718 | |
0.000%, 09/18/31(G) | | | 388 | | | | 387 | |
Windsor Holdings III, LLC, 2024 September Euro Term B Loan, 1st Lien | | | | | | | | |
6.898%, Euribor + 3.500%, 08/01/30(B) | | $ | 1,000 | | | $ | 1,114 | |
| | | | | | | | | | | | | |
Total Chemicals, Plastics and Rubber | | | | | | | 17,235 | |
| | | | | | | | | | | | | |
Consumer Durables [0.0%] |
Justrite (Safety Products) Term Loan B | | | | | | | | |
9.847%, 06/28/26 | | | 798 | | | | 797 | |
Safety Products, Delayed Term Loan, 1st Lien | | | | | | | | |
0.000%, 06/29/26(G) | | | 200 | | | | 200 | |
| | | | | | | | | | | | | |
Total Consumer Durables | | | | | | | 997 | |
| | | | | | | | | | | | | |
Consumer Products [0.1%] |
Stiga SPA, Term Loan B-1, 1st Lien | | | | | | | | |
8.518%, 03/02/26 | | | 2,584 | | | | 2,653 | |
| | | | | | | | | | | | | |
Containers, Packaging and Glass [0.1%] |
Altium Packaging LLC, 2024 Incremental Term Loan, 1st Lien | | | | | | | | |
7.345%, CME Term SOFR + 2.500%, 06/11/31(B) | | | 335 | | | | 333 | |
Kleopatra Finco S.a r.l., Facility B (EUR), 1st Lien | | | | | | | | |
8.126%, EURIBOR + 4.725%, 02/12/26(B) | | | 1,000 | | | | 1,040 | |
Pregis TopCo LLC, Initial Term Loan, 1st Lien | | | | | | | | |
8.845%, CME Term SOFR + 4.000%, 07/31/26(B) | | | 742 | | | | 743 | |
Trident TPI Holdings, Inc., Tranche B-6 Initial Term Loan, 1st Lien | | | | | | | | |
8.604%, CME Term SOFR + 4.000%, 09/15/28(B) | | | 597 | | | | 597 | |
| | | | | | | | | | | | | |
Total Containers, Packaging and Glass | | | | | | | 2,713 | |
| | | | | | | | | | | | | |
See accompanying notes to financial statements.
CITY NATIONAL ROCHDALE FUNDS | PAGE 53
schedule of investments |
September 30, 2024 |
City National Rochdale Fixed Income Opportunities Fund (continued) |
Description | | Face Amount (000)(1) | | | Value (000) | |
Diversified Natural Resources, Precious Metals and Minerals [0.0%] |
Domtar Corporation, Initial Term Loan, 1st Lien | | | | | | | | |
10.861%, LIBOR + 5.500%, 11/30/28(B) | | $ | 391 | | | $ | 373 | |
Mativ Holdings, Inc., Term B Loan, 1st Lien | | | | | | | | |
8.710%, CME Term SOFR + 3.750%, 04/20/28(B) | | | 612 | | | | 610 | |
| | | | | | | | | | | | | |
Total Diversified Natural Resources, Precious Metals and Minerals | | | | | | | 983 | |
| | | | | | | | | | | | | |
Diversified/Conglomerate Manufacturing [0.1%] |
Dedalus Finance GmbH, Senior Facility B2, 1st Lien | | | | | | | | |
7.370%, EURIBOR + 3.750%, 07/17/27(B) | | | 1,000 | | | | 1,086 | |
Pegasus BidCo B.V., 2024-2 Euro Term Loan, 1st Lien | | | | | | | | |
7.042%, Euribor + 3.500%, 07/12/29(B) | | | 1,000 | | | | 1,112 | |
| | | | | | | | | | | | | |
Total Diversified/Conglomerate Manufacturing | | | | | | | 2,198 | |
| | | | | | | | | | | | | |
Diversified/Conglomerate Service [0.9%] |
Apex Group Treasury Limited, EUR Term Loan, 1st Lien | | | | | | | | |
7.569%, EURIBOR + 4.000%, 07/27/28(B) | | | 1,000 | | | | 1,110 | |
Apex Group Treasury Limited, USD Term Loan, 1st Lien | | | | | | | | |
8.963%, CME Term SOFR + 3.750%, 07/27/28(B) | | | 665 | | | | 665 | |
APX Group, Inc., Initial Term Loan, 1st Lien | | | | | | | | |
8.035%, CME Term SOFR + 2.750%, 07/10/28(B) | | | 883 | | | | 882 | |
Boost Newco Borrower, LLC, USD Term B-1 Loan, 1st Lien | | | | | | | | |
7.104%, CME Term SOFR + 2.500%, 01/31/31(B) | | $ | 600 | | | $ | 600 | |
Cengage Learning, Inc., Term B Loan, 1st Lien | | | | | | | | |
9.538%, CME Term SOFR + 4.250%, 03/24/31(B) | | | 589 | | | | 589 | |
CTEC III GmbH, Facility B, 1st Lien | | | | | | | | |
7.005%, EURIBOR + 3.500%, 03/16/29(B) | | | 1,160 | | | | 1,286 | |
Inspired Finco Holdings Limited, Facility B5(A), 1st Lien | | | | | | | | |
7.378%, Euribor + 4.000%, 02/28/31(B) | | | 1,000 | | | | 1,115 | |
M2S Group Intermediate Holdings, Inc., Initial Term Loan, 1st Lien | | | | | | | | |
9.852%, CME Term SOFR + 4.750%, 08/25/31(B) | | | 465 | | | | 444 | |
Mermaid Bidco Inc., Facility B (USD), 1st Lien | | | | | | | | |
8.492%, CME Term SOFR + 3.250%, 07/03/31(B) | | | 970 | | | | 968 | |
MPH Acquisition Holdings LLC, Initial Term Loan, 1st Lien | | | | | | | | |
9.569%, CME Term SOFR + 4.250%, 09/01/28(B) | | | 366 | | | | 275 | |
Physician Partners, LLC, Initial Term Loan, 1st Lien | | | | | | | | |
9.564%, CME Term SOFR + 4.000%, 12/23/28(B) | | | 907 | | | | 576 | |
Poseidon Bidco S.A.S., Facility B2 (EUR), 1st Lien | | | | | | | | |
8.345%, Euribor + 5.000%, 03/13/30(B) | | | 1,000 | | | | 852 | |
TMS International Corporation, Term B-6 Loan, 1st Lien | | | | | | | | |
9.002%, CME Term SOFR + 3.750%, 03/02/30(B) | | | 520 | | | | 520 | |
See accompanying notes to financial statements.
CITY NATIONAL ROCHDALE FUNDS | PAGE 54
schedule of investments |
September 30, 2024 |
City National Rochdale Fixed Income Opportunities Fund (continued) |
Description | | Face Amount (000)(1) | | | Value (000) | |
Trans Union LLC, 2024 Refinancing Term B-8 Loan, 1st Lien | | | | | | | | |
6.595%, CME Term SOFR + 1.750%, 06/24/31(B) | | $ | 499 | | | $ | 498 | |
TRC Companies LLC, Initial Term Loan, 1st Lien | | | | | | | | |
8.710%, CME Term SOFR + 3.750%, 12/08/28(B) | | | 739 | | | | 738 | |
Unique BidCo AB, Facility B Loan, 1st Lien | | | | | | | | |
8.645%, EURIBOR + 5.250%, 03/16/29(B) | | | 1,000 | | | | 1,038 | |
Venga Finance S.a r.l., 2024 Incremental Dollar Term Loan, 1st Lien | | | | | | | | |
9.569%, CME Term SOFR + 4.250%, 06/28/29(B) | | | 1,630 | | | | 1,633 | |
Vestis Corporation , Term B-1 Loan, 1st Lien | | | | | | | | |
7.371%, CME Term SOFR + 2.250%, 02/22/31(B) | | | 1,223 | | | | 1,214 | |
ZF Invest, Senior Facility B, 1st Lien | | | | | | | | |
7.179%, EURIBOR + 3.475%, 07/12/28(B) | | | 1,000 | | | | 1,102 | |
| | | | | | | | | | | | | |
Total Diversified/Conglomerate Service | | | | | | | 16,105 | |
| | | | | | | | | | | | | |
Ecological [0.1%] |
Consolidated Energy Finance S.A., 2024 Incremental Term Loan, 1st Lien | | | | | | | | |
9.557%, CME Term SOFR + 4.500%, 11/15/30(B) | | | 1,102 | | | | 1,032 | |
GFL Environmental Inc., 2024 Refinancing Term Loan, 1st Lien | | | | | | | | |
7.321%, CME Term SOFR + 2.000%, 07/03/31(B) | | | 440 | | | | 439 | |
| | | | | | | | | | | | | |
Total Ecological | | | | | | | 1,471 | |
| | | | | | | | | | | | | |
Electronics [1.0%] |
Adeia Inc., Amendment No.3 Replacement Term Loan, 1st Lien | | | | | | | | |
7.961%, CME Term SOFR + 3.000%, 06/08/28(B) | | $ | 1,578 | | | $ | 1,577 | |
AI Silk Midco Limited, Facility B, 1st Lien | | | | | | | | |
8.351%, Euribor + 5.000%, 03/04/31(B) | | | 1,500 | | | | 1,660 | |
Aretec Group, Inc. (fka RCS Capital Corporation), Term B-2 Loan, 1st Lien | | | | | | | | |
8.845%, CME Term SOFR + 4.000%, 08/09/30(B) | | | 2,371 | | | | 2,320 | |
Boxer Parent Company Inc., 2031 New Dollar Term Loan, 1st Lien | | | | | | | | |
9.005%, CME Term SOFR + 3.750%, 07/30/31(B) | | | 790 | | | | 788 | |
Cloud Software Group, Inc., Fourth Amendment Incremental Term Loan, 1st Lien | | | | | | | | |
8.604%, CME Term SOFR + 4.000%, 03/30/29(B) | | | 2,573 | | | | 2,561 | |
Cloudera, Inc., Initial Term Loan, 1st Lien | | | | | | | | |
8.695%, CME Term SOFR + 3.750%, 10/08/28(B) | | | 748 | | | | 727 | |
ConnectWise, LLC, Initial Term Loan, 1st Lien | | | | | | | | |
8.365%, CME Term SOFR + 3.500%, 09/29/28(B) | | | 215 | | | | 214 | |
Evercommerce Solutions Inc., Term Loan, 1st Lien | | | | | | | | |
7.960%, CME Term SOFR + 3.000%, 07/06/28(B) | | | 909 | | | | 909 | |
Instructure Holdings, Inc., Initial Term Loan, 1st Lien | | | | | | | | |
8.074%, CME Term SOFR + 2.750%, 10/30/28(B) | | | 709 | | | | 709 | |
Instructure Holdings, Inc., Term Loan, 1st Lien | | | | | | | | |
0.000%, 09/11/31(G) | | | 215 | | | | 213 | |
See accompanying notes to financial statements.
CITY NATIONAL ROCHDALE FUNDS | PAGE 55
schedule of investments |
September 30, 2024 |
City National Rochdale Fixed Income Opportunities Fund (continued) |
Description | | Face Amount (000)(1) | | | Value (000) | |
McAfee Corp., First Amendment Tranche B-1 Term Loan, 1st Lien | | | | | | | | |
8.451%, CME Term SOFR + 3.250%, 03/01/29(B) | | $ | 680 | | | $ | 677 | |
MH Sub I, LLC (Micro Holding Corp.), 2023 May Incremental Term Loan, 1st Lien | | | | | | | | |
9.095%, CME Term SOFR + 4.250%, 05/03/28(B) | | | 394 | | | | 391 | |
Nobel Bidco B.V., Facility B, 1st Lien | | | | | | | | |
6.626%, EURIBOR + 3.500%, 06/09/28(B) | | | 1,000 | | | | 1,096 | |
Open Text Corporation, 2023 Replacement Term Loan, 1st Lien | | | | | | | | |
7.095%, CME Term SOFR + 2.250%, 01/31/30(B) | | | 998 | | | | 1,001 | |
Perforce Software, Inc., New Term Loan, 1st Lien | | | | | | | | |
8.695%, CME Term SOFR + 3.750%, 07/01/26(B) | | | 643 | | | | 640 | |
Rackspace Finance, LLC, Term B Loan, 1st Lien | | | | | | | | |
7.982%, CME Term SOFR + 2.750%, 05/15/28(B) | | | 1,321 | | | | 726 | |
Sabre GLBL Inc., 2022 Other Term B Loan, 1st Lien | | | | | | | | |
9.195%, CME Term SOFR + 4.250%, 06/30/28(B) | | | 265 | | | | 248 | |
Sabre GLBL Inc., 2022 Term B-2 Loan, 1st Lien | | | | | | | | |
9.945%, CME Term SOFR + 5.000%, 06/30/28(B) | | | 821 | | | | 778 | |
SS&C Technologies Holdings, Inc., Term B-8 Loan, 1st Lien | | | | | | | | |
6.845%, CME Term SOFR + 2.000%, 05/09/31(B) | | | 489 | | | | 489 | |
UPC Financing Partnership , Facility AX, 1st Lien | | | | | | | | |
8.136%, CME Term SOFR + 3.000%, 01/31/29(B) | | | 1,000 | | | | 994 | |
Victra Holdings, LLC, Third Amendment Incremental Term Loan, 1st Lien | | | | | | | | |
9.854%, CME Term SOFR + 5.250%, 03/31/29(B) | | $ | 613 | | | $ | 617 | |
| | | | | | | | | | | | | |
Total Electronics | | | | | | | 19,335 | |
| | | | | | | | | | | | | |
Energy [0.1%] |
Alpha Generation, Term Loan B, 1st Lien | | | | | | | | |
0.000%, 09/19/31(G) | | | 390 | | | | 390 | |
Arclight, Term Loan B, 1st Lien | | | | | | | | |
8.564%, 04/13/28 | | | 919 | | | | 919 | |
Chart Industries, Term Loan B, 1st Lien | | | | | | | | |
7.825%, 03/15/30 | | | 547 | | | | 545 | |
Tallgrass Energy, Term Loan, 1st Lien | | | | | | | | |
9.595%, 08/01/29 | | | 674 | | | | 672 | |
| | | | | | | | | | | | | |
Total Energy | | | | | | | 2,526 | |
| | | | | | | | | | | | | |
Entertainment & Leisure [0.0%] |
Creative Artists, Term Loan B, 1st Lien | | | | | | | | |
0.000%, 09/12/31(G) | | | 215 | | | | 215 | |
| | | | | | | | | | | | | |
Finance (including structured products) [0.9%] |
Blackhawk Network Holdings, Inc., Additional Term B-1 Loan, 1st Lien | | | | | | | | |
10.247%, CME Term SOFR + 5.000%, 03/12/29(B) | | | 595 | | | | 597 | |
Citadel Securities LP, Term Loan, 1st Lien | | | | | | | | |
7.095%, CME Term SOFR + 2.250%, 07/29/30(B) | | | 1,021 | | | | 1,020 | |
CTC Holdings, L.P., Term Loan, 1st Lien | | | | | | | | |
10.271%, CME Term SOFR + 5.000%, 02/20/29(B) | | | 888 | | | | 877 | |
DRW Holdings, LLC, 2024 Refinancing Term Loan, 1st Lien | | | | | | | | |
8.588%, CME Term SOFR + 3.500%, 06/26/31(B) | | | 1,700 | | | | 1,698 | |
See accompanying notes to financial statements.
CITY NATIONAL ROCHDALE FUNDS | PAGE 56
schedule of investments |
September 30, 2024 |
City National Rochdale Fixed Income Opportunities Fund (continued) |
Description | | Face Amount (000)(1) | | | Value (000) | |
EIG Management Company, LLC, Term Loan B, 1st Lien | | | | | | | | |
9.965%, CME Term SOFR + 5.000%, 05/17/29(B) | | $ | 680 | | | $ | 677 | |
FinCo I LLC, 2023 Initial Refinancing Term Loan, 1st Lien | | | | | | | | |
8.255%, CME Term SOFR + 3.000%, 06/27/29(B) | | | 652 | | | | 652 | |
HighTower Holding, LLC, Amendment No. 7 Term Loan, 1st Lien | | | | | | | | |
8.748%, CME Term SOFR + 3.500%, 08/21/28(B) | | | 871 | | | | 871 | |
Hudson River Trading LLC, Term Loan, 1st Lien | | | | | | | | |
8.319%, CME Term SOFR + 3.000%, 03/20/28(B) | | | 411 | | | | 410 | |
LendingTree, Inc., Initial Term B Loan, 1st Lien | | | | | | | | |
9.362%, CME Term SOFR + 3.750%, 08/25/28(B) | | | 1,074 | | | | 1,064 | |
Modena Buyer LLC, Initial Term Loan, 1st Lien | | | | | | | | |
9.104%, CME Term SOFR + 4.500%, 07/01/31(B) | | | 590 | | | | 564 | |
Osaic Holdings, Inc., Term B-3 Loan, 1st Lien | | | | | | | | |
8.845%, CME Term SOFR + 4.000%, 08/17/28(B) | | | 1,450 | | | | 1,433 | |
Quirch Foods Holdings, LLC, 2022-1 Incremental Term Loan, 1st Lien | | | | | | | | |
9.887%, CME Term SOFR + 5.000%, 10/27/27(B) | | | 965 | | | | 907 | |
Red Planet Borrower, LLC, Initial Term Loan, 1st Lien | | | | | | | | |
8.445%, CME Term SOFR + 3.500%, 10/02/28(B) | | | 987 | | | | 958 | |
Russell Investments US Institutional Holdco, Inc., 2027 Term Loan, 1st Lien | | | | | | | | |
10.252%, CME Term SOFR + 5.000%, 05/30/27(B) | | $ | 1,209 | | | $ | 1,038 | |
TIC Bidco Limited, Facility B (EUR), 1st Lien | | | | | | | | |
7.730%, Euribor + 4.250%, 06/19/31(B) | | | 887 | | | | 990 | |
TIC Bidco, Tem Loan, 1st Lien | | | | | | | | |
4.250%, 06/12/31 | | | 113 | | | | 126 | |
VFH Parent LLC, Term B-1 Loan, 1st Lien | | | | | | | | |
7.595%, CME Term SOFR + 2.750%, 06/21/31(B) | | | 684 | | | | 684 | |
Villa Dutch Bidco B.V., Additional Facility B2, 1st Lien | | | | | | | | |
8.792%, Euribor + 5.250%, 11/03/29(B) | | | 1,500 | | | | 1,649 | |
| | | | | | | | | | | | | |
Total Finance (including structured products) | | | | | | | 16,215 | |
| | | | | | | | | | | | | |
Financial Services [0.2%] |
Fleetcor/Corpay, Term Loan B, 1st Lien | | | | | | | | |
6.605%, 04/28/28 | | | 960 | | | | 958 | |
Neon Maple Purchaser Inc., Term Loan B, 1st Lien | | | | | | | | |
0.000%, 07/18/31(G) | | | 1,530 | | | | 1,513 | |
Polystorm Bidco, Term Loan, 1st Lien | | | | | | | | |
7.722%, 10/05/28 | | | 1,000 | | | | 1,113 | |
Synechron, Term Loan B, 1st Lien | | | | | | | | |
0.000%, 09/26/31(G) | | | 460 | | | | 455 | |
| | | | | | | | | | | | | |
Total Financial Services | | | | | | | 4,039 | |
| | | | | | | | | | | | | |
Financials [0.7%] |
Altisource Term Loan B (2018) | | | | | | | | |
14.185%, 04/30/25 | | | 635 | | | | 286 | |
Autokiniton Group, Tem Loan | | | | | | | | |
9.361%, 04/06/28 | | | 1,308 | | | | 1,307 | |
See accompanying notes to financial statements.
CITY NATIONAL ROCHDALE FUNDS | PAGE 57
schedule of investments |
September 30, 2024 |
City National Rochdale Fixed Income Opportunities Fund (continued) |
Description | | Face Amount (000)(1) | | | Value (000) | |
Bellis Acquisition Company, Term Loan B, 1st Lien | | | | | | | | |
7.802%, 05/14/31 | | $ | 1,000 | | | $ | 1,090 | |
Compass III, Term Loan, 1st Lien | | | | | | | | |
8.634%, 05/09/28 | | | 309 | | | | 337 | |
First Eagle, Extended Cov-Lite Term Loan B, 1st Lien | | | | | | | | |
7.604%, 03/05/29 | | | 1,025 | | | | 1,015 | |
Franklin Square, Term Loan B, 1st Lien | | | | | | | | |
7.497%, 04/17/31 | | | 855 | | | | 854 | |
Priority Payment, Term Loan B, 1st Lien | | | | | | | | |
9.807%, 05/07/31 | | | 1,010 | | | | 1,007 | |
Ren10 Holding, Term Loan, 1st Lien | | | | | | | | |
7.958%, 07/05/30 | | | 1,000 | | | | 1,112 | |
Shilton Bidco, Term Loan, 1st Lien | | | | | | | | |
7.722%, 01/13/27 | | | 1,000 | | | | 1,116 | |
Superannuation and Investments, Term Loan, 1st Lien | | | | | | | | |
8.710%, 12/01/28 | | | 759 | | | | 759 | |
Tate & Lyle, Term Loan | | | | | | | | |
8.971%, 04/01/29 | | | 926 | | | | 926 | |
Trevise Holding, Term Loan, 1st Lien | | | | | | | | |
7.614%, 07/09/29 | | | 1,000 | | | | 1,117 | |
WSH Services, Term Loan, 1st Lien | | | | | | | | |
10.458%, 04/25/31 | | | 1,000 | | | | 1,341 | |
Zara UK Midco LTD, Term Loan | | | | | | | | |
9.313%, 08/01/28 | | | 845 | | | | 777 | |
| | | | | | | | | | | | | |
Total Financials | | | | | | | 13,044 | |
| | | | | | | | | | | | | |
Food, Beverage & Tobacco [0.1%] |
Artisan Newco, Term Loan, 1st Lien | | | | | | | | |
0.000%, 02/12/29(G) | | | 980 | | | | 1,093 | |
| | | | | | | | | | | | | |
Gaming [0.1%] |
Scientific Games, Term Loan, 1st Lien | | | | | | | | |
7.464%, 02/04/29 | | | 1,000 | | | | 1,114 | |
| | | | | | | | | | | | | |
Government [0.1%] |
Japan Paris Club, Term Loan, 1st Lien | | | | | | | | |
0.000%, 01/10/28(E)(G) | | JPY | 183,333 | | | $ | 1,008 | |
| | | | | | | | | | | | | |
Healthcare [0.7%] |
Alloheim Term Loan B | | | | | | | | |
8.855%, 02/26/25 | | EUR | 1,500 | | | | 1,642 | |
Chrome Bidco, Facility B, 1st Lien | | | | | | | | |
7.292%, EURIBOR + 3.250%, 05/12/28(B) | | | 2,500 | | | | 2,449 | |
Envalior Finance GmbH, Facility B1 (EUR) | | | | | | | | |
9.136%, 03/28/30 | | | 1,000 | | | | 1,078 | |
Gesundheits GmbH Term Loan | | | | | | | | |
7.592%, 07/30/26 | | EUR | 2,000 | | | | 1,196 | |
Indivior, Term Loan B, 1st Lien | | | | | | | | |
10.611%, 06/26/26 | | | 991 | | | | 985 | |
Inovie Group, Term Loan, 1st Lien | | | | | | | | |
7.722%, 03/03/28 | | | 2,000 | | | | 2,022 | |
Mediq BV, Term Loan, 1st Lien | | | | | | | | |
7.178%, 03/03/28 | | | 1,000 | | | | 1,086 | |
PetIQ, Term Loan, 1st Lien | | | | | | | | |
9.641%, 04/07/28(B) | | | 1,014 | | | | 1,012 | |
Regional Care, Term Loan B, 1st Lien | | | | | | | | |
0.000%, 05/16/31(G) | | | 379 | | | | 378 | |
TakeCare Bidco SAS, Term Loan, 1st Lien | | | | | | | | |
7.347%, 05/26/28 | | | 1,000 | | | | 1,116 | |
| | | | | | | | | | | | | |
Total Healthcare | | | | | | | 12,964 | |
| | | | | | | | | | | | | |
Healthcare, Education and Childcare [0.9%] |
AHP Health Partners, Inc., 2024 Term B Loan, 1st Lien | | | | | | | | |
7.595%, CME Term SOFR + 2.750%, 08/24/28(B) | | | 875 | | | | 874 | |
Amneal Pharmaceuticals LLC, Initial Term Loan, 1st Lien | | | | | | | | |
10.345%, CME Term SOFR + 5.500%, 05/04/28(B) | | | 899 | | | | 909 | |
See accompanying notes to financial statements.
CITY NATIONAL ROCHDALE FUNDS | PAGE 58
schedule of investments |
September 30, 2024 |
City National Rochdale Fixed Income Opportunities Fund (continued) |
Description | | Face Amount (000)(1) | | | Value (000) | |
Auris Luxembourg III S.a r.l., Facility B3, 1st Lien | | | | | | | | |
8.268%, Euribor + 4.500%, 02/28/29(B) | | $ | 1,000 | | | $ | 1,112 | |
Bach Finance Limited, Existing Dollar Term Loan, 1st Lien | | | | | | | | |
9.057%, CME Term SOFR + 4.000%, 01/31/28(B) | | | 662 | | | | 664 | |
BVI Medical, Inc., Term B Loan, 1st Lien | | | | | | | | |
7.041%, Euribor + 3.500%, 03/02/26(B) | | | 1,000 | | | | 1,042 | |
CAB, Facility B, 1st Lien | | | | | | | | |
7.069%, EURIBOR + 3.500%, 01/28/28(B) | | | 1,000 | | | | 1,057 | |
Catalent Pharma Solutions, Inc., Dollar Term B-4 Loan, 1st Lien | | | | | | | | |
7.920%, CME Term SOFR + 3.000%, 02/22/28(B) | | | 499 | | | | 499 | |
Cheplapharm Arzneimittel GmbH, Facility B, 1st Lien | | | | | | | | |
7.685%, EURIBOR + 4.000%, 02/22/29(B) | | | 2,000 | | | | 2,231 | |
Elsan SAS , Facility B5, 1st Lien | | | | | | | | |
6.831%, EURIBOR + 3.350%, 06/16/28(B) | | | 1,000 | | | | 1,104 | |
Europa University Education Group, S.L.U., Facility B4, 1st Lien | | | | | | | | |
7.885%, Euribor + 4.500%, 10/23/29(B) | | | 1,000 | | | | 1,111 | |
Homevi, Term Loan, 1st Lien | | | | | | | | |
8.636%, 10/31/29 | | | 1,500 | | | | 1,629 | |
Houghton Mifflin Harcourt Company, Term B Loan, 1st Lien | | | | | | | | |
10.195%, CME Term SOFR + 5.250%, 04/09/29(B) | | | 930 | | | | 902 | |
McGraw-Hill, Term Loan B, 1st Lien | | | | | | | | |
9.228%, 08/01/31 | | | 364 | | | | 366 | |
Medical Solutions Holdings, Inc., Initial Term Loan, 1st Lien | | | | | | | | |
8.852%, CME Term SOFR + 3.500%, 11/01/28(B) | | $ | 901 | | | $ | 680 | |
Soliant Lower Intermediate, LLC, Initial Term Loan, 1st Lien | | | | | | | | |
8.595%, CME Term SOFR + 3.750%, 07/18/31(B) | | | 700 | | | | 700 | |
Surgery Center Holdings, Inc., 2024 Refinancing Term Loan, 1st Lien | | | | | | | | |
7.670%, CME Term SOFR + 2.750%, 12/19/30(B) | | | 584 | | | | 584 | |
Team Health Holdings, Inc., Extended Term Loan, 1st Lien | | | | | | | | |
10.502%, CME Term SOFR + 5.250%, 03/02/27(B) | | | 967 | | | | 922 | |
| | | | | | | | | | | | | |
Total Healthcare, Education and Childcare | | | | | | | 16,386 | |
| | | | | | | | | | | | | |
Home and Office Furnishings, Housewares and Durable Consumer Products [0.0%] |
ACProducts Holdings, Inc., Initial Term Loan, 1st Lien | | | | | | | | |
9.115%, CME Term SOFR + 4.250%, 05/17/28(B) | | | 507 | | | | 423 | |
| | | | | | | | | | | | | |
Homebuilders/Materials/Construction [0.1%] |
LSF10 XL Bidco S.C.A., Facility B4, 1st Lien | | | | | | | | |
7.897%, EURIBOR + 3.925%, 04/12/28(B) | | | 1,465 | | | | 1,482 | |
| | | | | | | | | | | | | |
Hotels, Leisure & Entertainment [0.1%] |
Sandy BidCo B.V., Facility B, 1st Lien | | | | | | | | |
6.823%, EURIBOR + 4.000%, 09/15/28(B) | | | 1,000 | | | | 1,107 | |
| | | | | | | | | | | | | |
See accompanying notes to financial statements.
CITY NATIONAL ROCHDALE FUNDS | PAGE 59
schedule of investments |
September 30, 2024 |
City National Rochdale Fixed Income Opportunities Fund (continued) |
Description | | Face Amount (000)(1) | | | Value (000) | |
Hotels, Motels, Inns and Gaming [0.5%] |
Allwyn Entertainment Financing (US) LLC, Term Loan B, 1st Lien | | | | | | | | |
7.554%, CME Term SOFR + 2.250%, 06/02/31(B) | | $ | 1,050 | | | $ | 1,048 | |
Caesars Entertainment, Inc., 2023 Incremental Term B Loan, 1st Lien | | | | | | | | |
7.595%, CME Term SOFR + 2.750%, 02/06/30(B) | | | 663 | | | | 662 | |
Flutter Entertainment plc, Term B Loan, 1st Lien | | | | | | | | |
6.604%, CME Term SOFR + 2.000%, 11/30/30(B) | | | 801 | | | | 801 | |
GBT US III LLC, Restatement Date Term Loan, 1st Lien | | | | | | | | |
8.279%, CME Term SOFR + 3.000%, 07/25/31(B) | | | 430 | | | | 429 | |
Golden Entertainment, Inc., 2023 Refinancing Term B-1 Facility Loan, 1st Lien | | | | | | | | |
6.854%, CME Term SOFR + 2.250%, 05/26/30(B) | | | 1,449 | | | | 1,446 | |
HNVR Holdco Limited, Facility D2, 1st Lien | | | | | | | | |
8.092%, Euribor + 4.250%, 09/12/27(B) | | | 1,000 | | | | 1,116 | |
LC Ahab US Bidco LLC, Initial Term Loan, 1st Lien | | | | | | | | |
8.345%, CME Term SOFR + 3.500%, 05/01/31(B) | | | 170 | | | | 171 | |
Light and Wonder International, Inc., Term B-2 Loan, 1st Lien | | | | | | | | |
7.333%, CME Term SOFR + 2.250%, 04/14/29(B) | | | 499 | | | | 498 | |
Ontario Gaming GTA Limited Partnership, Term B Loan, 1st Lien | | | | | | | | |
8.893%, CME Term SOFR + 4.250%, 08/01/30(B) | | | 657 | | | | 656 | |
Playa Resorts Holding B.V., 2022 Term Loan, 1st Lien | | | | | | | | |
7.595%, CME Term SOFR + 2.750%, 01/05/29(B) | | $ | 1,010 | | | $ | 1,002 | |
TripAdvisor, Inc., Initial Term B Loan, 1st Lien | | | | | | | | |
7.595%, CME Term SOFR + 2.750%, 07/08/31(B) | | | 750 | | | | 747 | |
Wyndham Hotels & Resorts, Inc., Term Loan, 1st Lien | | | | | | | | |
8.634%, 05/09/28 | | | 619 | | | | 674 | |
| | | | | | | | | | | | | |
Total Hotels, Motels, Inns and Gaming | | | | | | | 9,250 | |
| | | | | | | | | | | | | |
Industrial Services [0.1%] |
AVS Holding, Term Loan, 1st Lien | | | | | | | | |
7.875%, 12/10/29 | | | 1,000 | | | | 1,110 | |
Optimus Bidco, Term Loan, 1st Lien | | | | | | | | |
8.722%, 12/31/28 | | | 1,000 | | | | 1,046 | |
| | | | | | | | | | | | | |
Total Industrial Services | | | | | | | 2,156 | |
| | | | | | | | | | | | | |
Industrials [0.3%] |
American Traffic, Term Loan B, 1st Lien | | | | | | | | |
7.997%, 03/24/28 | | | 432 | | | | 433 | |
Barnes Group, Term Loan | | | | | | | | |
7.747%, 09/03/30 | | | 833 | | | | 833 | |
Boels Topholding, Term Loan, 1st Lien | | | | | | | | |
6.557%, 05/15/31 | | | 1,500 | | | | 1,675 | |
Euroports, Term Loan, 1st Lien | | | | | | | | |
8.634%, 06/12/29 | | | 1,000 | | | | 1,114 | |
Roper Indl Prods, Term Loan, 1st Lien | | | | | | | | |
7.472%, 11/22/29 | | | 988 | | | | 1,101 | |
| | | | | | | | | | | | | |
Total Industrials | | | | | | | 5,156 | |
| | | | | | | | | | | | | |
Information Technology [0.2%] |
Kantar Group, Term Loan 1st Lien | | | | | | | | |
7.969%, 01/31/29 | | | 866 | | | | 966 | |
See accompanying notes to financial statements.
CITY NATIONAL ROCHDALE FUNDS | PAGE 60
schedule of investments |
September 30, 2024 |
City National Rochdale Fixed Income Opportunities Fund (continued) |
Description | | Face Amount (000)(1) | | | Value (000) | |
Sitel Worldwide, Cov-Lite Term Loan, 1st Lien | | | | | | | | |
9.111%, 07/28/28 | | $ | 985 | | | $ | 642 | |
Ufinet/Zacaoa, Cov-Lite Term Loan, 1st Lien | | | | | | | | |
8.604%, CME Term SOFR + 4.000%, 03/22/29(B) | | | 2,511 | | | | 2,514 | |
| | | | | | | | | | | | | |
Total Information Technology | | | | | | | 4,122 | |
| | | | | | | | | | | | | |
Infrastructure [0.1%] |
Modulair Group, Term Loan, 1st Lien | | | | | | | | |
7.897%, 12/15/28 | | | 2,000 | | | | 2,183 | |
| | | | | | | | | | | | | |
Insurance [0.4%] |
Acrisure, LLC, 2024 Refinancing Term Loan, 1st Lien | | | | | | | | |
8.211%, CME Term SOFR + 3.250%, 11/06/30(B) | | | 2,095 | | | | 2,073 | |
Albion Development, Term Loan, 1st Lien | | | | | | | | |
7.958%, 08/17/29 | | | 2,500 | | | | 2,792 | |
Alliant Holdings Intermediate, LLC, Initial Term Loan, 1st Lien | | | | | | | | |
7.965%, CME Term SOFR + 3.000%, 09/19/31(B) | | | 405 | | | | 403 | |
Asurion, LLC, New B-11 Term Loan, 1st Lien | | | | | | | | |
9.195%, CME Term SOFR + 4.250%, 08/19/28(B) | | | 1,292 | | | | 1,271 | |
Asurion, LLC, New B-12 Term Loan, 1st Lien | | | | | | | | |
9.095%, CME Term SOFR + 4.250%, 09/19/30(B) | | | 400 | | | | 392 | |
Asurion, LLC, New B-4 Term Loan, 2nd Lien | | | | | | | | |
10.210%, CME Term SOFR + 5.250%, 01/20/29(B) | | | 1,000 | | | | 922 | |
| | | | | | | | | | | | | |
Total Insurance | | | | | | | 7,853 | |
| | | | | | | | | | | | | |
IT Services [0.0%] |
Team Services, Incremental Term Loan B, 1st Lien | | | | | | | | |
0.000%, 12/20/27(G) | | $ | 605 | | | $ | 597 | |
| | | | | | | | | | | | | |
Leisure, Amusement, Motion Pictures, Entertainment [0.1%] |
Herschend Entertainment Company, LLC, Initial Term Loan (2021), 1st Lien | | | | | | | | |
7.845%, CME Term SOFR + 3.000%, 08/27/28(B) | | | 716 | | | | 716 | |
LA Fitness, Term Loan B, 1st Lien | | | | | | | | |
10.505%, 02/05/29 | | | 527 | | | | 525 | |
Lakeshore Learning Materials, LLC, Initial Term Loan, 1st Lien | | | | | | | | |
8.460%, CME Term SOFR + 3.500%, 09/29/28(B) | | | 698 | | | | 698 | |
Recess Holdings, Inc., Amendment No. 3 Term Loan, 1st Lien | | | | | | | | |
9.752%, CME Term SOFR + 4.500%, 02/20/30(B) | | | 313 | | | | 314 | |
| | | | | | | | | | | | | |
Total Leisure, Amusement, Motion Pictures, Entertainment | | | | | | | 2,253 | |
| | | | | | | | | | | | | |
Machinery (Non-Agriculture, Non-Construction and Non-Electronic) [0.4%] |
Alliance Laundry Systems LLC, Initial Term B Loan, 1st Lien | | | | | | | | |
8.345%, CME Term SOFR + 3.500%, 08/19/31(B) | | | 550 | | | | 550 | |
ChampionX Corporation, Term B-1 Loan, 1st Lien | | | | | | | | |
8.102%, CME Term SOFR + 3.250%, 05/13/29(B) | | | 916 | | | | 917 | |
INNIO Group Holding GmbH, Facility B (EUR) Loan , 1st Lien | | | | | | | | |
7.414%, Euribor + 3.750%, 11/02/28(B) | | | 1,000 | | | | 1,116 | |
See accompanying notes to financial statements.
CITY NATIONAL ROCHDALE FUNDS | PAGE 61
schedule of investments |
September 30, 2024 |
City National Rochdale Fixed Income Opportunities Fund (continued) |
Description | | Face Amount (000)(1) | | | Value (000) | |
MKS Instruments, Inc., 2024-1 Dollar Term B Loan, 1st Lien | | | | | | | | |
7.170%, CME Term SOFR + 2.250%, 08/17/29(B) | | $ | 1,538 | | | $ | 1,537 | |
MKS Instruments, Inc., 2024-1 Euro Term B Loan, 1st Lien | | | | | | | | |
6.145%, Euribor + 2.750%, 08/17/29(B) | | | 980 | | | | 1,093 | |
Triton Water Holdings, Inc., 2024 Incremental Term Loan, 1st Lien | | | | | | | | |
8.604%, CME Term SOFR + 4.000%, 03/31/28(B) | | | 787 | | | | 786 | |
Triton Water Holdings, Inc., Initial Term Loan, 1st Lien | | | | | | | | |
8.115%, CME Term SOFR + 3.250%, 03/31/28(B) | | | 840 | | | | 838 | |
| | | | | | | | | | | | | |
Total Machinery (Non-Agriculture, Non-Construction and Non-Electronic) | | | | | | | 6,837 | |
| | | | | | | | | | | | | |
Manufacturing [0.1%] |
Allegro Microsystems, Term Loan B, 1st Lien | | | | | | | | |
7.497%, 10/31/30 | | | 705 | | | | 704 | |
Foley Products, Term Loan, 1st Lien | | | | | | | | |
10.235%, 12/29/28 | | | 660 | | | | 663 | |
| | | | | | | | | | | | | |
Total Manufacturing | | | | | | | 1,367 | |
| | | | | | | | | | | | | |
Manufacturing/Machinery/Industrial [0.2%] |
Ammeraal Beltech, Term Loan, 1st Lien | | | | | | | | |
8.722%, 12/29/28 | | | 1,326 | | | | 1,479 | |
Platin2025 Acquisition S.a r.l., Facility B, 1st Lien | | | | | | | | |
7.122%, EURIBOR + 3.900%, 11/19/28(B) | | | 1,000 | | | | 1,106 | |
Rubix Group, Term Loan, 1st Lien | | | | | | | | |
7.302%, 09/30/28 | | | 1,000 | | | | 1,114 | |
| | | | | | | | | | | | | |
Total Manufacturing/Machinery/Industrial | | | | | | | 3,699 | |
| | | | | | | | | | | | | |
Media [0.1%] |
Thryv/Dex Media, Term Loan B, 1st Lien | | | | | | | | |
12.094%, 05/01/29 | | $ | 191 | | | $ | 193 | |
Zephyr Midco, Term Loan, 1st Lien | | | | | | | | |
10.462%, 07/20/28 | | | 1,000 | | | | 1,342 | |
| | | | | | | | | | | | | |
Total Media | | | | | | | 1,535 | |
| | | | | | | | | | | | | |
Medical Devices [0.0%] |
Insulet, Term Loan B, 1st Lien | | | | | | | | |
7.747%, 08/04/31 | | | 450 | | | | 452 | |
| | | | | | | | | | | | | |
Mining, Steel, Iron and Nonprecious Metals [0.1%] |
Arsenal AIC Parent LLC, 2024-A Refinancing Term B Loan, 1st Lien | | | | | | | | |
8.095%, CME Term SOFR + 3.250%, 08/18/30(B) | | | 547 | | | | 546 | |
NWR Holdings B.V., Super Senior Term Facility, 1st Lien | | | | | | | | |
14.500%, 12/31/49(C) | | EUR | 1,011 | | | | — | |
Oxbow Carbon LLC, Tranche B Term Loan (2023), 1st Lien | | | | | | | | |
8.345%, CME Term SOFR + 3.500%, 05/10/30(B) | | | 1,006 | | | | 1,003 | |
| | | | | | | | | | | | | |
Total Mining, Steel, Iron and Nonprecious Metals | | | | | | | 1,549 | |
| | | | | | | | | | | | | |
Oil and Gas [0.6%] |
Brazos/Bison Midstream, Term Loan B, 1st Lien | | | | | | | | |
8.255%, 02/11/30 | | | 849 | | | | 849 | |
CD&R Firefly Bidco Ltd, Term Loan, 1st Lien | | | | | | | | |
10.726%, 03/01/29 | | | 1,500 | | | | 2,001 | |
GIP III Stetson I, L.P. (GIP III Stetson II, L.P.), Initial Term Loan (2023), 1st Lien | | | | | | | | |
8.345%, CME Term SOFR + 3.500%, 10/31/28(B) | | | 515 | | | | 514 | |
See accompanying notes to financial statements.
CITY NATIONAL ROCHDALE FUNDS | PAGE 62
schedule of investments |
September 30, 2024 |
City National Rochdale Fixed Income Opportunities Fund (continued) |
Description | | Face Amount (000)(1) | | | Value (000) | |
Ineos Finance PLC, 2031 Euro Term Loan, 1st Lien | | | | | | | | |
7.378%, Euribor + 4.000%, 02/07/31(B) | | $ | 1,000 | | | $ | 1,114 | |
New Fortress Energy Inc., Initial Term Loan, 1st Lien | | | | | | | | |
10.252%, CME Term SOFR + 5.000%, 10/30/28(B) | | | 1,443 | | | | 1,301 | |
NGL Energy Operating LLC, Initial Term Loan, 1st Lien | | | | | | | | |
8.595%, CME Term SOFR + 3.750%, 02/03/31(B) | | | 861 | | | | 856 | |
NGP XI Midstream Holdings, L.L.C., Initial Term Loan, 1st Lien | | | | | | | | |
8.604%, CME Term SOFR + 4.000%, 07/25/31(B) | | | 440 | | | | 440 | |
Ohio Valley Midstream, Term Loan B, 1st Lien | | | | | | | | |
8.586%, 08/07/31 | | | 540 | | | | 540 | |
Par Pacific Patroleum, Term Loan | | | | | | | | |
9.064%, 02/28/30 | | | 990 | | | | 990 | |
Rockpoint Gas Storage, Term Loan B, 1st Lien | | | | | | | | |
0.000%, 09/12/31(G) | | | 460 | | | | 458 | |
Ultra Clean Holdings Inc, Cov-Lite Term Loan, 1st Lien | | | | | | | | |
8.747%, 02/28/28(B) | | | 1,794 | | | | 1,798 | |
| | | | | | | | | | | | | |
Total Oil and Gas | | | | | | | 10,861 | |
| | | | | | | | | | | | | |
Other [0.3%] |
Areas Worldwide, Term Loan, 1st Lien | | | | | | | | |
8.664%, 12/31/29 | | | 432 | | | | 480 | |
Aspire Bakeries, Term Loan, 1st Lien | | | | | | | | |
9.528%, 12/13/30(B) | | | 507 | | | | 508 | |
Assytec, Term Loan, 1st Lien | | | | | | | | |
8.858%, 09/28/27 | | | 1,000 | | | | 1,110 | |
IVC EUR, Term Loan, 1st Lien | | | | | | | | |
8.795%, 11/17/28 | | | 1,500 | | | | 1,670 | |
LSF11 A5 Holdco LLC, Term Loan | | | | | | | | |
8.861%, 10/15/28 | | $ | 494 | | | $ | 493 | |
New Weener, Term Loan, 1st Ien | | | | | | | | |
8.164%, 11/16/28 | | | 1,000 | | | | 1,114 | |
Tackle Sarl, Term Loan, 1st Lien | | | | | | | | |
6.910%, 05/22/28 | | | 1,000 | | | | 1,109 | |
| | | | | | | | | | | | | |
Total Other | | | | | | | 6,484 | |
| | | | | | | | | | | | | |
Packaging / Paper / Forest Products [0.1%] |
Ahlstrom-Munksjo Holding 3 Oy, Facility B (EUR), 1st Lien | | | | | | | | |
7.222%, EURIBOR + 3.250%, 03/10/28(B) | | | 1,000 | | | | 1,110 | |
| | | | | | | | | | | | | |
Personal and Non-Durable Consumer Products (Manufacturing Only) [0.1%] |
ABG Intermediate Holdings 2 LLC, 2024 Refinancing Term Loan, 1st Lien | | | | | | | | |
7.595%, CME Term SOFR + 2.750%, 12/21/28(B) | | | 760 | | | | 760 | |
Breitling Holdings S.a r.l., Facility B, 1st Lien | | | | | | | | |
7.572%, EURIBOR + 3.900%, 10/25/28(B) | | | 1,000 | | | | 1,067 | |
| | | | | | | | | | | | | |
Total Personal and Non-Durable Consumer Products (Manufacturing Only) | | | | | | | 1,827 | |
| | | | | | | | | | | | | |
Personal Transportation [0.1%] |
AAdvantage Loyality IP Ltd. (American Airlines, Inc.), Initial Term Loan, 1st Lien | | | | | | | | |
10.294%, CME Term SOFR + 4.750%, 04/20/28(B) | | | 1,386 | | | | 1,423 | |
| | | | | | | | | | | | | |
Personal, Food and Miscellaneous Services [0.0%] |
Pax Midco Spain, S.L.U., Facility B2, 1st Lien | | | | | | | | |
8.738%, Euribor + 5.000%, 12/31/29(B) | | | 668 | | | | 742 | |
| | | | | | | | | | | | | |
See accompanying notes to financial statements.
CITY NATIONAL ROCHDALE FUNDS | PAGE 63
schedule of investments |
September 30, 2024 |
City National Rochdale Fixed Income Opportunities Fund (continued) |
Description | | Face Amount (000)(1) | | | Value (000) | |
Pharmaceuticals [0.4%] |
Financiere Verdi I SAS, 1st Lien | | | | | | | | |
9.497%, 03/31/28 | | $ | 1,000 | | | $ | 1,193 | |
Nidda Healthcare Holding GmbH, Term Loan, 1st Lien | | | | | | | | |
7.427%, 02/21/30 | | | 2,000 | | | | 2,225 | |
Organon & Co, Term Loan B, 1st Lien | | | | | | | | |
7.465%, 05/14/31 | | | 1,005 | | | | 1,001 | |
Pharmanovia Bidco, Term Loan, 1st Lien | | | | | | | | |
7.755%, 02/07/30 | | | 1,500 | | | | 1,653 | |
Stamina BidCo B.V., Facility B, 1st Lien | | | | | | | | |
7.674%, EURIBOR + 4.000%, 11/02/28(B) | | | 778 | | | | 870 | |
| | | | | | | | | | | | | |
Total Pharmaceuticals | | | | | | | 6,942 | |
| | | | | | | | | | | | | |
Printing, Publishing and Broadcasting [0.5%] |
AppLovin Corporation, Initial Term Loan (2024), 1st Lien | | | | | | | | |
7.345%, CME Term SOFR + 2.500%, 08/16/30(B) | | | 2,028 | | | | 2,026 | |
Cimpress plc, 2024 Refinancing Tranche B-1 Term Loan, 1st Lien | | | | | | | | |
7.845%, CME Term SOFR + 3.000%, 05/17/28(B) | | | 449 | | | | 448 | |
Constant Contact, Inc., Initial Term Loan, 1st Lien | | | | | | | | |
9.566%, CME Term SOFR + 4.000%, 02/10/28(B) | | | 438 | | | | 423 | |
Digital Media Solutions, LLC, DIP Term Loan, 1st Lien | | | | | | | | |
13.096%, 12/10/24 | | | 172 | | | | 172 | |
Digital Media Solutions, LLC, Initial Term Loan, 1st Lien | | | | | | | | |
16.596%, CME Term SOFR + 11.000%, 05/19/26(B) | | | 623 | | | | 62 | |
Digital Media Solutions, LLC, Tranche A Term Loan, 1st Lien | | | | | | | | |
5.596%, CME Term SOFR + 8.000%, 02/25/26(B) | | $ | 139 | | | $ | 139 | |
Digital Media Solutions, LLC, Tranche B Term Loan, 1st Lien | | | | | | | | |
16.596%, CME Term SOFR + 11.000%, 05/25/26(B) | | | 183 | | | | 182 | |
Dun & Bradstreet Corporation, The, 2022 Incremental Term B-2 Loan (2024), 1st Lien | | | | | | | | |
7.605%, CME Term SOFR + 2.750%, 01/18/29(B) | | | 410 | | | | 410 | |
LABL, Inc., Initial Euro Term Loan, 1st Lien | | | | | | | | |
8.378%, EURIBOR + 5.000%, 10/29/28(B) | | | 965 | | | | 1,007 | |
Magnite, Term Loan B, 1st Lien | | | | | | | | |
8.766%, 02/06/31 | | | 853 | | | | 858 | |
Neptune BidCo US Inc., Dollar Term B Loan, 1st Lien | | | | | | | | |
10.404%, CME Term SOFR + 5.000%, 04/11/29(B) | | | 770 | | | | 722 | |
Neptune BidCo US Inc., Euro Term B Loan, 1st Lien | | | | | | | | |
8.708%, EURIBOR + 5.000%, 04/11/29(B) | | | 988 | | | | 1,070 | |
Neptune BidCo US Inc., Term A Loan, 1st Lien | | | | | | | | |
10.154%, CME Term SOFR + 4.750%, 10/11/28(B) | | | 578 | | | | 539 | |
Neptune BidCo US Inc., Term Loan, 2nd Lien | | | | | | | | |
15.154%, CME Term SOFR + 9.750%, 10/11/29(B) | | | 1,060 | | | | 1,055 | |
Summer (BC) Bidco B LLC, Extended Facility B (USD), 1st Lien | | | | | | | | |
9.864%, CME Term SOFR + 5.000%, 02/15/29(B) | | | 786 | | | | 789 | |
See accompanying notes to financial statements.
CITY NATIONAL ROCHDALE FUNDS | PAGE 64
schedule of investments |
September 30, 2024 |
City National Rochdale Fixed Income Opportunities Fund (continued) |
Description | | Face Amount (000)(1) | | | Value (000) | |
Summer (BC) Bidco B LLC, Term Loan, 1st Lien | | | | | | | | |
7.969%, 01/31/29 | | $ | 134 | | | $ | 150 | |
| | | | | | | | | | | | | |
Total Printing, Publishing and Broadcasting | | | | | | | 10,052 | |
| | | | | | | | | | | | | |
Publishing and Media-other [0.1%] |
Infinitas Learn Cov-Lite Lien1 | | | | | | | | |
8.108%, 07/21/28 | | | 1,000 | | | | 1,112 | |
S4 Capital Lux, Term Loan, 1st Lien | | | | | | | | |
7.342%, 07/31/28 | | | 1,000 | | | | 1,034 | |
| | | | | | | | | | | | | |
Total Publishing and Media-other | | | | | | | 2,146 | |
| | | | | | | | | | | | | |
Retail [0.1%] |
Amazon Holdco, Term Loan, 1st Lien | | | | | | | | |
0.000%, 07/30/31(G) | | | 985 | | | | 981 | |
Platform Bidco Limites, Term Loan, 1st Lien | | | | | | | | |
7.858%, 09/29/28 | | | 1,000 | | | | 1,093 | |
| | | | | | | | | | | | | |
Total Retail | | | | | | | 2,074 | |
| | | | | | | | | | | | | |
Retail (non-food/drug) [0.3%] |
AL AS Adventure, Term Loan, 1st Lien | | | | | | | | |
8.642%, 04/24/26 | | | 2,116 | | | | 2,355 | |
Peer Holding III B.V, Term Loan | | | | | | | | |
6.972%, 11/27/26 | | EUR | 2,000 | | | | 2,234 | |
THG Operations Holdings Limited, Facility B, 1st Lien | | | | | | | | |
8.251%, 12/10/26 | | EUR | 1,000 | | | | 1,029 | |
| | | | | | | | | | | | | |
Total Retail (non-food/drug) | | | | | | | 5,618 | |
| | | | | | | | | | | | | |
Retail Stores [0.3%] |
Aragorn Parent Corporation, 2023 Replacement Term Loan, 1st Lien | | | | | | | | |
9.170%, CME Term SOFR + 4.250%, 12/15/28(B) | | | 347 | | | | 348 | |
Belfor Holdings Inc., Initial Tranche B-1 Term Loan, 1st Lien | | | | | | | | |
8.595%, CME Term SOFR + 3.750%, 11/01/30(B) | | $ | 1,401 | | | $ | 1,406 | |
EG Group Limited, Additional Term Facility (Tranche C) (EUR), 1st Lien | | | | | | | | |
8.878%, Euribor + 5.500%, 02/07/28(B) | | | 1,037 | | | | 1,155 | |
Evergreen Acqco 1 LP, Initial Term Loan, 1st Lien | | | | | | | | |
8.393%, CME Term SOFR + 3.750%, 04/26/28(B) | | | 321 | | | | 321 | |
Joann Stores, Exit Term Loan | | | | | | | | |
14.747%, 04/30/28 | | | 328 | | | | 262 | |
Mister Car Wash Holdings, Inc., 2024 Term Loan, 1st Lien | | | | | | | | |
7.845%, CME Term SOFR + 3.000%, 03/27/31(B) | | | 564 | | | | 564 | |
Peer Holding III B.V., Additional Facility (USD) 2, 1st Lien | | | | | | | | |
7.604%, CME Term SOFR + 3.000%, 07/01/31(B) | | | 915 | | | | 916 | |
Restoration Hardware, Inc., Initial Term Loan, 1st Lien | | | | | | | | |
7.460%, CME Term SOFR + 2.500%, 10/20/28(B) | | | 500 | | | | 480 | |
Rising Tide Holdings, Inc., Term Loan, 1st Lien | | | | | | | | |
6.176%, 09/12/28 | | | 25 | | | | 21 | |
WH Borrower, LLC, Initial Term Loan, 1st Lien | | | | | | | | |
10.786%, CME Term SOFR + 5.500%, 02/15/27(B) | | | 600 | | | | 597 | |
| | | | | | | | | | | | | |
Total Retail Stores | | | | | | | 6,070 | |
| | | | | | | | | | | | | |
Services [0.5%] |
American Public Education, Term Loan B, 1st Lien | | | | | | | | |
10.861%, 03/29/27 | | | 739 | | | | 730 | |
See accompanying notes to financial statements.
CITY NATIONAL ROCHDALE FUNDS | PAGE 65
schedule of investments |
September 30, 2024 |
City National Rochdale Fixed Income Opportunities Fund (continued) |
Description | | Face Amount (000)(1) | | | Value (000) | |
Devry Education, Term Loan B, 1st Lien | | | | | | | | |
7.997%, 08/12/28 | | $ | 580 | | | $ | 580 | |
Eagle Bidco Limited, Term Loan, 1st Lien | | | | | | | | |
9.735%, 03/10/28 | | | 1,182 | | | | 1,574 | |
Help at Home, Term Loan B, 1st Lien | | | | | | | | |
9.857%, 09/17/31 | | | 520 | | | | 513 | |
Kronosnet, Term Loan, 1st Lien | | | | | | | | |
9.600%, 07/28/29 | | | 1,500 | | | | 1,140 | |
Oravel Stays, Term Loan B, 1st Lien | | | | | | | | |
13.325%, 06/05/26 | | | 910 | | | | 911 | |
Pivotal Payments, Term Loan, 1st Lien | | | | | | | | |
7.955%, 09/29/25 | | | 1,002 | | | | 1,002 | |
Sitel Group, Term Loan, 1st Lien | | | | | | | | |
7.350%, 07/28/28 | | | 1,500 | | | | 1,082 | |
St. George’s University Scholastic Services LLC, Term Loan B, 1st Lien | | | | | | | | |
7.997%, 02/10/29 | | | 577 | | | | 575 | |
Third Coast, Term Loan B, 1st Lien | | | | | | | | |
0.000%, 09/19/30(G) | | | 680 | | | | 675 | |
| | | | | | | | | | | | | |
Total Services | | | | | | | 8,782 | |
| | | | | | | | | | | | | |
Software and Service [0.3%] |
Dye & Durham, Term Loan B, 1st Lien | | | | | | | | |
9.685%, 04/04/31 | | | 555 | | | | 557 | |
Idemia Group, Term Loan, 1st Lien | | | | | | | | |
7.722%, 09/30/28 | | | 1,500 | | | | 1,671 | |
Maximus, Term Loan B, 1st Lien | | | | | | | | |
7.247%, 05/21/31 | | | 623 | | | | 625 | |
Nielsen Consults, Term Loan, 1st Lien | | | | | | | | |
8.342%, 03/06/28 | | | 1,982 | | | | 2,203 | |
Perforce Software, Incremental Term Loan, 1st Lien | | | | | | | | |
9.997%, 03/25/31 | | | 505 | | | | 503 | |
| | | | | | | | | | | | | |
Total Software and Service | | | | | | | 5,559 | |
| | | | | | | | | | | | | |
Technology [0.2%] |
Dayforce, Cov-Lite Term Loan B, 1st Lien | | | | | | | | |
7.747%, 02/26/31 | | $ | 345 | | | $ | 344 | |
Innomotics, Term Loan, 1st Lien | | | | | | | | |
0.000%, 09/26/31(G) | | | 305 | | | | 305 | |
Leia Finco, Term Loan, 1st Lien | | | | | | | | |
0.000%, 07/02/31(G) | | | 895 | | | | 880 | |
UST Holdings Ltd, Term Loan, 1st Lien | | | | | | | | |
8.733%, 11/20/28 | | | 757 | | | | 759 | |
Virtusa Corporation, Term Loan B-2, 1st Lien | | | | | | | | |
8.497%, 02/15/29 | | | 1,233 | | | | 1,232 | |
| | | | | | | | | | | | | |
Total Technology | | | | | | | 3,520 | |
| | | | | | | | | | | | | |
Telecommunications [1.2%] |
AP Core Holdings II, LLC, Term B-2 Loan, 1st Lien | | | | | | | | |
10.460%, CME Term SOFR + 5.500%, 09/01/27(B) | | | 500 | | | | 456 | |
Atlantic Broadband, Term Loan B, 1st Lien | | | | | | | | |
8.576%, 09/18/30 | | | 597 | | | | 583 | |
Circet Europe, Senior Facility B, 1st Lien | | | | | | | | |
6.595%, EURIBOR + 3.250%, 10/13/28(B) | | | 1,500 | | | | 1,642 | |
Connect Finco Sarl, Amendment No. 4 Term Loan, 1st Lien | | | | | | | | |
9.345%, CME Term SOFR + 4.500%, 09/27/29(B) | | | 1,136 | | | | 1,063 | |
Creation Technologies Inc., Initial Term Loan, 1st Lien | | | | | | | | |
11.080%, CME Term SOFR + 5.500%, 10/05/28(B) | | | 1,394 | | | | 1,349 | |
Frontier Communications Holdings, LLC, 2024 Refinancing Term Loan, 1st Lien | | | | | | | | |
8.763%, CME Term SOFR + 3.500%, 07/01/31(B) | | | 800 | | | | 804 | |
See accompanying notes to financial statements.
CITY NATIONAL ROCHDALE FUNDS | PAGE 66
schedule of investments |
September 30, 2024 |
City National Rochdale Fixed Income Opportunities Fund (continued) |
Description | | Face Amount (000)(1) | | | Value (000) | |
Guardian US Holdco LLC, Initial Term Loan, 1st Lien | | | | | | | | |
8.835%, CME Term SOFR + 4.000%, 01/31/30(B) | | $ | 382 | | | $ | 379 | |
Lorca Finco PLC, Term Loan, 1st Lien | | | | | | | | |
7.195%, 04/17/31 | | | 2,500 | | | | 2,783 | |
Lumen Technologies Inc., Term B-1 Loan, 1st Lien | | | | | | | | |
7.319%, CME Term SOFR + 2.350%, 04/15/29(B) | | | 487 | | | | 426 | |
Lumen Technologies, Term Loan B-2, 1st Lien | | | | | | | | |
7.319%, 04/15/30 | | | 921 | | | | 796 | |
Lumen Technologies, Term Loan, 1st Lien | | | | | | | | |
11.247%, 06/01/28 | | | 1,239 | | | | 1,190 | |
Masorange Holdco Limited, Facility B4, 1st Lien | | | | | | | | |
8.104%, CME Term SOFR + 3.500%, 03/25/31(B) | | | 419 | | | | 419 | |
Patagonia Holdco LLC, Amendment No.1 Term Loan, 1st Lien | | | | | | | | |
10.854%, CME Term SOFR + 5.750%, 08/01/29(B) | | | 479 | | | | 443 | |
Radiate Holdco, LLC, Amendment No. 6 Term B Loan, 1st Lien | | | | | | | | |
8.210%, CME Term SOFR + 3.250%, 09/25/26(B) | | | 878 | | | | 751 | |
UPC Broadband Holding B.V., Facility AY, 1st Lien | | | | | | | | |
6.286%, EURIBOR + 3.000%, 01/31/29(B) | | | 1,000 | | | | 1,112 | |
VMED O2 UK Holdco 4 Limited, Facility Z, 1st Lien | | | | | | | | |
6.861%, Euribor + 3.425%, 10/15/31(B) | | | 2,000 | | | | 2,214 | |
WP/AP Telecom Holdings IV B.V., Facility B Loan, 1st Lien | | | | | | | | |
7.622%, EURIBOR + 4.000%, 11/19/28(B) | | | 2,000 | | | | 2,233 | |
Zayo Group Holdings, Term Loan, 1st Lien | | | | | | | | |
7.080%, 03/09/27 | | | 985 | | | | 1,025 | |
Ziggo B.V., Term Loan H Facility, 1st Lien | | | | | | | | |
6.436%, EURIBOR + 3.000%, 01/31/29(B) | | EUR | 2,000 | | | $ | 2,185 | |
| | | | | | | | | | | | | |
Total Telecommunications | | | | | | | 21,853 | |
| | | | | | | | | | | | | |
Telephones & Telecommunication [0.0%] |
Vodafone Spain, Term Loan, 1st Lien | | | | | | | | |
9.401%, 07/10/29 | | | 1,000 | | | | 997 | |
| | | | | | | | | | | | | |
Transportation, Airlines & Distribution [0.0%] |
Flint Group, Term Loan | | | | | | | | |
5.677%, 12/31/27 | | | 453 | | | | 83 | |
| | | | | | | | | | | | | |
Utilities [0.6%] |
Calpine Construction Finance Company, L.P., Refinancing Term Loan, 1st Lien | | | | | | | | |
6.845%, CME Term SOFR + 2.000%, 07/31/30(B) | | | 2,000 | | | | 1,986 | |
Eastern Power, LLC (Eastern Covert Midco, LLC), Term Loan, 1st Lien | | | | | | | | |
10.095%, CME Term SOFR + 5.250%, 04/03/28(B) | | | 1,000 | | | | 1,000 | |
Goodnight Water Solutions Holdings, LLC, Initial Term Loan, 1st Lien | | | | | | | | |
10.095%, CME Term SOFR + 5.250%, 06/04/29(B) | | | 1,325 | | | | 1,323 | |
Granite Generation LLC, Term Loan, 1st Lien | | | | | | | | |
8.590%, LIBOR + 3.750%, 11/01/26(B) | | | 250 | | | | 247 | |
Invenergy Thermal Operating I LLC, Term B Loan, 1st Lien | | | | | | | | |
9.674%, SOFR + 4.250%, 08/03/29(B) | | | 541 | | | | 545 | |
Invenergy Thermal Operating I LLC, Term C Loan, 1st Lien | | | | | | | | |
9.674%, SOFR + 4.250%, 08/03/29(B) | | | 48 | | | | 48 | |
See accompanying notes to financial statements.
CITY NATIONAL ROCHDALE FUNDS | PAGE 67
schedule of investments |
September 30, 2024 |
City National Rochdale Fixed Income Opportunities Fund (continued) |
Description | | Face Amount (000)(1) | | | Value (000) | |
Lackawanna Energy Center LLC, Term B-2 Advance, 1st Lien | | | | | | | | |
9.095%, CME Term SOFR + 4.250%, 08/06/29(B) | | $ | 727 | | | $ | 732 | |
Lackawanna Energy Center LLC, Term C Advance, 1st Lien | | | | | | | | |
9.095%, CME Term SOFR + 4.250%, 08/06/29(B) | | | 158 | | | | 160 | |
Lightning Power, LLC, Initial Term B Loan, 1st Lien | | | | | | | | |
8.346%, CME Term SOFR + 3.250%, 08/18/31(B) | | | 950 | | | | 951 | |
Talen Energy Supply, LLC, Initial Term B Loan, 1st Lien | | | | | | | | |
8.596%, CME Term SOFR + 3.500%, 05/17/30(B) | | | 387 | | | | 388 | |
Talen Energy Supply, LLC, Initial Term C Loan, 1st Lien | | | | | | | | |
8.596%, CME Term SOFR + 3.500%, 05/17/30(B) | | | 318 | | | | 318 | |
Vistra Operations Company LLC, 2018 Incremental Term Loan, 1st Lien | | | | | | | | |
6.845%, CME Term SOFR + 2.000%, 12/20/30(B) | | | 458 | | | | 458 | |
Vistra, Term Loan, 1st Lien | | | | | | | | |
7.472%, 06/18/29 | | | 953 | | | | 1,064 | |
WaterBridge Midstream Operating LLC, Term Loan B, 1st Lien | | | | | | | | |
9.393%, CME Term SOFR + 4.750%, 06/27/29(B) | | | 2,000 | | | | 1,929 | |
Description | | Face Amount (000)(1)/Shares | | | Value (000) | |
Waterbridge NDB Operating LLC, Initial Term Loan, 1st Lien | | | | | | | | |
9.603%, CME Term SOFR + 4.500%, 05/10/29(B) | | $ | 620 | | | $ | 618 | |
| | | | | | | | | | | | | |
Total Utilities | | | | | | | 11,767 | |
| | | | | | | | | | | | | |
Total Loan Participations | | | | |
(Cost $343,442) | | | | | | | 337,979 | |
| | | | | | | | | | | | | |
Non-Listed Business Development Companies [3.7%] |
Financials [3.7%] |
Golub Capital BDC 4 (J) | | | 3,943,455 | | | | 59,152 | |
TCW Direct Lending LLC (J) | | | 250 | | | | 10,920 | |
| | | | | | | | | | | | | |
Total Financials | | | | | | | 70,072 | |
| | | | | | | | | | | | | |
Total Non-Listed Business Development Companies | | | | |
(Cost $70,157) | | | | | | | 70,072 | |
| | | | | | | | | | | | | |
Limited Partnership [3.4%] |
Oberland Capital Healthcare Solutions Co-Invest Offshore LP(J) | | | N/A | | | | 3,105 | |
Oberland Capital Healthcare Solutions LP(J) | | | N/A | | | | 6,644 | |
Primary Wave Music IP Fund LP(J) | | | N/A | | | | 53,276 | |
| | | | | | | | | | | | | |
Total Limited Partnership | | | | |
(Cost $51,582) | | | | | | | 63,025 | |
| | | | | | | | | | | | | |
Note [2.6%] |
City National Rochdale FIOF Investments (Ireland) Limited(E)(I) | | | 46,612 | | | | 48,477 | |
| | | | | | | | | | | | | |
Total Note | | | | |
(Cost $228,412) | | | | | | | 48,477 | |
| | | | | | | | | | | | | |
Convertible Bonds [1.1%] |
Air Transportation [0.2%] |
ZTO Express Cayman | | | | | | | | |
1.500%, 09/01/27 | | | 2,700 | | | | 2,874 | |
| | | | | | | | | | | | | |
See accompanying notes to financial statements.
CITY NATIONAL ROCHDALE FUNDS | PAGE 68
schedule of investments |
September 30, 2024 |
City National Rochdale Fixed Income Opportunities Fund (continued) |
Description | | Face Amount (000)(1) | | | Value (000) | |
Automotive [0.0%] |
NIO | | | | | | | | |
3.875%, 10/15/29 | | $ | 500 | | | $ | 461 | |
| | | | | | | | | | | | | |
Batteries/Battery Sys [0.0%] |
L&F | | | | | | | | |
2.500%, 04/26/30 | | | 1,500 | | | | 887 | |
| | | | | | | | | | | | | |
Broadcasting & Cable [0.1%] |
Cable One | | | | | | | | |
0.000%, 03/15/26(D) | | | 300 | | | | 275 | |
Cable One | | | | | | | | |
1.125%, 03/15/28 | | | 2,015 | | | | 1,621 | |
| | | | | | | | | | | | | |
Total Broadcasting & Cable | | | 1,896 | |
| | | | | | | | | | | | | |
Building & Construction [0.1%] |
HTA Group | | | | | | | | |
2.875%, 03/18/27 | | | 1,400 | | | | 1,301 | |
| | | | | | | | | | | | | |
Chemicals [0.3%] |
Sasol Financing USA | | | | | | | | |
4.500%, 11/08/27 | | | 5,600 | | | | 5,124 | |
| | | | | | | | | | | | | |
Coal Mining [0.0%] |
New World Resources | | | | | | | | |
4.000%cash/8.000% PIK, 10/07/20(C) | | EUR | 380 | | | | — | |
| | | | | | | | | | | | | |
E-Commerce/Products [0.1%] |
Alibaba Group Holding | | | | | | | | |
0.500%, 06/01/31(A) | | | 290 | | | | 356 | |
PDD Holdings | | | | | | | | |
0.000%, 12/01/25(D) | | | 1,556 | | | | 1,565 | |
| | | | | | | | | | | | | |
Total E-Commerce/Products | | | 1,921 | |
| | | | | | | | | | | | | |
E-Commerce/Services [0.1%] |
Trip.com Group | | | | | | | | |
0.750%, 06/15/29(A) | | | 1,253 | | | | 1,433 | |
| | | | | | | | | | | | | |
Entertainment & Gaming [0.1%] |
Wynn Macau | | | | | | | | |
4.500%, 03/07/29(A) | | | 2,575 | | | | 2,727 | |
| | | | | | | | | | | | | |
Hotels and Motels [0.1%] |
H World Group | | | | | | | | |
3.000%, 05/01/26 | | | 1,368 | | | | 1,603 | |
| | | | | | | | | | | | | |
Total Convertible Bonds | | | | |
Cost ($19,875) | | | 20,227 | |
Sovereign Debt [0.9%] |
Angolan Government International Bond, MTN | | | | | | | | |
8.000%, 11/26/29 | | $ | 3,050 | | | $ | 2,771 | |
Argentina Paris Club | | | | | | | | |
2.910%, 05/30/21(C) | | CHF | 1,744 | | | | 1,339 | |
Ivory Coast Government International Bond | | | | | | | | |
6.125%, 06/15/33 | | | 4,400 | | | | 4,141 | |
National Bank of Uzbekistan | | | | | | | | |
8.500%, 07/05/29 | | | 1,736 | | | | 1,766 | |
Panama Government International Bond | | | | | | | | |
8.000%, 03/01/38 | | | 2,650 | | | | 2,994 | |
Senegal Government International Bond | | | | | | | | |
6.250%, 05/23/33 | | | 4,315 | | | | 3,716 | |
Sri Lanka Government International Bond | | | | | | | | |
7.850%, 03/14/29(C) | | | 560 | | | | 314 | |
7.550%, 03/28/30(C) | | | 424 | | | | 237 | |
| | | | | | | | | | | | | |
Total Sovereign Debt | | | | |
Cost ($17,383) | | | 17,278 | |
| | | | | | | | | | | | | |
Common Stock [0.3%] |
Broadcasting & Cable [0.0%] |
Digicel Holdings(E) | | | 107,067 | | | | 120 | |
| | | | | | | | | | | | | |
Capital Markets [0.1%] |
Golub Capital BDC | | | 172,264 | | | | 2,603 | |
| | | | | | | | | | | | | |
Consumer Cyclical [0.1%] |
Joann Stores | | | 218,423 | | | | 328 | |
TruKid * | | | 232 | | | | 579 | |
| | | | | | | | | | | | | |
Total Consumer Cyclical | | | | | | | 907 | |
| | | | | | | | | | | | | |
Diversified Minerals [0.0%] |
New World Resources, Cl A * | | | 44,276,198 | | | | — | |
| | | | | | | | | | | | | |
Energy [0.0%] |
BlackBrush Oil & Gas, L.P. | | | 39,375 | | | | — | |
| | | | | | | | | | | | | |
Financial Services [0.0%] |
A’ayan Leasing & Investment KSCP | | | 976,932 | | | | 340 | |
| | | | | | | | | | | | | |
See accompanying notes to financial statements.
CITY NATIONAL ROCHDALE FUNDS | PAGE 69
schedule of investments |
September 30, 2024 |
City National Rochdale Fixed Income Opportunities Fund (continued) |
Description | | Shares | | | Value (000) | |
Financials [0.0%] |
BCD Acquisition | | | 1,000,000 | | | $ | — | |
Copper Property CTL Pass Through Trust (E) | | | 3,788 | | | | 46 | |
| | | | | | | | | | | | | |
Total Financials | | | | | | | 46 | |
| | | | | | | | | | | | | |
Health Care [0.0%] |
Novartex (E) | | | 180,000 | | | | 61 | |
| | | | | | | | | | | | | |
Manufacturing [0.0%] |
Vivarte (E) | | | 6,000 | | | | 2 | |
Oil, Gas & Consumable Fuels [0.0%] |
Nostrum Oil & Gas * | | | 3,039,550 | | | | 163 | |
Summit Midstream * | | | 11,456 | | | | 401 | |
| | | | | | | | | | | | | |
Total Oil, Gas & Consumable Fuels | | | | | | | 564 | |
| | | | | | | | | | | | | |
Other [0.0%] |
ESC GCBREGS Corp | | | 4,750,000 | | | | — | |
Latina Offshore | | | 65 | | | | — | |
| | | | | | | | | | | | | |
Total Other | | | | | | | — | |
| | | | | | | | | | | | | |
Retailers [0.0%] |
Rising Tide Holdings Inc | | | 1,887 | | | | 6 | |
Toys ‘R’ Us Property Company I, LLC | | | 23,484 | | | | 118 | |
| | | | | | | | | | | | | |
Total Retailers | | | | | | | 124 | |
| | | | | | | | | | | | | |
Technology [0.0%] |
AS ADV Shares (E) | | | 127,800 | | | | 683 | |
Lumileds * | | | 4,241 | | | | 2 | |
| | | | | | | | | | | | | |
Total Technology | | | | | | | 685 | |
| | | | | | | | | | | | | |
Utilities [0.1%] |
Longview Power LLC | | | 64,904 | | | | 779 | |
| | | | | | | | | | | | | |
Total Common Stock | | | | |
(Cost $7,594) | | | | | | | 6,231 | |
| | | | | | | | | | | | | |
Description | | Number of Warrants/Shares | | | Value (000) | |
Warrant [0.0%] |
Altisource | | | | | | | | |
Expires 07/21/25* (H) | | | 4,485 | | | $ | 5 | |
| | | | | | | | | | | | | |
Total Warrant | | | | |
(Cost $—) | | | | | | | 5 | |
| | | | | | | | | | | | | |
Preferred Stock [0.0%] |
Energy [0.0%] |
Blackbrush Oil & Gas, LP | | | 1,308 | | | | 78 | |
| | | | | | | | | | | | | |
Total Preferred Stock | | | | |
(Cost $375) | | | | | | | 78 | |
| | | | | | | | | | | | | |
Short-Term Investment [4.1%] |
SEI Daily Income Trust Government Fund, Cl Institutional, 4.890%** | | | 76,017,191 | | | | 76,017 | |
| | | | | | | | | | | | | |
Total Short-Term Investment | | | | |
(Cost $76,017) | | | | | | | 76,017 | |
| | | | | | | | | | | | | |
Total Investments [101.0%] |
(Cost $2,164,109) | | | | | | $ | 1,894,699 | |
Percentages are based on net assets of $1,876,129 (000).
* | Non-income producing security. |
** | The rate reported is the 7-day effective yield as of September 30, 2024. |
(1) | U.S. Dollars unless otherwise indicated. |
(A) | Security exempt from registration under Rule 144A of the Securities Act of 1933. These securities may be resold in transactions exempt from registration normally to qualified institutions. On September 30, 2024, the value of these securities amounted to $700,485 (000), representing 37.3% of the net assets of the Fund. |
(B) | Variable or floating rate security. The rate shown is the effective interest rate as of period end. The rates for certain securities are not based on published reference rates and spreads and are either determined by the issuer or agent based on current market conditions; by using a formula based on the rates of underlying loans; or by adjusting periodically based on prevailing interest rates. |
(C) | In default on interest payments. Rate shown represents the last coupon rate prior to default. |
(E) | Level 3 security in accordance with fair value hierarchy. |
(F) | Step coupon security. Coupon rate will either increase (step-up bond) or decrease (step-down bond) at regular intervals until maturity. Interest rate shown reflects the rate currently in effect. |
(G) | Unsettled bank loan, Interest rate not available. |
(H) | Strike Price is unavailable. |
(I) | Issued by a related party. |
See accompanying notes to financial statements.
CITY NATIONAL ROCHDALE FUNDS | PAGE 70
schedule of investments |
September 30, 2024 |
City National Rochdale Fixed Income Opportunities Fund (continued) |
(J) | Unfunded Commitments as of September 30, 2024: |
Security | | Value | | | Unfunded
Commitments | | | Redemption
Frequency | | | Redemption
Notice
(Days) | |
Golub Capital BDC 4 | | $ | 59,151,821 | | | $ | 15,848,179 | | | | None | | | | None | |
Oberland Capital Healthcare Solutions Co-Invest Offshore LP | | | 3,104,467 | | | | 15,481,250 | | | | None | | | | None | |
Oberland Capital Healthcare Solutions LP | | | 6,644,442 | | | | 10,515,097 | | | | None | | | | None | |
Primary Wave Music IP Fund LP | | | 53,276,332 | | | | 1,699,014 | | | | None | | | | None | |
TCW Direct Lending LLC | | | 10,919,732 | | | | 14,067,260 | | | | None | | | | None | |
Total | | $ | 133,096,794 | | | $ | 57,610,800 | | | | | | | | | |
CHF — Swiss Franc
Cl — Class
CLO — Collateralized Loan Obligation
CME — Collateralized Chicago Mercantile Exchange
CMTUSD6Y — 1 Year CMT (Monthly)
DAC — Designated Activity Company
EUAMDB01 — 1 Year EUR LIBOR
EUR — Euro
EUR003M — Euribor 3 Month
Euribor — Euro Interbank Offered Rate
GBP — British Pound Sterling
H15T10Y — US Treasury Yield Curve Rate T Note Constant Maturity 10 Year
H15T5Y — US Treasury Yield Curve Rate T Note Constant Maturity 5 Year
JSC — Joint Stock Company
JPY — Japanese Yen
LIBOR — London Interbank Offered Rates
LLC — Limited Liability Company
LP — Limited Partnership
LTD — Limited
MTN — Medium Term Note
PIK — Payment-in Kind
PLC — Public Limited Company
REIT — Real Estate Investment Trust
Ser — Series
SOFR — Secured Overnight Financing Rate
TRY — Turkish Lira
TSFR3M — Term Secured Overnight Financing Rate 3 Months
ULC — Unlimited Liability Company
USD — U.S. Dollar
A list of the open forward foreign currency contracts held by the Fund at September 30, 2024, is as follows:
Counterparty | Settlement
Date | Currency to
Deliver
(000) | Currency to
Receive
(000) | | Unrealized
Appreciation
(Depreciation)
(000) | |
BNP Paribas | 11/22/24 | EUR | | | 748 | | USD | | | 832 | | | $ | (2 | ) |
HSBC | 11/22/24 | EUR | | | 1,496 | | USD | | | 1,670 | | | | 2 | |
State Street | 11/22/24 | EUR | | | 748 | | USD | | | 834 | | | | — | |
U.S. Bank | 10/24/24 | EUR | | | 201,635 | | USD | | | 225,209 | | | | 533 | |
U.S. Bank | 10/25/24 | GBP | | | 7,235 | | USD | | | 9,653 | | | | (20 | ) |
U.S. Bank | 10/25/24 | EUR | | | 500 | | USD | | | 558 | | | | — | |
U.S. Bank | 10/25/24 | EUR | | | 143,160 | | USD | | | 159,458 | | | | (68 | ) |
| | | | | | | | | | | | | | $ | 445 | |
A list of the open futures contracts held by the Fund at September 30, 2024, is as follows:
Type of
Contract | | Number of
Contracts | | | Expiration
Date | | | Notional
Amount
(000) | | | Value
(000) | | | Unrealized
Appreciation
(000) | |
Short Contracts | | | | | | | | | | | | | | | | | | | | |
U.S. 10-Year Treasury Note | | | (127 | ) | | | Dec-2024 | | | $ | (14,581 | ) | | $ | (14,513 | ) | | $ | 68 | |
The following is a summary of the inputs used as of September 30, 2024 in valuing the Fund’s investments and other financial instruments carried at value (000):
Investments in Securities | | Level 1 | | | Level 2 | | | Level 3(1) | | | Total | |
Corporate Bonds | | $ | — | | | $ | 881,720 | | | $ | 2,123 | | | $ | 883,843 | |
Collateralized Loan Obligations | | | — | | | | 371,467 | | | | — | | | | 371,467 | |
Loan Participations | | | — | | | | 336,971 | | | | 1,008 | | | | 337,979 | |
Non-Listed Business Development Companies(a) | | | — | | | | — | | | | — | | | | 70,072 | |
Limited Partnership(a) | | | — | | | | — | | | | — | | | | 63,025 | |
Note | | | — | | | | — | | | | 48,477 | | | | 48,477 | |
Convertible Bonds | | | — | | | | 20,227 | | | | — | | | | 20,227 | |
Sovereign Debt | | | — | | | | 17,278 | | | | — | | | | 17,278 | |
Common Stock | | | 4,414 | | | | 905 | | | | 912 | | | | 6,231 | |
Warrant | | | — | | | | 5 | | | | — | | | | 5 | |
Preferred Stock | | | — | | | | 78 | | | | — | | | | 78 | |
Short-Term Investment | | | 76,017 | | | | — | | | | — | | | | 76,017 | |
Total Investments in Securities | | $ | 80,431 | | | $ | 1,628,651 | | | $ | 52,520 | | | $ | 1,894,699 | |
See accompanying notes to financial statements.
CITY NATIONAL ROCHDALE FUNDS | PAGE 71
schedule of investments |
September 30, 2024 |
City National Rochdale Fixed Income Opportunities Fund (concluded) |
Other Financial Instruments | | Level 1 | | | Level 2 | | | Level 3 | | | Total | |
Futures Contracts* | | | | | | | | | | | | | | | | |
Unrealized Appreciation | | $ | 68 | | | $ | — | | | $ | — | | | $ | 68 | |
Forward Contracts* | | | | | | | | | | | | | | | | |
Unrealized Appreciation | | | — | | | | 535 | | | | — | | | | 535 | |
Unrealized Depreciation | | | — | | | | (90 | ) | | | — | | | | (90 | ) |
Total Other Financial Instruments | | $ | 68 | | | $ | 445 | | | $ | — | | | $ | 513 | |
* | Forwards and futures contracts are valued at the unrealized appreciation (depreciation) on the instrument. |
(a) | In accordance with Subtopic 820-10, certain investments that are measured at fair value using the net asset value per share (or its equivalent) practical expedient have not been classified in the fair value hierarchy. The fair value amounts presented in this table are intended to permit reconciliation of the fair value hierarchy to the amounts presented in the Schedule of Investments. |
(1) | Of the $52,520 (000) in Level 3 securities as of September 30, 2024, $48,477 (000) or 92.3% are not valued via third party pricing vendors and broker quotes. If significant, the disclosure of the unobservable inputs and the interrelationships and sensitivity between these inputs is required for those Level 3 securities that are not valued by third party vendors or broker quotes. |
The following is a reconciliation of investments in which significant unobservable inputs (Level 3) were used in determining value as of September 30, 2024:
| | | Investments
in Corporate
Bonds | | | Investments
in Loan
Participations | | | Investments
in Note | |
Beginning balance as of October 1, 2023 | | $ | 11 | | | $ | 656 | | | $ | 94,702 | |
Accrued discounts/ premiums | | | — | | | | (4 | ) | | | — | |
Realized gain/(loss) | | | — | | | | (789 | ) | | | — | |
Change in unrealized appreciation/(depreciation) | | | — | | | | 790 | | | | (37,092 | ) |
Purchases | | | — | | | | — | | | | 15,867 | |
Sales/paydowns | | | — | | | | (653 | ) | | | (25,000 | ) |
Transfers into Level 3 | | | 2,112 | | | | 1,008 | | | | — | |
Transfers out of Level 3 | | | — | | | | — | | | | — | |
Ending balance as of September 30, 2024 | | $ | 2,123 | | | $ | 1,008 | | | $ | 48,477 | |
Changes in unrealized gains/(losses) included in earnings related to securities still held at reporting date | | $ | (827 | ) | | $ | 74 | | | $ | (37,092 | ) |
| | | Investments
in Common
Stock | | | Total | |
Beginning balance as of October 1, 2023 | | $ | 2,155 | | | $ | 97,524 | |
Accrued discounts/ premiums | | | — | | | | (4 | ) |
Realized gain/(loss) | | | 721 | | | | (68 | ) |
Change in unrealized appreciation/(depreciation) | | | (685 | ) | | | (36,987 | ) |
Purchases | | | — | | | | 15,867 | |
Sales/paydowns | | | (1,319 | ) | | | (26,972 | ) |
Transfers into Level 3 | | | 46 | | | | 3,166 | |
Transfers out of Level 3 | | | (6 | ) | | | (6 | ) |
Ending balance as of September 30, 2024 | | $ | 912 | | | $ | 52,520 | |
Changes in unrealized gains/(losses) included in earnings related to securities still held at reporting date | | $ | 244 | | | $ | (143,353 | ) |
Amounts designated as “—” are either $0 or have been rounded to $0.
For more information on valuation inputs, see Note 2 — Significant Accounting Policies in the Notes to Financial Statements.
The following table summarizes the quantitative inputs and assumptions used for items categorized as material Level 3 investments as of September 30, 2024. The disclosures below also include qualitative information on the sensitivity of the fair value measurements to changes in the significant unobservable inputs.
| | Fair Value at
September 30,
2024 (000) |
Note | $48,477 |
The fair value of the life settlement policies, classified as Level 3, was determined based on the anticipated sales price of the remaining policies and expected proceeds from maturities. For the year ended September 30, 2024, transfers in and out of Level 3 were due to the availability of observable inputs to determine fair value.
See accompanying notes to financial statements.
CITY NATIONAL ROCHDALE FUNDS | PAGE 72
schedule of investments |
September 30, 2024 |
City National Rochdale Equity Income Fund |
Description | | Shares | | | Value (000) | |
Common Stock [99.1%] |
Communication Services [6.6%] |
AT&T | | | 174,500 | | | $ | 3,839 | |
Interpublic Group of | | | 72,800 | | | | 2,303 | |
Verizon Communications | | | 78,200 | | | | 3,512 | |
| | | | | | | | | | | | | |
Total Communication Services | | | 9,654 | |
| | | | | | | | | | | | | |
Consumer Discretionary [6.2%] |
Best Buy | | | 16,600 | | | | 1,715 | |
Ford Motor | | | 180,400 | | | | 1,905 | |
Genuine Parts | | | 11,700 | | | | 1,634 | |
H&R Block | | | 26,000 | | | | 1,652 | |
Wendy’s | | | 60,000 | | | | 1,051 | |
Whirlpool | | | 11,000 | | | | 1,177 | |
| | | | | | | | | | | | | |
Total Consumer Discretionary | | | 9,134 | |
| | | | | | | | | | | | | |
Consumer Staples [11.0%] |
Altria Group | | | 87,900 | | | | 4,486 | |
Coca-Cola | | | 46,600 | | | | 3,349 | |
General Mills | | | 34,500 | | | | 2,548 | |
Kimberly-Clark | | | 10,300 | | | | 1,465 | |
Philip Morris International | | | 27,500 | | | | 3,339 | |
Procter & Gamble | | | 5,900 | | | | 1,022 | |
| | | | | | | | | | | | | |
Total Consumer Staples | | | 16,209 | |
| | | | | | | | | | | | | |
Energy [5.8%] |
Chevron | | | 22,200 | | | | 3,269 | |
Valero Energy | | | 7,900 | | | | 1,067 | |
Williams | | | 93,800 | | | | 4,282 | |
| | | | | | | | | | | | | |
Total Energy | | | 8,618 | |
| | | | | | | | | | | | | |
Financials [25.0%] (A) |
Brookfield Asset Management, Cl A | | | 31,300 | | | | 1,480 | |
Cincinnati Financial | | | 27,000 | | | | 3,675 | |
Citigroup | | | 44,700 | | | | 2,798 | |
Citizens Financial Group | | | 98,200 | | | | 4,033 | |
Fidelity National Financial | | | 43,800 | | | | 2,718 | |
Fifth Third Bancorp | | | 95,300 | | | | 4,083 | |
Lazard, Cl A | | | 32,500 | | | | 1,638 | |
MetLife | | | 41,000 | | | | 3,382 | |
OneMain Holdings, Cl A | | | 31,700 | | | | 1,492 | |
Principal Financial Group | | | 16,000 | | | | 1,374 | |
Regions Financial | | | 175,000 | | | | 4,083 | |
Truist Financial | | | 24,000 | | | | 1,026 | |
Unum Group | | | 27,800 | | | | 1,653 | |
US Bancorp | | | 75,400 | | | $ | 3,448 | |
| | | | | | | | | | | | | |
Total Financials | | | 36,883 | |
| | | | | | | | | | | | | |
Health Care [3.9%] |
AbbVie | | | 12,800 | | | | 2,528 | |
Merck | | | 10,700 | | | | 1,215 | |
Pfizer | | | 68,800 | | | | 1,991 | |
| | | | | | | | | | | | | |
Total Health Care | | | 5,734 | |
| | | | | | | | | | | | | |
Industrials [2.8%] |
Lockheed Martin | | | 4,500 | | | | 2,630 | |
Watsco | | | 3,100 | | | | 1,525 | |
| | | | | | | | | | | | | |
Total Industrials | | | 4,155 | |
| | | | | | | | | | | | | |
Information Technology [4.4%] |
HP | | | 51,000 | | | | 1,829 | |
IBM | | | 13,700 | | | | 3,029 | |
Seagate Technology Holdings | | | 15,100 | | | | 1,654 | |
| | | | | | | | | | | | | |
Total Information Technology | | | 6,512 | |
| | | | | | | | | | | | | |
Materials [6.6%] |
FMC | | | 11,400 | | | | 752 | |
International Paper | | | 89,000 | | | | 4,348 | |
LyondellBasell Industries, Cl A | | | 32,400 | | | | 3,107 | |
Sonoco Products | | | 27,500 | | | | 1,502 | |
| | | | | | | | | | | | | |
Total Materials | | | 9,709 | |
| | | | | | | | | | | | | |
Real Estate [1.9%] |
NNN REIT | | | 32,500 | | | | 1,576 | |
Prologis | | | 9,900 | | | | 1,250 | |
| | | | | | | | | | | | | |
Total Real Estate | | | 2,826 | |
| | | | | | | | | | | | | |
Utilities [24.9%] |
American Electric Power | | | 39,200 | | | | 4,022 | |
Dominion Energy | | | 51,100 | | | | 2,953 | |
DTE Energy | | | 22,300 | | | | 2,864 | |
Duke Energy | | | 33,800 | | | | 3,897 | |
Entergy | | | 30,700 | | | | 4,040 | |
Eversource Energy | | | 33,700 | | | | 2,293 | |
FirstEnergy | | | 78,100 | | | | 3,464 | |
NiSource | | | 93,300 | | | | 3,233 | |
Public Service Enterprise Group | | | 40,600 | | | | 3,622 | |
Sempra | | | 30,700 | | | | 2,567 | |
WEC Energy Group | | | 32,200 | | | | 3,097 | |
See accompanying notes to financial statements.
CITY NATIONAL ROCHDALE FUNDS | PAGE 73
schedule of investments |
September 30, 2024 |
City National Rochdale Equity Income Fund (concluded) |
Description | | Shares | | | Value (000) | |
Xcel Energy | | | 12,200 | | | $ | 797 | |
| | | | | | | | | | | | | |
Total Utilities | | | 36,849 | |
| | | | | | | | | | | | | |
Total Common Stock |
(Cost $106,646) | | | 146,283 | |
| | | | | | | | | | | | | |
Short-Term Investment [0.5%] |
SEI Daily Income Trust Government Fund, Cl Institutional, 4.890%** | | | 770,911 | | | | 771 | |
| | | | | | | | | | | | | |
Total Short-Term Investment |
(Cost $771) | | | 771 | |
| | | | | | | | | | | | | |
Total Investments [99.6%] |
(Cost $107,417) | | $ | 147,054 | |
| | | | | | | | | | | | | |
Percentages are based on net assets of $147,619 (000).
** | The rate reported is the 7-day effective yield as of September 30, 2024. |
(A) | The Fund uses more specific categories in following its investment limitations on investment concentrations. Broad industry sectors are used for financial reporting purposes. |
Cl — Class
REIT — Real Estate Investment Trust
As of September 30, 2024, all of the Fund’s investments are Level 1, in accordance with the authoritative guidance on fair value measurements and disclosure under U.S. GAAP.
For more information on valuation inputs, see Note 2 -- Significant Accounting Policies in the Notes to Financial Statements.
See accompanying notes to financial statements.
CITY NATIONAL ROCHDALE FUNDS | PAGE 74
schedule of investments |
September 30, 2024 |
City National Rochdale U.S. Core Equity Fund |
Description | | Shares | | | Value (000) | |
Common Stock [99.5%] |
Communication Services [9.9%] |
Alphabet, Cl A | | | 112,550 | | | $ | 18,666 | |
Meta Platforms, Cl A | | | 14,450 | | | | 8,272 | |
T-Mobile US | | | 34,800 | | | | 7,181 | |
Walt Disney | | | 74,200 | | | | 7,137 | |
| | | | | | | | | | | | | |
Total Communication Services | | | 41,256 | |
| | | | | | | | | | | | | |
Consumer Discretionary [9.7%] |
Amazon.Com * | | | 85,162 | | | | 15,868 | |
Home Depot | | | 22,726 | | | | 9,208 | |
McDonald’s | | | 21,645 | | | | 6,591 | |
Tesla * | | | 24,130 | | | | 6,313 | |
TJX | | | 20,902 | | | | 2,457 | |
| | | | | | | | | | | | | |
Total Consumer Discretionary | | | 40,437 | |
| | | | | | | | | | | | | |
Consumer Staples [5.9%] |
Anheuser-Busch InBev ADR | | | 74,800 | | | | 4,958 | |
Costco Wholesale | | | 10,500 | | | | 9,309 | |
PepsiCo | | | 38,600 | | | | 6,564 | |
Walmart | | | 42,750 | | | | 3,452 | |
| | | | | | | | | | | | | |
Total Consumer Staples | | | 24,283 | |
| | | | | | | | | | | | | |
Energy [3.5%] |
EOG Resources | | | 38,437 | | | | 4,725 | |
ExxonMobil | | | 50,036 | | | | 5,865 | |
Occidental Petroleum | | | 28,600 | | | | 1,474 | |
Schlumberger | | | 60,000 | | | | 2,517 | |
| | | | | | | | | | | | | |
Total Energy | | | 14,581 | |
| | | | | | | | | | | | | |
Financials [15.3%] |
Bank of America | | | 96,100 | | | | 3,813 | |
Bank of New York Mellon | | | 32,550 | | | | 2,339 | |
Berkshire Hathaway, Cl B * | | | 19,000 | | | | 8,745 | |
Capital One Financial | | | 41,660 | | | | 6,238 | |
CME Group, Cl A | | | 14,000 | | | | 3,089 | |
JPMorgan Chase | | | 52,264 | | | | 11,021 | |
Marsh & McLennan | | | 28,150 | | | | 6,280 | |
Mastercard, Cl A | | | 18,390 | | | | 9,081 | |
S&P Global | | | 9,430 | | | | 4,872 | |
Visa, Cl A | | | 28,880 | | | | 7,940 | |
| | | | | | | | | | | | | |
Total Financials | | | 63,418 | |
| | | | | | | | | | | | | |
Health Care [11.0%] |
Amgen | | | 18,350 | | | | 5,913 | |
HCA Healthcare | | | 4,400 | | | | 1,788 | |
Novo Nordisk ADR | | | 55,450 | | | $ | 6,603 | |
Thermo Fisher Scientific | | | 11,824 | | | | 7,314 | |
UnitedHealth Group | | | 19,000 | | | | 11,109 | |
Vertex Pharmaceuticals * | | | 19,000 | | | | 8,836 | |
Zoetis, Cl A | | | 19,000 | | | | 3,712 | |
| | | | | | | | | | | | | |
Total Health Care | | | 45,275 | |
| | | | | | | | | | | | | |
Industrials [9.1%] |
Cintas | | | 33,360 | | | | 6,868 | |
CSX | | | 120,000 | | | | 4,144 | |
Northrop Grumman | | | 9,400 | | | | 4,964 | |
Parker-Hannifin | | | 7,150 | | | | 4,518 | |
Quanta Services | | | 20,125 | | | | 6,000 | |
Trane Technologies | | | 27,800 | | | | 10,807 | |
| | | | | | | | | | | | | |
Total Industrials | | | 37,301 | |
| | | | | | | | | | | | | |
Information Technology [30.5%](A) |
Adobe * | | | 15,200 | | | | 7,870 | |
Apple | | | 107,870 | | | | 25,134 | |
ASML Holding, Cl G | | | 9,815 | | | | 8,178 | |
Broadcom | | | 43,400 | | | | 7,486 | |
KLA | | | 6,150 | | | | 4,763 | |
Microsoft | | | 72,704 | | | | 31,284 | |
NVIDIA | | | 215,000 | | | | 26,110 | |
NXP Semiconductors | | | 33,840 | | | | 8,122 | |
Roper Technologies | | | 3,500 | | | | 1,948 | |
Salesforce | | | 17,200 | | | | 4,708 | |
| | | | | | | | | | | | | |
Total Information Technology | | | 125,603 | |
| | | | | | | | | | | | | |
Materials [0.9%] |
Linde | | | 7,450 | | | | 3,553 | |
| | | | | | | | | | | | | |
Real Estate [1.1%] |
American Tower | | | 19,300 | | | | 4,488 | |
| | | | | | | | | | | | | |
Utilities [2.6%] |
American Water Works | | | 22,183 | | | | 3,244 | |
NextEra Energy | | | 85,562 | | | | 7,233 | |
| | | | | | | | | | | | | |
Total Utilities | | | 10,477 | |
| | | | | | | | | | | | | |
Total Common Stock |
(Cost $198,202) | | | 410,672 | |
| | | | | | | | | | | | | |
See accompanying notes to financial statements.
CITY NATIONAL ROCHDALE FUNDS | PAGE 75
schedule of investments |
September 30, 2024 |
City National Rochdale U.S. Core Equity Fund (concluded) |
Description | | Shares | | | Value (000) | |
Short-Term Investment [0.5%] |
SEI Daily Income Trust Government Fund, Cl Institutional, 4.890%** | | | 1,861,898 | | | $ | 1,862 | |
| | | | | | | | | | | | | |
Total Short-Term Investment |
(Cost $1,862) | | | 1,862 | |
| | | | | | | | | | | | | |
Total Investments [100.0%] |
(Cost $200,064) | | $ | 412,534 | |
| | | | | | | | | | | | | |
Percentages are based on net assets of $412,442 (000).
* | Non-income producing security. |
** | The rate reported is the 7-day effective yield as of September 30, 2024. |
(A) | The Fund uses more specific categories in following its investment limitations on investment concentrations. Broad industry sectors are used for financial reporting purposes. |
ADR — American Depositary Receipt
Cl — Class
As of September 30, 2024, all of the Fund’s investments are Level 1, in accordance with the authoritative guidance on fair value measurements and disclosure under U.S. GAAP.
For more information on valuation inputs, see Note 2 - Significant Accounting Policies in the Notes to Financial Statements.
See accompanying notes to financial statements.
CITY NATIONAL ROCHDALE FUNDS | PAGE 76
statements of assets and liabilities (000) |
September 30, 2024 |
| | City National
Rochdale
Government Money
Market Fund | | | City National
Rochdale Municipal
High Income Fund | |
ASSETS: | | | | | | | | |
Cost of securities (including repurchase agreements) | | $ | 7,900,866 | | | $ | 850,499 | |
Investments in securities, at value | | $ | 6,498,866 | | | $ | 829,940 | |
Repurchase agreements, at value | | | 1,402,000 | | | | — | |
Dividend and interest receivable | | | 3,725 | | | | 11,991 | |
Receivable for investment securities sold | | | — | | | | 7,564 | |
Receivable for capital shares sold | | | 55,468 | | | | 332 | |
Prepaid expenses | | | 38 | | | | 5 | |
Total Assets | | $ | 7,960,097 | | | $ | 849,832 | |
| | | | | | | | | |
LIABILITIES: | | | | | | | | |
Payable for capital shares redeemed | | | 79,934 | | | | 1,333 | |
Payable for income distributions | | | 7,028 | | | | 1,718 | |
Payable for investment securities purchased | | | — | | | | 5,076 | |
Investment advisory fees payable | | | 252 | | | | 347 | |
Shareholder servicing and distribution fees payable | | | 2,028 | | | | 285 | |
Administrative fees payable | | | 127 | | | | 40 | |
Trustee fees payable | | | 2 | | | | — | |
Accrued expenses | | | 395 | | | | 72 | |
Total Liabilities | | | 89,766 | | | | 8,871 | |
Net Assets | | $ | 7,870,331 | | | $ | 840,961 | |
| | | | | | | | | |
Commitments and Contingencies† | | | | | | | | |
NET ASSETS: | | | | | | | | |
Paid-in Capital (unlimited authorization — $0.01 par value) | | $ | 7,870,304 | | | $ | 1,104,542 | |
Total distributable earnings/(loss) | | | 27 | | | | (263,581 | ) |
Net Assets | | $ | 7,870,331 | | | $ | 840,961 | |
| | | | | | | | | |
Class N Shares: | | | | | | | | |
Net Assets | | $ | 10 | | | $ | 544,405 | |
Total shares outstanding at end of year | | | 10 | | | | 57,436 | |
Net asset value, offering and redemption price per share (net assets ÷ shares outstanding) | | $ | 1.00 | | | $ | 9.48 | |
| | | | | | | | | |
Class S Shares: | | | | | | | | |
Net Assets | | $ | 1,232,366 | | | $ | — | |
Total shares outstanding at end of year | | | 1,232,362 | | | | — | |
Net asset value, offering and redemption price per share (net assets ÷ shares outstanding) | | $ | 1.00 | * | | $ | — | |
| | | | | | | | | |
Servicing Class Shares: | | | | | | | | |
Net Assets | | $ | 6,637,955 | | | $ | 296,556 | |
Total shares outstanding at end of year | | | 6,637,934 | | | | 31,270 | |
Net asset value, offering and redemption price per share (net assets ÷ shares outstanding) | | $ | 1.00 | * | | $ | 9.48 | |
Amounts designated as “—” are either $0 or have been rounded to $0.
* | NAV per share as of September 30, 2024 does not calculate to the stated NAV per share due to rounding of net assets and shares. |
† | See Note 2 in the Notes to Financial Statements.
|
See accompanying notes to financial statements.
CITY NATIONAL ROCHDALE FUNDS | PAGE 77
statements of assets and liabilities (000) |
September 30, 2024 |
| | | City National
Rochdale
Fixed Income
Opportunities Fund | | | City National
Rochdale Equity
Income Fund | | | City National
Rochdale U.S.
Core Equity Fund | |
ASSETS: | | | | | | | | | | | | |
Cost of securities | | $ | 2,164,109 | | | $ | 107,417 | | | $ | 200,064 | |
Investments in securities, at value | | $ | 1,894,699 | | | $ | 147,054 | | | $ | 412,534 | |
Foreign currency(1) | | | 2,767 | | | | — | | | | — | |
Dividend and interest receivable | | | 23,581 | | | | 431 | | | | 75 | |
Foreign tax reclaim receivable | | | 432 | | | | 86 | | | | 23 | |
Receivable for capital shares sold | | | 1,462 | | | | 238 | | | | 225 | |
Receivable for investment securities sold | | | 31,377 | | | | — | | | | — | |
Variation margin receivable | | | 45 | | | | — | | | | — | |
Unrealized gain on forward foreign currency contracts | | | 535 | | | | — | | | | — | |
Cash collateral for futures contracts | | | 158 | | | | — | | | | — | |
Prepaid expenses | | | 10 | | | | 1 | | | | 2 | |
Total Assets | | $ | 1,955,066 | | | $ | 147,810 | | | $ | 412,859 | |
| | | | | | | | | | | | | |
LIABILITIES: | | | | | | | | | | | | |
Payable to Custodian | | | 61 | | | | — | | | | 5 | |
Payable for investment securities purchased | | | 75,903 | | | | — | | | | — | |
Payable for capital shares redeemed | | | 1,068 | | | | 19 | | | | 80 | |
Unrealized loss on forward foreign currency contracts | | | 90 | | | | — | | | | — | |
Investment advisory fees payable | | | 777 | | | | 60 | | | | 133 | |
Shareholder servicing and distribution fees payable | | | 777 | | | | 60 | | | | 132 | |
Trustee fees payable | | | 1 | | | | — | | | | — | |
Administrative fees payable | | | 53 | | | | 30 | | | | 34 | |
Accrued expenses | | | 207 | | | | 22 | | | | 33 | |
Total Liabilities | | | 78,937 | | | | 191 | | | | 417 | |
Net Assets | | $ | 1,876,129 | | | $ | 147,619 | | | $ | 412,442 | |
| | | | | | | | | | | | | |
Commitments and Contingencies† | | | | | | | | | | | | |
NET ASSETS: | | | | | | | | | | | | |
Paid-in Capital (unlimited authorization — $0.01 par value) | | $ | 2,934,472 | | | $ | 98,341 | | | $ | 140,144 | |
Total distributable earnings/(loss) | | | (1,058,343 | ) | | | 49,278 | | | | 272,298 | |
Net Assets | | $ | 1,876,129 | | | $ | 147,619 | | | $ | 412,442 | |
| | | | | | | | | | | | | |
Institutional Class Shares: | | | | | | | | | | | | |
Net Assets | | $ | — | | | $ | — | | | $ | 280 | |
Total shares outstanding at end of year | | | — | | | | — | | | | 10 | |
Net asset value, offering and redemption price per share (net assets ÷ shares outstanding) | | $ | — | | | $ | — | | | $ | 28.44 | * |
| | | | | | | | | | | | | |
Class N Shares: | | | | | | | | | | | | |
Net Assets | | $ | 1,876,129 | | | $ | 147,619 | | | $ | 246,302 | |
Total shares outstanding at end of year | | | 95,443 | | | | 3,814 | | | | 8,762 | |
Net asset value, offering and redemption price per share (net assets ÷ shares outstanding) | | $ | 19.66 | | | $ | 38.71 | * | | $ | 28.11 | |
| | | | | | | | | | | | | |
Servicing Class Shares: | | | | | | | | | | | | |
Net Assets | | $ | — | | | $ | — | | | $ | 165,860 | |
Total shares outstanding at end of year | | | — | | | | — | | | | 5,876 | |
Net asset value, offering and redemption price per share (net assets ÷ shares outstanding) | | $ | — | | | $ | — | | | $ | 28.23 | |
(1) | Cost of foreign currency $2,746 (000). |
Amounts designated as “—” are either $0 or have been rounded to $0.
* | NAV per share as of September 30, 2024 does not calculate to the stated NAV per share due to rounding of net assets and shares. |
† | See Note 2 in the Notes to Financial Statements. |
See accompanying notes to financial statements.
CITY NATIONAL ROCHDALE FUNDS | PAGE 78
Statements of Operations
statements of operations (000) |
For the year ended September 30, 2024 |
| | | City National
Rochdale
Government Money
Market Fund | | | City National
Rochdale Municipal
High Income Fund | |
INVESTMENT INCOME: | | | | | | | | |
Interest Income | | $ | 400,847 | | | $ | 50,152 | |
Dividend Income | | | — | | | | 470 | |
Total Investment Income | | | 400,847 | | | | 50,622 | |
| | | | | | | | | |
EXPENSES: | | | | | | | | |
Investment Advisory Fees | | | 19,421 | | | | 4,658 | |
Shareholder Servicing Fees — Class N(1) | | | 801 | | | | 2,857 | |
Shareholder Servicing Fees — Class S(1) | | | 8,201 | | | | — | |
Shareholder Servicing Fees — Servicing Class | | | 15,381 | | | | 901 | |
Administration Fees | | | 1,509 | | | | 481 | |
Transfer Agent Fees | | | 184 | | | | 21 | |
Trustee Fees | | | 387 | | | | 126 | |
Professional Fees | | | 576 | | | | 90 | |
Custody Fees | | | 291 | | | | 35 | |
Registration Fees | | | 191 | | | | 28 | |
Printing Fees | | | 137 | | | | 16 | |
Insurance and Other Expenses | | | 394 | | | | 133 | |
Total Expenses | | | 47,473 | | | | 9,346 | |
Less, Waivers of: | | | | | | | | |
Investment Advisory Fees | | | (16,471 | ) | | | — | |
Net Expenses | | | 31,002 | | | | 9,346 | |
| | | | | | | | | |
Net Investment Income | | | 369,845 | | | | 41,276 | |
Net Realized Gain (Loss): | | | | | | | | |
Investments | | | 7 | | | | (23,688 | ) |
Net Change in Unrealized Appreciation on: | | | | | | | | |
Investments | | | — | | | | 107,975 | |
Net Increase in Net Assets Resulting from Operations | | $ | 369,852 | | | $ | 125,563 | |
(1) | Includes class specific distribution expenses. |
Amounts designated as “—” are either $0 or have been rounded to $0.
See accompanying notes to financial statements.
CITY NATIONAL ROCHDALE FUNDS | PAGE 79
statements of operations (000) |
For the year ended September 30, 2024 |
| | | City National
Rochdale
Fixed Income
Opportunities Fund | | | City National
Rochdale Equity
Income Fund | | | City National
Rochdale U.S.
Core Equity Fund | |
INVESTMENT INCOME: | | | | | | | | | | | | |
Dividend Income | | $ | 21,347 | | | $ | 6,261 | | | $ | 4,781 | |
Interest Income | | | 152,810 | | | | — | | | | — | |
Less: Foreign Taxes Withheld | | | — | | | | — | | | | (62 | ) |
Total Investment Income | | | 174,157 | | | | 6,261 | | | | 4,719 | |
| | | | | | | | | | | | | |
EXPENSES: | | | | | | | | | | | | |
Investment Advisory Fees | | | 10,000 | | | | 762 | | | | 1,542 | |
Shareholder Servicing Fees — Class N(1) | | | 10,000 | | | | 762 | | | | 1,136 | |
Shareholder Servicing Fees — Servicing Class | | | — | | | | — | | | | 396 | |
Administration Fees | | | 654 | | | | 357 | | | | 394 | |
Transfer Agent Fees | | | 46 | | | | 4 | | | | 9 | |
Trustee Fees | | | 170 | | | | 92 | | | | 102 | |
Professional Fees | | | 304 | | | | 33 | | | | 50 | |
Custody Fees | | | 190 | | | | 4 | | | | 33 | |
Registration Fees | | | 58 | | | | 5 | | | | 9 | |
Printing Fees | | | 35 | | | | 3 | | | | 7 | |
Deferred Tax Liability | | | 90 | | | | — | | | | — | |
Interest Expense on Borrowings | | | 936 | | | | 7 | | | | 1 | |
Insurance and Other Expenses | | | 306 | | | | 24 | | | | 35 | |
Total Expenses | | | 22,789 | | | | 2,053 | | | | 3,714 | |
Less, Waivers of: | | | | | | | | | | | | |
Investment Advisory Fees | | | (19 | ) | | | — | | | | — | |
Net Expenses | | | 22,770 | | | | 2,053 | | | | 3,714 | |
| | | | | | | | | | | | | |
Net Investment Income | | | 151,387 | | | | 4,208 | | | | 1,005 | |
Net Realized Gain (Loss) from: | | | | | | | | | | | | |
Securities Transactions | | | (60,883 | ) | | | 12,462 | | | | 66,514 | |
Futures Contracts | | | (117 | ) | | | — | | | | — | |
Forward Foreign Currency Contracts | | | (11,280 | ) | | | — | | | | — | |
Foreign Currency Transactions | | | 1,458 | | | | — | | | | — | |
Net Change in Unrealized Appreciation (Depreciation) on: | | | | | | | | | | | | |
Investments | | | 122,955 | | | | 23,349 | | | | 39,678 | |
Forward Foreign Currency Contracts | | | (5,029 | ) | | | — | | | | — | |
Foreign Currency Translations | | | (87 | ) | | | — | | | | — | |
Futures Contracts | | | (527 | ) | | | — | | | | — | |
Net Increase in Net Assets Resulting from Operations | | $ | 197,877 | | | $ | 40,019 | | | $ | 107,197 | |
(1) Includes class specific distribution expenses.
Amounts designated as “—” are either $0 or have been rounded to $0.
See accompanying notes to financial statements.
CITY NATIONAL ROCHDALE FUNDS | PAGE 80
statements of changes in net assets (000) |
For the years ended September 30, |
| | City National Rochdale
Government Money Market Fund | | | City National Rochdale
Municipal High Income Fund | |
| | 2024 | | | 2023 | | | 2024 | | | 2023 | |
OPERATIONS: |
Net Investment Income | | $ | 369,845 | | | $ | 261,007 | | | $ | 41,276 | | | $ | 51,015 | |
Net Realized Gain (Loss) from Security Transactions | | | 7 | | | | 8 | | | | (23,688 | ) | | | (76,511 | ) |
Net Change in Unrealized Appreciation (Depreciation) on Investments | | | — | | | | — | | | | 107,975 | | | | 44,529 | |
Net Increase in Net Assets Resulting from Operations | | | 369,852 | | | | 261,015 | | | | 125,563 | | | | 19,033 | |
| | | | | | | | | | | | | | | | | |
DISTRIBUTIONS: |
Class N | | | (6,920 | ) | | | (19,633 | ) | | | (24,115 | ) | | | (27,130 | ) |
Class S | | | (53,639 | ) | | | (40,751 | ) | | | — | | | | — | |
Servicing Class | | | (309,295 | ) | | | (200,615 | ) | | | (16,099 | ) | | | (21,761 | ) |
Total Distributions | | | (369,854 | ) | | | (260,999 | ) | | | (40,214 | ) | | | (48,891 | ) |
| | | | | | | | | | | | | | | | | |
CAPITAL SHARE TRANSACTIONS:(1) |
Class N: | | | | | | | | | | | | | | | | |
Shares Issued | | | 429,391 | | | | 2,349,456 | | | | 134,532 | | | | 228,335 | |
Shares Issued in Lieu of Dividends and Distributions | | | 6,920 | | | | 20,195 | | | | 12,286 | | | | 14,072 | |
Shares Redeemed | | | (1,100,521 | ) | | | (2,052,969 | ) | | | (270,443 | ) | | | (445,565 | ) |
Increase (Decrease) in Net Assets from Class N Share Transactions | | | (664,210 | ) | | | 316,682 | | | | (123,625 | ) | | | (203,158 | ) |
| | | | | | | | | | | | | | | | | |
Class S: | | | | | | | | | | | | | | | | |
Shares Issued | | | 4,109,649 | | | | 4,509,922 | | | | — | | | | — | |
Shares Issued in Lieu of Dividends and Distributions | | | — | | | | — | | | | — | | | | — | |
Shares Redeemed | | | (4,348,034 | ) | | | (3,764,560 | ) | | | — | | | | — | |
Increase (Decrease) in Net Assets from Class S Share Transactions | | | (238,385 | ) | | | 745,362 | | | | — | | | | — | |
| | | | | | | | | | | | | | | | | |
Servicing Class: | | | | | | | | | | | | | | | | |
Shares Issued | | | 15,193,995 | | | | 22,199,562 | | | | 57,135 | | | | 112,456 | |
Shares Issued in Lieu of Dividends and Distributions | | | 266,028 | | | | 145,596 | | | | 2,685 | | | | 3,737 | |
Shares Redeemed | | | (14,732,734 | ) | | | (19,921,782 | ) | | | (238,825 | ) | | | (253,292 | ) |
Increase (Decrease) in Net Assets from Servicing Class Share Transactions | | | 727,289 | | | | 2,423,376 | | | | (179,005 | ) | | | (137,099 | ) |
| | | | | | | | | | | | | | | | | |
Net Increase (Decrease) in Net Assets from Share Transactions | | | (175,306 | ) | | | 3,485,420 | | | | (302,630 | ) | | | (340,257 | ) |
Total Increase (Decrease) in Net Assets | | | (175,308 | ) | | | 3,485,436 | | | | (217,281 | ) | | | (370,115 | ) |
| | | | | | | | | | | | | | | | | |
NET ASSETS: |
Beginning of Year/Period | | | 8,045,639 | | | | 4,560,203 | | | | 1,058,242 | | | | 1,428,357 | |
End of Year/Period | | $ | 7,870,331 | | | $ | 8,045,639 | | | $ | 840,961 | | | $ | 1,058,242 | |
(1) | See Note 9 for shares issued and redeemed. |
Amounts designated as “—” are either $0 or have been rounded to $0.
See accompanying notes to financial statements.
CITY NATIONAL ROCHDALE FUNDS | PAGE 81
statements of changes in net assets (000) |
For the years ended September 30, |
| | | City National
Rochdale
Fixed Income
Opportunities
Fund | | | City National
Rochdale
Equity
Income Fund | |
| | 2024 | | | 2023 | | | 2024 | | | 2023 | |
OPERATIONS: | | | | | | | | | | | | | | | | |
Net Investment Income | | $ | 151,387 | | | $ | 173,297 | | | $ | 4,208 | | | $ | 5,590 | |
Net Realized Gain (Loss) from: | | | | | | | | | | | | | | | | |
Security Transactions and Futures Contracts | | | (61,000 | ) | | | (420,430 | ) | | | 12,462 | | | | (2,945 | ) |
Foreign Currency Transactions | | | (9,822 | ) | | | (22,345 | ) | | | — | | | | — | |
Net Change in Unrealized Appreciation (Depreciation) on: | | | | | | | | | | | | | | | | |
Investments and Futures Contracts | | | 122,428 | | | | 548,123 | | | | 23,349 | | | | 59 | |
Foreign Currency Translations | | | (5,116 | ) | | | (5,161 | ) | | | — | | | | — | |
Net Increase in Net Assets Resulting from Operations | | | 197,877 | | | | 273,484 | | | | 40,019 | | | | 2,704 | |
| | | | | | | | | | | | | | | | | |
DISTRIBUTIONS: | | | | | | | | | | | | | | | | |
Institutional Class | | | — | | | | — | | | | — | | | | — | |
Class N | | | (122,108 | ) | | | (210,639 | ) | | | (4,143 | ) | | | (30,788 | ) |
Servicing Class | | | — | | | | — | | | | — | | | | — | |
Total Distributions | | | (122,108 | ) | | | (210,639 | ) | | | (4,143 | ) | | | (30,788 | ) |
| | | | | | | | | | | | | | | | | |
CAPITAL SHARE TRANSACTIONS:(1) | | | | | | | | | | | | | | | | |
Institutional Class: | | | | | | | | | | | | | | | | |
Shares Issued | | | — | | | | — | | | | — | | | | — | |
Shares Issued in Lieu of Dividends and Distributions | | | — | | | | — | | | | — | | | | — | |
Shares Redeemed | | | — | | | | — | | | | — | | | | — | |
Increase (Decrease) in Net Assets from Institutional Class Share Transactions | | | — | | | | — | | | | — | | | | — | |
| | | | | | | | | | | | | | | | | |
Class N: | | | | | | | | | | | | | | | | |
Shares Issued | | | 333,094 | | | | 400,280 | | | | 12,604 | | | | 27,670 | |
Shares Issued in Lieu of Dividends and Distributions | | | 86,257 | | | | 142,070 | | | | 2,778 | | | | 20,143 | |
Shares Redeemed | | | (803,156 | ) | | | (1,491,668 | ) | | | (73,505 | ) | | | (52,543 | ) |
Decrease in Net Assets from Class N Share Transactions | | | (383,805 | ) | | | (949,318 | ) | | | (58,123 | ) | | | (4,730 | ) |
| | | | | | | | | | | | | | | | | |
Servicing Class: | | | | | | | | | | | | | | | | |
Shares Issued | | | — | | | | — | | | | — | | | | — | |
Shares Issued in Lieu of Dividends and Distributions | | | — | | | | — | | | | — | | | | — | |
Shares Redeemed | | | — | | | | — | | | | — | | | | — | |
Increase (Decrease) in Net Assets from Servicing Class Share Transactions | | | — | | | | — | | | | — | | | | — | |
| | | | | | | | | | | | | | | | | |
Net Decrease in Net Assets from Share Transactions | | | (383,805 | ) | | | (949,318 | ) | | | (58,123 | ) | | | (4,730 | ) |
Total Increase (Decrease) in Net Assets | | | (308,036 | ) | | | (886,473 | ) | | | (22,247 | ) | | | (32,814 | ) |
| | | | | | | | | | | | | | | | | |
NET ASSETS: | | | | | | | | | | | | | | | | |
Beginning of Year/Period | | | 2,184,165 | | | | 3,070,638 | | | | 169,866 | | | | 202,680 | |
End of Year/Period | | $ | 1,876,129 | | | $ | 2,184,165 | | | $ | 147,619 | | | $ | 169,866 | |
(1) | See Note 9 for shares issued and redeemed. |
Amounts designated as “—” are either $0 or have been rounded to $0.
See accompanying notes to financial statements.
CITY NATIONAL ROCHDALE FUNDS | PAGE 82
| | City National
Rochdale
U.S. Core
Equity Fund | |
| | 2024 | | | 2023 | |
| | | | | | | | |
| | $ | 1,005 | | | $ | 1,552 | |
| | | | | | | | |
| | | 66,514 | | | | 36,154 | |
| | | — | | | | — | |
| | | | | | | | |
| | | 39,678 | | | | 27,027 | |
| | | — | | | | — | |
| | | 107,197 | | | | 64,733 | |
| | | | | | | | |
| | | | | | | | |
| | | (18 | ) | | | (4 | ) |
| | | (25,483 | ) | | | (4,432 | ) |
| | | (18,780 | ) | | | (3,877 | ) |
| | | (44,281 | ) | | | (8,313 | ) |
| | | | | | | | |
| | | | | | | | |
| | | | | | | | |
| | | 103 | | | | 28 | |
| | | 18 | | | | 4 | |
| | | (11 | ) | | | (44 | ) |
| | | 110 | | | | (12 | ) |
| | | | | | | | |
| | | | | | | | |
| | | 40,465 | | | | 23,030 | |
| | | 21,111 | | | | 3,618 | |
| | | (61,735 | ) | | | (33,396 | ) |
| | | (159 | ) | | | (6,748 | ) |
| | | | | | | | |
| | | | | | | | |
| | | 19,974 | | | | 12,834 | |
| | | 2,142 | | | | 382 | |
| | | (36,888 | ) | | | (27,144 | ) |
| | | (14,772 | ) | | | (13,928 | ) |
| | | | | | | | |
| | | (14,821 | ) | | | (20,688 | ) |
| | | 48,095 | | | | 35,732 | |
| | | | | | | | |
| | | | | | | | |
| | | 364,347 | | | | 328,615 | |
| | $ | 412,442 | | | $ | 364,347 | |
See accompanying notes to financial statements.
CITY NATIONAL ROCHDALE FUNDS | PAGE 83
statement of cash flows (000) |
For the year ended September 30, 2024 |
| | | City National
Rochdale
Fixed Income
Opportunities Fund | |
Cash Flows from Operating Activities: | | | | |
Net increase in net assets from operations | | $ | 197,877 | |
Adjustments to reconcile net increase in net assets resulting from operations to net cash provided by operating activities: | | | | |
Purchase of investment securities | | | (1,425,018 | ) |
Proceeds from disposition of investment securities | | | 1,756,901 | |
Amortization (accretion of market discount) | | | (18,438 | ) |
Net realized loss on investments, futures contracts, forward foreign currency contracts and foreign currency transactions | | | 70,822 | |
Net change in unrealized appreciation on investments, forward foreign currency contracts, foreign currency transactions and futures contracts | | | (117,312 | ) |
| | | | | |
Changes in assets: | | | | |
Dividend and interest receivable | | | 5,056 | |
Reclaim receivable | | | 30 | |
Receivable for investment securities sold | | | (18,969 | ) |
Variation Margin | | | (45 | ) |
Unrealized gain on forward foreign currency contracts | | | 4,995 | |
Prepaid expenses | | | 20 | |
| | | | | |
Changes in liabilities: | | | | |
Payable for investment securities purchased | | | 49,059 | |
Variation margin payable | | | (86 | ) |
Unrealized loss on forward foreign currency contracts | | | 34 | |
Investment advisory fees payable | | | (149 | ) |
Shareholder servicing and distribution fees payable | | | (149 | ) |
Accrued expenses | | | (195 | ) |
Net cash provided by operating activities | | | 504,433 | |
| | | | | |
Cash Flows from Financing Activities: | | | | |
Proceeds from shares issued | | | 423,385 | |
Cost of shares redeemed | | | (808,029 | ) |
Distributions | | | (122,108 | ) |
Net cash used in financing activities | | | (506,752 | ) |
Net change in cash | | | (2,319 | ) |
Cash at beginning of year | | | 5,183 | |
Cash at end of year | | $ | 2,864 | |
| | | | | |
Non-cash operating and financing activities: | | | | |
Reinvestments of dividends and distributions | | $ | 86,257 | |
The following table provides a reconciliation of cash and foreign currency reported on the statement of assets and liabilities to the total of such amounts shown in this statement of cash flows.
Balance at the end of the year | | | | |
Payable to Custodian | | $ | (61 | ) |
Foreign Currency | | | 2,767 | |
Cash collateral for futures contracts | | | 158 | |
Total Cash and Foreign Currency | | $ | 2,864 | |
Supplemental Disclosure of Cash Flow Information: | | | | |
Interest Paid | | $ | 936 | |
See accompanying notes to financial statements.
CITY NATIONAL ROCHDALE FUNDS | PAGE 84
This page intentionally left blank.
CITY NATIONAL ROCHDALE FUNDS | PAGE 85
financial highlights |
For a Share Outstanding Throughout Each Period
For the year ended September 30, |
| | Net Asset
Value
Beginning
of Period | | | Net
Investment
Income† | | | Net
Realized and
Unrealized
Gains
(Losses) on
Securities | | | Dividends
from Net
Investment
Income | | | Distributions
from Realized
Capital Gains | | | Net Asset
Value End
of Period | | | Total
Return‡ | | | Net Assets End
of Period (000) | | | Ratio of
Expenses to
Average Net
Assets(1) | | | Ratio of Net
Investment
Income to
Average Net
Assets(1) | | | Ratio of Expenses
to Average Net
Assets (Excluding
Waivers &
Recovered Fees) | | | Portfolio
Turnover
Rate | |
City National Rochdale Government Money Market Fund |
Class N (commenced operations on June 21, 1999) |
2024 | | $ | 1.00 | | | $ | 0.047 | | | $ | 0.000 | * | | $ | (0.047 | ) | | $ | — | | | $ | 1.00 | | | | 4.84 | % | | $ | 10 | | | | 0.63 | % | | | 4.71 | % | | | 0.85 | % | | | — | % |
2023 | | | 1.00 | | | | 0.041 | | | | (0.001 | ) | | | (0.040 | ) | | | — | | | | 1.00 | | | | 4.00 | | | | 664,234 | | | | 0.65 | | | | 4.07 | | | | 0.87 | | | | — | |
2022 | | | 1.00 | | | | 0.004 | | | | 0.000 | * | | | (0.004 | ) | | | — | | | | 1.00 | | | | 0.39 | | | | 347,551 | | | | 0.29 | | | | 0.30 | | | | 0.86 | | | | — | |
2021 | | | 1.00 | | | | 0.000 | * | | | 0.000 | * | | | (0.000 | )* | | | — | | | | 1.00 | | | | 0.01 | | | | 642,240 | | | | 0.07 | | | | 0.01 | | | | 0.87 | | | | — | |
2020 | | | 1.00 | | | | 0.003 | | | | 0.001 | | | | (0.004 | ) | | | — | | | | 1.00 | | | | 0.42 | | | | 523,559 | | | | 0.38 | | | | 0.27 | | | | 0.88 | | | | — | |
Class S (commenced operations on October 6, 1999) |
2024 | | $ | 1.00 | | | $ | 0.046 | | | $ | 0.000 | * | | $ | (0.046 | ) | | $ | — | | | $ | 1.00 | | | | 4.68 | % | | $ | 1,232,366 | | | | 0.79 | % | | | 4.58 | % | | | 1.01 | % | | | — | % |
2023 | | | 1.00 | | | | 0.039 | | | | (0.001 | ) | | | (0.038 | ) | | | — | | | | 1.00 | | | | 3.85 | | | | 1,470,759 | | | | 0.80 | | | | 3.93 | | | | 1.02 | | | | — | |
2022 | | | 1.00 | | | | 0.003 | | | | — | | | | (0.003 | ) | | | — | | | | 1.00 | | | | 0.34 | | | | 725,394 | | | | 0.39 | | | | 0.35 | | | | 1.02 | | | | — | |
2021 | | | 1.00 | | | | 0.000 | * | | | 0.000 | * | | | (0.000 | )* | | | — | | | | 1.00 | | | | 0.01 | | | | 689,506 | | | | 0.07 | | | | 0.01 | | | | 1.02 | | | | — | |
2020 | | | 1.00 | | | | 0.003 | | | | 0.000 | * | | | (0.003 | ) | | | — | | | | 1.00 | | | | 0.35 | | | | 421,153 | | | | 0.50 | | | | 0.31 | | | | 1.03 | | | | — | |
Servicing Class (commenced operations on April 3, 2000) |
2024 | | $ | 1.00 | | | $ | 0.050 | | | $ | 0.000 | * | | $ | (0.050 | ) | | $ | — | | | $ | 1.00 | | | | 5.15 | % | | $ | 6,637,955 | | | | 0.34 | % | | | 5.03 | % | | | 0.56 | % | | | — | % |
2023 | | | 1.00 | | | | 0.043 | | | | (0.001 | ) | | | (0.042 | ) | | | — | | | | 1.00 | | | | 4.31 | | | | 5,910,646 | | | | 0.35 | | | | 4.33 | | | | 0.57 | | | | — | |
2022 | | | 1.00 | | | | 0.005 | | | | 0.000 | * | | | (0.005 | ) | | | — | | | | 1.00 | | | | 0.51 | | | | 3,487,258 | | | | 0.21 | | | | 0.47 | | | | 0.57 | | | | — | |
2021 | | | 1.00 | | | | 0.000 | * | | | 0.000 | * | | | (0.000 | )* | | | — | | | | 1.00 | | | | 0.02 | | | | 3,440,097 | | | | 0.07 | | | | 0.01 | | | | 0.57 | | | | — | |
2020 | | | 1.00 | | | | 0.005 | | | | 0.001 | | | | (0.006 | ) | | | — | | | | 1.00 | | | | 0.57 | | | | 3,216,095 | | | | 0.31 | | | | 0.46 | | | | 0.57 | | | | — | |
City National Rochdale Municipal High Income Fund |
Class N (commenced operations on December 30, 2013) |
2024 | | $ | 8.67 | | | $ | 0.39 | | | $ | 0.81 | | | $ | (0.39 | ) | | $ | — | | | $ | 9.48 | | | | 14.04 | % | | $ | 544,405 | | | | 1.10 | % | | | 4.34 | % | | | 1.10 | % | | | 18 | % |
2023 | | | 8.97 | | | | 0.36 | | | | (0.31 | ) | | | (0.35 | ) | | | — | | | | 8.67 | | | | 0.44 | | | | 616,138 | | | | 1.08 | | | | 3.99 | | | | 1.08 | | | | 25 | |
2022 | | | 11.07 | | | | 0.31 | | | | (2.10 | ) | | | (0.31 | ) | | | — | | | | 8.97 | | | | (16.47 | ) | | | 835,922 | | | | 1.07 | | | | 2.97 | | | | 1.07 | | | | 48 | |
2021 | | | 10.61 | | | | 0.33 | | | | 0.46 | | | | (0.33 | ) | | | — | | | | 11.07 | | | | 7.51 | | | | 1,235,195 | | | | 1.07 | | | | 3.03 | | | | 1.07 | | | | 15 | |
2020 | | | 10.95 | | | | 0.35 | | | | (0.34 | ) | | | (0.35 | ) | | | — | | | | 10.61 | | | | 0.17 | | | | 1,053,948 | | | | 1.08 | | | | 3.33 | | | | 1.08 | | | | 45 | |
Servicing Class (commenced operations on December 30, 2013) |
2024 | | $ | 8.67 | | | $ | 0.42 | | | $ | 0.80 | | | $ | (0.41 | ) | | $ | — | | | $ | 9.48 | | | | 14.32 | % | | $ | 296,556 | | | | 0.85 | % | | | 4.59 | % | | | 0.85 | % | | | 18 | % |
2023 | | | 8.98 | | | | 0.39 | | | | (0.33 | ) | | | (0.37 | ) | | | — | | | | 8.67 | | | | 0.58 | | | | 442,104 | | | | 0.84 | | | | 4.24 | | | | 0.84 | | | | 25 | |
2022 | | | 11.08 | | | | 0.33 | | | | (2.10 | ) | | | (0.33 | ) | | | — | | | | 8.98 | | | | (16.24 | ) | | | 592,435 | | | | 0.82 | | | | 3.22 | | | | 0.82 | | | | 48 | |
2021 | | | 10.62 | | | | 0.36 | | | | 0.46 | | | | (0.36 | ) | | | — | | | | 11.08 | | | | 7.77 | | | | 823,230 | | | | 0.82 | | | | 3.27 | | | | 0.82 | | | | 15 | |
2020 | | | 10.95 | | | | 0.38 | | | | (0.33 | ) | | | (0.38 | ) | | | — | | | | 10.62 | | | | 0.52 | | | | 608,688 | | | | 0.83 | | | | 3.58 | | | | 0.83 | | | | 45 | |
* | Amount represents less than $0.001. |
† | Per share calculations are based on Average Shares outstanding throughout the period. |
‡ | Returns are for the period indicated and have not been annualized. Fee waivers are in effect; if they had not been in effect, performance would have been lower. Returns shown do not reflect the deduction of taxes that a shareholder would pay on fund distributions or the redemption of fund shares. |
(1) | Ratio includes waivers and previously waived investment advisory fees recovered. The impact of the recovered fees may cause a higher net expense ratio. |
Amounts designated as “—” are either $0, 0% or have been rounded to $0.
See accompanying notes to financial statements.
CITY NATIONAL ROCHDALE FUNDS | PAGE 86
| | Net Asset
Value
Beginning
of Period | | | Net
Investment
Income† | | | Net
Realized
and
Unrealized
Gains
(Losses) on
Securities | | | Dividends
from Net
Investment
Income | | | Distributions
from
Realized
Capital Gains | | | Distributions
from Return
of Capital | | | Net Asset
Value End
of Period | | | Total
Return‡ | | | Net Assets
End of
Period (000) | | | Ratio of
Expenses
to Average
Net Assets(1) | | | Ratio
of Net
Investment
Income to
Average
Net Assets(1) | | | Ratio of
Expenses
to Average
Net Assets
(Excluding
Waivers &
Recovered
Fees) | | | Portfolio
Turnover
Rate | |
City National Rochdale Fixed Income Opportunities Fund | | | | |
Class N (commenced operations on July 1, 2009) | | | | |
2024 | | $ | 18.96 | | | $ | 1.48 | | | $ | 0.44 | | | $ | (1.22 | ) | | $ | — | | | $ | — | | | $ | 19.66 | | | | 10.32 | % | | $ | 1,876,129 | | | | 1.14 | % | | | 7.57 | % | | | 1.14 | % | | | 34 | % |
2023 | | | 18.60 | | | | 1.34 | | | | 0.71 | | | | (1.69 | ) | | | — | | | | — | | | | 18.96 | | | | 11.44 | | | | 2,184,165 | | | | 1.13 | | | | 7.06 | | | | 1.13 | | | | 63 | |
2022* | | | 23.39 | | | | 1.16 | | | | (4.62 | ) | | | (1.33 | ) | | | — | | | | — | | | | 18.60 | | | | (15.23 | ) | | | 3,070,638 | | | | 1.09 | (2) | | | 5.44 | | | | 1.09 | | | | 94 | |
2021* | | | 22.57 | | | | 1.21 | | | | 1.04 | | | | (1.43 | ) | | | — | | | | — | | | | 23.39 | | | | 10.14 | | | | 4,111,912 | | | | 1.10 | (2) | | | 5.14 | | | | 1.10 | | | | 117 | |
2020* | | | 24.22 | | | | 1.53 | | | | (1.83 | ) | | | (1.35 | ) | | | — | | | | — | | | | 22.57 | | | | (0.94 | ) | | | 3,739,101 | | | | 1.10 | (2) | | | 6.66 | | | | 1.11 | (2) | | | 143 | |
City National Rochdale Equity Income Fund |
Class N (commenced operations on June 1, 1999) | | | | |
2024 | | $ | 30.53 | | | $ | 0.93 | | | $ | 8.23 | | | $ | (0.98 | ) | | $ | — | | | $ | — | | | $ | 38.71 | | | | 30.37 | % | | $ | 147,619 | | | | 1.35 | % | | | 2.76 | % | | | 1.35 | % | | | 34 | % |
2023 | | | 35.40 | | | | 0.96 | | | | (0.42 | ) | | | (0.95 | ) | | | (4.46 | ) | | | — | | | | 30.53 | | | | 0.03 | | | | 169,866 | | | | 1.27 | | | | 2.76 | | | | 1.27 | | | | 32 | |
2022 | | | 40.58 | | | | 1.02 | | | | (2.42 | ) | | | (1.02 | ) | | | (2.76 | ) | | | — | | | | 35.40 | | | | (4.41 | ) | | | 202,680 | | | | 1.12 | | | | 2.47 | | | | 1.17 | | | | 24 | |
2021 | | | 35.52 | | | | 0.88 | | | | 5.30 | | | | (1.12 | ) | | | — | | | | — | | | | 40.58 | | | | 17.53 | | | | 237,219 | | | | 1.15 | | | | 2.25 | | | | 1.15 | | | | 30 | |
2020 | | | 41.01 | | | | 0.73 | | | | (4.73 | ) | | | (0.79 | ) | | | (0.36 | ) | | | (0.34 | ) | | | 35.52 | | | | (9.80 | ) | | | 222,097 | | | | 1.15 | | | | 1.95 | | | | 1.15 | | | | 20 | |
City National Rochdale U.S. Core Equity Fund |
Institutional Class (commenced operations on December 3, 2012) | | | | |
2024 | | $ | 24.21 | | | $ | 0.17 | | | $ | 7.16 | | | $ | (0.20 | ) | | $ | (2.90 | ) | | $ | — | | | $ | 28.44 | | | | 32.69 | % | | $ | 280 | | | | 0.57 | % | | | 0.64 | % | | | 0.57 | % | | | 20 | % |
2023 | | | 20.66 | | | | 0.19 | | | | 3.98 | | | | (0.16 | ) | | | (0.46 | ) | | | — | | | | 24.21 | | | | 20.43 | | | | 138 | | | | 0.54 | | | | 0.81 | | | | 0.54 | | | | 28 | |
2022 | | | 26.49 | | | | 0.17 | | | | (4.67 | ) | | | (0.18 | ) | | | (1.15 | ) | | | — | | | | 20.66 | | | | (18.18 | ) | | | 126 | | | | 0.52 | | | | 0.70 | | | | 0.52 | | | | 28 | |
2021 | | | 20.99 | | | | 0.15 | | | | 5.45 | | | | (0.10 | ) | | | — | | | | — | | | | 26.49 | | | | 26.76 | | | | 148 | | | | 0.51 | | | | 0.62 | | | | 0.51 | | | | 13 | |
2020 | | | 19.32 | | | | 0.10 | | | | 2.21 | | | | (0.14 | ) | | | (0.50 | ) | | | — | ^ | | | 20.99 | | | | 12.20 | | | | 5,633 | | | | 0.56 | | | | 0.52 | | | | 0.56 | | | | 14 | |
Class N (commenced operations on December 3, 2012) | | | | |
2024 | | $ | 23.97 | | | $ | 0.04 | | | $ | 7.08 | | | $ | (0.08 | ) | | $ | (2.90 | ) | | $ | — | | | $ | 28.11 | | | | 32.03 | % | | $ | 246,302 | | | | 1.07 | % | | | 0.16 | % | | | 1.07 | % | | | 20 | % |
2023 | | | 20.46 | | | | 0.07 | | | | 3.94 | | | | (0.04 | ) | | | (0.46 | ) | | | — | | | | 23.97 | | | | 19.85 | | | | 209,330 | | | | 1.04 | | | | 0.31 | | | | 1.04 | | | | 28 | |
2022 | | | 26.25 | | | | 0.04 | | | | (4.62 | ) | | | (0.06 | ) | | | (1.15 | ) | | | — | | | | 20.46 | | | | (18.61 | ) | | | 184,503 | | | | 1.02 | | | | 0.17 | | | | 1.02 | | | | 28 | |
2021 | | | 20.73 | | | | 0.02 | | | | 5.53 | | | | (0.03 | ) | | | — | | | | — | | | | 26.25 | | | | 26.79 | | | | 230,767 | | | | 1.01 | | | | 0.07 | | | | 1.01 | | | | 13 | |
2020 | | | 19.10 | | | | 0.05 | | | | 2.14 | | | | (0.06 | ) | | | (0.50 | ) | | | — | ^ | | | 20.73 | | | | 11.64 | | | | 171,355 | | | | 1.04 | | | | 0.26 | | | | 1.04 | | | | 14 | |
Servicing Class (commenced operations on December 3, 2012) | | | | |
2024 | | $ | 24.05 | | | $ | 0.11 | | | $ | 7.11 | | | $ | (0.14 | ) | | $ | (2.90 | ) | | $ | — | | | $ | 28.23 | | | | 32.38 | % | | $ | 165,860 | | | | 0.82 | % | | | 0.41 | % | | | 0.82 | % | | | 20 | % |
2023 | | | 20.52 | | | | 0.13 | | | | 3.96 | | | | (0.10 | ) | | | (0.46 | ) | | | — | | | | 24.05 | | | | 20.18 | | | | 154,879 | | | | 0.79 | | | | 0.57 | | | | 0.79 | | | | 28 | |
2022 | | | 26.33 | | | | 0.10 | | | | (4.64 | ) | | | (0.12 | ) | | | (1.15 | ) | | | — | | | | 20.52 | | | | (18.42 | ) | | | 143,986 | | | | 0.77 | | | | 0.42 | | | | 0.77 | | | | 28 | |
2021 | | | 20.77 | | | | 0.08 | | | | 5.54 | | | | (0.06 | ) | | | — | | | | — | | | | 26.33 | | | | 27.13 | | | | 187,735 | | | | 0.76 | | | | 0.32 | | | | 0.76 | | | | 13 | |
2020 | | | 19.13 | | | | 0.10 | | | | 2.14 | | | | (0.10 | ) | | | (0.50 | ) | | | — | ^ | | | 20.77 | | | | 11.91 | | | | 155,403 | | | | 0.78 | | | | 0.52 | | | | 0.78 | | | | 14 | |
† | Per share calculations are based on Average Shares outstanding throughout the period. |
‡ | Returns are for the period indicated and have not been annualized. Fee waivers are in effect; if they had not been in effect, performance would have been lower. Returns shown do not reflect the deduction of taxes that a shareholder would pay on fund distributions or the redemption of fund shares. |
^ | Amount represents less than $0.01 per share. |
* | Includes Consolidated investments in Irish Subsidiary. See Note 1 in the Notes to Financial Statements. |
(1) | Ratio includes waivers and previously waived investment advisory fees recovered. The impact of the recovered fees may cause a higher net expense ratio. |
(2) | The expense ratio includes acquired fund fee expenses from the investment in the Irish Subsidiary. Had this expense been excluded, the ratios would have been 1.09% and 1.09%, respectively. |
Amounts designated as “—” are either $0 or have been rounded to $0.
See accompanying notes to financial statements.
CITY NATIONAL ROCHDALE FUNDS | PAGE 87
notes to financial statements |
September 30, 2024 |
City National Rochdale Funds, a Delaware statutory trust (the “Trust”), is registered under the Investment Company Act of 1940, as amended (the “1940 Act”), as an open-end management investment company currently offering the following 5 series (each a “Fund” and collectively, the “Funds”): City National Rochdale Government Money Market Fund (“Government Money Market Fund”); City National Rochdale Municipal High Income Fund (“Municipal High Income Fund”) and City National Rochdale Fixed Income Opportunities Fund (“Fixed Income Opportunities Fund”) (collectively, the “Fixed Income Funds”); and City National Rochdale Equity Income Fund (“Equity Income Fund”) and City National Rochdale U.S. Core Equity Fund (“U.S. Core Equity Fund”) (collectively, the “Equity Funds”). The Trust is an investment company and accordingly follows the investment company accounting and reporting guidance of the Financial Accounting Standards Board (“FASB”) Accounting Standards Codification Topic 946 “Financial Services - Investment Companies”.
The investment objective of the Government Money Market Fund is to preserve your principal and maintain a high degree of liquidity while providing current income. The investment objective of the Municipal High Income Fund is to provide a high level of current income that is not subject to federal income tax. The investment objective of the Fixed Income Opportunities Fund is to provide a high level of current income. The investment objective of the Equity Income Fund is to provide significant income and long-term capital appreciation. The investment objective of the U.S. Core Equity Fund is to provide long-term capital appreciation.
The Trust is registered to offer: Class N shares of the Funds; Servicing Class shares of the Funds except for Fixed Income Opportunities Fund and Equity Income Fund; Institutional Class shares of U.S. Core Equity Fund; Class S shares of the Government Money Market Fund.
The assets of each Fund are segregated, and a shareholder’s interest is limited to the Fund in which shares are held. Each Fund is diversified.
On October 1, 2022, City National Rochdale Income Opportunities (Ireland) Limited, a wholly owned subsidiary of the Fixed Income Opportunities Fund, transferred its holdings to CNR FIOF Investments (Ireland) Limited, a company organized under the laws of Ireland (the “Irish Company”), and began the process of dissolving. The Irish Company is a “qualifying company” as defined in Section 110 of the Irish Taxes Consolidation Act 1997, as amended. As a result of this restructuring, the Irish Company issued a profit participation note to the Fixed Income Opportunities Fund, through which the Fund benefits from the profits of the transferred holdings. The Fixed Income Opportunities Fund does not hold an equity interest or voting rights in the Irish Company, nor does it have the ability to appoint directors. Consequently, the Fixed Income Opportunities Fund does not consolidate the operations of the Irish Company into the Fund’s financial statements, including in the September 30, 2024 Annual Financials and Other Information. The Irish Company (unlike the Fixed Income Opportunities Fund) may invest an unlimited portion of its net assets in life insurance policies. The Irish Company also may invest in other instruments, including fixed income securities, cash and cash equivalents, and U.S. Government securities.
2. | SIGNIFICANT ACCOUNTING POLICIES: |
The following is a summary of significant accounting policies followed by the Funds.
Use of Estimates – The Funds are investment companies that conform with accounting principles generally accepted in the United States of America (“GAAP”). Therefore, the Funds follow the accounting and reporting guidance for investment companies. The preparation of financial statements in conformity with GAAP requires management to make estimates and assumptions that affect the reported amounts of assets and liabilities, the disclosure of contingent assets and liabilities at the date of the financial statements, and the reported amounts of increases and decreases in net assets from operations during the reporting period. Actual results could differ from those estimates.
Security Valuation – Securities listed on a securities exchange, market or automated quotation system for which quotations are readily available (except for securities traded on NASDAQ) are valued at the last quoted sale price on the primary exchange or market (foreign or domestic) on which they are traded, or, if there is no such reported sale, at the most recent quoted bid price. For securities traded on NASDAQ, the NASDAQ Official Closing Price is used. If available, debt securities are priced based upon valuations provided by independent, third-party pricing agents. Such values generally reflect the last reported sales price if the security is actively traded. The third-party pricing agents may also value debt securities at an evaluated bid price by employing methodologies that utilize actual market transactions, broker-supplied valuations, or other methodologies designed to identify the market value for such securities. Debt obligations with remaining maturities of 60 days or less may be valued at their amortized cost, if the Fair Value Committee (the “Committee”) of City National Rochdale, LLC (“City National Rochdale” or the “Adviser”) concludes that such amortized cost approximates market value after taking into account factors such as credit, liquidity and interest rate conditions as well as issuer specific factors. Investments in underlying registered investment companies are valued at their respective daily net assets in
CITY NATIONAL ROCHDALE FUNDS | PAGE 88
accordance with pricing procedures approved by their respective boards. The prices for foreign securities are reported in local currency and converted to U.S. Dollars using currency exchange rates. Prices for most securities held by the Funds are provided daily by recognized independent pricing agents. If a security price cannot be obtained from an independent, third-party pricing agent, the Funds seek to obtain a bid price from one or more independent brokers.
Securities for which market prices are not “readily available” are valued in accordance with fair value procedures (the “Fair Value Procedures”) approved by the Trust’s Board of Trustees (the “Board”). The Funds’ Fair Value Procedures are implemented through the Committee designated by the Adviser. Some of the more common reasons that may necessitate that a security be valued using the Fair Value Procedures include: the security’s trading has been halted or suspended; the security has been de-listed from a national exchange; the security’s primary trading market is temporarily closed at a time when, under normal conditions, it would be open; for international securities, market events that occur after the close of the foreign markets that make closing prices not representative of fair value; or the security’s primary pricing source is not able or willing to provide a price. When a security is valued in accordance with the Fair Value Procedures, the Committee will determine the value after taking into consideration relevant information reasonably available to the Committee.
In accordance with GAAP, the objective of a fair value measurement is to determine the price that would be received to sell an asset or paid to transfer a liability, in an orderly transaction between market participants at the measurement date (an exit price). The fair value hierarchy gives the highest priority to quoted prices (unadjusted) in active markets for identical assets or liabilities (Level 1) and the lowest priority to unobservable inputs (Level 3). The three levels of the fair value hierarchy are described below:
| | ● | Level 1 — Unadjusted quoted prices in active markets for identical, unrestricted assets or liabilities that the Funds have the ability to access at the measurement date; |
| | ● | Level 2 — Quoted prices in inactive markets, or inputs that are observable (either directly or indirectly) for substantially the full term of the asset or liability; and |
| | ● | Level 3 — Prices, inputs or exotic modeling techniques which are both significant to the fair value measurement and unobservable (supported by little or no market activity). |
Investments are classified within the level of the lowest significant input considered in determining fair value. Investments classified within Level 3, the fair value measurement of which considers several inputs, may include Level 1 or Level 2 inputs as components of the overall fair value measurement.
For the year ended September 30, 2024, there have been no changes to the Funds’ fair value methodologies. For more details on the investment classifications, refer to the Schedules of Investments.
Security Transactions and Related Income – Security transactions are accounted for on the trade date of the security purchase or sale. Costs used in determining the net realized capital gains or losses on the sale of securities are those of the specific securities sold. Interest income is recognized on an accrual basis and dividend income is recognized on the ex-dividend date. Purchase discounts and premiums on securities held by the Funds are accreted and amortized to maturity using the scientific method, which approximates the effective interest method over the holding period of a security, except for the Government Money Market Fund, which uses a straight line basis which is not materially different from the scientific method.
Repurchase Agreements – Securities pledged as collateral for repurchase agreements are held by BNY Mellon until maturity of the repurchase agreements. Provisions of the agreements and procedures adopted by the investment adviser require that the market value of the collateral, including accrued interest thereon, is sufficient in the event of default by the counterparty. The Funds also invest in tri-party repurchase agreements. Securities held as collateral for tri-party repurchase agreements are maintained by the broker’s custodian bank in a segregated account until maturity of the repurchase agreements. Provisions of the agreements require that the market value of the collateral, including accrued interest thereon, is sufficient in the event of default. If the counterparty defaults and the value of the collateral declines or if the counterparty enters into an insolvency proceeding, realization of the collateral by a Fund may be delayed or limited.
TBA Transactions – The Funds may engage in “to be announced” (“TBA”) security transactions. Such transactions involve a commitment by a Fund to purchase or sell securities for a predetermined price or yield, with payment and delivery taking place beyond the customary settlement period. The Funds record TBA securities on the trade date and maintain security positions such that sufficient liquid assets will be available to make payments for the securities purchased.
Expense Allocation – Common expenses incurred by the Funds are allocated among the Funds (i) based upon relative average daily net assets, (ii) as incurred on a specific identification basis, (iii) equally, or (iv) based upon a combination of the above, depending on the nature of the expenditure.
Classes – Class-specific expenses are borne by that class. Income, non class-specific expenses, and realized and unrealized gains/losses are allocated to the respective class on the basis of relative net asset value each day.
CITY NATIONAL ROCHDALE FUNDS | PAGE 89
notes to financial statements |
September 30, 2024 |
Dividends and Distributions to Shareholders – Dividends from net investment income are declared daily and paid to shareholders monthly for the Government Money Market Fund and Fixed Income Funds, except for the Fixed Income Opportunities Fund. Dividends from net investment income are declared and paid quarterly for Fixed Income Opportunities Fund and Equity Funds. Distributions from net realized capital gains are distributed to shareholders at least annually. Dividends and distributions are recorded on the ex-dividend date.
Foreign Currency – Values of investments denominated in foreign currencies are converted into U.S. Dollars using the spot market rate of exchange at the time of valuation. Purchases and sales of investments and dividend and interest income are translated into U.S. Dollars using the spot market rate of exchange prevailing on the respective dates of such transactions. The Funds do not isolate the portion of gains and losses on investments that is due to changes in the foreign exchange rates from that which is due to changes in market prices of investments. Foreign securities and currency transactions may involve certain considerations and risks not typically associated with those of domestic origin.
Forward Foreign Currency Contracts – A forward foreign currency contract is an agreement between two parties to buy or sell a currency at a set price on a future date. Forward contracts are marked to market daily and the change in market value is recorded as an unrealized gain/(loss) on forward foreign currency contracts in the Statements of Assets and Liabilities. When a contract is closed, a Fund records a realized gain or loss equal to the difference between the value of the contract at the time it was opened and the value at the time it was closed, which is included within the realized gain/(loss) on foreign currency transactions in the Statements of Operations. A Fund could be at risk if the counterparties are unable to meet the terms of the contracts or if the value of the currency changes unfavorably.
To reduce counterparty risk with respect to over-the-counter (“OTC”) transactions, the Fixed Income Opportunities Fund has entered into master netting arrangements, established within the Fixed Income Opportunities Fund’s International Swaps and Derivatives Association, Inc. (“ISDA”) master agreements, which allow the Fixed Income Opportunities Fund to make (or to have an entitlement to receive) a single net payment in the event of default (close-out netting) for outstanding payables and receivables with respect to certain OTC positions in forward foreign currency contracts for each individual counterparty. In addition, the Fixed Income Opportunities Fund may require that certain counterparties post cash and/or securities in collateral accounts to cover their net payment obligations for those derivative contracts subject to ISDA master agreements. If the counterparty fails to perform under these agreements, the cash and/or securities will be made available to the Fixed Income Opportunities Fund.
For financial reporting purposes, the Fixed Income Opportunities Fund does not offset derivative assets and derivative liabilities that are subject to netting arrangements in the Statements of Assets and Liabilities.
Bankruptcy or insolvency laws of a particular jurisdiction may impose restrictions on or prohibitions against the right of offset in bankruptcy, insolvency or other events.
Collateral terms are contract specific for OTC derivatives. For derivatives traded under an ISDA master agreement, the collateral requirements are typically calculated by netting the marked to market amount of each transaction under such agreement and comparing that amount to the value of any collateral currently pledged by the Fixed Income Opportunities Fund, or the counterparty.
For financial reporting purposes, cash collateral that has been pledged to cover obligations of the Fixed Income Opportunities Fund, if any, is reported separately on the Statements of Assets and Liabilities as cash pledged as collateral. Non-cash collateral pledged by the Fixed Income Opportunities Fund, if any, is noted in the Schedules of Investments. Generally, the amount of collateral due from or to a party must exceed a minimum transfer amount threshold before a transfer has to be made. To the extent the amounts due to the Fixed Income Opportunities Fund from the Fund’s counterparties are not fully collateralized, contractually or otherwise, the Fixed Income Opportunities Fund bears the risk of loss from counterparty nonperformance.
Futures Contracts – To the extent consistent with their investment objective and strategies, certain Funds may use futures contracts for tactical hedging purposes as well as to enhance the Funds’ returns. Initial margin deposits of cash or securities are made upon entering into futures contracts. The contracts are marked to market daily and the resulting changes in value are accounted for as unrealized gains or losses. Variation margin payments are paid or received, depending upon whether unrealized gains or losses are incurred. When a contract is closed, a Fund records a realized gain or loss equal to the difference between the proceeds from (or cost of) the closing transaction and the amount invested in the contract.
Risks of entering into futures contracts include the possibility that there will be an imperfect price correlation between the futures contract and the underlying securities. It is possible that a lack of liquidity for futures contracts could exist in the secondary market, resulting in an inability to close a position prior to its maturity date. Futures contracts also involve the risk that a Fund could lose more than the original margin deposit required to initiate a futures transaction.
CITY NATIONAL ROCHDALE FUNDS | PAGE 90
Finally, the risk exists that losses could exceed amounts disclosed on the Statements of Assets and Liabilities. Refer to each Fund’s Schedule of Investments for details regarding open futures contracts as of September 30, 2024, if applicable.
Swaps – A Fund may invest in swaps as a non-principal investment strategy. A swap is a financial instrument that typically involves the exchange of cash flows between two parties on specified dates (settlement dates), where the cash flows are based on agreed-upon measures such as prices, interest rates or indices. The nominal amount on which these cash flows are calculated is called the notional amount. Swaps are individually negotiated and structured to include exposure to a variety of different types of investments or market factors, such as interest rates, foreign currency rates, mortgage securities, corporate borrowing rates, security prices, indices or inflation rates.
Swaps may increase or decrease the overall volatility of the investments of a Fund and its share price. The performance of swaps may be affected by a change in the specific interest rate, currency, or other factors that determine the payments due to and from a Fund. If a swap calls for payments by a Fund, the Fund must be prepared to make such payments when due. In addition, if the counterparty’s creditworthiness declines, the value of a swap would be likely to decline, potentially resulting in losses.
Generally, a swap has a fixed maturity date that is agreed upon by the parties. The agreement can be terminated before the maturity date only under limited circumstances, such as default by one of the parties or insolvency, among others, and can be transferred by a party only with the prior written consent of the other party. A Fund may be able to eliminate its exposure under a swap either by assignment or by other disposition, or by entering into an offsetting swap with the same party or a similarly creditworthy party. If the counterparty is unable to meet its obligations under the contract, declares bankruptcy, defaults or becomes insolvent, a Fund may not be able to recover the money it expected to receive under the contract.
A swap can be a form of leverage, which can magnify a Fund’s gains or losses. In order to reduce the risk associated with leveraging, a Fund will cover its current obligations under swaps according to guidelines established by the SEC. If a Fund enters into a swap on a net basis, it will segregate assets with a daily value at least equal to the excess, if any, of the Fund’s accrued obligations under the swap over the accrued amount the Fund is entitled to receive under the agreement. If a Fund enters into a swap on other than a net basis, it will segregate assets with a value equal to the full amount of the Fund’s accrued obligations under the agreement.
Options Contracts – A Fund may also purchase put and call options. Purchasing call options tends to increase a Fund’s exposure to the underlying instrument. Purchasing put options tends to decrease a Fund’s exposure to the underlying instrument. When purchasing an option, a Fund will pay a premium which is included on the Fund’s Statement of Assets and Liabilities and subsequently marked to market to reflect the current value of the option. Premiums paid for purchasing options which expire are treated as realized losses. Certain options may be purchased with premiums to be determined on a future date. The premiums for these options are based upon implied volatility parameters at specified terms. The risk associated with purchasing put and call options is limited to the premium paid. Premiums paid for purchasing options which are exercised or closed are added to the amounts paid or offset against the proceeds on the underlying investment transaction to determine the realized gain or loss.
The net realized gain or loss on options contracts is reflected in the Statements of Operations and the net unrealized gains/(losses) are included as a component of the net change in unrealized appreciation/(depreciation) on options contracts in the Statements of Operations. Realized and changes in unrealized gains or losses on options contracts during the period as disclosed in the Statements of Operations serve as indicators of the volume of derivative activity for a Fund. As of September 30, 2024 and for the year then ended, there were no open options contracts.
Restricted Securities – Restricted securities include securities that have not been registered under the Securities Act of 1933, as amended, and securities that are subject to restrictions on resale.
A Fund may invest in restricted securities that are consistent with the Fund’s investment objective and investment strategies. While restricted securities are generally presumed to be illiquid, it may be determined that a particular restricted security is liquid. In some cases, the issuer of restricted securities has agreed to register such securities for resale, at the issuer’s expense either upon demand by a Fund or in connection with another registered offering of the securities. Investments in restricted securities are valued at fair value as determined in good faith in accordance with procedures adopted by the Board. It is possible that the estimated value may differ significantly from the amount that might ultimately be realized in the near term, and the difference could be material.
Master Limited Partnerships – Entities commonly referred to as “MLPs” are generally organized under state law as limited partnerships or limited liability companies. The Equity Income Fund may, as a non-principal investment strategy, invest in MLPs receiving partnership taxation treatment under the Internal Revenue Code of 1986, interests or “units” of which are traded on securities exchanges like shares of corporate stock.
CITY NATIONAL ROCHDALE FUNDS | PAGE 91
notes to financial statements |
September 30, 2024 |
To qualify as an MLP for U.S. Federal income tax purposes, an entity must receive at least 90% of its income from qualifying sources such as interest, dividends, real estate rents, gains from the sale or disposition of real property, income and gains from certain mineral or natural resources activities, income and gains from the transportation or storage of certain fuels, and, in certain circumstances, income and gains from commodities or futures, forwards and options with respect to commodities, and gains from the sale or other disposition of a capital asset held for the production of such income. Mineral or natural resources activities include exploration, development, production, mining, processing, refining, marketing and transportation (including pipelines) of oil and gas, minerals, geothermal energy, fertilizer, timber or industrial source carbon dioxide. An MLP consists of a general partner and limited partners (or in the case of MLPs organized as limited liability companies, a managing member and members). The general partner or managing member typically controls the operations and management of the MLP and has an ownership stake in the partnership. The limited partners or members, through their ownership of limited partner or member interests, provide capital to the entity, are intended to have no role in the operation and management of the entity, and receive cash distributions. The MLPs themselves generally do not pay U.S. Federal income taxes. Thus, unlike investors in corporate securities, direct MLP investors are generally not subject to double taxation (i.e., corporate level tax and tax on corporate dividends). Currently, most MLPs operate in the energy, natural resources or real estate sectors.
Investments in Affiliated Securities – The Fixed Income Funds and Equity Funds may invest excess cash in the Government Money Market Fund, the Municipal High Income Fund and/or the Fixed Income Opportunities Fund.
Commitments and Contingencies — As of September 30, 2024, the Fixed Income Opportunities Fund has contractual unfunded commitments to provide additional funding of $57.6 million to certain investments. The aforementioned commitments to investments are subject to certain terms and conditions prior to closing of the relevant transactions. There can be no assurance that such transactions will close as expected.
3. | DERIVATIVE TRANSACTIONS: |
The following tables include only Funds that had exposure to more than one type of risk from derivatives held throughout the year. For Funds that held derivatives throughout the year with exposure to only one type of risk, additional information can be found on the Schedule of Investments and the Statements of Operations.
The fair value of derivative instruments as of September 30, 2024, was as follows:
| | | Asset Derivatives | | | Liability Derivatives | |
| | Statement of
Assets and
Liabilities
Location | | | Fair Value
(000) | | | Statement of
Assets and
Liabilities
Location | | | Fair Value
(000) | |
Derivatives not accounted for as hedging instruments: |
Fixed Income Opportunities Fund |
Interest rate contracts | Net Assets — Unrealized appreciation on futures contracts | | $ | 68 | | Net Assets — Unrealized depreciation on futures contracts | | $ | — | |
Foreign exchange contracts | Unrealized gain on forward foreign currency contracts | | | 535 | | Unrealized loss on forward foreign currency contracts | | | (90 | ) |
Total derivatives not accounted for as hedging instruments | | | | | | $ | 603 | | | | | | | $ | (90 | ) |
Amount of realized gain or (loss) on derivatives recognized in income:
Derivatives not accounted for
as hedging instruments | | Forward
Currency
Contracts
(000) | | | Futures
(000) | | | Total
(000) | |
Fixed Income Opportunities Fund |
Interest rate contracts | | $ | — | | | $ | (117 | ) | | $ | (117 | ) |
Foreign exchange contracts | | | (11,280 | ) | | | — | | | | (11,280 | ) |
Total | | $ | (11,280 | ) | | $ | (117 | ) | | $ | (11,397 | ) |
Change in unrealized appreciation or (depreciation) on derivatives recognized in income:
Derivatives not accounted for
as hedging instruments | | Forward
Currency
Contracts
(000) | | | Futures
(000) | | | Total
(000) | |
Fixed Income Opportunities Fund |
Interest rate contracts | | $ | — | | | $ | (527 | ) | | $ | (527 | ) |
Foreign exchange contracts | | | (5,029 | ) | | | — | | | | (5,029 | ) |
Total | | $ | (5,029 | ) | | $ | (527 | ) | | $ | (5,556 | ) |
The following table discloses the volume of the Fixed Income Opportunities Fund’s forward foreign currency contracts and futures contracts activity during the year ended September 30, 2024:
Fixed Income Opportunities Fund | | (000) | |
Forwards: | | | | |
Average Notional Balance Long | | $ | 1,921 | |
Average Notional Balance Short | | | 348,887 | |
Futures: | | | | |
Average Notional Balance Long | | | — | |
Average Notional Balance Short | | | 18,236 | |
CITY NATIONAL ROCHDALE FUNDS | PAGE 92
The following tables present, by derivative type, the Fixed Income Opportunities Fund’s OTC derivative assets and liabilities net of the related collateral posted for the benefit of the Fixed Income Opportunities Fund at September 30, 2024:
Derivative Type | | Derivative
Assets
Subject to
a Netting
Agreement
or Similar
Arrangement
(000) | | | Derivative
Available for
Offset
(000) | | | Collateral
Received
(000) | | | Net Amount
(000) | |
Fixed Income Opportunities Fund |
Forward Foreign Currency Contracts | | | | | | | | | | | | | | | | |
HSBC | | $ | 2 | | | $ | — | | | $ | — | | | $ | 2 | |
U.S. Bank | | | 533 | | | | (88 | ) | | | — | | | | 445 | |
Total | | | 535 | | | | (88 | ) | | | — | | | | 447 | |
Derivative Type | | Derivative
Liabilities
Subject to
a Netting
Agreement
or Similar
Arrangement
(000) | | | Derivative
Available for
Offset
(000) | | | Collateral
Received
(000) | | | Net Amount
(000) | |
Fixed Income Opportunities Fund |
Forward Foreign Currency Contracts | | | | | | | | | | | | | | | | |
BNP Paribas | | $ | (2 | ) | | $ | — | | | $ | — | | | $ | (2 | ) |
State Street | | | — | | | | — | | | | — | | | | — | |
U.S. Bank | | | (88 | ) | | | 88 | | | | — | | | | — | |
Total | | | (90 | ) | | | 88 | | | | — | | | | (2 | ) |
4. | ADMINISTRATION, TRANSFER AGENT, DISTRIBUTION AND SHAREHOLDER SERVICES AGREEMENTS: |
Pursuant to an Amended and Restated Administration Agreement dated January 1, 2013, as amended (the “Agreement”), SEI Investments Global Funds Services (the “Administrator”), a wholly owned subsidiary of SEI Investments Company, acts as the Trust’s administrator. Under the terms of the Agreement, the Administrator is entitled to receive an annual fee based on the average daily net assets of the Trust, subject to a minimum annual fee.
The Trust has adopted a Rule 12b-1 Distribution Plan (“the Plan”) with respect to Class N and Class S Shares that allows each Fund to pay distribution fees. Pursuant to the Plan, SEI Investments Distribution Co. (the “Distributor”) may receive a distribution fee, computed daily and paid monthly, at the annual rate of 0.50% of the average daily net assets of the Class S Shares and 0.30% of the average daily net assets of the Class N Shares of the Government Money Market Fund and 0.25% of the Class N Shares of the Fixed Income Funds and Equity Funds, which may be used by the Distributor to provide compensation for sales support and distribution-related activities. Pursuant to a Distribution Coordination Agreement, the entirety of the fees received by the Distributor pursuant to the Plan is transmitted to CNR Securities, LLC (“CNR Securities”) as Sub-Distribution Coordinator. CNR Securities then reallows those fees to broker-dealers and service providers, including the Adviser and other affiliates, for payments for distribution services of the type identified in the Plan, and retains any undistributed balance of fees received from the Distributor.
The Government Money Market Fund has contractually agreed to limit the distribution fee payable by Class S shares of the Fund to 0.45% through January 31, 2025. Any time prior to January 31, 2025, the arrangement may be terminated without penalty by the Board.
U.S. Bank Global Fund Services (the “Transfer Agent”) serves as transfer agent for the Trust and provides services at an annual rate of $20,000 per share class for all Funds plus other transaction based fees and out-of-pocket expenses.
The Trust has entered into a Shareholder Services Agreement that permits payment of compensation to City National Bank (“CNB”), its affiliates (including City National Rochdale) and others, which provide certain specified shareholder services to shareholders of all classes of each Fund, except for the Institutional Class shares. As compensation for the provision of such services, each Fund will pay CNB a fee of 0.25% of the average daily net assets of the applicable classes on an annual basis, payable monthly.
CNB and City National Rochdale have agreed to voluntarily waive portions of their shareholder servicing fees with respect to certain Funds. For the year ended September 30, 2024, CNB and City National Rochdale received $27,347,753 in shareholder servicing fees from the Trust.
Certain officers of the Trust are also officers or employees of City National Rochdale, CNB or the Administrator. Such officers are paid no fees by the Trust for serving as officers of the Trust.
5. | INVESTMENT ADVISORY FEES AND OTHER AGREEMENTS: |
Under the terms of the current investment management agreement, City National Rochdale receives an annual fee equal to a percentage of the average daily net assets of each Fund, as follows:
Fund | Fee |
Government Money Market Fund | 0.26% |
Municipal High Income Fund | 0.50 |
Fixed Income Opportunities Fund | 0.50 |
Equity Income Fund | 0.50 |
U.S. Core Equity Fund | 0.40 |
CITY NATIONAL ROCHDALE FUNDS | PAGE 93
notes to financial statements |
September 30, 2024 |
City National Rochdale has contractually agreed to waive the management fee for the Government Money Market Fund such that the fee charged is 0.15% through January 31, 2025. Anytime prior to January 31, 2025, the arrangement may be terminated without penalty (a) by the Board, or (b) by the Adviser effective no earlier than January 31, 2025, upon at least 60 days’ prior written notice. Management fees waived by the Adviser pursuant to this arrangement will not be eligible for reimbursement by the Fund to the Adviser. The Adviser has agreed to voluntarily waive additional Management Fees for the Fund such that the fee charged is 0.04%. This additional voluntary waiver may be terminated at any time.
As of September 30, 2024, Alcentra LTD, Alcentra NY, LLC, AllFinancial Partners II LLC, Federated Investment Management Company, Seix Investment Advisors LLC, and T. Rowe Price Associates, Inc. act as the investment sub-advisers with respect to the Fixed Income Opportunities Fund.
Sub-adviser fees are paid by City National Rochdale.
City National Rochdale has voluntarily agreed to limit its fees or reimburse expenses to the extent necessary to keep operating expenses at or below certain percentages of certain of the Funds’ respective average daily net assets. The voluntary expense limitations (expressed as percentages of the average daily net assets) are as follows:
| Fixed Income
Opportunities
Fund |
Institutional Class | n/a |
Class N | 1.09% |
Servicing Class | n/a |
6. | INVESTMENT TRANSACTIONS: |
The cost of security purchases and proceeds from the sale and maturities of securities, other than temporary investments in short-term securities for the year ended September 30, 2024, were as follows for the Fixed Income Funds and Equity Funds:
| | | Purchases | | | Sales and Maturities | |
Fund | | U.S. Gov’t
(000) | | | Other
(000) | | | U.S. Gov’t
(000) | | | Other
(000) | |
Municipal High Income Fund | | $ | — | | | $ | 162,504 | | | $ | — | | | $ | 463,845 | |
Fixed Income Opportunities Fund | | | — | | | | 503,298 | | | | — | | | | 848,008 | |
Equity Income Fund | | | — | | | | 52,126 | | | | — | | | | 109,445 | |
U.S. Core Equity | | | — | | | | 77,883 | | | | — | | | | 131,751 | |
The Funds may purchase or sell investment securities in transactions with affiliated entities under procedures adopted by the Board, pursuant to the 1940 Act. These transactions are effected at market rates without incurring broker commissions.
7. | FEDERAL TAX INFORMATION: |
Each Fund intends to continue to qualify as a regulated investment company for U.S. Federal income tax purposes and distribute all of its taxable income and net capital gains. Accordingly, no provisions for U.S. Federal income taxes are required.
Management has analyzed the Funds’ tax positions taken on U.S. Federal income tax returns for all open tax years and has concluded that as of September 30, 2024, no provision for income tax would be required in the Funds’ financial statements. The Funds’ U.S. Federal and state income and U.S. Federal excise tax returns for tax years for which the applicable statutes of limitations have not expired are subject to examination by the Internal Revenue Service and state departments of revenue.
The Funds may be subject to taxes imposed by countries in which they invest, with respect to their investments in issuers existing or operating in such countries. Such taxes are generally based on income earned. The Funds accrue such taxes when the related income is earned.
The timing and characterization of certain income and capital gains distributions are determined annually in accordance with U.S. Federal tax regulations, which may differ from accounting principles generally accepted in the United States of America. As a result, net investment income/(loss) and net realized gain/(loss) on investment transactions for a reporting period may differ significantly from distributions during such period. These book/tax differences may be temporary or permanent. To the extent these differences are permanent in nature, they are charged or credited to distributable earnings or paid-in capital, as appropriate, in the period that the differences arise.
The permanent difference that is credited or charged to Paid-in Capital and Distributable Earnings as of September 30, 2024 is primarily related to investments in partnerships and cumulative CFC book income/gain that have been reclassified to (from) the following accounts:
| | | Distributable
Earnings (Loss)
(000) | | | Paid-in Capital
(000) | |
Fixed Income Opportunities Fund | | $ | 31,709 | | | $ | (31,709 | ) |
CITY NATIONAL ROCHDALE FUNDS | PAGE 94
The tax character of dividends and distributions declared during the years ended September 30, 2024, and September 30, 2023, were as follows:
Fund | | Tax Exempt
Income
(000) | | | Ordinary
Income
(000) | | | Long-Term
Capital
Gain
(000) | | | Return of
Capital
(000) | | | Total
(000) | |
Government Money Market Fund |
2024 | | $ | — | | | $ | 369,854 | | | $ | — | | | $ | — | | | $ | 369,854 | |
2023 | | | — | | | | 260,999 | | | | — | | | | — | | | | 260,999 | |
Municipal High Income Fund |
2024 | | $ | 38,753 | | | $ | 1,461 | | | $ | — | | | $ | — | | | $ | 40,214 | |
2023 | | | 46,813 | | | | 2,078 | | | | — | | | | — | | | | 48,891 | |
Fixed Income Opportunities Fund |
2024 | | $ | — | | | $ | 122,108 | | | $ | — | | | $ | — | | | $ | 122,108 | |
2023 | | | — | | | | 210,639 | | | | — | | | | — | | | | 210,639 | |
Equity Income Fund |
2024 | | $ | — | | | $ | 4,143 | | | $ | — | | | $ | — | | | $ | 4,143 | |
2023 | | | — | | | | 5,535 | | | | 25,253 | | | | — | | | | 30,788 | |
U.S. Core Equity Fund |
2024 | | $ | — | | | $ | 2,943 | | | $ | 41,338 | | | $ | — | | | $ | 44,281 | |
2023 | | | — | | | | 1,038 | | | | 7,275 | | | | — | | | | 8,313 | |
As of September 30, 2024, the components of Distributable Earnings/(Accumulated Losses) on a tax basis were as follows:
Fund | | Undistributed
Tax-Exempt
Income
(000) | | | Undistributed
Ordinary
Income
(000) | | | Undistributed
Long-Term
Capital Gain
(000) | | | Capital Loss
Carryforwards
(000) | | | Post-October
Losses
(000) | | | Unrealized
Appreciation
(Depreciation)
(000) | | | Other
Temporary
Differences
(000)* | | | Total
Distributable
Earnings
(Accumulated
Losses)
(000) | |
Government Money Market Fund | | $ | — | | | $ | 30,645 | | | $ | — | | | $ | — | | | $ | — | | | $ | — | | | $ | (30,618 | ) | | $ | 27 | |
Municipal High Income Fund | | | 4,934 | | | | — | | | | — | | | | (244,615 | ) | | | — | | | | (21,126 | ) | | | (2,774 | ) | | | (263,581 | ) |
Fixed Income Opportunities Fund | | | — | | | | — | | | | — | | | | (796,638 | ) | | | — | | | | (260,257 | ) | | | (1,448 | ) | | | (1,058,343 | ) |
Equity Income Fund | | | — | | | | 156 | | | | 9,856 | | | | — | | | | — | | | | 39,257 | | | | 9 | | | | 49,278 | |
U.S. Core Equity Fund | | | — | | | | — | | | | 59,828 | | | | — | | | | — | | | | 212,470 | | | | — | | | | 272,298 | |
* | Other temporary differences primarily consist of dividend payable and Late Year Ordinary Losses. |
Post-October losses and Late-Year losses, if any, represent losses realized on investments and foreign currency transactions from November 1, 2023, through September 30, 2024, that, in accordance with U.S. Federal income tax regulations, the Funds have elected to defer and treat as having arisen in the following fiscal year. The Funds did not elect to defer any Post-October Losses in the current year.
Late-Year losses, if any, represent certain ordinary and specified losses which occur after December 31, 2023 and October 31, 2023, respectively, through September 30, 2024, that, in accordance with U.S. Federal income tax regulations, the Funds have elected to defer and treat as having arisen in the following fiscal year. The Fixed Income Opportunities Fund elected to defer $1,450,532 of such losses in the current year.
The Funds have capital losses carried forward as follows:
Fund | | Short-Term Loss
(000) | | | Long-Term Loss
(000) | | | Total
(000) | |
Municipal High Income Fund | | $ | 107,581 | | | $ | 137,034 | | | $ | 244,615 | |
Fixed Income Opportunities Fund | | | 152,225 | | | | 644,413 | | | | 796,638 | |
The aggregate gross unrealized appreciation on investments, the aggregate gross unrealized depreciation on investments and the net unrealized appreciation/(depreciation) for tax purposes as of September 30, 2024, for each of the Fixed Income Funds’ and Equity Funds’ investments were as follows:
Fund | | Federal
Tax Cost
(000) | | | Aggregate
Gross
Unrealized
Appreciation
(000) | | | Aggregate
Gross
Unrealized
Depreciation
(000) | | | Net
Unrealized
Appreciation
(Depreciation)
(000) | |
Municipal High Income Fund | | $ | 851,066 | | | $ | 38,309 | | | $ | (59,435 | ) | | $ | (21,126 | ) |
Fixed Income Opportunities Fund | | | 2,186,573 | | | | 46,031 | | | | (306,288 | ) | | | (260,257 | ) |
Equity Income Fund | | | 107,795 | | | | 39,945 | | | | (688 | ) | | | 39,257 | |
U.S. Core Equity Fund | | | 200,064 | | | | 214,188 | | | | (1,718 | ) | | | 212,470 | |
CITY NATIONAL ROCHDALE FUNDS | PAGE 95
notes to financial statements |
September 30, 2024 |
At September 30, 2024, the Government Money Market Fund’s cost of securities for U.S. Federal income tax purposes approximates the cost disclosed in the Schedule of Investments.
In the normal course of business, the Funds enter into contracts that provide general indemnifications. The Funds’ maximum exposure under these arrangements is dependent on future claims that may be made against the Funds and, therefore, cannot be established; however, based on experience, the risk of loss from such claims is considered remote.
The Fixed Income Opportunities Fund and the Equity Income Fund may invest in exchange-traded notes (“ETNs”), each as a non-principal investment strategy. ETNs are unsecured debt obligations of investment banks which are traded on exchanges and the returns of which are linked to the performance of market indexes. In addition to trading ETNs on exchanges, investors may redeem ETNs directly with the issuer on a weekly basis, typically in a minimum amount of 50,000 units, or hold the ETNs until maturity. ETNs are riskier than ordinary unsecured debt securities and have no principal protection. The Funds will generally invest in ETNs which are linked to commodities indexes. A Fund’s investment in an ETN may be influenced by many unpredictable factors, including highly volatile commodities prices, changes in supply and demand relationships, weather, agriculture, trade, changes in interest rates, and monetary and other governmental policies, action and inaction. Investing in ETNs is not equivalent to investing directly in index components or the relevant index itself. Because ETNs are debt securities, they possess credit risk; if the issuer has financial difficulties or goes bankrupt, the investor may not receive the return expected and may suffer a loss.
The Municipal High Income Fund and Fixed Income Opportunities Fund may invest in lower-rated corporate bonds, known as high yield bonds. High yield bonds involve greater risks of default, downgrade, or price declines and are more volatile than investment grade securities. Issuers of high yield bonds may be more susceptible than other issuers to economic downturns and investors are subject to a greater risk that the issuer may not be able to pay interest or dividends, or repay the principal upon maturity. Discontinuation of these payments could have a substantial adverse effect on the market value of the security.
The Fixed Income Opportunities Fund may invest in asset-backed and mortgage-backed securities. As a general rule, prepayments of the principal of the loans underlying mortgage-backed or other pass-through securities increase during a period of falling interest rates and decrease during a period of rising interest rates. In periods of declining interest rates, as a result of prepayments a Fund may be required to reinvest its assets in securities with lower interest rates. In periods of increasing interest rates, the securities subject to prepayment risk held by a Fund may exhibit price characteristics of longer-term debt securities.
The Fixed Income Opportunities Fund may invest in bank loans. Bank loans are not traded on an exchange and purchasers and sellers of bank loans generally rely on market makers, typically the administrative agent under a bank loan, to effect private sales transactions. As a result, bank loans may have relatively less liquidity than other types of fixed income assets, and a Fund may be more likely to incur losses on the sale of bank loans than on other, more liquid, investments.
LIBOR Risk
LIBOR was a leading benchmark or reference rate for various commercial and financial contracts, including corporate and municipal bonds, bank loans, asset-backed and mortgage-related securities, interest rate swaps and other derivatives. On July 27, 2017, the United Kingdom’s Financial Conduct Authority (FCA) announced the gradual phase out of the LIBOR rate, with nearly all LIBOR rate publications having ceased as of June 30, 2023 (some LIBOR rates continue to be published, but only on a temporary and synthetic basis). Alternatives to LIBOR have been established and others may be developed. The U.S. Federal Reserve, in conjunction with the Alternative Reference Rates Committee, a steering committee comprised of large U.S. financial institutions, has identified the Secured Overnight Financial Rate (“SOFR”) as the preferred alternative rate to LIBOR. SOFR is a relatively new index calculated by short-term repurchase agreements, backed by U.S. Treasury securities. There remains uncertainty surrounding the nature of any replacement rates.
The transition to a new reference rate may result in (i) increased volatility or illiquidity in markets for instruments or contracts that previously relied on or still rely on LIBOR; (ii) a reduction in the value of certain instruments or contracts held by a Fund; (iii) reduced effectiveness of related Fund transactions, such as hedging; (iv) additional tax, accounting and regulatory risks; or (v) costs incurred in connection with closing out positions and entering into new trades. Any pricing adjustments to a Fund’s investments resulting from a substitute reference rate may also adversely affect the Fund’s performance and/or NAV. There is no assurance that the composition or characteristics of any such alternative reference rate will be similar to or produce the same value or economic equivalence as LIBOR or that instruments or contracts using an alternative rate will have the same volume or liquidity.
A more complete description of risks is included in the Funds’ prospectus and statement of additional information.
CITY NATIONAL ROCHDALE FUNDS | PAGE 96
9. | CAPITAL SHARES ISSUED AND REDEEMED: |
Capital share activity for the year ended September 30, 2024, and the year ended September 30, 2023, was as follows (000):
| | | Government Money Market Fund | | | | | | | Municipal High
Income Fund | |
| | | 2024 | | | 2023 | | | | | | | 2024 | | | 2023 | |
CAPITAL SHARES ISSUED AND REDEEMED: | | | | | | | | | | | | | | | | |
Class N: | | | | | | | | | | | | | | | | | | | | |
Shares issued | | | 429,391 | | | | 2,349,457 | | | | | | | | 14,861 | | | | 25,198 | |
Shares issued in lieu of dividends and distributions | | | 6,920 | | | | 20,194 | | | | | | | | 1,346 | | | | 1,553 | |
Shares redeemed | | | (1,100,521 | ) | | | (2,052,969 | ) | | | | | | | (29,862 | ) | | | (48,815 | ) |
Net Class N transactions | | | (664,210 | ) | | | 316,682 | | | | | | | | (13,655 | ) | | | (22,064 | ) |
Class S: | | | | | | | | | | | | | | | | | | | | |
Shares issued | | | 4,109,648 | | | | 4,509,922 | | | | | | | | — | | | | — | |
Shares issued in lieu of dividends and distributions | | | — | | | | — | | | | | | | | — | | | | — | |
Shares redeemed | | | (4,348,034 | ) | | | (3,764,560 | ) | | | | | | | — | | | | — | |
Net Class S transactions | | | (238,386 | ) | | | 745,362 | | | | | | | | — | | | | — | |
Servicing Class: | | | | | | | | | | | | | | | | | | | | |
Shares issued | | | 15,193,996 | | | | 22,199,561 | | | | | | | | 6,272 | | | | 12,384 | |
Shares issued in lieu of dividends and distributions | | | 266,028 | | | | 145,596 | | | | | | | | 294 | | | | 412 | |
Shares redeemed | | | (14,732,734 | ) | | | (19,921,782 | ) | | | | | | | (26,280 | ) | | | (27,792 | ) |
Net Servicing Class transactions | | | 727,290 | | | | 2,423,375 | | | | | | | | (19,714 | ) | | | (14,996 | ) |
| | | Fixed Income Opportunities Fund | | | | | | | Equity Income Fund | | | | | | | U.S. Core Equity Fund | |
| | | 2024 | | | 2023 | | | | | | | 2024 | | | 2023 | | | | | | | 2024 | | | 2023 | |
CAPITAL SHARES ISSUED AND REDEEMED: | | | | | | | | | | | | | | | | | | | | | | | | | | | | |
Institutional Class: | | | | | | | | | | | | | | | | | | | | | | | | | | | | | | | | |
Shares issued | | | — | | | | — | | | | | | | | — | | | | — | | | | | | | | 4 | | | | 1 | |
Shares issued in lieu of dividends and distributions | | | — | | | | — | | | | | | | | — | | | | — | | | | | | | | 1 | | | | — | |
Shares redeemed | | | — | | | | — | | | | | | | | — | | | | — | | | | | | | | (1 | ) | | | (1 | ) |
Net Institutional Class transactions | | | — | | | | — | | | | | | | | — | | | | — | | | | | | | | 4 | | | | — | |
Class N: | | | | | | | | | | | | | | | | | | | | | | | | | | | | | | | | |
Shares issued | | | 17,034 | | | | 21,051 | | | | | | | | 380 | | | | 800 | | | | | | | | 1,588 | | | | 991 | |
Shares issued in lieu of dividends and distributions | | | 4,414 | | | | 7,601 | | | | | | | | 79 | | | | 581 | | | | | | | | 890 | | | | 166 | |
Shares redeemed | | | (41,216 | ) | | | (78,552 | ) | | | | | | | (2,209 | ) | | | (1,542 | ) | | | | | | | (2,448 | ) | | | (1,443 | ) |
Net Class N transactions | | | (19,768 | ) | | | (49,900 | ) | | | | | | | (1,750 | ) | | | (161 | ) | | | | | | | 30 | | | | (286 | ) |
Servicing Class: | | | | | | | | | | | | | | | | | | | | | | | | | | | | | | | | |
Shares issued | | | — | | | | — | | | | | | | | — | | | | — | | | | | | | | 795 | | | | 555 | |
Shares issued in lieu of dividends and distributions | | | — | | | | — | | | | | | | | — | | | | — | | | | | | | | 90 | | | | 18 | |
Shares redeemed | | | — | | | | — | | | | | | | | — | | | | — | | | | | | | | (1,449 | ) | | | (1,148 | ) |
Net Servicing Class transactions | | | — | | | | — | | | | | | | | — | | | | — | | | | | | | | (564 | ) | | | (575 | ) |
CITY NATIONAL ROCHDALE FUNDS | PAGE 97
notes to financial statements |
September 30, 2024 |
The Funds, except for the Government Money Market Fund, have an unsecured Loan Agreement (“LOC”) with U.S. Bank N.A. Under the terms of the LOC, borrowings for an individual Fund are limited to either the lesser of 10% of the Fund’s net assets or an explicit amount on the LOC. Interest is charged to a Fund based on its borrowings at prime rate minus 0.50%. The line of credit matures, unless renewed by September 3, 2025. The line of credit is with the Custodian. The Funds have authorized the Custodian to charge any of the accounts of the Funds for any missed payments. Interest expense amounts are shown as Interest Expense on Borrowings on the Statements of Operations.
Borrowing activity under the LOC for the year ended September 30, 2024, was as follows:
Fund | | Maximum
Amount
of Line of
Credit
(000) | | | Interest
Expense
(000) | | | Average
Rate | | | Average
Borrowings
(000) | | | Maximum
Amount
Outstanding
(000) | |
Municipal High Income Fund | | $ | 300,000 | | | $ | 1 | | | | 8.00 | % | | $ | 1,360 | | | $ | 1,450 | |
Fixed Income Opportunities Fund | | | 300,000 | | | | 936 | | | | 8.00 | % | | | 23,913 | | | | 80,517 | |
Equity Income Fund | | | 300,000 | | | | 7 | | | | 8.00 | % | | | 517 | | | | 1,937 | |
For the year ended September 30, 2024 there was no LOC activity outstanding.
11. SUBSEQUENT EVENTS:
The Trust has evaluated the need for additional disclosures and/or adjustments resulting from subsequent events. Based on this evaluation, no adjustments were required to the financial statements, and no issues were noted to disclose.
CITY NATIONAL ROCHDALE FUNDS | PAGE 98
report of independent registered public accounting firm |
|
To the Shareholders and Board of Trustees
of City National Rochdale Funds
Opinion on the Financial Statements
We have audited the accompanying statements of assets and liabilities, including the schedules of investments, of City National Rochdale Government Money Market Fund, City National Rochdale Municipal High Income Fund, City National Rochdale Fixed Income Opportunities Fund, City National Rochdale Equity Income Fund, and City National Rochdale U.S. Core Equity Fund (the “Funds”), each a series of City National Rochdale Funds, as of September 30, 2024, the related statements of operations and cash flows (for City National Rochdale Fixed Income Opportunities Fund only) for the year then ended, the statements of changes in net assets and the financial highlights for each of the years in the two-year period then ended, and the related notes (collectively referred to as the “financial statements”). In our opinion, the financial statements present fairly, in all material respects, the financial position of each of the Funds as of September 30, 2024, the results of their operations and cash flows (for City National Rochdale Fixed Income Opportunities Fund only) for the year then ended, and the changes in net assets and financial highlights for each of the years in the two-year period then ended, in conformity with accounting principles generally accepted in the United States of America.
The Funds’ financial highlights for the years ended September 30, 2022, and prior, were audited by another auditor whose report, dated November 29, 2022, expressed an unqualified opinion on those financial statements and financial highlights.
Basis for Opinion
These financial statements are the responsibility of the Funds’ management. Our responsibility is to express an opinion on the Funds’ financial statements based on our audits. We are a public accounting firm registered with the Public Company Accounting Oversight Board (United States) (“PCAOB”) and are required to be independent with respect to the Funds in accordance with the U.S. federal securities laws and the applicable rules and regulations of the Securities and Exchange Commission and the PCAOB.
We conducted our audits in accordance with the standards of the PCAOB. Those standards require that we plan and perform the audits to obtain reasonable assurance about whether the financial statements are free of material misstatement whether due to error or fraud.
Our audits included performing procedures to assess the risks of material misstatement of the financial statements, whether due to error or fraud, and performing procedures that respond to those risks. Such procedures included examining, on a test basis, evidence regarding the amounts and disclosures in the financial statements. Our procedures included confirmation of securities owned as of September 30, 2024, by correspondence with the custodians, brokers, agent banks, insurance companies and by other appropriate auditing procedures where replies were not received. Our audits also included evaluating the accounting principles used and significant estimates made by management, as well as evaluating the overall presentation of the financial statements. We believe that our audits provide a reasonable basis for our opinion.
We have served as the Funds’ auditor since 2023.
COHEN & COMPANY, LTD.
Philadelphia, Pennsylvania
November 27, 2024
CITY NATIONAL ROCHDALE FUNDS | PAGE 99
notice to shareholders (Unaudited) |
September 30, 2024 |
For shareholders that do not have a September 30, 2024, taxable year end, this notice is for informational purposes only. For shareholders with a September 30, 2024, taxable year end, please consult your tax advisor as to the pertinence of this notice.
For California income tax purposes, for the fiscal year ended September 30, 2024, the Municipal High Income Fund is designating 7.93% of its distributions paid from net investment income as exempt-interest dividends under Section 17145 of the California Revenue and Taxation Code.
For Federal income tax purposes, for the fiscal year ended September 30, 2024, each Fund is designating the following items with regard to distributions paid during the year:
| | (A)
Long Term
Capital Gain
Distributions | (B)
Return of
Capital | (C)
Ordinary
Income
Distributions | (D)
Tax Exempt
Interest | (E)
Total
Distributions | (F)
Dividends
Qualifying
for Corporate
Dividends
Rec.
Deduction (1) | (G)
Qualifying
Dividend
Income (2) | (H)
U.S.
Government
Interest (3) | (I)
Interest
Related
Dividends (4) | (J)
Qualified
Short-Term
Capital Gain
Dividends (5) | (K)
Foreign Tax
Credit |
Government Money Market Fund | 0.00% | 0.00% | 100.00% | 0.00% | 100.00% | 0.00% | 0.00% | 77.63% | 79.60% | 100.00% | 0.00% |
Municipal High Income Fund(3) | 0.00% | 0.00% | 3.54% | 96.46% | 100.00% | 0.00% | 0.00% | 0.00% | 0.00% | 0.00% | 0.00% |
Fixed Income Opportunities Fund(3) | 0.00% | 0.00% | 100.00% | 0.00% | 100.00% | 0.00% | 0.00% | 0.00% | 0.00% | 0.00% | 0.00% |
Equity Income Fund(3) | 0.00% | 0.00% | 100.00% | 0.00% | 100.00% | 100.00% | 100.00% | 0.00% | 0.00% | 0.00% | 0.00% |
U.S. Core Equity Fund(3) | 93.35% | 0.00% | 6.65% | 0.00% | 100.00% | 100.00% | 100.00% | 0.00% | 0.00% | 100.00% | 0.00% |
(1) | “Dividends Received Deduction” represent dividends which qualify for the corporate dividends received deduction. |
(2) | “Qualifying Dividend Income” represent qualifying dividends as created by the Jobs and Growth Tax Relief Reconciliation Act of 2003. The Fund intends to designate the maximum amount permitted by law. |
(3) | “U.S. Government Interest” represent the amount of interest that was derived from direct U.S. Government obligations and distributed during the fiscal year. This amount is reflected as a percentage of ordinary income. Generally, interest from direct U.S. Government obligations is exempt from state income tax. However, for shareholders who are residents of California, Connecticut or New York, the statutory threshold requirements were not satisfied to permit exemption of these amounts from state income. |
(4) | “Interest Related Dividends” represent qualifying interest that is exempt from U.S. withholding tax when paid to foreign investors as created by the American Jobs Creation Act of 2004. |
(5) | “Short-Term Capital Gain Dividends” represent qualifying short-term capital gain that is exempt from U.S. withholding tax when paid to foreign investors as created by the American Jobs Creation Act of 2004. |
Items (A), (B), (C), (D), (E) and (K) are based on the percentage of each fund’s total distribution.
Items (F) and (G) are based on the percentage of “Ordinary Income Distributions.”
Item (H) is based on the percentage of gross income of each Fund.
Item (I) is based on the percentage of net investment income distributions.
Item (J) is based on the percentage of short-term capital gain distributions.
CITY NATIONAL ROCHDALE FUNDS | PAGE 100
board approval of advisory and sub-advisory agreement |
(Unaudited) |
The Board of Trustees (the “Board”) of City National Rochdale Funds (the “Trust”) is comprised of six Trustees, all of whom are “Independent Trustees” (i.e., not “interested persons” of the Trust as defined in the Investment Company Act of 1940, as amended). At in-person meetings held on April 3, 2024, and May 16, 2024, the Board considered and approved the renewal of the following advisory and sub-advisory agreements:
| | ● | The advisory agreement between City National Rochdale, LLC (the “Adviser”) and the Trust, on behalf of the City National Rochdale Government Money Market Fund (the “Money Market Fund”), City National Rochdale Municipal High Income Fund (the “Municipal High Income Fund”), City National Rochdale Fixed Income Opportunities Fund (the “Fixed Income Opportunities Fund”), City National Rochdale Equity Income Fund (the “Equity Income Fund”), and City National Rochdale U.S. Core Equity Fund (the “U.S. Core Equity Fund”) (each, a “Fund” and collectively, the “Funds”); |
| | ● | The advisory agreement between the Adviser and CNR FIOF Investments (Ireland) Limited (the “Irish Company”), a company organized under the laws of Ireland; |
| | ● | The sub-advisory agreement between the Adviser and Alcentra Limited, with respect to the Fixed Income Opportunities Fund; |
| | ● | The sub-advisory agreement among the Adviser, Alcentra Limited and Alcentra NY, LLC (“Alcentra NY” and together with Alcentra Limited, “Alcentra”), with respect to the Fixed Income Opportunities Fund; |
| | ● | The sub-advisory agreement between the Adviser and AllFinancial Partners II, LLC (“AllFinancial”), with respect to the Fixed Income Opportunities Fund; |
| | ● | The sub-advisory agreement between the Adviser and Federated Investment Management Company (“Federated”), with respect to the Fixed Income Opportunities Fund; |
| | ● | The sub-advisory agreement between the Adviser and Seix Investment Advisors LLC (“Seix”), with respect to the Fixed Income Opportunities Fund; and |
| | ● | The sub-advisory agreement between the Adviser and T. Rowe Price Associates, Inc. (“T. Rowe Price”), with respect to the Fixed Income Opportunities Fund. |
The advisory and sub-advisory agreements listed above are collectively referred to below as the “Agreements.” Alcentra Limited, Alcentra NY, AllFinancial, Federated, Seix, and T. Rowe Price are collectively referred to below as the “Sub-Advisers.”
General Information
The following information summarizes the Board’s considerations associated with its review of the Agreements. In connection with their deliberations, the Trustees considered such information and factors as they believed, in light of the legal advice furnished to them and their own business judgment, to be relevant. The Agreements were considered separately for each Fund and the Irish Company, although the Board took into account the common interests of the Funds and the Irish Company in its review. As described below, the Board considered the nature, quality and extent of the various services performed by the Adviser and each Sub-Adviser. In considering these matters, the Independent Trustees discussed the renewal of the Agreements with management and in private sessions with their independent counsel at which no representatives of the Adviser or the Sub-Advisers were present.
The Board reviewed extensive materials regarding investment results of the Adviser and each Sub-Adviser with respect to the Funds (or portions of the Fixed Income Opportunities Fund) they manage and the Irish Company, as applicable, advisory fee and expense comparisons, financial information with respect to the Adviser and each Sub-Adviser, descriptions of various functions such as compliance monitoring and portfolio trading practices, and information about the personnel providing various services to the Funds and the Irish Company. The Board also took into account information they received at past meetings of the Board and its committees with respect to these matters.
In deciding to renew the Agreements, the Board and the Independent Trustees did not identify a single factor as controlling and this summary does not describe all of the matters considered. In addition, each Board member did not necessarily attribute the same weight to each matter. However, the Board and the Independent Trustees concluded that each of the various factors referred to below favored such renewal.
CITY NATIONAL ROCHDALE, LLC
Nature, Extent and Quality of Services
In reviewing the services provided by the Adviser to the Funds and the Irish Company, the Board considered a variety of matters, including the overall quality and depth of the Adviser’s organization, its overall financial strength and stability, its
CITY NATIONAL ROCHDALE FUNDS | PAGE 101
board approval of advisory and sub-advisory agreement |
(Unaudited) (Continued) |
commitment to compliance with applicable laws and regulations and the systems in place to ensure compliance with those requirements, its portfolio trading and soft dollar practices, and its disaster recovery and contingency planning practices. The Board also considered the experience, capability and integrity of the Adviser’s senior management, the background, education and experience of the Adviser’s personnel, and its efforts to retain, attract and motivate capable personnel to serve the Funds and the Irish Company. With respect to the Fixed Income Opportunities Fund, the Board considered the process the Adviser utilizes to select the Sub-Advisers and proactively oversee the Sub-Advisers with respect to various investment, valuation and compliance matters. The Board found all of these matters to be satisfactory.
Investment Performance
The Board assessed the performance of each Fund compared with the returns of its respective benchmark index or indexes and the averages of the funds included in its respective fund universe selected by Lipper, Inc. (each, a “Lipper Universe”), for the one-, three-, five-, ten- and 15-year and since inception periods ended December 31, 2023, as applicable. In addition, the Board reviewed the performance of each Fund compared to the average returns of certain funds (each, a “Peer Group” and collectively, the “Peer Groups”) in the Fund’s Lipper Universe selected by the Funds’ administrator based on the Fund’s total net assets, for the one-, three-, five-, ten- and 15-year periods ended December 31, 2023, as applicable. With respect to the performance results of the Funds, the Trustees noted that the meeting materials indicated as follows:
| | ● | The Money Market Fund (Servicing Class) outperformed the average returns of the funds in the Lipper U.S. Government Money Market Classification Universe for the one-, three-, five-, ten- and 15-year periods, but underperformed the Lipper Universe average return (by 0.06%) for the since inception period. The Trustees observed that the Fund’s yield continued to increase in 2023 as the Federal Reserve continued its interest rate hiking cycle, and that the Fund had outperformed its Peer Group average returns over the one-, three-, five-, and ten-year periods through February 29, 2024. The Trustees also considered the Adviser’s explanation that the floating rate notes that were previously purchased had contributed to the growth of the Fund’s gross yield. |
| | ● | The Municipal High Income Fund (Servicing Class) underperformed the average returns of the funds in the Lipper High Yield Municipal Classification Universe (by 1.53% or less), and the Bloomberg 60% Tax-Exempt High Yield/40% Municipal Investment Grade Custom Capped Custom Weighted Unhedged USD Index returns (by 2.94% or less) for the one-, three-, five-, and ten-year and since inception periods. The Trustees considered the Adviser’s explanation that the Fund’s underperformance for the one-year period as compared to the Bloomberg 60% Tax-Exempt High Yield/40% Municipal Investment Grade Custom Capped Custom Weighted Unhedged USD Index was largely due to shorter, higher quality bonds in which the Index has a heavier weighting than the Fund. The Trustees also considered the Adviser’s expectation that this trend will reverse in 2024, as investors search for more yield and become more comfortable with lower inflation. The Trustees further considered the Adviser’s assertion that the net redemptions that occurred in 2023 caused the Fund to sell bonds at suboptimal times and prices, contributing to the underperformance, and that maintaining duration at the level of the Index is appropriate given the likelihood of continued interest rate volatility. |
| | ● | The Fixed Income Opportunities Fund (Class N) outperformed the Bloomberg Global Credit-Corp Total Return Hedged Index returns for the one- and three-year periods, but underperformed the Index returns (by 0.33% or less) for the five- and ten-year and since inception periods. The Fund outperformed the Blended Index (a hybrid index composed of 40% Bloomberg Multiverse Total Return Index Value Hedged USD, 35% S&P Global Leveraged Loan Index, and 25% Bloomberg Emerging Markets High Yield Index) returns for the one- and three-year periods, but underperformed the Blended Index returns (by 0.56% or less) for the five- and ten-year and since inception periods. The Fund outperformed the average return of the funds in the Lipper Global High Yield Funds Classification Universe for the one-year period, but underperformed the Lipper Universe average returns (by 1.84% or less) for the three-, five-, and ten-year and since inception periods. The Trustees observed the Fund’s 11.84% return for the year ended December 31, 2023, and its outperformance of the Blended Index for the same period. The Trustees also considered the Adviser’s belief that the Lipper Universe does not provide for a meaningful comparison to the Fund in terms of performance because the funds in the Lipper Universe generally do not have exposure to structured credit, leveraged loans or emerging market bonds, which constitute approximately 70% of the Fund’s assets. |
CITY NATIONAL ROCHDALE FUNDS | PAGE 102
| | ● | The Equity Income Fund (Class N) underperformed the Dow Jones U.S. Select Dividend Index returns (by 6.62% or less) and the Lipper Equity Income Funds Classification Universe average returns (by 16.49% or less) for the one-, three-, five-, ten- and 15-year and since inception periods. The Trustees considered the Adviser’s explanation that the Fund’s underperformance was primarily due to the underperformance in the financial services sector following the March 2023 regional bank failures, stock selection in the utilities sector, and the Fund’s modest defensive tilt in sector weightings and individual stock holdings. The Trustees also considered (i) the Adviser’s response as 2023 progressed, which included a moderation in the Fund’s defensive tilt towards neutral, (ii) the Fund’s recent 8.5% performance on an absolute basis, and (iii) the Fund’s track record of being a Lipper Leader in capital preservation and expenses for all time periods. |
| | ● | The U.S. Core Equity Fund (Institutional Class) outperformed the average returns of the funds in the Lipper Large Cap Core Funds Classification Universe for the five- and ten-year and since inception periods, but underperformed the Lipper Universe average returns (by 0.95% or less) for the one- and three-year periods. The Fund underperformed the S&P 500 Index returns (by 2.90% or less) for the one-, three-, five-, and ten-year and since inception periods. The Trustees observed the Fund’s one-year return of 23.39% and considered the Adviser’s assertion that the Fund’s positive returns were helped by its overweight positions in financial services and consumer staples distribution and retail, and its underweighted positions in defensive pharmaceuticals, biotechnology and life sciences. |
The Board concluded that the Adviser continued to provide high quality management and oversight services to the Funds and the Irish Company. The Board noted that the investment results of the Funds over the long term were generally competitive; that the Adviser had given reasonable explanations for the performance of those Funds that had underperformed relative to their benchmarks and Peer Groups and had explained the impact of market conditions on the performance of the Funds; that the Adviser’s compliance team had made enhancements to the Funds’ and Adviser’s compliance programs during the past year; that the Adviser had historically replaced portfolio managers and/or sub-advisers for Funds or strategies that experienced performance challenges; that the results for the Money Market Fund compared to its Peer Group were acceptable given the special services and investment focuses of the Fund; and that consideration of returns of market indexes needed to take into account that indexes do not reflect the expenses of operating mutual funds.
Advisory Fees and Fund Expenses
The Board then reviewed information regarding the advisory fees (both before and after waivers) charged by the Adviser to each Fund, and the total expenses (net of fee waivers) for the last fiscal year of a share class of each Fund (as percentages of their respective average annual net assets), as compared to those of the funds included in its respective Lipper Universe and Peer Group.
The Board observed that the meeting materials indicated as follows with respect to the Funds’ investment advisory fees (gross of fee waivers) as of December 31, 2023:
| | ● | The gross advisory fees paid by the Fixed Income Opportunities Fund, Equity Income Fund, and U.S. Core Equity Fund were below their respective Peer Group and Lipper Universe averages. |
| | ● | The gross advisory fees paid by the Money Market Fund and Municipal High Income Fund were below their respective Lipper Universe averages, but above their respective Peer Group averages. |
The Board noted that with the exception of the strategies listed below, the Adviser does not manage investment portfolios for other registered investment companies, pension funds or institutional accounts that have similar investment objectives and policies as the Funds, so it did not have a basis to compare certain Funds’ advisory fees with advisory fees charged by the Adviser to other comparable client accounts. The Board also noted that the Adviser manages discretionary client account assets in the Core Equity and Equity Income strategies, in accordance with investment policies similar to those of the U.S. Core Equity Fund and Equity Income Fund, respectively. The Trustees reviewed the Adviser’s fee schedules and concluded that the advisory fees charged to the U.S. Core Equity Fund and Equity Income Fund were generally in the range of, and in some instances lower than, the fees that the Adviser charged to manage client accounts using similar strategies as those used by those Funds. The Trustees considered the Adviser’s explanation that the fees published in its fee schedules are applicable to each client’s entire account, regardless of the strategies used to manage the assets in the account, and that such fees are subject to negotiation. The Trustees also noted that management of mutual fund assets requires compliance with certain requirements under the 1940 Act that do not apply to separate accounts that
CITY NATIONAL ROCHDALE FUNDS | PAGE 103
board approval of advisory and sub-advisory agreement |
(Unaudited) (Continued) |
the Adviser manages. The Trustees also considered that any net advisory fees retained by the Adviser with respect to the Funds, after the payment of any sub-advisory fees, are rebated to shareholders investing in the Funds through separate accounts managed by the Adviser.
The Board observed that the meeting materials indicated as follows with respect to the total expense ratios of each Fund (net of fee waivers):
| | ● | The total expense ratios of the Institutional Class of the U.S. Core Equity Fund, and the Servicing Class of the Money Market Fund and the U.S. Core Equity Fund, were below both their respective Peer Group and Lipper Universe averages. |
| | ● | The total expense ratio of the Servicing Class of the Municipal High Income Fund was below its Lipper Universe average, but above its Peer Group average. |
| | ● | The total expense ratios of Class N of the Money Market Fund, the Fixed Income Opportunities Fund, and the U.S. Core Equity Fund were below their respective Peer Group averages, but above their respective Lipper Universe averages. |
| | ● | The total expense ratios of Class N of the Equity Income Fund and the Municipal High Income Fund were above both their respective Peer Group and Lipper Universe averages. |
The Board concluded that the advisory fees charged by the Adviser were fair and reasonable in relation to the value of services provided, and the total expenses of each Fund continued to be reasonable in light of the services provided, noting the different expense structures and arrangements for shareholder services and distribution of the various classes of the Funds.
Profitability, Benefits to the Adviser and Economies of Scale
The Board next considered information prepared by the Adviser relating to its costs and profits with respect to the Funds for the year ended December 31, 2023. The Board also considered the benefits received by the Adviser and its affiliates as a result of the Adviser’s relationship with the Funds (other than the investment advisory fees paid to the Adviser), including fees paid to the Adviser, City National Bank (“CNB”), City National Securities, Inc., and CNR Securities, LLC for providing certain shareholder servicing and/or sub-distribution services to the Funds and/or their shareholders, as applicable; benefits to CNB’s brokerage and wealth management business as a result of the availability of the Funds to its customers; and any research received from broker-dealers that execute transactions on behalf of the Funds. The Trustees recognized the competitiveness of the registered fund industry and the importance of an investment adviser’s long-term profitability, including for maintaining management stability and accountability. The Board recognized the difficulty in evaluating an investment adviser’s profitability with respect to the funds it manages in the context of an adviser with multiple lines of business, and noted that other profitability methodologies might also be reasonable. The Board observed that the profits of the Adviser from its relationships with the Funds were reasonable.
The Board also considered potential economies of scale realized by the Adviser as the Funds grow and how any such economies are shared with the Funds, reviewing information prepared by the Adviser relating to the Trust’s assets, as well as the assets of each Fund. The Board considered the Adviser’s explanation that it shares any economies of scale achieved with Fund shareholders through means other than breakpoints, such as expense caps and fee waivers, and the investments that the Adviser had made in its business over the past year, including devoting resources to innovation. Based on this explanation, the Board concluded that although there were no advisory fee breakpoints, the existing fee structure of each Fund reflected an appropriate sharing of any efficiencies or economies of scale to date and noted that it would have the opportunity to periodically reexamine the appropriateness of the advisory fees payable to the Adviser in light of any economies of scale experienced in the future.
Conclusion
The Board and the Independent Trustees concluded that, based on the various factors they had reviewed, the compensation payable to the Adviser under the advisory agreements was fair and reasonable in light of the nature and quality of the services the Adviser provided to the Funds and the Irish Company, and that renewal of the advisory agreements would be in the best interests of each Fund and the Irish Company, and their respective shareholders.
SUB-ADVISERS
Nature, Extent and Quality of Services
In reviewing the services provided by each Sub-Adviser, the Board considered a variety of matters, including the overall quality and depth of each Sub-Adviser’s organization and its overall financial strength and stability. The Board also considered, among other things, the investment operations and staff of each Sub-Adviser, its commitment to compliance with applicable laws and regulations and the Trust’s compliance policies and procedures, its portfolio trading and soft dollar practices, and its
CITY NATIONAL ROCHDALE FUNDS | PAGE 104
disaster recovery and contingency planning practices. In addition, the Board considered the background, education and experience of each Sub-Adviser’s key portfolio management and operational personnel, and each Sub-Adviser’s efforts to retain, attract and motivate capable personnel to serve the Fixed Income Opportunities Fund. The Board found all of these matters to be satisfactory.
Investment Performance
The Board reviewed information provided in the meeting materials setting forth the performance of the portion of the Fixed Income Opportunities Fund sub-advised by each Sub-Adviser compared with applicable benchmarks for various periods ended December 31, 2023. The Board made the following additional observations in reviewing the performance of the following Sub-Advisers of the Fixed Income Opportunities Fund:
| | ● | The annualized returns for the portion of the Fund managed by Federated were above the returns of the Bloomberg U.S. Corporate High Yield Index for the one-, three-, and five-year periods. |
| | ● | The annualized returns for the leveraged loan portfolio of the Fund managed by Seix were above the returns of the S&P LSTA U.S. Leveraged Loan Index for the one- and three-year periods, but below the Index’s return (by 0.09%) for the five-year period. The return for the high yield bond portfolio of the Fund managed by Seix was above the return for the Bloomberg U.S. Corporate High Yield Index for the one-year period. |
| | ● | The annualized returns for the portion of the Fund managed by Alcentra (European leveraged loans) were above the returns of the S&P LSTA European Leveraged Loan Index for the one-, three-, and five-year periods. The annualized returns for the portion of the Fund managed by Alcentra (U.S./European structured credit) were above the returns of the Palmer Square CLO Debt Index for the one-, three-, and five-year periods. |
| | ● | The return for the portion of the Fund managed by T. Rowe Price (the main portfolio) was above the return of the ICE BofA High Yield U.S. Emerging Markets Corporate Plus Index for the one-year period. The return for the portion of the Fund managed by T. Rowe Price (the liquid portfolio) was above the return of the ICE BofA High Yield U.S. Emerging Markets Corporate Plus Index for the one-year period. |
The Board also considered and reviewed information related to the services AllFinancial provides in respect of life settlement policies held by the Fixed Income Opportunities Fund.
The Board noted that, while not all of the Sub-Advisers outperformed their respective benchmarks for the periods under evaluation, in each case the Adviser reviewed the Sub-Adviser’s performance relative to current market conditions and with an understanding of the Sub-Adviser’s style and philosophy. The Board considered the investment results of the Fixed Income Opportunities Fund to be generally competitive, and determined that each of Alcentra Limited, Alcentra NY, AllFinancial, Federated, Seix, and T. Rowe Price continued to provide high quality sub-advisory services to the Fixed Income Opportunities Fund.
Sub-Advisory Fees and Benefits to Sub-Advisers
The Board reviewed information included in the meeting materials regarding the sub-advisory fees charged by each Sub-Adviser, and observed that the fees charged by each Sub-Adviser to the Fixed Income Opportunities Fund were generally equal to or lower than the fees it charged to its other advisory or sub-advisory clients, as applicable, to manage comparable mutual funds, private funds, and separate accounts. The Board noted that although certain Sub-Advisers charged lower fees to other mutual funds advised by the Sub-Advisers, those funds were significantly larger than the Fixed Income Opportunities Fund. The Trustees noted that the Adviser pays all sub-advisory fees out of its advisory fees. The Board also noted that the Adviser evaluates each Sub-Adviser’s fees relative to those of its respective asset class peer groups in an effort to ensure that they are reasonable and appropriate in light of the services provided. In addition, the Board considered the different advisory and sub-advisory fee splits of the Fixed Income Opportunities Fund, and noted the Adviser’s beliefs that the fees paid to the Sub-Advisers are priced at competitive levels, and that the overall advisory fees, gross advisory fees and sub-advisory fees are fair and reasonable in light of the services provided to the Funds by the Adviser and the Sub-Advisers, as applicable.
The Board also considered the benefits received by each Sub-Adviser and its affiliates as a result of its relationship with the Fixed Income Opportunities Fund (other than the sub-advisory fee paid to the Sub-Adviser), including any research services made available to the Sub-Adviser by broker-dealers providing execution services to the Fund, the intangible benefits of the Sub-Adviser’s association with the Fund generally, and any favorable publicity arising in connection with the Fund’s performance.
CITY NATIONAL ROCHDALE FUNDS | PAGE 105
board approval of advisory and sub-advisory agreement |
(Unaudited) (Continued) |
Conclusion
Based on their review, including their consideration of each of the factors referred to above, the Board and the Independent Trustees concluded that the compensation payable to each Sub-Adviser pursuant to its respective sub-advisory agreement was fair and reasonable in light of the nature and quality of the services provided by each Sub-Adviser to the Fixed Income Opportunities Fund, and that it would be in the best interests of the Fund and its shareholders to renew the sub-advisory agreements with each of Alcentra Limited, Alcentra NY, AllFinancial, Federated, Seix, and T. Rowe Price.
CITY NATIONAL ROCHDALE FUNDS | PAGE 106
This page intentionally left blank.
CITY NATIONAL ROCHDALE FUNDS | PAGE 107
This page intentionally left blank.
CITY NATIONAL ROCHDALE FUNDS | PAGE 108


CNR-AR-001-2300
Item 8. Changes in and Disagreements with Accountants for Open-End Management Investment Companies.
There were no changes in or disagreements with accountants on accounting and financial disclosure during the period covered by the report.
Item 9. Proxy Disclosures for Open-End Management Investment Companies.
There were no matters submitted to a vote of shareholders during the period covered by this report.
Item 10. Remuneration Paid to Directors, Officers, and Others of Open-End Management Investment Companies.
The remuneration paid by the company during the period covered by the report to the Trustees on the company’s Board of Trustees is disclosed as part of the financial statements included above in Item 7.
Item 11. Statement Regarding Basis for Approval of Investment Advisory Contract.
The disclosure regarding the Approval of Advisory Agreement, if applicable, is included as part of the financial statements included above in Item 7.
Item 12. Disclosure of Proxy Voting Policies and Procedures for Closed-End Management Investment Companies.
Not applicable to open-end management investment companies.
Item 13. Portfolio Managers of Closed-End Management Investment Companies
Not applicable to open-end management investment companies.
Item 14. Purchases of Equity Securities by Closed-End Management Company and Affiliated Purchasers.
Not applicable to open-end management investment companies.
Item 15. Submission of Matters to a Vote of Security Holders.
There have been no changes to the procedures by which shareholders may recommend nominees to the Registrant’s Board of Trustees during the period covered by this report
Item 16. Controls and Procedures.
(a) The Registrant’s principal executive and principal financial officers, or persons performing similar functions, have concluded that the Registrant’s disclosure controls and procedures (as defined in Rule 30a-3(c) under the Act (17 CFR 270.30a-3(c))) as of a date within 90 days of the filing date of the report, are effective based on the evaluation of these controls and procedures required by Rule 30a-3(b) under the Act (17 CFR 270.30a-3(b)) and Rules 13a-15(b) or 15d-15(b) under the Exchange Act (17 CFR 240.13a-15(b) or 240.15d-15(b)).
(b) There has been no change in the Registrant’s internal control over financial reporting (as defined in Rule 30a-3(d) under the Act (17 CFR 270.30a-3(d)) that occurred during the period covered by this report that has materially affected, or is reasonably likely to materially affect, the Registrant’s internal control over financial reporting.
Items 17. Disclosure of Securities Lending Activities for Closed-End Management Investment Companies.
Not applicable to open-end management investment companies.
Items 18. Recovery of Erroneously Awarded Compensation.
(a) Not applicable.
(b) Not applicable.
Items 19. Exhibits.
(a)(1) Code of Ethics is attached hereto.
(a)(2) A separate certification for the principal executive officer and the principal financial officer of the registrant as required by Rule 30a-2(a) under the Investment Company Act of 1940, as amended (17 CFR 270.30a-2(a)), are attached hereto.
(a)(3) Not applicable.
(b) Officer certifications as required by Rule 30a-2(b) under the Investment Company Act of 1940, as amended (17 CFR 270.30a-2(b)) are attached hereto.
SIGNATURES
Pursuant to the requirements of the securities Exchange Act of 1934 and the Investment Company Act of 1940, the Registrant has duly caused this report to be signed on its behalf by the undersigned, thereunto duly authorized.
| (Registrant) | | City National Rochdale Funds | |
| | | /s/ Gregg Giaquinto | |
| By (Signature and Title) | | Gregg Giaquinto, | |
| | | Principal Executive Officer | |
Date: December 9, 2024
Pursuant to the requirements of the Securities Exchange Act of 1934 and the Investment Company Act of 1940, this report has been signed below by the following persons on behalf of the Registrant and in the capacities and on the dates indicated.
| By (Signature and Title) | | /s/ Gregg Giaquinto | |
| | | Gregg Giaquinto, | |
| | | Principal Executive Officer | |
Date: December 9, 2024
| By (Signature and Title) | | /s/ Andrew Metzger | |
| | | Andrew Metzger, | |
| | | Principal Financial Officer | |
Date: December 9, 2024