FORM 6-K
SECURITIES AND EXCHANGE COMMISSION
Washington, D.C. 20549
Report of Foreign Issuer
Pursuant to Rule 13a-16 or 15d-16 of
the Securities Exchange Act of 1934
For the month of November 2011
Commission File Number: 001-14554
Banco Santander-Chile
Santander-Chile Bank
(Translation of Registrant’s Name into English)
Bandera 140
Santiago, Chile
(Address of principal executive office)
Indicate by check mark whether the registrant files or will file annual reports under cover of Form 20-F or Form 40-F:
| Form 20-F | X | Form 40-F |
Indicate by check mark if the registrant is submitting the Form 6-K in paper as permitted by Regulation S-T Rule 101(b)(1):
| Yes | No | X |
Indicate by check mark if the registrant is submitting the Form 6-K in paper as permitted by Regulation S-T Rule 101(b)(7):
| Yes | No | X |
Indicate by check mark whether by furnishing the information contained in this Form, the Registrant is also thereby furnishing the information to the Commission pursuant to Rule 12g3-2(b) under the Securities Exchange Act of 1934:
| Yes | No | X |
If “Yes” is marked, indicate below the file number assigned to the registrant in connection with Rule 12g3-2(b): N/A
Item | |
| 1. | Interim Report for the Nine-Month Period Ended September 30, 2011 |
TABLE OF CONTENTS
| Page | |
| Cautionary Statement Concerning Forward-Looking Statements | 1 |
| Certain Terms and Conventions | 2 |
| Presentation of Financial Information | 3 |
| Item 1. Key Information | 5 |
| Item 2. Information on the Company | 11 |
| Item 3. Operating and Financial Review and Prospects | 21 |
| Item 4. Major Shareholders And Related Party Transactions | 68 |
| Item 5. Financial Information | 71 |
| Item 6. The Offer and Listing | 71 |
| Item 7. Directors, Senior Management and Employees | 73 |
| Item 8. Additional Information | 81 |
| Item 9. Quantitative and Qualitative Disclosures About Market Risk | 82 |
CAUTIONARY STATEMENT CONCERNING FORWARD-LOOKING STATEMENTS
We have made statements in this report on Form 6-K that constitute forward-looking statements within the meaning of Section 27A of the Securities Act of 1933, as amended, Section 21E of the Securities Exchange Act of 1934, as amended, and the safe harbor provisions the Private Securities Litigation Reform Act of 1995. These statements appear throughout this report and include statements regarding our intent, belief or current expectations regarding:
| · | asset growth and alternative sources of funding |
| · | growth of our fee-based business |
| · | financing plans |
| · | impact of competition |
| · | impact of regulation |
| · | exposure to market risks including: |
| · | interest rate risk |
| · | foreign exchange risk |
| · | equity price risk |
| · | projected capital expenditures |
| · | liquidity |
| · | trends affecting: |
| · | our financial condition |
| · | our results of operation |
The sections of this report which contain forward-looking statements include, without limitation, “Item 1: Key Information–Risk Factors,” “Item 3: Operating and Financial Review and Prospects,” “Item 5: Financial Information–Legal Proceedings,” and “Item 9: Quantitative and Qualitative Disclosures About Market Risk.” Our forward-looking statements also may be identified by words such as “believes,” “expects,” “anticipates,” “projects,” “intends,” “should,” “could,” “may,” “seeks,” “aim,” “combined,” “estimates,” “probability,” “risk,” “VaR,” “target,” “goal,” “objective,” “future” or similar expressions.
You should understand that the following important factors, in addition to those discussed elsewhere in this report and in the documents which are incorporated by reference, could affect our future results and could cause those results or other outcomes to differ materially from those expressed in our forward-looking statements:
| · | changes in capital markets in general that may affect policies or attitudes towards lending to Chile or Chilean companies |
| · | changes in economic conditions |
| · | the monetary and interest rate policies of the Banco Central de Chile (the “Central Bank”) |
| · | inflation |
| · | deflation |
1
| · | unemployment |
| · | increases in defaults by our customers |
| · | decreases in deposits, customer loss or revenue loss |
| · | unanticipated turbulence in interest rates |
| · | movements in foreign exchange rates |
| · | movements in equity prices or other rates or prices |
| · | changes in Chilean and foreign laws and regulations |
| · | changes in taxes |
| · | competition, changes in competition and pricing environments |
| · | our inability to hedge certain risks economically |
| · | the adequacy of loss allowances |
| · | technological changes |
| · | changes in consumer spending and saving habits |
| · | increased costs |
| · | unanticipated increases in financing and other costs or the inability to obtain additional debt or equity financing on attractive terms |
| · | changes in, or failure to comply with, banking regulations |
| · | our ability to successfully market and sell additional services to our existing customers |
| · | disruptions in client service |
| · | natural disasters |
| · | implementation of new technologies |
| · | an inaccurate or ineffective client segmentation model |
You should not place undue reliance on such statements, which speak only as of the date at which they were made. The forward-looking statements contained in this document speak only as of the date of this report, and we do not undertake to update any forward-looking statement to reflect events or circumstances after the date hereof or to reflect the occurrence of unanticipated events.
CERTAIN TERMS AND CONVENTIONS
As used in this report on Form 6-K, “Santander-Chile”, “the Bank”, “we,” “our” and “us” or similar terms refer to Banco Santander Chile together with its consolidated subsidiaries.
When we refer to “Santiago” in this report, we refer to Banco Santiago and its consolidated subsidiaries prior to its merger with Old Santander-Chile. When we refer to “Old Santander-Chile” in this report, we refer to the former Banco Santander-Chile, which ceased to exist upon its merger into Santiago, effected on August 1, 2002, and its consolidated subsidiaries.
2
When we refer to “Banco Santander Spain” or “Santander Spain”, we refer to our parent company, Banco Santander, S.A.
As used in this report, the term “billion” means one thousand million (1,000,000,000).
In this report, references to “$”, “US$”, “U.S. dollars” and “dollars” are to United States dollars, references to “Chilean pesos,” “pesos” or “Ch$” are to Chilean pesos and references to “UF” are to Unidades de Fomento. The UF is an inflation-indexed Chilean monetary unit with a value in Chilean pesos that changes daily to reflect changes in the official Consumer Price Index (“CPI”) of the Instituto Nacional de Estadísticas (the Chilean National Institute of Statistics) for the previous month. See “Item 3: Operating and Financial Review and Prospects”.
In this report, references to the Audit Committee are to the Bank’s Comité de Directores y Auditoría.
In this report, references to “BIS” are to the Bank for International Settlement, and references to “BIS ratio” are to the capital adequacy ratio as calculated in accordance with the Basel Capital Accord.
PRESENTATION OF FINANCIAL INFORMATION
Santander-Chile is a Chilean bank and maintains its financial books and records in Chilean pesos and has prepared its unaudited condensed consolidated interim financial statements included in this report in accordance with International Financial Reporting Standards (“IFRS”) issued by the International Accounting Standards Board (“IASB”).
As required by local regulations, our locally filed condensed consolidated financial statements have been prepared in accordance with accounting principles issued by the Superintendency of Banks and Financial Institutions (“Chilean Bank GAAP” and the “SBIF,” respectively). The accounting principles issued by the SBIF are substantially similar to IFRS but there are some exceptions. Therefore, our locally filed consolidated interim financial statements have been adjusted for inclusion herein according to IAS 34: Interim Financial Reporting in order to comply with the requirements of the Securities and Exchange Commission (the “SEC”). For further details on the main differences between Chilean Bank GAAP and IFRS, see Item 3: A. Operating and Financial Review and Prospects—Accounting Standards Applied in 2011.
The notes to the unaudited condensed consolidated interim financial statements contain information in addition to that presented in the Unaudited Condensed Consolidated Interim Statement of Financial Position, Unaudited Condensed Consolidated Interim Statement of Income, Unaudited Condensed Consolidated Interim Statement of Comprehensive Income, Unaudited Condensed Consolidated Interim Statement of Changes in Equity and Unaudited Condensed Consolidated Interim Statement of Cash Flows. The notes provide narrative descriptions or details of these financial statements.
The unaudited condensed consolidated interim financial statements included in this report on Form 6-K have been prepared from accounting records maintained by the Bank and its subsidiaries.
We have formatted our financial information according to the classification format for banks used in Chile. We have not reclassified the line items to comply with Article 9 of Regulation S-X. Article 9 is a regulation of the SEC that contains classification requirements for bank holding company financial statements.
Functional and Presentation currency
The Chilean peso is the currency of the primary economic environment in which the Bank operates and the currency which influences its structure of costs and revenues. As such, in accordance with International Standard 21 —The Effects of Changes in Foreign Exchange Rates, the Chilean peso has been defined as the functional and presentation currency. Accordingly, all balances and transactions denominated in currencies other than the Chilean peso are treated as “foreign currency.”
For presentation purposes we have translated millions of Chilean pesos (Ch$ million) into thousands of US dollars (ThUS$) using the rate as indicated below under “Exchange Rates,” for the Unaudited Condensed
3
Consolidated Interim Statement of Financial Position, Unaudited Condensed Consolidated Interim Statement of Income, Unaudited Condensed Consolidated Interim Statement of Comprehensive Income, Unaudited Condensed Consolidated Interim Statement of Changes in Equity and Unaudited Condensed Consolidated Interim Statement of Cash Flow for the nine-month periods ended as of September 30, 2011 and 2010.
Loans
Unless otherwise specified, all references herein (except in the Unaudited Condensed Consolidated Interim Financial Statements) to loans are to loans and financial leases before deduction for loan loss allowance, and, except as otherwise specified, all market share data presented herein are based on information published periodically by the SBIF. Non-performing loans include loans for which principal or interest is overdue by more than 90 days, and do not accrue interest. Restructured loans for which no payments are overdue are not ordinarily classified as non-performing loans but do not accrue interest.
According to the IFRS, a loan is evaluated on each financial statement reporting date to determine whether objective evidence of impairment exists. A loan will be impaired if, and only if, objective evidence of impairment exists as a result of one or more events that occurred after the initial recognition of the loan, and such event or events have an impact on the estimated future cash flows of such loan that can be reliably estimated. It may not be possible to identify a single event that was the individual cause of the impairment.
An impairment loss relating to a loan is calculated as the difference between the carrying amount of the financial asset and the present value of estimated future cash flows, discounted at the effective interest rate computed at initial recognition.
Individually significant loans are individually tested for impairment. The remaining financial assets are evaluated collectively in groups with similar credit risk characteristics.
The reversal of an impairment loss occurs only if it can be objectively related to an event occurring after the initial impairment loss was recorded. In the case of loans recorded at amortized cost, the reversal is recorded in income.
Outstanding loans and the related percentages of our loan portfolio consisting of corporate and consumer loans in the section entitled “Item 2: C. Business Overview” are categorized based on the nature of the borrower. Outstanding loans and related percentages of our loan portfolio consisting of corporate and consumer loans in the section entitled “Item 3: E. Selected Statistical Information” are categorized in accordance with the reporting requirements of the SBIF, which are based on the type and term of loans. This disclosure is consistent with IFRS.
Effect of Rounding
Certain figures included in this report and in the Unaudited Condensed Consolidated Interim Financial Statements have been rounded up for ease of presentation. Percentage figures included in this report have not in all cases been calculated on the basis of such rounded figures but on the basis of such amounts prior to rounding. For this reason, certain percentage amounts in this report may vary from those obtained by performing the same calculations using the figures in the Unaudited Condensed Consolidated Interim Financial Statements. Certain other amounts that appear in this report may not sum due to rounding.
Economic and Market Data
In this report, unless otherwise indicated, all macroeconomic data related to the Chilean economy is based on information published by the Central Bank, and all market share and other data related to the Chilean financial system is based on information published by the SBIF and our analysis of such information. Information regarding the consolidated risk index of the Chilean financial system as a whole is not available.
Exchange Rates
This report contains translations of certain Chilean peso amounts into U.S. dollars at specified rates solely for the convenience of the reader. These translations should not be construed as representations that the Chilean peso amounts actually represent such U.S. dollar amounts, were converted from U.S. dollars at the rate indicated in
4
preparing the Unaudited Condensed Consolidated Interim Financial Statements, could be converted into U.S. dollars at the rate indicated, were converted or will be converted at all.
Unless otherwise indicated, all the U.S. dollar amounts at any period end, for any period have been translated from Chilean pesos based on the interbank market rate published by Reuters at 1:30 pm on the last business day of the period. On December 31, 2010, and September 30, 2011, the exchange rate in the Informal Exchange Market as published by Reuters at 1:30 pm on these days was Ch$467.95 and Ch$519.65, or 0.09% less and 0.40% more expensive, respectively, than the published observed exchange rate for such date of Ch$468.37 and Ch$521.76, respectively, per US$1.00. The Federal Reserve Bank of New York does not report a noon buying rate for the Chilean peso. For more information on the observed exchange rate. See “Item 1: A. Selected Financial Data—Exchange Rates.”
On January 3, 2011, Chile’s Central Bank announced plans to increase its total international reserves by US$12 billion in 2011. The Central Bank carried out this program throughout the year. The last announced phase started November 9 and ends December 8. We expect the effect of these purchases will be to further devalue the peso against the dollar, although actual outcomes could differ due to macroeconomic and other factors.
As of December 31, 2010 and September 30, 2011, one UF was equivalent to Ch$21,455.55 and Ch$22,012.69; respectively. The U.S. dollar equivalent of one UF was U.S.$45.81 as of December 31, 2010, using the observed exchange rate reported by the Central Bank as of December 31, 2010, of Ch$468.37 per U.S.$1.00. The U.S. dollar equivalent of one UF was U.S.$42.19 as of September 30, 2011, using the observed exchange rate reported by the Central Bank as of September 30, 2011, of Ch$521.76 per U.S.$1.00.
ITEM 1. KEY INFORMATION
A. Selected Financial Data
The following table presents historical financial information about us as of the dates and for each of the periods indicated. The following table should be read in conjunction with, and is qualified in its entirety by reference to, our Audited Condensed Consolidated Financial Statements appearing in our Annual Report for the year ended December 31, 2010 (the “2010 Form 20-F”) our Unaudited Condensed Consolidated Interim Financial Statements included herein. Our Unaudited Condensed Consolidated Interim Financial Statements and notes at and for the nine-month periods ended September 30, 2010 and 2011 included in this report are prepared in accordance with IFRS and therefore differ in some respects from the financial statements at and for the nine-month periods ended September 30, 2010 and 2011 previously issued locally by the Bank in Chile in accordance with Chilean Bank GAAP.
We have selected the following financial information from our Unaudited Condensed Consolidated Interim Financial Statements. You should read this information in connection with, and this information is qualified in its entirety by reference to, our Unaudited Condensed Consolidated Interim Financial Statements included in this report.
For the Nine-Months Ended September 30, | ||||||||||||
2011 | 2011 | 2010 | ||||||||||
| In US$ thousands(1) | In Ch$ millions(2) | |||||||||||
| UNAUDITED CONDENSED CONSOLIDATED INTERIM STATEMENT OF INCOME DATA (IFRS) | ||||||||||||
| Net interest income | 1,362,752 | 708,154 | 707,854 | |||||||||
Provision for loan losses | (446,343 | ) | (231,942 | ) | (208,826 | ) | ||||||
Net fee income and commission income | 403,021 | 209,430 | 193,945 | |||||||||
Operating costs (3) | (710,488 | ) | (369,205 | ) | (335,556 | ) | ||||||
Other income, net (4) | 89,610 | 46,567 | 66,506 | |||||||||
Income before tax | 698,552 | 363,004 | 423,923 | |||||||||
Income tax expense | (111,503 | ) | (57,943 | ) | (56,752 | ) | ||||||
5
For the Nine-Months Ended September 30, | ||||||||||||
2011 | 2011 | 2010 | ||||||||||
| In US$ thousands(1) | In Ch$ millions(2) | |||||||||||
Net income for the period | 587,049 | 305,061 | 367,171 | |||||||||
| Net income attributable to: | ||||||||||||
Bank shareholders | 580,551 | 301,684 | 367,270 | |||||||||
Non-controlling interests | 6,498 | 3,377 | (99 | ) | ||||||||
| Net income attributable to Bank shareholders per share | 0.0031 | 1.60 | 1.95 | |||||||||
| Net income attributable to Bank shareholders per ADS (5) | 3.20 | 1,663.36 | 2,024.94 | |||||||||
| Weighted-average shares outstanding (in millions) | 188,446.13 | 188,446.13 | ||||||||||
| Weighted-average ADS outstanding (in millions) | 181.373 | 181.373 | ||||||||||
September 30, 2011 | September 30, 2011 | December 31, 2010 | ||||||||||
| In US$ thousands(1) | In Ch$ millions(2) | |||||||||||
| UNAUDITED CONDENSED CONSOLIDATED INTERIM STATEMENT OF FINANCIAL POSITION DATA (IFRS) | ||||||||||||
Cash and deposits in banks | 3,488,471 | 1,812,784 | 1,762,198 | |||||||||
Financial investments (6) | 5,043,037 | 2,620,614 | 2,024,635 | |||||||||
| Loans and accounts receivable from customers and interbank loans net of allowance for loan losses | 33,260,490 | 17,283,814 | 15,301,835 | |||||||||
Financial derivative contracts (assets) | 3,871,038 | 2,011,585 | 1,624,378 | |||||||||
Other non-financial assets (7) | 3,708,299 | 1,927,018 | 1,377,668 | |||||||||
Total assets | 49,371,335 | 25,655,815 | 22,090,714 | |||||||||
Deposits (8) | 26,733,384 | 13,892,003 | 11,495,191 | |||||||||
Other interest bearing liabilities (9) | 13,339,744 | 6,931,998 | 6,235,959 | |||||||||
Financial derivative contracts (liabilities) | 3,127,632 | 1,625,274 | 1,643,979 | |||||||||
Total equity (10) | 3,888,649 | 2,020,737 | 1,937,977 | |||||||||
| Equity attributable to Bank shareholders (11) | 3,826,505 | 1,988,444 | 1,906,168 | |||||||||
As of September 30, | ||||||||
2011 | 2010 | |||||||
| CONSOLIDATED RATIOS (IFRS) | ||||||||
| Profitability and performance: | ||||||||
Net interest margin (12) | 4.7 | % | 5.5 | % | ||||
Return on average total assets (13) | 1.7 | % | 2.4 | % | ||||
Return on average equity (14) | 20.6 | % | 28.3 | % | ||||
| Capital: | ||||||||
| Average equity as a percentage of average total assets (15) | 8.3 | % | 8.4 | % | ||||
Total liabilities as a multiple of equity (16) | 11.70 | 10.8 | ||||||
| Credit Quality: | ||||||||
| Non-performing loans as a percentage of total loans (17) | 2.80 | % | 2.66 | % | ||||
Allowance for loan losses as percentage of total loans | 2.73 | % | 2.80 | % | ||||
| Operating Ratios: | ||||||||
Operating expenses /net operating profit before loan losses (18) | 40.5 | % | 37.1 | % | ||||
Operating expenses /average total assets | 2.3 | % | 2.4 | % | ||||
| OTHER DATA | ||||||||
CPI Inflation Rate (19) | 3.27 | % | 1.87 | % | ||||
| Revaluation (devaluation) rate (Ch$/US$) at period end (19) | 10.0 | % | (4.2 | %) | ||||
Number of employees at period end | 11,706 | 11,049 | ||||||
Number of branches and offices at period end | 494 | 500 | ||||||
6
| (1) | Amounts stated in U.S. dollars at and for the nine-month period ended September 30, 2011, have been translated from Chilean pesos at the interbank market exchange rate of Ch$519.65 = US$1.00 as of September 30, 2011. See “Item 1: A. Selected Financial Data–Exchange Rates” for more information on the observed exchange rate. |
| (2) | Except per share data, percentages and ratios, share numbers, employee numbers and branch numbers. |
| (3) | Operating costs is equal to the sum of the line items on personnel salaries and expenses, administrative expenses, depreciation and amortization and impairment within our Unaudited Condensed Consolidated Interim Statements of Income, corresponding to “Support expenses” as shown in note 4 to the Unaudited Condensed Consolidated Interim Financial Statements. |
| (4) | Other income, net is the sum of the line items on other operating income, net income from financial operations (net trading income), foreign exchange transactions, income from investment in other companies less other operating expense within our Unaudited Condensed Consolidated Interim Statements of Income. |
| (5) | 1 ADS = 1,039 shares of common stock. |
| (6) | Includes the line items on trading investments, investments available for sale and investments held to maturity, and investments under resale agreements. |
| (7) | Includes the line items on unsettled transactions, investments in other companies, intangible assets, property plant and equipment, current taxes, and deferred taxes. |
| (8) | Deposits is equal to the sum of the line items on deposits and other demand liabilities and time deposits and other time liabilities. |
| (9) | Other liabilities is equal to the sum of the line items on investments under repurchase agreements, interbank borrowings, issued debt instruments and other financial liabilities. |
| (10) | Equity includes equity attributable to Bank shareholders plus non-controlling interests less allowance for mandatory dividends. Provision for mandatory dividends is made pursuant to Article 79 of the Corporations Act, in accordance with the Bank’s internal dividend policy, pursuant to which at least 30% of net income for the period is distributed, except in the case of a contrary resolution adopted at the respective shareholders’ meeting by the unanimous vote of the outstanding shares. |
| (11) | Equity attributable to Bank shareholders is total equity minus non-controlling interest |
| (12) | Net interest income annualized divided by average interest earning assets (as presented in “Item 3: E. Selected Statistical Information”). |
| (13) | Net income for the period annualized divided by average total assets (as presented in “Item 3: E. Selected Statistical Information”). |
| (14) | Net income for the period annualized divided by average equity (as presented in “Item 3: E. Selected Statistical Information”). |
| (15) | This ratio is calculated using total equity including non-controlling interest. |
| (16) | Total liabilities divided by equity. |
| (17) | Non-performing loans include the aggregate unpaid principal and accrued but unpaid interest on all loans with at least one installment over 90 days overdue. |
| (18) | The efficiency ratio is equal to operating expenses over operating income. Operating expenses includes personnel salaries and expenses, administrative expenses, depreciation and amortization, impairment and other operating expenses. Operating income includes net interest income, net fee and commission income, net income from financial operations (net trading income), foreign exchange profit (loss), net and other operating income. |
| (19) | Based on information published by the Central Bank. |
7
Exchange Rates
Chile has two currency markets, the Mercado Cambiario Formal, or the Formal Exchange Market, and the Mercado Cambiario Informal, or the Informal Exchange Market. According to Law 18,840, the organic law of the Central Bank, and the Central Bank Act (Ley Orgánica Constitucional del Banco Central de Chile), the Central Bank determines which purchases and sales of foreign currencies must be carried out in the Formal Exchange Market. Pursuant to Central Bank regulations which are currently in effect, all payments, remittances or transfers of foreign currency abroad which are required to be effected through the Formal Exchange Market may be effected with foreign currency procured outside the Formal Exchange Market. The Formal Exchange Market is comprised of the banks and other entities so authorized by the Central Bank. The Informal Exchange Market is comprised of entities that are not expressly authorized to operate in the Formal Exchange Market, such as certain foreign exchange houses and travel agencies, among others. The Central Bank is empowered to require that certain purchases and sales of foreign currencies be carried out on the Formal Exchange Market. The conversion from pesos to U.S. dollars of all payments and distributions with respect to the ADSs described in this report must be transacted at the spot market rate in the Formal Exchange Market.
Both the Formal and Informal Exchange Markets are driven by free market forces. Current regulations require that the Central Bank be informed of certain transactions and that they be effected through the Formal Exchange Market. In order to keep the average exchange rate within certain limits, the Central Bank may intervene by buying or selling foreign currency on the Formal Exchange Market.
The U.S.$ Observed Exchange Rate (dólar observado), which is reported by the Central Bank and published daily in the Chilean newspapers, is the weighted average exchange rate of the previous business day’s transactions in the Formal Exchange Market. The Central Bank has the power to intervene by buying or selling foreign currency on the Formal Exchange Market to attempt to maintain the Observed Exchange Rate within a desired range. Even though the Central Bank is authorized to carry out its transactions at the Observed Exchange Rate, it generally uses spot rates for its transactions. Other banks generally carry out authorized transactions at spot rates as well.
Purchases and sales of foreign currencies may be legally carried out in the Informal Exchange Market. The Informal Exchange Market reflects transactions carried out at informal exchange rates by entities not expressly authorized to operate in the Formal Exchange Market. There are no limits imposed on the extent to which the rate of exchange in the Informal Exchange Market can fluctuate above or below the Observed Exchange Rate. In recent years, the variation between the Observed Exchange Rate and the Informal Exchange Rate has not been significant. On December 31, 2010, and September 30, 2011, the exchange rate in the Informal Exchange Market as published by Reuters at 1:30 pm on these days was Ch$467.95 and Ch$519.65, or 0.09% less and 0.40% more expensive, respectively, than the published observed exchange rate for such date of Ch$468.37 and Ch$521.76, respectively, per US$1.00.
The following table sets forth the annual low, high, average and period-end observed exchange rate for U.S. dollars for each of the following periods, as reported by the Central Bank. We make no representation that the Chilean peso or the U.S. dollar amounts referred to herein actually represent, could have been or could be converted into U.S. dollars or Chilean pesos, as the case may be, at the rates indicated, at any particular rate or at all. The Federal Reserve Bank of New York does not report a noon buying rate for pesos.
Daily Observed Exchange Rate Ch$ Per US$(1) | ||||||||||||||||
Year | Low(2) | High(2) | Average(3) | Period End(4) | ||||||||||||
2006 | 511.44 | 549.63 | 530.26 | 534.43 | ||||||||||||
2007 | 493.14 | 548.67 | 522.69 | 495.82 | ||||||||||||
2008 | 431.22 | 676.75 | 521.79 | 629.11 | ||||||||||||
2009 | 491.09 | 643.87 | 559.67 | 506.43 | ||||||||||||
2010 | 468.37 | 549.17 | 510.38 | 468.37 | ||||||||||||
Month | ||||||||||||||||
December 2010 | 468.37 | 487.87 | 474.78 | 468.37 | ||||||||||||
January 2011 | 466.05 | 499.03 | 489.44 | 483.32 | ||||||||||||
February 2011 | 468.94 | 484.14 | 475.69 | 475.63 | ||||||||||||
8
Daily Observed Exchange Rate Ch$ Per US$(1) | ||||||||||||||||
Year | Low(2) | High(2) | Average(3) | Period End(4) | ||||||||||||
March 2011 | 472.74 | 485.37 | 479.65 | 482.08 | ||||||||||||
April 2011 | 460.04 | 479.46 | 471.32 | 460.04 | ||||||||||||
May 2011 | 460.09 | 474.19 | 467.73 | 467.31 | ||||||||||||
June 2011 | 465.13 | 474.59 | 469.13 | 473.64 | ||||||||||||
July 2011 | 455.91 | 468.15 | 462.94 | 455.91 | ||||||||||||
August 2011 | 457.41 | 474.10 | 466.79 | 465.66 | ||||||||||||
September 2011 | 460.34 | 521.85 | 483.69 | 515.14 | ||||||||||||
October 2011 | 492.04 | 533.74 | 511.74 | 492.04 | ||||||||||||
| November 2011 up to November 21, 2011 | 490.29 | 511.66 | 501.58 | 510.11 | ||||||||||||
Source: Central Bank.
| (1) | Nominal figures. |
| (2) | Exchange rates are the actual low and high, on a day-by-day basis for each period. |
| (3) | The average of monthly average rates during the year. |
| (4) | As reported by the Central Bank on the first business day of the following period. |
Dividends
Under the current General Banking Law, a Chilean bank may only pay a single dividend per year (i.e., interim dividends are not permitted). Santander-Chile’s annual dividend is proposed by its Board of Directors and is approved by the shareholders at the annual ordinary shareholders’ meeting held the year following that in which the dividend is generated. For example, the 2011 dividend must be proposed and approved during the first four months of 2012. Following shareholder approval, the proposed dividend is declared and paid. Historically, the dividend for a particular year has been declared and paid no later than one month following the shareholders’ meeting. Dividends are paid to shareholders of record on the fifth day preceding the date set for payment of the dividend. The applicable record dates for the payment of dividends to holders of ADSs will, to the extent practicable, be the same.
Under the General Banking Law, a bank must distribute cash dividends in respect of any fiscal year in an amount equal to at least 30% of its net income for that year, as long as the dividend does not result in us not being able to comply with applicable minimum capital requirements. The balances of our distributable net income are generally retained for use in our business (including for the maintenance of any required legal reserves). Although our Board of Directors currently intends to pay regular annual dividends, the amount of dividend payments will depend upon, among other factors, our then current level of earnings, capital and legal reserve requirements, as well as market conditions, and there can be no assurance as to the amount or timing of future dividends.
Dividends payable to holders of ADSs are net of foreign currency conversion expenses of JPMorgan Chase Bank, N.A., as depositary (the “Depositary”) and will be subject to the Chilean withholding tax currently at the rate of 35% (subject to credits in certain cases as described in “Item 10: E. Taxation–Material Tax Consequences of Owning Shares of Our Common Stock or ADSs” of our 2010 Form 20-F.
Under the Foreign Investment Contract (as defined herein), the Depositary, on behalf of ADS holders, is granted access to the Formal Exchange Market to convert cash dividends from Chilean pesos to U.S. dollars and to pay such U.S. dollars to ADS holders outside Chile, net of taxes, and no separate registration by ADS holders is required. In the past, Chilean law required that holders of shares of Chilean companies who were not residents of Chile to register as foreign investors under one of the foreign investment regimes contemplated by Chilean law in order to have dividends, sale proceeds or other amounts with respect to their shares remitted outside Chile through the Formal Exchange Market. On April 19, 2001, the Central Bank deregulated the Exchange Market and eliminated the need to obtain approval from the Central Bank in order to remit dividends, but at the same time this eliminated the possibility of accessing the Formal Exchange Market. These changes do not affect the current Foreign Investment Contract, which was signed prior to April 19, 2001, which grants access to the Formal Exchange Market
9
with prior approval of the Central Bank. See “Item 10: D. Exchange Controls” of our 2010 Form 20-F.
The following table presents dividends declared and paid by us in nominal terms in the past three years:
Year | Dividend Ch$ mn (1) | Per share Ch$/share (2) | Per ADR Ch$/ADR (3) | % over earnings (4) | % over earnings (5) | |||||||||||||||
2009 | 213,295 | 1.13 | 1,176.00 | 65 | 52 | |||||||||||||||
2010 | 258,752 | 1.37 | 1,426.63 | 60 | 60 | |||||||||||||||
2011 | 286,294 | 1.52 | 1,578.48 | 60 | 57 | |||||||||||||||
| (1) | Million of nominal pesos. |
| (2) | Calculated on the basis of 188,446 million shares. |
| (3) | Calculated on the basis of 1,039 shares per ADS. |
| (4) | Calculated by dividing dividend paid in the year by net income attributable to shareholders for the previous year as required by local regulations. |
| (5) | Calculated by dividing dividend paid in the year by net income attributable to shareholders for the previous year under IFRS. |
B. Risk Factors
You should carefully consider the risk factors below and included in our 2010 Form 20-F which should be read in conjunction with all the other information presented in this report. These risks and uncertainties described below and therein are not the only ones that we face. Additional risks and uncertainties that we do not know about or that we currently think are immaterial may also impair our business operations.
We are subject to market risks that are presented in “Item 3: Operating and Financial Review and Prospects” and “Item 9: Quantitative and Qualitative Disclosures about Market Risk.”
Chile’s banking regulatory and capital markets environment is continually evolving and may change.
Changes in banking regulations may materially and adversely affect our business, financial condition and results of operations. Chilean laws, regulations, policies and interpretations of laws relating to the banking sector and financial institutions are continually evolving and changing. The Reformas al Mercado de Capitales II, also known as the “MK2 regulations,” among other things, modified certain provisions set forth in the General Banking Law. Under new legislation which went into effect on June 5, 2007, the limit on the amount that a bank is allowed to grant as an unsecured loan to a single individual or entity was increased to 10% of our regulatory capital (and up to 30% of our regulatory capital if any loans granted in excess of the 10% is secured by collateral). Previously, these limits were set at 5% and 25%, respectively. Although any such increase may increase our lending activity, it may also increase the risks associated with the growth of our loan portfolio and increase competition as the number of banks that can compete in the corporate segment increases.
A bill has been introduced by some members of Congress to modify the way in which the maximum interest rate is calculated in Chile. The government has recently introduced another bill in this respect which is currently being discussed. This new project is aimed at loans of less than UF 200 (Ch$ 4,402,538, US$ 8,472) and more than 90 days, thus including consumer loans in installments, lines of credit and credit card lines. Currently, the maximum interest rate is calculated as the average rate of all operations done within the banking industry over the previous month, multiplied by a factor of 1.5 times. As of October 14, 2011, the average annual interest rate for this type of loans reached 33.64% and the maximum annual interest rate reached 50.46%. The bill proposed by the government would change the factor to 1.36. Hence, the maximum annual interest rate would drop to 45.75%. On the other hand, the bill proposed by members of Congress would set the maximum interest rate at the equivalent of three times the MPR (Monetary Policy Rate). As of October 30, 2011, the MPR reached 5.25%, thus, the maximum annual interest rate would reach 15.75%. Recent developments on the discussion aim towards a consensus solution which could set
10
the maximum interest rate for this type of loans at around 25%. If the bill presented by the government is passed as it is, the impact would be mainly on Banefe’s segment, which represents less than 5% of our total loans. We have estimated that the impact on our results would be relatively minor. If the bill proposed by members of Congress were passed, it would have an adverse affect on our results of operations. Our average interest rate on loans of this category in 2011 has been 25.9%.
In 2012, new regulations regarding the selling of mandatory insurance for loans will be introduced that will increase competition and that could lower our fees from collecting these premiums. This could have a negative impact on fees, which impact has not yet been quantified.
The government has also sent to Congress a bill that aims to give additional enforcement powers to the SERNAC (Chile’s Consumer Protection Agency) regarding financial services and products. It also gives powers to require additional information from financial services and products issuers. This could lead to additional scrutiny regarding prices and contracts for financial products and services, increasing competition among bank and non-bank competitors and adversely affecting prices.
Any downgrading of Chile’s debt credit rating for domestic and international debt and/or our controlling shareholder’s ratings by international credit rating agencies may also affect our ratings, our business, our future financial performance and the value of our securities.
Our foreign currency deposit ratings are equivalent to the Chilean sovereign ratings. On October 11, 2011, Fitch downgraded our controlling shareholder’s ratings to AA- (Negative) from AA (Stable), following a similar action on October 7, 2011 with the Spanish sovereign which was downgraded to AA- (Negative) from AA+. On October 13, 2011, Fitch downgraded our rating to A+ (Negative) from AA- (Stable). Furthermore, on October 11, 2011, S&P downgraded the rating of our controlling shareholder to AA- (Negative) from AA. On October 13, S&P revised its outlook on our rating to negative from positive, reaffirming our A+ rating. Additionally, on October 19, 2011, Moody’s downgraded our controlling shareholder’s rating to Aa3 (Negative) from Aa2, following a similar action on October 18, 2011 on Spain’s sovereign rating which was downgraded to A1 (Negative) from Aa2. As of October 31, 2011, Moody’s has not undertaken any action on our rating which stands at Aa3 (Stable) since June 2010. Any additional adverse revisions to our controlling shareholder’s ratings and/or Chile’s credit ratings for domestic and international debt by international rating agencies may adversely affect our ratings, our business, future financial performance, stockholder’s equity and the price of our securities.
We could be vulnerable to the current disruptions and volatility in the Eurozone.
In 2011, the Eurozone has experienced difficult credit and liquidity conditions and market disruptions leading to less liquidity, greater volatility, and general economic weakening, including in Spain, the home of our controlling shareholder. Continued or worsening disruption and volatility in the Eurozone, especially Spain, could have a material adverse effect on our ability to access capital and liquidity on financial terms acceptable to us, if at all. If capital markets financing ceases to become available, or becomes excessively expensive, we may be forced to raise the rates we pay on deposits to attract more customers. Any such increase in capital markets funding costs or deposit rates could have a material adverse effect on our profitability.
ITEM 2. INFORMATION ON THE COMPANY
A. History and Development of the Company
Overview
We are the largest bank in Chile in terms of total assets, total deposits and shareholders’ equity. As of September 30, 2011, we had total assets of Ch$ 25,655,815 million (US$ 49,371 million), loans net of allowances for loans losses of Ch$ 17,283,814 million (US$ 33,260 million), total deposits of Ch$ 13,892,003 million (US$ 26,733 million) and shareholders’ equity of Ch$ 2,020,737 million (US$ 3,889 million). As of September 30, 2011, we employed 11,706 people (on a consolidated basis) and had the largest private branch network in Chile with 493 branches. Our headquarters are located in Santiago and we operate in every major region of Chile.
We provide a broad range of commercial and retail banking services to our customers, including Chilean peso and foreign currency denominated loans to finance a variety of commercial transactions, trade, foreign currency forward contracts and credit lines and a variety of retail banking services, including mortgage financing. We seek to offer our customers a wide range of products while providing high levels of service. In addition to our traditional banking operations, we offer a variety of financial services including financial leasing, financial advisory services, mutual fund management, securities brokerage, insurance brokerage and investment management.
The legal predecessor of Santander-Chile was Banco Santiago (“Santiago”). Santiago was incorporated by public deed dated September 7, 1977 granted at the Notary Office of Alfredo Astaburuaga Gálvez. Santiago received its permission to incorporate and function as a bank by Resolution No. 118 of the Superintendency of
11
Banks on October 27, 1977. Santiago’s by-laws were approved by Resolution No. 103 of the Superintendency of Banks on September 22, 1977. In January 1997, Santiago merged with Banco O’Higgins with Santiago being the surviving entity. In 1999, Santiago became a controlled subsidiary of Banco Santander Spain. As of June 30, 2002, Santiago was the second largest private sector bank in Chile in terms of total assets, deposits, loans and shareholders’ equity.
Old Santander-Chile was established as a subsidiary of Banco Santander Spain in 1978. In 1982, Old Santander-Chile acquired a significant portion of the assets and liabilities of Banco Español-Chile, a domestic bank that had become insolvent. In July 1996, Old Santander-Chile was merged into Banco Osorno y la Unión becoming “Banco Santander-Chile”, the third largest private bank in terms of outstanding loans at that date.
On August 1, 2002, Santiago and Old Santander Chile merged, whereby the latter ceased to exist and Santander-Chile (formerly known as Santiago) being the surviving entity.
Our principal executive offices are located at Bandera 140, Santiago, Chile. Our telephone number is +562-320-2000 and our website is www.santander.cl. None of the information contained on our website is incorporated by reference into, or forms part of, this report. Our agent for service of process in the United States is Puglisi & Associates located at 850 Library Ave. Suite 204 Newark, Delaware 19711.
B. Organizational Structure
Banco Santander Spain controls Santander-Chile through its holdings in Teatinos Siglo XXI Inversiones Ltda. and Santander-Chile Holding, which are controlled subsidiaries. In February 2011, Banco Santander Spain sold 1.9% of its ownership through Teatinos Siglo XXI Inversiones Ltda in the market. This gives Banco Santander Spain control of 75.00% of our shares and actual participation when excluding non-controlling interests participating in Santander Chile Holding is 74.84%.
Shareholder | Number of Shares | Percentage | ||||||
Teatinos Siglo XXI Inversiones Ltda. | 74,512,075,401 | 39.54 | % | |||||
Santander Chile Holding | 66,822,519,695 | 35.46 | % | |||||
Management Team
The chart below sets forth the names and areas of responsibility of our senior commercial managers.
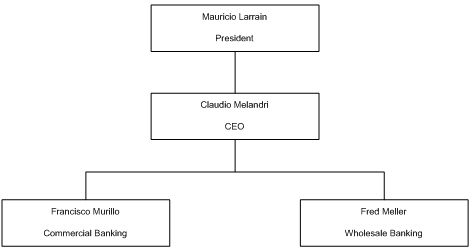
The chart below sets forth the names and areas of responsibilities of our operating managers.
12

C. Business Overview
We have 494 total branches, 260 of which are operated under the Santander brand name, with the remaining branches under certain specialty brand names, including 98 under the Santander Banefe brand name, 45 under the SuperCaja brand name, 37 under the BancaPrime brand name and 54 as auxiliary and payment centers. We provide a full range of financial services to corporate and individual customers. We divide our clients into the following segments: (i) Commercial Banking and (ii) Global Banking and Markets.
The Commercial Banking segment is comprised of the following sub–segments:
| · | Santander Banefe, consisting of individuals with monthly incomes between Ch$150,000 (US$289) and Ch$400,000 (US$770) and served through our Banefe branch network. This segment accounts for 4.4% of our total loans outstanding as of September 30, 2011. This segment offers customers a range of products, including consumer loans, credit cards, auto loans, residential mortgage loans, debit card accounts, savings products, mutual funds and insurance brokerage. |
| · | Individuals (Commercial Banking), consisting of individuals with a monthly income greater than Ch$400,000 (US$770). Clients in this segment account for 47.3% of our total loans outstanding as of September 30, 2011 and are offered a range of products, including consumer loans, credit cards, auto loans, commercial loans, foreign trade financing, residential mortgage loans, checking accounts, savings products, mutual funds and insurance brokerage. |
| · | Small and mid-sized companies, consisting of small companies with annual revenue of less than Ch$1,200 million (US$2.3 million). As of September 30, 2011, this segment represented approximately 14.2% of our total loans outstanding. Customers in this segment are offered a range of products, including commercial loans, leasing, factoring, foreign trade, credit cards, mortgage loans, checking accounts, savings products, mutual funds and insurance brokerage. |
| · | Institutional, such as universities, government agencies, municipalities and regional governments. As of September 30, 2011, these clients represented 2.0% of our total loans outstanding. Customers in this sub-segment are also offered the same products that are offered to the customers in our small businesses |
13
segment. This sub-segment is included in the Retail segment because customers in this sub-segment are a potential source for new individual customers.
| · | Companies, consisting of companies with annual revenue over Ch$1,200 million (US$2.3 million) and up to Ch$10,000 million (US$19.2 million). Customers in this segment are offered a wide range of products, including commercial loans, leasing, factoring, foreign trade, credit cards, mortgage loans, checking accounts, cash management, treasury services, financial advisory, savings products, mutual funds and insurance brokerage. As of September 30, 2011, these clients represented 8.9% of our total loans outstanding. |
| · | Real estate, consisting of all companies in the real estate sector with annual revenue over Ch$800 million (US$1.5 million), including construction companies and real estate companies that execute projects for sale to third parties. As of September 30, 2011, these clients represented 3.2% of our total loans outstanding. To these clients we offer, in addition to traditional banking services, specialized services for financing, primarily residential projects, in order to increase the sale of residential mortgage loans. |
| · | Large corporations, consisting of companies with annual revenue over Ch$10,000 million (US$19.2 million). Customers in this segment are also offered the same products that are offered to the customers in our mid-sized companies segment. As of September 30, 2011, these clients represented 8.9% of our total loans outstanding. |
The Global Banking and Markets segment is comprised of the following sub-segments:
| · | Corporate, consisting of companies that are foreign multinationals or part of a larger Chilean economic group with sales of over Ch$10,000 million (US$19.2 million). As of September 30, 2011, these clients represented 10.7% of our total loans outstanding. Customers in this segment are offered a wide range of products, including commercial loans, leasing, factoring, foreign trade, mortgage loans, checking accounts, cash management, treasury services, financial advisory, savings products, mutual funds and insurance brokerage. |
| · | The Treasury Division provides sophisticated financial products mainly to companies in the wholesale banking and the middle-market segments. This includes products such as short-term financing and funding, securities brokerage, interest rate and foreign currency derivatives, securitization services and other tailor made financial products. The Treasury division also manages our trading positions. |
In addition, we have a Corporate Activities segment comprised of all other operational and administrative activities that are not assigned to a specific segment or product mentioned above. This segment includes the Financial Management Division, which manages global functions such as the management of our structural foreign exchange gap position, our structural interest rate risk and our liquidity risk. The Financial Management Division also oversees the use of our resources, the distribution of capital among our different units and the overall financing cost of investments.
The table below sets forth our lines of business and certain statistical information relating to each of them for the nine-month period ended September 30, 2011. Please see “Note 4” to our Unaudited Condensed Consolidated Interim Financial Statements for details of revenue by business segment in the last three years.
14
As of September 30, 2011 (Ch$ million) | ||||||||||||||||||||||||||||
Loans and accounts receivable from customers (1) | Net interest income | Net fee income | Financial transactions, net (2) | Net loan loss allowances (3) | Operating expenses (4) | Net segment contribution (5) | ||||||||||||||||||||||
| SEGMENTS | ||||||||||||||||||||||||||||
Individuals | 9,187,526 | 416,739 | 140,905 | 5,432 | (157,586 | ) | (237,911 | ) | 167,579 | |||||||||||||||||||
Santander Banefe | 789,253 | 84,851 | 29,255 | 267 | (52,375 | ) | (52,227 | ) | 9,771 | |||||||||||||||||||
Commercial Banking | 8,398,273 | 331,888 | 111,650 | 5,165 | (105,211 | ) | (185,684 | ) | 157,808 | |||||||||||||||||||
SMEs | 2,522,698 | 149,164 | 28,702 | 7,611 | (49,450 | ) | (55,260 | ) | 80,767 | |||||||||||||||||||
Institutional | 351,644 | 19,531 | 1,382 | 677 | (209 | ) | (8,232 | ) | 13,149 | |||||||||||||||||||
Companies | 3,731,980 | 99,999 | 18,265 | 10,146 | (30,021 | ) | (30,039 | ) | 68,350 | |||||||||||||||||||
Companies | 1,572,862 | 46,370 | 9,542 | 5,308 | (15,613 | ) | (16,658 | ) | 28,949 | |||||||||||||||||||
Real estate | 572,887 | 13,825 | 2,295 | 548 | (307 | ) | (3,322 | ) | 13,039 | |||||||||||||||||||
Large Corporations | 1,586,231 | 39,804 | 6,428 | 4,290 | (14,101 | ) | (10,059 | ) | 26,362 | |||||||||||||||||||
| Global Banking & Markets | 1,905,005 | 35,369 | 17,689 | 54,711 | 4,788 | (25,788 | ) | 86,769 | ||||||||||||||||||||
Corporate | 1,892,850 | 47,046 | 17,989 | 1,182 | 7,410 | (10,230 | ) | 63,397 | ||||||||||||||||||||
Treasury (6) | 12,155 | (11,677 | ) | (300 | ) | 53,529 | (2,622 | ) | (15,558 | ) | 23,372 | |||||||||||||||||
Other (7) | 69,541 | (12,648 | ) | 2,487 | (307 | ) | 536 | (11,975 | ) | (21,907 | ) | |||||||||||||||||
TOTAL | 17,768,394 | 708,154 | 209,430 | 78,270 | (231,942 | ) | (369,205 | ) | 394,707 | |||||||||||||||||||
Other operating income | 1,164 | |||||||||||||||||||||||||||
Other operating expenses | (34,540 | ) | ||||||||||||||||||||||||||
| Income from investments in other companies | 1,673 | |||||||||||||||||||||||||||
Income tax | (57,943 | ) | ||||||||||||||||||||||||||
Consolidated profit (loss) for the period | 305,061 | |||||||||||||||||||||||||||
| (1) | Loans and accounts receivables from customers plus interbank loans, gross of loan loss allowances. |
| (2) | Includes net gains from trading, net mark-to-market gains and foreign exchange transactions. |
| (3) | Includes gross provisions for loan losses, net of releases on recoveries. |
| (4) | Equal to the sum of personnel expenses, administrative expenses, amortizations and depreciations and deterioration. |
| (5) | Equal to the sum of the net interest income, net fee income and net financial transactions, minus net provision for loan losses and operating expenses. |
| (6) | Includes the Treasury’s client business and trading business. |
| (7) | Includes Financial Management and the contribution of non-segmented items such as interbank loans, the cost of our capital and fixed assets. Net interest income and net financial transactions, included in other are mainly comprised of the results from the Financial Management Division (Gestion Financiera). The area of Financial Management carries out the function of managing the structural interest rate risk, the structural position in inflation indexed assets and liabilities, shareholder’s equity and liquidity. The aim of Financial Management is to inject stability and recurrence into the net income of commercial activities and to assure we comply with internal and regulatory limits regarding liquidity, regulatory capital, reserve requirements and market risk. |
Operations through Subsidiaries
Today, the General Banking Law permits us to directly provide the leasing and financial advisory services that we could formerly offer only through our subsidiaries, to offer investment advisory services outside of Chile and to undertake activities we could not formerly offer directly or through subsidiaries, such as factoring, securitization, foreign investment funds, custody and transport of securities and insurance brokerage services. For the nine–month period ended September 30, 2011, our subsidiaries collectively accounted for 2.36% of our total consolidated assets.
15
Percentage Owned | ||||||||||||||||||||||||
Subsidiary | As of September 30, 2011 | As of September 30, 2010 | ||||||||||||||||||||||
Direct | Indirect | Total | Direct | Indirect | Total | |||||||||||||||||||
| % | % | % | % | % | % | |||||||||||||||||||
Santander S.A. Corredores de Bolsa | 50.59 | 0.41 | 51.00 | 50.59 | 0.41 | 51.00 | ||||||||||||||||||
| Santander Corredores de Seguro Ltda. (Ex–Santander Leasing S.A.) | 99.75 | 0.01 | 99.76 | 99.75 | 0.01 | 99.76 | ||||||||||||||||||
| Santander Asset Management S.A. Administradora General de Fondos | 99.96 | 0.02 | 99.98 | 99.96 | 0.02 | 99.98 | ||||||||||||||||||
| Santander S.A. Agente de Valores Ltda. (Ex–Santander S.A. Agente de Valores) | 99.03 | - | 99.03 | 99.03 | - | 99.03 | ||||||||||||||||||
Santander S.A. Sociedad Securitizadora | 99.64 | - | 99.64 | 99.64 | - | 99.64 | ||||||||||||||||||
| Santander Servicios de Recaudación y Pagos Limitada | 99.90 | 0.10 | 100.00 | 99.90 | 0.10 | 100.00 | ||||||||||||||||||
Pursuant to the provisions of International Accounting Standard (IAS) 27 and Standard Interpretations Committee (SIC) 12, we must determine the existence of Special Purpose Entities (SPE), which must be consolidated with the financial results of the Bank. As a result, we have incorporated into our financial statements the following companies:
| · | Santander Gestión de Recaudación y Cobranzas Ltda. (collection services); |
| · | Multinegocios S.A. (management of sales force); |
| · | Servicios Administrativos y Financieros Ltda. (management of sales force); |
| · | Fiscalex Ltda. (collection services); |
| · | Multiservicios de Negocios Ltda. (call center); and |
| · | Bansa Santander S.A. (management of repossessed assets and leasing of properties). |
Competitive Strengths
We believe that our current profitability and competitive advantages are the result of the following strengths:
Profitability, efficiency and financial strength
We have the lowest cost structure in our peer group, which we define as the five largest banks in Chile in terms of shareholders’ equity, and have an efficiency ratio (operating expenses divided by operating revenues) of 37.0% for the year ended December 31, 2010 and 40.5% for the nine month period ended September 30, 2011. Our average return on equity was 29.0% and 20.6% for the same periods, and we had one of the strongest capital positions in our peer group with a ratio of total regulatory capital to risk-weighted assets of 14.52% at December 31, 2010 and 13.94% at September 30, 2011.
Leading market position
We are a market leader in Chile, ranking first or second in most indicators among other banks in our peer group as shown in the following table.
As of September 30, 2011, unless otherwise noted | ||||||||
Market Share | Rank | |||||||
Commercial loans | 18.5 | % | 2 | |||||
Consumer loans | 26.8 | % | 1 | |||||
Residential mortgage loans | 23.6 | % | 1 | |||||
Total loans | 20.8 | % | 1 | |||||
Deposits | 18.9 | % | 1 | |||||
Mutual funds (assets managed) | 16.6 | % | 2 | |||||
Credit card accounts(1) | 34.6 | % | 1 | |||||
16
As of September 30, 2011, unless otherwise noted | ||||||||
Market Share | Rank | |||||||
Checking accounts(2) | 25.3 | % | 1 | |||||
Branches(3) | 18.8 | % | 1 | |||||
Source: SBIF
| (1) | According to latest data available as of June 2011. |
| (2) | According to latest data available as of April 2011. |
| (3) | According to latest data available as of June 2011. Excludes special–service payment centers. |
We believe this market leadership provides us with a strong competitive position.
Operating in a stable economic environment within Latin America
We conduct substantially all of our business in Chile. The Chilean economy is generally recognized as among the most stable in Latin America, as evidenced by its A+ rating by Standard & Poor’s and Aa3 rating by Moody’s, the highest ratings in the region. Chile has consistently received investment-grade credit ratings since Standard & Poor’s and Moody’s started coverage in 1992 and 1994, respectively.
Opportunity for growth from current and new businesses
We believe there is substantial opportunity for growth based on the relatively low penetration in Chile of retail banking services and fee-based financial products in general. For example, in Chile only 29% of the workforce has a checking account and the ratio of total consumer loans to GDP is approximately 15.4% as of December 31, 2010.
We believe we are well-positioned to grow in these areas based on our extensive distribution network and our size, which afford us greater marketing opportunities and significant cost synergies.
State-of-the-art integrated technology platform
We operate a customer-centered technology platform that incorporates the standards and processes, as well as the proven innovations, of Banco Santander Spain worldwide. Because our IT platform is integrated with that of Banco Santander Spain, we are able to support our customer’s global businesses and benefit from a flexible and scalable platform that will support our growth in the country. We are currently in the process of upgrading our customer relationship management system which will enable us to deliver products and services targeted to the needs of individual customers and better integrate our different distribution channels.
Relationship with Banco Santander Spain
We believe that our relationship with our controlling shareholder, Banco Santander Spain, offers us a significant competitive advantage over our peer group. Our relationship with Banco Santander Spain allows us to:
| · | leverage the Banco Santander Spain’s global information systems platform, reducing our technology development costs, providing operational synergies with Banco Santander Spain and enhancing our ability to provide international products and services to our customers; |
| · | access the Banco Santander Spain’s multinational client base; |
| · | take advantage of the Banco Santander Spain’s global presence, in particular in other countries in Latin America, to offer international solutions for our Latin American corporate customers’ financial needs as they expand their operations globally; |
| · | selectively replicate or adapt the Banco Santander Spain’s successful product offerings from other countries in Chile; |
17
| · | benefit from the Banco Santander Spain’s operational expertise in areas such as internal controls and risk management, which practices have been developed in response to a wide range of market conditions across the world and which we believe will enhance our ability to expand our business within desired risk limits; |
| · | benefit from the Banco Santander Spain’s management training and development which is composed of a combination of in-house training and development with access to managerial expertise in other Banco Santander Spain units outside Chile. |
Although we benefit from our relationship with our controlling shareholder, as a matter of group policy, we are not dependent upon our parent company or other affiliates in the operation of our business. Funding from our parent company and its affiliates amounted approximately 4% of our total funding at September 30, 2011. Although we obtain certain services from our parent company, such as information technology and internal audit, these services are provided at market rates.
Please see "Item 4. Major Shareholders and Related Party Transactions" for additional information.
Strategy
Our goal is to create value by leveraging our client base, distribution network and range of services to profit from growth in the Chilean economy, while seeking to maintain our world-class efficiency levels and to proactively manage credit risks by applying our sophisticated credit analysis procedures. Our principal strategy is to actively manage our balance sheet, focusing on capital and continuing to expand our Commercial Banking segment, which includes individuals (from low income to high income), small and mid-sized companies (“SMEs”) and our middle-market segments. In the Commercial Banking segment, we expect the Chilean economy to continue growing, which in turn should result in increased banking activity and a rise in bank penetration levels via increased lending and deposits, more checking accounts, greater levels of assets under management and insurance brokerage. We seek to capitalize on this growth by increasing our customer base, leveraging on our extensive distribution network to cross-sell additional services and products and increase product usage. As part of this strategy, we are adopting focused marketing and sales efforts, pursuing strategic alliances with key market players, service providers and universities, selectively investing in our branch network and IT systems, and promoting the use of alternative distribution channels such as the internet, call centers and ATMs.
In our Global Banking and Markets segment (wholesale banking), we expect to continue to focus on non-lending products such as cash management, treasury services, asset management, investment banking and other tailored services to expand profitability. We also will seek to increase the synergies between this segment and Commercial Banking by reaching the employees of our major corporate customers. In the wholesale segment, our goal is to increase revenues by expanding the range of products we offer, cross-selling and focusing on sophisticated services and fee-based products. Historically, there has been low penetration of fee-based services in the Chilean financial market, with financial institutions focusing primarily on asset growth.
We will maintain a commitment to economic, social and environmental sustainability in our procedures, products, policies and relationships. We will continue building durable and transparent relationships with our customers through understanding their needs and designing our products and services to meet those needs. We believe that our commitment to transparency and sustainability will help us create a business platform to maintain growth in our operations over the long term and that is instrumental to forge business relationships, improve brand recognition and attract talented professionals. We will continue to sponsor educational opportunities through our portals to foster future potential customer relationships.
Competition
Overview
The Chilean financial services market consists of a variety of largely distinct sectors. The most important sector, commercial banking, includes a number of privately–owned banks and one public–sector bank, Banco del Estado (which operates within the same legal and regulatory framework as the private sector banks). The private–sector banks include local banks and a number of foreign–owned banks which are operating in Chile. The Chilean banking system is comprised of 24 private–sector banks and one public–sector bank. The five largest private–sector banks
18
along with the state–owned bank together accounted for 82.0% of all outstanding loans by Chilean financial institutions at September 30, 2011.
The Chilean banking system has experienced increased competition in recent years largely due to consolidation in the industry and new legislation. We also face competition from non–bank and non–finance competitors (principally department stores) with respect to some of our credit products, such as credit cards, consumer loans and insurance brokerage. In addition, we face competition from non–bank finance competitors, such as leasing, factoring and automobile finance companies, with respect to credit products, and mutual funds, pension funds and insurance companies, with respect to savings products. Currently, banks continue to be the main suppliers of leasing, factoring and mutual funds, and the insurance sales business has grown rapidly.
The following tables set out certain statistics comparing our market position to that of our peer group, defined as the five largest banks in Chile in terms of total loans market share as of September 30, 2011.
Loans
As of September 30, 2011, our loan portfolio was the largest among Chilean banks. Our loan portfolio on a stand–alone basis represented 20.8% of the market for loans in the Chilean financial system at such date. The following table sets forth our and our peer group’s market shares in terms of loans at the dates indicated.
As of September 30, 2011 | ||||||||||||
Loans (1) | Ch$ million | US$ million | Market Share | |||||||||
Santander Chile | 17,680,356 | 34,024 | 20.8 | % | ||||||||
Banco de Chile | 16,776,474 | 32,284 | 19.8 | % | ||||||||
Banco del Estado | 12,283,961 | 23,639 | 14.5 | % | ||||||||
Banco de Crédito e Inversiones | 10,779,682 | 20,744 | 12.7 | % | ||||||||
Corpbanca | 6,207,755 | 11,946 | 7.3 | % | ||||||||
BBVA, Chile | 5,897,571 | 11,349 | 6.9 | % | ||||||||
Others | 15,269,491 | 29,384 | 18.0 | % | ||||||||
Chilean financial system | 84,895,290 | 163,370 | 100.0 | % | ||||||||
Source: SBIF
| (1) | Excludes interbank loans. |
Deposits
On a stand-alone basis, we had a 18.9% market share in deposits, ranking first among banks in Chile at September 30, 2011. Deposit market share is based on total time and demand deposits at the respective dates. The following table sets forth our and our peer group’s market shares in terms of deposits at the dates indicated.
As of September 30, 2011 | ||||||||||||
Deposits | Ch$ million | US$ million | Market Share | |||||||||
Santander Chile | 13,892,003 | 26,733 | 18.9 | % | ||||||||
Banco del Estado | 13,780,978 | 26,520 | 18.8 | % | ||||||||
Banco de Chile | 13,537,792 | 26,052 | 18.4 | % | ||||||||
Banco de Crédito e Inversiones | 9,340,701 | 17,975 | 12.7 | % | ||||||||
Corpbanca | 4,908,252 | 9,445 | 6.7 | % | ||||||||
BBVA, Chile | 4,588,076 | 8,829 | 6.3 | % | ||||||||
Others | 13,333,930 | 25,659 | 18.2 | % | ||||||||
Chilean financial system | 73,381,732 | 141,213 | 100.0 | % | ||||||||
Source: SBIF
19
Total Equity
With Ch$ 1,959,791 million (US$ 3,771 million) in shareholders’ equity at September 30, 2011, we were the largest commercial bank in Chile in terms of shareholders’ equity representing 20.5% as of September 2011. The following table sets forth our and our peer group’s shareholders’ equity at September 30, 2011.
As of September 30, 2011 | ||||||||||||
Total Equity | Ch$ million | US$ million | Market Share | |||||||||
Santander Chile | 1,959,791 | 3,771 | 20.5 | % | ||||||||
Banco de Chile | 1,697,746 | 3,267 | 17.7 | % | ||||||||
Banco de Crédito e Inversiones | 1,169,637 | 2,251 | 12.2 | % | ||||||||
Banco del Estado | 1,026,029 | 1,974 | 10.7 | % | ||||||||
Corpbanca | 712,958 | 1,372 | 7.4 | % | ||||||||
BBVA, Chile | 531,750 | 1,023 | 5.5 | % | ||||||||
Others | 2,484,598 | 4,781 | 26.0 | % | ||||||||
Chilean financial system | 9,582,509 | 18,439 | 100.0 | % | ||||||||
Source: SBIF. Information according to local Chilean Bank GAAP.
Efficiency
As of September 30, 2011, we were the most efficient bank in our peer group. The following table sets forth our and our peer group’s efficiency ratio (defined as operating expenses as a percentage of operating revenue, which is the aggregate of net interest income, fees and income from services (net), net gains from mark–to–market and trading, exchange differences (net) and other operating income for the nine–month period indicated.
Efficiency ratio | Nine-Month Period Ended September 30, 2011 | |||
Santander Chile | 38.4 | % | ||
Corpbanca | 38.9 | % | ||
Banco de Crédito e Inversiones | 44.2 | % | ||
Banco de Chile | 45.7 | % | ||
BBVA, Chile | 49.0 | % | ||
Banco del Estado | 60.8 | % | ||
Chilean financial system | 44.5 | % | ||
Source: SBIF. Information according to local Chilean Bank GAAP.
Net income
For the nine-month period ended September 30, 2011, we were the largest bank in Chile in terms of net income with Ch$ 336,339 million (US$ 647 million). The following table sets forth our and our peer group’s net income at September 30, 2011.
Nine-Month Period Ended September 30, 2011 | ||||||||||||
Net income | Ch$ million | US$ million | Market Share | |||||||||
Santander Chile | 336,340 | 647 | 25.7 | % | ||||||||
Banco de Chile | 329,218 | 634 | 25.2 | % | ||||||||
Banco de Crédito e Inversiones | 188,375 | 363 | 14.4 | % | ||||||||
Corpbanca | 95,694 | 184 | 7.3 | % | ||||||||
Banco del Estado | 67,240 | 129 | 5.1 | % | ||||||||
BBVA, Chile | 59,259 | 114 | 4.5 | % | ||||||||
Others | 230,439 | 443 | 17.6 | % | ||||||||
Chilean financial system | 1,306,565 | 2,514 | 100.0 | % | ||||||||
Source: SBIF. Information according to local Chilean Bank GAAP.
20
Return on equity
As of September 30, 2011, we were the second most profitable bank in our peer group (as measured by return on equity) and the most capitalized bank as measured by the BIS ratio. The following table sets forth our and our peer group’s return on average equity and BIS ratio at the latest available date.
Return on equity as of September 30, 2011 | BIS Ratio as of July 31, 2011 | |||||
Banco de Chile | 25.9 | % | 13.3% | |||
Santander Chile | 22.9 | % | 13.7% | |||
Banco de Crédito e Inversiones | 21.5 | % | 14.5% | |||
Corpbanca | 17.9 | % | 15.8% | |||
BBVA, Chile | 14.9 | % | 12.7% | |||
Banco del Estado | 8.7 | % | 12.1% | |||
Others | 12.4 | % | 16.2% | |||
Chilean financial system | 18.2 | % | 14.1% | |||
Source: SBIF, calculated by dividing annual net income by period end equity, according to local Chilean Bank GAAP equity.
Asset Quality
As of September 30, 2011, we had the second highest non-performing loan loss to loan ratio in our peer group. The following table sets forth our and our peer group’s non-performing loan ratio as defined by the SBIF at the dates indicated.
Non-performing loan/total loans (1) as of September 30, 2011 | ||||
Banco de Chile | 0.97 | % | ||
Corpbanca | 1.67 | % | ||
BBVA, Chile | 1.82 | % | ||
Banco de Crédito e Inversiones | 2.16 | % | ||
Santander Chile | 2.81 | % | ||
Banco del Estado | 4.81 | % | ||
Others | 2.53 | % | ||
Chilean financial system | 2.45 | % | ||
Source: SBIF
| (1) | Non-performing loans divided by total loans excluding interbank loans. |
ITEM 3. OPERATING AND FINANCIAL REVIEW AND PROSPECTS
A. Accounting Standards Applied in 2011
Santander-Chile is a Chilean bank and maintains its financial books and records in Chilean pesos and prepares its consolidated financial statements in accordance with IFRS as issued by IASB, in order to comply with requirements of the SEC. As required by local regulations, our locally filed consolidated financial statements have been prepared in accordance with Chilean Bank GAAP. The accounting principles issued by the SBIF are substantially similar to IFRS but there are some exceptions. Therefore, our locally filed condensed consolidated interim financial statements have been adjusted according to IAS 34: Interim Financial Reporting. Chilean banks are subject to the regulatory supervision of the SBIF under the provisions of the General Banking Law. The General
21
Banking Law establishes that in accordance with legal regulations, Chilean banks must abide by the accounting standards stipulated by the SBIF.
Therefore, as stated above, in order to comply with requirements of the SEC, the Bank has prepared the unaudited consolidated interim financial statements included in this report under IFRS-IASB.
Differences between IFRS and Chilean Bank GAAP
As stated above, Chilean Bank GAAP, as prescribed by “Compendium of Accounting Standards” (the “Compendium”), differs in certain respects with IFRS. The main differences that should be considered by an investor are the following:
Suspension of Income Recognition on Accrual Basis
In accordance with the Compendium, financial institutions must suspend recognition of income on an accrual basis in their statements of income for certain loans included in the impaired portfolio. IFRS does not allow the suspension of accrual of interest on financial assets for which an impairment loss has been determined. We do not believe that this difference materially impacts our financial statements.
Charge-offs and Accounts Receivable
The Compendium requires companies to establish deadlines for the charge-off of loans and accounts receivables. IFRS does not require any such deadline for charge-offs. A charge-off due to impairment would be incurred if, and only if, there is objective evidence of impairment as a result of one or more events occurring after the initial recognition. This is measured on an “incurred” basis. We do not believe that this difference materially impacts our financial statements.
Assets Received in Lieu of Payment
The Compendium requires that the initial value of assets received in lieu of payment be the value agreed with a debtor as a result of the loan settlement or the value awarded in an auction, as applicable. These assets are required to be written off one year after their acquisition, if the assets have not been previously disposed of.
IFRS requires that assets received in lieu of payment be initially accounted for at fair value. Subsequently, asset valuation depends on the classification provided by the entity for that type of asset. No deadline is established for charging-off an asset. The restatement of gains and losses from repossessed assets would have an impact on the restatement of financial statements under full IFRS guidelines although we would not expect it to be material.
Goodwill and Intangible Assets
With respect to goodwill and intangible assets, the Compendium provides that:
| · | The value of “goodwill” and other depreciable intangible assets will be supported by two reports issued by specialists independent from the (i) bank, (ii) the bank’s external auditors, and (iii) each other. |
| · | For assets acquired before December 31, 2008, “goodwill” will be determined according to the Compendium, and will be amortized according to the original amortization schedule for such assets. |
| · | Goodwill arising from acquisitions before the date of transition to new Chilean Bank GAAP in January 2009 will be determined based on the previously used accounting criteria. |
With respect to goodwill and intangible assets, IFRS provides that:
| · | The use of independent experts’ valuations is not mandatory. |
| · | Beginning with the first full year in which IFRS applies, an entity must discontinue goodwill depreciation and is required to evaluate goodwill for impairment, in compliance with IAS 36. |
22
| · | It is possible to (i) choose a retroactive application of IFRS to goodwill generated before the date of the transition to IFRS, or (ii) adopt an optional exemption to record the balance of goodwill at December 31, 2008 as an attributed cost. |
Since we have no goodwill, we do not believe that this difference impacts our financial statements.
Fair Value Option with Respect to Financial Assets and Liabilities
According to the Compendium, banks are not allowed to value assets or liabilities at their fair value in place of the depreciated cost method.
IFRS allows an entity to value a financial asset or liability (or a group of financial assets or liabilities, or both), on the official recognition date, at fair value with changes in fair value to be recognized in its financial statements. Once this option has been made, it is irrevocable. The fair value option is not applicable to investments in capital instruments without a market price available in an active market, and thus whose fair value cannot be estimated in a reliable way.
We do not believe that this difference impacts our financial statements because this accounting treatment is optional.
Loan loss allowances
Considering our incurred loss approach for IFRS purposes by using our internally developed models, all differences with the SBIF models have been reversed in respect to our Consolidated Financial Statements prepared under IFRS as issued by the IASB.
Santander-Chile’s transition date to IFRS was January 1, 2008. The Bank prepared its opening balance under these standards as of such date. Consequently, the date of adoption of the new standards by the Bank and its subsidiaries was January 1, 2009.
The notes to the unaudited condensed consolidated interim financial statements contain information in addition to that presented in the Unaudited Condensed Consolidated Interim Statements of Financial Position, Unaudited Condensed Consolidated Interim Statements of Income, Unaudited Condensed Consolidated Interim Statements of Comprehensive Income, Unaudited Condensed Consolidated Interim Statements of Changes in Equity and Unaudited Condensed Consolidated Interim Statements of Cash Flows. These notes provide a narrative description of such statements.
B. Other Critical Accounting Policies
General
Our unaudited condensed consolidated interim financial statements include various estimates and assumptions, including but not limited to the adequacy of the allowance for loan losses, estimates of the fair value of certain financial instruments and the selection of useful lives of certain assets.
We evaluate these estimates and assumptions on an ongoing basis. Management bases its estimates and assumptions on historical experience and on various other factors that it believes to be reasonable under the circumstances. Actual results in future periods could differ from those estimates and assumptions, and if these differences were significant enough, our reported results of operations would be affected materially. We believe that the following are the more critical judgment areas or involve a higher degree of complexity in the application of the accounting policies that currently affect our financial condition and results of operations.
Allowance for loan losses
The Bank maintains loan loss allowances in amounts determined in accordance with its internal models. These models for rating and evaluating credit risk are approved by the Bank’s Board of Directors. Our credit scoring system considers both the length of time by which the loan is overdue and the borrower’s risk profile, which includes the borrower’s overall indebtedness and credit behavior under the borrower’s obligations to third parties.
23
Our internal provisioning models use statistical models that take into account a borrower’s credit history and indebtedness levels. Group ratings that determine loan loss allowances based only on non-performance are being phased out and replaced by statistical scoring systems. Large commercial loans are rated on an individual basis. For large commercial loans, leasing and factoring, we assign a risk category level to each borrower and its respective loans. We consider the following risk factors in classifying a borrower’s risk category: (i) the borrower’s industry or sector, (ii) owners or managers, (iii) financial condition, (iv) payment ability and (v) payment behavior. For a detailed description of the models we use to determine loan loss allowances for commercial loans. Group assessment for loan loss allowances is applied for a large number of borrowers whose individual loan amounts are relatively insignificant. Currently, we use group analysis to determine loan loss allowances for certain types of loans, such as loans to small- and mid-sized companies and commercial loans to individuals.
Derivative activities
As of September 30, 2011 and 2010, derivatives are measured at fair value on the statement of financial position and the net unrealized gain (loss) on derivatives is classified as a separate line item within the income statement. Under IFRS, banks must mark-to-market derivatives. A derivative financial instrument held for trading purposes must be marked to market and the unrealized gain or loss recognized in the income statement. The Bank recognizes three kinds of hedge accounting: (i) cash flow hedges, (ii) fair value hedges and (iii) hedging of foreign net investments.
| · | When a cash flow hedge exists, the fair value movements on the part of the hedging instrument and the hedged item that is effective are recognized in equity as “valuation adjustments”. Any ineffective portion of the fair value movement on the hedging instrument and the hedged item is recognized in the income statement. |
| · | When a fair value hedge exists, the fair value movements on the hedging instrument and the corresponding fair value movements on the hedged item are recognized in the income statement. |
| · | When a hedge of net investment in a foreign operation exists, the fair value movements on the part of the hedging instrument and the hedged item that is effective are recognized in equity. Any ineffective portion of the fair value movement on the hedging instrument is recognized in the income statement. |
C. Operating Results
Chilean Economy
All of our operations and substantially all of our customers are located in Chile. Accordingly, our financial condition and results of operations are substantially dependent upon economic conditions prevailing in this country. In 2010, the Chilean economy grew 5.1%, compared to a decrease of 1.5% in 2009 and an increase of 3.2% in 2008.
In the first half of 2011 the Chilean economy grew 8.4%. In the first half of 2011, internal demand increased 12.0%, private investment increased 15.4%, and private consumption increased 11.4%. Unemployment has also been decreasing. As of August 2011, the unemployment rate was 7.4%, compared to 8.3% in August 2010. Part of this growth can be explained by the strong rebound in economic activity compared to a weaker first half of 2010 that was negatively affected by the February 2010 earthquake. Going forward economic activity is expected to continue to increase, but at a slower pace given the uncertain global environment.
As a result of the economic recovery, the CPI and interest rates have been increasing. In the twelve month period ended September 30, 2011, CPI inflation reached 3.27%. CPI inflation in 2010 increased 2.97% compared to a 1.38% decrease in 2009. As a result of rising price levels and higher economic activity, interest rates also increased in 2011. The overnight interbank rate set by the Central Bank increased 250 basis points in the twelve month period ended September 30, 2011 to 5.25%.
The Chilean banking sector evolved in line with overall economic developments with an increase in the volume of loans. Total loans as of September 30, 2011 in the Chilean financial system were Ch$84,895,290 million (US$175.5 billion), an increase of 16.5% in the last twelve months. Total customer deposits (defined as time deposits plus checking accounts) totaled Ch$73,381,732 million (US$151.7 billion) as of September 30, 2011, an
24
increase of 19.6% in the last twelve months. The non-performing loan ratio defined as in the Chilean banking industry decreased from 2.7% at year-end 2010 to 2.4% as of September 30, 2011.
Impact of Inflation
Our assets and liabilities are denominated in Chilean pesos, UF and foreign currencies. The Bank no longer recognizes inflation accounting and has eliminated price level restatement in line with IFRS, but inflation impacts our results of operations as some loan and deposit products are contracted in UF. The UF is revalued in monthly cycles. Each day in the period beginning on the tenth day of the current month through the ninth day of the succeeding month, the nominal peso value of the UF is indexed up (or down in the event of deflation) in order to reflect a proportionate amount of the change in the Chilean CPI during the prior calendar month. One UF equaled Ch$20,942.88 at December 31, 2009, Ch$21,455.55 at December 31, 2010 and Ch$22,012.69 at September 30, 2011.
High levels of inflation in Chile could adversely affect the Chilean economy and have an adverse effect on us. Negative inflation rates also could negatively impact our results. In 2010, CPI inflation was 3.0% compared to a decline of 1.4% in 2009 and a rise of 7.1% in 2008. CPI inflation in year-to-date in the nine-month period ended September 30, 2011 increased 2.98% compared to a 2.68% increase year-to-date in the nine-month period ended September 30, 2010. There can be no assurance that Chilean inflation will not change significantly from the current level. Although we currently benefit from moderate levels of inflation, due to the current structure of our assets and liabilities (i.e., a significant portion of our loans are indexed to the inflation rate, but there are no corresponding features in deposits or other funding sources that would increase the size of our funding base), there can be no assurance that we will not be adversely affected by changing levels of inflation. In summary:
| · | UF-denominated assets and liabilities. In 2010, UF inflation was +2.45% compared to -2.4% in 2009 and +9.3% in 2008. UF inflation in the nine-month period ended September 30, 2011 increased 2.60% compared to a 1.90% increase in the nine-month period ended September 30, 2010. The effect of any changes in the nominal peso value of our UF-denominated interest earning assets and interest bearing liabilities is reflected in our results of operations as an increase (or decrease, in the event of deflation) in interest income and expense, respectively. Our net interest income will be positively affected by an inflationary environment to the extent that our average UF-denominated interest earning assets exceed our average UF-denominated interest bearing liabilities. Our net interest income will be negatively affected in a deflationary environment if our average UF-denominated interest earning assets exceed our average UF-denominated interest bearing liabilities. Our net interest income will be negatively affected by inflation in any period in which our average UF-denominated interest bearing liabilities exceed our average UF-denominated interest earning assets. Our average UF-denominated interest earning assets exceeded our average UF-denominated interest bearing liabilities by Ch$ 3,478,952 million in the nine-month period ended September 30, 2011 compared to Ch$ 3,092,340 million in the same period in 2010. See “Selected Statistical Information ―Average Balance Sheets, Income Earned from Interest-Earning Assets And Interest Paid on Interest Bearing Liabilities.” In general, the Bank has more UF-denominated financial assets than UF-denominated financial liabilities. In the nine-month period ended September 30, 2011, the interest gained on interest earning assets denominated in UF increased 21.4% compared to the same period in 2010 as a result of the higher inflation rates. In the nine-month period ended September 30, 2011, the interest paid on these liabilities increased 22.1% compared to the same period in 2010. |
| · | Inflation and interest rate hedge. A key component of our asset and liability policy is the management of interest rate risk. The Bank’s assets generally have a longer maturity than our liabilities. As the Bank’s mortgage portfolio grows, the maturity gap tends to rise as these loans, which are contracted in UF, have a longer maturity than the average maturity of our funding base. As most of our long term financial instruments and mortgage loans are contracted in UF and most of our deposits are in nominal pesos, the rise in mortgage lending increases the Bank’s exposure to inflation and to interest rate risk. The size of this gap is limited by internal and regulatory guidelines in order to avoid excessive potential losses due to strong shifts in interest rates (see “Item 9: Quantitative and Qualitative Disclosures About Market Risk”). In order to keep this duration gap below regulatory limits the Bank issues long term bonds denominated in UF or interest rate swaps. The financial cost of the bonds and the efficient part of these hedges is recorded as net interest income. In the nine-month period ended September 30, 2011, the loss from the swaps taken in |
25
order to hedge mainly for inflation and interest rate risk totaled Ch$24,208 million compared to Ch$15,202 million in the same period in 2010.
As of September 30, | % Change | |||||||||||
Inflation sensitive income | 2011 | 2010 | 2011/2010 | |||||||||
| (In million of Chilean pesos) | ||||||||||||
Interest earned on UF assets (1) | 492,160 | 405,419 | 21.4 | % | ||||||||
Interest paid on UF liabilities (1) | (272,347 | ) | (223,068 | ) | 22.1 | % | ||||||
Hedging results | (38,978 | ) | 2,965 | -- | % | |||||||
Net gain | 180,835 | 185,316 | (2.4 | %) | ||||||||
| (1) | Includes results from interest-rate hedging. |
| · | Peso-denominated assets and liabilities. Interest rates prevailing in Chile during any period primarily reflect the inflation rate during the period and the expectations of future inflation. The sensitivity of our peso-denominated interest earning assets and interest bearing liabilities to changes to such prevailing rates varies. (See “Item 3: C. Operating Results–Interest Rates”). We maintain a substantial amount of non-interest bearing peso-denominated demand deposits. Because such deposits are not sensitive to inflation, any decline in the rate of inflation would adversely affect our net interest margin on inflation indexed assets funded with such deposits, and any increase in the rate of inflation would increase the net interest margin on such assets. (See “Item 9: Quantitative and Qualitative Disclosures About Market Risk”). The ratio of the average of such demand deposits to average interest-earning assets was 17.5% as of September 30, 2011 and 18.1% as of September 30, 2010. |
Interest Rates
Interest rates earned and paid on our assets and liabilities reflect, to a certain degree, inflation, expectations regarding inflation, changes in short term interest rates set by the Central Bank and movements in long term real rates. The Central Bank manages short term interest rates based on its objectives of balancing low inflation and economic growth. Because our liabilities are generally re-priced sooner than our assets, changes in the rate of inflation or short term rates in the economy are reflected in the rates of interest paid by us on our liabilities before such changes are reflected in the rates of interest earned by us on our assets. Therefore, when short term interest rates fall, our net interest margin is positively impacted, but when short term rates increase, our interest margin is negatively affected. At the same time, our net interest margin tends to be adversely affected in the short term by a decrease in inflation rates since generally our UF-denominated assets exceed our UF-denominated liabilities. (See “Item 3: C. Operating Results–Impact of Inflation–Peso-denominated assets and liabilities”). An increase in long term rates has a positive effect on our net interest margin, because our interest earning assets generally have longer terms than our interest bearing liabilities. In addition, because our peso-denominated liabilities have relatively short re-pricing periods, they are generally more responsive to changes in inflation or short term rates than our UF-denominated liabilities. As a result, during periods when current inflation or expected inflation exceeds the previous period’s inflation, customers often switch funds from UF-denominated deposits to peso-denominated deposits, which generally bear higher interest rates, thereby adversely affecting our net interest margin.
Foreign Exchange Fluctuations
The Chilean government’s economic policies and any future changes in the value of the Chilean peso against the U.S. dollar could adversely affect our financial condition and results of operations. The Chilean peso has been subject to significant devaluation in the past and may be subject to significant fluctuations in the future. In 2010, the Chilean peso in relation to the U.S. dollar appreciated 7.5% compared to a 19.5% appreciation in 2009 and a 26.9% depreciation in 2008. Year-to-date as of September 30, 2011, the Chilean peso has depreciated 10.0%. (See “Item 1: A. Selected Financial Data–Exchange Rates”). A significant portion of our assets and liabilities are denominated in foreign currencies, principally the U.S. dollar, and we historically have maintained and may continue to maintain material gaps between the balances of such assets and liabilities. Because such assets and liabilities, as well as interest earned or paid on such assets and liabilities, and gains and losses realized upon the sale of such assets, are translated to Chilean pesos in preparing our financial statements, our reported income is affected by changes in the value of the Chilean peso relative to foreign currencies (principally the U.S. dollar). The translation gain or loss over
26
assets and liabilities (excluding derivatives held for trading) is included as foreign exchange transactions in the income statement. The translation and mark-to-market of foreign currency derivatives held for trading is recognized as a gain or loss in the net results from mark-to-market and trading.
The Bank also uses a sensitivity analysis with both internal limits and regulatory limits to seek to manage the potential loss in net interest income resulting from fluctuations of interest rates on U.S. dollar denominated assets and liabilities and a VaR model to limit foreign currency trading risk (see “Item 9: Quantitative and Qualitative Disclosures About Market Risk”).
27
The compositions of our assets, liabilities and equity as of September 30, 2011, by currency are as follows:
As of September 30, 2011, Ch$ million | ||||||||||||||||||||
Ch$(1) | UF | Ch$ linked to | US$ | Total | ||||||||||||||||
US$ | ||||||||||||||||||||
| Assets | ||||||||||||||||||||
Cash and deposits | 873,031 | - | - | 939,753 | 1,812,784 | |||||||||||||||
| Unsettled transactions | 460,788 | - | - | 355,813 | 816,601 | |||||||||||||||
| Trading investments | 81,456 | 419,703 | - | 2,654 | 503,813 | |||||||||||||||
| Investments under agreements to resell | 12,157 | - | - | - | 12,157 | |||||||||||||||
| Financial derivative contracts | 2,011,585 | - | - | - | 2,011,585 | |||||||||||||||
| Interbank loans | - | - | - | 88,019 | 88,019 | |||||||||||||||
| Loans and receivables from customers | 6,739,410 | 8,553,273 | 52,895 | 1,850,217 | 17,195,795 | |||||||||||||||
| Available for sale investments | 1,982,877 | 109,899 | - | 11,868 | 2,104,644 | |||||||||||||||
| Investments held to maturity | - | - | - | - | - | |||||||||||||||
| Investments in other companies | 8,232 | - | - | - | 8,232 | |||||||||||||||
| Intangible assets | 77,229 | - | - | - | 77,229 | |||||||||||||||
| Property, plant and equipment | 153,116 | - | - | - | 153,116 | |||||||||||||||
| Current taxes | 27,746 | - | - | - | 27,746 | |||||||||||||||
| Deferred taxes | 130,548 | - | - | - | 130,548 | |||||||||||||||
| Other assets (2) | 489,816 | 71,119 | 3,645 | 148,966 | 713,546 | |||||||||||||||
| Total assets | 13,047,991 | 9,153,994 | 56,540 | 3,397,290 | 25,655,815 | |||||||||||||||
| Liabilities | ||||||||||||||||||||
| Deposits and other sight obligations | 3,695,803 | 195,205 | - | 605,749 | 4,496,757 | |||||||||||||||
| Unsettled transactions | 173,022 | - | - | 293,041 | 466,063 | |||||||||||||||
| Investment under agreements to repurchase | 180,469 | 1,024 | - | 45,550 | 227,043 | |||||||||||||||
| Deposits and other time deposits | 5,805,419 | 2,249,181 | - | 1,340,646 | 9,395,246 | |||||||||||||||
| Financial derivative contracts | 1,625,274 | - | - | - | 1,625,274 | |||||||||||||||
| Interbank borrowings | - | 910 | - | 2,024,146 | 2,025,056 | |||||||||||||||
| Issued debt instruments | 254,306 | 2,662,905 | - | 1,595,695 | 4,512,906 | |||||||||||||||
| Other financial liabilities | 143,328 | 14,002 | 6,679 | 2,984 | 166,993 | |||||||||||||||
| Current taxes | 2,300 | - | - | - | 2,300 | |||||||||||||||
| Deferred taxes | 11,580 | - | - | - | 11,580 | |||||||||||||||
| Provisions | 142,834 | - | - | - | 142,834 | |||||||||||||||
| Other liabilities (2) | 261,153 | 25,773 | 4,033 | 272,067 | 563,026 | |||||||||||||||
| Total liabilities | 12,295,488 | 5,149,000 | 10,712 | 6,179,878 | 23,635,078 | |||||||||||||||
| Equity | ||||||||||||||||||||
| Attributable to Bank Shareholders | 1,988,444 | - | - | - | 1,988,444 | |||||||||||||||
| Capital | 891,303 | - | - | - | 891,303 | |||||||||||||||
| Reserves | 51,539 | - | - | - | 51,539 | |||||||||||||||
| Valuation adjustment | 593 | - | - | - | 593 | |||||||||||||||
| Retained earnings : | ||||||||||||||||||||
| Retained earnings of prior periods | 833,830 | - | - | - | 833,830 | |||||||||||||||
| Net income for the period | 301,684 | - | - | - | 301,684 | |||||||||||||||
| Minus: Provision for mandatory dividends | (90,505 | ) | - | - | - | (90,505 | ) | |||||||||||||
| Non−controlling interest | 32,293 | - | - | - | 32,293 | |||||||||||||||
| Total equity | 2,020,737 | - | - | - | 2,020,737 | |||||||||||||||
| Total liabilities and equity | 14,316,225 | 5,149,000 | 10,712 | 6,179,878 | 25,655,815 | |||||||||||||||
| (1) | Includes the value of swap instruments and balances of executed transactions which contractually defer the payment of sales transactions or the delivery of foreign currency acquired. |
| (2) | Other assets and liabilities include the threshold position from derivative contracts. |
28
Results of Operations for the Nine-Month Periods Ended September 30, 2011 and 2010
The following discussion is based upon and should be read in conjunction with the Unaudited Condensed Consolidated Interim Financial Statements included in this report. The Unaudited Interim Condensed Consolidated Financial Statements have been prepared in accordance with IFRS. The following table sets forth the principal components of our net income for the nine-month periods ended September 30, 2011 and 2010 as published by the Bank on October 27, 2011.
For the Nine-Month Period Ended September 30, | ||||||||||||||||
2011 | 2011 | 2010 | ||||||||||||||
| CONDENSED CONSOLIDATED INTERIM INCOME STATEMENT DATA | US$ thousands(1) | Ch$ million of constant pesos | % Change 2011 /2010 | |||||||||||||
| IFRS: | ||||||||||||||||
| Interest income and expense | ||||||||||||||||
Interest income | 2,446,412 | 1,271,278 | 1,045,602 | 21.6 | % | |||||||||||
Interest expense | (1,083,660 | ) | (563,124 | ) | (337,748 | ) | 66.7 | % | ||||||||
Net interest income | 1,362,752 | 708,154 | 707,854 | 0.0 | % | |||||||||||
| Fees and income from services | ||||||||||||||||
Fees and commission income | 522,546 | 271,541 | 247,346 | 9.8 | % | |||||||||||
Fees and commission expense | (119,525 | ) | (62,111 | ) | (53,401 | ) | 16.3 | % | ||||||||
Net fees and commission income | 403,021 | 209,430 | 193,945 | 8.0 | % | |||||||||||
| Other operating income | ||||||||||||||||
Net income from financial operations | 295,458 | 153,535 | 51,946 | 195.6 | % | |||||||||||
Foreign exchange profit (losses), net | (144,838 | ) | (75,265 | ) | 24,381 | (408.7 | %) | |||||||||
Financial transactions, net | 150,620 | 78,270 | 76,327 | 2.5 | % | |||||||||||
Other operating income | 2,240 | 1,164 | 25,826 | (95.5 | %) | |||||||||||
Total other operating income | 152,860 | 79,434 | 102,153 | (22.2 | %) | |||||||||||
Net operating profit before loan losses | 1,918,633 | 997,018 | 1,003,952 | (0.7 | %) | |||||||||||
Provision for loan losses | (446,343 | ) | (231,942 | ) | (208,826 | ) | 11.1 | % | ||||||||
Net operating profit | 1,472,290 | 765,076 | 795,126 | (3.8 | %) | |||||||||||
| Operating expenses | ||||||||||||||||
| Personnel salaries and expenses | (399,076 | ) | (207,380 | ) | (184,921 | ) | 12.1 | % | ||||||||
Administrative expenses | (234,924 | ) | (122,078 | ) | (109,743 | ) | 11.2 | % | ||||||||
Depreciation and amortization | (76,278 | ) | (39,638 | ) | (36,227 | ) | 9.4 | % | ||||||||
Impairment | (210 | ) | (109 | ) | (4,665 | ) | (97.7 | %) | ||||||||
Other operating expenses | (66,469 | ) | (34,540 | ) | (36,822 | ) | (6.2 | %) | ||||||||
Total operating expenses | (776,957 | ) | (403,745 | ) | (372,378 | ) | 8.4 | % | ||||||||
Operating income | 695,333 | 361,331 | 422,748 | (14.5 | %) | |||||||||||
| Other non-operating results | ||||||||||||||||
| Income from investments in other companies | 3,219 | 1,673 | 1,175 | 42.4 | % | |||||||||||
Total other non-operating results | 3,219 | 1,673 | 1,175 | 42.4 | % | |||||||||||
Income before tax | 698,552 | 363,004 | 423,923 | (14.4 | %) | |||||||||||
Income tax | (111,503 | ) | (57,943 | ) | (56,752 | ) | 2.1 | % | ||||||||
Net income for the period | 587,049 | 305,061 | 367,171 | (16.9 | %) | |||||||||||
| Net income attributable to: | ||||||||||||||||
Equity holders of the Bank | 580,551 | 301,684 | 367,270 | (17.9 | %) | |||||||||||
Non-controlling interests | 6,498 | 3,377 | (99 | ) | -- | % | ||||||||||
| (1) | Amounts stated in U.S. dollars at and for the nine-month period ended September 30, 2011, have been translated from Chilean pesos at the exchange rate of Ch$519.65 = US$1.00 as of September 30, 2011. See “Item 1: A. Selected Financial Data–Exchange Rates” for more information on exchange rate. |
Net income for the nine-month period ended September 30, 2011, decreased 16.9% to Ch$305,061 million. Our return on annualized average equity was 20.6% in the nine-month period ended September 30, 2011 compared to 28.3% in the same period in 2010.
29
In the nine-month period ended September 30, 2011, net operating profit before loan losses was Ch$997,018 million, a decrease of 0.7% compared to the corresponding period in 2010. Our net interest income was essentially unchanged at Ch$708,154 million in the 2011 period. The average balance of our interest-earning assets increased by 17.3% in the nine-month period ended September 30, 2011 compared to the corresponding period in 2010. However, our net interest margin decreased 80 basis points to 4.7% in the same period mainly due to higher funding costs. As discussed in further detail below, the rise in the average rate of interest paid on time deposits from the effect of higher short-term interest rates increased overall funding costs. This was only partially offset by higher volumes and higher asset yields reflecting higher inflation in 2011 compared to 2010.
Net fees and commission income increased 8.0% to Ch$209,430 million in the nine-month period ended September 30, 2011 compared to the same period in 2010. Net fees were positively affected by the growth of the Chilean economy and the Bank’s marketing and promotion efforts to increase product usage. Fees from credit, debit and ATM cards increased 9.8%, fees from insurance brokerage fees increased by 15.8% and securities brokerage fees increased 30.0% in the periods being analyzed. These increases were partially offset by a 6.5% decrease in fees from checking accounts and lines of credit. This decline was due to the reduction in the amount of lines of credit and overdraft lines made available to clients, following an increase in Chilean Bank GAAP of provisioning requirements for unused lines of credit.
Results of financial transactions, net, which is the sum of trading activities, fair value adjustments and foreign exchange transactions, totaled Ch$78,270 million in the nine-month period ended September 30, 2011, an increase of 2.5% compared to the corresponding period in 2010. These results include the results of our Treasury Department’s trading business and financial transactions with customers, Santander Global Connect (SGC) as well the results of our Financial Management Division. The results from SGC, a specialized platform designed to facilitate the sale of derivatives to a broad range of companies in all segments through our branch network and through market-making, increased 4.6%. Our proprietary trading results totaled a gain of Ch$13,895 million in the nine-month period ended September 30, 2011, which represented an increase of 98.5% compared to the corresponding period in 2010. This was mainly due to positive results in the foreign exchange market. The results from the Financial Management Division were a loss of Ch$8,545 million in the nine-month period ended September 30, 2011 compared to a gain of Ch$2,295 million in the nine-month period ended September 30, 2010. Throughout 2011, the Bank has maintained above average levels of liquidity, part of which is generated from US$ liabilities, as a conservative measure given the uncertainty surrounding global financial markets. These dollar liabilities are hedged through derivatives (short term foreign currency swaps), but as the short term interest rate differential between USD and CLP has increased, this has produced a higher cost registered in financial transactions, net. This higher cost is partially offset in net interest income where the interest earned on the short-term liquid asset is registered and the interest expense of the US$ liabilities is also recorded.
Other operating income totaled a gain of Ch$1,164 million in the nine-month period ended September 30, 2011, a 95.5% decrease from Ch$25,826 million in the corresponding period in 2010. This decline was mainly due to the gain from sale of branches recorded in 2010 which did not occur in 2011 as well as lower recoveries of provisions for contingencies and a decrease in insurance payments relating to the earthquake. In the nine-month period ended September 30, 2010, the Bank sold 16 branches for a gain of Ch$12,975 million recognized as income from the sale of Bank property, plant and equipment. These branches are now rented to us. The Bank did not finance this acquisition and the acquirers were non-related parties.
Charge-offs of non-performing loans increased 28.4% in the periods being analyzed, totaling Ch$194,222 million. Consumer loan charge-offs increased 37.5% in the nine-month period ended September 30, 2011 compared to the corresponding period in 2010. The rise was mainly due to the growth in consumer lending, which in the same period, increased 14.5%. The tightening of renegotiation policies for consumer loans also led to a greater amount of impaired consumer loans entering non-performing status and subsequently being charged-off. The ratio of non-performing consumer loans to total consumer loans rose from 2.87% as of September 30, 2010 to 3.84% as of September 30, 2011. Coverage of consumer non-performing loans was 217.6% as of September 30, 2011 compared to 294.9% as of September 30, 2010. The ratio of impaired consumer loans to total consumer loans decreased from 17.8% as of September 30, 2010 to 14.5% as of September 30, 2011.
Net provision expense increased by 11.1% to Ch$231,942 million in the nine-month period ended September 30, 2011 compared to the nine-month period ended September 30, 2010. This was mainly due to the 28.4% increase in charge-offs. Gross provisions on the other hand decreased 33.8% to Ch$53,739 million. This decrease was mainly due to lower gross provisions in consumer lending. In the nine-month period ended September 30, 2010, we recognized Ch$30,466 million in provisions mainly for consumer loans as a result of improvements made to credit scoring models. The effect of non-recurrence in 2011 of this change in our model was offset in part by an increase in gross provision for residential mortgage loans. The total impact of this change on loan loss reserves was Ch$13,006 million or 0.3% of the Bank’s total residential mortgage portfolio.
As a result of the factors mentioned above, net operating profit decreased 3.8% in the nine-month period ended September 30, 2011 compared to the nine-month period ended September 30, 2010 and totaled Ch$765,076 million.
30
Operating expenses in the nine-month period ended September 30, 2011 increased 8.4% compared to the corresponding period in 2010. Personnel salaries and expenses increased by 12.1% mainly due to higher headcount, as well as higher severance payments. Administrative expenses increased 11.2%. The main reason for this rise in administrative expenses was the greater business activity as well as the expenses related to IT projects being carried out to improve productivity. An additional factor was the 25.5% rise in branch rental expenses to Ch$16,437 million in the nine month period ended September 30, 2011 due to our branch sales in 2010. Our efficiency ratio was 40.5% in the nine-month period ended September 30, 2011 compared to 37.1% in the same period in 2010.
Other operating expenses were Ch$34,540 million in the nine-month period ended September 30, 2011, a 6.2% decrease compared to the same period in 2010. The decrease in other expenses was due in part to lower earthquake related expenses, lower expenses related to repossessed assets and lower credit card expenses.
Our income tax expense increased by 2.1% in the nine-month period ended September 30, 2011 compared to the same period in 2010. The effective tax rate paid was 16.0% in the nine-month period ended September 30, 2011 compared to 13.4% in the corresponding period in 2010. The statutory tax rate in Chile in 2011 was 20% compared to 17% in 2010. The higher effective tax rate is mainly due to this rise in the statutory corporate tax rate. The Chilean government and Congress in 2010 approved a temporary increase in the corporate tax rate to 20% in 2011, 18.5% in 2012 and back to 17% in 2013, as part of the plan to finance the reconstruction of public works in the zones most affected by the February 2010 earthquake and tsunami. The Bank’s effective tax rate tends to be below the statutory rate since for tax purposes the Bank must still recognize the effects of price level restatement on equity even though inflation accounting is no longer required by Chilean Bank GAAP.
Results of operations by business segments
For internal information, Banco Santander Chile maintained in 2011 the general criteria used in 2010 for business segmentation, with the following exception:
The system for calculating the internal transfer rate (ITR) changed. Prior to 2011, Banco Santander Chile’s management model applied an ITR to each operation on the basis of its maturity, regardless of whether it was an operation for assets or liabilities. During and since the financial and liquidity crisis, the real cost of liquidity has consistently and significantly differed from the reference yield curve. Therefore, the Bank decided to revise the system for measuring the spread by changing the ITR applied by the corporate centre to the units. This change makes the model more in line with the requirements of regulators, ensures a better pricing of operations and enables the market to better assess the profitability of businesses.
This change was not significant for the Bank and does not materially alter its results.
As a result of the above mentioned change in the ITR calculation in 2011, in order to compare homogeneous financial information, the income statement for the nine months period ended September 30, 2010 of the business segments should be adjusted, in the net interest income line, as follows:
| § | Individuals: a decrease of Ch$4,719 million; |
| § | Small and mid-sized companies: a decrease of Ch$27,065 million; |
| § | Institutional: a decrease of Ch$4,414 million; |
| § | Middle-market: a decrease of Ch$7,276; |
| § | Global banking and markets: an increase of Ch$18,566; and |
| § | Other: an increase of Ch$24,908. |
There was no effect to the reported amounts in net fee and commission income, ROF, provisions, support expenses, and loans and accounts receivables from customers as a result of the change in the ITR calculation.
Net interest income, before adjustments
Nine-Month Period Ended September 30, | % Change | |||||||||||
2011 | 2010 | 2011/2010 | ||||||||||
| (in millions of Ch$, except percentages) | ||||||||||||
Individuals | 416,739 | 400,204 | 4.1 | % | ||||||||
Small and mid-sized companies | 149,164 | 171,833 | (13.2 | %) | ||||||||
Institutional | 19,531 | 19,172 | 1.9 | % | ||||||||
Middle-market | 99,999 | 103,401 | (3.3 | %) | ||||||||
Global banking & markets | 35,369 | 16,836 | 110.1 | % | ||||||||
Other net interest income (1) | (12,648 | ) | 3,592 | -- | % | |||||||
Net interest income | 708,154 | 707,854 | 0.0 | % | ||||||||
Figures in the Unaudited Condensed Consolidated Interim Income Statement do not reflect these adjustments. However, in order to explain the variations of comparable periods, the explanations below do consider the adjustments when these are significant.
Net interest income, adjusted
Nine-Month Period Ended September 30, | % Change | |||||||||||
2011 | 2010 | 2011/2010 | ||||||||||
| (in Ch$ million, except percentages) | ||||||||||||
Individuals | 416,739 | 395,485 | 5.4 | % | ||||||||
Small and mid sized companies | 149,164 | 144,768 | 3.0 | % | ||||||||
Institutional | 19,531 | 14,758 | 32.3 | % | ||||||||
Total middle-market | 99,999 | 96,125 | 4.0 | % | ||||||||
Global banking & markets | 35,369 | 35,402 | (0.1 | %) | ||||||||
Other net interest income (1) | (12,648 | ) | 21,316 | -- | % | |||||||
Net interest income | 708,154 | 707,854 | 0.0 | % | ||||||||
Average interest-earning assets | 20,091,577 | 17,135,052 | 17.3 | % | ||||||||
Net interest margin (2) | 4.7 | % | 5.5 | % | ||||||||
| Average shareholders’ equity and average non-interest-bearing demand deposits to total average interest-earning assets | 27.5 | % | 28.2 | % | ||||||||
| (1) | Consists mainly of net interest income from the Financial Management Division and the cost of funding our fixed income trading portfolio. |
| (2) | Net interest margin is net interest income divided by average interest-earning assets. |
Our net interest income totaled Ch$708,154 million in the nine-month period ended September 30, 2011, substantially unchanged from the corresponding period in 2010. Average interest earning assets increased 17.3% in the nine-month period ended September 30, 2011, driven mainly by consumer and SME lending. Net interest margin in the same period in 2011 was 4.7% compared to 5.5% in the same period in 2010. Net interest margins were negatively affected by the rise in average short-term interest rates. As interest-bearing liabilities generally have shorter terms than interest-earning assets, a rise in short-term rates has a negative effect on our margins. The average nominal rate we paid on our peso denominated interest-bearing liabilities was 4.6% in the nine-month period ended September 30, 2011 compared to 1.6% in the nine-month period ended September 30, 2010. The average nominal rate we paid on our peso denominated time deposits was 4.0% in the nine-month period ended September 30, 2011 compared to 1.3% in the nine-month period ended September 30, 2010. As a result, interest expense in the nine-month period ended September 30, 2011 increased 66.7% compared to interest expense in the nine-month period ended September 30, 2010.
31
The impact of interest rate increases was partially offset by a higher local inflationary environment. In the nine-month period ended September 30, 2011, the value of the UF increased by 2.6% compared to a rise of 1.9% in the corresponding period in 2010. As we have more interest-earning assets than liabilities linked to the UF, our net interest income was positively affected by this change in inflationary trends. At the same time, the higher interest rate environment also pushed upward the nominal rate earned over our interest earning assets, albeit to a lesser extent than the rise of our funding costs. The average nominal rate earned over interest earning assets increased to 6.3% in the nine-month period ended September 30, 2011 from 6.1% in the nine-month period ended September 30, 2010.
The changes in net interest income by segment in the nine-month period ended September 30, 2011 as compared to the nine-month period ended September 30, 2010 were as follows:
| · | Net interest income from individuals increased 5.4%, mainly as a result of the 14.3% increase in loan volumes in this segment. This was partially offset by higher funding costs and lower yields earned on consumer loans. The average nominal rate earned over consumer loans grew from 14.2% in the in the nine-month period ended September 30, 2010 to 15.4% in in the nine-month period ended September 30, 2011. This was due to the normalization of loan spreads as economic growth gained momentum and following a period of high consumer loan yields and risk during the 2009 recession and the 2010 earthquake. Interest income from residential mortgage loans increased 21.2% as a result of the rise in inflation rate as the majority of these loans are linked to inflation. |
| · | Net interest income from small and mid-sized companies increased 3.0% mainly as a result of a 9.6% increase in loans to this segment in the same period. This was partially offset by the normalization of loan spreads as was the case in consumer loans and the increase in average short-term interest rates, which affected funding costs. |
| · | Net interest income from the total middle-market segment increased 4.0%, mainly as a result of the 18.1% increase in loans to this segment in the same period due to the general economic recovery. This was partially offset by the rise in funding costs. |
| · | Loans in the Global Banking and Markets segment increased 35.5% in the nine-month period ended September 30, 2011 compared to the same period in 2010. Net interest income from the Global Banking and Markets segment decreased 0.1% in the same period. This was mainly due to the higher short-term interest rates that tend to affect this segment more than others as these loans are also short-term in duration and, therefore, have lower yields. |
| · | Other net interest income consists mainly of net interest income from the available for sale investment portfolio and deposits in the Central Bank and the financial cost of supporting our cash position and investment portfolio for trading, the interest income from which is recognized as net income from financial operations and not interest income. The net interest income included as “other” totaled a loss of Ch$12,648 million in the nine month period ended September 30, 2011 compared to a gain of Ch$21,316 million in the nine-month period ended September 30, 2010. As short-term interest rates increased, the financial cost of maintaining these lower yielding assets rose. Simultaneously, the yield obtained on low yielding assets did not rise as the Bank increased its short-term liquidity as a proactive measure given the uncertainty surrounding global financial markets, since the second quarter of 2011. This segment reflects the impact of higher funding costs that finance the Bank’s financial investments and cash position. |
32
The following table shows our balances of loans and accounts receivables from customers and interbank loans by segment at the dates indicated.
At September 30, | % Change | |||||||||||
Loans by segment (Ch$ million) | 2011 | 2010 | 2011/2010 | |||||||||
Individuals | 9,187,526 | 8,035,617 | 14.3 | % | ||||||||
Small and mid-sized companies | 2,522,698 | 2,301,536 | 9.6 | % | ||||||||
| Institutional | 351,644 | 340,274 | 3.3 | % | ||||||||
Middle-market | 3,731,980 | 3,160,681 | 18.1 | % | ||||||||
Global banking & markets | 1,905,005 | 1,406,210 | 35.5 | % | ||||||||
Other | 69,541 | 59,933 | 16.0 | % | ||||||||
Total loans (1) | 17,768,394 | 15,304,251 | 16.1 | % | ||||||||
| (1) | Includes interbank loans. |
We expect continued loan growth in 2011 and 2012, although not necessarily at levels similar to the first nine months of 2011. If GDP does not grow in line with forecasts this could have a negative input on us.
Fee and commission income
The following table sets forth certain components of our income from services (net of fees paid to third parties directly connected to providing those services, principally fees relating to credit card processing and ATM network administration) in the nine-month periods ended September 30, 2011 and 2010.
Nine-Month Period Ended September 30, | % Change | |||||||||||
2011 | 2010 | 2011/2010 | ||||||||||
| (in Ch$ million, except percentages) | ||||||||||||
Collections | 46,387 | 43,372 | 7.0 | % | ||||||||
| Credit, debit and ATM cards | 45,249 | 41,222 | 9.8 | % | ||||||||
| Checking accounts and lines of credit | 30,223 | 32,340 | (6.5 | %) | ||||||||
| Asset management | 29,928 | 29,111 | 2.8 | % | ||||||||
| Insurance brokerage | 26,344 | 22,750 | 15.8 | % | ||||||||
| Letters of credit | 17,849 | 17,351 | 2.9 | % | ||||||||
| Brokerage and custody services | 8,323 | 6,404 | 30.0 | % | ||||||||
| Office banking | 1,883 | 1,344 | 40.1 | % | ||||||||
| Other fees | 3,244 | 51 | 6,260.8 | % | ||||||||
| Total fees and commission income, net | 209,430 | 193,945 | 8.0 | % | ||||||||
Net fees and commission income increased 8.0% to Ch$209,430 million in the nine-month period ended September 30, 2011 compared to the same period in 2010.
Fees from collections increased by 7.0% in the nine-month period ended September 30, 2011 compared to the same period in 2010. This was mainly due to an increase in collection of insurance premiums for loan related insurance as loan origination increased in the year. Going forward, this line item could be negatively impacted by proposed legislation to modify the mandatory loan insurance market. (See Item 1- Risk Factors—“Chile’s banking regulatory and capital markets environment is continually evolving and may change.”).
Fees from credit, debit and ATM cards increased by 9.8%, reflecting increased usage of our credit cards. Usage measured in terms of monetary purchases was up 21.2% in the nine-month period ended September 30, 2011 compared to the corresponding period in 2010. As of September 30, 2011, the Bank, which has a 25.4% market share of all bank credit card accounts, had generated 37.6% of all bank monetary purchases year-to-date.
Fees from checking accounts and lines of credit, which includes the maintenance fee for checking accounts and lines of credit and fees charged for the unauthorized overdraft of lines of credit, decreased 6.5% in the nine-month period ended September 30, 2011 compared to the nine-month period ended September 30, 2010. This decrease was due to the 27.4% decline in fees from lines of credit and authorized overdrafts, which totaled Ch$8,862 million in the nine month period ended September 30, 2011. This decrease was a result of an industry wide reduction in the amount of lines of credit and overdraft lines available to clients, following an increase in Chilean Bank GAAP of provisioning requirements for unused lines of credit. Fees from checking accounts increased 6.1% in the period
33
being analyzed and totaled Ch$21,361 million. This in line with the 7.3% increase in total checking accounts to 739,671 in the 12 month period being analyzed.
Fees from our asset management business increased 2.8% in the nine-month period ended September 30, 2011 compared to the same period in 2010. Total funds under management decreased 13.8% in the period being analyzed and totaled Ch$2,849,198 million (US$5.5 billion). The positive performance of our international equity funds managed by this subsidiary had a positive impact on fees, especially in the first half of the year. As global markets weakened the rate of growth of fees from asset management and total assets under management began to decelerate in the third quarter.
Insurance brokerage fees increased by 15.8%. This was mainly due to greater business volumes in our insurance brokerage subsidiary and higher sales of insurance products through our website and branch network.
Fees from letters of credit and other contingent operations increased 2.9%. This was mainly due to positive performance of our international and foreign trade financing businesses with clients.
Brokerage and custody fees increased 30.0% in the nine-month period ended September 30, 2011 as compared to the corresponding period in 2010. This was primarily due to higher stock brokerage fees, which increased 33.7% to Ch$7,160 million as more clients have used our online and branch-network brokerage services.
Fees from office banking increased 40.1% as more companies used this product. Other fee income increased by 6,260.8% mainly due to higher financial advisory and other services for corporations.
The following table sets forth, for the periods indicated our fee income broken down by segment for the periods indicated:
Nine-Month Period Ended September 30, | % Change | |||||||||||
2011 | 2010 | 2011/2010 | ||||||||||
| (in millions of Ch$, except percentages) | ||||||||||||
Individuals | 140,905 | 138,506 | 1.7 | % | ||||||||
Small and mid-sized companies | 28,702 | 25,973 | 10.5 | % | ||||||||
Institutional | 1,382 | 1,848 | (25.2 | %) | ||||||||
Middle-market | 18,265 | 16,304 | 12.0 | % | ||||||||
Global banking and markets | 17,689 | 17,497 | 1.1 | % | ||||||||
Other | 2,487 | (6,183 | ) | -- | % | |||||||
Total fees and commission income, net | 209,430 | 193,945 | 8.0 | % | ||||||||
Fees from individuals increased 1.7% in the nine-month period ended September 30, 2011 compared to the same period in 2010 mainly as a result of the increase in fees from credit cards, collections and insurance brokerage partially offset by the fall in fees from lines of credit.
The rise in fees by 10.5% from small and mid-sized companies and the middle market was mainly due to higher fees from office banking, brokerage and custody and foreign trade related business.
Fees from institutions decreased 25.2% primarily as a result of lower business activity with universities.
Fees from the Global Banking and Markets segment increased by 1.1%, mainly as a result of a slight increase in fees from investment banking activities.
Financial transactions, net
The following table sets forth information regarding our income (expenses) from financial transactions in the nine-month periods ended September 30, 2011 and 2010.
34
Nine-Month Period Ended September 30, | % Change | |||||||||||
2011 | 2010 | 2011/2010 | ||||||||||
| (in millions of Ch$, except percentages) | ||||||||||||
Net income from financial operations | 153,535 | 51,946 | 195.6 | % | ||||||||
Foreign exchange profit (loss), net | (75,265 | ) | 24,381 | -- | % | |||||||
Total financial transactions, net | 78,270 | 76,327 | 2.5 | % | ||||||||
Total financial transactions, net, which is the sum of trading activities, fair value adjustments in our securities portfolio and foreign exchange transactions, totaled Ch$78,270 million in the nine-month period ended September 30, 2011, an increase of 2.5% compared to the same period in 2010. These results include the results of our Treasury’s trading business and financial transactions with customers as well the results of our Financial Management Division.
Net income from financial operations was Ch$153,535 million in the nine-month period ended September 30, 2011 compared to Ch$51,946 million in the corresponding period in 2010. In the nine-month period ended September 30, 2011, the Chilean peso depreciated 10.0% compared to a 4.2% appreciation in the same period in 2010. This explains the difference in results from derivatives classified as trading which totaled Ch$111,492 million in the nine-month period ended September 30, 2011 compared to Ch$27,686 million in 2010. Derivatives are mainly composed of forwards and swap contracts that hedge our spot position in foreign currency. Our spot position includes all assets and liabilities in foreign currency and in Ch$ linked to US$ that are not derivatives. For more details see “Item 9—Quantitative and Qualitative Disclosures About Market Risk—Market risk management—Market risk – local and foreign financial management”. As the Chilean peso appreciates, we usually record a low or negative result from the fair value of derivatives held for trading. As the Chilean peso depreciates, we usually record a high result from the fair value of derivatives held for trading. This is offset by foreign exchange transaction results, which includes the mark-to-market of our spot foreign currency position.
Nine-Month Period Ended September 30, | % Change | |||||||||||
2011 | 2010 | 2011/2010 | ||||||||||
| (in millions of Ch$, except percentages) | ||||||||||||
Derivatives classified as trading | 111,492 | 27,686 | 302.7 | % | ||||||||
Trading investments | 31,466 | 26,596 | 18.3 | % | ||||||||
Sale of loans | 5,578 | 3,867 | 44.2 | % | ||||||||
Available-for-sale instruments sales | (1,912 | ) | (6,244 | ) | (69.4 | %) | ||||||
Other results | 6,911 | 41 | 16,756.1 | % | ||||||||
| Net income from financial operations | 153,535 | 51,946 | 195.6 | % | ||||||||
In the nine-month period ended September 30, 2011, we also recorded a gain of Ch$5,578 million from the sale of loans, mainly loans that have been previously charged-off compared to Ch$3,867 million in 2010. These loans were sold to various non-related collection companies and asset managers. The Bank also sold in 2011 shares it held in Visa Inc. and recorded a one-time gain from this sale of Ch$5,705 million in other results in net income from financial transactions.
The higher results from trading investments is mainly due to high interest income from this portfolio as 71% of this assets are denominated in UFs and, therefore, when inflation rises interest income from these assets increases. The negative result from the available for sale portfolio is mainly due to higher interest rates, which has a negative impact on the realized losses of these financial investments. The interest income from the available for sale portfolio is recorded as net interest income and interest income from the trading portfolio is recorded as income in net income from financial operations.
Foreign exchange activities produced a net loss of Ch$75,265 million in the nine-month period ended September 30, 2011 compared to a gain of Ch$24,381 million in the corresponding period in 2010. This decrease is mainly the result of the depreciation of the Chilean peso against the dollar in the nine-month period ended September 30, 2011 compared to an appreciation in the same period in 2010. The effects on net income from the
35
change in value of our spot foreign currency position should continue to be negative if the peso continues to depreciate as our spot funding base in foreign currency is larger than our spot asset position in foreign currency.
Foreign exchange transactions totaled a net loss of Ch$259,037 million in the nine-month period ended September 30, 2011 compared to a gain of Ch$156,905 million in the corresponding period in 2010. This lower result was mainly due to the depreciation of the Chilean peso against the dollar in the nine-month period ended September 30, 2011 compared to an appreciation in the same period in 2010. This is largely offset by the fair value of foreign exchange derivatives in net gains from trading and fair value as described above in net income from financial operations. The derivatives included in this line item are mainly cross-currency swaps that hedge the interest rate risk of bonds issued abroad. Excluding interest rate and other derivatives that qualify for hedge accounting, the conversion and fair value of foreign currency derivatives are for the most part recognized as a gain or loss in the net results from fair value and trading and not as foreign exchange transactions. This distorts the results from fair value and trading and foreign exchange transactions. In order to more easily compare the results from financial transactions, net, we present the following table that separates the results by line of business.
Nine-Month Period Ended September 30, | % Change | |||||||||||
2011 | 2010 | 2011/2010 | ||||||||||
| (in millions of Ch$, except percentages) | ||||||||||||
Santander Global Connect (1) | 40,847 | 39,044 | 4.6 | % | ||||||||
Market-making and other client activities | 26,495 | 24,120 | 9.8 | % | ||||||||
Client treasury services | 67,342 | 63,164 | 6.6 | % | ||||||||
Sale of loans and charged-off loans | 5,578 | 3,867 | 44.2 | % | ||||||||
Proprietary trading | 13,895 | 7,001 | 98.5 | % | ||||||||
Financial Management (ALCO) (2) | (8,545 | ) | 2,295 | -- | % | |||||||
Non-client treasury income | 10,928 | 13,163 | (17.0 | %) | ||||||||
Total financial transactions, net | 78,270 | 76,327 | 2.5 | % | ||||||||
| (1) | Santander Global Connect is our platform to sell derivatives, which consist mainly of foreign currency forward contracts, to our clients, mainly corporations and middle-market businesses. |
| (2) | The Financial Management Division manages the structural interest rate risk, the structural position in inflation-indexed assets and liabilities, capital requirements and liquidity levels. The aim of the Financial Management Division is to provide stability and continuity in our net interest income from commercial activities and to ensure that we comply with internal and regulatory limits regarding liquidity, regulatory capital, reserve requirements and market risk. |
Client treasury services increased 6.6% in the nine-month period ended September 30, 2011 compared to client treasury service income in the nine-month period ended September 30, 2010. The results from Santander Global Connect and market-making mainly include the results from the sale of derivatives, foreign exchange and fixed income instruments to our client base. Santander Global Connect is a specialized platform designed to facilitate the sale of derivatives to a broad range of companies in all segments and through the branch network. In the nine-month period ended September 30, 2011, the results from Santander Global Connect increased 4.6%. The results from market-making and other client services increased 9.8% in the period being analyzed, mainly due to growth in tailor
36
made treasury services sold to specific corporate clients. Market making, on the other hand, decreased 10.2% and totaled Ch$19,999 million in the nine month period ended September 30, 2011.
The results from non-client treasury income totaled a gain of Ch$10,928 million in the nine-month period ended September 30, 2011 and decreased 17.0% compared to the same period in 2010. Throughout 2011, the Bank has maintained above average levels of liquidity, part of which is generated from US$ liabilities, as a conservative measure given the uncertainty surrounding global financial markets. These dollar liabilities are hedged through derivatives (short term foreign currency swaps), but as the short term interest rate differential between US dollars and Chilean pesos has increased, this has produced a higher cost registered in financial transactions, net. This higher cost is partially offset in net interest income where the interest earned on the short-term liquid asset is registered and the interest expense of the US$ liabilities is also recorded. In addition, we recorded a gain in this line item of Ch$5,743 million from the one-time sale of shares in Visa Inc.
Other operating income
Nine-Month Period Ended September 30, | % Change | |||||||||||
2011 | 2010 | 2011/2010 | ||||||||||
| (in Ch$ million, except percentages) | ||||||||||||
Income from assets received in lieu of payment | (235 | ) | 1,247 | -- | % | |||||||
Operational leases | 209 | 308 | (88.3 | %) | ||||||||
Gain on sale of Bank premises and equipment | 830 | 13,243 | (93.7 | %) | ||||||||
Recovery of provisions for contingencies | 5 | 7,029 | (99.9 | %) | ||||||||
Insurance coverage for earthquake | 315 | 3,611 | (91.3 | %) | ||||||||
Other | 40 | 388 | (44.1 | %) | ||||||||
Sub-total other income | 1,399 | 24,579 | (94.3 | %) | ||||||||
Total other operating income | 1,164 | 25,826 | (95.5 | %) | ||||||||
Total other operating income totaled a gain of Ch$1,164 million in the nine-month period ended September 30, 2011, a 95.5% decrease from Ch$25,826 million in the corresponding period in 2010.
The main reason for this decrease was that in the nine-month period ended September 30, 2010, the Bank sold 16 branches for a gain of Ch$12,975 million recognized as income from the sale of Bank property, plant and equipment. These branches are now rented to us. The Bank did not finance this acquisition and the acquirers were non-related parties. In 2011, the Bank has sold only one branch.
Gains from the recovery of provisions not related to any specific risk and non-credit contingencies, such as legal and tax contingencies, decreased to Ch$5 million in the nine-month period ended September 30, 2011 compared to Ch$7,029 million in the nine-month period ended September 30, 2010. Gains from the recovery of provisions for contingencies in the nine-month period ended September 30, 2010 were mainly due to the reversal of provisions recognized in the early part of 2010 in anticipation of the potential negative impact of various events such as the February 2010 earthquake and tsunami and changes in our collective bargaining agreements; these negative impacts did not materialize to the extent initially estimated. However, this gain in 2010 was offset in part by higher provisions of Ch$5,951 million recognized for non-specific contingencies in other operating expenses in the nine-month period ended September 30, 2010.
The Bank also recognized in the nine-month period ended September 30, 2011 lower insurance claims from earthquake damage to branches and other installations. In the nine-month period ended September 30, 2011, these claims totaled Ch$315 million compared to Ch$3,611million in the nine-month period ended September 30, 2010.
37
Provision for loan losses
The following table sets forth, for the periods indicated, certain information relating to our provision expenses.
Nine-Month Period Ended September 30, | % Change | |||||||||||
2011 | 2010 | 2011/2010 | ||||||||||
(in Ch$ million, except percentages) | ||||||||||||
| Gross provision expenses(1) | (53,739 | ) | (81,149 | ) | (33.8 | %) | ||||||
| Charge-offs | (194,222 | ) | (151,232 | ) | 28.4 | % | ||||||
| Recoveries of loans previously charged-off | 16,019 | 23,555 | (32.0 | %) | ||||||||
| Provision expenses, net | (231,942 | ) | (208,826 | ) | 11.1 | % | ||||||
| Period-end loans(2) | 17,768,394 | 15,304,251 | 16.1 | % | ||||||||
| Non-performing loans (3) | 496,786 | 407,831 | 21.8 | % | ||||||||
| Impaired loans (4) | 1,326,621 | 1,488,116 | (10.9 | %) | ||||||||
| Loan loss allowance (5) | 484,580 | 428,881 | 13.0 | % | ||||||||
| Non-performing loans / period-end loans | 2.80 | % | 2.66 | % | – | |||||||
| Loan loss allowances /Total loans | 2.73 | % | 2.80 | % | – | |||||||
| Coverage ratio non-performing loans (6) | 97.54 | % | 105.16 | % | – | |||||||
| (1) | Net of the reversal of allowances on loans charged off during the period. Gross provision expenses without such netting was Ch$284,706 million in the 2011 period and Ch$248,563 in the 2010 period. |
| (2) | Includes Ch$88,038 million as of September 30, 2011 and Ch$72,232 million as of September 30, 2010 in interbank loans. |
| (3) | Non-performing loans include the aggregate unpaid principal and accrued but unpaid interest on all loans with at least one installment over 90 days overdue. |
| (4) | Impaired loans defined as of September 30, 2011 and 2010 include: (A) for loans whose allowance is determined on an individual basis: (1) all loans to a debtor that are rated C1 through D2 and (2) total loans to single debtors with a loan that is non-performing, excluding residential mortgage loans if the non-performance of the mortgage loans is less than 90 days; (B) for loans whose loan loss allowance is determined on a group basis: (1) total loans to a debtor, when a loan to that debtor is non-performing or has been renegotiated, excluding performing residential mortgage loans and (2) if the loan that is non-performing or renegotiated is a residential mortgage loan all loans to that debtor are considered impaired. See Note 10(a) of the Consolidated Financial Statements included in our 2010 Form 20-F. |
| (5) | Includes Ch$19 million as of September 30, 2011 and Ch$48 million as of September 30, 2010 in allowances for loan losses for interbank loans. |
| (6) | Loan loss allowance divided by non-performing loans. |
Net provision expense increased by 11.1% to Ch$231,942 million in the nine-month period ended September 30, 2011 compared to the nine-month period ended September 30, 2010.
Gross provision expense decreased 33.8% to Ch$53,739 million. This decrease was mainly due to lower gross provisions in consumer lending. In the nine-month period ended September 30, 2010, we recognized Ch$30,466 million in provisions mainly for consumer loans as a result of improvements made to credit scoring models. The minimum provision required for clients in most risk profiles was increased for performing consumer loans and this effect was recognized as a larger provision expenses and greater provision for loan losses. The effect of non-recurrence in 2011 of this change in our model was offset in part by an increase in gross provision for residential mortgage loans. In June 2011, the bank updated the data used in its provisioning model for residential mortgage loans in 2010. As of June 2011, residential mortgage loans are assigned an allowance level based on credit risk profiles, which are determined utilizing a statistical model that considers: (i) a borrower’s credit history, (ii) if a client is a new client or an existing client, (iii) if the client is a Bank client or a Banefe client and (iv) if this client has been renegotiated in the system. The total impact of this change on loan loss reserves was Ch$13,006 million or 0.3% of the Bank’s total residential mortgage portfolio. An additional impact of Ch$3,252 from this change will be recognized in the fourth quarter. The decrease in gross provisions in commercial loans was mainly due to a favorable evolution of asset quality among companies given the positive economic environment. We believe our allowance for loan loss is sufficient on the date hereof to cover all known losses in our credit portfolio.
38
The rise in the ratio of non-performing loans to total loans from 2.66% as of September 30, 2010 to 2.80% as of September 30, 2011 was mainly due to the 14.5% year-over-year increase in consumer loans that tend to be riskier loans. The following table shows gross provision expense by type of loan:
Gross provision expense by loan product
Nine-Month Period Ended September 30, | % Change | |||||||||||
2011 | 2010 | 2011 | ||||||||||
| (in millions of Ch$, except percentages) | ||||||||||||
Consumer loans | (18,809 | ) | (49,760 | ) | (62.2 | %) | ||||||
Residential mortgage loans | (15,528 | ) | (1,098 | ) | 1,314.2 | % | ||||||
Commercial loans | (19,750 | ) | (29,455 | ) | (32.9 | %) | ||||||
Contingent loans (off-balance sheet) | 313 | (830 | ) | -- | % | |||||||
Interbank loans | 35 | (6 | ) | -- | % | |||||||
Total gross provisions | (53,739 | ) | (81,149 | ) | (33.8 | %) | ||||||
For a description of the provisions related to our residential mortgage loans, please see “New Provisioning Model for Residential Mortgage Loans.”
Charge-offs increased 28.4% in the periods being analyzed, totaling Ch$194,222 million. Consumer loan charge-offs increased 37.5% in the nine-month period ended September 30, 2011 compared to the corresponding period in 2010. The rise was mainly due to the growth in consumer lending, which in the same period, increased 14.5%. The tightening of renegotiation policies for consumer loans also led to a greater amount of impaired consumer loans entering non-performing status and subsequently being charged-off. The ratio of non-performing consumer loans to total consumer loans rose from 2.87% as of September 30, 2010 to 3.84% as of September 30, 2011. Coverage of consumer non-performing loans was 217.6% as of September 30, 2011 compared to 294.9% as of September 30, 2010. The ratio of impaired consumer loans to total consumer loans decreased from 17.8% as of September 30, 2010 to 14.5% as of September 30, 2011. The rise in charge-offs in commercial loans was mainly due to the 19.1% rise in total commercial loans and greater charge-offs in the SME segment. Charge-offs in residential mortgage loans did not vary significantly. The following table shows charge-offs by type of loan:
Charge-offs by loan product
Nine-Month Period Ended September 30, | % Change | |||||||||||
2011 | 2010 | 2011 | ||||||||||
| (in millions of Ch$, except percentages) | ||||||||||||
Consumer loans | (125,416 | ) | (91,219 | ) | 37.5 | % | ||||||
Residential mortgage loans | (10,506 | ) | (10,589 | ) | (0.8 | %) | ||||||
Commercial loans | (58,300 | ) | (49,424 | ) | 18.0 | % | ||||||
Total charge-offs | (194,222 | ) | (151,232 | ) | 28.4 | % | ||||||
Recoveries on loans previously charged-off decreased by 32.0% in the nine-month period ended September 30, 2011 compared to the corresponding period in 2010. In previous periods, we have sold charged-off loans to third parties, recognizing a gain in financial transactions, net. We view this as a more efficient manner to recover value from the older stock of charged-off loans as this decreases our costs of collections; however, this leads to a decrease in recoveries recognized in this line item. The following table shows recoveries by type of loan:
39
Recovery of loans previously charged-off
Nine-Month Period Ended September 30, | % Change | |||||||||||
2011 | 2010 | 2011 | ||||||||||
| (in millions of Ch$, except percentages) | ||||||||||||
Consumer loans | 9,430 | 17,067 | (44.7 | %) | ||||||||
Residential mortgage loans | 1,213 | 1,229 | (1.3 | %) | ||||||||
Commercial loans | 5,376 | 5,259 | 2.2 | % | ||||||||
Total recoveries | 16,019 | 23,555 | (32.0 | %) | ||||||||
Recoveries of loans previously charged-off are recognized as income in the line item “provision for loan losses” within the Consolidated Statement of Income. We only recognize recoveries on loans previously charged off when interest and/or principal are paid in cash in connection with a loan that has already been charged-off in its entirety. Such recoveries do not have an impact on our allowance for loan losses because these recoveries are for loans that have been already charged-off and recognized as a loss in our income statement and are no longer on our balance sheet.
In some instances, we will sell a portfolio of charged-off loans to a third party. Gain (losses) on these charged-off loans is recognized as net income from financial transactions as disclosed in Note 24 of our Unaudited Condensed Consolidated Interim Financial Statements. The following table sets forth information about our sale of charged-off loans for the nine-month period ended September 30, 2011 and 2010.
Gains on sale of loans previously paid-off
Nine-Month Period Ended September 30, | % Change | |||||||||||
2011 | 2010 | 2011 | ||||||||||
| (in millions of Ch$, except percentages) | ||||||||||||
Sale of charged-off loans | 5,578 | 3,926 | 42.1 | % | ||||||||
The following table sets forth, for the periods indicated, our net provision expense broken down by business segment:
Nine-Month Period Ended September 30, | % Change | |||||||||||
2011 | 2010 | 2011 | ||||||||||
| (in millions of Ch$, except percentages) | ||||||||||||
Individuals | (157,586 | ) | (144,697 | ) | 8.9 | % | ||||||
Small and mid-sized companies (SME) | (49,450 | ) | (46,255 | ) | 8.0 | % | ||||||
Institutional | (209 | ) | (428 | ) | 51.2 | % | ||||||
Total middle-market (Companies) | (30,021 | ) | (16,536 | ) | 81.5 | % | ||||||
Global banking & markets | 4,788 | (955 | ) | -- | % | |||||||
Other | 536 | 45 | 1,091.1 | % | ||||||||
Total gross provisions | (231,942 | ) | (208,826 | ) | 11.1 | % | ||||||
We believe that our loan loss allowances are currently adequate for all known and estimated incurred losses.
40
Operating expenses
The following table sets forth information regarding our operating expenses in the nine-month period year ended September 30, 2011 and 2010.
Nine-Month Period Ended September 30, | % Change | |||||||||||
2011 | 2010 | 2011 | ||||||||||
| (in millions of Ch$, except percentages) | ||||||||||||
Personnel salaries and expenses | (207,380 | ) | (184,921 | ) | 12.1 | % | ||||||
Administrative expenses | (122,078 | ) | (109,743 | ) | 11.2 | % | ||||||
Depreciation and amortization | (39,638 | ) | (36,227 | ) | 9.4 | % | ||||||
Impairment | (109 | ) | (4,665 | ) | (97.7 | %) | ||||||
Other operating expenses | (34,540 | ) | (36,822 | ) | (6.2 | %) | ||||||
Total operating expenses | (403,745 | ) | (372,378 | ) | 8.4 | % | ||||||
Efficiency ratio(1) | 40.5 | % | 37.1 | % | ||||||||
| (1) | The efficiency ratio is the ratio of total operating expenses to total operating income. Total operating income consists of net interest income, fee income, and other operating income. |
Operating expenses in the nine-month period ended September 30, 2011 increased 8.4% compared to the corresponding period in 2010. The efficiency ratio was 40.5% in the nine-month period ended September 30, 2011 compared to 37.1% in the same period in 2010.
The 12.1% increase in personnel salaries and expenses was mainly due to higher salaries and headcount. Headcount as of September 30, 2011 totaled 11,706, an increase of 5.9% in the last twelve months. Total salary expenses increased 13.4% to Ch$132,453 million. The other important rise was in severance expenses, which increased 65.0% in the period being analyzed to Ch$7,459 million, mainly reflecting severance payments at the management level.
Administrative expenses increased 11.2%. The main reason for this rise in administrative expenses was the greater business activity as well as the expenses related to IT projects being carried out to improve productivity. An additional factor was the 25.5% rise in branch rental expenses to Ch$16,437 million in the nine month period ended September 30, 2011, since in 2010, the Bank sold 43 branches that are now rented by us.
Depreciation and amortization expense increased 9.4%, mainly due to higher amortization expenses of intangible assets such as software and other computer systems.
The rise in operating expenses was partially offset by the 97.7% decrease in impairment charges. These charges in 2010 included impairment charges directly related to earthquake related effects on our installations.
The following table sets forth, for the periods indicated, our personnel, administrative and depreciation expenses broken down by business segment.
Nine-Month Period Ended September 30, | % Change | |||||||||||
2011 | 2010 | 2011 | ||||||||||
| (in millions of Ch$, except percentages) | ||||||||||||
Individuals | (237,911 | ) | (214,325 | ) | 11.0 | % | ||||||
Small and mid-sized companies | (55,260 | ) | (49,987 | ) | 10.5 | % | ||||||
Institutional | (8,232 | ) | (7,463 | ) | 10.3 | % | ||||||
Total middle-market | (30,039 | ) | (24,984 | ) | 20.2 | % | ||||||
Global banking & markets | (25,788 | ) | (23,354 | ) | 10.4 | % | ||||||
Other | (11,975 | ) | (15,443 | ) | (22.5 | %) | ||||||
| Total personnel, administrative expense, depreciation and amortization and impairment | (369,205 | ) | (335,556 | ) | 10.0 | % | ||||||
By business segments, the 10.0% increase in costs in the nine-month period ended September 30, 2011 compared to the corresponding period in 2010 was mainly due to greater expenses incurred as a result of increased business activity associated with an improved economy, the rise in headcount and salaries and the increase in branch rental expenses. The decrease in Other is mainly due to the decrease in the impairment charges due to the earthquake recognized in 2010.
41
Other operating expenses
The following table sets forth information regarding other operating expenses in the nine-month periods ended September 30, 2011 and 2010.
Nine-Month Period Ended September 30, | % Change | |||||||||||
2011 | 2010 | 2011/2010 | ||||||||||
| (in millions of Ch$, except percentages) | ||||||||||||
Repossessed asset expenses | 4,291 | 5,793 | (25.9 | %) | ||||||||
Credit card expenses | 4,819 | 5,175 | (6.9 | %) | ||||||||
Customer service expenses | 6,998 | 6,528 | 7.2 | % | ||||||||
Earthquake related expenses | - | 2,544 | (100.0 | %) | ||||||||
Provision for contingencies | 2,644 | 5,951 | (7.3 | %) | ||||||||
Other expenses | 15,788 | 10,831 | 19.2 | % | ||||||||
Total | 34,540 | 36,822 | (6.2 | %) | ||||||||
Other operating expenses were Ch$34,540 million in the nine-month period ended September 30, 2011, a 6.2% decrease compared to the same period in 2010. Other operating expenses include provisions and expenses related to repossessed assets, expenses related to our credit card business, customer service expenses mainly related to our call-center and other expenses such as non-credit charge-offs, the cost of insurance policies (mainly life insurance) for products, and tax paid on interest of foreign debt issued by us. The decrease in other expenses was due in part to lower earthquake related expenses, lower expenses related to repossessed assets and lower credit card expenses. Other operating expenses also include provisions for contingencies that may be related to non-specific credits or other impairments such as tax, legal and labor contingencies, which were similar in 2011 and 2010. The 19.2% increase in other expenses was mainly due to higher expenses related to operating charge-offs, mainly robbed or vandalized ATMs.
Income tax
Nine-Month Period Ended September 30, | % Change | |||||||||||
2011 | 2010 | 2011 | ||||||||||
Income before tax | 363,004 | 423,923 | (14.4 | %) | ||||||||
Income tax | (57,943 | ) | (56,752 | ) | 2.1 | % | ||||||
Effective tax rate(1) | 16.0 | % | 13.4 | % | ||||||||
| (1) | The effective tax is the income tax divided by net income before tax. |
Our income tax expense increased by 2.1% in the nine-month period ended September 30, 2011 compared to the same period in 2010. The effective tax rate paid was 16.0% in the nine-month period ended September 30, 2011 compared to 13.4% in the corresponding period in 2010. The statutory tax rate in Chile in 2011 reached 20% compared to 17% in 2010. The higher effective tax rate in 2011 is mainly due to this rise in the statutory corporate tax rate.
The Chilean government and Congress in 2010 approved a temporary increase in the corporate tax rate to 20% in 2011, 18.5% in 2012 and back to 17% in 2013, as part of the plan to finance the reconstruction of public works in the zones most affected by the February 2010 earthquake and tsunami. Discussions are now in place to leave the corporate tax rate at 20%.
The Bank’s effective tax rate tends to be below the statutory rate because for tax purposes the Bank must still recognize the effects of price level restatement on equity even though inflation accounting is no longer required by Chilean Bank GAAP.
42
D. Liquidity and Capital Resources
Sources of Liquidity
Santander Chile’s liquidity depends upon its (i) capital, (ii) reserves and (iii) financial investments, including investments in government securities. To cover any liquidity shortfalls and to augment its liquidity position, Santander-Chile has established lines of credit with foreign and domestic banks and also has access to Central Bank borrowings.
The following table sets forth our contractual obligations and commercial commitments by time remaining to maturity. As of the date of the filing of this report, we do not have significant purchase obligations. As of September 30, 2011, the scheduled maturities of our contractual obligations and of other commercial commitments, including accrued interest, were as follows:
Contractual Obligations | Demand (MCh$) (MCh$) | Up to 1 month (MCh$) | Between 1 and 3 months (MCh$) | Between 3 and 12 months (MCh$) | Subtotal up to 1 year (MCh$) | Between 1 and 5 years (MCh$) | More than 5 years (MCh$) | Subtotal after 1 year (MCh$) | Total (MCh$) | |||||||||||||||||||||||||||
| Investments under repurchase agreements | - | 222,090 | 3,957 | 996 | 227,043 | - | - | - | 227,043 | |||||||||||||||||||||||||||
| Time deposits and other time liabilities | 104,667 | 4,403,631 | 2,372,548 | 2,106,023 | 8,986,869 | 382,859 | 25,518 | 408,377 | 9,395,246 | |||||||||||||||||||||||||||
| Financial derivative contracts | - | 232,812 | 137,528 | 363,897 | 734,237 | 547,419 | 343,618 | 891,037 | 1,625,274 | |||||||||||||||||||||||||||
| Interbank borrowings | 195,850 | 159,220 | 360,111 | 1,177,107 | 1,892,288 | 132,768 | - | 132,768 | 2,025,056 | |||||||||||||||||||||||||||
| Issued debt instruments | 21 | 549,536 | 60,660 | 181,910 | 792,127 | 2,302,748 | 1,418,031 | 3,720,779 | 4,512,906 | |||||||||||||||||||||||||||
| Other financial liabilities | 36,995 | 409 | 3,508 | 3,472 | 44,384 | 40,225 | 82,384 | 122,609 | 166,993 | |||||||||||||||||||||||||||
| Total | 337,533 | 5,567,698 | 2,938,312 | 3,833,405 | 12,676,948 | 3,406,019 | 1,869,551 | 5,275,570 | 17,952,518 | |||||||||||||||||||||||||||
Operational Leases
Certain bank premises and equipment are leased under various operating leases. Future minimum rental commitments as of September 30, 2011, under non-cancelable leases are as follows:
As of September 30, 2011 | ||||
| (in millions of Ch$) | ||||
Due within 1 year | 14,489 | |||
Due after 1 year but within 2 years | 12,942 | |||
Due after 2 years but within 3 years | 11,594 | |||
Due after 3 years but within 4 years | 10,302 | |||
Due after 4 years but within 5 years | 8,533 | |||
Due after 5 years | 57,283 | |||
Total | 115,143 | |||
Risk-Weighted Assets and Regulatory Capital
We currently have regulatory capital in excess of the minimum requirement under the current Chilean regulations. According to the General Banking Law, a bank is required to have regulatory capital of at least 8% of its risk weighted assets, net of required loan loss allowances, and paid in capital and reserves (i.e., the basic capital, as defined above) of at least 3% of its total assets, net of required loan loss allowances. For these purposes, the regulatory capital of a bank is the sum of (1) the bank’s basic capital, (2) subordinated bonds issued by the bank valued at their placement price for an amount up to 50% of its basic capital; provided that the value of the bonds is required to be decreased by 20% for each year that elapses during the period commencing six years prior to their maturity, and (3) its voluntary allowances for loan losses, for an amount of up to 1.25% of its risk weighted assets. Santander Chile does not have goodwill, but if it did, this value would be required to be deducted from regulatory capital. When calculating risk weighted assets, we also include off-balance sheet contingent loans. The merger of Old Santander Chile and Santiago on August 1, 2002 required a special regulatory pre-approval of the SBIF, which was granted on May 16, 2002. The resolution granting this pre-approval imposed a regulatory capital to risk weighted assets ratio of 12% for the merged bank. This requirement was reduced to 11% by the SBIF effective January 1, 2005. For purposes of weighing the risk of a bank’s assets, the General Banking Law considers five different categories of assets, based on the nature of the issuer, the availability of funds, and the nature of the assets and the existence of collateral securing such assets.
43
The following table sets forth our consolidated and risk-weighted assets and regulatory capital as of September 30, 2011 and December 31, 2010.
Consolidated assets as of | Risk-weighted assets | |||||||||||||||
September 30, 2011 | December 31, 2010 | September 30, 2011 | December 31, 2010 | |||||||||||||
| (Ch$ million) | ||||||||||||||||
Asset Balance (Net of allowances)(1) | ||||||||||||||||
Cash and deposits in bank | 1,812,784 | 1,762,198 | - | - | ||||||||||||
| Unsettled transactions | 816,601 | 374,368 | 159,774 | 126,083 | ||||||||||||
Trading investments | 503,813 | 379,670 | 60,743 | 57,588 | ||||||||||||
| Investments under resale agreements | 12,157 | 170,985 | 12,157 | 98,323 | ||||||||||||
| Financial derivative contracts | 1,379,903 | 1,452,068 | 917,611 | 871,872 | ||||||||||||
Interbank loans | 87,894 | 69,672 | 17,579 | 13,934 | ||||||||||||
| Loans and accounts receivables from customers | 17,159,790 | 15,175,975 | 15,123,033 | 13,350,182 | ||||||||||||
| Available for sale investments | 2,104,644 | 1,473,980 | 69,870 | 101,875 | ||||||||||||
Investments in other companies | 8,232 | 7,275 | 8,232 | 7,275 | ||||||||||||
Intangibles assets | 77,229 | 77,990 | 77,229 | 77,990 | ||||||||||||
| Property, plant and equipment | 153,116 | 154,985 | 153,116 | 154,985 | ||||||||||||
Current taxes | 27,746 | 12,499 | 2,775 | 1,250 | ||||||||||||
| Deferred taxes | 143,438 | 117,964 | 14,344 | 11,796 | ||||||||||||
| Other assets | 704,126 | 640,937 | 585,649 | 474,135 | ||||||||||||
| Off-balance sheet assets | ||||||||||||||||
| Contingent loans | 2,937,850 | 3,173,789 | 1,752,035 | 1,897,977 | ||||||||||||
Total | 27,929,323 | 25,044,355 | 18,954,147 | 17,245,265 | ||||||||||||
Ratio (2) (3) | ||||||||||||||||
September 30, 2011 | December 31, 2010 | September 30, 2011 | December 31, 2010 | |||||||||||||
| (Ch$ million) | % | % | ||||||||||||||
Basic capital | 1,927,498 | 1,831,798 | 6.90 | 7.30 | ||||||||||||
Regulatory capital | 2,642,682 | 2,503,898 | 13.94 | 14.52 | ||||||||||||
| (1) | As required by local regulations. |
| (2) | As a percentage of total assets. |
| (3) | As a percentage of risk weighted assets (BIS ratio). |
In line with the future adoption of Basel II regulations in Chile, the SBIF has recently proposed to increase the minimum regulatory capital ratio from 8% to 10%, which would require an amendment to the General Banking Law. Although we currently have a regulatory capital ratio of 13.94%, this change could require us to inject additional capital to our business in the future. According to initial estimates of the impact of market risk on regulatory capital, published by the SBIF, our regulatory capital to risk-weighted assets, net of loan loss allowance and deductions, including an initial estimate of the adjustments for market risk set forth under Basel II was 12.53% as of July 31, 2011, the latest date this figure was published. No assurance can be given that these changes will not have a material impact on our capitalization ratio.
44
Financial Investments
The following table sets forth our investment in Chilean government and corporate securities and certain other financial investments at the dates indicated. Financial investments that have a secondary market are carried at market value. All other financial investments are carried at acquisition cost, plus accrued interest and indexation readjustments, as applicable. Interest income from the trading portfolio is no longer included as interest income, but as income from trading and mark-to-market of securities.
a) Trading
As of | ||||||||
September 30, 2011 | December 31, 2010 | |||||||
| (in millions of Ch$) | ||||||||
| Chilean Central Bank and Government Securities | ||||||||
Chilean Central Bank bonds | 342,545 | 247,019 | ||||||
Chilean Central Bank notes | 27,589 | 68,985 | ||||||
Other Chilean Central Bank and government securities | 81,040 | 7,123 | ||||||
Subtotal | 451,174 | 323,127 | ||||||
| Other Chilean Securities | ||||||||
Time deposits in Chilean financial institutions | - | - | ||||||
Mortgage bonds of Chilean financial institutions | - | - | ||||||
Chilean financial institutions bonds | - | 19,628 | ||||||
Chilean financial institution bonds | 25,132 | 11,404 | ||||||
Other Chilean securities | - | - | ||||||
Subtotal | 25,132 | 31,032 | ||||||
| Foreign Financial Securities | - | - | ||||||
Other foreign financial instruments | 2,654 | - | ||||||
Subtotal | 2,654 | - | ||||||
| Investments in mutual funds | 24,853 | - | ||||||
Funds managed by related entities | - | 25,511 | ||||||
Subtotal | 24,853 | 25,511 | ||||||
Total | 503,813 | 379,670 | ||||||
b) Available for sale
As of | ||||||||
September 30, 2011 | December 31, 2010 | |||||||
| (in millions of Ch$) | ||||||||
| Chilean Central Bank and Government Securities | ||||||||
Chilean Central Bank bonds | 448,262 | 555,981 | ||||||
Chilean Central Bank notes | 1,302,975 | 366,210 | ||||||
Other Chilean Central Bank and government securities | 123,386 | 175,296 | ||||||
Subtotal | 1,874,623 | 1,097,487 | ||||||
| Other Chilean Securities | ||||||||
Time deposits in Chilean financial institutions | 149,151 | - | ||||||
Mortgage bonds of Chilean financial institutions | 68,673 | 218,112 | ||||||
Chilean financial institution bonds | - | - | ||||||
Other Chilean securities | 11,868 | - | ||||||
Chilean corporate bonds | 329 | 147,833 | ||||||
Subtotal | 230,021 | 365,945 | ||||||
| Others Financial Securities | ||||||||
Central Bank and Government Foreign Securities | - | - | ||||||
Other Foreign financial securities | - | 10,548 | ||||||
Subtotal | - | 10,548 | ||||||
Total | 2,104,644 | 1,473,980 | ||||||
45
The following table sets forth an analysis of our investments as of September 30, 2011 by remaining maturity and the weighted average nominal rates of such investments.
Within one year | Weighted average Nominal Rate | After one year but within five years | Weighted average Nominal Rate | After five years but within ten years | Weighted average Nominal Rate | After ten years | Weighted average Nominal Rate | Total | Weighted average Nominal Rate | |||||||||||||||||||||||||||||||
| (in millions of Ch$ , except rates) | ||||||||||||||||||||||||||||||||||||||||
| Held for Trading | ||||||||||||||||||||||||||||||||||||||||
| Central Bank and Government Securities | ||||||||||||||||||||||||||||||||||||||||
| Central Bank bonds | 130,110 | 2.2 | 197,104 | 2.2 | 15,331 | 0.6 | - | - | 342,545 | 5.0 | ||||||||||||||||||||||||||||||
| Central Bank notes | 20,432 | 0.2 | 7,095 | 0.1 | 62 | 0.0 | - | - | 27,589 | 0.3 | ||||||||||||||||||||||||||||||
| Other Chilean Central Bank and Treasury securities | - | - | 34,804 | 0.3 | 46,236 | 1.7 | - | - | 81,040 | 2.0 | ||||||||||||||||||||||||||||||
Subtotal | 150,542 | 239,003 | 61,629 | 451,174 | ||||||||||||||||||||||||||||||||||||
| Other Chilean Securities | ||||||||||||||||||||||||||||||||||||||||
| Mortgage finance bonds | - | - | - | - | - | - | - | - | - | - | ||||||||||||||||||||||||||||||
| Chilean financial institutions bonds | - | - | - | - | - | - | - | - | - | - | ||||||||||||||||||||||||||||||
| Chilean corporate bonds | - | - | 12,281 | 0.1 | 15,505 | 0.7 | - | - | 27,786 | 0.8 | ||||||||||||||||||||||||||||||
Subtotal | - | - | 12,281 | 15,505 | - | 27,786 | ||||||||||||||||||||||||||||||||||
| Investment in mutual funds | ||||||||||||||||||||||||||||||||||||||||
| Mutual funds administered by related parties | 24,853 | - | - | - | - | - | - | - | 24,853 | - | ||||||||||||||||||||||||||||||
Subtotal | 24,853 | - | - | - | 24,853 | |||||||||||||||||||||||||||||||||||
Total | 175,395 | 251,284 | 77,134 | - | 503,813 | |||||||||||||||||||||||||||||||||||
46
Within one year | Weighted average Nominal Rate | After one year but within five years | Weighted average Nominal Rate | After five years but within ten years | Weighted average Nominal Rate | After ten years | Weighted average Nominal Rate | Total | Weighted average Nominal Rate | |||||||||||||||||||||||||||||||
| (in millions of Ch$ , except rates) | ||||||||||||||||||||||||||||||||||||||||
| Available for sale Investments | ||||||||||||||||||||||||||||||||||||||||
| Chilean Central Bank Notes | 1,256,346 | 0.6 | % | 46,629 | 0.1 | % | - | -- | % | - | -- | % | 1,302,975 | 0.5 | % | |||||||||||||||||||||||||
| Chilean Central Bank Bonds | 106,549 | 0.6 | % | 311,542 | 1.6 | % | 30,171 | 3.9 | % | - | -- | % | 448,262 | 1.5 | % | |||||||||||||||||||||||||
| Chilean Treasury Bonds (Bonos) | - | -- | % | - | -- | % | - | -- | % | - | -- | % | - | 8.5 | % | |||||||||||||||||||||||||
| Other Chilean Central Bank and Treasury | 2,738 | 0.0 | % | 38,834 | 0.8 | % | 81,563 | 7.2 | % | 251 | 0.5 | % | 123,386 | 5.0 | % | |||||||||||||||||||||||||
| Subtotal | 1,365,633 | 397,005 | 111,734 | 251 | 1,874,623 | |||||||||||||||||||||||||||||||||||
| Other Financial Securities | ||||||||||||||||||||||||||||||||||||||||
| Chilean Corporate Bonds | - | -- | % | - | -- | % | - | -- | % | - | -- | % | - | |||||||||||||||||||||||||||
| Mortgage Finance Bonds | 51 | 0.0 | % | 1,885 | 0.0 | % | 5,200 | 0.1 | % | 61,537 | 0.9 | % | 68,673 | 0.8 | % | |||||||||||||||||||||||||
| Chilean Financial Institutions Bonds | - | -- | % | - | -- | % | - | -- | % | - | -- | % | - | |||||||||||||||||||||||||||
| Deposit in Chilean Financial Institutions | 148,862 | 2.2 | % | 289 | 0.3 | % | - | -- | % | - | -- | % | 149,151 | 2.2 | % | |||||||||||||||||||||||||
| Other Chilean Securities | -- | % | 329 | 7.4 | % | -- | % | - | -- | % | 329 | 7.4 | % | |||||||||||||||||||||||||||
| Central Bank and Government Foreign Securities | - | -- | % | - | -- | % | - | -- | % | - | -- | % | - | |||||||||||||||||||||||||||
| Others Foreign Securities | - | -- | % | 11,868 | 1.6 | % | - | -- | % | - | -- | % | 11,868 | 1.6 | % | |||||||||||||||||||||||||
| Subtotal | 148,913 | 14,731 | 5,200 | 61,537 | 230,021 | |||||||||||||||||||||||||||||||||||
| Total | 1,514,546 | 441,376 | 116,934 | 61,788 | 2,104,644 | |||||||||||||||||||||||||||||||||||
c) Held-to-maturity
No financial investments were classified as held-to-maturity as of September 30, 2011 and December 31, 2010.
Working Capital
As a bank, we satisfy our working capital needs through general funding, the majority of which derives from deposits and other borrowings from the public. (See “Item 3: D. Liquidity and Capital Resources–Deposits and Other Borrowings”). In our opinion, our working capital is sufficient for our present needs.
Liquidity Management
Liquidity management seeks to ensure that, even under adverse conditions, we have access to the funds necessary to cover client needs, maturing liabilities and capital requirements. Liquidity risk arises in the general funding for our financing, trading and investment activities. It includes the risk of unexpected increases in the cost of funding the portfolio of assets at appropriate maturities and rates, the risk of being unable to liquidate a position in a timely manner at a reasonable price and the risk that we will be required to repay liabilities earlier than anticipated.
Our general policy is to maintain liquidity adequate to ensure our ability to honor withdrawals of deposits, make repayments of other liabilities at maturity, extend loans and meet our own working capital needs. Our minimum amount of liquidity is determined by the statutory reserve requirements of the Central Bank. Deposits are subject to a statutory reserve requirement of 9% for demand deposits and 3.6% for Chilean peso, UF-denominated and foreign currency denominated time deposits with a term of less than a year. The Central Bank has statutory authority to increase these percentages to up to 40% for demand deposits and up to 20% for time deposits. In addition, a 100% special reserve (reserva técnica) applies to demand deposits, deposits in checking accounts, other demand deposits received or obligations payable on sight and incurred in the ordinary course of business, other than deposits
47
unconditionally payable immediately. This special reserve requirement applies to the amount by which the total of such deposits exceeds 2.5 times the amount of a bank’s regulatory capital. Interbank loans are deemed to have a maturity of more than 30 days, even if payable within the following 10 days.
The Central Bank also requires us to comply with the following liquidity limits:
| · | Our total liabilities with maturities of less than 30 days cannot exceed our total assets with maturities of less than 30 days by an amount greater than our capital. This limit must be calculated in local currency and foreign currencies together as one gap. |
| · | Our total liabilities with maturities of less than 90 days cannot exceed our total assets with maturities of less than 90 days by more than twice of our capital. This limit must be calculated in local currency and foreign currencies together as one gap. |
We have set other liquidity limits and ratios that minimize liquidity risk. See “Item 9: Quantitative and Qualitative Disclosure About Market Risk.”
Cash Flow
The tables below set forth our main sources of cash. The subsidiaries are not an important source of cash flow for us and therefore have no impact on our ability to meet our cash obligations. No legal or economic restrictions exist on the ability of subsidiaries to transfer funds to us in the form of loans or cash dividends as long as these subsidiaries abide by the regulations of the Ley de Sociedad Anónimas regarding loans to related parties and minimum dividend payments. See our Unaudited Condensed Consolidated Interim Statements of Cash Flows in our Unaudited Interim Consolidated Financial Statements for a detailed breakdown of the Bank’s cash flow.
Nine-Month Period Ended September 30, | ||||||||
2011 | 2010 | |||||||
| Millions of Ch$ | ||||||||
| Net cash provided by operating activities | 713,623 | (330,908 | ) | |||||
Operating activities provided cash of Ch$713,623 million in the nine-month period ended September 30, 2011 mainly as a result of a greater rate of growth of deposits and other funding sources compared to loan growth. The Ch$330,908 million in cash consumed by operating activities in the nine-month period ended September 30, 2010 was mainly due to a higher increase in our loan book and financial investments compared to our deposit base.
Nine-Month Period Ended September 30, | ||||||||
2011 | 2010 | |||||||
| Millions of Ch$ | ||||||||
| Net cash provided by investing activities | (31,777 | ) | (5,214 | ) | ||||
Net cash used in investing activities in the nine-month period ended September 30, 2011 totaled Ch$31,777 million. The largest consumption of cash involved the purchase of intangible assets mainly software and the purchase of property, plant and equipment. In the nine-month period ended September 30, 2010, the consumption of cash for investing totaled Ch$5,214 million due to the purchase of intangible assets mainly software and the purchase of property, plant and equipment partially offset by the sale of fixed and intangible assets.
Nine-Month Period Ended September 30, | ||||||||
2011 | 2010 | |||||||
| Millions of Ch$ | ||||||||
| Net cash provided by financing activities | (289,416 | ) | (258,756 | ) | ||||
48
In the nine-month period ended September 30, 2011, the net cash used by financing activities totaled Ch$289,416 million and the main consumption being dividends paid. In the nine-month period ended September 30, 2010, the consumption of cash by financing activities was due to similar reasons.
Deposits and Other Borrowings
The following table sets forth our average daily balance of liabilities for the nine-month periods ended September 30, 2011 and 2010, in each case together with the related average nominal interest rates paid thereon.
September 30, 2011 | September 30, 2010 | |||||||||||||||||||||||
Average Balance | % of Total Average Liabilities | Average Nominal Rate | Average Balance | % of Total Average Liabilities | Average Nominal Rate | |||||||||||||||||||
| (millions of Ch$ except percentages) | ||||||||||||||||||||||||
Savings accounts | 103,142 | 0.4 | % | 2.4 | % | 102,260 | 0.5 | % | 0.7 | % | ||||||||||||||
Time deposits | 8,939,789 | 37.6 | % | 3.5 | % | 7,373,762 | 35.9 | % | 2.1 | % | ||||||||||||||
Central Bank borrowings | 1,985 | 0.0 | % | 0.6 | % | 406,397 | 2.0 | % | 0.4 | % | ||||||||||||||
Repurchase agreements | 207,540 | 0.9 | % | 2.3 | % | 199,076 | 1.0 | % | 0.7 | % | ||||||||||||||
Mortgage finance bonds | 177,887 | 0.8 | % | 6.6 | % | 232,638 | 1.1 | % | 5.8 | % | ||||||||||||||
| Other interest bearing liabilities | 6,051,857 | 25.5 | % | 3.8 | % | 4,964,893 | 24.2 | % | 3.4 | % | ||||||||||||||
| Subtotal interest bearing liabilities | 15,482,200 | 65.1 | % | 3.6 | % | 13,279,026 | 64.6 | % | 2.5 | % | ||||||||||||||
| Non-interest bearing liabilities | ||||||||||||||||||||||||
Non-interest bearing deposits | 3,548,298 | 14.9 | % | 3,112,688 | 15.1 | % | ||||||||||||||||||
Derivatives | 1,476,427 | 6.2 | % | 1,279,839 | 6.2 | % | ||||||||||||||||||
| Other non-interest bearing deposits | 1,292,787 | 5.4 | % | 1,160,984 | 5.7 | % | ||||||||||||||||||
Shareholders’ equity | 1,974,640 | 8.3 | % | 1,727,841 | 8.4 | % | ||||||||||||||||||
| Subtotal non-interest bearing liabilities | 8,292,152 | 34.9 | % | 7,281,352 | 35.4 | % | ||||||||||||||||||
Total liabilities | 23,774,352 | 100.0 | % | 20,560,378 | 100.00 | % | ||||||||||||||||||
Our most important source of funding is our time deposits. Average time deposits represented 37.6% of our average total liabilities and shareholders’ equity as of September 30, 2011. Our current funding strategy is to continue to utilize all sources of funding in accordance with their costs, their availability and our general asset and liability management strategy. Special emphasis is being placed on lengthening the maturities of time deposits with institutional clients and increasing in general our deposits from retail customers. We also intend to continue to broaden our customer deposit base and to emphasize core deposit funding. We have also followed the strategy in matching long-term mortgage loan growth with the issuance of senior and subordinated bonds. We believe that broadening our deposit base by increasing the number of account holders has created a more stable funding source.
Composition of Deposits
The following table sets forth the composition of our deposits and similar commitments at September 30, 2011 and December 31, 2010.
As of September 30, 2011 | As of December 31, 2010 | |||||||
| (in millions of Ch$) | ||||||||
| Demand deposits and other demand obligations | ||||||||
Current accounts | 3,375,207 | 3,330,352 | ||||||
Other deposits and demand accounts | 363,009 | 368,934 | ||||||
Other demand obligations | 758,541 | 537,148 | ||||||
Subtotals (1) | 4,496,757 | 4,236,434 | ||||||
| Time deposits and other time deposits | ||||||||
Time deposits | 9,291,339 | 7,154,396 | ||||||
Time saving accounts | 102,636 | 103,191 | ||||||
Other time deposits | 1,271 | 1,170 | ||||||
| Subtotals | 9,395,246 | 7,258,757 | ||||||
Total deposits and other commitments | 13,892,003 | 11,495,191 | ||||||
| (1) | Of which Ch$81,997 million are from affiliated companies. |
49
Borrowings
The following table presents the long-term and short-term portions of our principal sources of borrowings during the periods indicated.
As of September 30, 2011 | ||||||||||||
Short-term | Long-term | Total | ||||||||||
| (in millions of Ch$) | ||||||||||||
Mortgage finance bonds(a) | 8,098 | 159,706 | 167,804 | |||||||||
Senior bonds (b) | 658,364 | 2,827,708 | 3,486,072 | |||||||||
Subordinated bonds (c) | 125,665 | 733,365 | 859,030 | |||||||||
Foreign interbank borrowings (d) | 1,892,288 | 132,768 | 2,025,056 | |||||||||
Other borrowings (e) | 44,384 | 122,609 | 166,993 | |||||||||
Total Borrowings | 2,728,799 | 3,976,156 | 6,704,955 | |||||||||
(a) Mortgage finance bonds
These bonds are used to finance the granting of mortgage loans. The outstanding principal amounts of the bonds are amortized on a quarterly basis. The range of maturities of these bonds is between five and twenty years. The bonds are linked to the UF index and bear a real weighted-average annual interest rate of 5.88% as of September 30, 2011. The following table sets forth the remaining maturities of our mortgage finance bonds at the same date.
As of September 30, 2011 | ||||
| (in millions of Ch$) | ||||
Due within 1 year | 8,098 | |||
Due after 1 year but within 2 years | 7,406 | |||
Due after 2 years but within 3 years | 10,749 | |||
Due after 3 years but within 4 years | 20,632 | |||
Due after 4 years but within 5 years | 16,258 | |||
Due after 5 years | 104,661 | |||
Total mortgage finance bonds | 167,804 | |||
(b) Senior Bonds
The following table sets forth, at the dates indicated, our issued bonds. The bonds are denominated principally in UFs or U.S. dollars, and are principally used to fund the Bank’s mortgage portfolio.
As of | ||||||||
September 2011 | December 2010 | |||||||
| (in millions of Ch$) | ||||||||
Santander bonds denominated in UF | 1,880,919 | 1,952,051 | ||||||
Santander bonds denominated in US$ | 1,254,136 | 936,134 | ||||||
Santander bonds denominated in CHF$ | 130,737 | 174,297 | ||||||
Santander bonds denominated in $ | 220,280 | 248,197 | ||||||
Total bonds | 3,486,072 | 3,310,679 | ||||||
The maturities of these bonds are as follows:
50
As of Sept. 30, 2011 (in millions of Ch$) | ||||
Due within 1 year | 658,364 | |||
Due after 1 year but within 2 years | 668,343 | |||
Due after 2 years but within 3 years | 541,908 | |||
Due after 3 years but within 4 years | 315,776 | |||
Due after 4 years but within 5 years | 535,565 | |||
Due after 5 years | 766,116 | |||
Total bonds | 3,486,072 | |||
During the nine-month period ended September 30, 2011, the Bank also issued senior bonds for UF 9,718,000 and Ch$26,800 million in local markets and US$500 million in international markets, detailed as follows:
| Series | Amount | Term | Issue rate | Issue date | Maturity date | ||||||
| FRN (144a) | USD 500,000,000 | 5 years | Libor (3M) + 125 bp | 01-11-2011 | 01-19-2016 | ||||||
| Total | USD 500,000,000 | ||||||||||
| BSTDFA0410 | UF 160,000 | 4 years | 3.0 % annual simple | 04-01-2010 | 04-01-2014 | ||||||
| BSTDFD0810 | UF 1,274,000 | 5 years | 3.0 % annual simple | 09-01-2010 | 09-01-2015 | ||||||
| BSTDFE0810 | UF 2,750,000 | 6 years | 3.0 % annual simple | 08-01-2010 | 08-01-2016 | ||||||
| BSTDE10211 | UF 896,000 | 5 years | 3.0 % annual simple | 02-01-2011 | 04-01-2016 | ||||||
| BSTDE20111 | UF 3,048,000 | 7.5 years | 3.5 % annual simple | 01-01-2011 | 07-01-2018 | ||||||
| BSTDE30111 | UF 1,590,000 | 8.5 years | 3.5 % annual simple | 01-01-2011 | 07-01-2019 | ||||||
| Total | UF 9,718,000 | ||||||||||
| BSTDE40611 | CLP 26,800,000,000 | 5 years | 6.75% annual simple | 06-01-2011 | 06-01-2016 | ||||||
| Total | CLP 26,800,000,000 | ||||||||||
(c) Subordinated bonds
The following table sets forth, at the dates indicated, the balances of our subordinated bonds. The following table sets forth, at the dates indicated, our issued subordinated bonds. The bonds are denominated principally in UFs or U.S. dollars, and are principally used to fund the Bank’s mortgage portfolio and are considered to be a part of our regulatory capital.
As of | ||||||||
September 2011 | December 2010 | |||||||
| (in millions of Ch$) | ||||||||
Subordinated bonds denominated in US$ | 333,044 | 244,957 | ||||||
Subordinated bonds linked to the UF | 525,986 | 441,118 | ||||||
Total subordinated bonds | 859,030 | 686,075 | ||||||
The maturities of these bonds, which are considered long-term, are as follows.
As of Sept. 30, 2011 (in millions of Ch$) | ||||
Due within 1 year | 125,665 | |||
Due after 1 year but within 2 years | 5,410 | |||
Due after 2 years but within 3 years | 5,751 | |||
Due after 3 years but within 4 years | 170,667 | |||
Due after 4 years but within 5 years | 4,283 | |||
Due after 5 years | 547,254 | |||
Total bonds | 859,030 | |||
51
In the nine-month period ended September 30, 2011, we issued subordinated bonds on the local market for UF 5,100,000, which is broken down as follows:.
Bonds Series | Amount | Term | Issue Rate | Issue Date | Maturity Date | |||
G3 | UF 3,000,000 | 25 years | 3.9% annual simple | 07-01-2010 | 07-01-2035 | |||
G5 | UF 2,100,000 | 20 years | 3.9% annual simple | 04-01-2011 | 04-01-2031 | |||
Total | UF 5,100,000 |
(d) Foreign interbank borrowings
These are short-term and long-term borrowings from foreign banks used to fund our foreign trade business. The maturities of these borrowings are as follows.
As of September 30, 2011 | ||||
| (in millions of Ch$) | ||||
Due within 1 year | 1,892,288 | |||
Due after 1 year but within 2 years | 132,768 | |||
Total loans from foreign financial institutions | 2,025,056 | |||
(e) Other borrowings
The principal categories of our other borrowings are repurchase agreements, obligations with the Central Bank and other domestic obligations. Central Bank borrowings include credit lines for the renegotiations of loans and other Central Bank borrowings. These credit lines were provided by the Central Bank for the renegotiations of loans due to the need to refinance debts as a result of the economic recession and crisis of the banking system in the early 1980s. The maturities of the outstanding amounts are as follows:
As of September 30, 2011 | ||||
| (in millions of Ch$) | ||||
Due within 1 year | 44,384 | |||
Due after 1 year but within 2 years | 4,434 | |||
Due after 2 years but within 3 years | 29,190 | |||
Due after 3 years but within 4 years | 3,509 | |||
Due after 4 years but within 5 years | 3,092 | |||
Due after 5 years | 82,384 | |||
Total other borrowings | 166,993 | |||
Other Off-Balance Sheet Arrangements and Commitments
In the ordinary course of our business, we are party to transactions with off balance sheet risk in the normal course of our business. These transactions expose us to credit risk in addition to amounts recognized in the unaudited condensed consolidated interim financial statements. The most important off-balance sheet item are contingent loans. Contingent loans consist of guarantees granted by us in Chilean peso, UF and foreign currencies (principally US$), unused letters of credit and commitments to extend credit such as overdraft protection and credit card lines of credit. Such commitments are agreements to lend to a customer at a future date, subject to the customer compliance with the contractual terms. Since a substantial portion of these commitments is expected to expire
52
without being drawn upon, the total amount of commitments does not necessarily represent our actual future cash requirements. We use the same credit policies in making commitments to extend credit as we do for granting loans. In the opinion of our management, our outstanding commitments do not represent an unusual credit risk.
The following table presents the Bank’s outstanding contingent loans as of September 30, 2011 and December 31, 2010:
As of | ||||||||
September 30, 2011 | December 31, 2010 | |||||||
| (in millions of Ch$) | ||||||||
Issued and documented letters of credit | 206,536 | 209,532 | ||||||
Confirmed foreign letters of credit | 53,094 | 85,739 | ||||||
Documented guarantees | 888,653 | 898,751 | ||||||
Other guarantees | 153,585 | 166,550 | ||||||
Subtotals | 1,301,868 | 1,360,572 | ||||||
Lines of credit with immediate availability | 4,496,281 | 4,832,359 | ||||||
Other irrevocable obligations | 103,604 | 129,428 | ||||||
Totals | 5,901,753 | 6,322,359 | ||||||
Asset and Liability Management
Please refer to “Item 9: Quantitative and Qualitative Disclosure about Market Risk–Market Risk Exposure Categories” regarding our policies with respect to asset and liability management.
E. Selected Statistical Information
The following information is included for analytical purposes and should be read in conjunction with our Unaudited Condensed Interim Consolidated Financial Statements as well as the discussion in the section entitled “Operating and Financial Review and Prospects.” The UF is linked to, and is adjusted daily to, reflect changes in the previous month’s Chilean consumer price index. See “Item 3: C. Operating Results–Impact of Inflation.” The following tables show, by currency of denomination, average balances and, where applicable, interest amounts and real rates for our assets and liabilities for the nine-month periods ended September 30, 2011 and 2010.
Average Balance Sheets, Income Earned from Interest-Earning Assets and Interest Paid on Interest-Bearing Liabilities
The average balances for interest-earning assets and interest-bearing liabilities, including interest and readjustments received and paid, have been calculated on the basis of daily balances for us on an unconsolidated basis. Such average balances are presented in Chilean pesos, UFs and in foreign currencies (principally U.S. dollars). Figures from our subsidiaries have been calculated on the basis of monthly balances. The average balances of our subsidiaries, except Santander Agente S.A. de Valores, have not been categorized by currency. As such it is not possible to calculate average balances by currency for such subsidiaries on the basis of daily, weekly or monthly balances.
The nominal interest rate has been calculated by dividing the amount of interest and principal readjustment due to changes in the UF index (gain or loss) during the period by the related average balance, both amounts expressed in constant pesos. The nominal rates calculated for each period have been converted into real rates using the following formulas:
Where:
| Rp | = real average rate for peso-denominated assets and liabilities (in Ch$ and UF) for the period; |
53
| Rd | = real average rate for foreign currency-denominated assets and liabilities for the period; |
| Np | = nominal average rate for peso-denominated assets and liabilities for the period; |
| Nd | = nominal average rate for foreign currency-denominated assets and liabilities for the period; |
| D | = devaluation rate of the Chilean peso to the U.S. dollar for the period; and |
| I | = inflation rate in Chile for the period (based on the variation of the Chilean Consumer Price Index). |
The real interest rate can be negative for a portfolio of peso-denominated loans when the inflation rate for the period is higher than the average nominal rate of the loan portfolio for the same period. A similar effect could occur for a portfolio of foreign currency denominated loans when the inflation rate for the period is higher than the sum of the devaluation rate for the period and the corresponding average nominal rate of the portfolio.
The formula for the average real rate for foreign currency denominated assets and liabilities (Rd) reflects a gain or loss in purchasing power caused by the difference between the devaluation rate of the Chilean peso and the inflation rate in Chile during the period. The following example illustrates the calculation of the real interest rate for a dollar-denominated asset bearing a nominal annual interest rate of 10.0% (Nd = 0.10), assuming a 5.0% annual devaluation rate (D = 0.05) and a 12.0% annual inflation rate (I = 0.12):
In the example, since the inflation rate was higher than the devaluation rate, the real rate is lower than the nominal rate in dollars. If, for example, the annual devaluation rate were 15.0%, using the same numbers, the real rate in Chilean pesos would be 12.9%, which is higher than the nominal rate in U.S. dollars. Using the same numbers, if the annual inflation rate were greater than 15.5%, the real rate would be negative.
Foreign exchange gains or losses on foreign currency-denominated assets and liabilities are not included in interest income or expense. Similarly, interest on the available for sale investment portfolio does not include trading or mark-to-market gains or losses on these investments. Interest is not recognized on non-performing loans. Non-performing loans that are overdue for 90 days or less have been included in each of the various categories of loans, and therefore affect the various averages. Non-performing loans consist of loans as to which either principal or interest is overdue (i.e., non-accrual loans) and restructured loans earning no interest.
Included in interbank deposits are checking accounts maintained in the Central Bank and foreign banks. Such assets have a distorting effect on the average interest rate earned on total interest-earning assets because currently balances maintained in Chilean peso amounts do not earn interest, and the only balances held in a foreign currency that earn interest are those maintained in U.S. dollars, but those only earn interest on the amounts that are legally required to be held for liquidity purposes. Additionally, this account includes interest earned by overnight investments. Consequently, the average interest earned on such assets is comparatively low. We maintain these deposits in these accounts to comply with statutory requirements and to facilitate international business, rather than to earn income.
The following tables show, by currency of denomination, average balances and, where applicable, interest amounts and real rates for our assets and liabilities for the nine-month periods ended September 30, 2011 and 2010.
54
Nine-Month Period Ended September 30, | ||||||||||||||||||||||||||||||||
| 2011 | 2010 | |||||||||||||||||||||||||||||||
| Average Balance | Interest Earned | Average Real Rate | Average Nominal Rate | Average Balance | Interest Average | Average Real Rate | Average Nominal Rate | |||||||||||||||||||||||||
| (in millions of Ch$, except for rate data) | ||||||||||||||||||||||||||||||||
| ASSETS | ||||||||||||||||||||||||||||||||
| INTEREST-EARNING ASSETS | ||||||||||||||||||||||||||||||||
| Deposits in Central Bank | ||||||||||||||||||||||||||||||||
Ch$ | 549,267 | 13,530 | (0.5 | %) | 2.50 | % | 399,950 | 3,186 | (1.8 | %) | 0.8 | % | ||||||||||||||||||||
UF | - | - | -- | % | -- | % | - | - | -- | % | -- | % | ||||||||||||||||||||
Foreign currency | - | - | -- | % | -- | % | - | - | -- | % | -- | % | ||||||||||||||||||||
Total | 549,267 | 13,530 | (0.5 | %) | 2.50 | % | 399,950 | 3,186 | (1.8 | %) | 0.8 | % | ||||||||||||||||||||
| Financial investments | ||||||||||||||||||||||||||||||||
Ch$ | 1,566,146 | 48,599 | 0.1 | % | 3.1 | % | 1,037,887 | 16,676 | (1.0 | %) | 1.6 | % | ||||||||||||||||||||
UF | 257,603 | 18,570 | 4.1 | % | 7.2 | % | 580,310 | 27,226 | 2.0 | % | 4.7 | % | ||||||||||||||||||||
Foreign currency | 825,968 | (16,104 | ) | 4.7 | % | (1.9 | )% | 635,114 | 14,421 | (4.7 | %) | 2.3 | % | |||||||||||||||||||
Total | 2,649,717 | 51,065 | 2.3 | % | 2.3 | % | 2,253,311 | 58,323 | (1.3 | %) | 2.6 | % | ||||||||||||||||||||
| Commercial loans | ||||||||||||||||||||||||||||||||
Ch$ | 4,523,099 | 299,084 | 3.5 | % | 6.6 | % | 4,106,786 | 276,186 | 3.9 | % | 6.7 | % | ||||||||||||||||||||
UF | 3,194,246 | 188,043 | 2.8 | % | 5.9 | % | 2,757,147 | 143,823 | 2.5 | % | 5.2 | % | ||||||||||||||||||||
Foreign currency | 1,619,174 | 31,703 | 8.9 | % | 2.0 | % | 895,681 | 22,825 | (4.4 | %) | 2.5 | % | ||||||||||||||||||||
Total | 9,336,519 | 518,830 | 4.2 | % | 5.6 | % | 7,759,614 | 442,834 | 2.4 | % | 5.7 | % | ||||||||||||||||||||
| Consumer loans | ||||||||||||||||||||||||||||||||
Ch$ | 2,506,733 | 395,010 | 12.4 | % | 15.8 | % | 2,048,698 | 299,408 | 11.6 | % | 14.6 | % | ||||||||||||||||||||
UF | 96,700 | 6,967 | 4.1 | % | 7.2 | % | 99,444 | 6,298 | 3.6 | % | 6.3 | % | ||||||||||||||||||||
Foreign currency | 13,591 | - | 6.8 | % | 0.0 | % | 11,212 | - | (6.8 | %) | 0.0 | % | ||||||||||||||||||||
Total | 2,617,024 | 401,977 | 12.1 | % | 15.4 | % | 2,159,354 | 305,706 | 11.1 | % | 14.2 | % | ||||||||||||||||||||
| Mortgage loans | ||||||||||||||||||||||||||||||||
Ch$ | 27,526 | 345 | (1.7 | %) | 1.3 | % | 28,605 | 1,704 | 3.2 | % | 6.0 | % | ||||||||||||||||||||
UF | 4,743,208 | 277,819 | 2.8 | % | 5.9 | % | 4,212,954 | 227,838 | 2.7 | % | 5.4 | % | ||||||||||||||||||||
Foreign currency | - | - | -- | % | -- | % | - | - | -- | % | -- | % | ||||||||||||||||||||
Total | 4,770,734 | 278,164 | 2.8 | % | 5.9 | % | 4,241,559 | 229,542 | 2.7 | % | 5.4 | % | ||||||||||||||||||||
| Interbank loans | ||||||||||||||||||||||||||||||||
Ch$ | 67,542 | 2,265 | 0.3 | % | 3.4 | % | 37,906 | 340 | (1.7 | %) | 0.9 | % | ||||||||||||||||||||
UF | - | - | -- | % | -- | % | - | - | -- | % | -- | % | ||||||||||||||||||||
Foreign currency | 6,923 | - | 6.8 | % | 0.0 | % | 1,643 | - | (6.8 | %) | 0.0 | % | ||||||||||||||||||||
Total | 74,465 | 2,265 | 0.9 | % | 3.1 | % | 39,549 | 340 | (1.9 | %) | 0.9 | % | ||||||||||||||||||||
| Other Outstanding Loans | ||||||||||||||||||||||||||||||||
Ch$ | 22,140 | 4,596 | 17.2 | % | 20.8 | % | 33,795 | 5,117 | 12.1 | % | 15.1 | % | ||||||||||||||||||||
UF | 18,258 | 761 | 1.1 | % | 4.2 | % | 14,759 | 234 | (1.1 | %) | 1.6 | % | ||||||||||||||||||||
Foreign currency | - | - | -- | % | -- | % | 1,877 | 22 | (5.7 | %) | 1.2 | % | ||||||||||||||||||||
Total | 40,398 | 5,357 | 9.9 | % | 13.3 | % | 50,431 | 5,373 | 7.6 | % | 10.7 | % | ||||||||||||||||||||
| Threshold | ||||||||||||||||||||||||||||||||
Ch$ | - | - | -- | % | -- | % | - | - | -- | % | -- | % | ||||||||||||||||||||
UF | - | - | -- | % | -- | % | - | - | -- | % | -- | % | ||||||||||||||||||||
Foreign currency | 53,453 | 90 | 7.0 | % | 0.2 | % | 231,284 | 298 | (6.7 | %) | 0.1 | % | ||||||||||||||||||||
Total | 53,453 | 90 | 7.0 | % | 0.2 | % | 231,284 | 298 | (6.7 | %) | 0.1 | % | ||||||||||||||||||||
| Total interest earning assets (1) | ||||||||||||||||||||||||||||||||
Ch$ | 9,262,453 | 763,429 | 5.1 | % | 8.2 | % | 7,693,627 | 602,617 | 5.0 | % | 7.8 | % | ||||||||||||||||||||
UF | 8,310,015 | 492,160 | 2.8 | % | 5.9 | % | 7,664,614 | 405,419 | 2.5 | % | 5.3 | % | ||||||||||||||||||||
Foreign currency | 2,519,109 | 15,689 | 7.5 | % | 0.6 | % | 1,776,811 | 37,566 | (4.8 | %) | 2.1 | % | ||||||||||||||||||||
Total | 20,091,577 | 1,271,278 | �� | 4.4 | % | 6.3 | % | 17,135,052 | 1,045,602 | 2.9 | % | 6.1 | % | |||||||||||||||||||
| NON-INTEREST-EARNING ASSETS | ||||||||||||||||||||||||||||||||
| Cash | ||||||||||||||||||||||||||||||||
Ch$ | 441,930 | 415,441 | ||||||||||||||||||||||||||||||
UF | - | - | ||||||||||||||||||||||||||||||
Foreign currencies | 16,296 | 13,466 | ||||||||||||||||||||||||||||||
Total | 458,226 | 428,907 | ||||||||||||||||||||||||||||||
| Allowance for loan losses | ||||||||||||||||||||||||||||||||
Ch$ | (531,179 | ) | (432,827 | ) | ||||||||||||||||||||||||||||
UF | - | - | ||||||||||||||||||||||||||||||
55
Nine-Month Period Ended September 30, | ||||||||||||||||||||||||||||||||
| 2011 | 2010 | |||||||||||||||||||||||||||||||
| Average Balance | Interest Earned | Average Real Rate | Average Nominal Rate | Average Balance | Interest Average | Average Real Rate | Average Nominal Rate | |||||||||||||||||||||||||
| (in millions of Ch$, except for rate data) | ||||||||||||||||||||||||||||||||
Foreign currencies | - | - | ||||||||||||||||||||||||||||||
Total | (531,179 | ) | (432,827 | ) | ||||||||||||||||||||||||||||
| Property, plant and equipment | ||||||||||||||||||||||||||||||||
Ch$ | 161,913 | 181,461 | ||||||||||||||||||||||||||||||
UF | 40 | - | ||||||||||||||||||||||||||||||
Foreign currencies | - | - | ||||||||||||||||||||||||||||||
Total | 161,953 | 181,461 | ||||||||||||||||||||||||||||||
| Derivatives (1) | ||||||||||||||||||||||||||||||||
Ch$ | 1,570,153 | 1,422,574 | ||||||||||||||||||||||||||||||
UF | - | - | ||||||||||||||||||||||||||||||
Foreign currencies | - | - | ||||||||||||||||||||||||||||||
Total | 1,570,153 | 1,422,574 | ||||||||||||||||||||||||||||||
| Financial investments trading (1) | ||||||||||||||||||||||||||||||||
Ch$ | 170,783 | 110,900 | ||||||||||||||||||||||||||||||
UF | 442,332 | 761,062 | ||||||||||||||||||||||||||||||
Foreign currencies | 12,101 | 22,388 | ||||||||||||||||||||||||||||||
Total | 625,216 | 894,350 | ||||||||||||||||||||||||||||||
| Other assets | ||||||||||||||||||||||||||||||||
Ch$ | 951,856 | 705,716 | ||||||||||||||||||||||||||||||
UF | 94,164 | 65,359 | ||||||||||||||||||||||||||||||
Foreign currencies | 352,387 | 159,786 | ||||||||||||||||||||||||||||||
Total | 1,398,407 | 930,861 | ||||||||||||||||||||||||||||||
| Total non-interest earning assets | ||||||||||||||||||||||||||||||||
| Ch$ | 2,765,456 | 2,403,265 | ||||||||||||||||||||||||||||||
| UF | 536,536 | 826,421 | ||||||||||||||||||||||||||||||
| Foreign currencies | 380,784 | 195,640 | ||||||||||||||||||||||||||||||
| Total | 3,682,776 | 3,425,326 | ||||||||||||||||||||||||||||||
| TOTAL ASSETS | ||||||||||||||||||||||||||||||||
Ch$ | 12,027,909 | 763,429 | 10,096,892 | 602,617 | ||||||||||||||||||||||||||||
UF | 8,846,551 | 492,160 | 8,491,035 | 405,419 | ||||||||||||||||||||||||||||
Foreign currencies | 2,899,893 | 15,689 | 1,972,451 | 37,566 | ||||||||||||||||||||||||||||
Total | 23,774,353 | 1,271,278 | 20,560,378 | 1,045,602 | ||||||||||||||||||||||||||||
| LIABILITIES AND SHAREHOLDERS’ EQUITY | ||||||||||||||||||||||||||||||||
| INTEREST-BEARING LIABILITIES | ||||||||||||||||||||||||||||||||
| Savings accounts | ||||||||||||||||||||||||||||||||
Ch$ | 1,141 | 2 | (2.7 | %) | 0.2 | % | 1,067 | 3 | (2.2 | %) | 0.3 | % | ||||||||||||||||||||
UF | 102,001 | 2,478 | (0.6 | %) | 2.4 | % | 101,193 | 724 | (1.7 | %) | 0.7 | % | ||||||||||||||||||||
Foreign currencies | - | - | -- | % | -- | % | - | - | -- | % | -- | % | ||||||||||||||||||||
Total | 103,142 | 2,480 | (0.6 | %) | 2.4 | % | 102,260 | 727 | (1.7 | %) | 0.7 | % | ||||||||||||||||||||
| Time deposits | ||||||||||||||||||||||||||||||||
Ch$ | 4,988,330 | 200,035 | 1.0 | % | 4.0 | % | 3,833,097 | 51,103 | (1.3 | %) | 1.3 | % | ||||||||||||||||||||
UF | 2,135,223 | 100,986 | 1.7 | % | 4.7 | % | 2,163,557 | 92,819 | 1.6 | % | 4.3 | % | ||||||||||||||||||||
Foreign currencies | 1,816,236 | 10,357 | 7.4 | % | 0.6 | % | 1,377,108 | 9,382 | (12.7 | %) | 0.7 | % | ||||||||||||||||||||
Total | 8,939,789 | 311,378 | 2.5 | % | 3.5 | % | 7,373,762 | 153,304 | (2.5 | %) | 2.1 | % | ||||||||||||||||||||
| Central Bank borrowings | ||||||||||||||||||||||||||||||||
Ch$ | 919 | 5 | (2.4 | %) | 0.5 | % | 404,852 | 1,633 | (2.0 | %) | 0.4 | % | ||||||||||||||||||||
UF | 1,066 | 6 | (2.4 | %) | 0.6 | % | 1,545 | 8 | (1.9 | %) | 0.5 | % | ||||||||||||||||||||
Foreign currencies | - | - | -- | % | -- | % | - | - | -- | % | -- | % | ||||||||||||||||||||
Total | 1,985 | 11 | (2.4 | %) | 0.6 | % | 406,397 | 1,641 | (2.0 | %) | 0.4 | % | ||||||||||||||||||||
| Repurchase agreements | ||||||||||||||||||||||||||||||||
Ch$ | 178,756 | 4,177 | (0.6 | %) | 2.3 | % | 141,055 | 486 | (2.1 | %) | 0.3 | % | ||||||||||||||||||||
UF | 19,438 | 653 | 0.3 | % | 3.4 | % | 55,878 | 970 | (0.7 | %) | 1.7 | % | ||||||||||||||||||||
56
Nine-Month Period Ended September 30, | ||||||||||||||||||||||||||||||||
| 2011 | 2010 | |||||||||||||||||||||||||||||||
| Average Balance | Interest Earned | Average Real Rate | Average Nominal Rate | Average Balance | Interest Average | Average Real Rate | Average Nominal Rate | |||||||||||||||||||||||||
| (in millions of Ch$, except for rate data) | ||||||||||||||||||||||||||||||||
Foreign currencies | 9,346 | 22 | 7.0 | % | 0.2 | % | 2,143 | 1 | (13.3 | %) | 0.1 | % | ||||||||||||||||||||
Total | 207,540 | 4,852 | (0.2 | %) | 2.3 | % | 199,076 | 1,457 | (1.8 | %) | 0.7 | % | ||||||||||||||||||||
| Mortgage finance bonds | ||||||||||||||||||||||||||||||||
Ch$ | - | - | -- | % | -- | % | - | - | -- | % | -- | % | ||||||||||||||||||||
UF | 177,887 | 11,817 | 3.5 | % | 6.6 | % | 232,638 | 13,584 | 3.3 | % | 5.8 | % | ||||||||||||||||||||
Foreign currencies | - | - | -- | % | -- | % | - | - | -- | % | -- | % | ||||||||||||||||||||
Total | 177,887 | 11,817 | 3.5 | % | 6.6 | % | 232,638 | 13,584 | 3.3 | % | 5.8 | % | ||||||||||||||||||||
| Other interest-bearing liabilities | ||||||||||||||||||||||||||||||||
Ch$ | 352,891 | 48,594 | 10.5 | % | 13.8 | % | 105,485 | 18,677 | 14.8 | % | 17.7 | % | ||||||||||||||||||||
UF | 2,395,448 | 156,407 | 3.4 | % | 6.5 | % | 2,017,463 | 114,963 | 3.1 | % | 5.7 | % | ||||||||||||||||||||
Foreign currencies | 3,303,518 | 27,585 | 7.7 | % | 0.8 | % | 2,841,945 | 33,395 | (12.3 | %) | 1.2 | % | ||||||||||||||||||||
Total | 6,051,857 | 232,586 | 6.2 | % | 3.8 | % | 4,964,893 | 167,035 | (5.5 | %) | 3.4 | % | ||||||||||||||||||||
| Total interest-bearing liabilities | ||||||||||||||||||||||||||||||||
Ch$ | 5,522,037 | 252,813 | 1.5 | % | 4.6 | % | 4,485,556 | 71,902 | (0.9 | %) | 1.6 | % | ||||||||||||||||||||
UF | 4,831,063 | 272,347 | 2.6 | % | 5.6 | % | 4,572,274 | 223,068 | 2.3 | % | 4.9 | % | ||||||||||||||||||||
Foreign currencies | 5,129,100 | 37,964 | 7.6 | % | 0.7 | % | 4,221,196 | 42,778 | (12.4 | %) | 1.0 | % | ||||||||||||||||||||
Total | 15,482,200 | 563,124 | 3.9 | % | 3.6 | % | 13,279,026 | 337,748 | (3.4 | %) | 2.5 | % | ||||||||||||||||||||
| NON-INTEREST-BEARING LIABILITIES | ||||||||||||||||||||||||||||||||
| Non-interest-bearing demand deposits | ||||||||||||||||||||||||||||||||
Ch$ | 3,519,024 | 3,095,549 | ||||||||||||||||||||||||||||||
UF | 16,441 | 15,114 | ||||||||||||||||||||||||||||||
Foreign currencies | 12,833 | 2,025 | ||||||||||||||||||||||||||||||
Total | 3,548,298 | 3,112,688 | ||||||||||||||||||||||||||||||
Derivatives | ||||||||||||||||||||||||||||||||
Ch$ | 1,476,428 | 1,279,839 | ||||||||||||||||||||||||||||||
UF | - | - | ||||||||||||||||||||||||||||||
Foreign currencies | - | - | ||||||||||||||||||||||||||||||
Total | 1,476,428 | 1,279,839 | ||||||||||||||||||||||||||||||
| Other non-interest-bearing liabilities | ||||||||||||||||||||||||||||||||
Ch$ | 618,899 | 514,729 | ||||||||||||||||||||||||||||||
UF | 288,867 | 348,744 | ||||||||||||||||||||||||||||||
Foreign currencies | 385,021 | 297,511 | ||||||||||||||||||||||||||||||
Total | 1,292,787 | 1,160,984 | ||||||||||||||||||||||||||||||
| Shareholders’ Equity | ||||||||||||||||||||||||||||||||
Ch$ | 1,974,640 | 1,727,841 | ||||||||||||||||||||||||||||||
UF | - | - | ||||||||||||||||||||||||||||||
Foreign currencies | - | - | ||||||||||||||||||||||||||||||
Total | 1,974,640 | 1,727,841 | ||||||||||||||||||||||||||||||
| Total non-interest-bearing liabilities and shareholders’ equity | ||||||||||||||||||||||||||||||||
Ch$ | 7,588,991 | 6,617,958 | ||||||||||||||||||||||||||||||
UF | 305,308 | 363,858 | ||||||||||||||||||||||||||||||
Foreign currencies | 397,854 | 299,536 | ||||||||||||||||||||||||||||||
Total | 8,292,153 | 7,281,352 | ||||||||||||||||||||||||||||||
| TOTAL LIABILITIES AND SHAREHOLDERS’ EQUITY | ||||||||||||||||||||||||||||||||
Ch$ | 13,111,028 | 252,813 | 11,103,514 | 71,902 | ||||||||||||||||||||||||||||
UF | 5,136,371 | 272,347 | 4,936,132 | 223,068 | ||||||||||||||||||||||||||||
Foreign currencies | 5,526,954 | 37,964 | 4,520,732 | 42,778 | ||||||||||||||||||||||||||||
Total | 23,774,353 | 563,124 | 20,560,378 | 337,748 | ||||||||||||||||||||||||||||
| (1) | Associated interest is recorded as a gain in financial transactions. |
57
Interest-Earning Assets: Net Interest Margin
The following table analyzes, by currency of denomination, the levels of average interest-earning assets and net interest earned by Santander-Chile, and illustrates the comparative margins obtained, for each of the nine-month periods ended September 30, 2011 and 2010.
Nine-Month Period Ended September 30, | ||||||||
2011 | 2010 | |||||||
| (in millions of Ch$) | ||||||||
| Total average interest-earning assets | ||||||||
Ch$ | 9,262,453 | 7,693,627 | ||||||
UF | 8,310,015 | 7,664,614 | ||||||
Foreign currencies | 2,519,109 | 1,776,811 | ||||||
| Total | 20,091,577 | 17,135,052 | ||||||
| Net interest earned (1) | ||||||||
Ch$ | 510,616 | 530,715 | ||||||
UF | 219,813 | 182,351 | ||||||
Foreign currencies | (22,275 | ) | (5,212 | ) | ||||
| Total | 708,154 | 707,854 | ||||||
| Net interest margin (2) | ||||||||
Ch$ | 7.4 | % | 9.2 | % | ||||
UF | 3.5 | % | 3.2 | % | ||||
Foreign currencies | (1.2 | %) | (0.4 | %) | ||||
Total | 4.7 | % | 5.5 | % | ||||
| (1) | Net interest earned is defined as interest revenue earned less interest expense incurred. |
| (2) | Net interest margin is defined as net interest earned divided by total average interest-earning assets on an annualized basis. |
Return on Equity and Assets; Dividend Payout
The following table presents certain information and selected financial ratios for Santander-Chile for the nine-month periods ended September 30, 2011 and 2010.
Nine-Month Period ended September 30, | ||||||||
Ch$ million | 2011 | 2010 | ||||||
Net income | 305,061 | 367,171 | ||||||
Average total assets | 23,771,353 | 20,560,378 | ||||||
Average equity | 1,974,640 | 1,727,841 | ||||||
| Net income (1) as a percentage of: | ||||||||
Average total assets | 1.7 | % | 2.4 | % | ||||
Average equity | 20.6 | % | 28.3 | % | ||||
| Average equity as a percentage of: | ||||||||
Average total assets | 8.3 | % | 8.4 | % | ||||
| (1) | Annualized |
The following table presents dividends declared and paid by us in the following years:
Year | Dividend Ch$ mn | Per share Ch$/share (1) | Per ADR Ch$/ADR (2) | % over earnings (3) | % over earnings (4) | |||||||||||||||
2010 | 258,752 | 1.37 | 1,426.63 | 60 | 60 | |||||||||||||||
2011 | 286,294 | 1.52 | 1,579.28 | 60 | 57 | |||||||||||||||
| (1) | Calculated on the basis of 188,446 million shares. |
58
| (2) | Calculated on the basis of 1,039 shares per ADS. |
| (3) | Calculated by dividing dividend paid in the year by net income attributable to shareholders for the previous year under Chilean Bank GAAP |
| (4) | Calculated by dividing dividend paid in the year by net income attributable to shareholders for the previous year under IFRS. |
Loan Portfolio
The following table analyzes our loans by product type. Except where otherwise specified, all loan amounts stated below are before deduction for loan loss allowances. Total loans reflect our loan portfolio, including principal amounts of past due loan and impaired loans. Any collateral provided generally consists of a mortgage on real estate, a pledge of marketable securities, a letter of credit or cash. The existence and amount of collateral generally vary from loan to loan.
As of | ||||||||
September 30, 2011 | December 31, 2010 | |||||||
| (Ch$ million) | ||||||||
| Commercial Loans: | ||||||||
Commercial loans | 7,147,476 | 6,107,117 | ||||||
| Foreign trade loans | 1,058,228 | 783,552 | ||||||
Loans with mortgage guarantee | 56,343 | 67,956 | ||||||
Factoring operations | 242,753 | 206,140 | ||||||
Leasing contracts | 1,231,720 | 1,122,916 | ||||||
Other loans and accounts receivables from customers | 1,757 | 17,948 | ||||||
Subtotal | 9,738,277 | 8,305,629 | ||||||
| Mortgage loans: | ||||||||
Draft loans | 171,589 | 138,094 | ||||||
Mortgage finance bonds | 119,573 | 184,364 | ||||||
Other mortgage mutual loans | 4,725,258 | 4,328,679 | ||||||
Leasing contracts | - | - | ||||||
Subtotal | 5,016,420 | 4,651,137 | ||||||
| Consumer loans: | ||||||||
Installment consumer loans | 1,715,815 | 1,604,603 | ||||||
Credit card loans | 906,769 | 794,216 | ||||||
Consumer leasing contracts | 3,746 | 3,735 | ||||||
Other consumer loans | 299,329 | 298,236 | ||||||
Subtotal | 2,925,659 | 2,700,790 | ||||||
Subtotal Loans to customers | 17,680,356 | 15,657,556 | ||||||
Interbank loans | 88,038 | 69,726 | ||||||
Total | 17,768,394 | 15,727,282 | ||||||
Our loan categories are as follows:
Commercial loans
Commercial loans are long-term and short-term loans, including checking overdraft lines for companies granted in Chilean pesos, inflation linked, US$ linked or denominated in US$. The interest on these loans is fixed or variable and is used primarily to finance working capital or investments. General commercial loans also includes factoring operations.
59
Foreign trade loans are fixed rate, short-term loans made in foreign currencies (principally US$) to finance imports and exports.
Mortgage loans financed with mortgage bonds mainly include mortgage loans (fixed and variable rate) that are inflation-indexed long-term loans with monthly payments of principal and interest secured by a real property mortgage. These are financed by issuing mortgage bonds.
Factoring operations mainly include short-term loans to companies with a fixed monthly nominal rate backed by a company invoice.
Leasing contracts are agreements for the financial leasing of capital equipment and other property.
Other outstanding loans include other loans and accounts payable.
Residential mortgage loans
Draft loans mainly include mortgage loans (fixed and variable rate) that are inflation-indexed long-term loans with monthly payments of principal and interest secured by a real property mortgage. These loans can be endorsed to a third party. These are financed by our general borrowings.
Residential mortgage loans backed by mortgage bonds are inflation-indexed, fixed or variable rate, long-term loans with monthly payments of principal and interest secured by a real property mortgage that are financed with mortgage finance bonds. At the time of approval, these types of mortgage loans cannot be more than 75% of the lower of the purchase price or the appraised value of the mortgaged property or such loan will be classified as a commercial loan. Mortgage bonds are our general obligations, and we are liable for all principal and accrued interest on such bonds. In addition, if the issuer of a mortgage finance bond becomes insolvent, the General Banking Law’s liquidation procedures provide that these types of mortgage loans with their corresponding mortgage bonds shall be auctioned as a unit and the acquirer must continue paying the mortgage finance bonds under the same conditions as the original issuer.
Other mortgage mutual loans mainly include mortgage loans (fixed and variable rate) that are inflation-indexed long-term loans with monthly payments of principal and interest secured by a real property mortgage. These are financed by our general borrowings.
Consumer loans
Installment consumer loans are loans to individuals, granted in Chilean pesos, generally on a fixed rate nominal basis, to finance the purchase of consumer goods or to pay for services.
Consumer loans through lines of credit are checking overdraft lines to individuals, granted in Chilean pesos, generally on a fixed rate nominal basis and linked to an individual’s checking account.
Credit card loans include credit card balances subject to nominal fixed rate interest charges.
Consumer leasing contracts are agreements for the financial leasing of automobiles and other property to individuals.
Non-client loans
Interbank loans are fixed rate, short-term loans to financial institutions that operate in Chile.
60
Maturity and Interest Rate Sensitivity of Loans
The following table sets forth an analysis by type and time remaining to maturity of our loans at September 30, 2011.
Due in 1 year or less | Due after 1 year through 5 years | Due after 5 years | Total balance at September 30, 2011 | |||||||||||||
| (in millions of Ch$) | ||||||||||||||||
General commercial loans | 3,024,650 | 2,738,385 | 1,384,441 | 7,147,476 | ||||||||||||
Foreign trade loans | 916,179 | 101,445 | 40,604 | 1,058,228 | ||||||||||||
Leasing contracts | 289,148 | 592,504 | 350,068 | 1,231,720 | ||||||||||||
Other outstanding loans | 300,853 | - | - | 300,853 | ||||||||||||
Subtotal commercial loans | 4,530,830 | 3,432,334 | 1,775,113 | 9,738,277 | ||||||||||||
Residential loans backed by mortgage bonds | 23,798 | 45,391 | 50,384 | 119,573 | ||||||||||||
Other residential mortgage loans | 278,917 | 904,214 | 3,713,716 | 4,896,847 | ||||||||||||
Subtotal residential mortgage loans | 302,715 | 949,605 | 3,764,100 | 5,016,420 | ||||||||||||
Consumer loans | 1,483,951 | 1,326,543 | 115,165 | 2,925,659 | ||||||||||||
Subtotal | 6,317,496 | 5,708,482 | 5,654,378 | 17,680,356 | ||||||||||||
Interbank loans | 88,038 | - | - | 88,038 | ||||||||||||
Total loans | 6,405,534 | 5,708,482 | 5,654,378 | 17,768,394 | ||||||||||||
The following tables present the interest rate sensitivity of outstanding loans due after one year at September 30, 2011. (See also “Item 3: C. Operating Results—Interest Rates”).
As of September 30, 2011 | ||||
| (in millions of Ch$) | ||||
| Variable Rate | ||||
Ch$ | - | |||
UF | 2,008,312 | |||
Foreign currencies | 156 | |||
Subtotal | 2,008,468 | |||
| Fixed Rate | ||||
Ch$ | 3,310,717 | |||
UF | 5,359,339 | |||
Foreign currencies | 684,336 | |||
Subtotal | 9,354,392 | |||
Total | 11,362,860 | |||
Loans by Economic Activity
The following table sets forth, at the dates indicated, an analysis of our client loan portfolio based on the borrower’s principal economic activity and geographic distribution. Loans to individuals for business purposes are allocated to their economic activity.
Domestic loans (*) as of, | Foreign loans as of, | Total loans as of, | % of total loans as of, | |||||||||||||||||||||||||||||
Sept. 30, 2011 | Dec. 31, 2010 | Sept. 30, 2011 | Dec. 31, 2010 | Sept. 30, 2011 | Dec. 31, 2010 | Sept. 30, 2011, % | Dec. 31, 2010, % | |||||||||||||||||||||||||
| (in millions of Ch$) | ||||||||||||||||||||||||||||||||
| Commercial loans | ||||||||||||||||||||||||||||||||
Manufacturing | 987,830 | 838,324 | - | - | 987,830 | 838,324 | 5.56 | 5.33 | ||||||||||||||||||||||||
Mining | 281,259 | 106,119 | - | - | 281,259 | 106,119 | 1.58 | 0.67 | ||||||||||||||||||||||||
Electricity, gas and water | 264,924 | 149,907 | - | - | 264,924 | 149,907 | 1.49 | 0.95 | ||||||||||||||||||||||||
Agriculture and livestock | 762,510 | 679,159 | - | - | 762,510 | 679,159 | 4.29 | 4.32 | ||||||||||||||||||||||||
Forestry | 88,291 | 84,375 | - | - | 88,291 | 84,375 | 0.50 | 0.54 | ||||||||||||||||||||||||
Fishing | 166,995 | 133,930 | - | - | 166,995 | 133,930 | 0.94 | 0.85 | ||||||||||||||||||||||||
Transport | 502,786 | 449,508 | - | - | 502,786 | 449,508 | 2.83 | 2.86 | ||||||||||||||||||||||||
Communications | 260,871 | 214,881 | - | - | 260,871 | 214,881 | 1.47 | 1.37 | ||||||||||||||||||||||||
Construction | 953,090 | 839,316 | - | - | 953,090 | 839,316 | 5.36 | 5.34 | ||||||||||||||||||||||||
Commerce | 2,067,261 | 1,732,800 | 88,029 | 69,709 | 2,155,290 | 1,802,509 | 12.13 | 11.46 | ||||||||||||||||||||||||
Services | 375,543 | 358,314 | - | - | 375,543 | 358,314 | 2.11 | 2.28 | ||||||||||||||||||||||||
Other | 3,026,926 | 2,719,013 | - | - | 3,026,926 | 2,719,013 | 17.04 | 17.29 | ||||||||||||||||||||||||
Subtotals | 9,738,286 | 8,305,646 | 88,029 | 69,709 | 9,826,315 | 8,375,355 | 55.30 | 53.26 | ||||||||||||||||||||||||
61
Domestic loans (*) as of, | Foreign loans as of, | Total loans as of, | % of total loans as of, | |||||||||||||||||||||||||||||
Sept. 30, 2011 | Dec. 31, 2010 | Sept. 30, 2011 | Dec. 31, 2010 | Sept. 30, 2011 | Dec. 31, 2010 | Sept. 30, 2011, % | Dec. 31, 2010, % | |||||||||||||||||||||||||
| (in millions of Ch$) | ||||||||||||||||||||||||||||||||
| Mortgage loans | 5,016,420 | 4,651,137 | - | - | 5,016,420 | 4,651,137 | 28.23 | 29.57 | ||||||||||||||||||||||||
| Consumer loans | 2,925,659 | 2,700,790 | - | - | 2,925,659 | 2,700,790 | 16.47 | 17.17 | ||||||||||||||||||||||||
Total | 17,680,365 | 15,657,573 | 88,029 | 69,709 | 17,768,394 | 15,727,282 | 100.00 | 100.00 | ||||||||||||||||||||||||
| (*) | As of September 30, 2011, foreign country loans, including foreign interbank deposits classified as financial investments and overnight deposits totaled Ch$543,471 million representing 2.1% of our total assets. |
Analysis of Santander Chile’s Loan Classification
New Provisioning Model for Residential Mortgage Loans
Prior to June 2011, residential mortgage loans were assigned an allowance level based on credit risk profiles which were determined utilizing a statistical model that considered a borrower’s credit history, including any defaults on obligations to other creditors, as well as the overdue periods on the loans borrowed from us. Once the rating of the client was determined, the allowance for a mortgage loan was calculated using a risk category, which was directly related to days overdue. The following table sets forth the allowance to loan ratios previously used by the Bank. The ratios represent the percentage of required allowance amount to the aggregate amount of the principal and accrued but unpaid interest on the loan.
Previous model Residential mortgage loans | Overdue days | ||||||||||||||||||||||||||||
| 1-30 | 31-60 | 61-120 | 121-180 | 181-360 | 361- 720 | >720 | |||||||||||||||||||||||
Mortgage | Profile 1 | 0.3 | % | 0.5 | % | 1.2 | % | 2.4 | % | 6.8 | % | 14.1 | % | 28.3 | % | ||||||||||||||
| Profile 2 | 1.5 | % | 1.6 | % | 2.5 | % | 4.4 | % | 6.8 | % | 14.1 | % | 28.3 | % | |||||||||||||||
As of June 2011, residential mortgage loans are assigned an allowance level based on credit risk profiles, which are determined utilizing a statistical model that considers: (i) a borrower’s credit history, (ii) if a client is a new client or an existing client, (iii) if the client is a Bank client or a Banefe client and (iv) if this client has been renegotiated in the system. The total impact of this change on loan loss reserves was Ch$13,006 million or 0.3% of the Bank’s total residential mortgage portfolio. An additional impact of Ch$3,252 from this change will be recognized in the fourth quarter.
As of June 2011, the model for determining provisions for residential mortgage loans is as follows. The ratios represent the percentage of required allowance amount to the aggregate amount of the principal and accrued but unpaid interest on the loan.
New model - Residential mortgage loans | Performing | Overdue days | |||||||||||||||||||
| 1-29 | 30-59 | 60-89 | >90 days | ||||||||||||||||||
| Mortgage (Bank client) | New client | 0.20 | % | 2.7 | % | 3.6 | % | 4.63 | % | 11.0 | % | ||||||||||
| Existing client | 0.29 | % | 1.49 | % | 2.97 | % | 3.7 | % | 11.0 | % | |||||||||||
| Renegotiated client | 1.75 | % | 1.75 | % | 1.75 | % | 1.75 | % | 11.0 | % | |||||||||||
| Mortgage (Banefe client) | New or existing client | 0.35 | % | 2.19 | % | 3.64 | % | 4.72 | % | 11.0 | % | ||||||||||
| Renegotiated client | 1.75 | % | 1.75 | % | 1.75 | % | 1.75 | % | 11.0 | % | |||||||||||
62
Planned modifications to allowances for group evaluations on small- and mid-sized commercial loans
Allowances based on group evaluations are permitted for a large number of borrowers whose individual loan amounts are relatively insignificant. These models are intended to be used primarily to analyze commercial loans to individuals and small companies and cover approximately 9% of our total loans.
Levels of required reserves are determined by us by classifying the loan portfolio using one or both of the following models:
| i. | A model based on the characteristics of the borrowers and their outstanding loans–borrowers and their loans with similar characteristics will be placed into groups and each group will be assigned a risk level. |
| ii. | A model based on the behavior of a group of loans–loans with analogous past payment histories and similar characteristics will be placed into groups and each group will be assigned a risk level. |
In the fourth quarter of 2011, the Bank plans on transferring those companies analyzed on a group basis to a credit scoring model more similar to the ones used for consumer and residential mortgage loans. The estimated impact of this change on our pre-tax provision expense is Ch$15,000-20,000 million, mainly corresponding to allowances that will be set aside for the performing portion of this loan portfolio.
The Bank believes its provisioning models are accurate and that its loan loss allowances are sufficient to cover known potential losses. While we do not expect major impacts on provisioning expenses in 2012 from changes to our provisioning models, going forward, the Bank and the SBIF will continuously revaluate the provisioning models in order to make sure they fully cover the incurred losses in our portfolio.
Analysis of Impaired and Non-Performing Loans
The following table sets forth all of our, non-performing loans and impaired loans as of September 30, 2011 and December 31, 2010.
As of | ||||||||
September 30, 2011 | December 31, 2010 | |||||||
| (in millions of Ch$, except percentages) | ||||||||
Non-performing loans(1) | 496,786 | 416,739 | ||||||
Impaired loans (2) | 1,326,621 | 1,480,476 | ||||||
Allowance for loan losses(3) | 484,580 | 425,447 | ||||||
Total loans(4) | 17,768,394 | 15,727,282 | ||||||
Allowance for loan losses / loans | 2.73 | % | 2.71 | % | ||||
Non-performing loans as a percentage of total loans | 2.80 | % | 2.65 | % | ||||
Loan loss allowance as a percentage of non−performing loans | 97.54 | % | 102.09 | % | ||||
| (1) | Non-performing loans include the principal and interest of any loan with one installment that is 90 days overdue, and do not accrue interest. |
| (2) | Impaired loans are defined under the guidelines established in IAS 39 Sections 58 and 59. Impaired loans defined as of December 31, 2011 and 2010 include: (A) for loans whose allowance is determined on an individual basis, impaired loans include: (1) all loans to a debtor that are rated C1 through D2 and (2) total loans to single debtors with a loan that is non-performing, excluding residential mortgage loans if the non-performance of the mortgage loans is less than 90 days; (B) for loans whose allowance for loan losses is determined on a group basis, impaired loans include: (1) total loans to a debtor, when a loan to that debtor is non-performing or has been renegotiated, excluding performing residential mortgage loans and (2) if the loan that is non-performing or renegotiated is a residential mortgage loan all loans to that debtor are considered impaired. |
| (3) | Includes allowance for interbank loans. |
| (4) | Includes interbank loans. |
63
Interest revenue and expense are recorded on an accrual basis using the effective interest method. However, when a given operation or transaction is past due by 90 days or more, when it originated from a refinancing or renegotiation, or when the Bank believes that the debtor poses a high risk of default, the interest and adjustments pertaining to these transactions are not reflected directly in the Consolidated Interim Statement of Income unless they have been actually received. Such unrecorded interest and adjustments are generally referred to as “suspended” and are reflected in memorandum accounts which are not part of the Unaudited Condensed Consolidated Interim Statements of Financial Position but are reported as part of the complementary information thereto (Note 23). These accounts are recognized as income, when collected, as a reversal of the related impairment losses. The Bank ceases accruing interest based on contract terms on the principal amount of any asset classified as an impaired asset. Thereafter, the Bank recognizes as interest income the accretion of the net present value of the written down amount of the loan due to the passage of time, based on the original effective interest rate of the loan. Any collected interest related to an asset classified as impaired is accounted for on a cash basis.
For the nine-months ended September 30, 2011 and 2010, the detail of income from suspended interest is as follows:
Nine-Months Ended September 30, | ||||||||
Suspended interest | 2011 | 2010 | ||||||
| (Ch$ million) | ||||||||
Commercial loans | 31,848 | 29,969 | ||||||
Mortgage loans | 9,954 | 8,573 | ||||||
Consumer loans | 19,624 | 32,374 | ||||||
Totals | 61,426 | 70,916 | ||||||
The following table analyzes our impaired loans. Impaired loans include: (i) all loans to a single client that are evaluated on a group basis, including performing loans, that have a loan classified as non-performing, (ii) all renegotiated consumer loans and (iii) all commercial loans at risk of default. See Note 10(a) of the Unaudited Condensed Consolidated Interim Financial Statements.
As of | ||||||||
September 30, 2011 | December 31, 2010 | |||||||
| (Ch$ million) | ||||||||
Total loans | 17,768,394 | 15,727,282 | ||||||
Allowance for loan losses | 484,580 | 425,447 | ||||||
Impaired loans(1) | 1,326,621 | 1,480,476 | ||||||
Impaired loans as a percentage of total loans | 7.47 | % | 9.41 | % | ||||
Amounts non-performing | 496,786 | 416,739 | ||||||
To the extent secured | 257,579 | 214,786 | ||||||
To the extent unsecured | 239,207 | 201,953 | ||||||
Amounts non-performing as a percentage of total loans | 2.80 | % | 2.65 | % | ||||
To the extent secured(2) | 1.45 | % | 1.37 | % | ||||
To the extent unsecured | 1.35 | % | 1.28 | % | ||||
| Loans loss allowances as a percentage of: | ||||||||
Total loans | 2.73 | % | 2.71 | % | ||||
Total amounts non-performing | 97.54 | % | 102.10 | % | ||||
Total amounts non-performing-unsecured | 202.57 | % | 210.67 | % | ||||
| (1) | Impaired loans are constructed under the guidelines established in IAS 39 Sections 58 and 59. Impaired loans include: (A) for loans whose allowance is determined on an individual basis, impaired loans include: (1) all loans to a debtor that are rated C1 through D2 and (2) total loans to single debtors with a loan that is non-performing, excluding residential mortgage loans if the non-performance of the mortgage loans is less than 90 |
64
days. (B) for loans whose loan loss allowance is determined on a group basis, impaired loans include: (1) total loans to a debtor, when a loan to that debtor is non-performing or has been renegotiated, excluding performing residential mortgage loans and (2) if the loan that is non-performing or renegotiated is a residential mortgage loan all loans to that debtor are considered impaired.
| (2) | Security generally consists of mortgages on real estate, pledges of marketable securities, letters of credit or cash. |
A breakdown of the loans included in the previous table which have been classified as impaired are as follows:
Impaired loans as of September 30, 2011 | Commercial | Residential mortgage | Consumer | Total | ||||||||||||
Non-performing loans (1) | 244,209 | 140,273 | 112,304 | 496,786 | ||||||||||||
Commercial loans at risk of default (2) | 305,503 | - | - | 305,503 | ||||||||||||
Re-negotiated loans (3) | 170,845 | 41,583 | 311,904 | 524,332 | ||||||||||||
Total | 720,557 | 181,856 | 424,208 | 1,326,621 | ||||||||||||
Impaired loans As of December 31, 2010 | Commercial | Residential mortgage | Consumer | Total | ||||||||||||
Non-performing loans (1) | 213,872 | 121,911 | 80,956 | 416,739 | ||||||||||||
Commercial loans at risk of default (2) | 444,129 | - | - | 444,129 | ||||||||||||
Re-negotiated loans (3) | 230,810 | 20,735 | 368,063 | 619,608 | ||||||||||||
Total | 888,811 | 142,646 | 449,019 | 1,480,476 | ||||||||||||
| (1) | All commercial loans analyzed individually at risk of default, defined as all loans to a debtor with a loan rated C1 through D2. |
| (2) | Total loans to a debtor, whose allowance level is determined on an individual basis, and who has a loan that is non-performing. |
| (3) | Renegotiated loans for loans whose loan loss allowance is analyzed on a group basis. |
We in certain instances renegotiate loans that have one or more installment that is non-performing. The type of concession we most often give when renegotiating a loan is a reduction in interest payment or a forgiveness of principal. The following table shows the success rate for renegotiated consumer and mortgage loans. The success rate for consumer loans is defined for each reported period as: (i) (the total amount of loans renegotiated in that period minus the amount of such renegotiated loans that are classified as non-performing loans as of September 30, 2011, minus the amount of such renegotiated loans that have been charged off as of September 30, 2011) divided by (ii) (the total amount of such renegotiated loans). The success rate for residential mortgage loans is defined for each reported period as: (i) (the total amount of loans renegotiated in that period minus the amount of such renegotiated loans that are classified as non-performing loans as of September 30, 2011 minus the amount of such renegotiated loans that have been charged off as of September 30, 2011divided by (ii) (the total amount of such renegotiated loans).
As of September 30, 2011 Period of renegotiation | Success rate Consumer Loans | Success rate Residential mortgage loans | |||||||
| 1Q 2010 | 73.6 | % | 90.2 | % | |||||
| 2Q 2010 | 72.6 | % | 90.7 | % | |||||
| 3Q 2010 | 68.5 | % | 84.9 | % | |||||
| 4Q 2010 | 69.4 | % | 100.0 | % | |||||
| 1Q 2011 | 72.4 | % | 100.0 | % | |||||
| 2Q 2011 | 99.9 | % | 100.0 | % | |||||
| 3Q 2011 | 100.0 | % | 100.0 | % | |||||
65
Based on information available regarding our borrowers, we believe that our loan loss allowances are sufficient to cover known potential losses and losses inherent in a loan portfolio of the size and nature of our loan portfolio.
Charge-offs by loan product
| Nine-Months Ended September 30, | % Change | |||||||||||
2011 | 2010 | 2011/2010 | ||||||||||
| (in millions of Ch$) | ||||||||||||
Consumer loans | (125,416 | ) | (91,219 | ) | 37.5 | % | ||||||
Residential mortgage loans | (10,506 | ) | (10,589 | ) | (0.8 | %) | ||||||
Commercial loans | (58,300 | ) | (49,424 | ) | 18.0 | % | ||||||
Total charge−offs | (194,222 | ) | (151,232 | ) | 28.4 | % | ||||||
Recovery of loans previously charged−off
Nine-Months Ended September 30, | % Change | |||||||||||
2011 | 2010 | 2011/2010 | ||||||||||
| (in millions of Ch$) | ||||||||||||
Consumer loans | 9,430 | 17,067 | (44.7 | %) | ||||||||
Residential mortgage loans | 1,213 | 1,229 | (1.3 | %) | ||||||||
Commercial loans | 5,376 | 5,259 | 2.2 | % | ||||||||
Total recoveries | 16,019 | 23,555 | (32.0 | %) | ||||||||
Based on information available regarding our borrowers, we believe that our loan loss allowance is sufficient to cover known potential losses and losses inherent in our loan portfolio.
66
Allocation of the Loan Loss Allowances
The following tables sets forth, as of September 30, 2011 and December 31, 2010, the proportions of our required minimum loan loss allowances that were attributable to our commercial, consumer and residential mortgage loans at each such date.
Total Allowance Ch$ million | Allowance amount as a percentage of loans in category | Allowance amount as a percentage of total loans | Allowance amount as a percentage of total allocated allowances | Total Allowance Ch$ million | Allowance amount as a percentage of loans in category | Allowance amount as a percentage of total loans | Allowance amount as a percentage of total allocated allowance | |||||||||||||||||||||||||
| Loans | As of September 30, 2011 | As of December 31, 2010 | ||||||||||||||||||||||||||||||
| Commercial loans | 146,294 | 2.0 | % | 0.8 | % | 30.2 | % | 132,775 | 2.2 | % | 0.8 | % | 31.2 | % | ||||||||||||||||||
| Foreign trade loans | 32,349 | 3.1 | % | 0.2 | % | 6.7 | % | 18,888 | 2.4 | % | 0.1 | % | 4.4 | % | ||||||||||||||||||
| General purpose mortgage loans | 3,429 | 6.1 | % | 0.0 | % | 0.7 | % | 4,350 | 6.4 | % | 0.0 | % | 1.0 | % | ||||||||||||||||||
| Factoring transactions | 3,582 | 1.5 | % | 0.0 | % | 0.7 | % | 2,083 | 1.0 | % | 0.0 | % | 0.5 | % | ||||||||||||||||||
| Leasing transactions | 18,424 | 1.5 | % | 0.1 | % | 3.8 | % | 14,742 | 1.3 | % | 0.1 | % | 3.5 | % | ||||||||||||||||||
| Other Loans and accounts receivables from customers | 1 | 0.1 | % | 0.0 | % | 0.0 | % | 9,664 | 53.8 | % | 0.1 | % | 2.3 | % | ||||||||||||||||||
| Subtotals | 204,079 | 2.1 | % | 1.1 | % | 42.1 | % | 182,502 | 2.2 | % | 1.2 | % | 42.9 | % | ||||||||||||||||||
| Mortgage loans | ||||||||||||||||||||||||||||||||
| Loans with letters of credit | 870 | 0.7 | % | 0.0 | % | 0.2 | % | 446 | 0.3 | % | 0.0 | % | 0.1 | % | ||||||||||||||||||
| Mortgage mutual loans | 27,996 | 0.6 | % | 0.2 | % | 5.8 | % | 11,319 | 6.1 | % | 0.1 | % | 2.7 | % | ||||||||||||||||||
| Other mortgage mutual loans | 7,246 | 4.2 | % | 0.0 | % | 1.5 | % | 5,567 | 0.1 | % | 0.0 | % | 1.3 | % | ||||||||||||||||||
| Leasing transactions | - | - | -- | % | -- | % | - | - | -- | % | -- | % | ||||||||||||||||||||
| Subtotals | 36,112 | 0.7 | % | 0.2 | % | 7.5 | % | 17,332 | 0.4 | % | 0.1 | % | 4.1 | % | ||||||||||||||||||
| Consumer loans | ||||||||||||||||||||||||||||||||
| Installment consumer loans | 185,996 | 10.8 | % | 1.0 | % | 38.4 | % | 176,219 | 11.0 | % | 1.1 | % | 41.4 | % | ||||||||||||||||||
| Credit card balances | 44,575 | 4.9 | % | 0.3 | % | 9.2 | % | 36,156 | 4.6 | % | 0.2 | % | 8.5 | % | ||||||||||||||||||
| Consumer leasing contracts | 103 | 2.7 | % | --0 | % | -- | % | 121 | 3.2 | % | -- | % | -- | % | ||||||||||||||||||
| Other consumer loans | 13,696 | 4.6 | % | 0.1 | % | 2.8 | % | 13,063 | 4.4 | % | 0.1 | % | 3.1 | % | ||||||||||||||||||
| Subtotals | 244,370 | 8.4 | % | 1.4 | % | 50.4 | % | 225,559 | 8.4 | % | 1.4 | % | 53.0 | % | ||||||||||||||||||
| Totals loans to clients | 484,561 | 2.7 | % | 2.7 | % | 100.0 | % | 425,393 | 2.7 | % | 2.7 | % | 100.0 | % | ||||||||||||||||||
| Interbank | 19 | 0.0 | % | 0.0 | % | 0.0 | % | 54 | 0.1 | % | 0.0 | % | 0.0 | % | ||||||||||||||||||
| Totals | 484,580 | 2.7 | % | 2.7 | % | 100.0 | % | 425,447 | 2.7 | % | 2.7 | % | 100.0 | % | ||||||||||||||||||
67
ITEM 4. MAJOR SHAREHOLDERS AND RELATED PARTY TRANSACTIONS
A. Major Shareholders
Banco Santander Spain controls Santander-Chile through its holdings in Teatinos Siglo XXI Inversiones Ltda. and Santander-Chile Holding, which are controlled subsidiaries. In February 2011, Banco Santander Spain sold 1.9% of its ownership of us through Teatinos Siglo XXI Inversiones Ltda in the market. This gives Banco Santander Spain control over 75.0% of our shares and actual participation when excluding non-controlling shareholders that participate in Santander Chile Holding is 74.84%.
Banco Santander Spain is in a position to cause the election of a majority of the members of Santander-Chile’s Board of Directors, to determine its dividend and other policies and to determine substantially all matters to be decided by a vote of shareholders. Banco Santander Spain holds ordinary shares to which no special voting rights are attached. Each share represents one vote and there are no shareholders with different voting rights.
The number of outstanding shares of Santander-Chile (of which there is only one class, being ordinary shares) at September 30, 2011 was 188,446,126,794 shares, without par value. Santander-Chile’s shares are listed for trading on the Chilean Stock Exchanges and on the NYSE in connection with the registration of ADRs. The market capitalization of Santander-Chile at the same date on the Chilean stock exchange was Ch$ 7,059,192 million and US$ 13,327 million on the NYSE. At September 30, 2011, Santander-Chile had 12,422 holders registered in Chile, including JPMorgan as Depositary (the “Depositary”) of Santander-Chile’s American Depositary Share Program. As of September 30, 2011, there were a total of 30 ADR holders on record, principally U.S. and international investment and commercial banks holding ADSs for themselves and third parties. Since some of these ADRs are held by nominees, the number of record holders may not be representative of the number of beneficial holders.
Other than the information disclosed in this section, there are no arrangements to the knowledge of Santander-Chile, which can result in a change of control of Santander-Chile.
B. Related Party Transactions
In the first six months of 2011, the Bank acquired from our controlling shareholder, Banco Santander Spain, certain loans to and accounts receivable with corporate clients in Chile. The aggregate principal amount of these loans and accounts receivable was US$971,053,000 at the time of purchase. The assets were purchased at fair market value, complying with applicable rules and regulation, and as of September 30, 2011, the aggregate principal amount of these assets was US$622,859,000. At the time of the acquisition, the maturity of these loans was between 12 and 18 months, and all are performing.
The Chilean Companies Law requires that our transactions with related parties be on a market basis, that is, on similar terms to those customarily prevailing in the market. We are required to compare the terms of any such transaction to those prevailing in the market at the date the transaction is to be entered into. Directors of companies that violate this provision are liable for losses resulting from such violations.
In addition, under the Chilean Companies Law, a company may not enter into a transaction with related parties unless (i) such transaction has received the prior approval of the company’s Board of Directors and (ii) the terms of such transaction are consistent with the terms of transactions of a similar type prevailing in the market. If it is not possible to make this determination, the board may appoint two independent evaluators. The evaluators’ final conclusions must be made available to shareholders and directors for a period of 20 business days, during which shareholders representing 5% or more of the issued voting shares may request the board to call a shareholders’ meeting to resolve the matter, with the agreement of two thirds of the issued voting shares required for approval. For purposes of this regulation, the law considers the amount of a proposed transaction to be material if (1) it exceeds 1% of the company’s net worth (provided that it also exceeds UF 20,000) or (2) it exceeds UF 20,000.
All resolutions approving such transactions will be reported to the company’s shareholders at the next annual shareholders’ meeting. Violations of this provision may result in administrative or civil liability to the corporation, the shareholders and/or third parties who suffer losses as a result of such violation.
68
Loans granted to related parties
In addition to subsidiaries and associated entities, the Bank’s “related parties” include the “key personnel” of the Bank’s executive staff (members of the Bank’s Board and the Managers of Banco Santander Chile and its subsidiaries, together with their close relatives), as well as the entities over which the key personnel could exert significant influence or control.
The Bank also considers the companies that are part of the Santander Group worldwide as related parties, given that all of them have a common parent, i.e., Banco Santander Spain. (located in Spain).
The table below shows loans and receivables and contingent loans with related parties. For more information, see “Note 31–Transactions with Related Parties” in our Unaudited Condensed Interim Consolidated Financial Statements appearing elsewhere in this report:
As of September 30, 2011 | As of December 31, 2010 | |||||||||||||||||||||||||||||||
Companies of the Group | Associated companies | Key personnel | Other | Companies of the Group | Associated companies | Key personnel | Other | |||||||||||||||||||||||||
| (in millions of Ch$) | (in millions of Ch$) | |||||||||||||||||||||||||||||||
| LOANS AND RECEIVABLES | ||||||||||||||||||||||||||||||||
Commercial loans | 35,618 | 682 | 2,197 | 73,438 | 36,966 | 670 | 2,478 | 14,015 | ||||||||||||||||||||||||
Mortgage loans | - | - | 15,962 | - | - | - | 15,157 | - | ||||||||||||||||||||||||
Consumer loans | - | - | 1,911 | - | - | - | 2,182 | - | ||||||||||||||||||||||||
| Loans and accounts receivables | 35,618 | 682 | 20,070 | 73,438 | 36,966 | 670 | 19,817 | 14,015 | ||||||||||||||||||||||||
| Provision for loan losses | (46 | ) | (1 | ) | (34 | ) | (33 | ) | (112 | ) | (1 | ) | (87 | ) | (14 | ) | ||||||||||||||||
Net loans | 35,572 | 681 | 20,036 | 73,405 | 36,854 | 669 | 19,730 | 14,001 | ||||||||||||||||||||||||
Guarantees | 25,580 | - | 18,717 | 1,054 | 7,641 | - | 18,649 | 1,359 | ||||||||||||||||||||||||
| Contingent loans | ||||||||||||||||||||||||||||||||
| Personal guarantees | - | - | - | - | - | - | - | - | ||||||||||||||||||||||||
Letters of credit | 1,020 | - | - | - | 2,964 | - | - | - | ||||||||||||||||||||||||
Guarantees | 12,761 | - | - | 250 | 12,307 | - | - | 84 | ||||||||||||||||||||||||
| Contingent loans | 13,781 | - | - | 250 | 15,271 | - | - | 84 | ||||||||||||||||||||||||
| Provision for contingent loans | (9 | ) | - | - | - | (1 | ) | - | - | - | ||||||||||||||||||||||
| Net contingent loans | 13,772 | - | - | 250 | 15,270 | - | - | 84 | ||||||||||||||||||||||||
Under the Chilean General Banking Law, Chilean banks are subject to certain lending limits, including the following:
| · | a bank may not extend to any person or legal entity (or group of related entities), directly or indirectly, unsecured loans in an amount that exceeds 5.0% of the bank’s regulatory capital, or secured loans in an amount that exceeds 25.0% of its regulatory capital. In the case of foreign export trade finance, this 5.0% ceiling is raised to: 10.0% for unsecured financing, 30.0% for secured financing. This ceiling is raised to 15.0% for loans granted to finance public works under the concessions system contemplated in the Decree with Force of Law 164 of 1991, of the Ministry of Public Works, provided that either the loan is secured on the concession, or the loan is granted as part of a loan syndication; |
| · | a bank may not grant loans bearing more favorable terms than those generally offered by banks in the same community to any entity (or group of related entities) that is directly or indirectly related to its owners or management; |
| · | a bank may not extend loans to another bank in an aggregate amount exceeding 30.0% of its regulatory capital; |
| · | a bank may not directly or indirectly grant a loan, the purpose of which is to allow the borrower to acquire shares in the lending bank; |
69
| · | a bank may not lend, directly or indirectly, to a Director or any other person who has the power to act on behalf of the bank, or to certain related parties; and |
| · | a bank may not grant loans to individuals or legal entities involved in the ownership or management of the bank, whether directly or indirectly (including holders of 1.0% or more of its shares), on more favorable terms than those generally offered to non-related parties. Loans may not be extended to senior executives and to companies in which such individuals have a participation of 5.0% or more of the equity or net earnings in such companies. The aggregate amount of loans to related parties may not exceed a bank’s regulatory capital. |
| · | We are not aware of any loans to any related parties exceeding the above lending limits. |
The largest related party loan was rendered by the Bank to Santander Investment Chile Ltda. for Ch$16,760 million (US$32.2 million). The loan is in Chilean nominal pesos at a rate of 0.50% per month and was due in October 2011.
The table below shows assets and liabilities with related parties:
As of September 30, 2011 | As of December 31, 2010 | |||||||||||||||||||||||||||||||
Companies of the Group | Associated companies | Key personnel | Other | Companies of the Group | Associated companies | Key personnel | Other | |||||||||||||||||||||||||
| (in millions of Ch$) | (in millions of Ch$) | |||||||||||||||||||||||||||||||
| Assets | ||||||||||||||||||||||||||||||||
| Cash and deposits in banks | 222,497 | - | - | - | 34,104 | - | - | - | ||||||||||||||||||||||||
Trading investments | - | - | - | - | - | - | - | - | ||||||||||||||||||||||||
| Investments under resale agreements | - | - | - | - | - | - | - | - | ||||||||||||||||||||||||
| Financial derivative contracts | 572,040 | - | - | - | 541,737 | - | - | - | ||||||||||||||||||||||||
| Available for sale investments | - | - | - | - | - | - | - | - | ||||||||||||||||||||||||
Other assets | 105,348 | - | - | - | 22,072 | - | - | - | ||||||||||||||||||||||||
| Liabilities | ||||||||||||||||||||||||||||||||
| Deposits and other demand liabilities | 5,738 | 8,779 | 1,594 | 9,671 | 9,905 | 6,014 | 1,311 | 4,128 | ||||||||||||||||||||||||
| Investments under repurchase agreements | 52,611 | - | - | - | 47,636 | - | - | - | ||||||||||||||||||||||||
| Time deposits and other time liabilities | 471,973 | 90 | 2,583 | 56,000 | 320,622 | - | 1,657 | 48,749 | ||||||||||||||||||||||||
| Financial derivative contracts | 457,725 | - | - | - | 317,601 | - | - | - | ||||||||||||||||||||||||
Issued debt instruments | 13,212 | - | - | - | 9,392 | - | - | - | ||||||||||||||||||||||||
| Other financial liabilities | 43,754 | - | - | - | 153,913 | - | - | - | ||||||||||||||||||||||||
Other liabilities | 1,163 | - | - | - | 2,782 | - | - | - | ||||||||||||||||||||||||
Other transactions with related parties
During the nine-month periods ended September 30, 2011 and 2010, we had the following significant income (expenses) from services provided to (by) related parties:
As of September 30, 2011 | As of September 30, 2010 | |||||||||||||||||||||||||||||||
Companies of the Group | Associated companies | Key personnel | Other | Companies of the Group | Associated companies | Key personnel | Other | |||||||||||||||||||||||||
| (in millions of Ch$) | (in millions of Ch$) | |||||||||||||||||||||||||||||||
| Income (expense) recorded | ||||||||||||||||||||||||||||||||
| Income and expenses from interest and readjustments | (12,923 | ) | 41 | 953 | (2,415 | ) | (7,385 | ) | 39 | 768 | 459 | |||||||||||||||||||||
| Income and expenses from fees and services | 58,741 | 30 | 84 | 155 | 50,735 | 2 | 69 | 118 | ||||||||||||||||||||||||
| Net income from financial and foreign exchange operations | 96,187 | - | (19 | ) | (8,658 | ) | 98,131 | - | (18 | ) | 1,479 | |||||||||||||||||||||
| Other operating revenues and expenses | (4,184 | ) | - | - | - | (3,551 | ) | - | - | - | ||||||||||||||||||||||
| Key personnel compensation and expenses | - | - | (25,213 | ) | - | - | - | (21,480 | ) | - | ||||||||||||||||||||||
| Administrative and other expenses | (17,421 | ) | (18,664 | ) | - | - | (14,466 | ) | (14,788 | ) | - | - | ||||||||||||||||||||
Totals | 120,400 | (18,593 | ) | (24,195 | ) | (10,918 | ) | 123,464 | (14,747 | ) | (20,661 | ) | 2,056 | |||||||||||||||||||
Only transactions with related parties equal to or greater than UF 5,000 are included individually in the table above. Transactions with related parties between UF 1,000 and up to UF 5,000 are included in other transactions with related parties. All transactions were conducted at arms-length.
70
ITEM 5. FINANCIAL INFORMATION
A. Consolidated Statements and Other Financial Information
Financial Information
See Item 10.
Legal Proceedings
We are subject to certain claims and are party to certain legal and arbitration proceedings in the normal course of our business, including claims for alleged operational errors. We do not believe that the liabilities related to such claims and proceedings are likely to have, in the aggregate, a material adverse effect on our consolidated financial condition or results of operations. For the years ended December 31, 2009 and 2010, the Disclosure Committee of Santander Chile has defined a significant legal proceeding as that implying an estimated incurred loss greater than an established cutoff amount. This cut-off amount is calculated as 16% of 5% of net interest income plus net fee income plus net financial transactions plus provision expenses plus administrative expenses and depreciation. This amount is then further reduced by 30%. As of September 30, 2011, this cutoff totaled Ch$ 3,421 million (US$ 6.6 million). As of September 30, 2011, there were no legal proceedings exceeding that amount. There are no material proceedings in which any of our directors, any members of our senior management, or any of our affiliates is either a party adverse to us or our subsidiaries or has a material interest adverse to us or our subsidiaries.
Upon the recommendation of our internal and external legal advisors, we estimate that our aggregate liability, if all legal proceedings were determined adversely to us, could result in significant losses not estimated by us. As of September 30, 2011, we have set aside Ch$ 437 million (US$ 0.8 million) as provisions for these legal actions. These provisions are presented under the “other” provisions item in our financial statements.
Dividends and dividend policy
See “Item 1: A. Selected Financial Data–Dividends.”
ITEM 6. THE OFFER AND LISTING
A. Historical Trading Information
The table below shows, for the periods indicated, the annual, quarterly and monthly high and low closing prices (in nominal Chilean pesos) of the shares of our common stock on the Santiago Stock Exchange and the annual, quarterly and monthly high and low closing prices (in U.S. dollars) as reported by the NYSE.
71
Santiago Stock Exchange | NYSE | |||||||||||||||
Common Stock | ADS | |||||||||||||||
High | Low | High | Low | |||||||||||||
(Ch$ per share) | (US$ per ADS) | |||||||||||||||
| Annual Price History | ||||||||||||||||
2006 | 26.20 | 19.60 | 51.46 | 37.40 | ||||||||||||
2007 | 27.10 | 21.25 | 55.30 | 41.76 | ||||||||||||
2008 | 24.86 | 16.51 | 54.60 | 28.16 | ||||||||||||
2009 | 31.00 | 18.23 | 64.78 | 31.22 | ||||||||||||
2010 | 47.37 | 30.74 | 99.44 | 59.40 | ||||||||||||
| Quarterly Price History | ||||||||||||||||
| 2009 | ||||||||||||||||
1st Quarter | 23.00 | 18.23 | 38.84 | 31.22 | ||||||||||||
2nd Quarter | 23.90 | 19.44 | 46.69 | 34.01 | ||||||||||||
3rd Quarter | 30.41 | 23.34 | 57.94 | 44.97 | ||||||||||||
4th Quarter | 31.00 | 26.96 | 64.78 | 52.64 | ||||||||||||
| 2010 | ||||||||||||||||
1st Quarter | 34.99 | 30.74 | 70.63 | 60.59 | ||||||||||||
2nd Quarter | 36.36 | 31.03 | 71.88 | 59.40 | ||||||||||||
3rd Quarter | 47.37 | 34.73 | 99.44 | 66.73 | ||||||||||||
4th Quarter | 45.20 | 41.61 | 97.02 | 91.28 | ||||||||||||
| 2011 | ||||||||||||||||
1st Quarter | 43.65 | 35.63 | 93.75 | 76.06 | ||||||||||||
2nd Quarter | 42.23 | 39.80 | 93.81 | 86.25 | ||||||||||||
3rd Quarter | 42.93 | 34.53 | 96.44 | 70.65 | ||||||||||||
| Monthly Price History | ||||||||||||||||
December 2010 | 44.30 | 41.61 | 95.83 | 91.38 | ||||||||||||
January 2011 | 43.65 | 38.62 | 93.75 | 81.42 | ||||||||||||
February 2011 | 40.02 | 37.17 | 86.43 | 81.16 | ||||||||||||
March 2011 | 40.05 | 35.63 | 86.75 | 76.06 | ||||||||||||
April 2011 | 42.01 | 39.89 | 92.55 | 86.25 | ||||||||||||
May 2011 | 41.19 | 39.80 | 92.40 | 87.91 | ||||||||||||
June 2011 | 42.23 | 42.23 | 93.81 | 93.81 | ||||||||||||
July 2011 | 42.93 | 42.93 | 96.44 | 96.44 | ||||||||||||
August 2011 | 41.39 | 41.39 | 93.96 | 93.96 | ||||||||||||
September 2011 | 41.04 | 41.04 | 91.76 | 91.76 | ||||||||||||
October 2011 | 38.70 | 38.70 | 82.54 | 82.54 | ||||||||||||
November 2011 up to November 21, 2011 | 38.80 | 36.34 | 80.38 | 73.94 | ||||||||||||
B. Nature of Trading Market
Nature of Trading Market
Shares of our common stock are traded on the Chilean Stock Exchanges. Each ADS represents 1,039 shares of common stock. ADRs have been issued pursuant to the Deposit Agreement, dated as of August 4, 2008, among Santander-Chile, the Depositary and all holders from time to time of ADRs. As of September 30, 2011, 28,046,976 ADSs were outstanding (equivalent to 29,140,807,594 shares of common stock or 15.46% of the total number of issued shares of common stock).
72
ITEM 7. DIRECTORS, SENIOR MANAGEMENT AND EMPLOYEES
A. Directors and Senior Management
Directors
We are managed by our Board of Directors, which, in accordance with our by-laws, consists of 11 directors and two alternates who are elected at annual ordinary shareholders’ meetings. Except as noted below, the current members of the Board of Directors were elected by the shareholders in the ordinary shareholders’ meeting held on April 26, 2011. Members of the Board of Directors are elected for three-year terms. Except as noted below, the term of each of the current board members expires in April of 2014. Cumulative voting is permitted for the election of directors. The Board of Directors may appoint replacements to fill any vacancies that occur during periods between elections. If any member of the Board of Directors resigns before his or her term has ended, and no other alternate director is available to take the position at the next annual ordinary shareholders’ meeting a new replacing member will be elected. Our executive officers are appointed by the Board of Directors and hold office at its discretion. Scheduled meetings of the Board of Directors are held monthly. Extraordinary meetings can be held when called in one of three ways: by the Chairman of the Board of Directors, by three directors with the consent of the Chairman of the Board of Directors or by the majority of directors. None of the members of our Board of Directors has a service contract which entitles any Director to any benefits upon termination of employment with Santander-Chile.
73
Our current directors are as follows:
Directors | Position | Committees | Term Expires |
| Mauricio Larraín Garcés | Chairman and Director | Asset and Liability Committee Executive Credit Committee Market Committee Marketing and Communications Committee University Committee Strategy Committee | April 2014 |
| Jesús Zabalza Lotina | First Vice Chairman and Director | Strategy Committee | April 2014 |
| Oscar Von Chrismar Carvajal | Second Vice Chairman and Director | Asset and Liability Committee Executive Credit Committee Market Committee Strategy Committee Technology Committee Marketing and Communications Committee Central Risk Committee | April 2014 |
| Carlos Olivos Marchant | Director | Audit Committee | April 2014 |
| Víctor Arbulú Crousillat | Director | Audit Committee | April 2014 |
| Marco Colodro Hadjes | Director | Asset and Liability Committee Executive Credit Committee Market Committee Central Risk Committee | April 2014 |
| Lucía Santa Cruz Sutil | Director | University Committee Marketing and Communications Committee | April 2014 |
| Roberto Méndez Torres | Director | Executive Credit Committee Marketing and Communications Committee University Committee Strategy Committee | April 2014 |
| Vittorio Corbo Lioi | Director | Asset and Liability Committee Market Committee | April 2014 |
| Roberto Zahler Mayanz | Director | Asset and Liability Committee Market Committee | April 2014 |
| Lisandro Serrano Spoerer | Director | Audit Committee Analysis and Resolution Committee | April 2014 |
| Juan Manuel Hoyos Martínez de Irujo | Alternate Director | Strategy Committee | April 2014 |
| Raimundo Monge Zegers | Alternate Director | Asset and Liability Committee Strategy Committee Market Committee | April 2014 |
Mauricio Larraín Garcés is our Chairman. He is a member of the Asset and Liability Committee, the Executive Credit Committee, the Market Committee, the Marketing and Communications Committee, the Strategy Committee and the University Committee. He is also President of Santander Chile Holding S.A. and Universia Chile S.A. He is a Director of the Asociación de Bancos e Instituciones Financieras de Chile and the Santiago Stock Exchange. He is General Director of E.S.E., the Universidad de los Andes’ business school. He is also a member of the Council of Paz Ciudadana and was a former President of ICARE. Mr. Larraín began working at Santander-Chile in 1989. Previously, he was Intendente (Director) of the Superintendency of Banks, Manager of External Debt at the Banco Central de Chile and a Senior Finance Specialist at the World Bank in Washington. He holds degrees in Law from Universidad Católica de Chile and from Harvard University.
74
Jesús María Zabalza Lotina became a Director and Vice-Chairman of the Board on October 28, 2008. He currently is a Director of Grupo Santander’s Latin America Division and a Board member of Banco Santander Puerto Rico and President of the Board of Banco Santander Colombia. He is a member of the Strategy Committee. Mr. Jesús Zabalza is a patron of the Fundación Padre Garralda. Previously, Mr. Zabalza was Director of Retail Banking in Madrid of Banco BBVA. He was also on the Board of e-La Caixa, Telefónica Factoring S.A, Adeslas y Terra. Mr. Zabalza holds a degree in Industrial Engineering from the University of Bilbao.
Oscar von Chrismar Carvajal became Executive Vice-Chairman of the Board on January 1, 2010 after having served as the chief executive officer of Santander-Chile since August 2003. Mr. Von Chrismar is a member of the Asset and Liability Committee, Executive Credit Committee, Market Committee, Strategy Committee, Technology Committee and the Marketing and Communications Committee. Prior to assuming the chief executive officer post, he was the Manager of Global Banking. Prior to the merger, he was the former chief executive officer of Old Santander-Chile since September 1997, after being General Manager of Banco Santander-Peru since September 1995. Mr. von Chrismar is also Alternate Director of Universia Chile S.A. Prior to that, Mr. von Chrismar was the manager of the Finance Division of Santander-Chile, a position that he had held since joining Santander-Chile in 1990. Mr. von Chrismar holds an Engineering degree from the Universidad de Santiago de Chile.
Carlos Olivos Marchant is Director since 2007 and has been a Board member since the merger was consummated in 2002. He is Chairman of the Audit Committee. He was a member of the Board of Santiago since 1987 until the date of the merger, and he was Chairman of that board between May 1999 until the merger. He is a partner in the law firm Guerrero, Olivos, Novoa y Errazuriz. From 1981 to 1983, Mr. Olivos served as General Counsel of the Central Bank of Chile, and from 1984 to 1986, he served as Chairman of the Board of Directors of Banco Osorno. Mr. Olivos holds a law degree from the Universidad de Chile and a Masters of Jurisprudence from New York University School of Law.
Vittorio Corbo Lioi is one of Chile’s leading economists. In 2003, Mr. Corbo was named President of Chile’s Central Bank. Following the end of his tenure there, Mr. Corbo has been named to various boards and is currently a Senior Investigator at the Centro de Estudio Públicos (CEP), a local think tank. Previously, Mr. Corbo was an economic advisor to the Bank between 1991 and 1995 and a member of the Board of Santander Chile between 1995 and 2003. Mr. Corbo is a member of the Asset and Liability Committee and the Market Committee. Mr. Corbo has a Business Administration Degree from the Universidad de Chile and a Ph.D. in Economics from MIT.
Víctor Arbulú Crousillat became a Director on May 6, 1999. He is a member of the Audit Committee and has been designated as a Financial Expert. He was a Managing Director of JPMorgan, member of its European management committee and Chief Executive Officer for Spain and Portugal from 1988 until 1998. He has worked for JPMorgan for over 25 years in various positions in Europe, North America and Latin America. Mr. Arbulú also worked for the Inter-American Development Bank. He is also Director of Aurum S.A. Mr. Arbulú holds a degree in Engineering and a Masters of Business Administration.
Marco Colodro Hadjes became a Director on April 19, 2005. Mr. Colodro is a member of the Asset and Liability Committee, Executive Credit Committee, Market Committee and since September 2010 is a member of the Audit Committee. Mr. Colodro was President of the Board of Telefónica Chile and a Director of Codelco. He is a former chairman of TVN (national television network) and former vice chairman of Banco del Estado (state bank). He was also owner of Agencia de Valores Alfa S.A. Prior to that, he was Foreign Trade Director at the Central Bank of Chile. Mr. Colodro holds a degree in Economics from the Universidad de Chile, and has done post-graduate studies at the University of Paris.
Lucía Santa Cruz Sutil became a Director on August 19, 2003. Ms. Santa Cruz was a member of our Audit Committee until May 2010 and the University Committee. She is a member of the University Committee and the Marketing and Communications Committee. Ms. Santa Cruz holds a degree in History and a Masters Degree in Philosophy from Oxford University. She is the Dean of the College of Liberal Arts of the Universidad Adolfo Ibañez. Ms. Santa Cruz is also a Director of Universia Chile S.A. She is also on the Board of Compañía de Seguros Generales y de Vida La Chilena Consolidada and Fundación Minera Escondida. She is also on the Advisory Board of Nestle Chile and the Fundación Educacional Santa Teresa de Avila. She is also a member of the Self-Regulation Committee for Insurance Companies in Chile.
75
Roberto Méndez Torres is a former member of the Board of Old Santander-Chile, to which he was appointed in 1996. He is a member of the Executive Credit Committee, the Marketing and Communications Committee, the Strategy Committee and the University Committee. He is a professor of Economics at Universidad Católica de Chile. He has been Advisor to Grupo Santander-Chile since 1989. Mr. Méndez is President and Director of Adimark Chile Gfk and on the Board of the Chilean and German Chamber of Commerce. He is also Vice-Chairman of Universia S.A. He graduated with a degree in Business from Universidad Católica de Chile, and holds an MBA and a Ph.D. from the Graduate School of Business at Stanford University.
Roberto Zahler Mayanz became a Director on August 31, 1999. He is a member of the Asset and Liability Committee and the Market Committee. Currently, he is President of Zahler & Co, a consulting firm. He is also Director of Air Liquide-Chile and member of the CLAAF or the Latin American Committee for Financial Affairs. He was formerly President of the Board of Siemens Chile. He was also a visiting professor at the IMF’s Research Department. Between 1991 and 1996, he was President of the Central Bank of Chile and Vice-President from 1989 to 1991. He also serves as a consultant for the World Bank, the IDB, the IMF and the International Bank of Settlements. Mr. Zahler has also provided technical assistance to various Central Banks and Finance Ministries in most countries of Latin America, Indonesia and Kosovo. Mr. Zahler holds a degree in Business Administration from the Universidad de Chile and a Masters in Economics from the University of Chicago.
Lisandro Serrano Spoerer was elected to the Board in January 2011. He is a member of the Audit Committee and the Analysis and Resolution Committee. He is currently Dean of the Universidad Gabriela Mistral. He is also a member of the Self-Regulation Committee of the Santiago Stock Exchange, a board member of various companies and a Member of Tribunal Patrimonial del Fútbol Profesional. Previously, he worked at PricewaterhouseCoopers from 1977 to 2003 where he was a partner in the tax division and later a Principal partner.
Juan Manuel Hoyos Martínez de Irujo was the Managing Director of McKinsey & Company in Spain from 1997 to 2003 where he was also President of the Client Committee of McKinsey’s Board. He began his career at McKinsey where he was named partner in 1984 and Director in 1991. Currently, he is in charge of partner development worldwide and continues to serve on the Board. His consulting career has been focused in the areas of strategy and organization of corporations, especially in the telecommunications, banking and metallurgy sectors. He has worked with companies in Spain, the United States, Latin America, the United Kingdom, Portugal and Africa. He is currently a member of our Strategy Committee. He received an economics degree from the Universidad Complutense de Madrid and holds an MBA in Finance and Accounting from Columbia University.
Raimundo Monge Zegers became an Alternate Director on April 29, 2003. He is currently a member of the Strategy Committee, the Asset and Liability Committee and the Market Committee. He is Corporate Director of Strategic and Financial Planning for Grupo Santander-Chile and is CEO of Santander-Chile Holding S.A. and Santander Inversiones Ltda. He is also President of Santander S.A. Sociedad Securitizadora and Santander Factoring S.A. He is a Director of Aurum S.A., Santander Asset Management Chile S.A. and Bansa Santander S.A. Mr. Monge has a degree in business from the Universidad Católica de Chile and an MBA from the University of California, Los Angeles.
Senior Management
Our senior managers are as follows:
Senior Manager | Position | Date Appointed | ||
| Claudio Melandri | Chief Executive Officer | January 1, 2010 | ||
| Gabriel Montoya | Corporate Financial Controller | April 1, 2009 | ||
| José Manuel Manzano | Corporate Director of Risk | July 1, 2007 | ||
| Javier Montero | Corporate Director of Internal Audit | May 1, 2010 | ||
| Alejandra Mehech | Corporate Director Human Resources | May 1, 2010 | ||
| Fred Meller | Global Banking and Markets | January 1, 2011 | ||
| Francisco Murillo | Manager Retail Banking | May 1, 2010 | ||
| Miguel Mata | Chief Financial Officer | November 1, 2011 | ||
| Felipe Contreras | Chief Accounting Officer | October 1, 2008 | ||
| Juan Fernández | Administration and Operations | June 1, 2011 |
76
| Angel Rebolledo | Administration and Operations | June 1, 2011 | ||
| Emiliano Muratore | Manager Financial Management | April 8, 2008 | ||
| Juan Pedro Santa María | General Counsel | July 30, 2009 |
Claudio Melandri has been Chief Executive Officer of Banco Santander Chile since January 2010. In June 1990, he joined Santander Chile as an account officer for companies. He was Branch Manager between August 1991 and March 1993 when he was named Manager of the Bank’s Head Office. From September 1994 until 1997, he was Manager of all branches in southern Chile. Between 1998 and 2005, he became Manager of the entire branch network of Santander Chile. Between August 2005 and September 2007, he was Executive Vice-President of Banco Santander Venezuela. In September 2007, he was named Corporate Director of Human Resources of Banco Santander Chile until February 2008, when he was named Manager of Commercial Banking until December 2009. He is also a member of the Board of Santander Seguros de Vida S.A., Santander Asset Management S.A., Administradora General de Fondos and Santander Seguros Generales S.A. Mr. Melandri has a degree in Business from the Universidad Tecnológica Metropolitana de Chile and an MBA from the Universidad Adolfo Ibáñez.
Gabriel Montoya B. was appointed Financial Controller of Santander Chile in April 2009 and has been working for Santander Spain and its affiliates since 1997. Between 2005-2009, Mr. Montoya was Director of the MIS America Project and was responsible for implementing management information systems in Chile, Mexico, Puerto Rico, Argentina and Brazil. Previous to that Mr. Montoya was Financial Controller of Santander Puerto Rico, Head of Financial Control for the Americas Division of Santander and various other management positions in Santander Colombia. Mr. Montoya has a Business Administration Degree from Universidad del Rosario and an Executive Administration Diploma from the Universidad de los Andes, both in Colombia.
José Manuel Manzano became Corporate Director of Risk in July 2007. Prior to that he was Corporate Director of Human Resources for Santander-Chile since October 31, 2002. Previously, he served as Manager of Human Resources for Old Santander-Chile since 1999. He was also General Manager of Santander Fund Management and Managing Director of Bancassurance. He is also a Director of Santander Chile Holding. Mr. Manzano holds an MBA and a degree in Business from Universidad Católica de Chile.
Javier Montero is the Corporate Director of Internal Auditing, a position he has held since May 1, 2010. Prior to that he was Manager of Internal Auditing in the Financial Risk Department at Banco Santander Chile since 2006. Mr. Montero has worked for Grupo Santander since 2000 in the Internal Auditing Division of Grupo Santander. Mr. Montero has a Business Degree and an Auditing degree from Universidad San Pablo in Madrid.
Francisco Murillo was appointed Manager of Retail Banking of Santander-Chile on May 1, 2010. Prior to that, he held the position of Corporate Director of Human Resources for Santander-Chile since February 21, 2008. Mr. Murillo has worked in Grupo Santander Chile since 1993. Previously he served as Corporate Director of Santander Asset Management and President of Bansander AFP. He was also the former CEO and Chief Investment Officer of Bansander AFP. Mr. Murillo is President of Santander Asset Management S.A. Administradora de General de Fondos, President of Santander Seguros de Vida S.A., President of Santander Seguros Generales S.A., Director of Santander Chile Holding, Director of Aurum S.A., Director of Santander Asset Management Chile S.A., Director of Santander Factoring, CEO of Teatinos Siglo XXI Inversiones Ltda and CEO of Aurum S.A. Mr. Murillo has a Business Degree from the Universidad Adolfo Ibañez.
Alejandra Mehech was appointed Corporate Director of Human Resources for Santander-Chile on May 1, 2010. Prior to that, Mrs. Mehech served as manager of Human Resources for the Global Businesses area and for senior executives, position she held since December 2007. She has also served as manager of Human Resources of the Asset Management Division of Grupo Santander in Chile. Mrs. Mehech has worked in Grupo Santander since 1994 and holds a Business Degree and a degree in Sociology, both from Universidad Católica de Chile.
Fred Meller became Manager of Global Banking & Market in January 2011. Prior to that he was Manager of Market Making for Europe and UK for Santander-Spain. Previously, he served as Treasurer for Santander-Chile since 2008. He was also General Manager of Santander Agente de Valores and Director of Deposito Central de Valores Chile. Mr. Meller holds a degree in Business Administration from Universidad Central de Chile.
77
Miguel Mata became CFO for Santander-Chile on November 2011. Prior to that he served at several staff positions related to Business Strategy. Mr. Mata joined Santander-Chile in 2002 when Santander-Chile merged with Banco Santiago. Previously he was Financial Controller for Banco Santiago. He has been working in banks since 1990, when he joined Banco O’Higgins, one of the predecessors of Banco Santiago. Mr. Mata holds a degree in Engineering from Universidad Católica de Chile.
Felipe Contreras F. was named Chief Accounting Officer of Santander Chile in October 2008. He has worked for 14 years in our Accounting Department, most recently as Manager of the Consolidation and Reporting Departments, overseeing our Chilean, U.S. and Spanish GAAP reporting requirements. He recently was in charge of our recent transition to International Financial Reporting Standards. Mr. Contreras is a Public Accountant from the University of Santiago and is currently a candidate to a Masters in Advanced Finance from the Universidad Adolfo Ibáñez.
Juan Fernández is our manager of Quality and Client Service since June 2011. Previously he was our Administration and Operations manager. He is the former Manager of Administration and Cost Control of Old Santander-Chile, a position he held from April 1999 until August 2002, when the merger with Santiago was consummated. Mr. Fernández is also Director of Santander Chile Holding S.A., Aquanima Chile S.A., Santander Factoring S.A., Isban Chile S.A., Bansa Santander S.A., Santander Consumer Chile S.A., Multinegocios S.A. and Santander S.A. Corredores de Bolsa. Previously Mr. Fernández served as Manager for Accounting and Administration of Old Santander-Chile since January 1993. Prior to that, Mr. Fernández held positions at Banchile Agencia de Valores y Subsidiarias, and at JPMorgan in Santiago and Madrid.
Emiliano Muratore was appointed Manager of Financial Management in April 2008. Mr. Muratore entered Santander Group in 1999 in Santander Argentina. From 2002 to 2006 he worked in Financial Management in Santander Spain. He is on the Board of Santander S.A. Agente de Valores. Mr. Muratore has a Business Degree from the Universidad Católica Argentina and a Masters in Finance from the Universidad de San Andrés in Buenos Aires.
Juan Pedro Santa María is our General Counsel, a position he has held since July 30, 2009 after being General Counsel of Grupo Santander Chile. He is also a Director of Santander Chile Holding S.A., Santander Factoring S.A., Bansa Santander S.A., Director of Aurum S.A. and Director of Santander Asset Management Chile S.A. Mr. Santa María, a lawyer, previously worked at Banco O’Higgins and Banco Santiago. He has been Chairman of the Law Committee at the Asociación de Bancos e Instituciones Financieras de Chile for the last twenty years. He has a degree in Law from the Pontificia Universidad Católica de Chile.
Angel Rebolledo was named Manager of Administration and Operation on June 1, 2011. He has worked in banking for 25 years of which 11 have been at Santander Chile. He was previously in charge of distribution network efficiency, Manager of Operations and Chief Information Officer. He is also a Board member of Redbanc S.A. and an alternate board member of AFT S.A. Mr. Rebolledo has a Business Degree from the Universidad de Santiago.
B. Board Practices
Audit Committee
Board member | Position in Committee |
| Carlos Olivos | Chairman |
| Víctor Arbulú Crousillat | First Vice Chairman and Financial Expert |
| Lisandro Serrano | Second Vice Chairman |
78
The Audit Committee (Comité de Directores y Auditoría) is comprised of three members of the Board of Directors. The General Counsel is the Committee Secretary. The Chief Executive Officer, General Auditor and other persons from the Bank can be invited to the meetings if necessary and are present on specific matters. This Committee’s primary responsibility is to support the Board of Directors in the continuous improvement of our system of internal controls, which includes reviewing the work of both the external auditors and the Internal Audit Department. The committee is also responsible for analyzing observations made by regulatory entities of the Chilean financial system about us and for recommending measures to be taken by our management in response. This committee also performs functions of a remuneration committee as established in Chilean Law, and reviews annually the salary and bonus programs for the executive officers of the Bank. The external auditors are recommended by this committee to our Board of Directors and appointed by our shareholders at the annual shareholders’ meeting.
This committee is also responsible for:
| · | Presenting to the Board of Directors a list of candidates for the selection of an external auditor. |
| · | Presenting to the board or directors a list of candidates for the selection of rating agencies. |
| · | Overseeing and analyzing the results of the external audit and the internal reviews. |
| · | Coordinating the activities of internal auditing with the external auditors’ review. |
| · | Analyzing the interim and year-end financial statements and reporting the results to the Board of Directors. |
| · | Analyzing the external auditors’ reports and their content, procedures and scope. |
| · | Analyzing the rating agencies’ reports and their content, procedures and scope. |
| · | Obtaining information regarding the effectiveness and reliability of the internal control systems and procedures. |
| · | Analyzing the information systems performance, and its sufficiency, reliability and use in connection with decision-making processes. |
| · | Obtaining information regarding compliance with the company’s policies regarding the due observance of laws, regulations and internal rules to which the company is subject. |
| · | Investigating suspicious and fraudulent activities (including conflicts). |
| · | Analyzing the reports of the inspection visits, instructions and presentations of the Superintendency of Banks. |
| · | Obtaining information, analyzing and verifying the company’s compliance with the annual audit program prepared by the internal audit department. |
| · | Informing the Board of Directors of accounting changes and their effects. |
| · | Examining on an annual basis the compensation plans of high level executives and managers. |
Asset and Liability Committee
Board member | Position in Committee |
| Mauricio Larraín | Chairman |
| Oscar von Chrismar | Vice-Chairman |
| Vittorio Corbo | Member |
| Marco Colodro | Member |
79
| Roberto Zahler | Member |
| Raimundo Monge | Member |
The Comité de Activos y Pasivos or the Asset and Liability Committee (the “ALCO”), following guidelines set by the Board of Directors and Santander Spain’s Global Risk Department, is responsible for establishing Santander-Chile’s policies, procedures and limits with respect to market risks and monitoring the overall performance in light of the risks assumed. The ALCO constantly monitors whether these policies are adhered to. Santander-Chile’s Market Risk and Control Department and the Financial Management Division perform the day-to-day risk management functions required for the trading and non-trading activities of Santander-Chile.
The Asset and Liabilities Management Committee includes the Chairman of the Board and five additional members of the Board, the Chief Executive Officer, the Manager of the Financial Management Division, the Manager of Market Risk, the Manager of the Treasury Division, the Financial Controller and other senior members of management. Senior members of Santander-Chile’s Finance Division have a formal meeting each month with the Asset and Liabilities Management Committee and outside consultants.
Market Committee
Board member | Position in Committee |
| Oscar von Chrismar | Chairman |
| Roberto Zahler | Vice-Chairman |
| Marco Colodro | Second Vice-Chairman |
| Vittorio Corbo | Member |
| Mauricio Larraín | Member |
| Raimundo Monge | Member |
The Comité de Mercados or the Market Committee is responsible for establishing Santander-Chile’s policies, procedures and limits with respect to its trading portfolio, market risks and monitoring the overall performance in light of the risks assumed. The ALCO constantly monitors whether these policies are fulfilled. Santander-Chile’s Market Risk and Control Department carry out the day-to-day risk management functions required for the trading and non-trading activities of Santander-Chile.
The Market Committee includes the Chairman of the Board, five additional members of the Board, the Manager of Global Banking and Markets, the Manager of the Treasury Division, the Manager of Proprietary Trading, the Manager of the Financial Management Division, the Manager of Market Risk, the Financial Controller and other senior members of management.
Central Risk Committee
Board member | Position in Committee |
| Oscar von Chrismar | Vice-Chairman |
| Marco Colodro | Member |
The Central Risk Committee is responsible for revising and following all risks that may affect us, including reputation risk. This Committee includes three Board members.
Executive Credit Committee
Board member | Position in Committee |
| Mauricio Larraín | Chairman |
| Oscar von Chrismar | Vice-Chairman |
| Marco Colodro | Second Vice-Chairman |
| Roberto Méndez | Member |
80
The Executive Credit Committee is comprised of the Chairman of the Board, three additional Board members, the General Counsel, the CEO, the Manager of Global Banking, the Corporate Director of Risk, the Manager of Corporate Banking, the Manager of Middle Market and two senior members of the Credit Risk department that present the loans being reviewed for approval. This committee confirms the loan positions reviewed by the Senior Loan Committee, with approval rights up to the maximum exposure permitted by the General Banking Law.
Marketing and Communications Committee
Board member | Position in Committee |
| Mauricio Larraín | Chairman |
| Roberto Méndez | Vice-Chairman |
| Lucía Santa Cruz | Second Vice-Chairman |
| Oscar von Chrismar | Member |
The Marketing and Communications Committee is comprised of the Chairman of the Board and three additional Board members, the CEO, the Manager of Retail Banking, the Manager of Santander Banefe, the Manager of Human Resources, the Manager of Corporate Communications, the Manager of Marketing and other senior managers. This committee reviews and confirms all matters related to products, corporate image and communications.
University Committee
Board member | Position in Committee |
| Mauricio Larraín | Chairman |
| Roberto Méndez | Vice-Chairman |
| Lucía Santa Cruz | Second Vice-Chairman |
The University Committee reviews our support for higher education and integrates this with the growth of the Institutional business segment and retail banking for college graduates.
Strategy Committee
Board member | Position in Committee |
| Mauricio Larraín | Chairman |
| Oscar von Chrismar | Vice Chairman |
| Raimundo Monge | Member |
| Juan Manuel Hoyos | Member |
| Roberto Méndez | Member |
| Jesús Zabalza | Member |
The Strategy Committee is in charge of our strategic planning process and follow-up.
ITEM 8. ADDITIONAL INFORMATION
The Chilean Congress is considering legislation that would unify debt information throughout the entire Chilean financial system. Currently, the SBIF runs a debt database consolidating only bank loans. The bill proposes the creation of a new unique debt database including information from all lenders, including banks, retail stores, insurance companies, credit unions and all other formal competitors in the credit business in Chile. The new database would consolidate a debtor’s data on an aggregate basis thus showing the real amount of debt each debtor has in the formal financial system. The bill could have a potential effect in terms of allowing for better screening and risk evaluation of each debtor as more and better data could be used to determine a debtor’s real payment capacity. Thus, lenders would be able to discriminate more efficiently and effectively between good and bad debtors.
81
ITEM 9. QUANTITATIVE AND QUALITATIVE DISCLOSURES ABOUT MARKET RISK
Introduction
This section describes the market risks that we are exposed to, the tools and methodology used to control these risks, the portfolios over which these market risk methods were applied and quantitative disclosure that demonstrate the level of exposure to market risk that we are assuming. This section also discloses the derivative instruments that we use to hedge exposures and offer to our clients.
The principal types of risk inherent in Santander-Chile’s business are market, liquidity, operational and credit risks. The effectiveness with which we are able to manage the balance between risk and reward is a significant factor in our ability to generate long term, stable earnings growth. Toward that end, our senior management places great emphasis on risk management.
Market Risk
Market risk is the risk of losses due to unexpected changes in interest rates, foreign exchange rates, inflation rates and other rates or prices. We are exposed to market risk mainly as a result of the following activities:
| · | trading in financial instruments, which exposes us to interest rate and foreign exchange rate risk; |
| · | engaging in banking activities, which subjects us to interest rate risk, since a change in interest rates affected gross interest income, gross interest expense and customer behavior; |
| · | engaging in banking activities, which exposes us to inflation rate risk, since a change in expected inflation affects gross interest income, gross interest expense and customer behavior; |
| · | trading in the local equity market, which subjects us to potential losses caused by fluctuations of the stock market; and |
| · | investing in assets whose returns or accounts are denominated in currencies other than the Chilean peso, which subjects us to foreign exchange risk between the Chilean peso and such other currencies. |
Market Risk Exposure Categories
Our policy with respect to asset and liability management is to capitalize on our competitive advantages in treasury operations, maximizing our net interest income and return on assets and equity with a view to interest rate, liquidity and foreign exchange risks, while remaining within the limits provided by Chilean banking regulations. Subject to these constraints, we constantly have mismatched positions with respect to interest rates, inflation-linked assets and liabilities and foreign currencies.
Our asset and liability management policies are developed by the ALCO following guidelines and limits established by our Board of Directors, Banco Santander Spain’s Global Risk Department and our Market Risk and Control Department. The ALCO is composed of the Chairman of the Board, four additional members of the Board, the Chief Executive Officer, the Manager of the Financial Management Division, the Manager of Market Risk, the Manager of the Treasury Division, the Financial Controller and other senior members of management. Senior members of Santander Chile’s Finance Division meet monthly on a formal basis with the ALCO and outside consultants. Following guidelines set by Santander Spain, the ALCO is responsible for developing financial strategies and policies regarding our asset and liability structure together with our Financial Management Division. The aim of the Financial Management Division is to inject stability and recurrence into the net interest income of commercial activities and to ensure that we comply with internal and regulatory limits regarding liquidity, regulatory capital, reserve requirements and market risk. Our Market Risk and Control Department carries out the day-to-day measurements of the risks taken by the ALCO.
The Market Committee is responsible for establishing our policies, strategies, procedures and limits with respect to our trading portfolio in line with the policies of Santander Spain. The composition of the Market Committee includes the Chairman of the Board, three additional members of the Board, the Chief Executive Officer, the
82
Manager of Global Banking and Markets, the Manager of the Treasury Division, the Manager of Proprietary Trading, the Manager of the Financial Management Division, the Manager of Market Risk, the Financial Controller and other senior members of management.
Impact of Inflation
Our assets and liabilities are denominated in Chilean pesos, UF and foreign currencies. The Bank no longer performs inflation accounting and has eliminated price level restatement in line with IFRS, but inflation impacts our results of operations as some loan and deposit products are contracted in UF. The UF is revalued in monthly cycles. Each day in the period beginning on the tenth day of the current month through the ninth day of the succeeding month, the nominal peso value of the UF is indexed up (or down in the event of deflation) in order to reflect a proportionate amount of the change in the Chilean Consumer Price Index during the prior calendar month. One UF equaled Ch$21,455.55 as of December 31, 2010, Ch$22,012.69 as of September 30, 2011 and Ch$21,339.99 as of September 30, 2010.
High levels of inflation in Chile could adversely affect the Chilean economy and have an adverse effect on our business, financial condition and results of operations. Negative inflation rates also could negatively impact our results. In 2010, CPI inflation was 3.0% compared to a decline of 1.4% in 2009 and a rise of 7.1% in 2008. CPI inflation in year-to-date in the nine-month period ended September 30, 2011 increased 2398% compared to a 2.68% increase year-to-date in the nine-month period ended September 30, 2010. There can be no assurance that Chilean inflation will not change significantly from the current level. Although we currently benefit from moderate levels of inflation, due to the current structure of our assets and liabilities (i.e., a significant portion of our loans are indexed to the inflation rate, but there are no corresponding features in deposits or other funding sources that would increase the size of our funding base), there can be no assurance that our business, financial condition and result of operations in the future will not be adversely affected by changing levels of inflation. In summary:
| · | UF-denominated assets and liabilities. In 2010, UF inflation was +2.45% compared to -2.4% in 2009 and +9.3% in 2008. UF inflation in the nine-month period ended September 30, 2011 increased 2.60% compared to a 1.90% increase in the nine-month period ended September 30, 2010. The effect of any changes in the nominal peso value of our UF-denominated interest earning assets and interest bearing liabilities is reflected in our results of operations as an increase (or decrease, in the event of deflation) in interest income and expense, respectively. Our net interest income will be positively affected by an inflationary environment to the extent that our average UF-denominated interest earning assets exceed our average UF-denominated interest bearing liabilities. Our net interest income will be negatively affected in a deflationary environment if our average UF-denominated interest earning assets exceed our average UF-denominated interest bearing liabilities. Our net interest income will be negatively affected by inflation in any period in which our average UF-denominated interest bearing liabilities exceed our average UF-denominated interest earning assets. Our average UF-denominated interest earning assets exceeded our average UF-denominated interest bearing liabilities by Ch$ 3,478,952 million in the nine-month period ended September 30, 2011 compared to Ch$ 3,092,340 million in the same period in 2010. See “Selected Statistical Information ―Average Balance Sheets, Income Earned from Interest-Earning Assets And Interest Paid on Interest-Bearing Liabilities.” In general, the Bank has more UF-denominated financial assets than UF-denominated financial liabilities. In the nine-month period ended September 30, 2011, the interest gained on interest earning assets denominated in UF increased 21.4% compared to the same period in 2010 as a result of the higher inflation rates. In the nine-month period ended September 30, 2011, the interest paid on these liabilities increased 22.1% compared to the same period in 2010. |
| · | Inflation and interest rate hedge. A key component of our asset and liability policy is the management of interest rate risk. The Bank’s assets generally have a longer maturity than our liabilities. As the Bank’s mortgage portfolio grows, the maturity gap tends to rise as these loans, which are contracted in UF, have a longer maturity than the average maturity of our funding base. As most of our long term financial instruments and mortgage loans are contracted in UF and most of our deposits are in nominal pesos, the rise in mortgage lending increases the Bank’s exposure to inflation and to interest rate risk. The size of this gap is limited by internal and regulatory guidelines in order to avoid excessive potential losses due to strong shifts in interest rates (see “Item 9: Quantitative and Qualitative Disclosures About Market Risk”). In order to keep this duration gap below regulatory limits the Bank issues long term bonds denominated in UF or |
83
interest rate swaps. The financial cost of the bonds and the efficient part of these hedges is recorded as net interest income. In the nine-month period ended September 30, 2011, the loss from the swaps taken in order to hedge mainly for inflation and interest rate risk totaled Ch$24,208 million compared to Ch$15,202 million in the same period in 2010.
As of September 30, | % Change | |||||||||||
Inflation sensitive income | 2011 | 2010 | 2011/2010 | |||||||||
| (In million of Chilean pesos) | ||||||||||||
Interest earned on UF assets (1) | 492,160 | 405,419 | 21.4 | % | ||||||||
Interest paid on UF liabilities (1) | (272,347 | ) | (223,068 | ) | 22.1 | % | ||||||
Hedging results | (38,978 | ) | 2,965 | -- | % | |||||||
Net gain | 180,835 | 185,316 | 2.4 | % | ||||||||
| (1) | Includes results from interest-rate hedging. |
| · | Peso-denominated assets and liabilities. Interest rates prevailing in Chile during any period primarily reflect the inflation rate during the period and the expectations of future inflation. The sensitivity of our peso-denominated interest earning assets and interest bearing liabilities to changes to such prevailing rates varies. (See “Item 3: C. Operating Results–Interest Rates”). We maintain a substantial amount of non-interest bearing peso-denominated demand deposits. Because such deposits are not sensitive to inflation, any decline in the rate of inflation would adversely affect our net interest margin on inflation indexed assets funded with such deposits, and any increase in the rate of inflation would increase the net interest margin on such assets. (See “Item 9: Quantitative and Qualitative Disclosures About Market Risk”). The ratio of the average of such demand deposits to average interest-earning assets was 17.5% as of September 30, 2011 and 18.1% as of September 30, 2010. |
Interest Rate Sensitivity
Interest rates earned and paid on our assets and liabilities reflect, to a certain degree, inflation, expectations regarding inflation, changes in short term interest rates set by the Central Bank and movements in long term real rates. The Central Bank manages short term interest rates based on its objectives of balancing low inflation and economic growth. Because our liabilities generally reprice sooner than our assets, changes in the rate of inflation or short term rates in the economy are reflected in the rates of interest paid by us on our liabilities before such changes are reflected in the rates of interest earned by us on our assets. Therefore, when short term interest rates fall, our net interest margin is positively impacted, but when short term rates increase, our interest margin is negatively affected. Our net interest margin also tends to be adversely affected in the short term by a decrease in inflation rates since generally our UF-denominated assets exceed our UF-denominated liabilities. An increase in long term rates has a positive effect on our net interest margin, because our interest earning assets generally have longer terms than our interest bearing liabilities. In addition, because our peso-denominated liabilities have relatively short repricing periods, they are generally more responsive to changes in inflation or short term rates than our UF-denominated liabilities. As a result, during periods when current inflation or expected inflation exceeds the previous period’s inflation, customers often switch funds from UF-denominated deposits to peso-denominated deposits, which generally bear higher interest rates, thereby adversely affecting our net interest margin.
As of September 30, 2011, the breakdown of maturities of assets and liabilities is as follows:
On-Demand | Up to 1 month | Between 1 and 3 months | Between 3 and 12 months | Between 1 and 5 years | More than 5 years | Total | ||||||||||||||||||||||
| Interest-earning assets: | ||||||||||||||||||||||||||||
| Cash and deposits in banks | 1,812,784 | - | - | - | - | - | 1,812,784 | |||||||||||||||||||||
| Unsettled transactions | 816,601 | - | - | - | - | - | 816,601 | |||||||||||||||||||||
| Trading investments | - | 27,316 | 2,070 | 146,009 | 251,284 | 77,134 | 503,813 | |||||||||||||||||||||
| Investment, under resale agreements | - | 12,157 | - | - | - | - | 12,157 | |||||||||||||||||||||
| Financial derivative contracts | - | 251,185 | 194,435 | 426,524 | 701,882 | 437,559 | 2,011,585 | |||||||||||||||||||||
| Interbank loans | 85,525 | - | 2,513 | - | - | - | 88,038 | |||||||||||||||||||||
| Loans | 484,171 | 1,732,868 | 1,526,070 | 2,574,387 | 5,708,482 | 5,654,378 | 17,680,356 | |||||||||||||||||||||
84
On-Demand | Up to 1 month | Between 1 and 3 months | Between 3 and 12 months | Between 1 and 5 years | More than 5 years | Total | ||||||||||||||||||||||
| Available for sale investments | - | 809,349 | 441,227 | 263,970 | 411,376 | 178,722 | 2,104,644 | |||||||||||||||||||||
| Total Interest-earning assets | 3,199,081 | 2,832,875 | 2,166,315 | 3,410,890 | 7,073,024 | 6,347,793 | 25,029,978 | |||||||||||||||||||||
| Interest-bearing liabilities: | ||||||||||||||||||||||||||||
| Deposits and other demand obligations | 4,496,757 | - | - | - | - | - | 4,496,757 | |||||||||||||||||||||
| Unsettled transactions | 466,063 | - | - | - | - | - | 466,063 | |||||||||||||||||||||
| Investments under repurchase agreements | - | 222,090 | 3,957 | 996 | - | - | 227,043 | |||||||||||||||||||||
| Time deposits and other time liabilities | 104,667 | 4,403,631 | 2,372,548 | 2,106,023 | 382,859 | 25,518 | 9,395,246 | |||||||||||||||||||||
| Financial derivative contracts | - | 232,812 | 137,528 | 363,897 | 547,419 | 343,618 | 1,625,274 | |||||||||||||||||||||
| Interbank borrowings | 195,850 | 159,220 | 360,111 | 1,177,107 | 132,768 | - | 2,025,056 | |||||||||||||||||||||
| Issued debt instruments | 21 | 549,536 | 60,660 | 181,910 | 2,302,748 | 1,418,031 | 4,512,906 | |||||||||||||||||||||
| Other financial liabilities | 36,995 | 409 | 3,508 | 3,472 | 40,225 | 82,384 | 166,993 | |||||||||||||||||||||
| Total interest-bearing liabilities | 5,300,353 | 5,567,698 | 2,938,312 | 3,833,405 | 3,406,019 | 1,869,551 | 22,915,338 | |||||||||||||||||||||
Asset/liability gap | (2,101,272 | ) | (2,734,823 | ) | (771,997 | ) | (422,515 | ) | 3,667,002 | 4,478,242 | 2,114,640 | |||||||||||||||||
| Cumulative gap | (2,101,272 | ) | (4,836,095 | ) | (5,608,092 | ) | (6,030,607 | ) | (2,363,605 | ) | 2,114,640 | |||||||||||||||||
The table below sets forth our average daily balance of liabilities for nine-months ended September 30, 2011 and 2010, in each case together with the related average nominal interest rate paid thereon.
| (millions of Ch$, except percentages) | September 30, 2011 | September 30, 2010 | ||||||||||||||||||||||
Average Balance | % of Total Average Liabilities | Average Nominal Rate | Average Balance | % of Total Average Liabilities | Average Nominal Rate | |||||||||||||||||||
| (millions of Ch$ except percentages) | ||||||||||||||||||||||||
Savings accounts | 103,142 | 0.4 | % | 2.4 | % | 102,260 | 0.5 | % | 0.7 | % | ||||||||||||||
Time deposits | 8,939,789 | 37.6 | % | 3.5 | % | 7,373,762 | 35.9 | % | 2.1 | % | ||||||||||||||
Central Bank borrowings | 1,985 | 0.0 | % | 0.6 | % | 406,397 | 2.0 | % | 0.4 | % | ||||||||||||||
Repurchase agreements | 207,540 | 0.9 | % | 2.3 | % | 199,076 | 1.0 | % | 0.7 | % | ||||||||||||||
Mortgage finance bonds | 177,887 | 0.8 | % | 6.6 | % | 232,638 | 1.1 | % | 5.8 | % | ||||||||||||||
| Other interest bearing liabilities | 6,051,857 | 25.5 | % | 3.8 | % | 4,964,893 | 24.2 | % | 3.4 | % | ||||||||||||||
| Subtotal interest bearing liabilities | 15,482,200 | 65.2 | % | 3.6 | % | 13,279,026 | 64.7 | % | 2.5 | % | ||||||||||||||
| Non-interest bearing liabilities | ||||||||||||||||||||||||
Non-interest bearing deposits | 3,548,298 | 14.9 | % | 3,112,688 | 15.1 | % | ||||||||||||||||||
Derivatives | 1,476,427 | 6.2 | % | 1,279,839 | 6.2 | % | ||||||||||||||||||
| Other non-interest bearing liabilities | 1,292,787 | 5.4 | % | 1,160,984 | 5.6 | % | ||||||||||||||||||
Shareholders’ equity | 1,974,640 | 8.3 | % | 1,727,841 | 8.4 | % | ||||||||||||||||||
| Subtotal non-interest bearing liabilities | 8,292,152 | 34.8 | % | 7,281,352 | 35.3 | % | ||||||||||||||||||
Total liabilities | 23,774,352 | 100.00 | % | 20,560,378 | 100.00 | % | ||||||||||||||||||
Foreign Exchange Fluctuations
The Chilean government’s economic policies and any future changes in the value of the Chilean peso against the U.S. dollar could adversely affect our financial condition and results of operations. The Chilean peso has been subject to significant devaluation in the past and may be subject to significant fluctuations in the future. In 2010, the Chilean peso in relation to the U.S. dollar appreciated 7.5% compared to a 19.5% appreciation in 2009 and a 26.9% depreciation in 2008. Year-to-date as of September 30, 2011, the Chilean peso has depreciated 10.0%. (See “Item 1: A. Selected Financial Data–Exchange Rates”). A significant portion of our assets and liabilities are denominated in foreign currencies, principally the U.S. dollar, and we historically have maintained and may continue to maintain material gaps between the balances of such assets and liabilities. Because such assets and liabilities, as well as interest earned or paid on such assets and liabilities, and gains and losses realized upon the sale of such assets, are translated to Chilean pesos in preparing our financial statements, our reported income is affected by changes in the value of the Chilean peso relative to foreign currencies (principally the U.S. dollar). The translation gain or loss over assets and liabilities (excluding derivatives held for trading) is included as foreign exchange transactions in the income statement. The translation and mark-to-market of foreign currency derivatives held for trading is recognized as a gain or loss in the net results from mark-to-market and trading.
85
The composition of our assets, liabilities and equity as of September 30, 2011, by currency are as follows:
| As of September 30, 2011, Ch$ million | ||||||||||||||||||||
| Ch$(1) | UF | Ch$ linked to | US$ | Total | ||||||||||||||||
| US$ | ||||||||||||||||||||
| Assets | ||||||||||||||||||||
| Cash and deposits | 873,031 | - | - | 939,753 | 1,812,784 | |||||||||||||||
| Unsettled transactions | 460,788 | - | - | 355,813 | 816,601 | |||||||||||||||
| Trading investments | 81,456 | 419,703 | - | 2,654 | 503,813 | |||||||||||||||
| Investments under agreements to resell | 12,157 | - | - | - | 12,157 | |||||||||||||||
| Financial derivative contracts | 2,011,585 | - | - | - | 2,011,585 | |||||||||||||||
| Interbank loans | - | - | - | 88,019 | 88,019 | |||||||||||||||
| Loans and receivables from customers | 6,739,410 | 8,553,273 | 52,895 | 1,850,217 | 17,195,795 | |||||||||||||||
| Available for sale investments | 1,982,877 | 109,899 | - | 11,868 | 2,104,644 | |||||||||||||||
| Investments held to maturity | - | - | - | - | - | |||||||||||||||
| Investments in other companies | 8,232 | - | - | - | 8,232 | |||||||||||||||
| Intangible assets | 77,229 | - | - | - | 77,229 | |||||||||||||||
| Property, plant and equipment | 153,116 | - | - | - | 153,116 | |||||||||||||||
| Current taxes | 27,746 | - | - | - | 27,746 | |||||||||||||||
| Deferred taxes | 130,548 | - | - | - | 130,548 | |||||||||||||||
| Other assets (2) | 489,816 | 71,119 | 3,645 | 148,966 | 713,546 | |||||||||||||||
| Total assets | 13,047,991 | 9,153,994 | 56,540 | 3,397,290 | 25,655,815 | |||||||||||||||
| Liabilities | ||||||||||||||||||||
| Deposits and other sight obligations | 3,695,803 | 195,205 | - | 605,749 | 4,496,757 | |||||||||||||||
| Unsettled transactions | 173,022 | - | - | 293,041 | 466,063 | |||||||||||||||
| Investment under agreements to repurchase | 180,469 | 1,024 | - | 45,550 | 227,043 | |||||||||||||||
| Deposits and other time deposits | 5,805,419 | 2,249,181 | - | 1,340,646 | 9,395,246 | |||||||||||||||
| Financial derivative contracts | 1,625,274 | - | - | - | 1,625,274 | |||||||||||||||
| Interbank borrowings | - | 910 | - | 2,024,146 | 2,025,056 | |||||||||||||||
| Issued debt instruments | 254,306 | 2,662,905 | - | 1,595,695 | 4,512,906 | |||||||||||||||
| Other financial liabilities | 143,328 | 14,002 | 6,679 | 2,984 | 166,993 | |||||||||||||||
| Current taxes | 2,300 | - | - | - | 2,300 | |||||||||||||||
| Deferred taxes | 11,580 | - | - | - | 11,580 | |||||||||||||||
| Provisions | 142,834 | - | - | - | 142,834 | |||||||||||||||
| Other liabilities (2) | 261,153 | 25,773 | 4,033 | 272,067 | 563,026 | |||||||||||||||
| Total liabilities | 12,295,488 | 5,149,000 | 10,712 | 6,179,878 | 23,635,078 | |||||||||||||||
| Equity | ||||||||||||||||||||
| Attributable to Bank Shareholders | 1,988,444 | - | - | - | 1,988,444 | |||||||||||||||
| Capital | 891,303 | - | - | - | 891,303 | |||||||||||||||
| Reserves | 51,539 | - | - | - | 51,539 | |||||||||||||||
| Valuation adjustment | 593 | - | - | - | 593 | |||||||||||||||
| Retained earnings : | ||||||||||||||||||||
| Retained earnings of prior periods | 833,830 | - | - | - | 833,830 | |||||||||||||||
| Net income for the period | 301,684 | - | - | - | 301,684 | |||||||||||||||
| Minus: Provision for mandatory dividends | (90,505 | ) | - | - | - | (90,505 | ) | |||||||||||||
| Non−controlling interest | 32,293 | - | - | - | 32,293 | |||||||||||||||
| Total equity | 2,020,737 | - | - | - | 2,020,737 | |||||||||||||||
| Total liabilities and equity | 14,316,225 | 5,149,000 | 10,712 | 6,179,878 | 25,655,815 | |||||||||||||||
| (1) | Includes the value of swap instruments and balances of executed transactions which contractually defer the payment of sales transactions or the delivery of foreign currency acquired. |
| (2) | Other assets and liabilities include the threshold position from derivative contracts. |
86
Liquidity risk management
The Financial Management Division receives information from all the business units on the liquidity profile of their financial assets and liabilities, as well as breakdowns of other projected cash flows stemming from future businesses. On the basis of that information, the Financial Management Division maintains a portfolio of liquid short-term assets, comprised mainly of liquid investments, loans and advances to other banks, to make sure the Bank has sufficient liquidity. The business units’ liquidity needs are met through short–term transfers from Financial Management to cover any short–term fluctuations and long-term financing to address all the structural liquidity requirements.
The Bank monitors its liquidity position every day, determining the future flows of its outlays and revenues. In addition, stress tests are performed at the close of each month, for which a variety of scenarios encompassing both normal market conditions and conditions of market fluctuation are used. The liquidity policy and procedures are subject to review and approval by the Bank’s Board. Periodic reports are generated by the Market Risk Department, providing a breakdown of the liquidity position of the Bank and its subsidiaries, including any exceptions and the corrective measures adopted, which are regularly submitted to the ALCO for review.
The Bank relies on customer (retail) and institutional deposits, obligations to banks, debt instruments, and time deposits as its main sources of funding. Although most obligations to banks, debt instruments and time deposits mature in over a year, customer (retail) and institutional deposits tend to have shorter maturities and a large proportion of them are payable within 90 days. The short–term nature of these deposits increases the Bank’s liquidity risk, and hence, the Bank actively manages this risk by continual supervision of the market trends and price management.
The Bank must comply with regulatory limits imposed by the SBIF and the Central Bank that are the following:
| · | The sum of the liabilities with a maturity of less than 30 days may not exceed the sum of the assets with a maturity of less than 30 days by more than an amount greater than our capital. This limit must be calculated in local currency and foreign currencies together as one gap. At September 30, 2011 the percentage of (i) our liabilities with a maturity of less than 30 days in excess of our assets with a maturity of less than 30 days to (ii) our capital and reserves, was 52%. |
| · | The sum of the liabilities in foreign currency with a maturity of less than 30 days may not exceed the sum of the assets in foreign currency with a maturity of less than 30 days by more than an amount greater than our capital. At September 30, 2011 the percentage of (i) our liabilities with a maturity of less than 30 days in foreign currency in excess of our assets in foreign currency with a maturity of less than 30 days to (ii) our capital and reserves, was 22%. |
| · | The sum of the liabilities with a maturity of less than 90 days may not exceed the sum of the assets with a maturity of less than 90 days by more than 2 times our capital. This limit must be calculated in local currency and foreign currencies together as one gap. At September 30, 2011 the percentage of (i) our liabilities with a maturity of less than 90 days in excess of our assets with a maturity of less than 90 days to (ii) our capital and reserves, was 58%. |
Market risk management
The Bank’s internal management of market risk is based chiefly on the procedures and standards of Santander Spain, which are in turn based on analysis of management in three principal components:
| · | trading portfolio; |
| · | local financial management portfolio; and |
| · | foreign financial management portfolio. |
The trading portfolio is comprised chiefly of investments valued at fair market value and free of any restriction on their immediate sale, which are often bought and sold by the Bank with the intention of selling them in the short
87
term to benefit from short–term price fluctuations. The financial management portfolios include all the financial investments not considered to be part of trading portfolio.
The ALCO has the overall responsibility for market risk. The Bank’s risk/finance department is responsible for formulating detailed management policies and applying them in the Bank’s operations, in conformity with the guidelines adopted by the ALCO and the Banco Santander de España Global Risk Department.
The department’s functions in related to trading portfolio imply the following:(i) apply the “Value at Risk” (VaR) techniques to measure the interest rate risk, (ii) adjust the trading portfolios to the market and measure the daily profit and loss from the commercial activities, (iii) compare the real VaR with the established limits, (iv) establish procedures to prevent losses in excess of predetermined limits and (v) furnish information on the trading activities to the ALCO, other members of the Bank’s management and the Santander – Spain Global Risk Department.
The department’s functions in relation to the financial management portfolios imply the following:(i) perform sensitivity simulations (as is explained below) to measure interest rate risk for the activities in local currency and the potential loss forecast by these simulations and (ii) provide daily reports thereon to the ALCO, other members of the Bank’s management, and the Santander – Spain Global Risk Department.
Market risk – management of trading portfolio
The Bank applies VaR methodologies to measure the market risk of its trading portfolio. The Bank has a consolidated commercial position comprised of fixed–income investments, foreign currency trading, and a minimal position in stock investments. This portfolio is comprised mostly of Central Bank of Chile bonds, mortgage bonds and locally issued, low–risk corporate bonds. At the end of the year, the trading portfolio included no stock portfolio investments.
For the Bank, the VaR estimate is made under the historical simulation methodology, which consists of observing the behavior of the profits and losses that would have occurred in the current portfolio if the market conditions for a given historical period had been in force, in order to infer the maximum loss on the basis of that information, with as given degree of confidence. The methodology has the advantage of precisely reflecting the historical distribution of the market variables and not requiring any assumptions regarding the distribution of specific probabilities. All the VaR measures are intended to determine the distribution function for a change in the value of a given portfolio, and once that distribution is known, to calculate the percentile related to the necessary degree of confidence, which will be equal to the value at risk by virtue of those parameters. As calculated by the Bank, the VaR is an estimate of the maximum expected loss of market value for a given portfolio over a 1–day horizon, with a 99.00% confidence level. It is the maximum 1–day loss that the Bank could expect to experience in a given portfolio, with a 99.00% confidence level. In other words, it is the loss that the Bank would expect to experience only 1.0% of the time. The VaR provides a single estimate of market risk which is not comparable from one market risk to another. Returns are calculated through the use of a 2–year time window or at least 520 data points obtained since the last reference date for calculation of the VaR going backward in time.
The Bank uses the VaR estimates to provide a warning when the statistically estimated incurred losses in its trading portfolio would exceed prudent levels, and hence, there are certain predetermined limits.
Limitations of the VaR model
When applying a calculation methodology, no assumptions are made regarding the probability distribution of the changes in the risk factors; the historically observed changes are used for the risk factors on which each position in the portfolio will be valued.
It is necessary to define a valuation function fj(xi) for each instrument j, preferably the same one used to calculate the market value and income of the daily position. This valuation function will be applied in each scenario to generate simulated prices for all the instruments in each scenario.
In addition, the VaR methodology is subject to the following limitations:
88
| · | Changes in market rates and prices may not be independent and identically distributed random variables, and may not have a normal distribution; In particular, the assumption of normal distribution may underestimate the probability of extreme market movements; |
| · | The historical data used by the Bank may not provide the best estimate of the joint distribution of changes in the risk factors in the future, and any modification of the data may be inadequate; In particular, the use of historical data may fail to capture the risk of potential extreme and adverse market fluctuations, regardless of the time period used; |
| · | A 1–day time horizon may not fully capture the market risk positions which cannot be liquidated or covered in a single day; It would not be possible to liquidate or cover all the positions in a single day; |
| · | The VaR is calculated at the close of business, but trading positions may change substantially in the course of the trading day; |
| · | The use of a 99% degree of confidence does not take account of, or make any statement about, the losses that could occur outside of that degree of confidence; and |
| · | A model such as the VaR does not capture all the complex effects of the risk factors over the value of the positions or portfolios, and accordingly, it could underestimate potential losses. |
At no time in the nine-month period ended September 30, 2011 did the Bank exceed the VaR limits in regard to the 3 components which comprise the trading portfolio: fixed–income investments, variable–income investments and foreign currency investments. The high, low, and average levels for each component as of September 30, 2011 and December 31, 2010 were as follows:
Consolidated | September 30, 2011 | December 31, 2010 | ||||||
| (in millions of $US) | ||||||||
| VaR: | ||||||||
High | 11.01 | 11.18 | ||||||
Low | 2.62 | 3.53 | ||||||
Average | 5.74 | 7.25 | ||||||
| Fixed–income investments: | ||||||||
High | 10.99 | 11.37 | ||||||
Low | 0.00 | 3.63 | ||||||
Average | 5.63 | 7.21 | ||||||
| Variable–income investments: | ||||||||
High | 0.23 | 0.18 | ||||||
Low | 0.00 | 0.02 | ||||||
Average | 0.08 | 0.09 | ||||||
| Foreign currency investments: | ||||||||
High | 6.96 | 3.91 | ||||||
Low | 0.00 | 0.48 | ||||||
Average | 0.87 | 1.68 | ||||||
Market risk – local and foreign financial management
The Bank’s financial management portfolio includes most of the Bank’s non–trading assets and liabilities, including the credit/loan portfolio. For these portfolios, investment and financing decisions are strongly influenced by the Bank’s commercial strategies.
89
The Bank uses a sensitivity analysis to measure the market risk of local and foreign currency (not included in the trading portfolio). The Bank performs a simulation of scenarios, which will be calculated as the difference between the present value of the flows in the chosen scenario (a curve with a parallel movement of 100 bp in all its segments) and their value in the base scenario (current market). All the inflation–indexed local currency (UF) positions are adjusted by a sensitivity factor of 0.57, which represents a 57 basis point change in the rate curve for the real rates and a 100 basis point change for the nominal rates. The same scenario is performed for the net foreign currency positions and the interest rates in US dollars. The Bank has also established limits in regard to the maximum loss which these interest rate movements could impose on the capital and net financial income budgeted for the year.
Limitations of the sensitivity models
The most important assumption is the use of a 100 basis point change in the yield curve (57 basis points for the real rates). The Bank uses a 100 basis point change because sudden changes of that magnitude are considered realistic. The Santander Spain Global Risk Department has established comparable limits by country, to be able to compare, monitor and consolidate the market risk by country in a realistic and orderly way. In addition, the sensitivity simulation methodology should be interpreted with consideration for the following limitations:
| · | The simulation of scenarios assumes that the volumes remain in the Bank’s Consolidated General Balance Sheet and are always renewed at maturity, thereby omitting the fact that certain credit risk and prepayment considerations may affect the maturity of certain positions. |
| · | This model assumes an identical change along the entire length of the yield curve and takes no account of the different movements for different maturities. |
| · | The model takes no account of the sensitivity of volumes which results from interest rate changes. |
| · | The limits to losses of budgeted financial income are calculated on the basis of the financial income foreseen for the year, which may not be actually earned, meaning that the real percentage of financial income at risk may be higher than the expected one. |
Market Risk – Financial management portfolio – September 30, 2011 and December 31, 2010
September 30, 2011 | December 31, 2010 | |||||||||||||||
Effect on net interest income | Effect on equity | Effect on net interest income | Effect on equity | |||||||||||||
| Financial management portfolio – local currency (in millions of $Ch$) | ||||||||||||||||
| Loss Limit | 22,380 | 167,530 | 37,300 | 152,300 | ||||||||||||
High | 19,291 | 107,745 | 16,849 | 126,306 | ||||||||||||
Low | 590 | 75,219 | 2,974 | 86,573 | ||||||||||||
Average | 6,919 | 97,662 | 10,317 | 109,133 | ||||||||||||
| Financial management portfolio – foreign currency (in millions of $US) | ||||||||||||||||
| Loss Limit | 44.0 | 44.0 | 46.0 | 74.0 | ||||||||||||
High | 22.8 | 16.0 | 25.8 | 11.9 | ||||||||||||
Low | 5.7 | 3.7 | 0.4 | 0.3 | ||||||||||||
Average | 16.8 | 9.3 | 14.6 | 3.1 | ||||||||||||
| Financial management portfolio – consolidated (in millions of $Ch$) | ||||||||||||||||
| Loss Limit | 37,300 | 167,530 | 37,300 | 152,300 | ||||||||||||
High | 21,149 | 107,845 | 20,129 | 126,309 | ||||||||||||
Low | 7,032 | 75,243 | 7,010 | 86,575 | ||||||||||||
Average | 12,046 | 97,772 | 12,993 | 109,156 | ||||||||||||
Market risk –Regulatory method
The following table illustrates our market risk exposure according to the Chilean regulatory method, as of September 30, 2011. This information is sent to the SBIF on a quarterly basis. Our maximum exposure to long-term interest rate fluctuations is set at 35% of regulatory capital and is approved by the board of directors.
90
Regulatory Market Risk | As of September 30, 2011 | |||
| (Ch$ million) | ||||
| Market risk of trading portfolio (EMR) | ||||
| Interest rate risk of trading portfolio | 66,347 | |||
| Foreign currency risk of trading portfolio | 2,318 | |||
| Risk from interest rate options | 82,747 | |||
| Risk from foreign currency options | 28 | |||
| Total market risk of trading portfolio | 151,440 | |||
| 10% x Risk-weighted assets | 1,868,655 | |||
| Subtotal | 2,020,095 | |||
Limit = Regulatory Capital | 2,624,649 | |||
| Available margin | 604,554 | |||
| Non-trading portfolio market risk | ||||
| Short-term interest rate risk | 49,909 | |||
| Inflation risk | 51,147 | |||
| Long-term interest rate risk | 376,115 | |||
| Total market risk of non-trading portfolio | 477,171 | |||
| Regulatory limit of exposure to short-term interest rate and inflation risk | ||||
| Short-term exposure to interest rate risk | 49,909 | |||
| Exposure to inflation risk | 51,147 | |||
Limit: 20% of (net interest income + net fee income sensitive to interest rates) | 185,939 | |||
Available margin | 84,883 | |||
| Regulatory limit of exposure to long-term interest rate risk | ||||
| Long-term exposure to interest rate risk | 376,115 | |||
35% of regulatory capital | 918,627 | |||
Available margin | 542,512 | |||
Volume Limits
We have also developed volume limits, which place a cap on the actual size of the different portfolios being monitored.
Fixed Income: Volume Equivalent. This system is considered to be an additional limit to the size of our consolidated fixed income trading portfolio. This measure seeks to conform the different instruments in our fixed income trading portfolio and convert the portfolio into a single instrument with a duration of one year. Santander-Chile limits the size of this volume equivalent portfolio. The equivalent volume is calculated by the Market Risk and Control Department and limits are set by the ALCO with respect to the size of the volume equivalent portfolio.
Net Foreign Currency Trading Position: Maximum Net Position. We also set an absolute limit on the size of Santander-Chile’s consolidated net foreign currency trading position. At September 30, 2011, this was equal to US$200 million. The limit on the size of the net foreign currency position is determined by the ALCO and is calculated and monitored by the Market Risk and Control Department.
Derivative activities
At December 31, 2010, and September 30, 2011, derivatives are valued at market price on the balance sheet and the net unrealized gain (loss) on derivatives is classified as a separate line item on the income statement. In prior periods, the notional amounts were carried off the balance sheet. Banks must mark to market derivatives. A derivative financial instrument held for trading purposes must be marked to market and the unrealized gain or loss recognized in the income statement. The SBIF recognizes three kinds of hedge accounting: (i) cash flow hedges, (ii) fair value hedges and (iii) hedging of foreign investments.
91
| · | When a cash flow hedge exists, the fair value movements on the part of the hedging instrument that is effective are recognized in equity. Any ineffective portion of the fair value movement on the hedging instrument is recognized in the income statement. |
| · | When a fair value hedge exists, the fair value movements on the hedging instrument and the corresponding fair value movements on the hedged item are recognized in the income statement. Hedged items in the balance sheet are presented at their market value since 2006. |
| · | When a hedge of foreign investment exposure exists (i.e. investment in a foreign branch), the fair value movements on the part of the hedging instrument that is effective are recognized in equity. Any ineffective portion of the fair value movement on the hedging instrument is recognized in the income statement. |
We classify some of our derivative financial instruments as being held for trading, due to the guidelines from the Superintendency of Banks. However, substantially all of our derivatives are not actually used for speculative purposes or trading. We use derivatives to hedge our exposure to foreign exchange, interest rate and inflation risks. We had the following derivative financial instruments portfolio as of September 30, 2011:
92
As of September 30, 2011 | ||||||||||||||||||||
Notional Amounts | Fair Value | |||||||||||||||||||
Within 3 months | After 3 months but within one year | After one year | Assets | Liabilities | ||||||||||||||||
| (Ch$ Million) | ||||||||||||||||||||
| Fair value hedge derivative instruments | ||||||||||||||||||||
| Currency forwards | - | - | - | - | - | |||||||||||||||
| Interest rate swaps | - | - | 812,874 | 25,260 | 41 | |||||||||||||||
| Cross currency swaps | - | 30,598 | 280,996 | 24,895 | 821 | |||||||||||||||
| Call currency options | - | - | - | - | - | |||||||||||||||
| Call interest rate options | - | - | - | - | - | |||||||||||||||
Put currency options | - | - | - | - | - | |||||||||||||||
| Put interest rate options | - | - | - | - | - | |||||||||||||||
| Interest rate future | - | - | - | - | - | |||||||||||||||
| Other Derivatives | - | - | - | - | - | |||||||||||||||
Subtotal | - | 30,598 | 1,093,870 | 50,155 | 862 | |||||||||||||||
| Cash Flow hedge derivative instruments | ||||||||||||||||||||
Currency forwards | - | - | - | - | - | |||||||||||||||
| Interest rate swaps | - | - | - | - | - | |||||||||||||||
| Cross currency swaps | 483,275 | 1,159,858 | 426,410 | 122,602 | 460 | |||||||||||||||
| Call currency options | - | - | - | - | - | |||||||||||||||
| Call interest rate options | - | - | - | - | - | |||||||||||||||
| Put currency options | - | - | - | - | - | |||||||||||||||
| Put interest rate options | - | - | - | - | - | |||||||||||||||
| Interest rate future | - | - | - | - | - | |||||||||||||||
| Other Derivatives | - | - | - | - | - | |||||||||||||||
Subtotal | 483,275 | 1,159,858 | 426,410 | 122,602 | 460 | |||||||||||||||
| Derivative instruments for trading | ||||||||||||||||||||
| Currency forwards | 14,397,468 | 10,743,681 | 628,282 | 595,038 | 496,613 | |||||||||||||||
| Interest rate swaps | 4,043,419 | 12,147,546 | 13,541,998 | 298,069 | 346,029 | |||||||||||||||
| Cross currency swaps | 771,693 | 3,034,275 | 10,857,155 | 940,860 | 776,690 | |||||||||||||||
| Call currency options | 29,549 | 62,026 | 4,957 | 2,966 | 1,582 | |||||||||||||||
| Call interest rate options | 2,639 | 13,734 | 36,160 | 24 | 363 | |||||||||||||||
| Put currency options | 14,665 | 28,539 | 3,615 | 684 | 1,529 | |||||||||||||||
| Put interest rate options | - | - | - | - | - | |||||||||||||||
| Interest rate future | - | - | - | - | - | |||||||||||||||
| Other Derivatives | 421,823 | - | 1,673 | 1,187 | 1,146 | |||||||||||||||
Subtotal | 19,681,256 | 26,029,801 | 25,073,840 | 1,838,828 | 1,623,952 | |||||||||||||||
Total | 20,164,531 | 27,220,257 | 26,594,120 | 2,011,585 | 1,625,274 | |||||||||||||||
93
Other Subsidiaries
For VaR measurements and scenario simulations, our consolidated trading and consolidated non-trading portfolios do not consolidate the asset liability structure of the following subsidiaries:
| · | Santander S.A. Corredores de Bolsa; |
| · | Santander Asset Management S.A. Administradora General de Fondos; |
| · | Santander S.A. Sociedad Securitizadora; |
| · | Santander Corredores de Seguros Ltda; and |
| · | Santander Servicios de Recaudación y Pagos Ltda. |
The balance sheets of these subsidiaries are mainly comprised of non sensitive assets and liabilities, fixed assets and capital and in total only represent 2.5% of our total consolidated assets.
ITEM 9. PURCHASES OF EQUITY SECURITIES BY THE ISSUER AND AFFILIATED PURCHASERS
In the nine-month period ended September 30, 2011, neither Santander-Chile nor any of its affiliates purchased any of Santander-Chile’s equity securities.
ITEM 10. EXHIBITS
(a) Index to Financial Statements
| Unaudited Condensed Consolidated Interim Financial Statements: | |
| Unaudited Condensed Consolidated Interim Statements of Financial Position at September 30, 2011 and December 31, 2010 | F-3 |
Unaudited Condensed Consolidated Interim Statements of Income for the quarters ended September 30, 2011 and September 30, 2010 and the nine month periods ended September 30, 2011 and September 30, 2010 | F-4 |
Unaudited Condensed Consolidated Interim Statements of Comprehensive Income for the quarters ended September 30, 2011 and September 30, 2010 and the nine month periods ended September 30, 2011 and September 30, 2010 | F-5 |
Unaudited Condensed Consolidated Interim Statements of Changes in Equity for the periods ended September 30, 2011 and September 30, 2010 | F-6 |
| Unaudited Condensed Consolidated Interim Statements of Cash Flows for the periods ended September 30, 2011 and 2010 | F-7 – F-8 |
| Notes to Unaudited Condensed Consolidated Interim Financial Statements | F-9 – F-106 |
94

Index
| Unaudited Condensed Consolidated Interim Financial Statements | |
| UNAUDITED CONDENSED CONSOLIDATED INTERIM STATEMENTS OF FINANCIAL POSITION | F-3 |
| UNAUDITED CONDENSED CONSOLIDATED INTERIM STATEMENTS OF INCOME | F-4 |
| UNAUDITED CONDENSED CONSOLIDATED INTERIM STATEMENTS OF COMPREHENSIVE INCOME | F-5 |
| UNAUDITED CONDENSED CONSOLIDATED INTERIM STATEMENTS OF CHANGES IN EQUITY | F-6 |
| UNAUDITED CONDENSED CONSOLIDATED INTERIM STATEMENTS OF CASH FLOW | F-7 |
| Notes to the Financial Statements | |
| NOTE 01 - SUMMARY OF SIGNIFICANT ACCOUNTING PRINCIPLES | F-9 |
| NOTE 02 - ACCOUNTING CHANGES | F-33 |
| NOTE 03 - SIGNIFICANT EVENTS | F-33 |
| NOTE 04 - BUSINESS SEGMENTS | F-35 |
| NOTE 05 - CASH AND CASH EQUIVALENTS | F-41 |
| NOTE 06 - TRADING INVESTMENTS | F-42 |
| NOTE 07 - DERIVATIVE FINANCIAL INSTRUMENTS AND HEDGE ACCOUNTING | F-43 |
| NOTE 08 - INTERBANK LOANS | F-49 |
| NOTE 09 - LOANS AND ACCOUNTS RECEIVABLE FROM CUSTOMERS | F-50 |
| NOTE 10 - LOAN PURCHASES, SALES AND SUBSTITUTIONS | F-55 |
| NOTE 11 - AVAILABLE FOR SALE INVESTMENTS | F-57 |
| NOTE 12 - INTANGIBLE ASSETS | F-57 |
| NOTE 13 - PROPERTY, PLANT, AND EQUIPMENT | F-59 |
| NOTE 14 - CURRENT AND DEFERRED TAXES | F-63 |
| NOTE 15 - OTHER ASSETS | F-66 |
| NOTE 16 - TIME DEPOSITS AND OTHER TIME LIABILITIES | F-67 |
| NOTE 17 - ISSUED DEBT INSTRUMENTS AND OTHER OBLIGATIONS | F-68 |
| NOTE 18 - MATURITIES OF ASSETS AND LIABILITIES | F-73 |
| NOTE 19 - OTHER LIABILITIES | F-75 |
| NOTE 20 - CONTINGENCIES AND COMMITMENTS | F-76 |
| NOTE 21 - EQUITY | F-78 |
| NOTE 22 - CAPITAL REQUIREMENTS (BASEL) | F-81 |
| NOTE 23 - NON CONTROLLING INTEREST.. | F-83 |
| NOTE 24 - INTEREST INCOME AND EXPENSE | F-86 |
| NOTE 25 - FEES AND COMMISSIONS | F-89 |
| NOTE 26 - NET INCOME FROM FINANCIAL OPERATIONS | F-90 |
| NOTE 27 - NET FOREIGN EXCHANGE PROFIT (LOSS) | F-90 |
| NOTE 28 - PROVISION FOR LOAN LOSSES | F-91 |
| NOTE 29 - PERSONNEL SALARIES AND EXPENSES | F-93 |
| NOTE 30 - ADMINISTRATIVE EXPENSES | F-94 |
| NOTE 31 - DEPRECIATION AMORTIZATION AND IMPAIRMENT | F-95 |
| NOTE 32 - OTHER OPERATING INCOME AND EXPENSES | F-96 |
| NOTE 33 - TRANSACTIONS WITH RELATED PARTIES | F-98 |
| NOTE 34 - FAIR VALUE OF FINANCIAL ASSETS AND LIABILITIES | F-103 |
| NOTE 35 - SUBSEQUENT EVENTS | F-106 |
F-2
BANCO SANTANDER CHILE AND SUBSIDIARIES
UNAUDITED CONDENSED CONSOLIDATED INTERIM STATEMENTS OF FINANCIAL POSITION
For periods ending
| As of September 30, | As of December 31, | |||||||||||||||
| 2011 | 2011 | 2010 | ||||||||||||||
| NOTE | ThUS$ | MCh$ | MCh$ | |||||||||||||
| ASSETS | ||||||||||||||||
| Cash and deposits in banks | 5 | 3,488,471 | 1,812,784 | 1,762,198 | ||||||||||||
| Unsettled transactions | 5 | 1,571,444 | 816,601 | 374,368 | ||||||||||||
| Trading investments | 6 | 969,524 | 503,813 | 379,670 | ||||||||||||
| Investments under resale agreements | - | 23,395 | 12,157 | 170,985 | ||||||||||||
| Financial derivative contracts | 7 | 3,871,038 | 2,011,585 | 1,624,378 | ||||||||||||
| Interbank loans, net | 8 | 169,381 | 88,019 | 69,672 | ||||||||||||
| Loans and accounts receivable from customers, net | 9 | 33,091,109 | 17,195,795 | 15,232,163 | ||||||||||||
| Available for sale investments | 10 | 4,050,118 | 2,104,644 | 1,473,980 | ||||||||||||
| Held to maturity investments | 10 | - | - | - | ||||||||||||
| Investments in other companies | - | 15,841 | 8,232 | 7,275 | ||||||||||||
| Intangible assets | 12 | 148,617 | 77,229 | 77,990 | ||||||||||||
| Property, plant, and equipment | 13 | 294,652 | 153,116 | 154,985 | ||||||||||||
| Current taxes | 14 | 53,394 | 27,746 | 12,499 | ||||||||||||
| Deferred taxes | 14 | 251,223 | 130,548 | 100,470 | ||||||||||||
| Other assets | 15 | 1,373,128 | 713,546 | 650,081 | ||||||||||||
| TOTAL ASSETS | 49,371,335 | 25,655,815 | 22,090,714 | |||||||||||||
| LIABILITIES | ||||||||||||||||
| Deposits and other demand liabilities | 16 | 8,653,434 | 4,496,757 | 4,236,434 | ||||||||||||
| Unsettled transactions | 5 | 896,879 | 466,063 | 300,125 | ||||||||||||
| Obligations under repurchase agreements | - | 436,915 | 227,043 | 294,725 | ||||||||||||
| Time deposits and other time liabilities | 16 | 18,079,950 | 9,395,246 | 7,258,757 | ||||||||||||
| Financial derivative contracts | 7 | 3,127,632 | 1,625,274 | 1,643,979 | ||||||||||||
| Interbank borrowings | - | 3,896,961 | 2,025,056 | 1,584,057 | ||||||||||||
| Issued debt instruments | 17 | 8,684,511 | 4,512,906 | 4,190,888 | ||||||||||||
| Other financial liabilities | 17 | 321,357 | 166,993 | 166,289 | ||||||||||||
| Current taxes | 14 | 4,426 | 2,300 | 1,293 | ||||||||||||
| Deferred taxes | 14 | 22,284 | 11,580 | 5,441 | ||||||||||||
| Provisions | - | 274,866 | 142,834 | 209,421 | ||||||||||||
| Other liabilities | 19 | 1,083,471 | 563,026 | 261,328 | ||||||||||||
| TOTAL LIABILITIES | 45,482,686 | 23,635,078 | 20,152,737 | |||||||||||||
| EQUITY | ||||||||||||||||
| Attributable to Bank shareholders: | - | 3,826,505 | 1.988,444 | 1,906,168 | ||||||||||||
| Capital | - | 1,715,199 | 891,303 | 891,303 | ||||||||||||
| Reserves | - | 99,180 | 51,539 | 51,539 | ||||||||||||
| Valuation adjustments | 21 | 1,141 | 593 | (5,180 | ) | |||||||||||
| Retained earnings | - | 2,010,985 | 1.045,009 | 968,506 | ||||||||||||
| Retained earnings of prior years | - | 1,604,599 | 833,830 | 614,731 | ||||||||||||
| Income for the period | - | 580,552 | 301,684 | 505,393 | ||||||||||||
| Minus: Provision for mandatory dividends | - | (174,166 | ) | (90,505 | ) | (151,618 | ) | |||||||||
| Non-controlling interest | 23 | 62,144 | 32,293 | 31,809 | ||||||||||||
| TOTAL EQUITY | 3,888,649 | 2,020,737 | 1,937,977 | |||||||||||||
| TOTAL LIABILITIES AND EQUITY | 49,371,335 | 25,655,815 | 22,090,714 | |||||||||||||
F-3
BANCO SANTANDER CHILE AND SUBSIDIARIES
UNAUDITED CONDENSED CONSOLIDATED INTERIM STATEMENTS OF INCOME
For periods ending as of
| For the 9-month period ended on September 30, | For the quarter ended on September 30, | For the 9-month period ended on September 30, | ||||||||||||||||||||||
| 2011 | 2011 | 2010 | 2011 | 2010 | ||||||||||||||||||||
| NOTE | ThUS$ | MCh$ | MCh$ | MCh$ | MCh$ | |||||||||||||||||||
| OPERATING INCOME | ||||||||||||||||||||||||
| Interest income | 24 | 2,446,412 | 420,729 | 355,445 | 1,271,278 | 1,045,602 | ||||||||||||||||||
| Interest expense | 24 | (1,083,660 | ) | (188,672 | ) | (119,771 | ) | (563,124 | ) | (337,748 | ) | |||||||||||||
| Net interest income | 1,362,752 | 232,057 | 235,674 | 708,154 | 707,854 | |||||||||||||||||||
| Fee and commission income | 25 | 522,546 | 87,651 | 85,379 | 271,541 | 247,346 | ||||||||||||||||||
| Fee and commission expense | 25 | (119,525 | ) | (21,660 | ) | (18,943 | ) | (62,111 | ) | (53,401 | ) | |||||||||||||
| Net fee and commission income | 403,021 | 65,991 | 66,436 | 209,430 | 193,945 | |||||||||||||||||||
| Net income from financial operations (net trading income) | 26 | 295,458 | 102,133 | (45,068 | ) | 153,535 | 51,946 | |||||||||||||||||
| Foreign exchange profit (loss), net | 27 | (144,838 | ) | (79,132 | ) | 66,781 | (75,265 | ) | 24,381 | |||||||||||||||
| Other operating income | 32 | 2,240 | (542 | ) | 2,065 | 1,164 | 25,826 | |||||||||||||||||
| Net operating profit before loan losses | 1,918,633 | 320,507 | 325,888 | 997,018 | 1,003,952 | |||||||||||||||||||
| Provisions for loan losses | 28 | (446,343 | ) | (94,915 | ) | (82,687 | ) | (231,942 | ) | (208,826 | ) | |||||||||||||
| NET OPERATING PROFIT | 1,472,290 | 225,592 | 243,201 | 765,076 | 795,126 | |||||||||||||||||||
| Personnel salaries and expenses | 29 | (399,076 | ) | (73,884 | ) | (63,330 | ) | (207,380 | ) | (184,921 | ) | |||||||||||||
| Administrative expenses | 30 | (234,924 | ) | (41,041 | ) | (37,983 | ) | (122,078 | ) | (109,743 | ) | |||||||||||||
| Depreciation and amortization | 31 | (76,278 | ) | (13,354 | ) | (11,294 | ) | (39,638 | ) | (36,227 | ) | |||||||||||||
| Impairment | 13 | (210 | ) | (77 | ) | (963 | ) | (109 | ) | (4,665 | ) | |||||||||||||
| Other operating expenses | 32 | (66,469 | ) | (10,192 | ) | (13,799 | ) | (34,540 | ) | (36,822 | ) | |||||||||||||
| Total operating expenses | (776,957 | ) | (138,548 | ) | (127,369 | ) | (403,745 | ) | (372,378 | ) | ||||||||||||||
| OPERATING INCOME | 695,333 | 87,044 | 115,832 | 361,331 | 422,748 | |||||||||||||||||||
| Income from investments in other companies | - | 3,219 | 546 | 832 | 1,673 | 1,175 | ||||||||||||||||||
| Income before tax | 698,552 | 87,590 | 116,664 | 363,004 | 423,923 | |||||||||||||||||||
| Income tax expense | 14 | (111,503 | ) | (15,566 | ) | (9,991 | ) | (57,943 | ) | (56,752 | ) | |||||||||||||
| NET INCOME FOR THE PERIOD | 587,049 | 72,024 | 106,673 | 305,061 | 367,171 | |||||||||||||||||||
| Attributable to: | ||||||||||||||||||||||||
| Bank shareholders (Equity holders of the Bank) | - | 580,551 | 70,901 | 105,255 | 301,684 | 367,270 | ||||||||||||||||||
| Non-controlling interest | 23 | 6,498 | 1,123 | 1,418 | 3,377 | (99 | ) | |||||||||||||||||
| Earnings per share attributable to Bank shareholders: | ||||||||||||||||||||||||
| (expressed in Chilean pesos) | ||||||||||||||||||||||||
| Basic earnings | - | 3.081 | 0.376 | 0.559 | 1.601 | 1.949 | ||||||||||||||||||
| Diluted earnings | - | 3.081 | 0.376 | 0.559 | 1.601 | 1.949 | ||||||||||||||||||
F-4
BANCO SANTANDER CHILE AND SUBSIDIARIES
UNAUDITED CONDENSED CONSOLIDATED INTERIM STATEMENTS OF COMPREHENSIVE INCOME
For periods ending as of
| For the 9-month period ended on September 30, | For the quarter ended on September 30, | For the 9-month period ended on September 30, | ||||||||||||||||||||||
| 2011 | 2011 | 2010 | 2011 | 2010 | ||||||||||||||||||||
| NOTE | ThUS$ | MCh$ | MCh$ | MCh$ | MCh$ | |||||||||||||||||||
| �� | ||||||||||||||||||||||||
| CONSOLIDATED INCOME FOR THE PERIOD | 587,049 | 72,024 | 106,673 | 305,061 | 367,171 | |||||||||||||||||||
| OTHER COMPREHENSIVE INCOME | ||||||||||||||||||||||||
| Available for sale investments | 21 | 41,347 | 22,561 | (2,924 | ) | 21,486 | 4,796 | |||||||||||||||||
| Cash flow hedge | 7 | (27,084 | ) | (12,051 | ) | 7,433 | (14,074 | ) | 10,306 | |||||||||||||||
| Other comprehensive income before income tax | 14,263 | 10,510 | 4,509 | 7,412 | 15,102 | |||||||||||||||||||
| Income tax related to other comprehensive income | 14 | (2,696 | ) | (2,058 | ) | (524 | ) | (1,401 | ) | (2,325 | ) | |||||||||||||
| Total other comprehensive income | 11,567 | 8,452 | 3,985 | 6,011 | 12,777 | |||||||||||||||||||
| CONSOLIDATED COMPREHENSIVE INCOME FOR THE PERIOD | 598,616 | 80,476 | 110,658 | 311,072 | 379,948 | |||||||||||||||||||
| Attributable to: | ||||||||||||||||||||||||
| Bank shareholders (Equity holders of the Bank) | - | 591,659 | 79,325 | 109,520 | 307,457 | 380,146 | ||||||||||||||||||
| Non-controlling interest | 23 | 6,957 | 1,151 | 1,138 | 3,615 | (198 | ) | |||||||||||||||||
F-5
BANCO SANTANDER CHILE AND SUBSIDIARIES
UNAUDITED CONDENSED CONSOLIDATED INTERIM STATEMENTS OF CHANGES IN EQUITY
For periods ending as of September 30, 2011 and 2010
| RESERVES | VALUATION ADJUSTMENTS | RETAINED EARNINGS | ||||||||||
| Capital | Reserves and other retained earnings | Merger of companies under common control | Available for sale investments | Cash flow hedge | Income tax | Retained earnings of prior years | Income for the period | Provision for mandatory dividends | Total attributable to shareholders | Non-controlling interest | Total Equity | |
| MCh$ | MCh$ | MCh$ | MCh$ | MCh$ | MCh$ | MCh$ | MCh$ | MCh$ | MCh$ | MCh$ | MCh$ | |
| Equity as of December 31, 2009 | 891,303 | 53,763 | (2,224) | (29,132) | (3,162) | 5,490 | 441,976 | 431,557 | (129,467) | 1,660,104 | 29,799 | 1,689,903 |
| Distribution of income from previous period | - | - | - | - | - | - | 431,557 | (431,557) | - | - | - | - |
| Opening balances as of January 1, 2010 | 891,303 | 53,763 | (2,224) | (29,132) | (3,162) | 5,490 | 873,533 | - | (129,467) | 1,660,104 | 29,799 | 1,689,903 |
| Increase or decrease of capital and reserves | - | - | - | - | - | - | - | - | - | - | - | - |
| Dividends distributions / Withdrawals made | - | - | - | - | - | - | (258,752) | - | 129,467 | (129,285) | - | (129,285) |
| Other changes in equity | - | - | - | - | - | - | (112) | - | - | (112) | (2) | (114) |
| Provisions for mandatory dividends | - | - | - | - | - | - | - | - | (110,181) | (110,181) | - | (110,181) |
| Subtotals | - | - | - | - | - | - | (258,864) | - | 19,286 | (239,578) | (2) | (239,580) |
| Other comprehensive income | - | - | - | 4,915 | 10,306 | (2,345) | - | - | - | 12,876 | (99) | 12,777 |
| Income for the period | - | - | - | - | - | - | - | 367,270 | - | 367,270 | (99) | 367,171 |
| Subtotals | - | - | - | 4,915 | 10,306 | (2,345) | - | 367,270 | - | 380,146 | (198) | 379,948 |
| Equity as of September 30, 2010 | 891,303 | 53,763 | (2,224) | (24,217) | 7,144 | 3,145 | 614,669 | 367,270 | (110,181) | 1,800,672 | 29,599 | 1,830,271 |
| Equity as of December 31, 2010 | 891,303 | 53,763 | (2,224) | (18,341) | 11,958 | 1,203 | 614,731 | 505,393 | (151,618) | 1,906,168 | 31,809 | 1,937,977 |
| Distribution of income from previous period | - | - | - | - | - | - | 505,393 | (505,393) | - | - | - | - |
| Equity as of January 1, 2011 | 891,303 | 53,763 | (2,224) | (18,341) | 11,958 | 1,203 | 1,120,124 | - | (151,618) | 1,906,168 | 31,809 | 1,937,977 |
| Increase or decrease of capital and reserves | - | - | - | - | - | - | - | - | - | - | - | - |
| Dividends distributions / Withdrawals made | - | - | - | - | - | - | (286,294) | - | 151,618 | (134,676) | (3,122) | (137,798) |
| Other changes in equity | - | - | - | - | - | - | - | - | - | - | (9) | (9) |
| Provision for mandatory dividends | - | - | - | - | - | - | - | - | (90,505) | (90,505) | - | (90,505) |
| Subtotals | - | - | - | - | - | - | (286,294) | - | 61,113 | (225,181) | (3,131) | (228,312) |
| Other comprehensive income | - | - | - | 21,197 | (14,074) | (1,350) | - | - | - | 5,773 | 238 | 6,011 |
| Income for the period | - | - | - | - | - | - | - | 301,684 | - | 301,684 | 3,377 | 305,061 |
| Subtotals | - | - | - | 21,197 | (14,074) | (1,350) | - | 301,684 | - | 307,457 | 3,615 | 311,072 |
| Equity as of September 30, 2011 | 891,303 | 53,763 | (2,224) | 2,856 | (2,116) | (147) | 833,830 | 301,684 | (90,505) | 1,988,444 | 32,293 | 2,020,737 |
| Period | Total attributable to shareholders | Allocated to reserves or retained earnings | Allocated to Dividends | Percentage distributed | Number of shares | Dividend per share (in pesos) | |||||
| MCh$ | MCh$ | MCh$ | % | ||||||||
| Year 2010 (Shareholders Meeting April 2011) | 477,155 | 190,861 | 286,294 | 60% | 188,446,126,794 | 1.519 | |||||
| Year 2009 (Shareholders Meeting April 2010) | 431,253 | 172,501 | 258,752 | 60% | 188,446,126,794 | 1.373 |
F-6
BANCO SANTANDER CHILE AND SUBSIDIARIES
UNAUDITED CONDENSED CONSOLIDATED INTERIM STATEMENTS OF CASH FLOW
For periods ending as of September 30, 2011 and 2010
| As of September 30, | ||||||||||||||||
| 2011 | 2011 | 2010 | ||||||||||||||
| NOTE | ThUS$ | MCh$ | MCh$ | |||||||||||||
| A - CASH FLOWS FROM OPERATING ACTIVITIES | ||||||||||||||||
| CONSOLIDATED INCOME BEFORE TAX | 698,552 | 363,004 | 423,923 | |||||||||||||
| Debits (credits) to income that do not represent cash flows | (1,244,575 | ) | (646,744 | ) | (643,865 | ) | ||||||||||
| Depreciation and amortization | 31 | 76,278 | 39,638 | 36,227 | ||||||||||||
| Impairment of property, plant, and equipment | 13 | 210 | 109 | 4,665 | ||||||||||||
| Provision for loan losses | 28 | 477,169 | 247,961 | 232,381 | ||||||||||||
| Mark to market of trading investments | - | (15,102 | ) | (7,848 | ) | 6,144 | ||||||||||
| Income from investments in other companies | - | (3,219 | ) | (1,673 | ) | (1,175 | ) | |||||||||
| Net gain on sale of assets received in lieu of payment | 32 | 452 | 235 | (1,247 | ) | |||||||||||
| Net gain on sale of property, plant and equipment | 32 | (1,597 | ) | (830 | ) | (13,243 | ) | |||||||||
| Net interest income | 24 | (1,362,752 | ) | (708,154 | ) | (707,854 | ) | |||||||||
| Net fee and commission income | 25 | (403,021 | ) | (209,430 | ) | (193,945 | ) | |||||||||
| Debits (credits) to income that do not represent cash flows | - | 34,789 | 18,078 | 30,834 | ||||||||||||
| Changes in assets and liabilities due to deferred taxes | 14 | (47,782 | ) | (24,830 | ) | (36,652 | ) | |||||||||
| Increase/decrease in operating assets and liabilities | 1,919,297 | 997,363 | (110,966 | ) | ||||||||||||
| Decrease (increase) of loans and accounts receivables from customers, net | - | (3,892,620 | ) | (2,022,800 | ) | (1,690,639 | ) | |||||||||
| Decrease (increase) of financial investments | - | (1,541,751 | ) | (801,171 | ) | 678,884 | ||||||||||
| Decrease (increase) due to repurchase agreements (assets) | - | 305,644 | 158,828 | 50,975 | ||||||||||||
| Decrease (increase) of interbank loans | - | (35,066 | ) | (18,222 | ) | (48,814 | ) | |||||||||
| Decrease of assets received or awarded in lieu of payment | - | 63,012 | 32,744 | 19,277 | ||||||||||||
| Increase of debits in checking accounts | - | 86,320 | 44,856 | 232,226 | ||||||||||||
| Increase (decrease) of time deposits and other time liabilities | - | 4,111,400 | 2,136,489 | (20,888 | ) | |||||||||||
| Increase (decrease) of obligations with domestic banks | - | - | - | (26,301 | ) | |||||||||||
| Increase of other demand liabilities or time obligations | - | 312,524 | 162,403 | 180,419 | ||||||||||||
| Increase (decrease) of obligations with foreign banks | - | 849,568 | 441,478 | (292,102 | ) | |||||||||||
| Decrease of obligations with Central Bank of Chile | - | (764 | ) | (397 | ) | (450 | ) | |||||||||
| Increase (decrease) due to repurchase agreements (liabilities) | - | (130,245 | ) | (67,682 | ) | (987,632 | ) | |||||||||
| Increase (decrease) of other short-term liabilities | - | (1,328 | ) | (690 | ) | 599 | ||||||||||
| Net increase of other assets and liabilities | - | (357,103 | ) | (185,568 | ) | 44,919 | ||||||||||
| Issuance of letters of credit | - | - | - | - | ||||||||||||
| Redemption of letters of credit | - | (81,072 | ) | (42,129 | ) | (71,825 | ) | |||||||||
| Senior bond issuances | - | 941,274 | 489,133 | 1,187,441 | ||||||||||||
| Redemption of senior bonds and payments of interest | - | (535,156 | ) | (278,094 | ) | (208,500 | ) | |||||||||
| Issuance of subordinated bonds | - | 221,260 | 114,978 | 97,692 | ||||||||||||
| Redemption of subordinated bonds and payments of interest | - | (52,341 | ) | (27,199 | ) | (28,637 | ) | |||||||||
| Interest received | - | 2,459,142 | 1,277,893 | 1,028,854 | ||||||||||||
| Interest paid | - | (1,096,257 | ) | (569,670 | ) | (394,613 | ) | |||||||||
| Dividends received from investments in other companies | - | 1,339 | 696 | 956 | ||||||||||||
| Fees and commissions received | 25 | 522,546 | 271,541 | 247,346 | ||||||||||||
| Fees and commissions paid | 25 | (119,525 | ) | (62,111 | ) | (53,401 | ) | |||||||||
| Income tax paid | 14 | (111,504 | ) | (57,943 | ) | (56,752 | ) | |||||||||
| Net cash from (used in) operating activities | 1,373,274 | 713,623 | (330,908 | ) | ||||||||||||
F-7
BANCO SANTANDER CHILE AND SUBSIDIARIES
UNAUDITED CONDENSED CONSOLIDATED INTERIM STATEMENTS OF CASH FLOW
For periods ending as of September 30, 2011 and 2010
| As of September 30, | ||||||||||||||||
| 2011 | 2011 | 2010 | ||||||||||||||
| NOTE | ThUS$ | MCh$ | MCh$ | |||||||||||||
| B - CASH FLOWS FROM INVESTMENT ACTIVITIES: | ||||||||||||||||
| Purchases of property, plant, and equipment | 12 | (25,519 | ) | (13,261 | ) | (7,712 | ) | |||||||||
| Sales of property, plant, and equipment | - | 321 | 167 | 14,576 | ||||||||||||
| Purchases of investments in other companies | - | - | - | 133 | ||||||||||||
| Sales of investments in other companies | - | 10,979 | 5,705 | 44 | ||||||||||||
| Purchases of intangibles assets | 11 | (45,777 | ) | (23,788 | ) | (12,255 | ) | |||||||||
| Net cash used in investment activities | (59,996 | ) | (31,777 | ) | (5,214 | ) | ||||||||||
| C - CASH FLOW FROM FINANCING ACTIVITIES: | ||||||||||||||||
| From shareholders’ financing activities | - | (550,936 | ) | (286,294 | ) | (258,752 | ) | |||||||||
| Increase of other obligations | - | - | - | - | ||||||||||||
| Dividends paid | - | (550,936 | ) | (286,294 | ) | (258,752 | ) | |||||||||
| From non-controlling interest financing activities | - | (6,008 | ) | (3,122 | ) | (4 | ) | |||||||||
| Increases of capital | - | - | - | - | ||||||||||||
| Dividends and/or withdrawals paid | - | (6,008 | ) | (3,122 | ) | (4 | ) | |||||||||
| Net cash used in financing activities | (556,944 | ) | (289,416 | ) | (258,756 | ) | ||||||||||
| D – NET INCREASE (DECREASE) IN CASH AND CASH EQUIVALENTS DURING THE PERIOD | - | 756,335 | 393,030 | (594,878 | ) | |||||||||||
| E – EFFECTS OF FOREIGN EXCHANGE RATE FLUCTUATIONS | - | (127,295 | ) | (66,149 | ) | (59,844 | ) | |||||||||
| F - INITIAL BALANCE OF CASH AND CASH EQUIVALENTS | - | 3,533,998 | 1,836,442 | 2,236,118 | ||||||||||||
| FINAL BALANCE OF CASH AND CASH EQUIVALENTS | 5 | 4,163,038 | 2,163,323 | 1,581,396 | ||||||||||||
| As of September 30 | |||||
| Reconciliation of provisions for Condensed Consolidated Interim Statements of Cash Flow | 2011 | 2011 | 2010 | ||
| ThUS$ | MCh$ | MCh$ | |||
| Provisions for loan losses for cash flow | 477,169 | 247,961 | 232,381 | ||
| Recovery of loans previously charged off | (30,826) | (16,019) | (23,555) | ||
| Provisions for loan losses ( Condensed Consolidated Statements of Income) | 446,343 | 231,942 | 208,826 | ||
F-8
BANCO SANTANDER CHILE AND SUBSIDIARIES NOTES TO THE UNAUDITED CONDENSED CONSOLIDATED INTERIM FINANCIAL STATEMENTS As of September 30, 2011 and 2010 and December 31, 2010 |
NOTE 01 – SUMMARY OF SIGNIFICANT ACCOUNTING PRINCIPLES
Corporate Information
Banco Santander Chile (formerly Banco Santiago) is a corporation (sociedad anónima bancaria) organized under the laws of the Republic of Chile, headquartered at 140 Bandera, Santiago, that provides a broad range of general banking services to its customers, from individuals to major corporations. Banco Santander Chile and its affiliates (collectively referred to herein as the “Bank” or “Banco Santander Chile”) offer commercial and consumer banking services, besides other services, including factoring, collection, leasing, securities and insurance brokerage, mutual and investment fund management, and investment banking.
A Special Meeting of Shareholders of Banco Santiago was held on July 18, 2002, the minutes of which were notarized as a public deed on July 19, 2002 at the Notarial Office from Santiago before Notary Nancy de la Fuente Hernández, and there agreed to merge Banco Santander Chile with Banco Santiago by merging the former into the latter, which acquired the former’s assets and liabilities. It was likewise agreed to dissolve Banco Santander Chile in advance and change the name from Banco Santiago to Banco Santander Chile. This change was authorized by Resolution No.79 of the Superintendency of Banks and Financial Institutions, adopted on July 26, 2002, published in the Official Journal on August 1, 2002 and registered on page 19,992 under number 16,346 for the year 2002 in the Registry of Commerce of the Curator of Real Estate of Santiago.
In addition to the amendments to the bylaws discussed above, the bylaws have been amended on multiple occasions, the last time at the Special Shareholders Meeting of April 24, 2007, the minutes of which were notarized as a public deed on May 24, 2007 at the Notarial Office of Nancy de la Fuente Hernández. This amendment was approved pursuant to Resolution No.61 of June 6, 2007 of the Superintendency of Banks and Financial Institutions. An extract thereof and the resolution were published in the Official Journal of June 23, 2007 and registered in the Registry of Commerce for 2007 on page 24,064 under number 17,563 of the aforementioned Curator.
By means of this last amendment, Banco Santander Chile, pursuant to its bylaws and as approved by the Superintendency of Banks and Financial Institutions, may also use the names Banco Santander Santiago or Santander Santiago or Banco Santander or Santander.
Banco Santander Spain controls Banco Santander-Chile through its share in Teatinos Siglo XXI Inversiones Ltda. and Santander-Chile Holding S.A., which are subsidiaries controlled by Banco Santander Spain. As of September 30, 2011 Banco Santander Spain owns or controls directly and indirectly 99.5% of the Santander-Chile Holding S.A. and 100% of Teatinos Siglo XXI Inversiones Ltda. This grant Banco Santander Spain control over 75% of the Bank’s shares.
a) Basis of preparation
These Condensed Consolidated Financial Statements have been prepared in accordance with the International Accounting Standard (IAS) N°34: “Interim Financial Reporting”, issued by the International Accounting Standards Board (IASB).
In accordance with IAS 34, the interim financial report is intended only to provide an update on the content of the latest annual consolidated financial statements authorized for issue, focusing on new activities, events and circumstances occurring during the six-month period, and does not duplicate information previously reported in the latest annual consolidated financial statements authorized for issue. Consequently, these financial statements do not include all the information required of complete consolidated financial statements prepared in accordance with International Financial Reporting Standards and, accordingly, for a proper comprehension of the information included in these financial statements, they shold be read together with the consolidated financial statements for the year ended December 31, 2010.
Santander’s transition date was January 1, 2008. The Bank prepared its opening balance under these standards as of such date. Consequently, the date of adoption of the new standards by the Bank and its subsidiaries was January 1, 2009.
For purposes of these financial statements we use certain terms and conventions. References to “US$”, “U.S. dollars” and “dollars” are to United States dollars, references to “Chilean pesos,” “pesos” or “Ch$” are to Chilean pesos and references to “UF” are to Unidades de Fomento. The UF is an inflation-indexed Chilean monetary unit with a value in Chilean pesos that changes daily to reflect changes in the official Consumer Price Index (“CPI”) of the Instituto Nacional de Estadísticas (the Chilean National Institute of Statistics) for the previous month.
The UF is revalued in monthly cycles. Each day in the period beginning on the tenth day of the current month through the ninth day of the succeeding month, the nominal peso value of the UF is indexed up (or down in the event of deflation) in order to reflect a proportionate amount of the change in the Chilean Consumer Price Index during the prior calendar month. One UF equaled Ch$22,012.69 as of September 30, 2011 and Ch$21,339.99 as of September 30, 2010. As of September 30, 2011 accumulated UF inflation was 2.6% compared to 2.0% in September 2010. The effect of any changes in the nominal peso value of our UF-denominated interest earning assets and interest bearing liabilities is reflected in our results of operations as an increase (or decrease, in the event of deflation) in interest income and expense, respectively.
F-9
BANCO SANTANDER CHILE AND SUBSIDIARIES NOTES TO THE UNAUDITED CONDENSED CONSOLIDATED INTERIM FINANCIAL STATEMENTS As of September 30, 2011 and 2010 and December 31, 2010 |
NOTE 01 – SUMMARY OF SIGNIFICANT ACCOUNTING POLICIES continued:
The main accounting policies adopted in preparing these financial statements are described below.
b) Basis of preparation for the Condensed Consolidated Interim Financial Statements
The Condensed Consolidated Interim Financial Statements include the preparation of separate (individual) financial statements of the Bank and the companies that participate in the consolidation of statement of financial position of September 30, 2011 and December 31, 2010, and consolidation of statement of income, comprehensive income, changes in equity and cash flows as of September 30, 2011 and 2010, and include the adjustments and reclassifications needed to comply with policies and valuation criteria established by the International Financial Reporting Standard.
Subsidiaries
“Subsidiaries” are defined as entities over which the Bank has the ability to exercise control, which is generally but not exclusively reflected by the direct or indirect ownership of at least 50% of the investee’s voting rights, or even if this percentage is lower or zero when the Bank is granted control pursuant to agreements with the investee’s shareholders. Control is understood as the power to significantly influence the investee’s financial and operating policies, so as to profit from its activities.
The interim financial statements of subsidiaries are consolidated with those of the Bank. According to this, all balances and transactions between consolidated corporations will be eliminated through the consolidation process.
In addition, third parties’ shares in the Consolidated Bank’s equity are presented as “Non-controlling interests” in the Condensed Consolidated Interim Statement of Financial Position. Their shares in the year’s income are presented under “Non-controlling interests” in the Condensed Consolidated Interim Statement of Income.
The following companies are considered “Subsidiaries” in which the Bank has the ability to exercise control and are therefore within the scope of consolidation:
| Percentage Share | ||||||||||||||||||||||||||||||||||||
| As of September 30, | As of December 31, | As of September 30, | ||||||||||||||||||||||||||||||||||
| 2011 | 2010 | 2010 | ||||||||||||||||||||||||||||||||||
Direct % | Indirect % | Total % | Direct % | Indirect % | Total % | Direct % | Indirect % | Total % | ||||||||||||||||||||||||||||
| Santander Corredora de Seguros Limitada | 99.75 | 0.01 | 99.76 | 99.75 | 0.01 | 99.76 | 99.75 | 0.01 | 99.76 | |||||||||||||||||||||||||||
| Santander S.A. Corredores de Bolsa | 50.59 | 0.41 | 51.00 | 50.59 | 0.41 | 51.00 | 50.59 | 0.41 | 51.00 | |||||||||||||||||||||||||||
| Santander Asset Management S.A. Administradora General de Fondos | 99.96 | 0.02 | 99.98 | 99.96 | 0.02 | 99.98 | 99.96 | 0.02 | 99.98 | |||||||||||||||||||||||||||
| Santander Agente de Valores Limitada (ex -Santander S.A. Agente de Valores) | 99.03 | - | 99.03 | 99.03 | - | 99.03 | 99.03 | - | 99.03 | |||||||||||||||||||||||||||
| Santander S.A. Sociedad Securitizadora | 99.64 | - | 99.64 | 99.64 | - | 99.64 | 99.64 | - | 99.64 | |||||||||||||||||||||||||||
| Santander Servicios de Recaudación y Pagos Limitada | 99.90 | 0.10 | 100.00 | 99.90 | 0.10 | 100.00 | 99.90 | 0.10 | 100.00 | |||||||||||||||||||||||||||
Special Purpose Entities
According to IFRS, the Bank must continuously analyze its basis of consolidation. The key criterion for such analysis is the degree of control held by the Bank over a given entity, not the percentage of ownership interest in such entity’s equity.
In particular, as set forth by International Accounting Standard 27 “Consolidated and Separate Financial Statements” (IAS 27) and by the Standard Interpretations Committee 12 “Consolidation – Special Purpose Entities” (SIC 12), issued by the IASB, the Bank must determine the existence of Special Purpose Entities (SPEs), which must be consolidated when in substance, the Bank controls the SPE. The following are the main criteria indicating control:
| · | The SPE’s activities have essentially been conducted on behalf of the company that presents the Condensed Consolidated Interim Financial Statements and in response to its specific business needs. |
| · | The necessary decision making authority is held to obtain most of the benefits from these entities’ activities, as well as the rights to obtain most of the benefits or other advantages from such entities. |
| · | The entity essentially retains most of the risks inherent to the ownership or residuals interests of the SPEs or its assets, for the purpose of obtaining the benefits from its activities. |
This assessment is based on methods and procedures which consider the risks and profits retained by the Bank, for which all the relevant factors, including the guarantees furnished or the losses associated with collection of the related assets retained by the Bank, are taken into account. As a consequence of this assessment, the Bank concluded that it exercised control over the following entities, which therefore are consolidated in their financial statements:
F-10
BANCO SANTANDER CHILE AND SUBSIDIARIES NOTES TO THE UNAUDITED CONDENSED CONSOLIDATED INTERIM FINANCIAL STATEMENTS As of September 30, 2011 and 2010 and December 31, 2010 |
NOTE 01 – SUMMARY OF SIGNIFICANT ACCOUNTING POLICIES continued:
| - | Santander Gestión de Recaudación y Cobranza Limitada. |
| - | Multinegocios S.A. |
| - | Servicios Administrativos y Financieros Limitada. |
| - | Fiscalex Limitada. |
| - | Multiservicios de Negocios Limitada. |
| - | Bansa Santander S.A. |
Associates
Associates are those entities over which the Bank may exercise significant influence but not control or joint control, usually this capacity is manifested by holding 20% or more of the entity’s voting power. Investments in associated entities are accounted for pursuant to the “equity method.”
The following companies are considered “Associates” in which the Bank accounts for its participation pursuant to the equity method:
| Associates | Percentage share | ||||
| As of September 30, | As of December 31, | As of September 30, | |||
| 2011 | 2010 | 2010 | |||
| Redbank S.A. | 33.43% | 33.43% | 33.43% | ||
| Transbank S.A. | 32.71% | 32.71% | 32.71% | ||
| Centro de Compensación Automatizado | 33.33% | 33.33% | 33.33% | ||
| Sociedad Interbancaria de Depósito de Valores S.A. | 29.28% | 29.28% | 29.28% | ||
| Cámara Compensación de Alto Valor S.A. | 11.52% | 11.52% | 11.52% | ||
| Administrador Financiero del Transantiago S.A. | 20.00% | 20.00% | 20.00% | ||
Sociedad Nexus S.A. is no longer accounted under the equity method, because the Bank lost its ability to exercise significant influence over this Company according to IAS 28.
Investments in other companies
The Bank and its controlled entities have certain investments in other entities in which they do not have control nor exercise significant influence. Participation in these companies is below 1%.
| c) | Non-controlling interest |
Non-controlling interest represents the portion of earnings and losses and net assets of a subsidiary not attributable, directly or indirectly to the Bank. It is presented separately in the Condensed Consolidated Interim Statement of Income, and separately from shareholders equity in the Condensed Consolidated Interim Statement of Financial Position.
In the case of Special Purpose Entities (SPEs), 100% of their Income and Equity is presented in non-controlling interest, since the Bank only has control but not actual ownership thereof.
| d) | Operating segments |
The Bank discloses separate information for each operating segment that:
| i. | has been identified; |
| ii. | exceeds the quantitative thresholds stipulated for a segment. |
Operating segments with similar economic characteristics often have a similar long-term financial performance. Two or more segments can be combined only if aggregation is consistent with the basic principles of the International Financial Reporting Standards 8 (IFRS 8) and the segments have similar economic characteristics and are similar in each of the following respects:
| i. | the nature of the products and services; |
| ii. | the nature of the production processes; |
| iii. | the type or category of customers that use their products and services; |
| iv. | the methods used to distribute their products or services; and |
| v. | if applicable, the nature of the regulatory environment, for example, banking, insurance, or public utilities. |
F-11
BANCO SANTANDER CHILE AND SUBSIDIARIES NOTES TO THE UNAUDITED CONDENSED CONSOLIDATED INTERIM FINANCIAL STATEMENTS As of September 30, 2011 and 2010 and December 31, 2010 |
NOTE 01 – SUMMARY OF SIGNIFICANT ACCOUNTING POLICIES continued:
The Bank reports separately on each operating segment that exceeds any of the following quantitative thresholds:
| i. | Its reported revenue, from both external customers and intersegment sales or transfers, is 10% or more of the combined internal and external revenue of all the operating segments. |
| ii. | The absolute amount of its reported profit or loss is 10% or more of the greater in absolute amount of: (i) the combined reported profit of all the operating segments that did not report a loss; and (ii) the combined reported loss of all the operating segments that reported a loss. |
| iii. | Its assets represent 10% or more of the combined assets of all the operating segments. |
Operating segments that do not reach any of the quantitative thresholds may be treated as segments to be reported, in which case the information must be disclosed separately if management believes it could be useful for the users of the Condensed Consolidated Interim financial statements.
Information about other business activities of the operating segments not separately reported is combined and disclosed in the “Other segments” category.
According to the information presented, the Bank’s segments were determined under the following definitions:
| i. | It engages in business activities from which it may earn revenues and incur expenses (including revenues and expenses from transactions with other components of the same entity); |
| ii. | Its operating results are regularly reviewed by the entity’s chief executive officer, who makes decisions about resources allocated to the segment and assess its performance; and |
| iii. | Discrete financial information is available for it. |
| e) | Functional and presentation currency |
The Bank, according to International Accounting Standard No.21 “The Effects of Changes in Foreign Exchange Rates” (IAS 21) has defined the Chilean peso as the functional and presentation currency. The functional currency is the currency of the primary economic environment in which the Bank operates and the currency which influences its structure of costs and revenues. The presentation currency is the currency in which financial statements are presented.
Accordingly, all balances and transactions denominated in currencies other than the Chilean Peso are treated as “foreign currency.”
For presentation purposes we have translated million Chilean pesos (MCh$) into thousand US dollars (ThUS$) using the rate as indicated below, for the Consolidated Statement of Financial Position, Consolidated Statement of Income, Consolidated Statement of Comprehensive Income and for the Consolidated Statement of Cash Flow for the period ended as of September 30, 2011.
| f) | Foreign currency transactions |
The Bank grants loans and accepts deposits in amounts denominated in foreign currencies, mainly the U.S. dollar. Assets and liabilities denominated in foreign currencies and only held by the Bank are translated to Chilean pesos based on the market rate published by Reuters at 1:30 p.m. on the last business day of every month; the rate used was Ch$519.65 and Ch$483.65 per US$1 as of September 30, 2011 and 2010, respectively (Ch$467.95 per US$1 as of December 30, 2010). The Subsidiaries record their foreign currency positions at the exchange rate reported by the Central Bank of Chile at the close of operations on the last business day of the month, amounting to Ch$515.14 andCh$485.23 per US$1 as of September 30, 2011 and 2010, respectively (Ch$468.01 per US$1 as of December 30). Considering that using these exchange rates does not cause any significant difference, these criteria have been kept on the Condensed Consolidated Interim Financial Statements.
The amount of net foreign exchange profits and losses includes recognition of the effects that exchange rate fluctuations have on assets and liabilities denominated in foreign currencies and the profits and losses on foreign exchange spot and forward transactions undertaken by the Bank.
| g) | Definitions and classification of financial instruments |
| i. | Definitions |
A “financial instrument” is any contract that gives rise to a financial asset of one entity, and simultaneously to a financial liability or equity instrument of another entity.
An “equity instrument” is a legal transaction that evidences a residual interest in the assets of the entity which issues it after deducting all of its liabilities.
A “financial derivative” is a financial instrument whose value changes in response to the changes in an observable market variable (such as an interest rate, a foreign exchange rate, a financial instrument’s price, or a market index, including credit ratings), which initial investment is very small compared to other financial instruments having a similar response to changes in market factors, and which is generally settled at a future date.
F-12
BANCO SANTANDER CHILE AND SUBSIDIARIES NOTES TO THE UNAUDITED CONDENSED CONSOLIDATED INTERIM FINANCIAL STATEMENTS As of September 30, 2011 and 2010 and December 31, 2010 |
“Hybrid financial instruments” are contracts that simultaneously include a non-derivative host contract together with a financial derivative, known as an embedded derivative, which is not separately transferable and has the effect that some of the cash flows of the hybrid contract vary in a similar fashion to a stand-alone derivative.
| ii. | Classification of financial assets for measurement purposes |
The financial assets are initially classified into the various categories used for management and measurement purposes.
F-13
BANCO SANTANDER CHILE AND SUBSIDIARIES NOTES TO THE UNAUDITED CONDENSED CONSOLIDATED INTERIM FINANCIAL STATEMENTS As of September 30, 2011 and 2010 and December 31, 2010 |
NOTE 01 – SUMMARY OF SIGNIFICANT ACCOUNTING POLICIES continued:
Financial assets are included for measurement purposes in one of the following categories:
| - | Portfolio of trading investments (at fair value through profit and loss): This category includes the financial assets acquired for the purpose of generating a profit in the short term from fluctuations in their prices. This category includes the portfolio of trading investments and financial derivative contracts not designated as hedging instruments. |
| - | Available for sale investment portfolio: Debt instruments not classified as “held-to-maturity investments,” “Credit investments (loans and accounts receivable from customers or interbank loans)” or “Financial assets at fair value through profit or loss.” Available for sale investments (AFS) are initially recorded at fair value, which includes transaction costs. AFS instruments are subsequently measured at fair value or based on appraisals made with the use of internal models, when appropriate. Unrealized gains or losses stemming from changes in fair value are recorded as a debit or credit to Other Comprehensive Income under the heading “Valuation Adjustments” within equity. When these investments are disposed of or become impaired, the cumulative gains or losses previously recognized in Other Comprehensive Income are transferred to the Condensed Consolidated Interim Income State under “Net income from financial operations.” |
| - | Held to maturity instrument portfolio: This category includes debt securities traded on an active market, with a fixed maturity, and with fixed or determinable payments, for which the Bank has both the intent and a proven ability to hold to maturity. Held to maturity investments are recorded at amortized cost plus interest earned less any impairment losses established when their carrying amount exceeds the present value of estimated future cash flows. |
| - | Credit investments (loans and accounts receivable from customers or interbank loans): This category includes financing granted to third parties, based on their nature, regardless of the type of borrower and the form of financing. It includes loans and accounts receivable from customers, interbank loans, and financial lease transactions in which the consolidated entities act as lessor. |
| iii. | Classification of financial assets for presentation purposes |
Financial assets are included, for presentation purposes, classified by their nature into the following line items in the Condensed Consolidated Interim financial statements:
| - | Cash and deposits in banks: This line includes cash balances, checking accounts and on-demand deposits with the Central Bank of Chile and other domestic and foreign financial institutions. Amounts placed in overnight transactions will continue to be reported in this line item and in the lines or items to which they correspond. If there is no special item for these transactions, they will be included with the related account as indicated above. |
| - | Unsettled transactions: This item includes the values of swap instruments and balances of executed transactions which contractually defer the payment of purchase-sale transactions or the delivery of the foreign currency acquired. |
| - | Trading investments: This item includes financial instruments held-for-trading and investments in mutual funds which must be adjusted to their fair value in the same way as instruments acquired for trading. |
| - | Investment under resale agreements: This item includes the balances of purchase of financial instruments under resale agreements. |
| - | Financial derivative contracts: Financial derivative contracts with positive fair values are presented in this item. It includes both independent contracts as well as derivatives that should and can be separated from a host contract, whether they are for trading or hedging, as shown in Note 7 to the Condensed Consolidated Interim Financial Statements. |
| - | Trading derivatives: Includes the fair value of derivatives which do not qualify for hedge accounting, including embedded derivatives separated from hybrid financial instruments. |
| - | Hedging derivatives: Includes the fair value of derivatives designated as hedging instruments in hedge accounting, including the embedded derivatives separated from the hybrid financial instruments designated as hedging instruments in hedge accounting. |
| - | Interbank loans: This item includes the balances of transactions with domestic and foreign banks, including the Central Bank of Chile, other than those reflected in the preceding items. |
| - | Loans and accounts receivables from customers: These loans are non-derivative financial assets for which fixed or determined amounts are charged, that are not listed on an active market and which the Bank does not intend to sell immediately or in the short term. When the Bank is the lessor in a lease, and it substantially transfers the risks and benefits incidental to the leased asset, the transaction is presented in loans and accounts receivable from customers. |
| - | Investment instruments: These are classified into two categories: held-to-maturity investments and available-for-sale investments. The held-to-maturity investment category includes only those instruments for which the Bank has the ability and intent to hold to maturity. The remaining investments are treated as available for sale. |
F-14
BANCO SANTANDER CHILE AND SUBSIDIARIES NOTES TO THE UNAUDITED CONDENSED CONSOLIDATED INTERIM FINANCIAL STATEMENTS As of September 30, 2011 and 2010 and December 31, 2010 |
NOTE 01 – SUMMARY OF SIGNIFICANT ACCOUNTING POLICIES continued:
| iv. | Classification of financial liabilities for measurement purposes |
Financial liabilities are initially classified into the various categories used for management and measurement purposes.
Financial liabilities are included, for measurement purposes, in one of the following categories:
| - | Financial liabilities held for trading (at fair value through profit or loss): financial liabilities issued to generate a short-term profits from fluctuations in their prices, financial derivatives not deemed to qualify for hedge accounting and financial liabilities arising from firm commitment of financial assets purchased under repurchase agreements or borrowed (“short positions”). |
| - | Financial liabilities at amortized cost: financial liabilities, regardless of their type and maturity, not included in any of the aforementioned categories which arise from the borrowing activities of financial institutions. |
| v. | Classification of financial liabilities for presentation purposes |
Financial liabilities are classified by their nature into the following line items in the Condensed Consolidated Interim financial statements:
| - | Deposits and other demand liabilities: This item includes all on-demand obligations except for term savings accounts, which are not considered on-demand instruments in view of their special characteristics. Obligations whose payment may be required during the period are deemed to be on-demand obligations. Operations which become callable the day after the closing date are not treated as on-demand obligations. |
| - | Unsettled transactions: This item includes the balances of asset purchases that are not settled on the same day and sales of foreign currencies not delivered. |
| - | Obligations under repurchase agreements: This item includes the balances of sales of financial instruments under securities repurchase and loan agreements. |
| - | Time deposits and other demand liabilities: This item shows the balances of deposit transactions in which the term in which the term in which they become callable has been stipulated. |
| - | Financial derivative contracts: This item includes financial derivative contracts with negative fair values, whether they are for trading or for account hedging purposes, as set forth in Note 7. |
| - | Trading derivatives: Includes the fair value of derivatives which do not qualify for hedge accounting, including embedded derivatives separated from hybrid financial instruments. |
| - | Hedging derivatives: Includes the fair value of the derivatives designated as hedging instruments, including embedded derivatives separated from hybrid financial instruments and designated as hedging instruments. |
| - | Interbank borrowings: This item includes obligations due to other domestic banks, foreign banks, or the Central Bank of Chile, which are not classified in any of the previous categories. |
| - | Debt instruments issued: This encompasses three items: Obligations under letters of credit, subordinated bonds, and senior bonds. |
| - | Other financial liabilities: This item includes credit obligations to persons other than domestic banks, foreign banks, or the Central Bank of Chile, for financing purposes or operations in the regular course of business. |
| h) | Valuation of financial assets and liabilities and recognition of fair value changes |
In general, financial assets and liabilities are initially recorded at fair value which, in the absence of evidence to the contrary, is deemed to be the transaction price. Financial Instruments not measured at fair value through profit or loss includes transaction costs. Subsequently, and at the end of each reporting period, they are measured pursuant to the criteria detailed below.
| i. | Valuation of financial assets |
Financial assets are measured according to their fair value, gross of any transaction costs that may be incurred for their sale, except for loans and accounts receivable.
F-15
BANCO SANTANDER CHILE AND SUBSIDIARIES NOTES TO THE UNAUDITED CONDENSED CONSOLIDATED INTERIM FINANCIAL STATEMENTS As of September 30, 2011 and 2010 and December 31, 2010 |
NOTE 01 – SUMMARY OF SIGNIFICANT ACCOUNTING POLICIES, continued:
The “fair value” of a financial instrument on a given date is the amount for which it could be bought or sold on that date between two knowledgeable, willing parties in an arm’s length transaction. The most objective and common reference for the fair value of a financial instrument is the price that would be paid in an active, transparent, and deep market (“quoted price” or “market price”).
If there is no market price for a given financial instrument, its fair value is estimated based on the price established in recent transactions involving similar instruments and, in the absence thereof, of valuation techniques commonly used by the international financial community, considering the specific features of the instrument to be valued and, particularly, the various classes of risk associated with it.
All derivatives are recorded in the Condensed Consolidated Interim Statements of Financial Position at the fair value from their trade date. If their fair value is positive, they are recorded as an asset, and if their fair value is negative, they are recorded as a liability. The fair value of the trade date is deemed, in the absence of evidence to the contrary, to be the transaction price. Changes in the fair value of derivatives from the trade date are recorded with a counterpart in “Net income from financial operations” in the Condensed Consolidated Interim Statement of Income.
Specifically, the fair value of financial derivatives included in the portfolios of financial assets or liabilities held for trading is deemed to be their daily quoted price. If, for exceptional reasons, the quoted price cannot be determined on a given date, the fair value is determined using similar methods to those used to measure over the counter (OTC) derivatives. The fair value of OTC derivatives is the sum of the future cash flows resulting from the instrument, discounted to present value at the date of valuation (“present value” or “theoretical close”) using valuation techniques commonly used by the financial markets, including “net present value” (NPV) and option pricing models, among other methods.
“Loans and accounts receivable from customers” and “Held-to-maturity instrument portfolio” are measured at amortized cost using the “effective interest method.” “Amortized cost” is the acquisition cost of a financial asset or liability plus or minus, as appropriate, prepayments of principal and the cumulative amortization (recorded in the Condensed Consolidated Interim income statement) of the difference between the initial cost and the maturity amount. For financial assets, amortized cost also includes any reductions for impairment or uncollectibility. For loans and accounts receivable designated as hedged items in fair value hedges, the changes in their fair value related to the risk or risks being hedged are recorded in “Net income from financial operations”.
The “effective interest rate” is the discount rate that exactly matches the initial amount of a financial instrument to all its estimated cash flows over its remaining life. For fixed-rate financial instruments, the effective interest rate coincides with the contractual interest rate established on the acquisition date plus, where applicable, the fees and transaction costs that, because of their nature, are a part of the financial return. For floating-rate financial instruments, the effective interest rate coincides with the rate of return prevailing until the next benchmark interest reset date.
Equity instruments whose fair value cannot be determined in a sufficiently objective manner and financial derivatives that have those instruments as their underlying assets and are settled by delivery of those instruments are measured at acquisition cost, adjusted, where appropriate, by any related impairment loss.
The amounts at which the financial assets are recorded represent, in all material respects, the Bank’s maximum exposure to credit risk at each reporting date. The Bank has also received collateral and other credit enhancements to mitigate its exposure to credit risk, which consist mainly of mortgage guarantees, equity instruments and personal securities, assets leased out under leasing and rental agreements, assets acquired under repurchase agreements, securities loans and derivatives.
| ii. | Valuation of financial liabilities |
In general, financial liabilities are measured at amortized cost, as defined above, except for those financial liabilities designated as hedged items (or hedging instruments) and financial liabilities held for trading, which are measured at fair value.
| iii. | Valuation techniques |
Financial instruments at fair value, determined on the basis of price quotations in active markets, include government debt securities, private sector debt securities, shares, short positions, and fixed-income securities issued.
In cases where price quotations cannot be observed, the Management makes its best estimate of the price that the market would set using its own internal models. In most cases, these models use data based on observable market parameters as significant inputs and, in very specific cases, they use significant inputs not observable in market data. Various techniques are employed to make these estimates, including the extrapolation of observable market data.
F-16
BANCO SANTANDER CHILE AND SUBSIDIARIES NOTES TO THE UNAUDITED CONDENSED CONSOLIDATED INTERIM FINANCIAL STATEMENTS As of September 30, 2011 and 2010 and December 31, 2010 |
NOTE 01 – SUMMARY OF SIGNIFICANT ACCOUNTING POLICIES continued:
The best evidence of the fair value of a financial instrument on initial recognition is the transaction price, unless the value of the instrument can be obtained from other market transactions performed with the same or similar instruments or can be measured by using a valuation technique in which the variables used include only observable market data, mainly interest rates.
The main techniques used as of September 30, 2011 and 2010 by the Bank’s internal models to determine the fair value of the financial instruments, are as follows:
| i. | In the valuation of financial instruments permitting static hedging (mainly “forwards” and “swaps”), the “present value” method is used. Estimated future cash flows are discounted using the interest rate curves of the related currencies. The interest rate curves are generally observable market data. |
| ii. | In the valuation of financial instruments requiring dynamic hedging (mainly structured options and other structured instruments), the Black-Scholes model is normally used. Where appropriate, observable market inputs are used to obtain factors such as the bid-offer spread, exchange rates, volatility, correlation indexes and market liquidity. |
| iii. | In the valuation of certain financial instruments exposed to interest rate risk, such as interest rate futures, caps and floors, the present value method (futures) and the Black-Scholes model (plain vanilla options) are used. The main inputs used in these models are observable market data, including the related interest rate curves, volatilities, correlations and exchange rates. |
The fair value of the financial instruments arising from the abovementioned internal models considers contractual terms and observable market data, which include interest rates, credit risk, exchange rates, and the quoted market price of shares, volatility and prepayments, among other things. The valuation models are not significantly subjective, since these methodologies can be adjusted and evaluated, as appropriate, through the internal calculation of fair value and the subsequent comparison with the related actively traded price.
| iv. | Recording results |
As a general rule, changes in the carrying amount of financial assets and liabilities are recorded in the Condensed Consolidated Interim Statement of Income, distinguishing between those arising from the accrual of interests, which are recorded under Interest income or Interest expense, as appropriate, and those arising from other transactions, which are recorded at their net amount under “Net income from financial operations”.
In the case of trading investments, the fair value adjustments, interest income, indexation adjustment and foreign exchange, are included in the Condensed Consolidated Interim Statement of Income under “Net income from financial operations.”
Adjustments due to changes in fair value are recorded as follows:
| - | Adjustments related to “Available-for-sale financial instruments” are recorded in Other Comprehensive Income and accumulated under the heading “Valuation adjustments” within Equity. |
| - | When the AFS instruments are disposed of or are determined to be impaired, the cumulative gain or loss previously accumulated as “Valuation Adjustment” is reclassified to the Condensed Consolidated Interim Statement of Income. |
| v. | Hedging transactions |
The Bank uses financial derivatives for the following purposes:
| i) | to sell to customers who request these instruments in the management of their market and credit risks, |
| ii) | to use these derivatives in the management of the risks of the Bank entities’ own positions and assets and liabilities (“hedging derivatives”), and |
| iii) | to obtain profits from changes in the price of these derivatives (“trading derivatives”). |
All financial derivatives that do not qualify for hedge accounting are accounted for as “trading derivatives.”
A derivative qualifies for hedge accounting if all of the following conditions are met:
| 1. | The derivative hedges one of the following three types of exposure: |
| a. | Changes in the value of assets and liabilities due to fluctuations, among others, in the interest rate and/or exchange rate to which the position or balance to be hedged is subject (“fair value hedge”); |
| b. | Changes in the estimated cash flows arising from financial assets and liabilities, commitments and highly probable forecasted transactions (“cash flow hedge”); |
| c. | The net investment in a foreign operation (“hedge of a net investment in a foreign operation”). |
F-17
BANCO SANTANDER CHILE AND SUBSIDIARIES NOTES TO THE UNAUDITED CONDENSED CONSOLIDATED INTERIM FINANCIAL STATEMENTS As of September 30, 2011 and 2010 and December 31, 2010 |
NOTE 01 – SUMMARY OF SIGNIFICANT ACCOUNTING POLICIES continued:
| 2. | It is effective in offsetting exposure inherent in the hedged item or position throughout the expected term of the hedge, which means that: |
| a. | At the date of arrangement the hedge is expected, under normal conditions, to be highly effective (“prospective effectiveness”). |
| b. | There is sufficient evidence that the hedge was actually effective during the life of the hedged item or position (“retrospective effectiveness”). |
| 3. | There must be adequate documentation evidencing the specific designation of the financial derivative to hedge certain balances or transactions and how this effective hedge was expected to be achieved and measured, provided that this is consistent with the Bank’s management of own risks. |
The changes in the value of financial instruments qualifying for hedge accounting are recorded as follows:
| a. | In fair value hedges, profits or losses arising on both the hedging instruments and the hedged items (attributable to the type of risk being hedged) are recorded directly in the Condensed Consolidated Interim Statement of Income. |
| b. | In fair value hedges of interest rate risk in a portfolio of financial instruments, gains or losses that arise in measuring the hedging instruments are recorded directly in the Condensed Consolidated Interim Statement of Income, whereas the gains or losses due to changes in the fair value of the hedged amount (attributable to the hedged risk) are recorded in the Condensed Consolidated Interim Statement of Income with an offset to “Net income from financial operations”. |
| c. | In cash flow hedges, the effective portion of the change in value of the hedging instrument is recorded temporarily in Other Comprehensive Income under the heading “Cash flow hedge” within Equity component “Valuation adjustments”, until the forecasted transaction occurs, thereafter being recorded in the Condensed Consolidated Interim Statement of Income, unless the forecasted transaction results in the recognition of non–financial assets or liabilities, in which case it is included in the cost of the non-financial asset or liability. |
| d. | The differences in valuation of the hedging instrument corresponding to the ineffective portion of the cash flow hedging transactions are recorded directly in the Condensed Consolidated Interim Statement of Income under “Income from financial operations”. |
If a derivative designated as a hedge instrument no longer meets the requirements described above due to expiration, ineffectiveness or for any other reason, the derivative is classified as a “trading derivative.” When the “Fair value hedging” is discontinued, the fair value adjustments of the book value for the hedged portion generated by the hedged risk are amortized to gain and losses from that date on.
When cash flow hedges are discontinued, any cumulative gain or loss of the hedging instrument recognized in other comprehensive income under “Valuation adjustments” (from the period when the hedge was effective) remains recorded in equity until the hedged transaction occurs, at which time it is recorded in the Condensed Consolidated Interim Statement of Income, unless the transaction is no longer expected to occur, in which case any cumulative profit or loss is recorded immediately in the Condensed Consolidated Interim Income Statement.
| v. | Derivatives embedded in hybrid financial instruments |
Derivatives embedded in other financial instruments or in other host contracts are accounted for separately as derivatives if their risks and characteristics are not closely related to those of the host contracts, provided that the host contracts are not classified as “Other financial assets (liabilities) at fair value through profit or loss” or as “Portfolio of trading investments.”
| vi. | Offsetting of financial instruments |
Financial asset and liability balances are offset, i.e., reported in the Condensed Consolidated Interim Statements of Financial Position at their net amount, only if the subsidiaries currently have a legally enforceable right to offset the recorded amounts and the Bank intend either to settle them on a net basis or to realize the asset and settle the liability simultaneously.
| vii. | Derecognition of financial assets and liabilities |
The accounting treatment of transfers of financial assets depends on the extent and the manner in which the risks and rewards associated with the transferred assets are transferred to third parties:
F-18
BANCO SANTANDER CHILE AND SUBSIDIARIES NOTES TO THE UNAUDITED CONDENSED CONSOLIDATED INTERIM FINANCIAL STATEMENTS As of September 30, 2011 and 2010 and December 31, 2010 |
NOTE 01 – SUMMARY OF SIGNIFICANT ACCOUNTING POLICIES continued:
| i. | If the Bank transfers substantially all the risks and rewards of ownership to third parties, as in the case of unconditional sales of financial assets, sales under repurchase agreements at fair value at the date of repurchase, sales of financial assets with a purchased call option or written put option deeply out of the money, utilization of assets in which the assignor does not retain subordinated debt nor grants any credit enhancement to the new holders, and other similar cases, the transferred financial asset is removed from the Condensed Consolidated Interim Statements of Financial Position and any rights or obligations retained or created in the transfer are simultaneously recorded. |
| ii. | If the Bank retains substantially all the risks and rewards of ownership associated with the transferred financial asset, as in the case of sales of financial assets under repurchase agreements to repurchase at a fixed price or at the sale price plus interest, securities lending agreements under which the borrower undertakes to return the same or similar assets, and other similar cases, the transferred financial asset is not derecognized from the Condensed Consolidated Interim Statements of Financial Position and continues to be measured by the same criteria as those used before the transfer. However, the following items are recorded: |
| 1. | An associated financial liability for an amount equal to the consideration received; this liability is subsequently measured at amortized cost. |
| 2. | Both the income from the transferred (but not removed) financial asset as well as any expenses incurred on the new financial liability. |
| iii. | If the Bank neither transfers nor substantially retains all the risks and rewards of ownership associated with the transferred financial asset—as in the case of sales of financial assets with a purchased call option or written put option that is not deeply in or out of the money, securitization of assets in which the transferor retains a subordinated debt or other type of credit enhancement for a portion of the transferred asset, and other similar cases—the following distinction is made: |
| 1. | If the transferor does not retain control of the transferred financial asset the asset is removed from the Condensed Consolidated Interim Statements of Financial Position and any rights or obligations retained or created in the transfer are recorded. |
| 2. | If the transferor retains control of the transferred financial asset it continues to be recorded in the Condensed Consolidated Interim Statements of Financial Position for an amount equal to its exposure to changes in value and a financial liability associated with the transferred financial asset is recorded. The net carrying amount of the transferred asset and the associated liability is the amortized cost of the rights and obligations retained, if the transferred asset is measured at amortized cost, or the fair value of the rights and obligations retained, if the transferred asset is measured at fair value. |
Accordingly, financial assets are only removed from the Condensed Consolidated Interim Statements of Financial Position when the rights over the cash flows they generate have terminated or when all the inherent risks and rewards of ownership have been substantially transferred to third parties. Similarly, financial liabilities are only derecognized in the Condensed Consolidated Interim Statements of Financial Position when the obligations specified in the contract are discharged, cancelled or expires.
| i) | Recognizing income and expenses |
The most significant criteria used by the Bank to recognize its revenues and expenses are summarized as follows:
| i. | Interest revenue, interest expense and similar items |
Interest revenue and expense are recorded on an accrual basis using the effective interest method.
However, when a given operation or transaction is past due by 90 days or more, when it originated from a refinancing or renegotiation, or when the Bank believes that the debtor poses a high risk of default, the interest and adjustments pertaining to these transactions are not recorded directly in the Condensed Consolidated Interim Statement of Income unless they have been actually received.
This interest and adjustments are generally referred to as “suspended” and are recorded in memorandum accounts which are not part of the Condensed Consolidated Interim Statements of Financial Position but are reported as part of the complementary information thereto (Note 23). Such interest is recognized as income, when collected, as a reversal of the related impairment losses.
The Bank ceases accruing interest based on contract terms on the principal amount of any asset classified as an impaired asset. Thereafter, the Bank recognizes as interest income the accretion of the net present value of the written down amount of the loan due to the passage of time, based on the original effective interest rate of the loan. On the other hand, any collected interest related to an asset classified as impaired is accounted for on a cash basis.
Dividends received from companies classified as “Investments in other companies” are recorded as income when the right to receive them arises.
F-19
BANCO SANTANDER CHILE AND SUBSIDIARIES NOTES TO THE UNAUDITED CONDENSED CONSOLIDATED INTERIM FINANCIAL STATEMENTS As of September 30, 2011 and 2010 and December 31, 2010 |
NOTE 01 – SUMMARY OF SIGNIFICANT ACCOUNTING POLICIES continued:
| ii. | Commissions, fees, and similar items |
Fee and commission income and expenses are recognized in the Condensed Consolidated Interim Statement of Income using criteria that vary according to their nature. The main criteria are:
| - | Fee and commission income and expenses related to financial assets and liabilities measured at fair value through profit or loss are recognized when paid. |
| - | Those arising from transactions or services that are performed over a period of time are recognized over the life of these transactions or services. |
| - | Those relating to services provided in a single act are recognized when the single act is performed. |
| iii. | Non-finance income and expenses |
Non-finance income and expenses are recognized for accounting purposes on an accrual basis.
| iv. | Loan arrangement fees |
Loan arrangement fees, mainly loan origination and application fees, are immediately recorded as direct costs related to loan origination within the Condensed Consolidated Interim Statement of Income.
| j) | Impairment |
| i. | Financial assets: |
A financial asset, other than those measured at fair value through profit and loss, is evaluated on each financial statement reporting date to determine whether objective evidence of impairment exists.
A financial asset or group of financial assets will be impaired if, and only if, objective evidence of impairment exists as a result of one or more events that occurred after initial recognition of the asset (“event causing the loss”), and the event or events have an impact on the estimated future cash flows of a financial asset or group of financial assets.
An impairment loss relating to financial assets recorded at amortized cost is calculated as the difference between the recorded amount of the asset and the present value of estimated future cash flows, discounted at the financial asset’s original effective interest rate.
An impairment loss relating to a financial asset available for sale is calculated based on a significant extended decline in its fair value.
Significant financial assets are individually tested to determine their impairment. The remaining financial assets are evaluated collectively in groups that share similar credit risk characteristics.
All impairment losses are recorded in income. Any cumulative loss relating to a financial asset available for sale previously recorded in equity is transferred to profit or loss as a reclassification adjustment.
The reversal of an impairment loss occurs only if it can be objectively related to an event occurring after the initial impairment loss was recorded. In the case of financial assets recorded at amortized cost and for the financial assets available for sale that are securities for sale, the reversal is recorded in income. In the case of financial assets that are variable-rate securities, the reversal is directly recorded in equity.
| ii. | Non-financial assets: |
The Bank’s non-financial assets, excluding investment properties, are reviewed at reporting date to determine whether they show signs of impairment (i.e. its carrying amount exceeds its recoverable amount). If such evidence exists, the amount to be recovered from the assets is then estimated.
In connection to other assets, impairment losses recorded in prior periods are assessed at each reporting date in search of any indication that the loss has decreased or disappeared and should be reversed. An impairment loss is reversed to the extent that it is not in excess of the cumulative impairment loss that has been recorded.
F-20
BANCO SANTANDER CHILE AND SUBSIDIARIES NOTES TO THE UNAUDITED CONDENSED CONSOLIDATED INTERIM FINANCIAL STATEMENTS As of September 30, 2011 and 2010 and December 31, 2010 |
NOTE 01 – SUMMARY OF SIGNIFICANT ACCOUNTING POLICIES continued:
| k) | Property, plant, and equipment |
This category includes buildings, land, furniture, vehicles, computer hardware and other fixtures owned by the consolidated entities or acquired under finance leases. Assets are classified according to their use as follows:
| i. | Property, plant and equipment for own use |
Property, plant and equipment for own use (including, among other things, tangible assets received by the consolidated entities in full or partial satisfaction of financial assets representing accounts receivable from third parties which are intended to be held for continuing own use and tangible assets acquired under finance leases) are presented at acquisition cost less the related accumulated depreciation and, if applicable, any impairment losses (net carrying amount higher than recoverable amount).
The acquisition cost of awarded assets is equivalent to the net amount of the financial assets surrendered in exchange for its award.
The Bank and its subsidiaries have chosen to measure certain items of property, plant, and equipment at the date of the transition into IFRS, both for at their fair value and at the previous GAAP revaluated and use these both as their deemed cost at that date, in accordance with paragraphs D5 and D6 of IFRS 1. Accordingly, the price-level restatement applied until December 31, 2007 was not reversed.
Depreciation is calculated using the straight line method over the acquisition cost of assets less their residual value, assuming that the land on which buildings and other structures stand has an indefinite life and, therefore, is not subject to depreciation.
The Bank must apply the following useful lives for the tangible assets that comprise its assets:
| ITEM | Useful Life (Months) | |
| Land | - | |
| Paintings and works of art | - | |
| Assets retired for disposal | - | |
| Carpets and curtains | 36 | |
| Computers and hardware | 36 | |
| Vehicles | 36 | |
| Computational systems and software | 36 | |
| ATM’s | 60 | |
| Machines and equipment in general | 60 | |
| Office furniture | 60 | |
| Telephone and communication systems | 60 | |
| Security systems | 60 | |
| Rights over telephone lines | 60 | |
| Air conditioning systems | 84 | |
| Installations in general | 120 | |
| Security systems (acquisitions up to October 2002) | 120 | |
| Buildings | 1,200 |
The consolidated entities assess at each reporting date whether there is any indication that the carrying amount of any of their tangible assets exceeds its recoverable amount. If this is the case, the carrying amount of the asset is reduced to its recoverable amount and future depreciation charges are adjusted in proportion to the revised carrying amount and to the new remaining useful life, if the useful life needs to be revised.
Similarly, if there is an indication of a recovery in the value of a tangible asset, the consolidated entities record the reversal of the impairment loss recorded in prior periods and adjust the future depreciation charges accordingly. In no circumstance may the reversal of an impairment loss on an asset increase its carrying value above the one it would have had if no impairment losses had been recorded in prior years.
The estimated useful lives of the items of property, plant and equipment held for own use are reviewed at least at the end of each reporting period to detect significant changes therein. If changes are detected, the useful lives of the assets are adjusted by correcting the depreciation charge to be recorded in the Condensed Consolidated Interim Statement of Income in future years on the basis of the new useful lives.
F-21
BANCO SANTANDER CHILE AND SUBSIDIARIES NOTES TO THE UNAUDITED CONDENSED CONSOLIDATED INTERIM FINANCIAL STATEMENTS As of September 30, 2011 and 2010 and December 31, 2010 |
NOTE 01 – SUMMARY OF SIGNIFICANT ACCOUNTING POLICIES continued:
Maintenance expenses relating to tangible assets (property, plant and equipment) held for own use are recorded as an expense in the period in which they are incurred.
| ii. | Assets leased out under operating leases |
The criteria used to record the acquisition cost of assets leased out under operating leases, to calculate their depreciation and their respective estimated useful lives, and to record the impairment losses thereof, are consistent with those described in relation to property, plant and equipment held for own use.
| l) | Leasing |
| i. | Finance leases |
Finance leases are leases that substantially transfer all the risks and rewards incidental to ownership of the leased asset to the lessee.
When the consolidated entities act as the lessor of an asset, the sum of the present value of the lease payments receivable from the lessee plus the guaranteed residual value, which is generally the exercise price of the lessee’s purchase option at the end of the lease term, is recognized as loans to third parties and it is therefore included under “Loans and accounts receivable from customers” in the Condensed Consolidated Interim Statements of Financial Position.
When the consolidated entities act as lessees, they show the cost of the leased assets in the Condensed Consolidated Interim Statements of Financial Position based on the nature of the leased asset, and simultaneously record a liability for the same amount (which is the lower of the fair value of the leased asset and the sum of the present value of the lease payments payable to the lessor plus, if appropriate, the exercise of the purchase option). The depreciation policy for these assets is consistent with that for property, plant and equipment for own use.
In both cases, the finance income and finance expenses arising from these contracts are credited and debited, respectively, to “Interest income” and “Interest expense” in the Condensed Consolidated Interim Income Statement so as to achieve a constant rate of return over the lease term.
| ii. | Operating leases |
In operating leases, ownership of the leased asset and substantially all the risks and rewards incidental thereto remain with the lessor.
When the consolidated entities act as the lessor, they present the acquisition cost of the leased assets under "Property, plant and equipment”. The depreciation policy for these assets is consistent with that for similar items of property, plant and equipment held for own use and revenues from operating leases is recorded on a straight line basis under “Other operating income” in the Condensed Consolidated Interim Income Statement.
When the consolidated entities act as the lessees, the lease expenses, including any incentives granted by the lessor, are charged on a straight line basis to “Administrative and expenses” in the Condensed Consolidated Interim Income Statement.
| iii. | Sale and leaseback transactions |
For sale at fair value and operating leasebacks, the profit or loss generated is recorded at the time of sale. In the case of finance leasebacks, the profit or loss generated is amortized over the lease term.
| m) | Factored receivables |
Factored receivables are valued at the amount disbursed by the Bank in exchange of invoices or other commercial instruments representing the credit which the transferor assigns to the Bank. The price difference between the amounts disbursed and the actual face value of the credits is recorded as interest income in the Condensed Consolidated Interim Income Statement through the effective interest method over the financing period.
When the assignment of these instruments involves no liability for the transferor, the Bank assumes the risks of insolvency of the parties responsible for payment.
F-22
BANCO SANTANDER CHILE AND SUBSIDIARIES NOTES TO THE UNAUDITED CONDENSED CONSOLIDATED INTERIM FINANCIAL STATEMENTS As of September 30, 2011 and 2010 and December 31, 2010 |
NOTE 01 – SUMMARY OF SIGNIFICANT ACCOUNTING POLICIES continued:
| n) | Intangible assets |
Intangible assets are identified as non-monetary assets (separately identifiable from other assets) without physical substance which arise as a result of a legal transaction (contractual terms) or are developed internally by the consolidated entities. They are assets whose cost can be estimated reliably and from which the consolidated entities have control and consider it probable that future economic benefits will be generated.
Intangible assets are recorded initially at acquisition or production cost and are subsequently measured at cost less any accumulated amortization and any accumulated impairment losses.
Internally developed computer software
Internally developed computer software is recorded as an intangible asset if, among other requirements (basically the Bank’s ability to use or sell it), it can be identified and its ability to generate future economic benefits can be demonstrated. The estimated useful life for software is 3 years.
Intangible assets are amortized on a straight-line basic over their estimated useful life.
Expenditure on research activities is recorded as an expense in the year in which it is incurred and cannot be subsequently capitalized.
| o) | Cash and cash equivalents |
For the preparation of the cash flow statement, the indirect method was used, beginning with the Bank’s consolidated pre-tax income and incorporating non-cash transactions, as well as income and expenses associated with cash flows, which are classified as investment or financing activities.
For the preparation of the cash flow statement, the following items are considered:
| i. | Cash flows: Inflows and outflows of cash and cash equivalents, such as deposits with the Central Bank of Chile, deposits in domestic banks, and deposits in foreign banks |
| ii. | Operating Activities: Main revenue-producing activities performed by banks and other activities that cannot be classified as investing or financing activities. |
| iii. | Investing Activities: The acquisition and disposal of long-term assets and other investments not included in cash and cash equivalents. |
| iv. | Financing activities: Activities that result in changes in the size and composition of the equity and liabilities that are not operating activities. |
| p) | Allowances for loan losses |
The Bank records allowances for loan losses in accordance with its internal models. These internal models for rating and evaluating credit risk were approved by the Bank’s Board of Directors.
According to the methodology developed by the Bank, loans are divided into three categories:
| i. | Consumer loans, |
| ii. | Mortgage loans, and |
| iii. | Commercial loans. |
The specialization of the Santander Bank’s risk function is based on the type of customer and, accordingly, a distinction is made between individualized customers that are individually evaluated and standardized customers, evaluated in groups in the risk management process.
The internal risk models used to calculate the allowances are described as follows:
Allowances for individual evaluations on commercial loans
For large commercial loans, leasing and factoring, the Bank assigns a risk category level to each borrower and his respective loans. The Bank considers the following risk factors within the analysis: industry or sector of the borrower, owners or managers of the borrower, their financial situation, their payment capacity and payment behavior.
The Bank assigns one of the following risk categories to each loan and borrower:
| i. | Classifications A1, A2 and A3, correspond to borrowers with no apparent credit risk. |
| ii. | Classification B corresponds to borrowers with some credit risk but no apparent deterioration of payment capacity. |
| iii. | Classifications C1, C2, C3, C4, D1 and D2 correspond to borrowers whose loans have deteriorated. |
F-23
BANCO SANTANDER CHILE AND SUBSIDIARIES NOTES TO THE UNAUDITED CONDENSED CONSOLIDATED INTERIM FINANCIAL STATEMENTS As of September 30, 2011 and 2010 and December 31, 2010 |
NOTE 01 – SUMMARY OF SIGNIFICANT ACCOUNTING POLICIES, continued:
For loans classified as A1, A2, A3 and B, the Bank assigns a specific level of risk for each borrower. As a result, borrowers within the same classification could have different levels of risk. All commercial loans for Companies, including leasing and factoring, have since been rated using a model for evaluating and calculating provisions on an individual basis. Since a debtor’s behavior varies over time, in order to determine the provisions, it is necessary to make a distinction between normal debtors and deteriorated debtors.
For loans classified in Categories C1, C2, C3, C4, D1, and D2, the Bank must maintain the following levels of reserves:
| Classification | Estimated range of loss | Allowance | ||
| C1 | Up to 3% | 2% | ||
| C2 | More than 3% and up to 19% | 10% | ||
| C3 | More than 19% and up to 29% | 25% | ||
| C4 | More than 29% and up to 49% | 40% | ||
| D1 | More than 49% and up to 79% | 65% | ||
| D2 | More than 79% | 90% |
Borrowers with insufficient payment capacity in foreseeable circumstances are classified under these categories. The categories listed above relate to a classification based on the level of estimated incurred loss of commercial loans and leasing transactions of the customer’s business as a whole, quantified according to the methodology used by the Bank.
For purposes of determining allowance amounts, the percentage associated with the estimated incurred loss rate is applied to the total credit.
Allowances for group evaluations
Banco Santander Chile uses group analysis for determining the provisioning levels for certain types of loans. These models are intended to be used primarily to analyze loans to individuals (including consumer loans, lines of credit, mortgage loans and commercial loans to individuals) and commercial loans, primarily to small and some mid-sized companies. Provisions are determined using these models to determine a historical loss rate by segment and risk profile of each group of clients.
The provisioning models for consumer loans separate these loans in four groups, each with its own model:
| - | New clients, not renegotiated |
| - | Old clients, not renegotiated |
| - | New clients, renegotiated |
| - | Old clients, renegotiated |
Each consumer model is separate by risk profile which is based on a scorecard statistical model that establishes a relation through regressions between various variables, such as payment behavior in the Bank, payment behavior outside the Bank, various socio-demographic data, among others, and a response variable that determines a client’s risk level, which in this case is 90 days non-performance. Once the scorecards have been determined, risk profiles are established that are statistically significant with similar estimated incurred loss levels or charge-off vintage.
The estimated incurred loss rates for consumer loans are defined by the “Vintage of Net Charge-Offs” (charge-offs net of recoveries). This methodology establishes the period in which the estimated incurred loss is maximized. Once this period is obtained its is applied to each risk profile of each model to obtain the net charge-off level associated with this period.
For group evaluation of commercial loans the industry or sector of the borrower, owners or managers of the borrower, the borrower’s financial situation, its payment capacity and payment behavior are used as the main variables for determining the risk profile. For group evaluation of mortgage loans we consider the borrower’s credit history, including any defaults on obligations to other creditors, as well as the overdue periods on the loans borrowed from us. The estimated incurred loss rates are then determined using historical averages and other statically estimates depending on the segment and loan product.
F-24
BANCO SANTANDER CHILE AND SUBSIDIARIES NOTES TO THE UNAUDITED CONDENSED CONSOLIDATED INTERIM FINANCIAL STATEMENTS As of September 30, 2011 and 2010 and December 31, 2010 |
NOTE 01 – SUMMARY OF SIGNIFICANT ACCOUNTING POLICIES, continued:
Allocations of mortgage and consumer Loans
Allocations for mortgage and consumer loans are directly related to the maturity of the allocations.
A rating is assigned to all mortgage and consumer loans on an individual basis, using an automatic and sophisticated statistical model which also considers the debtors’ credit behavior. Once the client’s rating is determined, the mortgage or consumer loan provision is calculated using a related risk category and percentage, which depends on its maturity.
During the 2011 period, the Bank--within its normal process of improving the provisions models--based on its experience, has recalibrated its mortgage provisions model, which generated an impact of approximately Ch$ 16,258 million increase in provisions. The effect of this upgrading, recorded as a change of estimate, according to the IAS 8 will be recorded in the Condensed Consolidated Interim Financial Statements.
Charge-offs
Charge-offs refers to derecognition in the Condensed Consolidated Interim Statements of Financial Position of assets corresponding to a loan. This includes a portion of a loan that might not be past due in the case of a loan paid in installments or in a leasing operation (no partial charges offs).
Charge-offs are always recorded with a charge to credit risk allowances. Any payments received on the charged-off accounts will be recorded on the Condensed Consolidated Interim Statements of Income as recovery of loans charged-off.
Loan and accounts receivable charge-offs are recorded on overdue, past due, and current installments based on the past due deadlines presented below.
| Type of loan | Term | |
| Consumer loans with or without real guarantees | 6 months | |
| Other transactions without real guarantees | 24 months | |
| Consumer loans with real guarantees | 36 months | |
| Mortgage loans | 48 months | |
| Consumer leasing | 6 months | |
| Other non mortgage leasing transactions | 12 months | |
| Mortgage leasing (household and business) | 36 months |
Recovery of loans previously charged off and accounts receivable from clients
Recovery of previously charged off loans and accounts receivable from customers, are recorded in the Condensed Consolidated Interim Income Statement as a reduction of provision for loan losses.
| q) | Provisions, contingent assets, and contingent liabilities |
Provisions are liabilities of uncertain timing or amount. Provisions are recognized in the Condensed Consolidated Interim Statements of Financial Position when the following requirements are simultaneously met:
| i. | It is a present obligation (legal or constructive) as a result of past events, and |
| ii. | It is probable that an outflow of resources will be required to settle these obligations and the amount of these resources can be reliably measured. |
Contingent assets or contingent liabilities are any potential rights or obligations arising from past events whose existence will be confirmed only by the occurrence or nonoccurrence of one or more uncertain future events that are not wholly under the Bank’s control.
The following are classified as contingent in the supplementary information:
| i. | Guarantees and bonds: Encompasses guarantees, bonds, and standby letters of credit, and guarantees of payment from buyers in factored receivables. |
| ii. | Confirmed foreign letters of credit: Encompasses letters of credit confirmed by the Bank. |
| iii. | Documentary letters of credit: Includes documentary letters of credit issued by the Bank, which have not yet been negotiated. |
| iv. | Documented guarantees: Guarantees with promissory notes. |
| v. | Interbank guarantee letters: Guarantees issued. |
F-25
BANCO SANTANDER CHILE AND SUBSIDIARIES NOTES TO THE UNAUDITED CONDENSED CONSOLIDATED INTERIM FINANCIAL STATEMENTS As of September 30, 2011 and 2010 and December 31, 2010 |
NOTE 01 – SUMMARY OF SIGNIFICANT ACCOUNTING POLICIES, continued:
| vi. | Unrestricted lines of credit: The unused amount of credit lines that allow customers to draw without prior approval by the Bank (for example, using credit cards or overdrafts in checking accounts). |
| vii. | Other credit commitments: Amounts not yet lent under committed loans, which must be disbursed at an agreed future date when events contractually agreed upon with the customer occur, such as in the case of lines of credit linked to the progress of a construction or similar project. |
| viii. | Other contingent credits: Includes any other kind of commitment by the Bank which may exist and give rise to lending when certain future events occur. In general, this includes unusual transactions such as pledges made to secure the payment of loans among third parties or derivative contracts made by third parties that may result in a payment obligation and are not covered by deposits. |
The consolidated annual accounts reflect all significant provisions for which it is estimated that the probability of having to meet the obligation is more likely than not.
Provisions are quantified using the best available information on the consequences of the event giving rise to them and are reviewed and adjusted at the end of each year and are used to address the specific liabilities for which they were originally recognized. Partial or total reversals are recorded when such liabilities cease to exist or decrease.
Provisions are classified according to the liabilities they cover as follows:
| - | Provisions for employee salaries and expenses. |
| - | Provision for mandatory dividends |
| - | Provisions for contingent credit risks |
| - | Provisions for contingencies |
| r) | Deferred income taxes and other deferred taxes |
The Bank records, when appropriate, deferred tax assets and liabilities for the estimated future tax effects attributable to differences between the carrying amount of assets and liabilities and their tax bases. The measurement of deferred tax assets and liabilities is based on the tax rate, according to the applicable tax laws, using the tax rate that applies to the period when the deferred asset and liability is settled. The future effects of changes in tax legislation or tax rates are recorded in deferred taxes beginning on the date in which the law approving such changes is published.
The effects of deferred taxes due to temporary differences between the tax basis and the carrying amount balances are recorded on an accrual basis, according to IAS 12.
| s) | Use of estimates |
The preparation of the financial statements requires Management to make estimates and assumptions that affect the application of the accounting policies and the reported amounts of assets, liabilities, revenues and expenses. Actual results may differ from these estimates.
In certain cases, generally accepted accounting principles require that assets or liabilities be recorded or disclosed at their fair values. The fair value is the amount at which an asset could be exchanged, or a liability settled, between knowledgeable parties in an arm’s length transaction. Where available, quoted market prices in active markets have been used as the basis for measurement. Where quoted market prices in active markets are not available, the Bank has estimated such values based on the best information available, including the use of internal valuation models and other valuation techniques.
The Bank has established allowances to cover incurred losses. In order to estimate the allowances, loan portfolios must be regularly evaluated taking into consideration factors such as changes in the nature and volume of the loan portfolio, trends in forecasted portfolio quality, credit quality and economic conditions that may adversely affect the borrowers’ ability to pay. Increases in the allowances for loan losses are reflected as “Provisions for loan losses” in the Condensed Consolidated Interim Statement of Income. Loans are charged-off when management determines that a loan or a portion thereof is uncollectible. Charge-offs are recorded as a reduction of the provision for loan losses.
The relevant estimates and assumptions are regularly reviewed by the Bank’s Management to quantify certain assets, liabilities, revenues, expenses, and commitments. Revised accounting estimates are recorded in the period in which the estimate is revised and in any affected future period.
F-26
BANCO SANTANDER CHILE AND SUBSIDIARIES NOTES TO THE UNAUDITED CONDENSED CONSOLIDATED INTERIM FINANCIAL STATEMENTS As of September 30, 2011 and 2010 and December 31, 2010 |
NOTE 01 – SUMMARY OF SIGNIFICANT ACCOUNTING POLICIES, continued:
These estimates, made on the basis of the best available information, mainly refer to:
| - | Impairment losses of certain assets (Notes 8, 9, 11, and 31) |
| - | The useful lives of tangible and intangible assets (Notes 12, 13, and 31) |
| - | The fair value of assets and liabilities (Notes 6, 7, 11, and 34) |
| - | Commitments and contingencies (Note 20) |
| - | Current and deferred taxes (Note 14) |
| t) | Non-current assets held for sale |
Non-current assets (or a group which includes assets and liabilities for disposal) expected to be recovered mainly through sales rather than through continued use, are classified as held for sale. Immediately prior to this classification, assets (or elements of a disposable group) are re-measured in accordance with the Bank’s policies. The assets (or disposal group) are measured at the lower of carrying value or fair value minus costs to sell. From this point on, the assets (or divestiture group) are measured at the minimum value between the book value and the fair value minus costs to sell.
Any impairment loss on disposal is first allocated to goodwill and then to the remaining assets and liabilities on a pro rata basis, except when no losses have been recorded in financial assets, deferred assets, employee benefit plan assets, and investment property, which are still evaluated according to the Bank’s accounting policies. Impairment losses on the initial classification of held-for-sale assets and profits and losses from the revaluation are recorded in income. Profits are not recorded if they outweigh any cumulative loss.
As of September 30, 2011 and December 31, 2010 the Bank has not classified any non-current assets as held for sale.
Assets received or awarded in lieu of payment
Assets received or awarded in lieu of payment of loans and accounts receivable from customers are recorded, in the case of assets received in lieu of payment, at the price agreed by the parties, or otherwise, when the parties do not reach an agreement, at the amount at which the Bank is awarded those assets at a judicial auction.
These assets are subsequently measured at the lower of the initially recorded amount or net realizable value, which corresponds to their fair value (liquidity value determined through an independent appraisal) less costs to sell.
At least once a year, the Bank performs the necessary analysis to update these assets' costs to sell. As of September 30, 2011 the average cost to sell (the cost of maintaining and selling the asset) was estimated at 5.5% of the appraised value. As of September 30, 2010 the average sale cost used was 5.9%.
| u) | Earnings per share |
Basic earnings per share are determined by dividing the net income attributable to the Bank shareholders in a period by the weighted average number of shares outstanding during the period.
Diluted earnings per share are determined in the same way as Basic Earnings, but the weighted average number of outstanding shares is adjusted to take into account the potential diluting effect of stock options, warrants, and convertible debt.
As of September 30, 2011 and 2010 the Bank did not have instruments that generated diluting effects on equity.
| v) | Temporary acquisition (assignment) of assets |
Purchases (sales) of financial assets under non-optional resale (repurchase) agreements at a fixed price (“repos”) are recorded in the Condensed Consolidated Interim Statements of Financial Position as financial assignments (receipts) based on the nature of the debtor (creditor) under “Deposits in the Central Bank of Chile,” “Deposits in financial institutions” or “Loans and accounts receivable from customers” (“Central Bank of Chile deposits,” “Deposits from financial institutions” or “Customer deposits”).
Differences between the purchase and sale prices are recorded as financial interest over the term of the contract.
F-27
BANCO SANTANDER CHILE AND SUBSIDIARIES NOTES TO THE UNAUDITED CONDENSED CONSOLIDATED INTERIM FINANCIAL STATEMENTS As of September 30, 2011 and 2010 and December 31, 2010 |
NOTE 01 – SUMMARY OF SIGNIFICANT ACCOUNTING POLICIES, continued:
| w) | Assets under management and investment funds managed by the Bank |
Assets owned by third parties and managed by certain companies that are within the Bank’s basis of consolidation (Santander Asset Management S.A., Administradora General de Fondos and Santander S.A. Sociedad Securitizadora), are not included in the Condensed Consolidated Interim Statements of Financial Position. Management fees are included under “Fee and commission income” in the Condensed Consolidated Interim Statement of Income.
| x) | Provision for mandatory dividends |
As of September 30, 2011 and 2010 the Bank recorded a provision for mandatory dividends. This provision is made pursuant to Article 79 of the Corporations Act, which is in accordance with the Bank’s internal policy, pursuant to which at least 30% of net income for the period is distributed, except in the case of a contrary resolution adopted at the respective shareholders’ meeting by unanimous vote of the outstanding shareholders. This provision is recorded, as a deduction under the “Retained earnings - Provisions for mandatory dividends” in the Condensed Consolidated Interim Statement of Changes in Equity.
| y) | Employee benefits |
| i. | Post-employment benefits – Defined benefits plans |
According to current collective bargaining and other agreements, the Bank has undertaken to supplement the benefits granted by the public systems corresponding to certain employees and other beneficiary right holders, for retirement, permanent disability or death, outstanding salaries or compensations, contributions to pension funds for active employees and post-employment social benefits.
Features of the Plan:
The main features of the Post-Employment Benefits Plan, sponsored by the Santander Chile Group are:
| a. | Aimed at the Group’s management |
| b. | The general requisite to apply for this benefit is that the employee must be carrying out his/her duties when turning 60 years old. |
| c. | The Bank will take on insurance (pension fund) on the employee’s behalf, for which it will pay regularly the respective premium (contribution). |
| d. | The Bank will be directly responsible for granting benefits. |
The Bank recognizes under line item “Provisions” in the Condensed Consolidated Interim Statements of Financial Position (or in assets under “Other assets,” depending on the funded status of the plan) the present value of its post-employment defined benefit obligations, net of the fair value of the plan assets and of the net recognized cumulative actuarial gains or losses, disclosed in the valuation of these obligations, which are deferred using the “corridor approach”, net of the past service cost, which is deferred over time as explained below.
“Plan assets” are defined as those which will be used to settle the obligations and which meet the following conditions:
| - | They are not owned by the consolidated entities, but by a legally separate third party not related to the Bank. |
| - | They are available only to pay or fund post-employment benefits and cannot be returned to the consolidated entities except when the assets remaining in the plan are sufficient to meet all the obligations of the plan or the entity in relation to the benefits due to current or former employees or to reimburse employee benefits already paid by the Bank. |
“Actuarial gains and losses” are defined as those arising from the differences between previous actuarial assumptions and what has actually occurred, and from changes in the actuarial assumptions used. For the plans, the Bank applies the “corridor approach” criterion, whereby it recognizes in the Condensed Consolidated Interim Statement of Income the amount resulting from dividing by five the higher of the net value of the accumulated actuarial gains and/or losses not recorded at the beginning of each period and exceeding 10% of the current value of the obligations or 10% of the fair value of the assets at the beginning of the period.
“Past service cost”—which arises from changes made to existing post-employment benefits from the introduction of new benefits—is recognized in the Condensed Consolidated Interim Income Statement on a straight-line basis over the period beginning on the date on which the new commitments arose to the date on which the employee has an irrevocable right to receive the new benefits.
F-28
BANCO SANTANDER CHILE AND SUBSIDIARIES NOTES TO THE UNAUDITED CONDENSED CONSOLIDATED INTERIM FINANCIAL STATEMENTS As of September 30, 2011 and 2010 and December 31, 2010 |
NOTE 01 – SUMMARY OF SIGNIFICANT ACCOUNTING POLICIES, continued:
Post-employment benefits are recorded in the Condensed Consolidated Interim Income Statement as follows:
| - | Current service cost, defined as the increase in the present value of the obligations arising as a consequence of the services provided by the employees during the period is recognized under the “Personnel salaries and expenses” line item. |
| - | Interest cost is defined as the increase in the present value of the obligations as a consequence of the passage of time which occurs during the period). When the obligations are shown in liabilities in the Condensed Consolidated Interim Statements of Financial Position net of the plan assets, the cost of the liabilities which are recorded in the Condensed Consolidated Interim Income Statement of income under “Personnel salaries and expenses”, reflects exclusively the obligations recognized as liabilities. |
| - | The expected return on the plan’s assets and the gains and losses in their value, less any cost arising from their management and the taxes to which they are subject are recorded in the Condensed Consolidated Interim Income Statement under “Personnel salaries and expenses”. |
| - | The actuarial gains and losses calculated using the corridor approach and unrecognized past service cost, are recorded in the Condensed Consolidated Interim Income Statement under “Personnel salaries and expenses”. |
| ii. | Severance Provision: |
Severance provisions for years of employment are recorded only when they actually occur or upon the availability of a formal and detailed plan in which the fundamental modifications to be made are identified, provided that such plan has already started to be implemented or its principal features have been publicly announced, or objective facts about its execution are known.
| iii. | Share-based compensation: |
The allocation of equity instruments to executives of the Bank and its Subsidiaries as a form of compensation for their services, when those instruments are provided at the end of a specific period of employment, is recorded as an expense in the Condensed Consolidated Interim Income Statement under the “Personnel salaries and expenses” item, as the relevant executives provide their services over the course of the period.
These benefits do not generate diluting effects, since they are based on shares of Banco Santander S.A. (the parent company of Banco Santander Chile, headquartered in Spain).
| z) | New accounting pronouncements |
| i. | New and revised IFRS effective in the current year |
The following new and revised IFRS have been adopted in these financial statements:
Improvements to IFRS – On May 06, 2010 the IASB issued improvements to IFRS 2010, incorporating amendments to 7 IFRS. This is the third set of modifications issued under the yearly improvement process which were designed to make necessary though no urgent modifications to IFRS. The modifications are effective for yearly periods beginning on or after July 1, 2010 and for yearly periods beginning on or after January 1, 2011. The adoption of these improvements had no significant impact on the Bank’s Condensed Consolidated Interim Financial Statements.
Amendment to IFRIC 14, IAS 19, Prepayments of a minimum funding requirement - On December 2009, the IASB issued Prepayments of a minimum funding requirement, modifications to IFRIC 14, IAS 19 - Limit over asset by defined benefits, minimum funding requirements and their interaction. The modifications have been carried out to remedy a non-intentional consequence of IFRIC 14 in which it is forbidden for entities in some circumstances to recognize certain voluntary prepayments as assets. The enforcement of this amendment had no significant impact on the Bank’s Condensed Consolidated Interim Financial Statements.
IFRIC 19, Extinguishing Financial Liabilities with Equity Instruments – The IASB issued this interpretation on November 26, 2009 which provides guidelines on how to record the extinction of a financial liability through the issuance of equity instruments. The interpretation concluded that issuing equity instruments to extinguish an obligation constitutes the paid consideration. The consideration should be measured at fair value of the issued equity instrument, unless the fair value is not easily determined, in which case, the equity instruments will be measured at fair value of the extinguished obligation. The enforcement of this interpretation had no significant impact on the Bank’s Condensed Consolidated Interim Financial Statements.
F-29
BANCO SANTANDER CHILE AND SUBSIDIARIES NOTES TO THE UNAUDITED CONDENSED CONSOLIDATED INTERIM FINANCIAL STATEMENTS As of September 30, 2011 and 2010 and December 31, 2010 |
NOTE 01 – SUMMARY OF SIGNIFICANT ACCOUNTING POLICIES, continued:
Amendment to IAS 24, Disclosure of Related Parties – On November 4, 2009 the IASB issued modifications to IAS 24. The revised regulation simplifies the disclosure requirements for entities controlled, jointly-controlled or significantly influenced by a government entity (designated as government-related entity) and clarifies the related entity definition. It is effective for yearly periods beginning on or after January 1, 2011. It requires back application. Therefore, on the first adoption year, disclosures for comparative years should be reissued. Early application is allowed, whether of the entire regulation or the partial exemption for related government entities. If an entity applies the regulation, or part of it, for a period before January 1, 2011 it is required that this fact is revealed. The Bank is no related to any government entity; therefore, the disclosure exemptions do not apply to it. In addition, the changes to the definition of Related Party did not cause an effect on the Bank’s Condensed Consolidated Interim Financial Statements.
Amendment to IAS 32, Financial Instruments: Presentation – On October 8, 2009 the IASB issued a modification to IAS 32, Financial Instruments: Presentation, entitled Classification of Right Issues. Pursuant with the modifications, rights, options and warrants that in some way fulfill the definition in paragraph 11 of IAS 32, issued to acquire a set number of non-derivative equity instruments belonging to an entity for a set amount in any currency are classified as equity instruments as long as the offer is made pro-ratio to all current owners of the same type of equity instrument. The enforcement of this modification had no significant impact on the Bank’s Condensed Consolidated Interim Financial Statements.
Amendment to IFRS 7, Financial Instruments: Disclosures - On October 7, 2010 the IASB issued Disclosures - Transfer of Financial Assets (Modifications to IFRS 7 Financial Instruments - Disclosures) which increases the disclosure requirements for transactions involving the transfer of financial assets. These modifications aim at providing better transparency over risk exposure of transactions where a financial asset is transferred but the transferring party retains some level of continuous exposure (referred to as ‘continuous involvement’) in the asset. Modifications also require the disclosure of when the transfers of financial assets have not been evenly distributed during the period (i.e., when transfers take place close to the report period). These modifications will be applied for annual periods beginning on or after January 1, 2011. Early adoption is allowed. In-advance enforcement is allowed. Disclosures are not required for any of the periods presented starting before the initial application date of the modifications. The adoption of these improvements had no significant impact on the Bank´s Condensed Condensed Consolidated Interim Financial Statement.
| ii. | New and revised IFRS in issue but not yet effective |
As of the date of issuance of these Condensed Consolidated Interim financial statements, the following accounting pronouncements have been issued by the IASB. These pronouncements are new pronouncements or amendments, revisions, modifications, or interpretations of existing pronouncements. Further, the applications of the below pronouncements is not mandatory until the dates noted below.
IAS 1, Presentation of Financial Statements – In June 2011 the presentation of Other Comprehensive Income was modified in two significant aspects: 1) An entity may present a single "Statement of Profit and Loss and Other Comprehensive Income" presented in two sections, but sections shall be presented together, with the profit or loss section presented first followed directly by the other comprehensive income section; 2) The Other Comprehensive Income item shall present line items for amount of OCI in the period, classified by nature and grouped into those that will not be reclassified subsequently to profit or loss; and those will be reclassified subsequently to profit or loss when specific conditions are met. The effective date is for the annual periods beginning on or after July 1, 2012, with early adoption permitted. The Bank believes this modification will not significantly affect the interim financial statements.
IAS 19 Employee Benefits – In June 2011 the following modifications were incorporated to the regulations: 1) Eliminates the use of the 'corridor' approach, recognizing in results gains and losses that arise from defined benefit plans; 2) Requirement to include service and finance cost in profit or loss and remeasurement in OCI; 3) Along with the previous requirements these modifications introduce improved disclosure requirements that will better show characteristics of defined benefit plan and the risk arising from those plans. The effective date is for the annual periods beginning on or after July 1, 2013 with early adoption permitted. The Bank is assessing the potential impact that this amendments will have on the Bank’s financial statements.
IFRS 10, Condensed Consolidated Interim Financial Statements – On May 12, 2011 the IASB issued the IFRS 10 Condensed Consolidated Interim Financial Statements which replaces IAS 27 Consolidated and Separated Interim Financial Statements and SIC 12 Consolidation - Special Purpose Entities. The purpose of this regulation is to provide a single consolidation basis for all entities, whatever the nature of the investment, based on control. The definition of control includes three elements: power over entity, exposure or rights to variable returns over the entity, and the capacity to use the power over the entity to affect the investor's returns. IFRS 10 provides a detailed guide on how to apply the control principle in different situations, including relationships of agency and potential possession of vote rights. An investor will reassess if s/he controls an entity if there are changes in facts and circumstances. IFRS 10 replaces IAS 27 in those matters related to when and how an investor should prepare Condensed Consolidated Interim Financial Statements and replaces the SIC 12 completely. The effective date is January 1, 2013 and its early enforcement is allowed under certain circumstances. The Bank is assessing the potential impact this regulation will have on the Bank’s financial statements.
IFRS 11, Joint Agreements - On May 12, 2011 the IASB issued IFRS 11 Joint Arrangements, which replaces IAS 31 Interests In Joint Ventures and SIC 13 Jointly Controlled Entities - Non monetary Contribution from Venturers. Under IFRS 11, joint arrangements are classified as joint operations or joint ventures, depending on the rights and obligations of the parties to the arrangements. In contrast, under IAS 31, there are three types of joint arrangements: jointly controlled entities, jointly controlled assets and jointly controlled operations. In addition, joint ventures under IFRS 11 are required to be accounted for using equity method of accounting, whereas jointly controlled entities under IAS 31 can be accounted for using the equity method of accounting or proportionate accounting. The effective date is January 1, 2013 and early adoption is permitted under certain circumstances. The Bank is assessing the potential impact this regulation will have on the Bank’s financial statements.
F-30
BANCO SANTANDER CHILE AND SUBSIDIARIES NOTES TO THE UNAUDITED CONDENSED CONSOLIDATED INTERIM FINANCIAL STATEMENTS As of September 30, 2011 and 2010 and December 31, 2010 |
IFRS 12, Disclosure of Interests in Other Entities - On May 12, 2011 the IASB issued IFRS 12 Disclosure of Interests in Other Entities, which requires detailed disclosures related to participation in subsidiaries, joint arrangements, associates and non-consolidated structured entities. IFRS 12 establishes objective revelations and minimum specific disclosures that an entity must provide to fulfill said objectives. An entity must reveal information that would help users of its financial statements to evaluate the nature and associated risks to the participation in other entities and the effects of said participations in its financial statements. Disclosure requirements are extensive and require significant efforts to gather the necessary information. The effective date is January 1, 2013; however, it is allowed to incorporate these new disclosures in the financial statements before that date. The Bank is assessing the potential impact this regulation will have on the Bank’s interim financial statements.
IFRS 13, Fair Value Measurement – Issued on May 12, 2011 by the IASB. It establishes a single source to serve as guide for the measure at fair value under IFRS. This regulation applies both to financial and non-financial measures of fair value. Fair Value is defined as “value that would be received by selling an asset or by paying for transferring a liability in an orderly transaction between market participants at the time of measurement date· (i.e. exit value). IFRS 13 is effective for annual periods beginning on or after January 1, 2013 with early adoption allowed--and it applies prospectively since the beginning of the year of its enforcement. The Bank is assessing the potential impact this regulation will have on the Bank’s financial statements.
IAS 27 Separate Financial Statements (revised in 2011) - On May 12, IAS 27 Consolidated and separate financial statements has been amended by the issuance of IFRS 10 but it keeps the guidelines for separate financial statements. Effective date is January 1, 2013 though its early adoption is permitted as the new regulations are adopted. The Bank believes this regulation will have no significant effect on the Bank’s financial statements since the modification does not alter the accounting treatment of the separate financial statements.
IAS 28, Investments in Associates and Join Ventures (revised in 2011) – On May 12, 2011 IAS 28 Investments in Associates has been amended pursuant to changes incorporated by IFRS 10, IFRS 11 and, IFRS 12. Effective date is January 1, 2013 though its early adoption is permitted as the new regulations are adopted. The Bank is assessing the potential impact this revision will have on the Bank’s interim financial statements.
Amendment to IFRS 1, First Time Adoption of IFRS – On December 20, 2010 the IASB published certain modifications to IFRS 1, specifically:
(i) Elimination of Set Dates for First Time Adopters - These modifications help first time adopters of IFRS by replacing the back application date of the recording of financial assets and liabilities of ‘January 1, 2004’ with the ‘transition date to IFRS’. In this way, first time IFRS adopters do not have to apply the recording requirements of IAS 39 retrospectively to a previous date and it frees adopters from recalculating profit and losses of ‘day 1’ over transactions that took place before the transition date to IFRS.
(ii) Severe Hyperinflation – These modifications provide guidelines for entities coming from a sever hyperinflation, allowing them at the date of transaction of entities, to measure all assets and liabilities held before the normalization of functional currency date to fair value on the transition date to IFRS and use that fair value as the attributed cost for those assets and liabilities in the statements of opening financial position under IFRS. Entities using this exemption will have to describe the circumstances of how and why their functional currency was subjected to sever hyperinflation and the circumstances that led to end those conditions.
These modifications will be mandatory for periods beginning on or after July 1, 2011. Early adoption is allowed. The Banks considers these modifications will have no effect on its financial statement since it is not a first time adopter of IFRS.
Amendment to IAS 12, Income Taxes – On December 20, 2010 the IASB published Deferred Taxes: Recovery of Underlying Assets – Modifications to IAS 12. The modifications establish an exemption to the IAS 12 general principle that the measurement of assets and liabilities by deferred taxes should reflect the tax consequences that would continue the way the entity expects to recover the book value of an asset. The exemption applies specifically to assets and liabilities by deferred taxes originating from investment properties measured using the fair value model from IAS 40 and investment properties acquired in a business combination, if this is afterwards measured using the IAS 40 fair value model. The modification incorporates the assumption that the current value of the investment property will be recovered when sold, except when the property is depreciable and kept within a business model that aims at consuming substantially all economic benefits through time rather than through sale. These modifications should be retrospectively applied demanding a re-statement of all l assets and liabilities related to deferred taxes within the reach of this modification, including those initially recorded in a business combination. These modifications will be mandatory for periods beginning on or after January 1, 2012. Early enforcement is allowed. These modifications will be adopted in the Bank´s financial statements for the period beginning on January 1, 2012. The Bank is assessing the potential impact of the adoption of these measures.
Amendments to IFRS 9 – Financial Instruments – On October 28, 2010 the IFRS published a revised version of IFRS 9, Financial Instruments. The revised regulation keeps the requirements for classification and measurement of financial assets published on November 2008 with added guidelines on classification and measurement of financial liabilities. As part of the restructuring of IFRS 9, the IASB has also reproduced the guidelines on recording of financial instruments and related implementation guidelines from IAS 39 to IFRS 9. These new guidelines constitute the first stage of the IASB project to replace IAS 39. The other stages, impairment and hedge accounting, have not been finished yet.
The guidelines included in IFRS 9 about the classification and measurement of financial assets has not changed from those established in IAS 39. In other words, financial liabilities will continue to be measured whether by amortized cost or fair value with change in income. The concept of bifurcation of embedded derivatives in a contract by financial asset has not change either. Financial liabilities kept to negotiate will continue to be measured at fair value with changes to income, and all other financial assets will be measured to amortized cost unless the fair value option is applied using the present criteria on IAS 39..
Notwithstanding the latter, there are two differences with regards to IAS 39:
F-31
BANCO SANTANDER CHILE AND SUBSIDIARIES NOTES TO THE UNAUDITED CONDENSED CONSOLIDATED INTERIM FINANCIAL STATEMENTS As of September 30, 2011 and 2010 and December 31, 2010 |
NOTE 01 – SUMMARY OF SIGNIFICANT ACCOUNTING POLICIES, continued:
| · | The presentation of effects from changes in fair value attributable to a liability’s credit risk; and |
| · | The elimination of the cost exemption for liability derivatives to be settled by giving non-traded equity instruments. |
The Bank’s Management, in agreement with the SBIF will not apply this regulation in advance but rather adopt it in the Group's financial statements for the period beginning on January 2013. The Bank has not had the chance to consider the potential impact of the adoption of these modifications.
IFRS 9, Financial Instruments – On November 12, 2009 the IASB issued IFRS 9, Financial Instruments. This regulation incorporates new requirements for the classification and measurement of financial assets and it is effective for annual periods beginning on or after January 2013, allowing early adoption. IFRS 9 specifies how an entity should classify and measure its financial assets. It requires that all financial assets be classified in their entire on the basis of the entity’s business model for the management of financial assets and the features of the financial assets agreement cash flows. Financial assets are measured either at amortized cost or fair value. Only financial assets classified as measured at amortized cost will be tested for impairment. The Bank management, in accordance with SBIF recommendations, will not apply this regulation in advance; furthermore, this regulation will not be applied as long as the SBIF does not set it as mandatory use standard for all balances.
F-32
BANCO SANTANDER CHILE AND SUBSIDIARIES NOTES TO THE UNAUDITED CONDENSED CONSOLIDATED INTERIM FINANCIAL STATEMENTS As of September 30, 2011 and 2010 and December 31, 2010 |
NOTE 02 – ACCOUNTING CHANGES:
As of September 30, 2011 and December 31, 2010, there have not been accounting changes that significantly affect the presentation of these consolidated financial statements.
NOTE 03 - SIGNIFICANT EVENTS:
As of September 30, 2011, the following significant events have occurred and had an impact on the Bank’s operations or the Condensed Consolidated Interim financial statements:
| a) | The Board |
In an Extraordinary Board Session on April 26, 2011 Mr. Lisandro Serrano Spoerer was confirmed as Director in the position left by Ms. Claudia Bobadilla Ferrer.
| b) | Issuance of bonds during 2011 |
In 2011, the Bank issued bonds as detailed below. The 2011 detail of placements is included in Note 16.
b.1) 2011 Senior bonds
| Series | Amount | Term | Issue Rate | Issuance date | Maturity date |
| Floating rate bond | USD 500,000,000 | 5 years | Libor (3 months) + 160 bp | 01/19/2011 | 01/19/2016 |
| Total | USD 500,000,000 | ||||
| E1 | UF 4,000,000 (i) | 5 years | 3.00 % per annum simple | 02/01/2011 | 02/01/2016 |
| E2 | UF 4,000,000 (ii) | 7.5 years | 3.50 % per annum simple | 01/01/2011 | 07/01/2018 |
| E3 | UF 4,000,000 (iii) | 8.5 years | 3.50 % per annum simple | 01/01/2011 | 07/01/2019 |
| Total | UF 8,000,000 | ||||
| E4 | CLP 50,000,000,000(iv) | 5 years | 6.75 % per annum simple | 06/01/2011 | 06/01/2016 |
| Total | CLP 50,000,000,000 |
| (i) | As of September 30, 2011 UF 896,000 in bonds have been issued; leaving this series with a UF 3,104,000 par value to be placed. |
| (ii) | As of September 30, 2011 UF 3,048,000 in bonds have been issued; leaving this series with a UF 952,000 par value to be placed. |
| (iii) | As of September 30, 2011 UF 1,590,000 in bonds have been issued; leaving this series with a UF 2,410,000 par value to be placed. |
| (iv) | As of September 30, 2011 CLP 26,800,000,000 in bonds have been issued; leaving this series with a CLP 23,200,000,000 par value to be placed. |
b.2) 2011 Subordinated bonds
In 2011, the Bank has issued the following subordinated bonds:
| Series | Amount | Term | Issue Rate | Issuance date | Maturity date |
| G3 | UF 3,000,000 | 25 years | 3.90% annual due | 07/01/2010 | 07/01/2035 |
| G5 | UF 4,000,000 (i) | 20 years | 3.90% annual due | 04/01/2011 | 04/01/2031 |
| Total | UF 7,000,000 |
| (i) | As of September 30, 2011 UF 2,100,000 in bonds have been issued; leaving this series with a UF 1,900,000 par value to be placed. |
F-33
BANCO SANTANDER CHILE AND SUBSIDIARIES NOTES TO THE UNAUDITED CONDENSED CONSOLIDATED INTERIM FINANCIAL STATEMENTS As of September 30, 2011 and 2010 and December 31, 2010 |
NOTE 03 - SIGNIFICANT EVENTS, continued:
| c) | Building sale |
In 2011, the Bank sold one branch. This transaction is detailed on Note 32.
| e) | Assignment of loans previously charged off |
In 2011, Banco Santander Chile signed agreements with “Fondo de Inversiones Cantábrico” to assign loans previously charged off. As of September 30, the following portfolio sales have been carried out:
| Date of agreement | Nominal portfolio sale | Nominal portfolio sale Total | Selling price | ||||||
| Commercial | Consumer | ||||||||
| MCh$ | MCh$ | MCh$ | MCh$ | ||||||
| 01-20-2011 | 888 | 8,222 | 9,110 | 592 | |||||
| 02-23-2011 | 774 | 6,802 | 7,576 | 492 | |||||
| 03-23-2011 | 969 | 6,828 | 7,797 | 506 | |||||
| 04-26-2011 | 768 | 6,386 | 7,154 | 465 | |||||
| 05-25-2011 | 990 | 6,611 | 7,601 | 494 | |||||
| 06-22-2011 | 805 | 7,676 | 8,481 | 551 | |||||
| 07-26-2011 | 930 | 9,207 | 10,137 | 659 | |||||
| 08-24-2011 | 2,351 | 10,221 | 12,572 | 817 | |||||
| 09-22-2011 | 664 | 14,745 | 15,409 | 1,002 | |||||
| Total | 9,139 | 76,698 | 85,837 | 5,578 | |||||
F-34
BANCO SANTANDER CHILE AND SUBSIDIARIES NOTES TO THE UNAUDITED CONDENSED CONSOLIDATED INTERIM FINANCIAL STATEMENTS As of September 30, 2011 and 2010 and December 31, 2010 |
NOTE 04 - BUSINESS SEGMENTS:
The Bank manages and measures the performance of its operations by business segment. The information included in this note is not necessarily comparable to that of other financial institutions, since it is based on management’s internal segment information system which has been adopted by the Bank. However, the valuation and classification of assets, liabilities, and income for each segment considers the accounting criteria established on Note 01.d) of the Consolidated Financial Statements.
Inter-segment transactions are conducted under normal arm’s length commercial terms and conditions. Each segment’s assets, liabilities, and income include items directly attributable to the segment to which they can be allocated on a reasonable basis.
The Bank has the following business segments:
Individuals
| a. | Santander Banefe |
Serves individuals with monthly incomes from Ch$150,000 to Ch$400,000, who receive services through Santander Banefe. This segment provides customers a variety of services, including consumer loans, credit cards, auto loans, mortgage loans, debit cards, savings products, mutual funds, and insurance.
| b. | Commercial banking |
Serves individuals with monthly incomes exceeding Ch$400,000 pesos. This segment provides customers a variety of services, including consumer loans, credit cards, auto loans, mortgage loans, debit cards, savings products, mutual funds, commercial loans, foreign trade, checking accounts, insurance and stock brokerage.
Small and mid-sized companies (PYMEs)
Serves small companies with annual sales of less than Ch$1,200 million. This segment provides customers a variety of products, including commercial loans, government-guaranteed loans, leasing, factoring, foreign trade, credit cards, mortgage loans, checking accounts, savings products, mutual funds, and insurance.
Institutional
Serves institutions such as universities, government agencies, and municipal and regional governments. This segment provides a variety of products, including commercial loans, leasing, factoring, foreign trade, credit cards, mortgage loans, checking accounts, transactional services, treasury services, savings products, mutual funds, and insurance.
Companies
This companies segment is composed of Commercial Banking and Company Banking, where sub-segments of medium-sized companies (Companies), real estate companies (Real Estate) and large corporations are found:
| a. | Companies |
Serves companies with annual sales exceeding Ch$1,200 million and up to Ch$10,000 million. This segment provides a wide variety of products, including commercial loans, leasing, factoring, foreign trade, credit cards, mortgage loans, checking accounts, transactional services, treasury services, financial consulting, savings products, mutual funds, and insurance.
| b. | Real estate |
This segment also includes all the companies engaged in the real estate industry who carry out projects to sell properties to third parties and all builders with annual sales exceeding Ch$800 million with no ceiling. These clients are offered not only the traditional banking services but also specialized services to finance projects, mainly residential, with the aim of expanding sales of mortgage loans.
| c. | Large Corporations |
Serves companies with annual sales exceeding Ch$10,000 million. This segment provides a wide variety of products, including commercial loans, leasing, factoring, foreign trade, credit cards, mortgage loans, checking accounts, transactional services, treasury services, financial consulting, savings products, mutual funds, and insurance.
F-35
BANCO SANTANDER CHILE AND SUBSIDIARIES NOTES TO THE UNAUDITED CONDENSED CONSOLIDATED INTERIM FINANCIAL STATEMENTS As of September 30, 2011 and 2010 and December 31, 2010 |
NOTE 4 - BUSINESS SEGMENTS, continued:
Global Banking and Markets
The Global Banking and Markets segment is comprised of:
| a. | Corporate |
Foreign multinational corporations or Chilean corporations whose sales exceed Ch$10,000 million. This segment provides a wide variety of products, including commercial loans, leasing, factoring, foreign trade, credit cards, mortgage loans, checking accounts, transactional services, treasury services, financial consulting, savings products, mutual funds, and insurance.
| b. | Treasury |
The Treasury Division provides sophisticated financial products, mainly to companies in the Wholesale Banking area and the Companies segment. These include products such as short-term financing and fund raising, brokerage services, derivatives, securitization, and other customized products. The Treasury area also handles intermediation of positions and manages the Bank’s owned investment portfolio.
Corporate Activities (“Other”)
This segment includes Financial Management, which develops global foreign exchange structural position management functions, involving the parent company’s structural interest risk and liquidity risk the latter, through issuances and utilizations. This segment also manages the Bank’s personal funds, capital allocation by unit, and the financing of investments made. The foregoing usually results in a negative contribution to income.
In addition, this segment encompasses all intra-segment income and activities not assigned to a given segment or product with customers.
The segment´s accounting policies are the same as those described in the summary of accounting policies, and are customized to meet the needs of the Bank’s management. The Bank earns most of its income in the form of interest income, fee and commission income and income from financial operations. To evaluate a segment’s financial performance, the highest decision making authority bases his assessment on the segment's interest income, fee and commission income, and expenses. This assessment helps the Bank make decisions over the resources that will be allocated to each segment.
To achieve the strategic objectives adopted by the top management and adapt to changing market conditions, the Bank makes changes in its organization from time to time, which in turn have a greater or lesser impact on how it is managed or administered. Hence, this disclosure furnishes information on how the Bank is managed as of September 30, 2011. The information for the previous year (2010) has been prepared with the valid criteria at the date of reporting of these financial statements, to achieve a proper comparability of figures.
Beginning on January1, 2010 the bussines segments Individual, PYMEs, Institutional and Companies now constitute the Comercial Banking segment wich reports directly to the CEO.
The Global Banking and Markets segment continues to report to the Organization Executive Vice-President .
The following tables set forth the Bank's income by business segment, for the periods ending as of September 30, 2011 and 2010, including the respective loans and Accounts receivable balances:
F-36
BANCO SANTANDER CHILE AND SUBSIDIARIES NOTES TO THE UNAUDITED CONDENSED CONSOLIDATED INTERIM FINANCIAL STATEMENTS As of September 30, 2011 and 2010 and December 31, 2010 |
NOTE 4 - BUSINESS SEGMENTS, continued:
| For the quarter ended as of September 30, 2011 | ||||||||||||||||||||||||
Net interest income | Net fee and commission income | ROF (1) | Provisions | Support expenses (2) | Segment’s net contribution | |||||||||||||||||||
| MCh$ | MCh$ | MCh$ | MCh$ | MCh$ | MCh$ | |||||||||||||||||||
| Segments | ||||||||||||||||||||||||
| Individuals | 128,536 | 43,639 | 1,258 | (67,934 | ) | (82,894 | ) | 22,605 | ||||||||||||||||
| Santander Banefe | 31,084 | 10,512 | 9 | (21,663 | ) | (19,225 | ) | 717 | ||||||||||||||||
| Commercial Banking | 97,452 | 33,127 | 1,249 | (46,271 | ) | (63,669 | ) | 21,888 | ||||||||||||||||
| Small and mid-sized companies (PYMEs) | 81,974 | 9,314 | 2,446 | (15,825 | ) | (19,228 | ) | 58,681 | ||||||||||||||||
| Institutional | 8,849 | 323 | 244 | (234 | ) | (2,841 | ) | 6,341 | ||||||||||||||||
| Companies | 22,636 | 6,040 | 3,582 | (11,246 | ) | (9,994 | ) | 11,018 | ||||||||||||||||
| Companies | 10,390 | 3,214 | 1,795 | (5,296 | ) | (5,358 | ) | 4,745 | ||||||||||||||||
| Large Corporations | 12,054 | 2,105 | 1,619 | (1,253 | ) | (3,477 | ) | 11,048 | ||||||||||||||||
| Real estate | 192 | 721 | 168 | (4,697 | ) | (1,159 | ) | (4,775 | ) | |||||||||||||||
| Commercial Banking | 241,995 | 59,316 | 7,530 | (95,239 | ) | (114,957 | ) | 98,645 | ||||||||||||||||
| Global Banking and Markets | 17,908 | 4,013 | 22,111 | (183 | ) | (9,318 | ) | 34,531 | ||||||||||||||||
| Corporate | 23,742 | 5,551 | 935 | 48 | (3,609 | ) | 26,667 | |||||||||||||||||
| Treasury | (5,834 | ) | (1,538 | ) | 21,176 | (231 | ) | (5,709 | ) | 7,864 | ||||||||||||||
| Other | (27,846 | ) | 2,662 | (6,640 | ) | 507 | (4,081 | ) | (35,398 | ) | ||||||||||||||
| Total | 232,057 | 65,991 | 23,001 | (94,915 | ) | (128,356 | ) | 97,778 | ||||||||||||||||
| Other operating income | (542 | ) | ||
| Other operating expenses | (10,192 | ) | ||
| Income from investments in other companies | 546 | |||
| Income tax expense | (15,566 | ) | ||
| Consolidated income for the period | 72,024 |
| (1) | Corresponds to the sum of net income from financial operations and the foreign exchange profit. |
| (2) | Corresponds to the sum of personnel salaries and expenses, administrative expenses, depreciation, amortization, and impairment. |
F-37
BANCO SANTANDER CHILE AND SUBSIDIARIES NOTES TO THE UNAUDITED CONDENSED CONSOLIDATED INTERIM FINANCIAL STATEMENTS As of September 30, 2011 and 2010 and December 31, 2010 |
NOTE 4 - BUSINESS SEGMENTS, continued:
| For the quarter ended as of September 30, 2010 | ||||||||||||||||||||||||
Net interest income | Net fee and commission income | ROF (1) | Provisions | Support expenses (2) | Segment’s net contribution | |||||||||||||||||||
| MCh$ | MCh$ | MCh$ | MCh$ | MCh$ | MCh$ | |||||||||||||||||||
| Segments | ||||||||||||||||||||||||
| Individuals | 139,371 | 48,597 | 699 | (61,733 | ) | (73,559 | ) | 53,375 | ||||||||||||||||
| Santander Banefe | 26,966 | 8,007 | 5 | (20,149 | ) | (19,506 | ) | (4,677 | ) | |||||||||||||||
| Commercial Banking | 112,405 | 40,590 | 694 | (41,584 | ) | (54,053 | ) | 58,052 | ||||||||||||||||
| Small and mid-sized companies (PYMEs) | 74,816 | 8,432 | 2,003 | (17,963 | ) | (16,934 | ) | 50,354 | ||||||||||||||||
| Institutional | 9,377 | 592 | 502 | (175 | ) | (2,540 | ) | 7,756 | ||||||||||||||||
| Companies | 40,262 | 3,900 | 4,071 | (2,277 | ) | (8,567 | ) | 37,389 | ||||||||||||||||
| Companies | 26,288 | 2,780 | 1,874 | (3,315 | ) | (4,103 | ) | 23,524 | ||||||||||||||||
| Large corporations | 6,279 | 468 | 1,954 | 1,132 | (3,405 | ) | 6,428 | |||||||||||||||||
| Real estate | 7,695 | 652 | 243 | (94 | ) | (1,059 | ) | 7,437 | ||||||||||||||||
| Commercial Banking | 263,826 | 61,521 | 7,275 | (82,148 | ) | (101,600 | ) | 148,874 | ||||||||||||||||
| Global Banking and Markets | (5,113 | ) | 5,941 | 13,525 | (312 | ) | (7,639 | ) | 6,402 | |||||||||||||||
| Corporate | (4,184 | ) | 5,865 | 1,033 | (312 | ) | (2,865 | ) | (463 | ) | ||||||||||||||
| Treasury | (929 | ) | 76 | 12,492 | - | (4,774 | ) | 6,865 | ||||||||||||||||
| Other | (23,039 | ) | (1,026 | ) | 913 | (227 | ) | (4,331 | ) | (27,710 | ) | |||||||||||||
| Total | 235,674 | 66,436 | 21,713 | (82,687 | ) | (113,570 | ) | 127,566 | ||||||||||||||||
| Other operating income | 2,065 | |||
| Other operating expenses | (13,799 | ) | ||
| Income from investments in other companies | 832 | |||
| Income tax expense | (9,991 | ) | ||
| Consolidated income for the period | 106,673 |
| (1) | Corresponds to the sum of net income from financial operations and the foreign exchange profit. |
| (2) | Corresponds to the sum of personnel salaries and expenses, administrative expenses, depreciation, amortization, and impairment. |
F-38
BANCO SANTANDER CHILE AND SUBSIDIARIES NOTES TO THE UNAUDITED CONDENSED CONSOLIDATED INTERIM FINANCIAL STATEMENTS As of September 30, 2011 and 2010 and December 31, 2010 |
NOTE 4 - BUSINESS SEGMENTS, continued:
| For the 9-month period ended on September 30, 2011 | ||||||||||||||||||||||||||||
| Net interest income | Net fee and commission income | ROF (2) | Provisions | Support expenses (3) | Segment’s net contribution | Loans and accounts receivables from customers (1) | ||||||||||||||||||||||
| MCh$ | MCh$ | MCh$ | MCh$ | MCh$ | MCh$ | MCh$ | ||||||||||||||||||||||
| Segments | ||||||||||||||||||||||||||||
| Individuals | 416,739 | 140,905 | 5,432 | (157,586 | ) | (237,911 | ) | 167,579 | 9,187,526 | |||||||||||||||||||
| Santander Banefe | 84,851 | 29,255 | 267 | (52,375 | ) | (52,227 | ) | 9,771 | 789,253 | |||||||||||||||||||
| Commercial banking | 331,888 | 111,650 | 5,165 | (105,211 | ) | (185,684 | ) | 157,808 | 8,398,273 | |||||||||||||||||||
| Small and mid-sized companies (PYMEs) | 149,164 | 28,702 | 7,611 | (49,450 | ) | (55,260 | ) | 80,767 | 2,522,698 | |||||||||||||||||||
| Institutional | 19,531 | 1,382 | 677 | (209 | ) | (8,232 | ) | 13,149 | 351,644 | |||||||||||||||||||
| Companies | 99,999 | 18,265 | 10,146 | (30,021 | ) | (30,039 | ) | 68,350 | 3,731,980 | |||||||||||||||||||
| Companies | 46,370 | 9,542 | 5,308 | (15,613 | ) | (16,658 | ) | 28,949 | 1,572,862 | |||||||||||||||||||
| Large corporations | 39,804 | 6,428 | 4,290 | (14,101 | ) | (10,059 | ) | 26,362 | 1,586,231 | |||||||||||||||||||
| Real estate | 13,825 | 2,295 | 548 | (307 | ) | (3,322 | ) | 13,039 | 572,887 | |||||||||||||||||||
| Commercial Banking | 685,433 | 189,254 | 23,866 | (237,266 | ) | (331,442 | ) | 329,845 | 15,793,848 | |||||||||||||||||||
| Global Banking and Markets | 35,369 | 17,689 | 54,711 | 4,788 | (25,788 | ) | 86,769 | 1,905,005 | ||||||||||||||||||||
| Corporate | 47,046 | 17,989 | 1,182 | 7,410 | (10,230 | ) | 63,397 | 1,892,850 | ||||||||||||||||||||
| Treasury | (11,677 | ) | (300 | ) | 53,529 | (2,622 | ) | (15,558 | ) | 23,372 | 12,155 | |||||||||||||||||
| Other | (12,648 | ) | 2,487 | (307 | ) | 536 | (11,975 | ) | (21,907 | ) | 69,541 | |||||||||||||||||
| Total | 708,154 | 209,430 | 78,270 | (231,942 | ) | (369,205 | ) | 394,707 | 17,768,394 | |||||||||||||||||||
| Other operating income | 1,164 | |||
| Other operating expenses | (34,540 | ) | ||
| Income from investments in other companies | 1,673 | |||
| Income tax expense | (57,943 | ) | ||
| Consolidated income for the period | 305,061 |
| (1) | Corresponds to Loans and accounts receivable from customers plus interbank loans, without deducting their allowances for loan losses. |
| (2) | Corresponds to the sum of the net income from financial operations and net foreign exchange profit (loss). |
| (3) | Corresponds to the sum of Personnel salaries and expenses, administrative expenses, amortization, and impairment. |
F-39
BANCO SANTANDER CHILE AND SUBSIDIARIES NOTES TO THE UNAUDITED CONDENSED CONSOLIDATED INTERIM FINANCIAL STATEMENTS As of September 30, 2011 and 2010 and December 31, 2010 |
NOTE 4 - BUSINESS SEGMENTS, continued:
| For the 9-month period ended as of September 30, 2010 | As of December 31, 2010 | |||||||||||||||||||||||||||
| Net interest income | Net fee and commission income | ROF (2) | Provisions | Support expenses (3) | Segment’s net contribution | Loans and accounts receivables from customers (1) | ||||||||||||||||||||||
| MCh$ | MCh$ | MCh$ | MCh$ | MCh$ | MCh$ | MCh$ | ||||||||||||||||||||||
| Segments | ||||||||||||||||||||||||||||
| Individuals | 400,204 | 138,506 | 1,782 | (144,697 | ) | (214,325 | ) | 181,470 | 8,407,416 | |||||||||||||||||||
| Santander Banefe | 77,975 | 23,594 | 10 | (51,962 | ) | (50,530 | ) | (913 | ) | 717,699 | ||||||||||||||||||
| Commercial banking | 322,229 | 114,912 | 1,772 | (92,735 | ) | (163,795 | ) | 182,383 | 7,689,717 | |||||||||||||||||||
| Small and mid-sized companies (PYMEs) | 171,833 | 25,973 | 5,187 | (46,255 | ) | (49,987 | ) | 106,751 | 2,375,192 | |||||||||||||||||||
| Institutional | 19,172 | 1,848 | 1,714 | (428 | ) | (7,463 | ) | 14,843 | 331,153 | |||||||||||||||||||
| Companies | 103,401 | 16,304 | 11,337 | (16,536 | ) | (24,984 | ) | 89,522 | 3,288,107 | |||||||||||||||||||
| Companies | 54,744 | 8,421 | 4,948 | (9,710 | ) | (11,973 | ) | 46,430 | 1,353,686 | |||||||||||||||||||
| Large corporations | 32,639 | 5,725 | 5,715 | (8,146 | ) | (9,899 | ) | 26,034 | 1,411,236 | |||||||||||||||||||
| Real estate | 16,018 | 2,158 | 674 | 1,320 | (3,112 | ) | 17,058 | 523,185 | ||||||||||||||||||||
| Commercial Banking | 694,610 | 182,631 | 20,020 | (207,916 | ) | (296,759 | ) | 392,586 | 14,401,868 | |||||||||||||||||||
| Global Banking and Markets | 16,836 | 17,497 | 49,325 | (955 | ) | (23,354 | ) | 59,349 | 1,293,305 | |||||||||||||||||||
| Corporate | 18,936 | 17,907 | 1,033 | (955 | ) | (8,608 | ) | 28,313 | 1,293,305 | |||||||||||||||||||
| Treasury | (2,100 | ) | (410 | ) | 48,292 | - | (14,746 | ) | 31,036 | - | ||||||||||||||||||
| Other | 3,592 | (6,183 | ) | 6,982 | 45 | (15,443 | ) | (18,191 | ) | 32,109 | ||||||||||||||||||
| Total | 707,854 | 193,945 | 76,327 | (208,826 | ) | (335,556 | ) | 433,744 | 15,727,282 | |||||||||||||||||||
| Other operating income | 25,826 | |||
| Other operating expenses | (36,822 | ) | ||
| Income from investments in other companies | 1,175 | |||
| Income tax expense | (56,752 | ) | ||
| Consolidated income for the period | 367,171 |
| (1) | Corresponds to Loans and accounts receivable from customers plus interbank loans, without deducting their allowances for loan losses. |
| (2) | Corresponds to the sum of the net income from financial operations and net foreign exchange profit (loss). |
| (3) | Corresponds to the sum of Personnel salaries and expenses, administrative expenses, amortization, and impairment. |
F-40
BANCO SANTANDER CHILE AND SUBSIDIARIES NOTES TO THE UNAUDITED CONDENSED CONSOLIDATED INTERIM FINANCIAL STATEMENTS As of September 30, 2011 and 2010 and December 31, 2010 |
NOTE 05 - CASH AND CASH EQUIVALENTS
| a) | The detail of the balances included under cash and cash equivalents is as follows: |
| As of September 30, | As of December 31, | |||||||
| 2011 | 2010 | |||||||
| MCh$ | MCh$ | |||||||
| Cash and deposits in banks | ||||||||
| Cash | 372,614 | 354,340 | ||||||
| Deposits in the Central Bank of Chile | 998,391 | 1,312,111 | ||||||
| Deposits in domestic banks | 860 | 418 | ||||||
| Deposits in foreign banks | 440,919 | 95,329 | ||||||
| Subtotals – Cash and bank deposits | 1,812,784 | 1,762,198 | ||||||
| Unsettled transactions, net | 350,538 | 74,243 | ||||||
| Cash and cash equivalents | 2,163,322 | 1,836,441 | ||||||
The level of funds in cash and at the Central Bank of Chile, which are included in the “Deposits in the Central Bank of Chile” line, reflects regulations governing the reserves that the Bank must maintain on average in monthly periods.
| b) | Unsettled transactions: |
Unsettled transactions are transactions in which only settlement remains pending, which will increase or decrease funds in the Central Bank of Chile or in foreign banks, normally within the next 24 to 48 business hours from the end of each period. These transactions are presented according to the following detail:
| As of September 30, | As of December 31, | |||||||
| 2011 | 2010 | |||||||
| MCh$ | MCh$ | |||||||
| Assets | ||||||||
| Documents held by other banks (documents to be exchanged) | 194,543 | 207,346 | ||||||
| Funds receivable | 622,058 | 167,022 | ||||||
| Subtotals | 816,601 | 374,368 | ||||||
| Liabilities | ||||||||
| Funds payable | 466,063 | 300,125 | ||||||
| Subtotals | 466,063 | 300,125 | ||||||
| Unsettled transactions, net | 350,538 | 74,243 | ||||||
Significant fluctuation was generated by a higher volume of Spot currency transactions. These transactions are related to many different currency purchases; a 75% of them correspond to US dollar currency purchases.
F-41
BANCO SANTANDER CHILE AND SUBSIDIARIES NOTES TO THE UNAUDITED CONDENSED CONSOLIDATED INTERIM FINANCIAL STATEMENTS As of September 30, 2011 and 2010 and December 31, 2010 |
NOTE 06 - TRADING INVESTMENTS:
The detail of the instruments deemed as financial trading investments is as follows:
| As of September 30, | As of December 31, | |||||||
| 2011 | 2010 | |||||||
| MCh$ | MCh$ | |||||||
| Chilean Central Bank and Government securities: | ||||||||
| Chilean Central Bank Bonds | 342,545 | 247,019 | ||||||
| Chilean Central Bank Notes | 27,589 | 68,985 | ||||||
| Other Chilean Central Bank and Government securities | 81,040 | 7,123 | ||||||
| Subtotals | 451,174 | 323,127 | ||||||
| Other Chilean securities: | ||||||||
| Time deposits in Chilean financial institutions | - | - | ||||||
| Mortgage finance bonds of Chilean financial institutions | - | - | ||||||
| Chilean financial institutions bonds | - | 19,628 | ||||||
| Chilean corporate bonds | 25,132 | 11,404 | ||||||
| Other Chilean securities | - | - | ||||||
| Subtotals | 25,132 | 31,032 | ||||||
| Foreign financial securities: | ||||||||
| Foreign Central Banks and Government securities | - | - | ||||||
| Other foreign financial instruments | 2,654 | - | ||||||
| Subtotals | 2,654 | - | ||||||
| Investments in mutual funds: | ||||||||
| Funds managed by related entities | 24,853 | 25,511 | ||||||
| Funds managed by others | - | - | ||||||
| Subtotals | 24,853 | 25,511 | ||||||
| Total | 503,813 | 379,670 | ||||||
As of September 30, 2011 and as of December 31, 2010 in the “Chilean Central Bank and Government securities” item there are no securities sold with repurchase agreement to customers and financial institutions.
As of September 30, 2011 and December 31, 2010 there are no securities sold under repurchase agreement to clients and financial institutions included under “Other Chilean Securities” and “Foreign financial securities”
F-42
BANCO SANTANDER CHILE AND SUBSIDIARIES NOTES TO THE UNAUDITED CONDENSED CONSOLIDATED INTERIM FINANCIAL STATEMENTS As of September 30, 2011 and 2010 and December 31, 2010 |
NOTE 07 - DERIVATIVE FINANCIAL INSTRUMENTS AND HEDGE ACCOUNTING:
| a) | As of September 30, 2011 and December 31, 2010 the Bank holds the following portfolio of derivative instruments: |
| As of September 30, 2011 | ||||||||||||||||||||||||
| Notional amount | Fair value | |||||||||||||||||||||||
| Up to 3 months | More than 3 months to one year | More than one year | Total | Assets | Liabilities | |||||||||||||||||||
| MCh$ | MCh$ | MCh$ | MCh$ | MCh$ | MCh$ | |||||||||||||||||||
| Fair value hedge derivatives | ||||||||||||||||||||||||
| Currency forwards | - | - | - | - | - | - | ||||||||||||||||||
| Interest rate swaps | - | - | 812,874 | 812,874 | 25,260 | 41 | ||||||||||||||||||
| Cross currency swaps | - | 30,598 | 280,996 | 311,594 | 24,895 | 821 | ||||||||||||||||||
| Call currency options | - | - | - | - | - | - | ||||||||||||||||||
| Call interest rate options | - | - | - | - | - | - | ||||||||||||||||||
| Put currency options | - | - | - | - | - | - | ||||||||||||||||||
| Put interest rate options | - | - | - | - | - | - | ||||||||||||||||||
| Interest rate futures | - | - | - | - | - | - | ||||||||||||||||||
| Other derivatives | - | - | - | - | - | - | ||||||||||||||||||
| Subtotal | - | 30,598 | 1,093,870 | 1,124,468 | 50,155 | 862 | ||||||||||||||||||
| Cash flow hedge derivatives | ||||||||||||||||||||||||
| Currency forwards | - | - | - | - | - | - | ||||||||||||||||||
| Interest rate swaps | - | - | - | - | - | - | ||||||||||||||||||
| Cross currency swaps | 483,275 | 1,159,858 | 426,410 | 2,069,543 | 122,602 | 460 | ||||||||||||||||||
| Call currency options | - | - | - | - | - | - | ||||||||||||||||||
| Call interest rate options | - | - | - | - | - | - | ||||||||||||||||||
| Put currency options | - | - | - | - | - | - | ||||||||||||||||||
| Put interest rate options | - | - | - | - | - | - | ||||||||||||||||||
| Interest rate futures | - | - | - | - | - | - | ||||||||||||||||||
| Other derivatives | - | - | - | - | - | - | ||||||||||||||||||
| Subtotals | 483,275 | 1,159,858 | 426,410 | 2,069,543 | 122,602 | 460 | ||||||||||||||||||
| Trading derivatives | ||||||||||||||||||||||||
| Currency forwards | 14,397,468 | 10,743,681 | 628,282 | 25,769,431 | 595,038 | 496,613 | ||||||||||||||||||
| Interest rate swaps | 4,043,419 | 12,147,546 | 13,541,998 | 29,732,963 | 298,069 | 346,029 | ||||||||||||||||||
| Cross currency swaps | 771,693 | 3,034,275 | 10,857,155 | 14,663,123 | 940,860 | 776,690 | ||||||||||||||||||
| Call currency options | 29,549 | 62,026 | 4,957 | 96,532 | 2,966 | 1,582 | ||||||||||||||||||
| Call interest rate options | 2,639 | 13,734 | 36,160 | 52,533 | 24 | 363 | ||||||||||||||||||
| Put currency options | 14,665 | 28,539 | 3,615 | 46,819 | 684 | 1,529 | ||||||||||||||||||
| Put interest rate options | - | - | - | - | - | - | ||||||||||||||||||
| Interest rate futures | - | - | - | - | - | - | ||||||||||||||||||
| Other derivatives | 421,823 | - | 1,673 | 423,496 | 1,187 | 1,146 | ||||||||||||||||||
| Subtotals | 19,681,256 | 26,029,801 | 25,073,840 | 70,784,897 | 1,838,828 | 1,623,952 | ||||||||||||||||||
| Totals | 20,164,531 | 27,220,257 | 26,594,120 | 73,978,908 | 2,011,585 | 1,625,274 | ||||||||||||||||||
F-43
BANCO SANTANDER CHILE AND SUBSIDIARIES NOTES TO THE UNAUDITED CONDENSED CONSOLIDATED INTERIM FINANCIAL STATEMENTS As of September 30, 2011 and 2010 and December 31, 2010 |
NOTE 07 - DERIVATIVE FINANCIAL INSTRUMENTS AND HEDGE ACCOUNTING, continued:
| As of December 31, 2010 | ||||||||||||||||||||||||
| Notional amount | Fair value | |||||||||||||||||||||||
Up to 3 months | More than 3 months to one year | More than one year | Total | Assets | Liabilities | |||||||||||||||||||
| MCh$ | MCh$ | MCh$ | MCh$ | MCh$ | MCh$ | |||||||||||||||||||
| Fair value hedge derivatives | ||||||||||||||||||||||||
| Currency forwards | - | - | - | - | - | - | ||||||||||||||||||
| Interest rate swaps | - | - | 702,306 | 702,306 | 5,827 | 6,464 | ||||||||||||||||||
| Cross currency swaps | 28,090 | 229,296 | 387,024 | 644,410 | 5,296 | 28,730 | ||||||||||||||||||
| Call currency options | - | - | - | - | - | - | ||||||||||||||||||
| Call interest rate options | - | - | - | - | - | - | ||||||||||||||||||
| Put currency options | - | - | - | - | - | - | ||||||||||||||||||
| Put interest rate options | - | - | - | - | - | - | ||||||||||||||||||
| Interest rate futures | - | - | - | - | - | - | ||||||||||||||||||
| Other derivatives | - | - | - | - | - | - | ||||||||||||||||||
| Subtotals | 28,090 | 229,296 | 1,089,330 | 1,346,716 | 11,123 | 35,194 | ||||||||||||||||||
| Cash flow hedge derivatives | ||||||||||||||||||||||||
| Currency forwards | - | - | - | - | - | - | ||||||||||||||||||
| Interest rate swaps | - | - | - | - | - | - | ||||||||||||||||||
| Cross currency swaps | 147,872 | 999,792 | 379,859 | 1,527,523 | 494 | 120,563 | ||||||||||||||||||
| Call currency options | - | - | - | - | - | - | ||||||||||||||||||
| Call interest rate options | - | - | - | - | - | - | ||||||||||||||||||
| Put currency options | - | - | - | - | - | - | ||||||||||||||||||
| Put interest rate options | - | - | - | - | - | - | ||||||||||||||||||
| Interest rate futures | - | - | - | - | - | - | ||||||||||||||||||
| Other derivatives | - | - | - | - | - | - | ||||||||||||||||||
| Subtotals | 147,872 | 999,792 | 379,859 | 1,527,523 | 494 | 120,563 | ||||||||||||||||||
| Trading derivatives | ||||||||||||||||||||||||
| Currency forwards | 10,374,003 | 6,830,128 | 792,254 | 17,996,385 | 283,722 | 348,152 | ||||||||||||||||||
| Interest rate swaps | 2,671,634 | 7,607,192 | 13,475,904 | 23,754,730 | 204,786 | 250,812 | ||||||||||||||||||
| Cross currency swaps | 1,081,609 | 2,783,653 | 10,061,745 | 13,927,007 | 1,123,547 | 887,222 | ||||||||||||||||||
| Call currency options | 20,724 | 29,247 | 936 | 50,907 | 272 | 233 | ||||||||||||||||||
| Call interest rate options | 34,076 | 16,690 | 59,676 | 110,442 | 82 | 1,269 | ||||||||||||||||||
| Put currency options | 6,364 | 4,906 | - | 11,270 | 230 | 385 | ||||||||||||||||||
| Put interest rate options | - | - | - | - | - | - | ||||||||||||||||||
| Interest rate futures | - | - | - | - | - | - | ||||||||||||||||||
| Other derivatives | 165,208 | - | - | 165,208 | 122 | 149 | ||||||||||||||||||
| Subtotals | 14,353,618 | 17,271,816 | 24,390,515 | 56,015,949 | 1,612,761 | 1,488,222 | ||||||||||||||||||
| Totals | 14,529,580 | 18,500,904 | 25,859,704 | 58,890,188 | 1,624,378 | 1,643,979 | ||||||||||||||||||
F-44
BANCO SANTANDER CHILE AND SUBSIDIARIES NOTES TO THE UNAUDITED CONDENSED CONSOLIDATED INTERIM FINANCIAL STATEMENTS As of September 30, 2011 and 2010 and December 31, 2010 |
NOTE 07 - DERIVATIVE FINANCIAL INSTRUMENTS AND HEDGE ACCOUNTING, continued:
| b) | Hedge Accounting |
Fair value hedges:
The Bank uses cross-currency swaps, interest rate swaps, and call money swaps to hedge its exposure to changes in fair value of hedged items attributable to interest rates. The aforementioned hedging instruments change the effective cost of long-term issuances from a fixed interest rate to a variable interest rate, decreasing the duration and modifying the sensitivity to the shortest segments of the curve.
Below is a detail of the hedged items and hedging instruments under fair value hedges as of September 30, 2011 and December 31, 2010 classified by term to maturity:
| As of September 30, 2011 | ||||||||||||||||||||
| Within 1 year | Between 1 and 3 years | Between 3 and 6 years | Over 6 years | Total | ||||||||||||||||
| MCh$ | MCh$ | MCh$ | MCh$ | MCh$ | ||||||||||||||||
| Hedged item | ||||||||||||||||||||
| Chilean Central Bank Bonds in Pesos (BCP) | - | - | - | - | - | |||||||||||||||
| Chilean Central Bank Bonds in UF (BCU) | - | - | - | - | - | |||||||||||||||
| Corporate bonds | - | 11,172 | - | - | 11,172 | |||||||||||||||
| Senior bonds | - | 363,755 | 331,453 | 148,482 | 843,690 | |||||||||||||||
| Subordinated bonds | - | - | 155,895 | - | 155,895 | |||||||||||||||
| Short-term loans | - | 25,000 | - | - | 25,000 | |||||||||||||||
| Interbank loans | - | - | - | - | - | |||||||||||||||
| Time deposits | 30,598 | 29,374 | - | - | 59,972 | |||||||||||||||
| Mortgage bonds | - | - | - | 28,739 | 28,739 | |||||||||||||||
| Totals | 30,598 | 429,301 | 487,348 | 177,221 | 1,124,468 | |||||||||||||||
| Hedging instrument | ||||||||||||||||||||
| Cross currency swap | 30,598 | 24,734 | 227,523 | 28,739 | 311,594 | |||||||||||||||
| Interest rate swap | - | 374,927 | 259,825 | - | 634,752 | |||||||||||||||
| Call money swap | - | 29,640 | - | 148,482 | 178,122 | |||||||||||||||
| Totals | 30,598 | 429,301 | 487,348 | 177,221 | 1,124,468 | |||||||||||||||
| As of December 31, 2010 | ||||||||||||||||||||
| Within 1 year | Between 1 and 3 years | Between 3 and 6 years | Over 6 years | Total | ||||||||||||||||
| MCh$ | MCh$ | MCh$ | MCh$ | MCh$ | ||||||||||||||||
| Hedged item | ||||||||||||||||||||
| Chilean Central Bank Bonds in Pesos (BCP) | - | - | - | - | - | |||||||||||||||
| Chilean Central Bank Bonds in UF (BCU) | - | - | - | - | - | |||||||||||||||
| Corporate bonds | - | 10,061 | - | - | 10,061 | |||||||||||||||
| Senior bonds | - | 374,360 | 358,862 | 49,591 | 782,813 | |||||||||||||||
| Subordinated bonds | - | 51,475 | 140,385 | - | 191,860 | |||||||||||||||
| Short-term loans | - | 25,000 | - | - | 25,000 | |||||||||||||||
| Interbank loans | 210,591 | - | - | - | 210,591 | |||||||||||||||
| Time deposits | 46,795 | 4,640 | - | - | 51,435 | |||||||||||||||
| Mortgage bonds | - | - | - | 74,956 | 74,956 | |||||||||||||||
| Totals | 257,386 | 465,536 | 499,247 | 124,547 | 1,346,716 | |||||||||||||||
| Hedging instrument | ||||||||||||||||||||
| Cross currency swap | 257,386 | 46,796 | 265,272 | 74,956 | 644,410 | |||||||||||||||
| Interest rate swap | - | 389,100 | 233,975 | - | 623,075 | |||||||||||||||
| Call money swap | - | 29,640 | - | 49,591 | 79,231 | |||||||||||||||
| Totals | 257,386 | 465,536 | 499,247 | 124,547 | 1,346,716 | |||||||||||||||
F-45
BANCO SANTANDER CHILE AND SUBSIDIARIES NOTES TO THE UNAUDITED CONDENSED CONSOLIDATED INTERIM FINANCIAL STATEMENTS As of September 30, 2011 and 2010 and December 31, 2010 |
NOTE 07 - DERIVATIVE FINANCIAL INSTRUMENTS AND HEDGE ACCOUNTING, continued:
Cash flow hedges:
The Bank uses cross currency swaps to hedge the risk from variability of cash flows attributable to changes in the interest rates of bonds and interbank loans at a variable rate. The cash flows of the cross currency swaps equal the cash flows of the hedged items, which modify uncertain cash flows to known cash flows derived from a fixed interest rate.
Below is the nominal amount of the hedged items as of September 30, 2011 and December 31, 2010 and the period when the cash flows will be generated:
| As of September 30, 2011 | ||||||||||||||||||||
| Within 1 year | Between 1 and 3 years | Between 3 and 6 years | Over 6 years | Total | ||||||||||||||||
| MCh$ | MCh$ | MCh$ | MCh$ | MCh$ | ||||||||||||||||
| Hedged item | ||||||||||||||||||||
| Interbank loans | 1,331,343 | 161,092 | - | - | 1,492,435 | |||||||||||||||
| Bonds | 311,790 | 265,318 | - | - | 577,108 | |||||||||||||||
| Total | 1,643,133 | 426,410 | - | - | 2,069,543 | |||||||||||||||
| Hedging instrument | - | - | ||||||||||||||||||
| Cross currency swap | 1,643,133 | 426,410 | - | - | 2,069,543 | |||||||||||||||
| Total | 1,643,133 | 426,410 | - | - | 2,069,543 | |||||||||||||||
| As of December 31, 2010 | ||||||||||||||||||||
| Within 1 year | Between 1 and 3 years | Between 3 and 6 years | Over 6 years | Total | ||||||||||||||||
| MCh$ | MCh$ | MCh$ | MCh$ | MCh$ | ||||||||||||||||
| Hedged item | ||||||||||||||||||||
| Interbank loans | 937,087 | 95,930 | - | - | 1,033,017 | |||||||||||||||
| Bonds | 210,577 | 283,929 | - | - | 494,506 | |||||||||||||||
| Total | 1,147,664 | 379,859 | - | - | 1,527,523 | |||||||||||||||
| Hedging instrument | ||||||||||||||||||||
| Cross currency swap | 1,147,664 | 379,859 | - | - | 1,527,523 | |||||||||||||||
| Total | 1,147,664 | 379,859 | - | - | 1,527,523 | |||||||||||||||
F-46
BANCO SANTANDER CHILE AND SUBSIDIARIES NOTES TO THE UNAUDITED CONDENSED CONSOLIDATED INTERIM FINANCIAL STATEMENTS As of September 30, 2011 and 2010 and December 31, 2010 |
NOTE 07 - DERIVATIVE FINANCIAL INSTRUMENTS AND HEDGE ACCOUNTING, continued:
Below is an estimate of the periods in which the flows are expected to be produced:
| As of September 30, 2011 | ||||||||||||||||||||
| Within 1 year | Between 1 and 3 years | Between 3 and 6 years | Over 6 years | Total | ||||||||||||||||
| MCh$ | MCh$ | MCh$ | MCh$ | MCh$ | ||||||||||||||||
| Hedged item | ||||||||||||||||||||
| Inflows | - | - | - | - | ||||||||||||||||
| Outflows | (24,756 | ) | (14,179 | ) | - | - | (38,935 | ) | ||||||||||||
| Net flows | (24,756 | ) | (14,179 | ) | - | - | (38,935 | ) | ||||||||||||
| Hedging instrument | ||||||||||||||||||||
| Inflows | 24,756 | 14,179 | - | - | 38,935 | |||||||||||||||
| Outflows | (56,449 | ) | (32,723 | ) | - | - | (89,172 | ) | ||||||||||||
| Net flows | (31,693 | ) | (18,544 | ) | - | - | (50,237 | ) | ||||||||||||
| As of December 31, 2010 | ||||||||||||||||||||
| Within 1 year | Between 1 and 3 years | Between 3 and 6 years | Over 6 years | Total | ||||||||||||||||
| MCh$ | MCh$ | MCh$ | MCh$ | MCh$ | ||||||||||||||||
| Hedged item | ||||||||||||||||||||
| Inflows | - | - | - | - | ||||||||||||||||
| Outflows | (17,627 | ) | (5,696 | ) | - | - | (23,323 | ) | ||||||||||||
| Net flows | (17,627 | ) | (5,696 | ) | - | - | (23,323 | ) | ||||||||||||
| Hedging instrument | ||||||||||||||||||||
| Inflows | 17,627 | 5,696 | - | - | 23,323 | |||||||||||||||
| Outflows | (30,044 | ) | (9,772 | ) | - | - | (39,816 | ) | ||||||||||||
| Net flows | (12,417 | ) | (4,076 | ) | - | - | (16,493 | ) | ||||||||||||
F-47
BANCO SANTANDER CHILE AND SUBSIDIARIES NOTES TO THE UNAUDITED CONDENSED CONSOLIDATED INTERIM FINANCIAL STATEMENTS As of September 30, 2011 and 2010 and December 31, 2010 |
NOTE 07 - DERIVATIVE FINANCIAL INSTRUMENTS AND HEDGE ACCOUNTING, continued:
| c) | Gain and losses for cash flow hedges whose effect was recognized in the Consolidated Statement of Changes in Equity for the periods ended as of September 30, 2011 and 2010, are shown below: |
| As of September 30 | |||
| 2011 | 2010 | ||
| MCh$ | MCh$ | ||
| Senior Bonds | (2,608) | 2,672 | |
| Loans | (11,179) | 4,499 | |
| Net flows | (13,787) | 7,171 | |
Since the variable cash flows for both the hedged item and the hedging instrument mirror each other, the hedges are nearly 100% efficient, which means that the fluctuations of value attributable to rate components are almost completely offset. As of September 30, 2010, hedge ineffectiveness recorded in the Condensed Consolidated Interim Statement of Income was MCh$ (23).
During 2010 the Bank recorded a future cash flow hedge for a syndicated loan granted to Banco Santander Chile and structured by Standard Chartered Bank for USD 175 million.
| d) | Below is a presentation of income generated by cash flow hedges amount that were reclassified from other comprehensive income to profit and loss during the period: |
| As of September 30 | |||
| 2011 | 2010 | ||
| MCh$ | MCh$ | ||
| Bonds | - | - | |
| Loan | 287 | 23 | |
| Net income from cash flow hedges | 287 | 23 | |
Since the variable flows for both the hedged element and the hedging element mirror each other, the hedges are 100% efficient, which means that the fluctuations of value attributable to rate components are almost completely offset.
| e) | Net investment hedges for foreign businesses: |
As of September 2011 and 2010, the Bank does not have foreign net investment hedges in its hedge accounting portfolio.
F-48
BANCO SANTANDER CHILE AND SUBSIDIARIES NOTES TO THE UNAUDITED CONDENSED CONSOLIDATED INTERIM FINANCIAL STATEMENTS As of September 30, 2011 and 2010 and December 31, 2010 |
NOTE 08 - INTERBANK LOANS
| a) | As of September 30, 2011 and December 31, 2010, the balances in the “Interbank loans” item are as follows: |
| As of September 30, | As of December 31, | |||||||
| 2011 | 2010 | |||||||
| MCh$ | MCh$ | |||||||
| Domestic banks | ||||||||
| Loans and advances to banks | - | - | ||||||
| Deposits in the Central Bank of Chile | - | - | ||||||
| Nontransferable Chilean Central Bank Bonds | - | - | ||||||
| Other Central Bank of Chile loans | - | - | ||||||
| Interbank loans | 9 | 17 | ||||||
| Overdrafts in checking accounts | - | - | ||||||
| Nontransferable domestic bank loans | - | - | ||||||
| Other domestic bank loans | - | - | ||||||
| Allowances and impairment for domestic bank loans | - | - | ||||||
| Foreign banks | ||||||||
| Loans to foreign banks | 88,029 | 69,709 | ||||||
| Overdrafts in checking accounts | - | - | ||||||
| Nontransferable foreign bank deposits | - | - | ||||||
| Other foreign bank loans | - | - | ||||||
| Allowances and impairment for foreign bank loans | (19 | ) | (54 | ) | ||||
| Total | 88,019 | 69,672 | ||||||
| b) | The amount in each period for allowances and impairment of interbank loans, which are included in the “Provisions for loan losses” item, is show below: |
| As of September 30, | As of December 31, | |||||||||||||||||||||||
| 2011 | 2010 | |||||||||||||||||||||||
| Domestic banks | Foreign banks | Total | Domestic banks | Foreign banks | Total | |||||||||||||||||||
| MCh$ | MCh$ | MCh$ | MCh$ | MCh$ | MCh$ | |||||||||||||||||||
| As of January 1 | - | 54 | 54 | - | 42 | 42 | ||||||||||||||||||
| Charge-offs | - | - | - | - | - | - | ||||||||||||||||||
| Allowances established | 280 | 169 | 449 | - | 131 | 131 | ||||||||||||||||||
| Allowances released | (405 | ) | (79 | ) | (484 | ) | - | (119 | ) | (119 | ) | |||||||||||||
| Total | (125 | ) | 144 | 19 | - | 54 | 54 | |||||||||||||||||
F-49
BANCO SANTANDER CHILE AND SUBSIDIARIES NOTES TO THE UNAUDITED CONDENSED CONSOLIDATED INTERIM FINANCIAL STATEMENTS As of September 30, 2011 and 2010 and December 31, 2010 |
NOTE 09 - LOANS AND ACCOUNTS RECEIVABLE FROM CUSTOMERS:
| a) | Loans and accounts receivable from customers, net |
As of September 30, 2011 and December 31, 2010 the composition of the loan portfolio is as follows:
| Assets before allowances | Allowances established | |||||||||||||||||||||||||||
| As of September 30, 2011 | Normal portfolio | Impaired loans (*) | Total | Individual allowances | Group allowances | Total | Loans and accounts receivable from customers, net | |||||||||||||||||||||
| MCh$ | MCh$ | MCh$ | MCh$ | MCh$ | MCh$ | MCh$ | ||||||||||||||||||||||
| Commercial loans | ||||||||||||||||||||||||||||
| Commercial loans | 6,570,310 | 577,166 | 7,147,476 | 67,068 | 79,226 | 146,294 | 7,001,182 | |||||||||||||||||||||
| Foreign trade loans | 997,530 | 60,698 | 1,058,228 | 31,403 | 946 | 32,349 | 1,025,879 | |||||||||||||||||||||
| General purpose mortgage loans | 34,893 | 21,450 | 56,343 | 194 | 3,235 | 3,429 | 52,914 | |||||||||||||||||||||
| Factoring transactions | 240,245 | 2,508 | 242,753 | 3,172 | 410 | 3,582 | 239,171 | |||||||||||||||||||||
| Leasing transactions | 1,173,038 | 58,682 | 1,231,720 | 16,597 | 1,827 | 18,424 | 1,213,296 | |||||||||||||||||||||
Other loans and accounts receivables from customers | 1,704 | 53 | 1,757 | - | 1 | 1 | 1,756 | |||||||||||||||||||||
| Subtotals | 9,017,720 | 720,557 | 9,738,277 | 118,434 | 85,645 | 204,079 | 9,534,198 | |||||||||||||||||||||
| Mortgage loans | ||||||||||||||||||||||||||||
| Loans with mortgage finance bonds | 115,194 | 4,379 | 119,573 | - | 870 | 870 | 118,703 | |||||||||||||||||||||
| Mortgage mutual loans | 4,608,421 | 116,837 | 4,725,258 | - | 27,996 | 27,996 | 4,697,262 | |||||||||||||||||||||
| Other mortgage mutual loans | 110,949 | 60,640 | 171,589 | - | 7,246 | 7,246 | 164,343 | |||||||||||||||||||||
| Leasing transactions | - | - | - | - | - | - | - | |||||||||||||||||||||
| Subtotals | 4,834,564 | 181,856 | 5,016,420 | - | 36,112 | 36,112 | 4,980,308 | |||||||||||||||||||||
| Consumer loans | ||||||||||||||||||||||||||||
| Installment consumer loans | 1,337,301 | 378,514 | 1,715,815 | - | 185,996 | 185,996 | 1,529,819 | |||||||||||||||||||||
| Credit card balances | 875,534 | 31,235 | 906,769 | - | 44,575 | 44,575 | 862,194 | |||||||||||||||||||||
| Consumer leasing contracts | 3,515 | 231 | 3,746 | - | 103 | 103 | 3,643 | |||||||||||||||||||||
| Other consumer loans | 285,101 | 14,228 | 299,329 | - | 13,696 | 13,696 | 285,633 | |||||||||||||||||||||
| Subtotals | 2,501,451 | 424,208 | 2,925,659 | - | 244,370 | 244,370 | 2,681,289 | |||||||||||||||||||||
| Totals | 16,353,735 | 1,326,621 | 17,680,356 | 118,434 | 366,127 | 484,561 | 17,195,795 | |||||||||||||||||||||
F-50
BANCO SANTANDER CHILE AND SUBSIDIARIES NOTES TO THE UNAUDITED CONDENSED CONSOLIDATED INTERIM FINANCIAL STATEMENTS As of September 30, 2011 and 2010 and December 31, 2010 |
NOTE 09 - LOANS AND ACCOUNTS RECEIVABLE FROM CUSTOMERS, continued:
| Assets before allowances | Allowances established | |||||||||||||||||||||||||||
| As of December 31, 2011 | Normal portfolio | Impaired loans | Total | Individual allowances | Group allowances | Total | Loans and accounts receivable from customers, net | |||||||||||||||||||||
| MCh$ | MCh$ | MCh$ | MCh$ | MCh$ | MCh$ | MCh$ | ||||||||||||||||||||||
| Commercial loans | ||||||||||||||||||||||||||||
| Commercial loans | 5,425,362 | 681,755 | 6,107,117 | 56,198 | 76,577 | 132,775 | 5,974,342 | |||||||||||||||||||||
| Foreign trade loans | 696,659 | 86,893 | 783,552 | 18,810 | 78 | 18,888 | 764,664 | |||||||||||||||||||||
| General purpose mortgage loans | 44,730 | 23,226 | 67,956 | 780 | 3,570 | 4,350 | 63,606 | |||||||||||||||||||||
| Factoring transactions | 201,321 | 4,819 | 206,140 | 1,711 | 372 | 2,083 | 204,057 | |||||||||||||||||||||
| Leasing transactions | 1,045,793 | 77,123 | 1,122,916 | 13,085 | 1,657 | 14,742 | 1,108,174 | |||||||||||||||||||||
Other loans and accounts receivables from customers | 2,953 | 14,995 | 17,948 | 5,976 | 3,688 | 9,664 | 8,284 | |||||||||||||||||||||
| Subtotals | 7,416,818 | 888,811 | 8,305,629 | 96,560 | 85,942 | 182,502 | 8,123,127 | |||||||||||||||||||||
| Mortgage loans | ||||||||||||||||||||||||||||
| Loans with mortgage finance bonds | 133,640 | 4,454 | 138,094 | - | 446 | 446 | 137,648 | |||||||||||||||||||||
| Mortgage mutual loans | 121,041 | 63,323 | 184,364 | - | 11,319 | 11,319 | 173,045 | |||||||||||||||||||||
| Other mortgage mutual loans | 4,253,810 | 74,869 | 4,328,679 | - | 5,567 | 5,567 | 4,323,112 | |||||||||||||||||||||
| Leasing transactions | - | - | - | - | - | - | - | |||||||||||||||||||||
| Subtotals | 4,508,491 | 142,646 | 4,651,137 | - | 17,332 | 17,332 | 4,633,805 | |||||||||||||||||||||
| Consumer loans | ||||||||||||||||||||||||||||
| Installment consumer loans | 1,192,464 | 412,139 | 1,604,603 | - | 176,219 | 176,219 | 1,428,384 | |||||||||||||||||||||
| Credit card balances | 771,988 | 22,228 | 794,216 | - | 36,156 | 36,156 | 758,060 | |||||||||||||||||||||
| Consumer leasing contracts | 3,407 | 328 | 3,735 | - | 121 | 121 | 3,614 | |||||||||||||||||||||
| Other consumer loans | 283,912 | 14,324 | 298,236 | - | 13,063 | 13,063 | 285,173 | |||||||||||||||||||||
| Subtotals | 2,251,771 | 449,019 | 2,700,790 | - | 225,559 | 225,559 | 2,475,231 | |||||||||||||||||||||
| Totals | 14,177,080 | 1,480,476 | 15,657,556 | 96,560 | 328,833 | 425,393 | 15,232,163 | |||||||||||||||||||||
F-51
BANCO SANTANDER CHILE AND SUBSIDIARIES NOTES TO THE UNAUDITED CONDENSED CONSOLIDATED INTERIM FINANCIAL STATEMENTS As of September 30, 2011 and 2010 and December 31, 2010 |
NOTE 09 - LOANS AND ACCOUNTS RECEIVABLE FROM CUSTOMERS, continued:
| b) | Portfolio characteristics: |
As of September 30, 2011 and December, 31 2010, the portfolio before allowances has the following detail by customer’s economic activity:
| Domestic loans (*) | Foreign loans (**) | Total loans | Distribution percentage | ||||||||||||
As of September 30, | As of December 31, | As of September 30, | As of December 31, | As of September 30, | As of December 31, | As of September 30, | As of December 31, | ||||||||
| 2011 | 2010 | 2011 | 2010 | 2011 | 2010 | 2011 | 2010 | ||||||||
| MCh$ | MCh$ | MCh$ | MCh$ | MCh$ | MCh$ | % | % | ||||||||
| Commercial loans | |||||||||||||||
| Manufacturing | 987,830 | 838,324 | - | - | 987,830 | 838,324 | 5.56 | 5.33 | |||||||
| Mining | 281,259 | 106,119 | - | - | 281,259 | 106,119 | 1.58 | 0.67 | |||||||
| Electricity, gas, and water | 264,924 | 149,907 | - | - | 264,924 | 149,907 | 1.49 | 0.95 | |||||||
| Agriculture and livestock | 762,510 | 679,159 | - | - | 762,510 | 679,159 | 4.29 | 4.32 | |||||||
| Forest | 88,291 | 84,375 | - | - | 88,291 | 84,375 | 0.50 | 0.54 | |||||||
| Fishing | 166,995 | 133,930 | - | - | 166,995 | 133,930 | 0.94 | 0.85 | |||||||
| Transport | 502,786 | 449,508 | - | - | 502,786 | 449,508 | 2.83 | 2.86 | |||||||
| Communications | 260,871 | 214,881 | - | - | 260,871 | 214,881 | 1.47 | 1.37 | |||||||
| Construction | 953,090 | 839,316 | - | - | 953,090 | 839,316 | 5.36 | 5.34 | |||||||
| Commerce | 2,067,261 | 1,732,800 | 88,029 | 69,709 | 2,155,290 | 1,802,509 | 12.13 | 11.46 | |||||||
| Services | 375,543 | 358,314 | - | - | 375,543 | 358,314 | 2.11 | 2.28 | |||||||
| Others | 3,026,926 | 2,719,013 | - | - | 3,026,926 | 2,719,013 | 17.04 | 17.29 | |||||||
| Subtotals | 9,738,286 | 8,305,646 | 88,029 | 69,709 | 9,826,315 | 8,375,355 | 55.30 | 53.26 | |||||||
| Mortgage loans | 5,016,420 | 4,651,137 | - | - | 5,016,420 | 4,651,137 | 28.23 | 29.57 | |||||||
| Consumer loans | 2,925,659 | 2,700,790 | - | - | 2,925,659 | 2,700,790 | 16.47 | 17.17 | |||||||
| Totals | 17,680,365 | 15,657,573 | 88,029 | 69,709 | 17,768,394 | 15,727,282 | 100.00 | 100.00 | |||||||
| (*) | Includes domestic loans for MCh$9 as of September 30, 2011 (MCh$17 as of December 31, 2010). |
| (**) | Includes foreign loans for MCh$88,029 as of September 30, 2010 (MCh$69,709 as of December 31, 2010), see Note 8. |
F-52
BANCO SANTANDER CHILE AND SUBSIDIARIES NOTES TO THE UNAUDITED CONDENSED CONSOLIDATED INTERIM FINANCIAL STATEMENTS As of September 30, 2011 and 2010 and December 31, 2010 |
NOTE 09 - LOANS AND ACCOUNTS RECEIVABLE FROM CUSTOMERS, continued:
| c) | Impaired loans |
| i) | As of September 30, 2011 and December 31, 2010 the composition of the impaired loans portfolio is as follows: |
| As of September 30, | As of December 31, | |||||||||||||||
| 2011 | 2010 | |||||||||||||||
| Commercial | Mortgage | Consumer | Total | Commercial | Mortgage | Consumer | Total | |||||||||
| MCh$ | MCh$ | MCh$ | MCh$ | MCh$ | MCh$ | MCh$ | MCh$ | |||||||||
| Individual allowance impairment | 305,503 | - | - | 305,503 | 444,129 | - | - | 444,129 | ||||||||
| Past due loans | 244,209 | 140,273 | 112,304 | 496,786 | 213,872 | 121,911 | 80,956 | 416,739 | ||||||||
| Impairment remains | 170,845 | 41,583 | 311,904 | 524,332 | 230,810 | 20,735 | 368,063 | 619,608 | ||||||||
| Totals | 720,557 | 181,856 | 424,208 | 1,326,621 | 888,811 | 142,646 | 449,019 | 1,480,476 | ||||||||
| ii) | The impaired secured and unsecured loan portfolio as of September 30, 2011 and December 31, 2010, is as follows: |
| As of September 30, | As of December 31, | |||||||||||||||
| 2011 | 2010 | |||||||||||||||
| Commercial | Mortgage | Consumer | Total | Commercial | Mortgage | Consumer | Total | |||||||||
| MCh$ | MCh$ | MCh$ | MCh$ | MCh$ | MCh$ | MCh$ | MCh$ | |||||||||
| Secured loan | 388,317 | 169,268 | 61,601 | 619,186 | 446,953 | 131,881 | 67,450 | 646,284 | ||||||||
| Unsecured loan | 332,240 | 12,588 | 362,607 | 707,435 | 441,858 | 10,765 | 381,569 | 834,192 | ||||||||
| Totals | 720,557 | 181,856 | 424,208 | 1,326,621 | 888,811 | 142,646 | 449,019 | 1,480,476 | ||||||||
| iii) | The portfolio of secured and unsecured past due loans as of September 30, 2011 and December 31, 2010 is as follows: |
| As of September 30, | As of December 31, | |||||||||||||||
| 2011 | 2010 | |||||||||||||||
| Commercial | Mortgage | Consumer | Total | Commercial | Mortgage | Consumer | Total | |||||||||
| MCh$ | MCh$ | MCh$ | MCh$ | MCh$ | MCh$ | MCh$ | MCh$ | |||||||||
| Secured loan | 118,766 | 128,783 | 10,030 | 257,579 | 96,007 | 111,708 | 7,071 | 214,786 | ||||||||
| Unsecured loan | 125,443 | 11,490 | 102,274 | 239,207 | 117,865 | 10,203 | 73,885 | 201,953 | ||||||||
| Totals | 244,209 | 140,273 | 112,304 | 496,786 | 213,872 | 121,911 | 80,956 | 416,739 | ||||||||
F-53
BANCO SANTANDER CHILE AND SUBSIDIARIES NOTES TO THE UNAUDITED CONDENSED CONSOLIDATED INTERIM FINANCIAL STATEMENTS As of September 30, 2011 and 2010 and December 31, 2010 |
NOTE 09 - LOANS AND ACCOUNTS RECEIVABLE FROM CUSTOMERS, continued:
| d) | Recovery of loans previously charged off by products |
For the quarter ended as of September 30, | For the 9-month period ended As of September 30, | |||||||||||||||
| Recoveries | 2011 | 2010 | 2011 | 2010 | ||||||||||||
| MCh$ | MCh$ | MCh$ | MCh$ | |||||||||||||
Commercial loans Consumer loans Mortgage loans | 1,815 | 2,026 | 5,376 | 5,259 | ||||||||||||
| 3,248 | 5,689 | 9,430 | 17,067 | |||||||||||||
| 659 | 301 | 1,213 | 1,229 | |||||||||||||
| Total recoveries (*) | 5,722 | 8,016 | 16,019 | 23,555 | ||||||||||||
(*) Recoveries of loans previously charged off are part of the Provision for loan losses conciliation, which is detailed in Note 28 of these Unaudited Condensed Interim Financial Statements.
| e) | Allowances established |
| Allowances | As of September 30, | As of December 31, | ||||||
| 2011 | 2010 | |||||||
| MCh$ | MCh$ | |||||||
| Customer loans | 284,257 | 310,552 | ||||||
| Interbank loans | 449 | 131 | ||||||
| Total Allowances | 284,706 | 310,683 | ||||||
F-54
BANCO SANTANDER CHILE AND SUBSIDIARIES NOTES TO THE UNAUDITED CONDENSED CONSOLIDATED INTERIM FINANCIAL STATEMENTS As of September 30, 2011 and 2010 and December 31, 2010 |
NOTE 10 – LOANS PURCHASES, SALES AND SUBSTITUTIONS:
| a) | Sales of loans |
In 2011 the following loan trading operations were conducted:
| As of September 30, 2011 | ||||||||||||||||
| Carrying amount | Sale price | Allowances | Effect on income | |||||||||||||
| MCh$ | MCh$ | MCh$ | MCh$ | |||||||||||||
| Loan item | ||||||||||||||||
| Charge off Portfolio | - | 5,578 | - | 5,578 | ||||||||||||
| Current Portfolio | - | - | - | - | ||||||||||||
In 2010 the following loan trading operations were conducted:
| As of December 31, 2010 | ||||||||||||||||
| Carrying amount | Sale price | Allowances | Effect on income | |||||||||||||
| MCh$ | MCh$ | MCh$ | MCh$ | |||||||||||||
| Loan item | ||||||||||||||||
| Charge off Portfolio | - | 12,021 | 2,197 | 9,824 | ||||||||||||
| Current Portfolio | 7,547 | 10,120 | - | 2,573 | ||||||||||||
| b) | Loans Purchases: |
During the first quarter of the year 2011, the Bank signed assignment agreements of loans and accounts receivable from customers granted by Banco Santander S.A. (the controlling shareholder of Banco Santander Chile) to corporate resident clients in Chile, for a total amount of ThUS$ 971,053. As of September 30, 2011, the carrying amount of these credits is ThUS$ 622,859.
F-55
BANCO SANTANDER CHILE AND SUBSIDIARIES NOTES TO THE UNAUDITED CONDENSED CONSOLIDATED INTERIM FINANCIAL STATEMENTS As of September 30, 2011 and 2010 and December 31, 2010 |
NOTE 11 - AVAILABLE FOR SALE INVESTMENTS:
As of September 30, 2011 and December 31, 2010 the detail of instruments designated as available for sale instruments is as follows:
| As of September 30, | As of December 31, | |||||||
| 2011 | 2010 | |||||||
| MCh$ | MCh$ | |||||||
| Chilean Central Bank and Government securities | ||||||||
| Chilean Central Bank Bonds | 448,262 | 555,981 | ||||||
| Chilean Central Bank Notes | 1,302,975 | 366,210 | ||||||
| Other Chilean Central Bank and Government securities | 123,386 | 175,296 | ||||||
| Subtotals | 1,874,623 | 1,097,487 | ||||||
| Other Chilean securities | ||||||||
| Time deposits in Chilean financial institutions | 149,151 | - | ||||||
| Mortgage finance bonds of Chilean financial institutions | 68,673 | 218,112 | ||||||
| Chilean financial institutions bonds | - | - | ||||||
| Chilean corporate bonds | 11,868 | - | ||||||
| Other Chilean securities | 329 | 147,833 | ||||||
| Subtotals | 230,021 | 365,945 | ||||||
| Foreign financial securities: | ||||||||
| Foreign Central Banks and Government securities | - | - | ||||||
| Other foreign financial securities | - | 10,548 | ||||||
| Subtotals | - | 10,548 | ||||||
| Totals | 2,104,644 | 1,473,980 | ||||||
Chilean Central Bank and Government securities include instruments sold to customers and financial institutions under repurchase agreements totaling Ch$112,055 million and Ch$144,034 million as of September 30, 2011 and December 31, 2010, respectively.
Other Chilean securities include instruments sold under repurchase agreements totaling Ch$152,138 as of December 31, 2010. As of September 30, 2011 there were no instruments under that kind of operations.
As of September 30, 2011 available-for-sale investments included unrealized net losses of Ch$2,890 million, recorded as a “Valuation adjustment” in Equity, distributed between Ch$2,856 million attributable to Bank shareholders and Ch$34 million attributable to non-controlling interest.
As of December 31, 2010 available-for-sale investments included unrealized net losses of Ch$18,596 million, recorded as “Valuation adjustment” in Equity, distributed between Ch$18,341 million attributable to Bank shareholders and Ch$255 million attributable to non-controlling interest.
F-56
BANCO SANTANDER CHILE AND SUBSIDIARIES NOTES TO THE UNAUDITED CONDENSED CONSOLIDATED INTERIM FINANCIAL STATEMENTS As of September 30, 2011 and 2010 and December 31, 2010 |
NOTE 12 - INTANGIBLE ASSETS:
| a) | Intangible assets as of September 30, 2011 and December 31, 2010 are as follows: |
| As of September 30, 2011 | ||||||||||||||||||||||||
Useful life (years) | Remaining useful life | Opening balance January 1, 2011 | Gross balance | Accumulated amortization | Net balance | |||||||||||||||||||
| MCh$ | MCh$ | MCh$ | MCh$ | |||||||||||||||||||||
| Licenses | 3 | 2.8 | 2,108 | 7,641 | (5,181 | ) | 2,460 | |||||||||||||||||
| Software development | 3 | 2.5 | 75,882 | 172,466 | (97,697 | ) | 74,769 | |||||||||||||||||
| Totals | 77,990 | 180,107 | (102,878 | ) | 77,229 | |||||||||||||||||||
| As of December 31, 2010 | ||||||||||||||||||||||||
Useful life (years) | Remaining useful life | Opening balance January 1, 2010 | Gross balance | Accumulated amortization | Net balance | |||||||||||||||||||
| MCh$ | MCh$ | MCh$ | MCh$ | |||||||||||||||||||||
| Licenses | 3 | 2 | 1,544 | 6,229 | (4,121 | ) | 2,108 | |||||||||||||||||
| Software development | 3 | 1.6 | 75,716 | 150,090 | (74,208 | ) | 75,882 | |||||||||||||||||
| Totals | 77,260 | 156,319 | (78,329 | ) | 77,990 | |||||||||||||||||||
| b) | The activity in intangible assets as of September 30, 2011 and December 31, 2010 is as follows: |
b.1) Gross balance
| Licenses | Software development (acquired) | Total | ||||||||||
| MCh$ | MCh$ | MCh$ | ||||||||||
| Gross balances 2011 | ||||||||||||
| Opening balances as of January 1, 2011 | 6,229 | 150,090 | 156,319 | |||||||||
| Acquisitions | 1,412 | 22,706 | 24,118 | |||||||||
| Disposals | - | (330 | ) | (330 | ) | |||||||
| Balances as of September 30, 2011 | 7,641 | 172,466 | 180,107 | |||||||||
| Gross balances 2010 | ||||||||||||
| Opening balances as of January 1, 2010 (*) | 4,422 | 123,939 | 128,361 | |||||||||
| Acquisitions | 1,807 | 26,524 | 28,331 | |||||||||
| Disposals | - | (373 | ) | (373 | ) | |||||||
| Balances as of December 31, 2010 | 6,229 | 150,090 | 156,319 | |||||||||
(*) As of January 1, 2010, intangible assets were recorded at their amortized cost value, net of accumulated amortization.
F-57
BANCO SANTANDER CHILE AND SUBSIDIARIES NOTES TO THE UNAUDITED CONDENSED CONSOLIDATED INTERIM FINANCIAL STATEMENTS As of September 30, 2011 and 2010 and December 31, 2010 |
NOTE 12 - INTANGIBLE ASSETS, continued:
b.2) Accumulated amortization
| Accumulated amortization | Licenses | Software development (acquired) | Total | |||||||||
| MCh$ | MCh$ | MCh$ | ||||||||||
| Opening balances as of January 1, 2011 | (4,121 | ) | (74,208 | ) | (78,329 | ) | ||||||
| Amortization for the period | (1,060 | ) | (23,489 | ) | (24,549 | ) | ||||||
| Other changes | - | - | - | |||||||||
| Balances as of September 30, 2011 | (5,181 | ) | (97,697 | ) | (102,878 | ) | ||||||
| Opening balances as of January 1, 2010 | (2,878 | ) | (48,223 | ) | (51,101 | ) | ||||||
| Amortization for the period | (1,243 | ) | (25,985 | ) | (27,228 | ) | ||||||
| Other changes | - | - | - | |||||||||
| Balances as of December 31, 2010 | (4,121 | ) | (74,208 | ) | (78,329 | ) | ||||||
| c) | As of September 30, 2011 and December 31, 2010, the Bank does not have any restriction on intangible assets. Additionally, intangible assets have not been pledged as security for liabilities. Also, there are no intangible debt amounts on the same dates. |
F-58
BANCO SANTANDER CHILE AND SUBSIDIARIES NOTES TO THE UNAUDITED CONDENSED CONSOLIDATED INTERIM FINANCIAL STATEMENTS As of September 30, 2011 and 2010 and December 31, 2010 |
NOTE 13 - PROPERTY, PLANT, AND EQUIPMENT
| a) | Property, plant and equipment as of September 30, 2011 and December 31, 2010 are as follows: |
| As of September 30, 2011 | ||||||||||||||||
Opening balance January 1, 2011 | Gross balance | Accumulated depreciation | Net balance | |||||||||||||
| MCh$ | MCh$ | MCh$ | MCh$ | |||||||||||||
| Land and buildings | 126,550 | 156,316 | (31,662 | ) | 124,654 | |||||||||||
| Equipment | 20,346 | 37,207 | (17,565 | ) | 19,642 | |||||||||||
| PP&E leased to third parties (operating leases) | 1,802 | 2,007 | - | 2,007 | ||||||||||||
| Other | 6,287 | 16,718 | (9,905 | ) | 6,813 | |||||||||||
| Total | 154,985 | 212,248 | (59,132 | ) | 153,116 | |||||||||||
| As of December 31, 2010 | ||||||||||||||||
Opening balance January 1, 2010 | Gross balance | Accumulated depreciation | Net balance | |||||||||||||
| MCh$ | MCh$ | MCh$ | MCh$ | |||||||||||||
| Land and buildings | 161,922 | 155,821 | (29,271 | ) | 126,550 | |||||||||||
| Equipment | 13,391 | 42,757 | (22,411 | ) | 20,346 | |||||||||||
PP&E leased to third parties (operating leases) | 689 | 1,840 | (38 | ) | 1,802 | |||||||||||
| Other | 8,120 | 18,943 | (12,656 | ) | 6,287 | |||||||||||
| Totals | 184,122 | 219,361 | (64,376 | ) | 154,985 | |||||||||||
F-59
BANCO SANTANDER CHILE AND SUBSIDIARIES NOTES TO THE UNAUDITED CONDENSED CONSOLIDATED INTERIM FINANCIAL STATEMENTS As of September 30, 2011 and 2010 and December 31, 2010 |
NOTE 13 - PROPERTY, PLANT, AND EQUIPMENT, continued:
| b) | The activity in property, plant, and equipment during 2011 and 2010 is as follows: |
b.1) Gross balance
| 2011 | Land and buildings | Equipment | Ceded under an operating leases | Other | Total | |||||||||||||||
| MCh$ | MCh$ | MCh$ | MCh$ | MCh$ | ||||||||||||||||
| Opening balances as of January 1, 2011 | 155,821 | 42,757 | 1,840 | 18,943 | 219,361 | |||||||||||||||
| Additions | 2,848 | 4,535 | 3,796 | 2,082 | 13,261 | |||||||||||||||
| Disposals | (4,946 | ) | (9,988 | ) | - | (5,331 | ) | (20,265 | ) | |||||||||||
| Impairment due to damage | - | (109 | ) | - | - | (109 | ) | |||||||||||||
| Transfers | 2,593 | 12 | (3,629 | ) | 1,024 | - | ||||||||||||||
| Other | - | - | - | - | - | |||||||||||||||
| Balances as of September 30, 2011 | 156,316 | 37,207 | 2,007 | 16,718 | 212,248 | |||||||||||||||
| 2010 | Land and buildings | Equipment | Ceded under an operating leases | Other | Total | |||||||||||||||
| MCh$ | MCh$ | MCh$ | MCh$ | MCh$ | ||||||||||||||||
| Opening balances as of January 1, 2010 | 180,868 | 27,993 | 727 | 17,513 | 227,101 | |||||||||||||||
| Additions | 7,884 | 7,781 | - | 3,336 | 19,001 | |||||||||||||||
| Disposals | (26,968 | ) | (235 | ) | - | (114 | ) | (27,317 | ) | |||||||||||
| Impairment due to damage | (4,739 | ) | (186 | ) | - | - | (4,925 | ) | ||||||||||||
| Transfers | - | - | 745 | - | 745 | |||||||||||||||
| Other | (1,224 | ) | 7,404 | 368 | (1,792 | ) | 4,756 | |||||||||||||
| Balances as of December 31, 2010 | 155,821 | 42,757 | 1,840 | 18,943 | 219,361 | |||||||||||||||
Banco Santander Chile recognized in its Condensed Consolidated Interim financial statements as of September 30, 2010 an Impairment loss for Ch$ 109 million corresponding to damage to ATMs. Reimbursement payments received from insurance totaled Ch$ 315 million, which are presented in line item “other operating income” (See Note 32).
As stated in Note 32, during 2011 the Bank sold 1 branch which, at the time of sale, had a net carrying amount of approximately Ch$ 48 million (See note 32).
F-60
BANCO SANTANDER CHILE AND SUBSIDIARIES NOTES TO THE UNAUDITED CONDENSED CONSOLIDATED INTERIM FINANCIAL STATEMENTS As of September 30, 2011 and 2010 and December 31, 2010 |
NOTE 13 - PROPERTY, PLANT, AND EQUIPMENT, continued:
b.2) Accumulated depreciation
| 2011 | Land and buildings | Equipment | Ceded under an operating leases | Other | Total | |||||||||||||||
| MCh$ | MCh$ | MCh$ | MCh$ | MCh$ | ||||||||||||||||
| Opening balances as of January 1, 2011 | (29,271 | ) | (22,411 | ) | (38 | ) | (12,656 | ) | (64,376 | ) | ||||||||||
| Depreciation charges in the period | (7,526 | ) | (5,003 | ) | - | (2,560 | ) | (15,089 | ) | |||||||||||
| Sales and disposals in the period | 5,173 | 9,849 | - | 5,311 | 20,333 | |||||||||||||||
| Other | (38 | ) | - | 38 | - | - | ||||||||||||||
| Balances as of September 30, 2011 | (31,662 | ) | (17,565 | ) | - | (9,905 | ) | (59,132 | ) | |||||||||||
| 2010 | Land and buildings | Equipment | Ceded under an operating leases | Other | Total | |||||||||||||||
| MCh$ | MCh$ | MCh$ | MCh$ | MCh$ | ||||||||||||||||
| Opening balances as of January 1, 2010 | (18,946 | ) | (14,602 | ) | (38 | ) | (9,393 | ) | (42,979 | ) | ||||||||||
| Depreciation charges in the period | (11,103 | ) | (7,809 | ) | - | (3,263 | ) | (22,175 | ) | |||||||||||
| Sales and disposals in the period | 778 | - | - | - | 778 | |||||||||||||||
| Other | - | - | - | - | - | |||||||||||||||
| Balances as of December 31, 2010 | (29,271 | ) | (22,411 | ) | (38 | ) | (12,656 | ) | (64,376 | ) | ||||||||||
| c) | Operational leases – Lessor |
As of September 30, 2011 and December 31, 2010, the future minimum lease inflows under non-cancellable operating leases are as follows:
| As of September 30, | As of December 31, | |||||||
| 2011 | 2010 | |||||||
| MCh$ | MCh$ | |||||||
| Due within 1 year | 258 | 597 | ||||||
| Due after 1 year but within 2 years | 930 | 591 | ||||||
| Due after 2 year but within 3 years | 846 | 587 | ||||||
| Due after 3 year but within 4 years | 354 | 184 | ||||||
| Due after 4 year but within 5 years | 332 | 165 | ||||||
| Due after 5 years | 2,727 | 2,090 | ||||||
| Totals | 5,446 | 4,214 | ||||||
F-61
BANCO SANTANDER CHILE AND SUBSIDIARIES NOTES TO THE UNAUDITED CONDENSED CONSOLIDATED INTERIM FINANCIAL STATEMENTS As of September 30, 2011 and 2010 and December 31, 2010 |
NOTE 13 - PROPERTY, PLANT, AND EQUIPMENT, continued:
| d) | Operational leases – Lessee |
Certain Bank’s premises and equipment are leased under operating leases. Future minimum rental payments under non-cancellable leases are as follows:
| As of September 30, | As of December 31, | |||||||
| 2011 | 2010 | |||||||
| MCh$ | MCh$ | |||||||
| Due within 1 year | 14,489 | 14,301 | ||||||
| Due after 1 year but within 2 years | 12,942 | 12,859 | ||||||
| Due after 2 year but within 3 years | 11,594 | 11,339 | ||||||
| Due after 3 year but within 4 years | 10,302 | 10,194 | ||||||
| Due after 4 year but within 5 years | 8,533 | 8,720 | ||||||
| Due after 5 years | 57,283 | 58,724 | ||||||
| Totals | 115,143 | 116,137 | ||||||
| e) | As of September 30, 2011 and 2010, the Bank has no financial leases which cannot be unilaterally rescinded. |
| f) | As of September 30, 2011 and December 31, 2010, the Bank does not have any restriction over property, plant, and equipment. Additionally, property, plant, and equipment have not been pledged as security for liabilities. Also, the Bank has no debt regarding Property, plant, and equipment as of those dates. |
F-62
BANCO SANTANDER CHILE AND SUBSIDIARIES NOTES TO THE UNAUDITED CONDENSED CONSOLIDATED INTERIM FINANCIAL STATEMENTS As of September 30, 2011 and 2010 and December 31, 2010 |
NOTE 14 - CURRENT AND DEFERRED TAXES:
a) Current taxes
At the end of each reporting period the bank recognizes an Income Tax Provision, which is determined based on the currently applicable tax legislation. This provision is recorded net of recoverable taxes, as follows:
| As of September 30, | As of December 31, | |||||||
| 2011 | 2010 | |||||||
| MCh$ | MCh$ | |||||||
| Summary of current tax liabilities (assets) | ||||||||
| Current taxes (assets) | (27,746 | ) | (12,499 | ) | ||||
| Current taxes liabilities | 2,300 | 1,293 | ||||||
| Total tax payable (recoverable) | (25,446 | ) | (11,206 | ) | ||||
| (Assets) liabilities current taxes detail (net) | ||||||||
| Income tax, tax rate 20% (17% as of December 31, 2010) | 76,513 | 92,593 | ||||||
| Minus: | ||||||||
| Provisional monthly payments (PPM) | (97,465 | ) | (96,245 | ) | ||||
| Credit for training expenses | (457 | ) | (1,328 | ) | ||||
| Other | (4,037 | ) | (6,226 | ) | ||||
| Total tax payable (recoverable) | (25,446 | ) | (11,206 | ) | ||||
| b) | Effect on income |
The effect of tax expense on income during the periods ended as of September 30, 2011 and 2010 is comprised of the following items:
For the quarter ended as of September 30, | For the 9-month period ended as of September 30, | |||||||||||||||
| 2011 | 2010 | 2011 | 2010 | |||||||||||||
| MCh$ | MCh$ | MCh$ | MCh$ | |||||||||||||
| Income tax expenses | ||||||||||||||||
| Current tax | 29,679 | 25,496 | 70,157 | 82,721 | ||||||||||||
| Credits (debits) for deferred taxes | ||||||||||||||||
| Origination and reversal of temporary differences | (14,269 | ) | (15,684 | ) | (12,895 | ) | (26,278 | ) | ||||||||
| Prior years’ tax benefit | - | - | - | - | ||||||||||||
| Subtotals | 15,410 | 9,812 | 57,262 | 56,443 | ||||||||||||
| Tax for rejected expenses (Article No.21) | 156 | 179 | 681 | 309 | ||||||||||||
| Other | - | - | - | - | ||||||||||||
| Net charges for income tax expense | 15,566 | 9,991 | 57,943 | 56,752 | ||||||||||||
F-63
BANCO SANTANDER CHILE AND SUBSIDIARIES NOTES TO THE UNAUDITED CONDENSED CONSOLIDATED INTERIM FINANCIAL STATEMENTS As of September 30, 2011 and 2010 and December 31, 2010 |
NOTE 14 - CURRENT AND DEFERRED TAXES, continued:
| c) | Effective tax rate reconciliation |
The reconciliation between the income tax rate and the effective rate applied in determining tax expenses as of September 30, 2011 and 2010, is as follows:
| As of September 30, | ||||||||||||||||
| 2011 | 2010 | |||||||||||||||
| Tax rate | Amount | Tax rate | Amount | |||||||||||||
| % | MCh$ | % | MCh$ | |||||||||||||
| Income tax using statutory rate | 20.00 | 72,601 | 17.00 | 72,067 | ||||||||||||
| Permanent differences | (3.38 | ) | (12,285 | ) | (1.89 | ) | (8,026 | ) | ||||||||
| Additions or deductions | - | - | - | - | ||||||||||||
| Unique tax (rejected expenses) | 0.19 | 681 | 0.07 | 308 | ||||||||||||
| Effect of change in tax rate | (0.85 | ) | (3,054 | ) | (1.79 | ) | (7,597 | ) | ||||||||
| Other | - | - | - | - | ||||||||||||
| Effective rates and expenses for income tax | 15.96 | 57,943 | 13.39 | 56,752 | ||||||||||||
Law No. 20,455 from 2010 increased the statutory tax rate to be applied to companies for their profit during 2011 and 2012, to 20% and 18.5% respectively. Due to this, in 2010, a Ch$7,596 million tax benefit was recorded, corresponding to the adjustment of temporary differences to be reversed during those years. As of September 30, 2011 the Bank recognized Ch$3,054 million
| d) | Effect of deferred taxes on comprehensive income |
Below is a summary of the separate effect of deferred tax on other comprehensive income, during the periods ended September 30, 2011 and December 31, 2010:
| As of September 30, | As of December 31, | |||||||
| 2011 | 2010 | |||||||
| MCh$ | MCh$ | |||||||
| Deferred tax assets | ||||||||
| Available for sale investments | 143 | 4,319 | ||||||
| Cash flow hedge | 414 | - | ||||||
| Total deferred tax assets affecting other comprehensive income | 557 | 4,319 | ||||||
| Deferred tax liabilities | ||||||||
| Available for sale investments | (712 | ) | (749 | ) | ||||
| Cash flow hedge | - | (2,324 | ) | |||||
| Total deferred tax liabilities affecting other comprehensive income | (712 | ) | (3,073 | ) | ||||
| Net deferred tax balances in equity | (155 | ) | 1,246 | |||||
| Deferred taxes in equity attributable to Bank shareholders | (147 | ) | 1,203 | |||||
| Deferred tax in equity attributable to non-controlling interest | (8 | ) | 43 | |||||
F-64
BANCO SANTANDER CHILE AND SUBSIDIARIES NOTES TO THE UNAUDITED CONDENSED CONSOLIDATED INTERIM FINANCIAL STATEMENTS As of September 30, 2011 and 2010 and December 31, 2010 |
NOTE 14 - CURRENT AND DEFERRED TAXES, continued:
| e) | Effect of deferred taxes on income |
Below are the effects as of September 30, 2011 and December 31, 2010 of deferred taxes on assets and liabilities affecting profit or loss, as a result of temporary differences:
| As of September 30, | As of December 31, | |||||||
| 2011 | 2010 | |||||||
| MCh$ | MCh$ | |||||||
| Deferred tax assets | ||||||||
| Interest and adjustments | 93 | 162 | ||||||
| Extraordinary charge-off | 6,235 | 5,197 | ||||||
| Assets received in lieu of payment | 446 | 919 | ||||||
| Exchange rate adjustments | 874 | 560 | ||||||
| Valuation of Property, plant and equipment | 6,758 | 5,491 | ||||||
| Allowance for loan losses | 71,323 | 46,585 | ||||||
| Provision for expenses | 11,764 | 6,606 | ||||||
| Derivatives | - | 4,300 | ||||||
| Leased assets | 27,691 | 22,007 | ||||||
| Subsidiaries’ tax losses | 4,407 | 4,168 | ||||||
| Other | 400 | 156 | ||||||
| Total deferred tax assets | 129,991 | 96,151 | ||||||
| Deferred tax liabilities | ||||||||
| Valuation of investments and derivatives | (8,662 | ) | (1,056 | ) | ||||
| Depreciation | (233 | ) | (443 | ) | ||||
| Prepaid expenses | (1,584 | ) | (646 | ) | ||||
| Other | (389 | ) | (223 | ) | ||||
| Total deferred tax liabilities | (10,868 | ) | (2,368 | ) | ||||
f) Summary of deferred tax assets and liabilities
Below is a summary of the deferred tax assets and liabilities, recognized in other comprehensive income and in profit or loss:
| As of September 30, | As of December 31, | |||||||
| 2011 | 2010 | |||||||
| MCh$ | MCh$ | |||||||
| Deferred tax assets | ||||||||
| Recognized in other comprehensive income | 557 | 4,319 | ||||||
| Recognized in profit or loss | 129,991 | 96,151 | ||||||
| Total deferred tax assets | 130,548 | 100,470 | ||||||
| Deferred tax liabilities | ||||||||
| Recognized in other comprehensive income | (712 | ) | (3,073 | ) | ||||
| Recognized in profit or loss | (10,868 | ) | (2,368 | ) | ||||
| Total deferred tax liabilities | (11,580 | ) | (5,441 | ) | ||||
F-65
BANCO SANTANDER CHILE AND SUBSIDIARIES NOTES TO THE UNAUDITED CONDENSED CONSOLIDATED INTERIM FINANCIAL STATEMENTS As of September 30, 2011 and 2010 and December 31, 2010 |
NOTE 15 – OTHER ASSETS:
Other assets item as of September 30, 2011 and December 31, 2010 is as follows:
| As of September 30, | As of December 31, | |||||||
| 2011 | 2010 | |||||||
| MCh$ | MCh$ | |||||||
| Assets for leasing (*) | 77,680 | 43,832 | ||||||
| Assets received or awarded in lieu of payment (**) | ||||||||
| Assets received in lieu of payment | 21,715 | 20,337 | ||||||
| Assets awarded at judicial sale | 10,610 | 7,798 | ||||||
| Provisions for assets received in lieu of payment or awarded | (2,852 | ) | (2,255 | ) | ||||
| Subtotals | 29,473 | 25,880 | ||||||
| Other assets | ||||||||
| Guarantee deposits | 148,123 | 208,512 | ||||||
| VAT credit | 7,589 | 9,634 | ||||||
| Income tax recoverable | 6,849 | 9,045 | ||||||
| Prepaid expenses | 73,095 | 81,348 | ||||||
| Higher value paid on purchase of mortgage finance bonds issued by Bank | - | 436 | ||||||
| Assets recovered from leasing for sale | 1,576 | 2,347 | ||||||
| Pension plan assets | 3,363 | 4,217 | ||||||
| Accounts and notes receivable | 94,307 | 100,958 | ||||||
| Notes receivable through brokerage and simultaneous transactions | 230,710 | 111,508 | ||||||
| Other assets | 40,781 | 52,364 | ||||||
| Subtotals | 606,393 | 580,369 | ||||||
| Totals | 713,546 | 650,081 | ||||||
| (*) | Assets available to be granted under financial leasing agreements. |
| (**) | The assets received in lieu of payment are assets received as payment of customers’ past-due debts. The assets acquired must at no time exceed, in the aggregate, 20% of the Bank’s effective equity. These assets represent 0.49% (0.47% as of December 31, 2010) of the Bank’s effective equity. |
The assets awarded at judicial sale are assets that have been acquired as payment of debts previously owed to the Bank. The assets awarded at judicial sales are not subject to the abovementioned requirement. These properties are assets available for sale. For most assets, the sale is expected to be completed within one year from the date on which the asset was received or acquired. If the asset in question is not sold within the year, it must be written off.
In addition, a provision is recorded for the initial award value plus its additions and its estimated realization value (appraisal) whichever is higher.
F-66
BANCO SANTANDER CHILE AND SUBSIDIARIES NOTES TO THE UNAUDITED CONDENSED CONSOLIDATED INTERIM FINANCIAL STATEMENTS As of September 30, 2011 and 2010 and December 31, 2010 |
NOTE 16 - TIME DEPOSITS AND OTHER TIME LIABILITIES:
As of September 30, 2011 and December 31, 2010 the composition of the item is as follows:
| As of September 30, | As of December 31, | |||||||
| 2011 | 2010 | |||||||
| MCh$ | MCh$ | |||||||
| Deposits and other demand liabilities | ||||||||
| Checking accounts | 3,375,207 | 3,330,352 | ||||||
| Other deposits and demand accounts | 363,009 | 368,934 | ||||||
| Other demand liabilities | 758,541 | 537,148 | ||||||
| Totals | 4,496,757 | 4,236,434 | ||||||
| Time deposits and other time liabilities | ||||||||
| Time deposits | 9,291,339 | 7,154,396 | ||||||
| Time savings account | 102,636 | 103,191 | ||||||
| Other time liabilities | 1,271 | 1,170 | ||||||
| Totals | 9,395,246 | 7,258,757 | ||||||
F-67
BANCO SANTANDER CHILE AND SUBSIDIARIES NOTES TO THE UNAUDITED CONDENSED CONSOLIDATED INTERIM FINANCIAL STATEMENTS As of September 30, 2011 and 2010 and December 31, 2010 |
NOTE 17 - ISSUED DEBT INSTRUMENTS AND OTHER OBLIGATIONS:
As of September 30, 2011 and December 31, 2010 the composition of the item is as follows:
| As of September 30, | As of December 31, | |||||||
| 2011 | 2010 | |||||||
| MCh$ | MCh$ | |||||||
| Other financial liabilities | ||||||||
| Obligations to public sector | 102,862 | 102,541 | ||||||
| Other domestic obligations | 61,085 | 38,000 | ||||||
| Foreign obligations | 3,046 | 25,748 | ||||||
| Subtotals | 166,993 | 166,289 | ||||||
| Issued debt instruments | ||||||||
| Mortgage finance bonds | 167,804 | 194,134 | ||||||
| Senior bonds | 3,486,072 | 3,310,679 | ||||||
| Subordinated bonds | 859,030 | 686,075 | ||||||
| Subtotals | 4,512,906 | 4,190,888 | ||||||
| Totals | 4,679,899 | 4,357,177 | ||||||
Debts classified as current are either demand obligations or will mature in one year or less. All other debts are classified as non-current. The Bank’s debts, both current and non-current, are summarized below:
| As of September 30, 2011 | ||||||||||||
| Current | Non-current | Total | ||||||||||
| MCh$ | MCh$ | MCh$ | ||||||||||
| Mortgage bonds | 8,098 | 159,706 | 167,804 | |||||||||
| Senior bonds | 658,364 | 2,827,708 | 3,486,072 | |||||||||
| Subordinated bonds | 125,665 | 733,365 | 859,030 | |||||||||
| Issued debt instruments | 792,127 | 3,720,779 | 4,512,906 | |||||||||
| Other financial liabilities | 44,384 | 122,609 | 166,993 | |||||||||
| Totals | 836,511 | 3,843,388 | 4,679,899 | |||||||||
| As of December 31, 2010 | ||||||||||||
| Current | Non-current | Total | ||||||||||
| MCh$ | MCh$ | MCh$ | ||||||||||
| Mortgage bonds | 10,751 | 183,383 | 194,134 | |||||||||
| Senior bonds | 547,107 | 2,763,572 | 3,310,679 | |||||||||
| Subordinated bonds | 21,692 | 664,383 | 686,075 | |||||||||
| Issued debt instruments | 579,550 | 3,611,338 | 4,190,888 | |||||||||
| Other financial liabilities | 44,042 | 122,247 | 166,289 | |||||||||
| Totals | 623,592 | 3,733,585 | 4,357,177 | |||||||||
F-68
BANCO SANTANDER CHILE AND SUBSIDIARIES NOTES TO THE UNAUDITED CONDENSED CONSOLIDATED INTERIM FINANCIAL STATEMENTS As of September 30, 2011 and 2010 and December 31, 2010 |
NOTE 17 – ISSUED DEBT INSTRUMENTS AND OTHER OBLIGATIONS, continued:
| a) | Mortgage finance bonds |
These bonds are used to finance mortgage loans. The outstanding principal of the bonds are amortized on a quarterly basis. The range of maturities of these bonds is between five and twenty years. The bonds are linked to the UF index and bear a weighted-average annual interest rate of 5.88% as of September 2011 (5.6% as of December 2010).
| As of September 30, | As of December 31, | |||||||
| 2011 | 2010 | |||||||
| MCh$ | MCh$ | |||||||
| Due within 1 year | 8,098 | 10,751 | ||||||
| Due after 1 year but within 2 years | 7,406 | 7,171 | ||||||
| Due after 2 year but within 3 years | 10,749 | 8,745 | ||||||
| Due after 3 year but within 4 years | 20,632 | 12,286 | ||||||
| Due after 4 year but within 5 years | 16,258 | 26,253 | ||||||
| Due after 5 years | 104,661 | 128,928 | ||||||
| Total mortgage bonds | 167,804 | 194,134 | ||||||
| b) | Senior bonds |
The following table shows senior bonds by currency:
| As of September 30, | As of December 31, | |||||||
| 2011 | 2010 | |||||||
| MCh$ | MCh$ | |||||||
| Santander bonds in UF | 1,880,919 | 1,952,051 | ||||||
| Santander bonds in US$ | 1,254,136 | 936,134 | ||||||
| Santander bonds in CHF$ | 130,737 | 174,297 | ||||||
| Santander bonds in $ | 220,280 | 248,197 | ||||||
| Total senior bonds | 3,486,072 | 3,310,679 | ||||||
F-69
BANCO SANTANDER CHILE AND SUBSIDIARIES NOTES TO THE UNAUDITED CONDENSED CONSOLIDATED INTERIM FINANCIAL STATEMENTS As of September 30, 2011 and 2010 and December 31, 2010 |
NOTE 17 – ISSUED DEBT INSTRUMENTS AND OTHER OBLIGATIONS, continued:
In 2011 the Bank issued bonds for USD 500,000,000; UF 9,718,000; and CLP 26,800,000,000; detailed as follows:
| Series | Amount | Term | Issue Rate | Issuance date | Maturity date |
| Floating rate bond | USD 500,000,000 | 5 years | Libor (3 months) + 125 bp | 01-11-2011 | 01-19-2016 |
| Total | USD 500,000,000 | ||||
| BSTDFA0410 | UF 160,000 | 4 years | 3.0 % per annum simple | 04-01-2010 | 01-04-2014 |
| BSTDFD0810 | UF 1,274,000 | 5 years | 3.0 % per annum simple | 09-01-2010 | 09-01-2015 |
| BSTDFE0810 | UF 2,750,000 | 6 years | 3.0 % per annum simple | 08-01-2010 | 08-01-2016 |
| BSTDE10211 | UF 896,000 | 5 years | 3.0 % per annum simple | 02-01-2011 | 04-01-2016 |
| BSTDE20111 | UF 3,048,000 | 7.5 years | 3.5 % per annum simple | 01-01-2011 | 07-01-2018 |
| BSTDE30111 | UF 1,590,000 | 8.5 years | 3.5 % per annum simple | 01-01-2011 | 07-01-2019 |
| Total | UF 9,718,000 | ||||
| BSTDE40611 | CLP 26,800,000,000 | 5 years | 6.75 % per annum simple | 06-01-2011 | 06-01-2016 |
| Total | CLP 26,800,000,000 |
On January 11, 2011 the Bank issued a 5-year floating rate note for USD 500,000,000 at 3-month Libor. The interest payment will be made quarterly starting on April 19, 2011. The issuance was made in USA on January 19, 2011.
In 2010 the Bank issued bonds denominated in UF for 21,496,000; USD 1,200,000,000; CHF 350,000,000; and CLP 247,255,000,000. The table below shows the issued bonds on the stated dates:
| Series | Amount | Term | Interest rate | Issuance date | Maturity date |
| F6 | UF 1,090,000 | 5 years | 3.5 % per annum simple | 09-01-2009 | 09-01-2014 |
| F7 | UF 3,000,000 | 4.5 years | 3.3 % per annum simple | 11-01-2009 | 05-01-2014 |
| F8 | UF 3,000,000 | 4.5 years | 3.6 % per annum simple | 01-01-2010 | 07-01-2014 |
| F9 | UF 3,000,000 | 5 years | 3.7 % per annum simple | 01-01-2010 | 01-01-2015 |
| FA | UF 2,840,000 | 4 years | To maturity(bullet) | 04-01-2010 | 04-01-2014 |
| FB | UF 3,000,000 | 5 years | 3.0% annual due | 04-01-2010 | 04-01-2015 |
| FC | UF 4,000,000 | 5 years | 4.5 % annual due | 08-01-2010 | 08-01-2015 |
| FD | UF 1,566,000 | 5 years | To maturity(bullet) | 09-01-2010 | 09-01-2015 |
| Total | UF 21,496,000 | ||||
| Floating rate bond | USD 500,000,000 | 2 years | Libor (3 months) + 125 bp | 04-15-2010 | 04-12-2012 |
| Fixed bonds | USD 500,000,000 | 5 years | 3.75 % per annum simple | 09-15-2010 | 09-15-2015 |
| Floating rate bond | USD 200,000,000 | 1 year | Libor (3 months) + 100 bp | 09-15-2010 | 09-15-2011 |
| Total | USD 1,200,000,000 | ||||
| Fixed bonds | CHF 250,000,000 | 5 years | 2.25% coupon rate | 11-16-2010 | 12-16-2015 |
| Floating rate bond | CHF 100,000,000 | 3 years | Libor (3 months) + 100 bp | 11-16-2010 | 11-16-2013 |
| Total | CHF 350,000,000 | ||||
| Bond pesos | CLP 247,255,000,000 | 10 years | 6.5% coupon rate | 09-15-2010 | 09-22-2020 |
| Total | CLP 247,255,000,000 |
F-70
BANCO SANTANDER CHILE AND SUBSIDIARIES NOTES TO THE UNAUDITED CONDENSED CONSOLIDATED INTERIM FINANCIAL STATEMENTS As of September 30, 2011 and 2010 and December 31, 2010 |
NOTE 17 – ISSUED DEBT INSTRUMENTS AND OTHER OBLIGATIONS, continued:
The maturity of these bonds are as follows:
| As of September 30, | As of December 31, | |||||||
| 2011 | 2010 | |||||||
| MCh$ | MCh$ | |||||||
| Due within 1 year | 658,364 | 547,107 | ||||||
| Due after 1 year but within 2 years | 668,343 | 374,727 | ||||||
| Due after 2 year but within 3 years | 541,908 | 389,813 | ||||||
| Due after 3 year but within 4 years | 315,776 | 390,953 | ||||||
| Due after 4 year but within 5 years | 535,565 | 340,331 | ||||||
| Due after 5 years | 766,116 | 1,267,748 | ||||||
| Total bonds | 3,486,072 | 3,310,679 | ||||||
| c) | Subordinated bonds |
The following table shows the balances of our subordinated bonds:
| As of September 30, | As of December 31, | |||||||
| 2011 | 2010 | |||||||
| MCh$ | MCh$ | |||||||
| Subordinated bonds denominated in US $ | 333,044 | 244,957 | ||||||
| Subordinated bonds denominated in UF | 525,986 | 441,118 | ||||||
| Total subordinated bonds | 859,030 | 686,075 | ||||||
In 2011 the Bank issued subordinated bonds on the local market for UF 5,100,000, detailed as follows:
| Interest | Issuance date | Maturity date | ||||||||
| Series | Amount | Term | rate | |||||||
| G3 | UF 3,000,000 | 25 years | 3.9 % per annum simple | 07-01-2010 | 07-01-2035 | |||||
| G5 | UF 2,100,000 | 20 years | 3.9 % per annum simple | 04-01-2011 | 04-01-2031 | |||||
| Total | UF 5,100,000 |
In 2010 the Bank placed subordinated bonds on the local market for UF 4,950,000, detailed as follows:
| Interest | Issuance date | Maturity date | ||||||||
| Series | Amount | Term | rate | |||||||
| G2 | UF 1,950,000 | 30 years | 4.8 % per annum simple | 06-17-2010 | 03-01-2038 | |||||
| G4 | UF 3,000,000 | 30 years | 3.9 % annual due | 07-01-2010 | 07-01-2040 | |||||
| Total | UF 4,950,000 |
F-71
BANCO SANTANDER CHILE AND SUBSIDIARIES NOTES TO THE UNAUDITED CONDENSED CONSOLIDATED INTERIM FINANCIAL STATEMENTS As of September 30, 2011 and 2010 and December 31, 2010 |
NOTE 17 – ISSUED DEBT INSTRUMENTS AND OTHER OBLIGATIONS, continued:
The maturities of bonds considered non-current, is as follows:
| As of September 30, | As of December 31, | ||
| 2011 | 2010 | ||
| MCh$ | MCh$ | ||
| Due within 1 year | 125,665 | 21,692 | |
| Due after 1 year but within 2 years | 5,410 | 105,505 | |
| Due after 2 year but within 3 years | 5,751 | - | |
| Due after 3 year but within 4 years | 170,667 | 139,452 | |
| Due after 4 year but within 5 years | 4,283 | 12,305 | |
| Due after 5 years | 547,254 | 407,121 | |
| Total subordinated bonds | 859,030 | 686,075 |
| d) | Other financial liabilities |
The composition of other financial obligations, by maturity, is detailed below:
| As of September 30, | As of December 31, | ||
| 2011 | 2010 | ||
| MCh$ | MCh$ | ||
| Non-current portion: | |||
| Due after 1 year but within 2 years | 4,434 | 4,606 | |
| Due after 2 year but within 3 years | 29,190 | 3,090 | |
| Due after 3 year but within 4 years | 3,509 | 28,786 | |
| Due after 4 year but within 5 years | 3,092 | 3,194 | |
| Due after 5 years | 82,384 | 82,571 | |
| Non-current portion subtotals | 122,609 | 122,247 | |
| Current portion: | |||
| Amounts due to credit card operators | 36,994 | 38,567 | |
| Acceptance of letters of credit | 2,504 | 721 | |
| Other long-term financial obligations, short-term portion | 4,886 | 4,754 | |
| Current portion subtotals | 44,384 | 44,042 | |
| Total other financial liabilities | 166,993 | 166,289 |
F-72
BANCO SANTANDER CHILE AND SUBSIDIARIES NOTES TO THE UNAUDITED CONDENSED CONSOLIDATED INTERIM FINANCIAL STATEMENTS As of September 30, 2011 and 2010 and December 31, 2010 |
NOTE 18 - MATURITIES OF ASSETS AND LIABILITIES:
As of September 30, 2011 and December 31, 2010 the detail of maturities of assets and liabilities is as follows:
| As of September 30, 2011 | Demand | Up to 1 month | Between 1 and 3 months | Between 3 and 12 months | Subtotal up to 1 year | Between 1 and 5 years | More than 5 years | Subtotal more than 1 year | Total |
| MCh$ | MCh$ | MCh$ | MCh$ | MCh$ | MCh$ | MCh$ | MCh$ | MCh$ | |
| Financial Assets | |||||||||
| Cash and deposits in banks | 1,812,784 | - | - | - | 1,812,784 | - | - | - | 1,812,784 |
| Unsettled transactions | 816,601 | - | - | - | 816,601 | - | - | - | 816,601 |
| Trading investments | - | 27,316 | 2,070 | 146,009 | 175,395 | 251,284 | 77,134 | 328,418 | 503,813 |
| Investments under resale agreements | - | 12,157 | - | - | 12,157 | - | - | - | 12,157 |
| Financial derivative contracts | - | 251,185 | 194,435 | 426,524 | 872,144 | 701,882 | 437,559 | 1,139,441 | 2,011,585 |
| Interbank loans (*) | 85,525 | - | 2,513 | - | 88,038 | - | - | - | 88,038 |
| Loans and accounts receivables from customers (**) | 484,171 | 1,732,868 | 1,526,070 | 2,574,387 | 6,317,496 | 5,708,482 | 5,654,378 | 11,362,860 | 17,680,356 |
| Available for sale investments | - | 809,349 | 441,227 | 263,970 | 1,514,546 | 411,376 | 178,722 | 590,098 | 2,104,644 |
| Held to maturity investments | - | - | - | - | - | - | - | - | - |
| Total assets | 3,199,081 | 2,832,875 | 2,166,315 | 3,410,890 | 11,609,161 | 7,073,024 | 6,347,793 | 13,420,817 | 25,029,978 |
| Financial Liabilities | |||||||||
| Deposits and other demand liabilities | 4,496,757 | - | - | - | 4,496,757 | - | - | - | 4,496,757 |
| Unsettled transactions | 466,063 | - | - | - | 466,063 | - | - | - | 466,063 |
| Investments under repurchase agreements | - | 222,090 | 3,957 | 996 | 227,043 | - | - | - | 227,043 |
| Time deposits and other time liabilities | 104,667 | 4,403,631 | 2,372,548 | 2,106,023 | 8,986,869 | 382,859 | 25,518 | 408,377 | 9,395,246 |
| Financial derivative contracts | - | 232,812 | 137,528 | 363,897 | 734,237 | 547,419 | 343,618 | 891,037 | 1,625,274 |
| Interbank borrowings | 195,850 | 159,220 | 360,111 | 1,177,107 | 1,892,288 | 132,768 | - | 132,768 | 2,025,056 |
| Issued debt instruments | 21 | 549,536 | 60,660 | 181,910 | 792,127 | 2,302,748 | 1,418,031 | 3,720,779 | 4,512,906 |
| Other financial liabilities | 36,995 | 409 | 3,508 | 3,472 | 44,384 | 40,225 | 82,384 | 122,609 | 166,993 |
| Total liabilities | 5,300,353 | 5,567,698 | 2,938,312 | 3,833,405 | 17,639,768 | 3,406,019 | 1,869,551 | 5,275,570 | 22,915,338 |
| (*) | Interbank loans are stated at their gross value. The allowance amounted Ch$144 million. |
| (**) | Loans and accounts receivables from customers are stated at their gross value. The allowance amounted Ch$484,561 million. |
F-73
BANCO SANTANDER CHILE AND SUBSIDIARIES NOTES TO THE UNAUDITED CONDENSED CONSOLIDATED INTERIM FINANCIAL STATEMENTS As of September 30, 2011 and 2010 and December 31, 2010 |
NOTE 18 - MATURITIES OF FINANCIAL ASSETS AND LIABILITIES, continued:
| As of December 31, 2010 | Demand | Up to 1 month | Between 1 and 3 months | Between 3 and 12 months | Subtotal up to 1 year | Between 1 and 5 years | More than 5 years | Subtotal more than 1 year | Total |
| MCh$ | MCh$ | MCh$ | MCh$ | MCh$ | MCh$ | MCh$ | MCh$ | MCh$ | |
| Financial Assets | |||||||||
| Cash and deposits in banks | 1,762,198 | - | - | - | 1,762,198 | - | - | - | 1,762,198 |
| Unsettled transactions: | 374,368 | - | - | - | 374,368 | - | - | - | 374,368 |
| Trading investments | - | 26,572 | 10,918 | 188,295 | 225,785 | 150,427 | 3,458 | 153,885 | 379,670 |
| Investments under resale agreements | - | 170,985 | - | - | 170,985 | - | - | - | 170,985 |
| Financial derivative contracts | - | 94,417 | 109,729 | 289,492 | 493,638 | 749,688 | 381,052 | 1,130,740 | 1,624,378 |
| Interbank loans (*) | 17 | 69,709 | - | - | 69,726 | - | - | - | 69,726 |
| Loans and accounts receivables from customers (**) | 610,951 | 1,696,614 | 1,109,796 | 2,274,513 | 5,691,874 | 4,773,163 | 5,192,519 | 9,965,682 | 15,657,556 |
| Available for sale investments | - | 189,600 | 120,076 | 265,667 | 575,343 | 532,292 | 366,345 | 898,637 | 1,473,980 |
| Held to maturity investments | - | - | - | - | - | - | - | - | - |
| Total assets | 2,747,534 | 2,247,897 | 1,350,519 | 3,017,967 | 9,363,917 | 6,205,570 | 5,943,374 | 12,148,944 | 21,512,861 |
| Financial Liabilities | |||||||||
| Deposits and other demand liabilities | 4,236,434 | - | - | - | 4,236,434 | - | - | - | 4,236,434 |
| Unsettled transactions | 300,125 | - | - | - | 300,125 | - | - | - | 300,125 |
| Investments under repurchase agreements | - | 284,020 | 9,769 | 936 | 294,725 | - | - | - | 294,725 |
| Time deposits and other time liabilities | 104,362 | 2,167,851 | 1,713,684 | 2,350,479 | 6,336,376 | 898,241 | 24,140 | 922,381 | 7,258,757 |
| Financial derivative contracts | - | 137,501 | 155,431 | 343,771 | 636,703 | 696,219 | 311,057 | 1,007,276 | 1,643,979 |
| Interbank borrowings | 831 | 29,877 | 179,361 | 1,249,718 | 1,459,787 | 124,270 | - | 124,270 | 1,584,057 |
| Issued debt instruments | - | 6,007 | 130,557 | 442,986 | 579,550 | 1,807,541 | 1,803,797 | 3,611,338 | 4,190,888 |
| Other financial liabilities | 38,567 | 1,089 | 773 | 3,613 | 44,042 | 39,677 | 82,570 | 122,247 | 166,289 |
| Total liabilities | 4,680,319 | 2,626,345 | 2,189,575 | 4,391,503 | 13,887,742 | 3,565,948 | 2,221,564 | 5,787,512 | 19,675,254 |
| (*) | Interbank loans are stated at their gross value. The allowance amounted Ch$54 million. |
| (**) | Loans and accounts receivables from customers are stated at their gross value. The allowance amounted Ch$425,393 million. |
F-74
BANCO SANTANDER CHILE AND SUBSIDIARIES NOTES TO THE UNAUDITED CONDENSED CONSOLIDATED INTERIM FINANCIAL STATEMENTS As of September 30, 2011 and 2010 and December 31, 2010 |
NOTE 19 - OTHER LIABILITIES
The Other liabilities as of September 30, 2011 and December 31, 2010 are as follows:
| As of September 30, | As of December 31, | |||||||
| 2011 | 2010 | |||||||
| MCh$ | MCh$ | |||||||
| Accounts and notes payable | 46,297 | 63,026 | ||||||
| Unearned income | 923 | 1,547 | ||||||
| Guarantees received (threshold) | 271,803 | 68,217 | ||||||
| Notes payable through brokerage and simultaneous transactions | 126,655 | 53,856 | ||||||
| Other liabilities | 117,348 | 74,682 | ||||||
| Totals | 563,026 | 261,328 | ||||||
F-75
BANCO SANTANDER CHILE AND SUBSIDIARIES NOTES TO THE UNAUDITED CONDENSED CONSOLIDATED INTERIM FINANCIAL STATEMENTS As of September 30, 2011 and 2010 and December 31, 2010 |
NOTE 20 - CONTINGENCIES AND COMMITMENTS:
| a) | Lawsuits and legal procedures |
As of the issuance date of these Condensed Consolidated Interim financial statements, the Bank and its affiliates were subject to certain legal actions in the normal course of their business. As of September, 2011 the Bank and its affiliates maintained provisions for these legal actions, totaling MCh$737 (MCh$839 as of December 31, 2010), which are part of the “Provisions for contingencies” item.
| b) | Contingent loans |
The following table shows the Bank’s contractual obligations to issue loans:
| As of September 30, | As of December 31, | |||||||
| 2011 | 2010 | |||||||
| MCh$ | MCh$ | |||||||
| Letters of credit issued | 206,536 | 209,532 | ||||||
| Foreign letters of credit confirmed | 53,094 | 85,739 | ||||||
| Guarantees | 888,653 | 898,751 | ||||||
| Pledges and other commercial commitments | 153,585 | 166,550 | ||||||
| Subtotals | 1,301,868 | 1,360,572 | ||||||
| Available on demand credit lines | 4,496,281 | 4,832,359 | ||||||
| Other irrevocable credit commitments | 103,604 | 129,428 | ||||||
| Totals | 5,901,753 | 6,322,359 | ||||||
| c) | Held securities |
The Bank holds securities in the normal course of its business as follows:
| As of September 30, | As of December 31, | |||||||
| 2011 | 2010 | |||||||
| MCh$ | MCh$ | |||||||
| Third party operations | ||||||||
| Collections | 208,807 | 173,219 | ||||||
| Assets from third parties managed by the Bank and its affiliates | 35 | 66 | ||||||
| Subtotals | 208,842 | 173,285 | ||||||
| Custody of securities | ||||||||
| Securities held in custody | 322,527 | 290,549 | ||||||
| Securities held in custody deposited in other entity | 561,757 | 611,145 | ||||||
| Issued securities held in custody | 8,886,279 | 9,944,224 | ||||||
| Subtotals | 9,770,563 | 10,845,918 | ||||||
| Totals | 9,979,405 | 11,019,203 | ||||||
| d) | Guarantees |
Banco Santander Chile has a comprehensive officer fidelity insurance policy, No. 2545451, with the Chilena Consolidada Insurance Company, for an amount of USD $5,000,000, which jointly covers both the Bank and its affiliates for the period from July 1, 2011 to June 30, 2012.
F-76
BANCO SANTANDER CHILE AND SUBSIDIARIES NOTES TO THE UNAUDITED CONDENSED CONSOLIDATED INTERIM FINANCIAL STATEMENTS As of September 30, 2011 and 2010 and December 31, 2010 |
NOTE 20 - CONTINGENCIES AND COMMITMENTS, continued:
Santander Asset Management S.A. Administradora General de Fondos
In conformity with General Standard No.125, the company designated Banco Santander Chile as the representative of the beneficiaries of the guarantees established by each of the managed funds, in compliance with Articles 226 and onward of Law No.18,045.
In addition to these guarantees for creating mutual funds, there are other guarantees for a guaranteed return on certain mutual funds for an amount of Ch$ 9,943.60 million and time deposits for UF 1,922,641.875 as a guaranty of Private Investment Funds (P.I.F.), as of September 30, 2011
Santander Agente de Valores Limitada
To ensure correct and full performance of all its obligations as an Agent, in conformity with the provisions of Articles No.30 and onward of Law No.18,045 on the Securities Market, the Company provided a guarantee in the amount of UF 4,000 through Insurance Policy No.210107110, underwritten by the Compañía de Seguros de Crédito Continental S.A., which matures on December 19, 2011.
Santander S.A. Corredores de Bolsa
The Company has given guarantees to the Bolsa de Comercio de Santiago for a current value of Ch$30,176 million to cover simultaneous transactions.
In addition, the Company has issued a guarantee to CCLV Contraparte Central S.A. (formerly known as Cámara de Compensación) in cash, for a total MCh$3,000 as of September 30, 2011.
Santander Corredora de Seguros Limitada
| a) | Insurance policies |
In accordance with Circular No.1,160 of the Superintendency of Securities and Insurance, the Company has an insurance policy in connection with its obligations as an intermediary in insurance contracts.
The company purchased a guarantee policy (No.10019899), and professional liability policy (No.10019900) for its insurance brokers from the Seguros Generales Consorcio Nacional de Seguros S.A. The policies have a UF 500 and UF 60,000 coverage, respectively, and are valid from April 15, 2011 through April 14, 2012.
| b) | Contingent loans and liabilities |
To satisfy its client´s needs, the Bank took on several contingent loans and liabilities, yet these could not be recognized in the Condensed Consolidated Interim Statements of Financial Position. Nevertheless these contingent loans and liabilities have credit risk and they are, therefore, part of the Bank´s global risk.
| c) | Trials |
As of September 30, 2011 there are trials for MCh$ 1,264.5 corresponding to processes mainly due to leased assets. The estimated loss amount is recorded under provisions.
F-77
BANCO SANTANDER CHILE AND SUBSIDIARIES NOTES TO THE UNAUDITED CONDENSED CONSOLIDATED INTERIM FINANCIAL STATEMENTS As of September 30, 2011 and 2010 and December 31, 2010 |
NOTE 21 – EQUITY:
| a) | Capital stock and preferred shares |
As of September 30, 2011 and December 31, 2010 the Bank had 188,446,126,794 authorized subscribed fully paid no par value shares. All shares have the same rights, and have no preferences or restrictions.
| Number of shares | ||||||||
| As of September 30, 2011 | As of December 31, 2010 | |||||||
| Issued as of January 1, | 188,446,126,794 | 188,446,126,794 | ||||||
| Issued of paid shares | - | - | ||||||
| Issued of outstanding shares | - | - | ||||||
| Stock options exercised | - | - | ||||||
| Totals | 188,446,126,794 | 188,446,126,794 | ||||||
As of September 30, 2011 and December, 31 2010 neither the Bank nor any of its subsidiaries or associates held any of the issued shares.
As of September 30, 2011 shares held by shareholders were as follows:
| Corporate Name or Shareholder's Name | Shares | ADRs (*) | Totals | % of Equity Holding |
| Teatinos Siglo XXI Inversiones Limitada | 74,512,075,401 | - | 74,512,075,401 | 39.54 |
| Santander Chile Holding S.A. | 66,822,519,695 | - | 66,822,519,695 | 35.46 |
| J.P. Morgan Chase Bank | - | 29,124,078,086 | 29,124,078,086 | 15.45 |
| Inversiones Antares S.A. | 170,363,545 | - | 170,363,545 | 0.09 |
| Banks and stock brokers on behalf of third parties | 8,556,946,074 | - | 8,556,946,074 | 4.54 |
| AFP on behalf of third parties | 3,195,221,751 | - | 3,195,221,751 | 1.70 |
| Other minority holders | 3,875,504,757 | 2,189,417,485 | 6,064,922,242 | 3.22 |
| Totals | 188,446,126,794 | 100.00 |
As of December 31, 2010 shares held by shareholders were as follows:
| Corporate Name or Shareholder's Name | Shares | ADRs (*) | Totals | % of Equity Holding |
| Teatinos Siglo XXI Inversiones Limitada | 78,108,391,607 | - | 78,108,391,607 | 41.45 |
| Santander Chile Holding S.A. | 66,822,519,695 | - | 66,822,519,695 | 35.46 |
| J.P. Morgan Chase Bank | - | 29,892,971,334 | 29,892,971,334 | 15.86 |
| Inversiones Antares S.A. | 250,363,545 | - | 250,363,545 | 0.13 |
| Antonio Hitschfeld Bollman | 100,000,000 | - | 100,000,000 | 0.05 |
| Banks and stock brokers on behalf of third parties | 8,277,713,845 | - | 8,277,713,845 | 4.39 |
| Other minority holders | 3,997,968,278 | 996,198,490 | 4,994,166,768 | 2.66 |
| Totals | 188,446,126,794 | 100.00 |
| (*) | American Depository Receipts (ADR) are certificates issued by a U.S. commercial bank to be traded on the U.S. securities markets. |
F-78
BANCO SANTANDER CHILE AND SUBSIDIARIES NOTES TO THE UNAUDITED CONDENSED CONSOLIDATED INTERIM FINANCIAL STATEMENTS As of September 30, 2011 and 2010 and December 31, 2010 |
NOTE 21 – EQUITY, continued:
| b) | Dividends |
During the period ended September 30, 2011 the dividends recognized as distributions to owners and the related amount of dividends per share are detailed in the Condensed Consolidated Interim Statements of Changes in Equity.
| c) | As of September 30, diluted and basic earnings per share were as follows: |
| As of September 30, | |||
| 2011 | 2010 | ||
| MCh$ | MCh$ | ||
| a) Basic earnings per share | |||
| Total income attributable to Bank shareholders | 301,684 | 367,270 | |
| Weighted average number of outstanding shares | 188,446,126,794 | 188,446,126,794 | |
| Earnings per share (in Ch$) | 1.601 | 1.949 | |
| b) Diluted earnings per share | |||
| Total income attributable to Bank shareholders | 301,684 | 367,270 | |
| Weighted average number of outstanding shares | 188,446,126,794 | 188,446,126,794 | |
| Assumed conversion of convertible debt | - | - | |
| Adjusted number of shares | 188,446,126,794 | 188,446,126,794 | |
| Diluted earnings per share (in Ch$) | 1.601 | 1.949 | |
As of September 30, 2011 and 2010 the Bank did not have instruments that generated diluting effects on equity.
F-79
BANCO SANTANDER CHILE AND SUBSIDIARIES NOTES TO THE UNAUDITED CONDENSED CONSOLIDATED INTERIM FINANCIAL STATEMENTS As of September 30, 2011 and 2010 and December 31, 2010 |
NOTE 21 – EQUITY, continued:
| d) | Other comprehensive income: |
| As of September 30, | As of December 31, | |||||||
| 2011 | 2010 | |||||||
| MCh$ | MCh$ | |||||||
| Available for sale investments | ||||||||
| As of January 1, | (18,596 | ) | (29,304 | ) | ||||
| Gain (on losses) on remeasuring available for sale investments, before tax | 19,053 | 12,316 | ||||||
| Reclassification adjustments on available for sale investments, before tax | - | - | ||||||
| Realized (gains) losses | 2,433 | (1,608 | ) | |||||
| Subtotals | 21,486 | 10,708 | ||||||
| Totals | 2,890 | (18,596 | ) | |||||
| Cash flow hedges | ||||||||
| As of January 1, | 11,958 | (3,162 | ) | |||||
| Gain (on losses) on remeasuring cash flow hedges, before tax | (13,787 | ) | 15,120 | |||||
| Reclassification adjustments on cash flow hedges, before tax | (287 | ) | - | |||||
| Amounts removed from equity and included in carrying amount of non-financial asset (liability) which acquisition or incurrence was hedge as a highly probable transition | - | - | ||||||
| Subtotals | (14,074 | ) | 15,120 | |||||
| Totals | (2,116 | ) | 11,958 | |||||
| Other comprehensive income, net of tax | 774 | (6,638 | ) | |||||
| Income tax related to other comprehensive income components | ||||||||
| Income tax relating to available for sale investments | (569 | ) | 3,570 | |||||
| Income tax relating to cash flow hedges | 414 | (2,324 | ) | |||||
| Total aggregated income tax related to other comprehensive income | (155 | ) | 1,246 | |||||
| Other comprehensive income, net of tax | 619 | (5,392 | ) | |||||
| Attributable to: | ||||||||
| Bank shareholders | 593 | (5,180 | ) | |||||
| Non-controlling interest | 26 | (212 | ) | |||||
F-80
BANCO SANTANDER CHILE AND SUBSIDIARIES NOTES TO THE UNAUDITED CONDENSED CONSOLIDATED INTERIM FINANCIAL STATEMENTS As of September 30, 2011 and 2010 and December 31, 2010 |
NOTE 22 - CAPITAL REQUIREMENTS (BASEL):
Pursuant to the General Law of Banks, the Bank must maintain a minimum ratio of effective equity to risk-weighted assets of 8% net of required allowances, and a minimum ratio of basic equity to consolidated total assets of 3%, net of required allowances. However, as a result of the Bank’s merger in 2002, the Superintendency of Banks and Financial Institutions (SBIF) has determined that the Bank’s combined effective net equity cannot be lower than 11% of its risk-weighted assets. Effective net equity is defined for these purposes as basic equity (capital and reserves) plus subordinated bonds, up to a maximum of 50% of basic equity.
Assets are allocated to different risk categories, each of which is assigned a weighting percentage according to the amount of capital required to be held for each type of asset. For example, cash, deposits in banks and financial instruments issued by the Central Bank of Chile have a 0% risk weighting, meaning that it is not necessary to hold equity to back these assets according to current regulations. Property, plant and equipment have a 100% risk weighting, meaning that a minimum capital equivalent to 11% of these assets must be held. All derivatives traded off the exchanges are also assigned a risk weighting, using a conversion factor applied to their notional values, to determine the amount of their exposure to credit risk. Off-balance-sheet contingent credits are also included for weighting purposes, as “Credit equivalents.”
According to Chapter 12-1 of the SBIF’s Updated Recompilation of Rules (Recopilacion Actualizada de Normas) effective January 2010, the SBIF changed existing regulation with the enforcement of Chapter B-3 from the Compendium of Accounting Standards, with changed the risk exposure of contingent loans allocations from 100% exposure to the following:
| Type of contingent loan | Exposition | |
| a) Pledges and other commercial commitments | 100% | |
| b) Foreign letters of credit confirmed | 20% | |
| c) Letters of credit issued | 20% | |
| d) Guarantees | 50% | |
| e) Interbank guarantee letters | 100% | |
| f) Available lines of credit | 50% | |
| h) Other loan commitments | ||
| - Higher Education Loans Law No. 20,027 | 15% | |
| - Others | 100% | |
| h) Other contingent loans | 100% |
F-81
BANCO SANTANDER CHILE AND SUBSIDIARIES NOTES TO THE UNAUDITED CONDENSED CONSOLIDATED INTERIM FINANCIAL STATEMENTS As of September 30, 2011 and 2010 and December 31, 2010 |
NOTE 22 – CAPITAL REQUIREMENTS (BASEL), continued:
The levels of Basic capital and Effective net equity at the close of each period are as follows:
| Consolidated assets(**) | Risk-weighted assets | ||||||
| As of September 30, | As of December 31, | As of September 30, | As of December 31, | ||||
| 2011 | 2010 | 2011 | 2010 | ||||
| MCh$ | MCh$ | MCh$ | MCh$ | ||||
| Balance-sheet assets (net of allowances) | |||||||
| Cash and deposits in banks | 1,812,784 | 1,762,198 | - | - | |||
| Unsettled transactions | 816,601 | 374,368 | 159,774 | 126,083 | |||
| Trading investments | 503,813 | 379,670 | 60,743 | 57,588 | |||
| Investments under resale agreements | 12,157 | 170,985 | 12,157 | 98,323 | |||
| Financial derivative contracts (*) | 1,379,903 | 1,452,068 | 917,611 | 871,872 | |||
| Interbank loans, net | 87,894 | 69,672 | 17,579 | 13,934 | |||
| Loans and accounts receivable from customers, net | 17,159,790 | 15,175,975 | 15,123,033 | 13,350,182 | |||
| Available for sale investments | 2,104,644 | 1,473,980 | 69,870 | 101,875 | |||
| Investments in other companies | 8,232 | 7,275 | 8,232 | 7,275 | |||
| Intangible assets | 77,229 | 77,990 | 77,229 | 77,990 | |||
| Property, plant, and equipment | 153,116 | 154,985 | 153,116 | 154,985 | |||
| Current taxes | 27,746 | 12,499 | 2,775 | 1,250 | |||
| Deferred taxes | 143,438 | 117,964 | 14,344 | 11,796 | |||
| Other assets | 704,126 | 640,937 | 585,649 | 474,135 | |||
| Off-balance-sheet assets | |||||||
| Contingent loans | 2,937,850 | 3,173,789 | 1,752,035 | 1,897,977 | |||
| Totals | 27,929,323 | 25,044,355 | 18,954,147 | 17,245,265 | |||
| (*) | “Financial derivative contracts” are presented at their “Credit Equivalent Risk” value as established in Chapter 12-1 of the Recopilación Actualizada de Normas – RAN – (Updated Compilation of Rules) issued by the SBIF. |
| (**) | Figures are presented as required by local regulations. |
The levels of Basic capital and Effective net equity at the close of each period are as follows:
| Percentage | ||||||||||||||||
| As of September 30, | As of December 31, | As of September 30, | As of December 31, | |||||||||||||
| 2011 | 2010 | 2011 | 2010 | |||||||||||||
| MCh$ | MCh$ | % | % | |||||||||||||
| Basic capital | 1,927,498 | 1,831,798 | 6.90 | 7.30 | ||||||||||||
| Effective net equity | 2,642,682 | 2,503,898 | 13.94 | 14.52 | ||||||||||||
F-82
BANCO SANTANDER CHILE AND SUBSIDIARIES NOTES TO THE UNAUDITED CONDENSED CONSOLIDATED INTERIM FINANCIAL STATEMENTS As of September 30, 2011 and 2010 and December 31, 2010 |
NOTE 23 – NON–CONTROLLING INTEREST
This item reflects the net amount of the subsidiaries’ net equity attributable to equity instruments which do not belong to the Bank either directly or indirectly, including the part that has been attributed to income for the period.
The non-controlling interest in the affiliates’ equity is summarized as follows:
| Other comprehensive income | ||||||||||||||||||||||||||||
For the 9-month period ended as of September 30, 2011 | Non- controlling share | Equity | Income | Available for sale investments | Deferred tax | Total other comprehensive income | Comprehensive income | |||||||||||||||||||||
| % | MCh$ | MCh$ | MCh$ | MCh$ | MCh$ | MCh$ | ||||||||||||||||||||||
| Affiliates | ||||||||||||||||||||||||||||
| Santander Agente de Valores Limitada (ex-Santander S.A. Agente de Valores) | 0.97 | 553 | 48 | 16 | (3 | ) | 13 | 61 | ||||||||||||||||||||
| Santander S.A. Sociedad Securitizadora | 0.36 | 3 | - | - | - | - | - | |||||||||||||||||||||
| Santander S.A. Corredores de Bolsa | 49.00 | 26,322 | 2,974 | 271 | (46 | ) | 225 | 3,199 | ||||||||||||||||||||
| Santander Asset Management S.A. Administradora General de Fondos | 0.02 | 11 | 5 | - | - | - | 5 | |||||||||||||||||||||
| Santander Corredora de Seguros Limitada (ex Santander Leasing S.A.) | 0.24 | 140 | 5 | - | - | - | 5 | |||||||||||||||||||||
| Subtotals | 27,029 | 3,032 | 287 | (49 | ) | 238 | 3,270 | |||||||||||||||||||||
| Special Purpose Entities: | ||||||||||||||||||||||||||||
| Bansa Santander S.A. | 100.00 | 1,436 | (206 | ) | - | - | - | (206 | ) | |||||||||||||||||||
| Santander Gestión de Recaudación y Cobranza Limitada. | 100.00 | 1,701 | (18 | ) | - | - | - | (18 | ) | |||||||||||||||||||
| Multinegocios S.A. | 100.00 | 142 | 9 | - | - | - | 9 | |||||||||||||||||||||
| Servicios de Administración y Financieros Limitada | 100.00 | 989 | 332 | - | - | - | 332 | |||||||||||||||||||||
| Servicios de Cobranzas Fiscalex Limitada | 100.00 | 139 | 23 | - | - | - | 23 | |||||||||||||||||||||
| Multiservicios de Negocios Limitada | 100.00 | 857 | 205 | - | - | - | 205 | |||||||||||||||||||||
| Subtotals | 5,264 | 345 | - | - | - | 345 | ||||||||||||||||||||||
| Totals | 32,293 | 3,377 | 287 | (49 | ) | 238 | 3,615 | |||||||||||||||||||||
F-83
BANCO SANTANDER CHILE AND SUBSIDIARIES NOTES TO THE UNAUDITED CONDENSED CONSOLIDATED INTERIM FINANCIAL STATEMENTS As of September 30, 2011 and 2010 and December 31, 2010 |
NOTE 23 - NON–CONTROLLING INTEREST, continued:
| Other comprehensive income | ||||||||||||||||||||||||||||
For the 9-month period ended as of September 30, 2010 | Non-controlling share | Equity | Income | Available for sale investments | Deferred tax | Total other comprehensive income | Comprehensive income | |||||||||||||||||||||
| % | MCh$ | MCh$ | MCh$ | MCh$ | MCh$ | MCh$ | ||||||||||||||||||||||
| Affiliates | ||||||||||||||||||||||||||||
| Santander Agente de Valores Limitada (ex-Santander S.A. Agente de Valores) | 0.97 | 476 | 13 | 29 | (5 | ) | 24 | 37 | ||||||||||||||||||||
| Santander S.A. Sociedad Securitizadora | 0.36 | 3 | (1 | ) | - | - | - | (1 | ) | |||||||||||||||||||
| Santander S.A. Corredores de Bolsa | 49.00 | 25,083 | 2,593 | (149 | ) | 26 | (123 | ) | 2,470 | |||||||||||||||||||
| Santander Asset Management S.A. Administradora General de Fondos | 0.02 | 13 | 5 | - | - | - | 5 | |||||||||||||||||||||
| Santander Corredora de Seguros Limitada (ex Santander Leasing S.A.) | 0.24 | 133 | 6 | - | - | - | 6 | |||||||||||||||||||||
| Subtotals | 25,708 | 2,616 | (120 | ) | 21 | (99 | ) | 2,517 | ||||||||||||||||||||
| Special Purpose Entities: | ||||||||||||||||||||||||||||
| Bansa Santander S.A. | 100.00 | 1,631 | (748 | ) | - | - | - | (748 | ) | |||||||||||||||||||
| Santander Gestión de Recaudación y Cobranza Limitada. | 100.00 | 856 | (2,511 | ) | - | - | - | (2,511 | ) | |||||||||||||||||||
| Multinegocios S.A. | 100.00 | 130 | 34 | - | - | - | 34 | |||||||||||||||||||||
| Servicios de Administración y Financieros Limitada | 100.00 | 566 | 230 | - | - | - | 230 | |||||||||||||||||||||
| Servicios de Cobranzas Fiscalex Limitada | 100.00 | 107 | 54 | - | - | - | 54 | |||||||||||||||||||||
| Multiservicios de Negocios Limitada | 100.00 | 601 | 226 | - | - | - | 226 | |||||||||||||||||||||
| Subtotals | 3,891 | (2,715 | ) | - | - | - | (2,715 | ) | ||||||||||||||||||||
| Totals | 29,599 | (99 | ) | (120 | ) | 21 | (99 | ) | (198 | ) | ||||||||||||||||||
The non-controlling interest in equity and the affiliates’ income as of September 30, 2010 is summarized as follows:
| Other comprehensive income | ||||||||||||||||||||||||
| For the quarter ended as of September 30, 2011 | Non controlling share | Income | Available for sale investments | Deferred tax | Total other comprehensive income | Comprehensive income | ||||||||||||||||||
| % | MCh$ | MCh$ | MCh$ | MCh$ | MCh$ | |||||||||||||||||||
| Affiliates | ||||||||||||||||||||||||
| Santander Agente de Valores Limitada (ex-Santander S.A. Agente de Valores) | 0.97 | 20 | 4 | (1 | ) | 3 | 23 | |||||||||||||||||
| Santander S.A. Sociedad Securitizadora | 0.36 | - | - | - | - | - | ||||||||||||||||||
| Santander S.A. Corredores de Bolsa | 49.00 | 832 | 32 | (6 | ) | 26 | 858 | |||||||||||||||||
| Santander Asset Management S.A. Administradora General de Fondos | 0.02 | 2 | - | - | - | 2 | ||||||||||||||||||
| Santander Corredora de Seguros Limitada (ex Santander Leasing S.A.) | 0.24 | 2 | - | - | - | 2 | ||||||||||||||||||
| Subtotals | 856 | 36 | (7 | ) | 29 | 885 | ||||||||||||||||||
| Special Purpose Entities: | ||||||||||||||||||||||||
| Bansa Santander S.A. | 100.00 | (20 | ) | - | - | - | (20 | ) | ||||||||||||||||
| Santander Gestión de Recaudación y Cobranza Limitada | 100.00 | 76 | - | - | - | 76 | ||||||||||||||||||
| Multinegocios S.A. | 100.00 | 9 | - | - | - | 9 | ||||||||||||||||||
| Servicios de Administración y Financieros Limitada | 100.00 | 125 | - | - | - | 125 | ||||||||||||||||||
| Servicios de Cobranzas Fiscalex Limitada | 100.00 | 6 | - | - | - | 6 | ||||||||||||||||||
| Multiservicios de Negocios Limitada | 100.00 | 70 | - | - | - | 70 | ||||||||||||||||||
| Subtotals | 266 | - | - | - | 266 | |||||||||||||||||||
| Totals | 1,122 | 36 | (7 | ) | 29 | 1,151 | ||||||||||||||||||
F-84
BANCO SANTANDER CHILE AND SUBSIDIARIES NOTES TO THE UNAUDITED CONDENSED CONSOLIDATED INTERIM FINANCIAL STATEMENTS As of September 30, 2011 and 2010 and December 31, 2010 |
NOTE 23 - NON–CONTROLLING INTERESTS continued:
| Other comprehensive income | ||||||||||||||||||||||||
| For the quarter ended as of September 30, 2010 | Non-controlling share | Income | Available for sale investments | Deferred tax | Total other comprehensive income | Comprehensive income | ||||||||||||||||||
| % | MCh$ | MCh$ | MCh$ | MCh$ | MCh$ | |||||||||||||||||||
| Affiliates | ||||||||||||||||||||||||
| Santander Agente de Valores Limitada (ex-Santander S.A. Agente de Valores) | 0.97 | 12 | (75 | ) | 13 | (62 | ) | (50 | ) | |||||||||||||||
| Santander S.A. Sociedad Securitizadora | 0.36 | (1 | ) | - | - | - | (1 | ) | ||||||||||||||||
| Santander Investment S.A. Corredores de Bolsa | 49.00 | 1,114 | (264 | ) | 46 | (218 | ) | 896 | ||||||||||||||||
| Santander Asset Management S.A. Administradora General de Fondos | 0.02 | 2 | - | - | - | 2 | ||||||||||||||||||
| Santander Corredora de Seguros Limitada (ex Santander Leasing S.A.) | 0.24 | 1 | - | - | - | 1 | ||||||||||||||||||
| Subtotals | 1,128 | (339 | ) | 59 | (280 | ) | 848 | |||||||||||||||||
| Special Purpose Entities: | ||||||||||||||||||||||||
| Bansa Santander S.A. | 100.00 | (289 | ) | - | - | - | (289 | ) | ||||||||||||||||
| Santander Gestión de Recaudación y Cobranza Limitada | 100.00 | 364 | - | - | - | 364 | ||||||||||||||||||
| Multinegocios S.A. | 100.00 | 24 | - | - | - | 24 | ||||||||||||||||||
| Servicios Administración y Financieros Limitada | 100.00 | 85 | - | - | - | 85 | ||||||||||||||||||
| Servicios de Cobranzas Fiscalex Limitada | 100.00 | 29 | - | - | - | 29 | ||||||||||||||||||
| Multiservicios de Negocios Limitada | 100.00 | 77 | - | - | - | 77 | ||||||||||||||||||
| Subtotals | 290 | - | - | - | 290 | |||||||||||||||||||
| Totals | 1,418 | (339 | ) | 59 | (280 | ) | 1,138 | |||||||||||||||||
F-85
BANCO SANTANDER CHILE AND SUBSIDIARIES NOTES TO THE UNAUDITED CONDENSED CONSOLIDATED INTERIM FINANCIAL STATEMENTS As of September 30, 2011 and 2010 and December 31, 2010 |
NOTE 24 -INTEREST INCOME AND EXPENSE:
This item refers to interest earned in the period by all the financial assets whose return, whether implicitly or explicitly, is determined by applying the effective interest rate method, regardless of the value at fair value, as well as the reclassifications of products as a consequence of hedge accounting.
| a) | The composition of income from interest and adjustments, not including income from hedge accounting, for all periods presented is as follows: |
| For the quarter ended on September 30, | |||||||||
| 2011 | 2010 | ||||||||
| Interest | Adjustments | Prepaid fees | Total | Interest | Adjustments | Prepaid fees | Total | ||
| Items | MCh$ | MCh$ | MCh$ | MCh$ | MCh$ | MCh$ | MCh$ | MCh$ | |
| Repurchase agreements | 840 | (2) | - | 838 | 509 | (115) | - | 394 | |
| Interbank loans | 433 | - | - | 433 | 266 | - | - | 266 | |
| Commercial loans | 155,239 | 18,497 | 1,024 | 174,760 | 118,433 | 17,724 | 420 | 136,577 | |
| Mortgage loans | 52,890 | 27,271 | 2,675 | 82,836 | 47,917 | 27,822 | 880 | 76,619 | |
| Consumer loans | 138,214 | 500 | 777 | 139,491 | 121,714 | 433 | 787 | 122,934 | |
| Investment instruments | 28,761 | 1,272 | - | 30,033 | 11,503 | 3,067 | - | 14,570 | |
| Other interest income | (915) | 513 | - | (402) | 1,376 | 565 | - | 1,941 | |
| Interest income | 375,462 | 48,051 | 4,476 | 427,989 | 301,718 | 49,496 | 2,087 | 353,301 | |
| For the 9-month period ended on September 30, | |||||||||
| 2011 | 2010 | ||||||||
| Interest | Adjustments | Prepaid fees | Total | Interest | Adjustments | Prepaid fees | Total | ||
| Items | MCh$ | MCh$ | MCh$ | MCh$ | MCh$ | MCh$ | MCh$ | MCh$ | |
| Repurchase agreements | 3,364 | (6) | - | 3,358 | 832 | 125 | - | 957 | |
| Interbank loans | 2,265 | - | - | 2,265 | 340 | - | - | 340 | |
| Commercial loans | 435,438 | 79,121 | 3,283 | 517,842 | 345,969 | 50,157 | 1,894 | 398,020 | |
| Mortgage loans | 150,344 | 120,054 | 7,717 | 278,115 | 141,549 | 77,980 | 2,901 | 222,430 | |
| Consumer loans | 398,396 | 2,052 | 2,216 | 402,664 | 354,103 | 1,137 | 2,121 | 357,361 | |
| Investment instruments | 62,062 | 6,820 | - | 68,882 | 33,947 | 10,798 | - | 44,745 | |
| Other interest income | 11,076 | 1,846 | - | 12,922 | 2,693 | 889 | - | 3,582 | |
| Interest income | 1,062,945 | 209,887 | 13,216 | 1,286,048 | 879,433 | 141,086 | 6,916 | 1,027,435 | |
F-86
BANCO SANTANDER CHILE AND SUBSIDIARIES NOTES TO THE UNAUDITED CONDENSED CONSOLIDATED INTERIM FINANCIAL STATEMENTS As of September 30, 2011 and 2010 and December 31, 2010 |
NOTE 24 -INTEREST INCOME AND EXPENSE, continued:
| b) | As indicated in Note 1 i), suspended interests are recorded in suspense accounts (off-balance-sheet accounts) until they are effectively received. |
The detail of income from suspended interest for all periods is presented as follows:
| As of September 30, | |||||||||
| 2011 | 2010 | ||||||||
| Interest | Adjustments | Prepaid fees | Total | Interest | Adjustments | Prepaid fees | Total | ||
| Off balance sheet | MCh$ | MCh$ (*) | MCh$ | MCh$ | MCh$ | MCh$ | MCh$ | MCh$ | |
| Commercial loans | 25,592 | 6,256 | - | 31,848 | 24,677 | 5,292 | - | 29,969 | |
| Mortgage loans | 4,048 | 5,906 | - | 9,954 | 4,322 | 4,251 | - | 8,573 | |
| Consumer loans | 18,581 | 1,043 | - | 19,624 | 31,604 | 770 | - | 32,374 | |
| Totals | 48,221 | 13,205 | - | 61,426 | 60,603 | 10,313 | - | 70,916 | |
| (*) | The adjustments are a result of changes in the Unidades de Fomento (‘UF’). The UF is an inflation-index Chilean monetary unit with a value in Chilean pesos that changes daily to reflect changes in the official Consumer Price Index (‘CPI’) of the Instituto Nacional de Estadísticas (the Chilean National Institute of Statistics) for the previous month. The effect of any changes in the nominal peso value of our UF-denominated interest earning assets and interest bearing liabilities is reflected in our results of operations as an increase (or decrease, in the event of deflation) in interest income and expense, respectively. |
| c) | The composition of expense from interest and adjustments, excluding expense from hedge accounting for all periods presented, is as follows: |
| For the quarter ended as of September 30, | |||||||||
| 2011 | 2010 | ||||||||
| Interest | Adjustments | Prepaid fees | Total | Interest | Adjustments | Prepaid fees | Total | ||
| Items | MCh$ | MCh$ (*) | MCh$ | MCh$ | MCh$ | MCh$ | MCh$ | MCh$ | |
| Demand deposits | (425) | (88) | - | (513) | (158) | (95) | - | (253) | |
| Repurchase agreements | (1,973) | (35) | - | (2,008) | (672) | (3) | - | (675) | |
| Time deposits and liabilities | (100,482) | (12,924) | - | (113,406) | (42,655) | (13,504) | - | (56,159) | |
| Interbank borrowings | (6,268) | (6) | - | (6,274) | (7,738) | (9) | - | (7,747) | |
| Issued debt instruments | (43,670) | (13,811) | - | (57,481) | (32,530) | (15,398) | - | (47,928) | |
| Other financial liabilities | (1,261) | (214) | - | (1,475) | (1,243) | (260) | - | (1,503) | |
| Other interest expense | (597) | (1,031) | - | (1,628) | (330) | (1,631) | - | (1,961) | |
| Interest expense | (154,676) | (28,109) | - | (182,785) | (85,326) | (30,900) | - | (116,226) | |
| (*) | The adjustments are a result of changes in the Unidades de Fomento (‘UF’). The UF is an inflation-index Chilean monetary unit with a value in Chilean pesos that changes daily to reflect changes in the official Consumer Price Index (‘CPI’) of the Instituto Nacional de Estadísticas (the Chilean National Institute of Statistics) for the previous month. The effect of any changes in the nominal peso value of our UF-denominated interest earning assets and interest bearing liabilities is reflected in our results of operations as an increase (or decrease, in the event of deflation) in interest income and expense, respectively. |
F-87
BANCO SANTANDER CHILE AND SUBSIDIARIES NOTES TO THE UNAUDITED CONDENSED CONSOLIDATED INTERIM FINANCIAL STATEMENTS As of September 30, 2011 and 2010 and December 31, 2010 |
NOTE 24 -INTEREST INCOME AND EXPENSE, continued:
| For the 9-month period ended on September 30, | |||||||||
| 2011 | 2010 | ||||||||
| Interest | Adjustments | Prepaid fees | Total | Interest | Adjustments | Prepaid fees | Total | ||
| Items | MCh$ | MCh$ | MCh$ | MCh$ | MCh$ | MCh$ | MCh$ | MCh$ | |
| Demand deposits | (855) | (421) | - | (1,276) | (345) | (295) | - | (640) | |
| Repurchase agreements | (4,678) | (205) | - | (4,883) | (1,294) | (213) | - | (1,507) | |
| Time deposits and liabilities | (249,497) | (59,627) | - | (309,124) | (112,688) | (40,466) | - | (153,154) | |
| Interbank borrowings | (19,379) | (31) | - | (19,410) | (23,078) | (26) | - | (23,104) | |
| Issued debt instruments | (127,148) | (65,263) | - | (192,411) | (92,775) | (41,840) | - | (134,615) | |
| Other financial liabilities | (3,767) | (1,001) | - | (4,768) | (3,674) | (772) | - | (4,446) | |
| Other interest expense | (1,788) | (5,256) | - | (7,044) | (330) | (4,750) | - | (5,080) | |
| Interest expense | (407,112) | (131,804) | - | (538,916) | (234,184) | (88,362) | - | (322,546) | |
| d) | The summary of interest and expenses for the periods presented is as follows: |
For the quarter ended as of September 30, | For the 9-month period ended as of September 30, | ||||||
| 2011 | 2010 | 2011 | 2010 | ||||
| Items | MCh$ | MCh$ | MCh$ | MCh$ | |||
| Interest income | 427,989 | 353,301 | 1,286,048 | 1,027,435 | |||
| Interest expense | (182,785) | (116,226) | (538,916) | (322,546) | |||
| Interest income | 245,204 | 237,075 | 747,132 | 704,889 | |||
| Income from hedge accounting (net) | (13,147) | (1,401) | (38,978) | 2,965 | |||
| Total net interest income | 232,057 | 235,674 | 708,154 | 707,854 | |||
F-88
BANCO SANTANDER CHILE AND SUBSIDIARIES NOTES TO THE UNAUDITED CONDENSED CONSOLIDATED INTERIM FINANCIAL STATEMENTS As of September 30, 2011 and 2010 and December 31, 2010 |
NOTE 25 – FEES AND COMMISSIONS:
This item includes the amount of fees earned and paid in the period, except for those which are an integral part of the financial instrument’s effective interest rate:
For the quarter ended as of September 30, | For the 9-month period ended as of September 30, | ||||||
| 2011 | 2010 | 2011 | 2010 | ||||
| MCh$ | MCh$ | MCh$ | MCh$ | ||||
| Fee and commission income | |||||||
| Fees and commissions for lines of credits and overdrafts | 2,763 | 3,685 | 8,862 | 12,209 | |||
| Fees and commissions for guarantees and letters of credit | 6,334 | 5,568 | 17,849 | 17,351 | |||
| Fees and commissions for card services | 30,252 | 27,151 | 90,974 | 78,434 | |||
| Fees and commissions for management of accounts | 7,256 | 6,921 | 21,361 | 20,131 | |||
| Fees and commissions for collections and payments | 14,683 | 15,324 | 46,387 | 43,372 | |||
| Fees and commissions for intermediation and management of securities | 2,759 | 2,797 | 9,939 | 7,669 | |||
| Fees and commissions for investments in mutual funds or others | 8,796 | 10,063 | 29,928 | 29,111 | |||
| Compensation for marketing of securities | 7,955 | 8,683 | 26,344 | 22,750 | |||
| Office banking | 2,912 | 2,386 | 8,749 | 6,813 | |||
| Other fees earned | 3,941 | 2,801 | 11,148 | 9,506 | |||
| Totals | 87,651 | 85,379 | 271,541 | 247,346 | |||
For the quarter ended as of September 30, | For the 9-month period ended as of September 30, | ||||||
| 2011 | 2010 | 2011 | 2010 | ||||
| MCh$ | MCh$ | MCh$ | MCh$ | ||||
| Fee and commission expense | |||||||
| Compensation for card operation | (15,868) | (13,633) | (45,725) | (37,212) | |||
| Fees and commissions for securities transactions | (290) | (397) | (1,616) | (1,265) | |||
| Office banking | (2,491) | (1,826) | (6,866) | (5,469) | |||
| Other fees | (3,011) | (3,087) | (7,904) | (9,455) | |||
| Totals | (21,660) | (18,943) | (62,111) | (53,401) | |||
The fees earned through transactions with letters of credit are recorded in the line item “Interest income” in the Condensed Consolidated Interim Statement of Income.
F-89
BANCO SANTANDER CHILE AND SUBSIDIARIES NOTES TO THE UNAUDITED CONDENSED CONSOLIDATED INTERIM FINANCIAL STATEMENTS As of September 30, 2011 and 2010 and December 31, 2010 |
NOTE 26 - NET INCOME FROM FINANCIAL OPERATIONS:
This item includes the adjustments for changes in financial instruments, except for interest attributable to the application of the effective interest rate method for adjustments to asset values, as well as the income earned in purchases and sales of financial instruments.
As of September 30, 2011 and 2010, the detail of income from financial operations is as follows:
For the quarter ended as of September 30, | For the 9-month period ended as of September 30, | |||||||||||||||
| 2011 | 2010 | 2011 | 2010 | |||||||||||||
| MCh$ | MCh$ | MCh$ | MCh$ | |||||||||||||
| Net income from financial operations | ||||||||||||||||
| Trading derivatives | 82,383 | (45,050 | ) | 111,492 | 27,686 | |||||||||||
| Trading investments | 13,029 | 6,419 | 31,466 | 26,596 | ||||||||||||
| Sale of loans and accounts receivables from customers | ||||||||||||||||
| Current portfolio | - | 522 | - | (59 | ) | |||||||||||
| Written-off portfolio | 2,227 | 972 | 5,578 | 3,926 | ||||||||||||
| Available for sale investments | 2,407 | (8,098 | ) | (1,912 | ) | (6,244 | ) | |||||||||
| Other income from financial operations(*) | 2,087 | 167 | 6,911 | 41 | ||||||||||||
| Totals | 102,133 | (45,068 | ) | 153,535 | 51,946 | |||||||||||
(*) On May 26, 2011, the Bank sold VISA shares for an amount of $5,705 million, the carrying amount of this shares was $1. The income arising from this sale was registered under net income from financial operations in Condensed Consolidated Interim Statement of Income.
NOTE 27 – NET FOREIGN EXCHANGE PROFIT (LOSS)
This item includes the income earned from foreign currency trading, differences arising from converting monetary items in a foreign currency to the functional currency, and those generated by non-monetary assets in a foreign currency at the time of their sale.
As of September 30, 2011 and 2010, the detail of foreign exchange income is as follows:
For the quarter ended as of September 30, | For the 9-month period ended as of September 30, | |||||||||||||||
| 2011 | 2010 | 2011 | 2010 | |||||||||||||
| MCh$ | MCh$ | MCh$ | MCh$ | |||||||||||||
| Currency exchange differences | ||||||||||||||||
| Net profit (loss) from currency exchange differences | (312,801 | ) | 317,926 | (259,037 | ) | 156,904 | ||||||||||
| Hedging derivatives | 229,253 | (249,505 | ) | 179,209 | (132,343 | ) | ||||||||||
| Income from adjustable assets in foreign currency | 5,412 | (2,798 | ) | 5,403 | (132 | ) | ||||||||||
| Income from adjustable liabilities in foreign currency | (996 | ) | 1,158 | (840 | ) | (48 | ) | |||||||||
| Totals | (79,132 | ) | 66,781 | (75,265 | ) | 24,381 | ||||||||||
F-90
BANCO SANTANDER CHILE AND SUBSIDIARIES NOTES TO THE UNAUDITED CONDENSED CONSOLIDATED INTERIM FINANCIAL STATEMENTS As of September 30, 2011 and 2010 and December 31, 2010 |
NOTE 28 - PROVISION FOR LOAN LOSSES:
The 2011 and 2010 activity for provision for loan losses recorded on the income statement is as follows:
For the quarter ended as of September 30, 2011 | Interbank loans | Loans and accounts receivable from customers | Contingent loans | Total | ||
| Commercial loans | Mortgage loans | Consumer loans | ||||
| MCh$ | MCh$ | MCh$ | MCh$ | MCh$ | MCh$ | |
| Allowances and charge-offs | ||||||
| - Individual evaluations | (41) | (17,027) | - | - | (312) | (17,380) |
| - Group evaluations | - | (18,950) | (15,535) | (62,280) | (21,496) | (118,261) |
| Total allowances and charge-offs | (41) | (35,977) | (15,535) | (62,280) | (21,808) | (135,641) |
| Allowances released | ||||||
| - Individual evaluations | 37 | 7,519 | - | - | 1,435 | 8,991 |
| - Group evaluations | - | 2,207 | 432 | 2,182 | 21,192 | 26,013 |
| Total released allowances | 37 | 9,726 | 432 | 2,182 | 22,627 | 35,004 |
| Recovery of loans previously charged off | - | 1,815 | 659 | 3,248 | - | 5,722 |
| Net charge to income | (4) | (24,436) | (14,444) | (56,850) | 819 | (94,915) |
For the quarter ended as of September 30, 2010 | Interbank loans | Loans and accounts receivable from customers | Contingent loans | Total | ||
| Commercial loans | Mortgage loans | Consumer loans | ||||
| MCh$ | MCh$ | MCh$ | MCh$ | MCh$ | MCh$ | |
| Allowances and charge-offs | ||||||
| - Individual evaluations | (34) | (13,266) | - | - | (1,234) | (14,534) |
| - Group evaluations | - | (16,974) | (4,205) | (61,739) | - | (82,918) |
| Total allowances and charge-offs | (34) | (30,240) | (4,205) | (61,739) | (1,234) | (97,452) |
| Allowances released | ||||||
| - Individual evaluations | 94 | 2,158 | - | - | - | 2,252 |
| - Group evaluations | - | 817 | 362 | 1,646 | 1,672 | 4,497 |
| Total released allowances | 94 | 2,975 | 362 | 1,646 | 1,672 | 6,749 |
| Recovery of loans previously charged off | - | 2,026 | 301 | 5,689 | - | 8,016 |
| Net charge to income | 60 | (25,239) | (3,542) | (54,404) | 438 | (82,687) |
F-91
BANCO SANTANDER CHILE AND SUBSIDIARIES NOTES TO THE UNAUDITED CONDENSED CONSOLIDATED INTERIM FINANCIAL STATEMENTS As of September 30, 2011 and 2010 and December 31, 2010 |
NOTE 28 - PROVISION FOR LOAN LOSSES, continued:
For the 9-month period ended as of September 30, 2011 | Interbank loans | Loans and accounts receivable from customers | Contingent loans | Total | ||
| Commercial loans | Mortgage loans | Consumer loans | ||||
| MCh$ | MCh$ | MCh$ | MCh$ | MCh$ | MCh$ | |
| Allowances and charge-offs | ||||||
| - Individual evaluations | (449) | (40,056) | - | - | (1,689) | (42,194) |
| - Group evaluations | - | (55,262) | (30,667) | (158,272) | (21,651) | (265,852) |
| Total allowances and charge-offs | (449) | (95,318) | (30,667) | (158,272) | (23,340) | (308,046) |
| Allowances released | ||||||
| - Individual evaluations | 484 | 12,329 | - | - | 3,250 | 16,063 |
| - Group evaluations | - | 4,939 | 4,633 | 14,047 | 20,403 | 44,022 |
| Total released allowances | 484 | 17,268 | 4,633 | 14,047 | 23,653 | 60,085 |
| Recovery of loans previously charged off | - | 5,376 | 1,213 | 9,430 | - | 16,019 |
| Net charge to income | 35 | (72,674) | (24,821) | (134,795) | 313 | (231,942) |
For the 9-month period ended as of September 30, 2010 | Interbank loans | Loans and accounts receivable from customers | Contingent loans | Total | ||
| Commercial loans | Mortgage loans | Consumer loans | ||||
| MCh$ | MCh$ | MCh$ | MCh$ | MCh$ | MCh$ | |
| Allowances and charge-offs | ||||||
| - Individual evaluations | (117) | (42,978) | - | - | (2,558) | (45,653) |
| - Group evaluations | - | (49,308) | (12,226) | (143,934) | - | (205,468) |
| Total allowances and charge-offs | (117) | (92,286) | (12,226) | (143,934) | (2,558) | (251,121) |
| Allowances released | ||||||
| - Individual evaluations | 111 | 8,459 | - | - | - | 8,570 |
| - Group evaluations | - | 4,948 | 539 | 2,955 | 1,728 | 10,170 |
| Total released allowances | 111 | 13,407 | 539 | 2,955 | 1,728 | 18,740 |
| Recovery of loans previously charged off | - | 5,259 | 1,229 | 17,067 | - | 23,555 |
| Net charge to income | (6) | (73,620) | (10,458) | (123,912) | (830) | (208,826) |
F-92
BANCO SANTANDER CHILE AND SUBSIDIARIES NOTES TO THE UNAUDITED CONDENSED CONSOLIDATED INTERIM FINANCIAL STATEMENTS As of September 30, 2011 and 2010 and December 31, 2010 |
NOTE 29 - PERSONNEL SALARIES AND EXPENSES:
| a) | Composition of personnel salaries and expenses |
For the quarter ended as of September 30, | For the 9-month period ending as of September 30, | ||||||
| 2011 | 2010 | 2011 | 2010 | ||||
| MCh$ | MCh$ | MCh$ | MCh$ | ||||
| Personnel salaries | 48,889 | 39,935 | 132,453 | 116,810 | |||
| Bonuses or gratifications | 15,348 | 16,332 | 48,120 | 46,999 | |||
| Stock-based benefits | 599 | 585 | 1,755 | 1,600 | |||
| Seniority compensation | 2,053 | 888 | 7,459 | 4,521 | |||
| Pension plans | 285 | 248 | 1,151 | 833 | |||
| Training expenses | 803 | 444 | 1,709 | 957 | |||
| Day care and kindergarten | 441 | 218 | 1,293 | 531 | |||
| Health funds | 650 | 617 | 1,851 | 1,820 | |||
| Welfare fund | 114 | 110 | 332 | 336 | |||
| Other personnel expenses | 4,702 | 3,953 | 11,257 | 10,514 | |||
| Totals | 73,884 | 63,330 | 207,380 | 184,921 | |||
F-93
BANCO SANTANDER CHILE AND SUBSIDIARIES NOTES TO THE UNAUDITED CONDENSED CONSOLIDATED INTERIM FINANCIAL STATEMENTS As of September 30, 2011 and 2010 and December 31, 2010 |
NOTE 30 - ADMINISTRATIVE EXPENSES:
Intangible assets as of September 30, 2011 and 2010 are as follows:
For the quarter ended as of September 30, | For the 9-month period ended as of September 30, | ||||||
| 2011 | 2010 | 2011 | 2010 | ||||
| MCh$ | MCh$ | MCh$ | MCh$ | ||||
| General administrative expenses | |||||||
| Maintenance and repair of property, plant and equipment | 3,160 | 2,780 | 9,132 | 8,247 | |||
| Office lease | 5,684 | 5,896 | 16,437 | 13,098 | |||
| Equipment lease | 74 | 31 | 135 | 115 | |||
| Insurance payments | 586 | 601 | 1,721 | 1,193 | |||
| Office supplies | 1,418 | 1,767 | 4,684 | 4,955 | |||
| Information technology and communication expenses | 5,303 | 4,783 | 15,813 | 15,462 | |||
| Lighting, heating, and other utilities | 1,283 | 1,377 | 3,581 | 4,053 | |||
| Security and valuables transport services | 2,841 | 2,629 | 8,494 | 7,623 | |||
| Representation and personnel travel expenses | 1,295 | 1,133 | 3,309 | 2,883 | |||
| Judicial and notarial expenses | 1,658 | 2,045 | 4,717 | 4,064 | |||
| Fees for technical reports | 1,714 | 965 | 4,354 | 3,787 | |||
| Other general administrative expenses | 767 | 552 | 1,812 | 1,409 | |||
| Subcontracted services | |||||||
| Data processing | 6,385 | 7,537 | 19,558 | 23,973 | |||
| Other | 2,295 | 17 | 9,450 | 23 | |||
| Board expenses | 308 | 245 | 949 | 644 | |||
| Publicity and advertising | 3,760 | 3,364 | 10,822 | 11,535 | |||
| Taxes, payroll taxes, and contributions | |||||||
| Real state contributions | 439 | 394 | 1,305 | 1,255 | |||
| Patents | 443 | 465 | 1,271 | 1,317 | |||
| Contributions to SBIF | 1,628 | 1,402 | 4,534 | 4,107 | |||
| Totals | 41,041 | 37,983 | 122,078 | 109,743 | |||
F-94
BANCO SANTANDER CHILE AND SUBSIDIARIES NOTES TO THE UNAUDITED CONDENSED CONSOLIDATED INTERIM FINANCIAL STATEMENTS As of September 30, 2011 and 2010 and December 31, 2010 |
NOTE 31 – DEPRECIATION AMORTIZATION AND IMPAIRMENT:
| a) | Depreciation and amortization and impairment charges for the periods ended on September 2011 and 2010 are detailed below: |
For the quarter ended as of September 30, | For the 9-month period ended as of September 30, | ||||||
| 2011 | 2010 | 2011 | 2010 | ||||
| MCh$ | MCh$ | MCh$ | MCh$ | ||||
| Depreciation and amortization | |||||||
| Depreciation of property, plant, and equipment | (5,239) | (5,362) | (15,089) | (16,687) | |||
| Amortizations of Intangible assets | (8,115) | (5,932) | (24,549) | (19,540) | |||
| Subtotals | (13,354) | (11,294) | (39,638) | (36,227) | |||
| Impairment of property, plant, and equipment | (77) | (963) | (109) | (4,665) | |||
| Totals | (13,431) | (12,257) | (39,747) | (40,892) | |||
| b) | The reconciliation between carrying values and balances as of December 2010, January 1, 2010 and 2011 and the September 30, 2011 balances is as follows: |
| Depreciation and amortization | ||||||||||||
| 2011 | ||||||||||||
| Property, plant, and equipment | Intangible assets | Total | ||||||||||
| MCh$ | MCh$ | MCh$ | ||||||||||
| Opening balances as of January 1, 2011 | (64,376 | ) | (78,329 | ) | (142,705 | ) | ||||||
| Depreciation and amortization charges in the period | (15,089 | ) | (24,549 | ) | (39,638 | ) | ||||||
| Sales and disposals in the period | 20,333 | - | 20,333 | |||||||||
| Balances as of September 30, 2011 | (59,132 | ) | (102,878 | ) | (162,010 | ) | ||||||
| Depreciation and amortization | ||||||||||||
| 2010 | ||||||||||||
| Property, plant, and equipment | Intangible assets | Total | ||||||||||
| MCh$ | MCh$ | MCh$ | ||||||||||
| Opening balances as of January 1, 2010 | (42,979 | ) | (51,101 | ) | (94,080 | ) | ||||||
| Depreciation and amortization charges in the period | (16,687 | ) | (19,540 | ) | (36,227 | ) | ||||||
| Sales and disposals in the period | 223 | - | 223 | |||||||||
| Balances as of December 31, 2010 | (59,443 | ) | (70,641 | ) | (130,084 | ) | ||||||
As of September 30, 2011 the amount of impairment to property, plant, and equipment totals MCh$32 for damages to ATMs.
F-95
BANCO SANTANDER CHILE AND SUBSIDIARIES NOTES TO THE UNAUDITED CONDENSED CONSOLIDATED INTERIM FINANCIAL STATEMENTS As of September 30, 2011 and 2010 and December 31, 2010 |
NOTE 32 - OTHER OPERATING INCOME AND EXPENSES:
| a) | Other operating expenses are comprised of the following components: |
For the quarter ended as of September 30, | For the 9-month period ended on September 30, | |||||||||||||||
| 2011 | 2010 | 2011 | 2010 | |||||||||||||
| MCh$ | MCh$ | MCh$ | MCh$ | |||||||||||||
| Income from assets received in lieu of payment | ||||||||||||||||
| Income from sale of assets received in lieu of payment | 54 | 686 | (235 | ) | 1,247 | |||||||||||
| Subtotals | 54 | 686 | (235 | ) | 1,247 | |||||||||||
| Income from sale of investments in other companies | ||||||||||||||||
| Gain on sale of investments in other companies | - | - | - | - | ||||||||||||
| Subtotals | - | - | - | - | ||||||||||||
| Other income | ||||||||||||||||
| Leases | (568 | ) | (35 | ) | 209 | 308 | ||||||||||
| Gain on sale of property, plant and equipment (*) | 21 | 48 | 830 | 13,243 | ||||||||||||
| Recovery of provisions for contingencies | - | 1 | 5 | 7,029 | ||||||||||||
| Compensation from insurance companies due to earthquake | 199 | 948 | 315 | 3,611 | ||||||||||||
| Dividends received from share in other companies | - | - | 8 | - | ||||||||||||
| Other | (248 | ) | 417 | 32 | 388 | |||||||||||
| Subtotals | (596 | ) | 1,379 | 1,399 | 24,579 | |||||||||||
| Totals | (542 | ) | 2,065 | 1,164 | 25,826 | |||||||||||
(*) In March 2011, Banco Santander Chile sold 1 branch. At the time of sale, its carrying value was Ch$48 million, its selling price was Ch$164 million, resulting
in a Ch$116 million gain
On April 30 and June 30, 2010 Banco Santander Chile sold 5 branches, resulting in a Ch$6,620 million gain and sold 11 branches in June, resulting in a
Ch$6,355 million gain.
F-96
BANCO SANTANDER CHILE AND SUBSIDIARIES NOTES TO THE UNAUDITED CONDENSED CONSOLIDATED INTERIM FINANCIAL STATEMENTS As of September 30, 2011 and 2010 and December 31, 2010 |
NOTE 32 - OTHER OPERATING INCOMES AND EXPENSES, continued:
| b) | Other operating expenses for the periods ended on September 30, 2010 and 2011 are as follows: |
For the quarter ended as of September 30, | For the 9-month period ended as of September 30, | |||||||
| 2011 | 2010 | 2011 | 2010 | |||||
| MCh$ | MCh$ | MCh$ | MCh$ | |||||
| Provisions and expenses for assets received in lieu of payment | ||||||||
| Provisions for assets received in lieu of payment | 775 | 1,886 | 2,153 | 4,128 | ||||
| Expenses for maintenance of assets received in lieu of payment | 703 | 473 | 2,138 | 1,665 | ||||
| Subtotals | 1,478 | 2,359 | 4,291 | 5,793 | ||||
| Credit card expenses | ||||||||
| Credit card expenses | 412 | 1,036 | 1,756 | 2,572 | ||||
| Credit card memberships | 1,096 | 1,005 | 3,063 | 2,603 | ||||
| Subtotals | 1,508 | 2,041 | 4,819 | 5,175 | ||||
| Customer services | 2,411 | 1,790 | 6,998 | 6,528 | ||||
| Other expenses | ||||||||
| Operating charge-offs | 2,223 | 1,308 | 5,525 | 2,287 | ||||
| Life insurance and general product insurance policies | 2,032 | 1,468 | 5,154 | 4,272 | ||||
| Additional tax on expenses paid overseas | 710 | 546 | 2,736 | 1,541 | ||||
| Provisions for contingencies (*) | (649) | 878 | 2,644 | 5,951 | ||||
| Earthquake expenses | - | 2,544 | - | 2,544 | ||||
| Other | 479 | 865 | 2,373 | 2,731 | ||||
| Subtotals | 4,795 | 7,609 | 18,432 | 19,326 | ||||
| Totals | 10,192 | 13,799 | 34,540 | 36,822 | ||||
F-97
BANCO SANTANDER CHILE AND SUBSIDIARIES NOTES TO THE UNAUDITED CONDENSED CONSOLIDATED INTERIM FINANCIAL STATEMENTS As of September 30, 2011 and 2010 and December 31, 2010 |
NOTE 33 - TRANSACTIONS WITH RELATED PARTIES:
In addition to affiliates and associated entities, the Bank’s “related parties” include its “key personnel” from the executive staff (members of the Bank’s Board and the Managers of Banco Santander Chile and its Affiliates, together with their close relatives), as well as the entities over which the key personnel could exercise significant influence or control.
The Bank also considers the companies that are part of the Santander Group worldwide as related parties, given that all of them have a common parent, i.e., Banco Santander S.A. (located in Spain).
Article 89 of the Ley de Sociedades Anónimas (Public Companies Act), which is also applicable to banks, provides that any transaction with a related party must be made under equitable conditions similar to those that customarily prevail in the market.
Moreover, Article 84 of the Ley General de Bancos (General Banking Act) establishes limits for loans that can be granted to related parties and prohibits lending to the Bank’s directors, managers, or representatives.
Transactions between the Bank and its related parties are specified below. To facilitate comprehension, we have divided the information into four categories:
Santander Group Companies
This category includes all the companies that are controlled by the Santander Group around the world, and hence, it also includes the companies over which the Bank exercises any degree of control (Affiliates and special-purpose entities).
Associated companies
This category includes the entities over which the Bank, in accordance with section b) of Note 1 to these Condensed Consolidated Interim Financial Statements, exercises a significant degree of influence and which generally belong to the group of entities known as “business support companies.”
Key personnel
This category includes members of the Bank’s Board and the managers of Banco Santander Chile and its Affiliates, together with their close relatives.
Other
This category encompasses the related parties that are not included in the groups identified above and which are, in general, entities over which the key personnel could exercise significant influence or control.
The terms for transactions with related parties are equivalent to those which prevail in transactions made under market conditions or to which the corresponding considerations in kind have been attributed.
F-98
BANCO SANTANDER CHILE AND SUBSIDIARIES NOTES TO THE UNAUDITED CONDENSED CONSOLIDATED INTERIM FINANCIAL STATEMENTS As of September 30, 2011 and 2010 and December 31, 2010 |
NOTE 33 - TRANSACTIONS WITH RELATED PARTIES, continued:
| a) | Loans to related parties: |
Below are loans and receivables, and contingent loans, corresponding to related entities:
| As of September 30, 2011 | As of December 31, 2010 | |||||||||||||||||||||||||||||||
Companies of the Group | Associated companies | Key personnel | Other | Companies of the Group | Associated companies | Key personnel | Other | |||||||||||||||||||||||||
| MCh$ | MCh$ | MCh$ | MCh$ | MCh$ | MCh$ | MCh$ | MCh$ | |||||||||||||||||||||||||
| Loans and accounts receivables | ||||||||||||||||||||||||||||||||
| Commercial loans | 35,618 | 682 | 2,197 | 73,438 | 36,966 | 670 | 2,478 | 14,015 | ||||||||||||||||||||||||
| Mortgage loans | - | - | 15,962 | - | - | - | 15,157 | - | ||||||||||||||||||||||||
| Consumer loans | - | - | 1,911 | - | - | - | 2,182 | - | ||||||||||||||||||||||||
| Loans and accounts receivables | 35,618 | 682 | 20,070 | 73,438 | 36,966 | 670 | 19,817 | 14,015 | ||||||||||||||||||||||||
| Provision for loan losses | (46 | ) | (1 | ) | (34 | ) | (33 | ) | (112 | ) | (1 | ) | (87 | ) | (14 | ) | ||||||||||||||||
| Net loans | 35,572 | 681 | 20,036 | 73,405 | 36,854 | 669 | 19,730 | 14,001 | ||||||||||||||||||||||||
| Guarantees | 25,580 | - | 18,717 | 1,054 | 7,641 | - | 18,649 | 1,359 | ||||||||||||||||||||||||
| Contingent loans | ||||||||||||||||||||||||||||||||
| Personal guarantees | - | - | - | - | - | - | - | - | ||||||||||||||||||||||||
| Letters of credit | 1,020 | - | - | - | 2,964 | - | - | - | ||||||||||||||||||||||||
| Guarantees | 12,761 | - | - | 250 | 12,307 | - | - | 84 | ||||||||||||||||||||||||
| Contingent loans | 13,781 | - | - | 250 | 15,271 | - | - | 84 | ||||||||||||||||||||||||
| Provisions for contingent loans | (9 | ) | - | - | - | (1 | ) | - | - | - | ||||||||||||||||||||||
| Net contingent loans | 13,772 | - | - | 250 | 15,270 | - | - | 84 | ||||||||||||||||||||||||
The activity of loans to related parties during the periods ended on September 30, 2011 and December, 2010 is shown below:
| As of September 30, | As of December 31, | |||||||||||||||||||||||||||||||
| 2011 | 2010 | |||||||||||||||||||||||||||||||
| Companies of the Group | Associated companies | Key personnel | Other | Companies of the Group | Associated companies | Key personnel | Other | |||||||||||||||||||||||||
| MCh$ | MCh$ | MCh$ | MCh$ | MCh$ | MCh$ | MCh$ | MCh$ | |||||||||||||||||||||||||
| Opening | 52,237 | 670 | 19,817 | 14,099 | 147,843 | 914 | 17,339 | 108,631 | ||||||||||||||||||||||||
| New loans | 36,121 | 23 | 4,343 | 61,927 | 11,954 | 256 | 6,901 | 11,600 | ||||||||||||||||||||||||
| Payments | (38,959 | ) | (11 | ) | (4,090 | ) | (2,338 | ) | (107,560 | ) | (500 | ) | (4,423 | ) | (106,132 | ) | ||||||||||||||||
| Closing | 49,399 | 682 | 20,070 | 73,688 | 52,237 | 670 | 19,817 | 14,099 | ||||||||||||||||||||||||
F-99
BANCO SANTANDER CHILE AND SUBSIDIARIES NOTES TO THE UNAUDITED CONDENSED CONSOLIDATED INTERIM FINANCIAL STATEMENTS As of September 30, 2011 and 2010 and December 31, 2010 |
NOTE 33 - TRANSACTIONS WITH RELATED PARTIES, continued:
| b) | Assets and liabilities with related parties |
| As of September 30, | As of December 31, | |||||||||||||||||||||||||||||||
| 2011 | 2010 | |||||||||||||||||||||||||||||||
| Companies of the Group | Associated companies | Key personnel | Other | Companies of the Group | Associated companies | Key personnel | Other | |||||||||||||||||||||||||
| MCh$ | MCh$ | MCh$ | MCh$ | MCh$ | MCh$ | MCh$ | MCh$ | |||||||||||||||||||||||||
| Assets | ||||||||||||||||||||||||||||||||
| Cash and deposits in banks | 222,497 | - | - | - | 34,104 | - | - | - | ||||||||||||||||||||||||
| Trading investments | - | - | - | - | - | - | - | - | ||||||||||||||||||||||||
| Investments under resale agreements | - | - | - | - | - | - | - | - | ||||||||||||||||||||||||
| Financial derivative contracts | 572,040 | - | - | - | 541,737 | - | - | - | ||||||||||||||||||||||||
| Available for sale investments | - | - | - | - | - | - | - | - | ||||||||||||||||||||||||
| Other assets | 28,534 | - | - | - | 132,152 | - | - | - | ||||||||||||||||||||||||
| Liabilities | ||||||||||||||||||||||||||||||||
| Deposits and other demand liabilities | 5,738 | 8,779 | 1,594 | 9,671 | 9,905 | 6,014 | 1,311 | 4,128 | ||||||||||||||||||||||||
| Investments under repurchase agreements | 52,611 | - | - | - | 47,636 | - | - | - | ||||||||||||||||||||||||
| Time deposits and other time liabilities | 471,973 | 90 | 2,583 | 56,000 | 320,622 | - | 1,657 | 48,749 | ||||||||||||||||||||||||
| Financial derivative contracts | 457,725 | - | - | - | 317,601 | - | - | - | ||||||||||||||||||||||||
| Issued debt instruments | 13,212 | - | - | - | 9,392 | - | - | - | ||||||||||||||||||||||||
| Other financial liabilities | 43,754 | - | - | - | 153,913 | - | - | - | ||||||||||||||||||||||||
| Other liabilities | 1,163 | - | - | - | 2,782 | - | - | - | ||||||||||||||||||||||||
| c) | Income (expenses) recorded with related parties |
| For the quarter ended as of September 30, | For the quarter ended as of September 30, | |||||||||||||||||||||||||||||||
| 2011 | 2010 | |||||||||||||||||||||||||||||||
| Companies of the Group | Associated companies | Key personnel | Other | Companies of the Group | Associated companies | Key personnel | Other | |||||||||||||||||||||||||
| MCh$ | MCh$ | MCh$ | MCh$ | MCh$ | MCh$ | MCh$ | MCh$ | |||||||||||||||||||||||||
| Income (expense) recorded | ||||||||||||||||||||||||||||||||
| Income and expenses from interest and adjustments | (7,796 | ) | 11 | 292 | (444 | ) | (2,387 | ) | 9 | 287 | (86 | ) | ||||||||||||||||||||
| Income and expenses from fees and services | 19,028 | 9 | 28 | 65 | 18,556 | (26 | ) | 11 | 66 | |||||||||||||||||||||||
| Net income from financial and foreign exchange operations | 98,001 | - | (5 | ) | (5,957 | ) | 151,954 | - | (7 | ) | 6,477 | |||||||||||||||||||||
| Other operating revenues and expenses | (1,706 | ) | - | - | - | (1,286 | ) | - | - | - | ||||||||||||||||||||||
| Key personnel compensation and expenses | - | - | (8,621 | ) | - | - | - | (7,733 | ) | - | ||||||||||||||||||||||
| Administrative and other expenses | (5,320 | ) | (7,183 | ) | - | - | (3,839 | ) | (4,341 | ) | - | - | ||||||||||||||||||||
| Totals | 102,207 | (7,163 | ) | (8,306 | ) | (6,336 | ) | 162,998 | (4,358 | ) | (7,442 | ) | 6,457 | |||||||||||||||||||
F-100
BANCO SANTANDER CHILE AND SUBSIDIARIES NOTES TO THE UNAUDITED CONDENSED CONSOLIDATED INTERIM FINANCIAL STATEMENTS As of September 30, 2011 and 2010 and December 31, 2010 |
NOTE 33 - TRANSACTIONS WITH RELATED PARTIES, continued:
For the 9-month period ended as of September 30, | For the 9-month period ended as of September 30, | |||||||||||||||||||||||||||||||
| 2011 | 2010 | |||||||||||||||||||||||||||||||
| Companies of the Group | Associated companies | Key personnel | Other | Companies of the Group | Associated companies | Key personnel | Other | |||||||||||||||||||||||||
| MCh$ | MCh$ | MCh$ | MCh$ | MCh$ | MCh$ | MCh$ | MCh$ | |||||||||||||||||||||||||
| Income (expense) recorded | ||||||||||||||||||||||||||||||||
| Income and expenses from interest and adjustments | (12,923 | ) | 41 | 953 | (2,415 | ) | (7,385 | ) | 39 | 768 | 459 | |||||||||||||||||||||
| Income and expenses from fees and services | 58,741 | 30 | 84 | 155 | 50,735 | 2 | 69 | 118 | ||||||||||||||||||||||||
| Net income from financial and foreign exchange operations | 96,187 | - | (19 | ) | (8,658 | ) | 98,131 | - | (18 | ) | 1,479 | |||||||||||||||||||||
| Other operating revenues and expenses | (4,184 | ) | - | - | - | (3,551 | ) | - | - | - | ||||||||||||||||||||||
| Key personnel compensation and expenses | - | - | (25,213 | ) | - | - | - | (21,480 | ) | - | ||||||||||||||||||||||
| Administrative and other expenses | (17,421 | ) | (18,664 | ) | - | - | (14,466 | ) | (14,788 | ) | - | - | ||||||||||||||||||||
| Total | 120,400 | (18,593 | ) | (24,195 | ) | (10,918 | ) | 123,464 | (14,747 | ) | (20,661 | ) | 2,056 | |||||||||||||||||||
(*) Reflects derivative contracts that hedge Group positions in Chile
F-101
BANCO SANTANDER CHILE AND SUBSIDIARIES NOTES TO THE UNAUDITED CONDENSED CONSOLIDATED INTERIM FINANCIAL STATEMENTS As of September 30, 2011 and 2010 and December 31, 2010 |
NOTE 33 - TRANSACTIONS WITH RELATED PARTIES, continued:
| d) | Payments to Board members and key management personnel |
The compensation received by the key management personnel, including Board members and all the executives holding manager positions, shown in the “Personnel salaries and expenses” and/or “Administrative expenses” items of the Consolidated Statement of Income, correspond to the following categories:
For the quarter ended as of September 30, | For the 9-month period ended as of September 30, | |||||||
| 2011 | 2010 | 2011 | 2010 | |||||
| MCh$ | MCh$ | MCh$ | MCh$ | |||||
| Personnel salaries | 4,182 | 3,736 | 12,005 | 10,853 | ||||
| Compensation to Board members | 274 | 245 | 732 | 644 | ||||
| Bonuses or gratifications | 2,608 | 2,159 | 8,230 | 6,647 | ||||
| Compensation in stock | 449 | 390 | 1,215 | 1,230 | ||||
| Training expenses | 28 | 18 | 87 | 32 | ||||
| Severance provision | 634 | 723 | 1,314 | 726 | ||||
| Health funds | 70 | 62 | 200 | 179 | ||||
| Other personnel expenses | 99 | 109 | 286 | 294 | ||||
| Pension plans | 277 | 291 | 1,144 | 875 | ||||
| Total | 8,621 | 7,733 | 25,213 | 21,480 | ||||
| e) | Composition of key personnel |
As of September 30, 2011 and 2010 the composition of the Bank’s key personnel is as follows:
| Positions | No. of executives | ||
| As of September 30, | As of September 30, | As of December 31, | |
| 2011 | 2010 | 2010 | |
| Directors | 12 | 13 | 13 |
| Division managers | 18 | 14 | 18 |
| Department managers | 90 | 80 | 82 |
| Managers | 66 | 62 | 68 |
| Total key personnel | 186 | 169 | 181 |
F-102
BANCO SANTANDER CHILE AND SUBSIDIARIES NOTES TO THE UNAUDITED CONDENSED CONSOLIDATED INTERIM FINANCIAL STATEMENTS As of September 30, 2011 and 2010 and December 31, 2010 |
NOTE 34 - FAIR VALUE OF FINANCIAL ASSETS AND LIABILITIES:
Fair value is defined as the amount at which a financial instrument (asset or liability) could be exchanged or settled, respectively, on given date between two independent knowledgeable, willing parties in an arm’s length transaction (i.e., not in a forced or liquidation sale). The most objective and customary reference for the fair value of an asset or liability is the quoted price that would be paid for it on a transparent organized market (“estimated fair value”).
For financial instruments with no available market prices, fair values have been estimated by using recent transactions in analogous instruments, and in the absence thereof, the present values or other valuation techniques based on mathematical valuation models sufficiently accepted by the international financial community. In the use of these models, consideration is given to the specific particularities of the asset or liability to be valued, and especially to the different kinds of risks associated with the asset or liability.
These techniques are inherently subjective and are significantly influenced by the assumptions used, including the discount rate, the estimates of future cash flows and prepayment expectations. Hence, the fair value estimated for an asset or liability may not coincide exactly with the price at which that asset or liability could be delivered or settled on the date of its valuation, and may not be justified in comparison with independent markets.
Measurement of fair value and hierarchy
IFRS 7 provides a hierarchy of reasonable value which separates the inputs and/or valuation technique assumptions used to measure the fair value of financial instruments. The hierarchy reflects the significance of the inputs used in making the measurement. The three levels of the hierarchy of fair values are the following:
Level 1: In quoted prices on active markets for identical assets and liabilities.
Level 2: Corresponds to inputs other than the quoted prices included in level 1 that are observable for assets or liabilities, either directly or indirectly; and
Level 3: Corresponds to inputs for the asset or the liability which are not based on observable market data.
The hierarchy level within which the fair value measurement is categorized in its entirely is determined based on the lowest level of input that is significant to fair value the measurement in its entirety.
The best evidence of a financial instrument’s fair value at the initial time is the transaction price (Level 1).
In cases where quoted market prices cannot be observed, Management makes its best estimate of the price that the market would set using its own internal models which in most cases use data based on observable market parameters as significant input (Level 2) and, in very specific cases, they use significant inputs not observable in market data (Level 3).
Financial instruments at fair value and determined by quotations published in active markets (Level 1) include:
| 1) | Chilean Government and Department of Treasury bonds |
Instruments which cannot be 100% observable in the market are valued according to other inputs observable in the market (Level 2). They include:
| 1) | Mortgage bonds |
| 2) | Private paper |
| 3) | Deposits |
| 4) | Average Chamber Swaps |
| 5) | FX Forward and Inflation |
| 6) | Cross Currency Swaps (CCS) |
| 7) | FX Options. |
| 8) | Interest Rate Swap (IRS) FX |
F-103
BANCO SANTANDER CHILE AND SUBSIDIARIES NOTES TO THE UNAUDITED CONDENSED CONSOLIDATED INTERIM FINANCIAL STATEMENTS As of September 30, 2011 and 2010 and December 31, 2010 |
NOTE 34 - FAIR VALUE OF FINANCIAL ASSETS AND LIABILITIES, continued:
In limited occasions significant inputs not observable in market data are used (Level 3). To carry out this estimate, several techniques are used, including extrapolation of observable market data or a mix of observable data.
The following financial instruments are classified under Level 3:
| Type of financial instrument | Model used in valuation | Description | |||
| ž | Caps/Floors/Swaptions | Black Normal Model for Cap/Floors and Swaptions | There is no observable input of implicit volatility. | ||
| ž | UF options | Black – Scholes | There is no observable input of implicit volatility. | ||
| ž | Cross currency swap with window | Hull-White | Hybrid HW model for rates and Brownian motion for FX There is no observable input of implicit volatility. | ||
| ž | CCS (special contracts) | Implicit Forward Rate Agreement (FRA) | Start Fwd unsupported by MUREX (platform) due to the UF forward estimate. | ||
| ž | Cross currency swap, Interest rate swap, Call money swap in Tasa Activa Bancaria (Active Bank Rate) TAB, | Other | Valuation obtained by using the interest curve and interpolating at flow maturities, but TAB is not a directly observable variable and is not correlated to any market input. | ||
| ž | Bonds (in our case, low liquidity bonds) | Other | Valued by using similar instrument prices plus a charge-off rate by illiquidity. |
The following table presents the assets and liabilities that are measured at fair value on a recurrent basis, as of September 30, 2011 and December 31, 2010:
| Fair value measurement | ||||||||||||||||
| As of September 30, 2011 | Level 1 | Level 2 | Level 3 | |||||||||||||
| MCh$ | MCh$ | MCh$ | MCh$ | |||||||||||||
| Assets | ||||||||||||||||
| Trading investments | 503,813 | 478,681 | 25,132 | - | ||||||||||||
| Available for sale investments | 2,104,644 | 1,874,639 | 229,716 | 289 | ||||||||||||
| Derivatives | 2,011,585 | - | 1,919,920 | 91,665 | ||||||||||||
| Totals | 4,620,042 | 2,353,320 | 2,174,768 | 91,954 | ||||||||||||
| Liabilities | ||||||||||||||||
| Derivatives | 1,625,274 | - | 1,623,901 | 1,373 | ||||||||||||
| Totals | 1,625,274 | - | 1,623,901 | 1,373 | ||||||||||||
| Fair value measurement | ||||||||||||||||
| As of December 31, 2010 | Level 1 | Level 2 | Level 3 | |||||||||||||
| MCh$ | MCh$ | MCh$ | MCh$ | |||||||||||||
| Assets | ||||||||||||||||
| Trading investments | 379,670 | 348,638 | 31,032 | - | ||||||||||||
| Available for sale investments | 1,473,980 | 1,097,487 | 376,224 | 269 | ||||||||||||
| Derivatives | 1,624,378 | - | 1,520,339 | 104,039 | ||||||||||||
| Totals | 3,478,028 | 1,446,125 | 1,927,595 | 104,308 | ||||||||||||
| Liabilities | ||||||||||||||||
| Derivatives | 1,643,979 | - | 1,638,557 | 5,422 | ||||||||||||
| Totals | 1,643,979 | - | 1,638,557 | 5,422 | ||||||||||||
F-104
BANCO SANTANDER CHILE AND SUBSIDIARIES NOTES TO THE UNAUDITED CONDENSED CONSOLIDATED INTERIM FINANCIAL STATEMENTS As of September 30, 2011 and 2010 and December 31, 2010 |
NOTE 34 - FAIR VALUE OF FINANCIAL ASSETS AND LIABILITIES, continued:
The following table presents the Bank’s activity for assets and liabilities measured at fair value on a recurrent basis using unobserved significant entries (Level 3) as of September 30, 2011 and 2010:
| Assets | Liabilities | |||||||
| MCh$ | MCh$ | |||||||
| As of January 1, 2011 | 104,308 | (5,422 | ) | |||||
| Total realized and unrealized profits (losses): | ||||||||
| Included in statement of income | (12,374 | ) | 4,049 | |||||
| Included in comprehensive income | 20 | - | ||||||
| Purchases, issuances, and allocations (net) | - | - | ||||||
| As of September 30, 2011 | 91,954 | (1,373 | ) | |||||
| Total profits or losses included in income for 2011 that are attributable to change in unrealized profits (losses) related to assets or liabilities as of September 30, 2011 | (12,354 | ) | 4,049 | |||||
| Assets | Liabilities | |||||||
| MCh$ | MCh$ | |||||||
| As of January 1, 2010 | 212,218 | (468,848 | ) | |||||
| Total realized and unrealized profits (losses): | ||||||||
| Included in statement of income | 44,616 | 474,270 | ||||||
| Included in comprehensive income | ||||||||
| Purchases, issuances, and allocations (net) | ||||||||
| As of September 30, 2010 | 256,834 | 5,422 | ||||||
| Total profits or losses included in income for 2010 that are attributable to change in unrealized profits (losses) related to assets or liabilities as of September 30, 2010 | 44,616 | (9,789 | ) | |||||
The realized and unrealized profits (losses) included in income for 2011 and 2010, in the assets and liabilities measured at fair value on a recurrent basis through unobservable market data (Level 3) are recorded in the Statement of Income under the “Net income from financial operations” item.
The potential effect as of September 30, 2011 and 2010 on the valuation of assets and liabilities measured at fair value on a recurrent basis through unobservable significant market data (level 3), generated by changes in the main assumptions if other reasonably possible assumptions that are less or more favorable were used, it is not considered by the Bank to be significant.
F-105
BANCO SANTANDER CHILE AND SUBSIDIARIES NOTES TO THE UNAUDITED CONDENSED CONSOLIDATED INTERIM FINANCIAL STATEMENTS As of September 30, 2011 and 2010 and December 31, 2010 |
NOTE 35 – SUBSEQUENT EVENTS
Between October 1, 2011 and the date on which these Condensed Consolidated Interim Financial Statements were issued (October 24, 2011), no other events have occurred which could significantly affect their interpretation.
FELIPE CONTRERAS FAJARDO Accounting Manager | CLAUDIO MELANDRI HINOJOSA Chief Executive Officer |
F-106

SIGNATURE
Pursuant to the requirements of the Securities Exchange Act of 1934, the registrant has duly caused this report to be signed on its behalf by the undersigned, thereunto duly authorized.
Banco Santander Chile | |||||
| Date: | November 21, 2011 | By: | /s/ Juan Pedro Santa María | ||
| Name: | Juan Pedro Santa María | ||||
| Title: | General Counsel | ||||