FORM 6-K
SECURITIES AND EXCHANGE COMMISSION
Washington, D.C. 20549
Report of Foreign Issuer
Pursuant to Rule 13a-16 or 15d-16 of
the Securities Exchange Act of 1934
Commission File Number: 001-14554
Banco Santander Chile
Santander Chile Bank
(Translation of Registrant’s Name into English)
Bandera 140
Santiago, Chile
(Address of principal executive office)
Indicate by check mark whether the registrant files or will file annual reports under cover of Form 20-F or Form 40-F:
| Form 20-F | x | Form 40-F | o |
Indicate by check mark if the registrant is submitting the Form 6-K in paper as permitted by Regulation S-T Rule 101(b)(1):
| Yes | o | No | x |
Indicate by check mark if the registrant is submitting the Form 6-K in paper as permitted by Regulation S-T Rule 101(b)(7):
| Yes | o | No | x |
Indicate by check mark whether by furnishing the information contained in this Form, the Registrant is also thereby furnishing the information to the Commission pursuant to Rule 12g3-2(b) under the Securities Exchange Act of 1934:
| Yes | o | No | x |
If “Yes” is marked, indicate below the file number assigned to the registrant in connection with Rule 12g3-2(b): N/A
Table of Contents
| Item | ||
| 1. | 3Q2011 Earnings Release | |
| 2. | 9M 2011 Financial Statements |
2
SIGNATURE
Pursuant to the requirements of the Securities Exchange Act of 1934, the registrant has duly caused this report to be signed on its behalf by the undersigned, thereunto duly authorized.
| BANCO SANTANDER-CHILE | |
| By: | /s/ |
| Name: | Juan Pedro Santa María |
| Title: | General Counsel |
Date: November 4, 2011
3

BANCO SANTANDER CHILE
THIRD QUARTER 2011
EARNINGS REPORT
INDEX
| SECTION | PAGE |
| SECTION 1: SUMMARY OF RESULTS | 2 |
| SECTION 2: BALANCE SHEET ANALYSIS | 6 |
| SECTION 3: ANALYSIS OF QUARTERLY INCOME STATEMENT | 9 |
| SECTION 4: CREDIT RISK RATINGS | 16 |
| SECTION 5: SHARE PERFORMANCE | 17 |
| ANNEX 1: NEW PROVISIONING MODEL FOR RESIDENTIAL MORTGAGE LOANS | 18 |
| ANNEX 2: BALANCE SHEET | 19 |
| ANNEX 3: YEAR-TO-DATE INCOME STATEMENT | 20 |
| ANNEX 4: QUARTERLY INCOME STATEMENTS | 21 |
| ANNEX 5: QUARTERLY EVOLUTION OF MAIN RATIOS AND OTHER INFORMATION | 22 |
| CONTACT INFORMATION | Santiago, Chile |
| Robert Moreno | Tel: (562) 320-8284 |
| Manager, Investor Relations Department | Fax: (562) 671-6554 |
| Banco Santander Chile | Email: rmorenoh@santander.cl |
| Bandera 140 Piso 19 | Website: www.santander.cl |
SECTION 1: SUMMARY OF RESULTS
3Q11: preparing for a more challenging environment
In the nine-month period ended September 30, 2011 (9M11), net income attributable to shareholders1 totaled Ch$332,963 million (Ch$1.77 per share and US$3.56/ADR2) and decreased 13.1% compared to net income in the same period of 2010. Return on average equity reached 23.8% in 9M11, among the highest returns in the Chilean financial system. The efficiency ratio in 9M11 reached 38.4%.
In 3Q11, net income attributable to shareholders totaled Ch$75,153 million (Ch$0.40 per share and US$0.80/ADR). Compared to 2Q11 (from now on QoQ) net income decreased 46.9%. Compared to 3Q10 (from now on YoY) net income decreased 40.0%. Several non-recurring items and a cautious stance regarding risks affected these results.
Our outlook for Chile in 2012 continues to be positive, with GDP expected to expand 4.5% and inflation to be close to 3.0%. Nonetheless, the Bank focused its actions on 4 main points in the quarter in order to maintain sustainable levels of high profitability in 2012: (i) Liquidity, (ii) Capital, (iii) Selective loan growth and spreads, and (iv) Prudent risk policies. This process is very similar to the approach we carried out in the 2008-2009 period.
| I. | Focus on liquidity |
Core deposits grow 6.9% QoQ and 30.9% YoY
Total deposits increased 4.4% QoQ. In the quarter, the Bank continued to focus on increasing its core deposit base (non-institutional deposits). These cheaper deposits led growth and expanded 6.9% QoQ and 30.9% YoY, representing more than 70% of the Bank’s deposit base. The Bank’s loan to deposit ratio (measured as loans minus marketable securities that fund mortgage portfolio over total deposits3) improved to 94.8% as of September 2011 compared to 96.8% as of June 2011 and 100.9% in September 2010.
The Bank’s market share in total deposits has increased 36 basis points in the last 12 months to 18.7%. Throughout 2011, funding costs in the banking system have risen due to higher short-term interest rates, but the Bank’s funding costs have increased at a slower pace given the focus on core deposit growth. We currently have opened a gap of 20 basis points in average cost of funds compared to the rest of the Chilean banking system.
3 Mortgage loans in Chile are long-term fixed rate loans. Therefore, we consider it to be more conservative form a market risk and liquidity stand point to fund these loans with long-term fixed rate bonds and not short-term variable rate deposits.
Investor Relations Department
Bandera 140 19th Floor, Santiago, Chile, Tel: 562-320-8284, fax: 562-671-6554,
email: rmorenoh@santander.cl
2
Average cost of funds
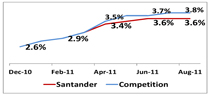
Cost of funds: Interest expenses / total liabilities annualized. Competition includes all Chilean banks minus Santander. Source of data: Superintendency of Banks of Chile (SBIF)
Surplus liquidity tops US$3 billion
In the quarter, the Bank’s deposit base increased at a faster pace than its loans. This additional liquidity was temporarily invested in Chilean sovereign risk. The Bank’s surplus liquidity, defined as financial investments minus non-structural liabilities, averaged US$3.0 billion in the quarter.
| II. | Focus on core capital |
Core capital at 10.2%. ROAE in 9M11 at 23.8%
The Bank currently has one of the highest capitalization levels in the Chilean financial system. Voting common shareholders’ equity is the sole component of our Tier I capital. The Bank core capital ratio reached 10.2%, increasing 40 bp QoQ. The Bank implemented a series of measures to boost core capital ratios by optimizing risk-weighted assets. As a result, the BIS ratio reached 13.9% as of September 30, 2011 compared to 13.4% as of June 2011. ROAE in the nine-month period ended September 30, 2011 reached 23.8%.
| III. | Focus on selective loan growth and spreads |
In 3Q11, total loans increased 1.5% QoQ and 16.1% YoY. The Bank has been following a more selective approach to loan growth given the market uncertainty, while continuing to focus on retail lending activities. Higher yielding loans to individuals increased 2.1% QoQ in 3Q11. This loan growth was led by lending to middle and upper income individuals, which expanded 2.2% QoQ. Lending to Santander Banefe slowed in the quarter and grew 1.3% QoQ. Lending to SMEs led growth in retail lending and expanded 2.8% QoQ. In the middle market, loans grew 2.9% QoQ (18.1% YoY). This year the Bank is obtaining attractive returns in this segment given the positive evolution of credit risk and spreads.
Rising spreads
The Banks net interest margin in the quarter reached 4.6% compared to 5.2% in 2Q11. The Bank’s margins in the quarter were negatively affected by lower QoQ inflation rates, as the Bank has more assets than liabilities linked to inflation. Inflation in the quarter descended from 1.44% in 2Q11 to 0.56% in 3Q11. For every 100 bp decline in inflation, net interest income falls by approximately Ch$25 billion. The increase in the Bank’s surplus liquidity has also temporarily reduced the Bank’s net interest margin.
Investor Relations Department
Bandera 140 19th Floor, Santiago, Chile, Tel: 562-320-8284, fax: 562-671-6554,
email: rmorenoh@santander.cl
3
These negative effects on margins were partially offset by rising loan spreads (excluding the impacts of mismatches in inflation indexed assets and liabilities). Loan spreads in the quarter began to rise as the Bank implemented a stricter pricing policy in light of a potential deterioration of economic conditions and a potentially higher cost of capital. This should also help to sustain or improve margins in coming quarters.
Loan spreads*, %
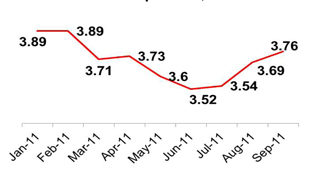
Spread = Loan yield minus cost of funds and excluding impacts of inflation indexed asset and liability mismatches.
| IV. | Prudent credit risk policies |
Risk index stable despite higher provisions
On a year-to date basis net provision expense has increased 7.6% compared to a 16.1% rise in loan growth. Provision for loan losses in the quarter increased 58.9% QoQ and 75.4% YoY. This rise was mainly due to one-time provisions expenses, the expansion of our lending volumes, especially consumer lending and more prudent credit risk policies implemented in light of a possible deterioration of the macro environment. This included restricting renegotiations and, therefore, increasing charge-offs. This also resulted in a temporary rise in NPLs, but did not affect the Bank’s risk index. The Risk Index, which includes non-performing loans and additional risk parameters, remained stable QoQ at 2.94%. The Bank is required to have 100% coverage at all times of its Risk Index. The NPL ratio, which includes all loans that are more than 90 days overdue, as of September 2011 reached 2.81%. The coverage ratio of total NPLs (loan loss allowances over non-performing loans) reached 104.8% as of September 2011.
Investor Relations Department
Bandera 140 19th Floor, Santiago, Chile, Tel: 562-320-8284, fax: 562-671-6554,
email: rmorenoh@santander.cl
4
Banco Santander Chile: Summary of Quarterly Results
| Quarter | Change % | |||||||||||||||||||
| 3Q11 / | 3Q11 / | |||||||||||||||||||
| (Ch$ million) | 3Q11 | 2Q11 | 3Q10 | 3Q10 | 2Q11 | |||||||||||||||
| Net interest income | 232,057 | 247,414 | 235,674 | (1.5 | )% | (6.2 | )% | |||||||||||||
| Fee income | 65,991 | 72,050 | 66,436 | (0.7 | )% | (8.4 | )% | |||||||||||||
| Core revenues | 298,048 | 319,464 | 302,110 | (1.3 | )% | (6.7 | )% | |||||||||||||
| Financial transactions, net | 23,001 | 29,076 | 21,713 | 5.9 | % | (20.9 | )% | |||||||||||||
| Provision expense | (90,372 | ) | (56,874 | ) | (51,525 | ) | 75.4 | % | 58.9 | % | ||||||||||
| Operating expenses | (128,356 | ) | (125,161 | ) | (113,570 | ) | 13.0 | % | 2.6 | % | ||||||||||
| Operating income, net of provisions and costs | 102,321 | 166,505 | 158,728 | (35.5 | )% | (38.5 | )% | |||||||||||||
| Other operating & Non-op. Income | (27,168 | ) | (24,993 | ) | (33,372 | ) | (18.6 | )% | 8.7 | % | ||||||||||
| Net income attributable to shareholders | 75,153 | 141,512 | 125,356 | (40.0 | )% | (46.9 | )% | |||||||||||||
| Net income/share (Ch$) | 0.40 | 0.75 | 0.67 | (40.0 | )% | (46.9 | )% | |||||||||||||
Net income/ADR (US$)1 | 0.80 | 1.66 | 1.42 | (43.5 | )% | (51.4 | )% | |||||||||||||
| Total loans | 17,680,356 | 17,422,041 | 15,232,019 | 16.1 | % | 1.5 | % | |||||||||||||
| Deposits | 13,892,003 | 13,306,475 | 11,146,945 | 24.6 | % | 4.4 | % | |||||||||||||
| Shareholders’ equity | 1,927,498 | 1,866,467 | 1,757,340 | 9.7 | % | 3.3 | % | |||||||||||||
| Net interest margin | 4.6 | % | 5.2 | % | 5.7 | % | ||||||||||||||
| Efficiency ratio | 41.3 | % | 36.5 | % | 37.2 | % | ||||||||||||||
Return on average equity2 | 15.8 | % | 30.5 | % | 29.3 | % | ||||||||||||||
NPL / Total loans3 | 2.8 | % | 2.6 | % | 2.7 | % | ||||||||||||||
| Coverage NPLs | 104.8 | % | 111.9 | % | 105.1 | % | ||||||||||||||
Risk index4 | 2.94 | % | 2.90 | % | 2.82 | % | ||||||||||||||
PDLs/ Total loans5 | 1.27 | % | 1.23 | % | 1.36 | % | ||||||||||||||
| Coverage PDLs | 232.45 | % | 235.86 | % | 206.64 | % | ||||||||||||||
| BIS ratio | 13.9 | % | 13.4 | % | 14.5 | % | ||||||||||||||
| Branches | 494 | 487 | 500 | |||||||||||||||||
| ATMs | 1,892 | 1,946 | 1,914 | |||||||||||||||||
| Employees | 11,706 | 11,516 | 11,049 | |||||||||||||||||
| 1. | The change in earnings per ADR may differ from the change in earnings per share due to the exchange rate movements. Earnings per ADR was calculated using the Observed Exchange Rate Ch$515.14 per US$ as of September 30, 2011. |
| 2. | Annualized quarterly Net income attributable to shareholders / Average equity attributable to shareholders. |
| 3. | NPLs: Non-performing loans; full balance of loans with one installment 90 days or more overdue. |
| 4. | Risk Index: Loan loss allowances / Total loans; measures the percentage of loans the banks must provision for given their internal models and the Superintendency of Banks guidelines. |
| 5. | PDLs: Past due loans; all loan installments that are more than 90 days overdue. |
Investor Relations Department
Bandera 140 19th Floor, Santiago, Chile, Tel: 562-320-8284, fax: 562-671-6554,
email: rmorenoh@santander.cl
5
SECTION 2: BALANCE SHEET ANALYSIS
LOANS
Selective loan growth led by retail lending to middle-upper income individuals
| Loans | Quarter ended, | % Change | ||||||||||||||||||
| (Ch$ million) | Sep-11 | Jun-11 | Sep-10 | Sep. 11 / 10 | Sep. 11 / Jun. 11 | |||||||||||||||
Total loans to individuals1 | 9,215,686 | 9,026,697 | 8,035,617 | 14.7 | % | 2.1 | % | |||||||||||||
| Consumer loans | 2,925,659 | 2,893,038 | 2,554,884 | 14.5 | % | 1.1 | % | |||||||||||||
| Residential mortgage loans | 5,016,419 | 4,909,630 | 4,498,799 | 11.5 | % | 2.2 | % | |||||||||||||
| SMEs | 2,524,836 | 2,455,349 | 2,301,536 | 9.7 | % | 2.8 | % | |||||||||||||
| Total retail lending | 11,740,522 | 11,482,046 | 10,337,153 | 13.6 | % | 2.3 | % | |||||||||||||
| Institutional lending | 351,686 | 372,939 | 340,274 | 3.4 | % | (5.7 | )% | |||||||||||||
| Middle-Market & Real estate | 3,731,881 | 3,625,439 | 3,160,681 | 18.1 | % | 2.9 | % | |||||||||||||
| Corporate | 1,833,084 | 1,950,992 | 1,406,210 | 30.4 | % | (6.0 | )% | |||||||||||||
Total loans 2 | 17,680,356 | 17,422,041 | 15,232,019 | 16.1 | % | 1.5 | % | |||||||||||||
1. Includes consumer loans, residential mortgage loans and other commercial loans to individuals.
2. Total loans gross of loan loss allowances. Total loans include other non-segmented loans and excludes interbank loans.
In 3Q11, total loans increased 1.5% QoQ and 16.1% YoY. The Bank has been following a more selective approach to loan growth given the market uncertainty while continuing to focus on retail lending activities.
Loans to individuals, which include consumer, mortgage and commercial loans to high-income individuals, increased of 2.1% QoQ in 3Q11. This loan growth was driven by lending to middle and upper income individuals, which expanded 2.2% QoQ. Lending to Santander Banefe increased 1.3% QoQ as the bank adopted a more selective approach to loan growth in this segment.
Breakdown loans to individuals (Ch$ million) | Sep-11 | % Change Sep. 11 / 10 | % Change Sep. 11 / Jun. 11 | |||||||||
| Middle-upper income | 8,420,540 | 14.3 | % | 2.2 | % | |||||||
| Santander Banefe | 795,146 | 18.9 | % | 1.3 | % | |||||||
| Individuals | 9,215,686 | 14.7 | % | 2.1 | % | |||||||
By product, consumer loans increased 1.1% QoQ and 14.5% YoY. In the quarter, the Bank focused on expanding its higher yielding credit card loan portfolio that increased 2.3% QoQ and 28.2% YoY. Installment loans were flat QoQ. Residential mortgage loans increased 2.2% QoQ (11.5% YoY), as long-term rates remained attractive and demand for purchasing homes continued to rise.
Lending to SMEs (defined as companies that sell less than Ch$1,200 million per year) led growth in retail lending and expanded 2.8% QoQ (9.7% YoY), reflecting the Bank’s shift in focus in the quarter given market uncertainties. This segment tends to perform better in slower economic growth periods given the high level of diversification of this portfolio.
Investor Relations Department
Bandera 140 19th Floor, Santiago, Chile, Tel: 562-320-8284, fax: 562-671-6554,
email: rmorenoh@santander.cl
6
In the middle market (comprised of companies with annual sales between Ch$1,200 million and Ch$10.000 million per year), loans grew a healthy 2.9% QoQ (18.1% YoY). This year the Bank is obtaining attractive returns in this segment given the positive evolution of credit risk and spreads.
Corporate lending (companies with sale over Ch$10,000 million per year or that are part of a large foreign or local economic group) decreased 6.0% QoQ (+30.4% YoY). This fall was mainly due to 3 corporate debt obligation that were paid in full as company’s currently have strong liquidity levels. Non-lending activities with this segment continued to grow in the quarter. (See Funding and Financial transactions, net).
FUNDING
Focus on liquidity. Core deposits grow 6.9% QoQ and 30.9% YoY
| Funding | Quarter ended, | % Change | ||||||||||||||||||
| (Ch$ million) | Sep-11 | Jun-11 | Sep-10 | Sep. 11 / 10 | Sep. 11 / Jun. 11 | |||||||||||||||
| Demand deposits | 4,496,757 | 4,450,290 | 3,991,732 | 12.7 | % | 1.0 | % | |||||||||||||
| Time deposits | 9,395,246 | 8,856,185 | 7,155,213 | 31.3 | % | 6.1 | % | |||||||||||||
| Total deposits | 13,892,003 | 13,306,475 | 11,146,945 | 24.6 | % | 4.4 | % | |||||||||||||
| Mutual funds (off-balance sheet) | 2,852,379 | 3,136,413 | 3,305,683 | (13.7 | )% | (9.1 | )% | |||||||||||||
| Total customer funds | 16,744,382 | 16,442,888 | 14,452,628 | 15.9 | % | 1.8 | % | |||||||||||||
Loans to deposits1 | 94.8 | % | 96.8 | % | 100.9 | % | ||||||||||||||
1. (Loans - marketable securities that fund mortgage portfolio) / (Time deposits + demand deposits).
Customer funds increased 1.8% in the quarter led by a 4.4% QoQ rise in total deposits. Demand deposits increased 1.0% in the same period and time deposits were up 6.1%. In the quarter, the Bank continued to focus on increasing its core deposit base. Core deposits (non-institutional deposits) increased 6.9% QoQ and 30.9% YoY. The Bank’s loan to deposit ratio (measured as loans minus marketable securities that fund mortgage portfolio over total deposits) improved to 94.8% as of September 2011 compared to 96.8% as of June 2011 and 100.9% in September 2010. The Bank’s market share in total deposits has increased 36 basis points in the last 12 months to 18.7%. Mutual funds under management decreased 9.1% QoQ. This was mainly due to weak equity markets.
Investor Relations Department
Bandera 140 19th Floor, Santiago, Chile, Tel: 562-320-8284, fax: 562-671-6554,
email: rmorenoh@santander.cl
7
SHAREHOLDERS’ EQUITY AND REGULATORY CAPITAL
Core capital at 10.2%. ROAE in 9M11 at 23.8%
| Quarter ended, | Change % | |||||||||||||||||||
(Ch$ million) | Sep-11 | Jun-11 | Sep-10 | Sep. 11 / 10 | Sep. 11 / Jun. 11 | |||||||||||||||
| 891,303 | 891,303 | 1,757,340 | (49.3 | )% | 0.0 | % | ||||||||||||||
| Reserves | 51,538 | 51,538 | 51,539 | (0.0 | )% | 0.0 | % | |||||||||||||
| Valuation adjustment | 593 | (7,831 | ) | (13,928 | ) | (104.3 | )% | (107.6 | )% | |||||||||||
| Retained Earnings: | 984,064 | 931,457 | 828,426 | 18.8 | % | 5.6 | % | |||||||||||||
| Retained earnings prior periods | 750,989 | 750,990 | 560,128 | 34.1 | % | 0.0 | % | |||||||||||||
| Income for the period | 332,963 | 257,810 | 383,283 | (13.1 | )% | 29.2 | % | |||||||||||||
| Provision for mandatory dividend | (99,889 | ) | (77,343 | ) | (114,985 | ) | (13.1 | )% | 29.2 | % | ||||||||||
| Equity attributable to shareholders | 1,927,498 | 1,866,467 | 2,623,377 | (26.5 | )% | 3.3 | % | |||||||||||||
| Non-controlling interest | 32,293 | 31,171 | 29,599 | 9.1 | % | 3.6 | % | |||||||||||||
| Total Equity | 1,959,791 | 1,897,638 | 2,652,976 | (26.1 | )% | 3.3 | % | |||||||||||||
| Quarterly ROAE | 15.8 | % | 30.5 | % | 23.0 | % | ||||||||||||||
Shareholders’ equity totaled Ch$1,927,498 million (US$4.0 billion) as of September 30, 2011. ROAE in the nine-month period ended September 30, 2011 reached 23.8%. During the quarter, the Bank implemented a series of measures to boost core capital ratios by optimizing risk-weighted assets. As a result, the BIS ratio reached 13.9% as of September 30, 2011 compared to 13.4% as of June 2011 and the Bank’s core capital ratio reached 10.2% as of September 2011 compared to 9.8% as of June 2011. Voting common shareholders’ equity is the sole component of our Tier I capital.
| Capital Adequacy | Quarter ended, | Change % | ||||||||||||||||||
(Ch$ million) | Sep-11 | Jun-11 | Sep-10 | Sep. 11 / 10 | Sep. 11 / Jun. 11 | |||||||||||||||
| Tier I (Core Capital) | 1,927,498 | 1,866,467 | 1,757,340 | 9.7 | % | 3.3 | % | |||||||||||||
| Tier II | 715,184 | 669,798 | 672,740 | 6.3 | % | 6.8 | % | |||||||||||||
| Regulatory capital | 2,642,682 | 2,536,265 | 2,430,080 | 8.7 | % | 4.2 | % | |||||||||||||
| Risk weighted assets | 18,954,146 | 18,964,803 | 16,739,710 | 13.2 | % | (0.1 | )% | |||||||||||||
| Tier I (Core capital) ratio | 10.2 | % | 9.8 | % | 10.5 | % | ||||||||||||||
| BIS ratio | 13.9 | % | 13.4 | % | 14.5 | % | ||||||||||||||
Investor Relations Department
Bandera 140 19th Floor, Santiago, Chile, Tel: 562-320-8284, fax: 562-671-6554,
email: rmorenoh@santander.cl
8
SECTION 3: ANALYSIS OF QUARTERLY INCOME STATEMENT
NET INTEREST INCOME
Net interest margins negatively affected by lower inflation in the quarter and higher levels of liquidity. Loan spreads rising.
| Quarter | Change % | |||||||||||||||||||
(Ch$ million) | 3Q11 | 2Q11 | 3Q10 | 3Q11 / 3Q10 | 3Q11 / 2Q11 | |||||||||||||||
| Interest income | 420,729 | 472,132 | 355,445 | 18.4 | % | (10.9 | )% | |||||||||||||
| Interest expense | (188,672 | ) | (224,718 | ) | (119,771 | ) | 57.5 | % | (16.0 | )% | ||||||||||
| Net interest income | 232,057 | 247,414 | 235,674 | (1.5 | )% | (6.2 | )% | |||||||||||||
| Average interest-earning assets | 20,068,322 | 19,099,828 | 16,463,951 | 21.9 | % | 5.1 | % | |||||||||||||
| Average loans | 17,460,992 | 17,146,712 | 14,874,816 | 17.4 | % | 1.8 | % | |||||||||||||
Interest earning asset yield1 | 8.4 | % | 9.9 | % | 8.6 | % | ||||||||||||||
Cost of funds2 | 4.1 | % | 5.2 | % | 2.8 | % | ||||||||||||||
Net interest margin (NIM)3 | 4.6 | % | 5.2 | % | 5.7 | % | ||||||||||||||
| Avg. equity + non-interest bearing demand deposits / Avg. interest earning assets | 31.3 | % | 33.6 | % | 34.7 | % | ||||||||||||||
Quarterly inflation rate5 | 0.56 | % | 1.44 | % | 0.65 | % | ||||||||||||||
| Central Bank reference rate | 5.25 | % | 5.25 | % | 2.50 | % | ||||||||||||||
| Avg. 10 year Central Bank yield (real) | 2.63 | % | 2.90 | % | 2.82 | % | ||||||||||||||
1. Interest income divided by interest earning assets.
2. Interest expense divided by interest bearing liabilities + demand deposits.
3. Net interest income divided by average interest earning assets annualized.
4. Net interest income net of provision expenses divided by interest earning assets.
5. Inflation measured as the variation of the Unidad de Fomento in the quarter.
Net interest income decreased 6.2% QoQ and 1.5% YoY. The Net interest margin (NIM) in 3Q11 reached 4.6% compared to 5.2% in 2Q11. Compared to 3Q10, the decline in net interest income and NIM was mainly due to higher short-term interest rates. The Central Bank has increased short-term interest rates by 300 basis points to 5.25% in the last twelve months. The Bank’s liabilities have a shorter duration than assets and, therefore, re-price more quickly in a rising interest rate environment. This has increased funding costs as reflected in the 57.5% YoY rise in interest expense in the quarter. Interest income on the other hand has increased 18.4% slightly above the 17.4% YoY increase in average loans. To offset this, the Bank focused on increasing core deposit base. We have currently opened a gap of 20 basis points in average cost of funds compared to the rest of the Chilean banking system.
Compared to 2Q11, the decrease in the Bank’s net interest income and NIM was mainly due to: (i) the lower QoQ inflation rates, which negatively affected margins, as the Bank has more assets than liabilities linked to inflation. Inflation in the quarter descended from 1.44% in 2Q11 to 0.56% in 3Q11. For every 100 bp decline in inflation, net interest income falls by approximately Ch$25 billion. This more than offset in the quarter rising loan spreads, which are gradually incorporating the higher interest rate environment. (ii) The increase in the Bank’s surplus liquidity has also temporarily reduced the Bank’s net interest margin. The Bank deposit base has increased 24.6% YoY and 4.4% QoQ compared to a 17.4% YoY and 1.8% QoQ increase in average loans.
Investor Relations Department
Bandera 140 19th Floor, Santiago, Chile, Tel: 562-320-8284, fax: 562-671-6554,
email: rmorenoh@santander.cl
9
This additional liquidity has been temporarily invested in sovereign Chilean risk. The Bank’s surplus liquidity, defined as financial investments minus non-structural liabilities, averaged US$3.0 billion in the quarter.
Surplus liquidity (US$ million)

Surplus liquidity: Financial investments minus non-structural liabilities
The negative effects on margins were partially offset by rising loan spreads (excluding the impacts of mismatches in inflation indexed assets and liabilities). Loan spreads in the quarter began to rise as the Bank implemented a stricter pricing policy in light of a potential deterioration of economic conditions. This should also help to sustain or improve margins in coming quarters.
Loan spreads*, %
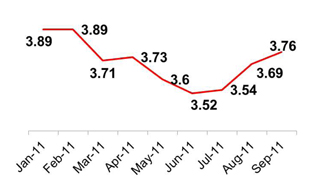
Spread = Loan yield minus cost of funds and excluding impacts of inflation indexed asset and liability mismatches. Excludes corporate banking
Investor Relations Department
Bandera 140 19th Floor, Santiago, Chile, Tel: 562-320-8284, fax: 562-671-6554,
email: rmorenoh@santander.cl
10
PROVISION FOR LOAN LOSSES
Risk index stable despite higher provisions. Provision expense in 3Q11 affected by various one-time expenses
| Quarter | Change % | |||||||||||||||||||
| (Ch$ million) | 3Q11 | 2Q11 | 3Q10 | 3Q11 / 3Q10 | 3Q11 / 2Q11 | |||||||||||||||
| Gross provisions | (18,628 | ) | 1,040 | (9,974 | ) | 86.8 | % | (1891.2 | )% | |||||||||||
| Charge-offs | (77,466 | ) | (62,577 | ) | (49,568 | ) | 56.3 | % | 23.8 | % | ||||||||||
| Gross provisions and charge-offs | (96,094 | ) | (61,537 | ) | (59,542 | ) | 61.4 | % | 56.2 | % | ||||||||||
| Loan loss recoveries | 5,722 | 4,663 | 8,017 | (28.6 | )% | 22.7 | % | |||||||||||||
Net provisions for loan losses1 | (90,372 | ) | (56,874 | ) | (51,525 | ) | 75.4 | % | 58.9 | % | ||||||||||
Total loans2 | 17,680,355 | 17,422,041 | 15,232,019 | 16.1 | % | 1.5 | % | |||||||||||||
Loan loss allowances1 | 520,565 | 505,887 | 428,833 | 21.4 | % | 2.9 | % | |||||||||||||
Non-performing loans3 (NPLs) | 496,786 | 452,150 | 407,831 | 21.8 | % | 9.9 | % | |||||||||||||
Risk Index4 | 2.94 | % | 2.90 | % | 2.82 | % | ||||||||||||||
| NPL / Total loans | 2.81 | % | 2.60 | % | 2.68 | % | ||||||||||||||
Coverage ratio of NPLs5 | 104.8 | % | 111.9 | % | 105.1 | % | ||||||||||||||
| 1. | The Bank reclassified Ch$ 31,162 million in provision reversals for off balance sheet lines of credit recognized in 3Q10 as Other operating income to Provisions for loan losses as required by the SBIF. |
| 2. | Excludes interbank loans. |
| 3. | NPLs: Non-performing loans; full balance of loans with one installment 90 days or more overdue. |
| 4. | Risk Index: Loan loss allowances / Total loans; measures the percentage of loans the banks must provision for given their internal models and the Superintendency of Banks guidelines. |
| 5. | Loan loss allowances / NPLs. |
Provision for loan losses in the quarter increased 58.9% QoQ and 75.4% YoY. On a year-to date basis net provision expense has increased 7.6% compared to a 16.1% rise in loan growth. The QoQ increase was mainly due to:
| i. | Strengthening of the residential mortgage provisioning model. As announced in our 2Q11 earnings report, the Bank improved its provisioning model for residential mortgage lending. This change was done in line with our strategic objective of accompanying our loan growth in retail lending with a proactive stance regarding credit risk. This signified a one-time provision expense of approximately Ch$10,000 million in 3Q11. The Bank migrated to a model with more parameters to determine the risk level of a client with a mortgage loan. Previously, the main factor for determining the reserve level was non-performance. For more details on the new model, see Annex 1. |
| ii. | Higher provisions in the middle-market. In 3Q11, the bank set aside Ch$4,000 million in provisions for two deteriorated loan positions in the middle market. We do not expect further provisions for these cases in the future. |
| iii. | Provisions related to La Polar. The Bank set aside a further Ch$600 million in provisions for this loan position in 3Q11. |
| iv. | Translation loss of provisions in US$. In the quarter, the Chilean peso depreciated 9%. As some large commercial loan positions are denominated in US$ and, since the Bank must set aside minimum provisions for all large loans analyzed on an individual basis, this resulted in Ch$4,600 million in higher provision directly related to the depreciation of the exchange rate. |
Investor Relations Department
Bandera 140 19th Floor, Santiago, Chile, Tel: 562-320-8284, fax: 562-671-6554,
email: rmorenoh@santander.cl
11
Excluding these one-time items, the adjusted provision expenses increased 38.1% QoQ and 25.1% YoY in 3Q11. This rise was mainly due to one-time provisions expenses, the expansion of our lending volumes, especially consumer lending and more prudent credit risk policies implemented in light of a possible deterioration of the macro environment. This included restricting renegotiations and, therefore, increasing charge-offs. This also resulted in a temporary rise in NPLs, but did not affect the Bank’s risk index. The Risk Index, which measures the percentage of loans the banks must provision for given their internal models and the Superintendency of Banks guidelines, remained stable QoQ at 2.94%. We are required to have 100% coverage at all times of its Risk Index. The NPL ratio as of September 2011 reached 2.81%. The coverage ratio of total NPLs (loan loss allowances over non-performing loans) reached 104.8% as of September 2011.
Risk Index vs NPLs, %
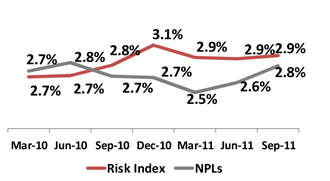
NPLs: Non-performing loans; full balance of loans with one installment 90 days or more overdue.
Risk Index: Loan loss allowances / Total loans; measures the percentage of loans the banks must provision for given their internal models and the Superintendency of Banks guidelines.
NET FEE INCOME
Market conditions and the temporary slowdown in loan originations affected fee income
| Fee Income | Quarter | Change % | ||||||||||||||||||
| (Ch$ million) | 3Q11 | 2Q11 | 3Q10 | 3Q11 / 3Q10 | 3Q11 / 2Q11 | |||||||||||||||
| Collection fees | 14,684 | 16,215 | 15,324 | (4.2 | )% | (9.4 | )% | |||||||||||||
| Credit, debit & ATM card fees | 14,383 | 16,079 | 13,518 | 6.4 | % | (10.5 | )% | |||||||||||||
| Checking accounts & lines of credit | 10,020 | 10,025 | 10,604 | (5.5 | )% | (0.0 | )% | |||||||||||||
| Asset management | 8,796 | 10,179 | 10,063 | (12.6 | )% | (13.6 | )% | |||||||||||||
| Insurance brokerage | 7,955 | 9,574 | 8,683 | (8.4 | )% | (16.9 | )% | |||||||||||||
| Guarantees, pledges and other contingent operations | 6,335 | 5,697 | 5,568 | 13.8 | % | 11.2 | % | |||||||||||||
| Fees from brokerage and custody of securities | 2,469 | 2,592 | 2,399 | 2.9 | % | (4.7 | )% | |||||||||||||
| Other Fees | 1,349 | 1,689 | 277 | 388.8 | % | 43,344.9 | % | |||||||||||||
| Total fees | 65,991 | 72,050 | 66,436 | (0.7 | )% | (8.4 | )% | |||||||||||||
Net fee income was down 8.4% QoQ and 0.7% YoY in 3Q11. The main reason for this decline was the temporary slowdown in loan origination, which had a negative impact on loan related insurance premiums. At the same time, the weaker markets negatively affected our mutual fund fees and fees from securities brokerage. Credit card fees were down due to a seasonal rise in credit card expenses paid to the credit card processor. Gross fees from credit cards were up 3.0% QoQ in line with the growth of this product.
Investor Relations Department
Bandera 140 19th Floor, Santiago, Chile, Tel: 562-320-8284, fax: 562-671-6554,
email: rmorenoh@santander.cl
12
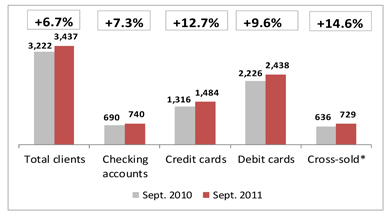
The Bank’s client base, especially cross-sold clients continues to grow at a solid pace. The amount of cross-sold clients is growing at double the pace of our total client base. Credit cards continue to be the fastest growing product, the number of which has increased 12.7% YoY.
Evolution of client base
NET RESULTS FROM FINANCIAL TRANSACTIONS
Positive results from client treasury services
| Results from Financial Transactions* | Quarter | Change % | ||||||||||||||||||
| (Ch$ million) | 3Q11 | 2Q11 | 3Q10 | 3Q11 / 3Q10 | 3Q11 / 2Q11 | |||||||||||||||
| Net income from financial operations | 102,133 | 2,027 | (45,068 | ) | — | % | 4,938.6 | % | ||||||||||||
| Foreign exchange profit (loss), net | (79,132 | ) | 27,049 | 66,781 | — | % | — | % | ||||||||||||
| Net results from financial transactions | 23,001 | 29,076 | 21,713 | 5.9 | % | (20.9 | )% | |||||||||||||
| * | These results mainly include the mark-to-market of the Available for sale investment portfolio, realized and unrealized gains of Financial investments held for trading, the interest revenue generated by the Held for trading portfolio, gains or losses from the sale of charged-off loans and the mark-to-market of derivatives. The results recorded as Foreign exchange profits (loss), net mainly includes the translation gains or losses of assets and a liability denominated in foreign currency. |
Net results from financial transactions, which include the sum of the net income from financial operations and net foreign exchange profits, totaled a gain of Ch$23,001 million in 3Q11, a decrease of 20.9% QoQ and an increase of 5.9% YoY. In order to comprehend more clearly these line items, we present them by business area in the table below.
| Results from Financial Transactions | Quarter | Change % | ||||||||||||||||||
| (Ch$ million) | 3Q11 | 2Q11 | 3Q10 | 3Q11 / 3Q10 | 3Q11 / 2Q11 | |||||||||||||||
Santander Global Connect1 | 16,259 | 15,045 | 11,628 | 39.8 | % | 8.1 | % | |||||||||||||
| Market-making | 4,958 | 6,012 | 8,451 | (41.3 | )% | (17.5 | )% | |||||||||||||
| Client treasury services | 21,217 | 21,058 | 20,079 | 5.7 | % | 0.8 | % | |||||||||||||
| Non-client treasury services | 1,784 | 8,018 | 1,635 | 9.2 | % | (77.7 | )% | |||||||||||||
| Net results from financial transactions | 23,001 | 29,076 | 21,713 | 5.9 | % | (20.9 | )% | |||||||||||||
| 1. | Santander Global Connect is the Bank’s commercial platform for selling treasury products to our clients. |
Investor Relations Department
Bandera 140 19th Floor, Santiago, Chile, Tel: 562-320-8284, fax: 562-671-6554,
email: rmorenoh@santander.cl
13
The quarterly results were mainly driven by Client treasury services, which totaled Ch$21,217 million in 3Q11 – more than 90% of this line item – that increased 0.8% QoQ and 5.7% YoY. The higher market volatility, especially in the foreign exchange market led to a greater number of clients to hedge exposures resulting in a high gain from Santander Global Connect.
Non-client treasury services fell in the quarter as the Bank maintained high levels of liquidity and avoided taking any major prop-trading positions or gaps, lowering trading results.
OPERATING EXPENSES AND EFFICIENCY
Operating expenses flat QoQ
| Operating Expenses | Quarter | Change % | ||||||||||||||||||
| (Ch$ million) | 3Q11 | 2Q11 | 3Q10 | 3Q11 / 3Q10 | 3Q11 / 2Q11 | |||||||||||||||
| Personnel salaries and expenses | (73,884 | ) | (70,655 | ) | (63,330 | ) | 16.7 | % | 4.6 | % | ||||||||||
| Administrative expenses | (41,041 | ) | (41,535 | ) | (37,983 | ) | 8.1 | % | (1.2 | )% | ||||||||||
| Depreciation and amortization | (13,354 | ) | (12,944 | ) | (11,294 | ) | 18.2 | % | 3.2 | % | ||||||||||
| Impairment | (77 | ) | (27 | ) | (963 | ) | (92.0 | )% | 185.2 | % | ||||||||||
| Operating expenses | (128,356 | ) | (125,161 | ) | (113,570 | ) | 13.0 | % | 2.6 | % | ||||||||||
Efficiency ratio1 | 41.3 | % | 36.5 | % | 37.2 | % | ||||||||||||||
| 1. | Operating expenses / Operating income. Operating income = Net interest income + Net fee income+ Net results from Financial transactions + Other operating income and expenses. |
Operating expenses in 3Q11 increased 2.6% QoQ and 13.0% YoY. The efficiency ratio reached 41.3% in 3Q11. The 4.6% QoQ increase in personnel expenses was mainly due to the increase in headcount and a rise in severance payments. Headcount increased 5.9% YoY and 1.6% QoQ. Of the 190 persons hired in 3Q11, 160 were collection agents. As of June 30, 2011 headcount totaled 11,706 employees.
Administrative expenses fell 1.2% QoQ as the Bank commenced to implement a stricter stance regarding costs. At the same time, the Bank continues with its projects of in investing in technology and alternative distribution channels to enhance productivity in future periods. The Bank is currently investment in a new Client Relationship Management system and other IT projects. These projects should drive stronger revenue growth while increasing productivity. The Bank also opened 7 branches in the quarter, 4 of which were Banca Prime branches for upper income individuals.
Investor Relations Department
Bandera 140 19th Floor, Santiago, Chile, Tel: 562-320-8284, fax: 562-671-6554,
email: rmorenoh@santander.cl
14
OTHER INCOME AND EXPENSES
| Quarter | Change % | |||||||||||||||||||
| (Ch$ million) | 3Q11 | 2Q11 | 3Q10 | 3Q11 / 3Q10 | 3Q11 / 2Q11 | |||||||||||||||
| Other operating income | 2,194 | 3,309 | 2,656 | (17.4 | )% | (33.7 | )% | |||||||||||||
| Other operating expenses | (12,156 | ) | (8,800 | ) | (21,333 | ) | (43.0 | )% | 38.1 | % | ||||||||||
| Other operating income, net | (9,962 | ) | (5,491 | ) | (18,677 | ) | (46.7 | )% | 81.4 | % | ||||||||||
| Income from investments in other companies | 546 | 552 | 832 | (34.4 | )% | (1.1 | )% | |||||||||||||
| Income tax expense | (16,629 | ) | (19,416 | ) | (14,109 | ) | 17.9 | % | (14.4 | )% | ||||||||||
| Income tax rate | 17.9 | % | 12.0 | % | 10.0 | % | ||||||||||||||
Other operating income, net, totaled Ch$-9,962 million in 3Q11. The lower loss compared to 3Q10 was mainly due to lower charge-off of repossessed assets. Compared to 2Q11 the higher loss from other operating income, net was mainly due to an increase in charge-off of fixed assets mainly related to vandalized ATMs.
The 14.4% QoQ decrease in income tax expense was mainly due to lower net income before taxes. In addition, in 2Q11, the Bank recognized a one-time tax benefit from real estate taxes (contribuciones) paid over assets it has leased to clients. Compared to 3Q10, the rise in the effective tax rate was due the rise of the statutory tax rate to 20% from 17% last year. In 3Q10, the Bank’s effective income tax rate also benefitted from the application of the new corporate tax rates over deferred taxes, which resulted in a higher net asset position in differed taxes and therefore a lower effective tax rate in said quarter.
In 2012, the statutory corporate tax rate should decline to 18.5% and 17% in 2013.
Investor Relations Department
Bandera 140 19th Floor, Santiago, Chile, Tel: 562-320-8284, fax: 562-671-6554,
email: rmorenoh@santander.cl
15
SECTION 4: CREDIT RISK RATINGS
International ratings
The Bank has credit ratings from three leading international agencies. In the quarter, Fitch lowered the Bank ratings from AA- to A+. Standard and Poor’s modified its outlook to negative and there was no change regarding our ratings from Moody’s. These rating changes were driven by a reduction in ratings of our controlling shareholder.
| Moody’s (Outlook stable) | Rating | |
| Foreign currency bank deposits | Aa3 | |
| Senior bonds | Aa3 | |
| Subordinated debt | A1 | |
| Bank Deposits in Local Currency | Aa3 | |
| Bank financial strength | B- | |
| Short-term deposits | P-1 |
| Standard and Poor’s (Outlook negative) | Rating | |
| Long-term Foreign Issuer Credit | A+ | |
| Long-term Local Issuer Credit | A+ | |
| Short-term Foreign Issuer Credit | A-1 | |
| Short-term Local Issuer Credit | A-1 |
| Fitch (Outlook negative) | Rating | |
| Foreign Currency Long-term Debt | A+ | |
| Local Currency Long-term Debt | A+ | |
| Foreign Currency Short-term Debt | F1 | |
| Local Currency Short-term Debt | F1 | |
| Viability rating | a+ | |
| Individual rating | B |
Local ratings:
Our local ratings, the highest in Chile, are the following:
| Local ratings | Fitch Ratings | Feller Rate | ||
| Shares | Level 2 | 1CN1 | ||
| Short-term deposits | N1+ | Level 1+ | ||
| Long-term deposits | AAA | AAA | ||
| Mortgage finance bonds | AAA | AAA | ||
| Senior bonds | AAA | AAA | ||
| Subordinated bonds | AA | AA+ | ||
| Outlook | Stable | Stable |
Investor Relations Department
Bandera 140 19th Floor, Santiago, Chile, Tel: 562-320-8284, fax: 562-671-6554,
email: rmorenoh@santander.cl
16
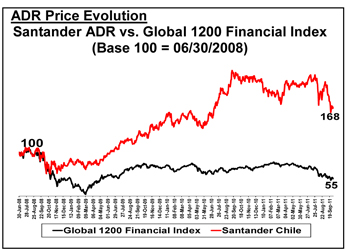
SECTION 5: SHARE PERFORMANCE
As of September 2011
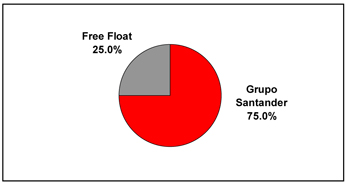
Ownership Structure:
ADR price (US$) 9M11 | ||
| 09/30/11: | 73.48 | |
| Maximum (1H11): | 96.44 | |
| Minimum (1H11): | 70.64 |
Market Capitalization: | US$13,329 million | |
| P/E 12 month trailing*: | 16.5 | |
| P/BV (06/30/11)**: | 3.66 | |
| Dividend yield***: | 3.7% |
| * | Price as of Sept. 30, 2011 / 12mth. earnings |
| ** | Price as of Sept. 30, 2011 / Book value as of 09/30/11 |
| *** | Based on closing price on record date of last dividend payment. |
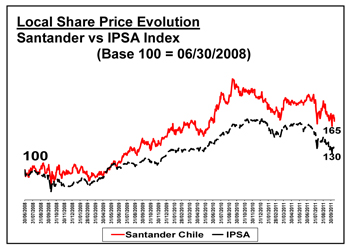
| Local share price (Ch$) 9M11 | ||
| 09/30/11: | 37.46 | |
| Maximum (9M11): | 43.64 | |
| Minimum (9M11): | 35.63 | |
Dividends:
| Year paid | Ch$/share | % of previous year earnings | ||||||
| 2007: | 0.99 | 65 | % | |||||
| 2008: | 1.06 | 65 | % | |||||
| 2009: | 1.13 | 65 | % | |||||
| 2010: | 1.37 | 60 | % | |||||
| 2011: | 1.52 | 60 | % | |||||
Investor Relations Department
Bandera 140 19th Floor, Santiago, Chile, Tel: 562-320-8284, fax: 562-671-6554,
email: rmorenoh@santander.cl
17
ANNEX 1: NEW PROVISIONING MODEL FOR RESIDENTIAL MORTGAGE LOANS
Prior to June 2011, residential mortgage loans were assigned an allowance level based on credit risk profiles which were determined utilizing a statistical model that considered a borrower’s credit history, including any defaults on obligations to other creditors, as well as the overdue periods on the loans borrowed from us. Once the rating of the client was determined, the allowance for a mortgage loan was calculated using a risk category, which was directly related to days overdue. The following table sets forth the allowance to loan ratios previously used by the Bank. The ratios represent the percentage of required allowance amount to the aggregate amount of the principal and accrued but unpaid interest on the loan.
Previous model Residential mortgage loans | Overdue days | ||||||||||||||||||||||||||||
1-30 | 31-60 | 61-120 | 121-180 | 181-360 | 361- 720 | >720 | |||||||||||||||||||||||
| Mortgage | Profile 1 | 0.3 | % | 0.5 | % | 1.2 | % | 2.4 | % | 6.8 | % | 14.1 | % | 28.3 | % | ||||||||||||||
| Profile 2 | 1.5 | % | 1.6 | % | 2.5 | % | 4.4 | % | 6.8 | % | 14.1 | % | 28.3 | % | |||||||||||||||
As of June 2011, residential mortgage loans are assigned an allowance level based on credit risk profiles, which were determined utilizing a statistical model that considers: (i) a borrower’s credit history, (ii) if a client is a new client or an existing client, (iii) if the client is a Bank client or a Banefe client and (iv) if this client has been renegotiated in the system.
As of June 2011, the model for determining provisions for residential mortgage loans is as follows. The ratios represent the percentage of required allowance amount to the aggregate amount of the principal and accrued but unpaid interest on the loan.
New model Residential mortgage loans | Performing | Overdue days | |||||||||||||||||||
1-29 | 30-59 | 60-89 | >90 days | ||||||||||||||||||
| Mortgage (Bank client) | New client | 0.20 | % | 2.7 | % | 3.6 | % | 4.63 | % | 11.0 | % | ||||||||||
| Existing client | 0.29 | % | 1.49 | % | 2.97 | % | 3.7 | % | 11.0 | % | |||||||||||
| Renegotiated client | 1.75 | % | 1.75 | % | 1.75 | % | 1.75 | % | 11.0 | % | |||||||||||
| Mortgage (Banefe client) | New or existing client | 0.35 | % | 2.19 | % | 3.64 | % | 4.72 | % | 11.0 | % | ||||||||||
| Renegotiated client | 1.75 | % | 1.75 | % | 1.75 | % | 1.75 | % | 11.0 | % | |||||||||||
Investor Relations Department
Bandera 140 19th Floor, Santiago, Chile, Tel: 562-320-8284, fax: 562-671-6554,
email: rmorenoh@santander.cl
18
ANNEX 2: BALANCE SHEET
| Sep-11 | Sep-11 | Dec-10 | Sept. 11 / Dec. 10 | |||||||||||||
| US$ths | Ch$ million | % Chg. | ||||||||||||||
| Assets | ||||||||||||||||
| Cash and balances from Central Bank | 3,488,473 | 1,812,785 | 1,762,198 | 2.9 | % | |||||||||||
| Funds to be cleared | 1,571,444 | 816,601 | 374,368 | 118.1 | % | |||||||||||
| Financial assets held for trading | 969,524 | 503,813 | 379,670 | 32.7 | % | |||||||||||
| Investment collateral under agreements to repurchase | 23,395 | 12,157 | 170,985 | (92.9 | )% | |||||||||||
| Derivatives | 3,871,038 | 2,011,585 | 1,624,378 | 23.8 | % | |||||||||||
| Interbank loans | 169,141 | 87,894 | 69,672 | 26.2 | % | |||||||||||
| Loans, net of loan loss allowances | 33,021,822 | 17,159,790 | 15,175,975 | 13.1 | % | |||||||||||
| Available-for-sale financial assets | 4,050,118 | 2,104,644 | 1,473,980 | 42.8 | % | |||||||||||
| Held-to-maturity investments | 0 | 0 | 0 | — | % | |||||||||||
| Investments in other companies | 15,841 | 8,232 | 7,275 | 13.2 | % | |||||||||||
| Intangible assets | 148,617 | 77,229 | 77,990 | (1.0 | )% | |||||||||||
| Fixed assets | 294,652 | 153,116 | 154,985 | (1.2 | )% | |||||||||||
| Current tax assets | 53,394 | 27,746 | 12,499 | 122.0 | % | |||||||||||
| Deferred tax assets | 276,028 | 143,438 | 117,964 | 21.6 | % | |||||||||||
| Other assets | 1,354,999 | 704,125 | 640,937 | 9.9 | % | |||||||||||
| Total Assets | 49,308,486 | 25,623,155 | 22,042,876 | 16.2 | % | |||||||||||
| Liabilities and Equity | ||||||||||||||||
| Demand deposits | 8,653,434 | 4,496,757 | 4,236,434 | 6.1 | % | |||||||||||
| Funds to be cleared | 896,879 | 466,063 | 300,125 | 55.3 | % | |||||||||||
| Investments sold under agreements to repurchase | 436,915 | 227,043 | 294,725 | (23.0 | )% | |||||||||||
| Time deposits and savings accounts | 18,079,950 | 9,395,246 | 7,258,757 | 29.4 | % | |||||||||||
| Derivatives | 3,127,632 | 1,625,274 | 1,643,979 | (1.1 | )% | |||||||||||
| Deposits from credit institutions | 3,896,961 | 2,025,056 | 1,584,057 | 27.8 | % | |||||||||||
| Marketable debt securities | 8,684,511 | 4,512,906 | 4,190,888 | 7.7 | % | |||||||||||
| Other obligations | 321,357 | 166,993 | 166,289 | 0.4 | % | |||||||||||
| Current tax liabilities | 4,426 | 2,300 | 1,293 | 77.9 | % | |||||||||||
| Deferred tax liability | 22,284 | 11,580 | 5,441 | 112.8 | % | |||||||||||
| Provisions | 329,299 | 171,120 | 235,953 | (27.5 | )% | |||||||||||
| Other liabilities | 1,083,472 | 563,026 | 261,328 | 115.4 | % | |||||||||||
| Total Liabilities | 45,537,119 | 23,663,364 | 20,179,269 | 17.3 | % | |||||||||||
| Equity | ||||||||||||||||
| Capital | 1,715,199 | 891,303 | 891,303 | 0.0 | % | |||||||||||
| Reserves | 99,178 | 51,538 | 51,539 | (0.0 | )% | |||||||||||
| Unrealized gain (loss) Available-for-sale financial assets | 1,143 | 594 | (5,180 | ) | — | % | ||||||||||
| Retained Earnings: | 1,893,703 | 984,063 | 894,136 | 10.1 | % | |||||||||||
| Retained earnings previous periods | 1,445,182 | 750,989 | 560,128 | 34.1 | % | |||||||||||
| Net income | 640,745 | 332,963 | 477,155 | (30.2 | )% | |||||||||||
| Provision for mandatory dividend | (192,224 | ) | (99,889 | ) | (143,147 | ) | (30.2 | )% | ||||||||
| Total Shareholders' Equity | 3,709,224 | 1,927,498 | 1,831,798 | 5.2 | % | |||||||||||
| Minority Interest | 62,144 | 32,293 | 31,809 | 1.5 | % | |||||||||||
| Total Equity | 3,771,367 | 1,959,791 | 1,863,607 | 5.2 | % | |||||||||||
| Total Liabilities and Equity | 49,308,486 | 25,623,155 | 22,042,876 | 16.2 | % | |||||||||||
Figures in US$ have been translated at the exchange rate of Ch$519.65
Investor Relations Department
Bandera 140 19th Floor, Santiago, Chile, Tel: 562-320-8284, fax: 562-671-6554,
email: rmorenoh@santander.cl
19
ANNEX 3: YEAR-TO-DATE INCOME STATEMENTS
| YTD Income Statement Unaudited | Sep-11 | Sep-11 | Sep-10 | Sept. 11 / Sept. 10 | ||||||||||||
| US$ths. | Ch$ million | % Chg. | ||||||||||||||
| Interest income | 2,446,412 | 1,271,278 | 1,045,602 | 21.6 | % | |||||||||||
| Interest expense | (1,083,660 | ) | (563,124 | ) | (337,748 | ) | 66.7 | % | ||||||||
| Net interest income | 1,362,752 | 708,154 | 707,854 | 0.0 | % | |||||||||||
| Fee and commission income | 522,546 | 271,541 | 247,346 | 9.8 | % | |||||||||||
| Fee and commission expense | (119,525 | ) | (62,111 | ) | (53,401 | ) | 16.3 | % | ||||||||
| Net fee and commission income | 403,021 | 209,430 | 193,945 | 8.0 | % | |||||||||||
| Net income from financial operations | 295,458 | 153,535 | 51,946 | 195.6 | % | |||||||||||
| Foreign exchange profit (loss), net | (144,838 | ) | (75,265 | ) | 24,381 | — | % | |||||||||
| Total financial transactions, net | 150,621 | 78,270 | 76,327 | 2.5 | % | |||||||||||
| Other operating income | 15,497 | 8,053 | 27,554 | (70.8 | )% | |||||||||||
| Net operating profit before loan losses | 1,931,891 | 1,003,907 | 1,005,680 | (0.2 | )% | |||||||||||
| Provision for loan losses | (377,023 | ) | (195,920 | ) | (182,120 | ) | 7.6 | % | ||||||||
| Net operating profit | 1,554,868 | 807,987 | 823,560 | (1.9 | )% | |||||||||||
| Personnel salaries and expenses | (399,076 | ) | (207,380 | ) | (184,921 | ) | 12.1 | % | ||||||||
| Administrative expenses | (234,924 | ) | (122,078 | ) | (109,743 | ) | 11.2 | % | ||||||||
| Depreciation and amortization | (76,278 | ) | (39,638 | ) | (36,227 | ) | 9.4 | % | ||||||||
| Impairment | (210 | ) | (109 | ) | (4,665 | ) | (97.7 | )% | ||||||||
| Operating expenses | (710,488 | ) | (369,205 | ) | (335,556 | ) | 10.0 | % | ||||||||
| Other operating expenses | (79,994 | ) | (41,569 | ) | (45,963 | ) | (9.6 | )% | ||||||||
| Total operating expenses | (790,482 | ) | (410,774 | ) | (381,519 | ) | 7.7 | % | ||||||||
| Operating income | 764,386 | 397,213 | 442,041 | (10.1 | )% | |||||||||||
| Income from investments in other companies | 3,219 | 1,673 | 1,175 | 42.4 | % | |||||||||||
| Income before taxes | 767,605 | 398,886 | 443,216 | (10.0 | )% | |||||||||||
| Income tax expense | (120,362 | ) | (62,546 | ) | (60,032 | ) | 4.2 | % | ||||||||
| Net income from ordinary activities | 647,243 | 336,340 | 383,184 | (12.2 | )% | |||||||||||
| Net income discontinued operations | 0 | 0 | 0 | — | % | |||||||||||
| Net income attributable to: | ||||||||||||||||
| Minority interest | 6,499 | 3,377 | (99 | ) | — | % | ||||||||||
| Net income attributable to shareholders | 640,745 | 332,963 | 383,283 | (13.1 | )% | |||||||||||
Figures in US$ have been translated at the exchange rate of Ch$519.65
Investor Relations Department
Bandera 140 19th Floor, Santiago, Chile, Tel: 562-320-8284, fax: 562-671-6554,
email: rmorenoh@santander.cl
20
ANNEX 4: QUARTERLY INCOME STATEMENTS
| Unaudited Quarterly Income Statement | 3Q11 | 3Q11 | 2Q11 | 3Q10 | 3Q11 / 3Q10 | 3Q11 / 2Q11 | ||||||||||||||||||
| US$ths. | Ch$mn | % Chg. | ||||||||||||||||||||||
| Interest income | 809,639 | 420,729 | 472,132 | 355,445 | 18.4 | % | (10.9 | )% | ||||||||||||||||
| Interest expense | (363,075 | ) | (188,672 | ) | (224,718 | ) | (119,771 | ) | 57.5 | % | (16.0 | )% | ||||||||||||
| Net interest income | 446,564 | 232,057 | 247,414 | 235,674 | (1.5 | )% | (6.2 | )% | ||||||||||||||||
| Fee and commission income | 168,673 | 87,651 | 92,652 | 85,379 | 2.7 | % | (5.4 | )% | ||||||||||||||||
| Fee and commission expense | (41,682 | ) | (21,660 | ) | (20,602 | ) | (18,943 | ) | 14.3 | % | 5.1 | % | ||||||||||||
| Net fee and commission income | 126,991 | 65,991 | 72,050 | 66,436 | (0.7 | )% | (8.4 | )% | ||||||||||||||||
| Net income from financial operations | 196,542 | 102,133 | 2,027 | (45,068 | ) | — | % | 4938.6 | % | |||||||||||||||
| Foreign exchange profit (loss), net | (152,279 | ) | (79,132 | ) | 27,049 | 66,781 | — | % | — | % | ||||||||||||||
| Total financial transactions, net | 44,262 | 23,001 | 29,076 | 21,713 | 5.9 | % | (20.9 | )% | ||||||||||||||||
| Other operating income | 4,222 | 2,194 | 3,309 | 2,656 | (17.4 | )% | (33.7 | )% | ||||||||||||||||
| Net operating profit before loan losses | 622,040 | 323,243 | 351,849 | 326,479 | (1.0 | )% | (8.1 | )% | ||||||||||||||||
| Provision for loan losses | (173,909 | ) | (90,372 | ) | (56,874 | ) | (51,525 | ) | 75.4 | % | 58.9 | % | ||||||||||||
| Net operating profit | 448,130 | 232,871 | 294,975 | 274,954 | (15.3 | )% | (21.1 | )% | ||||||||||||||||
| Personnel salaries and expenses | (142,180 | ) | (73,884 | ) | (70,655 | ) | (63,330 | ) | 16.7 | % | 4.6 | % | ||||||||||||
| Administrative expenses | 132,041 | (41,041 | ) | (41,535 | ) | (37,983 | ) | 8.1 | % | (1.2 | )% | |||||||||||||
| Depreciation and amortization | (25,698 | ) | (13,354 | ) | (12,944 | ) | (11,294 | ) | 18.2 | % | 3.2 | % | ||||||||||||
| Impairment | (148 | ) | (77 | ) | (27 | ) | (963 | ) | (92.0 | )% | 185.2 | % | ||||||||||||
| Operating expenses | (247,005 | ) | (128,356 | ) | (125,161 | ) | (113,570 | ) | 13.0 | % | 2.6 | % | ||||||||||||
| Other operating expenses | (23,393 | ) | (12,156 | ) | (8,800 | ) | (21,333 | ) | (43.0 | )% | 38.1 | % | ||||||||||||
| Total operating expenses | (270,397 | ) | (140,512 | ) | (133,961 | ) | (134,903 | ) | 4.2 | % | 4.9 | % | ||||||||||||
| Operating income | 177,733 | 92,359 | 161,014 | 140,051 | (34.1 | )% | (42.6 | )% | ||||||||||||||||
| Income from investments in other companies | 1,051 | 546 | 552 | 832 | (34.4 | )% | (1.1 | )% | ||||||||||||||||
| Income before taxes | 178,784 | 92,905 | 161,566 | 140,883 | (34.1 | )% | (42.5 | )% | ||||||||||||||||
| Income tax expense | (32,000 | ) | (16,629 | ) | (19,416 | ) | (14,109 | ) | 17.9 | % | (14.4 | )% | ||||||||||||
| Net income from ordinary activities | 146,783 | 76,276 | 142,150 | 126,774 | (39.8 | )% | (46.3 | )% | ||||||||||||||||
| Net income discontinued operations | 0 | 0 | 0 | 0 | ||||||||||||||||||||
| Net income attributable to: | ||||||||||||||||||||||||
| Minority interest | 2,161 | 1,123 | 638 | 1,418 | -20.8 | % | 76.0 | % | ||||||||||||||||
| Net income attributable to shareholders | 144,622 | 75,153 | 141,512 | 125,356 | (40.0 | )% | (46.9 | )% | ||||||||||||||||
Figures in US$ have been translated at the exchange rate of Ch$519.65
Investor Relations Department
Bandera 140 19th Floor, Santiago, Chile, Tel: 562-320-8284, fax: 562-671-6554,
email: rmorenoh@santander.cl
21
ANNEX 5: QUARTERLY EVOLUTION OF MAIN RATIOS AND OTHER INFORMATION
| Mar-10 | Jun-10 | Sep-10 | Dec-10 | Mar-11 | Jun-11 | Sep-11 | ||||||||||||||||||||||
| (Ch$ millions) | ||||||||||||||||||||||||||||
| Loans | ||||||||||||||||||||||||||||
| Consumer loans | 2,303,983 | 2,404,128 | 2,554,884 | 2,700,791 | 2,815,118 | 2,893,038 | 2,925,659 | |||||||||||||||||||||
| Residential mortgage loans | 4,219,733 | 4,360,496 | 4,498,799 | 4,651,136 | 4,758,712 | 4,909,630 | 5,016,419 | |||||||||||||||||||||
| Commercial loans | 7,519,854 | 7,817,843 | 8,178,336 | 8,305,630 | 9,200,538 | 9,619,373 | 9,738,278 | |||||||||||||||||||||
| Total loans | 14,043,570 | 14,582,467 | 15,232,019 | 15,657,557 | 16,774,368 | 17,422,041 | 17,680,356 | |||||||||||||||||||||
| Allowance for loan losses | (375,366 | ) | (387,625 | ) | (428,833 | ) | (481,582 | ) | (489,034 | ) | (505,887 | ) | (520,565 | ) | ||||||||||||||
| Total loans, net of allowances | 13,668,204 | 14,194,842 | 14,803,186 | 15,175,975 | 16,285,334 | 16,916,154 | 17,159,791 | |||||||||||||||||||||
| Loans by segment | ||||||||||||||||||||||||||||
| Individuals | 7,411,686 | 7,715,031 | 8,035,617 | 8,407,416 | 8,652,205 | 9,026,697 | 9,215,686 | |||||||||||||||||||||
| SMEs | 2,143,885 | 2,210,170 | 2,301,536 | 2,375,192 | 2,467,951 | 2,455,349 | 2,524,836 | |||||||||||||||||||||
| Total retail lending | 9,555,571 | 9,925,201 | 10,337,153 | 10,782,608 | 11,120,156 | 11,482,046 | 11,740,522 | |||||||||||||||||||||
| Institutional lending | 313,079 | 330,980 | 340,274 | 331,153 | 352,593 | 372,939 | 351,686 | |||||||||||||||||||||
| Middle-Market & Real estate | 2,907,944 | 2,983,741 | 3,160,681 | 3,288,107 | 3,562,558 | 3,625,439 | 3,731,881 | |||||||||||||||||||||
| Corporate | 1,279,965 | 1,347,855 | 1,406,210 | 1,293,321 | 1,757,732 | 1,950,992 | 1,833,084 | |||||||||||||||||||||
| Customer funds | ||||||||||||||||||||||||||||
| Demand deposits | 3,890,230 | 4,168,884 | 3,991,732 | 4,236,434 | 4,315,563 | 4,450,290 | 4,496,757 | |||||||||||||||||||||
| Time deposits | 6,818,939 | 7,193,376 | 7,155,213 | 7,258,757 | 8,408,818 | 8,856,185 | 9,395,246 | |||||||||||||||||||||
| Total deposits | 10,709,169 | 11,362,260 | 11,146,945 | 11,495,191 | 12,724,381 | 13,306,475 | 13,892,003 | |||||||||||||||||||||
| Mutual funds (Off balance sheet) | 3,635,544 | 3,510,479 | 3,305,683 | 3,188,151 | 3,142,373 | 3,136,413 | 2,852,379 | |||||||||||||||||||||
| Total customer funds | 14,344,713 | 14,872,739 | 14,452,628 | 14,683,342 | 15,866,754 | 16,442,888 | 16,744,382 | |||||||||||||||||||||
| Loans / Deposits1 | 104.3 | % | 99.8 | % | 100.9 | % | 99.8 | % | 96.9 | % | 96.8 | % | 94.8 | % | ||||||||||||||
| Average balances | ||||||||||||||||||||||||||||
| Avg. interest earning assets | 15,776,237 | 15,816,902 | 16,463,951 | 17,176,435 | 17,866,010 | 19,099,828 | 20,068,323 | |||||||||||||||||||||
| Avg. loans | 13,879,173 | 14,291,144 | 14,874,816 | 15,470,132 | 16,150,015 | 17,146,712 | 17,460,992 | |||||||||||||||||||||
| Avg. assets | 20,746,299 | 20,742,244 | 20,915,047 | 21,841,681 | 22,679,590 | 24,435,586 | 24,961,680 | |||||||||||||||||||||
| Avg. demand deposits | 3,678,104 | 4,107,978 | 4,005,565 | 4,056,105 | 4,271,464 | 4,560,188 | 4,372,511 | |||||||||||||||||||||
| Avg equity | 1,665,977 | 1,644,453 | 1,712,967 | 1,801,866 | 1,857,339 | 1,853,926 | 1,901,447 | |||||||||||||||||||||
| Avg. free funds | 5,344,081 | 5,752,431 | 5,718,532 | 5,857,971 | 6,128,803 | 6,414,114 | 6,273,958 | |||||||||||||||||||||
| Capitalization | ||||||||||||||||||||||||||||
| Risk weighted assets | 15,513,732 | 16,210,259 | 16,739,710 | 17,245,265 | 18,013,990 | 18,964,803 | 18,954,146 | |||||||||||||||||||||
| Tier I (Shareholders' equity) | 1,683,103 | 1,665,326 | 1,757,340 | 1,831,799 | 1,905,690 | 1,866,467 | 1,927,498 | |||||||||||||||||||||
| Tier II | 599,353 | 627,608 | 672,740 | 672,099 | 642,221 | 669,798 | 715,184 | |||||||||||||||||||||
| Regulatory capital | 2,282,455 | 2,292,934 | 2,430,080 | 2,503,898 | 2,547,912 | 2,536,265 | 2,642,682 | |||||||||||||||||||||
| Tier I ratio | 10.8 | % | 10.3 | % | 10.5 | % | 10.6 | % | 10.6 | % | 9.8 | % | 10.2 | % | ||||||||||||||
| BIS ratio | 14.7 | % | 14.1 | % | 14.5 | % | 14.5 | % | 14.1 | % | 13.4 | % | 13.9 | % | ||||||||||||||
| Profitability & Efficiency | ||||||||||||||||||||||||||||
| Net interest margin | 5.8 | % | 6.1 | % | 5.7 | % | 5.4 | % | 5.1 | % | 5.2 | % | 4.6 | % | ||||||||||||||
| Efficiency ratio | 32.9 | % | 34.9 | % | 37.2 | % | 35.1 | % | 37.5 | % | 36.5 | % | 41.3 | % | ||||||||||||||
| Avg. Free funds / interest earning assets | 33.9 | % | 36.4 | % | 34.7 | % | 34.1 | % | 34.3 | % | 33.6 | % | 31.3 | % | ||||||||||||||
| Return on avg. equity | 28.6 | % | 33.8 | % | 29.3 | % | 20.8 | % | 25.0 | % | 30.5 | % | 15.8 | % | ||||||||||||||
| Return on avg. assets | 2.3 | % | 2.7 | % | 2.4 | % | 1.7 | % | 2.1 | % | 2.3 | % | 1.2 | % | ||||||||||||||
Investor Relations Department
Bandera 140 19th Floor, Santiago, Chile, Tel: 562-320-8284, fax: 562-671-6554,
email: rmorenoh@santander.cl
22
2| Mar-10 | Jun-10 | Sep-10 | Dec-10 | Mar-11 | Jun-11 | Sep-11 | ||||||||||||||||||||||
| Asset quality | ||||||||||||||||||||||||||||
| Non-performing loans (NPLs)2 | 385,211 | 415,556 | 407,831 | 416,739 | 413,775 | 452,150 | 496,786 | |||||||||||||||||||||
| Past due loans3 | 197,060 | 200,524 | 207,530 | 206,601 | 216,072 | 214,483 | 223,948 | |||||||||||||||||||||
| Expected loss4 | 375,366 | 387,625 | 428,833 | 481,582 | 489,034 | 505,887 | 520,565 | |||||||||||||||||||||
| NPLs / total loans | 2.74 | % | 2.85 | % | 2.68 | % | 2.66 | % | 2.47 | % | 2.60 | % | 2.81 | % | ||||||||||||||
| PDL / total loans | 1.40 | % | 1.38 | % | 1.36 | % | 1.32 | % | 1.29 | % | 1.23 | % | 1.27 | % | ||||||||||||||
| Coverage of NPLs (Loan loss allowance / NPLs) | 97.44 | % | 93.28 | % | 105.15 | % | 115.56 | % | 118.19 | % | 111.88 | % | 104.79 | % | ||||||||||||||
| Coverage of PDLs (Loan loss allowance / PDLs) | 190.5 | % | 193.3 | % | 206.6 | % | 233.1 | % | 226.3 | % | 235.9 | % | 232.4 | % | ||||||||||||||
| Expected loss (Loan loss allowances / Loans) | 2.67 | % | 2.66 | % | 2.82 | % | 3.08 | % | 2.92 | % | 2.90 | % | 2.94 | % | ||||||||||||||
| Cost of credit (prov. expense / loans) | 2.04 | % | 1.62 | % | 1.35 | % | 2.57 | % | 1.16 | % | 1.31 | % | 2.04 | % | ||||||||||||||
| Network | ||||||||||||||||||||||||||||
| Branches | 498 | 499 | 500 | 504 | 506 | 487 | 494 | |||||||||||||||||||||
| ATMs | 1,856 | 1,871 | 1,914 | 2,018 | 2,017 | 1,946 | 1,892 | |||||||||||||||||||||
| Employees | 11,155 | 11,133 | 11,049 | 11,001 | 11,115 | 11,516 | 11,706 | |||||||||||||||||||||
| Market information (period-end) | ||||||||||||||||||||||||||||
| Net income per share (Ch$) | 0.63 | 0.74 | 0.67 | 0.50 | 0.62 | 0.75 | 0.40 | |||||||||||||||||||||
| Net income per ADR (US$) | 1.25 | 1.41 | 1.42 | 1.11 | 1.33 | 1.66 | 0.80 | |||||||||||||||||||||
| Stock price | 34.4 | 35.7 | 45.1 | 42.3 | 40.1 | 42.2 | 37.5 | |||||||||||||||||||||
| ADR price | 68.2 | 67.1 | 96.6 | 93.4 | 86.8 | 93.8 | 73.5 | |||||||||||||||||||||
| Market capitalization (US$mn) | 12,373 | 12,168 | 17,512 | 16,946 | 15,734 | 17,015 | 13,327 | |||||||||||||||||||||
| Shares outstanding | 188,446.1 | 188,446.1 | 188,446.1 | 188,446.1 | 188,446.1 | 188,446.1 | 188,446.1 | |||||||||||||||||||||
| ADRs (1 ADR = 1,039 shares) | 181.4 | 181.4 | 181.4 | 181.4 | 181.4 | 181.4 | 181.4 | |||||||||||||||||||||
| Other Data | ||||||||||||||||||||||||||||
| Quarterly inflation rate5 | 0.27 | % | 0.97 | % | 0.65 | % | 0.54 | % | 0.57 | % | 1.44 | % | 0.56 | % | ||||||||||||||
| Central Bank monetary policy reference rate (nominal) | 0.50 | % | 1.00 | % | 2.50 | % | 3.25 | % | 4.00 | % | 5.25 | % | 5.25 | % | ||||||||||||||
| Avg. 10 year Central Bank yield (real) | 3.14 | % | 3.04 | % | 2.82 | % | 3.01 | % | 3.09 | % | 2.90 | % | 2.63 | % | ||||||||||||||
| Avg. 10 year Central Bank yield (nominal) | 6.41 | % | 6.42 | % | 6.07 | % | 6.12 | % | 6.67 | % | 6.31 | % | 5.64 | % | ||||||||||||||
| Observed Exchange rate (Ch$/US$) (period-end) | 526.29 | 543.09 | 485.23 | 468.37 | 482.08 | 471.13 | 515.14 | |||||||||||||||||||||
1 Ratio = Loans - marketable securities / Time deposits + demand deposits
2 Capital + future interest of all loans with one installment 90 days or more overdue.
3 Total installments plus lines of credit more than 90 days overdue
4 Based on internal credit models and SBIF guidelines. Banks must have a 100% coverage of expected loss
5 Calculated using the variation of the Unidad de Fomento (UF) in the period
Investor Relations Department
Bandera 140 19th Floor, Santiago, Chile, Tel: 562-320-8284, fax: 562-671-6554,
email: rmorenoh@santander.cl
23
C0NTENTS
| Consolidated Interim Financial Statements | |
| CONSOLIDATED INTERIM STATEMENTS OF FINANCIAL POSITION | 3 |
| CONSOLIDATED INTERIM STATEMENTS OF INCOME | 4 |
| CONSOLIDATED INTERIM STATEMENTS OF COMPREHENSIVE INCOME | 5 |
| CONSOLIDATED INTERIM STATEMENTS OF CHANGES IN EQUITY | 6 |
| CONSOLIDATED INTERIM STATEMENTS OF CASH FLOW | 7 |
| Notes to the Financial Statements | |
| NOTE 01 -SUMMARY OF SIGNIFICANT ACCOUNTING PRINCIPLES | 9 |
| NOTE 02 - ACCOUNTING CHANGES | 34 |
| NOTE 03 - SIGNIFICANT EVENTS | 37 |
| NOTE 04 - BUSINESS SEGMENTS | 39 |
| NOTE 05 - CASH AND CASH EQUIVALENTS | 45 |
| NOTE 06 - TRADING INVESTMENTS | 46 |
| NOTE 07 - DERIVATIVE FINANCIAL INSTRUMENTS AND HEDGE ACCOUNTING | 47 |
| NOTE 08 - INTERBANK LOANS | 53 |
| NOTE 09 - LOANS AND ACCOUNTS RECEIVABLE FROM CUSTOMERS | 54 |
| NOTE 10 - AVAILABLE FOR SALE INVESTMENTS | 59 |
| NOTE 11 - INTANGIBLE ASSETS | 60 |
| NOTE 12 - PROPERTY, PLANT, AND EQUIPMENT | 62 |
| NOTE 13 - CURRENT AND DEFERRED TAXES | 66 |
| NOTE 14 - OTHER ASSETS | 69 |
| NOTE 15 - TIME DEPOSITS AND OTHER TIME LIABILITIES | 70 |
| NOTE 16 - ISSUED DEBT INSTRUMENTS AND OTHER OBLIGATIONS | 71 |
| NOTE 17 - MATURITIES OF ASSETS AND LIABILITIES | 76 |
| NOTE 18 - OTHER LIABILITIES | 78 |
| NOTE 19 - CONTINGENCIES AND COMMITMENTS | 79 |
| NOTE 20 - EQUITY | 81 |
| NOTE 21 - CAPITAL REQUIREMENTS (BASEL) | 84 |
| NOTE 22 - NON CONTROLLING INTEREST | 86 |
| NOTE 23 - INTEREST INCOME AND EXPENSE | 89 |
| NOTE 24 - FEES AND COMMISSIONS | 92 |
| NOTE 25 - NET INCOME FROM FINANCIAL OPERATIONS | 93 |
| NOTE 26 - NET FOREIGN EXCHANGE PROFIT (LOSS) | 94 |
| NOTE 27 - PROVISION FOR LOAN LOSSES | 95 |
| NOTE 28 - PERSONNEL SALARIES AND EXPENSES | 97 |
| NOTE 29 - ADMINISTRATIVE EXPENSES | 98 |
| NOTE 30 - DEPRECIATION AMORTIZATION AND IMPAIRMENT | 99 |
| NOTE 31 - OTHER OPERATING INCOME AND EXPENSES | 100 |
| NOTE 32 - TRANSACTIONS WITH RELATED PARTIES | 102 |
| NOTE 33 - FAIR VALUE OF FINANCIAL ASSETS AND LIABILITIES | 107 |
| NOTE 34 - SUBSEQUENT EVENTS | 110 |

2
BANCO SANTANDER CHILE AND SUBSIDIARIES
CONSOLIDATED INTERIM STATEMENTS OF FINANCIAL POSITION
For periods ending as of
| September 30, | September 30, | December 31, | ||||||||||||||
| 2011 | 2011 | 2010 | ||||||||||||||
| NOTE | ThUS$ | MCh$ | MCh$ | |||||||||||||
| ASSETS | ||||||||||||||||
| Cash and deposits in banks | 5 | 3,488,473 | 1,812,785 | 1,762,198 | ||||||||||||
| Unsettled transactions | 5 | 1,571,444 | 816,601 | 374,368 | ||||||||||||
| Trading investments | 6 | 969,524 | 503,813 | 379,670 | ||||||||||||
| Investments under resale agreements | - | 23,395 | 12,157 | 170,985 | ||||||||||||
| Financial derivative contracts | 7 | 3,871,038 | 2,011,585 | 1,624,378 | ||||||||||||
| Interbank loans, net | 8 | 169,141 | 87,894 | 69,672 | ||||||||||||
| Loans and accounts receivable from customers, net nnrnetnet | 9 | 33,021,822 | 17,159,790 | 15,175,975 | ||||||||||||
| Available for sale investments | 10 | 4,050,118 | 2,104,644 | 1,473,980 | ||||||||||||
| Held to maturity investments | - | - | - | - | ||||||||||||
| Investments in other companies | - | 15,841 | 8,232 | 7,275 | ||||||||||||
| Intangible assets | 11 | 148,617 | 77,229 | 77,990 | ||||||||||||
| Property, plant, and equipment | 12 | 294,652 | 153,116 | 154,985 | ||||||||||||
| Current taxes | 13 | 53,394 | 27,746 | 12,499 | ||||||||||||
| Deferred tax | 13 | 276,028 | 143,438 | 117,964 | ||||||||||||
| Other assets | 14 | 1,354,999 | 704,125 | 640,937 | ||||||||||||
| TOTAL ASSETS | 49,308,486 | 25,623,155 | 22,042,876 | |||||||||||||
| LIABILITIES | ||||||||||||||||
| Deposits and other demand liabilities | 15 | 8,653,434 | 4,496,757 | 4,236,434 | ||||||||||||
| Unsettled transactions | 5 | 896,879 | 466,063 | 300,125 | ||||||||||||
| Investments under repurchase agreements | - | 436,915 | 227,043 | 294,725 | ||||||||||||
| Time deposits and other time liabilities | 15 | 18,079,950 | 9,395,246 | 7,258,757 | ||||||||||||
| Financial derivative contracts | 7 | 3,127,632 | 1,625,274 | 1,643,979 | ||||||||||||
| Interbank borrowings | - | 3,896,961 | 2,025,056 | 1,584,057 | ||||||||||||
| Issued debt instruments | 16 | 8,684,511 | 4,512,906 | 4,190,888 | ||||||||||||
| Other financial liabilities | 16 | 321,357 | 166,993 | 166,289 | ||||||||||||
| Current taxes | 13 | 4,426 | 2,300 | 1,293 | ||||||||||||
| Deferred tax | 13 | 22,284 | 11,580 | 5,441 | ||||||||||||
| Provisions | - | 329,299 | 171,120 | 235,953 | ||||||||||||
| Other liabilities | 18 | 1,083,472 | 563,026 | 261,328 | ||||||||||||
| TOTAL LIABILITIES | 45,537,119 | 23,663,364 | 20,179,269 | |||||||||||||
| EQUITY | ||||||||||||||||
| Attributable to Bank shareholders: | 3,709,223 | 1,927,498 | 1,831,798 | |||||||||||||
| Capital | - | 1,715,199 | 891,303 | 891,303 | ||||||||||||
| Reserves | - | 99,180 | 51,539 | 51,539 | ||||||||||||
| Valuation adjustments | 20 | 1,141 | 593 | (5,180 | ) | |||||||||||
| Retained earnings | - | 1,893,703 | 984,063 | 894,136 | ||||||||||||
| Retained earnings of prior years | - | 1,445,182 | 750.989 | 560,128 | ||||||||||||
| Income for the period | - | 640,745 | 332.963 | 477,155 | ||||||||||||
| Minus: Provision for mandatory dividends | - | (192,224 | ) | (99.889 | ) | (143,147 | ) | |||||||||
| Non-controlling interest | 22 | 62,144 | 32,293 | 31,809 | ||||||||||||
| TOTAL EQUITY | 3,771,367 | 1,959,791 | 1,863,607 | |||||||||||||
| TOTAL LIABILITIES AND EQUITY | 49,308,486 | 25,623,155 | 22,042,876 | |||||||||||||
3
BANCO SANTANDER CHILE AND SUBSIDIARIES
CONSOLIDATED INTERIM STATEMENTS OF INCOME
As of September 30, | For the quarter ended on September 30, | For the 9-month period ended on September 30 , | ||||||||||||||||||||||
| 2011 | 2011 | 2010 | 2011 | 2010 | ||||||||||||||||||||
| NOTE | ThUS$ | MCh$ | MCh$ | MCh$ | MCh$ | |||||||||||||||||||
| OPERATING INCOME | ||||||||||||||||||||||||
| Interest income | 23 | 2,446,412 | 420,729 | 355,445 | 1,271,278 | 1,045,602 | ||||||||||||||||||
| Interest expense | 23 | (1,083,660 | ) | (188,672 | ) | (119,771 | ) | (563,124 | ) | (337,748 | ) | |||||||||||||
| Net interest income | 1.362.752 | 232,057 | 235,674 | 708,154 | 707,854 | |||||||||||||||||||
| Fee and commission income | 24 | 522,546 | 87,651 | 85,379 | 271,541 | 247,346 | ||||||||||||||||||
| Fee and commission expense | 24 | (119,525 | ) | (21,660 | ) | (18,943 | ) | (62,111 | ) | (53,401 | ) | |||||||||||||
| Net fee and commission income | 403,021 | 65,991 | 66,436 | 209,430 | 193,945 | |||||||||||||||||||
| Net income from financial operations (net trading income) | 25 | 295,458 | 102,133 | (45,068 | ) | 153,535 | 51,946 | |||||||||||||||||
| Foreign exchange profit (loss), net | 26 | (144,838 | ) | (79,132 | ) | 66,781 | (75,265 | ) | 24,381 | |||||||||||||||
| Other operating income | 31 | 15,498 | 2,194 | 2,656 | 8,053 | 27,554 | ||||||||||||||||||
| Total operating income | 1,931,891 | 323,243 | 326,479 | 1,003,907 | 1,005,680 | |||||||||||||||||||
| Provisions for loan losses | 27 | (377,023 | ) | (90,372 | ) | (51,525 | ) | (195,920 | ) | (182,120 | ) | |||||||||||||
| NET OPERATING PROFIT | 1,554,868 | 232,871 | 274,954 | 807,987 | 823,560 | |||||||||||||||||||
| Personnel salaries and expenses | 28 | (399,076 | ) | (73,884 | ) | (63,330 | ) | (207,380 | ) | (184,921 | ) | |||||||||||||
| Administrative expenses | 29 | (234,924 | ) | (41,041 | ) | (37,983 | ) | (122,078 | ) | (109,743 | ) | |||||||||||||
| Depreciation and amortization | 30 | (76,278 | ) | (13,354 | ) | (11,294 | ) | (39,638 | ) | (36,227 | ) | |||||||||||||
| Impairment | 12 | (210 | ) | (77 | ) | (963 | ) | (109 | ) | (4,665 | ) | |||||||||||||
| Other operating expenses | 31 | (79,994 | ) | (12,156 | ) | (21,333 | ) | (41,569 | ) | (45,963 | ) | |||||||||||||
| Other operating expenses | (790,482 | ) | (140,512 | ) | (134,903 | ) | (410,774 | ) | (381,519 | ) | ||||||||||||||
| OPERATING INCOME | 764,386 | 92,359 | 140,051 | 397,213 | 442,041 | |||||||||||||||||||
| Income from investments in other companies | - | 3,219 | 546 | 832 | 1,673 | 1,175 | ||||||||||||||||||
| Income before tax | 767,605 | 92,905 | 140,883 | 398,886 | 443,216 | |||||||||||||||||||
| Income tax expense | 13 | (120,362 | ) | (16,629 | ) | (14,109 | ) | (62,546 | ) | (60,032 | ) | |||||||||||||
| NET INCOME FOR THE PERIOD | 647,243 | 76,276 | 126,774 | 336,340 | 383,184 | |||||||||||||||||||
| Attributable to: | ||||||||||||||||||||||||
| Bank shareholders (Equity holders of the Bank) | - | 640,745 | 75,153 | 125,356 | 332,963 | 383,283 | ||||||||||||||||||
| Non-controlling interest | 22 | 6,498 | 1,123 | 1,418 | 3,377 | (99 | ) | |||||||||||||||||
| Earnings per share attributable to Bank shareholders: | ||||||||||||||||||||||||
| (expressed in Chilean pesos) | ||||||||||||||||||||||||
| Basic earnings | - | 3.4004 | 0.399 | 0.665 | 1.767 | 1.5598 | ||||||||||||||||||
| Diluted earnings | - | 3.4004 | 0.399 | 0.665 | 1.767 | 1.5598 | ||||||||||||||||||
4
BANCO SANTANDER CHILE AND SUBSIDIARIES
CONSOLIDATED INTERIM STATEMENTS OF COMPREHENSIVE INCOME
As of September 30, | For the quarter ended on September 30, | For the 9-month period ended on September 30, | ||||||||||||||||||||||
| 2011 | 2011 | 2010 | 2011 | 2010 | ||||||||||||||||||||
| NOTE | ThUS$ | MCh$ | MCh$ | MCh$ | MCh$ | |||||||||||||||||||
| CONSOLIDATED INCOME FOR THE PERIOD | 647,243 | 76,276 | 126,774 | 336,340 | 383,184 | |||||||||||||||||||
| OTHER COMPREHENSIVE INCOME | ||||||||||||||||||||||||
| Available for sale investments | 20 | 41,347 | 22,561 | (2,924 | ) | 21,486 | 4,796 | |||||||||||||||||
| Cash flow hedge | 7 | (27,084 | ) | (12,051 | ) | 7,433 | (14,074 | ) | 10,306 | |||||||||||||||
| Other comprehensive income before income tax | 14,263 | 10,510 | 4,509 | 7,412 | 15,102 | |||||||||||||||||||
| Income tax related to other comprehensive income | 13 | (2,696 | ) | (2,058 | ) | (524 | ) | (1,401 | ) | (2,325 | ) | |||||||||||||
| Total other comprehensive income | 11,567 | 8,452 | 3,985 | 6,011 | 12,777 | |||||||||||||||||||
| CONSOLIDATED COMPREHENSIVE INCOME FOR THE PERIOD | 658,810 | 84,728 | 130,759 | 342,351 | 395,961 | |||||||||||||||||||
| Attributable to: | ||||||||||||||||||||||||
| Bank shareholders (Equity holders of the Bank) | - | 651,853 | 83,577 | 129,621 | 338,736 | 396,159 | ||||||||||||||||||
| Non-controlling interest | 22 | 6,957 | 1,151 | 1,138 | 3,615 | (198 | ) | |||||||||||||||||
5
BANCO SANTANDER CHILE AND SUBSIDIARIES
CONSOLIDATED INTERIM STATEMENTS OF CHANGES IN EQUITY
| RESERVES | VALUATION ADJUSTMENTS | RETAINED EARNINGS | ||||||||||||||||||||||||||||||||||||||||||||||
| Capital | Reserves and other retained earnings | Merger of companies under common control | Available for sale investments | Cash flow hedge | Income tax | Retained earnings of prior years | Income for the period | Provision for mandatory dividends | Total attributable to shareholders | Non- controlling interest | Total Equity | |||||||||||||||||||||||||||||||||||||
| MCh$ | MCh$ | MCh$ | MCh$ | MCh$ | MCh$ | MCh$ | MCh$ | MCh$ | MCh$ | MCh$ | MCh$ | |||||||||||||||||||||||||||||||||||||
| Balances as of December 31, 2009 | 891,303 | 53,763 | (2,224 | ) | (29,132 | ) | (3,162 | ) | 5,490 | 440,401 | 431,253 | (129,376 | ) | 1,658,316 | 29,799 | 1,688,115 | ||||||||||||||||||||||||||||||||
| Distribution of income from previous period | - | - | - | - | - | - | 431,253 | (431,253 | ) | - | - | - | - | |||||||||||||||||||||||||||||||||||
| First Enforcement of Chapter B3 | - | - | - | - | - | - | (52,662 | ) | - | - | (52,662 | ) | - | (52,662 | ) | |||||||||||||||||||||||||||||||||
| Opening balances as of January 1, 2010 | 891,303 | 53,763 | (2,224 | ) | (29,132 | ) | (3,162 | ) | 5,490 | 818,992 | - | (129,376 | ) | 1,605,654 | 29,799 | 1,635,453 | ||||||||||||||||||||||||||||||||
| Increase or decrease of capital and reserves | - | - | - | - | - | - | - | - | - | - | - | - | ||||||||||||||||||||||||||||||||||||
| Dividends distributions / Withdrawals made | - | - | - | - | - | - | (258,752 | ) | - | 129,376 | (129,376 | ) | - | (129,376 | ) | |||||||||||||||||||||||||||||||||
| Other changes in equity | - | - | - | - | - | - | (112 | ) | - | - | (112 | ) | (2 | ) | (114 | ) | ||||||||||||||||||||||||||||||||
| Provisions for mandatory dividends | - | - | - | - | - | - | - | - | (114,985 | ) | (114,985 | ) | - | (114,985 | ) | |||||||||||||||||||||||||||||||||
| Subtotals | - | - | - | - | - | - | (258,864 | ) | - | 14,391 | (244,473 | ) | (2 | ) | (244,475 | ) | ||||||||||||||||||||||||||||||||
| Other comprehensive income | - | - | - | 4,915 | 10,306 | (2,345 | ) | - | - | - | 12,876 | (99 | ) | 12,777 | ||||||||||||||||||||||||||||||||||
| Income for the period | - | - | - | - | - | - | - | 383,283 | - | 383,283 | (99 | ) | 383,184 | |||||||||||||||||||||||||||||||||||
| Subtotals | - | - | - | 4,915 | 10,306 | (2,345 | ) | - | 383,283 | - | 396,159 | (198 | ) | 395,961 | ||||||||||||||||||||||||||||||||||
| Balances as of September 30, 2010 | 891,303 | 53,763 | (2,224 | ) | (24,217 | ) | 7,144 | 3,145 | 560,128 | 383,283 | (114,985 | ) | 1,757,340 | 29,599 | 1,786,939 | |||||||||||||||||||||||||||||||||
| Balances as of December 31, 2010 | 891,303 | 53,763 | (2,224 | ) | (18,341 | ) | 11,958 | 1,203 | 560,128 | 477,155 | (143,147 | ) | 1,831,798 | 31,809 | 1,863,607 | |||||||||||||||||||||||||||||||||
| Distribution of income from previous period | - | - | - | - | - | - | 477,155 | (477,155 | ) | - | - | - | - | |||||||||||||||||||||||||||||||||||
| Opening balances as of January 1, 2011 | 891,303 | 53,763 | (2,224 | ) | (18,341 | ) | 11,958 | 1,203 | 1,037,283 | - | (143,147 | ) | 1,831,798 | 31,809 | 1,863,607 | |||||||||||||||||||||||||||||||||
| Increase or decrease of capital and reserves | - | - | - | - | - | - | - | - | - | - | - | - | ||||||||||||||||||||||||||||||||||||
| Dividends distributions / Withdrawals made | - | - | - | - | - | - | (286,294 | ) | - | 143,147 | (143,147 | ) | (3,122 | ) | (146,269 | ) | ||||||||||||||||||||||||||||||||
| Other changes in equity | - | - | - | - | - | - | - | - | - | - | (9 | ) | (9 | ) | ||||||||||||||||||||||||||||||||||
| Provision for mandatory dividends | - | - | - | - | - | - | - | - | (99,889 | ) | (99,889 | ) | - | (99,889 | ) | |||||||||||||||||||||||||||||||||
| Subtotals | - | - | - | - | - | - | (286,294 | ) | - | 43,258 | (243,036 | ) | (3,131 | ) | (246,167 | ) | ||||||||||||||||||||||||||||||||
| Other comprehensive income | - | - | - | 21,197 | (14,074 | ) | (1,350 | ) | - | - | - | 5,773 | 238 | 6,011 | ||||||||||||||||||||||||||||||||||
| Income for the period | - | - | - | - | - | - | - | 332,963 | - | 332,963 | 3,377 | 336,340 | ||||||||||||||||||||||||||||||||||||
| Subtotals | - | - | - | 21,197 | (14,074 | ) | (1,350 | ) | - | 332,963 | - | 338,736 | 3,615 | 342,351 | ||||||||||||||||||||||||||||||||||
| Balances as of September 30, 2011 | 891,303 | 53,763 | (2,224 | ) | 2,856 | (2,116 | ) | (147 | ) | 750,989 | 332,963 | (99,889 | ) | 1,927,498 | 32,293 | 1,959,791 | ||||||||||||||||||||||||||||||||
| Period | Total attributable to shareholders | Allocated to reserves or retained earnings | Allocated to Dividends | Percentage distributed | Number of shares | Dividend per share (in pesos) | ||||||||||||||||||
| MCh$ | MCh$ | MCh$ | % | |||||||||||||||||||||
| Year 2010 (Shareholders Meeting April 2011) | 477,155 | 190,861 | 286,294 | 60 | % | 188,446,126,794 | 1.519 | |||||||||||||||||
| Year 2009 (Shareholders Meeting April 2010) | 431,253 | 172,501 | 258,752 | 60 | % | 188,446,126,794 | 1.373 | |||||||||||||||||
6
BANCO SANTANDER CHILE AND SUBSIDIARIES
CONSOLIDATED INTERIM STATEMENTS OF CASH FLOW
For periods ending as of
| September 30, | |||||||||||||||
| 2011 | 2011 | 2010 | |||||||||||||
| NOTE | ThUS$ | MCh$ | MCh$ | ||||||||||||
| A - CASH FLOWS FROM OPERATING ACTIVITIES | |||||||||||||||
| CONSOLIDATED INCOME BEFORE TAX | 767,605 | 398,886 | 443,216 | ||||||||||||
| Debits (credits) to income that do not represent cash flows | (1,300,486 | ) | (675,799 | ) | (665,521 | ) | |||||||||
| Depreciation and amortization | 30 | 76,278 | 39,638 | 36,227 | |||||||||||
| Impairment of property, plant, and equipment | 12 | 210 | 109 | 4,665 | |||||||||||
| Provision for loan losses | 27 | 407,850 | 211,939 | 205,675 | |||||||||||
| Mark to market of trading investments | - | (15,102 | ) | (7,848 | ) | 6,144 | |||||||||
| Income from investments in other companies | - | (3,219 | ) | (1,673 | ) | (1,175 | ) | ||||||||
| Net gain on sale of assets received in lieu of payment | 31 | (12,805 | ) | (6,654 | ) | 2,975 | |||||||||
| Provisions for assets received in lieu of payment | 31 | 4,109 | 2,135 | 4,106 | |||||||||||
| Net gain on sale of investments in other companies | - | - | - | - | |||||||||||
| Net gain on sale of property, plant and equipment | 31 | (1,597 | ) | (830 | ) | (13,243 | ) | ||||||||
| Charge off of assets received in lieu of payment | 31 | 13,698 | 7,118 | 9,163 | |||||||||||
| Net interest income | 23 | (1,362,752 | ) | (708,154 | ) | (707,854 | ) | ||||||||
| Net fee and commission income | 24 | (403,021 | ) | (209,430 | ) | (193,945 | ) | ||||||||
| Debits (credits) to income that do not represent cash flows | - | 34,789 | 18,078 | 26,705 | |||||||||||
| Changes in assets and liabilities due to deferred taxes | 13 | (38,924 | ) | (20,227 | ) | (44,964 | ) | ||||||||
| Increase/decrease in operating assets and liabilities | 1,737,872 | 903,087 | (177,658 | ) | |||||||||||
| Decrease (increase) of loans and accounts receivables from customers, net | - | (3,641,557 | ) | (1,892,335 | ) | (1,690,639 | ) | ||||||||
| Decrease (increase) of financial investments | - | (1,541,751 | ) | (801,170 | ) | 499,020 | |||||||||
| Decrease (increase) due to resale agreements (assets) | - | 305,644 | 158,828 | 50,975 | |||||||||||
| Decrease (increase) of interbank loans | - | (35,066 | ) | (18,222 | ) | (48,814 | ) | ||||||||
| Decrease of assets received or awarded in lieu of payment | - | 63,543 | 33,020 | 19,277 | |||||||||||
| Increase of debits in checking accounts | - | 86,320 | 44,856 | 232,226 | |||||||||||
| Increase (decrease) of time deposits and other time liabilities | - | 4,105,929 | 2,133,646 | (20,888 | ) | ||||||||||
| Increase (decrease) of obligations with domestic banks | - | - | - | (26,301 | ) | ||||||||||
| Increase of other demand liabilities or time obligations | - | 312,524 | 162,403 | 180,419 | |||||||||||
| Increase (decrease) of obligations with foreign banks | - | 849,568 | 441,478 | (292,102 | ) | ||||||||||
| Decrease of obligations with Central Bank of Chile | - | (764 | ) | (397 | ) | (450 | ) | ||||||||
| Increase (decrease) due to resale agreements (liabilities) | - | (130,245 | ) | (67,682 | ) | (987,632 | ) | ||||||||
| Increase (decrease) of other short-term liabilities | - | (1,328 | ) | (690 | ) | 599 | |||||||||
| Net increase of other assets and liabilities | - | (606,874 | ) | (315,360 | ) | 50,563 | |||||||||
| Issuance of letters of credit | - | - | - | - | |||||||||||
| Redemption of letters of credit | - | (81,072 | ) | (42,129 | ) | (71,825 | ) | ||||||||
| Senior bond issuances | - | 941,274 | 489,133 | 1,187,441 | |||||||||||
| Redemption of senior bonds and payments of interest | - | (535,156 | ) | (278,094 | ) | (28,637 | ) | ||||||||
| Interest received | - | 2,459,142 | 1,277,893 | 1,028,854 | |||||||||||
| Interest paid | - | (1,096,257 | ) | (569,670 | ) | (394,613 | ) | ||||||||
| Dividends received from investments in other companies | - | 1,339 | 696 | 956 | |||||||||||
| Fees and commissions received | 24 | 522,546 | 271,541 | 247,346 | |||||||||||
| Fees and commissions paid | 24 | (119,525 | ) | (62,111 | ) | (53,401 | ) | ||||||||
| Income tax paid | 13 | (120,362 | ) | (62,546 | ) | (60,032 | ) | ||||||||
| Net cash from (used in) operating activities | 1,204,991 | 626,174 | (399,963 | ) | |||||||||||
7
BANCO SANTANDER CHILE AND SUBSIDIARIES
CONSOLIDATED INTERIM STATEMENTS OF CASH FLOW
For periods ending as of
| September 30, | ||||||||||||||||
| 2011 | 2011 | 2010 | ||||||||||||||
| NOTE | ThUS$ | MCh$ | MCh$ | |||||||||||||
| B - CASH FLOWS FROM INVESTMENT ACTIVITIES: | ||||||||||||||||
| Purchases of property, plant, and equipment | 12 | (25,519 | ) | (13,261 | ) | (7,712 | ) | |||||||||
| Sales of property, plant, and equipment | - | 321 | 167 | 14,576 | ||||||||||||
| Purchases of investments in other companies | - | - | - | 133 | ||||||||||||
| Sales of investments in other companies | - | 10,979 | 5,705 | 44 | ||||||||||||
| Purchases of intangibles assets | 11 | (46,412 | ) | (24,118 | ) | (12,255 | ) | |||||||||
| Net cash used in investment activities | (60,631 | ) | (31,507 | ) | (5,214 | ) | ||||||||||
| C - CASH FLOW FROM FINANCING ACTIVITIES: | ||||||||||||||||
| From shareholders’ financing activities | - | (382,017 | ) | (198,515 | ) | (189,697 | ) | |||||||||
| Increase of other obligations | - | - | - | - | ||||||||||||
| Issuance of subordinated bonds | - | 221,260 | 114,978 | 97,692 | ||||||||||||
| Redemption of subordinated bonds and payments of interest | - | (52,341 | ) | (27,199 | ) | (28,637 | ) | |||||||||
| Dividends paid | - | (550,936 | ) | (286,294 | ) | (258,752 | ) | |||||||||
| From non-controlling interest financing activities | - | (6,008 | ) | (3,122 | ) | (4 | ) | |||||||||
| Increases of capital | - | - | - | - | ||||||||||||
| Dividends and/or withdrawals paid | - | (6,008 | ) | (3,122 | ) | (4 | ) | |||||||||
| Net cash used in financing activities | (388,025 | ) | (201,637 | ) | (189,701 | ) | ||||||||||
| D – VARIATION OF CASH AND CASH EQUIVALENTS DURING THE PERIOD | - | (127,295 | ) | (66,149 | ) | (59,844 | ) | |||||||||
| E – EFFECTS OF FOREIGN EXCHANGE RATE VARIATIONS | - | 756,335 | 393,030 | (594,878 | ) | |||||||||||
| F - INITIAL BALANCE OF CASH AND CASH EQUIVALENTS | - | 3,533,998 | 1,836,442 | 2,236,118 | ||||||||||||
| FINAL BALANCE OF CASH AND CASH EQUIVALENTS | 5 | 4,163,038 | 2,163,323 | 1,581,396 | ||||||||||||
| As of September 30 | ||||||||
| Reconciliation of provisions for Consolidated Interim Statements of Cash Flow | 2011 | 2010 | ||||||
| MCh$ | MCh$ | |||||||
| Provisions for loan losses for cash flow | 211,939 | 205,675 | ||||||
| Recovery of loans previously charged off | (16,019 | ) | (23,555 | ) | ||||
| Expenses on provisions for loan losses | 195,920 | 182,120 | ||||||
8
BANCO SANTANDER CHILE AND SUBSIDIARIES NOTES TO THE CONSOLIDATED INTERIM FINANCIAL STAEMENTS As of September 30, 2011 and 2010 and December 31, 2010 |
NOTE 01 – SUMMARY OF SIGNIFICANT ACCOUNTING PRINCIPLES
Corporate Information
Banco Santander Chile (formerly Banco Santiago) is a corporation (sociedad anónima bancaria) organized under the laws of the Republic of Chile, headquartered at 140 Bandera St., that provides a broad range of general banking services to its customers, from individuals to major corporations. Banco Santander Chile and its affiliates (collectively referred to herein as the “Bank” or “Banco Santander Chile”) offer commercial and consumer banking services, besides other services, including factoring, collection, leasing, securities and insurance brokerage, mutual and investment fund management, and investment banking.
A Special Meeting of Shareholders of Banco Santiago was held on July 18, 2002, the minutes of which were notarized as a public deed on July 19, 2002 at the Notarial Office from Santiago before Notary Nancy de la Fuente Hernández, and there agreed to merge Banco Santander Chile with Banco Santiago by merging the former into the latter, which acquired the former’s assets and liabilities. It was likewise agreed to dissolve Banco Santander Chile in advance and change the name from Banco Santiago to Banco Santander Chile. This change was authorized by Resolution No.79 of the Superintendency of Banks and Financial Institutions, adopted on July 26, 2002, published in the Official Journal on August 1, 2002 and registered on page 19,992 under number 16,346 for the year 2002 in the Registry of Commerce of the Curator of Real Estate of Santiago.
In addition to the amendments to the bylaws discussed above, the bylaws have been amended on multiple occasions, the last time at the Special Shareholders Meeting of April 24, 2007, the minutes of which were notarized as a public deed on May 24, 2007 at the Notarial Office of Nancy de la Fuente Hernández. This amendment was approved pursuant to Resolution No.61 of June 6, 2007 of the Superintendency of Banks and Financial Institutions. An extract thereof and the resolution were published in the Official Journal of June 23, 2007 and registered in the Registry of Commerce for 2007 on page 24,064 under number 17,563 of the aforementioned Curator.
By means of this last amendment, Banco Santander Chile, pursuant to its bylaws and as approved by the Superintendency of Banks and Financial Institutions, may also use the names Banco Santander Santiago or Santander Santiago or Banco Santander or Santander.
Banco Santander Spain controls Banco Santander-Chile through its share in Teatinos Siglo XXI Inversiones Ltda. and Santander-Chile Holding S.A., which are subsidiaries controlled by Banco Santander Spain. As of September 30, 2011 Banco Santander Spain owns or controls directly and indirectly 99.5% of the Santander-Chile Holding S.A. and 100% of Teatinos Siglo XXI Inversiones Ltda. This grants Banco Santander Spain control over 75% of the Bank’s shares.
| a) | Basis of preparation |
These Consolidated Financial Statements have been prepared in accordance with the Compendium of Accounting Standards issued by the Superintendency of Banks and Financial Institutions (SBIF), a regulatory agency. Article 15 of the General Banking Law states that, in accordance with the laws, banks must use the accounting criteria issued by the Superintendency and that, in any situation not provided for therein—if it is not contrary to its instructions—must abide by the generally accepted accounting principles, which correspond with the technical standards issued by the Colegio de Contadores de Chile AG (Association of Chilean Accountants), which coincide with the International Financial Reporting Standards(IFRS) adopted by the International Accounting Standard Board (IASB). In the event of discrepancies between the accounting principles and the accounting criteria issued by the SBIF (Compendium of Accounting Standard), the latter will prevail.
| b) | Basis of preparation for the Consolidated Interim Financial Statements |
The Consolidated Interim Financial Statements include the preparation of separate (individual) financial statements of the Bank and the companies that participate in the consolidation of September 30, 2011 and 2010, and include the adjustments and reclassifications needed to comply with policies and valuation criteria established by the Compendium of Accounting Standards issued by the SBIF.
Subsidiaries
“Subsidiaries” are defined as entities over which the Bank has the ability to exercise control, which is generally but not exclusively reflected by the direct or indirect ownership of at least 50% of the investee’s voting rights, or even if this percentage is lower or zero when the Bank is granted control pursuant to agreements with the investee’s shareholders. Control is understood as the power to significantly influence the investee’s financial and operating policies, so as to profit from its activities.
The interim financial statements of subsidiaries are consolidated with those of the Bank. According to this, all balances and transactions between consolidated corporations will be eliminated through the consolidation process.
In addition, third parties’ shares in the Consolidated Bank’s equity are presented as “Non-controlling interests” in the Consolidated Interim Statement of Financial Position. Their shares in the year’s income are presented under “Non-controlling interests” in the Consolidated Interim Statement of Income.
9
BANCO SANTANDER CHILE AND SUBSIDIARIES NOTES TO THE CONSOLIDATED INTERIM FINANCIAL STAEMENTS As of September 30, 2011 and 2010 and December 31, 2010 |
NOTE 01 – SUMMARY OF SIGNIFICANT ACCOUNTING POLICIES continued:
The following companies are considered “Subsidiaries” in which the Bank holds equity and accounts for it through the equity method:
| Percentage Share | ||||||||||||||||||||||||||||||||||||
| As of September 30, | As of December 31, | As of September 30, | ||||||||||||||||||||||||||||||||||
| Subsidiaries | 2011 | 2010 | 2010 | |||||||||||||||||||||||||||||||||
Direct % | Indirect % | Total % | Direct % | Indirect % | Total % | Direct % | Indirect % | Total % | ||||||||||||||||||||||||||||
| Santander Corredora de Seguros Limitada | 99.75 | 0.01 | 99.76 | 99.75 | 0.01 | 99.76 | 99.75 | 0.01 | 99.76 | |||||||||||||||||||||||||||
| Santander S.A. Corredores de Bolsa | 50.59 | 0.41 | 51.00 | 50.59 | 0.41 | 51.00 | 50.59 | 0.41 | 51.00 | |||||||||||||||||||||||||||
| Santander Asset Management S.A. Administradora General de Fondos | 99.96 | 0.02 | 99.98 | 99.96 | 0.02 | 99.98 | 99.96 | 0.02 | 99.98 | |||||||||||||||||||||||||||
| Santander Agente de Valores Limitada (former Santander S.A. Agente de Valores) | 99.03 | - | 99.03 | 99.03 | - | 99.03 | 99.03 | - | 99.03 | |||||||||||||||||||||||||||
| Santander S.A. Sociedad Securitizadora | 99.64 | - | 99.64 | 99.64 | - | 99.64 | 99.64 | - | 99.64 | |||||||||||||||||||||||||||
| Santander Servicios de Recaudación y Pagos Limitada | 99.90 | 0.10 | 100.00 | 99.90 | 0.10 | 100.00 | 99.90 | 0.10 | 100.00 | |||||||||||||||||||||||||||
Special Purpose Entities
According to IFRS, the Bank must continuously analyze its perimeter of consolidation. The key criterion for such analysis is the degree of control held by the Bank over a given entity, not the percentage of ownership interest in such entity’s equity.
In particular, as set forth by International Accounting Standard 27 “Consolidated and Separate Financial Statements” (IAS 27) and by the Standard Interpretations Committee 12 “Consolidation – Special Purpose Entities” (SIC 12), issued by the IASB, the Bank must determine the existence of Special Purpose Entities (SPEs), which must be included in its perimeter of consolidation. The following are its main characteristics:
| · | The SPEs’ activities have essentially been conducted on behalf of the company that presents the Consolidated Interim Financial Statements and in response to its specific business needs. |
| · | The necessary decision making authority is held to obtain most of the benefits from these entities’ activities, as well as the rights to obtain most of the benefits or other advantages from such entities. |
| · | The entity essentially retains most of the risks inherent to the ownership or residuals of the SPEs or its assets, for the purpose of obtaining the benefits from its activities. |
This assessment is based on methods and procedures which consider the risks and profits retained by the Bank, for which all the relevant factors, including the guarantees furnished or the losses associated with collection of the related assets retained by the Bank, are taken into account. As a consequence of this assessment, the Bank concluded that it exercised control over the following entities, which therefore are part of the consolidation perimeter:
| - | Santander Gestión de Recaudación y Cobranza Limitada. |
| - | Multinegocios S.A. |
| - | Servicios Administrativos y Financieros Limitada. |
| - | Fiscalex Limitada. |
| - | Multiservicios de Negocios Limitada. |
| - | Bansa Santander S.A. |
Associates
Associated are those entities over which the Bank may exercise significant influence but not control or joint control, usually this capacity is manifested by holding 20% or more of the entity’s voting power. Investments in associated entities are accounted for pursuant to the “equity method.”
10
BANCO SANTANDER CHILE AND SUBSIDIARIES NOTES TO THE CONSOLIDATED INTERIM FINANCIAL STAEMENTS As of September 30, 2011 and 2010 and December 31, 2010 |
NOTE 01 – SUMMARY OF SIGNIFICANT ACCOUNTING POLICIES continued:
The following companies are considered “Associates” in which the Bank accounts for its participation pursuant to the equity method:
| Percentage Share | ||||||||||||
| Associates | As of September 30, | As of December 31, | As of September 30, | |||||||||
| 2011 | 2010 | 2010 | ||||||||||
| Redbank S.A. | 33.43 | % | 33.43 | % | 33.43 | % | ||||||
| Transbank S.A. | 32.71 | % | 32.71 | % | 32.71 | % | ||||||
| Centro de Compensación Automatizado | 33.33 | % | 33.33 | % | 33.33 | % | ||||||
| Sociedad Interbancaria de Depósito de Valores S.A. | 29.28 | % | 29.28 | % | 29.28 | % | ||||||
| Cámara Compensación de Alto Valor S.A. | 11.52 | % | 11.52 | % | 11.52 | % | ||||||
| Administrador Financiero del Transantiago S.A. | 20.00 | % | 20.00 | % | 20.00 | % | ||||||
Investments in other companies
The Bank and its controlled entities have certain investments in shares since these are required to get the right to operate according to their line of business. Participation in these companies is below 1%.
c) Non-controlling interest
Non-controlling interest represents the portion of earnings and losses and net assets which the Bank does not own, either directly or indirectly. It is presented separately in the Consolidated Interim Statement of Income, and separately from shareholders equity in the Consolidated Interim Statement of Financial Position.
In the case of Special Purpose Entities (SPEs), 100% of their Income and Equity is presented in non-controlling interest, since the Bank only has control but not actual ownership thereof.
d) Operating segments
The Bank discloses separate information for each operating segment that:
| i. | has been identified; |
| ii. | exceeds the quantitative thresholds stipulated for a segment. |
Operating segments with similar economic characteristics often have a similar long-term financial performance. Two or more segments can be combined only if aggregation is consistent with the basic principles of the International Financial Reporting Standards 8 (IFRS 8) and the segments have similar economic characteristics and are similar in each of the following respects:
| i. | nature of the products and services; |
| ii. | nature of the production processes; |
| iii. | type or category of customers that use their products and services; |
| iv. | methods used to distribute their products or services; and |
| v. | if applicable, the nature of the regulatory environment, for example, banking, insurance, or public utilities. |
The Bank reports separately on each operating segment that exceeds any of the following quantitative thresholds:
| i. | Its reported revenue, from both external customers and intersegment sales or transfers, is 10% or more of the combined internal and external revenue of all the operating segments. |
| ii. | The absolute amount of its reported profit or loss is 10% or more of the greater in absolute amount of: (i) the combined reported profit of all the operating segments that did not report a loss; (ii) the combined reported loss of all the operating segments that reported a loss. |
| iii. | Its assets represent 10% or more of the combined assets of all the operating segments. |
11
BANCO SANTANDER CHILE AND SUBSIDIARIES NOTES TO THE CONSOLIDATED INTERIM FINANCIAL STAEMENTS As of September 30, 2011 and 2010 and December 31, 2010 |
NOTE 01 – SUMMARY OF SIGNIFICANT ACCOUNTING POLICIES continued:
Operating segments that do not reach any of the quantitative thresholds may be treated as segments to be reported, in which case the information must be disclosed separately if management believes it could be useful for the users of the consolidated interim financial statements.
Information about other business activities of the operating segments not separately reported is combined and disclosed in the “Other segments” category.
According to the information presented, the Bank’s segments were determined under the following definitions:
| i. | It engages in business activities from which it may earn revenues and incur expenses (including revenues and expenses from transactions with other components of the same entity); |
| ii. | Its operating results are regularly reviewed by the entity’s chief executive officer, who makes decisions about resources allocated to the segment and assess its performance; and |
| iii. | Discrete financial information is available for it. |
e) Functional and presentation currency
The Bank, according to International Accounting Standard No.21 “The Effects of Changes in Foreign Exchange Rates” (IAS 21) has defined the Chilean peso as functional and presentation currency, which is the currency of the primary economic environment in which the Bank operates and the currency which influences its structure of costs and revenues, has been defined as the functional and presentation currency.
Accordingly, all balances and transactions denominated in currencies other than the Chilean Peso are treated as “foreign currency.”
For presentation purposes we had translated million Chilean pesos (MCh$) into thousand US dollars (ThUS$) using the rate as indicated in f) below, for the Consolidated Statement of Financial Position, Consolidated Statement of Income, Consolidated Statement of Comprehensive Income and for the Consolidated Statement of Cash Flow for the period ended as of September 30, 2011.
f) Foreign currency transactions
The Bank grants loans and accepts deposits in amounts denominated in foreign currencies, mainly the U.S. dollar. Assets and liabilities denominated in foreign currencies and only held by the Bank are translated to Chilean pesos based on the market rate published by Reuters at 1:30 p.m. on the last business day of every month; the rate used was Ch$519.65 per US$1 as of September 30, 2011 (Ch$467.95 per US$1 as of December 30, 2010). The Subsidiaries record their foreign currency positions at the exchange rate reported by the Central Bank of Chile at the close of operations on the last business day of the month, amounting to Ch$515.14 per US$1 as of September 30, 2011 (Ch$468.01 per US$1 as of December 30). Considering that using these exchange rates does not cause any significant difference, these criteria have been kept on the Consolidated Interim Financial Statements.
The amounts of net foreign exchange profits and losses includes recognition of the effects that exchange rate variations have on assets and liabilities denominated in foreign currencies and the profits and losses on foreign exchange spot and forward transactions undertaken by the Bank.
g) Definitions and classification of financial instruments
| i. | Definitions |
A “financial instrument” is any contract that gives rise to a financial asset of one entity, and simultaneously to a financial liability or equity instrument of another entity.
An “equity instrument” is a legal transaction that evidences a residual interest in the assets of the entity which issues it after deducting allot its liabilities.
A “financial derivative” is a financial instrument whose value changes in response to the changes in an observable market variable (such as an interest rate, a foreign exchange rate, a financial instrument’s price, or a market index, including credit ratings), which initial investment is very small compared to other financial instruments having a similar response to changes in market factors, and which is generally settled at a future date.
“Hybrid financial instruments” are contracts that simultaneously include a non-derivative host contract together with a financial derivative, known as an embedded derivative, which is not separately transferable and has the effect that some of the cash flows of the hybrid contract vary in a way similar to a stand-alone derivative.
| ii. | Classification of financial assets for measurement purposes |
The financial assets are initially classified into the various categories used for management and measurement purposes.
12
BANCO SANTANDER CHILE AND SUBSIDIARIES NOTES TO THE CONSOLIDATED INTERIM FINANCIAL STAEMENTS As of September 30, 2011 and 2010 and December 31, 2010 |
NOTE 01 – SUMMARY OF SIGNIFICANT ACCOUNTING POLICIES continued:
Financial assets are included for measurement purposes in one of the following categories:
| - | Portfolio of trading investments (at fair value through profit and loss): This category includes the financial assets acquired for the purpose of generating a profit in the short term from fluctuations in their prices. This category includes the portfolio of trading investments and financial derivative contracts not designated as hedging instruments. |
| - | Available for sale investment portfolio: Debt instruments not classified as “held-to-maturity investments,” “Credit investments (loans and accounts receivable from customers or interbank loans)” or “Financial assets at fair value through profit or loss.” Available for sale investments (AFS) are initially recorded at fair value, which includes transactional costs. AFS instruments are subsequently measured at fair value or based on appraisals made with the use of internal models, when appropriate. Unrealized gains or losses stemming from changes in fair value are recorded as a debit or credit to Other Comprehensive Income under the heading “Valuation Adjustments” within equity. When these investments are disposed of or become impaired, the cumulative gains or losses previously recognized in Other Comprehensive Income are transferred to the Consolidated Interim Income State under “Net income from financial operations.” |
| - | Held to maturity instruments portfolio: This category includes debt securities traded on an active market, with a fixed maturity, and with fixed or determinable payments, for which the Bank has both the intent and a proven ability to hold to maturity. Held to maturity investments are recorded at their amortized cost plus interest earned less any impairment losses established when their carrying amount exceeds the present value of estimated future cash flows. |
| - | Credit investments (loans and accounts receivable from customers or interbank loans): This category includes financing granted to third parties, based on their nature, regardless of the type of borrower and the form of financing. It includes loans and accounts receivable from customers, interbank loans, and financial lease transactions in which the consolidated entities act as lessor. |
| iii. | Classification of financial assets for presentation purposes |
Financial assets are included, for presentation purposes, classified by their nature into the following line items in the consolidated interim financial statements:
| - | Cash and deposits in banks: This line includes cash balances, checking accounts and on-demand deposits with the Central Bank of Chile and other domestic and foreign financial institutions. Amounts placed in overnight transactions will continue to be reported in this line item and in the lines or items to which they correspond. If there is no special item for these transactions, they will be included with the related account as indicated above. |
| - | Unsettled transactions: This item includes the values of swap instruments and balances of executed transactions which contractually defer the payment of purchase-sale transactions or the delivery of the foreign currency acquired. |
| - | Trading investments: This item includes financial instruments held-for-trading and investments in mutual funds which must be adjusted to their fair value in the same way as instruments acquired for trading. |
| - | Financial derivative contracts: Financial derivative contracts with positive fair values are presented in this item. It includes both independent contracts as well as derivatives that should and can be separated from a host contract, whether they are for trading or hedging, as shown in Note 7 to the Consolidated Interim Financial Statements. |
| - | Trading derivatives: Includes the fair value of derivatives which do not qualify for hedge accounting, including embedded derivatives separated from hybrid financial instruments. |
| - | Hedging derivatives: Includes the fair value of derivatives designated as hedging instruments in hedge accounting, including the embedded derivatives separated from the hybrid financial instruments designated as hedging instruments in hedge accounting. |
| - | Interbank loans: This item includes the balances of transactions with domestic and foreign banks, including the Central Bank of Chile, other than those reflected in the preceding items. |
| - | Loans and accounts receivables from customers: These loans are non-derivative financial assets for which fixed or determined amounts are charged, that are not listed on an active market and which the Bank does not intend to sell immediately or in the short term. When the Bank is the lessor in a lease, and it substantially transfers the risks and benefits incidental to the leased asset, the transaction is presented in loans and accounts receivable from customers. |
| - | Investment instruments: These are classified into two categories: held-to-maturity investments and available-for-sale investments. The held-to-maturity investment category includes only those instruments for which the Bank has the ability and intent to hold them until their maturity. Other available for sale investments are treated as available for sale. |
13
BANCO SANTANDER CHILE AND SUBSIDIARIES NOTES TO THE CONSOLIDATED INTERIM FINANCIAL STAEMENTS As of September 30, 2011 and 2010 and December 31, 2010 |
NOTE 01 – SUMMARY OF SIGNIFICANT ACCOUNTING POLICIES continued:
| iv. | Classification of financial liabilities for measurement purposes |
Financial liabilities are initially classified into the various categories used for management and measurement purposes.
Financial liabilities are included, for measurement purposes, in one of the following categories:
| - | Financial liabilities held for trading (at fair value through profit or loss): Financial liabilities issued to generate a short-term profit from fluctuations in their prices, financial derivatives not deemed to qualify for hedge accounting and financial liabilities arising from firm commitment of financial assets purchased under repurchase agreements or borrowed (“short positions”). |
| - | Financial liabilities at amortized cost: financial liabilities, regardless of their type and maturity, not included in any of the aforementioned categories which arise from the borrowing activities of financial institutions. |
| v. | Classification of financial liabilities for presentation purposes |
Financial liabilities are classified by their nature into the following line items in the consolidated interim financial statements:
| - | Deposits and other demand liabilities. This item includes all on-demand obligations except for term savings accounts, which are not considered on-demand instruments in view of their special characteristics. Obligations whose payment may be required during the period are deemed to be on-demand obligations. Operations which become callable the day after the closing date are not treated as on-demand obligations. |
| - | Unsettled transactions: This item includes the balances of asset purchases that are not settled on the same day and for sales of foreign currencies not delivered. |
| - | Investments under repurchase agreements: This item includes the balances of sales of financial instruments under securities repurchase and loan agreements. |
| - | Time deposits and other demand liabilities: This item shows the balances of deposit transactions in which a term at the end of which they become callable has been stipulated. |
| - | Financial derivative contracts: This item includes financial derivative contracts with negative fair values, whether they are for trading or for account hedging purposes, as set forth in Note 7. |
| - | Trading derivatives: Includes the fair value of derivatives which do not qualify for hedge accounting, including embedded derivatives separated from hybrid financial instruments. |
| - | Hedging derivatives: Includes the fair value of the derivatives designated as hedging instruments, including embedded derivatives separated from hybrid financial instruments and designated as hedging instruments. |
| - | Interbank borrowings: This item includes obligations due to other domestic banks, foreign banks, or the Central Bank of Chile, which were not classified in any of the previous categories. |
| - | Debt instruments issued: This encompasses three items: Obligations under letters of credit, subordinated bonds, and senior bonds. |
| - | Other financial liabilities: This item includes credit obligations to persons other than domestic banks, foreign banks, or the Central Bank of Chile, for financing purposes or operations in the regular course of business. |
h) Valuation of financial assets and liabilities and recognition of fair value changes
In general, financial assets and liabilities are initially recorded at fair value which, in the absence of evidence to the contrary, is deemed to be the transaction price. Financial Instruments not measured at fair value through profit or loss includes transaction costs. Subsequently, and at the end of each reporting period, they are measured pursuant to the following criteria.
| i. | Valuation of financial assets |
Financial assets are measured according to their fair value, gross of any transaction costs that may be incurred for their sale, except for loans and accounts receivable.
14
BANCO SANTANDER CHILE AND SUBSIDIARIES NOTES TO THE CONSOLIDATED INTERIM FINANCIAL STAEMENTS As of September 30, 2011 and 2010 and December 31, 2010 |
NOTE 01 – SUMMARY OF SIGNIFICANT ACCOUNTING POLICIES, continued:
The “fair value” of a financial instrument on a given date is the amount for which it could be bought or sold on that date by two knowledgeable, willing parties in an arm’s length transaction. The most objective and common reference for the fair value of a financial instrument is the price that would be paid on an active, transparent, and deep market (“quoted price” or “market price”).
If there is no market price for a given financial instrument, its fair value is estimated based on the price established in recent transactions involving similar instruments and, in the absence thereof, of valuation techniques commonly used by the international financial community, considering the specific features of the instrument to be valued and, particularly, the various classes of risk associated with it.
All derivatives are recorded in the Consolidated Interim Statements of Financial Position at the fair value from their trade date. If their fair value is positive, they are recorded as an asset, and if their fair value is negative, they are recorded as a liability. The fair value of the trade date is deemed, in the absence of evidence to the contrary, to be the transaction price. Changes in the fair value of derivatives from the trade date are recorded with a counterpart in “Net income from financial operations” in the Consolidated Interim Statement of Income.
Specifically, the fair value of financial derivatives included in the portfolios of financial assets or liabilities held for trading is deemed to be their daily quoted price. If, for exceptional reasons, the quoted price cannot be determined on a given date, the fair value is determined using similar methods to those used to measure over the counter (OTC) derivatives. The fair value of OTC derivatives is the sum of the future cash flows resulting from the instrument, discounted to present value at the date of valuation (“present value” or “theoretical close”) using valuation techniques commonly used by the financial markets: “net present value” (NPV) and option pricing models, among other methods.
“Loans and accounts receivable from customers” and “Held-to-maturity instrument portfolio” are measured at amortized cost using the “effective interest method.” “Amortized cost” is the acquisition cost of a financial asset or liability plus or minus, as appropriate, prepayments of principal and the cumulative amortization (recorded in the consolidated interim income statement) of the difference between the initial cost and the maturity amount. For financial assets, amortized cost also includes any reductions for impairment or uncollectibility. For loans and accounts receivable designated as hedged items in fair value hedges, the changes in their fair value related to the risk or risks being hedged are recorded in “Net income from financial operations”.
The “effective interest rate” is the discount rate that exactly matches the initial amount of a financial instrument to all its estimated cash flows over its remaining life. For fixed-rate financial instruments, the effective interest rate coincides with the contractual interest rate established on the acquisition date plus, where applicable, the fees and transaction costs that, because of their nature, are a part of the financial return. For floating-rate financial instruments, the effective interest rate coincides with the rate of return prevailing until the next benchmark interest reset date.
Equity instruments whose fair value cannot be determined in a sufficiently objective manner and financial derivatives that have those instruments as their underlying assets and are settled by delivery of those instruments are measured at acquisition cost, adjusted, where appropriate, by any related impairment loss.
The amounts at which the financial assets are recorded represent, in all material respects, the Bank’s maximum exposure to credit risk at each reporting date. The Bank has also received collateral and other credit enhancements to mitigate its exposure to credit risk, which consist mainly of mortgage guarantees, equity instruments and personal securities, assets leased out under leasing and rental agreements, assets acquired under repurchase agreements, securities loans and derivatives.
| ii. | Valuation of financial liabilities |
In general, financial liabilities are measured at amortized cost, as defined above, except for those financial liabilities designated as hedged items (or hedging instruments) and financial liabilities held for trading, which are measured at fair value.
| iii. | Valuation techniques |
Financial instruments at fair value, determined on the basis of quotations in active markets, include government debt securities, private sector debt securities, shares, short positions, and fixed-income securities issued.
In cases where quotations cannot be observed, the Management makes its best estimate of the price that the market would set using its own internal models. In most cases, these models use data based on observable market parameters as significant inputs and, in very specific cases, they use significant inputs not observable in market data. Various techniques are employed to make these estimates, including the extrapolation of observable market data.
15
BANCO SANTANDER CHILE AND SUBSIDIARIES NOTES TO THE CONSOLIDATED INTERIM FINANCIAL STAEMENTS As of September 30, 2011 and 2010 and December 31, 2010 |
NOTE 01 – SUMMARY OF SIGNIFICANT ACCOUNTING POLICIES continued:
The best evidence of the fair value of a financial instrument on initial recognition is the transaction price, unless the value of the instrument can be obtained from other market transactions performed with the same or similar instruments or can be measured by using a valuation technique in which the variables used include only observable market data, mainly interest rates.
The main techniques used as of September 30, 2011 and 2010 by the Bank’s internal models to determine the fair value of the financial instruments, are as follows:
| i. | In the valuation of financial instruments permitting static hedging (mainly “forwards” and “swaps”), the “present value” method is used. Estimated future cash flows are discounted using the interest rate curves of the related currencies. The interest rate curves are generally observable market data. |
| ii. | In the valuation of financial instruments requiring dynamic hedging (mainly structured options and other structured instruments), the Black-Scholes model is normally used. Where appropriate, observable market inputs are used to obtain factors such as the bid-offer spread, exchange rates, volatility, correlation indexes and market liquidity. |
| iii. | In the valuation of certain financial instruments exposed to interest rate risk, such as interest rate futures, caps and floors, the present value method (futures) and the Black-Scholes model (plain vanilla options) are used. The main inputs used in these models are observable market data, including the related interest rate curves, volatilities, correlations and exchange rates. |
The fair value of the financial instruments arising from the abovementioned internal models considers contractual terms and observable market data, which include interest rates, credit risk, exchange rates, and the quoted market price of shares, volatility and prepayments, among other things. The valuation models are not significantly subjective, since these methodologies can be adjusted and evaluated, as appropriate, through the internal calculation of fair value and the subsequent comparison with the related actively traded price.
| iv. | Recording results |
As a general rule, changes in the carrying amount of financial assets and liabilities are recorded in the Consolidated Interim Statement of Income, distinguishing between those arising from the accrual of interests, which are recorded under Interest income or Interest expense, as appropriate, and those arising from other reasons, which are recorded at their net amount under “Net income from financial operations”.
In the case of trading investments, the fair value adjustments, interest income, indexation and foreign exchange, are included in the Consolidated Interim Statement of Income under “Net income from financial operations.”
Adjustments due to changes in fair value from:
| - | “Available-for-sale financial instruments” are recorded in Other Comprehensive Income and accumulated under the heading “Valuation adjustments” within Equity. |
| - | When the AFS instruments are disposed of or are determined to be impaired, the cumulative gain or loss previously accumulated as “Valuation Adjustment” is reclassified to the Consolidated Interim Statement of Income. |
| v. | Hedging transactions |
The Bank uses financial derivatives for the following purposes:
| i) | to sell to customers who request these instruments in the management of their market and credit risks, |
| ii) | to use these derivatives in the management of the risks of the Bank entities’ own positions and assets and liabilities (“hedging derivatives”), and |
| iii) | to obtain profits from changes in the price of these derivatives (“trading derivatives”). |
All financial derivatives that do not qualify for hedge accounting are accounted for as “trading derivatives.”
A derivative qualifies for hedge accounting if all the following conditions are met:
| 1. | The derivative hedges one of the following three types of exposure: |
| a. | Changes in the value of assets and liabilities due to fluctuations, among others, in the interest rate and/or exchange rate to which the position or balance to be hedged is subject (“fair value hedge”); |
| b. | Changes in the estimated cash flows arising from financial assets and liabilities, commitments and highly probable forecasted transactions (“cash flow hedge”); |
| c. | The net investment in a foreign operation (“hedge of a net investment in a foreign operation”). |
16
BANCO SANTANDER CHILE AND SUBSIDIARIES NOTES TO THE CONSOLIDATED INTERIM FINANCIAL STAEMENTS As of September 30, 2011 and 2010 and December 31, 2010 |
NOTE 01 – SUMMARY OF SIGNIFICANT ACCOUNTING POLICIES continued:
| 2. | It is effective in offsetting exposure inherent in the hedged item or position throughout the expected term of the hedge, which means that: |
| a. | At the date of arrangement the hedge is expected, under normal conditions, to be highly effective (“prospective effectiveness”). |
| b. | There is sufficient evidence that the hedge was actually effective during the life of the hedged item or position (“retrospective effectiveness”). |
| 3. | There must be adequate documentation evidencing the specific designation of the financial derivative to hedge certain balances or transactions and how this effective hedge was expected to be achieved and measured, provided that this is consistent with the Bank’s management of own risks. |
The changes in the value of financial instruments qualifying for hedge accounting are recorded as follows:
| a. | In fair value hedges, profits or losses arising on both the hedging instruments and the hedged items (attributable to the type of risk being hedged) are recorded directly in the Consolidated Interim Statement of Income. |
| b. | In fair value hedges of interest rate risk in a portfolio of financial instruments, gains or losses that arise in measuring the hedging instruments are recorded directly in the Consolidated Interim Statement of Income, whereas the gains or losses due to changes in the fair value of the hedged amount (attributable to the hedged risk) are recorded in the Consolidated Interim Statement of Income with an offset to “Net income from financial operations”. |
| c. | In cash flow hedges, the effective portion of the change in value of the hedging instrument is recorded temporarily in Other Comprehensive Income under the heading “Cash flow hedge” within Equity component “Valuation adjustments”, until the forecasted transaction occurs, thereafter being recorded in the Consolidated Interim Statement of Income, unless the forecasted transaction results in the recognition of non–financial assets or liabilities, in which case it is included in the cost of the non-financial asset or liability. |
| d. | The differences in valuation of the hedging instrument corresponding to the ineffective portion of the cash flow hedging transactions are recorded directly in the Consolidated Interim Statement of Income under “Income from financial operations”. |
If a derivative designated as a hedge no longer meets the requirements described above due to expiration, ineffectiveness or for any other reason, the derivative is classified as a “trading derivative.” When the “Fair value hedging” is discontinued, the fair value adjustments of the book value for the hedged portion generated by the hedged risk are amortized to gain and losses from that date on.
When cash flow hedges are discontinued, any cumulative gain or loss of the hedging instrument recognized in other comprehensive income under “Valuation adjustments” (from the period when the hedge was effective) remains recorded in equity until the hedged transaction occurs, at which time it is recorded in the Consolidated Interim Statement of Income, unless the transaction is no longer expected to occur, in which case any cumulative profit or loss is recorded immediately in the Consolidated Interim Income Statement.
v. Derivatives embedded in hybrid financial instruments
Derivatives embedded in other financial instruments or in other host contracts are accounted for separately as derivatives if their risks and characteristics are not closely related to those of the host contracts, provided that the host contracts are not classified as “Other financial assets (liabilities) at fair value through profit or loss” or as “Portfolio of trading investments.”
vi. Offsetting of financial instruments
Financial asset and liability balances are offset, i.e., reported in the Consolidated Interim Statements of Financial Position at their net amount, only if the subsidiaries currently have a legally enforceable right to offset the recorded amounts and intend either to settle them on a net basis or to realize the asset and settle the liability simultaneously.
vii. De-recognition of financial assets and liabilities
The accounting treatment of transfers of financial assets depends on the extent and the manner in which the risks and rewards associated with the transferred assets are transferred to third parties:
17
BANCO SANTANDER CHILE AND SUBSIDIARIES NOTES TO THE CONSOLIDATED INTERIM FINANCIAL STAEMENTS As of September 30, 2011 and 2010 and December 31, 2010 |
NOTE 01 – SUMMARY OF SIGNIFICANT ACCOUNTING POLICIES continued:
| i. | If the Bank transfers substantially all the risks and rewards to third parties, as in the case of unconditional sales of financial assets, sales under repurchase agreements at fair value at the date of repurchase, sales of financial assets with a purchased call option or written put option deeply out of the money, utilization of assets in which the assignor does not retain subordinated debt nor grants any credit enhancement to the new holders, and other similar cases, the transferred financial asset is removed from the Consolidated Interim Statements of Financial Position and any rights or obligations retained or created in the transfer are simultaneously recorded. |
| ii. | If the Bank retains substantially all the risks and rewards associated with the transferred financial asset, as in the case of sales of financial assets under repurchase agreements to repurchase at a fixed price or at the sale price plus interest, securities lending agreements under which the borrower undertakes to return the same or similar assets, and other similar cases, the transferred financial asset is not removed from the Consolidated Interim Statements of Financial Position and continues to be measured by the same criteria as those used before the transfer. However, the following items are recorded: |
| 1. | An associated financial liability for an amount equal to the consideration received; this liability is subsequently measured at amortized cost. |
| 2. | Both the income from the transferred (but not removed) financial asset as well as any expenses incurred on the new financial liability. |
| iii. | If the Bank neither transfers nor substantially retains all the risks and rewards associated with the transferred financial asset—as in the case of sales of financial assets with a purchased call option or written put option that is not deeply in or out of the money, securitization of assets in which the transferor retains a subordinated debt or other type of credit enhancement for a portion of the transferred asset, and other similar cases—the following distinction is made: |
| 1. | If the transferor does not retain control of the transferred financial asset: The asset is removed from the Consolidated Interim Statements of Financial Position and any rights or obligations retained or created in the transfer are recorded. |
| 2. | If the transferor retains control of the transferred financial asset: It continues to be recorded in the Consolidated Interim Statements of Financial Position for an amount equal to its exposure to changes in value and a financial liability associated with the transferred financial asset is recorded. The net carrying amount of the transferred asset and the associated liability is the amortized cost of the rights and obligations retained, if the transferred asset is measured at amortized cost, or the fair value of the rights and obligations retained, if the transferred asset is measured at fair value. |
Accordingly, financial assets are only removed from the Consolidated Interim Statements of Financial Position when the rights over the cash flows they generate have terminated or when all the inherent risks and rewards have been substantially transferred to third parties. Similarly, financial liabilities are only derecognized in the Consolidated Interim Statements of Financial Position when the obligations specified in the contract are discharged, cancelled or expire.
| i) | Recognizing income and expenses |
The most significant criteria used by the Bank to recognize its revenues and expenses are summarized as follows:
| i. | Interest revenue, interest expense and similar items |
Interest revenue and expense are recorded on an accrual basis using the effective interest method.
However, when a given operation or transaction is past due by 90 days or more, when it originated from a refinancing or renegotiation, or when the Bank believes that the debtor poses a high risk of default, the interest and adjustments pertaining to these transactions are not recorded directly in the Consolidated Interim Statement of Income unless they have been actually received.
These interests and adjustments are generally referred to as “suspended” and are recorded in memorandum accounts which are not part of the Consolidated Interim Statements of Financial Position but are reported as part of the complementary information thereto (Note 23). This interest is recognized as income, when collected, as a reversal of the related impairment losses.
The Bank can stop the accrual of interests based on contract terms about the capital amount of any asset classified as deteriorated asset. Thereafter, the Bank recognizes as interest income the accretion of the net present value of the written down amount of the loan due to the passage of time, based on the original effective interest rate of the loan. On the other hand, any collected interest related to an asset classified as impaired is accounted for on a cash basis.
Dividends received from companies classified as “Investments in other companies” are recorded as income when the right to receive them arises.
18
BANCO SANTANDER CHILE AND SUBSIDIARIES NOTES TO THE CONSOLIDATED INTERIM FINANCIAL STAEMENTS As of September 30, 2011 and 2010 and December 31, 2010 |
NOTE 01 – SUMMARY OF SIGNIFICANT ACCOUNTING POLICIES continued:
ii. Commissions, fees, and similar items
Fee and commission income and expenses are recognized in the Consolidated Interim Statement of Income using criteria that vary according to their nature. The main criteria are:
| - | Fee and commission income and expenses related to financial assets and liabilities measured at fair value with changes in results are acknowledged when paid. |
| - | Those arising from transactions or services that are performed over a period of time are recognized over the life of these transactions or services. |
| - | Those relating to services provided in a single act are recognized when the single act is performed. |
iii. Non-finance income and expenses
These are recognized for accounting purposes on an accrual basis.
iv. Loan arrangement fees
Loan arrangement fees, mainly loan origination and application fees, are accrued and recorded in the Consolidated Interim Statement of Income over the term of the loan Regarding loan origination fees, the Bank immediately records direct costs related to loan origination within the Consolidated Interim Statement of Income.
j) Impairment
i. Financial assets:
A financial asset, other than that a fair value through profit and loss, is evaluated on each financial statement filing date to determine whether objective evidence of impairment exists.
A financial asset or group of financial assets will be impaired if, and only if, objective evidence of impairment exists as a result of one or more events that occurred after initial recognition of the asset (“event causing the loss”), and this event or events causing the loss have an impact on the estimated future cash flows of a financial asset or group of financial assets.
An impairment loss relating to financial assets recorded at amortized cost is calculated as the difference between the recorded amount of the asset and the present value of estimated future cash flows, discounted at the financial asset’s original effective interest rate.
An impairment loss relating to a financial asset available for sale is calculated based on a significant extended decline in its fair value.
Individually significant financial assets are individually tested to determine their impairment. The remaining financial assets are evaluated collectively in groups that share similar credit risk characteristics.
All impairment losses are recorded in income. Any cumulative loss relating to a financial asset available for sale previously recorded in equity is transferred to profit or loss as a reclassification adjustment.
The reversal of an impairment loss occurs only if it can be objectively related to an event occurring after the initial impairment loss was recorded. In the case of financial assets recorded at amortized cost and for the financial assets available for sale that are securities for sale, the reversal is recorded in income. In the case of financial assets that are variable-rate securities, the reversal is directly recorded in equity.
ii. Non-financial assets:
The Bank’s non-financial assets, excluding investment properties, are reviewed at reporting date to determine whether they show signs of impairment (i.e. its carrying amount exceeds its recoverable amount). If such evidence exists, the amount to be recovered from the assets is then estimated.
In connection to other assets, impairment losses recorded in prior periods are assessed at each reporting date in search of any indication that the loss has decreased or disappeared and should be reversed. An Impairment loss is reversed to the extent that it is not in excess of the cumulative impairment loss that has been recorded.
19
BANCO SANTANDER CHILE AND SUBSIDIARIES NOTES TO THE CONSOLIDATED INTERIM FINANCIAL STAEMENTS As of September 30, 2011 and 2010 and December 31, 2010 |
NOTE 01 – SUMMARY OF SIGNIFICANT ACCOUNTING POLICIES continued:
k) Property, plant, and equipment
This category includes the amount of buildings, land, furniture, vehicles, computer hardware and other fixtures owned by the consolidated entities or acquired under finance leases. Assets are classified according to their use as follows:
i. Property, plant and equipment for own use
Property, plant and equipment for own use (including, among other things, tangible assets received by the consolidated entities in full or partial satisfaction of financial assets representing accounts receivable from third parties which are intended to be held for continuing own use and tangible assets acquired under finance leases) are presented at acquisition cost less the related accumulated depreciation and, if applicable, any impairment losses (net carrying amount higher than recoverable amount).
The acquisition cost of awarded assets is equivalent to the net amount of the financial assets surrendered in exchange for its award.
The Bank and its subsidiaries have chosen to measure certain items of property, plant, and equipment goods at the date of the transition into IFRS, both for at their fair value and at the previous GAAP revaluated and use these both as their deemed cost at that date, in accordance with paragraphs D5 and D6 of IFRS 1. Accordingly, the price-level restatement applied until December 31, 2007 was not reversed.
Depreciation is calculated using the straight line method over the acquisition cost of assets less their residual value, assuming that the land on which buildings and other structures stand has an indefinite life and, therefore, is not subject to depreciation.
The Bank must apply the following useful lives for the tangible assets that comprise its assets:
| ITEM | Useful Life (Months) | |
| Land | - | |
| Paintings and works of art | - | |
| Assets retired for disposal | - | |
| Carpets and curtains | 36 | |
| Computers and hardware | 36 | |
| Vehicles | 36 | |
| Computational systems and software | 36 | |
| ATM’s | 60 | |
| Machines and equipment in general | 60 | |
| Office furniture | 60 | |
| Telephone and communication systems | 60 | |
| Security systems | 60 | |
| Rights over telephone lines | 60 | |
| Air conditioning systems | 84 | |
| Installations in general | 120 | |
| Security systems (acquisitions up to October 2002) | 120 | |
| Buildings | 1,200 |
The consolidated entities assess at each reporting date whether there is any indication that the carrying amount of any of their tangible assets’ exceeds its recoverable amount. If this is the case, the carrying amount of the asset is reduced to its recoverable amount and future depreciation charges are adjusted in proportion to the revised carrying amount and to the new remaining useful life, if the useful life needs to be revised.
Similarly, if there is an indication of a recovery in the value of a tangible asset, the consolidated entities record the reversal of the impairment loss recorded in prior periods and adjust the future depreciation charges accordingly. In no circumstance may the reversal of an impairment loss on an asset increase its carrying value above the one it would have had if no impairment losses had been recorded in prior years.
The estimated useful lives of the items of property, plant and equipment held for own use are reviewed at least at the end of each reporting period to detect significant changes therein. If changes are detected, the useful lives of the assets are adjusted by correcting the depreciation charge to be recorded in the Consolidated Interim Statement of Income in future years on the basis of the new useful lives.
20
BANCO SANTANDER CHILE AND SUBSIDIARIES NOTES TO THE CONSOLIDATED INTERIM FINANCIAL STAEMENTS As of September 30, 2011 and 2010 and December 31, 2010 |
NOTE 01 – SUMMARY OF SIGNIFICANT ACCOUNTING POLICIES continued:
Maintenance expenses relating to tangible assets (property, plant and equipment) held for own use are recorded as an expense in the period in which they are incurred.
ii. Assets leased out under operating leases
The criteria used to record the acquisition cost of assets leased out under operating leases, to calculate their depreciation and their respective estimated useful lives, and to record the impairment losses thereof, are consistent with those described in relation to property, plant and equipment held for own use.
l) Leasing
i. Finance leases
Finance leases are leases that substantially transfer all the risks and rewards incidental to ownership of the leased asset to the lessee.
When the consolidated entities act as the lessor of an asset, the sum of the present value of the lease payments receivable from the lessee plus the guaranteed residual value, which is generally the exercise price of the lessee’s purchase option at the end of the lease term, is recognized as loans to third parties and it is therefore included under “Loans and accounts receivable from customers” in the Consolidated Interim Statements of Financial Position.
When the consolidated entities act as lessees, they show the cost of the leased assets in the Consolidated Interim Statements of Financial Position based on the nature of the leased asset, and simultaneously record a liability for the same amount (which is the lower of the fair value of the leased asset and the sum of the present value of the lease payments payable to the lessor plus, if appropriate, the exercise of the purchase option). The depreciation policy for these assets is consistent with that for property, plant and equipment for own use.
In both cases, the finance revenues and finance expenses arising from these contracts are credited and debited, respectively, to “Interest income” and “Interest expense” in the in the Consolidated Interim Income Statement so as to achieve a constant rate of return over the lease term.
ii. Operating leases
In operating leases, ownership of the leased asset and substantially all the risks and rewards incidental thereto remain with the lessor.
When the consolidated entities act as the lessor, they present the acquisition cost of the leased assets under "Property, plant and equipment”. The depreciation policy for these assets is consistent with that for similar items of property, plant and equipment held for own use and revenues from operating leases is recorded on a straight line basis under “Other operating income” in the Consolidated Interim Income Statement.
When the consolidated entities act as the lessees, the lease expenses, including any incentives granted by the lessor, are charged on a straight line basis to “Administrative and other expenses” in the Consolidated Interim Income Statement.
iii. Sale and leaseback transactions
For sale at fair value and operating leasebacks, the profit or loss generated is recorded at the time of sale. In the case of finance leasebacks, the profit or loss generated is amortized over the lease term.
m) Factored receivables
Factored receivables are valued at the amount disbursed by the Bank in exchange of invoices or other commercial instruments representing the credit which the transferor assigns to the Bank. The price difference between the amounts disbursed and the actual face value of the credits is recorded as interest income in the Consolidated Interim Income Statement through the effective interest method over the financing period.
When the assignment of these instruments involves no liability for the assignor, the Bank assumes the risks of insolvency of the parties responsible for payment.
21
BANCO SANTANDER CHILE AND SUBSIDIARIES NOTES TO THE CONSOLIDATED INTERIM FINANCIAL STAEMENTS As of September 30, 2011 and 2010 and December 31, 2010 |
NOTE 01 – SUMMARY OF SIGNIFICANT ACCOUNTING POLICIES continued:
n) Intangible assets
Intangible assets are identified as non-monetary assets (separately identifiable from other assets) without physical substance which arise as a result of a legal transaction (contractual terms) or are developed internally by the consolidated entities. They are assets whose cost can be estimated reliably and from which the consolidated entities have control and consider it probable that future economic benefits will be generated.
Intangible assets are recorded initially at acquisition or production cost and are subsequently measured at cost less any accumulated amortization and any accumulated impairment losses.
Internally developed computer software
Internally developed computer software is recorded as an intangible asset if, among other requirements (basically the Bank’s ability to use or sell it), it can be identified and its ability to generate future economic benefits can be demonstrated. The estimated useful life for software is 3 years.
Intangible assets are amortized on a straight-line basic over their estimated useful life.
Expenditure on research activities is recorded as an expense in the year in which it is incurred and cannot be subsequently capitalized.
o) Cash and cash equivalents
For the preparation of the cash flow statement, the indirect method was used, beginning with the Bank’s consolidated pre-tax income and incorporating non-cash transactions, as well as income and expenses associated with cash flows, which are classified as investment or financing activities.
For the preparation of the cash flow statement, the following items are considered:
| i. | Cash flows: Inflows and outflows of cash and cash equivalents, such as deposits with the Central Bank of Chile, deposits in domestic banks, and deposits in foreign banks |
| ii. | Operating Activities: Main revenue-producing activities performed by banks and other activities that cannot be classified as investing or financing activities. |
| iii. | Investing Activities: The acquisition and disposal of long-term assets and other investments not included in cash and cash equivalents. |
| iv. | Financing activities: Activities that result in changes in the size and composition of the equity and liabilities that are not operating activities. |
p) Allowances for loan losses
The Bank records allowances for probable loan losses in accordance with its internal models. These internal models for rating and evaluating credit risk were approved by the Bank’s Board of Directors.
According to the methodology developed by the Bank, loans are divided into three categories:
| i. | Consumer loans, |
| ii. | Mortgage loans, and |
| iii. | Commercial loans. |
The specialization of the Santander Bank’s risk function is based on the type of customer and, accordingly, a distinction is made between individualized customers that are individually evaluated and standardized customers, evaluated in groups in the risk management process.
The internal risk models used to calculate the allowances are described as follows:
Allowances for individual evaluations on commercial loans
The Bank assigns a risk category level to each borrower and his respective loans. The Bank considers the following risk factors within the analysis: industry or sector of the borrower, owners or managers of the borrower, their financial situation and payment capacity, and payment behavior.
The Bank assigns one of the following risk categories to each loan and borrower:
| i. | Normal Compliance Portfolio, which corresponds to debtors with a payment capacity that allows them to comply with their obligations and commitments; and this is not likely to change, based on the current economical and financial situation. The classifications assigned to this portfolio are categories from A1 to A6. |
22
BANCO SANTANDER CHILE AND SUBSIDIARIES NOTES TO THE CONSOLIDATED INTERIM FINANCIAL STAEMENTS As of September 30, 2011 and 2010 and December 31, 2010 |
NOTE 01 – SUMMARY OF SIGNIFICANT ACCOUNTING POLICIES, continued:
| ii. | Substandard Portfolio: includes debtors with financial difficulties or a significant worsening of their payment capacity and about which are reasonable doubts about the total refund of the capital and interest within the agreed terms, showing low comfort in fulfilling their short-term financial obligations. Debtors who in the last period have slow their payments in more than 90 days. The classifications assigned to this portfolio are categories from B1 to B4. |
| iii. | Default Portfolio: includes debtors and their credits from which payment is considered remote since they show a deteriorated or null payment capacity. Debtors with manifest signs of a possible break, those who required a force debt restructuring, and any debtor who has been in default for over 90 days in his payment of interest or capital, are included in this portfolio. The classifications assigned to this portfolio are categories from C1 to C6. |
As part of individual debtor analysis, the Bank classifies debtors in the following categories, assigning them a percentage of default likelihood and loss due to default, which result in the expected loss percentages.
| Type of Portfolio | Debtor’s Category | Default Probability (%) | Loss due to Default (%) | Expected Loss (%) | ||||||||||||
| A1 | 0.04 | 90.0 | 0.03600 | |||||||||||||
| A2 | 0.10 | 82.5 | 0.08250 | |||||||||||||
| Normal portfolio | A3 | 0.25 | 87.5 | 0.21875 | ||||||||||||
| A4 | 2.00 | 87.5 | 1.75000 | |||||||||||||
| A5 | 4.75 | 90.0 | 4.27500 | |||||||||||||
| A6 | 10.00 | 90.0 | 9.00000 | |||||||||||||
| B1 | 15.00 | 92.5 | 13.87500 | |||||||||||||
| Substandard Portfolio | B2 | 22.00 | 92.5 | 20.35000 | ||||||||||||
| B3 | 33.00 | 97.5 | 32.17500 | |||||||||||||
| B4 | 45.00 | 97.5 | 43.87500 | |||||||||||||
For the Default Portfolio, the Bank must keep the following reserve levels:
| Classification | Estimated range of loss | Allowance | ||||
| C1 | Up to 3% | 2 | % | |||
| C2 | More than 3% and up to 19% | 10 | % | |||
| C3 | More than 19% and up to 29% | 25 | % | |||
| C4 | More than 29% and up to 49% | 40 | % | |||
| C5 | More than 49% and up to 79% | 65 | % | |||
| C6 | More than 79% | 90 | % | |||
For the purpose of determining allowance amounts, the percentage associated with the estimated loss rate is applied to the total credit.
Notwithstanding the latter, the Bank must keep a minimum provision percentage of 0.5% over allocations and contingent credits of the normal portfolio, which is accounted for as “minimum provision adjustment” within the item Provisions by Liability Contingencies.
Allowances for group evaluations
Banco Santander Chile uses group analysis for determining the provisioning levels for certain types of loans. These models are intended to be used primarily to analyze loans to individuals (including consumer loans, lines of credit, mortgage loans and commercial loans to individuals) and commercial loans, primarily to small and some mid-sized companies.
Provisions are determined using one of these two models to determine a historical loss rate by segment and risk profile of each group of clients:
| i. | Model based on debtor’s characteristics and his pending loans. Debtors and allocations with similar characteristics may be grouped and each group will be assigned a risk level. |
23
BANCO SANTANDER CHILE AND SUBSIDIARIES NOTES TO THE CONSOLIDATED INTERIM FINANCIAL STAEMENTS As of September 30, 2011 and 2010 and December 31, 2010 |
NOTE 01 – SUMMARY OF SIGNIFICANT ACCOUNTING POLICIES, continued:
| ii. | The model based on the behavior of an allocations group. Debtors and allocations with similar payment histories will be grouped and each group will be assigned a risk level. |
These group evaluations requires the creation of credit groups with homogeneous characteristics in terms of type of debtor and agreed conditions, so as to establish, through technically-based estimated and following prudent criteria, both the group's behavior and recovery of its deteriorated credits; and, consequently, constitute the necessary provisions to hedge the portfolio's risk.
Banco Santander Chile uses provision methodologies for the Group portfolio, in which it includes business credits for non-portfolio debtors, mortgage loans, and consumer loans (including installments, credit cards, and credit lines). The model used applies historical loss rates by segment and risk profile over the corresponding Loans and accounts receivables from customers to each portfolio for its respective provision constitution.
The provisioning model for consumer loans separates these loans in four groups, each with its own model:
| ž | New clients, not renegotiated |
| ž | Old clients, not renegotiated |
| ž | New clients, renegotiated |
| ž | Old clients, renegotiated |
Each consumer model is separated by risk profile which is established based on a scorecard statistical model that establishes a relation through regression among various variables such as payment behavior in the Bank, payment behavior outside the Bank, various socio-demographic data, among others, and a response variable which determines the client's risk which in this case is 90 days non-performance. Once the scorecards have been determined, risk profiles are established that are statistically significant with similar estimated incurred loss levels or charge-off vintage.
The estimated incurred loss rates for consumer loans are defined by the “Vintage of Net Charge-Offs” (charge-offs net of recoveries). This methodology establishes the period in which the estimated incurred loss is maximized. Once this period is obtained, it is applied to each risk profile of each model to obtain the net charge-off level associated with this period.
In the case of group business and mortgage models, business, risk profile and default trench segments are used, creating a matrix in which loss rates for each segment, profile and default are placed. The estimated incurred loss rates are then determined through historical measurements and statistical estimates, depending on the segment and the portfolio or product.
Allocations of mortgage and consumer loans
Allocations for mortgage and consumer loans are directly related to the maturity of the allocations.
A rating is assigned to all mortgage and consumer loans on an individual basis, using an automatic and sophisticated statistical model which also considers the debtors’ credit behavior. Once the client’s rating is determined, the mortgage or consumer loan provision is calculated using a related risk category and percentage, which depends on its maturity.
During the 2011 period, the Bank—within its normal process of improving the provisions models—based on its experience, has recalibrated its mortgage provisions model, which generated an impact of approximately Ch$ 16,258 million of bigger provisions. The effect of this upgrading, being a change of estimate according to the IAS 8, will be registered at the Consolidated Interim Financial Statements.
Additional Provisions
According to the SBIF regulation, banks are allowed to establish Provisions over the limits described below so as to protect themselves from the risk of non-predictable economical fluctuations that could affect the macroeconomical environment or the situation of a specific economical sector.
According to no. 10 of Chapter B-1 from the SBIF Compendium of Accounting Regulations, these provisions will be informed in liabilities, like provisions for contingent loans.
Charge-offs
As a general rule, charge-offs should be done when the contract rights over cash flow expire. In the case of allocations, even if this does not happen, the respective balances will be charged off according to Title II of Chapter B-2 of the SBIF Compendium of Accounting Regulations.
24
BANCO SANTANDER CHILE AND SUBSIDIARIES NOTES TO THE CONSOLIDATED INTERIM FINANCIAL STAEMENTS As of September 30, 2011 and 2010 and December 31, 2010 |
NOTE 01 – SUMMARY OF SIGNIFICANT ACCOUNTING POLICIES, continued:
These charge-offs refer to de-recognition in the Consolidated Interim Statements of Financial Position of assets corresponding to a loan. This includes a portion of a loan that might not be past due in the case of a loan paid in installments or in a leasing operation (no partial charge-offs).
Charge-offs are always recorded with a charge to credit risk allowances, according to Chapter B-1 of the Compendium of Accounting Regulations, whatever the cause by which the charge-off proceeds. After payments obtained from charge-off operations will be recognized at the Consolidated Interim Statement as Charge-off Credits Recovery.
Credit charge-offs and accounts receivable will be materialized overdue, default and current installments, and the deadline must be calculated from the beginning of the default, i.e., it should be done when an installment or operation credit portion reaches the deadline to charge-off as stated below:
| Allocation Type | Term | |
| Consumer Loans with or without security interest | 6 months | |
| Other operations with no security interest | 24 months | |
| Business credits with security interest | 36 months | |
| Mortgage loans | 48 months | |
| Consumer leasing | 6 months | |
| Other non-mortgage leasing operations | 12 months | |
| Mortgage leasing (housing and business) | 36 months |
Any renegotiation of an already charged-off loan will not create income—as long as the operation is still deteriorated—and the effective payments received must be treated as recovery from loans previously charged off.
The renegotiated credit could only be re-entered to assets if it stops being deteriorated, also acknowledging the activation income as recovery from Loans previously charged off .
Recovery of loans previously charged off and accounts receivable from customers
Recovery of previously charged off loans and accounts receivable from customers, are recorded in the Consolidated Interim Income Statement as a reduction of provision for loan losses.
q) Provisions, contingent assets, and contingent liabilities
Provisions are liabilities of uncertain timing or amount. Provisions are recognized in the Consolidated Interim Statements of Financial Position when the following requirements are simultaneously met:
| i. | It is a present obligation (legal or constructive) as a result of past events, and |
| ii. | It is probable that an outflow of resources will be required to settle these obligations and the amount of these resources can be readily measured. |
Contingent assets or contingent liabilities are any potential rights or obligations arising from past events whose existence will be confirmed only by the occurrence or nonoccurrence if one or more uncertain future events that are not wholly under the Bank’s control.
The following are classified as contingent in the supplementary information:
| i. | Guarantees and bonds: Encompasses guarantees, bonds, and standby letters of credit, and guarantees of payment from buyers in factored receivables. |
| ii. | Confirmed foreign letters of credit: Encompasses letters of credit confirmed by the Bank. |
| iii. | Documentary letters of credit: Includes documentary letters of credit issued by the Bank, which have not yet been negotiated. |
| iv. | Documented guarantees: Guarantees with promissory notes. |
| v. | Interbank guarantee letters: Guarantees issued. |
25
BANCO SANTANDER CHILE AND SUBSIDIARIES NOTES TO THE CONSOLIDATED INTERIM FINANCIAL STAEMENTS As of September 30, 2011 and 2010 and December 31, 2010 |
NOTE 01 – SUMMARY OF SIGNIFICANT ACCOUNTING POLICIES, continued:
| vi. | Unrestricted lines of credit: The unused amount of credit lines that allow customers to draw without prior approval by the Bank (for example, using credit cards or overdrafts in checking accounts). |
| vii. | Other credit commitments Amounts not yet lent under committed loans, which must be disbursed at an agreed future date when events contractually agreed upon with the customer occur, such as in the case of lines of credit linked to the progress of a construction or similar projects. |
| viii. | Other contingent credits: Includes any other kind of commitment by the Bank which may exist and give rise to lending when certain future events occur. In general, this includes unusual transactions such as pledges made to secure the payment of loans among third parties or derivative contracts made by third parties that may result in a payment obligation and are not covered by deposits. |
The consolidated annual accounts reflect all significant provisions for which it is estimated that the probability of having to meet the obligation is more likely than not.
Provisions are quantified using the best available information on the consequences of the event giving rise to them and are reviewed and adjusted at the end of each year and are used to address the specific liabilities for which they were originally recognized. Partial or total reversals are recorded when such liabilities cease to exist or decrease.
Provisions are classified according to the liabilities they cover as follows:
| - | Provisions for employee salaries and expenses. |
| - | Provision for mandatory dividends |
| - | Provisions for contingent credit risks |
| - | Provisions for contingencies |
r) Deferred income taxes and other deferred taxes
The Bank records, when appropriate, deferred tax assets and liabilities for the estimated future tax effects attributable to differences between the carrying amount of assets and liabilities and their tax bases. The measurement of deferred tax assets and liabilities is based on the tax rate, according to the applicable tax laws, using the tax rate that applies to the period when the deferred asset and liability is settled. The future effects of changes in tax legislation or tax rates are recorded in deferred taxes beginning on the date on which the law approving such changes is published.
s) Use of estimates
The preparation of the financial statements requires Management to make estimates and assumptions that affect the application of the accounting policies and the reported amounts of assets, liabilities, revenues and expenses. Actual results may differ from these estimates.
In certain cases, generally accepted accounting principles require that assets or liabilities be recorded or disclosed at their fair values. The fair value is the amount at which an asset could be exchanged, or a liability settled, between knowledgeable parties , in an arm’s length transaction. Where available, quoted market prices in active markets have been used as the basis for measurement. Where quoted market prices in active markets are not available, the Bank has estimated such values based on the best information available, including the use of internal valuation models and other valuation techniques.
The Bank has established allowances to cover incurred losses in accordance with regulations issued by the Superintendency of Banks and Financial Institutions. These regulations require that, to estimate the allowances, they must be regularly evaluated taking into consideration factors such as changes in the nature and volume of the loan portfolio, trends in forecasted portfolio quality, credit quality and economic conditions that may adversely affect the borrowers’ ability to pay. Increases in the allowances for loan losses are reflected as “Provisions for loan losses” in the Consolidated Interim Statement of Income. Loans are charged-off when management determines that a loan or a portion thereof is uncollectible. Charge-offs are recorded as a reduction of the provisions for loan losses.
The relevant estimates and assumptions are regularly reviewed by the Bank’s Management to quantify certain assets, liabilities, revenues, expenses, and commitments. Revised accounting estimates are recorded in the period in which the estimate is revised and in any affected future period.
26
BANCO SANTANDER CHILE AND SUBSIDIARIES NOTES TO THE CONSOLIDATED INTERIM FINANCIAL STAEMENTS As of September 30, 2011 and 2010 and December 31, 2010 |
NOTE 01 – SUMMARY OF SIGNIFICANT ACCOUNTING POLICIES, continued:
These estimates, made on the basis of the best available information, mainly refer to:
| - | Impairment losses of certain assets (Notes 8, 9, 10, and 30) |
| - | The useful lives of tangible and intangible assets (Notes 11, 12, and 30) |
| - | The fair value of assets and liabilities (Notes 6, 7, 10, and 33) |
| - | Commitments and contingencies (Note 19) |
| - | Current and deferred taxes (Note 13) |
t) Non-current assets held for sale
Non-current assets (or a group which includes assets and liabilities for disposal) expected to be recovered mainly through sales rather than through continued use, are classified as held for sale. Immediately prior to this classification, assets (or elements of a disposable group) are re-measured in accordance with the Bank’s policies. The assets (or disposal group) are measured at the lower of carrying value or fair value minus cost of sale. From this moment on, the assets (or divestiture group) are measured at the minimum value between the book value and the fair value minus sale cost.
Any impairment loss on disposal is first allocated to goodwill and then to the remaining assets and liabilities on a pro rata basis, except when no losses have been recorded in financial assets, deferred assets, employee benefit plan assets, and investment property, which are still evaluated according to the Bank’s accounting policies. Impairment losses on the initial classification of held-for-sale assets, and profits and losses from the revaluation are recorded in income. Profits are not recorded if they outweigh any cumulative loss.
As of September 30, 2011 and December 31, 2010 the Bank has not classified any non-current assets as held for sale.
Assets received or awarded in lieu of payment
Assets received or awarded in lieu of payment of loans and accounts receivable from customers are recorded, in the case of assets received in lieu of payment, at the price agreed by the parties, or otherwise, when the parties do not reach an agreement, at the amount at which the Bank is awarded those assets at a judicial auction.
These assets are subsequently valued at the lower of initially recorded value or net realizable value, which corresponds to their fair value (liquidity value determined through an independent appraisal) minus the cost of sales associated therewith.
At least once a year, the Bank carries out the necessary analysis to update these assets' cost to sale. As of September 30, 2011 the average cost to sale (the cost of maintaining and selling the asset) was estimated at 5.5% of the appraised value. As of September 30, 2010 the average sale cost used was 5.9%.
In general, it is estimated that these assets will be divested within one year since their awarding date. To comply with article 84 of the General Banking Law, those assets which are not sold during that period, will be charge-off in a single payment.
u) Earnings per share
Basic earnings per share are determined by dividing the net income attributable to the Bank shareholders in a period by the weighted average number of shares outstanding during the period.
Diluted earnings per share are determined in the same way as Basic Earnings, but the weighted average number of outstanding shares is adjusted to take into account the potential diluting effect of stock options, warrants, and convertible debt.
As of September 30, 2011 and 2010 the Bank did not have instruments that generated diluting effects on equity.
v) Temporary acquisition (assignment) of assets
Purchases (sales) of financial assets under non-optional resale (repurchase) agreements at a fixed price (“repos”) are recorded in the Consolidated Interim Statements of Financial Position as financial assignments (receipts) based on the nature of the debtor (creditor) under “Deposits in the Central Bank of Chile,” “Deposits in financial institutions” or “Loans and accounts receivable from customers” (“Central Bank of Chile deposits,” “Deposits from financial institutions” or “Customer deposits”).
Differences between the purchase and sale prices are recorded as financial interest over the term of the contract.
27
BANCO SANTANDER CHILE AND SUBSIDIARIES NOTES TO THE CONSOLIDATED INTERIM FINANCIAL STAEMENTS As of September 30, 2011 and 2010 and December 31, 2010 |
NOTE 01 – SUMMARY OF SIGNIFICANT ACCOUNTING POLICIES, continued:
w) Assets under management and investment funds managed by the Bank
Assets owned by third parties and managed by certain companies that are within the Bank’s perimeter of consolidation (Santander Asset Management S.A., Administradora General de Fondos and Santander S.A. Sociedad Securitizadora), are not included in the Consolidated Interim Statements of Financial Position. Commissions generated from this activity are included under “Fee and commission income” in the Consolidated Interim Income Statement.
x) Provision for mandatory dividends
As of September 30, 2011 and 2010 the Bank recorded a provision for mandatory dividends. This provision is made pursuant to Article 79 of the Corporations Act, which is in accordance with the Bank’s internal policy, pursuant to which at least 30% of net income for the period is distributed, except in the case of a contrary resolution adopted at the respective shareholders’ meeting by unanimous vote of the outstanding shares. This provision is recorded, as a deduction under the “Retained earnings - Provisions for mandatory dividends” in the Consolidated Interim Statement of Changes in Equity.
y) Employee benefits
i. Post-employment Retributions – Defined Benefit Plant:
According to current collective bargaining and other agreements, the Bank has undertaken to supplement the benefits granted by the public systems corresponding to certain employees and other beneficiary right holders, for retirement, permanent disability or death, outstanding salaries or compensations, contributions to pension funds for active employees and post-employment social benefits.
Features of the Plan:
The main features of the Post-Employment Benefits Plan promoted by the Santander Chile Group are:
| a. | Aimed at the Group’s management |
| b. | The general requisite to apply for this benefit is that the employee must be carrying out his/her duties when turning 60 years old. |
| c. | The Bank will take on insurance (pension fund) on the employee’s behalf, for which it will regularly the respective premium (contribution). |
| d. | The Bank will be directly responsible for granting benefits. |
The Bank recognizes under line item “Provisions” in the Consolidated Interim Statements of Financial Position (or in assets under “Other assets,” depending on the funded status of the plan) the present value of its post-employment defined benefit obligations, net of the fair value of the plan assets and of the net recognized cumulative actuarial gains or losses, disclosed in the valuation of these obligations, which are deferred using “corridor approach”, net of the past service cost, which is deferred in time as explained below.
“Plan assets” are defined as those which will be used to settle the obligations and which meet the following requirements:
| - | They are not owned by the consolidated entities, but by a legally separate third party not related to the Bank. |
| - | They are available only to pay or fund post-employment benefits and cannot be returned to the consolidated entities except when the assets remaining in the plan are sufficient to meet all the obligations of the plan or the entity in relation to the benefits due to current or former employees or to reimburse employee benefits previously paid by the Bank. |
“Actuarial gains and losses” are defined as those arising from the differences between previous actuarial assumptions and what has actually occurred, and from changes in the actuarial assumptions used. The Bank applies, by plans, the “corridor approach” criterion, whereby it recognizes in the Consolidated Interim Statement of Income, the amount resulting from dividing by five the higher of the net value of the accumulated actuarial profits and/or losses not recorded at the beginning of each period and exceeding 10% of the current value of the obligations or 10% of the fair value of the assets at the beginning of the period..
“Past service cost”—which arises from changes made to existing post-retirement benefits or the introduction of new benefits—is recorded in the Consolidated Interim Income Statement on a straight line basis over the period beginning on the date on which the new commitments arose to the date on which the employee has an irrevocable right to receive the new benefits.
28
BANCO SANTANDER CHILE AND SUBSIDIARIES NOTES TO THE CONSOLIDATED INTERIM FINANCIAL STAEMENTS As of September 30, 2011 and 2010 and December 31, 2010 |
NOTE 01 – SUMMARY OF SIGNIFICANT ACCOUNTING POLICIES, continued:
Post-employment benefits are recorded in the Consolidated Interim Income Statement as follows:
| - | Current service cost, defined as the increase in the current value of the obligations arising as a consequence of the services provided by the employees during the period under the “Personnel salaries and expenses” item. |
| - | Interest cost, defined as the increase in the present value of the obligations as a consequence of the passage of time which occurs during the period). When the obligations are shown in liabilities in the Consolidated Interim Statements of Financial Position net of the plan assets, the cost of the liabilities which are recorded in the Consolidated Interim Income Statement reflects exclusively the obligations recorded in liabilities. |
| - | The expected return on the plan’s assets and the gains and losses in their value, less any cost arising from their management and the taxes to which they are subject. |
| - | The actuarial gains and losses calculated using the corridor approach and unrecognized past service cost the cost of not-acknowledged past services, are recorded in the Consolidated Interim Income Statement under “Personnel salaries and expenses”. |
ii. Severance Provision:
Severance provisions for years of employment are recorded only when they actually occur or upon the availability of a formal and detailed plan in which the fundamental modifications to be made are identified, provided that such plan has already started to be implemented or its principal features have been publicly announced, or objective facts about its execution are known.
iii. Share-based compensation:
The allocation of equity instruments to executives of the Bank and its Subsidiaries as a form of compensation for their services, when those instruments are provided at the end of a specific period of employment, is recorded as an expense in the Consolidated Interim Income Statement under the “Personnel wages and expenses” item, as the relevant executives provide their services over the course of the period.
These benefits do not generate diluting effects, since they are based on shares of Banco Santander S.A. (the parent company of Banco Santander Chile, headquartered in Spain).
z) New accounting pronouncements
| i. | Incorporation of new accounting regulations and instructions issued by the SBIF as well as by the IASB |
As of the date of issuance of these Consolidated Interim Financial Statements, the following accounting pronouncements have been issued by the both the SBIF and the IASB, which have been fully incorporated by the Bank and are detailed as follows:
| 1) | Accounting Regulations Issued by the SBIF |
Circular Letter No. 3518 – On February 2, 2011 the SBIF issued this circular to complement the instructions enforced from January 2011 related to Chapters B-1 and B-3, so as detail some instructions. The incorporated changes follow only the addition and elimination of words from the text to clarify the presented regulations. This letter had no significant effect on these consolidated interim financial statements.
Circular No. 3,540 - On October 8, 2010 the SBIF issued this circular to adapt formats to the new provision instructions and cover certain information needs with a bigger breakdown, Chapter C-3 is replaced "Monthly Financial Statements" of the Compendium of Accounting Regulation. Changes incorporated in this Chapter are only due to the elimination or creation of the lines or items stated in the annex to this circular, which will be enforced starting with the information referred to on January 31, 2011.
Circular No. 3,503 – In August 2010, the SBIF issued this Circular which supplements and modifies the instructions related to the Compendium of Accounting Standards, chapters B-1, B-2, B-3, and C1 related to allowances and impaired portfolios. The changes incorporated here correspond to news texts and rewording of concepts related to type of credits and portfolios. These modifications will be enforced as of January 1, 2011. In addition, this circular incorporates regulations relating to additional provisions included in No.9 of Chapter B-1 which are valid during 2010. The effects on the financial statements due to the adoption of this Circular are described in Note 2 “Accounting Changes.”
29
BANCO SANTANDER CHILE AND SUBSIDIARIES NOTES TO THE CONSOLIDATED INTERIM FINANCIAL STAEMENTS As of September 30, 2011 and 2010 and December 31, 2010 |
NOTE 01 – SUMMARY OF SIGNIFICANT ACCOUNTING POLICIES, continued:
| 2) | Accounting Regulations Issued by the International Accounting Standards Board |
Improvements to IFRS – On May 06, 2010 the IASB issued improvements to IFRS 2010, incorporating amendments to 7 IFRS. This is the third set of modifications issued under the yearly improvement process which were designed to make necessary though no urgent modifications to IFRS. The modifications are effective for yearly periods beginning on or after July 1, 2010 and for yearly periods beginning on or after January 1, 2011. The adoption of these improvements had no significant impact on the Bank’s Consolidated Interim Financial Statements.
Amendment to IFRIC 14, IAS 19 – Limit over asset by defined benefits, minimum funding requirements and their interaction - On December 2009, the IASB issued Prepayments of a minimum funding requirement, modifications to IFRIC 14, IAS 19 - Limit over asset by defined benefits, minimum funding requirements and their interaction . The modifications have been carried out to remedy a non-intentional consequence of IFRIC 14 in which it is forbidden for entities in some circumstances to recognize certain voluntary prepayments as assets. The enforcement of this amendment had no significant impact on the Bank’s Consolidated Interim Financial Statements.
IFRIC 19, Extinguishing Financial Liabilities with Equity Instruments – Issued on November 26, 2009. This interpretation provides guidelines on how to record the extinction of a financial liability through the issuance of equity instruments. The interpretation concluded that issuing equity instruments to extinguish an obligation constitutes the paid consideration. The consideration should be measured at fair value of the issued equity instrument, unless the fair value is not easily determined, in which case, the equity instruments will be measured at fair value of the extinguished obligation. The enforcement of this interpretation had no significant impact on the Bank’s Consolidated Interim Financial Statements.
Amendment to IAS 24, Disclosure of Related Parties – On November 4, 2009 the IASB issued modifications to IAS 24. The revised regulation simplifies the disclosure requirements for entities controlled, jointly-controlled or significantly influenced by a government entity (designated as government-related entity) and clarifies the related entity definition. It is effective for yearly periods beginning on or after January 1, 2011. It requires back application. Therefore, on the first adoption year, disclosures for comparative years should be reissued. In advance application is allowed, whether of the entire regulation or the partial exemption for related government entities. If an entity applies the regulation, or part of it, for a period before January 1, 2011; it is demanded that this fact is revealed. The Bank is no related to any government entity; therefore, the disclosure exemptions do not apply to it. In addition, the changes to the definition of Related Party did not cause an effect on the Bank’s Consolidated Interim Financial Statements.
Amendment to IAS 32, Financial Instruments: Presentation – On October 8, 2009 the IASB issued a modification to IAS 32, Financial Instruments: Presentation, entitled Classification of Right Issues. Pursuant with the modifications, rights, options and warrants that in some way fulfill the definition in paragraph 11 of IAS 32, issued to acquire a set number of non-derivative equity instruments belonging to an entity for a set amount in any currency are classified as equity instruments as long as the offer is made pro-ratio to all current owners of the same type of equity instrument. The enforcement of this modification had no significant impact on the Bank’s Consolidated Interim Financial Statements.
| ii. | New accounting regulations and instructions issued by the SBIF as well as by the IASB not enforced as of September 30, 2011. |
At the end date of these financial statements new IFRS had been published as well as interpretations of these regulations that were not mandatory as of September 30, 2011. Though in some cases the IASB has allowed for their in advance adoption, the Bank has not done so up to said date.
| 1) | Accounting Regulations Issued by the SBIF |
Circular Letter No. 1 – On May 4, 2010 the SBIF informed about the issuance of the Supreme Decree No. 1512 which regulates the universal credits from Law No. 20448. To do so, it requests that all corresponding measures be applied to fulfill the dispositions in said decree on October 24, this year. The main issues to deal with regarding this are related to the systems for calculating the Annual Equivalent Cost, the conditions by which the information should be given to consumers, and the content of the universal credit contracts that the entity will be forced to offer from that date on. The Bank in currently carrying out the necessary modifications to adopt that regulations.
30
BANCO SANTANDER CHILE AND SUBSIDIARIES NOTES TO THE CONSOLIDATED INTERIM FINANCIAL STAEMENTS As of September 30, 2011 and 2010 and December 31, 2010 |
NOTE 01 – SUMMARY OF SIGNIFICANT ACCOUNTING POLICIES, continued:
| 2) | Accounting Regulations Issued by the International Accounting Standards Board |
IAS 1, Presentation of Financial Statements – On June, 2011 the presentation of Other Comprehensive Income is modified in two significant aspects: 1) An entity may present a single "Statement of Profit and Loss and Other Comprehensive Income" presented in two sections, but sections shall be presented together, with the profit or loss section presented first followed directly by the other comprehensive income section; 2) The Other Comprehensive Income item shall present line items for amount of OCI in the period, classified by nature and grouped into those that will not be reclassified subsequently to profit or loss; and those will be reclassified subsequently to profit or loss when specific conditions are met. The effective date is for the annual periods beginning on or after July 1, 2012; with early adoption permitted. The Bank believes this modification will not significantly affect the interim financial statements.
IAS 19 Employee Benefits – On June 2011 the following modifications were incorporated to the regulations: 1) Eliminates the use of the 'corridor' approach, recognizing in results gains and losses that arise from defined benefit plans; 2) Require to include service and finance cost in profit or loss and remeasurement in OCI; 3) Alongside previous requirement introduces improvement disclosure requirements that will better show characteristics of defined benefit plan and the risk arising from those plans. The effective date is for the annual periods beginning on or after July 1, 2013; with early adoption permitted. The Bank is assessing the potential impact tha this amendments will have on the Bank’s financial statements.
IFRS 10, Consolidated Interim Financial Statements – On May 12, 2011 the IASB issued the IFRS 10 Consolidated Interim Financial Statements which replaces the IAS 27 Consolidated and Separated Interim Financial Statements and SIC 12 Consolidation - Special Purpose Entities. The purpose of this regulation is to provide a single consolidation basis for all entities, whatever the nature of the investment, based on control. The definition of control includes three elements: power over entity, exposure or rights to variable returns over the entity, and the capacity to use the power over the entity to affect the investor's returns. IFRS 10 provides a detailed guide on how to apply the control principle in different situations, including relationships of agency and potential possession of vote rights. An investor will reassess if s/he controls an entity if there are changes in facts and circumstances. IFRS 10 replaces IAS 27 in those matters related to when and how an investor should prepare Consolidated Interim Financial Statements and replaces the SIC 12 completely. The effective date is January 1, 2013 and its enforcement in advance is allowed under certain circumstances. The Bank is assessing the potential impact this regulation will have on the Bank’s financial statements.
IFRS 11, Joint Agreements - On May 12, 2011 the IASB issued IFRS 11 Joint Arrangements, which replaces IAS 31 Interests In Joint Ventures and SIC 13 Jointly Controlled Entities - Non monetary Contribution from Venturers. IFRS 11 classifies all joint arrangements as joint operations (combining the current concepts on jointly controlled assets and operations) or joint ventures (equivalent to current concept of jointly controlled entity). A joint operation is a joint agreement in which the parts which have control have rights over assets and obligations towards liabilities. A joint venture is a joint arrangement in which the parties which have joint control have rights over the agreement's net assets. IFRS 11 needs to use the Equity Method to enter the participation in a joint business; therefore, it eliminates the proportion in the consolidation. The effective date is January 1, 2013 and early adoption is permitted under certain circumstances. The Bank is assessing the potential impact this regulation will have on the Bank’s financial statements.
IFRS 12, Disclosure of Interests in Other Entities - On May 12, 2011 the IASB issued IFRS 12 Disclosure of Interests in Other Entities, which requires detailed disclosures related to participation in subsidiaries, joint arrangements, associates and non-consolidated structured entities. IFRS 12 establishes objective revelations and minimum specific disclosures that an entity must provide to fulfill said objectives. An entity must reveal information that would help users of its financial statements to evaluate the nature and associated risks to the participation in other entities and the effects of said participations in its financial statements. Disclosure requirements are extensive and require significant efforts to gather the necessary information. The effective date is January 1, 2013; however, it is allowed to incorporate these new disclosures in the financial statements before that date. The Bank is assessing the potential impact this regulation will have on the Bank’s interim financial statements.
IFRS 13, Fair Value Measurement– Issued on May 12, 2011 by the IASB. It establishes a single source to serve as guide for the measure at fair value under IFRS. This regulation applied both to financial and non-financial measures at fair value. Fair Value is defined as “value that would be received by selling an asset or by paying for transferring a liability in an ordered transaction between market parties at the time of measure· (i.e. exit value). IFRS 13 is effective for yearly periods beginning on or after January 1, 2013-–early enforcement is allowed—and it applies prospectively since the beginning of the year of its enforcement. The Bank is assessing the potential impact this regulation will have on the Bank’s financial statements.
31
BANCO SANTANDER CHILE AND SUBSIDIARIES NOTES TO THE CONSOLIDATED INTERIM FINANCIAL STAEMENTS As of September 30, 2011 and 2010 and December 31, 2010 |
NOTE 01 – SUMMARY OF SIGNIFICANT ACCOUNTING POLICIES, continued:
IAS 27 Separate Financial Statements (revised in 2011) - On May 12, IAS 27 Consolidated and separate financial statements has been amended by the issuance of IFRS 10 but it keeps the guidelines for separate financial statements. Effective date is January 1, 2013 though its early adoption is permitted as the new regulations are adopted. The Bank believes this regulation will have no significant effect on the Bank’s financial statements since the modification does not alter the accounting treatment of the separate financial statements.
IAS 28, Investments in Associates and Join Ventures (revised in 2011) – On May 12, 2011 IAS 28 Investments in Associates has been amended pursuant to changes incorporated by IFRS 10, IFRS 11 and, IFRS 12. Effective date is January 1, 2013 though its early adoption is permitted as the new regulations are adopted. The Bank is assessing the potential impact this revision will have on the Bank’s interim financial statements.
Amendment to IFRS 1, First Time Adoption of IFRS – On December 20, 2010 the IASB published certain modifications to IFRS 1, specifically:
(i) Elimination of Set Dates for First Time Adopters - These modifications help first time adopters of IFRS by replacing the back application date of the un-record of financial assets and liabilities of ‘January 1, 2004’ with the ‘transition date to IFRS’. In this way, first time IFRS adopters do not have to apply the un-record requirements of IAS 39 retrospectively to a previous date and it frees adopters from recalculating profit and losses of ‘day 1’ over transactions that took place before the transition date to IFRS.
(ii) Severe Hyperinflation – These modifications provide guidelines for entities coming from a sever hyperinflation, allowing them at the date of transaction of entities, to measure all assets and liabilities held before the normalization of functional currency date to fair value on the transition date to IFRS and use that fair value as the attributed cost for those assets and liabilities in the statements of opening financial position under IFRS. Entities using this exemption will have to describe the circumstances of how and why their functional currency was subjected to sever hyperinflation and the circumstances that led to end those conditions.
These modifications will be mandatorily applied for yearly periods beginning on or after July 1, 2011. In-advance enforcement is allowed. The Banks considers these modifications will have no effect on its financial statement since it is not a first time adopter of IFRS.
Amendment to IAS 12, Income Taxes – On December 20, 2010 the IASB published Deferred Taxes: Recovery of Underlying Assets – Modifications to IAS 12. The modifications establish an exemption to the IAS 12 general principle that the measurement of assets and liabilities by deferred taxes should reflect the tax consequences that would continue the way the entity expects to recover the book value of an asset. The exemption applies specifically to assets and liabilities by deferred taxes originating from investment properties measured using the fair value model from IAS 40 and investment properties acquired in a business combination, if this is afterwards measured using the IAS 40 fair value model. The modification incorporates the assumption that the current value of the investment property will be recovered when sold, except when the property is depreciable and kept within a business model that aims at consuming substantially all economic benefits through time rather than through sale. This modifications should be back applied demanding a back re issuance of all assets and liabilities by deferred taxes within the reach of this modification, including those initially recorded in a business combination. These modifications will be mandatorily applied for yearly periods beginning on or after January 1, 2012. In-advance enforcement is allowed. In-advance enforcement is allowed. The Bank considers that these modifications will be adopted in its financial statements for the period beginning on January 1, 2012. The Bank is assessing the potential impact of the adoption of these measures.
Amendments to IFRS 9 – Financial Instruments – On October 28, 2010 the IFRS published a revised version of IFRS 9, Financial Instruments. The revised regulation keeps the requirements for classification and measurement of financial assets published on November 2008 but it adds guidelines on classification and measurement of financial liabilities. As part of the restructuring of IFRS 9, the IASB has also reproduced the guidelines on un-record of financial instruments and related implementation guidelines from IAS 39 to IFRS 9. These new guidelines constitute the first stage of the IASB project to replace IAS 39. The other stages, impairment and hedge accounting, have not been finished yet.
The guidelines included in IFRS 9 about the classification and measurement of financial assets has not changed from those established in IAS 39. In other words, financial liabilities will continue to be measured whether by amortized cost or fair value with change in income. The concept of bifurcation of embedded derivatives in a contract by financial asset has not change either. Financial liabilities kept to negotiate will continue to be measured at fair value with changes to income, and all other financial assets will be measured to amortized cost unless the fair value option is applied using the present criteria on IAS 39..
Notwithstanding the latter, there are two differences with regards to IAS 39:
| · | The presentation of effects from changes in fair value attributable to a liability’s credit risk; and |
| · | The elimination of the cost exemption for liability derivatives to be settled by giving non-traded equity instruments. |
32
BANCO SANTANDER CHILE AND SUBSIDIARIES NOTES TO THE CONSOLIDATED INTERIM FINANCIAL STAEMENTS As of September 30, 2011 and 2010 and December 31, 2010 |
NOTE 01 – SUMMARY OF SIGNIFICANT ACCOUNTING POLICIES, continued:
The Bank’s Management, in agreement with the SBIF will not apply this regulation in advance but rather adopt it in the Group's financial statements for the period beginning on January 2013. The Bank has not had the chance to consider the potential impact of the adoption of these modifications.
Amendment to IFRS 7, Financial Instruments: Disclosures - On October 7, 2010 the IASB issued Disclosures - Transfer of Financial Assets (Modifications to IFRS 7 Financial Instruments - Disclosures) which increases the disclosure requirements for transactions involving the transfer of financial assets. These modifications aim at providing a bigger transparency over risk exposure of transactions where a financial asset is transferred but the transferring party retains some level of continuous exposure (referred to as ‘continuous involvement’) in the asset. Modifications also require to disclosure when the transfers of financial assets have not been evenly distributed during the period (i.e., when transfers take place close to the report period). These modifications will be applied for yearly periods beginning on or after January 1, 2011. In-advance enforcement is allowed. In-advance enforcement is allowed. Disclosures are not required for any of the periods presented starting before the initial application date of the modifications. The Bank’s management is assessing the potential impact of the adoption of these modifications.
IFRS 9, Financial Instruments – On November 12, 2009 the IASB issued IFRS 9, Financial Instruments. This regulation incorporates new requirements for the classification and measurement of financial assets and it is effective for yearly periods beginning on or after January 2013, allowing it to be enforced in advance. IFRS 9 specifies how an entity should classify and measure its financial assets. It requires that all financial assets be classified in their entirely on the basis of the entity’s business model for the management of financial assets and the features of the financial assets agreement cash flows. Financial assets are measured whether by amortized cost or fair value. Only financial assets classified as measured to amortized cost will be tested for Impairment. The Bank management, according to SBIF, will not apply this regulation in advance; furthermore, this regulation will not be applied as long as the SBIF does not set it as mandatory use standard for all balances.
33
BANCO SANTANDER CHILE AND SUBSIDIARIES NOTES TO THE CONSOLIDATED INTERIM FINANCIAL STAEMENTS As of September 30, 2011 and 2010 and December 31, 2010 |
NOTE 02 – ACCOUNTING CHANGES:
On August 12, 2010 Circular Letter No. 3,503 was issued which includes certain modifications to provisions and impaired portfolio included in Chapters B-1, B-2, B-3 y C1. Such modifications will be enforced from January 1, 2011 except from those relating to additional provisions included in No. 9 of Chapter B-1 which have been enforced since 2010. In addition, and as a supplement to the abovementioned Circular Letter, Letter to Management No. 9 was issued on December 21, 2010 which specifies that adjustments as a consequence of the adoption of the modifications starting on January 1, 2011 could be carried out during the first quarter of 2011; however, there is nothing to prevent entities from anticipating this recognition of safeguards, in total or in parts, constituting larger provisions, transitorily as additional, with charge to the income from the 2010 period. As of December 31, 2010 the Bank has acknowledged said changes in advance, which created an effect of MCH$39,800 in the profits from the period ending as of December 31, 2010.
Reclassifications of additional provision stocks to individual effective provisions and contingent risk provisions—required by the modifications to Chapter B-1 of the Compendium of Accounting Regulations—are as follows:
Closing balance as of December 31, | Pro Form Balance as of December 31, | |||||||||||
| Statement of financial position | 2010 | Reclassification | 2010 | |||||||||
| MCh$ | MCh$ | MCh$ | ||||||||||
| Assets | ||||||||||||
| Total allocations | 15,657,556 | - | 15,657,556 | |||||||||
| Commercial loans allowances | (199,347 | ) | (39,343 | ) (*) | (238,690 | ) | ||||||
| Mortgage loans allowances | (17,332 | ) | - | (17,332 | ) | |||||||
| Consumer loans allowances | (225,559 | ) | - | (225,559 | ) | |||||||
| Total Allowances | (442,238 | ) | (39,343 | ) | (481,581 | ) | ||||||
| Loans and accounts receivables from customers, net | 15,215,318 | (39,343 | ) | 15,175,975 | ||||||||
| Liabilities | ||||||||||||
| Provision for personnel salaries and expenses | 36,016 | - | 36,016 | |||||||||
| Provision for mandatory dividends | 143,147 | - | 143,147 | |||||||||
| Allowance for contingent loans | 5,636 | 35,002 | (**) | 40,638 | ||||||||
| Allowance for contingencies (additional) | 90,497 | (74,345 | ) | 16,152 | ||||||||
| Allowances | 275,296 | (39,343 | ) | 235,953 | ||||||||
Closing balance as of September 30, | Pro Form Balance as of September 30, | |||||||||||
| Statement of income | 2010 | Reclassifications | 2010 | |||||||||
| MCh$ | MCh$ | MCh$ | ||||||||||
| Provisions for loan losses | ||||||||||||
| Provisions for loans and accounts receivable | (231,551 | ) | - | (231,551 | ) | |||||||
| Provisions for contingent loans | (830 | ) | 26,706 | 25,876 | ||||||||
| Additional provisions | - | - | - | |||||||||
| Normal portfolio minimum provision adjustment | - | - | - | |||||||||
| Recovery of loans previously charged off | 23,555 | - | 23,555 | |||||||||
| Provisions for loan losses | (208,826 | ) | 26,706 | (182,120 | ) | |||||||
| Income from assets received in lieu of payment | 2,975 | - | 2,975 | |||||||||
| Provisions for contingencies | 40,058 | (33,022 | ) | 7,036 | ||||||||
| Other income | 17,543 | - | 17,543 | |||||||||
| Other operating income | 60,576 | (33,022 | ) | 27,554 | ||||||||
| Provisions and expenses for assets received in lieu of payment | (14,881 | ) | - | (14,881 | ) | |||||||
| Provisions for contingencies | (12,268 | ) | 6,316 | (5,952 | ) | |||||||
| Other expenses | (25,130 | ) | - | (25,130 | ) | |||||||
| Other operating expenses | (52,279 | ) | 6,316 | (45,963 | ) | |||||||
| Net income from other operating income and expenses | 8,297 | (26,706 | ) | (18,409 | ) | |||||||
(*) Contingent provisions (additional) for MCh$74,345 are reclassified in:
MCh$ 39,800 of individual provisions under Chapter B-1 of the Compendium of Accounting Regulations, constituted by (*) MCh$ 39,343 corresponding to provisions over individual effective allocations and MCh$ 457 reclassified to provisions for contingent loan risks.
(**) The MCh$ 35,002 correspond to:
i: MCh$ 457 provisions for contingent loans risks, reclassified from MCh$ 39,800 on.
ii. MCh$ 34,545 provisions for unrestricted lines of credit.
34
BANCO SANTANDER CHILE AND SUBSIDIARIES NOTES TO THE CONSOLIDATED INTERIM FINANCIAL STAEMENTS As of September 30, 2011 and 2010 and December 31, 2010 |
NOTE 02 – ACCOUNTING CHANGES, continued:
To present the comparative financial statements, the Bank has carried out the necessary reclassifications to the said Consolidated Interim Income Statement as of September 30, 2010 following Circular Letter No. 3503.
Closing balance as of September 30, | Pro Form Balance as of September 30, | |||||||||||
| 2010 | Reclassifications | 2010 | ||||||||||
| MCh$ | MCh$ | MCh$ | ||||||||||
| OPERATING INCOME | ||||||||||||
| Interest income | 1,045,602 | - | 1,045,602 | |||||||||
| Interest expense | (337,748 | ) | - | (337,748 | ) | |||||||
| Net interest income | 707,854 | - | 707,854 | |||||||||
| Fee and commission income | 247,346 | - | 247,346 | |||||||||
| Fee and commission expense | (53,401 | ) | - | (53,401 | ) | |||||||
| Net fee and commission income | 193,945 | - | 193,945 | |||||||||
| Net income from financial operations (net trading income) | 51,946 | - | 51,946 | |||||||||
| Foreign exchange profit (loss), net | 24,381 | - | 24,381 | |||||||||
| Other operating income | 60,576 | (33,022 | ) | 27,554 | ||||||||
| Total operating income | 1,038,702 | (33,022 | ) | 1,005,680 | ||||||||
| Provisions for loan losses | (208,826 | ) | 26,706 | (182,120 | ) | |||||||
| NET OPERATING PROFIT | 829,876 | (6,316 | ) | 823,560 | ||||||||
| Personnel salaries and expenses | (184,921 | ) | - | (184,921 | ) | |||||||
| Administrative expenses | (109,743 | ) | - | (109,743 | ) | |||||||
| Depreciation and amortization | (36,227 | ) | - | (36,227 | ) | |||||||
| Impairment | (4,665 | ) | - | (4,665 | ) | |||||||
| Other operating expenses | (52,279 | ) | 6,316 | (45,963 | ) | |||||||
| Total operating expenses | (387,835 | ) | 6,316 | (381,519 | ) | |||||||
| OPERATING INCOME | ||||||||||||
| Income from investments in other companies | 1,175 | - | 1,175 | |||||||||
| Income before tax | 443,216 | - | 443,216 | |||||||||
| Income tax expense | (60,032 | ) | - | (60,032 | ) | |||||||
| CONSOLIDATED INCOME FOR THE PERIOD | 383,184 | - | 383,184 | |||||||||
| Attributable to: | ||||||||||||
| Bank shareholders (Equity holders of the Bank) | 383,283 | - | 383,283 | |||||||||
| Non-controlling interest | (99 | ) | - | (99 | ) | |||||||
Earnings per share attributable to Bank shareholders (expressed in Chilean pesos): | ||||||||||||
| Basic earnings | 2.034 | - | 2.034 | |||||||||
| Diluted earnings | 2.034 | - | 2.034 | |||||||||
35
BANCO SANTANDER CHILE AND SUBSIDIARIES NOTES TO THE CONSOLIDATED INTERIM FINANCIAL STAEMENTS As of September 30, 2011 and 2010 and December 31, 2010 |
NOTE 02 – ACCOUNTING CHANGES, continued:
To present the comparative financial statements, the Bank has carried out the necessary reclassifications to the said Consolidated Interim Income Statement as of December 31, 2010 following Circular Letter No. 3503.
Closing balance as of December 31, | Pro Form Balance as of December 31, | |||||||||||
| 2010 | Reclassifications | 2010 | ||||||||||
| MCh$ | MCh$ | MCh$ | ||||||||||
| ASSETS | ||||||||||||
| Cash and deposits in banks | 1,762,198 | - | 1,762,198 | |||||||||
| Unsettled transactions: | 374,368 | - | 374,368 | |||||||||
| Trading investments | 379,670 | - | 379,670 | |||||||||
| Investments under repurchase agreements | 170,985 | - | 170,985 | |||||||||
| Financial derivative contracts | 1,624,378 | - | 1,624,378 | |||||||||
| Interbank loans, net | 69,672 | - | 69,672 | |||||||||
| Loans and accounts receivables from customers, net | 15,215,318 | (39,343 | ) | 15,175,975 | ||||||||
| Available for sale investments | 1,473,980 | - | 1,473,980 | |||||||||
| Held to maturity investments | - | - | - | |||||||||
| Investments in other companies | 7,275 | - | 7,275 | |||||||||
| Intangible assets | 77,990 | - | 77,990 | |||||||||
| Property, plant, and equipment | 154,985 | - | 154,985 | |||||||||
| Current taxes | 12,499 | - | 12,499 | |||||||||
| Deferred taxes | 117,964 | - | 117,964 | |||||||||
| Other assets | 640,937 | - | 640,937 | |||||||||
| TOTAL ASSETS | 22,082,219 | (39,343 | ) | 22,042,876 | ||||||||
| LIABILITIES | ||||||||||||
| Deposits and other demand liabilities | 4,236,434 | - | 4,236,434 | |||||||||
| Unsettled transactions: | 300,125 | - | 300,125 | |||||||||
| Investments under repurchase agreements | 294,725 | - | 294,725 | |||||||||
| Time deposits and other time liabilities | 7,258,757 | - | 7,258,757 | |||||||||
| Financial derivative contracts | 1,643,979 | - | 1,643,979 | |||||||||
| Interbank borrowings | 1,584,057 | - | 1,584,057 | |||||||||
| Issued debt instruments | 4,190,888 | - | 4,190,888 | |||||||||
| Other financial liabilities | 166,289 | - | 166,289 | |||||||||
| Current tax | 1,293 | - | 1,293 | |||||||||
| Deferred taxes | 5,441 | - | 5,441 | |||||||||
| Provisions | 275,296 | (39,343 | ) | 235,953 | ||||||||
| Other liabilities | 261,328 | - | 261,328 | |||||||||
| TOTAL LIABILITIES | 20,218,612 | (39,343 | ) | 20,179,269 | ||||||||
| EQUITY | ||||||||||||
| Attributable to Bank shareholders: | 1,831,798 | - | 1,831,798 | |||||||||
| Capital | 891,303 | - | 891,303 | |||||||||
| Reserves | 51,539 | - | 51,539 | |||||||||
| Valuation adjustments | (5,180 | ) | - | (5,180 | ) | |||||||
| Retained Earnings | 894,136 | - | 894,136 | |||||||||
| Retained earnings of prior years | 560,128 | - | 560,128 | |||||||||
| Income for the period | 477,155 | - | 477,155 | |||||||||
| Minus: Provision for mandatory dividends | (143,147 | ) | - | (143,147 | ) | |||||||
| Non-controlling interest | 31,809 | - | 31,809 | |||||||||
| TOTAL EQUITY | 1,863,607 | - | 1,863,607 | |||||||||
| TOTAL LIABILITIES AND EQUITY | 22,082,219 | (39,343 | ) | 22,042,876 | ||||||||
36
BANCO SANTANDER CHILE AND SUBSIDIARIES NOTES TO THE CONSOLIDATED INTERIM FINANCIAL STAEMENTS As of September 30, 2011 and 2010 and December 31, 2010 |
NOTE 03 - SIGNIFICANT EVENTS:
As of September 30, 2011, the following significant events have occurred and had an impact on the Bank’s operations or the consolidated interim financial statements:
a) The Board
In an Extraordinary Board Session on April 26, 2011 Mr. Lisandro Serrano Spoerer was confirmed as Director in the position left by Ms. Claudia Bobadilla Ferrer.
b) Issuance of bonds during 2011
In 2011, the Bank placed senior bonds in the amount of UF 500,000,000. The 2011 detail is included in Note 16.
b.1) 2011 Senior Bonds
| Series | Amount | Term | Issue Rate | Issuance date | Maturity date | |||||||
| Floating rate bond | USD | 500,000,000 | 5 years | Libor (3 months) + 160 bp | 01/19/2011 | 01/19/2016 | ||||||
| Total | USD | 500,000,000 | ||||||||||
| E1 | UF | 4,000,000 | (i) | 5 years | 3.30 % per annum simple | 03/04/2011 | 02/01/2016 | |||||
| E2 | UF | 4,000,000 | (ii) | 7 years | 3.50 % per annum simple | 01/01/2011 | 07/01/2018 | |||||
| E3 | UF | 4,000,000 | (iii) | 8 years | 3.50 % per annum simple | 01/01/2011 | 07/01/2019 | |||||
| Total | UF | 8,000,000 | ||||||||||
| E4 | CLP | 50,000,000 | (iv) | 5 years | 6.75 % per annum simple | 06/01/2011 | 06/01/2016 | |||||
| Total | UF | 50,000,000 | ||||||||||
| (i) | As of September 30, 2011 UF 896,000 in bonds have been issued; leaving this series with a UF 3,104,000 par value to be placed. |
| (ii) | As of September 30, 2011 UF 3,048,000 in bonds have been issued; leaving this series with a UF 952,000 par value to be placed. |
| (iii) | As of September 30, 2011 UF 1,750,000 in bonds have been issued; leaving this series with a UF 2,250,000 par value to be placed. |
| (iv) | As of September 30, 2011 CLP 26,800,000,000 in bonds have been issued; leaving this series with a CLP 13,200,000,000 par value to be placed. |
b. 2) 2011 Subordinated bonds
In 2011, the Bank has issued the following subordinated bonds:
| Series | Amount | Term | Issue Rate | Issuance date | Maturity date | |||||||
| G3 | UF | 3,000,000 | 25 years | 3.95% annual due | 07/01/2010 | 07/01/2035 | ||||||
| G5 | UF | 4,000,000 | (i) | 20 years | 3.50% annual due | 06/30/2011 | 04/01/2031 | |||||
| Total | UF | 7,000,000 |
| (i) | As of September 30, 2011 UF 2,100,000 in bonds have been issued; leaving this series with a UF 1,900,000 par value to be placed. |
37
BANCO SANTANDER CHILE AND SUBSIDIARIES NOTES TO THE CONSOLIDATED INTERIM FINANCIAL STAEMENTS As of September 30, 2011 and 2010 and December 31, 2010 |
NOTE 03 - SIGNIFICANT EVENTS, continued:
c) Building sale
In 2011, the Bank sold one branch. This transaction is detailed on Note 31.
e) Assignment of loans previously charged off
In 2011, Banco Santander Chile signed agreements with “Fondo de Inversiones Cantábrico” to assign loans previously charged off. As of September 30, the following portfolio sales have been carried out:
| Nominal portfolio sale | Nominal portfolio sale | |||||||||||||||
| Date of | Commercial | Consumer | Total | Selling price | ||||||||||||
| agreement | MCh$ | MCh$ | MCh$ | MCh$ | ||||||||||||
| 01-20-2011 | 888 | 8,222 | 9,110 | 592 | ||||||||||||
| 02-23-2011 | 774 | 6,802 | 7,576 | 492 | ||||||||||||
| 03-23-2011 | 969 | 6,828 | 7,797 | 506 | ||||||||||||
| 04-26-2011 | 768 | 6,386 | 7,154 | 465 | ||||||||||||
| 05-25-2011 | 990 | 6,611 | 7,601 | 494 | ||||||||||||
| 06-22-2011 | 805 | 7,676 | 8,481 | 551 | ||||||||||||
| 07-26-2011 | 930 | 9,207 | 10,137 | 659 | ||||||||||||
| 08-24-2011 | 2,351 | 10,221 | 12,572 | 817 | ||||||||||||
| 09-22-2011 | 664 | 14,745 | 15,409 | 1,002 | ||||||||||||
| Total | 9,139 | 76,698 | 85,837 | 5,578 | ||||||||||||
38
BANCO SANTANDER CHILE AND SUBSIDIARIES NOTES TO THE CONSOLIDATED INTERIM FINANCIAL STAEMENTS As of September 30, 2011 and 2010 and December 31, 2010 |
NOTE 04 - BUSINESS SEGMENTS:
The Bank manages and measures the performance of its operations by business segment. The information included in this note is not necessarily comparable to that of other financial institutions, since it is based on management’s segment internal information system which has been adopted by the Bank. However, the valuation and classification of assets, liabilities, and income for each segment considers the accounting criteria established on Note 01.d) of the Consolidated Financial Statements.
Inter-segment transactions are conducted under normal arm’s length commercial terms and conditions. Each segment’s assets, liabilities, and income include items directly attributable to the segment to which they can be allocated on a reasonable basis.
The Bank has the following business segments:
Individuals
| a. | Santander Banefe |
Serves individuals with monthly incomes from Ch$150,000 to Ch$400,000, who receive services through Santander Banefe. This segment gives customers a variety of services, including consumer loans, credit cards, auto loans, mortgage loans, debit cards, savings products, mutual funds, and insurance.
| b. | Commercial banking |
Serves individuals with monthly incomes exceeding Ch$400,000 pesos. This segment gives customers a variety of services, including consumer loans, credit cards, auto loans, mortgage loans, debit cards, savings products, mutual funds, commercial loans, foreign trade, checking accounts, insurance and stock brokerage.
Small and mid-sized companies (PYMEs)
Serves small companies with annual sales of less than Ch$1,200 million. This segment gives customers a variety of products, including commercial loans, government-guaranteed loans, leasing, factoring, foreign trade, credit cards, mortgage loans, checking accounts, savings products, mutual funds, and insurance.
Institutional
Serves institutions such as universities, government agencies, and municipal and regional governments. This segment provides a variety of products, including commercial loans, leasing, factoring, foreign trade, credit cards, mortgage loans, checking accounts, transactional services, treasury services, savings products, mutual funds, and insurance.
Companies
This segment is composed of Commercial Banking and Company Banking, where sub-segments of medium-sized companies (Companies), real estate companies (Real Estate) and large corporations are found:
| a. | Companies |
Serves companies with annual sales exceeding Ch$1,200 million and up to Ch$10,000 million. This segment provides a wide variety of products, including commercial loans, leasing, factoring, foreign trade, credit cards, mortgage loans, checking accounts, transactional services, treasury services, financial consulting, savings products, mutual funds, and insurance.
| b. | Real estate |
This segment also includes all the companies engaged in the real estate industry who carry out projects to sell properties to third parties and all builders with annual sales exceeding Ch$800 million with no ceiling. These clients are offered not only the traditional banking services but also specialized services to finance projects, chiefly residential, with the aim of expanding sales of mortgage loans.
| c. | Large Corporations |
Serves companies with annual sales exceeding Ch$10,000 million. This segment provides a wide variety of products, including commercial loans, leasing, factoring, foreign trade, credit cards, mortgage loans, checking accounts, transactional services, treasury services, financial consulting, savings products, mutual funds, and insurance.
39
BANCO SANTANDER CHILE AND SUBSIDIARIES NOTES TO THE CONSOLIDATED INTERIM FINANCIAL STAEMENTS As of September 30, 2011 and 2010 and December 31, 2010 |
NOTE 4 - BUSINESS SEGMENTS, continued:
Global Banking and Markets
The Global Banking and Markets segment is comprised of:
| a. | Corporate |
Foreign multinational corporations or Chilean corporations whose sales exceed Ch$10,000 million. This segment provides a wide variety of products, including commercial loans, leasing, factoring, foreign trade, credit cards, mortgage loans, checking accounts, transactional services, treasury services, financial consulting, savings products, mutual funds, and insurance.
| b. | Treasury |
The Treasury Division provides sophisticated financial products, mainly to companies in the Wholesale Banking area and the Companies segment. These include products such as short-term financing and fund raising, brokerage services, derivatives, securitization, and other tailor-made products. The Treasury area also handles intermediation of positions and manages the owned investment portfolio.
Corporate Activities (“Other”)
This segment includes Financial Management, which develops global foreign exchange structural position management functions, involving the parent company’s structural interest risk and liquidity risk. The latter, through issuances and utilizations. This segment also manages the Bank’s personal funds, capital allocation by unit, and the financing of investments made. The foregoing usually results in a negative contribution to income.
In addition, this segment encompasses all the intra-segment income and all the activities not assigned to a given segment or product with customers.
The segments’ accounting policies are the same as those described in the summary of accounting policies, and are customized to meet the needs of the Bank’s management. The Bank earns most of its income in the form of interest income, fee and commission income and income from financial operations. To evaluate a segment’s financial performance, the highest decision making authority bases his assessment on the segment's interest income, fee and commission income, and expenses. This assessment helps the Bank make decisions over the resources that will be allocated to each segment.
To achieve the strategic objectives adopted by the top management and adapt to changing market conditions, the Bank makes changes in its organization from time to time, which in turn have a greater or lesser impact on how it is managed or administered. Hence, this disclosure furnishes information on how the Bank is managed as of September 31, 2011. The information for the previous year (2010) has been prepared with the valid criteria at the date of reporting of these financial statements, to achieve the dully comparability of figures.
Specifically, starting on January 2010, the Individual, PYMEs, Institutional and Companies segments are now part of the Business Banking and report directly to the CEO. The Global Banking and Markets segment still reports to the Executive VP of the Organization.
The tables presented below show the Bank's income by business segment, for the periods ending as of September 30, 2011 and 2010, including the respective loans and Accounts receivable balances:
40
BANCO SANTANDER CHILE AND SUBSIDIARIES NOTES TO THE CONSOLIDATED INTERIM FINANCIAL STAEMENTS As of September 30, 2011 and 2010 and December 31, 2010 |
NOTE 4 - BUSINESS SEGMENTS, continued:
| For the quarter ended as of September 30, 2011 | ||||||||||||||||||||||||
Net interest income | Net fee and commission income | ROF (1) | Provisions | Support expenses(2) | Segment’s net contribution | |||||||||||||||||||
| MCh$ | MCh$ | MCh$ | MCh$ | MCh$ | MCh$ | |||||||||||||||||||
| Segments | ||||||||||||||||||||||||
| Individuals | 128,536 | 46,639 | 1,258 | (67,802 | ) | (82,894 | ) | 22,737 | ||||||||||||||||
| Santander Banefe | 31,084 | 10,512 | 9 | (21,663 | ) | (19,225 | ) | 717 | ||||||||||||||||
| Commercial Banking | 97,452 | 33,127 | 1,249 | (46,139 | ) | (63,669 | ) | 22,020 | ||||||||||||||||
| Small and mid-sized companies (PYMEs) | 81,974 | 9,314 | 2,446 | (14,824 | ) | (19,228 | ) | 59,682 | ||||||||||||||||
| Institutional | 8,849 | 323 | 244 | (186 | ) | (2,841 | ) | 6,389 | ||||||||||||||||
| Companies | 22,636 | 6,040 | 3,582 | (8,118 | ) | (9,994 | ) | 14,146 | ||||||||||||||||
| Companies | 10,390 | 3,214 | 1,795 | (4,147 | ) | (5,358 | ) | 5,894 | ||||||||||||||||
| Large Corporations | 12,054 | 2,105 | 1,619 | 726 | (3,477 | ) | 13,027 | |||||||||||||||||
| Real estate | 192 | 721 | 168 | (4,697 | ) | (1,159 | ) | (4,775 | ) | |||||||||||||||
| Commercial Banking | 241,995 | 59,316 | 7,530 | (90,930 | ) | (114,957 | ) | 102,954 | ||||||||||||||||
| Global Banking and Markets | 17,908 | 4,013 | 22,111 | 45 | (9,318 | ) | 34,759 | |||||||||||||||||
| Corporate | 23,742 | 5,551 | 935 | 48 | (3,609 | ) | 26,667 | |||||||||||||||||
| Treasury | (5,834 | ) | (1,538 | ) | 21,176 | (3 | ) | (5,709 | ) | 8,092 | ||||||||||||||
| Other | 27,846 | 2,662 | (6,640 | ) | 513 | (4,081 | ) | (35,392 | ) | |||||||||||||||
| Total | 232,057 | 65,991 | 23,001 | (90,372 | ) | (128,356 | ) | 102,321 | ||||||||||||||||
| Other operating income | 2,194 | |||||||||||||||||||||||
| Other operating expenses | (12,156 | ) | ||||||||||||||||||||||
| Income from investments in other companies | 546 | |||||||||||||||||||||||
| Income tax expense | (16,629 | ) | ||||||||||||||||||||||
| Consolidated income for the period | 76,276 | |||||||||||||||||||||||
(1) Corresponds to the sum of net income from financial operations and the foreign exchange profit.
(2) Corresponds to the sum of personnel salaries and expenses, administrative expenses, depreciation, amortization, and impairment.
41
BANCO SANTANDER CHILE AND SUBSIDIARIES NOTES TO THE CONSOLIDATED INTERIM FINANCIAL STAEMENTS As of September 30, 2011 and 2010 and December 31, 2010 |
NOTE 4 - BUSINESS SEGMENTS, continued:
| For the quarter ended as of September 30, 2010 | ||||||||||||||||||||||||
Net interest income | Net fee and commission income | ROF (1) | Provisions | Support expenses(2) | Segment’s net contribution | |||||||||||||||||||
| MCh$ | MCh$ | MCh$ | MCh$ | MCh$ | MCh$ | |||||||||||||||||||
| Segments | ||||||||||||||||||||||||
| Individuals | 134,652 | 48,597 | 699 | (30,432 | ) | (73,559 | ) | 79,957 | ||||||||||||||||
| Santander Banefe | 3,796 | 8,007 | 5 | (15,836 | ) | (19,506 | ) | (23,534 | ) | |||||||||||||||
| Commercial Banking | 130,856 | 40,590 | 694 | (14,596 | ) | (54,053 | ) | 103,491 | ||||||||||||||||
| Small and mid-sized companies (PYMEs) | 47,751 | 8,432 | 2,003 | (17,963 | ) | (16,934 | ) | 23,289 | ||||||||||||||||
| Institutional | 4,963 | 592 | 502 | (175 | ) | (2,540 | ) | 3,342 | ||||||||||||||||
| Companies | 32,986 | 3,900 | 4,071 | (2,416 | ) | (8,567 | ) | 29,974 | ||||||||||||||||
| Companies | 14,470 | 2,780 | 1,874 | (3,315 | ) | (4,103 | ) | 11,706 | ||||||||||||||||
| Large corporations | 14,167 | 468 | 1,954 | 993 | (3,405 | ) | 14,177 | |||||||||||||||||
| Real estate | 4,349 | 652 | 243 | (94 | ) | (1,059 | ) | 4,091 | ||||||||||||||||
| Commercial Banking | 220,352 | 61,521 | 7,275 | (50,986 | ) | (101,600 | ) | 136,562 | ||||||||||||||||
| Global Banking and Markets | 13,453 | 5,941 | 13,525 | (312 | ) | (7,639 | ) | 24,968 | ||||||||||||||||
| Corporate | 14,382 | 5,865 | 1,033 | (312 | ) | (2,865 | ) | 18,103 | ||||||||||||||||
| Treasury | (929 | ) | 76 | 12,492 | - | (4,774 | ) | 6,865 | ||||||||||||||||
| Other | (1,869 | ) | (1,026 | ) | 913 | (227 | ) | (4,331 | ) | (2,802 | ) | |||||||||||||
| Total | 235,674 | 66,436 | 21,713 | (51,525 | ) | (113,570 | ) | 158,728 | ||||||||||||||||
| Other operating income | 2,656 | |||||||||||||||||||||||
| Other operating expenses | (21,333 | ) | ||||||||||||||||||||||
| Income from investments in other companies | 832 | |||||||||||||||||||||||
| Income tax expense | (14,109 | ) | ||||||||||||||||||||||
| Consolidated income for the period | 126,774 | |||||||||||||||||||||||
(1) Corresponds to sum of net income from financial operations and the foreign exchange profit.
(2) Corresponds to the sum of personnel salaries and expenses, administrative expenses, depreciation, amortization, and impairment.
42
BANCO SANTANDER CHILE AND SUBSIDIARIES NOTES TO THE CONSOLIDATED INTERIM FINANCIAL STAEMENTS As of September 30, 2011 and 2010 and December 31, 2010 |
NOTE 4 - BUSINESS SEGMENTS, continued:
| For the 9-month period ended on September 30, 2011 | ||||||||||||||||||||||||||||
Net interest income | Net fee and commission income | ROF (2) | Provisions | Support expenses (3) | Segment’s net contribution | Loans and accounts receivables from customers (1) | ||||||||||||||||||||||
| MCh$ | MCh$ | MCh$ | MCh$ | MCh$ | MCh$ | MCh$ | ||||||||||||||||||||||
| Segments | ||||||||||||||||||||||||||||
| Individuals | 416,739 | 140,905 | 5,432 | (156,561 | ) | (237,911 | ) | 168,604 | 9,187,526 | |||||||||||||||||||
| Santander Banefe | 84,851 | 29,255 | 267 | (52,375 | ) | (52,227 | ) | 9,771 | 789,253 | |||||||||||||||||||
| Commercial banking | 331,888 | 111,650 | 5,165 | (104,186 | ) | (185,684 | ) | 158,833 | 8,398,273 | |||||||||||||||||||
| Small and mid-sized companies (PYMEs) | 149,164 | 28,702 | 7,611 | (41,708 | ) | (55,260 | ) | 88,509 | 2,522,698 | |||||||||||||||||||
| Institutional | 19,531 | 1,382 | 677 | 134 | (8,232 | ) | 13,492 | 351,644 | ||||||||||||||||||||
| Companies | 99,999 | 18,265 | 10,146 | (5,771 | ) | (30,039 | ) | 92,600 | 3,731,980 | |||||||||||||||||||
| Companies | 46,370 | 9,542 | 5,308 | (6,776 | ) | (16,658 | ) | 37,786 | 1,572,862 | |||||||||||||||||||
| Large corporations | 39,804 | 6,428 | 4,290 | 1,312 | (10,059 | ) | 41,775 | 1,586,231 | ||||||||||||||||||||
| Real estate | 13,825 | 2,295 | 548 | (307 | ) | (3,322 | ) | 13,039 | 572,887 | |||||||||||||||||||
| Commercial Banking | 685,433 | 189,254 | 23,866 | (203,906 | ) | (331,442 | ) | 363,205 | 15,793,848 | |||||||||||||||||||
| Global Banking and Markets | 35,369 | 17,689 | 54,711 | 7,407 | (25,788 | ) | 89,388 | 1,905,005 | ||||||||||||||||||||
| Corporate | 47,046 | 17,989 | 1,182 | 7,410 | (10,230 | ) | 63,397 | 1,892,850 | ||||||||||||||||||||
| Treasury | (11,677 | ) | (300 | ) | 53,529 | (3 | ) | (15,558 | ) | 25,991 | 12,155 | |||||||||||||||||
| Other | (12,648 | ) | 2,487 | (307 | ) | 579 | (11,975 | ) | (21,864 | ) | 69,542 | |||||||||||||||||
| Total | 708,154 | 209,430 | 78,270 | (195,920 | ) | (369,205 | ) | 430,729 | 17,768,395 | |||||||||||||||||||
| Other operating income | 8,053 | |||||||||||||||||||||||||||
| Other operating expenses | (41,569 | ) | ||||||||||||||||||||||||||
| Income from investments in other companies | 1,673 | |||||||||||||||||||||||||||
| Income tax expense | (62,546 | ) | ||||||||||||||||||||||||||
| Consolidated income for the period | 336,340 | |||||||||||||||||||||||||||
| (1) | Corresponds to Loans and accounts receivable from customers plus interbank loans, without deducting their allowances for loan losses. |
| (2) | Corresponds to the sum of the net income from financial operations and net foreign exchange profit (loss). |
| (3) | Corresponds to the sum of Personnel salaries and expenses, administrative expenses, amortization, and impairment. |
43
BANCO SANTANDER CHILE AND SUBSIDIARIES NOTES TO THE CONSOLIDATED INTERIM FINANCIAL STAEMENTS As of September 30, 2011 and 2010 and December 31, 2010 |
NOTE 4 - BUSINESS SEGMENTS, continued:
| For the 9-month period ended as of September 30, 2010 | As of December 31, 2010 | |||||||||||||||||||||||||||
Net interest income | Net fee and commission income | ROF (2) | Provisions | Support expenses (3) | Segment’s net contribution | Loans and accounts receivables from customers (1) | ||||||||||||||||||||||
| MCh$ | MCh$ | MCh$ | MCh$ | MCh$ | MCh$ | MCh$ | ||||||||||||||||||||||
| Segments | ||||||||||||||||||||||||||||
| Individuals | 395,485 | 138,506 | 1,782 | (117,991 | ) | (214,325 | ) | 203,457 | 8,407,416 | |||||||||||||||||||
| Santander Banefe | 54,805 | 23,594 | 10 | (51,962 | ) | (50,530 | ) | (24,083 | ) | 717,699 | ||||||||||||||||||
| Commercial banking | 340,680 | 114,912 | 1,772 | (66,029 | ) | (163,795 | ) | 227,540 | 7,689,717 | |||||||||||||||||||
| Small and mid-sized companies (PYMEs) | 144,768 | 25,973 | 5,187 | (46,255 | ) | (49,987 | ) | 79,686 | 2,375,192 | |||||||||||||||||||
| Institutional | 14,758 | 1,848 | 1,714 | (428 | ) | (7,463 | ) | 10,429 | 331,153 | |||||||||||||||||||
| Companies | 96,125 | 16,304 | 11,337 | (16,536 | ) | (24,984 | ) | 82,246 | 3,288,107 | |||||||||||||||||||
| Companies | 42,926 | 8,421 | 4,948 | (9,710 | ) | (11,973 | ) | 34,612 | 1,353,686 | |||||||||||||||||||
| Large corporations | 40,527 | 5,725 | 5,715 | (8,146 | ) | (9,899 | ) | 33,922 | 1,411,236 | |||||||||||||||||||
| Real estate | 12,672 | 2,158 | 674 | 1,320 | (3,112 | ) | 13,712 | 523,185 | ||||||||||||||||||||
| Commercial Banking | 651,136 | 182,631 | 20,020 | (181,210 | ) | (296,759 | ) | 375,818 | 14,401,868 | |||||||||||||||||||
| Global Banking and Markets | 35,402 | 17,497 | 49,325 | (955 | ) | (23,354 | ) | 77,915 | 1,293,305 | |||||||||||||||||||
| Corporate | 37,502 | 17,907 | 1,033 | (955 | ) | (8,608 | ) | 46,879 | 1,293,305 | |||||||||||||||||||
| Treasury | (2,100 | ) | (410 | ) | 48,292 | - | (14,746 | ) | 31,036 | - | ||||||||||||||||||
| Other | 21,316 | (6,183 | ) | 6,982 | 45 | (15,443 | ) | 6,717 | 32,109 | |||||||||||||||||||
| Total | 707,854 | 193,945 | 76,327 | (182,120 | ) | (335,556 | ) | 460,450 | 15,727,282 | |||||||||||||||||||
| Other operating income | 27,554 | |||||||||||||||||||||||||||
Other operating expenses | (45,963 | ) | ||||||||||||||||||||||||||
Income from investments in other companies | 1,175 | |||||||||||||||||||||||||||
Income tax expense | (60,032 | ) | ||||||||||||||||||||||||||
Consolidated income for the period | 383,184 | |||||||||||||||||||||||||||
| (1) | Corresponds to Loans and accounts receivable from customers plus interbank loans, without deducting their allowances for loan losses. |
| (2) | Corresponds to the sum of the net income from financial operations and net foreign exchange profit (loss). |
| (3) | Corresponds to the sum of Personnel salaries and expenses, administrative expenses, amortization, and impairment. |
44
BANCO SANTANDER CHILE AND SUBSIDIARIES NOTES TO THE CONSOLIDATED INTERIM FINANCIAL STAEMENTS As of September 30, 2011 and 2010 and December 31, 2010 |
NOTE 05 - CASH AND CASH EQUIVALENTS
a) The detail of the balances included under cash and cash equivalents is as follows:
| As of September 30 | As of December 31 | |||||||
| 2011 | 2010 | |||||||
| MCh$ | MCh$ | |||||||
| Cash and deposits in banks | ||||||||
| Cash | 372,614 | 354,340 | ||||||
| Deposits in the Central Bank of Chile | 998,391 | 1,312,111 | ||||||
| Deposits in domestic banks | 861 | 418 | ||||||
| Deposits in foreign banks | 440,919 | 95,329 | ||||||
| Subtotals – Cash and bank deposits | 1,812,785 | 1,762,198 | ||||||
| Unsettled transactions, net | 350,538 | 74,243 | ||||||
| Cash and cash equivalents | 2.163.323 | 1,836,441 | ||||||
The level of funds in cash and at the Central Bank of Chile, which are included in the “Deposits in the Central Bank of Chile” line, reflects regulations governing the reserves that the Bank must maintain on average in monthly periods.
b) Unsettled transactions:
Unsettled transactions are transactions in which only settlement remains pending, which will increase or decrease funds in the Central Bank of Chile or in foreign banks, normally within the next 24 to 48 business hours from the end of each period. These transactions are presented according to the following detail:
| As of September 30 | As of December 31 | |||||||
| 2011 | 2010 | |||||||
| MCh$ | MCh$ | |||||||
| Assets | ||||||||
| Documents held by other banks (documents to be exchanged) | 194,543 | 207,346 | ||||||
| Funds receivable | 622,058 | 167,022 | ||||||
| Subtotals | 816,601 | 374,368 | ||||||
| Liabilities | ||||||||
| Funds payable | 466,063 | 300,125 | ||||||
| Subtotals | 466,063 | 300,125 | ||||||
| Unsettled transactions, net | 350,538 | 74,243 | ||||||
45
BANCO SANTANDER CHILE AND SUBSIDIARIES NOTES TO THE CONSOLIDATED INTERIM FINANCIAL STAEMENTS As of September 30, 2011 and 2010 and December 31, 2010 |
NOTE 06 - TRADING INVESTMENTS:
The detail of the instruments deemed as financial trading investments is as follows:
| As of September 30 | As of December 31 | |||||||
| 2011 | 2010 | |||||||
| MCh$ | MCh$ | |||||||
| Chilean Central Bank and Government securities: | ||||||||
| Chilean Central Bank Bonds | 342,545 | 247,019 | ||||||
| Chilean Central Bank Notes | 27,589 | 68,985 | ||||||
| Other Chilean Central Bank and Government securities | 81,040 | 7,123 | ||||||
| Subtotals | 451,174 | 323,127 | ||||||
| Other Chilean securities: | ||||||||
| Time deposits in Chilean financial institutions | - | - | ||||||
| Mortgage finance bonds of Chilean financial institutions | - | - | ||||||
| Chilean financial institutions bonds | - | 19,628 | ||||||
| Chilean corporate bonds | 25,132 | 11,404 | ||||||
| Other Chilean securities | - | - | ||||||
| Subtotals | 25,132 | 31,032 | ||||||
| Foreign financial securities: | ||||||||
| Foreign Central Banks and Government securities | - | - | ||||||
| Other foreign financial instruments | 2,654 | - | ||||||
| Subtotals | 2,654 | - | ||||||
| Investments in mutual funds: | ||||||||
| Funds managed by related entities | 24,853 | 25,511 | ||||||
| Funds managed by others | - | - | ||||||
| Subtotals | 24,853 | 25,511 | ||||||
| Total | 503,813 | 379,670 | ||||||
As of September 30, 2011 in the “Chilean Central Bank and Government securities” item there are no securities sold with repurchase agreement to customers and financial institutions (MCh$ 506,127 as of September 30, 2010).
As of September 30, 2011 and 2010 there are no securities sold with repurchase agreement to clients and financial institutions included under “Other Chilean Securities” and “Foreign financial securities”
46
BANCO SANTANDER CHILE AND SUBSIDIARIES NOTES TO THE CONSOLIDATED INTERIM FINANCIAL STAEMENTS As of September 30, 2011 and 2010 and December 31, 2010 |
NOTE 07 - DERIVATIVE FINANCIAL INSTRUMENTS AND HEDGE ACCOUNTING:
| a) | As of September 30, 2011 and December 31, 2010 the Bank holds the following portfolio of derivative instruments: |
| As of September 30, 2011 | ||||||||||||||||||||
| Notional amount | Fair value | |||||||||||||||||||
Up to 3 months | More than 3 months to one year | More than one year | Assets | Liabilities | ||||||||||||||||
| MCh$ | MCh$ | MCh$ | MCh$ | MCh$ | ||||||||||||||||
| Fair value hedge derivatives | ||||||||||||||||||||
| Currency forwards | - | - | - | - | - | |||||||||||||||
| Interest rate swaps | - | - | 812,874 | 25,260 | 41 | |||||||||||||||
| Cross currency swaps | - | 30,598 | 280,996 | 24,895 | 821 | |||||||||||||||
| Call currency options | - | - | - | - | - | |||||||||||||||
| Call interest rate options | - | - | - | - | - | |||||||||||||||
| Put currency options | - | - | - | - | - | |||||||||||||||
| Put interest rate options | - | - | - | - | - | |||||||||||||||
| Interest rate futures | - | - | - | - | - | |||||||||||||||
| Other derivatives | - | - | - | - | - | |||||||||||||||
| Subtotal | - | 30,598 | 1,093,870 | 50,155 | 862 | |||||||||||||||
| Cash flow hedge derivatives | ||||||||||||||||||||
| Currency forwards | - | - | - | - | - | |||||||||||||||
| Interest rate swaps | - | - | - | - | - | |||||||||||||||
| Cross currency swaps | 483,275 | 1,159,858 | 426,410 | 122,602 | 460 | |||||||||||||||
| Call currency options | - | - | - | - | - | |||||||||||||||
| Call interest rate options | - | - | - | - | - | |||||||||||||||
| Put currency options | - | - | - | - | - | |||||||||||||||
| Put interest rate options | - | - | - | - | - | |||||||||||||||
| Interest rate futures | - | - | - | - | - | |||||||||||||||
| Other derivatives | - | - | - | - | - | |||||||||||||||
| Subtotals | 483,275 | 1,159,858 | 426,410 | 122,602 | 460 | |||||||||||||||
| Trading derivatives | ||||||||||||||||||||
| Currency forwards | 14,397,468 | 10,743,681 | 628,282 | 595,038 | 496,613 | |||||||||||||||
| Interest rate swaps | 4,043,419 | 12,147,546 | 13,541,998 | 298,069 | 346,029 | |||||||||||||||
| Cross currency swaps | 771,693 | 3,034,275 | 10,857,155 | 940,860 | 776,690 | |||||||||||||||
| Call currency options | 29,549 | 62,026 | 4,957 | 2,966 | 1,582 | |||||||||||||||
| Call interest rate options | 2,639 | 13,734 | 36,160 | 24 | 363 | |||||||||||||||
| Put currency options | 14,665 | 28,539 | 3,615 | 684 | 1,529 | |||||||||||||||
| Put interest rate options | - | - | - | - | - | |||||||||||||||
| Interest rate futures | - | - | - | - | - | |||||||||||||||
| Other derivatives | 421,823 | - | 1,673 | 1,187 | 1,146 | |||||||||||||||
| Subtotals | 19,681,256 | 26,029,801 | 25,073,840 | 1,838,828 | 1,623,952 | |||||||||||||||
| Totals | 20,164,531 | 27,220,257 | 26,594,120 | 2,011,585 | 1,625,274 | |||||||||||||||
47
BANCO SANTANDER CHILE AND SUBSIDIARIES NOTES TO THE CONSOLIDATED INTERIM FINANCIAL STAEMENTS As of September 30, 2011 and 2010 and December 31, 2010 |
NOTE 7 - DERIVATIVE FINANCIAL INSTRUMENTS AND HEDGE ACCOUNTING, continued:
| As of December 31, 2010 | ||||||||||||||||||||
| Notional amount | Fair value | |||||||||||||||||||
Up to 3 months | More than 3 months to one year | More than one year | Assets | Liabilities | ||||||||||||||||
| MCh$ | MCh$ | MCh$ | MCh$ | MCh$ | ||||||||||||||||
| Fair value hedge derivatives | ||||||||||||||||||||
| Currency forwards | - | - | - | - | - | |||||||||||||||
| Interest rate swaps | - | - | 702,306 | 5,827 | 6,464 | |||||||||||||||
| Cross currency swaps | 28,090 | 229,296 | 387,024 | 5,296 | 28,730 | |||||||||||||||
| Call currency options | - | - | - | - | - | |||||||||||||||
| Call interest rate options | - | - | - | - | - | |||||||||||||||
| Put currency options | - | - | - | - | - | |||||||||||||||
| Put interest rate options | - | - | - | - | - | |||||||||||||||
| Interest rate futures | - | - | - | - | - | |||||||||||||||
| Other derivatives | - | - | - | - | - | |||||||||||||||
| Subtotals | 28,090 | 229,296 | 1,089,330 | 11,123 | 35,194 | |||||||||||||||
| Cash flow hedge derivatives | ||||||||||||||||||||
| Currency forwards | - | - | - | - | - | |||||||||||||||
| Interest rate swaps | - | - | - | - | - | |||||||||||||||
| Cross currency swaps | 147,872 | 999,792 | 379,859 | 494 | 120,563 | |||||||||||||||
| Call currency options | - | - | - | - | - | |||||||||||||||
| Call interest rate options | - | - | - | - | - | |||||||||||||||
| Put currency options | - | - | - | - | - | |||||||||||||||
| Put interest rate options | - | - | - | - | - | |||||||||||||||
| Interest rate futures | - | - | - | - | - | |||||||||||||||
| Other derivatives | - | - | - | - | - | |||||||||||||||
| Subtotals | 147,872 | 999,792 | 379,859 | 494 | 120,563 | |||||||||||||||
| Trading derivatives | ||||||||||||||||||||
| Currency forwards | 10,374,003 | 6,830,128 | 792,254 | 283,722 | 348,152 | |||||||||||||||
| Interest rate swaps | 2,671,634 | 7,607,192 | 13,475,904 | 204,786 | 250,812 | |||||||||||||||
| Cross currency swaps | 1,081,609 | 2,783,653 | 10,061,745 | 1,123,547 | 887,222 | |||||||||||||||
| Call currency options | 20,724 | 29,247 | 936 | 272 | 233 | |||||||||||||||
| Call interest rate options | 34,076 | 16,690 | 59,676 | 82 | 1,269 | |||||||||||||||
| Put currency options | 6,364 | 4,906 | - | 230 | 385 | |||||||||||||||
| Put interest rate options | - | - | - | - | - | |||||||||||||||
| Interest rate futures | - | - | - | - | - | |||||||||||||||
| Other derivatives | 165,208 | - | - | 122 | 149 | |||||||||||||||
| Subtotals | 14,353,618 | 17,271,816 | 24,390,515 | 1,612,761 | 1,488,222 | |||||||||||||||
| Totals | 14,529,580 | 18,500,904 | 25,859,704 | 1,624,378 | 1,643,979 | |||||||||||||||
48
BANCO SANTANDER CHILE AND SUBSIDIARIES NOTES TO THE CONSOLIDATED INTERIM FINANCIAL STAEMENTS As of September 30, 2011 and 2010 and December 31, 2010 |
NOTE 7 - DERIVATIVE FINANCIAL INSTRUMENTS AND HEDGE ACCOUNTING, continued:
| b) | Hedge Accounting |
Fair value hedges:
The Bank uses cross-currency swaps, interest rate swaps, and call money swaps to hedge its exposure to changes in fair value of hedged items attributable to interest rates. The aforementioned hedging instruments change the effective cost of long-term issuances from a fixed interest rate to a variable interest rate, decreasing the duration and modifying the sensitivity to the shortest segments of the curve.
Below is a detail of the hedged elements and hedge instruments under fair value hedges as of September 30, 2011 and December 31, 2010 classified by term to maturity:
| As of September 30, 2011 | ||||||||||||||||
| Within 1 year | Between 1 and 3 years | Between 3 and 6 years | Over 6 years | |||||||||||||
| MCh$ | MCh$ | MCh$ | MCh$ | |||||||||||||
| Hedged item | ||||||||||||||||
| Chilean Central Bank Bonds in Pesos (BCP) | ||||||||||||||||
| Chilean Central Bank Bonds in UF (BCU) | ||||||||||||||||
| Corporate bonds | - | 11,172 | - | - | ||||||||||||
| Senior bonds | - | 363,755 | 331,453 | 148,482 | ||||||||||||
| Subordinated bonds | - | - | 155,895 | - | ||||||||||||
| Short-term loans | - | 25,000 | - | - | ||||||||||||
| Interbank loans | - | - | - | - | ||||||||||||
| Time deposits | 30,598 | 29,374 | - | - | ||||||||||||
| Mortgage finance bonds | - | - | - | 28,739 | ||||||||||||
| Totals | 30,598 | 429,301 | 487,348 | 177,221 | ||||||||||||
| Hedging instrument | ||||||||||||||||
| Cross currency swap | 30,598 | 24,734 | 227,523 | 28,739 | ||||||||||||
| Interest rate swap | - | 374,927 | 259,825 | - | ||||||||||||
| Call money swap | - | 29,640 | - | 148,482 | ||||||||||||
| Totals | 30,598 | 429,301 | 487,348 | 177,221 | ||||||||||||
| As of December 31, 2010 | ||||||||||||||||
| Within 1 year | Between 1 and 3 years | Between 3 and 6 years | Over 6 years | |||||||||||||
| MCh$ | MCh$ | MCh$ | MCh$ | |||||||||||||
| Hedged item | ||||||||||||||||
| Chilean Central Bank Bonds in Pesos (BCP) | - | - | - | - | ||||||||||||
| Chilean Central Bank Bonds in UF (BCU) | - | - | - | - | ||||||||||||
| Corporate bonds | - | 10,061 | - | - | ||||||||||||
| Senior bonds | - | 374,360 | 358,862 | 49,591 | ||||||||||||
| Subordinated bonds | - | 51,475 | 140,385 | - | ||||||||||||
| Short-term loans | - | 25,000 | - | - | ||||||||||||
| Interbank loans | 210,591 | - | - | - | ||||||||||||
| Time deposits | 46,795 | 4,640 | - | - | ||||||||||||
| Mortgage finance bonds | - | - | - | 74,956 | ||||||||||||
| Totals | 257,386 | 465,536 | 499,247 | 124,547 | ||||||||||||
| Hedging instrument | ||||||||||||||||
| Cross currency swap | 257,386 | 46,796 | 265,272 | 74,956 | ||||||||||||
| Interest rate swap | - | 389,100 | 233,975 | - | ||||||||||||
| Call money swap | - | 29,640 | - | 49,591 | ||||||||||||
| Totals | 257,386 | 465,536 | 499,247 | 124,547 | ||||||||||||
49
BANCO SANTANDER CHILE AND SUBSIDIARIES NOTES TO THE CONSOLIDATED INTERIM FINANCIAL STAEMENTS As of September 30, 2011 and 2010 and December 31, 2010 |
NOTE 7 - DERIVATIVE FINANCIAL INSTRUMENTS AND HEDGE ACCOUNTING, continued:
Cash flow hedges:
The Bank uses cross currency swaps to hedge the risk from variability of cash flows attributable to changes in the interest rates of bonds and interbank loans at a variable rate. The cash flows of the cross currency swaps equal the cash flows of the hedged items, which modify uncertain cash flows to known cash flows derived from a fixed interest rate.
Below is the nominal amount of the hedged items as of September 30, 2011 and December 31, 2010 and the period when the cash flows will be generated:
| As of September 30, 2011 | ||||||||||||||||
| Within 1 year | Between 1 and 3 years | Between 3 and 6 years | Over 6 years | |||||||||||||
| MCh$ | MCh$ | MCh$ | MCh$ | |||||||||||||
| Hedged item | ||||||||||||||||
| Interbank loans | 1,331,343 | 161,092 | - | - | ||||||||||||
| Bonds | 311,790 | 265,318 | - | - | ||||||||||||
| Total | 1,643,133 | 426,410 | - | - | ||||||||||||
| Hedging instrument | - | - | ||||||||||||||
| Cross currency swap | 1,643,133 | 426,410 | - | - | ||||||||||||
| Total | 1,643,133 | 426,410 | - | - | ||||||||||||
| As of December 31, 2010 | ||||||||||||||||
| Within 1 year | Between 1 and 3 years | Between 3 and 6 years | Over 6 years | |||||||||||||
| MCh$ | MCh$ | MCh$ | MCh$ | |||||||||||||
| Hedged item | ||||||||||||||||
| Interbank loans | 937,087 | 95,930 | - | - | ||||||||||||
| Bonds | 210,577 | 283,929 | - | - | ||||||||||||
| Total | 1,147,664 | 379,859 | - | - | ||||||||||||
| Hedging instrument | ||||||||||||||||
| Cross currency swap | 1,147,664 | 379,859 | - | - | ||||||||||||
| Total | 1,147,664 | 379,859 | - | - | ||||||||||||
50
BANCO SANTANDER CHILE AND SUBSIDIARIES NOTES TO THE CONSOLIDATED INTERIM FINANCIAL STAEMENTS As of September 30, 2011 and 2010 and December 31, 2010 |
NOTE 7 - DERIVATIVE FINANCIAL INSTRUMENTS AND HEDGE ACCOUNTING, continued:
Below is an estimate of the periods in which the flows are expected to be produced:
| As of September 30, 2011 | ||||||||||||||||
| Within 1 year | Between 1 and 3 years | Between 3 and 6 years | Over 6 years | |||||||||||||
| MCh$ | MCh$ | MCh$ | MCh$ | |||||||||||||
| Hedged item | ||||||||||||||||
| Inflows | - | - | - | - | ||||||||||||
| Outflows | (24,756 | ) | (14,179 | ) | - | - | ||||||||||
| Net flows | (24,756 | ) | (14,179 | ) | - | - | ||||||||||
| Hedging instrument | ||||||||||||||||
| Inflows | 24,756 | 14,179 | - | - | ||||||||||||
| Outflows | (56,449 | ) | (32,723 | ) | - | - | ||||||||||
| Net flows | (31,693 | ) | (18,544 | ) | - | - | ||||||||||
| As of December 31, 2010 | ||||||||||||||||
| Within 1 year | Between 1 and 3 years | Between 3 and 6 years | Over 6 years | |||||||||||||
| MCh$ | MCh$ | MCh$ | MCh$ | |||||||||||||
| Hedged item | ||||||||||||||||
| Inflows | - | - | - | - | ||||||||||||
| Outflows | (17,627 | ) | (5,696 | ) | - | - | ||||||||||
| Net flows | (17,627 | ) | (5,696 | ) | - | - | ||||||||||
| Hedging instrument | ||||||||||||||||
| Inflows | 17,627 | 5,696 | - | - | ||||||||||||
| Outflows | (30,044 | ) | (9,772 | ) | - | - | ||||||||||
| Net flows | (12,417 | ) | (4,076 | ) | - | - | ||||||||||
51
BANCO SANTANDER CHILE AND SUBSIDIARIES NOTES TO THE CONSOLIDATED INTERIM FINANCIAL STAEMENTS As of September 30, 2011 and 2010 and December 31, 2010 |
NOTE 7 - DERIVATIVE FINANCIAL INSTRUMENTS AND HEDGE ACCOUNTING, continued:
| c) | Gain and losses for cash flow hedges whose effect was recognized in the Consolidated Statement of Changes in Equity for the periods ended as of September 30, 2011 and 2010, are shown below: |
| As of September 30 | ||||||||
| 2011 | 2010 | |||||||
| MCh$ | MCh$ | |||||||
| Senior Bonds | (2,608 | ) | 2,672 | |||||
| Loan | (11,179 | ) | 4,499 | |||||
| Net flows | (13,787 | ) | 7,171 | |||||
Since the variable flows for both the hedged element and the hedging element mirror each other, the hedges are nearly 100% efficient, which means that the fluctuations of value attributable to rate components are almost completely offset. As of September 30, 2010, hedge ineffectiveness recorded in the Consolidated Statement of Income was MCh$ (23).
During 2010 the Bank recorded a future flow hedge for a syndicated loan granted to Banco Santander Chile and structured by Standard Chartered Bank for USD 175 million.
| d) | Below is a presentation of income generated by cash flow hedges amount that were reclassified from other comprehensive income to profit and loss during the period: |
Since the variable flows for both the hedged element and the hedging element mirror each other, the hedges are 100% efficient, which means that the fluctuations of value attributable to rate components are almost completely offset.
| As of September 30 | ||||||||
| 2011 | 2010 | |||||||
| MCh$ | MCh$ | |||||||
| Bonds | - | - | ||||||
| Loan | 287 | 23 | ||||||
| Net income from cash flow hedges | 287 | 23 | ||||||
| e) | Net investment hedges for foreign businesses: |
As of September 2011 and 2010, the Bank does not present foreign net investment hedges in its hedge accounting portfolio.
52
BANCO SANTANDER CHILE AND SUBSIDIARIES NOTES TO THE CONSOLIDATED INTERIM FINANCIAL STAEMENTS As of September 30, 2011 and 2010 and December 31, 2010 |
NOTE 08 - INTERBANK LOANS
| a) | As of September 30, 2011 and December 31, 2010, the balances in the “Interbank loans” item are as follows: |
| As of September 30 | As of December 31 | |||||||
| 2011 | 2010 | |||||||
| MCh$ | MCh$ | |||||||
| Domestic banks | ||||||||
| Loans and advances to banks | - | - | ||||||
| Deposits in the Central Bank of Chile | - | - | ||||||
| Nontransferable Chilean Central Bank Bonds | - | - | ||||||
| Other Central Bank of Chile loans | - | - | ||||||
| Interbank loans | 9 | 17 | ||||||
| Overdrafts in checking accounts | - | - | ||||||
| Nontransferable domestic bank loans | - | - | ||||||
| Other domestic bank loans | - | - | ||||||
| Allowances and impairment for domestic bank loans | - | - | ||||||
| Foreign banks | ||||||||
| Loans to foreign banks | 88,030 | 69,709 | ||||||
| Overdrafts in checking accounts | - | - | ||||||
| Nontransferable foreign bank deposits | - | - | ||||||
| Other foreign bank loans | - | - | ||||||
| Allowances and impairment for foreign bank loans | (145 | ) | (54 | ) | ||||
| Total | 87,894 | 69,672 | ||||||
| b) | The amount in each period for allowances and impairment of interbank loans, which are included in the “Provisions for loan losses” item, is shown below: |
As of September 30 2011 | As of December 31 2010 | |||||||||||||||||||||||
Domestic banks | Foreign banks | Total | Domestic banks | Foreign banks | Total | |||||||||||||||||||
MCh$ | MCh$ | MCh$ | MCh$ | MCh$ | MCh$ | |||||||||||||||||||
| As of January 1 | - | 54 | 54 | - | 42 | 42 | ||||||||||||||||||
| Charge-offs | - | - | - | - | - | - | ||||||||||||||||||
| Allowances established | 405 | 169 | 574 | - | 131 | 131 | ||||||||||||||||||
| Allowances released | (405 | ) | (78 | ) | (483 | ) | - | (119 | ) | (119 | ) | |||||||||||||
| Total | - | 145 | 145 | - | 54 | 54 | ||||||||||||||||||
53
BANCO SANTANDER CHILE AND SUBSIDIARIES NOTES TO THE CONSOLIDATED INTERIM FINANCIAL STAEMENTS As of September 30, 2011 and 2010 and December 31, 2010 |
NOTE 09 - LOANS AND ACCOUNTS RECEIVABLE FROM CUSTOMERS:
| a) | Loans and accounts receivable from customers, net |
As of September 30, 2011 and December 31, 2010 the composition of the loan portfolio is as follows:
| Assets before allowances | Allowances established | |||||||||||||||||||||||||||
| As of September 30, 2011 | Normal portfolio | Impaired loans (*) | Total | Individual allowances | Group allowances | Total | Loans and accounts receivable from customers, net | |||||||||||||||||||||
| MCh$ | MCh$ | MCh$ | MCh$ | MCh$ | MCh$ | MCh$ | ||||||||||||||||||||||
| Commercial loans | ||||||||||||||||||||||||||||
| Commercial loans | 6,570,310 | 577,166 | 7,147,476 | 103,073 | 79,226 | 182,299 | 6,965,177 | |||||||||||||||||||||
| Foreign trade loans | 997,530 | 60,698 | 1,058,228 | 31,403 | 946 | 32,349 | 1,025,879 | |||||||||||||||||||||
| General purpose mortgage loans | 34,893 | 21,450 | 56,343 | 194 | 3,235 | 3,429 | 52,914 | |||||||||||||||||||||
| Factoring transactions | 240,245 | 2,508 | 242,753 | 3,172 | 410 | 3,582 | 239,171 | |||||||||||||||||||||
| Leasing transactions | 1,173,038 | 58,682 | 1,231,720 | 16,597 | 1,827 | 18,424 | 1,213,296 | |||||||||||||||||||||
| Other Loans and Accounts | 1,704 | 53 | 1,757 | - | 1 | 1 | 1,756 | |||||||||||||||||||||
| Subtotals | 9,017,720 | 720,557 | 9,738,277 | 154,439 | 85,645 | 240,084 | 9,498,193 | |||||||||||||||||||||
| Mortgage loans | ||||||||||||||||||||||||||||
| Loans with mortgage finance bonds | 115,194 | 4,379 | 119,573 | - | 870 | 870 | 118,703 | |||||||||||||||||||||
| Mortgage mutual loans | 4,608,421 | 116,837 | 4,725,258 | - | 27,996 | 27,996 | 4,697,262 | |||||||||||||||||||||
| Other mortgage mutual loans | 110,949 | 60,640 | 171,589 | - | 7,246 | 7,246 | 164,343 | |||||||||||||||||||||
| Leasing transactions | - | - | - | - | - | - | - | |||||||||||||||||||||
| Subtotals | 4,834,564 | 181,856 | 5,016,420 | - | 36,112 | 36,112 | 4,980,308 | |||||||||||||||||||||
| Consumer loans | ||||||||||||||||||||||||||||
| Installment consumer loans | 1,337,301 | 378,514 | 1,715,815 | - | 185,996 | 185,996 | 1,529,819 | |||||||||||||||||||||
| Credit card balances | 875,534 | 31,235 | 906,769 | - | 44,575 | 44,575 | 862,194 | |||||||||||||||||||||
| Consumer leasing contracts | 3,515 | 231 | 3,746 | - | 103 | 103 | 3,643 | |||||||||||||||||||||
| Other consumer loans | 285,101 | 14,228 | 299,329 | - | 13,696 | 13,696 | 285,633 | |||||||||||||||||||||
| Subtotals | 2,501,451 | 424,208 | 2,925,659 | - | 244,370 | 244,370 | 2,681,289 | |||||||||||||||||||||
| Totals | 16,353,735 | 1,326,621 | 17,680,356 | 154,439 | 366,127 | 520,566 | 17,159,790 | |||||||||||||||||||||
54
BANCO SANTANDER CHILE AND SUBSIDIARIES NOTES TO THE CONSOLIDATED INTERIM FINANCIAL STAEMENTS As of September 30, 2011 and 2010 and December 31, 2010 |
NOTE 09 - LOANS AND ACCOUNTS RECEIVABLE FROM CUSTOMERS, continued:
| Assets before allowances | Allowances established | |||||||||||||||||||||||||||
| As of December 31, 2010 | Normal portfolio | Impaired loans | Total | Individual allowances | Group allowances | Total | Loans and accounts receivable from customers, net | |||||||||||||||||||||
| MCh$ | MCh$ | MCh$ | MCh$ | MCh$ | MCh$ | MCh$ | ||||||||||||||||||||||
| Commercial loans | ||||||||||||||||||||||||||||
| Commercial loans | 5,425,362 | 681,755 | 6,107,117 | 114,051 | 76,577 | 190,628 | 5,916,489 | |||||||||||||||||||||
| Foreign trade loans | 696,659 | 86,893 | 783,552 | 18,810 | 78 | 18,888 | 764,664 | |||||||||||||||||||||
| General purpose mortgage loans | 44,730 | 23,226 | 67,956 | 780 | 3,570 | 4,350 | 63,606 | |||||||||||||||||||||
| Factoring transactions | 201,321 | 4,819 | 206,140 | 3,041 | 372 | 3,413 | 202,727 | |||||||||||||||||||||
| Leasing transactions | 1,045,793 | 77,123 | 1,122,916 | 10,090 | 1,657 | 11,747 | 1,111,169 | |||||||||||||||||||||
| Other Loans and Accounts | 2,953 | 14,995 | 17,948 | 5,976 | 3,688 | 9,664 | 8,284 | |||||||||||||||||||||
| Subtotals | 7,416,818 | 888,811 | 8,305,629 | 152,748 | 85,942 | 238,690 | 8,066,939 | |||||||||||||||||||||
| Mortgage loans | ||||||||||||||||||||||||||||
| Loans with mortgage finance bonds | 133,640 | 4,454 | 138,094 | - | 446 | 446 | 137,648 | |||||||||||||||||||||
| Mortgage mutual loans | 121,041 | 63,323 | 184,364 | - | 11,319 | 11,319 | 173,045 | |||||||||||||||||||||
| Other mortgage mutual loans | 4,253,810 | 74,869 | 4,328,679 | - | 5,567 | 5,567 | 4,323,112 | |||||||||||||||||||||
| Leasing transactions | - | - | - | - | - | - | - | |||||||||||||||||||||
| Subtotals | 4,508,491 | 142,646 | 4,651,137 | - | 17,332 | 17,332 | 4,633,805 | |||||||||||||||||||||
| Consumer loans | ||||||||||||||||||||||||||||
| Installment consumer loans | 1,192,464 | 412,139 | 1,604,603 | - | 176,219 | 176,219 | 1,428,384 | |||||||||||||||||||||
| Credit card balances | 771,988 | 22,228 | 794,216 | - | 36,156 | 36,156 | 758,060 | |||||||||||||||||||||
| Consumer leasing contracts | 3,407 | 328 | 3,735 | - | 121 | 121 | 3,614 | |||||||||||||||||||||
| Other consumer loans | 283,912 | 14,324 | 298,236 | - | 13,063 | 13,063 | 285,173 | |||||||||||||||||||||
| Subtotals | 2,251,771 | 449,019 | 2,700,790 | - | 225,559 | 225,559 | 2,475,231 | |||||||||||||||||||||
| Totals | 14,177,080 | 1,480,476 | 15,657,556 | 152,748 | 328,833 | 481,581 | 15,175,975 | |||||||||||||||||||||
55
BANCO SANTANDER CHILE AND SUBSIDIARIES NOTES TO THE CONSOLIDATED INTERIM FINANCIAL STAEMENTS As of September 30, 2011 and 2010 and December 31, 2010 |
NOTE 09 - LOANS AND ACCOUNTS RECEIVABLE FROM CUSTOMERS, continued:
| b) | Portfolio characteristics: |
As of September 30, 2011 and December, 31 2010, the portfolio before allowances has the following detail by customer’s economic activity:
| Domestic loans (*) | Foreign loans (**) | Total loans | Distribution percentage | |||||||||||||||||||||||||||||
As of September 30 | As of December 31 | As of September 30 | As of December 31 | As of September 30 | As of December 31 | As of September 30 | As of December 31 | |||||||||||||||||||||||||
| 2011 | 2010 | 2011 | 2010 | 2011 | 2010 | 2011 | 2010 | |||||||||||||||||||||||||
| MCh$ | MCh$ | MCh$ | MCh$ | MCh$ | MCh$ | % | % | |||||||||||||||||||||||||
| Commercial loans | ||||||||||||||||||||||||||||||||
| Manufacturing | 987,830 | 838,324 | - | - | 987,830 | 838,324 | - | 5.33 | ||||||||||||||||||||||||
| Mining | 281,259 | 106,119 | - | - | 281,259 | 106,119 | 1.58 | 0.67 | ||||||||||||||||||||||||
| Electricity, gas, and water | 264,924 | 149,907 | - | - | 264,924 | 149,907 | 1.49 | 0.95 | ||||||||||||||||||||||||
| Agriculture and livestock | 762,510 | 679,159 | - | - | 762,510 | 679,159 | 4.29 | 4.32 | ||||||||||||||||||||||||
| Forest | 88,291 | 84,375 | - | - | 88,291 | 84,375 | 0.50 | 0.54 | ||||||||||||||||||||||||
| Fishing | 166,995 | 133,930 | - | - | 166,995 | 133,930 | 0.94 | 0.85 | ||||||||||||||||||||||||
| Transport | 502,786 | 449,508 | - | - | 502,786 | 449,508 | 2.83 | 2.86 | ||||||||||||||||||||||||
| Communications | 260,871 | 214,881 | - | - | 260,871 | 214,881 | 1.47 | 1.37 | ||||||||||||||||||||||||
| Construction | 953,090 | 839,316 | - | - | 953,090 | 839,316 | 5.37 | 5.34 | ||||||||||||||||||||||||
| Commerce | 2,067,261 | 1,732,800 | 88,030 | 69,709 | 2,155,291 | 1,802,509 | 12.14 | 11.46 | ||||||||||||||||||||||||
| Services | 375,543 | 358,314 | - | - | 375,543 | 358,314 | 2.11 | 2.28 | ||||||||||||||||||||||||
| Others | 3,026,926 | 2,719,013 | - | - | 3,026,926 | 2,719,013 | 17.04 | 17.29 | ||||||||||||||||||||||||
| Subtotals | 9,738,286 | 8,305,646 | 88,030 | 69,709 | 9,826,316 | 8,375,355 | 55.33 | 53.26 | ||||||||||||||||||||||||
| Mortgage loans | 5,016,420 | 4,651,137 | - | - | 5,016,420 | 4,651,137 | - | 29.57 | ||||||||||||||||||||||||
| Consumer loans | 2,925,959 | 2,700,790 | - | - | 2,925,659 | 2,700,790 | - | 17.17 | ||||||||||||||||||||||||
| Totals | 17,680,365 | 15,657,573 | 88,030 | 69,709 | 17,768,395 | 15,727,282 | 55.33 | 100.00 | ||||||||||||||||||||||||
| (*) | Includes domestic loans for MCh$9 as of September 30, 2011 (MCh$17 as of December 31, 2010). |
| (**) | Includes foreign loans for MCh$ 88,030 as of September 31, 2010 (MCh$ 69,709 as of December 31, 2010), see Note 8. |
56
BANCO SANTANDER CHILE AND SUBSIDIARIES NOTES TO THE CONSOLIDATED INTERIM FINANCIAL STAEMENTS As of September 30, 2011 and 2010 and December 31, 2010 |
NOTE 09 - LOANS AND ACCOUNTS RECEIVABLE FROM CUSTOMERS, continued:
| c) | Impaired loans |
i) As of September 30, 2011 and December 31, 2010 the composition of the impaired loans portfolio is as follows:
| As of September 30 | As of December 31 | |||||||||||||||||||||||||||||||
| 2011 | 2010 | |||||||||||||||||||||||||||||||
| Commercial | Mortgage | Consumer | Total | Commercial | Mortgage | Consumer | Total | |||||||||||||||||||||||||
| MCh$ | MCh$ | MCh$ | MCh$ | MCh$ | MCh$ | MCh$ | MCh$ | |||||||||||||||||||||||||
| Individual allowance impairment | 305,503 | - | - | 305,503 | 444,129 | - | - | 444,129 | ||||||||||||||||||||||||
| Past due loans | 244,209 | 140,273 | 112,304 | 496,786 | 213,872 | 121,911 | 80,956 | 416,739 | ||||||||||||||||||||||||
| Impairment remains | 170,845 | 41,583 | 311,904 | 524,332 | 230,810 | 20,735 | 368,063 | 619,608 | ||||||||||||||||||||||||
| Totals | 720,557 | 181,856 | 424,208 | 1,326,621 | 888,811 | 142,646 | 449,019 | 1,480,476 | ||||||||||||||||||||||||
ii) The impaired secured and unsecured loan portfolio as of September 30, 2011 and December 31, 2010, is as follows:
| As of September 30 | As of December 31 | |||||||||||||||||||||||||||||||
| 2011 | 2010 | |||||||||||||||||||||||||||||||
| Commercial | Mortgage | Consumer | Total | Commercial | Mortgage | Consumer | Total | |||||||||||||||||||||||||
| MCh$ | MCh$ | MCh$ | MCh$ | MCh$ | MCh$ | MCh$ | MCh$ | |||||||||||||||||||||||||
| Secured debt | 388,317 | 169,268 | 61,601 | 619,186 | 446,953 | 131,881 | 67,450 | 646,284 | ||||||||||||||||||||||||
| Unsecured debt | 332,240 | 12,588 | 362,607 | 707,435 | 441,858 | 10,765 | 381,569 | 834,192 | ||||||||||||||||||||||||
| Totals | 720,557 | 181,856 | 424,208 | 1,326,621 | 888,811 | 142,646 | 449,019 | 1,480,476 | ||||||||||||||||||||||||
iii) The portfolio of past due loans secured and unsecured as of September 30, 2011 and December 31, 2010 is as follows:
| As of September 30 | As of December 31 | |||||||||||||||||||||||||||||||
| 2011 | 2010 | |||||||||||||||||||||||||||||||
| Commercial | Mortgage | Consumer | Total | Commercial | Mortgage | Consumer | Total | |||||||||||||||||||||||||
| MCh$ | MCh$ | MCh$ | MCh$ | MCh$ | MCh$ | MCh$ | MCh$ | |||||||||||||||||||||||||
| Secured debt | 118,766 | 128,783 | 10,030 | 257,579 | 96,007 | 111,708 | 7,071 | 214,786 | ||||||||||||||||||||||||
| Unsecured debt | 125,443 | 11,490 | 102,274 | 239,207 | 117,865 | 10,203 | 73,885 | 201,953 | ||||||||||||||||||||||||
| Totals | 244,209 | 140,273 | 112,304 | 496,786 | 213,872 | 121,911 | 80,956 | 416,739 | ||||||||||||||||||||||||
57
BANCO SANTANDER CHILE AND SUBSIDIARIES NOTES TO THE CONSOLIDATED INTERIM FINANCIAL STAEMENTS As of September 30, 2011 and 2010 and December 31, 2010 |
NOTE 09 - LOANS AND ACCOUNTS RECEIVABLE FROM CUSTOMERS, continued:
| d) | Recovery of loans previously charged off by products |
For the quarter ended as of September 30, | For the 9-month period ended As of September 30, | |||||||||||||||
| Recoveries | 2011 | 2010 | 2011 | 2010 | ||||||||||||
| MCh$ | MCh$ | MCh$ | MCh$ | |||||||||||||
| Commercial loans | 1,815 | 2,026 | 5,376 | 5,259 | ||||||||||||
| Consumer loans | 3,248 | 5,689 | 9,430 | 17,067 | ||||||||||||
| Mortgage loans | 659 | 301 | 1,213 | 1,229 | ||||||||||||
| Total recoveries | 5,722 | 8,016 | 16,019 | 23,555 | ||||||||||||
| e) | Allowances established |
| Allowances | As of September 30, | As of December 31, | ||||||
| 2011 | 2010 | |||||||
| MCh$ | MCh$ | |||||||
| Customer loans | 286,785 | 327,397 | ||||||
| Interbank loans | 574 | 131 | ||||||
| Total Allowances | 287,359 | 327,528 | ||||||
58
BANCO SANTANDER CHILE AND SUBSIDIARIES NOTES TO THE CONSOLIDATED INTERIM FINANCIAL STAEMENTS As of September 30, 2011 and 2010 and December 31, 2010 |
NOTE 10 - AVAILABLE FOR SALE INVESTMENTS:
As of September 30, 2011 and December 31, 2010 the detail of instruments designated as available for sale instruments is as follows:
| As of September 30, | As of December 31, | |||||||
| 2011 | 2010 | |||||||
| MCh$ | MCh$ | |||||||
| Chilean Central Bank and Government securities | ||||||||
| Chilean Central Bank Bonds | 448,262 | 555,981 | ||||||
| Chilean Central Bank Notes | 1,302,975 | 366,210 | ||||||
| Other Chilean Central Bank and Government securities | 123,386 | 175,296 | ||||||
| Subtotals | 1,874,623 | 1,097,487 | ||||||
| Other Chilean securities | ||||||||
| Time deposits in Chilean financial institutions | 149,151 | - | ||||||
| Mortgage finance bonds of Chilean financial institutions | 68,673 | 218,112 | ||||||
| Chilean financial institutions bonds | - | - | ||||||
| Chilean corporate bonds | 11,868 | - | ||||||
| Other Chilean securities | 329 | 147,833 | ||||||
| Subtotals | 230,021 | 365,945 | ||||||
| Foreign financial securities: | ||||||||
| Foreign Central Banks and Government securities | - | - | ||||||
| Other foreign financial securities | - | 10,548 | ||||||
| Subtotals | - | 10,548 | ||||||
| Totals | 2,104,644 | 1,473,980 | ||||||
Chilean Central Bank and Government securities include instruments sold to customers and financial institutions under repurchase agreements totaling Ch$ 112,055 million and Ch$144,034 million as of September 30, 2011 and December 31, 2010, respectively.
As of September 30, 2011 available for sale investments included unrealized net losses of Ch$2,890 million, recorded as a “Valuation adjustment” in Equity, distributed between Ch$2,856 million attributable to Bank shareholders and Ch$34 million attributable to non-controlling interest.
As of December 31, 2010 available for sale investments included unrealized net losses of Ch$18,596 million, recorded as “Valuation adjustment” in Equity, distributed between Ch$18,341 million attributable to Bank shareholders and Ch$255 million attributable to non-controlling interest.
59
BANCO SANTANDER CHILE AND SUBSIDIARIES NOTES TO THE CONSOLIDATED INTERIM FINANCIAL STAEMENTS As of September 30, 2011 and 2010 and December 31, 2010 |
NOTE 11 - INTANGIBLE ASSETS:
| a) | Intangible assets as of September 30, 2011 and December 31, 2010 are as follows: |
| As of September 30, 2011 | ||||||||||||||||||||||||
| Useful life | Remaining | Opening balance January 1, 2011 | Gross balance | Accumulated amortization | Net balance | |||||||||||||||||||
| (years) | useful life | MCh$ | MCh$ | MCh$ | MCh$ | |||||||||||||||||||
| Licenses | 3 | 2.8 | 2,108 | 7,641 | (5,181 | ) | 2,460 | |||||||||||||||||
| Software development (acquired) | 3 | 2.5 | 75,882 | 172,466 | (97,697 | ) | 74,769 | |||||||||||||||||
| Totals | 77,990 | 180,107 | (102,878 | ) | 77,229 | |||||||||||||||||||
| As of December 31, 2010 | ||||||||||||||||||||||||
| Useful life | Remaining | Opening balance January 1, 2010 | Gross balance | Accumulated amortization | Net balance | |||||||||||||||||||
| (years) | useful life | MCh$ | MCh$ | MCh$ | MCh$ | |||||||||||||||||||
| Licenses | 3 | 2 | 1,544 | 6,229 | (4,121 | ) | 2,108 | |||||||||||||||||
| Software development (acquired) | 3 | 1.6 | 75,716 | 150,090 | (74,208 | ) | 75,882 | |||||||||||||||||
| Totals | 77,260 | 156,319 | (78,329 | ) | 77,990 | |||||||||||||||||||
| b) | The activity in intangible assets as of September 30, 2011 and December 31, 2010 is as follows: |
b.1) Gross balance
| Licenses | Software development (acquired) | Total | ||||||||||
| MCh$ | MCh$ | MCh$ | ||||||||||
| Gross balances 2011 | ||||||||||||
| Opening balances as of January 1, 2011 | 6,229 | 150,090 | 156,319 | |||||||||
| Acquisitions | 1,412 | 22,376 | 23,788 | |||||||||
| Balances as of September 30, 2011 | 7,641 | 172,466 | 180,107 | |||||||||
| Gross balances 2010 | ||||||||||||
| Opening balances as of January 1, 2010 (*) | 4,422 | 123,939 | 128,361 | |||||||||
| Acquisitions | 1,807 | 26,151 | 27,958 | |||||||||
| Balances as of December 31, 2010 | 6,229 | 150,090 | 156,319 | |||||||||
(*) As of January 1, 2010, intangible assets were recorded at their amortized cost value, net of accumulated amortization.
60
BANCO SANTANDER CHILE AND SUBSIDIARIES NOTES TO THE CONSOLIDATED INTERIM FINANCIAL STAEMENTS As of September 30, 2011 and 2010 and December 31, 2010 |
NOTE 11 - INTANGIBLE ASSETS, continued:
b.2) Accumulated amortization
| Accumulated amortization | Licenses | Software development (acquired) | Total | |||||||||
| MCh$ | MCh$ | MCh$ | ||||||||||
| Opening balances as of January 1, 2011 | (4,121 | ) | (74,208 | ) | (78,329 | ) | ||||||
| Amortization for the period | (1,060 | ) | (23,489 | ) | (24,549 | ) | ||||||
| Other changes | - | - | - | |||||||||
| Balances as of September 30, 2011 | (5,181 | ) | (97,697 | ) | (102,878 | ) | ||||||
| Opening balances as of January 1, 2010 | (2,878 | ) | (48,223 | ) | (51,101 | ) | ||||||
| Amortization for the period | (1,243 | ) | (25,985 | ) | (27,228 | ) | ||||||
| Other changes | - | - | - | |||||||||
| Balances as of December 31, 2010 | (4,121 | ) | (74,208 | ) | (78,329 | ) | ||||||
| c) | As of September 30, 2011 and December 31, 2010, the Bank does not have any restriction on intangible assets. Additionally, intangible assets have not been pledged as security for liabilities. Also, there are no intangible debt amounts on the same dates. |
61
BANCO SANTANDER CHILE AND SUBSIDIARIES NOTES TO THE CONSOLIDATED INTERIM FINANCIAL STAEMENTS As of September 30, 2011 and 2010 and December 31, 2010 |
NOTE 12 - PROPERTY, PLANT, AND EQUIPMENT
a) Property, plant and equipment as of September 30, 2011 and December 31, 2010 are as follows:
| As of September 30, 2011 | ||||||||||||||||
Opening balance January 1, 2011 | Gross balance | Accumulated depreciation | Net balance | |||||||||||||
| MCh$ | MCh$ | MCh$ | MCh$ | |||||||||||||
| Land and buildings | 126,550 | 156,316 | (31,662 | ) | 124,654 | |||||||||||
| Equipment | 20,346 | 37,207 | (17,565 | ) | 19,642 | |||||||||||
| Ceded under operating leases | 1,802 | 2,007 | - | 2,007 | ||||||||||||
| Other | 6,287 | 16,718 | (9,905 | ) | 6,813 | |||||||||||
| Total | 154,985 | 212,248 | (59,132 | ) | 153,116 | |||||||||||
| As of December 31, 2010 | ||||||||||||||||
Opening balance January 1, 2010 | Gross balance | Accumulated depreciation | Net balance | |||||||||||||
| MCh$ | MCh$ | MCh$ | MCh$ | |||||||||||||
| Land and buildings | 161,922 | 155,821 | (29,271 | ) | 126,550 | |||||||||||
| Equipment | 13,391 | 42,757 | (22,411 | ) | 20,346 | |||||||||||
| Ceded under operating leases | 689 | 1,840 | (38 | ) | 1,802 | |||||||||||
| Other | 8,120 | 18,943 | (12,656 | ) | 6,287 | |||||||||||
| Totals | 184,122 | 219,361 | (64,376 | ) | 154,985 | |||||||||||
62
BANCO SANTANDER CHILE AND SUBSIDIARIES NOTES TO THE CONSOLIDATED INTERIM FINANCIAL STAEMENTS As of September 30, 2011 and 2010 and December 31, 2010 |
NOTE 12 - PROPERTY, PLANT, AND EQUIPMENT, continued:
b) The activity in property, plant, and equipment during 2011 and 2010 is as follows:
b.1) Gross balance
Land and buildings | Equipment | Ceded under an operating leases | Other | Total | ||||||||||||||||
| 2011 | MCh$ | MCh$ | MCh$ | MCh$ | MCh$ | |||||||||||||||
| Opening balances as of January 1, 2011 | 155,821 | 42,757 | 1,840 | 18,943 | 219,361 | |||||||||||||||
| Additions | 2,848 | 4,535 | 3,796 | 2,082 | 13,261 | |||||||||||||||
| Disposals | (4,946 | ) | (9,988 | ) | - | (5,331 | ) | (20,265 | ) | |||||||||||
| Impairment due to damage | - | (109 | ) | - | - | (109 | ) | |||||||||||||
| Transfers | 2,593 | 12 | (3,629 | ) | 1,024 | - | ||||||||||||||
| Other | - | - | - | - | - | |||||||||||||||
| Balances as of September 30, 2011 | 156,316 | 37,207 | 2,007 | 16,718 | 212,248 | |||||||||||||||
Land and buildings | Equipment | Ceded under an operating leases | Other | Total | ||||||||||||||||
| 2010 | MCh$ | MCh$ | MCh$ | MCh$ | MCh$ | |||||||||||||||
| Opening balances as of January 1, 2010 | 180,868 | 27,993 | 727 | 17,513 | 227,101 | |||||||||||||||
| Additions | 7,884 | 7,781 | - | 3,336 | 19,001 | |||||||||||||||
| Disposals | (26,968 | ) | (235 | ) | - | (114 | ) | (27,317 | ) | |||||||||||
| Impairment due to damage | (4,739 | ) | (186 | ) | - | - | (4,925 | ) | ||||||||||||
| Transfers | (745 | ) | - | 745 | - | - | ||||||||||||||
| Other | (479 | ) | 7,404 | 368 | (1,792 | ) | 5,501 | |||||||||||||
| Balances as of December 31, 2010 | 155,821 | 42,757 | 1,840 | 18,943 | 219,361 | |||||||||||||||
Banco Santander Chile has had to recognize in its consolidated interim financial statements as of September 31, 2010 an Impairment loss for Ch$ 109 million corresponding to damage to ATMs. Reimbursement payments received from insurances totaled Ch$ 315 million, which are presented in line item “other operating income” (See Note 31).
As stated in Note 31, during 2011 the Bank has sold 1 branch which, at the time of sale, had a net carrying amount of approximately Ch$ 48 million (See note 31).
63
BANCO SANTANDER CHILE AND SUBSIDIARIES NOTES TO THE CONSOLIDATED INTERIM FINANCIAL STAEMENTS As of September 30, 2011 and 2010 and December 31, 2010 |
NOTE 12 - PROPERTY, PLANT, AND EQUIPMENT, continued:
b.2) Accumulated depreciation
Land and buildings | Equipment | Ceded under an operating leases | Other | Total | ||||||||||||||||
| 2011 | MCh$ | MCh$ | MCh$ | MCh$ | MCh$ | |||||||||||||||
| Opening balances as of January 1, 2011 | (29,271 | ) | (22,411 | ) | (38 | ) | (12,656 | ) | (64,376 | ) | ||||||||||
| Depreciation charges in the period | (7,526 | ) | (5,003 | ) | - | (2,560 | ) | (15,089 | ) | |||||||||||
| Sales and disposals in the period | 5,173 | 9,849 | - | 5,311 | 20,333 | |||||||||||||||
| Other | (38 | ) | - | 38 | - | - | ||||||||||||||
| Balances as of September 30, 2011 | (31,662 | ) | (17,565 | ) | - | (9,905 | ) | (59,132 | ) | |||||||||||
Land and buildings | Equipment | Ceded under an operating leases | Other | Total | ||||||||||||||||
| 2010 | MCh$ | MCh$ | MCh$ | MCh$ | MCh$ | |||||||||||||||
| Opening balances as of January 1, 2010 | (18,946 | ) | (14,602 | ) | (38 | ) | (9,393 | ) | (42,979 | ) | ||||||||||
| Depreciation charges in the period | (11,103 | ) | (7,809 | ) | - | (3,263 | ) | (22,175 | ) | |||||||||||
| Sales and disposals in the period | 778 | - | - | - | 778 | |||||||||||||||
| Other | - | - | - | - | - | |||||||||||||||
| Balances as of December 31, 2010 | (29,271 | ) | (22,411 | ) | (38 | ) | (12,656 | ) | (64,376 | ) | ||||||||||
| c) | Operational leases – Lessor |
As of September 30, 2011 and December 31, 2010, the future minimum lease inflows under non-cancellable operating leases are as follows:
| As of September 30, | As of December 31, | |||||||
| 2011 | 2010 | |||||||
| MCh$ | MCh$ | |||||||
| Due within 1 year | 258 | 597 | ||||||
| Due after 1 year but within 2 years | 930 | 591 | ||||||
| Due after 2 year but within 3 years | 846 | 587 | ||||||
| Due after 3 year but within 4 years | 354 | 184 | ||||||
| Due after 4 year but within 5 years | 332 | 165 | ||||||
| Due after 5 years | 2,726 | 2,090 | ||||||
| Totals | 5,447 | 4,214 | ||||||
64
BANCO SANTANDER CHILE AND SUBSIDIARIES NOTES TO THE CONSOLIDATED INTERIM FINANCIAL STAEMENTS As of September 30, 2011 and 2010 and December 31, 2010 |
NOTE 12 - PROPERTY, PLANT, AND EQUIPMENT, continued:
| d) | Operational leases – Lessee |
Certain Bank’s premises and equipment are leased under operating leases. Future minimum rental payments under non-cancellable leases are as follows:
| As of September 30, | As of December 31, | |||||||
| 2011 | 2010 | |||||||
| MCh$ | MCh$ | |||||||
| Due within 1 year | 14,489 | 14,301 | ||||||
| Due after 1 year but within 2 years | 12,942 | 12,859 | ||||||
| Due after 2 year but within 3 years | 11,594 | 11,339 | ||||||
| Due after 3 year but within 4 years | 10,302 | 10,194 | ||||||
| Due after 4 year but within 5 years | 8,533 | 8,720 | ||||||
| Due after 5 years | 57,283 | 58,724 | ||||||
| Totals | 115,143 | 116,137 | ||||||
| e) | As of September 30, 2011 and 2010, the Bank has no financial leases which cannot be unilaterally rescinded. |
| f) | As of September 30, 2011 and December 31, 2010, the Bank does not have any restriction over property, plant, and equipment. Additionally, property, plant, and equipment have not been pledged as security for liabilities. Also, the Bank has no debt regarding Property, plant, and equipment to those dates. |
65
BANCO SANTANDER CHILE AND SUBSIDIARIES NOTES TO THE CONSOLIDATED INTERIM FINANCIAL STAEMENTS As of September 30, 2011 and 2010 and December 31, 2010 |
NOTE 13 - CURRENT AND DEFERRED TAXES:
a) Current tax
At the end of each reporting period the bank recognizes an Income Tax Provision, which is determined based on the currently applicable tax legislation. This provision is recorded net of recoverable taxes, as shown as follows:
| As of September 30, | As of December 31, | |||||||
| 2011 | 2010 | |||||||
| MCh$ | MCh$ | |||||||
| Summary of current tax liabilities (assets) | ||||||||
| Current taxes (assets) | (27,746 | ) | (12,499 | ) | ||||
| Current taxes liabilities | 2,300 | 1,293 | ||||||
| Total tax payable (recoverable) | (25,446 | ) | (11,206 | ) | ||||
| (Assets) liabilities current taxes detail (net) | ||||||||
| Income tax, tax rate 20%(17% as of December 31, 2010) | 76,513 | 92,593 | ||||||
| Minus: | ||||||||
| Provisional monthly payments (PPM) | (97,465 | ) | (96,245 | ) | ||||
| Credit for training expenses | (457 | ) | (1,328 | ) | ||||
| Other | (4,037 | ) | (6,226 | ) | ||||
| Total tax payable (recoverable) | (25,446 | ) | (11,206 | ) | ||||
b) Effect on income
The effect of tax expense on income during the periods ended as of September 30, 2011 and 2010 is comprised of the following items:
For the quarter ended as of September 30, | For the 9-month period ended as of September 30, | |||||||||||||||
| 2011 | 2010 | 2011 | 2010 | |||||||||||||
| MCh$ | MCh$ | MCh$ | MCh$ | |||||||||||||
| Income tax expenses | ||||||||||||||||
| Current tax | 29,679 | 29,614 | 70,157 | 86,001 | ||||||||||||
| Credits (debits) for deferred taxes | ||||||||||||||||
| Origination and reversal of temporary differences | (13,206 | ) | (15,684 | ) | (8,292 | ) | (26,278 | ) | ||||||||
| Prior years’ tax benefit | - | - | - | - | ||||||||||||
| Subtotals | 16,473 | 13,930 | 61,865 | 59,723 | ||||||||||||
| Tax for rejected expenses (Article No.21) | 156 | 179 | 681 | 309 | ||||||||||||
| Other | - | - | - | - | ||||||||||||
| Net charges for income tax expense | 16,629 | 14,109 | 62,546 | 60,032 | ||||||||||||
66
BANCO SANTANDER CHILE AND SUBSIDIARIES NOTES TO THE CONSOLIDATED INTERIM FINANCIAL STAEMENTS As of September 30, 2011 and 2010 and December 31, 2010 |
NOTE 13 - CURRENT AND DEFERRED TAXES, continued:
c) Effective tax rate reconciliation
The reconciliation between the income tax rate and the effective rate applied in determining tax expenses as of September 30, 2011 and 2010, is as follows:
| As of September 30, | ||||||||||||||||
| 2011 | 2010 | |||||||||||||||
| Tax rate | Amount | Tax rate | Amount | |||||||||||||
| % | MCh$ | % | MCh$ | |||||||||||||
| Income tax using statutory rate (17 %) | 20.00 | 79,777 | 17.00 | 75,346 | ||||||||||||
| Permanent differences | (3.08 | ) | (12,285 | ) | (1.81 | ) | (8,026 | ) | ||||||||
| Additions or deductions | - | - | - | - | ||||||||||||
| Unique tax (rejected expenses) | 0.17 | 681 | 0.07 | 308 | ||||||||||||
| Effect of change in tax rate | (1.41 | ) | (5,627 | ) | (1.17 | ) | (7,596 | ) | ||||||||
| Other | - | - | - | - | ||||||||||||
| Effective rates and expenses for income tax | 15.68 | 62,546 | 14.09 | 60,032 | ||||||||||||
Law No. 20,455 from 2010 increased the statutory tax rate to be applied to companies for their profit during 2011 and 2012, to 20% and 18.5% respectively. Due to this, in 2010, a Ch$7,596 million tax benefit was recorded, corresponding to the adjustment of temporary differences to be reversed during those years. As of September 30, 2011 the Bank recognized an expanse of Ch$1,244 millions
d) Effect of deferred taxes on comprehensive income
Below is a summary of the separate effect of deferred tax on other comprehensive income, during the periods ended September 30, 2011 and December 31, 2010:
| As of September 30, | As of December 31, | |||||||
| 2011 | 2010 | |||||||
| MCh$ | MCh$ | |||||||
| Deferred tax assets | ||||||||
| Available for sale investments | 143 | 4,319 | ||||||
| Cash flow hedge | 414 | - | ||||||
| Total deferred tax assets affecting other comprehensive income | 557 | 4,319 | ||||||
| Deferred tax liabilities | ||||||||
| Available for sale investments | (712 | ) | (749 | ) | ||||
| Cash flow hedge | - | (2,324 | ) | |||||
| Total deferred tax liabilities affecting other comprehensive income | (712 | ) | (3,073 | ) | ||||
| Net deferred tax balances in equity | (155 | ) | 1,246 | |||||
| Deferred taxes in equity attributable to Bank shareholders | (147 | ) | 1,203 | |||||
| Deferred tax in equity attributable to non-controlling interest | (8 | ) | 43 | |||||
67
BANCO SANTANDER CHILE AND SUBSIDIARIES NOTES TO THE CONSOLIDATED INTERIM FINANCIAL STAEMENTS As of September 30, 2011 and 2010 and December 31, 2010 |
NOTE 13 - CURRENT AND DEFERRED TAXES, continued:
e) Effect of deferred taxes on income
Below are the effects as of September 30, 2011 and December 31, 2010 of deferred taxes on assets and liabilities affecting profit or loss, as a result of temporary differences:
| As of September 30, | As of December 31, | |||||||
| 2011 | 2010 | |||||||
| MCh$ | MCh$ | |||||||
| Deferred tax assets | ||||||||
| Interest and adjustments | 93 | 162 | ||||||
| Extraordinary charge-off | 6,235 | 5,197 | ||||||
| Assets received in lieu of payment | 2,317 | 2,473 | ||||||
| Exchange rate adjustments | 874 | 560 | ||||||
| Valuation of Property, plant and equipment | 6,758 | 5,491 | ||||||
| Allowance for loan losses | 82,342 | 62,525 | ||||||
| Provision for expenses | 11,764 | 6,606 | ||||||
| Derivatives | - | 4,300 | ||||||
| Leased assets | 27,691 | 22,007 | ||||||
| Subsidiaries’ tax losses | 4,407 | 4,168 | ||||||
| Other | 400 | 156 | ||||||
| Total deferred tax assets | 142,881 | 113,645 | ||||||
| Deferred tax liabilities | ||||||||
| Valuation of investments and derivatives | (8,662 | ) | (1,056 | ) | ||||
| Depreciation | (233 | ) | (443 | ) | ||||
| Prepaid expenses | (1,584 | ) | (646 | ) | ||||
| Other | (389 | ) | (223 | ) | ||||
| Total deferred tax liabilities | (10,868 | ) | (2,368 | ) | ||||
f) Summary of deferred tax assets and liabilities
Below is a summary of the deferred tax assets and liabilities, recognized in other comprehensive income and in profit or loss:
| As of September 30, | As of December 31, | |||||||
| 2011 | 2010 | |||||||
| MCh$ | MCh$ | |||||||
| Deferred tax assets | ||||||||
| Recognized in other comprehensive income | 557 | 4,319 | ||||||
| Recognized in profit or loss | 142,881 | 113,645 | ||||||
| Total deferred tax assets | 143,438 | 117,964 | ||||||
| Deferred tax liabilities | ||||||||
| Recognized in other comprehensive income | (712 | ) | (3,073 | ) | ||||
| Recognized in profit or loss | (10,868 | ) | (2,368 | ) | ||||
| Total deferred tax liabilities | (11,580 | ) | (5,441 | ) | ||||
68
BANCO SANTANDER CHILE AND SUBSIDIARIES NOTES TO THE CONSOLIDATED INTERIM FINANCIAL STAEMENTS As of September 30, 2011 and 2010 and December 31, 2010 |
NOTE 14 – OTHER ASSETS:
Other assets item as of September 30, 2011 and December 31, 2010 is as follows:
| As of September 30, | As of December 31, | |||||||
| 2011 | 2010 | |||||||
| MCh$ | MCh$ | |||||||
| Assets for leasing (*) | 77,680 | 43,832 | ||||||
| Assets received or awarded in lieu of payment (**) | ||||||||
| Assets received in lieu of payment | 11,946 | 10,798 | ||||||
| Assets awarded at judicial sale | 10,610 | 7,798 | ||||||
| Provisions for assets received in lieu of payment or awarded | (2,438 | ) | (1,860 | ) | ||||
| Subtotals | 20,118 | 16,736 | ||||||
| Other assets | ||||||||
| Guarantee deposits | 148,123 | 208,512 | ||||||
| VAT credit | 7,589 | 9,634 | ||||||
| Income tax recoverable | 6,849 | 9,045 | ||||||
| Prepaid expenses | 73,095 | 81,348 | ||||||
| Assets recovered from leasing for sale | 1,576 | 2,347 | ||||||
| Pension plan assets | 3,363 | 4,217 | ||||||
| Accounts and notes receivable | 94,307 | 100,958 | ||||||
| Notes receivable through brokerage and simultaneous transactions | 230,710 | 111,508 | ||||||
| Other assets | 40,715 | 52,800 | ||||||
| Subtotals | 606,327 | 580,369 | ||||||
| Totals | 704,125 | 640,937 | ||||||
| (*) | Assets available to be granted under financial leasing agreements. |
| (**) | The assets received in lieu of payment are assets received as payment of customers’ past-due debts. The assets acquired must at no time exceed, in the aggregate, 20% of the Bank’s effective equity. These assets represent 0.49% (0.47% as of December 31, 2010) of the Bank’s effective equity |
The assets awarded at judicial sale are assets that have been acquired as payment of debts previously owed towards the Bank. The assets awarded at judicial sales are not subject to the abovementioned requirement. These properties are assets available for sale. For most assets, the sale is expected to be completed within one year from the date on which the asset was received or acquired. If the asset in question is not sold within the year, it must be written off.
In addition, a provision is recorded for the initial award value plus its additions and its estimated realization value (appraisal) when the first is higher.
69
BANCO SANTANDER CHILE AND SUBSIDIARIES NOTES TO THE CONSOLIDATED INTERIM FINANCIAL STAEMENTS As of September 30, 2011 and 2010 and December 31, 2010 |
NOTE 15 - TIME DEPOSITS AND OTHER TIME LIABILITIES:
As of September 30, 2011 and December 31, 2010 the composition of the item is as follows:
| As of September 30, | As of December 31, | |||||||
| 2011 | 2010 | |||||||
| MCh$ | MCh$ | |||||||
| Deposits and other demand liabilities | ||||||||
| Checking accounts | 3,375,207 | 3,330,352 | ||||||
| Other deposits and demand accounts | 363,009 | 368,934 | ||||||
| Other demand liabilities | 758,541 | 537,148 | ||||||
| Totals | 4,496,757 | 4,236,434 | ||||||
| Time deposits and other time liabilities | ||||||||
| Time deposits | 9,291,339 | 7,154,396 | ||||||
| Time savings account | 102,636 | 103,191 | ||||||
| Other time liabilities | 1,271 | 1,170 | ||||||
| Totals | 9,395,246 | 7,258,757 | ||||||
70
BANCO SANTANDER CHILE AND SUBSIDIARIES NOTES TO THE CONSOLIDATED INTERIM FINANCIAL STAEMENTS As of September 30, 2011 and 2010 and December 31, 2010 |
NOTE 16 - ISSUED DEBT INSTRUMENTS AND OTHER OBLIGATIONS:
As of September 30, 2011 and December 31, 2010 the composition of the item is as follows:
| As of September 30, | As of December 31, | |||||||
| 2011 | 2010 | |||||||
| MCh$ | MCh$ | |||||||
| Other financial liabilities | ||||||||
| Obligations to public sector | 102,862 | 102,541 | ||||||
| Other domestic obligations | 61,085 | 38,000 | ||||||
| Foreign obligations | 3,046 | 25,748 | ||||||
| Subtotals | 166,993 | 166,289 | ||||||
| Issued debt instruments | ||||||||
| Mortgage finance bonds | 167,804 | 194,134 | ||||||
| Senior bonds | 3,486,072 | 3,310,679 | ||||||
| Subordinated bonds | 859,030 | 686,075 | ||||||
| Subtotals | 4,512,906 | 4,190,888 | ||||||
| Totals | 4,679,899 | 4,357,177 | ||||||
Debts classified as current are either demand obligations or will mature in one year or less. All other debts are classified as non-current. The Bank’s debts, both current and non-current, are summarized below:
| As of September 30, 2011 | ||||||||||||
| Current | Non-current | Total | ||||||||||
| MCh$ | MCh$ | MCh$ | ||||||||||
| Mortgage bonds | 8,097 | 159,707 | 167,804 | |||||||||
| Senior bonds | 659,286 | 2,826,786 | 3,486,072 | |||||||||
| Subordinated bonds | 172,344 | 686,686 | 859,030 | |||||||||
| Issued debt instruments | 839,727 | 3,673,179 | 4,512,906 | |||||||||
| Other financial liabilities | 44,384 | 122,609 | 166,993 | |||||||||
| Totals | 884,111 | 3,795,788 | 4,679,899 | |||||||||
| As of December 31, 2010 | ||||||||||||
| Current | Non-current | Total | ||||||||||
| MCh$ | MCh$ | MCh$ | ||||||||||
| Mortgage bonds | 10,751 | 183,383 | 194,134 | |||||||||
| Senior bonds | 547,107 | 2,763,572 | 3,310,679 | |||||||||
| Subordinated bonds | 21,692 | 664,383 | 686,075 | |||||||||
| Issued debt instruments | 579,550 | 3,611,338 | 4,190,888 | |||||||||
| Other financial liabilities | 44,042 | 122,247 | 166,289 | |||||||||
| Totals | 623,592 | 3,733,585 | 4,357,177 | |||||||||
71
BANCO SANTANDER CHILE AND SUBSIDIARIES NOTES TO THE CONSOLIDATED INTERIM FINANCIAL STAEMENTS As of September 30, 2011 and 2010 and December 31, 2010 |
NOTE 16 – ISSUED DEBT INSTRUMENTS AND OTHER OBLIGATIONS, continued:
| a) | Mortgage finance bonds |
These bonds are used to finance mortgage loans. The outstanding principal of the bonds are amortized on a quarterly basis. The range of maturities of these bonds is between five and twenty years. The bonds are linked to the UF index and bear a weighted-average annual interest rate of 5.88% as of September 2011 (5.6% as of December 2010).
| As of September 30, | As of December 31, | |||||||
| 2011 | 2010 | |||||||
| MCh$ | MCh$ | |||||||
| Due within 1 year | 8,098 | 10,751 | ||||||
| Due after 1 year but within 2 years | 7,406 | 7,171 | ||||||
| Due after 2 year but within 3 years | 10,749 | 8,745 | ||||||
| Due after 3 year but within 4 years | 20,632 | 12,286 | ||||||
| Due after 4 year but within 5 years | 16,257 | 26,253 | ||||||
| Due after 5 years | 104,661 | 128,928 | ||||||
| Total mortgage bonds | 167,803 | 194,134 | ||||||
| b) | Senior bonds |
The following table shows senior bonds by currency:
| As of September 30, | As of December 31, | |||||||
| 2011 | 2010 | |||||||
| MCh$ | MCh$ | |||||||
| Santander bonds in UF | 1,880,919 | 1,952,051 | ||||||
| Santander bonds in US$ | 1,254,136 | 936,134 | ||||||
| Santander bonds in CHF$ | 130,737 | 174,297 | ||||||
| Santander bonds in $ | 220,281 | 248,197 | ||||||
| Total senior bonds | 3,486,073 | 3,310,679 | ||||||
72
BANCO SANTANDER CHILE AND SUBSIDIARIES NOTES TO THE CONSOLIDATED INTERIM FINANCIAL STAEMENTS As of September 30, 2011 and 2010 and December 31, 2010 |
NOTE 16 – ISSUED DEBT INSTRUMENTS AND OTHER OBLIGATIONS, continued:
In 2011 the Bank issued bonds for UF 9,718,000 and CLP 26,800,000,000; detailed as follows:
| Series | Amount | Term | Issue Rate | Issuance date | Maturity date | ||||||||
| Floating rate bond | USD | 500,000,000 | 5 years | Libor (3 months) + 125 bp | 01-11-2011 | 01-19-2016 | |||||||
| Total | USD | 500,000,000 | |||||||||||
| BSTDFA0410 | UF | 160,000 | 4 years | 3.0 % per annum simple | 04-01-2010 | 01-04-2014 | |||||||
| BSTDFD0810 | UF | 1,274,000 | 5 years | 3.0 % per annum simple | 08-01-2010 | 08-01-2015 | |||||||
| BSTDFE0810 | UF | 2,750,000 | 6 years | 3.0 % per annum simple | 08-01-2010 | 08-01-2016 | |||||||
| BSTDE10211 | UF | 896,000 | 5 years | 3.3 % per annum simple | 02-01-2011 | 04-01-2016 | |||||||
| BSTDE20111 | UF | 3,048,000 | 7.5 years | 3.5 % per annum simple | 01-01-2011 | 07-01-2018 | |||||||
| BSTDE30111 | UF | 1,590,000 | 8.5 years | 3.5 % per annum simple | 01-01-2011 | 07-01-2019 | |||||||
| Total | UF | 9,718,000 | |||||||||||
| BSTDE40611 | CLP | 26,800,000,000 | 5 years | 6.75 % per annum simple | 06-01-2011 | 06-01-2016 | |||||||
| Total | CLP | 26,800,000,000 | |||||||||||
On January 11, 2011 the Bank issued a 5 year floating rate note for USD 500.000.000 at 3-month Libor. The interest payment will be done quarterly starting on April 19, 2011. The issuance was made in USA on January 19, 2011.
In 2010 the Bank issued bonds denominated in UF for 21,496,000; USD 1,200,000,000; CHF 350,000,000; and CLP 247,255,000,000. The table below shows the issued bonds on the stated dates:
| Series | Amount | Term | Interest rate | Issuance date | Maturity date | ||||||||
| F6 | UF | 1,090,000 | 5 years | 3.5 % per annum simple | 09-01-2009 | 09-01-2014 | |||||||
| F7 | UF | 3,000,000 | 4.5 years | 3.3 % per annum simple | 11-01-2009 | 05-01-2014 | |||||||
| F8 | UF | 3,000,000 | 4.5 years | 3.6 % per annum simple | 01-01-2010 | 07-01-2014 | |||||||
| F9 | UF | 3,000,000 | 5 years | 3.7 % per annum simple | 01-01-2010 | 01-01-2015 | |||||||
| FA | UF | 2,840,000 | 4 years | To maturity (bullet) | 04-01-2010 | 04-01-2014 | |||||||
| FB | UF | 3,000,000 | 5 years | 3,0% annual due | 04-01-2010 | 04-01-2015 | |||||||
| FC | UF | 4,000,000 | 5 years | 4.5 % annual due | 08-01-2010 | 08-01-2015 | |||||||
| FD | UF | 1,566,000 | 5 years | To maturity (bullet) | 09-01-2010 | 09-01-2015 | |||||||
| Total | UF | 21,496,000 | |||||||||||
| Floating rate bond | USD | 500,000,000 | 2 years | Libor (3 months) + 125 bp | 04-15-2010 | 04-12-2012 | |||||||
| Fixed bonds | USD | 500,000,000 | 5 years | 3.75 % per annum simple | 09-15-2010 | 09-15-2015 | |||||||
| Floating rate bond | USD | 200,000,000 | 1 year | Libor (3 months) + 100 bp | 09-15-2010 | 09-15-2011 | |||||||
| Floating rate bond | USD | 500,000,000 | 5 years | Libor (3 months) + 125 bp | 01-11-2011 | 01-19-2016 | |||||||
| Total | USD | 1,200,000,000 | |||||||||||
| Fixed bonds | CHF | 250,000,000 | 5 years | 2.25 coupon rate | 11-16-2010 | 12-16-2015 | |||||||
| Floating rate bond | CHF | 100,000,000 | 3 years | Libor (3 months) + 100 bp | 11-16-2010 | 11-16-2013 | |||||||
| Total | CHF | 350,000,000 | |||||||||||
| Bono pesos | CLP | 247,255,000,000 | 10 years | 6.5 coupon rate | 09-15-2010 | 09-22-2020 | |||||||
| Total | CLP | 247,255,000,000 | |||||||||||
73
BANCO SANTANDER CHILE AND SUBSIDIARIES NOTES TO THE CONSOLIDATED INTERIM FINANCIAL STAEMENTS As of September 30, 2011 and 2010 and December 31, 2010 |
NOTE 16 – ISSUED DEBT INSTRUMENTS AND OTHER OBLIGATIONS, continued:
The maturity of these bonds are as follows:
| As of September 30, | As of December 31, | |||||||
| 2011 | 2010 | |||||||
| MCh$ | MCh$ | |||||||
| Due within 1 year | 658,364 | 547,107 | ||||||
| Due after 1 year but within 2 years | 668,343 | 374,727 | ||||||
| Due after 2 year but within 3 years | 541,908 | 389,813 | ||||||
| Due after 3 year but within 4 years | 315,776 | 390,953 | ||||||
| Due after 4 year but within 5 years | 535,565 | 340,331 | ||||||
| Due after 5 years | 766,117 | 1,267,748 | ||||||
| Total bonds | 3,486,073 | 3,310,679 | ||||||
c) Subordinated bonds
The following table shows the balances of our subordinated bonds:
| As of September 30, | As of December 31, | |||||||
| 2011 | 2010 | |||||||
| MCh$ | MCh$ | |||||||
| Subordinated bonds denominated in US $ | 333,044 | 244,957 | ||||||
| Subordinated bonds denominated in UF | 525,986 | 441,118 | ||||||
| Total subordinated bonds | 859,030 | 686,075 | ||||||
In 2011 the Bank issued subordinated bonds on the local market for UF 5,100,000, detailed as follows:
| Interest | |||||||||||||
| Series | Amount | Term | rate | Issuance date | Maturity date | ||||||||
| G3 | UF | 3,000,000 | 25 years | 3.9 % per annum simple | 07-01-2010 | 07-01-2035 | |||||||
| G5 | UF | 2,100,000 | 20 years | 3.9 % per annum simple | 04-01-2011 | 04-01-2031 | |||||||
| Total | UF | 5,100,000 | |||||||||||
In 2010 the Bank placed subordinated bonds on the local market for UF 4,950,000, detailed as follows:
| Interest | |||||||||||||
| Series | Amount | Term | rate | Issuance date | Maturity date | ||||||||
| G2 | UF | 1,950,000 | 30 years | 4.8 % per annum simple | 06-17-2010 | 03-01-2038 | |||||||
| G4 | UF | 3,000,000 | 30 years | 3.9 % annual due | 07-01-2010 | 07-01-2040 | |||||||
| Total | UF | 4,950,000 | |||||||||||
74
BANCO SANTANDER CHILE AND SUBSIDIARIES NOTES TO THE CONSOLIDATED INTERIM FINANCIAL STAEMENTS As of September 30, 2011 and 2010 and December 31, 2010 |
NOTE 16 – ISSUED DEBT INSTRUMENTS AND OTHER OBLIGATIONS, continued:
The maturities of bonds considered non-current, is as follows:
| As of September 30, | As of December 31, | |||||||
| 2011 | 2010 | |||||||
| MCh$ | MCh$ | |||||||
| Due within 1 year | 125,665 | 21,692 | ||||||
| Due after 1 year but within 2 years | 5,410 | 105,505 | ||||||
| Due after 2 year but within 3 years | 5,751 | - | ||||||
| Due after 3 year but within 4 years | 170,667 | 139,452 | ||||||
| Due after 4 year but within 5 years | 4,283 | 12,305 | ||||||
| Due after 5 years | 547,254 | 407,121 | ||||||
| Total subordinated bonds | 859,030 | 686,075 | ||||||
d) Other financial liabilities
The composition of other financial obligations, by maturity, is detailed below:
| As of September 30, | As of December 31, | |||||||
| 2011 | 2010 | |||||||
| MCh$ | MCh$ | |||||||
| Non-current portion: | ||||||||
| Due after 1 year but within 2 years | 4,434 | 4,606 | ||||||
| Due after 2 year but within 3 years | 29,190 | 3,090 | ||||||
| Due after 3 year but within 4 years | 3,509 | 28,786 | ||||||
| Due after 4 year but within 5 years | 3,092 | 3,194 | ||||||
| Due after 5 years | 82,384 | 82,571 | ||||||
| Non-current portion subtotals | 122,609 | 122,247 | ||||||
| Current portion: | ||||||||
| Amounts due to credit card operators | 36,994 | 38,567 | ||||||
| Acceptance of letters of credit | 2,504 | 721 | ||||||
| Other long-term financial obligations, short-term portion | 4,886 | 4,754 | ||||||
| Current portion subtotals | 44,384 | 44,042 | ||||||
| Total other financial liabilities | 166,993 | 166,289 | ||||||
75
BANCO SANTANDER CHILE AND SUBSIDIARIES NOTES TO THE CONSOLIDATED INTERIM FINANCIAL STAEMENTS As of September 30, 2011 and 2010 and December 31, 2010 |
NOTE 17 - MATURITIES OF ASSETS AND LIABILITIES:
As of September 30, 2011 and December 31, 2010 the detail of maturities of assets and liabilities is as follows:
| Demand | Up to 1 month | Between 1 and 3 months | Between 3 and 12 months | Subtotal up to 1 year | Between 1 and 5 years | More than 5 years | Subtotal more than 1 year | Total | ||||||||||||||||||||||||||||
| As of September 30, 2011 | MCh$ | MCh$ | MCh$ | MCh$ | MCh$ | MCh$ | MCh$ | MCh$ | MCh$ | |||||||||||||||||||||||||||
| Assets | ||||||||||||||||||||||||||||||||||||
| Cash and deposits in banks | 1,812,785 | - | - | - | 1,812,785 | - | - | - | 1,812,785 | |||||||||||||||||||||||||||
| Unsettled transactions: | 816,601 | - | - | - | 816,601 | - | - | - | 816,601 | |||||||||||||||||||||||||||
| Trading investments | - | 27,316 | 2,070 | 146,009 | 175,395 | 251,284 | 77,134 | 328,418 | 503,813 | |||||||||||||||||||||||||||
| Investments under repurchase agreements | - | 12,157 | - | - | 12,157 | - | - | - | 12,157 | |||||||||||||||||||||||||||
| Financial derivative contracts | - | 251,185 | 194,435 | 426,524 | 872,144 | 701,882 | 437,559 | 1,139,441 | 2,011,585 | |||||||||||||||||||||||||||
| Interbank loans (*) | 85,381 | - | 2,513 | - | 87,894 | - | - | - | 87,894 | |||||||||||||||||||||||||||
| Loans and accounts receivables from customers (**) | 484,171 | 1,732,868 | 1,526,070 | 2,574,387 | 6,317,496 | 5,708,482 | 5,654,378 | 11,362,860 | 17,680,356 | |||||||||||||||||||||||||||
| Available for sale investments | - | 809,349 | 441,227 | 263,970 | 1,514,546 | 411,376 | 178,723 | 590,099 | 2,104,644 | |||||||||||||||||||||||||||
| Held to maturity investments | - | - | - | - | - | - | - | - | - | |||||||||||||||||||||||||||
| Total assets | 3,198,938 | 2,832,875 | 2,166,315 | 3,410,890 | 11,609,018 | 7,073,024 | 6,347,794 | 13,420,818 | 25,029,835 | |||||||||||||||||||||||||||
| Liabilities | ||||||||||||||||||||||||||||||||||||
| Deposits and other demand liabilities | 4,496,757 | - | - | - | 4,496,757 | - | - | - | 4,496,757 | |||||||||||||||||||||||||||
| Unsettled transactions: | 466,063 | - | - | - | 466,063 | - | - | - | 466,063 | |||||||||||||||||||||||||||
| Investments under repurchase agreements | - | 222,090 | 3,957 | 996 | 227,043 | - | - | - | 227,043 | |||||||||||||||||||||||||||
| Time deposits and other time liabilities | 104,667 | 4,403,631 | 2,372,548 | 2,106,023 | 8,986,869 | 382,859 | 25,518 | 408,377 | 9,395,246 | |||||||||||||||||||||||||||
| Financial derivative contracts | - | 232,812 | 137,528 | 363,897 | 734,237 | 547,419 | 343,617 | 891,036 | 1,625,274 | |||||||||||||||||||||||||||
| Interbank borrowings | 195,850 | 159,220 | 360,111 | 1,177,107 | 1,892,288 | 132,768 | - | 132,768 | 2,025,056 | |||||||||||||||||||||||||||
| Issued debt instruments | 21 | 549,536 | 60,660 | 181,910 | 792,127 | 2,302,747 | 1,418,032 | 3,720,779 | 4,512,906 | |||||||||||||||||||||||||||
| Other financial liabilities | 36,995 | 409 | 3,508 | 3,472 | 44,384 | 40,225 | 82,384 | 122,609 | 166,993 | |||||||||||||||||||||||||||
| Total liabilities | 5,300,353 | 5,567,698 | 2,938,312 | 3,833,405 | 17,636,769 | 3,406,018 | 1,869,551 | 5,275,569 | 22,915,338 | |||||||||||||||||||||||||||
| (*) | Allocations are presented at gross value. The amounts are Commercial, Ch$240,084 million; Mortgage Ch$36,112 million, and Consumer Ch$244,370 million. |
| (**) | Loans and accounts receivables from customers are stated at their gross value. The allowances amounted Ch$520,566 million. |
76
BANCO SANTANDER CHILE AND SUBSIDIARIES NOTES TO THE CONSOLIDATED INTERIM FINANCIAL STAEMENTS As of September 30, 2011 and 2010 and December 31, 2010 |
NOTE 17 - MATURITIES OF ASSETS AND LIABILITIES, continued:
| Demand | Up to 1 month | Between 1 and 3 months | Between 3 and 12 months | Subtotal up to 1 year | Between 1 and 5 years | More than 5 years | Subtotal more than 1 year | Total | ||||||||||||||||||||||||||||
| As of December 31, 2010 | MCh$ | MCh$ | MCh$ | MCh$ | MCh$ | MCh$ | MCh$ | MCh$ | MCh$ | |||||||||||||||||||||||||||
| Assets | ||||||||||||||||||||||||||||||||||||
| Cash and deposits in banks | 1,762,198 | - | - | - | 1,762,198 | - | - | - | 1,762,198 | |||||||||||||||||||||||||||
| Unsettled transactions: | 374,368 | - | - | - | 374,368 | - | - | - | 374,368 | |||||||||||||||||||||||||||
| Trading investments | - | 26,572 | 10,918 | 188,295 | 225,785 | 150,427 | 3,458 | 153,885 | 379,670 | |||||||||||||||||||||||||||
| Investments under repurchase agreements | - | 170,985 | - | - | 170,985 | - | - | - | 170,985 | |||||||||||||||||||||||||||
| Financial derivative contracts | - | 94,417 | 109,729 | 289,492 | 493,638 | 749,688 | 381,052 | 1,130,740 | 1,624,378 | |||||||||||||||||||||||||||
| Interbank loans (*) | 17 | 69,709 | - | - | 69,726 | - | - | - | 69,726 | |||||||||||||||||||||||||||
| Loans and accounts receivables from customers (**) | 610,951 | 1,696,614 | 1,109,796 | 2,274,513 | 5,691,874 | 4,773,163 | 5,192,519 | 9,965,682 | 15,657,556 | |||||||||||||||||||||||||||
| Available for sale investments | - | 189,600 | 120,076 | 265,667 | 575,343 | 532,292 | 366,345 | 898,637 | 1,473,980 | |||||||||||||||||||||||||||
| Held to maturity investments | - | - | - | - | - | - | - | - | - | |||||||||||||||||||||||||||
| Total assets | 2,747,534 | 2,247,897 | 1,350,519 | 3,017,967 | 9,363,917 | 6,205,570 | 5,943,374 | 12,148,944 | 21,512,861 | |||||||||||||||||||||||||||
| Liabilities | ||||||||||||||||||||||||||||||||||||
| Deposits and other demand liabilities | 4,236,434 | - | - | - | 4,236,434 | - | - | - | 4,236,434 | |||||||||||||||||||||||||||
| Unsettled transactions | 300,125 | - | - | - | 300,125 | - | - | - | 300,125 | |||||||||||||||||||||||||||
| Investments under repurchase agreements | - | 284,020 | 9,769 | 936 | 294,725 | - | - | - | 294,725 | |||||||||||||||||||||||||||
| Time deposits and other time liabilities | 104,362 | 2,167,851 | 1,713,684 | 2,350,479 | 6,336,376 | 898,241 | 24,140 | 922,381 | 7,258,757 | |||||||||||||||||||||||||||
| Financial derivative contracts | - | 137,501 | 155,431 | 343,771 | 636,703 | 696,219 | 311,057 | 1,007,276 | 1,643,979 | |||||||||||||||||||||||||||
| Interbank borrowings | 831 | 29,877 | 179,361 | 1,249,718 | 1,459,787 | 124,270 | - | 124,270 | 1,584,057 | |||||||||||||||||||||||||||
| Issued debt instruments | - | 6,007 | 130,557 | 442,986 | 579,550 | 1,807,541 | 1,803,797 | 3,611,338 | 4,190,888 | |||||||||||||||||||||||||||
| Other financial liabilities | 38,567 | 1,089 | 773 | 3,613 | 44,042 | 39,677 | 82,570 | 122,247 | 166,289 | |||||||||||||||||||||||||||
| Total liabilities | 4,680,319 | 2,626,345 | 2,189,575 | 4,391,503 | 13,887,742 | 3,565,948 | 2,221,564 | 5,787,512 | 19,675,254 | |||||||||||||||||||||||||||
| (*) | Interbank loans are stated at their gross value. The allowance amounted Ch$54 million. |
| (**) | Loans and accounts receivables from customers are stated at their gross value. The allowance amounted Ch$481,581 million. |
.
77
BANCO SANTANDER CHILE AND SUBSIDIARIES NOTES TO THE CONSOLIDATED INTERIM FINANCIAL STAEMENTS As of September 30, 2011 and 2010 and December 31, 2010 |
NOTE 18 - OTHER LIABILITIES
The Other liabilities as of September 30, 2011 and December 31, 2010 are as follows:
| As of September 30, | As of December 31, | |||||||
| 2011 | 2010 | |||||||
| MCh$ | MCh$ | |||||||
| Accounts and notes payable | 67,556 | 63,026 | ||||||
| Unearned income | 923 | 1,547 | ||||||
| Guarantees received (threshold) | 271,803 | 68,217 | ||||||
| Notes payable through brokerage and simultaneous transactions | 126,655 | 53,856 | ||||||
| Other liabilities | 96,089 | 74,682 | ||||||
| Totals | 563,026 | 261,328 | ||||||
78
BANCO SANTANDER CHILE AND SUBSIDIARIES NOTES TO THE CONSOLIDATED INTERIM FINANCIAL STAEMENTS As of September 30, 2011 and 2010 and December 31, 2010 |
NOTE 19 -CONTINGENCIES AND COMMITMENTS:
a) Lawsuits and legal procedures
As of the issuance date of these consolidated interim financial statements, the Bank and its affiliates were subject to certain legal actions in the normal course of their business. As of September, 2011 the Bank and its affiliates maintained provisions for these legal actions, totaling MCh$737 (MCh$839 as of December 31, 2010), which are part of the “Provisions for contingencies” item.
b) Contingent loans
The following table shows the Bank’s contractual obligations to issue loans:
| As of September 30, | As of December 31, | |||||||
| 2011 | 2010 | |||||||
| MCh$ | MCh$ | |||||||
| Letters of credit issued | 206,536 | 209,532 | ||||||
| Foreign letters of credit confirmed | 53,094 | 85,739 | ||||||
| Guarantees | 888,653 | 898,751 | ||||||
| Pledges and other commercial commitments | 153,585 | 166,550 | ||||||
| Subtotals | 1,301,868 | 1,360,572 | ||||||
| Available on demand credit lines | 4,496,281 | 4,832,359 | ||||||
| Other irrevocable credit commitments | 103,604 | 129,428 | ||||||
| Totals | 5,901,753 | 6,322,359 | ||||||
c) Held securities
The Bank holds securities in the normal course of its business as follows:
| As of September 30, | As of December 31, | |||||||
| 2011 | 2010 | |||||||
| MCh$ | MCh$ | |||||||
| Third party operations | ||||||||
| Collections | 208,807 | 173,219 | ||||||
| Assets from third parties managed by the Bank and its affiliates | 35 | 66 | ||||||
| Subtotals | 208,842 | 173,285 | ||||||
| Custody of securities | ||||||||
| Securities held in custody | 322,527 | 290,549 | ||||||
| Securities held in custody deposited in other entity | 561,757 | 611,145 | ||||||
| Issued securities held in custody | 8,886,279 | 9,944,224 | ||||||
| Subtotals | 9,770,563 | 10,845,918 | ||||||
| Totals | 9,979,405 | 11,019,203 | ||||||
| d) | Guarantees |
Banco Santander Chile has a comprehensive officer fidelity insurance policy, No. 2545451, with the Chilena Consolidada Insurance Company, for an amount of USD $5,000,000, which jointly covers both the Bank and its affiliates for the period from July 1, 2011 to June 30, 2012.
79
BANCO SANTANDER CHILE AND SUBSIDIARIES NOTES TO THE CONSOLIDATED INTERIM FINANCIAL STAEMENTS As of September 30, 2011 and 2010 and December 31, 2010 |
NOTE 19 -CONTINGENCIES AND COMMITMENTS, continued:
Santander Asset Management S.A. Administradora General de Fondos
In conformity with General Standard No.125, the company designated Banco Santander Chile as the representative of the beneficiaries of the guarantees established by each of the managed funds, in compliance with Articles 226 and onward of Law No.18,045.
In addition to these guarantees for creating mutual funds, there are other guarantees for a guaranteed return on certain mutual funds, for an amount of Ch$ 9,943.60 million and time deposits for UF 1,922,641.875 as a guaranty of Private Investment Funds (P.I.F.), as of September 30, 2011
Santander Agente de Valores Limitada
To ensure correct and full performance of all its obligations as an Agent, in conformity with the provisions of Articles No.30 and onward of Law No.18,045 on the Securities Market, the Company provided a guarantee in the amount of UF 4,000 through Insurance Policy No.210107110, underwritten by the Compañía de Seguros de Crédito Continental S.A., which matures on December 19, 2011.
Santander S.A. Corredores de Bolsa
The Company has given guarantees to the Bolsa de Comercio de Santiago for a current value of Ch$30,176 million to cover simultaneous transactions.
In addition, this line includes a guarantee given to CCLV Contraparte Central S.A. (formerly known as Cámara de Compensación) in cash, for a total MCH$3,000 as of September 30, 2011.
Santander Corredora de Seguros Limitada
| a) | Insurance policies |
In accordance with Circular No.1,160 of the Superintendency of Securities and Insurance, the Company has an insurance policy in connection with its obligations as an intermediary in insurance contracts.
The company purchased a guarantee policy (No.10019899), and professional liability policy (No.10019900) for its insurance brokers, from the Seguros Generales Consorcio Nacional de Seguros S.A. The policies have a UF 500 and UF 60,000 coverage, respectively, and are valid from April 15, 2011 through April 14, 2012.
| b) | Contingent loans and liabilities |
To satisfy its client-s needs, the Bank took on several contingent loans and liabilities, yet these could not be recognized in the Consolidated Statements of Financial Position. Nevertheless these contingent loans and liabilities have credit risk and they are, therefore, part of the Bank-s global risk.
| c) | Trials |
As of September 30, 2011 there are trials for MCh$ 1,264.5 corresponding to processes mainly due to leased assets. The estimated loss amount is registered under provisions.
80
BANCO SANTANDER CHILE AND SUBSIDIARIES NOTES TO THE CONSOLIDATED INTERIM FINANCIAL STAEMENTS As of September 30, 2011 and 2010 and December 31, 2010 |
NOTE 20 – EQUITY:
| a) | Capital stock and preferred shares |
As of September 30, 2011 and December 31, 2010 the Bank had 188,446,126,794 authorized subscribed fully paid and no par value shares. All shares have the same rights, and have no preferences of restrictions.
| Number of shares | ||||||||
| As of September 30, 2011 | As of December 31, 2010 | |||||||
| Issued as of January 1 | 188,446,126,794 | 188,446,126,794 | ||||||
| Issued of paid shares | - | - | ||||||
| Issued of outstanding shares | - | - | ||||||
| Stock options exercised | - | - | ||||||
| Issued as of | 188,446,126,794 | 188,446,126,794 | ||||||
As of September 30, 2011 and December, 31 2010 no neither the Bank nor any of its subsidiaries or associates held any of the issued shares.
As of September 30, 2011 shares held by shareholders were as follows:
| Corporate Name or Shareholder's Name | Shares | ADRs (*) | Totals | % of Equity Holding | ||||||||||||
| Teatinos Siglo XXI Inversiones Limitada | 74,512,075,401 | - | 74,512,075,401 | 39.54 | ||||||||||||
| Santander Chile Holding S.A. | 66,822,519,695 | - | 66,822,519,695 | 35.46 | ||||||||||||
| J.P. Morgan Chase Bank | - | 29,124,078,086 | 29,124,078,086 | 15.45 | ||||||||||||
| Inversiones Antares S.A. | 170,363,545 | - | 170,363,545 | 0.09 | ||||||||||||
| Banks and stock brokers on behalf of third parties | 8,556,946,074 | - | 8,556,946,074 | 4.54 | ||||||||||||
| AFP on behalf of third parties | 3,195,221,751 | - | 3,195,221,751 | 1.70 | ||||||||||||
| Other minority holders | 3,875,504,757 | 2,189,417,485 | 6,064,922,242 | 3.22 | ||||||||||||
| Totals | 188,446,126,794 | 100.00 | ||||||||||||||
As of December 31, 2010 shares held by shareholders were as follows:
| Corporate Name or Shareholder's Name | Shares | ADRs (*) | Totals | % of Equity Holding | ||||||||||||
| Teatinos Siglo XXI Inversiones Limitada | 78,108,391,607 | - | 78,108,391,607 | 41.45 | ||||||||||||
| Santander Chile Holding S.A. | 66,822,519,695 | - | 66,822,519,695 | 35.46 | ||||||||||||
| J.P. Morgan Chase Bank | - | 29,892,971,334 | 29,892,971,334 | 15.86 | ||||||||||||
| Inversiones Antares S.A. | 250,363,545 | - | 250,363,545 | 0.13 | ||||||||||||
| Antonio Hitschfeld Bollman | 100,000,000 | - | 100,000,000 | 0.05 | ||||||||||||
| Banks and stock brokers on behalf of third parties | 8,277,713,845 | - | 8,277,713,845 | 4.39 | ||||||||||||
| Other minority holders | 3,997,968,278 | 996,198,490 | 4,994,166,768 | 2.66 | ||||||||||||
| Totals | 188,446,126,794 | 100.00 | ||||||||||||||
| (*) | American Depository Receipts (ADR) are certificates issued by a U.S. commercial bank to be traded on the U.S. securities markets. |
81
BANCO SANTANDER CHILE AND SUBSIDIARIES NOTES TO THE CONSOLIDATED INTERIM FINANCIAL STAEMENTS As of September 30, 2011 and 2010 and December 31, 2010 |
NOTE 20 – EQUITY, continued:
| b) | Dividends |
During the period ended on September 30, 2011 the dividends recognized as distributions to owners and the related amount of dividends per share are detailed in the Consolidated Interim Statements of Changes in Equity.
| c) | As of September 30, diluted earnings and basic earnings per share were as follows: |
| As of September 30, | ||||||||
| 2011 | 2010 | |||||||
| MCh$ | MCh$ | |||||||
| a) Basic earnings per share | ||||||||
| Total income attributable to Bank shareholders | 332,963 | 383,283 | ||||||
| Weighted average number of outstanding shares | 188,446,126,794 | 188,446,126,794 | ||||||
| Dividend per share (in Ch$) | 1,767 | 2,034 | ||||||
| b) Diluted earnings per share | ||||||||
| Total income attributable to Bank shareholders | 332,963 | 383,283 | ||||||
| Weighted average number of outstanding shares | 188,446,126,794 | 188,446,126,794 | ||||||
| Assumed conversion of convertible debt | - | - | ||||||
| Adjusted number of shares | 188,446,126,794 | 188,446,126,794 | ||||||
| Diluted earnings per share (in Ch$) | 1.767 | 2.034 | ||||||
As of September 30, 2011 and 2010 the Bank did not have instruments that generated diluting effects on equity.
82
BANCO SANTANDER CHILE AND SUBSIDIARIES NOTES TO THE CONSOLIDATED INTERIM FINANCIAL STAEMENTS As of September 30, 2011 and 2010 and December 31, 2010 |
NOTE 20 – EQUITY, continued:
d) Other comprehensive income:
As of September 30, | As of December 31, | |||||||
| 2011 | 2010 | |||||||
| MCh$ | MCh$ | |||||||
| Available for sale investments | ||||||||
| As of January 1 | (18,596 | ) | (29,304 | ) | ||||
| Gain (on losses) on remeasuring available for sale investments, before tax | 19,053 | 12,316 | ||||||
| Reclassification adjustments on available for sale investments, before tax | - | - | ||||||
| Realized (gains) losses | 2,433 | (1,608 | ) | |||||
| Subtotals | 21,486 | 10,708 | ||||||
| Totals | 2,890 | (18,596 | ) | |||||
| Cash flow hedges | ||||||||
| As of January 1 | 11,958 | (3,162 | ) | |||||
| Gain (on losses) on remeasuring cash flow hedges, before tax | (13,787 | ) | 15,120 | |||||
| Reclassification adjustments on cash flow hedges, before tax | (287 | ) | - | |||||
| Amounts removed from equity and included in carrying amount of non-financial asset (liability) which acquisition or incurrence was hedge as a highly probable transition | - | - | ||||||
| Subtotals | (14,074 | ) | 15,120 | |||||
| Totals | (2,116 | ) | 11,958 | |||||
| Other comprehensive income, net of tax | 774 | (6,638 | ) | |||||
| Income tax related to other comprehensive income components | ||||||||
| Income tax relating to available for sale investments | (569 | ) | 3,570 | |||||
| Income tax relating to cash flow hedges | 414 | (2,324 | ) | |||||
| Total aggregated income tax related to other comprehensive income | (155 | ) | 1,246 | |||||
| Other comprehensive income, net of tax | 619 | (5,392 | ) | |||||
| Attributable to: | ||||||||
| Bank shareholders | 593 | (5,180 | ) | |||||
| Non-controlling interest | 26 | (212 | ) | |||||
83
BANCO SANTANDER CHILE AND SUBSIDIARIES NOTES TO THE CONSOLIDATED INTERIM FINANCIAL STAEMENTS As of September 30, 2011 and 2010 and December 31, 2010 |
NOTE 21 - CAPITAL REQUIREMENTS (BASEL):
Pursuant to the General Law of Banks, the Bank must maintain a minimum ratio of effective equity to risk-weighted assets of 8% net of required allowances, and a minimum ratio of basic equity to consolidated total assets of 3%, net of required allowances. However, as a result of the Bank’s merger in 2002, the Superintendency of Banks and Financial Institutions (SBIF) has determined that the Bank’s combined effective net equity cannot be lower than 11% of its risk-weighted assets. Effective net equity is defined for these purposes as basic equity (capital and reserves) plus subordinated bonds, up to a maximum of 50% of basic equity.
Assets are allocated to different risk categories, each of which is assigned a weighting percentage according to the amount of capital required to be held for each type of asset. For example, cash, deposits in banks and financial instruments issued by the Central Bank of Chile have a 0% risk weighting, meaning that it is not necessary to hold equity to back these assets according to current regulations. Property, plant and equipment have a 100% risk weighting, meaning that a minimum capital equivalent to 11% of these assets must be held. All derivatives traded off the exchanges are also assigned a risk weighting, using a conversion factor applied to their notional values, to determine the amount of their exposure to credit risk. Off-balance-sheet contingent credits are also included for weighting purposes, as “Credit equivalents.”
According to Chapter 12-1 of the SBIF’s Updated Recompilation of Rules (Recopilacion Actualizada de Normas) effective January 2010, the SBIF changed existing regulation with the enforcement of Chapter B-3 from the Compendium of Accounting Standards, with changed the risk exposure of contingent allocations from 100% exposition to the following:
| Type of contingent loan | Exposition | |||
| a) Pledges and other commercial commitments | 100 | % | ||
| b) Foreign letters of credit confirmed | 20 | % | ||
| c) Letters of credit issued | 20 | % | ||
| d) Guarantees | 50 | % | ||
| e) Interbank guarantee letters | 100 | % | ||
| f) Available lines of credit | 50 | % | ||
| h) Other loan commitments | ||||
| - Higher Education Loans Law No. 20,027 | 15 | % | ||
| - Others | 100 | % | ||
| h) Other contingent loans | 100 | % | ||
84
BANCO SANTANDER CHILE AND SUBSIDIARIES NOTES TO THE CONSOLIDATED INTERIM FINANCIAL STAEMENTS As of September 30, 2011 and 2010 and December 31, 2010 |
NOTE 21 – CAPITAL REQUIREMENTS (BASEL), continued:
The levels of Basic capital and Effective net equity at the close of each period are as follows:
| Consolidated assets | Risk-weighted assets | |||||||||||||||
| As of September 30, | As of December 31, | As of September 30, | As of December 31, | |||||||||||||
| 2011 | 2010 | 2011 | 2010 | |||||||||||||
| MCh$ | MCh$ | MCh$ | MCh$ | |||||||||||||
| Balance-sheet assets (net of allowances) | ||||||||||||||||
| Cash and deposits in banks | 1,812,785 | 1,762,198 | - | - | ||||||||||||
| Unsettled transactions | 816,601 | 374,368 | 159,774 | 126,083 | ||||||||||||
| Trading investments | 503,813 | 379,670 | 60,743 | 57,588 | ||||||||||||
| Investments under resale agreements | 12,157 | 170,985 | 12,157 | 98,323 | ||||||||||||
| Financial derivative contracts (*) | 1,379,903 | 1,452,068 | 917,611 | 871,872 | ||||||||||||
| Interbank loans, net | 87,894 | 69,672 | 17,579 | 13,934 | ||||||||||||
| Loans and accounts receivable from customers, net | 17,159,790 | 15,175,975 | 15,123,033 | 13,350,182 | ||||||||||||
| Available for sale investments | 2,104,644 | 1,473,980 | 69,870 | 101,875 | ||||||||||||
| Investments in other companies | 8,232 | 7,275 | 8,232 | 7,275 | ||||||||||||
| Intangible assets | 77,229 | 77,990 | 77,229 | 77,990 | ||||||||||||
| Property, plant, and equipment | 153,116 | 154,985 | 153,116 | 154,985 | ||||||||||||
| Current taxes | 27,746 | 12,499 | 2,775 | 1,250 | ||||||||||||
| Deferred taxes | 143,438 | 117,964 | 14,344 | 11,796 | ||||||||||||
| Other assets | 704,125 | 640,937 | 585,649 | 474,135 | ||||||||||||
| Off-balance-sheet assets | ||||||||||||||||
| Contingent loans | 2,937,850 | 3,173,789 | 1,752,035 | 1,897,977 | ||||||||||||
| Totals | 27,929,323 | 25,044,355 | 18,954,147 | 17,245,265 | ||||||||||||
| (*) | “Financial derivative contracts” are presented at their “Credit Equivalent Risk” value as established in Chapter 12-1 of the Recopilación Actualizada de Normas – RAN – (updated compilation of rules) issued by the SBIF. |
The levels of Basic capital and Effective net equity at the close of each period are as follows:
| Percentage | ||||||||||||||||
| As of September 30, | As of December 31, | As of September 30, | As of December 31, | |||||||||||||
| 2011 | 2010 | 2011 | 2010 | |||||||||||||
| MCh$ | MCh$ | % | % | |||||||||||||
| Basic capital | 1,927,498 | 1,831,798 | 6.90 | 7.30 | ||||||||||||
| Effective net equity | 2,642,682 | 2,503,898 | 13.94 | 14.52 | ||||||||||||
85
BANCO SANTANDER CHILE AND SUBSIDIARIES NOTES TO THE CONSOLIDATED INTERIM FINANCIAL STAEMENTS As of September 30, 2011 and 2010 and December 31, 2010 |
NOTE 22 – NON CONTROLLING INTEREST
This item reflects the net amount of the subsidiaries’ net equity attributable to equity instruments which do not belong to the Bank either directly or indirectly, including the part that has been attributed to income for the period.
The non-controlling interest in the affiliates’ equity is summarized as follows:
| Other comprehensive income | ||||||||||||||||||||||||||||
| For the 9-month period ended | Non controlling share | Equity | Income | Available for sale investments | Deferred tax | Total other comprehensive income | Comprehensive income | |||||||||||||||||||||
| as of September 30, 2011 | % | MCh$ | MCh$ | MCh$ | MCh$ | MCh$ | MCh$ | |||||||||||||||||||||
| Affiliates | ||||||||||||||||||||||||||||
| Santander Agente de Valores Limitada (ex-Santander S.A. Agente de Valores) | 0.97 | % | 553 | 48 | 17 | (3 | ) | 14 | 62 | |||||||||||||||||||
| Santander S.A. Sociedad Securitizadora | 0.36 | % | 3 | - | - | - | - | - | ||||||||||||||||||||
| Santander S.A. Corredores de Bolsa | 49.00 | % | 26,322 | 2,974 | 272 | (48 | ) | 224 | 3,198 | |||||||||||||||||||
| Santander Asset Management S.A. Administradora General de Fondos | 0.02 | % | 11 | 5 | - | - | - | 5 | ||||||||||||||||||||
| Santander Corredora de Seguros Limitada (ex Santander Leasing S.A.) | 0.25 | % | 140 | 5 | - | - | - | 5 | ||||||||||||||||||||
| Subtotals | 27,029 | 3,032 | 289 | (51 | ) | 238 | 3,270 | |||||||||||||||||||||
| Special Purpose Entities: | ||||||||||||||||||||||||||||
| Bansa Santander S.A. | 100 | % | 1,436 | (206 | ) | - | - | - | (206 | ) | ||||||||||||||||||
| Santander Gestión de Recaudación y Cobranza Limitada. | 100 | % | 1,701 | (18 | ) | - | - | - | (18 | ) | ||||||||||||||||||
| Multinegocios S.A. | 100 | % | 142 | 9 | - | - | - | 9 | ||||||||||||||||||||
| Servicios de Administración y Financieros Limitada | 100 | % | 989 | 332 | - | - | - | 332 | ||||||||||||||||||||
| Servicios de Cobranzas Fiscalex Limitada | 100 | % | 139 | 23 | - | - | - | 23 | ||||||||||||||||||||
| Multiservicios de Negocios Limitada | 100 | % | 857 | 205 | - | - | - | 205 | ||||||||||||||||||||
| Subtotals | 5,264 | 345 | - | - | - | 345 | ||||||||||||||||||||||
| Totals | 32,293 | 3,377 | 289 | (51 | ) | 238 | 3,615 | |||||||||||||||||||||
86
BANCO SANTANDER CHILE AND SUBSIDIARIES NOTES TO THE CONSOLIDATED INTERIM FINANCIAL STAEMENTS As of September 30, 2011 and 2010 and December 31, 2010 |
NOTE 22 - NON CONTROLLING INTEREST, continued:
| Other comprehensive income | ||||||||||||||||||||||||||||
| For the 9-month period ended | Non controlling share | Equity | Income | Available for sale investments | Deferred tax | Total other comprehensive income | Comprehensive income | |||||||||||||||||||||
| as of September 30, 2010 | % | MCh$ | MCh$ | MCh$ | MCh$ | MCh$ | MCh$ | |||||||||||||||||||||
| Affiliates | ||||||||||||||||||||||||||||
| Santander Agente de Valores Limitada (ex-Santander S.A. Agente de Valores) | 0.97 | 476 | 13 | 29 | (5 | ) | 24 | 37 | ||||||||||||||||||||
| Santander S.A. Sociedad Securitizadora | 0.36 | 3 | (1 | ) | - | - | - | (1 | ) | |||||||||||||||||||
| Santander S.A. Corredores de Bolsa | 49.00 | 25,083 | 2,593 | (149 | ) | 26 | (123 | ) | 2,470 | |||||||||||||||||||
| Santander Asset Management S.A. Administradora General de Fondos | 0.02 | 13 | 5 | - | - | - | 5 | |||||||||||||||||||||
| Santander Corredora de Seguros Limitada (ex Santander Leasing S.A.) | 0.24 | 133 | 6 | - | - | - | 6 | |||||||||||||||||||||
| Subtotals | 25,708 | 2,616 | (120 | ) | 21 | (99 | ) | 2,517 | ||||||||||||||||||||
| Special Purpose Entities: | ||||||||||||||||||||||||||||
| Bansa Santander S.A. | 100,00 | 1,631 | (748 | ) | - | - | - | (748 | ) | |||||||||||||||||||
| Santander Gestión de Recaudación y Cobranza Limitada. | 100,00 | 856 | (2,511 | ) | - | - | - | (2,511 | ) | |||||||||||||||||||
| Multinegocios S.A. | 100,00 | 130 | 34 | - | - | - | 34 | |||||||||||||||||||||
| Servicios de Administración y Financieros Limitada | 100,00 | 566 | 230 | - | - | - | 230 | |||||||||||||||||||||
| Servicios de Cobranzas Fiscalex Limitada | 100,00 | 107 | 54 | - | - | - | 54 | |||||||||||||||||||||
| Multiservicios de Negocios Limitada | 100,00 | 601 | 226 | - | - | - | 226 | |||||||||||||||||||||
| Subtotals | 3,891 | (2,715 | ) | - | - | - | (2,715 | ) | ||||||||||||||||||||
| Totals | 29,599 | (99 | ) | (120 | ) | 21 | (99 | ) | (198 | ) | ||||||||||||||||||
The non-controlling interest in equity and the affiliates income as of September 30, 2010 is summarized as follows:
| Other comprehensive income | ||||||||||||||||||||||||
Non controlling share | Income | Available for sale investments | Deferred tax | Total other comprehensive income | Comprehensive income | |||||||||||||||||||
| For the quarter ended as of September 30, 2011 | % | MCh$ | MCh$ | MCh$ | MCh$ | MCh$ | ||||||||||||||||||
| Affiliates | ||||||||||||||||||||||||
| Santander Agente de Valores Limitada (ex-Santander S.A. Agente de Valores) | 0.97 | % | 20 | 4 | (1 | ) | 3 | 23 | ||||||||||||||||
| Santander S.A. Sociedad Securitizadora | 0.36 | % | - | - | - | - | - | |||||||||||||||||
| Santander S.A. Corredores de Bolsa | 49.00 | % | 832 | 32 | (6 | ) | 26 | 858 | ||||||||||||||||
| Santander Asset Management S.A. Administradora General de Fondos | 0.02 | % | 2 | - | - | - | 2 | |||||||||||||||||
| Santander Corredora de Seguros Limitada (ex Santander Leasing S.A.) | 0.25 | % | 2 | - | - | - | 2 | |||||||||||||||||
| Subtotals | 856 | 36 | (7 | ) | 29 | 885 | ||||||||||||||||||
| Special Purpose Entities: | ||||||||||||||||||||||||
| Bansa Santander S.A. | 100 | % | (20 | ) | - | - | - | (20 | ) | |||||||||||||||
| Santander Gestión de Recaudación y Cobranza Limitada. | 100 | % | 76 | - | - | - | 76 | |||||||||||||||||
| Multinegocios S.A. | 100 | % | 9 | - | - | - | 9 | |||||||||||||||||
| Servicios de Administración y Financieros Limitada | 100 | % | 125 | - | - | - | 125 | |||||||||||||||||
| Servicios de Cobranzas Fiscalex Limitada | 100 | % | 6 | - | - | - | 6 | |||||||||||||||||
| Multiservicios de Negocios Limitada | 100 | % | 71 | - | - | - | 71 | |||||||||||||||||
| Subtotals | 267 | - | - | - | 267 | |||||||||||||||||||
| Totals | 1,123 | 36 | (7 | ) | 29 | 1,151 | ||||||||||||||||||
87
BANCO SANTANDER CHILE AND SUBSIDIARIES NOTES TO THE CONSOLIDATED INTERIM FINANCIAL STAEMENTS As of September 30, 2011 and 2010 and December 31, 2010 |
NOTE 22 - NON CONTROLLING INTERESTS continued:
| Other comprehensive income | ||||||||||||||||||||||||
Non controlling share | Income | Available for sale investments Available for sale investments | Deferred tax | Total other comprehensive income | Comprehensive income | |||||||||||||||||||
| For the quarter ended as of September 30, 2010 | % | MCh$ | MCh$ | MCh$ | MCh$ | MCh$ | ||||||||||||||||||
| Affiliates | ||||||||||||||||||||||||
| Santander Agente de Valores Limitada (ex-Santander S.A. Agente de Valores) | 0.97 | 12 | (75 | ) | 13 | (62 | ) | (50 | ) | |||||||||||||||
| Santander S.A. Sociedad Securitizadora | 0.36 | (1 | ) | - | - | - | (1 | ) | ||||||||||||||||
| Santander Investment S.A. Corredores de Bolsa | 49.00 | 1,114 | (264 | ) | 46 | (218 | ) | 896 | ||||||||||||||||
| Santander Asset Management S.A. Administradora General de Fondos | 0.02 | 2 | - | - | - | 2 | ||||||||||||||||||
| Santander Corredora de Seguros Limitada (ex Santander Leasing S.A.) | 0.24 | 1 | - | - | - | 1 | ||||||||||||||||||
| Subtotals | 1,128 | (339 | ) | 59 | (280 | ) | 848 | |||||||||||||||||
| Special Purpose Entities: | ||||||||||||||||||||||||
| Bansa Santander S.A. | 100 | (289 | ) | - | - | - | (289 | ) | ||||||||||||||||
| Santander Gestión de Recaudación y Cobranza Limitada | 100 | 364 | - | - | - | 364 | ||||||||||||||||||
| Multinegocios S.A. | 100 | 24 | - | - | - | 24 | ||||||||||||||||||
| Servicios Administración y Financieros Limitada | 100 | 85 | - | - | - | 85 | ||||||||||||||||||
| Servicios de Cobranzas Fiscalex Limitada | 100 | 29 | - | - | - | 29 | ||||||||||||||||||
| Multiservicios de Negocios Limitada | 100 | 77 | - | - | - | 77 | ||||||||||||||||||
| Subtotals | 290 | - | - | - | 290 | |||||||||||||||||||
| Totals | 1,418 | (339 | ) | 59 | (280 | ) | 1,138 | |||||||||||||||||
88
BANCO SANTANDER CHILE AND SUBSIDIARIES NOTES TO THE CONSOLIDATED INTERIM FINANCIAL STAEMENTS As of September 30, 2011 and 2010 and December 31, 2010 |
NOTE 23 -INTEREST INCOME AND EXPENSE:
This item refers to interest earned in the period by all the financial assets whose return, whether implicitly or explicitly, is determined by applying the effective interest rate method, regardless of the value at fair value, as well as the reclassifications of products as a consequence of hedge accounting.
| a) | The composition of income from interest and adjustments, not including income from hedge accounting, for all periods presented is as follows: |
| For the quarter ended on September 30, | ||||||||||||||||||||||||||||||||
| 2011 | 2010 | |||||||||||||||||||||||||||||||
| Interest | Adjustments | Prepaid fees | Total | Interest | Adjustments | Prepaid fees | Total | |||||||||||||||||||||||||
| Items | MCh$ | MCh$ | MCh$ | MCh$ | MCh$ | MCh$ | MCh$ | MCh$ | ||||||||||||||||||||||||
| Repurchase agreements | 840 | (2 | ) | - | 838 | 509 | (115 | ) | - | 394 | ||||||||||||||||||||||
| Interbank loans | 433 | - | - | 433 | 266 | - | - | 266 | ||||||||||||||||||||||||
| Commercial loans | 155,239 | 18,497 | 1,024 | 174,760 | 118,433 | 17,724 | 420 | 136,577 | ||||||||||||||||||||||||
| Mortgage loans | 52,890 | 27,271 | 2,675 | 82,836 | 47,917 | 27,822 | 880 | 76,619 | ||||||||||||||||||||||||
| Consumer loans | 138,214 | 500 | 777 | 139,491 | 121,714 | 433 | 787 | 122,934 | ||||||||||||||||||||||||
| Investment instruments | 28,761 | 1,272 | - | 30,033 | 11,503 | 3,067 | - | 14,570 | ||||||||||||||||||||||||
| Other interest income | (915 | ) | 513 | - | (402 | ) | 1,376 | 565 | - | 1,941 | ||||||||||||||||||||||
| Interest income | 375,462 | 48,051 | 4,476 | 427,989 | 301,718 | 49,496 | 2,087 | 353,301 | ||||||||||||||||||||||||
| For the 9-month period ended on September 30, | ||||||||||||||||||||||||||||||||
| 2011 | 2010 | |||||||||||||||||||||||||||||||
| Interest | Adjustments | Prepaid fees | Total | Interest | Adjustments | Prepaid fees | Total | |||||||||||||||||||||||||
| Items | MCh$ | MCh$ | MCh$ | MCh$ | MCh$ | MCh$ | MCh$ | MCh$ | ||||||||||||||||||||||||
| Repurchase agreements | 3,364 | (6 | ) | - | 3,358 | 832 | 125 | - | 957 | |||||||||||||||||||||||
| Interbank loans | 2,265 | - | - | 2,265 | 340 | - | - | 340 | ||||||||||||||||||||||||
| Commercial loans | 435,438 | 79,121 | 3,283 | 517,842 | 345,969 | 50,157 | 1,894 | 398,020 | ||||||||||||||||||||||||
| Mortgage loans | 150,344 | 120,054 | 7,717 | 278,115 | 141,549 | 77,980 | 2,901 | 222,430 | ||||||||||||||||||||||||
| Consumer loans | 398,396 | 2,052 | 2,216 | 402,664 | 354,103 | 1,137 | 2,121 | 357,361 | ||||||||||||||||||||||||
| Investment instruments | 62,062 | 6,820 | - | 68,882 | 33,947 | 10,798 | - | 44,745 | ||||||||||||||||||||||||
| Other interest income | 11,076 | 1,846 | - | 12,922 | 2,693 | 889 | - | 3,582 | ||||||||||||||||||||||||
| Interest income | 1,062,945 | 209,887 | 13,216 | 1,286,048 | 879,433 | 141,086 | 6,916 | 1,027,435 | ||||||||||||||||||||||||
89
BANCO SANTANDER CHILE AND SUBSIDIARIES NOTES TO THE CONSOLIDATED INTERIM FINANCIAL STAEMENTS As of September 30, 2011 and 2010 and December 31, 2010 |
NOTE 23 -INTEREST INCOME AND EXPENSE, continued:
| b) | As indicated in Note 1 i), suspended interests are recorded in suspense accounts (off-balance-sheet accounts) until they are effectively received. |
The detail of income from suspended interest for all periods is presented as follows:
| As of September 30, | ||||||||||||||||||||||||||||||||
| 2011 | 2010 | |||||||||||||||||||||||||||||||
| Interest | Adjustments | Prepaid fees | Total | Interest | Adjustments | Prepaid fees | Total | |||||||||||||||||||||||||
| Off balance sheet | MCh$ | MCh$ | MCh$ | MCh$ | MCh$ | MCh$ | MCh$ | MCh$ | ||||||||||||||||||||||||
| Commercial loans | 25,592 | 6,256 | - | 31,848 | 24,677 | 5,292 | - | 29,969 | ||||||||||||||||||||||||
| Mortgage loans | 4,048 | 5,906 | - | 9,954 | 4,322 | 4,251 | - | 8,573 | ||||||||||||||||||||||||
| Consumer loans | 18,581 | 1,043 | - | 19,624 | 31,604 | 770 | - | 32,374 | ||||||||||||||||||||||||
| Totals | 48,221 | 13,205 | - | 61,426 | 60,603 | 10,313 | - | 70,916 | ||||||||||||||||||||||||
| c) | The composition of expense from interest and adjustments, excluding expense from hedge accounting for all periods presented, is as follows: |
| For the quarter ended as of September 30, | ||||||||||||||||||||||||||||||||
| 2011 | 2010 | |||||||||||||||||||||||||||||||
| Interest | Adjustments | Prepaid fees | Total | Interest | Adjustments | Prepaid fees | Total | |||||||||||||||||||||||||
| Items | MCh$ | MCh$ | MCh$ | MCh$ | MCh$ | MCh$ | MCh$ | MCh$ | ||||||||||||||||||||||||
| Demand deposits | (425 | ) | (88 | ) | - | (513 | ) | (158 | ) | (95 | ) | - | (253 | ) | ||||||||||||||||||
| Repurchase agreements | (1,973 | ) | (35 | ) | - | (2,008 | ) | (672 | ) | (3 | ) | - | (675 | ) | ||||||||||||||||||
| Time deposits and liabilities | (100,482 | ) | (12,924 | ) | - | (113,406 | ) | (42,655 | ) | (13,504 | ) | - | (56,159 | ) | ||||||||||||||||||
| Interbank borrowings | (6,268 | ) | (6 | ) | - | (6,274 | ) | (7,738 | ) | (9 | ) | - | (7,747 | ) | ||||||||||||||||||
| Issued debt instruments | (43,670 | ) | (13,811 | ) | - | (57,481 | ) | (32,530 | ) | (15,398 | ) | - | (47,928 | ) | ||||||||||||||||||
| Other financial liabilities | (1,261 | ) | (214 | ) | - | (1,475 | ) | (1,243 | ) | (260 | ) | - | (1,503 | ) | ||||||||||||||||||
| Other interest expense | (597 | ) | (1,031 | ) | - | (1,628 | ) | (330 | ) | (1,631 | ) | - | (1,961 | ) | ||||||||||||||||||
| Interest expense | (154,676 | ) | (28,109 | ) | - | (182,785 | ) | (85,326 | ) | (30,900 | ) | - | (116,226 | ) | ||||||||||||||||||
90
BANCO SANTANDER CHILE AND SUBSIDIARIES NOTES TO THE CONSOLIDATED INTERIM FINANCIAL STAEMENTS As of September 30, 2011 and 2010 and December 31, 2010 |
NOTE 23 -INTEREST INCOME AND EXPENSE, continued:
| For the 9-month period ended on September 30, | ||||||||||||||||||||||||||||||||
| 2011 | 2010 | |||||||||||||||||||||||||||||||
| Interest | Adjustments | Prepaid fees | Total | Interest | Adjustments | Prepaid fees | Total | |||||||||||||||||||||||||
| Items | MCh$ | MCh$ | MCh$ | MCh$ | MCh$ | MCh$ | MCh$ | MCh$ | ||||||||||||||||||||||||
| Demand deposits | (855 | ) | (421 | ) | - | (1,276 | ) | (345 | ) | (295 | ) | - | (640 | ) | ||||||||||||||||||
| Repurchase agreements | (4,678 | ) | (205 | ) | - | (4,883 | ) | (1,294 | ) | (213 | ) | - | (1,507 | ) | ||||||||||||||||||
| Time deposits and liabilities | (249,497 | ) | (59,627 | ) | - | (309,124 | ) | (112,688 | ) | (40,466 | ) | - | (153,154 | ) | ||||||||||||||||||
| Interbank borrowings | (19,379 | ) | (31 | ) | - | (19,410 | ) | (23,078 | ) | (26 | ) | - | (23,104 | ) | ||||||||||||||||||
| Issued debt instruments | (127,148 | ) | (65,263 | ) | - | (192,411 | ) | (92,775 | ) | (41,840 | ) | - | (134,615 | ) | ||||||||||||||||||
| Other financial liabilities | (3,767 | ) | (1,001 | ) | - | (4,768 | ) | (3,674 | ) | (772 | ) | - | (4,446 | ) | ||||||||||||||||||
| Other interest expense | (1,788 | ) | (5,256 | ) | - | (7,044 | ) | (330 | ) | (4,750 | ) | - | (5,080 | ) | ||||||||||||||||||
| Interest expense | (407,112 | ) | (131,804 | ) | - | (538,916 | ) | (234,184 | ) | (88,362 | ) | - | (322,546 | ) | ||||||||||||||||||
d) The summary of interest and expenses for the periods presented is as follows:
For the quarter ended as of September 30, | For the 9-month period ended as of September 30, | |||||||||||||||
| 2011 | 2010 | 2011 | 2010 | |||||||||||||
| Items | MCh$ | MCh$ | MCh$ | MCh$ | ||||||||||||
| Interest income | 427,989 | 353,301 | 1,286,048 | 1,027,435 | ||||||||||||
| Interest expense | (182,785 | ) | (116,226 | ) | (538,916 | ) | (322,546 | ) | ||||||||
| Interest income | 245,204 | 237,075 | 747,132 | 704,889 | ||||||||||||
| Income from hedge accounting (net) | (13,147 | ) | (1,401 | ) | (38,978 | ) | 2,965 | |||||||||
| Total net interest income | 232,057 | 235,674 | 708,154 | 707,854 | ||||||||||||
91
BANCO SANTANDER CHILE AND SUBSIDIARIES NOTES TO THE CONSOLIDATED INTERIM FINANCIAL STAEMENTS As of September 30, 2011 and 2010 and December 31, 2010 |
NOTE 24 – FEES AND COMMISSIONS:
This item includes the amount of fees earned and paid in the period, except for those which are an integral part of the financial instrument’s effective interest rate:
For the quarter ended as of September 30, | For the 9-month period ended as of September 30, | |||||||||||||||
| 2011 | 2010 | 2011 | 2010 | |||||||||||||
| MCh$ | MCh$ | MCh$ | MCh$ | |||||||||||||
| Fee and commission income | ||||||||||||||||
| Fees and commissions for lines of credits and overdrafts | 2,763 | 3,685 | 8,862 | 12,209 | ||||||||||||
| Fees and commissions for guarantees and letters of credit | 6,334 | 5,568 | 17,849 | 17,351 | ||||||||||||
| Fees and commissions for card services | 30,252 | 27,151 | 90,974 | 78,434 | ||||||||||||
| Fees and commissions for management of accounts | 7,256 | 6,921 | 21,361 | 20,131 | ||||||||||||
| Fees and commissions for collections and payments | 14,683 | 15,324 | 46,387 | 43,372 | ||||||||||||
| Fees and commissions for intermediation and management of securities | 2,759 | 2,797 | 9,939 | 7,669 | ||||||||||||
| Fees and commissions for investments in mutual funds or others | 8,796 | 10,063 | 29,928 | 29,111 | ||||||||||||
| Compensation for marketing of securities | 7,955 | 8,683 | 26,344 | 22,750 | ||||||||||||
| Office banking | 2,912 | 2,386 | 8,749 | 6,813 | ||||||||||||
| Other fees earned | 3,941 | 2,801 | 11,148 | 9,506 | ||||||||||||
| Totals | 87,651 | 85,379 | 271,541 | 247,346 | ||||||||||||
For the quarter ended as of September 30, | For the 9-month period ended as of September 30, | |||||||||||||||
| 2011 | 2010 | 2011 | 2010 | |||||||||||||
| MCh$ | MCh$ | MCh$ | MCh$ | |||||||||||||
| Fee and commission expense | ||||||||||||||||
| Compensation for card operation | (15,868 | ) | (13,633 | ) | (45,725 | ) | (37,212 | ) | ||||||||
| Fees and commissions for securities transactions | (290 | ) | (397 | ) | (1,616 | ) | (1,265 | ) | ||||||||
| Office banking | (2,491 | ) | (1,826 | ) | (6,866 | ) | (5,469 | ) | ||||||||
| Other fees | (3,011 | ) | (3,087 | ) | (7,904 | ) | (9,455 | ) | ||||||||
| Totals | (21,660 | ) | (18,943 | ) | (62,111 | ) | (53,401 | ) | ||||||||
The fees earned through transactions with letters of credit are recorded in the line item “Interest income” in the Consolidated Statement of Income.
92
BANCO SANTANDER CHILE AND SUBSIDIARIES NOTES TO THE CONSOLIDATED INTERIM FINANCIAL STAEMENTS As of September 30, 2011 and 2010 and December 31, 2010 |
NOTE 25 - NET INCOME FROM FINANCIAL OPERATIONS:
This item includes the adjustments for changes in financial instruments, except for interest attributable to the application of the effective interest rate method for adjustments to asset values, as well as the income earned in purchases and sales of financial instruments.
As of September 30, 2011 and 2010, the detail of income from financial operations is as follows:
For the quarter ended as of September 30, | For the 9-month period ended as of September 30, | |||||||||||||||
| 2011 | 2010 | 2011 | 2010 | |||||||||||||
| MCh$ | MCh$ | MCh$ | MCh$ | |||||||||||||
| Net income from financial operations | ||||||||||||||||
| Trading derivatives | 82,383 | (45,050 | ) | 111,491 | 27.686 | |||||||||||
| Trading investments | 14,804 | 6,419 | 31,545 | 26.596 | ||||||||||||
| Sale of loans and accounts receivables from customers | ||||||||||||||||
| Current portfolio | - | 522 | - | (59 | ) | |||||||||||
| Written-off portfolio | 2,478 | 972 | 5,578 | 3.926 | ||||||||||||
| Available for sale investments | 633 | (8,098 | ) | (1,991 | ) | (6.244 | ) | |||||||||
| Other income from financial operations | 1,843 | 167 | 6,912 | 41 | ||||||||||||
| Totals | 102,141 | (45,068 | ) | 153,535 | 51,946 | |||||||||||
93
BANCO SANTANDER CHILE AND SUBSIDIARIES NOTES TO THE CONSOLIDATED INTERIM FINANCIAL STAEMENTS As of September 30, 2011 and 2010 and December 31, 2010 |
NOTE 26 – NET FOREIGN EXCHANGE PROFIT (LOSS)
This item includes the income earned from foreign currency trading, differences arising from converting monetary items in a foreign currency to the functional currency, and those generated by non-monetary assets in a foreign currency at the time of their sale.
As of September 30, 2011 and 2010, the detail of foreign exchange income is as follows:
For the quarter ended as of September 30, | For the 9-month period ended as of September 30, | |||||||||||||||
| 2011 | 2010 | 2011 | 2010 | |||||||||||||
| MCh$ | MCh$ | MCh$ | MCh$ | |||||||||||||
| Currency exchange differences | ||||||||||||||||
| Net profit (loss) from currency exchange differences | (312,801 | ) | 317,927 | (259,037 | ) | 156,905 | ||||||||||
| Hedging derivatives: | 229,253 | (249,505 | ) | 179,209 | (132,343 | ) | ||||||||||
| Income from adjustable assets in foreign currency | 5,412 | (4,497 | ) | 5,403 | (1,831 | ) | ||||||||||
| Income from adjustable liabilities in foreign currency | (996 | ) | 2,856 | (840 | ) | 1,650 | ||||||||||
| Totals | (79,132 | ) | 66,781 | (75,265 | ) | 24,381 | ||||||||||
94
BANCO SANTANDER CHILE AND SUBSIDIARIES NOTES TO THE CONSOLIDATED INTERIM FINANCIAL STAEMENTS As of September 30, 2011 and 2010 and December 31, 2010 |
NOTE 27 - PROVISION FOR LOAN LOSSES:
The 2011 and 2010 activity for provision for loan losses recorded on the income statement is as follows:
| Loans and accounts receivable from customers | ||||||||||||||||||||||||
For the quarter ended as of September 30, 2011 | Interbank loans MCh$ | Commercial loans MCh$ | Mortgage loans MCh$ | Consumer loans MCh$ | Contingent loans MCh$ | Total MCh$ | ||||||||||||||||||
| Allowances and charge-offs | ||||||||||||||||||||||||
| - Individual evaluations | (5 | ) | (17,027 | ) | - | - | (408 | ) | (17,440 | ) | ||||||||||||||
| - Group evaluations | - | (18,950 | ) | (15,535 | ) | (62,280 | ) | (77 | ) | (96,842 | ) | |||||||||||||
| Total allowances and charge-offs | (5 | ) | (35,977 | ) | (15,535 | ) | (62,280 | ) | (485 | ) | (114,282 | ) | ||||||||||||
| Allowances released | ||||||||||||||||||||||||
| - Individual evaluations | 37 | 6,502 | - | - | 1,435 | 7,974 | ||||||||||||||||||
| - Group evaluations | - | 2,207 | 432 | 2,182 | 5,393 | 10,214 | ||||||||||||||||||
| Total released allowances | 37 | 8,709 | 432 | 2,182 | 6,828 | 18,188 | ||||||||||||||||||
| Recovery of loans previously charged off | - | 1,815 | 659 | 3,248 | - | 5,722 | ||||||||||||||||||
| Net charge to income | 32 | (25,453 | ) | (14,444 | ) | (56,850 | ) | 6,343 | (90,372 | ) | ||||||||||||||
| Loans and accounts receivable from customers | ||||||||||||||||||||||||
| For the 9-month period ended | Interbank loans | Commercial loans | Mortgage loans | Consumer loans | Contingent loans | Total | ||||||||||||||||||
as of September 30, 2011 | MCh$ | MCh$ | MCh$ | MCh$ | MCh$ | MCh$ | ||||||||||||||||||
| Allowances and charge-offs | ||||||||||||||||||||||||
| - Individual evaluations | (574 | ) | (40,056 | ) | - | - | (4,590 | ) | (45,220 | ) | ||||||||||||||
| - Group evaluations | - | (55,262 | ) | (30,667 | ) | (158,272 | ) | (232 | ) | (244,433 | ) | |||||||||||||
| Total allowances and charge-offs | (574 | ) | (95,318 | ) | (30,667 | ) | (158,272 | ) | (4,822 | ) | (289,653 | ) | ||||||||||||
| Allowances released | ||||||||||||||||||||||||
| - Individual evaluations | 483 | 29,958 | - | - | 3,251 | 33,692 | ||||||||||||||||||
| - Group evaluations | - | 4,939 | 4,633 | 14,047 | 20,403 | 44,022 | ||||||||||||||||||
| Total released allowances | 483 | 34,897 | 4,633 | 14,047 | 23,654 | 77,714 | ||||||||||||||||||
| Recovery of loans previously charged off | - | 5,376 | 1,213 | 9,430 | - | 16,019 | ||||||||||||||||||
| Net charge to income | (91 | ) | (55,045 | ) | (24,821 | ) | (134,795 | ) | 18,832 | (195,920 | ) | |||||||||||||
95
BANCO SANTANDER CHILE AND SUBSIDIARIES NOTES TO THE CONSOLIDATED INTERIM FINANCIAL STAEMENTS As of September 30, 2011 and 2010 and December 31, 2010 |
NOTE 27 - PROVISION FOR LOAN LOSSES, continued:
| Loans and accounts receivable from customers | ||||||||||||||||||||||||
For the quarter ended as of September30, 2010 | Interbank loans MCh$ | Commercial loans MCh$ | Mortgage loans MCh$ | Consumer loans MCh$ | Contingent loans MCh$ | Total MCh$ | ||||||||||||||||||
| Allowances and charge-offs | ||||||||||||||||||||||||
| - Individual evaluations | (34 | ) | (13,266 | ) | - | - | (1,114 | ) | (14,414 | ) | ||||||||||||||
| - Group evaluations | - | (16,974 | ) | (4,205 | ) | (61,739 | ) | 31,510 | (51,408 | ) | ||||||||||||||
| Total allowances and charge-offs | (34 | ) | (30,240 | ) | (4,205 | ) | (61,739 | ) | 30,396 | (65,822 | ) | |||||||||||||
| Allowances released | ||||||||||||||||||||||||
| - Individual evaluations | 94 | 552 | - | - | - | 646 | ||||||||||||||||||
| - Group evaluations | - | 2,423 | 362 | 1,646 | 1,204 | 5,635 | ||||||||||||||||||
| Total released allowances | 94 | 2,975 | 362 | 1,646 | 1,204 | 6,281 | ||||||||||||||||||
| Recovery of loans previously charged off | - | 2,026 | 301 | 5,689 | - | 8,016 | ||||||||||||||||||
| Net charge to income | 60 | (25,239 | ) | (3,542 | ) | (54,404 | ) | 31,600 | (51,525 | ) | ||||||||||||||
| Loans and accounts receivable from customers | ||||||||||||||||||||||||
For the 9-month period ended as of September 30, 2010 | Interbank loans MCh$ | Commercial loans MCh$ | Mortgage loans MCh$ | Consumer loans MCh$ | Contingent loans MCh$ | Total MCh$ | ||||||||||||||||||
| Allowances and charge-offs | ||||||||||||||||||||||||
| - Individual evaluations | (117 | ) | (42,979 | ) | - | - | (2,453 | ) | (45,549 | ) | ||||||||||||||
| - Group evaluations | - | (49,307 | ) | (12,226 | ) | (143,934 | ) | 26,915 | (178,552 | ) | ||||||||||||||
| Total allowances and charge-offs | (117 | ) | (92,286 | ) | (12,226 | ) | (143,934 | ) | 24,462 | (224,101 | ) | |||||||||||||
| Allowances released | ||||||||||||||||||||||||
| - Individual evaluations | 111 | 8,459 | - | - | - | 8,570 | ||||||||||||||||||
| - Group evaluations | - | 4,948 | 539 | 2,955 | 1,414 | 9,856 | ||||||||||||||||||
| Total released allowances | 111 | 13,407 | 539 | 2,955 | 1,414 | 18,426 | ||||||||||||||||||
| Recovery of loans previously charged off | - | 5,259 | 1,229 | 17,067 | - | 23,555 | ||||||||||||||||||
| Net charge to income | (6 | ) | (73,620 | ) | (10,458 | ) | (123,912 | ) | 25,876 | (182,120 | ) | |||||||||||||
96
BANCO SANTANDER CHILE AND SUBSIDIARIES NOTES TO THE CONSOLIDATED INTERIM FINANCIAL STAEMENTS As of September 30, 2011 and 2010 and December 31, 2010 |
NOTE 28 - PERSONNEL SALARIES AND EXPENSES:
| a) | Composition of personnel salaries and expenses |
For the quarter ended as of September 30, | For the 9-month period ending as of September 30, | |||||||||||||||
| 2011 | 2010 | 2011 | 2010 | |||||||||||||
| MCh$ | MCh$ | MCh$ | MCh$ | |||||||||||||
| Personnel salaries | 48,889 | 39,935 | 132,453 | 116,810 | ||||||||||||
| Bonuses or gratifications | 15,348 | 16,332 | 48,120 | 46,999 | ||||||||||||
| Stock-based benefits | 599 | 585 | 1,755 | 1,600 | ||||||||||||
| Seniority compensation | 2,053 | 888 | 7,459 | 4,521 | ||||||||||||
| Pension plans | 285 | 248 | 1,151 | 833 | ||||||||||||
| Training expenses | 803 | 444 | 1,709 | 957 | ||||||||||||
| Day care and kindergarten | 441 | 218 | 1,293 | 531 | ||||||||||||
| Health funds | 650 | 617 | 1,851 | 1,820 | ||||||||||||
| Welfare fund | 114 | 110 | 332 | 336 | ||||||||||||
| Other personnel expenses | 4,702 | 3,953 | 11,257 | 10,514 | ||||||||||||
| Totals | 73,884 | 63,330 | 207,380 | 184,921 | ||||||||||||
97
BANCO SANTANDER CHILE AND SUBSIDIARIES NOTES TO THE CONSOLIDATED INTERIM FINANCIAL STAEMENTS As of September 30, 2011 and 2010 and December 31, 2010 |
NOTE 29 - ADMINISTRATIVE EXPENSES:
As of September 30, 2011 and 2010, the composition of the item is as follows:
For the quarter ended as of September 30, | For the 9-month period ended as of September 30, | |||||||||||||||
| 2011 | 2010 | 2011 | 2010 | |||||||||||||
| MCh$ | MCh$ | MCh$ | MCh$ | |||||||||||||
| General administrative expenses | ||||||||||||||||
| Maintenance and repair of property, plant and equipment | 3,160 | 2,780 | 9,132 | 8,247 | ||||||||||||
| Office lease | 5,684 | 5,896 | 16,437 | 13,098 | ||||||||||||
| Equipment lease | 74 | 31 | 135 | 115 | ||||||||||||
| Insurance payments | 586 | 601 | 1,721 | 1,193 | ||||||||||||
| Office supplies | 1,418 | 1,767 | 4,684 | 4,955 | ||||||||||||
| Information technology and communication expenses | 5,303 | 4,783 | 15,813 | 15,462 | ||||||||||||
| Lighting, heating, and other utilities | 1,283 | 1,377 | 3,581 | 4,053 | ||||||||||||
| Security and valuables transport services | 2,841 | 2,629 | 8,494 | 7,623 | ||||||||||||
| Representation and personnel travel expenses | 1,295 | 1,133 | 3,309 | 2,883 | ||||||||||||
| Judicial and notarial expenses | 1,658 | 2,045 | 4,717 | 4,064 | ||||||||||||
| Fees for technical reports | 1,714 | 965 | 4,354 | 3,787 | ||||||||||||
| Other general administrative expenses | 767 | 569 | 1,812 | 1,432 | ||||||||||||
| Outsourced services | ||||||||||||||||
| Subcontracted services | 6,385 | 5,272 | 19,558 | 15,137 | ||||||||||||
| Others | 2,295 | 2,265 | 9,450 | 8,836 | ||||||||||||
| Board expenses | 308 | 245 | 949 | 644 | ||||||||||||
| Marketing expenses | 3,760 | 3,364 | 10,822 | 11,535 | ||||||||||||
| Taxes, payroll taxes, and contributions | ||||||||||||||||
| Real state contributions | 439 | 394 | 1,305 | 1,255 | ||||||||||||
| Patents | 443 | 465 | 1,271 | 1,317 | ||||||||||||
| Contributions to SBIF | 1,628 | 1,402 | 4,534 | 4,107 | ||||||||||||
| Totals | 41,041 | 37,983 | 122,078 | 109,743 | ||||||||||||
98
BANCO SANTANDER CHILE AND SUBSIDIARIES NOTES TO THE CONSOLIDATED INTERIM FINANCIAL STAEMENTS As of September 30, 2011 and 2010 and December 31, 2010 |
NOTE 30 – DEPRECIATION AMORTIZATION AND IMPAIRMENT:
| a) | Depreciation and amortization and impairment charges for the periods ended on September 2011 and 2010 are detailed below: |
For the quarter ended as of September 30, | For the 9-month period ended as of September 30, | |||||||||||||||
| 2011 | 2010 | 2011 | 2010 | |||||||||||||
| MCh$ | MCh$ | MCh$ | MCh$ | |||||||||||||
| Depreciation and amortization | ||||||||||||||||
| Depreciation of property, plant, and equipment | (5,239 | ) | (5,362 | ) | (15,089 | ) | (16,687 | ) | ||||||||
| Amortizations of Intangible assets | (8,115 | ) | (5,932 | ) | (24,549 | ) | (19,540 | ) | ||||||||
| Subtotals | (13,354 | ) | (11,294 | ) | (39,638 | ) | (36,227 | ) | ||||||||
| Impairment of property, plant, and equipment | (77 | ) | (963 | ) | (109 | ) | (4,665 | ) | ||||||||
| Totals | (13,431 | ) | (12,257 | ) | (39,747 | ) | (40,892 | ) | ||||||||
| b) | The reconciliation between carrying values and balances as of December 2010, January 1, 2010 and 2011 and the September 30, 2011 balances is as follows: |
| Depreciation and amortization | ||||||||||||
| 2011 | ||||||||||||
Property, plant, and equipment | Intangible assets | Total | ||||||||||
| MCh$ | MCh$ | MCh$ | ||||||||||
| Opening balances as of January 1, 2011 | (64,376 | ) | (78,329 | ) | (142,705 | ) | ||||||
| Depreciation and amortization charges in the period | (15,089 | ) | (24,549 | ) | (39,638 | ) | ||||||
| Sales and disposals in the period | 235 | - | 235 | |||||||||
| Balances as of September 30, 2011 | (79,230 | ) | (102,878 | ) | (182,108 | ) | ||||||
| Depreciation and amortization | ||||||||||||
| 2010 | ||||||||||||
Property, plant, and equipment | Intangible assets | Total | ||||||||||
| MCh$ | MCh$ | MCh$ | ||||||||||
| Opening balances as of January 1, 2010 | (42,979 | ) | (51,101 | ) | (94,080 | ) | ||||||
| Depreciation and amortization charges in the period | (22,175 | ) | (27,228 | ) | (49,403 | ) | ||||||
| Sales and disposals in the period | 778 | - | 778 | |||||||||
| Balances as of December 31, 2010 | (64,376 | ) | (78,329 | ) | (142,705 | ) | ||||||
As of September 30, 2011 the amount of impairment to property, plant, and equipment totals MCh$32 for damages to ATMs.
99
BANCO SANTANDER CHILE AND SUBSIDIARIES NOTES TO THE CONSOLIDATED INTERIM FINANCIAL STAEMENTS As of September 30, 2011 and 2010 and December 31, 2010 |
NOTE 31 - OTHER OPERATING INCOME AND EXPENSES:
| a) | Other operating expenses are comprised of the following components: |
For the quarter ended as of September 30, | For the 9-month period ended on September 30, | |||||||||||||||
| 2011 | 2010 | 2011 | 2010 | |||||||||||||
| MCh$ | MCh$ | MCh$ | MCh$ | |||||||||||||
| Income from assets received in lieu of payment | ||||||||||||||||
| Income from sale of assets received in lieu of payment | 882 | 751 | 2,636 | 1,644 | ||||||||||||
| Recovery of charge-offs and income from assets received in lieu of payment | 1,908 | 526 | 4,018 | 1,331 | ||||||||||||
| Subtotals | 2,790 | 1,277 | 6,654 | 2,975 | ||||||||||||
| Income from sale of investments in other companies | ||||||||||||||||
| Gain on sale of investments in other companies | - | - | - | - | ||||||||||||
| Subtotals | - | - | - | - | ||||||||||||
| Other income | ||||||||||||||||
| Leases | (568 | ) | 1 | 209 | 308 | |||||||||||
| Gain on sale of property, plant and equipment (*) | 21 | 48 | 830 | 13,243 | ||||||||||||
| Recovery of provisions for contingencies | - | 1 | 5 | 7,036 | ||||||||||||
| Compensation from insurance companies due to earthquake | 199 | 948 | 315 | 3,611 | ||||||||||||
| Dividends received from share in other companies | - | - | 8 | - | ||||||||||||
| Other | (248 | ) | 381 | 32 | 381 | |||||||||||
| Subtotals | (596 | ) | 1,379 | 1,399 | 24,579 | |||||||||||
| Totals | 2,194 | 2,656 | 8,053 | 27,554 | ||||||||||||
(*) In March 2011, Banco Santander Chile sold 1 branch. At the time of sale, its carrying value was Ch$48 million, its selling price was Ch$165 million, resulting in a Ch$116 million gain
(*) On April 30 and June 30, 2010 Banco Santander Chile sold 5 branches, resulting in a Ch$6,620 gain and sold 11 branches in June, resulting in a Ch$6,355 million gain.
100
BANCO SANTANDER CHILE AND SUBSIDIARIES NOTES TO THE CONSOLIDATED INTERIM FINANCIAL STAEMENTS As of September 30, 2011 and 2010 and December 31, 2010 |
NOTE 31 - OTHER OPERATING INCOMES AND EXPENSES, continued:
| b) | Other operating expenses for the periods ended on September 30, 2010 and 2011 are as follows: |
For the quarter ended as of September 30, | For the 9-month period ended as of September 30, | |||||||||||||||
| 2011 | 2010 | 2011 | 2010 | |||||||||||||
| MCh$ | MCh$ | MCh$ | MCh$ | |||||||||||||
| Provisions and expenses for assets received in lieu of payment | ||||||||||||||||
| Charge-offs of assets received in lieu of payment | 1,787 | 7,615 | 7,118 | 9,163 | ||||||||||||
| Provisions for assets received in lieu of payment | 858 | 1,806 | 2,135 | 4,106 | ||||||||||||
| Expenses for maintenance of assets received in lieu of payment | 703 | 473 | 2,138 | 1,665 | ||||||||||||
| Subtotals | 3,348 | 9,894 | 11,391 | 14,934 | ||||||||||||
| Credit card expenses | ||||||||||||||||
| Credit card expenses | 412 | 1,036 | 1,756 | 2,572 | ||||||||||||
| Credit card memberships | 1,096 | 1,005 | 3,063 | 2,603 | ||||||||||||
| Subtotals | 1,508 | 2,041 | 4,819 | 5,175 | ||||||||||||
| Customer services | 2,411 | 1,790 | 6,998 | 6,528 | ||||||||||||
| Other expenses | ||||||||||||||||
| Operating charge-offs | 2,223 | 1,308 | 5,525 | 2,287 | ||||||||||||
| Life insurance and general product insurance policies | 2,032 | 1,468 | 5,154 | 4,272 | ||||||||||||
| Additional tax on expenses paid overseas | 710 | 546 | 2,736 | 1,541 | ||||||||||||
| Provisions for contingencies (*) | (649 | ) | 877 | 2,644 | 5,951 | |||||||||||
| Earthquake expenses | - | 2,544 | - | 2,544 | ||||||||||||
| Other | 573 | 865 | 2,302 | 2,731 | ||||||||||||
| Subtotals | 4,889 | 7,608 | 18,361 | 19,326 | ||||||||||||
| Totals | 12,156 | 21,333 | 41,569 | 45,963 | ||||||||||||
101
BANCO SANTANDER CHILE AND SUBSIDIARIES NOTES TO THE CONSOLIDATED INTERIM FINANCIAL STAEMENTS As of September 30, 2011 and 2010 and December 31, 2010 |
NOTE 32 - TRANSACTIONS WITH RELATED PARTIES:
In addition to affiliates and associated entities, the Bank’s “related parties” include its “key personnel” from the executive staff (members of the Bank’s Board and the Managers of Banco Santander Chile and its Affiliates, together with their close relatives), as well as the entities over which the key personnel could exercise significant influence or control.
The Bank also considers the companies that are part of the Santander Group worldwide as related parties, given that all of them have a common parent, i.e., Banco Santander S.A. (located in Spain).
Article 89 of the Ley de Sociedades Anónimas (Public Companies Act), which is also applicable to banks, provides that any transaction with a related party must be made under equitable conditions similar to those that customarily prevail in the market.
Moreover, Article 84 of the Ley General de Bancos (General Banking Act) establishes limits for loans that can be granted to related parties and prohibits lending to the Bank’s directors, managers, or representatives.
Transactions between the Bank and its related parties are specified below. To facilitate comprehension, we have divided the information into four categories:
Santander Group Companies
This category includes all the companies that are controlled by the Santander Group around the world, and hence, it also includes the companies over which the Bank exercises any degree of control (Affiliates and special-purpose entities).
Associated companies
This category includes the entities over which the Bank, in accordance with section b) of Note 1 to these Consolidated Interim Financial Statements, exercises a significant degree of influence and which generally belong to the group of entities known as “business support companies.”
Key personnel
This category includes members of the Bank’s Board and the managers of Banco Santander Chile and its Affiliates, together with their close relatives.
Other
This category encompasses the related parties that are not included in the groups identified above and which are, in general, entities over which the key personnel could exercise significant influence or control.
The terms for transactions with related parties are equivalent to those which prevail in transactions made under market conditions or to which the corresponding considerations in kind have been attributed.
102
BANCO SANTANDER CHILE AND SUBSIDIARIES NOTES TO THE CONSOLIDATED INTERIM FINANCIAL STAEMENTS As of September 30, 2011 and 2010 and December 31, 2010 |
NOTE 32 - TRANSACTIONS WITH RELATED PARTIES, continued:
| a) | Loans to related parties: |
Below are loans and receivables, and contingent loans, corresponding to related entities:
| As of September 30, 2011 | As of December 31, 2010 | |||||||||||||||||||||||||||||||
Companies of the Group | Associated companies | Key personnel | Other | Companies of the Group | Associated companies | Key personnel | Other | |||||||||||||||||||||||||
| MCh$ | MCh$ | MCh$ | MCh$ | MCh$ | MCh$ | MCh$ | MCh$ | |||||||||||||||||||||||||
| Loans and accounts receivables | ||||||||||||||||||||||||||||||||
| Commercial loans | 35,618 | 682 | 2,197 | 73,438 | 36,966 | 670 | 2,478 | 14,015 | ||||||||||||||||||||||||
| Mortgage loans | - | - | 15,962 | - | - | - | 15,157 | - | ||||||||||||||||||||||||
| Consumer loans | - | - | 1,911 | - | - | - | 2,182 | - | ||||||||||||||||||||||||
| Loans and accounts receivables | 35,618 | 682 | 20,070 | 73,438 | 36,966 | 670 | 19,817 | 14,015 | ||||||||||||||||||||||||
| Provision for loan losses | (46 | ) | (1 | ) | (34 | ) | (33 | ) | (112 | ) | (1 | ) | (87 | ) | (14 | ) | ||||||||||||||||
| Net loans | 35,572 | 681 | 20,036 | 73,405 | 36,854 | 669 | 19,730 | 14,001 | ||||||||||||||||||||||||
| Guarantees | 25,580 | - | 18,717 | 1,054 | 7,641 | - | 18,649 | 1,359 | ||||||||||||||||||||||||
| Contingent loans | ||||||||||||||||||||||||||||||||
| Personal guarantees | - | - | - | - | - | - | - | - | ||||||||||||||||||||||||
| Letters of credit | 1,020 | - | - | - | 2,964 | - | - | - | ||||||||||||||||||||||||
| Guarantees | 12,761 | - | - | 250 | 12,307 | - | - | 84 | ||||||||||||||||||||||||
| Contingent loans | 13,781 | - | - | 250 | 15,271 | - | - | 84 | ||||||||||||||||||||||||
| Provisions for contingent loans | (9 | ) | - | - | - | (1 | ) | - | - | - | ||||||||||||||||||||||
| Net contingent loans | 13,772 | - | - | 250 | 15,270 | - | - | 84 | ||||||||||||||||||||||||
The activity of loans to related parties during the periods ended on September 30, 2011 and December, 2010 is shown below:
| As of September 30, | As of December 31, | |||||||||||||||||||||||||||||||
| 2011 | 2010 | |||||||||||||||||||||||||||||||
Companies of the Group MCh$ | Associated companies MCh$ | Key personnel MCh$ | Other MCh$ | Companies of the Group MCh$ | Associated companies MCh$ | Key personnel MCh$ | Other MCh$ | |||||||||||||||||||||||||
| Opening | 52,237 | 670 | 19,818 | 14,099 | 147,843 | 914 | 17,339 | 108,631 | ||||||||||||||||||||||||
| New loans | 36,121 | 23 | 4,342 | 61,927 | 11,954 | 256 | 6,901 | 11,600 | ||||||||||||||||||||||||
| Payments | (38,959 | ) | (11 | ) | (4,090 | ) | (2,338 | ) | (107,560 | ) | (500 | ) | (4,422 | ) | (106,132 | ) | ||||||||||||||||
| Closing | 49,399 | 682 | 20,070 | 73,688 | 52,237 | 670 | 19,818 | 14,099 | ||||||||||||||||||||||||
103
BANCO SANTANDER CHILE AND SUBSIDIARIES NOTES TO THE CONSOLIDATED INTERIM FINANCIAL STAEMENTS As of September 30, 2011 and 2010 and December 31, 2010 |
NOTE 32 - TRANSACTIONS WITH RELATED PARTIES, continued:
| b) | Assets and liabilities with related parties |
| As of September 30, | As of December 31, | |||||||||||||||||||||||||||||||
| 2011 | 2010 | |||||||||||||||||||||||||||||||
Companies of the Group | Associated companies | Key personnel | Other | Companies of the Group | Associated companies | Key personnel | Other | |||||||||||||||||||||||||
| MCh$ | MCh$ | MCh$ | MCh$ | MCh$ | MCh$ | MCh$ | MCh$ | |||||||||||||||||||||||||
| Assets | ||||||||||||||||||||||||||||||||
| Cash and deposits in banks | 222,497 | - | - | - | 34,104 | - | - | - | ||||||||||||||||||||||||
| Trading investments | - | - | - | - | - | - | - | - | ||||||||||||||||||||||||
| Investments under resale agreements | - | - | - | - | - | - | - | - | ||||||||||||||||||||||||
| Financial derivative contracts | 572,040 | - | - | - | 541,737 | - | - | - | ||||||||||||||||||||||||
| Available for sale investments | - | - | - | - | - | - | - | - | ||||||||||||||||||||||||
| Other assets | 28,534 | - | - | - | 22,072 | - | - | - | ||||||||||||||||||||||||
| Liabilities | ||||||||||||||||||||||||||||||||
| Deposits and other demand liabilities | 5,738 | 8,779 | 1,594 | 9,671 | 9,905 | 6,014 | 1,311 | 4,128 | ||||||||||||||||||||||||
| Investments under repurchase agreements | 52,611 | - | - | - | 47,636 | - | - | - | ||||||||||||||||||||||||
| Time deposits and other time liabilities | 471,973 | 90 | 2,583 | 56,000 | 320,622 | - | 1,657 | 48,749 | ||||||||||||||||||||||||
| Financial derivative contracts | 457,725 | - | - | - | 317,601 | - | - | - | ||||||||||||||||||||||||
| Issued debt instruments | 13,212 | - | - | - | 9,392 | - | - | - | ||||||||||||||||||||||||
| Other financial liabilities | 43,754 | - | - | - | 153,913 | - | - | - | ||||||||||||||||||||||||
| Other liabilities | 1,163 | - | - | - | 2,782 | - | - | - | ||||||||||||||||||||||||
| c) | Income (expenses) recorded with related parties |
| For the quarter ended as of September 30, | For the quarter ended as of September 30, | |||||||||||||||||||||||||||||||
| 2011 | 2010 | |||||||||||||||||||||||||||||||
Companies of the Group | Associated companies | Key personnel | Other | Companies of the Group | Associated companies | Key personnel | Other | |||||||||||||||||||||||||
| MCh$ | MCh$ | MCh$ | MCh$ | MCh$ | MCh$ | MCh$ | MCh$ | |||||||||||||||||||||||||
| Income (expense) recorded | ||||||||||||||||||||||||||||||||
| Income and expenses from interest and adjustments | (7,796 | ) | 11 | 292 | (444 | ) | (2,387 | ) | 9 | 287 | (86 | ) | ||||||||||||||||||||
| Income and expenses from fees and services | 19,028 | 9 | 28 | 65 | 18,556 | (26 | ) | 11 | 66 | |||||||||||||||||||||||
| Net income from financial and foreign exchange operations | 98,001 | - | (5 | ) | (5,957 | ) | 151,954 | - | (7 | ) | 6,477 | |||||||||||||||||||||
| Other operating revenues and expenses | (1,706 | ) | - | - | - | (1,286 | ) | - | - | - | ||||||||||||||||||||||
| Key personnel compensation and expenses | - | - | (8,621 | ) | - | - | - | (7,733 | ) | - | ||||||||||||||||||||||
| Administrative and other expenses | (5,320 | ) | (7,183 | ) | - | - | (3,839 | ) | (4,341 | ) | - | - | ||||||||||||||||||||
| Totals | 102,207 | (7,163 | ) | (8,306 | ) | (6,336 | ) | 162,998 | (4,358 | ) | (7,442 | ) | 6,457 | |||||||||||||||||||
104
BANCO SANTANDER CHILE AND SUBSIDIARIES NOTES TO THE CONSOLIDATED INTERIM FINANCIAL STAEMENTS As of September 30, 2011 and 2010 and December 31, 2010 |
NOTE 32 - TRANSACTIONS WITH RELATED PARTIES, continued:
For the 9-month period ended as of September 30, | For the 9-month period ended as of September 30, | |||||||||||||||||||||||||||||||
| 2011 | 2010 | |||||||||||||||||||||||||||||||
Companies of the Group | Associated companies | Key personnel | Other | Companies of the Group | Associated companies | Key personnel | Other | |||||||||||||||||||||||||
| MCh$ | MCh$ | MCh$ | MCh$ | MCh$ | MCh$ | MCh$ | MCh$ | |||||||||||||||||||||||||
| Income (expense) recorded | ||||||||||||||||||||||||||||||||
| Income and expenses from interest and adjustments | (12,923 | ) | 41 | 953 | (2,415 | ) | (7,385 | ) | 39 | 768 | 459 | |||||||||||||||||||||
| Income and expenses from fees and services | 58,741 | 30 | 84 | 155 | 50,735 | 2 | 69 | 118 | ||||||||||||||||||||||||
| Net income from financial and foreign exchange operations | 96,187 | - | (19 | ) | (8,658 | ) | 98,131 | - | (18 | ) | 1,479 | |||||||||||||||||||||
| Other operating revenues and expenses | (4,184 | ) | - | - | - | (3,551 | ) | - | - | - | ||||||||||||||||||||||
| Key personnel compensation and expenses | - | - | (25,213 | ) | - | - | - | (21,480 | ) | - | ||||||||||||||||||||||
| Administrative and other expenses | (17,421 | ) | (18,664 | ) | - | - | (14,466 | ) | (14,788 | ) | - | - | ||||||||||||||||||||
| Total | 120,400 | (18,593 | ) | (24,195 | ) | (10,918 | ) | 123,464 | (14,747 | ) | (20,661 | ) | 2,056 | |||||||||||||||||||
(*) Reflects derivative contracts that hedge Group positions in Chile
105
BANCO SANTANDER CHILE AND SUBSIDIARIES NOTES TO THE CONSOLIDATED INTERIM FINANCIAL STAEMENTS As of September 30, 2011 and 2010 and December 31, 2010 |
NOTE 32 - TRANSACTIONS WITH RELATED PARTIES, continued:
| d) | Payments to Board members and key management personnel |
The compensation received by the key management personnel, including Board members and all the executives holding manager positions, shown in the “Personnel salaries and expenses” and/or “Administrative expenses” items of the Consolidated Statement of Income, correspond to the following categories:
For the quarter ended as of September 30, | For the 9-month period ended as of September 30, | |||||||||||||||
| 2011 | 2010 | 2011 | 2010 | |||||||||||||
| MCh$ | MCh$ | MCh$ | MCh$ | |||||||||||||
| Personnel salaries | 4,182 | 3,736 | 12,005 | 10,853 | ||||||||||||
| Compensation to board members | 274 | 245 | 732 | 644 | ||||||||||||
| Bonuses or gratifications | 2,608 | 2,159 | 8,230 | 6,647 | ||||||||||||
| Compensation in stock | 449 | 390 | 1,215 | 1,230 | ||||||||||||
| Training expenses | 28 | 18 | 87 | 32 | ||||||||||||
| Severance provision | 634 | 723 | 1,314 | 726 | ||||||||||||
| Health funds | 70 | 62 | 200 | 179 | ||||||||||||
| Other personnel expenses | 99 | 109 | 286 | 294 | ||||||||||||
| Pension plans | 277 | 291 | 1,144 | 875 | ||||||||||||
| Total | 8,621 | 7,733 | 25,213 | 21,480 | ||||||||||||
| e) | Composition of key personnel |
As of September 30, 2011 and September 30, 2010 the composition of the Bank’s key personnel is as follows:
| Positions | No. of executives | |||||||
| As of September 30, | As of September 30, | |||||||
| 2011 | 2010 | |||||||
| Directors | 12 | 12 | ||||||
| Division managers | 18 | 14 | ||||||
| Department managers | 90 | 80 | ||||||
| Managers | 66 | 62 | ||||||
| Total key personnel | 186 | 168 | ||||||
106
BANCO SANTANDER CHILE AND SUBSIDIARIES NOTES TO THE CONSOLIDATED INTERIM FINANCIAL STAEMENTS As of September 30, 2011 and 2010 and December 31, 2010 |
NOTE 33 - FAIR VALUE OF FINANCIAL ASSETS AND LIABILITIES:
Fair value is defined as the amount at which a financial instrument (asset or liability) could be delivered or settled, respectively, on a given date between two independent knowledgeable parties who act freely and prudently (i.e., not in a forced or liquidation sale). The most objective and customary reference for the fair value of an asset or liability is the quoted price that would be paid for it on a transparent organized market (“estimated fair value”).
For financial instruments with no available market prices, fair values have been estimated by using recent transactions in analogous instruments, and in the absence thereof, the present values or other valuation techniques based on mathematical valuation models sufficiently accepted by the international financial community. In the use of these models, consideration is given to the specific particularities of the asset or liability to be valued, and especially to the different kinds of risks associated with the asset or liability.
These techniques are inherently subjective and are significantly influenced by the assumptions used, including the discount rate, the estimates of future cash flows and prepayment expectations. Hence, the fair value estimated for an asset or liability may not coincide exactly with the price at which that asset or liability could be delivered or settled on the date of its valuation, and may not be justified in comparison with independent markets.
Measurement of fair value and hierarchy
IFRS 7 provides a hierarchy of reasonable value which separates the inputs and/or valuation technique assumptions used to measure the fair value of financial instruments. The hierarchy reflects the significance of the inputs used in making the measurement. The three levels of the hierarchy of fair values are the following:
| Level 1: In quoted prices on active markets for identical assets and liabilities. |
| Level 2: Corresponds to inputs other than the quoted prices included in level 1 that are observable for assets or liabilities, either directly or indirectly; and |
| Level 3: Corresponds to inputs for the asset or the liability which are not based on observable market data. |
The hierarchy level within which the fair value measurement is categorized in its entirely is determined based on the lowest level of input that is significant to fair value the measurement in its entirety.
The best evidence of a financial instrument’s fair value at the initial time is the transaction price (Level 1).
In cases where quoted market prices cannot be observed, Management makes its best estimate of the price that the market would set using its own internal models which in most cases use data based on observable market parameters as significant input (Level 2) and, in very specific cases, significant inputs not observable in market data (Level 3).
Financial instruments at fair value and determined by quotations published in active markets (Level 1) include:
| 1) Chilean Government and Department of Treasury bonds |
Instruments which cannot be 100% observable in the market are valued according to other inputs observable in the market (Level 2). They include:
| 1) Mortgage bonds |
| 2) Private paper |
| 3) Deposits |
| 4) Average Chamber Swaps |
| 5) FX Forward and Inflation |
| 6) Cross Currency Swaps (CCS) |
| 7) FX Options. |
| 8) Interest Rate Swap (IRS) FX |
107
BANCO SANTANDER CHILE AND SUBSIDIARIES NOTES TO THE CONSOLIDATED INTERIM FINANCIAL STAEMENTS As of September 30, 2011 and 2010 and December 31, 2010 |
NOTE 33 - FAIR VALUE OF FINANCIAL ASSETS AND LIABILITIES, continued:
In limited occasions significant inputs not observable in market data are used (Level 3). To carry out this estimate, several techniques are used, including extrapolation of observable market data or a mix of observable data.
The following financial instruments are classified under Level 3:
| Type of financial instrument | Model used in valuation | Description | ||
ž Caps/Floors/Swaptions | Black Normal Model for Cap/Floors and Swaptions | There is no observable input of implicit volatility. | ||
ž UF options | Black – Scholes | There is no observable input of implicit volatility. | ||
ž Cross currency swap with window | Hull-White | Hybrid HW model for rates and Brownian motion for FX There is no observable input of implicit volatility. | ||
ž CCS (special contracts) | Implicit Forward Rate Agreement (FRA) | Start Fwd unsupported by MUREX (platform) due to the UF forward estimate. | ||
ž Cross currency swap, Interest rate swap, Call money swap in Tasa Activa Bancaria (Active Bank Rate) TAB, | Other | Valuation obtained by using the interest curve and interpolating at flow maturities, but TAB is not a directly observable variable and is not correlated to any market input. | ||
ž Bonds (in our case, low liquidity bonds) | Other | Valuated by using similar instrument prices plus a charge-off rate by illiquidity. |
The following table presents the assets and liabilities that are measured at fair value on a recurrent basis, as of September 30, 2011 and December 31, 2010:
| Fair value Measurement | ||||||||||||||||
| Level 1 | Level 2 | Level 3 | ||||||||||||||
| As of September 30, 2011 | MCh$ | MCh$ | MCh$ | MCh$ | ||||||||||||
| Assets | ||||||||||||||||
| Trading investments | 503,813 | 478,681 | 25,132 | - | ||||||||||||
| Available for sale investments | 2,104,644 | 1,874,641 | 229,714 | 289 | ||||||||||||
| Derivatives | 2,011,585 | - | 1,919,920 | 91,665 | ||||||||||||
| Totals | 4,620,042 | 2,353,322 | 2,174,766 | 91,954 | ||||||||||||
| Liabilities | ||||||||||||||||
| Derivatives | 1,625,274 | - | 1,623,901 | 1,373 | ||||||||||||
| Totals | 1,625,274 | - | 1,623,901 | 1,373 | ||||||||||||
| Fair value measurement | ||||||||||||||||
| Level 1 | Level 2 | Level 3 | ||||||||||||||
| As of December 31, 2010 | MCh$ | MCh$ | MCh$ | MCh$ | ||||||||||||
| Assets | ||||||||||||||||
| Trading investments | 379,670 | 348,638 | 31,032 | - | ||||||||||||
| Available for sale investments | 1,473,980 | 1,097,487 | 376,224 | 269 | ||||||||||||
| Derivatives | 1,624,378 | - | 1,520,339 | 104,039 | ||||||||||||
| Totals | 3,478,028 | 1,446,125 | 1,927,595 | 104,308 | ||||||||||||
| Liabilities | ||||||||||||||||
| Derivatives | 1,643,979 | - | 1,638,557 | 5,422 | ||||||||||||
| Totals | 1,643,979 | - | 1,638,557 | 5,422 | ||||||||||||
108
BANCO SANTANDER CHILE AND SUBSIDIARIES NOTES TO THE CONSOLIDATED INTERIM FINANCIAL STAEMENTS As of September 30, 2011 and 2010 and December 31, 2010 |
NOTE 33 - FAIR VALUE OF FINANCIAL ASSETS AND LIABILITIES, continued:
The following table presents the Bank’s activity for assets and liabilities measured at fair value on a recurrent basis using unobserved significant entries (Level 3) as of September 30, 2011 and 2010:
| Assets | Liabilities | |||||||
| MCh$ | MCh$ | |||||||
| As of January 1, 2011 | 104,308 | (5,422 | ) | |||||
| Total realized and unrealized profits (losses): | ||||||||
| Included in statement of income | (12,374 | ) | 4,049 | |||||
| Included in comprehensive income | 20 | - | ||||||
| Purchases, issuances, and allocations (net) | - | - | ||||||
| As of September 30, 2011 | 91,954 | (1,373 | ) | |||||
| Total profits or losses included in income for 2011 that are attributable to change in unrealized profits (losses) related to assets or liabilities as of September 30, 2011 | (12,354 | ) | 4,049 | |||||
| Assets | Liabilities | |||||||
| MCh$ | MCh$ | |||||||
| As of January 1, 2010 | 212,218 | (468,848 | ) | |||||
| Total realized and unrealized profits (losses): | ||||||||
| Included in statement of income | 44,616 | (9,789 | ) | |||||
| Included in comprehensive income | ||||||||
| Purchases, issuances, and allocations (net) | ||||||||
| As of September 30, 2010 | 256,834 | (478,637 | ) | |||||
| Total profits or losses included in income for 2010 that are attributable to change in unrealized profits (losses) related to assets or liabilities as of September 30, 2010 | 44,616 | (9,789 | ) | |||||
The realized and unrealized profits (losses) included in income for 2011 and 2010, in the assets and liabilities measured at fair value on a recurrent basis through unobservable market data (Level 3) are recorded in the Statement of Income under the “Net profit from financial operations” item.
The potential effect as of September 30, 2011 and 2010 on the valuation of assets and liabilities measured at fair value on a recurrent basis through unobservable significant market data (level 3), generated by changes in the main assumptions if other reasonably possible assumptions that are less or more favorable were used, it is not considered by the Bank to be significant.
109
BANCO SANTANDER CHILE AND SUBSIDIARIES NOTES TO THE CONSOLIDATED INTERIM FINANCIAL STAEMENTS As of September 30, 2011 and 2010 and December 31, 2010 |
NOTE 34 – SUBSEQUENT EVENTS
Between October 1, 2011 and the date on which these Consolidated Interim Financial Statements were issued (October 24, 2011), no other events have occurred which could significantly affect their interpretation.
FELIPE CONTRERAS FAJARDO Accounting Manager | CLAUDIO MELANDRI HINOJOSA Chief Executive Officer |
110