
THIRD QUARTER 2010
EARNINGS REPORT
| Investor Relations Department | 0 |
Bandera 140 19th Floor, Santiago, Chile, Tel: 562-320-8284, fax: 562-671-6554, | |
| email: rmorenoh@santander.cl |
INDEX
| SECTION | PAGE | |
| SECTION 1: SUMMARY OF RESULTS | 2 | |
| SECTION 2: BALANCE SHEET ANALYSIS | 5 | |
| SECTION 3: ANALYSIS OF QUARTERLY INCOME STATEMENT | 8 | |
| SECTION 4: CREDIT RISK RATINGS | 15 | |
| SECTION 5: SHARE PERFORMANCE | 16 | |
| SECTION 6: INSTITUTIONAL BACKGROUND | 17 | |
| ANNEX 1: BALANCE SHEET | 18 | |
| ANNEX 2: YEAR TO DATE INCOME STATEMENT | 19 | |
| ANNEX 3: QUARTERLY INCOME STATEMENTS | 20 | |
| ANNEX 4: QUARTERLY EVOLUTION OF MAIN RATIOS AND OTHER INFORMATION | 21 |
| CONTACT INFORMATION | Santiago, Chile |
| Robert Moreno | Tel: (562) 320-8284 |
| Manager, Investor Relations Department | Fax: (562) 671-6554 |
| Banco Santander Chile | Email: rmorenoh@santander.cl |
| Bandera 140 Piso 19 | Website: www.santander.cl |
| Investor Relations Department | 1 |
Bandera 140 19th Floor, Santiago, Chile, Tel: 562-320-8284, fax: 562-671-6554, | |
| email: rmorenoh@santander.cl |
SECTION 1: SUMMARY OF RESULTS
Net income increases 14.1% YoY in 3Q10
Year-to-date & Quarterly results, Ch$ billion and change, %
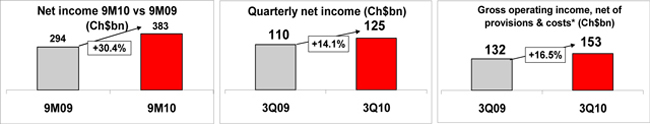
*Gross operating income, net of provisions & costs = Net interest revenue + fees + financial transactions, net + provision expenses + operating expenses
In 3Q10, net income attributable to shareholders1 totaled Ch$125,356 million (Ch$0.67 per share and US$1.42/ADR2). These results represent an increase of 14.1% compared to 3Q09 (from now on YoY) and a decrease of 9.7% compared to 2Q10 (from now on QoQ). The efficiency ratio in 3Q10 reached 33.8%.
ROAE reaches 29.3% in 3Q10. Core capital at 10.5%.
With these results, the Bank’s ROAE in the quarter reached 29.3% and 30.5% for 9M10. The Bank currently has one of the highest ROEs and capitalization levels in the Chilean financial system. As of September 30, 2010, the Bank’s BIS ratio reached 14.5% and its Core Capital ratio stood at 10.5%.
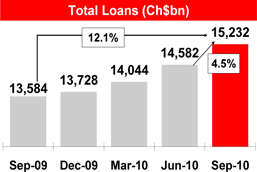
Total loans grow 4.5% QoQ in 3Q10. Strong growth of the Bank’s credit card business.
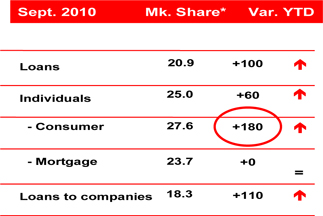
In 3Q10, total loans increased 4.5% QoQ with loan growth seen in all products and segments. YoY, loan growth reached 12.1%. Higher yielding retail loans increased 4.2% QoQ, led by a 6.3% increase in consumer loans. Notable was the 9.9% QoQ and 35.6% YoY increase in credit card consumer loans, as the Bank continues to gain market share in credit card loans and purchases. The Bank’s market share in consumer and credit card loans has increased 150 basis points, since the beginning of the year to 27.3%. The Bank’s market share in credit card purchases, including retailers, is approximately 19%.
1 The results in this report are unaudited.
2 Earnings per ADR is calculated using an exchange rate of Ch$483.65 per US$.
| Investor Relations Department | 2 |
Bandera 140 19th Floor, Santiago, Chile, Tel: 562-320-8284, fax: 562-671-6554, | |
| email: rmorenoh@santander.cl |
Gross income, net of provisions & costs from retail activities increases 23.5% QoQ and 42.1% YoY in 3Q10
By business segments, results were driven mainly by retail banking activities in line with our strategic objectives. Gross income, net of provisions and costs in retail banking increased 23.5% QoQ and 42.1% YoY. Net interest income grew 18.9% QoQ and 15.1% YoY driven by loan growth and higher margins with both individuals and small and middle-sized companies (SMEs). Fee income grew 3.7% QoQ and 4.8% YoY in these segments, driven by higher fees from credit cards and insurance brokerage. Provision expenses in retail banking increased 2.9% QoQ as the Bank proactively implemented some improvements in its standardized credit scoring models for consumer loans. However, YoY provision expense decreased 19.1% as asset quality continues to improve. Operating expenses from retail banking decreased 0.6% QoQ and increased 8.4% YoY, driven by the rise in commercial activity.
The Bank also showed positive results in its middle market segment whose gross income, net of provisions increased 29.7% QoQ and 113.9% YoY as loan growth and improvements in asset quality drove earnings in this segment.
These results were partially offset by lower income from our Global Banking and Markets business, which was negatively affected in the quarter by the rising interest rate environment. This reduced earnings from our treasury services and fixed income portfolios.
The loss in our Financial Management Division decreased 57.7% YoY in 3Q10 as higher inflation benefited its operations. QoQ, the results of this division was negatively affected by the rise in short-term interest rates.
Gross income net of provisions and costs (Ch$ million) | 3Q10 | YoY Chg. | QoQ Chg. | |||||||||
| Individuals | 79,091 | 42.1 | % | 23.5 | % | |||||||
| SMEs | 50,354 | 34.0 | % | 67.9 | % | |||||||
| Total retail banking | 129,445 | 42.1 | % | 23.5 | % | |||||||
| Institutional lending | 7,756 | 108.4 | % | 118.6 | % | |||||||
| Middle-market | 37,389 | 113.9 | % | 29.7 | % | |||||||
| Global Banking & Markets | 6,402 | (92.3 | )% | (74.8 | )% | |||||||
Financial Management & Corporate Activities1 | (27,710 | ) | (57.7 | )% | — | % | ||||||
Gross income, net of provisions & costs2 | 153,282 | 16.5 | % | (3.6 | )% | |||||||
| 1 | The Corporate Activities segment is comprised of all other operational and administrative activities that are not assigned to a specific segment or product mentioned above. These activities include the Financial Management Division, which oversees, among other elements: (i) the management of our structural foreign exchange gap position, our structural interest rate risk and our liquidity risk and, (ii) the use of our resources, the distribution of capital among our different segments and the overall financing cost of our investments. |
| 2 | Includes net interest income, fee income, financial transactions, net, provision expense and operating expenses. Provision expense in 3Q10 includes the provision reversal for contingent loans, which is included in Other operating income. |
Net income up 30.4% in 9M10
In the nine-month period ended September 30, 2010 (9M10), net income attributable to shareholders totaled Ch$383,283 million (Ch$2.03/share and US$4.37/ADR) and increased 30.4% compared to results in the nine month period ended September 30, 2009 (9M09). Gross income, net of provisions and costs increased 21.1% with a 12.2% increase in net interest revenue, a 21.5% decrease in provision and expense and a 10.0% rise in operating costs. The Bank’s net interest margin reached 5.9%, 40 basis point above the margins reached in 9M09. The efficiency ratio in 9M10 reached 34.0%.
| Investor Relations Department | 3 |
Bandera 140 19th Floor, Santiago, Chile, Tel: 562-320-8284, fax: 562-671-6554, | |
| email: rmorenoh@santander.cl |
Banco Santander Chile: Summary of Quarterly Results
| Quarter | Change % | |||||||||||||||||||
| (Ch$ million) | 3Q10 | 2Q10 | 3Q09 | 3Q10 / 3Q09 | 3Q / 2Q 10 | |||||||||||||||
| Net interest income | 235,674 | 242,782 | 217,253 | 8.5 | % | (2.9 | )% | |||||||||||||
| Fee income | 66,436 | 65,158 | 64,756 | 2.6 | % | 2.0 | % | |||||||||||||
| Core revenues | 302,110 | 307,940 | 282,009 | 7.1 | % | (1.9 | )% | |||||||||||||
| Financial transactions, net | 21,713 | 25,041 | 31,510 | (31.1 | )% | (13.3 | )% | |||||||||||||
Provision expense1 | (56,971 | ) | (55,952 | ) | (79,122 | ) | (28.0 | )% | 1.8 | % | ||||||||||
| Operating expenses | (113,570 | ) | (117,987 | ) | (102,775 | ) | 10.5 | % | (3.7 | )% | ||||||||||
| Gross income, net of provisions & costs | 153,282 | 159,042 | 131,622 | 16.5 | % | (3.6 | )% | |||||||||||||
Other operating & Non-op. Income 2 | (27,926 | ) | (20,219 | ) | (21,721 | ) | 28.6 | % | 38.1 | % | ||||||||||
| Net income attributable to shareholders | 125,356 | 138,823 | 109,901 | 14.1 | % | (9.7 | )% | |||||||||||||
| Net income/share (Ch$) | 0.67 | 0.74 | 0.58 | 14.1 | % | (9.7 | )% | |||||||||||||
Net income/ADR (US$) 3 | 1.42 | 1.41 | 1.11 | 28.4 | % | 1.1 | % | |||||||||||||
| Total loans | 15,232,019 | 14,582,467 | 13,583,627 | 12.1 | % | 4.5 | % | |||||||||||||
| Customer funds | 14,451,712 | 14,872,739 | 14,085,927 | 2.6 | % | (2.8 | )% | |||||||||||||
| Shareholders’ equity | 1,757,340 | 1,665,326 | 1,555,148 | 13.0 | % | 5.5 | % | |||||||||||||
| Net interest margin | 5.7 | % | 6.1 | % | 5.7 | % | ||||||||||||||
| Efficiency ratio | 33.8 | % | 35.2 | % | 32.6 | % | ||||||||||||||
Return on average equity 4 | 29.3 | % | 33.8 | % | 28.8 | % | ||||||||||||||
NPL / Total loans 5 | 2.7 | % | 2.8 | % | 2.8 | % | ||||||||||||||
| Coverage NPLs | 105.1 | % | 93.3 | % | 88.2 | % | ||||||||||||||
Risk Index 6 | 2.8 | % | 2.7 | % | 2.5 | % | ||||||||||||||
| BIS ratio | 14.5 | % | 14.1 | % | 15.2 | % | ||||||||||||||
| Branches | 500 | 499 | 502 | |||||||||||||||||
| ATMs | 1,914 | 1,871 | 1,991 | |||||||||||||||||
| Employees | 11,049 | 11,133 | 11,280 | |||||||||||||||||
| 1. | Includes provision reversal for contingent loans, which is included in Other operating income in 3Q10. |
| 2. | Includes Other operating income, Other operating expenses, income attributable to investments in other companies, income tax and net of minority interest. |
| 3. | The change in earnings per ADR may differ from the change in earnings per share due to the exchange rate. Earnings per ADR was calculated using an exchange rate of Ch$483.65 per US$. |
| 4. | Annualized quarterly Net income attributable to shareholders / Average equity attributable to shareholders. |
| 5. | NPL: Non-performing loans, full balance of loans with one installment 90 days or more overdue. |
| 6. | Risk Index: Loan loss allowances over total loans, measures how much the Bank expects to loose on its loan book, according to its internal models and the Superintendency of Banks guidelines. Banks must have 100% coverage of the Risk Index. |
| Investor Relations Department | 4 |
Bandera 140 19th Floor, Santiago, Chile, Tel: 562-320-8284, fax: 562-671-6554, | |
| email: rmorenoh@santander.cl |
SECTION 2: BALANCE SHEET ANALYSIS
LOANS
Loans grow 4.5% QoQ in 3Q10 with growth seen in all products and segments
| Loans | Quarter ended, | % Change | ||||||||||||||||||
| (Ch$ million) | Sep-10 | Jun-10 | Sep-09 | Sept. 10/09 | Sept. 10 / Jun. 10 | |||||||||||||||
Total loans to individuals1 | 8,035,617 | 7,715,031 | 6,980,092 | 15.1 | % | 4.2 | % | |||||||||||||
| Consumer loans | 2,554,884 | 2,404,128 | 2,155,200 | 18.5 | % | 6.3 | % | |||||||||||||
| Residential mortgage loans | 4,498,799 | 4,360,496 | 4,033,091 | 11.5 | % | 3.2 | % | |||||||||||||
| SMEs | 2,301,536 | 2,210,170 | 2,055,911 | 11.9 | % | 4.1 | % | |||||||||||||
| Total retail lending | 10,337,153 | 9,925,201 | 9,036,003 | 14.4 | % | 4.2 | % | |||||||||||||
| Institutional lending | 340,274 | 330,980 | 285,129 | 19.3 | % | 2.8 | % | |||||||||||||
| Middle-Market & Real estate | 3,160,681 | 2,983,741 | 2,838,365 | 11.4 | % | 5.9 | % | |||||||||||||
| Corporate | 1,406,210 | 1,347,855 | 1,449,001 | (3.0 | )% | 4.3 | % | |||||||||||||
Total loans 2 | 15,232,019 | 14,582,467 | 13,583,627 | 12.1 | % | 4.5 | % | |||||||||||||
| 1. | Includes consumer loans, residential mortgage loans and other loans to individuals |
| 2. | Total loans gross of loan loss allowances. Total loans include other non-segmented loans and exclude interbank loans. |
In 3Q10, total loans increased 4.5% QoQ with growth seen in all products and segments. YoY, loan growth reached 12.1%. The recent economic data for Chile show that economic growth has been accelerating with a strong rise in investment and consumption levels. Unemployment figures have also been better than expected as well as wage growth. The Bank’s market share also continued to increase in the quarter. The most important rise in market share has been in consumer and credit card loans, which increased 180 basis points, since the beginning of the year to 27.6%.
Source: Superintendency of Banks of Chile
Higher yielding retail loans increased 4.2% QoQ. Loans to individuals increased 4.2% QoQ, led by a 6.3% increase in consumer loans. Notable was the 9.9% QoQ and 35.6% YoY increase in credit card consumer loans as the Bank continues to gain market share in credit card purchases. Residential mortgage loans increased 3.2% QoQ as long-term rates remained attractive and lower than expected negative impacts of the earthquake on this market. Lending to SMEs increased 4.1% QoQ also reflecting the strength of economic growth.
| Investor Relations Department | 5 |
Bandera 140 19th Floor, Santiago, Chile, Tel: 562-320-8284, fax: 562-671-6554, | |
| email: rmorenoh@santander.cl |
In the middle market, which is comprised of companies with annual sales between Ch$3.5 billion and Ch$10 billion increased 5.9% QoQ. This segment was positively impacted by economic growth and reconstruction investments. Corporate lending also showed positive growth in 3Q10, reflecting the stronger evolution of investment levels in the economy and the on-going reconstruction effort.
FUNDING
The Bank issues the first Chilean peso denominated corporate bond ever in international markets. The Bank’s FX deposit rating are upgraded in the quarter
| (Ch$ million) | Sep-10 | Jun-10 | Sep-09 | Sept. 10/09 | Sept. 10 / Jun. 10 | |||||||||||||||
| Demand deposits | 3,991,732 | 4,168,884 | 3,152,739 | 26.6 | % | (4.2 | )% | |||||||||||||
| Time deposits | 7,155,213 | 7,193,376 | 7,456,731 | (4.0 | )% | (0.5 | )% | |||||||||||||
| Total customer deposits | 11,146,945 | 11,362,260 | 10,609,470 | 5.1 | % | (1.9 | )% | |||||||||||||
| Mutual funds | 3,304,767 | 3,510,479 | 3,476,457 | (4.9 | )% | (5.9 | )% | |||||||||||||
| Total customer funds | 14,451,712 | 14,872,739 | 14,085,927 | 2.6 | % | (2.8 | )% | |||||||||||||
| Loans to deposits* | 100.9 | % | 99.8 | % | 102.4 | % | ||||||||||||||
| Bonds | 3,979,448 | 3,245,162 | 2,717,508 | 46.4 | % | 22.6 | % | |||||||||||||
* (Loans - marketable securities that fund mortgage portfolio) / (Time deposits + demand deposits).
Customer funds decreased 2.8% in the quarter. The balance of demand deposits decreased 4.2% QoQ. Demand deposits denominated in foreign currencies, which represent 10% of the total, declined 21% in the quarter, as a direct result of the appreciation of the peso against the U.S. dollar. The rising interest rate environment also had a negative impact on demand deposits as clients shifted funds towards time deposits.
The 0.5% decrease in time deposits was mainly due to a reduction of the balance of wholesale short-term deposits in favor of long-term fixed rate funding in order to maintain stable spreads in a rising interest rate environment. This was offset by a 1.8% QoQ increase in core retail deposits, which totaled Ch$3,217,465 million as of September 30, 2010. In 3Q10, the Bank’s foreign currency time deposit was upgraded by Fitch from A+ to AA-, two notches above the sovereign ceiling.
The Bank also continued to access the international bond market in order to maintain strong liquidity levels and to minimize negative impacts of rising rates on our net interest margin by replacing short-term non-core deposits with long-term funding. For this reason, bonds have increased 22.6% QoQ and 46.4% YoY. In September 2010, the Bank, issued, among other notes, a Ch$247,255 million 10-yr bond in international markets. This was the first ever international Chilean peso issuance abroad by a Chilean corporate.
Mutual funds under management decreased 5.9% QoQ. This was mainly due to negative mark-to-market effects on fixed income funds as short-term interest rates increased and the appreciation of the peso against the dollar which negatively affected fixed income-dollar funds. Highly profitable equity funds continued to expand in the quarter (See Fee income).
| Investor Relations Department | 6 |
Bandera 140 19th Floor, Santiago, Chile, Tel: 562-320-8284, fax: 562-671-6554, | |
| email: rmorenoh@santander.cl |
SHAREHOLDERS’ EQUITY AND REGULATORY CAPITAL
ROAE of 29.3% achieved in 3Q10. BIS ratio stood at 14.5%
| Quarter | Change % | |||||||||||||||||||
| (Ch$ million) | Sep-10 | Jun-10 | Sep-09 | Sept. 10/09 | Sept. 10 / Jun. 10 | |||||||||||||||
| Capital | 891,303 | 891,303 | 891,303 | 0.0 | % | 0.0 | % | |||||||||||||
| Reserves | 51,538 | 51,539 | (16,960 | ) | (403.9 | )% | (0.0 | )% | ||||||||||||
| Unrealized gain (loss) Available-for-sale financial assets | (13,928 | ) | (18,193 | ) | (33,001 | ) | (57.8 | )% | (23.4 | )% | ||||||||||
| Retained Earnings: | 828,426 | 740,677 | 713,806 | 16.1 | % | 11.8 | % | |||||||||||||
| Retained earnings previous periods | 560,128 | 560,128 | 508,045 | 10.3 | % | 0.0 | % | |||||||||||||
| Net income | 383,283 | 257,927 | 293,944 | 30.4 | % | 48.6 | % | |||||||||||||
| Provision for mandatory dividend | (114,985 | ) | (77,378 | ) | (88,183 | ) | 30.4 | % | 48.6 | % | ||||||||||
| Minority Interest | 29,599 | 28,460 | 30,887 | (4.2 | )% | 4.0 | % | |||||||||||||
| Total Equity | 1,786,939 | 1,693,786 | 1,586,035 | 12.7 | % | 5.5 | % | |||||||||||||
| Equity attributable to shareholders | 1,757,340 | 1,665,326 | 1,555,148 | 13.0 | % | 5.5 | % | |||||||||||||
| ROAE | 29.3 | % | 33.8 | % | 28.8 | % | ||||||||||||||
Shareholders’ equity totaled Ch$1,757,340 million (US$3.6 billion) as of September 30, 2010. ROAE in 3Q10 reached 29.3%. This strong profitability was achieved while having one of the highest levels of capitalization in the banking system. Voting common shareholders’ equity is the sole component of our Tier I capital and represented 10.5% of risk weighted assets. The BIS ratio reached 14.5% compared to 14.1% in the previous quarter.
| Capital Adequacy | Quarter ended | Change % | ||||||||||||||||||
| (Ch$ million) | Sep-10 | Jun-10 | Sep-09 | Sept. 10/09 | Sept. 10 / Jun. 10 | |||||||||||||||
| Tier I | 1,757,340 | 1,665,326 | 1,555,148 | 13.0 | % | 5.5 | % | |||||||||||||
| Tier II | 672,740 | 627,608 | 563,856 | 19.3 | % | 7.2 | % | |||||||||||||
| Regulatory capital | 2,430,080 | 2,292,934 | 2,119,004 | 14.7 | % | 6.0 | % | |||||||||||||
| Risk weighted assets | 16,739,710 | 16,210,259 | 13,918,058 | 20.3 | % | 3.3 | % | |||||||||||||
| Tier I (Core capital) ratio | 10.5 | % | 10.3 | % | 11.2 | % | ||||||||||||||
| BIS ratio | 14.5 | % | 14.1 | % | 15.2 | % | ||||||||||||||
| Investor Relations Department | 7 |
Bandera 140 19th Floor, Santiago, Chile, Tel: 562-320-8284, fax: 562-671-6554, | |
| email: rmorenoh@santander.cl |
SECTION 3: ANALYSIS OF QUARTERLY INCOME STATEMENT
NET INTEREST INCOME
Lower inflation rate explains QoQ drop in net interest income
| Quarter | Change % | |||||||||||||||||||
| (Ch$ million) | 3Q10 | 2Q10 | 3Q09 | 3Q10 / 3Q09 | 3Q / 2Q 10 | |||||||||||||||
| Net interest income | 235,674 | 242,782 | 217,253 | 8.5 | % | (2.9 | )% | |||||||||||||
| Average interest-earning assets | 16,463,951 | 15,816,902 | 15,184,842 | 8.4 | % | 4.1 | % | |||||||||||||
| Average loans | 14,874,816 | 14,291,144 | 13,479,883 | 10.3 | % | 4.1 | % | |||||||||||||
Net interest margin (NIM) 1 | 5.7 | % | 6.1 | % | 5.7 | % | ||||||||||||||
| Avg. equity + non-interest bearing demand deposits / Avg. interest earning assets | 34.7 | % | 36.4 | % | 30.3 | % | ||||||||||||||
Quarterly inflation rate 2 | 0.65 | % | 0.97 | % | (0.47 | )% | ||||||||||||||
| Avg. overnight interbank rate (nominal) | 1.76 | % | 0.51 | % | 0.46 | % | ||||||||||||||
| Avg. 10 year Central Bank yield (real) | 2.82 | % | 3.04 | % | 2.88 | % | ||||||||||||||
| 1. | Annualized. |
| 2. | Inflation measured as the variation of the Unidad de Fomento in the quarter. |
Net interest income decreased 2.9% QoQ and increased 8.5% YoY. The YoY rise in net interest income was mainly due to:
(a) Loan growth. Average loans increased 10.3% YoY. By segment, YoY net interest income growth was led by a 15.1% increase from retail banking and a 29.4% increase in net interest income from the middle-market;
(b) Higher inflation rate. The Bank maintains long-term assets (mainly medium and long-term financial investments) that are denominated in Unidades de Fomento (UFs), an inflation indexed unit, which are partially funded with nominal or non-interest bearing peso short-term deposits. The UF inflation reached 0.65% in 3Q10 compared to - -0.47% in 3Q09 and;
(c) Improved funding mix. The ratio of average equity and non-interest bearing demand deposits to average interest earning assets reached 34.7% in 3Q10 compared to 30.3% in 3Q09. These positive factors were partially offset by the increase in funding costs as short-term interest rates increased in the quarter.
Compared to 2Q10, the 2.9% decrease in net interest income was mainly due to the lower inflation rates and higher short-term interest rates which increased funding costs. This was partially offset by the 4.1% QoQ increase in average loans. Going forward, we expect the Central Bank to continue to rising rates as inflation is expected to continue to rise and economic growth remains strong.
| Investor Relations Department | 8 |
Bandera 140 19th Floor, Santiago, Chile, Tel: 562-320-8284, fax: 562-671-6554, | |
| email: rmorenoh@santander.cl |
PROVISION FOR LOAN LOSSES
Coverage of NPLs reaches 105.1%
| Quarter | Change % | |||||||||||||||||||
| (Ch$ million) | 3Q101 | 2Q10 | 3Q09 | 3Q10 / 3Q09 | 3Q / 2Q 10 | |||||||||||||||
| Gross provisions | (41,135 | ) | (14,012 | ) | (25,377 | ) | 62.1 | % | 193.6 | % | ||||||||||
Provision reversal for contingent loans1 | 25,716 | — | — | |||||||||||||||||
| Charge-offs | (49,568 | ) | (49,506 | ) | (65,613 | ) | (24.5 | )% | 0.1 | % | ||||||||||
| Gross provisions and charge-offs | (64,987 | ) | (63,518 | ) | (90,990 | ) | (28.6 | )% | 2.3 | % | ||||||||||
| Loan loss recoveries | 8,016 | 7,566 | 11,868 | (32.5 | )% | 5.9 | % | |||||||||||||
| Net provisions for loan losses | (56,971 | ) | (55,952 | ) | (79,122 | ) | (28.0 | )% | 1.8 | % | ||||||||||
Total loans 2 | 15,232,019 | 14,582,467 | 13,583,627 | 12.1 | % | 4.5 | % | |||||||||||||
| Total reserves (RLL) | 428,833 | 387,624 | 338,020 | 26.9 | % | 10.6 | % | |||||||||||||
Non-performing loans 3 (NPLs) | 407,831 | 415,556 | 383,172 | 6.4 | % | (1.9 | )% | |||||||||||||
| Gross provision expense / Loans | 2.38 | % | 1.74 | % | 2.68 | % | ||||||||||||||
Cost of credit 4 | 2.17 | % | 1.53 | % | 2.33 | % | ||||||||||||||
| Risk Index (RLL / Total loans) | 2.82 | % | 2.66 | % | 2.49 | % | ||||||||||||||
| NPL / Total loans | 2.68 | % | 2.85 | % | 2.82 | % | ||||||||||||||
Coverage of NPLs5 | 105.1 | % | 93.3 | % | 88.2 | % | ||||||||||||||
| 1. | Includes provision reversal for contingent loans, which is included in Other operating income in 3Q10. |
| 2. | Excludes interbank loans. |
| 3. | NPL: Non-performing loans: Full balance of loans with one installment 90 days or more overdue. |
| 4. | Cost of credit: Net provision expense, annualized / Loans. |
| 5. | Coverage NPL: RLL / NPLs. |
In 3Q10, the Bank proactively implemented some improvements in its standardized credit scoring models for consumer loans. This impacted two line items of our income statement: Provision Expenses and Other Operating Income. The net effect of this improvement in the models was a charge of Ch$2,077 million in the quarter. Two major changes were incorporated in the models. On the one hand, the minimum provision required for clients in most risk profiles was increased for performing consumer loans. This had a one-time impact of Ch$27,793 million in provision expense. At the same time, the Bank adjusted the minimum provision levels that are set aside for the unused portion of credit card lines for clients that use their card for transactional and not credit purposes. Previously, these clients were assigned a provision level equal to the average for the whole credit card sample independent if they actually used their approved lines or not. This signified a one-time reversal of Ch$25,716 million recognized as Other operating income. As these provisions are for unused credit lines, accounting rules requires us to record these as a non-operating item in the income statement and as a non-credit provision in Other liabilities.
Incorporating both effects, adjusted provision expense in the quarter totaled Ch$56,971 million and increased 1.8% QoQ and decreased 28.0% YoY. The QoQ increase was mainly due to the net effect of the modifications made to our consumer loan provisioning models and higher provisions in commercial lending. The YoY decline was mainly due to the improvements in asset quality as the economy strengthened. By loan product, provision expense was as follows:
| Investor Relations Department | 9 |
Bandera 140 19th Floor, Santiago, Chile, Tel: 562-320-8284, fax: 562-671-6554, | |
| email: rmorenoh@santander.cl |
Net provisions for loan losses by segment | Quarter | Change % | ||||||||||||||||||
| (Ch$ million) | 3Q102 | 2Q10 | 3Q09 | 3Q10 / 3Q09 | 3Q / 2Q 10 | |||||||||||||||
Commercial loans1 | (19,060 | ) | (15,264 | ) | (18,374 | ) | 3.7 | % | 24.9 | % | ||||||||||
| Residential mortgage loans | (4,529 | ) | (4,021 | ) | (2,741 | ) | 65.2 | % | 12.6 | % | ||||||||||
Consumer loans2 | (33,382 | ) | (36,667 | ) | (58,007 | ) | (42.5 | )% | (9.0 | )% | ||||||||||
| Net provisions for loan losses | (56,971 | ) | (55,952 | ) | (79,122 | ) | (28.0 | )% | 1.8 | % | ||||||||||
1 Includes net provision expenses for interbank loans.
2 Includes provision reversal for contingent loans, which is included in Other operating income in 3Q10.
Asset quality and coverage improved in the quarter. Non-performing loans decreased 1.9% QoQ. The NPL ratio reached 2.68% as of September 30, 2010 compared to 2.85% at the end of the second quarter. Coverage ratios also increased as the adjustments in our credit scoring models improved the coverage ratio in consumer lending. The coverage ratio of total NPLs reached 105.1% as of September 30, 2010 compared to 93.3% as of June 30, 2010.
The NPL ratio of consumer loans decreased from 2.99% as of June 2010 to 2.87% as of September 30, 2010. The coverage ratio of consumer NPLs in the same period increased from 256.6% to 294.9%.

The Bank’s Risk Index increased to 2.82% in the quarter, reflecting the more conservative provisioning standards incorporated into our consumer loan models. This ratio, defined as loan loss allowances over total loans, measures how much the Bank expects to loose on its loan book, according to its internal models and the Superintendency of Banks guidelines. The Bank is required to have 100% coverage of its Risk index.
| Investor Relations Department | 10 |
Bandera 140 19th Floor, Santiago, Chile, Tel: 562-320-8284, fax: 562-671-6554, | |
| email: rmorenoh@santander.cl |
NET FEE INCOME
Solid QoQ growth of usage-linked fees
| Fee Income | Quarter | Change % | ||||||||||||||||||
| (Ch$ million) | 3Q10 | 2Q10 | 3Q09 | 3Q10 / 3Q09 | 3Q / 2Q 10 | |||||||||||||||
| Collection fees | 15,324 | 14,236 | 17,168 | (10.7 | )% | 7.6 | % | |||||||||||||
| Credit, debit & ATM card fees | 13,518 | 13,353 | 13,702 | (1.3 | )% | 1.2 | % | |||||||||||||
| Checking accounts & lines of credit | 10,604 | 10,470 | 12,284 | (13.7 | )% | 1.3 | % | |||||||||||||
| Asset management | 10,063 | 9,657 | 8,302 | 21.2 | % | 4.2 | % | |||||||||||||
| Insurance brokerage | 8,683 | 8,962 | 4,221 | 105.7 | % | (3.1 | )% | |||||||||||||
| Guarantees, pledges and other contingent operations | 5,568 | 5,954 | 6,260 | (11.1 | )% | (6.5 | )% | |||||||||||||
| Fees from brokerage of securities | 2,399 | 2,098 | 1,763 | 36.1 | % | 14.3 | % | |||||||||||||
| Other Fees | 276 | 428 | 1,056 | (73.9 | )% | (35.5 | )% | |||||||||||||
| Total fees | 66,436 | 65,158 | 64,756 | 2.6 | % | 2.0 | % | |||||||||||||
Net fee income increased 2.0% QoQ and 2.6% YoY. Fee income growth was mainly driven by retail banking activities, which experienced a 3.7% QoQ and 4.8% YoY increase in fee income. The evolution of the main products was the following:
Collection fees in 3Q10 increased 7.6% QoQ. This was mainly due to higher collection of loan insurance policies on behalf of third parties and higher fees from the payment of services, mainly on-line. These fees were negatively affected by the earthquake in the first half of the year and as the economy has rebounded, these fees have quickly been recovering. The 10.7% YoY decline was mainly due to the temporary interruption of collection activities in the zones more affected by the earthquake.
Fees from credit, debit and ATM cards increased 1.2% QoQ mainly as credit card usage continues to rise. As of June 2010, the latest data available, the Bank’s market share in terms of monetary purchases with credit cards reached 19.1%, including retailers. YoY purchases with Santander cards were up 33.2% in real terms. The Bank continued to expand its alliances with corporate customers to issue co-branded credit cards. In the quarter the Bank signed an alliance with Pre-Unic a mid-sized retailer in Chile with 42 stores throughout Chile for the administration of their credit card operations. In the quarter the Bank also renewed its 16 year alliance with Lan, Chile’s leading airline.

Fees from checking accounts and lines of credit increased 1.2% QoQ and declined 13.7% YoY. The QoQ increase was mainly due to the increase in number of checking accounts and the lower impact in the quarter from the temporary waiving of fees in some of the more affected areas by the earthquake. The YoY decline was mainly due to regulatory changes that prohibited fees charged for unauthorized overdrafts as of April 2009.
| Investor Relations Department | 11 |
Bandera 140 19th Floor, Santiago, Chile, Tel: 562-320-8284, fax: 562-671-6554, | |
| email: rmorenoh@santander.cl |
Fees from asset management increased 4.2% QoQ and 21.2% YoY. Equity funds, which generate higher management fees, continued to expand in the quarter driving fee income. However, total assets under management decreased 5.9% QoQ 4.9% YoY. The fall was mainly due to negative mark-to-market effects on fixed income funds as short-term interest rates increased and the appreciation of the peso against the dollar which negatively affected fixed income-dollar funds.
Fees from insurance brokerage decreased 3.1% QoQ and increased 105.7% YoY. The Bank’s success in selling insurance online, coupled with an increase in premiums on behalf of insurance underwriters has driven insurance brokerage fees. The Bank’s success in selling insurance online, coupled with a greater demand for insurance in general has driven insurance brokerage fees. Fees from the brokerage grew 14.3% QoQ and 36.1% YoY. These fees were driven by the Bank’s new internet platform for stock trading and a greater demand for investing in the local stock market.
OPERATING EXPENSES AND EFFICIENCY
The efficiency ratio reaches 33.8% in 3Q10 compared to 35.2% in 2Q10
| Operating Expenses | Quarter | Change % | ||||||||||||||||||
| (Ch$ million) | 3Q10 | 2Q10 | 3Q09 | 3Q10 / 3Q09 | 3Q / 2Q 10 | |||||||||||||||
| Personnel expenses | (63,330 | ) | (66,002 | ) | (55,751 | ) | 13.6 | % | (4.0 | )% | ||||||||||
| Administrative expenses | (37,983 | ) | (35,707 | ) | (34,955 | ) | 8.7 | % | 6.4 | % | ||||||||||
| Depreciation and amortization | (11,294 | ) | (12,592 | ) | (12,069 | ) | (6.4 | )% | (10.3 | )% | ||||||||||
| Impairment | (963 | ) | (3,686 | ) | 0 | — | % | (73.9 | )% | |||||||||||
| Operating expenses | (113,570 | ) | (117,987 | ) | (102,775 | ) | 10.5 | % | (3.7 | )% | ||||||||||
Efficiency ratio1 | 33.8 | % | 35.2 | % | 32.6 | % | ||||||||||||||
| 1 | Operating expenses / Operating income. Operating income = Net interest income + Net fee income+ Financial transactions net + other operating income and expenses. |
Operating expenses in 3Q10 decreased 3.7% QoQ and increased 10.5% YoY. The efficiency ratio reached 33.8% in the same period compared to 35.2% in 2Q10. The QoQ decrease in costs was mainly due to lower costs from the earthquake and lower personnel expenses. Headcount did not vary significantly in the quarter. The 6.4% QoQ increase in administrative expenses was mainly due to higher costs related to the maintenance and repair of branches and other fixed assets.
The YoY rise in costs was mainly due to a rise in personnel expenses that is directly related to an increase in commercial activity and as a result variable incentives to commercial teams have increased, especially in retail banking. This should be compensated in future quarters with stronger revenue growth. The YoY increase in administrative expenses was mainly due to higher costs related to the maintenance and repair of branches and other fixed assets which was mainly due to the earthquake. In total in 2010, the impact of the earthquake on administrative expenses was Ch$4.4 billion. The higher inflation also fueled administrative cost growth as 2/3 of administrative expenses are linked to inflation.
| Investor Relations Department | 12 |
Bandera 140 19th Floor, Santiago, Chile, Tel: 562-320-8284, fax: 562-671-6554, | |
| email: rmorenoh@santander.cl |
NET RESULTS FROM FINANCIAL TRANSACTIONS
Positive results from client treasury activities in the quarter
| Net Results from Financial Transactions* | Quarter | Change % | ||||||||||||||||||
| (Ch$ million) | 3Q10 | 2Q10 | 3Q09 | 3Q10 / 3Q09 | 3Q / 2Q 10 | |||||||||||||||
| Net gains from mark-to-market and trading | (45,068 | ) | 44,922 | 51,447 | (187.6 | )% | (200.3 | )% | ||||||||||||
| Exchange differences, net | 66,781 | (19,881 | ) | (19,937 | ) | (435.0 | )% | (435.9 | )% | |||||||||||
| Net results from financial transactions | 21,713 | 25,041 | 31,510 | (31.1 | )% | (13.3 | )% | |||||||||||||
| * | These results mainly include the mark-to-market of the available for sale investment portfolio, realized and unrealized gains of financial investments held for trading, the interest revenue generated by the held for trading portfolio, gains or losses from the sale of charged-off loans and the mark-to-market of derivatives. The results recorded as Exchange differences, net mainly includes the translation gains or losses of assets and a liability denominated in foreign currency. |
Net results from financial transactions, which include the sum of the net gains from mark-to-market and trading and exchange differences, net totaled a gain of Ch$21,713 million in 3Q10. In order to better understand this line item, we present them by business area in the table below.
| Net Results from Financial Transactions | Quarter | Change % | ||||||||||||||||||
| (Ch$ million) | 3Q10 | 2Q10 | 3Q09 | 3Q10 / 3Q09 | 3Q / 2Q 10 | |||||||||||||||
Santander Global Connect 1 & Market making 2 | 21,568 | 26,169 | 15,322 | 40.8 | % | (17.6 | )% | |||||||||||||
| Financial Management (ALCO) & Prop. trading | 145 | (1,128 | ) | 16,188 | (99.1 | )% | (112.9 | )% | ||||||||||||
| Net results from financial transactions | 21,713 | 25,041 | 31,510 | (31.1 | )% | (13.3 | )% | |||||||||||||
| 1. | Santander Global Connect is the Bank’s commercial platform for selling treasury products to our clients. |
| 2. | This line item also includes the gain or loss from the sale of charged-off loans. |
The 13.3% QoQ and 31.1% YoY decrease in this line item was mainly due lower results from Financial Management Division and the Bank’s proprietary trading business, which were negatively affected by the rising rate environment. This was partially offset by the Ch$21,568 million gain from the Bank’s treasury services to companies through the Santander Global Connect platform that increased 40.8% YoY.
| Investor Relations Department | 13 |
Bandera 140 19th Floor, Santiago, Chile, Tel: 562-320-8284, fax: 562-671-6554, | |
| email: rmorenoh@santander.cl |
OTHER INCOME AND EXPENSES
| Quarter | Change % | |||||||||||||||||||
| (Ch$ million) | 3Q10 | 2Q10 | 3Q09 | 3Q10 / 3Q09 | 3Q / 2Q 10 | |||||||||||||||
| Other operating income | 34,560 | 19,951 | 3,219 | 973.6 | % | 73.2 | % | |||||||||||||
| Other operating expenses | (22,075 | ) | (17,648 | ) | (1,922 | ) | 1048.5 | % | 25.1 | % | ||||||||||
| Other operating income, net | 12,485 | 2,303 | 1,297 | 862.6 | % | 442.1 | % | |||||||||||||
Provision reversal for contingent loans1 | (25,716 | ) | — | — | ||||||||||||||||
Adjusted Other operating income, net1 | (13,231 | ) | 2,303 | 1,297 | — | % | — | % | ||||||||||||
| Income attributable to investments in other companies | 832 | 223 | 97 | 757.7 | % | 273.1 | % | |||||||||||||
| Income tax | (14,109 | ) | (24,163 | ) | (22,439 | ) | (37.1 | )% | (41.6 | )% | ||||||||||
| Income tax rate | 10.0 | % | 15.0 | % | 16.9 | % | ||||||||||||||
| 1. | Excludes provision reversal for contingent loans, which is included in Other operating income in 3Q10 (See Provision Expense). |
Other operating income, net, adjusted for the reversal of provisions for contingent loans, which for purposes of analyses, we included in provision expense, totaled a loss of Ch$13,231 million in the quarter. As previously mentioned in the Provision Expense section, the Bank adjusted the minimum provision levels that are set aside for the unused portion of credit card lines for clients that use their card for transactional and not credit purposes. This signified a reversal of Ch$25,716 million recognized as Other operating income.
Excluding this effect, the net loss recognized in other operating income in 3Q10 was mainly due to higher charge-offs of repossessed assets mainly linked to a single repossessed asset in the agriculture sector.
Income tax decreased 41.6% QoQ and 37.1% YoY. The statutory corporate tax rate in Chile will rise to 20% in 2011 and gradually return to 17% in 2013 as a part of the government’s plan to finance the earthquake reconstruction efforts. As a result of these changes, the Bank had to apply these rates over deferred taxes. The application of the new corporate tax rates over deferred taxes, resulted in a higher net asset position in differed taxes and therefore a lower effective tax rate in 3Q10.
| Investor Relations Department | 14 |
Bandera 140 19th Floor, Santiago, Chile, Tel: 562-320-8284, fax: 562-671-6554, | |
| email: rmorenoh@santander.cl |
SECTION 4: CREDIT RISK RATINGS
International ratings
The Bank has credit ratings from three leading international agencies. All of our ratings are assigned a stable outlook. Fitch upgraded the Bank’s foreign currency deposit rating in October 2010.
| Moody’s | Rating | |
| Foreign currency bank deposits | Aa3 | |
| Senior bonds | Aa3 | |
| Subordinated debt | A1 | |
| Bank Deposits in Local Currency | Aa3 | |
| Bank financial strength | B- | |
| Short-term deposits | P-1 |
| Standard and Poor’s | Rating | |
| Long-term Foreign Issuer Credit | A+ | |
| Long-term Local Issuer Credit | A+ | |
| Short-term Foreign Issuer Credit | A-1 | |
| Short-term Local Issuer Credit | A-1 |
| Fitch | Rating | |
| Foreign Currency Long-term Debt | AA- | |
| Local Currency Long-term Debt | AA- | |
| Foreign Currency Short-term Debt | F1+ | |
| Local Currency Short-term Debt | F1+ | |
| Individual rating | B |
Local ratings:
Our local ratings, the highest in Chile, are the following:
| Local ratings | Fitch Ratings | Feller Rate | ||
| Shares | Level 2 | 1CN1 | ||
| Short-term deposits | N1+ | Level 1+ | ||
| Long-term deposits | AAA | AAA | ||
| Mortgage finance bonds | AAA | AAA | ||
| Senior bonds | AAA | AAA | ||
| Subordinated bonds | AA | AA+ | ||
| Outlook | Stable | Stable |
| Investor Relations Department | 15 |
Bandera 140 19th Floor, Santiago, Chile, Tel: 562-320-8284, fax: 562-671-6554, | |
| email: rmorenoh@santander.cl |
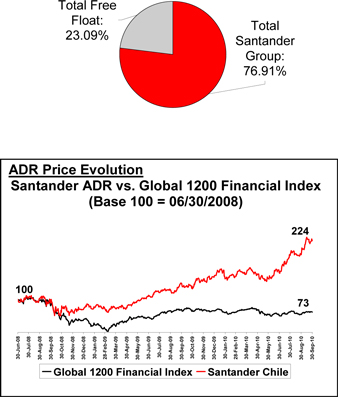
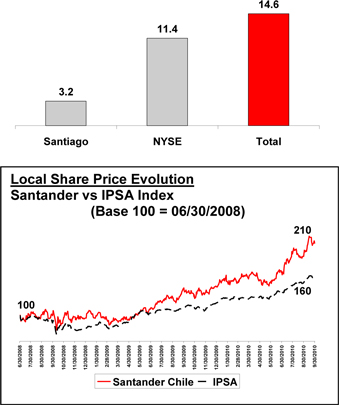
SECTION 5: SHARE PERFORMANCE
As of September 2010
Ownership Structure:
| ADR price (US$) 2010 | ||||
| 09/30/10: | 96.55 | |||
| Maximum (2010): | 99.44 | |||
| Minimum (2010): | 59.40 | |||
Market Capitalization: US$17,512 million | ||||
| P/E 12 month trailing*: | 15.2 | |||
| P/BV (06/30/10)**: | 4.83 | |||
| Dividend yield***: | 3.9 | % | ||
| * | Price as of Sept. 30 / 12mth Earnings |
| ** | Price as of Sept. 30 / Book value as of 09/30/10 |
| *** | Based on closing price on record date of last dividend payment. |
Average daily traded volumes YTD 2010
US$ million
| Local share price (Ch$) 2010 | ||||
| 09/30/10: | 45.06 | |||
| Maximum (2010): | 47.37 | |||
| Minimum (2010): | 31.03 | |||
Dividends:
| % of previous year | ||||||||
| Year paid | Ch$/share | earnings | ||||||
| 2006: | 0.83 | 65 | % | |||||
| 2007: | 0.99 | 65 | % | |||||
| 2008: | 1.06 | 65 | % | |||||
| 2009: | 1.13 | 65 | % | |||||
| 2010: | 1.37 | 60 | % | |||||
| Investor Relations Department | 16 |
Bandera 140 19th Floor, Santiago, Chile, Tel: 562-320-8284, fax: 562-671-6554, | |
| email: rmorenoh@santander.cl |
SECTION 6: INSTITUTIONAL BACKGROUND
Institutional Background
As per the latest public records published by the Superintendency of Banks of Chile for September 2010, Banco Santander Chile was the largest bank in terms of loans and equity. The Bank has the highest credit ratings among all Latin American companies, with an A+ rating from Standard and Poor’s and Aa3 by Moody’s, which are the same ratings assigned to the Republic of Chile, and AA- by Fitch which pierces the sovereign ceiling. The stock is traded on the New York Stock Exchange (NYSE: SAN) and the Santiago Stock Exchange (SSE: Bsantander). The Bank’s main shareholder is Santander, which controls 76.91% of Banco Santander Chile.
For more information see www.santander.cl
Banco Santander (SAN.MC, STD.N) is a retail and commercial bank, based in Spain. Santander has more than 90 million customers, 13,660 branches – more than any other international bank – and 169,460 employees around the world. It is the largest financial group in Spain and Latin America, with leading positions in the United Kingdom and Portugal and a broad presence in Europe through its Santander Consumer Finance arm. In 2009, Santander registered EUR 8,943 million in net attributable profit. Banco Santander’s eligible capital at the close of the third quarter came to EUR 79,704 million, with a surplus of EUR 34,769 million above the required regulatory minimum. With this capital base, the BIS ratio, using Basel II criteria, comes to 14.2%, Tier I to 10.1% and core capital 8.6%. These ratios place Santander among the most solvent banks in the world.
For more information see www.santander.com
| Investor Relations Department | 17 |
Bandera 140 19th Floor, Santiago, Chile, Tel: 562-320-8284, fax: 562-671-6554, | |
| email: rmorenoh@santander.cl |
ANNEX 1: BALANCE SHEET
| Sep-10 | Sep-10 | Jun-10 | Sep-09 | Sept. 10/09 | Sept. 10 / Jun. 10 | |||||||||||||||||||
| US$ths | Ch$mn | % Chg. | ||||||||||||||||||||||
| Assets | ||||||||||||||||||||||||
| Cash and balances from Central Bank | 3,148,117 | 1,522,587 | 1,398,881 | 906,871 | 67.9 | % | 8.8 | % | ||||||||||||||||
| Funds to be cleared | 1,003,333 | 485,262 | 486,914 | 405,829 | 19.6 | % | (0.3 | )% | ||||||||||||||||
| Financial assets held for trading | 821,549 | 397,342 | 812,454 | 733,319 | (45.8 | )% | (51.1 | )% | ||||||||||||||||
| Investment collateral under agreements to repurchase | 134,384 | 64,995 | 5,000 | 16,086 | 304.0 | % | 1199.9 | % | ||||||||||||||||
| Derivatives | 3,424,729 | 1,656,370 | 1,531,224 | 1,428,496 | 16.0 | % | 8.2 | % | ||||||||||||||||
| Interbank loans | 149,248 | 72,184 | 41,437 | 56,674 | 27.4 | % | 74.2 | % | ||||||||||||||||
| Loans, net of reserves for loan losses | 30,607,228 | 14,803,186 | 14,194,842 | 13,245,608 | 11.8 | % | 4.3 | % | ||||||||||||||||
| Available-for-sale financial assets | 3,310,297 | 1,601,025 | 1,341,296 | 1,903,217 | (15.9 | )% | 19.4 | % | ||||||||||||||||
| Held-to-maturity investments | - | - | - | - | — | % | — | % | ||||||||||||||||
| Investments in other companies | 15,096 | 7,301 | 6,502 | 7,184 | 1.6 | % | 12.3 | % | ||||||||||||||||
| Intangible assets | 144,681 | 69,975 | 71,074 | 64,858 | 7.9 | % | (1.5 | )% | ||||||||||||||||
| Fixed assets | 331,717 | 160,435 | 163,184 | 186,763 | (14.1 | )% | (1.7 | )% | ||||||||||||||||
| Current tax assets | 12,298 | 5,948 | 5,464 | 4,519 | 31.6 | % | 8.9 | % | ||||||||||||||||
| Deferred tax assets | 285,243 | 137,958 | 111,938 | 105,422 | 30.9 | % | 23.2 | % | ||||||||||||||||
| Other assets | 1,350,739 | 653,285 | 595,246 | 541,467 | 20.7 | % | 9.8 | % | ||||||||||||||||
| Total Assets | 44,738,660 | 21,637,853 | 20,765,456 | 19,606,313 | 10.4 | % | 4.2 | % | ||||||||||||||||
| Liabilities and Equity | ||||||||||||||||||||||||
| Demand deposits | 8,253,348 | 3,991,732 | 4,168,884 | 3,152,739 | 26.6 | % | (4.2 | )% | ||||||||||||||||
| Funds to be cleared | 881,739 | 426,453 | 303,207 | 254,983 | 67.2 | % | 40.6 | % | ||||||||||||||||
| Investments sold under agreements to repurchase | 310,059 | 149,960 | 146,098 | 807,034 | (81.4 | )% | 2.6 | % | ||||||||||||||||
| Time deposits and savings accounts | 14,794,196 | 7,155,213 | 7,193,376 | 7,456,731 | (4.0 | )% | (0.5 | )% | ||||||||||||||||
| Derivatives | 3,416,096 | 1,652,195 | 1,250,547 | 1,318,230 | 25.3 | % | 32.1 | % | ||||||||||||||||
| Deposits from credit institutions | 3,572,834 | 1,728,001 | 2,100,234 | 1,741,380 | (0.8 | )% | (17.7 | )% | ||||||||||||||||
| Marketable debt securities | 8,227,950 | 3,979,448 | 3,245,162 | 2,717,508 | 46.4 | % | 22.6 | % | ||||||||||||||||
| Other obligations | 339,510 | 164,204 | 158,089 | 145,925 | 12.5 | % | 3.9 | % | ||||||||||||||||
| Current tax liabilities | 58,900 | 28,487 | 21,656 | 60,503 | (52.9 | )% | 31.5 | % | ||||||||||||||||
| Deferred tax liability | 8,047 | 3,892 | 2,672 | 2,149 | 81.1 | % | 45.7 | % | ||||||||||||||||
| Provisions | 424,387 | 205,255 | 191,001 | 151,724 | 35.3 | % | 7.5 | % | ||||||||||||||||
| Other liabilities | 756,899 | 366,074 | 290,744 | 211,372 | 73.2 | % | 25.9 | % | ||||||||||||||||
| Total Liabilities | 41,043,966 | 19,850,914 | 19,071,670 | 18,020,278 | 10.2 | % | 4.1 | % | ||||||||||||||||
| Equity | ||||||||||||||||||||||||
| Capital | 1,842,868 | 891,303 | 891,303 | 891,303 | 0.0 | % | 0.0 | % | ||||||||||||||||
| Reserves | 106,563 | 51,539 | 51,539 | (16,960 | ) | — | % | 0.0 | % | |||||||||||||||
| Unrealized gain (loss) Available-for-sale financial assets | (28,798 | ) | (13,928 | ) | (18,193 | ) | (33,001 | ) | (57.8 | )% | (23.4 | )% | ||||||||||||
| Retained Earnings: | 1,712,863 | 828,426 | 740,677 | 713,806 | 16.1 | % | 11.8 | % | ||||||||||||||||
| Retained earnings previous periods | 1,158,127 | 560,128 | 560,128 | 508,045 | 10.3 | % | 0.0 | % | ||||||||||||||||
| Net income | 792,480 | 383,283 | 257,927 | 293,944 | 30.4 | % | 48.6 | % | ||||||||||||||||
| Provision for mandatory dividend | (237,744 | ) | (114,985 | ) | (77,378 | ) | (88,183 | ) | 30.4 | % | 48.6 | % | ||||||||||||
| Total Shareholders' Equity | 3,633,495 | 1,757,340 | 1,665,326 | 1,555,148 | 13.0 | % | 5.5 | % | ||||||||||||||||
| Minority Interest | 61,199 | 29,599 | 28,460 | 30,887 | (4.2 | )% | 4.0 | % | ||||||||||||||||
| Total Equity | 3,694,695 | 1,786,939 | 1,693,786 | 1,586,035 | 12.7 | % | 5.5 | % | ||||||||||||||||
| Total Liabilities and Equity | 44,738,660 | 21,637,853 | 20,765,456 | 19,606,313 | 10.4 | % | 4.2 | % | ||||||||||||||||
| Investor Relations Department | 18 |
Bandera 140 19th Floor, Santiago, Chile, Tel: 562-320-8284, fax: 562-671-6554, | |
| email: rmorenoh@santander.cl |
ANNEX 2: YTD INCOME STATEMENT
| Sep-10 | Sep-10 | Sep-09 | Sept. 10/09 | |||||||||||||
| US$ths. | Ch$ million | % Chg. | ||||||||||||||
| Interest revenue | 2,161,898 | 1,045,602 | 865,415 | 20.8 | % | |||||||||||
| Interest expense | (698,331 | ) | (337,748 | ) | (234,278 | ) | 44.2 | % | ||||||||
| Net interest income | 1,463,567 | 707,854 | 631,137 | 12.2 | % | |||||||||||
| Fee income | 511,415 | 247,346 | 235,424 | 5.1 | % | |||||||||||
| Fee expense | (110,412 | ) | (53,401 | ) | (45,892 | ) | 16.4 | % | ||||||||
| Net fee income | 401,003 | 193,945 | 189,532 | 2.3 | % | |||||||||||
| Net gains from mark-to-market and trading | 107,404 | 51,946 | 52,013 | (0.1 | )% | |||||||||||
| Exchange differences, net | 50,410 | 24,381 | 77,968 | (68.7 | )% | |||||||||||
| Financial transactions, net | 157,815 | 76,327 | 129,981 | (41.3 | )% | |||||||||||
| Other operating income | 125,248 | 60,576 | 8,645 | 600.7 | % | |||||||||||
| Total operating income | 2,147,632 | 1,038,702 | 959,295 | 8.3 | % | |||||||||||
| Provision expense | (431,771 | ) | (208,826 | ) | (266,093 | ) | (21.5 | )% | ||||||||
| Total operating income net of provisions | 1,715,861 | 829,876 | 693,202 | 19.7 | % | |||||||||||
| Personnel expenses | (382,345 | ) | (184,921 | ) | (167,846 | ) | 10.2 | % | ||||||||
| Administrative expenses | (226,906 | ) | (109,743 | ) | (102,661 | ) | 6.9 | % | ||||||||
| Depreciation and amortization | (74,903 | ) | (36,227 | ) | (34,655 | ) | 4.5 | % | ||||||||
| Impairment | (9,645 | ) | (4,665 | ) | 0 | — | % | |||||||||
| Operating expenses | (693,799 | ) | (335,556 | ) | (305,162 | ) | 10.0 | % | ||||||||
| Other operating expenses | (108,093 | ) | (52,279 | ) | (29,632 | ) | 76.4 | % | ||||||||
| Total operating expenses | (801,892 | ) | (387,835 | ) | (334,794 | ) | 15.8 | % | ||||||||
| Net operating income | 913,969 | 442,041 | 358,408 | 23.3 | % | |||||||||||
| Income attributable to investments in other companies | 2,429 | 1,175 | 863 | 36.2 | % | |||||||||||
| Net income before taxes | 916,398 | 443,216 | 359,271 | 23.4 | % | |||||||||||
| Income tax | (124,123 | ) | (60,032 | ) | (60,514 | ) | (0.8 | )% | ||||||||
| Net income from ordinary activities | 792,275 | 383,184 | 298,757 | 28.3 | % | |||||||||||
| Net income discontinued operations | 0 | 0 | 0 | — | % | |||||||||||
| Net income attributable to: | ||||||||||||||||
| Minority interest | (205 | ) | (99 | ) | 4,813 | — | % | |||||||||
| Net income attributable to shareholders | 792,480 | 383,283 | 293,944 | 30.4 | % | |||||||||||
| Investor Relations Department | 19 |
Bandera 140 19th Floor, Santiago, Chile, Tel: 562-320-8284, fax: 562-671-6554, | |
| email: rmorenoh@santander.cl |
ANNEX 3 : QUARTERLY INCOME STATEMENTS
3Q10 | 3Q10 | 2Q10 | 3Q09 | 3Q10 / 3Q09 | 3Q / 2Q 10 | |||||||||||||||||||
| US$ths. | Ch$mn | % Chg. | ||||||||||||||||||||||
| Interest revenue | 734,922 | 355,445 | 368,919 | 279,880 | 27.0 | % | (3.7 | )% | ||||||||||||||||
| Interest expense | (247,640 | ) | (119,771 | ) | (126,137 | ) | (62,627 | ) | 91.2 | % | (5.0 | )% | ||||||||||||
| Net interest income | 487,282 | 235,674 | 242,782 | 217,253 | 8.5 | % | (2.9 | )% | ||||||||||||||||
| Fee income | 176,531 | 85,379 | 82,808 | 79,584 | 7.3 | % | 3.1 | % | ||||||||||||||||
| Fee expense | (39,167 | ) | (18,943 | ) | (17,650 | ) | (14,828 | ) | 27.8 | % | 7.3 | % | ||||||||||||
| Net fee income | 137,364 | 66,436 | 65,158 | 64,756 | 2.6 | % | 2.0 | % | ||||||||||||||||
| Net gains from mark-to-market and trading | (93,183 | ) | (45,068 | ) | 44,922 | 51,447 | — | % | — | % | ||||||||||||||
| Exchange differences, net | 138,077 | 66,781 | (19,881 | ) | (19,937 | ) | — | % | — | % | ||||||||||||||
| Total financial transactions, net | 44,894 | 21,713 | 25,041 | 31,510 | (31.1 | )% | (13.3 | )% | ||||||||||||||||
| Other operating income, net | 71,457 | 34,560 | 19,951 | 3,219 | 973.6 | % | 73.2 | % | ||||||||||||||||
| Total operating income | 740,997 | 358,383 | 352,932 | 316,738 | 13.1 | % | 1.5 | % | ||||||||||||||||
| Provision expense | (170,965 | ) | (82,687 | ) | (55,952 | ) | (79,122 | ) | 4.5 | % | 47.8 | % | ||||||||||||
| Total operating income net of provisions | 570,032 | 275,696 | 296,980 | 237,616 | 16.0 | % | (7.2 | )% | ||||||||||||||||
| Personnel expenses | (130,942 | ) | (63,330 | ) | (66,002 | ) | (55,751 | ) | 13.6 | % | (4.0 | )% | ||||||||||||
| Administrative expenses | 268,126 | (37,983 | ) | (35,707 | ) | (34,955 | ) | 8.7 | % | 6.4 | % | |||||||||||||
| Depreciation and amortization | (23,352 | ) | (11,294 | ) | (12,592 | ) | (12,069 | ) | (6.4 | )% | (10.3 | )% | ||||||||||||
| Impairment | (1,991 | ) | (963 | ) | (3,686 | ) | 0 | — | % | (73.9 | )% | |||||||||||||
| Operating expenses | (234,819 | ) | (113,570 | ) | (117,987 | ) | (102,775 | ) | 10.5 | % | (3.7 | )% | ||||||||||||
| Other operating expenses | (45,643 | ) | (22,075 | ) | (17,648 | ) | (1,922 | ) | 1048.5 | % | 25.1 | % | ||||||||||||
| Total operating expenses | (280,461 | ) | (135,645 | ) | (135,635 | ) | (104,697 | ) | 29.6 | % | 0.0 | % | ||||||||||||
| Net operating income | 289,571 | 140,051 | 161,345 | 132,919 | 5.4 | % | (13.2 | )% | ||||||||||||||||
| Income attributable to investments in other companies | 1,720 | 832 | 223 | 97 | 757.7 | % | 273.1 | % | ||||||||||||||||
| Net income before taxes | 291,291 | 140,883 | 161,568 | 133,016 | 5.9 | % | (12.8 | )% | ||||||||||||||||
| Income tax | (29,172 | ) | (14,109 | ) | (24,163 | ) | (22,439 | ) | (37.1 | )% | (41.6 | )% | ||||||||||||
| Net income from ordinary activities | 262,119 | 126,774 | 137,405 | 110,577 | 14.6 | % | (7.7 | )% | ||||||||||||||||
| Net income discontinued operations | 0 | 0 | 0 | 0 | ||||||||||||||||||||
| Net income attributable to: | ||||||||||||||||||||||||
| Minority interest | 2,932 | 1,418 | (1,418 | ) | 676 | 109.8 | % | — | % | |||||||||||||||
| Net income attributable to shareholders | 259,187 | 125,356 | 138,823 | 109,901 | 14.1 | % | -9.7 | % | ||||||||||||||||
| Investor Relations Department | 20 |
Bandera 140 19th Floor, Santiago, Chile, Tel: 562-320-8284, fax: 562-671-6554, | |
| email: rmorenoh@santander.cl |
ANNEX 4: QUARTERLY EVOLUTION OF MAIN RATIOS AND OTHER INFORMATION
| Mar-09 | Jun-09 | Sep-09 | Dec-09 | Mar-10 | Jun-10 | Sep-10 | ||||||||||||||||||||||
| (Ch$ millions) | ||||||||||||||||||||||||||||
| Loans | ||||||||||||||||||||||||||||
| Consumer loans | 2,187,832 | 2,121,045 | 2,155,200 | 2,244,035 | 2,303,983 | 2,404,128 | 2,554,884 | |||||||||||||||||||||
| Residential mortgage loans | 3,927,343 | 3,970,896 | 4,033,091 | 4,159,052 | 4,219,733 | 4,360,496 | 4,498,799 | |||||||||||||||||||||
| Commercial loans | 7,870,502 | 7,309,545 | 7,395,336 | 7,324,777 | 7,519,854 | 7,817,843 | 8,178,336 | |||||||||||||||||||||
| Total loans | 13,985,677 | 13,401,486 | 13,583,627 | 13,727,864 | 14,043,570 | 14,582,467 | 15,232,019 | |||||||||||||||||||||
| Allowance for loan losses | (281,265 | ) | (314,191 | ) | (338,020 | ) | (349,485 | ) | (374,064 | ) | (387,624 | ) | (428,833 | ) | ||||||||||||||
| Total loans, net of allowances | 13,704,412 | 13,087,295 | 13,245,607 | 13,378,379 | 13,669,506 | 14,194,843 | 14,803,186 | |||||||||||||||||||||
| Loans by segment | ||||||||||||||||||||||||||||
| Individuals | 6,782,663 | 6,815,737 | 6,980,092 | 7,287,296 | 7,411,686 | 7,715,031 | 8,035,617 | |||||||||||||||||||||
| SMEs | 2,007,115 | 2,002,641 | 2,055,911 | 2,097,592 | 2,143,885 | 2,210,170 | 2,301,536 | |||||||||||||||||||||
| Total retail lending | 8,789,778 | 8,818,378 | 9,036,003 | 9,384,888 | 9,555,571 | 9,925,201 | 10,337,153 | |||||||||||||||||||||
| Institutional lending | 262,664 | 262,947 | 285,129 | 291,867 | 313,079 | 330,980 | 340,274 | |||||||||||||||||||||
| Middle-Market & Real estate | 3,048,591 | 2,844,124 | 2,838,365 | 2,779,165 | 2,907,944 | 2,983,741 | 3,160,681 | |||||||||||||||||||||
| Corporate | 1,903,951 | 1,505,737 | 1,449,001 | 1,266,310 | 1,279,965 | 1,347,855 | 1,406,210 | |||||||||||||||||||||
| Customer funds | ||||||||||||||||||||||||||||
| Demand deposits | 3,092,010 | 3,083,814 | 3,152,739 | 3,533,534 | 3,890,230 | 4,168,884 | 3,991,732 | |||||||||||||||||||||
| Time deposits | 8,677,857 | 8,342,396 | 7,456,731 | 7,175,257 | 6,818,939 | 7,193,376 | 7,155,213 | |||||||||||||||||||||
| Total deposits | 11,769,867 | 11,426,210 | 10,609,470 | 10,708,791 | 10,709,169 | 11,362,260 | 11,146,945 | |||||||||||||||||||||
| Mutual funds (Off balance sheet) | 3,085,227 | 3,342,860 | 3,476,457 | 3,427,829 | 3,635,544 | 3,510,479 | 3,304,767 | |||||||||||||||||||||
| Total customer funds | 14,855,094 | 14,769,070 | 14,085,927 | 14,136,620 | 14,344,713 | 14,872,739 | 14,451,712 | |||||||||||||||||||||
Loans / Deposits1 | 96.5 | % | 94.3 | % | 102.4 | % | 100.9 | % | 104.3 | % | 99.8 | % | 100.9 | % | ||||||||||||||
| Average balances | ||||||||||||||||||||||||||||
| Avg. interest earning assets | 15,742,285 | 15,147,554 | 15,184,842 | 15,562,696 | 15,776,237 | 15,816,902 | 16,463,951 | |||||||||||||||||||||
| Avg. loans | 14,312,882 | 13,733,919 | 13,479,883 | 13,647,750 | 13,879,173 | 14,291,144 | 14,874,816 | |||||||||||||||||||||
| Avg. assets | 20,491,544 | 19,719,613 | 19,384,473 | 20,123,590 | 20,738,402 | 20,742,244 | 20,915,047 | |||||||||||||||||||||
| Avg. demand deposits | 2,952,461 | 3,087,754 | 3,079,230 | 3,278,373 | 3,678,104 | 4,107,978 | 4,005,565 | |||||||||||||||||||||
| Avg equity | 1,517,710 | 1,495,755 | 1,528,506 | 1,608,510 | 1,665,977 | 1,644,453 | 1,712,967 | |||||||||||||||||||||
| Avg. free funds | 4,470,170 | 4,583,509 | 4,607,736 | 4,886,883 | 5,344,081 | 5,752,431 | 5,718,532 | |||||||||||||||||||||
| Capitalization | ||||||||||||||||||||||||||||
| Risk weighted assets | 13,979,591 | 13,544,319 | 13,918,058 | 14,202,118 | 15,513,732 | 16,210,259 | 16,739,710 | |||||||||||||||||||||
| Tier I (Shareholders' equity) | 1,543,039 | 1,497,019 | 1,555,148 | 1,658,316 | 1,683,103 | 1,665,326 | 1,757,340 | |||||||||||||||||||||
| Tier II | 560,232 | 535,978 | 563,856 | 555,776 | 599,353 | 627,608 | 672,740 | |||||||||||||||||||||
| Regulatory capital | 2,103,271 | 2,032,997 | 2,119,004 | 2,214,092 | 2,282,455 | 2,292,934 | 2,430,080 | |||||||||||||||||||||
| Tier I ratio | 11.0 | % | 11.1 | % | 11.2 | % | 11.7 | % | 10.8 | % | 10.3 | % | 10.5 | % | ||||||||||||||
| BIS ratio | 15.0 | % | 15.0 | % | 15.2 | % | 15.6 | % | 14.7 | % | 14.1 | % | 14.5 | % | ||||||||||||||
| Profitability & Efficiency | ||||||||||||||||||||||||||||
| Net interest margin | 4.8 | % | 6.0 | % | 5.7 | % | 5.8 | % | 5.8 | % | 6.1 | % | 5.7 | % | ||||||||||||||
| Efficiency ratio | 34.5 | % | 31.5 | % | 32.6 | % | 30.5 | % | 33.0 | % | 35.2 | % | 33.8 | % | ||||||||||||||
| Avg. Free funds / interest earning assets | 28.4 | % | 30.3 | % | 30.3 | % | 31.4 | % | 33.9 | % | 36.4 | % | 34.7 | % | ||||||||||||||
| Return on avg. equity | 20.2 | % | 28.7 | % | 28.8 | % | 34.1 | % | 28.6 | % | 33.8 | % | 29.3 | % | ||||||||||||||
| Return on avg. assets | 1.5 | % | 2.2 | % | 2.3 | % | 2.7 | % | 2.3 | % | 2.7 | % | 2.4 | % | ||||||||||||||
| Investor Relations Department | 21 |
Bandera 140 19th Floor, Santiago, Chile, Tel: 562-320-8284, fax: 562-671-6554, | |
| email: rmorenoh@santander.cl |
| Mar-09 | Jun-09 | Sep-09 | Dec-09 | Mar-10 | Jun-10 | Sep-10 | ||||||||||||||||||||||
| Asset quality | ||||||||||||||||||||||||||||
Non-performing loans (NPLs)2 | 392,802 | 415,311 | 383,172 | 409,067 | 385,211 | 415,556 | 407,831 | |||||||||||||||||||||
Expected loss4 | 281,265 | 314,191 | 338,020 | 349,485 | 374,064 | 387,624 | 428,833 | |||||||||||||||||||||
| NPLs / total loans | 2.81 | % | 3.10 | % | 2.82 | % | 2.98 | % | 2.74 | % | 2.85 | % | 2.68 | % | ||||||||||||||
| Coverage of NPLs (Loan loss allowance / NPLs) | 71.60 | % | 75.65 | % | 88.22 | % | 85.43 | % | 97.11 | % | 93.28 | % | 105.15 | % | ||||||||||||||
| Expected loss (Loan loss allowances / Loans) | 2.01 | % | 2.34 | % | 2.49 | % | 2.55 | % | 2.66 | % | 2.66 | % | 2.82 | % | ||||||||||||||
| Cost of credit (prov. expense / loans) | 2.60 | % | 2.87 | % | 2.33 | % | 1.97 | % | 2.00 | % | 1.53 | % | 2.17 | % | ||||||||||||||
| Network | ||||||||||||||||||||||||||||
| Branches | 500 | 501 | 502 | 498 | 498 | 499 | 500 | |||||||||||||||||||||
| ATMs | 1,929 | 1,929 | 1,991 | 1,917 | 1,856 | 1,871 | 1,914 | |||||||||||||||||||||
| Employees | 11,578 | 11,391 | 11,280 | 11,204 | 11,155 | 11,133 | 11,049 | |||||||||||||||||||||
| Market information (period-end) | ||||||||||||||||||||||||||||
| Net income per share (Ch$) | 0.41 | 0.57 | 0.58 | 0.73 | 0.63 | 0.74 | 0.67 | |||||||||||||||||||||
| Net income per ADR (US$) | 0.73 | 1.12 | 1.11 | 1.49 | 1.25 | 1.41 | 1.42 | |||||||||||||||||||||
| Stock price | 19.1 | 23.9 | 30.4 | 30.7 | 34.4 | 35.7 | 45.1 | |||||||||||||||||||||
| ADR price | 34.4 | 46.7 | 57.5 | 64.8 | 68.2 | 67.1 | 96.6 | |||||||||||||||||||||
| Market capitalization (US$mn) | 6,230 | 8,468 | 10,436 | 11,749 | 12,373 | 12,168 | 17,512 | |||||||||||||||||||||
| Shares outstanding | 188,446.1 | 188,446.1 | 188,446.1 | 188,446.1 | 188,446.1 | 188,446.1 | 188,446.1 | |||||||||||||||||||||
| ADRs (1 ADR = 1,039 shares) | 181.4 | 181.4 | 181.4 | 181.4 | 181.4 | 181.4 | 181.4 | |||||||||||||||||||||
| Other Data | ||||||||||||||||||||||||||||
Quarterly inflation rate5 | (2.30 | )% | (0.13 | )% | (0.47 | )% | 0.52 | % | 0.27 | % | 0.97 | % | 0.65 | % | ||||||||||||||
| Avg. overnight interbank rate (nominal) | 5.49 | % | 1.40 | % | 0.46 | % | 0.43 | % | 0.40 | % | 0.51 | % | 1.76 | % | ||||||||||||||
| Avg. 10 year Central Bank yield (real) | 2.60 | % | 2.86 | % | 2.88 | % | 3.09 | % | 3.14 | % | 3.04 | % | 2.82 | % | ||||||||||||||
| Avg. 10 year Central Bank yield (nominal) | 5.09 | % | 5.63 | % | 5.70 | % | 6.13 | % | 6.41 | % | 6.42 | % | 6.07 | % | ||||||||||||||
| Observed Exchange rate (Ch$/US$) (period-end) | 582.1 | 529.07 | 546.07 | 506.43 | 526.29 | 543.09 | 485.23 | |||||||||||||||||||||
1 Ratio = Loans - marketable securities / Time deposits + demand deposits
2 Capital + future interest of all loans with one installment 90 days or more overdue.
3 Total installments plus lines of credit more than 90 days overdue
4 Based on internal credit models and SBIF guidelines. Banks must have a 100% coverage of expected loss
5 Calculated using the variation of the Unidad de Fomento (UF) in the period
| Investor Relations Department | 22 |
Bandera 140 19th Floor, Santiago, Chile, Tel: 562-320-8284, fax: 562-671-6554, | |
| email: rmorenoh@santander.cl |