SECURITIES AND EXCHANGE COMMISSION
Washington, D.C. 20549
(Exact name of registrant as specified in charter)
(Address of principal executive offices) (Zip code)
(Name and address of agent for service)

DAVIDSON MULTI-CAP EQUITY FUND
ANNUAL REPORT
For the year ended
June 30, 2023
Dear Shareholder:
At this time last year, we were contemplating “a tale of two markets,” with exuberant equity performance in 2021 giving way to a sharp pullback in the first 6 months of 2022. At that time, we noted that “things feel tenuous,” given the state of the economy at that time.
The whipsaw effect continues, as equity markets have posted substantial gains over the past twelve months; despite favorable performance, however, things still feel tenuous. With labor and material costs continuing to rise – albeit at a slower pace – corporate margins are likely to be declining from historical highs, thus causing slower earnings growth in the future. The equity market has yet to reflect this, preferring to focus on positive consumer sentiment, a stable housing market and robust demand for labor. However, the bond market, as evidenced by the most inverted yield curve since the early 1980s, is predicting recession. Though hard to predict which will be proven correct, it is difficult for some to imagine an equity market that will finish 2023 stronger than how it began.
At Davidson Funds, we remain steadfast to our long-term approach to investing. We manage a diversified portfolio, cognizant of cyclical and secular dynamics, that focuses on companies from diverse sectors with attractive returns on capital, cash flow, and growth prospects. As active managers and fundamental investors, our goal is to create a resilient portfolio that can weather the market turbulence that seems commonplace in today’s financial markets.
PERFORMANCE OVERVIEW
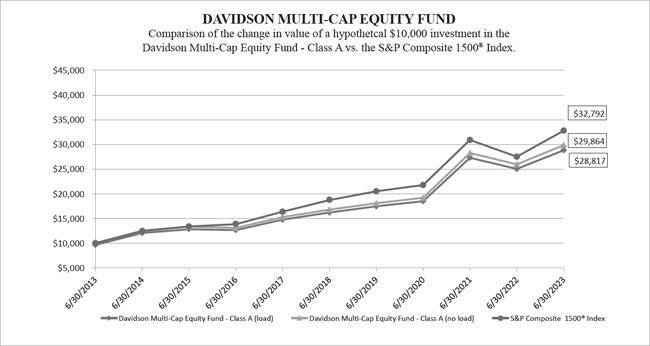
The S&P Composite 1500® Index, the benchmark for the Davidson Multi-Cap Equity Fund, finished the twelve month period ended June 30, 2023 up 19.24%. The Class A shares of the Fund returned 10.97% on a fully-loaded basis and 14.98% on a no-load* basis during the twelve month period ended June 30, 2023; the Class I shares generated a total return of 15.28% over the same time period.
The Health Care sector was the Fund’s primary contributor to performance; within this sector, Horizon Therapeutics PLC (“Horizon”) and Align Technology Inc. (“Align”) were stand-out performers. Regarding Horizon, in November the company confirmed that it was engaged in preliminary discussions to potentially be acquired by one of several suitors; in December, Amgen formally announced a definitive agreement to acquire Horizon. More recently, shares fell from their merger-level price after the Federal Trade Commission announced it will sue to block the acquisition by Amgen, claiming that the merger would be anticompetitive – though the share price remains well above pre-announcement levels. Shares of Align rallied after the company reported favorable quarterly earnings results, citing a more stable environment and improving consumer interest in their dental treatments. Consumer Staples sector holdings Sprouts Farmers Market Inc. (“Sprouts”) and Walmart Inc. (“Walmart”) were also additive to relative performance. Sprouts posted strong quarterly results on the top and bottom lines, while also guiding for fiscal 2023 earnings above street estimates (helped by buybacks & strong comps). Walmart shares also rallied after the company beat earnings estimates on the top & bottom lines, as well as reporting comps that were much better than expected. Profit margins are expected to improve for the company going forward, despite a more cautious view on the U.S. consumer.
The Financials sector was the Fund’s primary detractor from performance; within this sector, shares of First Republic Bank/CA (“First Republic”), First Foundation Inc. (“First Foundation”) and Fidelity National Information Services, Inc. (“Fidelity National”) detracted from performance. Shares of First Republic fell in sympathy with regional banks due to Silicon Valley Bank going into receivership in March and concerns about a possible run on the bank by depositors. First Foundation was also negatively impacted by regional bank turmoil; additionally, investors were concerned about increased competition for brokered deposits. Regarding Fidelity National, softness in the U.K. economy, strength in the U.S. dollar and higher interest expenses due to increasing interest rates weighed on the stock. The Fund’s underweight position in the Information Technology sector also contributed to relative underperformance, given the overall strength of this market segment over the last twelve months.
MARKET PERSPECTIVE
Inflation continues to moderate and is likely to continue that path in the coming months; however, the ultimate level it settles at is much debated as inflation still remains above the Fed’s 2% target. Thus far, the Fed has managed to raise interest rates significantly without inflicting broader economic damage, though there are clearly pressures in the economy building as seen last quarter with the banking crisis and most recently, weakness in segments such as commercial real estate. Currently members of the Fed committee appear to express more concern about stubborn inflation, and the market’s expectations for further interest rate increases, given more resilient employment and economic data.
Employment remains fairly strong overall and we continue to see labor shortages in pockets of the economy that are not only still keeping the economy on relatively solid footing, but also adding to the Fed’s challenge for curbing inflation. Despite this employment strength, there are signs of consumer stress building as excess pandemic savings are running out, aggregate debt levels have risen and stimulus plans such as student debt relief are beginning to expire. We believe there continues to be a path for a soft landing for the economy, but we see a more subdued demand environment from most companies, with little confidence from management teams for significant improvement.
An interesting theme we have seen at the security level year-to-date in 2023, is last year’s winners becoming this year’s losers, and vice versa. Several positions we trimmed last year or early in 2023 due to their outperformance are now at levels that we’ve begun to add back to them due to their underperformance and in our view, a still-positive fundamental outlook. We continue to broadly position the portfolio more defensively. Regarding our sector allocations, we are overweight Consumer Staples, Utilities, Communication Services and REITs, and underweight the Technology and Financials sectors. The strategy’s size allocation has not changed markedly; we are modestly overweight large-and mid-cap stocks and underweight small-cap stocks. From a style perspective, the strategy remains over-weight growth, under-weight core and market-weight value. We continue to opportunistically add companies where we see a compelling risk/reward tradeoff that balances an attractive fundamental growth outlook, earnings and cash flow stability, healthy balance sheet and reasonable valuation.
IN CLOSING
We would like to take this opportunity to thank you again for your trust you have placed in us; the continued support of our shareholders truly remains our greatest asset. As always, please feel free to contact us with any questions or comments you may have.
Sincerely,

Andrew I. Davidson
President
Davidson Investment Advisors, Inc.
Must be preceded or accompanied by a prospectus.
Past performance does not guarantee future results. Investment performance reflects fee waivers and in the absence of these waivers returns would be lower.
Mutual fund investing involves risk. Principal loss is possible. Small- and medium capitalization companies tend to have limited liquidity and greater price volatility than large-capitalization companies. Growth stocks typically are more volatile than value stocks; however, value stocks have a lower expected growth rate in earnings and sales. Investments in foreign securities involve political, economic and currency risks, greater volatility and differences in accounting methods. These risks are greater for emerging markets. Investments in exchange-traded funds (“ETFs”), are subject to additional risks that do not apply to conventional mutual funds, including the risks that the market price of an ETFs shares may trade at a discount to its net asset value (“NAV”), an active secondary trading market may not develop or be maintained, or trading may be halted by the exchange in which they trade, which may impact a fund’s ability to sell its shares. The Fund will bear its share of the fees and expenses of the underlying funds. Shareholders will pay higher expenses than would be the case if making direct investments in the underlying funds.
The S&P Composite 1500® Index combines three leading indices, the S&P 500®, the S&P MidCap 400® and the S&P SmallCap 600® to cover approximately 90% of the U.S. market capitalization. It is designed for investors seeking to replicate the performance of the U.S. equity market or benchmark against a representative universe of tradeable stocks. One cannot invest directly in an index.
Fund holdings and/or sector allocations are subject to change at any time and are not recommendations to buy or sell any security. Please refer to the Schedule of Investments for a complete listing of fund holdings. Current and future portfolio holdings are subject to risk.
Earnings growth is not a measure of the Fund’s future performance.
The opinions expressed in this letter are those of the fund manager, are subject to change, are not guaranteed, and should not be considered investment advice.
Diversification does not assure a profit or protect against a loss in a declining market.
*The no-load basis refers to the performance with front-end and back-end sales loads waived. The fully-loaded returns reflect a 3.5% sales load for the A shares.
Davidson Investment Advisors, Inc. is the adviser to the Davidson Funds, which are distributed by Quasar Distributors, LLC.
Davidson Multi-Cap Equity Fund
EXPENSE EXAMPLE at June 30, 2023 (Unaudited)
Shareholders in mutual funds generally incur two types of costs: (1) transaction costs, including sales charges (loads) on purchase payments, reinvested dividends, or other distributions; redemption fees; and exchange fees; and (2) ongoing costs, including management fees; distribution and/or service fees; and other Fund expenses. This Example is intended to help you understand your ongoing costs (in dollars) of investing in the Fund and to compare these costs with the ongoing costs of investing in other mutual funds. The Example is based on an investment of $1,000 invested in Class A and Class I at the beginning of the period and held for the entire period (1/1/23 – 6/30/23).
Actual Expenses
The first line of the tables below provides information about actual account values and actual expenses. The Example below includes, but is not limited to, management fees, fund accounting, custody and transfer agent fees. However, the Example below does not include portfolio trading commissions and related expenses. In addition, you will be assessed fees for outgoing wire transfers, returned checks, and stop payment orders at prevailing rates charged by U.S. Bank Global Fund Services, the Fund’s transfer agent. You may use the information in the first line of the tables, together with the amount you invested, to estimate the expenses that you paid over the period. Simply divide your account value by $1,000 (for example, an $8,600 account value divided by $1,000 = 8.6), then multiply the result by the number in the first line under the heading entitled “Expenses Paid During Period’’ to estimate the expenses you paid on your account during this period.
Hypothetical Example for Comparison Purposes
The second line of the tables below provides information about hypothetical account values and hypothetical expenses based on the Fund’s actual expense ratio and an assumed rate of return of 5% per year before expenses, which is not the Fund’s actual return. The hypothetical account values and expenses may not be used to estimate the actual ending account balance or expenses you paid for the period. You may use this information to compare the ongoing costs of investing in the Fund and other funds. To do so, compare this 5% hypothetical example with the 5% hypothetical examples that appear in the shareholder reports of the other funds. Please note that the expenses shown in the tables are meant to highlight your ongoing costs only and will not help you determine the relative total costs of owning different funds, as they may charge transactional costs, such as sales charges (loads), redemption fees, or exchange fees. Therefore, the second line of the tables is useful in comparing ongoing costs only and will not help you determine the relative total costs of owning different funds. In addition, if these transactional costs were included, your costs would have been higher.
| Class A | Beginning Account Value 1/1/23 | Ending Account Value 6/30/23 | Expenses Paid During Period* 1/1/23 - 6/30/23 | |||
| Actual | $1,000.00 | $1,113.70 | $6.03 | |||
| Hypothetical (5% return before expenses) | $1,000.00 | $1,019.09 | $5.76 |
*Expenses are equal to the Fund’s annualized expense ratio of 1.15%, multiplied by the average account value over the period, multiplied by 181 (days in most recent fiscal half-year)/365 days to reflect the one-half year expense.
Davidson Multi-Cap Equity Fund
EXPENSE EXAMPLE at June 30, 2023 (Unaudited), Continued
Class I
| Beginning Account Value 1/1/23 | Ending Account Value 6/30/23 | Expenses Paid During Period* 1/1/23 - 6/30/23 | ||||
| Actual | $1,000.00 | $1,115.10 | $4.72 | |||
| Hypothetical (5% return before expenses) | $1,000.00 | $1,020.33 | $4.51 |
*Expenses are equal to the Fund’s annualized expense ratio of 0.90%, multiplied by the average account value over the period, multiplied by 181 (days in most recent fiscal half-year)/365 days to reflect the one-half year expense.
Davidson Multi-Cap Equity Fund
Comparison of the change in value of a hypothetical $10,000 investment in the
Davidson Multi-Cap Equity Fund - Class A vs. the S&P Composite 1500® Index.
| Average Annual Total Return: | 1 Year | 5 Years | 10 Years | Since Inception (10/30/2013) | ||||
| Class A (with sales load) | 10.97% | 11.43% | 11.16% | — | ||||
| Class A (without sales load) | 14.98% | 12.23% | 11.56% | — | ||||
| Class I | 15.28% | 12.51% | — | 10.99% | ||||
| S&P Composite 1500® Index | 19.24% | 11.83% | 12.61% | 11.88% |
Performance data quoted on this page represents past performance and does not guarantee future results. The investment return and principal value of an investment will fluctuate so that an investor’s shares, when redeemed, may be worth more or less than their original cost. Current performance of the Fund may be lower or higher than the performance quoted. Performance data current to the most recent month end may be obtained by calling (877) 332-0529.
Returns reflect reinvestment of dividends and capital gains distributions. Fee waivers are in effect. In the absence of fee waivers, returns would be reduced. Class A shares may be subject to a 3.50% front-end sales load. Class A shares do not have a contingent deferred sales charge (“CDSC”) except that a charge of 1% applies to certain redemptions made within seven calendar days, or to redemptions made within twelve months following purchases of $1 million or more without an initial sales charge. The performance data and graph do not reflect the deduction of taxes that a shareholder would pay on dividends, capital gains distributions, or redemption of Fund shares. Indices do not incur expenses and are not available for investment.
The S&P Composite 1500® Index combines the S&P 500® Index, the S&P MidCap 400® Index, and the S&P SmallCap 600® Index. The S&P 500® Index is an unmanaged index considered representative of the U.S. stock market. The S&P MidCap 400® Index is an unmanaged index considered representative of mid-sized U.S. companies. The S&P SmallCap 600® Index is a market-value weighted index considered representative of small-cap U.S. stocks
Davidson Multi-Cap Equity Fund
SECTOR ALLOCATION OF PORTFOLIO ASSETS at June 30, 2023 (Unaudited)

Percentages represent market value as a percentage of total investments.
The Global Industry Classification Standard (GICS®) was developed by and/or is the exclusive property of MSCI, Inc. and Standard & Poor’s Financial Services LLC (“S&P”). GICS is a service mark of MSCI and S&P and has been licensed for use by U.S. Bancorp Fund Services, LLC.
Davidson Multi-Cap Equity Fund
SCHEDULE OF INVESTMENTS at June 30, 2023
| Shares | COMMON STOCKS - 92.90% | Value | ||||||
| Aerospace & Defense - 1.97% | ||||||||
| 22,652 | Raytheon Technologies Corp. | $ | 2,218,990 | |||||
| Air Freight & Logistics - 2.08% | ||||||||
| 9,448 | Fedex Corp. | 2,342,159 | ||||||
| Automobile Components - 2.00% | ||||||||
| 22,076 | Aptiv PLC (a)(b) | 2,253,739 | ||||||
| Banks - 2.12% | ||||||||
| 51,954 | Citigroup, Inc. | 2,391,962 | ||||||
| Beverages - 2.30% | ||||||||
| 10,517 | Constellation Brands, Inc. - Class A | 2,588,549 | ||||||
| Biotechnology - 2.29% | ||||||||
| 7,348 | Vertex Pharmaceuticals, Inc. (a) | 2,585,835 | ||||||
| Broadline Retail - 4.06% | ||||||||
| 35,142 | Amazon.com, Inc. (a) | 4,581,111 | ||||||
| Capital Markets - 2.29% | ||||||||
| 8,014 | Goldman Sachs Group, Inc. | 2,584,836 | ||||||
| Chemicals - 3.00% | ||||||||
| 28,549 | Corteva, Inc. | 1,635,858 | ||||||
| 24,350 | HB Fuller Co. | 1,741,268 | ||||||
| 3,377,126 | ||||||||
| Communications Equipment - 1.87% | ||||||||
| 13,034 | Arista Networks, Inc. (a) | 2,112,290 | ||||||
The accompanying notes are an integral part of these financial statements.
Davidson Multi-Cap Equity Fund
SCHEDULE OF INVESTMENTS at June 30, 2023, Continued
| Shares | COMMON STOCKS - 92.90%, continued | Value | ||||||
| Consumer Staples Distribution & Retail - 3.79% | ||||||||
| 47,739 | Sprouts Farmers Market, Inc. (a) | $ | 1,753,453 | |||||
| 16,011 | Walmart, Inc. | 2,516,609 | ||||||
| 4,270,062 | ||||||||
| Electric Utilities - 1.64% | ||||||||
| 45,350 | Exelon Corp. | 1,847,559 | ||||||
| Electrical Equipment - 2.80% | ||||||||
| 15,695 | Eaton Corp. PLC (b) | 3,156,264 | ||||||
| Entertainment - 4.11% | ||||||||
| 14,120 | Electronic Arts, Inc. | 1,831,364 | ||||||
| 6,366 | Netflix, Inc. (a) | 2,804,159 | ||||||
| 4,635,523 | ||||||||
| Financial Services - 3.22% | ||||||||
| 24,526 | PayPal Holdings, Inc. (a) | 1,636,620 | ||||||
| 8,411 | Visa, Inc. - Class A | 1,997,444 | ||||||
| 3,634,064 | ||||||||
| Health Care Equipment & Supplies - 6.51% | ||||||||
| 7,090 | Align Technology, Inc. (a) | 2,507,308 | ||||||
| 9,845 | Becton, Dickinson & Co. | 2,599,178 | ||||||
| 25,358 | Medtronic PLC (b) | 2,234,040 | ||||||
| 7,340,526 | ||||||||
| Health Care Providers & Services - 3.49% | ||||||||
| 8,038 | Cigna Corp. | 2,255,463 | ||||||
| 6,963 | Laboratory Corp. of America Holdings | 1,680,381 | ||||||
| 3,935,844 | ||||||||
The accompanying notes are an integral part of these financial statements.
Davidson Multi-Cap Equity Fund
SCHEDULE OF INVESTMENTS at June 30, 2023, Continued
| Shares | COMMON STOCKS - 92.90%, continued | Value | ||||||
| Hotels, Restaurants & Leisure - 1.79% | ||||||||
| 20,399 | Starbucks Corp. | $ | 2,020,725 | |||||
| Industrial Conglomerates - 1.59% | ||||||||
| 8,641 | Honeywell International, Inc. | 1,793,007 | ||||||
| Insurance - 1.93% | ||||||||
| 16,452 | Progressive Corp. | 2,177,751 | ||||||
| Interactive Media & Services - 3.84% | ||||||||
| 35,773 | Alphabet, Inc. - Class C (a)(c) | 4,327,460 | ||||||
| Machinery - 2.15% | ||||||||
| 27,259 | Otis Worldwide Corp. | 2,426,324 | ||||||
| Multi-Utilities - 1.59% | ||||||||
| 12,321 | Sempra Energy | 1,793,814 | ||||||
| Oil, Gas & Consumable Fuels - 4.25% | ||||||||
| 16,118 | Chevron Corp. | 2,536,168 | ||||||
| 19,696 | EOG Resources, Inc. | 2,254,010 | ||||||
| 4,790,178 | ||||||||
| Personal Care Products - 1.72% | ||||||||
| 9,895 | Estee Lauder Cos., Inc. - Class A | 1,934,180 | ||||||
| Pharmaceuticals - 1.92% | ||||||||
| 33,804 | Bristol-Myers Squibb Co. | 2,161,766 | ||||||
| Semiconductors & Semiconductor Equipment - 1.50% | ||||||||
| 10,695 | Silicon Laboratories, Inc. (a) | 1,687,029 | ||||||
The accompanying notes are an integral part of these financial statements.
Davidson Multi-Cap Equity Fund
SCHEDULE OF INVESTMENTS at June 30, 2023, Continued
| Shares | COMMON STOCKS - 92.90%, continued | Value | ||||||
| Software - 12.91% | ||||||||
| 33,148 | Fortinet, Inc. (a) | $ | 2,505,657 | |||||
| 4,900 | Intuit, Inc. | 2,245,131 | ||||||
| 14,240 | Microsoft Corp. | 4,849,290 | ||||||
| 13,308 | Salesforce, Inc. (a) | 2,811,448 | ||||||
| 20,242 | Splunk, Inc. (a) | 2,147,474 | ||||||
| 14,559,000 | ||||||||
| Technology Hardware, Storage & Peripherals - 4.34% | ||||||||
| 25,212 | Apple, Inc. | 4,890,372 | ||||||
| Textiles, Apparel & Luxury Goods - 2.04% | ||||||||
| 71,394 | Gildan Activewear, Inc. (b) | 2,301,743 | ||||||
| Wireless Telecommunication Services - 1.79% | ||||||||
| 14,568 | T-Mobile US, Inc. (a) | 2,023,495 | ||||||
| TOTAL COMMON STOCKS (Cost $61,591,267) | 104,752,283 | |||||||
| REITs - 4.86% | ||||||||
| 165,781 | AGNC Investment Corp. | 1,679,362 | ||||||
| 18,070 | Camden Property Trust | 1,967,281 | ||||||
| 40,902 | CubeSmart | 1,826,683 | ||||||
| TOTAL REITs (Cost $4,214,113) | 5,473,326 | |||||||
The accompanying notes are an integral part of these financial statements.
Davidson Multi-Cap Equity Fund
SCHEDULE OF INVESTMENTS at June 30, 2023, Continued
| MONEY MARKET FUND - 2.29% | Value | |||||||
| 2,586,727 | First American Government Obligations Fund, Class X, 5.01% (d) | $ | 2,586,727 | |||||
| TOTAL MONEY MARKET FUND (Cost $2,586,727) | 2,586,727 | |||||||
| Total Investments in Securities (Cost $68,392,107) - 100.05% | 112,812,336 | |||||||
| Liabilities in Excess of Other Assets - (0.05)% | (57,873 | ) | ||||||
| NET ASSETS - 100.00% | $ | 112,754,463 | ||||||
| PLC | Public Limited Company |
| REIT | Real Estate Investment Trust |
| (a) | Non-income producing security. |
| (b) | U.S. traded security of a foreign issuer. |
| (c) | Non-voting shares. |
| (d) | Rate shown is the 7-day annualized yield as of June 30, 2023. |
The Global Industry Classification Standard (GICS®) was developed by and/or is the exclusive property of MSCI, Inc. and Standard & Poor’s Financial Services LLC (“S&P”). GICS is a service mark of MSCI and S&P and has been licensed for use by U.S. Bancorp Fund Services, LLC.
The accompanying notes are an integral part of these financial statements.
Davidson Multi-Cap Equity Fund
STATEMENT OF ASSETS AND LIABILITIES at June 30, 2023
| ASSETS: | ||||
| Investments in securities, at value (identified cost $68,392,107) | $ | 112,812,336 | ||
| Cash | 59 | |||
| Receivables | ||||
| Fund shares sold | 106,698 | |||
| Dividends and interest | 109,631 | |||
| Prepaid expenses | 28,272 | |||
| Total assets | 113,056,996 | |||
| LIABILITIES: | ||||
| Payables | ||||
| Fund shares redeemed | 161,770 | |||
| Advisory fee (Note 4) | 44,956 | |||
| 12b-1 distribution fees - Class A | 37,092 | |||
| Audit fees | 22,500 | |||
| Administration fees | 14,159 | |||
| Transfer agent fees and expenses | 7,615 | |||
| Fund accounting fees | 5,671 | |||
| Custody fees | 2,998 | |||
| Shareholder reporting | 2,317 | |||
| Chief Compliance Officer fees | 1,250 | |||
| Legal fees | 1,021 | |||
| Trustee fees and expenses | 256 | |||
| Other expenses | 928 | |||
| Total liabilities | 302,533 | |||
| NET ASSETS | $ | 112,754,463 | ||
| COMPONENTS OF NET ASSETS: | ||||
| Paid-in capital | $ | 68,161,398 | ||
| Total distributable earnings | 44,593,065 | |||
| Net assets | $ | 112,754,463 | ||
The accompanying notes are an integral part of these financial statements.
Davidson Multi-Cap Equity Fund
STATEMENT OF ASSETS AND LIABILITIES at June 30, 2023, Continued
| CALCULATION OF NET ASSET VALUE PER SHARE: | ||||
| Class A | ||||
| Net assets applicable to shares outstanding | $ | 60,926,002 | ||
| Shares issued and outstanding [unlimited number of shares (par value $0.01) authorized] | 2,130,065 | |||
| Net asset value and redemption price per share (1) | $ | 28.60 | ||
| Maximum offering price per share (Net asset value per share divided by 96.50%) | $ | 29.64 | ||
| Class I | ||||
| Net assets applicable to shares outstanding | $ | 51,828,461 | ||
| Shares issued and outstanding [unlimited number of shares (par value $0.01) authorized] | 1,812,936 | |||
| Net asset value, redemption and offering price per share (1) | $ | 28.59 | ||
(1) A redemption fee of 1.00% is assessed against shares held for seven calendar days or less.
The accompanying notes are an integral part of these financial statements.
Davidson Multi-Cap Equity Fund
STATEMENT OF OPERATIONS For the Year Ended June 30, 2023
| INVESTMENT INCOME | ||||
| Income | ||||
| Dividends (net of withholding taxes of $7,180) | $ | 1,447,497 | ||
| Interest | 98,583 | |||
| Total investment income | 1,546,080 | |||
| Expenses | ||||
| Advisory fees (Note 4) | 705,350 | |||
| Administration fees (Note 4) | 156,398 | |||
| 12b-1 distribution fees - Class A (Note 5) | 154,677 | |||
| Transfer agent fees and expenses (Note 4) | 77,555 | |||
| Fund accounting fees (Note 4) | 65,331 | |||
| Federal and state registration fees | 33,467 | |||
| Audit fees | 22,500 | |||
| Trustee fees and expenses | 15,702 | |||
| Custody fees (Note 4) | 15,677 | |||
| Chief Compliance Officer fee (Note 4) | 15,001 | |||
| Reports to shareholders | 10,781 | |||
| Legal fees | 9,550 | |||
| Insurance expense | 3,064 | |||
| Other expenses | 11,857 | |||
| Total expenses before advisory fee waiver | 1,296,910 | |||
| Less: advisory fee waiver (Note 4) | (165,594 | ) | ||
| Net expenses | 1,131,316 | |||
| Net investment income | 414,764 | |||
| REALIZED AND UNREALIZED GAIN/(LOSS) ON INVESTMENTS AND REDEMPTION IN-KIND: | ||||
| Net realized gain on investments | 3,066,147 | |||
| Net realized gain on redemption in-kind | 3,618,488 | |||
| Capital Gain Distributions from regulated investment companies | 3 | |||
| Net change in unrealized appreciation/(depreciation) on investments | 8,494,809 | |||
| Net realized and unrealized gain on investments and redemption in-kind | 15,179,447 | |||
| Net increase in net assets resulting from operations | $ | 15,594,211 | ||
The accompanying notes are an integral part of these financial statements.
Davidson Multi-Cap Equity Fund
STATEMENTS OF CHANGES IN NET ASSETS
| Year Ended June 30, 2023 | Year Ended June 30, 2022 | |||||||
| INCREASE/(DECREASE) IN NET ASSETS FROM OPERATIONS: | ||||||||
| Net investment income | $ | 414,764 | $ | 325,060 | ||||
| Net realized gain on investments | 3,066,147 | 12,334,085 | ||||||
| Net realized gain on redemption in-kind | 3,618,488 | 2,602,073 | ||||||
| Capital Gain Distributions from regulated investment companies | 3 | — | ||||||
| Net change in unrealized appreciation/(depreciation) on investments | 8,494,809 | (24,815,762 | ) | |||||
| Net increase/(decrease) in net assets resulting from operations | 15,594,211 | (9,554,544 | ) | |||||
| DISTRIBUTIONS TO SHAREHOLDERS: | ||||||||
| Net dividends and distributions to shareholders - Class A | (6,215,717 | ) | (6,755,514 | ) | ||||
| Net dividends and distributions to shareholders - Class I | (4,471,951 | ) | (4,553,431 | ) | ||||
| Total distributions to shareholders | (10,687,668 | ) | (11,308,945 | ) | ||||
| CAPITAL SHARE TRANSACTIONS: | ||||||||
| Net decrease in net assets derived from net change in outstanding shares (a) | (3,602,087 | ) | (1,731,793 | ) | ||||
| Total increase/(decrease) in net assets | 1,304,456 | (22,595,282 | ) | |||||
| NET ASSETS: | ||||||||
| Beginning of year | 111,450,007 | 134,045,289 | ||||||
| End of year | $ | 112,754,463 | $ | 111,450,007 | ||||
| (a) | A summary of share transactions can be found on the following page. |
The accompanying notes are an integral part of these financial statements.
Davidson Multi-Cap Equity Fund
STATEMENTS OF CHANGES IN NET ASSETS, Continued
| Class A | ||||||||||||||||
| Year Ended | Year Ended | |||||||||||||||
| June 30, 2023 | June 30, 2022 | |||||||||||||||
| Shares | Paid-in Capital | Shares | Paid-in Capital | |||||||||||||
| Shares sold | 43,367 | $ | 1,189,358 | 42,712 | $ | 1,376,464 | ||||||||||
| Shares issued on reinvestments of distributions | 215,285 | 5,711,499 | 197,336 | 6,368,045 | ||||||||||||
| Shares redeemed* | (484,352 | ) | (13,587,933 | ) | (321,243 | ) | (10,258,516 | ) | ||||||||
| Net decrease | (225,700 | ) | $ | (6,687,076 | ) | (81,195 | ) | $ | (2,514,007 | ) | ||||||
| * Net of redemption fees of | $ | — | $ | 8 | ||||||||||||
| Class I | ||||||||||||||||
| Year Ended | Year Ended | |||||||||||||||
| June 30, 2023 | June 30, 2022 | |||||||||||||||
| Shares | Paid-in Capital | Shares | Paid-in Capital | |||||||||||||
| Shares sold | 411,439 | $ | 11,332,854 | 204,716 | $ | 6,612,451 | ||||||||||
| Shares issued on reinvestments of distributions | 145,696 | 3,858,040 | 129,464 | 4,172,615 | ||||||||||||
| Shares redeemed** | (418,797 | ) | (12,105,905 | ) | (309,008 | ) | (10,002,852 | ) | ||||||||
| Net increase | 138,338 | $ | 3,084,989 | 25,172 | $ | 782,214 | ||||||||||
| ** Net of redemption fees of | $ | — | $ | 5 | ||||||||||||
The accompanying notes are an integral part of these financial statements.
Davidson Multi-Cap Equity Fund - Class A
FINANCIAL HIGHLIGHTS
For a share outstanding throughout each year
| Year Ended June 30, | ||||||||||||||||||||
| 2023 | 2022 | 2021 | 2020 | 2019 | ||||||||||||||||
| Net asset value, beginning of year | $ | 27.65 | $ | 32.80 | $ | 24.99 | $ | 25.26 | $ | 26.01 | ||||||||||
| Income from investment operations: | ||||||||||||||||||||
| Net investment income^ | 0.08 | �� | 0.05 | 0.13 | 0.16 | 0.15 | ||||||||||||||
| Net realized and unrealized gain/(loss) on investments | 3.83 | (2.29 | ) | 10.98 | 1.40 | 1.58 | ||||||||||||||
| Total from investment operations | 3.91 | (2.24 | ) | 11.11 | 1.56 | 1.73 | ||||||||||||||
| Less distributions: | ||||||||||||||||||||
| From net investment income | (0.07 | ) | (0.07 | ) | (0.13 | ) | (0.15 | ) | (0.36 | ) | ||||||||||
| From net realized gain on investments | (2.89 | ) | (2.84 | ) | (3.17 | ) | (1.68 | ) | (2.12 | ) | ||||||||||
| Total distributions | (2.96 | ) | (2.91 | ) | (3.30 | ) | (1.83 | ) | (2.48 | ) | ||||||||||
| Redemption fees retained | — | 0.00 | ^# | — | — | 0.00 | ^# | |||||||||||||
| Net asset value, end of year | $ | 28.60 | $ | 27.65 | $ | 32.80 | $ | 24.99 | $ | 25.26 | ||||||||||
| Total return | 14.98 | % | -8.10 | % | 47.29 | % | 6.20 | % | 7.71 | % | ||||||||||
| Ratios/supplemental data: | ||||||||||||||||||||
| Net assets, end of year (thousands) | $ | 60,926 | $ | 65,143 | $ | 79,939 | $ | 61,821 | $ | 70,763 | ||||||||||
| Ratio of expenses to average net assets: | ||||||||||||||||||||
| Before fee waivers | 1.30 | % | 1.26 | % | 1.26 | % | 1.30 | % | 1.28 | % | ||||||||||
| After fee waivers | 1.15 | % | 1.15 | % | 1.15 | % | 1.15 | % | 1.15 | % | ||||||||||
| Ratio of net investment income to average net assets: | ||||||||||||||||||||
| Before fee waivers | 0.12 | % | 0.04 | % | 0.33 | % | 0.48 | % | 0.47 | % | ||||||||||
| After fee waivers | 0.27 | % | 0.15 | % | 0.44 | % | 0.63 | % | 0.60 | % | ||||||||||
| Portfolio turnover rate | 16.44 | % | 15.60 | % | 25.04 | % | 22.69 | % | 21.39 | % | ||||||||||
^ Based on average shares outstanding.
# Amount is less than $0.01 per share.
The accompanying notes are an integral part of these financial statements.
Davidson Multi-Cap Equity Fund - Class I
FINANCIAL HIGHLIGHTS
For a share outstanding throughout each year
| Year Ended June 30, | ||||||||||||||||||||
| 2023 | 2022 | 2021 | 2020 | 2019 | ||||||||||||||||
| Net asset value, beginning of year | $ | 27.65 | $ | 32.80 | $ | 24.99 | $ | 25.26 | $ | 26.06 | ||||||||||
| Income from investment operations: | ||||||||||||||||||||
| Net investment income^ | 0.15 | 0.13 | 0.20 | 0.22 | 0.23 | |||||||||||||||
| Net realized and unrealized gain/(loss) on investments | 3.83 | (2.29 | ) | 10.98 | 1.41 | 1.55 | ||||||||||||||
| Total from investment operations | 3.98 | (2.16 | ) | 11.18 | 1.63 | 1.78 | ||||||||||||||
| Less distributions: | ||||||||||||||||||||
| From net investment income | (0.15 | ) | (0.15 | ) | (0.20 | ) | (0.22 | ) | (0.46 | ) | ||||||||||
| From net realized gain on investments | (2.89 | ) | (2.84 | ) | (3.17 | ) | (1.68 | ) | (2.12 | ) | ||||||||||
| Total distributions | (3.04 | ) | (2.99 | ) | (3.37 | ) | (1.90 | ) | (2.58 | ) | ||||||||||
| Redemption fees retained | — | 0.00 | ^# | — | 0.00 | ^# | — | |||||||||||||
| Net asset value, end of year | $ | 28.59 | $ | 27.65 | $ | 32.80 | $ | 24.99 | $ | 25.26 | ||||||||||
| Total return | 15.28 | % | -7.87 | % | 47.65 | % | 6.47 | % | 7.96 | % | ||||||||||
| Ratios/supplemental data: | ||||||||||||||||||||
| Net assets, end of year (thousands) | $ | 51,828 | $ | 46,307 | $ | 54,106 | $ | 39,419 | $ | 41,261 | ||||||||||
| Ratio of expenses to average net assets: | ||||||||||||||||||||
| Before fee waivers | 1.05 | % | 1.01 | % | 1.01 | % | 1.05 | % | 1.03 | % | ||||||||||
| After fee waivers | 0.90 | % | 0.90 | % | 0.90 | % | 0.90 | % | 0.90 | % | ||||||||||
| Ratio of net investment income to average net assets: | ||||||||||||||||||||
| Before fee waivers | 0.38 | % | 0.29 | % | 0.58 | % | 0.73 | % | 0.77 | % | ||||||||||
| After fee waivers | 0.53 | % | 0.40 | % | 0.69 | % | 0.88 | % | 0.90 | % | ||||||||||
| Portfolio turnover rate | 16.44 | % | 15.60 | % | 25.04 | % | 22.69 | % | 21.39 | % | ||||||||||
^ Based on average shares outstanding.
# Amount is less than $0.01 per share.
The accompanying notes are an integral part of these financial statements.
Davidson Multi-Cap Equity Fund
NOTES TO FINANCIAL STATEMENTS at June 30, 2023
NOTE 1 - ORGANIZATION
The Davidson Multi-Cap Equity Fund (the “Fund”) is a diversified series of Advisors Series Trust (the “Trust”), which is registered under the Investment Company Act of 1940, as amended, (the “1940 Act”) as an open-end management investment company. The Fund follows the investment company accounting and reporting guidance of the Financial Accounting Standards Board (“FASB”) Accounting Standard Codification Topic 946 “Financial Services – Investment Companies”. The Fund’s investment objective is to seek long-term capital appreciation. The Fund offers Class A and Class I shares. The Fund’s Class A shares and Class I shares commenced operations on August 11, 2008 and October 30, 2013, respectively. Class A shares are subject to a maximum front-end sales load of 3.50%, which decreases depending on the amount invested.
NOTE 2 - SIGNIFICANT ACCOUNTING POLICIES
The following is a summary of significant accounting policies consistently followed by the Fund. These policies are in conformity with accounting principles generally accepted in the United States of America.
| A. | Security Valuation: All investments in securities are recorded at their estimated fair value, as described in Note 3. |
| B. | Federal Income Taxes: It is the Fund’s policy to comply with the requirements of Subchapter M of the Internal Revenue Code applicable to regulated investment companies and to distribute substantially all of its taxable income to its shareholders. Therefore, no Federal income or excise tax provision is required. |
The Fund recognizes the tax benefits of uncertain tax positions only where the position is “more likely than not” to be sustained assuming examination by tax authorities. The tax returns of the Fund’s prior three fiscal years are open for examination. Management has reviewed all open tax years in major jurisdictions and concluded that there is no impact on the Fund’s net assets and no tax liability resulting from unrecognized tax events relating to uncertain income tax positions taken or expected to be taken on the tax return. The Fund identifies its major tax jurisdictions as U.S. Federal and the state of Wisconsin; however the Fund is not aware of any tax positions for which it is reasonably possible that the total amounts of unrecognized tax benefits will change materially in the next twelve months.
| C. | Securities Transactions, Income and Distributions: Securities transactions are accounted for on the trade date. Realized gains and losses on securities sold are determined on a last-in, first-out basis. Interest income is recorded on an accrual basis. Dividend income, income and capital gain distributions from underlying funds, and distributions to shareholders are recorded on the ex-dividend date. Withholding taxes on foreign dividends have been provided for in accordance with the Fund’s understanding of the applicable country’s tax rules and rates. |
Investment income, expenses (other than those specific to the class of shares), and realized and unrealized gains and losses on investments are allocated to the separate classes of the Fund based upon their relative net assets on the date income is earned or expensed and realized and unrealized gains and losses are incurred.
The Fund is charged for those expenses that are directly attributable to it, such as investment advisory, custody and transfer agent fees. Common expenses of the Trust are typically allocated among the funds in the Trust based on a fund’s respective net assets, or by other equitable means.
Davidson Multi-Cap Equity Fund
NOTES TO FINANCIAL STATEMENTS at June 30, 2023, Continued
The Fund distributes substantially all net investment income, if any, and net realized capital gains, if any, annually. Distributions from net realized gains for book purposes may include short-term capital gains. All short-term capital gains are included in ordinary income for tax purposes. The amount of dividends and distributions to shareholders from net investment income and net realized capital gains is determined in accordance with Federal income tax regulations, which differs from accounting principles generally accepted in the United States of America. To the extent these book/tax differences are permanent, such amounts are reclassified within the capital accounts based on their Federal tax treatment.
| D. | Reclassification of Capital Accounts: Accounting principles generally accepted in the United States of America require that certain components of net assets relating to permanent differences be reclassified between financial and tax reporting. These reclassifications have no effect on net assets or net asset value per share. For the year ended June 30, 2023, the Fund made the following permanent tax adjustments on the statement of assets and liabilities: |
| Distributable | Paid-in | |||||
| Earnings | Capital | |||||
| $ | (4,494,632 | ) | $ | 4,494,632 | ||
| E. | Use of Estimates: The preparation of financial statements in conformity with accounting principles generally accepted in the United States of America requires management to make estimates and assumptions that affect the reported amounts of assets and liabilities at the date of the financial statements and the reported amounts of increases and decreases in net assets during the reporting period. Actual results could differ from those estimates. |
| F. | Redemption Fees: The Fund charges a 1.00% redemption fee to shareholders who redeem shares held for 7 calendar days or less. Such fees are retained by the Fund and accounted for as an addition to paid-in capital. No redemption fees were retained for the year ended June 30, 2023. |
| G. | Events Subsequent to the Fiscal Year End: In preparing the financial statements as of June 30, 2023, management considered the impact of subsequent events for potential recognition or disclosure in the financial statements. Management has determined there were no subsequent events that would need to be disclosed in the Fund’s financial statements. |
NOTE 3 – SECURITIES VALUATION
The Fund has adopted authoritative fair value accounting standards which establish an authoritative definition of fair value and set out a hierarchy for measuring fair value. These standards require additional disclosures about the various inputs and valuation techniques used to develop the measurements of fair value, a discussion in changes in valuation techniques and related inputs during the period and expanded disclosure of valuation levels for majority security types. These inputs are summarized in the three broad levels listed below:
| ● | Level 1 – Unadjusted quoted prices in active markets for identical assets or liabilities that the Fund has the ability to access. |
| ● | Level 2 - Observable inputs other than quoted prices included in Level 1 that are observable for the asset or liability, either directly or indirectly. These inputs may include quoted prices for the identical instrument on an inactive market, prices for similar instruments, interest rates, prepayment speeds, credit risk, yield curves, default rates and similar data. |
Davidson Multi-Cap Equity Fund
NOTES TO FINANCIAL STATEMENTS at June 30, 2023, Continued
| ● | Level 3 - Unobservable inputs for the asset or liability, to the extent relevant observable inputs are not available, representing the Fund’s own assumptions about the assumptions a market participant would use in valuing the asset or liability, and would be based on the best information available. |
Following is a description of the valuation techniques applied to the Fund’s major categories of assets and liabilities measured at fair value on a recurring basis.
The Fund determines the fair value of its investments and computes its net asset value per share as of the close of regular trading on the New York Stock Exchange (4:00 pm EST).
Equity Securities: The Fund’s investments are carried at fair value. Equity securities, including common stocks, real estate investment trusts, and exchange-traded funds, that are primarily traded on a national securities exchange shall be valued at the last sale price on the exchange on which they are primarily traded on the day of valuation or, if there has been no sale on such day, at the mean between the bid and asked prices. Securities primarily traded in the NASDAQ Global Market System for which market quotations are readily available shall be valued using the NASDAQ Official Closing Price (“NOCP”). If the NOCP is not available, such securities shall be valued at the last sale price on the day of valuation, or if there has been no sale on such day, at the mean between the bid and asked prices. Over-the-counter securities which are not traded in the NASDAQ Global Market System shall be valued at the most recent sales price. To the extent, these securities are actively traded and valuation adjustments are not applied, they are categorized in Level 1 of the fair value hierarchy.
Investment Companies: Investments in open-end mutual funds, including money market funds, are generally priced at their net asset value per share provided by the service agent of the funds and will be classified in Level 1 of the fair value hierarchy.
Short-Term Debt Securities: Short-term debt securities, including those securities having a maturity of 60 days or less, are valued at the evaluated mean between the bid and asked prices. To the extent the inputs are observable and timely, these securities would be classified in Level 2 of the fair value hierarchy.
Accounting Pronouncements: The Board of Trustees (the “Board”) has adopted a valuation policy for use by the Fund and its Valuation Designee (as defined below) in calculating the Fund’s net asset value (“NAV”). Pursuant to Rule 2a-5 under the 1940 Act, the Board has designated the Fund’s investment advisor, Davidson Investment Advisors, Inc. (“Advisor”), as the “Valuation Designee” to perform all of the fair value determinations as well as to perform all of the responsibilities that may be performed by the Valuation Designee in accordance with Rule 2a-5, subject to the Board’s oversight. The Advisor, as Valuation Designee is, authorized to make all necessary determinations of the fair values of portfolio securities and other assets for which market quotations are not readily available or if it is deemed that the prices obtained from brokers and dealers or independent pricing services are unreliable.
Depending on the relative significance of the valuation inputs, fair valued securities may be classified in either Level 2 or Level 3 of the fair value hierarchy.
Davidson Multi-Cap Equity Fund
NOTES TO FINANCIAL STATEMENTS at June 30, 2023, Continued
The inputs or methodology used for valuing securities are not an indication of the risk associated with investing in those securities. The following is a summary of the inputs used to value the Fund’s securities as of June 30, 2023:
| Level 1 | Level 2 | Level 3 | Total | |||||||||||||
| Common Stocks | ||||||||||||||||
| Communication Services | $ | 10,986,478 | $ | — | $ | — | $ | 10,986,478 | ||||||||
| Consumer Discretionary | 11,157,317 | — | — | 11,157,317 | ||||||||||||
| Consumer Staples | 8,801,792 | — | — | 8,801,792 | ||||||||||||
| Energy | 4,790,178 | — | — | 4,790,178 | ||||||||||||
| Financials | 10,788,613 | — | — | 10,788,613 | ||||||||||||
| Health Care | 16,023,970 | — | — | 16,023,970 | ||||||||||||
| Industrials | 11,936,745 | — | — | 11,936,745 | ||||||||||||
| Information Technology | 23,248,691 | — | — | 23,248,691 | ||||||||||||
| Materials | 3,377,126 | — | — | 3,377,126 | ||||||||||||
| Utilities | 3,641,373 | — | — | 3,641,373 | ||||||||||||
| Total Common Stocks | 104,752,283 | — | — | 104,752,283 | ||||||||||||
| REITs | 5,473,326 | — | — | 5,473,326 | ||||||||||||
| Money Market Fund | 2,586,727 | — | — | 2,586,727 | ||||||||||||
| Total Investments in Securities | $ | 112,812,336 | $ | — | $ | — | $ | 112,812,336 | ||||||||
Refer to the Fund’s schedule of investments for a detailed break-out of securities by industry classification.
In June 2022, the FASB issued Accounting Standards Update 2022-03, which amends Fair Value Measurement (Topic 820): Fair Value Measurement of Equity Securities Subject to Contractual Sale Restrictions (“ASU 2022-03”). ASU 2022-03 clarifies guidance for fair value measurement of an equity security subject to a contractual sale restriction and establishes new disclosure requirements for such equity securities. ASU 2022-03 is effective for fiscal years beginning after December 15, 2023 and for interim periods within those fiscal years, with early adoption permitted. Management is currently evaluating the impact of these amendments on the Fund’s financial statements.
In October 2022, the Securities and Exchange Commission (the “SEC”) adopted a final rule relating to Tailored Shareholder Reports for Mutual Funds and Exchange-Traded Funds; Fee Information in Investment Company Advertisements. The rule and form amendments will, among other things, require the Fund to transmit concise and visually engaging shareholder reports that highlight key information. The amendments will require that funds tag information in a structured data format and that certain more in-depth information be made available online and available for delivery free of charge to investors on request. The amendments became effective January 24, 2023. There is an 18-month transition period after the effective date of the amendment.
Davidson Multi-Cap Equity Fund
NOTES TO FINANCIAL STATEMENTS at June 30, 2023, Continued
NOTE 4 - INVESTMENT ADVISORY FEE AND OTHER TRANSACTIONS WITH AFFILIATES
Davidson Investment Advisors, Inc. (the “Advisor”) provides the Fund with investment management services under an investment advisory agreement. The Advisor furnishes all investment advice, office space, facilities, and provides most of the personnel needed by the Fund. As compensation for its services, the Advisor is entitled to a monthly fee at the annual rate of 0.65% based upon the average daily net assets of the Fund. For year ended June 30, 2023, the Fund incurred $705,350 in advisory fees. Advisory fees payable at June 30, 2023 for the Fund were $44,956.
The Fund is responsible for its own operating expenses. The Advisor has contractually agreed to waive all or a portion of its management fees and pay expenses of the Fund to ensure that the total annual fund operating expenses (excluding acquired fund fees and expenses, taxes, interest expense, dividend on securities sold short and extraordinary expenses, Rule 12b-1 fees, and other class-specific expenses) do not exceed 0.90% of average daily net assets of the Fund. Any such reductions made by the Advisor in its fees or payment of expenses which are the Fund’s obligation are subject to reimbursement by the Fund to the Advisor, if so requested by the Advisor, in any subsequent month in the 36-month period from the date of the management fee reduction and expense payment if the aggregate amount actually paid by the Fund toward the operating expenses for such fiscal year (taking into account the reimbursement) will not cause the Fund to exceed the lesser of: (1) the expense limitation in place at the time of the management fee reduction and expense payment; or (2) the expense limitation in place at the time of the reimbursement. Any such reimbursement is also contingent upon Board’s review and approval. Such reimbursement may not be paid prior to the Fund’s payment of current ordinary operating expenses. For the year ended June 30, 2023, the Advisor reduced its fees and absorbed Fund expenses in the amount of $165,594. The Advisor may recapture portions of the amounts shown below no later than the corresponding dates:
| 6/30/2024 | 6/30/2025 | 6/30/2026 | Total | |||||||||||
| $ | 134,567 | $ | 140,086 | $ | 165,594 | $ | 440,247 | |||||||
U.S. Bancorp Fund Services, LLC, doing business as U.S. Bank Global Fund Services (“Fund Services”) serves as the Fund’s administrator, fund accountant and transfer agent. U.S. Bank N.A. serves as the custodian (the “Custodian”) to the Fund. The Custodian is an affiliate of Fund Services. Fund Services maintains the Fund’s books and records, calculates the Fund’s NAV, prepares various federal and state regulatory filings, coordinates the payment of fund expenses, reviews expense accruals and prepares materials supplied to the Board.
The officers of the Trust and the Chief Compliance Officer are also employees of Fund Services. Fees paid by the Fund for administration and accounting, transfer agency, custody and compliance services for the year ended June 30, 2023 are disclosed in the statement of operations.
Quasar Distributors, LLC (“Quasar”) acts as the Fund’s principal underwriter in a continuous public offering of the Fund’s shares. Quasar is a wholly-owned broker-dealer subsidiary of Foreside Financial Group, LLC, doing business as ACA Foreside, a division of ACA Group.
The Distributor has advised the Fund that it has received $20,581 in front-end sales charges resulting from sales of Class A shares. For the year ended June 30, 2023, the Distributor paid commissions of $15,681 to D.A. Davidson & Co. (“DAD”), the Advisor’s affiliated broker dealer. Additionally, DAD will receive all of the initial sales charges for purchases of Class A shares of the Fund without a dealer of record and the 1.00% charge on Class A shares redeemed within twelve months of purchase.
Davidson Multi-Cap Equity Fund
NOTES TO FINANCIAL STATEMENTS at June 30, 2023, Continued
NOTE 5 – DISTRIBUTION AGREEMENT AND PLAN
The Fund has adopted a Distribution Plan pursuant to Rule 12b-1 (the “Plan”). The Plan permits the Fund to pay the Distributor for distribution and related expenses at an annual rate of up to 0.25% of the Class A shares average daily net assets. The expenses covered by the Plan may include the cost of preparing and distributing prospectuses and other sales material, advertising and public relations expenses, payments to financial intermediaries and compensation of personnel involved in selling shares of the Fund. Payments made pursuant to the Plan will represent compensation for distribution and service activities, not reimbursements for specific expenses incurred. For the year ended June 30, 2023, the 12b-1 distribution fees incurred under the Plan by the Fund’s shares are disclosed in the statement of operations.
NOTE 6 – PURCHASES AND SALES OF SECURITIES
For the year ended June 30, 2023, the cost of purchases and the proceeds from sales of securities, excluding short-term securities, were $17,436,295 and $31,478,831, respectively. There were no purchases or sales of long-term U.S. Government securities.
For the year ended June 30, 2023, the proceeds from sales of securities, excluding short-term securities, includes securities redeemed in-kind of $10,423,198.
NOTE 7 – CONTROL OWNERSHIP
The beneficial ownership, either directly or indirectly of more than 25% of the voting securities of a fund creates a presumption of control of the fund, under Section 2(a)(9) of the 1940 Act. At June 30, 2023, the Fund’s percentage of control ownership positions greater than 25% is as follows:
| Percentage of Shares Held | |
| D.A. Davidson & Co., Inc. | 29.20% |
| D.A. Davidson & Co., Inc. FBO Customer | 28.31% |
Davidson Multi-Cap Equity Fund
NOTES TO FINANCIAL STATEMENTS at June 30, 2023, Continued
NOTE 8 – INCOME TAXES AND DISTRIBUTIONS TO SHAREHOLDERS
The tax character of distributions paid during the year ended June 30, 2023 and year ended June 30, 2022 was as follows:
| Year Ended June 30, 2023 | Year Ended June 30, 2022 | ||||||
| Ordinary income | $ | 401,057 | $ | 5,641,242 | |||
| Long-term capital gains | 10,286,611 | 5,667,703 | |||||
As of June 30, 2023, the components of accumulated earnings/(losses) on a tax basis were as follows:
| Cost of investments (a) | $ | 68,413,064 | ||
| Gross tax unrealized appreciation | 46,778,348 | |||
| Gross tax unrealized depreciation | (2,379,076 | ) | ||
| Net tax unrealized appreciation (a) | 44,399,272 | |||
| Undistributed ordinary income | 193,793 | |||
| Total distributable earnings | 193,793 | |||
| Total accumulated earnings/(losses) | $ | 44,593,065 |
(a) The difference between book-basis and tax-basis net unrealized appreciation and cost is attributable primarily to the tax deferral of losses on wash sales.
NOTE 9 – PRINCIPAL RISKS
Below is a summary of some, but not all, of the principal risks of investing in the Fund, each of which may adversely affect the Fund’s net asset value and total return. The Fund’s most recent prospectus provides further descriptions of the Fund’s investment objective, principal investment strategies and principal risks.
| ● | Market and Regulatory Risk. Events in the financial markets and economy may cause volatility and uncertainty and adversely impact the Fund’s performance. Market events may affect a single issuer, industry, sector, or the market as a whole. Traditionally liquid investments may experience periods of diminished liquidity. Governmental and regulatory actions, including tax law changes, may also impair portfolio management and have unexpected or adverse consequences on particular markets, strategies, or investments. The Fund’s investments may decline in value due to factors affecting individual issuers (such as the results of supply and demand), or sectors within the securities markets. The value of a security or other investment also may go up or down due to general market conditions that are not specifically related to a particular issuer, such as real or perceived adverse economic conditions, changes in interest rates or exchange rates, or adverse investor sentiment generally. In addition, unexpected events and their aftermaths, such as the spread of deadly diseases; natural, environmental or man-made disasters; financial, political or social disruptions; terrorism and war; and other tragedies or catastrophes, can cause investor fear and panic, which can adversely affect the economies of many companies, sectors, nations, regions and the market in general, in ways that cannot necessarily be foreseen. |
Davidson Multi-Cap Equity Fund
NOTES TO FINANCIAL STATEMENTS at June 30, 2023, Continued
| ● | Small and Medium Companies Risk. Investing in securities of small- and medium-capitalization companies may involve greater volatility than investing in larger and more established companies because small and medium capitalization companies can be subject to more abrupt or erratic share price changes than larger, more established companies. |
| ● | Foreign and Emerging Market Securities Risk. Foreign securities may be more volatile and less liquid than domestic (U.S.) securities, which could affect the Fund’s investments. Securities markets of other countries are generally smaller than U.S. securities markets. These risks are enhanced in emerging markets. |
| ● | ETF and Mutual Fund Risk. When the Fund invests in a mutual fund or ETF, it will bear additional expenses based on its pro rata share of the mutual fund’s or ETF’s operating expenses, including the potential duplication of management fees. The risk of owning a mutual fund or ETF generally reflects the risks of owning the underlying securities the mutual fund or ETF holds. The Fund also will incur brokerage costs when it purchases ETFs. |
NOTE 10 –OFFICERS
At a meeting held on June 22-23, 2023, the Board of Trustees of the Trust appointed Ms. Lillian A. Kabakali the Assistant Secretary of the Trust, effective July 10, 2023. Effective July 20, 2023, Mr. Michael L. Ceccato retired from his service as Vice President, Chief Compliance Officer and Anti-Money Laundering Officer of the Trust. At a meeting held on July 20, 2023, the Board of Trustees of the Trust appointed Joseph Kolinsky as the successor Vice President, Chief Compliance Officer and Anti-Money Laundering Officer of the Trust, effective July 20, 2023.
Davidson Multi-Cap Equity Fund
NOTICE TO SHAREHOLDERS at June 30, 2023 (Unaudited)
For the year ended June 30, 2023, the Fund designated $401,057 as ordinary income and $10,286,611 as long-term capital gains for purposes of the dividends paid deduction.
For the year ended June 30, 2023, certain dividends paid by the Fund may be subject to a maximum tax rate of 15%, as provided by the Tax Cuts and Jobs Act of 2017. The percentage of dividends declared from net investment income designated as qualified dividend income for the Fund was 100.00%.
For corporate shareholders in the Fund, the percent of ordinary income distributions qualifying for the corporate dividends received deduction for the year ended June 30, 2023 was 100.00%.
The percentage of taxable ordinary income distributions that were designated as short-term capital gain distributions under Section 871(k)(2)(C) of the Internal Revenue Code of 1986, as amended, for the Fund was 9.09%.
How to Obtain a Copy of the Fund’s Proxy Voting Policies
A description of the policies and procedures that the Fund uses to determine how to vote proxies relating to portfolio securities is available without charge upon request by calling 1-877-332-0529 or on the U.S. Securities and Exchange Commission’s website at http://www.sec.gov.
How to Obtain a Copy of the Fund’s Proxy Voting Records for the 12-Month Period Ended June 30
Information regarding how the Fund voted proxies relating to portfolio securities during the most recent 12-month period ended June 30 is available without charge, upon request, by calling 1-877-332-0529. Furthermore, you can obtain the Fund’s proxy voting records on the SEC’s website at http://www.sec.gov.
Quarterly Filings on Form N-PORT
The Fund files its complete schedule of portfolio holdings with the SEC for the first and third quarters of each fiscal year on Part F of Form N-PORT. The Fund’s Form N-PORT is available on the SEC’s website at http://www.sec. gov. Information included in the Fund’s Form N-PORT is also available by calling 1-877-332-0529.
Householding
In an effort to decrease costs, the Fund will reduce the number of duplicate prospectuses, supplements, and certain other shareholder documents that you receive by sending only one copy of each to those addresses shown by two or more accounts. Please call the Fund’s transfer agent toll free at 1-877-332-0529 to request individual copies of these documents. The Fund will begin sending individual copies 30 days after receiving your request. This policy does not apply to account statements.
REPORT OF INDEPENDENT REGISTERED PUBLIC ACCOUNTING FIRM
To the Board of Trustees of
Advisors Series Trust and
Shareholders of
Davidson Multi-Cap Equity Fund
Opinion on the Financial Statements
We have audited the accompanying statement of assets and liabilities of Davidson Multi-Cap Equity Fund (the “Fund”), a series of Advisors Series Trust (the “Trust”), including the schedule of investments, as of June 30, 2023, the related statement of operations for the year then ended, the statements of changes in net assets for each of the two years in the period then ended, and the financial highlights for each of the five years in the period then ended, and the related notes (collectively referred to as the “financial statements”). In our opinion, the financial statements present fairly, in all material respects, the financial position of the Fund as of June 30, 2023, the results of its operations for the year then ended, the changes in its net assets for each of the two years in the period then ended, and the financial highlights for each of the five years in the period then ended, in conformity with accounting principles generally accepted in the United States of America.
Basis for Opinion
These financial statements are the responsibility of the Fund’s management. Our responsibility is to express an opinion on the Fund’s financial statements based on our audits. We are a public accounting firm registered with the Public Company Accounting Oversight Board (United States) (“PCAOB”) and are required to be independent with respect to the Fund in accordance with the U.S. federal securities laws and the applicable rules and regulations of the Securities and Exchange Commission and the PCAOB. We have served as the auditor of one or more of the funds in the Trust since 2003.
We conducted our audits in accordance with the standards of the PCAOB. Those standards require that we plan and perform the audit to obtain reasonable assurance about whether the financial statements are free of material misstatement, whether due to error or fraud. The Fund is not required to have, nor were we engaged to perform, an audit of its internal control over financial reporting. As part of our audits we are required to obtain an understanding of internal control over financial reporting, but not for the purpose of expressing an opinion on the effectiveness of the Fund’s internal control over financial reporting. Accordingly, we express no such opinion.
Our audits included performing procedures to assess the risks of material misstatement of the financial statements, whether due to error or fraud, and performing procedures that respond to those risks. Such procedures included examining, on a test basis, evidence regarding the amounts and disclosures in the financial statements. Our audits also included evaluating the accounting principles used and significant estimates made by management, as well as evaluating the overall presentation of the financial statements. Our procedures included confirmation of securities owned as of June 30, 2023 by correspondence with the custodian. We believe that our audits provide a reasonable basis for our opinion.
| TAIT, WELLER & BAKER LLP |
Philadelphia, Pennsylvania
August 25, 2023
Davidson Multi-Cap Equity Fund
INFORMATION ABOUT TRUSTEES AND OFFICERS (Unaudited)
This chart provides information about the Trustees and Officers who oversee the Fund. Officers elected by the Trustees manage the day-to-day operations of the Fund and execute policies formulated by the Trustees.
Independent Trustees (1)
| Name, Address and Age | Position Held with the Trust | Term of Office and Length of Time Served* | Principal Occupation During Past Five Years | Number of Portfolios in Fund Complex Overseen by Trustee(2) | Other Directorships Held During Past Five Years(3) |
| David G. Mertens (age 63) 615 E. Michigan Street Milwaukee, WI 53202 | Trustee | Indefinite term; since March 2017. | Partner and Head of Business Development QSV Equity Investors, LLC, formerly Ballast Equity Management, LLC (a privately-held investment advisory firm) (February 2019 to present); Managing Director and Vice President, Jensen Investment Management, Inc. (a privately-held investment advisory firm) (2002 to 2017). | 1 | Trustee, Advisors Series Trust (for series not affiliated with the Fund). |
| Joe D. Redwine (age 75) 615 E. Michigan Street Milwaukee, WI 53202 | Trustee | Indefinite term; since September 2008. | Retired; formerly Manager, President, CEO, U.S. Bancorp Fund Services, LLC and its predecessors (May 1991 to July 2017). | 1 | Trustee, Advisors Series Trust (for series not affiliated with the Fund). |
Davidson Multi-Cap Equity Fund
INFORMATION ABOUT TRUSTEES AND OFFICERS (Unaudited), continued
Independent Trustees (1) continued
| Name, Address and Age | Position Held with the Trust | Term of Office and Length of Time Served* | Principal Occupation During Past Five Years | Number of Portfolios in Fund Complex Overseen by Trustee(2) | Other Directorships Held During Past Five Years(3) |
| Raymond B. Woolson (age 64) 615 E. Michigan Street Milwaukee, WI 53202 | Chairman of the Board
Trustee | Indefinite term; since January 2020.
Indefinite term; since January 2016. | President, Apogee Group, Inc. (financial consulting firm) (1998 to present). | 1 | Trustee, Advisors Series Trust (for series not affiliated with the Fund); Indpenedent Trustee, DoubleLine Funds Trust (an open-end investment company with 19 portfolios), DoubleLine Opportunistic Credit Fund, DoubleLine Income Solutions Fund, and DoubleLine Yield Opportunities Fund from 2010 to present; Independent Trustee, DoubleLine ETF Trust (an open-end investment company with 2 portfolios) from March 2022 to present. |
| Michele Rackey (age 64) 615 E. Michigan Street Milwaukee, WI 53202 | Trustee | Indefinite term; since January 2023. | Chief Executive Officer, Government Employees Benefit Association (GEBA) (benefits and wealth management organization) (2004 to 2020); Board Member, Association Business Services Inc. (ABSI) (for-profit subsidiary of the American Society of Association Executives) (2019 to present). | 1 | Trustee, Advisors Series Trust (for series not affiliated with the Fund). |
Davidson Multi-Cap Equity Fund
INFORMATION ABOUT TRUSTEES AND OFFICERS (Unaudited), continued
Officers
| Name, Address and Age | Position Held with the Trust | Term of Office and Length of Time Served | Principal Occupation During Past Five Years |
| Jeffrey T. Rauman (age 54) 615 E. Michigan Street Milwaukee, WI 53202 | President, Chief Executive Officer and Principal Executive Officer | Indefinite term; since December 2018. | Senior Vice President, Compliance and Administration, U.S. Bank Global Fund Services (February 1996 to present). |
| Kevin J. Hayden (age 52) 615 E. Michigan Street Milwaukee, WI 53202 | Vice President, Treasurer and Principal Financial Officer | Indefinite term; since January 2023. | Vice President, Compliance and Administration, U.S. Bank Global Fund Services (June 2005 to present). |
| Cheryl L. King (age 61) 615 E. Michigan Street Milwaukee, WI 53202 | Assistant Treasurer | Indefinite term; since January 2023. | Vice President, Compliance and Administration, U.S. Bank Global Fund Services (October 1998 to present). |
| Richard R. Conner (age 40) 615 E. Michigan Street Milwaukee, WI 53202 | Assistant Treasurer | Indefinite term; since December 2018. | Assistant Vice President, Compliance and Administration, U.S. Bank Global Fund Services (July 2010 to present). |
| Michael L. Ceccato (age 65) 615 E. Michigan Street Milwaukee, WI 53202 | Vice President, Chief Compliance Officer and AML Officer | Indefinite term; since September 2009. | Senior Vice President, U.S. Bank Global Fund Services and Senior Vice President, U.S. Bank N.A. (February 2008 to July 2023). |
| Elaine E. Richards (age 55) 2020 East Financial Way, Suite 100 Glendora, CA 91741 | Vice President and Secretary | Indefinite term; since September 2019. | Senior Vice President, U.S. Bank Global Fund Services (July 2007 to present). |
Davidson Multi-Cap Equity Fund
INFORMATION ABOUT TRUSTEES AND OFFICERS (Unaudited), continued
| * | The Trustees have designated a mandatory retirement age of 75, such that each Trustee, serving as such on the date he or she reaches the age of 75, shall submit his or her resignation not later than the last day of the calendar year in which his or her 75th birthday occurs (“Retiring Trustee”). Upon request, the Board may, by vote of a majority of Trustees eligible to vote on such matter, determine whether or not to extend such Retiring Trustee’s term and on the length of a one-time extension of up to three additional years. Joe Redwine’s term as Independent Trustee has been extended for an additional three years to expire December 31, 2025. |
| (1) | The Trustees of the Trust who are not “interested persons” of the Trust as defined under the 1940 Act (“Independent Trustees”). |
| (2) | As of June 30, 2023, the Trust was comprised of 35 active portfolios managed by unaffiliated investment advisers. The term “Fund Complex” applies only to the funds. The fund does not hold itself out as related to any other series within the Trust for investment purposes, nor does it share the same investment adviser with any other series. |
| (3) | “Other Directorships Held” includes only directorships of companies required to register or file reports with the SEC under the Securities Exchange Act of 1934, as amended, (that is, “public companies”) or other investment companies registered under the 1940 Act. |
The Statement of Additional Information includes additional information about the Fund’s Trustees and Officers and is available, without charge, upon request by calling 1-877-332-0529.
PRIVACY NOTICE
The Fund collects non-public information about you from the following sources:
| ● | Information we receive about you on applications or other forms; |
| ● | Information you give us orally; and/or |
| ● | Information about your transactions with us or others. |
We do not disclose any non-public personal information about our customers or former customers without the customer’s authorization, except as permitted by law or in response to inquiries from governmental authorities. We may share information with affiliated and unaffiliated third parties with whom we have contracts for servicing the Fund. We will provide unaffiliated third parties with only the information necessary to carry out their assigned responsibilities. We maintain physical, electronic and procedural safeguards to guard your non-public personal information and require third parties to treat your personal information with the same high degree of confidentiality.
In the event that you hold shares of the Fund through a financial intermediary, including, but not limited to, a broker-dealer, bank, or trust company, the privacy policy of your financial intermediary would govern how your non-public personal information would be shared by those entities with unaffiliated third parties.
Advisor Davidson Investment Advisors, Inc. Davidson Building 8 Third Street North Great Falls, Montana 59401 www.davidsonmutualfunds.com
Distributor Quasar Distributors, LLC 111 East Kilbourn Avenue, Suite 2200 Milwaukee, Wisconsin 53202
Custodian U.S. Bank N.A. 1555 North RiverCenter Drive, Suite 302 Milwaukee, Wisconsin 53212
Transfer Agent. Fund Accountant and
Independent Registered
Legal Counsel Sullivan & Worcester LLP 1633 Broadway, 32nd Floor New York, New York 10019
This report is intended for the shareholders of the Fund and may not be used as sales literature unless preceded or accompanied by a current prospectus. To obtain a free prospectus please call 877-332-0529 |
DAVIDSON MULTI-CAP EQUITY FUND
ANNUAL REPORT For the year ended June 30, 2023 |

| FYE 6/30/2023 | FYE 6/30/2022 | |
Audit Fees | $18,900 | $18,900 |
Audit-Related Fees | N/A | N/A |
Tax Fees | $3,600 | $3,600 |
All Other Fees | N/A | N/A |
| FYE 6/30/2023 | FYE 6/30/2022 | |
Audit-Related Fees | 0% | 0% |
Tax Fees | 0% | 0% |
All Other Fees | 0% | 0% |
Non-Audit Related Fees | FYE 6/30/2023 | FYE 6/30/2022 |
Registrant | N/A | N/A |
Registrant’s Investment Adviser | N/A | N/A |
| (a) | Not applicable to registrants who are not listed issuers (as defined in Rule 10A-3 under the Securities Exchange Act of 1934). |
| (b) | Not Applicable. |
| (a) | Schedule of Investments is included as part of the report to shareholders filed under Item 1 of this Form. |
| (b) | Not Applicable. |
| (a) | The Registrant’s President/Chief Executive Officer/Principal Executive Officer and Vice President/Treasurer/Principal Financial Officer have reviewed the Registrant's disclosure controls and procedures (as defined in Rule 30a-3(c) under the Investment Company Act of 1940, as amended, (the “Act”)) as of a date within 90 days of the filing of this report, as required by Rule 30a-3(b) under the Act and Rules 13a-15(b) or 15d‑15(b) under the Securities Exchange Act of 1934. Based on their review, such officers have concluded that the disclosure controls and procedures are effective in ensuring that information required to be disclosed in this report is appropriately recorded, processed, summarized and reported and made known to them by others within the Registrant and by the Registrant’s service provider. |
| (b) | There were no changes in the Registrant's internal control over financial reporting (as defined in Rule 30a-3(d) under the Act) that occurred during the period covered by this report that has materially affected, or is reasonably likely to materially affect, the Registrant's internal control over financial reporting. |