UNITED STATES
SECURITIES AND EXCHANGE COMMISSION
Washington, D.C. 20549
SECURITIES AND EXCHANGE COMMISSION
Washington, D.C. 20549
FORM N-CSR
CERTIFIED SHAREHOLDER REPORT OF REGISTERED
MANAGEMENT INVESTMENT COMPANIES
Investment Company Act file number 811-07959
Advisors Series Trust
(Exact name of registrant as specified in charter)
(Exact name of registrant as specified in charter)
615 East Michigan Street
Milwaukee, WI 53202
(Address of principal executive offices) (Zip code)
(Address of principal executive offices) (Zip code)
Jeffrey T. Rauman, President/Chief Executive Officer
Advisors Series Trust
c/o U.S. Bancorp Fund Services, LLC
777 East Wisconsin Avenue, 5th Floor
Milwaukee, WI 53202
(Name and address of agent for service)
(Name and address of agent for service)
(626) 914-7363
Registrant's telephone number, including area code
Date of fiscal year end: September 30, 2023
Date of reporting period: September 30, 2023
Item 1. Reports to Stockholders.
(a)
| Annual | SHENKMAN CAPITAL FLOATING | ||
| Report | RATE HIGH INCOME FUND | ||
| September 30, 2023 | SHENKMAN CAPITAL SHORT | ||
| DURATION HIGH INCOME FUND |
 | ||||||||
| Each a series of Advisors Series Trust (the “Trust”) | ||||||||
| SHENKMAN CAPITAL | Institutional | |||||||
| FLOATING RATE | Class F | Class | ||||||
| HIGH INCOME FUND | (SFHFX) | (SFHIX) | ||||||
| SHENKMAN CAPITAL | Institutional | |||||||
| SHORT DURATION | Class A | Class C | Class F | Class | ||||
| HIGH INCOME FUND | (SCFAX) | (SCFCX) | (SCFFX) | (SCFIX) | ||||
| c/o U.S. Bank Global Fund Services | |||
| P.O. Box 701 | |||
| Milwaukee, Wisconsin 53201-0701 | |||
| 1-855-SHENKMAN (1-855-743-6562) | |||
SHENKMAN CAPITAL FLOATING RATE HIGH INCOME FUND
SHAREHOLDER LETTER
September 30, 2023
Dear Shareholder,
Fund Overview and Performance
The Shenkman Capital Floating Rate High Income Fund (the “Fund”) seeks to generate high current income through active selection and management of investments, primarily in the leveraged loan universe, and looks to build a portfolio with the best chance of providing superior risk-adjusted returns. For the fiscal year ended September 30, 2023 (the “Annual Period”), the Morningstar LSTA US Leveraged Loan Index (the “Index”) and Morningstar LSTA US B- Ratings and Above Loan Index (the “B- & Above Index”) returned 13.05% and 13.23%, respectively, as rates rose sharply during the Period. The Federal Reserve’s firmly hawkish stance pressured fixed income assets and prompted renewed interest in floating rate instruments, providing a tailwind for the leveraged loan market. The Fund’s institutional class shares (SFHIX) had a net return of 11.77% for the Annual Period. The Fund’s F class shares (SFHFX) had a net return of 11.75% for the Annual Period.
On a loan-to-loan basis, the Fund returned 13.61% (gross) for the Annual Period. The primary driver of Fund performance relative to the Index during the Annual Period was the allocation to high yield bonds as fixed income assets underperformed floating rate instruments amid sharply higher interest rates. For further context, over the Annual Period, high yield and investment grade bonds, as measured by the ICE BofA U.S. High Yield Index (H0A0) and the ICE BofA U.S. Corporate Index (C0A0), posted returns of 10.20% and 3.99%, respectively, while the Index returned 13.05%. The Fund’s return of 11.77% showed outperformance versus other corporate credit asset classes. Periodic Index returns by rating exhibited differentiation, with BB-rated, B-rated, and CCC & Below-rated loans returning 11.36%, 14.31%, and 8.65%, respectively. The Fund had a lower weight than the Index in riskier credit profiles, including CCC-rated/below loans, which contributed to relative performance, while negative selection in BB-rated credits was a detractor for the period. From a sector attribution standpoint, the Fund benefitted from an underweight and positive selection in Health Care Equipment & Services and positive selection in IT Services. Main detractors were negative selection in Diversified Telecommunication Services and the overweight and negative selection in Entertainment.
The Fund remained well-diversified, with investments in over 350 issuers across more than 50 industries. For liquidity purposes, the Fund targets an allocation of approximately 15% of assets to cash and bonds.
Market Commentary
Following a record $614 billion in leveraged loan issuance in 2021, primary loan market activity slowed significantly in 2022 as market volatility increased and rates rose rapidly. Full year 2022 issuance of $225 billion
1
SHENKMAN CAPITAL FLOATING RATE HIGH INCOME FUND
SHAREHOLDER LETTER – Continued
September 30, 2023
represents a 63% decline in volume versus the prior year. The limited issuance theme carried over into 2023 as first and second quarter issuance totaled just $70.3 billion and $66.5 billion in loans came to market, respectively. However, primary issuance rebounded sharply in the third quarter as $122.5 billion came to market, with more than 75% of proceeds earmarked as repricing/refinancing. Year-to-date issuance of $257.9 billion is now 26% ahead of the same period last year, though net issuance of $59.2 billion trails the prior year by nearly 60%, helping to maintain a favorable supply/demand technical. From a demand perspective, CLO formations totaled $35.2 billion in the third quarter, following issuance of $22.4 billion and $34.3 billion in the second and first quarters, respectively. CLO Issuance totaled $183.7 billion and $130.3 billion in 2021 and 2022, respectively, the highest and second-highest annual volumes on record. Despite the tailwind of rising rates and tepid issuance, retail demand for leveraged loans has been tempered by recession fears. Leveraged loan mutual funds experienced an inflow of $900 million in the third quarter following outflows of $7.9 billion and $11 billion in the second and first quarters, respectively. Three loan issuers defaulted in the third quarter affecting $2.5 billion in principal, a notable decrease in default activity after 10 loan issuer defaults affecting $14.2 billion in loans during the second quarter and 11 loan issuer defaults totaling $11 billion in the first quarter. As a result, the trailing twelve-month par-weighted default rate ended the Annual Period at 1.90%, a 72bp increase over the Annual Period, but a 51bp decrease from the previous quarter, according to J.P. Morgan Research. For context, the historical leveraged loan default rate is approximately 3%.
Outlook
Investors are seemingly coming to the realization that higher rates are likely to remain longer than previously anticipated as the Federal Reserve remains steadfast in its commitment to control inflation in the wake of several years of pandemic-driven market disruption. The financial markets are assessing the potential impact on earnings over the coming quarters, with intense focus on corporate results and earnings outlooks. The relatively robust labor market and stalled CPI decreases, in our opinion, suggests that the Fed is likely to remain undeterred from their stated intent to contain inflation and further rate hikes remain likely. With the terminal rate still unknown, we anticipate smaller adjustments from the Fed in the short term, but believe a pivot to rate cuts seems unlikely without a major catalyst. The coming months could be a crucial test of market resilience as consumers and corporations adjust to the "new normal" of sharply higher borrowing costs, especially as geopolitical risks continue to loom large. We continue to monitor developments across industries and the broader economy, seeking to assess the potential impact on the leveraged loan market. Given the current credit spreads, higher for longer base rates priced into the forward curve, and
2
SHENKMAN CAPITAL FLOATING RATE HIGH INCOME FUND
SHAREHOLDER LETTER – Continued
September 30, 2023
upside of loan prices below par, we believe the leveraged loan market presents compelling relative value opportunities, particularly given the Federal Reserve’s ongoing commitment to combat inflation with base rates likely to remain higher for longer. As we seek to proactively manage the portfolio and trading exposures across our global platform, our goal remains to safeguard against potential downside risks while concurrently optimizing returns.
We maintain a constructive outlook on the loan market overall; however, we contend that credit selection will remain a primary driver of performance differentiation this year. In the event of episodic market turbulence, we believe there is potential for increased dispersion between better quality and riskier credits after a period of significant compression. Consequently, we remain cautious as we continuously assess the relative value of the Fund’s positions. A foundational pillar of our investment philosophy remains the preservation of capital as we strive to deliver, or beat, market returns throughout the cycle with a lower risk profile. As a conservative asset manager, we intend to remain defensively positioned in our portfolios and will seek to take advantage of market dislocations only in what we believe to be creditworthy, Shenkman-approved issuers in both the primary and secondary markets.
Thank you again for your continued support and trust in the Fund. We look forward to growing with you.
Sources: LCD, JPM Research
IMPORTANT INFORMATION
The Shenkman Group of Companies (the “Shenkman Group”) consists of Shenkman Capital Management, Inc., and its affiliates and subsidiaries, including, without limitation, Shenkman Capital Management Ltd, Romark Credit Advisors LP, and Romark CLO Advisors LLC. The Shenkman Group focuses on the leveraged finance market and is dedicated to providing in-depth, bottom-up, fundamental credit analysis.
Shenkman Capital Management, Inc. (“Shenkman” or “Shenkman Capital”) is registered as an investment adviser with the U.S. Securities and Exchange Commission (the “SEC”). Romark Credit Advisors LP is also registered as an investment adviser with the SEC and Romark CLO Advisors LLC is registered as a relying adviser of Romark Credit Advisors LP (together, “Romark”). Shenkman Capital Management Ltd is a wholly-owned subsidiary of Shenkman Capital Management, Inc. and is authorized and regulated by the U.K. Financial Conduct Authority. Such registrations do not imply any specific skill or training. EEA Investors: This material is provided to you because you have been classified as a professional client in accordance with the Markets in Financial Instruments Directive (Directive 2014/65/EU) (known as “MiFID II”) or as otherwise defined under applicable local regulations. If you are unsure about your classification or believe that you may be a retail client under these rules, please contact the Shenkman Group and disregard this information.
3
SHENKMAN CAPITAL FLOATING RATE HIGH INCOME FUND
SHAREHOLDER LETTER – Continued
September 30, 2023
Past performance does not guarantee future results.
Opinions expressed are subject to change at any time, are not guaranteed and should not be considered investment advice.
Mutual fund investing involves risk. Principal loss is possible. There can be no assurance that the Fund will achieve its stated objective. In addition to the normal risks associated with investing, bonds and bank loans, and the funds that invest in them are subject to interest rate risk and can be expected to decline in value as interest rates rise. Investment by the Fund in lower-rated and non-rated securities presents a greater risk of loss to principal and interest than higher-rated securities. The Fund invests in foreign securities which involve political, economic and currency risks, greater volatility and differences in accounting methods. Derivatives may involve certain costs and risks such as liquidity, interest rate, market, credit, management, and the risk that a position could not be closed when most advantageous. Leverage may cause the effect of an increase or decrease in the value of the portfolio securities to be magnified and the fund to be more volatile than if leverage was not used.
Investments in CLOs carry additional risks, including the possibility that distributions from collateral securities will not be adequate to make interest payments and that the quality of the collateral may decline in value or default.
Diversification does not assure a profit, nor does it protect against a loss in a declining market.
Credit quality weights by rating are derived from the highest bond rating as determined by S&P, Moody’s or Fitch. Bond ratings are grades given to bonds that indicate their credit quality as determined by private independent rating services such as S&P Global Ratings (“S&P”) or Moody’s and Fitch. These firms evaluate a bond issuer’s financial strength, or its ability to pay a bond’s principal and interest in a timely fashion. Ratings are expressed as letters ranging from ‘AAA’, which is the highest grade, to ‘D’, which is the lowest grade. In limited situations when none of the three rating agencies have issued a formal rating, the Advisor will classify the security as nonrated.
The ICE BofA U.S. High Yield Index (H0A0) has an inception date of August 31, 1986 and tracks the performance of U.S. dollar denominated below investment grade corporate debt publicly issued in the U.S. domestic market.
The ICE BofA U.S. Corporate Index (C0A0) has an inception date of December 31, 1972, and tracks the performance of U.S. dollar denominated investment grade corporate debt publicly issued in the U.S. domestic market.
The Morningstar® LSTA US Leveraged Loan Index is a market-value weighted index designed to measure the performance of the US leveraged loan market.
The Morningstar® LSTA US B- Ratings and Above Loan Index tracks the current outstanding balance and spread over LIBOR for fully funded institutional term loans that are rated B- or above and syndicated to U.S. loan investors. The Morningstar® LSTA US B- Ratings and Above Loan Index is unmanaged, not available for direct investment and does not reflect deductions for fees or expenses.
You cannot invest directly in an index.
Duration is a measure of the sensitivity of the price (the value of principal) of a fixed-income investment to a change in interest rates. Duration is expressed as a number of years.
4
SHENKMAN CAPITAL FLOATING RATE HIGH INCOME FUND
SHAREHOLDER LETTER – Continued
September 30, 2023
Fund holdings and sector allocations are subject to change at any time and should not be considered a recommendation to buy or sell any security. Please refer to the Schedule of Investments for a complete list of fund holdings.
An original issue discount (OID) is the discount in price from a bond’s face value at the time a bond or other debt instrument is first issued.
The Secured Overnight Financing Rate (SOFR) is a broad measure of the cost of borrowing cash overnight collateralized by Treasury securities.
Must be preceded or accompanied by a prospectus.
The credit rating is a financial indicator to potential investors of debt securities such as bonds. These are assigned by credit rating agencies such as Moody’s and S&P to have letter designations (such as AAA, B, CC) which represent the quality of a bond. Moody’s assigns bond credit ratings of Aaa, Aa, A, Baa, Ba, B, Caa, Ca, C, with WR and NR as withdrawn and not rated. S&P assigns bond credit ratings of AAA, AA, A, BBB, BB, B, CCC, CC, C, D.
These materials may contain information obtained from third parties, and may include ratings from credit ratings agencies such as S&P. Reproduction and distribution of third party content in any form is prohibited except with the prior written permission of the related third party. Third-party information contained in this presentation was obtained from sources that the Shenkman Group considers to be reliable; however, no representation is made as to, and no responsibility, warranty or liability is accepted for, the accuracy, completeness, timeliness or availability of such information, including ratings. Neither the Shenkman Group nor any third party content provider is responsible for any errors or omissions (negligent or otherwise), regardless of the cause, or for the results obtained from the use of such content. NEITHER THE SHENKMAN GROUP NOR ANY THIRD PARTY CONTENT PROVIDERS GIVE ANY EXPRESS OR IMPLIED WARRANTIES, INCLUDING, BUT NOT LIMITED TO, ANY WARRANTIES OF MERCHANTABILITY OR FITNESS FOR A PARTICULAR PURPOSE OR USE. NEITHER THE SHENKMAN GROUP NOR ANY THIRD PARTY CONTENT PROVIDERS SHALL BE LIABLE FOR ANY DIRECT, INDIRECT, INCIDENTAL, EXEMPLARY, COMPENSATORY, PUNITIVE, SPECIAL OR CONSEQUENTIAL DAMAGES, COSTS, EXPENSES, LEGAL FEES, OR LOSSES (INCLUDING LOST INCOME OR PROFITS AND OPPORTUNITY COSTS OR LOSSES CAUSED BY NEGLIGENCE) IN CONNECTION WITH ANY USE OF SUCH THIRD PARTY CONTENT, INCLUDING RATINGS. Credit ratings are statements of opinions and are not statements of fact or recommendations to purchase, hold or sell securities. They do not address the suitability of securities or the suitability of securities for investment purposes, and should not be relied on as investment advice.
References to indices are for information purposes only. The Shenkman Group believes that any indices discussed herein are broad market indices and are indicative of the type of investments that the Shenkman Group may purchase, but may contain different securities than those held in the Shenkman Group portfolios managed pursuant to the strategies described herein. The indices have not been selected to represent an appropriate benchmark. The strategies referred to herein are not design to mimic the investments on which any index is based. The indices are unmanaged and not available for direct investment and do not reflect deductions for fees or expenses.
The Shenkman Capital Floating Rate High Income Fund is distributed by Quasar Distributors, LLC, which is not affiliated with Shenkman Capital Management, Inc.
5
SHENKMAN CAPITAL SHORT DURATION HIGH INCOME FUND
SHAREHOLDER LETTER
September 30, 2023
Dear Shareholder,
The Shenkman Capital Short Duration High Income Fund (the “Fund”) continued to seek a high level of current income over the past fiscal year by focusing on investments within the non-investment grade universe, we believed to be high quality, yet short duration. The Fund’s Institutional Class (SCFIX) returned 8.32% for the fiscal year-ended September 30, 2023 (the “Annual Period”), and ended the Annual Period with a duration-to-worst of 1.78 years and average final maturity of 2.49 years. The Fund’s Class A shares returned 7.99% (without sales load) and 4.72% (with maximum sales load imposed on purchases of 3.00%) for the Annual Period, and the Class F shares returned 8.25%. Additionally, the Class C shares returned 7.23% (without sales load) and 6.23% (with maximum deferred sales load of 1.00%) for the Annual Period. The Fund’s benchmark, the ICE BofA 0-2 Year Duration BB-B U.S. HY Constrained Index (H42C), returned 8.93% for the Annual Period. The ICE BofA U.S. Treasuries 0-3 Year Index (G1QA) returned 3.13% for the Annual Period.
In what was a relatively strong period for the broader high yield market, as measured by the ICE BofA U.S. High Yield Index (H0A0) after a challenging prior twelve months, the Fund participated in the market rally despite its more defensive shorter tenor positioning while outpacing shorter dated Treasuries (G1QA). The broader high yield market as measured by the H0A0 surged 10.20% for the Period. Given the significant downward average price movement in the high yield market over the last 18 months, the impact of duration-based index rebalancing for the Benchmark has resulted in greater performance dispersion relative to the Fund. That having been said, the Fund’s underperformance versus the Benchmark was largely attributable to its negative selection in B rated credits and negative selection and underweight in credits with maturities between 1 and 3 years, outweighing the positive effects from having exposure to CCC rated credits and positive selection and underweight in BB rated credits. On a sector basis, negative selection and underweight in Financials and negative selection in Technology were also detractors, outweighing positive selection in Industrials and Automotives and having exposure to CCC rated credits. The Fund’s sector positioning is generally largely a function of its focus on bottom-up, individual security selection and fundamental analysis and less driven by top-down, sector-driven allocations. The Fund’s top three broader sector exposures are concentrated in Leisure, Gaming & Travel, Industrials and Healthcare. We believe our Leisure, Gaming & Travel exposure is well diversified, including subsegments that have historically been more stable such as fast-food franchisors and regional theme parks as well as exposure to, in our opinion, well positioned companies with credit-specific positive catalysts within Hotels & Gaming subsegments. The Industrials sector exposure captures a wide range of sub-industries and holdings that are broadly diversified and include service companies that in our view have
6
SHENKMAN CAPITAL SHORT DURATION HIGH INCOME FUND
SHAREHOLDER LETTER – Continued
September 30, 2023
attractive business models and competitive positions. The Healthcare sector is historically among the most stable and defensive sector given its consistent/recurring revenues, solid free cash flow generation and strong asset coverage. Additionally, within Energy, we have intentionally avoided the Oil & Gas sector given the unfavorable risk/reward for shorter maturities in the space and the asymmetric downside volatility associated with the violent and uncontrollable swings in commodity prices; however, we have favored the Midstream sector with historically relatively strong recurring cash flows, significant asset coverage, and generally more stable credit profiles due to the lower volatility inherent in transport and storage. The Fund’s exposure to bank loans was a contributor to performance as bank loan returns outpaced short duration for the Annual Period. The Fund’s bank loan weighting increased during the Annual Period from 5.03% to 10.39%. As of September 30, 2023, the average price of the Fund’s investments at the end of the period was $97.16 (up from $94.67 a year ago), with a current yield of 6.49%, SEC 30-Day unsubsidized yield of 6.68%, yield-to-maturity of 7.55%, and a yield-to-worst of 7.46%. As we believe diversification remains a key factor in helping to mitigate risk, the portfolio was well-diversified, ending the period with investments in 201 issuers across 15 sectors as of September 30, 2023.
Market Commentary
The past twelve months saw several macro-pressures, including turbulence in the banking sector and market uncertainty due to monetary policy actions by the Fed. Despite this, the broader high yield market, as measured by the H0A0, rallied 10.20% during the Annual Period, given the strength in broader equity markets. Within broader high yield (H0A0), the shorter duration tiers of the market lagged longer duration whereas by ratings category, CCC rated bonds posted the strongest performance while BB rated bonds trailed lower rated tiers.
The J.P. Morgan U.S. trailing 12-month par-weighted bond default rate ended the period at 1.32%, up 48bp YTD but well below the long-term historical average of 3.1%. Additionally, new issue volume has been stronger in 2023 with $136.6 billion of high yield issuance year to date, up 52% from 2022’s year-to-date period, as refinancing continued to be the dominant use of proceeds for new issuance, accounting for 63% YTD 2023.
Outlook
A significant increase in treasury rates combined with the strength of CCCs helped drive the tightening of spreads in the market during the quarter. Credit fundamentals have stayed relatively healthy, as evidenced by relatively low default rates and a positive credit rating agency upgrade to downgrade ratio. However, as higher capital costs are transmitted through the economy, we believe pressures could increase and focus on single-name selection, as well as industry idiosyncrasies, will be critical components for
7
SHENKMAN CAPITAL SHORT DURATION HIGH INCOME FUND
SHAREHOLDER LETTER – Continued
September 30, 2023
outperformance. With the market’s yield near 9% and the average price below 90.00, in our opinion, the market could be poised to have a strong fourth-quarter performance relative to other major asset classes. We continue to believe the higher-quality short duration segment of the high yield market remains well positioned as a lower volatility solution with the ability to seek to capture attractive risk-adjusted returns in the current environment.
Thank you again for your continued support and trust in our strategy. We look forward to growing with you.
IMPORTANT INFORMATION
The Shenkman Group of Companies (the “Shenkman Group”) consists of Shenkman Capital Management, Inc., and its affiliates and subsidiaries, including, without limitation, Shenkman Capital Management Ltd, Romark Credit Advisors LP, and Romark CLO Advisors LLC. The Shenkman Group focuses on the leveraged finance market and is dedicated to providing in-depth, bottom-up, fundamental credit analysis.
Shenkman Capital Management, Inc. (“Shenkman” or “Shenkman Capital”) is registered as an investment adviser with the U.S. Securities and Exchange Commission (the “SEC”). Romark Credit Advisors LP is also registered as an investment adviser with the SEC and Romark CLO Advisors LLC is registered as a relying adviser of Romark Credit Advisors LP (together, “Romark”). Shenkman Capital Management Ltd is a wholly-owned subsidiary of Shenkman Capital Management, Inc. and is authorized and regulated by the U.K. Financial Conduct Authority. Such registrations do not imply any specific skill or training. EEA Investors: This material is provided to you because you have been classified as a professional client in accordance with the Markets in Financial Instruments Directive (Directive 2014/65/EU) (known as “MiFID II”) or as otherwise defined under applicable local regulations. If you are unsure about your classification or believe that you may be a retail client under these rules, please contact the Shenkman Group and disregard this information.
Any third-party information contained herein was obtained from sources that Shenkman considers to be reliable; however, no representation is made as to, and Shenkman accepts no responsibility, warranty or liability for the accuracy or completeness of such information. Past performance does not guarantee future results.
Opinions expressed are subject to change at any time, are not guaranteed and should not be considered investment advice.
Mutual fund investing involves risk. Principal loss is possible. There can be no assurance that the Fund will achieve its stated objective. In addition to the normal risks associated with investing, bonds and bank loans, and the funds that invest in them are subject to interest rate risk and can be expected to decline in value as interest rates rise. Investment by the Fund in lower-rated and non-rated securities presents a greater risk of loss to principal and interest than higher-
8
SHENKMAN CAPITAL SHORT DURATION HIGH INCOME FUND
SHAREHOLDER LETTER – Continued
September 30, 2023
rated securities. The Fund invests in foreign securities which involve political, economic and currency risks, greater volatility and differences in accounting methods. Derivatives may involve certain costs and risks such as liquidity, interest rate, market, credit, management, and the risk that a position could not be closed when most advantageous. Leverage may cause the effect of an increase or decrease in the value of the portfolio securities to be magnified and the fund to be more volatile than if leverage was not used.
Diversification does not assure a profit, nor does it protect against a loss in a declining market.
The ICE BofA U.S. High Yield Index (H0A0) has an inception date of August 31, 1986 and tracks the performance of U.S. dollar denominated below investment grade corporate debt publicly issued in the U.S. domestic market.
The ICE BofA 0-2 Year Duration BB-B U.S. HY Constrained Index (H42C) consists of all securities in the ICE BofA BB-B U.S. High Yield Index (HUC4) that have a duration-to-worst of 2 years or less. The ICE BofA U.S. High Yield, BB-B Rated, Constrained Index (HUC4) has an inception date of December 31, 1996, and is a subset of the ICE BofA U.S. High Yield Index (H0A0) that consists of all securities rated BB1 through B3, based on an average of Moody’s, S&P and Fitch, but caps issuer exposure at 2%.
The ICE BofA U.S. Treasuries 0-3 year Index (G1QA) is an unmanaged index that tracks the performance of the direct sovereign debt of the U.S. Government having a maturity of less than three years.
You cannot invest directly in an index.
Free cash flow (FCF) is the cash a company generates after taking into consideration cash outflows that support its operations and maintain its capital assets.
Duration is a measure of the sensitivity of the price (the value of principal) of a fixed-income investment to a change in interest rates. Duration is expressed as a number of years.
Duration-to-worst is the duration of a bond computed using either the final maturity date, or a call date within the bond’s call schedule, whichever would result in the lowest yield to the investor.
Yield is defined as the income return on an investment. This refers to the interest or dividends received from a security and is usually expressed annually as a percentage based on the investment’s cost, its current market value or its face value.
Yield-to-worst is the lowest potential yield that can be received on a bond without the issuer actually defaulting.
Spread-to-worst is the difference between the yield-to-worst of a bond and yield-to-worst of a U.S. Treasury with a similar duration.
Current Yield is the annual income (interest or dividends) divided by the current price of the security. This measure looks at the current price of a bond instead of its face value and represents the return an investor would expect if he or she purchased the bond and held it for a year. This measure is not an accurate reflection of the actual return that an investor will receive in all cases because bond and stock prices are constantly changing due to market factors.
9
SHENKMAN CAPITAL SHORT DURATION HIGH INCOME FUND
SHAREHOLDER LETTER – Continued
September 30, 2023
Yield-to-Maturity is the rate of return anticipated on a bond if held until the end of its lifetime. YTM is considered a long-term bond yield expressed as an annual rate. The YTM calculation takes into account the bond’s current market price, par value, coupon interest rate and time to maturity. It is also assumed that all coupon payments are reinvested at the same rate as the bond’s current yield. YTM is a complex but accurate calculation of a bond’s return that helps investors compare bonds with different maturities and coupons.
Fund holdings and sector allocations are subject to change at any time and should not be considered a recommendation to buy or sell any security. Please refer to the Schedule of Investments for a complete list of fund holdings.
Must be preceded or accompanied by a prospectus.
The credit rating is a financial indicator to potential investors of debt securities such as bonds. These are assigned by credit rating agencies such as Moody’s and S&P Global Ratings (“S&P”) to have letter designations (such as AAA, B, CC) which represent the quality of a bond. Moody’s assigns bond credit ratings of Aaa, Aa, A, Baa, Ba, B, Caa, Ca, C, with WR and NR as withdrawn and not rated. S&P assigns bond credit ratings of AAA, AA, A, BBB, BB, B, CCC, CC, C, D.
Any information in these materials from ICE Data Indices, LLC (“ICE BofA”) was used with permission. ICE BofA PERMITS USE OF THE ICE BofA INDICES AND RELATED DATA ON AN “AS IS” BASIS, MAKES NO WARRANTIES REGARDING SAME, DOES NOT GUARANTEE THE SUITABILITY, QUALITY, ACCURACY, TIMELINESS, AND/OR COMPLETENESS OF THE ICE BofA INDICES OR ANY DATA INCLUDED IN, RELATED TO, OR DERIVED THEREFROM, ASSUMES NO LIABILITY IN CONNECTION WITH THE USE OF THE FOREGOING, AND DOES NOT SPONSOR, ENDORSE, OR RECOMMEND THE SHENKMAN GROUP, OR ANY OF ITS PRODUCTS OR SERVICES.
References to indices are for information purposes only. The Shenkman Group believes that any indices discussed herein are broad market indices and are indicative of the type of investments that the Shenkman Group may purchase, but may contain different securities than those held in the Shenkman Group portfolios managed pursuant to the strategies described herein. The indices have not been selected to represent an appropriate benchmark. The strategies referred to herein are not designed to mimic the investments on which any index is based. The indices are unmanaged and not available for direct investment and do not reflect deductions for fees or expenses.
The Shenkman Capital Short Duration High Income Fund is distributed by Quasar Distributors, LLC.
10
SHENKMAN CAPITAL FLOATING RATE HIGH INCOME FUND
Comparison of the change in value of a hypothetical $1,000,000 investment
in the Shenkman Capital Floating Rate High Income Fund –
Institutional Class vs. the Morningstar® LSTA US Leveraged Loan Index
and the Morningstar® LSTA US B- Ratings and Above Loan Index
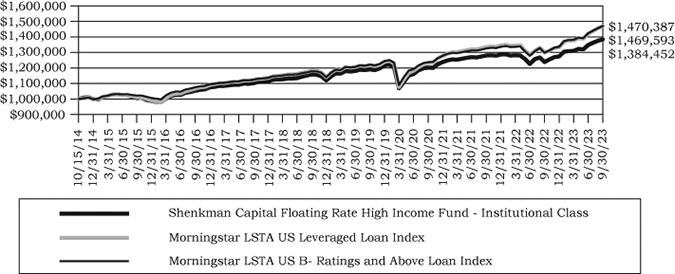
Average Annual Total Return:
| Since Inception | ||||
One Year | Five Year | 10/15/2014 | 3/1/2017 | |
| Class F (SFHFX) | 11.75% | 3.61% | — | 3.74% |
| Institutional Class (SFHIX) | 11.77% | 3.63% | 3.70% | — |
| Morningstar LSTA US Leveraged | ||||
| Loan Index | 13.05% | 4.46% | 4.39% | 4.46% |
| Morningstar LSTA US B- Ratings | ||||
| and Above Loan Index | 13.23% | 4.52% | 4.40% | 4.46% |
Performance data quoted represents past performance; past performance does not guarantee future results. The investment return and principal value of an investment will fluctuate so that an investor’s shares, when redeemed, may be worth more or less than their original cost. Current performance of the Fund may be lower or higher than the performance quoted. Performance data current to the most recent month end may be obtained by calling 1-855-743-6562.
SFHFX Expense Ratio – Gross: 0.81%
SFHFX Expense Ratio – Net: 0.64%*
SFHIX Expense Ratio – Gross: 0.71%
SFHIX Expense Ratio – Net: 0.54%*
Expense ratios shown are as of the Fund’s registration statement dated January 28, 2023.
| * | Shenkman Capital Management, Inc., the Fund’s investment advisor, has contractually agreed to waive a portion or all of its management fees and pay Fund expenses in order to limit total annual fund operating expenses to the net amount presented through at least January 27, 2024. |
Returns reflect reinvestment of dividends and capital gains distributions. Fee waivers are in effect. In the absence of fee waivers, returns would be reduced. The performance
11
SHENKMAN CAPITAL FLOATING RATE HIGH INCOME FUND
data and graph do not reflect the deduction of taxes that a shareholder would pay on dividends, capital gains distributions, or redemption of Fund shares. Indices do not incur expenses and are not available for investment.
The Morningstar® LSTA US Leveraged Loan Index is a market-value weighted index designed to measure the performance of the US leveraged loan market.
The Morningstar® LSTA US B- Ratings and Above Loan Index tracks the current outstanding balance and spread over LIBOR for fully funded institutional term loans that are rated B- or above and syndicated to U.S. loan investors. The Morningstar® LSTA US B- Ratings and Above Loan Index is unmanaged, not available for direct investment and does not reflect deductions for fees or expenses.
12
SHENKMAN CAPITAL SHORT DURATION HIGH INCOME FUND
Comparison of the change in value of a hypothetical $1,000,000 investment
in the Shenkman Capital Short Duration High Income Fund –
Institutional Class vs. the ICE BofA 0-3 Year U.S. Treasury Index and
the ICE BofA 0-2 Year Duration BB-B U.S. High Yield Constrained Index
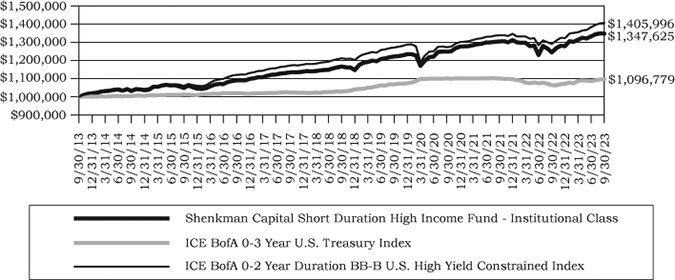
Average Annual Total Return:
| One | Five | Ten | Since Inception | |||
Year | Year | Year | 10/31/2012 | 5/17/2013 | 1/28/2014 | |
| Class A (SCFAX) | ||||||
| (with sales load) | 4.72% | 1.97% | 2.39% | 2.53% | — | — |
| Class A (SCFAX) | ||||||
| (without sales load) | 7.99% | 2.60% | 2.70% | 2.82% | — | — |
| Class C (SCFCX) | ||||||
| (with deferred | ||||||
| sales load) | 6.23% | 1.84% | — | — | — | 1.82% |
| Class C (SCFCX) | ||||||
| (without deferred | ||||||
| sales load) | 7.23% | 1.84% | — | — | — | 1.82% |
| Class F (SCFFX) | 8.25% | 2.85% | 2.94% | — | 2.91% | — |
| Institutional | ||||||
| Class (SCFIX) | 8.32% | 2.93% | 3.03% | 3.15% | — | — |
| ICE BofA 0-3 Year | ||||||
| U.S. Treasury Index | 3.13% | 1.28% | 0.93% | 0.88% | 0.91% | 0.95% |
| ICE BofA 0-2 Year | ||||||
| Duration BB-B | ||||||
| U.S. High Yield | ||||||
| Constrained Index | 8.93% | 3.01% | 3.47% | 3.61% | 3.40% | 3.35% |
Performance data quoted represents past performance; past performance does not guarantee future results. The investment return and principal value of an investment will fluctuate so that an investor’s shares, when redeemed, may be worth more or less than their original cost. Current performance of the Fund may be lower or higher than the performance quoted. Performance data current to the most recent month end may be obtained by calling 1-855-743-6562.
13
SHENKMAN CAPITAL SHORT DURATION HIGH INCOME FUND
SCFAX Expense Ratio – Gross: 1.01%
SCFAX Expense Ratio – Net: 1.00%*
SCFCX Expense Ratio – Gross: 1.76%
SCFCX Expense Ratio – Net: 1.75%*
SCFFX Expense Ratio – Gross: 0.76%
SCFFX Expense Ratio – Net: 0.75%*
SCFIX Expense Ratio – Gross: 0.66%
SCFIX Expense Ratio – Net: 0.65%*
Expense ratios shown are as of the Fund’s registration statement dated January 28, 2023.
| * | Shenkman Capital Management, Inc., the Fund’s investment advisor, has contractually agreed to waive a portion or all of its management fees and pay Fund expenses in order to limit total annual fund operating expenses to the net amount presented through at least January 27, 2024. |
Returns reflect reinvestment of dividends and capital gains distributions. Fee waivers are in effect. In the absence of fee waivers, returns would be reduced. Class A shares may be subject to a 3.00% front-end sales load. Class A shares do not have a contingent deferred sales charge (“CDSC”) except that a charge of 1% applies to certain redemptions made within thirty calendar days. Class C shares may be subject to a CDSC of 1.00% on redemptions held for eighteen months or less after purchase. The performance data and graph do not reflect the deduction of taxes that a shareholder would pay on dividends, capital gains distributions, or redemption of Fund shares. Indices do not incur expenses and are not available for investment.
The ICE BofA 0-3 Year U.S. Treasury Index (G1QA) tracks the performance of US dollar denominated sovereign debt publicly issued by the U.S. government in its domestic market with maturities less than three years.
The ICE BofA 0-2 Year Duration BB-B U.S. HY Constrained Index (H42C) consists of all securities in the ICE BofA BB-B U.S. High Yield Index (HUC4) that have a duration-to-worst of 2 years or less. The HUC4 index is a subset of the ICE BofA U.S. High Yield Index (H0A0) that includes all securities in the H0A0 rated BB1 through B3, inclusive. The HUC4 index is unmanaged, not available for direct investment and does not reflect deductions for fees or expenses.
Information used herein from ICE Data Indices, LLC (“ICE BofA”) was used with permission. ICE BofA PERMITS USE OF THE ICE BofA INDICES AND RELATED DATA ON AN “AS IS” BASIS, MAKES NO SUITABILITY, QUALITY, ACCURACY, TIMELINESS, AND/OR COMPLETENESS OF THE ICE BofA INDICES OR ANY DATA INCLUDED IN, RELATED TO, OR DERIVED THEREFROM, ASSUMES NO LIABILITY IN CONNECTION WITH THE USE OF THE FOREGOING, AND DOES NOT SPONSOR, ENDORSE, OR RECOMMEND SHENKMAN CAPITAL MANAGEMENT, INC., OR ANY OF ITS PRODUCTS OR SERVICES.
14
SHENKMAN CAPITAL FUNDS
EXPENSE EXAMPLE
September 30, 2023 (Unaudited)
As a shareholder of a fund, you incur two types of costs: (1) transaction costs including sales charges (loads), if applicable; redemption fees, if applicable; and exchange fees; and (2) ongoing costs, including management fees; distribution and/or service (12b-1 fees); and other fund expenses. This Example is intended to help you understand your ongoing costs (in dollars) of investing in the Funds and to compare these costs with the ongoing costs of investing in other mutual funds.
The Example is based on an investment of $1,000 invested at the beginning of the period indicated and held for the entire period from April 1, 2023 to September 30, 2023.
Actual Expenses
The information in the table under the heading “Actual” provides information about actual account values and actual expenses. You may use the information in these columns together with the amount you invested, to estimate the expenses that you paid over the period. Simply divide your account value by $1,000 (for example, an $8,600 account value divided by $1,000 = 8.6), then multiply the result by the number in the row entitled “Expenses Paid During Period” to estimate the expenses you paid on your account during this period. There are some account fees that are charged to certain types of accounts, such as Individual Retirement Accounts (generally, a $15 fee is charged to the account annually) that would increase the amount of expenses paid on your account. The example below does not include portfolio trading commissions and related expenses, and other extraordinary expenses as determined under generally accepted accounting principles.
Hypothetical Example for Comparison Purposes
The information in the table under the heading “Hypothetical (5% return before expenses)” provides information about hypothetical account values and hypothetical expenses based on the respective Fund’s actual expense ratio and assumed rate of return of 5% per year before expenses, which is not the Fund’s actual return. The hypothetical account values and expenses may not be used to estimate the actual ending account balance or expenses you paid for the period. You may use this information to compare the ongoing costs of investing in the Funds and other funds. To do so, compare this 5% hypothetical example with the 5% hypothetical examples that appear in the shareholder reports of the other funds. As noted above, there are some account fees that are charged to certain types of accounts that would increase the amount of expense paid on your account.
Please note that the expenses shown in the table are meant to highlight your ongoing costs only and do not reflect any transaction costs, such as sales charges (loads), redemption fees, or exchange fees. Therefore, the information under the heading “Hypothetical (5% return before expenses)” is useful in comparing ongoing costs only and will not help you determine the
15
SHENKMAN CAPITAL FUNDS
EXPENSE EXAMPLE – Continued
September 30, 2023 (Unaudited)
relative total costs of owning different funds. In addition, if these transactional costs were included, your costs would have been higher.
| Beginning | Ending | Expenses Paid | |
| Account Value | Account Value | During Period(1) | |
| Shenkman Capital Floating Rate High Income Fund | |||
| Actual | |||
| Class F | $1,000.00 | $1,056.50 | $2.89 |
| Institutional Class | $1,000.00 | $1,056.70 | $2.78 |
| Hypothetical (5% return | |||
| before expenses) | |||
| Class F | $1,000.00 | $1,022.26 | $2.84 |
| Institutional Class | $1,000.00 | $1,022.36 | $2.74 |
(1) | Shenkman Capital Floating Rate High Income Fund – Class F and Institutional Class expenses are equal to the Fund shares’ annualized expense ratio of 0.56% and 0.54%, respectively, multiplied by the average account value over the period, multiplied by 183 days/365 days (to reflect the six-month period of operation). The Fund’s ending account values in the table are based on its six-month total return of 5.65% for Class F and 5.67% for the Institutional Class as of September 30, 2023. |
| Beginning | Ending | Expenses Paid | |
| Account Value | Account Value | During Period(2) | |
| Shenkman Capital Short Duration High Income Fund | |||
| Actual | |||
| Class A | $1,000.00 | $1,024.10 | $4.87 |
| Class C | $1,000.00 | $1,020.50 | $8.61 |
| Class F | $1,000.00 | $1,025.40 | $3.71 |
| Institutional Class | $1,000.00 | $1,025.70 | $3.30 |
| Hypothetical (5% return | |||
| before expenses) | |||
| Class A | $1,000.00 | $1,020.26 | $4.86 |
| Class C | $1,000.00 | $1,016.55 | $8.59 |
| Class F | $1,000.00 | $1,021.41 | $3.70 |
| Institutional Class | $1,000.00 | $1,021.81 | $3.29 |
(2) | Shenkman Capital Short Duration High Income Fund – Class A, Class C, Class F, and Institutional Class expenses are equal to the Fund shares’ annualized expense ratio of 0.96%, 1.70%, 0.73% and 0.65%, respectively, multiplied by the average account value over the period, multiplied by 183 days/365 days (to reflect the six-month period of operation). The Fund’s ending account values in the table are based on its six-month total return of 2.41% for Class A, 2.05% for Class C, 2.54% for Class F, and 2.57% for the Institutional Class as of September 30, 2023. |
16
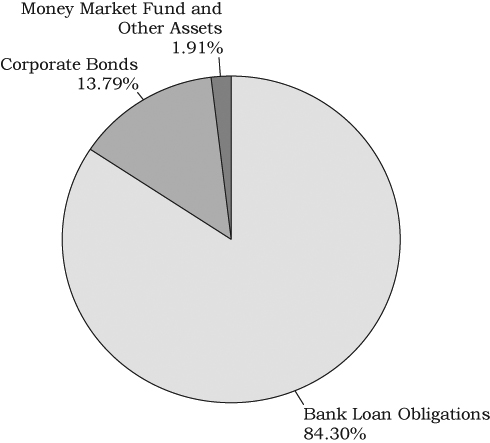
SHENKMAN CAPITAL FLOATING RATE HIGH INCOME FUND
PORTFOLIO ALLOCATION
September 30, 2023 (Unaudited)
| % Net | |
| TOP TEN HOLDINGS | Assets |
| Stars Group Holdings B.V., Senior Secured First Lien Term | |
| Loan 7.902% (3 Month SOFR USD + 2.25%), 07/21/2026 | 1.06% |
| Verscend Holding Corp., Senior Secured First Lien Term | |
| Loan 9.431% (1 Month SOFR USD + 4.00%), 08/27/2025 | 0.82% |
| Triton Water Holdings, Inc., | |
| Senior Secured First Lien Term Loan 8.753% | |
| (3 Month SOFR USD + 3.25%, 0.500% Floor), 03/31/2028 | 0.79% |
| Project Alpha Intermediate Holding, Inc., | |
| Senior Secured First Lien Term Loan 9.431% | |
| (1 Month SOFR USD + 4.00%), 04/26/2024 | 0.79% |
| Asurion, LLC, Senior Secured First Lien Term Loan 9.666% | |
| (1 Month SOFR USD + 4.25%), 12/23/2026 | 0.78% |
| Cambrex Corp., Senior Secured First Lien Term Loan 8.916% | |
| (1 Month SOFR USD + 3.50%, 0.750% Floor), 12/04/2026 | 0.76% |
| Caesars Entertainment, Inc. 6.25%, 07/01/2025 | 0.75% |
| Gen Digital, Inc. 5.00%, 04/15/2025 | 0.74% |
| Boxer Parent Co., Inc., Senior Secured First Lien Term | |
| Loan 9.181% (1 Month SOFR USD + 3.75%), 10/02/2025 | 0.68% |
| Surgery Center Holdings, Inc., | |
| Senior Secured First Lien Term Loan 9.189% | |
| (1 Month SOFR USD + 3.75%, 0.750% Floor), 09/03/2026 | 0.68% |
The portfolio’s holdings and allocations are subject to change. The top ten holdings presented exclude the money market fund. The percentages are of total net assets as of September 30, 2023.
17
SHENKMAN CAPITAL FLOATING RATE HIGH INCOME FUND
SCHEDULE OF INVESTMENTS
September 30, 2023
| Principal | Fair | |||||||
| Amount | Value | |||||||
| BANK LOANS – 84.30% (d) | ||||||||
| AEROSPACE & DEFENSE – 1.04% | ||||||||
| Barnes Group, Inc., | ||||||||
| Senior Secured First Lien Term Loan | ||||||||
| 8.416% (1 Month SOFR USD + 3.00%), | ||||||||
| 08/12/2030 (a) | $ | 596,000 | $ | 597,639 | ||||
| Bleriot U.S. Bidco, Inc., | ||||||||
| Senior Secured First Lien Term Loan | ||||||||
| 9.652% (3 Month SOFR USD + 4.00%), | ||||||||
| 10/31/2028 (a) | 297,255 | 297,971 | ||||||
| Dynasty Acquisition Co., Inc. | ||||||||
| Senior Secured First Lien Term Loan | ||||||||
| 9.316% (1 Month SOFR USD + 4.00%), | ||||||||
| 08/24/2028 (a) | 552,615 | 552,156 | ||||||
| Senior Secured First Lien Term Loan | ||||||||
| 9.316% (1 Month SOFR USD + 4.00%), | ||||||||
| 08/24/2028 (a) | 237,405 | 237,208 | ||||||
| KKR Apple Bidco, LLC, | ||||||||
| Senior Secured First Lien Term Loan | ||||||||
| 9.316% (1 Month SOFR USD + 4.00%, | ||||||||
| 0.500% Floor), 09/22/2028 (a) | 633,807 | 634,070 | ||||||
| LSF11 Trinity Bidco, Inc., | ||||||||
| Senior Secured First Lien Term Loan | ||||||||
| 9.832% (1 Month SOFR USD + 4.50%), | ||||||||
| 06/14/2030 (a) | 399,000 | 399,000 | ||||||
| Spirit Aerosystems, Inc., | ||||||||
| Senior Secured First Lien Term Loan | ||||||||
| 9.619% (3 Month SOFR USD + 4.25%, | ||||||||
| 0.500% Floor), 01/15/2027 (a) | 329,525 | 329,443 | ||||||
| 3,047,487 | ||||||||
| AUTO RETAIL – 0.89% | ||||||||
| CWGS Group, LLC | ||||||||
| Senior Secured First Lien Term Loan | ||||||||
| 7.931% (1 Month SOFR USD + 2.50%, | ||||||||
| 0.750% Floor), 06/05/2028 (a) | 49,846 | 47,039 | ||||||
| Senior Secured First Lien Term Loan | ||||||||
| 7.945% (1 Month SOFR USD + 2.50%, | ||||||||
| 0.750% Floor), 06/05/2028 (a) | 687,528 | 648,814 | ||||||
The accompanying notes are an integral part of these financial statements.
18
SHENKMAN CAPITAL FLOATING RATE HIGH INCOME FUND
SCHEDULE OF INVESTMENTS – Continued
September 30, 2023
| Principal | Fair | |||||||
| Amount | Value | |||||||
| BANK LOANS – 84.30% (d) – Continued | ||||||||
| AUTO RETAIL – 0.89% – Continued | ||||||||
| FleetPride, Inc., | ||||||||
| Senior Secured First Lien Term Loan | ||||||||
| 9.829%, 09/04/2028 (a)(g) | $ | 351,000 | $ | 347,709 | ||||
| LS Group Opco Acquisition, LLC, | ||||||||
| Senior Secured First Lien Term Loan | ||||||||
| 8.692% (1 Month SOFR USD + 3.25%, | ||||||||
| 0.750% Floor), 11/02/2027 (a) | 991,950 | 988,230 | ||||||
| Mavis Tire Express Services Topco Corp, | ||||||||
| Senior Secured First Lien Term Loan | ||||||||
| 9.431% (1 Month SOFR USD + 4.00%, | ||||||||
| 0.750% Floor), 05/04/2028 (a) | 592,017 | 591,277 | ||||||
| 2,623,069 | ||||||||
| AUTOMOTIVE – 0.85% | ||||||||
| American Axle & Manufacturing, Inc. | ||||||||
| Senior Secured First Lien Term Loan | ||||||||
| 8.929% (1 Month SOFR USD + 3.50%, | ||||||||
| 0.500% Floor), 12/13/2029 (a) | 525,327 | 524,234 | ||||||
| Senior Secured First Lien Term Loan | ||||||||
| 8.929% (6 Month SOFR USD + 3.50%, | ||||||||
| 0.500% Floor), 12/13/2029 (a) | 226,008 | 225,538 | ||||||
| Autokiniton U.S. Holdings, Inc., | ||||||||
| Senior Secured First Lien Term Loan | ||||||||
| 9.931% (1 Month SOFR USD + 4.50%, | ||||||||
| 0.500% Floor), 04/06/2028 (a) | 299,690 | 294,445 | ||||||
| First Brands Group, LLC | ||||||||
| Senior Secured First Lien Term Loan | ||||||||
| 10.881% (6 Month SOFR USD + 5.00%, | ||||||||
| 1.000% Floor), 03/30/2027 (a) | 319,182 | 315,723 | ||||||
| Senior Secured First Lien Term Loan | ||||||||
| 10.881% (6 Month SOFR USD + 5.00%, | ||||||||
| 1.000% Floor), 03/30/2027 (a) | 469,817 | 464,827 | ||||||
| Phinia, Inc., | ||||||||
| Senior Secured First Lien Term Loan | ||||||||
| 9.49% (3 Month SOFR USD + 4.00%), | ||||||||
| 07/03/2028 (a) | 269,208 | 269,881 | ||||||
The accompanying notes are an integral part of these financial statements.
19
SHENKMAN CAPITAL FLOATING RATE HIGH INCOME FUND
SCHEDULE OF INVESTMENTS – Continued
September 30, 2023
| Principal | Fair | |||||||
| Amount | Value | |||||||
| BANK LOANS – 84.30% (d) – Continued | ||||||||
| AUTOMOTIVE – 0.85% – Continued | ||||||||
| Tenneco, Inc. | ||||||||
| Senior Secured First Lien Term Loan | ||||||||
| 10.476% (3 Month SOFR USD + 5.00%, | ||||||||
| 0.500% Floor), 11/17/2028 (a) | $ | 479,646 | $ | 408,450 | ||||
| Senior Secured First Lien Term Loan | ||||||||
| 10.49% (1 Month SOFR USD + 5.00%, | ||||||||
| 0.500% Floor), 11/17/2028 (a) | 1,354 | 1,153 | ||||||
| 2,504,251 | ||||||||
| BUILDING PRODUCTS – 2.41% | ||||||||
| Cornerstone Building Brands, Inc., | ||||||||
| Senior Secured First Lien Term Loan | ||||||||
| 8.682% (1 Month SOFR USD + 3.25%, | ||||||||
| 0.500% Floor), 04/12/2028 (a) | 746,572 | 730,476 | ||||||
| CPG International, LLC, | ||||||||
| Senior Secured First Lien Term Loan | ||||||||
| 7.916% (1 Month SOFR USD + 2.50%, | ||||||||
| 0.500% Floor), 04/30/2029 (a) | 1,246,410 | 1,246,927 | ||||||
| Griffon Corp., | ||||||||
| Senior Secured First Lien Term Loan | ||||||||
| 7.791% (3 Month SOFR USD + 2.25%, | ||||||||
| 0.500% Floor), 01/24/2029 (a) | 382,980 | 383,507 | ||||||
| Janus International Group, LLC, | ||||||||
| Senior Secured First Lien Term Loan | ||||||||
| 8.677% (1 Month SOFR USD + 3.25%, | ||||||||
| 1.000% Floor), 08/05/2030 (a) | 804,000 | 802,493 | ||||||
| QUIKRETE Holdings, Inc. | ||||||||
| Senior Secured First Lien Term Loan | ||||||||
| 8.056% (1 Month SOFR USD + 2.625%), | ||||||||
| 02/01/2027 (a) | 900,067 | 899,914 | ||||||
| Senior Secured First Lien Term Loan | ||||||||
| 8.181% (1 Month SOFR USD + 2.75%), | ||||||||
| 03/19/2029 (a) | 1,127,825 | 1,129,364 | ||||||
| SRS Distribution, Inc., | ||||||||
| Senior Secured First Lien Term Loan | ||||||||
| 8.931% (1 Month SOFR USD + 3.50%, | ||||||||
| 0.500% Floor), 06/02/2028 (a) | 771,066 | 764,439 | ||||||
The accompanying notes are an integral part of these financial statements.
20
SHENKMAN CAPITAL FLOATING RATE HIGH INCOME FUND
SCHEDULE OF INVESTMENTS – Continued
September 30, 2023
| Principal | Fair | |||||||
| Amount | Value | |||||||
| BANK LOANS – 84.30% (d) – Continued | ||||||||
| BUILDING PRODUCTS – 2.41% – Continued | ||||||||
| TAMKO Building Products, LLC, | ||||||||
| Senior Secured First Lien Term Loan | ||||||||
| 8.898% (3 Month SOFR USD + 3.50%), | ||||||||
| 09/13/2030 (a) | $ | 457,053 | $ | 455,627 | ||||
| VC GB Holdings I Corp., | ||||||||
| Senior Secured First Lien Term Loan | ||||||||
| 8.652% (1 Month SOFR USD + 3.00%, | ||||||||
| 0.500% Floor), 07/21/2028 (a) | 651,398 | 640,461 | ||||||
| 7,053,208 | ||||||||
| CHEMICALS – 3.76% | ||||||||
| Axalta Coating Systems U.S. Holdings , Inc., | ||||||||
| Senior Secured First Lien Term Loan | ||||||||
| 7.812% (1 Month SOFR USD + 2.50%, | ||||||||
| 0.500% Floor), 12/20/2029 (a) | 840,325 | 842,820 | ||||||
| Discovery Purchaser Corp., | ||||||||
| Senior Secured First Lien Term Loan | ||||||||
| 9.617% (3 Month SOFR USD + 4.375%, | ||||||||
| 0.500% Floor), 10/04/2029 (a) | 627,260 | 606,002 | ||||||
| Ineos U.S. Finance, LLC | ||||||||
| Senior Secured First Lien Term Loan | ||||||||
| 7.916% (1 Month SOFR USD + 2.50%, | ||||||||
| 0.500% Floor), 11/06/2028 (a) | 709,200 | 703,548 | ||||||
| Senior Secured First Lien Term Loan | ||||||||
| 8.916% (1 Month SOFR USD + 3.50%), | ||||||||
| 02/19/2030 (a) | 1,007,475 | 1,001,178 | ||||||
| Ineos U.S. Petrochem, LLC | ||||||||
| Senior Secured First Lien Term Loan | ||||||||
| 8.181% (1 Month SOFR USD + 2.75%, | ||||||||
| 0.500% Floor), 01/29/2026 (a) | 488,750 | 487,773 | ||||||
| Senior Secured First Lien Term Loan | ||||||||
| 9.166% (1 Month SOFR USD + 3.75%), | ||||||||
| 03/14/2030 (a) | 238,403 | 237,957 | ||||||
| Koppers, Inc. | ||||||||
| Senior Secured First Lien Term Loan | ||||||||
| 9.31% (Daily SOFR USD + 4.00%, | ||||||||
| 0.500% Floor), 04/10/2030 (a) | 87,264 | 87,591 | ||||||
| Senior Secured First Lien Term Loan | ||||||||
| 9.44% (1 Month SOFR USD + 4.00%, | ||||||||
| 0.500% Floor), 04/10/2030 (a) | 146,415 | 146,965 | ||||||
The accompanying notes are an integral part of these financial statements.
21
SHENKMAN CAPITAL FLOATING RATE HIGH INCOME FUND
SCHEDULE OF INVESTMENTS – Continued
September 30, 2023
| Principal | Fair | |||||||
| Amount | Value | |||||||
| BANK LOANS – 84.30% (d) – Continued | ||||||||
| CHEMICALS – 3.76% – Continued | ||||||||
| LSF11 A5 Holdco, LLC | ||||||||
| Senior Secured First Lien Term Loan | ||||||||
| 9.666% (1 Month SOFR USD + 4.25%, | ||||||||
| 0.500% Floor), 10/15/2028 (a) | $ | 324,188 | $ | 320,540 | ||||
| Senior Secured First Lien Term Loan | ||||||||
| 8.931% (1 Month SOFR USD + 3.50%, | ||||||||
| 0.500% Floor), 10/16/2028 (a) | 453,104 | 443,022 | ||||||
| Lummus Technology Holdings V, LLC, | ||||||||
| Senior Secured First Lien Term Loan | ||||||||
| 8.931% (1 Month SOFR USD + 3.50%), | ||||||||
| 06/30/2027 (a) | 467,753 | 467,201 | ||||||
| Nouryon Finance B.V. | ||||||||
| Senior Secured First Lien Term Loan | ||||||||
| 8.427% (1 Month SOFR USD + 3.00%), | ||||||||
| 10/01/2025 (a) | 264,130 | 264,460 | ||||||
| Senior Secured First Lien Term Loan | ||||||||
| 9.318%, 04/03/2028 (a)(g) | 49,727 | 49,209 | ||||||
| Senior Secured First Lien Term Loan | ||||||||
| 9.347% (3 Month SOFR USD + 4.00%), | ||||||||
| 04/03/2028 (a) | 308,228 | 305,017 | ||||||
| Olympus Water U.S. Holding Corp, | ||||||||
| Senior Secured First Lien Term Loan | ||||||||
| 10.39% (3 Month SOFR USD + 5.00%, | ||||||||
| 0.500% Floor), 11/09/2028 (a) | 285,000 | 285,178 | ||||||
| Orion Engineered Carbons GmbH, | ||||||||
| Senior Secured First Lien Term Loan | ||||||||
| 7.64% (3 Month SOFR USD + 2.15%, | ||||||||
| 0.500% Floor), 09/22/2028 (a) | 282,240 | 280,476 | ||||||
| PMHC II, Inc., | ||||||||
| Senior Secured First Lien Term Loan | ||||||||
| 9.698% (3 Month SOFR USD + 4.25%, | ||||||||
| 0.500% Floor), 04/23/2029 (a) | 1,080,436 | 1,022,606 | ||||||
| Polar U.S. Borrower, LLC | ||||||||
| Senior Secured First Lien Term Loan | ||||||||
| 9.821% (6 Month SOFR USD + 4.75%), | ||||||||
| 10/15/2025 (a) | 259,516 | 209,722 | ||||||
| Senior Secured First Lien Term Loan | ||||||||
| 10.151% (3 Month SOFR USD + 4.75%), | ||||||||
| 10/15/2025 (a) | 221,794 | 179,237 | ||||||
The accompanying notes are an integral part of these financial statements.
22
SHENKMAN CAPITAL FLOATING RATE HIGH INCOME FUND
SCHEDULE OF INVESTMENTS – Continued
September 30, 2023
| Principal | Fair | |||||||
| Amount | Value | |||||||
| BANK LOANS – 84.30% (d) – Continued | ||||||||
| CHEMICALS – 3.76% – Continued | ||||||||
| PQ Corp., | ||||||||
| Senior Secured First Lien Term Loan | ||||||||
| 7.969% (3 Month SOFR USD + 2.50%, | ||||||||
| 0.500% Floor), 06/09/2028 (a) | $ | 350,923 | $ | 350,310 | ||||
| PQ Performance Chemicals, | ||||||||
| Senior Secured First Lien Term Loan | ||||||||
| 8.692% (1 Month SOFR USD + 3.25%, | ||||||||
| 0.750% Floor), 08/02/2028 (a) | 519,743 | 518,443 | ||||||
| SCIH Salt Holdings, Inc., | ||||||||
| Senior Secured First Lien Term Loan | ||||||||
| 9.631% (3 Month SOFR USD + 4.00%, | ||||||||
| 0.750% Floor), 03/16/2027 (a) | 1,043,456 | 1,038,750 | ||||||
| Tronox Finance, LLC | ||||||||
| Senior Secured First Lien Term Loan | ||||||||
| 7.931% (1 Month SOFR USD + 2.50%), | ||||||||
| 03/10/2028 (a) | 70,154 | 69,041 | ||||||
| Senior Secured First Lien Term Loan | ||||||||
| 8.152% (1 Month SOFR USD + 2.50%), | ||||||||
| 03/10/2028 (a) | 346,154 | 340,664 | ||||||
| Vantage Specialty Chemicals, Inc., | ||||||||
| Senior Secured First Lien Term Loan | ||||||||
| 10.081% (1 Month SOFR USD + 4.75%, | ||||||||
| 0.500% Floor), 10/26/2026 (a) | 765,794 | 752,201 | ||||||
| 11,009,911 | ||||||||
| COMMERCIAL SERVICES – 6.00% | ||||||||
| AlixPartners, , LLP, | ||||||||
| Senior Secured First Lien Term Loan | ||||||||
| 8.181% (1 Month SOFR USD + 2.75%, | ||||||||
| 0.500% Floor), 02/04/2028 (a) | 1,034,342 | 1,034,859 | ||||||
| Allied Universal Holdco, LLC | ||||||||
| Senior Secured First Lien Term Loan | ||||||||
| 9.166% (1 Month SOFR USD + 3.75%, | ||||||||
| 0.500% Floor), 05/12/2028 (a) | 459,673 | 444,759 | ||||||
| Senior Secured First Lien Term Loan | ||||||||
| 9.781% (1 Month SOFR USD + 4.75%, | ||||||||
| 0.500% Floor), 05/12/2028 (a) | 445,000 | 439,438 | ||||||
The accompanying notes are an integral part of these financial statements.
23
SHENKMAN CAPITAL FLOATING RATE HIGH INCOME FUND
SCHEDULE OF INVESTMENTS – Continued
September 30, 2023
| Principal | Fair | |||||||
| Amount | Value | |||||||
| BANK LOANS – 84.30% (d) – Continued | ||||||||
| COMMERCIAL SERVICES – 6.00% – Continued | ||||||||
| American Auto Auction Group, LLC, | ||||||||
| Senior Secured First Lien Term Loan | ||||||||
| 10.39% (3 Month SOFR USD + 5.00%, | ||||||||
| 0.750% Floor), 12/30/2027 (a) | $ | 484,373 | $ | 460,154 | ||||
| Apex Group Treasury, LLC, | ||||||||
| Senior Secured First Lien Term Loan | ||||||||
| 9.379% (3 Month SOFR USD + 3.75%, | ||||||||
| 0.500% Floor), 07/27/2028 (a) | 738,382 | 733,305 | ||||||
| Aramark Services, Inc., | ||||||||
| Senior Secured First Lien Term Loan | ||||||||
| 7.931% (1 Month SOFR USD + 2.50%), | ||||||||
| 06/24/2030 (a) | 458,001 | 458,288 | ||||||
| Camelot U.S. Acquisition, LLC | ||||||||
| Senior Secured First Lien Term Loan | ||||||||
| 8.431% (1 Month SOFR USD + 3.00%), | ||||||||
| 10/30/2026 (a) | 657,535 | 657,946 | ||||||
| Senior Secured First Lien Term Loan | ||||||||
| 8.431% (1 Month SOFR USD + 3.00%, | ||||||||
| 1.000% Floor), 10/30/2026 (a) | 1,837,244 | 1,836,482 | ||||||
| Corelogic, Inc., | ||||||||
| Senior Secured First Lien Term Loan | ||||||||
| 8.931% (1 Month SOFR USD + 3.50%, | ||||||||
| 0.500% Floor), 06/02/2028 (a) | 316,833 | 293,927 | ||||||
| Deerfield Dakota Holding, LLC, | ||||||||
| Senior Secured First Lien Term Loan | ||||||||
| 9.14% (3 Month SOFR USD + 3.75%, | ||||||||
| 1.000% Floor), 04/09/2027 (a) | 1,994,017 | 1,948,743 | ||||||
| Dun & Bradstreet Corp., | ||||||||
| Senior Secured First Lien Term Loan | ||||||||
| 8.167% (1 Month SOFR USD + 2.75%), | ||||||||
| 02/06/2026 (a) | 1,766,540 | 1,765,984 | ||||||
| EAB Global, Inc., | ||||||||
| Senior Secured First Lien Term Loan | ||||||||
| 8.872% (6 Month LIBOR USD + 3.50%, | ||||||||
| 0.500% Floor), 08/16/2028 (a) | 492,645 | 489,874 | ||||||
| Galaxy U.S. Opco, Inc., | ||||||||
| Senior Secured First Lien Term Loan | ||||||||
| 10.066% (1 Month SOFR USD + 4.75%, | ||||||||
| 0.500% Floor), 04/30/2029 (a) | 354,323 | 339,707 | ||||||
The accompanying notes are an integral part of these financial statements.
24
SHENKMAN CAPITAL FLOATING RATE HIGH INCOME FUND
SCHEDULE OF INVESTMENTS – Continued
September 30, 2023
| Principal | Fair | |||||||
| Amount | Value | |||||||
| BANK LOANS – 84.30% (d) – Continued | ||||||||
| COMMERCIAL SERVICES – 6.00% – Continued | ||||||||
| Garda World Security Corp., | ||||||||
| Senior Secured First Lien Term Loan | ||||||||
| 9.746% (3 Month SOFR USD + 4.25%), | ||||||||
| 10/30/2026 (a) | $ | 880,876 | $ | 881,743 | ||||
| Garrett LX III Sarl | ||||||||
| Senior Secured First Lien Term Loan | ||||||||
| 9.869% (3 Month SOFR USD + 4.50%, | ||||||||
| 0.500% Floor), 05/01/2028 (a) | 107,143 | 107,411 | ||||||
| Senior Secured First Lien Term Loan | ||||||||
| 10.131% (3 Month SOFR USD + 4.50%, | ||||||||
| 0.500% Floor), 05/01/2028 (a) | 160,714 | 161,116 | ||||||
| Indy U.S. BIDCO, LLC | ||||||||
| Senior Secured First Lien Term Loan | ||||||||
| 9.066% (1 Month SOFR USD + 3.75%), | ||||||||
| 03/06/2028 (a) | 602,691 | 578,583 | ||||||
| Senior Secured First Lien Term Loan | ||||||||
| 11.566% (1 Month SOFR USD + 6.25%, | ||||||||
| 0.500% Floor), 03/06/2028 (a) | 635,009 | 620,191 | ||||||
| OMNIA Partners, LLC | ||||||||
| Senior Secured First Lien Term Loan | ||||||||
| 9.601% (3 Month SOFR USD + 4.25%), | ||||||||
| 07/25/2030 (a) | 552,133 | 553,455 | ||||||
| Senior Secured First Lien Delayed-Draw | ||||||||
| Term Loan 9.915%, 07/31/2030 (a)(g)(i) | 51,867 | 51,991 | ||||||
| Pre-Paid Legal Services, Inc., | ||||||||
| Senior Secured First Lien Term Loan | ||||||||
| 8.931% (1 Month SOFR USD + 3.50%, | ||||||||
| 0.500% Floor), 12/15/2028 (a) | 443,618 | 440,014 | ||||||
| Saphilux Sarl, | ||||||||
| Senior Secured First Lien Term Loan | ||||||||
| 4.75% (3 Month SOFR USD + 4.75%, | ||||||||
| 0.500% Floor), 07/18/2028 (a) | 366,000 | 366,686 | ||||||
| SS&C Technologies, Inc. | ||||||||
| Senior Secured First Lien Term Loan | ||||||||
| 7.666% (1 Month SOFR USD + 2.25%, | ||||||||
| 0.500% Floor), 03/22/2029 (a) | 599,903 | 600,515 | ||||||
| Senior Secured First Lien Term Loan | ||||||||
| 7.666% (1 Month SOFR USD + 2.25%, | ||||||||
| 0.500% Floor), 03/22/2029 (a) | 397,970 | 398,376 | ||||||
The accompanying notes are an integral part of these financial statements.
25
SHENKMAN CAPITAL FLOATING RATE HIGH INCOME FUND
SCHEDULE OF INVESTMENTS – Continued
September 30, 2023
| Principal | Fair | |||||||
| Amount | Value | |||||||
| BANK LOANS – 84.30% (d) – Continued | ||||||||
| COMMERCIAL SERVICES – 6.00% – Continued | ||||||||
| Tempo Acquisition, LLC, | ||||||||
| Senior Secured First Lien Term Loan | ||||||||
| 8.316% (1 Month SOFR USD + 3.00%, | ||||||||
| 0.500% Floor), 08/31/2028 (a) | $ | 74,813 | $ | 74,953 | ||||
| Trans Union, LLC, | ||||||||
| Senior Secured First Lien Term Loan | ||||||||
| 7.681% (1 Month SOFR USD + 2.25%, | ||||||||
| 0.500% Floor), 12/01/2028 (a) | 1,262,537 | 1,263,491 | ||||||
| VT Topco, Inc., | ||||||||
| Senior Secured First Lien Term Loan | ||||||||
| 9.661% (1 Month SOFR USD + 4.25%, | ||||||||
| 0.500% Floor), 08/09/2030 (a) | 579,720 | 580,749 | ||||||
| 17,582,740 | ||||||||
| CONSTRUCTION & ENGINEERING – 1.99% | ||||||||
| Amentum Government Services Holdings, LLC | ||||||||
| Senior Secured First Lien Term Loan | ||||||||
| 9.431% (1 Month SOFR USD + 4.00%), | ||||||||
| 02/01/2027 (a) | 925,898 | 921,269 | ||||||
| Senior Secured First Lien Term Loan | ||||||||
| 9.331% (1 Month SOFR USD + 4.00%, | ||||||||
| 0.500% Floor), 02/15/2029 (a) | 298,395 | 295,039 | ||||||
| American Residential Services, LLC, | ||||||||
| Senior Secured First Lien Term Loan | ||||||||
| 9.152% (3 Month SOFR USD + 3.50%, | ||||||||
| 0.750% Floor), 10/15/2027 (a) | 660,328 | 659,502 | ||||||
| Api Group DE, Inc. | ||||||||
| Senior Secured First Lien Term Loan | ||||||||
| 7.931% (1 Month SOFR USD + 2.50%), | ||||||||
| 10/01/2026 (a) | 506,738 | 508,046 | ||||||
| Senior Secured First Lien Term Loan | ||||||||
| 8.181% (1 Month SOFR USD + 2.75%), | ||||||||
| 01/03/2029 (a) | 499,308 | 501,065 | ||||||
| Brand Industrial Services, Inc., | ||||||||
| Senior Secured First Lien Term Loan | ||||||||
| 10.872% (3 Month SOFR USD + 5.50%, | ||||||||
| 0.500% Floor), 07/25/2030 (a) | 835,000 | 815,753 | ||||||
The accompanying notes are an integral part of these financial statements.
26
SHENKMAN CAPITAL FLOATING RATE HIGH INCOME FUND
SCHEDULE OF INVESTMENTS – Continued
September 30, 2023
| Principal | Fair | |||||||
| Amount | Value | |||||||
| BANK LOANS – 84.30% (d) – Continued | ||||||||
| CONSTRUCTION & ENGINEERING – 1.99% – Continued | ||||||||
| Centuri Group, Inc., | ||||||||
| Senior Secured First Lien Term Loan | ||||||||
| 7.931% (1 Month SOFR USD + 2.50%, | ||||||||
| 0.500% Floor), 08/28/2028 (a) | $ | 663,572 | $ | 662,175 | ||||
| Tecta America Corp. | ||||||||
| Senior Secured First Lien Term Loan | ||||||||
| 9.431% (1 Month SOFR USD + 4.00%, | ||||||||
| 0.750% Floor), 04/06/2028 (a) | 685,161 | 684,794 | ||||||
| Senior Secured First Lien Term Loan | ||||||||
| 9.696% (1 Month SOFR USD + 4.25%, | ||||||||
| 0.750% Floor), 04/10/2028 (a) | 213,000 | 212,886 | ||||||
| Tiger Acquisition, LLC, | ||||||||
| Senior Secured First Lien Term Loan | ||||||||
| 8.666% (1 Month SOFR USD + 3.25%, | ||||||||
| 0.500% Floor), 06/01/2028 (a) | 583,100 | 576,995 | ||||||
| 5,837,524 | ||||||||
| CONSUMER DISCRETIONARY – 2.15% | ||||||||
| Champ Acquisition Corp., | ||||||||
| Senior Secured First Lien Term Loan | ||||||||
| 11.152% (3 Month SOFR USD + 5.50%), | ||||||||
| 12/19/2025 (a) | 160,548 | 160,829 | ||||||
| Fugue Finance, LLC, | ||||||||
| Senior Secured First Lien Term Loan | ||||||||
| 9.354% (3 Month SOFR USD + 4.00%, | ||||||||
| 0.500% Floor), 01/31/2028 (a) | 445,144 | 446,535 | ||||||
| Hanesbrands, Inc., | ||||||||
| Senior Secured First Lien Term Loan | ||||||||
| 9.081% (1 Month SOFR USD + 3.75%, | ||||||||
| 0.500% Floor), 03/08/2030 (a) | 503,470 | 494,659 | ||||||
| Houghton Mifflin Harcourt Co., | ||||||||
| Senior Secured First Lien Term Loan | ||||||||
| 10.666% (1 Month SOFR USD + 5.25%, | ||||||||
| 0.500% Floor), 04/09/2029 (a) | 1,212,750 | 1,151,105 | ||||||
| KUEHG Corp., | ||||||||
| Senior Secured First Lien Term Loan | ||||||||
| 10.39% (3 Month SOFR USD + 5.00%, | ||||||||
| 0.500% Floor), 06/12/2030 (a) | 252,000 | 252,827 | ||||||
The accompanying notes are an integral part of these financial statements.
27
SHENKMAN CAPITAL FLOATING RATE HIGH INCOME FUND
SCHEDULE OF INVESTMENTS – Continued
September 30, 2023
| Principal | Fair | |||||||
| Amount | Value | |||||||
| BANK LOANS – 84.30% (d) – Continued | ||||||||
| CONSUMER DISCRETIONARY – 2.15% – Continued | ||||||||
| Learning Care Group (U.S.) No. 2, Inc. | ||||||||
| Senior Secured First Lien Term Loan | ||||||||
| 10.117% (3 Month SOFR USD + 4.75%, | ||||||||
| 0.500% Floor), 08/11/2028 (a) | $ | 146,389 | $ | 146,572 | ||||
| Senior Secured First Lien Term Loan | ||||||||
| 10.14% (3 Month SOFR USD + 4.75%, | ||||||||
| 0.500% Floor), 08/11/2028 (a) | 8,611 | 8,622 | ||||||
| Prometric Holdings, Inc. | ||||||||
| Senior Secured First Lien Term Loan | ||||||||
| 8.684% (3 Month SOFR USD + 3.00%, | ||||||||
| 1.000% Floor), 01/29/2025 (a) | 946,349 | 939,961 | ||||||
| Senior Secured First Lien Term Loan | ||||||||
| 10.575%, 01/29/2028 (a)(g) | 724,000 | 702,280 | ||||||
| Renaissance Holding Corp, | ||||||||
| Senior Secured First Lien Term Loan | ||||||||
| 10.066% (3 Month SOFR USD + 4.75%, | ||||||||
| 0.500% Floor), 04/05/2030 (a) | 730,000 | 725,437 | ||||||
| Spring Education Group, Inc., | ||||||||
| Senior Secured First Lien Term Loan | ||||||||
| 10.081%, 09/28/2030 (a)(g) | 361,000 | 358,386 | ||||||
| Tory Burch, LLC, | ||||||||
| Senior Secured First Lien Term Loan | ||||||||
| 8.696% (1 Month SOFR USD + 3.25%, | ||||||||
| 0.500% Floor), 04/14/2028 (a) | 366,563 | 362,373 | ||||||
| Tumi, Inc., | ||||||||
| Senior Secured First Lien Term Loan | ||||||||
| 8.066% (1 Month SOFR USD + 2.75%, | ||||||||
| 0.500% Floor), 06/21/2030 (a) | 380,048 | 381,237 | ||||||
| WW International , Inc., | ||||||||
| Senior Secured First Lien Term Loan | ||||||||
| 8.931% (1 Month SOFR USD + 3.50%, | ||||||||
| 0.500% Floor), 04/13/2028 (a) | 233,415 | 177,493 | ||||||
| 6,308,316 | ||||||||
| CONSUMER NON-DISCRETIONARY – 0.26% | ||||||||
| Kronos Acquisition Holdings, Inc., | ||||||||
| Senior Secured First Lien Term Loan | ||||||||
| 9.402% (3 Month SOFR USD + 3.75%, | ||||||||
| 0.500% Floor), 12/22/2026 (a) | 763,413 | 761,076 | ||||||
The accompanying notes are an integral part of these financial statements.
28
SHENKMAN CAPITAL FLOATING RATE HIGH INCOME FUND
SCHEDULE OF INVESTMENTS – Continued
September 30, 2023
| Principal | Fair | |||||||
| Amount | Value | |||||||
| BANK LOANS – 84.30% (d) – Continued | ||||||||
| ENVIRONMENTAL SERVICES – 1.40% | ||||||||
| Belfor Holdings, Inc. | ||||||||
| Senior Secured First Lien Term Loan | ||||||||
| 9.446% (1 Month SOFR USD + 4.00%), | ||||||||
| 04/06/2026 (a) | $ | 493,880 | $ | 494,910 | ||||
| Senior Secured First Lien Term Loan | ||||||||
| 9.581% (1 Month SOFR USD + 4.25%, | ||||||||
| 0.500% Floor), 04/06/2026 (a) | 383,060 | 384,018 | ||||||
| Brightview Landscapes, LLC, | ||||||||
| Senior Secured First Lien Term Loan | ||||||||
| 8.619% (3 Month SOFR USD + 3.25%, | ||||||||
| 0.500% Floor), 04/20/2029 (a) | 466,785 | 467,770 | ||||||
| Covanta Holding Corp. | ||||||||
| Senior Secured First Lien Term Loan | ||||||||
| 7.816% (1 Month SOFR USD + 2.50%, | ||||||||
| 0.500% Floor), 11/30/2028 (a) | 345,597 | 344,115 | ||||||
| Senior Secured First Lien Term Loan | ||||||||
| 7.816% (1 Month SOFR USD + 2.50%, | ||||||||
| 0.500% Floor), 11/30/2028 (a) | 26,282 | 26,169 | ||||||
| Senior Secured First Lien Term Loan | ||||||||
| 8.334% (1 Month SOFR USD + 3.00%, | ||||||||
| 0.500% Floor), 11/30/2028 (a) | 413,901 | 413,471 | ||||||
| Senior Secured First Lien Term Loan | ||||||||
| 8.334% (1 Month SOFR USD + 3.00%, | ||||||||
| 0.500% Floor), 11/30/2028 (a) | 31,043 | 31,010 | ||||||
| EnergySolutions, LLC, | ||||||||
| Senior Secured First Lien Term Loan | ||||||||
| 9.323% (1 Month SOFR USD + 4.00%, | ||||||||
| 0.500% Floor), 09/18/2030 (a) | 362,000 | 360,190 | ||||||
| GFL Environmental, Inc. | ||||||||
| Senior Secured First Lien Term Loan | ||||||||
| 7.823% (1 Month SOFR USD + 2.50%, | ||||||||
| 0.500% Floor), 05/31/2027 (a) | 106,000 | 106,050 | ||||||
| Senior Secured First Lien Term Loan | ||||||||
| 7.907%, 05/31/2027 (a)(g) | 167,550 | 167,828 | ||||||
| WIN Waste Innovations Holdings, Inc., | ||||||||
| Senior Secured First Lien Term Loan | ||||||||
| 8.181% (1 Month SOFR USD + 2.75%, | ||||||||
| 0.500% Floor), 03/24/2028 (a) | 1,418,625 | 1,309,483 | ||||||
| 4,105,014 | ||||||||
The accompanying notes are an integral part of these financial statements.
29
SHENKMAN CAPITAL FLOATING RATE HIGH INCOME FUND
SCHEDULE OF INVESTMENTS – Continued
September 30, 2023
| Principal | Fair | |||||||
| Amount | Value | |||||||
| BANK LOANS – 84.30% (d) – Continued | ||||||||
| FINANCIALS: DIVERSIFIED – 2.32% | ||||||||
| Amynta Agency Borrower, Inc., | ||||||||
| Senior Secured First Lien Term Loan | ||||||||
| 10.416% (1 Month SOFR USD + 5.00%), | ||||||||
| 02/28/2028 (a) | $ | 328,178 | $ | 328,701 | ||||
| Avolon TLB Borrower 1 (U.S.), LLC, | ||||||||
| Senior Secured First Lien Term Loan | ||||||||
| 7.825% (1 Month SOFR USD + 2.50%, | ||||||||
| 0.500% Floor), 06/22/2028 (a) | 496,755 | 497,346 | ||||||
| Blackstone Mortgage Trust, Inc., | ||||||||
| Senior Secured First Lien Term Loan | ||||||||
| 7.681% (1 Month SOFR USD + 2.25%), | ||||||||
| 04/23/2026 (a) | 561,600 | 552,828 | ||||||
| Castlelake Aviation One, LLC, | ||||||||
| Senior Secured First Lien Term Loan | ||||||||
| 8.421% (3 Month SOFR USD + 2.75%, | ||||||||
| 0.500% Floor), 10/22/2027 (a) | 522,055 | 521,914 | ||||||
| Citco Group, Ltd., | ||||||||
| Senior Secured First Lien Term Loan | ||||||||
| 8.591% (3 Month SOFR USD + 3.50%, | ||||||||
| 0.500% Floor), 04/26/2028 (a) | 429,660 | 430,556 | ||||||
| Corp. Service Co., | ||||||||
| Senior Secured First Lien Term Loan | ||||||||
| 8.666% (1 Month SOFR USD + 3.25%, | ||||||||
| 0.500% Floor), 11/02/2029 (a) | 571,500 | 572,143 | ||||||
| Edelman Financial Engines Centre, LLC, | ||||||||
| Senior Secured First Lien Term Loan | ||||||||
| 8.931% (1 Month SOFR USD + 3.50%, | ||||||||
| 0.750% Floor), 04/07/2028 (a) | 447,855 | 443,880 | ||||||
| Focus Financial Partners, LLC, | ||||||||
| Senior Secured First Lien Term Loan | ||||||||
| 8.566% (1 Month SOFR USD + 3.25%, | ||||||||
| 0.500% Floor), 06/30/2028 (a) | 754,738 | 753,742 | ||||||
| GTCR W Merger Sub, LLC, | ||||||||
| Senior Secured First Lien Term Loan | ||||||||
| 9.422%, 09/21/2023 (a)(g) | 144,000 | 144,053 | ||||||
| Moneygram International, Inc., | ||||||||
| Senior Secured First Lien Term Loan | ||||||||
| 10.777% (1 Month SOFR USD + 5.50%, | ||||||||
| 0.500% Floor), 06/01/2030 (a) | 319,000 | 303,249 | ||||||
The accompanying notes are an integral part of these financial statements.
30
SHENKMAN CAPITAL FLOATING RATE HIGH INCOME FUND
SCHEDULE OF INVESTMENTS – Continued
September 30, 2023
| Principal | Fair | |||||||
| Amount | Value | |||||||
| BANK LOANS – 84.30% (d) – Continued | ||||||||
| FINANCIALS: DIVERSIFIED – 2.32% – Continued | ||||||||
| NAB Holdings, LLC, | ||||||||
| Senior Secured First Lien Term Loan | ||||||||
| 8.392% (3 Month SOFR USD + 3.00%, | ||||||||
| 0.500% Floor), 11/24/2028 (a) | $ | 496,847 | $ | 496,047 | ||||
| VFH Parent, LLC, | ||||||||
| Senior Secured First Lien Term Loan | ||||||||
| 8.189% (1 Month SOFR USD + 3.00%, | ||||||||
| 0.500% Floor), 01/12/2029 (a) | 1,064,250 | 1,058,705 | ||||||
| WEX, Inc., | ||||||||
| Senior Secured First Lien Term Loan | ||||||||
| 7.467% (1 Month SOFR USD + 2.25%), | ||||||||
| 03/31/2028 (a) | 699,075 | 700,868 | ||||||
| 6,804,032 | ||||||||
| FINANCIALS: INSURANCE – 3.18% | ||||||||
| Acrisure, LLC | ||||||||
| Senior Secured First Lien Term Loan | ||||||||
| 11.121% (3 Month SOFR USD + 5.75%, | ||||||||
| 1.000% Floor), 02/15/2027 (a) | 908,983 | 915,801 | ||||||
| Senior Secured First Lien Term Loan | ||||||||
| 9.681% (1 Month LIBOR USD + 4.25%, | ||||||||
| 0.500% Floor), 02/16/2027 (a) | 260,363 | 260,282 | ||||||
| AssuredPartners, Inc. | ||||||||
| Senior Secured First Lien Term Loan | ||||||||
| 8.931% (1 Month SOFR USD + 3.50%, | ||||||||
| 0.500% Floor), 02/12/2027 (a) | 356,788 | 357,010 | ||||||
| Senior Secured First Lien Term Loan | ||||||||
| 8.946% (1 Month SOFR USD + 3.50%), | ||||||||
| 02/12/2027 (a) | 631,992 | 631,154 | ||||||
| Asurion, LLC | ||||||||
| Senior Secured First Lien Term Loan | ||||||||
| 9.666% (1 Month SOFR USD + 4.25%), | ||||||||
| 12/23/2026 (a) | 2,329,745 | 2,286,062 | ||||||
| Senior Secured Second Lien Term Loan | ||||||||
| 10.681% (1 Month SOFR USD + 5.25%), | ||||||||
| 01/22/2029 (a) | 1,160,000 | 1,033,224 | ||||||
The accompanying notes are an integral part of these financial statements.
31
SHENKMAN CAPITAL FLOATING RATE HIGH INCOME FUND
SCHEDULE OF INVESTMENTS – Continued
September 30, 2023
| Principal | Fair | |||||||
| Amount | Value | |||||||
| BANK LOANS – 84.30% (d) – Continued | ||||||||
| FINANCIALS: INSURANCE – 3.18% – Continued | ||||||||
| Broadstreet Partners, Inc., | ||||||||
| Senior Secured First Lien Term Loan | ||||||||
| 9.316% (1 Month SOFR USD + 4.00%), | ||||||||
| 01/26/2029 (a) | $ | 315,210 | $ | 315,637 | ||||
| HUB International, Ltd., | ||||||||
| Senior Secured First Lien Term Loan | ||||||||
| 9.584% (3 Month SOFR USD + 4.25%, | ||||||||
| 0.750% Floor), 06/20/2030 (a) | 1,157,094 | 1,161,555 | ||||||
| Jones Deslauriers Insurance Management, Inc., | ||||||||
| Senior Secured First Lien Term Loan | ||||||||
| 9.548%, 07/28/2030 (a)(g) | 367,000 | 369,296 | ||||||
| OneDigital Borrower, LLC, | ||||||||
| Senior Secured First Lien Term Loan | ||||||||
| 9.666% (1 Month SOFR USD + 4.25%, | ||||||||
| 0.500% Floor), 11/16/2027 (a) | 295,148 | 295,271 | ||||||
| USI, Inc. | ||||||||
| Senior Secured First Lien Term Loan | ||||||||
| 9.14% (3 Month SOFR USD + 3.75%, | ||||||||
| 0.500% Floor), 11/14/2029 (a) | 948,253 | 948,712 | ||||||
| Senior Secured First Lien Term Loan | ||||||||
| 9.422%, 09/13/2030 (a)(g) | 456,000 | 455,430 | ||||||
| Senior Secured First Lien Term Loan | ||||||||
| 8.64% (3 Month SOFR USD + 3.25%), | ||||||||
| 09/14/2030 (a) | 288,000 | 287,640 | ||||||
| 9,317,074 | ||||||||
| FOOD & BEVERAGE – 1.57% | ||||||||
| BCPE Empire Holdings, Inc., | ||||||||
| Senior Secured First Lien Term Loan | ||||||||
| 10.066% (1 Month SOFR USD + 4.75%, | ||||||||
| 0.500% Floor), 12/11/2028 (a) | 452,865 | 453,374 | ||||||
| H-Food Holdings, LLC | ||||||||
| Senior Secured First Lien Term Loan | ||||||||
| 9.269% (6 Month LIBOR USD + 3.6875%), | ||||||||
| 05/23/2025 (a) | 862,225 | 755,766 | ||||||
| Senior Secured First Lien Term Loan | ||||||||
| 9.581% (6 Month LIBOR USD + 4.00%), | ||||||||
| 05/23/2025 (a) | 119,063 | 104,552 | ||||||
The accompanying notes are an integral part of these financial statements.
32
SHENKMAN CAPITAL FLOATING RATE HIGH INCOME FUND
SCHEDULE OF INVESTMENTS – Continued
September 30, 2023
| Principal | Fair | |||||||
| Amount | Value | |||||||
| BANK LOANS – 84.30% (d) – Continued | ||||||||
| FOOD & BEVERAGE – 1.57% – Continued | ||||||||
| Pegasus Bidco BV, | ||||||||
| Senior Secured First Lien Term Loan | ||||||||
| 9.615% (3 Month SOFR USD + 4.25%, | ||||||||
| 0.500% Floor), 07/12/2029 (a) | $ | 983,568 | $ | 985,412 | ||||
| Triton Water Holdings, Inc., | ||||||||
| Senior Secured First Lien Term Loan | ||||||||
| 8.753% (3 Month SOFR USD + 3.25%, | ||||||||
| 0.500% Floor), 03/31/2028 (a) | 2,366,489 | 2,311,268 | ||||||
| 4,610,372 | ||||||||
| HEALTHCARE: EQUIPMENT & SUPPLIES – 2.99% | ||||||||
| athenahealth Group, Inc., | ||||||||
| Senior Secured First Lien Term Loan | ||||||||
| 8.568% (1 Month SOFR USD + 3.25%, | ||||||||
| 0.500% Floor), 02/15/2029 (a) | 1,671,771 | 1,645,131 | ||||||
| Azalea TopCo, Inc. | ||||||||
| Senior Secured First Lien Term Loan | ||||||||
| 8.946% (1 Month SOFR USD + 3.50%), | ||||||||
| 07/24/2026 (a) | 569 | 548 | ||||||
| Senior Secured First Lien Term Loan | ||||||||
| 9.003% (1 Month SOFR USD + 3.75%, | ||||||||
| 0.750% Floor), 07/24/2026 (a) | 351,554 | 339,139 | ||||||
| Senior Secured First Lien Term Loan | ||||||||
| 9.184% (3 Month SOFR USD + 3.50%), | ||||||||
| 07/24/2026 (a) | 218,159 | 210,415 | ||||||
| Senior Secured First Lien Term Loan | ||||||||
| 9.196% (1 Month SOFR USD + 3.75%, | ||||||||
| 0.750% Floor), 07/24/2026 (a) | 278 | 269 | ||||||
| Senior Secured First Lien Term Loan | ||||||||
| 9.434% (3 Month SOFR USD + 3.75%, | ||||||||
| 0.750% Floor), 07/24/2026 (a) | 108,854 | 105,225 | ||||||
| Bausch & Lomb Corp., | ||||||||
| Senior Secured First Lien Term Loan | ||||||||
| 8.755% (3 Month SOFR USD + 3.25%, | ||||||||
| 0.500% Floor), 05/10/2027 (a) | 751,488 | 731,866 | ||||||
| Cvet Midco 2, LP, | ||||||||
| Senior Secured First Lien Term Loan | ||||||||
| 10.39% (3 Month SOFR USD + 5.00%, | ||||||||
| 0.500% Floor), 10/15/2029 (a) | 233,825 | 231,695 | ||||||
The accompanying notes are an integral part of these financial statements.
33
SHENKMAN CAPITAL FLOATING RATE HIGH INCOME FUND
SCHEDULE OF INVESTMENTS – Continued
September 30, 2023
| Principal | Fair | |||||||
| Amount | Value | |||||||
| BANK LOANS – 84.30% (d) – Continued | ||||||||
| HEALTHCARE: EQUIPMENT & SUPPLIES – 2.99% – Continued | ||||||||
| Embecta Corp, | ||||||||
| Senior Secured First Lien Term Loan | ||||||||
| 8.337% (6 Month SOFR USD + 3.00%, | ||||||||
| 0.500% Floor), 03/30/2029 (a) | $ | 405,220 | $ | 397,781 | ||||
| Gainwell Acquisition Corp., | ||||||||
| Senior Secured First Lien Term Loan | ||||||||
| 9.49% (3 Month SOFR USD + 4.00%, | ||||||||
| 0.750% Floor), 10/01/2027 (a) | 1,545,544 | 1,511,735 | ||||||
| Greenway Health, LLC, | ||||||||
| Senior Secured First Lien Term Loan | ||||||||
| 9.181% (1 Month SOFR USD + 3.75%, | ||||||||
| 1.000% Floor), 02/16/2024 (a) | 363,032 | 340,342 | ||||||
| Insulet Corp., | ||||||||
| Senior Secured First Lien Term Loan | ||||||||
| 8.681% (1 Month SOFR USD + 3.25%, | ||||||||
| 0.500% Floor), 05/04/2028 (a) | 762,450 | 762,850 | ||||||
| Medline Borrower, LP, | ||||||||
| Senior Secured First Lien Term Loan | ||||||||
| 8.681% (1 Month SOFR USD + 3.25%, | ||||||||
| 0.500% Floor), 10/23/2028 (a) | 926,766 | 925,344 | ||||||
| Navicure, Inc., | ||||||||
| Senior Secured First Lien Term Loan | ||||||||
| 9.431% (1 Month SOFR USD + 4.00%), | ||||||||
| 10/22/2026 (a) | 1,563,767 | 1,567,434 | ||||||
| 8,769,774 | ||||||||
| HEALTHCARE: FACILITIES – 3.38% | ||||||||
| ADMI Corp. | ||||||||
| Senior Secured First Lien Term Loan | ||||||||
| 8.806% (1 Month SOFR USD + 3.375%, | ||||||||
| 0.500% Floor), 12/23/2027 (a) | 636,787 | 591,893 | ||||||
| Senior Secured First Lien Term Loan | ||||||||
| 9.181% (1 Month SOFR USD + 3.75%, | ||||||||
| 0.500% Floor), 12/23/2027 (a) | 637,000 | 595,821 | ||||||
| CHG Healthcare Services, Inc. | ||||||||
| Senior Secured First Lien Term Loan | ||||||||
| 8.681% (1 Month SOFR USD + 3.25%, | ||||||||
| 0.500% Floor), 09/29/2028 (a) | 295,253 | 294,398 | ||||||
| Senior Secured First Lien Term Loan | ||||||||
| 9.145% (3 Month SOFR USD + 3.75%, | ||||||||
| 0.500% Floor), 09/29/2028 (a) | 390,304 | 390,548 | ||||||
The accompanying notes are an integral part of these financial statements.
34
SHENKMAN CAPITAL FLOATING RATE HIGH INCOME FUND
SCHEDULE OF INVESTMENTS – Continued
September 30, 2023
| Principal | Fair | |||||||
| Amount | Value | |||||||
| BANK LOANS – 84.30% (d) – Continued | ||||||||
| HEALTHCARE: FACILITIES – 3.38% – Continued | ||||||||
| Electron Bidco, Inc., | ||||||||
| Senior Secured First Lien Term Loan | ||||||||
| 8.431% (1 Month SOFR USD + 3.00%, | ||||||||
| 0.500% Floor), 11/01/2028 (a) | $ | 1,207,255 | $ | 1,203,899 | ||||
| Heartland Dental, LLC, | ||||||||
| Senior Secured First Lien Term Loan | ||||||||
| 10.331% (1 Month SOFR USD + 5.00%, | ||||||||
| 0.750% Floor), 04/28/2028 (a) | 934,612 | 926,070 | ||||||
| Option Care Health, Inc., | ||||||||
| Senior Secured First Lien Term Loan | ||||||||
| 8.181% (1 Month SOFR USD + 2.75%, | ||||||||
| 0.500% Floor), 10/27/2028 (a) | 1,044,702 | 1,048,948 | ||||||
| Pluto Acquisition I, Inc., | ||||||||
| Senior Secured First Lien Term Loan | ||||||||
| 9.684% (3 Month SOFR USD + 4.00%), | ||||||||
| 06/22/2026 (a) | 1,043,739 | 917,186 | ||||||
| Premier Dental Services, Inc. | ||||||||
| Senior Secured First Lien Delayed-Draw Term | ||||||||
| Loan 10.184% (3 Month SOFR USD + | ||||||||
| 4.50%, 0.750% Floor), 08/18/2028 (a) | 31,240 | 25,753 | ||||||
| Senior Secured First Lien Term Loan | ||||||||
| 10.184% (3 Month SOFR USD + 4.50%, | ||||||||
| 0.750% Floor), 08/18/2028 (a) | 305,794 | 252,089 | ||||||
| Select Medical Corp., | ||||||||
| Senior Secured First Lien Term Loan | ||||||||
| 8.316% (1 Month SOFR USD + 3.00%), | ||||||||
| 03/06/2027 (a) | 398,788 | 398,290 | ||||||
| Sotera Health Holdings, LLC | ||||||||
| Senior Secured First Lien Term Loan | ||||||||
| 8.181% (1 Month SOFR USD + 2.75%, | ||||||||
| 0.500% Floor), 12/11/2026 (a) | 261,000 | 259,467 | ||||||
| Senior Secured First Lien Term Loan | ||||||||
| 9.073% (1 Month SOFR USD + 3.75%, | ||||||||
| 0.500% Floor), 12/11/2026 (a) | 324,188 | 325,403 | ||||||
| Surgery Center Holdings, Inc., | ||||||||
| Senior Secured First Lien Term Loan | ||||||||
| 9.189% (1 Month SOFR USD + 3.75%, | ||||||||
| 0.750% Floor), 09/03/2026 (a) | 1,984,063 | 1,988,468 | ||||||
The accompanying notes are an integral part of these financial statements.
35
SHENKMAN CAPITAL FLOATING RATE HIGH INCOME FUND
SCHEDULE OF INVESTMENTS – Continued
September 30, 2023
| Principal | Fair | |||||||
| Amount | Value | |||||||
| BANK LOANS – 84.30% (d) – Continued | ||||||||
| HEALTHCARE: FACILITIES – 3.38% – Continued | ||||||||
| U.S. Radiology Specialists, Inc., | ||||||||
| Senior Secured First Lien Term Loan | ||||||||
| 10.74% (3 Month SOFR USD + 5.25%, | ||||||||
| 0.500% Floor), 12/15/2027 (a) | $ | 715,260 | $ | 695,590 | ||||
| 9,913,823 | ||||||||
| HEALTHCARE: LIFE SCIENCES – 2.51% | ||||||||
| Avantor Funding, Inc., | ||||||||
| Senior Secured First Lien Term Loan | ||||||||
| 7.666% (1 Month SOFR USD + 2.25%, | ||||||||
| 0.500% Floor), 11/08/2027 (a) | 708,031 | 708,795 | ||||||
| Cambrex Corp., | ||||||||
| Senior Secured First Lien Term Loan | ||||||||
| 8.916% (1 Month SOFR USD + 3.50%, | ||||||||
| 0.750% Floor), 12/04/2026 (a) | 2,221,882 | 2,215,639 | ||||||
| Curia Global, Inc., | ||||||||
| Senior Secured First Lien Term Loan | ||||||||
| 9.169% (3 Month SOFR USD + 3.75%, | ||||||||
| 0.750% Floor), 08/31/2026 (a) | 1,634,553 | 1,365,881 | ||||||
| Fortrea Holdings, Inc., | ||||||||
| Senior Secured First Lien Term Loan | ||||||||
| 9.066% (1 Month SOFR USD + 3.75%, | ||||||||
| 0.500% Floor), 07/01/2030 (a) | 737,153 | 735,616 | ||||||
| ICON Luxembourg Sarl, | ||||||||
| Senior Secured First Lien Term Loan | ||||||||
| 7.902% (3 Month SOFR USD + 2.25%, | ||||||||
| 0.500% Floor), 07/03/2028 (a) | 861,515 | 862,248 | ||||||
| Parexel International, | ||||||||
| Senior Secured First Lien Term Loan | ||||||||
| 8.681% (1 Month SOFR USD + 3.25%, | ||||||||
| 0.500% Floor), 11/15/2028 (a) | 619,628 | 616,038 | ||||||
| PRA Health Sciences, Inc., | ||||||||
| Senior Secured First Lien Term Loan | ||||||||
| 7.902% (3 Month SOFR USD + 2.25%, | ||||||||
| 0.500% Floor), 07/03/2028 (a) | 214,647 | 214,830 | ||||||
| Star Parent, Inc., | ||||||||
| Senior Secured First Lien Term Loan | ||||||||
| 9.386% (3 Month SOFR USD + 4.00%), | ||||||||
| 09/19/2030 (a) | 652,250 | 638,706 | ||||||
| 7,357,753 | ||||||||
The accompanying notes are an integral part of these financial statements.
36
SHENKMAN CAPITAL FLOATING RATE HIGH INCOME FUND
SCHEDULE OF INVESTMENTS – Continued
September 30, 2023
| Principal | Fair | |||||||
| Amount | Value | |||||||
| BANK LOANS – 84.30% (d) – Continued | ||||||||
| HEALTHCARE: MANAGED HEALTH CARE – 0.82% | ||||||||
| Verscend Holding Corp., | ||||||||
| Senior Secured First Lien Term Loan | ||||||||
| 9.431% (1 Month SOFR USD + 4.00%), | ||||||||
| 08/27/2025 (a) | $ | 2,385,528 | $ | 2,389,154 | ||||
| HEALTHCARE: PHARMACEUTICALS & BIOTECHNOLOGY – 1.04% | ||||||||
| Jazz Pharmaceuticals, Inc., | ||||||||
| Senior Secured First Lien Term Loan | ||||||||
| 8.931% (1 Month SOFR USD + 3.50%, | ||||||||
| 0.500% Floor), 05/05/2028 (a) | 1,546,828 | 1,547,369 | ||||||
| Organon & Co., | ||||||||
| Senior Secured First Lien Term Loan | ||||||||
| 8.442% (1 Month SOFR USD + 3.00%, | ||||||||
| 0.500% Floor), 06/02/2028 (a) | 1,493,426 | 1,493,052 | ||||||
| 3,040,421 | ||||||||
| INDUSTRIAL MACHINERY – 4.94% | ||||||||
| AI Aqua Merger Sub, Inc., | ||||||||
| Senior Secured First Lien Term Loan | ||||||||
| 9.062% (1 Month SOFR USD + 3.75%, | ||||||||
| 0.500% Floor), 07/31/2028 (a) | 898,625 | 890,973 | ||||||
| Ali Group North America Corp., | ||||||||
| Senior Secured First Lien Term Loan | ||||||||
| 7.431% (1 Month SOFR USD + 2.00%), | ||||||||
| 07/30/2029 (a) | 565,267 | 565,660 | ||||||
| ASP Blade Holdings, Inc., | ||||||||
| Senior Secured First Lien Term Loan | ||||||||
| 9.652% (3 Month SOFR USD + 4.00%, | ||||||||
| 0.500% Floor), 10/13/2028 (a) | 411,439 | 364,510 | ||||||
| AZZ, Inc., | ||||||||
| Senior Secured First Lien Term Loan | ||||||||
| 9.066% (1 Month SOFR USD + 3.75%, | ||||||||
| 0.500% Floor), 05/11/2029 (a) | 555,543 | 557,392 | ||||||
| Brookfield WEC Holdings, Inc., | ||||||||
| Senior Secured First Lien Term Loan | ||||||||
| 8.181% (1 Month SOFR USD + 2.75%, | ||||||||
| 0.500% Floor), 08/01/2025 (a) | 1,683,518 | 1,684,494 | ||||||
The accompanying notes are an integral part of these financial statements.
37
SHENKMAN CAPITAL FLOATING RATE HIGH INCOME FUND
SCHEDULE OF INVESTMENTS – Continued
September 30, 2023
| Principal | Fair | |||||||
| Amount | Value | |||||||
| BANK LOANS – 84.30% (d) – Continued | ||||||||
| INDUSTRIAL MACHINERY – 4.94% – Continued | ||||||||
| Chart Industries, Inc., | ||||||||
| Senior Secured First Lien Term Loan | ||||||||
| 9.174% (1 Month SOFR USD + 3.75%, | ||||||||
| 0.500% Floor), 03/15/2030 (a) | $ | 1,940,950 | $ | 1,945,803 | ||||
| Clark Equipment Co., | ||||||||
| Senior Secured First Lien Term Loan | ||||||||
| 7.99% (3 Month SOFR USD + 2.50%, | ||||||||
| 0.500% Floor), 04/20/2029 (a) | 391,176 | 391,786 | ||||||
| Columbus McKinnon Corp., | ||||||||
| Senior Secured First Lien Term Loan | ||||||||
| 8.422% (3 Month SOFR USD + 2.75%, | ||||||||
| 0.500% Floor), 05/15/2028 (a) | 591,603 | 592,715 | ||||||
| Conair Holdings, LLC, | ||||||||
| Senior Secured First Lien Term Loan | ||||||||
| 9.181% (1 Month SOFR USD + 3.75%, | ||||||||
| 0.500% Floor), 05/17/2028 (a) | 340,845 | 327,494 | ||||||
| CPM Holdings, Inc., | ||||||||
| Senior Secured First Lien Term Loan | ||||||||
| 9.818% (1 Month SOFR USD + 4.50%, | ||||||||
| 0.500% Floor), 09/27/2028 (a) | 649,000 | 648,393 | ||||||
| EMRLD Borrower, LP, | ||||||||
| Senior Secured First Lien Term Loan | ||||||||
| 8.316% (1 Month SOFR USD + 3.00%), | ||||||||
| 05/31/2030 (a) | 800,177 | 800,181 | ||||||
| Filtration Group Corp. | ||||||||
| Senior Secured First Lien Term Loan | ||||||||
| 8.931% (1 Month SOFR USD + 3.50%, | ||||||||
| 0.500% Floor), 10/20/2028 (a) | 623,901 | 622,148 | ||||||
| Senior Secured First Lien Term Loan | ||||||||
| 9.681% (1 Month SOFR USD + 4.25%, | ||||||||
| 0.500% Floor), 10/23/2028 (a) | 407,950 | 409,027 | ||||||
| Gates Global, LLC, | ||||||||
| Senior Secured First Lien Term Loan | ||||||||
| 8.931% (1 Month SOFR USD + 3.50%, | ||||||||
| 0.500% Floor), 11/16/2029 (a) | 521,730 | 522,627 | ||||||
| LSF12 Badger Bidco, LLC, | ||||||||
| Senior Secured First Lien Term Loan | ||||||||
| 11.316% (1 Month SOFR USD + 6.00%), | ||||||||
| 09/02/2030 (a) | 586,000 | 586,000 | ||||||
The accompanying notes are an integral part of these financial statements.
38
SHENKMAN CAPITAL FLOATING RATE HIGH INCOME FUND
SCHEDULE OF INVESTMENTS – Continued
September 30, 2023
| Principal | Fair | |||||||
| Amount | Value | |||||||
| BANK LOANS – 84.30% (d) – Continued | ||||||||
| INDUSTRIAL MACHINERY – 4.94% – Continued | ||||||||
| Madison IAQ, LLC, | ||||||||
| Senior Secured First Lien Term Loan | ||||||||
| 8.689% (1 Month SOFR USD + 3.25%, | ||||||||
| 0.500% Floor), 06/21/2028 (a) | $ | 597,253 | $ | 588,557 | ||||
| Pro Mach Group, Inc., | ||||||||
| Senior Secured First Lien Term Loan | ||||||||
| 9.446% (1 Month SOFR USD + 4.00%, | ||||||||
| 1.000% Floor), 08/31/2028 (a) | 970,003 | 972,070 | ||||||
| Roper Industrial Products Investment Co., LLC., | ||||||||
| Senior Secured First Lien Term Loan | ||||||||
| 9.89% (3 Month SOFR USD + 4.50%, | ||||||||
| 0.500% Floor), 11/22/2029 (a) | 539,290 | 541,121 | ||||||
| TK Elevator Midco GMBH, | ||||||||
| Senior Secured First Lien Term Loan | ||||||||
| 9.381% (6 Month SOFR USD + 3.50%, | ||||||||
| 0.500% Floor), 07/30/2027 (a) | 903,462 | 902,558 | ||||||
| Vertiv Group Corp., | ||||||||
| Senior Secured First Lien Term Loan | ||||||||
| 8.192% (1 Month SOFR USD + 2.75%), | ||||||||
| 03/02/2027 (a) | 571,577 | 571,477 | ||||||
| 14,484,986 | ||||||||
| LEISURE: CASINOS & GAMING – 3.72% | ||||||||
| 888 Acquisitions, Ltd. | ||||||||
| Senior Secured First Lien Term Loan | ||||||||
| 10.817% (6 Month SOFR USD + 5.25%, | ||||||||
| 0.500% Floor), 07/08/2028 (a) | 482,524 | 456,386 | ||||||
| Aristocrat Technologies, Inc., | ||||||||
| Senior Secured First Lien Term Loan | ||||||||
| 7.74% (3 Month SOFR USD + 2.25%, | ||||||||
| 0.500% Floor), 05/24/2029 (a) | 224,143 | 224,983 | ||||||
| Bally’s Corp., | ||||||||
| Senior Secured First Lien Term Loan | ||||||||
| 8.838% (3 Month SOFR USD + 3.25%, | ||||||||
| 0.500% Floor), 10/02/2028 (a) | 416,696 | 409,285 | ||||||
| Caesars Entertainment, Inc., | ||||||||
| Senior Secured First Lien Term Loan | ||||||||
| 8.666% (1 Month SOFR USD + 3.25%, | ||||||||
| 0.500% Floor), 02/06/2030 (a) | 709,435 | 710,545 | ||||||
The accompanying notes are an integral part of these financial statements.
39
SHENKMAN CAPITAL FLOATING RATE HIGH INCOME FUND
SCHEDULE OF INVESTMENTS – Continued
September 30, 2023
| Principal | Fair | |||||||
| Amount | Value | |||||||
| BANK LOANS – 84.30% (d) – Continued | ||||||||
| LEISURE: CASINOS & GAMING – 3.72% – Continued | ||||||||
| Entain Holdings (Gibraltar), Ltd. | ||||||||
| Senior Secured First Lien Term Loan | ||||||||
| 7.99% (3 Month SOFR USD + 2.50%, | ||||||||
| 0.500% Floor), 03/29/2027 (a) | $ | 730,193 | $ | 730,127 | ||||
| Senior Secured First Lien Term Loan | ||||||||
| 8.99% (3 Month SOFR USD + 3.50%, | ||||||||
| 0.500% Floor), 10/31/2029 (a) | 1,062,527 | 1,062,861 | ||||||
| Everi Holdings, Inc., | ||||||||
| Senior Secured First Lien Term Loan | ||||||||
| 7.931% (1 Month SOFR USD + 2.50%, | ||||||||
| 0.500% Floor), 08/03/2028 (a) | 454,538 | 454,822 | ||||||
| Fertitta Entertainment, LLC, | ||||||||
| Senior Secured First Lien Term Loan | ||||||||
| 9.316% (1 Month SOFR USD + 4.00%, | ||||||||
| 0.500% Floor), 01/29/2029 (a) | 1,046,914 | 1,038,136 | ||||||
| Ontario Gaming GTA, LP, | ||||||||
| Senior Secured First Lien Term Loan | ||||||||
| 9.64% (3 Month SOFR USD + 4.25%, | ||||||||
| 0.500% Floor), 08/01/2030 (a) | 738,000 | 739,461 | ||||||
| Penn National Gaming, Inc., | ||||||||
| Senior Secured First Lien Term Loan | ||||||||
| 8.166% (1 Month SOFR USD + 2.75%, | ||||||||
| 0.500% Floor), 05/03/2029 (a) | 590,968 | 590,968 | ||||||
| Scientific Games International, Inc., | ||||||||
| Senior Secured First Lien Term Loan | ||||||||
| 8.434% (1 Month SOFR USD + 3.00%, | ||||||||
| 0.500% Floor), 04/16/2029 (a) | 857,150 | 858,221 | ||||||
| Stars Group Holdings B.V. | ||||||||
| Senior Secured First Lien Term Loan | ||||||||
| 7.902% (3 Month SOFR USD + 2.25%), | ||||||||
| 07/21/2026 (a) | 3,109,416 | 3,111,359 | ||||||
| Senior Secured First Lien Term Loan | ||||||||
| 8.902% (3 Month SOFR USD + 3.25%, | ||||||||
| 0.500% Floor), 07/21/2028 (a) | 504,900 | 506,415 | ||||||
| 10,893,569 | ||||||||
The accompanying notes are an integral part of these financial statements.
40
SHENKMAN CAPITAL FLOATING RATE HIGH INCOME FUND
SCHEDULE OF INVESTMENTS – Continued
September 30, 2023
| Principal | Fair | |||||||
| Amount | Value | |||||||
| BANK LOANS – 84.30% (d) – Continued | ||||||||
| LEISURE: HOTELS – 2.05% | ||||||||
| Alterra Mountain Co., | ||||||||
| Senior Secured First Lien Term Loan | ||||||||
| 8.931% (1 Month SOFR USD + 3.50%, | ||||||||
| 0.500% Floor), 08/17/2028 (a) | $ | 1,795,729 | $ | 1,796,484 | ||||
| Carnival Corp., | ||||||||
| Senior Secured First Lien Term Loan | ||||||||
| 8.681% (1 Month SOFR USD + 3.25%, | ||||||||
| 0.750% Floor), 10/18/2028 (a) | 482,408 | 480,799 | ||||||
| Herschend Entertainment Co, LLC, | ||||||||
| Senior Secured First Lien Term Loan | ||||||||
| 9.181% (1 Month SOFR USD + 3.75%, | ||||||||
| 0.500% Floor), 08/28/2028 (a) | 1,179,679 | 1,181,154 | ||||||
| Hilton Grand Vacations Borrower, LLC, | ||||||||
| Senior Secured First Lien Term Loan | ||||||||
| 8.431% (1 Month SOFR USD + 3.00%, | ||||||||
| 0.500% Floor), 08/02/2028 (a) | 435,120 | 436,275 | ||||||
| Lakeland Tours, LLC, | ||||||||
| Senior Unsecured First Lien Term Loan | ||||||||
| 8.00%, 09/27/2027 | 333,330 | 256,664 | ||||||
| RHP Hotel Properties, LP, | ||||||||
| Senior Secured First Lien Term Loan | ||||||||
| 8.066% (1 Month SOFR USD + 2.75%), | ||||||||
| 05/20/2030 (a) | 633,815 | 636,113 | ||||||
| United PF Holdings, LLC, | ||||||||
| Senior Secured First Lien Term Loan | ||||||||
| 9.631% (3 Month SOFR USD + 4.00%), | ||||||||
| 12/30/2026 (a) | 1,030,977 | 846,050 | ||||||
| Wyndham Hotels & Resorts, Inc., | ||||||||
| Senior Secured First Lien Term Loan | ||||||||
| 7.666% (1 Month SOFR USD + 2.25%), | ||||||||
| 05/24/2030 (a) | 376,058 | 376,796 | ||||||
| 6,010,335 | ||||||||
| LEISURE: RESTAURANTS – 1.91% | ||||||||
| 1011778 B.C. Unlimited Liability Co., | ||||||||
| Senior Secured First Lien Term Loan | ||||||||
| 7.574% (1 Month SOFR USD + 2.25%), | ||||||||
| 09/12/2030 (a) | 624,000 | 622,378 | ||||||
The accompanying notes are an integral part of these financial statements.
41
SHENKMAN CAPITAL FLOATING RATE HIGH INCOME FUND
SCHEDULE OF INVESTMENTS – Continued
September 30, 2023
| Principal | Fair | |||||||
| Amount | Value | |||||||
| BANK LOANS – 84.30% (d) – Continued | ||||||||
| LEISURE: RESTAURANTS – 1.91% – Continued | ||||||||
| Dave & Buster’s, Inc., | ||||||||
| Senior Secured First Lien Term Loan | ||||||||
| 9.188% (1 Month SOFR USD + 3.75%, | ||||||||
| 0.500% Floor), 06/29/2029 (a) | $ | 962,893 | $ | 964,298 | ||||
| Fogo De Chao, Inc., | ||||||||
| Senior Secured First Lien Term Loan | ||||||||
| 10.16% (3 Month SOFR USD + 4.75%, | ||||||||
| 0.500% Floor), 09/22/2030 (a) | 442,000 | 433,529 | ||||||
| IRB Holding Corp., | ||||||||
| Senior Secured First Lien Term Loan | ||||||||
| 8.416% (1 Month SOFR USD + 3.00%, | ||||||||
| 0.750% Floor), 12/15/2027 (a) | 1,561,634 | 1,557,800 | ||||||
| Tacala, LLC, | ||||||||
| Senior Secured First Lien Term Loan | ||||||||
| 9.431% (1 Month SOFR USD + 4.00%, | ||||||||
| 0.750% Floor), 02/05/2027 (a) | 1,123,807 | 1,121,351 | ||||||
| Whatabrands, LLC, | ||||||||
| Senior Secured First Lien Term Loan | ||||||||
| 8.431% (1 Month SOFR USD + 3.00%, | ||||||||
| 0.500% Floor), 08/03/2028 (a) | 895,058 | 892,820 | ||||||
| 5,592,176 | ||||||||
| MEDIA: BROADCASTING – 1.04% | ||||||||
| EW Scripps Co., | ||||||||
| Senior Secured First Lien Term Loan | ||||||||
| 7.993% (1 Month SOFR USD + 2.563%, | ||||||||
| 0.750% Floor), 05/01/2026 (a) | 447,271 | 441,866 | ||||||
| Hubbard Radio, LLC, | ||||||||
| Senior Secured First Lien Term Loan | ||||||||
| 9.70% (1 Month LIBOR USD + 4.25%, | ||||||||
| 1.000% Floor), 03/28/2025 (a) | 457,988 | 417,342 | ||||||
| iHeartCommunications, Inc., | ||||||||
| Senior Secured First Lien Term Loan | ||||||||
| 8.431% (1 Month SOFR USD + 3.00%), | ||||||||
| 05/01/2026 (a) | 495,000 | 446,492 | ||||||
| Nexstar Broadcasting, Inc., | ||||||||
| Senior Secured First Lien Term Loan | ||||||||
| 7.931% (1 Month SOFR USD + 2.50%), | ||||||||
| 09/18/2026 (a) | 700,890 | 700,890 | ||||||
The accompanying notes are an integral part of these financial statements.
42
SHENKMAN CAPITAL FLOATING RATE HIGH INCOME FUND
SCHEDULE OF INVESTMENTS – Continued
September 30, 2023
| Principal | Fair | |||||||
| Amount | Value | |||||||
| BANK LOANS – 84.30% (d) – Continued | ||||||||
| MEDIA: BROADCASTING – 1.04% – Continued | ||||||||
| Univision Communications, Inc. | ||||||||
| Senior Secured First Lien Term Loan | ||||||||
| 8.681% (1 Month SOFR USD + 3.25%, | ||||||||
| 0.750% Floor), 03/13/2026 (a) | $ | 530,996 | $ | 530,597 | ||||
| Senior Secured First Lien Term Loan | ||||||||
| 9.64% (3 Month SOFR USD + 4.25%, | ||||||||
| 0.500% Floor), 06/24/2029 (a) | 516,463 | 516,592 | ||||||
| 3,053,779 | ||||||||
| MEDIA: CABLE & SATELLITE – 3.20% | ||||||||
| Charter Communications Operating, LLC, | ||||||||
| Senior Secured First Lien Term Loan | ||||||||
| 6.795%, 04/30/2025 (a)(g) | 466,849 | 467,724 | ||||||
| Connect U.S. Finco, LLC, | ||||||||
| Senior Secured First Lien Term Loan | ||||||||
| 8.816% (1 Month SOFR USD + 3.50%, | ||||||||
| 1.000% Floor), 12/11/2026 (a) | 1,467,677 | 1,442,910 | ||||||
| Coral-U.S. Co-Borrower, LLC, | ||||||||
| Senior Secured First Lien Term Loan | ||||||||
| 7.697% (1 Month SOFR USD + 2.25%), | ||||||||
| 01/31/2028 (a) | 585,000 | 581,253 | ||||||
| CSC Holdings, LLC, | ||||||||
| Senior Secured First Lien Term Loan | ||||||||
| 9.832% (1 Month SOFR USD + 4.50%), | ||||||||
| 01/18/2028 (a) | 323,375 | 307,206 | ||||||
| DIRECTV Financing, LLC, | ||||||||
| Senior Secured First Lien Term Loan | ||||||||
| 10.431% (1 Month SOFR USD + 5.00%, | ||||||||
| 0.750% Floor), 08/02/2027 (a) | 1,313,377 | 1,286,564 | ||||||
| Iridium Satellite, LLC, | ||||||||
| Senior Secured First Lien Term Loan | ||||||||
| 7.816% (1 Month SOFR USD + 2.50%, | ||||||||
| 0.750% Floor), 09/20/2030 (a) | 836,204 | 836,033 | ||||||
| Radiate Holdco, LLC, | ||||||||
| Senior Secured First Lien Term Loan | ||||||||
| 8.681% (1 Month SOFR USD + 3.25%, | ||||||||
| 0.750% Floor), 09/25/2026 (a) | 958,501 | 787,629 | ||||||
The accompanying notes are an integral part of these financial statements.
43
SHENKMAN CAPITAL FLOATING RATE HIGH INCOME FUND
SCHEDULE OF INVESTMENTS – Continued
September 30, 2023
| Principal | Fair | |||||||
| Amount | Value | |||||||
| BANK LOANS – 84.30% (d) – Continued | ||||||||
| MEDIA: CABLE & SATELLITE – 3.20% – Continued | ||||||||
| Telenet Financing USD, LLC, | ||||||||
| Senior Secured First Lien Term Loan | ||||||||
| 7.447% (1 Month SOFR USD + 2.00%), | ||||||||
| 04/28/2028 (a) | $ | 755,000 | $ | 737,541 | ||||
| Telesat Canada, | ||||||||
| Senior Secured First Lien Term Loan | ||||||||
| 8.434% (3 Month SOFR USD + 2.75%), | ||||||||
| 12/07/2026 (a) | 517,907 | 382,226 | ||||||
| Viasat, Inc., | ||||||||
| Senior Secured First Lien Term Loan | ||||||||
| 9.816% (1 Month SOFR USD + 4.50%, | ||||||||
| 0.500% Floor), 03/02/2029 (a) | 308,438 | 287,298 | ||||||
| Virgin Media Bristol, LLC, | ||||||||
| Senior Secured First Lien Term Loan | ||||||||
| 7.947% (1 Month SOFR USD + 2.50%), | ||||||||
| 01/31/2028 (a) | 630,000 | 613,661 | ||||||
| WideOpenWest Finance, LLC, | ||||||||
| Senior Secured First Lien Term Loan | ||||||||
| 8.39% (3 Month SOFR USD + 3.00%, | ||||||||
| 0.500% Floor), 12/20/2028 (a) | 731,963 | 723,120 | ||||||
| Xplornet Communications, Inc., | ||||||||
| Senior Secured First Lien Term Loan | ||||||||
| 9.652% (3 Month SOFR USD + 4.00%, | ||||||||
| 0.500% Floor), 10/02/2028 (a) | 1,188,257 | 937,238 | ||||||
| 9,390,403 | ||||||||
| MEDIA: DIVERSIFIED – 1.41% | ||||||||
| ABG Intermediate Holdings 2, LLC | ||||||||
| Senior Secured First Lien Term Loan | ||||||||
| 8.321%, 12/21/2028 (a)(g)(i) | 89,716 | 89,829 | ||||||
| Senior Secured First Lien Term Loan | ||||||||
| 9.431% (1 Month SOFR USD + 4.00%), | ||||||||
| 12/21/2028 (a) | 469,284 | 469,873 | ||||||
| AP Core Holdings II, LLC, | ||||||||
| Senior Secured First Lien Term Loan | ||||||||
| 10.931% (1 Month SOFR USD + 5.50%, | ||||||||
| 0.750% Floor), 09/01/2027 (a) | 317,000 | 308,828 | ||||||
The accompanying notes are an integral part of these financial statements.
44
SHENKMAN CAPITAL FLOATING RATE HIGH INCOME FUND
SCHEDULE OF INVESTMENTS – Continued
September 30, 2023
| Principal | Fair | |||||||
| Amount | Value | |||||||
| BANK LOANS – 84.30% (d) – Continued | ||||||||
| MEDIA: DIVERSIFIED – 1.41% – Continued | ||||||||
| Arches Buyer, Inc., | ||||||||
| Senior Secured First Lien Term Loan | ||||||||
| 8.666% (1 Month SOFR USD + 3.25%, | ||||||||
| 0.500% Floor), 12/06/2027 (a) | $ | 1,304,718 | $ | 1,280,052 | ||||
| Buzz Finco, LLC, | ||||||||
| Senior Secured First Lien Term Loan | ||||||||
| 8.166% (1 Month SOFR USD + 2.75%), | ||||||||
| 01/29/2027 (a) | 607,950 | 608,142 | ||||||
| Dotdash Meredith, Inc., | ||||||||
| Senior Secured First Lien Term Loan | ||||||||
| 9.43% (1 Month SOFR USD + 4.00%, | ||||||||
| 0.500% Floor), 12/01/2028 (a) | 526,508 | 508,738 | ||||||
| Getty Images, Inc., | ||||||||
| Senior Secured First Lien Term Loan | ||||||||
| 9.99% (3 Month SOFR USD + 4.50%), | ||||||||
| 02/19/2026 (a) | 851,412 | 854,817 | ||||||
| 4,120,279 | ||||||||
| MEDIA: ENTERTAINMENT – 2.73% | ||||||||
| Cirque du Soleil Holding U.S.A. Newco, Inc., | ||||||||
| Senior Secured First Lien Term Loan | ||||||||
| 9.64% (3 Month SOFR USD + 4.25%, | ||||||||
| 0.500% Floor), 03/08/2030 (a) | 1,728,315 | 1,721,299 | ||||||
| Creative Artists Agency, LLC, | ||||||||
| Senior Secured First Lien Term Loan | ||||||||
| 8.816% (1 Month SOFR USD + 3.50%), | ||||||||
| 11/27/2028 (a) | 770,971 | 769,252 | ||||||
| Delta 2 (Lux) SARL, | ||||||||
| Senior Secured First Lien Term Loan | ||||||||
| 8.316% (1 Month SOFR USD + 3.00%, | ||||||||
| 0.500% Floor), 01/15/2030 (a) | 850,000 | 850,956 | ||||||
| Hoya Midco, LLC, | ||||||||
| Senior Secured First Lien Term Loan | ||||||||
| 8.619% (3 Month SOFR USD + 3.25%, | ||||||||
| 0.500% Floor), 01/26/2029 (a) | 557,419 | 558,988 | ||||||
| Nascar Holdings, LLC, | ||||||||
| Senior Secured First Lien Term Loan | ||||||||
| 7.931% (1 Month SOFR USD + 2.50%), | ||||||||
| 10/19/2026 (a) | 227,444 | 228,099 | ||||||
The accompanying notes are an integral part of these financial statements.
45
SHENKMAN CAPITAL FLOATING RATE HIGH INCOME FUND
SCHEDULE OF INVESTMENTS – Continued
September 30, 2023
| Principal | Fair | |||||||
| Amount | Value | |||||||
| BANK LOANS – 84.30% (d) – Continued | ||||||||
| MEDIA: ENTERTAINMENT – 2.73% – Continued | ||||||||
| Playtika Holding Corp., | ||||||||
| Senior Secured First Lien Term Loan | ||||||||
| 8.181% (1 Month SOFR USD + 2.75%), | ||||||||
| 03/13/2028 (a) | $ | 1,061,916 | $ | 1,062,086 | ||||
| Pug, LLC, | ||||||||
| Senior Secured First Lien Term Loan | ||||||||
| 8.931% (1 Month SOFR USD + 3.50%), | ||||||||
| 02/12/2027 (a) | 666,644 | 631,228 | ||||||
| UFC Holdings, LLC, | ||||||||
| Senior Secured First Lien Term Loan | ||||||||
| 8.369% (3 Month SOFR USD + 2.75%, | ||||||||
| 0.750% Floor), 04/29/2026 (a) | 735,701 | 735,741 | ||||||
| William Morris Endeavor Entertainment, LLC | ||||||||
| Senior Secured First Lien Term Loan | ||||||||
| 8.181% (1 Month SOFR USD + 2.75%), | ||||||||
| 05/16/2025 (a) | 26,733 | 26,733 | ||||||
| Senior Secured First Lien Term Loan | ||||||||
| 8.196% (1 Month SOFR USD + 2.75%), | ||||||||
| 05/16/2025 (a) | 930,871 | 930,871 | ||||||
| WMG Acquisition Corp., | ||||||||
| Senior Secured First Lien Term Loan | ||||||||
| 7.327% (1 Month LIBOR USD + 2.125%), | ||||||||
| 01/20/2028 (a) | 498,077 | 498,513 | ||||||
| 8,013,766 | ||||||||
| METALS & MINING – 0.58% | ||||||||
| Arsenal AIC Parent, LLC, | ||||||||
| Senior Secured First Lien Term Loan | ||||||||
| 9.879% (3 Month SOFR USD + 4.50%), | ||||||||
| 08/18/2030 (a) | 510,000 | 509,681 | ||||||
| Atkore International, Inc., | ||||||||
| Senior Secured First Lien Term Loan | ||||||||
| 7.652% (6 Month SOFR USD + 2.00%, | ||||||||
| 0.500% Floor), 05/26/2028 (a) | 386,988 | 387,794 | ||||||
| Grinding Media, Inc., | ||||||||
| Senior Secured First Lien Term Loan | ||||||||
| 9.53% (3 Month SOFR USD + 4.00%, | ||||||||
| 0.750% Floor), 10/12/2028 (a) | 819,280 | 814,160 | ||||||
| 1,711,635 | ||||||||
The accompanying notes are an integral part of these financial statements.
46
SHENKMAN CAPITAL FLOATING RATE HIGH INCOME FUND
SCHEDULE OF INVESTMENTS – Continued
September 30, 2023
| Principal | Fair | |||||||
| Amount | Value | |||||||
| BANK LOANS – 84.30% (d) – Continued | ||||||||
| MIDSTREAM: STORAGE & TRANSPORT – 1.89% | ||||||||
| Buckeye Partners, LP, | ||||||||
| Senior Secured First Lien Term Loan | ||||||||
| 7.666% (1 Month SOFR USD + 2.25%), | ||||||||
| 11/02/2026 (a) | $ | 670,818 | $ | 671,127 | ||||
| ITT Holdings, LLC, | ||||||||
| Senior Secured First Lien Term Loan | ||||||||
| 8.181% (1 Month SOFR USD + 2.75%, | ||||||||
| 0.500% Floor), 07/10/2028 (a) | 568,400 | 568,696 | ||||||
| Northriver Midstream Finance, LP, | ||||||||
| Senior Secured First Lien Term Loan | ||||||||
| 8.327% (1 Month SOFR USD + 3.00%), | ||||||||
| 08/16/2030 (a) | 740,138 | 738,883 | ||||||
| Oryx Midstream Services Permian Basin, LLC, | ||||||||
| Senior Secured First Lien Term Loan | ||||||||
| 8.692% (1 Month SOFR USD + 3.25%, | ||||||||
| 0.500% Floor), 10/05/2028 (a) | 1,503,191 | 1,504,603 | ||||||
| TransMontaigne Operating Co., LP | ||||||||
| Senior Secured First Lien Term Loan | ||||||||
| 8.931% (1 Month SOFR USD + 3.50%, | ||||||||
| 0.500% Floor), 11/17/2028 (a) | 509,426 | 508,290 | ||||||
| Senior Secured First Lien Term Loan | ||||||||
| 8.933% (1 Month SOFR USD + 3.50%, | ||||||||
| 0.500% Floor), 11/17/2028 (a) | 509,427 | 508,290 | ||||||
| Traverse Midstream Partners, LLC, | ||||||||
| Senior Secured First Lien Term Loan | ||||||||
| 9.216% (3 Month SOFR USD + 3.75%, | ||||||||
| 0.500% Floor), 02/16/2028 (a) | 652,652 | 653,419 | ||||||
| UGI Energy Services, LLC, | ||||||||
| Senior Secured First Lien Term Loan | ||||||||
| 8.666% (1 Month SOFR USD + 3.25%, | ||||||||
| 0.500% Floor), 02/22/2030 (a) | 374,173 | 374,373 | ||||||
| 5,527,681 | ||||||||
| OIL & GAS: EQUIPMENT & SERVICES – 0.13% | ||||||||
| U.S. Silica Co., | ||||||||
| Senior Secured First Lien Term Loan | ||||||||
| 10.181% (1 Month SOFR USD + 4.75%, | ||||||||
| 0.500% Floor), 03/25/2030 (a) | 390,168 | 391,457 | ||||||
The accompanying notes are an integral part of these financial statements.
47
SHENKMAN CAPITAL FLOATING RATE HIGH INCOME FUND
SCHEDULE OF INVESTMENTS – Continued
September 30, 2023
| Principal | Fair | |||||||
| Amount | Value | |||||||
| BANK LOANS – 84.30% (d) – Continued | ||||||||
| PACKAGING – 1.94% | ||||||||
| Clydesdale Acquisition Holdings, Inc., | ||||||||
| Senior Secured First Lien Term Loan | ||||||||
| 9.591% (1 Month SOFR USD + 4.175%, | ||||||||
| 0.500% Floor), 04/13/2029 (a) | $ | 618,175 | $ | 610,655 | ||||
| LABL, Inc., | ||||||||
| Senior Secured First Lien Term Loan | ||||||||
| 10.416% (1 Month SOFR USD + 5.00%, | ||||||||
| 0.500% Floor), 10/30/2028 (a) | 823,335 | 821,845 | ||||||
| Mauser Packaging Solutions Holding Co., | ||||||||
| Senior Secured First Lien Term Loan | ||||||||
| 9.33% (1 Month SOFR USD + 4.00%), | ||||||||
| 08/13/2026 (a) | 935,396 | 936,097 | ||||||
| Pregis Topco, LLC | ||||||||
| Senior Secured First Lien Term Loan | ||||||||
| 9.066% (1 Month SOFR USD + 3.75%), | ||||||||
| 07/31/2026 (a) | 524,563 | 524,374 | ||||||
| Senior Secured First Lien Term Loan | ||||||||
| 9.181% (1 Month SOFR USD + 3.75%, | ||||||||
| 0.500% Floor), 07/31/2026 (a) | 539,000 | 537,992 | ||||||
| Proampac PG Borrower, LLC, | ||||||||
| Senior Secured First Lien Term Loan | ||||||||
| 12.00% (Prime Rate + 3.50%, | ||||||||
| 0.750% Floor), 09/15/2028 (a) | 410,000 | 408,668 | ||||||
| RLG Holdings, LLC, | ||||||||
| Senior Secured First Lien Term Loan | ||||||||
| 9.681% (1 Month SOFR USD + 4.25%, | ||||||||
| 0.750% Floor), 07/07/2028 (a) | 577,710 | 544,492 | ||||||
| Sabert Corp., | ||||||||
| Senior Secured First Lien Term Loan | ||||||||
| 9.931% (1 Month SOFR USD + 4.50%, | ||||||||
| 1.000% Floor), 12/10/2026 (a) | 386,708 | 388,158 | ||||||
| Trident TPI Holdings, Inc., | ||||||||
| Senior Secured First Lien Term Loan | ||||||||
| 9.652% (3 Month LIBOR USD + 4.00%, | ||||||||
| 0.500% Floor), 09/15/2028 (a) | 912,963 | 911,187 | ||||||
| 5,683,468 | ||||||||
The accompanying notes are an integral part of these financial statements.
48
SHENKMAN CAPITAL FLOATING RATE HIGH INCOME FUND
SCHEDULE OF INVESTMENTS – Continued
September 30, 2023
| Principal | Fair | |||||||
| Amount | Value | |||||||
| BANK LOANS – 84.30% (d) – Continued | ||||||||
| REAL ESTATE: MANAGEMENT – 0.28% | ||||||||
| Cushman & Wakefield U.S. Borrower, LLC, | ||||||||
| Senior Secured First Lien Term Loan | ||||||||
| 9.316% (1 Month SOFR USD + 4.00%, | ||||||||
| 0.500% Floor), 01/31/2030 (a) | $ | 288,000 | $ | 286,200 | ||||
| Greystar Real Estate Partners, LLC, | ||||||||
| Senior Secured First Lien Term Loan | ||||||||
| 9.147% (1 Month SOFR USD + 3.75%, | ||||||||
| 0.500% Floor), 08/21/2030 (a) | 548,000 | 548,000 | ||||||
| 834,200 | ||||||||
| RETAIL: FOOD & DRUG – 0.28% | ||||||||
| BJ’s Wholesale Club, Inc., | ||||||||
| Senior Secured First Lien Term Loan | ||||||||
| 8.079% (1 Month SOFR USD + 2.75%), | ||||||||
| 02/03/2027 (a) | 645,834 | 648,182 | ||||||
| JP Intermediate B, LLC, | ||||||||
| Senior Secured First Lien Term Loan | ||||||||
| 10.817% (3 Month SOFR USD + 5.6145%, | ||||||||
| 1.000% Floor), 11/20/2027 (a) | 452,852 | 161,328 | ||||||
| 809,510 | ||||||||
| RETAILING – 1.55% | ||||||||
| Belron Finance U.S., LLC, | ||||||||
| Senior Secured First Lien Term Loan | ||||||||
| 8.056% (3 Month SOFR USD + 2.425%, | ||||||||
| 0.500% Floor), 04/13/2028 (a) | 1,194,694 | 1,193,799 | ||||||
| Great Outdoors Group, LLC, | ||||||||
| Senior Secured First Lien Term Loan | ||||||||
| 9.402% (3 Month SOFR USD + 3.75%, | ||||||||
| 0.750% Floor), 03/06/2028 (a) | 1,140,918 | 1,140,005 | ||||||
| Harbor Freight Tools U.S.A., Inc., | ||||||||
| Senior Secured First Lien Term Loan | ||||||||
| 8.181% (1 Month SOFR USD + 2.75%, | ||||||||
| 0.500% Floor), 10/19/2027 (a) | 487,215 | 484,253 | ||||||
| Michaels Cos., Inc., | ||||||||
| Senior Secured First Lien Term Loan | ||||||||
| 9.902% (3 Month SOFR USD + 4.25%, | ||||||||
| 0.750% Floor), 04/14/2028 (a) | 480,930 | 440,267 | ||||||
The accompanying notes are an integral part of these financial statements.
49
SHENKMAN CAPITAL FLOATING RATE HIGH INCOME FUND
SCHEDULE OF INVESTMENTS – Continued
September 30, 2023
| Principal | Fair | |||||||
| Amount | Value | |||||||
| BANK LOANS – 84.30% (d) – Continued | ||||||||
| RETAILING – 1.55% – Continued | ||||||||
| PetSmart, Inc., | ||||||||
| Senior Secured First Lien Term Loan | ||||||||
| 9.166% (1 Month SOFR USD + 3.75%, | ||||||||
| 0.750% Floor), 02/11/2028 (a) | $ | 452,690 | $ | 452,003 | ||||
| Sally Holdings, LLC, | ||||||||
| Senior Secured First Lien Term Loan | ||||||||
| 7.566% (1 Month SOFR USD + 2.25%), | ||||||||
| 02/28/2030 (a) | 478,595 | 479,717 | ||||||
| Topgolf Callaway Brands Corp., | ||||||||
| Senior Secured First Lien Term Loan | ||||||||
| 8.916% (1 Month SOFR USD + 3.50%), | ||||||||
| 03/18/2030 (a) | 339,295 | 338,058 | ||||||
| 4,528,102 | ||||||||
| TECHNOLOGY HARDWARE – 1.26% | ||||||||
| EOS U.S. Finco, LLC, | ||||||||
| Senior Secured First Lien Term Loan | ||||||||
| 11.268% (3 Month SOFR USD + 6.00%, | ||||||||
| 0.500% Floor), 10/05/2029 (a) | 416,988 | 406,563 | ||||||
| Ingram Micro, Inc., | ||||||||
| Senior Secured First Lien Term Loan | ||||||||
| 9.038% (3 Month LIBOR USD + 3.50%, | ||||||||
| 0.500% Floor), 06/30/2028 (a) | 394,200 | 393,954 | ||||||
| MKS Instruments, Inc., | ||||||||
| Senior Secured First Lien Term Loan | ||||||||
| 8.166% (1 Month SOFR USD + 2.75%, | ||||||||
| 0.500% Floor), 08/17/2029 (a) | 888,105 | 889,135 | ||||||
| Presidio Holdings, Inc. | ||||||||
| Senior Secured First Lien Term Loan | ||||||||
| 8.916% (1 Month SOFR USD + 3.50%), | ||||||||
| 01/22/2027 (a) | 15,103 | 15,103 | ||||||
| Senior Secured First Lien Term Loan | ||||||||
| 8.969% (3 Month SOFR USD + 3.50%), | ||||||||
| 01/22/2027 (a) | 448,776 | 448,776 | ||||||
| World Wide Technology Holding Co., LLC, | ||||||||
| Senior Secured First Lien Term Loan | ||||||||
| 8.678% (1 Month SOFR USD + 3.25%, | ||||||||
| 0.500% Floor), 03/01/2030 (a) | 1,538,270 | 1,540,193 | ||||||
| 3,693,724 | ||||||||
The accompanying notes are an integral part of these financial statements.
50
SHENKMAN CAPITAL FLOATING RATE HIGH INCOME FUND
SCHEDULE OF INVESTMENTS – Continued
September 30, 2023
| Principal | Fair | |||||||
| Amount | Value | |||||||
| BANK LOANS – 84.30% (d) – Continued | ||||||||
| TECHNOLOGY: SOFTWARE & SERVICES – 10.83% | ||||||||
| Access CIG, LLC | ||||||||
| Senior Secured Second Lien Term Loan | ||||||||
| 13.409% (3 Month SOFR USD + 7.75%), | ||||||||
| 02/27/2026 (a) | $ | 616,742 | $ | 604,923 | ||||
| Senior Secured First Lien Term Loan | ||||||||
| 10.316% (1 Month SOFR USD + 5.00%, | ||||||||
| 0.500% Floor), 08/18/2028 (a) | 715,000 | 706,956 | ||||||
| Barracuda Parent, LLC, | ||||||||
| Senior Secured First Lien Term Loan | ||||||||
| 9.869% (3 Month SOFR USD + 4.50%, | ||||||||
| 0.500% Floor), 08/15/2029 (a) | 736,932 | 731,132 | ||||||
| Boxer Parent Co., Inc., | ||||||||
| Senior Secured First Lien Term Loan | ||||||||
| 9.181% (1 Month SOFR USD + 3.75%), | ||||||||
| 10/02/2025 (a) | 1,992,022 | 1,992,290 | ||||||
| Central Parent, Inc., | ||||||||
| Senior Secured First Lien Term Loan | ||||||||
| 9.64% (3 Month SOFR USD + 4.25%, | ||||||||
| 0.500% Floor), 07/06/2029 (a) | 728,940 | 729,979 | ||||||
| Cloud Software Group, Inc. | ||||||||
| Senior Secured First Lien Term Loan | ||||||||
| 9.99% (1 Month SOFR USD + 4.50%, | ||||||||
| 0.500% Floor), 03/30/2029 (a) | 2,412 | 2,324 | ||||||
| Senior Secured First Lien Term Loan | ||||||||
| 9.99% (3 Month SOFR USD + 4.50%, | ||||||||
| 0.500% Floor), 03/30/2029 (a) | 957,676 | 922,509 | ||||||
| CommerceHub, Inc., | ||||||||
| Senior Secured First Lien Term Loan | ||||||||
| 9.522% (3 Month SOFR USD + 4.00%, | ||||||||
| 0.750% Floor), 12/29/2027 (a) | 454,431 | 440,941 | ||||||
| Connectwise, LLC, | ||||||||
| Senior Secured First Lien Term Loan | ||||||||
| 8.931% (1 Month SOFR USD + 3.50%, | ||||||||
| 0.500% Floor), 09/29/2028 (a) | 1,880,555 | 1,854,697 | ||||||
| DCert Buyer, Inc., | ||||||||
| Senior Secured First Lien Term Loan | ||||||||
| 9.331% (3 Month SOFR USD + 4.00%), | ||||||||
| 10/16/2026 (a) | 445,789 | 443,714 | ||||||
The accompanying notes are an integral part of these financial statements.
51
SHENKMAN CAPITAL FLOATING RATE HIGH INCOME FUND
SCHEDULE OF INVESTMENTS – Continued
September 30, 2023
| Principal | Fair | |||||||
| Amount | Value | |||||||
| BANK LOANS – 84.30% (d) – Continued | ||||||||
| TECHNOLOGY: SOFTWARE & SERVICES – 10.83% – Continued | ||||||||
| E2Open, LLC, | ||||||||
| Senior Secured First Lien Term Loan | ||||||||
| 8.931% (1 Month SOFR USD + 3.50%, | ||||||||
| 0.500% Floor), 02/04/2028 (a) | $ | 607,925 | $ | 608,369 | ||||
| Ensono, LP, | ||||||||
| Senior Secured First Lien Term Loan | ||||||||
| 9.431% (1 Month SOFR USD + 4.00%, | ||||||||
| 0.750% Floor), 05/19/2028 (a) | 989,424 | 956,278 | ||||||
| Gen Digital, Inc., | ||||||||
| Senior Secured First Lien Term Loan | ||||||||
| 7.416% (1 Month SOFR USD + 2.00%, | ||||||||
| 0.500% Floor), 09/12/2029 (a) | 746,691 | 745,246 | ||||||
| GI Consilio Parent, LLC, | ||||||||
| Senior Secured First Lien Term Loan | ||||||||
| 9.431% (1 Month SOFR USD + 4.00%, | ||||||||
| 0.500% Floor), 05/12/2028 (a) | 293,241 | 286,141 | ||||||
| Greeneden U.S. Holdings II, LLC, | ||||||||
| Senior Secured First Lien Term Loan | ||||||||
| 9.431% (1 Month SOFR USD + 4.00%, | ||||||||
| 0.750% Floor), 12/01/2027 (a) | 552,124 | 553,223 | ||||||
| McAfee Corp., | ||||||||
| Senior Secured First Lien Term Loan | ||||||||
| 9.18% (1 Month SOFR USD + 3.75%, | ||||||||
| 0.500% Floor), 03/01/2029 (a) | 1,872,496 | 1,832,115 | ||||||
| Mitchell International, Inc., | ||||||||
| Senior Secured First Lien Term Loan | ||||||||
| 9.181% (1 Month SOFR USD + 3.75%, | ||||||||
| 0.500% Floor), 10/16/2028 (a) | 1,361,357 | 1,341,332 | ||||||
| Mosel Bidco SE, | ||||||||
| Senior Secured First Lien Term Loan | ||||||||
| 9.996%, 02/28/2033 (a)(g) | 732,000 | 732,915 | ||||||
| N-Able International Holdings II, LLC, | ||||||||
| Senior Secured First Lien Term Loan | ||||||||
| 8.434% (3 Month SOFR USD + 2.75%, | ||||||||
| 0.500% Floor), 07/19/2028 (a) | 502,740 | 502,112 | ||||||
| Open Text Corp., | ||||||||
| Senior Secured First Lien Term Loan | ||||||||
| 8.166% (1 Month SOFR USD + 2.75%, | ||||||||
| 0.500% Floor), 01/31/2030 (a) | 1,395,000 | 1,396,828 | ||||||
The accompanying notes are an integral part of these financial statements.
52
SHENKMAN CAPITAL FLOATING RATE HIGH INCOME FUND
SCHEDULE OF INVESTMENTS – Continued
September 30, 2023
| Principal | Fair | |||||||
| Amount | Value | |||||||
| BANK LOANS – 84.30% (d) – Continued | ||||||||
| TECHNOLOGY: SOFTWARE & SERVICES – 10.83% – Continued | ||||||||
| Optiv Security, Inc., | ||||||||
| Senior Secured First Lien Term Loan | ||||||||
| 10.338% (6 Month SOFR USD + 5.25%), | ||||||||
| 07/31/2026 (a) | $ | 554,999 | $ | 539,459 | ||||
| Peraton Corp., | ||||||||
| Senior Secured First Lien Term Loan | ||||||||
| 9.166% (1 Month SOFR USD + 3.75%, | ||||||||
| 0.750% Floor), 02/01/2028 (a) | 1,951,198 | 1,949,579 | ||||||
| Project Alpha Intermediate Holding, Inc., | ||||||||
| Senior Secured First Lien Term Loan | ||||||||
| 9.431% (1 Month SOFR USD + 4.00%), | ||||||||
| 04/26/2024 (a) | 2,304,394 | 2,305,119 | ||||||
| Proofpoint, Inc., | ||||||||
| Senior Secured First Lien Term Loan | ||||||||
| 8.681% (1 Month SOFR USD + 3.25%, | ||||||||
| 0.500% Floor), 08/31/2028 (a) | 1,425,608 | 1,415,607 | ||||||
| Quartz Acquireco, LLC, | ||||||||
| Senior Secured First Lien Term Loan | ||||||||
| 8.818% (1 Month SOFR USD + 3.50%), | ||||||||
| 06/28/2030 (a) | 527,000 | 527,000 | ||||||
| RealPage, Inc., | ||||||||
| Senior Secured First Lien Term Loan | ||||||||
| 8.431% (1 Month SOFR USD + 3.00%, | ||||||||
| 0.500% Floor), 04/24/2028 (a) | 1,197,794 | 1,185,565 | ||||||
| Rocket Software, Inc. | ||||||||
| Senior Secured First Lien Term Loan | ||||||||
| 9.681% (1 Month SOFR USD + 4.25%), | ||||||||
| 11/28/2025 (a) | 328,263 | 328,572 | ||||||
| Senior Secured First Lien Term Loan | ||||||||
| 9.681% (1 Month SOFR USD + 4.25%, | ||||||||
| 0.500% Floor), 11/28/2025 (a) | 214,888 | 214,889 | ||||||
| Senior Secured First Lien Term Loan | ||||||||
| 10.074%, 11/28/2028 (a)(b)(g) | 645,000 | 635,325 | ||||||
| Sedgwick Claims Management Services, Inc., | ||||||||
| Senior Secured First Lien Term Loan | ||||||||
| 9.066% (1 Month SOFR USD + 3.75%), | ||||||||
| 02/24/2028 (a) | 1,316,385 | 1,315,483 | ||||||
The accompanying notes are an integral part of these financial statements.
53
SHENKMAN CAPITAL FLOATING RATE HIGH INCOME FUND
SCHEDULE OF INVESTMENTS – Continued
September 30, 2023
| Principal | Fair | |||||||
| Amount | Value | |||||||
| BANK LOANS – 84.30% (d) – Continued | ||||||||
| TECHNOLOGY: SOFTWARE & SERVICES – 10.83% – Continued | ||||||||
| SolarWinds Holdings, Inc., | ||||||||
| Senior Secured First Lien Term Loan | ||||||||
| 9.066% (1 Month SOFR USD + 3.75%), | ||||||||
| 02/05/2027 (a) | $ | 1,058,980 | $ | 1,061,506 | ||||
| Sovos Compliance, LLC, | ||||||||
| Senior Secured First Lien Term Loan | ||||||||
| 9.931% (1 Month SOFR USD + 4.50%, | ||||||||
| 0.500% Floor), 08/11/2028 (a) | 490,282 | 483,347 | ||||||
| UKG, Inc. | ||||||||
| Senior Secured First Lien Term Loan | ||||||||
| 8.618% (3 Month SOFR USD + 3.25%, | ||||||||
| 0.500% Floor), 05/04/2026 (a) | 967,354 | 965,705 | ||||||
| Senior Secured First Lien Term Loan | ||||||||
| 9.219% (3 Month SOFR USD + 3.75%), | ||||||||
| 05/04/2026 (a) | 719,040 | 719,155 | ||||||
| Senior Secured First Lien Term Loan | ||||||||
| 10.022% (3 Month SOFR USD + 4.50%, | ||||||||
| 0.500% Floor), 05/04/2026 (a) | 254,363 | 255,475 | ||||||
| VS Buyer, LLC, | ||||||||
| Senior Secured First Lien Term Loan | ||||||||
| 8.666% (1 Month SOFR USD + 3.25%), | ||||||||
| 02/26/2027 (a) | 452,312 | 451,182 | ||||||
| 31,736,992 | ||||||||
| TELECOMMUNICATION SERVICES: DIVERSIFIED – 2.02% | ||||||||
| Altice France SA, | ||||||||
| Senior Secured First Lien Term Loan | ||||||||
| 10.808% (3 Month SOFR USD + 5.50%), | ||||||||
| 08/15/2028 (a) | 336,889 | 305,937 | ||||||
| Cincinnati Bell, Inc., | ||||||||
| Senior Secured First Lien Term Loan | ||||||||
| 8.666% (1 Month SOFR USD + 3.25%, | ||||||||
| 0.500% Floor), 11/22/2028 (a) | 569,850 | 560,769 | ||||||
| Consolidated Communications, Inc., | ||||||||
| Senior Secured First Lien Term Loan | ||||||||
| 8.931% (1 Month SOFR USD + 3.50%, | ||||||||
| 0.750% Floor), 10/04/2027 (a) | 553,868 | 493,850 | ||||||
The accompanying notes are an integral part of these financial statements.
54
SHENKMAN CAPITAL FLOATING RATE HIGH INCOME FUND
SCHEDULE OF INVESTMENTS – Continued
September 30, 2023
| Principal | Fair | |||||||
| Amount | Value | |||||||
| BANK LOANS – 84.30% (d) – Continued | ||||||||
| TELECOMMUNICATION SERVICES: DIVERSIFIED – 2.02% – Continued | ||||||||
| Crown Subsea Communications Holding, Inc., | ||||||||
| Senior Secured First Lien Term Loan | ||||||||
| 10.694% (1 Month SOFR USD + 5.25%, | ||||||||
| 0.750% Floor), 04/27/2027 (a) | $ | 885,788 | $ | 890,770 | ||||
| Eagle Broadband Investments, LLC, | ||||||||
| Senior Secured First Lien Term Loan | ||||||||
| 8.652% (3 Month SOFR USD + 3.00%, | ||||||||
| 0.750% Floor), 11/12/2027 (a) | 611,296 | 598,116 | ||||||
| Guardian U.S. Holdco, LLC, | ||||||||
| Senior Secured First Lien Term Loan | ||||||||
| 9.389% (3 Month SOFR USD + 4.00%, | ||||||||
| 0.500% Floor), 01/31/2030 (a) | 354,113 | 354,954 | ||||||
| Lumen Technologies, Inc., | ||||||||
| Senior Secured First Lien Term Loan | ||||||||
| 7.681% (1 Month SOFR USD + 2.25%), | ||||||||
| 03/15/2027 (a) | 630,836 | 452,382 | ||||||
| Voyage U.S., LLC, | ||||||||
| Senior Secured First Lien Term Loan | ||||||||
| 9.088% (3 Month SOFR USD + 3.50%, | ||||||||
| 0.500% Floor), 07/20/2028 (a) | 471,380 | 468,582 | ||||||
| Zayo Group Holdings, Inc. | ||||||||
| Senior Secured First Lien Term Loan | ||||||||
| 8.431% (1 Month SOFR USD + 3.00%), | ||||||||
| 03/09/2027 (a) | 1,272,474 | 1,042,855 | ||||||
| Senior Secured First Lien Term Loan | ||||||||
| 9.641% (1 Month SOFR USD + 4.325%, | ||||||||
| 0.500% Floor), 03/09/2027 (a) | 364,450 | 297,938 | ||||||
| Ziggo Financing Partnership, | ||||||||
| Senior Secured First Lien Term Loan | ||||||||
| 7.947% (1 Month SOFR USD + 2.50%), | ||||||||
| 04/28/2028 (a) | 455,000 | 445,425 | ||||||
| 5,911,578 | ||||||||
| TELECOMMUNICATION SERVICES: WIRELESS – 0.18% | ||||||||
| CCI Buyer, Inc., | ||||||||
| Senior Secured First Lien Term Loan | ||||||||
| 9.39% (3 Month SOFR USD + 4.00%, | ||||||||
| 0.750% Floor), 12/17/2027 (a) | 531,375 | 525,288 | ||||||
The accompanying notes are an integral part of these financial statements.
55
SHENKMAN CAPITAL FLOATING RATE HIGH INCOME FUND
SCHEDULE OF INVESTMENTS – Continued
September 30, 2023
| Principal | Fair | |||||||
| Amount | Value | |||||||
| BANK LOANS – 84.30% (d) – Continued | ||||||||
| TRANSPORTATION – 3.19% | ||||||||
| AAdvantage Loyalty IP, Ltd. | ||||||||
| Senior Secured First Lien Term Loan | ||||||||
| 10.00% (3 Month LIBOR USD + 4.75%, | ||||||||
| 0.750% Floor), 04/20/2028 (a) | $ | 36,359 | $ | 37,521 | ||||
| Senior Secured First Lien Term Loan | ||||||||
| 10.338% (3 Month SOFR USD + 4.75%, | ||||||||
| 0.750% Floor), 04/20/2028 (a) | 654,466 | 675,368 | ||||||
| Atlas CC Acquisition Corp. | ||||||||
| Senior Secured First Lien Term Loan | ||||||||
| 9.934% (3 Month SOFR USD + 4.25%, | ||||||||
| 0.750% Floor), 05/25/2028 (a) | 1,094,146 | 1,027,475 | ||||||
| Senior Secured First Lien Term Loan | ||||||||
| 9.934% (3 Month SOFR USD + 4.25%, | ||||||||
| 0.750% Floor), 05/25/2028 (a) | 231,314 | 217,218 | ||||||
| Avis Budget Car Rental, LLC, | ||||||||
| Senior Secured First Lien Term Loan | ||||||||
| 8.916% (1 Month SOFR USD + 3.50%, | ||||||||
| 0.500% Floor), 03/15/2029 (a) | 491,785 | 492,402 | ||||||
| Brown Group Holding, LLC | ||||||||
| Senior Secured First Lien Term Loan | ||||||||
| 9.066% (1 Month SOFR USD + 3.75%, | ||||||||
| 0.500% Floor), 07/02/2029 (a) | 195,786 | 195,908 | ||||||
| Senior Secured First Lien Term Loan | ||||||||
| 9.119% (3 Month SOFR USD + 3.75%, | ||||||||
| 0.500% Floor), 07/02/2029 (a) | 480,171 | 480,472 | ||||||
| Senior Secured First Lien Term Loan | ||||||||
| 9.172% (3 Month SOFR USD + 3.75%, | ||||||||
| 0.500% Floor), 07/02/2029 (a) | 227,853 | 227,995 | ||||||
| Hertz Corp. | ||||||||
| Senior Secured First Lien Term Loan | ||||||||
| 8.696% (1 Month SOFR USD + 3.25%, | ||||||||
| 0.500% Floor), 06/30/2028 (a) | 378,346 | 378,556 | ||||||
| Senior Secured First Lien Term Loan | ||||||||
| 8.696% (1 Month SOFR USD + 3.25%, | ||||||||
| 0.500% Floor), 06/30/2028 (a) | 72,945 | 72,985 | ||||||
| Kenan Advantage Group, Inc., | ||||||||
| Senior Secured First Lien Term Loan | ||||||||
| 9.298% (6 Month SOFR USD + 4.00%, | ||||||||
| 0.750% Floor), 03/24/2026 (a) | 479,046 | 478,481 | ||||||
The accompanying notes are an integral part of these financial statements.
56
SHENKMAN CAPITAL FLOATING RATE HIGH INCOME FUND
SCHEDULE OF INVESTMENTS – Continued
September 30, 2023
| Principal | Fair | |||||||
| Amount | Value | |||||||
| BANK LOANS – 84.30% (d) – Continued | ||||||||
| TRANSPORTATION – 3.19% – Continued | ||||||||
| Lasership, Inc., | ||||||||
| Senior Secured First Lien Term Loan | ||||||||
| 10.396% (3 Month SOFR USD + 4.50%, | ||||||||
| 0.750% Floor), 05/08/2028 (a) | $ | 1,576,585 | $ | 1,471,742 | ||||
| Mileage Plus Holdings, LLC, | ||||||||
| Senior Secured First Lien Term Loan | ||||||||
| 10.798% (3 Month SOFR USD + 5.25%, | ||||||||
| 1.000% Floor), 06/21/2027 (a) | 55,973 | 58,238 | ||||||
| PODS, LLC, | ||||||||
| Senior Secured First Lien Term Loan | ||||||||
| 8.431% (1 Month SOFR USD + 3.00%, | ||||||||
| 0.750% Floor), 03/31/2028 (a) | 1,849,565 | 1,796,095 | ||||||
| Uber Technologies, Inc., | ||||||||
| Senior Secured First Lien Term Loan | ||||||||
| 8.159% (3 Month SOFR USD + 2.75%), | ||||||||
| 03/04/2030 (a) | 570,688 | 571,141 | ||||||
| United Airlines, Inc., | ||||||||
| Senior Secured First Lien Term Loan | ||||||||
| 9.182% (1 Month LIBOR USD + 3.75%, | ||||||||
| 0.750% Floor), 04/21/2028 (a) | 609,437 | 611,342 | ||||||
| WWEX UNI TopCo Holdings, LLC, | ||||||||
| Senior Secured First Lien Term Loan | ||||||||
| 9.652% (3 Month SOFR USD + 4.00%, | ||||||||
| 0.750% Floor), 07/26/2028 (a) | 562,973 | 555,291 | ||||||
| 9,348,230 | ||||||||
| UTILITIES: POWER – 0.61% | ||||||||
| Calpine Construction Finance Co., LP, | ||||||||
| Senior Secured First Lien Term Loan | ||||||||
| 7.566% (1 Month SOFR USD + 2.25%), | ||||||||
| 07/31/2030 (a) | 372,000 | 370,538 | ||||||
| Calpine Corp., | ||||||||
| Senior Secured First Lien Term Loan | ||||||||
| 7.931% (1 Month SOFR USD + 2.50%), | ||||||||
| 12/16/2027 (a) | 266,000 | 266,205 | ||||||
| Eastern Power, LLC, | ||||||||
| Senior Secured First Lien Term Loan | ||||||||
| 9.181% (1 Month SOFR USD + 3.75%, | ||||||||
| 1.000% Floor), 10/02/2025 (a) | 115,205 | 111,773 | ||||||
The accompanying notes are an integral part of these financial statements.
57
SHENKMAN CAPITAL FLOATING RATE HIGH INCOME FUND
SCHEDULE OF INVESTMENTS – Continued
September 30, 2023
| Principal | Fair | |||||||
| Amount | Value | |||||||
| BANK LOANS – 84.30% (d) – Continued | ||||||||
| UTILITIES: POWER – 0.61% – Continued | ||||||||
| Lightstone Holdco, LLC | ||||||||
| Senior Secured First Lien Term Loan | ||||||||
| 11.066% (1 Month SOFR USD + 5.75%, | ||||||||
| 1.000% Floor), 02/01/2027 (a) | $ | 781,550 | $ | 731,645 | ||||
| Senior Secured First Lien Term Loan | ||||||||
| 11.081% (1 Month SOFR USD + 5.75%, | ||||||||
| 1.000% Floor), 02/01/2027 (a) | 44,204 | 41,381 | ||||||
| WaterBridge Midstream Operating, LLC, | ||||||||
| Senior Secured First Lien Term Loan | ||||||||
| 11.363% (3 Month SOFR USD + 5.75%, | ||||||||
| 1.000% Floor), 06/22/2026 (a) | 273,288 | 274,015 | ||||||
| 1,795,557 | ||||||||
| TOTAL BANK LOANS | ||||||||
| (Cost $248,793,657) | 247,091,714 | |||||||
| CORPORATE BONDS – 13.79% (f) | ||||||||
| AEROSPACE & DEFENSE – 0.63% | ||||||||
| TransDigm, Inc. 6.25%, 03/15/2026 (h) | 1,850,000 | 1,824,767 | ||||||
| BUILDING PRODUCTS – 0.16% | ||||||||
| Standard Industries, Inc. | ||||||||
| 3.375%, 01/15/2031 (h) | 600,000 | 464,601 | ||||||
| CHEMICALS – 0.19% | ||||||||
| Olympus Water U.S. Holding Corp. | ||||||||
| 7.125%, 10/01/2027 (h) | 490,000 | 453,899 | ||||||
| Trinseo Materials Operating SCA / | ||||||||
| Trinseo Materials Finance, Inc. | ||||||||
| 5.125%, 04/01/2029 (c)(h) | 238,000 | 124,457 | ||||||
| 578,356 | ||||||||
| COMMERCIAL SERVICES – 0.57% | ||||||||
| Garda World Security Corp. | ||||||||
| 4.625%, 02/15/2027 (c)(h) | 710,000 | 650,393 | ||||||
| OPENLANE, Inc. 5.125%, 06/01/2025 (h) | 424,000 | 410,671 | ||||||
The accompanying notes are an integral part of these financial statements.
58
SHENKMAN CAPITAL FLOATING RATE HIGH INCOME FUND
SCHEDULE OF INVESTMENTS – Continued
September 30, 2023
| Principal | Fair | |||||||
| Amount | Value | |||||||
| CORPORATE BONDS – 13.79% (f) – Continued | ||||||||
| COMMERCIAL SERVICES – 0.57% – Continued | ||||||||
| Tempo Acquisition, LLC / | ||||||||
| Tempo Acquisition Finance Corp. | ||||||||
| 5.75%, 06/01/2025 (h) | $ | 625,000 | $ | 611,318 | ||||
| 1,672,382 | ||||||||
| CONSTRUCTION & ENGINEERING – 0.34% | ||||||||
| Pike Corp. 5.50%, 09/01/2028 (h) | 1,138,000 | 996,727 | ||||||
| ENVIRONMENTAL SERVICES – 0.39% | ||||||||
| GFL Environmental, Inc. | ||||||||
| 4.00%, 08/01/2028 (c)(h) | 541,000 | 473,356 | ||||||
| Stericycle, Inc. 5.375%, 07/15/2024 (h) | 679,000 | 670,995 | ||||||
| 1,144,351 | ||||||||
| FINANCIALS: DIVERSIFIED – 0.24% | ||||||||
| Macquarie Airfinance Holdings, Ltd. | ||||||||
| 8.125%, 03/30/2029 (c)(h) | 689,000 | 690,430 | ||||||
| HEALTHCARE: EQUIPMENT & SUPPLIES – 0.21% | ||||||||
| Garden Spinco Corp. | ||||||||
| 8.625%, 07/20/2030 (h) | 589,000 | 614,823 | ||||||
| HEALTHCARE: FACILITIES – 1.42% | ||||||||
| Fresenius Medical Care U.S. Finance III, Inc. | ||||||||
| 2.375%, 02/16/2031 (h) | 925,000 | 671,011 | ||||||
| RegionalCare Hospital Partners | ||||||||
| Holdings, Inc. / LifePoint Health, Inc. | ||||||||
| 9.75%, 12/01/2026 (h) | 1,577,000 | 1,529,024 | ||||||
| Select Medical Corp. 6.25%, 08/15/2026 (h) | 437,000 | 427,338 | ||||||
| Tenet Healthcare Corp. 6.25%, 02/01/2027 | 1,570,000 | 1,520,597 | ||||||
| 4,147,970 | ||||||||
| HEALTHCARE: MANAGED HEALTH CARE – 0.35% | ||||||||
| Verscend Escrow Corp. | ||||||||
| 9.75%, 08/15/2026 (h) | 1,010,000 | 1,011,399 | ||||||
| HEALTHCARE: PHARMACEUTICALS & BIOTECHNOLOGY – 0.47% | ||||||||
| Teva Pharmaceutical Finance | ||||||||
| Netherlands III B.V. 3.15%, 10/01/2026 (c) | 1,515,000 | 1,351,212 | ||||||
The accompanying notes are an integral part of these financial statements.
59
SHENKMAN CAPITAL FLOATING RATE HIGH INCOME FUND
SCHEDULE OF INVESTMENTS – Continued
September 30, 2023
| Principal | Fair | |||||||
| Amount | Value | |||||||
| CORPORATE BONDS – 13.79% (f) – Continued | ||||||||
| HEALTHCARE: REITs – 0.27% | ||||||||
| MPT Operating Partnership, LP / | ||||||||
| MPT Finance Corp. 3.50%, 03/15/2031 | $ | 1,270,000 | $ | 794,882 | ||||
| INDUSTRIAL MACHINERY – 0.24% | ||||||||
| WESCO Distribution, Inc. | ||||||||
| 7.125%, 06/15/2025 (h) | 715,000 | 717,413 | ||||||
| LEISURE: CASINOS & GAMING – 2.6% | ||||||||
| Allwyn Entertainment Financing UK Plc | ||||||||
| 7.875%, 04/30/2029 (c)(h) | 440,000 | 446,050 | ||||||
| Caesars Entertainment, Inc. | ||||||||
| 6.25%, 07/01/2025 (h) | 2,225,000 | 2,197,824 | ||||||
| Caesars Resort Collection, LLC / | ||||||||
| CRC Finco, Inc. 5.75%, 07/01/2025 (h) | 849,000 | 846,092 | ||||||
| Churchill Downs, Inc. 5.50%, 04/01/2027 (h) | 731,000 | 697,538 | ||||||
| International Game Technology PLC | ||||||||
| 6.50%, 02/15/2025 (c)(h) | 931,000 | 930,431 | ||||||
| 4.125%, 04/15/2026 (c)(h) | 610,000 | 574,317 | ||||||
| Premier Entertainment Sub, LLC / | ||||||||
| Premier Entertainment Finance Corp. | ||||||||
| 5.625%, 09/01/2029 (h) | 561,000 | 432,640 | ||||||
| 5.875%, 09/01/2031 (h) | 562,000 | 416,501 | ||||||
| VICI Properties, LP / VICI Note Co., Inc. | ||||||||
| 3.50%, 02/15/2025 (h) | 1,145,000 | 1,096,581 | ||||||
| 7,637,974 | ||||||||
| LEISURE: HOTELS – 0.66% | ||||||||
| NCL Corp., Ltd. | ||||||||
| 3.625%, 12/15/2024 (c)(h) | 460,000 | 442,183 | ||||||
| 8.375%, 02/01/2028 (c)(h) | 444,000 | 450,685 | ||||||
| Royal Caribbean Cruises, Ltd. | ||||||||
| 11.50%, 06/01/2025 (c) | 190,000 | 200,954 | ||||||
| Sabre GLBL, Inc. 8.625%, 06/01/2027 (h) | 972,000 | 827,259 | ||||||
| 1,921,081 | ||||||||
The accompanying notes are an integral part of these financial statements.
60
SHENKMAN CAPITAL FLOATING RATE HIGH INCOME FUND
SCHEDULE OF INVESTMENTS – Continued
September 30, 2023
| Principal | Fair | |||||||
| Amount | Value | |||||||
| CORPORATE BONDS – 13.79% (f) – Continued | ||||||||
| LEISURE: RESTAURANTS – 0.21% | ||||||||
| CEC Entertainment, LLC | ||||||||
| 6.75%, 05/01/2026 (h) | $ | 660,000 | $ | 624,845 | ||||
| MEDIA: CABLE & SATELLITE – 0.4% | ||||||||
| DISH DBS Corp. | ||||||||
| 5.875%, 11/15/2024 | 475,000 | 442,876 | ||||||
| 5.125%, 06/01/2029 | 575,000 | 319,628 | ||||||
| Hughes Satellite Systems Corp. | ||||||||
| 6.625%, 08/01/2026 | 490,000 | 419,690 | ||||||
| 1,182,194 | ||||||||
| MEDIA: ENTERTAINMENT – 0.32% | ||||||||
| Playtika Holding Corp. | ||||||||
| 4.25%, 03/15/2029 (h) | 1,130,000 | 944,703 | ||||||
| METALS & MINING – 0.31% | ||||||||
| GrafTech Finance, Inc. | ||||||||
| 4.625%, 12/15/2028 (h) | 127,000 | 98,332 | ||||||
| GrafTech Global Enterprises, Inc. | ||||||||
| 9.875%, 12/15/2028 (h) | 857,000 | 813,079 | ||||||
| 911,411 | ||||||||
| MIDSTREAM: STORAGE & TRANSPORT – 0.47% | ||||||||
| Venture Global Calcasieu Pass, LLC | ||||||||
| 6.25%, 01/15/2030 (h) | 290,000 | 276,893 | ||||||
| 3.875%, 11/01/2033 (h) | 510,000 | 396,544 | ||||||
| Venture Global LNG, Inc. | ||||||||
| 8.125%, 06/01/2028 (h) | 712,000 | 705,444 | ||||||
| 1,378,881 | ||||||||
| PACKAGING – 0.25% | ||||||||
| Ball Corp. 5.25%, 07/01/2025 | 758,000 | 743,906 | ||||||
| TECHNOLOGY HARDWARE – 0.32% | ||||||||
| Entegris Escrow Corp. | ||||||||
| 4.75%, 04/15/2029 (h) | 1,005,000 | 904,340 | ||||||
The accompanying notes are an integral part of these financial statements.
61
SHENKMAN CAPITAL FLOATING RATE HIGH INCOME FUND
SCHEDULE OF INVESTMENTS – Continued
September 30, 2023
| Principal | Fair | |||||||
| Amount | Value | |||||||
| CORPORATE BONDS – 13.79% (f) – Continued | ||||||||
| TECHNOLOGY: SOFTWARE & SERVICES – 1.24% | ||||||||
| Boxer Parent Co., Inc. | ||||||||
| 7.125%, 10/02/2025 (h) | $ | 385,000 | $ | 383,545 | ||||
| Elastic N.V. 4.125%, 07/15/2029 (c)(h) | 844,000 | 719,706 | ||||||
| Gen Digital, Inc. | ||||||||
| 5.00%, 04/15/2025 (h) | 2,220,000 | 2,170,572 | ||||||
| 6.75%, 09/30/2027 (h) | 380,000 | 372,893 | ||||||
| 3,646,716 | ||||||||
| TELECOMMUNICATION SERVICES: DIVERSIFIED – 0.53% | ||||||||
| Altice France SA/France | ||||||||
| 5.50%, 01/15/2028 (c)(h) | 400,000 | 307,451 | ||||||
| Frontier Communications Holdings, LLC | ||||||||
| 5.00%, 05/01/2028 (h) | 522,000 | 446,432 | ||||||
| Northwest Fiber, LLC / Northwest | ||||||||
| Fiber Finance Sub, Inc. | ||||||||
| 4.75%, 04/30/2027 (h) | 349,000 | 310,968 | ||||||
| 6.00%, 02/15/2028 (h) | 622,000 | 509,769 | ||||||
| 1,574,620 | ||||||||
| TRANSPORTATION – 0.81% | ||||||||
| Uber Technologies, Inc. | ||||||||
| 8.00%, 11/01/2026 (h) | 1,350,000 | 1,367,234 | ||||||
| XPO, Inc. | ||||||||
| 6.25%, 06/01/2028 (h) | 758,000 | 734,835 | ||||||
| 7.125%, 06/01/2031 (h) | 264,000 | 260,331 | ||||||
| 2,362,400 | ||||||||
| UTILITIES: PROPANE – 0.19% | ||||||||
| AmeriGas Partners, LP / AmeriGas | ||||||||
| Finance Corp. 5.50%, 05/20/2025 | 585,000 | 567,426 | ||||||
| TOTAL CORPORATE BONDS | ||||||||
| (Cost $42,737,193) | 40,409,810 | |||||||
The accompanying notes are an integral part of these financial statements.
62
SHENKMAN CAPITAL FLOATING RATE HIGH INCOME FUND
SCHEDULE OF INVESTMENTS – Continued
September 30, 2023
| Fair | ||||||||
| Shares | Value | |||||||
| MONEY MARKET FUND – 2.94% | ||||||||
| First American Government | ||||||||
| Obligations Fund – Class X, 5.26% (e) | 8,625,601 | $ | 8,625,601 | |||||
| TOTAL MONEY MARKET FUND | ||||||||
| (Cost $8,625,601) | 8,625,601 | |||||||
| Total Investments (Cost $300,156,451) – 101.03% | 296,127,125 | |||||||
| Liabilities in Excess of Other Assets – (1.03%) | (3,023,170 | ) | ||||||
| TOTAL NET ASSETS – 100.00% | $ | 293,103,955 | ||||||
Percentages are stated as a percent of net assets.
| LIBOR | London Interbank Offered Rate |
| PLC | Public Limited Company |
| REIT | Real Estate Investment Trust |
| SOFR | Secured Overnight Funding Rate |
| (a) | Variable rate securities. The coupon rate shown is the effective interest rate as of September 30, 2023. |
| (b) | Value determined using significant unobservable inputs. |
| (c) | U.S. traded security of a foreign issuer. |
| (d) | Rates for senior loans will typically have interest rates that redetermine periodically by reference to a base lending rate plus a spread. Senior loans that reference SOFR may be subject to a credit spread adjustment, particularly to legacy LIBOR bank loans that have transitioned to SOFR as the base lending rate. |
| (e) | Rate shown is the 7-day annualized yield as of September 30, 2023. |
| (f) | All or a portion is posted as collateral for delayed settlement securities. |
| (g) | Final terms of the bank loan are not yet known, so reference index and spread information may not be presented. |
| (h) | Security exempt from registration under Rule 144A of the Securities Act of 1933, as amended, and may be sold only to dealers in the program or other “qualified institutional buyers.” As of September 30, 2023, the value of these investments was $34,249,593 or 11.69% of total net assets. |
| (i) | All or a portion of the loan is unfunded. |
The Global Industry Classification Standard (GICS®) was developed by and/or is the exclusive property of MSCI, Inc. and Standard & Poor’s Financial Services LLC (“S&P”). GICS is a service mark of MSCI and S&P and has been licensed for use by Shenkman Capital Management, Inc. Industries presented are at the discretion of Shenkman Capital Management, Inc. and therefore may not follow the exact naming convention prescribed by GICS.
The accompanying notes are an integral part of these financial statements.
63
SHENKMAN CAPITAL SHORT DURATION HIGH INCOME FUND
PORTFOLIO ALLOCATION
September 30, 2023 (Unaudited)
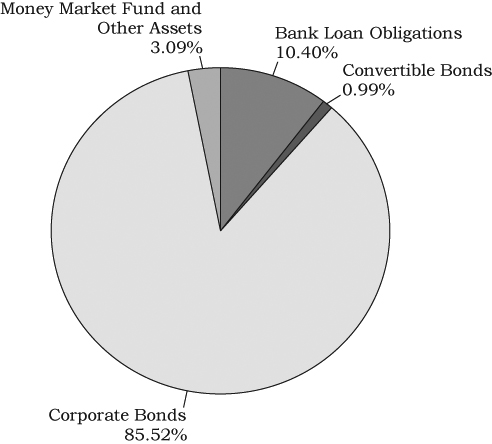
| % Net | |
| TOP TEN HOLDINGS | Assets |
| Aramark Services, Inc. 6.375%, 05/01/2025 | 1.69% |
| Verscend Escrow Corp. 9.75%, 08/15/2026 | 1.54% |
| Caesars Entertainment, Inc. 6.25%, 07/01/2025 | 1.51% |
| MGM Resorts International 6.75%, 05/01/2025 | 1.26% |
| Gen Digital, Inc. 5.00%, 04/15/2025 | 1.14% |
| CCO Holdings, LLC / CCO Holdings Capital Corp. | |
| 5.50%, 05/01/2026 | 1.07% |
| TransDigm, Inc. 6.25%, 03/15/2026 | 1.04% |
| Stericycle, Inc. 5.375%, 07/15/2024 | 1.00% |
| Univision Communications, Inc. 5.125%, 02/15/2025 | 0.99% |
| WESCO Distribution, Inc. 7.125%, 06/15/2025 | 0.96% |
The portfolio’s holdings and allocations are subject to change. The top ten holdings presented exclude the money market fund. The percentages are of total net assets as of September 30, 2023.
64
SHENKMAN CAPITAL SHORT DURATION HIGH INCOME FUND
SCHEDULE OF INVESTMENTS
September 30, 2023
| Principal | Fair | |||||||
| Amount | Value | |||||||
| CORPORATE BONDS – 85.52% (e) | ||||||||
| AEROSPACE & DEFENSE – 1.68% | ||||||||
| Howmet Aerospace, Inc. | ||||||||
| 5.125%, 10/01/2024 | $ | 3,546,000 | $ | 3,502,291 | ||||
| TransDigm, Inc. | ||||||||
| 6.25%, 03/15/2026 (c) | 16,560,000 | 16,334,131 | ||||||
| 7.50%, 03/15/2027 | 420,000 | 421,234 | ||||||
| 5.50%, 11/15/2027 | 2,327,000 | 2,186,966 | ||||||
| Triumph Group, Inc. | ||||||||
| 9.00%, 03/15/2028 (c) | 3,960,000 | 3,920,826 | ||||||
| 26,365,448 | ||||||||
| AUTO RETAIL – 0.76% | ||||||||
| Lithia Motors, Inc. 4.625%, 12/15/2027 (c) | 5,910,000 | 5,403,432 | ||||||
| Penske Automotive Group, Inc. | ||||||||
| 3.50%, 09/01/2025 | 6,819,000 | 6,459,365 | ||||||
| 11,862,797 | ||||||||
| AUTOMOTIVE – 7.21% | ||||||||
| Adient Global Holdings, Ltd. | ||||||||
| 4.875%, 08/15/2026 (b)(c) | 1,720,000 | 1,624,174 | ||||||
| 7.00%, 04/15/2028 (b)(c) | 3,035,000 | 3,013,765 | ||||||
| Allison Transmission, Inc. | ||||||||
| 4.75%, 10/01/2027 (c) | 4,450,000 | 4,111,719 | ||||||
| American Axle & Manufacturing, Inc. | ||||||||
| 6.25%, 03/15/2026 | 3,727,000 | 3,619,371 | ||||||
| 6.50%, 04/01/2027 | 7,732,000 | 7,348,977 | ||||||
| Clarios Global, LP / Clarios U.S. Finance Co. | ||||||||
| 6.25%, 05/15/2026 (b)(c) | 10,982,000 | 10,777,751 | ||||||
| 8.50%, 05/15/2027 (b)(c) | 11,384,000 | 11,372,689 | ||||||
| Dana Financing Luxembourg SARL | ||||||||
| 5.75%, 04/15/2025 (b)(c) | 4,834,000 | 4,734,166 | ||||||
| Dana, Inc. 5.375%, 11/15/2027 | 4,456,000 | 4,136,497 | ||||||
| Ford Motor Credit Co., LLC | ||||||||
| 3.664%, 09/08/2024 | 1,855,000 | 1,796,498 | ||||||
| 5.125%, 06/16/2025 | 6,215,000 | 6,019,880 | ||||||
| 3.375%, 11/13/2025 | 8,955,000 | 8,330,479 | ||||||
| 8.136% (3 Month SOFR USD + 2.95%), | ||||||||
| 03/06/2026 (a) | 3,675,000 | 3,684,119 | ||||||
| 6.95%, 06/10/2026 | 4,283,000 | 4,282,401 | ||||||
| 2.70%, 08/10/2026 | 4,195,000 | 3,745,676 | ||||||
The accompanying notes are an integral part of these financial statements.
65
SHENKMAN CAPITAL SHORT DURATION HIGH INCOME FUND
SCHEDULE OF INVESTMENTS – Continued
September 30, 2023
| Principal | Fair | |||||||
| Amount | Value | |||||||
| CORPORATE BONDS – 85.52% (e) – Continued | ||||||||
| AUTOMOTIVE – 7.21% – Continued | ||||||||
| Goodyear Tire & Rubber Co. | ||||||||
| 9.50%, 05/31/2025 | $ | 7,100,000 | $ | 7,213,571 | ||||
| 5.00%, 05/31/2026 | 7,622,000 | 7,287,477 | ||||||
| IHO Verwaltungs GmbH 4.75% Cash or | ||||||||
| 6.00% PIK, 09/15/2026 (b)(c)(f) | 3,135,000 | 2,874,786 | ||||||
| Jaguar Land Rover Automotive PLC | ||||||||
| 7.75%, 10/15/2025 (b)(c) | 5,576,000 | 5,594,161 | ||||||
| Patrick Industries, Inc. | ||||||||
| 7.50%, 10/15/2027 (c) | 5,736,000 | 5,498,329 | ||||||
| ZF North America Capital, Inc. | ||||||||
| 4.75%, 04/29/2025 (c) | 3,790,000 | 3,654,745 | ||||||
| 6.875%, 04/14/2028 (c) | 2,625,000 | 2,570,858 | ||||||
| 113,292,089 | ||||||||
| BUILDING PRODUCTS – 0.13% | ||||||||
| AmeriTex HoldCo Intermediate, LLC | ||||||||
| 10.25%, 10/15/2028 (c) | 2,097,000 | 2,076,030 | ||||||
| CHEMICALS – 2.84% | ||||||||
| Avient Corp. 5.75%, 05/15/2025 (c) | 10,971,000 | 10,782,850 | ||||||
| Celanese U.S. Holdings, LLC | ||||||||
| 6.05%, 03/15/2025 | 1,626,000 | 1,620,662 | ||||||
| Consolidated Energy Finance SA | ||||||||
| 6.50%, 05/15/2026 (b)(c) | 890,000 | 831,287 | ||||||
| INEOS Finance PLC | ||||||||
| 6.75%, 05/15/2028 (b)(c) | 3,845,000 | 3,601,541 | ||||||
| INEOS Quattro Finance 2 PLC | ||||||||
| 3.375%, 01/15/2026 (b)(c) | 2,400,000 | 2,188,863 | ||||||
| Methanex Corp. 4.25%, 12/01/2024 (b) | 4,906,000 | 4,779,538 | ||||||
| NOVA Chemicals Corp. | ||||||||
| 4.875%, 06/01/2024 (b)(c) | 11,389,000 | 11,198,051 | ||||||
| Olympus Water U.S. Holding Corp. | ||||||||
| 9.75%, 11/15/2028 (c) | 3,705,000 | 3,701,723 | ||||||
| SCIL IV, LLC / SCIL, U.S.A. Holdings, LLC | ||||||||
| 5.375%, 11/01/2026 (c) | 2,910,000 | 2,662,152 | ||||||
| SNF Group SACA 3.125%, 03/15/2027 (b)(c) | 2,617,000 | 2,318,957 | ||||||
| Trinseo Materials Operating SCA / | ||||||||
| Trinseo Materials Finance, Inc. | ||||||||
| 5.375%, 09/01/2025 (b)(c) | 1,018,000 | 939,013 | ||||||
| 44,624,637 | ||||||||
The accompanying notes are an integral part of these financial statements.
66
SHENKMAN CAPITAL SHORT DURATION HIGH INCOME FUND
SCHEDULE OF INVESTMENTS – Continued
September 30, 2023
| Principal | Fair | |||||||
| Amount | Value | |||||||
| CORPORATE BONDS – 85.52% (e) – Continued | ||||||||
| COMMERCIAL SERVICES – 4.71% | ||||||||
| Allied Universal Holdco, LLC / | ||||||||
| Allied Universal Finance Corp. | ||||||||
| 6.625%, 07/15/2026 (c) | $ | 5,840,000 | $ | 5,541,864 | ||||
| Aramark Services, Inc. | ||||||||
| 5.00%, 04/01/2025 (c) | 5,055,000 | 4,976,323 | ||||||
| 6.375%, 05/01/2025 | 26,095,000 | 26,510,954 | ||||||
| 5.00%, 02/01/2028 (c) | 1,236,000 | 1,144,503 | ||||||
| Brink’s Co. 5.50%, 07/15/2025 (c) | 5,365,000 | 5,264,036 | ||||||
| Camelot Finance SA | ||||||||
| 4.50%, 11/01/2026 (b)(c) | 4,625,000 | 4,284,353 | ||||||
| Garda World Security Corp. | ||||||||
| 9.50%, 11/01/2027 (b)(c) | 2,814,000 | 2,693,733 | ||||||
| 7.75%, 02/15/2028 (b)(c) | 1,420,000 | 1,394,018 | ||||||
| Iron Mountain, Inc. | ||||||||
| 4.875%, 09/15/2027 (c) | 8,125,000 | 7,503,480 | ||||||
| 7.00%, 02/15/2029 (c) | 4,010,000 | 3,927,635 | ||||||
| OPENLANE, Inc. | ||||||||
| 5.125%, 06/01/2025 (c) | 5,938,000 | 5,751,333 | ||||||
| Tempo Acquisition, LLC / Tempo Acquisition | ||||||||
| Finance Corp. 5.75%, 06/01/2025 (c) | 5,142,000 | 5,029,438 | ||||||
| 74,021,670 | ||||||||
| CONSTRUCTION & ENGINEERING – 0.53% | ||||||||
| Williams Scotsman International, Inc. | ||||||||
| 6.125%, 06/15/2025 (c) | 8,333,000 | 8,258,545 | ||||||
| CONSUMER DISCRETIONARY – 0.06% | ||||||||
| Acushnet Co. 7.375%, 10/15/2028 (c) | 945,000 | 953,269 | ||||||
| ENVIRONMENTAL SERVICES – 2.15% | ||||||||
| Clean Harbors, Inc. 4.875%, 07/15/2027 (c) | 2,495,000 | 2,354,304 | ||||||
| GFL Environmental, Inc. | ||||||||
| 4.25%, 06/01/2025 (b)(c) | 9,493,000 | 9,133,544 | ||||||
| 3.75%, 08/01/2025 (b)(c) | 5,850,000 | 5,551,388 | ||||||
| 5.125%, 12/15/2026 (b)(c) | 1,055,000 | 1,006,041 | ||||||
| Stericycle, Inc. 5.375%, 07/15/2024 (c) | 15,956,000 | 15,767,884 | ||||||
| 33,813,161 | ||||||||
The accompanying notes are an integral part of these financial statements.
67
SHENKMAN CAPITAL SHORT DURATION HIGH INCOME FUND
SCHEDULE OF INVESTMENTS – Continued
September 30, 2023
| Principal | Fair | |||||||
| Amount | Value | |||||||
| CORPORATE BONDS – 85.52% (e) – Continued | ||||||||
| FINANCIALS: CONSUMER FINANCE – 2.96% | ||||||||
| Ally Financial, Inc. | ||||||||
| 5.75%, 11/20/2025 | $ | 3,022,000 | $ | 2,937,604 | ||||
| 7.10%, 11/15/2027 | 2,880,000 | 2,882,298 | ||||||
| 6.992% (6 Month SOFR USD + 3.26%), | ||||||||
| 06/13/2029 (a) | 1,456,000 | 1,426,101 | ||||||
| goeasy, Ltd. | ||||||||
| 5.375%, 12/01/2024 (b)(c) | 5,709,000 | 5,603,508 | ||||||
| 4.375%, 05/01/2026 (b)(c) | 2,390,000 | 2,189,156 | ||||||
| Navient Corp. | ||||||||
| 6.125%, 03/25/2024 | 10,300,000 | 10,254,276 | ||||||
| 5.875%, 10/25/2024 | 1,000,000 | 985,240 | ||||||
| 6.75%, 06/25/2025 | 1,755,000 | 1,730,562 | ||||||
| OneMain Finance Corp. | ||||||||
| 8.25%, 10/01/2023 | 3,206,000 | 3,206,000 | ||||||
| 6.125%, 03/15/2024 | 3,351,000 | 3,343,485 | ||||||
| 6.875%, 03/15/2025 | 5,124,000 | 5,083,172 | ||||||
| 7.125%, 03/15/2026 | 2,000,000 | 1,961,691 | ||||||
| 3.50%, 01/15/2027 | 1,381,000 | 1,183,869 | ||||||
| SLM Corp. 3.125%, 11/02/2026 | 4,285,000 | 3,720,044 | ||||||
| 46,507,006 | ||||||||
| FINANCIALS: DIVERSIFIED – 1.29% | ||||||||
| Aircastle, Ltd. | ||||||||
| 4.125%, 05/01/2024 (b) | 3,419,000 | 3,370,923 | ||||||
| 5.25%, 08/11/2025 (b)(c) | 3,485,000 | 3,396,325 | ||||||
| 6.50%, 07/18/2028 (b)(c) | 2,723,000 | 2,673,328 | ||||||
| Block, Inc. 2.75%, 06/01/2026 | 4,154,000 | 3,740,720 | ||||||
| Macquarie Airfinance Holdings, Ltd. | ||||||||
| 8.375%, 05/01/2028 (b)(c) | 1,800,000 | 1,826,613 | ||||||
| 8.125%, 03/30/2029 (b)(c) | 1,377,000 | 1,379,857 | ||||||
| Starwood Property Trust, Inc. | ||||||||
| 3.75%, 12/31/2024 (c) | 1,383,000 | 1,318,140 | ||||||
| 3.625%, 07/15/2026 (c) | 2,809,000 | 2,494,674 | ||||||
| 20,200,580 | ||||||||
The accompanying notes are an integral part of these financial statements.
68
SHENKMAN CAPITAL SHORT DURATION HIGH INCOME FUND
SCHEDULE OF INVESTMENTS – Continued
September 30, 2023
| Principal | Fair | |||||||
| Amount | Value | |||||||
| CORPORATE BONDS – 85.52% (e) – Continued | ||||||||
| FINANCIALS: INSURANCE – 1.04% | ||||||||
| Acrisure, LLC / Acrisure Finance, Inc. | ||||||||
| 7.00%, 11/15/2025 (c) | $ | 3,832,000 | $ | 3,726,406 | ||||
| 10.125%, 08/01/2026 (c) | 3,149,000 | 3,231,444 | ||||||
| HUB International, Ltd. | ||||||||
| 7.00%, 05/01/2026 (c) | 7,675,000 | 7,666,285 | ||||||
| NFP Corp. 6.875%, 08/15/2028 (c) | 1,910,000 | 1,642,516 | ||||||
| 16,266,651 | ||||||||
| FINANCIALS: THRIFTS & MORTGAGES – 1.41% | ||||||||
| Nationstar Mortgage Holdings, Inc. | ||||||||
| 5.00%, 02/01/2026 (c) | 1,382,000 | 1,292,184 | ||||||
| 6.00%, 01/15/2027 (c) | 5,731,000 | 5,421,626 | ||||||
| PennyMac Financial Services, Inc. | ||||||||
| 5.375%, 10/15/2025 (c) | 8,125,000 | 7,732,847 | ||||||
| Rocket Mortgage, LLC / Rocket Mortgage | ||||||||
| Co-Issuer, Inc. 2.875%, 10/15/2026 (c) | 2,272,000 | 1,995,736 | ||||||
| United Wholesale Mortgage, LLC | ||||||||
| 5.50%, 11/15/2025 (c) | 5,950,000 | 5,658,083 | ||||||
| 22,100,476 | ||||||||
| FOOD & BEVERAGE – 0.24% | ||||||||
| B&G Foods, Inc. 5.25%, 04/01/2025 | 745,000 | 731,768 | ||||||
| Post Holdings, Inc. 5.75%, 03/01/2027 (c) | 3,240,000 | 3,114,569 | ||||||
| 3,846,337 | ||||||||
| HEALTHCARE: EQUIPMENT & SUPPLIES – 0.24% | ||||||||
| Owens & Minor, Inc. 4.375%, 12/15/2024 | 3,870,000 | 3,763,999 | ||||||
| HEALTHCARE: FACILITIES – 2.81% | ||||||||
| Encompass Health Corp. | ||||||||
| 5.75%, 09/15/2025 | 1,885,000 | 1,856,382 | ||||||
| Fresenius Medical Care U.S. Finance III, Inc. | ||||||||
| 1.875%, 12/01/2026 (c) | 922,000 | 804,812 | ||||||
| HCA, Inc. | ||||||||
| 8.36%, 04/15/2024 | 3,846,000 | 3,889,447 | ||||||
| 5.375%, 02/01/2025 | 1,805,000 | 1,786,890 | ||||||
| 7.69%, 06/15/2025 | 658,000 | 673,830 | ||||||
| 7.58%, 09/15/2025 | 2,251,000 | 2,300,300 | ||||||
The accompanying notes are an integral part of these financial statements.
69
SHENKMAN CAPITAL SHORT DURATION HIGH INCOME FUND
SCHEDULE OF INVESTMENTS – Continued
September 30, 2023
| Principal | Fair | |||||||
| Amount | Value | |||||||
| CORPORATE BONDS – 85.52% (e) – Continued | ||||||||
| HEALTHCARE: FACILITIES – 2.81% – Continued | ||||||||
| Legacy LifePoint Health, LLC | ||||||||
| 4.375%, 02/15/2027 (c) | $ | 512,000 | $ | 442,225 | ||||
| RegionalCare Hospital Partners | ||||||||
| Holdings, Inc. / LifePoint Health, Inc. | ||||||||
| 9.75%, 12/01/2026 (c) | 7,896,000 | 7,655,785 | ||||||
| Select Medical Corp. 6.25%, 08/15/2026 (c) | 4,829,000 | 4,722,232 | ||||||
| Surgery Center Holdings, Inc. | ||||||||
| 6.75%, 07/01/2025 (c) | 5,013,000 | 4,980,691 | ||||||
| 10.00%, 04/15/2027 (c) | 3,852,000 | 3,899,091 | ||||||
| Tenet Healthcare Corp. | ||||||||
| 4.875%, 01/01/2026 | 1,620,000 | 1,553,601 | ||||||
| 6.25%, 02/01/2027 | 9,848,000 | 9,538,114 | ||||||
| 44,103,400 | ||||||||
| HEALTHCARE: LIFE SCIENCES – 0.85% | ||||||||
| Catalent Pharma Solutions, Inc. | ||||||||
| 5.00%, 07/15/2027 (c) | 1,290,000 | 1,184,829 | ||||||
| IQVIA, Inc. 5.00%, 10/15/2026 (c) | 12,749,000 | 12,200,409 | ||||||
| 13,385,238 | ||||||||
| HEALTHCARE: MANAGED HEALTH CARE – 1.54% | ||||||||
| Verscend Escrow Corp. | ||||||||
| 9.75%, 08/15/2026 (c) | 24,204,000 | 24,237,523 | ||||||
| HEALTHCARE: PHARMACEUTICALS & BIOTECHNOLOGY – 1.48% | ||||||||
| Bausch Health Cos., Inc. | ||||||||
| 5.50%, 11/01/2025 (b)(c) | 3,694,000 | 3,277,317 | ||||||
| 9.00%, 12/15/2025 (b)(c) | 4,744,000 | 4,322,187 | ||||||
| Teva Pharmaceutical Finance | ||||||||
| Netherlands III B.V. | ||||||||
| 6.00%, 04/15/2024 (b) | 8,534,000 | 8,499,354 | ||||||
| 7.125%, 01/31/2025 (b) | 2,400,000 | 2,410,529 | ||||||
| 3.15%, 10/01/2026 (b) | 5,385,000 | 4,802,825 | ||||||
| 23,312,212 | ||||||||
| HEALTHCARE: REITs – 0.74% | ||||||||
| MPT Operating Partnership, LP / | ||||||||
| MPT Finance Corp. 5.25%, 08/01/2026 | 10,059,000 | 8,576,495 | ||||||
| Sabra Health Care, LP 5.125%, 08/15/2026 | 3,260,000 | 3,122,119 | ||||||
| 11,698,614 | ||||||||
The accompanying notes are an integral part of these financial statements.
70
SHENKMAN CAPITAL SHORT DURATION HIGH INCOME FUND
SCHEDULE OF INVESTMENTS – Continued
September 30, 2023
| Principal | Fair | |||||||
| Amount | Value | |||||||
| CORPORATE BONDS – 85.52% (e) – Continued | ||||||||
| INDUSTRIAL MACHINERY – 2.01% | ||||||||
| EnPro Industries, Inc. 5.75%, 10/15/2026 | $ | 6,489,000 | $ | 6,228,174 | ||||
| Hillenbrand, Inc. 5.75%, 06/15/2025 | 2,105,000 | 2,076,445 | ||||||
| Regal Rexnord Corp. 6.05%, 02/15/2026 (c) | 7,441,000 | 7,358,590 | ||||||
| TK Elevator U.S. Newco, Inc. | ||||||||
| 5.25%, 07/15/2027 (c) | 925,000 | 852,379 | ||||||
| WESCO Distribution, Inc. | ||||||||
| 7.125%, 06/15/2025 (c) | 15,029,000 | 15,079,723 | ||||||
| 31,595,311 | ||||||||
| LEISURE: CASINOS & GAMING – 8.51% | ||||||||
| Boyd Gaming Corp. 4.75%, 12/01/2027 | 1,600,000 | 1,475,989 | ||||||
| Caesars Entertainment, Inc. | ||||||||
| 6.25%, 07/01/2025 (c) | 23,955,000 | 23,662,411 | ||||||
| 8.125%, 07/01/2027 (c) | 6,050,000 | 6,083,768 | ||||||
| Caesars Resort Collection, LLC / | ||||||||
| CRC Finco, Inc. 5.75%, 07/01/2025 (c) | 12,075,000 | 12,033,642 | ||||||
| Churchill Downs, Inc. | ||||||||
| 5.50%, 04/01/2027 (c) | 10,265,000 | 9,795,119 | ||||||
| International Game Technology PLC | ||||||||
| 6.50%, 02/15/2025 (b)(c) | 4,529,000 | 4,526,231 | ||||||
| 4.125%, 04/15/2026 (b)(c) | 12,083,000 | 11,376,183 | ||||||
| 6.25%, 01/15/2027 (b)(c) | 4,505,000 | 4,414,627 | ||||||
| Light & Wonder International, Inc. | ||||||||
| 7.00%, 05/15/2028 (c) | 4,399,000 | 4,328,308 | ||||||
| MGM Resorts International | ||||||||
| 6.75%, 05/01/2025 | 19,830,000 | 19,746,099 | ||||||
| 5.75%, 06/15/2025 | 8,169,000 | 7,986,978 | ||||||
| 4.625%, 09/01/2026 | 427,000 | 399,249 | ||||||
| 5.50%, 04/15/2027 | 1,385,000 | 1,296,059 | ||||||
| Penn Entertainment, Inc. | ||||||||
| 5.625%, 01/15/2027 (c) | 3,228,000 | 3,039,130 | ||||||
| VICI Properties, LP / VICI Note Co., Inc. | ||||||||
| 5.625%, 05/01/2024 (c) | 7,810,000 | 7,767,107 | ||||||
| 3.50%, 02/15/2025 (c) | 1,865,000 | 1,786,135 | ||||||
| 4.625%, 06/15/2025 (c) | 5,805,000 | 5,611,171 | ||||||
| 4.50%, 09/01/2026 (c) | 2,405,000 | 2,261,812 | ||||||
| 4.25%, 12/01/2026 (c) | 5,240,000 | 4,887,579 | ||||||
| 3.75%, 02/15/2027 (c) | 1,255,000 | 1,140,028 | ||||||
| 133,617,625 | ||||||||
The accompanying notes are an integral part of these financial statements.
71
SHENKMAN CAPITAL SHORT DURATION HIGH INCOME FUND
SCHEDULE OF INVESTMENTS – Continued
September 30, 2023
| Principal | Fair | |||||||
| Amount | Value | |||||||
| CORPORATE BONDS – 85.52% (e) – Continued | ||||||||
| LEISURE: HOTELS – 8.02% | ||||||||
| Carnival Corp. 9.875%, 08/01/2027 (b)(c) | $ | 4,695,000 | $ | 4,904,296 | ||||
| Cedar Fair, LP / Canada’s Wonderland Co. / | ||||||||
| Magnum Management Corp. / | ||||||||
| Millennium Op | ||||||||
| 5.50%, 05/01/2025 (c) | 12,871,000 | 12,617,213 | ||||||
| 5.375%, 04/15/2027 | 2,655,000 | 2,489,233 | ||||||
| NCL Corp., Ltd. | ||||||||
| 3.625%, 12/15/2024 (b)(c) | 1,150,000 | 1,105,457 | ||||||
| 5.875%, 02/15/2027 (b)(c) | 3,270,000 | 3,112,724 | ||||||
| 8.375%, 02/01/2028 (b)(c) | 1,305,000 | 1,324,650 | ||||||
| Park Intermediate Holdings, LLC / | ||||||||
| PK Domestic Property, LLC / PK Finance | ||||||||
| Co-Issuer 7.50%, 06/01/2025 (c) | 10,760,000 | 10,754,674 | ||||||
| RHP Hotel Properties, LP / | ||||||||
| RHP Finance Corp. | ||||||||
| 4.75%, 10/15/2027 | 4,315,000 | 3,930,900 | ||||||
| 7.25%, 07/15/2028 (c) | 1,623,000 | 1,596,111 | ||||||
| RLJ Lodging Trust, LP | ||||||||
| 3.75%, 07/01/2026 (c) | 9,557,000 | 8,652,143 | ||||||
| Royal Caribbean Cruises, Ltd. | ||||||||
| 11.50%, 06/01/2025 (b)(c) | 6,464,000 | 6,836,650 | ||||||
| 5.50%, 08/31/2026 (b)(c) | 866,000 | 819,154 | ||||||
| Sabre GLBL, Inc. | ||||||||
| 8.625%, 06/01/2027 (c) | 5,081,000 | 4,324,387 | ||||||
| 11.25%, 12/15/2027 (c) | 866,000 | 799,685 | ||||||
| Service Properties Trust | ||||||||
| 4.65%, 03/15/2024 | 3,640,000 | 3,594,592 | ||||||
| 4.35%, 10/01/2024 | 8,985,000 | 8,635,447 | ||||||
| 4.50%, 03/15/2025 | 490,000 | 459,226 | ||||||
| 7.50%, 09/15/2025 | 3,820,000 | 3,757,317 | ||||||
| 5.25%, 02/15/2026 | 2,210,000 | 2,016,133 | ||||||
| Six Flags Theme Parks, Inc. | ||||||||
| 7.00%, 07/01/2025 (c) | 4,865,000 | 4,857,257 | ||||||
| Travel + Leisure Co. | ||||||||
| 5.875%, 10/01/2025 (h) | 3,498,000 | 3,466,326 | ||||||
| 6.625%, 07/31/2026 (c) | 9,100,000 | 8,862,035 | ||||||
| 6.00%, 04/01/2027 (h) | 2,810,000 | 2,676,103 | ||||||
The accompanying notes are an integral part of these financial statements.
72
SHENKMAN CAPITAL SHORT DURATION HIGH INCOME FUND
SCHEDULE OF INVESTMENTS – Continued
September 30, 2023
| Principal | Fair | |||||||
| Amount | Value | |||||||
| CORPORATE BONDS – 85.52% (e) – Continued | ||||||||
| LEISURE: HOTELS – 8.02% – Continued | ||||||||
| TripAdvisor, Inc. 7.00%, 07/15/2025 (c) | $ | 12,192,000 | $ | 12,181,881 | ||||
| Vail Resorts, Inc. 6.25%, 05/15/2025 (c) | 12,287,000 | 12,232,692 | ||||||
| 126,006,286 | ||||||||
| LEISURE: RESTAURANTS – 1.52% | ||||||||
| 1011778 B.C., ULC / New Red Finance, Inc. | ||||||||
| 5.75%, 04/15/2025 (b)(c) | 3,135,000 | 3,114,122 | ||||||
| CEC Entertainment, LLC | ||||||||
| 6.75%, 05/01/2026 (c) | 5,509,000 | 5,215,563 | ||||||
| Dave & Buster’s, Inc. | ||||||||
| 7.625%, 11/01/2025 (c) | 4,459,000 | 4,461,970 | ||||||
| IRB Holding Corp. 7.00%, 06/15/2025 (c) | 11,127,000 | 11,142,355 | ||||||
| 23,934,010 | ||||||||
| MEDIA: BROADCASTING – 2.89% | ||||||||
| Graham Holdings Co. 5.75%, 06/01/2026 (c) | 3,645,000 | 3,526,829 | ||||||
| Sirius XM Radio, Inc. | ||||||||
| 3.125%, 09/01/2026 (c) | 4,478,000 | 3,995,675 | ||||||
| 5.00%, 08/01/2027 (c) | 12,551,000 | 11,476,697 | ||||||
| TEGNA, Inc. 4.75%, 03/15/2026 (c) | 3,590,000 | 3,405,600 | ||||||
| Univision Communications, Inc. | ||||||||
| 5.125%, 02/15/2025 (c) | 15,929,000 | 15,543,382 | ||||||
| 6.625%, 06/01/2027 (c) | 8,045,000 | 7,497,821 | ||||||
| 45,446,004 | ||||||||
| MEDIA: CABLE & SATELLITE – 2.81% | ||||||||
| C&W Senior Financing DAC | ||||||||
| 6.875%, 09/15/2027 (b)(c) | 2,685,000 | 2,363,004 | ||||||
| CCO Holdings, LLC / CCO Holdings | ||||||||
| Capital Corp. | ||||||||
| 5.50%, 05/01/2026 (c) | 17,381,000 | 16,807,309 | ||||||
| 5.125%, 05/01/2027 (c) | 3,165,000 | 2,952,384 | ||||||
| Connect Finco SARL / Connect | ||||||||
| U.S. Finco, LLC 6.75%, 10/01/2026 (b)(c) | 2,500,000 | 2,334,768 | ||||||
| CSC Holdings, LLC 5.50%, 04/15/2027 (c) | 5,300,000 | 4,544,105 | ||||||
| DIRECTV Financing, LLC / | ||||||||
| DIRECTV Financing Co-Obligor, Inc. | ||||||||
| 5.875%, 08/15/2027 (c) | 4,474,000 | 3,968,125 | ||||||
The accompanying notes are an integral part of these financial statements.
73
SHENKMAN CAPITAL SHORT DURATION HIGH INCOME FUND
SCHEDULE OF INVESTMENTS – Continued
September 30, 2023
| Principal | Fair | |||||||
| Amount | Value | |||||||
| CORPORATE BONDS – 85.52% (e) – Continued | ||||||||
| MEDIA: CABLE & SATELLITE – 2.81% – Continued | ||||||||
| DISH DBS Corp. 5.875%, 11/15/2024 | $ | 4,955,000 | $ | 4,619,892 | ||||
| Hughes Satellite Systems Corp. | ||||||||
| 5.25%, 08/01/2026 | 1,043,000 | 939,154 | ||||||
| 6.625%, 08/01/2026 | 2,418,000 | 2,071,041 | ||||||
| Viasat, Inc. 5.625%, 09/15/2025 (c) | 3,843,000 | 3,559,905 | ||||||
| 44,159,687 | ||||||||
| MEDIA: DIVERSIFIED – 0.59% | ||||||||
| Match Group Holdings II, LLC | ||||||||
| 5.00%, 12/15/2027 (c) | 4,560,000 | 4,211,233 | ||||||
| Outfront Media Capital, LLC / | ||||||||
| Outfront Media Capital Corp. | ||||||||
| 6.25%, 06/15/2025 (c) | 5,200,000 | 5,107,104 | ||||||
| 9,318,337 | ||||||||
| MEDIA: ENTERTAINMENT – 1.32% | ||||||||
| Live Nation Entertainment, Inc. | ||||||||
| 4.875%, 11/01/2024 (c) | 11,376,000 | 11,209,171 | ||||||
| 5.625%, 03/15/2026 (c) | 9,423,000 | 9,040,114 | ||||||
| 6.50%, 05/15/2027 (c) | 500,000 | 493,504 | ||||||
| 20,742,789 | ||||||||
| METALS & MINING – 0.38% | ||||||||
| Cleveland-Cliffs, Inc. | ||||||||
| 6.75%, 03/15/2026 (c) | 5,920,000 | 5,909,448 | ||||||
| MIDSTREAM: STORAGE & TRANSPORT – 3.32% | ||||||||
| Antero Midstream Partners, LP / | ||||||||
| Antero Midstream Finance Corp. | ||||||||
| 7.875%, 05/15/2026 (c) | 4,550,000 | 4,585,667 | ||||||
| Buckeye Partners, LP | ||||||||
| 4.35%, 10/15/2024 | 3,460,000 | 3,349,467 | ||||||
| 4.125%, 03/01/2025 (c) | 4,856,000 | 4,618,453 | ||||||
| 3.95%, 12/01/2026 | 1,139,000 | 1,023,956 | ||||||
| Crestwood Midstream Partners, LP / | ||||||||
| Crestwood Midstream Finance Corp. | ||||||||
| 5.75%, 04/01/2025 | 2,505,000 | 2,466,749 | ||||||
| 5.625%, 05/01/2027 (c) | 1,799,000 | 1,726,859 | ||||||
The accompanying notes are an integral part of these financial statements.
74
SHENKMAN CAPITAL SHORT DURATION HIGH INCOME FUND
SCHEDULE OF INVESTMENTS – Continued
September 30, 2023
| Principal | Fair | |||||||
| Amount | Value | |||||||
| CORPORATE BONDS – 85.52% (e) – Continued | ||||||||
| MIDSTREAM: STORAGE & TRANSPORT – 3.32% – Continued | ||||||||
| EQM Midstream Partners, LP | ||||||||
| 4.00%, 08/01/2024 | $ | 2,000,000 | $ | 1,951,058 | ||||
| 6.00%, 07/01/2025 (c) | 714,000 | 703,667 | ||||||
| 7.50%, 06/01/2027 (c) | 3,695,000 | 3,708,764 | ||||||
| Genesis Energy, LP / | ||||||||
| Genesis Energy Finance Corp. | ||||||||
| 6.50%, 10/01/2025 | 3,675,000 | 3,615,313 | ||||||
| 6.25%, 05/15/2026 | 2,183,000 | 2,095,331 | ||||||
| NuStar Logistics, LP 5.75%, 10/01/2025 | 5,734,000 | 5,582,422 | ||||||
| Sunoco, LP / Sunoco Finance Corp. | ||||||||
| 6.00%, 04/15/2027 | 2,341,000 | 2,271,202 | ||||||
| 7.00%, 09/15/2028 (c) | 5,122,000 | 5,068,898 | ||||||
| Tallgrass Energy Partners, LP / | ||||||||
| Tallgrass Energy Finance Corp. | ||||||||
| 7.50%, 10/01/2025 (c) | 2,630,000 | 2,625,739 | ||||||
| Venture Global LNG, Inc. | ||||||||
| 8.125%, 06/01/2028 (c) | 6,748,000 | 6,685,862 | ||||||
| 52,079,407 | ||||||||
| PACKAGING – 3.25% | ||||||||
| Ardagh Packaging Finance PLC / | ||||||||
| Ardagh Holdings U.S.A., Inc. | ||||||||
| 5.25%, 04/30/2025 (b)(c) | 10,953,000 | 10,688,630 | ||||||
| 4.125%, 08/15/2026 (b)(c) | 4,879,000 | 4,466,105 | ||||||
| Ball Corp. 5.25%, 07/01/2025 | 3,480,000 | 3,415,295 | ||||||
| Berry Global, Inc. | ||||||||
| 4.50%, 02/15/2026 (c) | 5,140,000 | 4,875,548 | ||||||
| 4.875%, 07/15/2026 (c) | 7,701,000 | 7,379,842 | ||||||
| Crown Americas, LLC / Crown Americas | ||||||||
| Capital Corp. VI 4.75%, 02/01/2026 | 1,477,000 | 1,420,087 | ||||||
| LABL, Inc. 6.75%, 07/15/2026 (c) | 6,916,000 | 6,709,385 | ||||||
| Mauser Packaging Solutions Holding Co. | ||||||||
| 7.875%, 08/15/2026 (c) | 2,414,000 | 2,331,861 | ||||||
| 9.25%, 04/15/2027 (c) | 2,100,000 | 1,838,358 | ||||||
| Owens-Brockway Glass Container, Inc. | ||||||||
| 6.625%, 05/13/2027 (c) | 3,627,000 | 3,539,596 | ||||||
The accompanying notes are an integral part of these financial statements.
75
SHENKMAN CAPITAL SHORT DURATION HIGH INCOME FUND
SCHEDULE OF INVESTMENTS – Continued
September 30, 2023
| Principal | Fair | |||||||
| Amount | Value | |||||||
| CORPORATE BONDS – 85.52% (e) – Continued | ||||||||
| PACKAGING – 3.25% – Continued | ||||||||
| Sealed Air Corp. | ||||||||
| 5.125%, 12/01/2024 (c) | $ | 3,503,000 | $ | 3,461,169 | ||||
| 5.50%, 09/15/2025 (c) | 205,000 | 201,009 | ||||||
| 4.00%, 12/01/2027 (c) | 810,000 | 723,602 | ||||||
| 51,050,487 | ||||||||
| REAL ESTATE: HOMEBUILDING – 0.2% | ||||||||
| Shea Homes, LP / Shea Homes | ||||||||
| Funding Corp. 4.75%, 02/15/2028 | 582,000 | 523,745 | ||||||
| TRI Pointe Group, Inc. / TRI Pointe | ||||||||
| Homes, Inc. 5.875%, 06/15/2024 | 2,670,000 | 2,653,905 | ||||||
| 3,177,650 | ||||||||
| REAL ESTATE: MANAGEMENT – 0.21% | ||||||||
| Newmark Group, Inc. 6.125%, 11/15/2023 | 3,268,000 | 3,265,075 | ||||||
| RETAIL: FOOD & DRUG – 1.75% | ||||||||
| Albertsons Cos., Inc. / Safeway, Inc. / | ||||||||
| New Albertsons, LP / Albertsons, LLC | ||||||||
| 3.25%, 03/15/2026 (c) | 3,565,000 | 3,305,817 | ||||||
| 7.50%, 03/15/2026 (c) | 13,344,000 | 13,536,287 | ||||||
| 4.625%, 01/15/2027 (c) | 2,325,000 | 2,198,031 | ||||||
| 6.50%, 02/15/2028 (c) | 5,260,000 | 5,204,989 | ||||||
| U.S. Foods, Inc. 6.875%, 09/15/2028 (c) | 3,278,000 | 3,274,886 | ||||||
| 27,520,010 | ||||||||
| RETAILING – 0.56% | ||||||||
| Bath & Body Works, Inc. | ||||||||
| 9.375%, 07/01/2025 (c) | 4,552,000 | 4,738,805 | ||||||
| PetSmart, Inc. / PetSmart Finance | ||||||||
| Corp. 4.75%, 02/15/2028 (c) | 4,716,000 | 4,136,236 | ||||||
| 8,875,041 | ||||||||
| TECHNOLOGY HARDWARE – 0.87% | ||||||||
| CDW, LLC / CDW Finance Corp. | ||||||||
| 4.125%, 05/01/2025 | 5,065,000 | 4,899,438 | ||||||
| Presidio Holdings, Inc. | ||||||||
| 8.25%, 02/01/2028 (c) | 3,175,000 | 3,037,531 | ||||||
The accompanying notes are an integral part of these financial statements.
76
SHENKMAN CAPITAL SHORT DURATION HIGH INCOME FUND
SCHEDULE OF INVESTMENTS – Continued
September 30, 2023
| Principal | Fair | |||||||
| Amount | Value | |||||||
| CORPORATE BONDS – 85.52% (e) – Continued | ||||||||
| TECHNOLOGY HARDWARE – 0.87% – Continued | ||||||||
| Sensata Technologies B.V. | ||||||||
| 5.625%, 11/01/2024 (b)(c) | $ | 4,445,000 | $ | 4,399,683 | ||||
| Western Digital Corp. 4.75%, 02/15/2026 | 1,371,000 | 1,308,384 | ||||||
| 13,645,036 | ||||||||
| TECHNOLOGY: SOFTWARE & SERVICES – 3.86% | ||||||||
| Boxer Parent Co., Inc. | ||||||||
| 7.125%, 10/02/2025 (c) | 10,157,000 | 10,118,617 | ||||||
| 9.125%, 03/01/2026 (c) | 2,982,000 | 2,977,154 | ||||||
| Consensus Cloud Solutions, Inc. | ||||||||
| 6.00%, 10/15/2026 (c) | 4,975,000 | 4,585,427 | ||||||
| Gen Digital, Inc. | ||||||||
| 5.00%, 04/15/2025 (c) | 18,275,000 | 17,868,107 | ||||||
| 6.75%, 09/30/2027 (c) | 6,773,000 | 6,646,329 | ||||||
| Go Daddy Operating Co., LLC / GD | ||||||||
| Finance Co., Inc. 5.25%, 12/01/2027 (c) | 1,220,000 | 1,152,290 | ||||||
| Open Text Corp. 6.90%, 12/01/2027 (b)(c) | 4,485,000 | 4,499,437 | ||||||
| PTC, Inc. 3.625%, 02/15/2025 (c) | 7,472,000 | 7,188,004 | ||||||
| Shift4 Payments, LLC / Shift4 Payments | ||||||||
| Finance Sub, Inc. 4.625%, 11/01/2026 (c) | 5,881,000 | 5,549,135 | ||||||
| 60,584,500 | ||||||||
| TELECOMMUNICATION SERVICES: DIVERSIFIED – 1.45% | ||||||||
| Altice France SA 8.125%, 02/01/2027 (b)(c) | 2,415,000 | 2,145,651 | ||||||
| Cogent Communications Group, Inc. | ||||||||
| 3.50%, 05/01/2026 (c) | 3,105,000 | 2,871,038 | ||||||
| Iliad Holding SASU | ||||||||
| 6.50%, 10/15/2026 (b)(c) | 7,788,000 | 7,325,407 | ||||||
| Northwest Fiber, LLC / Northwest Fiber | ||||||||
| Finance Sub, Inc. 4.75%, 04/30/2027 (c) | 3,155,000 | 2,811,184 | ||||||
| Uniti Group, LP / Uniti Group Finance, Inc. / | ||||||||
| CSL Capital, LLC 10.50%, 02/15/2028 (c) | 1,049,000 | 1,028,469 | ||||||
| Videotron, Ltd. | ||||||||
| 5.375%, 06/15/2024 (b)(c) | 3,510,000 | 3,483,219 | ||||||
| 5.125%, 04/15/2027 (b)(c) | 3,325,000 | 3,149,922 | ||||||
| 22,814,890 | ||||||||
The accompanying notes are an integral part of these financial statements.
77
SHENKMAN CAPITAL SHORT DURATION HIGH INCOME FUND
SCHEDULE OF INVESTMENTS – Continued
September 30, 2023
| Principal | Fair | |||||||
| Amount | Value | |||||||
| CORPORATE BONDS – 85.52% (e) – Continued | ||||||||
| TELECOMMUNICATION SERVICES: WIRELESS – 0.15% | ||||||||
| Sprint Capital Corp. 6.875%, 11/15/2028 | $ | 1,578,000 | $ | 1,631,206 | ||||
| Sprint, LLC 7.625%, 03/01/2026 | 660,000 | 679,084 | ||||||
| 2,310,290 | ||||||||
| TRANSPORTATION – 2.49% | ||||||||
| American Airlines, Inc. | ||||||||
| 11.75%, 07/15/2025 (c) | 1,500,000 | 1,613,388 | ||||||
| American Airlines, Inc. / AAdvantage | ||||||||
| Loyalty IP, Ltd. 5.50%, 04/20/2026 (b)(c) | 1,265,000 | 1,236,630 | ||||||
| Mileage Plus Holdings, LLC / Mileage Plus | ||||||||
| Intellectual Property Assets, Ltd. | ||||||||
| 6.50%, 06/20/2027 (c) | 5,315,250 | 5,272,639 | ||||||
| Uber Technologies, Inc. | ||||||||
| 7.50%, 05/15/2025 (c) | 9,220,000 | 9,287,998 | ||||||
| 8.00%, 11/01/2026 (c) | 13,705,000 | 13,879,944 | ||||||
| 7.50%, 09/15/2027 (c) | 1,690,000 | 1,705,943 | ||||||
| XPO Escrow Sub, LLC | ||||||||
| 7.50%, 11/15/2027 (c) | 2,247,000 | 2,275,593 | ||||||
| XPO, Inc. 6.25%, 06/01/2028 (c) | 3,925,000 | 3,805,051 | ||||||
| 39,077,186 | ||||||||
| UTILITIES: POWER – 3.08% | ||||||||
| Calpine Corp. 5.25%, 06/01/2026 (c) | 5,458,000 | 5,285,798 | ||||||
| NextEra Energy Operating Partners, LP | ||||||||
| 4.25%, 07/15/2024 (c) | 11,013,000 | 10,789,972 | ||||||
| 4.25%, 09/15/2024 (c) | 72,000 | 69,200 | ||||||
| NRG Energy, Inc. | ||||||||
| 3.75%, 06/15/2024 (c) | 2,024,000 | 1,982,565 | ||||||
| 6.625%, 01/15/2027 | 5,815,000 | 5,701,730 | ||||||
| Vistra Operations Co., LLC | ||||||||
| 4.875%, 05/13/2024 (c) | 2,430,000 | 2,405,239 | ||||||
| 3.55%, 07/15/2024 (c) | 570,000 | 556,046 | ||||||
| 5.50%, 09/01/2026 (c) | 6,639,000 | 6,336,102 | ||||||
| 5.625%, 02/15/2027 (c) | 10,641,000 | 10,102,493 | ||||||
| 5.00%, 07/31/2027 (c) | 5,520,000 | 5,080,721 | ||||||
| 48,309,866 | ||||||||
The accompanying notes are an integral part of these financial statements.
78
SHENKMAN CAPITAL SHORT DURATION HIGH INCOME FUND
SCHEDULE OF INVESTMENTS – Continued
September 30, 2023
| Principal | Fair | |||||||
| Amount | Value | |||||||
| CORPORATE BONDS – 85.52% (e) – Continued | ||||||||
| UTILITIES: PROPANE – 1.61% | ||||||||
| AmeriGas Partners, LP / | ||||||||
| AmeriGas Finance Corp. | ||||||||
| 5.50%, 05/20/2025 | $ | 12,573,000 | $ | 12,195,304 | ||||
| 5.875%, 08/20/2026 | 4,030,000 | 3,880,815 | ||||||
| 5.75%, 05/20/2027 | 1,515,000 | 1,421,545 | ||||||
| 9.375%, 06/01/2028 (c) | 4,881,000 | 4,953,507 | ||||||
| Ferrellgas, LP / Ferrellgas Finance Corp. | ||||||||
| 5.375%, 04/01/2026 (c) | 1,900,000 | 1,783,180 | ||||||
| Suburban Propane Partners, LP / | ||||||||
| Suburban Energy Finance Corp. | ||||||||
| 5.875%, 03/01/2027 | 1,177,000 | 1,125,188 | ||||||
| 25,359,539 | ||||||||
| TOTAL CORPORATE BONDS | ||||||||
| (Cost $1,376,935,425) | 1,343,488,156 | |||||||
| CONVERTIBLE BONDS – 0.99% | ||||||||
| LEISURE: HOTELS – 0.13% | ||||||||
| Expedia Group, Inc. 4.953%, 02/15/2026 (i) | 900,000 | 786,420 | ||||||
| TripAdvisor, Inc. 0.25%, 04/01/2026 | 1,527,000 | 1,297,950 | ||||||
| 2,084,370 | ||||||||
| TECHNOLOGY: SOFTWARE & SERVICES – 0.22% | ||||||||
| DocuSign, Inc. 5.125%, 01/15/2024 (i) | 2,440,000 | 2,403,406 | ||||||
| Splunk, Inc. 1.125%, 06/15/2027 | 1,101,000 | 1,044,298 | ||||||
| 3,447,704 | ||||||||
| TELECOMMUNICATION SERVICES: DIVERSIFIED – 0.27% | ||||||||
| Liberty Latin America, Ltd. | ||||||||
| 2.00%, 07/15/2024 (b) | 4,395,000 | 4,153,275 | ||||||
| TRANSPORTATION – 0.09% | ||||||||
| Spirit Airlines, Inc. 1.00%, 05/15/2026 | 1,755,000 | 1,468,058 | ||||||
The accompanying notes are an integral part of these financial statements.
79
SHENKMAN CAPITAL SHORT DURATION HIGH INCOME FUND
SCHEDULE OF INVESTMENTS – Continued
September 30, 2023
| Principal | Fair | |||||||
| Amount | Value | |||||||
| CONVERTIBLE BONDS – 0.99% – Continued | ||||||||
| UTILITIES: POWER – 0.28% | ||||||||
| NextEra Energy Partners, LP | ||||||||
| 6.82%, 06/15/2024 (c)(i) | $ | 1,445,000 | $ | 1,374,195 | ||||
| 2.50%, 06/15/2026 (c) | 3,530,000 | 3,011,090 | ||||||
| 4,385,285 | ||||||||
| TOTAL CONVERTIBLE BONDS | ||||||||
| (Cost $15,713,311) | 15,538,692 | |||||||
| BANK LOANS – 10.40% (j) | ||||||||
| AEROSPACE & DEFENSE – 0.07% | ||||||||
| Transdigm, Inc., | ||||||||
| Senior Secured First Lien Term Loan | ||||||||
| 8.492% (3 Month SOFR USD + 3.25%), | ||||||||
| 08/24/2028 (a) | 1,010,000 | 1,011,656 | ||||||
| AUTO RETAIL – 0.25% | ||||||||
| LS Group Opco Acquisition, LLC, | ||||||||
| Senior Secured First Lien Term Loan | ||||||||
| 8.692% (1 Month SOFR USD + 3.25%, | ||||||||
| 0.750% Floor), 11/02/2027 (a) | 3,908,911 | 3,894,252 | ||||||
| AUTOMOTIVE – 0.20% | ||||||||
| Thor Industries, Inc., | ||||||||
| Senior Secured First Lien Term Loan | ||||||||
| 8.431% (1 Month SOFR USD + 3.00%), | ||||||||
| 02/02/2026 (a) | 3,086,924 | 3,094,641 | ||||||
| CHEMICALS – 0.12% | ||||||||
| Nouryon Finance B.V., | ||||||||
| Senior Secured First Lien Term Loan | ||||||||
| 8.427% (1 Month SOFR USD + 3.00%), | ||||||||
| 10/01/2025 (a) | 1,939,070 | 1,941,493 | ||||||
| COMMERCIAL SERVICES – 0.89% | ||||||||
| Camelot U.S. Acquisition 1 Co. | ||||||||
| Senior Secured First Lien Term Loan | ||||||||
| 8.431% (1 Month SOFR USD + 3.00%), | ||||||||
| 10/30/2026 (a) | 1,327,214 | 1,328,044 | ||||||
| Senior Secured First Lien Term Loan | ||||||||
| 8.431% (1 Month SOFR USD + 3.00%, | ||||||||
| 1.000% Floor), 10/30/2026 (a) | 3,912,437 | 3,910,813 | ||||||
The accompanying notes are an integral part of these financial statements.
80
SHENKMAN CAPITAL SHORT DURATION HIGH INCOME FUND
SCHEDULE OF INVESTMENTS – Continued
September 30, 2023
| Principal | Fair | |||||||
| Amount | Value | |||||||
| BANK LOANS – 10.40% (j) – Continued | ||||||||
| COMMERCIAL SERVICES – 0.89% – Continued | ||||||||
| Dun & Bradstreet Corp., | ||||||||
| Senior Secured First Lien Term Loan | ||||||||
| 8.167% (1 Month SOFR USD + 2.75%), | ||||||||
| 02/06/2026 (a) | $ | 4,910,500 | $ | 4,908,953 | ||||
| Garda World Security Corp., | ||||||||
| Senior Secured First Lien Term Loan | ||||||||
| 9.746% (3 Month SOFR USD + 4.25%), | ||||||||
| 10/30/2026 (a) | 3,862,824 | 3,866,629 | ||||||
| 14,014,439 | ||||||||
| CONSTRUCTION & ENGINEERING – 0.20% | ||||||||
| Api Group DE, Inc., | ||||||||
| Senior Secured First Lien Term Loan | ||||||||
| 7.931% (1 Month SOFR USD + 2.50%), | ||||||||
| 10/01/2026 (a) | 3,163,086 | 3,171,247 | ||||||
| CONSUMER DISCRETIONARY – 0.26% | ||||||||
| Wand NewCo 3, Inc., | ||||||||
| Senior Secured First Lien Term Loan | ||||||||
| 8.166% (1 Month SOFR USD + 2.75%), | ||||||||
| 02/05/2026 (a) | 4,149,455 | 4,147,504 | ||||||
| ENVIRONMENTAL SERVICES – 0.00% | ||||||||
| GFL Environmental, Inc., | ||||||||
| Senior Secured First Lien Term Loan | ||||||||
| 7.828%, 05/31/2027 (a)(g) | 29,006 | 29,020 | ||||||
| FINANCIALS: DIVERSIFIED – 0.20% | ||||||||
| Castlelake Aviation One, LLC, | ||||||||
| Senior Secured First Lien Term Loan | ||||||||
| 8.421% (3 Month LIBOR USD + 2.75%, | ||||||||
| 0.500% Floor), 10/22/2026 (a) | 3,089,545 | 3,090,071 | ||||||
| FINANCIALS: INSURANCE – 0.56% | ||||||||
| Acrisure, LLC | ||||||||
| Senior Secured First Lien Term Loan | ||||||||
| 11.121% (3 Month SOFR USD + 5.75%, | ||||||||
| 1.000% Floor), 02/15/2027 (a) | 3,637,575 | 3,664,857 | ||||||
| Senior Secured First Lien Term Loan | ||||||||
| 9.681% (1 Month LIBOR USD + 4.25%, | ||||||||
| 0.500% Floor), 02/16/2027 (a) | 1,580,000 | 1,579,510 | ||||||
The accompanying notes are an integral part of these financial statements.
81
SHENKMAN CAPITAL SHORT DURATION HIGH INCOME FUND
SCHEDULE OF INVESTMENTS – Continued
September 30, 2023
| Principal | Fair | |||||||
| Amount | Value | |||||||
| BANK LOANS – 10.40% (j) – Continued | ||||||||
| FINANCIALS: INSURANCE – 0.56% – Continued | ||||||||
| AssuredPartners, Inc., | ||||||||
| Senior Secured First Lien Term Loan | ||||||||
| 9.065%, 02/12/2027 (a)(g) | $ | 1,239,000 | $ | 1,239,000 | ||||
| NFP Corp, | ||||||||
| Senior Secured First Lien Term Loan | ||||||||
| 8.681% (1 Month SOFR USD + 3.25%), | ||||||||
| 02/15/2027 (a) | 2,371,082 | 2,345,462 | ||||||
| 8,828,829 | ||||||||
| HEALTHCARE: EQUIPMENT & SUPPLIES – 0.33% | ||||||||
| Insulet Corp., | ||||||||
| Senior Secured First Lien Term Loan | ||||||||
| 8.683%, 04/28/2028 (a)(g) | 912,666 | 913,145 | ||||||
| Medline Borrower, LP, | ||||||||
| Senior Secured First Lien Term Loan | ||||||||
| 8.683%, 09/29/2028 (a)(g) | 349,000 | 348,464 | ||||||
| Navicure, Inc., | ||||||||
| Senior Secured First Lien Term Loan | ||||||||
| 9.431% (1 Month SOFR USD + 4.00%), | ||||||||
| 10/22/2026 (a) | 3,826,638 | 3,835,611 | ||||||
| 5,097,220 | ||||||||
| HEALTHCARE: FACILITIES – 0.61% | ||||||||
| Select Medical Corp., | ||||||||
| Senior Secured First Lien Term Loan | ||||||||
| 8.316% (1 Month SOFR USD + 3.00%), | ||||||||
| 03/06/2027 (a) | 3,229,752 | 3,225,715 | ||||||
| Surgery Center Holdings, Inc., | ||||||||
| Senior Secured First Lien Term Loan | ||||||||
| 9.189% (1 Month SOFR USD + 3.75%, | ||||||||
| 0.750% Floor), 09/03/2026 (a) | 6,405,258 | 6,419,478 | ||||||
| 9,645,193 | ||||||||
| HEALTHCARE: MANAGED HEALTH CARE – 0.63% | ||||||||
| Verscend Holding Corp., | ||||||||
| Senior Secured First Lien Term Loan | ||||||||
| 9.431% (1 Month SOFR USD + 4.00%), | ||||||||
| 08/27/2025 (a) | 9,795,092 | 9,809,980 | ||||||
The accompanying notes are an integral part of these financial statements.
82
SHENKMAN CAPITAL SHORT DURATION HIGH INCOME FUND
SCHEDULE OF INVESTMENTS – Continued
September 30, 2023
| Principal | Fair | |||||||
| Amount | Value | |||||||
| BANK LOANS – 10.40% (j) – Continued | ||||||||
| HEALTHCARE: PHARMACEUTICALS & BIOTECHNOLOGY – 0.48% | ||||||||
| Jazz Pharmaceuticals, Inc., | ||||||||
| Senior Secured First Lien Term Loan | ||||||||
| 8.931% (1 Month SOFR USD + 3.50%, | ||||||||
| 0.500% Floor), 05/05/2028 (a) | $ | 7,603,985 | $ | 7,606,646 | ||||
| INDUSTRIAL MACHINERY – 0.44% | ||||||||
| TK Elevator Midco GMBH, | ||||||||
| Senior Secured First Lien Term Loan | ||||||||
| 9.381% (6 Month SOFR USD + 3.50%, | ||||||||
| 0.500% Floor), 07/30/2027 (a) | 5,730,390 | 5,724,660 | ||||||
| Vertiv Group Corp., | ||||||||
| Senior Secured First Lien Term Loan | ||||||||
| 8.182%, 03/02/2027 (a)(g) | 1,230,836 | 1,230,620 | ||||||
| 6,955,280 | ||||||||
| LEISURE: HOTELS – 0.05% | ||||||||
| Carnival Corp., | ||||||||
| Senior Secured First Lien Term Loan | ||||||||
| 8.681% (1 Month SOFR USD + 3.25%, | ||||||||
| 0.750% Floor), 10/18/2028 (a) | 412,949 | 411,572 | ||||||
| Sabre GLBL, Inc., | ||||||||
| Senior Secured First Lien Term Loan | ||||||||
| 10.416% (1 Month SOFR USD + 5.00%, | ||||||||
| 0.500% Floor), 06/30/2028 (a) | 436,605 | 388,032 | ||||||
| 799,604 | ||||||||
| LEISURE: RESTAURANTS – 0.34% | ||||||||
| IRB Holding Corp., | ||||||||
| Senior Secured First Lien Term Loan | ||||||||
| 8.416% (1 Month SOFR USD + 3.00%, | ||||||||
| 0.750% Floor), 12/15/2027 (a) | 5,347,920 | 5,334,791 | ||||||
| MEDIA: BROADCASTING – 0.27% | ||||||||
| Univision Communications, Inc., | ||||||||
| Senior Secured First Lien Term Loan | ||||||||
| 8.681% (1 Month SOFR USD + 3.25%, | ||||||||
| 0.750% Floor), 03/13/2026 (a) | 4,282,199 | 4,278,988 | ||||||
The accompanying notes are an integral part of these financial statements.
83
SHENKMAN CAPITAL SHORT DURATION HIGH INCOME FUND
SCHEDULE OF INVESTMENTS – Continued
September 30, 2023
| Principal | Fair | |||||||
| Amount | Value | |||||||
| BANK LOANS – 10.40% (j) – Continued | ||||||||
| MEDIA: CABLE & SATELLITE – 0.12% | ||||||||
| Charter Communications Operating, LLC, | ||||||||
| Senior Secured First Lien Term Loan | ||||||||
| 6.795%, 04/30/2025 (a)(g) | $ | 1,183,795 | $ | 1,186,014 | ||||
| DIRECTV Financing, LLC, | ||||||||
| Senior Secured First Lien Term Loan | ||||||||
| 10.431% (1 Month SOFR USD + 5.00%, | ||||||||
| 0.750% Floor), 08/02/2027 (a) | 658,261 | 644,823 | ||||||
| 1,830,837 | ||||||||
| MEDIA: ENTERTAINMENT – 0.70% | ||||||||
| Playtika Holding Corp., | ||||||||
| Senior Secured First Lien Term Loan | ||||||||
| 8.181% (1 Month SOFR USD + 2.75%), | ||||||||
| 03/13/2028 (a) | 264,322 | 264,365 | ||||||
| UFC Holdings, LLC, | ||||||||
| Senior Secured First Lien Term Loan | ||||||||
| 8.369% (3 Month SOFR USD + 2.75%, | ||||||||
| 0.750% Floor), 04/29/2026 (a) | 3,795,145 | 3,795,353 | ||||||
| William Morris Endeavor Entertainment, LLC | ||||||||
| Senior Secured First Lien Term Loan | ||||||||
| 8.181% (1 Month SOFR USD + 2.75%), | ||||||||
| 05/16/2025 (a) | 193,491 | 193,491 | ||||||
| Senior Secured First Lien Term Loan | ||||||||
| 8.196% (1 Month SOFR USD + 2.75%), | ||||||||
| 05/16/2025 (a) | 6,737,506 | 6,737,506 | ||||||
| 10,990,715 | ||||||||
| RETAILING – 0.12% | ||||||||
| PetSmart, Inc., | ||||||||
| Senior Secured First Lien Term Loan | ||||||||
| 9.166% (1 Month SOFR USD + 3.75%, | ||||||||
| 0.750% Floor), 02/11/2028 (a) | 1,898,941 | 1,896,055 | ||||||
The accompanying notes are an integral part of these financial statements.
84
SHENKMAN CAPITAL SHORT DURATION HIGH INCOME FUND
SCHEDULE OF INVESTMENTS – Continued
September 30, 2023
| Principal | Fair | |||||||
| Amount | Value | |||||||
| BANK LOANS – 10.40% (j) – Continued | ||||||||
| TECHNOLOGY HARDWARE – 0.20% | ||||||||
| Presidio Holdings, Inc. | ||||||||
| Senior Secured First Lien Term Loan | ||||||||
| 8.916% (1 Month SOFR USD + 3.50%), | ||||||||
| 01/22/2027 (a) | $ | 99,492 | $ | 99,492 | ||||
| Senior Secured First Lien Term Loan | ||||||||
| 8.969% (3 Month SOFR USD + 3.50%), | ||||||||
| 01/22/2027 (a) | 2,956,327 | 2,956,327 | ||||||
| 3,055,819 | ||||||||
| TECHNOLOGY: SOFTWARE & SERVICES – 1.98% | ||||||||
| Boxer Parent Co., Inc., | ||||||||
| Senior Secured First Lien Term Loan | ||||||||
| 9.181% (1 Month SOFR USD + 3.75%), | ||||||||
| 10/02/2025 (a) | 9,500,819 | 9,502,102 | ||||||
| Open Text Corp., | ||||||||
| Senior Secured First Lien Term Loan | ||||||||
| 7.166% (1 Month SOFR USD + 1.75%), | ||||||||
| 05/30/2025 (a) | 5,399,048 | 5,408,983 | ||||||
| Project Alpha Intermediate Holding, Inc., | ||||||||
| Senior Secured First Lien Term Loan | ||||||||
| 9.431% (1 Month SOFR USD + 4.00%), | ||||||||
| 04/26/2024 (a) | 9,334,812 | 9,337,752 | ||||||
| UKG, Inc. | ||||||||
| Senior Secured First Lien Term Loan | ||||||||
| 8.618% (3 Month SOFR USD + 3.25%, | ||||||||
| 0.500% Floor), 05/04/2026 (a) | 3,463,581 | 3,457,676 | ||||||
| Senior Secured First Lien Term Loan | ||||||||
| 9.219% (3 Month SOFR USD + 3.75%), | ||||||||
| 05/04/2026 (a) | 3,131,865 | 3,132,366 | ||||||
| Senior Secured First Lien Term Loan | ||||||||
| 10.022% (3 Month SOFR USD + 4.50%, | ||||||||
| 0.500% Floor), 05/04/2026 (a) | 327,000 | 328,431 | ||||||
| 31,167,310 | ||||||||
The accompanying notes are an integral part of these financial statements.
85
SHENKMAN CAPITAL SHORT DURATION HIGH INCOME FUND
SCHEDULE OF INVESTMENTS – Continued
September 30, 2023
| Principal | Fair | |||||||
| Amount | Value | |||||||
| BANK LOANS – 10.40% (j) – Continued | ||||||||
| TRANSPORTATION – 1.24% | ||||||||
| AAdvantage Loyalty IP, Ltd., | ||||||||
| Senior Secured First Lien Term Loan | ||||||||
| 10.338% (3 Month SOFR USD + 4.75%, | ||||||||
| 0.750% Floor), 04/20/2028 (a) | $ | 5,716,715 | $ | 5,899,307 | ||||
| Kenan Advantage Group, Inc., | ||||||||
| Senior Secured First Lien Term Loan | ||||||||
| 9.298% (6 Month SOFR USD + 4.00%, | ||||||||
| 0.750% Floor), 03/24/2026 (a) | 983,349 | 982,189 | ||||||
| Mileage Plus Holdings, LLC, | ||||||||
| Senior Secured First Lien Term Loan | ||||||||
| 10.798% (3 Month SOFR USD + 5.25%, | ||||||||
| 1.000% Floor), 06/21/2027 (a) | 4,781,006 | 4,974,422 | ||||||
| PODS, LLC, | ||||||||
| Senior Secured First Lien Term Loan | ||||||||
| 8.431% (1 Month SOFR USD + 3.00%, | ||||||||
| 0.750% Floor), 03/31/2028 (a) | 4,794,488 | 4,655,879 | ||||||
| SkyMiles IP, Ltd., | ||||||||
| Senior Secured First Lien Term Loan | ||||||||
| 9.076% (3 Month SOFR USD + 3.75%, | ||||||||
| 1.000% Floor), 10/20/2027 (a) | 2,861,189 | 2,965,808 | ||||||
| 19,477,605 | ||||||||
| UTILITIES: POWER – 0.14% | ||||||||
| Calpine Corp., | ||||||||
| Senior Secured First Lien Term Loan | ||||||||
| 7.931%, 12/16/2027 (a)(g) | 2,245,000 | 2,246,729 | ||||||
| TOTAL BANK LOANS | ||||||||
| (Cost $162,291,237) | 163,415,924 | |||||||
The accompanying notes are an integral part of these financial statements.
86
SHENKMAN CAPITAL SHORT DURATION HIGH INCOME FUND
SCHEDULE OF INVESTMENTS – Continued
September 30, 2023
| Fair | ||||||||
| Shares | Value | |||||||
| MONEY MARKET FUND – 3.19% | ||||||||
| First American Government | ||||||||
| Obligations Fund – Class X, 5.26% (d) | 50,181,256 | $ | 50,181,256 | |||||
| TOTAL MONEY MARKET FUND | ||||||||
| (Cost $50,181,256) | 50,181,256 | |||||||
| Total Investments (Cost $1,605,121,229) – 100.10% | 1,572,624,028 | |||||||
| Liabilities in Excess of Other Assets – (0.10%) | (1,617,988 | ) | ||||||
| TOTAL NET ASSETS – 100.00% | $ | 1,571,006,040 | ||||||
Percentages are stated as a percent of net assets.
| LIBOR | London Interbank Offered Rate |
| PIK | Payment-in-kind |
| PLC | Public Limited Company |
| REIT | Real Estate Investment Trust |
| SOFR | Secured Overnight Funding Rate |
| (a) | Variable rate securities. The coupon rate shown is the effective interest rate as of September 30, 2023. |
| (b) | U.S. traded security of a foreign issuer. |
| (c) | Security exempt from registration under Rule 144A of the Securities Act of 1933, as amended, and may be sold only to dealers in the program or other “qualified institutional buyers.” As of September 30, 2023, the value of these investments was $1,027,766,145 or 65.42% of total net assets. |
| (d) | Rate shown is the 7-day annualized yield as of September 30, 2023. |
| (e) | All or a portion is posted as collateral for delayed settlement securities. |
| (f) | Security has the ability to pay in kind or pay in cash. When applicable, separate rates of such payments are disclosed. |
| (g) | Final terms of the bank loan are not yet known, so reference index and spread information may not be presented. |
| (h) | Step-up bond; pays one interest rate for a certain period and a different rate thereafter. The interest rates presented are the rates in effect as of September 30, 2023. |
| (i) | Zero-coupon security. Rate shown is the weighted average amortized yield as of September 30, 2023. |
| (j) | Rates for senior loans will typically have interest rates that redetermine periodically by reference to a base lending rate plus a spread. Senior loans that reference SOFR may be subject to a credit spread adjustment, particularly to legacy LIBOR bank loans that have transitioned to SOFR as the base lending rate. |
The Global Industry Classification Standard (GICS®) was developed by and/or is the exclusive property of MSCI, Inc. and Standard & Poor’s Financial Services LLC (“S&P”). GICS is a service mark of MSCI and S&P and has been licensed for use by Shenkman Capital Management, Inc. Industries presented are at the discretion of Shenkman Capital Management, Inc. and therefore may not follow the exact naming convention prescribed by GICS.
The accompanying notes are an integral part of these financial statements.
87
SHENKMAN CAPITAL FUNDS
STATEMENTS OF ASSETS AND LIABILITIES
September 30, 2023
| Shenkman | Shenkman | |||||||
| Capital Floating | Capital Short | |||||||
| Rate High | Duration High | |||||||
| Income Fund | Income Fund | |||||||
| ASSETS: | ||||||||
| Investments, at value (cost $300,156,451 | ||||||||
| and $1,605,121,229, respectively) | $ | 296,127,125 | $ | 1,572,624,028 | ||||
| Cash | 57,372 | 23,713 | ||||||
| Receivables | ||||||||
| Securities sold | 6,182,306 | 1,915,110 | ||||||
| Interest | 2,487,905 | 25,286,565 | ||||||
| Fund shares sold | 156,116 | 3,947,290 | ||||||
| Prepaid expenses | 29,393 | 81,243 | ||||||
| Total assets | 305,040,217 | 1,603,877,949 | ||||||
| LIABILITIES: | ||||||||
| Payables | ||||||||
| Securities purchased | 10,968,559 | 27,309,577 | ||||||
| Fund shares redeemed | 479,332 | 1,637,729 | ||||||
| Distributions payable | 293,449 | 2,788,652 | ||||||
| Administration and accounting expenses | 51,588 | 173,123 | ||||||
| Advisory fees (Note 4) | 83,326 | 700,092 | ||||||
| Audit | 27,300 | 30,600 | ||||||
| Transfer agent fees and expenses | 19,643 | 26,585 | ||||||
| Compliance fees | 2,083 | 2,083 | ||||||
| Printing and mailing | 6,750 | 14,096 | ||||||
| Legal | 1,487 | 1,887 | ||||||
| Shareholder servicing fees | 338 | 64,385 | ||||||
| 12b-1 distribution fees | — | 114,509 | ||||||
| Custody fees | 950 | 6,965 | ||||||
| Trustee fees and expenses | — | 327 | ||||||
| Other accrued expenses and other liabilities | 1,457 | 1,299 | ||||||
| Total liabilities | 11,936,262 | 32,871,909 | ||||||
| NET ASSETS | $ | 293,103,955 | $ | 1,571,006,040 | ||||
| NET ASSETS CONSIST OF: | ||||||||
| Capital stock | $ | 318,397,586 | $ | 1,646,143,184 | ||||
| Total accumulated deficit | (25,293,631 | ) | (75,137,144 | ) | ||||
| Total net assets | $ | 293,103,955 | $ | 1,571,006,040 | ||||
The accompanying notes are an integral part of these financial statements.
88
SHENKMAN CAPITAL FUNDS
STATEMENTS OF ASSETS AND LIABILITIES – Continued
September 30, 2023
| Shenkman | Shenkman | |||||||
| Capital Floating | Capital Short | |||||||
| Rate High | Duration High | |||||||
| Income Fund | Income Fund | |||||||
| NET ASSETS | ||||||||
| Class A: | ||||||||
| Net assets applicable to outstanding | ||||||||
| Class A shares | — | $ | 21,087,063 | |||||
| Shares issued and outstanding | — | 2,201,215 | ||||||
Net asset value, redemption price per share(1) | — | $ | 9.58 | |||||
| Maximum offering price per share | ||||||||
| (net asset value divided by 97.00%) | — | $ | 9.88 | |||||
| Class C: | ||||||||
| Net assets applicable to outstanding | ||||||||
| Class C shares | — | $ | 18,501,982 | |||||
| Shares issued and outstanding | — | 1,937,786 | ||||||
| Net asset value, offering price | ||||||||
and redemption price per share(1) | — | $ | 9.55 | |||||
| Class F: | ||||||||
| Net assets applicable to outstanding | ||||||||
| Class F shares | $ | 9,956,129 | $ | 795,530,485 | ||||
| Shares issued and outstanding | 1,089,245 | 83,256,706 | ||||||
| Net asset value, offering price | ||||||||
and redemption price per share(1) | $ | 9.14 | $ | 9.56 | ||||
| Institutional Class: | ||||||||
| Net assets applicable to outstanding | ||||||||
| Institutional Class shares | $ | 283,147,826 | $ | 735,886,510 | ||||
| Shares issued and outstanding | 30,976,612 | 76,927,976 | ||||||
| Net asset value, offering price | ||||||||
and redemption price per share(1) | $ | 9.14 | $ | 9.57 | ||||
(1) | A redemption fee of 1.00% is assessed against shares redeemed within 30 days of purchase. |
The accompanying notes are an integral part of these financial statements.
89
SHENKMAN CAPITAL FUNDS
STATEMENTS OF OPERATIONS
For the Year Ended September 30, 2023
| Shenkman | Shenkman | |||||||
| Capital Floating | Capital Short | |||||||
| Rate High | Duration High | |||||||
| Income Fund | Income Fund | |||||||
| INVESTMENT INCOME: | ||||||||
| Interest income | $ | 24,398,186 | $ | 86,908,489 | ||||
| Consent and term loan fee income | 127,562 | 387,597 | ||||||
| Total investment income | 24,525,748 | 87,296,086 | ||||||
| EXPENSES: | ||||||||
| Investment advisory fees (Note 4) | 1,491,384 | 8,390,415 | ||||||
| Administration and accounting fees (Note 4) | 306,028 | 1,023,476 | ||||||
| Transfer agent fees and expenses (Note 4) | 118,446 | 157,291 | ||||||
| Federal and state registration fees | 44,096 | 130,554 | ||||||
| Audit fees | 28,050 | 31,450 | ||||||
| Reports to shareholders | 23,194 | 52,771 | ||||||
| Trustee fees and expenses | 16,683 | 16,998 | ||||||
| Custody fees (Note 4) | 13,221 | 86,109 | ||||||
| Chief Compliance Officer fees (Note 4) | 12,500 | 12,500 | ||||||
| Miscellaneous expenses | 8,619 | 21,983 | ||||||
| Legal fees | 7,402 | 13,673 | ||||||
| Insurance expense | 5,957 | 20,710 | ||||||
| Interest expense (Note 8) | 429 | — | ||||||
| Service fees – Class A (Note 6) | — | 11,757 | ||||||
| Service fees – Class C (Note 6) | — | 7,439 | ||||||
| Service fees – Class F (Note 6) | 1,869 | 571,593 | ||||||
| 12b-1 distribution fees – Class A (Note 5) | — | 54,862 | ||||||
| 12b-1 distribution fees – Class C (Note 5) | — | 172,838 | ||||||
| Total expenses before advisory fee waiver | 2,077,878 | 10,776,419 | ||||||
| Advisory fee recoupment/(waiver) | ||||||||
| by Advisor (Note 4) | (464,935 | ) | (41,985 | ) | ||||
| Net expenses | 1,612,943 | 10,734,434 | ||||||
| NET INVESTMENT INCOME | 22,912,805 | 76,561,652 | ||||||
| NET REALIZED AND UNREALIZED GAIN/(LOSS): | ||||||||
| Net realized loss on investments | (5,635,402 | ) | (23,139,973 | ) | ||||
| Change in unrealized | ||||||||
| appreciation/(depreciation) on investments | 15,725,745 | 65,221,376 | ||||||
| Net realized and unrealized gain on investments | 10,090,343 | 42,081,403 | ||||||
| NET INCREASE IN NET ASSETS | ||||||||
| RESULTING FROM OPERATIONS | $ | 33,003,148 | $ | 118,643,055 | ||||
The accompanying notes are an integral part of these financial statements.
90
SHENKMAN CAPITAL FLOATING RATE HIGH INCOME FUND
STATEMENTS OF CHANGES IN NET ASSETS
| Year Ended | Year Ended | |||||||
| September 30, | September 30, | |||||||
| 2023 | 2022 | |||||||
| OPERATIONS: | ||||||||
| Net investment income | $ | 22,912,805 | $ | 12,146,662 | ||||
| Net realized loss on investments | (5,635,402 | ) | (1,087,748 | ) | ||||
| Change in unrealized appreciation/ | ||||||||
| (depreciation) on investments | 15,725,745 | (21,520,923 | ) | |||||
| Net increase/(decrease) in net assets | ||||||||
| resulting from operations | 33,003,148 | (10,462,009 | ) | |||||
| DISTRIBUTIONS TO SHAREHOLDERS: | ||||||||
| Class F | (762,241 | ) | (443,965 | ) | ||||
| Institutional Class | (22,010,261 | ) | (11,704,296 | ) | ||||
| Total distributions | (22,772,502 | ) | (12,148,261 | ) | ||||
| CAPITAL SHARE TRANSACTIONS: | ||||||||
| Proceeds from shares sold: | ||||||||
| Class F | 6,914,839 | 6,999,849 | ||||||
| Institutional Class | 47,076,543 | 88,939,715 | ||||||
| Proceeds from shares issued to | ||||||||
| holders in reinvestment of dividends: | ||||||||
| Class F | 705,077 | 443,965 | ||||||
| Institutional Class | 18,514,960 | 9,699,429 | ||||||
| Cost of shares redeemed: | ||||||||
| Class F | (7,113,416 | ) | (7,801,767 | ) | ||||
| Institutional Class | (82,336,061 | ) | (64,192,070 | ) | ||||
| Redemption fees retained: | ||||||||
| Class F | 294 | 350 | ||||||
| Institutional Class | 8,178 | 8,929 | ||||||
| Net increase/(decrease) in net assets derived | ||||||||
| from capital share transactions | (16,229,586 | ) | 34,098,400 | |||||
| TOTAL INCREASE/(DECREASE) IN NET ASSETS | (5,998,940 | ) | 11,488,130 | |||||
| NET ASSETS: | ||||||||
| Beginning of period | 299,102,895 | 287,614,765 | ||||||
| End of year | $ | 293,103,955 | $ | 299,102,895 | ||||
| CHANGES IN SHARES OUTSTANDING: | ||||||||
| Shares sold: | ||||||||
| Class F | 760,238 | 749,697 | ||||||
| Institutional Class | 5,190,582 | 9,570,555 | ||||||
| Shares issued to holders as reinvestment of dividends: | ||||||||
| Class F | 78,031 | 48,312 | ||||||
| Institutional Class | 2,048,535 | 1,056,306 | ||||||
| Shares redeemed: | ||||||||
| Class F | (784,375 | ) | (848,415 | ) | ||||
| Institutional Class | (9,102,540 | ) | (6,983,553 | ) | ||||
| Net increase/(decrease) in shares outstanding | (1,809,529 | ) | 3,592,902 | |||||
The accompanying notes are an integral part of these financial statements.
91
SHENKMAN CAPITAL SHORT DURATION HIGH INCOME FUND
STATEMENTS OF CHANGES IN NET ASSETS
| Year Ended | Year Ended | |||||||
| September 30, | September 30, | |||||||
| 2023 | 2022 | |||||||
| OPERATIONS: | ||||||||
| Net investment income | $ | 76,561,652 | $ | 46,909,871 | ||||
| Net realized loss on investments | (23,139,973 | ) | (9,799,356 | ) | ||||
| Change in unrealized appreciation/ | ||||||||
| (depreciation) on investments | 65,221,376 | (109,074,109 | ) | |||||
| Net increase/(decrease) in net assets | ||||||||
| resulting from operations | 118,643,055 | (71,963,594 | ) | |||||
| DISTRIBUTIONS TO SHAREHOLDERS: | ||||||||
| Class A | (1,034,024 | ) | (665,374 | ) | ||||
| Class C | (699,829 | ) | (386,011 | ) | ||||
| Class F | (38,077,343 | ) | (22,058,354 | ) | ||||
| Institutional Class | (36,437,362 | ) | (23,732,311 | ) | ||||
| Total distributions | (76,248,558 | ) | (46,842,050 | ) | ||||
| CAPITAL SHARE TRANSACTIONS: | ||||||||
| Proceeds from shares sold: | ||||||||
| Class A | 10,804,489 | 12,273,785 | ||||||
| Class C | 7,315,741 | 5,032,498 | ||||||
| Class F | 477,580,347 | 412,305,150 | ||||||
| Institutional Class | 178,124,165 | 278,147,337 | ||||||
| Proceeds from shares issued to | ||||||||
| holders in reinvestment of dividends: | ||||||||
| Class A | 493,032 | 275,659 | ||||||
| Class C | 345,521 | 130,646 | ||||||
| Class F | 17,376,094 | 8,065,188 | ||||||
| Institutional Class | 26,039,542 | 20,479,687 | ||||||
| Cost of shares redeemed: | ||||||||
| Class A | (11,847,737 | ) | (10,347,070 | ) | ||||
| Class C | (5,195,575 | ) | (4,766,835 | ) | ||||
| Class F | (401,743,737 | ) | (353,338,576 | ) | ||||
| Institutional Class | (208,559,114 | ) | (140,978,785 | ) | ||||
| Redemption fees retained: | ||||||||
| Class A | 46 | 62 | ||||||
| Class C | 36 | 47 | ||||||
| Class F | 1,530 | 1,901 | ||||||
| Institutional Class | 1,501 | 1,969 | ||||||
| Net increase in net assets derived | ||||||||
| from capital share transactions | 90,735,881 | 227,282,663 | ||||||
| TOTAL INCREASE IN NET ASSETS | 133,130,378 | 108,477,019 | ||||||
| NET ASSETS: | ||||||||
| Beginning of period | 1,437,875,662 | 1,329,398,643 | ||||||
| End of year | $ | 1,571,006,040 | $ | 1,437,875,662 | ||||
The accompanying notes are an integral part of these financial statements.
92
SHENKMAN CAPITAL SHORT DURATION HIGH INCOME FUND
STATEMENTS OF CHANGES IN NET ASSETS – Continued
| Year Ended | Year Ended | |||||||
| September 30, | September 30, | |||||||
| 2023 | 2022 | |||||||
| CHANGES IN SHARES OUTSTANDING: | ||||||||
| Shares sold: | ||||||||
| Class A | 1,128,525 | 1,248,109 | ||||||
| Class C | 769,034 | 511,490 | ||||||
| Class F | 49,996,967 | 42,233,031 | ||||||
| Institutional Class | 18,624,644 | 28,198,782 | ||||||
| Shares issued to holders as | ||||||||
| reinvestment of dividends: | ||||||||
| Class A | 51,502 | 28,386 | ||||||
| Class C | 36,194 | 13,524 | ||||||
| Class F | 1,819,274 | 834,178 | ||||||
| Institutional Class | 2,724,334 | 2,116,154 | ||||||
| Shares redeemed: | ||||||||
| Class A | (1,236,421 | ) | (1,058,860 | ) | ||||
| Class C | (545,272 | ) | (492,193 | ) | ||||
| Class F | (42,107,107 | ) | (36,238,732 | ) | ||||
| Institutional Class | (21,870,090 | ) | (14,481,597 | ) | ||||
| Net increase in shares outstanding | 9,391,584 | 22,912,272 | ||||||
The accompanying notes are an integral part of these financial statements.
93
SHENKMAN CAPITAL FLOATING RATE HIGH INCOME FUND
FINANCIAL HIGHLIGHTS
For a share outstanding throughout each year
Class F
| Year Ended September 30, | ||||||||||||||||||||
| 2023 | 2022 | 2021 | 2020 | 2019 | ||||||||||||||||
| PER SHARE DATA: | ||||||||||||||||||||
| Net asset value, beginning of year | $ | 8.83 | $ | 9.50 | $ | 9.22 | $ | 9.56 | $ | 9.80 | ||||||||||
| Income from investment operations: | ||||||||||||||||||||
| Net investment income | 0.69 | (1) | 0.37 | (1) | 0.30 | (1) | 0.41 | (1) | 0.50 | |||||||||||
| Net realized and unrealized | ||||||||||||||||||||
| gain/(loss) on investments | 0.31 | (0.67 | ) | 0.29 | (0.34 | ) | (0.24 | ) | ||||||||||||
| Total from investment operations | 1.00 | (0.30 | ) | 0.59 | 0.07 | 0.26 | ||||||||||||||
| Less distributions: | ||||||||||||||||||||
| From net investment income | (0.69 | ) | (0.37 | ) | (0.31 | ) | (0.42 | ) | (0.50 | ) | ||||||||||
| Total distributions | (0.69 | ) | (0.37 | ) | (0.31 | ) | (0.42 | ) | (0.50 | ) | ||||||||||
| Redemption fees retained | 0.00 | (1)(2) | 0.00 | (1)(2) | 0.00 | (1)(2) | 0.01 | (1) | — | |||||||||||
| Net asset value, end of year | $ | 9.14 | $ | 8.83 | $ | 9.50 | $ | 9.22 | $ | 9.56 | ||||||||||
| TOTAL RETURN | 11.75 | % | -3.26 | % | 6.44 | % | 1.04 | % | 2.69 | % | ||||||||||
| SUPPLEMENTAL DATA AND RATIOS: | ||||||||||||||||||||
| Net assets, end of year (thousands) | $ | 9,956 | $ | 9,141 | $ | 10,312 | $ | 2,265 | $ | 5,856 | ||||||||||
| Ratio of expenses to | ||||||||||||||||||||
| average net assets: | ||||||||||||||||||||
| Before advisory fee waiver | 0.72 | % | 0.71 | % | 0.82 | % | 0.78 | % | 0.77 | % | ||||||||||
| After advisory fee waiver | 0.56 | % | 0.54 | % | 0.60 | % | 0.56 | % | 0.57 | % | ||||||||||
| Ratio of net investment income | ||||||||||||||||||||
| to average net assets: | ||||||||||||||||||||
| Before advisory fee waiver | 7.51 | % | 3.78 | % | 2.92 | % | 4.12 | % | 4.93 | % | ||||||||||
| After advisory fee waiver | 7.67 | % | 3.95 | % | 3.14 | % | 4.34 | % | 5.13 | % | ||||||||||
| Portfolio turnover rate | 40 | % | 39 | % | 59 | % | 47 | % | 28 | % | ||||||||||
(1) | Based on average shares outstanding. |
(2) | Amount is less than $0.01 per share. |
The accompanying notes are an integral part of these financial statements.
94
SHENKMAN CAPITAL FLOATING RATE HIGH INCOME FUND
FINANCIAL HIGHLIGHTS
For a share outstanding throughout each year
Institutional Class
| Year Ended September 30, | ||||||||||||||||||||
| 2023 | 2022 | 2021 | 2020 | 2019 | ||||||||||||||||
| PER SHARE DATA: | ||||||||||||||||||||
| Net asset value, beginning of year | $ | 8.83 | $ | 9.50 | $ | 9.22 | $ | 9.56 | $ | 9.80 | ||||||||||
| Income from investment operations: | ||||||||||||||||||||
| Net investment income | 0.70 | (1) | 0.37 | (1) | 0.31 | (1) | 0.40 | (1) | 0.51 | |||||||||||
| Net realized and unrealized | ||||||||||||||||||||
| gain/(loss) on investments | 0.31 | (0.67 | ) | 0.28 | (0.32 | ) | (0.25 | ) | ||||||||||||
| Total from investment operations | 1.01 | (0.30 | ) | 0.59 | 0.08 | 0.26 | ||||||||||||||
| Less distributions: | ||||||||||||||||||||
| From net investment income | (0.70 | ) | (0.37 | ) | (0.31 | ) | (0.42 | ) | (0.50 | ) | ||||||||||
| Total distributions | (0.70 | ) | (0.37 | ) | (0.31 | ) | (0.42 | ) | (0.50 | ) | ||||||||||
| Redemption fees retained | 0.00 | (1)(2) | 0.00 | (1)(2) | 0.00 | (1)(2) | 0.00 | (1)(2) | 0.00 | (1)(2) | ||||||||||
| Net asset value, end of year | $ | 9.14 | $ | 8.83 | $ | 9.50 | $ | 9.22 | $ | 9.56 | ||||||||||
| TOTAL RETURN | 11.77 | % | -3.26 | % | 6.48 | % | 0.94 | % | 2.82 | % | ||||||||||
| SUPPLEMENTAL DATA AND RATIOS: | ||||||||||||||||||||
| Net assets, end of year (thousands) | $ | 283,148 | $ | 289,962 | $ | 277,303 | $ | 230,854 | $ | 228,454 | ||||||||||
| Ratio of expenses to | ||||||||||||||||||||
| average net assets: | ||||||||||||||||||||
| Before advisory fee waiver | 0.70 | % | 0.71 | % | 0.76 | % | 0.76 | % | 0.74 | % | ||||||||||
| After advisory fee waiver | 0.54 | % | 0.54 | % | 0.54 | % | 0.54 | % | 0.54 | % | ||||||||||
| Ratio of net investment income | ||||||||||||||||||||
| to average net assets: | ||||||||||||||||||||
| Before advisory fee waiver | 7.52 | % | 3.83 | % | 3.05 | % | 4.14 | % | 4.97 | % | ||||||||||
| After advisory fee waiver | 7.68 | % | 4.00 | % | 3.27 | % | 4.36 | % | 5.17 | % | ||||||||||
| Portfolio turnover rate | 40 | % | 39 | % | 59 | % | 47 | % | 28 | % | ||||||||||
(1) | Based on average shares outstanding. |
(2) | Amount is less than $0.01 per share. |
The accompanying notes are an integral part of these financial statements.
95
SHENKMAN CAPITAL SHORT DURATION HIGH INCOME FUND
FINANCIAL HIGHLIGHTS
For a share outstanding throughout each year
Class A
| Year Ended September 30, | ||||||||||||||||||||
| 2023 | 2022 | 2021 | 2020 | 2019 | ||||||||||||||||
| PER SHARE DATA: | ||||||||||||||||||||
| Net asset value, beginning of year | $ | 9.30 | $ | 10.09 | $ | 9.93 | $ | 10.06 | $ | 10.00 | ||||||||||
| Income from investment operations: | ||||||||||||||||||||
| Net investment income | 0.45 | (1) | 0.30 | (1) | 0.26 | (1) | 0.31 | (1) | 0.36 | |||||||||||
| Net realized and unrealized | ||||||||||||||||||||
| gain/(loss) on investments | 0.28 | (0.79 | ) | 0.16 | (0.13 | ) | 0.06 | |||||||||||||
| Total from investment operations | 0.73 | (0.49 | ) | 0.42 | 0.18 | 0.42 | ||||||||||||||
| Less distributions: | ||||||||||||||||||||
| From net investment income | (0.45 | ) | (0.30 | ) | (0.26 | ) | (0.31 | ) | (0.36 | ) | ||||||||||
| Total distributions | (0.45 | ) | (0.30 | ) | (0.26 | ) | (0.31 | ) | (0.36 | ) | ||||||||||
| Redemption fees retained | 0.00 | (1)(2) | 0.00 | (1)(2) | 0.00 | (1)(2) | 0.00 | (1)(2) | 0.00 | (1)(2) | ||||||||||
| Net asset value, end of year | $ | 9.58 | $ | 9.30 | $ | 10.09 | $ | 9.93 | $ | 10.06 | ||||||||||
| TOTAL RETURN | 7.99 | % | -4.99 | % | 4.25 | % | 1.86 | % | 4.33 | % | ||||||||||
| SUPPLEMENTAL DATA AND RATIOS: | ||||||||||||||||||||
| Net assets, end of year (thousands) | $ | 21,087 | $ | 20,992 | $ | 20,580 | $ | 15,946 | $ | 13,407 | ||||||||||
| Ratio of expenses to | ||||||||||||||||||||
| average net assets: | ||||||||||||||||||||
| Before advisory fee | ||||||||||||||||||||
| recoupment/waiver | 0.96 | % | 0.96 | % | 0.98 | % | 1.02 | % | 1.03 | % | ||||||||||
| After advisory fee | ||||||||||||||||||||
| recoupment/waiver | 0.96 | % | 0.95 | % | 0.96 | % | 0.97 | % | 0.96 | % | ||||||||||
| Ratio of net investment income | ||||||||||||||||||||
| to average net assets: | ||||||||||||||||||||
| Before advisory fee | ||||||||||||||||||||
| recoupment/waiver | 4.76 | % | 3.03 | % | 2.59 | % | 3.06 | % | 3.61 | % | ||||||||||
| After advisory fee | ||||||||||||||||||||
| recoupment/waiver | 4.76 | % | 3.04 | % | 2.61 | % | 3.11 | % | 3.68 | % | ||||||||||
| Portfolio turnover rate | 51 | % | 50 | % | 80 | % | 100 | % | 77 | % | ||||||||||
(1) | Based on average shares outstanding. |
(2) | Amount is less than $0.01 per share. |
The accompanying notes are an integral part of these financial statements.
96
SHENKMAN CAPITAL SHORT DURATION HIGH INCOME FUND
FINANCIAL HIGHLIGHTS
For a share outstanding throughout each year
Class C
| Year Ended September 30, | ||||||||||||||||||||
| 2023 | 2022 | 2021 | 2020 | 2019 | ||||||||||||||||
| PER SHARE DATA: | ||||||||||||||||||||
| Net asset value, beginning of year | $ | 9.27 | $ | 10.06 | $ | 9.90 | $ | 10.03 | $ | 9.97 | ||||||||||
| Income from investment operations: | ||||||||||||||||||||
| Net investment income | 0.38 | (1) | 0.23 | (1) | 0.19 | (1) | 0.23 | (1) | 0.29 | |||||||||||
| Net realized and unrealized | ||||||||||||||||||||
| gain/(loss) on investments | 0.28 | (0.80 | ) | 0.15 | (0.12 | ) | 0.06 | |||||||||||||
| Total from investment operations | 0.66 | (0.57 | ) | 0.34 | 0.11 | 0.35 | ||||||||||||||
| Less distributions: | ||||||||||||||||||||
| From net investment income | (0.38 | ) | (0.22 | ) | (0.18 | ) | (0.24 | ) | (0.29 | ) | ||||||||||
| Total distributions | (0.38 | ) | (0.22 | ) | (0.18 | ) | (0.24 | ) | (0.29 | ) | ||||||||||
| Redemption fees retained | 0.00 | (1)(2) | 0.00 | (1)(2) | 0.00 | (1)(2) | 0.00 | (1)(2) | — | |||||||||||
| Net asset value, end of year | $ | 9.55 | $ | 9.27 | $ | 10.06 | $ | 9.90 | $ | 10.03 | ||||||||||
| TOTAL RETURN | 7.23 | % | -5.71 | % | 3.49 | % | 1.10 | % | 3.57 | % | ||||||||||
| SUPPLEMENTAL DATA AND RATIOS: | ||||||||||||||||||||
| Net assets, end of year (thousands) | $ | 18,502 | $ | 15,554 | $ | 16,546 | $ | 13,615 | $ | 11,406 | ||||||||||
| Ratio of expenses to | ||||||||||||||||||||
| average net assets: | ||||||||||||||||||||
| Before advisory fee | ||||||||||||||||||||
| recoupment/waiver | 1.70 | % | 1.70 | % | 1.73 | % | 1.77 | % | 1.77 | % | ||||||||||
| After advisory fee | ||||||||||||||||||||
| recoupment/waiver | 1.70 | % | 1.69 | % | 1.71 | % | 1.72 | % | 1.70 | % | ||||||||||
| Ratio of net investment income | ||||||||||||||||||||
| to average net assets: | ||||||||||||||||||||
| Before advisory fee | ||||||||||||||||||||
| recoupment/waiver | 4.03 | % | 2.30 | % | 1.84 | % | 2.32 | % | 2.87 | % | ||||||||||
| After advisory fee | ||||||||||||||||||||
| recoupment/waiver | 4.03 | % | 2.31 | % | 1.86 | % | 2.37 | % | 2.94 | % | ||||||||||
| Portfolio turnover rate | 51 | % | 50 | % | 80 | % | 100 | % | 77 | % | ||||||||||
(1) | Based on average shares outstanding. |
(2) | Amount is less than $0.01 per share. |
The accompanying notes are an integral part of these financial statements.
97
SHENKMAN CAPITAL SHORT DURATION HIGH INCOME FUND
FINANCIAL HIGHLIGHTS
For a share outstanding throughout each year
Class F
| Year Ended September 30, | ||||||||||||||||||||
| 2023 | 2022 | 2021 | 2020 | 2019 | ||||||||||||||||
| PER SHARE DATA: | ||||||||||||||||||||
| Net asset value, beginning of year | $ | 9.28 | $ | 10.06 | $ | 9.91 | $ | 10.04 | $ | 9.97 | ||||||||||
| Income from investment operations: | ||||||||||||||||||||
| Net investment income | 0.47 | (1) | 0.32 | (1) | 0.28 | (1) | 0.33 | (1) | 0.39 | |||||||||||
| Net realized and unrealized | ||||||||||||||||||||
| gain/(loss) on investments | 0.28 | (0.78 | ) | 0.15 | (0.13 | ) | 0.07 | |||||||||||||
| Total from investment operations | 0.75 | (0.46 | ) | 0.43 | 0.20 | 0.46 | ||||||||||||||
| Less distributions: | ||||||||||||||||||||
| From net investment income | (0.47 | ) | (0.32 | ) | (0.28 | ) | (0.33 | ) | (0.39 | ) | ||||||||||
| Total distributions | (0.47 | ) | (0.32 | ) | (0.28 | ) | (0.33 | ) | (0.39 | ) | ||||||||||
| Redemption fees retained | 0.00 | (1)(2) | 0.00 | (1)(2) | 0.00 | (1)(2) | 0.00 | (1)(2) | 0.00 | (1)(2) | ||||||||||
| Net asset value, end of year | $ | 9.56 | $ | 9.28 | $ | 10.06 | $ | 9.91 | $ | 10.04 | ||||||||||
| TOTAL RETURN | 8.25 | % | -4.79 | % | 4.49 | % | 2.09 | % | 4.68 | % | ||||||||||
| SUPPLEMENTAL DATA AND RATIOS: | ||||||||||||||||||||
| Net assets, end of year (thousands) | $ | 795,530 | $ | 682,182 | $ | 671,520 | $ | 446,802 | $ | 289,716 | ||||||||||
| Ratio of expenses to | ||||||||||||||||||||
| average net assets: | ||||||||||||||||||||
| Before advisory fee | ||||||||||||||||||||
| recoupment/waiver | 0.73 | % | 0.74 | % | 0.76 | % | 0.79 | % | 0.80 | % | ||||||||||
| After advisory fee | ||||||||||||||||||||
| recoupment/waiver | 0.73 | % | 0.73 | % | 0.74 | % | 0.74 | % | 0.73 | % | ||||||||||
| Ratio of net investment income | ||||||||||||||||||||
| to average net assets: | ||||||||||||||||||||
| Before advisory fee | ||||||||||||||||||||
| recoupment/waiver | 5.00 | % | 3.27 | % | 2.81 | % | 3.29 | % | 3.83 | % | ||||||||||
| After advisory fee | ||||||||||||||||||||
| recoupment/waiver | 5.00 | % | 3.28 | % | 2.83 | % | 3.34 | % | 3.90 | % | ||||||||||
| Portfolio turnover rate | 51 | % | 50 | % | 80 | % | 100 | % | 77 | % | ||||||||||
(1) | Based on average shares outstanding. |
(2) | Amount is less than $0.01 per share. |
The accompanying notes are an integral part of these financial statements.
98
SHENKMAN CAPITAL SHORT DURATION HIGH INCOME FUND
FINANCIAL HIGHLIGHTS
For a share outstanding throughout each year
Institutional Class
| Year Ended September 30, | ||||||||||||||||||||
| 2023 | 2022 | 2021 | 2020 | 2019 | ||||||||||||||||
| PER SHARE DATA: | ||||||||||||||||||||
| Net asset value, beginning of year | $ | 9.29 | $ | 10.07 | $ | 9.92 | $ | 10.05 | $ | 9.98 | ||||||||||
| Income from investment operations: | ||||||||||||||||||||
| Net investment income | 0.49 | (1) | 0.33 | (1) | 0.29 | (1) | 0.34 | (1) | 0.40 | |||||||||||
| Net realized and unrealized | ||||||||||||||||||||
| gain/(loss) on investments | 0.27 | (0.79 | ) | 0.15 | (0.13 | ) | 0.06 | |||||||||||||
| Total from investment operations | 0.76 | (0.46 | ) | 0.44 | 0.21 | 0.46 | ||||||||||||||
| Less distributions: | ||||||||||||||||||||
| From net investment income | (0.48 | ) | (0.32 | ) | (0.29 | ) | (0.34 | ) | (0.39 | ) | ||||||||||
| Total distributions | (0.48 | ) | (0.32 | ) | (0.29 | ) | (0.34 | ) | (0.39 | ) | ||||||||||
| Redemption fees retained | 0.00 | (1)(2) | 0.00 | (1)(2) | 0.00 | (1)(2) | 0.00 | (1)(2) | 0.00 | (1)(2) | ||||||||||
| Net asset value, end of year | $ | 9.57 | $ | 9.29 | $ | 10.07 | $ | 9.92 | $ | 10.05 | ||||||||||
| TOTAL RETURN | 8.32 | % | -4.62 | % | 4.47 | % | 2.18 | % | 4.77 | % | ||||||||||
| SUPPLEMENTAL DATA AND RATIOS: | ||||||||||||||||||||
| Net assets, end of year (thousands) | $ | 724,207 | $ | 719,148 | $ | 620,753 | $ | 274,166 | $ | 259,009 | ||||||||||
| Ratio of expenses to | ||||||||||||||||||||
| average net assets: | ||||||||||||||||||||
| Before advisory fee | ||||||||||||||||||||
| recoupment/waiver | 0.65 | % | 0.66 | % | 0.67 | % | 0.70 | % | 0.72 | % | ||||||||||
| After advisory fee | ||||||||||||||||||||
| recoupment/waiver | 0.65 | % | 0.65 | % | 0.65 | % | 0.65 | % | 0.65 | % | ||||||||||
| Ratio of net investment income | ||||||||||||||||||||
| to average net assets: | ||||||||||||||||||||
| Before advisory fee | ||||||||||||||||||||
| recoupment/waiver | 5.07 | % | 3.38 | % | 2.89 | % | 3.38 | % | 3.91 | % | ||||||||||
| After advisory fee | ||||||||||||||||||||
| recoupment/waiver | 5.07 | % | 3.39 | % | 2.91 | % | 3.43 | % | 3.98 | % | ||||||||||
| Portfolio turnover rate | 51 | % | 50 | % | 80 | % | 100 | % | 77 | % | ||||||||||
(1) | Based on average shares outstanding. |
(2) | Amount is less than $0.01 per share. |
The accompanying notes are an integral part of these financial statements.
99
SHENKMAN CAPITAL FUNDS
NOTES TO FINANCIAL STATEMENTS
September 30, 2023
NOTE 1 – ORGANIZATION
The Shenkman Capital Short Duration High Income Fund (the “Short Duration High Income Fund”) and the Shenkman Capital Floating Rate High Income Fund (the “Floating Rate High Income Fund”) (each a “Fund” and collectively, the “Funds”) are diversified series of Advisors Series Trust (the “Trust”), which is registered under the Investment Company Act of 1940 (the “1940 Act”), as amended, as an open-end management investment company. The Funds follow the investment company accounting and reporting guidance of the Financial Accounting Standards Board (“FASB”) Accounting Standard Codification Topic 946 “Financial Services – Investment Companies.”
The Short Duration High Income Fund commenced operations on October 31, 2012. The Floating Rate High Income Fund commenced operations on October 15, 2014. The primary investment objective of the Funds is to seek a high level of current income. The Short Duration High Income Fund currently offers Class A, Class C, Class F, and Institutional Class shares. Class F shares became available for purchase on May 17, 2013, while Class C shares became available for purchase on January 28, 2014.
The Floating Rate High Income Fund currently offers Class F and Institutional Class shares. Institutional Class shares became available for purchase on October 15, 2014 and Class F shares became available for purchase on March 1, 2017.
Each class of shares differs principally in its respective distribution expenses, service fees and sales charges on Class A and contingent deferred sales charge (“CDSC”) for Class C. Each class of shares has identical rights to earnings, assets and voting privileges, except for class-specific expenses and exclusive rights to vote on matters affecting only individual classes.
NOTE 2 – SIGNIFICANT ACCOUNTING POLICIES
The following is a summary of significant accounting policies consistently followed by the Funds in the preparation of the financial statements. These policies are in conformity with accounting principles generally accepted in the United States of America.
Security Valuation – All investments in securities are recorded at their estimated fair value, as described in Note 3.
Federal Income Taxes – It is the Funds’ policy to comply with the requirements of Subchapter M of the Internal Revenue Code applicable to regulated investment companies and to distribute substantially all of its taxable income to its shareholders. Therefore, no Federal income or excise tax provision is required.
The Funds recognize the tax benefits of uncertain tax positions only where the position is “more likely than not” to be sustained assuming examination by tax authorities. The tax returns of the Funds’ prior three fiscal years are open for examination. Management has reviewed all open tax years in major
100
SHENKMAN CAPITAL FUNDS
NOTES TO FINANCIAL STATEMENTS – Continued
September 30, 2023
jurisdictions and concluded that there is no impact on the Funds’ net assets and no tax liability resulting from unrecognized tax events relating to uncertain income tax positions taken or expected to be taken on a tax return. The Funds identify their major tax jurisdictions as U.S. Federal and the state of Wisconsin. The Funds are not aware of any tax positions for which it is reasonably possible that the total amounts of unrecognized tax benefits will change materially in the next twelve months.
Securities Transactions, Income, and Distributions – Securities transactions are accounted for on the trade date. Securities sold are determined on a specific identification process. Interest income is recorded on an accrual basis. The Funds may receive other income, such as amendment fees, consent fees and commitment fees. These fees are recorded as income when the Funds become aware of their existence and are included in consent and term loan fee income in the statements of operations. Discounts and premiums on securities purchased are accreted/amortized over the life of the respective security using the effective interest method, except for premiums on certain callable debt securities that are amortized to the earliest call date. Pay-in-kind interest income and non-cash dividend income received in the form of securities in-lieu of cash are recorded at the fair value of the securities received. Dividend income and distributions to shareholders are recorded on the ex-dividend date. Withholding taxes on foreign dividends have been provided for in accordance with the Funds’ understanding of the applicable country’s tax rules and rates.
Each Fund distributes substantially all of its net investment income, if any, monthly, and net realized capital gains, if any, annually. The amount of dividends and distributions to shareholders from net investment income and net realized capital gains is determined in accordance with Federal income tax regulations, which differ from accounting principles generally accepted in the United States of America. To the extent these book/tax differences are permanent, such amounts are reclassified within the capital accounts based on their Federal tax treatment. Distributions from net realized gains for book purposes may include short-term capital gains. All short-term capital gains are included in ordinary income for tax purposes.
Investment income, expenses (other than those specific to the class of shares), and realized and unrealized gains and losses on investments are allocated to the separate classes of a Fund based upon their relative net assets on the date income is earned or expensed and realized and unrealized gains and losses are incurred.
Each Fund is charged for those expenses that are directly attributable to that Fund, such as investment advisory, custody and transfer agent fees. Expenses that are not attributable to a Fund are typically allocated among the Funds in proportion to their respective net assets. Common expenses of the Trust are typically allocated among the funds in the Trust based on a fund’s respective net assets, or by other equitable means.
101
SHENKMAN CAPITAL FUNDS
NOTES TO FINANCIAL STATEMENTS – Continued
September 30, 2023
Securities Purchased on a When-Issued Basis – The Funds may purchase securities on a when-issued basis, for payment and delivery at a later date, generally within one month. The price and yield are generally fixed on the date of commitment to purchase, and the value of the security is thereafter reflected in a Fund’s net asset value. During the period between purchase and settlement, no payment is made by the Funds and no interest accrues to the Funds. At the time of settlement, the market value of the security may be more or less than the purchase price.
Redemption Fees – The Funds charge a 1% redemption fee to shareholders who redeem shares held for 30 days or less. Such fees are retained by the Funds and accounted for as an addition to paid-in capital. Redemption fees retained are disclosed in the statements of changes.
Use of Estimates – The preparation of financial statements in conformity with accounting principles generally accepted in the United States of America requires management to make estimates and assumptions that affect the reported amounts of assets and liabilities and disclosure of contingent assets and liabilities at the date of the financial statements and the reported amounts of increases and decreases in net assets from operation during the reporting period. Actual results could differ from those estimates.
Reclassification of Capital Accounts – Accounting principles generally accepted in the United States of America require that certain components of net assets relating to permanent differences be reclassified between financial and tax reporting. These reclassifications have no effect on net assets or net asset value per share. The Funds did not have any reclassification of capital account adjustments for the year ended September 30, 2023.
Bridge Loan Commitments – In connection with floating rate loan interests, the Funds may also enter into bridge loan commitments. Bridge loan commitments may obligate the Funds to furnish temporary financing to a borrower until permanent financing can be arranged. At September 30, 2023, the Funds did not have any outstanding bridge loan commitments.
Unfunded Loan Commitments – Unfunded loan commitments are contractual obligations for funding to a borrower. At September 30, 2023, the Floating Rate High Income Fund and the Short Duration High Income Fund had $141,583 and $0, respectively, in outstanding unfunded loan commitments.
Events Subsequent to the Fiscal Period End – In preparing the financial statements as of September 30, 2023, management considered the impact of subsequent events for the potential recognition or disclosure in these financial statements. Refer to Note 13 for information regarding a subsequent event.
102
SHENKMAN CAPITAL FUNDS
NOTES TO FINANCIAL STATEMENTS – Continued
September 30, 2023
NOTE 3 – SECURITIES VALUATION
The Funds have adopted authoritative fair value accounting standards which establish an authoritative definition of fair value and set out a hierarchy for measuring fair value. These standards require additional disclosures about the various inputs and valuation techniques used to develop the measurements of fair value, a discussion in changes in valuation techniques and related inputs during the period and expanded disclosure of valuation levels for major security types. These inputs are summarized in the three broad levels listed below:
| Level 1 – | Unadjusted quoted prices in active markets for identical assets or liabilities that the Funds have the ability to access. | |
| Level 2 – | Observable inputs other than quoted prices included in Level 1 that are observable for the asset or liability, either directly or indirectly. These inputs may include quoted prices for the identical instrument on an inactive market, prices for similar instruments, interest rates, prepayment speeds, credit risk, yield curves, default rates and similar data. | |
| Level 3 – | Unobservable inputs for the asset or liability, to the extent relevant observable inputs are not available, representing the Funds’ own assumptions about the assumptions a market participant would use in valuing the asset or liability, and would be based on the best information available. |
Following is a description of the valuation techniques applied to the Funds’ major categories of assets and liabilities measured at fair value on a recurring basis.
Each Fund determines the fair value of its investments and computes its net asset value per share as of the close of regular trading on the New York Stock Exchange (4:00 pm EST).
Bank Loan Obligations – Bank loan obligations are valued at market on the basis of valuations furnished by an independent pricing service which utilizes quotations obtained from dealers in bank loans. These securities will generally be classified in Level 2 of the fair value hierarchy.
Debt Securities – Debt securities, such as corporate bonds, asset-backed securities, mortgage-backed securities, municipal bonds, U.S. Treasuries and U.S. government agency issues are valued at market on the basis of valuations furnished by an independent pricing service which utilizes both dealer-supplied valuations and formula-based techniques. The pricing service may consider recently executed transactions in securities of the issuer or comparable issuers, market price quotations (where observable), bond spreads, and fundamental data relating to the issuer. In addition, the model may incorporate market observable data such as reported sales of
103
SHENKMAN CAPITAL FUNDS
NOTES TO FINANCIAL STATEMENTS – Continued
September 30, 2023
similar securities, broker quotes, yields, bids, offers, and reference data. Certain securities are valued principally using dealer quotations. Debt securities having a maturity of 60 days or less are valued at the evaluated mean between the bid and asked price. These securities will generally be classified in Level 2 of the fair value hierarchy.
Equity Securities – Equity securities that are primarily traded on a national securities exchange shall be valued at the last sale price on the exchange on which they are primarily traded on the day of valuation or, if there has been no sale on such day, at the mean between the bid and asked prices. Securities primarily traded in the NASDAQ Global Market System for which market quotations are readily available shall be valued using the NASDAQ Official Closing Price (“NOCP”). If the NOCP is not available, such securities shall be valued at the last sale price on the day of valuation, or if there has been no sale on such day, at the mean between the bid and asked prices. Over-the-counter securities which are not traded in the NASDAQ Global Market System shall be valued at the most recent sales price. To the extent these securities are actively traded and valuation adjustments are not applied, they are categorized in Level 1 of the fair value hierarchy.
Investment Companies – Investments in open-end mutual funds, including money market funds, are generally priced at their net asset value per share provided by the service agent of the funds and will be classified in Level 1 of the fair value hierarchy.
Short-Term Securities – Short-term securities having a maturity of less than 60 days are valued at the evaluated mean between bid and asked price. To the extent the inputs are observable and timely, these securities would be classified in Level 2 of the fair value hierarchy.
Restricted Securities – The Funds may invest in securities that are subject to legal or contractual restrictions on resale (“restricted securities”). Restricted securities may be resold in transactions that are exempt from registration under the Federal securities laws. Private placement securities are generally considered to be restricted except for those securities traded between qualified institutional investors under the provisions of Rule 144A of the Securities Act of 1933. The sale or other disposition of these securities may involve additional expenses and the prompt sale of these securities at an acceptable price may be difficult. At September 30, 2023, the Funds held securities issued pursuant to Rule 144A under the Securities Act of 1933. All Rule 144A securities have been classified as liquid under the Funds’ liquidity risk management program.
The Board of Trustees (the “Board”) has adopted a valuation policy for use by each Fund and its Valuation Designee (as defined below) in calculating each Fund’s net asset value (“NAV”). Pursuant to Rule 2a-5 under the 1940 Act, the Board has designated the Fund’s investment advisor, Shenkman Capital Management, Inc. (“Advisor”), as the “Valuation Designee” to perform
104
SHENKMAN CAPITAL FUNDS
NOTES TO FINANCIAL STATEMENTS – Continued
September 30, 2023
all of the fair value determinations as well as to perform all of the responsibilities that may be performed by the Valuation Designee in accordance with Rule 2a-5, subject to the Board’s oversight. The Advisor, as Valuation Designee is, authorized to make all necessary determinations of the fair values of portfolio securities and other assets for which market quotations are not readily available or if it is deemed that the prices obtained from brokers and dealers or independent pricing services are unreliable.
Depending on the relative significance of the valuation inputs, fair valued securities may be classified in either Level 2 or Level 3 of the fair value hierarchy.
The inputs or methodology used for valuing securities are not an indication of the risk associated with investing in those securities.
The following is a summary of the inputs used to value the Funds’ securities as of September 30, 2023:
| Floating Rate High Income Fund | |||||||||||||||||
| Level 1 | Level 2 | Level 3 | Total | ||||||||||||||
| Fixed Income | |||||||||||||||||
| Bank Loan | |||||||||||||||||
| Obligations | $ | — | $ | 246,456,389 | $ | 635,325 | $ | 247,091,714 | |||||||||
| Corporate Bonds | — | 40,409,810 | — | 40,409,810 | |||||||||||||
| Total Fixed | |||||||||||||||||
| Income | — | 286,866,199 | 635,325 | 287,501,524 | |||||||||||||
| Money Market | |||||||||||||||||
| Fund | 8,625,601 | — | — | 8,625,601 | |||||||||||||
| Total | |||||||||||||||||
| Investments | $ | 8,625,601 | $ | 286,866,199 | $ | 635,325 | $ | 296,127,125 | |||||||||
| Short Duration High Income Fund | |||||||||||||||||
| Level 1 | Level 2 | Level 3 | Total | ||||||||||||||
| Fixed Income | |||||||||||||||||
| Corporate Bonds | $ | — | $ | 1,343,488,156 | $ | — | $ | 1,343,488,156 | |||||||||
| Convertible | |||||||||||||||||
| Bonds | — | 15,538,692 | — | 15,538,692 | |||||||||||||
| Bank Loan | |||||||||||||||||
| Obligations | — | 163,415,924 | — | 163,415,924 | |||||||||||||
| Total Fixed | |||||||||||||||||
| Income | — | 1,522,442,772 | — | 1,522,442,772 | |||||||||||||
| Money Market | |||||||||||||||||
| Fund | 50,181,256 | — | — | 50,181,256 | |||||||||||||
| Total | |||||||||||||||||
| Investments | $ | 50,181,256 | $ | 1,522,442,772 | $ | — | $ | 1,572,624,028 | |||||||||
105
SHENKMAN CAPITAL FUNDS
NOTES TO FINANCIAL STATEMENTS – Continued
September 30, 2023
Refer to the Funds’ schedules of investments for a detailed break-out of securities.
The following is a reconciliation of the Floating Rate High Income Fund’s Level 3 investments for which significant unobservable inputs were used in determining fair value. The Short Duration High Income Fund did not hold Level 3 investments at September 30, 2023, and as such no reconciliation is presented.
Shenkman Capital Floating Rate High Income Fund
Level 3 Reconciliation Disclosure
| Bank | |||||
| Loans | |||||
| Balance as of September 30, 2022 | $ | — | |||
| Purchases | 635,325 | ||||
| Balance as of September 30, 2023 | $ | 635,325 | |||
| Change in unrealized appreciation/(depreciation) during the | |||||
| period for Level 3 investments held at September 30, 2023 | $ | — | |||
The Level 3 investments as of September 30, 2023 represented 0.22% of net assets and did not warrant a disclosure of significant unobservable valuation inputs.
The Trust Rule 18f-4 Compliance Policy (“Trust Policy”) governs the use of derivatives by the Funds. The Trust Policy imposes limits on the amount of derivatives a fund can enter into, eliminates the asset segregation framework currently used by a fund to comply with Section 18 of the 1940 Act, treats derivatives as senior securities and requires funds whose use of derivatives is more than a limited specified exposure amount to establish and maintain a comprehensive derivatives risk management program and appoint a derivatives risk manager. Each Fund is considered a limited derivatives user under the Trust Policy and therefore, is required to limit its derivatives exposure to no more than 10% of the Fund’s net assets. At September 30, 2023, the Floating Rate High Income Fund and the Short Duration High Income Fund had derivative exposure of 1.44% and 0.78%, respectively, of each Fund’s Net Asset Value. The exposure was due to unsettled bank loans held for more than 35 days.
Accounting Pronouncements – In December 2022, the Financial Accounting Standards Board issued an Accounting Standards Update, ASU 2022-06, Reference Rate Reform (Topic 848) – Deferral of the Sunset Date of Topic 848 (“ASU 2022-06”). ASU 2022-06 is an amendment to ASU 2020-04, which provided optional guidance to ease the potential accounting burden due to the discontinuation of the LIBOR and other interbank-offered based reference rates and which was effective as of March 12, 2020 through
106
SHENKMAN CAPITAL FUNDS
NOTES TO FINANCIAL STATEMENTS – Continued
September 30, 2023
December 31, 2022. ASU 2022-06 extends the effective period through December 31, 2024. Management is currently evaluating the impact, if any, of applying ASU 2022-06.
In October 2022, the Securities and Exchange Commission (the “SEC”) adopted a final rule relating to Tailored Shareholder Reports for Mutual Funds and Exchange-Traded Funds; Fee Information in Investment Company Advertisements. The rule and form amendments will, among other things, require the Fund to transmit concise and visually engaging shareholder reports that highlight key information. The amendments will require that funds tag information in a structured data format and that certain more in-depth information be made available online and available for delivery free of charge to investors on request. The amendments became effective January 24, 2023. There is an 18-month transition period after the effective date of the amendment.
In June 2022, the FASB issued Accounting Standards Update 2022-03, which amends Fair Value Measurement (Topic 820): Fair Value Measurement of Equity Securities Subject to Contractual Sale Restrictions (“ASU 2022-03”). ASU 2022-03 clarifies guidance for fair value measurement of an equity security subject to a contractual sale restriction and establishes new disclosure requirements for such equity securities. ASU 2022-03 is effective for fiscal years beginning after December 15, 2023 and for interim periods within those fiscal years, with early adoption permitted. Management is currently evaluating the impact of these amendments on the Fund’s financial statements.
NOTE 4 – INVESTMENT ADVISORY FEE AND OTHER TRANSACTIONS WITH AFFILIATES
The Funds have an investment advisory agreement with Shenkman Capital Management, Inc. (the “Advisor”) pursuant to which the Advisor is responsible for providing investment management services to each Fund. The Advisor furnishes all investment advice, office space and facilities, and provides most of the personnel needed by the Funds. As compensation for its services, the Advisor is entitled to a fee, computed daily and payable monthly, based upon the average daily net assets of the Funds at the annual rates of:
| Floating Rate High Income Fund | 0.50% | ||
| Short Duration High Income Fund | 0.55% |
For the year ended September 30, 2023, the Floating Rate High Income Fund and the Short Duration High Income Fund incurred $1,491,384 and $8,390,415, respectively, in advisory fees. Advisory fees payable to the Advisor at September, 30, 2023 for the Floating Rate High Income Fund and the Short Duration High Income Fund were $83,326 and $700,092, respectively. The amounts shown on the statements of assets and liabilities are net amounts due to the Advisor.
107
SHENKMAN CAPITAL FUNDS
NOTES TO FINANCIAL STATEMENTS – Continued
September 30, 2023
Each Fund is responsible for its own operating expenses, including Rule 12b-1 fees, shareholder servicing plan fees, custodian fees, taxes, transfer agency fees, interest and other customary Fund expenses. However, the Advisor has contractually agreed to waive all or a portion of its management fees and pay Floating Rate High Income Fund and Short Duration High Income Fund expenses in order to limit each Fund’s total annual operating expenses (excluding acquired fund fees and expenses, taxes, interest expense, dividends on securities sold short, extraordinary expenses, Rule 12b-1 fees, shareholder servicing fees and any other class-specific expenses) to the following amounts of the average daily net assets:
| Floating Rate High Income Fund | 0.54% | ||
| Short Duration High Income Fund | 0.65% |
Any such reduction made by the Advisor in its fees or payment of expenses which are the Funds’ obligation are subject to reimbursement by the Funds to the Advisor, if so requested by the Advisor, in any subsequent month in the 36-month period from the date of the management fee reduction and expense payment if the aggregate amount actually paid by the Funds toward the operating expenses for such fiscal year (taking into account the reimbursement) will not cause a Fund to exceed the lesser of: (1) the expense limitation in place at the time of the management fee reduction and expense payment; or (2) the expense limitation in place at the time of the reimbursement. Any such reimbursement is also contingent upon Board review and approval. Such reimbursement may not be paid prior to the Funds’ payment of current ordinary operating expenses. For the year ended September 30, 2023, the Advisor reduced its fees in the amount of $464,935 for the Floating Rate High Income Fund and in the amount of $49,094 for the Short Duration High Income Fund. The Floating Rate High Income Fund and the Short Duration High Income Fund reimbursed the Advisor $0 and $7,109, respectively, during the year ended September 30, 2023. The Advisor may recapture portions of the amounts shown below no later than the corresponding dates:
| 9/30/2024 | 9/30/2025 | 9/30/2026 | Total | ||||||||||||||
| Floating Rate High | |||||||||||||||||
| Income Fund | $ | 595,808 | $ | 524,312 | $ | 464,935 | $ | 1,585,055 | |||||||||
| Short Duration High | |||||||||||||||||
| Income Fund | 167,019 | 62,257 | 49,094 | 278,370 | |||||||||||||
U.S. Bancorp Fund Services, LLC, doing business as U.S. Bank Global Fund Services (“Fund Services”) serves as the Funds’ administrator, fund accountant and transfer agent. U.S. Bank N.A. serves as custodian (the “Custodian”) to the Funds. The Custodian is an affiliate of Fund Services. Fund Services maintains the Funds’ books and records, calculates the Funds’ NAV, prepares various federal and state regulatory filings, coordinates
108
SHENKMAN CAPITAL FUNDS
NOTES TO FINANCIAL STATEMENTS – Continued
September 30, 2023
the payment of fund expenses, reviews expense accruals and prepares materials supplied to the Board. The officers of the Trust, including the Chief Compliance Officer, are employees of Fund Services. Fees paid by the Funds for administration and accounting, transfer agency, custody and compliance services for the year ended September 30, 2023, are disclosed in the statements of operations.
Quasar Distributors, LLC (“Quasar”) acts as the Funds’ principal underwriter in a continuous public offering of the Funds’ shares. Quasar is a wholly-owned broker-dealer subsidiary of Foreside Financial Group, LLC, doing business as ACA Foreside, a division of ACA Group.
NOTE 5 – DISTRIBUTION AGREEMENT AND PLAN
The Short Duration High Income Fund adopted a Distribution Plan pursuant to Rule 12b-1 (the “Plan”). The Plan permits the Short Duration High Income Fund to pay for distribution and related expenses at an annual rate of up to 0.25% of the average daily net assets of the Short Duration High Income Fund’s Class A shares and up to 1.00% of the average daily net assets of the Short Duration High Income Fund’s Class C shares. The expenses covered by the Plan may include the cost in connection with the promotion and distribution of shares and the provision of personal services to shareholders, including, but not necessarily limited to, advertising, compensation to underwriters, dealers and selling personnel, the printing and mailing of prospectuses to other than current Fund shareholders, and the printing and mailing of sales literature. Payments made pursuant to the Plan will represent compensation for distribution and service activities, not reimbursements for specific expenses incurred. For the year ended September 30, 2023, the Short Duration High Income Fund incurred distribution expenses on its Class A and Class C shares of $54,862 and $172,838, respectively.
NOTE 6 – SHAREHOLDER SERVICING FEE
The Funds entered into a shareholder servicing agreement (the “Agreement”) with the Advisor, under which the Advisor will provide, or arrange for others to provide, certain specified shareholder services. As compensation for the provision of shareholder services, the Funds may pay servicing fees at an annual rate of up to 0.10% of the average daily net assets of the Class A, Class C, and Class F shares. Payments to the Advisor under the Agreement may reimburse the Advisor for payments it makes to selected brokers, dealers and administrators which have entered into service agreements with the Advisor for services provided to shareholders of the Funds. The services provided by such intermediaries are primarily designed to assist shareholders of each Fund and include the furnishing of office space and equipment, telephone facilities, personnel, and assistance to the Funds in servicing such shareholders. Services provided by such
109
SHENKMAN CAPITAL FUNDS
NOTES TO FINANCIAL STATEMENTS – Continued
September 30, 2023
intermediaries also include the provision of support services to the Funds and include establishing and maintaining shareholders’ accounts and record processing, purchase and redemption transactions, answering routine client inquiries regarding the Funds, and providing such other personal services to shareholders as the Funds may reasonably request. For the year ended September 30, 2023, the Floating Rate High Income Fund’s Class F shares incurred $1,869 in shareholder servicing fees. For the year ended September 30, 2023, the Class A, Class C and Class F shares of the Short Duration High Income Fund incurred $11,757, $7,439 and $571,593, respectively, in shareholder servicing fees.
NOTE 7 – PURCHASES AND SALES OF SECURITIES
For the year ended September 30, 2023, the cost of purchases and the proceeds from sales of securities (excluding short-term securities) were as follows:
| Purchases | Sales | ||||||||
| Floating Rate High Income Fund | $ | 116,119,673 | $ | 128,945,083 | |||||
| Short Duration High Income Fund | 851,280,308 | 735,601,715 | |||||||
The Funds had no purchases or sales of U.S. government obligations during the year ended September 30, 2023. Likewise, the Funds had no Rule 17a-7 purchases or sales during the year ended September 30, 2023.
NOTE 8 – LINES OF CREDIT
The Floating Rate High Income Fund and the Short Duration High Income Fund have secured lines of credit in the amount of $40,000,000 and $150,000,000, respectively. These lines of credit are intended to provide short-term financing, if necessary, subject to certain restrictions, in connection with shareholder redemptions. The credit facility is with the Funds’ custodian, U.S. Bank N.A. During the year ended September 30, 2023, the Floating Rate High Income Fund had an outstanding average day balance of $5,288, a weighted average interest rate of 8.00% and paid $429 in interest. The maximum amount outstanding for the Floating Rate High Income Fund during the year ended September 30, 2023 was $401,000. The Short Duration High Income Fund did not draw upon its lines of credit during the year ended September 30, 2023. At September 30, 2023, neither of the Funds had any outstanding loan amounts.
110
SHENKMAN CAPITAL FUNDS
NOTES TO FINANCIAL STATEMENTS – Continued
September 30, 2023
NOTE 9 – INCOME TAXES AND DISTRIBUTIONS TO SHAREHOLDERS
As of September 30, 2023, the components of accumulated earnings/(losses) on a tax basis were as follows:
| Floating Rate | Short Duration | |||||||||
| High Income Fund | High Income Fund | |||||||||
| Tax cost of investments | $ | 300,328,759 | $ | 1,605,435,878 | ||||||
| Gross unrealized appreciation | 2,033,014 | 2,913,964 | ||||||||
| Gross unrealized depreciation | (6,234,648 | ) | (35,725,814 | ) | ||||||
| Net unrealized depreciation | (4,201,634 | ) | (32,811,850 | ) | ||||||
| Undistributed ordinary income | 458,092 | 3,273,328 | ||||||||
| Total distributable earnings | 458,092 | 3,273,328 | ||||||||
| Other accumulated losses | (21,550,089 | ) | (45,598,622 | ) | ||||||
| Total accumulated losses | $ | (25,293,631 | ) | $ | (75,137,144 | ) | ||||
At September 30, 2023, the Funds had tax basis capital losses to offset future gains as follows:
| Capital Loss Carryover | ||||||||||||||
| Long-Term | Short-Term | Total | Expiration Date | |||||||||||
| Floating Rate | ||||||||||||||
| High Income | ||||||||||||||
| Fund | $ | 19,869,437 | $ | 1,387,203 | $ | 21,256,640 | No Expiration | |||||||
| Short Duration | ||||||||||||||
| High Income | ||||||||||||||
| Fund | 28,493,184 | 14,316,786 | 42,809,970 | No Expiration | ||||||||||
The tax character of distributions paid during the year ended September 30, 2023 and the year ended September 30, 2022 was as follows:
| Floating Rate High Income Fund | |||||||||
| Year Ended | Year Ended | ||||||||
| September 30, 2023 | September 30, 2022 | ||||||||
| Ordinary income | $ | 22,772,502 | $ | 12,148,261 | |||||
| Total distributions paid | $ | 22,772,502 | $ | 12,148,261 | |||||
| Short Duration High Income Fund | |||||||||
| Year Ended | Year Ended | ||||||||
| September 30, 2023 | September 30, 2022 | ||||||||
| Ordinary income | $ | 76,248,558 | $ | 46,842,050 | |||||
| Total distributions paid | $ | 76,248,558 | $ | 46,842,050 | |||||
The Funds designated as long-term capital gain dividend, pursuant to Internal Revenue Code Section 852(b)(3), the amount necessary to reduce the earnings and profits of the Funds related to net capital gain to zero for the tax year ended September 30, 2023.
111
SHENKMAN CAPITAL FUNDS
NOTES TO FINANCIAL STATEMENTS – Continued
September 30, 2023
NOTE 10 – CONTROL OWNERSHIP
The beneficial ownership, either directly or indirectly of more than 25% of the voting securities of a fund creates a presumption of control of the fund, under Section 2(a)(9) of the 1940 Act. As of September 30, 2023, each Fund’s percentage of control ownership positions greater than 25% were as follows:
| Percent of | |||
Fund | Shareholder | Shares Held | |
| Floating Rate High | |||
| Income Fund | National Financial Services, LLC | 38.54% | |
| Short Duration High | |||
| Income Fund | Merrill Lynch Pierce Fenner & Smith | 28.61% |
NOTE 11 – PRINCIPAL RISKS
Below is a summary of some, but not all, of the principal risks of investing in the Funds, each of which may adversely affect a Fund’s net asset value and total return. The Funds’ most recent prospectus provides further descriptions of each Fund’s investment objective, principal investment strategies and principal risks. The following risks apply to both Funds, unless specifically noted.
General Market Risk. Economies and financial markets throughout the world are becoming increasingly interconnected, which increases the likelihood that events or conditions in one country or region will adversely impact markets or issuers in other countries or regions. Securities in the Fund’s portfolio may underperform in comparison to securities in general financial markets, a particular financial market or other asset classes due to a number of factors, including: inflation (or expectations for inflation); interest rates; global demand for particular products or resources; natural disasters or events; pandemic diseases; terrorism; regulatory events; and government controls. U.S. and international markets have experienced significant periods of volatility in recent years and months due to a number of economic, political and global macro factors including the impact of COVID-19 as a global pandemic, which has resulted in a public health crisis, disruptions to business operations and supply chains, stress on the global healthcare system, growth concerns in the U.S. and overseas, staffing shortages and the inability to meet consumer demand, and widespread concern and uncertainty. The global recovery from COVID-19 is proceeding at slower than expected rates due to the emergence of variant strains and may last for an extended period of time. Continuing uncertainties regarding interest rates, rising inflation, political events, rising government debt in the U.S. and trade tensions also contribute to market volatility. As a result of continuing political tensions and armed conflicts, including the war between Ukraine and Russia, the U.S. and the European Union imposed sanctions on certain Russian individuals and companies, including certain financial
112
SHENKMAN CAPITAL FUNDS
NOTES TO FINANCIAL STATEMENTS – Continued
September 30, 2023
institutions, and have limited certain exports and imports to and from Russia. The war has contributed to recent market volatility and may continue to do so.
Bank Loan Risk. Each Fund’s investments in secured and unsecured assignments of (or participations in) bank loans may create substantial risk. In making investments in bank loans, which are made by banks or other financial intermediaries to borrowers, the Fund will depend primarily upon the creditworthiness of the borrower, whose financial condition may be troubled or highly leveraged, for payment of principal and interest. When the Funds are a participant in a loan, the Funds have no direct claim on the loan and would be a creditor of the lender, and not the borrower, in the event of a borrower’s insolvency or default. Transactions involving floating rate loans have significantly longer settlement periods (e.g., longer than seven days) than more traditional investments and, as a result, sale proceeds related to the sale of loans may not be available to make additional investments or to meet the Fund’s redemption obligations until potentially a substantial period after the sale of the loans. In addition, loans are not registered under the federal securities laws like stocks and bonds, so investors in loans have less protection against improper practices than investors in registered securities.
Covenant Lite Loan Risk. (Floating Rate High Income Fund). Some covenant lite loans tend to have fewer or no financial maintenance covenants and restrictions. A covenant lite loan typically contains fewer clauses which allow an investor to proactively enforce financial covenants or prevent undesired actions by the borrower/ issuer. Covenant lite loans also generally provide fewer investor protections if certain criteria are breached. The Fund may experience losses or delays in enforcing its rights on its holdings of covenant lite loans.
LIBOR Risk. The London Interbank Offered Rate (“LIBOR”) for U.S. Dollars, which is commonly used as a reference rate within various financial contracts (any such rate, a “Reference Rate”), ceased publication after June 30, 2023 (the one-week and two-month tenors of U.S. Dollar LIBOR ceased to be published after December 31, 2021). The Alternative Reference Rates Committee (the “ARRC”) convened by the Board of Governors of the Federal Reserve System (“FRB”) recommended certain SOFR term rates as the replacement (in commercial loan agreements) for U.S. Dollar LIBOR. The ARRC’s recommendations are consistent with replacements proposed under the Adjustable Interest Rate (LIBOR) Act (the “LIBOR Act”), which became effective in March, 2022, and the final rule implementing the LIBOR Act adopted by the FRB, which became effective in February, 2023. The FRB also recommended certain SOFR-based replacements for derivative transactions. The Secured Overnight Financing Rate (“SOFR”) is a secured, risk-free rate, where LIBOR was an unsecured rate reflecting counterparty risk, and certain of the recommended replacement rates proposed by the ARRC and under the LIBOR Act included a credit spread adjustment to address this difference.
113
SHENKMAN CAPITAL FUNDS
NOTES TO FINANCIAL STATEMENTS – Continued
September 30, 2023
However, in new issue transactions (i.e., transactions not transitioning from London interbank offered rates) a market practice developed to absorb the credit spread adjustment as part of the pricing spread over the applicable benchmark rate, as opposed to indicating a credit spread adjustment as a separate item (for example, as an adjustment to a SOFR-based benchmark rate) within the applicable benchmark rate. Investors should expect that the Funds will be a party to SOFR-based contracts, or contracts utilizing different Reference Rates. Considered in their entirety, the impacts of the discontinuation of U.S. Dollar LIBOR on financial markets generally and on the specific financial contracts to which the Funds are a party may adversely affect the performance of the Funds.
Collateralized Loan Obligation Risk. (Floating Rate High Income Fund). The risks of an investment in a collateralized loan obligation depend largely on the type of the collateral securities and the class of the debt obligation in which the Fund invests. Collateralized loan obligations are generally subject to credit, interest rate, valuation, liquidity, prepayment and extension risks. These securities also are subject to risk of default on the underlying asset, particularly during periods of economic downturn. Collateralized loan obligations carry additional risks including, but not limited to, (i) the possibility that distributions from collateral securities will not be adequate to make interest or other payments, (ii) the collateral may decline in value or default, (iii) the Fund may invest in obligations that are subordinate to other classes, and (iv) the complex structure of the security may not be fully understood at the time of investment and produce disputes with the issuer or unexpected investment results.
High Yield Risk. High yield debt obligations, including bonds and loans, rated below BBB by S&P or Baa by Moody’s (commonly referred to as “junk bonds”) typically carry higher coupon rates than investment grade securities, but also are described as speculative by both S&P and Moody’s and may be subject to greater market price fluctuations, less liquidity and greater risk of loss of income or principal including greater possibility of default and bankruptcy of the issuer of such instruments than more highly rated bonds and loans.
Counterparty Risk. Counterparty risk arises upon entering into borrowing arrangements and is the risk from the potential inability of counterparties to meet the terms of their contracts.
Credit Risk. The issuers of the bonds and other debt instruments held by each Fund may not be able to make interest or principal payments.
Impairment of Collateral Risk. The value of any collateral securing a bond or loan can decline, and may be insufficient to meet the borrower’s obligations or difficult to liquidate. In addition, each Fund’s access to collateral may be limited by bankruptcy or other insolvency laws.
114
SHENKMAN CAPITAL FUNDS
NOTES TO FINANCIAL STATEMENTS – Continued
September 30, 2023
Interest Rate Risk. Each Fund’s investments in fixed-income instruments will change in value based on changes in interest rates. When interest rates decline, the value of a portfolio invested in fixed-rate obligations can be expected to rise. Conversely, when interest rates rise, the value of a portfolio investment in fixed-rate obligations can be expected to decline. Although the value of each Fund’s investments will vary, the fluctuations in value of each Fund’s investments in floating rate instruments should be minimized as a result of changes in market interest rates. However, because floating rates on loans and other instruments only reset periodically, changes in prevailing interest rates can still be expected to cause some fluctuation in the value of the Funds.
Investment Risk. The Funds are not a complete investment program and you may lose money by investing in the Funds. The Funds invest primarily in high yield debt obligations issued by companies that may have significant risks as a result of business, financial, market or legal uncertainties. There can be no assurance that the Advisor will correctly evaluate the nature and magnitude of the various factors that could affect the value of, and return on, each Fund’s investments.
Leverage Risk. Leverage can increase the investment returns of the funds if the securities purchased increase in value in an amount exceeding the cost of the borrowing. However, if the securities decrease in value, the Funds will suffer a greater loss than would have resulted without the use of leverage.
Liquidity Risk. Low or lack of trading volume may make it difficult to sell instruments held by the Funds at quoted market prices. Each Fund’s investments may at any time consist of significant amounts of positions that are thinly traded or for which no market exists. For example, the investments held by the Fund may not be liquid in all circumstances so that, in volatile markets, the Advisor may not be able to close out a position without incurring a loss. The foregoing risks may be accentuated when the Funds are required to liquidate positions to meet withdrawal requests. Additionally, floating rate loans generally are subject to legal or contractual restrictions on resale, may trade infrequently, and their value may be impaired when the Funds need to liquidate such loans. High yield bonds and loans generally trade only in the over-the-counter market rather than on an organized exchange and may be more difficult to purchase or sell at a fair price, which could have a negative impact on each Fund’s performance.
Initial Public Offering (“IPO”) and Unseasoned Company Risk. The market value of IPO shares may fluctuate considerably due to factors such as the absence of a prior public market, unseasoned trading, the small number of shares available for trading and limited information about the issuer. Additionally, investments in unseasoned companies may involve greater risks, in part because they have limited product lines, markets and financial or managerial resources. In addition, less frequently-traded securities may be
115
SHENKMAN CAPITAL FUNDS
NOTES TO FINANCIAL STATEMENTS – Continued
September 30, 2023
subject to more abrupt price movements than securities of larger capitalized companies.
Convertible Bond Risk. Convertible bonds are hybrid securities that have characteristics of both bonds and common stocks and are therefore subject to both debt security risks and equity risk. Convertible bonds are subject to equity risk especially when their conversion value is greater than the interest and principal value of the bond. The prices of equity securities may rise or fall because of economic or political changes and may decline over short or extended periods of time.
Foreign Instruments Risk. Investments in foreign instruments involve certain risks not associated with investments in U.S. companies. Foreign instruments in each Fund’s portfolio subject the respective Fund to the risks associated with investing in the particular country, including the political, regulatory, economic, social and other conditions or events occurring in the country, as well as fluctuations in its currency, foreign currency exchange controls, foreign tax issues and the risks associated with less developed custody and settlement practices.
Management Risk. Each Fund is an actively managed portfolio. The Advisor’s management practices and investment strategies may not work to produce the desired results. The success of each Fund is largely dependent upon the ability of the Advisor to manage the Fund and implement each Fund’s investment program. If the Funds were to lose the services of the Advisor or its senior officers, the Funds may be adversely affected. Additionally, if the Funds or any of the other accounts managed by the Advisor were to incur substantial losses or were subject to an unusually high level of redemptions or withdrawals, the revenues of the Advisor may decline substantially. Such losses and/or withdrawals may impair the Advisor’s ability to retain employees and its ability to provide the same level of service to the Fund as it has in the past and continue operations.
Preferred Stock Risk. Preferred stocks may be more volatile than fixed-income securities and are more correlated with the issuer’s underlying common stock than fixed-income securities. Additionally, the dividend on a preferred stock may be changed or omitted by the issuer.
Rule 144A Securities Risk. The market for Rule 144A securities typically is less active than the market for publicly-traded securities. Rule 144A securities carry the risk that the liquidity of these securities may become impaired, making it more difficult for the Funds to sell these bonds.
U.S. Government Obligations Risk. Certain U.S. government securities are supported by the full faith and credit of the United States; others are supported by the right of the issuer to borrow from the U.S. Treasury; others are supported by the discretionary authority of the U.S. government to purchase the agency’s obligations; and still others are supported only by the
116
SHENKMAN CAPITAL FUNDS
NOTES TO FINANCIAL STATEMENTS – Continued
September 30, 2023
credit of the issuing agency, instrumentality, or enterprise. Although U.S. government-sponsored enterprises such as the Federal Home Loan Mortgage Corporation (Freddie Mac) and the Federal National Mortgage Association (Fannie Mae) may be chartered or sponsored by Congress, they are not funded by Congressional appropriations, and their securities are not issued by the U.S. Treasury, are not supported by the full faith and credit of the U.S. government, and involve increased credit risks.
When-Issued Instruments Risk. The price or yield obtained in a when-issued transaction may be less favorable than the price or yield available in the market when the instruments’ delivery takes place. Additionally, failure of a party to a transaction to consummate the trade may result in a loss to the Funds or missing an opportunity to obtain a price considered advantageous.
Yankee Bond Risk. Yankee bonds are subject to the same risks as other debt issues, notably credit risk, market risk, currency and liquidity risk. Other risks include adverse political and economic developments; the extent and quality of government regulations of financial markets and institutions; the imposition of foreign withholding taxes; and the expropriation or nationalization of foreign issuers.
Zero Coupon Securities Risk. (Floating Rate High Income Fund). While interest payments are not made on such securities, holders of such securities are deemed to have received income annually, notwithstanding that cash may not be received currently. Some of these securities may be subject to substantially greater price fluctuations during periods of changing market interest rates than are comparable securities that pay interest currently. Longer term zero coupon bonds are more exposed to interest rate risk than shorter term zero coupon bonds.
NOTE 12 – CHANGES TO TRUST OFFICERS
At a meeting held on June 22-23, 2023, the Board appointed Ms. Lillian A. Kabakali the Assistant Secretary of the Trust, effective July 10, 2023. Effective July 20, 2023, Mr. Michael L. Ceccato retired from his service as Vice President, Chief Compliance Officer and Anti-Money Laundering Officer of the Trust. At a meeting held on July 20, 2023, the Board appointed Joseph Kolinsky as the successor Vice President, Chief Compliance Officer and Anti-Money Laundering Officer of the Trust, effective July 20, 2023.
NOTE 13 – SUBSEQUENT EVENT – CHANGES TO BOARD OF TRUSTEES
Effective October 18, 2023, Mr. Ray Woolson retired from his service as Trustee and Chairman of the Board to attend to health-related matters. At the recommendation of the Nominating and Governance Committee, on October 24, 2023, the Board appointed Mr. David Mertens as the successor Chairman of the Board, and Ms. Michele Rackey was appointed as Chairman of the Nominating and Governance Committee of the Board.
117
SHENKMAN CAPITAL FUNDS
REPORT OF INDEPENDENT REGISTERED
PUBLIC ACCOUNTING FIRM
To the Board of Trustees
Advisors Series Trust and Shareholders of:
Shenkman Capital Floating Rate High Income Fund
Shenkman Capital Short Duration High Income Fund
Opinion on the Financial Statements
We have audited the accompanying statements of assets and liabilities of the Shenkman Capital Floating Rate High Income Fund and the Shenkman Capital Short Duration High Income Fund (the “Funds”), each a series of Advisors Series Trust (the “Trust”), including the schedules of investments, as of September 30, 2023, the related statements of operations for the year then ended, the statements of changes in net assets for each of the two years in the period then ended, the financial highlights for each of the five years in the period then ended, and the related notes (collectively referred to as the “financial statements”). In our opinion, the financial statements present fairly, in all material respects, the financial position of the Funds as of September 30, 2023, the results of their operations for the year then ended, the changes in their net assets for each of the two years in the period then ended, and their financial highlights for the periods indicated above, in conformity with accounting principles generally accepted in the United States of America.
Basis for Opinion
These financial statements are the responsibility of the Funds’ management. Our responsibility is to express an opinion on the Funds’ financial statements based on our audits. We are a public accounting firm registered with the Public Company Accounting Oversight Board (United States) (“PCAOB”) and are required to be independent with respect to the Funds in accordance with the U.S. federal securities laws and the applicable rules and regulations of the Securities and Exchange Commission and the PCAOB. We have served as the auditor of one or more of the funds in the Trust since 2003.
We conducted our audits in accordance with the standards of the PCAOB. Those standards require that we plan and perform the audits to obtain reasonable assurance about whether the financial statements are free of material misstatement, whether due to error or fraud. The Funds are not required to have, nor were we engaged to perform, an audit of the Funds’ internal control over financial reporting. As part of our audits we are required to obtain an understanding of internal control over financial reporting, but not for the purpose of expressing an opinion on the effectiveness of the Funds’ internal control over financial reporting. Accordingly, we express no such opinion.
Our audits included performing procedures to assess the risks of material misstatement of the financial statements, whether due to error or fraud, and performing procedures that respond to those risks. Such procedures included examining, on a test basis, evidence regarding the amounts and disclosures in the financial statements. Our audits also included evaluating the accounting principles used and significant estimates made by management, as well as evaluating the overall presentation of the financial statements. Our procedures included confirmation of securities owned as of September 30, 2023 by correspondence with the custodian, transfer agents, brokers or by other appropriate auditing procedures where replies were not received. We believe that our audits provide a reasonable basis for our opinion.
| TAIT, WELLER & BAKER LLP |
Philadelphia, Pennsylvania
November 29, 2023
118
SHENKMAN CAPITAL FUNDS
INFORMATION ABOUT TRUSTEES AND OFFICERS
(Unaudited)
This chart provides information about the Trustees and Officers who oversee the Funds. Officers elected by the Trustees manage the day-to-day operations of the Funds and execute policies formulated by the Trustees.
Independent Trustees(1)
| Number | |||||
| of | |||||
| Term of | Portfolios | ||||
| Office | in Fund | Other | |||
| Position | and | Principal | Complex | Directorships | |
| Held | Length | Occupation | Overseen | Held | |
| Name, Address | with the | of Time | During Past | by | During Past |
and Age | Trust | Served* | Five Years | Trustee(2) | Five Years(3) |
| David G. Mertens | Trustee | Indefinite | Partner and | 2 | Trustee, |
| (age 63) | term; | Head of | Advisors | ||
| 615 E. Michigan St. | since | Business | Series Trust | ||
| Milwaukee, WI | March | Development, | (for series not | ||
| 53202 | 2017. | QSV Equity | affiliated with | ||
| Investors, LLC, | the Funds). | ||||
| (formerly known | |||||
| as Ballast Equity | |||||
| Management, | |||||
| LLC) (a privately- | |||||
| held investment | |||||
| advisory firm) | |||||
| (February 2019 | |||||
| to present); | |||||
| Managing | |||||
| Director and | |||||
| Vice President, | |||||
| Jensen | |||||
| Investment | |||||
| Management, Inc. | |||||
| (a privately-held | |||||
| investment | |||||
| advisory firm) | |||||
| (2002 to 2017). | |||||
| Joe D. Redwine | Trustee | Indefinite | Retired; | 2 | Trustee, |
| (age 76) | term; | formerly | Advisors | ||
| 615 E. Michigan St. | since | Manager, | Series Trust | ||
| Milwaukee, WI | September | President, CEO, | (for series not | ||
| 53202 | 2008. | U.S. Bancorp | affiliated with | ||
| Fund Services, | the Funds). | ||||
| LLC, and its | |||||
| predecessors, | |||||
| (May 1991 to | |||||
| July 2017). |
119
SHENKMAN CAPITAL FUNDS
INFORMATION ABOUT TRUSTEES AND OFFICERS – Continued
(Unaudited)
| Number | |||||
| of | |||||
| Term of | Portfolios | ||||
| Office | in Fund | Other | |||
| Position | and | Principal | Complex | Directorships | |
| Held | Length | Occupation | Overseen | Held | |
| Name, Address | with the | of Time | During Past | by | During Past |
and Age | Trust | Served* | Five Years | Trustee(2) | Five Years(3) |
| Raymond B. Woolson | Chairman | Indefinite | President, | 2 | Trustee, |
| (age 64) | of the | term; | Apogee Group, | Advisors | |
| 615 E. Michigan St. | Board | since | Inc. (financial | Series Trust | |
| Milwaukee, WI 53202 | January | consulting firm) | (for series not | ||
| 2020. | (1998 to | affiliated with | |||
| Trustee | Indefinite | present). | the Funds); | ||
| term; | Independent | ||||
| since | Trustee, | ||||
| January | DoubleLine | ||||
| 2016. | Funds Trust | ||||
| (an open-end | |||||
| investment | |||||
| company with | |||||
| 19 portfolios), | |||||
| DoubleLine | |||||
| Opportunistic | |||||
| Credit Fund, | |||||
| DoubleLine | |||||
| Income | |||||
| Solutions | |||||
| Fund, and | |||||
| DoubleLine | |||||
| Yield | |||||
| Opportunities | |||||
| Fund from | |||||
| 2010 to | |||||
| present; | |||||
| Independent | |||||
| Trustee, | |||||
| DoubleLine | |||||
| ETF Trust | |||||
| (an open-end | |||||
| investment | |||||
| company with | |||||
| 2 portfolios) | |||||
| from March | |||||
| 2022 to | |||||
| present. |
120
SHENKMAN CAPITAL FUNDS
INFORMATION ABOUT TRUSTEES AND OFFICERS – Continued
(Unaudited)
| Number | |||||
| of | |||||
| Term of | Portfolios | ||||
| Office | in Fund | Other | |||
| Position | and | Principal | Complex | Directorships | |
| Held | Length | Occupation | Overseen | Held | |
| Name, Address | with the | of Time | During Past | by | During Past |
and Age | Trust | Served* | Five Years | Trustee(2) | Five Years(3) |
| Michele Rackey | Trustee | Indefinite | Chief | 2 | Trustee, |
| (age 64) | term; | Executive | Advisors | ||
| 615 E. Michigan St. | since | Officer, | Series Trust | ||
| Milwaukee, WI | January | Government | (for series not | ||
| 53202 | 2023. | Employees | affiliated with | ||
| Benefit | the Funds). | ||||
| Association | |||||
| (GEBA) (benefits | |||||
| and wealth | |||||
| management | |||||
| organization) | |||||
| (2004 to 2020); | |||||
| Board Member, | |||||
| Association | |||||
| Business | |||||
| Services Inc. | |||||
| (ABSI) (for-profit | |||||
| subsidiary of | |||||
| the American | |||||
| Society of | |||||
| Association | |||||
| Executives) | |||||
| (2019 to 2020). |
121
SHENKMAN CAPITAL FUNDS
INFORMATION ABOUT TRUSTEES AND OFFICERS – Continued
(Unaudited)
Officers
| Term of | |||
| Office | |||
| Position | and | ||
| Held | Length | ||
| Name, Address | with the | of Time | Principal Occupation |
and Age | Trust | Served | During Past Five Years |
| Jeffrey T. Rauman | President, | Indefinite | Senior Vice President, Compliance and |
| (age 54) | Chief | term; | Administration, U.S. Bank Global Fund |
| 615 E. Michigan St. | Executive | since | Services (February 1996 to present). |
| Milwaukee, WI | Officer and | December | |
| 53202 | Principal | 2018. | |
| Executive | |||
| Officer | |||
| Kevin J. Hayden | Vice | Indefinite | Vice President, Compliance and |
| (age 52) | President, | term; | Administration, U.S. Bank Global Fund |
| 615 E. Michigan St. | Treasurer | since | Services (June 2005 to present). |
| Milwaukee, WI | and | January | |
| 53202 | Principal | 2023. | |
| Financial | |||
| Officer | |||
| Cheryl L. King | Assistant | Indefinite | Vice President, Compliance and |
| (age 62) | Treasurer | term; | Administration, U.S. Bank Global Fund |
| 615 E. Michigan St. | since | Services (October 1998 to present). | |
| Milwaukee, WI | January | ||
| 53202 | 2023. | ||
| Richard R. Conner | Assistant | Indefinite | Assistant Vice President, Compliance |
| (age 41) | Treasurer | term; | and Administration, U.S. Bank Global |
| 615 E. Michigan St. | since | Fund Services (July 2010 to present). | |
| Milwaukee, WI | December | ||
| 53202 | 2018. | ||
| Joseph R. Kolinsky | Vice | Indefinite | Vice President, U.S. Bank Global Fund |
| (age 52) | President, | term; | Services (May 2023 to present); Chief |
| 2020 E. | Chief | since | Compliance Officer, Chandler Asset |
| Financial Way, | Compliance | July | Management, Inc. (2020 to 2022); |
| Suite 100 | Officer and | 2023. | Director, Corporate Compliance, Pacific |
| Glendora, CA | AML Officer | Life Insurance Company (2018 to 2019). | |
| 91741 |
122
SHENKMAN CAPITAL FUNDS
INFORMATION ABOUT TRUSTEES AND OFFICERS – Continued
(Unaudited)
| Term of | |||
| Office | |||
| Position | and | ||
| Held | Length | ||
| Name, Address | with the | of Time | Principal Occupation |
and Age | Trust | Served | During Past Five Years |
| Elaine E. Richards | Vice | Indefinite | Senior Vice President, U.S. Bank Global |
| (age 55) | President | term; | Fund Services (July 2007 to present). |
| 2020 East | and | since | |
| Financial Way, | Secretary | September | |
| Suite 100 | 2019. | ||
| Glendora, CA | |||
| 91741 | |||
| Lillian A. Kabakali | Assistant | Indefinite | Vice President, U.S. Bank Global Fund |
| (age 42) | Secretary | term; | Services (April 2023 to present); |
| 2020 East | since | Vice President, Compliance, | |
| Financial Way, | July | Guggenheim Partners Investment | |
| Suite 100 | 2023. | Management Holdings, LLC (April 2019 | |
| Glendora, CA | to April 2023); Senior Associate, | ||
| 91741 | Compliance, Guggenheim Partners | ||
| Investment Management Holdings, LLC | |||
| (January 2018 to April 2019). |
| * | The Trustees have designated a mandatory retirement age of 75, such that each Trustee, serving as such on the date he or she reaches the age of 75, shall submit his or her resignation not later than the last day of the calendar year in which his or her 75th birthday occurs (“Retiring Trustee”). Upon request, the Board may, by vote of a majority of Trustees eligible to vote on such matter, determine whether or not to extend such Retiring Trustee’s term and on the length of a one-time extension of up to three additional years. At a meeting held December 7-8, 2022, by vote of the majority of Trustees (not including Mr. Redwine), Mr. Redwine’s term as Trustee was extended for three additional years to expire December 31, 2025. |
| (1) | The Trustees of the Trust who are not “interested persons” of the Trust as defined under the 1940 Act (“Independent Trustees”). |
| (2) | As of September 30, 2023, the Trust was comprised of 34 active portfolios managed by unaffiliated investment advisors. The term “Fund Complex” applies only to the Funds. The Funds do not hold themselves out as related to any other series within the Trust for investment purposes, nor do they share the same investment advisor with any other series. |
| (3) | “Other Directorships Held” includes only directorship of companies required to register or file reports with the SEC under the Securities Exchange Act of 1934 Act, as amended, (that is, “public companies”) or other investment companies registered under the 1940 Act. |
The Funds’ Statement of Additional Information includes additional information about the Funds’ Trustees and Officers and is available, without charge, upon request by calling 1-855-743-6562 or by visiting the Funds’ website at www.shenkmancapital.com.
123
SHENKMAN CAPITAL FUNDS
NOTICE TO SHAREHOLDERS
September 30, 2023 (Unaudited)
Federal Tax Distribution Information
For the year ended September 30, 2023, the Floating Rate High Income Fund and the Short Duration High Income Fund designated $22,772,502 and $76,248,558, respectively, as ordinary income for purposes of the dividends paid deduction.
For the fiscal year ended September 30, 2023, certain dividends paid by the Funds may be subject to a maximum tax rate of 23.8%, as provided for by the Jobs and Growth Tax Relief Reconciliation Act of 2003. The percentage of dividends declared from ordinary income designated as qualified dividend income was as follows:
| Shenkman Capital Floating Rate High Income Fund | 0.00% | ||
| Shenkman Capital Short Duration High Income Fund | 0.00% |
For corporate shareholders, the percent of ordinary income distributions qualifying for the corporate dividends received deduction for the fiscal year ended September 30, 2023 was as follows:
| Shenkman Capital Floating Rate High Income Fund | 0.00% | ||
| Shenkman Capital Short Duration High Income Fund | 0.00% |
How to Obtain a Copy of the Funds’ Proxy Voting Policies
A description of the policies and procedures that the Funds use to determine how to vote proxies relating to portfolio securities is available without charge, upon request, by calling 1-855-SHENKMAN (1-855-743-6562) or on the U.S. Securities and Exchange Commission’s (“SEC”) website at http://www.sec.gov.
How to Obtain a Copy of the Funds’ Proxy Voting Records for the 12-Month Period Ended June 30
Information regarding how the Funds voted proxies relating to portfolio securities during the most recent 12-month period ended June 30 is available without charge, upon request, by calling 1-855-SHENKMAN (1-855-743-6562). Furthermore, you can obtain the Funds’ proxy voting records on the SEC’s website at http://www.sec.gov.
Quarterly Filings on Form N-PORT
The Funds file their complete schedule of portfolio holdings with the SEC for the first and third quarters of each fiscal year on Part F of Form N-PORT. The Funds’ Form N-PORT is available on the SEC’s website at http://www.sec.gov. Information included in the Funds’ Form N-PORT is also available, upon request, by calling 1-855-SHENKMAN (1-855-743-6562).
124
SHENKMAN CAPITAL FUNDS
NOTICE TO SHAREHOLDERS – Continued
September 30, 2023 (Unaudited)
Householding
In an effort to decrease costs, the Funds will reduce the number of duplicate prospectuses, supplements, and certain other shareholder documents that you receive by sending only one copy of each to those addresses shown by two or more accounts. Please call the Funds’ transfer agent toll free at 1-855-SHENKMAN (1-855-743-6562) to request individual copies of these documents. The Funds will begin sending individual copies 30 days after receiving your request. This policy does not apply to account statements.
125
SHENKMAN CAPITAL FUNDS
PRIVACY NOTICE
The Funds collect non-public information about you from the following sources:
• Information we receive about you on applications or other forms;
• Information you give us orally; and/or
• Information about your transactions with us or others.
We do not disclose any non-public personal information about our customers or former customers without the customer’s authorization, except as permitted by law or in response to inquiries from governmental authorities. We may share information with affiliated and unaffiliated third parties with whom we have contracts for servicing the Funds. We will provide unaffiliated third parties with only the information necessary to carry out their assigned responsibilities. We maintain physical, electronic and procedural safeguards to guard your non-public personal information and require third parties to treat your personal information with the same high degree of confidentiality.
In the event that you hold shares of the Funds through a financial intermediary, including, but not limited to, a broker-dealer, bank, or trust company, the privacy policy of your financial intermediary would govern how your non-public personal information would be shared by those entities with unaffiliated third parties.
126
(This Page Intentionally Left Blank.)
Advisor
Shenkman Capital Management, Inc.
151 West 42nd Street, 29th Floor
New York, NY 10036
Distributor
Quasar Distributors, LLC
111 East Kilbourn Avenue, Suite 2200
Milwaukee, WI 53202
Transfer Agent
U.S. Bank Global Fund Services
615 East Michigan Street
Milwaukee, WI 53202
(855) 743-6562
Custodian
U.S. Bank N.A.
1555 North RiverCenter Drive, Suite 302
Milwaukee, WI 53212
Independent Registered Public Accounting Firm
Tait, Weller & Baker LLP
Two Liberty Place
50 South 16th Street, Suite 2900
Philadelphia, PA 19102
Legal Counsel
Sullivan & Worcester LLP
1633 Broadway, 32nd Floor
New York, NY 10019
This report is intended for shareholders of the Funds and may not be used as sales literature unless preceded or accompanied by a current prospectus.
Past performance results shown in this report should not be considered a representation of future performance. Share price and returns will fluctuate so that shares, when redeemed, may be worth more or less than their original cost. Statements and other information herein are dated and are subject to change.
SJ-ANNUAL
(b) Not Applicable.
Item 2. Code of Ethics.
The registrant has adopted a code of ethics that applies to the registrant’s principal executive officer and principal financial officer. The registrant has not made any substantive amendments to its code of ethics during the period covered by this report. The registrant has not granted any waivers from any provisions of the code of ethics during the period covered by this report.
A copy of the registrant’s Code of Ethics is filed herewith.
Item 3. Audit Committee Financial Expert.
The registrant’s Board of Trustees has determined that there is at least one audit committee financial expert serving on its audit committee. Mr. Joe D. Redwine and Ms. Michele Rackey are the “audit committee financial experts” and are considered to be “independent” as each term is defined in Item 3 of Form N CSR.
Item 4. Principal Accountant Fees and Services.
The registrant has engaged its principal accountant to perform audit services, audit-related services, tax services and other services during the past two fiscal years. “Audit services” refer to performing an audit of the registrant's annual financial statements or services that are normally provided by the accountant in connection with statutory and regulatory filings or engagements for those fiscal years. “Audit-related services” refer to the assurance and related services by the principal accountant that are reasonably related to the performance of the audit. “Tax services” refer to professional services rendered by the principal accountant including the review of federal income tax returns, review of federal excise tax returns, review of state tax returns, if any, and assistance with calculation of required income, capital gain and excise distributions. There were no “other services” provided by the principal accountant. The following table details the aggregate fees billed or expected to be billed for each of the last two fiscal years for audit fees, audit-related fees, tax fees and other fees by the principal accountant.
| FYE 9/30/2023 | FYE 9/30/2022 | |
Audit Fees | $50,700 | $49,000 |
Audit-Related Fees | N/A | N/A |
Tax Fees | $7,200 | $7,200 |
All Other Fees | N/A | N/A |
(e)(1) The audit committee has adopted pre-approval policies and procedures that require the audit committee to pre‑approve all audit and non‑audit services of the registrant, including services provided to any entity affiliated with the registrant.
(e)(2) The percentage of fees billed by Tait, Weller, & Baker LLP applicable to non-audit services pursuant to waiver of pre-approval requirement were as follows:
| FYE 9/30/2023 | FYE 9/30/2022 | |
Audit-Related Fees | 0% | 0% |
Tax Fees | 0% | 0% |
All Other Fees | 0% | 0% |
(f) All of the principal accountant’s hours spent on auditing the registrant’s financial statements were attributed to work performed by full‑time permanent employees of the principal accountant.
(g) The following table indicates the non-audit fees billed or expected to be billed by the registrant’s accountant for services to the registrant and to the registrant’s investment adviser (and any other controlling entity, etc.—not sub-adviser) for the last two years.
Non-Audit Related Fees | FYE 9/30/2023 | FYE 9/30/2022 |
Registrant | N/A | N/A |
Registrant’s Investment Adviser | N/A | N/A |
(h) The audit committee of the board of trustees/directors has considered whether the provision of non-audit services that were rendered to the registrant's investment adviser is compatible with maintaining the principal accountant's independence and has concluded that the provision of such non-audit services by the accountant has not compromised the accountant’s independence.
The registrant has not been identified by the U.S. Securities and Exchange Commission as having filed an annual report issued by a registered public accounting firm branch or office that is located in a foreign jurisdiction where the Public Company Accounting Oversight Board is unable to inspect or completely investigate because of a position taken by an authority in that jurisdiction.
The registrant is not a foreign issuer.
Item 5. Audit Committee of Listed Registrants.
| (a) | Not applicable to registrants who are not listed issuers (as defined in Rule 10A-3 under the Securities Exchange Act of 1934). |
| (b) | Not Applicable. |
Item 6. Investments.
| (a) | Schedule of Investments is included as part of the report to shareholders filed under Item 1 of this Form. |
| (b) | Not Applicable. |
Item 7. Disclosure of Proxy Voting Policies and Procedures for Closed-End Management Investment Companies.
Not applicable to open-end investment companies.
Item 8. Portfolio Managers of Closed-End Management Investment Companies.
Not applicable to open-end investment companies.
Item 9. Purchases of Equity Securities by Closed‑End Management Investment Company and Affiliated Purchasers.
Not applicable to open-end investment companies.
Item 10. Submission of Matters to a Vote of Security Holders.
There have been no material changes to the procedures by which shareholders may recommend nominees to the Registrant’s Board of Trustees.
Item 11. Controls and Procedures.
| (a) | The Registrant’s President/Chief Executive Officer/Principal Executive Officer and Vice President/Treasurer/Principal Financial Officer have reviewed the Registrant's disclosure controls and procedures (as defined in Rule 30a-3(c) under the Investment Company Act of 1940, as amended, (the “Act”)) as of a date within 90 days of the filing of this report, as required by Rule 30a-3(b) under the Act and Rules 13a-15(b) or 15d‑15(b) under the Securities Exchange Act of 1934. Based on their review, such officers have concluded that the disclosure controls and procedures are effective in ensuring that information required to be disclosed in this report is appropriately recorded, processed, summarized and reported and made known to them by others within the Registrant and by the Registrant’s service provider. |
| (b) | There were no changes in the Registrant's internal control over financial reporting (as defined in Rule 30a-3(d) under the Act) that occurred during the period covered by this report that has materially affected, or is reasonably likely to materially affect, the Registrant's internal control over financial reporting. |
Item 12. Disclosure of Securities Lending Activities for Closed-End Management Investment Companies.
Not applicable to open-end investment companies.
Item 13. Exhibits.
(3) Any written solicitation to purchase securities under Rule 23c‑1 under the Act sent or given during the period covered by the report by or on behalf of the registrant to 10 or more persons. Not applicable to open-end investment companies.
(4) Change in the registrant’s independent public accountant. There was no change in the registrant’s independent public accountant for the period covered by this report.
SIGNATURES
Pursuant to the requirements of the Securities Exchange Act of 1934 and the Investment Company Act of 1940, as amended, the registrant has duly caused this report to be signed on its behalf by the undersigned, thereunto duly authorized.
(Registrant) Advisors Series Trust
By (Signature and Title)* /s/ Jeffrey T. Rauman_
Jeffrey T. Rauman, President/Chief Executive Officer/Principal
Executive Officer
Date 12/7/2023
Pursuant to the requirements of the Securities Exchange Act of 1934 and the Investment Company Act of 1940, as amended, this report has been signed below by the following persons on behalf of the registrant and in the capacities and on the dates indicated.
By (Signature and Title)* /s/ Jeffrey T. Rauman
Jeffrey T. Rauman, President/Chief Executive Officer/Principal
Executive Officer
Date 12/7/2023
By (Signature and Title)* /s/ Kevin J. Hayden
Kevin J. Hayden, Vice President/Treasurer/Principal Financial
Officer
Date 12/7/2023
* Print the name and title of each signing officer under his or her signature.