UNITED STATES
SECURITIES AND EXCHANGE COMMISSION
Washington, D.C. 20549
SECURITIES AND EXCHANGE COMMISSION
Washington, D.C. 20549
FORM N-CSR
CERTIFIED SHAREHOLDER REPORT OF REGISTERED
MANAGEMENT INVESTMENT COMPANIES
Investment Company Act file number 811-07959
Advisors Series Trust
(Exact name of registrant as specified in charter)
(Exact name of registrant as specified in charter)
615 East Michigan Street
Milwaukee, WI 53202
(Address of principal executive offices) (Zip code)
(Address of principal executive offices) (Zip code)
Jeffrey T. Rauman, President/Chief Executive Officer
Advisors Series Trust
c/o U.S. Bancorp Fund Services, LLC
777 East Wisconsin Avenue, 5th Floor
Milwaukee, WI 53202
(Name and address of agent for service)
(Name and address of agent for service)
(626) 914-7363
Registrant's telephone number, including area code
Date of fiscal year end: September 30, 2023
Date of reporting period: September 30, 2023
Item 1. Reports to Stockholders.
(a)
| Annual Report | |
| September 30, 2023 |
Poplar Forest Funds
Poplar Forest Partners Fund
Class A (PFPFX)
Class I (IPFPX)
Poplar Forest Cornerstone Fund
Investor Class (IPFCX)
POPLAR FOREST FUNDS
TABLE OF CONTENTS
| Performance | 1 |
| Letter to Partner | 2 |
| Sector Allocation of Portfolio Assets | 14 |
| Expense Example | 16 |
| Investment Highlights | 18 |
| Schedules of Investments | 21 |
| Statements of Assets and Liabilities | 28 |
| Statements of Operations | 30 |
| Statements of Changes in Net Assets | 31 |
| Financial Highlights | 33 |
| Notes to Financial Statements | 36 |
| Report of Independent Registered Public Accounting Firm | 47 |
| Notice to Shareholders | 49 |
| Information about Trustees and Officers | 50 |
| Householding | 54 |
| Privacy Notice | 55 |
POPLAR FOREST FUNDS
Performance of each Fund class for the 1-, 3-, 5-, 10-year and since inception periods as of September 30, 2023 is as follows:
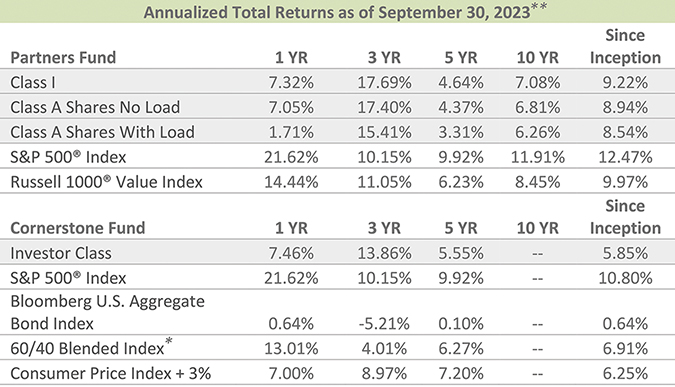
| * | The 60/40 blended index comprises 60% S&P 500® Index and 40% Bloomberg U.S. Aggregate Bond Index. | |
| ** | Returns for periods greater than 1 year have been annualized. |
Performance data quoted represents past performance; past performance does not guarantee future results. The investment return and principal value of an investment will fluctuate so that an investor’s shares, when redeemed, may be worth more or less than their original cost. Current performance of the Funds may be lower or higher than the performance quoted. Performance data current to the most recent month-end may be obtained by calling 1-877-522-8860. Performance for Class A shares with load reflects a maximum 5.00% sales charge. Class A shares without load do not take into account any sales charges which would reduce performance.
As of the Funds’ most recently filed registration statement, the Partners Fund Class A shares gross expense ratio is 1.29%; net expense ratio is 1.20% and is applicable to investors. The Partners Fund Institutional Class shares gross expense ratio is 1.04%; net expense ratio is 0.95% and is applicable to investors. The Cornerstone Fund gross expense ratio is 1.44%; net expense ratio is 0.90% and is applicable to investors. The Adviser has contractually agreed to the fee waiver through at least January 27, 2024.
| Poplar Forest Funds Annual Report, September 2023 | |
1
POPLAR FOREST FUNDS
Portfolio Manager Commentary
Dear Partner,
I’ve been a music nut since I was in middle school. As soon as my savings allowed, I bought a stereo system that provided hours of listening pleasure all through high school and college. By graduation, LPs were giving way to compact discs. Then came MP3s and streaming. I’ve been a Spotify devotee for more than a decade and I find it is simply amazing that my phone can access over 100 million songs virtually anywhere, anytime.
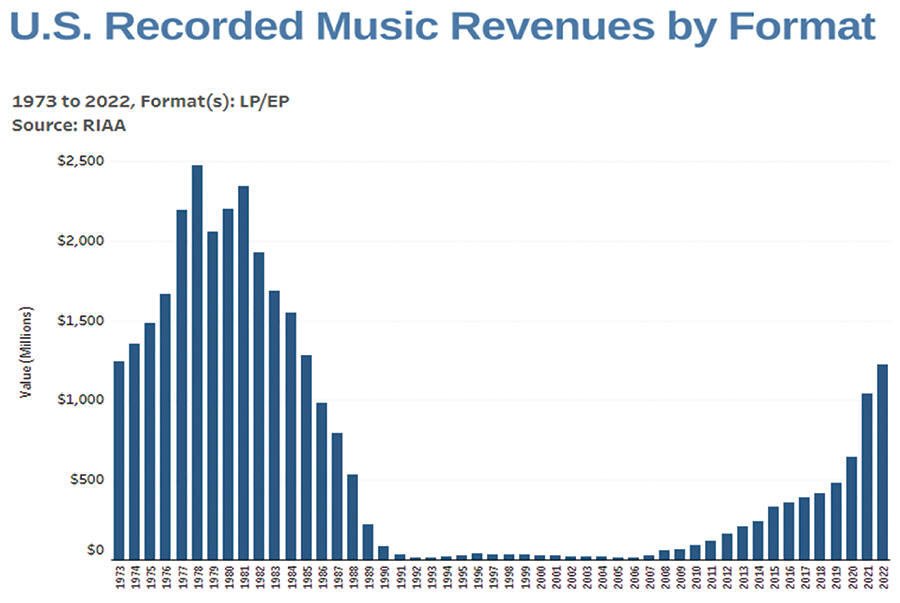
As mind-boggling as Spotify is, I found myself missing the sound quality and physical interaction with my carefully curated album collection. I still had more than a hundred of my beloved LPs – from The Clash, to B.B. King, Tom Petty, Stevie Ray Vaughn, and so many more – in a crate in the closet, but nothing to play them on. So I sprung for a new turntable and speakers, and started buying vinyl again. I’m not alone. As you can see below, after almost disappearing in the 1990s, album sales are on the rise again. What to make of this resurgence of old, analog technology in our increasingly digital world? I think it is more than sound quality and appreciating the cover art and liner notes. Listening to an album also reveals its “deep cuts” – tracks you might not discover on a hit-driven streaming service.
One album for which I’ve recently gained a new appreciation is Brothers and Sisters, which was released in 1973 by The Allman Brothers Band. As a teen, I didn’t have enough life experience to appreciate the lyrics, keyboard solos, and blues riffs the band laid down, but today, at 58, I find that the music speaks to me. While this record includes one of the band’s biggest hits, “Ramblin’ Man,” I’m particularly drawn to three lesser-known tunes: “Pony Boy,” “Jelly Jelly,” and “Southbound.” These songs have existed for fifty years, but I suspect few people know them well – like I didn’t until I looked past the hits and dug a little deeper.
| Poplar Forest Funds Annual Report, September 2023 | |
2
POPLAR FOREST FUNDS
When picking stocks for Poplar Forest’s portfolio, my colleagues and I do much the same thing. While we pursue Value stocks of all sizes, of course, we often find particularly compelling opportunities in the investment world’s equivalent of the music industry’s deep cuts: out-of-favor, unappreciated, or undiscovered medium-sized companies, or “Midcaps.” My thinking about Midcaps is that because fewer people are paying attention to them, there may be more opportunity to uncover values that others don’t see. In addition, Midcap companies may have scale advantages over their smaller competitors and more growth potential than their largest competitors.
In recent years, investors overall have been enthralled by the performance of the biggest companies while they’ve increasingly ignored just about everything else. It hasn’t always been this way; historically, the stocks that you may not have heard about are often the ones that may get your portfolio grooving.
“Band is jumping and so am I
I’m just groovin’, can’t stop moving…
When morning comes and it’s time to go
Pony Boy, carry me home.”
From “Pony Boy”
I have long believed that having the flexibility to invest in Midcaps was critical to long-term investment success. In my Capital Group days, when I was managing portfolios with $20 billion of assets, I realized that I had lost that flexibility and that realization was part of the reason I started Poplar Forest in 2007. Early in my career, before the market was sliced and diced the way it is now, the importance of Midcaps was harder to prove, but now, more than 25 years later, we have the data.
Well-known index provider FTSE Russell splits the U.S market into two groups: the largest thousand companies (the “Large Cap” Index) and the next 2,000 (the “Small Cap” Index). The largest thousand are further segregated into the Top 200 (generally at least $40 billion market cap) and Midcaps (the next 800). As you can see below, from June 30, 1996, when I first became a diversified portfolio manager, through Sept. 30, 2023, Midcap Value stocks have beaten their larger peers by almost 2% a year and Small Cap Value stocks by more than 1% per year. While 1-2% a year may not sound like much, over 25 years, it makes a huge difference. History suggests that Midcaps make more money in the long-term, and Poplar Forest was specifically designed to take advantage of this potential for outperformance.
| Annualized | Value of $10,000 | Excess Return | |
Total Return | invested on | Relative to | |
| 6/30/96-9/30/23 | 6/30/96(1) | Top 200 | |
| Russell Top 200 Value Index | 7.85% | $ 78,406 | |
| Russell Midcap Value Index | 9.73% | $125,564 | +60% |
Russell 1000 Value Index | 8.38% | $ 89,612 | +14% |
| Russell 2000 Value Index | 8.55% | $ 93,522 | +19% |
(1) Through September 30, 2023. | |||
| Source: FTSE Russell and Poplar Forest calculations. Past performance does not guarantee future results. | |||
Poplar Forest owns stock in plenty of big companies, like Merck, Intel, Chevron and Wells Fargo, but the size of our portfolios doesn’t limit us to investing in only the
| Poplar Forest Funds Annual Report, September 2023 | |
3
POPLAR FOREST FUNDS
biggest. When you compare the market cap distribution of our portfolio to the stocks owned by other Value managers, you can see that we offer a differentiated Value strategy with above average exposure to what has historically been a sweet spot in markets. In market environments in which investors favor the biggest companies, our exposure to Midcap companies may be a hindrance, but over time, we believe that our investment flexibility will prove to be advantageous. Much like Allman Brothers guitarist Dickey Betts sings in the chorus to “Pony Boy,” the final song on the Brothers and Sisters album, I believe that Midcaps will help carry us home.
| % of Fund Assets by Market Capitalization | |||
| Poplar Forest | Morningstar Large | Large Value | |
| Company size | Partners Fund | Value Index | Fund Average |
| Giant (>$222.8B) | 8.1% | 30.8% | 40.4% |
| Large ($43.6B – $222.8B) | 33.4% | 45.8% | 24.5% |
| Mid ($7.9B – $43.6B) | 41.1% | 22.9% | 28.2% |
| Small ($2.1B – $7.9B) | 11.2% | 0.6% | 4.0% |
| Source: Morningstar Data as of 08/31/23 | |||
Since the start of 2023, we’ve made five new investments – almost all Midcaps: Tyson Foods ($20 billion market cap) in the first quarter, Oshkosh ($6 billion) in the second, and three new investments in the most recent quarter. Of the three newest stocks, two are economically-sensitive companies ($5-7 billion each) that we believe are under-earning and whose P/E multiples are depressed because of investors’ fear of recession. Both businesses consistently generate free cash flow and offer, in our assessment, above average earnings growth potential over the next few years, yet they are both valued at just 9x Wall Street’s best guess for 2024 earnings. The third new investment is a nearly $40 billion market cap, historically recession-resistant business with an above average dividend yield, a strong balance sheet and a valuation of slightly more than 13x expected 2024 earnings. In short, we have invested in: two cyclical stocks that we believe offer attractive upside potential with limited downside in a recession given their valuations; and one defensive business with limited earnings risk in a recession and a well-covered dividend that produces a substantial yield premium relative to the company’s peers.
Having the market cap flexibility to pursue bargains in any of the thousand largest companies in the U.S. has allowed us to build a portfolio that we believe offers very compelling value on both an absolute basis and relative to other Large Value funds. As you can see below, based on Morningstar’s assessment, our portfolio companies offer comparable long-term earnings growth at a close to 25% P/E discount as compared to other Large Value portfolios.
| Portfolio Comparison | |||
| Poplar Forest | Morningstar Large | Large Value | |
| Partners Fund | Value Index | Fund Average | |
| Long-term Earnings Growth | 10.0% | 10.7% | 9.4% |
| Price/Earnings | 11.4x | 14.9x | 14.2x |
| Price/Book | 1.6x | 2.4x | 2.2x |
| Price/Sales | 0.7x | 1.5x | 1.7x |
| Price/Cash Flow | 6.2x | 9.7x | 9.6x |
| Source: Morningstar Data as of 08/31/23 | |||
Poplar Forest Funds Annual Report, September 2023 |
4
POPLAR FOREST FUNDS
“You’re my blue sky, you’re my sunny day
Lord you know it makes me high
When you turn your love my way.”
From “Blue Sky” on the Allman’s 1972 Album Eat a Peach
For the last 18 months, investors have understandably been living with fears of recession as the Fed set about normalizing monetary policy after COVID. Short-term interest rates have increased from near zero to more than 5.25% and the yield on 10-year Treasury bonds almost tripled from around 1.5% to more than 4.6%. History suggests that such a dramatic tightening of monetary policy will cause a recession, but so far, investors mostly see blue skies. Monthly payments for new home and auto loans have soared due to higher prices and higher interest rates and historically, that leads to a weakening economy. Yet employment is still strong and consumer spending has remained resilient while inflation has moderated.
The emerging opinion is that inflation has been defeated without a recession, and as a result, the Fed can soon stop raising interest rates. Economic resilience has allowed companies to maintain margins and corporate earnings estimates have been trending higher in recent months. Stocks, as measured by the S&P 500 Index (“S&P 500”), have been quite strong this year, though that strength has been concentrated in the biggest growth companies.
P/E ratios can be a helpful tool for judging investors’ attitudes. When the outlook is optimistic, buyers are willing to assign a high multiple for stocks, while pessimism is reflected in low multiples. As you can see in the chart below, outside of recessionary periods when earnings are depressed, the price/earnings ratio of the S&P 500 has rarely exceeded 21-22x trailing earnings – the S&P 500 is currently near this lofty level.
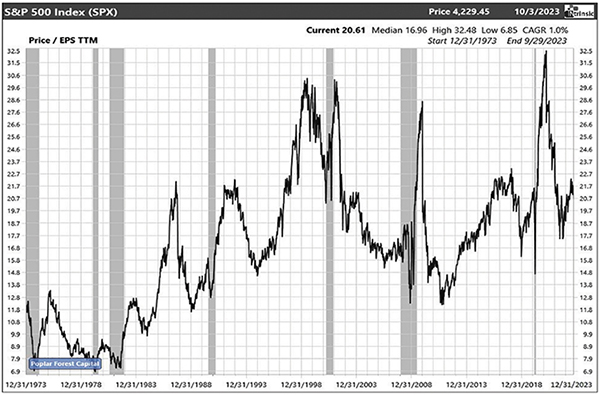
Source: Intrinsic Research. TTM = trailing 12 months
Poplar Forest Funds Annual Report, September 2023 |
5
POPLAR FOREST FUNDS
In the half-century since the release of Brothers and Sisters, the only non-recessionary period in which investors were more optimistic, as reflected in P/E ratios, was during the late-1990s Tech Bubble – and we know how badly that ended. High valuations, in and of themselves, don’t mean that stocks can’t keep moving higher if earnings grow, but they may help gauge downside potential. With current valuations – and implied investor expectations – about as high as they get, the S&P 500 would appear to offer a mediocre tradeoff between risk and reward. In contrast, the low valuation of Poplar Forest Partners portfolio suggests a much more attractive risk/reward ratio.
The companies in our portfolio are currently being valued at roughly 10x Wall Street’s best guess for earnings in 2024 – a valuation that offers very attractive upside should a recession be avoided. Our risk-adjusted fair value analysis for the companies we own suggests they deserve to be valued at 14.5-15.0x 2024 earnings – a 45-50% premium to their current valuation. With the S&P 500 currently valued at roughly 19x expected 2024 earnings, our companies look like particularly good value.
“Oh, it’s stormin’, stormin’ rain and I’m as lonesome as a man can be…
it’s a down-right rotten, low down dirty shame, the way that you treated me.”
From “Jelly Jelly”
At a time when other investors are focused on blue economic skies, we think it is prudent to plan more conservatively. To help us avoid the “Jelly Jelly” blues at Poplar Forest, our financial forecasts continue to assume a recession will hit sometime in the next 12 months. I sincerely hope that assumption is too conservative, but given restrictive monetary policy and exuberant investor attitudes, it seems especially prudent right now to emphasize risk management in our portfolio management decisions. Monetary policy is purported to work with long and variable lags, and history suggests that it could start storming soon.
In a recession, we believe that our companies’ earnings may get hit by about 20%. If that is correct, then our portfolio would be valued at just 12.5x – still a very low multiple in an absolute sense, and even more so considering those would be depressed earnings. The upside potential weighted against what appears to be limited recessionary downside is one of the best risk/reward ratios I can remember.
“I got that old lonesome feelin’ that’s sometimes called the blues
Well I been workin’ every night, travelin’ every day…
You can tell your other man, sweet daddy’s on his way…
Well I’m going to make it on up to you
For all the things you should have had before.”
from Southbound
When I first started Poplar Forest, album sales were just starting to emerge from a 16-year drought in sales. I realize that collecting, storing, and listening to records isn’t as easy as streaming digital music, but I find it to be more than worth the trouble. As I’ve said, the sound is richer and there is something viscerally satisfying about pulling a treasured album out of its sleeve, placing it on the platter and dropping the needle. In a way, it’s almost like I can “touch” the music when playing an LP – something that doesn’t happen when I stream a digital recording.
In the same way that an album can be a physical manifestation of music, “free cash flow” – the amount of money left over after a company has paid its bills and invested
Poplar Forest Funds Annual Report, September 2023 |
6
POPLAR FOREST FUNDS
for future growth – may be a similar expression of business success. When the free cash flow that our companies produce is divided by the value of those companies, the result is what we call the “free cash yield.” Based on results over the last 12 months, our portfolio is valued at a 7% free cash yield (a substantial premium to the S&P 500’s 4.0% free cash yield) and we see prospects for double-digit annual growth in those cash flows in the next three to five years. While the short-term may be volatile as bulls and bears debate the likelihood of recession, our portfolio’s combination of free cash yield and growth point to substantial long-term appreciation potential.
As you can see below, in late 2007 when we started Poplar Forest, and after a multi-year run starting in 2000 that saw the Russell 1000 Value Index beat the S&P by a cumulative 50%, there was not much value left in Value stocks, at least as compared to the S&P 500. Today, the tables have turned and our opportunity set is about as robust as I can remember it. Interest rates are roughly back to where they were in 2007 while the P/E ratio for the S&P 500 is roughly 25% higher; yet, we’ve been able to assemble a portfolio that has a 25% lower valuation as compared to the companies we owned back then.
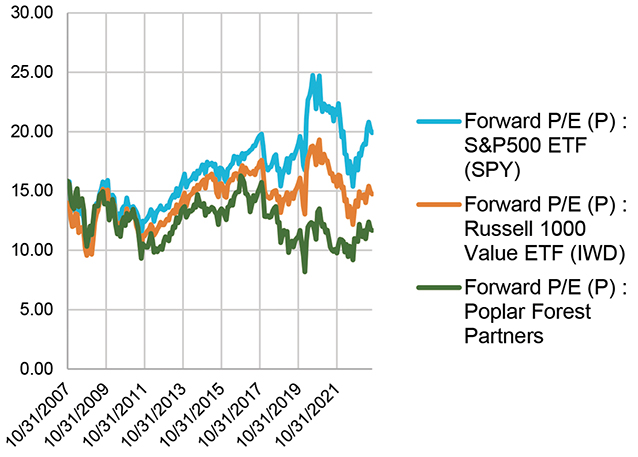
Source: CapitalIQ
I started Poplar Forest with the goal of providing like-minded clients with market beating long-term investment results through a high conviction, disciplined, absolute value investment strategy. Then, as now, I was focused on finding out-of-favor and underappreciated stocks with idiosyncratic return characteristics and I believe we’ve done a good job of that. However, the decade-long compression in Value stocks’ relative valuations has certainly been an unexpected headwind to our results. That said, those headwinds have created an environment that in our view positions Value investing for a renaissance similar to that experienced by album sales over the last decade.
Poplar Forest Funds Annual Report, September 2023 |
7
POPLAR FOREST FUNDS
We remain committed to an investment process that seeks to uncover what we believe are bargains with above average long-term potential and below average risk. In a market environment in which investors are enamored with the leading Growth stocks, it might be easy for us to get those old lonesome blues were it not for the support of a fantastic group of client partners on whose behalf we work each day. I don’t know when the current Growth stock infatuation will end, but when it does, I believe that our portfolio has the potential to produce chart-topping results – to quote Gregg Allman in “Southbound”: “Sweet Daddy’s on his way!”
Sincerely,

J. Dale Harvey
September 30, 2023
Poplar Forest Funds Annual Report, September 2023 |
8
POPLAR FOREST FUNDS
Partners Fund Portfolio Review
The Partners Fund Institutional Class shares produced a return of 7.32% while Class A shares (no load) produced an 7.05% return for the twelve months ending September 30, 2023. This compared to a return of 21.62% for the S&P 500 Index (“S&P 500”) and 14.44% for the Russell 1000 Value Index.
Relative to the S&P 500, the portfolio’s top contributing sectors to performance over this fiscal period were Industrials, Real Estate (from an underweight in a poorly performing sector) and Energy. The bottom contributing sectors were Financials, Consumer Discretionary and Communication Services.
At the security level, the top contributors were Intel Corporation, Cencora (formerly AmerisourceBergen), FedEx, Chevron and AIG. The Fund’s top detractors from overall performance were Advance Auto, CVS Health Corporation, Dollar Tree, Tyson Foods and Fidelity National Information Services.
Portfolio Changes and Positioning
Poplar Forest Capital’s process is designed to find attractive investment opportunities in all parts of the economic cycle. By focusing on normalized earnings power, we try to avoid capitalizing above-trend and below-trend results. Additionally, we incorporate a recession assumption and evaluate the balance sheet of each of our investments to understand whether the financial strength exists to manage through more difficult than forecast periods. Within this framework, our goal is to find companies whose prospects are underappreciated by investors. Over the last year, we have become more cautious on the U.S. economy given the Fed’s battle to tame inflation and unwinding of quantitative easing. This has led us to exit positions with lower credit ratings and greater cyclicality. Our new investments have more defensive business models – greater recurring revenues – and idiosyncratic opportunities to improve profitability. The imbedded credit quality of our portfolio is arguably higher than at any time since we opened our doors in late 2007. At the same time, our concentrated value portfolio trades at one of the widest discounts to the S&P 500 since inception. We expect this discount to buffer the portfolio if a recession ensues and provide additional return potential as turnaround metrics are achieved.
Cornerstone Fund Portfolio Review
The Cornerstone Fund produced a 7.46% return. This compares to a 13.01% return for a 60/40 blend of the S&P 500® Index and the Bloomberg U.S. Aggregate Bond Index for the twelve months ending September 30, 2023.
At the security level, the Fund benefitted from top contributing equity investments Las Vegas Sands, FedEx, Cencora (formerly AmerisourceBergen), Intel and Apollo Global. Top detracting equity investments were Advance Auto, CVS Health, Dollar Tree, Tyson Foods and Fidelity National Information Services.
While the overlap between the equities owned in the Cornerstone and Partners Funds is high, the Cornerstone Fund remains far more defensive with roughly 38% in cash and equivalents and fixed income investments. Our equity exposure remains at ~61% which is where it has been for the last year but down from where it was historically. As interest rates have climbed, we have shifted our investments within fixed income to a higher ratio of treasuries to corporates. At September 30, 2023 our fixed investments in AAA bonds were 57% versus 50.6% a year ago.
Poplar Forest Funds Annual Report, September 2023 |
9
POPLAR FOREST FUNDS
We remain focused on trying to manage downside risk while also striving to protect our investors’ long-term purchasing power. Our equities currently account for approximately 61% of the Fund, in line with where the portfolio was at September 30, 2022. The draw-down this year was less than that of the Partners Fund.
As we look ahead, we believe our portfolio is well positioned to generate solid inflation-adjusted returns. The Fund remains focused on high quality companies that are trading at what we believe are discounted valuations, while our bond selections continue to emphasize our goal of capital preservation.
Disclosures
Must be preceded or accompanied by a prospectus.
Mutual fund investing involves risk. Principal loss is possible. The Funds may invest in debt securities which typically decrease in value when interest rates rise. This risk is usually greater for longer-term debt securities. The Funds may invest in foreign securities which involve greater volatility and political, economic and currency risks and differences in accounting methods. These risks are greater in emerging markets. Investing in small and medium sized companies may involve greater risk than investing in larger, more established companies because small and medium capitalization companies can be subject to greater share price volatility. The Funds may invest in options, which may be subject to greater fluctuations in value than an investment in the underlying securities. When the Funds invest in other funds and ETFs an investor will indirectly bear the principal risks and its share of the fees and expenses of the underlying funds. Investments in asset-backed and mortgage-backed securities involve additional risks such as credit risk, prepayment risk, possible illiquidity and default, and increased susceptibility to adverse economic developments. Diversification does not assure a profit, nor does it protect against a loss in a declining market.
Value stocks typically are less volatile than growth stocks; however, value stocks have a lower expected growth rate in earnings and sales.
Opinions expressed are subject to change at any time, are not guaranteed and should not be considered investment advice. Fund holdings and sector allocations are subject to change and should not be considered recommendations to buy or sell any security.
Poplar Forest Funds are distributed by Quasar Distributors, LLC.
Partners Fund Top Ten Holdings and Percentage Weights as of 9/30/23:
| Equitable Holdings | 4.80% | |
| Intel Corp. | 4.78% | |
| Cencora Inc. | 4.65% | |
| IBM | 4.64% | |
| Chevron Corp. | 4.42% | |
| United Therapeutics | 4.40% | |
| Allstate Corp. | 4.30% | |
| CVS Health Corp. | 4.17% | |
| National Fuel Gas | 4.16% | |
| Dow Inc. | 4.13% |
Poplar Forest Funds Annual Report, September 2023 |
10
POPLAR FOREST FUNDS
Cornerstone Fund Top Ten Equity Holdings and Percentage Weights as of 9/30/23:
| United Therapeutics | 2.94% | |
| IBM | 2.88% | |
| Intel Corp. | 2.77% | |
| Equitable Holdings | 2.74% | |
| Cencora Inc. | 2.69% | |
| Allstate Corp. | 2.61% | |
| Philip Morris | 2.59% | |
| CVS Health Corp. | 2.59% | |
| National Fuel Gas | 2.57% | |
| Dow Inc. | 2.53% |
S&P 500 Index: Is a market value weighted index consisting of 500 stocks chosen for market size, liquidity and industry group representation. The Index is unmanaged.
Russell 1000® Index: An index of approximately 1,000 of the largest companies in the U.S. equity market. The Index is a subset of the Russell 3000 Index, representing the top companies by market capitalization.
Russell 1000® Growth Index: Measures the performance of those Russell 1000 Index companies with higher price-to-book ratios and higher forecasted growth values.
Russell 1000® Value index: measures the performance of the Russell 1000’s value segment, which is defined to include firms whose share prices have lower price/book ratios and lower expected long-term mean earnings growth rates.
Russell 2000 Index: The Russell 2000 Index refers to a stock market index that measures the performance of the 2,000 smaller companies included in the Russell 3000 Index. The Russell 2000 is managed by FTSE Russell and is widely regarded as a bellwether of the U.S. economy because of its focus on smaller companies that focus on the U.S. market.
Russell Top 200 Value Index: Measures the performance of the 200 largest companies (63% of total market capitalization) in the Russell 1000 Index, with a weighted average market capitalization of $186 billion. The Russell Top 200 Index is tracked by an exchange-traded fund, iShares Russell Top 200 Index (NYSE Arca: IWL).
Russell Midcap Value Index: Measures the performance of the midcap value segment of the U.S. equity universe. It includes those Russell Midcap Index companies with relatively lower price-to-book ratios, lower I/B/E/S forecast medium term (2 year) growth and lower sales per share historical growth (5 years).
The Bloomberg U.S. Aggregate Bond Index: is a broad-based flagship benchmark that measures the investment grade, U.S. dollar-denominated, fixed-rate taxable bond market. The index includes Treasuries, government-related and corporate securities, mortgage-backed securities, asset-backed securities and commercial mortgage-backed securities.
Blended index: (also known as a blended benchmark) is a combination of two or more indices in varying percentages. To take a simple example, if an investor’s assets are allocated to 60% stocks and 40% bonds, the portfolio’s performance might be best measured against a blended benchmark consisting of 60% in a stock index (e.g. S&P 500® index) and 40% in a bond index (e.g. Bloomberg U.S. Aggregate Bond Index).
Poplar Forest Funds Annual Report, September 2023 |
11
POPLAR FOREST FUNDS
The Consumer Price Index (CPI): is a measure of the average change over time in the prices paid by urban consumers for a market basket of consumer goods and services. The annual percentage change in a CPI is used as a measure of inflation.
Morningstar Large Value Index: Average of all Value funds in Morningstar’s mutual fund database. The index is designed to provide consistent representation of the large-cap value segment of the U.S. equity market, with no overlapping constituents across styles.
Morningstar Large Value Fund Average: Large-value funds invest in stocks of big U.S. companies that are less expensive or growing more slowly than other large-cap stocks. Stocks in the top 70% of the capitalization of the U.S. equity market are defined as large-cap. Value is defined based on low valuations (low price ratios and high dividend yields) and slow growth (low growth rates for earnings, sales, book value, and cash flow).
It is not possible to invest directly in an index.
Index performance is not indicative of a Fund’s performance. Past performance does not guarantee future results.
Earnings growth is not a measure of a Fund’s future performance.
Absolute Value: Refers to valuing businesses using discounted cash flow analysis to determine a company’s financial worth.
Compound Annual Growth Rate (CAGR): The year-over-year growth rate of an investment over a specified period of time. The compound annual growth rate is calculated by taking the nth root of the total percentage growth rate, where n is the number of years in the period being considered.
Earnings Growth: The annual rate of growth of earnings typically measured as Earnings Per Share Growth.
Earnings Per Share (EPS): The net income of a company divided by the total number of shares it has outstanding.
Free Cash Flow: Is equal to the after-tax net income of a company plus depreciation and amortization less capital expenditures.
Free Cash Yield: A financial solvency ratio that compares the free cash flow per share a company is expected to earn against its market value per share.
Inflation: Is a quantitative measure of the rate at which the average price level of a basket of selected goods and services in an economy increases over a period of time. Often expressed as a percentage, inflation indicates a decrease in the purchasing power of a nation’s currency.
Price/Book Ratio (P/B): The price/book ratio of a fund is the weighted average of the price/book ratios of all the stocks in a fund’s portfolio.
Price/Cash Flow Ratio (P/CF): A stock valuation measure calculated by dividing a firm’s cash flow per share into the current stock price. Financial analysts often prefer to value stocks using cash flow rather than earnings because the latter is more easily manipulated.
Price/Earnings (P/E) Ratio: Is a common tool for comparing the prices of different common stocks and is calculated by dividing the earnings per share into the current market price of a stock.
Poplar Forest Funds Annual Report, September 2023 |
12
POPLAR FOREST FUNDS
Price/Sales Ratio: This ratio represents the amount an investor is willing to pay for a dollar generated from a particular company’s operations.
Risk-adjusted Returns: The return on an investment such as a stock or corporate bond when compared to cash or equivalents.
Trailing 12 Months (TTM): A term used to describe the past 12 consecutive months of a company’s performance data, that’s used for reporting financial figures.
Poplar Forest Funds Annual Report, September 2023 |
13
POPLAR FOREST PARTNERS FUND
SECTOR ALLOCATION OF PORTFOLIO ASSETS at September 30, 2023 (Unaudited)
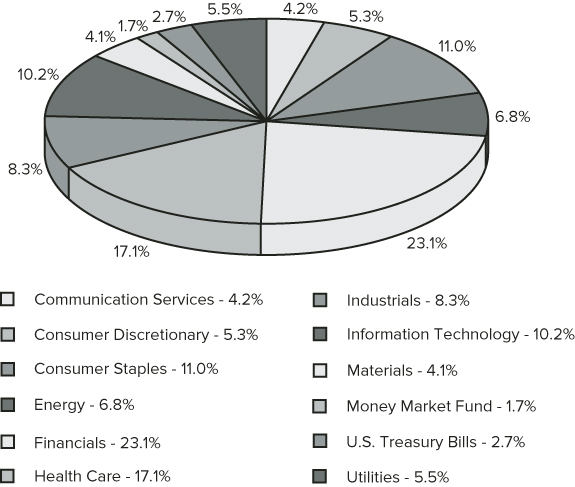
Percentages represent market value as a percentage of total investments.
The Global Industry Classification Standard (GICS®) was developed by and/or is the exclusive property of MSCI, Inc. and Standard & Poor’s Financial Services LLC (“S&P”). GICS is a service mark of MSCI and S&P and has been licensed for use by U.S. Bancorp Fund Services, LLC.
Poplar Forest Funds Annual Report, September 2023 |
14
POPLAR FOREST CORNERSTONE FUND
SECTOR ALLOCATION OF PORTFOLIO ASSETS at September 30, 2023 (Unaudited)
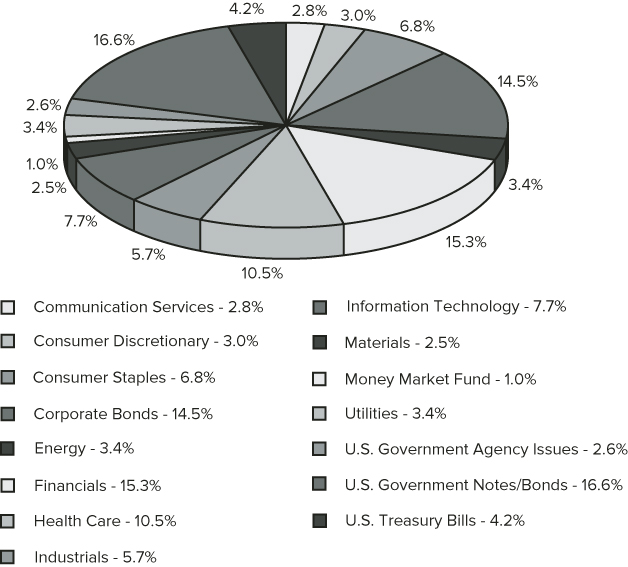
Percentages represent market value as a percentage of total investments.
The Global Industry Classification Standard (GICS®) was developed by and/or is the exclusive property of MSCI, Inc. and Standard & Poor’s Financial Services LLC (“S&P”). GICS is a service mark of MSCI and S&P and has been licensed for use by U.S. Bancorp Fund Services, LLC.
Poplar Forest Funds Annual Report, September 2023 |
15
POPLAR FOREST FUNDS
EXPENSE EXAMPLE at September 30, 2023 (Unaudited)
As a shareholder of a mutual fund, you incur two types of costs: (1) transaction costs, including sales charges (loads) on purchase payments, redemption fees, and exchange fees, and (2) ongoing costs, including management fees, distribution and/or service fees, and other fund expenses. This Example is intended to help you understand your ongoing costs (in dollars) of investing in the Funds and to compare these costs with the ongoing costs of investing in other mutual funds. The Example is based on an investment of $1,000 invested at the beginning of the period and held for the entire period (4/1/23 – 9/30/23).
Actual Expenses
For each class of each Fund, two lines are presented in the tables below, with the first line providing information about actual account values and actual expenses. You will be assessed fees for outgoing wire transfers, returned checks, and stop payment orders at prevailing rates charged by U.S. Bancorp Fund Services, LLC, the Funds’ transfer agent. The Example below includes, but is not limited to, management fees, 12b-1 fees, fund accounting, custody and transfer agent fees. You may use this information, together with the amount you invested, to estimate the expenses that you paid over the period. Simply divide your account value by $1,000 (for example, an $8,600 account value divided by $1,000 = 8.6), then multiply the result by the number in the first line under the heading entitled “Expenses Paid During Period’’ to estimate the expenses you paid on your account during this period.
Hypothetical Example for Comparison Purposes
For each class of each Fund, the second line provides information about hypothetical account values and hypothetical expenses based on the respective Fund’s actual expense ratio and an assumed rate of return of 5% per year before expenses, which is not the Fund’s actual return. The hypothetical account values and expenses may not be used to estimate the actual ending account balance or expenses you paid for the period. You may use this information to compare the ongoing costs of investing in the Funds and other funds. To do so, compare this 5% hypothetical example with the 5% hypothetical examples that appear in the shareholder reports of the other funds. Please note that the expenses shown in the table are meant to highlight your ongoing costs only and do not reflect any transaction costs, such as sales charges (loads), redemption fees, or exchange fees. Therefore, the second line of the tables for each class of each Fund is useful in comparing ongoing costs only, and will not help you determine the relative total costs of owning different funds. In addition, if these transaction costs were included, your costs would have been higher.
Poplar Forest Funds Annual Report, September 2023 |
16
POPLAR FOREST FUNDS
EXPENSE EXAMPLE at September 30, 2023 (Unaudited), Continued
| Beginning | Ending | Expenses Paid | Annualized | |
| Account Value | Account Value | During Period | Expense | |
4/1/23 | 9/30/23 | 4/1/23 – 9/30/23 | Ratio* | |
| Poplar Forest Partners Fund | ||||
| Class A Shares | ||||
| Actual | $1,000.00 | $963.80 | $5.91 | 1.20% |
| Hypothetical (5% return | ||||
| before expenses) | $1,000.00 | $1,019.05 | $6.07 | 1.20% |
| Institutional Class Shares | ||||
| Actual | $1,000.00 | $965.30 | $4.68 | 0.95% |
| Hypothetical (5% return | ||||
| before expenses) | $1,000.00 | $1,020.31 | $4.81 | 0.95% |
| Beginning | Ending | Expenses Paid | Annualized | |
| Account Value | Account Value | During Period | Expense | |
4/1/23 | 9/30/23 | 4/1/23 – 9/30/23 | Ratio* | |
| Poplar Forest Cornerstone Fund | ||||
| Investor Class Shares | ||||
| Actual | $1,000.00 | $977.80 | $4.46 | 0.90% |
| Hypothetical (5% return | ||||
| before expenses) | $1,000.00 | $1,020.56 | $4.56 | 0.90% |
| * | Expenses are equal to the annualized expense ratio of each class, multiplied by the average account value over the period, multiplied by 183 (days in most recent fiscal half-year) / 365 days to reflect the one-half year expense. |
Poplar Forest Funds Annual Report, September 2023 |
17
POPLAR FOREST PARTNERS FUND
Comparison of the change in value of a $100,000 investment in the
Poplar Forest Partners Fund – Institutional Class Shares vs
the S&P 500® Index and the Russell 1000® Value Index
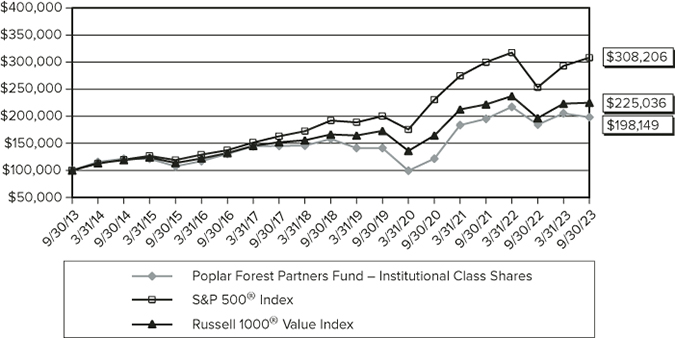
Average Annual Total Return: | 1 Year | 5 Year | 10 Year |
| Poplar Forest Partners Fund – | |||
| Institutional Class Shares | 7.32% | 4.64% | 7.08% |
| Poplar Forest Partners Fund – | |||
| Class A Shares (with sales load) | 1.71% | 3.31% | 6.26% |
| Poplar Forest Partners Fund – | |||
| Class A Shares (without sales load) | 7.05% | 4.37% | 6.81% |
S&P 500® Index | 21.62% | 9.92% | 11.91% |
Russell 1000® Value Index | 14.44% | 6.23% | 8.45% |
Performance data quoted represents past performance; past performance does not guarantee future results. The investment return and principal value of an investment will fluctuate so that an investor’s shares, when redeemed, may be worth more or less than their original cost. Current performance of the Fund may be lower or higher than the performance quoted. Performance data current to the most recent month end may be obtained by calling 1-877-522-8860.
Returns reflect the reinvestment of dividends and capital gain distributions. Fee waivers are in effect. In the absence of fee waivers, returns would be reduced. Class A shares may be subject to a 5.00% front-end sales load. The performance data and graph do not reflect the deduction of taxes that a shareholder may pay on dividends, capital gain distributions, or redemption of Fund shares. This chart does not imply any future performance. Indices do not incur expenses and are not available for investment.
The S&P 500® Index is a market-value weighted index consisting of 500 stocks chosen for market size, liquidity, and industry group representation.
The Russell 1000® Value Index is an index of approximately 1,000 of the largest companies in the U.S. equity markets, and is a subset of the Russell 3000® Index.
Poplar Forest Funds Annual Report, September 2023 |
18
POPLAR FOREST CORNERSTONE FUND
Comparison of the change in value of a $25,000 investment in the
Poplar Forest Cornerstone Fund – Investor Class Shares vs.
the S&P 500® Index, the Bloomberg U.S. Aggregate Bond Index,
the Blended Index and the Consumer Price Index +3%
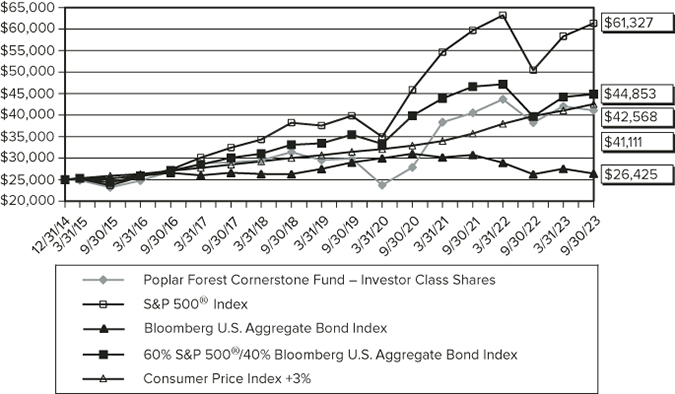
| Since | |||
Average Annual Total Return: | 1 Year | 5 Year | Inception1 |
| Poplar Forest Cornerstone Fund – | |||
| Investor Class Shares | 7.46% | 5.55% | 5.85% |
S&P 500® Index | 21.62% | 9.92% | 10.80% |
| Bloomberg U.S. Aggregate Bond Index | 0.64% | 0.10% | 0.64% |
60% S&P 500®/ 40% U.S. Aggregate Bond Index | 13.01% | 6.27% | 6.91% |
| Consumer Price Index +3% | 7.00% | 7.20% | 6.25% |
Performance data quoted represents past performance; past performance does not guarantee future results. The investment return and principal value of an investment will fluctuate so that an investor’s shares, when redeemed, may be worth more or less than their original cost. Current performance of the Fund may be lower or higher than the performance quoted. Performance data current to the most recent month end may be obtained by calling 1-877-522-8860.
Returns reflect the reinvestment of dividends and capital gain distributions. Fee waivers are in effect. In the absence of fee waivers, returns would be reduced. The performance data and graph do not reflect the deduction of taxes that a shareholder may pay on dividends, capital gain distributions, or redemption of Fund shares. This chart does not imply any future performance. Indices do not incur expenses and are not available for investment.
The S&P 500® Index is a market-value weighted index consisting of 500 stocks chosen for market size, liquidity, and industry group representation.
The Bloomberg U.S. Aggregate Bond Index is a broad based benchmark that measures the investment grade, U.S. dollar-denominated, fixed-rate taxable market, including Treasuries, government related and corporate securities.
Poplar Forest Funds Annual Report, September 2023 |
19
POPLAR FOREST CORNERSTONE FUND
The blended index is a 60% S&P 500® Index and 40% Bloomberg U.S. Aggregate Bond Index blend.
Consumer Price Index (CPI) is a measure of the average change over time in the prices paid by urban consumers for a market basket of consumer goods and services. The annual percentage change in the CPI is used as a measure of inflation. The CPI +3% is a measure defined as an objective in the Fund’s prospectus.
1 | The Fund commenced operations on December 31, 2014. |
Poplar Forest Funds Annual Report, September 2023 |
20
POPLAR FOREST PARTNERS FUND
SCHEDULE OF INVESTMENTS at September 30, 2023
| Shares | COMMON STOCKS – 95.6% | Value | |||||
| Air Freight & Logistics – 3.6% | |||||||
| 39,500 | FedEx Corp. | $ | 10,464,340 | ||||
| Banks – 5.8% | |||||||
| 135,000 | Citigroup, Inc. | 5,552,550 | |||||
| 274,000 | Wells Fargo & Co. | 11,195,640 | |||||
| 16,748,190 | |||||||
| Biotechnology – 4.4% | |||||||
| 56,500 | United Therapeutics Corp. (a) | 12,761,655 | |||||
| Capital Markets – 0.9% | |||||||
| 45,000 | Stifel Financial Corp. | 2,764,800 | |||||
| Chemicals – 4.1% | |||||||
| 232,500 | Dow, Inc. | 11,987,700 | |||||
| Consumer Finance – 2.2% | |||||||
| 241,000 | Ally Financial, Inc. | 6,429,880 | |||||
| Consumer Staples Distribution – 3.0% | |||||||
| 82,500 | Dollar Tree, Inc. (a) | 8,782,125 | |||||
| Diversified Telecommunication Services – 2.6% | |||||||
| 503,000 | AT&T, Inc. | 7,555,060 | |||||
| Electrical Equipment – 2.1% | |||||||
| 158,500 | Sensata Technologies Holding plc | 5,994,470 | |||||
| Entertainment – 1.6% | |||||||
| 432,000 | Warner Bros. Discovery, Inc. (a) | 4,691,520 | |||||
| Financial Services – 7.9% | |||||||
| 490,000 | Equitable Holdings, Inc. | 13,911,100 | |||||
| 164,000 | Fidelity National Information Services, Inc. | 9,064,280 | |||||
| 22,975,380 | |||||||
| Food Products – 4.0% | |||||||
| 227,000 | Tyson Foods, Inc. – Class A | 11,461,230 | |||||
| Gas Utilities – 4.2% | |||||||
| 232,500 | National Fuel Gas Co. | 12,069,075 | |||||
| Health Care Providers & Services – 8.8% | |||||||
| 75,000 | Cencora, Inc. | 13,497,750 | |||||
| 173,000 | CVS Health Corp. | 12,078,860 | |||||
| 25,576,610 | |||||||
| Hotels, Restaurants & Leisure – 2.7% | |||||||
| 168,000 | Las Vegas Sands Corp. | 7,701,120 | |||||
| Insurance – 6.2% | |||||||
| 112,000 | Allstate Corp. | 12,477,920 | |||||
| 90,000 | American International Group, Inc. | 5,454,000 | |||||
| 17,931,920 | |||||||
The accompanying notes are an integral part of these financial statements.
Poplar Forest Funds Annual Report, September 2023 |
21
POPLAR FOREST PARTNERS FUND
SCHEDULE OF INVESTMENTS at September 30, 2023, Continued
| Shares | Value | ||||||
| IT Services – 5.4% | |||||||
| 102,000 | DXC Technology Co. (a) | $ | 2,124,660 | ||||
| 96,000 | International Business Machines Corp. | 13,468,800 | |||||
| 15,593,460 | |||||||
| Machinery – 2.6% | |||||||
| 79,000 | Oshkosh Corp. | 7,538,970 | |||||
| Multi-Utilities – 1.3% | |||||||
| 85,500 | Dominion Energy, Inc. | 3,819,285 | |||||
| Oil, Gas & Consumable Fuels – 6.8% | |||||||
| 76,000 | Chevron Corp. | 12,815,120 | |||||
| 152,500 | Murphy Oil Corp. | 6,915,875 | |||||
| 19,730,995 | |||||||
| Pharmaceuticals – 3.9% | |||||||
| 110,000 | Merck & Co., Inc. | 11,324,500 | |||||
| Semiconductors & Semiconductor Equipment – 4.8% | |||||||
| 390,000 | Intel Corp. | 13,864,500 | |||||
| Textiles, Apparel & Luxury Goods – 2.7% | |||||||
| 270,000 | Tapestry, Inc. | 7,762,500 | |||||
| Tobacco – 4.0% | |||||||
| 126,000 | Philip Morris International, Inc. | 11,665,080 | |||||
| TOTAL COMMON STOCKS | |||||||
| (Cost $228,543,236) | 277,194,365 | ||||||
| SHORT-TERM INVESTMENTS – 4.4% | |||||||
| Money Market Fund – 1.7% | |||||||
| 5,000,193 | Morgan Stanley Institutional Liquidity Funds – | ||||||
| Treasury Portfolio, Institutional Class, 5.203% (b) | 5,000,193 | ||||||
The accompanying notes are an integral part of these financial statements.
Poplar Forest Funds Annual Report, September 2023 |
22
POPLAR FOREST PARTNERS FUND
SCHEDULE OF INVESTMENTS at September 30, 2023, Continued
| Principal | |||||||
| Amount | Value | ||||||
| U.S. Treasury Bills – 2.7% | |||||||
| $ | 4,900,000 | 5.341%, 10/26/2023 (c) | $ | 4,882,796 | |||
| 3,000,000 | 5.387%, 12/7/2023 (c) | 2,970,808 | |||||
| 7,853,604 | |||||||
| TOTAL SHORT-TERM INVESTMENTS | |||||||
| (Cost $12,852,585) | 12,853,797 | ||||||
| Total Investments | |||||||
| (Cost $241,395,821) – 100.0% | 290,048,162 | ||||||
| Liabilities in Excess of Other Assets – (0.0)% | (58,061 | ) | |||||
| TOTAL NET ASSETS – 100.00% | $ | 289,990,101 | |||||
| (a) | Non-income producing security. |
| (b) | Rate shown represents the 7-day annualized yield as of September 30, 2023. |
| (c) | Rate shown is the discount rate at September 30, 2023. |
The Global Industry Classification Standard (GICS®) was developed by and/or is the exclusive property of MSCI, Inc. and Standard & Poor’s Financial Services LLC (“S&P”). GICS is a service mark of MSCI and S&P and has been licensed for use by U.S. Bancorp Fund Services, LLC.
The accompanying notes are an integral part of these financial statements.
Poplar Forest Funds Annual Report, September 2023 |
23
POPLAR FOREST CORNERSTONE FUND
SCHEDULE OF INVESTMENTS at September 30, 2023
| Shares | COMMON STOCKS – 61.0% | Value | |||||
| Air Freight & Logistics – 2.5% | |||||||
| 2,900 | FedEx Corp. | $ | 768,268 | ||||
| Banks – 4.1% | |||||||
| 16,300 | Citigroup, Inc. | 670,419 | |||||
| 14,200 | Wells Fargo & Co. | 580,212 | |||||
| 1,250,631 | |||||||
| Biotechnology – 2.9% | |||||||
| 4,000 | United Therapeutics Corp. (a) | 903,480 | |||||
| Chemicals – 2.5% | |||||||
| 15,100 | Dow, Inc. | 778,556 | |||||
| Consumer Finance – 1.3% | |||||||
| 15,200 | Ally Financial, Inc. | 405,536 | |||||
| Consumer Staples Distribution – 1.7% | |||||||
| 4,900 | Dollar Tree, Inc. (a) | 521,605 | |||||
| Diversified Telecommunication Services – 1.7% | |||||||
| 35,500 | AT&T, Inc. | 533,210 | |||||
| Electrical Equipment – 1.4% | |||||||
| 11,700 | Sensata Technologies Holding plc | 442,494 | |||||
| Entertainment – 1.1% | |||||||
| 29,600 | Warner Bros. Discovery, Inc. (a) | 321,456 | |||||
| Financial Services – 6.2% | |||||||
| 4,021 | Apollo Global Management, Inc. | 360,925 | |||||
| 29,700 | Equitable Holdings, Inc. | 843,183 | |||||
| 12,400 | Fidelity National Information Services, Inc. | 685,348 | |||||
| 1,889,456 | |||||||
| Food Products – 2.5% | |||||||
| 15,000 | Tyson Foods, Inc. – Class A | 757,350 | |||||
| Gas Utilities – 2.6% | |||||||
| 15,200 | National Fuel Gas Co. | 789,032 | |||||
| Health Care Providers & Services – 5.3% | |||||||
| 4,600 | Cencora, Inc. | 827,862 | |||||
| 11,400 | CVS Health Corp. | 795,948 | |||||
| 1,623,810 | |||||||
| Hotels, Restaurants & Leisure – 1.6% | |||||||
| 10,800 | Las Vegas Sands Corp. | 495,072 | |||||
| Insurance – 3.7% | |||||||
| 7,200 | Allstate Corp. | 802,152 | |||||
| 5,700 | American International Group, Inc. | 345,420 | |||||
| 1,147,572 | |||||||
The accompanying notes are an integral part of these financial statements.
Poplar Forest Funds Annual Report, September 2023 |
24
POPLAR FOREST CORNERSTONE FUND
SCHEDULE OF INVESTMENTS at September 30, 2023, Continued
| Shares | Value | ||||||
| IT Services – 3.6% | |||||||
| 10,500 | DXC Technology Co. (a) | $ | 218,715 | ||||
| 6,300 | International Business Machines Corp. | 883,890 | |||||
| 1,102,605 | |||||||
| Machinery – 1.8% | |||||||
| 5,800 | Oshkosh Corp. | 553,494 | |||||
| Multi-Utilities – 0.8% | |||||||
| 5,600 | Dominion Energy, Inc. | 250,152 | |||||
| Oil, Gas & Consumable Fuels – 3.4% | |||||||
| 4,000 | Chevron Corp. | 674,480 | |||||
| 8,400 | Murphy Oil Corp. | 380,940 | |||||
| 1,055,420 | |||||||
| Pharmaceuticals – 2.2% | |||||||
| 6,600 | Merck & Co., Inc. | 679,470 | |||||
| Semiconductors & Semiconductor Equipment – 2.8% | |||||||
| 23,900 | Intel Corp. | 849,645 | |||||
| Software – 1.3% | |||||||
| 2,500 | VMware, Inc. (a) | 416,200 | |||||
| Textiles, Apparel & Luxury Goods – 1.4% | |||||||
| 14,400 | Tapestry, Inc. | 414,000 | |||||
| Tobacco – 2.6% | |||||||
| 8,600 | Philip Morris International, Inc. | 796,188 | |||||
| TOTAL COMMON STOCKS | |||||||
| (Cost $15,902,362) | 18,744,702 | ||||||
| Principal | |||||||
| Amount | CORPORATE BONDS – 12.9% | ||||||
| Banks – 2.2% | |||||||
| Citizens Financial Group, Inc. | |||||||
| $ | 700,000 | 3.750%, 07/01/2024 | 674,322 | ||||
| Electric Utilities – 3.4% | |||||||
| Dominion Energy South Carolina, Inc. | |||||||
| 300,000 | 4.250%, 08/15/2028 | 280,359 | |||||
| DTE Electric Co. | |||||||
| 925,000 | 3.000%, 03/01/2032 | 766,372 | |||||
| 1,046,731 | |||||||
| Gas Utilities – 2.4% | |||||||
| National Fuel Gas Co. | |||||||
| 800,000 | 3.950%, 09/15/2027 | 733,932 | |||||
The accompanying notes are an integral part of these financial statements.
Poplar Forest Funds Annual Report, September 2023 |
25
POPLAR FOREST CORNERSTONE FUND
SCHEDULE OF INVESTMENTS at September 30, 2023, Continued
| Principal | |||||||
| Amount | Value | ||||||
| Pharmaceuticals – 2.4% | |||||||
| Bristol-Myers Squibb Co. | |||||||
| $ | 725,000 | 6.125%, 05/01/2038 | $ | 725,586 | |||
| Specialty Retail – 2.5% | |||||||
| Dick’s Sporting Goods, Inc. | |||||||
| 1,000,000 | 3.150%, 01/15/2032 | 769,879 | |||||
| TOTAL CORPORATE BONDS | |||||||
| (Cost $4,151,255) | 3,950,450 | ||||||
| U.S. GOVERNMENT AGENCY ISSUES – 2.6% | |||||||
| Federal Home Loan Banks | |||||||
| 800,000 | 4.500%, 09/30/2027 (c) | 791,102 | |||||
| TOTAL U.S. GOVERNMENT AGENCY ISSUES | |||||||
| (Cost $800,000) | 791,102 | ||||||
| PREFERRED STOCKS – 1.5% | |||||||
| Consumer Finance – 1.5% | |||||||
| Ally Financial, Inc. | |||||||
| 700,000 | Series B, 4.700% (5 Year CMT Rate + | ||||||
| 3.868%), 8/15/2072 (b) | 481,896 | ||||||
| TOTAL PREFERRED STOCKS | |||||||
| (Cost $713,346) | 481,896 | ||||||
| U.S. GOVERNMENT NOTES/BONDS – 16.6% | |||||||
| U.S. Treasury Notes | |||||||
| 310,000 | 0.500%, 11/30/2023 | 307,548 | |||||
| 145,000 | 0.750%, 12/31/2023 | 143,348 | |||||
| 165,000 | 0.875%, 01/31/2024 | 162,547 | |||||
| 165,000 | 1.500%, 02/29/2024 | 162,348 | |||||
| 145,000 | 2.250%, 03/31/2024 | 142,726 | |||||
| 800,000 | 4.125%, 01/31/2025 | 787,844 | |||||
| 300,000 | 2.625%, 04/15/2025 | 288,586 | |||||
| 770,000 | 3.875%, 02/15/2043 | 669,659 | |||||
| 815,000 | 4.125%, 08/15/2053 | 739,103 | |||||
| U.S. Treasury Notes TIPS | |||||||
| 901,187 | 0.125%, 07/15/2024 | 880,415 | |||||
| 896,303 | 0.250%, 07/15/2029 | 799,292 | |||||
| TOTAL U.S. GOVERNMENT NOTES/BONDS | |||||||
| (Cost $5,378,154) | 5,083,416 | ||||||
The accompanying notes are an integral part of these financial statements.
Poplar Forest Funds Annual Report, September 2023 |
26
POPLAR FOREST CORNERSTONE FUND
SCHEDULE OF INVESTMENTS at September 30, 2023, Continued
| Shares/ | |||||||
| Principal | |||||||
| Amount | SHORT-TERM INVESTMENTS – 5.2% | Value | |||||
| Money Market Fund – 1.0% | |||||||
| 310,698 | Morgan Stanley Institutional Liquidity Funds – | ||||||
| Treasury Portfolio, Institutional Class, 5.203% (d) | $ | 310,698 | |||||
| U.S. Treasury Bills – 4.2% | |||||||
| $ | 325,000 | 5.148%, 10/26/2023 (e) | 323,859 | ||||
| 500,000 | 5.310%, 11/24/2023 (e) | 496,104 | |||||
| 168,000 | 4.747%, 4/18/2024 (e) | 163,127 | |||||
| 165,000 | 5.189%, 6/13/2024 (e) | 158,899 | |||||
| 165,000 | 5.400%, 9/5/2024 (e) | 156,957 | |||||
| 1,298,946 | |||||||
| TOTAL SHORT-TERM INVESTMENTS | |||||||
| (Cost $1,610,689) | 1,609,644 | ||||||
| Total Investments | |||||||
| (Cost $28,555,806) – 99.8% | 30,661,210 | ||||||
| Other Assets in Excess of Liabilities – 0.2% | 59,474 | ||||||
| TOTAL NET ASSETS – 100.00% | $ | 30,720,684 | |||||
CMT – Constant Maturity Treasury
TIPS – Treasury Inflation Protected Securities
| (a) | Non-income producing security. |
| (b) | Variable or floating rate security based on a reference index and spread. The rate reported is the rate in effect as of September 30, 2023. |
| (c) | Step-up bond; pays one interest rate for a certain period and a higher rate thereafter. The interest rate shown is the rate in effect as of September 30, 2023, and steps up every six months with a terminal rate of 10% as of March 30, 2027. |
| (d) | Rate shown represents the 7-day annualized yield as of September 30, 2023. |
| (e) | Rate shown is the discount rate at September 30, 2023. |
The Global Industry Classification Standard (GICS®) was developed by and/or is the exclusive property of MSCI, Inc. and Standard & Poor’s Financial Services LLC (“S&P”). GICS is a service mark of MSCI and S&P and has been licensed for use by U.S. Bancorp Fund Services, LLC.
The accompanying notes are an integral part of these financial statements.
Poplar Forest Funds Annual Report, September 2023 |
27
POPLAR FOREST FUNDS
STATEMENTS OF ASSETS AND LIABILITIES at September 30, 2023
| Poplar Forest | Poplar Forest | |||||||
| Partners Fund | Cornerstone Fund | |||||||
| ASSETS | ||||||||
| Investments in securities, at value (identified cost | ||||||||
| $241,395,821 and $28,555,806, respectively) | $ | 290,048,162 | $ | 30,661,210 | ||||
| Receivables | ||||||||
| Fund shares issued | 51,726 | — | ||||||
| Dividends and interest | 522,212 | 117,978 | ||||||
| Prepaid expenses | 27,887 | 4,750 | ||||||
| Total assets | 290,649,987 | 30,783,938 | ||||||
| LIABILITIES | ||||||||
| Payables | ||||||||
| Fund shares redeemed | 347,246 | 8,000 | ||||||
| Due to Adviser | 176,565 | 6,130 | ||||||
| 12b-1 fees | 13,849 | — | ||||||
| Custody fees | 3,315 | 555 | ||||||
| Administration and fund accounting fees | 45,508 | 16,352 | ||||||
| Transfer agent fees and expenses | 34,372 | 4,003 | ||||||
| Audit fees | 22,500 | 21,000 | ||||||
| Chief Compliance Officer fee | 2,083 | 2,083 | ||||||
| Trustee fees and expenses | 550 | 551 | ||||||
| Accrued expenses | 13,898 | 4,580 | ||||||
| Total liabilities | 659,886 | 63,254 | ||||||
| NET ASSETS | $ | 289,990,101 | $ | 30,720,684 | ||||
The accompanying notes are an integral part of these financial statements.
Poplar Forest Funds Annual Report, September 2023 |
28
POPLAR FOREST FUNDS
STATEMENTS OF ASSETS AND LIABILITIES at September 30, 2023, Continued
| Poplar Forest | Poplar Forest | |||||||
| Partners Fund | Cornerstone Fund | |||||||
| CALCULATION OF NET ASSET VALUE PER SHARE | ||||||||
| Class A Shares | ||||||||
| Net assets applicable to shares outstanding | $ | 22,717,011 | $ | — | ||||
| Shares issued and outstanding [unlimited number | ||||||||
| of shares (par value $0.01) authorized] | 487,790 | — | ||||||
| Net asset value and redemption price per share | $ | 46.57 | $ | — | ||||
| Maximum offering price per share (Net asset value | ||||||||
| per share divided by 95.00%) | $ | 49.02 | $ | — | ||||
| Investor Class Shares | ||||||||
| Net assets applicable to shares outstanding | $ | — | $ | 30,720,684 | ||||
| Shares issued and outstanding [unlimited number | ||||||||
| of shares (par value $0.01) authorized] | — | 1,145,504 | ||||||
| Net asset value, offering and redemption price per share | $ | — | $ | 26.82 | ||||
| Institutional Class Shares | ||||||||
| Net assets applicable to shares outstanding | $ | 267,273,090 | $ | — | ||||
| Shares issued and outstanding [unlimited number | ||||||||
| of shares (par value $0.01) authorized] | 5,726,254 | — | ||||||
| Net asset value, offering and redemption price per share | $ | 46.68 | $ | — | ||||
| COMPONENTS OF NET ASSETS | ||||||||
| Paid-in capital | $ | 230,557,771 | $ | 27,314,737 | ||||
| Total distributable earnings | 59,432,330 | 3,405,947 | ||||||
| Net assets | $ | 289,990,101 | $ | 30,720,684 | ||||
The accompanying notes are an integral part of these financial statements.
Poplar Forest Funds Annual Report, September 2023 |
29
POPLAR FOREST FUNDS
STATEMENTS OF OPERATIONS For the Year Ended September 30, 2023
| Poplar Forest | Poplar Forest | |||||||
| Partners Fund | Cornerstone Fund | |||||||
| INVESTMENT INCOME | ||||||||
| Income | ||||||||
| Dividends | $ | 9,341,777 | $ | 572,505 | ||||
| Interest | 658,424 | 455,316 | ||||||
| Total Income | 10,000,201 | 1,027,821 | ||||||
| Expenses | ||||||||
| Advisory fees (Note 4) | 2,744,179 | 250,300 | ||||||
| Administration and fund accounting fees (Note 4) | 292,115 | 97,719 | ||||||
| Transfer agent fees and expenses (Note 4) | 145,454 | 22,936 | ||||||
| Sub-transfer agent fees (Note 4) | 80,985 | 843 | ||||||
| 12b-1 fees – Class A shares (Note 5) | 62,391 | — | ||||||
| Registration fees | 38,994 | 4,722 | ||||||
| Custody fees (Note 4) | 37,405 | 5,404 | ||||||
| Audit fees | 22,500 | 21,003 | ||||||
| Printing and mailing expense | 18,634 | 4,219 | ||||||
| Trustees fees and expenses | 17,121 | 16,893 | ||||||
| Chief Compliance Officer fee (Note 4) | 12,500 | 12,501 | ||||||
| Legal fees | 7,323 | 7,324 | ||||||
| Insurance expense | 5,832 | 2,374 | ||||||
| Interest expense (Note 7) | 2,381 | — | ||||||
| Miscellaneous | 30,956 | 7,918 | ||||||
| Total expenses | 3,518,770 | 454,156 | ||||||
| Less: Advisory fees waived (Note 4) | (322,385 | ) | (172,569 | ) | ||||
| Net expenses | 3,196,385 | 281,587 | ||||||
| Net investment income | 6,803,816 | 746,234 | ||||||
| REALIZED AND UNREALIZED GAIN ON INVESTMENTS | ||||||||
| Net realized gain from investments | 7,661,715 | 503,400 | ||||||
| Net change in unrealized appreciation on investments | 8,554,026 | 799,623 | ||||||
| Net realized and unrealized gain on investments | 16,215,741 | 1,303,023 | ||||||
| Net Increase in Net Assets Resulting from Operations | $ | 23,019,557 | $ | 2,049,257 | ||||
The accompanying notes are an integral part of these financial statements.
Poplar Forest Funds Annual Report, September 2023 |
30
POPLAR FOREST PARTNERS FUND
STATEMENTS OF CHANGES IN NET ASSETS
| Year Ended | Year Ended | |||||||
| September 30, 2023 | September 30, 2022 | |||||||
| NET INCREASE/(DECREASE) IN NET ASSETS FROM: | ||||||||
| OPERATIONS | ||||||||
| Net investment income | $ | 6,803,816 | $ | 5,151,136 | ||||
| Net realized gain from investments | 7,661,715 | 21,976,629 | ||||||
| Net change in unrealized appreciation/ | ||||||||
| (depreciation) on investments | 8,554,026 | (45,477,946 | ) | |||||
| Net increase/(decrease) in net assets | ||||||||
| resulting from operations | 23,019,557 | (18,350,181 | ) | |||||
| DIVIDENDS AND DISTRIBUTIONS TO SHAREHOLDERS | ||||||||
| Net dividends and distributions to shareholders — | ||||||||
| Class A Shares | (1,490,955 | ) | (3,177,349 | ) | ||||
| Net dividends and distributions to shareholders — | ||||||||
| Institutional Class Shares | (18,740,307 | ) | (38,843,292 | ) | ||||
| Total dividends and distributions to shareholders | (20,231,262 | ) | (42,020,641 | ) | ||||
| CAPITAL SHARE TRANSACTIONS | ||||||||
| Net increase/(decrease) in net assets derived | ||||||||
| from net change in outstanding shares (a) | (12,650,817 | ) | 46,622,960 | |||||
| Total decrease in net assets | (9,862,522 | ) | (13,747,862 | ) | ||||
| NET ASSETS | ||||||||
| Beginning of year | 299,852,623 | 313,600,485 | ||||||
| End of year | $ | 289,990,101 | $ | 299,852,623 | ||||
| (a) | A summary of share transactions is as follows: |
Year Ended September 30, 2023 | Year Ended September 30, 2022 | ||||||||||||||||
| Class A Shares | Shares | Paid-in Capital | Shares | Paid-in Capital | |||||||||||||
| Shares sold | 39,588 | $ | 1,959,738 | 123,157 | $ | 6,537,843 | |||||||||||
| Shares issued on | |||||||||||||||||
| reinvestments of distributions | 24,537 | 1,225,624 | 53,592 | 2,723,003 | |||||||||||||
| Shares redeemed | (83,934 | ) | (4,111,423 | ) | (99,674 | ) | (5,070,147 | ) | |||||||||
| Net increase/(decrease) | (19,809 | ) | $ | (926,061 | ) | 77,075 | $ | 4,190,699 | |||||||||
Year Ended September 30, 2023 | Year Ended September 30, 2022 | ||||||||||||||||
| Institutional Class Shares | Shares | Paid-in Capital | Shares | Paid-in Capital | |||||||||||||
| Shares sold | 996,167 | $ | 49,799,303 | 1,418,632 | $ | 75,102,907 | |||||||||||
| Shares issued on | |||||||||||||||||
| reinvestments of distributions | 267,033 | 13,340,977 | 561,705 | 28,529,000 | |||||||||||||
| Shares redeemed | (1,526,866 | ) | (74,865,036 | ) | (1,153,787 | ) | (61,199,646 | ) | |||||||||
| Net increase/(decrease) | (263,666 | ) | $ | (11,724,756 | ) | 826,550 | $ | 42,432,261 | |||||||||
The accompanying notes are an integral part of these financial statements.
Poplar Forest Funds Annual Report, September 2023 |
31
POPLAR FOREST CORNERSTONE FUND
STATEMENTS OF CHANGES IN NET ASSETS
| Year Ended | Year Ended | |||||||
| September 30, 2023 | September 30, 2022 | |||||||
| NET INCREASE/(DECREASE) IN NET ASSETS FROM: | ||||||||
| OPERATIONS | ||||||||
| Net investment income | $ | 746,234 | $ | 549,728 | ||||
| Net realized gain from investments | 503,400 | 2,183,894 | ||||||
| Net change in unrealized appreciation/ | ||||||||
| (depreciation) on investments | 799,623 | (4,474,030 | ) | |||||
| Net increase/(decrease) in net assets | ||||||||
| resulting from operations | 2,049,257 | (1,740,408 | ) | |||||
| DIVIDENDS AND DISTRIBUTIONS TO SHAREHOLDERS | ||||||||
| Net dividends and distributions to shareholders — | ||||||||
| Investor Class Shares | (2,422,156 | ) | (3,563,788 | ) | ||||
| Total dividends and distributions to shareholders | (2,422,156 | ) | (3,563,788 | ) | ||||
| CAPITAL SHARE TRANSACTIONS | ||||||||
| Net increase in net assets derived from | ||||||||
| net change in outstanding shares (a) | 2,987,055 | 3,967,318 | ||||||
| Total increase/(decrease) in net assets | 2,614,156 | (1,336,878 | ) | |||||
| NET ASSETS | ||||||||
| Beginning of year | 28,106,528 | 29,443,406 | ||||||
| End of year | $ | 30,720,684 | $ | 28,106,528 | ||||
| (a) | A summary of share transactions is as follows: |
Year Ended September 30, 2023 | Year Ended September 30, 2022 | ||||||||||||||||
| Investor Class Shares | Shares | Paid-in Capital | Shares | Paid-in Capital | |||||||||||||
| Shares sold | 70,046 | $ | 1,974,059 | 62,751 | $ | 1,948,560 | |||||||||||
| Shares issued on | |||||||||||||||||
| reinvestments of distributions | 85,138 | 2,355,782 | 114,029 | 3,375,255 | |||||||||||||
| Shares redeemed | (47,594 | ) | (1,342,786 | ) | (45,031 | ) | (1,356,497 | ) | |||||||||
| Net increase | 107,590 | $ | 2,987,055 | 131,749 | $ | 3,967,318 | |||||||||||
The accompanying notes are an integral part of these financial statements.
Poplar Forest Funds Annual Report, September 2023 |
32
POPLAR FOREST PARTNERS FUND
FINANCIAL HIGHLIGHTS For a share outstanding throughout each year
| Class A Shares | ||||||||||||||||||||
| Year Ended September 30, | ||||||||||||||||||||
| 2023 | 2022 | 2021 | 2020 | 2019 | ||||||||||||||||
| Net asset value, beginning of year | $ | 46.07 | $ | 55.97 | $ | 35.69 | $ | 42.22 | $ | 52.65 | ||||||||||
| Income from investment operations: | ||||||||||||||||||||
| Net investment income^ | 0.90 | 0.69 | 0.74 | 0.74 | 0.58 | |||||||||||||||
| Net realized and unrealized | ||||||||||||||||||||
| gain/(loss) on investments | 2.54 | (3.18 | ) | 20.48 | (6.65 | ) | (6.50 | ) | ||||||||||||
| Total from investment operations | 3.44 | (2.49 | ) | 21.22 | (5.91 | ) | (5.92 | ) | ||||||||||||
| Less distributions: | ||||||||||||||||||||
| From net investment income | (0.50 | ) | (0.94 | ) | (0.94 | ) | (0.62 | ) | (0.50 | ) | ||||||||||
| From net realized | ||||||||||||||||||||
| gain on investments | (2.44 | ) | (6.47 | ) | — | — | (4.01 | ) | ||||||||||||
| Total distributions | (2.94 | ) | (7.41 | ) | (0.94 | ) | (0.62 | ) | (4.51 | ) | ||||||||||
| Net asset value, end of year | $ | 46.57 | $ | 46.07 | $ | 55.97 | $ | 35.69 | $ | 42.22 | ||||||||||
| Total return | 7.05 | % | -5.68 | % | 60.26 | % | -14.27 | % | -10.71 | % | ||||||||||
| Ratios/supplemental data: | ||||||||||||||||||||
| Net assets, end of year (thousands) | $ | 22,717 | $ | 23,387 | $ | 24,098 | $ | 16,840 | $ | 29,359 | ||||||||||
| Ratio of expenses | ||||||||||||||||||||
| to average net assets: | ||||||||||||||||||||
| Before fee waiver | 1.30 | % | 1.29 | % | 1.34 | % | 1.43 | % | 1.36 | % | ||||||||||
| After fee waiver | 1.20 | % | 1.20 | % | 1.21 | % | 1.25 | % | 1.25 | % | ||||||||||
| Ratio of net investment income | ||||||||||||||||||||
| to average net assets: | ||||||||||||||||||||
| Before fee waiver | 1.73 | % | 1.21 | % | 1.35 | % | 1.75 | % | 1.25 | % | ||||||||||
| After fee waiver | 1.83 | % | 1.30 | % | 1.48 | % | 1.93 | % | 1.36 | % | ||||||||||
| Portfolio turnover rate | 35.12 | % | 30.29 | % | 40.94 | % | 40.35 | % | 30.72 | % | ||||||||||
| ^ | Based on average shares outstanding. |
The accompanying notes are an integral part of these financial statements.
Poplar Forest Funds Annual Report, September 2023 |
33
POPLAR FOREST PARTNERS FUND
FINANCIAL HIGHLIGHTS For a share outstanding throughout each year
| Institutional Class | ||||||||||||||||||||
| Year Ended September 30, | ||||||||||||||||||||
| 2023 | 2022 | 2021 | 2020 | 2019 | ||||||||||||||||
| Net asset value, beginning of year | $ | 46.16 | $ | 56.07 | $ | 35.75 | $ | 42.29 | $ | 52.79 | ||||||||||
| Income from investment operations: | ||||||||||||||||||||
| Net investment income^ | 1.03 | 0.83 | 0.86 | 0.84 | 0.69 | |||||||||||||||
| Net realized and unrealized | ||||||||||||||||||||
| gain/(loss) on investments | 2.55 | (3.19 | ) | 20.50 | (6.65 | ) | (6.53 | ) | ||||||||||||
| Total from investment operations | 3.58 | (2.36 | ) | 21.36 | (5.81 | ) | (5.84 | ) | ||||||||||||
| Less distributions: | ||||||||||||||||||||
| From net investment income | (0.62 | ) | (1.08 | ) | (1.04 | ) | (0.73 | ) | (0.65 | ) | ||||||||||
| From net realized | ||||||||||||||||||||
| gain on investments | (2.44 | ) | (6.47 | ) | — | — | (4.01 | ) | ||||||||||||
| Total distributions | (3.06 | ) | (7.55 | ) | (1.04 | ) | (0.73 | ) | (4.66 | ) | ||||||||||
| Net asset value, end of year | $ | 46.68 | $ | 46.16 | $ | 56.07 | $ | 35.75 | $ | 42.29 | ||||||||||
| Total return | 7.32 | % | -5.43 | % | 60.63 | % | -14.03 | % | -10.49 | % | ||||||||||
| Ratios/supplemental data: | ||||||||||||||||||||
| Net assets, end of year (thousands) | $ | 267,273 | $ | 276,465 | $ | 289,502 | $ | 192,576 | $ | 362,369 | ||||||||||
| Ratio of expenses | ||||||||||||||||||||
| to average net assets: | ||||||||||||||||||||
| Before fee waiver | 1.05 | % | 1.04 | % | 1.09 | % | 1.18 | % | 1.11 | % | ||||||||||
| After fee waiver | 0.95 | % | 0.95 | % | 0.96 | % | 1.00 | % | 1.00 | % | ||||||||||
| Ratio of net investment income | ||||||||||||||||||||
| to average net assets: | ||||||||||||||||||||
| Before fee waiver | 1.98 | % | 1.46 | % | 1.59 | % | 2.00 | % | 1.50 | % | ||||||||||
| After fee waiver | 2.08 | % | 1.55 | % | 1.72 | % | 2.18 | % | 1.61 | % | ||||||||||
| Portfolio turnover rate | 35.12 | % | 30.29 | % | 40.94 | % | 40.35 | % | 30.72 | % | ||||||||||
| ^ | Based on average shares outstanding. |
The accompanying notes are an integral part of these financial statements.
Poplar Forest Funds Annual Report, September 2023 |
34
POPLAR FOREST CORNERSTONE FUND
FINANCIAL HIGHLIGHTS For a share outstanding throughout each year
| Investor Shares | ||||||||||||||||||||
| Year Ended September 30, | ||||||||||||||||||||
| 2023 | 2022 | 2021 | 2020 | 2019 | ||||||||||||||||
| Net asset value, beginning of year | $ | 27.08 | $ | 32.49 | $ | 22.76 | $ | 25.58 | $ | 28.20 | ||||||||||
| Income from investment operations: | ||||||||||||||||||||
| Net investment income^ | 0.66 | 0.54 | 0.60 | 0.45 | 0.42 | |||||||||||||||
| Net realized and unrealized | ||||||||||||||||||||
| gain/(loss) on investments | 1.43 | (2.03 | ) | 9.64 | (2.11 | ) | (1.83 | ) | ||||||||||||
| Total from investment operations | 2.09 | (1.49 | ) | 10.24 | (1.66 | ) | (1.41 | ) | ||||||||||||
| Less distributions: | ||||||||||||||||||||
| From net investment income | (0.45 | ) | (0.72 | ) | (0.51 | ) | (0.34 | ) | (0.42 | ) | ||||||||||
| From net realized | ||||||||||||||||||||
| gain on investments | (1.90 | ) | (3.20 | ) | — | (0.82 | ) | (0.79 | ) | |||||||||||
| Total distributions | (2.35 | ) | (3.92 | ) | (0.51 | ) | (1.16 | ) | (1.21 | ) | ||||||||||
| Net asset value, end of year | $ | 26.82 | $ | 27.08 | $ | 32.49 | $ | 22.76 | $ | 25.58 | ||||||||||
| Total return | 7.46 | % | -5.60 | % | 45.53 | % | -6.89 | % | -4.71 | % | ||||||||||
| Ratios/supplemental data: | ||||||||||||||||||||
| Net assets, end of year (thousands) | $ | 30,721 | $ | 28,107 | $ | 29,443 | $ | 22,084 | $ | 26,739 | ||||||||||
| Ratio of expenses | ||||||||||||||||||||
| to average net assets: | ||||||||||||||||||||
| Before fee waiver | 1.45 | % | 1.44 | % | 1.53 | %# | 1.76 | % | 1.64 | % | ||||||||||
| After fee waiver | 0.90 | % | 0.90 | % | 0.90 | %# | 0.90 | % | 0.90 | % | ||||||||||
| Ratio of net investment income | ||||||||||||||||||||
| to average net assets: | ||||||||||||||||||||
| Before fee waiver | 1.83 | % | 1.22 | % | 1.38 | % | 1.05 | % | 0.92 | % | ||||||||||
| After fee waiver | 2.38 | % | 1.76 | % | 2.01 | % | 1.91 | % | 1.66 | % | ||||||||||
| Portfolio turnover rate | 36.43 | % | 29.73 | % | 36.13 | % | 39.97 | % | 38.12 | % | ||||||||||
| ^ | Based on average shares outstanding. |
| # | Includes expenses of Class A Shares which converted to Investor Class Shares on October 30, 2020. |
The accompanying notes are an integral part of these financial statements.
Poplar Forest Funds Annual Report, September 2023 |
35
POPLAR FOREST FUNDS
NOTES TO FINANCIAL STATEMENTS at September 30, 2023
NOTE 1 – ORGANIZATION
The Poplar Forest Partners Fund (the “Partners Fund”) and the Poplar Forest Cornerstone Fund (“Cornerstone Fund”), (each, a “Fund” and collectively, the “Funds”) are diversified series of Advisors Series Trust (the “Trust”), which is registered under the Investment Company Act of 1940, as amended, (the “1940 Act”) as an open-end management investment company. Each Fund is an investment company and accordingly follows the investment company accounting and reporting guidance of the Financial Accounting Standards Board (FASB) Accounting Standard Codification Topic 946 “Financial Services – Investment Companies.”
The investment objective of the Partners Fund is to seek long-term growth of capital. The investment objective of the Cornerstone Fund is to seek to achieve current income and long-term growth of capital. The Partners Fund currently offers Class A shares and Institutional Class shares. The Cornerstone Fund currently offers Investor Class shares. Class A shares are subject to a maximum front-end sales load of 5.00%, which decreases depending on the amount invested. The Partner Fund’s Class A shares and Institutional Class shares commenced operations on December 31, 2009.
The Cornerstone Fund’s Class A shares and Institutional Class shares commenced operations on December 31, 2014. At the close of business on October 30, 2020, the Cornerstone Fund’s Class A shares converted to the Institutional Class shares. On January 28, 2021, the class name changed from Institutional Class to Investor Class.
NOTE 2 – SIGNIFICANT ACCOUNTING POLICIES
The following is a summary of significant accounting policies consistently followed by the Funds. These policies are in conformity with accounting principles generally accepted in the United States of America.
| A. | Security Valuation: All investments in securities are recorded at their estimated fair value, as described in Note 3. | |
| B. | Federal Income Taxes: It is the Funds’ policy to comply with the requirements of Subchapter M of the Internal Revenue Code applicable to regulated investment companies and to distribute substantially all of its taxable income to its shareholders. Therefore, no Federal income or excise tax provision is required. | |
| The Funds recognize the tax benefits of uncertain tax positions only where the position is “more likely than not” to be sustained assuming examination by tax authorities. The tax returns of the Funds’ prior three fiscal years are open for examination. Management has reviewed all open tax years in major jurisdictions and concluded that there is no impact on the Funds’ net assets and no tax liability resulting from unrecognized tax events relating to uncertain income tax positions taken or expected to be taken on a tax return. The Funds identify their major tax jurisdictions as U.S. Federal and the state of Wisconsin. The Funds are not aware of any tax positions for which it is reasonably possible that the total amounts of unrecognized tax benefits will change materially in the next twelve months. |
Poplar Forest Funds Annual Report, September 2023 |
36
POPLAR FOREST FUNDS
NOTES TO FINANCIAL STATEMENTS at September 30, 2023, Continued
| C. | Security Transactions, Income and Distributions: Security transactions are accounted for on the trade date. Realized gains and losses on securities sold are calculated on the basis of specific cost. Interest income is recorded on an accrual basis. Discounts and premiums on securities purchased are accreted/amortized over the life of the respective security using the effective interest method, except for premiums on certain callable debt securities that are amortized to the earliest call date. Dividend income, income and capital gain distributions from underlying funds, and distributions to shareholders are recorded on the ex-dividend date. Withholding taxes on foreign dividends have been provided for in accordance with the Funds’ understanding of the applicable country’s tax rules and rates. | |
| Investment income, expenses (other than those specific to the class of shares), and realized and unrealized gains and losses on investments are allocated to the separate classes of each Fund based upon their relative net assets on the date income is earned or expensed and realized and unrealized gains and losses are incurred. | ||
| Each Fund is charged for those expenses that are directly attributable to the Fund, such as investment advisory, custody and transfer agent fees. Expenses that are not attributable to a Fund are typically allocated among the Funds in proportion to their respective net assets. Common expenses of the Trust are typically allocated among the funds in the Trust based on a fund’s respective net assets, or by other equitable means. | ||
| The Funds distribute substantially all net investment income, if any, and net realized gains, if any, annually. Distributions from net realized gains for book purposes may include short-term capital gains. All short-term capital gains are included in ordinary income for tax purposes. | ||
| The amount of dividends and distributions to shareholders from net investment income and net realized capital gains is determined in accordance with Federal income tax regulations which differ from accounting principles generally accepted in the United States of America. To the extent these book/tax differences are permanent, such amounts are reclassified within the capital accounts based on their Federal tax treatment. | ||
| D. | Reclassification of Capital Accounts: Accounting principles generally accepted in the United States of America require that certain components of net assets relating to permanent differences be reclassified between financial and tax reporting. These reclassifications have no effect on net assets or net asset value per share. | |
| For the year ended September 30, 2023, the Funds made the following permanent tax adjustments on the statements of assets and liabilities: |
| Total | |||||||||
| Distributable | |||||||||
| Earnings | Paid-in Capital | ||||||||
| Partners Fund | $ | (3,144,944 | ) | $ | 3,144,944 | ||||
| Cornerstone Fund | $ | (58,303 | ) | $ | 58,303 | ||||
Poplar Forest Funds Annual Report, September 2023 |
37
POPLAR FOREST FUNDS
NOTES TO FINANCIAL STATEMENTS at September 30, 2023, Continued
| E. | Use of Estimates: The preparation of financial statements in conformity with accounting principles generally accepted in the United States of America requires management to make estimates and assumptions that affect the reported amounts of assets and liabilities at the date of the financial statements and the reported amounts of increases and decreases in net assets during the reporting period. Actual results could differ from those estimates. | |
| F. | Events Subsequent to the Fiscal Year End: In preparing the financial statements as of September 30, 2023, management considered the impact of subsequent events for potential recognition or disclosure in the financial statements. Refer to Note 12 for information on a subsequent event regarding changes to the Board of Trustees. |
NOTE 3 – SECURITIES VALUATION
The Funds have adopted authoritative fair value accounting standards which establish an authoritative definition of fair value and set out a hierarchy for measuring fair value. These standards require additional disclosures about the various inputs and valuation techniques used to develop the measurements of fair value, a discussion in changes in valuation techniques and related inputs during the period and expanded disclosure of valuation levels for major security types. These inputs are summarized in the three broad levels listed below:
| Level 1 – | Unadjusted quoted prices in active markets for identical assets or liabilities that the Funds have the ability to access. | |
| Level 2 – | Observable inputs other than quoted prices included in level 1 that are observable for the asset or liability, either directly or indirectly. These inputs may include quoted prices for the identical instrument on an inactive market, prices for similar instruments, interest rates, prepayment speeds, credit risk, yield curves, default rates and similar data. | |
| Level 3 – | Unobservable inputs for the asset or liability, to the extent relevant observable inputs are not available, representing each Fund’s own assumptions about the assumptions a market participant would use in valuing the asset or liability, and would be based on the best information available. |
Following is a description of the valuation techniques applied to the Funds’ major categories of assets and liabilities measured at fair value on a recurring basis.
Each Fund determines the fair value of its investments and computes its net asset value per share as of the close of regular trading on the New York Stock Exchange (4:00 pm EST).
Equity Securities: The Funds’ investments are carried at fair value. Equity securities that are primarily traded on a national securities exchange shall be valued at the last sale price on the exchange on which they are primarily traded on the day of valuation or, if there has been no sale on such day, at the mean between the bid and asked
Poplar Forest Funds Annual Report, September 2023 |
38
POPLAR FOREST FUNDS
NOTES TO FINANCIAL STATEMENTS at September 30, 2023, Continued
prices. Securities primarily traded in the NASDAQ Global Market System for which market quotations are readily available shall be valued using the NASDAQ Official Closing Price (“NOCP”). If the NOCP is not available, such securities shall be valued at the last sale price on the day of valuation, or if there has been no sale on such day, at the mean between the bid and asked prices. Over-the-counter (“OTC”) securities which are not traded in the NASDAQ Global Market System shall be valued at the most recent sales price. To the extent these securities are actively traded and valuation adjustments are not applied, they are categorized in level 1 of the fair value hierarchy.
Investment Companies: Investments in open-end mutual funds, including money market funds, are generally priced at their net asset value per share provided by the service agent of the funds and will be classified in level 1 of the fair value hierarchy.
Debt Securities: Debt securities are valued at the mean of the bid and asked prices furnished by an independent pricing service using valuation methods that are designed to represent fair value. These valuation methods can include matrix pricing and other analytical pricing models, market transactions, and dealer-supplied valuations. The pricing service may consider recently executed transactions in securities of the issuer or comparable issuers, market price quotations (where observable), bond spreads, and fundamental data relating to the issuer. Most debt securities are categorized in level 2 of the fair value hierarchy.
Short-Term Securities: Short-term debt securities, including those securities having a maturity of 60 days or less, are valued at the evaluated mean between the bid and asked prices. To the extent the inputs are observable and timely, these securities would be classified in level 2 of the fair value hierarchy.
The Board of Trustees (the “Board”) has adopted a valuation policy for use by the Funds and its Valuation Designee (as defined below) in calculating each Fund’s net asset value (“NAV”). Pursuant to Rule 2a-5 under the 1940 Act, the Board has designated the Funds’ investment adviser, Poplar Forest Capital, LLC (“Adviser”), as the “Valuation Designee” to perform all of the fair value determinations as well as to perform all of the responsibilities that may be performed by the Valuation Designee in accordance with Rule 2a-5, subject to the Board’s oversight. The Adviser, as Valuation Designee is, authorized to make all necessary determinations of the fair values of portfolio securities and other assets for which market quotations are not readily available or if it is deemed that the prices obtained from brokers and dealers or independent pricing services are unreliable.
Depending on the relative significance of the valuation inputs, fair valued securities may be classified in either level 2 or level 3 of the fair value hierarchy.
Poplar Forest Funds Annual Report, September 2023 |
39
POPLAR FOREST FUNDS
NOTES TO FINANCIAL STATEMENTS at September 30, 2023, Continued
The inputs or methodology used for valuing securities are not an indication of the risk associated with investing in those securities. The following is a summary of the inputs used to value the Funds’ securities as of September 30, 2023:
| Partners Fund | ||||||||||||||||
| Level 1 | Level 2 | Level 3 | Total | |||||||||||||
| Common Stocks | ||||||||||||||||
| Communication Services | $ | 12,246,580 | $ | — | $ | — | $ | 12,246,580 | ||||||||
| Consumer Discretionary | 15,463,620 | — | — | 15,463,620 | ||||||||||||
| Consumer Staples | 31,908,435 | — | — | 31,908,435 | ||||||||||||
| Energy | 19,730,995 | — | — | 19,730,995 | ||||||||||||
| Financials | 66,850,170 | — | — | 66,850,170 | ||||||||||||
| Health Care | 49,662,765 | — | — | 49,662,765 | ||||||||||||
| Industrials | 23,997,780 | — | — | 23,997,780 | ||||||||||||
| Information Technology | 29,457,960 | — | — | 29,457,960 | ||||||||||||
| Materials | 11,987,700 | — | — | 11,987,700 | ||||||||||||
| Utilities | 15,888,360 | — | — | 15,888,360 | ||||||||||||
| Total Common Stocks | 277,194,365 | — | — | 277,194,365 | ||||||||||||
| Money Market Fund | 5,000,193 | — | — | 5,000,193 | ||||||||||||
| U.S. Treasury Bills | — | 7,853,604 | — | 7,853,604 | ||||||||||||
| Total Investments | $ | 282,194,558 | $ | 7,853,604 | $ | — | $ | 290,048,162 | ||||||||
| Cornerstone Fund | ||||||||||||||||
| Level 1 | Level 2 | Level 3 | Total | |||||||||||||
| Common Stocks | ||||||||||||||||
| Communication Services | $ | 854,666 | $ | — | $ | — | $ | 854,666 | ||||||||
| Consumer Discretionary | 909,072 | — | — | 909,072 | ||||||||||||
| Consumer Staples | 2,075,143 | — | — | 2,075,143 | ||||||||||||
| Energy | 1,055,420 | — | — | 1,055,420 | ||||||||||||
| Financials | 4,693,195 | — | — | 4,693,195 | ||||||||||||
| Health Care | 3,206,760 | — | — | 3,206,760 | ||||||||||||
| Industrials | 1,764,256 | — | — | 1,764,256 | ||||||||||||
| Information Technology | 2,368,450 | — | — | 2,368,450 | ||||||||||||
| Materials | 778,556 | — | — | 778,556 | ||||||||||||
| Utilities | 1,039,184 | — | — | 1,039,184 | ||||||||||||
| Total Common Stocks | 18,744,702 | — | — | 18,744,702 | ||||||||||||
| Fixed Income Securities | ||||||||||||||||
| Corporate Bonds | — | 3,950,450 | — | 3,950,450 | ||||||||||||
| U.S. Government Agency Issues | — | 791,102 | — | 791,102 | ||||||||||||
| U.S. Government Notes/Bonds | — | 5,083,416 | — | 5,083,416 | ||||||||||||
| Total Fixed Income Securities | — | 9,824,968 | — | 9,824,968 | ||||||||||||
| Preferred Stocks | — | 481,896 | — | 481,896 | ||||||||||||
| Money Market Fund | 310,698 | — | — | 310,698 | ||||||||||||
| U.S. Treasury Bills | — | 1,298,946 | — | 1,298,946 | ||||||||||||
| Total Investments | $ | 19,055,400 | $ | 11,605,810 | $ | — | $ | 30,661,210 | ||||||||
Poplar Forest Funds Annual Report, September 2023 |
40
POPLAR FOREST FUNDS
NOTES TO FINANCIAL STATEMENTS at September 30, 2023, Continued
Refer to each Fund’s schedule of investments for a detailed break-out of securities by industry classification.
The Trust Rule 18f-4 Compliance Policy (“Trust Policy”) governs the use of derivatives by the Funds. The Trust Policy imposes limits on the amount of derivatives a fund can enter into, eliminates the asset segregation framework currently used by a fund to comply with Section 18 of the 1940 Act, treats derivatives as senior securities and requires funds whose use of derivatives is more than a limited specified exposure amount to establish and maintain a comprehensive derivatives risk management program and appoint a derivatives risk manager. Each Fund is considered a limited derivatives user under the Trust Policy and therefore, is required to limit its derivatives exposure to no more than 10% of each Fund’s net assets. For the year ended September 30, 2023, the Funds did not enter into derivatives transactions.
In June 2022, FASB issued Accounting Standards Update 2022-03, which amends Fair Value Measurement (Topic 820): Fair Value Measurement of Equity Securities Subject to Contractual Sale Restrictions (“ASU 2022-03”). ASU 2022-03 clarifies guidance for fair value measurement of an equity security subject to a contractual sale restriction and establishes new disclosure requirements for such equity securities. ASU 2022-03 is effective for fiscal years beginning after December 15, 2023 and for interim periods within those fiscal years, with early adoption permitted. Management is currently evaluating the impact of these amendments on the Funds’ financial statements.
In October 2022, the Securities and Exchange Commission (the “SEC”) adopted a final rule relating to Tailored Shareholder Reports for Mutual Funds and Exchange-Traded Funds; Fee Information in Investment Company Advertisements. The rule and form amendments will, among other things, require the Funds to transmit concise and visually engaging shareholder reports that highlight key information. The amendments will require that funds tag information in a structured data format and that certain more in-depth information be made available online and available for delivery free of charge to investors on request. The amendments became effective January 24, 2023. There is an 18-month transition period after the effective date of the amendment.
NOTE 4 – INVESTMENT ADVISORY FEE AND OTHER TRANSACTIONS WITH AFFILIATES
The Adviser provides the Funds with investment management services under an investment advisory agreement. The Adviser furnishes all investment advice, office space, facilities, and provides most of the personnel needed by the Funds. As compensation for its services, each Fund pays the Adviser a monthly management fee. For the Partners Fund, the fees are calculated at an annual rate of 0.85% of average daily net assets for the first $250 million of assets, 0.775% of the Fund’s average daily net assets for the next $750 million of assets, and 0.70% of the Fund’s average daily net assets in excess of $1 billion. For the Cornerstone Fund, the fees are calculated at an annual rate of 0.80% of average daily net assets for the first $250 million of assets, 0.70% of the Fund’s average daily net assets for the next $750 million of assets, and 0.60% of the Fund’s average daily net assets in excess of $1 billion. For the year ended September 30, 2023, the advisory fees incurred by the Funds are disclosed in the statements of operations. Any amount due from the Adviser is paid monthly to the Funds.
Poplar Forest Funds Annual Report, September 2023 |
41
POPLAR FOREST FUNDS
NOTES TO FINANCIAL STATEMENTS at September 30, 2023, Continued
The Funds are responsible for their own operating expenses. The Adviser has contractually agreed to reduce fees payable to it by the Funds and to pay Fund operating expenses (excluding acquired fund fees and expenses, interest expense, taxes, extraordinary expenses, Rule 12b-1 fees, shareholder servicing fees, and other class-specific expenses) to the extent necessary to limit each Fund’s aggregate annual operating expenses as a percent of average daily net assets as follows:
| Partners Fund | 0.95% | |
| Cornerstone Fund | 0.90% |
Any such reduction made by the Adviser in its fees or payment of expenses which are a Fund’s obligation are subject to reimbursement by the Fund to the Adviser, if so requested by the Adviser, in any subsequent month in the 36-month period from the date of the management fee reduction and expense payment if the aggregate amount actually paid by the Fund toward the operating expenses for such fiscal year (taking into account the reimbursement) will not cause the Fund to exceed the lesser of (1) the expense limitation in place at the time of the management fee reduction and expense payment; or (2) the expense limitation in place at the time of the reimbursement. Any such reimbursement is also contingent upon Board of Trustees review and approval. Such reimbursement may not be paid prior to the Funds’ payment of current ordinary operating expenses. For the year ended September 30, 2023, the Adviser reduced its fees in the amount of $322,385 and $172,569 in the Partners Fund and the Cornerstone Fund, respectively. No amounts were recouped by the Adviser. The expense limitation will remain in effect through at least January 27, 2024, and may be terminated only by the Trust’s Board of Trustees. The Adviser may recapture portions of the amounts shown below no later than the corresponding dates:
9/30/2024 | 9/30/2025 | 9/30/2026 | Total | ||
| Partners Fund | $364,245 | $295,589 | $322,385 | $982,219 | |
| Cornerstone Fund | 172,025 | 168,782 | 172,569 | 513,376 |
U.S. Bancorp Fund Services, LLC, doing business as U.S. Bank Global Fund Services (“Fund Services”) serves as the Funds’ administrator, fund accountant and transfer agent. U.S. Bank N.A. serves as custodian (the “Custodian”) to the Funds. The Custodian is an affiliate of Fund Services. Fund Services maintains the Funds’ books and records, calculates the Funds’ NAV, prepares various federal and state regulatory filings, coordinates the payment of fund expenses, reviews expense accruals and prepares materials supplied to the Board of Trustees. The officers of the Trust, including the Chief Compliance Officer, are employees of Fund Services. Fees paid by the Funds for administration and accounting, transfer agency, custody and compliance services for the year ended September 30, 2023, are disclosed in the statements of operations.
Quasar Distributors, LLC (“Quasar” or the “Distributor”) acts as the Funds’ principal underwriter in a continuous public offering of the Funds’ shares. Quasar is a wholly-owned broker-dealer subsidiary of Foreside Financial Group, LLC, doing business as ACA Foreside, a division of ACA Group.
The Funds have entered into agreements with various brokers, dealers, and financial intermediaries in connection with the sale of shares of the Funds. The agreements provide for periodic payments by the Funds to the brokers, dealers, and financial
Poplar Forest Funds Annual Report, September 2023 |
42
POPLAR FOREST FUNDS
NOTES TO FINANCIAL STATEMENTS at September 30, 2023, Continued
intermediaries for providing certain shareholder maintenance services (sub-transfer agent fees). These shareholder services include the pre-processing and quality control of new accounts, shareholder correspondence, answering customer inquiries regarding account status, and facilitating shareholder telephone transactions. The sub-transfer agent fees expensed by the Funds during the year ended September 30, 2023 are included in the statements of operations.
NOTE 5 – DISTRIBUTION AGREEMENT AND PLAN
The Funds have adopted a Distribution Plan pursuant to Rule 12b-1 (the “Plan”). The Plan permits the Partners Fund to pay the Distributor for distribution and related expenses at an annual rate of up to 0.25% of the average daily net assets of the Fund’s Class A shares. The expenses covered by the Plan may include the cost in connection with the promotion and distribution of shares and the provision of personal services to shareholders, including, but not necessarily limited to, advertising, compensation to underwriters, dealers and selling personnel, the printing and mailing of prospectuses to other than current Fund shareholders, and the printing and mailing of sales literature. Payments made pursuant to the Plan will represent compensation for distribution and service activities, not reimbursements for specific expenses incurred. The 12b-1 fees accrued by the Fund’s Class A shares for the year ended September 30, 2023 are disclosed in the statements of operations.
NOTE 6 – PURCHASES AND SALES OF SECURITIES
For the year ended September 30, 2023, the cost of purchases and the proceeds from sales of securities, excluding short-term securities, were as follows.
| Purchases | Sales | ||||||||||||||||
| Non- | Non- | ||||||||||||||||
| Government | Government | Government | Government | ||||||||||||||
| Partners Fund | $ | — | $ | 110,254,426 | $ | — | $ | 134,411,071 | |||||||||
| Cornerstone Fund | 3,176,228 | 8,165,723 | 1,475,000 | 9,038,990 | |||||||||||||
NOTE 7 – LINES OF CREDIT
The Partners Fund and the Cornerstone Fund have secured lines of credit in the amount of $55,000,000 and $4,000,000, respectively. These lines of credit are intended to provide short-term financing, if necessary, subject to certain restrictions, in connection with shareholder redemptions. The credit facility is with the Funds’ custodian, U.S. Bank N.A. During year ended September 30, 2023, the Partners Fund drew upon its line of credit. The Partners Fund had an average daily outstanding balance of $27,863, a weighted average interest rate of 8.43%, paid interest expense of $2,381 and had a maximum amount outstanding of $4,913,000. At September 30, 2023, the Funds had no outstanding loan amounts.
Poplar Forest Funds Annual Report, September 2023 |
43
POPLAR FOREST FUNDS
NOTES TO FINANCIAL STATEMENTS at September 30, 2023, Continued
NOTE 8 – INCOME TAXES AND DISTRIBUTIONS TO SHAREHOLDERS
The tax character of distributions paid by the Funds during the years ended September 30, 2023 and September 30, 2022 was as follows:
| Year Ended | Year Ended | ||
September 30, 2023 | September 30, 2022 | ||
| Partners Fund | |||
| Ordinary income | $ 4,025,828 | $ 9,720,898 | |
| Long-term capital gains | 16,205,434 | 32,299,743 |
| Year Ended | Year Ended | ||
September 30, 2023 | September 30, 2022 | ||
| Cornerstone Fund | |||
| Ordinary income | $ 461,847 | $ 837,215 | |
| Long-term capital gains | 1,960,309 | 2,726,573 |
As of September 30, 2023, the components of capital on a tax basis were as follows:
| Partners Fund | Cornerstone Fund | ||||||||
| Cost of investments (a) | $ | 241,920,785 | $ | 28,420,826 | |||||
| Gross unrealized appreciation | 59,516,151 | 3,997,992 | |||||||
| Gross unrealized depreciation | (11,388,774 | ) | (1,757,608 | ) | |||||
| Net unrealized appreciation (a) | 48,127,377 | 2,240,384 | |||||||
| Undistributed ordinary income | 6,742,208 | 720,619 | |||||||
| Undistributed long-term capital gains | 4,562,745 | 444,944 | |||||||
| Total distributable earnings | 11,304,953 | 1,165,563 | |||||||
| Other accumulated gains/(losses) | — | — | |||||||
| Total accumulated earnings/(losses) | $ | 59,432,330 | $ | 3,405,947 | |||||
| (a) | The difference between book-basis and tax-basis cost and net unrealized appreciation is attributable primarily to the tax deferral of losses on wash sale adjustments and tax adjustments related to a transfer in-kind. |
NOTE 9 – PRINCIPAL RISKS
Below is a summary of some, but not all, of the principal risks of investing in the Funds, each of which may adversely affect a Fund’s net asset value and total return. The Funds’ most recent prospectus provides further descriptions of each Fund’s investment objective, principal investment strategies and principal risks.
General Market Risk – Economies and financial markets throughout the world are becoming increasingly interconnected, which increases the likelihood that events or conditions in one country or region will adversely impact markets or issuers in other countries or regions. Securities in each Fund’s portfolio may underperform in comparison to securities in general financial markets, a particular financial market or other asset classes due to a number of factors, including: inflation (or expectations for inflation); interest rates; global demand for particular products or resources; natural
Poplar Forest Funds Annual Report, September 2023 |
44
POPLAR FOREST FUNDS
NOTES TO FINANCIAL STATEMENTS at September 30, 2023, Continued
disasters or events; pandemic diseases; terrorism; regulatory events; and government controls. U.S. and international markets have experienced significant periods of volatility in recent years and months due to a number of economic, political and global macro factors including the impact of COVID-19 as a global pandemic, which has resulted in a public health crisis, disruptions to business operations and supply chains, stress on the global healthcare system, growth concerns in the U.S. and overseas, staffing shortages and the inability to meet consumer demand, and widespread concern and uncertainty. The global recovery from COVID-19 is proceeding at slower than expected rates due to the emergence of variant strains and may last for an extended period of time. Continuing uncertainties regarding interest rates, rising inflation, political events, rising government debt in the U.S. and trade tensions also contribute to market volatility. As a result of continuing political tensions and armed conflicts, including the war between Ukraine and Russia, the U.S. and the European Union imposed sanctions on certain Russian individuals and companies, including certain financial institutions, and have limited certain exports and imports to and from Russia. The war has contributed to recent market volatility and may continue to do so.
Value-Style Investing Risk (Both Funds) – Value stocks can perform differently from the market as a whole and from other types of stocks. Value stocks may be purchased based upon the belief that a given security may be out of favor; that belief may be misplaced or the security may stay out of favor for an extended period of time.
Debt Securities Risk (Both Funds) – The following risks are associated with the Funds’ investment in debt securities.
| o | Prepayment and Extension Risk. The risk that the securities may be paid off earlier or later than expected. Either situation could cause securities to pay lower-than-market rates of interest, which could hurt the Fund’s yield or share price. | |
| o | Interest Rate Risk. The Funds’ investments in fixed income securities will change in value based on changes in interest rates. If rates increase, the value of these investments generally declines. Securities with greater interest rate sensitivity and longer maturities generally are subject to greater fluctuations in value. | |
| o | Credit Risk. The risk of loss on an investment due to the deterioration of an issuer’s financial strength. Such a deterioration of financial strength may result in a reduction of the credit rating of the issuer’s securities and may lead to the issuer’s inability to honor its contractual obligations, including making timely payment of interest and principal. | |
| o | High-Yield Securities Risk. Debt securities that are rated below investment grade (i.e., “junk bonds”) are subject to additional risk factors due to the speculative nature of these securities, such as increased possibility of default liquidation of the security, and changes in value based on public perception of the issuer. |
Poplar Forest Funds Annual Report, September 2023 |
45
POPLAR FOREST FUNDS
NOTES TO FINANCIAL STATEMENTS at September 30, 2023, Continued
Large-Sized Companies Risk (Partners Fund) – Larger, more established companies may be unable to respond quickly to new competitive challenges like changes in consumer tastes or innovative smaller competitors. In addition, large-cap companies are sometimes unable to attain the high growth rates of successful, smaller companies, especially during extended periods of economic expansion.
Medium-Sized Companies Risk (Both Funds) – Investing in securities of medium-sized companies may involve greater risk than investing in larger, more established companies because they can be subject to greater share price volatility than larger, more established companies.
NOTE 10 – CONTROL OWNERSHIP
The beneficial ownership, either directly or indirectly of more than 25% of the voting securities of a Fund creates a presumption of control of the Fund, under Section 2(a)(9) of the 1940 Act. The following table reflects shareholders that maintain accounts of more than 25% of the voting securities of a Fund as of September 30, 2023:
Fund | Shareholder | Percent of Shares Held | |
| Cornerstone Fund | Charles Schwab & Co. | 38.29% | |
| Cornerstone Fund | The Kirby Jones Foundation Delaware | 25.60% |
NOTE 11 – CHANGES TO TRUST OFFICERS
At a meeting held on June 22-23, 2023, the Board of Trustees of the Trust appointed Ms. Lillian A. Kabakali as the Assistant Secretary of the Trust, effective July 10, 2023. Effective July 20, 2023, Mr. Michael L. Ceccato retired from his service as Vice President, Chief Compliance Officer and Anti-Money Laundering Officer of the Trust. At a meeting held on July 20, 2023, the Board of Trustees of the Trust appointed Joseph Kolinsky as the successor Vice President, Chief Compliance Officer and Anti-Money Laundering Officer of the Trust, effective July 20, 2023.
NOTE 12 – SUBSEQUENT EVENT – CHANGES TO BOARD OF TRUSTEES
Effective October 18, 2023, Mr. Ray Woolson retired from his service as Trustee and Chairman of the Board of Trustees of the Trust (the “Board”) to attend to health-related matters. At the recommendation of the Nominating and Governance Committee, on October 24, 2023, the Board appointed Mr. David Mertens as the successor Chairman of the Board, and Ms. Michele Rackey was appointed as Chairman of the Nominating and Governance Committee of the Board.
Poplar Forest Funds Annual Report, September 2023 |
46
POPLAR FOREST FUNDS
REPORT OF INDEPENDENT REGISTERED PUBLIC ACCOUNTING FIRM
To the Shareholders of
Poplar Forest Partners Fund
Poplar Forest Cornerstone Fund
and Board of Directors
of Advisors Series Trust
Opinion on the Financial Statements
We have audited the accompanying statements of assets and liabilities of the Poplar Forest Partners Fund and the Poplar Forest Cornerstone Fund (the “Funds”), each a series of Advisors Series Trust (the “Trust”), including the schedules of investments, as of September 30, 2023, the related statement of operations for the year then ended, the statements of changes in net assets for each of the two years in the period then ended, and the financial highlights for each of the five years in the period then ended, and the related notes (collectively referred to as the “financial statements”). In our opinion, the financial statements present fairly, in all material respects, the financial position of the Funds as of September 30, 2023, the results of their operations for the year then ended, the changes in their net assets for each of the two years in the period then ended, and their financial highlights for each of the five years in the period then ended, in conformity with accounting principles generally accepted in the United States of America.
Basis for Opinion
These financial statements are the responsibility of the Funds’ management. Our responsibility is to express an opinion on the Funds’ financial statements based on our audits. We are a public accounting firm registered with the Public Company Accounting Oversight Board (United States) (“PCAOB”) and are required to be independent with respect to the Funds in accordance with the U.S. federal securities laws and the applicable rules and regulations of the Securities and Exchange Commission and the PCAOB. We have served as the auditor of one or more of the funds in the Trust since 2003.
We conducted our audits in accordance with the standards of the PCAOB. Those standards require that we plan and perform the audits to obtain reasonable assurance about whether the financial statements are free of material misstatement, whether due to error or fraud. The Funds are not required to have, nor were we engaged to perform, an audit of the Funds’ internal control over financial reporting. As part of our audits we are required to obtain an understanding of internal control over financial reporting, but not for the purpose of expressing an opinion on the effectiveness of the Funds’ internal control over financial reporting. Accordingly, we express no such opinion.
Our audits included performing procedures to assess the risks of material misstatement of the financial statements, whether due to error or fraud, and performing procedures that respond to those risks. Such procedures included examining, on a test basis, evidence regarding the amounts and disclosures in the financial statements. Our audits also included evaluating the accounting principles
Poplar Forest Funds Annual Report, September 2023 |
47
POPLAR FOREST FUNDS
REPORT OF INDEPENDENT REGISTERED PUBLIC ACCOUNTING FIRM, Continued
used and significant estimates made by management, as well as evaluating the overall presentation of the financial statements. Our procedures included confirmation of securities owned as of September 30, 2023 by correspondence with the custodian. We believe that our audits provide a reasonable basis for our opinion.
TAIT, WELLER & BAKER LLP
Philadelphia, Pennsylvania
November 29, 2023
Poplar Forest Funds Annual Report, September 2023 |
48
POPLAR FOREST FUNDS
NOTICE TO SHAREHOLDERS at September 30, 2023 (Unaudited)
For the year ended September 30, 2023, the Partners Fund and the Cornerstone Fund designated $4,025,828 and $461,847, respectively, as ordinary income for purposes of the dividends paid deduction. For the year ended September 30, 2023, the Partners Fund and the Cornerstone Fund designated $16,205,434 and $1,960,309, respectively, as long-term capital gains for purposes of the dividends paid deduction.
Certain dividends paid by the Partners Fund and the Cornerstone Fund may be subject to a maximum tax rate of 23%, as provided by the Tax Cuts and Jobs Act of 2017. For the Partners Fund and the Cornerstone Fund, the percentage of dividends declared from net investment income designated as qualified dividend income for the year ended September 30, 2023 was 100.00% and 98.65%, respectively.
For corporate shareholders in the Partners Fund and Cornerstone Fund, the percent of ordinary income distributions qualifying for the corporate dividends received deduction for the year ended September 30, 2023 was 100.00% and 94.18%, respectively.
The percentage of taxable ordinary income distributions that are designated as short-term capital gain distributions under Internal Revenue Section 871 (k)(2)(C) for the Partners Fund and Cornerstone Fund was 0% and 0%, respectively.
How to Obtain a Copy of the Funds’ Proxy Voting Policies
A description of the policies and procedures that the Funds use to determine how to vote proxies relating to portfolio securities is available without charge, upon request, by calling 1-877-522-8860 or on the U.S. Securities and Exchange Commission’s (“SEC”) website at http://www.sec.gov.
How to Obtain a Copy of the Funds’ Proxy Voting Records for the 12-Month Period Ended June 30
Information regarding how the Funds voted proxies relating to portfolio securities during the most recent 12-month period ended June 30 is available without charge, upon request, by calling 1-877-522-8860. Furthermore, you can obtain the Funds’ proxy voting records on the SEC’s website at http://www.sec.gov.
Quarterly Filings on Form N-PORT
The Funds file their complete schedules of portfolio holdings with the SEC for the first and third quarters of each fiscal year on Part F of Form N-PORT. The Funds’ Form N-PORT is available on the SEC’s website at http://www.sec.gov. Information included in the Funds’ Form N-PORT is also available, upon request, by calling 1-877-522-8860.
Poplar Forest Funds Annual Report, September 2023 |
49
POPLAR FOREST FUNDS
INFORMATION ABOUT TRUSTEES AND OFFICERS (Unaudited)
This chart provides information about the Trustees and Officers who oversee the Funds. Officers elected by the Trustees manage the day-to-day operations of the Funds and execute policies formulated by the Trustees.
| Term of | Number of | Other | ||||
| Office and | Principal | Portfolios in | Directorships | |||
| Position | Length | Occupation | Fund Complex | Held | ||
| Name, Address | Held with | of Time | During Past | Overseen by | During Past | |
and Age | the Trust(4) | Served* | Five Years | Trustee(2) | Five Years(3) | |
Independent Trustees(1) | ||||||
| David G. Mertens | Trustee | Indefinite | Partner and Head of | 2 | Trustee, | |
| (age 63) | term; | Business Development, | Advisors | |||
| 615 E. Michigan Street | since | QSV Equity Investors, | Series Trust | |||
| Milwaukee, WI 53202 | March | LLC, (formerly known | (for series not | |||
| 2017. | as Ballast Equity | affiliated with | ||||
| Management, LLC) | the Funds). | |||||
| (a privately-held | ||||||
| investment advisory | ||||||
| firm) (February 2019 | ||||||
| to present); Managing | ||||||
| Director and Vice | ||||||
| President, Jensen | ||||||
| Investment Management, | ||||||
| Inc. (a privately-held | ||||||
| investment advisory | ||||||
| firm) (2002 to 2017). | ||||||
| Joe D. Redwine | Trustee | Indefinite | Retired; formerly | 2 | Trustee, | |
| (age 76) | term; | Manager, President, | Advisors | |||
| 615 E. Michigan Street | since | CEO, U.S. Bancorp | Series Trust | |||
| Milwaukee, WI 53202 | September | Fund Services, LLC, | (for series not | |||
| 2008. | and its predecessors, | affiliated with | ||||
| (May 1991 to July 2017). | the Funds). |
Poplar Forest Funds Annual Report, September 2023 |
50
POPLAR FOREST FUNDS
INFORMATION ABOUT TRUSTEES AND OFFICERS (Unaudited), Continued
| Term of | Number of | Other | ||||
| Office and | Principal | Portfolios in | Directorships | |||
| Position | Length | Occupation | Fund Complex | Held | ||
| Name, Address | Held with | of Time | During Past | Overseen by | During Past | |
and Age | the Trust(4) | Served* | Five Years | Trustee(2) | Five Years(3) | |
Independent Trustees(1) | ||||||
| Raymond B. Woolson | Chairman | Indefinite | President, Apogee | 2 | Trustee, | |
| (age 64) | of the | term; | Group, Inc. (financial | Advisors | ||
| 615 E. Michigan Street | Board | since | consulting firm) | Series Trust | ||
| Milwaukee, WI 53202 | January | (1998 to present). | (for series not | |||
| 2020. | affiliated with | |||||
| Trustee | Indefinite | the Funds); | ||||
| term; | Independent | |||||
| since | Trustee, | |||||
| January | DoubleLine | |||||
| 2016. | Funds Trust | |||||
| (an open-end | ||||||
| investment | ||||||
| company with | ||||||
| 19 portfolios), | ||||||
| DoubleLine | ||||||
| Opportunistic | ||||||
| Credit Fund, | ||||||
| DoubleLine | ||||||
| Income | ||||||
| Solutions | ||||||
| Fund, and | ||||||
| DoubleLine | ||||||
| Yield | ||||||
| Opportunities | ||||||
| Fund from | ||||||
| 2010 to | ||||||
| present; | ||||||
| Independent | ||||||
| Trustee, | ||||||
| DoubleLine | ||||||
| ETF Trust | ||||||
| (an open-end | ||||||
| investment | ||||||
| company with | ||||||
| 2 portfolios) | ||||||
| from March | ||||||
| 2022 to | ||||||
| present. |
Poplar Forest Funds Annual Report, September 2023 |
51
POPLAR FOREST FUNDS
INFORMATION ABOUT TRUSTEES AND OFFICERS (Unaudited), Continued
| Term of | Number of | Other | ||||
| Office and | Principal | Portfolios in | Directorships | |||
| Position | Length | Occupation | Fund Complex | Held | ||
| Name, Address | Held with | of Time | During Past | Overseen by | During Past | |
and Age | the Trust(4) | Served* | Five Years | Trustee(2) | Five Years(3) | |
Independent Trustees(1) | ||||||
| Michele Rackey | Trustee | Indefinite | Chief Executive Officer, | 2 | Trustee, | |
| (age 64) | term; | Government Employees | Advisors | |||
| 615 E. Michigan Street | since | Benefit Association | Series Trust | |||
| Milwaukee, WI 53202 | January | (GEBA) (benefits and | (for series not | |||
| 2023. | wealth management | affiliated with | ||||
| organization) (2004 | the Funds). | |||||
| to 2020); Board | ||||||
| Member, Association | ||||||
| Business Services | ||||||
| Inc. (ABSI) (for-profit | ||||||
| subsidiary of the | ||||||
| American Society of | ||||||
| Association Executives) | ||||||
| (2019 to 2020). |
| Term of | |||
| Office and | |||
| Position | Length | ||
| Name, Address | Held with | of Time | Principal Occupation |
and Age | the Trust | Served | During Past Five Years |
| Officers | |||
| Jeffrey T. Rauman | President, | Indefinite | Senior Vice President, Compliance and |
| (age 54) | Chief | term; | Administration, U.S. Bank Global Fund Services |
| 615 E. Michigan Street | Executive | since | (February 1996 to present). |
| Milwaukee, WI 53202 | Officer and | December | |
| Principal | 2018. | ||
| Executive | |||
| Officer | |||
| Kevin J. Hayden | Vice | Indefinite | Vice President, Compliance and Administration, |
| (age 52) | President, | term; | U.S. Bank Global Fund Services |
| 615 E. Michigan Street | Treasurer | since | (June 2005 to present). |
| Milwaukee, WI 53202 | and | January | |
| Principal | 2023. | ||
| Financial | |||
| Officer | |||
| Cheryl L. King | Assistant | Indefinite | Vice President, Compliance and Administration, |
| (age 62) | Treasurer | term; | U.S. Bank Global Fund Services |
| 615 E. Michigan Street | since | (October 1998 to present). | |
| Milwaukee, WI 53202 | January | ||
| 2023. | |||
| Richard R. Conner | Assistant | Indefinite | Assistant Vice President, Compliance and |
| (age 41) | Treasurer | term; | Administration, U.S. Bank Global Fund Services |
| 615 E. Michigan Street | since | (July 2010 to present). | |
| Milwaukee, WI 53202 | December | ||
| 2018. |
Poplar Forest Funds Annual Report, September 2023 |
52
POPLAR FOREST FUNDS
INFORMATION ABOUT TRUSTEES AND OFFICERS (Unaudited), Continued
| Term of | |||
| Office and | |||
| Position | Length | ||
| Name, Address | Held with | of Time | Principal Occupation |
and Age | the Trust | Served | During Past Five Years |
| Officers | |||
| Joseph R. Kolinsky | Vice | Indefinite | Vice President, U.S. Bank Global Fund Services |
| (age 52) | President, | term; | (May 2023 to present); Chief Compliance |
| 2020 E. Financial | Chief | since | Officer, Chandler Asset Management, Inc. |
| Way, Suite 100 | Compliance | July | (2020 to 2022); Director, Corporate |
| Glendora, CA 91741 | Officer and | 2023. | Compliance, Pacific Life Insurance Company |
| AML Officer | (2018 to 2019). | ||
| Elaine E. Richards | Vice | Indefinite | Senior Vice President, U.S. Bank Global Fund |
| (age 55) | President | term; | Services (July 2007 to present). |
| 2020 E. Financial | and | since | |
| Way, Suite 100 | Secretary | September | |
| Glendora, CA 91741 | 2019. | ||
| Lillian A. Kabakali | Assistant | Indefinite | Vice President, U.S. Bank Global Fund Services |
| (age 42) | Secretary | term; | (April 2023 to present); Vice President, |
| 2020 E. Financial | since | Compliance, Guggenheim Partners Investment | |
| Way, Suite 100 | July | Management Holdings, LLC (April 2019 to | |
| Glendora, CA 91741 | 2023. | April 2023); Senior Associate, Compliance, | |
| Guggenheim Partners Investment Management | |||
| Holdings, LLC (January 2018 to April 2019). |
| * | The Trustees have designated a mandatory retirement age of 75, such that each Trustee, serving as such on the date he or she reaches the age of 75, shall submit his or her resignation not later than the last day of the calendar year in which his or her 75th birthday occurs (“Retiring Trustee”). Upon request, the Board may, by vote of a majority of Trustees eligible to vote on such matter, determine whether or not to extend such Retiring Trustee’s term and on the length of a one-time extension of up to three additional years. At a meeting held December 7-8, 2022, by vote of the majority of Trustees (not including Mr. Redwine), Mr. Redwine’s term as Trustee was extended for three additional years to expire December 31, 2025. |
| (1) | The Trustees of the Trust who are not “interested persons” of the Trust as defined under the 1940 Act (“Independent Trustees”). |
| (2) | As of September 30, 2023, the Trust was comprised of 34 active portfolios managed by unaffiliated investment advisers. The term “Fund Complex” applies only to the Funds. The Funds do not hold themselves out as related to any other series within the Trust for investment purposes, nor do they share the same investment adviser with any other series. |
| (3) | “Other Directorships Held” includes only directorship of companies required to register or file reports with the SEC under the Securities Exchange Act of 1934 Act, as amended, (that is, “public companies”) or other investment companies registered under the 1940 Act. |
| (4) | Effective October 18, 2023, Mr. Ray Woolson retired from his service as Trustee and Chairman of the Board of Trustees of the Trust (the “Board”) to attend to health-related matters. At the recommendation of the Nominating and Governance Committee, on October 24, 2023, the Board appointed Mr. David Mertens as the successor Chairman of the Board, and Ms. Michele Rackey was appointed as Chairman of the Nominating and Governance Committee of the Board. |
The Statement of Additional Information includes additional information about the Funds’ Trustees and Officers and is available, without charge, upon request by calling 1-877-522-8860.
Poplar Forest Funds Annual Report, September 2023 |
53
POPLAR FOREST FUNDS
HOUSEHOLDING (Unaudited)
In an effort to decrease costs, the Funds will reduce the number of duplicate prospectuses, supplements, and certain other shareholder documents that you receive by sending only one copy of each to those addresses shown by two or more accounts. Please call the Funds’ transfer agent toll free at 1-877-522-8860 to request individual copies of these documents. The Funds will begin sending individual copies 30 days after receiving your request. This policy does not apply to account statements.
Poplar Forest Funds Annual Report, September 2023 |
54
POPLAR FOREST FUNDS
PRIVACY NOTICE
The Funds collect non-public information about you from the following sources:
| • | Information we receive about you on applications or other forms; |
| • | Information you give us orally; and/or |
| • | Information about your transactions with us or others. |
We do not disclose any non-public personal information about our customers or former customers without the customer’s authorization, except as permitted by law or in response to inquiries from governmental authorities. We may share information with affiliated and unaffiliated third parties with whom we have contracts for servicing the Funds. We will provide unaffiliated third parties with only the information necessary to carry out their assigned responsibilities. We maintain physical, electronic and procedural safeguards to guard your non-public personal information and require third parties to treat your personal information with the same high degree of confidentiality.
In the event that you hold shares of the Funds through a financial intermediary, including, but not limited to, a broker-dealer, bank, or trust company, the privacy policy of your financial intermediary would govern how your non-public personal information would be shared by those entities with unaffiliated third parties.
Poplar Forest Funds Annual Report, September 2023 |
55
(This Page Intentionally Left Blank.)
Investment Adviser
Poplar Forest Capital, LLC
225 South Lake Avenue, Suite 950
Pasadena, CA 91101
Distributor
Quasar Distributors, LLC
111 East Kilbourn Avenue, Suite 2200
Milwaukee, WI 53202
Transfer Agent, Fund Accountant and Fund Administrator
U.S. Bank Global Fund Services
615 East Michigan Street
Milwaukee, WI 53202
(877) 522-8860
Custodian
U.S. Bank National Association
Custody Operations
1555 North RiverCenter Drive, Suite 302
Milwaukee, WI 53212
Independent Registered Public Accounting Firm
Tait, Weller & Baker LLP
Two Liberty Place
50 South 16th Street, Suite 2900
Philadelphia, PA 19102
Legal Counsel
Sullivan & Worcester LLP
1633 Broadway, 32nd Floor
New York, NY 10019
This report is intended for shareholders of the Funds and may not be used as sales literature unless preceded or accompanied by a current prospectus. For a current prospectus, please call 1-877-522-8860.
(b) Not Applicable
Item 2. Code of Ethics.
The registrant has adopted a code of ethics that applies to the registrant’s principal executive officer and principal financial officer. The registrant has not made any substantive amendments to its code of ethics during the period covered by this report. The registrant has not granted any waivers from any provisions of the code of ethics during the period covered by this report.
Item 3. Audit Committee Financial Expert.
The registrant’s Board of Trustees has determined that there is at least one audit committee financial expert serving on its audit committee. Mr. Joe D. Redwine and Ms. Michele Rackey are the “audit committee financial experts” and are considered to be “independent” as each term is defined in Item 3 of Form N CSR.
Item 4. Principal Accountant Fees and Services.
The registrant has engaged its principal accountant to perform audit services, audit-related services, tax services and other services during the past two fiscal years. “Audit services” refer to performing an audit of the registrant's annual financial statements or services that are normally provided by the accountant in connection with statutory and regulatory filings or engagements for those fiscal years. “Audit-related services” refer to the assurance and related services by the principal accountant that are reasonably related to the performance of the audit. “Tax services” refer to professional services rendered by the principal accountant including the review of federal income tax returns, review of federal excise tax returns, review of state tax returns, if any, and assistance with calculation of required income, capital gain and excise distributions. There were no “other services” provided by the principal accountant. The following table details the aggregate fees billed or expected to be billed for each of the last two fiscal years for audit fees, audit-related fees, tax fees and other fees by the principal accountant.
| FYE 9/30/2023 | FYE 9/30/2022 | |
Audit Fees | $36,300 | $36,300 |
Audit-Related Fees | N/A | N/A |
Tax Fees | $7,200 | $7,200 |
All Other Fees | N/A | N/A |
(e)(1) The audit committee has adopted pre-approval policies and procedures that require the audit committee to pre‑approve all audit and non‑audit services of the registrant, including services provided to any entity affiliated with the registrant.
(e)(2) The percentage of fees billed by Tait, Weller, & Baker LLP applicable to non-audit services pursuant to waiver of pre-approval requirement were as follows:
FYE 9/30/2023 | FYE 9/30/2022 | |
Audit-Related Fees | 0% | 0% |
Tax Fees | 0% | 0% |
All Other Fees | 0% | 0% |
(f) All of the principal accountant’s hours spent on auditing the registrant’s financial statements were attributed to work performed by full‑time permanent employees of the principal accountant.
(g) The following table indicates the non-audit fees billed or expected to be billed by the registrant’s accountant for services to the registrant and to the registrant’s investment adviser (and any other controlling entity, etc.—not sub-adviser) for the last two years.
Non-Audit Related Fees | FYE 9/30/2023 | FYE 9/30/2022 |
Registrant | N/A | N/A |
Registrant’s Investment Adviser | $6,000 | $6,000 |
(h) The audit committee of the board of trustees/directors has considered whether the provision of non-audit services that were rendered to the registrant's investment adviser is compatible with maintaining the principal accountant's independence and has concluded that the provision of such non-audit services by the accountant has not compromised the accountant’s independence.
The registrant has not been identified by the U.S. Securities and Exchange Commission as having filed an annual report issued by a registered public accounting firm branch or office that is located in a foreign jurisdiction where the Public Company Accounting Oversight Board is unable to inspect or completely investigate because of a position taken by an authority in that jurisdiction.
The registrant is not a foreign issuer.
Item 5. Audit Committee of Listed Registrants.
| (a) | Not applicable to registrants who are not listed issuers (as defined in Rule 10A-3 under the Securities Exchange Act of 1934). |
| (b) | Not Applicable. |
Item 6. Investments.
| (a) | Schedule of Investments is included as part of the report to shareholders filed under Item 1 of this Form. |
| (b) | Not Applicable. |
Item 7. Disclosure of Proxy Voting Policies and Procedures for Closed-End Management Investment Companies.
Not applicable to open-end investment companies.
Item 8. Portfolio Managers of Closed-End Management Investment Companies.
Not applicable to open-end investment companies.
Item 9. Purchases of Equity Securities by Closed‑End Management Investment Company and Affiliated Purchasers.
Not applicable to open-end investment companies.
Item 10. Submission of Matters to a Vote of Security Holders.
There have been no material changes to the procedures by which shareholders may recommend nominees to the Registrant’s Board of Trustees.
Item 11. Controls and Procedures.
| (a) | The Registrant’s President/Chief Executive Officer/Principal Executive Officer and Vice President/Treasurer/Principal Financial Officer have reviewed the Registrant's disclosure controls and procedures (as defined in Rule 30a-3(c) under the Investment Company Act of 1940, as amended, (the “Act”)) as of a date within 90 days of the filing of this report, as required by Rule 30a-3(b) under the Act and Rules 13a-15(b) or 15d‑15(b) under the Securities Exchange Act of 1934. Based on their review, such officers have concluded that the disclosure controls and procedures are effective in ensuring that information required to be disclosed in this report is appropriately recorded, processed, summarized and reported and made known to them by others within the Registrant and by the Registrant’s service provider. |
| (b) | There were no changes in the Registrant's internal control over financial reporting (as defined in Rule 30a-3(d) under the Act) that occurred during the period covered by this report that has materially affected, or is reasonably likely to materially affect, the Registrant's internal control over financial reporting. |
Item 12. Disclosure of Securities Lending Activities for Closed-End Management Investment Companies.
Not applicable to open-end investment companies.
Item 13. Exhibits.
(3) Any written solicitation to purchase securities under Rule 23c‑1 under the Act sent or given during the period covered by the report by or on behalf of the registrant to 10 or more persons. Not applicable to open-end investment companies.
(4) Change in the registrant’s independent public accountant. There was no change in the registrant’s independent public accountant for the period covered by this report.
SIGNATURES
Pursuant to the requirements of the Securities Exchange Act of 1934 and the Investment Company Act of 1940, as amended, the registrant has duly caused this report to be signed on its behalf by the undersigned, thereunto duly authorized.
(Registrant) Advisors Series Trust
By (Signature and Title)* /s/ Jeffrey T. Rauman
Jeffrey T. Rauman, President/Chief Executive Officer/Principal
Executive Officer
Date 12/7/2023
Pursuant to the requirements of the Securities Exchange Act of 1934 and the Investment Company Act of 1940, as amended, this report has been signed below by the following persons on behalf of the registrant and in the capacities and on the dates indicated.
By (Signature and Title)* /s/ Jeffrey T. Rauman
Jeffrey T. Rauman, President/Chief Executive Officer/Principal Executive Officer
Date 12/7/2023
By (Signature and Title)* /s/ Kevin J. Hayden
Kevin J. Hayden, Vice President/Treasurer/Principal Financial Officer
Date 12/8/2023
* Print the name and title of each signing officer under his or her signature.