UNITED STATES
SECURITIES AND EXCHANGE COMMISSION
Washington, D.C. 20549
SECURITIES AND EXCHANGE COMMISSION
Washington, D.C. 20549
FORM N-CSR
CERTIFIED SHAREHOLDER REPORT OF REGISTERED
MANAGEMENT INVESTMENT COMPANIES
Investment Company Act file number 811-07959
Advisors Series Trust
(Exact name of registrant as specified in charter)
(Exact name of registrant as specified in charter)
615 East Michigan Street
Milwaukee, WI 53202
(Address of principal executive offices) (Zip code)
(Address of principal executive offices) (Zip code)
Jeffrey T. Rauman, President/Chief Executive Officer
Advisors Series Trust
c/o U.S. Bancorp Fund Services, LLC
777 East Wisconsin Avenue, 5th Floor
Milwaukee, WI 53202
(Name and address of agent for service)
(Name and address of agent for service)
(626) 914-7363
Registrant's telephone number, including area code
Date of fiscal year end: November 30, 2022
Date of reporting period: November 30, 2022
Item 1. Reports to Stockholders.
(a)
Semper MBS Total Return Fund
Class A – SEMOX
Investor Class – SEMPX
Institutional Class – SEMMX
Semper Short Duration Fund
Investor Class – SEMRX
Institutional Class – SEMIX
Annual Report
November 30, 2022
SEMPER FUNDS
Table of Contents
Shareholder Letter | 1 | ||
Allocation of Portfolio Assets | 11 | ||
Expense Example | 13 | ||
Investment Highlights | 15 | ||
Schedules of Investments | 17 | ||
Statements of Assets and Liabilities | 36 | ||
Statements of Operations | 39 | ||
Statements of Changes in Net Assets | 40 | ||
Financial Highlights | 44 | ||
Notes to Financial Statements | 49 | ||
Report of Independent Registered Public Accounting Firm | 64 | ||
Notice to Shareholders | 65 | ||
Statement Regarding Liquidity Risk Management Program | 66 | ||
Information about Trustees and Officers | 67 | ||
Householding | 71 | ||
Privacy Notice | 72 |
SEMPER FUNDS
January 8, 2023
Dear Shareholder,
2022 will go down on record as one of the most tumultuous and challenged performance years on record for the U.S. fixed income market, including the structured credit portion of the bond market that comprises the Semper MBS Total Return Fund (the “Total Return Fund”) and the Semper Short Duration Fund (the “Short Duration Fund”). As we described in last summer’s semi-annual report, the domestic bond market was buffeted by the uncertainty surrounding the Fed’s fight to tame sharply higher inflation, largely caused by a combination of the Fed’s 2020-2021 dovish monetary policy, unprecedented fiscal stimulus, supply chain problems, and a labor shortage, which in turn were all fallout from the COVID pandemic. The war in Ukraine and its impact on energy and food prices has also resulted in upward pressure on inflation.
With yields now having risen to levels unseen for over a decade, we believe that the income provided by debt securities has once again become an enticing and important component of investors’ allocation decisions. Yields are now high enough so that break evens for additional price declines are substantially shorter, and attractive enough to restore the diversification element that bonds historically offered during times of equity market weakness. There is now room for yields to fall, lifting bond prices higher, during these flight to safety/quality/liquidity events.
After pivoting from an accommodative policy in 2021 towards a view that rapidly increasing inflation was going to be transitory, the Fed early in 2022 shifted to an aggressively hawkish posture with the aim of combating levels of inflation that were last seen in the 1980s. As the Fed tightened policy, shorter maturity yields experienced a greater increase than longer maturities and the curve tilted to an inverted slope with the 2-year Treasury yield rising from 0.6% as of November 30th, 2021 to 4.5% as of November 30th, 2022 while the 10-year Treasury yield rose from 1.45% a year ago to 3.6% on November 30th, 2022, the end of the Funds’ current fiscal year.
Investors in fixed income markets bore the effects of the Fed’s rate hikes as the markets posted some of the worst returns on record. For the full 2022 fiscal year, the Bloomberg U.S. Aggregate Bond Index, a broad measure of the overall U.S. investment grade bond market, had a total return of -12.84%, the Bloomberg U.S. MBS Index, the benchmark index for the Total Return Fund returned -11.50%, and the Bloomberg 1-3 Year Government Index and the Bloomberg U.S. Treasury 1-3 Year Index, the benchmark indices for the Short Duration Fund returned -4.18% and -4.19%, respectively. These returns are lower than the worst calendar year returns in the history of these indices, which date back nearly 50 years. According to a report from Vanguard that references data back to 1926, the second worst year for U.S. fixed income investors, next to 2022, was 1969, during which the overall bond market suffered an 8% decline. In addition to rapidly rising interest rates, these rates have moved with extreme levels of volatility throughout the year, keeping risk premiums high and investor sentiment low.
1
SEMPER FUNDS
As investors grappled with NAV declines across virtually all fixed income funds, bond fund outflows increased sharply, with the outflows being more severe for funds focused on non-Agency mortgage-backed securities (RMBS) and structured products generally due to the uncertainty created in mortgage prepayments and home prices. The RMBS sector was already on its “back foot” from the technical created by the supply wave during the surge in refinancing and home purchase activity during 2020 and 2021. This combination of interest rate increases and RMBS market technicals pushed yields and spreads in the sector higher, to levels unseen since 2009 at the height of the housing induced Great Recession.
Portfolio Updates
The Total Return Fund and the Short Duration Fund have been negatively impacted by this extreme weakness in the fixed income market. Although both Funds have relatively low interest rate sensitivity, the spread widening in all credit sectors had a negative impact on bond prices in the Funds, despite continuing strengthening of the credit quality of these bonds from a strong housing market and good consumer credit performance.
Both Funds’ primary strategies during the fiscal year remained unchanged. The Total Return Fund, under normal market conditions, invests at least 80% of its net assets in mortgage-backed securities (“MBS”), and seeks to provide a high level of risk-adjusted current income and capital appreciation. Throughout the fiscal year, the Fund’s largest allocation was to the non-Agency RMBS sector as it has been since inception of the Fund in 2013. The November 30, 2022 allocation to RMBS totaled 87%. Approximately 33% of this allocation consisted of bonds supported by collateral with 1 – 3 years of seasoning; 30% with 3 – 10 years of seasoning; and 35% with 10-years or more seasoning. This significant seasoning is important because the more seasoned loans have generally built up substantial levels of home equity, an important source of borrower’s credit quality and overall bond credit support. The RMBS held in the Fund included a 13% allocation to Legacy bonds – bonds issued before 2008; a 16% allocation to Prime Jumbo 2.0 and Non-Qualified Mortgage bonds (Non-QM), generally issued in the last few years; a 28% allocation to Agency Credit Risk Transfer (CRT) bonds issued by Fannie Mae and Freddie Mac, which are not government guaranteed but are supported by pools of high quality Agency quality loans; and a 9% allocation to Single Family Rental bonds (SFR), bonds issued by single family home rental management companies. The Total Return Fund also had an 8% allocation to commercial MBS (CMBS), primarily multi-family housing securities. The Total Return Fund did not have an allocation to government agency guaranteed MBS given our continued relative value view on this sector characterized by greater interest rate sensitivity, lower yield, and risk of relative underperformance its longer duration and uncertainty surrounding the Fed 30% ownership position of the Agency sector.
The rapid rise in interest rates had a significant impact on Total Return Fund characteristics. Duration extended from about 1 year to 2.3 years, largely because of
2
SEMPER FUNDS
the projected extension of cash flows as mortgage refinancings slowed and the virtual elimination of expectations for early calls of deals, especially in the Non-QM and Prime Jumbo 2.0 sectors. The significant allocation to floating rate mortgage securities served to keep duration lower. Early in the fiscal year we increased the floating rate exposure from 60% to 73%. As short interest rates rose during the year, the average coupon of the Fund’s bonds increased from 4.1% to 6.5%, contributing to much higher interest income and dividend distributions. The Fund’s yield to maturity rose from 4.3% to 8.8%, in part from the higher coupons and in part from higher yield as spreads widened, further pressuring bond price declines. The average bond price in the Fund declined from $99.5 a year earlier to $82.3 as of November 30th, 2022.
Similar to the Total Return Fund, the Short Duration Fund is invested in securitized debt credit sectors including MBS, CMBS, Asset-Backed Securities (ABS), and senior tranches of collateralized loan obligations (CLO) rated AAA. Unlike the Total Return Fund which is highly concentrated in RMBS with an emphasis on mezzanine and subordinated bonds offering significant total return potential, the Short Duration Fund’s investments are more diversified and focused on senior bonds across the listed securitized debt subsectors. Additionally, the Fund is well positioned for a rising interest rate environment. The Fund maintains significant diversification with no more than 25% allocated to any of its sectors. We are maintaining a low duration to minimize interest rate sensitivity, through the purchase of securities generally with average lives under three years and many with floating rate coupons. Duration was 0.3 years as of November 30th, 2022, down from 0.4 years one year earlier. A primary reason for the continued low duration is the Fund’s 90% allocation to securities with floating rate coupons, including Agency CRT bonds and AAA-rated CLO tranches, an increase from 76% a year earlier. At fiscal year-end, approximately 24% of the portfolio was invested in non-Agency RMBS, 24% in Agency MBS, consisting of Fannie Mae and Freddie Mac issued Credit Risk Transfer securities (Agency CRT), 24% in CMBS – primarily floating rate Commercial Real Estate CLOs and Single Asset Single Borrower bonds with a significant residential real estate component along with multi-family securitizations, 2% in ABS, and 23% in AAA-rated CLO securities. The primary changes occurred very early in the fiscal year when we sold most of the Fund’s ABS which were in fixed rate subprime auto loan bonds and added to the allocation of CLO, which benefit from their floating rate coupon structures. As a result of general rate increases, increasing floating rate coupon resets, and higher yield from spread widening/price declines, the portfolio’s yield to maturity increased from 2.6% to 7.8%. While the Fund’s average bond price declined about 6% from $101.1 to $95.2, the exaggerated yield increase is in part the result of short average lives/maturities of the bonds. The average bond coupon increased from 2.65% to 5.93% during the course of the fiscal year. Over 78% of the fund assets were rated investment grade, with positive credit trends continuing.
The Total Return Fund net performance for the one year ended November 30, 2022 for the Institutional Class was -13.87%, for the Investor Class net performance was -14.16%, and for the Class A net performance was -14.15% without the maximum
3
SEMPER FUNDS
2.00% front-end sales load and -15.89% including the front-end sales load. The performance of the Bloomberg U.S. Mortgage-Backed Securities Index (the “Index”), the Fund’s benchmark index, during the fiscal year was -11.50%. Performance of the Bloomberg U.S. Aggregate Index, which represents the overall U.S. investment grade bond market was -12.84%.
The primary sources of negative performance for the Total Return Fund during the fiscal year was price depreciation from rising interest rates and from spread widening. Unrealized price declines reduced performance by about -17%. Interest income was about +5% during the fiscal year. Portfolio performance during the month of December, 2022, following the fiscal year end, was positive, and this strength has carried into the early part of January.
The Short Duration Fund net performance for the one-year ending November 30, 2022 for the Institutional Class was -2.66%, and for the Investor Class was -2.80%. The performance of the Bloomberg 1-3 Year U.S. Government Index during this same period was -4.18%. The performance of the Bloomberg 1-3 Year U.S. Treasury Index was -4.19%. The Short Duration Fund’s primary positive contributor to performance was interest income, totaling about 3%. Unrealized price declines were about -4%.
We expect to maintain a similar overall Total Return Fund composition throughout 2023, with the largest allocation to floating rate non-Agencies, and a modest allocation to CMBS, while continuing to maintain a duration lower than the overall mortgage market.
We expect that the Short Duration Fund’s overall composition will remain similar as well, with a significant allocation to RMBS, CMBS, and AAA-rated CLOs to achieve the required diversification, with very low interest rate sensitivity. When we get closer to the Fed reversing monetary policy to a more accommodative stance, potentially in response to much lower inflation and either a recession or very slow economic growth, we would expect to add to the fixed rate ABS allocation and reduce some of the Fund’s floating rate exposure.
Both the Total Return Fund and the Short Duration Fund continue to have significant capacity and appropriate liquidity.
Market Outlook
We expect RMBS and other profiles with exposure to mortgage credit to perform well in the coming several quarters, although we believe that volatility will persist until the markets become reassured that the Fed is approaching its peak level of interest rates as it continues its battle to slow inflation.
Our base case view is that home prices will decline by 10 to 15% to reach sustainable levels of affordability. Home price appreciation (HPA) surged with values increasing by approximately 40% nationally over the 2-year period from March 2020 to March 2022. Over the course of the spring and summer, the housing market transitioned from having some markets such as Los Angeles, San Francisco, and Seattle,
4
SEMPER FUNDS
exhibiting signs of becoming overheated, to a national affordability shock as mortgage rates rose sharply due to the Fed’s aggressive tightening policy. Initially, this led to concerns among some investors that a housing crisis would ensue and that markets would repeat the 2008 experience. However, the data paints a different backdrop today and we believe that after affordability normalizes in 2023, home prices will remain above pre-COVID levels.
A key driver of this view is that unlike in 2008 when there was an excess supply of housing, supply remains extremely tight today after more than a decade of lackluster volumes of housing construction. Shifting from oversupply to undersupply has a meaningful effect on the potential decline in prices. Our view is predicated on the following:
| • | Undersupply is supportive of home prices in the long run |
| ∘ | The U.S. housing shortage is estimated to be near 4 million units | |
| ∘ | In a normal year household formation runs about 1.4 to 1.5 million units | |
| ∘ | Housing completions have averaged less than 1 million per year since 2009 and have only recently begin to trend towards a rate that meets household formation | |
| ∘ | If we surged to 2 million units of completions per year, it would still take 6 to 8 years to fill the shortage |
A demand wave exists amongst Millennials
| ➣ | Millennials are now the largest age group in the U.S and as a group they serve as a potential increase to the buyer base | |
| ➣ | Data shows an increasing homeownership rate for the 25 to 34 age cohort. This metric has been increasing since 2016 after a decline during the Great Financial Crisis | |
| ➣ | Additionally, the 15 to 25 age cohort is similar in size to the Millennial demographic – foreshadowing that housing demand will persist (if not grow) in the years to come |
Affordability improvements will be met with demand
| ➣ | 30-year fixed rate mortgages rose from mid-3% to over 7% in October, before receding to mid-6% in December | |
| ➣ | Debt-to-income (DTI) ratios on home purchases have risen from historical lows of near 25% to roughly 40% | |
| ➣ | We expect DTI to retrace to 1990s and early 2000s levels of slightly below 30% and our view is that the 30 year mortgage rate is likely to remain between 6% and 7% as the Fed reaches their terminal rate and the long end of the Treasury yield curve stabilizes |
Mortgage credit has fundamentally and structurally improved versus where it stood prior to the Great Financial Crisis (GFC). Underwriting standards have been
5
SEMPER FUNDS
conservative in the post-GFC era with credit scores, loan to value ratios, and debt to income metrics all improving significantly versus where they stood in 2008. On top of the conservative underwriting, a prolonged period of strong home price growth and low interest rates has further enhanced the quality of existing mortgages and the market is comprised of borrowers with significant equity and fixed-rate mortgages.
As a result of these factors, the mortgage market is largely comprised of high-quality borrowers, with significant equity, and low, fixed-rate mortgages. Fundamental credit risk is low since these borrowers are well positioned to weather a housing contraction and continue servicing their debt, and structurally, due to a lack of adjustable rate mortgages there is very little risk of systemic payment shocks. The following data points are noteworthy contrasts:
| ➣ | The median FICO of a newly originated loan has averaged near 750 since 2008, versus a pre-GFC level of near 720. The lowest 10th percentile is near 650 versus 600 pre-GFC. | |
| ➣ | According to CoreLogic data through Q3 2022, the average LTV of 43.6% is significantly lower than the above 70% level that existed going in to the GFC. | |
| ➣ | The adjustable rate share of mortgages approached 40% in the years prior to the GFC. Today Adjustable Rate Mortgages (ARMs) make up only about 10% of outstanding mortgages. | |
| ➣ | Nationally, mortgage delinquencies are below 3% versus an average level above 4% during the late-1990s and early-2000s. Conservative underwriting has led to a lower level of stressed mortgages. |
Lastly, in addition to fundamentally stronger mortgages, homeowners are in a better fiscal position to service mortgage debt after having reduced their debt levels and cost of funds. Household debt as a percent of income is significantly lower than in 2007 and 2008.
Given the views on housing and mortgage credit, we believe that non-Agency RMBS offers compelling value at current market levels. When factoring in the fact that conservative standards following 2008 have led to these bonds being much stronger in terms of bond level credit enhancement, loan performance, and borrower credit quality, RMBS presents a substantially different return/risk opportunity than the last time we saw yields at these levels during the Great Financial Crisis.
Loss adjusted yields in the sector are attractive on an absolute and relative basis. With investment grade bonds yielding 6% to 8% and below investment grade rated RMBS yielding 9% to above 15%, the sector is poised to produce some of the strongest returns across credit markets in 2023. Yield spreads in RMBS widened more than other portions of credit markets in 2022 due to the technical of heavy volume of securitization supply during Q1 and Q2 that faced a stark reduction in demand throughout the year as funds faced elevated outflows and bank deposits declined. The consensus expectation across investment banks is that supply will shrink by 40 to 50% in 2023.
6
SEMPER FUNDS
| Investment Grade | Current | 12/31/2021 | 2022 Spread |
| Senior and Mezz | Spreads | Spread | Change |
| AGENCY CRT LCF (BBB) | 350 | 165 | 185 |
| SASB Multifamily (BBB) | 425 | 175 | 250 |
| Non-QM (BBB) | 550 | 205 | 345 |
| SFR (BBB) | 450 | 170 | 280 |
| Corp BBB | 159 | 113 | 46 |
| Below Investment Grade | Current | 12/31/2021 | 2022 Spread |
| Mezz and Sub | Spreads | Spread | Change |
| STACR CRT B1 (BB/NR) | 550 | 335 | 215 |
| STACR CRT B2 (B/NR) | 1200 | 660 | 540 |
| Non-QM Mezz (B) | 1000 | 390 | 610 |
| SFR Mezz (B/NR) | 575 | 325 | 250 |
| Corp B | 468 | 312 | 156 |
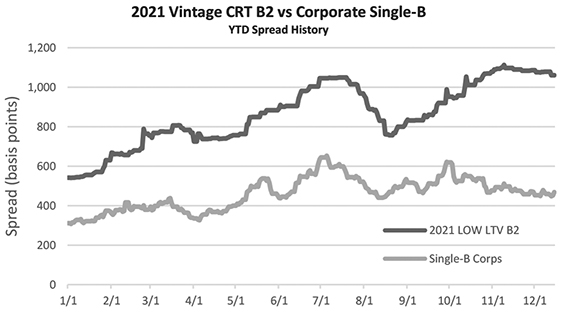
With shifting market technicals serving as a catalyst, we believe that the spread widening in non-Agency RMBS has the potential to reverse to normalized levels. Another key catalyst is the expected decline in interest rate volatility that is anticipated to occur as the Fed nears the end of the current tightening cycle. Current market consensus has the Fed reaching their terminal rate between late Q1 to early Q2. The risk premium priced into mortgage spreads moves directionally with interest rate volatility and we believe that spreads are poised to compress as volatility recedes from crisis-era levels. As an example, over the course of this year, 2021 vintage GSE CRT securities with low Loan-To-Values (LTV) at issuance have widened by almost 300 basis points relative to single-B corporates.
7
SEMPER FUNDS
We view this as a pricing dislocation that is not warranted by the fundamental profiles. Given the significant degree of structural deleveraging and asset coverage increases from home price appreciation, the credit profile of the CRT security has improved while corporate credit fundamentals have deteriorated over the timeline. This type of pricing dislocation exists across the universe of Non-Agency RMBS creating the potential for the sector to outperform as spread relationships normalize.
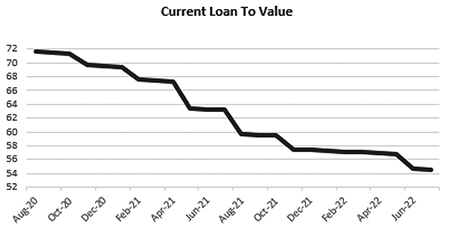
Our view is that seasoned mortgages offer one of the best opportunities for absolute and relative performance as we enter the new year. The seasoned profiles have benefited the most from fundamental improvement, yet due to market dynamics, they have yet to distinguish themselves from other credit profiles. Below is an example of a mid-2020 vintage CRT security currently valued at loss adjusted yield near 13%. The charts show LTVs that have declined significantly as well as the degree of structural improvement in credit enhancement and loss coverage ratios.

After interest rates surged higher during 2022, fixed income investments are poised to offer the benefits that investors have historically sought from their allocation. While the ultimate path and timing of the Federal Reserve’s tightening policy is still to be determined, the historical level of hikes enacted this year has created a line of sight to the future as the target rate begins to approach projections for the terminal value. Reductions in interest rate volatility is expected to lead to improved investor sentiment and demand for yields that have retraced to levels last seen nearly 15 years ago. In the midst of this backdrop, we believe that Non-Agency RMBS are poised to outperform after having experienced inordinate spread widening in 2022. Additionally, we believe that seasoned profiles, who’s pricing largely did not benefit from superior credit fundamentals in 2022, can perform even more strongly in 2023.
8
SEMPER FUNDS
Fundamental views on housing and mortgage credit combine with the favorable shift in market technicals due to a sharp supply reduction will present a supportive tone and potential tailwind, which we believe will benefit both Funds.
Sincerely,
Semper Capital Management, L.P.
Past performance is not a guarantee of future results.
Opinions expressed are those of Semper Capital Management, L.P., the Semper MBS Total Return Fund’s and the Semper Short Duration Fund’s investment adviser, and are subject to change, are not guaranteed and should not be considered investment advice.
Mutual fund investing involves risk. Principal loss is possible.
The Funds invest in debt securities: As interest rates rise, the value of debt securities decrease; whereas prepayment risk tends to occur during periods of declining interest rates. This risk is usually greater for longer-term debt securities. Recent turbulence in the financial markets and reduced liquidity in credit and fixed-income market may have an adverse effect on the Funds. Investments in mortgage-backed and asset- backed securities include additional risks that investors should be aware of such as credit risk, interest rate risk, prepayment risk, real estate market risk, possible illiquidity and default, as well as increased susceptibility to adverse economic developments. Many of the risks of investing in commercial mortgage-backed securities reflect the risks of investing in the real estate securing the underlying mortgage loans. Accordingly, the Funds may not be suitable for all investors.
In addition, the MBS Total Return Fund invests in lower-rated and non-rated securities that present a greater risk of loss to principal and interest than higher-rated securities. The Fund may make short sales of securities, which involves the risk that losses to those securities may exceed the original amount invested by the Fund. The Fund may invest in securities that are less liquid which can be difficult to sell. The Fund may use certain types of investment derivatives such as futures, forwards, and swaps. Derivatives involve risks different from, and in certain cases, greater than the risks presented by more traditional investments. The Fund may use leverage which may exaggerate the effect of any increase or decrease in the value of portfolio securities. The Fund may invest in To Be Announced (“TBA”) securities which involve interest rate and investment exposure risks. The Fund may invest in when-issued securities which may involve less favorable prices for securities, when delivered, and failure to deliver securities could cause a loss to the Fund.
Fund holdings and sector allocations are subject to change and should not be considered a recommendation to buy or sell any security. For a complete listing of Fund holdings, please refer to the schedule of investments in this report.
Diversification does not assure a profit nor protect against loss in a declining market.
The Bloomberg U.S. MBS Index covers agency mortgage-backed pass-through securities – both fixed-rate and hybrid ARM – issued by Ginnie Mae (GNMA), Fannie Mae (FNMA), and Freddie Mac (FHLMC). Pool aggregates must have at least $250 million outstanding with a weighted average maturity of at least one year.
The Bloomberg 1-3 Year U.S. Government Index covers U.S. Treasury and agency securities issued by the U.S. Government with a maturity from 1 up to but not including 3 years. This unmanaged index contains only dollar-denominated issues with at least $250 million par outstanding.
The Bloomberg 1-3 Year U.S. Treasury Index covers U.S. Treasury securities issued by the U.S. Government with a maturity from 1 up to but not including 3 years. This unmanaged index contains only dollar-denominated issues with at least $250 million par outstanding.
9
SEMPER FUNDS
The Bloomberg U.S. Aggregate Index is a market capitalization-weighted index, meaning the securities in the index are weighted according to the market size of each bond type. Most U.S. traded investment grade bonds are represented. Municipal bonds, and Treasury Inflation-Protected Securities are excluded, due to tax treatment issues. The index includes Treasury securities, Government agency bonds, mortgage-backed bonds, corporate bonds, and a small amount of foreign bonds traded in the U.S.
One cannot invest directly in an index.
Effective Duration: Calculation for bonds with cash flow variability. It takes into account that expected cash flows will fluctuate as interest rates change.
Yield: Interest income divided by price for a bond or portfolio of bonds.
Yield to Maturity: Anticipated rate of return on a bond or portfolio of bonds if held until the maturity date.
Par is the face value or nominal value of a bond.
Basis point equals 1/100th of 1%.
This report must be preceded or accompanied by a prospectus.
The Semper Funds are distributed by Quasar Distributors, LLC.
10
SEMPER MBS TOTAL RETURN FUND
ALLOCATION OF PORTFOLIO ASSETS at November 30, 2022 (Unaudited)

| * | Includes Agency Credit Risk Transfer bonds, which are issued by but not guaranteed by Fannie Mae and Freddie Mac. |
Percentages represent market value as a percentage of total investments.
11
SEMPER SHORT DURATION FUND
ALLOCATION OF PORTFOLIO ASSETS at November 30, 2022 (Unaudited)

| * | Includes Agency Credit Risk Transfer bonds, which are issued by but not guaranteed by Fannie Mae and Freddie Mac. |
Percentages represent market value as a percentage of total investments.
12
SEMPER FUNDS
EXPENSE EXAMPLE at November 30, 2022 (Unaudited)
As a shareholder of a mutual fund, you incur two types of costs: (1) transaction costs, including sales charges (loads) on purchase payments, redemption fees, and exchange fees, and (2) ongoing costs, including management fees, distribution and/or service fees, and other fund expenses. This Example is intended to help you understand your ongoing costs (in dollars) of investing in the Funds and to compare these costs with the ongoing costs of investing in other mutual funds. The Example is based on an investment of $1,000 invested at the beginning of the period and held for the entire period (6/1/22 – 11/30/22).
Actual Expenses
The first line of the tables below provides information about actual account values and actual expenses. You will be assessed fees for outgoing wire transfers, returned checks, and stop payment orders at prevailing rates charged by U.S. Bancorp Fund Services, LLC, the Funds’ transfer agent. The Example below includes, but is not limited to, management fees, 12b-1 fees, fund accounting, custody and transfer agent fees. You may use this information, together with the amount you invested, to estimate the expenses that you paid over the period. Simply divide your account value by $1,000 (for example, an $8,600 account value divided by $1,000 = 8.6), then multiply the result by the number in the first line under the heading entitled “Expenses Paid During Period” to estimate the expenses you paid on your account during this period.
Hypothetical Example for Comparison Purposes
The second line of the tables below provides information about hypothetical account values and hypothetical expenses based on the Fund’s actual expense ratio and an assumed rate of return of 5% per year before expenses, which is not the Fund’s actual return. The hypothetical account values and expenses may not be used to estimate the actual ending account balance or expenses you paid for the period. You may use this information to compare the ongoing costs of investing in the Fund and other funds. To do so, compare this 5% hypothetical example with the 5% hypothetical examples that appear in the shareholder reports of the other funds. Please note that the expenses shown in the table are meant to highlight your ongoing costs only and do not reflect any transaction costs, such as sales charges (loads), redemption fees, or exchange fees. Therefore, the second line of the table is useful in comparing ongoing costs only, and will not help you determine the relative total costs of owning different funds. In addition, if these transaction costs were included, your costs would have been higher.
13
SEMPER FUNDS
EXPENSE EXAMPLE at November 30, 2022 (Unaudited), Continued
Total Return Fund
| Beginning | Ending | Expenses Paid | Annualized | |
| Account Value | Account Value | During Period | Expense | |
6/1/22 | 11/30/22 | 6/1/22 – 11/30/22 | Ratio(1) | |
| Class A | ||||
Actual(2) | $1,000.00 | $ 915.20 | $5.76 | 1.20% |
Hypothetical (5% return | ||||
before expenses)(3) | $1,000.00 | $1,019.05 | $6.07 | 1.20% |
| Investor Class | ||||
Actual(2) | $1,000.00 | $ 915.10 | $5.76 | 1.20% |
Hypothetical (5% return | ||||
before expenses)(3) | $1,000.00 | $1,019.05 | $6.07 | 1.20% |
| Institutional Class | ||||
Actual(2) | $1,000.00 | $ 917.20 | $4.57 | 0.95% |
Hypothetical (5% return | ||||
before expenses)(3) | $1,000.00 | $1,020.31 | $4.81 | 0.95% |
| (1) | Expenses are equal to the annualized expense ratio of each class, multiplied by the average account value over the period, multiplied by 183 (days in most recent fiscal half-year) / 365 days to reflect the one-half year expense. |
| (2) | Excluding interest expense, the actual expenses would be $5.04, $5.04, and $3.84 for Class A, Investor Class, and Institutional Class, respectively. |
| (3) | Excluding interest expense, the hypothetical expenses would be $5.32, $5.32, and $4.05 for Class A, Investor Class, and Institutional Class, respectively. |
Short Duration Fund
| Beginning | Ending | Expenses Paid | Annualized | |
| Account Value | Account Value | During Period | Expense | |
6/1/22 | 11/30/22 | 6/1/22 – 11/30/22 | Ratio(1) | |
| Investor Class | ||||
Actual(2) | $1,000.00 | $ 998.80 | $4.36 | 0.87% |
Hypothetical (5% return | ||||
before expenses)(3) | $1,000.00 | $1,020.71 | $4.41 | 0.87% |
| Institutional Class | ||||
Actual(2) | $1,000.00 | $ 999.00 | $3.11 | 0.62% |
Hypothetical (5% return | ||||
before expenses)(3) | $1,000.00 | $1,021.96 | $3.14 | 0.62% |
| (1) | Expenses are equal to the annualized expense ratio of each class, multiplied by the average account value over the period, multiplied by 183 (days in most recent fiscal half-year) / 365 days to reflect the one-half year expense. |
| (2) | Excluding interest expense, the actual expenses would be $4.26 and $3.01 for Investor Class and Institutional Class, respectively. |
| (3) | Excluding interest expense, the hypothetical expenses would be $4.31 and $3.04 for Investor Class and Institutional Class, respectively. |
14
SEMPER MBS TOTAL RETURN FUND
Comparison of the change in value of a $1,000,000 investment in the
Semper MBS Total Return Fund – Institutional Class vs
the Bloomberg U.S. MBS Index

| Since | Since | ||||
| One | Three | Five | Inception | Inception | |
Average Annual Total Return | Year | Years | Years | (7/22/13) | (12/18/15) |
| Semper MBS Total Return Fund – | |||||
| Investor Class | -14.16% | -5.17% | -1.58% | 2.31% | — |
| Semper MBS Total Return Fund – | |||||
| Institutional Class | -13.87% | -4.99% | -1.37% | 2.55% | — |
| Semper MBS Total Return Fund – | |||||
| Class A (with sales load) | -15.89% | -5.76% | -1.96% | — | -0.16% |
| Semper MBS Total Return Fund – | |||||
| Class A (without sales load) | -14.15% | -5.13% | -1.56% | — | 0.13% |
| Bloomberg U.S. MBS Index | -11.50% | -2.99% | -0.38% | 1.05% | 0.26% |
Performance data quoted represents past performance and does not guarantee future results. The investment return and principal value of an investment will fluctuate so that an investor’s shares, when redeemed, may be worth more or less than their original cost. Current performance of the Fund may be lower or higher than the performance quoted. The most recent month-end performance may be obtained by calling 1-855-736-7799 (855-SEM-PRXX).
Returns reflect reinvestment of dividends and capital gains distributions. Fee waivers were in effect prior to November 30, 2014. In the absence of fee waivers, returns would be reduced. For the years ended November 30, 2015, November 30, 2016, and November 30, 2017, the adviser recouped previously waived fees. In the absence of the recoupment, returns would be higher. Class A shares may be subject to a 2.00% front-end sales load. The performance data and graph do not reflect the deduction of taxes that a shareholder may pay on dividends, capital gains distributions, or redemption of Fund shares. This chart does not imply any future performance. Indices do not incur expenses and are not available for investment.
The Bloomberg U.S. MBS Index covers agency mortgage-backed pass-through securities – both fixed-rate and hybrid adjustable rate mortgages – issued by Ginnie Mae (GNMA), Fannie Mae (FNMA), and Freddie Mac (FHLMC). Pool aggregates must have at least $250 million par outstanding with a weighted average maturity of at least one year.
15
SEMPER SHORT DURATION FUND
Comparison of the change in value of a $1,000,000 investment in the
Semper Short Duration Fund – Institutional Class vs the Bloomberg 1-3 Year
Government Index and the Bloomberg 1-3 Year U.S. Treasury Index

| Since | |||||
| One | Three | Five | Ten | Inception | |
| Average Annual Total Return | Year | Years | Years | Years | (12/23/10) |
Semper Short Duration Fund – | |||||
| Investor Class | -2.80% | -0.68% | 0.65% | 1.12% | 1.58% |
| Semper Short Duration Fund – | |||||
| Institutional Class | -2.66% | -0.47% | 0.87% | 1.35% | 1.82% |
| Bloomberg 1-3 Year | |||||
| Government Index | -4.18% | -0.45% | 0.71% | 0.65% | 0.73% |
| Bloomberg 1-3 Year | |||||
| U.S. Treasury Index | -4.19% | -0.45% | 0.71% | 0.64% | 0.72% |
Performance data quoted represents past performance and does not guarantee future results. The investment return and principal value of an investment will fluctuate so that an investor’s shares, when redeemed, may be worth more or less than their original cost. Current performance of the Fund may be lower or higher than the performance quoted. The most recent month-end performance may be obtained by calling 1-855-736-7799 (855-SEM-PRXX).
Returns reflect reinvestment of dividends and capital gains distributions. Fee waivers are in effect. In the absence of fee waivers, returns would be reduced. The performance data and graph do not reflect the deduction of taxes that a shareholder may pay on dividends, capital gains distributions, or redemption of Fund shares. This chart does not imply any future performance. Indices do not incur expenses and are not available for investment.
The Bloomberg 1-3 Year Government Index (the “Index”) includes Treasury and agency securities issued by the U.S. Government with a maturity from one up to (but not including) three years. The Index contains only dollar denominated, investment grade issues with at least $250 million par outstanding. Total return includes the reinvestment of income.
The Bloomberg 1-3 Year U.S. Treasury Index covers U.S. Treasury securities issued by the U.S. Government with a maturity from one up to but not including three years. This unmanaged index contains only dollar-denominated issues with at least $250 million par outstanding. Total return includes the reinvestment of income.
16
SEMPER MBS TOTAL RETURN FUND
SCHEDULE OF INVESTMENTS at November 30, 2022
| Principal | ||||||||
| Amount | Value | |||||||
| COMMERCIAL MORTGAGE-BACKED SECURITIES – AGENCY – 0.0% | ||||||||
Fannie Mae-Aces | ||||||||
Series 2006-M1, Class IO, 0.209%, 3/25/36 (a)(g) | $ | 1,084,440 | $ | 6 | ||||
GNMA REMIC Trust | ||||||||
Series 2012-25, Class IO, 0.398%, 8/16/52 (a)(g) | 37,109 | 30 | ||||||
Government National Mortgage Association | ||||||||
Series 2002-28, Class IO, 0.822%, 1/16/42 (a)(g) | 9,200 | — | ||||||
Series 2005-23, Class IO, 0.004%, 6/17/45 (a)(g) | 116,624 | — | ||||||
Series 2006-68, Class IO, 0.473%, 5/16/46 (a)(g) | 114,009 | 412 | ||||||
| Total Commercial Mortgage-Backed Securities – Agency | ||||||||
| (cost $35,491) | 448 | |||||||
| COMMERCIAL MORTGAGE-BACKED SECURITIES – NON-AGENCY – 11.5% | ||||||||
Bayview Commercial Asset Trust | ||||||||
Series 2004-3, Class B2, 9.069% | ||||||||
(1 Month LIBOR USD + 5.025%), 1/25/35 (c)(h) | 33,415 | 33,500 | ||||||
Series 2006-2A, Class M1, 4.509% | ||||||||
(1 Month LIBOR USD + 0.465%), 7/25/36 (c)(h) | 648,174 | 587,908 | ||||||
Series 2006-2A, Class M3, 4.569% | ||||||||
(1 Month LIBOR USD + 0.525%), 7/25/36 (c)(h) | 936,959 | 863,663 | ||||||
Series 2006-3A, Class M1, 4.554% | ||||||||
(1 Month LIBOR USD + 0.510%), 10/25/36 (c)(h) | 819,152 | 761,834 | ||||||
Series 2007-2A, Class A1, 4.314% | ||||||||
(1 Month LIBOR USD + 0.270%), 7/25/37 (c)(h) | 1,305,632 | 1,146,796 | ||||||
Freddie Mac Multi-Family Structured Credit Risk | ||||||||
Series 2021-MN1, Class M2, 7.297% | ||||||||
(SOFR30A + 3.750%), 1/25/51 (c)(h) | 3,537,000 | 3,011,059 | ||||||
Series 2021-MN1, Class B1, 11.297% | ||||||||
(SOFR30A + 7.750%), 1/25/51 (c)(h) | 6,603,000 | 6,116,886 | ||||||
Series 2021-MN3, Class B1, 10.371% | ||||||||
(SOFR30A + 6.850%), 11/25/51 (c)(h) | 6,413,000 | 5,607,011 | ||||||
GMAC Commercial Mortgage Asset Corp. | ||||||||
Series 2005-DRUM, Class AIO, 0.171%, 5/10/50 (a)(c)(g) | 138,635,777 | 2,257,496 | ||||||
Series 2012-BLIS, Class IO, 0.576%, 7/10/50 (c)(g) | 27,557,339 | 1,520,197 | ||||||
Lehman Brothers Small Balance Commercial Mortgage Trust | ||||||||
Series 2006-3A, Class M2, 4.434% | ||||||||
(1 Month LIBOR USD + 0.390%), 12/25/36 (c)(h) | 2,705,322 | 2,592,197 | ||||||
Series 2007-1A, Class M1, 4.544% | ||||||||
(1 Month LIBOR USD + 0.500%), 3/25/37 (c)(h) | 5,881,000 | 5,586,910 | ||||||
Multi-Family Connecticut Avenue Securities Trust | ||||||||
Series 2019-01, Class M10, 7.294% | ||||||||
(1 Month LIBOR USD + 3.250%), 10/25/49 (c)(h) | 5,099,476 | 4,721,613 | ||||||
The accompanying notes are an integral part of these financial statements.
17
SEMPER MBS TOTAL RETURN FUND
SCHEDULE OF INVESTMENTS at November 30, 2022, Continued
| Principal | ||||||||
| Amount | Value | |||||||
Multi-Family Connecticut Avenue Securities Trust (Continued) | ||||||||
Series 2019-01, Class B10, 9.544% | ||||||||
(1 Month LIBOR USD + 5.500%), 10/25/49 (c)(h) | $ | 2,384,000 | $ | 2,114,929 | ||||
Series 2020-01, Class M10, 7.794% | ||||||||
(1 Month LIBOR USD + 3.750%), 3/25/50 (c)(h) | 1,000,000 | 917,408 | ||||||
Velocity Commercial Capital Loan Trust | ||||||||
Series 2017-2, Class M4, 5.000%, 11/25/47 (a)(c) | 333,437 | 274,102 | ||||||
Series 2018-1, Class M5, 6.260%, 4/25/48 (c) | 225,878 | 214,363 | ||||||
Series 2018-2, Class M3, 4.720%, 10/26/48 (a)(c) | 252,925 | 230,225 | ||||||
Series 2019-1, Class M5, 5.700%, 3/25/49 (a)(c) | 553,944 | 449,232 | ||||||
| Total Commercial Mortgage-Backed | ||||||||
| Securities – Non-Agency (cost $41,992,219) | 39,007,329 | |||||||
| RESIDENTIAL MORTGAGE-BACKED SECURITIES – AGENCY – 25.0% | ||||||||
Fannie Mae Connecticut Avenue Securities | ||||||||
Series 2020-R01, Class 1B1, 7.266% | ||||||||
(1 Month LIBOR USD + 3.250%), 1/25/40 (c)(h) | 1,000,000 | 942,513 | ||||||
Series 2020-SBT1, Class 2B1, 10.616% | ||||||||
(1 Month LIBOR USD + 6.600%), 2/25/40 (c)(h) | 11,475,000 | 10,291,117 | ||||||
Series 2020-SBT1, Class 1B1, 10.766% | ||||||||
(1 Month LIBOR USD + 6.750%), 2/25/40 (c)(h) | 14,106,000 | 12,653,960 | ||||||
FNMA Grantor Trust | ||||||||
Series 2003-T2, Class A1, 3.741% | ||||||||
(1 Month LIBOR USD + 0.280%), 3/25/33 (h) | 29,195 | 28,886 | ||||||
Series 2004-T3, Class 2A, 3.791%, 8/25/43 (a) | 31,429 | 30,819 | ||||||
FNMA Pool | ||||||||
Class #888534, 5.000%, 8/1/37 | 6,167 | 6,133 | ||||||
FNMA REMIC Trust | ||||||||
Series 2007-30, Class ZM, 4.250%, 4/25/37 | 60,258 | 57,617 | ||||||
Series 2007-W8, Class 1A5, 6.424%, 9/25/37 (a) | 7,333 | 7,392 | ||||||
Freddie Mac Structured Agency Credit Risk | ||||||||
Series 2021-DNA2, Class B1, 6.921% | ||||||||
(SOFR30A + 3.400%), 8/25/33 (c)(h) | 2,393,000 | 2,152,840 | ||||||
Series 2021-DNA2, Class B2, 9.521% | ||||||||
(SOFR30A + 6.000%), 8/25/33 (c)(h) | 1,000,000 | 814,104 | ||||||
Series 2019-FTR3, Class B2, 8.386% | ||||||||
(1 Month LIBOR USD + 4.800%), 9/25/47 (c)(h) | 6,233,500 | 4,883,628 | ||||||
Series 2019-FTR4, Class B2, 9.016% | ||||||||
(1 Month LIBOR USD + 5.000%), 11/25/47 (c)(h) | 10,050,000 | 8,041,081 | ||||||
Series 2019-DNA4, Class B2, 10.266% | ||||||||
(1 Month LIBOR USD + 6.250%), 10/25/49 (c)(h) | 987,000 | 884,920 | ||||||
The accompanying notes are an integral part of these financial statements.
18
SEMPER MBS TOTAL RETURN FUND
SCHEDULE OF INVESTMENTS at November 30, 2022, Continued
| Principal | ||||||||
| Amount | Value | |||||||
Freddie Mac Structured Agency Credit Risk (Continued) | ||||||||
Series 2020-HQA5, Class B2, 10.921% | ||||||||
(SOFR30A + 7.400%), 11/25/50 (c)(h) | $ | 4,460,000 | $ | 4,188,617 | ||||
Freddie Mac Structured Agency Credit Risk REMIC Trust | ||||||||
Series 2021-HQA1, Class B2, 8.521% | ||||||||
(SOFR30A + 5.000%), 8/25/33 (c)(h) | 1,486,000 | 1,130,788 | ||||||
Series 2021-DNA3, Class B1, 7.021% | ||||||||
(SOFR30A + 3.500%), 10/25/33 (c)(h) | 2,506,400 | 2,230,605 | ||||||
Series 2021-DNA3, Class B2, 9.771% | ||||||||
(SOFR30A + 6.250%), 10/25/33 (c)(h) | 1,000,000 | 822,153 | ||||||
Series 2021-DNA6, Class B2, 11.047% | ||||||||
(SOFR30A + 7.500%), 10/25/41 (c)(h) | 1,000,000 | 850,339 | ||||||
Series 2020-HQA1, Class B2, 9.116% | ||||||||
(1 Month LIBOR USD + 5.100%), 1/25/50 (c)(h) | 8,679,000 | 7,391,697 | ||||||
Series 2020-DNA2, Class B2, 8.816% | ||||||||
(1 Month LIBOR USD + 4.800%), 2/25/50 (c)(h) | 6,990,000 | 5,658,153 | ||||||
Series 2020-HQA2, Class B2, 11.616% | ||||||||
(1 Month LIBOR USD + 7.600%), 3/25/50 (c)(h) | 10,250,000 | 9,571,152 | ||||||
Series 2020-DNA4, Class B2, 14.016% | ||||||||
(1 Month LIBOR USD + 10.000%), 8/25/50 (c)(h) | 1,888,000 | 2,044,230 | ||||||
Series 2020-HQA4, Class B2, 13.416% | ||||||||
(1 Month LIBOR USD + 9.400%), 9/25/50 (c)(h) | 1,780,000 | 1,882,431 | ||||||
Series 2020-DNA5, Class B2, 15.021% | ||||||||
(SOFR30A + 11.500%), 10/25/50 (c)(h) | 1,810,000 | 2,030,722 | ||||||
Series 2020-DNA6, Class B2, 9.171% | ||||||||
(SOFR30A + 5.650%), 12/25/50 (c)(h) | 5,750,000 | 4,773,345 | ||||||
Freddie Mac Whole Loan Securities Trust | ||||||||
Series 2017-SC01, Class M2, 3.648%, 12/25/46 (a)(c) | 595,000 | 522,698 | ||||||
Series 2017-SC02, Class M2, 3.858%, 5/25/47 (a)(c) | 1,411,000 | 1,272,762 | ||||||
| Total Residential Mortgage-Backed | ||||||||
| Securities – Agency (cost $98,092,293) | 85,164,702 | |||||||
| RESIDENTIAL MORTGAGE-BACKED SECURITIES – NON-AGENCY – 63.0% | ||||||||
AFC Home Equity Loan Trust | ||||||||
Series 1997-3, Class 1A4, 7.470%, 9/27/27 (j) | 53,334 | 52,088 | ||||||
AMSR Trust | ||||||||
Series 2020-SFR4, Class G1, 4.002%, 11/17/37 (c) | 750,000 | 665,298 | ||||||
Series 2021-SFR3, Class H, 4.896%, 10/17/38 (c) | 1,750,000 | 1,466,244 | ||||||
Asset Backed Securities Corp. Home Equity Loan Trust | ||||||||
Series 1999-LB1, Class A1F, 7.110%, 6/21/29 | 359,644 | 355,608 | ||||||
The accompanying notes are an integral part of these financial statements.
19
SEMPER MBS TOTAL RETURN FUND
SCHEDULE OF INVESTMENTS at November 30, 2022, Continued
| Principal | ||||||||
| Amount | Value | |||||||
Asset Backed Securities Corp. | ||||||||
Long Beach Home Equity Loan Trust | ||||||||
Series 2000-LB1, Class AF5, 6.998%, 9/21/30 (j) | $ | 508,920 | $ | 471,819 | ||||
Banc of America Funding Corp. | ||||||||
Series 2006-D, Class 5A2, 3.009%, 5/20/36 (a) | 6,669 | 5,728 | ||||||
Series 2008-R4, Class 1A4, 4.036% | ||||||||
(1 Month LIBOR USD + 0.450%), 7/25/37 (c)(h) | 1,315,727 | 781,001 | ||||||
Bear Stearns Asset Backed Securities I Trust | ||||||||
Series 2006-IM1, Class A3, 4.604% | ||||||||
(1 Month LIBOR USD + 0.560%), 4/25/36 (h) | 4,924,148 | 6,833,345 | ||||||
Series 2006-IM1, Class A6, 4.684% | ||||||||
(1 Month LIBOR USD + 0.640%), 4/25/36 (h) | 2,924,277 | 3,926,524 | ||||||
Bellemeade Re Ltd. | ||||||||
Series 2021-2A, Class B1, 7.697% | ||||||||
(SOFR30A + 4.150%), 6/25/31 (c)(h) | 2,281,000 | 1,837,774 | ||||||
Chase Home Lending Mortgage Trust | ||||||||
Series 2019-ATR2, Class B4, 4.010%, 7/25/49 (a)(c) | 1,870,117 | 1,221,649 | ||||||
Chase Mortgage Finance Corp. | ||||||||
Series 2020-CL1, Class M4, 8.394% | ||||||||
(1 Month LIBOR USD + 4.350%), 10/25/57 (c)(h) | 318,066 | 308,170 | ||||||
Citigroup Mortgage Loan Trust | ||||||||
Series 2004-HYB4, Class WA, 3.569%, 12/25/34 (a) | 7,343 | 6,933 | ||||||
CitiMortgage Alternative Loan Trust | ||||||||
Series 2007-A7, Class 2A1, 4.444% | ||||||||
(1 Month LIBOR USD + 0.400%), 7/25/37 (h) | 154,886 | 123,348 | ||||||
COLT Mortgage Loan Trust | ||||||||
Series 2021-3, Class B2, 4.120%, 9/27/66 (a)(c) | 1,578,000 | 895,732 | ||||||
Series 2021-4, Class B2, 4.140%, 10/25/66 (a)(c) | 2,625,000 | 1,937,691 | ||||||
Conseco Finance Home Loan Trust | ||||||||
Series 2000-E, Class B1, 10.260%, 8/15/31 (a) | 121,359 | 15,798 | ||||||
CoreVest American Finance Trust | ||||||||
Series 2019-1, Class E, 5.795%, 3/15/52 (a)(c) | 242,500 | 218,097 | ||||||
Countrywide Alternative Loan Trust | ||||||||
Series 2004-15, Class 2A2, 3.757%, 9/25/34 (a) | 296,152 | 264,486 | ||||||
Series 2006-4CB, Class 2A3, 5.500%, 4/25/36 | 3,608 | 2,885 | ||||||
Series 2006-OA3, Class 1A1, 4.444% | ||||||||
(1 Month LIBOR USD + 0.400%), 5/25/36 (h) | 7,801 | 6,835 | ||||||
Series 2006-OA9, Class 1A1, 4.139% | ||||||||
(1 Month LIBOR USD + 0.200%), 7/20/46 (h) | 23,980 | 18,661 | ||||||
Countrywide Asset-Backed Certificates | ||||||||
Series 2006-24, Class 2A3, 4.194% | ||||||||
(1 Month LIBOR USD + 0.150%), 6/25/47 (h) | 928 | 926 | ||||||
The accompanying notes are an integral part of these financial statements.
20
SEMPER MBS TOTAL RETURN FUND
SCHEDULE OF INVESTMENTS at November 30, 2022, Continued
| Principal | ||||||||
| Amount | Value | |||||||
Credit Suisse Mortgage Trust | ||||||||
Series 2020-AFC1, Class B1, 3.445%, 2/25/50 (a)(c) | $ | 4,228,000 | $ | 3,504,524 | ||||
Series 2020-AFC1, Class B2, 4.416%, 2/25/50 (a)(c) | 5,459,650 | 4,548,422 | ||||||
Deephaven Residential Mortgage Trust | ||||||||
Series 2021-1, Class B2, 3.955%, 5/25/65 (a)(c)(e) | 3,200,000 | 2,557,694 | ||||||
Series 2021-4, Class B2, 4.472%, 11/25/66 (a)(c) | 4,000,000 | 2,703,620 | ||||||
Flagstar Mortgage Trust | ||||||||
Series 2018-1, Class B5, 3.953%, 3/25/48 (a)(c) | 1,206,000 | 649,220 | ||||||
Fort KL | ||||||||
Series 2021-SFR1, Class G, 4.105%, 9/17/38 (c) | 6,811,000 | 5,702,823 | ||||||
GreenPoint Mortgage Funding Trust | ||||||||
Series 2005-AR4, Class 4A1A, 4.664% | ||||||||
(1 Month LIBOR USD + 0.620%), 10/25/45 (h) | 16,168,121 | 14,231,850 | ||||||
GSAA Home Equity Trust | ||||||||
Series 2006-5, Class 2A1, 4.184% | ||||||||
(1 Month LIBOR USD + 0.140%), 3/25/36 (h) | 26,245 | 9,762 | ||||||
JP Morgan Mortgage Trust | ||||||||
Series 2014-IVR6, Class B4, 4.392%, 7/25/44 (a)(c) | 500,500 | 415,569 | ||||||
Series 2017-1, Class B5, 3.449%, 1/25/47 (a)(c) | 1,766,160 | 1,404,715 | ||||||
Series 2019-HYB1, Class B4, 4.052%, 10/25/49 (a)(c) | 4,979,610 | 4,437,797 | ||||||
Series 2019-5, Class B6, 4.332%, 11/25/49 (a)(c)(e) | 3,601,237 | 1,868,978 | ||||||
Series 2019-5, Class B5, 4.486%, 11/25/49 (a)(c) | 1,232,439 | 801,874 | ||||||
Series 2020-2, Class B5, 3.822%, 7/25/50 (a)(c) | 2,226,107 | 1,608,538 | ||||||
Series 2020-2, Class B6Z, 6.562%, 7/25/50 (a)(c) | 3,632,673 | 2,385,893 | ||||||
Series 2021-3, Class A3X, 0.500%, 7/25/51 (a)(c)(g) | 62,471,291 | 1,633,890 | ||||||
Series 2021-6, Class AX4, 0.200%, 10/25/51 (a)(c)(g) | 78,146,084 | 768,234 | ||||||
JP Morgan Wealth Management | ||||||||
Series 2021-CL1, Class M4, 6.297% | ||||||||
(SOFR30A + 2.750%), 3/25/51 (c)(h) | 1,036,681 | 866,669 | ||||||
Series 2021-CL1, Class M5, 7.197% | ||||||||
(SOFR30A + 3.650%), 3/25/51 (c)(h) | 705,612 | 611,725 | ||||||
Lehman Mortgage Trust | ||||||||
Series 2008-4, Class A1, 4.396% | ||||||||
(1 Month LIBOR USD + 0.380%), 1/25/37 (h) | 22,389,308 | 6,979,968 | ||||||
LSTAR Securities Investment Ltd. | ||||||||
Series 2019-3, Class A2, 8.268% | ||||||||
(1 Month LIBOR USD + 4.500%), 4/1/24 (c)(d)(h) | 3,250,159 | 3,273,958 | ||||||
Series 2019-4, Class A2, 8.268% | ||||||||
(1 Month LIBOR USD + 4.500%), 5/1/24 (c)(d)(h) | 10,441,908 | 10,516,644 | ||||||
Series 2021-1, Class A, 5.568% | ||||||||
(1 Month LIBOR USD + 1.800%), 2/1/26 (c)(d)(h) | 926,614 | 839,102 | ||||||
Series 2021-2, Class A2, 6.518% | ||||||||
(1 Month LIBOR USD + 2.750%), 3/2/26 (c)(d)(h) | 9,730,449 | 9,800,028 | ||||||
The accompanying notes are an integral part of these financial statements.
21
SEMPER MBS TOTAL RETURN FUND
SCHEDULE OF INVESTMENTS at November 30, 2022, Continued
| Principal | ||||||||
| Amount | Value | |||||||
Merrill Lynch Mortgage Investors Trust | ||||||||
Series 2005-AR1, Class M2, 5.049% | ||||||||
(1 Month LIBOR USD + 1.005%), 6/25/36 (h) | $ | 2,285,675 | $ | 1,925,275 | ||||
Mill City Mortgage Loan Trust | ||||||||
Series 2019-1, Class B1, 3.500%, 10/25/69 (a)(c) | 2,245,863 | 1,755,532 | ||||||
Morgan Stanley Residential Mortgage Loan Trust | ||||||||
Series 2021-5, Class A9IO, 0.250%, 8/25/51 (a)(c)(g) | 37,254,224 | 504,515 | ||||||
New Residential Mortgage Loan Trust | ||||||||
Series 2021-NQ2R, Class B1, 3.008%, 10/25/58 (a)(c)(e) | 2,034,000 | 1,677,818 | ||||||
Series 2021-NQ2R, Class B2, 3.963%, 10/25/58 (a)(c)(e) | 1,813,000 | 1,428,718 | ||||||
NMLT Trust | ||||||||
Series 2021-INV1, Class B1, 3.613%, 5/25/56 (a)(c) | 7,326,000 | 4,615,282 | ||||||
Series 2021-INV2, Class B2, 4.072%, 8/25/56 (a)(c) | 4,000,000 | 2,589,869 | ||||||
Oaktown Re VI Ltd. | ||||||||
Series 2021-1A, Class M2, 7.497% | ||||||||
(SOFR30A + 3.950%), 10/25/33 (c)(h) | 1,226,000 | 1,108,991 | ||||||
Pretium Mortgage Credit Partners LLC | ||||||||
Series 2021-NPL6, Class A2, 5.071%, 7/25/51 (c)(j) | 2,503,000 | 2,207,696 | ||||||
Progress Residential Trust | ||||||||
Series 2020-SFR3, Class H, 6.234%, 10/17/27 (c) | 1,000,000 | 926,143 | ||||||
RAAC Series Trust | ||||||||
Series 2004-SP1, Class AI3, 6.118%, 3/25/34 (d) | 2,064 | 1,995 | ||||||
Radnor RE Ltd. | ||||||||
Series 2021-2, Class M2, 8.547% | ||||||||
(SOFR30A + 5.000%), 11/25/31 (c)(h) | 1,234,000 | 1,153,937 | ||||||
RALI Series Trust | ||||||||
Series 2006-QS6, Class 1AV, 0.771%, 6/25/36 (a)(g) | 5,241,331 | 114,125 | ||||||
Series 2006-QS6, Class 1A11, 4.744% | ||||||||
(1 Month LIBOR USD + 0.700%), 6/25/36 (h) | 2,315,143 | 1,841,359 | ||||||
RAMP Series Trust | ||||||||
Series 2007-RS1, Class A3, 4.384% | ||||||||
(1 Month LIBOR USD + 0.340%), 2/25/37 (h) | 9,723,687 | 2,915,906 | ||||||
Series 2007-RS1, Class A4, 4.604% | ||||||||
(1 Month LIBOR USD + 0.560%), 2/25/37 (h) | 10,547,597 | 2,801,870 | ||||||
Reperforming Loan REMIC Trust | ||||||||
Series 2005-R1, Class 1AF1, 4.404% | ||||||||
(1 Month LIBOR USD + 0.360%), 3/25/35 (c)(h) | 1,601,648 | 1,516,673 | ||||||
Series 2006-R1, Class AF1, 4.384% | ||||||||
(1 Month LIBOR USD + 0.340%), 1/25/36 (c)(h) | 2,069,027 | 1,966,230 | ||||||
Residential Accredit Loans, Inc. Series Trust | ||||||||
Series 2005-QS13, Class 2A1, 4.716% | ||||||||
(1 Month LIBOR USD + 0.700%), 9/25/35 (h) | 3,016,480 | 2,377,008 | ||||||
The accompanying notes are an integral part of these financial statements.
22
SEMPER MBS TOTAL RETURN FUND
SCHEDULE OF INVESTMENTS at November 30, 2022, Continued
| Principal | ||||||||
| Amount | Value | |||||||
Residential Accredit Loans, Inc. Series Trust (Continued) | ||||||||
Series 2006-QS6, Class 1A9, 4.644% | ||||||||
(1 Month LIBOR USD + 0.600%), 6/25/36 (h) | $ | 2,832,407 | $ | 2,238,011 | ||||
Series 2008-QR1, Class 2A1, 4.544% | ||||||||
(1 Month LIBOR USD + 0.500%), 9/25/36 (h) | 1,548,223 | 1,109,417 | ||||||
Series 2006-QS18, Class 1A1, 4.644% | ||||||||
(1 Month LIBOR USD + 0.600%), 12/25/36 (h) | 2,718,634 | 2,162,352 | ||||||
Residential Funding Securities Corp. | ||||||||
Series 2002-RP1, Class A1, 4.904% | ||||||||
(1 Month LIBOR USD + 0.860%), 3/25/33 (c)(h) | 498,345 | 486,393 | ||||||
Seasoned Credit Risk Transfer Trust | ||||||||
Series 2018-2, Class XSIO, 0.065%, 11/25/57 (a) | 431,309,126 | 1,175,576 | ||||||
Series 2018-2, Class BX, 3.164%, 11/25/57 (a) | 8,004,612 | 2,632,426 | ||||||
Star Trust | ||||||||
Series 2021-SFR2, Class G, 7.304% | ||||||||
(1 Month LIBOR USD + 3.400%), 1/17/24 (c)(h) | 2,800,000 | 2,697,003 | ||||||
Series 2021-SFR2, Class H, 8.054% | ||||||||
(1 Month LIBOR USD + 4.150%), 1/17/24 (c)(h) | 2,421,000 | 2,320,062 | ||||||
Series 2021-SFR1, Class H, 8.354% | ||||||||
(1 Month LIBOR USD + 4.450%), 4/17/38 (c)(h) | 1,000,000 | 937,400 | ||||||
Starwood Mortgage Residential Trust | ||||||||
Series 2020-INV1, Class B1, 3.257%, 11/25/55 (c) | 2,750,000 | 2,084,218 | ||||||
Series 2020-INV1, Class B2, 4.261%, 11/25/55 (c) | 1,000,000 | 792,107 | ||||||
Structured Adjustable Rate Mortgage Loan Trust | ||||||||
Series 2005-21, Class 3A1, 3.530%, 11/25/35 (a) | 27,286 | 24,149 | ||||||
Terwin Mortgage Trust | ||||||||
Series 2004-4SL, Class B3, 8.000%, 3/25/34 (a)(c) | 21,259 | 15,990 | ||||||
Towd Point Mortgage Trust | ||||||||
Series 2019-HY1, Class B2, 6.194% | ||||||||
(1 Month LIBOR USD + 2.150%), 10/25/48 (c)(h) | 11,739,000 | 10,881,381 | ||||||
Series 2019-HY1, Class B3, 6.194% | ||||||||
(1 Month LIBOR USD + 2.150%), 10/25/48 (c)(h) | 6,170,000 | 4,556,840 | ||||||
Series 2019-HY1, Class B4, 6.194% | ||||||||
(1 Month LIBOR USD + 2.150%), 10/25/48 (c)(h) | 6,170,000 | 4,253,067 | ||||||
Series 2019-1, Class B2, 3.704%, 3/25/58 (a)(c) | 4,000,000 | 2,722,655 | ||||||
Series 2018-6, Class B2, 3.837%, 3/25/58 (a)(c) | 2,750,000 | 1,975,010 | ||||||
Series 2018-3, Class B2, 3.672%, 5/25/58 (a)(c) | 1,750,000 | 1,223,496 | ||||||
Series 2019-HY2, Class B2, 6.294% | ||||||||
(1 Month LIBOR USD + 2.250%), 5/25/58 (c)(h) | 8,639,000 | 7,387,853 | ||||||
Series 2019-HY2, Class B3, 6.294% | ||||||||
(1 Month LIBOR USD + 2.250%), 5/25/58 (c)(h) | 2,294,000 | 1,732,485 | ||||||
Series 2019-HY2, Class B4, 6.294% | ||||||||
(1 Month LIBOR USD + 2.250%), 5/25/58 (c)(h) | 1,836,000 | 1,316,752 | ||||||
The accompanying notes are an integral part of these financial statements.
23
SEMPER MBS TOTAL RETURN FUND
SCHEDULE OF INVESTMENTS at November 30, 2022, Continued
| Principal | ||||||||
| Amount | Value | |||||||
Towd Point Mortgage Trust (Continued) | ||||||||
Series 2019-HY3, Class B1, 6.044% | ||||||||
(1 Month LIBOR USD + 2.000%), 10/25/59 (c)(h) | $ | 5,514,000 | $ | 4,842,845 | ||||
Series 2019-HY3, Class B2, 6.044% | ||||||||
(1 Month LIBOR USD + 2.000%), 10/25/59 (c)(h) | 4,130,000 | 3,526,222 | ||||||
Series 2019-HY3, Class B3, 6.044% | ||||||||
(1 Month LIBOR USD + 2.000%), 10/25/59 (c)(h) | 1,106,000 | 798,400 | ||||||
Series 2019-HY3, Class B4, 6.044% | ||||||||
(1 Month LIBOR USD + 2.000%), 10/25/59 (c)(h) | 1,105,000 | 750,123 | ||||||
TRK Trust | ||||||||
Series 2021-INV2, Class B1, 4.104%, 11/25/56 (a)(c) | 4,000,000 | 2,613,849 | ||||||
Verus Securitization Trust | ||||||||
Series 2019-INV3, Class B2, 4.791%, 11/25/59 (a)(c) | 650,000 | 511,094 | ||||||
Series 2021-R3, Class B2, 4.070%, 4/25/64 (a)(c)(e) | 3,081,000 | 2,126,848 | ||||||
Series 2021-5, Class B2, 3.941%, 9/25/66 (a)(c)(e) | 1,750,000 | 1,235,313 | ||||||
Series 2021-6, Class B2, 4.526%, 10/25/66 (a)(c) | 4,369,000 | 2,632,447 | ||||||
Series 2021-8, Class B2, 4.334%, 11/25/66 (a)(c)(j) | 288,000 | 180,063 | ||||||
VOLT LLC | ||||||||
Series 2021-NPL4, Class A2, 4.949%, 3/27/51 (c)(j) | 1,500,000 | 1,284,852 | ||||||
Washington Mutual Mortgage Pass-Through | ||||||||
Certificates Series Trust | ||||||||
Series 2007-4, Class 1A5, 7.000%, 6/25/37 | 5,106,767 | 2,379,388 | ||||||
| Total Residential Mortgage-Backed | ||||||||
| Securities – Non-Agency (cost $277,048,806) | 214,573,166 | |||||||
| PRIVATE PLACEMENT PARTICIPATION AGREEMENT – 0.0% | ||||||||
CCTC Acquisition Partners LLC, | ||||||||
Convertible Promissory Note | ||||||||
12.000%, 2/8/23 (e)(f)(i) | 749,058 | 0 | ||||||
| Total Private Placement Participation Agreement | ||||||||
| (cost $749,058) | 0 | |||||||
The accompanying notes are an integral part of these financial statements.
24
SEMPER MBS TOTAL RETURN FUND
SCHEDULE OF INVESTMENTS at November 30, 2022, Continued
| Shares | Value | |||||||
| MONEY MARKET FUND – 2.3% | ||||||||
First American Government | ||||||||
Obligations Fund – Class Z, 3.632% (b) | 7,992,460 | $ | 7,992,460 | |||||
| Total Money Market Fund (cost $7,992,460) | 7,992,460 | |||||||
| Total Investments (cost $425,910,327) – 101.8% | 346,738,105 | |||||||
| Liabilities less Other Assets – (1.8)% | (6,248,704 | ) | ||||||
| TOTAL NET ASSETS – 100.0% | $ | 340,489,401 | ||||||
| (a) | Variable rate security. The coupon is based on an underlying pool of loans and represents the rate in effect as of November 30, 2022. |
| (b) | Rate shown is the 7-day annualized yield as of November 30, 2022. |
| (c) | Security exempt from registration under Rule 144A of the Securities Act of 1933, as amended, and may be sold only to dealers in the program or other “qualified institutional buyers.” As of November 30, 2022, the value of these investments was $281,608,929 or 82.7% of total net assets. |
| (d) | Step-up bond. The interest rate may step up conditioned upon the aggregate remaining principal balance of the underlying mortgage loans being reduced below a targeted percentage of the aggregate original principal balance of the mortgage loans. The interest rate shown is the rate in effect as of November 30, 2022. |
| (e) | Security valued at fair value using procedures adopted by Semper Capital Management, L.P., the Fund’s valuation designee. Value determined using significant unobservable inputs. As of November 30, 2022, the total value of fair valued securities was $10,895,369 or 3.2% of total net assets. |
| (f) | Non-income producing. |
| (g) | Interest only security. |
| (h) | Variable or floating rate security based on a reference index and spread. The rate reported is the rate in effect as of November 30, 2022. |
| (i) | Security is restricted. The Fund cannot sell or otherwise transfer this agreement without prior written approval of CCTC Acquisition Partners LLC. As of November 30, 2022, the value of this investment was $0 or 0.0% of total net assets. The security was acquired in February 2018 at a cost of $749,058. |
| (j) | Step-up bond. The interest rate will step up if the issuer does not redeem the bond by an expected redemption date. The interest rate shown is the rate in effect as of November 30, 2022. |
FNMA – Federal National Mortgage Association
GNMA – Government National Mortgage Association
LIBOR – London Interbank Offered Rate
REMIC – Real Estate Mortgage Investment Conduit
SOFR – Secured Overnight Financing Rate
The accompanying notes are an integral part of these financial statements.
25
SEMPER SHORT DURATION FUND
SCHEDULE OF INVESTMENTS at November 30, 2022
| Principal | ||||||||
| Amount | Value | |||||||
| ASSET-BACKED SECURITIES – NON-AGENCY – 1.7% | ||||||||
Exeter Automobile Receivables Trust | ||||||||
Series 2021-2A, Class D, 1.400%, 4/15/27 | $ | 950,000 | $ | 866,613 | ||||
Series 2021-4A, Class D, 1.960%, 1/17/28 | 560,000 | 506,937 | ||||||
GLS Auto Receivables Trust | ||||||||
Series 2020-4A, Class D, 1.640%, 10/15/26 (c) | 1,750,000 | 1,662,606 | ||||||
SLM Private Credit Student Loan Trust | ||||||||
Series 2003-C, Class A5, 4.953% | ||||||||
(28 Day Auction Rate + 0.000%), 9/15/32 (f) | 200,000 | 194,236 | ||||||
SoFi Professional Loan Program, LLC | ||||||||
Series 2016-B, Class A1, 5.216% | ||||||||
(1 Month LIBOR USD + 1.200%), 6/25/33 (c)(f) | 57,716 | 57,689 | ||||||
Series 2016-C, Class A1, 5.116% | ||||||||
(1 Month LIBOR USD + 1.100%), 10/27/36 (c)(f) | 60,382 | 60,371 | ||||||
South Carolina Student Loan Corp. | ||||||||
Series 2013-1, Class A, 4.544% | ||||||||
(1 Month LIBOR USD + 0.500%), 1/25/41 (f) | 86,033 | 85,431 | ||||||
| Total Asset-Backed Securities – Non-Agency | ||||||||
| (cost $3,652,283) | 3,433,883 | |||||||
| COLLATERALIZED LOAN OBLIGATIONS – 22.8% | ||||||||
Anchorage Capital CLO Ltd. | ||||||||
Series 2014-4RA, Class A, 5.424% | ||||||||
(3 Month LIBOR USD + 1.050%), 1/28/31 (c)(f) | 2,448,796 | 2,416,795 | ||||||
Apidos CLO XV | ||||||||
Series 2013-15A, Class A1RR, 5.253% | ||||||||
(3 Month LIBOR USD + 1.010%), 4/20/31 (c)(f) | 1,000,000 | 984,373 | ||||||
Apidos CLO XXIV | ||||||||
Series 2016-24A, Class A1AL, 5.193% | ||||||||
(3 Month LIBOR USD + 0.950%), 10/20/30 (c)(f) | 2,500,000 | 2,455,747 | ||||||
Atlas Senior Loan Fund IX Ltd. | ||||||||
Series 2018-9A, Class A, 5.113% | ||||||||
(3 Month LIBOR USD + 0.870%), 4/20/28 (c)(f) | 919,502 | 912,606 | ||||||
Benefit Street Partners CLO V-B Ltd. | ||||||||
Series 2018-5BA, Class A1A, 5.333% | ||||||||
(3 Month LIBOR USD + 1.090%), 4/20/31 (c)(f) | 1,680,000 | 1,649,163 | ||||||
Carlyle Global Market Strategies CLO Ltd. | ||||||||
Series 2014-5A, Class A1RR, 5.219% | ||||||||
(3 Month LIBOR USD + 1.140%), 7/15/31 (c)(f) | 2,243,454 | 2,201,305 | ||||||
Series 2015-AR3, Class 1A, 5.223% | ||||||||
(3 Month LIBOR USD + 0.980%), 7/20/31 (c)(f) | 1,761,799 | 1,720,190 | ||||||
The accompanying notes are an integral part of these financial statements.
26
SEMPER SHORT DURATION FUND
SCHEDULE OF INVESTMENTS at November 30, 2022, Continued
| Principal | ||||||||
| Amount | Value | |||||||
Crestline Denali CLO XVII Ltd. | ||||||||
Series 2018-1A, Class AR, 5.139% | ||||||||
(3 Month LIBOR USD + 1.060%), 10/15/31 (c)(f) | $ | 2,500,000 | $ | 2,459,638 | ||||
Crown Point CLO IV Ltd. | ||||||||
Series 2018-4A, Class A, 5.343% | ||||||||
(3 Month LIBOR USD + 1.100%), 4/20/31 (c)(f) | 2,177,000 | 2,139,503 | ||||||
Ellington CLO IV Ltd. | ||||||||
Series 2019-4A, Class AR, 5.659% | ||||||||
(3 Month LIBOR USD + 1.580%), 4/15/29 (c)(f) | 613,986 | 609,703 | ||||||
ICG US CLO Ltd. | ||||||||
Series 2015-1A, Class A1R, 5.367% | ||||||||
(3 Month LIBOR USD + 1.140%), 10/19/28 (c)(f) | 1,284,807 | 1,268,747 | ||||||
KKR CLO 9 Ltd. | ||||||||
Series 2017-9, Class AR2, 5.029% | ||||||||
(3 Month LIBOR USD + 0.950%), 7/15/30 (c)(f) | 742,535 | 728,225 | ||||||
KKR Financial CLO Ltd. | ||||||||
Series 2013-1A, Class A1R, 5.369% | ||||||||
(3 Month LIBOR USD + 1.290%), 4/15/29 (c)(f) | 1,645,525 | 1,628,861 | ||||||
Mountain View CLO X Ltd. | ||||||||
Series 2015-10A, Class AR, 4.761% | ||||||||
(3 Month LIBOR USD + 0.820%), 10/13/27 (c)(f) | 1,013,327 | 1,008,207 | ||||||
Nassau II Ltd. | ||||||||
Series 2017-IIA, Class AL, 5.329% | ||||||||
(3 Month LIBOR USD + 1.250%), 1/15/30 (c)(f) | 732,791 | 724,922 | ||||||
Neuberger Berman Loan Advisers CLO 25 Ltd. | ||||||||
Series 2017-25A, Class AR, 5.124% | ||||||||
(3 Month LIBOR USD + 0.930%), 10/18/29 (c)(f) | 2,955,000 | 2,906,777 | ||||||
Newfleet CLO Ltd. | ||||||||
Series 2016-1A, Class A1R, 5.193% | ||||||||
(3 Month LIBOR USD + 0.950%), 4/20/28 (c)(f) | 61,564 | 61,219 | ||||||
OHA Credit Partners VII Ltd. | ||||||||
Series 2012-7A, Class AR3, 5.745% | ||||||||
(3 Month LIBOR USD + 1.070%), 2/20/34 (c)(f) | 726,000 | 700,037 | ||||||
OZLM VI Ltd. | ||||||||
Series 2014-6A, Class A1S, 5.159% | ||||||||
(3 Month LIBOR USD + 1.080%), 4/17/31 (c)(f) | 2,955,609 | 2,889,261 | ||||||
OZLM VIII Ltd. | ||||||||
Series 2014-8A, Class A1R3, 5.059% | ||||||||
(3 Month LIBOR USD + 0.980%), 10/17/29 (c)(f) | 2,241,405 | 2,203,729 | ||||||
Regatta XIV Funding Ltd. | ||||||||
Series 2018-3A, Class A, 5.548% | ||||||||
(3 Month LIBOR USD + 1.190%), 10/25/31 (c)(f) | 1,000,000 | 979,360 | ||||||
The accompanying notes are an integral part of these financial statements.
27
SEMPER SHORT DURATION FUND
SCHEDULE OF INVESTMENTS at November 30, 2022, Continued
| Principal | ||||||||
| Amount | Value | |||||||
Saranac CLO III Ltd. | ||||||||
Series 2014-3A, Class ALR, 5.202% | ||||||||
(3 Month LIBOR USD + 1.600%), 6/22/30 (c)(f) | $ | 1,734,104 | $ | 1,713,859 | ||||
Saranac CLO VII Ltd. | ||||||||
Series 2014-2A, Class A1AR, 5.905% | ||||||||
(3 Month LIBOR USD + 1.230%), 11/20/29 (c)(f) | 1,994,458 | 1,971,117 | ||||||
Sound Point CLO V-R Ltd. | ||||||||
Series 2014-IRA, Class A, 5.344% | ||||||||
(3 Month LIBOR USD + 1.150%), 7/18/31 (c)(f) | 1,550,000 | 1,508,895 | ||||||
Sound Point CLO XXI Ltd. | ||||||||
Series 2018-3A, Class A1A, 5.507% | ||||||||
(3 Month LIBOR USD + 1.180%), 10/26/31 (c)(f) | 1,000,000 | 971,773 | ||||||
Telos CLO Ltd. | ||||||||
Series 2013-4A, Class AR, 5.319% | ||||||||
(3 Month LIBOR USD + 1.240%), 1/17/30 (c)(f) | 1,063,083 | 1,047,003 | ||||||
Venture XVII CLO Ltd. | ||||||||
Series 2014-17A, Class ARR, 4.959% | ||||||||
(3 Month LIBOR USD + 0.880%), 4/15/27 (c)(f) | 1,342,935 | 1,321,130 | ||||||
Wellfleet CLO Ltd. | ||||||||
Series 2017-2A, Class A1R, 5.303% | ||||||||
(3 Month LIBOR USD + 1.060%), 10/20/29 (c)(f) | 2,925,980 | 2,881,684 | ||||||
Zais CLO 8 Ltd. | ||||||||
Series 2018-1A, Class A, 5.029% | ||||||||
(3 Month LIBOR USD + 0.950%), 4/15/29 (c)(f) | 1,010,779 | 998,197 | ||||||
| Total Collateralized Loan Obligations (cost $45,763,509) | 45,062,026 | |||||||
| COMMERCIAL MORTGAGE-BACKED SECURITIES – AGENCY – 0.0% | ||||||||
GNMA | ||||||||
Series 2009-4, Class IO, 0.390%, 1/16/49 (a)(d) | 302,690 | 740 | ||||||
| Total Commercial Mortgage-Backed Securities – Agency | ||||||||
| (cost $1,655) | 740 | |||||||
| COMMERCIAL MORTGAGE-BACKED SECURITIES – NON-AGENCY – 24.1% | ||||||||
Arbor Realty Collateralized Loan Obligation Ltd. | ||||||||
Series 2021-FL2, Class C, 5.825% | ||||||||
(1 Month LIBOR USD + 1.950%), 5/15/36 (c)(f) | 1,113,000 | 1,042,584 | ||||||
Series 2021-FL2, Class D, 6.375% | ||||||||
(1 Month LIBOR USD + 2.500%), 5/15/36 (c)(f) | 3,000,000 | 2,777,621 | ||||||
Bayview Commercial Asset Trust | ||||||||
Series 2007-2A, Class A1, 4.314% | ||||||||
(1 Month LIBOR USD + 0.270%), 7/25/37 (c)(f) | 205,583 | 180,573 | ||||||
The accompanying notes are an integral part of these financial statements.
28
SEMPER SHORT DURATION FUND
SCHEDULE OF INVESTMENTS at November 30, 2022, Continued
| Principal | ||||||||
| Amount | Value | |||||||
BDS Ltd. | ||||||||
Series 2021-FL7, Class D, 6.289% | ||||||||
(1 Month LIBOR USD + 2.350%), 6/16/36 (c)(f) | $ | 3,250,000 | $ | 3,027,101 | ||||
Series 2021-FL7, Class E, 6.739% | ||||||||
(1 Month LIBOR USD + 2.800%), 6/16/36 (c)(f) | 2,500,000 | 2,299,987 | ||||||
BX Commercial Mortgage Trust | ||||||||
Series 2021-VOLT, Class F, 6.275% | ||||||||
(1 Month LIBOR USD + 2.400%), 9/15/36 (c)(f) | 2,500,000 | 2,311,559 | ||||||
Series 2021-VOLT, Class G, 6.725% | ||||||||
(1 Month LIBOR USD + 2.850%), 9/15/36 (c)(f) | 1,500,000 | 1,375,101 | ||||||
Series 2019-XL, Class F, 5.909% | ||||||||
(1 Month LIBOR USD + 2.114%), 10/15/36 (c)(f) | 850,000 | 817,102 | ||||||
Series 2019-XL, Class G, 6.209% | ||||||||
(1 Month LIBOR USD + 2.414%), 10/15/36 (c)(f) | 1,717,000 | 1,642,523 | ||||||
Series 2021-SOAR, Class E, 5.676% | ||||||||
(1 Month LIBOR USD + 1.800%), 6/15/38 (c)(f) | 3,473,686 | 3,252,264 | ||||||
BXMT Ltd. | ||||||||
Series 2020-FL3, Class A, 4.881% | ||||||||
(1 Month LIBOR USD + 1.514%), 11/15/37 (c)(f)(g) | 1,250,000 | 1,232,099 | ||||||
Series 2020-FL2, Class C, 5.639% | ||||||||
(1 Month LIBOR USD + 1.764%), 2/15/38 (c)(f)(g) | 2,950,000 | 2,781,095 | ||||||
Series 2020-FL2, Class D, 5.939% | ||||||||
(1 Month LIBOR USD + 2.064%), 2/15/38 (c)(f)(g) | 2,000,000 | 1,906,323 | ||||||
Series 2021-FL4, Class C, 5.625% | ||||||||
(1 Month LIBOR USD + 1.750%), 5/15/38 (c)(f)(g) | 3,000,000 | 2,762,514 | ||||||
Series 2021-FL4, Class D, 6.125% | ||||||||
(1 Month LIBOR USD + 2.250%), 5/15/38 (c)(f)(g) | 3,500,000 | 3,200,351 | ||||||
DBCG Mortgage Trust | ||||||||
Series 2017-BBG, Class C, 4.876% | ||||||||
(1 Month LIBOR USD + 1.000%), 6/15/34 (c)(f) | 350,000 | 337,760 | ||||||
HGI CRE CLO Ltd. | ||||||||
Series 2021-FL1, Class C, 5.587% | ||||||||
(1 Month LIBOR USD + 1.700%), 6/16/36 (c)(f) | 2,500,000 | 2,370,810 | ||||||
Series 2021-FL1, Class D, 6.237% | ||||||||
(1 Month LIBOR USD + 2.350%), 6/16/36 (c)(f) | 2,000,000 | 1,850,823 | ||||||
Series 2021-FL1, Class E, 6.837% | ||||||||
(1 Month LIBOR USD + 2.950%), 6/16/36 (c)(f) | 750,000 | 691,800 | ||||||
Series 2021-FL2, Class D, 6.037% | ||||||||
(1 Month LIBOR USD + 2.150%), 9/17/36 (c)(f)(g) | 1,500,000 | 1,376,642 | ||||||
Series 2021-FL2, Class E, 6.337% | ||||||||
(1 Month LIBOR USD + 2.450%), 9/17/36 (c)(f)(g) | 2,038,000 | 1,863,479 | ||||||
The accompanying notes are an integral part of these financial statements.
29
SEMPER SHORT DURATION FUND
SCHEDULE OF INVESTMENTS at November 30, 2022, Continued
| Principal | ||||||||
| Amount | Value | |||||||
Multi-Family Housing Mortgage Loan Trust | ||||||||
Series 2021-FL5, Class D, 6.478% | ||||||||
(1 Month LIBOR USD + 2.614%), 7/15/36 (c)(f) | $ | 1,500,000 | $ | 1,403,982 | ||||
Series 2021-FL6, Class C, 5.761% | ||||||||
(1 Month LIBOR USD + 1.850%), 7/16/36 (c)(f) | 3,300,000 | 3,089,781 | ||||||
Series 2021-FL7, Class E, 6.739% | ||||||||
(1 Month LIBOR USD + 2.800%), 10/16/36 (c)(f) | 1,700,000 | 1,568,447 | ||||||
STWD Ltd. | ||||||||
Series 2021-FL2, Class D, 6.711% | ||||||||
(1 Month LIBOR USD + 2.800%), 4/18/38 (c)(f) | 2,000,000 | 1,838,158 | ||||||
Velocity Commercial Capital Loan Trust | ||||||||
Series 2017-2, Class AFL, 4.944% | ||||||||
(1 Month LIBOR USD + 0.900%), 11/25/47 (c)(f) | 106,052 | 105,459 | ||||||
Series 2019-2, Class M3, 3.480%, 7/25/49 (a)(c) | 389,580 | 345,921 | ||||||
| Total Commercial Mortgage-Backed Securities – | ||||||||
| Non-Agency (cost $50,847,086) | 47,451,859 | |||||||
| CORPORATE BOND – 1.0% | ||||||||
Korth Direct Mortgage, Inc. | ||||||||
10.000%, 3/25/25 (c)(h) | 2,000,000 | 1,891,250 | ||||||
| Total Corporate Bond (cost $1,896,473) | 1,891,250 | |||||||
| RESIDENTIAL MORTGAGE-BACKED SECURITIES – AGENCY – 24.2% | ||||||||
Fannie Mae Connecticut Avenue Securities | ||||||||
Series 2014-C04, Class 2M2, 9.016% | ||||||||
(1 Month LIBOR USD + 5.000%), 11/25/24 (f) | 93,337 | 94,270 | ||||||
Series 2017-C01, Class 1ED1, 5.266% | ||||||||
(1 Month LIBOR USD + 1.250%), 7/25/29 (f) | 191,468 | 191,255 | ||||||
Series 2017-C01, Class 1B1, 9.766% | ||||||||
(1 Month LIBOR USD + 5.750%), 7/25/29 (f) | 2,960,000 | 3,184,007 | ||||||
Series 2017-C03, Class 1M2C, 7.016% | ||||||||
(1 Month LIBOR USD + 3.000%), 10/25/29 (f) | 1,000,000 | 978,657 | ||||||
Series 2017-C04, Class 2M2, 6.866% | ||||||||
(1 Month LIBOR USD + 2.850%), 11/25/29 (f) | 917,253 | 931,467 | ||||||
Series 2019-R06, Class 2B1, 7.794% | ||||||||
(1 Month LIBOR USD + 3.750%), 9/25/39 (c)(f) | 2,000,000 | 1,935,810 | ||||||
Series 2020-SBT1, Class 1M2, 7.666% | ||||||||
(1 Month LIBOR USD + 3.650%), 2/25/40 (c)(f) | 1,983,000 | 1,941,724 | ||||||
Series 2021-R01, Class 1M2, 5.071% | ||||||||
(SOFR30A + 1.550%), 10/25/41 (c)(f) | 3,350,000 | 3,220,020 | ||||||
The accompanying notes are an integral part of these financial statements.
30
SEMPER SHORT DURATION FUND
SCHEDULE OF INVESTMENTS at November 30, 2022, Continued
| Principal | ||||||||
| Amount | Value | |||||||
Fannie Mae Connecticut Avenue Securities (Continued) | ||||||||
Series 2021-R01, Class 1B1, 6.621% | ||||||||
(SOFR30A + 3.100%), 10/25/41 (c)(f) | $ | 1,150,000 | $ | 1,060,875 | ||||
Series 2021-R03, Class 1M2, 5.171% | ||||||||
(SOFR30A + 1.650%), 12/25/41 (c)(f) | 510,000 | 470,316 | ||||||
FHLMC REMIC Trust | ||||||||
Series 3834, Class GA, 3.500%, 3/15/26 | 134 | 134 | ||||||
Freddie Mac Structured Agency Credit Risk | ||||||||
Series 2017-HQA3, Class M2B, 6.366% | ||||||||
(1 Month LIBOR USD + 2.350%), 4/25/30 (f) | 1,500,000 | 1,479,154 | ||||||
Series 2021-DNA2, Class M2, 5.821% | ||||||||
(SOFR30A + 2.300%), 8/25/33 (c)(f) | 4,112,000 | 3,961,641 | ||||||
Series 2021-DNA2, Class B1, 6.921% | ||||||||
(SOFR30A + 3.400%), 8/25/33 (c)(f) | 2,060,000 | 1,853,259 | ||||||
Series 2021-DNA6, Class M2, 5.047% | ||||||||
(SOFR30A + 1.500%), 10/25/41 (c)(f) | 1,285,000 | 1,202,303 | ||||||
Series 2018-HRP1, Class M2, 5.666% | ||||||||
(1 Month LIBOR USD + 1.650%), 4/25/43 (c)(f) | 81,816 | 81,861 | ||||||
Series 2018-HRP2, Class M3, 6.416% | ||||||||
(1 Month LIBOR USD + 2.400%), 2/25/47 (c)(f) | 1,834,958 | 1,786,728 | ||||||
Series 2018-HRP2, Class B1, 8.216% | ||||||||
(1 Month LIBOR USD + 4.200%), 2/25/47 (c)(f) | 2,042,000 | 1,964,222 | ||||||
Series 2018-SPI2, Class M2, 3.820%, 5/25/48 (a)(c) | 29,416 | 27,845 | ||||||
Series 2020-HQA5, Class B1, 7.521% | ||||||||
(SOFR30A + 4.000%), 11/25/50 (c)(f) | 1,350,000 | 1,255,181 | ||||||
Series 2020-DNA6, Class B1, 6.521% | ||||||||
(SOFR30A + 3.000%), 12/25/50 (c)(f) | 775,000 | 721,302 | ||||||
Freddie Mac Structured Agency Credit Risk REMIC Trust | ||||||||
Series 2021-HQA1, Class M2AS, 4.771% | ||||||||
(SOFR30A + 1.250%), 8/25/33 (c)(f) | 4,500,000 | 4,508,424 | ||||||
Series 2021-DNA3, Class B1, 7.021% | ||||||||
(SOFR30A + 3.500%), 10/25/33 (c)(f) | 1,500,000 | 1,334,946 | ||||||
Series 2021-DNA5, Class B1, 6.571% | ||||||||
(SOFR30A + 3.050%), 1/25/34 (c)(f) | 3,269,000 | 2,921,349 | ||||||
Series 2022-DNA3, Class M18, 6.421% | ||||||||
(SOFR30A + 2.900%), 4/25/42 (c)(f) | 3,000,000 | 2,874,552 | ||||||
Series 2020-DNA1, Class B1, 6.316% | ||||||||
(1 Month LIBOR USD + 2.300%), 1/25/50 (c)(f) | 3,300,000 | 3,151,240 | ||||||
Series 2020-DNA4, Class B1, 10.016% | ||||||||
(1 Month LIBOR USD + 6.000%), 8/25/50 (c)(f) | 1,085,129 | 1,152,950 | ||||||
Series 2020-HQA4, Class B1, 9.266% | ||||||||
(1 Month LIBOR USD + 5.250%), 9/25/50 (c)(f) | 1,000,000 | 1,016,875 | ||||||
The accompanying notes are an integral part of these financial statements.
31
SEMPER SHORT DURATION FUND
SCHEDULE OF INVESTMENTS at November 30, 2022, Continued
| Principal | ||||||||
| Amount | Value | |||||||
Freddie Mac Structured Agency | ||||||||
Credit Risk REMIC Trust (Continued) | ||||||||
Series 2021-DNA1, Class B1, 6.171% | ||||||||
(SOFR30A + 2.650%), 1/25/51 (c)(f) | $ | 1,060,000 | $ | 892,677 | ||||
Series 2022-DNA7, Class M1A, 6.021% | ||||||||
(SOFR30A + 2.500%), 3/25/52 (c)(f) | 1,379,089 | 1,378,675 | ||||||
Freddie Mac Whole Loan Securities Trust | ||||||||
Series 2017-SC01, Class M1, 3.648%, 12/25/46 (a)(c) | 242,047 | 232,138 | ||||||
GNMA | ||||||||
Series 2008-55, Class WT, 5.483%, 6/20/37 (a) | 6,329 | 6,358 | ||||||
| Total Residential Mortgage-Backed Securities – Agency | ||||||||
| (cost $49,921,991) | 47,812,215 | |||||||
| �� | ||||||||
| RESIDENTIAL MORTGAGE-BACKED SECURITIES – NON-AGENCY – 23.7% | ||||||||
AMSR Trust | ||||||||
Series 2020-SFR4, Class G2, 4.870%, 11/17/37 (c) | 2,089,000 | 1,867,367 | ||||||
Angel Oak Mortgage Trust | ||||||||
Series 2021-3, Class M1, 2.479%, 5/25/66 (a)(c) | 620,000 | 362,009 | ||||||
Bellemeade Re Ltd. | ||||||||
Series 2020-3A, Class M2, 8.894% | ||||||||
(1 Month LIBOR USD + 4.850%), 10/25/30 (c)(f) | 1,764,000 | 1,726,599 | ||||||
Series 2021-1A, Class M1C, 6.497% | ||||||||
(SOFR30A + 2.950%), 3/25/31 (c)(f) | 2,685,000 | 2,559,060 | ||||||
Series 2021-2A, Class M1C, 5.397% | ||||||||
(SOFR30A + 1.850%), 6/25/31 (c)(f) | 3,450,000 | 3,064,694 | ||||||
Series 2021-3A, Class M1C, 5.097% | ||||||||
(SOFR30A + 1.550%), 9/25/31 (c)(f) | 1,725,000 | 1,522,842 | ||||||
Bombardier Capital Mortgage Securitization Corp. | ||||||||
Series 1999-B, Class A3, 7.180%, 12/15/29 (a) | 86,567 | 12,749 | ||||||
Boston Lending Trust | ||||||||
Series 2021-1, Class M1, 2.000%, 7/25/61 (a)(c)(g) | 1,103,048 | 908,054 | ||||||
Series 2021-1, Class M2, 2.000%, 7/25/61 (a)(c)(g) | 513,046 | 408,018 | ||||||
Brean Asset Backed Securities Trust | ||||||||
Series 2022-RM5, Class A, 4.500%, 9/25/62 (a)(c) | 2,162,096 | 1,976,296 | ||||||
Centex Home Equity Loan Trust | ||||||||
Series 2003-A, Class AF4, 4.250%, 12/25/31 (e) | 9,082 | 8,948 | ||||||
Credit-Based Asset Servicing and Securitization | ||||||||
Series 2003-CB1, Class AF, 3.950%, 1/25/33 | 3 | 3 | ||||||
Eagle RE Ltd. | ||||||||
Series 2021-1, Class M1C, 6.247% | ||||||||
(SOFR30A + 2.700%), 10/25/33 (c)(f) | 3,865,000 | 3,772,388 | ||||||
GSAA Trust | ||||||||
Series 2004-3, Class M1, 6.720%, 4/25/34 (e) | 33,824 | 30,311 | ||||||
The accompanying notes are an integral part of these financial statements.
32
SEMPER SHORT DURATION FUND
SCHEDULE OF INVESTMENTS at November 30, 2022, Continued
| Principal | ||||||||
| Amount | Value | |||||||
Home RE Ltd. | ||||||||
Series 2021-1, Class M1C, 6.344% | ||||||||
(1 Month LIBOR USD + 2.300%), 7/25/33 (c)(f) | $ | 1,000,000 | $ | 965,220 | ||||
Series 2021-1, Class M2, 6.894% | ||||||||
(1 Month LIBOR USD + 2.850%), 7/25/33 (c)(f) | 1,000,000 | 928,609 | ||||||
IMC Home Equity Loan Trust | ||||||||
Series 1998-3, Class A8, 5.432%, 8/20/29 (g) | 2,400 | 2,377 | ||||||
JP Morgan Mortgage Trust | ||||||||
Series 2014-IVR6, Class 2A4, 4.220%, 7/25/44 (a)(c) | 171,940 | 166,820 | ||||||
Series 2014-IVR6, Class B3, 4.392%, 7/25/44 (a)(c) | 1,638,898 | 1,368,801 | ||||||
Series 2018-7FRB, Class B3, 4.365%, 4/25/46 (a)(c) | 2,714,386 | 2,479,892 | ||||||
Series 2019-6, Class B3, 4.238%, 12/25/49 (a)(c) | 4,207,531 | 3,599,479 | ||||||
JP Morgan Wealth Management | ||||||||
Series 2021-CL1, Class M3, 5.347% | ||||||||
(SOFR30A + 1.800%), 3/25/51 (c)(f) | 1,237,329 | 1,066,721 | ||||||
Lehman Mortgage Trust | ||||||||
Series 2008-4, Class A1, 4.396% | ||||||||
(1 Month LIBOR USD + 0.380%), 1/25/37 (f) | 738,180 | 230,131 | ||||||
LSTAR Securities Investment Ltd. | ||||||||
Series 2019-3, Class A2, 8.268% | ||||||||
(1 Month LIBOR USD + 4.500%), 4/1/24 (c)(f)(g) | 1,366,789 | 1,376,797 | ||||||
Series 2019-4, Class A2, 8.268% | ||||||||
(1 Month LIBOR USD + 4.500%), 5/1/24 (c)(f)(g) | 2,075,091 | 2,089,943 | ||||||
Series 2021-1, Class A, 5.568% | ||||||||
(1 Month LIBOR USD + 1.800%), 2/1/26 (c)(f)(g) | 231,653 | 209,775 | ||||||
Series 2021-2, Class A2, 6.518% | ||||||||
(1 Month LIBOR USD + 2.750%), 3/2/26 (c)(f)(g) | 3,371,000 | 3,395,105 | ||||||
Radnor RE Ltd. | ||||||||
Series 2021-2, Class M1B, 7.247% | ||||||||
(SOFR30A + 3.700%), 11/25/31 (c)(f) | 2,066,000 | 1,948,281 | ||||||
Series 2022-1, Class M1A, 7.297% | ||||||||
(SOFR30A + 3.750%), 9/25/32 (c)(f) | 3,000,000 | 2,989,728 | ||||||
Series 2021-1, Class M1C, 6.247% | ||||||||
(SOFR30A + 2.700%), 12/27/33 (c)(f) | 1,500,000 | 1,425,386 | ||||||
Star Trust | ||||||||
Series 2021-SFR1, Class E, 5.604% | ||||||||
(1 Month LIBOR USD + 1.700%), 4/17/38 (c)(f) | 3,460,000 | 3,203,993 | ||||||
Towd Point HE Trust | ||||||||
Series 2021-HE1, Class M2, 2.500%, 2/25/63 (a)(c) | 1,230,000 | 1,081,635 | ||||||
| Total Residential Mortgage-Backed | ||||||||
| Securities – Non-Agency (cost $50,892,690) | 46,748,031 | |||||||
The accompanying notes are an integral part of these financial statements.
33
SEMPER SHORT DURATION FUND
SCHEDULE OF INVESTMENTS at November 30, 2022, Continued
| Shares | Value | |||||||
| MONEY MARKET FUND – 1.7% | ||||||||
First American Government | ||||||||
Obligations Fund – Class Z, 3.632% (b) | 3,307,755 | $ | 3,307,755 | |||||
| Total Money Market Fund (cost $3,307,755) | 3,307,755 | |||||||
| Total Investments (cost $206,283,442) – 99.2% | 195,707,759 | |||||||
| Other Assets less Liabilities – 0.8% | 1,588,297 | |||||||
| TOTAL NET ASSETS – 100.0% | $ | 197,296,056 | ||||||
| (a) | Variable rate security. The coupon is based on an underlying pool of loans and represents the rate in effect as of November 30, 2022. |
| (b) | Rate shown is the 7-day annualized yield as of November 30, 2022. |
| (c) | Security exempt from registration under Rule 144A of the Securities Act of 1933, as amended, and may be sold only to dealers in the program or other “qualified institutional buyers.” As of November 30, 2022, the value of these investments was $183,596,226 or 93.1% of total net assets. |
| (d) | Interest only security. |
| (e) | Step-up bond. The interest rate may step up conditioned upon the aggregate remaining principal balance of the underlying mortgage loans being reduced below a targeted percentage of the aggregate original principal balance of the mortgage loans. The interest rate shown is the rate in effect as of November 30, 2022. |
| (f) | Variable or floating rate security based on a reference index and spread. The rate reported is the rate in effect as of November 30, 2022. |
| (g) | Step-up bond. The interest rate will step up if the issuer does not redeem the bond by an expected redemption date. The interest rate shown is in effect as of November 30, 2022. |
| (h) | Security valued at fair value using procedures adopted by Semper Capital Management, L.P., the Fund’s valuation designee. Value determined using significant unobservable inputs. As of November 30, 2022, the total value of fair valued securities was $1,891,250 or 1.0% of total net assets. |
FHLMC – Federal Home Loan Mortgage Corporation
GNMA – Government National Mortgage Association
LIBOR – London Interbank Offered Rate
REMIC – Real Estate Mortgage Investment Conduit
SOFR – Secured Overnight Financing Rate
The accompanying notes are an integral part of these financial statements.
34
SEMPER FUNDS
35
SEMPER FUNDS
STATEMENTS OF ASSETS AND LIABILITIES at November 30, 2022
| Semper MBS Total | Semper Short | |||||||
| Return Fund | Duration Fund | |||||||
ASSETS | ||||||||
| Investments in securities, at value | ||||||||
| (identified cost $425,910,327 | ||||||||
| and $206,283,442, respectively) | $ | 346,738,105 | $ | 195,707,759 | ||||
| Cash | — | 6,535 | ||||||
| Receivables | ||||||||
| Fund shares issued | 229,182 | 1,104,832 | ||||||
| Securities sold | — | 425,633 | ||||||
| Interest | 1,101,647 | 582,681 | ||||||
| Prepaid expenses | 23,501 | 18,522 | ||||||
| Total assets | 348,092,435 | 197,845,962 | ||||||
LIABILITIES | ||||||||
| Payables | ||||||||
| Dividends | 1,036,823 | 117,426 | ||||||
| Fund shares redeemed | 6,129,639 | 185,070 | ||||||
| Due to Adviser | 176,337 | 95,766 | ||||||
| Interest expense (Note 7) | 19,214 | 5,648 | ||||||
| Administration and fund accounting fees | 79,893 | 47,219 | ||||||
| Sub-transfer agency fees | 67,891 | 33,762 | ||||||
| Transfer agent fees and expenses | 27,121 | 14,019 | ||||||
| 12b-1 distribution fees | 11,306 | 10,935 | ||||||
| Audit fees | 28,244 | 26,594 | ||||||
| Custody fees | 10,587 | 5,049 | ||||||
| Chief Compliance Officer fee | 1,667 | 1,667 | ||||||
| Trustee fees and expenses | 165 | 164 | ||||||
| Accrued expenses | 14,147 | 6,587 | ||||||
| Total liabilities | 7,603,034 | 549,906 | ||||||
NET ASSETS | $ | 340,489,401 | $ | 197,296,056 | ||||
The accompanying notes are an integral part of these financial statements.
36
SEMPER FUNDS
STATEMENTS OF ASSETS AND LIABILITIES at November 30, 2022, Continued
| Semper MBS Total | Semper Short | |||||||
| Return Fund | Duration Fund | |||||||
CALCULATION OF NET ASSET | ||||||||
VALUE PER SHARE | ||||||||
| Class A | ||||||||
| Net assets applicable to shares outstanding | $ | 4,586,769 | ||||||
| Shares issued and outstanding [unlimited | ||||||||
| number of shares (par value $0.01) authorized] | 581,811 | |||||||
| Net asset value and | ||||||||
| redemption price per share | $ | 7.88 | ||||||
| Maximum offering price per share (Net asset | ||||||||
| value per share divided by 98.00%) | $ | 8.04 | ||||||
| Investor Class | ||||||||
| Net assets applicable to shares outstanding | $ | 17,667,740 | $ | 19,654,976 | ||||
| Shares issued and outstanding [unlimited | ||||||||
| number of shares (par value $0.01) authorized] | 2,244,121 | 2,158,504 | ||||||
| Net asset value, offering and | ||||||||
| redemption price per share | $ | 7.87 | $ | 9.11 | ||||
| Institutional Class | ||||||||
| Net assets applicable to shares outstanding | $ | 318,234,892 | $ | 177,641,080 | ||||
| Shares issued and outstanding [unlimited | ||||||||
| number of shares (par value $0.01) authorized] | 40,505,493 | 19,517,746 | ||||||
| Net asset value, offering and | ||||||||
| redemption price per share | $ | 7.86 | $ | 9.10 | ||||
COMPONENTS OF NET ASSETS | ||||||||
| Paid-in capital | $ | 805,594,898 | $ | 233,983,721 | ||||
| Total accumulated deficit | (465,105,497 | ) | (36,687,665 | ) | ||||
| Net assets | $ | 340,489,401 | $ | 197,296,056 | ||||
The accompanying notes are an integral part of these financial statements.
37
SEMPER FUNDS
(This Page Intentionally Left Blank.)
38
SEMPER FUNDS
STATEMENTS OF OPERATIONS For the Year Ended November 30, 2022
| Semper MBS Total | Semper Short | |||||||
| Return Fund | Duration Fund | |||||||
INVESTMENT INCOME | ||||||||
| Income | ||||||||
| Interest | $ | 36,074,130 | $ | 8,066,973 | ||||
| Total income | 36,074,130 | 8,066,973 | ||||||
| Expenses | ||||||||
| Advisory fees (Note 4) | 4,180,868 | 868,907 | ||||||
| Sub-transfer agency expenses (Note 4) | 504,003 | 196,257 | ||||||
| Administration and fund | ||||||||
| accounting fees (Note 4) | 608,338 | 310,086 | ||||||
| Transfer agent fees and expenses (Note 4) | 180,761 | 80,019 | ||||||
| 12b-1 fees – Class A (Note 5) | 18,029 | — | ||||||
| 12b-1 fees – Investor Class (Note 5) | 84,468 | 81,065 | ||||||
| Custody fees (Note 4) | 77,628 | 29,953 | ||||||
| Registration fees | 54,917 | 44,959 | ||||||
| Audit fees | 28,243 | 26,594 | ||||||
| Shareholder reporting | 18,944 | 6,537 | ||||||
| Trustees fees and expenses | 13,566 | 13,472 | ||||||
| Insurance expense | 12,730 | 5,644 | ||||||
| Chief Compliance Officer fee (Note 4) | 11,668 | 11,667 | ||||||
| Legal fees | 8,989 | 8,230 | ||||||
| Miscellaneous | 13,868 | 7,645 | ||||||
| Total expenses before | ||||||||
| interest expense and waiver | 5,817,020 | 1,691,035 | ||||||
| Interest expense (Note 7) | 375,478 | 11,902 | ||||||
| Total expenses before waiver | 6,192,498 | 1,702,937 | ||||||
| Less: Advisory fee waiver (Note 4) | — | (113,064 | ) | |||||
| Net expenses | 6,192,498 | 1,589,873 | ||||||
| Net investment income | 29,881,632 | 6,477,100 | ||||||
REALIZED AND UNREALIZED | ||||||||
GAIN/(LOSS) ON INVESTMENTS | ||||||||
| Net realized loss on investments | (65,510,278 | ) | (1,737,515 | ) | ||||
| Capital gain distributions from | ||||||||
| regulated investment companies | 174 | 52 | ||||||
| Net change in unrealized | ||||||||
| appreciation/(depreciation) on investments | (55,306,882 | ) | (12,146,962 | ) | ||||
| Net realized and unrealized | ||||||||
| loss on investments | (120,816,986 | ) | (13,884,425 | ) | ||||
| Net Decrease in Net Assets | ||||||||
| Resulting from Operations | $ | (90,935,354 | ) | $ | (7,407,325 | ) | ||
The accompanying notes are an integral part of these financial statements.
39
SEMPER MBS TOTAL RETURN FUND
STATEMENTS OF CHANGES IN NET ASSETS
| Year Ended | Year Ended | |||||||
| November 30, 2022 | November 30, 2021 | |||||||
NET INCREASE/(DECREASE) | ||||||||
IN NET ASSETS FROM: | ||||||||
OPERATIONS | ||||||||
| Net investment income | $ | 29,881,632 | $ | 34,781,729 | ||||
| Net realized loss from investments | (65,510,278 | ) | (1,671,966 | ) | ||||
| Capital gain distributions from | ||||||||
| regulated investment companies | 174 | — | ||||||
| Net change in unrealized | ||||||||
| appreciation/(depreciation) on investments | (55,306,882 | ) | 72,909,995 | |||||
| Net increase/(decrease) in net assets | ||||||||
| resulting from operations | (90,935,354 | ) | 106,019,758 | |||||
DISTRIBUTIONS TO SHAREHOLDERS | ||||||||
| Class A | (328,921 | ) | (290,578 | ) | ||||
| Investor Class | (1,479,115 | ) | (1,958,082 | ) | ||||
| Institutional Class | (29,361,415 | ) | (35,887,701 | ) | ||||
| Total distributions to shareholders | (31,169,451 | ) | (38,136,361 | ) | ||||
CAPITAL SHARE TRANSACTIONS | ||||||||
| Net decrease in net assets derived | ||||||||
| from net change in outstanding shares (a) | (726,366,839 | ) | (28,061,955 | ) | ||||
| Total increase/(decrease) in net assets | (848,471,644 | ) | 39,821,442 | |||||
NET ASSETS | ||||||||
| Beginning of year | 1,188,961,045 | 1,149,139,603 | ||||||
| End of year | $ | 340,489,401 | $ | 1,188,961,045 | ||||
The accompanying notes are an integral part of these financial statements.
40
SEMPER MBS TOTAL RETURN FUND
STATEMENTS OF CHANGES IN NET ASSETS, Continued
(a) | A summary of share transactions is as follows: |
| Class A | |||||||||||||||||
Year Ended | Year Ended | ||||||||||||||||
November 30, 2022 | November 30, 2021 | ||||||||||||||||
| Shares | Paid-in Capital | Shares | Paid-in Capital | ||||||||||||||
Shares sold | 35,264 | $ | 324,765 | 91,008 | $ | 862,325 | |||||||||||
Shares issued on | |||||||||||||||||
reinvestments of | |||||||||||||||||
distributions | 35,620 | 310,537 | 28,964 | 275,742 | |||||||||||||
Shares redeemed | (402,897 | ) | (3,481,596 | ) | (336,108 | ) | (3,172,324 | ) | |||||||||
Net decrease | (332,013 | ) | $ | (2,846,294 | ) | (216,136 | ) | $ | (2,034,257 | ) | |||||||
| Investor Class | |||||||||||||||||
Year Ended | Year Ended | ||||||||||||||||
November 30, 2022 | November 30, 2021 | ||||||||||||||||
| Shares | Paid-in Capital | Shares | Paid-in Capital | ||||||||||||||
Shares sold | 457,548 | $ | 4,155,550 | 3,275,933 | $ | 31,148,954 | |||||||||||
Shares issued on | |||||||||||||||||
reinvestments of | |||||||||||||||||
distributions | 154,517 | 1,355,553 | 183,238 | 1,742,943 | |||||||||||||
Shares redeemed | (4,031,528 | ) | (36,314,030 | ) | (5,847,919 | ) | (55,410,210 | ) | |||||||||
Net decrease | (3,419,463 | ) | $ | (30,802,927 | ) | (2,388,748 | ) | $ | (22,518,313 | ) | |||||||
| Institutional Class | |||||||||||||||||
Year Ended | Year Ended | ||||||||||||||||
November 30, 2022 | November 30, 2021 | ||||||||||||||||
| Shares | Paid-in Capital | Shares | Paid-in Capital | ||||||||||||||
Shares sold | 16,211,079 | $ | 148,455,588 | 45,024,249 | $ | 425,466,879 | |||||||||||
Shares issued on | |||||||||||||||||
reinvestments of | |||||||||||||||||
distributions | 1,906,706 | 16,802,782 | 2,169,159 | 20,604,769 | |||||||||||||
Shares redeemed | (94,746,703 | ) | (857,975,988 | ) | (47,850,311 | ) | (449,581,033 | ) | |||||||||
Net decrease | (76,628,918 | ) | $ | (692,717,618 | ) | (656,903 | ) | $ | (3,509,385 | ) | |||||||
The accompanying notes are an integral part of these financial statements.
41
SEMPER SHORT DURATION FUND
STATEMENTS OF CHANGES IN NET ASSETS
| Year Ended | Year Ended | |||||||
| November 30, 2022 | November 30, 2021 | |||||||
NET INCREASE/(DECREASE) | ||||||||
IN NET ASSETS FROM: | ||||||||
OPERATIONS | ||||||||
| Net investment income | $ | 6,477,100 | $ | 6,109,735 | ||||
| Net realized gain/(loss) from investments | (1,737,515 | ) | 2,025,997 | |||||
| Capital gain distributions from | ||||||||
| regulated investment companies | 52 | 15 | ||||||
| Net change in unrealized | ||||||||
| appreciation/(depreciation) on investments | (12,146,962 | ) | 945,704 | |||||
| Net increase/(decrease) in net assets | ||||||||
| resulting from operations | (7,407,325 | ) | 9,081,451 | |||||
DISTRIBUTIONS TO SHAREHOLDERS | ||||||||
| Investor Class | (784,739 | ) | (710,984 | ) | ||||
| Institutional Class | (6,075,776 | ) | (5,373,028 | ) | ||||
| Total distributions to shareholders | (6,860,515 | ) | (6,084,012 | ) | ||||
CAPITAL SHARE TRANSACTIONS | ||||||||
| Net decrease in net assets derived | ||||||||
| from net change in outstanding shares (a) | (102,369,369 | ) | (77,247,779 | ) | ||||
| Total decrease in net assets | (116,637,209 | ) | (74,250,340 | ) | ||||
NET ASSETS | ||||||||
| Beginning of year | 313,933,265 | 388,183,605 | ||||||
| End of year | $ | 197,296,056 | $ | 313,933,265 | ||||
The accompanying notes are an integral part of these financial statements.
42
SEMPER SHORT DURATION FUND
STATEMENTS OF CHANGES IN NET ASSETS, Continued
(a) | A summary of share transactions is as follows: |
| Investor Class | |||||||||||||||||
Year Ended | Year Ended | ||||||||||||||||
November 30, 2022 | November 30, 2021 | ||||||||||||||||
| Shares | Paid-in Capital | Shares | Paid-in Capital | ||||||||||||||
Shares sold | 843,055 | $ | 7,992,425 | 1,384,295 | $ | 13,348,877 | |||||||||||
Shares issued on | |||||||||||||||||
reinvestments of | |||||||||||||||||
distributions | 78,441 | 730,430 | 66,623 | 641,754 | |||||||||||||
Shares redeemed | (3,370,671 | ) | (31,528,202 | ) | (3,171,088 | ) | (30,525,869 | ) | |||||||||
Net decrease | (2,449,175 | ) | $ | (22,805,347 | ) | (1,720,170 | ) | $ | (16,535,238 | ) | |||||||
| Institutional Class | |||||||||||||||||
Year Ended | Year Ended | ||||||||||||||||
November 30, 2022 | November 30, 2021 | ||||||||||||||||
| Shares | Paid-in Capital | Shares | Paid-in Capital | ||||||||||||||
Shares sold | 5,796,219 | $ | 54,298,349 | 11,283,375 | $ | 108,653,902 | |||||||||||
Shares issued on | |||||||||||||||||
reinvestments of | |||||||||||||||||
distributions | 566,492 | 5,264,668 | 492,970 | 4,748,213 | |||||||||||||
Shares redeemed | (14,844,708 | ) | (139,127,039 | ) | (18,087,670 | ) | (174,114,656 | ) | |||||||||
Net decrease | (8,481,997 | ) | $ | (79,564,022 | ) | (6,311,325 | ) | $ | (60,712,541 | ) | |||||||
The accompanying notes are an integral part of these financial statements.
43
SEMPER MBS TOTAL RETURN FUND
FINANCIAL HIGHLIGHTS For a share outstanding throughout each year
| Class A | ||||||||||||||||||||
| Year Ended November 30, | ||||||||||||||||||||
| 2022 | 2021 | 2020 | 2019 | 2018 | ||||||||||||||||
| Net asset value, beginning of year | $ | 9.64 | $ | 9.08 | $ | 10.43 | $ | 10.50 | $ | 10.69 | ||||||||||
| Income from investment operations: | ||||||||||||||||||||
| Net investment income^ | 0.39 | 0.26 | 0.36 | 0.46 | 0.53 | |||||||||||||||
| Net realized and unrealized | ||||||||||||||||||||
| gain/(loss) on investments | (1.73 | ) | 0.59 | (1.32 | ) | (0.03 | ) | (0.12 | ) | |||||||||||
| Total from investment operations | (1.34 | ) | 0.85 | (0.96 | ) | 0.43 | 0.41 | |||||||||||||
| Less distributions: | ||||||||||||||||||||
| From net investment income | (0.42 | ) | (0.29 | ) | (0.39 | ) | (0.50 | ) | (0.60 | ) | ||||||||||
| Total distributions | (0.42 | ) | (0.29 | ) | (0.39 | ) | (0.50 | ) | (0.60 | ) | ||||||||||
| Net asset value, end of year | $ | 7.88 | $ | 9.64 | $ | 9.08 | $ | 10.43 | $ | 10.50 | ||||||||||
| Total return | -14.15 | % | 9.45 | % | -9.14 | % | 4.19 | % | 3.91 | % | ||||||||||
| Ratios/supplemental data: | ||||||||||||||||||||
| Net assets, end of year (thousands) | $ | 4,586 | $ | 8,810 | $ | 10,256 | $ | 33,799 | $ | 24,483 | ||||||||||
| Ratio of expenses to average net assets | 1.12 | %* | 1.05 | % | 1.09 | % | 1.02 | % | 1.00 | % | ||||||||||
| Ratio of net investment income | ||||||||||||||||||||
| to average net assets | 4.05 | % | 2.77 | % | 3.83 | % | 4.38 | % | 4.97 | % | ||||||||||
| Portfolio turnover rate | 13 | % | 78 | % | 79 | % | 118 | % | 137 | % | ||||||||||
| ^ | Based on average shares outstanding. |
| * | Includes interest expense of 0.05%. |
The accompanying notes are an integral part of these financial statements.
44
SEMPER MBS TOTAL RETURN FUND
FINANCIAL HIGHLIGHTS For a share outstanding throughout each year
Investor Class
| Year Ended November 30, | ||||||||||||||||||||
| 2022 | 2021 | 2020 | 2019 | 2018 | ||||||||||||||||
| Net asset value, beginning of year | $ | 9.63 | $ | 9.07 | $ | 10.43 | $ | 10.50 | $ | 10.69 | ||||||||||
| Income from investment operations: | ||||||||||||||||||||
| Net investment income^ | 0.38 | 0.26 | 0.36 | 0.46 | 0.51 | |||||||||||||||
| Net realized and unrealized | ||||||||||||||||||||
| gain/(loss) on investments | (1.71 | ) | 0.59 | (1.33 | ) | (0.03 | ) | (0.10 | ) | |||||||||||
| Total from investment operations | (1.33 | ) | 0.85 | (0.97 | ) | 0.43 | 0.41 | |||||||||||||
| Less distributions: | ||||||||||||||||||||
| From net investment income | (0.43 | ) | (0.29 | ) | (0.39 | ) | (0.50 | ) | (0.60 | ) | ||||||||||
| Total distributions | (0.43 | ) | (0.29 | ) | (0.39 | ) | (0.50 | ) | (0.60 | ) | ||||||||||
| Net asset value, end of year | $ | 7.87 | $ | 9.63 | $ | 9.07 | $ | 10.43 | $ | 10.50 | ||||||||||
| Total return | -14.16 | % | 9.46 | % | -9.24 | % | 4.19 | % | 3.92 | % | ||||||||||
| Ratios/supplemental data: | ||||||||||||||||||||
| Net assets, end of year (thousands) | $ | 17,668 | $ | 54,546 | $ | 73,022 | $ | 205,755 | $ | 225,054 | ||||||||||
| Ratio of expenses to average net assets | 1.12 | %* | 1.05 | % | 1.09 | % | 1.02 | % | 1.01 | % | ||||||||||
| Ratio of net investment income | ||||||||||||||||||||
| to average net assets | 4.05 | % | 2.77 | % | 3.81 | % | 4.38 | % | 4.77 | % | ||||||||||
| Portfolio turnover rate | 13 | % | 78 | % | 79 | % | 118 | % | 137 | % | ||||||||||
| ^ | Based on average shares outstanding. |
| * | Includes interest expense of 0.05%. |
The accompanying notes are an integral part of these financial statements.
45
SEMPER MBS TOTAL RETURN FUND
FINANCIAL HIGHLIGHTS For a share outstanding throughout each year
Institutional Class
| Year Ended November 30, | ||||||||||||||||||||
| 2022 | 2021 | 2020 | 2019 | 2018 | ||||||||||||||||
| Net asset value, beginning of year | $ | 9.61 | $ | 9.05 | $ | 10.44 | $ | 10.51 | $ | 10.70 | ||||||||||
| Income from investment operations: | ||||||||||||||||||||
| Net investment income^ | 0.39 | 0.29 | 0.38 | 0.48 | 0.55 | |||||||||||||||
| Net realized and unrealized | ||||||||||||||||||||
| gain/(loss) on investments | (1.69 | ) | 0.59 | (1.36 | ) | (0.02 | ) | (0.11 | ) | |||||||||||
| Total from investment operations | (1.30 | ) | 0.88 | (0.98 | ) | 0.46 | 0.44 | |||||||||||||
| Less distributions: | ||||||||||||||||||||
| From net investment income | (0.45 | ) | (0.32 | ) | (0.41 | ) | (0.53 | ) | (0.63 | ) | ||||||||||
| Total distributions | (0.45 | ) | (0.32 | ) | (0.41 | ) | (0.53 | ) | (0.63 | ) | ||||||||||
| Net asset value, end of year | $ | 7.86 | $ | 9.61 | $ | 9.05 | $ | 10.44 | $ | 10.51 | ||||||||||
| Total return | -13.87 | % | 9.75 | % | -9.28 | % | 4.45 | % | 4.20 | % | ||||||||||
| Ratios/supplemental data: | ||||||||||||||||||||
| Net assets, end of year (thousands) | $ | 318,235 | $ | 1,125,605 | $ | 1,065,862 | $ | 2,088,703 | $ | 1,693,755 | ||||||||||
| Ratio of expenses to average net assets | 0.87 | %* | 0.80 | % | 0.84 | % | 0.77 | % | 0.76 | % | ||||||||||
| Ratio of net investment income | ||||||||||||||||||||
| to average net assets | 4.30 | % | 3.02 | % | 4.04 | % | 4.63 | % | 5.13 | % | ||||||||||
| Portfolio turnover rate | 13 | % | 78 | % | 79 | % | 118 | % | 137 | % | ||||||||||
| ^ | Based on average shares outstanding. |
| * | Includes interest expense of 0.05%. |
The accompanying notes are an integral part of these financial statements.
46
SEMPER SHORT DURATION FUND
FINANCIAL HIGHLIGHTS For a share outstanding throughout each year
| Investor Class Shares | ||||||||||||||||||||
| Year Ended November 30, | ||||||||||||||||||||
| 2022 | 2021 | 2020 | 2019 | 2018 | ||||||||||||||||
| Net asset value, beginning of year | $ | 9.63 | $ | 9.56 | $ | 9.89 | $ | 9.87 | $ | 9.92 | ||||||||||
| Income from investment operations: | ||||||||||||||||||||
| Net investment income^ | 0.21 | 0.14 | 0.18 | 0.28 | 0.26 | |||||||||||||||
| Net realized and unrealized | ||||||||||||||||||||
| gain/(loss) on investments | (0.48 | ) | 0.08 | (0.33 | ) | 0.03 | (0.05 | ) | ||||||||||||
| Total from investment operations | (0.27 | ) | 0.22 | (0.15 | ) | 0.31 | 0.21 | |||||||||||||
| Less distributions: | �� | |||||||||||||||||||
| From net investment income | (0.25 | ) | (0.15 | ) | (0.18 | ) | (0.29 | ) | (0.26 | ) | ||||||||||
| Total distributions | (0.25 | ) | (0.15 | ) | (0.18 | ) | (0.29 | ) | (0.26 | ) | ||||||||||
| Net asset value, end of year | $ | 9.11 | $ | 9.63 | $ | 9.56 | $ | 9.89 | $ | 9.87 | ||||||||||
| Total return | -2.80 | % | 2.25 | % | -1.43 | % | 3.20 | % | 2.17 | % | ||||||||||
| Ratios/supplemental data: | ||||||||||||||||||||
| Net assets, end of year (thousands) | $ | 19,655 | $ | 44,379 | $ | 60,465 | $ | 88,502 | $ | 62,155 | ||||||||||
| Ratio of expenses to average net assets: | ||||||||||||||||||||
| Before fee waiver | 0.91 | % | 0.87 | % | 0.88 | % | 0.90 | % | 1.07 | % | ||||||||||
| After fee waiver | 0.86 | %* | 0.85 | % | 0.85 | % | 0.85 | % | 0.85 | % | ||||||||||
| Ratio of net investment income | ||||||||||||||||||||
| to average net assets: | ||||||||||||||||||||
| Before fee waiver | 2.34 | % | 1.48 | % | 1.87 | % | 2.77 | % | 2.37 | % | ||||||||||
| After fee waiver | 2.39 | % | 1.50 | % | 1.90 | % | 2.82 | % | 2.59 | % | ||||||||||
| Portfolio turnover rate | 42 | % | 83 | % | 107 | % | 131 | % | 158 | % | ||||||||||
| ^ | Based on average shares outstanding. |
| * | Includes interest expense of 0.01%. |
The accompanying notes are an integral part of these financial statements.
47
SEMPER SHORT DURATION FUND
FINANCIAL HIGHLIGHTS For a share outstanding throughout each year
Institutional Class Shares
| Year Ended November 30, | ||||||||||||||||||||
| 2022 | 2021 | 2020 | 2019 | 2018 | ||||||||||||||||
| Net asset value, beginning of year | $ | 9.63 | $ | 9.55 | $ | 9.90 | $ | 9.88 | $ | 9.93 | ||||||||||
| Income from investment operations: | ||||||||||||||||||||
| Net investment income^ | 0.25 | 0.17 | 0.20 | 0.30 | 0.28 | |||||||||||||||
| Net realized and unrealized | ||||||||||||||||||||
| gain/(loss) on investments | (0.50 | ) | 0.08 | (0.34 | ) | 0.03 | (0.04 | ) | ||||||||||||
| Total from investment operations | (0.25 | ) | 0.25 | (0.14 | ) | 0.33 | 0.24 | |||||||||||||
| Less distributions: | ||||||||||||||||||||
| From net investment income | (0.28 | ) | (0.17 | ) | (0.21 | ) | (0.31 | ) | (0.29 | ) | ||||||||||
| Total distributions | (0.28 | ) | (0.17 | ) | (0.21 | ) | (0.31 | ) | (0.29 | ) | ||||||||||
| Net asset value, end of year | $ | 9.10 | $ | 9.63 | $ | 9.55 | $ | 9.90 | $ | 9.88 | ||||||||||
| Total return | -2.66 | % | 2.61 | % | -1.28 | % | 3.38 | % | 2.45 | % | ||||||||||
| Ratios/supplemental data: | ||||||||||||||||||||
| Net assets, end of year (thousands) | $ | 177,641 | $ | 269,554 | $ | 327,719 | $ | 361,705 | $ | 105,295 | ||||||||||
| Ratio of expenses to average net assets: | ||||||||||||||||||||
| Before fee waiver | 0.66 | % | 0.62 | % | 0.63 | % | 0.65 | % | 0.82 | % | ||||||||||
| After fee waiver | 0.61 | %* | 0.60 | % | 0.60 | % | 0.60 | % | 0.60 | % | ||||||||||
| Ratio of net investment income | ||||||||||||||||||||
| to average net assets: | ||||||||||||||||||||
| Before fee waiver | 2.59 | % | 1.73 | % | 2.06 | % | 2.96 | % | 2.57 | % | ||||||||||
| After fee waiver | 2.64 | % | 1.75 | % | 2.09 | % | 3.01 | % | 2.79 | % | ||||||||||
| Portfolio turnover rate | 42 | % | 83 | % | 107 | % | 131 | % | 158 | % | ||||||||||
| ^ | Based on average shares outstanding. |
| * | Includes interest expense of 0.01%. |
The accompanying notes are an integral part of these financial statements.
48
SEMPER FUNDS
NOTES TO FINANCIAL STATEMENTS at November 30, 2022
NOTE 1 – ORGANIZATION
The Semper MBS Total Return Fund and the Semper Short Duration Fund (each a “Fund” and collectively, the “Funds”) are each a diversified series of Advisors Series Trust (the “Trust”), which is registered under the Investment Company Act of 1940, as amended, (the “1940 Act”) as an open-end management investment company. The Funds follow the investment company accounting and reporting guidance of the Financial Accounting Standards Board (“FASB”) Accounting Standard Codification Topic 946 “Financial Services – Investment Companies”.
The investment objective of the Semper MBS Total Return Fund (“Total Return Fund”) is to seek a high level of risk-adjusted current income and capital appreciation. The investment objective of the Semper Short Duration Fund (“Short Duration Fund”) is to seek a high level of current income that is consistent with preservation of capital. Each Fund currently offers Investor Class shares and Institutional Class shares and the Total Return Fund offers Class A shares. The Total Return Fund Class A shares may be subject to a 2.00% front-end sales load. The Total Return Fund’s Investor Class shares and Institutional Class shares commenced operations on July 22, 2013 and the Class A shares commenced operations on December 18, 2015. The Short Duration Fund’s Investor Class shares and Institutional Class shares commenced operations on December 23, 2010.
NOTE 2 – SIGNIFICANT ACCOUNTING POLICIES
The following is a summary of significant accounting policies consistently followed by the Funds. These policies are in conformity with accounting principles generally accepted in the United States of America.
| A. | Security Valuation: All investments in securities are recorded at their estimated fair value, as described in Note 3. | |
| B. | Federal Income Taxes: It is the Funds’ policy to comply with the requirements of Subchapter M of the Internal Revenue Code applicable to regulated investment companies and to distribute substantially all of its taxable income to its shareholders. Therefore, no Federal income or excise tax provision is required. | |
| The Funds recognize the tax benefits of uncertain tax positions only where the position is “more likely than not” to be sustained assuming examination by tax authorities. The tax returns of the Funds’ prior three fiscal years are open for examination. Management has reviewed all open tax years in major jurisdictions and concluded that there is no impact on the Funds’ net assets and no tax liability resulting from unrecognized tax events relating to uncertain income tax positions taken or expected to be taken on a tax return. The Funds identify their major tax jurisdictions as U.S. Federal and the state of Wisconsin. The Funds are not aware of any tax positions for which it is reasonably possible that the total amounts of unrecognized tax benefits will change materially in the next twelve months. |
49
SEMPER FUNDS
NOTES TO FINANCIAL STATEMENTS at November 30, 2022, Continued
| C. | Security Transactions, Income and Distributions: Security transactions are accounted for on the trade date. Realized gains and losses on securities sold are calculated on the basis of high amortized cost. Interest income is recorded on an accrual basis. Discounts and premiums on securities purchased are accreted/amortized over the life of the respective security using the effective interest method, except for premiums on certain callable debt securities that are amortized to the earliest call date. Non-cash interest income included in interest income, if any, is recorded at the fair market value of additional par received. Paydown gains and losses on mortgage-related and other asset-backed securities are recorded as components of interest income on the statement of operations. Distributions to shareholders are recorded on the ex-dividend date. | |
| Investment income, expenses (other than those specific to the class of shares), and realized and unrealized gains and losses on investments are allocated to the separate classes of each Fund based upon their relative net assets on the date income is earned or expensed and realized and unrealized gains and losses are incurred. | ||
| Each Fund is charged for those expenses that are directly attributable to the Fund, such as investment advisory, custody and transfer agent fees. Expenses that are not attributable to a Fund are typically allocated among the Funds in proportion to their respective net assets. Common expenses of the Trust are typically allocated among the funds in the Trust based on a fund’s respective net assets, or by other equitable means. | ||
| The Funds declare dividends from net investment income daily and distribute the dividends to shareholders monthly. The Funds distribute any realized gains, if any, annually. Distributions from net realized gains for book purposes may include short-term capital gains. All short-term capital gains are included in ordinary income for tax purposes. | ||
| The amount of dividends and distributions to shareholders from net investment income and net realized capital gains is determined in accordance with Federal income tax regulations which differ from accounting principles generally accepted in the United States of America. To the extent these book/tax differences are permanent, such amounts are reclassified within the capital accounts based on their Federal tax treatment. | ||
| D. | Restricted Securities: The Funds may invest in securities that are subject to legal or contractual restrictions on resale (“restricted securities”). Restricted securities may be resold in transactions that are exempt from registration under the Federal securities laws. The sale or other disposition of these securities may involve additional expenses and the prompt sale of these securities at an acceptable price may be difficult. At November 30, 2022, the Funds held securities issued pursuant to Rule 144a under the Securities Act |
50
SEMPER FUNDS
NOTES TO FINANCIAL STATEMENTS at November 30, 2022, Continued
| of 1933. All Rule 144a securities except for six securities in the Total Return Fund and two securities in the Short Duration Fund have been classified as liquid under the Funds’ liquidity risk management program. At November 30, 2022, the Total Return Fund held $14,416,829 or 4.2% and the Short Duration Fund held $3,604,880 or 1.8% in 144a securities classified as illiquid. Other restricted investments held by the Funds at November 30, 2022 are disclosed in the notes to the schedules of investments. | ||
| E. | Reclassification of Capital Accounts: Accounting principles generally accepted in the United States of America require that certain components of net assets relating to permanent differences be reclassified between financial and tax reporting. These reclassifications have no effect on net assets or net asset value per share. For the year ended November 30, 2022, there were no reclassifications between paid-in capital and total distributable earnings. | |
| F. | Use of Estimates: The preparation of financial statements in conformity with accounting principles generally accepted in the United States of America requires management to make estimates and assumptions that affect the reported amounts of assets and liabilities at the date of the financial statements and the reported amounts of increases and decreases in net assets during the reporting period. Actual results could differ from those estimates. | |
| G. | Events Subsequent to the Fiscal Year End: In preparing the financial statements as of November 30, 2022, management considered the impact of subsequent events for potential recognition or disclosure in the financial statements. Refer to Note 13 for information on a subsequent event regarding the February 15, 2023 shareholder meeting. |
NOTE 3 – SECURITIES VALUATION
The Funds have adopted authoritative fair value accounting standards which establish an authoritative definition of fair value and set out a hierarchy for measuring fair value. These standards require additional disclosures about the various inputs and valuation techniques used to develop the measurements of fair value, a discussion in changes in valuation techniques and related inputs during the period and expanded disclosure of valuation levels for major security types. These inputs are summarized in the three broad levels listed below:
| Level 1 – | Unadjusted quoted prices in active markets for identical assets or liabilities that each Fund has the ability to access. | |
| Level 2 – | Observable inputs other than quoted prices included in level 1 that are observable for the asset or liability, either directly or indirectly. These inputs may include quoted prices for the identical instrument on an inactive market, prices for similar instruments, interest rates, prepayment speeds, credit risk, yield curves, default rates and similar data. |
51
SEMPER FUNDS
NOTES TO FINANCIAL STATEMENTS at November 30, 2022, Continued
| Level 3 – | Unobservable inputs for the asset or liability, to the extent relevant observable inputs are not available, representing each Fund’s own assumptions about the assumptions a market participant would use in valuing the asset or liability, and would be based on the best information available. |
Following is a description of the valuation techniques applied to the Funds’ major categories of assets and liabilities measured at fair value on a recurring basis.
Each Fund determines the fair value of its investments and computes its net asset value per share as of the close of regular trading on the New York Stock Exchange (4:00 pm EST).
Market values for fixed income securities are normally determined on the basis of valuations provided by independent pricing services. Each independent pricing service typically values securities based on one or more inputs as described below. Securities that use similar valuation techniques and inputs as described below are categorized as level 2 of the fair value hierarchy. To the extent the significant inputs are unobservable, the values are generally categorized as level 3.
Mortgage- and Asset-Backed Securities: Mortgage- and asset-backed securities are securities issued as separate tranches, or classes, of securities within each deal. These securities are normally valued by independent pricing service providers that use broker-dealer quotations or valuation estimates from their internal pricing models. The pricing models for these securities usually consider tranche-level attributes, estimated cash flows and market-based yield spreads for each tranche, current market data and incorporate deal collateral performance, as available.
U.S. Government Securities: U.S. Government securities are normally valued using a model that incorporates market observable data such as reported sales of similar securities, broker quotes, yields, bids, offers, and reference data. Certain securities are valued principally using dealer quotations.
U.S. Government Agency Securities: U.S. Government agency securities are comprised of two main categories consisting of agency issued debt and mortgage pass-throughs. Agency issued debt securities are generally valued in a manner similar to U.S. Government securities. Mortgage pass-throughs include to-be-announced (“TBAs”) securities and mortgage pass-through certificates. TBA securities and mortgage pass-throughs are generally valued using dealer quotations.
Other Debt Securities: Other debt securities, including corporate and municipal bonds, are valued at their mean prices furnished by an independent pricing service provider using valuation methods that are designed to represent fair value. These valuation methods can include matrix pricing and other analytical pricing models, market transactions, and dealer-supplied valuations. The pricing service may consider yields or recently executed transactions of investments with comparable quality, type of issue, coupon maturity and rating, market price quotations (where observable), bond spreads, and fundamental data relating to the issuer.
52
SEMPER FUNDS
NOTES TO FINANCIAL STATEMENTS at November 30, 2022, Continued
Investment Companies: Investments in open-end mutual funds, including money market funds, are generally priced at their net asset value per share provided by the service agent of the Funds and will be classified in level 1 of the fair value hierarchy.
Short-Term Securities: Short-term debt securities, including those securities having a maturity of 60 days or less, are valued at the evaluated mean between the bid and asked prices. To the extent the inputs are observable and timely, these securities would be classified in level 2 of the fair value hierarchy.
Prior to the effectiveness of Rule 2a-5 on September 8, 2022, the Board of Trustees had delegated day-to-day valuation issues to a Valuation Committee of the Trust which was comprised of representatives from the Funds’ administrator, U.S. Bancorp Fund Services, LLC, doing business as U.S. Bank Global Fund Services (“Fund Services”). The function of the Valuation Committee was to value securities where current and reliable market quotations were not readily available or the closing price did not represent fair value by following procedures approved by the Board of Trustees. These procedures considered many factors, including the type of security, size of holding, trading volume and news events. All actions taken by the Valuation Committee were subsequently reviewed and ratified by the Board of Trustees. The Valuation Committee served until September 7, 2022. Effective September 8, 2022, the Board of Trustees approved Semper Capital Management, L.P. (the “Adviser”) as the Funds’ valuation designee under Rule 2a-5.
Depending on the relative significance of the valuation inputs, fair valued securities may be classified in either level 2 or level 3 of the fair value hierarchy.
The inputs or methodology used for valuing securities are not an indication of the risk associated with investing in those securities. The following is a summary of the inputs used to value the Funds’ securities as of November 30, 2022:
Total Return Fund
| Level 1 | Level 2 | Level 3 | Total | |||||||||||||
| Fixed Income | ||||||||||||||||
Commercial Mortgage-Backed | ||||||||||||||||
Securities – Agency | $ | — | $ | 448 | $ | — | $ | 448 | ||||||||
Commercial Mortgage-Backed | ||||||||||||||||
Securities – Non-Agency | — | 39,007,329 | — | 39,007,329 | ||||||||||||
Residential Mortgage-Backed | ||||||||||||||||
Securities – Agency | — | 85,164,702 | — | 85,164,702 | ||||||||||||
Residential Mortgage-Backed | ||||||||||||||||
Securities – Non-Agency | — | 203,677,797 | 10,895,369 | 214,573,166 | ||||||||||||
| Total Fixed Income | — | 327,850,276 | 10,895,369 | 338,745,645 | ||||||||||||
| Money Market Fund | 7,992,460 | — | — | 7,992,460 | ||||||||||||
| Total Investments | $ | 7,992,460 | $ | 327,850,276 | $ | 10,895,369 | $ | 346,738,105 | ||||||||
53
SEMPER FUNDS
NOTES TO FINANCIAL STATEMENTS at November 30, 2022, Continued
Short Duration Fund
| Level 1 | Level 2 | Level 3 | Total | |||||||||||||
| Fixed Income | ||||||||||||||||
Asset-Backed | ||||||||||||||||
Securities – Non-Agency | $ | — | $ | 3,433,883 | $ | — | $ | 3,433,883 | ||||||||
Collateralized Loan Obligations | — | 45,062,026 | — | 45,062,026 | ||||||||||||
Commercial Mortgage-Backed | ||||||||||||||||
Securities – Agency | — | 740 | — | 740 | ||||||||||||
Commercial Mortgage-Backed | ||||||||||||||||
Securities – Non-Agency | — | 47,451,859 | — | 47,451,859 | ||||||||||||
Corporate Bond | — | — | 1,891,250 | 1,891,250 | ||||||||||||
Residential Mortgage-Backed | ||||||||||||||||
Securities – Agency | — | 47,812,215 | — | 47,812,215 | ||||||||||||
Residential Mortgage-Backed | ||||||||||||||||
Securities – Non-Agency | — | 46,748,031 | — | 46,748,031 | ||||||||||||
| Total Fixed Income | — | 190,508,754 | 1,891,250 | 192,400,004 | ||||||||||||
| Money Market Fund | 3,307,755 | — | — | 3,307,755 | ||||||||||||
| Total Investments | $ | 3,307,755 | $ | 190,508,754 | $ | 1,891,250 | $ | 195,707,759 | ||||||||
Refer to each Fund’s schedule of investments for a detailed break-out of securities by type.
The following is a reconciliation of the Total Return Fund’s level 3 investments for which significant unobservable inputs were used in determining value.
| Investments in Securities, at Value | ||||||||
| Private Placement | ||||||||
| Residential | Participation | |||||||
| MBS – Non-Agency | Agreements | |||||||
Balance as of November 30, 2021 | $ | 6,223,549 | $ | 4,995,532 | ||||
Accrued discounts/premiums | — | — | ||||||
Realized gain/(loss) | (88,707 | ) | — | |||||
Change in unrealized appreciation/(depreciation) | (1,219,988 | ) | — | |||||
Purchases | — | 94,498 | ||||||
Sales | (2,211,234 | ) | (5,090,030 | ) | ||||
Transfers in and/or out of Level 3 | 8,191,749 | — | ||||||
Balance as of November 30, 2022 | $ | 10,895,369 | $ | — | ||||
The change in unrealized appreciation/(depreciation) for level 3 securities still held at November 30, 2022, and still classified as level 3 was $0.
54
SEMPER FUNDS
NOTES TO FINANCIAL STATEMENTS at November 30, 2022, Continued
The following is a reconciliation of the Short Duration Fund’s level 3 investments for which significant unobservable inputs were used in determining value.
| Investments in Securities, at Value | ||||||||
| Private Placement | ||||||||
| Corporate | Participation | |||||||
| Bond | Agreements | |||||||
Balance as of November 30, 2021 | $ | — | $ | 1,999,106 | ||||
Accrued discounts/premiums | 5,223 | — | ||||||
Realized gain/(loss) | — | — | ||||||
Change in unrealized appreciation/(depreciation) | (5,223 | ) | — | |||||
Purchases | 1,891,250 | 18,900 | ||||||
Sales | — | (2,018,006 | ) | |||||
Transfers in and/or out of Level 3 | — | — | ||||||
Balance as of November 30, 2022 | $ | 1,891,250 | $ | — | ||||
The change in unrealized appreciation/(depreciation) for level 3 securities still held at November 30, 2022, and still classified as level 3 was $(5,223).
The following is a summary of quantitative information about level 3 valued measurements:
Total Return Fund
| Valuation | Unobservable | |||
11/30/22 | Technique(s) | Input | Input/Range | |
Residential | $10,895,369 | Market | Prior/Recent | $51.90 -$82.49 |
MBS – | Comparable | Transaction | (weighted avg. | |
Non-Agency | $72.18) | |||
| Short Duration Fund | ||||
| Valuation | Unobservable | |||
11/30/22 | Technique(s) | Input | Input/Range | |
Corporate Bond | $1,891,250 | Market | Prior/Recent | $94.56 |
| Transaction | Transaction | |||
| Method |
Accounting Pronouncements – In March 2020, FASB issued Accounting Standards Update 2020-04, Reference Rate Reform: Facilitation of the Effects of Reference Rate Reform on Financial Reporting (“ASU 2020-04”) and in January 2021, FASB issued Accounting Standards Update 2021-01, Reference Rate Reform (Topic 848): Scope (“ASU 2021-01”), which provides optional, temporary relief with respect to the financial reporting of contracts subject to certain types of modifications due to the planned discontinuation of the London Interbank Offered Rate (“LIBOR”) and other interbank offered rates as of the end of 2021. The temporary relief provided by ASU 2020-04 and ASU 2021-01 is effective for certain reference rate-related contract modifications that occur during the period from March 12, 2020 through
55
SEMPER FUNDS
NOTES TO FINANCIAL STATEMENTS at November 30, 2022, Continued
December 31, 2022. Management is evaluating the impact of ASU 2020-04 and ASU 2021-01 on the Funds’ investments, debt securities and other contracts that will undergo reference rate-related modifications as a result of the reference rate reform.
In October 2020, the Securities and Exchange Commission (the “SEC”) adopted new regulations governing the use of derivatives by registered investment companies (“Rule 18f-4”). Funds were required to implement and comply with Rule 18f-4 by August 19, 2022. Once implemented, Rule 18f-4 imposes limits on the amount of derivatives a fund can enter into, eliminates the asset segregation framework currently used by funds to comply with Section 18 of the 1940 Act, treats derivatives as senior securities and requires funds whose use of derivatives is more than a limited specified exposure amount to establish and maintain a comprehensive derivatives risk management program and appoint a derivatives risk manager. The Funds are considered limited derivatives users under Rule 18f-4. The Funds did not enter into derivatives transactions during the year ended November 30, 2022. The Funds are in compliance with Rule 18f-4.
In December 2020, the SEC adopted a new rule providing a framework for fund valuation practices (“Rule 2a-5”). Rule 2a-5 establishes requirements for determining fair value in good faith for purposes of the 1940 Act. Rule 2a-5 permits fund boards to designate certain parties to perform fair value determinations, subject to board oversight and certain other conditions. Rule 2a-5 also defines when market quotations are “readily available” for purposes of the 1940 Act and the threshold for determining whether a fund must fair value a security. In connection with Rule 2a-5, the SEC also adopted related recordkeeping requirements and rescinded previously issued guidance, including with respect to the role of a board in determining fair value and the accounting and auditing of fund investments. The Funds are in compliance with Rule 2a-5, which had a compliance date of September 8, 2022.
The global outbreak of COVID-19 (commonly referred to as “coronavirus”) has disrupted economic markets and the prolonged economic impact is uncertain. Although vaccines for COVID-19 are becoming more widely available, the ultimate economic fallout from the pandemic, amid the spread of COVID-19 variants, and the long-term impact on economies, markets, industries and individual companies are not known. The operational and financial performance of individual companies and the market in general depends on future developments, including the duration and spread of any future outbreaks and the pace of recovery which may vary from market to market, and such uncertainty may in turn adversely affect the value and liquidity of the Funds’ investments, impair the Funds’ ability to satisfy redemption requests, and negatively impact the Funds’ performance.
NOTE 4 – INVESTMENT ADVISORY FEE AND OTHER TRANSACTIONS WITH AFFILIATES
The Adviser provides the Funds with investment management services under an investment advisory agreement. The Adviser furnishes all investment advice, office
56
SEMPER FUNDS
NOTES TO FINANCIAL STATEMENTS at November 30, 2022, Continued
space, facilities, and provides most of the personnel needed by the Funds. As compensation for its services, each Fund pays the Adviser a monthly management fee. For the Total Return Fund, the fees are calculated at an annual rate of 0.60% of the Fund’s average daily net assets for the first $1.5 billion of assets, 0.55% of the Fund’s average daily net assets for the next $1 billion of assets, and 0.50% of the Fund’s average daily net assets in excess of $2.5 billion. For the Short Duration Fund, the Adviser is entitled to a monthly fee at the annual rate of 0.35% based upon the Fund’s average daily net assets. For the year ended November 30, 2022, the advisory fees incurred by the Funds are disclosed in the statements of operations.
Each Fund is responsible for its own operating expenses. The Adviser has contractually agreed to reduce fees payable to it by each Fund and to pay Fund operating expenses to the extent necessary to limit the aggregate annual operating expenses (excluding acquired fund fees and expenses, interest expense, dividends on securities sold short, taxes, extraordinary expenses, Rule 12b-1 fees, shareholder servicing fees and any other class-specific expenses). The Total Return Fund expenses are limited to 0.90% of the average daily net assets of the Fund and the Short Duration Fund expenses are limited to 0.60% of the average daily net assets of the Fund. Any such reductions made by the Adviser in its fees or payment of expenses which are a Fund’s obligation are subject to reimbursement by the Fund to the Adviser, if so requested by the Adviser, in any subsequent month in the 36-month period from the date of the management fee reduction and expense payment if the aggregate amount actually paid by the Fund toward the operating expenses for such fiscal year (taking into account the reimbursement) will not cause the Fund to exceed the lesser of: (1) the expense limitation in place at the time of the management fee reduction and expense payment; or (2) the expense limitation in place at the time of the reimbursement. Any such reimbursement is also contingent upon Board of Trustees review and approval. Such reimbursement may not be paid prior to each Fund’s payment of current ordinary operating expenses.
During the year ended November 30, 2022, the Adviser reduced it fees and absorbed Fund expenses in the amount of $152,632 in the Short Duration Fund. The Adviser recouped management fees of $39,568 during the year ended November 30, 2022 from the Short Duration Fund. Any amount due from the Adviser is paid monthly to each Fund. The expense limitation will remain in effect through at least March 29, 2023 and may be terminated only by the Trust’s Board of Trustees. The Adviser may recapture portions of the amounts shown below no later than the corresponding dates:
Short Duration Fund | |||||
Expiration | Amount | ||||
| 11/30/23 | $ | 122,730 | |||
| 11/30/24 | 73,061 | ||||
| 11/30/25 | 152,632 | ||||
$ | 348,423 | ||||
57
SEMPER FUNDS
NOTES TO FINANCIAL STATEMENTS at November 30, 2022, Continued
Fund Services serves as the Funds’ administrator, fund accountant and transfer agent. U.S. Bank N.A. serves as custodian (the “Custodian”) to the Funds. The Custodian is an affiliate of Fund Services. Fund Services maintains the Funds’ books and records, calculates the Funds’ NAV, prepares various federal and state regulatory filings, coordinates the payment of fund expenses, reviews expense accruals and prepares materials supplied to the Board of Trustees. The officers of the Trust, including the Chief Compliance Officer, are employees of Fund Services. Fees paid by the Funds for administration and accounting, transfer agency, custody and compliance services for the year ended November 30, 2022 are disclosed in the statements of operations.
Quasar Distributors, LLC (“Quasar”) acts as the Funds’ principal underwriter in a continuous public offering of the Funds’ shares. Quasar is a wholly-owned broker-dealer subsidiary of Foreside Financial Group, LLC.
The Funds have entered into agreements with various brokers, dealers and financial intermediaries to compensate them for transfer agent services that would otherwise be executed by Fund Services. These sub-transfer agency services include pre-processing and quality control of new accounts, maintaining detailed shareholder account records, shareholder correspondence, answering customer inquiries regarding account status, and facilitating shareholder telephone transactions. Sub-transfer agency expenses paid by the Funds for the year ended November 30, 2022 are disclosed in the statements of operations.
NOTE 5 – DISTRIBUTION AGREEMENT AND PLAN
The Funds have adopted a Distribution Plan pursuant to Rule 12b-1 (the “Plan”). The Plan permits the Funds to pay the Distributor for distribution and related expenses at an annual rate of up to 0.25% of the average daily net assets of each Fund’s Investor Class and the Total Return Fund’s Class A. The expenses covered by the Plan may include the cost in connection with the promotion and distribution of shares and the provision of personal services to shareholders, including, but not necessarily limited to, advertising, compensation to underwriters, dealers and selling personnel, the printing and mailing of prospectuses to other than current Fund shareholders, and the printing and mailing of sales literature. Payments made pursuant to the Plan will represent compensation for distribution and service activities, not reimbursements for specific expenses incurred. For the year ended November 30, 2022, the 12b-1 distribution fees incurred by the Funds are disclosed in the statements of operations.
NOTE 6 – PURCHASES AND SALES OF SECURITIES
For the year ended November 30, 2022, the cost of purchases and the proceeds from sales of securities, excluding short-term securities, were as follows:
Non-Government | Government | |||||||||||||||
| Purchases | Sales | Purchases | Sales | |||||||||||||
| Total Return Fund | $ | 88,747,932 | $ | 797,379,724 | $ | 2,503 | $ | 15,282 | ||||||||
| Short Duration Fund | 102,276,903 | 205,720,765 | — | 192,387 | ||||||||||||
58
SEMPER FUNDS
NOTES TO FINANCIAL STATEMENTS at November 30, 2022, Continued
NOTE 7 – LINES OF CREDIT
The Total Return Fund and the Short Duration Fund have a secured line of credit in the amount of $275,000,000. The line of credit is intended to provide short-term financing, if necessary, subject to certain restrictions, in connection with shareholder redemptions. The credit facility is with the Funds’ custodian, U.S. Bank N.A. During the year ended November 30, 2022, the Funds drew upon their line of credit. The Total Return Fund had an average daily outstanding balance of $8,415,093, a weighted average interest rate of 4.40%, paid interest expense of $375,478 and had a maximum amount outstanding of $55,567,000. The Short Duration Fund had an average daily outstanding balance of $169,288, a weighted average interest rate of 4.70%, paid interest expense of $11,902 and had a maximum amount outstanding of $8,851,000. At November 30, 2022, the Funds had no outstanding loan amounts.
NOTE 8 – INCOME TAXES AND DISTRIBUTIONS TO SHAREHOLDERS
The tax character of distributions paid during the years ended November 30, 2022 and November 30, 2021 was as follows:
| Total Return Fund | Short Duration Fund | |||||||||||||||
| Nov. 30, 2022 | Nov. 30, 2021 | Nov. 30, 2022 | Nov. 30, 2021 | |||||||||||||
| Ordinary income | $ | 31,169,451 | $ | 38,136,361 | $ | 6,860,515 | $ | 6,084,012 | ||||||||
As of November 30, 2022, the components of capital on a tax basis were as follows:
| Total | Short | |||||||
| Return Fund | Duration Fund | |||||||
| Cost of investments (a) | $ | 426,060,114 | $ | 206,283,442 | ||||
| Gross unrealized appreciation | 4,517,485 | 180,305 | ||||||
| Gross unrealized depreciation | (83,839,494 | ) | (10,755,988 | ) | ||||
| Net unrealized depreciation (a) | (79,322,009 | ) | (10,575,683 | ) | ||||
| Undistributed ordinary income | 1,814,755 | 378,161 | ||||||
| Undistributed long-term capital gains | — | — | ||||||
| Total distributable earnings | 1,814,755 | 378,161 | ||||||
| Other accumulated gains/(losses) | (387,598,243 | ) | (26,490,143 | ) | ||||
| Total accumulated earnings/(losses) | $ | (465,105,497 | ) | $ | (36,687,665 | ) | ||
| (a) | The book basis and tax basis cost are the same in the Short Duration Fund. The difference between book basis and tax basis net unrealized depreciation and cost is attributable primarily to wash sales in the Total Return Fund. The difference between book basis and tax basis distributable earnings are primarily due to losses disallowed and recognized on wash sales, capital loss carryforwards, tax adjustments to dividends payable and partnerships. |
59
SEMPER FUNDS
NOTES TO FINANCIAL STATEMENTS at November 30, 2022, Continued
As of November 30, 2022, the Funds had tax capital losses which may be carried over to offset future gains. Such losses expire as follows:
Short-Term Indefinite | Long-Term Indefinite | |
| Total Return Fund | $208,830,296 | $177,731,124 |
| Short Duration Fund | 20,600,411 | 5,772,306 |
NOTE 9 – PRINCIPAL RISKS
Below is a summary of some, but not all, of the principal risks of investing in the Funds, each of which may adversely affect a Fund’s net asset value and total return. The Funds’ most recent prospectus provides further descriptions of each Fund’s investment objective, principal investment strategies and principal risks.
| • | General Market Risk – Economies and financial markets throughout the world are becoming increasingly interconnected, which increases the likelihood that events or conditions in one country or region will adversely impact markets or issuers in other countries or regions. Securities in the Fund’s portfolio may underperform in comparison to securities in general financial markets, a particular financial market or other asset classes due to a number of factors, including inflation (or expectations for inflation), deflation (or expectations for deflation), interest rates, global demand for particular products or resources, market instability, debt crises and downgrades, embargoes, tariffs, sanctions and other trade barriers, regulatory events, other governmental trade or market control programs and related geopolitical events. In addition, the value of the Fund’s investments may be negatively affected by the occurrence of global events such as war, terrorism, environmental disasters, natural disasters or events, country instability, and infectious disease epidemics or pandemics. For example, the outbreak of COVID-19, a novel coronavirus disease, has negatively affected economies, markets and individual companies throughout the world, including those in which the Fund invests. The effects of this pandemic to public health and business and market conditions, including exchange trading suspensions and closures, may continue to have a significant negative impact on the performance of the Fund’s investments, increase the Fund’s volatility, negatively impact the Fund’s arbitrage and pricing mechanisms, exacerbate pre-existing political, social and economic risks to the Fund, and negatively impact broad segments of businesses and populations. The Fund’s operations may be interrupted as a result, which may contribute to the negative impact on investment performance. In addition, governments, their regulatory agencies, or self-regulatory organizations may take actions in response to the pandemic that affect the instruments in which the Fund invests, or the issuers of such instruments, in ways that could have a significant negative impact on the Fund’s investment performance. The full impact of the COVID-19 pandemic, or other future epidemics or pandemics, is currently unknown. |
60
SEMPER FUNDS
NOTES TO FINANCIAL STATEMENTS at November 30, 2022, Continued
| • | Liquidity Risk – Liquidity risk exists when particular investments are difficult to purchase or sell. A Fund’s investments in illiquid securities may reduce the returns of the Fund because it may be difficult to sell the illiquid securities at an advantageous time or price or achieve its desired level of exposure to a certain sector. Liquidity risk may be the result of, among other things, the reduced number and capacity of traditional market participants to make a market in fixed-income securities or the lack of an active market. Liquid investments may become illiquid or less liquid after purchase by a Fund, particularly during periods of market turmoil. Illiquid and relatively less liquid investments may be harder to value, especially in changing markets. | |
| • | Risks Associated with Mortgage-Backed and Other Asset-Backed Securities – In addition to the risks associated with other fixed income securities, mortgage-backed and asset-backed securities are subject to certain other risks. The value of these securities will be influenced by the factors affecting the housing market or the other assets underlying such securities. As a result, during periods of declining asset values, difficult or frozen credit markets, significant changes in interest rates, or deteriorating economic conditions, mortgage-backed and asset-backed securities may decline in value, face valuation difficulties, become more volatile and/or become illiquid. The liquidity of these assets may change over time. | |
| • | Residential Mortgage-Backed Securities Risk – RMBS are subject to the risks generally associated with mortgage-backed securities. RMBS may not be backed by the full faith and credit of the U.S. Government and are subject to risk of default on the underlying mortgages. RMBS issued by non-government entities may offer higher yields than those issued by government entities, but also may be subject to greater volatility than government issues. Delinquencies and defaults by borrowers in payments on the underlying mortgages, and the related losses, are affected by general economic conditions, the borrower’s equity in the mortgaged property and the borrower’s financial circumstances. | |
| • | Credit Risk Transfer Securities Risk – Credit risk transfer securities are unguaranteed and unsecured debt securities issued by the government sponsored entity and therefore are not directly linked to or backed by the underlying mortgage loans. As a result, in the event that a government sponsored entity fails to pay principal or interest on its credit risk transfer securities or goes through a bankruptcy, insolvency or similar proceeding, holders of such credit risk transfer securities have no direct recourse to the underlying mortgage loans and will generally receive recovery on par with other unsecured note holders in such a scenario. The risks associated with an investment in credit risk transfer securities are different than the risks |
61
SEMPER FUNDS
NOTES TO FINANCIAL STATEMENTS at November 30, 2022, Continued
| associated with an investment in mortgage-backed securities issued by Fannie Mae and Freddie Mac, or other government sponsored entities or issued by a private issuer, because some or all of the mortgage default or credit risk associated with the underlying mortgage loans is transferred to investors. As a result, investors in these securities could lose some or all of their investment in these securities if the underlying mortgage loans default. | ||
| • | Privately Issued Mortgage-Related Securities Risk – MBS issued or guaranteed by private issuers is also known as “non-agency MBS”. Privately issued mortgage-backed securities generally offer a higher rate of interest (but greater credit risk) than securities issued by U.S. Government issuers, as there are no direct or indirect governmental guarantees of payment. The degree of risks will depend significantly on the ability of borrowers to make payments on the underlying mortgages and the seniority of the security held by a Fund with respect to such payments. The market for privately-issued mortgage-backed securities is smaller and less liquid than the market for mortgage-backed securities issued by U.S. government issuers. | |
| • | Sub-Prime Mortgage Risk – The risk that an issuer of a sub-prime mortgage security will default on its payments of interest or principal on a security when due is more pronounced in the case of sub-prime mortgage instruments than more highly ranked securities. Because of this increased risk, these securities may also be less liquid and subject to more pronounced declines in value than more highly rated instruments in times of market stress. | |
| • | High Yield Risk – Fixed income securities that are rated below investment grade (i.e., “junk bonds”) are subject to additional risk factors due to the speculative nature of the securities, such as increased possibility of default liquidation of the security, and changes in value based on public perception of the issuer. | |
| • | Rule 144A Securities Risk – The market for Rule 144A securities typically is less active than the market for publicly-traded securities. Rule 144A securities carry the risk that the liquidity of these securities may become impaired, making it more difficult for a Fund to sell these securities. |
NOTE 10 – CONTROL OWNERSHIP
The beneficial ownership, either directly or indirectly, of more than 25% of the voting securities of a fund creates a presumption of control of the fund, under Section 2(a)(9) of the 1940 Act. As of November 30, 2022, each Fund’s percentage of control ownership positions greater than 25% are as follows:
Fund | Shareholder | Percent of Shares Held |
Total Return Fund | Reliance Trust Co. | 29.19% |
Short Duration Fund | Charles Schwab & Co., Inc. | 31.73% |
62
SEMPER FUNDS
NOTES TO FINANCIAL STATEMENTS at November 30, 2022, Continued
NOTE 11 – CHANGE IN TRUSTEES AND OFFICERS
At a meeting held December 7-8, 2022, by vote of the majority of the Board of Trustees (not including Mr. Joe Redwine), Mr. Redwine’s term as Trustee was extended for three additional years. Ms. Michele Rackey was approved by the Board as an Independent Trustee effective January 1, 2023. Mr. Kevin Hayden was approved by the Board as Vice President, Treasurer and Ms. Cheryl King was approved as Assistant Treasurer effective January 1, 2023. Mr. Ryan Charles resigned as Assistant Secretary effective January 1, 2023.
NOTE 12 – OTHER TAX INFORMATION (Unaudited)
For the year ended November 30, 2022, the Total Return Fund and the Short Duration Fund designated $31,169,451 and $6,860,515, respectively, as ordinary income for purposes of the dividends paid deduction.
For the year ended November 30, 2022, none of the dividends paid from net investment income qualifies for the dividend received deduction available to corporate shareholders of the Funds. For shareholders in the Funds, none of the dividend income distributed for the year ended November 30, 2022 is designated as qualified dividend income under the Tax Cuts and Jobs Act of 2017.
On December 28, 2022, the Investor class, Institutional class, and Class A of the Total Return Fund each distributed $0.0159866 per share of net investment income.
On December 31, 2022, the Investor class, Institutional class, and Class A of the Total Return Fund distributed $0.052261226, $0.053938698, and $0.052262559 per share of net investment income, respectively.
On December 28, 2022, the Investor class and the Institutional class of the Short Duration Fund each distributed $0.01199773 per share of net investment income.
On December 31, 2022, the Investor class and the Institutional class of the Short Duration Fund distributed $0.043545974 and $0.04547433 per share of net investment income, respectively.
NOTE 13 – SUBSEQUENT EVENT – ADDITION OF A SUB-ADVISER
At a meeting held December 8, 2022, the Board of Trustees (the “Board”) of the Trust approved, and recommended approval by a vote of each Fund’s shareholders, an investment sub-advisory agreement between the Adviser and Medalist Partners LP, on behalf of each Fund. The Board also approved, and recommended approval by a vote of each Fund’s shareholders, for the Funds to operate under a “manager of managers” arrangement, which would allow greater flexibility with respect to changing sub-advisory arrangements.
A special meeting of the Funds’ shareholders is being held to seek shareholder approval of the investment sub-advisory agreement and for the Funds to operate under a “manager of managers” arrangement. The special meeting is scheduled for February 15, 2023 at 11:00 a.m. central time.
63
SEMPER FUNDS
REPORT OF INDEPENDENT REGISTERED PUBLIC ACCOUNTING FIRM
To the Board of Trustees
Advisors Series Trust and Shareholders of:
Semper MBS Total Return Fund
Semper Short Duration Fund
Opinion on the Financial Statements
We have audited the accompanying statements of assets and liabilities of the Semper MBS Total Return Fund and Semper Short Duration Fund (the “Funds”), each a series of Advisors Series Trust (the “Trust”), including the schedules of investments, as of November 30, 2022, the related statements of operations for the year then ended, the statements of changes in net assets for each of the two years in the period then ended, and the financial highlights for each of the five years in the period then ended, and the related notes (collectively referred to as the “financial statements”). In our opinion, the financial statements present fairly, in all material respects, the financial position of the Funds as of November 30, 2022, the results of their operations for the year then ended, the changes in their net assets for each of the two years in the period then ended, and their financial highlights for each of the five years in the period then ended, in conformity with accounting principles generally accepted in the United States of America.
Basis for Opinion
These financial statements are the responsibility of the Funds’ management. Our responsibility is to express an opinion on the Funds’ financial statements based on our audits. We are a public accounting firm registered with the Public Company Accounting Oversight Board (United States) (“PCAOB”) and are required to be independent with respect to the Funds in accordance with the U.S. federal securities laws and the applicable rules and regulations of the Securities and Exchange Commission and the PCAOB. We have served as the auditor of one or more of the funds in the Trust since 2003.
We conducted our audits in accordance with the standards of the PCAOB. Those standards require that we plan and perform the audits to obtain reasonable assurance about whether the financial statements are free of material misstatement, whether due to error or fraud. The Funds are not required to have, nor were we engaged to perform, an audit of the Funds’ internal control over financial reporting. As part of our audits we are required to obtain an understanding of internal control over financial reporting, but not for the purpose of expressing an opinion on the effectiveness of the Funds’ internal control over financial reporting. Accordingly, we express no such opinion.
Our audits included performing procedures to assess the risks of material misstatement of the financial statements, whether due to error or fraud, and performing procedures that respond to those risks. Such procedures included examining, on a test basis, evidence regarding the amounts and disclosures in the financial statements. Our audits also included evaluating the accounting principles used and significant estimates made by management, as well as evaluating the overall presentation of the financial statements. Our procedures included confirmation of securities owned as of November 30, 2022 by correspondence with the custodian, private companies, and brokers; when replies from brokers were not received, we performed other auditing procedures. We believe that our audits provide a reasonable basis for our opinion.
| TAIT, WELLER & BAKER LLP |
Philadelphia, Pennsylvania
January 27, 2023
64
SEMPER FUNDS
NOTICE TO SHAREHOLDERS at November 30, 2022 (Unaudited)
How to Obtain a Copy of the Funds’ Proxy Voting Policies
A description of the policies and procedures that the Funds use to determine how to vote proxies relating to portfolio securities is available without charge, upon request, by calling 1-855-736-7799 or on the U.S. Securities and Exchange Commission’s (“SEC”) website at http://www.sec.gov.
How to Obtain a Copy of the Funds’ Proxy Voting Records for the 12-Month Period Ended June 30
Information regarding how the Funds voted proxies relating to portfolio securities during the 12-month period ended June 30 will be available without charge, upon request, by calling 1-855-736-7799. Furthermore, you can obtain the Funds’ proxy voting records on the SEC’s website at http://www.sec.gov.
Quarterly Filings on Form N-PORT
The Funds file their complete schedules of portfolio holdings with the SEC for the first and third quarters of each fiscal year on Part F of Form N-PORT. The Funds’ Form N-PORT is available on the SEC’s website at http://www.sec.gov. Information included in the Funds’ Form N-PORT is also available, upon request, by calling 1-855-736-7799.
65
SEMPER FUNDS
STATEMENT REGARDING LIQUIDITY RISK MANAGEMENT PROGRAM (Unaudited)
Each Fund has adopted a liquidity risk management program (the “program”). The Board has designated a committee at the Adviser to serve as the administrator of the program. The Adviser’s committee conducts the day-to-day operation of the programs pursuant to policies and procedures administered by the committee.
Under the program, the Adviser’s committee manages each Fund’s liquidity risk, which is the risk that the Fund could not meet shareholder redemption requests without significant dilution of remaining shareholders’ interests in the Fund. This risk is managed by monitoring the degree of liquidity of each Fund’s investments, limiting the amount of each Fund’s illiquid investments, and utilizing various risk management tools and facilities available to each Fund for meeting shareholder redemptions, among other means. The committee’s process of determining the degree of liquidity of each Fund’s investments is supported by one or more third-party liquidity assessment vendors.
The Board reviewed a report prepared by the committee regarding the operation and effectiveness of the program for the period July 1, 2021 through June 30, 2022. No material liquidity events impacting the Fund were noted in the report. The report noted that the Semper MBS Total Return Funds made use of its line of credit during the reporting period and that such line was fully repaid in a timely manner. In addition, the committee provided its assessment that the program had been effective in managing each Fund’s liquidity risk.
66
SEMPER FUNDS
INFORMATION ABOUT TRUSTEES AND OFFICERS (Unaudited)
This chart provides information about the Trustees and Officers who oversee the Funds. Officers elected by the Trustees manage the day-to-day operations of the Funds and execute policies formulated by the Trustees.
| Term of | Number of | ||||
| Office | Portfolios | Other | |||
| and | Principal | in Fund | Directorships | ||
| Position | Length | Occupation | Complex | Held | |
| Name, Address | Held with | of Time | During Past | Overseen by | During Past |
and Age | the Trust | Served* | Five Years | Trustee(2) | Five Years(3) |
Independent Trustees(1) | |||||
David G. Mertens | Trustee | Indefinite | Partner and Head of | 2 | Trustee, |
(age 62) | term; | Business Development | Advisors | ||
615 E. Michigan Street | since | Ballast Equity | Series Trust | ||
Milwaukee, WI 53202 | March | Management, LLC | (for series not | ||
2017. | (a privately-held | affiliated with | |||
investment advisory | the Funds). | ||||
firm) (February 2019 | |||||
to present); Managing | |||||
Director and Vice | |||||
President, Jensen | |||||
Investment | |||||
Management, Inc. | |||||
(a privately-held | |||||
investment advisory | |||||
firm) (2002 to 2017). | |||||
Joe D. Redwine | Trustee | Indefinite | Retired; formerly | 2 | Trustee, |
(age 75) | term; | Manager, President, | Advisors | ||
615 E. Michigan Street | since | CEO, U.S. Bancorp | Series Trust | ||
Milwaukee, WI 53202 | September | Fund Services, LLC | (for series not | ||
2008. | and its predecessors | affiliated with | |||
(May 1991 to July 2017). | the Funds). |
67
SEMPER FUNDS
INFORMATION ABOUT TRUSTEES AND OFFICERS (Unaudited), Continued
| Term of | Number of | ||||
| Office | Portfolios | Other | |||
| and | Principal | in Fund | Directorships | ||
| Position | Length | Occupation | Complex | Held | |
| Name, Address | Held with | of Time | During Past | Overseen by | During Past |
and Age | the Trust | Served* | Five Years | Trustee(2) | Five Years(3) |
Raymond B. Woolson | Chairman | Indefinite | President, Apogee | 2 | Trustee, |
(age 63) | of the | term; | Group, Inc. (financial | Advisors | |
615 E. Michigan Street | Board | since | consulting firm) | Series Trust | |
Milwaukee, WI 53202 | January | (1998 to present). | (for series not | ||
2020. | affiliated with | ||||
Trustee | Indefinite | the Funds); | |||
term; | Independent | ||||
since | Trustee, | ||||
January | DoubleLine | ||||
2016. | Funds Trust | ||||
(an open-end | |||||
investment | |||||
company with | |||||
19 portfolios), | |||||
DoubleLine | |||||
Opportunistic | |||||
Credit Fund, | |||||
DoubleLine | |||||
Income | |||||
Solutions | |||||
Fund and | |||||
DoubleLine | |||||
Yield | |||||
Opportunities | |||||
Fund from | |||||
2010 to | |||||
present; | |||||
Independent | |||||
Trustee, | |||||
DoubleLine | |||||
ETF Trust (an | |||||
open-end | |||||
investment | |||||
company with | |||||
2 portfolios) | |||||
from March | |||||
2022 to | |||||
present. |
68
SEMPER FUNDS
INFORMATION ABOUT TRUSTEES AND OFFICERS (Unaudited), Continued
| Term of | |||
| Office | |||
| and | |||
| Position | Length | ||
| Name, Address | Held with | of Time | Principal Occupation |
and Age | the Trust | Served | During Past Five Years |
| Officers | |||
Jeffrey T. Rauman | President, | Indefinite | Senior Vice President, Compliance and |
(age 53) | Chief | term; | Administration, U.S. Bank Global Fund Services |
615 E. Michigan Street | Executive | since | (February 1996 to present). |
Milwaukee, WI 53202 | Officer and | December | |
Principal | 2018. | ||
Executive | |||
Officer | |||
Cheryl L. King | Vice | Indefinite | Vice President, Compliance and Administration, |
(age 61) | President, | term; | U.S. Bank Global Fund Services |
615 E. Michigan Street | Treasurer | since | (October 1998 to present). |
Milwaukee, WI 53202 | and | December | |
Principal | 2007. | ||
Financial | |||
Officer | |||
Kevin J. Hayden | Assistant | Indefinite | Vice President, Compliance and Administration, |
(age 51) | Treasurer | term; | U.S. Bank Global Fund Services |
615 E. Michigan Street | since | (June 2005 to present). | |
Milwaukee, WI 53202 | September | ||
2013. | |||
Richard R. Conner | Assistant | Indefinite | Assistant Vice President, Compliance and |
(age 40) | Treasurer | term; | Administration, U.S. Bank Global Fund Services |
615 E. Michigan Street | since | (July 2010 to present). | |
Milwaukee, WI 53202 | December | ||
2018. | |||
Michael L. Ceccato | Vice | Indefinite | Senior Vice President, U.S. Bank Global Fund |
(age 65) | President, | term; | Services and Senior Vice President, U.S. Bank N.A. |
615 E. Michigan Street | Chief | since | (February 2008 to present). |
Milwaukee, WI 53202 | Compliance | September | |
Officer and | 2009. | ||
AML Officer | |||
Elaine E. Richards | Vice | Indefinite | Senior Vice President, U.S. Bank Global Fund |
(age 54) | President | term; | Services (July 2007 to present). |
2020 East Financial Way, | and | since | |
Suite 100 | Secretary | September | |
Glendora, CA 91741 | 2019. |
69
SEMPER FUNDS
INFORMATION ABOUT TRUSTEES AND OFFICERS (Unaudited), Continued
| Term of | |||
| Office | |||
| and | |||
| Position | Length | ||
| Name, Address | Held with | of Time | Principal Occupation |
and Age | the Trust | Served | During Past Five Years |
Ryan Charles | Assistant | Indefinite | Assistant Vice President, U.S. Bank Global Fund |
(age 44) | Secretary | term; | Services (May 2021 to present); Chief Legal |
2020 East Financial Way, | since | Officer and Secretary Davis Selected Advisers, L.P. | |
Suite 100 | January | (2004 to 2021). | |
Glendora, CA 91741 | 2022. |
| * | The Trustees have designated a mandatory retirement age of 75, such that each Trustee, serving as such on the date he or she reaches the age of 75, shall submit his or her resignation not later than the last day of the calendar year in which his or her 75th birthday occurs (“Retiring Trustee”). Upon request, the Board may, by vote of a majority of Trustees eligible to vote on such matter, determine whether or not to extend such Retiring Trustee’s term and on the length of a one-time extension of up to three additional years. |
| (1) | The Trustees of the Trust who are not “interested persons” of the Trust as defined under the 1940 Act (“Independent Trustees”). |
| (2) | As of November 30, 2022, the Trust was comprised of 35 active portfolios managed by unaffiliated investment advisers. The term “Fund Complex” applies only to the Funds. The Funds do not hold themselves out as related to any other series within the Trust for investment purposes, nor do they share the same investment adviser with any other series. |
| (3) | “Other Directorships Held” includes only directorships of companies required to register or file reports with the SEC under the Securities Exchange Act of 1934, as amended, (that is, “public companies”) or other investment companies registered under the 1940 Act. |
The Statement of Additional Information includes additional information about the Funds’ Trustees and Officers and is available, without charge, upon request by calling 1-855-736-7799.
70
SEMPER FUNDS
HOUSEHOLDING (Unaudited)
In an effort to decrease costs, the Funds will reduce the number of duplicate prospectuses, supplements, and certain other shareholder documents that you receive by sending only one copy of each to those addresses shown by two or more accounts. Please call the Funds’ transfer agent toll free at 1-855-736-7799 to request individual copies of these documents. The Funds will begin sending individual copies 30 days after receiving your request. This policy does not apply to account statements.
71
SEMPER FUNDS
PRIVACY NOTICE
The Funds collect non-public information about you from the following sources:
| • | Information we receive about you on applications or other forms; |
| • | Information you give us orally; and/or |
| • | Information about your transactions with us or others. |
We do not disclose any non-public personal information about our customers or former customers without the customer’s authorization, except as permitted by law or in response to inquiries from governmental authorities. We may share information with affiliated and unaffiliated third parties with whom we have contracts for servicing the Funds. We will provide unaffiliated third parties with only the information necessary to carry out their assigned responsibilities. We maintain physical, electronic and procedural safeguards to guard your non-public personal information and require third parties to treat your personal information with the same high degree of confidentiality.
In the event that you hold shares of the Funds through a financial intermediary, including, but not limited to, a broker-dealer, bank, or trust company, the privacy policy of your financial intermediary would govern how your non-public personal information would be shared by those entities with unaffiliated third parties.
72
(This Page Intentionally Left Blank.)
Investment Adviser
Semper Capital Management, L.P.
52 Vanderbilt Avenue, Suite 401
New York, New York 10017
Independent Registered Public Accounting Firm
Tait, Weller & Baker LLP
Two Liberty Place
50 South 16th Street, Suite 2900
Philadelphia, Pennsylvania 19102
Legal Counsel
Sullivan & Worcester LLP
1633 Broadway, 32nd Floor
New York, New York 10019
Custodian
U.S. Bank N.A.
Custody Operations
1555 North RiverCenter Drive, Suite 302
Milwaukee, Wisconsin 53212
Transfer Agent, Fund Accountant and Fund Administrator
U.S. Bank Global Fund Services
615 East Michigan Street
Milwaukee, Wisconsin 53202
1-855-736-7799 (855-SEM-PRXX)
Distributor
Quasar Distributors, LLC
111 East Kilbourn Avenue, Suite 2200
Milwaukee, Wisconsin 53202
This report is intended for shareholders of the Funds and may not be used as sales literature unless preceded or accompanied by a current prospectus. For a current prospectus, please call 1-855-736-7799 (855-SEM-PRXX). Statements and other information herein are dated and are subject to change.
(b) Not applicable
Item 2. Code of Ethics.
The registrant has adopted a code of ethics that applies to the registrant’s principal executive officer and principal financial officer. The registrant has not made any substantive amendments to its code of ethics during the period covered by this report. The registrant has not granted any waivers from any provisions of the code of ethics during the period covered by this report.
A copy of the registrant’s Code of Ethics is filed herewith.
Item 3. Audit Committee Financial Expert.
The registrant’s Board of Trustees has determined that there is at least one audit committee financial expert serving on its audit committee. Mr. Joe D. Redwine and Ms. Michele Rackey are the “audit committee financial experts” and are considered to be “independent” as each term is defined in Item 3 of Form N‑CSR.
Item 4. Principal Accountant Fees and Services.
The registrant has engaged its principal accountant to perform audit services, audit-related services, tax services and other services during the past two fiscal years. “Audit services” refer to performing an audit of the registrant's annual financial statements or services that are normally provided by the accountant in connection with statutory and regulatory filings or engagements for those fiscal years. “Audit-related services” refer to the assurance and related services by the principal accountant that are reasonably related to the performance of the audit. “Tax services” refer to professional services rendered by the principal accountant including the review of federal income tax returns, review of federal excise tax returns, review of state tax returns, if any, and assistance with calculation of required income, capital gain and excise distributions. There were no “other services” provided by the principal accountant. The following table details the aggregate fees billed or expected to be billed for each of the last two fiscal years for audit fees, audit-related fees, tax fees and other fees by the principal accountant.
FYE 11/30/2022 | FYE 11/30/2021 | |
(a) Audit Fees | $47,650 | $58,950 |
(b) Audit-Related Fees | N/A | N/A |
(c) Tax Fees | $7,200 | $10,800 |
(d) All Other Fees | N/A | N/A |
(e)(1) The audit committee has adopted pre-approval policies and procedures that require the audit committee to pre‑approve all audit and non‑audit services of the registrant, including services provided to any entity affiliated with the registrant.
(e)(2) The percentage of fees billed by Tait, Weller, & Baker LLP applicable to non-audit services pursuant to waiver of pre-approval requirement were as follows:
| FYE 11/30/2022 | FYE 11/30/2021 | |
Audit-Related Fees | 0% | 0% |
Tax Fees | 0% | 0% |
All Other Fees | 0% | 0% |
(f) All of the principal accountant’s hours spent on auditing the registrant’s financial statements were attributed to work performed by full‑time permanent employees of the principal accountant.
(g) The following table indicates the non-audit fees billed or expected to be billed by the registrant’s accountant for services to the registrant and to the registrant’s investment adviser (and any other controlling entity, etc.—not sub-adviser) for the last two years.
Non-Audit Related Fees | FYE 11/30/2022 | FYE 11/30/2021 |
Registrant | N/A | N/A |
Registrant’s Investment Adviser | N/A | N/A |
(h) The audit committee of the board of trustees/directors has considered whether the provision of non-audit services that were rendered to the registrant's investment adviser is compatible with maintaining the principal accountant's independence and has concluded that the provision of such non-audit services by the accountant has not compromised the accountant’s independence.
The registrant has not been identified by the U.S. Securities and Exchange Commission as having filed an annual report issued by a registered public accounting firm branch or office that is located in a foreign jurisdiction where the Public Company Accounting Oversight Board is unable to inspect or completely investigate because of a position taken by an authority in that jurisdiction.
The registrant is not a foreign issuer.
Item 5. Audit Committee of Listed Registrants.
(a) Not applicable to registrants who are not listed issuers (as defined in Rule 10A-3 under the Securities Exchange Act of 1934).
(b) Not applicable.
Item 6. Investments.
(a) Schedule of Investments is included as part of the report to shareholders filed under Item 1 of this Form.
(b) Not applicable.
Item 7. Disclosure of Proxy Voting Policies and Procedures for Closed-End Management Investment Companies.
Not applicable to open-end investment companies.
Item 8. Portfolio Managers of Closed-End Management Investment Companies.
Not applicable to open-end investment companies.
Item 9. Purchases of Equity Securities by Closed‑End Management Investment Company and Affiliated Purchasers.
Not applicable to open-end investment companies.
Item 10. Submission of Matters to a Vote of Security Holders.
There have been no material changes to the procedures by which shareholders may recommend nominees to the Registrant’s Board of Trustees.
Item 11. Controls and Procedures.
| (a) | The Registrant’s President/Chief Executive Officer/Principal Executive Officer and Vice President/Treasurer/Principal Financial Officer have reviewed the Registrant's disclosure controls and procedures (as defined in Rule 30a-3(c) under the Investment Company Act of 1940, as amended, (the “Act”)) as of a date within 90 days of the filing of this report, as required by Rule 30a-3(b) under the Act and Rules 13a-15(b) or 15d‑15(b) under the Securities Exchange Act of 1934. Based on their review, such officers have concluded that the disclosure controls and procedures are effective in ensuring that information required to be disclosed in this report is appropriately recorded, processed, summarized and reported and made known to them by others within the Registrant and by the Registrant’s service provider. |
| (b) | There were no changes in the Registrant's internal control over financial reporting (as defined in Rule 30a-3(d) under the Act) that occurred during the period covered by this report that has materially affected, or is reasonably likely to materially affect, the Registrant's internal control over financial reporting. |
Item 12. Disclosure of Securities Lending Activities for Closed-End Management Investment Companies.
Not applicable to open-end investment companies.
Item 13. Exhibits.
(3) Any written solicitation to purchase securities under Rule 23c‑1 under the Act sent or given during the period covered by the report by or on behalf of the registrant to 10 or more persons. Not applicable to open-end investment companies.
(4) Change in the registrant’s independent public accountant. There was no change in the registrant’s independent public accountant for the period covered by this report.
SIGNATURES
Pursuant to the requirements of the Securities Exchange Act of 1934 and the Investment Company Act of 1940, as amended, the registrant has duly caused this report to be signed on its behalf by the undersigned, thereunto duly authorized.
(Registrant) Advisors Series Trust
By (Signature and Title)* /s/ Jeffrey T. Rauman
Jeffrey T. Rauman, President/Chief Executive Officer/Principal
Executive Officer
Date 2/6/2023
Pursuant to the requirements of the Securities Exchange Act of 1934 and the Investment Company Act of 1940, as amended, this report has been signed below by the following persons on behalf of the registrant and in the capacities and on the dates indicated.
By (Signature and Title)* /s/ Jeffrey T. Rauman
Jeffrey T. Rauman, President/Chief Executive Officer/Principal
Executive Officer
Date 2/6/2023
By (Signature and Title)* /s/ Kevin J. Hayden
Kevin J. Hayden, Vice President/Treasurer/Principal Financial Officer
Date 2/6/2023
* Print the name and title of each signing officer under his or her signature.