UNITED STATES
SECURITIES AND EXCHANGE COMMISSION
Washington, D.C. 20549
SECURITIES AND EXCHANGE COMMISSION
Washington, D.C. 20549
FORM N-CSR
CERTIFIED SHAREHOLDER REPORT OF REGISTERED
MANAGEMENT INVESTMENT COMPANIES
Investment Company Act file number 811-07959
Advisors Series Trust
(Exact name of registrant as specified in charter)
(Exact name of registrant as specified in charter)
615 East Michigan Street
Milwaukee, WI 53202
(Address of principal executive offices) (Zip code)
Jeffrey T. Rauman, President/Chief Executive Officer
Advisors Series Trust
c/o U.S. Bancorp Fund Services, LLC
777 East Wisconsin Avenue, 5th Floor
Milwaukee, WI 53202
(Name and address of agent for service)
(Name and address of agent for service)
(626) 914-7363
(Registrant's telephone number, including area code)
Date of fiscal year end: November 30, 2022
Date of reporting period: November 30, 2022
Item 1. Reports to Stockholders.
(a)
PIA Funds
PIA BBB Bond Fund
Managed Account Completion Shares (MACS)
PIA MBS Bond Fund
Managed Account Completion Shares (MACS)
PIA High Yield (MACS) Fund
Managed Account Completion Shares (MACS)
Annual Report
November 30, 2022
PIA Funds
Dear Shareholder:
We are pleased to provide you with this annual report for the fiscal year from December 1, 2021, through November 30, 2022, regarding the PIA BBB Bond Fund and the PIA MBS Bond Fund (each, a “Fund” and together, the “Funds”) for which Pacific Income Advisers, Inc. (“PIA”), is the investment adviser.
During the fiscal year ended November 30, 2022, the total returns, including the reinvestment of dividends and capital gains, were as follows:
| PIA BBB Bond Fund | -16.00% |
| PIA MBS Bond Fund | -11.12% |
As stated in the most recently filed prospectus, the PIA BBB Bond Fund’s gross expense ratio and net expense ratio are 0.15% and 0.15%, respectively; while the PIA MBS Bond Fund’s gross expense ratio and net expense ratio are 0.31% and 0.23%, respectively.
PIA has agreed to temporarily pay for all operating expenses (excluding acquired fund fees and expenses) incurred by each Fund through at least March 29, 2023, to the extent necessary to limit Total Annual Fund Operating Expenses After Expense Reimbursement to 0.15% and 0.23% of average daily net assets for the BBB Bond Fund and the MBS Bond Fund, respectively. The net expense is what the investor has paid.
PIA BBB Bond Fund
The PIA BBB Bond Fund returned -16.00% for the twelve-month period ended November 30, 2022, versus the Bloomberg U.S. Credit Baa Bond Index return of -15.50%. The Fund has a strategy of using a broad diversification of BBB-rated issuers, industry sectors and range of maturities. The bonds held in the Fund represent approximately 210 different issuers. The Bloomberg U.S. Credit Baa Bond Index has over 500 issuers. The Fund is structured so as to approximate the returns of its benchmark, while holding a smaller number of issuers. In order to achieve this objective, the overall duration, the partial durations, as well as the sector allocations of the Fund approximate those of its benchmark. While the top 20 issuers in the Bloomberg U.S. Credit Baa Bond Index are represented in the Fund, for the remaining issuers in the benchmark, only a subset is represented in the Fund, based on market conditions. This will cause some variability in the returns of the Fund relative to those of the benchmark.
PIA MBS Bond Fund
The PIA MBS Bond Fund returned -11.12% for the fiscal year ended November 30, 2022, and the Bloomberg U.S. MBS Fixed Rate Index returned -11.50%. The 30-year fixed mortgage rate, according to the Freddie Mac Primary Mortgage Market Survey, increased by approximately 3.4% to 6.5%. The Fund’s shorter duration position was the primary contributor to the outperformance, as interest rates rose during the period. Lower coupon mortgage pools underperformed higher coupon pools, and the Fund’s underweight to lower coupon pools was a positive. 15-year mortgage-backed securities (“MBS”) outperformed 30-year MBS, and the Fund’s underweight in 15-year MBS was a detractor. Ginnie Mae 30-year MBS outperformed conventional 30-year MBS (Fannie Mae and Freddie Mac), which was a negative, given the Fund’s underweight in Ginnie Mae mortgages.
1
PIA Funds
Bond Market in Review
The Federal Open Market Committee voted to raise the Federal Funds rate by 375 basis points during the reporting period in order to combat increasing inflation. The yields on 2-year, 5-year, 10-year and 30-year Treasuries increased by 375, 258, 216 and 195 basis points, respectively, from December 1, 2021, to November 30, 2022. Spreads on BBB-rated bonds over Treasuries increased during the period from 123 to 162 basis points. Option-adjusted spreads on fixed rate agency MBS increased from 34 to 52 basis points, as their average life increased from 6.0 to 7.6 years.
We believe that the PIA BBB Bond Fund and the PIA MBS Bond Fund provide our clients with a means of efficiently investing in a broadly diversified portfolio of BBB-rated bonds and agency mortgage-backed bonds, respectively.
Please take a moment to review the Funds’ statements of assets and liabilities and the results of operations for the fiscal ended November 30, 2022. We look forward to reporting to you again with the semi-annual report dated May 31, 2023.

Lloyd McAdams
Chairman of the Board
Pacific Income Advisers, Inc.
2
PIA Funds
Past performance is not a guarantee of future results.
Opinions expressed above are those of Pacific Income Advisers, Inc., the Funds’ investment adviser, are subject to change, are not guaranteed and should not be considered recommendations to buy or sell any security and should not be considered investment advice.
Must be preceded or accompanied by a prospectus.
Mutual fund investing involves risk. Principal loss is possible. Investments in debt securities typically decrease in value when interest rates rise. This risk is usually greater for longer-term debt securities. Investments in asset-backed and mortgage-backed securities include additional risks that investors should be aware of such as credit risk, prepayment risk, possible illiquidity and default, as well as increased susceptibility to adverse economic developments.
Investment by the PIA BBB Bond Fund in lower-rated and non-rated securities presents a greater risk of loss to principal and interest than higher-rated securities. The Fund may invest in foreign securities which involve greater volatility and political, economic and currency risks and differences in accounting methods. These risks are greater for emerging markets.
The Funds may also use options, futures contracts, and swaps, which have the risks of unlimited losses of the underlying holdings due to unanticipated market movements and failure to correctly predict the direction of securities prices, interest rates and currency rates. Derivatives involve risks different from, and in certain cases, greater than the risks presented by more traditional investments. These risks are fully disclosed in the Prospectus.
Bond ratings provide the probability of an issuer defaulting based on the analysis of the issuer’s financial condition and profit potential. Bond rating services are provided by credit rating agencies currently registered as Nationally Recognized Statistical Rating Organizations (“NRSROs”). Bond ratings start at AAA (denoting the highest investment quality) and usually end at D (meaning payment is in default). Securities not covered by any agency will receive a non-rated (NR) rating.
Diversification does not assure a profit or protect against risk in a declining market.
The Bloomberg U.S. Credit Baa Bond Index is an unmanaged index consisting of bonds rated Baa. The issues must be publicly traded and meet certain maturity and issue size requirements. Bonds are represented by the Industrial, Utility, Finance and non-corporate sectors. Non-corporate sectors include sovereign, supranational, foreign agency and foreign local government issuers.
The Bloomberg U.S. MBS Fixed Rate Index tracks fixed-rate mortgage-backed pass-through securities issued by Ginnie Mae (GNMA), Fannie Mae (FNMA) and Freddie Mac (FHLMC). The index is composed of MBS generics that group the larger universe of eligible agency mortgage pass-through pools according to four main characteristics: agency, program, coupon, and vintage.
Gross domestic product is the amount of goods and services produced in a year, in a country.
Consumer Price Index measures the weighted average of prices of a basket of consumer goods and services, such as transportation, food and medical care.
Duration is the measure of the sensitivity of the price of a fixed income security to a change in interest rates, expressed in number of years.
Basis point equals 1/100th of 1%.
Spread is the difference in yield between a corporate bond and a similar maturity U.S. Treasury Bond. It is the compensation investors receive for accepting credit risk of a corporate bond.
The option-adjusted spread is the spread earned over Treasuries, measured over multiple possible future interest rate scenarios, after accounting for the value of the embedded option in the security, which in the case of MBS, gives mortgage holders the option to either refinance or repay early.
Please refer to the schedule of investments in the report for complete holdings information. Fund holdings and sector allocations are subject to change at any time and are not recommendations to buy or sell any security. Investment performance reflects fee waivers and/or expense reimbursements in effect. In the absence of such waivers or reimbursements, total return would be reduced.
Quasar Distributors, LLC, Distributor
3
PIA Funds
Dear Shareholder:
We are pleased to provide you with this report for the period from December 1, 2021 through November 30, 2022, regarding the PIA High Yield (MACS) Fund (the “Fund”) for which Pacific Income Advisers, Inc. (“PIA”), is the investment adviser.
The Fund performed in-line with its benchmark, the Bloomberg U.S. Corporate High-Yield Index (the “Index”), returning -8.50%, after fees and expenses, for the twelve months ended November 30, 2022, versus -8.96% for the Index.
As stated in the most recently filed prospectus, the Fund’s gross expense ratio is 0.20%.
The Fund’s primary objective is to seek a high level of current income. The Fund’s secondary objective is to seek capital growth when that is consistent with its primary objective.
Lloyd McAdams
Chairman of the Board
Pacific Income Advisers, Inc.
4
PIA Funds
Past performance is not a guarantee of future results.
Opinions expressed above are those of Pacific Income Advisers, Inc., the Fund’s investment adviser, are subject to change, are not guaranteed, should not be considered recommendations to buy or sell any security and should not be considered investment advice.
Must be preceded or accompanied by a prospectus.
Mutual fund investing involves risk. Principal loss is possible. Investments in debt securities typically decrease in value when interest rates rise. This risk is usually greater for longer-term debt securities. The Fund may invest in foreign securities which involve greater volatility and political, economic and currency risks and differences in accounting methods. These risks may increase for emerging markets. Investment by the Fund in lower-rated and non-rated securities presents a greater risk of loss to principal and interest than higher-rated securities. The Fund may invest in derivatives, which may involve risks greater than the risks presented by more traditional investments. The risk of owning an exchange-traded fund (“ETF”) or mutual fund generally reflects the risks of owning the underlying securities that the ETF or mutual fund holds. It will also bear additional expenses, including operating expenses, brokerage costs, and the potential duplication of management fees.
The Bloomberg U.S. Corporate High-Yield Index measures the market of USD-denominated, non-investment grade, fixed rate, taxable corporate bonds. Securities are classified as high yield if the middle rating of Moody’s Investors Service, Inc., Fitch Ratings, Inc., and Standard & Poor’s Ratings Services is Ba1/BB+/BB+ or below after dropping the highest and lowest available ratings. The index excludes emerging markets debt.
You cannot invest directly in an index.
Bond ratings provide the probability of an issuer defaulting based on the analysis of the issuer’s financial condition and profit potential. Bond rating services are provided by credit rating agencies currently registered as Nationally Recognized Statistical Rating Organizations (“NRSROs”). Bond ratings start at AAA (denoting the highest investment quality) and usually end at D (meaning payment is in default). Securities not covered by any agency will receive a non-rated (NR) rating.
Please refer to the schedule of investments in the report for complete holdings information. Fund holdings and sector allocations are subject to change at any time and are not recommendations to buy or sell any security. Investment performance reflects fee waivers in effect. In the absence of such waivers, total return would be reduced.
Quasar Distributors, LLC, Distributor
5
PIA Funds
PIA BBB BOND FUND
Comparison of the change in value of a $10,000 investment in the
PIA BBB Bond Fund vs the Bloomberg U.S. Credit Baa Bond Index
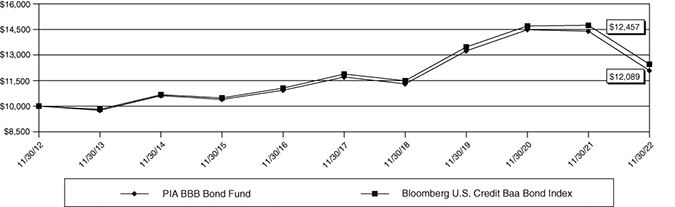
Average Annual Total Return* | 1 Year | 5 Year | 10 Year |
| PIA BBB Bond Fund | -16.00% | 0.66% | 1.92% |
| Bloomberg U.S. Credit Baa Bond Index | -15.50% | 0.97% | 2.23% |
Performance data quoted represents past performance; past performance does not guarantee future results. The investment return and principal value of an investment will fluctuate so that an investor’s shares, when redeemed, may be worth more or less than their original cost. Current performance of the Fund may be lower or higher than the performance quoted. Performance data current to the most recent month end may be obtained by calling 1-800-251-1970.
This chart illustrates the performance of a hypothetical $10,000 investment made in the Fund ten years ago. Returns reflect the reinvestment of dividends and capital gain distributions. Fee waivers are in effect. In the absence of fee waivers, returns would be reduced. The performance data and graph do not reflect the deduction of taxes that a shareholder may pay on dividends, capital gain distributions, or redemption of Fund shares. This chart does not imply any future performance.
The Bloomberg U.S. Credit Baa Bond Index is an unmanaged index consisting of bonds rated Baa. The issues must be publicly traded and meet certain maturity and issue size requirements. Bonds are represented by the Industrial, Utility, Finance and non-corporate sectors. Non-corporate sectors include sovereign, supranational, foreign agency and foreign local government issuers.
Indices do not incur expenses and are not available for investment.
| * | Average Annual Total Return represents the average change in account value over the periods indicated. |
6
PIA Funds
PIA MBS BOND FUND
Comparison of the change in value of a $10,000 investment in the
PIA MBS Bond Fund vs the Bloomberg U.S. MBS Fixed Rate Index

Average Annual Total Return* | 1 Year | 5 Year | 10 Year |
| PIA MBS Bond Fund | -11.12% | -0.45% | 0.71% |
| Bloomberg U.S. MBS Fixed Rate Index | -11.50% | -0.38% | 0.81% |
Performance data quoted represents past performance; past performance does not guarantee future results. The investment return and principal value of an investment will fluctuate so that an investor’s shares, when redeemed, may be worth more or less than their original cost. Current performance of the Fund may be lower or higher than the performance quoted. Performance data current to the most recent month end may be obtained by calling 1-800-251-1970.
This chart illustrates the performance of a hypothetical $10,000 investment made in the Fund ten years ago. Returns reflect the reinvestment of dividends and capital gain distributions. Fee waivers are in effect. In the absence of fee waivers, returns would be reduced. The performance data and graph do not reflect the deduction of taxes that a shareholder may pay on dividends, capital gain distributions, or redemption of Fund shares. This chart does not imply any future performance.
The Bloomberg U.S. MBS Fixed Rate Index tracks fixed-rate mortgage-backed pass-through securities issued by Ginnie Mae (GNMA), Fannie Mae (FNMA) and Freddie Mac (FHLMC). The index is composed of MBS generics that group the larger universe of eligible agency mortgage pass-through pools according to four main characteristics: agency, program, coupon, and vintage.
Indices do not incur expenses and are not available for investment.
| * | Average Annual Total Return represents the average change in account value over the periods indicated. |
7
PIA Funds
PIA HIGH YIELD (MACS) FUND
Comparison of the change in value of a $10,000 investment in the
PIA High Yield (MACS) Fund vs the Bloomberg U.S. Corporate High-Yield Index

| Since Inception | |||
Average Annual Total Return* | 1 Year | 3 Year | (12/26/17) |
| PIA High Yield (MACS) Fund | -8.50% | 2.68% | 3.06% |
| Bloomberg U.S. Corporate High-Yield Index | -8.96% | 0.92% | 2.51% |
Performance data quoted represents past performance; past performance does not guarantee future results. The investment return and principal value of an investment will fluctuate so that an investor’s shares, when redeemed, may be worth more or less than their original cost. Current performance of the Fund may be lower or higher than the performance quoted. Performance data current to the most recent month end may be obtained by calling 1-800-251-1970.
This chart illustrates the performance of a hypothetical $10,000 investment made in the Fund on its inception date, December 26, 2017. Returns reflect the reinvestment of dividends and capital gain distributions. Fee waivers are in effect. In the absence of fee waivers, returns would be reduced. The performance data and graph do not reflect the deduction of taxes that a shareholder may pay on dividends, capital gain distributions, or redemption of Fund shares. This chart does not imply any future performance.
The Bloomberg U.S. Corporate High-Yield Index measures the market of USD-denominated, non-investment grade, fixed-rate, taxable corporate bonds. Securities are classified as high yield if the middle rating of Moody’s Investors Service, Inc., Fitch Ratings, Inc., and Standard & Poor’s Ratings Services is Ba1/BB+/BB+ or below after dropping the highest and lowest available ratings. The index excludes emerging markets debt.
Indices do not incur expenses and are not available for investment.
| * | Average Annual Total Return represents the average change in account value over the periods indicated. |
8
PIA Funds
Expense Example – November 30, 2022
(Unaudited)
As a shareholder of a mutual fund, you incur two types of costs: (1) transaction costs, including sales charges (loads) on purchase payments, redemption fees, and exchange fees, and (2) ongoing costs, including management fees, distribution and/or service fees, and other fund expenses. This Example is intended to help you understand your ongoing costs (in dollars) of investing in the PIA Funds and to compare these costs with the ongoing costs of investing in other mutual funds. The BBB Bond Fund, MBS Bond Fund, and High Yield (MACS) Fund Example is based on an investment of $1,000 invested at the beginning of the period and held for the entire period (6/1/22 – 11/30/22).
Actual Expenses
The first line of the tables below provides information about actual account values and actual expenses. Although the Funds charge no sales loads or transaction fees, you will be assessed fees for outgoing wire transfers, returned checks, and stop payment orders at prevailing rates charged by U.S. Bancorp Fund Services, LLC, the Funds’ transfer agent. The Example below includes, but is not limited to, fund accounting, custody and transfer agent fees. You may use the information in the first line, together with the amount you invested, to estimate the expenses that you paid over the period. Simply divide your account value by $1,000 (for example, an $8,600 account value divided by $1,000 = 8.6), then multiply the result by the number in the first line under the heading entitled “Expenses Paid During Period” to estimate the expenses you paid on your account during this period.
Hypothetical Example for Comparison Purposes
The second line of the tables below provides information about hypothetical account values and hypothetical expenses based on the Funds’ actual expense ratios and an assumed rate of return of 5% per year before expenses, which is different from the Funds’ actual returns. The hypothetical account values and expenses may not be used to estimate the actual ending account balance or expenses you paid for the period. You may use this information to compare the ongoing costs of investing in the Funds and other funds. To do so, compare this 5% hypothetical example with the 5% hypothetical examples that appear in the shareholder reports of the other funds. Please note that the expenses shown in the table are meant to highlight your ongoing costs only and do not reflect any transaction costs, such as sales charges (loads), redemption fees, or exchange fees. Therefore, the second line of the tables is useful in comparing ongoing costs only, and will not help you determine the relative total costs of owning different funds. In addition, if these transaction costs were included, your costs would have been higher.
9
PIA Funds
Expense Example – November 30, 2022 (continued)
(Unaudited)
| Beginning | Ending | Expenses Paid | |
| Account Value | Account Value | During Period | |
6/1/22 | 11/30/22 | 6/1/22 – 11/30/22* | |
| PIA BBB Bond Fund | |||
| Actual | $1,000.00 | $ 959.10 | $0.74 |
| Hypothetical (5% return before expenses) | $1,000.00 | $1,024.32 | $0.76 |
| PIA MBS Bond Fund | |||
| Actual | $1,000.00 | $ 955.70 | $1.13 |
| Hypothetical (5% return before expenses) | $1,000.00 | $1,023.92 | $1.17 |
| PIA High Yield (MACS) Fund | |||
| Actual | $1,000.00 | $ 973.60 | $0.99 |
| Hypothetical (5% return before expenses) | $1,000.00 | $1,024.07 | $1.01 |
| * | Expenses are equal to a Fund’s annualized expense ratio, multiplied by the average account value over the period, multiplied by 183 (days in most recent fiscal half-year) / 365 days to reflect the one-half year expense. The annualized expense ratio of the PIA BBB Bond Fund, the PIA MBS Bond Fund and the PIA High Yield (MACS) Fund was 0.15%, 0.23%, 0.20%, respectively. |
10
PIA Funds
PIA BBB BOND FUND
Allocation of Portfolio Assets – November 30, 2022
(Unaudited)
Investments by Sector
As a Percentage of Total Investments

11
PIA Funds
PIA MBS BOND FUND
Allocation of Portfolio Assets – November 30, 2022
(Unaudited)
Investments by Issuer
As a Percentage of Total Investments

12
PIA Funds
PIA HIGH YIELD (MACS) FUND
Allocation of Portfolio Assets – November 30, 2022
(Unaudited)
Investments by Sector
As a Percentage of Total Investments

13
PIA Funds
PIA BBB BOND FUND
Schedule of Investments – November 30, 2022
| Principal Amount | Value | ||||||
| CORPORATE BONDS 91.4% | |||||||
| Aerospace & Defense 2.7% | |||||||
| Boeing Co. | |||||||
| $ | 1,950,000 | 5.15%, due 5/1/30 | $ | 1,899,416 | |||
| 1,400,000 | 5.705%, due 5/1/40 | 1,329,880 | |||||
| Northrop Grumman Corp. | |||||||
| 1,000,000 | 4.40%, due 5/1/30 | 975,981 | |||||
| Raytheon Technologies Corp. | |||||||
| 1,000,000 | 3.50%, due 3/15/27 | 939,928 | |||||
| 1,000,000 | 4.35%, due 4/15/47 | 872,355 | |||||
| 6,017,560 | |||||||
| Agricultural Chemicals 0.3% | |||||||
| Nutrien Ltd. | |||||||
| 700,000 | 2.95%, due 5/13/30 | 600,099 | |||||
| Agriculture 0.3% | |||||||
| Bunge Limited Finance Corp. | |||||||
| 600,000 | 3.75%, due 9/25/27 | 562,724 | |||||
| Airlines 1.2% | |||||||
| Delta Air Lines, Inc. | |||||||
| 2,000,000 | 2.90%, due 10/28/24 | 1,898,810 | |||||
| Southwest Airlines Co. | |||||||
| 500,000 | 5.125%, due 6/15/27 | 502,641 | |||||
| United Airlines 2020-1 Class B | |||||||
| Pass Through Trust | |||||||
| 381,000 | 4.875%, due 7/15/27 | 360,740 | |||||
| 2,762,191 | |||||||
| Autos 0.4% | |||||||
| Ford Motor Credit Co. LLC | |||||||
| 500,000 | 3.815%, due 11/2/27 | 447,380 | |||||
| General Motors Co. | |||||||
| 400,000 | 5.20%, due 4/1/45 | 338,262 | |||||
| 785,642 | |||||||
| Banks 6.5% | |||||||
| Barclays Plc | |||||||
| 1,000,000 | 4.836%, due 5/9/28 | 915,994 | |||||
| 1,000,000 | 5.746% (1 Year CMT Rate | ||||||
| + 3.000%), due 8/9/33 (g) | 951,725 | ||||||
| Citigroup, Inc. | |||||||
| 1,700,000 | 4.45%, due 9/29/27 | 1,635,898 | |||||
| 540,000 | 5.30%, due 5/6/44 | 495,811 | |||||
| Cooperatieve Rabobank UA | |||||||
| 1,000,000 | 3.75%, due 7/21/26 | 937,340 | |||||
| Credit Suisse Group AG | |||||||
| 1,050,000 | 4.55%, due 4/17/26 | 911,916 | |||||
| Fifth Third Bancorp | |||||||
| 500,000 | 4.055% (SOFR + 1.355%), | ||||||
| due 4/25/28 (g) | 469,151 | ||||||
| 225,000 | 8.25%, due 3/1/38 | 272,958 | |||||
| Lloyds Banking Group Plc | |||||||
| 800,000 | 4.65%, due 3/24/26 | 760,394 | |||||
| Morgan Stanley | |||||||
| 400,000 | 2.484% (SOFR + 1.360%), | ||||||
| due 9/16/36 (g) | 296,560 | ||||||
| Natwest Group Plc | |||||||
| 1,700,000 | 4.269% (3 Month LIBOR USD | ||||||
| + 1.762%), due 3/22/25 (g) | 1,654,182 | ||||||
| Regions Financial Corp. | |||||||
| 1,000,000 | 1.80%, due 8/12/28 | 850,043 | |||||
| Santander Holdings USA, Inc. | |||||||
| 700,000 | 3.45%, due 6/2/25 | 665,764 | |||||
| Santander UK Group Holdings Plc | |||||||
| 2,000,000 | 1.089% (SOFR + 0.787%), | ||||||
| due 3/15/25 (g) | 1,855,655 | ||||||
| Westpac Banking Corp. | |||||||
| 300,000 | 3.133%, due 11/18/41 | 194,611 | |||||
| Zions Bancorp NA | |||||||
| 2,000,000 | 3.25%, due 10/29/29 | 1,646,006 | |||||
| 14,514,008 | |||||||
The accompanying notes are an integral part of these financial statements.
14
PIA Funds
PIA BBB BOND FUND
Schedule of Investments – November 30, 2022 (continued)
| Principal Amount | Value | ||||||
| Beverages 0.9% | |||||||
| Constellation Brands, Inc. | |||||||
| $ | 700,000 | 2.875%, due 5/1/30 | $ | 600,799 | |||
| Keurig Dr Pepper, Inc. | |||||||
| 1,000,000 | 3.20%, due 5/1/30 | 879,022 | |||||
| 500,000 | 4.50%, due 4/15/52 | 422,699 | |||||
| 1,902,520 | |||||||
| Biotechnology 2.0% | |||||||
| Amgen, Inc. | |||||||
| 1,000,000 | 2.20%, due 2/21/27 | 908,191 | |||||
| 500,000 | 2.80%, due 8/15/41 | 355,835 | |||||
| 1,006,000 | 4.663%, due 6/15/51 | 903,434 | |||||
| Biogen, Inc. | |||||||
| 700,000 | 2.25%, due 5/1/30 | 576,399 | |||||
| Gilead Sciences, Inc. | |||||||
| 1,100,000 | 1.65%, due 10/1/30 | 881,616 | |||||
| 500,000 | 2.60%, due 10/1/40 | 356,391 | |||||
| Royalty Pharma Plc | |||||||
| 500,000 | 2.15%, due 9/2/31 | 384,465 | |||||
| 4,366,331 | |||||||
| Broker 1.0% | |||||||
| Goldman Sachs Group, Inc. | |||||||
| 950,000 | 6.75%, due 10/1/37 | 1,015,172 | |||||
| Merrill Lynch & Co., Inc. | |||||||
| 1,050,000 | 6.11%, due 1/29/37 | 1,086,466 | |||||
| 2,101,638 | |||||||
| Brokerage Asset Managers Exchanges 0.4% | |||||||
| Brightsphere Investment | |||||||
| Group, Inc. | |||||||
| 1,000,000 | 4.80%, due 7/27/26 | 902,650 | |||||
| Building Materials 0.4% | |||||||
| Carrier Global Corp. | |||||||
| 240,000 | 2.70%, due 2/15/31 | 200,172 | |||||
| Masco Corp. | |||||||
| 1,000,000 | 2.00%, due 10/1/30 | 783,167 | |||||
| 983,339 | |||||||
| Cable & Satellite 1.0% | |||||||
| Charter Communications | |||||||
| Operating LLC / Charter | |||||||
| Communications | |||||||
| Operating Capital | |||||||
| 1,000,000 | 2.80%, due 4/1/31 | 789,561 | |||||
| 1,000,000 | 2.30%, due 2/1/32 | 744,385 | |||||
| 1,000,000 | 3.90%, due 6/1/52 | 658,140 | |||||
| 2,192,086 | |||||||
| Casino Hotels 0.4% | |||||||
| Sands China Ltd. | |||||||
| 1,000,000 | 2.55%, due 3/8/27 (h) | 835,830 | |||||
| Cellular Telecom 1.6% | |||||||
| T-Mobile USA, Inc. | |||||||
| 1,600,000 | 3.875%, due 4/15/30 | 1,465,104 | |||||
| 600,000 | 2.25%, due 11/15/31 | 476,282 | |||||
| 1,100,000 | 3.40%, due 10/15/52 | 764,415 | |||||
| 500,000 | 5.65%, due 1/15/53 | 494,262 | |||||
| Vodafone Group Plc | |||||||
| 400,000 | 4.375%, due 5/30/28 | 395,474 | |||||
| 3,595,537 | |||||||
| Chemicals 0.4% | |||||||
| Dow Chemical Co. | |||||||
| 396,000 | 7.375%, due 11/1/29 | 438,940 | |||||
| 500,000 | 6.90%, due 5/15/53 | 542,769 | |||||
| 981,709 | |||||||
| Chemicals-Diversified 0.5% | |||||||
| DuPont de Nemours, Inc. | |||||||
| 1,000,000 | 4.725%, due 11/15/28 | 995,714 | |||||
| Coatings/Paint 0.2% | |||||||
| Sherwin-Williams Co. | |||||||
| 600,000 | 2.20%, due 3/15/32 | 474,005 | |||||
| Commercial Finance 0.2% | |||||||
| Air Lease Corp. | |||||||
| 450,000 | 2.875%, due 1/15/26 | 414,248 | |||||
The accompanying notes are an integral part of these financial statements.
15
PIA Funds
PIA BBB BOND FUND
Schedule of Investments – November 30, 2022 (continued)
| Principal Amount | Value | ||||||
| Commercial Services 0.9% | |||||||
| Global Payments, Inc. | |||||||
| $ | 500,000 | 1.20%, due 3/1/26 | $ | 435,709 | |||
| Moody’s Corp. | |||||||
| 250,000 | 2.00%, due 8/19/31 | 198,354 | |||||
| 250,000 | 3.10%, due 11/29/61 | 162,327 | |||||
| Quanta Services, Inc. | |||||||
| 1,500,000 | 2.90%, due 10/1/30 | 1,244,054 | |||||
| 2,040,444 | |||||||
| Communications Equipment 0.2% | |||||||
| Harris Corp. | |||||||
| 500,000 | 6.15%, due 12/15/40 | 522,285 | |||||
| Computers 1.0% | |||||||
| Dell International LLC / | |||||||
| EMC Corp. | |||||||
| 900,000 | 6.02%, due 6/15/26 | 917,332 | |||||
| 500,000 | 6.20%, due 7/15/30 | 513,935 | |||||
| 500,000 | 3.45%, due 12/15/51 (c) | 315,746 | |||||
| HP, Inc. | |||||||
| 500,000 | 3.40%, due 6/17/30 | 430,008 | |||||
| 2,177,021 | |||||||
| Construction Materials Manufacturing 0.3% | |||||||
| Vulcan Materials Co. | |||||||
| 620,000 | 3.90%, due 4/1/27 | 591,503 | |||||
| Consumer Finance 0.2% | |||||||
| Synchrony Financial | |||||||
| 500,000 | 4.50%, due 7/23/25 | 478,649 | |||||
| Consumer Products 0.2% | |||||||
| Church & Dwight Co., Inc. | |||||||
| 500,000 | 3.15%, due 8/1/27 | 469,379 | |||||
| Diversified Banks 0.4% | |||||||
| Deutsche Bank AG | |||||||
| 1,000,000 | 4.10%, due 1/13/26 | 953,453 | |||||
| Diversified Financial Services 2.3% | |||||||
| AerCap Ireland Capital DAC / | |||||||
| AerCap Global Aviation Trust | |||||||
| 1,500,000 | 3.30%, due 1/30/32 | 1,190,669 | |||||
| Ally Financial, Inc. | |||||||
| 500,000 | 2.20%, due 11/2/28 | 397,779 | |||||
| Blackstone Secured Lending Fund | |||||||
| 1,000,000 | 3.625%, due 1/15/26 | 930,284 | |||||
| Capital One Financial Corp. | |||||||
| 1,400,000 | 3.65%, due 5/11/27 | 1,318,137 | |||||
| GE Capital International | |||||||
| Funding Co. Unlimited Co. | |||||||
| 433,000 | 4.418%, due 11/15/35 | 407,610 | |||||
| Nomura Holdings, Inc. | |||||||
| 1,000,000 | 2.172%, due 7/14/28 | 822,535 | |||||
| 5,067,014 | |||||||
| Diversified Manufacturing Operations 0.2% | |||||||
| Parker-Hannifin Corp. | |||||||
| 550,000 | 3.25%, due 6/14/29 | 495,700 | |||||
| E-Commerce & Products 0.2% | |||||||
| eBay, Inc. | |||||||
| 500,000 | 2.60%, due 5/10/31 | 408,323 | |||||
| Electric 0.2% | |||||||
| American Electric Power Co, Inc. | |||||||
| 500,000 | 5.95%, due 11/1/32 | 523,249 | |||||
| Electric – Distribution 0.2% | |||||||
| Sempra Energy | |||||||
| 600,000 | 4.125% (5 Year CMT Rate | ||||||
| + 2.868%), due 4/1/52 (g) | 464,614 | ||||||
| Electric – Integrated 4.5% | |||||||
| Constellation Energy | |||||||
| Generation LLC | |||||||
| 2,000,000 | 3.25%, due 6/1/25 | 1,919,752 | |||||
| Dominion Energy, Inc. | |||||||
| 500,000 | 2.25%, due 8/15/31 | 399,273 | |||||
| DTE Energy Co. | |||||||
| 600,000 | 1.05%, due 6/1/25 | 543,552 | |||||
The accompanying notes are an integral part of these financial statements.
16
PIA Funds
PIA BBB BOND FUND
Schedule of Investments – November 30, 2022 (continued)
| Principal Amount | Value | ||||||
| Electric – Integrated 4.5% (continued) | |||||||
| Duke Energy Corp. | |||||||
| $ | 950,000 | 2.45%, due 6/1/30 | $ | 790,385 | |||
| 1,000,000 | 3.30%, due 6/15/41 | 739,842 | |||||
| Eversource Energy | |||||||
| 500,000 | 2.55%, due 3/15/31 | 414,132 | |||||
| FirstEnergy Corp. | |||||||
| 700,000 | 2.25%, due 9/1/30 | 557,599 | |||||
| NextEra Energy Capital | |||||||
| Holdings, Inc. | |||||||
| 500,000 | 4.625%, due 7/15/27 | 495,617 | |||||
| 400,000 | 2.25%, due 6/1/30 | 331,175 | |||||
| Pacific Gas and Electric Co. | |||||||
| 5,000,000 | 3.50%, due 8/1/50 | 3,229,968 | |||||
| Southwestern Electric Power Co. | |||||||
| 400,000 | 3.25%, due 11/1/51 | 267,405 | |||||
| Xcel Energy, Inc. | |||||||
| 500,000 | 2.35%, due 11/15/31 | 401,199 | |||||
| 10,089,899 | |||||||
| Electric Utilities 0.4% | |||||||
| Dominion Resources, Inc. | |||||||
| 470,000 | 4.90%, due 8/1/41 | 422,092 | |||||
| NiSource Finance Corp. | |||||||
| 400,000 | 5.25%, due 2/15/43 | 376,935 | |||||
| 799,027 | |||||||
| Electrical Equipment Manufacturing 0.3% | |||||||
| Fortive Corp. | |||||||
| 750,000 | 3.15%, due 6/15/26 | 704,429 | |||||
| Electronic Components and | |||||||
| Semiconductors 1.4% | |||||||
| Broadcom, Inc. | |||||||
| 431,000 | 4.15%, due 11/15/30 | 386,279 | |||||
| 1,500,000 | 3.419%, due 4/15/33 (c) | 1,208,714 | |||||
| 55,000 | 3.187%, due 11/15/36 (c) | 39,906 | |||||
| 583,000 | 4.926%, due 5/15/37 (c) | 508,950 | |||||
| Micron Technology, Inc. | |||||||
| 250,000 | 2.703%, due 4/15/32 | 193,117 | |||||
| NXP BV / NXP Funding LLC / | |||||||
| NXP USA, Inc. | |||||||
| 500,000 | 4.40%, due 6/1/27 | 477,377 | |||||
| 500,000 | 2.50%, due 5/11/31 | 394,424 | |||||
| 3,208,767 | |||||||
| Electronic Instrumentation 0.1% | |||||||
| Agilent Technologies, Inc. | |||||||
| 215,000 | 2.30%, due 3/12/31 | 174,808 | |||||
| Electronics 0.3% | |||||||
| Roper Technologies, Inc. | |||||||
| 650,000 | 1.40%, due 9/15/27 | 554,468 | |||||
| Enterprise Software & Services 1.9% | |||||||
| Oracle Corp. | |||||||
| 1,685,000 | 1.65%, due 3/25/26 | 1,510,000 | |||||
| 800,000 | 2.875%, due 3/25/31 | 668,309 | |||||
| 1,400,000 | 3.65%, due 3/25/41 | 1,036,061 | |||||
| 1,350,000 | 3.95%, due 3/25/51 | 984,493 | |||||
| 4,198,863 | |||||||
| Entertainment 0.9% | |||||||
| Warnermedia Holdings, Inc. | |||||||
| 1,000,000 | 4.279%, due 3/15/32 (c) | 847,143 | |||||
| 1,500,000 | 5.141%, due 3/15/52 (c) | 1,150,655 | |||||
| 1,997,798 | |||||||
| Environmental Control 0.4% | |||||||
| Republic Services, Inc. | |||||||
| 1,000,000 | 0.875%, due 11/15/25 | 894,217 | |||||
| Finance Companies 0.4% | |||||||
| FS KKR Capital Corp. | |||||||
| 1,000,000 | 4.625%, due 7/15/24 | 967,539 | |||||
| Financial Services 0.2% | |||||||
| Legg Mason, Inc. | |||||||
| 500,000 | 5.625%, due 1/15/44 | 494,891 | |||||
The accompanying notes are an integral part of these financial statements.
17
PIA Funds
PIA BBB BOND FUND
Schedule of Investments – November 30, 2022 (continued)
| Principal Amount | Value | ||||||
| Food 0.9% | |||||||
| ConAgra Brands, Inc. | |||||||
| $ | 1,300,000 | 7.00%, due 10/1/28 | $ | 1,394,566 | |||
| General Mills, Inc. | |||||||
| 700,000 | 2.25%, due 10/14/31 | 569,014 | |||||
| 1,963,580 | |||||||
| Food – Confectionery 0.7% | |||||||
| Mondelez International, Inc. | |||||||
| 2,000,000 | 1.50%, due 2/4/31 | 1,541,637 | |||||
| Food – Meat products 0.3% | |||||||
| Tyson Foods, Inc. | |||||||
| 600,000 | 4.35%, due 3/1/29 | 579,500 | |||||
| Food – Retail 0.4% | |||||||
| Kroger Co. | |||||||
| 1,000,000 | 2.20%, due 5/1/30 | 815,877 | |||||
| Food and Beverage 1.7% | |||||||
| Anheuser-Busch InBev | |||||||
| Worldwide, Inc. | |||||||
| 500,000 | 4.00%, due 4/13/28 | 483,580 | |||||
| 1,600,000 | 4.35%, due 6/1/40 | 1,441,143 | |||||
| 2,100,000 | 4.50%, due 6/1/50 | 1,889,744 | |||||
| 3,814,467 | |||||||
| Food Wholesale/Distribution 0.3% | |||||||
| Sysco Corp. | |||||||
| 464,000 | 5.95%, due 4/1/30 | 484,612 | |||||
| 400,000 | 3.15%, due 12/14/51 | 272,674 | |||||
| 757,286 | |||||||
| General Industrial Machinery 0.4% | |||||||
| IDEX Corp. | |||||||
| 1,000,000 | 3.00%, due 5/1/30 | 864,963 | |||||
| Hand & Machine Tools 0.1% | |||||||
| Kennametal, Inc. | |||||||
| 330,000 | 2.80%, due 3/1/31 | 258,066 | |||||
| Health and Personal Care Stores 1.5% | |||||||
| CVS Health Corp. | |||||||
| 2,150,000 | 3.75%, due 4/1/30 | 1,982,816 | |||||
| 500,000 | 5.125%, due 7/20/45 | 464,745 | |||||
| 1,000,000 | 5.05%, due 3/25/48 | 920,594 | |||||
| 3,368,155 | |||||||
| Health Care Facilities and Services 0.3% | |||||||
| Laboratory Corporation of | |||||||
| America Holdings | |||||||
| 640,000 | 3.25%, due 9/1/24 | 618,663 | |||||
| Healthcare 0.1% | |||||||
| DH Europe Finance II | |||||||
| 350,000 | 2.60%, due 11/15/29 | 308,431 | |||||
| Healthcare – Products 0.7% | |||||||
| Boston Scientific Corp. | |||||||
| 560,000 | 2.65%, due 6/1/30 | 481,241 | |||||
| Danaher Corp. | |||||||
| 1,000,000 | 2.60%, due 10/1/50 | 656,713 | |||||
| GE Healthcare Holding LLC | |||||||
| 500,000 | 5.857%, due 3/15/30 (c) | 517,241 | |||||
| 1,655,195 | |||||||
| Healthcare – Services 1.5% | |||||||
| CommonSpirit Health | |||||||
| 600,000 | 2.782%, due 10/1/30 | 483,016 | |||||
| Elevance Health, Inc. | |||||||
| 500,000 | 5.50%, due 10/15/32 | 514,775 | |||||
| 600,000 | 4.65%, due 8/15/44 | 538,123 | |||||
| HCA, Inc. | |||||||
| 1,000,000 | 4.125%, due 6/15/29 | 912,437 | |||||
| 600,000 | 4.375%, due 3/15/42 (c) | 485,518 | |||||
| Humana, Inc. | |||||||
| 500,000 | 4.875%, due 4/1/30 | 488,992 | |||||
| 3,422,861 | |||||||
The accompanying notes are an integral part of these financial statements.
18
PIA Funds
PIA BBB BOND FUND
Schedule of Investments – November 30, 2022 (continued)
| Principal Amount | Value | ||||||
| Healthcare REITs 0.6% | |||||||
| Sabra Health Care LP | |||||||
| $ | 1,000,000 | 3.90%, due 10/15/29 | $ | 824,516 | |||
| Welltower, Inc. | |||||||
| 700,000 | 2.75%, due 1/15/31 | 566,279 | |||||
| 1,390,795 | |||||||
| Insurance 1.2% | |||||||
| Aon Corp. | |||||||
| 600,000 | 2.80%, due 5/15/30 | 512,374 | |||||
| Fairfax Financial Holdings Ltd. | |||||||
| 1,000,000 | 3.375%, due 3/3/31 | 808,916 | |||||
| Lincoln National Corp. | |||||||
| 120,000 | 3.80%, due 3/1/28 | 111,033 | |||||
| Metlife, Inc. | |||||||
| 855,000 | 6.40%, due 12/15/66 (f) | 806,342 | |||||
| Prudential Financial, Inc. | |||||||
| 500,000 | 5.125% (5 Year CMT Rate | ||||||
| + 3.162%), due 3/1/52 (g) | 428,438 | ||||||
| 2,667,103 | |||||||
| Integrated Oils 0.4% | |||||||
| Ecopetrol S.A. | |||||||
| 900,000 | 4.125%, due 1/16/25 | 847,514 | |||||
| Life & Health Insurance 0.2% | |||||||
| Corebridge Financial, Inc. | |||||||
| 500,000 | 3.90%, due 4/5/32 (c) | 439,783 | |||||
| Life Insurance 0.4% | |||||||
| AXA Equitable Holdings, Inc. | |||||||
| 1,000,000 | 5.00%, due 4/20/48 | 866,433 | |||||
| Media 1.4% | |||||||
| Discovery Communications LLC | |||||||
| 1,000,000 | 3.625%, due 5/15/30 | 841,409 | |||||
| Fox Corp. | |||||||
| 975,000 | 4.709%, due 1/25/29 | 935,423 | |||||
| Time Warner Entertainment | |||||||
| Company, LP | |||||||
| 810,000 | 8.375%, due 7/15/33 | 906,751 | |||||
| Viacom Inc. | |||||||
| 610,000 | 4.375%, due 3/15/43 | 427,869 | |||||
| 3,111,452 | |||||||
| Medical Equipment and Supplies | |||||||
| Manufacturing 0.7% | |||||||
| Becton Dickinson and Co. | |||||||
| 550,000 | 4.685%, due 12/15/44 | 498,532 | |||||
| Smith & Nephew Plc | |||||||
| 1,400,000 | 2.032%, due 10/14/30 | 1,094,156 | |||||
| 1,592,688 | |||||||
| Medical Products 0.5% | |||||||
| Stryker Corp. | |||||||
| 700,000 | 1.95%, due 6/15/30 | 574,762 | |||||
| Zimmer Biomet Holdings, Inc. | |||||||
| 500,000 | 3.05%, due 1/15/26 | 472,977 | |||||
| 1,047,739 | |||||||
| Metals 0.4% | |||||||
| Southern Copper Corp. | |||||||
| 750,000 | 6.75%, due 4/16/40 | 810,098 | |||||
| Metals and Mining 0.3% | |||||||
| Newmont Corp. | |||||||
| 800,000 | 4.875%, due 3/15/42 | 727,617 | |||||
| Nondepository Credit Intermediation 1.3% | |||||||
| General Motors Financial Co., Inc. | |||||||
| 600,000 | 4.00%, due 1/15/25 | 583,782 | |||||
| 1,300,000 | 3.60%, due 6/21/30 | 1,112,014 | |||||
| 1,500,000 | 2.35%, due 1/8/31 | 1,156,344 | |||||
| 2,852,140 | |||||||
| Office Property REITs 0.5% | |||||||
| Alexandria Real Estate | |||||||
| Equities, Inc. | |||||||
| 650,000 | 1.875%, due 2/1/33 | 481,982 | |||||
| Boston Properties LP | |||||||
| 675,000 | 3.25%, due 1/30/31 | 563,050 | |||||
| 1,045,032 | |||||||
The accompanying notes are an integral part of these financial statements.
19
PIA Funds
PIA BBB BOND FUND
Schedule of Investments – November 30, 2022 (continued)
| Principal Amount | Value | ||||||
| Oil and Gas 3.9% | |||||||
| Cenovus Energy, Inc. | |||||||
| $ | 1,000,000 | 2.65%, due 1/15/32 | $ | 805,558 | |||
| Diamondback Energy, Inc. | |||||||
| 500,000 | 3.125%, due 3/24/31 | 419,672 | |||||
| Enterprise Products | |||||||
| Operating LLC | |||||||
| 1,200,000 | 2.80%, due 1/31/30 | 1,035,475 | |||||
| 850,000 | 4.85%, due 8/15/42 | 757,764 | |||||
| 500,000 | 3.30%, due 2/15/53 | 341,461 | |||||
| Hess Corp. | |||||||
| 800,000 | 5.60%, due 2/15/41 | 768,803 | |||||
| Kinder Morgan Energy Partners | |||||||
| 1,270,000 | 5.80%, due 3/15/35 | 1,249,911 | |||||
| Kinder Morgan, Inc. | |||||||
| 600,000 | 2.00%, due 2/15/31 | 469,293 | |||||
| 700,000 | 5.55%, due 6/1/45 | 650,861 | |||||
| Pioneer Natural Resources Co. | |||||||
| 1,000,000 | 2.15%, due 1/15/31 | 806,337 | |||||
| Valero Energy Corp. | |||||||
| 750,000 | 2.80%, due 12/1/31 | 619,378 | |||||
| 655,000 | 6.625%, due 6/15/37 | 698,732 | |||||
| 8,623,245 | |||||||
| Oil and Gas Extraction 0.3% | |||||||
| Canadian Natural | |||||||
| Resources Ltd. | |||||||
| 700,000 | 4.95%, due 6/1/47 | 627,314 | |||||
| Oil and Gas Services and Equipment 0.4% | |||||||
| Halliburton Co. | |||||||
| 24,000 | 3.80%, due 11/15/25 | 23,473 | |||||
| 1,000,000 | 2.92%, due 3/1/30 | 862,563 | |||||
| 886,036 | |||||||
| Oil Refining & Marketing 0.4% | |||||||
| Phillips 66 | |||||||
| 950,000 | 1.30%, due 2/15/26 | 852,440 | |||||
| Packaging & Containers 0.6% | |||||||
| Berry Global, Inc. | |||||||
| 1,000,000 | 1.57%, due 1/15/26 | 891,038 | |||||
| WRKCo, Inc. | |||||||
| 500,000 | 3.90%, due 6/1/28 | 460,071 | |||||
| 1,351,109 | |||||||
| Paper 0.4% | |||||||
| International Paper Co. | |||||||
| 700,000 | 6.00%, due 11/15/41 | 699,899 | |||||
| Weyerhaeuser Co. | |||||||
| 226,000 | 7.375%, due 3/15/32 | 250,895 | |||||
| 950,794 | |||||||
| Petroleum and Coal Products Manufacturing 0.2% | |||||||
| Suncor Energy, Inc. | |||||||
| 500,000 | 3.75%, due 3/4/51 | 368,132 | |||||
| Pharmaceuticals 3.2% | |||||||
| AbbVie, Inc. | |||||||
| 700,000 | 3.20%, due 11/21/29 | 637,463 | |||||
| 2,200,000 | 4.55%, due 3/15/35 | 2,086,735 | |||||
| 800,000 | 4.40%, due 11/6/42 | 711,558 | |||||
| 268,000 | 4.75%, due 3/15/45 | 248,232 | |||||
| Cardinal Health, Inc. | |||||||
| 125,000 | 3.41%, due 6/15/27 | 117,366 | |||||
| Cigna Corp. | |||||||
| 500,000 | 4.50%, due 2/25/26 | 497,675 | |||||
| 1,600,000 | 2.40%, due 3/15/30 | 1,351,790 | |||||
| 600,000 | 3.40%, due 3/15/50 | 431,659 | |||||
| Viatris, Inc. | |||||||
| 600,000 | 2.70%, due 6/22/30 | 477,616 | |||||
| Zoetis, Inc. | |||||||
| 600,000 | 2.00%, due 5/15/30 | 491,056 | |||||
| 7,051,150 | |||||||
| Pipeline Transportation of Crude Oil 0.2% | |||||||
| Magellan Midstream Partners LP | |||||||
| 500,000 | 3.20%, due 3/15/25 | 476,702 | |||||
The accompanying notes are an integral part of these financial statements.
20
PIA Funds
PIA BBB BOND FUND
Schedule of Investments – November 30, 2022 (continued)
| Principal Amount | Value | ||||||
| Pipeline Transportation of Natural Gas 0.9% | |||||||
| Williams Companies, Inc. | |||||||
| $ | 1,000,000 | 2.60%, due 3/15/31 | $ | 820,862 | |||
| Williams Partners LP | |||||||
| 800,000 | 3.90%, due 1/15/25 | 781,181 | |||||
| 500,000 | 5.10%, due 9/15/45 | 444,425 | |||||
| 2,046,468 | |||||||
| Pipelines 3.6% | |||||||
| Boardwalk Pipelines LP | |||||||
| 500,000 | 3.60%, due 9/1/32 | 417,093 | |||||
| El Paso Electric Co. | |||||||
| 850,000 | 6.00%, due 5/15/35 | 849,685 | |||||
| Enbridge, Inc. | |||||||
| 1,000,000 | 3.125%, due 11/15/29 | 880,036 | |||||
| 250,000 | 3.40%, due 8/1/51 | 175,476 | |||||
| Energy Transfer LP | |||||||
| 500,000 | 4.25%, due 4/1/24 | 490,027 | |||||
| Energy Transfer Partners LP | |||||||
| 1,000,000 | 7.60%, due 2/1/24 | 1,014,155 | |||||
| MPLX LP | |||||||
| 1,315,000 | 4.25%, due 12/1/27 | 1,249,273 | |||||
| 600,000 | 4.95%, due 3/14/52 | 497,233 | |||||
| ONEOK, Inc. | |||||||
| 500,000 | 6.10%, due 11/15/32 | 504,719 | |||||
| Plains All American Pipeline LP / | |||||||
| PAA Finance Corp. | |||||||
| 546,000 | 3.80%, due 9/15/30 | 477,075 | |||||
| Targa Resources Corp. | |||||||
| 500,000 | 5.20%, due 7/1/27 | 493,067 | |||||
| TransCanada PipeLines Ltd. | |||||||
| 1,100,000 | 4.10%, due 4/15/30 | 1,025,128 | |||||
| �� | 8,072,967 | ||||||
| Property & Casualty Insurance 1.5% | |||||||
| Fidelity National Financial, Inc. | |||||||
| 2,000,000 | 2.45%, due 3/15/31 | 1,534,956 | |||||
| Hanover Insurance Group, Inc. | |||||||
| 1,400,000 | 4.50%, due 4/15/26 | 1,373,673 | |||||
| Mercury General Corp. | |||||||
| 500,000 | 4.40%, due 3/15/27 | 469,186 | |||||
| 3,377,815 | |||||||
| Railroad 1.4% | |||||||
| Canadian Pacific Railway Co. | |||||||
| 700,000 | 2.90%, due 2/1/25 | 669,867 | |||||
| 1,000,000 | 2.45%, due 12/2/31 | 831,187 | |||||
| Norfolk Southern Corp. | |||||||
| 700,000 | 3.85%, due 1/15/24 | 692,265 | |||||
| 250,000 | 2.30%, due 5/15/31 | 207,715 | |||||
| 1,000,000 | 2.90%, due 8/25/51 | 662,384 | |||||
| 3,063,418 | |||||||
| Real Estate 1.6% | |||||||
| American Homes 4 Rent LP | |||||||
| 1,000,000 | 4.25%, due 2/15/28 | 930,407 | |||||
| Crown Castle, Inc. | |||||||
| 500,000 | 3.65%, due 9/1/27 | 466,101 | |||||
| 600,000 | 2.25%, due 1/15/31 | 484,142 | |||||
| Essex Portfolio, LP | |||||||
| 1,000,000 | 3.375%, due 4/15/26 | 941,138 | |||||
| STORE Capital Corp. | |||||||
| 810,000 | 4.50%, due 3/15/28 | 737,039 | |||||
| 3,558,827 | |||||||
| Refining & Marketing 0.2% | |||||||
| Marathon Petroleum Corp. | |||||||
| 500,000 | 3.625%, due 9/15/24 | 487,612 | |||||
| REITS 0.6% | |||||||
| Prologis LP | |||||||
| 1,000,000 | 1.75%, due 2/1/31 | 783,230 | |||||
| Ventas Realty LP | |||||||
| 500,000 | 3.75%, due 5/1/24 | 487,408 | |||||
| 1,270,638 | |||||||
The accompanying notes are an integral part of these financial statements.
21
PIA Funds
PIA BBB BOND FUND
Schedule of Investments – November 30, 2022 (continued)
| Principal Amount | Value | ||||||
| REITS – Diversified 0.3% | |||||||
| Equinix, Inc. | |||||||
| $ | 500,000 | 1.55%, due 3/15/28 | $ | 415,091 | |||
| 100,000 | 3.90%, due 4/15/32 | 88,922 | |||||
| GLP Capital LP / GLP | |||||||
| Financing II, Inc. | |||||||
| 250,000 | 3.25%, due 1/15/32 | 197,615 | |||||
| 701,628 | |||||||
| REITS – Health Care 0.5% | |||||||
| Healthpeak Properties, Inc. | |||||||
| 350,000 | 2.125%, due 12/1/28 | 294,693 | |||||
| Omega Healthcare Investors, Inc. | |||||||
| 1,000,000 | 3.25%, due 4/15/33 | 732,854 | |||||
| 1,027,547 | |||||||
| REITS – Office Property 0.2% | |||||||
| Corporate Office Properties LP | |||||||
| 500,000 | 2.75%, due 4/15/31 | 376,844 | |||||
| Residential Building 0.2% | |||||||
| DR Horton, Inc. | |||||||
| 500,000 | 2.60%, due 10/15/25 | 466,330 | |||||
| Restaurants 1.1% | |||||||
| McDonald’s Corp. | |||||||
| 1,100,000 | 3.50%, due 7/1/27 | 1,050,097 | |||||
| 550,000 | 4.875%, due 12/9/45 | 514,783 | |||||
| Starbucks Corp. | |||||||
| 1,000,000 | 2.55%, due 11/15/30 | 852,888 | |||||
| 2,417,768 | |||||||
| Retail 1.1% | |||||||
| AutoNation, Inc. | |||||||
| 200,000 | 3.50%, due 11/15/24 | 191,619 | |||||
| Lowe’s Cos, Inc. | |||||||
| 1,000,000 | 4.50%, due 4/15/30 | 969,607 | |||||
| 500,000 | 1.70%, due 10/15/30 | 396,173 | |||||
| 500,000 | 5.625%, due 4/15/53 | 494,059 | |||||
| Tractor Supply Co. | |||||||
| 500,000 | 1.75%, due 11/1/30 | 387,860 | |||||
| 2,439,318 | |||||||
| Retail – Auto Parts 0.4% | |||||||
| AutoZone, Inc. | |||||||
| 500,000 | 4.75%, due 8/1/32 | 489,005 | |||||
| Genuine Parts Co. | |||||||
| 500,000 | 1.875%, due 11/1/30 | 384,065 | |||||
| 873,070 | |||||||
| Retail – Drug Store 0.4% | |||||||
| Walgreens Boots Alliance, Inc. | |||||||
| 1,000,000 | 3.20%, due 4/15/30 | 866,997 | |||||
| Software 0.8% | |||||||
| Fidelity National Information | |||||||
| Services, Inc. | |||||||
| 600,000 | 5.10%, due 7/15/32 | 585,088 | |||||
| Fiserv, Inc. | |||||||
| 600,000 | 3.85%, due 6/1/25 | 582,214 | |||||
| VMware, Inc. | |||||||
| 550,000 | 4.65%, due 5/15/27 | 535,512 | |||||
| 1,702,814 | |||||||
| Software & Services 0.5% | |||||||
| Equifax, Inc. | |||||||
| 500,000 | 3.10%, due 5/15/30 | 421,594 | |||||
| Hewlett Packard Enterprise Co. | |||||||
| 700,000 | 4.90%, due 10/15/25 (b) | 698,367 | |||||
| 1,119,961 | |||||||
| Telecommunications 2.3% | |||||||
| British Telecommunications Plc | |||||||
| 855,000 | 9.625%, due 12/15/30 (d) | 1,028,335 | |||||
| Deutsche Telekom | |||||||
| International Finance | |||||||
| 345,000 | 8.75%, due 6/15/30 (e) | 410,409 | |||||
| France Telecom SA | |||||||
| 575,000 | 5.375%, due 1/13/42 | 562,111 | |||||
| �� | Grupo Televisa SAB | ||||||
| 300,000 | 6.625%, due 3/18/25 | 306,531 | |||||
| Juniper Networks, Inc. | |||||||
| 2,000,000 | 2.00%, due 12/10/30 | 1,509,669 | |||||
The accompanying notes are an integral part of these financial statements.
22
PIA Funds
PIA BBB BOND FUND
Schedule of Investments – November 30, 2022 (continued)
| Principal Amount | Value | ||||||
| Telecommunications 2.3% (continued) | |||||||
| Rogers Communications, Inc. | |||||||
| $ | 989,000 | 5.00%, due 3/15/44 | $ | 858,188 | |||
| Telefonica Emisiones SAU | |||||||
| 475,000 | 7.045%, due 6/20/36 | 496,593 | |||||
| 5,171,836 | |||||||
| Tobacco 1.8% | |||||||
| Altria Group, Inc. | |||||||
| 148,000 | 4.80%, due 2/14/29 | 141,894 | |||||
| 1,600,000 | 3.40%, due 5/6/30 | 1,372,700 | |||||
| BAT Capital Corp. | |||||||
| 1,000,000 | 2.259%, due 3/25/28 | 837,424 | |||||
| 600,000 | 4.54%, due 8/15/47 | 433,692 | |||||
| 800,000 | 5.65%, due 3/16/52 | 666,478 | |||||
| Reynolds American, Inc. | |||||||
| 600,000 | 4.45%, due 6/12/25 | 589,149 | |||||
| 4,041,337 | |||||||
| Transportation 1.0% | |||||||
| CSX Corp. | |||||||
| 1,390,000 | 6.22%, due 4/30/40 | 1,530,024 | |||||
| FedEx Corp. | |||||||
| 1,000,000 | 3.25%, due 5/15/41 | 722,591 | |||||
| 2,252,615 | |||||||
| Transportation and Logistics 0.2% | |||||||
| Kirby Corp. | |||||||
| 450,000 | 4.20%, due 3/1/28 | 408,482 | |||||
| Travel & Lodging 0.2% | |||||||
| Marriott International, Inc. | |||||||
| 600,000 | 3.75%, due 3/15/25 | 582,559 | |||||
| Trucking & Leasing 0.4% | |||||||
| GATX Corp. | |||||||
| 1,300,000 | 1.90%, due 6/1/31 | 971,385 | |||||
| Utilities 0.4% | |||||||
| Southern Co. | |||||||
| 1,000,000 | 3.25%, due 7/1/26 | 949,111 | |||||
| Waste and Environment Services and Equipment 0.6% | |||||||
| Waste Connections, Inc. | |||||||
| 500,000 | 4.20%, due 1/15/33 | 470,942 | |||||
| Waste Management, Inc. | |||||||
| 1,000,000 | 1.50%, due 3/15/31 | 790,394 | |||||
| 1,261,336 | |||||||
| Water 0.3% | |||||||
| American Water Capital Corp. | |||||||
| 650,000 | 2.80%, due 5/1/30 | 563,894 | |||||
| Wireless 0.5% | |||||||
| American Tower Corp. | |||||||
| 500,000 | 2.75%, due 1/15/27 | 452,277 | |||||
| 1,000,000 | 1.875%, due 10/15/30 | 777,207 | |||||
| 1,229,484 | |||||||
| Wirelines 4.5% | |||||||
| AT&T, Inc. | |||||||
| 1,400,000 | 2.30%, due 6/1/27 | 1,259,068 | |||||
| 875,000 | 2.55%, due 12/1/33 | 684,167 | |||||
| 2,368,000 | 3.50%, due 9/15/53 | 1,657,355 | |||||
| 1,196,000 | 3.55%, due 9/15/55 | 827,276 | |||||
| 727,000 | 3.80%, due 12/1/57 | 518,960 | |||||
| Verizon Communications, Inc. | |||||||
| 1,000,000 | 3.00%, due 3/22/27 | 937,403 | |||||
| 550,000 | 3.15%, due 3/22/30 | 487,361 | |||||
| 500,000 | 2.55%, due 3/21/31 | 415,583 | |||||
| 1,500,000 | 4.862%, due 8/21/46 | 1,364,021 | |||||
| 2,000,000 | 3.55%, due 3/22/51 | 1,469,507 | |||||
| 600,000 | 2.987%, due 10/30/56 | 377,836 | |||||
| 9,998,537 | |||||||
| Total Corporate Bonds | |||||||
| (cost $239,550,910) | 203,118,766 | ||||||
| SOVEREIGN BONDS 5.1% | |||||||
| Republic of Colombia | |||||||
| 600,000 | 3.875%, due 4/25/27 | 524,599 | |||||
| 600,000 | 3.125%, due 4/15/31 | 438,555 | |||||
| 890,000 | 7.375%, due 9/18/37 | 818,133 | |||||
| Republic of Indonesia | |||||||
| 500,000 | 3.85%, due 10/15/30 | 469,983 | |||||
The accompanying notes are an integral part of these financial statements.
23
PIA Funds
PIA BBB BOND FUND
Schedule of Investments – November 30, 2022 (continued)
| Principal Amount/ | |||||||
| Shares | Value | ||||||
| SOVEREIGN BONDS 5.1% (continued) | |||||||
| Republic of Panama | |||||||
| $ | 1,700,000 | 2.252%, due 9/29/32 | $ | 1,283,500 | |||
| 750,000 | 6.70%, due 1/26/36 | 793,787 | |||||
| Republic of Peru | |||||||
| 400,000 | 3.00%, due 1/15/34 | 323,922 | |||||
| 1,050,000 | 6.55%, due 3/14/37 | 1,123,460 | |||||
| Republic of Philippines | |||||||
| 1,625,000 | 5.00%, due 1/13/37 | 1,585,933 | |||||
| Republic of Uruguay | |||||||
| 800,000 | 4.375%, due 1/23/31 | 800,885 | |||||
| United Mexican States | |||||||
| 1,300,000 | 4.50%, due 4/22/29 | 1,263,579 | |||||
| 2,490,000 | 4.75%, due 3/8/44 | 2,097,122 | |||||
| Total Sovereign Bonds | |||||||
| (cost $14,034,524) | 11,523,458 | ||||||
| U.S. GOVERNMENT AGENCIES & | |||||||
| INSTRUMENTALITIES 0.9% | |||||||
| U.S. Treasury Notes | |||||||
| 2,000,000 | 4.125%, due 10/31/27 | 2,022,578 | |||||
| Total U.S. Government | |||||||
| Agencies & Instrumentalities | |||||||
| (cost $1,982,897) | 2,022,578 | ||||||
| SHORT-TERM INVESTMENTS 1.2% | |||||||
| Money Market Fund 0.1% | |||||||
| 139,769 | Fidelity Institutional Money | ||||||
| Market Government Portfolio – | |||||||
| Class I, 3.56% (a) | 139,769 | ||||||
| U.S. Treasury Bill 1.1% | |||||||
| United States Treasury Bill | |||||||
| $ | 2,500,000 | 4.370%, due 5/11/23 (i) | 2,449,919 | ||||
| Total Short-Term Investments | |||||||
| (cost $2,590,916) | 2,589,688 | ||||||
| Total Investments | ||||||
| (cost $258,159,247) | 98.6% | 219,254,490 | ||||
| Other Assets less Liabilities | 1.4% | 3,082,954 | ||||
| TOTAL NET ASSETS | 100.0% | $ | 222,337,444 | |||
| (a) | Rate shown is the 7-day annualized yield as of November 30, 2022. |
| (b) | Step-up bond; pays one interest rate for a certain period and a higher rate thereafter. The interest rate shown is the rate in effect as of November 30, 2022, and remains in effect until the bond’s maturity date. |
| (c) | Security purchased within the terms of a private placement memorandum, exempt from registration under Rule 144A of the Securities Act of 1933, as amended, and may be sold only to dealers in the program or other “qualified institutional buyers.” As of November 30, 2022, the value of these investments was $5,513,656 or 2.48% of total net assets. |
| (d) | Step-up bond; pays one interest rate for a certain period and can either increase or decrease thereafter. Coupon rate increases by 25 basis points for each rating downgrade of one notch below A-/A3 made by Standard & Poor’s or Moody’s Investors Service, Inc. Coupon rate decreases by 25 basis points for each upgrade. The minimum coupon rate is 8.625%. |
| (e) | Step-up bond; pays one interest rate for a certain period and can either increase or decrease thereafter. Coupon rate increases by 50 basis points if both Standard & Poor’s and Moody’s ratings are downgraded to less than an A rating. If the rating is then raised to higher than BBB, the coupon rate decreases by 50 basis points. |
| (f) | Coupon rate shown is the rate in effect as of November 30, 2022, and remains in effect until December 2031, after that date the bond will change to a Floating-Rate equal to the 3 Month LIBOR + 2.205%, if not called, until final maturity date. |
| (g) | Variable or floating rate security based on a reference index and spread. The rate reported is the rate in effect as of November 30, 2022. |
| (h) | Step-up bond; pays one interest rate for a certain period and can increase thereafter. Coupon rate increases by 25 basis points for each rating downgrade of one notch made by Standard & Poor’s, Moody’s Investor Service, or Fitch Ratings. The maximum coupon increase is 200 basis points. |
| (i) | Rate shown is the discount rate at November 30, 2022. |
Basis point = 1/100th of a percent.
CMT = Constant Maturity Treasury
LIBOR = London Interbank Offered Rate
SOFR = Secured Overnight Financing Rate
The accompanying notes are an integral part of these financial statements.
24
PIA Funds
PIA MBS BOND FUND
Schedule of Investments – November 30, 2022
| Principal Amount | Value | ||||||
| ASSET-BACKED SECURITIES 2.2% | |||||||
| Other Asset-Backed Securities 2.2% | |||||||
| CF Hippolyta Issuer LLC | |||||||
| $ | 1,371,542 | 1.69%, due 7/15/60, | |||||
| Series 2020-1 Class A (b) | $ | 1,214,665 | |||||
| Total Asset-Backed Securities | |||||||
| (cost $1,371,353) | 1,214,665 | ||||||
| MORTGAGE-BACKED SECURITIES 91.4% | |||||||
| Commercial Mortgage-Backed Securities 3.4% | |||||||
| BX Trust | |||||||
| 440,000 | 5.125% (1 Month LIBOR USD | ||||||
| + 1.250%), due 11/17/36, Series | |||||||
| 2021-RISE Class B (b) (e) | 418,555 | ||||||
| Cold Storage Trust | |||||||
| 1,474,486 | 4.775% (1 Month LIBOR USD | ||||||
| + 0.900%), due 11/15/37, Series | |||||||
| 2020-ICE5 Class A (b) (e) | 1,434,195 | ||||||
| 1,852,750 | |||||||
| U.S. Government Securities 88.0% | |||||||
| FHLMC Pool | |||||||
| 276,745 | 2.50%, due 12/1/31, #G18622 | 261,414 | |||||
| 62,285 | 5.00%, due 10/1/38, #G04832 | 64,097 | |||||
| 207,508 | 3.50%, due 5/1/42, #G08491 | 195,762 | |||||
| 171,665 | 3.00%, due 8/1/43, #G08540 | 157,278 | |||||
| 313,804 | 4.00%, due 8/1/44, #G08601 | 306,371 | |||||
| 250,786 | 3.00%, due 3/1/45, #G08631 | 227,275 | |||||
| 391,149 | 3.00%, due 5/1/45, #G08640 | 354,114 | |||||
| 368,599 | 3.00%, due 5/1/45, #Q33337 | 332,856 | |||||
| 323,009 | 3.00%, due 1/1/47, #G08741 | 290,807 | |||||
| 212,560 | 3.00%, due 1/1/47, #Q45636 | 190,821 | |||||
| 178,719 | 3.50%, due 4/1/48, #Q55213 | 166,743 | |||||
| 78,257 | 3.50%, due 9/1/48, #G08835 | 72,916 | |||||
| 71,764 | 4.00%, due 2/1/49, #ZT1710 | 68,900 | |||||
| 196,967 | 3.00%, due 4/1/49, #ZN5108 | 175,401 | |||||
| 141,606 | 3.50%, due 7/1/49, #QA1057 | 131,151 | |||||
| 124,990 | 3.50%, due 7/1/49, #SD8001 | 115,761 | |||||
| 191,060 | 3.00%, due 10/1/49, #SD8016 | 170,081 | |||||
| 1,438,043 | 2.50%, due 12/1/51, #QD2700 | 1,230,376 | |||||
| 1,448,857 | 2.00%, due 2/1/52, #QD7338 | 1,191,938 | |||||
| 1,900,320 | 2.00%, due 2/1/52, #SD8193 | 1,563,479 | |||||
| 1,425,984 | 2.50%, due 2/1/52, #SD8194 | 1,218,875 | |||||
| 830,045 | 2.50%, due 2/1/52, #QD7063 | 710,402 | |||||
| 1,448,344 | 2.00%, due 3/1/52, #SD8199 | 1,190,784 | |||||
| 1,936,990 | 2.00%, due 4/1/52, #SD8204 | 1,591,541 | |||||
| 1,937,579 | 3.50%, due 5/1/52, #SD8214 | 1,774,334 | |||||
| 1,500,000 | 4.50%, due 12/1/52, #SD8275 | 1,457,845 | |||||
| FNMA Pool | |||||||
| 49,737 | 4.00%, due 5/1/26, #AH8174 | 49,707 | |||||
| 366,313 | 2.50%, due 10/1/31, #BC9305 | 341,988 | |||||
| 249,794 | 2.50%, due 11/1/31, #BD9466 | 235,672 | |||||
| 88,116 | 3.50%, due 5/1/33, #BK5720 | 85,555 | |||||
| 84,386 | 3.50%, due 5/1/33, #MA3364 | 81,523 | |||||
| 216,339 | 4.00%, due 12/1/39, #AE0215 | 210,527 | |||||
| 344,715 | 3.50%, due 7/1/43, #AB9774 | 324,429 | |||||
| 463,778 | 3.00%, due 8/1/43, #AU3363 | 424,428 | |||||
| 146,206 | 4.00%, due 9/1/44, #AS3392 | 142,588 | |||||
| 159,697 | 3.50%, due 4/1/45, #AY3376 | 149,564 | |||||
| 557,750 | 3.00%, due 6/1/45, #AZ0504 | 504,166 | |||||
| 130,784 | 3.50%, due 8/1/45, #AS5699 | 122,431 | |||||
| 68,585 | 3.50%, due 9/1/45, #AS5722 | 64,197 | |||||
| 174,128 | 3.00%, due 10/1/45, #AZ6877 | 157,117 | |||||
| 468,523 | 3.50%, due 12/1/45, #BA2275 | 439,280 | |||||
| 278,190 | 3.50%, due 12/1/45, #MA2471 | 260,636 | |||||
| 162,409 | 3.50%, due 3/1/46, #MA2549 | 151,868 | |||||
| 393,381 | 3.00%, due 7/1/46, #MA2670 | 354,525 | |||||
| 237,323 | 3.00%, due 9/1/46, #AS7904 | 213,698 | |||||
| 174,075 | 3.00%, due 5/1/47, #AS9562 | 156,306 | |||||
| 164,669 | 3.50%, due 9/1/47, #MA3120 | 153,713 | |||||
| 280,713 | 3.50%, due 3/1/48, #MA3305 | 261,406 | |||||
| 368,036 | 4.50%, due 5/1/48, #BM4135 | 364,422 | |||||
| 152,523 | 4.00%, due 7/1/48, #MA3415 | 146,111 | |||||
| 126,328 | 4.00%, due 8/1/48, #BK5416 | 121,285 | |||||
| 121,248 | 3.00%, due 4/1/49, #BN6240 | 107,944 | |||||
| 147,217 | 3.00%, due 5/1/49, #MA3670 | 131,127 | |||||
The accompanying notes are an integral part of these financial statements.
25
PIA Funds
PIA MBS BOND FUND
Schedule of Investments – November 30, 2022 (continued)
| Principal Amount/ | |||||||
| Shares | Value | ||||||
| U.S. Government Securities 88.0% (continued) | |||||||
| FNMA Pool (continued) | |||||||
| $ | 1,220,952 | 3.00%, due 12/1/50, #FM7827 | $ | 1,086,754 | |||
| 1,364,174 | 3.00%, due 8/1/51, #FM8407 | 1,211,770 | |||||
| 1,886,220 | 2.50%, due 1/1/52, #BU7884 | 1,613,453 | |||||
| 1,916,039 | 2.00%, due 2/1/52, #MA4547 | 1,576,445 | |||||
| 24,852 | 2.50%, due 2/1/52, #BV3506 | 21,265 | |||||
| 1,896,960 | 2.50%, due 2/1/52, #MA4548 | 1,620,004 | |||||
| 2,769,495 | 2.50%, due 3/1/52, #MA4563 | 2,367,225 | |||||
| 1,944,325 | 2.00%, due 4/1/52, #MA4577 | 1,597,604 | |||||
| 1,932,085 | 2.50%, due 4/1/52, #MA4578 | 1,650,085 | |||||
| 1,932,792 | 3.00%, due 4/1/52, #MA4579 | 1,708,187 | |||||
| 1,492,344 | 4.00%, due 10/1/52, #MA4783 | 1,409,679 | |||||
| FNMA TBA | |||||||
| 1,500,000 | 4.00%, due 12/15/41 (d) | 1,415,098 | |||||
| GNMA Pool | |||||||
| 160,596 | 5.00%, due 9/15/39, #726311 | 163,775 | |||||
| 116,040 | 4.00%, due 6/15/45, #AM8608 | 112,661 | |||||
| 84,769 | 4.00%, due 2/15/46, #AR3772 | 81,431 | |||||
| 83,099 | 4.00%, due 10/15/46, #AQ0545 | 80,425 | |||||
| 73,374 | 4.00%, due 12/15/46, #AQ0562 | 71,382 | |||||
| 799,026 | 3.00%, due 5/15/47, #AW1730 | 718,791 | |||||
| 421,555 | 3.00%, due 8/15/47, #AZ5554 | 379,049 | |||||
| 252,708 | 3.50%, due 11/15/47, #BD4824 | 235,001 | |||||
| 162,409 | 3.50%, due 4/20/49, #MA5875 | 152,183 | |||||
| 240,144 | 3.50%, due 7/20/49, #MA6039 | 224,900 | |||||
| 170,638 | 3.00%, due 8/20/49, #MA6089 | 155,181 | |||||
| 441,064 | 3.00%, due 9/20/49, #MA6153 | 401,106 | |||||
| 460,090 | 3.00%, due 12/20/49, #MA6338 | 418,408 | |||||
| 1,893,362 | 2.00%, due 1/20/52, #MA7826 | 1,610,419 | |||||
| 1,883,922 | 2.50%, due 1/20/52, #MA7827 | 1,653,847 | |||||
| 1,438,879 | 2.50%, due 3/20/52, #MA7936 | 1,261,753 | |||||
| 1,965,788 | 3.50%, due 6/20/52, #MA8099 | 1,822,715 | |||||
| 47,788,131 | |||||||
| Total Mortgage-Backed Securities | |||||||
| (cost $55,690,343) | 49,640,881 | ||||||
| SHORT-TERM INVESTMENTS 7.5% | |||||||
| Money Market Fund 1.3% | |||||||
| 721,508 | Fidelity Institutional Money | ||||||
| Market Government Portfolio – | |||||||
| Class I, 3.56% (a) | 721,508 | ||||||
| U.S. Treasury Bill 6.2% | |||||||
| United States Treasury Bill | |||||||
| $ | 3,400,000 | 3.774%, due 3/23/23 (c) | 3,355,438 | ||||
| Total Short-Term Investments | |||||||
| (cost $4,081,587) | 4,076,946 | ||||||
| Total Investments | ||||||
| (cost $61,143,283) | 101.1 | % | 54,932,492 | |||
| Liabilities less Other Assets | (1.1 | )% | (619,158 | ) | ||
| TOTAL NET ASSETS | 100.0 | % | $ | 54,313,334 | ||
| (a) | Rate shown is the 7-day annualized yield as of November 30, 2022. |
| (b) | Security purchased within the terms of a private placement memorandum, exempt from registration under Rule 144A of the Securities Act of 1933, as amended, and may be sold only to dealers in the program or other “qualified institutional buyers.” As of November 30, 2022, the value of these investments was $3,067,415 or 5.65% of total net assets. |
| (c) | Rate shown is the discount rate at November 30, 2022. |
| (d) | Security purchased on a when-issued basis. As of November 30, 2022 the total cost of investments purchased on a when-issued basis was $1,415,098 or 2.61% of total net assets. |
| (e) | Variable or floating rate security based on a reference index and spread. The rate reported is the rate in effect as of November 30, 2022. |
FHLMC – Federal Home Loan Mortgage Corporation
FNMA – Federal National Mortgage Association
GNMA – Government National Mortgage Association
LIBOR – London Interbank Offered Rate
TBA – To Be Announced
The accompanying notes are an integral part of these financial statements.
26
PIA Funds
PIA HIGH YIELD (MACS) FUND
Schedule of Investments – November 30, 2022
| Shares/ | |||||||
| Principal Amount | Value | ||||||
| COMMON STOCKS 0.2% | |||||||
| Building Materials 0.2% | |||||||
| 2,996 | Northwest Hardwoods (d) (e) | $ | 239,680 | ||||
| Total Common Stocks | |||||||
| (cost $137,017) | 239,680 | ||||||
| CORPORATE BONDS 91.1% | |||||||
| Advertising Sales 0.6% | |||||||
| Outfront Media Capital LLC / | |||||||
| Outfront Media Capital Corp. | |||||||
| $ | 925,000 | 4.25%, due 1/15/29 (b) | 773,300 | ||||
| Aerospace/Defense 2.2% | |||||||
| F-Brasile SpA / F-Brasile US LLC | |||||||
| 1,775,000 | 7.375%, due 8/15/26 (b) | 1,444,618 | |||||
| Triumph Group, Inc. | |||||||
| 1,450,000 | 7.75%, due 8/15/25 | 1,245,311 | |||||
| 2,689,929 | |||||||
| Appliances 0.9% | |||||||
| WASH Multifamily | |||||||
| Acquisition, Inc. | |||||||
| 1,185,000 | 5.75%, due 4/15/26 (b) | 1,112,312 | |||||
| Auto Manufacturers 1.1% | |||||||
| PM General Purchaser LLC | |||||||
| 1,575,000 | 9.50%, due 10/1/28 (b) | 1,384,288 | |||||
| Auto Parts & Equipment 1.9% | |||||||
| Dealer Tire LLC / DT Issuer LLC | |||||||
| 1,506,000 | 8.00%, due 2/1/28 (b) | 1,285,212 | |||||
| Dornoch Debt Merger Sub, Inc. | |||||||
| 1,650,000 | 6.625%, due 10/15/29 (b) | 1,100,083 | |||||
| 2,385,295 | |||||||
| Building – Heavy Construction 1.2% | |||||||
| Railworks Holdings LP / | |||||||
| Railworks Rally, Inc. | |||||||
| 1,600,000 | 8.25%, due 11/15/28 (b) | 1,475,199 | |||||
| Building & Construction 1.1% | |||||||
| Brundage-Bone Concrete | |||||||
| Pumping Holdings, Inc. | |||||||
| 1,550,000 | 6.00%, due 2/1/26 (b) | 1,444,158 | |||||
| Building Materials 5.2% | |||||||
| APi Group DE, Inc. | |||||||
| 1,285,000 | 4.125%, due 7/15/29 (b) | 1,070,264 | |||||
| Eco Material Technologies, Inc. | |||||||
| 1,525,000 | 7.875%, due 1/31/27 (b) | 1,453,020 | |||||
| MIWD Holdco II LLC / | |||||||
| MIWD Finance Corp. | |||||||
| 1,475,000 | 5.50%, due 2/1/30 (b) | 1,211,262 | |||||
| New Enterprise Stone & | |||||||
| Lime Co, Inc. | |||||||
| 1,400,000 | 5.25%, due 7/15/28 (b) | 1,269,184 | |||||
| SRM Escrow Issuer LLC | |||||||
| 1,650,000 | 6.00%, due 11/1/28 (b) | 1,471,503 | |||||
| 6,475,233 | |||||||
| Chemicals 1.0% | |||||||
| Diamond BC BV | |||||||
| 1,650,000 | 4.625%, due 10/1/29 (b) | 1,246,897 | |||||
| Chemicals – Diversified 3.6% | |||||||
| Iris Holdings, Inc. | |||||||
| 1,550,000 | 8.75% Cash or 9.50% PIK, | ||||||
| due 2/15/26 (b) (c) | 1,325,250 | ||||||
| LSF11 A5 HoldCo LLC | |||||||
| 1,400,000 | 6.625%, due 10/15/29 (b) | 1,139,810 | |||||
| Polar US Borrower LLC / | |||||||
| Schenectady International | |||||||
| Group, Inc. | |||||||
| 1,175,000 | 6.75%, due 5/15/26 (b) | 492,131 | |||||
| SCIH Salt Holdings, Inc. | |||||||
| 1,000,000 | 4.875%, due 5/1/28 (b) | 885,300 | |||||
| 765,000 | 6.625%, due 5/1/29 (b) | 634,273 | |||||
| 4,476,764 | |||||||
The accompanying notes are an integral part of these financial statements.
27
PIA Funds
PIA HIGH YIELD (MACS) FUND
Schedule of Investments – November 30, 2022 (continued)
| Principal Amount | Value | ||||||
| Chemicals – Plastics 1.1% | |||||||
| Neon Holdings, Inc. | |||||||
| $ | 1,650,000 | 10.125%, due 4/1/26 (b) | $ | 1,417,796 | |||
| Chemicals – Specialty 4.0% | |||||||
| Herens Holdco Sarl | |||||||
| 1,500,000 | 4.75%, due 5/15/28 (b) | 1,202,408 | |||||
| SCIL IV LLC / | |||||||
| SCIL USA Holdings LLC | |||||||
| 1,450,000 | 5.375%, due 11/1/26 (b) | 1,217,542 | |||||
| SK Invictus Intermediate II Sarl | |||||||
| 1,550,000 | 5.00%, due 10/30/29 (b) | 1,241,806 | |||||
| Unifrax Escrow Issuer Corp. | |||||||
| 1,650,000 | 5.25%, due 9/30/28 (b) | 1,364,550 | |||||
| 5,026,306 | |||||||
| Commercial Services 4.3% | |||||||
| Alta Equipment Group, Inc. | |||||||
| 1,550,000 | 5.625%, due 4/15/26 (b) | 1,369,025 | |||||
| CPI Acquisition, Inc. | |||||||
| 1,404,000 | 8.625%, due 3/15/26 (b) | 1,361,001 | |||||
| NESCO Holdings II, Inc. | |||||||
| 1,500,000 | 5.50%, due 4/15/29 (b) | 1,321,448 | |||||
| StoneMor, Inc. | |||||||
| 1,625,000 | 8.50%, due 5/15/29 (b) | 1,326,390 | |||||
| 5,377,864 | |||||||
| Consumer Services 0.9% | |||||||
| Cimpress Plc | |||||||
| 1,560,000 | 7.00%, due 6/15/26 (b) | 1,091,220 | |||||
| Containers and Packaging 0.7% | |||||||
| Pactiv Evergreen Group Issuer | |||||||
| LLC / Pactiv Evergreen | |||||||
| Group Issuer, Inc. | |||||||
| 950,000 | 4.375%, due 10/15/28 (b) | 830,029 | |||||
| Diversified Financial Services 1.1% | |||||||
| VistaJet Malta Finance PLC / | |||||||
| XO Management Holding, Inc. | |||||||
| 1,675,000 | 6.375%, due 2/1/30 (b) | 1,367,219 | |||||
| Diversified Manufacturing 0.5% | |||||||
| FXI Holdings, Inc. | |||||||
| 795,000 | 12.25%, due 11/15/26 (b) | 651,900 | |||||
| Engineering & Construction 2.8% | |||||||
| Arcosa, Inc. | |||||||
| 1,600,000 | 4.375%, due 4/15/29 (b) | 1,393,175 | |||||
| Brand Energy & Infrastructure | |||||||
| Services, Inc. | |||||||
| 1,450,000 | 8.50%, due 7/15/25 (b) | 1,151,858 | |||||
| Promontoria Holding 264 BV | |||||||
| 1,050,000 | 7.875%, due 3/1/27 (b) | 995,159 | |||||
| 3,540,192 | |||||||
| Enterprise Software & Services 2.0% | |||||||
| Helios Software Holdings Inc / | |||||||
| ION Corporate Solutions | |||||||
| Finance Sarl | |||||||
| 1,625,000 | 4.625%, due 5/1/28 (b) | 1,241,341 | |||||
| Rocket Software, Inc. | |||||||
| 1,600,000 | 6.50%, due 2/15/29 (b) | 1,260,736 | |||||
| 2,502,077 | |||||||
| Entertainment 2.5% | |||||||
| Everi Holdings, Inc. | |||||||
| 650,000 | 5.00%, due 7/15/29 (b) | 563,229 | |||||
| Premier Entertainment Sub | |||||||
| LLC / Premier Entertainment | |||||||
| Finance Corp. | |||||||
| 1,650,000 | 5.875%, due 9/1/31 (b) | 1,260,287 | |||||
| Scientific Games Holdings | |||||||
| LP/Scientific Games | |||||||
| US FinCo, Inc. | |||||||
| 1,500,000 | 6.625%, due 3/1/30 (b) | 1,263,994 | |||||
| 3,087,510 | |||||||
| Finance – Commercial 1.3% | |||||||
| Burford Capital Global | |||||||
| Finance LLC | |||||||
| 700,000 | 6.25%, due 4/15/28 (b) | 643,371 | |||||
| 1,050,000 | 6.875%, due 4/15/30 (b) | 956,052 | |||||
| 1,599,423 | |||||||
The accompanying notes are an integral part of these financial statements.
28
PIA Funds
PIA HIGH YIELD (MACS) FUND
Schedule of Investments – November 30, 2022 (continued)
| Principal Amount | Value | ||||||
| Financial Services 1.1% | |||||||
| Arrow Bidco LLC | |||||||
| $ | 1,391,000 | 9.50%, due 3/15/24 (b) | $ | 1,388,779 | |||
| Food and Beverage 0.7% | |||||||
| H-Food Holdings LLC / | |||||||
| Hearthside Finance Co, Inc. | |||||||
| 1,400,000 | 8.50%, due 6/1/26 (b) | 807,571 | |||||
| Food Service 0.9% | |||||||
| TKC Holdings, Inc. | |||||||
| 1,850,000 | 10.50%, due 5/15/29 (b) | 1,057,673 | |||||
| Forest and Paper | |||||||
| Products Manufacturing 1.2% | |||||||
| Mativ, Inc. | |||||||
| 1,710,000 | 6.875%, due 10/1/26 (b) | 1,499,721 | |||||
| Healthcare – Services 2.3% | |||||||
| Akumin Escrow, Inc. | |||||||
| 1,550,000 | 7.50%, due 8/1/28 (b) | 1,063,858 | |||||
| Hadrian Merger Sub, Inc. | |||||||
| 603,000 | 8.50%, due 5/1/26 (b) | 543,415 | |||||
| ModivCare Escrow Issuer, Inc. | |||||||
| 1,450,000 | 5.00%, due 10/1/29 (b) | 1,203,500 | |||||
| 2,810,773 | |||||||
| Household Products/Warehouse 0.9% | |||||||
| Kronos Acquisition | |||||||
| Holdings, Inc. / KIK Custom | |||||||
| Products, Inc. | |||||||
| 1,250,000 | 5.00%, due 12/31/26 (b) | 1,141,650 | |||||
| Internet 1.4% | |||||||
| Getty Images, Inc. | |||||||
| 1,743,000 | 9.75%, due 3/1/27 (b) | 1,724,428 | |||||
| Iron/Steel 0.4% | |||||||
| Carpenter Technology Corp. | |||||||
| 500,000 | 7.625%, due 3/15/30 | 494,436 | |||||
| Machinery – Diversified 1.2% | |||||||
| Husky III Holding Ltd. | |||||||
| 700,000 | 13.00% Cash or 13.75% PIK, | ||||||
| due 2/15/25 (b) (c) | 612,500 | ||||||
| Titan Acquisition Ltd. / | |||||||
| Titan Co-Borrower LLC | |||||||
| 950,000 | 7.75%, due 4/15/26 (b) | 844,769 | |||||
| 1,457,269 | |||||||
| Machinery – Farm 0.7% | |||||||
| OT Merger Corp. | |||||||
| 1,475,000 | 7.875%, due 10/15/29 (b) | 864,011 | |||||
| Machinery – Thermal Process 0.9% | |||||||
| GrafTech Finance, Inc. | |||||||
| 1,350,000 | 4.625%, due 12/15/28 (b) | 1,126,973 | |||||
| Machinery Manufacturing 2.3% | |||||||
| Granite US Holdings Corp. | |||||||
| 1,250,000 | 11.00%, due 10/1/27 (b) | 1,312,125 | |||||
| JPW Industries Holding Corp. | |||||||
| 1,580,000 | 9.00%, due 10/1/24 (b) | 1,362,126 | |||||
| MAI Holdings, Inc. | |||||||
| 700,000 | 9.50%, due 6/1/23 (b) (d) | 199,500 | |||||
| 2,873,751 | |||||||
| Manufactured Goods 1.5% | |||||||
| FXI Holdings, Inc. | |||||||
| 836,000 | 7.875%, due 11/1/24 (b) | 695,803 | |||||
| Park-Ohio Industries, Inc. | |||||||
| 1,520,000 | 6.625%, due 4/15/27 | 1,165,308 | |||||
| 1,861,111 | |||||||
| Media 1.2% | |||||||
| Univision Communications, Inc. | |||||||
| 1,375,000 | 4.50%, due 5/1/29 (b) | 1,172,119 | |||||
| 350,000 | 7.375%, due 6/30/30 (b) | 346,939 | |||||
| 1,519,058 | |||||||
The accompanying notes are an integral part of these financial statements.
29
PIA Funds
PIA HIGH YIELD (MACS) FUND
Schedule of Investments – November 30, 2022 (continued)
| Principal Amount | Value | ||||||
| Metals and Mining 2.0% | |||||||
| SunCoke Energy, Inc. | |||||||
| $ | 1,525,000 | 4.875%, due 6/30/29 (b) | $ | 1,293,675 | |||
| TMS International Corp/DE | |||||||
| 1,700,000 | 6.25%, due 4/15/29 (b) | 1,226,273 | |||||
| 2,519,948 | |||||||
| Office Automation & Equipment 2.1% | |||||||
| Pitney Bowes, Inc. | |||||||
| 1,650,000 | 6.875%, due 3/15/27 (b) | 1,300,365 | |||||
| Xerox Holdings Corp. | |||||||
| 1,650,000 | 5.50%, due 8/15/28 (b) | 1,329,983 | |||||
| 2,630,348 | |||||||
| Oil and Gas Services 5.1% | |||||||
| Archrock Partners LP / Archrock | |||||||
| Partners Finance Corp. | |||||||
| 650,000 | 6.875%, due 4/1/27 (b) | 629,980 | |||||
| CSI Compressco LP / CSI | |||||||
| Compressco Finance, Inc. | |||||||
| 1,675,000 | 7.50%, due 4/1/25 (b) | 1,540,896 | |||||
| Enerflex Ltd. | |||||||
| 1,400,000 | 9.00%, due 10/15/27 (b) | 1,377,383 | |||||
| USA Compression Partners LP / | |||||||
| USA Compression Finance Corp. | |||||||
| 985,000 | 6.875%, due 4/1/26 | 944,679 | |||||
| 250,000 | 6.875%, due 9/1/27 | 237,916 | |||||
| Welltec International ApS | |||||||
| 1,600,000 | 8.25%, due 10/15/26 (b) | 1,583,844 | |||||
| 6,314,698 | |||||||
| Packaging 1.3% | |||||||
| Mauser Packaging | |||||||
| Solutions Holding Co. | |||||||
| 1,650,000 | 5.50%, due 4/15/24 (b) | 1,623,311 | |||||
| Paper 2.1% | |||||||
| Clearwater Paper Corp. | |||||||
| 1,550,000 | 4.75%, due 8/15/28 (b) | 1,380,756 | |||||
| Mercer International, Inc. | |||||||
| 1,500,000 | 5.125%, due 2/1/29 | 1,271,355 | |||||
| 2,652,111 | |||||||
| Pipelines 8.9% | |||||||
| Genesis Energy LP / Genesis | |||||||
| Energy Finance Corp. | |||||||
| 175,000 | 8.00%, due 1/15/27 | 167,215 | |||||
| 1,450,000 | 7.75%, due 2/1/28 | 1,386,171 | |||||
| Global Partners LP / | |||||||
| GLP Finance Corp. | |||||||
| 350,000 | 7.00%, due 8/1/27 | 332,217 | |||||
| 1,175,000 | 6.875%, due 1/15/29 | 1,052,372 | |||||
| ITT Holdings LLC | |||||||
| 1,764,000 | 6.50%, due 8/1/29 (b) | 1,511,574 | |||||
| Martin Midstream Partners LP / | |||||||
| Martin Midstream Finance Corp. | |||||||
| 1,450,000 | 11.50%, due 2/28/25 (b) | 1,446,448 | |||||
| NGL Energy Operating LLC / | |||||||
| NGL Energy Finance Corp. | |||||||
| 1,550,000 | 7.50%, due 2/1/26 (b) | 1,401,407 | |||||
| Summit Midstream | |||||||
| Holdings LLC / Summit | |||||||
| Midstream Finance Corp. | |||||||
| 1,475,000 | 5.75%, due 4/15/25 | 1,235,224 | |||||
| 1,375,000 | 8.50%, due 10/15/26 (b) | 1,316,498 | |||||
| TransMontaigne Partners LP / | |||||||
| TLP Finance Corp. | |||||||
| 1,336,000 | 6.125%, due 2/15/26 | 1,165,183 | |||||
| 11,014,309 | |||||||
| Publishing and Broadcasting 1.1% | |||||||
| Salem Media Group, Inc. | |||||||
| 1,385,000 | 6.75%, due 6/1/24 (b) | 1,342,127 | |||||
| Radio 3.0% | |||||||
| Audacy Capital Corp. | |||||||
| 1,400,000 | 6.75%, due 3/31/29 (b) | 318,374 | |||||
| Beasley Mezzanine Holdings LLC | |||||||
| 1,550,000 | 8.625%, due 2/1/26 (b) | 1,028,813 | |||||
| Spanish Broadcasting System, Inc. | |||||||
| 1,710,000 | 9.75%, due 3/1/26 (b) | 1,022,283 | |||||
| Urban One, Inc. | |||||||
| 1,537,000 | 7.375%, due 2/1/28 (b) | 1,300,817 | |||||
| 3,670,287 | |||||||
The accompanying notes are an integral part of these financial statements.
30
PIA Funds
PIA HIGH YIELD (MACS) FUND
Schedule of Investments – November 30, 2022 (continued)
| Principal Amount/ | |||||||
| Shares | Value | ||||||
| REITs – Storage 0.9% | |||||||
| Iron Mountain, Inc. | |||||||
| $ | 250,000 | 5.00%, due 7/15/28 (b) | $ | 227,750 | |||
| 1,000,000 | 5.25%, due 7/15/30 (b) | 901,265 | |||||
| 1,129,015 | |||||||
| Rental Auto/Equipment 1.1% | |||||||
| PROG Holdings, Inc. | |||||||
| 1,500,000 | 6.00%, due 11/15/29 (b) | 1,309,493 | |||||
| Retail – Office Supplies 1.3% | |||||||
| Staples, Inc. | |||||||
| 1,035,000 | 7.50%, due 4/15/26 (b) | 921,461 | |||||
| 900,000 | 10.75%, due 4/15/27 (b) | 656,501 | |||||
| 1,577,962 | |||||||
| Retail – Propane Distribution 1.1% | |||||||
| Ferrellgas LP / Ferrellgas | |||||||
| Finance Corp. | |||||||
| 1,600,000 | 5.875%, due 4/1/29 (b) | 1,350,030 | |||||
| Tobacco Manufacturing 1.0% | |||||||
| Vector Group Ltd. | |||||||
| 1,375,000 | 5.75%, due 2/1/29 (b) | 1,184,196 | |||||
| Transportation Services 2.2% | |||||||
| Bristow Group, Inc. | |||||||
| 1,500,000 | 6.875%, due 3/1/28 (b) | 1,405,384 | |||||
| First Student Bidco Inc / | |||||||
| First Transit Parent, Inc. | |||||||
| 1,600,000 | 4.00%, due 7/31/29 (b) | 1,331,088 | |||||
| 2,736,472 | |||||||
| Water 1.2% | |||||||
| Solaris Midstream | |||||||
| Holdings LLC | |||||||
| 1,500,000 | 7.625%, due 4/1/26 (b) | 1,479,240 | |||||
| Total Corporate Bonds | |||||||
| (cost $131,954,580) | 113,115,662 | ||||||
| MONEY MARKET FUND 6.9% | |||||||
| 8,659,003 | Fidelity Institutional Money | ||||||
| Market Government Portfolio – | |||||||
| Class I, 3.56% (a) | 8,659,003 | ||||||
| Total Money Market Fund | |||||||
| (cost $8,659,003) | 8,659,003 | ||||||
| Total Investments | ||||||
| (cost $140,750,600) | 98.2% | 122,014,345 | ||||
| Other Assets less Liabilities | 1.8% | 2,202,041 | ||||
| TOTAL NET ASSETS | 100.0% | $ | 124,216,386 | |||
| (a) | Rate shown is the 7-day annualized yield as of November 30, 2022. |
| (b) | Security purchased within the terms of a private placement memorandum, exempt from registration under Rule 144A of the Securities Act of 1933, as amended, and may be sold only to dealers in the program or other “qualified institutional buyers.” As of November 30, 2022, the value of these investments was $102,418,275 or 82.45% of total net assets. |
| (c) | Payment-in-kind interest is generally paid by issuing additional par of the security rather than paying cash. |
| (d) | Security valued at fair value using methods determined in good faith by or at the direction of the Fund’s valuation designee. Value determined using significant unobservable inputs. As of November 30, 2022, the total value of fair valued securities was $439,180 or 0.35% of total net assets. |
| (e) | Non-income producing security. |
The accompanying notes are an integral part of these financial statements.
31
PIA Funds
Statements of Assets and Liabilities – November 30, 2022
| BBB | MBS | High Yield | ||||||||||
| Bond Fund | Bond Fund | (MACS) Fund | ||||||||||
| Assets: | ||||||||||||
| Investments in securities, at value | ||||||||||||
| (cost $258,159,247, $61,143,283, and $140,750,600, respectively) | $ | 219,254,490 | $ | 54,932,492 | $ | 122,014,345 | ||||||
| Receivable for fund shares sold | 917,306 | 698,211 | 23,957 | |||||||||
| Interest receivable | 2,300,103 | 129,708 | 2,202,006 | |||||||||
| Due from investment adviser (Note 4) | — | 16,942 | — | |||||||||
| Prepaid expenses | 17,482 | 1,339 | 30,305 | |||||||||
| Total assets | 222,489,381 | 55,778,692 | 124,270,613 | |||||||||
| Liabilities: | ||||||||||||
| Payable for securities purchased | — | 1,408,711 | — | |||||||||
| Payable for fund shares redeemed | 79,500 | 1,506 | — | |||||||||
| Administration fees | 16,563 | 16,199 | 16,137 | |||||||||
| Custody fees | 3,452 | 1,524 | 1,337 | |||||||||
| Transfer agent fees and expenses | 16,563 | 7,039 | 4,849 | |||||||||
| Fund accounting fees | 6,166 | 2,266 | 3,395 | |||||||||
| Audit fees | 21,850 | 21,850 | 21,850 | |||||||||
| Chief Compliance Officer fee | 1,833 | 1,833 | 1,833 | |||||||||
| Trustees’ fees and expenses | 114 | 115 | 114 | |||||||||
| Accrued expenses | 5,896 | 4,315 | 4,712 | |||||||||
| Total liabilities | 151,937 | 1,465,358 | 54,227 | |||||||||
| Net Assets | $ | 222,337,444 | $ | 54,313,334 | $ | 124,216,386 | ||||||
| Net Assets Consist of: | ||||||||||||
| Paid-in capital | $ | 266,541,844 | $ | 62,333,430 | $ | 146,254,062 | ||||||
| Total distributable deficit | (44,204,400 | ) | (8,020,096 | ) | (22,037,676 | ) | ||||||
| Net Assets | $ | 222,337,444 | $ | 54,313,334 | $ | 124,216,386 | ||||||
| Net Asset Value, Offering Price and Redemption Price Per Share | $ | 8.10 | $ | 8.32 | $ | 8.03 | ||||||
| Shares Issued and Outstanding | ||||||||||||
| (Unlimited number of shares authorized, par value $0.01) | 27,462,104 | 6,531,028 | 15,465,294 | |||||||||
The accompanying notes are an integral part of these financial statements.
32
PIA Funds
Statements of Operations – Year Ended November 30, 2022
| BBB | MBS | High Yield | ||||||||||
| Bond Fund | Bond Fund | (MACS) Fund | ||||||||||
| Investment Income: | ||||||||||||
| Interest | $ | 8,321,541 | $ | 1,243,911 | $ | 10,300,077 | ||||||
| Total investment income | 8,321,541 | 1,243,911 | 10,300,077 | |||||||||
| Expenses: | ||||||||||||
| Administration fees (Note 4) | 102,460 | 97,724 | 98,390 | |||||||||
| Transfer agent fees and expenses (Note 4) | 52,251 | 26,472 | 31,443 | |||||||||
| Fund accounting fees (Note 4) | 37,816 | 11,263 | 20,467 | |||||||||
| Sub-transfer agent fees (Note 4) | 35,944 | 5,440 | 53 | |||||||||
| Registration fees | 29,560 | 25,254 | 20,229 | |||||||||
| Audit fees | 21,966 | 21,966 | 21,966 | |||||||||
| Custody fees (Note 4) | 19,669 | 9,368 | 9,893 | |||||||||
| Trustees’ fees and expenses | 13,450 | 13,260 | 13,498 | |||||||||
| Chief Compliance Officer fee (Note 4) | 11,060 | 11,060 | 11,060 | |||||||||
| Reports to shareholders | 9,952 | 4,311 | 4,924 | |||||||||
| Miscellaneous | 9,585 | 8,319 | 9,545 | |||||||||
| Legal fees | 6,762 | 6,762 | 6,777 | |||||||||
| Insurance | 5,273 | 2,922 | 3,613 | |||||||||
| Interest expense (Note 6) | 1,073 | — | — | |||||||||
| Total expenses | 356,821 | 244,121 | 251,858 | |||||||||
| Less: Expense reimbursement from adviser (Note 4) | — | (114,009 | ) | — | ||||||||
| Net expenses | 356,821 | 130,112 | 251,858 | |||||||||
| Net investment income | 7,964,720 | 1,113,799 | 10,048,219 | |||||||||
| Realized and Unrealized Gain/(Loss) on Investments | ||||||||||||
| Net realized loss on investments | (3,531,604 | ) | (753,504 | ) | (3,384,629 | ) | ||||||
| Capital gain distributions from regulated investment companies | 20 | 10 | 33 | |||||||||
| Net change in unrealized appreciation/(depreciation) on investments | (49,173,955 | ) | (7,140,848 | ) | (17,814,818 | ) | ||||||
| Net loss on investments | (52,705,539 | ) | (7,894,342 | ) | (21,199,414 | ) | ||||||
| Net decrease in net assets resulting from operations | $ | (44,740,819 | ) | $ | (6,780,543 | ) | $ | (11,151,195 | ) | |||
The accompanying notes are an integral part of these financial statements.
33
PIA Funds
PIA BBB BOND FUND
Statements of Changes in Net Assets
| Year Ended | Year Ended | |||||||
| November 30, 2022 | November 30, 2021 | |||||||
| Increase/(Decrease) in Net Assets From Operations: | ||||||||
| Net investment income | $ | 7,964,720 | $ | 8,370,015 | ||||
| Net realized gain/(loss) on investments | (3,531,604 | ) | 1,013,377 | |||||
| Capital gain distributions from regulated investment companies | 20 | — | ||||||
| Net change in unrealized appreciation/(depreciation) on investments | (49,173,955 | ) | (10,860,643 | ) | ||||
| Net decrease in net assets resulting from operations | (44,740,819 | ) | (1,477,251 | ) | ||||
| Distributions Paid to Shareholders: | ||||||||
| Net dividends and distributions to shareholders | (8,011,175 | ) | (8,386,268 | ) | ||||
| Total dividends and distributions | (8,011,175 | ) | (8,386,268 | ) | ||||
| Capital Share Transactions: | ||||||||
| Net proceeds from shares sold | 29,776,262 | 62,845,536 | ||||||
| Distributions reinvested | 7,458,429 | 7,813,505 | ||||||
| Payment for shares redeemed | (58,827,508 | ) | (50,219,174 | ) | ||||
| Net increase/(decrease) in net assets from capital share transactions | (21,592,817 | ) | 20,439,867 | |||||
| Total increase/(decrease) in net assets | (74,344,811 | ) | 10,576,348 | |||||
| Net Assets, Beginning of year | 296,682,255 | 286,105,907 | ||||||
| Net Assets, End of year | $ | 222,337,444 | $ | 296,682,255 | ||||
| Transactions in Shares: | ||||||||
| Shares sold | 3,484,371 | 6,250,540 | ||||||
| Shares issued on reinvestment of distributions | 865,199 | 779,458 | ||||||
| Shares redeemed | (6,651,962 | ) | (5,002,238 | ) | ||||
| Net increase/(decrease) in shares outstanding | (2,302,392 | ) | 2,027,760 | |||||
The accompanying notes are an integral part of these financial statements.
34
PIA Funds
PIA MBS BOND FUND
Statements of Changes in Net Assets
| Year Ended | Year Ended | |||||||
| November 30, 2022 | November 30, 2021 | |||||||
| Increase/(Decrease) in Net Assets From Operations: | ||||||||
| Net investment income | $ | 1,113,799 | $ | 458,097 | ||||
| Net realized gain/(loss) on investments | (753,504 | ) | 172,635 | |||||
| Capital gain distributions from regulated investment companies | 10 | — | ||||||
| Net change in unrealized appreciation/(depreciation) on investments | (7,140,848 | ) | (1,147,300 | ) | ||||
| Net decrease in net assets resulting from operations | (6,780,543 | ) | (516,568 | ) | ||||
| Distributions Paid to Shareholders: | ||||||||
| Net dividends and distributions to shareholders | (1,175,696 | ) | (652,838 | ) | ||||
| Total dividends and distributions | (1,175,696 | ) | (652,838 | ) | ||||
| Capital Share Transactions: | ||||||||
| Net proceeds from shares sold | 8,603,375 | 25,444,468 | ||||||
| Distributions reinvested | 983,921 | 578,178 | ||||||
| Payment for shares redeemed | (7,713,760 | ) | (39,320,666 | ) | ||||
| Net increase/(decrease) in net assets from capital share transactions | 1,873,536 | (13,298,020 | ) | |||||
| Total decrease in net assets | (6,082,703 | ) | (14,467,426 | ) | ||||
| Net Assets, Beginning of year | 60,396,037 | 74,863,463 | ||||||
| Net Assets, End of year | $ | 54,313,334 | $ | 60,396,037 | ||||
| Transactions in Shares: | ||||||||
| Shares sold | 973,365 | 2,641,148 | ||||||
| Shares issued on reinvestment of distributions | 113,200 | 60,030 | ||||||
| Shares redeemed | (872,068 | ) | (4,093,655 | ) | ||||
| Net increase/(decrease) in shares outstanding | 214,497 | (1,392,477 | ) | |||||
The accompanying notes are an integral part of these financial statements.
35
PIA Funds
PIA HIGH YIELD (MACS) FUND
Statements of Changes in Net Assets
| Year Ended | Year Ended | |||||||
| November 30, 2022 | November 30, 2021 | |||||||
| Increase/(Decrease) in Net Assets From Operations: | ||||||||
| Net investment income | $ | 10,048,219 | $ | 8,931,589 | ||||
| Net realized gain/(loss) on investments | (3,384,629 | ) | 3,321,318 | |||||
| Capital gain distributions from regulated investment companies | 33 | — | ||||||
| Net change in unrealized appreciation/(depreciation) on investments | (17,814,818 | ) | (2,205,141 | ) | ||||
| Net increase/(decrease) in net assets resulting from operations | (11,151,195 | ) | 10,047,766 | |||||
| Distributions Paid to Shareholders: | ||||||||
| Net dividends and distributions to shareholders | (12,223,197 | ) | (8,951,519 | ) | ||||
| Total dividends and distributions | (12,223,197 | ) | (8,951,519 | ) | ||||
| Capital Share Transactions: | ||||||||
| Net proceeds from shares sold | 4,878,056 | 2,632,929 | ||||||
| Distributions reinvested | 12,133,748 | 8,645,006 | ||||||
| Payment for shares redeemed | (1,236,517 | ) | (354,859 | ) | ||||
| Net increase in net assets from capital share transactions | 15,775,287 | 10,923,076 | ||||||
| Total increase/(decrease) in net assets | (7,599,105 | ) | 12,019,323 | |||||
| Net Assets, Beginning of year | 131,815,491 | 119,796,168 | ||||||
| Net Assets, End of year | $ | 124,216,386 | $ | 131,815,491 | ||||
| Transactions in Shares: | ||||||||
| Shares sold | 581,406 | 270,389 | ||||||
| Shares issued on reinvestment of distributions | 1,392,407 | 879,616 | ||||||
| Shares redeemed | (141,315 | ) | (35,903 | ) | ||||
| Net increase in shares outstanding | 1,832,498 | 1,114,102 | ||||||
The accompanying notes are an integral part of these financial statements.
36
PIA Funds
PIA BBB BOND FUND
Financial Highlights
| Year Ended November 30, | ||||||||||||||||||||
| 2022 | 2021 | 2020 | 2019 | 2018 | ||||||||||||||||
| Per Share Operating Performance | ||||||||||||||||||||
| (For a fund share outstanding throughout each year) | ||||||||||||||||||||
| Net asset value, beginning of year | $ | 9.97 | $ | 10.32 | $ | 9.76 | $ | 8.67 | $ | 9.35 | ||||||||||
| Income From Investment Operations: | ||||||||||||||||||||
| Net investment income | 0.29 | 0.28 | 0.33 | 0.37 | 0.37 | |||||||||||||||
| Net realized and unrealized gain/(loss) on investments | (1.87 | ) | (0.35 | ) | 0.56 | 1.09 | (0.68 | ) | ||||||||||||
| Total from investment operations | (1.58 | ) | (0.07 | ) | 0.89 | 1.46 | (0.31 | ) | ||||||||||||
| Less Distributions: | ||||||||||||||||||||
| Distributions from net investment income | (0.29 | ) | (0.28 | ) | (0.33 | ) | (0.37 | ) | (0.37 | ) | ||||||||||
| Total distributions | (0.29 | ) | (0.28 | ) | (0.33 | ) | (0.37 | ) | (0.37 | ) | ||||||||||
| Net asset value, end of year | $ | 8.10 | $ | 9.97 | $ | 10.32 | $ | 9.76 | $ | 8.67 | ||||||||||
| Total Return | -16.00 | % | -0.61 | % | 9.37 | % | 17.10 | % | -3.44 | % | ||||||||||
| Ratios/Supplemental Data: | ||||||||||||||||||||
| Net assets, end of year (in 000’s) | $ | 222,337 | $ | 296,682 | $ | 286,106 | $ | 142,283 | $ | 148,575 | ||||||||||
| Ratio of expenses to average net assets: | ||||||||||||||||||||
| Net of expense reimbursement | 0.15 | % | 0.15 | % | 0.17 | % | 0.19 | % | 0.16 | % | ||||||||||
| Before expense reimbursement | 0.15 | % | 0.15 | % | 0.17 | % | 0.20 | % | 0.17 | % | ||||||||||
| Ratio of net investment income to average net assets: | ||||||||||||||||||||
| Net of expense reimbursement | 3.26 | % | 2.83 | % | 3.41 | % | 3.97 | % | 3.97 | % | ||||||||||
| Before expense reimbursement | 3.26 | % | 2.83 | % | 3.41 | % | 3.96 | % | 3.96 | % | ||||||||||
| Portfolio turnover rate | 10 | % | 20 | % | 36 | % | 20 | % | 15 | % | ||||||||||
The accompanying notes are an integral part of these financial statements.
37
PIA Funds
PIA MBS BOND FUND
Financial Highlights
| Year Ended November 30, | ||||||||||||||||||||
| 2022 | 2021 | 2020 | 2019 | 2018 | ||||||||||||||||
| Per Share Operating Performance | ||||||||||||||||||||
| (For a fund share outstanding throughout each year) | ||||||||||||||||||||
| Net asset value, beginning of year | $ | 9.56 | $ | 9.71 | $ | 9.57 | $ | 9.17 | $ | 9.49 | ||||||||||
| Income From Investment Operations: | ||||||||||||||||||||
| Net investment income | 0.17 | 0.08 | 0.17 | 0.26 | 0.24 | |||||||||||||||
| Net realized and unrealized gain/(loss) on investments | (1.23 | ) | (0.15 | ) | 0.19 | 0.42 | (0.31 | ) | ||||||||||||
| Total from investment operations | (1.06 | ) | (0.07 | ) | 0.36 | 0.68 | (0.07 | ) | ||||||||||||
| Less Distributions: | ||||||||||||||||||||
| Distributions from net investment income | (0.18 | ) | (0.08 | ) | (0.22 | ) | (0.28 | ) | (0.25 | ) | ||||||||||
| Total distributions | (0.18 | ) | (0.08 | ) | (0.22 | ) | (0.28 | ) | (0.25 | ) | ||||||||||
| Net asset value, end of year | $ | 8.32 | $ | 9.56 | $ | 9.71 | $ | 9.57 | $ | 9.17 | ||||||||||
| Total Return | -11.12 | % | -0.73 | % | 3.77 | % | 7.53 | % | -0.72 | % | ||||||||||
| Ratios/Supplemental Data: | ||||||||||||||||||||
| Net assets, end of year (in 000’s) | $ | 54,313 | $ | 60,396 | $ | 74,863 | $ | 69,730 | $ | 60,204 | ||||||||||
| Ratio of expenses to average net assets: | ||||||||||||||||||||
| Net of expense reimbursement | 0.23 | % | 0.23 | % | 0.23 | % | 0.23 | % | 0.21 | % | ||||||||||
| Before expense reimbursement | 0.43 | % | 0.31 | % | 0.36 | % | 0.36 | % | 0.34 | % | ||||||||||
| Ratio of net investment income to average net assets: | ||||||||||||||||||||
| Net of expense reimbursement | 1.97 | % | 0.56 | % | 1.74 | % | 2.73 | % | 2.53 | % | ||||||||||
| Before expense reimbursement | 1.77 | % | 0.48 | % | 1.61 | % | 2.60 | % | 2.40 | % | ||||||||||
| Portfolio turnover rate | 146 | % | 680 | % | 171 | % | 20 | % | 239 | % | ||||||||||
The accompanying notes are an integral part of these financial statements.
38
PIA Funds
PIA HIGH YIELD (MACS) FUND
Financial Highlights
| Year Ended November 30, | December 26, 2017* | |||||||||||||||||||
| through | ||||||||||||||||||||
| 2022 | 2021 | 2020 | 2019 | November 30, 2018 | ||||||||||||||||
| Per Share Operating Performance | ||||||||||||||||||||
| (For a fund share outstanding throughout each period) | ||||||||||||||||||||
| Net asset value, beginning of period | $ | 9.67 | $ | 9.57 | $ | 9.42 | $ | 9.44 | $ | 10.00 | ||||||||||
| Income From Investment Operations: | ||||||||||||||||||||
| Net investment income | 0.69 | 0.68 | 0.64 | 0.64 | 0.56 | |||||||||||||||
| Net realized and unrealized gain/(loss) on investments | (1.48 | ) | 0.10 | 0.15 | 0.02 | (0.56 | ) | |||||||||||||
| Total from investment operations | (0.79 | ) | 0.78 | 0.79 | 0.66 | 0.00 | ||||||||||||||
| Less Distributions: | ||||||||||||||||||||
| Distributions from net investment income | (0.70 | ) | (0.68 | ) | (0.64 | ) | (0.64 | ) | (0.56 | ) | ||||||||||
| Distributions from net realized gains on investments | (0.15 | ) | — | (0.02 | ) | (0.04 | ) | — | ||||||||||||
| Total distributions | (0.85 | ) | (0.68 | ) | (0.66 | ) | (0.68 | ) | (0.56 | ) | ||||||||||
| Increase from payment made by affiliate | ||||||||||||||||||||
| and administrator due to operational error | — | — | 0.02 | — | — | |||||||||||||||
| Net asset value, end of period | $ | 8.03 | $ | 9.67 | $ | 9.57 | $ | 9.42 | $ | 9.44 | ||||||||||
| Total Return | -8.50 | % | 8.31 | % | 9.25 | %^ | 7.21 | % | -0.07 | %++ | ||||||||||
| Ratios/Supplemental Data: | ||||||||||||||||||||
| Net assets, end of period (in 000’s) | $ | 124,216 | $ | 131,815 | $ | 119,796 | $ | 79,915 | $ | 73,794 | ||||||||||
| Ratio of expenses to average net assets: | ||||||||||||||||||||
| Net of expense reimbursement | 0.20 | % | 0.20 | % | 0.24 | % | 0.25 | % | 0.23 | %+ | ||||||||||
| Before expense reimbursement | 0.20 | % | 0.20 | % | 0.24 | % | 0.28 | % | 0.30 | %+ | ||||||||||
| Ratio of net investment income to average net assets: | ||||||||||||||||||||
| Net of expense reimbursement | 7.98 | % | 6.91 | % | 7.11 | % | 6.72 | % | 6.23 | %+ | ||||||||||
| Before expense reimbursement | 7.98 | % | 6.91 | % | 7.11 | % | 6.69 | % | 6.16 | %+ | ||||||||||
| Portfolio turnover rate | 24 | % | 70 | % | 51 | % | 36 | % | 22 | %++ | ||||||||||
| * | Commencement of operations. | |
| + | Annualized for periods less than one year. | |
| ++ | Not annualized for periods less than one year. | |
| ^ | Includes increase from payment made by affiliate and administrator due to operational error. On September 18, 2020, the High Yield (MACS) Fund received a reimbursement of $199,712 from the Adviser and Administrator related to a corporate action instruction error during the year ended November 30, 2020. Due to a miscommunication, the tender offer for the Martin Midstream corporate action was not processed correctly. This resulted in the Fund’s position being tendered rather than exchanged. Had the Fund not received the payment, total return would have been 9.02%. |
The accompanying notes are an integral part of these financial statements.
39
PIA Funds
Notes to Financial Statements – November 30, 2022
Note 1 – Organization
The PIA BBB Bond Fund, the PIA MBS Bond Fund and the PIA High Yield (MACS) Fund (the “Funds”) are each a series of Advisors Series Trust (the “Trust”), which is registered under the Investment Company Act of 1940, as amended, as an open-end management investment company. Each Fund is an investment company and accordingly follows the investment company accounting and reporting guidance of the Financial Accounting Standards Board (“FASB”) Accounting Standard Codification Topic 946 “Financial Services – Investment Companies.”
Currently, the Funds offer the Managed Account Completion Shares (MACS) class. Each of the Funds is diversified and has separate assets and liabilities and differing investment objectives. The investment objective of the PIA BBB Bond Fund (the “BBB Bond Fund”) is to seek to provide a total rate of return that approximates that of bonds rated within the BBB category by Standard and Poor’s Ratings Services, the Baa category by Moody’s Investors Services, Inc. or the BBB category by Fitch Ratings, Inc. The investment objective of the PIA MBS Bond Fund (the “MBS Bond Fund”) is to seek to provide a total rate of return that exceeds the Bloomberg Barclays U.S. MBS Fixed Rate Index. The investment objective of the PIA High Yield (MACS) Fund (the “High Yield (MACS) Fund”) is to seek a high level of current income. The BBB Bond Fund and the MBS Bond Fund commenced operations on September 25, 2003 and February 28, 2006, respectively. The High Yield (MACS) Fund commenced operations on December 26, 2017, prior to which, its only activity was a transfer in-kind of securities and cash. This transfer in-kind was nontaxable, whereby the Fund issued 6,563,978 shares on December 26, 2017. The fair value and cost of securities received by the Fund was $61,624,087 and $60,648,008, respectively. In addition, the Fund received $4,015,697 of cash and interest receivable. For financial reporting purposes, assets received, and shares issued by the Fund were recorded at fair value; however, the cost basis of the investments received was carried forward to align ongoing reporting of the Fund’s realized and unrealized gains and losses with amounts distributable to shareholders for tax purposes. Only authorized investment advisory clients of Pacific Income Advisers, Inc. are eligible to invest in the Funds.
Note 2 – Significant Accounting Policies
The following is a summary of significant accounting policies consistently followed by the Funds in the preparation of their financial statements. These policies are in conformity with accounting principles generally accepted in the United States of America.
Security Valuation – All investments in securities are recorded at their estimated fair value, as described in Note 3.
Securities Purchased on a When-Issued Basis – Delivery and payment for securities that have been purchased by the Funds on a forward-commitment or when-issued basis can take place up to a month or more after the transaction date. During this period, such securities are subject to market fluctuations. The Funds are required to hold and maintain until the settlement date, cash or other liquid assets in an amount sufficient to meet the purchase price. The purchase of securities on a when-issued or forward-commitment basis may increase the volatility of the Funds’ net asset values if the Funds make such purchases while remaining substantially fully invested. In connection with the ability to purchase securities on a when-issued basis, the Funds may also enter into dollar rolls in which the Funds sell securities purchased on a forward-commitment basis and simultaneously contract with a counterparty to repurchase similar (same type, coupon, and maturity), but not identical securities on a specified future date. As an inducement for the Funds to “rollover” their purchase commitments, the Funds receive negotiated amounts in the form of reductions of the purchase price of the commitment. Dollar rolls are considered a form of leverage.
40
PIA Funds
Notes to Financial Statements – November 30, 2022 (continued)
Federal Income Taxes – It is the Funds’ policy to comply with the requirements of Subchapter M of the Internal Revenue Code applicable to regulated investment companies and to distribute substantially all of its taxable income to its shareholders. Therefore, no federal income or excise tax provision is required.
The Funds recognize the tax benefits of uncertain tax positions only where the position is “more likely than not” to be sustained assuming examination by tax authorities. The tax returns of the Funds’ prior three fiscal years are open for examination. Management has reviewed all open tax years in major jurisdictions and concluded that there is no impact on the Funds’ net assets and no tax liability resulting from unrecognized tax events relating to uncertain income tax positions taken or expected to be taken on a tax return. The Funds identify their major tax jurisdictions as U.S. federal and the state of Wisconsin; however the Funds are not aware of any tax positions for which it is reasonably possible that the total amounts of unrecognized tax benefits will change materially in the next twelve months.
Expenses – Each Fund is charged for those expenses that are directly attributable to the Fund, such as administration and custodian fees. Expenses that are not directly attributable to a Fund are typically allocated among the Funds in proportion to their respective net assets. Common expenses of the Trust are typically allocated among the funds in the Trust based on a fund’s respective net assets, or by other equitable means.
Securities Transactions and Investment Income – Security transactions are accounted for on a trade date basis. Realized gains and losses on sales of securities are calculated on a first in, first out basis. Interest income is recorded on an accrual basis. Discounts and premiums on securities purchased are accreted or amortized using the effective interest method, except for premiums on certain callable debt securities that are amortized to the earliest call date. Paydown gains and losses on mortgage-related and other asset-based securities are recorded as components of interest income on the Statement of Operations.
Distributions to Shareholders – Distributions to shareholders are recorded on the ex-dividend date. The Funds distribute substantially all net investment income, if any, monthly and net realized gains, if any, annually. Distributions from net realized gains for book purposes may include short-term capital gains. All short-term capital gains are included in ordinary income for tax purposes.
The amount and character of income and net realized gains to be distributed are determined in accordance with federal income tax rules and regulations, which may differ from accounting principles generally accepted in the United States of America. To the extent that these differences are attributable to permanent book and tax accounting differences, the components of net assets have been adjusted.
Reclassification of Capital Accounts – Accounting principles generally accepted in the United States of America require that certain components of net assets relating to permanent differences be reclassified between financial and tax reporting. These reclassifications have no effect on net assets or net asset value per share. For the year ended November 30, 2022, there were no reclassifications between paid-in capital and distributable earnings.
Guarantees and Indemnifications – In the normal course of business, the Funds enter into contracts with service providers that contain general indemnification clauses. The Funds’ maximum exposure under these arrangements is unknown as this would involve future claims against the Funds that have not yet occurred. Based on experience, the Funds expect the risk of loss to be remote.
41
PIA Funds
Notes to Financial Statements – November 30, 2022 (continued)
Use of Estimates – The preparation of financial statements in conformity with accounting principles generally accepted in the United States of America requires management to make estimates and assumptions that affect the reported amounts of assets and liabilities and disclosure of contingent assets and liabilities at the date of the financial statements and the reported amounts of increases and decreases in net assets from operation during the reporting period. Actual results could differ from those estimates.
Accounting Pronouncements – In March 2020, the Financial Accounting Standards Board(“FASB”) issued Accounting Standards Update 2020-04, Reference Rate Reform: Facilitation of the Effects of Reference Rate Reform on Financial Reporting (“ASU 2020-04”) and in January 2021, FASB issued Accounting Standards Update 2021-01, Reference Rate Reform (Topic 848): Scope (“ASU 2021-01”), which provides optional, temporary relief with respect to the financial reporting of contracts subject to certain types of modifications due to the planned discontinuation of the London Interbank Offered Rate (“LIBOR”) and other interbank offered rates as of the end of 2021. The temporary relief provided by ASU 2020-04 and ASU 2021-01 is effective for certain reference rate-related contract modifications that occur during the period from March 12, 2020 through December 31, 2022. Management is evaluating the impact of ASU 2020-04 and ASU 2021-01 on the Funds’ investments, derivatives, debt and other contracts that will undergo reference rate-related modifications as a result of the reference rate reform. Management has also been working with other financial institutions and counterparties to modify contracts as required by applicable regulation and within the regulatory deadlines.
In October 2020, the Securities and Exchange Commission (the “SEC”) adopted new regulations governing the use of derivatives by registered investment companies (“Rule 18f-4”). Funds were required to implement and comply with Rule 18f-4 by August 19, 2022. Rule 18f-4 imposes limits on the amount of derivatives a fund can enter into, eliminates the asset segregation framework currently used by funds to comply with Section 18 of the 1940 Act, treats derivatives as senior securities and requires funds whose use of derivatives is more than a limited specified exposure amount to establish and maintain a comprehensive derivatives risk management program and appoint a derivatives risk manager. The Funds’ most recently filed statement of additional information allows the Funds to enter into derivative transactions. The Funds are considered limited derivative users under Rule 18f-4. During the year ended November 30, 2022, the MBS Bond Fund held a limited number of TBA securities. The BBB Bond Fund and the High Yield MACS Fund did not enter into derivatives transactions. The Funds are in compliance with Rule 18f-4 as of November 30, 2022.
In December 2020, the SEC adopted a new rule providing a framework for fund valuation practices (“Rule 2a-5”). Rule 2a-5 establishes requirements for determining fair value in good faith for purposes of the 1940 Act. Rule 2a-5 permits fund boards to designate certain parties to perform fair value determinations, subject to board oversight and certain other conditions. Rule 2a-5 also defines when market quotations are “readily available” for purposes of the 1940 Act and the threshold for determining whether a fund must fair value a security. In connection with Rule 2a-5, the SEC also adopted related recordkeeping requirements and rescinded previously issued guidance, including with respect to the role of a board in determining fair value and the accounting and auditing of fund investments. The Funds are in compliance with Rule 2a-5, which had a compliance date of September 8, 2022. Effective September 8, 2022, the Board of Trustees approved Pacific Income Advisers, Inc. (“PIA” or the “Adviser”), as the Funds’ valuation designee under Rule 2a-5.
42
PIA Funds
Notes to Financial Statements – November 30, 2022 (continued)
Events Subsequent to the Fiscal Year End – In preparing the financial statements as of November 30, 2022, management considered the impact of subsequent events for the potential recognition or disclosure in these financial statements. Management has determined there were no subsequent events that would need to be disclosed in the Funds’ financial statements.
Note 3 – Securities Valuation
The Funds have adopted authoritative fair value accounting standards which establish an authoritative definition of fair value and set out a hierarchy for measuring fair value. These standards require additional disclosures about the various inputs and valuation techniques used to develop the measurements of fair value, a discussion in changes in valuation techniques and related inputs during the period and expanded disclosure of valuation levels for major security types. These inputs are summarized in the three broad levels listed below:
| Level 1 – | Unadjusted quoted prices in active markets for identical assets or liabilities that the Funds have the ability to access. | |
| Level 2 – | Observable inputs other than quoted prices included in Level 1 that are observable for the asset or liability, either directly or indirectly. These inputs may include quoted prices for the identical instrument on an inactive market, prices for similar instruments, interest rates, prepayment speeds, credit risk, yield curves, default rates and similar data. | |
| Level 3 – | Unobservable inputs for the asset or liability, to the extent relevant observable inputs are not available, representing the Funds’ own assumptions about the assumptions a market participant would use in valuing the asset or liability, and would be based on the best information available. |
Following is a description of the valuation techniques applied to the Funds’ major categories of assets and liabilities measured at fair value on a recurring basis. The Funds’ investments are carried at fair value.
Each Fund determines the fair value of its investments and computes its net asset value per share as of the close of regular trading on the New York Stock Exchange (4:00 pm EST).
Investment Companies – Investments in open-end mutual funds, including money market funds, are generally priced at their net asset value per share provided by the service agent of the funds and will be classified in Level 1 of the fair value hierarchy.
Corporate Bonds – Corporate bonds, including listed issues, are valued at market on the basis of valuations furnished by an independent pricing service which utilizes both dealer-supplied valuations and formula-based techniques. The pricing service may consider recently executed transactions in securities of the issuer or comparable issuers, market price quotations (where observable), bond spreads, and fundamental data relating to the issuer. Most corporate bonds are categorized in Level 2 of the fair value hierarchy.
Bank Loan Obligations – Bank loan obligations are valued at market on the basis of valuations furnished by an independent pricing service which utilizes quotations obtained from dealers in bank loans. These securities will generally be classified in Level 2 of the fair value hierarchy.
Foreign Securities – Foreign economies may differ from the U.S. economy and individual foreign companies may differ from domestic companies in the same industry.
43
PIA Funds
Notes to Financial Statements – November 30, 2022 (continued)
Foreign companies or entities are frequently not subject to accounting and financial reporting standards applicable to domestic companies, and there may be less information available about foreign issuers. Securities of foreign issuers are generally less liquid and more volatile than those of comparable domestic issuers. There is frequently less government regulation of broker-dealers and issuers than in the United States. In addition, investments in foreign countries are subject to the possibility of expropriation, confiscatory taxation, political or social instability or diplomatic developments that could adversely affect the value of those investments.
All foreign securities owned by the Funds are U.S. dollar denominated.
Mortgage- and Asset-Backed Securities – Mortgage- and asset-backed securities are securities issued as separate tranches, or classes, of securities within each deal. These securities are normally valued by pricing service providers that use broker-dealer quotations or valuation estimates from their internal pricing models. The pricing models for these securities usually consider tranche-level attributes, estimated cash flows and market-based yield spreads for each tranche, current market data and incorporate deal collateral performance, as available. Mortgage- and asset-backed securities that use similar valuation techniques and inputs as described above are categorized as Level 2 of the fair value hierarchy.
U.S. Government Securities – U.S. Government securities are normally valued using a model that incorporates market observable data such as reported sales of similar securities, broker quotes, yields, bids, offers, and reference data. Certain securities are valued principally using dealer quotations. U.S. Government securities are typically categorized in Level 2 of the fair value hierarchy.
U.S. Government Agency Securities – U.S. Government agency securities are comprised of two main categories consisting of agency issued debt and mortgage pass-throughs. Agency issued debt securities are generally valued in a manner similar to U.S. government securities. Mortgage pass-throughs include to-be-announced (“TBAs”) securities and mortgage pass-through certificates. TBA securities and mortgage pass-throughs are generally valued using dealer quotations. These securities are typically categorized in Level 2 of the fair value hierarchy.
Equity Securities – Equity securities that are primarily traded on a national securities exchange shall be valued at the last sale price on the exchange on which they are primarily traded on the day of valuation or, if there has been no sale on such day, at the mean between the bid and asked prices. Securities primarily traded in the NASDAQ Global Market System for which market quotations are readily available shall be valued using the NASDAQ Official Closing Price (“NOCP”). If the NOCP is not available, such securities shall be valued at the last sale price on the day of valuation, or if there has been no sale on such day, at the mean between the bid and asked prices. Over-the-counter (“OTC”) securities which are not traded in the NASDAQ Global Market System shall be valued at the most recent sales price. To the extent, these securities are actively traded and valuation adjustments are not applied, they are categorized in Level 1 of the fair value hierarchy.
Short-Term Securities – Short-term debt securities, including those securities having a maturity of 60 days or less, are valued at the evaluated mean between the bid and asked prices. To the extent the inputs are observable and timely, these securities would be classified in Level 2 of the fair value hierarchy.
Prior to the effectiveness of Rule 2a-5, the Board of Trustees (“Board”) had delegated day-to-day valuation issues to a Valuation Committee of the Trust which was comprised of representatives from the Funds’ administrator, U.S. Bancorp Fund Services, LLC, doing business as U.S. Bank Global Fund Services (“Fund Services”). The function of the Valuation Committee was to value securities where current and reliable market quotations were not readily available, or
44
PIA Funds
Notes to Financial Statements – November 30, 2022 (continued)
the closing price did not represent fair value by following procedures approved by the Board. These procedures considered many factors, including the type of security, size of holding, trading volume and news events. All actions taken by the Valuation Committee were subsequently reviewed and ratified by the Board. The Valuation Committee served through September 7, 2022. Effective September 8, 2022, the Board of Trustees approved Pacific Income Advisers, Inc. (“PIA” or the “Adviser”), as the Funds’ valuation designee under Rule 2a-5.
Restricted Securities – The Funds may invest in securities that are subject to legal or contractual restrictions on resale (“restricted securities”). Restricted securities may be resold in transactions that are exempt from registration under the Federal securities laws. Private placement securities are generally considered to be restricted except for those securities traded between qualified institutional investors under the provisions of Rule 144A of the Securities Act of 1933. The sale or other disposition of these securities may involve additional expenses and the prompt sale of these securities at an acceptable price may be difficult. At November 30, 2022, the Funds held securities issued pursuant to Rule 144A under the Securities Act of 1933. There were no other restricted investments held by the Funds at November 30, 2022.
Depending on the relative significance of the valuation inputs, fair valued securities may be classified in either Level 2 or Level 3 of the fair value hierarchy.
The inputs or methodology used for valuing securities are not an indication of the risk associated with investing in those securities. The following is a summary of the inputs used to value the Funds’ securities as of November 30, 2022:
| BBB Bond Fund | |||||||||||||||||
| Level 1 | Level 2 | Level 3 | Total | ||||||||||||||
| Fixed Income | |||||||||||||||||
| Corporate Bonds | $ | — | $ | 203,118,766 | $ | — | $ | 203,118,766 | |||||||||
| Sovereign Bonds | — | 11,523,458 | — | 11,523,458 | |||||||||||||
| U.S. Government Agencies & Instrumentalities | — | 2,022,578 | — | 2,022,578 | |||||||||||||
| Total Fixed Income | — | 216,664,802 | — | 216,664,802 | |||||||||||||
| Money Market Fund | 139,769 | — | — | 139,769 | |||||||||||||
| U.S. Treasury Bill | — | 2,449,919 | — | 2,449,919 | |||||||||||||
| Total Investments | $ | 139,769 | $ | 219,114,721 | $ | — | $ | 219,254,490 | |||||||||
| MBS Bond Fund | |||||||||||||||||
| Level 1 | Level 2 | Level 3 | Total | ||||||||||||||
| Fixed Income | |||||||||||||||||
| Asset-Backed Securities | $ | — | $ | 1,214,665 | $ | — | $ | 1,214,665 | |||||||||
| Commercial Mortgage-Backed Securities | — | 1,852,750 | — | 1,852,750 | |||||||||||||
| Mortgage-Backed Securities – | |||||||||||||||||
| U.S. Government Agencies | — | 47,788,131 | — | 47,788,131 | |||||||||||||
| Total Fixed Income | — | 50,855,546 | — | 50,855,546 | |||||||||||||
| Money Market Fund | 721,508 | — | — | 721,508 | |||||||||||||
| U.S. Treasury Bill | — | 3,355,438 | — | 3,355,438 | |||||||||||||
| Total Investments | $ | 721,508 | $ | 54,210,984 | $ | — | $ | 54,932,492 | |||||||||
45
PIA Funds
Notes to Financial Statements – November 30, 2022 (continued)
| High Yield (MACS) Fund | |||||||||||||||||
| Level 1 | Level 2 | Level 3 | Total | ||||||||||||||
| Common Stocks | $ | — | $ | — | $ | 239,680 | $ | 239,680 | |||||||||
| Fixed Income | |||||||||||||||||
| Corporate Bonds | — | 112,916,162 | 199,500 | 113,115,662 | |||||||||||||
| Total Fixed Income | — | 112,916,162 | 199,500 | 113,115,662 | |||||||||||||
| Money Market Fund | 8,659,003 | — | — | 8,659,003 | |||||||||||||
| Total Investments | $ | 8,659,003 | $ | 112,916,162 | $ | 439,180 | $ | 122,014,345 | |||||||||
Refer to each Fund’s schedule of investments for a detailed break-out of securities by industry classification.
The following is a reconciliation of the MBS Bond Fund’s Level 3 investments for which significant unobservable inputs were used in determining value.
| Investments in Securities, at Value | |||||
| Mortgage-Backed Securities | |||||
| Balance as of November 30, 2021 | $ | 439,450 | |||
| Accrued discounts/premiums | — | ||||
| Realized gain/(loss) | — | ||||
| Change in unrealized appreciation/(depreciation) | (20,895 | ) | |||
| Purchases | — | ||||
| Sales | — | ||||
| Transfers in and/or out of Level 3 | (418,555 | ) | |||
| Balance as of November 30, 2022 | $ | — | |||
The following is a reconciliation of the High Yield (MACS) Fund’s Level 3 investments for which significant unobservable inputs were used in determining value.
| Investments in Securities, at Value | |||||||||
| Common Stocks | Corporate Bonds | ||||||||
| Balance as of November 30, 2021 | $ | 173,768 | $ | 147,000 | |||||
| Accrued discounts/premiums | — | 4,794 | |||||||
| Realized gain/(loss) | — | — | |||||||
| Change in unrealized appreciation/(depreciation) | 65,912 | 47,706 | |||||||
| Purchases | — | — | |||||||
| Sales | — | — | |||||||
| Transfers in and/or out of Level 3 | — | — | |||||||
| Balance as of November 30, 2022 | $ | 239,680 | $ | 199,500 | |||||
The change in unrealized appreciation/(depreciation) for Level 3 securities still held at November 30, 2022, and still classified as Level 3 was $113,618.
46
PIA Funds
Notes to Financial Statements – November 30, 2022 (continued)
The global outbreak of COVID-19 (commonly referred to as “coronavirus”) has disrupted economic markets and the prolonged economic impact is uncertain. Although vaccines for COVID-19 are becoming more widely available, the ultimate economic fallout from the pandemic, amid the spread of COVID-19 variants, and the long-term impact on economies, markets, industries and individual companies are not known. The operational and financial performance of individual companies and the market in general depends on future developments, including the duration and spread of any future outbreaks and the pace of recovery which may vary from market to market, and such uncertainty may in turn adversely affect the value and liquidity of the Funds’ investments, impair the Funds’ ability to satisfy redemption requests, and negatively impact the Funds’ performance.
Note 4 – Investment Advisory Fee and Other Transactions with Affiliates
The Funds have investment advisory agreements with the Adviser pursuant to which the Adviser is responsible for providing investment management services to the Funds. The Adviser furnishes all investment advice, office space and facilities, and provides most of the personnel needed by the Funds. Under the agreement, the Funds do not pay the Adviser an investment advisory fee. However, investors in the Funds will be charged investment advisory fees by the Adviser and persons other than the Adviser. Clients of PIA pay PIA an investment advisory fee to manage their assets, including assets invested in the Funds. Participants in “wrap-fee” programs pay fees to the program sponsor, who in turn pays fees to the Adviser.
The Funds are responsible for their own operating expenses. PIA has temporarily agreed to reduce fees payable to it by the Funds and to pay Fund operating expenses (excluding acquired fund fees and expenses) to the extent necessary to limit each Fund’s aggregate annual operating expenses as a percent of average daily net assets as follows:
| BBB Fund | 0.19% | ||
| MBS Fund | 0.23% | ||
| High Yield (MACS) Fund | 0.25% |
The Adviser may not recoup amounts subject to the temporary expense limitation in future periods. For the year ended November 30, 2022, the Adviser absorbed Fund expenses in the amount of $0, $114,009, and $0 for the BBB Bond Fund, the MBS Bond Fund and the High Yield (MACS) Fund, respectively.
Fund Services serves as the Funds’ administrator, fund accountant and transfer agent. U.S. Bank N.A. serves as custodian (the “Custodian”) to the Funds. The Custodian is an affiliate of Fund Services. Fund Services maintains the Funds’ books and records, calculates the Funds’ NAV, prepares various federal and state regulatory filings, coordinates the payment of fund expenses, reviews expense accruals and prepares materials supplied to the Board of Trustees. The officers of the Trust, including the Chief Compliance Officer, are employees of Fund Services. Fees paid by the Funds for administration and accounting, transfer agency, custody and compliance services for the year ended November 30, 2022, are disclosed in the Statements of Operations.
The BBB Bond Fund, the MBS Bond Fund and the High Yield (MACS) Fund have entered into agreements with various brokers, dealers and financial intermediaries to compensate them for transfer agent services that would otherwise be executed by Fund Services. These sub-transfer agent services include pre-processing and quality control of new accounts, maintaining detailed shareholder account records, shareholder correspondence, answering customer inquiries
47
PIA Funds
Notes to Financial Statements – November 30, 2022 (continued)
regarding account status, and facilitating shareholder telephone transactions. The BBB Bond Fund, the MBS Bond Fund, and the High Yield (MACS) Fund expensed $35,944, $5,440, and $53, respectively, of sub-transfer agent fees during the year ended November 30, 2022.
Quasar Distributors, LLC (“Quasar”) acts as the Fund’s principal underwriter in a continuous public offering of the Fund’s shares. Quasar is a wholly-owned broker-dealer subsidiary of Foreside Financial Group, LLC.
Note 5 – Purchases and Sales of Securities
For the year ended November 30, 2022, the cost of purchases and the proceeds from sales of securities, excluding short-term securities, were as follows:
| Non-Government | Government | ||||||||||||||||
| Purchases | Sales | Purchases | Sales | ||||||||||||||
| BBB Bond Fund | $ | 18,409,223 | $ | 34,402,825 | $ | 5,396,466 | $ | 8,166,348 | |||||||||
| MBS Bond Fund | — | 26,327 | 82,171,445 | 76,868,799 | |||||||||||||
| High Yield (MACS) Fund | 35,950,018 | 27,765,107 | — | — | |||||||||||||
Note 6 – Line of Credit
The BBB Bond Fund, the MBS Bond Fund and the High Yield (MACS) Fund have a secured line of credit in the amount of $15,000,000, $8,000,000 and $15,000,000, respectively. These lines of credit are intended to provide short-term financing, if necessary, subject to certain restrictions, in connection with shareholder redemptions. The credit facility is with the Funds’ custodian, U.S. Bank N.A. During the year ended November 30, 2022, the BBB Fund drew on its line of credit. The Fund had an outstanding average daily balance of $20,460, paid a weighted average interest rate of 5.17%, and incurred interest expense of $1,073. The maximum amount outstanding for the BBB Fund during the year ended November 30, 2022, was $897,000. At November 30, 2022, the Fund had no outstanding loan amount. The MBS Fund and the High Yield (MACS) Fund did not draw upon their line of credit.
Note 7 – Federal Income Tax Information
The tax character of distributions paid during the years ended November 30, 2022, and November 30, 2021 were as follows:
| BBB Bond Fund | MBS Bond Fund | High Yield (MACS) Fund | |||||||||||||||||||||||
| Nov. 30, 2022 | Nov. 30, 2021 | Nov. 30, 2022 | Nov. 30, 2021 | Nov. 30, 2022 | Nov. 30, 2021 | ||||||||||||||||||||
| Ordinary income | $ | 8,011,175 | $ | 8,386,268 | $ | 1,175,696 | $ | 652,838 | $ | 12,223,197 | $ | 8,951,519 | |||||||||||||
| Long-term | |||||||||||||||||||||||||
| capital gains | — | — | — | — | — | — | |||||||||||||||||||
48
PIA Funds
Notes to Financial Statements – November 30, 2022 (continued)
As of November 30, 2022, the Funds’ most recently completed fiscal year end, the components of capital on a tax basis were as follows:
| BBB | MBS | High Yield | |||||||||||
| Bond Fund | Bond Fund | (MACS) Fund | |||||||||||
| Cost of investments (a) | $ | 258,175,764 | $ | 61,143,283 | $ | 140,750,600 | |||||||
| Gross unrealized appreciation | 845,658 | 44,744 | 760,581 | ||||||||||
| Gross unrealized depreciation | (39,766,932 | ) | (6,255,535 | ) | (19,496,836 | ) | |||||||
| Net unrealized appreciation/(depreciation) (a) | (38,921,274 | ) | (6,210,791 | ) | (18,736,255 | ) | |||||||
| Undistributed ordinary income | 66,879 | 31,386 | 83,175 | ||||||||||
| Undistributed long-term capital gain | — | — | — | ||||||||||
| Total distributable earnings | 66,879 | 31,386 | 83,175 | ||||||||||
| Other accumulated gains/(losses) | (5,350,005 | ) | (1,840,691 | ) | (3,384,596 | ) | |||||||
| Total accumulated earnings/(losses) | $ | (44,204,400 | ) | $ | (8,020,096 | ) | $ | (22,037,676 | ) | ||||
| (a) | The difference between book-basis and tax-basis net unrealized appreciation in the Funds is attributable primarily to wash sales. |
At November 30, 2021 the Funds’ most recently completed fiscal year end, the BBB Bond Fund, the MBS Bond Fund and the High Yield (MACS) Fund had tax short-term capital losses and tax long-term capital losses, which may be carried over indefinitely to offset future gains, as follows:
| BBB | MBS | High Yield | |||||||||||
| Bond Fund | Bond Fund | (MACS) Fund | |||||||||||
| Short-term capital losses | $ | 1,737,988 | $ | 1,485,808 | $ | 300,557 | |||||||
| Long-term capital losses | 3,612,017 | 354,883 | 3,084,039 | ||||||||||
Note 8 – Principal Risks
Below is a summary of some, but not all, of the principal risks of investing in the Funds, each of which may adversely affect the Funds’ net asset value and total return. The Funds’ most recent prospectus provides further descriptions of each Fund’s investment objective, principal investment strategies and principal risks.
| • | General Market Risk. Economies and financial markets throughout the world are becoming increasingly interconnected, which increases the likelihood that events or conditions in one country or region will adversely impact markets or issuers in other countries or regions. Securities in the Fund’s portfolio may underperform in comparison to securities in general financial markets, a particular financial market or other asset classes due to a number of factors, including inflation (or expectations for inflation), deflation (or expectations for deflation), interest rates, global demand for particular products or resources, market instability, debt crises and downgrades, embargoes, tariffs, sanctions and other trade barriers, regulatory events, other governmental trade or market control programs and related geopolitical events. In addition, the value of the Fund’s investments may be negatively affected by the occurrence of global events such as war, terrorism, environmental disasters, natural disasters or events, country instability, and infectious disease epidemics or pandemics. For example, the outbreak of COVID-19, a novel coronavirus disease, has negatively affected economies, markets and individual companies throughout the world, including those in which the Fund invests. The effects of this pandemic to public health and |
49
PIA Funds
Notes to Financial Statements – November 30, 2022 (continued)
| business and market conditions, including exchange trading suspensions and closures, may continue to have a significant negative impact on the performance of the Fund’s investments, increase the Fund’s volatility, negatively impact the Fund’s arbitrage and pricing mechanisms, exacerbate pre-existing political, social and economic risks to the Fund, and negatively impact broad segments of businesses and populations. The Fund’s operations may be interrupted as a result, which may contribute to the negative impact on investment performance. In addition, governments, their regulatory agencies, or self-regulatory organizations may take actions in response to the pandemic that affect the instruments in which the Fund invests, or the issuers of such instruments, in ways that could have a significant negative impact on the Fund’s investment performance. The full impact of the COVID-19 pandemic, or other future epidemics or pandemics, is currently unknown. | ||
| • | Interest Rate Risk. The value of a Fund’s investments in fixed-income securities will change based on changes in interest rates. If interest rates increase, the value of these investments generally declines. Securities with greater interest rate sensitivity and longer maturities generally are subject to greater fluctuations in value. | |
| • | Credit Risk. The issuers of the bonds and other debt securities held by the Funds may not be able to make interest or principal payments. | |
| • | Counterparty Risk. Fund transactions involving a counterparty are subject to the risk that the counterparty or a third party will not fulfill its obligation to the Funds. Counterparty risk may arise because of the counterparty’s financial condition (i.e., financial difficulties, bankruptcy, or insolvency), market activities and developments, or other reasons, whether foreseen or not. A counterparty’s inability to fulfill its obligation may result in significant financial loss to the Fund. |
BBB Bond Fund
| • | High Yield Securities Risk. The BBB Bond Fund may hold high yield securities as a result of credit rating downgrades. Securities with ratings lower than BBB or Baa are known as “high yield” securities (commonly known as “junk bonds”). High yield securities typically carry higher coupon rates than investment grade securities, but also are considered as speculative and may be subject to greater market price fluctuations, less liquidity and greater risk of loss of income or principal including greater possibility of default and bankruptcy of the issuer of such instruments than more highly rated bonds and loans. | |
| • | Foreign and Emerging Market Securities Risk. Investments in foreign currencies and foreign issuers are subject to additional risks, including political and economic risks, greater volatility, civil conflicts and war, sanctions or other measures by the United States or other governments, liquidity risks, currency fluctuations, higher transaction costs, delayed settlement, possible foreign controls on investment, expropriation and nationalization risks, and less stringent investor protection and disclosure standards of foreign markets. Events and evolving conditions in certain economies or markets may alter the risks associated with investments tied to countries or regions that historically were perceived as comparatively stable becoming riskier and more volatile. These risks are magnified in countries in “emerging markets.” Emerging market countries typically have less-established market economies than developed countries and may face greater social, economic, regulatory and political uncertainties. In addition, emerging markets typically present greater illiquidity and price volatility concerns due to smaller or limited local capital markets and greater difficulty in determining market valuations of securities due to limited public information on issuers. |
50
PIA Funds
Notes to Financial Statements – November 30, 2022 (continued)
MBS Bond Fund
| • | ETF and Mutual Fund Risk. When the MBS Bond Fund invests in an ETF or mutual fund, it will bear additional expenses based on its pro rata share of the ETF’s or mutual fund’s operating expenses, including the potential duplication of management fees. The risk of owning an ETF or mutual fund generally reflects the risks of owning the underlying securities that the ETF or mutual fund holds. The Fund also will incur brokerage costs when it purchases ETFs. | |
| • | Extension Risk. An issuer may pay principal on an obligation held by the Fund (such as an asset-backed or mortgage-backed security) later than expected. This may happen during a period of rising interest rates. Under these circumstances, the value of the obligation will decrease. | |
| • | Risks Associated with Mortgage-Backed Securities. These risks include General Market Risk, Interest Rate Risk, Credit Risk, Prepayment Risk and Extension Risk (each described above). During periods of difficult or frozen credit markets, significant changes in interest rates, or deteriorating economic conditions, such securities may decline in value, face valuation difficulties, become more volatile and/or become illiquid. | |
| • | Risks associated with Real Estate and Regulatory Actions. Although some of the securities in the Fund are expected to either have a U.S. government sponsored entity guarantee or be AAA rated by any NSRSO, if real estate experiences a significant price decline, this could adversely affect the prices of the securities the Fund owns. In addition, any adverse regulatory action could impact the prices of the securities the Fund owns. | |
| • | Liquidity Risk. Reduced liquidity in the bond markets can result from a number of events, such as limited trading activity, reductions in bond inventory, and rapid or unexpected changes in interest rates. Less liquid markets could lead to greater price volatility and limit the Fund’s ability to sell a holding at a suitable price. | |
| • | TBA Securities Risk. In a TBA transaction, a seller agrees to deliver a security at a future date, but does not specify the particular security to be delivered. Instead, the seller agrees to accept any security that meets specified terms. TBA transactions involve the risk that the securities received may have less favorable characteristics than what was anticipated when the Adviser entered into the transaction. Adviser accounts with TBA securities are also subject to counterparty risk and will be exposed to changes in the value of the underlying investments during the term of the agreement. | |
| • | Dollar Roll Risk. Dollar rolls involve the risk that the MBS Bond Fund’s counterparty will be unable to deliver the mortgage-backed securities underlying the dollar roll at the fixed time. If the buyer files for bankruptcy or becomes insolvent, the buyer or its representative may ask for and receive an extension of time to decide whether to enforce the Fund’s repurchase obligation. In addition, the Fund earns interest by investing the transaction proceeds during the roll period. Dollar roll transactions may have the effect of creating leverage in the Fund’s portfolio. | |
| • | Risks Associated with Inflation and Deflation. Inflation risk is the risk that the rising cost of living may erode the purchasing power of an investment over time. Deflation risk is the risk that prices throughout the economy decline over time—the opposite of inflation. |
51
PIA Funds
Notes to Financial Statements – November 30, 2022 (continued)
| • | Government-Sponsored Entities Risk. Securities issued or guaranteed by government-sponsored entities, including GNMA, FNMA, and FHLMC, may not be guaranteed or insured by the U.S. government and may only be supported by the credit of the issuing agency. | |
| • | Asset-Backed Securities Risks. These risks include Market and Regulatory Risk, Interest Rate Risk, Credit Risk, Prepayment Risk and Extension Risk (each described above). Asset-backed securities may decline in value when defaults on the underlying assets occur and may exhibit additional volatility in periods of changing interest rates. |
High Yield (MACS) Fund
| • | High Yield Securities Risk. High yield securities (or “junk bonds”) entail greater risk of loss of principal because of their greater exposure to credit risk. High yield securities typically carry higher coupon rates than investment grade securities, but also are considered as speculative and may be subject to greater market price fluctuations, less liquidity and greater risk of loss of income or principal including greater possibility of default and bankruptcy of the issuer of such instruments than more highly rated bonds and loans. | |
| • | Liquidity Risk. Reduced liquidity in the bond markets can result from a number of events, such as limited trading activity, reductions in bond inventory, and rapid or unexpected changes in interest rates. Less liquid markets could lead to greater price volatility and limit the Fund’s ability to sell a holding at a suitable price. | |
| • | Convertible Securities Risk. Convertible securities are subject to the risks of both debt securities and equity securities. The values of convertible securities tend to decline as interest rates rise and, due to the conversion feature, tend to vary with fluctuations in the market value of the underlying common or preferred stock. | |
| • | Foreign and Emerging Market Securities Risk. Investments in foreign currencies and foreign issuers are subject to additional risks, including political and economic risks, greater volatility, civil conflicts and war, sanctions or other measures by the United States or other governments, liquidity risks, currency fluctuations, higher transaction costs, delayed settlement, possible foreign controls on investment, expropriation and nationalization risks, and less stringent investor protection and disclosure standards of foreign markets. Events and evolving conditions in certain economies or markets may alter the risks associated with investments tied to countries or regions that historically were perceived as comparatively stable becoming riskier and more volatile. These risks are magnified in countries in “emerging markets.” Emerging market countries typically have less-established market economies than developed countries and may face greater social, economic, regulatory and political uncertainties. In addition, emerging markets typically present greater illiquidity and price volatility concerns due to smaller or limited local capital markets and greater difficulty in determining market valuations of securities due to limited public information on issuers. | |
| • | Loan Participation and Assignment Risk. Loan participations and assignments involve special types of risk, including credit risk, interest rate risk, liquidity risk, and the risks of being a lender. Bank loans (i.e., loan participations and assignments), like other high yield corporate debt obligations, have a higher risk of default and may be less liquid and/or become illiquid. | |
| • | Rule 144A Securities Risk. The market for Rule 144A securities typically is less active than the market for publicly-traded securities. Rule 144A securities carry the risk that the liquidity of these securities may become impaired, making it more difficult for the Fund to sell these securities. |
52
PIA Funds
Notes to Financial Statements – November 30, 2022 (continued)
Note 9 – Control Ownership
The beneficial ownership, either directly or indirectly of more than 25% of the voting securities of a Fund creates a presumption of control of the Fund, under Section 2(a)(9) of the 1940 Act. The following table reflects shareholders that maintain accounts of more than 25% of the voting securities of a Fund as of November 30, 2022:
Fund | Shareholder | Percent of Shares Held | |
| BBB Bond Fund | Wells Fargo LLC | 44.02% | |
| MBS Bond Fund | Morgan Stanley LLC | 35.84% | |
| High Yield (MACS) Fund | First Hawaiian Bank | 93.83% |
Note 10 – Trustees and Officers
At a meeting held December 7-8, 2022, by vote of the majority of the Board of Trustees (not including Mr. Joe Redwine), Mr. Redwine’s term as Trustee was extended for three additional years. Ms. Michele Rackey was approved by the Board as an Independent Trustee effective January 1, 2023. Mr. Kevin Hayden was approved by the Board as Vice President, Treasurer and Ms. Cheryl King was approved as Assistant Treasurer effective January 1, 2023. Mr. Ryan Charles resigned as Assistant Secretary effective January 1, 2023.
Note 11 – Other Tax Information (Unaudited)
For the year ended November 30, 2022, the BBB Bond Fund, MBS Bond Fund, and the High Yield (MACS) Fund designated $8,011,175, $1,175,696, and $12,223,197, respectively, as ordinary income for purposes of the dividends paid deduction. For the year ended November 30, 2022, none of the dividends paid from net investment income qualifies for the dividend received deduction available to corporate shareholders of the Funds. For shareholders in the Funds, none of the dividend income distributed for the year ended November 30, 2022 is designated as qualified dividend income under the Tax Cuts and Jobs Act of 2017.
On December 29, 2022, the BBB Bond Fund and the MBS Bond Fund, and the High Yield (MACS) Fund distributed $0.02603570, $0.02509831, and $0.05870271, per share, respectively, of net investment income.
53
PIA Funds
Report of Independent Registered Public Accounting Firm
To the Board of Trustees Advisors Series Trust and Shareholders of
PIA BBB Bond Fund
PIA MBS Bond Fund
PIA High Yield (MACS) Fund
Opinion on the Financial Statements
We have audited the accompanying statements of assets and liabilities of the PIA BBB Bond Fund, PIA MBS Bond Fund, and PIA High Yield (MACS) fund, a series of Advisors Series Trust (the “Trust”), including the schedules of investments, as of November 30, 2022, the related statements of operations, the statements of changes in net assets, and financial highlights for each of the periods indicated in the table below, and the related notes (collectively referred to as the “financial statements”). In our opinion, the financial statements and financial highlights referred to above present fairly, in all material respects, the financial position of the Funds as of November 30, 2022, the results of their operations, the changes in their net assets, and their financial highlights for the periods indicated in the table below, in conformity with accounting principles generally accepted in the United States of America.
| Individual Funds | |||
| Constituting | Statement Of | Statements Of | |
Advisors Series Trust | Operations | Changes In Net Assets | Financial Highlights |
| PIA BBB Bond Fund and | For the year ended | For each of the two years in the period | For each of the five years in the period ended |
| PIA MBS Bond Fund | November 30, 2022 | ended November 30, 2022 | November 30, 2022 |
| PIA High Yield (MACS) | For the year ended | For each of the two years in the period | For each of the four years in the period ended |
| November 30, 2022 | ended November 30, 2022 | November 30, 2022 and for the period December 26, | |
| 2017 (commencement of operations) through | |||
| November 30, 2018 |
Basis for Opinion
These financial statements are the responsibility of the Fund’s management. Our responsibility is to express an opinion on the Fund’s financial statements based on our audits. We are a public accounting firm registered with the Public Company Accounting Oversight Board (United States) (“PCAOB”) and are required to be independent with respect to the Fund in accordance with the U.S. federal securities laws and the applicable rules and regulations of the Securities and Exchange Commission and the PCAOB. We have served as the auditor of one or more of the funds in the Trust since 2003.
We conducted our audits in accordance with the standards of the PCAOB. Those standards require that we plan and perform the audit to obtain reasonable assurance about whether the financial statements are free of material misstatement, whether due to error or fraud. The Fund is not required to have, nor were we engaged to perform, an audit of its internal control over financial reporting. As part of our audits we are required to obtain an understanding of internal control over financial reporting, but not for the purpose of expressing an opinion on the effectiveness of the Fund’s internal control over financial reporting. Accordingly, we express no such opinion.
54
PIA Funds
Report of Independent Registered Public Accounting Firm (continued)
Our audits included performing procedures to assess the risks of material misstatement of the financial statements, whether due to error or fraud, and performing procedures that respond to those risks. Such procedures included examining, on a test basis, evidence regarding the amounts and disclosures in the financial statements. Our audits also included evaluating the accounting principles used and significant estimates made by management, as well as evaluating the overall presentation of the financial statements. Our procedures included confirmation of securities owned as of November 30, 2022 by correspondence with the custodian and brokers; when replies were not received from brokers, we performed other auditing procedures. We believe that our audits provide a reasonable basis for our opinion.
| TAIT, WELLER & BAKER LLP |
Philadelphia, Pennsylvania
January 27, 2023
55
PIA Funds
Notice to Shareholders – November 30, 2022
(Unaudited)
How to Obtain a Copy of the Funds’ Proxy Voting Policies
A description of the policies and procedures that the Funds use to determine how to vote proxies relating to portfolio securities is available without charge, upon request, by calling 1-800-251-1970, or on the Securities and Exchange Commission’s (“SEC”) website at http://www.sec.gov.
How to Obtain a Copy of the Funds’ Proxy Voting Records for the 12-Month Period Ended June 30
Information regarding how the Funds voted proxies relating to portfolio securities during the most recent 12-month period ended June 30 is available without charge, upon request, by calling 1-800-251-1970. Furthermore, you can obtain the Funds’ proxy voting records on the SEC’s website at http://www.sec.gov.
Quarterly Filings on Form N-PORT
The Funds file their complete schedules of portfolio holdings with the SEC for the first and third quarters of each fiscal year on Part F of Form N-PORT. The Funds’ Form N-PORT is available on the SEC’s website at http://www.sec.gov. Information included in the Funds’ Form N-PORT is also available by calling 1-800-251-1970.
Householding
In an effort to decrease costs, the Funds will reduce the number of duplicate prospectuses, supplements, and certain other shareholder documents that you receive by sending only one copy of each to those addresses shown by two or more accounts. Please call the Funds’ transfer agent toll free at 1-800-251-1970 to request individual copies of these documents. The Funds will begin sending individual copies 30 days after receiving your request. This policy does not apply to account statements.
56
PIA Funds
Statement Regarding Liquidity Risk Management Program
(Unaudited)
Each Fund has adopted a liquidity risk management program (the “program”). The Board has designated a committee at the Adviser to serve as the administrator of the program. The Adviser’s committee conducts the day-to-day operation of the programs pursuant to policies and procedures administered by the committee.
Under the program, the Adviser’s committee manages each Fund’s liquidity risk, which is the risk that the Fund could not meet shareholder redemption requests without significant dilution of remaining shareholders’ interests in the Fund. This risk is managed by monitoring the degree of liquidity of each Fund’s investments, limiting the amount of each Fund’s illiquid investments, and utilizing various risk management tools and facilities available to each Fund for meeting shareholder redemptions, among other means. The committee’s process of determining the degree of liquidity of each Fund’s investments is supported by one or more third-party liquidity assessment vendors.
The Board reviewed a report prepared by the committee regarding the operation and effectiveness of the program for the period July 1, 2021 through June 30, 2022. No significant liquidity events impacting the Fund were noted in the report. The report noted that the PIA BBB Bond Fund made use of its line of credit during the reporting period and that such line was fully repaid in a timely manner. In addition, the committee provided its assessment that the program had been effective in managing each Fund’s liquidity risk.
57
PIA Funds
Information About Trustees and Officers
(Unaudited)
This chart provides information about the Trustees and Officers who oversee the Funds. Officers elected by the Trustees manage the day-to-day operations of the Funds and execute policies formulated by the Trustees.
| Number of | Other | ||||
| Portfolios in | Directorships | ||||
| Term of Office | Fund Complex | Held During | |||
| Name, Address | Position Held | and Length of | Principal Occupation | Overseen by | Past Five |
and Age | with the Trust | Time Served* | During Past Five Years | Trustee(2) | Years(3) |
Independent Trustees(1) | |||||
| David G. Mertens | Trustee | Indefinite term; | Partner and Head of Business | 6 | Trustee, |
| (age 62) | since | Development Ballast Equity | Advisors Series | ||
| 615 E. Michigan Street | March 2017. | Management, LLC (a | Trust (for series | ||
| Milwaukee, WI 53202 | privately-held investment | not affiliated | |||
| advisory firm) (February 2019 | with the Funds). | ||||
| to present); Managing Director | |||||
| and Vice President, Jensen | |||||
| Investment Management, Inc. | |||||
| (a privately-held investment | |||||
| advisory firm) (2002 to 2017). | |||||
| Joe D. Redwine | Trustee | Indefinite term; | Retired; formerly Manager, | 6 | Trustee, |
| (age 75) | since | President, CEO, U.S. Bancorp | Advisors Series | ||
| 615 E. Michigan Street | September 2008. | Fund Services, LLC and its | Trust (for series | ||
| Milwaukee, WI 53202 | predecessors (May 1991 to | not affiliated | |||
| July 2017). | with the Funds). |
58
PIA Funds
Information About Trustees and Officers (continued)
(Unaudited)
| Number of | Other | ||||
| Portfolios in | Directorships | ||||
| Term of Office | Fund Complex | Held During | |||
| Name, Address | Position Held | and Length of | Principal Occupation | Overseen by | Past Five |
and Age | with the Trust | Time Served* | During Past Five Years | Trustee(2) | Years(3) |
| Raymond B. Woolson | Chairman | Indefinite term; | President, Apogee Group, Inc. | 6 | Trustee, |
| (age 63) | of the | since | (financial consulting firm) | Advisors Series | |
| 615 E. Michigan Street | Board | January 2020. | (1998 to present). | Trust (for series | |
| Milwaukee, WI 53202 | not affiliated | ||||
| Trustee | Indefinite term; | with the Funds); | |||
| since | Independent | ||||
| January 2016. | Trustee, | ||||
| DoubleLine | |||||
| Funds Trust (an | |||||
| open-end | |||||
| investment | |||||
| company with 19 | |||||
| portfolios), | |||||
| DoubleLine | |||||
| Opportunistic | |||||
| Credit Fund, | |||||
| DoubleLine | |||||
| Income Solutions | |||||
| Fund, and | |||||
| DoubleLine Yield | |||||
| Opportunities | |||||
| Fund from 2010 | |||||
| to present; | |||||
| Independent | |||||
| Trustee, | |||||
| DoubleLine ETF | |||||
| Trust (an open- | |||||
| end investment | |||||
| company with | |||||
| 2 portfolios) | |||||
| from March | |||||
| 2022 to present. |
59
PIA Funds
Information About Trustees and Officers (continued)
(Unaudited)
| Term of Office | |||
| Name, Address | Position Held | and Length of | Principal Occupation |
and Age | with the Trust | Time Served | During Past Five Years |
| Officers | |||
| Jeffrey T. Rauman | President, | Indefinite term; | Senior Vice President, Compliance and Administration, |
| (age 53) | Chief | since | U.S. Bank Global Fund Services (February 1996 to present). |
| 615 E. Michigan Street | Executive | December 2018. | |
| Milwaukee, WI 53202 | Officer and | ||
| Principal | |||
| Executive | |||
| Officer | |||
| Cheryl L. King | Vice | Indefinite term; | Vice President, Compliance and Administration, U.S. Bank Global |
| (age 61) | President, | since | Fund Services (October 1998 to present). |
| 615 E. Michigan Street | Treasurer and | December 2007. | |
| Milwaukee, WI 53202 | Principal | ||
| Financial | |||
| Officer | |||
| Kevin J. Hayden | Assistant | Indefinite term; | Vice President, Compliance and Administration, U.S. Bank Global |
| (age 51) | Treasurer | since | Fund Services (June 2005 to present). |
| 615 E. Michigan Street | September 2013. | ||
| Milwaukee, WI 53202 | |||
| Richard R. Conner | Assistant | Indefinite term; | Assistant Vice President, Compliance and Administration, |
| (age 40) | Treasurer | since | U.S. Bank Global Fund Services (July 2010 to present). |
| 615 E. Michigan Street | December 2018. | ||
| Milwaukee, WI 53202 | |||
| Michael L. Ceccato | Vice | Indefinite term; | Senior Vice President, U.S. Bank Global Fund Services and |
| (age 65) | President, | since | Senior Vice President, U.S. Bank N.A. (February 2008 to present). |
| 615 E. Michigan Street | Chief | September 2009. | |
| Milwaukee, WI 53202 | Compliance | ||
| Officer and | |||
| AML Officer |
60
PIA Funds
Information About Trustees and Officers (continued)
(Unaudited)
| Term of Office | |||
| Name, Address | Position Held | and Length of | Principal Occupation |
and Age | with the Trust | Time Served | During Past Five Years |
| Elaine E. Richards | Vice | Indefinite term; | Senior Vice President, U.S. Bank Global Fund Services |
| (age 54) | President | since | (July 2007 to present). |
| 2020 East Financial Way, | and | September 2019. | |
| Suite 100 | Secretary | ||
| Glendora, CA 91741 | |||
| Ryan Charles | Assistant | Indefinite term; | Assistant Vice President, U.S. Bank Global Fund Services |
| (age 44) | Secretary | since | (May 2021 to present); Chief Legal Officer and Secretary Davis |
| 2020 East Financial Way, | January 2022. | Selected Advisers, L.P. (2004 to 2021). | |
| Suite 100 | |||
| Glendora, CA 91741 |
| * | The Trustees have designated a mandatory retirement age of 75, such that each Trustee, serving as such on the date he or she reaches the age of 75, shall submit his or her resignation not later than the last day of the calendar year in which his or her 75th birthday occurs (“Retiring Trustee”). Upon request, the Board may, by vote of a majority of Trustees eligible to vote on such matter, determine whether or not to extend such Retiring Trustee’s term and on the length of a one-time extension of up to three additional years. |
| (1) | The Trustees of the Trust who are not “interested persons” of the Trust as defined under the 1940 Act (“Independent Trustees”). |
| (2) | As of November 30, 2022, the Trust was comprised of 35 active portfolios managed by unaffiliated investment advisers. The term “Fund Complex” applies only to the Funds and the PIA High Yield Fund, PIA Short Duration Fund, and the PIA Short-Term Securities Fund. The Funds do not hold themselves out as related to any other series within the Trust for investment purposes, nor does it share the same investment adviser with any other series. |
| (3) | “Other Directorships Held” includes only directorships of companies required to register or file reports with the SEC under the Securities Exchange Act of 1934, as amended, (that is, “public companies”) or other investment companies registered under the 1940 Act. |
The Statement of Additional Information includes additional information about the Funds’ Trustees and Officers and is available, without charge, upon request by calling 1-800-251-1970.
61
(This Page Intentionally Left Blank.)
PRIVACY NOTICE
The Funds collect non-public information about you from the following sources:
• Information we receive about you on applications or other forms;
• Information you give us orally; and/or
• Information about your transactions with us or others.
We do not disclose any non-public personal information about our customers or former customers without the customer’s authorization, except as permitted by law or in response to inquiries from governmental authorities. We may share information with affiliated and unaffiliated third parties with whom we have contracts for servicing the Funds. We will provide unaffiliated third parties with only the information necessary to carry out their assigned responsibilities. We maintain physical, electronic and procedural safeguards to guard your non-public personal information and require third parties to treat your personal information with the same high degree of confidentiality.
In the event that you hold shares of the Funds through a financial intermediary, including, but not limited to, a broker-dealer, bank, or trust company, the privacy policy of your financial intermediary would govern how your non-public personal information would be shared by those entities with unaffiliated third parties.
Adviser
Pacific Income Advisers, Inc.
2321 Rosecrans Avenue, Suite 1260
El Segundo, CA 90245
Distributor
Quasar Distributors, LLC
111 East Kilbourn Avenue, Suite 2200
Milwaukee, WI 53202
Transfer Agent
U.S. Bank Global Fund Services
615 East Michigan Street
Milwaukee, WI 53202
(800) 251-1970
Custodian
U.S. Bank N.A.
Custody Operations
1555 North RiverCenter Drive, Suite 302
Milwaukee, WI 53212
Independent Registered Public Accounting Firm
Tait, Weller & Baker LLP
Two Liberty Place
50 South 16th Street, Suite 2900
Philadelphia, PA 19102
Legal Counsel
Sullivan & Worcester LLP
1633 Broadway, 32nd Floor
New York, NY 10019
Past performance results shown in this report should not be considered a representation of future performance. Share price and returns will fluctuate so that shares, when redeemed, may be worth more or less than their original cost. Statements and other information herein are dated and are subject to change.
PIA Funds
PIA Short-Term
Securities Fund
Annual Report
November 30, 2022
PIA Short-Term Securities Fund
Dear Shareholder:
We are pleased to provide you with this annual report for the fiscal year from December 1, 2021 through November 30, 2022, regarding the PIA Short-Term Securities Fund (the “Fund”) for which Pacific Income Advisers, Inc. (“PIA”), is the investment adviser.
For the fiscal year ended November 30, 2022, the total return for the Fund, including the reinvestment of dividends and capital gains, was -1.49%. The Fund’s return outperformed the Fund’s benchmark index, the ICE BofA 1-Year U.S. Treasury Note Index, which returned -1.51%(1) for the same period.
The Fund’s investment objective is to seek a high level of current income, consistent with low volatility of principal through investing in short-term investment grade debt securities.
During the fiscal year ended November 30, 2022, the Fund benefited from a shorter duration position relative to the Fund’s benchmark, as short-term interest rates increased substantially. The Fund also benefited from a reduced weighting in fixed rate corporate debt securities, which underperformed equivalent maturity Treasury securities during the period and an increased weighting in floating rate corporate debt securities, as the multiple increases in the Federal Funds Rate implemented by the Federal Reserve in 2022 resulted in floating rate securities outperforming equivalent maturity fixed rate securities.
As stated in the most recently filed prospectus, the Fund’s gross expense ratio is 0.43% and the Fund’s net expense ratio is 0.39%. PIA has contractually agreed to waive all or a portion of its management fees and pay Fund expenses to ensure that the Total Annual Fund Operating Expenses After Fee Waiver (excluding acquired fund fees and expenses) do not exceed 0.39% of the Fund’s average daily net assets through at least March 29, 2023. The net expense is what the investor has paid.
Bond Market in Review
The Federal Open Market Committee voted to raise the Federal Funds rate by 375 basis points during the reporting period in order to combat increasing inflation. The yields on 1-year, 2-year, 5-year, 10-year and 30-year Treasuries increased by 447, 375, 258, 216 and 195 basis points, respectively, from December 1, 2021 to November 30, 2022. Spreads on investment grade corporate bonds over Treasuries increased during the period from 99 to 133 basis points. Option-adjusted spreads on fixed rate agency mortgage-backed securities increased from 34 to 52 basis points.
Please take a moment to review the Fund’s statement of assets and liabilities and the results of operations for the fiscal ended November 30, 2022. We look forward to reporting to you again with the semi-annual report dated May 31, 2023.
Lloyd McAdams
Chairman of the Board
Pacific Income Advisers, Inc.
1
PIA Short-Term Securities Fund
Past performance is not a guarantee of future results.
Opinions expressed above are those of Pacific Income Advisers, Inc., the Fund’s investment adviser, are subject to change, are not guaranteed and should not be considered recommendations to buy or sell any security.
Must be preceded or accompanied by a prospectus.
Mutual fund investing involves risk. Principal loss is possible. Investments in debt securities typically decrease in value when interest rates rise. This risk is usually greater for longer-term debt securities. Investments in asset-backed and mortgage-backed securities include additional risks that investors should be aware of such as credit risk, prepayment risk, possible illiquidity and default, as well as increased susceptibility to adverse economic developments. The Fund may invest in derivatives, which may involve risks greater than the risks presented by more traditional investments. The risk of owning an exchange-traded fund (“ETF”) or mutual fund generally reflects the risks of owning the underlying securities that the ETF or mutual fund holds. It will also bear additional expenses, including operating expenses, brokerage costs and the potential duplication of management fees.
Diversification does not assure a profit or protect against risk in a declining market.
The ICE BofA 1-Year U.S. Treasury Note Index (the “Index”) is an unmanaged index presented for comparative purposes only. The Index is comprised of a single U.S. Treasury issue with approximately one year to final maturity purchased at the beginning of each month and held for one full month. At the end of the month, that issue is sold and rolled into a newly selected issue. You cannot invest directly in an index.
| (1) | In previous years, the Fund utilized the same benchmark “without transactions costs”. Going forward, the Fund will compare its returns to the index “with transactions costs”. Index returns include transactions costs, which may be higher or lower than the actual transaction costs incurred by the Fund. |
Gross domestic product is the amount of goods and services produced in a year, in a country.
Consumer Price Index measures the weighted average of prices of a basket of consumer goods and services, such as transportation, food and medical care.
Duration is the measure of the sensitivity of the price of a fixed income security to a change in interest rates, expressed in number of years.
Basis point equals 1/100th of 1%.
Spread is the difference in yield between a corporate bond and a similar maturity U.S. Treasury bond. It is the compensation investors receive for accepting credit risk of a corporate bond.
Bond ratings provide the probability of an issuer defaulting based on the analysis of the issuer’s financial condition and profit potential. Bond rating services are provided by credit rating agencies currently registered as Nationally Recognized Statistical Rating Organizations (“NRSROs”). Bond ratings start at AAA (denoting the highest investment quality) and usually end at D (meaning payment is in default). Securities not covered by any agency will receive a non-rated (NR) rating. The portfolio has 0% in non-rated securities.
The option-adjusted spread is the spread earned over Treasuries, measured over multiple possible future interest rate scenarios, after accounting for the value of the embedded option in the security, which in the case of MBS, gives mortgage holders the option to either refinance or repay early.
Please refer to the schedule of investments in the report for complete holdings information. Fund holdings and sector allocations are subject to change at any time and are not recommendations to buy or sell any security. Investment performance reflects fee waivers in effect. In the absence of such waivers, total return would be reduced.
Quasar Distributors, LLC, Distributor
2
PIA Short-Term Securities Fund
Comparison of the change in value of a $10,000 investment in the
PIA Short-Term Securities Fund vs the ICE BofA 1-Year U.S. Treasury Note Index
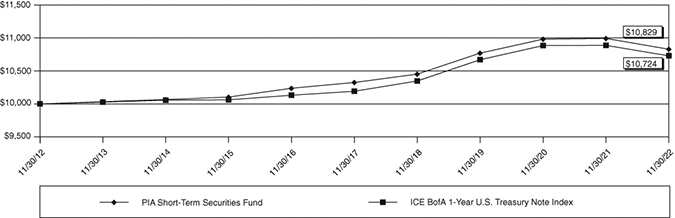
Average Annual Total Return* | 1 Year | 5 Years | 10 Years |
| PIA Short-Term Securities Fund | -1.49% | 0.96% | 0.80% |
ICE BofA 1-Year U.S. Treasury Note Index(1) | -1.51% | 1.02% | 0.70% |
Performance data quoted represents past performance; past performance does not guarantee future results. The investment return and principal value of an investment will fluctuate so that an investor’s shares, when redeemed, may be worth more or less than their original cost. Current performance of the Fund may be lower or higher than the performance quoted. Performance data current to the most recent month end may be obtained by calling 1-800-251-1970.
This chart illustrates the performance of a hypothetical $10,000 investment made in the Fund ten years ago. Returns reflect the reinvestment of dividends and capital gain distributions. Fee waivers are in effect. In the absence of fee waivers, returns would be reduced. The performance data and graph do not reflect the deduction of taxes that a shareholder may pay on dividends, capital gain distributions, or redemption of Fund shares. This chart does not imply any future performance.
The ICE BofA 1-Year U.S. Treasury Note Index is an unmanaged index consisting of a single U.S. Treasury issue with approximately one year to final maturity purchased at the beginning of each month and held for one full month. At the end of the month, that issue is sold and rolled into a newly selected issue.
Indices do not incur expenses and are not available for investment.
| * | Average Annual Total Return represents the average change in account value over the periods indicated. | |
| (1) | In previous years, the Fund utilized the same benchmark “without transactions costs”. Going forward, the Fund will compare its returns to the index “with transactions costs”. Index returns include transactions costs, which may be higher or lower than the actual transaction costs incurred by the Fund. |
3
PIA Short-Term Securities Fund
Expense Example – November 30, 2022
(Unaudited)
As a shareholder of a mutual fund, you incur two types of costs: (1) transaction costs, including sales charges (loads) on purchase payments, redemption fees, and exchange fees, and (2) ongoing costs, including management fees, distribution and/or service fees, and other fund expenses. This Example is intended to help you understand your ongoing costs (in dollars) of investing in the PIA Short-Term Securities Fund and to compare these costs with the ongoing costs of investing in other mutual funds. The Example is based on an investment of $1,000 invested at the beginning of the period and held for the entire period (6/1/22 – 11/30/22).
Actual Expenses
The first line of the table below provides information about actual account values and actual expenses. Although the Fund charges no sales loads or transaction fees, you will be assessed fees for outgoing wire transfers, returned checks, and stop payment orders at prevailing rates charged by U.S. Bancorp Fund Services, LLC, the Fund’s transfer agent. The Example below includes, but is not limited to, management fees, fund accounting, custody and transfer agent fees. You may use the information in the first line, together with the amount you invested, to estimate the expenses that you paid over the period. Simply divide your account value by $1,000 (for example, an $8,600 account value divided by $1,000 = 8.6), then multiply the result by the number in the first line under the heading entitled “Expenses Paid During Period” to estimate the expenses you paid on your account during this period.
Hypothetical Example for Comparison Purposes
The second line of the table below provides information about hypothetical account values and hypothetical expenses based on the Fund’s actual expense ratio and an assumed rate of return of 5% per year before expenses, which is different from the Fund’s actual returns. The hypothetical account values and expenses may not be used to estimate the actual ending account balance or expenses you paid for the period. You may use this information to compare the ongoing costs of investing in the Fund and other funds. To do so, compare this 5% hypothetical example with the 5% hypothetical examples that appear in the shareholder reports of the other funds. Please note that the expenses shown in the table are meant to highlight your ongoing costs only and do not reflect any transaction costs, such as sales charges (loads), redemption fees, or exchange fees. Therefore, the second line of the table is useful in comparing ongoing costs only, and will not help you determine the relative total costs of owning different funds. In addition, if these transaction costs were included, your costs would have been higher.
| Beginning Account | Ending Account | Expenses Paid During | |
Value 6/1/22 | Value 11/30/22 | Period 6/1/22 – 11/30/22* | |
| Actual | $1,000.00 | $1,001.20 | $1.96 |
| Hypothetical (5% return before expenses) | $1,000.00 | $1,023.11 | $1.98 |
| * | Expenses are equal to the Fund’s annualized expense ratio, multiplied by the average account value over the period, multiplied by 183 (days in most recent fiscal half-year) / 365 days to reflect the one-half year expense. The annualized expense ratio of the Fund is 0.39%. |
4
PIA Short-Term Securities Fund
Allocation of Portfolio Assets – November 30, 2022
(Unaudited)
Investments by Type
As a Percentage of Total Investments
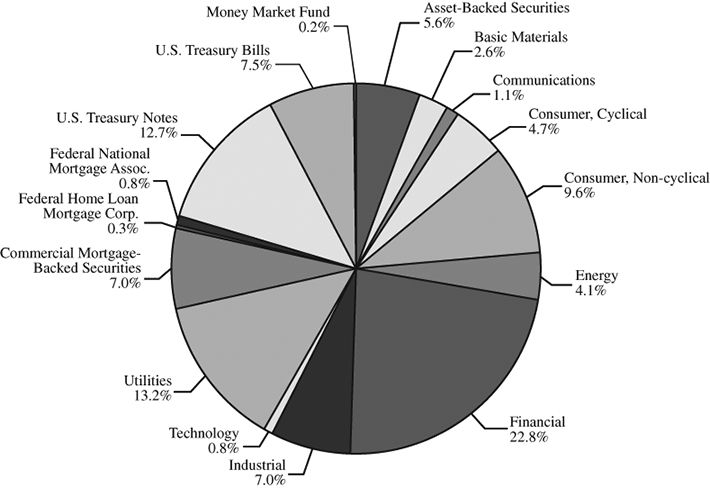
5
PIA Short-Term Securities Fund
Schedule of Investments – November 30, 2022
| Principal Amount | Value | ||||||
| ASSET-BACKED SECURITIES 5.6% | |||||||
| Other Asset-Backed Securities | |||||||
| American Credit Acceptance | |||||||
| Receivables Trust | |||||||
| 2021-2 Class C | |||||||
| $ | 4,049,000 | 0.97%, due 7/13/27 (a) | $ | 3,957,823 | |||
| FCI Funding | |||||||
| 2021-1 LLC Class A | |||||||
| 362,942 | 1.13%, due 4/15/33 (a) | 354,040 | |||||
| PenFed Auto Receivables | |||||||
| Owner Trust 2022-A Class A | |||||||
| 1,000,000 | 3.96%, due 4/15/26 (a) | 981,788 | |||||
| Santander Drive Auto | |||||||
| Receivables Trust | |||||||
| 2022-5 Class A | |||||||
| 2,000,000 | 3.98%, due 1/15/25 | 1,985,543 | |||||
| Total Asset-Backed Securities | |||||||
| (cost $7,342,703) | 7,279,194 | ||||||
| CORPORATE BONDS 65.8% | |||||||
| Aerospace & Defense 1.5% | |||||||
| Teledyne Technologies, Inc. | |||||||
| 2,000,000 | 0.65%, due 4/1/23 | 1,966,710 | |||||
| Agricultural Chemicals 1.1% | |||||||
| Nutrien Ltd. | |||||||
| 500,000 | 1.90%, due 5/13/23 | 492,314 | |||||
| 1,000,000 | 5.90%, due 11/7/24 | 1,011,929 | |||||
| 1,504,243 | |||||||
| Banks 6.1% | |||||||
| Canadian Imperial | |||||||
| Bank of Commerce | |||||||
| 1,000,000 | 3.685% (SOFR + 0.400%), | ||||||
| due 12/14/23 (c) | 993,310 | ||||||
| Citizens Bank NA/Providence RI | |||||||
| 2,000,000 | 6.064% (SOFR + 1.450%), | ||||||
| due 10/24/25 (c) | 2,022,148 | ||||||
| Huntington National Bank | |||||||
| 1,000,000 | 5.699% (SOFR + 1.215%), | ||||||
| due 11/18/25 (c) | 1,001,186 | ||||||
| JPMorgan Chase & Co. | |||||||
| 500,000 | 0.697% (SOFR + 0.580%), | ||||||
| due 3/16/24 (c) | 492,722 | ||||||
| Morgan Stanley | |||||||
| 1,000,000 | 4.358% (SOFR + 0.625%), | ||||||
| due 1/24/25 (c) | 984,304 | ||||||
| Royal Bank of Canada | |||||||
| 2,000,000 | 0.50%, due 10/26/23 | 1,923,589 | |||||
| Toronto-Dominion Bank | |||||||
| 500,000 | 0.75%, due 6/12/23 | 489,339 | |||||
| 7,906,598 | |||||||
| Biotechnology 1.7% | |||||||
| Gilead Sciences, Inc. | |||||||
| 2,248,000 | 0.75%, due 9/29/23 | 2,169,847 | |||||
| Broker 0.7% | |||||||
| Goldman Sachs Group, Inc. | |||||||
| 1,000,000 | 4.399% (SOFR + 0.700%), | ||||||
| due 1/24/25 (c) | 982,263 | ||||||
| Building Materials 0.4% | |||||||
| Martin Marietta Materials, Inc. | |||||||
| 500,000 | 0.65%, due 7/15/23 | 485,892 | |||||
| Chemicals – Specialty 0.7% | |||||||
| Ecolab, Inc. | |||||||
| 1,000,000 | 0.90%, due 12/15/23 | 960,366 | |||||
| Coatings/Paint 0.7% | |||||||
| Sherwin-Williams Co. | |||||||
| 1,000,000 | 4.05%, due 8/8/24 | 983,905 | |||||
| Commercial Services 0.7% | |||||||
| Quanta Services, Inc. | |||||||
| 1,000,000 | 0.95%, due 10/1/24 | 915,751 | |||||
The accompanying notes are an integral part of these financial statements.
6
PIA Short-Term Securities Fund
Schedule of Investments – November 30, 2022 (continued)
| Principal Amount | Value | ||||||
| Depository Credit Intermediation 1.1% | |||||||
| Bank of Montreal | |||||||
| $ | 1,515,000 | 3.534% (SOFR + 0.350%), | |||||
| due 12/8/23 (c) | $ | 1,506,311 | |||||
| Diversified Financial Services 5.3% | |||||||
| American Express Co. | |||||||
| 2,000,000 | 0.75%, due 11/3/23 | 1,926,023 | |||||
| Blackstone Secured | |||||||
| Lending Fund | |||||||
| 2,000,000 | 3.65%, due 7/14/23 | 1,977,090 | |||||
| Capital One Financial Corp. | |||||||
| 1,000,000 | 3.874% (SOFR + 0.690%), | ||||||
| due 12/6/24 (c) | 978,034 | ||||||
| Charles Schwab Corp. | |||||||
| 2,000,000 | 3.836% (SOFR + 0.500%), | ||||||
| due 3/18/24 (c) | 1,986,788 | ||||||
| 6,867,935 | |||||||
| Electric – Integrated 7.9% | |||||||
| American Electric | |||||||
| Power Co., Inc. | |||||||
| 2,000,000 | 4.92% (3 Month LIBOR USD | ||||||
| + 0.480%), due 11/1/23 (c) | 1,988,129 | ||||||
| CenterPoint Energy | |||||||
| Resources Corp. | |||||||
| 500,000 | 0.70%, due 3/2/23 | 494,332 | |||||
| DTE Energy Co. | |||||||
| 500,000 | 4.22%, due 11/1/24 | 492,206 | |||||
| Georgia Power Co. | |||||||
| 1,000,000 | 2.10%, due 7/30/23 | 979,572 | |||||
| NextEra Energy Capital | |||||||
| Holdings, Inc. | |||||||
| 500,000 | 4.20% (SOFR + 0.400%), | ||||||
| due 11/3/23 (c) | 495,797 | ||||||
| Public Service | |||||||
| Enterprise Group, Inc. | |||||||
| 2,000,000 | 0.841%, due 11/8/23 | 1,918,253 | |||||
| Southern California Edison Co. | |||||||
| 2,000,000 | 0.70%, due 8/1/23 | 1,937,987 | |||||
| 1,000,000 | 4.348% (SOFR + 0.830%), | ||||||
| due 4/1/24 (c) | 993,089 | ||||||
| Tampa Electric Co. | |||||||
| 500,000 | 3.875%, due 7/12/24 | 488,431 | |||||
| Xcel Energy, Inc. | |||||||
| 500,000 | 0.50%, due 10/15/23 | 479,730 | |||||
| 10,267,526 | |||||||
| Electronic Components | |||||||
| and Semiconductors 0.4% | |||||||
| Skyworks Solutions, Inc. | |||||||
| 500,000 | 0.90%, due 6/1/23 | 488,589 | |||||
| Entertainment 1.1% | |||||||
| Warnermedia Holdings, Inc. | |||||||
| 1,500,000 | 3.528%, due 3/15/24 (a) | 1,452,103 | |||||
| Financial Services 2.9% | |||||||
| Ares Capital Corp. | |||||||
| 3,847,000 | 3.50%, due 2/10/23 | 3,831,998 | |||||
| Food 0.6% | |||||||
| Conagra Brands, Inc. | |||||||
| 500,000 | 0.50%, due 8/11/23 | 483,981 | |||||
| General Mills, Inc. | |||||||
| 250,000 | 5.241%, due 11/18/25 | 250,271 | |||||
| 734,252 | |||||||
| Food – Meat products 1.4% | |||||||
| Hormel Foods Corp. | |||||||
| 2,000,000 | 0.65%, due 6/3/24 | 1,880,848 | |||||
| Gas – Distribution 3.0% | |||||||
| CenterPoint Energy, Inc. | |||||||
| 1,000,000 | 4.467% (SOFR + 0.650%), | ||||||
| due 5/13/24 (c) | 985,857 | ||||||
The accompanying notes are an integral part of these financial statements.
7
PIA Short-Term Securities Fund
Schedule of Investments – November 30, 2022 (continued)
| Principal Amount | Value | ||||||
| Gas – Distribution 3.0% (continued) | |||||||
| Southern California Gas Co. | |||||||
| $ | 3,000,000 | 3.620% (3 Month | |||||
| LIBOR USD + 0.350%), | |||||||
| due 9/14/23 (c) | $ | 2,992,904 | |||||
| 3,978,761 | |||||||
| Healthcare – Products 1.9% | |||||||
| GE Healthcare Holding LLC | |||||||
| 1,000,000 | 5.55%, due 11/15/24 (a) | 1,003,269 | |||||
| PerkinElmer, Inc. | |||||||
| 1,000,000 | 0.55%, due 9/15/23 | 963,134 | |||||
| Thermo Fisher Scientific, Inc. | |||||||
| 500,000 | 4.177% (SOFR + 0.530%), | ||||||
| due 10/18/24 (c) | 495,556 | ||||||
| 2,461,959 | |||||||
| Healthcare – Services 0.7% | |||||||
| Humana, Inc. | |||||||
| 1,000,000 | 0.65%, due 8/3/23 | 970,543 | |||||
| Household Products/Wares 0.4% | |||||||
| Avery Dennison Corp. | |||||||
| 500,000 | 0.85%, due 8/15/24 | 466,635 | |||||
| Investment Companies 3.7% | |||||||
| Golub Capital BDC, Inc. | |||||||
| 5,000,000 | 3.375%, due 4/15/24 | 4,792,425 | |||||
| Leisure Time 0.7% | |||||||
| Brunswick Corp. | |||||||
| 1,000,000 | 0.85%, due 8/18/24 | 918,225 | |||||
| Life/Health Insurance 1.9% | |||||||
| Athene Global Funding | |||||||
| 2,000,000 | 4.518% (SOFR + 0.700%), | ||||||
| due 5/24/24 (a) (c) | 1,961,942 | ||||||
| Security Benefit | |||||||
| Global Funding | |||||||
| 500,000 | 1.25%, due 5/17/24 (a) | 466,542 | |||||
| 2,428,484 | |||||||
| Medical Products 0.4% | |||||||
| Baxter International, Inc. | |||||||
| 500,000 | 4.427% (SOFRINDX | ||||||
| + 0.440%), due 11/29/24 (c) | 488,182 | ||||||
| Miscellaneous Manufacturing 0.7% | |||||||
| Carlisle Cos, Inc. | |||||||
| 1,000,000 | 0.55%, due 9/1/23 | 964,581 | |||||
| Mutual Insurance 0.4% | |||||||
| MassMutual Global Funding II | |||||||
| 500,000 | 4.15%, due 8/26/25 (a) | 490,699 | |||||
| Nondepository Credit Intermediation 1.5% | |||||||
| Caterpillar Financial | |||||||
| Services Corp. | |||||||
| 2,000,000 | 0.45%, due 9/14/23 | 1,936,044 | |||||
| Oil and Gas 2.5% | |||||||
| Chevron USA, Inc. | |||||||
| 1,500,000 | 3.90%, due 11/15/24 | 1,480,562 | |||||
| ConocoPhillips Co. | |||||||
| 1,000,000 | 2.125%, due 3/8/24 | 967,567 | |||||
| EQT Corp. | |||||||
| 250,000 | 5.678%, due 10/1/25 | 249,615 | |||||
| Pioneer Natural Resources Co. | |||||||
| 500,000 | 0.55%, due 5/15/23 | 490,647 | |||||
| 3,188,391 | |||||||
| Packaging & Containers 2.9% | |||||||
| Berry Global, Inc. | |||||||
| 1,000,000 | 0.95%, due 2/15/24 | 949,562 | |||||
| Graphic Packaging | |||||||
| International LLC | |||||||
| 1,000,000 | 0.821%, due 4/15/24 (a) | 933,078 | |||||
| Sonoco Products Co. | |||||||
| 2,000,000 | 1.80%, due 2/1/25 | 1,856,973 | |||||
| 3,739,613 | |||||||
| Pharmaceuticals 0.4% | |||||||
| GlaxoSmithKline Capital Plc | |||||||
| 500,000 | 0.534%, due 10/1/23 | 481,634 | |||||
The accompanying notes are an integral part of these financial statements.
8
PIA Short-Term Securities Fund
Schedule of Investments – November 30, 2022 (continued)
| Principal Amount | Value | ||||||
| Pipelines 1.6% | |||||||
| Enbridge, Inc. | |||||||
| $ | 450,000 | 4.218% (SOFR + 0.400%), | |||||
| due 2/17/23 (c) | $ | 449,603 | |||||
| 1,000,000 | 4.448% (SOFRINDX | ||||||
| + 0.630%), due 2/16/24 (c) | 990,406 | ||||||
| Gray Oak Pipeline LLC | |||||||
| 700,000 | 2.00%, due 9/15/23 (a) | 680,424 | |||||
| 2,120,433 | |||||||
| REITs – Storage 0.8% | |||||||
| Public Storage | |||||||
| 1,000,000 | 4.167% (SOFR + 0.470%), | ||||||
| due 4/23/24 (c) | 994,023 | ||||||
| Rental Auto/Equipment 0.7% | |||||||
| Triton Container | |||||||
| International Ltd. | |||||||
| 500,000 | 0.80%, due 8/1/23 (a) | 481,758 | |||||
| 500,000 | 1.15%, due 6/7/24 (a) | 461,712 | |||||
| 943,470 | |||||||
| Retail 1.4% | |||||||
| 7-Eleven, Inc. | |||||||
| 2,000,000 | 0.80%, due 2/10/24 (a) | 1,897,344 | |||||
| Retail – Drug Store 1.5% | |||||||
| Walgreens Boots Alliance, Inc. | |||||||
| 2,000,000 | 0.95%, due 11/17/23 | 1,922,508 | |||||
| Semiconductors 0.4% | |||||||
| Analog Devices, Inc. | |||||||
| 500,000 | 3.768% (SOFR + 0.250%), | ||||||
| due 10/1/24 (c) | 493,301 | ||||||
| Tobacco 0.7% | |||||||
| Philip Morris International, Inc. | |||||||
| 1,000,000 | 1.125%, due 5/1/23 | 984,628 | |||||
| Utilities 2.2% | |||||||
| Consolidated Edison, Inc. | |||||||
| 950,000 | 0.65%, due 12/1/23 | 910,351 | |||||
| Southern Co. | |||||||
| 2,000,000 | 4.187% (SOFR + 0.370%), | ||||||
| due 5/10/23 (c) | 1,993,727 | ||||||
| 2,904,078 | |||||||
| Wirelines 1.1% | |||||||
| AT&T, Inc. | |||||||
| 1,000,000 | 0.90%, due 3/25/24 | 949,146 | |||||
| Verizon Communications, Inc. | |||||||
| 500,000 | 3.921% (SOFR + 0.500%), | ||||||
| due 3/22/24 (c) | 496,814 | ||||||
| 1,445,960 | |||||||
| Total Corporate Bonds | |||||||
| (cost $88,262,391) | 85,917,058 | ||||||
| MORTGAGE-BACKED SECURITIES 8.1% | |||||||
| Commercial Mortgage-Backed Securities 7.0% | |||||||
| BX Trust 2021-RISE | |||||||
| 3,000,000 | 4.623% (1 Month | ||||||
| LIBOR USD + 0.748%), | |||||||
| due 11/17/36, Series 2021-RISE | |||||||
| Class A (a) (c) | 2,859,998 | ||||||
| Cold Storage Trust 2020-ICE5 | |||||||
| 6,389,438 | 4.775% (1 Month | ||||||
| LIBOR USD + 0.900%), | |||||||
| due 11/15/37, Series 2020-ICE5 | |||||||
| Class A (a) (c) | 6,214,843 | ||||||
| 9,074,841 | |||||||
The accompanying notes are an integral part of these financial statements.
9
PIA Short-Term Securities Fund
Schedule of Investments – November 30, 2022 (continued)
| Principal Amount | Value | ||||||
| U.S. Government Agencies 1.1% | |||||||
| FHLMC ARM Pool (c) | |||||||
| $ | 35 | 3.275% (1 Year | |||||
| CMT Rate + 2.275%), | |||||||
| due 6/1/23, #845755 | $ | 35 | |||||
| 22,420 | 3.683% (1 Year | ||||||
| CMT Rate + 2.276%), | |||||||
| due 1/1/25, #785726 | 22,086 | ||||||
| 66,923 | 4.375% (1 Year | ||||||
| CMT Rate + 2.250%), | |||||||
| due 10/1/34, #782784 | 68,117 | ||||||
| 17,234 | 3.19% (12 Month | ||||||
| LIBOR USD + 1.857%), | |||||||
| due 4/1/36, #847671 | 17,400 | ||||||
| FHLMC Pool | |||||||
| 31,142 | 5.00%, due 10/1/38, #G04832 | 32,049 | |||||
| FNMA ARM Pool (c) | |||||||
| 5,041 | 3.29% (6 Month | ||||||
| LIBOR USD + 2.165%), | |||||||
| due 7/1/25, #555206 | 4,956 | ||||||
| 25,684 | 3.395% (1 Year | ||||||
| CMT Rate + 2.092%), | |||||||
| due 4/1/30, #562912 | 24,846 | ||||||
| 45,601 | 3.765% (12 Month | ||||||
| LIBOR USD + 1.515%), | |||||||
| due 10/1/33, #743454 | 44,743 | ||||||
| 196,784 | 2.00% (12 Month | ||||||
| LIBOR USD + 1.750%), | |||||||
| due 11/1/33, #755253 | 192,541 | ||||||
| 246,242 | 3.857% (1 Year | ||||||
| CMT Rate + 2.295%), | |||||||
| due 5/1/34, #AC5719 | 243,795 | ||||||
| 40,356 | 3.753% (12 Month | ||||||
| LIBOR USD + 1.503%), | |||||||
| due 7/1/34, #779693 | 39,674 | ||||||
| 33,116 | 3.632% (12 Month | ||||||
| LIBOR USD + 1.382%), | |||||||
| due 10/1/34, #795136 | 33,129 | ||||||
| 154,893 | 2.023% (12 Month | ||||||
| LIBOR USD + 1.602%), | |||||||
| due 1/1/36, #849264 | 151,787 | ||||||
| 21,038 | 2.135% (12 Month | ||||||
| LIBOR USD + 1.885%), | |||||||
| due 3/1/37, #907868 | 20,569 | ||||||
| 203,920 | 2.265% (12 Month | ||||||
| LIBOR USD + 2.015%), | |||||||
| due 11/1/37, #953653 | 200,273 | ||||||
| FNMA Pool | |||||||
| 74,905 | 5.00%, due 6/1/40, #AD5479 | 76,495 | |||||
| 9,951 | 4.00%, due 11/1/41, #AJ3797 | 9,694 | |||||
| Freddie Mac Pool | |||||||
| 299,501 | 3.50%, due 8/1/49, #SD8005 | 277,295 | |||||
| 1,459,484 | |||||||
| Total Mortgage-Backed Securities | |||||||
| (cost $10,870,238) | 10,534,325 | ||||||
| U.S. GOVERNMENT AGENCIES & | |||||||
| INSTRUMENTALITIES 12.7% | |||||||
| U.S. Treasury Notes | |||||||
| 500,000 | 1.625%, due 12/15/22 | 499,640 | |||||
| 2,500,000 | 1.75%, due 5/15/23 | 2,467,926 | |||||
| 8,000,000 | 0.125%, due 7/15/23 | 7,775,549 | |||||
| 6,000,000 | 0.125%, due 8/15/23 | 5,807,544 | |||||
| Total U.S. Government Agencies | |||||||
| & Instrumentalities | |||||||
| (cost $16,726,944) | 16,550,659 | ||||||
The accompanying notes are an integral part of these financial statements.
10
PIA Short-Term Securities Fund
Schedule of Investments – November 30, 2022 (continued)
| Principal Amount\ | |||||||
| Shares | Value | ||||||
| SHORT-TERM INVESTMENTS 7.7% | |||||||
| Money Market Fund 0.2% | |||||||
| 275,198 | Fidelity Institutional Money | ||||||
| Market Government Portfolio – | |||||||
| Class I, 3.56% (b) | $ | 275,198 | |||||
| U.S. Treasury Bills 7.5% | |||||||
| U.S. Treasury Bills (d) | |||||||
| $ | 1,400,000 | 3.789%, due 3/30/23 | 1,380,641 | ||||
| 6,600,000 | 4.155%, due 4/13/23 | 6,495,639 | |||||
| 2,000,000 | 3.150%, due 8/10/23 | 1,938,552 | |||||
| 9,814,832 | |||||||
| Total Short-Term Investments | |||||||
| (cost $10,112,256) | 10,090,030 | ||||||
| Total Investments | ||||||
| (cost $133,314,532) | 99.9% | 130,371,266 | ||||
| Other Assets less Liabilities | 0.1% | 121,771 | ||||
| TOTAL NET ASSETS | 100.0% | $ | 130,493,037 | |||
| (a) | Security purchased within the terms of a private placement memorandum, exempt from registration under Rule 144A of the Securities Act of 1933, as amended, and may be sold only to dealers in the program or other “qualified institutional buyers.” As of November 30, 2022, the value of these investments was $24,197,363 or 18.54% of total net assets. |
| (b) | Rate shown is the 7-day annualized yield as of November 30, 2022. |
| (c) | Variable or floating rate security based on a reference index and spread. The rate reported is the rate in effect as of November 30, 2022. |
| (d) | Rate shown is the discount rate at November 30, 2022 |
ARM – Adjustable Rate Mortgage
CMT – Constant Maturity Treasury
FHLMC – Federal Home Loan Mortgage Corporation
FNMA – Federal National Mortgage Association
LIBOR – London Interbank Offered Rate
SOFR – Secured Overnight Financing Rate
SOFRINDX – Secured Overnight Financing Rate Index
The accompanying notes are an integral part of these financial statements.
11
PIA Short-Term Securities Fund
Statement of Assets and Liabilities – November 30, 2022
| Assets: | ||||
| Investments in securities, at value (cost $133,314,532) | $ | 130,371,266 | ||
| Receivable for securities sold | 2,857 | |||
| Receivable for fund shares sold | 4,684 | |||
| Interest receivable | 387,702 | |||
| Prepaid expenses | 18,665 | |||
| Total assets | 130,785,174 | |||
| Liabilities: | ||||
| Payable for fund shares redeemed | 205,959 | |||
| Investment advisory fees | 21,685 | |||
| Administration fees | 15,736 | |||
| Custody fees | 2,153 | |||
| Transfer agent fees and expenses | 14,187 | |||
| Fund accounting fees | 2,262 | |||
| Audit fees | 21,850 | |||
| Legal fees | 125 | |||
| Chief Compliance Officer fee | 1,833 | |||
| Trustees’ fees and expenses | 114 | |||
| Accrued expenses | 6,233 | |||
| Total liabilities | 292,137 | |||
| Net Assets | $ | 130,493,037 | ||
| Net Assets Consist of: | ||||
| Paid-in capital | $ | 133,910,334 | ||
| Total distributable deficit | (3,417,297 | ) | ||
| Net Assets | $ | 130,493,037 | ||
| Net Asset Value, Offering Price and Redemption Price Per Share | $ | 9.78 | ||
| Shares Issued and Outstanding (Unlimited number of shares authorized, par value $0.01) | 13,344,072 | |||
The accompanying notes are an integral part of these financial statements.
12
PIA Short-Term Securities Fund
Statement of Operations – Year Ended November 30, 2022
| Investment Income: | ||||
| Interest | $ | 2,171,309 | ||
| Total investment income | 2,171,309 | |||
| Expenses: | ||||
| Investment advisory fees (Note 4) | 272,930 | |||
| Administration fees (Note 4) | 97,595 | |||
| Transfer agent fees and expenses (Note 4) | 50,465 | |||
| Sub-transfer agent fees (Note 4) | 33,135 | |||
| Registration fees | 23,819 | |||
| Audit fees | 21,966 | |||
| Fund accounting fees (Note 4) | 14,302 | |||
| Trustees’ fees and expenses | 13,063 | |||
| Custody fees (Note 4) | 12,631 | |||
| Chief Compliance Officer fee (Note 4) | 11,060 | |||
| Reports to shareholders | 9,340 | |||
| Miscellaneous | 9,132 | |||
| Legal fees | 6,711 | |||
| Insurance | 3,864 | |||
| Total expenses | 580,013 | |||
| Less: Fee waiver by adviser (Note 4) | (47,800 | ) | ||
| Net expenses | 532,213 | |||
| Net investment income | 1,639,096 | |||
| Realized and Unrealized Gain/(Loss) on Investments: | ||||
| Net realized loss on investments | (262,258 | ) | ||
| Capital gain distributions from regulated investment companies | 14 | |||
| Net change in unrealized appreciation/(depreciation) on investments | (3,491,048 | ) | ||
| Net loss on investments | (3,753,292 | ) | ||
| Net decrease in net assets resulting from operations | $ | (2,114,196 | ) | |
The accompanying notes are an integral part of these financial statements.
13
PIA Short-Term Securities Fund
Statements of Changes in Net Assets
| Year Ended | Year Ended | |||||||
| November 30, 2022 | November 30, 2021 | |||||||
| Increase/(decrease) in Net Assets From Operations: | ||||||||
| Net investment income | $ | 1,639,096 | $ | 1,088,531 | ||||
| Net realized gain/(loss) on investments | (262,258 | ) | 404,423 | |||||
| Capital gain distributions from regulated investment companies | 14 | — | ||||||
| Net change in unrealized appreciation/(depreciation) on investments | (3,491,048 | ) | (1,191,099 | ) | ||||
| Net increase/(decrease) in net assets resulting from operations | (2,114,196 | ) | 301,855 | |||||
| Dividends and Distributions to Shareholders: | ||||||||
| Net dividends and distributions to shareholders | (1,646,721 | ) | (1,333,355 | ) | ||||
| Total dividends and distributions | (1,646,721 | ) | (1,333,355 | ) | ||||
| Capital Share Transactions: | ||||||||
| Proceeds from shares sold | 9,327,270 | 23,044,810 | ||||||
| Distributions reinvested | 1,557,732 | 1,261,890 | ||||||
| Payment for shares redeemed | (18,578,226 | ) | (81,656,669 | ) | ||||
| Net decrease in net assets from capital share transactions | (7,693,224 | ) | (57,349,969 | ) | ||||
| Total decrease in net assets | (11,454,141 | ) | (58,381,469 | ) | ||||
| Net Assets, Beginning of year | 141,947,178 | 200,328,647 | ||||||
| Net Assets, End of year | $ | 130,493,037 | $ | 141,947,178 | ||||
| Transactions in Shares: | ||||||||
| Shares sold | 944,065 | 2,278,464 | ||||||
| Shares issued on reinvestment of distributions | 158,452 | 124,899 | ||||||
| Shares redeemed | (1,884,309 | ) | (8,076,003 | ) | ||||
| Net decrease in shares outstanding | (781,792 | ) | (5,672,640 | ) | ||||
The accompanying notes are an integral part of these financial statements.
14
PIA Short-Term Securities Fund
Financial Highlights
| Year Ended November 30, | ||||||||||||||||||||
| 2022 | 2021 | 2020 | 2019 | 2018 | ||||||||||||||||
| Per Share Operating Performance | ||||||||||||||||||||
| (For a fund share outstanding throughout each year) | ||||||||||||||||||||
| Net asset value, beginning of year | $ | 10.05 | $ | 10.12 | $ | 10.07 | $ | 9.97 | $ | 10.00 | ||||||||||
| Income From Investment Operations: | ||||||||||||||||||||
| Net investment income | 0.12 | 0.06 | 0.13 | 0.20 | 0.15 | |||||||||||||||
| Net realized and unrealized gain/(loss) on investments | (0.27 | ) | (0.05 | ) | 0.06 | 0.10 | (0.03 | ) | ||||||||||||
| Total from investment operations | (0.15 | ) | 0.01 | 0.19 | 0.30 | 0.12 | ||||||||||||||
| Less Distributions: | ||||||||||||||||||||
| Distributions from net investment income | (0.12 | ) | (0.08 | ) | (0.14 | ) | (0.20 | ) | (0.15 | ) | ||||||||||
| Total distributions | (0.12 | ) | (0.08 | ) | (0.14 | ) | (0.20 | ) | (0.15 | ) | ||||||||||
| Net asset value, end of year | $ | 9.78 | $ | 10.05 | $ | 10.12 | $ | 10.07 | $ | 9.97 | ||||||||||
| Total Return | -1.49 | % | 0.11 | % | 1.95 | % | 3.04 | % | 1.23 | % | ||||||||||
| Ratios/Supplemental Data: | ||||||||||||||||||||
| Net assets, end of year (in 000’s) | $ | 130,493 | $ | 141,947 | $ | 200,329 | $ | 163,481 | $ | 165,329 | ||||||||||
| Ratio of expenses to average net assets: | ||||||||||||||||||||
| Net of fee waivers | 0.39 | % | 0.39 | % | 0.39 | % | 0.39 | % | 0.39 | % | ||||||||||
| Before fee waivers | 0.43 | % | 0.43 | % | 0.42 | % | 0.45 | % | 0.42 | % | ||||||||||
| Ratio of net investment income to average net assets: | ||||||||||||||||||||
| Net of fee waivers | 1.20 | % | 0.66 | % | 1.23 | % | 2.00 | % | 1.53 | % | ||||||||||
| Before fee waivers | 1.16 | % | 0.62 | % | 1.20 | % | 1.94 | % | 1.50 | % | ||||||||||
| Portfolio turnover rate | 25 | % | 44 | % | 58 | % | 48 | % | 28 | % | ||||||||||
The accompanying notes are an integral part of these financial statements.
15
PIA Short-Term Securities Fund
Notes to Financial Statements – November 30, 2022
Note 1 – Organization
The PIA Short-Term Securities Fund (the “Fund”) is a diversified series of Advisors Series Trust (the “Trust”), which is registered under the Investment Company Act of 1940, as amended, as an open-end management investment company. The Fund is an investment company and accordingly follows the investment company accounting and reporting guidance of the Financial Accounting Standards Board (“FASB”) Accounting Standard Codification Topic 946 “Financial Services – Investment Companies.”
The investment objective of the Fund is to seek a high level of current income, consistent with low volatility of principal through investing in short-term investment grade debt securities. The Fund commenced operations on April 22, 1994.
Note 2 – Significant Accounting Policies
The following is a summary of significant accounting policies consistently followed by the Fund in the preparation of its financial statements. These policies are in conformity with accounting principles generally accepted in the United States of America.
Security Valuation – All investments in securities are recorded at their estimated fair value, as described in Note 3.
Securities Purchased on a When-Issued Basis – Delivery and payment for securities that have been purchased by the Fund on a forward-commitment or when-issued basis can take place up to a month or more after the transaction date. During this period, such securities are subject to market fluctuations. The Fund is required to hold and maintain until the settlement date, cash or other liquid assets in an amount sufficient to meet the purchase price. The purchase of securities on a when-issued or forward-commitment basis may increase the volatility of the Fund’s net asset value if the Fund makes such purchases while remaining substantially fully invested. In connection with the ability to purchase securities on a when-issued basis, the Fund may also enter into dollar rolls in which the Fund sells securities purchased on a forward-commitment basis and simultaneously contracts with a counterparty to repurchase similar (same type, coupon, and maturity), but not identical securities on a specified future date. As an inducement for the Fund to “rollover” its purchase commitments, the Fund receives negotiated amounts in the form of reductions of the purchase price of the commitment. Dollar rolls are considered a form of leverage.
Federal Income Taxes – It is the Fund’s policy to comply with the requirements of Subchapter M of the Internal Revenue Code applicable to regulated investment companies and to distribute substantially all of its taxable income to its shareholders. Therefore, no federal income or excise tax provision is required.
The Fund recognizes the tax benefits of uncertain tax positions only where the position is “more likely than not” to be sustained assuming examination by tax authorities. The tax returns of the Fund’s prior three fiscal years are open for examination. Management has reviewed all open tax years in major jurisdictions and concluded that there is no impact on the Fund’s net assets and no tax liability resulting from unrecognized tax events relating to uncertain income tax positions taken or expected to be taken on a tax return. The Fund identifies its major tax jurisdictions as U.S. federal and the state of Wisconsin; however the Fund is not aware of any tax positions for which it is reasonably possible that the total amounts of unrecognized tax benefits will change materially in the next twelve months.
16
PIA Short-Term Securities Fund
Notes to Financial Statements – November 30, 2022 (continued)
Expenses – The Fund is charged for those expenses that are directly attributable to the Fund, such as investment advisory and custodian fees. Expenses that are not directly attributable to the Fund are typically allocated among the PIA Funds in proportion to their respective net assets. Common expenses of the Trust are typically allocated among the funds in the Trust based on a fund’s respective net assets, or by other equitable means.
Securities Transactions and Investment Income – Security transactions are accounted for on a trade date basis. Realized gains and losses on sales of securities are calculated on the basis of identified cost. Interest income is recorded on an accrual basis. Discounts and premiums on securities purchased are amortized over the life of the respective security using the effective interest method, except for premiums on certain callable debt securities that are amortized to the earliest call date. Paydown gains and losses on mortgage-related and other asset-based securities are recorded as components of interest income on the Statement of Operations.
Distributions to Shareholders – Distributions to shareholders are recorded on the ex-dividend date. The Fund distributes substantially all net investment income, if any, monthly and net realized gains, if any, annually. All short-term capital gains are included in ordinary income for tax purposes.
Reclassification of Capital Accounts – Accounting principles generally accepted in the United States of America require that certain components of net assets relating to permanent differences be reclassified between financial and tax reporting. These reclassifications have no effect on net assets or net asset value per share. For the year ended November 30, 2022, there were no reclassifications between paid-in capital and distributable earnings.
Guarantees and Indemnifications – In the normal course of business, the Fund enters into contracts with service providers that contain general indemnification clauses. The Fund’s maximum exposure under these arrangements is unknown as this would involve future claims against the Fund that have not yet occurred. Based on experience, the Fund expects the risk of loss to be remote.
Use of Estimates – The preparation of financial statements in conformity with accounting principles generally accepted in the United States of America requires management to make estimates and assumptions that affect the reported amounts of assets and liabilities and disclosure of contingent assets and liabilities at the date of the financial statements and the reported amounts of increases and decreases in net assets from operation during the reporting period. Actual results could differ from those estimates.
Accounting Pronouncements – In March 2020, FASB issued Accounting Standards Update 2020-04, Reference Rate Reform: Facilitation of the Effects of Reference Rate Reform on Financial Reporting (“ASU 2020-04”) and in January 2021, FASB issued Accounting Standards Update 2021-01, Reference Rate Reform (Topic 848): Scope (“ASU 2021-01”), which provides optional, temporary relief with respect to the financial reporting of contracts subject to certain types of modifications due to the planned discontinuation of the London Interbank Offered Rate (“LIBOR”) and other interbank offered rates as of the end of 2021. The temporary relief provided by ASU 2020-04 and ASU 2021-01 is effective for certain reference rate-related contract modifications that occur during the period from March 12, 2020 through December 31, 2022. Management is evaluating the impact of ASU 2020-04 and ASU 2021-01 on the Fund’s investments, derivatives, debt and other contracts that will undergo reference rate-related modifications as a result of the reference rate reform. Management has also been working with other financial institutions and counterparties to modify contracts as required by applicable regulation and within the regulatory deadlines.
17
PIA Short-Term Securities Fund
Notes to Financial Statements – November 30, 2022 (continued)
In October 2020, the Securities and Exchange Commission (the “SEC”) adopted new regulations governing the use of derivatives by registered investment companies (“Rule 18f-4”). Funds were required to implement and comply with Rule 18f-4 by August 19, 2022. Rule 18f-4 imposes limits on the amount of derivatives a fund can enter into, eliminates the asset segregation framework currently used by funds to comply with Section 18 of the 1940 Act, treats derivatives as senior securities and requires funds whose use of derivatives is more than a limited specified exposure amount to establish and maintain a comprehensive derivatives risk management program and appoint a derivatives risk manager. The Fund’s most recently filed statement of additional information allows the Fund to enter into derivative transactions. The Fund is considered a limited derivative user under Rule 18f-4. During the year ended November 30, 2022, the Fund did not enter into derivatives transactions. The Fund is in compliance with Rule 18f-4 as of November 30, 2022.
In December 2020, the SEC adopted a new rule providing a framework for fund valuation practices (“Rule 2a-5”). Rule 2a-5 establishes requirements for determining fair value in good faith for purposes of the 1940 Act. Rule 2a-5 permits fund boards to designate certain parties to perform fair value determinations, subject to board oversight and certain other conditions. Rule 2a-5 also defines when market quotations are “readily available” for purposes of the 1940 Act and the threshold for determining whether a fund must fair value a security. In connection with Rule 2a-5, the SEC also adopted related recordkeeping requirements and rescinded previously issued guidance, including with respect to the role of a board in determining fair value and the accounting and auditing of fund investments. The Fund is in compliance with Rule 2a-5, which had a compliance date of September 8, 2022.
Events Subsequent to the Fiscal Year End – In preparing the financial statements as of November 30, 2022, management considered the impact of subsequent events for the potential recognition or disclosure in these financial statements. Management has determined there were no subsequent events that would need to be disclosed in the Fund’s financial statements.
Note 3 – Securities Valuation
The Fund has adopted authoritative fair value accounting standards which establish an authoritative definition of fair value and set out a hierarchy for measuring fair value. These standards require additional disclosures about the various inputs and valuation techniques used to develop the measurements of fair value, a discussion in changes in valuation techniques and related inputs during the period and expanded disclosure of valuation levels for major security types. These inputs are summarized in the three broad levels listed below:
| Level 1 – | Unadjusted quoted prices in active markets for identical assets or liabilities that the Fund has the ability to access. | |
| Level 2 – | Observable inputs other than quoted prices included in Level 1 that are observable for the asset or liability, either directly or indirectly. These inputs may include quoted prices for the identical instrument on an inactive market, prices for similar instruments, interest rates, prepayment speeds, credit risk, yield curves, default rates and similar data. | |
| Level 3 – | Unobservable inputs for the asset or liability, to the extent relevant observable inputs are not available, representing the Fund’s own assumptions about the assumptions a market participant would use in valuing the asset or liability, and would be based on the best information available. |
18
PIA Short-Term Securities Fund
Notes to Financial Statements – November 30, 2022 (continued)
Following is a description of the valuation techniques applied to the Fund’s major categories of assets and liabilities measured at fair value on a recurring basis. The Fund’s investments are carried at fair value.
The Fund determines the fair value of its investments and computes its net asset value per share as of the close of regular trading on the New York Stock Exchange (4:00 pm EST).
Corporate Bonds – Corporate bonds, including listed issues, are valued at market on the basis of valuations furnished by an independent pricing service which utilizes both dealer-supplied valuations and formula-based techniques. The pricing service may consider recently executed transactions in securities of the issuer or comparable issuers, market price quotations (where observable), bond spreads, and fundamental data relating to the issuer. Most corporate bonds are categorized in Level 2 of the fair value hierarchy.
Foreign Securities – Foreign economies may differ from the U.S. economy and individual foreign companies may differ from domestic companies in the same industry.
Foreign companies or entities are frequently not subject to accounting and financial reporting standards applicable to domestic companies, and there may be less information available about foreign issuers. Securities of foreign issuers are generally less liquid and more volatile than those of comparable domestic issuers. There is frequently less government regulation of broker-dealers and issuers than in the United States. In addition, investments in foreign countries are subject to the possibility of expropriation, confiscatory taxation, political or social instability or diplomatic developments that could adversely affect the value of those investments.
Mortgage- and Asset-Backed Securities – Mortgage- and asset-backed securities are securities issued as separate tranches, or classes, of securities within each deal. These securities are normally valued by pricing service providers that use broker-dealer quotations or valuation estimates from their internal pricing models. The pricing models for these securities usually consider tranche-level attributes, estimated cash flows and market-based yield spreads for each tranche, current market data and incorporate deal collateral performance, as available. Mortgage- and asset-backed securities that use similar valuation techniques and inputs as described above are categorized as Level 2 of the fair value hierarchy.
U.S. Government Securities – U.S. Government securities are normally valued using a model that incorporates market observable data such as reported sales of similar securities, broker quotes, yields, bids, offers, and reference data. Certain securities are valued principally using dealer quotations. U.S. Government securities are typically categorized in Level 2 of the fair value hierarchy.
U.S. Government Agency Securities – U.S. government agency securities are comprised of two main categories consisting of agency issued debt and mortgage pass-throughs. Agency issued debt securities are generally valued in a manner similar to U.S. government securities. Mortgage pass-throughs include to-be-announced (“TBAs”) securities and mortgage pass-through certificates. TBA securities and mortgage pass-throughs are generally valued using dealer quotations. These securities are typically categorized in Level 2 of the fair value hierarchy.
Investment Companies – Investments in open-end mutual funds, including money market funds, are generally priced at their net asset value per share provided by the service agent of the funds and will be classified in Level 1 of the fair value hierarchy.
19
PIA Short-Term Securities Fund
Notes to Financial Statements – November 30, 2022 (continued)
Short-Term Securities – Short-term debt securities, including those securities having a maturity of 60 days or less, are valued at the evaluated mean between the bid and asked prices. To the extent the inputs are observable and timely, these securities would be classified in Level 2 of the fair value hierarchy.
Prior to the effectiveness of Rule 2a-5, on September 8, 2022, the Board of Trustees (“Board”) had delegated day-to-day valuation issues to a Valuation Committee of the Trust which was comprised of representatives from the Fund’s administrator, U.S. Bancorp Fund Services, LLC, doing business as U.S. Bank Global Fund Services (“Fund Services”). The function of the Valuation Committee was to value securities where current and reliable market quotations were not readily available, or the closing price did not represent fair value by following procedures approved by the Board. These procedures considered many factors, including the type of security, size of holding, trading volume and news events. All actions taken by the Valuation Committee were subsequently reviewed and ratified by the Board. The Valuation Committee served through September 7, 2022. Effective September 8, 2022, the Board of Trustees approved Pacific Income Advisers, Inc. (“PIA” or the “Adviser”), as the Fund’s valuation designee under Rule 2a-5.
Restricted Securities – The Fund may invest in securities that are subject to legal or contractual restrictions on resale (“restricted securities”). Restricted securities may be resold in transactions that are exempt from registration under the Federal securities laws. Private placement securities are generally considered to be restricted except for those securities traded between qualified institutional investors under the provisions of Rule 144A of the Securities Act of 1933. The sale or other disposition of these securities may involve additional expenses and the prompt sale of these securities at an acceptable price may be difficult. At November 30, 2022, the Fund held securities issued pursuant to Rule 144A under the Securities Act of 1933. There were no other restricted investments held by the Fund at November 30, 2022.
Depending on the relative significance of the valuation inputs, fair valued securities may be classified in either Level 2 or Level 3 of the fair value hierarchy.
The inputs or methodology used for valuing securities are not an indication of the risk associated with investing in those securities. The following is a summary of the inputs used to value the Fund’s securities as of November 30, 2022:
| Level 1 | Level 2 | Level 3 | Total | ||||||||||||||
| Fixed Income | |||||||||||||||||
| Asset-Backed Securities | $ | — | $ | 7,279,194 | $ | — | $ | 7,279,194 | |||||||||
| Corporate Bonds | — | 85,917,058 | — | 85,917,058 | |||||||||||||
| Mortgage-Backed Securities | — | 10,534,325 | — | 10,534,325 | |||||||||||||
| U.S. Government Agencies | |||||||||||||||||
| and Instrumentalities | — | 16,550,659 | — | 16,550,659 | |||||||||||||
| Total Fixed Income | — | 120,281,236 | — | 120,281,236 | |||||||||||||
| Short-Term Investments | 275,198 | 9,814,832 | — | 10,090,030 | |||||||||||||
| Total Investments | $ | 275,198 | $ | 130,096,068 | $ | — | $ | 130,371,266 | |||||||||
Refer to the Fund’s schedule of investments for a detailed break-out of securities by industry classification.
20
PIA Short-Term Securities Fund
Notes to Financial Statements – November 30, 2022 (continued)
The following is a reconciliation of the Fund’s Level 3 investments for which significant unobservable inputs were used in determining value.
| Investments in Securities, at Value | ||||
Mortgage-Backed Securities | ||||
| Balance as of November 30, 2021 | $ | 2,982,188 | ||
| Accrued discounts/premiums | — | |||
| Realized gain/(loss) | — | |||
| Change in unrealized appreciation/(depreciation) | (122,190 | ) | ||
| Purchases | — | |||
| Sales | — | |||
| Transfers in and/or out of Level 3 | (2,859,998 | ) | ||
| Balance as of November 30, 2022 | $ | — | ||
The global outbreak of COVID-19 (commonly referred to as “coronavirus”) has disrupted economic markets and the prolonged economic impact is uncertain. Although vaccines for COVID-19 are becoming more widely available, the ultimate economic fallout from the pandemic, amid the spread of COVID-19 variants, and the long-term impact on economies, markets, industries and individual companies are not known. The operational and financial performance of individual companies and the market in general depends on future developments, including the duration and spread of any future outbreaks and the pace of recovery which may vary from market to market, and such uncertainty may in turn adversely affect the value and liquidity of the Fund’s investments, impair the Fund’s ability to satisfy redemption requests, and negatively impact the Fund’s performance.
Note 4 – Investment Advisory Fee and other Transactions with Affiliates
The Fund has an investment advisory agreement with the Adviser pursuant to which the Adviser is responsible for providing investment management services to the Fund. The Adviser furnishes all investment advice, office space and facilities, and provides most of the personnel needed by the Fund. As compensation for its services, PIA is entitled to a fee, computed daily and payable monthly. The Fund pays fees calculated at an annual rate of 0.20% based upon the average daily net assets of the Fund. For the year ended November 30, 2022, the Fund incurred $272,930 in advisory fees.
The Fund is responsible for its own operating expenses. The Adviser has contractually agreed to reduce fees payable to it by the Fund and to pay Fund operating expenses to the extent necessary to limit the Fund’s aggregate annual operating expenses (excluding acquired fund fees and expenses) to 0.39% of the average daily net assets. Any such reduction made by the Adviser in its fees or payment of expenses which are the Fund’s obligation are subject to reimbursement by the Fund to the Adviser, if so requested by the Adviser, in any subsequent month in the 36-month period from the date of the management fee reduction and expense payment if the aggregate amount actually paid by the Fund toward the operating expenses for such fiscal year (taking into account the reimbursement) will not cause the Fund to exceed the lesser of: (1) the expense limitation in place at the time of the management fee reduction and expense payment; or (2) the expense limitation in place at the time of the reimbursement. Any such reimbursement is also contingent upon Board of Trustees review and approval. Such reimbursement may not be paid prior to the Fund’s
21
PIA Short-Term Securities Fund
Notes to Financial Statements – November 30, 2022 (continued)
payment of current ordinary operating expenses. For the year ended November 30, 2022, the Adviser reduced its fees and/or absorbed Fund expenses in the amount of $48,575; $775 was reimbursed to the Adviser. The Adviser may recapture portions of the amounts shown below no later than the corresponding dates:
Date | Amount | |||
| 11/30/23 | $ | 59,299 | ||
| 11/30/24 | 73,303 | |||
| 11/30/25 | 48,575 | |||
| $ | 181,177 | |||
Fund Services serves as the Fund’s administrator, fund accountant and transfer agent. U.S. Bank N.A. serves as custodian (the “Custodian”) to the Fund. The Custodian is an affiliate of Fund Services. Fund Services maintains the Fund’s books and records, calculates the Fund’s NAV, prepares various federal and state regulatory filings, coordinates the payment of fund expenses, reviews expense accruals and prepares materials supplied to the Board of Trustees. The officers of the Trust, including the Chief Compliance Officer, are employees of Fund Services. Fees paid by the Fund for administration and accounting, transfer agency, custody and compliance services for the year ended November 30, 2022, are disclosed in the Statement of Operations.
The Fund has entered into agreements with various brokers, dealers and financial intermediaries to compensate them for transfer agent services that would otherwise be executed by Fund Services. These sub-transfer agent services include pre-processing and quality control of new accounts, maintaining detailed shareholder account records, shareholder correspondence, answering customer inquiries regarding account status, and facilitating shareholder telephone transactions. The Fund expensed $33,135 of sub-transfer agent fees during the year ended November 30, 2022.
Quasar Distributors, LLC (“Quasar”) acts as the Fund’s principal underwriter in a continuous public offering of the Fund’s shares. Quasar is a wholly-owned broker-dealer subsidiary of Foreside Financial Group, LLC.
Note 5 – Purchases and Sales of Securities
For the year ended November 30, 2022, the cost of purchases and the proceeds from sales of securities, excluding short-term securities, were as follows:
Non-Government | Government | ||
Purchases | Sales | Purchases | Sales |
| $24,463,028 | $45,512,865 | $4,853,337 | $10,810,747 |
Note 6 – Line of Credit
The Fund has a secured line of credit in the amount of $15,000,000. The line of credit is intended to provide short-term financing, if necessary, subject to certain restrictions, in connection with shareholder redemptions. The credit facility is with the Fund’s custodian, U.S. Bank N.A. The Fund did not draw upon its line of credit during the year ended November 30, 2022.
22
PIA Short-Term Securities Fund
Notes to Financial Statements – November 30, 2022 (continued)
Note 7 – Federal Income Tax Information
The tax character of distributions paid during the years ended November 30, 2022 and November 30, 2021 are as follows:
November 30, 2022 | November 30, 2021 | ||
| Ordinary income | $1,646,721 | $1,333,355 |
As of November 30, 2022, the components of accumulated earnings/(losses) on a tax basis were as follows:
| Cost of investments (a) | $ | 133,319,189 | |||
| Gross unrealized appreciation | 46,051 | ||||
| Gross unrealized depreciation | (2,993,974 | ) | |||
| Net unrealized depreciation (a) | (2,947,923 | ) | |||
| Undistributed ordinary income | 28,550 | ||||
| Undistributed long-term capital gains | — | ||||
| Total distributable earnings | 28,550 | ||||
| Other accumulated gains/(losses) | (497,924 | ) | |||
| Total accumulated earnings/(losses) | $ | (3,417,297 | ) |
| (a) | The book-basis and tax-basis net unrealized depreciation are the same. |
The Fund had tax capital losses which may be carried over to offset future gains. Such losses expire as follows:
Short-Term Indefinite | Long-Term Indefinite | Total |
| $233,053 | $264,871 | $497,924 |
Note 8 – Principal Risks
Below is a summary of some, but not all, of the principal risks of investing in the Fund, each of which may adversely affect the Fund’s net asset value and total return. The Fund’s most recent prospectus provides further descriptions of the Fund’s investment objective, principal investment strategies and principal risks.
| • | General Market Risk. Economies and financial markets throughout the world are becoming increasingly interconnected, which increases the likelihood that events or conditions in one country or region will adversely impact markets or issuers in other countries or regions. Securities in the Fund’s portfolio may underperform in comparison to securities in general financial markets, a particular financial market or other asset classes due to a number of factors, including inflation (or expectations for inflation), deflation (or expectations for deflation), interest rates, global demand for particular products or resources, market instability, debt crises and downgrades, embargoes, tariffs, sanctions and other trade barriers, regulatory events, other governmental trade or market control programs and related geopolitical events. In addition, the value of the Fund’s investments may be negatively affected by the occurrence of global events such as war, terrorism, environmental disasters, natural disasters or events, country instability, and infectious disease epidemics or pandemics. For example, the outbreak of COVID-19, a novel coronavirus disease, has negatively affected economies, markets and individual companies throughout the world, including those in which the Fund invests. The effects of this pandemic to public health and business and market conditions, including exchange trading suspensions and closures, may continue to have |
23
PIA Short-Term Securities Fund
Notes to Financial Statements – November 30, 2022 (continued)
| a significant negative impact on the performance of the Fund’s investments, increase the Fund’s volatility, negatively impact the Fund’s arbitrage and pricing mechanisms, exacerbate pre-existing political, social and economic risks to the Fund, and negatively impact broad segments of businesses and populations. The Fund’s operations may be interrupted as a result, which may contribute to the negative impact on investment performance. In addition, governments, their regulatory agencies, or self-regulatory organizations may take actions in response to the pandemic that affect the instruments in which the Fund invests, or the issuers of such instruments, in ways that could have a significant negative impact on the Fund’s investment performance. The full impact of the COVID-19 pandemic, or other future epidemics or pandemics, is currently unknown. | ||
| • | U.S. Government Securities Risk. Some U.S. government securities, such as Treasury bills, notes, and bonds and mortgage-backed securities guaranteed by the Government National Mortgage Association (Ginnie Mae), are supported by the full faith and credit of the United States; others are supported by the right of the issuer to borrow from the U.S. Treasury; others are supported by the discretionary authority of the U.S. government to purchase the agency’s obligations; still others are supported only by the credit of the issuing agency, instrumentality, or enterprise. Although U.S. government-sponsored enterprises may be chartered or sponsored by Congress, they are not funded by Congressional appropriations, and their securities are not issued by the U.S. Treasury, their obligations are not supported by the full faith and credit of the U.S. government, and so investments in their securities or obligations issued by them involve greater risk than investments in other types of U.S. government securities. In addition, certain governmental entities have been subject to regulatory scrutiny regarding their accounting policies and practices and other concerns that may result in legislation, changes in regulatory oversight and/or other consequences that could adversely affect the credit quality, availability or investment character of securities issued or guaranteed by these entities. | |
| • | Counterparty Risk. Fund transactions involving a counterparty are subject to the risk that the counterparty or a third party will not fulfill its obligation to the Fund. Counterparty risk may arise because of the counterparty’s financial condition (i.e., financial difficulties, bankruptcy, or insolvency), market activities and developments, or other reasons, whether foreseen or not. A counterparty’s inability to fulfill its obligation may result in significant financial loss to the Fund. | |
| • | Credit Risk. The issuers of the bonds and other debt securities held by the Fund may not be able to make interest or principal payments. | |
| • | Interest Rate Risk. The value of the Fund’s investments in fixed-income securities will change based on changes in interest rates. If interest rates increase, the value of these investments generally declines. Securities with greater interest rate sensitivity and longer maturities generally are subject to greater fluctuations in value. | |
| • | Prepayment Risk. Issuers of securities held by the Fund may be able to prepay principal due on these securities, particularly during periods of declining interest rates. Securities subject to prepayment risk generally offer less potential for gains when interest rates decline and may offer a greater potential for loss when interest rates rise. When debt obligations are prepaid or when securities are called, the Fund may have to reinvest in securities with a lower yield. Prepayment risk is a major risk of mortgage-backed securities. | |
| • | Extension Risk. An issuer may pay principal on an obligation held by the Fund (such as an asset-backed or mortgage-backed security) later than expected. This may happen during a period of rising interest rates. Under these circumstances, the value of the obligation will decrease. |
24
PIA Short-Term Securities Fund
Notes to Financial Statements – November 30, 2022 (continued)
| • | Risks Associated with Asset-Backed Securities. These include General Market Risk, Interest Rate Risk, Credit Risk, Prepayment Risk and Extension Risk (each described above). During periods of difficult or frozen credit markets, significant changes in interest rates, or deteriorating economic conditions, such securities may decline in value, face valuation difficulties, become more volatile and/or become illiquid. | |
| • | Risks Associated with Mortgage-Backed Securities. These include General Market Risk, Interest Rate Risk, Credit Risk, Prepayment Risk and Extension Risk (each described above) as well as the risk that the structure of certain mortgage-backed securities may make their reaction to interest rates and other factors difficult to predict, making their prices very volatile. | |
| • | Liquidity Risk. Reduced liquidity in the bond markets can result from a number of events, such as limited trading activity, reductions in bond inventory, and rapid or unexpected changes in interest rates. Less liquid markets could lead to greater price volatility and limit the Fund’s ability to sell a holding at a suitable price. | |
| • | Rule 144A Securities Risk. The market for Rule 144A securities typically is less active than the market for publicly-traded securities. Rule 144A securities carry the risk that the liquidity of these securities may become impaired, making it more difficult for the Fund to sell these securities. | |
| • | Adjustable Rate and Floating Rate Securities Risks. Although adjustable and floating rate debt securities tend to be less volatile than fixed-rate debt securities, they nevertheless fluctuate in value. | |
| • | High Yield Securities Risk. Securities with ratings lower than BBB- or Baa3 are known as “high yield” securities (commonly known as “junk bonds”). High yield securities typically carry higher coupon rates than investment grade securities, but also are considered as speculative and may be subject to greater market price fluctuations, less liquidity and greater risk of loss of income or principal including greater possibility of default and bankruptcy of the issuer of such instruments than more highly rated bonds and loans. |
Note 9 – Control Ownership
The beneficial ownership, either directly or indirectly of more than 25% of the voting securities of a Fund creates a presumption of control of the Fund, under Section 2(a)(9) of the 1940 Act. As of November 30, 2022, Capinco C/O U.S. Bank NA, for the benefit of their customers, owned 40.24% of the outstanding shares of the Fund.
Note 10 – Trustees and Officers
At a meeting held December 7-8, 2022, by vote of the majority of the Board of Trustees (not including Mr. Joe Redwine), Mr. Redwine’s term as Trustee was extended for three additional years. Ms. Michele Rackey was approved by the Board as an Independent Trustee effective January 1, 2023. Mr. Kevin Hayden was approved by the Board as Vice President, Treasurer and Ms. Cheryl King was approved as Assistant Treasurer effective January 1, 2023. Mr. Ryan Charles resigned as Assistant Secretary effective January 1, 2023.
Note 11 – Other Tax Information (Unaudited)
For the year ended November 30, 2022, the Short-Term Securities Fund designated $1,646,721 as ordinary income for purposes of the dividends paid deduction. For the year ended November 30, 2022, none of the dividends paid from net investment income qualifies for the dividend received deduction available to corporate shareholders of the Fund. For shareholders in the Fund, none of the dividend income distributed for the year ended November 30, 2022 is designated as qualified dividend income under the Tax Cuts and Jobs Act of 2017.
On December 29, 2022, the Short-Term Securities Fund distributed $0.02417422, per share of net investment income.
25
PIA Short-Term Securities Fund
Report of Independent Registered Public Accounting Firm
To the Board of Trustees
Advisors Series Trust and
Shareholders of
PIA Short-Term Securities Fund
Opinion on the Financial Statements
We have audited the accompanying statement of assets and liabilities of the PIA Short-Term Securities Fund, a series of Advisors Series Trust (the “Trust”), including the schedule of investments, as of November 30, 2022, the related statement of operations for the year then ended, the statements of changes in net assets for each of the two years in the period then ended, financial highlights for each of the five years in the period then ended, and the related notes (collectively referred to as the “financial statements”). In our opinion, the financial statements present fairly, in all material respects, the financial position of the Fund as of November 30, 2022, the results of its operations for the year then ended, the changes in its net assets for each of the two years in the period then ended, and the financial highlights for each of the five years in the period then ended, in conformity with accounting principles generally accepted in the United States of America.
Basis for Opinion
These financial statements are the responsibility of the Fund’s management. Our responsibility is to express an opinion on the Fund’s financial statements based on our audits. We are a public accounting firm registered with the Public Company Accounting Oversight Board (United States) (“PCAOB”) and are required to be independent with respect to the Fund in accordance with the U.S. federal securities laws and the applicable rules and regulations of the Securities and Exchange Commission and the PCAOB. We have served as the auditor of one or more of the funds in the Trust since 2003.
We conducted our audits in accordance with the standards of the PCAOB. Those standards require that we plan and perform the audit to obtain reasonable assurance about whether the financial statements are free of material misstatement, whether due to error or fraud. The Fund is not required to have, nor were we engaged to perform, an audit of its internal control over financial reporting. As part of our audits we are required to obtain an understanding of internal control over financial reporting, but not for the purpose of expressing an opinion on the effectiveness of the Fund’s internal control over financial reporting. Accordingly, we express no such opinion.
Our audits included performing procedures to assess the risks of material misstatement of the financial statements, whether due to error or fraud, and performing procedures that respond to those risks. Such procedures included examining, on a test basis, evidence regarding the amounts and disclosures in the financial statements. Our audits also included evaluating the accounting principles used and significant estimates made by management, as well as evaluating the overall presentation of the financial statements. Our procedures included confirmation of securities owned as of November 30, 2022 by correspondence with the custodian. We believe that our audits provide a reasonable basis for our opinion.
 | |
| TAIT, WELLER & BAKER LLP |
Philadelphia, Pennsylvania
January 27, 2023
26
PIA Short-Term Securities Fund
Notice to Shareholders – November 30, 2022
(Unaudited)
How to Obtain a Copy of the Fund’s Proxy Voting Policies
A description of the policies and procedures that the Fund uses to determine how to vote proxies relating to portfolio securities is available without charge, upon request, by calling 1-800-251-1970, or on the Securities and Exchange Commission’s (“SEC”) website at http://www.sec.gov.
How to Obtain a Copy of the Fund’s Proxy Voting Records for the 12-Month Period Ended June 30
Information regarding how the Fund voted proxies relating to portfolio securities during the most recent 12-month period ended June 30 is available without charge, upon request, by calling 1-800-251-1970. Furthermore, you can obtain the Fund’s proxy voting records on the SEC’s website at http://www.sec.gov.
Quarterly Filings on Form N-PORT
The Fund files its complete schedules of portfolio holdings with the SEC for the first and third quarters of each fiscal year on Part F of Form N-PORT. The Fund’s Form N-PORT is available on the SEC’s website at http://www.sec.gov. Information included in the Fund’s Form N-PORT is also available by calling 1-800-251-1970.
Householding
In an effort to decrease costs, the Fund will reduce the number of duplicate prospectuses, supplements, and certain other shareholder documents that you receive by sending only one copy of each to those addresses shown by two or more accounts. Please call the Fund’s transfer agent toll free at 1-800-251-1970 to request individual copies of these documents. The Fund will begin sending individual copies 30 days after receiving your request. This policy does not apply to account statements.
27
PIA Short-Term Securities Fund
Statement Regarding Liquidity Risk Management Program
(Unaudited)
The Fund has adopted a liquidity risk management program (the “program”). The Board has designated a committee at the Adviser to serve as the administrator of the program. The Adviser’s committee conducts the day-to-day operation of the program pursuant to policies and procedures administered by the committee.
Under the program, the Adviser’s committee manages the Fund’s liquidity risk, which is the risk that the Fund could not meet shareholder redemption requests without significant dilution of remaining shareholders’ interests in the Fund. This risk is managed by monitoring the degree of liquidity of the Fund’s investments, limiting the amount of the Fund’s illiquid investments, and utilizing various risk management tools and facilities available to the Fund for meeting shareholder redemptions, among other means. The committee’s process of determining the degree of liquidity of the Fund’s investments is supported by one or more third-party liquidity assessment vendors.
The Board reviewed a report prepared by the committee regarding the operation and effectiveness of the program for the period July 1, 2021 through June 30, 2022. No significant liquidity events impacting the Fund were noted in the report. In addition, the committee provided its assessment that the program had been effective in managing the Fund’s liquidity risk.
28
PIA Short-Term Securities Fund
Information About Trustees and Officers
(Unaudited)
This chart provides information about the Trustees and Officers who oversee the Fund. Officers elected by the Trustees manage the day-to-day operations of the Fund and execute policies formulated by the Trustees.
| Number of | Other | ||||
| Portfolios in | Directorships | ||||
| Term of Office | Fund Complex | Held During | |||
| Name, Address | Position Held | and Length of | Principal Occupation | Overseen by | Past Five |
and Age | with the Trust | Time Served* | During Past Five Years | Trustee(2) | Years(3) |
Independent Trustees(1) | |||||
| David G. Mertens | Trustee | Indefinite term; | Partner and Head of Business | 6 | Trustee, |
| (age 62) | since | Development Ballast Equity | Advisors Series | ||
| 615 E. Michigan Street | March 2017. | Management, LLC (a privately- | Trust (for series | ||
| Milwaukee, WI 53202 | held investment advisory firm) | not affiliated | |||
| (February 2019 to present); | with the Fund). | ||||
| Managing Director and Vice | |||||
| President, Jensen Investment | |||||
| Management, Inc. (a privately- | |||||
| held investment advisory firm) | |||||
| (2002 to 2017). | |||||
| Joe D. Redwine | Trustee | Indefinite term; | Retired; formerly Manager, | 6 | Trustee, |
| (age 75) | since | President, CEO, U.S. Bancorp | Advisors Series | ||
| 615 E. Michigan Street | September 2008. | Fund Services, LLC and its | Trust (for series | ||
| Milwaukee, WI 53202 | predecessors (May 1991 to | not affiliated | |||
| July 2017). | with the Fund). |
29
PIA Short-Term Securities Fund
Information About Trustees and Officers (continued)
(Unaudited)
| Number of | Other | ||||
| Portfolios in | Directorships | ||||
| Term of Office | Fund Complex | Held During | |||
| Name, Address | Position Held | and Length of | Principal Occupation | Overseen by | Past Five |
and Age | with the Trust | Time Served* | During Past Five Years | Trustee(2) | Years(3) |
| Raymond B. Woolson | Chairman | Indefinite term; | President, Apogee Group, Inc. | 6 | Trustee, |
| (age 63) | of the | since | (financial consulting firm) | Advisors Series | |
| 615 E. Michigan Street | Board | January 2020. | (1998 to present). | Trust (for series | |
| Milwaukee, WI 53202 | not affiliated | ||||
| Trustee | Indefinite term; | with the Fund); | |||
| since | Independent | ||||
| January 2016. | Trustee, | ||||
| DoubleLine | |||||
| Funds Trust | |||||
| (an open-end | |||||
| investment | |||||
| company with | |||||
| 19 portfolios), | |||||
| DoubleLine | |||||
| Opportunistic | |||||
| Credit Fund, | |||||
| DoubleLine | |||||
| Income Solutions | |||||
| Fund, and | |||||
| DoubleLine Yield | |||||
| Opportunities | |||||
| Fund from 2010 | |||||
| to present; | |||||
| Independent | |||||
| Trustee, | |||||
| DoubleLine ETF | |||||
| Trust (an open- | |||||
| end investment | |||||
| company with | |||||
| 2 portfolios) | |||||
| from March | |||||
| 2022 to present. |
30
PIA Short-Term Securities Fund
Information About Trustees and Officers (continued)
(Unaudited)
| Term of Office | |||
| Name, Address | Position Held | and Length of | Principal Occupation |
and Age | with the Trust | Time Served | During Past Five Years |
| Officers | |||
| Jeffrey T. Rauman | President, | Indefinite term; | Senior Vice President, Compliance and Administration, |
| (age 53) | Chief | since | U.S. Bank Global Fund Services (February 1996 to present). |
| 615 E. Michigan Street | Executive | December 2018. | |
| Milwaukee, WI 53202 | Officer and | ||
| Principal | |||
| Executive | |||
| Officer | |||
| Cheryl L. King | Vice President, | Indefinite term; | Vice President, Compliance and Administration, |
| (age 61) | Treasurer and | since | U.S. Bank Global Fund Services (October 1998 to present). |
| 615 E. Michigan Street | Principal | December 2007. | |
| Milwaukee, WI 53202 | Financial | ||
| Officer | |||
| Kevin J. Hayden | Assistant | Indefinite term; | Vice President, Compliance and Administration, |
| (age 51) | Treasurer | since | U.S. Bank Global Fund Services (June 2005 to present). |
| 615 E. Michigan Street | September 2013. | ||
| Milwaukee, WI 53202 | |||
| �� | |||
| Richard R. Conner | Assistant | Indefinite term; | Assistant Vice President, Compliance and Administration, |
| (age 40) | Treasurer | since | U.S. Bank Global Fund Services (July 2010 to present). |
| 615 E. Michigan Street | December 2018. | ||
| Milwaukee, WI 53202 | |||
| Michael L. Ceccato | Vice President, | Indefinite term; | Senior Vice President, U.S. Bank Global Fund Services and |
| (age 65) | Chief | since | Senior Vice President, U.S. Bank N.A. (February 2008 to present). |
| 615 E. Michigan Street | Compliance | September 2009. | |
| Milwaukee, WI 53202 | Officer and | ||
| AML Officer | |||
| Elaine E. Richards | Vice President | Indefinite term; | Senior Vice President, U.S. Bank Global Fund Services |
| (age 54) | and Secretary | since | (July 2007 to present). |
| 2020 East Financial Way, | September 2019. | ||
| Suite 100 | |||
| Glendora, CA 91741 |
31
PIA Short-Term Securities Fund
Information About Trustees and Officers (continued)
(Unaudited)
| Term of Office | |||
| Name, Address | Position Held | and Length of | Principal Occupation |
and Age | with the Trust | Time Served | During Past Five Years |
| Ryan Charles | Assistant | Indefinite term; | Assistant Vice President, U.S. Bank Global Fund Services |
| (age 44) | Secretary | since | (May 2021 to present); Chief Legal Officer and Secretary |
| 2020 East Financial Way, | January 2022. | Davis Selected Advisers, L.P. (2004 to 2021). | |
| Suite 100 | |||
| Glendora, CA 91741 |
| * | The Trustees have designated a mandatory retirement age of 75, such that each Trustee, serving as such on the date he or she reaches the age of 75, shall submit his or her resignation not later than the last day of the calendar year in which his or her 75th birthday occurs (“Retiring Trustee”). Upon request, the Board may, by vote of a majority of Trustees eligible to vote on such matter, determine whether or not to extend such Retiring Trustee’s term and on the length of a one-time extension of up to three additional years. |
| (1) | The Trustees of the Trust who are not “interested persons” of the Trust as defined under the 1940 Act (“Independent Trustees”). |
| (2) | As of November 30, 2022, the Trust was comprised of 35 active portfolios managed by unaffiliated investment advisers. The term “Fund Complex” applies only to the Fund and the PIA BBB Bond Fund, the PIA High Yield (MACS) Fund, the PIA MBS Fund, the PIA Short Duration Fund, and the PIA High Yield Fund. The Funds do not hold themselves out as related to any other series within the Trust for investment purposes, nor does it share the same investment adviser with any other series. |
| (3) | “Other Directorships Held” includes only directorships of companies required to register or file reports with the SEC under the Securities Exchange Act of 1934, as amended, (that is, “public companies”) or other investment companies registered under the 1940 Act. |
The Statement of Additional Information includes additional information about the Fund’s Trustees and Officers and is available, without charge, upon request by calling 1-800-251-1970.
32
PRIVACY NOTICE
The Fund collects non-public information about you from the following sources:
• Information we receive about you on applications or other forms;
• Information you give us orally; and/or
• Information about your transactions with us or others.
We do not disclose any non-public personal information about our customers or former customers without the customer’s authorization, except as permitted by law or in response to inquiries from governmental authorities. We may share information with affiliated and unaffiliated third parties with whom we have contracts for servicing the Fund. We will provide unaffiliated third parties with only the information necessary to carry out their assigned responsibilities. We maintain physical, electronic and procedural safeguards to guard your non-public personal information and require third parties to treat your personal information with the same high degree of confidentiality.
In the event that you hold shares of the Fund through a financial intermediary, including, but not limited to, a broker-dealer, bank, or trust company, the privacy policy of your financial intermediary would govern how your non-public personal information would be shared by those entities with unaffiliated third parties.
(This Page Intentionally Left Blank.)
Adviser
Pacific Income Advisers, Inc.
2321 Rosecrans Avenue, Suite 1260
El Segundo, CA 90245
Distributor
Quasar Distributors, LLC
111 East Kilbourn Avenue, Suite 2200
Milwaukee, WI 53202
Transfer Agent
U.S. Bank Global Fund Services
Milwaukee, WI 53202
(800) 251-1970
Custodian
U.S. Bank N.A.
Custody Operations
1555 North RiverCenter Drive, Suite 302
Milwaukee, WI 53212
Independent Registered Public Accounting Firm
Tait, Weller & Baker LLP
Two Liberty Place
50 South 16th Street, Suite 2900
Philadelphia, PA 19102
Legal Counsel
Sullivan & Worcester LLP
1633 Broadway, 32nd Floor
New York, NY 10019
Past performance results shown in this report should not be considered a representation of future performance. Share price and returns will fluctuate so that shares, when redeemed, may be worth more or less than their original cost. Statements and other information herein are dated and are subject to change.
PIA Funds
PIA High Yield Fund
Institutional Class
Annual Report
November 30, 2022
PIA High Yield Fund
Dear Shareholder:
We are pleased to provide you with this report for the period from December 1, 2021 through November 30, 2022, regarding the PIA High Yield Fund (the “Fund”) for which Pacific Income Advisers, Inc. (“PIA”), is the investment adviser.
The Fund performed in-line with its benchmark, the Bloomberg U.S. Corporate High-Yield Index (the “Index”), returning -9.26%, after fees and expenses, for the twelve months ended November 30, 2022, versus -8.96% for the Index.
The Adviser has agreed to temporarily pay for all operating expenses (excluding acquired fund fees and expenses, interest, taxes and extraordinary expenses) incurred by the Fund through at least March 29, 2023 to the extent necessary to limit Net Annual Fund Operating Expenses for the Fund to 0.86% of the average daily net assets. The Net Expense is what the investor has paid.
The Fund’s primary objective is to seek a high level of current income. The Fund’s secondary objective is to seek capital growth when that is consistent with its primary objective.
Lloyd McAdams
Chairman of the Board
Pacific Income Advisers, Inc.
1
PIA High Yield Fund
Past performance is not a guarantee of future results.
Opinions expressed above are those of Pacific Income Advisers, Inc., the Fund’s investment adviser, are subject to change, are not guaranteed, should not be considered recommendations to buy or sell any security and should not be considered investment advice.
Must be preceded or accompanied by a prospectus.
Mutual fund investing involves risk. Principal loss is possible. Investments in debt securities typically decrease in value when interest rates rise. This risk is usually greater for longer-term debt securities. The Fund may invest in foreign securities which involve greater volatility and political, economic and currency risks and differences in accounting methods. These risks may increase for emerging markets. Investment by the Fund in lower-rated and non-rated securities presents a greater risk of loss to principal and interest than higher-rated securities. The Fund may invest in derivatives, which may involve risks greater than the risks presented by more traditional investments. The risk of owning an exchange-traded fund (“ETF”) or mutual fund generally reflects the risks of owning the underlying securities that the ETF or mutual fund holds. It will also bear additional expenses, including operating expenses, brokerage costs and the potential duplication of management fees.
The Bloomberg U.S. Corporate High-Yield Index measures the market of USD-denominated, non-investment grade, fixed rate, taxable corporate bonds. Securities are classified as high yield if the middle rating of Moody’s Investors Service, Inc., Fitch Ratings, Inc., and Standard & Poor’s Ratings Services is Ba1/BB+/BB+ or below after dropping the highest and lowest available ratings. The index excludes emerging markets debt.
You cannot invest directly in an index.
Bond ratings provide the probability of an issuer defaulting based on the analysis of the issuer’s financial condition and profit potential. Bond rating services are provided by credit rating agencies currently registered as Nationally Recognized Statistical Rating Organizations (“NRSROs”). Bond ratings start at AAA (denoting the highest investment quality) and usually end at D (meaning payment is in default). Securities not covered by any agency will receive a non-rated (NR) rating.
Please refer to the schedule of investments in the report for complete holdings information. Fund holdings and sector allocations are subject to change at any time and are not recommendations to buy or sell any security. Investment performance reflects fee waivers in effect. In the absence of such waivers, total return would be reduced.
Quasar Distributors, LLC, Distributor
2
PIA High Yield Fund
Comparison of the change in value of a $10,000 investment in the
PIA High Yield Fund vs the Bloomberg U.S. Corporate High-Yield Index
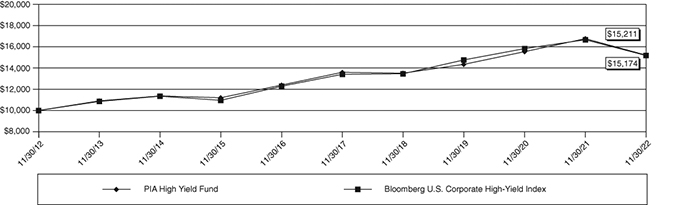
Average Annual Total Return* | 1 Year | 5 Years | 10 Years |
| PIA High Yield Fund | -9.26% | 2.27% | 4.28% |
| Bloomberg U.S. Corporate High-Yield Index | -8.96% | 2.50% | 4.26% |
Performance data quoted represents past performance; past performance does not guarantee future results. The investment return and principal value of an investment will fluctuate so that an investor’s shares, when redeemed, may be worth more or less than their original cost. Current performance of the Fund may be lower or higher than the performance quoted. Performance data current to the most recent month end may be obtained by calling 1-800-251-1970.
This chart illustrates the performance of a hypothetical $10,000 investment made in the Fund ten years ago.
Returns reflect the reinvestment of dividends and capital gain distributions. Fee waivers are in effect. In the absence of fee waivers, returns would be reduced. The performance data and graph do not reflect the deduction of taxes that a shareholder may pay on dividends, capital gain distributions, or redemption of Fund shares. This chart does not imply any future performance.
The Bloomberg U.S. Corporate High-Yield Index measures the market of USD-denominated, non-investment grade, fixed-rate, taxable corporate bonds. Securities are classified as high yield if the middle rating of Moody’s Investors Service, Inc., Fitch Ratings, Inc., and Standard & Poor’s Ratings Services is Ba1/BB+/BB+ or below after dropping the highest and lowest available ratings. The index excludes emerging markets debt.
Indices do not incur expenses and are not available for investment.
| * | Average Annual Total Return represents the average change in account value over the periods indicated. |
3
PIA High Yield Fund
Expense Example – November 30, 2022
(Unaudited)
As a shareholder of a mutual fund, you incur two types of costs: (1) transaction costs, including sales charges (loads) on purchase payments, redemption fees, and exchange fees, and (2) ongoing costs, including management fees, distribution and/or service fees, and other fund expenses. This Example is intended to help you understand your ongoing costs (in dollars) of investing in the Fund and to compare these costs with the ongoing costs of investing in other mutual funds. The Example is based on an investment of $1,000 invested at the beginning of the period and held for the entire period (6/1/22 – 11/30/22).
Actual Expenses
The first line of the table below provides information about actual account values and actual expenses. Although the Fund charges no sales loads or transaction fees, you will be assessed fees for outgoing wire transfers, returned checks, and stop payment orders at prevailing rates charged by U.S. Bancorp Fund Services, LLC, the Fund’s transfer agent. The Example below includes, but is not limited to, management fees, fund accounting, custody and transfer agent fees. You may use the information in the first line, together with the amount you invested, to estimate the expenses that you paid over the period. Simply divide your account value by $1,000 (for example, an $8,600 account value divided by $1,000 = 8.6), then multiply the result by the number in the first line under the heading entitled “Expenses Paid During Period’’ to estimate the expenses you paid on your account during this period.
Hypothetical Example for Comparison Purposes
The second line of the table below provides information about hypothetical account values and hypothetical expenses based on the Fund’s actual expense ratio and an assumed rate of return of 5% per year before expenses, which is different from the Fund’s actual returns. The hypothetical account values and expenses may not be used to estimate the actual ending account balance or expenses you paid for the period. You may use this information to compare the ongoing costs of investing in the Fund and other funds. To do so, compare this 5% hypothetical example with the 5% hypothetical examples that appear in the shareholder reports of the other funds. Please note that the expenses shown in the table are meant to highlight your ongoing costs only and do not reflect any transaction costs, such as sales charges (loads), redemption fees, or exchange fees. Therefore, the second line of the table is useful in comparing ongoing costs only, and will not help you determine the relative total costs of owning different funds. In addition, if these transaction costs were included, your costs would have been higher.
| Beginning Account | Ending Account | Expenses Paid During | |
Value 6/1/22 | Value 11/30/22 | Period 6/1/22 – 11/30/22* | |
| Actual | $1,000.00 | $ 967.80 | $4.24 |
| Hypothetical (5% return before expenses) | $1,000.00 | $1,020.76 | $4.36 |
| * | Expenses are equal to the Fund’s annualized expense ratio, multiplied by the average account value over the period, multiplied by 183 (days in most recent fiscal half-year) / 365 days to reflect the one-half year expense. The annualized expense ratio of the Fund is 0.86%. |
4
PIA High Yield Fund
Allocation of Portfolio Assets – November 30, 2022
(Unaudited)
Investments by Sector
As a Percentage of Total Investments
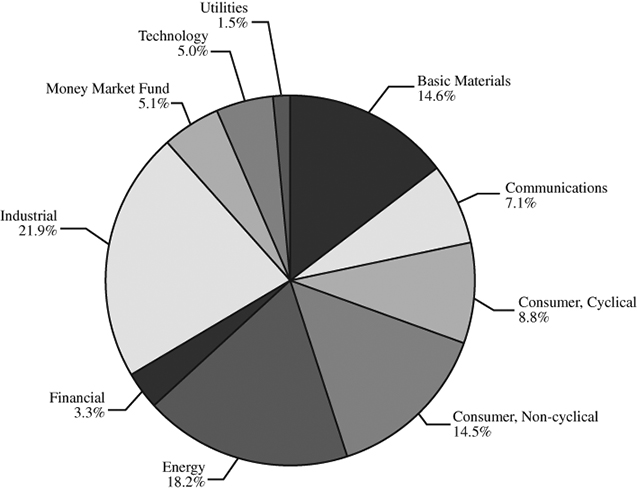
5
PIA High Yield Fund
Schedule of Investments – November 30, 2022
| Shares/ | |||||||
| Principal Amount | Value | ||||||
| COMMON STOCKS 0.5% | |||||||
| Building Materials 0.5% | |||||||
| 2,996 | Northwest Hardwoods (d) (e) | $ | 239,680 | ||||
| Total Common Stocks | |||||||
| (cost $137,017) | 239,680 | ||||||
| CORPORATE BONDS 92.8% | |||||||
| Aerospace/Defense 2.2% | |||||||
| F-Brasile SpA / | |||||||
| F-Brasile US LLC | |||||||
| $ | 700,000 | 7.375%, due 8/15/26 (a) | 569,709 | ||||
| Triumph Group, Inc. | |||||||
| 600,000 | 7.75%, due 8/15/25 | 515,301 | |||||
| 1,085,010 | |||||||
| Appliances 1.0% | |||||||
| WASH Multifamily | |||||||
| Acquisition, Inc. | |||||||
| 550,000 | 5.75%, due 4/15/26 (a) | 516,263 | |||||
| Auto Manufacturers 1.1% | |||||||
| PM General Purchaser LLC | |||||||
| 625,000 | 9.50%, due 10/1/28 (a) | �� | 549,321 | ||||
| Auto Parts & Equipment 2.0% | |||||||
| Dealer Tire LLC / | |||||||
| DT Issuer LLC | |||||||
| 650,000 | 8.00%, due 2/1/28 (a) | 554,707 | |||||
| Dornoch Debt Merger Sub, Inc. | |||||||
| 650,000 | 6.625%, due 10/15/29 (a) | 433,366 | |||||
| 988,073 | |||||||
| Building – Heavy Construction 1.3% | |||||||
| Railworks Holdings LP / | |||||||
| Railworks Rally, Inc. | |||||||
| 696,000 | 8.25%, due 11/15/28 (a) | 641,712 | |||||
| Building & Construction 1.2% | |||||||
| Brundage-Bone Concrete | |||||||
| Pumping Holdings, Inc. | |||||||
| 650,000 | 6.00%, due 2/1/26 (a) | 605,615 | |||||
| Building Materials 4.4% | |||||||
| APi Group DE, Inc. | |||||||
| 625,000 | 4.125%, due 7/15/29 (a) | 520,556 | |||||
| Eco Material Technologies, Inc. | |||||||
| 625,000 | 7.875%, due 1/31/27 (a) | 595,500 | |||||
| MIWD Holdco II LLC / | |||||||
| MIWD Finance Corp. | |||||||
| 625,000 | 5.50%, due 2/1/30 (a) | 513,247 | |||||
| New Enterprise Stone & | |||||||
| Lime Co, Inc. | |||||||
| 100,000 | 5.25%, due 7/15/28 (a) | 90,656 | |||||
| SRM Escrow Issuer LLC | |||||||
| 550,000 | 6.00%, due 11/1/28 (a) | 490,501 | |||||
| 2,210,460 | |||||||
| Chemicals 0.9% | |||||||
| Diamond BC BV | |||||||
| 600,000 | 4.625%, due 10/1/29 (a) | 453,417 | |||||
| Chemicals – Diversified 3.2% | |||||||
| Iris Holdings, Inc. | |||||||
| 600,000 | 8.75% Cash or 9.50% PIK, | ||||||
| due 2/15/26 (a) (c) | 513,000 | ||||||
| LSF11 A5 HoldCo LLC | |||||||
| 584,000 | 6.625%, due 10/15/29 (a) | 475,464 | |||||
| Polar US Borrower LLC / | |||||||
| Schenectady International | |||||||
| Group, Inc. | |||||||
| 450,000 | 6.75%, due 5/15/26 (a) | 188,476 | |||||
| SCIH Salt Holdings, Inc. | |||||||
| 300,000 | 4.875%, due 5/1/28 (a) | 265,590 | |||||
| 215,000 | 6.625%, due 5/1/29 (a) | 178,260 | |||||
| 1,620,790 | |||||||
| Chemicals – Plastics 1.1% | |||||||
| Neon Holdings, Inc. | |||||||
| 650,000 | 10.125%, due 4/1/26 (a) | 558,526 | |||||
| Chemicals – Specialty 4.6% | |||||||
| Herens Holdco Sarl | |||||||
| 750,000 | 4.75%, due 5/15/28 (a) | 601,204 | |||||
The accompanying notes are an integral part of these financial statements.
6
PIA High Yield Fund
Schedule of Investments – November 30, 2022 (continued)
| Principal Amount | Value | ||||||
| Chemicals – Specialty 4.6% (continued) | |||||||
| SCIL IV LLC / | |||||||
| SCIL USA Holdings LLC | |||||||
| $ | 650,000 | 5.375%, due 11/1/26 (a) | $ | 545,795 | |||
| SK Invictus Intermediate II Sarl | |||||||
| 700,000 | 5.00%, due 10/30/29 (a) | 560,816 | |||||
| Unifrax Escrow Issuer Corp. | |||||||
| 692,000 | 5.25%, due 9/30/28 (a) | 572,284 | |||||
| 2,280,099 | |||||||
| Commercial Services 4.4% | |||||||
| Alta Equipment Group, Inc. | |||||||
| 550,000 | 5.625%, due 4/15/26 (a) | 485,783 | |||||
| CPI Acquisition, Inc. | |||||||
| 600,000 | 8.625%, due 3/15/26 (a) | 581,624 | |||||
| NESCO Holdings II, Inc. | |||||||
| 650,000 | 5.50%, due 4/15/29 (a) | 572,627 | |||||
| StoneMor, Inc. | |||||||
| 700,000 | 8.50%, due 5/15/29 (a) | 571,368 | |||||
| 2,211,402 | |||||||
| Consumer Services 0.9% | |||||||
| Cimpress Plc | |||||||
| 650,000 | 7.00%, due 6/15/26 (a) | 454,675 | |||||
| Containers and Packaging 0.3% | |||||||
| Pactiv Evergreen Group | |||||||
| Issuer LLC / Pactiv Evergreen | |||||||
| Group Issuer, Inc. | |||||||
| 175,000 | 4.375%, due 10/15/28 (a) | 152,900 | |||||
| Diversified Financial Services 1.0% | |||||||
| VistaJet Malta Finance PLC / | |||||||
| XO Management Holding, Inc. | |||||||
| 625,000 | 6.375%, due 2/1/30 (a) | 510,156 | |||||
| Engineering & Construction 2.8% | |||||||
| Arcosa, Inc. | |||||||
| 600,000 | 4.375%, due 4/15/29 (a) | 522,441 | |||||
| Brand Energy & Infrastructure | |||||||
| Services, Inc. | |||||||
| 594,000 | 8.50%, due 7/15/25 (a) | 471,865 | |||||
| Promontoria Holding 264 BV | |||||||
| 400,000 | 7.875%, due 3/1/27 (a) | 379,108 | |||||
| 1,373,414 | |||||||
| Enterprise Software & Services 2.4% | |||||||
| Helios Software Holdings, Inc. / | |||||||
| ION Corporate Solutions | |||||||
| Finance Sarl | |||||||
| 875,000 | 4.625%, due 5/1/28 (a) | 668,415 | |||||
| Rocket Software, Inc. | |||||||
| 700,000 | 6.50%, due 2/15/29 (a) | 551,572 | |||||
| 1,219,987 | |||||||
| Entertainment 2.0% | |||||||
| Premier Entertainment | |||||||
| Sub LLC / Premier | |||||||
| Entertainment Finance Corp. | |||||||
| 700,000 | 5.875%, due 9/1/31 (a) | 534,667 | |||||
| Scientific Games | |||||||
| Holdings LP / Scientific | |||||||
| Games US FinCo, Inc. | |||||||
| 542,000 | 6.625%, due 3/1/30 (a) | 456,723 | |||||
| 991,390 | |||||||
| Finance – Commercial 1.2% | |||||||
| Burford Capital Global | |||||||
| Finance LLC | |||||||
| 320,000 | 6.25%, due 4/15/28 (a) | 294,112 | |||||
| 350,000 | 6.875%, due 4/15/30 (a) | 318,684 | |||||
| 612,796 | |||||||
| Financial Services 1.3% | |||||||
| Arrow Bidco LLC | |||||||
| 650,000 | 9.50%, due 3/15/24 (a) | 648,962 | |||||
| Food Service 0.8% | |||||||
| TKC Holdings, Inc. | |||||||
| 700,000 | 10.50%, due 5/15/29 (a) | 400,201 | |||||
The accompanying notes are an integral part of these financial statements.
7
PIA High Yield Fund
Schedule of Investments – November 30, 2022 (continued)
| Principal Amount | Value | ||||||
| Forest and Paper Products | |||||||
| Manufacturing 1.1% | |||||||
| Mativ, Inc. | |||||||
| $ | 625,000 | 6.875%, due 10/1/26 (a) | $ | 548,144 | |||
| Healthcare – Services 2.6% | |||||||
| Akumin Escrow, Inc. | |||||||
| 650,000 | 7.50%, due 8/1/28 (a) | 446,134 | |||||
| Hadrian Merger Sub, Inc. | |||||||
| 349,000 | 8.50%, due 5/1/26 (a) | 314,514 | |||||
| ModivCare Escrow Issuer, Inc. | |||||||
| 625,000 | 5.00%, due 10/1/29 (a) | 518,750 | |||||
| 1,279,398 | |||||||
| Household Products/Warehouse 1.1% | |||||||
| Kronos Acquisition | |||||||
| Holdings, Inc. / KIK Custom | |||||||
| Products, Inc. | |||||||
| 575,000 | 5.00%, due 12/31/26 (a) | 525,159 | |||||
| Internet 1.2% | |||||||
| Getty Images, Inc. | |||||||
| 616,000 | 9.75%, due 3/1/27 (a) | 609,437 | |||||
| Machinery – Diversified 1.0% | |||||||
| Husky III Holding Ltd. | |||||||
| 468,000 | 13.00% Cash or 13.75% PIK, | ||||||
| due 2/15/25 (a) (c) | 409,500 | ||||||
| Titan Acquisition Ltd. / | |||||||
| Titan Co-Borrower LLC | |||||||
| 132,000 | 7.75%, due 4/15/26 (a) | 117,378 | |||||
| 526,878 | |||||||
| Machinery – Farm 0.7% | |||||||
| OT Merger Corp. | |||||||
| 625,000 | 7.875%, due 10/15/29 (a) | 366,106 | |||||
| Machinery – Thermal Process 1.1% | |||||||
| GrafTech Finance, Inc. | |||||||
| 650,000 | 4.625%, due 12/15/28 (a) | 542,617 | |||||
| Machinery Manufacturing 2.5% | |||||||
| Granite US Holdings Corp. | |||||||
| 450,000 | 11.00%, due 10/1/27 (a) | 472,365 | |||||
| JPW Industries Holding Corp. | |||||||
| 725,000 | 9.00%, due 10/1/24 (a) | 625,026 | |||||
| MAI Holdings, Inc. | |||||||
| 600,000 | 9.50%, due 6/1/23 (a) (d) | 171,000 | |||||
| 1,268,391 | |||||||
| Manufactured Goods 2.1% | |||||||
| FXI Holdings, Inc. | |||||||
| 634,000 | 7.875%, due 11/1/24 (a) | 527,678 | |||||
| Park-Ohio Industries, Inc. | |||||||
| 710,000 | 6.625%, due 4/15/27 | 544,322 | |||||
| 1,072,000 | |||||||
| Media 1.1% | |||||||
| Univision Communications, Inc. | |||||||
| 475,000 | 4.50%, due 5/1/29 (a) | 404,914 | |||||
| 150,000 | 7.375%, due 6/30/30 (a) | 148,688 | |||||
| 553,602 | |||||||
| Metals and Mining 2.3% | |||||||
| SunCoke Energy, Inc. | |||||||
| 725,000 | 4.875%, due 6/30/29 (a) | 615,026 | |||||
| TMS International Corp. | |||||||
| 750,000 | 6.25%, due 4/15/29 (a) | 541,003 | |||||
| 1,156,029 | |||||||
| Office Automation & Equipment 2.4% | |||||||
| Pitney Bowes, Inc. | |||||||
| 750,000 | 6.875%, due 3/15/27 (a) | 591,075 | |||||
| Xerox Holdings Corp. | |||||||
| 775,000 | 5.50%, due 8/15/28 (a) | 624,689 | |||||
| 1,215,764 | |||||||
| Oil & Gas Services 5.1% | |||||||
| Archrock Partners LP / | |||||||
| Archrock Partners | |||||||
| Finance Corp. | |||||||
| 250,000 | 6.875%, due 4/1/27 (a) | 242,300 | |||||
The accompanying notes are an integral part of these financial statements.
8
PIA High Yield Fund
Schedule of Investments – November 30, 2022 (continued)
| Principal Amount | Value | ||||||
| Oil & Gas Services 5.1% (continued) | |||||||
| CSI Compressco LP / CSI | |||||||
| Compressco Finance, Inc. | |||||||
| $ | 775,000 | 7.50%, due 4/1/25 (a) | $ | 712,952 | |||
| Enerflex Ltd. | |||||||
| 445,000 | 9.00%, due 10/15/27 (a) | 437,811 | |||||
| USA Compression | |||||||
| Partners LP / USA | |||||||
| Compression Finance Corp. | |||||||
| 315,000 | 6.875%, due 4/1/26 | 302,105 | |||||
| 250,000 | 6.875%, due 9/1/27 | 237,916 | |||||
| Welltec International ApS | |||||||
| 600,000 | 8.25%, due 10/15/26 (a) | 593,941 | |||||
| 2,527,025 | |||||||
| Packaging 1.2% | |||||||
| Mauser Packaging Solutions | |||||||
| Holding Co. | |||||||
| 600,000 | 5.50%, due 4/15/24 (a) | 590,295 | |||||
| Paper 2.4% | |||||||
| Clearwater Paper Corp. | |||||||
| 750,000 | 4.75%, due 8/15/28 (a) | 668,108 | |||||
| Mercer International, Inc. | |||||||
| 600,000 | 5.125%, due 2/1/29 | 508,542 | |||||
| 1,176,650 | |||||||
| Pipelines 10.2% | |||||||
| Genesis Energy LP / Genesis | |||||||
| Energy Finance Corp. | |||||||
| 75,000 | 8.00%, due 1/15/27 | 71,663 | |||||
| 675,000 | 7.75%, due 2/1/28 | 645,287 | |||||
| Global Partners LP / | |||||||
| GLP Finance Corp. | |||||||
| 150,000 | 7.00%, due 8/1/27 | 142,379 | |||||
| 416,000 | 6.875%, due 1/15/29 | 372,584 | |||||
| ITT Holdings LLC | |||||||
| 725,000 | 6.50%, due 8/1/29 (a) | 621,254 | |||||
| Martin Midstream | |||||||
| Partners LP / Martin | |||||||
| Midstream Finance Corp. | |||||||
| 750,000 | 11.50%, due 2/28/25 (a) | 748,163 | |||||
| NGL Energy Operating LLC / | |||||||
| NGL Energy Finance Corp. | |||||||
| 700,000 | 7.50%, due 2/1/26 (a) | 632,893 | |||||
| Summit Midstream | |||||||
| Holdings LLC / Summit | |||||||
| Midstream Finance Corp. | |||||||
| 750,000 | 5.75%, due 4/15/25 | 628,080 | |||||
| 625,000 | 8.50%, due 10/15/26 (a) | 598,408 | |||||
| TransMontaigne Partners LP / | |||||||
| TLP Finance Corp. | |||||||
| 750,000 | 6.125%, due 2/15/26 | 654,107 | |||||
| 5,114,818 | |||||||
| Publishing and Broadcasting 1.3% | |||||||
| Salem Media Group, Inc. | |||||||
| 675,000 | 6.75%, due 6/1/24 (a) | 654,104 | |||||
| Radio 3.3% | |||||||
| Audacy Capital Corp. | |||||||
| 700,000 | 6.75%, due 3/31/29 (a) | 159,187 | |||||
| Beasley Mezzanine | |||||||
| Holdings LLC | |||||||
| 660,000 | 8.625%, due 2/1/26 (a) | 438,075 | |||||
| Spanish Broadcasting | |||||||
| System, Inc. | |||||||
| 750,000 | 9.75%, due 3/1/26 (a) | 448,370 | |||||
| Urban One, Inc. | |||||||
| 700,000 | 7.375%, due 2/1/28 (a) | 592,434 | |||||
| 1,638,066 | |||||||
| REITs – Storage 1.0% | |||||||
| Iron Mountain, Inc. | |||||||
| 550,000 | 5.00%, due 7/15/28 (a) | 501,050 | |||||
The accompanying notes are an integral part of these financial statements.
9
PIA High Yield Fund
Schedule of Investments – November 30, 2022 (continued)
| Principal Amount/ | |||||||
| Shares | Value | ||||||
| Rental Auto/Equipment 0.9% | |||||||
| PROG Holdings, Inc. | |||||||
| $ | 500,000 | 6.00%, due 11/15/29 (a) | $ | 436,498 | |||
| Retail – Office Supplies 1.6% | |||||||
| Staples, Inc. | |||||||
| 500,000 | 7.50%, due 4/15/26 (a) | 445,149 | |||||
| 500,000 | 10.75%, due 4/15/27 (a) | 364,723 | |||||
| 809,872 | |||||||
| Retail – Propane Distribution 1.2% | |||||||
| Ferrellgas LP / Ferrellgas | |||||||
| Finance Corp. | |||||||
| 700,000 | 5.875%, due 4/1/29 (a) | 590,638 | |||||
| Tobacco Manufacturing 1.1% | |||||||
| Vector Group Ltd. | |||||||
| 625,000 | 5.75%, due 2/1/29 (a) | 538,271 | |||||
| Transportation Services 2.7% | |||||||
| Bristow Group, Inc. | |||||||
| 750,000 | 6.875%, due 3/1/28 (a) | 702,692 | |||||
| First Student Bidco, Inc. / | |||||||
| First Transit Parent, Inc. | |||||||
| 750,000 | 4.00%, due 7/31/29 (a) | 623,947 | |||||
| 1,326,639 | |||||||
| Water 1.5% | |||||||
| Solaris Midstream Holdings LLC | |||||||
| 750,000 | 7.625%, due 4/1/26 (a) | 739,620 | |||||
| Total Corporate Bonds | |||||||
| (cost $54,711,036) | 46,392,240 | ||||||
| MONEY MARKET FUND 5.0% | |||||||
| 2,515,456 | Fidelity Institutional Money | ||||||
| Market Government Portfolio – | |||||||
| Class I, 3.56% (b) | 2,515,456 | ||||||
| Total Money Market Fund | |||||||
| Total Investments | ||||||
| (cost $57,363,509) | 98.3% | 49,147,376 | ||||
| Other Assets less Liabilities | 1.7% | 856,477 | ||||
| TOTAL NET ASSETS | 100.0% | $ | 50,003,853 | |||
| (a) | Security purchased within the terms of a private placement memorandum, exempt from registration under Rule 144A of the Securities Act of 1933, as amended, and may be sold only to dealers in the program or other “qualified institutional buyers.” As of November 30, 2022, the value of these investments was $41,769,954 or 83.53% of total net assets. |
| (b) | Rate shown is the 7-day annualized yield as of November 30, 2022. |
| (c) | Payment-in-kind interest is generally paid by issuing additional par of the security rather than paying cash. |
| (d) | Security valued at fair value using methods determined in good faith by or at the direction of the Fund’s valuation designee. Value determined using significant unobservable inputs. As of November 30, 2022, the total value of fair valued securities was $410,680 or 0.82% of total net assets. |
| (e) | Non-income producing security. |
The accompanying notes are an integral part of these financial statements.
10
PIA High Yield Fund
Statement of Assets and Liabilities – November 30, 2022
| Assets: | ||||
| Investments in securities, at value (cost $57,363,509) | $ | 49,147,376 | ||
| Receivable for fund shares sold | 1,119 | |||
| Interest receivable | 906,925 | |||
| Prepaid expenses | 19,261 | |||
| Total assets | 50,074,681 | |||
| Liabilities: | ||||
| Payable to investment adviser | 12,475 | |||
| Administration fees | 16,163 | |||
| Transfer agent fees and expenses | 9,108 | |||
| Fund accounting fees | 2,980 | |||
| Audit fees | 21,850 | |||
| Chief Compliance Officer fee | 1,833 | |||
| Custody fees | 990 | |||
| Shareholder reporting | 2,008 | |||
| Trustees’ fees and expenses | 115 | |||
| Accrued expenses | 3,306 | |||
| Total liabilities | 70,828 | |||
| Net Assets | $ | 50,003,853 | ||
| Net Assets Consist of: | ||||
| Paid-in capital | $ | 60,639,654 | ||
| Total distributable deficit | (10,635,801 | ) | ||
| Net Assets | $ | 50,003,853 | ||
| Net Asset Value, Offering Price and Redemption Price Per Share | $ | 8.28 | ||
| Shares Issued and Outstanding (Unlimited number of shares authorized, par value $0.01) | 6,037,689 | |||
The accompanying notes are an integral part of these financial statements.
11
PIA High Yield Fund
Statement of Operations – Year Ended November 30, 2022
| Investment Income: | ||||
| Interest | $ | 4,417,735 | ||
| Total investment income | 4,417,735 | |||
| Expenses: | ||||
| Investment advisory fees (Note 4) | 290,789 | |||
| Administration fees (Note 4) | 97,804 | |||
| Transfer agent fees and expenses (Note 4) | 34,205 | |||
| Registration fees | 24,799 | |||
| Audit fees | 21,966 | |||
| Fund accounting fees (Note 4) | 18,547 | |||
| Sub-transfer agent fees (Note 4) | 16,912 | |||
| Trustees’ fees and expenses | 13,251 | |||
| Chief Compliance Officer fee (Note 4) | 11,061 | |||
| Reports to shareholders | 8,274 | |||
| Miscellaneous | 8,120 | |||
| Legal fees | 6,162 | |||
| Custody fees (Note 4) | 5,530 | |||
| Insurance | 2,797 | |||
| Interest expense (Note 6) | 327 | |||
| Total expenses | 560,544 | |||
| Less: Fee waiver by adviser (Note 4) | (105,856 | ) | ||
| Net expenses | 454,688 | |||
| Net investment income | 3,963,047 | |||
| Realized and Unrealized Loss on Investments: | ||||
| Net realized loss on investments | (2,103,039 | ) | ||
| Net change in unrealized appreciation/(depreciation) on investments | (6,859,699 | ) | ||
| Net loss on investments | (8,962,738 | ) | ||
| Net decrease in net assets resulting from operations | $ | (4,999,691 | ) | |
The accompanying notes are an integral part of these financial statements.
12
PIA High Yield Fund
Statements of Changes in Net Assets
| Year Ended | Year Ended | |||||||
| November 30, 2022 | November 30, 2021 | |||||||
| Increase/(decrease) in Net Assets From Operations: | ||||||||
| Net investment income | $ | 3,963,047 | $ | 3,870,827 | ||||
| Net realized gain/(loss) on investments | (2,103,039 | ) | 724,316 | |||||
| Net change in unrealized appreciation/(depreciation) on investments | (6,859,699 | ) | 27,863 | |||||
| Net increase/(decrease) in net assets resulting from operations | (4,999,691 | ) | 4,623,006 | |||||
| Distributions Paid to Shareholders: | ||||||||
| Net dividends and distributions to shareholders | (3,984,648 | ) | (3,875,270 | ) | ||||
| Total dividends and distributions | (3,984,648 | ) | (3,875,270 | ) | ||||
| Capital Share Transactions: | ||||||||
| Proceeds from shares sold | 12,161,800 | 19,445,712 | ||||||
| Distributions reinvested | 1,235,174 | 1,362,781 | ||||||
| Payment for shares redeemed | (14,804,437 | ) | (16,270,863 | ) | ||||
| Net increase/(decrease) in net assets from capital share transactions | (1,407,463 | ) | 4,537,630 | |||||
| Total increase/(decrease) in net assets | (10,391,802 | ) | 5,285,366 | |||||
| Net Assets, Beginning of year | 60,395,655 | 55,110,289 | ||||||
| Net Assets, End of year | $ | 50,003,853 | $ | 60,395,655 | ||||
| Transactions in Shares: | ||||||||
| Shares sold | 1,393,691 | 1,942,276 | ||||||
| Shares issued on reinvestment of distributions | 138,498 | 136,250 | ||||||
| Shares redeemed | (1,625,229 | ) | (1,623,400 | ) | ||||
| Net increase/(decrease) in shares outstanding | (93,040 | ) | 455,126 | |||||
The accompanying notes are an integral part of these financial statements.
13
PIA High Yield Fund
Financial Highlights
| Year Ended November 30, | ||||||||||||||||||||
| 2022 | 2021 | 2020 | 2019 | 2018 | ||||||||||||||||
| Per Share Operating Performance | ||||||||||||||||||||
| (For a fund share outstanding throughout each year) | ||||||||||||||||||||
| Net asset value, beginning of year | $ | 9.85 | $ | 9.71 | $ | 9.61 | $ | 9.67 | $ | 10.33 | ||||||||||
| Income From Investment Operations: | ||||||||||||||||||||
| Net investment income | 0.68 | 0.61 | 0.63 | 0.64 | 0.60 | |||||||||||||||
| Net realized and unrealized gain/(loss) on investments | (1.57 | ) | 0.14 | 0.08 | (0.06 | ) | (0.66 | ) | ||||||||||||
| Total from investment operations | (0.89 | ) | 0.75 | 0.71 | 0.58 | (0.06 | ) | |||||||||||||
| Less Distributions: | ||||||||||||||||||||
| Distributions from net investment income | (0.68 | ) | (0.61 | ) | (0.63 | ) | (0.64 | ) | (0.60 | ) | ||||||||||
| Distributions from net realized gains | — | — | (0.01 | ) | — | — | ||||||||||||||
| Total distributions | (0.68 | ) | (0.61 | ) | (0.64 | ) | (0.64 | ) | (0.60 | ) | ||||||||||
| Increase from payment by affiliate and | ||||||||||||||||||||
| administrator due to operational error | — | — | 0.03 | — | — | |||||||||||||||
| Net asset value, end of year | $ | 8.28 | $ | 9.85 | $ | 9.71 | $ | 9.61 | $ | 9.67 | ||||||||||
| Total Return | -9.26 | % | 7.85 | % | 8.36 | %^ | 6.14 | % | -0.63 | % | ||||||||||
| Ratios/Supplemental Data: | ||||||||||||||||||||
| Net assets, end of year (in 000’s) | $ | 50,004 | $ | 60,396 | $ | 55,110 | $ | 52,086 | $ | 57,278 | ||||||||||
| Ratio of expenses to average net assets: | ||||||||||||||||||||
| Net of fee waivers | 0.86 | % | 0.86 | % | 0.86 | % | 0.86 | % | 0.82 | % | ||||||||||
| Before fee waivers | 1.06 | % | 0.97 | % | 1.11 | % | 1.03 | % | 0.99 | % | ||||||||||
| Ratio of net investment income to average net assets: | ||||||||||||||||||||
| Net of fee waivers | 7.50 | % | 6.13 | % | 6.80 | % | 6.53 | % | 5.95 | % | ||||||||||
| Before fee waivers | 7.30 | % | 6.02 | % | 6.55 | % | 6.36 | % | 5.78 | % | ||||||||||
| Portfolio turnover rate | 23 | % | 72 | % | 51 | % | 63 | % | 48 | % | ||||||||||
| ^ | Includes increase from payment made by affiliate and administrator due to the corporate action operational error. On September 18, 2020, the Fund received a reimbursement of $153,625 from the Adviser and Administrator related to a corporate action instruction error during the year ended November 30, 2020. Due to a miscommunication, the tender offer for the Martin Midstream corporate action was not processed correctly. This resulted in the Fund’s position being tendered rather than exchanged.. Had the Fund not received the payment, total return would have been 8.03%. |
The accompanying notes are an integral part of these financial statements.
14
PIA High Yield Fund
Notes to Financial Statements – November 30, 2022
Note 1 – Organization
The PIA High Yield Fund (the “Fund”) is a diversified series of Advisors Series Trust (the “Trust”), which is registered under the Investment Company Act of 1940, as amended, as an open-end management investment company. The Fund is an investment company and accordingly follows the investment company accounting and reporting guidance of the Financial Accounting Standards Board (“FASB”) Accounting Standard Codification Topic 946 “Financial Services – Investment Companies.”
Currently, the Fund offers the Institutional Class. The primary investment objective of the Fund is to seek a high level of current income. The Fund commenced operations on December 31, 2010.
Note 2 – Significant Accounting Policies
The following is a summary of significant accounting policies consistently followed by the Fund in the preparation of its financial statements. These policies are in conformity with accounting principles generally accepted in the United States of America.
Security Valuation – All investments in securities are recorded at their estimated fair value, as described in Note 3.
Federal Income Taxes – It is the Fund’s policy to comply with the requirements of Subchapter M of the Internal Revenue Code applicable to regulated investment companies and to distribute substantially all of its taxable income to its shareholders. Therefore, no federal income or excise tax provision is required.
The Fund recognizes the tax benefits of uncertain tax positions only where the position is “more likely than not” to be sustained assuming examination by tax authorities. The tax returns of the Fund’s prior three fiscal years are open for examination. Management has reviewed all open tax years in major jurisdictions and concluded that there is no impact on the Fund’s net assets and no tax liability resulting from unrecognized tax events relating to uncertain income tax positions taken or expected to be taken on a tax return. The Fund identifies its major tax jurisdictions as U.S. federal and the state of Wisconsin; however the Fund is not aware of any tax positions for which it is reasonably possible that the total amounts of unrecognized tax benefits will change materially in the next twelve months.
Expenses – The Fund is charged for those expenses that are directly attributable to the Fund, such as administration and custodian fees. Expenses that are not directly attributable to a Fund are typically allocated among the other PIA Funds in proportion to their respective net assets. Common expenses of the Trust are typically allocated among the funds in the Trust based on a fund’s respective net assets, or by other equitable means.
Securities Transactions and Investment Income – Security transactions are accounted for on the trade date. Realized gains and losses on sales of securities are calculated on a first-in, first-out basis. Dividend income and capital gain distributions from underlying funds are recorded on the ex-dividend date. Interest income is recorded on an accrual basis. Discounts and premiums on securities purchased are accreted/amortized over the life of the respective security using the effective interest method, except for premiums on certain callable debt securities that are amortized to the earliest call date. Non-cash interest income included in interest income, if any, is recorded at fair market value of additional par received.
Distributions to Shareholders – Distributions to shareholders are recorded on the ex-dividend date. The Fund distributes substantially all net investment income, if any, monthly and net realized gains, if any, annually. Distributions from net realized gains for book purposes may include short-term capital gains. All short-term capital gains are included in ordinary income for tax purposes.
15
PIA High Yield Fund
Notes to Financial Statements – November 30, 2022 (continued)
The amount and character of income and net realized gains to be distributed are determined in accordance with Federal income tax rules and regulations, which may differ from accounting principles generally accepted in the United States of America. To the extent that these differences are attributable to permanent book and tax accounting differences, the components of net assets have been adjusted.
Reclassification of Capital Accounts – Accounting principles generally accepted in the United States of America require that certain components of net assets relating to permanent differences be reclassified between financial and tax reporting. These reclassifications have no effect on net assets or net asset value per share. For the year ended November 30, 2022, there were no reclassifications between paid-in capital and distributable earnings.
Guarantees and Indemnifications – In the normal course of business, the Fund enters into contracts with service providers that contain general indemnification clauses. The Fund’s maximum exposure under these arrangements is unknown as this would involve future claims against the Fund that have not yet occurred. Based on experience, the Fund expects the risk of loss to be remote.
Use of Estimates – The preparation of financial statements in conformity with accounting principles generally accepted in the United States of America requires management to make estimates and assumptions that affect the reported amounts of assets and liabilities and disclosure of contingent assets and liabilities at the date of the financial statements and the reported amounts of increases and decreases in net assets from operation during the reporting period. Actual results could differ from those estimates.
Accounting Pronouncements – In March 2020, FASB issued Accounting Standards Update 2020-04, Reference Rate Reform: Facilitation of the Effects of Reference Rate Reform on Financial Reporting (“ASU 2020-04”) and in January 2021, FASB issued Accounting Standards Update 2021-01, Reference Rate Reform (Topic 848): Scope (“ASU 2021-01”), which provides optional, temporary relief with respect to the financial reporting of contracts subject to certain types of modifications due to the planned discontinuation of the London Interbank Offered Rate (“LIBOR”) and other interbank offered rates as of the end of 2021. The temporary relief provided by ASU 2020-04 and ASU 2021-01 is effective for certain reference rate-related contract modifications that occur during the period from March 12, 2020 through December 31, 2022. Management is evaluating the impact of ASU 2020-04 and ASU 2021-01 on the Fund’s investments, derivatives, debt and other contracts that will undergo reference rate-related modifications as a result of the reference rate reform. Management has also been working with other financial institutions and counterparties to modify contracts as required by applicable regulation and within the regulatory deadlines.
In October 2020, the Securities and Exchange Commission (the “SEC”) adopted new regulations governing the use of derivatives by registered investment companies (“Rule 18f-4”). Funds were required to implement and comply with Rule 18f-4 by August 19, 2022. Rule 18f-4 imposes limits on the amount of derivatives a fund can enter into, eliminates the asset segregation framework currently used by funds to comply with Section 18 of the 1940 Act, treats derivatives as senior securities and requires funds whose use of derivatives is more than a limited specified exposure amount to establish and maintain a comprehensive derivatives risk management program and appoint a derivatives risk manager. The Fund’s most recently filed statement of additional information allows the Fund to enter into derivative transactions. The Fund is considered a limited derivative user under Rule 18f-4. During the year ended November 30, 2022, the Fund did not enter into derivatives transactions. The Fund is in compliance with Rule 18f-4 as of November 30, 2022.
16
PIA High Yield Fund
Notes to Financial Statements – November 30, 2022 (continued)
In December 2020, the SEC adopted a new rule providing a framework for fund valuation practices (“Rule 2a-5”). Rule 2a-5 establishes requirements for determining fair value in good faith for purposes of the 1940 Act. Rule 2a-5 permits fund boards to designate certain parties to perform fair value determinations, subject to board oversight and certain other conditions. Rule 2a-5 also defines when market quotations are “readily available” for purposes of the 1940 Act and the threshold for determining whether a fund must fair value a security. In connection with Rule 2a-5, the SEC also adopted related recordkeeping requirements and rescinded previously issued guidance, including with respect to the role of a board in determining fair value and the accounting and auditing of fund investments. The Fund is in compliance with Rule 2a-5, which had a compliance date of September 8, 2022.
Events Subsequent to the Fiscal Year End – In preparing the financial statements as of November 30, 2022, management considered the impact of subsequent events for the potential recognition or disclosure in these financial statements. Management has determined there were no subsequent events that would need to be disclosed in the Fund’s financial statements.
Note 3 – Securities Valuation
The Fund has adopted authoritative fair value accounting standards which establish an authoritative definition of fair value and set out a hierarchy for measuring fair value. These standards require additional disclosures about the various inputs and valuation techniques used to develop the measurements of fair value, a discussion in changes in valuation techniques and related inputs during the period and expanded disclosure of valuation levels for major security types. These inputs are summarized in the three broad levels listed below:
| Level 1 – | Unadjusted quoted prices in active markets for identical assets or liabilities that the Fund has the ability to access. | |
| Level 2 – | Observable inputs other than quoted prices included in Level 1 that are observable for the asset or liability, either directly or indirectly. These inputs may include quoted prices for the identical instrument on an inactive market, prices for similar instruments, interest rates, prepayment speeds, credit risk, yield curves, default rates and similar data. | |
| Level 3 – | Unobservable inputs for the asset or liability, to the extent relevant observable inputs are not available, representing the Fund’s own assumptions about the assumptions a market participant would use in valuing the asset or liability, and would be based on the best information available. |
Following is a description of the valuation techniques applied to the Fund’s major categories of assets and liabilities measured at fair value on a recurring basis. The Fund’s investments are carried at fair value.
The Fund determines the fair value of its investments and computes its net asset value per share as of the close of regular trading on the New York Stock Exchange (4:00 pm EST).
Corporate Bonds – Corporate bonds, including listed issues, are valued at market on the basis of valuations furnished by an independent pricing service which utilizes both dealer-supplied valuations and formula-based techniques. The pricing service may consider recently executed transactions in securities of the issuer or comparable issuers, market price quotations (where observable), bond spreads, and fundamental data relating to the issuer. Most corporate bonds are categorized in Level 2 of the fair value hierarchy.
17
PIA High Yield Fund
Notes to Financial Statements – November 30, 2022 (continued)
Bank Loan Obligations – Bank loan obligations are valued at market on the basis of valuations furnished by an independent pricing service which utilizes quotations obtained from dealers in bank loans. These securities will generally be classified in Level 2 of the fair value hierarchy.
Foreign Securities – Foreign economies may differ from the U.S. economy and individual foreign companies may differ from domestic companies in the same industry.
Foreign companies or entities are frequently not subject to accounting and financial reporting standards applicable to domestic companies, and there may be less information available about foreign issuers. Securities of foreign issuers are generally less liquid and more volatile than those of comparable domestic issuers. There is frequently less government regulation of broker-dealers and issuers than in the United States. In addition, investments in foreign countries are subject to the possibility of expropriation, confiscatory taxation, political or social instability or diplomatic developments that could adversely affect the value of those investments.
Equity Securities – Equity securities, including common stocks, that are primarily traded on a national securities exchange shall be valued at the last sale price on the exchange on which they are primarily traded on the day of valuation or, if there has been no sale on such day, at the mean between the bid and asked prices. Securities primarily traded in the NASDAQ Global Market System for which market quotations are readily available shall be valued using the NASDAQ Official Closing Price (“NOCP”). If the NOCP is not available, such securities shall be valued at the last sale price on the day of valuation, or if there has been no sale on such day, at the mean between the bid and asked prices. Over-the-counter (“OTC”) securities which are not traded in the NASDAQ Global Market System shall be valued at the most recent sales price. To the extent, these securities are actively traded and valuation adjustments are not applied, they are categorized in Level 1 of the fair value hierarchy.
Investment Companies – Investments in open-end mutual funds, including money market funds, are generally priced at their net asset value per share provided by the service agent of the funds and will be classified in Level 1 of the fair value hierarchy.
Short-Term Securities – Short-term debt securities, including those securities having a maturity of 60 days or less, are valued at the evaluated mean between the bid and asked prices. To the extent the inputs are observable and timely, these securities would be classified in Level 2 of the fair value hierarchy.
Prior to the effectiveness of Rule 2a-5, on September 8, 2022, the Board of Trustees (“Board”) had delegated day-to-day valuation issues to a Valuation Committee of the Trust which was comprised of representatives from the Fund’s administrator, U.S. Bancorp Fund Services, LLC, doing business as U.S. Bank Global Fund Services (“Fund Services”). The function of the Valuation Committee was to value securities where current and reliable market quotations were not readily available, or the closing price did not represent fair value by following procedures approved by the Board. These procedures considered many factors, including the type of security, size of holding, trading volume and news events. All actions taken by the Valuation Committee were subsequently reviewed and ratified by the Board. The Valuation Committee served through September 7, 2022. Effective September 8, 2022, the Board of Trustees approved Pacific Income Advisers, Inc. (“PIA” or the “Adviser”), as the Fund’s valuation designee under Rule 2a-5.
Restricted Securities – The Fund may invest in securities that are subject to legal or contractual restrictions on resale (“restricted securities”). Restricted securities may be resold in transactions that are exempt from registration under the
18
PIA High Yield Fund
Notes to Financial Statements – November 30, 2022 (continued)
Federal securities laws. Private placement securities are generally considered to be restricted except for those securities traded between qualified institutional investors under the provisions of Rule 144A of the Securities Act of 1933. The sale or other disposition of these securities may involve additional expenses and the prompt sale of these securities at an acceptable price may be difficult. At November 30, 2022, the Fund held securities issued pursuant to Rule 144A under the Securities Act of 1933. There were no other restricted investments held by the Fund at November 30, 2022.
Depending on the relative significance of the valuation inputs, fair valued securities may be classified in either Level 2 or Level 3 of the fair value hierarchy.
The inputs or methodology used for valuing securities are not an indication of the risk associated with investing in those securities. The following is a summary of the inputs used to value the Fund’s securities as of November 30, 2022:
| Level 1 | Level 2 | Level 3 | Total | ||||||||||||||
| Common Stocks | $ | — | $ | — | $ | 239,680 | $ | 239,680 | |||||||||
| Fixed Income | |||||||||||||||||
| Corporate Bonds | — | 46,221,240 | 171,000 | 46,392,240 | |||||||||||||
| Total Fixed Income | — | 46,221,240 | 171,000 | 46,392,240 | |||||||||||||
| Money Market Fund | 2,515,456 | — | — | 2,515,456 | |||||||||||||
| Total Investments | $ | 2,515,456 | $ | 46,221,240 | $ | 410,680 | $ | 49,147,376 | |||||||||
Refer to the Fund’s schedule of investments for a detailed break-out of securities by industry classification.
The following is a reconciliation of the Fund’s Level 3 investments for which significant unobservable inputs were used in determining value.
| Investments in Securities, at Value | |||||||||
| Common Stocks | Corporate Bonds | ||||||||
| Balance as of November 30, 2021 | $ | 173,768 | $ | 126,000 | |||||
| Accrued discounts/premiums | — | 4,063 | |||||||
| Realized gain/(loss) | — | — | |||||||
| Change in unrealized appreciation/(depreciation) | 65,912 | 40,937 | |||||||
| Purchases | — | — | |||||||
| Sales | — | — | |||||||
| Transfers in and/or out of Level 3 | — | — | |||||||
| Balance as of November 30, 2022 | $ | 239,680 | $ | 171,000 | |||||
The change in unrealized appreciation/(depreciation) for Level 3 securities still held at November 30, 2022, and still classified as Level 3 was $106,849.
The global outbreak of COVID-19 (commonly referred to as “coronavirus”) has disrupted economic markets and the prolonged economic impact is uncertain. Although vaccines for COVID-19 are becoming more widely available, the ultimate economic fallout from the pandemic, amid the spread of COVID-19 variants, and the long-term impact on
19
PIA High Yield Fund
Notes to Financial Statements – November 30, 2022 (continued)
economies, markets, industries and individual companies are not known. The operational and financial performance of individual companies and the market in general depends on future developments, including the duration and spread of any future outbreaks and the pace of recovery which may vary from market to market, and such uncertainty may in turn adversely affect the value and liquidity of the Fund’s investments, impair the Fund’s ability to satisfy redemption requests, and negatively impact the Fund’s performance.
Note 4 – Investment Advisory Fee and Other Transactions with Affiliates
The Fund has an investment advisory agreement with Pacific Income Advisers, Inc. (“PIA” or the “Adviser”) pursuant to which the Adviser is responsible for providing investment management services to the Fund. The Adviser furnishes all investment advice, office space and facilities, and provides most of the personnel needed by the Fund. As compensation for its services, PIA is entitled to a fee, computed daily and payable monthly calculated at an annual rate of 0.55% based upon the Fund’s average daily net assets. For the year ended November 30, 2022, the Fund incurred $290,789 in advisory fees.
The Fund is responsible for its own operating expenses. The Adviser has temporarily agreed to reduce fees payable to it by the Fund and to pay Fund operating expenses (excluding acquired fund fees and expenses) to the extent necessary to limit the Fund’s aggregate annual operating expenses to 0.86% of average daily net assets. The Adviser may not recoup expense reimbursements in future periods. For the year ended November 30, 2022, the Adviser reduced its fees in the amount of $105,856.
Fund Services serves as the Fund’s administrator, fund accountant and transfer agent. U.S. Bank N.A. serves as custodian (the “Custodian”) to the Fund. The Custodian is an affiliate of Fund Services. Fund Services maintains the Fund’s books and records, calculates the Fund’s NAV, prepares various federal and state regulatory filings, coordinates the payment of fund expenses, reviews expense accruals and prepares materials supplied to the Board of Trustees. The officers of the Trust, including the Chief Compliance Officer, are employees of Fund Services. Fees paid by the Fund for administration and accounting, transfer agency, custody and compliance services for the year ended November 30, 2022, are disclosed in the Statement of Operations.
The Fund has entered into agreements with various brokers, dealers and financial intermediaries to compensate them for transfer agent services that would otherwise be executed by Fund Services. These sub-transfer agent services include pre-processing and quality control of new accounts, maintaining detailed shareholder account records, shareholder correspondence, answering customer inquiries regarding account status, and facilitating shareholder telephone transactions. The Fund expensed $16,912 of sub-transfer agent fees during the year ended November 30, 2022.
Quasar Distributors, LLC (“Quasar”) acts as the Fund’s principal underwriter in a continuous public offering of the Fund’s shares. Quasar is a wholly-owned broker-dealer subsidiary of Foreside Financial Group, LLC.
Note 5 – Purchases and Sales of Securities
For the year ended November 30, 2022, the cost of purchases and the proceeds from sales of securities (excluding short-term securities and U.S. Government securities) were $11,651,171 and $15,048,453, respectively. There were no purchases and sales of U.S. Government securities during the year ended November 30, 2022.
20
PIA High Yield Fund
Notes to Financial Statements – November 30, 2022 (continued)
Note 6 – Line of Credit
The Fund has a secured line of credit in the amount of $10,000,000. This line of credit is intended to provide short-term financing, if necessary, subject to certain restrictions, in connection with shareholder redemptions. The credit facility is with the Fund’s custodian, U.S. Bank N.A. During the year ended November 30, 2022, the Fund drew on its line of credit. The Fund had an outstanding average daily balance of $1,359, paid a weighted average interest rate of 3.50%, and incurred interest expense of $327. The maximum amount outstanding for the Fund during the year ended November 30, 2022, was $124,000. At November 30, 2022, the Fund had no outstanding loan amounts.
Note 7 – Federal Income Tax Information
The tax character of distributions paid during the years ended November 30, 2022 and November 30, 2021 are as follows:
| Year ended | Year ended | ||
November 30, 2022 | November 30, 2021 | ||
| Ordinary income | $3,984,648 | $3,875,270 |
As of November 30, 2022, the components of capital on a tax basis were as follows:
| Cost of investments (a) | $ | 57,363,509 | |||
| Gross unrealized appreciation | 316,655 | ||||
| Gross unrealized depreciation | (8,532,788 | ) | |||
| Net unrealized depreciation (a) | (8,216,133 | ) | |||
| Undistributed ordinary income | 31,107 | ||||
| Undistributed long-term capital gains | — | ||||
| Total distributable earnings | 31,107 | ||||
| Other accumulated gains/(losses) | (2,450,775 | ) | |||
| Total accumulated earnings/(losses) | $ | (10,635,801 | ) |
| (a) | The book-basis and tax-basis net unrealized depreciation are the same. |
As of November 30, 2022, the Fund had tax capital losses which may be carried over to offset future gains. Such losses expire as follows:
Short-Term Indefinite | Long-Term Indefinite |
| $105,122 | $2,345,653 |
Note 8 – Principal Risks
Below is a summary of some, but not all, of the principal risks of investing in the Fund, each of which may adversely affect the Fund’s net asset value and total return. The Fund’s most recent prospectus provides further descriptions of the Fund’s investment objective, principal investment strategies and principal risks.
| • | High Yield Securities Risk. High yield securities (or “junk bonds”) entail greater risk of loss of principal because of their greater exposure to credit risk. High yield securities typically carry higher coupon rates than investment |
21
PIA High Yield Fund
Notes to Financial Statements – November 30, 2022 (continued)
| grade securities, but also are considered as speculative and may be subject to greater market price fluctuations, less liquidity and greater risk of loss of income or principal including greater possibility of default and bankruptcy of the issuer of such instruments than more highly rated bonds and loans. | ||
| • | Counterparty Risk. Fund transactions involving a counterparty are subject to the risk that the counterparty or a third party will not fulfill its obligation to the Fund. Counterparty risk may arise because of the counterparty’s financial condition (i.e., financial difficulties, bankruptcy, or insolvency), market activities and developments, or other reasons, whether foreseen or not. A counterparty’s inability to fulfill its obligation may result in significant financial loss to the Fund. | |
| • | Credit Risk. The issuers of the bonds and other instruments held by the Fund may not be able to make interest or principal payments. | |
| • | General Market Risk. Economies and financial markets throughout the world are becoming increasingly interconnected, which increases the likelihood that events or conditions in one country or region will adversely impact markets or issuers in other countries or regions. Securities in the Fund’s portfolio may underperform in comparison to securities in general financial markets, a particular financial market or other asset classes due to a number of factors, including inflation (or expectations for inflation), deflation (or expectations for deflation), interest rates, global demand for particular products or resources, market instability, debt crises and downgrades, embargoes, tariffs, sanctions and other trade barriers, regulatory events, other governmental trade or market control programs and related geopolitical events. In addition, the value of the Fund’s investments may be negatively affected by the occurrence of global events such as war, terrorism, environmental disasters, natural disasters or events, country instability, and infectious disease epidemics or pandemics. For example, the outbreak of COVID-19, a novel coronavirus disease, has negatively affected economies, markets and individual companies throughout the world, including those in which the Fund invests. The effects of this pandemic to public health and business and market conditions, including exchange trading suspensions and closures, may continue to have a significant negative impact on the performance of the Fund’s investments, increase the Fund’s volatility, negatively impact the Fund’s arbitrage and pricing mechanisms, exacerbate pre-existing political, social and economic risks to the Fund, and negatively impact broad segments of businesses and populations. The Fund’s operations may be interrupted as a result, which may contribute to the negative impact on investment performance. In addition, governments, their regulatory agencies, or self-regulatory organizations may take actions in response to the pandemic that affect the instruments in which the Fund invests, or the issuers of such instruments, in ways that could have a significant negative impact on the Fund’s investment performance. The full impact of the COVID-19 pandemic, or other future epidemics or pandemics, is currently unknown. | |
| • | Interest Rate Risk. The value of the Fund’s investments in fixed-income securities will change based on changes in interest rates. If interest rates increase, the value of these investments generally declines. Securities with greater interest rate sensitivity and longer maturities generally are subject to greater fluctuations in value. | |
| • | Liquidity Risk. Reduced liquidity in the bond markets can result from a number of events, such as limited trading activity, reductions in bond inventory, and rapid or unexpected changes in interest rates. Less liquid markets could lead to greater price volatility and limit the Fund’s ability to sell a holding at a suitable price. |
22
PIA High Yield Fund
Notes to Financial Statements – November 30, 2022 (continued)
| • | ETF and Mutual Fund Risk. When the Fund invests in an ETF or mutual fund, it will bear additional expenses based on its pro rata share of the ETF’s or mutual fund’s operating expenses, including the potential duplication of management fees. The risk of owning an ETF or mutual fund generally reflects the risks of owning the underlying securities that the ETF or mutual fund holds. The Fund also will incur brokerage costs when it purchases ETFs. | |
| • | Rule 144A Securities Risk. The market for Rule 144A securities typically is less active than the market for publicly traded securities. Rule 144A securities carry the risk that the liquidity of these securities may become impaired, making it more difficult for the Fund to sell these securities. |
Note 9 – Control Ownership
The beneficial ownership, either directly or indirectly of more than 25% of the voting securities of a Fund creates a presumption of control of the Fund, under Section 2(a)(9) of the 1940 Act. As of November 30, 2022, International Union UAW Strike Trust, for the benefit of their customers, owned 60.54% of the outstanding shares of the Fund.
Note 10 – Trustees and Officers
At a meeting held December 7-8, 2022, by vote of the majority of the Board of Trustees (not including Mr. Joe Redwine), Mr. Redwine’s term as Trustee was extended for three additional years. Ms. Michele Rackey was approved by the Board as an Independent Trustee effective January 1, 2023. Mr. Kevin Hayden was approved by the Board as Vice President, Treasurer and Ms. Cheryl King was approved as Assistant Treasurer effective January 1, 2023. Mr. Ryan Charles resigned as Assistant Secretary effective January 1, 2023.
Note 11 – Other Tax Information (Unaudited)
For the year ended November 30, 2022, the High Yield Fund designated $3,984,648 as ordinary income for purposes of the dividends paid deduction. For the year ended November 30, 2022, none of the dividends paid from net investment income qualifies for the dividend received deduction available to corporate shareholders of the Fund. For shareholders in the Fund, none of the dividend income distributed for the year ended November 30, 2022 is designated as qualified dividend income under the Tax Cuts and Jobs Act of 2017.
On December 29, 2022, the High Yield Fund distributed $0.05433130, per share of net investment income.
23
PIA High Yield Fund
Report of Independent Registered Public Accounting Firm
To the Board of Trustees
Advisors Series Trust and
Shareholders of
PIA High Yield Fund
Opinion on the Financial Statements
We have audited the accompanying statement of assets and liabilities of the PIA High Yield Fund, a series of Advisors Series Trust (the “Trust”), including the schedule of investments, as of November 30, 2022, the related statement of operations for the year then ended, the statements of changes in net assets for each of the two years in the period then ended, financial highlights for each of the five years in the period then ended, and the related notes (collectively referred to as the “financial statements”). In our opinion, the financial statements present fairly, in all material respects, the financial position of the Fund as of November 30, 2022, the results of its operations for the year then ended, the changes in its net assets for each of the two years in the period then ended, and the financial highlights for each of the five years in the period then ended, in conformity with accounting principles generally accepted in the United States of America.
Basis for Opinion
These financial statements are the responsibility of the Fund’s management. Our responsibility is to express an opinion on the Fund’s financial statements based on our audits. We are a public accounting firm registered with the Public Company Accounting Oversight Board (United States) (“PCAOB”) and are required to be independent with respect to the Fund in accordance with the U.S. federal securities laws and the applicable rules and regulations of the Securities and Exchange Commission and the PCAOB. We have served as the auditor of one or more of the funds in the Trust since 2003.
We conducted our audits in accordance with the standards of the PCAOB. Those standards require that we plan and perform the audit to obtain reasonable assurance about whether the financial statements are free of material misstatement, whether due to error or fraud. The Fund is not required to have, nor were we engaged to perform, an audit of its internal control over financial reporting. As part of our audits we are required to obtain an understanding of internal control over financial reporting, but not for the purpose of expressing an opinion on the effectiveness of the Fund’s internal control over financial reporting. Accordingly, we express no such opinion.
Our audits included performing procedures to assess the risks of material misstatement of the financial statements, whether due to error or fraud, and performing procedures that respond to those risks. Such procedures included examining, on a test basis, evidence regarding the amounts and disclosures in the financial statements. Our audits also included evaluating the accounting principles used and significant estimates made by management, as well as evaluating the overall presentation of the financial statements. Our procedures included confirmation of securities owned as of November 30, 2022 by correspondence with the custodian. We believe that our audits provide a reasonable basis for our opinion.
| |
| TAIT, WELLER & BAKER LLP |
Philadelphia, Pennsylvania
January 27, 2023
24
PIA High Yield Fund
Notice to Shareholders – November 30, 2022
(Unaudited)
How to Obtain a Copy of the Fund’s Proxy Voting Policies
A description of the policies and procedures that the Fund uses to determine how to vote proxies relating to portfolio securities is available without charge, upon request, by calling 1-800-251-1970, or on the Securities and Exchange Commission’s (“SEC”) website at http://www.sec.gov.
How to Obtain a Copy of the Fund’s Proxy Voting Records for the 12-Month Period Ended June 30
Information regarding how the Fund voted proxies relating to portfolio securities during the most recent 12-month period ended June 30 is available without charge, upon request, by calling 1-800-251-1970. Furthermore, you can obtain the Fund’s proxy voting records on the SEC’s website at http://www.sec.gov.
Quarterly Filings on Form N-Port
The Fund files its complete schedules of portfolio holdings with the SEC for the first and third quarters of each fiscal year on Part F of Form N-PORT. The Fund’s Form N-PORT is available on the SEC’s website at http://www.sec.gov. Information included in the Fund’s Form N-PORT is also available by calling 1-800-251-1970.
Householding
In an effort to decrease costs, the Fund will reduce the number of duplicate prospectuses, supplements, and certain other shareholder documents that you receive by sending only one copy of each to those addresses shown by two or more accounts. Please call the Fund’s transfer agent toll free at 1-800-251-1970 to request individual copies of these documents. The Fund will begin sending individual copies 30 days after receiving your request. This policy does not apply to account statements.
25
PIA High Yield Fund
Statement Regarding Liquidity Risk Management Program
(Unaudited)
The Fund has adopted a liquidity risk management program (the “program”). The Board has designated a committee at the Adviser to serve as the administrator of the program. The Adviser’s committee conducts the day-to-day operation of the programs pursuant to policies and procedures administered by the committee.
Under the program, the Adviser’s committee manages the Fund’s liquidity risk, which is the risk that the Fund could not meet shareholder redemption requests without significant dilution of remaining shareholders’ interests in the Fund. This risk is managed by monitoring the degree of liquidity of the Fund’s investments, limiting the amount of the Fund’s illiquid investments, and utilizing various risk management tools and facilities available to the Fund for meeting shareholder redemptions, among other means. The committee’s process of determining the degree of liquidity of the Fund’s investments is supported by one or more third-party liquidity assessment vendors.
The Board reviewed a report prepared by the committee regarding the operation and effectiveness of the program for the period July 1, 2021 through June 30, 2022. No significant liquidity events impacting the Fund were noted in the report. The report noted that the PIA High Yield Fund made use of its line of credit during the reporting period and that such line was fully repaid in a timely manner. In addition, the committee provided its assessment that the program had been effective in managing the Fund’s liquidity risk.
26
PIA High Yield Fund
Information About Trustees and Officers
(Unaudited)
This chart provides information about the Trustees and Officers who oversee the Fund. Officers elected by the Trustees manage the day-to-day operations of the Fund and execute policies formulated by the Trustees.
| Number of | Other | ||||
| Portfolios in | Directorships | ||||
| Term of Office | Fund Complex | Held During | |||
| Name, Address | Position Held | and Length of | Principal Occupation | Overseen by | Past Five |
and Age | with the Trust | Time Served* | During Past Five Years | Trustee(2) | Years(3) |
Independent Trustees(1) | |||||
| David G. Mertens | Trustee | Indefinite term; | Partner and Head of Business | 6 | Trustee, |
| (age 62) | since | Development Ballast Equity | Advisors Series | ||
| 615 E. Michigan Street | March 2017. | Management, LLC | Trust (for series | ||
| Milwaukee, WI 53202 | (a privately-held investment | not affiliated | |||
| advisory firm) (February 2019 | with the Fund). | ||||
| to present); Managing Director | |||||
| and Vice President, Jensen | |||||
| Investment Management, Inc. | |||||
| (a privately-held investment | |||||
| advisory firm) (2002 to 2017). | |||||
| Joe D. Redwine | Trustee | Indefinite term; | Retired; formerly Manager, | 6 | Trustee, |
| (age 75) | since | President, CEO, U.S. Bancorp | Advisors Series | ||
| 615 E. Michigan Street | September 2008. | Fund Services, LLC and its | Trust (for series | ||
| Milwaukee, WI 53202 | predecessors (May 1991 to | not affiliated | |||
| July 2017). | with the Fund). |
27
PIA High Yield Fund
Information About Trustees and Officers (continued)
(Unaudited)
| Number of | Other | ||||
| Portfolios in | Directorships | ||||
| Term of Office | Fund Complex | Held During | |||
| Name, Address | Position Held | and Length of | Principal Occupation | Overseen by | Past Five |
and Age | with the Trust | Time Served* | During Past Five Years | Trustee(2) | Years(3) |
| Raymond B. Woolson | Chairman | Indefinite term; | President, Apogee Group, Inc. | 6 | Trustee, Advisors |
| (age 63) | of the | since | (financial consulting firm) | Series Trust (for | |
| 615 E. Michigan Street | Board | January 2020. | (1998 to present). | series not | |
| Milwaukee, WI 53202 | affiliated with | ||||
| Trustee | Indefinite term; | the Fund); | |||
| since | Independent | ||||
| January 2016. | Trustee, | ||||
| DoubleLine | |||||
| Funds Trust (an | |||||
| open-end | |||||
| investment | |||||
| company with | |||||
| 19 portfolios), | |||||
| DoubleLine | |||||
| Opportunistic | |||||
| Credit Fund, | |||||
| DoubleLine | |||||
| Income Solutions | |||||
| Fund, and | |||||
| DoubleLine Yield | |||||
| Opportunities | |||||
| Fund from 2010 | |||||
| to present; | |||||
| Independent | |||||
| Trustee, | |||||
| DoubleLine ETF | |||||
| Trust (an open- | |||||
| end investment | |||||
| company with | |||||
| 2 portfolios) | |||||
| from March | |||||
| 2022 to present. |
28
PIA High Yield Fund
Information About Trustees and Officers (continued)
(Unaudited)
| Term of Office | |||
| Name, Address | Position Held | and Length of | Principal Occupation |
and Age | with the Trust | Time Served | During Past Five Years |
| Officers | |||
| Jeffrey T. Rauman | President, | Indefinite term; | Senior Vice President, Compliance and Administration, |
| (age 53) | Chief | since | U.S. Bank Global Fund Services (February 1996 to present). |
| 615 E. Michigan Street | Executive | December 2018. | |
| Milwaukee, WI 53202 | Officer and | ||
| Principal | |||
| Executive | |||
| Officer | |||
| Cheryl L. King | Vice President, | Indefinite term; | Vice President, Compliance and Administration, |
| (age 61) | Treasurer and | since | U.S. Bank Global Fund Services (October 1998 to present). |
| 615 E. Michigan Street | Principal | December 2007. | |
| Milwaukee, WI 53202 | Financial | ||
| Officer | |||
| Kevin J. Hayden | Assistant | Indefinite term; | Vice President, Compliance and Administration, |
| (age 51) | Treasurer | since | U.S. Bank Global Fund Services (June 2005 to present). |
| 615 E. Michigan Street | September 2013. | ||
| Milwaukee, WI 53202 | |||
| Richard R. Conner | Assistant | Indefinite term; | Assistant Vice President, Compliance and Administration, |
| (age 40) | Treasurer | since | U.S. Bank Global Fund Services (July 2010 to present). |
| 615 E. Michigan Street | December 2018. | ||
| Milwaukee, WI 53202 | |||
| Michael L. Ceccato | Vice President, | Indefinite term; | Senior Vice President, U.S. Bank Global Fund Services and |
| (age 65) | Chief | since | Senior Vice President, U.S. Bank N.A. (February 2008 to present). |
| 615 E. Michigan Street | Compliance | September 2009. | |
| Milwaukee, WI 53202 | Officer and | ||
| AML Officer | |||
| Elaine E. Richards | Vice President | Indefinite term; | Senior Vice President, U.S. Bank Global Fund Services |
| (age 54) | and Secretary | since | (July 2007 to present). |
| 2020 East Financial Way, | September 2019. | ||
| Suite 100 | |||
| Glendora, CA 91741 |
29
PIA High Yield Fund
Information About Trustees and Officers (continued)
(Unaudited)
| Term of Office | |||
| Name, Address | Position Held | and Length of | Principal Occupation |
and Age | with the Trust | Time Served | During Past Five Years |
| Ryan Charles | Assistant | Indefinite term; | Assistant Vice President, U.S. Bank Global Fund Services |
| (age 44) | Secretary | since | (May 2021 to present); Chief Legal Officer and Secretary Davis |
| 2020 East Financial Way, | January 2022. | Selected Advisers, L.P. (2004 to 2021). | |
| Suite 100 | |||
| Glendora, CA 91741 |
| * | The Trustees have designated a mandatory retirement age of 75, such that each Trustee, serving as such on the date he or she reaches the age of 75, shall submit his or her resignation not later than the last day of the calendar year in which his or her 75th birthday occurs (“Retiring Trustee”). Upon request, the Board may, by vote of a majority of Trustees eligible to vote on such matter, determine whether or not to extend such Retiring Trustee’s term and on the length of a one-time extension of up to three additional years. |
| (1) | The Trustees of the Trust who are not “interested persons” of the Trust as defined under the 1940 Act (“Independent Trustees”). |
| (2) | As of November 30, 2022, the Trust was comprised of 35 active portfolios managed by unaffiliated investment advisers. The term “Fund Complex” applies only to the Fund and the PIA BBB Bond Fund, the PIA High Yield (MACS) Fund, the PIA MBS Fund, the PIA Short Duration Fund, and the PIA Short-Term Securities Fund. The Funds do not hold themselves out as related to any other series within the Trust for investment purposes, nor does it share the same investment adviser with any other series. |
| (3) | “Other Directorships Held” includes only directorships of companies required to register or file reports with the SEC under the Securities Exchange Act of 1934, as amended, (that is, “public companies”) or other investment companies registered under the 1940 Act. |
The Statement of Additional Information includes additional information about the Fund’s Trustees and Officers and is available, without charge, upon request by calling 1-800-251-1970.
30
PRIVACY NOTICE
The Fund collects non-public information about you from the following sources:
• Information we receive about you on applications or other forms;
• Information you give us orally; and/or
• Information about your transactions with us or others.
We do not disclose any non-public personal information about our customers or former customers without the customer’s authorization, except as permitted by law or in response to inquiries from governmental authorities. We may share information with affiliated and unaffiliated third parties with whom we have contracts for servicing the Fund. We will provide unaffiliated third parties with only the information necessary to carry out their assigned responsibilities. We maintain physical, electronic and procedural safeguards to guard your non-public personal information and require third parties to treat your personal information with the same high degree of confidentiality.
In the event that you hold shares of the Fund through a financial intermediary, including, but not limited to, a broker-dealer, bank, or trust company, the privacy policy of your financial intermediary would govern how your non-public personal information would be shared by those entities with unaffiliated third parties.
Adviser
Pacific Income Advisers, Inc.
2321 Rosecrans Avenue, Suite 1260
El Segundo, CA 90245
Distributor
Quasar Distributors, LLC
111 East Kilbourn Avenue, Suite 2200
Milwaukee, WI 53202
Transfer Agent
U.S. Bank Global Fund Services
615 East Michigan Street
Milwaukee, WI 53202
(800) 251-1970
Custodian
U.S. Bank N.A.
Custody Operations
1555 North RiverCenter Drive, Suite 302
Milwaukee, WI 53212
Independent Registered Public Accounting Firm
Tait, Weller & Baker LLP
Two Liberty Place
50 South 16th Street, Suite 2900
Philadelphia, PA 19102
Legal Counsel
Sullivan & Worcester LLP
1633 Broadway, 32nd Floor
New York, NY 10019
Past performance results shown in this report should not be considered a representation of future performance. Share price and returns will fluctuate so that shares, when redeemed, may be worth more or less than their original cost. Statements and other information herein are dated and are subject to change.
(b) Not Applicable
Item 2. Code of Ethics.
The registrant has adopted a code of ethics that applies to the registrant’s principal executive officer and principal financial officer. The registrant has not made any substantive amendments to its code of ethics during the period covered by this report. The registrant has not granted any waivers from any provisions of the code of ethics during the period covered by this report.
A copy of the registrant’s Code of Ethics is filed herewith.
Item 3. Audit Committee Financial Expert.
The registrant’s Board of Trustees has determined that there is at least one audit committee financial expert serving on its audit committee. Mr. Joe D. Redwine and Ms. Michele Rackey are the “audit committee financial experts” and are considered to be “independent” as each term is defined in Item 3 of Form N‑CSR.
Item 4. Principal Accountant Fees and Services.
The registrant has engaged its principal accountant to perform audit services, audit-related services, tax services and other services during the past two fiscal years. “Audit services” refer to performing an audit of the registrant's annual financial statements or services that are normally provided by the accountant in connection with statutory and regulatory filings or engagements for those fiscal years. “Audit-related services” refer to the assurance and related services by the principal accountant that are reasonably related to the performance of the audit. “Tax services” refer to professional services rendered by the principal accountant including the review of federal income tax returns, review of federal excise tax returns, review of state tax returns, if any, and assistance with calculation of required income, capital gain and excise distributions. There were no “other services” provided by the principal accountant. The following table details the aggregate fees billed or expected to be billed for each of the last two fiscal years for audit fees, audit-related fees, tax fees and other fees by the principal accountant.
| FYE 11/30/2022 | FYE11/30/2021 | |
(a) Audit Fees | $93,000 | $91,250 |
(b) Audit-Related Fees | N/A | N/A |
(c) Tax Fees | $18,000 | 18,000 |
(d) All Other Fees | N/A | N/A |
(e)(1) The audit committee has adopted pre-approval policies and procedures that require the audit committee to pre‑approve all audit and non‑audit services of the registrant, including services provided to any entity affiliated with the registrant.
(e)(2) The percentage of fees billed by Tait, Weller & Baker LLP applicable to non-audit services pursuant to waiver of pre-approval requirement were as follows:
| FYE 11/30/2022 | FYE 11/30/2021 | |
Audit-Related Fees | 0% | 0% |
Tax Fees | 0% | 0% |
All Other Fees | 0% | 0% |
(f) All of the principal accountant’s hours spent on auditing the registrant’s financial statements were attributed to work performed by full‑time permanent employees of the principal accountant.
(g) The following table indicates the non-audit fees billed or expected to be billed by the registrant’s accountant for services to the registrant and to the registrant’s investment adviser (and any other controlling entity, etc.—not sub-adviser) for the last two years.
Non-Audit Related Fees | FYE 11/30/2022 | FYE 11/30/2021 |
Registrant | N/A | N/A |
Registrant’s Investment Adviser | N/A | N/A |
(h) The audit committee of the board of trustees/directors has considered whether the provision of non-audit services that were rendered to the registrant's investment adviser is compatible with maintaining the principal accountant's independence and has concluded that the provision of such non-audit services by the accountant has not compromised the accountant’s independence.
The registrant has not been identified by the U.S. Securities and Exchange Commission as having filed an annual report issued by a registered public accounting firm branch or office that is located in a foreign jurisdiction where the Public Company Accounting Oversight Board is unable to inspect or completely investigate because of a position taken by an authority in that jurisdiction.
The registrant is not a foreign issuer.
Item 5. Audit Committee of Listed Registrants.
| (a) | Not applicable to registrants who are not listed issuers (as defined in Rule 10A-3 under the Securities Exchange Act of 1934). |
| (b) | Not Applicable. |
Item 6. Investments.
| (a) | Schedule of Investments is included as part of the report to shareholders filed under Item 1 of this Form. |
(b) Not Applicable.
Item 7. Disclosure of Proxy Voting Policies and Procedures for Closed-End Management Investment Companies.
Not applicable to open-end investment companies.
Item 8. Portfolio Managers of Closed-End Management Investment Companies.
Not applicable to open-end investment companies.
Item 9. Purchases of Equity Securities by Closed‑End Management Investment Company and Affiliated Purchasers.
Not applicable to open-end investment companies.
Item 10. Submission of Matters to a Vote of Security Holders.
There have been no material changes to the procedures by which shareholders may recommend nominees to the Registrant’s Board of Trustees.
Item 11. Controls and Procedures.
| (a) | The Registrant’s President/Chief Executive Officer/Principal Executive Officer and Vice President/Treasurer/Principal Financial Officer have reviewed the Registrant's disclosure controls and procedures (as defined in Rule 30a-3(c) under the Investment Company Act of 1940, as amended, (the “Act”)) as of a date within 90 days of the filing of this report, as required by Rule 30a-3(b) under the Act and Rules 13a-15(b) or 15d‑15(b) under the Securities Exchange Act of 1934. Based on their review, such officers have concluded that the disclosure controls and procedures are effective in ensuring that information required to be disclosed in this report is appropriately recorded, processed, summarized and reported and made known to them by others within the Registrant and by the Registrant’s service provider. |
| (b) | There were no changes in the Registrant's internal control over financial reporting (as defined in Rule 30a-3(d) under the Act) that occurred during the period covered by this report that has materially affected, or is reasonably likely to materially affect, the Registrant's internal control over financial reporting. |
Item 12. Disclosure of Securities Lending Activities for Closed-End Management Investment Companies.
Not applicable to open-end investment companies.
Item 13. Exhibits.
(3) Any written solicitation to purchase securities under Rule 23c‑1 under the Act sent or given during the period covered by the report by or on behalf of the registrant to 10 or more persons. Not applicable to open-end investment companies.
| (4) | Change in the registrant’s independent public accountant. There was no change in the registrant’s independent public accountant for the period covered by this report. |
SIGNATURES
Pursuant to the requirements of the Securities Exchange Act of 1934 and the Investment Company Act of 1940, the registrant has duly caused this report to be signed on its behalf by the undersigned, thereunto duly authorized.
(Registrant) Advisors Series Trust
By (Signature and Title)* /s/ Jeffrey T. Rauman
Jeffrey T. Rauman, President/Chief Executive
Officer/Principal Executive Officer
Date 2/6/2023
Pursuant to the requirements of the Securities Exchange Act of 1934 and the Investment Company Act of 1940, this report has been signed below by the following persons on behalf of the registrant and in the capacities and on the dates indicated.
By (Signature and Title)* /s/ Jeffrey T. Rauman
Jeffrey T. Rauman, President/Chief Executive
Officer/Principal Executive Officer
Date 2/6/2023
By (Signature and Title)* /s/ Kevin J. Hayden
Kevin J. Hayden, Vice President/Treasurer/Principal
Financial Officer
Date 2/6/2023
* Print the name and title of each signing officer under his or her signature.