UNITED STATES
SECURITIES AND EXCHANGE COMMISSION
Washington, D.C. 20549
SECURITIES AND EXCHANGE COMMISSION
Washington, D.C. 20549
FORM N-CSR
CERTIFIED SHAREHOLDER REPORT OF REGISTERED
MANAGEMENT INVESTMENT COMPANIES
Investment Company Act file number 811-07959
Advisors Series Trust
(Exact name of registrant as specified in charter)
(Exact name of registrant as specified in charter)
615 East Michigan Street
Milwaukee, WI 53202
(Address of principal executive offices) (Zip code)
(Address of principal executive offices) (Zip code)
Jeffrey T. Rauman, President/Chief Executive Officer
Advisors Series Trust
c/o U.S. Bancorp Fund Services, LLC
777 East Wisconsin Avenue, 4th Floor
Milwaukee, WI 53202
(Name and address of agent for service)
(Name and address of agent for service)
(626) 914-7235
Registrant's telephone number, including area code
Date of fiscal year end: October 31, 2024
Date of reporting period: April 30, 2024
Item 1. Reports to Stockholders.
(a)
______________________________________________________
HUBER SELECT LARGE CAP VALUE FUND
HUBER SMALL CAP VALUE FUND
HUBER LARGE CAP VALUE FUND
HUBER MID CAP VALUE FUND
Investor Class
Institutional Class
______________________________________________________
SEMI-ANNUAL REPORT
April 30, 2024
Huber Funds
TABLE OF CONTENTS
| Letter to Shareholders | 1 |
| Expense Example | 4 |
| Sector Allocation of Portfolio Assets | 7 |
| Schedules of Investments | 9 |
| Statements of Assets And Liabilities | 22 |
| Statements of Operations | 26 |
| Statements of Changes in Net Assets | 28 |
| Financial Highlights | 36 |
| Notes to Financial Statements | 44 |
| Notice to Shareholders | 59 |
| Householding | 60 |
| Approval of Investment Advisory Agreement | 61 |
| Privacy Notice | 67 |
June 1, 2024
Dear Shareholder:
The following investment review relates to the performance of the Huber Funds for the six months ended April 30th, 2024:
Market Overview
During the six months ended April 30th, 2024, the S&P 500 Index reached new highs as inflation began to normalize following the conclusion of Federal Reserve rate hikes in July of 2023. Value stocks struggled to keep pace with their growth counterparts, led by AI darling Nvidia which returned +112% over the period.
Select Large Cap Value Fund
The Fund’s Institutional Class shares returned +21.22% over the six months ended April 30th, 2024, compared to the Bloomberg US 1000 Value Index return of +17.73%.
Stock selection drove the majority of the Fund’s outperformance during the period. The largest positive contributors to performance were Eli Lilly, Citigroup, United Rentals, Enova, and Select Medical. The largest detractors were KBR, Herbalife, Northrop Grumman, New Fortress Energy, and Oracle.
Small Cap Value Fund
The Fund’s Institutional Class shares returned +10.89% over the six months ended April 30th, 2024, compared to the Bloomberg US 2000 Value Index return of +17.34%.
Stock selection drove the majority of the Fund’s underperformance during the period. The largest positive contributors to performance were Cipher Pharmaceuticals, JAKKS Pacific, Lyft, Enova, and CSI Compressco. The largest detractors were Comtech, W&T Offshore, Commercial Vehicle Group, C&F Financial, and Herbalife.
Large Cap Value Fund
The Fund’s Institutional Class shares returned +19.91% over the six months ended April 30th, 2024, compared to the Bloomberg US 1000 Value Index return of +17.73%.
Stock selection drove the majority of the Fund’s outperformance during the period. The largest positive contributors to performance were Eli Lilly, Citigroup, Lionsgate, United Rentals, and First Horizon. The largest detractors were KBR, Northrop Grumman, New Fortress Energy, Commercial Vehicle Group, and Oracle.
Mid Cap Value Fund
The Fund’s Institutional Class shares returned +11.86% over the six months ended April 30th, 2024, compared to the Bloomberg US 2500 Value Index return of +17.61%.
1
Stock selection drove the majority of the Fund’s underperformance during the period. The largest positive contributors to performance were Tenet Healthcare, Citigroup, Enova, United Rentals, and Lyft. The largest detractors were Comtech, Commercial Vehicle Group, Herbalife, W&T Offshore, and Tetra Technologies.
Conclusion
A passive holder of the S&P 500 today has a nearly 35% allocation to the top 10 stocks. We cannot recall a time when the index was more concentrated, as at the peak of the .com bubble the top 10 stocks accounted for roughly 25% of the index. With history as a guide we continue to believe that the price momentum strategy followed by the indices will prove a losing one, and that outperformance will accrue to those committed to a disciplined and detailed bottom-up value strategy. We appreciate your continued trust in us.
Sincerely,
The Huber Capital Management Team
Past performance is not a guarantee of future results.
Mutual fund investing involves risk. Principal loss is possible. The Funds may invest in foreign securities which involve greater volatility and political, economic and currency risks and differences in accounting methods. The risks are greater for investments in emerging markets. Additionally, the Funds are subject to sector emphasis risk meaning that companies in the same or related businesses may comprise a significant portion of a Fund’s portfolio and adversely affect the value of the portfolio to a greater extent than if such business comprised a lesser portion of a portfolio. Investments in initial public offerings (“IPOs”) carry additional risk such as market and liquidity risk and can fluctuate considerably. When a Fund’s asset base is small, the impact of IPOs on the Fund’s performance could be magnified. Investments in smaller companies involve additional risks such as limited liquidity and greater volatility. Small- and medium-capitalization companies tend to have limited liquidity and greater price volatility than large-capitalization companies. Value stocks have a lower expected growth rate in earnings and sales, versus growth stocks.
Fund holdings and sector allocations are subject to change at any time and should not be considered a recommendation to buy or sell any security. Please see the schedule of investments in this report for complete Fund holdings.
Current and future portfolio holdings are subject to risk.
The information provided herein represents the opinion of Huber Capital Management, LLC and is not intended to be a forecast of future events, a guarantee of future results, nor investment advice.
The Bloomberg US 1000 Value Index is screened from the Bloomberg US 1000 Index and is constructed based on a linear combination of risk factors. The four factors are: 1) Earnings Yield, 2) Valuation, 3) Dividend Yield and 4) Growth. The factors are equally weighted when forming a composite signal where Growth is considered to be a negative indicator and thus flipped to be a negative. The Index is market-capitalization-weighted.
The Bloomberg US 2500 Value Index is screened from the Bloomberg US 2500 Index and is constructed based on a linear combination of risk factors. The four factors are: 1) Earnings Yield, 2) Valuation, 3) Dividend Yield and 4) Growth. The factors are equally weighted when forming a composite signal where Growth is considered to be a negative indicator and thus flipped to be a negative. The Index is market-capitalization-weighted.
2
The Bloomberg US 2000 Value Index is screened from the Bloomberg US 2000 Index and is constructed based on a linear combination of risk factors. The four factors are: 1) Earnings Yield, 2) Valuation, 3) Dividend Yield and 4) Growth. The factors are equally weighted when forming a composite signal where Growth is considered to be a negative indicator and thus flipped to be a negative. The Index is market-capitalization-weighted.
The S&P 500® Index, an unmanaged index, consists of 500 stocks chosen for market size, liquidity, and industry group representation. It is a market-value weighted index (stock price times number of shares outstanding), with each stock’s weight in the Index proportionate to its market value.
Indices in general do not reflect the payment of transaction costs, fees and expenses associated with actual investment in the Funds. The Funds’ value disciplines may prevent or restrict investment in major stocks in the benchmark indices. It is not possible to invest directly in an index. The Funds’ returns may not correlate with the returns of their benchmark indexes.
Short term performance may reflect conditions that are unsustainable and thus are unlikely to be repeated in the future.
Diversification does not assure a profit, nor does it protect against a loss in a declining market.
The Funds are distributed by Quasar Distributors, LLC.
3
Huber Funds
EXPENSE EXAMPLE – April 30, 2024 (Unaudited)
As a shareholder of a mutual fund, you incur two types of costs: (1) transaction costs, including sales charges (loads) on purchase payments, redemption fees, and exchange fees, and (2) ongoing costs, including management fees, distribution and/or service fees, and other Fund expenses. These Examples are intended to help you understand your ongoing costs (in dollars) of investing in the Funds and to compare these costs with the ongoing costs of investing in other mutual funds. The Example is based on an investment of $1,000 invested in each Fund at the beginning of the period and held for the entire period (11/1/23 – 4/30/24).
Actual Expenses
For each class of the Select Large Cap Value Fund, the Small Cap Value Fund, the Large Cap Value Fund and the Mid Cap Value Fund, two lines are presented in the tables below – the first line for each class provides information about actual account values and actual expenses. You may be assessed a fee for outgoing wire transfers, returned checks, and stop payment orders at prevailing rates charged by U.S. Bank Global Fund Services, the Funds’ transfer agent. The Examples below include, but are not limited to, management fees, fund accounting, custody and transfer agent fees. You may use the information in this line, together with the amount you invested, to estimate the expenses that you paid over the period. Simply divide your account value by $1,000 (for example, an $8,600 account value divided by $1,000 = 8.6), then multiply the result by the number in the first line under the heading entitled “Expenses Paid During Period” for your Fund and class to estimate the expenses you paid on your account during this period.
Hypothetical Example for Comparison Purposes
For each class of each Fund, the second line for each class provides information about hypothetical account values and hypothetical expenses based on the respective Fund’s actual expense ratio and an assumed rate of return of 5% per year before expenses, which is not the Fund’s actual return. The hypothetical account values and expenses may not be used to estimate the actual ending account balance or expenses you paid for the period. You may use this information to compare the ongoing costs of investing in the Funds and other funds. To do so, compare this 5% hypothetical example with the 5% hypothetical examples that appear in the shareholder reports of the other funds. Please note that the expenses shown in the table are meant to highlight your ongoing costs only and do not reflect any transaction costs, such as sales charges (loads), redemption fees, or exchange fees. Therefore, the second line of the table is useful in comparing ongoing costs only and will not help you determine the relative total costs of owning different funds. In addition, if these transaction costs were included, your costs would have been higher.
4
Huber Funds
EXPENSE EXAMPLE – April 30, 2024 (Unaudited), Continued
| Select Large Cap Value Fund | ||||
| Beginning | Ending | Expenses Paid | Annualized | |
| Account Value | Account Value | During Period | Expense | |
11/1/23 | 4/30/24 | 11/1/23 – 4/30/24 | Ratio* | |
| Investor Class | ||||
| Actual | $1,000.00 | $1,210.30 | $7.36 | 1.34% |
| Hypothetical (5% return | ||||
| before expenses) | $1,000.00 | $1,018.20 | $6.72 | 1.34% |
| Institutional Class | ||||
| Actual | $1,000.00 | $1,212.20 | $5.45 | 0.99% |
| Hypothetical (5% return | ||||
| before expenses) | $1,000.00 | $1,019.94 | $4.97 | 0.99% |
| Small Cap Value Fund | ||||
| Beginning | Ending | Expenses Paid | Annualized | |
| Account Value | Account Value | During Period | Expense | |
11/1/23 | 4/30/24 | 11/1/23 – 4/30/24 | Ratio* | |
| Investor Class | ||||
| Actual | $1,000.00 | $1,107.80 | $7.97 | 1.52% |
| Hypothetical (5% return | ||||
| before expenses) | $1,000.00 | $1,017.30 | $7.62 | 1.52% |
| Institutional Class | ||||
| Actual | $1,000.00 | $1,108.90 | $6.76 | 1.29% |
| Hypothetical (5% return | ||||
| before expenses) | $1,000.00 | $1,018.45 | $6.47 | 1.29% |
| Large Cap Value Fund | ||||
| Beginning | Ending | Expenses Paid | Annualized | |
| Account Value | Account Value | During Period | Expense | |
11/1/23 | 4/30/24 | 11/1/23 – 4/30/24 | Ratio* | |
| Investor Class | ||||
| Actual | $1,000.00 | $1,197.50 | $5.46 | 1.00% |
| Hypothetical (5% return | ||||
| before expenses) | $1,000.00 | $1,019.89 | $5.02 | 1.00% |
| Institutional Class | ||||
| Actual | $1,000.00 | $1,199.10 | $4.10 | 0.75% |
| Hypothetical (5% return | ||||
| before expenses) | $1,000.00 | $1,021.13 | $3.77 | 0.75% |
5
Huber Funds
EXPENSE EXAMPLE – April 30, 2024 (Unaudited), Continued
| Mid Cap Value Fund | ||||
| Beginning | Ending | Expenses Paid | Annualized | |
| Account Value | Account Value | During Period | Expense | |
11/1/23 | 4/30/24 | 11/1/23 – 4/30/24 | Ratio * | |
| Investor Class | ||||
| Actual | $1,000.00 | $1,118.10 | $5.53 | 1.05% |
| Hypothetical (5% return | ||||
| before expenses) | $1,000.00 | $1,019.64 | $5.27 | 1.05% |
| Institutional Class | ||||
| Actual | $1,000.00 | $1,118.60 | $5.27 | 1.00% |
| Hypothetical (5% return | ||||
| before expenses) | $1,000.00 | $1,019.89 | $5.02 | 1.00% |
| * | Expenses are equal to the annualized expense ratio of each class, multiplied by the average account value over the period, multiplied by 182 (days in most recent fiscal half-year) / 366 days to reflect the one-half year expense. |
6
Huber Funds
SECTOR ALLOCATION OF PORTFOLIO ASSETS – April 30, 2024 (Unaudited)
HUBER SELECT LARGE CAP VALUE FUND
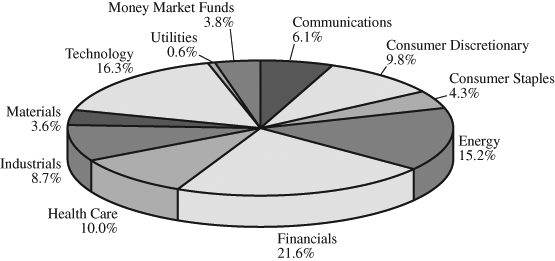
HUBER SMALL CAP VALUE FUND
Percentages represent market value as a percentage of total investments.
7
Huber Funds
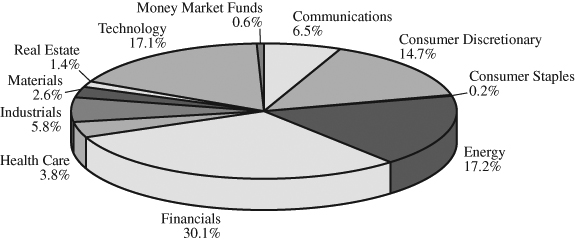
SECTOR ALLOCATION OF PORTFOLIO ASSETS – April 30, 2024 (Unaudited)
HUBER LARGE CAP VALUE FUND

HUBER MID CAP VALUE FUND

Percentages represent market value as a percentage of total investments.
8
Huber Select Large Cap Value Fund
SCHEDULE OF INVESTMENTS at April 30, 2024 (Unaudited)
| COMMON STOCKS - 95.2% | Shares | Value | ||||||
| Aerospace & Defense - 2.4% | ||||||||
| Northrop Grumman Corp. | 10,593 | $ | 5,137,923 | |||||
| Automotive - 1.2% | ||||||||
Goodyear Tire & Rubber Co.(a) | 215,889 | 2,582,032 | ||||||
| Banking - 18.6% | ||||||||
| Bank of America Corp. | 227,546 | 8,421,478 | ||||||
| Citigroup, Inc. | 174,268 | 10,687,856 | ||||||
| First Citizens BancShares, Inc. - Class A | 1,800 | 3,036,168 | ||||||
| First Horizon Corp. | 379,626 | 5,664,020 | ||||||
| JPMorgan Chase & Co. | 18,233 | 3,495,995 | ||||||
| Regions Financial Corp. | 180,500 | 3,478,235 | ||||||
| Truist Financial Corp. | 114,700 | 4,306,985 | ||||||
| 39,090,737 | ||||||||
| Beverages - 0.8% | ||||||||
| Anheuser-Busch InBev SA/NV - ADR | 27,900 | 1,664,514 | ||||||
| Biotech & Pharmaceuticals - 8.9% | ||||||||
| Eli Lilly & Co. | 20,437 | 15,963,341 | ||||||
| Merck & Co., Inc. | 14,193 | 1,834,019 | ||||||
| Pfizer, Inc. | 39,530 | 1,012,759 | ||||||
| 18,810,119 | ||||||||
| Chemicals - 3.6% | ||||||||
| Innospec, Inc. | 17,352 | 2,082,240 | ||||||
| Olin Corp. | 104,102 | 5,442,453 | ||||||
| 7,524,693 | ||||||||
| Consumer Services - 4.8% | ||||||||
| Rent-A-Center, Inc. | 326,432 | 10,122,656 | ||||||
| Cosmetics/Personal Care - 1.0% | ||||||||
| Kenvue, Inc. | 108,000 | 2,032,560 | ||||||
| Electric Utilities - 0.6% | ||||||||
| Constellation Energy Corp. | 6,977 | 1,297,303 | ||||||
| Electrical Equipment - 0.2% | ||||||||
| TE Connectivity Ltd. | 3,357 | 474,948 | ||||||
| Entertainment Content - 0.8% | ||||||||
Lions Gate Entertainment Corp. - Class B(a) | 180,000 | 1,697,400 | ||||||
| Food - 0.3% | ||||||||
| Tyson Foods, Inc. - Class A | 11,458 | 694,928 | ||||||
The accompanying notes are an integral part of these financial statements.
9
Huber Select Large Cap Value Fund
SCHEDULE OF INVESTMENTS at April 30, 2024 (Unaudited), Continued
| COMMON STOCKS - 95.2%, Continued | Shares | Value | ||||||
| Health Care Facilities & Services - 1.0% | ||||||||
| Select Medical Holdings Corp. | 70,796 | $ | 2,008,483 | |||||
| Home Construction - 0.4% | ||||||||
| Lennar Corp. - Class B | 5,560 | 780,568 | ||||||
| Industrial Support Services - 2.4% | ||||||||
| United Rentals, Inc. | 7,400 | 4,943,126 | ||||||
| Insurance - 1.3% | ||||||||
| CNO Financial Group, Inc. | 100,821 | 2,654,617 | ||||||
| Internet Media & Services - 1.8% | ||||||||
Lyft, Inc. - Class A(a) | 245,000 | 3,831,800 | ||||||
| Oil & Gas Producers - 15.0% | ||||||||
| BP PLC - ADR | 259,200 | 10,049,184 | ||||||
| Cheniere Energy, Inc. | 27,600 | 4,355,832 | ||||||
| Devon Energy Corp. | 47,000 | 2,405,460 | ||||||
| Golar LNG Ltd. | 134,700 | 3,302,844 | ||||||
| New Fortress Energy, Inc. | 52,411 | 1,373,168 | ||||||
| Shell PLC - ADR | 141,300 | 10,125,558 | ||||||
| 31,612,046 | ||||||||
| Retail - Discretionary - 0.9% | ||||||||
| Home Depot, Inc. | 5,398 | 1,804,120 | ||||||
| Software - 6.3% | ||||||||
| Microsoft Corp. | 27,928 | 10,873,208 | ||||||
| Oracle Corp. | 20,300 | 2,309,125 | ||||||
| 13,182,333 | ||||||||
| Specialty Finance - 1.6% | ||||||||
Enova International, Inc.(a) | 55,709 | 3,372,066 | ||||||
| Technology Hardware - 0.1% | ||||||||
| Hewlett Packard Enterprise Co. | 16,471 | 280,007 | ||||||
| Technology Services - 9.7% | ||||||||
| KBR, Inc. | 209,477 | 13,603,436 | ||||||
| Mastercard, Inc. - Class A | 10,859 | 4,899,581 | ||||||
| Science Applications International Corp. | 15,205 | 1,956,884 | ||||||
| 20,459,901 | ||||||||
| Telecommunications - 3.4% | ||||||||
| AT&T, Inc. | 421,380 | 7,117,108 | ||||||
The accompanying notes are an integral part of these financial statements.
10
Huber Select Large Cap Value Fund
SCHEDULE OF INVESTMENTS at April 30, 2024 (Unaudited), Continued
| COMMON STOCKS - 95.2%, Continued | Shares | Value | ||||||
| Tobacco & Cannabis - 2.1% | ||||||||
| Philip Morris International, Inc. | 47,259 | $ | 4,486,769 | |||||
| Transportation & Logistics - 3.5% | ||||||||
| FedEx Corp. | 28,400 | 7,434,552 | ||||||
| Transportation Equipment - 2.5% | ||||||||
Commercial Vehicle Group, Inc.(a) | 21,556 | 129,552 | ||||||
| General Motors Co. | 115,300 | 5,134,309 | ||||||
| 5,263,861 | ||||||||
| TOTAL COMMON STOCKS | ||||||||
| (Cost $137,108,811) | 200,361,170 | |||||||
| SHORT-TERM INVESTMENTS - 3.8% | ||||||||
| Money Market Funds - 3.8% | ||||||||
| First American Government | ||||||||
Obligations Fund - Class X, 5.23%(b) | 3,954,562 | 3,954,562 | ||||||
| First American Treasury | ||||||||
Obligations Fund - Class X, 5.21%(b) | 3,954,562 | 3,954,562 | ||||||
| TOTAL SHORT-TERM INVESTMENTS | ||||||||
| (Cost $7,909,124) | 7,909,124 | |||||||
| TOTAL INVESTMENTS - 99.0% | ||||||||
| (Cost $145,017,935) | 208,270,294 | |||||||
| Other Assets in Excess of Liabilities - 1.0% | 2,009,391 | |||||||
| TOTAL NET ASSETS - 100.0% | $ | 210,279,685 | ||||||
Percentages are stated as a percent of net assets.
| ADR | American Depositary Receipt |
| PLC | Public Limited Company |
| SA/NV | Societe Anonime/Naamloze Vennootschap |
(a) | Non-income producing security. |
(b) | The rate shown represents the 7-day effective yield as of April 30, 2024. |
The accompanying notes are an integral part of these financial statements.
11
Huber Small Cap Value Fund
SCHEDULE OF INVESTMENTS at April 30, 2024 (Unaudited)
| COMMON STOCKS - 98.3% | Shares | Value | ||||||
| Advertising - 0.5% | ||||||||
Stagwell, Inc.(a) | 52,605 | $ | 313,000 | |||||
| Asset Management - 2.7% | ||||||||
| Virtus Investment Partners, Inc. | 8,281 | 1,816,189 | ||||||
| Automotive - 7.9% | ||||||||
Goodyear Tire & Rubber Co.(a) | 95,200 | 1,138,592 | ||||||
| Miller Industries, Inc. | 84,878 | 4,134,407 | ||||||
| 5,272,999 | ||||||||
| Banking - 22.0% | ||||||||
| C&F Financial Corp. | 44,325 | 1,736,210 | ||||||
Carter Bankshares, Inc.(a) | 139,813 | 1,701,524 | ||||||
| First Citizens BancShares, Inc. - Class A | 2,683 | 4,525,577 | ||||||
| First Horizon Corp. | 141,679 | 2,113,851 | ||||||
| First United Corp. | 78,008 | 1,762,201 | ||||||
| Northrim BanCorp, Inc. | 36,729 | 1,755,646 | ||||||
| Old National Bancorp/IN | 26,029 | 430,519 | ||||||
| South State Corp. | 9,241 | 699,544 | ||||||
| 14,725,072 | ||||||||
| Biotech & Pharmaceuticals - 2.1% | ||||||||
Cipher Pharmaceuticals, Inc.(a) | 224,700 | 1,402,080 | ||||||
| Chemicals - 2.6% | ||||||||
| Innospec, Inc. | 14,387 | 1,726,440 | ||||||
| Commercial Support Services - 1.4% | ||||||||
| H&R Block, Inc. | 20,100 | 949,323 | ||||||
| Consumer Services - 4.6% | ||||||||
| Rent-A-Center, Inc. | 99,584 | 3,088,100 | ||||||
| Entertainment Content - 3.2% | ||||||||
Lions Gate Entertainment Corp. - Class B(a) | 226,106 | 2,132,179 | ||||||
| Food - 0.2% | ||||||||
Herbalife Ltd.(a) | 17,800 | 153,970 | ||||||
| Health Care Facilities & Services - 1.7% | ||||||||
| Select Medical Holdings Corp. | 16,500 | 468,105 | ||||||
Tenet Healthcare Corp.(a) | 5,801 | 651,394 | ||||||
| 1,119,499 | ||||||||
| Home Construction - 0.4% | ||||||||
Taylor Morrison Home Corp.(a) | 5,000 | 280,050 | ||||||
The accompanying notes are an integral part of these financial statements.
12
Huber Small Cap Value Fund
SCHEDULE OF INVESTMENTS at April 30, 2024 (Unaudited), Continued
| COMMON STOCKS - 98.3%, Continued | Shares | Value | ||||||
| Insurance - 2.6% | ||||||||
| CNO Financial Group, Inc. | 67,244 | $ | 1,770,535 | |||||
| Global Indemnity Group LLC - Class A | 700 | 22,302 | ||||||
| 1,792,837 | ||||||||
| Internet Media & Services - 2.8% | ||||||||
Lyft, Inc. - Class A(a) | 122,000 | 1,908,080 | ||||||
| Leisure Facilities & Services - 1.8% | ||||||||
| Boston Pizza Royalties Income Fund | 105,854 | 1,208,749 | ||||||
| Oil & Gas Producers - 11.2% | ||||||||
| Berry Corp. | 81,700 | 693,633 | ||||||
| Golar LNG Ltd. | 181,238 | 4,443,956 | ||||||
Gulfport Energy Corp.(a) | 800 | 126,968 | ||||||
| W&T Offshore, Inc. | 986,330 | 2,219,243 | ||||||
| 7,483,800 | ||||||||
| Oil & Gas Services & Equipment - 6.1% | ||||||||
| Kodiak Gas Services, Inc. | 41,585 | 1,130,280 | ||||||
TETRA Technologies, Inc.(a) | 690,298 | 2,961,379 | ||||||
| 4,091,659 | ||||||||
| Specialty Finance - 2.8% | ||||||||
Enova International, Inc.(a) | 30,702 | 1,858,392 | ||||||
| Technology Hardware - 5.6% | ||||||||
Comtech Telecommunications Corp.(a) | 68,548 | 128,870 | ||||||
Xperi, Inc.(a) | 346,361 | 3,640,254 | ||||||
| 3,769,124 | ||||||||
| Technology Services - 11.6% | ||||||||
| KBR, Inc. | 89,475 | 5,810,507 | ||||||
| Science Applications International Corp. | 15,110 | 1,944,657 | ||||||
| 7,755,164 | ||||||||
| Transportation Equipment - 4.5% | ||||||||
Commercial Vehicle Group, Inc.(a) | 496,378 | 2,983,232 | ||||||
| TOTAL COMMON STOCKS | ||||||||
| (Cost $40,658,472) | 65,829,938 | |||||||
The accompanying notes are an integral part of these financial statements.
13
Huber Small Cap Value Fund
SCHEDULE OF INVESTMENTS at April 30, 2024 (Unaudited), Continued
| REAL ESTATE INVESTMENT TRUSTS - 1.4% | Shares | Value | ||||||
| Granite Real Estate Investment Trust | 16,937 | $ | 841,261 | |||||
Seritage Growth Properties - Class A(a) | 10,184 | 95,119 | ||||||
| TOTAL REAL ESTATE | ||||||||
| INVESTMENT TRUSTS | ||||||||
| (Cost $618,327) | 936,380 | |||||||
| SHORT-TERM INVESTMENTS - 0.6% | ||||||||
| Money Market Funds - 0.6% | ||||||||
| First American Government | ||||||||
Obligations Fund - Class X, 5.23%(b) | 202,790 | 202,790 | ||||||
| First American Treasury | ||||||||
Obligations Fund - Class X, 5.21%(b) | 202,790 | 202,790 | ||||||
| TOTAL SHORT-TERM INVESTMENTS | ||||||||
| (Cost $405,580) | 405,580 | |||||||
| TOTAL INVESTMENTS - 100.3% | ||||||||
| (Cost $41,682,379) | 67,171,898 | |||||||
| Liabilities in Excess of Other Assets - (0.3)% | (188,498 | ) | ||||||
| TOTAL NET ASSETS - 100.0% | $ | 66,983,400 | ||||||
Percentages are stated as a percent of net assets.
(a) | Non-income producing security. |
(b) | The rate shown represents the 7-day effective yield as of April 30, 2024. |
The accompanying notes are an integral part of these financial statements.
14
Huber Large Cap Value Fund
SCHEDULE OF INVESTMENTS at April 30, 2024 (Unaudited)
| COMMON STOCKS - 99.6% | Shares | Value | ||||||
| Aerospace & Defense - 2.8% | ||||||||
| Northrop Grumman Corp. | 700 | $ | 339,521 | |||||
| Automotive - 0.3% | ||||||||
Goodyear Tire & Rubber Co.(a) | 3,403 | 40,700 | ||||||
| Banking - 15.5% | ||||||||
| Bank of America Corp. | 5,300 | 196,153 | ||||||
| Citigroup, Inc. | 12,800 | 785,023 | ||||||
| First Horizon Corp. | 25,292 | 377,357 | ||||||
| JPMorgan Chase & Co. | 1,100 | 210,914 | ||||||
| Regions Financial Corp. | 5,000 | 96,350 | ||||||
| Truist Financial Corp. | 6,000 | 225,300 | ||||||
| 1,891,097 | ||||||||
| Biotech & Pharmaceuticals - 14.4% | ||||||||
| Eli Lilly & Co. | 2,000 | 1,562,200 | ||||||
| Merck & Co., Inc. | 1,100 | 142,142 | ||||||
| Pfizer, Inc. | 1,600 | 40,992 | ||||||
| 1,745,334 | ||||||||
| Chemicals - 0.8% | ||||||||
| Innospec, Inc. | 800 | 96,000 | ||||||
| Consumer Services - 4.1% | ||||||||
| Rent-A-Center, Inc. | 15,894 | 492,873 | ||||||
| Electric Utilities - 2.3% | ||||||||
| American Electric Power Co., Inc. | 300 | 25,809 | ||||||
| Constellation Energy Corp. | 533 | 99,106 | ||||||
| Entergy Corp. | 900 | 96,003 | ||||||
| NextEra Energy, Inc. | 800 | 53,576 | ||||||
| 274,494 | ||||||||
| Electrical Equipment - 0.3% | ||||||||
| TE Connectivity Ltd. | 300 | 42,444 | ||||||
| Entertainment Content - 2.2% | ||||||||
Lions Gate Entertainment Corp. - Class B(a) | 28,200 | 265,926 | ||||||
| Food - 0.9% | ||||||||
| Lamb Weston Holdings, Inc. | 500 | 41,670 | ||||||
| Tyson Foods, Inc. - Class A | 1,100 | 66,715 | ||||||
| 108,385 | ||||||||
The accompanying notes are an integral part of these financial statements.
15
Huber Large Cap Value Fund
SCHEDULE OF INVESTMENTS at April 30, 2024 (Unaudited), Continued
| COMMON STOCKS - 99.6%, Continued | Shares | Value | ||||||
| Health Care Facilities & Services - 0.3% | ||||||||
| Select Medical Holdings Corp. | 1,100 | $ | 31,207 | |||||
| Industrial Support Services - 1.1% | ||||||||
| United Rentals, Inc. | 200 | 133,598 | ||||||
| Institutional Financial Services - 0.7% | ||||||||
| Goldman Sachs Group, Inc. | 200 | 85,342 | ||||||
| Insurance - 1.7% | ||||||||
| CNO Financial Group, Inc. | 8,073 | 212,562 | ||||||
| Internet Media & Services - 1.2% | ||||||||
Lyft, Inc. - Class A(a) | 9,400 | 147,016 | ||||||
| Oil & Gas Producers - 18.3% | ||||||||
| BP PLC - ADR | 14,900 | 577,673 | ||||||
| Chesapeake Energy Corp. | 1,000 | 89,880 | ||||||
| Golar LNG Ltd. | 31,803 | 779,810 | ||||||
| New Fortress Energy, Inc. | 4,000 | 104,800 | ||||||
| Shell PLC - ADR | 9,300 | 666,438 | ||||||
| 2,218,601 | ||||||||
| Retail - Consumer Staples - 2.2% | ||||||||
| Walmart, Inc. | 4,500 | 267,075 | ||||||
| Retail - Discretionary - 1.7% | ||||||||
| Home Depot, Inc. | 600 | 200,532 | ||||||
| Software - 9.2% | ||||||||
| Microsoft Corp. | 2,600 | 1,012,258 | ||||||
| Oracle Corp. | 900 | 102,375 | ||||||
| 1,114,633 | ||||||||
| Specialty Finance - 1.3% | ||||||||
Enova International, Inc.(a) | 2,510 | 151,931 | ||||||
| Technology Services - 11.8% | ||||||||
| KBR, Inc. | 17,930 | 1,164,374 | ||||||
| Mastercard, Inc. - Class A | 550 | 248,160 | ||||||
| Visa, Inc. - Class A | 100 | 26,861 | ||||||
| 1,439,395 | ||||||||
| Telecommunications - 0.5% | ||||||||
| AT&T, Inc. | 3,900 | 65,871 | ||||||
| Tobacco & Cannabis - 0.5% | ||||||||
| Philip Morris International, Inc. | 600 | 56,964 | ||||||
The accompanying notes are an integral part of these financial statements.
16
Huber Large Cap Value Fund
SCHEDULE OF INVESTMENTS at April 30, 2024 (Unaudited), Continued
| COMMON STOCKS - 99.6%, Continued | Shares | Value | ||||||
| Transportation & Logistics - 3.2% | ||||||||
| FedEx Corp. | 1,500 | $ | 392,670 | |||||
| Transportation Equipment - 2.3% | ||||||||
| General Motors Co. | 6,300 | 280,539 | ||||||
| TOTAL COMMON STOCKS | ||||||||
| (Cost $5,573,529) | 12,094,710 | |||||||
| SHORT-TERM INVESTMENTS - 0.4% | ||||||||
| Money Market Funds - 0.4% | ||||||||
| First American Government | ||||||||
Obligations Fund - Class X, 5.23%(b) | 25,782 | 25,782 | ||||||
| First American Treasury | ||||||||
Obligations Fund - Class X, 5.21%(b) | 25,782 | 25,782 | ||||||
| TOTAL SHORT-TERM INVESTMENTS | ||||||||
| (Cost $51,564) | 51,564 | |||||||
| TOTAL INVESTMENTS - 100.0% | ||||||||
| (Cost $5,625,093) | 12,146,274 | |||||||
Other Assets in Excess of Liabilities - 0.0%(c) | 5,101 | |||||||
| TOTAL NET ASSETS - 100.0% | $ | 12,151,375 | ||||||
Percentages are stated as a percent of net assets.
| ADR | American Depositary Receipt |
| PLC | Public Limited Company |
(a) | Non-income producing security. |
(b) | The rate shown represents the 7-day effective yield as of April 30, 2024. |
(c) | Represents less than 0.05% of net assets. |
The accompanying notes are an integral part of these financial statements.
17
Huber Mid Cap Value Fund
SCHEDULE OF INVESTMENTS at April 30, 2024 (Unaudited)
| COMMON STOCKS - 94.7% | Shares | Value | ||||||
| Aerospace & Defense - 1.9% | ||||||||
| Northrop Grumman Corp. | 400 | $ | 194,012 | |||||
| Asset Management - 0.2% | ||||||||
| Virtus Investment Partners, Inc. | 109 | 23,906 | ||||||
| Automotive - 5.7% | ||||||||
Goodyear Tire & Rubber Co.(a) | 8,100 | 96,876 | ||||||
| Miller Industries, Inc. | 10,085 | 491,240 | ||||||
| 588,116 | ||||||||
| Banking - 20.3% | ||||||||
| Citigroup, Inc. | 6,300 | 386,379 | ||||||
| First Citizens BancShares, Inc. - Class A | 350 | 590,367 | ||||||
| First Horizon Corp. | 21,417 | 319,542 | ||||||
| Regions Financial Corp. | 14,000 | 269,780 | ||||||
| South State Corp. | 2,052 | 155,336 | ||||||
| Truist Financial Corp. | 10,000 | 375,500 | ||||||
| 2,096,904 | ||||||||
| Biotech & Pharmaceuticals - 1.1% | ||||||||
| GSK PLC - ADR | 2,800 | 116,032 | ||||||
| Chemicals - 5.6% | ||||||||
| Innospec, Inc. | 2,788 | 334,560 | ||||||
| Olin Corp. | 4,559 | 238,345 | ||||||
| 572,905 | ||||||||
| Consumer Services - 4.8% | ||||||||
| Rent-A-Center, Inc. | 15,800 | 489,958 | ||||||
| Electric Utilities - 0.4% | ||||||||
| Entergy Corp. | 400 | 42,668 | ||||||
| Food - 0.4% | ||||||||
| Conagra Brands, Inc. | 700 | 21,546 | ||||||
| Lamb Weston Holdings, Inc. | 266 | 22,168 | ||||||
| 43,714 | ||||||||
| Health Care Facilities & Services - 3.3% | ||||||||
| Select Medical Holdings Corp. | 2,200 | 62,414 | ||||||
Tenet Healthcare Corp.(a) | 2,500 | 280,725 | ||||||
| 343,139 | ||||||||
| Industrial Support Services - 3.2% | ||||||||
| United Rentals, Inc. | 500 | 333,995 | ||||||
The accompanying notes are an integral part of these financial statements.
18
Huber Mid Cap Value Fund
SCHEDULE OF INVESTMENTS at April 30, 2024 (Unaudited), Continued
| COMMON STOCKS - 94.7%, Continued | Shares | Value | ||||||
| Insurance - 2.1% | ||||||||
| CNO Financial Group, Inc. | 4,510 | $ | 118,748 | |||||
| Global Indemnity Group LLC - Class A | 2,881 | 91,789 | ||||||
| 210,537 | ||||||||
| Internet Media & Services - 2.4% | ||||||||
Lyft, Inc. - Class A(a) | 15,600 | 243,984 | ||||||
| Oil & Gas Producers - 12.5% | ||||||||
| BP PLC - ADR | 4,700 | 182,219 | ||||||
| Golar LNG Ltd. | 27,339 | 670,352 | ||||||
| New Fortress Energy, Inc. | 4,000 | 104,800 | ||||||
| W&T Offshore, Inc. | 144,200 | 324,450 | ||||||
| 1,281,821 | ||||||||
| Oil & Gas Services & Equipment - 6.0% | ||||||||
TETRA Technologies, Inc.(a) | 142,924 | 613,144 | ||||||
| Specialty Finance - 3.5% | ||||||||
Enova International, Inc.(a) | 5,904 | 357,369 | ||||||
| Technology Services - 10.9% | ||||||||
| KBR, Inc. | 15,894 | 1,032,156 | ||||||
| Science Applications International Corp. | 700 | 90,090 | ||||||
| 1,122,246 | ||||||||
| Telecommunications - 0.5% | ||||||||
| AT&T, Inc. | 3,200 | 54,048 | ||||||
| Transportation & Logistics - 3.3% | ||||||||
| FedEx Corp. | 1,300 | 340,314 | ||||||
| Transportation Equipment - 6.6% | ||||||||
Commercial Vehicle Group, Inc.(a) | 69,688 | 418,825 | ||||||
| General Motors Co. | 5,800 | 258,274 | ||||||
| 677,099 | ||||||||
| TOTAL COMMON STOCKS | ||||||||
| (Cost $6,501,901) | 9,745,911 | |||||||
The accompanying notes are an integral part of these financial statements.
19
Huber Mid Cap Value Fund
SCHEDULE OF INVESTMENTS at April 30, 2024 (Unaudited), Continued
| REAL ESTATE INVESTMENT TRUSTS - 0.5% | Shares | Value | ||||||
| Granite Real Estate Investment Trust | 1,100 | $ | 54,637 | |||||
| TOTAL REAL ESTATE | ||||||||
| INVESTMENT TRUSTS | ||||||||
| (Cost $29,536) | 54,637 | |||||||
| SHORT-TERM INVESTMENTS - 4.6% | ||||||||
| Money Market Funds - 4.6% | ||||||||
| First American Government | ||||||||
Obligations Fund - Class X, 5.23%(b) | 238,541 | 238,541 | ||||||
| First American Treasury | ||||||||
Obligations Fund - Class X, 5.21%(b) | 238,541 | 238,541 | ||||||
| TOTAL SHORT-TERM INVESTMENTS | ||||||||
| (Cost $477,082) | 477,082 | |||||||
| TOTAL INVESTMENTS - 99.8% | ||||||||
| (Cost $7,008,519) | 10,277,630 | |||||||
| Other Assets in Excess of Liabilities - 0.2% | 18,591 | |||||||
| TOTAL NET ASSETS - 100.0% | $ | 10,296,221 | ||||||
Percentages are stated as a percent of net assets.
| ADR | American Depositary Receipt |
| PLC | Public Limited Company |
(a) | Non-income producing security. |
(b) | The rate shown represents the 7-day effective yield as of April 30, 2024. |
The accompanying notes are an integral part of these financial statements.
20
Huber Funds
(This Page Intentionally Left Blank.)
21
Huber Funds
STATEMENTS OF ASSETS AND LIABILITIES at April 30, 2024 (Unaudited)
| Huber Select | Huber | |||||||
| Large Cap | Small Cap | |||||||
| Value Fund | Value Fund | |||||||
| ASSETS | ||||||||
| Investments in securities, at value | ||||||||
| (identified cost $145,017,935 and | ||||||||
| $41,682,379, respectively) | $ | 208,270,294 | $ | 67,171,898 | ||||
| Cash | — | 7,401 | ||||||
| Receivables | ||||||||
| Fund shares issued | 3,007,296 | 600 | ||||||
| Investment securities sold | — | 12,897 | ||||||
| Dividends and interest | 172,541 | 35,568 | ||||||
| Dividend tax reclaim | 11,054 | 9,056 | ||||||
| Prepaid expenses | 37,881 | 21,367 | ||||||
| Total assets | 211,499,066 | 67,258,787 | ||||||
| LIABILITIES | ||||||||
| Payables | ||||||||
| Fund shares redeemed | 2,224 | — | ||||||
| Investment securities purchased | 1,023,149 | 124,546 | ||||||
| Advisory fees | 125,614 | 47,846 | ||||||
| 12b-1 distribution fees | 27,704 | 51,006 | ||||||
| Administration fees | — | 3,808 | ||||||
| Audit fees | 11,189 | 11,190 | ||||||
| Chief Compliance Officer fee | 907 | 907 | ||||||
| Custody fees | 988 | 1,589 | ||||||
| Fund accounting fees | 132 | 2,030 | ||||||
| Shareholder servicing fees | 23,223 | 24,412 | ||||||
| Transfer agent fees and expenses | 2,123 | 3,354 | ||||||
| Trustee fees and expenses | 2,036 | 2,036 | ||||||
| Accrued expenses | 92 | 2,663 | ||||||
| Total liabilities | 1,219,381 | 275,387 | ||||||
| NET ASSETS | $ | 210,279,685 | $ | 66,983,400 | ||||
The accompanying notes are an integral part of these financial statements.
22
Huber Funds
STATEMENTS OF ASSETS AND LIABILITIES at April 30, 2024 (Unaudited), Continued
| Huber Select | Huber | |||||||
| Large Cap | Small Cap | |||||||
| Value Fund | Value Fund | |||||||
| CALCULATION OF NET ASSET VALUE PER SHARE | ||||||||
| Investor Class | ||||||||
| Net assets applicable to shares outstanding | $ | 32,785,605 | $ | 25,079,456 | ||||
| Shares issued and outstanding [unlimited number | ||||||||
| of shares (par value $0.01) authorized] | 1,070,365 | 1,004,316 | ||||||
| Net asset value, offering and | ||||||||
| redemption price per share (Note 1)^ | $ | 30.63 | $ | 24.97 | ||||
| Institutional Class | ||||||||
| Net assets applicable to shares outstanding | $ | 177,494,080 | $ | 41,903,944 | ||||
| Shares issued and outstanding [unlimited number | ||||||||
| of shares (par value $0.01) authorized] | 5,802,136 | 1,655,995 | ||||||
| Net asset value, offering and | ||||||||
| redemption price per share (Note 1)^ | $ | 30.59 | $ | 25.30 | ||||
| COMPONENTS OF NET ASSETS | ||||||||
| Paid-in capital | $ | 154,526,232 | $ | 55,401,931 | ||||
| Total distributable earnings | 55,753,453 | 11,581,469 | ||||||
| Net assets | $ | 210,279,685 | $ | 66,983,400 | ||||
| ^ | A redemption fee of 1% is assessed against shares redeemed within 60 days of purchase. |
The accompanying notes are an integral part of these financial statements.
23
Huber Funds
STATEMENTS OF ASSETS AND LIABILITIES at April 30, 2024 (Unaudited)
| Huber | Huber | |||||||
| Large Cap | Mid Cap | |||||||
| Value Fund | Value Fund | |||||||
| ASSETS | ||||||||
| Investments in securities, at value | ||||||||
| (identified cost $5,625,093 and | ||||||||
| $7,008,519, respectively) | $ | 12,146,274 | $ | 10,277,630 | ||||
| Receivables | ||||||||
| Fund shares sold | 700 | — | ||||||
| Dividends and interest | 2,514 | 5,486 | ||||||
| Dividend tax reclaim | 743 | 22 | ||||||
| Due from Adviser (Note 4) | 10,245 | 9,615 | ||||||
| Prepaid expenses | 25,873 | 30,085 | ||||||
| Total assets | 12,186,349 | 10,322,838 | ||||||
| LIABILITIES | ||||||||
| Payables | ||||||||
| 12b-1 distribution fees | 7,580 | 339 | ||||||
| Administration fees | 3,920 | 3,944 | ||||||
| Audit fees | 11,190 | 11,190 | ||||||
| Chief Compliance Officer fee | 908 | 907 | ||||||
| Custody fees | 913 | 856 | ||||||
| Fund accounting fees | 2,526 | 2,643 | ||||||
| Shareholder servicing fees | 1,802 | 805 | ||||||
| Transfer agent fees and expenses | 2,374 | 2,536 | ||||||
| Trustee fees and expenses | 2,067 | 2,037 | ||||||
| Accrued expenses | 1,694 | 1,360 | ||||||
| Total liabilities | 34,974 | 26,617 | ||||||
| NET ASSETS | $ | 12,151,375 | $ | 10,296,221 | ||||
The accompanying notes are an integral part of these financial statements.
24
Huber Funds
STATEMENTS OF ASSETS AND LIABILITIES at April 30, 2024 (Unaudited), Continued
| Huber | Huber | |||||||
| Large Cap | Mid Cap | |||||||
| Value Fund | Value Fund | |||||||
| CALCULATION OF NET ASSET VALUE PER SHARE | ||||||||
| Investor Class | ||||||||
| Net assets applicable to shares outstanding | $ | 1,949,464 | $ | 409,246 | ||||
| Shares issued and outstanding [unlimited number | ||||||||
| of shares (par value $0.01) authorized] | 90,074 | 27,366 | ||||||
| Net asset value, offering and | ||||||||
| redemption price per share (Note 1)^ | $ | 21.64 | $ | 14.95 | ||||
| Institutional Class | ||||||||
| Net assets applicable to shares outstanding | $ | 10,201,911 | $ | 9,886,975 | ||||
| Shares issued and outstanding [unlimited number | ||||||||
| of shares (par value $0.01) authorized] | 469,032 | 660,402 | ||||||
| Net asset value, offering and | ||||||||
| redemption price per share (Note 1)^ | $ | 21.75 | $ | 14.97 | ||||
| COMPONENTS OF NET ASSETS | ||||||||
| Paid-in capital | $ | 7,123,518 | $ | 8,122,036 | ||||
| Total distributable earnings | 5,027,857 | 2,174,185 | ||||||
| Net assets | $ | 12,151,375 | $ | 10,296,221 | ||||
| ^ | A redemption fee of 1% is assessed against shares redeemed within 60 days of purchase. |
The accompanying notes are an integral part of these financial statements.
25
Huber Funds
STATEMENTS OF OPERATIONS For the Six Months Ended April 30, 2024 (Unaudited)
| Huber Select | Huber | |||||||
| Large Cap | Small Cap | |||||||
| Value Fund | Value Fund | |||||||
| INVESTMENT INCOME | ||||||||
| Dividends (net of foreign taxes and issuance fees | ||||||||
| withheld of $1,646 and $10,023, respectively) | $ | 1,681,303 | $ | 572,688 | ||||
| Interest | 178,478 | 43,779 | ||||||
| Total investment income | 1,859,781 | 616,467 | ||||||
| Expenses | ||||||||
| Advisory fees (Note 4) | 574,968 | 323,357 | ||||||
| Administration fees (Note 4) | 69,260 | 43,352 | ||||||
| Transfer agent fees and expenses (Note 4) | 32,672 | 25,595 | ||||||
| 12b-1 distribution fees - Investor Class (Note 6) | 28,932 | 20,293 | ||||||
| Fund accounting fees (Note 4) | 26,379 | 16,862 | ||||||
| Registration fees | 17,476 | 15,447 | ||||||
| Shareholder servicing fees - Investor Class (Note 5) | 11,573 | 8,915 | ||||||
| Audit fees | 11,189 | 11,190 | ||||||
| Trustee fees and expenses | 8,375 | 8,375 | ||||||
| Chief Compliance Officer fee (Note 4) | 5,594 | 5,594 | ||||||
| Custody fees (Note 4) | 4,978 | 7,109 | ||||||
| Reports to shareholders | 3,500 | 3,144 | ||||||
| Miscellaneous expense | 2,682 | 2,641 | ||||||
| Legal fees | 2,654 | 2,698 | ||||||
| Insurance expense | 2,312 | 2,053 | ||||||
| Total expenses | 802,544 | 496,625 | ||||||
| Less: advisory fee waiver (Note 4) | (4,630 | ) | (45,903 | ) | ||||
| Net expenses | 797,914 | 450,722 | ||||||
| Net investment income | 1,061,867 | 165,745 | ||||||
| REALIZED AND UNREALIZED GAIN/(LOSS) | ||||||||
| ON INVESTMENTS AND FOREIGN CURRENCY | ||||||||
| Net realized gain/(loss) on: | ||||||||
| Investments | (1,337,897 | ) | 347,047 | |||||
| Foreign currency | — | (640 | ) | |||||
| Net change in unrealized appreciation/(depreciation) on: | ||||||||
| Investments | 25,515,130 | 5,718,224 | ||||||
| Foreign currency | — | 23 | ||||||
| Net realized and unrealized gain | ||||||||
| on investments and foreign currency | 24,177,233 | 6,064,654 | ||||||
| Net Increase in Net Assets | ||||||||
| Resulting from Operations | $ | 25,239,100 | $ | 6,230,399 | ||||
The accompanying notes are an integral part of these financial statements.
26
Huber Funds
STATEMENTS OF OPERATIONS For the Six Months Ended April 30, 2024 (Unaudited)
| Huber | Huber | |||||||
| Large Cap | Mid Cap | |||||||
| Value Fund | Value Fund | |||||||
| INVESTMENT INCOME | ||||||||
| Dividends (net of foreign taxes and issuance fees | ||||||||
| withheld of $149 and $399, respectively) | $ | 126,819 | $ | 96,618 | ||||
| Interest | 5,804 | 12,332 | ||||||
| Total investment income | 132,623 | 108,950 | ||||||
| Expenses | ||||||||
| Administration fees (Note 4) | 27,863 | 27,816 | ||||||
| Transfer agent fees and expenses (Note 4) | 16,948 | 17,143 | ||||||
| Fund accounting fees (Note 4) | 15,547 | 15,530 | ||||||
| Registration fees | 13,621 | 14,494 | ||||||
| Audit fees | 11,189 | 11,190 | ||||||
| Trustee fees and expenses | 8,406 | 8,375 | ||||||
| Chief Compliance Officer fee (Note 4) | 5,595 | 5,594 | ||||||
| Legal fees | 2,702 | 2,702 | ||||||
| Miscellaneous expense | 2,526 | 2,582 | ||||||
| Custody fees (Note 4) | 2,656 | 2,857 | ||||||
| 12b-1 distribution fees - Investor Class (Note 6) | 2,238 | 99 | ||||||
| Reports to shareholders | 1,665 | 1,645 | ||||||
| Insurance expense | 1,647 | 1,629 | ||||||
| Total expenses | 112,603 | 111,656 | ||||||
| Less: advisory fee waiver and | ||||||||
| expenses reimbursed (Note 4) | (68,009 | ) | (60,884 | ) | ||||
| Net expenses | 44,594 | 50,772 | ||||||
| Net investment income | 88,029 | 58,178 | ||||||
| REALIZED AND UNREALIZED GAIN/(LOSS) | ||||||||
| ON INVESTMENTS AND FOREIGN CURRENCY | ||||||||
| Net realized gain/(loss) on: | ||||||||
| Investments | 143,235 | 151,414 | ||||||
| Foreign currency | — | 17 | ||||||
| Net change in unrealized appreciation/(depreciation) on: | ||||||||
| Investments | 1,783,719 | 931,472 | ||||||
| Net realized and unrealized gain on | ||||||||
| investments and foreign currency | 1,926,954 | 1,082,903 | ||||||
| Net Increase in Net Assets | ||||||||
| Resulting from Operations | $ | 2,014,983 | $ | 1,141,081 | ||||
The accompanying notes are an integral part of these financial statements.
27
Huber Select Large Cap Value Fund
STATEMENTS OF CHANGES IN NET ASSETS
| Six Months Ended | ||||||||
| April 30, 2024 | Year Ended | |||||||
| (Unaudited) | October 31, 2023 | |||||||
| INCREASE/(DECREASE) IN NET ASSETS FROM: | ||||||||
| OPERATIONS | ||||||||
| Net investment income | $ | 1,061,867 | $ | 1,195,605 | ||||
| Net realized loss on investments | (1,337,897 | ) | (3,950,623 | ) | ||||
| Net change in unrealized | ||||||||
| appreciation/(depreciation) on investments | 25,515,130 | 7,201,923 | ||||||
| Net increase in net assets | ||||||||
| resulting from operations | 25,239,100 | 4,446,905 | ||||||
| DISTRIBUTIONS TO SHAREHOLDERS | ||||||||
| Net dividends and distributions to shareholders – | ||||||||
| Investor Class shares | (145,815 | ) | (109,488 | ) | ||||
| Net dividends and distributions to shareholders – | ||||||||
| Institutional Class shares | (1,234,306 | ) | (461,084 | ) | ||||
| Total distributions to shareholders | (1,380,121 | ) | (570,572 | ) | ||||
| CAPITAL SHARE TRANSACTIONS | ||||||||
| Net increase in net assets derived from | ||||||||
| net change in outstanding shares (a) | 95,905,467 | 18,654,983 | ||||||
| Total increase in net assets | 119,764,446 | 22,531,316 | ||||||
| NET ASSETS | ||||||||
| Beginning of period | 90,515,239 | 67,983,923 | ||||||
| End of period | $ | 210,279,685 | $ | 90,515,239 | ||||
The accompanying notes are an integral part of these financial statements.
28
Huber Select Large Cap Value Fund
STATEMENTS OF CHANGES IN NET ASSETS, Continued
| (a) | A summary of share transactions is as follows: |
| Investor Class | ||||||||||||||||
| Six Months Ended | ||||||||||||||||
| April 30, 2024 | Year Ended | |||||||||||||||
| (Unaudited) | October 31, 2023 | |||||||||||||||
| Shares | Paid-in Capital | Shares | Paid-in Capital | |||||||||||||
| Shares sold | 488,319 | $ | 14,610,183 | 136,916 | $ | 3,403,244 | ||||||||||
| Shares issued | ||||||||||||||||
| on reinvestments | ||||||||||||||||
| of distributions | 5,053 | 139,770 | 4,356 | 105,894 | ||||||||||||
| Shares redeemed** | (110,678 | ) | (3,282,097 | ) | (138,843 | ) | (3,491,346 | ) | ||||||||
| Net increase | 382,694 | $ | 11,467,856 | 2,429 | $ | 17,792 | ||||||||||
| ** Net of redemption | ||||||||||||||||
| fees of | $ | 696 | $ | — | ||||||||||||
| Institutional Class | ||||||||||||||||
| Six Months Ended | ||||||||||||||||
| April 30, 2024 | Year Ended | |||||||||||||||
| (Unaudited) | October 31, 2023 | |||||||||||||||
| Shares | Paid-in Capital | Shares | Paid-in Capital | |||||||||||||
| Shares sold | 3,072,050 | $ | 88,288,749 | 971,313 | $ | 24,203,655 | ||||||||||
| Shares issued | ||||||||||||||||
| on reinvestments | ||||||||||||||||
| of distributions | 41,747 | 1,151,392 | 18,687 | 452,975 | ||||||||||||
| Shares redeemed** | (172,403 | ) | (5,002,530 | ) | (244,527 | ) | (6,019,439 | ) | ||||||||
| Net increase | 2,941,394 | $ | 84,437,611 | 745,473 | $ | 18,637,191 | ||||||||||
| ** Net of redemption | ||||||||||||||||
| fees of | $ | 3,996 | $ | 281 | ||||||||||||
The accompanying notes are an integral part of these financial statements.
29
Huber Small Cap Value Fund
STATEMENTS OF CHANGES IN NET ASSETS
| Six Months Ended | ||||||||
| April 30, 2024 | Year Ended | |||||||
| (Unaudited) | October 31, 2023 | |||||||
| INCREASE/(DECREASE) IN NET ASSETS FROM: | ||||||||
| OPERATIONS | ||||||||
| Net investment income | $ | 165,745 | $ | 164,317 | ||||
| Net realized gain/(loss) on: | ||||||||
| Investments | 347,047 | (1,423,395 | ) | |||||
| Foreign currency | (640 | ) | (1,761 | ) | ||||
| Net change in unrealized | ||||||||
| appreciation/(depreciation) on: | ||||||||
| Investments | 5,718,224 | (851,384 | ) | |||||
| Foreign currency | 23 | 604 | ||||||
| Net increase/(decrease) in net assets | ||||||||
| resulting from operations | 6,230,399 | (2,111,619 | ) | |||||
| DISTRIBUTIONS TO SHAREHOLDERS | ||||||||
| Net dividends and distributions to shareholders – | ||||||||
| Investor Class shares | (90,752 | ) | — | |||||
| Net dividends and distributions to shareholders – | ||||||||
| Institutional Class shares | (184,962 | ) | — | |||||
| Total distributions to shareholders | (275,714 | ) | — | |||||
| CAPITAL SHARE TRANSACTIONS | ||||||||
| Net increase in net assets derived from | ||||||||
| net change in outstanding shares (a) | 2,704,825 | 2,501,083 | ||||||
| Total increase in net assets | 8,659,510 | 389,464 | ||||||
| NET ASSETS | ||||||||
| Beginning of period | 58,323,890 | 57,934,426 | ||||||
| End of period | $ | 66,983,400 | $ | 58,323,890 | ||||
The accompanying notes are an integral part of these financial statements.
30
Huber Small Cap Value Fund
STATEMENTS OF CHANGES IN NET ASSETS, Continued
| (a) | A summary of share transactions is as follows: |
| Investor Class | ||||||||||||||||
| Six Months Ended | ||||||||||||||||
| April 30, 2024 | Year Ended | |||||||||||||||
| (Unaudited) | October 31, 2023 | |||||||||||||||
| Shares | Paid-in Capital | Shares | Paid-in Capital | |||||||||||||
| Shares sold | 17,265 | $ | 436,638 | 63,999 | $ | 1,460,859 | ||||||||||
| Shares issued | ||||||||||||||||
| on reinvestments | ||||||||||||||||
| of distributions | 3,644 | 89,231 | — | — | ||||||||||||
| Shares redeemed** | (74,148 | ) | (1,819,852 | ) | (77,086 | ) | (1,764,826 | ) | ||||||||
| Net decrease | (53,239 | ) | $ | (1,293,983 | ) | (13,087 | ) | $ | (303,967 | ) | ||||||
| ** Net of redemption | ||||||||||||||||
| fees of | $ | 13 | $ | — | ||||||||||||
| Institutional Class | ||||||||||||||||
| Six Months Ended | ||||||||||||||||
| April 30, 2024 | Year Ended | |||||||||||||||
| (Unaudited) | October 31, 2023 | |||||||||||||||
| Shares | Paid-in Capital | Shares | Paid-in Capital | |||||||||||||
| Shares sold | 181,664 | $ | 4,632,777 | 190,305 | $ | 4,541,447 | ||||||||||
| Shares issued | ||||||||||||||||
| on reinvestments | ||||||||||||||||
| of distributions | 3,230 | 80,083 | — | — | ||||||||||||
| Shares redeemed** | (28,888 | ) | (714,052 | ) | (73,844 | ) | (1,736,397 | ) | ||||||||
| Net increase | 156,006 | $ | 3,998,808 | 116,461 | $ | 2,805,050 | ||||||||||
| ** Net of redemption | ||||||||||||||||
| fees of | $ | 21 | $ | 272 | ||||||||||||
The accompanying notes are an integral part of these financial statements.
31
Huber Large Cap Value Fund
STATEMENTS OF CHANGES IN NET ASSETS
| Six Months Ended | ||||||||
| April 30, 2024 | Year Ended | |||||||
| (Unaudited) | October 31, 2023 | |||||||
| INCREASE/(DECREASE) IN NET ASSETS FROM: | ||||||||
| OPERATIONS | ||||||||
| Net investment income | $ | 88,029 | $ | 182,484 | ||||
| Net realized gain/(loss) on investments | 143,235 | (441,278 | ) | |||||
| Net change in unrealized | ||||||||
| appreciation/(depreciation) on investments | 1,783,719 | 295,766 | ||||||
| Net increase in net assets | ||||||||
| resulting from operations | 2,014,983 | 36,972 | ||||||
| DISTRIBUTIONS TO SHAREHOLDERS | ||||||||
| Net dividends and distributions to shareholders – | ||||||||
| Investor Class shares | (25,612 | ) | (20,900 | ) | ||||
| Net dividends and distributions to shareholders – | ||||||||
| Institutional Class shares | (159,544 | ) | (136,174 | ) | ||||
| Total distributions to shareholders | (185,156 | ) | (157,074 | ) | ||||
| CAPITAL SHARE TRANSACTIONS | ||||||||
| Net increase in net assets derived | ||||||||
| from net change in outstanding shares (a) | 149,338 | 190,710 | ||||||
| Total increase in net assets | 1,979,165 | 70,608 | ||||||
| NET ASSETS | ||||||||
| Beginning of period | 10,172,210 | 10,101,602 | ||||||
| End of period | $ | 12,151,375 | $ | 10,172,210 | ||||
The accompanying notes are an integral part of these financial statements.
32
Huber Large Cap Value Fund
STATEMENTS OF CHANGES IN NET ASSETS, Continued
| (a) | A summary of share transactions is as follows: |
| Investor Class | ||||||||||||||||
| Six Months Ended | ||||||||||||||||
| April 30, 2024 | Year Ended | |||||||||||||||
| (Unaudited) | October 31, 2023 | |||||||||||||||
| Shares | Paid-in Capital | Shares | Paid-in Capital | |||||||||||||
| Shares sold | 3,033 | $ | 60,901 | 2,840 | $ | 53,039 | ||||||||||
| Shares issued | ||||||||||||||||
| on reinvestments | ||||||||||||||||
| of distributions | 1,332 | 25,613 | 1,135 | 20,898 | ||||||||||||
| Shares redeemed | (236 | ) | (5,106 | ) | (6 | ) | (112 | ) | ||||||||
| Net increase | 4,129 | $ | 81,408 | 3,969 | $ | 73,825 | ||||||||||
| Institutional Class | ||||||||||||||||
| Six Months Ended | ||||||||||||||||
| April 30, 2024 | Year Ended | |||||||||||||||
| (Unaudited) | October 31, 2023 | |||||||||||||||
| Shares | Paid-in Capital | Shares | Paid-in Capital | |||||||||||||
| Shares sold | — | $ | — | 265 | $ | 5,000 | ||||||||||
| Shares issued | ||||||||||||||||
| on reinvestments | ||||||||||||||||
| of distributions | 3,518 | 67,924 | 7,365 | 136,174 | ||||||||||||
| Shares redeemed** | — | 6 | (1,306 | ) | (24,289 | ) | ||||||||||
| Net increase | 3,518 | $ | 67,930 | 6,324 | $ | 116,885 | ||||||||||
| ** Net of redemption | ||||||||||||||||
| fees of | $ | 6 | $ | — | ||||||||||||
The accompanying notes are an integral part of these financial statements.
33
Huber Mid Cap Value Fund
STATEMENTS OF CHANGES IN NET ASSETS
| Six Months Ended | ||||||||
| April 30, 2024 | Year Ended | |||||||
| (Unaudited) | October 31, 2023 | |||||||
| INCREASE/(DECREASE) IN NET ASSETS FROM: | ||||||||
| OPERATIONS | ||||||||
| Net investment income | $ | 58,178 | $ | 111,406 | ||||
| Net realized gain/(loss) on: | ||||||||
| Investments | 151,414 | (514,111 | ) | |||||
| Foreign currency | 17 | 5 | ||||||
| Net change in unrealized | ||||||||
| appreciation/(depreciation) on: | ||||||||
| Investments | 931,472 | (335,967 | ) | |||||
| Foreign currency | — | 6 | ||||||
| Net increase/(decrease) in net assets | ||||||||
| resulting from operations | 1,141,081 | (738,661 | ) | |||||
| DISTRIBUTIONS TO SHAREHOLDERS | ||||||||
| Net dividends and distributions to shareholders – | ||||||||
| Investor Class shares | (4,608 | ) | (9,347 | ) | ||||
| Net dividends and distributions to shareholders – | ||||||||
| Institutional Class shares | (121,758 | ) | (157,585 | ) | ||||
| Total distributions to shareholders | (126,366 | ) | (166,932 | ) | ||||
| CAPITAL SHARE TRANSACTIONS | ||||||||
| Net increase/(decrease) in net assets derived | ||||||||
| from net change in outstanding shares (a) | (452,972 | ) | 1,632,344 | |||||
| Total increase in net assets | 561,743 | 726,751 | ||||||
| NET ASSETS | ||||||||
| Beginning of period | 9,734,478 | 9,007,727 | ||||||
| End of period | $ | 10,296,221 | $ | 9,734,478 | ||||
The accompanying notes are an integral part of these financial statements.
34
Huber Mid Cap Value Fund
STATEMENTS OF CHANGES IN NET ASSETS, Continued
| (a) | A summary of share transactions is as follows: |
| Investor Class | ||||||||||||||||
| Six Months Ended | ||||||||||||||||
| April 30, 2024 | Year Ended | |||||||||||||||
| (Unaudited) | October 31, 2023 | |||||||||||||||
| Shares | Paid-in Capital | Shares | Paid-in Capital | |||||||||||||
| Shares issued | ||||||||||||||||
| on reinvestments | ||||||||||||||||
| of distributions | 326 | $ | 4,608 | 665 | $ | 9,162 | ||||||||||
| Shares redeemed | (341 | ) | (4,839 | ) | (7,750 | ) | (111,089 | ) | ||||||||
| Net decrease | (15 | ) | $ | (231 | ) | (7,085 | ) | $ | (101,927 | ) | ||||||
| Institutional Class | ||||||||||||||||
| Six Months Ended | ||||||||||||||||
| April 30, 2024 | Year Ended | |||||||||||||||
| (Unaudited) | October 31, 2023 | |||||||||||||||
| Shares | Paid-in Capital | Shares | Paid-in Capital | |||||||||||||
| Shares sold | 327 | $ | 4,694 | 139,105 | $ | 1,960,879 | ||||||||||
| Shares issued | ||||||||||||||||
| on reinvestments | ||||||||||||||||
| of distributions | 4,177 | 59,144 | 11,436 | 157,585 | ||||||||||||
| Shares redeemed | (34,992 | ) | (516,579 | ) | (26,774 | ) | (384,193 | ) | ||||||||
| Net increase/(decrease) | (30,488 | ) | $ | (452,741 | ) | 123,767 | $ | 1,734,271 | ||||||||
The accompanying notes are an integral part of these financial statements.
35
Huber Select Large Cap Value Fund
FINANCIAL HIGHLIGHTS – For a share outstanding throughout each period
Investor Class
| Six Months | ||||||||||||||||||||||||
| Ended | ||||||||||||||||||||||||
| April 30, | Year Ended October 31, | |||||||||||||||||||||||
| 2024 | ||||||||||||||||||||||||
| (Unaudited) | 2023 | 2022 | 2021 | 2020 | 2019 | |||||||||||||||||||
| Net asset value, | ||||||||||||||||||||||||
| beginning of period | $ | 25.50 | $ | 24.30 | $ | 24.44 | $ | 16.33 | $ | 17.63 | $ | 15.94 | ||||||||||||
| Income from | ||||||||||||||||||||||||
| investment operations: | ||||||||||||||||||||||||
| Net investment income^ | 0.18 | 0.31 | 0.13 | 0.11 | 0.10 | 0.14 | ||||||||||||||||||
| Net realized and unrealized | ||||||||||||||||||||||||
| gain/(loss) on investments | ||||||||||||||||||||||||
| and foreign currency | ||||||||||||||||||||||||
| related transactions | 5.16 | 1.05 | (0.19 | ) | 8.33 | (1.26 | ) | 1.74 | ||||||||||||||||
| Total from | ||||||||||||||||||||||||
| investment operations | 5.34 | 1.36 | (0.06 | ) | 8.44 | (1.16 | ) | 1.88 | ||||||||||||||||
| Less distributions: | ||||||||||||||||||||||||
| From net investment income | (0.21 | ) | (0.16 | ) | (0.08 | ) | (0.33 | ) | (0.14 | ) | (0.19 | ) | ||||||||||||
| Redemption fees retained | 0.00 | ^+ | — | 0.00 | ^+ | 0.00 | ^+ | 0.00 | ^+ | 0.00 | ^+ | |||||||||||||
| Net asset value, end of period | $ | 30.63 | $ | 25.50 | $ | 24.30 | $ | 24.44 | $ | 16.33 | $ | 17.63 | ||||||||||||
| Total return | 21.03 | %‡ | 5.61 | % | -0.26 | % | 52.32 | % | -6.68 | % | 12.03 | % | ||||||||||||
| Ratios/supplemental data: | ||||||||||||||||||||||||
| Net assets, end of | ||||||||||||||||||||||||
| period (thousands) | $ | 32,786 | $ | 17,538 | $ | 16,648 | $ | 6,251 | $ | 5,043 | $ | 6,258 | ||||||||||||
| Ratio of expenses to | ||||||||||||||||||||||||
| average net assets: | ||||||||||||||||||||||||
| Before advisory fee waiver | 1.34 | %† | 1.48 | % | 1.59 | % | 1.67 | % | 1.66 | % | 1.57 | % | ||||||||||||
| After advisory fee waiver | 1.34 | %† | 1.34 | % | 1.33 | % | 1.26 | % | 1.35 | % | 1.34 | % | ||||||||||||
| Ratio of net investment income | ||||||||||||||||||||||||
| to average net assets: | ||||||||||||||||||||||||
| Before advisory fee waiver | 1.11 | %† | 1.09 | % | 0.28 | % | 0.09 | % | 0.30 | % | 0.64 | % | ||||||||||||
| After advisory fee waiver | 1.11 | %† | 1.23 | % | 0.54 | % | 0.50 | % | 0.61 | % | 0.87 | % | ||||||||||||
| Portfolio turnover rate | 17.63 | %‡ | 30.78 | % | 35.89 | % | 48.63 | % | 19.50 | % | 19.52 | % | ||||||||||||
+ | Less than $0.005 per share. |
| ^ | Based on average shares outstanding. |
| † | Annualized. |
| ‡ | Not annualized. |
The accompanying notes are an integral part of these financial statements.
36
Huber Select Large Cap Value Fund
FINANCIAL HIGHLIGHTS – For a share outstanding throughout each period
Institutional Class
| Six Months | ||||||||||||||||||||||||
| Ended | ||||||||||||||||||||||||
| April 30, | Year Ended October 31, | |||||||||||||||||||||||
| 2024 | ||||||||||||||||||||||||
| (Unaudited) | 2023 | 2022 | 2021 | 2020 | 2019 | |||||||||||||||||||
| Net asset value, | ||||||||||||||||||||||||
| beginning of period | $ | 25.51 | $ | 24.27 | $ | 24.39 | $ | 16.32 | $ | 17.62 | $ | 15.92 | ||||||||||||
| Income from | ||||||||||||||||||||||||
| investment operations: | ||||||||||||||||||||||||
| Net investment income^ | 0.37 | 0.39 | 0.21 | 0.16 | 0.17 | 0.20 | ||||||||||||||||||
| Net realized and unrealized | ||||||||||||||||||||||||
| gain/(loss) on investments | ||||||||||||||||||||||||
| and foreign currency | ||||||||||||||||||||||||
| related transactions | 5.01 | 1.06 | (0.19 | ) | 8.31 | (1.28 | ) | 1.73 | ||||||||||||||||
| Total from | ||||||||||||||||||||||||
| investment operations | 5.38 | 1.45 | 0.02 | 8.47 | (1.11 | ) | 1.93 | |||||||||||||||||
| Less distributions: | ||||||||||||||||||||||||
| From net investment income | (0.30 | ) | (0.21 | ) | (0.14 | ) | (0.40 | ) | (0.19 | ) | (0.23 | ) | ||||||||||||
Redemption fees retained^+ | 0.00 | 0.00 | 0.00 | 0.00 | 0.00 | 0.00 | ||||||||||||||||||
| Net asset value, end of period | $ | 30.59 | $ | 25.51 | $ | 24.27 | $ | 24.39 | $ | 16.32 | $ | 17.62 | ||||||||||||
| Total return | 21.22 | %‡ | 6.01 | % | 0.07 | % | 52.71 | % | -6.38 | % | 12.43 | % | ||||||||||||
| Ratios/supplemental data: | ||||||||||||||||||||||||
| Net assets, end of | ||||||||||||||||||||||||
| period (thousands) | $ | 177,494 | $ | 72,977 | $ | 51,336 | $ | 40,792 | $ | 41,902 | $ | 43,912 | ||||||||||||
| Ratio of expenses to | ||||||||||||||||||||||||
| average net assets: | ||||||||||||||||||||||||
| Before advisory fee waiver | 0.99 | %† | 1.13 | % | 1.25 | % | 1.40 | % | 1.30 | % | 1.22 | % | ||||||||||||
| After advisory fee waiver | 0.99 | %† | 0.99 | % | 0.99 | % | 0.99 | % | 0.99 | % | 0.99 | % | ||||||||||||
| Ratio of net investment income | ||||||||||||||||||||||||
| to average net assets: | ||||||||||||||||||||||||
| Before advisory fee waiver | 1.43 | %† | 1.41 | % | 0.61 | % | 0.36 | % | 0.66 | % | 0.99 | % | ||||||||||||
| After advisory fee waiver | 1.43 | %† | 1.55 | % | 0.87 | % | 0.77 | % | 0.97 | % | 1.22 | % | ||||||||||||
| Portfolio turnover rate | 17.63 | %‡ | 30.78 | % | 35.89 | % | 48.63 | % | 19.50 | % | 19.52 | % | ||||||||||||
+ | Less than $0.005 per share. |
| ^ | Based on average shares outstanding. |
| † | Annualized. |
| ‡ | Not annualized. |
The accompanying notes are an integral part of these financial statements.
37
Huber Small Cap Value Fund
FINANCIAL HIGHLIGHTS – For a share outstanding throughout each period
Investor Class
| Six Months | ||||||||||||||||||||||||
| Ended | ||||||||||||||||||||||||
| April 30, | Year Ended October 31, | |||||||||||||||||||||||
| 2024 | ||||||||||||||||||||||||
| (Unaudited) | 2023 | 2022 | 2021 | 2020 | 2019 | |||||||||||||||||||
| Net asset value, | ||||||||||||||||||||||||
| beginning of period | $ | 22.62 | $ | 23.45 | $ | 23.21 | $ | 13.86 | $ | 18.02 | $ | 16.74 | ||||||||||||
| Income from | ||||||||||||||||||||||||
| investment operations: | ||||||||||||||||||||||||
| Net investment | ||||||||||||||||||||||||
| income/(loss)^ | 0.04 | 0.04 | (0.02 | ) | (0.04 | ) | 0.00 | + | 0.00 | + | ||||||||||||||
| Net realized and unrealized | ||||||||||||||||||||||||
| gain/(loss) on investments | ||||||||||||||||||||||||
| and foreign currency | ||||||||||||||||||||||||
| related transactions | 2.40 | (0.87 | ) | 0.48 | 9.47 | (4.15 | ) | 1.31 | ||||||||||||||||
| Total from | ||||||||||||||||||||||||
| investment operations | 2.44 | (0.83 | ) | 0.46 | 9.43 | (4.15 | ) | 1.31 | ||||||||||||||||
| Less distributions: | ||||||||||||||||||||||||
| From net investment income | (0.09 | ) | — | (0.22 | ) | (0.08 | ) | (0.01 | ) | (0.03 | ) | |||||||||||||
| Redemption fees retained | 0.00 | ^+ | — | 0.00 | ^+ | 0.00 | ^+ | 0.00 | ^+ | 0.00 | ^+ | |||||||||||||
| Net asset value, end of period | $ | 24.97 | $ | 22.62 | $ | 23.45 | $ | 23.21 | $ | 13.86 | $ | 18.02 | ||||||||||||
| Total return | 10.78 | %‡ | -3.54 | % | 2.02 | % | 68.19 | % | -23.03 | % | 7.97 | % | ||||||||||||
| Ratios/supplemental data: | ||||||||||||||||||||||||
| Net assets, end of | ||||||||||||||||||||||||
| period (thousands) | $ | 25,079 | $ | 23,926 | $ | 25,107 | $ | 24,753 | $ | 14,937 | $ | 21,003 | ||||||||||||
| Ratio of expenses to | ||||||||||||||||||||||||
| average net assets: | ||||||||||||||||||||||||
| Before advisory fee waiver | 1.66 | %† | 1.66 | % | 1.71 | % | 1.86 | % | 2.03 | % | 1.77 | % | ||||||||||||
| After advisory fee waiver | 1.52 | %† | 1.53 | % | 1.53 | % | 1.56 | % | 1.65 | % | 1.58 | % | ||||||||||||
| Ratio of net investment income/ | ||||||||||||||||||||||||
| (loss) to average net assets: | ||||||||||||||||||||||||
| Before advisory fee waiver | 0.23 | %† | 0.05 | % | (0.27 | %) | (0.48 | %) | (0.35 | %) | (0.16 | %) | ||||||||||||
| After advisory fee waiver | 0.37 | %† | 0.18 | % | (0.09 | %) | (0.18 | %) | 0.03 | % | 0.03 | % | ||||||||||||
| Portfolio turnover rate | 18.07 | %‡ | 43.63 | % | 41.12 | % | 75.60 | % | 71.53 | % | 37.26 | % | ||||||||||||
+ | Less than $0.005 per share. |
| ^ | Based on average shares outstanding. |
| † | Annualized. |
| ‡ | Not annualized. |
The accompanying notes are an integral part of these financial statements.
38
Huber Small Cap Value Fund
FINANCIAL HIGHLIGHTS – For a share outstanding throughout each period
Institutional Class
| Six Months | ||||||||||||||||||||||||
| Ended | ||||||||||||||||||||||||
| April 30, | Year Ended October 31, | |||||||||||||||||||||||
| 2024 | ||||||||||||||||||||||||
| (Unaudited) | 2023 | 2022 | 2021 | 2020 | 2019 | |||||||||||||||||||
| Net asset value, | ||||||||||||||||||||||||
| beginning of period | $ | 22.93 | $ | 23.73 | $ | 23.48 | $ | 14.04 | $ | 18.23 | $ | 16.95 | ||||||||||||
| Income from | ||||||||||||||||||||||||
| investment operations: | ||||||||||||||||||||||||
| Net investment income^ | 0.09 | 0.08 | 0.03 | 0.01 | 0.05 | 0.04 | ||||||||||||||||||
| Net realized and unrealized | ||||||||||||||||||||||||
| gain/(loss) on investments | ||||||||||||||||||||||||
| and foreign currency | ||||||||||||||||||||||||
| related transactions | 2.40 | (0.88 | ) | 0.49 | 9.56 | (4.20 | ) | 1.32 | ||||||||||||||||
| Total from | ||||||||||||||||||||||||
| investment operations | 2.49 | (0.80 | ) | 0.52 | 9.57 | (4.15 | ) | 1.36 | ||||||||||||||||
| Less distributions: | ||||||||||||||||||||||||
| From net investment income | (0.12 | ) | — | (0.27 | ) | (0.13 | ) | (0.04 | ) | (0.08 | ) | |||||||||||||
Redemption fees retained^+ | 0.00 | 0.00 | 0.00 | 0.00 | 0.00 | 0.00 | ||||||||||||||||||
| Net asset value, end of period | $ | 25.30 | $ | 22.93 | $ | 23.73 | $ | 23.48 | $ | 14.04 | $ | 18.23 | ||||||||||||
| Total return | 10.89 | %‡ | -3.37 | % | 2.25 | % | 68.47 | % | -22.80 | % | 8.16 | % | ||||||||||||
| Ratios/supplemental data: | ||||||||||||||||||||||||
| Net assets, end of | ||||||||||||||||||||||||
| period (thousands) | $ | 41,904 | $ | 34,398 | $ | 32,827 | $ | 26,662 | $ | 18,188 | $ | 20,051 | ||||||||||||
| Ratio of expenses to | ||||||||||||||||||||||||
| average net assets: | ||||||||||||||||||||||||
| Before advisory fee waiver | 1.43 | %† | 1.48 | % | 1.53 | % | 1.65 | % | 1.73 | % | 1.54 | % | ||||||||||||
| After advisory fee waiver | 1.29 | %†* | 1.35 | % | 1.35 | % | 1.35 | % | 1.35 | % | 1.35 | % | ||||||||||||
| Ratio of net investment income/ | ||||||||||||||||||||||||
| (loss) to average net assets: | ||||||||||||||||||||||||
| Before advisory fee waiver | 0.46 | %† | 0.23 | % | (0.07 | %) | (0.27 | %) | (0.05 | %) | 0.07 | % | ||||||||||||
| After advisory fee waiver | 0.60 | %† | 0.36 | % | 0.11 | % | 0.03 | % | 0.33 | % | 0.26 | % | ||||||||||||
| Portfolio turnover rate | 18.07 | %‡ | 43.63 | % | 41.12 | % | 75.60 | % | 71.53 | % | 37.26 | % | ||||||||||||
+ | Less than $0.005 per share. |
| ^ | Based on average shares outstanding. |
| # | Portfolio turnover rate calculated for the period ended October 31, 2011. |
| † | Annualized. |
| ‡ | Not annualized. |
| * | Effective December 1, 2023, the expense cap was reduced from 1.35% to 1.28%. |
The accompanying notes are an integral part of these financial statements.
39
Huber Large Cap Value Fund
FINANCIAL HIGHLIGHTS – For a share outstanding throughout each period
Investor Class
| Six Months | ||||||||||||||||||||||||
| Ended | ||||||||||||||||||||||||
| April 30, | Year Ended October 31, | |||||||||||||||||||||||
| 2024 | ||||||||||||||||||||||||
| (Unaudited) | 2023 | 2022 | 2021 | 2020 | 2019 | |||||||||||||||||||
| Net asset value, | ||||||||||||||||||||||||
| beginning of period | $ | 18.35 | $ | 18.58 | $ | 18.89 | $ | 13.18 | $ | 15.69 | $ | 14.58 | ||||||||||||
| Income from | ||||||||||||||||||||||||
| investment operations: | ||||||||||||||||||||||||
| Net investment income^ | 0.14 | 0.29 | 0.21 | 0.20 | 0.20 | 0.22 | ||||||||||||||||||
| Net realized and unrealized | ||||||||||||||||||||||||
| gain/(loss) on investments | ||||||||||||||||||||||||
| and foreign currency | ||||||||||||||||||||||||
| related transactions | 3.45 | (0.27 | ) | (0.31 | ) | 5.74 | (2.52 | ) | 1.08 | |||||||||||||||
| Total from | ||||||||||||||||||||||||
| investment operations | 3.59 | 0.02 | (0.10 | ) | 5.94 | (2.32 | ) | 1.30 | ||||||||||||||||
| Less distributions: | ||||||||||||||||||||||||
| From net investment income | (0.30 | ) | (0.25 | ) | (0.21 | ) | (0.23 | ) | (0.19 | ) | (0.19 | ) | ||||||||||||
| Net asset value, end of period | $ | 21.64 | $ | 18.35 | $ | 18.58 | $ | 18.89 | $ | 13.18 | $ | 15.69 | ||||||||||||
| Total return | 19.75 | %‡ | 0.12 | % | -0.50 | % | 45.52 | % | -15.00 | % | 9.17 | % | ||||||||||||
| Ratios/supplemental data: | ||||||||||||||||||||||||
| Net assets, end of | ||||||||||||||||||||||||
| period (thousands) | $ | 1,949 | $ | 1,577 | $ | 1,523 | $ | 1,646 | $ | 1,074 | $ | 1,296 | ||||||||||||
| Ratio of expenses to | ||||||||||||||||||||||||
| average net assets: | ||||||||||||||||||||||||
| Before advisory fee waiver and | ||||||||||||||||||||||||
| expense reimbursement | 2.20 | %† | 2.44 | % | 2.32 | % | 2.74 | % | 4.94 | % | 4.52 | % | ||||||||||||
| After advisory fee waiver and | ||||||||||||||||||||||||
| expense reimbursement | 1.00 | %† | 1.00 | % | 0.97 | % | 0.89 | % | 1.00 | % | 0.85 | % | ||||||||||||
| Ratio of net investment income/ | ||||||||||||||||||||||||
| (loss) to average net assets: | ||||||||||||||||||||||||
| Before advisory fee waiver and | ||||||||||||||||||||||||
| expense reimbursement | 0.14 | %† | 0.12 | % | (0.19 | %) | (0.66 | %) | (2.58 | %) | (2.17 | %) | ||||||||||||
| After advisory fee waiver and | ||||||||||||||||||||||||
| expense reimbursement | 1.34 | %† | 1.56 | % | 1.16 | % | 1.19 | % | 1.36 | % | 1.50 | % | ||||||||||||
| Portfolio turnover rate | 23.77 | %‡ | 33.77 | % | 44.34 | % | 26.45 | % | 36.17 | % | 35.66 | % | ||||||||||||
| ^ | Based on average shares outstanding. |
| † | Annualized. |
| ‡ | Not annualized. |
The accompanying notes are an integral part of these financial statements.
40
Huber Large Cap Value Fund
FINANCIAL HIGHLIGHTS – For a share outstanding throughout each period
Institutional Class
| Six Months | ||||||||||||||||||||||||
| Ended | ||||||||||||||||||||||||
| April 30, | Year Ended October 31, | |||||||||||||||||||||||
| 2024 | ||||||||||||||||||||||||
| (Unaudited) | 2023 | 2022 | 2021 | 2020 | 2019 | |||||||||||||||||||
| Net asset value, | ||||||||||||||||||||||||
| beginning of period | $ | 18.46 | $ | 18.68 | $ | 18.98 | $ | 13.26 | $ | 15.75 | $ | 14.66 | ||||||||||||
| Income from | ||||||||||||||||||||||||
| investment operations: | ||||||||||||||||||||||||
| Net investment income^ | 0.16 | 0.34 | 0.26 | 0.23 | 0.23 | 0.23 | ||||||||||||||||||
| Net realized and unrealized | ||||||||||||||||||||||||
| gain/(loss) on investments | ||||||||||||||||||||||||
| and foreign currency | ||||||||||||||||||||||||
| related transactions | 3.47 | (0.26 | ) | (0.32 | ) | 5.76 | (2.51 | ) | 1.09 | |||||||||||||||
| Total from | ||||||||||||||||||||||||
| investment operations | 3.63 | 0.08 | (0.06 | ) | 5.99 | (2.28 | ) | 1.32 | ||||||||||||||||
| Less distributions: | ||||||||||||||||||||||||
| From net investment income | (0.34 | ) | (0.30 | ) | (0.24 | ) | (0.27 | ) | (0.21 | ) | (0.23 | ) | ||||||||||||
| Redemption fees retained | 0.00 | ^+ | — | 0.00 | ^+ | — | — | — | ||||||||||||||||
| Net asset value, end of period | $ | 21.75 | $ | 18.46 | $ | 18.68 | $ | 18.98 | $ | 13.26 | $ | 15.75 | ||||||||||||
| Total return | 19.91 | %‡ | 0.41 | % | -0.31 | % | 45.66 | % | -14.73 | % | 9.25 | % | ||||||||||||
| Ratios/supplemental data: | ||||||||||||||||||||||||
| Net assets, end of | ||||||||||||||||||||||||
| period (thousands) | $ | 10,202 | $ | 8,595 | $ | 8,579 | $ | 8,808 | $ | 2,788 | $ | 3,805 | ||||||||||||
| Ratio of expenses to | ||||||||||||||||||||||||
| average net assets: | ||||||||||||||||||||||||
| Before advisory fee waiver and | ||||||||||||||||||||||||
| expense reimbursement | 1.95 | %† | 2.19 | % | 2.10 | % | 2.60 | % | 4.69 | % | 4.42 | % | ||||||||||||
| After advisory fee waiver and | ||||||||||||||||||||||||
| expense reimbursement | 0.75 | %† | 0.75 | % | 0.75 | % | 0.75 | % | 0.75 | % | 0.75 | % | ||||||||||||
| Ratio of net investment income/ | ||||||||||||||||||||||||
| (loss) to average net assets: | ||||||||||||||||||||||||
| Before advisory fee waiver and | ||||||||||||||||||||||||
| expense reimbursement | 0.40 | %† | 0.38 | % | 0.04 | % | (0.52 | %) | (2.33 | %) | (2.07 | %) | ||||||||||||
| After advisory fee waiver and | ||||||||||||||||||||||||
| expense reimbursement | 1.60 | %† | 1.82 | % | 1.39 | % | 1.33 | % | 1.61 | % | 1.60 | % | ||||||||||||
| Portfolio turnover rate | 23.77 | %‡ | 33.77 | % | 44.34 | % | 26.45 | % | 36.17 | % | 35.66 | % | ||||||||||||
+ | Less than $0.005 per share. |
| ^ | Based on average shares outstanding. |
| † | Annualized. |
| ‡ | Not annualized. |
The accompanying notes are an integral part of these financial statements.
41
Huber Mid Cap Value Fund
FINANCIAL HIGHLIGHTS – For a share outstanding throughout each period
Investor Class
| Six Months | ||||||||||||||||||||||||
| Ended | ||||||||||||||||||||||||
| April 30, | Year Ended October 31, | |||||||||||||||||||||||
| 2024 | ||||||||||||||||||||||||
| (Unaudited) | 2023 | 2022 | 2021 | 2020 | 2019 | |||||||||||||||||||
| Net asset value, | ||||||||||||||||||||||||
| beginning of period | $ | 13.53 | $ | 14.95 | $ | 14.80 | $ | 9.53 | $ | 12.32 | $ | 12.29 | ||||||||||||
| Income from | ||||||||||||||||||||||||
| investment operations: | ||||||||||||||||||||||||
| Net investment income^ | 0.06 | 0.18 | 0.13 | 0.05 | 0.04 | 0.05 | ||||||||||||||||||
| Net realized and unrealized | ||||||||||||||||||||||||
| gain/(loss) on investments | ||||||||||||||||||||||||
| and foreign currency | ||||||||||||||||||||||||
| related transactions | 1.53 | (1.33 | ) | 0.16 | 5.30 | (2.83 | ) | 0.10 | ||||||||||||||||
| Total from | ||||||||||||||||||||||||
| investment operations | 1.59 | (1.15 | ) | 0.29 | 5.35 | (2.79 | ) | 0.15 | ||||||||||||||||
| Less distributions: | ||||||||||||||||||||||||
| From net investment income | (0.17 | ) | (0.27 | ) | (0.14 | ) | (0.08 | ) | (0.00 | )+ | (0.12 | ) | ||||||||||||
| Redemption fees retained | — | — | 0.00 | ^+ | — | — | — | |||||||||||||||||
| Net asset value, end of period | $ | 14.95 | $ | 13.53 | $ | 14.95 | $ | 14.80 | $ | 9.53 | $ | 12.32 | ||||||||||||
| Total return | 11.81 | %‡ | -7.72 | % | 1.99 | % | 56.34 | % | -22.65 | % | 1.32 | % | ||||||||||||
| Ratios/supplemental data: | ||||||||||||||||||||||||
| Net assets, end of | ||||||||||||||||||||||||
| period (thousands) | $ | 409 | $ | 370 | $ | 516 | $ | 510 | $ | 256 | $ | 331 | ||||||||||||
| Ratio of expenses to | ||||||||||||||||||||||||
| average net assets: | ||||||||||||||||||||||||
| Before advisory fee waiver and | ||||||||||||||||||||||||
| expense reimbursement | 2.25 | %† | 2.64 | % | 2.76 | % | 3.71 | % | 13.99 | % | 12.16 | % | ||||||||||||
| After advisory fee waiver and | ||||||||||||||||||||||||
| expense reimbursement | 1.05 | %† | 1.05 | % | 1.05 | % | 1.14 | % | 1.30 | % | 1.08 | % | ||||||||||||
| Ratio of net investment income/ | ||||||||||||||||||||||||
| (loss) to average net assets: | ||||||||||||||||||||||||
| Before advisory fee waiver and | ||||||||||||||||||||||||
| expense reimbursement | (0.11 | %)† | (0.33 | %) | (0.86 | %) | (2.18 | %) | (12.29 | %) | (10.62 | %) | ||||||||||||
| After advisory fee waiver and | ||||||||||||||||||||||||
| expense reimbursement | 1.09 | %† | 1.26 | % | 0.85 | % | 0.39 | % | 0.40 | % | 0.46 | % | ||||||||||||
| Portfolio turnover rate | 38.12 | %‡ | 66.66 | % | 73.00 | % | 59.38 | % | 118.94 | % | 90.36 | % | ||||||||||||
+ | Less than $0.005 per share. |
| ^ | Based on average shares outstanding. |
| † | Annualized. |
| ‡ | Not annualized. |
The accompanying notes are an integral part of these financial statements.
42
Huber Mid Cap Value Fund
FINANCIAL HIGHLIGHTS – For a share outstanding throughout each period
Institutional Class
| Six Months | ||||||||||||||||||||||||
| Ended | ||||||||||||||||||||||||
| April 30, | Year Ended October 31, | |||||||||||||||||||||||
| 2024 | ||||||||||||||||||||||||
| (Unaudited) | 2023 | 2022 | 2021 | 2020 | 2019 | |||||||||||||||||||
| Net asset value, | ||||||||||||||||||||||||
| beginning of period | $ | 13.55 | $ | 14.97 | $ | 14.83 | $ | 9.55 | $ | 12.33 | $ | 12.33 | ||||||||||||
| Income from | ||||||||||||||||||||||||
| investment operations: | ||||||||||||||||||||||||
| Net investment income^ | 0.09 | 0.18 | 0.13 | 0.08 | 0.07 | 0.06 | ||||||||||||||||||
| Net realized and unrealized | ||||||||||||||||||||||||
| gain/(loss) on investments | ||||||||||||||||||||||||
| and foreign currency | ||||||||||||||||||||||||
| related transactions | 1.51 | (1.32 | ) | 0.17 | 5.30 | (2.85 | ) | 0.09 | ||||||||||||||||
| Total from | ||||||||||||||||||||||||
| investment operations | 1.60 | (1.14 | ) | 0.30 | 5.38 | (2.78 | ) | 0.15 | ||||||||||||||||
| Less distributions: | ||||||||||||||||||||||||
| From net investment income | (0.18 | ) | (0.28 | ) | (0.16 | ) | (0.10 | ) | (0.00 | )+ | (0.15 | ) | ||||||||||||
| Redemption fees retained | — | — | 0.00 | ^+ | — | — | — | |||||||||||||||||
| Net asset value, end of period | $ | 14.97 | $ | 13.55 | $ | 14.97 | $ | 14.83 | $ | 9.55 | $ | 12.33 | ||||||||||||
| Total return | 11.86 | %‡ | -7.66 | % | 2.02 | % | 56.61 | % | -22.55 | % | 1.35 | % | ||||||||||||
| Ratios/supplemental data: | ||||||||||||||||||||||||
| Net assets, end of | ||||||||||||||||||||||||
| period (thousands) | $ | 9,887 | $ | 9,364 | $ | 8,492 | $ | 6,958 | $ | 1,310 | $ | 1,549 | ||||||||||||
| Ratio of expenses to | ||||||||||||||||||||||||
| average net assets: | ||||||||||||||||||||||||
| Before advisory fee waiver and | ||||||||||||||||||||||||
| expense reimbursement | 2.20 | %† | 2.59 | % | 2.71 | % | 3.57 | % | 13.69 | % | 12.08 | % | ||||||||||||
| After advisory fee waiver and | ||||||||||||||||||||||||
| expense reimbursement | 1.00 | %† | 1.00 | % | 1.00 | % | 1.00 | % | 1.00 | % | 1.00 | % | ||||||||||||
| Ratio of net investment income/ | ||||||||||||||||||||||||
| (loss) to average net assets: | ||||||||||||||||||||||||
| Before advisory fee waiver and | ||||||||||||||||||||||||
| expense reimbursement | (0.05 | %)† | (0.30 | %) | (0.81 | %) | (2.05 | %) | (11.99 | %) | (10.54 | %) | ||||||||||||
| After advisory fee waiver and | ||||||||||||||||||||||||
| expense reimbursement | 1.15 | %† | 1.29 | % | 0.90 | % | 0.52 | % | 0.70 | % | 0.54 | % | ||||||||||||
| Portfolio turnover rate | 38.12 | %‡ | 66.66 | % | 73.00 | % | 59.38 | % | 118.94 | % | 90.36 | % | ||||||||||||
+ | Less than $0.005 per share. |
| ^ | Based on average shares outstanding. |
| † | Annualized. |
| ‡ | Not annualized. |
The accompanying notes are an integral part of these financial statements.
43
Huber Funds
NOTES TO FINANCIAL STATEMENTS at April 30, 2024 (Unaudited)
NOTE 1 – ORGANIZATION
The Huber Select Large Cap Value Fund, the Huber Small Cap Value Fund, the Huber Large Cap Value Fund, and the Huber Mid Cap Value Fund (each a “Fund” and collectively, the “Funds”) are each a diversified series of Advisors Series Trust (the “Trust”), which is registered under the Investment Company Act of 1940, as amended, as an open-end management investment company. Each of the Funds has separate assets and liabilities and differing investment objectives. The investment objective of the Huber Select Large Cap Value Fund (the “Select Large Cap Value Fund”), Huber Large Cap Value Fund (the “Large Cap Value Fund”), and the Huber Mid Cap Value Fund (the “Mid Cap Value Fund”) is current income and capital appreciation. The investment objective of the Huber Small Cap Value Fund (the “Small Cap Value Fund”) is capital appreciation. The Funds follow the investment company accounting and reporting guidance of the Financial Accounting Standards Board (“FASB”) Accounting Standard Codification Topic 946 “Financial Services – Investment Companies”.
The Investor Class of the Select Large Cap Value Fund and the Small Cap Value Fund commenced operations on June 29, 2007. As of October 25, 2011, the former Institutional shares were re-designated as Investor Class shares. The Select Large Cap Value Fund and the Small Cap Value Institutional Classes subsequently commenced operations on October 25, 2011. The Large Cap Value Fund commenced operations on December 31, 2012. The Mid Cap Value Fund commenced operations on December 31, 2015.
NOTE 2 – SIGNIFICANT ACCOUNTING POLICIES
The following is a summary of significant accounting policies consistently followed by the Funds in the preparation of their financial statements. These policies are in conformity with accounting principles generally accepted in the United States of America.
| A. | Security Valuation: All investments in securities are recorded at their estimated fair value, as described in Note 3. | |
| B. | Federal Income Taxes: It is the Funds’ policy to comply with the requirements of Subchapter M of the Internal Revenue Code applicable to regulated investment companies and to distribute substantially all of its taxable income to shareholders. Therefore, no Federal income or excise tax provision is required. | |
| The Funds recognize the tax benefits of uncertain tax positions only where the position is “more likely than not” to be sustained assuming examination by tax authorities. The tax returns of the Funds’ prior three fiscal years are open for examination. Management has reviewed all open tax years in major jurisdictions and concluded that there is no impact on the Funds’ net |
44
Huber Funds
NOTES TO FINANCIAL STATEMENTS at April 30, 2024 (Unaudited), Continued
| assets and no tax liability resulting from unrecognized tax events relating to uncertain income tax positions taken or expected to be taken on a tax return. The Funds identify their major tax jurisdictions as U.S. Federal and the state of Wisconsin; however, the Funds are not aware of any tax positions for which it is reasonably possible that the total amounts of unrecognized tax benefits will change materially in the next twelve months. | ||
| C. | Securities Transactions, Income and Distributions: Security transactions are accounted for on the trade date. Realized gains and losses on securities sold are calculated on the basis of specified cost. Interest income is recorded on an accrual basis. Dividend income and distributions to shareholders are recorded on the ex-dividend date. Withholding taxes on foreign dividends have been provided for in accordance with the Funds’ understanding of the applicable country’s tax rules and rates. | |
| Investment income, expenses (other than those specific to the class of shares), and realized and unrealized gains and losses on investments are allocated to the separate classes of each Fund based upon their relative net assets on the date income is earned or expensed and realized and unrealized gains and losses are incurred. | ||
| Each Fund is charged for those expenses that are directly attributable to the Fund, such as investment advisory, custody and transfer agent fees. Expenses that are not attributable to a Fund are typically allocated among the Funds in proportion to their respective net assets. Common expenses of the Trust are typically allocated among funds in the Trust based on a fund’s respective net assets, or by other equitable means. | ||
| The Funds distribute substantially all net investment income, if any, annually and net realized capital gains, if any, annually. Distributions from net realized gains for book purposes may include short-term capital gains. All short-term capital gains are included in ordinary income for tax purposes. | ||
| The amount and character of income and net realized gains to be distributed are determined in accordance with Federal income tax rules and regulations which may differ from accounting principles generally accepted in the United States of America. To the extent these book/tax differences are permanent, such amounts are reclassified within the capital accounts based on their Federal tax treatment. | ||
| D. | Reclassification of Capital Accounts: Accounting principles generally accepted in the United States of America require that certain components of net assets relating to permanent differences be reclassified between financial and tax reporting. These reclassifications have no effect on net assets or net asset value per share. |
45
Huber Funds
NOTES TO FINANCIAL STATEMENTS at April 30, 2024 (Unaudited), Continued
| E. | Use of Estimates: The preparation of financial statements in conformity with accounting principles generally accepted in the United States of America requires management to make estimates and assumptions that affect the reported amounts of assets and liabilities and disclosure of contingent assets and liabilities at the date of the financial statements and the reported amounts of increases and decreases in net assets from operation during the reporting period. Actual results could differ from those estimates. | |
| F. | Redemption Fees: The Funds charge a 1.00% redemption fee to shareholders who redeem shares held for 60 days or less. Such fees are retained by the Funds and accounted for as an addition to paid-in capital. The redemption fees retained by each Fund are disclosed in the statements of changes. | |
| G. | REITs: The Funds have made certain investments in real estate investment trusts (“REITs”) which pay dividends to their shareholders based upon funds available from operations. It is quite common for these dividends to exceed the REIT’s taxable earnings and profits resulting in the excess portion of such dividends being designated as a return of capital. The Funds intend to include the gross dividends from such REITs in their annual distributions to its shareholders and, accordingly, a portion of the Funds’ distributions may also be designated as a return of capital. | |
| H. | Foreign Currency: Investment securities and other assets and liabilities denominated in foreign currencies are translated into U.S. dollar amounts at the date of valuation. Purchases and sales of investment securities and income and expense items denominated in foreign currencies are translated to U.S. dollar amounts on the respective dates of such transactions. | |
| The Funds do not isolate those portions of the results of operations resulting from changes in foreign exchange rates on investments from the fluctuations arising from changes in market prices of securities held. Such fluctuations are included with the net realized and unrealized gain or loss from investments. | ||
| Reported net realized foreign exchange gains or losses arise from sales of foreign currencies, currency gains or losses realized between the trade and settlement dates on securities transactions, and the difference between the amounts of dividends, interest, and foreign withholding taxes recorded on the Funds’ books and the U.S. dollar equivalent of the amounts actually received or paid. Net unrealized foreign exchange gains and losses arise from changes in the fair values of assets and liabilities, other than investments in securities at fiscal period-end, resulting from changes in exchange rates. |
46
Huber Funds
NOTES TO FINANCIAL STATEMENTS at April 30, 2024 (Unaudited), Continued
| I. | Events Subsequent to the Fiscal Period End: In preparing the financial statements as of April 30, 2024, management considered the impact of subsequent events for potential recognition or disclosure in the financial statements. Management has determined there were no subsequent events that would need to be disclosed in the Funds’ financial statements. |
NOTE 3 – SECURITIES VALUATION
The Funds have adopted authoritative fair value accounting standards which establish an authoritative definition of fair value and set out a hierarchy for measuring fair value. These standards require additional disclosures about the various inputs and valuation techniques used to develop the measurements of fair value, a discussion in changes in valuation techniques and related inputs during the period and expanded disclosure of valuation levels for major security types. These inputs are summarized in the three broad levels listed below:
| Level 1 – | Unadjusted quoted prices in active markets for identical assets or liabilities that the Funds have the ability to access. | |
| Level 2 – | Observable inputs other than quoted prices included in level 1 that are observable for the asset or liability, either directly or indirectly. These inputs may include quoted prices for identical instrument on an inactive market, prices for similar instruments, interest rates, prepayment speed, credit risk, yield curves, default rates, and similar data. | |
| Level 3 – | Unobservable inputs for the asset or liability, to the extent relevant observable inputs are not available, representing the Fund’s own assumptions about the assumptions a market participant would use in valuing the asset or liability, and would be based on the best information available. |
Following is a description of the valuation techniques applied to the Funds’ major categories of assets and liabilities measured at fair value on a recurring basis.
Each Fund determines the fair value of its investments and computes its net asset value per share as of the close of regular trading on the New York Stock Exchange (4:00 EST).
Equity Securities: The Funds’ investments are carried at fair value. Securities that are primarily traded on a national securities exchange shall be valued at the last sale price on the exchange on which they are primarily traded on the day of valuation or, if there has been no sale on such day, at the mean between the bid and asked prices. Securities primarily traded in the NASDAQ Global Market System for which market quotations are readily available shall be valued using the NASDAQ Official Closing Price (“NOCP”). If the NOCP is not available,
47
Huber Funds
NOTES TO FINANCIAL STATEMENTS at April 30, 2024 (Unaudited), Continued
such securities shall be valued at the last sale price on the day of valuation, or if there has been no sale on such day, at the mean between the bid and asked prices. Over-the-counter securities which are not traded in the NASDAQ Global Market System shall be valued at the most recent sales price. The values for foreign securities are reported in local currency and converted to U.S. dollars using currency exchange rates. Exchange rates are provided daily by a recognized independent pricing agent. To the extent, these securities are actively traded, and valuation adjustments are not applied, they are categorized in level 1 of the fair value hierarchy.
Investment Companies: Investments in open-end mutual funds, including money market funds, are generally priced at their net asset value per share provided by the service agent of the funds and will be classified in level 1 of the fair value hierarchy.
Short-Term Securities: Short-term debt securities, including those securities having a maturity of 60 days or less, are valued at the evaluated mean between the bid and asked prices. To the extent the inputs are observable and timely, these securities would be classified in level 2 of the fair value hierarchy.
The Board of Trustees (the “Board”) has adopted a valuation policy for use by the Funds and their Valuation Designee (as defined below) in calculating each Fund’s net asset value (“NAV”). Pursuant to Rule 2a-5 under the 1940 Act, the Board has designated the Fund’s investment adviser, Huber Capital Management, LLC (“Adviser”), as the “Valuation Designee” to perform all of the fair value determinations as well as to perform all of the responsibilities that may be performed by the Valuation Designee in accordance with Rule 2a-5, subject to the Board’s oversight. The Adviser, as Valuation Designee is, authorized to make all necessary determinations of the fair values of portfolio securities and other assets for which market quotations are not readily available or if it is deemed that the prices obtained from brokers and dealers or independent pricing services are unreliable.
Depending on the relative significance of the valuation inputs, fair valued securities may be classified in either level 2 or level 3 of the fair value hierarchy.
48
Huber Funds
NOTES TO FINANCIAL STATEMENTS at April 30, 2024 (Unaudited), Continued
The inputs or methodology used for valuing securities are not an indication of the risk associated with investing in those securities. The following is a summary of the inputs used to value the Funds’ securities as of April 30, 2024:
| Huber Select Large Cap Value Fund | |||||||||||||||||
| Level 1 | Level 2 | Level 3 | Total | ||||||||||||||
| Assets: | |||||||||||||||||
| Common Stocks | $ | 200,361,170 | $ | — | $ | — | $ | 200,361,170 | |||||||||
| Money Market Funds | 7,909,124 | — | — | 7,909,124 | |||||||||||||
| Total Assets | $ | 208,270,294 | $ | — | $ | — | $ | 208,270,294 | |||||||||
| Huber Small Cap Value Fund | |||||||||||||||||
| Level 1 | Level 2 | Level 3 | Total | ||||||||||||||
| Assets: | |||||||||||||||||
| Common Stocks | $ | 65,807,636 | $ | 22,302 | $ | — | $ | 65,829,938 | |||||||||
| Real Estate | |||||||||||||||||
| Investment Trusts | 936,380 | — | — | 936,380 | |||||||||||||
| Money Market Funds | 405,580 | — | — | 405,580 | |||||||||||||
| Total Assets | $ | 67,149,596 | $ | 22,302 | $ | — | $ | 67,171,898 | |||||||||
| Huber Large Cap Value Fund | |||||||||||||||||
| Level 1 | Level 2 | Level 3 | Total | ||||||||||||||
| Assets: | |||||||||||||||||
| Common Stocks | $ | 12,094,710 | $ | — | $ | — | $ | 12,094,710 | |||||||||
| Money Market Funds | 51,564 | — | — | 51,564 | |||||||||||||
| Total Assets | $ | 12,146,274 | $ | — | $ | — | $ | 12,146,274 | |||||||||
| Huber Mid Cap Value Fund | |||||||||||||||||
| Level 1 | Level 2 | Level 3 | Total | ||||||||||||||
| Assets: | |||||||||||||||||
| Common Stocks | $ | 9,654,122 | $ | 91,789 | $ | — | $ | 9,745,911 | |||||||||
| Real Estate | |||||||||||||||||
| Investment Trusts | 54,637 | — | — | 54,637 | |||||||||||||
| Money Market Funds | 477,082 | — | — | 477,082 | |||||||||||||
| Total Assets | $ | 10,185,841 | $ | 91,789 | $ | — | $ | 10,277,630 | |||||||||
In June 2022, the FASB issued Accounting Standards Update 2022-03, which amends Fair Value Measurement (Topic 820): Fair Value Measurement of Equity Securities Subject to Contractual Sale Restrictions (“ASU 2022-03”). ASU 2022-03 clarifies guidance for fair value measurement of an equity security subject to a contractual sale restriction and establishes new disclosure requirements for such equity securities. ASU 2022-03 is effective for fiscal years
49
Huber Funds
NOTES TO FINANCIAL STATEMENTS at April 30, 2024 (Unaudited), Continued
beginning after December 15, 2023 and for interim periods within those fiscal years, with early adoption permitted. Management is currently evaluating the impact of these amendments on the Funds’ financial statements.
In October 2022, the Securities and Exchange Commission (the “SEC”) adopted a final rule relating to Tailored Shareholder Reports for Mutual Funds and Exchange-Traded Funds; Fee Information in Investment Company Advertisements. The rule and form amendments will, among other things, require the Funds to transmit concise and visually engaging shareholder reports that highlight key information. The amendments will require that funds tag information in a structured data format and that certain more in-depth information be made available online and available for delivery free of charge to investors on request. The amendments became effective January 24, 2023. There is an 18-month transition period after the effective date of the amendment.
NOTE 4 – INVESTMENT ADVISORY FEE AND OTHER TRANSACTIONS WITH AFFILIATES
The Funds have an investment advisory agreement with the Adviser pursuant to which the Adviser is responsible for providing investment management services to the Funds. The Adviser furnishes all investment advice, office space and facilities, and provides most of the personnel needed by the Funds. As compensation for its services, the Adviser is entitled to a fee, computed daily and payable monthly. The Select Large Cap Value Fund pays fees calculated at an annual rate of 0.99% based upon the Fund’s average daily net assets for the first $10 billion, 0.75% based upon the Fund’s average daily net assets for the next $10 billion, and 0.50% based upon the Fund’s average daily net assets in excess of $20 billion. The Adviser has agreed to voluntarily reduce the Select Large Cap Value Fund’s contractual management fee from 0.99% to 0.75% through February 28, 2025. The Small Cap Value Fund pays fees calculated at an annual rate of 1.35% based upon the Fund’s average daily net assets for the first $5 billion and 1.00% based upon the Fund’s average daily net assets in excess of $5 billion. The Adviser has agreed to voluntarily reduce the Small Cap Value Fund’s contractual management fee from 1.35% to 0.99% through February 28, 2025. The Large Cap Value Fund pays fees calculated at an annual rate of 0.75% based upon the Fund’s average daily net assets for the first $10 billion and 0.50% based upon the Fund’s average daily net assets in excess of $10 billion. The Adviser has agreed to voluntarily reduce the Large Cap Value Fund’s contractual management fee from 0.75% to 0.00% through February 28, 2025. The Mid Cap Value Fund pays fees calculated at an annual rate of 1.00% based upon the Fund’s average daily net assets. The Adviser has agreed to voluntarily reduce the Mid Cap Value Fund’s contractual management fee from 1.00% to 0.00% through February 28, 2025. For the six months ended April 30, 2024, the advisory fees incurred by the Funds are disclosed in the statements of operations.
50
Huber Funds
NOTES TO FINANCIAL STATEMENTS at April 30, 2024 (Unaudited), Continued
The Funds are responsible for their own operating expenses. The Adviser has contractually agreed to reduce fees payable to it by the Funds and to pay Fund operating expenses (excluding class specific expenses such as the 0.25% 12b-1 fees applied to the Investor Class, 0.15% shareholder servicing fees applied to the Investor Class and 0.10% applied to the Institutional Class of the Mid Cap Value Fund, acquired fund fees and expenses, interest expense, taxes and extraordinary expenses) to the extent necessary to limit the Funds’ aggregate annual operating expenses as follows:
Expense Caps | |||
| Select Large Cap Value Fund | 0.99% | ||
| Small Cap Value Fund (a) | 1.28% | ||
| Large Cap Value Fund | 0.75% | ||
| Mid Cap Value Fund | 1.00% | ||
| Percent of average daily net assets of the Funds. |
| (a) | Effective December 1, 2023, the Advisor has contractually agreed to waive a portion or all of its management fees and pay Huber Small Cap Value Fund expenses in order to limit total annual fund operating expenses (excluding, if applicable, acquired fund fees and expenses, interest, taxes, extraordinary expenses and class specific expenses, such as distribution (12b-1) fees or shareholder servicing plan fees) to 1.28% of average daily net assets of the Fund. Prior to December 1, 2023, the expense cap for the Huber Small Cap Value Fund was 1.35%. |
Any such reduction made by the Adviser in its fees or payment of expenses which are the Funds’ obligation are subject to reimbursement by the Funds to the Adviser, if so requested by the Adviser, in any subsequent month in the 36-month period from the date of the management fee reduction and expense payment if the aggregate amount actually paid by the Funds toward the operating expenses for such fiscal year (taking into account the reimbursement) will not cause the Fund to exceed the lesser of: (1) the expense limitation in place at the time of the management fee reduction and expense payment; or (2) the expense limitation in place at the time of the reimbursement. Any such reimbursement is also contingent upon Board of Trustees review and approval. Such reimbursement may not be paid prior to the Funds’ payment of current ordinary operating expenses. For the six months ended April 30, 2024, the Adviser reduced its fees and absorbed Fund expenses in the amount of $4,630 for the Select Large Cap Value Fund, $45,903 for the Small Cap Value Fund, $68,009 for the Large Cap Value Fund, and $60,884 for the Mid Cap Value Fund.
51
Huber Funds
NOTES TO FINANCIAL STATEMENTS at April 30, 2024 (Unaudited), Continued
No amounts were recouped by the Adviser. The Adviser may recapture portions of the amounts shown below no later than the corresponding dates:
| Select | |||||||||||||||||
| Large Cap | Small Cap | Large Cap | Mid Cap | ||||||||||||||
Date | Value Fund | Value Fund | Value Fund | Value Fund | |||||||||||||
| 10/31/2024 | $ | 72,834 | $ | 66,527 | $ | 95,480 | $ | 106,398 | |||||||||
| 10/31/2025 | 163,721 | 120,526 | 165,712 | 167,037 | |||||||||||||
| 10/31/2026 | 132,170 | 91,741 | 136,091 | 135,635 | |||||||||||||
| 4/30/2027 | 4,630 | 45,903 | 68,009 | 60,884 | |||||||||||||
| $ | 373,355 | $ | 324,697 | $ | 465,292 | $ | 469,954 | ||||||||||
U.S. Bancorp Fund Services, LLC, doing business as U.S. Bank Global Fund Services (“Fund Services”) serves as the Funds’ administrator, fund accountant and transfer agent. U.S. Bank N.A. serves as the Funds’ custodian (the “Custodian”). The Custodian is an affiliate of Fund Services. Fund Services maintains the Funds’ books and records, calculates the Fund’s NAV, prepares various federal and state regulatory filings, coordinates the payment of fund expenses, reviews expense accruals and prepares materials supplied to the Board of Trustees. The officers of the Trust, including the Chief Compliance Officer, are employees of Fund Services. Fees paid by the Funds for administration and accounting, transfer agency, custody and compliance services for the six months ended April 30, 2024, are disclosed in the statements of operations.
Quasar Distributors, LLC (“Quasar”) acts as the Fund’s principal underwriter in a continuous public offering of the Fund’s shares. Quasar is a wholly-owned subsidiary of Foreside Financial Group, LLC, doing business as ACA Group.
NOTE 5 – SHAREHOLDER SERVICING FEE
The Funds have entered into a shareholder servicing agreement (the “Agreement”) with the Adviser, under which the Investor Class of the Funds may pay servicing fees at an annual rate of up to 0.15% of the average daily net assets of each Investor Class and at an annual rate of up to 0.10% of the average daily net assets of the Institutional Class of the Mid Cap Value Fund. Payments to the Adviser under the Agreement may reimburse the Adviser for payments it makes to selected brokers, dealers and administrators which have entered into service agreements with the Adviser for services provided to shareholders of the Funds. The services provided by such intermediaries are primarily designed to assist shareholders of the Funds and include the furnishing of office space and equipment, telephone facilities, personnel and assistance to the Funds in servicing such shareholders. Services provided by such intermediaries also include the provision of support services to the Funds and include establishing and maintaining shareholders’ accounts and record processing, purchase and redemption transactions, answering routine client inquiries regarding the Funds,
52
Huber Funds
NOTES TO FINANCIAL STATEMENTS at April 30, 2024 (Unaudited), Continued
and providing such other personal services to shareholders as the Funds may reasonably request. For the six months ended April 30, 2024, the shareholder servicing fees accrued by each Fund’s Investor Class are disclosed in the statements of operations. The Mid Cap Value Fund did not accrue shareholder servicing fees during the six months ended April 30, 2024.
NOTE 6 – 12B-1 DISTRIBUTION AGREEMENT AND PLAN
The Funds have adopted a Distribution Plan pursuant to Rule 12b-1 (the “Plan”). The Plan permits the Funds to pay Quasar Distributors, LLC (the “Distributor”) for distribution and related expenses at an annual rate of up to 0.25% of each Fund’s Investor Class’ average daily net assets. The expenses covered by the Plan may include the cost of preparing and distributing prospectuses and other sales material, advertising and public relations expenses, payments to financial intermediaries and compensation of personnel involved in selling shares of the Funds. Payments made pursuant to the Plan will represent reimbursement for specific expenses incurred in connection with the promotion and distribution of shares. For the six months ended April 30, 2024, the 12b-1 fees accrued by each Fund’s Investor Class are disclosed in the statements of operations.
NOTE 7 – PURCHASES AND SALES OF SECURITIES
For the six months ended April 30, 2024, the cost of purchases and the proceeds from sales of securities (excluding short-term securities) were as follows:
| Select Large | Small Cap | Large Cap | Mid Cap | ||||||||||||||
| Cap Value Fund | Value Fund | Value Fund | Value Fund | ||||||||||||||
| Purchases | $ | 114,746,288 | $ | 14,103,601 | $ | 2,951,881 | $ | 3,730,133 | |||||||||
| Sales | 26,114,372 | 11,606,326 | 2,641,348 | 4,415,742 | |||||||||||||
During the six months ended April 30, 2024, there were no purchases or sales of U.S. government securities in any of the Funds.
NOTE 8 – INCOME TAXES AND DISTRIBUTIONS TO SHAREHOLDERS
The tax character of distributions paid during the six months ended April 30, 2024, and the year ended October 31, 2023, was as follows:
| Select Large Cap Value Fund | |||||||||
| Six Months Ended | Year Ended | ||||||||
| April 30, 2024 | October 31, 2023 | ||||||||
| Ordinary income | $ | 1,380,121 | $ | 570,572 | |||||
| Small Cap Value Fund | |||||||||
| Six Months Ended | Year Ended | ||||||||
| April 30, 2024 | October 31, 2023 | ||||||||
| Ordinary income | $ | 275,714 | $ | — | |||||
53
Huber Funds
NOTES TO FINANCIAL STATEMENTS at April 30, 2024 (Unaudited), Continued
| Large Cap Value Fund | |||||||||
| Six Months Ended | Year Ended | ||||||||
| April 30, 2024 | October 31, 2023 | ||||||||
| Ordinary income | $ | 185,156 | $ | 157,074 | |||||
| Mid Cap Value Fund | |||||||||
| Six Months Ended | Year Ended | ||||||||
| April 30, 2024 | October 31, 2023 | ||||||||
| Ordinary income | $ | 126,366 | $ | 166,932 | |||||
As of October 31, 2023, the Funds’ most recently completed fiscal year end, the components of accumulated earnings/(losses) on a tax basis were as follows:
| Select | |||||||||
| Large Cap | Small Cap | ||||||||
| Value Fund | Value Fund | ||||||||
| Cost of investments for tax purposes (a) | $ | 52,049,280 | $ | 39,477,960 | |||||
| Gross tax unrealized appreciation | 39,674,765 | 21,596,004 | |||||||
| Gross tax unrealized depreciation | (2,355,320 | ) | (2,460,277 | ) | |||||
| Net tax unrealized appreciation | 37,319,445 | 19,135,727 | |||||||
| Net unrealized depreciation | |||||||||
| on foreign currency | — | (180 | ) | ||||||
| Undistributed ordinary income | 952,699 | 275,713 | |||||||
| Undistributed long-term capital gain | — | — | |||||||
| Total distributable earnings | 952,699 | 275,713 | |||||||
| Other accumulated losses | (6,377,670 | ) | (13,784,476 | ) | |||||
| Total accumulated earnings/(losses) | $ | 31,894,474 | $ | 5,626,784 | |||||
| Large Cap | Mid Cap | ||||||||
| Value Fund | Value Fund | ||||||||
| Cost of investments for tax purposes (a) | $ | 5,510,653 | $ | 7,539,423 | |||||
| Gross tax unrealized appreciation | 4,898,812 | 2,643,931 | |||||||
| Gross tax unrealized depreciation | (215,096 | ) | (427,833 | ) | |||||
| Net tax unrealized appreciation | 4,683,716 | 2,216,098 | |||||||
| Net unrealized depreciation | |||||||||
| on foreign currency | — | — | |||||||
| Undistributed ordinary income | 137,934 | 96,688 | |||||||
| Undistributed long-term capital gain | — | — | |||||||
| Total distributable earnings | 137,934 | 96,688 | |||||||
| Other accumulated losses | (1,623,620 | ) | (1,153,316 | ) | |||||
| Total accumulated earnings/(losses) | $ | 3,198,030 | $ | 1,159,470 | |||||
| (a) | The difference between book-basis and tax-basis net unrealized appreciation and cost is attributable primarily to the tax deferral of losses on wash sales, PFICs and partnerships. |
54
Huber Funds
NOTES TO FINANCIAL STATEMENTS at April 30, 2024 (Unaudited), Continued
At October 31, 2023, the Funds had capital loss carryforwards as follows:
| Capital Loss Carryforwards | |||||||||
| Short-Term | Long-Term | ||||||||
| Select Large Cap Value Fund | $ | 5,918,033 | $ | 459,637 | |||||
| Small Cap Value Fund | 10,304,965 | 3,203,175 | |||||||
| Large Cap Value Fund | 1,120,076 | 503,544 | |||||||
| Mid Cap Value Fund | 821,060 | 332,256 | |||||||
These capital losses may be carried forward indefinitely to offset future gains.
NOTE 9 – CONTROL OWNERSHIP
A beneficial ownership, either directly or indirectly, of more than 25% of the voting securities of a fund creates a presumption of control of the fund, under Section 2(a)(9) of the 1940 Act. As of April 30, 2024, each Fund’s percentage of control ownership positions greater than 25% are as follows:
Select Large Cap Value Fund | Investor Class | Institutional Class | |
| Pershing LLC | 60.61% | — | |
Small Cap Value Fund | Investor Class | Institutional Class | |
| National Financial Services LLC | — | 41.08% | |
| Shadowlawn Investments LP | 51.82% | — | |
Large Cap Value Fund | Investor Class | Institutional Class | |
| Lizanne Falsetto Living Trust | — | 57.00% | |
| Morgan Stanley Smith Barney LLC | 70.62% | 27.87% | |
| National Financial Services LLC | 29.38% | — | |
Mid Cap Value Fund | Investor Class | Institutional Class | |
| Lizanne Falsetto Living Trust | — | 53.74% | |
| Hilton Family Trust | 88.51% | — |
NOTE 10 – PRINCIPAL RISKS
Below is a summary of some, but not all, of the principal risks of investing in the Funds, each of which may adversely affect a Fund’s net asset value and total return. The Funds’ most recent prospectus provides further descriptions of each Fund’s investment objective, principal investment strategies and principal risks.
| • | General Market Risk – Economies and financial markets throughout the world are becoming increasingly interconnected, which increases the likelihood that events or conditions in one country or region will adversely impact markets or issuers in other countries or regions. Securities in the Fund’s portfolio may underperform in comparison to securities in general financial markets, a particular financial market or other asset classes due to a number of factors, including: inflation (or expectations for inflation); interest rates; global demand for particular products or resources; natural |
55
Huber Funds
NOTES TO FINANCIAL STATEMENTS at April 30, 2024 (Unaudited), Continued
| disasters or events; pandemic diseases; terrorism; regulatory events; and government controls. U.S. and international markets have experienced significant periods of volatility in recent years and months due to a number of economic, political and global macro factors, which has resulted in disruptions to business operations and supply chains, stress on the global healthcare system, growth concerns in the U.S. and overseas, staffing shortages and the inability to meet consumer demand, and widespread concern and uncertainty. Continuing uncertainties regarding interest rates, rising inflation, political events, rising government debt in the U.S. and trade tensions also contribute to market volatility. Conflict, loss of life and disaster connected to ongoing armed conflict between Ukraine and Russia in Europe and Israel and Hamas in the Middle East could have severe adverse effects on the region, including significant adverse effects on the regional or global economies and the markets for certain securities. The U.S. and the European Union imposed sanctions on certain Russian individuals and companies, including certain financial institutions, and have limited certain exports and imports to and from Russia. The war has contributed to recent market volatility and may continue to do so. | ||
| • | Foreign Securities and Emerging Markets Risk – Investments in foreign currencies and foreign issuers are subject to additional risks, including political and economic risks, greater volatility, civil conflicts and war, sanctions or other measures by the United States or other governments, liquidity risks, currency fluctuations, higher transaction costs, delayed settlement, possible foreign controls on investment, expropriation and nationalization risks, and less stringent investor protection and disclosure standards of foreign markets. Events and evolving conditions in certain economies or markets may alter the risks associated with investments tied to countries or regions that historically were perceived as comparatively stable becoming riskier and more volatile. These risks are magnified in countries in “emerging markets.” Emerging market countries typically have less-established market economies than developed countries and may face greater social, economic, regulatory and political uncertainties. In addition, emerging markets typically present greater illiquidity and price volatility concerns due to smaller or limited local capital markets and greater difficulty in determining market valuations of securities due to limited public information on issuers. | |
| • | Initial Public Offering Risk – The risk exists that the market value of IPO shares will fluctuate considerably due to factors such as the absence of a prior public market, unseasoned trading, the small number of shares available for trading and limited information about the issuer. The purchase of IPO shares may involve high transaction costs. IPO shares are subject to |
56
Huber Funds
NOTES TO FINANCIAL STATEMENTS at April 30, 2024 (Unaudited), Continued
| market risk and liquidity risk. When the Select Large Cap Value Fund’s asset base is small, a significant portion of the Fund’s performance could be attributable to investments in IPOs, because such investments would have a magnified impact on the Fund. As the Fund’s assets grow, the effect of the Fund’s investments in IPOs on the Fund’s performance probably will decline, which could reduce the Fund’s performance. | ||
| • | Value Style Investing Risk – Certain equity securities (generally referred to as value securities) are purchased primarily because they are selling at prices below what an Adviser believes to be their fundamental value and not necessarily because the issuing companies are expected to experience significant earnings growth. The Funds bear the risk that the companies that issued these securities may not overcome the adverse business developments or other factors causing their securities to be perceived by the Adviser to be under-priced or that the market may never come to recognize their fundamental value. A value stock may not increase in price, as anticipated by the Adviser investing in such securities, if other investors fail to recognize the company’s value and bid up the price or invest in markets favoring faster growing companies. A Fund’s strategy of investing in value stocks also carries the risk that in certain markets value stocks will under-perform growth stocks. | |
| • | Sector Emphasis Risk – The Adviser’s value investment strategy of identifying investment opportunities through a bottom-up process emphasizing internally generated fundamental research, may from time to time result in the Funds investing significant amounts of their portfolios in securities of issuers principally engaged in the same or related businesses. Market conditions, interest rates and economic, regulatory or financial developments could significantly affect a single business or a group of related businesses. Sector emphasis risk is the risk that the securities of companies in such business or businesses, if comprising a significant portion of the Funds’ portfolios, could react in some circumstances negatively to these or other developments and adversely affect the value of the portfolio to a greater extent than if such business or businesses comprised a lesser portion of a Fund’s portfolio. | |
| • | Small-Cap Companies Risk (Small Cap Value Fund only) – Investing in securities of small-sized companies may involve greater volatility than investing in larger and more established companies because companies with small market capitalizations can be subject to more abrupt or erratic share price changes than larger, more established companies. | |
| • | Mid-Sized Companies Risk (Mid Cap Value Fund only) – Investing in securities of mid cap companies may involve greater risk than investing in larger, more established companies because they can be subject to more |
57
Huber Funds
NOTES TO FINANCIAL STATEMENTS at April 30, 2024 (Unaudited), Continued
| abrupt or erratic share price changes. Smaller companies may have limited product lines, or limited market or financial resources and their management may be dependent on a limited number of key individuals. Securities of these companies may have limited market liquidity and their prices may be more volatile. These stocks present greater risks than securities of larger, more diversified companies. | ||
| • | Large-Sized Company Risk (Select Large Cap Value Fund) – The stocks of larger companies may underperform relative to those of small and mid-sized companies. Larger, more established companies may be unable to respond quickly to new competitive challenges like changes in consumer tastes or innovative smaller competitors. In addition, large-cap companies are sometimes unable to attain the high growth rates of successful, smaller companies, especially during extended periods of economic expansion. |
NOTE 11 – OFFICER CHANGES
Effective March 22, 2024, Ms. Lillian Kabakali was appointed Secretary and Vice President of the Trust and Ms. Elaine Richards was appointed Assistant Secretary of the Trust. Previously, Ms. Kabakali served as Assistant Secretary and Ms. Richards served as Secretary and Vice President of the Trust.
Effective June 6, 2024, Ms. Cheryl King retired from her service as Assistant Treasurer of the Trust.
58
Huber Funds
NOTICE TO SHAREHOLDERS at April 30, 2024 (Unaudited)
How to Obtain a Copy of the Funds’ Proxy Voting Policies
A description of the policies and procedures that the Funds use to determine how to vote proxies relating to portfolio securities is available without charge upon request by calling 1-888-482-3726 (888-HUBERCM) or on the U.S. Securities and Exchange Commission’s (“SEC”) website at http://www.sec.gov.
How to Obtain a Copy of the Funds’ Proxy Voting Records for the 12-Month Period Ended June 30
Information regarding how the Funds voted proxies relating to portfolio securities during the most recent period ended June 30 is available without charge, upon request, by calling 1-888-482-3726 (888-HUBERCM). Furthermore, you can obtain the Funds’ proxy voting records on the SEC’s website at http://www.sec.gov.
Quarterly Filings on Form N-PORT
The Funds file their complete schedule of portfolio holdings with the SEC for the first and third quarters of each fiscal year on Part F of Form N-PORT. The Funds’ Form N-PORT is available on the SEC’s website at http://www.sec.gov. Information included in the Funds’ Form N-PORT is also available by calling 1-888-482-3726 (888-HUBERCM).
59
Huber Funds
HOUSEHOLDING (Unaudited)
In an effort to decrease costs, the Funds will reduce the number of duplicate prospectuses, supplements, and certain other shareholder documents that you receive by sending only one copy of each to those addresses shown by two or more accounts. Please call the Funds’ transfer agent toll free at 1-888-482-3726 (888-HUBERCM) to request individual copies of these documents. The Funds will begin sending individual copies 30 days after receiving your request. This policy does not apply to account statements.
60
Huber Funds
APPROVAL OF INVESTMENT ADVISORY AGREEMENT (Unaudited)
Huber Select Large Cap Value Fund
Huber Small Cap Value Fund
Huber Large Cap Value Fund
Huber Mid Cap Value Fund
At meetings held on October 18, 2023 and December 14-15, 2023, the Board (which is comprised of three persons, all of whom are Independent Trustees as defined under the Investment Company Act of 1940, as amended), considered and approved, for another annual term, the continuance of the investment advisory agreement (the “Advisory Agreement”) between Advisors Series Trust (the “Trust”) and Huber Capital Management, LLC (the “Adviser”) on behalf of the Huber Select Large Cap Value Fund (the “Select Large Cap Value Fund”), Huber Small Cap Value Fund (the “Small Cap Value Fund”), Huber Large Cap Value Fund (the “Large Cap Value Fund”) and Huber Mid Cap Value Fund (the “Mid Cap Value Fund”) (collectively, the “Funds”). At both meetings, the Board received and reviewed substantial information regarding the Funds, the Adviser and the services provided by the Adviser to the Funds under the Advisory Agreement. This information, together with the information provided to the Board throughout the course of the year, formed the primary (but not exclusive) basis for the Board’s determination. Below is a summary of the factors considered by the Board and the conclusions that formed the basis for the Board’s approval of the continuance of the Advisory Agreement:
| 1. | THE NATURE, EXTENT AND QUALITY OF THE SERVICES PROVIDED AND TO BE PROVIDED BY THE ADVISER UNDER THE ADVISORY AGREEMENT. The Board considered the nature, extent and quality of the Adviser’s overall services provided to the Funds, as well as its specific responsibilities in all aspects of day-to-day investment management of the Funds. The Board considered the qualifications, experience and responsibilities of the portfolio manager, as well as the responsibilities of other key personnel of the Adviser involved in the day-to-day activities of the Funds. The Board also considered the resources and compliance structure of the Adviser, including information regarding its compliance program, its chief compliance officer and the Adviser’s compliance record, as well as the Adviser’s cybersecurity program, liquidity risk management program, business continuity plan, valuation procedures, and risk management process. The Board also noted that the Adviser was working towards implementation of newly adopted Securities and Exchange Commission rules applicable to the Fund, including the new tailored shareholder reports. The Board further considered the prior relationship between the Adviser and the Trust, as well as the Board’s knowledge of the Adviser’s operations, and noted that during the course of |
61
Huber Funds
APPROVAL OF INVESTMENT ADVISORY AGREEMENT (Unaudited), Continued
| the prior year they had met with certain personnel of the Adviser to discuss the Funds’ performance and investment outlook as well as various marketing and compliance topics. The Board concluded that the Adviser had the quality and depth of personnel, resources, investment processes and compliance policies and procedures essential to performing its duties under the Advisory Agreement and that they were satisfied with the nature, overall quality and extent of such management services. | ||
| 2. | THE FUNDS’ HISTORICAL PERFORMANCE AND THE OVERALL PERFORMANCE OF THE ADVISER. In assessing the quality of the portfolio management delivered by the Adviser, the Board reviewed the short-term and long-term performance of each Fund as of June 30, 2023, on both an absolute basis and a relative basis in comparison to its peer funds utilizing Morningstar classifications, appropriate securities market benchmarks, a cohort that is comprised of similarly managed funds selected by an independent third-party consulting firm engaged by the Board to assist it in its 15(c) review (the “Cohort”), and the Adviser’s similarly managed accounts, if applicable. While the Board considered both short-term and long-term performance, it placed greater emphasis on longer term performance. When reviewing performance against the comparative Morningstar peer group universe, the Board took into account that the investment objectives and strategies of each Fund, its focus on tax efficiency as well as its level of risk tolerance, may differ significantly from funds in the peer universe. When reviewing the Fund’s performance against broad market benchmarks, the Board took into account the differences in portfolio construction between the Fund and such benchmarks as well as other differences between actively managed funds and passive benchmarks, such as objectives and risks. In assessing periods of relative underperformance or outperformance, the Board took into account that relative performance can be significantly impacted by performance measurement periods and that some periods of underperformance may be transitory in nature while others may reflect more significant underlying issues. | |
Select Large Cap Value Fund: The Board noted that the Fund outperformed the Morningstar peer group average for the one-, three-, five-, and ten-year periods ended June 30, 2023. The Fund underperformed its Cohort average for the one- and ten-year periods, and outperformed for the three- and five-year periods ended June 30, 2023. The Board also reviewed the performance of the Fund against broad-based securities market benchmark, noting that it had outperformed its primary benchmark index for the one-, three- and five-year periods, but underperformed during the ten-year period, all periods ended June 30, 2023. |
62
Huber Funds
APPROVAL OF INVESTMENT ADVISORY AGREEMENT (Unaudited), Continued
| The Board also considered the Fund’s performance compared to the Adviser’s similarly managed composite, noting it outperformed for the one-, three-, five- and ten-year periods ended June 30, 2023. | ||
Small Cap Value Fund: The Board noted that the Fund outperformed the Morningstar peer group average for the one- and three-year periods, but underperformed for the five- and ten-year periods ended June 30, 2023. During this same time the Fund outperformed its Cohort average for the one-year period, performed at the average for the three-year period and underperformed for the five- and ten-year periods. The Board also reviewed the performance of the Fund against broad-based securities market benchmarks, noting that it had outperformed its primary benchmark index for the one- and three-year periods, but underperformed over the five- and ten-year periods ended June 30, 2023. | ||
| The Board also considered the Fund’s performance compared to the Adviser’s similarly managed composite, noting it underperformed the similarly managed composite for the one-, three-, five- and ten-year periods ended June 30, 2023. | ||
Large Cap Value Fund: The Board noted that the Fund underperformed the Morningstar peer group average and its Cohort average for the one-, three-, five-, and ten-year periods ended June 30, 2023. The Board also reviewed the performance of the Fund against a broad-based securities market benchmark, noting that it had outperformed its primary benchmark for the one-year period and underperformed for the three-, five-, and ten-year periods ended June 30, 2023. | ||
| The Board also considered the Fund’s performance compared to the Adviser’s similarly managed composite, noting it outperformed the similarly managed composite for the one-year period and underperformed for the three-,five-, and ten-year periods ended June 30, 2023. | ||
Mid Cap Value Fund: The Board noted that the Fund underperformed its primary benchmark, the Morningstar peer group average, and its Cohort average for the one-, three-, and five-year periods ended June 30, 2023. | ||
| The Board noted that the Adviser represented it had no similarly managed accounts. | ||
| 3. | THE COSTS OF THE SERVICES TO BE PROVIDED BY THE ADVISER AND THE STRUCTURE OF THE ADVISER’S FEE UNDER THE ADVISORY AGREEMENT. In considering the advisory fee and total expenses of the Funds, the Board reviewed comparisons to the applicable Morningstar peer funds, the Cohort, and the Adviser’s similarly managed |
63
Huber Funds
APPROVAL OF INVESTMENT ADVISORY AGREEMENT (Unaudited), Continued
| accounts for other types of clients, as well as all expense waivers and reimbursements, if any, for each Fund. When reviewing fees charged to other similarly managed accounts, the Board took into account the type of account and the differences in the management of that account that might be germane to the difference, if any, in the fees charged to such accounts. | ||
Select Large Cap Value Fund: The Board noted that the contractual advisory fee is 0.99%, but the Adviser has voluntarily lowered this to 0.75%. The Board noted that the Adviser had contractually agreed to maintain an annual expense ratio for the Fund of 0.99% (excluding certain operating expenses and class-level expenses, the “Expense Cap”). The Board noted that the Fund’s management fee (with the voluntary waiver) and net expense ratio were above the median and average of the Cohort. The Board also noted that the net expense ratio was above the average of its Morningstar peer group. The Board found that the contractual management fees charged to the Fund were generally above the fees charged to its institutional separate account clients, noting the Adviser represented that there are higher costs associated with managing the Fund and that the minimum investment amount for the separate account clients is much higher than that of the Fund. | ||
Small Cap Value Fund: The Board noted that the contractual advisory fee is 1.35%, but the Adviser has voluntarily lowered this to 0.99%. The Board noted that the Adviser had contractually agreed to maintain an annual expense ratio for the Fund of 1.35% (excluding certain operating expenses and class-level expenses, the “Expense Cap”). The Board also noted that the Fund’s management fee (with the voluntary waiver) and net expense ratio was above the Cohort average and median. The Board also noted that the net expense ratio was above the average of its Morningstar peer group. The Board found that the management fees charged to the Fund were generally above the fees charged to its institutional separate account clients, noting the Adviser represented that there are higher costs associated with managing the Fund. | ||
Large Cap Value Fund: The Board noted that the contractual advisory fee is 0.75%, but the Adviser has voluntarily lowered this to 0.00%. The Board noted that the Adviser had contractually agreed to maintain an annual expense ratio for the Fund of 0.75% (excluding certain operating expenses and class-level expenses, the “Expense Cap”). The Board noted that the Fund’s net expense ratio was below the Morningstar peer group average. The Board also noted that the Fund’s management fee (with the voluntary waiver) was below the Cohort average and median, while the net expense |
64
Huber Funds
APPROVAL OF INVESTMENT ADVISORY AGREEMENT (Unaudited), Continued
| ratio was at the median and above the average of its Cohort. The Board also considered that after advisory fee waivers and the reimbursement of Fund expenses necessary to maintain the Expense Caps, the Adviser did not receive any advisory fees from the Fund during the year ended June 30, 2023. The Board found that the contractual management fees charged to the Fund were generally above the fees charged to its institutional separate account clients, noting the Adviser represented that there are higher costs associated with managing the Fund. | ||
Mid Cap Value Fund: The Board noted that the contractual advisory fee is 1.00%, but the Adviser has voluntarily lowered this to 0.00%. The Board noted that the Adviser had contractually agreed to maintain an annual expense ratio for the Fund of 1.00% (excluding certain operating expenses and class-level expenses, the “Expense Cap”). The Board noted that the Fund’s management fee (with the voluntary waiver) was below the Cohort average and median. The Board also noted that the Fund’s net expense ratio was above the median and average of the Cohort. The Board also noted that the Fund’s net expense ratio was below the average of its Morningstar peer group. The Board also considered that after advisory fee waivers and the reimbursement of Fund expenses necessary to maintain the Expense Caps, the Adviser did not receive any advisory fees from the Fund during the year ended June 30, 2023. | ||
| 4. | ECONOMIES OF SCALE. The Board also considered whether economies of scale were being realized by the Adviser that should be shared with shareholders, noting that the Advisory Agreement provides for breakpoints when the Funds reach certain asset levels (beginning at $10 billion for the Select Large Cap Value Fund, $5 billion for the Small Cap Value Fund and $10 billion for the Large Cap Value Fund). The Board noted that these breakpoint levels were significantly above each respective Fund’s current asset level and that they would continue to review economies of scale at asset levels that were below these breakpoint levels. The Board also noted that the Mid Cap Value Fund does not have breakpoints in its advisory fee schedule. The Board noted that the Adviser has contractually agreed to reduce its advisory fees or reimburse Fund expenses so that the Funds do not exceed the specified Expense Caps. The Board also noted that the Adviser had voluntarily reduced each Fund’s advisory fee and continued to waive all or a portion of each Fund’s advisory fee to maintain the Expense Caps, and therefore, at current asset levels, it did not appear that there were additional significant economies of scale being realized by the Adviser that should be shared with shareholders. As a result, the Board concluded that it would continue to monitor economies of scale in the future as circumstances |
65
Huber Funds
APPROVAL OF INVESTMENT ADVISORY AGREEMENT (Unaudited), Continued
| changed and assuming asset levels increase. The Board noted that the current breakpoint schedules in the Advisory Agreement may be adjusted if additional significant economies of scale are realized as Fund assets grow such that their economies may be shared with shareholders at lower asset levels than currently provided in the Advisory Agreement. | ||
| 5. | THE PROFITS TO BE REALIZED BY THE ADVISER AND ITS AFFILIATES FROM THEIR RELATIONSHIP WITH THE FUNDS. The Board reviewed the Adviser’s financial information and took into account both the direct benefits and the indirect benefits to the Adviser from advising the Funds. The Board considered the profitability to the Adviser from its relationship with the Funds and considered any additional material benefits, including benefits received in the form of Rule 12b-1 fees received by the Adviser, “soft dollars” benefits that may be received by the Adviser in exchange for Fund brokerage, and shareholder servicing plan fees received by the Adviser. The Board considered the financial condition of the parent company of the Adviser. The Board considered the parent company’s representations that it would financially support the Adviser when necessary. After such review, the Board determined that the profitability to the Adviser with respect to the Advisory Agreement for each Fund was negative, and that the Adviser had maintained sufficient resources and profit levels to support the services it provides to the Funds. |
No single factor was determinative of the Board’s decision to approve the continuance of the Advisory Agreement for the Select Large Cap Value Fund, Small Cap Value Fund, Large Cap Value Fund and Mid Cap Value Fund, but rather the Trustees based their determination on the total mix of information available to them. Based on a consideration of all the factors in their totality, the Trustees determined that the advisory arrangements with the Adviser, including the advisory fees, were fair and reasonable to the Funds. The Board, including a majority of the Independent Trustees, therefore determined that the continuance of the Advisory Agreement for the Funds would be in the best interests of each Fund and its shareholders.
66
Huber Funds
PRIVACY NOTICE
The Funds collect non-public information about you from the following sources:
• Information we receive about you on applications or other forms;
• Information you give us orally; and/or
• Information about your transactions with us or others.
We do not disclose any non-public personal information about our customers or former customers without the customer’s authorization, except as permitted by law or in response to inquiries from governmental authorities. We may share information with affiliated and unaffiliated third parties with whom we have contracts for servicing the Funds. We will provide unaffiliated third parties with only the information necessary to carry out their assigned responsibilities. We maintain physical, electronic and procedural safeguards to guard your non-public personal information and require third parties to treat your personal information with the same high degree of confidentiality.
In the event that you hold shares of the Funds through a financial intermediary, including, but not limited to, a broker-dealer, bank, or trust company, the privacy policy of your financial intermediary would govern how your non-public personal information would be shared by those entities with unaffiliated third parties.
67
(This Page Intentionally Left Blank.)
Investment Adviser
Huber Capital Management, LLC
1700 East Walnut Avenue, Suite 460
El Segundo, CA 90245
Independent Registered Public Accounting Firm
Tait, Weller & Baker LLP
Two Liberty Place
50 South 16th Street, Suite 2900
Philadelphia, PA 19102
Legal Counsel
Sullivan & Worcester LLP
1251 Avenue of the Americas, 19th Floor
New York, NY 10020
Custodian
U.S. Bank National Association
1555 North RiverCenter Drive, Suite 302
Milwaukee, WI 53212
Transfer Agent, Fund Accountant and Fund Administrator
U.S. Bank Global Fund Services
615 East Michigan Street
Milwaukee, WI 53202
1-888-482-3726 (888-HUBERCM)
Distributor
Quasar Distributors, LLC
3 Canal Plaza, Suite 100
Portland, ME 04101
This report is intended for shareholders of the Huber Funds and may not be used as sales literature unless preceded or accompanied by a current prospectus. For a current prospectus, please call 1-888-482-3726 (888-HUBERCM). Statements and other information herein are dated and are subject to change.
(b) Not applicable.
Item 2. Code of Ethics.
Not applicable for semi-annual reports.
Item 3. Audit Committee Financial Expert.
Not applicable for semi-annual reports.
Item 4. Principal Accountant Fees and Services.
Not applicable for semi-annual reports.
Item 5. Audit Committee of Listed Registrants.
(a) Not applicable.
(b) Not applicable.
Item 6. Investments.
(a) Schedule of Investments is included as part of the report to shareholders filed under Item 1 of this Form.
(b) Not applicable.
Item 7. Disclosure of Proxy Voting Policies and Procedures for Closed-End Management Investment Companies.
Not applicable to open-end investment companies.
Item 8. Portfolio Managers of Closed-End Management Investment Companies.
Not applicable to open-end investment companies.
Item 9. Purchases of Equity Securities by Closed‑End Management Investment Company and Affiliated Purchasers.
Not applicable to open-end investment companies.
Item 10. Submission of Matters to a Vote of Security Holders.
There have been no material changes to the procedures by which shareholders may recommend nominees to the Registrant’s Board of Trustees.
Item 11. Controls and Procedures.
| (a) | The Registrant’s President/Chief Executive Officer/Principal Executive Officer and Vice President/Treasurer/Principal Financial Officer have reviewed the Registrant's disclosure controls and procedures (as defined in Rule 30a-3(c) under the Investment Company Act of 1940, as amended, (the “Act”)) as of a date within 90 days of the filing of this report, as required by Rule 30a-3(b) under the Act and Rules 13a-15(b) or 15d‑15(b) under the Securities Exchange Act of 1934. Based on their review, such officers have concluded that the disclosure controls and procedures are effective in ensuring that information required to be disclosed in this report is appropriately recorded, processed, summarized and reported and made known to them by others within the Registrant and by the Registrant’s service provider. |
| (b) | There were no changes in the Registrant's internal control over financial reporting (as defined in Rule 30a-3(d) under the Act) that occurred during the period covered by this report that has materially affected, or is reasonably likely to materially affect, the Registrant's internal control over financial reporting. |
Item 12. Disclosure of Securities Lending Activities for Closed-End Management Investment Companies.
Not applicable to open-end investment companies.
Item 13. Exhibits.
| (a) | (1) Any code of ethics or amendment thereto, that is the subject of the disclosure required by Item 2, to the extent that the registrant intends to satisfy Item 2 requirements through filing an exhibit. Not applicable. |
(3) Any written solicitation to purchase securities under Rule 23c‑1 under the Act sent or given during the period covered by the report by or on behalf of the registrant to 10 or more persons. Not applicable to open-end investment companies.
(4) Change in the registrant’s independent public accountant. There was no change in the registrant’s independent public accountant for the period covered by this report.
SIGNATURES
Pursuant to the requirements of the Securities Exchange Act of 1934 and the Investment Company Act of 1940, as amended, the registrant has duly caused this report to be signed on its behalf by the undersigned, thereunto duly authorized.
(Registrant) Advisors Series Trust
By (Signature and Title)* /s/ Jeffrey T. Rauman
Jeffrey T. Rauman, President/Chief Executive Officer/Principal
Executive Officer
Date 7/8/2024
Pursuant to the requirements of the Securities Exchange Act of 1934 and the Investment Company Act of 1940, as amended, this report has been signed below by the following persons on behalf of the registrant and in the capacities and on the dates indicated.
By (Signature and Title)* /s/ Jeffrey T. Rauman
Jeffrey T. Rauman, President/Chief Executive Officer/Principal
Executive Officer
Date 7/8/2024
By (Signature and Title)* /s/ Kevin J. Hayden
Kevin J. Hayden, Vice President/Treasurer/Principal Financial
Officer
Date 7/8/2024
* Print the name and title of each signing officer under his or her signature.