UNITED STATES
SECURITIES AND EXCHANGE COMMISSION
Washington, D.C. 20549
FORM N-CSR
CERTIFIED SHAREHOLDER REPORT OF REGISTERED
MANAGEMENT INVESTMENT COMPANIES
Investment Company Act file Number 811-01807
| Value Line Larger Companies Fund, Inc. | |
| (Exact name of registrant as specified in charter) |
| | |
| 7 Times Square, New York, N.Y. 10036 | |
| (Address of principal executive offices) (Zip Code) |
Registrant’s telephone number, including area code: 212-907-1900
Date of fiscal year end: December 31, 2012
Date of reporting period: December 31, 2012
Item I. Reports to Stockholders
A copy of the Annual Report to Stockholders for the period ended 12/31/12 is included with this Form.
| | | | | | | |
| | | | | | | |
| | INVESTMENT ADVISER | | EULAV Asset Management | | A N N U A L R E P O R T | |
| | | | 7 Times Square 21st Floor | | D e c e m b e r 3 1 , 2 0 1 2 | |
| | | | New York, NY 10036-6524 | | | |
| | DISTRIBUTOR | | EULAV Securities LLC | | | |
| | | | 7 Times Square 21st Floor | | | |
| | | | New York, NY 10036-6524 | | | |
| | CUSTODIAN BANK | | State Street Bank and Trust Co. | | | |
| | | | 225 Franklin Street | | | |
| | | | Boston, MA 02110 | | | |
| | SHAREHOLDER | | State Street Bank and Trust Co. | | | |
| | SERVICING AGENT | | c/o BFDS | | | |
| | | | P.O. Box 219729 | | Value Line Larger Companies Fund, Inc. | |
| | | | Kansas City, MO 64121-9729 | | |
| | INDEPENDENT | | PricewaterhouseCoopers LLP | | |
| | REGISTERED PUBLIC | | 300 Madison Avenue | | |
| | ACCOUNTING FIRM | | New York, NY 10017 | | |
| | LEGAL COUNSEL | | Peter D. Lowenstein, Esq. | | |
| | | | 496 Valley Road | | |
| | | | Cos Cob, CT 06807-0272 | | |
| | DIRECTORS | | Mitchell E. Appel | | |
| | | | Joyce E. Heinzerling | | |
| | | | Francis C. Oakley | | |
| | | | David H. Porter | | |
| | | | Paul Craig Roberts | | |
| | | | Nancy-Beth Sheerr | | |
| | | | Daniel S. Vandivort | | |
| | OFFICERS | | Mitchell E. Appel | | | |
| | | | President | | | |
| | | | Michael J. Wagner | | | |
| | | | Chief Compliance Officer | | | |
| | | | Emily D. Washington | | | |
| | | | Treasurer and Secretary | | | |
| | | | | | | |
| | | | | |  | |
| | | | | | | |
| |  | | | |
 | | | |
| | This audited report is issued for information to shareholders. It is not authorized for distribution to prospective investors unless preceded or accompanied by a currently effective prospectus of the Fund (obtainable from the Distributor). | | | |
| | | | #00090993 | | | |
| Value Line Larger Companies Fund, Inc. |
| |
| To Our Value Line Larger |
To Our Shareholders (unaudited):
Enclosed is your annual report for the twelve month period ending December 31, 2012. We encourage you to carefully review this report, which includes economic observations, your Fund’s performance data and highlights, schedule of investments, and financial statements.
The Value Line Larger Companies Fund (the “Fund”) had a total return of 14.82% for 2012 which compares to a total return of 16.00% for the Standard & Poor’s 500 stock Index(1).
The year started off well for the stock market as signs of improvement in employment, housing, good corporate earnings reports, and a more constructive view of the European debt crises were important factors driving the rally. During this time, riskier assets and higher beta stocks generally outperformed historically less volatile groups. The “risk-on” trade was in full swing as investors became more comfortable with the state of and outlook for the US economy. May brought a correction of more than 6% for the S&P 500 Index as the “risk-on” trade faded. Those riskier assets and higher beta stocks that led the earlier rally generally suffered the most during the May correction as less volatile sectors outperformed. The market proceeded to stage an impressive rally from the beginning of June through October in anticipation of yet another monetary easing by the Federal Reserve, this time known as QE3. After the announcement of the Fed’s latest effort to help the economy, stocks initially rose. However, shortly thereafter, share prices began to fade as the anticipation of the news wore off and the market began to refocus on more fundamental issues like sluggish global economic growth, election uncertainties, and of course the dreaded “fiscal cliff”. The S&P 500 ended the year with a solid positive return of 16% for its fourth year in a row of positive gains.
All sectors in the Fund posted positive returns for the year. Results benefitted from good stock selection in the Consumer Staples, Energy, and Healthcare sectors. However, while returns were positive, stock selection in the Consumer Discretionary, Materials, and Telecommunication sectors underperformed their peers in the Index.
| |
| Value Line Larger Companies Fund, Inc. |
| |
| Companies Fund Shareholders |
We continue to emphasize larger-capitalized stocks in the Fund that generally are ranked in the higher categories of 1, 2 or 3 in the Value Line Timeliness Ranking System™. The Fund ended the period with over weighted positions versus its Index in the technology, consumer discretionary, healthcare, and materials sectors, while being underweighted in the financial services, consumer staples, and energy sectors.
We believe the current environment is especially conducive to a well-diversified portfolio. Our goal is to generating solid returns through capital growth across economic cycles.
Thank you for investing with the Value Line Funds.
| | |
| | Sincerely, |
| | |
| | /s/ Mitchell Appel |
| | Mitchell Appel, President |
| | |
| | /s/ Mark Spellman |
| | Mark Spellman, Portfolio Manager |
| |
| Past performance does not guarantee future results. Investment return and principal value of an investment can fluctuate so that an investor’s shares, when redeemed, may be worth more or less than their original cost; and that current performance may be lower or higher than the performance data quoted. Investors should carefully consider the investment objectives, risks, charges and expense of a fund. This and other important information about a fund is contained in the fund’s prospectus. A copy of our fund’s prospectus can be obtained free of charge by going to our website at www.vlfunds.com or calling 800.243.2729. |
| (1) | The Standard & Poor’s 500 Index consists of 500 stocks which are traded on the New York Stock Exchange, American Stock Exchange and the NASDAQ National Market System and is representative of the broad stock market. This is an unmanaged index and does not reflect charges, expenses or taxes. It is not possible to directly invest in this index. |
Value Line Larger Companies Fund, Inc.
| |
| To Our Value Line Larger Companies Fund Shareholders |
Economic Highlights (unaudited)
The S&P 500 gained 16.0% in 2012, making this the benchmark index’s largest annual return since 2009 and the fourth-largest return in the last decade. This performance was particularly impressive given the pre-election uncertainties, yearend concerns regarding the fiscal cliff, and the lingering sovereign debt issues in Europe.
At home, GDP grew 2.2% for the year, indicating an economy firmly in a mid-cycle expansion. The consumer showed renewed vigor during the holiday shopping season with retail sales exceeding expectations and increasing 4.7% year-over-year. While consumer spending ended 2012 on a high note, ongoing fiscal uncertainty and tax increases could rein in consumer spending in 2013. Consumers’ growing unease can be seen in the December decline in the Consumer Confidence Index. The financial impact of the increase in the payroll tax undoubtedly contributed to this decline in Consumer Confidence.
The labor market has been improving at a measured pace. The national unemployment rate stood at 7.8% at yearend, though with significant variation among the states. While 15 states posted unemployment rates under 6%, there were 5 states, including California, with rates still exceeding 9%. Despite the improvement over 2011’s 8.5% unemployment rate, job creation was not strong enough for the Fed to alter its economic stimulus policy of keeping short term interest rates at extremely low levels. The Fed announced in December that future monetary tightening would be contingent on the unemployment rate falling below 6.5% or inflation breaching 2.5%.
Despite the growing economy, inflationary pressures have remained modest. Consumer prices remained in check, with headline prices rising 1.7% on a year-over-year basis. Limited wage growth has contributed to the relatively benign inflationary environment.
The housing market continues to be a bright spot for the economy. The residential housing recovery continued to gain steam, with construction in December resulting in new housing starts that were nearly 40% higher than a year earlier. Housing prices continued their upward march with price increases in 20 metropolitan areas over the last 12 months. This rising wealth effect stemming from high home values may offset some of the headwinds for the consumer from the recent tax policy changes.
Value Line Larger Companies Fund, Inc.
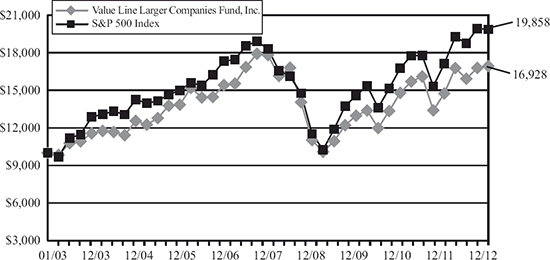
The following graph compares the performance of the Value Line Larger Companies Fund, Inc. to that of the S&P 500 Index (the “Index”). The Value Larger Companies Fund, Inc. is a professionally managed mutual fund, while the Index is not available for investment and is unmanaged. The returns for the Index do not reflect charges, expenses or taxes, but do include the reinvestment of dividends. The comparison is shown for illustrative purposes only.
Comparison of a Change in Value of a $10,000 Investment in the Value Line
Larger Companies Fund, Inc. and the S&P 500 Index*
Performance Data: **
| | | Average Annual
Total Return | | Growth of an Assumed
Investment of $10,000 | |
| 1 year ended 12/31/12 | | | 14.82 | % | | | $ | 11,482 | | |
| 5 years ended 12/31/12 | | | (1.01 | )% | | | $ | 9,504 | | |
| 10 years ended 12/31/12 | | | 5.40 | % | | | $ | 16,928 | | |
| | |
| * | The Standard and Poor’s 500 Stock Index is an unmanaged index that is representative of the larger- capitalization stocks traded in the United States. |
| | |
| ** | The performance data quoted represent past performance and are no guarantee of future performance. The average annual total returns and growth of an assumed investment of $10,000 include dividends reinvested and capital gains distributions accepted in shares. The investment return and principal value of an investment will fluctuate so that an investment, when redeemed, may be worth more or less than its original cost. The performance data and graph do not reflect the deduction of taxes that a shareholder would pay on fund distributions or the redemption of fund shares. |
| |
| Value Line Larger Companies Fund, Inc. |
| |
FUND EXPENSES (unaudited):
Example
As a shareholder of the Fund, you incur ongoing costs, including management fees, distribution and service (12b-1) fees, and other Fund expenses. This Example is intended to help you understand your ongoing costs (in dollars) of investing in the Fund and to compare these costs with the ongoing costs of investing in other mutual funds.
The Example is based on an investment of $1,000 invested at the beginning of the period and held for the entire period (July 1, 2012 through December 31, 2012).
Actual Expenses
The first line of the table below provides information about actual account values and actual expenses. You may use the information in this line, together with the amount you invested, to estimate the expenses that you paid over the period. Simply divide your account value by $1,000 (for example an $8,600 account value divided by $1,000 = 8.6), then multiply the result by the number in the first line under the heading “Expenses Paid During Period” to estimate the expenses you paid on your account during this period.
Hypothetical Example for Comparison Purposes
The second line of the table below provides information about hypothetical account values and hypothetical expenses based on the Fund’s actual expense ratio and an assumed rate of return of 5% per year before expenses, which is not the Fund’s actual return. The hypothetical account values and expenses may not be used to estimate the actual ending account balance or expenses you paid for the period. You may use this information to compare the ongoing costs of investing in the Fund and other funds. To do so, compare this 5% hypothetical example with the 5% hypothetical examples that appear in the shareholder reports of other funds.
Please note that the expenses shown in the table are meant to highlight your ongoing costs only and do not reflect any transactional costs, such as sales charges (loads), redemption fees, or exchange fees. Therefore, the table is useful in comparing ongoing costs only and will not help you determine the relative total costs of owning different funds. In addition, if transactional costs were included, your costs would have been higher.
| | | | | | | | | | | | | |
| | Beginning account value 7/1/12 | | Ending account value 12/31/12 | | Expenses paid during period 7/1/12 thru 12/31/12* | |
| Actual | | $ | 1,000.00 | | | | $ | 1,063.55 | | | | $ | 5.42 | | |
| Hypothetical (5% return before expenses) | | $ | 1,000.00 | | | | $ | 1,019.88 | | | | $ | 5.31 | | |
| | |
| * | Expenses are equal to the Fund’s annualized expense ratio of 1.05% multiplied by the average account value over the period, multiplied by 184/366 to reflect the one-half year period. This expense ratio may differ from the expense ratio shown in the Financial Highlights. |
Value Line Larger Companies Fund, Inc.
| |
| Portfolio Highlights at December 31, 2012 (unaudited) |
Ten Largest Holdings
| | | | | | | | | |
| Issue | | Shares | | Value | | Percentage of Net Assets |
| Apple, Inc. | | 6,500 | | $ | 3,464,695 | | 1.9 | % |
| Starbucks Corp. | | 55,000 | | $ | 2,949,100 | | 1.6 | % |
| Google, Inc. Class A | | 4,000 | | $ | 2,837,480 | | 1.5 | % |
| Union Pacific Corp. | | 22,000 | | $ | 2,765,840 | | 1.5 | % |
| SAP AG ADR | | 34,000 | | $ | 2,732,920 | | 1.5 | % |
| ARM Holdings PLC ADR | | 70,000 | | $ | 2,648,100 | | 1.4 | % |
| U.S. Bancorp | | 82,000 | | $ | 2,619,080 | | 1.4 | % |
| International Business Machines Corp. | | 13,000 | | $ | 2,490,150 | | 1.4 | % |
| Monsanto Co. | | 26,000 | | $ | 2,460,900 | | 1.3 | % |
| eBay, Inc. | | 48,000 | | $ | 2,448,960 | | 1.3 | % |
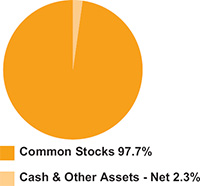
Asset Allocation – Percentage of Net Assets
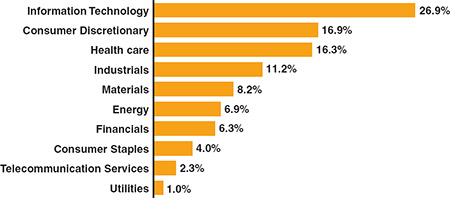
| Sector Weightings – Percentage of Total Investment Securities* |
*Sector weightings exclude short-term investments.
Value Line Larger Companies Fund, Inc.
| | |
| Schedule of Investments | December 31, 2012 |
| Shares | | | | Value | |
| | | | | |
| COMMON STOCKS (97.7%) | | | | |
| | | | | | | | |
| | | | CONSUMER DISCRETIONARY (16.5%) | | | | |
| | 5,000 | | AutoZone, Inc. * | | $ | 1,772,149 | |
| | 34,000 | | Coach, Inc. | | | 1,887,340 | |
| | 63,000 | | Comcast Corp. Class A | | | 2,264,850 | |
| | 44,000 | | DIRECTV * | | | 2,207,040 | |
| | 47,000 | | Las Vegas Sands Corp. | | | 2,169,520 | |
| | 24,000 | | McDonald’s Corp. | | | 2,117,040 | |
| | 40,000 | | NIKE, Inc. Class B | | | 2,064,000 | |
| | 3,500 | | Priceline.com, Inc. * | | | 2,174,200 | |
| | 55,000 | | Starbucks Corp. | | | 2,949,100 | |
| | 36,000 | | Target Corp. | | | 2,130,120 | |
| | 50,000 | | TJX Companies, Inc. (The) | | | 2,122,500 | |
| | 42,000 | | Viacom, Inc. Class B | | | 2,215,080 | |
| | 45,000 | | Walt Disney Co. (The) | | | 2,240,550 | |
| | 31,000 | | Yum! Brands, Inc. | | | 2,058,400 | |
| | | | | | | 30,371,889 | |
| | | | | | | | |
| | | | CONSUMER STAPLES (3.9%) | | | | |
| | 24,000 | | Costco Wholesale Corp. | | | 2,370,480 | |
| | 20,000 | | CVS Caremark Corp. | | | 967,000 | |
| | 44,000 | | General Mills, Inc. | | | 1,778,040 | |
| | 31,000 | | PepsiCo, Inc. | | | 2,121,330 | |
| | | | | | | 7,236,850 | |
| | | | | | | | |
| | | | ENERGY (6.8%) | | | | |
| | 16,000 | | Chevron Corp. | | | 1,730,240 | |
| | 41,000 | | Enterprise Products Partners L.P. | | | 2,053,280 | |
| | 19,000 | | EOG Resources, Inc. | | | 2,295,010 | |
| | 26,000 | | Exxon Mobil Corp. | | | 2,250,300 | |
| | 29,000 | | Schlumberger Ltd. | | | 2,009,410 | |
| | 45,000 | | TransCanada Corp. (1) | | | 2,129,400 | |
| | | | | | | 12,467,640 | |
| | | | | | | | |
| | | | FINANCIALS (6.2%) | | | | |
| | 11,000 | | BlackRock, Inc. | | | 2,273,810 | |
| | 37,000 | | Capital One Financial Corp. | | | 2,143,410 | |
| | 50,000 | | JPMorgan Chase & Co. | | | 2,198,500 | |
| | 21,700 | | M&T Bank Corp. | | | 2,136,799 | |
| | 82,000 | | U.S. Bancorp | | | 2,619,080 | |
| | | | | | | 11,371,599 | |
| | | | | | | | |
| | | | HEALTH CARE (16.0%) | | | | |
| | 51,000 | | Agilent Technologies, Inc. | | | 2,087,940 | |
| | 25,000 | | Allergan, Inc. | | | 2,293,250 | |
| | 25,000 | | Amgen, Inc. | | | 2,158,000 | |
| | 13,500 | | Biogen Idec, Inc. * | | | 1,980,045 | |
| Shares | | | | Value | |
| | 66,000 | | Bristol-Myers Squibb Co. | | $ | 2,150,940 | |
| | 40,000 | | Express Scripts Holding Co. * | | | 2,160,000 | |
| | 33,000 | | Gilead Sciences, Inc. * | | | 2,423,850 | |
| | 21,000 | | McKesson Corp. | | | 2,036,160 | |
| | 28,000 | | Novartis AG ADR | | | 1,772,400 | |
| | 15,000 | | Novo Nordisk A/S ADR | | | 2,448,150 | |
| | 46,000 | | Teva Pharmaceutical Industries Ltd. ADR | | | 1,717,640 | |
| | 29,500 | | Thermo Fisher Scientific, Inc. | | | 1,881,510 | |
| | 41,000 | | UnitedHealth Group, Inc. | | | 2,223,840 | |
| | 24,000 | | Watson Pharmaceuticals, Inc. * | | | 2,064,000 | |
| | | | | | | 29,397,725 | |
| | | | | | | | |
| | | | INDUSTRIALS (10.9%) | | | | |
| | 40,000 | | ADT Corp. (The) | | | 1,859,600 | |
| | 24,000 | | Boeing Co. (The) | | | 1,808,640 | |
| | 25,000 | | Canadian National Railway Co. | | | 2,275,250 | |
| | 39,000 | | Danaher Corp. | | | 2,180,100 | |
| | 47,000 | | Expeditors International of Washington, Inc. | | | 1,858,850 | |
| | 21,000 | | FedEx Corp. | | | 1,926,120 | |
| | 12,000 | | Precision Castparts Corp. | | | 2,273,040 | |
| | 40,000 | | Tyco International Ltd. | | | 1,170,000 | |
| | 22,000 | | Union Pacific Corp. | | | 2,765,840 | |
| | 25,000 | | United Technologies Corp. | | | 2,050,250 | |
| | | | | | | 20,167,690 | |
| | | | | | | | |
| | | | INFORMATION TECHNOLOGY (26.2%) | | | | |
| | 34,000 | | Accenture PLC Class A | | | 2,261,000 | |
| | 52,000 | | Altera Corp. | | | 1,790,880 | |
| | 6,500 | | Apple, Inc. | | | 3,464,695 | |
| | 70,000 | | ARM Holdings PLC ADR | | | 2,648,100 | |
| | 19,000 | | Baidu, Inc. ADR * | | | 1,905,510 | |
| | 41,000 | | Check Point Software Technologies Ltd. * | | | 1,953,240 | |
| | 30,000 | | Citrix Systems, Inc. * | | | 1,972,500 | |
| | 31,000 | | Cognizant Technology Solutions Corp. Class A * | | | 2,295,550 | |
| | 48,000 | | eBay, Inc. * | | | 2,448,960 | |
| | 92,000 | | EMC Corp. * | | | 2,327,600 | |
| | 4,000 | | Google, Inc. Class A * | | | 2,837,480 | |
| | 91,000 | | Intel Corp. | | | 1,877,330 | |
| | 13,000 | | International Business Machines Corp. | | | 2,490,150 | |
See Notes to Financial Statements.
Value Line Larger Companies Fund, Inc.
| | | | | | | | |
| Shares | | | | Value | |
| | 37,000 | | Intuit, Inc. | | $ | 2,201,500 | |
| | 41,071 | | Motorola Solutions, Inc. | | | 2,286,833 | |
| | 68,000 | | Oracle Corp. | | | 2,265,760 | |
| | 36,000 | | QUALCOMM, Inc. | | | 2,232,720 | |
| | 34,000 | | SAP AG ADR (1) | | | 2,732,920 | |
| | 57,000 | | Texas Instruments, Inc. | | | 1,763,580 | |
| | 16,000 | | Visa, Inc. Class A | | | 2,425,280 | |
| | 23,000 | | VMware, Inc. Class A * | | | 2,165,220 | |
| | | | | | | 48,346,808 | |
| | | | | | | | |
| | | | MATERIALS (8.0%) | | | | |
| | 20,000 | | Air Products & Chemicals, Inc. | | | 1,680,400 | |
| | 23,000 | | BHP Billiton Ltd. ADR (1) | | | 1,804,120 | |
| | 40,000 | | E.I. du Pont de Nemours & Co. | | | 1,798,800 | |
| | 33,000 | | Ecolab, Inc. | | | 2,372,700 | |
| | 26,000 | | Monsanto Co. | | | 2,460,900 | |
| | 46,000 | | Potash Corporation of Saskatchewan, Inc. | | | 1,871,740 | |
| | 9,000 | | Praxair, Inc. | | | 985,050 | |
| | 106,000 | | Yamana Gold, Inc. | | | 1,824,260 | |
| | | | | | | 14,797,970 | |
| | | | | | | | |
| | | | TELECOMMUNICATION SERVICES (2.2%) | | | | |
| | 80,000 | | America Movil SAB de C.V. Series L, ADR | | | 1,851,200 | |
| | 52,000 | | BCE, Inc. | | | 2,232,880 | |
| | | | | | | 4,084,080 | |
| | | | | | | | |
| | | | UTILITIES (1.0%) | | | | |
| | 28,333 | | Duke Energy Corp. | | | 1,807,646 | |
| | | | TOTAL COMMON STOCKS
(Cost $132,150,761) (97.7%) | | | 180,049,897 | |
| | | | | | | | |
Principal Amount | | | | Value | |
| | | | | |
| SHORT-TERM INVESTMENTS (4.2%) | | | | |
| | | | | | | | |
| | | | REPURCHASE AGREEMENTS (1.5%) | | | | |
| $ | 2,800,000 | | With Morgan Stanley, 0.15%, dated 12/31/12, due 01/02/13, delivery value $2,800,023, (collateralized by $2,860,000 U.S. Treasury Notes 0.125% due 12/31/13, with a value of $2,858,344) | | | 2,800,000 | |
| | | | | | | | |
Principal Amount | | | | Value | |
| | | | | |
| INVESTMENTS OF CASH COLLATERAL FOR SECURITIES ON LOAN (2.7%) | | | | |
| | | | | | | | |
| | | | JOINT REPURCHASE AGREEMENTS (2.7%) | | | | |
| $ | 2,061,554 | | Joint Repurchase Agreement with Morgan Stanley, 0.18%, dated 12/31/12, due 01/02/13, delivery value $2,061,574 (collateralized by $2,102,786 U.S. Treasury Notes 2.750% - 3.250% due 07/31/16 - 02/15/19, with a value of $2,081,712) | | $ | 2,061,554 | |
| | 662,642 | | Joint Repurchase Agreement with Barclays, 0.20%, dated 12/31/12, due 01/02/13, delivery value $662,650 (collateralized by $675,896 U.S. Treasury Note 2.000% due 01/31/16, with a value of $670,582) | | | 662,642 | |
| | 2,135,181 | | Joint Repurchase Agreement with Credit Suisse First Boston, 0.20%, dated 12/31/12, due 01/02/13, delivery value $2,135,204 (collateralized by $2,178,083 U.S. Treasury Note 3.625% due 08/15/19, with a value of $2,152,982) | | | 2,135,181 | |
| | | | | | | | |
| | | | TOTAL INVESTMENTS OF CASH COLLATERAL FOR SECURITIES ON LOAN | | | | |
| | | | (Cost $4,859,377) (2.7%) | | | 4,859,377 | |
| | | | | | | | |
| | | | TOTAL SHORT-TERM INVESTMENTS | | | | |
| | | | (Cost $7,659,377) (4.2%) | | | 7,659,377 | |
| | | | | | | | |
| | | | TOTAL INVESTMENT SECURITIES (101.9%) | | | | |
| | | | (Cost $139,810,138) | | | 187,709,274 | |
| | | | | | | | |
| EXCESS OF LIABILITIES OVER CASH AND OTHER ASSETS (-1.9%) | | | (3,466,692 | ) |
| | | | | | | | |
| NET ASSETS (100%) | | $ | 184,242,582 | |
See Notes to Financial Statements.
Value Line Larger Companies Fund, Inc.
| | | | | |
| | | Value | |
| | | | | |
NET ASSET VALUE OFFERING AND REDEMPTION PRICE, PER OUTSTANDING SHARE ($184,242,582 ÷ 9,315,786 shares outstanding) | | $ | 19.78 | |
| * | Non-income producing. |
| (1) | A portion or all of the security was held on loan. As of December 31, 2012, the market value of the securities on loan was $5,030,767. |
| ADR | American Depositary Receipt. |
Value Line Larger Companies Fund, Inc.
| |
Statement of Assets and Liabilities at December 31, 2012 |
| Assets: | | | | |
Investment securities, at value
(Cost - $132,150,761) (securities on loan, at value, $5,030,767) | | $ | 180,049,897 | |
Repurchase agreement
(Cost - $7,659,377) | | | 7,659,377 | |
| Cash | | | 388,535 | |
| Receivable for securities sold | | | 1,825,432 | |
| Interest and dividends receivable | | | 165,791 | |
| Prepaid expenses | | | 8,689 | |
| Receivable for securities lending income | | | 5,872 | |
| Receivable for capital shares sold | | | 3,006 | |
| Total Assets | | | 190,106,599 | |
| | | | | |
| Liabilities: | | | | |
| Payable upon return of securities on loan | | | 5,058,324 | |
| Payable for securities purchased | | | 407,317 | |
| Payable for capital shares redeemed | | | 162,582 | |
| Accrued expenses: | | | | |
| Advisory fee | | | 118,108 | |
| Sub-transfer agent fees | | | 1,003 | |
| Directors’ fees and expenses | | | 712 | |
| Other | | | 115,971 | |
| Total Liabilities | | | 5,864,017 | |
| Net Assets | | $ | 184,242,582 | |
| | | | | |
| Net assets consist of: | | | | |
| Capital stock, at $1.00 par value (authorized 50,000,000, outstanding 9,315,786 shares) | | $ | 9,315,786 | |
| Additional paid-in capital | | | 172,955,315 | |
| Undistributed net investment income | | | 1,359,830 | |
| Accumulated net realized loss on investments and foreign currency | | | (47,287,177 | ) |
| Net unrealized appreciation of investments and foreign currency translations | | | 47,898,828 | |
| Net Assets | | $ | 184,242,582 | |
| | | | | |
Net Asset Value, Offering and Redemption Price per Outstanding Share ($184,242,582 ÷ 9,315,786 shares outstanding) | | $ | 19.78 | |
| |
Statement of Operations for the Year Ended December 31, 2012 |
| Investment Income: | | | | |
| Dividends (net of foreign withholding tax of $81,173) | | $ | 3,241,605 | |
| Securities lending income | | | 26,259 | |
| Interest | | | 6,523 | |
| Total Income | | | 3,274,387 | |
| | | | | |
| Expenses: | | | | |
| Advisory fee | | | 1,406,574 | |
| Service and distribution plan fees | | | 468,858 | |
| Auditing and legal fees | | | 143,222 | |
| Transfer agent fees | | | 114,758 | |
| Printing and postage | | | 87,205 | |
| Directors’ fees and expenses | | | 40,896 | |
| Registration and filing fees | | | 33,327 | |
| Custodian fees | | | 29,133 | |
| Insurance | | | 22,243 | |
| Sub-transfer agent fees | | | 6,233 | |
| Other | | | 31,576 | |
| Total Expenses Before Fees Waived and Custody Credits | | | 2,384,025 | |
| Less: Service and Distribution Plan Fees Waived | | | (468,858 | ) |
| Less: Custody Credits | | | (179 | ) |
| Net Expenses | | | 1,914,988 | |
| Net Investment Income | | | 1,359,399 | |
| Net Realized and Unrealized Gain on Investments and Foreign Exchange Transactions: | | | | |
| Net Realized Gain | | | 3,786,520 | |
| Change in Net Unrealized Appreciation/(Depreciation) | | | 20,499,383 | |
| Net Realized Gain and Change in Net Unrealized Appreciation/ (Depreciation) on Investments and Foreign Exchange Transactions | | | 24,285,903 | |
| Net Increase in Net Assets from Operations | | $ | 25,645,302 | |
See Notes to Financial Statements.
Value Line Larger Companies Fund, Inc.
| |
Statement of Changes in Net Assets for the Years Ended December 31, 2012 and 2011 |
| | | Year Ended December 31, 2012 | | | Year Ended December 31, 2011 | |
| Operations: | | | | | | |
| Net investment income | | $ | 1,359,399 | | | $ | 1,179,527 | |
| Net realized gain on investments and foreign currency | | | 3,786,520 | | | | 12,657,618 | |
| Change in net unrealized appreciation/(depreciation) | | | 20,499,383 | | | | (14,145,452 | ) |
| Net increase/(decrease) in net assets from operations | | | 25,645,302 | | | | (308,307 | ) |
| | | | | | | | | |
| Distributions to Shareholders: | | | | | | | | |
| Net investment income | | | (1,087,423 | ) | | | (848,007 | ) |
| Capital Share Transactions: | | | | | | | | |
| Proceeds from sale of shares | | | 2,278,669 | | | | 4,074,940 | |
| Proceeds from reinvestment of dividends to shareholders | | | 1,033,051 | | | | 809,225 | |
| Cost of shares redeemed | | | (22,410,433 | ) | | | (24,468,360 | ) |
| Net decrease in net assets from capital share transactions | | | (19,098,713 | ) | | | (19,584,195 | ) |
| Total Increase/(Decrease) in Net Assets | | | 5,459,166 | | | | (20,740,509 | ) |
| | | | | | | | | |
| Net Assets: | | | | | | | | |
| Beginning of year | | | 178,783,416 | | | | 199,523,925 | |
| End of year | | $ | 184,242,582 | | | $ | 178,783,416 | |
| Undistributed net investment income, at end of year | | $ | 1,359,830 | | | $ | 1,170,635 | |
See Notes to Financial Statements.
| Value Line Larger Companies Fund, Inc. |
| |
| Notes to Financial Statements |
1. Significant Accounting Policies
Value Line Larger Companies Fund, Inc., (the “Fund”) is registered under the Investment Company Act of 1940, as amended, as a diversified, open-end management investment company whose sole investment objective is to realize capital growth.
The preparation of financial statements in conformity with generally accepted accounting principles requires management to make estimates and assumptions that affect the reported amounts of assets and liabilities and disclosure of contingent assets and liabilities at the date of the financial statements and the reported amounts of revenues and expenses during the reporting period. Actual results could differ from those estimates. The following is a summary of significant accounting policies consistently followed by the Fund in the preparation of its financial statements.
(A) Security Valuation: Securities listed on a securities exchange are valued at the closing sales prices on the date as of which the net asset value is being determined. Securities traded on the NASDAQ Stock Market are valued at the NASDAQ Official Closing Price. In the absence of closing sales prices for such securities and for securities traded in the over-the-counter market, the security is valued at the midpoint between the latest available and representative asked and bid prices. Short-term instruments with maturities of 60 days or less at the date of purchase are valued at amortized cost which approximates market value. Short-term instruments with maturities greater than 60 days at the date of purchase are valued at the midpoint between the latest available and representative asked and bid prices, and commencing 60 days prior to maturity such securities are value at amortized cost. Securities for which market quotations are not readily available or that are not readily marketable and all other assets of the Fund are valued at fair value as the Board of Directors may determine in good faith. In addition, the Fund may use the fair value of a security when the closing market price on the primary exchange where the security is traded no longer accurately reflects the value of a security due to factors affecting one or more relevant securities markets or the specific issuer.
(B) Fair Value Measurements: The Fund follows fair valuation accounting standards (FASB ASC 820-10) which establish a definition of fair value and set out a hierarchy for measuring fair value. These standards require additional disclosures about the various inputs and valuation techniques used to develop the measurements of fair value and a discussion of changes in valuation techniques and related inputs during the period. These inputs are summarized in the three broad levels listed below:
| ● | Level 1 – Inputs that reflect unadjusted quoted prices in active markets for identical assets or liabilities that the Fund has the ability to access at the measurement date; |
| ● | Level 2 – Inputs other than quoted prices that are observable for the asset or liability either directly or indirectly, including inputs in markets that are not considered to be active; |
| ● | Level 3 – Inputs that are unobservable. |
Transfers between investment levels may occur as the markets fluctuate and/or the availability of data used in an investment’s valuation changes. The inputs or methodologies used for valuing securities are not necessarily an indication of the risk associated with investing in those securities.
| Value Line Larger Companies Fund, Inc. |
| |
| December 31, 2012 |
The following table summarizes the inputs used to value the Fund’s investments in securities as of December 31, 2012:
| | | | | | | | | | | | | |
| Investments in Securities: | | Level 1 | | | Level 2 | | | Level 3 | | | Total | |
| Assets | | | | | | | | | | | | |
| Common Stocks | | $ | 180,049,897 | | | $ | 0 | | | $ | 0 | | | $ | 180,049,897 | |
| Short-Term Investments | | | 0 | | | | 7,659,377 | | | | 0 | | | | 7,659,377 | |
| Total Investments in Securities | | $ | 180,049,897 | | | $ | 7,659,377 | | | $ | 0 | | | $ | 187,709,274 | |
The Fund follows the updated provisions surrounding fair value measurements and disclosures on transfers in and out of all levels of the fair value hierarchy on a gross basis and the reasons for the transfers as well as to disclosures about the valuation techniques and inputs used to measure fair value for investments that fall in either Level 2 or Level 3 of the fair value hierarchy.
The amounts and reasons for all transfers in and out of each level within the three-tier hierarchy are disclosed when the Fund had an amount of total transfers during the reporting period that was meaningful in relation to its net assets as of the end of the reporting period.
For the year ended December 31, 2012, there were no Level 3 investments. The Schedule of Investments includes a breakdown of the Schedule’s investments by category.
(C) Repurchase Agreements: In connection with transactions in repurchase agreements, the Fund’s custodian takes possession of the underlying collateral securities, the value of which exceeds the principal amount of the repurchase transaction, including accrued interest. To the extent that any repurchase transaction exceeds one business day, it is the Fund’s policy to mark-to-market on a daily basis to ensure the adequacy of the collateral. In the event of default of the obligation to repurchase, the Fund has the right to liquidate the collateral and apply the proceeds in satisfaction of the obligation. Under certain circumstances, in the event of default or bankruptcy by the other party to the agreement, realization and/or retention of the collateral or proceeds may be subject to legal proceedings.
In December 2011, the Financial Accounting Standards Board issued Accounting Standards Update No. 2011-11 (“ASU 2011-11”), “Balance Sheet (Topic 210): Disclosures about Offsetting Assets and Liabilities.” The ASU 2011-11 requires disclosure of both gross and net balances for certain investments and transactions entered into under master netting agreements, better aligning US GAAP requirements with International Financial Reporting Standards. The ASU 2011-11 is effective for annual periods beginning on or after January 1, 2013. The Fund’s management is evaluating the effect of this guidance on the financial statements.
(D) Federal Income Taxes: It is the policy of the Fund to qualify as a regulated investment company by complying with the provisions available to regulated investment companies, as defined in applicable sections of the Internal Revenue Code, and to distribute all of its investment income and capital gains to its shareholders. Therefore, no provision for federal income tax is required.
Management has analyzed the Fund’s tax positions taken on federal and state income tax returns for all open tax years (fiscal years ended December 31, 2009 through December 31, 2012), and has concluded that no provision for federal or state income tax is required in the Fund’s financial statements. The Fund’s federal and state income tax returns for tax years for which the applicable statutes of limitations have not expired are subject to examination by the Internal Revenue Service and state departments of revenue.
| Value Line Larger Companies Fund, Inc. |
| |
| Notes to Financial Statements |
(E) Security Transactions and Distributions: Security transactions are accounted for on the date the securities are purchased or sold. Interest income is accrued as earned. Realized gains and losses on sales of securities are calculated for financial accounting and federal income tax purposes on the identified cost basis. Dividend income and distributions to shareholders are recorded on the ex-dividend date. Distributions are determined in accordance with income tax regulations, which may differ from generally accepted accounting principles.
(F) Foreign Currency Translation: The books and records of the Fund are maintained in U.S. dollars. Assets and liabilities which are denominated in foreign currencies are translated to U.S. dollars at the prevailing rates of exchange. The Fund does not isolate changes in the value of investments caused by foreign exchange rate differences from the changes due to other circumstances.
Income and expenses are translated to U.S. dollars based upon the rates of exchange on the respective dates of such transactions.
Net realized foreign exchange gains or losses arise from currency fluctuations realized between the trade and settlement dates on securities transactions, the differences between the U.S. dollar amounts of dividends, interest, and foreign withholding taxes recorded by the Fund, and the U.S. dollar equivalent of the amounts actually received or paid. Net unrealized foreign exchange gains and losses arise from changes in the value of assets and liabilities, other than investments, at the end of the fiscal period, resulting from changes in the exchange rates. The effect of the change in foreign exchange rates on the value of investments is included in realized gain/loss on investments and change in net unrealized appreciation/(depreciation) on investments.
(G) Representations and Indemnifications: In the normal course of business, the Fund enters into contracts that contain a variety of representations and warranties which provide general indemnifications. The Fund’s maximum exposure under these arrangements is unknown, as this would involve future claims that may be made against the Fund that have not yet occurred. However, based on experience, the Fund expects the risk of loss to be remote.
(H) Foreign Taxes: The Fund may be subject to foreign taxes on income, gains on investments, or currency repatriation, a portion of which may be recoverable. The Fund will accrue such taxes and recoveries as applicable, based upon its current interpretation of tax rules and regulations that exist in the markets in which it invests.
(I) Securities Lending: Under an agreement with State Street Bank & Trust (“State Street”), the Fund can lend its securities to brokers, dealers and other financial institutions approved by the Board of Directors. By lending its investment securities, the Fund attempts to increase its net investment income through receipt of interest on the loan. Any gain or loss in the market price of the securities loaned that might occur and any interest or dividends declared during the term of the loan would accrue to the account of the Fund. Risks of delay in recovery of the securities or even loss of rights in the collateral may occur should the borrower of the securities fail financially. Generally, in the event of a counter-party default, the Fund has the right to use the collateral to offset the losses incurred. The lending fees received and the Fund’s portion of the interest income earned on the cash collateral are included in the Statement of Operations.
Upon entering into a securities lending transaction, the Fund receives cash or other securities as collateral in an amount equal to or exceeding 102% of the current market value of the loaned securities. Any cash received as collateral is invested by State Street Global Advisors, acting in its capacity as securities lending agent (the “Agent”), in The Value Line Funds collateral account, which is subsequently invested into joint repurchase agreements. A portion of the dividends received on the collateral is rebated to the borrower of the securities and the remainder is split between the Agent and the Fund.
Value Line Larger Companies Fund, Inc.
The Fund enters into a joint repurchase agreement whereby its uninvested cash collateral from securities lending is deposited into a joint cash account with other funds managed by the investment adviser and is used to invest in one or more repurchase agreements. The value and face amount of the joint repurchase agreement are allocated to the funds based on their pro-rata interest. A repurchase agreement is accounted for as a loan by the fund to the seller, collateralized by securities which are delivered to the fund’s custodian. The market value, including accrued interest, of the initial collateralization is required to be at least 102% of the dollar amount invested by the funds, with the value of the underlying securities marked to market daily to maintain coverage of at least 100%. The joint repurchase agreement held by the Fund at year end had been entered into on December 31, 2012.
As of December 31, 2012, the Fund loaned securities which were collateralized by cash. The value of the securities on loan and the value of the related collateral were as follows:
Value of Securities Loaned | Value of Collateral | | Total Collateral (including Calculated Mark) | |
| $5,030,767 | $ 5,058,324 | | $ | 5,142,328 | |
(J) Subsequent Events: Management has evaluated all subsequent transactions and events through the date on which these financial statements were issued and has determined that no additional items require disclosure.
2. Capital Share Transactions, Dividends and Distributions to Shareholders
Transactions in capital stock were as follows:
| | | | | | | |
| | | Year Ended December 31, 2012 | | | Year Ended December 31, 2011 | |
| Shares sold | | | 119,348 | | | | 220,351 | |
| Shares issued to shareholders in reinvestment of dividends and distributions | | | 53,004 | | | | 47,021 | |
| Shares redeemed | | | (1,169,950 | ) | | | (1,374,704 | ) |
| Net decrease | | | (997,598 | ) | | | (1,107,332 | ) |
| Dividends per share from net investment income | | $ | 0.1173 | | | $ | 0.0825 | |
3. Purchases and Sales of Securities
Purchases and sales of investment securities, excluding short-term securities, were as follows:
| | | Year Ended December 31, 2012 | |
| Purchases: | | | | |
| Investment Securities | | $ | 30,599,996 | |
| Sales: | | | | |
| Investment Securities | | $ | 52,394,940 | |
Value Line Larger Companies Fund, Inc.
| Notes to Financial Statements |
4. Income Taxes
At December 31, 2012, information on the tax components of capital is as follows:
| | | | | |
| Cost of investments for tax purposes | | $ | 139,725,012 | |
| Gross tax unrealized appreciation | | $ | 50,645,782 | |
| Gross tax unrealized depreciation | | $ | (2,661,520 | ) |
| Net tax unrealized appreciation on investments | | $ | 47,984,262 | |
| Undistributed ordinary income | | $ | 1,359,830 | |
| Capital loss carryforward, expires | | | | |
| December 31, 2016 | | $ | 8,070,807 | |
| December 31, 2017 | | $ | 39,301,496 | |
During the year ended December 31, 2012, as permitted under federal income tax regulations, the Fund utilized $3,204,954 of capital loss carryforwards.
To the extent that current or future capital gains are offset by capital losses, the Fund does not anticipate distributing any such gains to shareholders.
It is uncertain whether the Fund will be able to realize the benefits of the losses before they expire.
The differences between book basis and tax basis unrealized appreciation/(depreciation) on investments were primarily attributed to wash sales and investments in partnerships.
Permanent book-tax differences relating to the current year were reclassified within the composition of the net asset accounts. The Fund decreased undistributed net investment income by $82,781, decreased accumulated realized loss by $83,132, and decreased additional paid-in-capital by $351. Net assets were not affected by these reclassifications. These reclassifications were primarily due to differing treatments of foreign currency translation and investment in partnerships for tax purposes.
On December 22, 2010, the Regulated Investment Company Modernization Act of 2010 (the “Act”) was signed by the President. Under the Act, net capital losses recognized by the Fund after December 31, 2010, may get carried forward indefinitely, and retain their character as short-term and/or long term losses. Prior to this Act, pre-enactment net capital losses incurred by the Fund were carried forward for eight years and treated as short-term losses. The Act requires under the transition that post-enactment net capital loses are used before pre-enactment net capital losses.
The tax composition of distributions to shareholders for the years ended December 31, 2012 and December 31, 2011 were as follows:
| | | 2012 | | | 2011 | |
| Ordinary income | | $ | 1,087,423 | | | $ | 848,007 | |
5. Investment Advisory Fees, Service and Distribution Fees, Sub-Transfer Agent Fee and Transactions With Affiliates
An advisory fee of $1,406,574 was paid or payable to EULAV Asset Management (the “Adviser”) for the year ended December 31, 2012. This was computed at an annual rate of 0.75% of the daily net assets during the period and paid monthly. The Adviser provides research, investment programs, and supervision of the investment portfolio and pays costs of administrative services, office space, equipment and compensation of administrative, bookkeeping, and clerical personnel necessary for managing the affairs of the Fund. The Adviser also provides persons, satisfactory to the Fund’s Board of Directors, to act as officers and employees of the Fund and pays their salaries.
Value Line Larger Companies Fund, Inc.
The Fund has a Service and Distribution Plan (the “Plan”), adopted pursuant to Rule 12b-1 under the Investment Company Act of 1940, which compensates EULAV Securities LLC (the “Distributor”) for advertising, marketing and distributing the Fund’s shares and for servicing the Fund’s shareholders at an annual rate of 0.25% of the Fund’s average daily net assets. For the year ended December 31, 2012, fees amounting to $468,858, before fee waivers, were accrued under the Plan. Effective May 1, 2007, and renewed annually, the Distributor contractually agreed to waive the Fund’s 12b-1 fee. For the year ended December 31, 2012, all 12b-1 fees were waived. The Distributor has no right to recoup previously waived amounts.
Effective July 5, 2012, the Fund has a Sub-Transfer Agent Plan (the “sub TA plan”) which compensates financial intermediaries that provide sub-transfer agency and related services to investors that hold their Fund shares in omnibus accounts maintained by the financial intermediaries with the Fund. The sub-transfer agency fee, which may be paid directly to the financial intermediary or indirectly via the Distributor, is equal to the lower of (i) the aggregate amount of additional transfer agency fees and expenses that the Fund would otherwise pay to the transfer agent if each subaccount in the omnibus account maintained by the financial intermediary with the Fund were a direct account with the Fund and (ii) the amount by which the fees charged by the financial intermediary for including the Fund on its platform and providing shareholder, sub-transfer agency and related services exceed the amount paid under the Fund’s Plan with respect to Fund assets attributable to shares held by the financial intermediary in the omnibus account. In addition, the amount of sub-transfer agency fees payable by the Fund to all financial intermediaries in the aggregate is subject to a maximum cap of 0.05% of the Fund’s average daily net assets. If the sub-transfer agency fee is paid to financial intermediaries indirectly via the Distributor, the Distributor does not retain any amount thereof and such fee otherwise reduces the amount that the Distributor is contractually obligated to pay to the financial intermediary. For the year ended December 31, 2012, fees amounting to $6,233 were paid under the sub TA plan.
For the year ended December 31, 2012, the Fund’s expenses were reduced by $179 under a custody credit arrangement with the custodian.
Direct expenses of the Fund are charged to the Fund while common expenses of the Value Line Funds are allocated proportionately based upon the Funds’ respective net assets. The Fund bears all other costs and expenses.
Certain officers and a Trustee of the Adviser are also officers and a director of the Fund. At December 31, 2012, the officers and directors of the Fund as a group owned 562 shares, representing less than 1% of the outstanding shares.
| Value Line Larger Companies Fund, Inc. |
| |
| Financial Highlights |
Selected data for a share of capital stock outstanding throughout each year:
| | | | | | | | | | | | | | | | |
| | | Years Ended December 31, | |
| | | 2012 | | | 2011 | | | 2010 | | | 2009 | | | 2008 | |
| Net asset value, beginning of year | | $ | 17.34 | | | $ | 17.47 | | | $ | 15.40 | | | $ | 13.18 | | | $ | 21.63 | |
| | | | | | | | | | | | | | | | | | | | | |
| Income from investment operations: | | | | | | | | | | | | | | | | | | | | |
| Net investment income | | | 0.16 | | | | 0.12 | | | | 0.09 | | | | 0.10 | | | | 0.09 | |
| Net gains or (losses) on securities (both realized and unrealized) | | | 2.40 | | | | (0.17 | ) | | | 2.08 | | | | 2.22 | | | | (8.34 | ) |
| Total from investment operations | | | 2.56 | | | | (0.05 | ) | | | 2.17 | | | | 2.32 | | | | (8.25 | ) |
| | | | | | | | | | | | | | | | | | | | | |
| Less distributions: | | | | | | | | | | | | | | | | | | | | |
| Dividends from net investment income | | | (0.12 | ) | | | (0.08 | ) | | | (0.10 | ) | | | (0.10 | ) | | | (0.03 | ) |
| Distributions from net realized gains | | | — | | | | — | | | | — | | | | — | | | | (0.17 | ) |
| Total distributions | | | (0.12 | ) | | | (0.08 | ) | | | (0.10 | ) | | | (0.10 | ) | | | (0.20 | ) |
| Net asset value, end of year | | $ | 19.78 | | | $ | 17.34 | | | $ | 17.47 | | | $ | 15.40 | | | $ | 13.18 | |
| | | | | | | | | | | | | | | | | | | | | |
| Total return | | | 14.82 | % | | | (0.27 | )% | | | 14.09 | % | | | 17.62 | % | | | (38.12 | )% |
| | | | | | | | | | | | | | | | | | | | | |
| Ratios/Supplemental Data: | | | | | | | | | | | | | | | | | | | | |
| Net assets, end of year (in thousands) | | $ | 184,243 | | | $ | 178,783 | | | $ | 199,524 | | | $ | 202,454 | | | $ | 191,950 | |
Ratio of expenses to average net assets(1) | | | 1.27 | % | | | 1.25 | % | | | 1.21 | %(2) | | | 1.26 | % | | | 1.18 | % |
Ratio of expenses to average net assets(3) | | | 1.02 | % | | | 1.00 | % | | | 0.92 | %(4) | | | 1.01 | % | | | 0.93 | % |
| Ratio of net investment income to average net assets | | | 0.72 | % | | | 0.60 | % | | | 0.44 | % | | | 0.62 | % | | | 0.53 | % |
| Portfolio turnover rate | | | 17 | % | | | 30 | % | | | 153 | % | | | 157 | % | | | 157 | % |
| (1) | Ratio reflects expenses grossed up for the custody credit arrangement and grossed up for the waiver of the service and distribution plan fees by the Distributor. The ratio of expenses to average net assets net of custody credits but exclusive of the fee waivers, would have been 1.17% for the year ended December 31, 2008 and would not have changed for the other years shown. |
| (2) | Ratio reflects expenses grossed up for the reimbursement by Value Line, Inc. of certain expenses incurred by the Fund. |
| (3) | Ratio reflects expenses net of the service and distribution fees by the Distributor, but exclusive of the custody credit arrangement. |
| (4) | Ratio reflects expenses net of the reimbursement by Value Line, Inc. of certain expenses incurred by the Fund. |
See Notes to Financial Statements.
Value Line Larger Companies Fund, Inc.
| |
| Report of Independent Registered Public Accounting Firm |
To the Board of Directors and Shareholders of Value Line Larger Companies Fund, Inc.:
In our opinion, the accompanying statement of assets and liabilities, including the schedule of investments, and the related statements of operations and of changes in net assets and the financial highlights present fairly, in all material respects, the financial position of Value Line Larger Companies Fund, Inc. (the “Fund”) at December 31, 2012, the results of its operations for the year then ended, the changes in its net assets for each of the two years in the period then ended and the financial highlights for each of the five years in the period then ended, in conformity with accounting principles generally accepted in the United States of America. These financial statements and financial highlights (hereafter referred to as “financial statements”) are the responsibility of the Fund’s management. Our responsibility is to express an opinion on these financial statements based on our audits. We conducted our audits of these financial statements in accordance with the standards of the Public Company Accounting Oversight Board (United States). Those standards require that we plan and perform the audit to obtain reasonable assurance about whether the financial statements are free of material misstatement. An audit includes examining, on a test basis, evidence supporting the amounts and disclosures in the financial statements, assessing the accounting principles used and significant estimates made by management, and evaluating the overall financial statement presentation. We believe that our audits, which included confirmation of securities at December 31, 2012 by correspondence with the custodian and brokers, provide a reasonable basis for our opinion.
PricewaterhouseCoopers LLP
New York, New York
February 22, 2013
Value Line Larger Companies Fund, Inc.
| |
| 2012 Annual Report (unaudited) |
FACTORS CONSIDERED BY THE BOARD IN APPROVING CONTINUANCE OF
THE INVESTMENT ADVISORY AGREEMENT
FOR VALUE LINE LARGER COMPANIES FUND, INC.
The Investment Company Act of 1940 (the “1940 Act”) requires the Board of Directors, including a majority of Directors who are not “interested persons” of Value Line Larger Companies Fund, Inc. (the “Fund”), as that term is defined in the 1940 Act (the “Independent Directors”), to annually consider the continuance of the Fund’s investment advisory agreement (“Agreement”) with its investment adviser, EULAV Asset Management.1
In considering whether the continuance of the Agreement was in the best interests of the Fund and its shareholders, the Board requested and the Adviser provided such information as the Board deemed to be reasonably necessary to evaluate the terms of the Agreement. At meetings held throughout the year, including the meeting specifically focused upon the review of the Agreement, the Independent Directors met in executive sessions separately from the non-Independent Director of the Fund and any officers of the Adviser. In selecting the Adviser and approving the continuance of the Agreement, the Independent Directors relied upon the assistance of counsel to the Independent Directors.
Both in the meeting specifically focused upon the review of the Agreement and at other meetings, the Board, including the Independent Directors, received materials relating to the Adviser’s investment and management services under the Agreement. These materials included information on: (i) the investment performance of the Fund, including a comparison to a peer group of funds consisting of the Fund and all retail and institutional large-cap growth funds regardless of asset size or primary channel of distribution (the “Performance Universe”), and its benchmark index, each as selected, classified and prepared objectively by Lipper Inc., an independent evaluation service (“Lipper”); (ii) the investment process, portfolio holdings, investment restrictions, valuation procedures, and financial statements for the Fund; (iii) sales and redemption data with respect to the Fund; (iv) the general investment outlook in the markets in which the Fund invests; (v) arrangements with respect to the distribution of the Fund’s shares; (vi) the allocation and cost of the Fund’s brokerage (none of which was effected through any affiliate of the Adviser); and (vii) the overall nature, quality and extent of services provided by the Adviser.
As part of their review, the Board requested, and the Adviser provided, additional information in order to evaluate the quality of the Adviser’s services and the reasonableness of its fees under the Agreement. In a separate executive session, the Independent Directors reviewed information, which included data comparing: (i) the Fund’s management fee rate, transfer agent and custodian fee rate, Rule 12b-1 fee rate, and the rate of other non-management expenses, to those of a peer group of funds consisting of the Fund and 13 other retail no-load large-cap growth funds (excluding outliers), as selected objectively by Lipper (“Expense Group”), and a peer group of funds consisting of the Fund, the Expense Group and all other retail no-load large-cap growth funds (excluding outliers), as selected, classified and prepared objectively by Lipper (“Expense Universe”); (ii) the Fund’s expense ratio to those of its Expense Group and Expense Universe; and (iii) the Fund’s investment performance over various time periods to the average performance of the Performance Universe as well as the appropriate Lipper Index, as selected objectively by Lipper (the “Lipper Index”).
| | | |
1 | For periods prior to December 23, 2010, the term “Adviser” means the Adviser’s predecessor entities that previously served as the Fund’s adviser, EULAV Asset Management, LLC and Value Line, Inc. (“VLI”). Likewise, for periods prior to December 23, 2010, the term “Distributor” refers to the predecessor entities of the Fund’s current distributor, EULAV Securities LLC (the “Distributor”), which were EULAV Securities, Inc. and Value Line Securities, Inc. |
Value Line Larger Companies Fund, Inc.
| |
| 2012 Annual Report (unaudited) |
In the separate executive session, the Independent Directors also reviewed information regarding: (a) the financial results and condition of the Adviser, and the Adviser’s and the Distributor’s profitability from the services that have been performed for the Fund and the Value Line family of funds; (b) the Adviser’s investment management staffing and resources; (c) the ownership, control and day-to-day management of the Adviser, including representations of VLI that it does not “control” (as that term is defined in the 1940 Act) either the Adviser or the Distributor; and (d) the Fund’s potential for achieving economies of scale. In support of its review of the statistical information, the Board was provided with a detailed description of the methodology used by Lipper to determine the Expense Group, the Expense Universe and the Performance Universe to prepare its information.
The following summarizes matters considered by the Board in connection with its continuance of the Agreement. However, the Board did not identify any single factor as all-important or controlling, and the summary does not detail all the matters that were considered.
Investment Performance. The Board reviewed the Fund’s overall investment performance and compared it to its Performance Universe and the Lipper Index. The Board noted that the Fund underperformed the Performance Universe average and the Lipper Index for the one-year, three-year, five-year and ten-year periods ended March 31, 2012.
The Adviser’s Personnel and Methods. The Board reviewed the background of the portfolio manager responsible for the daily management of the Fund’s portfolio, seeking to achieve the Fund’s investment objective and adhering to the Fund’s investment strategies. The Independent Directors also engaged in discussions with the Adviser’s senior management responsible for the overall functioning of the Fund’s investment operations. The Board viewed favorably (i) the Adviser’s use of analytic tools in support of the portfolio management, compliance and shareholder relation functions which the Adviser previously committed resources to acquire, (ii) continuity of the Adviser’s staff attributable in part to its actions previously taken to attract and retain personnel, including its prior improvements to employee benefit programs and increased base compensation and merit-based compensation for certain staff members to be more industry competitive, and (iii) that the Adviser continues to receive the Value Line ranking systems without cost. The Board concluded that the Fund’s management team and the Adviser’s overall resources were adequate and that the Adviser had investment management capabilities and personnel essential to performing its duties under the Agreement.
Management Fee and Expenses. The Board considered the Adviser’s management fee rate under the Agreement relative to the management fee rates applicable to the funds in the Expense Group and Expense Universe, both before and after applicable fee waivers. Before giving effect to fee waivers applicable to certain funds in the Expense Group, the Board noted that, for the most recent fiscal year for which audited financial data is available, the Fund’s management fee rate was lower than that of the Expense Group average. After giving effect to applicable fee waivers, the Board also noted that, for the most recent fiscal year for which audited financial data is available, the Fund’s management fee rate was slightly lower than that of the Expense Group average and greater than that of the Expense Universe average. The Board concluded that the Fund’s management fee rate was satisfactory for the purpose of approving continuance of the Agreement.
Value Line Larger Companies Fund, Inc.
| |
| 2012 Annual Report (unaudited) |
The Board also considered the Fund’s total expense ratio relative to those of funds in its Expense Group and Expense Universe. The Distributor and the Board agreed that the Distributor will extend the existing contractual waiver of the Fund’s Rule 12b-1 fee for another one-year period ending June 30, 2013. This waiver effectively reduces the Fund’s Rule 12b-1 fee rate from 0.25% to 0.00% of the Fund’s average daily net assets for the one-year period ending June 30, 2013. Such waiver cannot be changed during the contractual waiver period without the Board’s approval. The Board noted that, for the most recent fiscal year for which audited financial data is available, the Fund’s expense ratio was lower than that of the Expense Group average and the Expense Universe average, after giving effect to fee waivers applicable to the Fund and certain funds in the Expense Group and Universe. The Board concluded that the Fund’s expense ratio was satisfactory for the purpose of approving continuance of the Agreement.
Nature, Extent and Quality of Services. The Board considered the nature, extent and quality of other services provided by the Adviser and the Distributor. At meetings held throughout the year, the Board reviewed the resources and effectiveness of the Adviser’s overall compliance program, as well as the services provided by the Distributor. The Board viewed favorably the additional resources devoted by the Adviser to enhance its and the Fund’s overall compliance program as well as steps being undertaken to enhance the shareholders’ experience with the Fund, such as a more robust website. The Board reviewed the services provided by the Adviser and its affiliates in supervising the Fund’s third party service providers. Based on this review, the Board concluded that the nature, quality, cost, and extent of such other services provided by the Adviser and its affiliates were satisfactory, reliable and beneficial to the Fund’s shareholders.
Profitability. The Board considered the level of profitability of the Adviser and the Distributor with respect to the Fund individually and in the aggregate for all the funds within the Value Line group of funds, including the impact of the restructuring and certain actions taken during prior years. These actions included the reduction (voluntary in some instances and contractual in other instances) of management and/or Rule 12b-1 fees for certain funds, the Adviser’s termination of the use of soft dollar research, and the cessation of trading through the Distributor. The Board also considered the Adviser’s continued attention to the rationalization and differentiation of funds within the Value Line group of funds to better identify opportunities for savings and efficiencies among the funds, and better use of the Adviser’s resources. The Board concluded that the profitability of the Adviser and the Distributor with respect to the Fund, including the financial results derived from the Fund’s Agreement, were within a range the Board considered reasonable.
Other Benefits. The Board also considered the character and amount of other direct and incidental benefits received by the Adviser and the Distributor from their association with the Fund. The Board concluded that potential “fall-out” benefits that the Adviser and the Distributor may receive, such as greater name recognition, appear to be reasonable, and may in some cases benefit the Fund.
Economies of Scale. The Board considered that, given the current and anticipated size of the Fund, any perceived and potential economies of scale were not yet a significant consideration for the Fund and that the addition of break points to the fee structure was not currently necessary.
Value Line Larger Companies Fund, Inc.
| |
| 2012 Annual Report (unaudited) |
Fees and Services Provided for Other Comparable Funds/Accounts Managed by the Adviser and its Affiliates. The Board was informed by the Adviser that the Adviser does not manage any non-mutual fund account that has similar objectives and policies as those of the Fund.
Conclusion. The Board examined the totality of the information it was provided at the meeting specifically addressing approval of the Agreement and at other meetings held during the past year and did not identify any single controlling factor. Based on its evaluation of all material factors deemed relevant and with the advice of independent counsel, the Board concluded that the rate at which the Fund pays a management fee to the Adviser under the Agreement does not constitute a fee that is so disproportionately large as to bear no reasonable relationship to the services rendered and that could not have been the product of arm’s-length bargaining. Further, the Board concluded that the Fund’s Agreement, and the management fee rate thereunder, is fair and reasonable and voted to continue the Agreement as in the best interest of the Fund and its shareholders.
Value Line Larger Companies Fund, Inc.
| |
| Federal Tax Notice (unaudited) |
| For corporate taxpayers, 100% of the ordinary income distribution paid during the calendar year 2012, qualify for the corporate dividends received deductions. |
| |
| During the calendar year 2012, 100% of the ordinary income distribution are treated as qualified dividends. |
The Fund files its complete schedule of portfolio holdings with the Securities and Exchange Commission (“SEC”) for the first and third quarters of each fiscal year on Form N-Q. The Fund’s Forms N-Q are available on the SEC’s website at http://www.sec.gov and may be reviewed and copied at the SEC’s Public Reference Room in Washington, D.C. Information on the operation of the Public Reference Room may be obtained by calling 1-800-SEC-0330.
A description of the policies and procedures that the Fund uses to determine how to vote proxies relating to portfolio securities, and information regarding how the Fund voted these proxies for the 12-month period ended June 30 is available through the Fund’s website at http://www.vlfunds.com and on the SEC’s website at http://www.sec.gov. The description of the policies and procedures is also available without charge, upon request, by calling 1-800-243-2729.
Value Line Larger Companies Fund, Inc.
MANAGEMENT INFORMATION
The business and affairs of the Fund are managed by the Fund’s officers under the direction of the Board of Directors. The following table sets forth information on each Director and Officer of the Fund. Each Director serves as a director or trustee of each of the 11 Value Line Funds. Each Director serves until his or her successor is elected and qualified.
| | | | | | | |
| Name, Address, and YOB | | Position | | Length of Time Served | | Principal Occupation During the Past 5 Years |
| Interested Director* | | | | | | |
Mitchell E. Appel YOB: 1970 Other Directorships: None | | Director | | Since 2010 | | President of each of the Value Line Funds since June 2008; Chief Financial Officer of Value Line, Inc. (“Value Line”) from April 2008 to December 2010 and from September 2005 to November 2007; Director from February 2010 to December 2010; Chief Financial Officer of XTF Asset Management from November 2007 to April 2008; Chief Financial Officer of the Distributor since April 2008 and President since February 2009; President of the Adviser since February 2009, Trustee since December 2010 and Treasurer since January 2011. |
| Non-Interested Directors | | | | | | |
Joyce E. Heinzerling 500 East 77th Street New York, NY 10162 YOB: 1956 Other Directorships: Burnham Investors Trust, since 2004 (4 funds) | | Director | | Since 2008 | | President, Meridian Fund Advisers LLC. (consultants) since April 2009; General Counsel, Archery Capital LLC (private investment fund) until April 2009. |
Francis C. Oakley 54 Scott Hill Road Williamstown, MA 01267 YOB: 1931 Other Directorships: None | | Director | | Since 2000 | | Professor of History, Williams College, (1961-2002). Professor Emeritus since 2002; President Emeritus since 1994 and President, (1985-1994); Chairman (1993-1997) and Interim President (2002-2003) of the American Council of Learned Societies. Trustee since 1997 and Chairman of the Board since 2005, National Humanities Center. |
David H. Porter 5 Birch Run Drive Saratoga Springs, NY 12866 YOB: 1935 Other Directorships: None | | Director | | Since 1997 | | Professor, Skidmore College since 2008; Visiting Professor of Classics, Williams College, (1999-2008); President Emeritus, Skidmore College since 1999 and President, (1987-1998). |
Paul Craig Roberts 169 Pompano St. Panama City Beach, FL 32413 YOB: 1939 Other Directorships: None | | Director | | Since 1983 | | Chairman, Institute for Political Economy. |
Value Line Larger Companies Fund, Inc.
| Name, Address, and YOB | | Position | | Length of Time Served | | Principal Occupation During the Past 5 Years |
Nancy-Beth Sheerr 1409 Beaumont Drive Gladwyne, PA 19035 YOB: 1949 Other Directorships: None | | Director | | Since 1996 | | Senior Financial Adviser, Veritable L.P. (Investment Adviser). |
Daniel S. Vandivort 59 Indian Head Road Riverside, CT 06878 YOB: 1954 Other Directorships: None | | Director
(Chairman of Board since 2010) | | Since 2008 | | President, Chief Investment Officer, Weiss, Peck and Greer/Robeco Investment Management (2005-2007); Managing Director, Weiss, Peck and Greer, (1995-2005). |
| Officers | | | | | | |
Mitchell E. Appel YOB: 1970 | | President | | Since 2008 | | President of each of the Value Line Funds since June 2008; Chief Financial Officer of Value Line from April 2008 to December 2010 and from September 2005 to November 2007; Director from February 2010 to December 2010; Chief Financial Officer of XTF Asset Management from November 2007 to April 2008; Chief Financial Officer of the Distributor since April 2008 and President since February 2009; President of the Adviser since February 2009, Trustee since December 2010 and Treasurer since January 2011. |
Michael J. Wagner YOB: 1950 | | Chief
Compliance
Officer | | Since 2009 | | Chief Compliance Officer of Value Line Funds since June 2009; President of Northern Lights Compliance Service, LLC (formerly Fund Compliance Services, LLC (2006 – present)) and Senior Vice President (2004 – 2006) and President and Chief Operations Officer (2003 – 2006) of Gemini Fund Services, LLC; Director of Constellation Trust Company until 2008. |
Emily D. Washington YOB: 1979 | | Treasurer and Secretary | | Since 2008 | | Treasurer and Chief Financial Officer (Principal Financial and Accounting Officer) of each of the Value Line Funds since August 2008 and Secretary since 2010; Associate Director of Mutual Fund Accounting at Value Line until August 2008. |
| * | Mr. Appel is an “interested person” as defined in the Investment Company Act of 1940 by virtue of his position with the Adviser and Distributor. |
Unless otherwise indicated, the address for each of the above officers is c/o Value Line Funds, 7 Times Square, New York, NY 10036.
| The Fund’s Statement of Additional Information (SAI) includes additional information about the Fund’s Directors and is available, without charge, upon request by calling 1-800-243-2729 or on the Fund’s website, www.vlfunds.com. |
Value Line Larger Companies Fund, Inc.
| |
| The Value Line Family of Funds |
In 1950, Value Line started its first mutual fund. Since then, knowledgeable investors have been relying on the Value Line Funds to help them build their financial futures. Over the years, Value Line Funds has evolved into what we are today — a diversified family of no-load mutual funds with a wide range of investment objectives — ranging from small, mid and large capitalization equities to taxable and tax-exempt fixed income. We also provide strategies that effectively combine both equities and fixed income, diligently taking into account the potential risk and reward of each investment.
1950 — The Value Line Fund seeks long-term growth of capital. Current income is a secondary objective.
1952 — Value Line Income and Growth Fund’s primary investment objective is income, as high and dependable as is consistent with reasonable risk. Capital growth to increase total return is a secondary objective.
1956 — Value Line Premier Growth Fund seeks long-term growth of capital. No consideration is given to current income in the choice of investments.
1972 — Value Line Larger Companies Fund’s sole investment objective is to realize capital growth.
1981 — Value Line U.S. Government Securities Fund seeks maximum income without undue risk to capital. Under normal conditions, at least 80% of the value of its net assets will be invested in securities issued or guaranteed by the U.S. Government and its agencies and instrumentalities.
1983 — Value Line Centurion Fund* seeks long-term growth of capital.
1984 — The Value Line Tax Exempt Fund seeks to provide investors with the maximum income exempt from federal income taxes while avoiding undue risk to principal. The fund may be subject to state and local taxes and the Alternative Minimum Tax (if applicable).
1986 — Value Line Core Bond Fund** seeks to maximize current income.
1987 — Value Line Strategic Asset Management Trust* seeks to achieve a high total investment return consistent with reasonable risk.
1993 — Value Line Small Cap Opportunities Fund*** invests in U.S. common stocks of small capitalization companies, with its primary objective being long-term growth of capital.
1993 — Value Line Asset Allocation Fund seeks high total investment return, consistent with reasonable risk. The Fund invests in stocks, bonds and money market instruments utilizing quantitative modeling to determine the asset mix.
| | |
| * | Only available through the purchase of Guardian Investor, a tax deferred variable annuity, or ValuePlus, a variable life insurance policy. |
| ** | Formerly known as the Value Line Aggressive Income Trust. |
| *** | Formerly known as the Value Line Emerging Opportunities Fund, Inc. |
For more complete information about any of the Value Line Funds, including charges and expenses, send for a prospectus from EULAV Securities LLC, 7 Times Square, New York, New York 10036-6524 or call 1-800-243-2729, 9am–5pm CST, Monday–Friday, or visit us at www.vlfunds.com. Read the prospectus carefully before you invest or send money.
Item 2 Code of Ethics
(a) The Registrant has adopted a Code of Ethics that applies to its principal executive officer, and principal financial officer and principal accounting officer.
(f) Pursuant to item 12(a), the Registrant is attaching as an exhibit a copy of its Code of Ethics that applies to its principal executive officer, and principal financial officer and principal accounting officer.
Item 3 Audit Committee Financial Expert.
(a)(1)The Registrant has an Audit Committee Financial Expert serving on its Audit Committee.
(2) The Registrant’s Board has designated Daniel S. Vandivort, a member of the Registrant’s Audit Committee, as the Registrant’s Audit Committee Financial Expert. Mr. Vandivort is an independent director who has served as President, Chief Investment Officer to Weis, Peck and Greer/Robeco Investment Management. He has also previously served as Managing Director for Weis, Peck and Greer (1995-2005).
A person who is designated as an “audit committee financial expert” shall not make such person an “expert” for any purpose, including without limitation under Section 11 of the Securities Act of 1933 or under applicable fiduciary laws, as a result of being designated or identified as an audit committee financial expert. The designation or identification of a person as an audit committee financial expert does not impose on such person any duties, obligations, or liabilities that are greater than the duties, obligations, and liabilities imposed on such person as a member of the audit committee and Board of Trustees in the absence of such designation or identification.
Item 4 Principal Accountant Fees and Services
(a) Audit Fees 2012 - $41,870
Audit Fees 2011 - $43,150
(b) Audit-Related fees – None.
(c) Tax Preparation Fees 2012 -$21,565
Tax Preparation Fees 2011 - $20,262
(d) All Other Fees – None
(e) (1) Audit Committee Pre-Approval Policy. All services to be performed for the Registrant by PricewaterhouseCoopers LLP must be pre-approved by the audit committee. All services performed were pre-approved by the committee.
(e) (2) Not applicable.
(f) Not applicable.
(g) Aggregate Non-Audit Fees 2012 -$2,400
Aggregate Non-Audit Fees 2011 - $2,400
(h) Not applicable.
Item 11 Controls and Procedures
| | (a) | The registrant’s principal executive officer and principal financial officer have concluded that the registrant’s disclosure controls and procedures (as defined in rule 30a-2(c) under the Act (17 CFR 270.30a-2(c)) based on their evaluation of these controls and procedures as of a date within 90 days of the filing date of this report, are appropriately designed to ensure that material information relating to the registrant is made known to such officers and are operating effectively. |
| | (b) | The registrant’s principal executive officer and principal financial officer have determined that there have been no significant changes in the registrant’s internal controls or in other factors that could significantly affect these controls subsequent to the date of their evaluation, including corrective actions with regard to significant deficiencies and material weaknesses. |
Item 12 Exhibits
| | (a) | Code of Business Conduct and Ethics for Principal Executive and Senior Financial Officers attached hereto as Exhibit 100.COE |
| | (b) | (1) Certification pursuant to Rule 30a-2(a) under the Investment Company Act of 1940 (17 CFR 270.30a-2) attached hereto as Exhibit 99.CERT. |
(2) Certification pursuant to Section 906 of the Sarbanes-Oxley Act of 2002 attached hereto as Exhibit 99.906.CERT.
SIGNATURES
Pursuant to the requirements of the Securities Exchange Act of 1934 and the Investment Company Act of 1940, the registrant has duly caused this report to be signed on its behalf by the undersigned, thereunto duly authorized.
| By: | /s/ Mitchell E. Appel | |
| | Mitchell E. Appel, President | |
| | | |
| Date: | March 8, 2013 | | |
Pursuant to the requirements of the Securities Exchange Act of 1934 and the Investment Company Act of 1940, this report has been signed below by the following persons on behalf of the registrant and in the capacities and on the dates indicated.
| By: | /s/ Mitchell E. Appel | |
| | Mitchell E. Appel, President, Principal Executive Officer | |
| | | |
| By: | /s/ Emily D. Washington | |
| | Emily D. Washington, Treasurer, Principal Financial Officer | |
| | | |
| Date: | March 8, 2013 | | |