UNITED STATES
SECURITIES AND EXCHANGE COMMISSION
Washington, D.C. 20549
FORM N-CSR
CERTIFIED SHAREHOLDER REPORT OF REGISTERED
MANAGEMENT INVESTMENT COMPANIES
Investment Company Act file Number _811-02278_
Value Line Premier Growth Fund, Inc.
(Exact name of registrant as specified in charter)
220 East 42nd Street, New York, N.Y. 10017
(Address of principal executive offices) (Zip Code)
Registrant’s telephone number, including area code: 212-907-1500
Date of fiscal year end: December 31, 2008
Date of reporting period: December 31, 2008
Item I. | Reports to Stockholders. |
A copy of the Annual Report to Stockholders for the period ended 12/31/08 is included with this Form.
| | | |
INVESTMENT ADVISER | EULAV Asset Management, LLC | A N N U A L R E P O R T |
| | 220 East 42nd Street New York, NY 10017-5891 | D e c e m b e r 3 1, 2 0 0 8 |
| | |
| | | |
| DISTRIBUTOR | Value Line Securities, Inc. | |
| | 220 East 42nd Street | |
| | New York, NY 10017-5891 | |
| | | |
| CUSTODIAN BANK | State Street Bank and Trust Co. | |
| | 225 Franklin Street | |
| | Boston, MA 02110 | Value Line Premier Growth Fund, Inc. |
| | |
| SHAREHOLDER | State Street Bank and Trust Co. |
| SERVICING AGENT | c/o BFDS |
| | P.O. Box 219729 |
| | Kansas City, MO 64121-9729 |
| | |
| INDEPENDENT | PricewaterhouseCoopers LLP |
| REGISTERED PUBLIC | 300 Madison Avenue |
| ACCOUNTING FIRM | New York, NY 10017 |
| | | |
| Peter D. Lowenstein, Esq. | |
| | 496 Valley Road | |
| | Cos Cob, CT 06807-0272 | |
| | | |
| DIRECTORS | Joyce E. Heinzerling | |
| | Francis C. Oakley | |
| | David H. Porter | |
| | Paul Craig Roberts | |
| | Thomas T. Sarkany | |
| | Nancy-Beth Sheerr | |
| | Daniel S. Vandivort | |
| | | |
| OFFICERS | Mitchell E. Appel | |
| | President | |
| | Howard A. Brecher | |
| | Vice President and Secretary | |
| | Emily D. Washington | |
| | Treasurer | |
| | | |
| | |
| | |
| | |
| | | |
| | |
| This audited report is issued for information to shareholders. It is not authorized for distribution to prospective investors unless preceded or accompanied by a currently effective prospectus of the Fund (obtainable from the Distributor). |
| #00062642 |
Value Line Premier Growth Fund, Inc.
| |
| To Our Value Line Premier |
To Our Shareholders (unaudited):
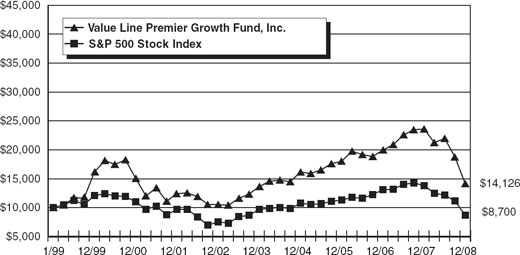
The year ended December 31, 2008 was a very challenging one for investors. The Value Line Premier Growth Fund (the “Fund”) experienced a loss of 40.13%, versus a loss of 37.00% for the benchmark Standard & Poor’s 500 Index(1).
We take some solace from having once again outperformed our peer group, mid-capitalization growth funds. Lipper Inc., the mutual fund analysis company, awards its top Lipper Leader rank to funds that achieve top-quintile performance. Your fund achieved top Lipper Leader ranking for both Total Return and Consistent Return, in recognition of the Fund’s top-quintile performance within its category for all time spans under review—one year, three years, five years, and ten years. Morningstar, another independent mutual fund advisory service, rates the Fund Above Average for Overall Return and Below Average for Overall Risk exposure relative to other funds in its peer group, certainly an enviable combination(2).
Our success derives from finding the long-term winners, and then sticking with them as long as they continue to perform well. We seek companies that have established a track record of superior earnings performance and superior stock price performance, relative to their competition. We then monitor quarterly earnings reports and relative stock momentum for any signs of subpar performance. With about 400 stocks in the portfolio, we do not hesitate to sell laggards, replacing them with stocks showing superior momentum. This discipline has contributed greatly to your Fund’s long-term success.
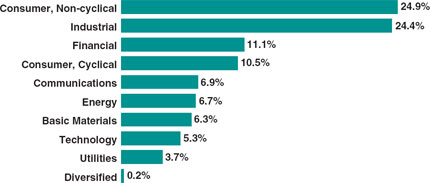
The Fund’s widely diversified portfolio contains representatives from nearly every industry. The diversification is also reflected in the fact that only about 7% of Fund assets are invested in the portfolio’s ten largest holdings, as of December 31, 2008. We invest across all classifications of company size, too. Current holdings are about 35% large-capitalization, 45% mid-cap, and 20% small-cap.
We believe our disciplined strategy will continue to serve your Fund well. Thank you for your continued confidence in us.
| | | |
| | Sincerely, | |
| | | |
| |  | |
| | | |
| | Mitchell E. Appel President | |
February 20, 2009
| | |
| (1) | The Standard & Poor’s 500 Index consists of 500 stocks which are traded on the New York Stock Exchange, American Stock Exchange and the NASDAQ National Market System and is representative of the broad stock market. This is an unmanaged index and does not reflect charges, expenses or taxes. It is not possible to directly invest in this index. |
| | |
| (2) | For each fund with at least a three-year history, Morningstar calculates a Morningstar Rating based on a Morningstar-Risk-Adjusted Return measure that accounts for variation in a fund’s monthly performance (including the effects of sales charges, loads and redemption fees), placing more emphasis on downward variations and rewarding consistent performance. (Each share class is counted as a fraction of one fund within the scale and rated separately, which may cause slight variations in the distribution percentages.) The top 10% of the funds in an investment category receive 5 stars, 22.5% receive 4 stars, 35% receive 3 stars, the next 22.5% receive 2 stars, and the bottom 10% receive 1 star. The Overall Morningstar Rating is a weighted average of the fund’s three-, five-, and 10-year (if applicable). |
Value Line Premier Growth Fund, Inc.
Economic Observations (unaudited)
The recession is in full bloom, having hit this country with its worst business setback in several generations. Meanwhile, the downturn is spreading overseas with ferocity, creating a global crisis.
The current situation is traceable to several events, beginning with the sharp declines in housing construction, home sales, and real estate prices. We also have seen a reduction in credit availability, a high level of bank failures, rising foreclosure rates, increasing unemployment, a contraction in retailing and auto activity, and sharp declines in manufacturing and nonmanufacturing. These developments are consistent with a deep and prolonged recession. As 2009 unfolds, we are facing a serious worldwide contraction that optimistically will last only through the middle of this year. Government reaction to this global upheaval is likely to involve attempts to pass additional stimulus measures, with an emphasis on infrastructure rebuilding and employment improvement. It is hoped that such efforts will shorten the downturn’s duration and reduce its severity.
Meanwhile, inflation, which had earlier moved sharply higher in this country due to dramatic increases in oil, food, and commodity prices, has moderated quickly, thanks to even more dramatic declines in energy prices since last summer. Our expectation is that, absent a more potent long-term business expansion than we now project, inflation should remain in check for the most part through the early years of the next decade. In fact, there is the possibility that we could see selective bouts of deflation along the way, especially if consumer demand falters for any extended period of time.
Value Line Premier Growth Fund, Inc.
The following graph compares the performance of the Value Line Premier Growth Fund, Inc. to that of the S&P 500 Index. The Value Line Premier Growth Fund, Inc. is a professionally managed mutual fund, while the Index is not available for investment and is unmanaged. The returns for the Index do not reflect charges, expenses or taxes but do include the reinvestment of dividends. The comparison is shown for illustrative purposes only.
Comparison of a Change in Value of a $10,000 Investment
in the Value Line Premier Growth Fund, Inc.
and the S&P 500 Stock Index*
| * | The Standard and Poor’s 500 Stock Index is an unmanaged index that is representative of the larger-capitalization stocks traded in the United States. |
| Performance Data:** | | | | | | |
| | | Average Annual Total Return | | | Growth of an Assumed Investment of $10,000 | |
| 1 year ended 12/31/08 | | (40.13 | )% | | | $ | 5,987 | |
| 5 years ended 12/31/08 | | 0.69 | % | | | $ | 10,350 | |
| 10 years ended 12/31/08 | | 3.51 | % | | | $ | 14,126 | |
| | |
| ** | The performance data quoted represent past performance and are no guarantee of future performance. The average annual total returns and growth of an assumed investment of $10,000 include dividends reinvested and capital gains distributions accepted in shares. The investment return and principal value of an investment will fluctuate so that an investment, when redeemed, may be worth more or less than its original cost. The performance data and graph do not reflect the deduction of taxes that a shareholder would pay on fund distributions or the redemption of fund shares. |
Value Line Premier Growth Fund, Inc.
| | |
| | |
| FUND EXPENSES (unaudited): | |
Example
As a shareholder of the Fund, you incur ongoing costs, including management fees, distribution and service (12b-1) fees, and other Fund expenses. This Example is intended to help you understand your ongoing costs (in dollars) of investing in the Fund and to compare these costs with the ongoing costs of investing in other mutual funds.
The Example is based on an investment of $1,000 invested at the beginning of the period and held for the entire period (July 1, 2008 through December 31, 2008).
Actual Expenses
The first line of the table below provides information about actual account values and actual expenses. You may use the information in this line, together with the amount you invested, to estimate the expenses that you paid over the period. Simply divide your account value by $1,000 (for example an $8,600 account value divided by $1,000 = 8.6), then multiply the result by the number in the first line under the heading “Expenses Paid During Period” to estimate the expenses you paid on your account during this period.
Hypothetical Example for Comparison Purposes
The second line of the table below provides information about hypothetical account values and hypothetical expenses based on the Fund’s actual expense ratio and an assumed rate of return of 5% per year before expenses, which is not the Fund’s actual return. The hypothetical account values and expenses may not be used to estimate the actual ending account balance or expenses you paid for the period. You may use this information to compare the ongoing costs of investing in the Fund and other funds. To do so, compare this 5% hypothetical example with the 5% hypothetical examples that appear in the shareholder reports of the other funds.
Please note that the expenses shown in the table are meant to highlight your ongoing costs only and do not reflect any transactional costs, such as sales charges (loads), redemption fees, or exchange fees. Therefore, the table is useful in comparing ongoing costs only, and will not help you determine the relative total costs of owning different funds. In addition, if transactional costs were included, your costs would have been higher.
| | | Beginning account value 7/1/08 | | | Ending account value 12/31/08 | | | Expenses paid during period 7/1/08 thru 12/31/08* | |
| Actual | | $ | 1,000.00 | | | $ | 642.70 | | | $ | 5.04 | |
| Hypothetical (5% return before expenses) | | $ | 1,000.00 | | | $ | 1,019.00 | | | $ | 6.19 | |
| | | | | | | | | | | | | |
| * | Expenses are equal to the Fund’s annualized expense ratio of 1.22% multiplied by the average account value over the period, multiplied by 184/366 to reflect the one-half year period. This expense ratio may differ from the expense ratio shown in the Financial Highlights. |
Value Line Premier Growth Fund, Inc.
Portfolio Highlights at December 31, 2008 (unaudited)
Ten Largest Holdings
| | | | | | | | | | |
| Issue | | Shares | | | Value | | | Percentage of Net Assets | |
| Landstar System, Inc. | | | 76,000 | | | $ | 2,920,680 | | | | 0.93 | % |
| Intuitive Surgical, Inc. | | | 20,000 | | | $ | 2,539,800 | | | | 0.81 | % |
| Southwestern Energy Co. | | | 80,000 | | | $ | 2,317,600 | | | | 0.74 | % |
| Range Resources Corp. | | | 66,000 | | | $ | 2,269,740 | | | | 0.73 | % |
| Express Scripts, Inc. | | | 40,000 | | | $ | 2,199,200 | | | | 0.70 | % |
| Gilead Sciences, Inc. | | | 42,000 | | | $ | 2,147,880 | | | | 0.69 | % |
| Henry Schein, Inc. | | | 56,000 | | | $ | 2,054,640 | | | | 0.66 | % |
| Alexion Pharmaceuticals, Inc. | | | 56,000 | | | $ | 2,026,640 | | | | 0.65 | % |
| Jacobs Engineering Group, Inc. | | | 40,000 | | | $ | 1,924,000 | | | | 0.62 | % |
| Stericycle, Inc. | | | 36,600 | | | $ | 1,906,128 | | | | 0.61 | % |
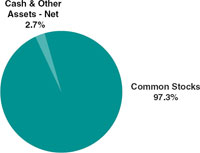
Asset Allocation — Percentage of Total Net Assets
Sector Weightings — Percentage of Total Investment Securities
| | |
| | Value Line Premier Growth Fund, Inc. |
| Schedule of Investments | December 31, 2008 |
| Shares | | | | Value | |
| COMMON STOCKS (97.3%) | | | | |
| | | | AEROSPACE/DEFENSE (3.3%) | | | | |
| | 12,000 | | Alliant Techsystems, Inc. * | | $ | 1,029,120 | |
| | 36,000 | | BE Aerospace, Inc. * | | | 276,840 | |
| | 20,000 | | Esterline Technologies Corp. * | | | 757,800 | |
| | 17,400 | | Goodrich Corp. | | | 644,148 | |
| | 12,500 | | L-3 Communications Holdings, Inc. | | | 922,250 | |
| | 11,000 | | Lockheed Martin Corp. | | | 924,880 | |
| | 15,000 | | Northrop Grumman Corp. | | | 675,600 | |
| | 44,000 | | Orbital Sciences Corp. * | | | 859,320 | |
| | 23,800 | | Precision Castparts Corp. | | | 1,415,624 | |
| | 18,400 | | Raytheon Co. | | | 939,136 | |
| | 19,600 | | Rockwell Collins, Inc. | | | 766,164 | |
| | 27,000 | | Teledyne Technologies, Inc. * | | | 1,202,850 | |
| | | | | | | 10,413,732 | |
| | | | | | | | |
| | | | AIR TRANSPORT (0.3%) | | | | |
| | 106,500 | | Lan Airlines S.A. ADR | | | 857,325 | |
| | | | | | | | |
| | | | APPAREL (0.9%) | | | | |
| | 24,000 | | Gildan Activewear, Inc. Class A * | | | 282,240 | |
| | 46,000 | | Guess?, Inc. | | | 706,100 | |
| | 30,000 | | Phillips-Van Heusen Corp. | | | 603,900 | |
| | 15,000 | | VF Corp. | | | 821,550 | |
| | 26,500 | | Warnaco Group, Inc. (The) * | | | 520,195 | |
| | | | | | | 2,933,985 | |
| | | | | | | | |
| | | | AUTO PARTS (1.1%) | | | | |
| | 13,000 | | Autoliv, Inc. | | | 278,980 | |
| | 32,000 | | BorgWarner, Inc. | | | 696,640 | |
| | 12,600 | | Eaton Corp. | | | 626,346 | |
| | 60,000 | | Johnson Controls, Inc. | | | 1,089,600 | |
| | 56,000 | | LKQ Corp. * | | | 652,960 | |
| | | | | | | 3,344,526 | |
| | | | | | | | |
| | | | BANK (0.8%) | | | | |
| | 25,000 | | Bank of Hawaii Corp. | | | 1,129,250 | |
| | 7,322 | | PNC Financial Services Group, Inc. | | | 358,778 | |
| | 30,000 | | Wells Fargo & Co. | | | 884,400 | |
| | | | | | | 2,372,428 | |
| | | | | | | | |
| | | | BANK — CANADIAN (0.6%) | | | | |
| | 13,300 | | Bank of Montreal | | | 341,677 | |
| | 22,100 | | Bank of Nova Scotia | | | 601,120 | |
| | 8,200 | | Canadian Imperial Bank of Commerce | | | 342,350 | |
| Shares | | | | Value | |
| | 14,400 | | Royal Bank of Canada | | $ | 427,104 | |
| | 7,400 | | Toronto-Dominion Bank (The) | | | 265,438 | |
| | | | | | | 1,977,689 | |
| | | | | | | | |
| | | | BANK — FOREIGN (1.7%) | | | | |
| | 68,800 | | Banco Bilbao Vizcaya Argentaria, S.A. ADR | | | 859,312 | |
| | 163,750 | | Banco Itau Holding Financeira S.A. ADR | | | 1,899,500 | |
| | 60,000 | | Banco Santander Central Hispano S.A. ADR | | | 569,400 | |
| | 5,500 | | Banco Santander Chile S.A. ADR | | | 192,665 | |
| | 35,000 | | Bancolombia S.A. ADR | | | 817,250 | |
| | 16,000 | | ICICI Bank Ltd. ADR | | | 308,000 | |
| | 10,000 | | Unibanco - Uniao de Bancos Brasileiros S.A. GDR | | | 646,200 | |
| | | | | | | 5,292,327 | |
| | | | | | | | |
| | | | BANK — MIDWEST (0.6%) | | | | |
| | 8,808 | | Commerce Bancshares, Inc. | | | 387,111 | |
| | 17,900 | | Northern Trust Corp. | | | 933,306 | |
| | 20,000 | | U.S. Bancorp | | | 500,200 | |
| | | | | | | 1,820,617 | |
| | | | | | | | |
| | | | BEVERAGE — ALCOHOLIC (0.3%) | | | | |
| | 20,000 | | Molson Coors Brewing Co. Class B | | | 978,400 | |
| | | | | | | | |
| | | | BEVERAGE — SOFT DRINK (0.8%) | | | | |
| | 16,800 | | Coca-Cola Femsa, S.A.B. de C.V. ADR | | | 730,968 | |
| | 29,000 | | Companhia de Bebidas das Americas ADR | | | 1,284,990 | |
| | 20,000 | | Fomento Economico Mexicano S.A.B. de C.V. ADR | | | 602,600 | |
| | | | | | | 2,618,558 | |
| | | | | | | | |
| | | | BIOTECHNOLOGY (0.8%) | | | | |
| | 9,000 | | Myriad Genetics, Inc. * | | | 596,340 | |
| | 18,000 | | Techne Corp. | | | 1,161,360 | |
| | 12,800 | | United Therapeutics Corp. * | | | 800,640 | |
| | | | | | | 2,558,340 | |
| | | | | | | | |
| | | | BUILDING MATERIALS (1.1%) | | | | |
| | 8,800 | | Ameron International Corp. | | | 553,696 | |
| | 24,000 | | Fluor Corp. | | | 1,076,880 | |
See Notes to Financial Statements.
| |
| Value Line Premier Growth Fund, Inc. |
| |
| Schedule of Investments |
| Shares | | | | Value | |
| | | | | | | | |
| | 40,000 | | Jacobs Engineering Group, Inc. * | | $ | 1,924,000 | |
| | | | | | | 3,554,576 | |
| | | | | | | | |
| | | | CABLE TV (1.0%) | | | | |
| | 41,000 | | DIRECTV Group, Inc. (The) * | | | 939,310 | |
| | 37,800 | | Rogers Communications, Inc. Class B | | | 1,137,024 | |
| | 59,000 | | Shaw Communications, Inc. Class B | | | 1,043,120 | |
| | | | | | | 3,119,454 | |
| | | | | | | | |
| | | | CANADIAN ENERGY (0.6%) | | | | |
| | 20,000 | | Nexen, Inc. | | | 351,600 | |
| | 38,000 | | Suncor Energy, Inc. | | | 741,000 | |
| | 17,000 | | Talisman Energy, Inc. | | | 169,830 | |
| | 26,000 | | TransCanada Corp. | | | 705,640 | |
| | | | | | | 1,968,070 | |
| | | | | | | | |
| | | | CHEMICAL — BASIC (0.9%) | | | | |
| | 21,000 | | Agrium, Inc. | | | 716,730 | |
| | 28,000 | | Celanese Corp. Series A | | | 348,040 | |
| | 22,000 | | FMC Corp. | | | 984,060 | |
| | 12,000 | | Potash Corporation of Saskatchewan, Inc. | | | 878,640 | |
| | | | | | | 2,927,470 | |
| | | | | | | | |
| | | | CHEMICAL — DIVERSIFIED (1.7%) | | | | |
| | 15,000 | | Air Products & Chemicals, Inc. | | | 754,050 | |
| | 44,000 | | Albemarle Corp. | | | 981,200 | |
| | 16,000 | | Bayer AG ADR | | | 950,400 | |
| | 24,000 | | Monsanto Co. | | | 1,688,400 | |
| | 25,000 | | Pall Corp. | | | 710,750 | |
| | 27,000 | | Zoltek Companies, Inc. * | | | 242,730 | |
| | | | | | | 5,327,530 | |
| | | | | | | | |
| | | | CHEMICAL — SPECIALTY (3.0%) | | | | |
| | 29,000 | | Airgas, Inc. | | | 1,130,710 | |
| | 11,400 | | CF Industries Holdings, Inc. | | | 560,424 | |
| | 26,000 | | Ecolab, Inc. | | | 913,900 | |
| | 15,000 | | H.B. Fuller Co. | | | 241,650 | |
| | 17,500 | | Lubrizol Corp. (The) | | | 636,825 | |
| | 17,000 | | Mosaic Co. (The) | | | 588,200 | |
| | 30,000 | | Praxair, Inc. | | | 1,780,800 | |
| | 16,000 | | Sherwin-Williams Co. (The) | | | 956,000 | |
| | 30,000 | | Sigma-Aldrich Corp. | | | 1,267,200 | |
| | 36,800 | | Syngenta AG ADR | | | 1,440,352 | |
| | | | | | | 9,516,061 | |
| Shares | | | | Value | |
| | | | | | | | |
| | | | COMPUTER & PERIPHERALS (0.5%) | | | | |
| | 37,200 | | MICROS Systems, Inc. * | | $ | 607,104 | |
| | 42,300 | | NCR Corp. * | | | 598,122 | |
| | 20,000 | | Synaptics, Inc. * | | | 331,200 | |
| | | | | | | 1,536,426 | |
| | | | | | | | |
| | | | COMPUTER SOFTWARE & SERVICES (2.3%) | | | | |
| | 28,000 | | Accenture Ltd. Class A | | | 918,120 | |
| | 60,000 | | ANSYS, Inc. * | | | 1,673,400 | |
| | 60,000 | | Cognizant Technology Solutions Corp. Class A * | | | 1,083,600 | |
| | 30,000 | | Concur Technologies, Inc. * | | | 984,600 | |
| | 28,400 | | Infosys Technologies Ltd. ADR | | | 697,788 | |
| | 3,000 | | ManTech International Corp. Class A * | | | 162,570 | |
| | 26,000 | | Omniture, Inc. * | | | 276,640 | |
| | 42,000 | | Satyam Computer Services Ltd. ADR | | | 379,680 | |
| | 26,000 | | SEI Investments Co. | | | 408,460 | |
| | 27,000 | | Sybase, Inc. * | | | 668,790 | |
| | | | | | | 7,253,648 | |
| | | | | | | | |
| | | | DIVERSIFIED COMPANIES (2.9%) | | | | |
| | 85,000 | | ABB Ltd. ADR | | | 1,275,850 | |
| | 24,300 | | Acuity Brands, Inc. | | | 848,313 | |
| | 33,000 | | AMETEK, Inc. | | | 996,930 | |
| | 35,600 | | Barnes Group, Inc. | | | 516,200 | |
| | 18,300 | | Brink’s Co. (The) | | | 491,904 | |
| | 34,875 | | Brookfield Asset Management, Inc. Class A | | | 532,541 | |
| | 16,000 | | Danaher Corp. | | | 905,760 | |
| | 19,000 | | Honeywell International, Inc. | | | 623,770 | |
| | 17,200 | | ITT Corp. | | | 791,028 | |
| | 6,700 | | SPX Corp. | | | 271,685 | |
| | 17,000 | | United Technologies Corp. | | | 911,200 | |
| | 13,700 | | Valmont Industries, Inc. | | | 840,632 | |
| | | | | | | 9,005,813 | |
| | | | | | | | |
| | | | DRUG (4.2%) | | | | |
| | 56,000 | | Alexion Pharmaceuticals, Inc.* | | | 2,026,640 | |
| | 17,200 | | Allergan, Inc. | | | 693,504 | |
| | 21,000 | | Auxilium Pharmaceuticals, Inc.* | | | 597,240 | |
| | 27,400 | | BioMarin Pharmaceutical, Inc.* | | | 487,720 | |
| | 27,060 | | Celgene Corp. * | | | 1,495,877 | |
| | 18,400 | | Covance, Inc. * | | | 846,952 | |
See Notes to Financial Statements.
| Value Line Premier Growth Fund, Inc. |
| |
| December 31, 2008 |
| Shares | | | | Value | |
| | | | | | | | |
| | 42,000 | | Gilead Sciences, Inc. * | | $ | 2,147,880 | |
| | 32,500 | | Immucor, Inc. * | | | 863,850 | |
| | 20,800 | | Novo Nordisk A/S ADR | | | 1,068,912 | |
| | 4,000 | | PAREXEL International Corp. * | | | 38,840 | |
| | 32,000 | | Perrigo Co. | | | 1,033,920 | |
| | 32,000 | | Pharmaceutical Product Development, Inc. | | | 928,320 | |
| | 23,000 | | Teva Pharmaceutical Industries Ltd. ADR | | | 979,110 | |
| | | | | | | 13,208,765 | |
| | | | | | | | |
| | | | E-COMMERCE (0.6%) | | | | |
| | 60,000 | | Ariba, Inc. * | | | 432,600 | |
| | 19,600 | | Ctrip.com International Ltd. ADR | | | 466,480 | |
| | 30,000 | | Salesforce.com, Inc. * | | | 960,300 | |
| | | | | | | 1,859,380 | |
| | | | | | | | |
| | | | EDUCATIONAL SERVICES (1.1%) | | | | |
| | 15,000 | | Blackboard, Inc. * | | | 393,450 | |
| | 15,500 | | ITT Educational Services, Inc. * | | | 1,472,190 | |
| | 6,700 | | Strayer Education, Inc. | | | 1,436,547 | |
| | | | | | | 3,302,187 | |
| | | | | | | | |
| | | | ELECTRICAL EQUIPMENT (1.7%) | | | | |
| | 23,200 | | Cooper Industries Ltd. Class A | | | 678,136 | |
| | 19,000 | | Emerson Electric Co. | | | 695,590 | |
| | 8,000 | | EnerSys * | | | 88,000 | |
| | 44,000 | | FLIR Systems, Inc. * | | | 1,349,920 | |
| | 27,000 | | General Cable Corp. * | | | 477,630 | |
| | 21,500 | | Thomas & Betts Corp. * | | | 516,430 | |
| | 30,000 | | Trimble Navigation Ltd. * | | | 648,300 | |
| | 12,600 | | W.W. Grainger, Inc. | | | 993,384 | |
| | | | | | | 5,447,390 | |
| | | | | | | | |
| | | | ELECTRICAL UTILITY — CENTRAL (0.6%) | | | | |
| | 13,000 | | Entergy Corp. | | | 1,080,690 | |
| | 20,000 | | ITC Holdings Corp. | | | 873,600 | |
| | | | | | | 1,954,290 | |
| | | | | | | | |
| | | | ELECTRICAL UTILITY — EAST (1.2%) | | | | |
| | 18,000 | | Exelon Corp. | | | 1,000,980 | |
| | 17,000 | | FirstEnergy Corp. | | | 825,860 | |
| | 8,000 | | NSTAR | | | 291,920 | |
| | 24,000 | | Public Service Enterprise Group, Inc. | | | 700,080 | |
| Shares | | | | Value | |
| | | | | | | | |
| | 27,000 | | Southern Co. | | $ | 999,000 | |
| | | | | | | 3,817,840 | |
| | | | | | | | |
| | | | ELECTRICAL UTILITY — WEST (0.4%) | | | | |
| | 15,000 | | MDU Resources Group, Inc. | | | 323,700 | |
| | 18,500 | | Sempra Energy | | | 788,655 | |
| | | | | | | 1,112,355 | |
| | | | | | | | |
| | | | ELECTRONICS (0.8%) | | | | |
| | 40,800 | | Amphenol Corp. Class A | | | 978,384 | |
| | 27,550 | | Diodes, Inc. * | | | 166,953 | |
| | 26,500 | | Harris Corp. | | | 1,008,325 | |
| | 31,000 | | MEMC Electronic Materials, Inc. * | | | 442,680 | |
| | | | | | | 2,596,342 | |
| | | | | | | | |
| | | | ENTERTAINMENT (0.1%) | | | | |
| | 15,100 | | Central European Media Enterprises Ltd. Class A * | | | 327,972 | |
| | | | | | | | |
| | | | ENTERTAINMENT TECHNOLOGY (0.2%) | | | | |
| | 16,000 | | Activision Blizzard, Inc. * | | | 138,240 | |
| | 13,000 | | Dolby Laboratories, Inc. Class A * | | | 425,880 | |
| | | | | | | 564,120 | |
| | | | | | | | |
| | | | ENVIRONMENTAL (1.3%) | | | | |
| | 37,500 | | Republic Services, Inc. | | | 929,625 | |
| | 36,600 | | Stericycle, Inc. * | | | 1,906,128 | |
| | 37,800 | | Waste Connections, Inc. * | | | 1,193,346 | |
| | | | | | | 4,029,099 | |
| | | | | | | | |
| | | | FINANCIAL SERVICES — DIVERSIFIED (3.8%) | | | | |
| | 12,000 | | Affiliated Managers Group, Inc. * | | | 503,040 | |
| | 10,700 | | BlackRock, Inc. | | | 1,435,405 | |
| | 12,000 | | Credicorp Ltd. | | | 599,520 | |
| | 5,000 | | Credit Suisse Group ADR | | | 141,300 | |
| | 34,000 | | Eaton Vance Corp. | | | 714,340 | |
| | 15,961 | | Fidelity National Information Services, Inc. | | | 259,685 | |
| | 9,000 | | Franklin Resources, Inc. | | | 574,020 | |
| | 18,000 | | Global Payments, Inc. | | | 590,220 | |
| | 18,300 | | HDFC Bank Ltd. ADR | | | 1,306,254 | |
| | 7,980 | | Lender Processing Services, Inc. | | | 235,011 | |
See Notes to Financial Statements.
| Value Line Premier Growth Fund, Inc. |
| |
| Schedule of Investments |
| Shares | | | | Value | |
| | | | | | | | |
| | 38,000 | | Leucadia National Corp. * | | $ | 752,400 | |
| | 11,011 | | Loews Corp. | | | 311,061 | |
| | 9,300 | | MasterCard, Inc. Class A | | | 1,329,249 | |
| | 19,000 | | Principal Financial Group, Inc. | | | 428,830 | |
| | 21,000 | | ProAssurance Corp. * | | | 1,108,380 | |
| | 24,000 | | T. Rowe Price Group, Inc. | | | 850,560 | |
| | 45,000 | | Western Union Co. (The) | | | 645,300 | |
| | | | | | | 11,784,575 | |
| | | | | | | | |
| | | | FOOD PROCESSING (2.4%) | | | | |
| | 11,000 | | Bunge Ltd. | | | 569,470 | |
| | 13,000 | | Diageo PLC ADR | | | 737,620 | |
| | 56,250 | | Flowers Foods, Inc. | | | 1,370,250 | |
| | 18,600 | | General Mills, Inc. | | | 1,129,950 | |
| | 16,600 | | Groupe Danone ADR | | | 200,528 | |
| | 15,000 | | H.J. Heinz Co. | | | 564,000 | |
| | 28,000 | | Hormel Foods Corp. | | | 870,240 | |
| | 30,000 | | McCormick & Company, Inc. | | | 955,800 | |
| | 17,000 | | Perdigao S.A. ADR | | | 448,460 | |
| | 4,000 | | Ralcorp Holdings, Inc. * | | | 233,600 | |
| | 12,000 | | TreeHouse Foods, Inc. * | | | 326,880 | |
| | | | | | | 7,406,798 | |
| | | | | | | | |
| | | | FOOD WHOLESALERS (0.2%) | | | | |
| | 20,000 | | Green Mountain Coffee Roasters, Inc. * | | | 774,000 | |
| | | | | | | | |
| | | | FOREIGN ELECTRONICS (0.2%) | | | | |
| | 21,000 | | Canon, Inc. ADR | | | 659,400 | |
| | | | | | | | |
| | | | FOREIGN TELECOMMUNICATIONS (1.0%) | | | | |
| | 12,601 | | Brasil Telecom Participacoes S.A. ADR | | | 486,777 | |
| | 16,600 | | PT Telekomunikasi Indonesia ADR | | | 416,162 | |
| | 41,000 | | Tele Norte Leste Participacoes S.A. ADR | | | 570,720 | |
| | 11,700 | | Telefonica S.A. ADR | | | 788,463 | |
| | 34,000 | | Telefonos de Mexico S.A. de C.V. ADR | | | 711,960 | |
| | | | | | | 2,974,082 | |
| | | | | | | | |
| | | | GROCERY (0.3%) | | | | |
| | 32,000 | | Ruddick Corp. | | | 884,800 | |
| | | | | | | | |
| | | | HEALTH CARE INFORMATION SYSTEMS (0.1%) | | | | |
| | 10,000 | | Cerner Corp. * | | | 384,500 | |
| | | | | | | | |
| Shares | | | | Value | |
| | | | | | | | |
| | | | HOME APPLIANCES (0.3%) | | | | |
| | 33,000 | | Toro Co. (The) | | $ | 1,089,000 | |
| | | | | | | | |
| | | | HOTEL/GAMING (1.0%) | | | | |
| | 18,000 | | Bally Technologies, Inc. * | | | 432,540 | |
| | 24,500 | | Marriott International, Inc. Class A | | | 476,525 | |
| | 8,487 | | MGM MIRAGE * | | | 116,781 | |
| | 52,000 | | Penn National Gaming, Inc. * | | | 1,111,760 | |
| | 10,000 | | Vail Resorts, Inc. * | | | 266,000 | |
| | 29,000 | | WMS Industries, Inc. * | | | 780,100 | |
| | | | | | | 3,183,706 | |
| | | | | | | | |
| | | | HOUSEHOLD PRODUCTS (1.2%) | | | | |
| | 24,200 | | Church & Dwight Company, Inc. | | | 1,358,104 | |
| | 16,000 | | Energizer Holdings, Inc. * | | | 866,240 | |
| | 10,000 | | Procter & Gamble Co. (The) | | | 618,200 | |
| | 35,000 | | Tupperware Brands Corp. | | | 794,500 | |
| | | | | | | 3,637,044 | |
| | | | | | | | |
| | | | HUMAN RESOURCES (0.5%) | | | | |
| | 8,000 | | Hewitt Associates, Inc. Class A * | | | 227,040 | |
| | 25,300 | | Watson Wyatt Worldwide, Inc. Class A | | | 1,209,846 | |
| | | | | | | 1,436,886 | |
| | | | | | | | |
| | | | INDUSTRIAL SERVICES (3.3%) | | | | |
| | 18,300 | | Brink’s Home Security Holdings, Inc. * | | | 401,136 | |
| | 30,000 | | C.H. Robinson Worldwide, Inc. | | | 1,650,900 | |
| | 63,000 | | Corrections Corp. of America * | | | 1,030,680 | |
| | 40,000 | | EMCOR Group, Inc. * | | | 897,200 | |
| | 29,000 | | FTI Consulting, Inc. * | | | 1,295,720 | |
| | 42,000 | | Geo Group, Inc. (The) * | | | 757,260 | |
| | 34,500 | | Iron Mountain, Inc. * | | | 853,185 | |
| | 36,000 | | Quanta Services, Inc. * | | | 712,800 | |
| | 17,000 | | Rollins, Inc. | | | 307,360 | |
| | 20,000 | | Stanley, Inc. * | | | 724,400 | |
| | 43,369 | | URS Corp. * | | | 1,768,154 | |
| | | | | | | 10,398,795 | |
| | | | | | | | |
| | | | INFORMATION SERVICES (1.3%) | | | | |
| | 19,000 | | Alliance Data Systems Corp. * | | | 884,070 | |
| | 14,000 | | Dun & Bradstreet Corp. (The) | | | 1,080,800 | |
See Notes to Financial Statements.
| Value Line Premier Growth Fund, Inc. |
| |
| December 31, 2008 |
| Shares | | | | Value | |
| | | | | | | | |
| | 11,000 | | FactSet Research Systems, Inc. | | $ | 486,640 | |
| | 22,600 | | IHS, Inc. Class A * | | | 845,692 | |
| | 63,000 | | Nuance Communications, Inc. * | | | 652,680 | |
| | | | | | | 3,949,882 | |
| | | | | | | | |
| | | | INSURANCE — LIFE (0.8%) | | | | |
| | 20,600 | | AFLAC, Inc. | | | 944,304 | |
| | 34,000 | | Manulife Financial Corp. | | | 579,020 | |
| | 18,212 | | MetLife, Inc. | | | 634,870 | |
| | 2,264 | | Reinsurance Group of America, Inc. | | | 96,945 | |
| | 6,000 | | Torchmark Corp. | | | 268,200 | |
| | | | | | | 2,523,339 | |
| | | | | | | | |
| | | | INSURANCE — PROPERTY & CASUALTY (1.4%) | | | | |
| | 19,000 | | ACE Ltd. | | | 1,005,480 | |
| | 30,000 | | American Financial Group, Inc. | | | 686,400 | |
| | 15,000 | | Arch Capital Group Ltd. * | | | 1,051,500 | |
| | 25,000 | | Assurant, Inc. | | | 750,000 | |
| | 13,000 | | Axis Capital Holdings Ltd. | | | 378,560 | |
| | 24,100 | | Sun Life Financial, Inc. | | | 557,674 | |
| | | | | | | 4,429,614 | |
| | | | | | | | |
| | | | INTERNET (0.9%) | | | | |
| | 13,500 | | Amazon.com, Inc. * | | | 692,280 | |
| | 34,000 | | Atheros Communications * | | | 486,540 | |
| | 18,000 | | CyberSource Corp. * | | | 215,820 | |
| | 5,000 | | Google, Inc. Class A * | | | 1,538,250 | |
| | | | | | | 2,932,890 | |
| | | | | | | | |
| | | | MACHINERY (4.6%) | | | | |
| | 28,400 | | Bucyrus International, Inc. Class A | | | 525,968 | |
| | 14,000 | | Caterpillar, Inc. | | | 625,380 | |
| | 11,700 | | CNH Global N.V. | | | 182,520 | |
| | 15,500 | | Cummins, Inc. | | | 414,315 | |
| | 23,300 | | Curtiss-Wright Corp. | | | 777,987 | |
| | 19,200 | | Deere & Co. | | | 735,744 | |
| | 21,000 | | Donaldson Company, Inc. | | | 706,650 | |
| | 18,000 | | Flowserve Corp. | | | 927,000 | |
| | 42,600 | | Foster Wheeler Ltd. * | | | 995,988 | |
| | 23,200 | | Gardner Denver, Inc. * | | | 541,488 | |
| | 28,125 | | Graco, Inc. | | | 667,406 | |
| | 29,850 | | IDEX Corp. | | | 720,878 | |
| Shares | | | | Value | |
| | | | | | | | |
| | 6,400 | | John Bean Technologies Corp. | | $ | 52,288 | |
| | 21,000 | | Kaydon Corp. | | | 721,350 | |
| | 31,500 | | Lennox International, Inc. | | | 1,017,135 | |
| | 42,000 | | Manitowoc Company, Inc. (The) | | | 363,720 | |
| | 15,600 | | MSC Industrial Direct Co., Inc. Class A | | | 574,548 | |
| | 6,000 | | Regal-Beloit Corp. | | | 227,940 | |
| | 34,000 | | Robbins & Myers, Inc. | | | 549,780 | |
| | 26,000 | | Roper Industries, Inc. | | | 1,128,660 | |
| | 21,000 | | Snap-on, Inc. | | | 826,980 | |
| | 31,200 | | Terex Corp. * | | | 540,384 | |
| | 16,000 | | Wabtec Corp. | | | 636,000 | |
| | | | | | | 14,460,109 | |
| | | | | | | | |
| | | | MARITIME (0.3%) | | | | |
| | 34,000 | | Kirby Corp. * | | | 930,240 | |
| | | | | | | | |
| | | | MEDICAL SERVICES (1.5%) | | | | |
| | 26,000 | | Amedisys, Inc. * | | | 1,074,840 | |
| | 20,900 | | Fresenius Medical Care AG & Co. KGaA ADR | | | 986,062 | |
| | 10,000 | | Kendle International, Inc. * | | | 257,200 | |
| | 13,200 | | Laboratory Corporation of America Holdings * | | | 850,212 | |
| | 15,000 | | Pediatrix Medical Group, Inc. * | | | 475,500 | |
| | 42,400 | | Psychiatric Solutions, Inc. * | | | 1,180,840 | |
| | | | | | | 4,824,654 | |
| | | | | | | | |
| | | | MEDICAL SUPPLIES (6.4%) | | | | |
| | 12,200 | | Bard (C.R.), Inc. | | | 1,027,972 | |
| | 21,000 | | Baxter International, Inc. | | | 1,125,390 | |
| | 14,500 | | Becton, Dickinson & Co. | | | 991,655 | |
| | 11,000 | | Bio-Rad Laboratories, Inc. Class A * | | | 828,410 | |
| | 17,500 | | Charles River Laboratories International, Inc. * | | | 458,500 | |
| | 19,400 | | Covidien Ltd. | | | 703,056 | |
| | 37,000 | | DENTSPLY International, Inc. | | | 1,044,880 | |
| | 13,000 | | Edwards Lifesciences Corp. * | | | 714,350 | |
| | 12,600 | | Haemonetics Corp. * | | | 711,900 | |
| | 56,000 | | Henry Schein, Inc. * | | | 2,054,640 | |
| | 26,384 | | Hologic, Inc. * | | | 344,839 | |
| | 24,000 | | IDEXX Laboratories, Inc. * | | | 865,920 | |
| | 51,200 | | Illumina, Inc. * | | | 1,333,760 | |
| | 20,000 | | Intuitive Surgical, Inc. * | | | 2,539,800 | |
| | 8,000 | | Life Technologies Corp. * | | | 186,480 | |
| | 20,000 | | Masimo Corp. * | | | 596,600 | |
See Notes to Financial Statements.
| Value Line Premier Growth Fund, Inc. |
| |
| Schedule of Investments |
| Shares | | | | Value | |
| | | | | | | | |
| | 21,000 | | Natus Medical, Inc. * | | $ | 271,950 | |
| | 28,000 | | NuVasive, Inc. * | | | 970,200 | |
| | 27,000 | | Owens & Minor, Inc. | | | 1,016,550 | |
| | 15,700 | | Stryker Corp. | | | 627,215 | |
| | 18,000 | | Varian Medical Systems, Inc. * | | | 630,720 | |
| | 22,400 | | West Pharmaceutical Services, Inc. | | | 846,048 | |
| | | | | | | 19,890,835 | |
| | | | | | | | |
| | | | METALS & MINING DIVERSIFIED (0.2%) | | | | |
| | 27,000 | | Allegheny Technologies, Inc. | | | 689,310 | |
| | | | | | | | |
| | | | METALS FABRICATING (0.2%) | | | | |
| | 26,000 | | Harsco Corp. | | | 719,680 | |
| | | | | | | | |
| | | | NATURAL GAS — DISTRIBUTION (0.9%) | | | | |
| | 18,000 | | AGL Resources, Inc. | | | 564,300 | |
| | 15,800 | | BG Group PLC ADR | | | 1,124,170 | |
| | 33,600 | | Southern Union Co. | | | 438,144 | |
| | 31,000 | | UGI Corp. | | | 757,020 | |
| | | | | | | 2,883,634 | |
| | | | | | | | |
| | | | NATURAL GAS — DIVERSIFIED (2.7%) | | | | |
| | 32,000 | | Energen Corp. | | | 938,560 | |
| | 8,600 | | EOG Resources, Inc. | | | 572,588 | |
| | 20,000 | | Equitable Resources, Inc. | | | 671,000 | |
| | 24,000 | | National Fuel Gas Co. | | | 751,920 | |
| | 24,000 | | Penn Virginia Corp. | | | 623,520 | |
| | 20,000 | | Questar Corp. | | | 653,800 | |
| | 80,000 | | Southwestern Energy Co. * | | | 2,317,600 | |
| | 53,470 | | XTO Energy, Inc. | | | 1,885,887 | |
| | | | | | | 8,414,875 | |
| | | | | | | | |
| | | | OILFIELD SERVICES/EQUIPMENT (1.3%) | | | | |
| | 11,000 | | Arena Resources, Inc. * | | | 308,990 | |
| | 25,000 | | AZZ, Inc. * | | | 627,500 | |
| | 20,000 | | Bristow Group, Inc. * | | | 535,800 | |
| | 10,500 | | Core Laboratories N.V. | | | 628,530 | |
| | 14,600 | | Exterran Holdings, Inc. * | | | 310,980 | |
| | 44,000 | | FMC Technologies, Inc. * | | | 1,048,520 | |
| | 8,000 | | Superior Energy Services, Inc. * | | | 127,440 | |
| | 32,000 | | Weatherford International Ltd. * | | | 346,240 | |
| | 18,000 | | Willbros Group, Inc. * | | | 152,460 | |
| | | | | | | 4,086,460 | |
| Shares | | | | Value | |
| | | | | | | | |
| | | | PACKAGING & CONTAINER (1.1%) | | | | |
| | 30,700 | | AptarGroup, Inc. | | $ | 1,081,868 | |
| | 7,000 | | Ball Corp. | | | 291,130 | |
| | 34,000 | | CLARCOR, Inc. | | | 1,128,120 | |
| | 18,500 | | Greif, Inc. Class A | | | 618,455 | |
| | 15,000 | | Owens-Illinois, Inc. * | | | 409,950 | |
| | | | | | | 3,529,523 | |
| | | | | | | | |
| | | | PAPER & FOREST PRODUCTS (0.1%) | | | | |
| | 4,000 | | Aracruz Celulose S.A. ADR | | | 45,120 | |
| | 37,000 | | Votorantim Celulose e Papel S.A. ADR * | | | 293,410 | |
| | | | | | | 338,530 | |
| | | | | | | | |
| | | | PETROLEUM — INTEGRATED (1.1%) | | | | |
| | 14,000 | | BASF AG ADR | | | 550,340 | |
| | 64,000 | | Petroleo Brasileiro S.A. ADR | | | 1,567,360 | |
| | 32,000 | | Tesoro Corp. | | | 421,440 | |
| | 13,700 | | Total S.A. ADR | | | 757,610 | |
| | | | | | | 3,296,750 | |
| | | | | | | | |
| | | | PETROLEUM — PRODUCING (1.7%) | | | | |
| | 8,600 | | CNOOC Ltd. ADR | | | 819,064 | |
| | 22,200 | | Forest Oil Corp. * | | | 366,078 | |
| | 30,000 | | Quicksilver Resources, Inc. * | | | 167,100 | |
| | 66,000 | | Range Resources Corp. | | | 2,269,740 | |
| | 77,500 | | Tenaris S.A. ADR | | | 1,625,950 | |
| | | | | | | 5,247,932 | |
| | | | | | | | |
| | | | PHARMACY SERVICES (1.4%) | | | | |
| | 28,000 | | CVS Caremark Corp. | | | 804,720 | |
| | 40,000 | | Express Scripts, Inc. * | | | 2,199,200 | |
| | 30,000 | | Medco Health Solutions, Inc. * | | | 1,257,300 | |
| | | | | | | 4,261,220 | |
| | | | | | | | |
| | | | POWER (0.5%) | | | | |
| | 58,000 | | Covanta Holding Corp. * | | | 1,273,680 | |
| | 23,000 | | Reliant Energy, Inc. * | | | 132,940 | |
| | | | | | | 1,406,620 | |
| | | | | | | | |
| | | | PRECISION INSTRUMENT (1.4%) | | | | |
| | 15,400 | | Mettler-Toledo International, Inc. * | | | 1,037,960 | |
See Notes to Financial Statements.
| Value Line Premier Growth Fund, Inc. |
| |
| December 31, 2008 |
| Shares | | | | Value | |
| | | | | | | | |
| | 68,680 | | Siliconware Precision Industries Co. ADR | | $ | 306,313 | |
| | 38,000 | | Thermo Fisher Scientific, Inc. * | | | 1,294,660 | |
| | 9,400 | | Triumph Group, Inc. | | | 399,124 | |
| | 19,000 | | Waters Corp. * | | | 696,350 | |
| | 24,000 | | Woodward Governor Co. | | | 552,480 | |
| | | | | | | 4,286,887 | |
| | | | | | | | |
| | | | R.E.I.T. (0.9%) | | | | |
| | 9,200 | | AvalonBay Communities, Inc. | | | 557,336 | |
| | 16,000 | | BRE Properties, Inc. | | | 447,680 | |
| | 9,400 | | Essex Property Trust, Inc. | | | 721,450 | |
| | 12,000 | | LaSalle Hotel Properties | | | 132,600 | |
| | 21,000 | | ProLogis | | | 291,690 | |
| | 4,000 | | SL Green Realty Corp. | | | 103,600 | |
| | 16,000 | | Taubman Centers, Inc. | | | 407,360 | |
| | | | | | | 2,661,716 | |
| | | | | | | | |
| | | | RAILROAD (1.4%) | | | | |
| | 13,500 | | Burlington Northern Santa Fe Corp. | | | 1,022,085 | |
| | 22,900 | | Canadian National Railway Co. | | | 841,804 | |
| | 19,000 | | Canadian Pacific Railway Ltd. | | | 638,780 | |
| | 41,000 | | Kansas City Southern * | | | 781,050 | |
| | 20,000 | | Norfolk Southern Corp. | | | 941,000 | |
| | | | | | | 4,224,719 | |
| | | | | | | | |
| | | | RECREATION (0.3%) | | | | |
| | 27,000 | | Marvel Entertainment, Inc. * | | | 830,250 | |
| | | | | | | | |
| | | | RESTAURANT (1.5%) | | | | |
| | 27,000 | | Darden Restaurants, Inc. | | | 760,860 | |
| | 20,000 | | McDonald’s Corp. | | | 1,243,800 | |
| | 126,562 | | Sonic Corp. * | | | 1,540,259 | |
| | 34,000 | | Yum! Brands, Inc. | | | 1,071,000 | |
| | | | | | | 4,615,919 | |
| | | | | | | | |
| | | | RETAIL — AUTOMOTIVE (0.6%) | | | | |
| | 8,400 | | AutoZone, Inc. * | | | 1,171,548 | |
| | 27,000 | | Copart, Inc. * | | | 734,130 | |
| | | | | | | 1,905,678 | |
| | | | | | | | |
| | | | RETAIL — SPECIAL LINES (1.8%) | | | | |
| | 33,500 | | Aeropostale, Inc. * | | | 539,350 | |
| | 34,500 | | Buckle, Inc. (The) | | | 752,790 | |
| | 45,000 | | Coach, Inc. * | | | 934,650 | |
| | 45,000 | | Dick’s Sporting Goods, Inc. * | | | 634,950 | |
| Shares | | | | | Value | |
| | | | | | | | |
| | 44,000 | | GameStop Corp. Class A * | | $ | 953,040 | |
| | 11,000 | | Gymboree Corp. (The) * | | | 286,990 | |
| | 48,700 | | Rush Enterprises, Inc. Class A * | | | 417,359 | |
| | 34,300 | | TJX Companies, Inc. (The) | | | 705,551 | |
| | 33,700 | | Urban Outfitters, Inc. * | | | 504,826 | |
| | | | | | | 5,729,506 | |
| | | | | | | | |
| | | | RETAIL BUILDING SUPPLY (0.3%) | | | | |
| | 23,500 | | Fastenal Co. | | | 818,975 | |
| | | | | | | | |
| | | | RETAIL STORE (0.4%) | | | | |
| | 18,000 | | Costco Wholesale Corp. | | | 945,000 | |
| | 33,000 | | Nordstrom, Inc. | | | 439,230 | |
| | | | | | | 1,384,230 | |
| | | | | | | | |
| | | | SECURITIES BROKERAGE (0.6%) | | | | |
| | 6,200 | | Goldman Sachs Group, Inc. (The) | | | 523,218 | |
| | 6,300 | | IntercontinentalExchange, Inc. * | | | 519,372 | |
| | 33,000 | | Raymond James Financial, Inc. | | | 565,290 | |
| | 7,000 | | Stifel Financial Corp. * | | | 320,950 | |
| | | | | | | 1,928,830 | |
| | | | | | | | |
| | | | SHOE (0.8%) | | | | |
| | 13,000 | | Deckers Outdoor Corp. * | | | 1,038,310 | |
| | 20,000 | | NIKE, Inc. Class B | | | 1,020,000 | |
| | 16,000 | | Wolverine World Wide, Inc. | | | 336,640 | |
| | | | | | | 2,394,950 | |
| | | | | | | | |
| | | | STEEL — GENERAL (0.1%) | | | | |
| | 16,000 | | Cliffs Natural Resources, Inc. | | | 409,760 | |
| | | | | | | | |
| | | | TELECOMMUNICATION SERVICES (2.3%) | | | | |
| | 35,750 | | American Tower Corp. Class A * | | | 1,048,190 | |
| | 21,000 | | CenturyTel, Inc. | | | 573,930 | |
| | 50,877 | | Crown Castle International Corp. * | | | 894,418 | |
| | 16,000 | | Equinix, Inc. * | | | 851,040 | |
| | 14,500 | | Millicom International Cellular S.A. | | | 651,195 | |
| | 20,000 | | Mobile TeleSystems ADR | | | 533,600 | |
| | 19,500 | | Philippine Long Distance Telephone Co. ADR | | | 915,525 | |
| | 34,000 | | Telmex Internacional S.A.B. de C.V. ADR | | | 386,240 | |
| | 52,300 | | TW Telecom, Inc. * | | | 442,981 | |
See Notes to Financial Statements.
| Value Line Premier Growth Fund, Inc. |
| |
| Schedule of Investments |
| Shares | | | | Value | |
| | | | | | | | |
| | 127,500 | | Vimpel-Communications ADR | | $ | 912,900 | |
| | | | | | | 7,210,019 | |
| | | | | | | | |
| | | | TELECOMMUNICATIONS EQUIPMENT (0.6%) | | | | |
| | 22,700 | | Anixter International, Inc. * | | | 683,724 | |
| | 34,000 | | CommScope, Inc. * | | | 528,360 | |
| | 12,000 | | Comtech Telecommunications Corp. * | | | 549,840 | |
| | | | | | | 1,761,924 | |
| | | | | | | | |
| | | | THRIFT (0.7%) | | | | |
| | 89,768 | | Hudson City Bancorp, Inc. | | | 1,432,697 | |
| | 47,250 | | People’s United Financial, Inc. | | | 842,468 | |
| | | | | | | 2,275,165 | |
| | | | | | | | |
| | | | TIRE & RUBBER (0.1%) | | | | |
| | 12,400 | | Carlisle Companies, Inc. | | | 256,680 | |
| | | | | | | | |
| | | | TOBACCO (0.6%) | | | | |
| | 16,000 | | Altria Group, Inc. | | | 240,960 | |
| | 17,000 | | British American Tobacco PLC ADR | | | 899,980 | |
| | 16,000 | | Philip Morris International, Inc. | | | 696,160 | |
| | | | | | | 1,837,100 | |
| | | | | | | | |
| | | | TOILETRIES & COSMETICS (0.7%) | | | | |
| | 24,000 | | Avon Products, Inc. | | | 576,720 | |
| | 14,000 | | Chattem, Inc. * | | | 1,001,420 | |
| | 34,800 | | Luxottica Group S.p.A. ADR | | | 630,576 | |
| | | | | | | 2,208,716 | |
| | | | | | | | |
| | | | TRUCKING (1.2%) | | | | |
| | 33,000 | | Hunt (J.B.) Transport Services, Inc. | | | 866,910 | |
| | 76,000 | | Landstar System, Inc. | | | 2,920,680 | |
| | | | | | | 3,787,590 | |
| | | | | | | | |
| | | | WATER UTILITY (0.2%) | | | | |
| | 27,600 | | Cia de Saneamento Basico do Estado de Sao Paulo ADR | | | 668,196 | |
| | | | | | | | |
| | | | WIRELESS NETWORKING (0.7%) | | | | |
| | 11,300 | | Itron, Inc. * | | | 720,262 | |
| | 15,900 | | Research In Motion Ltd. * | | | 645,222 | |
| | 43,000 | | SBA Communications Corp. Class A * | | | 701,760 | |
| | | | | | | 2,067,244 | |
| | | | | | | | |
| | | | | | Value | |
| | | | | | | | |
| | | | TOTAL COMMON STOCKS AND TOTAL INVESTMENT SECURITIES (97.3%) (Cost $320,597,166) | | $ | 304,290,452 | |
| CASH AND OTHER ASSETS IN EXCESS OF LIABILITIES (2.7%) | | | 8,300,576 | |
| NET ASSETS (100%) | | $ | 312,591,028 | |
| NET ASSET VALUE OFFERING AND REDEMPTION PRICE, PER OUTSTANDING SHARE ($312,591,028 ÷ 18,727,885 shares outstanding) | | $ | 16.69 | |
ADR American Depositary Receipt.
GDR Global Depositary Receipt.
See Notes to Financial Statements.
Value Line Premier Growth Fund, Inc.
| Statement of Assets and Liabilities at December 31, 2008 |
| Assets: | | | | |
| Investment securities, at value (Cost - $320,597,166) | | $ | 304,290,452 | |
| Cash | | | 8,170,265 | |
| Dividends receivable | | | 499,840 | |
| Receivable for securities sold | | | 401,285 | |
| Receivable for capital shares sold | | | 298,835 | |
| Prepaid expenses | | | 24,061 | |
| Total Assets | | | 313,684,738 | |
| | | | | |
| Liabilities: | | | | |
| Payable for capital shares repurchased | | | 740,898 | |
| Accrued expenses: | | | | |
| Advisory fee | | | 192,655 | |
| Service and distribution plan fees | | | 64,218 | |
| Directors’ fees and expenses | | | 12,449 | |
| Other | | | 83,490 | |
| Total Liabilities | | | 1,093,710 | |
| | | | | |
| Net Assets | | $ | 312,591,028 | |
| | | | | |
| Net assets consist of: | | | | |
| Capital stock, at $1.00 par value (authorized 100,000,000, outstanding 18,727,885 shares) | | $ | 18,727,885 | |
| Additional paid-in capital | | | 314,867,033 | |
| Undistributed net investment income | | | 133,530 | |
| Accumulated net realized loss on investments and foreign currency | | | (4,830,702 | ) |
| Net unrealized depreciation of investments and foreign currency translations | | | (16,306,718 | ) |
| Net Assets | | $ | 312,591,028 | |
| | | | | |
| Net Asset Value, Offering and Redemption Price per Outstanding Share ($312,591,028 ÷ 18,727,885 shares outstanding) | | $ | 16.69 | |
| Statement of Operations for the Year Ended December 31, 2008 |
| Investment Income: | | | | |
| Dividends (net of foreign withholding tax of $223,500) | | $ | 5,303,122 | |
| Interest | | | 319,794 | |
| Total Income | | | 5,622,916 | |
| | | | | |
| Expenses: | | | | |
| Advisory fee | | | 3,553,528 | |
| Service and distribution plan fees | | | 1,184,509 | |
| Auditing and legal fees | | | 231,640 | |
| Transfer agent fees | | | 158,352 | |
| Printing and postage | | | 139,853 | |
| Custodian fees | | | 90,546 | |
| Directors’ fees and expenses | | | 48,514 | |
| Registration and filing fees | | | 48,136 | |
| Insurance | | | 37,364 | |
| Other | | | 11,974 | |
| Total Expenses Before Custody Credits | | | 5,504,416 | |
| Less: Custody Credits | | | (21,329 | ) |
| Net Expenses | | | 5,483,087 | |
| | | | | |
| Net Investment Income | | | 139,829 | |
| | | | | |
| Net Realized and Unrealized Gain/(Loss) on Investments and Foreign Exchange Transactions: | | | | |
| Net Realized Loss | | | (4,820,592 | ) |
| Change in Net Unrealized Appreciation/(Depreciation) | | | (221,191,837 | ) |
| | | | | |
| Net Realized Loss and Change in Net Unrealized Appreciation/(Depreciation) on Investments and Foreign Exchange Transactions | | | (226,012,429 | ) |
| Net Decrease in Net Assets from Operations | | $ | (225,872,600 | ) |
See Notes to Financial Statements.
| Value Line Premier Growth Fund, Inc. |
| |
| Statement of Changes in Net Assets for the Years Ended December 31, 2008 and 2007 |
| | | Year Ended December 31, 2008 | | | Year Ended December 31, 2007 | |
| Operations: | | | | | | |
| Net investment income | | $ | 139,829 | | | $ | 309,217 | |
| Net realized gain/(loss) on investments and foreign currency | | | (4,820,592 | ) | | | 44,301,419 | |
| Change in net unrealized appreciation/(depreciation) | | | (221,191,837 | ) | | | 43,669,561 | |
| Net increase/(decrease) in net assets from operations | | | (225,872,600 | ) | | | 88,280,197 | |
| Distributions to Shareholders: | | | | | | | | |
| Net investment income | | | — | | | | (606,845 | ) |
| Net realized gain from investment transactions | | | (15,319,824 | ) | | | (36,752,741 | ) |
| Total Distributions | | | (15,319,824 | ) | | | (37,359,586 | ) |
| Capital Share Transactions: | | | | | | | | |
| Proceeds from sale of shares | | | 87,156,337 | | | | 109,600,229 | |
| Proceeds from reinvestment of dividends and distributions to shareholders | | | 14,812,865 | | | | 36,036,975 | |
| Cost of shares repurchased | | | (118,670,150 | ) | | | (115,859,406 | ) |
| Net increase/(decrease) in net assets from capital share transactions | | | (16,700,948 | ) | | | 29,777,798 | |
| Total Increase/(Decrease) in Net Assets | | | (257,893,372 | ) | | | 80,698,409 | |
| Net Assets: | | | | | | | | |
| Beginning of year | | | 570,484,400 | | | | 489,785,991 | |
| End of year | | $ | 312,591,028 | | | $ | 570,484,400 | |
| | | | | | | | | |
| Undistributed net investment income, at end of year | | $ | 133,530 | | | $ | 1,381 | |
Value Line Premier Growth Fund, Inc.
| |
| Notes to Financial Statements |
1. Significant Accounting Policies
Value Line Premier Growth Fund, Inc. (the “Fund”) (formerly known as the Value Line Special Situations Fund, Inc.) is registered under the Investment Company Act of 1940, as amended, as a diversified, open-end management investment company whose primary investment objective is long-term growth of capital. The Fund invests primarily in a diversified portfolio of U.S. equity securities with favorable growth potential.
The preparation of financial statements in conformity with generally accepted accounting principles requires management to make estimates and assumptions that affect the reported amounts of assets and liabilities and disclosure of contingent assets and liabilities at the date of the financial statements and the reported amounts of revenues and expenses during the reporting period. Actual results could differ from those estimates. The following is a summary of significant accounting policies consistently followed by the Fund in the preparation of its financial statements.
(A) Security Valuation. Securities listed on a securities exchange are valued at the closing sales prices on the date as of which the net asset value is being determined. Securities traded on the NASDAQ Stock Market are valued at the NASDAQ Official Closing Price. In the absence of closing sales prices for such securities and for securities traded in the over-the-counter market, the security is valued at the midpoint between the latest available and representative asked and bid prices. Short-term instruments with maturities of 60 days or less at the date of purchase are valued at amortized cost which approximates market value. Short-term instruments with maturities greater than 60 days at the date of purchase are valued at the midpoint between the latest available and representative asked and bid prices, and commencing 60 days prior to maturity such securities are valued at amortized cost. Securities for which market quotations are not readily available or that are not readily marketable and all other assets of the Fund are valued at fair value as the Board of Directors may determine in good faith.
In addition, the Fund may use the fair value of a security when the closing market price on the primary exchange where the security is traded no longer accurately reflects the value of a security due to factors affecting one or more relevant securities markets or the specific issuer.
(B) Fair Value Measurements. The Fund adopted Financial Accounting Standards Board Statement of Financial Accounting Standards No. 157, Fair Value Measurements (“FAS 157”), effective January 1, 2008. In accordance with FAS 157, fair value is defined as the price that the Fund would receive upon selling an investment in a timely transaction to an independent buyer in the principal or most advantageous market of the investment. FAS 157 established a three-tier hierarchy to maximize the use of observable market data and minimize the use of unobservable inputs and to establish classification of fair value measurements for disclosure purposes. Inputs refer broadly to the assumptions that market participants would use in pricing the asset or liability, including assumptions about risk, for example, the risk inherent in a particular valuation technique used to measure fair value including such a pricing model and/or the risk inherent in the inputs to the valuation technique. Inputs may be observable or unobservable. Observable inputs are inputs that reflect the assumptions market participants would use in pricing the asset or liability developed based on market data obtained from sources independent of the reporting entity. Unobservable inputs are inputs that reflect the reporting entity’s own assumptions about the assumptions market participants would use in pricing the asset or liability developed based on the best information available in the circumstances. The three-tier hierarchy of inputs is summarized in the three broad Levels listed below.
| | |
| ● | Level 1 – quoted prices in active markets for identical investments |
| Level 2 – other significant observable inputs (including quoted prices for similar investments, interest rates, prepayment speeds, credit risk, etc.) |
Value Line Premier Growth Fund, Inc.
| Level 3 – significant unobservable inputs (including the Fund’s own assumptions in determining the fair value of investments) |
The following is a summary of the inputs used as of December 31, 2008 in valuing the Fund’s investments carried at value:
| | | | | | | |
| Valuation Inputs | | Investments in Securities | | | Other Financial Instruments* | |
| Level 1 – Quoted Prices | | $ | 304,290,452 | | | | — | |
| Level 2 – Other Significant Observable Inputs | | | — | | | | — | |
| Level 3 – Significant Unobservable Inputs | | | — | | | | — | |
| Total | | $ | 304,290,452 | | | | — | |
| * | Other financial instruments include futures, forwards and swap contracts. |
For the year ended December 31, 2008, there were no Level 3 investments.
(C) Repurchase Agreements. In connection with transactions in repurchase agreements, the Fund’s custodian takes possession of the underlying collateral securities, the value of which exceeds the principal amount of the repurchase transaction, including accrued interest. To the extent that any repurchase transaction exceeds one business day, it is the Fund’s policy to mark-to-market the collateral on a daily basis to ensure the adequacy of the collateral. In the event of default of the obligation to repurchase, the Fund has the right to liquidate the collateral and apply the proceeds in satisfaction of the obligation. Under certain circumstances, in the event of default or bankruptcy by the other party to the agreement, realization and/or retention of the collateral or proceeds may be subject to legal proceedings. There were no open repurchase agreements at December 31, 2008.
(D) Federal Income Taxes. It is the Fund’s policy to comply with the requirements of the Internal Revenue Code applicable to regulated investment companies, including the distribution requirements of the Tax Reform Act of 1986, and to distribute all of its taxable income to its shareholders. Therefore, no federal income tax provision is required.
(E) Security Transactions and Distributions. Security transactions are accounted for on the date the securities are purchased or sold. Interest income is accrued as earned. Realized gains and losses on sales of securities are calculated for financial accounting and federal income tax purposes on the identified cost basis. Dividend income and distributions to shareholders are recorded on the ex-dividend date. Distributions are determined in accordance with income tax regulations which may differ from generally accepted accounting principles.
(F) Foreign Currency Translation. The books and records of the Fund are maintained in U.S. dollars. Assets and liabilities which are denominated in foreign currencies are translated to U.S. dollars at the prevailing rates of exchange. The Fund does not isolate changes in the value of investments caused by foreign exchange rate differences from the changes due to other circumstances.
Income and expenses are translated to U.S. dollars based upon the rates of exchange on the respective dates of such transactions.
Net realized foreign exchange gains or losses arise from currency fluctuations realized between the trade and settlement dates on securities transactions, the differences between the U.S. dollar amounts of dividends, interest, and foreign withholding taxes recorded by the Fund, and the U.S. dollar equivalent of the amounts actually received or paid. Net unrealized foreign exchange gains and losses arise from changes in the value of assets and liabilities, other than investments, at the end of the fiscal period, resulting from changes in the exchange rates. The effect of the change in foreign exchange rates on the value of investments is included in realized gain/loss on investments and change in net unrealized appreciation/depreciation on investments.
Value Line Premier Growth Fund, Inc.
| |
| Notes to Financial Statements |
(G) Representations and Indemnifications. In the normal course of business, the Fund enters into contracts that contain a variety of representations and warranties which provide general indemnifications. The Fund’s maximum exposure under these arrangements is unknown, as this would involve future claims that may be made against the Fund that have not yet occurred. However, based on experience, the Fund expects the risk of loss to be remote.
(H) Accounting for Real Estate Investment Trusts. The Fund owns shares of Real Estate Investment Trusts (“REITs”) which report information on the source of their distributions annually. Distributions received from REITs during the year which represent a return of capital are recorded as a reduction of cost and distributions which represent a capital gain dividend are recorded as a realized long-term capital gain on investments.
(I) Foreign Taxes. The Fund may be subject to foreign taxes on income, gains on investments, or currency repatriation, a portion of which may be recoverable. The Fund will accrue such taxes and recoveries as applicable, based upon its current interpretation of tax rules and regulations that exist in the markets in which it invests.
| | |
| 2. | Capital Share Transactions and Distributions to Shareholders |
Transactions in capital stock were as follows:
| | | | | | | |
| | | Year Ended December 31, 2008 | | | Year Ended December 31, 2007 | |
| | | | | | | |
| Shares sold | | | 3,439,750 | | | | 3,730,927 | |
| Shares issued to shareholders in reinvestment of dividends and distributions | | | 938,090 | | | | 1,254,567 | |
| | | | 4,377,840 | | | | 4,985,494 | |
| | | | | | | | | |
| Shares repurchased | | | (5,069,355 | ) | | | (3,974,513 | ) |
| Net increase/(decrease) | | | (691,515 | ) | | | 1,010,981 | |
| Distributions per share from net investment income | | $ | — | | | $ | 0.0334 | |
| Distributions per share from net realized gains | | $ | 0.8513 | | | $ | 2.0207 | |
| 3. | Purchases and Sales of Securities |
Purchases and sales of investment securities, excluding short-term securities, were as follows:
| | | | | |
| | | Year Ended December 31, 2008 | |
| | | | | |
| Purchases: | | | | |
| Investment Securities | | $ | 79,911,524 | |
| Sales: | | | | |
| Investment Securities | | $ | 97,248,830 | |
Value Line Premier Growth Fund, Inc.
| | |
| Notes to Financial Statements | December 31, 2008 |
At December 31, 2008, information on the tax components of capital is as follows:
| | | | | |
| Cost of investments for tax purposes | | $ | 320,595,409 | |
| Gross tax unrealized appreciation | | $ | 57,217,784 | |
| Gross tax unrealized depreciation | | | (73,522,741 | ) |
| Net tax unrealized depreciation on investments | | $ | (16,304,957 | ) |
| Undistributed ordinary income | | $ | 134,953 | |
| Capital loss carryforward, expires December 31, 2016 | | $ | (2,201,097 | ) |
During the year ended December 31, 2008, as permitted under federal income tax regulations, the Fund elected to defer $2,632,785 of post-October net capital and currency losses to the next taxable year.
To the extent that current or future capital gains are offset by capital losses, the Fund does not anticipate distributing any such gains to shareholders.
It is uncertain whether the Fund will be able to realize the benefits of the losses before they expire.
The differences between book and tax basis unrealized appreciation/(depreciation) on investments were primarily attributed to wash sales and investments in REITs.
Permanent book-tax differences relating to the current year were reclassified within the composition of the net asset accounts. The Fund decreased undistributed net investment income by approximately $7,680, decreased accumulated net realized loss by approximately $15,776, and decreased additional paid-in-capital by $8,096. These reclassifications were primarily due to differing treatments of distributions and foreign currency translation for tax purposes.
The tax composition of distributions to shareholders for the years ended December 31, 2008 and December 31, 2007 were as follows:
| | | | | | | |
| | | 2008 | | | 2007 | |
| | | | | | | |
| Ordinary income | | $ | — | | | $ | 311,861 | |
| Long—term capital gain | | | 15,319,824 | | | | 37,047,725 | |
| | | $ | 15,319,824 | | | $ | 37,359,586 | |
| 5. | Investment Advisory Fee, Service and Distribution Fees, and Transactions With Affiliates |
On June 30, 2008, Value Line, Inc. (“Value Line”) reorganized its investment management division into EULAV Asset Management, LLC (“EULAV”), a newly formed, wholly-owned subsidiary. As part of the reorganization, each advisory agreement was transferred from Value Line to EULAV and EULAV replaced Value Line as the Fund’s investment adviser. The portfolio managers, who are now employees of EULAV, have not changed as a result of the reorganization.
An advisory fee of $3,553,528 was paid or payable to Value Line or EULAV (the “Adviser”), the Fund’s investment adviser for the year ended December 31, 2008. This was computed at the rate of 3/4 of 1% of the average daily net assets during the year and paid monthly. The Adviser provides research, investment programs, supervision of the investment portfolio and pays costs of administrative services, office space, equipment and compensation of administrative, bookkeeping and clerical personnel necessary for managing the affairs of the Fund. The Adviser also provides persons, satisfactory to the Fund’s Board of Directors, to act as officers and employees of the Fund and pays their salaries. Direct expenses of the Fund are charged to the fund while common expenses of the Value Line Funds are allocated proportionately based upon the Funds’ respective net assets. The Fund bears all other costs and expenses.
Value Line Premier Growth Fund, Inc.
The Fund has a Service and Distribution Plan (the “Plan”), adopted pursuant to Rule 12b-1 under the Investment Company Act of 1940, for the payment of certain expenses incurred by Value Line Securities, Inc. (the “Distributor”), a wholly-owned subsidiary of Value Line in advertising, marketing and distributing the Fund’s shares and for servicing the Fund’s shareholders at an annual rate of 0.25% of the Fund’s average daily net assets. For the year ended December 31, 2008, fees amounting to $1,184,509 were paid or payable to the Distributor under the Plan.
For the year ended December 31, 2008, the Fund’s expenses were reduced by $21,329 under a custody credit agreement with the custodian.
Certain officers, employees and a director of Value Line and/or affiliated companies are also officers and a director of the Fund.
The Adviser and/or affiliated companies and the Value Line Profit Sharing and Savings Plan owned 80,969 shares of the Fund’s capital stock, representing less than 1% of the outstanding shares at December 31, 2008. In addition, the officers and directors of the Fund as a group owned 1,287 shares of the Fund, representing less than 1% of the outstanding shares.
By letter dated June 15, 2005, the staff of the Northeast Regional Office of the Securities and Exchange Commission (“SEC”) informed Value Line that it was conducting an investigation in the matter of Value Line Securities, Inc. (“VLS”). Value Line has supplied numerous documents to the SEC in response to its requests and various individuals, including employees and former employees of Value Line, directors of the Fund and others, have provided testimony to the SEC. On May 8, 2008, the SEC issued a formal order of private investigation regarding whether VLS’ brokerage charges and related expense reimbursements from the Value Line Funds (“Funds”) during periods prior to 2005 were excessive and whether adequate disclosure was made to the SEC and the boards of directors and shareholders of the Funds. Thereafter, certain officers of Value Line, who are former officers of the Funds, asserted their constitutional privilege not to provide testimony. Value Line has informed the Funds that it believes the SEC has completed the fact finding phase of its investigation and Value Line will seek to settle this matter with the SEC. Although management of Value Line cannot determine the effect that the investigation will have on Value Line’s financial statements, it believes that any settlement is likely to be material to it and has informed the Funds of its belief, in light of settlement discussions to date, that there are no loss contingencies that should be accrued or disclosed in the Fund’s financial statements and that the resolution of this matter is not likely to have a materially adverse effect on the ability of the Adviser or VLS to perform their respective contracts with the Fund.
Value Line Premier Growth Fund, Inc.
Selected data for a share of capital stock outstanding throughout each year:
| | | | | | | | | | | | | | | | |
| | | Years Ended December 31, | |
| | | 2008 | | | 2007 | | | 2006 | | | 2005 | | | 2004 | |
| Net asset value, beginning of year | | $ | 29.38 | | | $ | 26.61 | | | $ | 25.60 | | | $ | 24.23 | | | $ | 20.84 | |
| Income from investment operations: | | | | | | | | | | | | | | | | | | | | |
| Net investment income/(loss) | | | 0.01 | | | | 0.02 | | | | (0.01 | ) | | | (0.01 | ) | | | (0.06 | ) |
| Net gains or (losses) on securities (both realized and unrealized) | | | (11.85 | ) | | | 4.80 | | | | 2.75 | | | | 2.80 | | | | 3.89 | |
| Total from investment operations | | | (11.84 | ) | | | 4.82 | | | | 2.74 | | | | 2.79 | | | | 3.83 | |
| | | | | | | | | | | | | | | | | | | | | |
| Less distributions: | | | | | | | | | | | | | | | | | | | | |
| Dividends from net investment income | | | — | | | | (0.03 | ) | | | — | | | | — | | | | — | |
| Distributions from net realized gains | | | (0.85 | ) | | | (2.02 | ) | | | (1.73 | ) | | | (1.42 | ) | | | (0.44 | ) |
| Total distributions | | | (0.85 | ) | | | (2.05 | ) | | | (1.73 | ) | | | (1.42 | ) | | | (0.44 | ) |
| Net asset value, end of year | | $ | 16.69 | | | $ | 29.38 | | | $ | 26.61 | | | $ | 25.60 | | | $ | 24.23 | |
| | | | | | | | | | | | | | | | | | | | | |
| Total return | | | (40.13 | )% | | | 18.30 | % | | | 10.68 | % | | | 11.49 | % | | | 18.42 | % |
| | | | | | | | | | | | | | | | | | | | | |
| Ratios/Supplemental Data: | | | | | | | | | | | | | | | | | | | | |
| Net assets, end of year (in thousands) | | $ | 312,591 | | | $ | 570,484 | | | $ | 489,786 | | | $ | 441,114 | | | $ | 384,030 | |
Ratio of expenses to average net assets(1) | | | 1.16 | % | | | 1.11 | % | | | 1.18 | % | | | 1.13 | % | | | 1.15 | % |
| Ratio of net investment income/(loss) to average net assets | | | 0.03 | % | | | 0.06 | % | | | (0.06 | )% | | | (0.06 | )% | | | (0.31 | )% |
| Portfolio turnover rate | | | 18 | % | | | 29 | % | | | 38 | % | | | 44 | % | | | 54 | % |
| (1) | Ratio reflects expenses grossed up for custody credit arrangement. The ratio of expenses to average net assets, net of custody credits, would have been unchanged for the years shown. |
See Notes to Financial Statements.
Value Line Premier Growth Fund, Inc.
| |
| Report of Independent Registered Public Accounting Firm |
To the Board of Directors and Shareholders of the Value Line Premier Growth Fund, Inc.
In our opinion, the accompanying statement of assets and liabilities, including the schedule of investments, and the related statements of operations and of changes in net assets and the financial highlights present fairly, in all material respects, the financial position of Value Line Premier Growth Fund, Inc. (the “Fund”) at December 31, 2008, the results of its operations for the year then ended, the changes in its net assets for each of the two years in the period then ended and the financial highlights for each of the five years in the period then ended, in conformity with accounting principles generally accepted in the United States of America. These financial statements and financial highlights (hereafter referred to as “financial statements”) are the responsibility of the Fund’s management; our responsibility is to express an opinion on these financial statements based on our audits. We conducted our audits of these financial statements in accordance with the standards of the Public Company Accounting Oversight Board (United States). Those standards require that we plan and perform the audit to obtain reasonable assurance about whether the financial statements are free of material misstatement. An audit includes examining, on a test basis, evidence supporting the amounts and disclosures in the financial statements, assessing the accounting principles used and significant estimates made by management, and evaluating the overall financial statement presentation. We believe that our audits, which included confirmation of securities at December 31, 2008 by correspondence with the custodian and brokers, provide a reasonable basis for our opinion.
PricewaterhouseCoopers LLP
New York, New York
February 27, 2009
Value Line Premier Growth Fund, Inc.
| |
| Federal Tax Notice (unaudited) |
| During the Calendar year 2008, the Fund distributed $15,319,914 of long-term capital gain to its shareholders. |
The Fund files its complete schedule of portfolio holdings with the Securities and Exchange Commission (“SEC”) for the first and third quarters of each fiscal year on Form N-Q. The Fund’s Forms N-Q are available on the SEC’s website at http://www.sec.gov and may be reviewed and copied at the SEC’s Public Reference Room in Washington, D.C. Information on the operation of the Public Reference Room may be obtained by calling 1-800-SEC-0330.
A description of the policies and procedures that the Fund uses to determine how to vote proxies relating to portfolio securities, and information regarding how the Fund voted these proxies for the 12-month period ended June 30 is available through the Fund’s website at http://www.vlfunds.com and on the SEC’s website at http://www.sec.gov. The description of the policies and procedures is also available without charge, upon request, by calling 1-800-243-2729.
Value Line Premier Growth Fund, Inc.
| Management of the Fund |
| |
| MANAGEMENT INFORMATION |
The business and affairs of the Fund are managed by the Fund’s officers under the direction of the Board of Directors. The following table sets forth information on each Director and officer of the Fund. Each Director serves as a director or trustee of each of the 14 Value Line Funds. Each Director serves until his or her successor is elected and qualified.
| | | | | | | | | |
| Name, Address, and Age | | Position | | Length of Time Served | | Principal Occupation During the Past 5 Years | | Other Directorships Held by Director |
| Interested Director* | | | | | | | | | |
Thomas T. Sarkany Age 62 | | Director | | Since 2008 | | Mutual Fund Marketing Director of Value Line Securities, Inc. (the “Distributor”). | | None |
| Non-Interested Directors | | | | | | | | | |
Joyce E. Heinzerling 500 East 77th Street New York, NY 10162 Age 53 | | Director | | Since 2008 | | General Counsel, Archery Capital LLC (private investment fund) | | Burnham Investors Trust, since 2004 (4 funds). |
Francis C. Oakley 54 Scott Hill Road Williamstown, MA 01267 Age 77 | | Director (Lead Independent Director since 2008) | | Since 2000 | | Professor of History, Williams College, (1961–2002). Professor Emeritus since 2002; President Emeritus since 1994 and President, (1985 – 1994); Chairman (1993–1997) and Interim President (2002–2003) of the American Council of Learned Societies. Trustee since 1997 and Chairman of the Board since 2005, National Humanities Center. | | None |
David H. Porter 5 Birch Run Drive Saratoga Springs, NY 12866 Age 73 | | Director | | Since 1997 | | Visiting Professor of Classics, Williams College, since 1999; President Emeritus, Skidmore College since 1999 and President, 1987–1998. | | None |
Paul Craig Roberts 169 Pompano St. Panama City Beach, FL 32413 Age 69 | | Director | | Since 1983 | | Chairman, Institute for Political Economy. | | None |
| Value Line Premier Growth Fund, Inc. |
| |
| Management of the Fund |
| Name, Address, and Age | | Position | | Length of
Time Served | | Principal Occupation
During the Past 5 Years | | Other
Directorships
Held by Director |
Nancy-Beth Sheerr 1409 Beaumont Drive Gladwyne, PA 19035 Age 59 | | Director | | Since 1996 | | Senior Financial Advisor, Veritable L.P. (investment adviser) since 2004; Senior Financial Advisor, Hawthorn, (2001–2004). | | None |
Daniel S. Vandivort 59 Indian Head Road Riverside, CT 06878 Age 54 | | Director | | Since 2008 | | President, Chief Investment Officer, Weiss, Peck and Greer/Robeco Investment Management 2005–2007; Managing Director, Weiss, Peck and Greer, 1995–2005. | | None |
| Officers | | | | | | | | | |
Mitchell E. Appel Age 38 | | President | | Since 2008 | | President of each of the Value Line Funds since June 2008; Chief Financial Officer of Value Line since April 2008 and from September 2005 to November 2007; Treasurer from June 2005 to September 2005; Chief Financial Officer of XTF Asset Management from November 2007 to April 2008; Chief Financial Officer of Circle Trust Company from January 2003 to May 2005; Chief Financial Officer of the Distributor since April 2008. | | |
Howard A. Brecher Age 55 | | Vice President and Secretary | | Since 2008 | | Vice President and Secretary of each of the Value Line Funds since June 2008; Vice President, Secretary and a Director of Value Line; Vice President of the Distributor and Secretary since June 2008; Vice President, Secretary, Treasurer, General Counsel and a Director of Arnold Bernhard & Co., Inc. | | |
Emily D. Washington Age 30 | | Treasurer | | Since 2008 | | Treasurer and Chief Financial Officer (Principal Financial and Accounting Officer) of each of the Value Line Funds since August 2008; Associate Director of Mutual Fund Accounting at Value Line until August 2008. | | |
| * | Mr. Sarkany is an “interested person” as defined in the Investment Company Act of 1940 by virtue of his position with the Distributor. |
Unless otherwise indicated, the address for each of the above officers is c/o Value Line Funds, 220 East 42nd Street, New York, NY 10017.
| The Fund’s Statement of Additional Information (SAI) includes additional information about the Fund’s Directors and is available, without charge, upon request by calling 1-800-243-2729 or on the Fund’s website, www.vlfunds.com. |
| Value Line Premier Growth Fund, Inc. |
| |
[This page is intentionally left blank.]
| Value Line Premier Growth Fund, Inc. |
| |
| The Value Line Family of Funds |
1950 — The Value Line Fund seeks long-term growth of capital. Current income is a secondary objective.
1952 — Value Line Income and Growth Fund’s primary investment objective is income, as high and dependable as is consistent with reasonable risk. Capital growth to increase total return is a secondary objective.
1956 — Value Line Premier Growth Fund seeks long-term growth of capital. No consideration is given to current income in the choice of investments.
1972 — Value Line Larger Companies Fund’s sole investment objective is to realize capital growth.
1979 — The Value Line Cash Fund, a money market fund, seeks to secure as high a level of current income as is consistent with maintaining liquidity and preserving capital. An investment in the Fund is not insured or guaranteed by the Federal Deposit Insurance Corporation or any other government agency. Although the Fund seeks to preserve the value of your investment at $1.00 per share, it is possible to lose money by investing in the Fund.
1981 — Value Line U.S. Government Securities Fund seeks maximum income without undue risk to capital. Under normal conditions, at least 80% of the value of its net assets will be invested in securities issued or guaranteed by the U.S. Government and its agencies and instrumentalities.
1983 — Value Line Centurion Fund* seeks long-term growth of capital.
1984 — The Value Line Tax Exempt Fund seeks to provide investors with the maximum income exempt from federal income taxes while avoiding undue risk to principal. The fund may be subject to state and local taxes and the Alternative Minimum Tax (if applicable).
1985 — Value Line Convertible Fund seeks high current income together with capital appreciation primarily from convertible securities ranked 1 or 2 for year-ahead performance by the Value Line Convertible Ranking System.
1986 — Value Line Aggressive Income Trust seeks to maximize current income.
1987 — Value Line New York Tax Exempt Trust seeks to provide New York taxpayers with the maximum income exempt from New York State, New York City and federal income taxes while avoiding undue risk to principal. The Trust may be subject to state and local taxes and the Alternative Minimum Tax (if applicable).
1987 — Value Line Strategic Asset Management Trust* seeks to achieve a high total investment return consistent with reasonable risk.
1993 — Value Line Emerging Opportunities Fund invests primarily in common stocks or securities convertible into common stock, with its primary objective being long-term growth of capital.
1993 — Value Line Asset Allocation Fund seeks high total investment return, consistent with reasonable risk. The Fund invests in stocks, bonds and money market instruments utilizing quantitative modeling to determine the asset mix.
| * | Only available through the purchase of Guardian Investor, a tax deferred variable annuity, or ValuePlus, a variable life insurance policy. |
For more complete information about any of the Value Line Funds, including charges and expenses, send for a prospectus from Value Line Securities, Inc., 220 East 42nd Street, New York, New York 10017-5891 or call 1-800-243-2729, 9am–5pm CST, Monday – Friday, or visit us at www.vlfunds.com. Read the prospectus carefully before you invest or send money.
(a) The Registrant has adopted a Code of Ethics that applies to its principal executive officer, and principal financial officer and principal accounting officer.
(f) Pursuant to item 12(a), the Registrant is attaching as an exhibit a copy of its Code of Ethics that applies to its principal executive officer, and principal financial officer and principal accounting officer.
| Item 3. | Audit Committee Financial Expert. |
(a)(1)The Registrant has an Audit Committee Financial Expert serving on its Audit Committee.
(2) The Registrant’s Board has designated Francis C. Oakley, a member of the Registrant’s Audit Committee, as the Registrant’s Audit Committee Financial Expert. Mr. Oakley is an independent director who is a Professor of History with Williams College. He spent most of his professional career at Williams College, where he served as a faculty member, President Emeritus and President (1961-2003). He also served as Chairman (1993-1997) and President (2002-2003) of The American Council of Learned Societies. He has also previously served as Trustee and Chairman of the Board of Trustees of National Humanities Center.
A person who is designated as an “audit committee financial expert” shall not make such person an "expert" for any purpose, including without limitation under Section 11 of the Securities Act of 1933 or under applicable fiduciary laws, as a result of being designated or identified as an audit committee financial expert. The designation or identification of a person as an audit committee financial expert does not impose on such person any duties, obligations, or liabilities that are greater than the duties, obligations, and liabilities imposed on such person as a member of the audit committee and Board of Trustees in the absence of such designation or identification.
| Item 4. | Principal Accountant Fees and Services |
| | | | |
| | (a) | Audit Fees 2008 - $50,271 |
| | | | |
| | (b) | Audit-Related fees – None. |
| | | | |
| | (c) | Tax Preparation Fees 2008 -$12,311 |
| | | | |
| | (d) | All Other Fees –None |
| | | | |
| | (e) | (1) | Audit Committee Pre-Approval Policy. All services to be performed for the Registrant by PricewaterhouseCoopers LLP must be pre-approved by the audit committee. All services performed were pre-approved by the committee. |
| | | | |
| | (e) | (2) | Not applicable. |
| | | | |
| | (f) | Not applicable. |
| | | | |
| | (g) | Aggregate Non-Audit Fees 2008 -$12,311 |
| | | | |
| | (h) | Not applicable. |
| Item 11. | Controls and Procedures. |
| | | |
| | (a) | The registrant’s principal executive officer and principal financial officer have concluded that the registrant’s disclosure controls and procedures (as defined in rule 30a-2(c) under the Act (17 CFR 270.30a-2(c) ) based on their evaluation of these controls and procedures as of a date within 90 days of the filing date of this report, are appropriately designed to ensure that material information relating to the registrant is made known to such officers and are operating effectively. |
| | | |
| | (b) | The registrant’s principal executive officer and principal financial officer have determined that there have been no significant changes in the registrant’s internal controls or in other factors that could significantly affect these controls subsequent to the date of their evaluation, including corrective actions with regard to significant deficiencies and material weaknesses. |
| Item 12. | Exhibits. |
| | | | |
| | (a) | Code of Business Conduct and Ethics for Principal Executive and Senior Financial Officers attached hereto as Exhibit 99.2R CODE ETH. |
| | | | |
| | (b) | (1) | Certification pursuant to Rule 30a-2(a) under the Investment Company Act of 1940 (17 CFR 270.30a-2) attached hereto as Exhibit 99.CERT. |
| | | | |
| | | (2) | Certification pursuant to Section 906 of the Sarbanes-Oxley Act of 2002 attached hereto as Exhibit 99.906.CERT. |
SIGNATURES
Pursuant to the requirements of the Securities Exchange Act of 1934 and the Investment Company Act of 1940, the registrant has duly caused this report to be signed on its behalf by the undersigned, thereunto duly authorized.
| By | /s/ Mitchell E. Appel | |
| | Mitchell E. Appel, President | |
| | | |
| | | |
| Date: | March 10, 2009 | |
Pursuant to the requirements of the Securities Exchange Act of 1934 and the Investment Company Act of 1940, this report has been signed below by the following persons on behalf of the registrant and in the capacities and on the dates indicated.
| By: | /s/ Mitchell E. Appel | |
| | Mitchell E. Appel, President, Principal Executive Officer |
| | | |
| | | |
| By: | /s/ Emily D. Washington | |
| | Emily D. Washington, Treasurer, Principal Financial Officer |
| | | |
| | | |
| Date: | March 10, 2009 | |