UNITED STATES
SECURITIES AND EXCHANGE COMMISSION
Washington, D.C. 20549
FORM N-CSR
CERTIFIED SHAREHOLDER REPORT OF REGISTERED
MANAGEMENT INVESTMENT COMPANIES
Investment Company Act file Number _811-02278_
Value Line Premier Growth Fund, Inc.
(Exact name of registrant as specified in charter)
7 Times Square, New York, N.Y. 10036
(Address of principal executive offices) (Zip Code)
Registrant’s telephone number, including area code: 212-907-1900
Date of fiscal year end: December 31
Date of reporting period: December 31, 2011
Item I. Reports to Stockholders.
A copy of the Annual Report to Stockholders for the period ended 12/31/11 is included with this Form.
| | | | | | | |
| | | | | | | |
| | INVESTMENT ADVISER | | EULAV Asset Management 7 Times Square, 21st Floor New York, NY 10036-6524 | | A N N U A L R E P O R T | |
| | | | | D e c e m b e r 3 1 , 2 0 1 1 | |
| | | | | | |
| | DISTRIBUTOR | | EULAV Securities LLC | | | |
| | | | 7 Times Square, 21st Floor | | | |
| | | | New York, NY 10036-6524 | | | |
| | CUSTODIAN BANK | | State Street Bank and Trust Co. | | | |
| | | | 225 Franklin Street | | | |
| | | | Boston, MA 02110 | | | |
| | SHAREHOLDER | | State Street Bank and Trust Co. | | | |
| | SERVICING AGENT | | c/o BFDS | | | |
| | | | P.O. Box 219729 | | | |
| | | | Kansas City, MO 64121-9729 | | | |
| | INDEPENDENT | | PricewaterhouseCoopers LLP | | Value Line Premier Growth Fund, Inc. | |
| | REGISTERED PUBLIC | | 300 Madison Avenue | | |
| | ACCOUNTING FIRM | | New York, NY 10017 | | |
| | LEGAL COUNSEL | | Peter D. Lowenstein, Esq. | | |
| | | | 496 Valley Road | | |
| | | | Cos Cob, CT 06807-0272 | | |
| | DIRECTORS | | Mitchell E. Appel | | |
| | | | Joyce E. Heinzerling | | |
| | | | Francis C. Oakley | | |
| | | | David H. Porter | | | |
| | | | Paul Craig Roberts | | | |
| | | | Nancy-Beth Sheerr | | | |
| | | | Daniel S. Vandivort | | | |
| | OFFICERS | | Mitchell E. Appel | | | |
| | | | President | | | |
| | | | Michael J. Wagner | | | |
| | | | Chief Compliance Officer | | | |
| | | | Emily D. Washington | | | |
| | | | Treasurer and Secretary | | | |
| | | | | | | |
| | | | | |  | |
| | | | | | | |
| | | | | | | |
| | This audited report is issued for information to shareholders. It is not authorized for distribution to prospective investors unless preceded or accompanied by a currently effective prospectus of the Fund (obtainable from the Distributor). | | | |
| | | | | |
| | #00084256 | | | |
| Value Line Premier Growth Fund, Inc. | |
| | |
| | To Our Value Line Premier |
| | |
| To Our Shareholders (unaudited): | |
Enclosed is your annual report for the year ended December 31, 2011. We encourage you to carefully review this report, which includes economic observations, your Fund’s performance data and highlights, schedule of investments, and financial statements.
We’re pleased to report that Value Line Premier Growth Fund, Inc. (the “Fund”) earned a total return of 4.59% in 2011, versus a total return of 2.11% for the benchmark Standard & Poor’s 500 Stock Index.(1) Contributing to the superior performance was good stock selection in the Consumer Discretionary and Industrials sectors. In addition, your Fund avoided the losing stocks in the banking industry. The Fund has outpaced the S&P 500 benchmark in eight of the past ten years. For the three years ending December 31, 2011, the Fund earned an average annual total return of 18.96%, versus 14.11% for the S&P 500; for five years, 3.58% versus a loss of (0.25)% for the S&P 500; and for ten years, 6.72% versus 2.72% for the S&P 500. For the 15-year period, which has been entirely under the same portfolio manager, the Fund’s average annual total return was 9.85%, versus 5.33% for the S&P 500.
Morningstar, the independent mutual fund advisory service, awards your Fund an Overall rating of Four Stars, based upon a Return rating of Above Average and a Risk rating of Below Average versus its category peers, as of December 31, 2011. The Fund carries a ten-year rating of Five Stars (out of 415 funds), a five-year rating of Four Stars (596 funds), and a three-year rating of Three Stars (659 funds). Lipper another independent mutual fund advisory service, awards its top Lipper Leader rating of 5 for Total Return, Consistent Return and Preservation of capital, versus its category peers as of December 31, 2011*. According to Lipper, your Fund’s total returns beat 94% of its peers in the multi-cap growth category for the ten-year period (out of 234 funds) ending December 31, 2011; 76% of its peers for the five-year period (338 funds); 70% of its peers for the three-year period (412 funds); and 95% of its peers for the one-year period (489 funds).
In these difficult times, we’re particularly gratified by the Morningstar rating of below-average risk and the Lipper top-tier rank for capital preservation. We take every opportunity to control the risk and volatility of the portfolio without surrendering the potential for strong total returns. Investments are widely diversified, with representatives from nearly every industry. The diversification is also reflected in the fact that only 12.8% of the Fund’s assets are invested in the portfolio’s ten largest holdings, as of the end of 2011. We invest across the entire range of company size, too. Current holdings are split about evenly among large-cap, mid-cap and small-cap stocks.
Also contributing to risk control is our very disciplined investment strategy. First and foremost, this strategy means that the Fund invests in high-quality companies with proven long-term records of success, demonstrated by superior earnings performance and superior stock performance relative to their competition. This is a portfolio of growth stocks. Second, we closely monitor quarterly earnings reports and relative stock price momentum of the Fund’s holdings for any signs of sub-par performance. With about 250 stocks in the portfolio, we do not become attached to any single holding and do not hesitate to sell laggards, replacing them with stocks showing superior momentum. Yet annual portfolio turnover has averaged a moderate 18% over the past five years, limiting trading expenses.
We believe our time-tested investment discipline will continue to serve the Fund well. Thank you for your confidence in us.
| | | |
| | Sincerely, | |
| | | |
| | /s/ Mitchell Appel | |
| | Mitchell Appel, President | |
| | | |
| | /s/ Stephen E. Grant | |
| | Stephen E. Grant, Portfolio Manager | |
(1) | The Standard & Poor’s 500 Index consists of 500 stocks which are traded on the New York Stock Exchange, American Stock Exchange and the NASDAQ National Market System and is representative of the broad stock market. This is an unmanaged index and does not reflect charges, expenses or taxes. It is not possible to directly invest in this index. |
| * | Total Return: 4 for 3yr out of 427 funds, 4 for 5yr 347 funds, 5 for 10yr 236 funds. |
| | Consistent return: 4 for 3yr out of 424 funds, 4 for 5yr 344 funds, 5 for 10yr 233 funds. |
| | Preservation: 5 for 3yr out of 10,210 funds, 5 for 5yr 8,217 funds, 5 for 10yr 4,769 funds. |
Value Line Premier Growth Fund, Inc.
The Morningstar RatingTM for funds methodology rates funds based on an enhanced Morningstar Risk-Adjusted Return measure, which also accounts for the effects of all sales charges, loads, or redemption fees. Funds are ranked by their Morningstar Risk-Adjusted Return scores and stars are assigned using the following scale: 1 star 10%; 2 stars 22.5%; 3 stars 35%; 4 stars 22.5%; 5 stars 10%. Funds are rated for up to three periods–the trailing three-, five-, and 10-years.
For a fund that does not change categories during the evaluation period, the overall rating is calculated using the following weights:
| | | |
| Age of fund | | Overall rating |
| At least three years, but less than five | | 100% three-year rating |
| At least five years, but less than 10 | | 60% five-year rating / 40% three-year rating |
| At least 10 years | | 50% 10-year rating / 30% five-year rating / 20% three-year rating |
Lipper Leader ratings for Total Return reflect funds’ historical total return performance relative to peers. Ratings for Total Return are computed for all Lipper classifications with five or more distinct portfolios and span both equity and fixed-income funds (e.g., large-cap core, general U.S. Treasury, etc.). Leader ratings for Consistent Return reflect funds’ historic returns, adjusted for volatility, relative to peers. Ratings for Consistent Return are computed for all Lipper classifications with five or more distinct portfolios and span both equity and fixed-income funds (e.g., large-cap core, general U.S. Treasury, etc.). Leader ratings for Preservation reflect funds’ historical loss avoidance relative to other funds within the same asset class. Scores for Preservation are computed from three broad asset classes – equity funds, mixed-equity funds, and fixed-income (bond) funds. The ratings are subject to change every month and are calculated for the following time periods: 3-year, 5-year, 10-year, and overall. The overall calculation is based on an equal-weighted average of percentile ranks for metrics over 3-year, 5-year, and 10-year periods (if applicable). The highest 20% of funds in each classification are named Lipper Leaders for Total Return. The next 20% receive a rating of 4; the middle 20% are rated 3; the next 20% are rated 2, and the lowest 20% are rated 1.
Past performance does not guarantee future results. Investment return and principal value of an investment can fluctuate so that an investor’s shares, when redeemed, may be worth more or less than their original cost; and that current performance may be lower or higher than the performance data quoted. Investors should carefully consider the investment objectives, risks, charges and expense of a fund. This and other important information about a fund is contained in the fund’s prospectus. A copy of our funds’ prospectus can be obtained by going to our website at www.vlfunds.com or calling 800.243-2729.
Value Line Premier Growth Fund, Inc.
| |
| To Our Value Line Premier Growth Fund Shareholders |
| |
| Economic Highlights (unaudited) |
The first half of 2011 saw the broad U.S. stock market rising on the heels of strengthening corporate profits. The S&P 500 returned 6% for the first six months of the year despite significant global economic concerns. Several members of the European Union continued to face a serious debt crisis including Greece, Portugal, Ireland, and Spain. Further, the nuclear disaster in Japan and the geopolitical upheaval in commodity markets added to investor concerns. At home, disappointing job growth in the United States kept the national unemployment rate firmly above 9% for the second quarter.
By mid-year there was mounting evidence that the U.S. recovery had slowed to a crawl. Consumer spending, which accounts for roughly 70% of economic activity, declined in June for the first time in 2 years. First quarter GDP was up by only 0.4%, and second quarter GDP growth, while stronger, was still disappointing at 1.3%. Employment growth in July lagged June numbers, and it was reported that the level of new factory orders decreased. By August, only 58% of the population was working, the lowest level in nearly 3 decades. Housing prices remained almost uniformly weak. There were additional pressures on the market coming from Europe stemming from the sovereign debt crisis and increasing fears of a double dip recession.
Much of the summer was consumed by the drama of the U.S. debt ceiling negotiations, resulting in an 11th hour deal that appeared to satisfy few constituents. It surely did not satisfy Standard & Poors who felt that the $2.1 trillion deficit reduction over 10 years was insufficient to solve the country’s debt problem. The rating agency proceeded to downgrade U.S. Treasury debt from AAA to AA+. Within a few days the rating agency imposed the same rating cut on the long-term debt of several U.S. Agencies including Fannie Mae and Freddie Mac. The other major rating agencies, Moody’s and Fitch, maintained AAA ratings for U.S. Treasury debt as well as for the U.S. Agencies. Investor confidence plunged on the heels of the debt ceiling debacle and the U.S. Treasury debt downgrade. Returns for the S&P 500 turned negative in August giving up its returns for the year.
The bond market rallied as stocks took a dive. Yields fell and prices rose across fixed income markets as investors looked for safer havens. Despite the rating downgrade, investor demand for Treasuries soared, and by early September, 10-year Treasury note yields had fallen to an all-time low of 1.90%. This downward pressure on Treasury yields came largely from an employment report showing no new jobs being added in August. While modestly better job creation was reported in September, it was not enough to move the unemployment level below 9.1%.
The market posted a strong rally in final quarter of 2011. Investors increased their purchase of risk assets as news regarding progress in the European debt crisis began to emerge and U.S. economic data came in slightly better than expected. The S&P 500 Index closed out the year with a gain of 2.1%.
Value Line Premier Growth Fund, Inc.
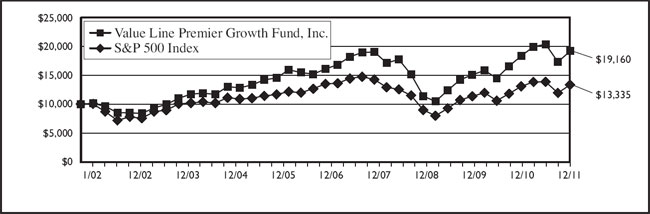
The following graph compares the performance of the Value Line Premier Growth Fund, Inc. to that of the S&P 500 Index (the “Index”). The Value Line Premier Growth Fund, Inc. is a professionally managed mutual fund, while the Index is not available for investment and is unmanaged. The returns for the Index do not reflect charges, expenses or taxes but do include the reinvestment of dividends. The comparison is shown for illustrative purposes only.
Comparison of a Change in Value of a $10,000 Investment in the Value Line Premier Growth Fund,
Inc. and the S&P 500 Index*
| | | | | | | |
| Performance Data: ** | | | | | | |
| | | | | | | |
| | | Average Annual Total Return | | | Growth of an Assumed Investment of $10,000 | |
| | | | | | | |
| 1 year ended 12/31/11 | | | 4.59 | % | | $ | 10,459 | |
| 5 years ended 12/31/11 | | | 3.58 | % | | $ | 11,922 | |
| 10 years ended 12/31/11 | | | 6.72 | % | | $ | 19,160 | |
* | The Standard and Poor’s 500 Index is an unmanaged index that is representative of the larger-capitalization stocks traded in the United States. |
| | |
| ** | The performance data quoted represent past performance and are no guarantee of future performance. The average annual total returns and growth of an assumed investment of $10,000 include dividends reinvested and capital gains distributions accepted in shares. The investment return and principal value of an investment will fluctuate so that an investment, when redeemed, may be worth more or less than its original cost. The performance data and graph do not reflect the deduction of taxes that a shareholder would pay on fund distributions or the redemption of fund shares. |
| Value Line Premier Growth Fund, Inc. |
| |
FUND EXPENSES (unaudited):
Example
As a shareholder of the Fund, you incur ongoing costs, including management fees, distribution and service (12b-1) fees, and other Fund expenses. This Example is intended to help you understand your ongoing costs (in dollars) of investing in the Fund and to compare these costs with the ongoing costs of investing in other mutual funds.
The Example is based on an investment of $1,000 invested at the beginning of the period and held for the entire period (July 1, 2011 through December 31, 2011).
Actual Expenses
The first line of the table below provides information about actual account values and actual expenses. You may use the information in this line, together with the amount you invested, to estimate the expenses that you paid over the period. Simply divide your account value by $1,000 (for example an $8,600 account value divided by $1,000 = 8.6), then multiply the result by the number in the first line under the heading “Expenses Paid During Period” to estimate the expenses you paid on your account during this period.
Hypothetical Example for Comparison Purposes
The second line of the table below provides information about hypothetical account values and hypothetical expenses based on the Fund’s actual expense ratio and an assumed rate of return of 5% per year before expenses, which is not the Fund’s actual return. The hypothetical account values and expenses may not be used to estimate the actual ending account balance or expenses you paid for the period. You may use this information to compare the ongoing costs of investing in the Fund and other funds. To do so, compare this 5% hypothetical example with the 5% hypothetical examples that appear in the shareholder reports of other funds.
Please note that the expenses shown in the table are meant to highlight your ongoing costs only and do not reflect any transactional costs, such as sales charges (loads), redemption fees, or exchange fees. Therefore, the table is useful in comparing ongoing costs only and will not help you determine the relative total costs of owning different funds. In addition, if transactional costs were included, your costs would have been higher.
| | | | | | | | | | |
| | | Beginning account value 7/1/11 | | | Ending account value 12/31/11 | | | Expenses paid during period 7/1/11 thru 12/31/11* | |
| | | | | | | | | | |
| Actual | | $ | 1,000.00 | | | $ | 941.60 | | | $ | 6.22 | |
| Hypothetical (5% return before expenses) | | $ | 1,000.00 | | | $ | 1,018.80 | | | $ | 6.46 | |
* | Expenses are equal to the Fund’s annualized expense ratio of 1.27% multiplied by the average account value over the period, multiplied by 184/365 to reflect the one-half year period. This expense ratio may differ from the expense ratio shown in the Financial Highlights. |
Value Line Premier Growth Fund, Inc.
| Portfolio Highlights at December 31, 2011 (unaudited) |
Ten Largest Holdings
| | | | | | | | | | |
| Issue | | Shares | | | Value | | | Percentage of Net Assets | |
| Alexion Pharmaceuticals, Inc. | | | 80,000 | | | $ | 5,720,000 | | | | 1.9 | % |
| Companhia de Bebidas das Americas ADR | | | 130,000 | | | $ | 4,691,700 | | | | 1.6 | % |
| FMC Technologies, Inc. | | | 88,000 | | | $ | 4,596,240 | | | | 1.5 | % |
| MasterCard, Inc. Class A | | | 11,800 | | | $ | 4,399,276 | | | | 1.5 | % |
| ANSYS, Inc. | | | 60,000 | | | $ | 3,436,800 | | | | 1.2 | % |
| Intuitive Surgical, Inc. | | | 7,000 | | | $ | 3,241,070 | | | | 1.1 | % |
| Praxair, Inc. | | | 30,000 | | | $ | 3,207,000 | | | | 1.1 | % |
| Roper Industries, Inc. | | | 34,000 | | | $ | 2,953,580 | | | | 1.0 | % |
| Stericycle, Inc. | | | 36,600 | | | $ | 2,851,872 | | | | 1.0 | % |
| Salesforce.com, Inc. | | | 27,000 | | | $ | 2,739,420 | | | | 0.9 | % |
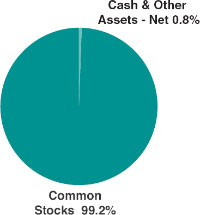
Asset Allocation – Percentage of Total Net Assets
| |
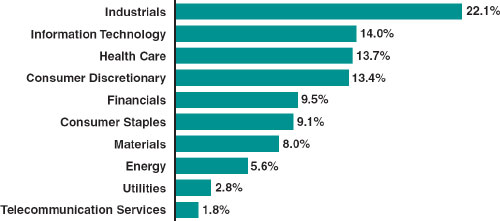
| Sector Weightings – Percentage of Total Investment Securities |
Value Line Premier Growth Fund, Inc.
| | |
| Schedule of Investments | December 31, 2011 |
| Shares | | | | Value | |
| | | | | | | | |
| COMMON STOCKS (99.2%) | | | | |
| | | | | | | | |
| | | | CONSUMER DISCRETIONARY (13.3%) | | | | |
| | 8,400 | | AutoZone, Inc. * | | $ | 2,729,748 | |
| | 24,000 | | Bed Bath & Beyond, Inc. * | | | 1,391,280 | |
| | 28,000 | | BorgWarner, Inc. * | | | 1,784,720 | |
| | 29,000 | | Brinker International, Inc. | | | 776,040 | |
| | 10,500 | | Buckle, Inc. (The) | | | 429,135 | |
| | 5,000 | | Chipotle Mexican Grill, Inc.* | | | 1,688,700 | |
| | 14,000 | | Coach, Inc. | | | 854,560 | |
| | 39,200 | | Ctrip.com International Ltd. | | | | |
| | | | ADR * | | | 917,280 | |
| | 17,000 | | Darden Restaurants, Inc. | | | 774,860 | |
| | 16,000 | | Deckers Outdoor Corp. * | | | 1,209,120 | |
| | 17,000 | | DIRECTV Class A * | | | 726,920 | |
| | 34,000 | | Domino’s Pizza, Inc. * | | | 1,154,300 | |
| | 10,000 | | Fossil, Inc. * | | | 793,600 | |
| | 16,000 | | Genuine Parts Co. | | | 979,200 | |
| | 15,200 | | Gildan Activewear, Inc. | | | 285,608 | |
| | 27,000 | | HSN, Inc. | | | 979,020 | |
| | 27,000 | | Johnson Controls, Inc. | | | 844,020 | |
| | 17,000 | | Life Time Fitness, Inc. * | | | 794,750 | |
| | 56,000 | | LKQ Corp. * | | | 1,684,480 | |
| | 12,000 | | McDonald’s Corp. | | | 1,203,960 | |
| | 7,000 | | Monro Muffler Brake, Inc. | | | 271,530 | |
| | 16,000 | | New Oriental Education & | | | | |
| | | | Technology Group, Inc. | | | | |
| | | | ADR * | | | 384,800 | |
| | 8,000 | | NIKE, Inc. Class B | | | 770,960 | |
| | 18,000 | | O’Reilly Automotive, Inc. * | | | 1,439,100 | |
| | 13,000 | | Penn National Gaming, Inc. * | | | 494,910 | |
| | 5,000 | | Priceline.com, Inc. * | | | 2,338,550 | |
| | 20,000 | | PVH Corp. | | | 1,409,800 | |
| | 27,000 | | Signet Jewelers Ltd. | | | 1,186,920 | |
| | 25,000 | | Starbucks Corp. | | | 1,150,250 | |
| | 34,300 | | TJX Companies, Inc. (The) | | | 2,214,065 | |
| | 6,000 | | Ulta Salon, Cosmetics & | | | | |
| | | | Fragrance, Inc. * | | | 389,520 | |
| | 10,000 | | Under Armour, Inc. Class A * | | | 717,900 | |
| | 21,000 | | Vitamin Shoppe, Inc. * | | | 837,480 | |
| | 26,500 | | Warnaco Group, Inc. (The) * | | | 1,326,060 | |
| | 6,000 | | Wynn Resorts Ltd. | | | 662,940 | |
| | 34,000 | | Yum! Brands, Inc. | | | 2,006,340 | |
| | | | | | | 39,602,426 | |
| | | | | | | | |
| | | | CONSUMER STAPLES (9.0%) | | | | |
| | 68,000 | | BRF - Brasil Foods S.A. | | | | |
| | | | ADR | | | 1,329,400 | |
| Shares | | | | Value | |
| | 17,000 | | British American Tobacco | | | | |
| | | | PLC ADR | | $ | 1,612,960 | |
| | 7,400 | | Brown-Forman | | | | |
| | | | Corp. Class B | | | 595,774 | |
| | 11,000 | | Bunge Ltd. | | | 629,200 | |
| | 48,400 | | Church & Dwight Co., Inc. | | | 2,214,784 | |
| | 16,800 | | Coca-Cola Femsa, S.A.B. | | | | |
| | | | de C.V. ADR | | | 1,599,528 | |
| | 130,000 | | Companhia de Bebidas das | | | | |
| | | | Americas ADR | | | 4,691,700 | |
| | 14,000 | | Costco Wholesale Corp. | | | 1,166,480 | |
| | 14,000 | | Energizer Holdings, Inc. * | | | 1,084,720 | |
| | 49,875 | | Flowers Foods, Inc. | | | 946,628 | |
| | 20,000 | | Fomento Economico Mexicano | | | | |
| | | | S.A.B. de C.V. ADR | | | 1,394,200 | |
| | 26,000 | | General Mills, Inc. | | | 1,050,660 | |
| | 43,000 | | Green Mountain Coffee | | | | |
| | | | Roasters, Inc. * | | | 1,928,550 | |
| | 15,000 | | Herbalife Ltd. | | | 775,050 | |
| | 40,000 | | Hormel Foods Corp. | | | 1,171,600 | |
| | 14,000 | | Mead Johnson Nutrition Co. | | | 962,220 | |
| | 10,000 | | PepsiCo, Inc. | | | 663,500 | |
| | 20,000 | | Reynolds American, Inc. | | | 828,400 | |
| | 32,000 | | Ruddick Corp. | | | 1,364,480 | |
| | 4,000 | | TreeHouse Foods, Inc. * | | | 261,520 | |
| | 9,000 | | Whole Foods Market, Inc. | | | 626,220 | |
| | | | | | | 26,897,574 | |
| | | | | | | | |
| | | | ENERGY (5.6%) | | | | |
| | 7,000 | | Cabot Oil & Gas Corp. | | | 531,300 | |
| | 8,600 | | CNOOC Ltd. ADR | | | 1,502,248 | |
| | 19,000 | | Concho Resources, Inc. * | | | 1,781,250 | |
| | 21,000 | | Core Laboratories N.V. | | | 2,392,950 | |
| | 12,000 | | Devon Energy Corp. | | | 744,000 | |
| | 20,000 | | EQT Corp. | | | 1,095,800 | |
| | 88,000 | | FMC Technologies, Inc. * | | | 4,596,240 | |
| | 2,000 | | Oil States International, Inc. * | | | 152,740 | |
| | 3,000 | | Rosetta Resources, Inc. * | | | 130,500 | |
| | 22,000 | | Tenaris S.A. ADR | | | 817,960 | |
| | 26,000 | | TransCanada Corp. | | | 1,135,420 | |
| | 18,000 | | Ultrapar Participacoes | | | | |
| | | | S.A. ADR | | | 309,600 | |
| | 33,000 | | World Fuel Services Corp. | | | 1,385,340 | |
| | | | | | | 16,575,348 | |
| | | | | | | | |
| | | | FINANCIALS (9.4%) | | | | |
| | 19,000 | | Affiliated Managers | | | | |
| | | | Group, Inc. * | | | 1,823,050 | |
| | 20,600 | | AFLAC, Inc. | | | 891,156 | |
See Notes to Financial Statements.
Value Line Premier Growth Fund, Inc.
| Shares | | | | Value | |
| | 45,000 | | Arch Capital Group Ltd. * | | $ | 1,675,350 | |
| | 9,490 | | AvalonBay | | | | |
| | | | Communities, Inc. | | | 1,239,394 | |
| | 35,000 | | Bancolombia S.A. ADR | | | 2,084,600 | |
| | 13,300 | | Bank of Montreal | | | 728,973 | |
| | 22,100 | | Bank of Nova Scotia | | | 1,100,801 | |
| | 10,700 | | BlackRock, Inc. | | | 1,907,168 | |
| | 16,000 | | BRE Properties, Inc. | | | 807,680 | |
| | 8,200 | | Canadian Imperial | | | | |
| | | | Bank of Commerce | | | 593,434 | |
| | 27,000 | | Digital Realty Trust, | | | | |
| | | | Inc. REIT | | | 1,800,090 | |
| | 19,000 | | Eaton Vance Corp. | | | 449,160 | |
| | 8,000 | | Equity Lifestyle Properties, | | | | |
| | | | Inc. REIT | | | 533,520 | |
| | 9,400 | | Essex Property Trust, Inc. | | | 1,320,794 | |
| | 75,500 | | HDFC Bank Ltd. ADR | | | 1,984,140 | |
| | 16,000 | | ICICI Bank Ltd. ADR | | | 422,880 | |
| | 71,376 | | Itau Unibanco Banco | | | | |
| | | | Multiplo S.A. ADR | | | 1,324,739 | |
| | 20,000 | | Leucadia National Corp. | | | 454,800 | |
| | 9,000 | | M&T Bank Corp. | | | 687,060 | |
| | 2,000 | | PartnerRe Ltd. | | | 128,420 | |
| | 9,000 | | Portfolio Recovery | | | | |
| | | | Associates, Inc. * | | | 607,680 | |
| | 15,000 | | ProAssurance Corp. | | | 1,197,300 | |
| | 13,000 | | Royal Bank of Canada | | | 662,480 | |
| | 18,000 | | Stifel Financial Corp. * | | | 576,900 | |
| | 21,000 | | T. Rowe Price Group, Inc. | | | 1,195,950 | |
| | 8,000 | | Taubman Centers, Inc. | | | 496,800 | |
| | 7,400 | | Toronto-Dominion | | | | |
| | | | Bank (The) | | | 553,594 | |
| | 30,000 | | Wells Fargo & Co. | | | 826,800 | |
| | | | | | | 28,074,713 | |
| | | | HEALTH CARE (13.6%) | | | | |
| | 80,000 | | Alexion Pharmaceuticals, | | | | |
| | | | Inc. * | | | 5,720,000 | |
| | 17,200 | | Allergan, Inc. | | | 1,509,128 | |
| | 16,000 | | Bayer AG ADR | | | 1,020,800 | |
| | 14,500 | | Becton, Dickinson & Co. | | | 1,083,440 | |
| | 5,400 | | Bio-Rad Laboratories, | | | | |
| | | | Inc. Class A * | | | 518,616 | |
| | 14,800 | | Bio-Reference | | | | |
| | | | Laboratories, Inc. * | | | 240,796 | |
| | 7,000 | | C.R. Bard, Inc. | | | 598,500 | |
| | 22,000 | | Cerner Corp. * | | | 1,347,500 | |
| | 2,000 | | Computer Programs & | | | | |
| | | | Systems, Inc. | | | 102,220 | |
| | | | | | | | |
| Shares | | | | Value | |
| | 6,000 | | DaVita, Inc. * | | $ | 454,860 | |
| | 4,000 | | DENTSPLY | | | | |
| | | | International, Inc. | | | 139,960 | |
| | 26,000 | | Edwards Lifesciences | | | | |
| | | | Corp. * | | | 1,838,200 | |
| | 19,000 | | Endo Pharmaceuticals Holdings, | | | | |
| | | | Inc. * | | | 656,070 | |
| | 46,000 | | Express Scripts, Inc. * | | | 2,055,740 | |
| | 20,900 | | Fresenius Medical Care AG & | | | | |
| | | | Co. KGaA ADR | | | 1,420,782 | |
| | 38,800 | | Henry Schein, Inc. * | | | 2,499,884 | |
| | 52,000 | | HMS Holdings Corp. * | | | 1,662,960 | |
| | 24,000 | | IDEXX Laboratories, Inc. * | | | 1,847,040 | |
| | 32,000 | | Impax Laboratories, Inc. * | | | 645,440 | |
| | 7,000 | | Intuitive Surgical, Inc. * | | | 3,241,070 | |
| | 4,000 | | MAKO Surgical Corp. * | | | 100,840 | |
| | 9,400 | | Mettler-Toledo | | | | |
| | | | International, Inc. * | | | 1,388,474 | |
| | 3,100 | | MWI Veterinary | | | | |
| | | | Supply, Inc. * | | | 205,964 | |
| | 17,800 | | Novo Nordisk A/S ADR | | | 2,051,628 | |
| | 28,500 | | Owens & Minor, Inc. | | | 792,015 | |
| | 14,000 | | Pharmasset, Inc. * | | | 1,794,800 | |
| | 28,000 | | SXC Health | | | | |
| | | | Solutions Corp. * | | | 1,581,440 | |
| | 3,700 | | Techne Corp. | | | 252,562 | |
| | 23,000 | | Teva Pharmaceutical | | | | |
| | | | Industries Ltd. ADR | | | 928,280 | |
| | 12,000 | | Thermo Fisher | | | | |
| | | | Scientific, Inc. * | | | 539,640 | |
| | 12,000 | | UnitedHealth Group, Inc. | | | 608,160 | |
| | 15,000 | | Universal Health Services, | | | | |
| | | | Inc. Class B | | | 582,900 | |
| | 22,000 | | Volcano Corp. * | | | 523,380 | |
| | 10,000 | | WellPoint, Inc. | | | 662,500 | |
| | | | | | | 40,615,589 | |
| | | | | | | | |
| | | | INDUSTRIALS (22.0%) | | | | |
| | 85,000 | | ABB Ltd. ADR * | | | 1,600,550 | |
| | 9,000 | | Acacia Research - Acacia | | | | |
| | | | Technologies * | | | 328,590 | |
| | 24,300 | | Acuity Brands, Inc. | | | 1,287,900 | |
| | 49,500 | | AMETEK, Inc. | | | 2,083,950 | |
| | 20,600 | | AZZ, Inc. | | | 936,064 | |
| | 31,000 | | BE Aerospace, Inc. * | | | 1,200,010 | |
| | 23,000 | | C.H. Robinson | | | | |
| | | | Worldwide, Inc. | | | 1,604,940 | |
See Notes to Financial Statements.
| Value Line Premier Growth Fund, Inc. |
| |
| Schedule of Investments |
| Shares | | | | Value | |
| | 22,900 | | Canadian National | | | | |
| | | | Railway Co. | | $ | 1,799,024 | |
| | 3,000 | | Chart Industries, Inc. * | | | 162,210 | |
| | 36,000 | | Chicago Bridge & | | | | |
| | | | Iron Co. N.V. | | | 1,360,800 | |
| | 34,000 | | CLARCOR, Inc. | | | 1,699,660 | |
| | 7,000 | | Clean Harbors, Inc. * | | | 446,110 | |
| | 32,000 | | Danaher Corp. | | | 1,505,280 | |
| | 28,000 | | Donaldson Co., Inc. | | | 1,906,240 | |
| | 35,200 | | Eaton Corp. | | | 1,532,256 | |
| | 41,000 | | EnerSys * | | | 1,064,770 | |
| | 18,000 | | Esterline Technologies | | | | |
| | | | Corp. * | | | 1,007,460 | |
| | 12,000 | | Fastenal Co. | | | 523,320 | |
| | 7,000 | | FedEx Corp. | | | 584,570 | |
| | 16,000 | | Flowserve Corp. | | | 1,589,120 | |
| | 11,000 | | Fluor Corp. | | | 552,750 | |
| | 23,200 | | Gardner Denver, Inc. | | | 1,787,792 | |
| | 4,000 | | GeoEye, Inc. * | | | 88,880 | |
| | 6,000 | | Graco, Inc. | | | 245,340 | |
| | 17,800 | | HEICO Corp. | | | 1,040,944 | |
| | 29,850 | | IDEX Corp. | | | 1,107,733 | |
| | 17,600 | | IHS, Inc. Class A * | | | 1,516,416 | |
| | 20,000 | | Iron Mountain, Inc. | | | 616,000 | |
| | 33,000 | | J.B. Hunt Transport | | | | |
| | | | Services, Inc. | | | 1,487,310 | |
| | 21,000 | | Kansas City Southern * | | | 1,428,210 | |
| | 21,000 | | Kirby Corp. * | | | 1,382,640 | |
| | 5,000 | | L-3 Communications | | | | |
| | | | Holdings, Inc. | | | 333,400 | |
| | 88,500 | | Lan Airlines S.A. ADR | | | 2,056,740 | |
| | 26,000 | | Lincoln Electric | | | | |
| | | | Holdings, Inc. | | | 1,017,120 | |
| | 20,000 | | Norfolk Southern Corp. | | | 1,457,200 | |
| | 20,000 | | Polypore International, Inc. * | | | 879,800 | |
| | 12,800 | | Precision Castparts Corp. | | | 2,109,312 | |
| | 6,000 | | Regal-Beloit Corp. | | | 305,820 | |
| | 43,500 | | Republic Services, Inc. | | | 1,198,425 | |
| | 54,000 | | Rollins, Inc. | | | 1,199,880 | |
| | 34,000 | | Roper Industries, Inc. | | | 2,953,580 | |
| | 50,700 | | Rush Enterprises, Inc. | | | | |
| | | | Class A * | | | 1,060,644 | |
| | 36,600 | | Stericycle, Inc. * | | | 2,851,872 | |
| | 2,000 | | Teledyne Technologies, Inc.* | | | 109,700 | |
| | 33,000 | | Toro Co. (The) | | | 2,001,780 | |
| | 13,700 | | Towers Watson & Co. Class A | | | 821,041 | |
| | 15,000 | | TransDigm Group, Inc. * | | | 1,435,200 | |
| | 17,000 | | Union Pacific Corp. | | | 1,800,980 | |
| | | | | | | | |
| Shares | | | | Value | |
| | 17,000 | | United Technologies Corp. | | $ | 1,242,530 | |
| | 6,700 | | Valmont Industries, Inc. | | | 608,293 | |
| | 8,000 | | Verisk Analytics, Inc. | | | | |
| | | | Class A * | | | 321,040 | |
| | 7,600 | | W.W. Grainger, Inc. | | | 1,422,644 | |
| | 16,000 | | Wabtec Corp. | | | 1,119,200 | |
| | 31,200 | | Waste Connections, Inc. | | | 1,033,968 | |
| | 24,000 | | Woodward Inc. | | | 982,320 | |
| | | | | | | 65,799,328 | |
| | | | | | | | |
| | | | INFORMATION TECHNOLOGY (13.9%) | | | | |
| | 23,000 | | Accenture PLC Class A | | | 1,224,290 | |
| | 20,000 | | Acme Packet, Inc. * | | | 618,200 | |
| | 16,000 | | Alliance Data Systems | | | | |
| | | | Corp. * | | | 1,661,440 | |
| | 30,800 | | Amphenol Corp. Class A | | | 1,398,012 | |
| | 18,700 | | Anixter International, Inc. * | | | 1,115,268 | |
| | 60,000 | | ANSYS, Inc. * | | | 3,436,800 | |
| | 60,000 | | Ariba, Inc. * | | | 1,684,800 | |
| | 14,000 | | Avago Technologies Ltd. | | | 404,040 | |
| | 7,000 | | Baidu, Inc. ADR * | | | 815,290 | |
| | 21,000 | | Canon, Inc. ADR | | | 924,840 | |
| | 26,000 | | Check Point Software | | | | |
| | | | Technologies Ltd. * | | | 1,366,040 | |
| | 42,000 | | Cognizant Technology Solutions | | | | |
| | | | Corp. Class A * | | | 2,701,020 | |
| | 3,000 | | CommVault Systems, Inc. * | | | 128,160 | |
| | 16,000 | | Equinix, Inc. * | | | 1,622,400 | |
| | 10,000 | | FactSet Research | | | | |
| | | | Systems, Inc. | | | 872,800 | |
| | 3,000 | | Google, Inc. Class A * | | | 1,937,700 | |
| | 40,000 | | Informatica Corp. * | | | 1,477,200 | |
| | 4,200 | | LogMeIn, Inc. * | | | 161,910 | |
| | 11,800 | | MasterCard, Inc. Class A | | | 4,399,276 | |
| | 37,200 | | MICROS Systems, Inc. * | | | 1,732,776 | |
| | 12,000 | | Netgear, Inc. * | | | 402,840 | |
| | 38,000 | | Rackspace Hosting, Inc. * | | | 1,634,380 | |
| | 27,000 | | Salesforce.com, Inc. * | | | 2,739,420 | |
| | 25,000 | | Solera Holdings, Inc. | | | 1,113,500 | |
| | 12,000 | | Taleo Corp. Class A * | | | 464,280 | |
| | 26,000 | | Teradata Corp. * | | | 1,261,260 | |
| | 7,000 | | TIBCO Software, Inc. * | | | 167,370 | |
| | 28,000 | | Trimble Navigation Ltd. * | | | 1,215,200 | |
| | 16,000 | | VeriFone Systems, Inc. * | | | 568,320 | |
| | 13,000 | | VMware, Inc. Class A * | | | 1,081,470 | |
| | 19,300 | | Wright Express Corp. * | | | 1,047,604 | |
| | | | | | | 41,377,906 | |
See Notes to Financial Statements.
| Value Line Premier Growth Fund, Inc. |
| |
| December 31, 2011 |
| Shares | | | | Value | |
| | | | | | | | |
| | | | MATERIALS (7.9%) | | | | |
| | 16,000 | | Agrium, Inc. | | $ | 1,073,760 | |
| | 15,000 | | Air Products & Chemicals, | | | | |
| | | | Inc. | | | 1,277,850 | |
| | 27,000 | | Albemarle Corp. | | | 1,390,770 | |
| | 30,700 | | AptarGroup, Inc. | | | 1,601,619 | |
| | 20,000 | | Ball Corp. | | | 714,200 | |
| | 14,000 | | BASF AG ADR | | | 976,220 | |
| | 11,000 | | Celanese Corp. Series A | | | 486,970 | |
| | 4,000 | | CF Industries Holdings, Inc. | | | 579,920 | |
| | 14,000 | | Clearwater Paper Corp. * | | | 498,540 | |
| | 18,000 | | Crown Holdings, Inc. * | | | 604,440 | |
| | 20,000 | | Cytec Industries, Inc. | | | 893,000 | |
| | 8,000 | | FMC Corp. | | | 688,320 | |
| | 16,500 | | Greif, Inc. Class A | | | 751,575 | |
| | 9,000 | | LSB Industries, Inc. * | | | 252,270 | |
| | 17,000 | | Mosaic Co. (The) | | | 857,310 | |
| | 9,000 | | NewMarket Corp. | | | 1,782,990 | |
| | 30,000 | | Praxair, Inc. | | | 3,207,000 | |
| | 24,000 | | Rockwood Holdings, Inc. * | | | 944,880 | |
| | 20,200 | | Scotts Miracle-Gro Co. (The) | | | | |
| | | | Class A | | | 943,138 | |
| | 8,000 | | Sherwin-Williams Co. (The) | | | 714,160 | |
| | 30,000 | | Sigma-Aldrich Corp. | | | 1,873,800 | |
| | 12,800 | | Syngenta AG ADR | | | 754,432 | |
| | 18,000 | | Valspar Corp. (The) | | | 701,460 | |
| | | | | | | 23,568,624 | |
| | | | | | | | |
| | | | TELECOMMUNICATION SERVICES (1.8%) | | | | |
| | 4,000 | | AboveNet, Inc. * | | | 260,040 | |
| | 12,000 | | American Tower Corp. | | | | |
| | | | Class A | | | 720,120 | |
| | 40,000 | | Crown Castle | | | | |
| | | | International Corp. * | | | 1,792,000 | |
| | 4,000 | | Millicom International | | | | |
| | | | Cellular S.A. | | | 403,960 | |
| | 10,000 | | Rogers Communications, | | | | |
| | | | Inc. Class B | | | 385,100 | |
| | 43,000 | | SBA Communications Corp. | | | | |
| | | | Class A * | | | 1,847,280 | |
| | | | | | | 5,408,500 | |
| | | | | | | | |
| Shares | | | | Value | |
| | | | | | | | |
| | | | UTILITIES (2.7%) | | | | |
| | 18,000 | | AGL Resources, Inc. | | $ | 760,680 | |
| | 27,600 | | Cia de Saneamento Basico do | | | | |
| | | | Estado de Sao Paulo ADR | | | 1,535,940 | |
| | 25,000 | | CPFL Energia S.A. ADR | | | 705,250 | |
| | 20,000 | | ITC Holdings Corp. | | | 1,517,600 | |
| | 19,400 | | NSTAR | | | 911,024 | |
| | 16,000 | | Oneok, Inc. | | | 1,387,040 | |
| | 20,000 | | Questar Corp. | | | 397,200 | |
| | 26,800 | | Wisconsin Energy Corp. | | | 936,928 | |
| | | | | | | 8,151,662 | |
| | | | TOTAL COMMON STOCKS | | | | |
| | | | AND TOTAL INVESTMENT | | | | |
| | | | SECURITIES (99.2%) | | | | |
| | | | (Cost $177,501,500) | | | 296,071,670 | |
| | | | | | | | |
| CASH AND OTHER ASSETS IN EXCESS | | | | |
| OF LIABILITIES (0.8%) | | | 2,355,968 | |
| NET ASSETS (100%) | | $ | 298,427,638 | |
| NET ASSET VALUE OFFERING AND | | | | |
| REDEMPTION PRICE, PER | | | | |
| OUTSTANDING SHARE | | | | |
| ($298,427,638 ÷ 11,271,263 | | | | |
| shares outstanding) | | $ | 26.48 | |
| * | Non-income producing. |
| ADR | American Depositary Receipt. |
| REIT | Real Estate Investment Trust. |
See Notes to Financial Statements.
Value Line Premier Growth Fund, Inc.
| | | | | |
Statement of Assets and Liabilities at December 31, 2011 | | | | |
| | | | | |
| Assets: | | | | |
| Investment securities, at value (Cost - $177,501,500) | | $ | 296,071,670 | |
| Receivable for securities sold | | | 2,488,420 | |
| Receivable for capital shares sold | | | 658,197 | |
| Dividends receivable | | | 382,745 | |
| Prepaid expenses | | | 8,519 | |
| Total Assets | | | 299,609,551 | |
| | | | | |
| Liabilities: | | | | |
| Due to custodian | | | 601,292 | |
| Payable for capital shares redeemed | | | 181,355 | |
| Accrued expenses: | | | | |
| Advisory fee | | | 190,389 | |
| Service and distribution plan fees | | | 63,463 | |
| Directors’ fees and expenses | | | 761 | |
| Other | | | 144,653 | |
| Total Liabilities | | | 1,181,913 | |
| Net Assets | | $ | 298,427,638 | |
| | | | | |
| Net assets consist of: | | | | |
| Capital stock, at $1.00 par value (authorized 100,000,000, outstanding 11,271,263 shares) | | $ | 11,271,263 | |
| Additional paid-in capital | | | 165,151,301 | |
| Undistributed net investment loss | | | (121 | ) |
| Accumulated net realized gain on investments and foreign currency | | | 3,434,916 | |
| Net unrealized appreciation of investments and foreign currency translations | | | 118,570,279 | |
| Net Assets | | $ | 298,427,638 | |
| | | | | |
| Net Asset Value, Offering and Redemption Price per Outstanding Share ($298,427,638 ÷ 11,271,263 shares outstanding) | | $ | 26.48 | |
| Statement of Operations for the Year Ended December 31, 2011 | | | | |
| | | | | |
| Investment Income: | | | | |
| Dividends (net of foreign withholding tax of $133,475) | | $ | 2,964,942 | |
| Interest | | | 3,329 | |
| Total Income | | | 2,968,271 | |
| Expenses: | | | | |
| Advisory fee | | | 2,329,709 | |
| Service and distribution plan fees | | | 776,570 | |
| Auditing and legal fees | | | 200,927 | |
| Transfer agent fees | | | 170,410 | |
| Printing and postage | | | 118,762 | |
| Directors’ fees and expenses | | | 62,611 | |
| Custodian fees | | | 57,037 | |
| Insurance | | | 39,824 | |
| Registration and filing fees | | | 34,909 | |
| Other | | | 53,050 | |
| Total Expenses Before Custody Credits | | | 3,843,809 | |
| Less: Custody Credits | | | (314 | ) |
| Net Expenses | | | 3,843,495 | |
| Net Investment Loss | | | (875,224 | ) |
| | | | | |
| Net Realized and Unrealized Gain/(Loss) on Investments and Foreign Exchange Transactions: | | | | |
| Net Realized Gain | | | 24,860,610 | |
| Change in Net Unrealized Appreciation/(Depreciation) | | | (11,072,204 | ) |
| | | | | |
| Net Realized Gain and Change in Net Unrealized Appreciation/(Depreciation) on Investments and Foreign Exchange Transactions | | | 13,788,406 | |
| | | | | |
| Net Increase in Net Assets from Operations | | $ | 12,913,182 | |
See Notes to Financial Statements.
| Value Line Premier Growth Fund, Inc. |
| |
Statement of Changes in Net Assets for the Years Ended December 31, 2011 and 2010 |
| | | Year Ended December 31, 2011 | | | Year Ended December 31, 2010 | |
| Operations: | | | | | | |
| Net investment loss | | $ | (875,224 | ) | | $ | (66,321 | ) |
| Net realized gain on investments and foreign currency | | | 24,860,610 | | | | 18,569,195 | |
| Change in net unrealized appreciation/(depreciation) | | | (11,072,204 | ) | | | 41,553,338 | |
| Net increase in net assets from operations | | | 12,913,182 | | | | 60,056,212 | |
| | | | | | | | | |
| Distributions to Shareholders: | | | | | | | | |
| Net investment income | | | — | | | | (351,716 | ) |
| Net realized gain from investment transactions | | | (16,656,912 | ) | | | — | |
| Decrease in net assets from distributions to shareholders | | | (16,656,912 | ) | | | (351,716 | ) |
| | | | | | | | | |
| Capital Share Transactions: | | | | | | | | |
| Proceeds from sale of shares | | | 40,563,849 | | | | 19,293,231 | |
| Proceeds from reinvestment of dividends and distributions to shareholders | | | 15,804,377 | | | | 333,041 | |
| Cost of shares redeemed | | | (66,025,801 | ) | | | (115,440,166 | ) |
| Net decrease in net assets from capital share transactions | | | (9,657,575 | ) | | | (95,813,894 | ) |
| Total (Decrease) in Net Assets | | | (13,401,305 | ) | | | (36,109,398 | ) |
| | | | | | | | | |
| Net Assets: | | | | | | | | |
| Beginning of year | | | 311,828,943 | | | | 347,938,341 | |
| End of year | | $ | 298,427,638 | | | $ | 311,828,943 | |
| Undistributed net investment loss at end of year | | $ | (121 | ) | | $ | — | |
See Notes to Financial Statements.
| Value Line Premier Growth Fund, Inc. |
| |
| Notes to Financial Statements |
1. Significant Accounting Policies
Value Line Premier Growth Fund, Inc., (the “Fund”) is registered under the Investment Company Act of 1940, as amended, as a diversified, open-end management investment company whose primary investment objective is long-term growth of capital. The Fund invests primarily in a diversified portfolio of U.S. equity securities with favorable growth potential.
The preparation of financial statements in conformity with generally accepted accounting principles requires management to make estimates and assumptions that affect the reported amounts of assets and liabilities and disclosure of contingent assets and liabilities at the date of the financial statements and the reported amounts of revenues and expenses during the reporting period. Actual results could differ from those estimates. The following is a summary of significant accounting policies consistently followed by the Fund in the preparation of its financial statements.
(A) Security Valuation: Securities listed on a securities exchange are valued at the closing sales prices on the date as of which the net asset value is being determined. Securities traded on the NASDAQ Stock Market are valued at the NASDAQ Official Closing Price. In the absence of closing sales prices for such securities and for securities traded in the over-the-counter market, the security is valued at the midpoint between the latest available and representative asked and bid prices. Short-term instruments with maturities of 60 days or less at the date of purchase are valued at amortized cost, which approximates market value. Short-term instruments with maturities greater than 60 days at the date of purchase are valued at the midpoint between the latest available and representative asked and bid prices, and commencing 60 days prior to maturity such securities are valued at amortized cost. Securities for which market quotations are not readily available or that are not readily marketable and all other assets of the Fund are valued at fair value as the Board of Directors may determine in good faith. In addition, the Fund may use the fair value of a security when the closing market price on the primary exchange where the security is traded no longer accurately reflects the value of a security due to factors affecting one or more relevant securities markets or the specific issuer.
(B) Fair Value Measurements: The Fund follows fair valuation accounting standards (FASB ASC 820-10) which establish a definition of fair value and set out a hierarchy for measuring fair value. These standards require additional disclosures about the various inputs and valuation techniques used to develop the measurements of fair value and a discussion of changes in valuation techniques and related inputs during the period. These inputs are summarized in the three broad levels listed below:
| | |
| • | Level 1 – Inputs that reflect unadjusted quoted prices in active markets for identical assets or liabilities that the Fund has the ability to access at the measurement date; |
| | |
| • | Level 2 – Inputs other than quoted prices that are observable for the asset or liability either directly or indirectly, including inputs in markets that are not considered to be active; |
| | |
| • | Level 3 – Inputs that are unobservable. |
Transfers between investment levels may occur as the markets fluctuate and/or the availability of data used in an investment’s valuation changes. The inputs or methodologies used for valuing securities are not necessarily an indication of the risk associated with investing in those securities.
| Value Line Premier Growth Fund, Inc. |
| |
| December 31, 2011 |
The following table summarizes the inputs used to value the Fund’s investments in securities as of December 31, 2011:
| | | | | | | | | | | | | |
| Investments in Securities: | Level 1 | | Level 2 | | Level 3 | | Total | |
| Assets Common Stocks | | $ | 296,071,670 | | | $ | 0 | | | $ | 0 | | | $ | 296,071,670 | |
| Total Investments in Securities | | $ | 296,071,670 | | | $ | 0 | | | $ | 0 | | | $ | 296,071,670 | |
In May 2011, the Financial Accounting Standards Board (“FASB”) issued Accounting Standards Update No. 2011-04, “Fair Value Measurements and Disclosures (Topic 820) - Amendments to Achieve Common Fair Value Measurement and Disclosure Requirements in U.S. GAAP and IFRSs” (“ASU 2011-04”). ASU 2011-04 clarifies the application of existing fair value measurement requirements, changes certain principles related to measuring fair value, and requires additional disclosures about fair value measurements.
Specifically, the guidance specifies that the concepts of highest and best use and valuation premise in a fair value measurement are only relevant when measuring the fair value of nonfinancial assets whereas they are not relevant when measuring the fair value of financial assets and liabilities.
Required disclosures are expanded under the new guidance, especially for fair value measurements that are categorized within Level 3 of the fair value hierarchy, for which quantitative information about the unobservable inputs used, and a narrative description of the valuation processes in place and sensitivity of recurring Level 3 measurements to changes in unobservable inputs will be required. Entities will also be required to disclose the categorization by level of the fair value hierarchy for items that are not measured at fair value in the statement of financial position but for which the fair value is required to be disclosed.
ASU 2011-04 is effective for annual periods beginning after December 15, 2011 and is to be applied prospectively. The Fund is currently assessing the impact of this guidance on its financial statements.
The Fund follows the updated provisions surrounding fair value measurements and disclosures on transfers in and out of all levels of the fair value hierarchy on a gross basis and the reasons for the transfers as well as to disclosures about the valuation techniques and inputs used to measure fair value for investments that fall in either Level 2 or Level 3 fair value hierarchy.
For the year ended December 31, 2011, there was no significant transfer activity between Level 1 and Level 2.
For the year ended December 31, 2011, there were no Level 3 investments. The Schedule of Investments includes a breakdown of the Schedule’s investments by category.
(C) Repurchase Agreements: In connection with transactions in repurchase agreements, the Fund’s custodian takes possession of the underlying collateral securities, the value of which exceeds the principal amount of the repurchase transaction, including accrued interest. To the extent that any repurchase transaction exceeds one business day, it is the Fund’s policy to mark-to-market on a daily basis to ensure the adequacy of the collateral. In the event of default of the obligation to repurchase, the Fund has the right to liquidate the collateral and apply the proceeds in satisfaction of the obligation. Under certain circumstances, in the event of default or bankruptcy by the other party to the agreement, realization and/or retention of the collateral or proceeds may be subject to legal proceedings. There were no open repurchase agreements at December 31, 2011.
| Value Line Premier Growth Fund, Inc. |
| |
| Notes to Financial Statements |
(D) Federal Income Taxes: It is the policy of the Fund to qualify as a regulated investment company by complying with the provisions available to regulated investment companies, as defined in applicable sections of the Internal Revenue Code, and to distribute all of its investment income and capital gains to its shareholders. Therefore, no provision for federal income tax is required.
Management has analyzed the Fund’s tax positions taken on federal and state income tax returns for all open tax years (fiscal years ended December 31, 2008 through December 31, 2011), and has concluded that no provision for federal or state income tax is required in the Fund’s financial statements. The Fund’s federal and state income tax returns for tax years for which the applicable statutes of limitations have not expired are subject to examination by the Internal Revenue Service and state departments of revenue.
(E) Security Transactions and Distributions: Security transactions are accounted for on the date the securities are purchased or sold. Interest income is accrued as earned. Realized gains and losses on sales of securities are calculated for financial accounting and federal income tax purposes on the identified cost basis. Dividend income and distributions to shareholders are recorded on the ex-dividend date. Distributions are determined in accordance with income tax regulations, which may differ from generally accepted accounting principles.
(F) Foreign Currency Translation: The books and records of the Fund are maintained in U.S. dollars. Assets and liabilities which are denominated in foreign currencies are translated to U.S. dollars at the prevailing rates of exchange. The Fund does not isolate changes in the value of investments caused by foreign exchange rate differences from the changes due to other circumstances.
Income and expenses are translated to U.S. dollars based upon the rates of exchange on the respective dates of such transactions.
Net realized foreign exchange gains or losses arise from currency fluctuations realized between the trade and settlement dates on securities transactions, the differences between the U.S. dollar amounts of dividends, interest, and foreign withholding taxes recorded by the Fund, and the U.S. dollar equivalent of the amounts actually received or paid. Net unrealized foreign exchange gains and losses arise from changes in the value of assets and liabilities, other than investments, at the end of the fiscal period, resulting from changes in the exchange rates. The effect of the change in foreign exchange rates on the value of investments is included in realized gain/loss on investments and change in net unrealized appreciation/depreciation on investments.
(G) Representations and Indemnifications: In the normal course of business, the Fund enters into contracts that contain a variety of representations and warranties which provide general indemnifications. The Fund’s maximum exposure under these arrangements is unknown, as this would involve future claims that may be made against the Fund that have not yet occurred. However, based on experience, the Fund expects the risk of loss to be remote.
(H) Accounting for Real Estate Investment Trusts: The Fund owns shares of Real Estate Investment Trusts (“REITs”) which report information on the source of their distributions annually. Distributions received from REITs during the year which represent a return of capital are recorded as a reduction of cost and distributions which represent a capital gain dividend are recorded as a realized long-term capital gain on investments.
| Value Line Premier Growth Fund, Inc. |
| |
| December 31, 2011 |
(I) Foreign Taxes: The Fund may be subject to foreign taxes on income, gains on investments, or currency repatriation, a portion of which may be recoverable. The Fund will accrue such taxes and recoveries as applicable, based upon its current interpretation of tax rules and regulations that exist in the markets in which it invests.
(J) Subsequent Events: Management has evaluated all subsequent transactions and events through the date on which these financial statements were issued, and except as already included in the notes to these financial statements, has determined that no additional items require disclosure.
2. Capital Share Transactions and Distributions to Shareholders
Transactions in capital stock were as follows:
| | | | | | | |
| | | Year Ended December 31, 2011 | | | Year Ended December 31, 2010 | |
| Shares sold | | | 1,409,608 | | | | 826,552 | |
| Shares issued to shareholders in reinvestment of dividends and distributions | | | 601,156 | | | | 12,381 | |
| Shares redeemed | | | (2,367,431 | ) | | | (4,973,787 | ) |
| Net decrease | | | (365,667 | ) | | | (4,134,854 | ) |
| Dividends per share from net investment income | | $ | — | | | $ | 0.0300 | |
| Distributions per share from net realized gains | | $ | 1.5605 | | | $ | — | |
3. Purchases and Sales of Securities
Purchases and sales of investment securities, excluding short-term securities, were as follows:
| | | | | |
| | | Year Ended December 31, 2011 | |
| Purchases: | | | | |
| Investment Securities | | $ | 59,858,286 | |
| Sales: | | | | |
| Investment Securities | | $ | 65,954,419 | |
4. Income Taxes
At December 31, 2011, information on the tax components of capital is as follows:
| | | | | |
| Cost of investments for tax purposes | | $ | 177,501,570 | |
| Gross tax unrealized appreciation | | $ | 123,072,365 | |
| Gross tax unrealized depreciation | | $ | 4,502,265 | |
| Net tax unrealized appreciation on investments | | $ | 118,570,100 | |
| Undistributed long-term gain | | $ | 3,566,624 | |
During the year ended December 31, 2011, as permitted under federal income tax regulations, the Fund elected to defer $121 of late year ordinary losses and $131,638 of post-October net short term capital losses to the next taxable year and utilized $4,725,444 of capital loss carryforwards.
The differences between book basis and tax basis unrealized appreciation/depreciation on investments were primarily attributed to wash sales.
| Value Line Premier Growth Fund, Inc. |
| |
| Notes to Financial Statements |
Permanent book-tax differences relating to the current year were reclassified within the composition of the net asset accounts. The Fund decreased undistributed net investment loss by $875,103, decreased accumulated realized gain by $1,349, and decreased additional paid-in-capital by $873,754. These reclassifications were primarily due to differing treatments of net operating losses, investments in REITS, and foreign currency translation for tax purposes.
On December 22, 2010, the Regulated Investment Company Modernization Act of 2010 (“the Act”) was signed by the President. Under the Act, net capital losses recognized by the Fund after December 31, 2010, may get carried forward indefinitely, and retain their character as short-term and/or long term losses. Prior to this Act, pre-enactment net capital losses incurred by the Fund were carried forward for eight years and treated as short-term losses. The Act requires under the transition that post-enactment net capital loses are used before pre-enactment net capital losses.
The tax composition of distributions to shareholders for the years ended December 31, 2011 and December 31, 2010 were as follows:
| | | | | | | |
| | | 2011 | | | 2010 | |
| Ordinary income | | $ | — | | | $ | 351,716 | |
| Long-term capital gain | | | 16,656,912 | | | | — | |
| | | $ | 16,656,912 | | | $ | 351,716 | |
5. Investment Advisory Fee, Service and Distribution Fees and Transactions With Affiliates
An advisory fee of $2,329,709 was paid or payable to EULAV Asset Management (the “Adviser”) for the year ended December 31, 2011. This was computed at an annual rate of 0.75% of the daily net assets during the year and paid monthly. The Adviser provides research, investment programs, supervision of the investment portfolio and pays costs of administrative services, office space, equipment and compensation of administrative, bookkeeping, and clerical personnel necessary for managing the affairs of the Fund. The Adviser also provides persons, satisfactory to the Fund’s Board of Directors, to act as officers and employees of the Fund and pays their salaries.
The Fund has a Service and Distribution Plan (the “Plan”), adopted pursuant to Rule 12b-1 under the Investment Company Act of 1940, which compensates EULAV Securities LLC (the “Distributor”) for advertising, marketing and distributing the Fund’s shares and for servicing the Fund’s shareholders at an annual rate of 0.25% of the Fund’s average daily net assets. For the year ended December 31, 2011, fees amounting to $776,570 were paid or payable under the Plan.
For the year ended December 31, 2011, the Fund’s expenses were reduced by $314 under a custody credit agreement with the custodian.
Direct expenses of the Fund are charged to the Fund while common expenses of the Value Line Funds are allocated proportionately based upon the Funds’ respective net assets. The Fund bears all other costs and expenses.
Certain officers and Trustee of the Adviser are also officers and directors of the Fund. At December 31, 2011, the officers and directors as a group owned 320 shares, representing less than 1% of the outstanding shares.
| Value Line Premier Growth Fund, Inc. |
| |
| Financial Highlights |
Selected data for a share of capital stock outstanding throughout each year:
| | | | | | | | | | | | | | | | |
| | | Years Ended December 31, | |
| | | 2011 | | | 2010 | | | 2009 | | | 2008 | | | 2007 | |
| Net asset value, beginning of year | | $ | 26.82 | | | $ | 22.07 | | | $ | 16.69 | | | $ | 29.38 | | | $ | 26.61 | |
| | | | | | | | | | | | | | | | | | | | | |
| Income from investment operations: | | | | | | | | | | | | | | | | | | | | |
| Net investment income/(loss) | | | (0.08 | ) | | | (0.01 | )(2) | | | 0.02 | | | | 0.01 | | | | 0.02 | |
| Net gains or (losses) on securities (both realized and unrealized) | | | 1.30 | | | | 4.79 | | | | 5.37 | | | | (11.85 | ) | | | 4.80 | |
| Total from investment operations | | | 1.22 | | | | 4.78 | | | | 5.39 | | | | (11.84 | ) | | | 4.82 | |
| | | | | | | | | | | | | | | | | | | | | |
| Less distributions: | | | | | | | | | | | | | | | | | | | | |
| Dividends from net investment income | | | — | | | | (0.03 | ) | | | (0.01 | ) | | | — | | | | (0.03 | ) |
| Distributions from net realized gains | | | (1.56 | ) | | | — | | | | — | | | | (0.85 | ) | | | (2.02 | ) |
| Total distributions | | | (1.56 | ) | | | (0.03 | ) | | | (0.01 | ) | | | (0.85 | ) | | | (2.05 | ) |
| Net asset value, end of year | | $ | 26.48 | | | $ | 26.82 | | | $ | 22.07 | | | $ | 16.69 | | | $ | 29.38 | |
| | | | | | | | | | | | | | | | | | | | | |
| Total return | | | 4.59 | % | | | 21.66 | % | | | 32.29 | % | | | (40.13 | )% | | | 18.30 | % |
| | | | | | | | | | | | | | | | | | | | | |
| Ratios/Supplemental Data: | | | | | | | | | | | | | | | | | | | | |
| Net assets, end of year (in thousands) | | $ | 298,428 | | | $ | 311,829 | | | $ | 347,938 | | | $ | 312,591 | | | $ | 570,484 | |
Ratio of expenses to average net assets(1) | | | 1.24 | % | | | 1.23 | %(3) | | | 1.22 | % | | | 1.16 | % | | | 1.11 | % |
| Ratio of net investment income/(loss) to average net assets | | | (0.28 | )% | | | (0.02 | )% | | | 0.11 | % | | | 0.03 | % | | | 0.06 | % |
| Portfolio turnover rate | | | 20 | % | | | 16 | % | | | 8 | % | | | 18 | % | | | 29 | % |
| (1) | Ratio reflects expenses grossed up for custody credit arrangement. The ratio of expenses to average net assets net of custody credits would have been unchanged for the years shown. |
| (2) | Based on average shares outstanding. |
| (3) | Ratio reflects expenses grossed up for the reimbursement by Value Line, Inc. of certain expenses incurred by the Fund. The ratio of expenses to average net assets net of the reimbursement by Value Line, Inc. and net of custody credits would have been 1.19% for the year ended December 31, 2010. |
See Notes to Financial Statements.
| Value Line Premier Growth Fund, Inc. |
| |
| Report of Independent Registered Public Accounting Firm |
To the Board of Directors and Shareholders of Value Line Premier Growth Fund, Inc.
In our opinion, the accompanying statement of assets and liabilities, including the schedule of investments, and the related statements of operations and of changes in net assets and the financial highlights present fairly, in all material respects, the financial position of Value Line Premier Growth Fund, Inc. (the “Fund”) at December 31, 2011, the results of its operations for the year then ended, the changes in its net assets for each of the two years in the period then ended and the financial highlights for each of the five years in the period then ended, in conformity with accounting principles generally accepted in the United States of America. These financial statements and financial highlights (hereafter referred to as “financial statements”) are the responsibility of the Fund’s management. Our responsibility is to express an opinion on these financial statements based on our audits. We conducted our audits of these financial statements in accordance with the standards of the Public Company Accounting Oversight Board (United States). Those standards require that we plan and perform the audit to obtain reasonable assurance about whether the financial statements are free of material misstatement. An audit includes examining, on a test basis, evidence supporting the amounts and disclosures in the financial statements, assessing the accounting principles used and significant estimates made by management, and evaluating the overall financial statement presentation. We believe that our audits, which included confirmation of securities at December 31, 2011 by correspondence with the custodian, provide a reasonable basis for our opinion.
PricewaterhouseCoopers LLP
New York, New York
February 27, 2012
| Value Line Premier Growth Fund, Inc. |
| |
| Factors Considered By The Board In Approving Continuance Of The Investment Advisory Agreement For Value Line Premier Growth Fund, Inc. (Unaudited) |
The Investment Company Act of 1940 (the “1940 Act”) requires the Board of Directors, including a majority of Directors who are not “interested persons” of Value Line Premier Growth Fund, Inc. (the “Fund”), as that term is defined in the 1940 Act (the “Independent Directors”), to annually consider the continuance of the Fund’s investment advisory agreement (“Agreement”) with its investment adviser, EULAV Asset Management.1
In considering whether the continuance of the Agreement was in the best interests of the Fund and its shareholders, the Board requested and the Adviser provided such information as the Board deemed to be reasonably necessary to evaluate the terms of the Agreement. At meetings held throughout the year, including the meeting specifically focused upon the review of the Agreement, the Independent Directors met in executive sessions separately from the non-Independent Director of the Fund and any officers of the Adviser. In selecting the Adviser and approving the continuance of the Agreement, the Independent Directors relied upon the assistance of counsel to the Independent Directors.
Both in the meeting that specifically addressed the continuance of the Agreement and at other meetings, the Board, including the Independent Directors, received materials relating to the Adviser’s investment and management services under the Agreement. These materials included information on: (i) the investment performance of the Fund, compared to a peer group of funds consisting of the Fund and all retail and institutional multi-cap growth funds regardless of asset size or primary channel of distribution (the “Performance Universe”), and its benchmark index, each as classified by Lipper Inc., an independent evaluation service (“Lipper”); (ii) the investment process, portfolio holdings, investment restrictions, valuation procedures, and financial statements for the Fund; (iii) sales and redemption data with respect to the Fund; (iv) the general investment outlook in the markets in which the Fund invests; (v) arrangements with respect to the distribution of the Fund’s shares; (vi) the allocation and cost of the Fund’s brokerage (none of which was effected through any affiliate of the Adviser); and (vii) the overall nature, quality and extent of services provided by the Adviser.
As part of their review, the Board requested, and the Adviser provided, additional information in order to evaluate the quality of the Adviser’s services and the reasonableness of its fees under the Agreement. In a separate executive session, the Independent Directors reviewed information, which included data comparing: (i) the Fund’s management fee rate, transfer agent and custodian fee rates, service fee (including 12b-1 fees) rates, and the rate of the Fund’s other non-management fees, to those incurred by a peer group of funds consisting of the Fund and 11 other retail no-load multi-cap growth funds (excluding outliers), as selected objectively by Lipper (“Expense Group”), and a peer group of funds consisting of the Fund, the Expense Group and all other retail no-load multi-cap growth funds (excluding outliers), as selected objectively by Lipper (“Expense Universe”); (ii) the Fund’s expense ratio to those of its Expense Group and Expense Universe; and (iii) the Fund’s investment performance over various time periods to the average performance of the Performance Universe as well as the appropriate Lipper Index, as selected objectively by Lipper (the “Lipper Index”).
1 For periods prior to December 23, 2010, the term “Adviser” means the Adviser’s predecessor entities that previously served as the Fund’s adviser, EULAV Asset Management, LLC and Value Line, Inc. (“VLI”). In accordance with the 1940 Act, the Agreement had a two-year initial term ending December 2012. Nevertheless, the Board determined to consider the Agreement’s continuance annually and undertook that review in June 2011.
| Value Line Premier Growth Fund, Inc. |
| |
| Annual Report (unaudited) |
In the separate executive session, the Independent Directors also reviewed information regarding: (a) the financial results and condition of the Adviser both before and after its restructuring on December 23, 2010,2 and the Adviser’s and certain of its affiliates’ profitability from the services that have been performed for the Fund and the Value Line family of funds; (b) the Adviser’s investment management staffing and resources; (c) the ownership, control and day-to-day management of the Adviser, including representations of VLI that it does not “control” (as that term is defined in the 1940 Act) either the Adviser or Value Line Securities, Inc. (the “Distributor”) after the restructuring; and (d) the Fund’s potential for achieving economies of scale. In support of its review of the statistical information, the Board was provided with a detailed description of the methodology used by Lipper to determine the Expense Group, the Expense Universe and the Performance Universe to prepare its information.
The following summarizes matters considered by the Board in connection with its continuance of the Agreement. However, the Board did not identify any single factor as all-important or controlling, and the summary does not detail all the matters that were considered.
Investment Performance. The Board reviewed the Fund’s overall investment performance and compared it to its Performance Universe and the Lipper Index. The Board noted that the Fund outperformed the Performance Universe average and the Lipper Index for the one-year, five-year and ten-year periods ended March 31, 2011. The Board also noted that the Fund’s performance for the three-year period ended March 31, 2011 was equivalent to the performance of the Performance Universe average and the Lipper Index.
The Adviser’s Personnel and Methods. The Board reviewed the background of the portfolio manager responsible for the daily management of the Fund’s portfolio, seeking to achieve the Fund’s investment objective and adhering to the Fund’s investment strategies. The Independent Directors also engaged in discussions with the Adviser’s senior management responsible for the overall functioning of the Fund’s investment operations. The Board viewed favorably (i) the Adviser’s commitment of resources to acquire analytic tools in support of the portfolio management and compliance functions, (ii) actions taken by the Adviser to attract and retain personnel, including improvements to the Adviser’s employee benefit programs and increased merit-based compensation for certain staff members, and (iii) that the Adviser continues to receive the Value Line ranking systems without cost. The Board concluded that the Fund’s management team and the Adviser’s overall resources were adequate and that the Adviser had investment management capabilities and personnel essential to performing its duties under the Agreement.
Management Fee and Expenses. The Board considered the Adviser’s fee rate under the Agreement relative to the management fee rates applicable to the funds in the Expense Group and Expense Universe averages, both before and after applicable fee waivers. The Board noted that, for the most recent fiscal year for which audited financial data is available, the Fund’s management fee rate was less than that of the Expense Group average both before and after giving effect to fee waivers applicable to funds in the Expense Group. The Board also noted that, for the most recent fiscal year for which audited financial data is available, the Fund’s management fee rate was more than that of the Expense Universe average after giving effect to applicable fee waivers for certain funds in the Expense Universe. The Board concluded that the Fund’s management fee rate was satisfactory for the purpose of approving continuance of the Agreement.
2 On December 23, 2010, the Adviser was restructured as a Delaware statutory trust and renamed EULAV Asset Management. It had formerly been organized as a limited liability company named EULAV Asset Management, LLC.
| Value Line Premier Growth Fund, Inc. |
| |
| Annual Report (unaudited) |
The Board also considered the Fund’s total expense ratio relative to its Expense Group and Expense Universe averages. The Board noted that, for the most recent fiscal year for which audited financial data is available, the Fund’s expense ratio was less than that of the Expense Group average and slightly more than that of the Expense Universe average, after giving effect to fee waivers applicable to funds in the Expense Group and Universe. The Board concluded that the average expense ratio was satisfactory for the purpose of approving continuance of the Agreement.
Nature, Extent and Quality of Services. The Board considered the nature, extent and quality of other services provided by the Adviser and the Distributor. At meetings held throughout the year, the Board reviewed the resources and effectiveness of the Adviser’s overall compliance program, as well as the services provided by the Distributor. The Board viewed favorably the additional resources devoted by the Adviser to enhance its and the Fund’s overall compliance program as well as steps being undertaken to enhance the shareholders’ experience with the Fund, such as a more robust website. The Board reviewed the services provided by the Adviser and its affiliates in supervising the Fund’s third party service providers. Based on this review, the Board concluded that the nature, quality, cost, and extent of such other services provided by the Adviser and its affiliates were satisfactory, reliable and beneficial to the Fund’s shareholders.
Profitability. The Board considered the level of profitability of the Adviser and its affiliates with respect to the Fund individually and in the aggregate for all the funds within the Value Line group of funds, including the impact of the restructuring and certain actions taken during prior years. These actions included the reduction (voluntary in some instances and contractual in other instances) of management and/or Rule 12b-1 fees for certain funds, the Adviser’s termination of the use of soft dollar research, and the cessation of trading through the Distributor. The Board also considered the Adviser’s continued attention to the rationalization and differentiation of funds within the Value Line group of funds to better identify opportunities for savings and efficiencies among the funds. The Board concluded that the profitability of the Adviser and its affiliates with respect to the Fund, including the financial results derived from the Fund’s Agreement, were within a range the Board considered reasonable.
Other Benefits. The Board also considered the character and amount of other direct and incidental benefits received by the Adviser and its affiliates from their association with the Fund. The Board concluded that potential “fall-out” benefits that the Adviser and its affiliates may receive, such as greater name recognition, appear to be reasonable, and may in some cases benefit the Fund.
Economies of Scale. The Board considered that, given the current and anticipated size of the Fund, any perceived and potential economies of scale were not yet a significant consideration for the Fund and that the addition of break points to the fee structure was not currently necessary.
Fees and Services Provided for Other Comparable Funds/Accounts Managed by the Adviser and its Affiliates. The Board was informed by the Adviser that the Adviser does not manage any non-mutual fund account that has similar objectives and policies as those of the Fund.
| Value Line Premier Growth Fund, Inc. |
| |
| Annual Report (unaudited) |
Conclusion. The Board examined the totality of the information it was provided at the meeting specifically addressing approval of the Agreement and at other meetings held during the past year and did not identify any single controlling factor. Based on its evaluation of all material factors deemed relevant and with the advice of independent counsel, the Board concluded that the rate at which the Fund pays a management fee to the Adviser under the Agreement does not constitute a fee that is so disproportionately large as to bear no reasonable relationship to the services rendered and that could not have been the product of arm’s-length bargaining. Further, the Board concluded that the Fund’s Agreement, and the management fee rate thereunder, is fair and reasonable and voted to continue the Agreement as in the best interest of the Fund and its shareholders.
| Value Line Premier Growth Fund, Inc. |
| |
| Federal Tax Notice (unaudited) |
| During the year ended December 31, 2011, the Fund distributed $16,656,912 from long-term capital gains. |
The Fund files its complete schedule of portfolio holdings with the Securities and Exchange Commission (“SEC”) for the first and third quarters of each fiscal year on Form N-Q. The Fund’s Forms N-Q are available on the SEC’s website at http://www.sec.gov and may be reviewed and copied at the SEC’s Public Reference Room in Washington, D.C. Information on the operation of the Public Reference Room may be obtained by calling 1-800-SEC-0330.
A description of the policies and procedures that the Fund uses to determine how to vote proxies relating to portfolio securities, and information regarding how the Fund voted these proxies for the 12-month period ended June 30 is available through the Fund’s website at http://www.vlfunds.com and on the SEC’s website at http://www.sec.gov. The description of the policies and procedures is also available without charge, upon request, by calling 1-800-243-2729.
| Value Line Premier Growth Fund, Inc. |
| |
| Management of the Fund |
MANAGEMENT INFORMATION
The business and affairs of the Fund are managed by the Fund’s officers under the direction of the Board of Directors. The following table sets forth information on each Director and Officer of the Fund. Each Director serves as a director or trustee of each of the 13 Value Line Funds. Each Director serves until his or her successor is elected and qualified.
| | | | | | | | | |
| Name, Address, and YOB | | Position | | Length of Time Served | | Principal Occupation During the Past 5 Years | | Other Directorships Held by Director |
| Interested Director* | | | | | | | | |
Mitchell E. Appel YOB: 1970 | | Director | | Since 2010 | | President of each of the Value Line Funds since June 2008; Chief Financial Officer of Value Line, Inc. (“Value Line”) from April 2008 to December 2010 and from September 2005 to November 2007; Director from February 2010 to December 2010; Chief Financial Officer of XTF Asset Management from November 2007 to April 2008; Chief Financial Officer of the Distributor since April 2008 and President since February 2009; President of the Adviser since February 2009, Trustee since December 2010 and Treasurer since January 2011. | | None |
| Non-Interested Directors | | | | | | | | |
Joyce E. Heinzerling 500 East 77th Street New York, NY 10162 YOB: 1956 | | Director | | Since 2008 | | President, Meridian Fund Advisers LLC. (consultants) since April 2009; General Counsel, Archery Capital LLC (private investment fund) until April 2009. | | Burnham Investors Trust, since 2004
(4 funds). |
Francis C. Oakley 54 Scott Hill Road Williamstown, MA 01267 YOB: 1931 | | Director | | Since 2000 | | Professor of History, Williams College, (1961-2002). Professor Emeritus since 2002; President Emeritus since 1994 and President, (1985-1994); Chairman (1993-1997) and Interim President (2002-2003) of the American Council of Learned Societies. Trustee since 1997 and Chairman of the Board since 2005, National Humanities Center. | | None |
David H. Porter 5 Birch Run Drive Saratoga Springs, NY 12866 YOB: 1935 | | Director | | Since 1997 | | Professor, Skidmore College since 2008; Visiting Professor of Classics, Williams College, (1999-2008); President Emeritus, Skidmore College since 1999 and President, (1987-1998). | | None |
| Value Line Premier Growth Fund, Inc. |
| |
| Management of the Fund |
| Name, Address, and DOB | | Position | | Length of Time Served | | Principal Occupation During the Past 5 Years | | Other Directorships Held by Director |
Paul Craig Roberts 169 Pompano St. Panama City Beach, FL 32413 YOB: 1939 | | Director | | Since 1983 | | Chairman, Institute for Political Economy. | | None |
Nancy-Beth Sheerr 1409 Beaumont Drive Gladwyne, PA 19035 YOB: 1949 | | Director | | Since 1996 | | Senior Financial Adviser, Veritable L.P. (Investment Adviser). | | None |
Daniel S. Vandivort 59 Indian Head Road Riverside, CT 06878 YOB: 1954 | | Director (Chairman of Board since 2010) | | Since 2008 | | President, Chief Investment Officer, Weiss, Peck and Greer/Robeco Investment Management (2005-2007); Managing Director, Weiss, Peck and Greer, (1995-2005). | | None |
| Officers | | | | | | | | |
Mitchell E. Appel YOB: 1970 | | President | | Since 2008 | | President of each of the Value Line Funds since June 2008; Chief Financial Officer of Value Line from April 2008 to December 2010 and from September 2005 to November 2007; Director from February 2010 to December 2010; Chief Financial Officer of XTF Asset Management from November 2007 to April 2008; Chief Financial Officer of the Distributor since April 2008 and President since February 2009; President of the Adviser since February 2009, Trustee since December 2010 and Treasurer since January 2011. |
Michael J. Wagner YOB: 1950 | | Chief Compliance Officer | | Since 2009 | | Chief Compliance Officer of Value Line Funds since June 2009; President of Northern Lights Compliance Service, LLC (formerly Fund Compliance Services, LLC (2006 – present)) and Senior Vice President (2004 – 2006) and President and Chief Operations Officer (2003 – 2006) of Gemini Fund Services, LLC; Director of Constellation Trust Company until 2008. |
Emily D. Washington YOB: 1979 | | Treasurer and Secretary | | Since 2008 | | Treasurer and Chief Financial Officer (Principal Financial and Accounting Officer) of each of the Value Line Funds since August 2008 and secretary since 2010; Associate Director of Mutual Fund Accounting at Value Line until August 2008. |
| * | Mr. Appel is an “interested person” as defined in the Investment Company Act of 1940 by virtue of his position with the Adviser and Distributor. |
Unless otherwise indicated, the address for each of the above officers is c/o Value Line Funds, 7 Times Square, New York, NY 10036.
| |
| The Fund’s Statement of Additional Information (SAI) includes additional information about the Fund’s Directors and is available, without charge, upon request by calling 1-800-243-2729 or on the Fund’s website, www.vlfunds.com. |
| Value Line Premier Growth Fund, Inc. |
| |
| The Value Line Family of Funds |
1950 — The Value Line Fund seeks long-term growth of capital. Current income is a secondary objective.
1952 — Value Line Income and Growth Fund’s primary investment objective is income, as high and dependable as is consistent with reasonable risk. Capital growth to increase total return is a secondary objective.
1956 — Value Line Premier Growth Fund seeks long-term growth of capital. No consideration is given to current income in the choice of investments.
1972 — Value Line Larger Companies Fund’s sole investment objective is to realize capital growth.
1979 — Value Line U.S. Government Money Market Fund, a money market fund, seeks to secure as high a level of current income as is consistent with maintaining liquidity and preserving capital. An investment in the Fund is not insured or guaranteed by the Federal Deposit Insurance Corporation or any other government agency. Although the Fund seeks to preserve the value of your investment at $1.00 per share, it is possible to lose money by investing in the Fund.
1981 — Value Line U.S. Government Securities Fund seeks maximum income without undue risk to capital. Under normal conditions, at least 80% of the value of its net assets will be invested in securities issued or guaranteed by the U.S. Government and its agencies and instrumentalities.
1983 — Value Line Centurion Fund* seeks long-term growth of capital.
1984 — The Value Line Tax Exempt Fund seeks to provide investors with the maximum income exempt from federal income taxes while avoiding undue risk to principal. The fund may be subject to state and local taxes and the Alternative Minimum Tax (if applicable).
1986 — Value Line Aggressive Income Trust seeks to maximize current income.
1987 — Value Line New York Tax Exempt Trust seeks to provide New York taxpayers with the maximum income exempt from New York State, New York City and federal income taxes while avoiding undue risk to principal. The Trust may be subject to state and local taxes and the Alternative Minimum Tax (if applicable).
1987 — Value Line Strategic Asset Management Trust* seeks to achieve a high total investment return consistent with reasonable risk.
1993 — Value Line Emerging Opportunities Fund invests in US common stocks of small capitalization companies, with its primary objective being long-term growth of capital.
1993 — Value Line Asset Allocation Fund seeks high total investment return, consistent with reasonable risk. The Fund invests in stocks, bonds and money market instruments utilizing quantitative modeling to determine the asset mix.
| | |
| * | Only available through the purchase of Guardian Investor, a tax deferred variable annuity, or ValuePlus, a variable life insurance policy. |
For more complete information about any of the Value Line Funds, including charges and expenses, send for a prospectus from EULAV Securities LLC, 7 Times Square, New York, New York 10036-6524 or call 1-800-243-2729, 9am-5pm CST, Monday–Friday, or visit us at www.vlfunds.com. Read the prospectus carefully before you invest or send money.
Item 2. Code of Ethics
(a) The Registrant has adopted a Code of Ethics that applies to its principal
executive officer, and principal financial officer and principal accounting officer.
(f) Pursuant to item 12(a), the Registrant is attaching as an exhibit a copy of its Code of Ethics that applies to its principal executive officer, and principal financial officer and principal accounting officer.
Item 3. Audit Committee Financial Expert.
(a)(1)The Registrant has an Audit Committee Financial Expert serving on its Audit Committee.
(2) The Registrant’s Board has designated Daniel S. Vandivort, a member of the Registrant’s Audit Committee, as the Registrant’s Audit Committee Financial Expert. Mr. Vandivort is an independent director who has served as President, Chief Investment Officer to Weis, Peck and Greer/Robeco Investment Management. He has also previously served as Managing Director for Weis, Peck and Greer (1995-2005).
A person who is designated as an “audit committee financial expert” shall not make such person an "expert" for any purpose, including without limitation under Section 11 of the Securities Act of 1933 or under applicable fiduciary laws, as a result of being designated or identified as an audit committee financial expert. The designation or identification of a person as an audit committee financial expert does not impose on such person any duties, obligations, or liabilities that are greater than the duties, obligations, and liabilities imposed on such person as a member of the audit committee and Board of Trustees in the absence of such designation or identification.
Item 4. Principal Accountant Fees and Services
(a) Audit Fees 2011 - $67,687
(b) Audit-Related fees – None.
(c) Tax Preparation Fees 2011 -$32,224
(d) All Other Fees –None
(e) (1) Audit Committee Pre-Approval Policy. All services to be performed for the Registrant by PricewaterhouseCoopers LLP must be pre-approved by the audit committee. All services performed were pre-approved by the committee.
(e) (2) Not applicable.
(f) Not applicable.
(g) Aggregate Non-Audit Fees 2011 -$2,400
(h) Not applicable.
Item 11. Controls and Procedures.
(a) The registrant’s principal executive officer and principal financial officer have concluded that the registrant’s disclosure controls and procedures (as defined in rule 30a-2(c) under the Act (17 CFR 270.30a-2(c) ) based on their evaluation of these controls and procedures as of a date within 90 days of the filing date of this report, are appropriately designed to ensure that material information relating to the registrant is made known to such officers and are operating effectively.
(b) The registrant’s principal executive officer and principal financial officer have determined that there have been no significant changes in the registrant’s internal controls or in other factors that could significantly affect these controls subsequent to the date of their evaluation, including corrective actions with regard to significant deficiencies and material weaknesses.
Item 12. Exhibits.
| (a) | Code of Business Conduct and Ethics for Principal Executive and Senior Financial Officers attached hereto as Exhibit 100.COE |
| (b) | (1) Certification pursuant to Rule 30a-2(a) under the Investment Company Act of 1940 (17 CFR 270.30a-2) attached hereto as Exhibit 99.CERT. |
| | (2) Certification pursuant to Section 906 of the Sarbanes-Oxley Act of 2002 attached hereto as Exhibit 99.906.CERT. |
SIGNATURES
Pursuant to the requirements of the Securities Exchange Act of 1934 and the Investment Company Act of 1940, the registrant has duly caused this report to be signed on its behalf by the undersigned, thereunto duly authorized.
| By: | /s/ Mitchell E. Appel | |
| | Mitchell E. Appel, President |
| | | |
| Date: | March 6, 2012 | |
| | | |
| Pursuant to the requirements of the Securities Exchange Act of 1934 and the Investment Company Act of 1940, this report has been signed below by the following persons on behalf of the registrant and in the capacities and on the dates indicated. |
| | | |
| By: | /s/ Mitchell E. Appel | |
| | Mitchell E. Appel, President, Principal Executive Officer |
| | | |
| By: | /s/ Emily D. Washington | |
| | Emily D. Washington, Treasurer, Principal Financial Officer |
| | | |
| Date: | March 6, 2012 | |