UNITED STATES
SECURITIES AND EXCHANGE COMMISSION
Washington, D.C. 20549
Form N-CSR
CERTIFIED SHAREHOLDER REPORT OF REGISTERED
MANAGEMENT INVESTMENT COMPANIES
Investment Company Act File Number: 811-01241
Eaton Vance Growth Trust
(Exact Name of Registrant as Specified in Charter)
Two International Place, Boston, Massachusetts 02110
(Address of Principal Executive Offices)
Maureen A. Gemma
Two International Place, Boston, Massachusetts 02110
(Name and Address of Agent for Services)
(617) 482-8260
(Registrant’s Telephone Number)
September 30
Date of Fiscal Year End
March 31, 2021
Date of Reporting Period
| Item 1. | Reports to Stockholders |

Eaton Vance
Atlanta Capital SMID-Cap Fund
Semiannual Report
March 31, 2021

Commodity Futures Trading Commission Registration. The Commodity Futures Trading Commission (“CFTC”) has adopted regulations that subject registered investment companies and advisers to regulation by the CFTC if a fund invests more than a prescribed level of its assets in certain CFTC-regulated instruments (including futures, certain options and swap agreements) or markets itself as providing investment exposure to such instruments. The investment adviser has claimed an exclusion from the definition of “commodity pool operator” under the Commodity Exchange Act with respect to its management of the Fund. Accordingly, neither the Fund nor the adviser with respect to the operation of the Fund is subject to CFTC regulation. Because of its management of other strategies, the Fund’s adviser is registered with the CFTC as a commodity pool operator. The adviser is also registered as a commodity trading advisor.
Fund shares are not insured by the FDIC and are not deposits or other obligations of, or guaranteed by, any depository institution. Shares are subject to investment risks, including possible loss of principal invested.
This report must be preceded or accompanied by a current summary prospectus or prospectus. Before investing, investors should consider carefully the investment objective, risks, and charges and expenses of a mutual fund. This and other important information is contained in the summary prospectus and prospectus, which can be obtained from a financial intermediary. Prospective investors should read the prospectus carefully before investing. For further information, please call 1-800-262-1122.
Semiannual Report March 31, 2021
Eaton Vance
Atlanta Capital SMID-Cap Fund
Eaton Vance
Atlanta Capital SMID-Cap Fund
March 31, 2021
Performance1,2
Portfolio Managers Charles B. Reed, CFA, William O. Bell IV, CFA and W. Matthew Hereford, CFA, each of Atlanta Capital Management Company, LLC
| | | | | | | | | | | | | | | | | | | | | | | | |
| % Average Annual Total Returns | | Class
Inception Date | | | Performance
Inception Date | | | Six Months | | | One Year | | | Five Years | | | Ten Years | |
| | | | | | |
Class A at NAV | | | 11/28/2003 | | | | 04/30/2002 | | | | 31.33 | % | | | 65.45 | % | | | 15.26 | % | | | 13.70 | % |
Class A with 5.75% Maximum Sales Charge | | | — | | | | — | | | | 23.79 | | | | 55.92 | | | | 13.91 | | | | 13.03 | |
Class C at NAV | | | 10/01/2009 | | | | 04/30/2002 | | | | 30.86 | | | | 64.29 | | | | 14.40 | | | | 12.86 | |
Class C with 1% Maximum Sales Charge | | | — | | | | — | | | | 29.86 | | | | 63.29 | | | | 14.40 | | | | 12.86 | |
Class I at NAV | | | 04/30/2002 | | | | 04/30/2002 | | | | 31.50 | | | | 65.90 | | | | 15.56 | | | | 13.98 | |
Class R at NAV | | | 08/03/2009 | | | | 04/30/2002 | | | | 31.16 | | | | 65.12 | | | | 14.98 | | | | 13.42 | |
Class R6 at NAV | | | 07/01/2014 | | | | 04/30/2002 | | | | 31.54 | | | | 66.05 | | | | 15.65 | | | | 14.05 | |
|
| |
| | | | | | |
Russell 2500TM Index | | | — | | | | — | | | | 41.33 | % | | | 89.40 | % | | | 15.92 | % | | | 12.19 | % |
Russell 2000® Index | | | — | | | | — | | | | 48.05 | | | | 94.85 | | | | 16.34 | | | | 11.67 | |
| | | | | | |
| % Total Annual Operating Expense Ratios3 | | | | | Class A | | | Class C | | | Class I | | | Class R | | | Class R6 | |
| | | | | | |
| | | | | | | 1.17 | % | | | 1.92 | % | | | 0.92 | % | | | 1.42 | % | | | 0.82 | % |
Fund Profile
Sector Allocation (% of net assets)4

Top 10 Holdings (% of net assets)4
| | | | |
W.R. Berkley Corp. | | | 4.5 | % |
| |
Carlisle Cos., Inc. | | | 3.9 | |
| |
Aramark | | | 3.5 | |
| |
WEX, Inc. | | | 3.3 | |
| |
J.B. Hunt Transport Services, Inc. | | | 3.2 | |
| |
Envista Holdings Corp. | | | 3.1 | |
| |
AptarGroup, Inc. | | | 3.0 | |
| |
DENTSPLY SIRONA, Inc. | | | 2.9 | |
| |
Terminix Global Holdings, Inc. | | | 2.7 | |
| |
RPM International, Inc. | | | 2.6 | |
| |
Total | | | 32.7 | % |
See Endnotes and Additional Disclosures in this report.
Past performance is no guarantee of future results. Returns are historical and are calculated by determining the percentage change in net asset value (NAV) or offering price (as applicable) with all distributions reinvested. Investment return and principal value will fluctuate so that shares, when redeemed, may be worth more or less than their original cost. Performance for periods less than or equal to one year is cumulative. Performance is for the stated time period only; due to market volatility, current Fund performance may be lower or higher than the quoted return. For performance as of the most recent month-end, please refer to eatonvance.com.
Eaton Vance
Atlanta Capital SMID-Cap Fund
March 31, 2021
Endnotes and Additional Disclosures
| 1 | Russell 2500TM Index is an unmanaged index of approximately 2,500 small- and mid-cap U.S. stocks. Russell 2000® Index is an unmanaged index of 2,000 U.S. small-cap stocks. Unless otherwise stated, index returns do not reflect the effect of any applicable sales charges, commissions, expenses, taxes or leverage, as applicable. It is not possible to invest directly in an index. |
| 2 | Total Returns at NAV do not include applicable sales charges. If sales charges were deducted, the returns would be lower. Total Returns shown with maximum sales charge reflect the stated maximum sales charge. Unless otherwise stated, performance does not reflect the deduction of taxes on Fund distributions or redemptions of Fund shares. |
Performance prior to the inception date of a class may be linked to the performance of an older class of the Fund. This linked performance is adjusted for any applicable sales charge, but is not adjusted for class expense differences. If adjusted for such differences, the performance would be different. The performance of Class R6 is linked to Class I. Performance presented in the Financial Highlights included in the financial statements is not linked.
| 3 | Source: Fund prospectus. The expense ratios for the current reporting period can be found in the Financial Highlights section of this report. |
| 4 | Excludes cash and cash equivalents. |
Fund profile subject to change due to active management.
Eaton Vance
Atlanta Capital SMID-Cap Fund
March 31, 2021
Fund Expenses
Example: As a Fund shareholder, you incur two types of costs: (1) transaction costs, including sales charges (loads) on purchases and redemption fees (if applicable); and (2) ongoing costs, including management fees; distribution and/or service fees; and other Fund expenses. This Example is intended to help you understand your ongoing costs (in dollars) of Fund investing and to compare these costs with the ongoing costs of investing in other mutual funds. The Example is based on an investment of $1,000 invested at the beginning of the period and held for the entire period (October 1, 2020 – March 31, 2021).
Actual Expenses: The first section of the table below provides information about actual account values and actual expenses. You may use the information in this section, together with the amount you invested, to estimate the expenses that you paid over the period. Simply divide your account value by $1,000 (for example, an $8,600 account value divided by $1,000 = 8.6), then multiply the result by the number in the first section under the heading entitled “Expenses Paid During Period” to estimate the expenses you paid on your account during this period.
Hypothetical Example for Comparison Purposes: The second section of the table below provides information about hypothetical account values and hypothetical expenses based on the actual Fund expense ratio and an assumed rate of return of 5% per year (before expenses), which is not the actual Fund return. The hypothetical account values and expenses may not be used to estimate the actual ending account balance or expenses you paid for the period. You may use this information to compare the ongoing costs of investing in your Fund and other funds. To do so, compare this 5% hypothetical example with the 5% hypothetical examples that appear in the shareholder reports of the other funds.
Please note that the expenses shown in the table are meant to highlight your ongoing costs only and do not reflect any transactional costs, such as sales charges (loads) or redemption fees (if applicable). Therefore, the second section of the table is useful in comparing ongoing costs only, and will not help you determine the relative total costs of owning different funds. In addition, if these transactional costs were included, your costs would be higher.
| | | | | | | | | | | | | | | | |
| | | Beginning
Account Value
(10/1/20) | | | Ending
Account Value
(3/31/21) | | | Expenses Paid
During Period*
(10/1/20 – 3/31/21) | | | Annualized
Expense
Ratio | |
| | | | |
Actual | | | | | | | | | | | | | | | | |
Class A | | $ | 1,000.00 | | | $ | 1,313.30 | | | $ | 6.63 | | | | 1.15 | % |
Class C | | $ | 1,000.00 | | | $ | 1,308.60 | | | $ | 10.94 | | | | 1.90 | % |
Class I | | $ | 1,000.00 | | | $ | 1,315.00 | | | $ | 5.19 | | | | 0.90 | % |
Class R | | $ | 1,000.00 | | | $ | 1,311.60 | | | $ | 8.07 | | | | 1.40 | % |
Class R6 | | $ | 1,000.00 | | | $ | 1,315.40 | | | $ | 4.68 | | | | 0.81 | % |
| | | | | |
Hypothetical | | | | | | | | | | | | | | | | |
(5% return per year before expenses) | | | | | | | | | | | | | | | | |
Class A | | $ | 1,000.00 | | | $ | 1,019.20 | | | $ | 5.79 | | | | 1.15 | % |
Class C | | $ | 1,000.00 | | | $ | 1,015.50 | | | $ | 9.55 | | | | 1.90 | % |
Class I | | $ | 1,000.00 | | | $ | 1,020.40 | | | $ | 4.53 | | | | 0.90 | % |
Class R | | $ | 1,000.00 | | | $ | 1,018.00 | | | $ | 7.04 | | | | 1.40 | % |
Class R6 | | $ | 1,000.00 | | | $ | 1,020.90 | | | $ | 4.08 | | | | 0.81 | % |
| * | Expenses are equal to the Fund’s annualized expense ratio for the indicated Class, multiplied by the average account value over the period, multiplied by 182/365 (to reflect the one-half year period). The Example assumes that the $1,000 was invested at the net asset value per share determined at the close of business on September 30, 2020. |
Eaton Vance
Atlanta Capital SMID-Cap Fund
March 31, 2021
Portfolio of Investments (Unaudited)
| | | | | | | | |
| Common Stocks — 98.7% | |
| Security | | Shares | | | Value | |
|
| Aerospace & Defense — 1.7% | |
| | |
Hexcel Corp.(1) | | | 3,857,162 | | | $ | 216,001,072 | |
| |
| | | | $ | 216,001,072 | |
|
| Banks — 2.2% | |
| | |
Prosperity Bancshares, Inc. | | | 2,163,160 | | | $ | 161,999,052 | |
| | |
Umpqua Holdings Corp. | | | 6,782,371 | | | | 119,030,611 | |
| |
| | | | $ | 281,029,663 | |
|
| Building Products — 2.1% | |
| | |
Lennox International, Inc. | | | 879,050 | | | $ | 273,903,190 | |
| |
| | | | $ | 273,903,190 | |
|
| Capital Markets — 7.0% | |
| | |
Affiliated Managers Group, Inc. | | | 2,093,048 | | | $ | 311,926,943 | |
| | |
FactSet Research Systems, Inc. | | | 326,293 | | | | 100,690,757 | |
| | |
Morningstar, Inc. | | | 872,445 | | | | 196,335,023 | |
| | |
SEI Investments Co. | | | 4,540,469 | | | | 276,650,776 | |
| |
| | | | $ | 885,603,499 | |
|
| Chemicals — 2.6% | |
| | |
RPM International, Inc.(2) | | | 3,543,753 | | | $ | 325,493,713 | |
| |
| | | | $ | 325,493,713 | |
|
| Commercial Services & Supplies — 2.0% | |
| | |
IAA, Inc.(1) | | | 4,549,232 | | | $ | 250,844,653 | |
| |
| | | | $ | 250,844,653 | |
|
| Containers & Packaging — 3.0% | |
| | |
AptarGroup, Inc. | | | 2,700,310 | | | $ | 382,552,918 | |
| |
| | | | $ | 382,552,918 | |
|
| Distributors — 2.3% | |
| | |
LKQ Corp.(1) | | | 4,402,922 | | | $ | 186,375,688 | |
| | |
Pool Corp. | | | 291,208 | | | | 100,536,650 | |
| |
| | | | $ | 286,912,338 | |
|
| Diversified Consumer Services — 4.7% | |
| | |
frontdoor, inc.(1) | | | 2,712,006 | | | $ | 145,770,322 | |
| | |
Service Corp. International | | | 2,128,575 | | | | 108,663,754 | |
| | |
Terminix Global Holdings, Inc.(1)(3) | | | 7,100,922 | | | | 338,500,952 | |
| |
| | | | $ | 592,935,028 | |
| | | | | | | | |
| Security | | Shares | | | Value | |
|
| Electrical Equipment — 1.7% | |
| | |
Acuity Brands, Inc.(2) | | | 1,325,331 | | | $ | 218,679,615 | |
| |
| | | | $ | 218,679,615 | |
|
| Electronic Equipment, Instruments & Components — 4.3% | |
| | |
Dolby Laboratories, Inc., Class A | | | 2,261,188 | | | $ | 223,224,479 | |
| | |
FLIR Systems, Inc. | | | 2,237,572 | | | | 126,355,691 | |
| | |
Trimble, Inc.(1) | | | 2,541,313 | | | | 197,688,738 | |
| |
| | | | $ | 547,268,908 | |
|
| Food & Staples Retailing — 1.1% | |
| | |
Casey’s General Stores, Inc. | | | 645,879 | | | $ | 139,632,581 | |
| |
| | | | $ | 139,632,581 | |
|
| Health Care Equipment & Supplies — 6.8% | |
| | |
DENTSPLY SIRONA, Inc. | | | 5,755,850 | | | $ | 367,280,788 | |
| | |
Envista Holdings Corp.(1)(3) | | | 9,800,041 | | | | 399,841,673 | |
| | |
Teleflex, Inc. | | | 228,289 | | | | 94,844,948 | |
| |
| | | | $ | 861,967,409 | |
|
| Health Care Providers & Services — 0.7% | |
| | |
Henry Schein, Inc.(1) | | | 1,336,213 | | | $ | 92,519,388 | |
| |
| | | | $ | 92,519,388 | |
|
| Hotels, Restaurants & Leisure — 5.4% | |
| | |
Aramark | | | 11,639,049 | | | $ | 439,723,271 | |
| | |
Choice Hotels International, Inc. | | | 2,358,483 | | | | 253,041,641 | |
| |
| | | | $ | 692,764,912 | |
|
| Industrial Conglomerates — 3.9% | |
| | |
Carlisle Cos., Inc.(2)(3) | | | 2,980,034 | | | $ | 490,453,996 | |
| |
| | | | $ | 490,453,996 | |
|
| Insurance — 8.8% | |
| | |
Brown & Brown, Inc. | | | 5,667,318 | | | $ | 259,053,106 | |
| | |
Markel Corp.(1) | | | 247,113 | | | | 281,614,917 | |
| | |
W.R. Berkley Corp. | | | 7,597,491 | | | | 572,470,947 | |
| |
| | | | $ | 1,113,138,970 | |
|
| IT Services — 7.9% | |
| | |
Broadridge Financial Solutions, Inc. | | | 1,205,816 | | | $ | 184,610,430 | |
| | |
Gartner, Inc.(1) | | | 1,543,035 | | | | 281,681,039 | |
| | |
Jack Henry & Associates, Inc.(2) | | | 729,574 | | | | 110,690,967 | |
| | |
WEX, Inc.(1) | | | 2,026,444 | | | | 423,972,614 | |
| |
| | | | $ | 1,000,955,050 | |
| | | | |
| | 5 | | See Notes to Financial Statements. |
Eaton Vance
Atlanta Capital SMID-Cap Fund
March 31, 2021
Portfolio of Investments (Unaudited) — continued
| | | | | | | | |
| Security | | Shares | | | Value | |
|
| Life Sciences Tools & Services — 1.5% | |
| | |
Bio-Techne Corp. | | | 503,220 | | | $ | 192,194,815 | |
| |
| | | | $ | 192,194,815 | |
|
| Machinery — 6.1% | |
| | |
Donaldson Co., Inc. | | | 2,084,943 | | | $ | 121,260,285 | |
| | |
Graco, Inc. | | | 1,796,482 | | | | 128,664,041 | |
| | |
IDEX Corp. | | | 896,894 | | | | 187,737,852 | |
| | |
Nordson Corp. | | | 963,817 | | | | 191,491,161 | |
| | |
Woodward, Inc. | | | 1,179,208 | | | | 142,247,861 | |
| |
| | | | $ | 771,401,200 | |
|
| Marine — 1.5% | |
| | |
Kirby Corp.(1)(3) | | | 3,155,908 | | | $ | 190,238,134 | |
| |
| | | | $ | 190,238,134 | |
|
| Professional Services — 4.2% | |
| | |
Booz Allen Hamilton Holding Corp., Class A | | | 2,430,572 | | | $ | 195,733,963 | |
| | |
CACI International, Inc., Class A(1) | | | 1,010,743 | | | | 249,309,869 | |
| | |
TransUnion | | | 962,400 | | | | 86,616,000 | |
| |
| | | | $ | 531,659,832 | |
|
| Real Estate Management & Development — 2.2% | |
| | |
Jones Lang LaSalle, Inc.(1) | | | 1,543,437 | | | $ | 276,336,961 | |
| |
| | | | $ | 276,336,961 | |
|
| Road & Rail — 5.1% | |
| | |
J.B. Hunt Transport Services, Inc. | | | 2,435,601 | | | $ | 409,351,460 | |
| | |
Landstar System, Inc. | | | 1,489,053 | | | | 245,783,088 | |
| |
| | | | $ | 655,134,548 | |
|
| Software — 3.8% | |
| | |
Blackbaud, Inc.(1)(2)(3) | | | 2,702,133 | | | $ | 192,067,613 | |
| | |
Fair Isaac Corp.(1) | | | 181,959 | | | | 88,441,172 | |
| | |
Manhattan Associates, Inc.(1) | | | 1,778,826 | | | | 208,798,596 | |
| |
| | | | $ | 489,307,381 | |
|
| Specialty Retail — 3.3% | |
| | |
Burlington Stores, Inc.(1) | | | 702,554 | | | $ | 209,923,135 | |
| | |
Ulta Beauty, Inc.(1) | | | 682,636 | | | | 211,050,572 | |
| |
| | | | $ | 420,973,707 | |
|
| Textiles, Apparel & Luxury Goods — 2.8% | |
| | |
Columbia Sportswear Co.(2) | | | 2,041,690 | | | $ | 215,663,715 | |
| | | | | | | | |
| Security | | Shares | | | Value | |
|
| Textiles, Apparel & Luxury Goods (continued) | |
| | |
Deckers Outdoor Corp.(1) | | | 420,069 | | | $ | 138,799,199 | |
| |
| | | | $ | 354,462,914 | |
| |
Total Common Stocks
(identified cost $6,947,540,759) | | | $ | 12,534,366,395 | |
|
| Short-Term Investments — 1.4% | |
| Description | | Units | | | Value | |
| | |
Eaton Vance Cash Reserves Fund, LLC, 0.10%(4) | | | 178,657,740 | | | $ | 178,657,740 | |
| |
Total Short-Term Investments
(identified cost $178,657,740) | | | $ | 178,657,740 | |
| |
Total Investments — 100.1%
(identified cost $7,126,198,499) | | | $ | 12,713,024,135 | |
| |
Other Assets, Less Liabilities — (0.1)% | | | $ | (13,057,771 | ) |
| |
Net Assets — 100.0% | | | $ | 12,699,966,364 | |
The percentage shown for each investment category in the Portfolio of Investments is based on net assets.
| (1) | Non-income producing security. |
| (2) | All or a portion of this security was on loan at March 31, 2021. The aggregate market value of securities on loan at March 31, 2021 was $13,742,287. |
| (3) | Affiliated company (see Note 10). |
| (4) | Affiliated investment company, available to Eaton Vance portfolios and funds, which invests in high quality, U.S. dollar denominated money market instruments. The rate shown is the annualized seven-day yield as of March 31, 2021. |
| | | | |
| | 6 | | See Notes to Financial Statements. |
Eaton Vance
Atlanta Capital SMID-Cap Fund
March 31, 2021
Statement of Assets and Liabilities (Unaudited)
| | | | |
| Assets | | March 31, 2021 | |
| |
Unaffiliated investments, at value (identified cost, $6,043,079,011) — including $10,615,267 of securities on loan | | $ | 10,923,264,027 | |
| |
Affiliated investments, at value (identified cost, $1,083,119,488) — including $3,127,020 of securities on loan | | | 1,789,760,108 | |
| |
Dividends receivable | | | 3,005,746 | |
| |
Dividends receivable from affiliated investments | | | 8,638 | |
| |
Receivable for investments sold | | | 22,221,295 | |
| |
Receivable for Fund shares sold | | | 14,631,588 | |
| |
Securities lending income receivable | | | 5,523 | |
| |
Total assets | | $ | 12,752,896,925 | |
|
| Liabilities | |
| |
Payable for Fund shares redeemed | | $ | 41,094,332 | |
| |
Payable to affiliates: | | | | |
| |
Investment adviser fee | | | 8,428,926 | |
| |
Distribution and service fees | | | 585,471 | |
| |
Accrued expenses | | | 2,821,832 | |
| |
Total liabilities | | $ | 52,930,561 | |
| |
Net Assets | | $ | 12,699,966,364 | |
|
| Sources of Net Assets | |
| |
Paid-in capital | | $ | 6,419,470,752 | |
| |
Distributable earnings | | | 6,280,495,612 | |
| |
Total | | $ | 12,699,966,364 | |
|
| Class A Shares | |
| |
Net Assets | | $ | 1,475,967,430 | |
| |
Shares Outstanding | | | 41,294,105 | |
| |
Net Asset Value and Redemption Price Per Share | | | | |
| |
(net assets ÷ shares of beneficial interest outstanding) | | $ | 35.74 | |
| |
Maximum Offering Price Per Share | | | | |
| |
(100 ÷ 94.25 of net asset value per share) | | $ | 37.92 | |
|
| Class C Shares | |
| |
Net Assets | | $ | 50,375,406 | |
| |
Shares Outstanding | | | 1,594,879 | |
| |
Net Asset Value and Offering Price Per Share* | | | | |
| |
(net assets ÷ shares of beneficial interest outstanding) | | $ | 31.59 | |
|
| Class I Shares | |
| |
Net Assets | | $ | 5,867,609,461 | |
| |
Shares Outstanding | | | 143,934,110 | |
| |
Net Asset Value, Offering Price and Redemption Price Per Share | | | | |
| |
(net assets ÷ shares of beneficial interest outstanding) | | $ | 40.77 | |
|
| Class R Shares | |
| |
Net Assets | | $ | 531,258,216 | |
| |
Shares Outstanding | | | 15,471,317 | |
| |
Net Asset Value, Offering Price and Redemption Price Per Share | | | | |
| |
(net assets ÷ shares of beneficial interest outstanding) | | $ | 34.34 | |
|
| Class R6 Shares | |
| |
Net Assets | | $ | 4,774,755,851 | |
| |
Shares Outstanding | | | 116,278,051 | |
| |
Net Asset Value, Offering Price and Redemption Price Per Share | | | | |
| |
(net assets ÷ shares of beneficial interest outstanding) | | $ | 41.06 | |
On sales of $50,000 or more, the offering price of Class A shares is reduced.
| * | Redemption price per share is equal to the net asset value less any applicable contingent deferred sales charge. |
| | | | |
| | 7 | | See Notes to Financial Statements. |
Eaton Vance
Atlanta Capital SMID-Cap Fund
March 31, 2021
Statement of Operations (Unaudited)
| | | | |
| Investment Income | | Six Months Ended
March 31, 2021 | |
| |
Dividends | | $ | 38,750,939 | |
| |
Dividends from affiliated investments | | | 3,096,051 | |
| |
Securities lending income, net | | | 14,976 | |
| |
Total investment income | | $ | 41,861,966 | |
|
| Expenses | |
| |
Investment adviser fee | | $ | 47,664,287 | |
| |
Distribution and service fees | | | | |
| |
Class A | | | 1,842,481 | |
| |
Class C | | | 345,441 | |
| |
Class R | | | 1,291,420 | |
| |
Trustees’ fees and expenses | | | 54,250 | |
| |
Custodian fee | | | 826,618 | |
| |
Transfer and dividend disbursing agent fees | | | 3,656,785 | |
| |
Legal and accounting services | | | 129,467 | |
| |
Printing and postage | | | 193,808 | |
| |
Registration fees | | | 116,742 | |
| |
Miscellaneous | | | 64,777 | |
| |
Total expenses | | $ | 56,186,076 | |
| |
Net investment loss | | $ | (14,324,110 | ) |
|
| Realized and Unrealized Gain (Loss) | |
| |
Net realized gain (loss) — | | | | |
| |
Investment transactions | | $ | 862,630,756 | |
| |
Investment transactions — affiliated investments | | | (123,339,395 | ) |
| |
Net realized gain | | $ | 739,291,361 | |
| |
Change in unrealized appreciation (depreciation) — | | | | |
| |
Investments | | $ | 1,625,420,648 | |
| |
Investments — affiliated investments | | | 904,583,372 | |
| |
Net change in unrealized appreciation (depreciation) | | $ | 2,530,004,020 | |
| |
Net realized and unrealized gain | | $ | 3,269,295,381 | |
| |
Net increase in net assets from operations | | $ | 3,254,971,271 | |
| | | | |
| | 8 | | See Notes to Financial Statements. |
Eaton Vance
Atlanta Capital SMID-Cap Fund
March 31, 2021
Statements of Changes in Net Assets
| | | | | | | | |
| Increase (Decrease) in Net Assets | | Six Months Ended
March 31, 2021
(Unaudited) | | | Year Ended
September 30, 2020 | |
| | |
From operations — | | | | | | | | |
| | |
Net investment loss | | $ | (14,324,110 | ) | | $ | (8,929,012 | ) |
| | |
Net realized gain | | | 739,291,361 | | | | 1,413,253,804 | |
| | |
Net change in unrealized appreciation (depreciation) | | | 2,530,004,020 | | | | (2,104,878,343 | ) |
| | |
Net increase (decrease) in net assets from operations | | $ | 3,254,971,271 | | | $ | (700,553,551 | ) |
| | |
Distributions to shareholders — | | | | | | | | |
| | |
Class A | | $ | (154,422,465 | ) | | $ | (118,485,141 | ) |
| | |
Class C | | | (12,753,521 | ) | | | (13,171,852 | ) |
| | |
Class I | | | (540,064,143 | ) | | | (434,441,377 | ) |
| | |
Class R | | | (57,217,960 | ) | | | (40,829,936 | ) |
| | |
Class R6 | | | (399,558,828 | ) | | | (239,893,424 | ) |
| | |
Total distributions to shareholders | | $ | (1,164,016,917 | ) | | $ | (846,821,730 | ) |
| | |
Transactions in shares of beneficial interest — | | | | | | | | |
| | |
Proceeds from sale of shares | | | | | | | | |
| | |
Class A | | $ | 121,514,898 | | | $ | 271,681,617 | |
| | |
Class C | | | 3,278,575 | | | | 3,623,558 | |
| | |
Class I | | | 643,520,905 | | | | 1,234,996,774 | |
| | |
Class R | | | 14,458,799 | | | | 55,368,341 | |
| | |
Class R6 | | | 670,327,492 | | | | 1,352,459,833 | |
| | |
Net asset value of shares issued to shareholders in payment of distributions declared | | | | | | | | |
| | |
Class A | | | 134,278,929 | | | | 105,132,614 | |
| | |
Class C | | | 12,582,280 | | | | 11,594,986 | |
| | |
Class I | | | 434,914,351 | | | | 361,434,165 | |
| | |
Class R | | | 56,975,127 | | | | 40,110,464 | |
| | |
Class R6 | | | 343,313,653 | | | | 202,187,227 | |
| | |
Cost of shares redeemed | | | | | | | | |
| | |
Class A | | | (441,684,186 | ) | | | (580,456,181 | ) |
| | |
Class C | | | (15,201,126 | ) | | | (53,727,685 | ) |
| | |
Class I | | | (1,375,073,762 | ) | | | (2,533,279,161 | ) |
| | |
Class R | | | (102,284,521 | ) | | | (127,499,186 | ) |
| | |
Class R6 | | | (854,862,529 | ) | | | (911,921,901 | ) |
| | |
Net asset value of shares converted | | | | | | | | |
| | |
Class A | | | 60,645,288 | | | | 15,520,040 | |
| | |
Class C | | | (60,645,288 | ) | | | (15,520,040 | ) |
| | |
Net decrease in net assets from Fund share transactions | | $ | (353,941,115 | ) | | $ | (568,294,535 | ) |
| | |
Net increase (decrease) in net assets | | $ | 1,737,013,239 | | | $ | (2,115,669,816 | ) |
|
| Net Assets | |
| | |
At beginning of period | | $ | 10,962,953,125 | | | $ | 13,078,622,941 | |
| | |
At end of period | | $ | 12,699,966,364 | | | $ | 10,962,953,125 | |
| | | | |
| | 9 | | See Notes to Financial Statements. |
Eaton Vance
Atlanta Capital SMID-Cap Fund
March 31, 2021
Financial Highlights
| | | | | | | | | | | | | | | | | | | | | | | | |
| | | Class A | |
| | |
| | | Six Months Ended
March 31, 2021
(Unaudited) | | | Year Ended September 30, | |
| | | 2020 | | | 2019 | | | 2018 | | | 2017 | | | 2016 | |
| | | | | | | |
Net asset value — Beginning of period | | $ | 30.690 | | | $ | 34.740 | | | $ | 34.450 | | | $ | 29.050 | | | $ | 25.770 | | | $ | 23.780 | |
| | | | | | |
| Income (Loss) From Operations | | | | | | | | | | | | | | | | | | | | | | | | |
| | | | | | |
Net investment loss(1) | | $ | (0.076 | ) | | $ | (0.088 | ) | | $ | (0.088 | ) | | $ | (0.096 | ) | | $ | (0.101 | ) | | $ | (0.087 | ) |
| | | | | | |
Net realized and unrealized gain (loss) | | | 8.811 | | | | (1.586 | ) | | | 2.526 | | | | 6.606 | | | | 4.379 | | | | 3.812 | |
| | | | | | |
Total income (loss) from operations | | $ | 8.735 | | | $ | (1.674 | ) | | $ | 2.438 | | | $ | 6.510 | | | $ | 4.278 | | | $ | 3.725 | |
| | | | |
| Less Distributions | | | | | | | | | | | | | | | | | |
| | | | | | |
From net realized gain | | $ | (3.685 | ) | | $ | (2.376 | ) | | $ | (2.148 | ) | | $ | (1.110 | ) | | $ | (0.998 | ) | | $ | (1.735 | ) |
| | | | | | |
Total distributions | | $ | (3.685 | ) | | $ | (2.376 | ) | | $ | (2.148 | ) | | $ | (1.110 | ) | | $ | (0.998 | ) | | $ | (1.735 | ) |
| | | | | | |
Net asset value — End of period | | $ | 35.740 | | | $ | 30.690 | | | $ | 34.740 | | | $ | 34.450 | | | $ | 29.050 | | | $ | 25.770 | |
| | | | | | |
Total Return(2) | | | 31.33 | %(3) | | | (5.21 | )% | | | 8.29 | % | | | 22.97 | % | | | 17.06 | % | | | 16.27 | % |
| | | | |
| Ratios/Supplemental Data | | | | | | | | | | | | | | | | | |
| | | | | | |
Net assets, end of period (000’s omitted) | | $ | 1,475,967 | | | $ | 1,360,610 | | | $ | 1,764,848 | | | $ | 1,935,900 | | | $ | 1,711,298 | | | $ | 1,764,805 | |
| | | | | | |
Ratios (as a percentage of average daily net assets): | | | | | | | | | | | | | | | | | | | | | | | | |
| | | | | | |
Expenses | | | 1.15 | %(4) | | | 1.17 | % | | | 1.17 | % | | | 1.16 | %(5) | | | 1.19 | %(5) | | | 1.21 | %(5) |
| | | | | | |
Net investment loss | | | (0.46 | )%(4) | | | (0.29 | )% | | | (0.28 | )% | | | (0.30 | )%(5) | | | (0.38 | )%(5) | | | (0.35 | )%(5) |
| | | | | | |
Portfolio Turnover of the Portfolio(6) | | | — | | | | — | | | | — | | | | 3 | % | | | 11 | % | | | 17 | % |
| | | | | | |
Portfolio Turnover of the Fund | | | 6 | %(3) | | | 21 | % | | | 16 | % | | | 5 | %(7) | | | — | | | | — | |
| (1) | Computed using average shares outstanding. |
| (2) | Returns are historical and are calculated by determining the percentage change in net asset value with all distributions reinvested and do not reflect the effect of sales charges. |
| (5) | Includes the Fund’s share of the Portfolio’s allocated expenses for the period while the Fund was investing in the Portfolio. |
| (6) | Portfolio turnover represents the rate of portfolio activity for the period while the Fund was investing in the Portfolio. |
| (7) | For the period from May 21, 2018 through September 30, 2018 when the Fund was making investments directly in securities. |
References to Portfolio herein are to SMID-Cap Portfolio, a Massachusetts business trust in which the Fund invested all of its investable assets prior to the close of business on May 18, 2018 and which had the same investment objective and policies as the Fund during such period.
| | | | |
| | 10 | | See Notes to Financial Statements. |
Eaton Vance
Atlanta Capital SMID-Cap Fund
March 31, 2021
Financial Highlights — continued
| | | | | | | | | | | | | | | | | | | | | | | | |
| | | Class C | |
| | |
| | | Six Months Ended
March 31, 2021
(Unaudited) | | | Year Ended September 30, | |
| | | 2020 | | | 2019 | | | 2018 | | | 2017 | | | 2016 | |
| | | | | | | |
Net asset value — Beginning of period | | $ | 27.620 | | | $ | 31.700 | | | $ | 31.870 | | | $ | 27.140 | | | $ | 24.320 | | | $ | 22.690 | |
| | | | | | |
| Income (Loss) From Operations | | | | | | | | | | | | | | | | | | | | | | | | |
| | | | | | |
Net investment loss(1) | | $ | (0.176 | ) | | $ | (0.290 | ) | | $ | (0.298 | ) | | $ | (0.310 | ) | | $ | (0.284 | ) | | $ | (0.257 | ) |
| | | | | | |
Net realized and unrealized gain (loss) | | | 7.831 | | | | (1.429 | ) | | | 2.276 | | | | 6.150 | | | | 4.102 | | | | 3.622 | |
| | | | | | |
Total income (loss) from operations | | $ | 7.655 | | | $ | (1.719 | ) | | $ | 1.978 | | | $ | 5.840 | | | $ | 3.818 | | | $ | 3.365 | |
| | | | |
| Less Distributions | | | | | | | | | | | | | | | | | |
| | | | | | |
From net realized gain | | $ | (3.685 | ) | | $ | (2.361 | ) | | $ | (2.148 | ) | | $ | (1.110 | ) | | $ | (0.998 | ) | | $ | (1.735 | ) |
| | | | | | |
Total distributions | | $ | (3.685 | ) | | $ | (2.361 | ) | | $ | (2.148 | ) | | $ | (1.110 | ) | | $ | (0.998 | ) | | $ | (1.735 | ) |
| | | | | | |
Net asset value — End of period | | $ | 31.590 | | | $ | 27.620 | | | $ | 31.700 | | | $ | 31.870 | | | $ | 27.140 | | | $ | 24.320 | |
| | | | | | |
Total Return(2) | | | 30.86 | %(3) | | | (5.89 | )% | | | 7.46 | % | | | 22.09 | % | | | 16.15 | % | | | 15.41 | % |
| | | | |
| Ratios/Supplemental Data | | | | | | | | | | | | | | | | | |
| | | | | | |
Net assets, end of period (000’s omitted) | | $ | 50,375 | | | $ | 101,804 | | | $ | 181,257 | | | $ | 239,937 | | | $ | 226,669 | | | $ | 240,309 | |
| | | | | | |
Ratios (as a percentage of average daily net assets): | | | | | | | | | | | | | | | | | | | | | | | | |
| | | | | | |
Expenses | | | 1.90 | %(4) | | | 1.92 | % | | | 1.92 | % | | | 1.91 | %(5) | | | 1.94 | %(5) | | | 1.96 | %(5) |
| | | | | | |
Net investment loss | | | (1.22 | )%(4) | | | (1.03 | )% | | | (1.03 | )% | | | (1.06 | )%(5) | | | (1.13 | )%(5) | | | (1.10 | )%(5) |
| | | | | | |
Portfolio Turnover of the Portfolio(6) | | | — | | | | — | | | | — | | | | 3 | % | | | 11 | % | | | 17 | % |
| | | | | | |
Portfolio Turnover of the Fund | | | 6 | %(3) | | | 21 | % | | | 16 | % | | | 5 | %(7) | | | — | | | | — | |
| (1) | Computed using average shares outstanding. |
| (2) | Returns are historical and are calculated by determining the percentage change in net asset value with all distributions reinvested and do not reflect the effect of sales charges. |
| (5) | Includes the Fund’s share of the Portfolio’s allocated expenses for the period while the Fund was investing in the Portfolio. |
| (6) | Portfolio turnover represents the rate of portfolio activity for the period while the Fund was investing in the Portfolio. |
| (7) | For the period from May 21, 2018 through September 30, 2018 when the Fund was making investments directly in securities. |
References to Portfolio herein are to SMID-Cap Portfolio, a Massachusetts business trust in which the Fund invested all of its investable assets prior to the close of business on May 18, 2018 and which had the same investment objective and policies as the Fund during such period.
| | | | |
| | 11 | | See Notes to Financial Statements. |
Eaton Vance
Atlanta Capital SMID-Cap Fund
March 31, 2021
Financial Highlights — continued
| | | | | | | | | | | | | | | | | | | | | | | | |
| | | Class I | |
| | |
| | | Six Months Ended
March 31, 2021
(Unaudited) | | | Year Ended September 30, | |
| | | 2020 | | | 2019 | | | 2018 | | | 2017 | | | 2016 | |
| | | | | | | |
Net asset value — Beginning of period | | $ | 34.480 | | | $ | 38.710 | | | $ | 38.030 | | | $ | 31.880 | | | $ | 28.120 | | | $ | 25.740 | |
| | | | | | |
| Income (Loss) From Operations | | | | | | | | | | | | | | | | | | | | | | | | |
| | | | | | |
Net investment loss(1) | | $ | (0.040 | ) | | $ | (0.012 | ) | | $ | (0.009 | ) | | $ | (0.020 | ) | | $ | (0.039 | ) | | $ | (0.027 | ) |
| | | | | | |
Net realized and unrealized gain (loss) | | | 10.015 | | | | (1.767 | ) | | | 2.837 | | | | 7.280 | | | | 4.797 | | | | 4.142 | |
| | | | | | |
Total income (loss) from operations | | $ | 9.975 | | | $ | (1.779 | ) | | $ | 2.828 | | | $ | 7.260 | | | $ | 4.758 | | | $ | 4.115 | |
| | | | |
| Less Distributions | | | | | | | | | | | | | | | | | |
| | | | | | |
From net investment income | | $ | — | | | $ | (0.015 | ) | | $ | — | | | $ | — | | | $ | — | | | $ | — | |
| | | | | | |
From net realized gain | | | (3.685 | ) | | | (2.436 | ) | | | (2.148 | ) | | | (1.110 | ) | | | (0.998 | ) | | | (1.735 | ) |
| | | | | | |
Total distributions | | $ | (3.685 | ) | | $ | (2.451 | ) | | $ | (2.148 | ) | | $ | (1.110 | ) | | $ | (0.998 | ) | | $ | (1.735 | ) |
| | | | | | |
Net asset value — End of period | | $ | 40.770 | | | $ | 34.480 | | | $ | 38.710 | | | $ | 38.030 | | | $ | 31.880 | | | $ | 28.120 | |
| | | | | | |
Total Return(2) | | | 31.50 | %(3) | | | (4.95 | )% | | | 8.55 | % | | | 23.30 | % | | | 17.35 | % | | | 16.56 | % |
| | | | |
| Ratios/Supplemental Data | | | | | | | | | | | | | | | | | |
| | | | | | |
Net assets, end of period (000’s omitted) | | $ | 5,867,609 | | | $ | 5,185,675 | | | $ | 6,906,251 | | | $ | 7,422,332 | | | $ | 6,245,313 | | | $ | 4,816,563 | |
| | | | | | |
Ratios (as a percentage of average daily net assets): | | | | | | | | | | | | | | | | | | | | | | | | |
| | | | | | |
Expenses | | | 0.90 | %(4) | | | 0.92 | % | | | 0.92 | % | | | 0.91 | %(5) | | | 0.94 | %(5) | | | 0.96 | %(5) |
| | | | | | |
Net investment loss | | | (0.21 | )%(4) | | | (0.04 | )% | | | (0.03 | )% | | | (0.06 | )%(5) | | | (0.13 | )%(5) | | | (0.10 | )%(5) |
| | | | | | |
Portfolio Turnover of the Portfolio(6) | | | — | | | | — | | | | — | | | | 3 | % | | | 11 | % | | | 17 | % |
| | | | | | |
Portfolio Turnover of the Fund | | | 6 | %(3) | | | 21 | % | | | 16 | % | | | 5 | %(7) | | | — | | | | — | |
| (1) | Computed using average shares outstanding. |
| (2) | Returns are historical and are calculated by determining the percentage change in net asset value with all distributions reinvested. |
| (5) | Includes the Fund’s share of the Portfolio’s allocated expenses for the period while the Fund was investing in the Portfolio. |
| (6) | Portfolio turnover represents the rate of portfolio activity for the period while the Fund was investing in the Portfolio. |
| (7) | For the period from May 21, 2018 through September 30, 2018 when the Fund was making investments directly in securities. |
References to Portfolio herein are to SMID-Cap Portfolio, a Massachusetts business trust in which the Fund invested all of its investable assets prior to the close of business on May 18, 2018 and which had the same investment objective and policies as the Fund during such period.
| | | | |
| | 12 | | See Notes to Financial Statements. |
Eaton Vance
Atlanta Capital SMID-Cap Fund
March 31, 2021
Financial Highlights — continued
| | | | | | | | | | | | | | | | | | | | | | | | |
| | | Class R | |
| | |
| | | Six Months Ended
March 31, 2021
(Unaudited) | | | Year Ended September 30, | |
| | | 2020 | | | 2019 | | | 2018 | | | 2017 | | | 2016 | |
| | | | | | | |
Net asset value — Beginning of period | | $ | 29.660 | | | $ | 33.710 | | | $ | 33.580 | | | $ | 28.410 | | | $ | 25.290 | | | $ | 23.420 | |
| | | | | | |
| Income (Loss) From Operations | | | | | | | | | | | | | | | | | | | | | | | | |
| | | | | | |
Net investment loss(1) | | $ | (0.113 | ) | | $ | (0.161 | ) | | $ | (0.162 | ) | | $ | (0.171 | ) | | $ | (0.166 | ) | | $ | (0.147 | ) |
| | | | | | |
Net realized and unrealized gain (loss) | | | 8.478 | | | | (1.528 | ) | | | 2.440 | | | | 6.451 | | | | 4.284 | | | | 3.752 | |
| | | | | | |
Total income (loss) from operations | | $ | 8.365 | | | $ | (1.689 | ) | | $ | 2.278 | | | $ | 6.280 | | | $ | 4.118 | | | $ | 3.605 | |
| | | | |
| Less Distributions | | | | | | | | | | | | | | | | | |
| | | | | | |
From net realized gain | | $ | (3.685 | ) | | $ | (2.361 | ) | | $ | (2.148 | ) | | $ | (1.110 | ) | | $ | (0.998 | ) | | $ | (1.735 | ) |
| | | | | | |
Total distributions | | $ | (3.685 | ) | | $ | (2.361 | ) | | $ | (2.148 | ) | | $ | (1.110 | ) | | $ | (0.998 | ) | | $ | (1.735 | ) |
| | | | | | |
Net asset value — End of period | | $ | 34.340 | | | $ | 29.660 | | | $ | 33.710 | | | $ | 33.580 | | | $ | 28.410 | | | $ | 25.290 | |
| | | | | | |
Total Return(2) | | | 31.16 | %(3) | | | (5.43 | )% | | | 8.01 | % | | | 22.67 | % | | | 16.74 | % | | | 16.00 | % |
| | | | |
| Ratios/Supplemental Data | | | | | | | | | | | | | | | | | |
| | | | | | |
Net assets, end of period (000’s omitted) | | $ | 531,258 | | | $ | 480,822 | | | $ | 588,076 | | | $ | 583,049 | | | $ | 458,145 | | | $ | 337,874 | |
| | | | | | |
Ratios (as a percentage of average daily net assets): | | | | | | | | | | | | | | | | | | | | | | | | |
| | | | | | |
Expenses | | | 1.40 | %(4) | | | 1.42 | % | | | 1.42 | % | | | 1.41 | %(5) | | | 1.44 | %(5) | | | 1.46 | %(5) |
| | | | | | |
Net investment loss | | | (0.71 | )%(4) | | | (0.54 | )% | | | (0.53 | )% | | | (0.55 | )%(5) | | | (0.63 | )%(5) | | | (0.60 | )%(5) |
| | | | | | |
Portfolio Turnover of the Portfolio(6) | | | — | | | | — | | | | — | | | | 3 | % | | | 11 | % | | | 17 | % |
| | | | | | |
Portfolio Turnover of the Fund | | | 6 | %(3) | | | 21 | % | | | 16 | % | | | 5 | %(7) | | | — | | | | — | |
| (1) | Computed using average shares outstanding. |
| (2) | Returns are historical and are calculated by determining the percentage change in net asset value with all distributions reinvested. |
| (5) | Includes the Fund’s share of the Portfolio’s allocated expenses for the period while the Fund was investing in the Portfolio. |
| (6) | Portfolio turnover represents the rate of portfolio activity for the period while the Fund was investing in the Portfolio. |
| (7) | For the period from May 21, 2018 through September 30, 2018 when the Fund was making investments directly in securities. |
References to Portfolio herein are to SMID-Cap Portfolio, a Massachusetts business trust in which the Fund invested all of its investable assets prior to the close of business on May 18, 2018 and which had the same investment objective and policies as the Fund during such period.
| | | | |
| | 13 | | See Notes to Financial Statements. |
Eaton Vance
Atlanta Capital SMID-Cap Fund
March 31, 2021
Financial Highlights — continued
| | | | | | | | | | | | | | | | | | | | | | | | |
| | | Class R6 | |
| | |
| | | Six Months Ended
March 31, 2021
(Unaudited) | | | Year Ended September 30, | |
| | | 2020 | | | 2019 | | | 2018 | | | 2017 | | | 2016 | |
| | | | | | | |
Net asset value — Beginning of period | | $ | 34.690 | | | $ | 38.930 | | | $ | 38.200 | | | $ | 31.990 | | | $ | 28.190 | | | $ | 25.780 | |
| | | | | | |
| Income (Loss) From Operations | | | | | | | | | | | | | | | | | | | | | | | | |
| | | | | | |
Net investment income (loss)(1) | | $ | (0.023 | ) | | $ | 0.019 | | | $ | 0.023 | | | $ | 0.016 | | | $ | (0.010 | ) | | $ | (0.002 | ) |
| | | | | | |
Net realized and unrealized gain (loss) | | | 10.078 | | | | (1.774 | ) | | | 2.855 | | | | 7.304 | | | | 4.808 | | | | 4.147 | |
| | | | | | |
Total income (loss) from operations | | $ | 10.055 | | | $ | (1.755 | ) | | $ | 2.878 | | | $ | 7.320 | | | $ | 4.798 | | | $ | 4.145 | |
| | | | |
| Less Distributions | | | | | | | | | | | | | | | | | |
| | | | | | |
From net investment income | | $ | — | | | $ | (0.049 | ) | | $ | — | | | $ | — | | | $ | — | | | $ | — | |
| | | | | | |
From net realized gain | | | (3.685 | ) | | | (2.436 | ) | | | (2.148 | ) | | | (1.110 | ) | | | (0.998 | ) | | | (1.735 | ) |
| | | | | | |
Total distributions | | $ | (3.685 | ) | | $ | (2.485 | ) | | $ | (2.148 | ) | | $ | (1.110 | ) | | $ | (0.998 | ) | | $ | (1.735 | ) |
| | | | | | |
Net asset value — End of period | | $ | 41.060 | | | $ | 34.690 | | | $ | 38.930 | | | $ | 38.200 | | | $ | 31.990 | | | $ | 28.190 | |
| | | | | | |
Total Return(2) | | | 31.54 | %(3) | | | (4.85 | )% | | | 8.64 | % | | | 23.41 | % | | | 17.45 | % | | | 16.66 | % |
| | | | |
| Ratios/Supplemental Data | | | | | | | | | | | | | | | | | |
| | | | | | |
Net assets, end of period (000’s omitted) | | $ | 4,774,756 | | | $ | 3,834,042 | | | $ | 3,638,192 | | | $ | 2,828,862 | | | $ | 1,642,985 | | | $ | 798,553 | |
| | | | | | |
Ratios (as a percentage of average daily net assets): | | | | | | | | | | | | | | | | | | | | | | | | |
| | | | | | |
Expenses | | | 0.81 | %(4) | | | 0.82 | % | | | 0.82 | % | | | 0.82 | %(5) | | | 0.84 | %(5) | | | 0.87 | %(5) |
| | | | | | |
Net investment income (loss) | | | (0.12 | )%(4) | | | 0.06 | % | | | 0.07 | % | | | 0.05 | %(5) | | | (0.03 | )%(5) | | | (0.01 | )%(5) |
| | | | | | |
Portfolio Turnover of the Portfolio(6) | | | — | | | | — | | | | — | | | | 3 | % | | | 11 | % | | | 17 | % |
| | | | | | |
Portfolio Turnover of the Fund | | | 6 | %(3) | | | 21 | % | | | 16 | % | | | 5 | %(7) | | | — | | | | — | |
| (1) | Computed using average shares outstanding. |
| (2) | Returns are historical and are calculated by determining the percentage change in net asset value with all distributions reinvested. |
| (5) | Includes the Fund’s share of the Portfolio’s allocated expenses for the period while the Fund was investing in the Portfolio. |
| (6) | Portfolio turnover represents the rate of portfolio activity for the period while the Fund was investing in the Portfolio. |
| (7) | For the period from May 21, 2018 through September 30, 2018 when the Fund was making investments directly in securities. |
References to Portfolio herein are to SMID-Cap Portfolio, a Massachusetts business trust in which the Fund invested all of its investable assets prior to the close of business on May 18, 2018 and which had the same investment objective and policies as the Fund during such period.
| | | | |
| | 14 | | See Notes to Financial Statements. |
Eaton Vance
Atlanta Capital SMID-Cap Fund
March 31, 2021
Notes to Financial Statements (Unaudited)
1 Significant Accounting Policies
Eaton Vance Atlanta Capital SMID-Cap Fund (the Fund) is a diversified series of Eaton Vance Growth Trust (the Trust). The Trust is a Massachusetts business trust registered under the Investment Company Act of 1940, as amended (the 1940 Act), as an open-end management investment company. The Fund’s investment objective is to seek long-term capital growth. The Fund offers five classes of shares. Class A shares are generally sold subject to a sales charge imposed at time of purchase. Class C shares are sold at net asset value and are generally subject to a contingent deferred sales charge (see Note 5). Effective January 25, 2019, Class C shares generally automatically convert to Class A shares ten years after their purchase and, effective November 5, 2020, automatically convert to Class A shares eight years after their purchase as described in the Fund’s prospectus. Class I, Class R and Class R6 shares are sold at net asset value and are not subject to a sales charge. Each class represents a pro-rata interest in the Fund, but votes separately on class-specific matters and (as noted below) is subject to different expenses. Realized and unrealized gains and losses and net investment income and losses, other than class-specific expenses, are allocated daily to each class of shares based on the relative net assets of each class to the total net assets of the Fund. Sub-accounting, recordkeeping and similar administrative fees payable to financial intermediaries, which are a component of transfer and dividend disbursing agent fees on the Statement of Operations, are not allocated to Class R6 shares. Each class of shares differs in its distribution plan and certain other class-specific expenses.
The following is a summary of significant accounting policies of the Fund. The policies are in conformity with accounting principles generally accepted in the United States of America (U.S. GAAP). The Fund is an investment company and follows accounting and reporting guidance in the Financial Accounting Standards Board (FASB) Accounting Standards Codification Topic 946.
A Investment Valuation — The following methodologies are used to determine the market value or fair value of investments.
Equity Securities. Equity securities listed on a U.S. securities exchange generally are valued at the last sale or closing price on the day of valuation or, if no sales took place on such date, at the mean between the closing bid and ask prices on the exchange where such securities are principally traded. Equity securities listed on the NASDAQ Global or Global Select Market generally are valued at the NASDAQ official closing price. Unlisted or listed securities for which closing sales prices or closing quotations are not available are valued at the mean between the latest available bid and ask prices.
Affiliated Fund. The Fund may invest in Eaton Vance Cash Reserves Fund, LLC (Cash Reserves Fund), an affiliated investment company managed by Eaton Vance Management (EVM). While Cash Reserves Fund is not a registered money market mutual fund, it conducts all of its investment activities in accordance with the requirements of Rule 2a-7 under the 1940 Act. Investments in Cash Reserves Fund are valued at the closing net asset value per unit on the valuation day. Cash Reserves Fund generally values its investment securities based on available market quotations provided by a third party pricing service.
Fair Valuation. Investments for which valuations or market quotations are not readily available or are deemed unreliable are valued at fair value using methods determined in good faith by or at the direction of the Trustees of the Fund in a manner that most fairly reflects the security’s “fair value”, which is the amount that the Fund might reasonably expect to receive for the security upon its current sale in the ordinary course. Each such determination is based on a consideration of relevant factors, which are likely to vary from one pricing context to another. These factors may include, but are not limited to, the type of security, the existence of any contractual restrictions on the security’s disposition, the price and extent of public trading in similar securities of the issuer or of comparable companies or entities, quotations or relevant information obtained from broker/dealers or other market participants, information obtained from the issuer, analysts, and/or the appropriate stock exchange (for exchange-traded securities), an analysis of the company’s or entity’s financial statements, and an evaluation of the forces that influence the issuer and the market(s) in which the security is purchased and sold.
B Investment Transactions — Investment transactions for financial statement purposes are accounted for on a trade date basis. Realized gains and losses on investments sold are determined on the basis of identified cost.
C Income — Dividend income is recorded on the ex-dividend date for dividends received in cash and/or securities.
D Federal Taxes — The Fund’s policy is to comply with the provisions of the Internal Revenue Code applicable to regulated investment companies and to distribute to shareholders each year substantially all of its net investment income, and all or substantially all of its net realized capital gains. Accordingly, no provision for federal income or excise tax is necessary.
As of March 31, 2021, the Fund had no uncertain tax positions that would require financial statement recognition, de-recognition, or disclosure. The Fund files a U.S. federal income tax return annually after its fiscal year-end, which is subject to examination by the Internal Revenue Service for a period of three years from the date of filing.
E Expenses — The majority of expenses of the Trust are directly identifiable to an individual fund. Expenses which are not readily identifiable to a specific fund are allocated taking into consideration, among other things, the nature and type of expense and the relative size of the funds.
F Use of Estimates — The preparation of the financial statements in conformity with U.S. GAAP requires management to make estimates and assumptions that affect the reported amounts of assets and liabilities at the date of the financial statements and the reported amounts of income and expense during the reporting period. Actual results could differ from those estimates.
G Indemnifications — Under the Trust’s organizational documents, its officers and Trustees may be indemnified against certain liabilities and expenses arising out of the performance of their duties to the Fund. Under Massachusetts law, if certain conditions prevail, shareholders of a Massachusetts business
Eaton Vance
Atlanta Capital SMID-Cap Fund
March 31, 2021
Notes to Financial Statements (Unaudited) — continued
trust (such as the Trust) could be deemed to have personal liability for the obligations of the Trust. However, the Trust’s Declaration of Trust contains an express disclaimer of liability on the part of Fund shareholders and the By-laws provide that the Trust shall assume, upon request by the shareholder, the defense on behalf of any Fund shareholders. Moreover, the By-laws also provide for indemnification out of Fund property of any shareholder held personally liable solely by reason of being or having been a shareholder for all loss or expense arising from such liability. Additionally, in the normal course of business, the Fund enters into agreements with service providers that may contain indemnification clauses. The Fund’s maximum exposure under these arrangements is unknown as this would involve future claims that may be made against the Fund that have not yet occurred.
H Interim Financial Statements — The interim financial statements relating to March 31, 2021 and for the six months then ended have not been audited by an independent registered public accounting firm, but in the opinion of the Fund’s management, reflect all adjustments, consisting only of normal recurring adjustments, necessary for the fair presentation of the financial statements.
2 Distributions to Shareholders and Income Tax Information
It is the present policy of the Fund to make at least one distribution annually (normally in December) of all or substantially all of its net investment income and to distribute annually all or substantially all of its net realized capital gains. Distributions to shareholders are recorded on the ex-dividend date. Distributions are declared separately for each class of shares. Shareholders may reinvest income and capital gain distributions in additional shares of the same class of the Fund at the net asset value as of the ex-dividend date or, at the election of the shareholder, receive distributions in cash. Distributions to shareholders are determined in accordance with income tax regulations, which may differ from U.S. GAAP. As required by U.S. GAAP, only distributions in excess of tax basis earnings and profits are reported in the financial statements as a return of capital. Permanent differences between book and tax accounting relating to distributions are reclassified to paid-in capital. For tax purposes, distributions from short-term capital gains are considered to be from ordinary income.
At September 30, 2020, the Fund had a late year ordinary loss of $5,374,664 which it has elected to defer to the following taxable year pursuant to income tax regulations. Late year ordinary losses represent certain specified losses realized in that portion of a taxable year after October 31 that are treated as ordinary for tax purposes plus ordinary losses attributable to that portion of a taxable year after December 31.
The cost and unrealized appreciation (depreciation) of investments of the Fund at March 31, 2021, as determined on a federal income tax basis, were as follows:
| | | | |
| |
Aggregate cost | | $ | 7,125,439,679 | |
| |
Gross unrealized appreciation | | $ | 5,587,584,456 | |
| |
Gross unrealized depreciation | | | — | |
| |
Net unrealized appreciation | | $ | 5,587,584,456 | |
3 Investment Adviser Fee and Other Transactions with Affiliates
The investment adviser fee is earned by Boston Management and Research (BMR) as compensation for investment advisory services rendered to the Fund. On March 1, 2021, Morgan Stanley acquired Eaton Vance Corp. (the “Transaction”) and BMR became an indirect, wholly-owned subsidiary of Morgan Stanley. In connection with the Transaction, the Fund entered into a new investment advisory agreement (the “New Agreement”) with BMR, which took effect on March 1, 2021. The Fund’s prior fee reduction agreement was incorporated into the New Agreement. Pursuant to the New Agreement (and the Fund’s investment advisory agreement with BMR in effect prior to March 1, 2021), the fee is computed at an annual rate of 1.00% of the Fund’s average daily net assets up to $500 million, 0.9375% on net assets of $500 million but less than $1 billion, 0.875% on net assets of $1 billion but less than $2.5 billion, 0.8125% on net assets of $2.5 billion but less than $5 billion, 0.75% on net assets of $5 billion but less than $7.5 billion, 0.73% on net assets of $7.5 billion but less than $10 billion, 0.72% on net assets of $10 billion but less than $15 billion and 0.70% on net assets of $15 billion and over, and is payable monthly. Pursuant to an amendment to the New Agreement, which took effect on May 1, 2021, the fee will be computed at an annual rate of 0.72% on net assets of $7.5 billion but less than $10 billion, 0.71% on net assets of $10 billion but less than $15 billion and 0.69% on net assets of $15 billion and over. For the six months ended March 31, 2021, the investment adviser fee amounted to $47,664,287 or 0.79% (annualized) of the Fund’s average daily net assets. EVM, an affiliate of BMR and, effective March 1, 2021, an indirect, wholly-owned subsidiary of Morgan Stanley, serves as administrator of the Fund, but receives no compensation.
Pursuant to an investment sub-advisory agreement, BMR has delegated the investment management of the Fund to Atlanta Capital Management Company, LLC (Atlanta Capital), an affiliate of BMR and, effective March 1, 2021, an indirect, wholly-owned subsidiary of Morgan Stanley. In connection with the Transaction, BMR entered into a new sub-advisory agreement with Atlanta Capital, which took effect on March 1, 2021. Subsequently, there was an amendment to the new sub-advisory agreement, which took effect on May 1, 2021. BMR pays Atlanta Capital a portion of its investment adviser fee for sub-advisory services provided to the Fund. The Fund may invest its cash in Cash Reserves Fund. EVM does not currently receive a fee for advisory services provided to Cash Reserves Fund.
Eaton Vance
Atlanta Capital SMID-Cap Fund
March 31, 2021
Notes to Financial Statements (Unaudited) — continued
EVM provides sub-transfer agency and related services to the Fund pursuant to a Sub-Transfer Agency Support Services Agreement. For the six months ended March 31, 2021, EVM earned $2,099 from the Fund pursuant to such agreement, which is included in transfer and dividend disbursing agent fees on the Statement of Operations. The Fund was informed that Eaton Vance Distributors, Inc. (EVD), an affiliate of EVM and the Fund’s principal underwriter, received $14,101 as its portion of the sales charge on sales of Class A shares for the six months ended March 31, 2021. EVD also received distribution and service fees from Class A, Class C and Class R shares (see Note 4) and contingent deferred sales charges (see Note 5).
Trustees and officers of the Fund who are members of EVM’s or BMR’s organizations receive remuneration for their services to the Fund out of the investment adviser fee. Trustees of the Fund who are not affiliated with the investment adviser may elect to defer receipt of all or a percentage of their annual fees in accordance with the terms of the Trustees Deferred Compensation Plan. For the six months ended March 31, 2021, no significant amounts have been deferred. Certain officers and Trustees of the Fund are officers of the above organizations.
4 Distribution Plans
The Fund has in effect a distribution plan for Class A shares (Class A Plan) pursuant to Rule 12b-1 under the 1940 Act. Pursuant to the Class A Plan, the Fund pays EVD a distribution and service fee of 0.25% per annum of its average daily net assets attributable to Class A shares for distribution services and facilities provided to the Fund by EVD, as well as for personal services and/or the maintenance of shareholder accounts. Distribution and service fees paid or accrued to EVD for the six months ended March 31, 2021 amounted to $1,842,481 for Class A shares.
The Fund also has in effect distribution plans for Class C shares (Class C Plan) and Class R shares (Class R Plan) pursuant to Rule 12b-1 under the 1940 Act. Pursuant to the Class C Plan, the Fund pays EVD amounts equal to 0.75% per annum of its average daily net assets attributable to Class C shares for providing ongoing distribution services and facilities to the Fund. For the six months ended March 31, 2021, the Fund paid or accrued to EVD $259,081 for Class C shares.
The Class R Plan requires the Fund to pay EVD an amount up to 0.50% per annum of its average daily net assets attributable to Class R shares for providing ongoing distribution services and facilities to the Fund. The Trustees of the Trust have currently limited Class R distribution payments to 0.25% per annum of the average daily net assets attributable to Class R shares. For the six months ended March 31, 2021, the Fund paid or accrued to EVD $645,710 for Class R shares.
Pursuant to the Class C and Class R Plans, the Fund also makes payments of service fees to EVD, financial intermediaries and other persons in amounts equal to 0.25% per annum of its average daily net assets attributable to that class. Service fees paid or accrued are for personal services and/or the maintenance of shareholder accounts. They are separate and distinct from the sales commissions and distribution fees payable to EVD. Service fees paid or accrued for the six months ended March 31, 2021 amounted to $86,360 and $645,710 for Class C and Class R shares, respectively.
Distribution and service fees are subject to the limitations contained in the Financial Industry Regulatory Authority Rule 2341(d).
5 Contingent Deferred Sales Charges
A contingent deferred sales charge (CDSC) of 1% generally is imposed on redemptions of Class C shares made within 12 months of purchase. Class A shares may be subject to a 1% CDSC if redeemed within 18 months of purchase (depending on the circumstances of purchase). Generally, the CDSC is based upon the lower of the net asset value at date of redemption or date of purchase. No charge is levied on shares acquired by reinvestment of dividends or capital gain distributions. For the six months ended March 31, 2021, the Fund was informed that EVD received approximately $1,000 of CDSCs paid by Class C shareholders and no CDSCs paid by Class A shareholders.
6 Purchases and Sales of Investments
Purchases and sales of investments, other than short-term obligations, aggregated $670,234,696 and $2,180,561,484, respectively, for the six months ended March 31, 2021.
Eaton Vance
Atlanta Capital SMID-Cap Fund
March 31, 2021
Notes to Financial Statements (Unaudited) — continued
7 Shares of Beneficial Interest
The Fund’s Declaration of Trust permits the Trustees to issue an unlimited number of full and fractional shares of beneficial interest (without par value). Such shares may be issued in a number of different series (such as the Fund) and classes. Transactions in Fund shares were as follows:
| | | | | | | | |
| Class A | | Six Months Ended
March 31, 2021
(Unaudited) | | | Year Ended
September 30, 2020 | |
| | |
Sales | | | 3,761,638 | | | | 8,902,972 | |
| | |
Issued to shareholders electing to receive payments of distributions in Fund shares | | | 4,654,382 | | | | 3,228,889 | |
| | |
Redemptions | | | (13,371,241 | ) | | | (19,126,574 | ) |
| | |
Converted from Class C shares | | | 1,918,080 | | | | 520,676 | |
| | |
Net decrease | | | (3,037,141 | ) | | | (6,474,037 | ) |
| | |
| Class C | | Six Months Ended
March 31, 2021
(Unaudited) | | | Year Ended
September 30, 2020 | |
| | |
Sales | | | 112,729 | | | | 127,999 | |
| | |
Issued to shareholders electing to receive payments of distributions in Fund shares | | | 492,072 | | | | 393,317 | |
| | |
Redemptions | | | (531,227 | ) | | | (1,976,043 | ) |
| | |
Converted to Class A shares | | | (2,165,130 | ) | | | (576,624 | ) |
| | |
Net decrease | | | (2,091,556 | ) | | | (2,031,351 | ) |
| | |
| Class I | | Six Months Ended
March 31, 2021
(Unaudited) | | | Year Ended
September 30, 2020 | |
| | |
Sales | | | 17,406,003 | | | | 37,203,522 | |
| | |
Issued to shareholders electing to receive payments of distributions in Fund shares | | | 13,231,346 | | | | 9,902,306 | |
| | |
Redemptions | | | (37,113,267 | ) | | | (75,102,431 | ) |
| | |
Net decrease | | | (6,475,918 | ) | | | (27,996,603 | ) |
| | |
| Class R | | Six Months Ended
March 31, 2021
(Unaudited) | | | Year Ended
September 30, 2020 | |
| | |
Sales | | | 456,954 | | | | 1,865,358 | |
| | |
Issued to shareholders electing to receive payments of distributions in Fund shares | | | 2,053,898 | | | | 1,272,137 | |
| | |
Redemptions | | | (3,252,616 | ) | | | (4,369,936 | ) |
| | |
Net decrease | | | (741,764 | ) | | | (1,232,441 | ) |
Eaton Vance
Atlanta Capital SMID-Cap Fund
March 31, 2021
Notes to Financial Statements (Unaudited) — continued
| | | | | | | | |
| Class R6 | | Six Months Ended
March 31, 2021
(Unaudited) | | | Year Ended
September 30, 2020 | |
| | |
Sales | | | 18,033,002 | | | | 38,372,196 | |
| | |
Issued to shareholders electing to receive payments of distributions in Fund shares | | | 10,372,014 | | | | 5,509,189 | |
| | |
Redemptions | | | (22,654,984 | ) | | | (26,798,959 | ) |
| | |
Net increase | | | 5,750,032 | | | | 17,082,426 | |
8 Line of Credit
The Fund participates with other portfolios and funds managed by EVM and its affiliates in an $800 million unsecured line of credit agreement with a group of banks, which is in effect through October 26, 2021. Borrowings are made by the Fund solely for temporary purposes related to redemptions and other short-term cash needs. Interest is charged to the Fund based on its borrowings at an amount above either the Eurodollar rate or Federal Funds rate. In addition, a fee computed at an annual rate of 0.15% on the daily unused portion of the line of credit is allocated among the participating portfolios and funds at the end of each quarter. In connection with the renewal of the agreement in October 2020, an upfront fee and arrangement fee totaling $950,000 was incurred that was allocated to the participating portfolios and funds. Because the line of credit is not available exclusively to the Fund, it may be unable to borrow some or all of its requested amounts at any particular time. The Fund did not have any significant borrowings or allocated fees during the six months ended March 31, 2021.
9 Securities Lending Agreement
The Fund has established a securities lending agreement with State Street Bank and Trust Company (SSBT) as securities lending agent in which the Fund lends portfolio securities to qualified borrowers in exchange for collateral consisting of either cash or securities issued or guaranteed by the U.S. government or its agencies or instrumentalities in an amount at least equal to the market value of the securities on loan. The market value of securities loaned is determined daily and any additional required collateral is delivered to the Fund on the next business day. Cash collateral is invested in the State Street Navigator Securities Lending Government Money Market Portfolio, a money market fund registered under the 1940 Act. The Fund earns interest on the amount invested but it must pay (and at times receive from) the broker a loan rebate fee computed as a varying percentage of the collateral received. For security loans secured by non-cash collateral, the Fund earns a negotiated lending fee from the borrower. A portion of the income earned by the Fund from its investment of cash collateral, net of rebate fees, and lending fees received is allocated to SSBT for its services as lending agent and the portion allocated to the Fund is presented as securities lending income, net on the Statement of Operations. Non-cash collateral is held by the lending agent on behalf of the Fund and cannot be sold or re-pledged by the Fund; accordingly, such collateral is not reflected in the Statement of Assets and Liabilities.
The Fund is subject to possible delay in the recovery of loaned securities. Pursuant to the securities lending agreement, SSBT has provided indemnification to the Fund in the event of default by a borrower with respect to a loan. The Fund bears the risk of loss with respect to the investment of cash collateral.
At March 31, 2021, the value of the securities loaned (all common stock) and the value of the collateral received, which exceeded the value of the securities loaned, amounted to $13,742,287 and $14,604,420, respectively. Collateral received was comprised of U.S. government and/or agencies securities. The securities lending transactions have no contractual maturity date and each of the Fund and borrower has the option to terminate a loan at any time.
Eaton Vance
Atlanta Capital SMID-Cap Fund
March 31, 2021
Notes to Financial Statements (Unaudited) — continued
10 Investments in Affiliated Companies/Funds
An affiliated company is a company in which a fund has a direct or indirect ownership of, control of, or voting power of 5 percent or more of the outstanding voting shares, or a company that is under common ownership or control with a fund. At March 31, 2021, the value of the Fund’s investments in affiliated companies and funds was $1,789,760,108, which represents 14.1% of the Fund’s net assets. Transactions in affiliated companies and funds by the Fund for the six months ended March 31, 2021 were as follows:
| | | | | | | | | | | | | | | | | | | | | | | | | | | | | | | | |
Name of
affiliated
company/fund | | Value, beginning
of period | | | Purchases | | | Sales proceeds | | | Net realized gain (loss) | | | Change in
unrealized
appreciation
(depreciation) | | | Value, end of period | | | Dividend
income | | | Shares/
Units, end
of period | |
|
Common Stocks * | |
| | | | | | | | |
Blackbaud, Inc.(1)(2) | | $ | 182,967,527 | | | $ | — | | | $ | (40,599,599 | ) | | $ | (2,194,288 | ) | | $ | 51,893,973 | | | $ | 192,067,613 | | | $ | — | | | | 2,702,133 | |
| | | | | | | | |
Carlisle Cos., Inc. (1) | | | 352,737,154 | | | | 43,300,842 | | | | (25,580,383 | ) | | | 1,022,556 | | | | 118,973,827 | | | | 490,453,996 | | | | 3,009,073 | | | | 2,980,034 | |
| | | | | | | | |
Envista Holdings Corp.(2) | | | 292,019,264 | | | | — | | | | (78,245,711 | ) | | | 13,632,246 | | | | 172,435,874 | | | | 399,841,673 | | | | — | | | | 9,800,041 | |
| | | | | | | | |
Hexcel Corp.(2) | | | 180,913,846 | | | | — | | | | (76,843,182 | ) | | | (46,449,806 | ) | | | 158,380,214 | | | | — | (3) | | | — | | | | — | (3) |
| | | | | | | | |
Kirby Corp.(2) | | | 114,149,192 | | | | — | | | | — | | | | — | | | | 76,088,942 | | | | 190,238,134 | | | | — | | | | 3,155,908 | |
| | | | | | | | |
Sally Beauty Holdings, Inc. | | | 70,635,813 | | | | — | | | | (73,736,721 | ) | | | (117,562,850 | ) | | | 120,663,758 | | | | — | | | | — | | | | — | |
| | | | | | | | |
Terminix Global Holdings, Inc.(2) | | | 301,927,931 | | | | — | | | | (22,319,444 | ) | | | 2,676,594 | | | | 56,215,871 | | | | 338,500,952 | | | | — | | | | 7,100,922 | |
| | | | | | | | |
WEX, Inc.(2) | | | 351,240,560 | | | | | | | | (102,735,012 | ) | | | 25,536,153 | | | | 149,930,913 | | | | — | (3) | | | — | | | | — | (3) |
|
Short-Term Investments | |
| | | | | | | | |
Eaton Vance Cash Reserves Fund, LLC | | | 203,022,465 | | | | 1,240,953,230 | | | | (1,265,317,955 | ) | | | — | | | | — | | | | 178,657,740 | | | | 86,978 | | | | 178,657,740 | |
| | | | | | | | |
Totals | | | | | | | | | | | | | | $ | (123,339,395 | ) | | $ | 904,583,372 | | | $ | 1,789,760,108 | | | $ | 3,096,051 | | | | | |
| * | The related industry is the same as the presentation in the Portfolio of Investments. |
| (1) | All or portion of this security was on loan at March 31, 2021. |
| (2) | Non-income producing security. |
| (3) | Company is no longer an affiliate as of March 31, 2021. |
11 Fair Value Measurements
Under generally accepted accounting principles for fair value measurements, a three-tier hierarchy to prioritize the assumptions, referred to as inputs, is used in valuation techniques to measure fair value. The three-tier hierarchy of inputs is summarized in the three broad levels listed below.
| • | | Level 1 – quoted prices in active markets for identical investments |
| • | | Level 2 – other significant observable inputs (including quoted prices for similar investments, interest rates, prepayment speeds, credit risk, etc.) |
| • | | Level 3 – significant unobservable inputs (including a fund’s own assumptions in determining the fair value of investments) |
In cases where the inputs used to measure fair value fall in different levels of the fair value hierarchy, the level disclosed is determined based on the lowest level input that is significant to the fair value measurement in its entirety. The inputs or methodology used for valuing securities are not necessarily an indication of the risk associated with investing in those securities.
Eaton Vance
Atlanta Capital SMID-Cap Fund
March 31, 2021
Notes to Financial Statements (Unaudited) — continued
At March 31, 2021, the hierarchy of inputs used in valuing the Fund’s investments, which are carried at value, were as follows:
| | | | | | | | | | | | | | | | |
| Asset Description | | Level 1 | | | Level 2 | | | Level 3 | | | Total | |
| | | | |
Common Stocks | | $ | 12,534,366,395 | * | | $ | — | | | $ | — | | | $ | 12,534,366,395 | |
| | | | |
Short-Term Investments | | | — | | | | 178,657,740 | | | | — | | | | 178,657,740 | |
| | | | |
Total Investments | | $ | 12,534,366,395 | | | $ | 178,657,740 | | | $ | — | | | $ | 12,713,024,135 | |
| * | The level classification by major category of investments is the same as the category presentation in the Portfolio of Investments. |
12 Risks and Uncertainties
Pandemic Risk
An outbreak of respiratory disease caused by a novel coronavirus was first detected in China in late 2019 and subsequently spread internationally. This coronavirus has resulted in closing borders, enhanced health screenings, changes to healthcare service preparation and delivery, quarantines, cancellations, disruptions to supply chains and customer activity, as well as general concern and uncertainty. Health crises caused by outbreaks, such as the coronavirus outbreak, may exacerbate other pre-existing political, social and economic risks and disrupt normal market conditions and operations. The impact of this outbreak has negatively affected the worldwide economy, the economies of individual countries, individual companies, and the market in general, and may continue to do so in significant and unforeseen ways, as may other epidemics and pandemics that may arise in the future. Any such impact could adversely affect the Fund’s performance, or the performance of the securities in which the Fund invests.
Eaton Vance
Atlanta Capital SMID-Cap Fund
March 31, 2021
Joint Special Meeting of Shareholders (Unaudited)
Eaton Vance Atlanta Capital SMID-Cap Fund (the “Fund”) held a Joint Special Meeting of Shareholders with certain other Eaton Vance funds on February 18, 2021 and adjourned to February 26, 2021 for the following purposes: (1) to approve a new investment advisory agreement with Boston Management and Research to serve as the Fund’s investment adviser (“Proposal 1”); and (2) to approve a new investment sub-advisory agreement with Atlanta Capital Management Company, LLC to serve as the Fund’s investment sub-adviser (“Proposal 2”). The shareholder meeting results are as follows:
| | | | | | | | | | | | | | | | |
| | | Number of Shares(1) | |
| | | For | | | Against | | | Abstain(2) | | | Broker
Non-Votes(2) | |
| | | | |
Proposal 1 | | | 165,886,691.148 | | | | 2,956,121.540 | | | | 5,578,127.765 | | | | 0 | |
| | | | |
Proposal 2 | | | 165,318,663.649 | | | | 3,299,265.363 | | | | 5,803,011.441 | | | | 0 | |
| (1) | Fractional shares were voted proportionately. |
| (2) | Abstentions and broker non-votes (i.e., shares for which a broker returns a proxy but for which (i) the beneficial owner has not voted and (ii) the broker holding the shares does not have discretionary authority to vote on the particular matter) were treated as shares that were present at the meeting for purposes of establishing a quorum, but had the effect of a negative vote on Proposal 1 and Proposal 2. |
Eaton Vance
Atlanta Capital SMID-Cap Fund
March 31, 2021
Board of Trustees’ Contract Approval
Overview of the Contract Review Process
Even though the following description of the Board’s (as defined below) consideration of investment advisory and, as applicable, sub-advisory agreements covers multiple funds, for purposes of this shareholder report, the description is only relevant as to Eaton Vance Atlanta Capital SMID-Cap Fund.
| | | | |
| Fund | | Investment Adviser | | Investment Sub-Adviser |
| | |
Eaton Vance Atlanta Capital SMID-Cap Fund | | Boston Management and Research | | Atlanta Capital Management Company, LLC |
At a meeting held on November 24, 2020 (the “November Meeting”), the Board of each Eaton Vance open-end Fund and portfolios in which each such Fund invests, as applicable (each, a “Fund” and, collectively, the “Funds”), including a majority of the Board members (the “Independent Trustees”) who are not “interested persons” (as defined in the Investment Company Act of 1940 (the “1940 Act”)) of the Funds, Eaton Vance Management (“EVM”) or Boston Management and Research (“BMR” and, together with EVM, the “Advisers”), voted to approve a new investment advisory agreement between each Fund and either EVM or BMR (the “New Investment Advisory Agreements”) and, for certain Funds, a new investment sub-advisory agreement between an Adviser and the applicable Sub-Adviser (the “New Investment Sub-Advisory Agreements”(1) and, together with the New Investment Advisory Agreements, the “New Agreements”), each of which is intended to go into effect upon the completion of the Transaction (as defined below), as more fully described below. In voting its approval of the New Agreements at the November Meeting, the Board relied on an order issued by the Securities and Exchange Commission in response to the impacts of the COVID-19 pandemic that provided temporary relief from the in-person meeting requirements under Section 15 of the 1940 Act.
In voting its approval of the New Agreements, the Board of each Fund relied upon the recommendation of its Contract Review Committee, which is a committee comprised exclusively of Independent Trustees. Prior to and during meetings leading up to the November Meeting, the Contract Review Committee reviewed and discussed information furnished by the Advisers, the Sub-Advisers, and Morgan Stanley, as requested by the Independent Trustees, that the Contract Review Committee considered reasonably necessary to evaluate the terms of the New Agreements and to form its recommendation. Such information included, among other things, the terms and anticipated impacts of Morgan Stanley’s pending acquisition of Eaton Vance Corp. (the “Transaction”) on the Funds and their shareholders. In addition to considering information furnished specifically to evaluate the impact of the Transaction on the Funds and their respective shareholders, the Board and its Contract Review Committee also considered information furnished for prior meetings of the Board and its committees, including information provided in connection with the annual contract review process for the Funds, which most recently culminated in April 2020 (the “2020 Annual Approval Process”).
The Board of each Fund, including the Independent Trustees, concluded that the applicable New Investment Advisory Agreement and, as applicable, New Investment Sub-Advisory Agreement, including the fees payable thereunder, was fair and reasonable, and it voted to approve the New Investment Advisory Agreement and, as applicable, New Investment Sub-Advisory Agreement and to recommend that shareholders do so as well.
Shortly after the announcement of the Transaction, the Board, including all of the Independent Trustees, met with senior representatives from the Advisers and Morgan Stanley at its meeting held on October 13, 2020 to discuss certain aspects of the Transaction and the expected impacts of the Transaction on the Funds and their shareholders. As part of the Board’s evaluation process, counsel to the Independent Trustees, on behalf of the Contract Review Committee, requested additional information to assist the Independent Trustees in their evaluation of the New Agreements and the implications of the Transaction, as well as other contractual arrangements that may be affected by the Transaction. The Contract Review Committee considered information furnished by the Advisers and Morgan Stanley, their respective affiliates, and, as applicable, the Sub-Advisers during meetings on November 5, 2020, November 10, 2020, November 13, 2020, November 17, 2020 and November 24, 2020.
During its meetings on November 10, 2020 and November 17, 2020, the Contract Review Committee further discussed the approval of the New Agreements with senior representatives of the Advisers, the Affiliated Sub-Advisers, and Morgan Stanley. The representatives from the Advisers, the Affiliated Sub-Advisers, and Morgan Stanley each made presentations to, and responded to questions from, the Independent Trustees. The Contract Review Committee considered the Advisers’, the Affiliated Sub-Advisers’ and Morgan Stanley’s responses related to the Transaction and specifically to the Funds, as well as information received in connection with the 2020 Annual Approval Process, with respect to its evaluation of the New Agreements. Among other information, the Board considered:
Information about the Transaction and its Terms
| | • | | Information about the material terms and conditions, and expected impacts, of the Transaction that relate to the Funds, including the expected impacts on the businesses conducted by the Advisers, the Affiliated Sub-Advisers and Eaton Vance Distributors, Inc., as the distributor of Fund shares; |
| | • | | Information about the advantages of the Transaction as they relate to the Funds and their shareholders; |
| (1) | With respect to certain of the Funds, the applicable Adviser is currently a party to a sub-advisory agreement (collectively, the “Current Sub-Advisory Agreements”) with Atlanta Capital Management Company, LLC (“Atlanta Capital”), BMO Global Asset Management (Asia) Limited, Eaton Vance Advisers International Ltd. (“EVAIL”), Goldman Sachs Asset Management, L.P., Hexavest Inc. (“Hexavest”), Parametric Portfolio Associates LLC (“Parametric”) or Richard Bernstein Advisors LLC (collectively, the “Sub-Advisers” and, with respect to Atlanta Capital, EVAIL, Hexavest and Parametric, each an affiliate of the Advisers, the “Affiliated Sub-Advisers”). Accordingly, references to the “Sub-Advisers,” the “Affiliated Sub-Advisers” or the “New Sub-Advisory Agreements” are not applicable to all Funds. |
Eaton Vance
Atlanta Capital SMID-Cap Fund
March 31, 2021
Board of Trustees’ Contract Approval — continued
| | • | | A commitment that the Funds would not bear any expenses, directly or indirectly, in connection with the Transaction; |
| | • | | A commitment that, for a period of three years after the Closing, at least 75% of each Fund’s Board members must not be “interested persons” (as defined in the 1940 Act) of the investment adviser (or predecessor investment adviser, if applicable) pursuant to Section 15(f)(1)(A) of the 1940 Act; |
| | • | | A commitment that Morgan Stanley would use its reasonable best efforts to ensure that it did not impose any “unfair burden” (as that term is used in section 15(f)(1)(B) of the 1940 Act) on the Funds as a result of the Transaction; |
| | • | | Information with respect to personnel and/or other resources of the Advisers and their affiliates, including the Affiliated Sub-Advisers, as a result of the Transaction, as well as any expected changes to compensation, including any retention-based compensation intended to incentivize key personnel at the Advisers and their affiliates, including the Affiliated Sub-Advisers; |
| | • | | Information regarding any changes that are expected with respect to the Funds’ slate of officers as a result of the Transaction; |
Information about Morgan Stanley
| | • | | Information about Morgan Stanley’s overall business, including information about the advisory, brokerage and related businesses that Morgan Stanley operates; |
| | • | | Information about Morgan Stanley’s financial condition, including its access to capital and other resources required to support the investment advisory businesses related to the Funds; |
| | • | | Information on how the Funds are expected to fit within Morgan Stanley’s overall business strategy, and any changes that Morgan Stanley contemplates implementing to the Funds in the short- or long-term following the closing of the Transaction (the “Closing”); |
| | • | | Information regarding risk management functions at Morgan Stanley and its affiliates, including how existing risk management protocols and procedures may impact the Funds and/or the businesses of the Advisers and their affiliates, including the Affiliated Sub-Advisers, as they relate to the Funds; |
| | • | | Information on the anticipated benefits of the Transaction to the Funds with respect to potential additional distribution capabilities and the ability to access new markets and customer segments through Morgan Stanley’s distribution network, including, in particular, its institutional client base; |
| | • | | Information regarding the financial condition and reputation of Morgan Stanley, its worldwide presence, experience as a fund sponsor and manager, commitment to maintain a high level of cooperation with, and support to, the Funds, strong client service capabilities, and relationships in the asset management industry; |
Information about the New Agreements for Funds
| | • | | A representation that, after the Closing, all of the Funds will continue to be advised by their current Adviser and Sub-Adviser, as applicable; |
| | • | | Information regarding the terms of the New Agreements, including certain changes as compared to the current investment advisory agreement between each Fund and its Adviser (collectively, the “Current Advisory Agreements”) and, as applicable, the current investment sub-advisory agreement between a Fund and a Sub-Adviser (together with the Current Advisory Agreements, the “Current Agreements”); |
| | • | | Information confirming that the fee rates payable under the New Agreements are not changed as compared to the Current Agreements; |
| | • | | A representation that the New Agreements will not cause any diminution in the nature, extent and quality of services provided by the Advisers and the Sub-Advisers to the Funds and their respective shareholders, including with respect to compliance and other non-advisory services; |
Information about Fund Performance, Fees and Expenses
| | • | | A report from an independent data provider comparing the investment performance of each Fund (including, as relevant, total return data, income data, Sharpe ratios and information ratios) to the investment performance of comparable funds and, as applicable, benchmark indices, over various time periods as of the 2020 Annual Approval Process, as well as performance information as of a more recent date; |
| | • | | A report from an independent data provider comparing each Fund’s total expense ratio (and its components) to those of comparable funds as of the 2020 Annual Approval Process, as well as fee and expense information as of a more recent date; |
| | • | | In certain instances, data regarding investment performance relative to customized groups of peer funds and blended indices identified by the Advisers in consultation with the Portfolio Management Committee of the Board as of the 2020 Annual Approval Process, as well as corresponding performance information as of a more recent date; |
| | • | | Comparative information concerning the fees charged and services provided by the Adviser and the Sub-Adviser to each Fund in managing other accounts (which may include other mutual funds, collective investment funds and institutional accounts) using investment strategies and techniques similar to those used in managing such Fund(s), if any; |
| | • | | Profitability analyses of the Advisers and the Affiliated Sub-Advisers, as applicable, with respect to each of the Funds as of the 2020 Annual Approval Process, as well as information regarding the impact of the Transaction on profitability; |
Information about Portfolio Management and Trading
| | • | | Descriptions of the investment management services currently provided and expected to be provided to each Fund after the Transaction, as well as each of the Funds’ investment strategies and policies; |
| | • | | The procedures and processes used to determine the fair value of Fund assets, when necessary, and actions taken to monitor and test the effectiveness of such procedures and processes; |
| | • | | Information about any changes to the policies and practices of the Advisers and, as applicable, each Fund’s Sub-Adviser with respect to trading, including their processes for seeking best execution of portfolio transactions; |
Eaton Vance
Atlanta Capital SMID-Cap Fund
March 31, 2021
Board of Trustees’ Contract Approval — continued
| | • | | Information regarding the impact on trading and access to capital markets associated with the Funds’ affiliations with Morgan Stanley and its affiliates, including potential restrictions with respect to the Funds’ ability to execute portfolio transactions with Morgan Stanley and its affiliates; |
Information about the Advisers and the Sub-Advisers
| | • | | Information about the financial results and condition of the Advisers and the Affiliated Sub-Advisers since the culmination of the 2020 Annual Approval Process and any material changes in financial condition that are reasonably expected to occur before and after the Closing; |
| | • | | Information regarding contemplated changes to the individual investment professionals whose responsibilities include portfolio management and investment research for the Funds, and, for portfolio managers and certain other investment professionals, information relating to their responsibilities with respect to managing other mutual funds and investment accounts, as applicable, post-Closing; |
| | • | | The Code of Ethics of the Advisers and their affiliates, including the Affiliated Sub-Advisers, together with information relating to compliance with, and the administration of, such codes; |
| | • | | Policies and procedures relating to proxy voting and the handling of corporate actions and class actions; |
| | • | | Information concerning the resources devoted to compliance efforts undertaken by the Advisers and their affiliates, including the Affiliated Sub-Advisers, including descriptions of their various compliance programs and their record of compliance; |
| | • | | Information concerning the business continuity and disaster recovery plans of the Advisers and their affiliates, including the Affiliated Sub-Advisers; |
| | • | | A description of the Advisers’ oversight of the Sub-Advisers, including with respect to regulatory and compliance issues, investment management and other matters; |
Other Relevant Information
| | • | | Information concerning the nature, cost and character of the administrative and other non-investment advisory services provided by the Advisers and their affiliates; |
| | • | | Information concerning oversight of the relationship with the custodian, subcustodians and fund accountants by EVM and/or administrator to each of the Funds; |
| | • | | Confirmation that the Advisers intend to continue to manage the Funds in a manner materially consistent with each Fund’s current investment objective(s) and principal investment strategies; |
| | • | | Information regarding Morgan Stanley’s commitment to maintaining competitive compensation arrangements to attract and retain highly qualified personnel; |
| | • | | Confirmation that the Advisers’ current senior management teams have indicated their strong support of the Transaction; and |
| | • | | Information regarding the fact that Morgan Stanley and Eaton Vance Corp. will each derive benefits from the Transaction and that, as a result, they have a financial interest in the matters that were being considered. |
As indicated above, the Board and its Contract Review Committee also considered information received at its regularly scheduled meetings throughout the year, which included information from portfolio managers and other investment professionals of the Advisers and the Sub-Advisers regarding investment and performance matters, and considered various investment and trading strategies used in pursuing the Funds’ investment objectives. The Board also received information regarding risk management techniques employed in connection with the management of the Funds. The Board and its committees evaluated issues pertaining to industry and regulatory developments, compliance procedures, fund governance and other issues with respect to the Funds, and received and participated in reports and presentations provided by the Advisers and their affiliates, including the Affiliated Sub-Advisers, with respect to such matters.
The Contract Review Committee was advised throughout the evaluation process by Goodwin Procter LLP, independent legal counsel for the Independent Trustees. The members of the Contract Review Committee, with the advice of such counsel, exercised their own business judgment in determining the material factors to be considered in evaluating the New Agreements and the weight to be given to each such factor. The conclusions reached with respect to the New Agreements were based on a comprehensive evaluation of all the information provided and not any single factor. Moreover, each Independent Trustee may have placed varying emphasis on particular factors in reaching conclusions with respect to the New Agreements.
Nature, Extent and Quality of Services
In considering whether to approve the New Agreements, the Board evaluated the nature, extent and quality of services currently provided to each Fund by the Advisers and, as applicable, the Sub-Advisers under the Current Agreements. In evaluating the nature, extent and quality of services to be provided by the Advisers and the Sub-Advisers under the New Agreements, the Board considered, among other information, the expected impact, if any, of the Transaction on the operations, facilities, organization and personnel of the Advisers and the Sub-Advisers, and that Morgan Stanley and the Advisers have advised the Board that, following the Transaction, there is not expected to be any diminution in the nature, extent and quality of services provided by the Advisers and the Sub-Advisers, as applicable, to the Funds and their shareholders, including compliance and other non-advisory services, and that there are not expected to be any changes in portfolio management personnel as a result of the Transaction.
The Board also considered the financial resources of Morgan Stanley and the Advisers and the importance of having a Fund manager with, or with access to, significant organizational and financial resources. The Board considered the benefits to the Funds of being part of a larger combined organization with greater financial resources following the Transaction, particularly during periods of market disruptions and volatility. In this regard, the Board considered
Eaton Vance
Atlanta Capital SMID-Cap Fund
March 31, 2021
Board of Trustees’ Contract Approval — continued
information provided by Morgan Stanley regarding its business and operating structure, scale of operation, leadership and reputation, distribution capabilities, and financial condition, as well as information on how the Funds are expected to fit within Morgan Stanley’s overall business strategy and any changes that Morgan Stanley contemplates in the short- or long-term following the Closing. The Board also noted Morgan Stanley’s and the Advisers’ commitment to keep the Board apprised of developments with respect to its long-term integration plans for the Advisers, the Affiliated Sub-Advisers, and existing Morgan Stanley affiliates and their respective personnel.
The Board considered the Advisers’ and the Sub-Advisers’ management capabilities and investment processes in light of the types of investments held by each Fund, including the education, experience and number of investment professionals and other personnel who provide portfolio management, investment research, and similar services to each Fund. In particular, the Board considered the abilities and experience of the Advisers’ and, as applicable, the Sub-Advisers’ investment professionals in implementing each Fund’s investment strategies. The Board also took into account the resources dedicated to portfolio management and other services, the compensation methods of the Advisers and other factors, including the reputation and resources of the Advisers to recruit and retain highly qualified research, advisory and supervisory investment professionals. With respect to the recruitment and retention of key personnel, the Board noted information from Morgan Stanley and the Advisers regarding the benefits of joining Morgan Stanley. In addition, the Board considered the time and attention devoted to the Funds by senior management, as well as the infrastructure, operational capabilities and support staff in place to assist in the portfolio management and operations of the Funds, including the provision of administrative services. With respect to the foregoing, the Board also considered information from the Advisers and Morgan Stanley regarding the anticipated impact of the Transaction on such matters. The Board also considered the business-related and other risks to which the Advisers or their affiliates may be subject in managing the Funds and in connection with the Transaction.
The Board considered the compliance programs of the Advisers and relevant affiliates thereof, including the Affiliated Sub-Advisers. The Board considered compliance and reporting matters regarding, among other things, personal trading by investment professionals, disclosure of portfolio holdings, late trading, frequent trading, portfolio valuation, business continuity and the allocation of investment opportunities. The Board also considered the responses of the Advisers and their affiliates to requests in recent years from regulatory authorities, such as the Securities and Exchange Commission and the Financial Industry Regulatory Authority. The Board also considered certain information relating to the compliance record of Morgan Stanley and its affiliates, including information requests in recent years from regulatory authorities. With respect to the foregoing, including the compliance programs of the Advisers and the Sub-Advisers, the Board noted information regarding the impacts of the Transaction, as well as the Advisers’ and Morgan Stanley’s commitment to keep the Board apprised of developments with respect to its long-term integration plans for the Advisers, the Affiliated Sub-Advisers and existing Morgan Stanley affiliates and their respective personnel.
The Board considered other administrative services provided and to be provided or overseen by the Advisers and their affiliates, including transfer agency and accounting services. The Board evaluated the benefits to shareholders of investing in a fund that is a part of a large fund complex offering exposure to a variety of asset classes and investment disciplines, as well as the ability, in many cases, to exchange an investment among different funds without incurring additional sales charges. The Board noted information that the Transaction was not expected to have any material impact on such matters in the near-term.
In evaluating the nature, extent and quality of the services to be provided under the New Agreements, the Board also considered investment performance information provided for each Fund in connection with the 2020 Annual Approval Process, as well as information provided as of a more recent date. In this regard, the Board compared each Fund’s investment performance to that of comparable funds identified by an independent data provider (the peer group), as well as appropriate benchmark indices and, for certain Funds, a custom peer group of similarly managed funds. The Board also considered, where applicable, Fund-specific performance explanations based on criteria established by the Board in connection with the 2020 Annual Approval Process and, where applicable, performance explanations as of a more recent date. In addition to the foregoing information, it was also noted that the Board has received and discussed with management information throughout the year at periodic intervals comparing each Fund’s performance against applicable benchmark indices and peer groups. In addition, the Board considered each Fund’s performance in light of overall financial market conditions. Where a Fund’s relative underperformance to its peers was significant during one or more specified periods, the Board noted the explanation from the applicable Adviser concerning the Fund’s relative performance versus its peer group.
After consideration of the foregoing factors, among others, and based on their review of the materials provided and the assurances received from, and recommendations of, the Advisers and Morgan Stanley, the Board determined that the Transaction was not expected to adversely affect the nature, extent and quality of services provided to the Funds by the Advisers and their affiliates, including the Affiliated Sub-Advisers, and that the Transaction was not expected to have an adverse effect on the ability of the Advisers and their affiliates, including the Affiliated Sub-Advisers, to provide those services. The Board concluded that the nature, extent and quality of services expected to be provided by the Advisers and the Sub-Advisers, taken as a whole, are appropriate and expected to be consistent with the terms of the New Agreements.
Management Fees and Expenses
The Board considered contractual fee rates payable by each Fund for advisory and administrative services (referred to collectively as “management fees”) in connection with the 2020 Annual Approval Process, as well as information provided as of a more recent date. As part of its review, the Board considered each Fund’s management fees and total expense ratio over various periods, as compared to those of comparable funds, before and after giving effect to any undertaking to waive fees or reimburse expenses. The Board also considered factors, and, where applicable, certain Fund-specific factors, that had an impact on a Fund’s total expense ratio relative to comparable funds, as identified by the Advisers in response to inquiries from the Contract Review Committee. The Board considered that the New Agreements do not change a Fund’s management fee rate or the computation method for calculating such fees, including any separately executed permanent contractual management fee reduction currently in place for the Fund.
Eaton Vance
Atlanta Capital SMID-Cap Fund
March 31, 2021
Board of Trustees’ Contract Approval — continued
The Board also received and considered, where applicable, information about the services offered and the fee rates charged by the Advisers and the Sub-Advisers to other types of accounts with investment objectives and strategies that are substantially similar to and/or managed in a similar investment style as a Fund. In this regard, the Board received information about the differences in the nature and scope of services the Advisers and the Sub-Advisers, as applicable, provide to the Funds as compared to other types of accounts and the material differences in compliance, reporting and other legal burdens and risks to the Advisers and such Sub-Advisers as between each Fund and other types of accounts.
After considering the foregoing information, and in light of the nature, extent and quality of the services expected to be provided by the Advisers and the Sub-Advisers, the Board concluded that the management fees charged for advisory and related services are reasonable with respect to its approval of the New Agreements.
Profitability and “Fall-Out” Benefits
During the 2020 Annual Approval Process, the Board considered the level of profits realized by the Advisers and relevant affiliates thereof, including the Affiliated Sub-Advisers, in providing investment advisory and administrative services to the Funds and to all Eaton Vance funds as a group. The Board considered the level of profits realized without regard to marketing support or other payments by the Advisers and their affiliates to third parties in respect of distribution or other services. In light of the foregoing factors and the nature, extent and quality of the services rendered, the profits realized by the Advisers and their affiliates, including the Sub-Advisers, were not deemed to be excessive by the Board.
The Board noted that Morgan Stanley and the Advisers are expected to realize, over time, cost savings from the Transaction based on eliminating duplicate corporate overhead expenses. The Board considered, however, information from the Advisers and Morgan Stanley that such cost savings are not expected to be realized immediately upon the Closing and that, accordingly, there are currently no specific expected changes in the levels of profitability associated with the advisory and other services provided to the Funds that are contemplated as a result of the Transaction. The Board noted that it will continue to receive information regarding profitability during its annual contract review processes, including the extent to which cost savings and/or other efficiencies result in changes to profitability levels.
The Board also considered direct or indirect fall-out benefits received by the Advisers and their affiliates, including the Affiliated Sub-Advisers, in connection with their respective relationships with the Funds, including the benefits of research services that may be available to the Advisers and their affiliates as a result of securities transactions effected for the Funds and other investment advisory clients. In evaluating the fall-out benefits to be received by the Advisers and their affiliates under the New Agreements, the Board considered whether the Transaction would have an impact on the fall-out benefits currently realized by the Advisers and their affiliates in connection with services provided pursuant to the Current Advisory Agreements.
The Board of each Fund considered that Morgan Stanley may derive reputational and other benefits from its ability to use the names of the Advisers and their affiliates in connection with operating and marketing the Funds. The Board considered that the Transaction, if completed, would significantly increase Morgan Stanley’s assets under management and expand Morgan Stanley’s investment capabilities.
Economies of Scale
The Board also considered the extent to which the Advisers and their affiliates, on the one hand, and the Funds, on the other hand, can expect to realize benefits from economies of scale as the assets of the Funds increase. The Board acknowledged the difficulty in accurately measuring the benefits resulting from economies of scale, if any, with respect to the management of any specific Fund or group of funds. As part of the 2020 Annual Approval Process, the Board reviewed data summarizing the increases and decreases in the assets of the Funds and of all Eaton Vance funds as a group over various time periods, and evaluated the extent to which the total expense ratio of each Fund and the profitability of the Advisers and their affiliates may have been affected by such increases or decreases.
The Board noted that Morgan Stanley and the Advisers are expected to benefit from possible growth of the Funds resulting from enhanced distribution capabilities, including with respect to the Funds’ potential access to Morgan Stanley’s institutional client base. Based upon the foregoing, the Board concluded that the Funds currently share in the benefits from economies of scale, if any, when they are realized by the Advisers, and that the Transaction is not expected to impede a Fund from continuing to benefit from any future economies of scale realized by its Adviser.
Conclusion
Based on its consideration of the foregoing, and such other information it deemed relevant, including the factors and conclusions described above, the Contract Review Committee recommended to the Board approval of the New Agreements. Based on the recommendation of the Contract Review Committee, the Board, including a majority of the Independent Trustees, unanimously voted to approve the New Agreements for the Funds and recommended that shareholders approve the New Agreements.
Eaton Vance
Atlanta Capital SMID-Cap Fund
March 31, 2021
Officers and Trustees
Officers
Eric A. Stein
President
Deidre E. Walsh
Vice President
Maureen A. Gemma
Secretary and Chief Legal Officer
James F. Kirchner
Treasurer
Richard F. Froio
Chief Compliance Officer
Trustees
William H. Park
Chairperson
Thomas E. Faust Jr.*
Mark R. Fetting
Cynthia E. Frost
George J. Gorman
Valerie A. Mosley
Helen Frame Peters
Keith Quinton
Marcus L. Smith
Susan J. Sutherland
Scott E. Wennerholm
Eaton Vance Funds
| | |
| Privacy Notice | | April 2021 |
| | |
| |
| FACTS | | WHAT DOES EATON VANCE DO WITH YOUR
PERSONAL INFORMATION? |
| | | |
| |
| | |
| Why? | | Financial companies choose how they share your personal information. Federal law gives consumers the right to limit some but not all sharing. Federal law also requires us to tell you how we collect, share, and protect your personal information. Please read this notice carefully to understand what we do. |
| | |
| | | |
| What? | | The types of personal information we collect and share depend on the product or service you have with us. This information can include: ∎ Social Security number and income ∎ investment experience and risk tolerance ∎ checking account number and wire transfer instructions |
| | |
| | | |
| How? | | All financial companies need to share customers’ personal information to run their everyday business. In the section below, we list the reasons financial companies can share their customers’ personal information; the reasons Eaton Vance chooses to share; and whether you can limit this sharing. |
| | |
| | | |
| | | | |
Reasons we can share your
personal information | | Does Eaton Vance share? | | Can you limit this sharing? |
| For our everyday business purposes — such as to process your transactions, maintain your account(s), respond to court orders and legal investigations, or report to credit bureaus | | Yes | | No |
| For our marketing purposes — to offer our products and services to you | | Yes | | No |
| For joint marketing with other financial companies | | No | | We don’t share |
| For our investment management affiliates’ everyday business purposes — information about your transactions, experiences, and creditworthiness | | Yes | | Yes |
| For our affiliates’ everyday business purposes — information about your transactions and experiences | | Yes | | No |
| For our affiliates’ everyday business purposes — information about your creditworthiness | | No | | We don’t share |
| For our investment management affiliates to market to you | | Yes | | Yes |
| For our affiliates to market to you | | No | | We don’t share |
| For nonaffiliates to market to you | | No | | We don’t share |
| | |
| To limit our sharing | | Call toll-free 1-800-262-1122 or email: EVPrivacy@eatonvance.com Please note: If you are a new customer, we can begin sharing your information 30 days from the date we sent this notice. When you are no longer our customer, we continue to share your information as described in this notice. However, you can contact us at any time to limit our sharing. |
| | |
| | | |
| | |
| Questions? | | Call toll-free 1-800-262-1122 or email: EVPrivacy@eatonvance.com |
| | |
| | | |
Eaton Vance Funds
| | |
| Privacy Notice — continued | | April 2021 |
| | |
| Who we are |
| Who is providing this notice? | | Eaton Vance Management, Eaton Vance Distributors, Inc., Eaton Vance Trust Company, Eaton Vance Management (International) Limited, Eaton Vance Advisers International Ltd., Eaton Vance Global Advisors Limited, Eaton Vance Management’s Real Estate Investment Group, Boston Management and Research, Calvert Research and Management, Eaton Vance and Calvert Fund Families and our investment advisory affiliates (“Eaton Vance”) (see Investment Management Affiliates definition below) |
| What we do |
| How does Eaton Vance protect my personal information? | | To protect your personal information from unauthorized access and use, we use security measures that comply with federal law. These measures include computer safeguards and secured files and buildings. We have policies governing the proper handling of customer information by personnel and requiring third parties that provide support to adhere to appropriate security standards with respect to such information. |
| How does Eaton Vance collect my personal information? | | We collect your personal information, for example, when you ∎ open an account or make deposits or withdrawals from your account ∎ buy securities from us or make a wire transfer ∎ give us your contact information We also collect your personal information from others, such as credit bureaus, affiliates, or other companies. |
| Why can’t I limit all sharing? | | Federal law gives you the right to limit only ∎ sharing for affiliates’ everyday business purposes — information about your creditworthiness ∎ affiliates from using your information to market to you ∎ sharing for nonaffiliates to market to you State laws and individual companies may give you additional rights to limit sharing. See below for more on your rights under state law. |
| Definitions |
| Investment Management Affiliates | | Eaton Vance Investment Management Affiliates include registered investment advisers, registered broker-dealers, and registered and unregistered funds. Investment Management Affiliates does not include entities associated with Morgan Stanley Wealth Management, such as Morgan Stanley Smith Barney LLC and Morgan Stanley & Co. |
| Affiliates | | Companies related by common ownership or control. They can be financial and nonfinancial companies. ∎ Our affiliates include companies with a Morgan Stanley name and financial companies such as Morgan Stanley Smith Barney LLC and Morgan Stanley & Co. |
| Nonaffiliates | | Companies not related by common ownership or control. They can be financial and nonfinancial companies. ∎ Eaton Vance does not share with nonaffiliates so they can market to you. |
| Joint marketing | | A formal agreement between nonaffiliated financial companies that together market financial products or services to you. ∎ Eaton Vance doesn’t jointly market. |
| Other important information |
Vermont: Except as permitted by law, we will not share personal information we collect about Vermont residents with Nonaffiliates unless you provide us with your written consent to share such information. California: Except as permitted by law, we will not share personal information we collect about California residents with Nonaffiliates and we will limit sharing such personal information with our Affiliates to comply with California privacy laws that apply to us. |
Eaton Vance Funds
IMPORTANT NOTICES
Delivery of Shareholder Documents. The Securities and Exchange Commission (SEC) permits funds to deliver only one copy of shareholder documents, including prospectuses, proxy statements and shareholder reports, to fund investors with multiple accounts at the same residential or post office box address. This practice is often called “householding” and it helps eliminate duplicate mailings to shareholders. Eaton Vance, or your financial intermediary, may household the mailing of your documents indefinitely unless you instruct Eaton Vance, or your financial intermediary, otherwise. If you would prefer that your Eaton Vance documents not be householded, please contact Eaton Vance at 1-800-262-1122, or contact your financial intermediary. Your instructions that householding not apply to delivery of your Eaton Vance documents will typically be effective within 30 days of receipt by Eaton Vance or your financial intermediary.
Portfolio Holdings. Each Eaton Vance Fund and its underlying Portfolio(s) (if applicable) files a schedule of portfolio holdings on Part F to Form N-PORT with the SEC. Certain information filed on Form N-PORT may be viewed on the Eaton Vance website at www.eatonvance.com, by calling Eaton Vance at 1-800-262-1122 or in the EDGAR database on the SEC’s website at www.sec.gov.
Proxy Voting. From time to time, funds are required to vote proxies related to the securities held by the funds. The Eaton Vance Funds or their underlying Portfolios (if applicable) vote proxies according to a set of policies and procedures approved by the Funds’ and Portfolios’ Boards. You may obtain a description of these policies and procedures and information on how the Funds or Portfolios voted proxies relating to portfolio securities during the most recent 12-month period ended June 30, without charge, upon request, by calling 1-800-262-1122 and by accessing the SEC’s website at www.sec.gov.
This Page Intentionally Left Blank
Investment Adviser
Boston Management and Research
Two International Place
Boston, MA 02110
Investment Sub-Adviser
Atlanta Capital Management Company, LLC
1075 Peachtree Street NE
Suite 2100
Atlanta, GA 30309
Administrator
Eaton Vance Management
Two International Place
Boston, MA 02110
Principal Underwriter*
Eaton Vance Distributors, Inc.
Two International Place
Boston, MA 02110
(617) 482-8260
Custodian
State Street Bank and Trust Company
State Street Financial Center, One Lincoln Street
Boston, MA 02111
Transfer Agent
BNY Mellon Investment Servicing (US) Inc.
Attn: Eaton Vance Funds
P.O. Box 9653
Providence, RI 02940-9653
(800) 262-1122
Fund Offices
Two International Place
Boston, MA 02110
| * | FINRA BrokerCheck. Investors may check the background of their Investment Professional by contacting the Financial Industry Regulatory Authority (FINRA). FINRA BrokerCheck is a free tool to help investors check the professional background of current and former FINRA-registered securities firms and brokers. FINRA BrokerCheck is available by calling 1-800-289-9999 and at www.FINRA.org. The FINRA BrokerCheck brochure describing this program is available to investors at www.FINRA.org. |

7726 3.31.21

Eaton Vance
Atlanta Capital Focused Growth Fund
Semiannual Report
March 31, 2021

Commodity Futures Trading Commission Registration. The Commodity Futures Trading Commission (“CFTC”) has adopted regulations that subject registered investment companies and advisers to regulation by the CFTC if a fund invests more than a prescribed level of its assets in certain CFTC-regulated instruments (including futures, certain options and swap agreements) or markets itself as providing investment exposure to such instruments. The investment adviser has claimed an exclusion from the definition of “commodity pool operator” under the Commodity Exchange Act with respect to its management of the Fund. Accordingly, neither the Fund nor the adviser with respect to the operation of the Fund is subject to CFTC regulation. Because of its management of other strategies, the Fund’s adviser is registered with the CFTC as a commodity pool operator. The adviser is also registered as a commodity trading advisor.
Fund shares are not insured by the FDIC and are not deposits or other obligations of, or guaranteed by, any depository institution. Shares are subject to investment risks, including possible loss of principal invested.
This report must be preceded or accompanied by a current summary prospectus or prospectus. Before investing, investors should consider carefully the investment objective, risks, and charges and expenses of a mutual fund. This and other important information is contained in the summary prospectus and prospectus, which can be obtained from a financial intermediary. Prospective investors should read the prospectus carefully before investing. For further information, please call 1-800-262-1122.
Semiannual Report March 31, 2021
Eaton Vance
Atlanta Capital Focused Growth Fund
Eaton Vance
Atlanta Capital Focused Growth Fund
March 31, 2021
Performance1,2
Portfolio Managers Joseph B. Hudepohl, CFA, Robert R. Walton, Jr., CFA, Jeffrey A. Miller, CFA and Lance V. Garrison, CFA, each of Atlanta Capital Management Company, LLC
| | | | | | | | | | | | | | | | | | | | | | | | |
| % Average Annual Total Returns | | Class
Inception Date | | | Performance
Inception Date | | | Six Months | | | One Year | | | Five Years | | | Ten Years | |
| | | | | | |
Class A at NAV | | | 11/28/2003 | | | | 04/30/2002 | | | | 11.54 | % | | | 49.21 | % | | | 20.61 | % | | | 13.71 | % |
Class A with 5.75% Maximum Sales Charge | | | — | | | | — | | | | 5.13 | | | | 40.64 | | | | 19.20 | | | | 13.03 | |
Class C at NAV | | | 05/02/2011 | | | | 04/30/2002 | | | | 11.21 | | | | 48.01 | | | | 19.71 | | | | 12.88 | |
Class C with 1% Maximum Sales Charge | | | — | | | | — | | | | 10.21 | | | | 47.01 | | | | 19.71 | | | | 12.88 | |
Class I at NAV | | | 04/30/2002 | | | | 04/30/2002 | | | | 11.74 | | | | 49.48 | | | | 20.90 | | | | 13.99 | |
|
| |
| | | | | | |
Russell 1000® Growth Index | | | — | | | | — | | | | 12.44 | % | | | 62.74 | % | | | 21.04 | % | | | 16.62 | % |
| | | | | | |
| % Total Annual Operating Expense Ratios3 | | | | | | | | | | | Class A | | | Class C | | | Class I | |
| | | | | | |
Gross | | | | | | | | | | | | | | | 1.10 | % | | | 1.85 | % | | | 0.85 | % |
Net | | | | | | | | | | | | | | | 1.05 | | | | 1.80 | | | | 0.80 | |
Fund Profile
Sector Allocation (% of net assets)4

Top 10 Holdings (% of net assets)4
| | | | |
Visa, Inc., Class A | | | 7.0 | % |
| |
Danaher Corp. | | | 6.5 | |
| |
Alphabet, Inc., Class C | | | 6.5 | |
| |
Microsoft Corp. | | | 6.2 | |
| |
Thermo Fisher Scientific, Inc. | | | 5.4 | |
| |
Facebook, Inc., Class A | | | 4.7 | |
| |
Fiserv, Inc. | | | 4.7 | |
| |
American Tower Corp. | | | 4.3 | |
| |
Verisk Analytics, Inc. | | | 4.1 | |
| |
Zoetis, Inc. | | | 4.0 | |
| |
Total | | | 53.4 | % |
See Endnotes and Additional Disclosures in this report.
Past performance is no guarantee of future results. Returns are historical and are calculated by determining the percentage change in net asset value (NAV) or offering price (as applicable) with all distributions reinvested. Investment return and principal value will fluctuate so that shares, when redeemed, may be worth more or less than their original cost. Performance for periods less than or equal to one year is cumulative. Performance is for the stated time period only; due to market volatility, current Fund performance may be lower or higher than the quoted return. For performance as of the most recent month-end, please refer to eatonvance.com.
Eaton Vance
Atlanta Capital Focused Growth Fund
March 31, 2021
Endnotes and Additional Disclosures
| 1 | Russell 1000® Growth Index is an unmanaged index of U.S. large- cap growth stocks. Unless otherwise stated, index returns do not reflect the effect of any applicable sales charges, commissions, expenses, taxes or leverage, as applicable. It is not possible to invest directly in an index. |
| 2 | Total Returns at NAV do not include applicable sales charges. If sales charges were deducted, the returns would be lower. Total Returns shown with maximum sales charge reflect the stated maximum sales charge. Unless otherwise stated, performance does not reflect the deduction of taxes on Fund distributions or redemptions of Fund shares. |
Performance prior to the inception date of a class may be linked to the performance of an older class of the Fund. This linked performance is adjusted for any applicable sales charge, but is not adjusted for class expense differences. If adjusted for such differences, the performance would be different. The performance of Class C is linked to Class A. Performance presented in the Financial Highlights included in the financial statements is not linked.
| 3 | Source: Fund prospectus. Net expense ratios reflect a contractual expense reimbursement that continues through 1/31/22. Without the reimbursement, performance would have been lower. The expense ratios for the current reporting period can be found in the Financial Highlights section of this report. |
| 4 | Excludes cash and cash equivalents. |
Fund profile subject to change due to active management.
Eaton Vance
Atlanta Capital Focused Growth Fund
March 31, 2021
Fund Expenses
Example: As a Fund shareholder, you incur two types of costs: (1) transaction costs, including sales charges (loads) on purchases and redemption fees (if applicable); and (2) ongoing costs, including management fees; distribution and/or service fees; and other Fund expenses. This Example is intended to help you understand your ongoing costs (in dollars) of Fund investing and to compare these costs with the ongoing costs of investing in other mutual funds. The Example is based on an investment of $1,000 invested at the beginning of the period and held for the entire period (October 1, 2020 – March 31, 2021).
Actual Expenses: The first section of the table below provides information about actual account values and actual expenses. You may use the information in this section, together with the amount you invested, to estimate the expenses that you paid over the period. Simply divide your account value by $1,000 (for example, an $8,600 account value divided by $1,000 = 8.6), then multiply the result by the number in the first section under the heading entitled “Expenses Paid During Period” to estimate the expenses you paid on your account during this period.
Hypothetical Example for Comparison Purposes: The second section of the table below provides information about hypothetical account values and hypothetical expenses based on the actual Fund expense ratio and an assumed rate of return of 5% per year (before expenses), which is not the actual Fund return. The hypothetical account values and expenses may not be used to estimate the actual ending account balance or expenses you paid for the period. You may use this information to compare the ongoing costs of investing in your Fund and other funds. To do so, compare this 5% hypothetical example with the 5% hypothetical examples that appear in the shareholder reports of the other funds.
Please note that the expenses shown in the table are meant to highlight your ongoing costs only and do not reflect any transactional costs, such as sales charges (loads) or redemption fees (if applicable). Therefore, the second section of the table is useful in comparing ongoing costs only, and will not help you determine the relative total costs of owning different funds. In addition, if these transactional costs were included, your costs would be higher.
| | | | | | | | | | | | | | | | |
| | | Beginning
Account Value
(10/1/20) | | | Ending
Account Value
(3/31/21) | | | Expenses Paid
During Period*
(10/1/20 – 3/31/21) | | | Annualized
Expense
Ratio | |
| | | | |
Actual | | | | | | | | | | | | | | | | |
Class A | | $ | 1,000.00 | | | $ | 1,115.40 | | | $ | 5.54 | | | | 1.05 | % |
Class C | | $ | 1,000.00 | | | $ | 1,112.10 | | | $ | 9.48 | | | | 1.80 | % |
Class I | | $ | 1,000.00 | | | $ | 1,117.40 | | | $ | 4.22 | | | | 0.80 | % |
| | | | | |
Hypothetical | | | | | | | | | | | | | | | | |
(5% return per year before expenses) | | | | | | | | | | | | | | | | |
Class A | | $ | 1,000.00 | | | $ | 1,019.70 | | | $ | 5.29 | | | | 1.05 | % |
Class C | | $ | 1,000.00 | | | $ | 1,016.00 | | | $ | 9.05 | | | | 1.80 | % |
Class I | | $ | 1,000.00 | | | $ | 1,020.90 | | | $ | 4.03 | | | | 0.80 | % |
| * | Expenses are equal to the Fund’s annualized expense ratio for the indicated Class, multiplied by the average account value over the period, multiplied by 182/365 (to reflect the one-half year period). The Example assumes that the $1,000 was invested at the net asset value per share determined at the close of business on September 30, 2020. |
Eaton Vance
Atlanta Capital Focused Growth Fund
March 31, 2021
Portfolio of Investments (Unaudited)
| | | | | | | | |
| Common Stocks — 96.9% | |
| Security | | Shares | | | Value | |
|
| Capital Markets — 3.2% | |
| | |
Intercontinental Exchange, Inc. | | | 109,144 | | | $ | 12,189,202 | |
| |
| | | | $ | 12,189,202 | |
|
| Chemicals — 7.7% | |
| | |
Ecolab, Inc. | | | 66,941 | | | $ | 14,330,060 | |
| | |
Linde PLC | | | 54,244 | | | | 15,195,914 | |
| |
| | | | $ | 29,525,974 | |
|
| Electronic Equipment, Instruments & Components — 3.9% | |
| | |
Amphenol Corp., Class A | | | 225,679 | | | $ | 14,888,044 | |
| |
| | | | $ | 14,888,044 | |
|
| Equity Real Estate Investment Trusts (REITs) — 4.3% | |
| | |
American Tower Corp. | | | 68,669 | | | $ | 16,416,011 | |
| |
| | | | $ | 16,416,011 | |
|
| Health Care Equipment & Supplies — 6.5% | |
| | |
Danaher Corp. | | | 112,065 | | | $ | 25,223,590 | |
| |
| | | | $ | 25,223,590 | |
|
| Insurance — 3.0% | |
| | |
Marsh & McLennan Cos., Inc. | | | 95,255 | | | $ | 11,602,059 | |
| |
| | | | $ | 11,602,059 | |
|
| Interactive Media & Services — 11.2% | |
| | |
Alphabet, Inc., Class C(1) | | | 12,110 | | | $ | 25,051,109 | |
| | |
Facebook, Inc., Class A(1) | | | 61,397 | | | | 18,083,259 | |
| |
| | | | $ | 43,134,368 | |
|
| IT Services — 17.7% | |
| | |
Fiserv, Inc.(1) | | | 150,453 | | | $ | 17,909,925 | |
| | |
Gartner, Inc.(1) | | | 50,191 | | | | 9,162,367 | |
| | |
Mastercard, Inc., Class A | | | 40,236 | | | | 14,326,028 | |
| | |
Visa, Inc., Class A | | | 126,609 | | | | 26,806,924 | |
| |
| | | | $ | 68,205,244 | |
|
| Life Sciences Tools & Services — 5.4% | |
| | |
Thermo Fisher Scientific, Inc. | | | 45,924 | | | $ | 20,958,795 | |
| |
| | | | $ | 20,958,795 | |
| | | | | | | | |
| Security | | Shares | | | Value | |
|
| Machinery — 3.0% | |
| | |
Xylem, Inc. | | | 109,144 | | | $ | 11,479,766 | |
| |
| | | | $ | 11,479,766 | |
|
| Multiline Retail — 3.7% | |
| | |
Dollar General Corp. | | | 69,802 | | | $ | 14,143,281 | |
| |
| | | | $ | 14,143,281 | |
|
| Pharmaceuticals — 4.0% | |
| | |
Zoetis, Inc. | | | 96,984 | | | $ | 15,273,040 | |
| |
| | | | $ | 15,273,040 | |
|
| Professional Services — 7.4% | |
| | |
IHS Markit, Ltd. | | | 132,093 | | | $ | 12,783,960 | |
| | |
Verisk Analytics, Inc. | | | 89,652 | | | | 15,840,612 | |
| |
| | | | $ | 28,624,572 | |
|
| Software — 11.9% | |
| | |
Adobe, Inc.(1) | | | 16,154 | | | $ | 7,679,127 | |
| | |
Intuit, Inc. | | | 37,911 | | | | 14,522,188 | |
| | |
Microsoft Corp. | | | 100,620 | | | | 23,723,177 | |
| |
| | | | $ | 45,924,492 | |
|
| Specialty Retail — 4.0% | |
| | |
TJX Cos., Inc. (The) | | | 230,507 | | | $ | 15,248,038 | |
| |
| | | | $ | 15,248,038 | |
| |
Total Common Stocks
(identified cost $259,504,588) | | | $ | 372,836,476 | |
|
| Short-Term Investments — 3.1% | |
| Description | | Units | | | Value | |
| | |
Eaton Vance Cash Reserves Fund, LLC, 0.10%(2) | | | 11,847,411 | | | $ | 11,847,411 | |
| |
Total Short-Term Investments
(identified cost $11,847,411) | | | $ | 11,847,411 | |
| |
Total Investments — 100.0%
(identified cost $271,351,999) | | | $ | 384,683,887 | |
| |
Other Assets, Less Liabilities — (0.0)%(3) | | | $ | (172,859 | ) |
| |
Net Assets — 100.0% | | | $ | 384,511,028 | |
The percentage shown for each investment category in the Portfolio of Investments is based on net assets.
| | | | |
| | 5 | | See Notes to Financial Statements. |
Eaton Vance
Atlanta Capital Focused Growth Fund
March 31, 2021
Portfolio of Investments (Unaudited) — continued
| (1) | Non-income producing security. |
| (2) | Affiliated investment company, available to Eaton Vance portfolios and funds, which invests in high quality, U.S. dollar denominated money market instruments. The rate shown is the annualized seven-day yield as of March 31, 2021. |
| (3) | Amount is less than (0.05)%. |
| | | | |
| | 6 | | See Notes to Financial Statements. |
Eaton Vance
Atlanta Capital Focused Growth Fund
March 31, 2021
Statement of Assets and Liabilities (Unaudited)
| | | | |
| Assets | | March 31, 2021 | |
| |
Unaffiliated investments, at value (identified cost, $259,504,588) | | $ | 372,836,476 | |
| |
Affiliated investment, at value (identified cost, $11,847,411) | | | 11,847,411 | |
| |
Dividends receivable | | | 99,020 | |
| |
Dividends receivable from affiliated investment | | | 540 | |
| |
Receivable for Fund shares sold | | | 696,075 | |
| |
Total assets | | $ | 385,479,522 | |
|
| Liabilities | |
| |
Payable for Fund shares redeemed | | $ | 564,148 | |
| |
Payable to affiliates: | | | | |
| |
Investment adviser fee | | | 208,935 | |
| |
Distribution and service fees | | | 38,904 | |
| |
Other | | | 4,063 | |
| |
Accrued expenses | | | 152,444 | |
| |
Total liabilities | | $ | 968,494 | |
| |
Net Assets | | $ | 384,511,028 | |
|
| Sources of Net Assets | |
| |
Paid-in capital | | $ | 261,275,367 | |
| |
Distributable earnings | | | 123,235,661 | |
| |
Total | | $ | 384,511,028 | |
| |
| Class A Shares | | | | |
| |
Net Assets | | $ | 55,037,681 | |
| |
Shares Outstanding | | | 3,478,392 | |
| |
Net Asset Value and Redemption Price Per Share | | | | |
| |
(net assets ÷ shares of beneficial interest outstanding) | | $ | 15.82 | |
| |
Maximum Offering Price Per Share | | | | |
| |
(100 ÷ 94.25 of net asset value per share) | | $ | 16.79 | |
|
| Class C Shares | |
| |
Net Assets | | $ | 32,944,638 | |
| |
Shares Outstanding | | | 2,294,519 | |
| |
Net Asset Value and Offering Price Per Share* | | | | |
| |
(net assets ÷ shares of beneficial interest outstanding) | | $ | 14.36 | |
|
| Class I Shares | |
| |
Net Assets | | $ | 296,528,709 | |
| |
Shares Outstanding | | | 21,531,568 | |
| |
Net Asset Value, Offering Price and Redemption Price Per Share | | | | |
| |
(net assets ÷ shares of beneficial interest outstanding) | | $ | 13.77 | |
On sales of $50,000 or more, the offering price of Class A shares is reduced.
| * | Redemption price per share is equal to the net asset value less any applicable contingent deferred sales charge. |
| | | | |
| | 7 | | See Notes to Financial Statements. |
Eaton Vance
Atlanta Capital Focused Growth Fund
March 31, 2021
Statement of Operations (Unaudited)
| | | | |
| Investment Income | | Six Months Ended
March 31, 2021 | |
| |
Dividends | | $ | 1,173,933 | |
| |
Dividends from affiliated investment | | | 3,752 | |
| |
Total investment income | | $ | 1,177,685 | |
|
| Expenses | |
| |
Investment adviser fee | | $ | 1,221,791 | |
| |
Distribution and service fees | | | | |
| |
Class A | | | 67,236 | |
| |
Class C | | | 160,113 | |
| |
Trustees’ fees and expenses | | | 9,878 | |
| |
Custodian fee | | | 42,023 | |
| |
Transfer and dividend disbursing agent fees | | | 120,818 | |
| |
Legal and accounting services | | | 24,324 | |
| |
Printing and postage | | | 24,072 | |
| |
Registration fees | | | 45,992 | |
| |
Miscellaneous | | | 14,956 | |
| |
Total expenses | | $ | 1,731,203 | |
| |
Net investment loss | | $ | (553,518 | ) |
|
| Realized and Unrealized Gain (Loss) | |
| |
Net realized gain (loss) — | | | | |
| |
Investment transactions | | $ | 11,839,049 | |
| |
Investment transactions — affiliated investment | | | 188 | |
| |
Net realized gain | | $ | 11,839,237 | |
| |
Change in unrealized appreciation (depreciation) — | | | | |
| |
Investments | | $ | 29,908,144 | |
| |
Investments — affiliated investment | | | (188 | ) |
| |
Net change in unrealized appreciation (depreciation) | | $ | 29,907,956 | |
| |
Net realized and unrealized gain | | $ | 41,747,193 | |
| |
Net increase in net assets from operations | | $ | 41,193,675 | |
| | | | |
| | 8 | | See Notes to Financial Statements. |
Eaton Vance
Atlanta Capital Focused Growth Fund
March 31, 2021
Statements of Changes in Net Assets
| | | | | | | | |
| Increase (Decrease) in Net Assets | | Six Months Ended
March 31, 2021
(Unaudited) | | | Year Ended
September 30, 2020 | |
| | |
From operations — | | | | | | | | |
| | |
Net investment loss | | $ | (553,518 | ) | | $ | (327,829 | ) |
| | |
Net realized gain | | | 11,839,237 | | | | 2,223,874 | |
| | |
Net change in unrealized appreciation (depreciation) | | | 29,907,956 | | | | 62,313,924 | |
| | |
Net increase in net assets from operations | | $ | 41,193,675 | | | $ | 64,209,969 | |
| | |
Distributions to shareholders — | | | | | | | | |
| | |
Class A | | $ | (297,329 | ) | | $ | (52,041 | ) |
| | |
Class C | | | (193,944 | ) | | | (20,820 | ) |
| | |
Class I | | | (1,869,445 | ) | | | (316,561 | ) |
| | |
Total distributions to shareholders | | $ | (2,360,718 | ) | | $ | (389,422 | ) |
| | |
Transactions in shares of beneficial interest — | | | | | | | | |
| | |
Proceeds from sale of shares | | | | | | | | |
| | |
Class A | | $ | 7,089,454 | | | $ | 31,597,700 | |
| | |
Class C | | | 3,786,092 | | | | 19,661,797 | |
| | |
Class I | | | 67,068,612 | | | | 275,752,936 | |
| | |
Net asset value of shares issued to shareholders in payment of distributions declared | | | | | | | | |
| | |
Class A | | | 286,856 | | | | 49,668 | |
| | |
Class C | | | 193,795 | | | | 20,604 | |
| | |
Class I | | | 1,866,715 | | | | 316,509 | |
| | |
Cost of shares redeemed | | | | | | | | |
| | |
Class A | | | (10,004,631 | ) | | | (31,884,538 | ) |
| | |
Class C | | | (4,236,545 | ) | | | (3,080,018 | ) |
| | |
Class I | | | (74,393,386 | ) | | | (144,884,149 | ) |
| | |
Net asset value of shares converted | | | | | | | | |
| | |
Class A | | | 552,294 | | | | 150,057 | |
| | |
Class C | | | (552,294 | ) | | | (150,057 | ) |
| | |
Net increase (decrease) in net assets from Fund share transactions | | $ | (8,343,038 | ) | | $ | 147,550,509 | |
| | |
Net increase in net assets | | $ | 30,489,919 | | | $ | 211,371,056 | |
|
| Net Assets | |
| | |
At beginning of period | | $ | 354,021,109 | | | $ | 142,650,053 | |
| | |
At end of period | | $ | 384,511,028 | | | $ | 354,021,109 | |
| | | | |
| | 9 | | See Notes to Financial Statements. |
Eaton Vance
Atlanta Capital Focused Growth Fund
March 31, 2021
Financial Highlights
| | | | | | | | | | | | | | | | | | | | | | | | |
| | | Class A | |
| | |
| | | Six Months Ended
March 31, 2021
(Unaudited) | | | Year Ended September 30, | |
| | | 2020 | | | 2019 | | | 2018 | | | 2017 | | | 2016 | |
| | | | | | | |
Net asset value — Beginning of period | | $ | 14.260 | | | $ | 11.580 | | | $ | 11.320 | | | $ | 13.260 | | | $ | 12.880 | | | $ | 14.130 | |
| | | | | | |
| Income (Loss) From Operations | | | | | | | | | | | | | | | | | | | | | | | | |
| | | | | | |
Net investment income (loss)(1) | | $ | (0.032 | ) | | $ | (0.031 | ) | | $ | (0.008 | ) | | $ | (0.023 | ) | | $ | (0.003 | ) | | $ | 0.005 | |
| | | | | | |
Net realized and unrealized gain | | | 1.676 | | | | 2.727 | | | | 1.788 | | | | 2.629 | | | | 2.170 | | | | 1.398 | |
| | | | | | |
Total income from operations | | $ | 1.644 | | | $ | 2.696 | | | $ | 1.780 | | | $ | 2.606 | | | $ | 2.167 | | | $ | 1.403 | |
| | | | |
| Less Distributions | | | | | | | | | | | | | | | | | |
| | | | | | |
From net investment income | | $ | — | | | $ | — | | | $ | — | | | $ | — | | | $ | — | | | $ | (0.006 | ) |
| | | | | | |
From net realized gain | | | (0.084 | ) | | | (0.016 | ) | | | (1.520 | ) | | | (4.546 | ) | | | (1.787 | ) | | | (2.647 | ) |
| | | | | | |
Total distributions | | $ | (0.084 | ) | | $ | (0.016 | ) | | $ | (1.520 | ) | | $ | (4.546 | ) | | $ | (1.787 | ) | | $ | (2.653 | ) |
| | | | | | |
Net asset value — End of period | | $ | 15.820 | | | $ | 14.260 | | | $ | 11.580 | | | $ | 11.320 | | | $ | 13.260 | | | $ | 12.880 | |
| | | | | | |
Total Return(2) | | | 11.54 | %(3) | | | 23.31 | %(4) | | | 18.91 | %(4) | | | 26.96 | %(4) | | | 19.35 | %(4) | | | 10.35 | % |
| | | | |
| Ratios/Supplemental Data | | | | | | | | | | | | | | | | | |
| | | | | | |
Net assets, end of period (000’s omitted) | | $ | 55,038 | | | $ | 51,523 | | | $ | 42,531 | | | $ | 18,938 | | | $ | 19,896 | | | $ | 54,078 | |
| | | | | | |
Ratios (as a percentage of average daily net assets): | | | | | | | | | | | | | | | | | | | | | | | | |
| | | | | | |
Expenses | | | 1.05 | %(5) | | | 1.05 | %(4) | | | 1.10 | %(4) | | | 1.25 | %(4) | | | 1.27 | %(4) | | | 1.21 | % |
| | | | | | |
Net investment income (loss) | | | (0.42 | )%(5) | | | (0.25 | )% | | | (0.08 | )% | | | (0.21 | )% | | | (0.03 | )% | | | 0.04 | % |
| | | | | | |
Portfolio Turnover | | | 8 | %(3) | | | 23 | % | | | 18 | % | | | 14 | % | | | 28 | % | | | 39 | % |
| (1) | Computed using average shares outstanding. |
| (2) | Returns are historical and are calculated by determining the percentage change in net asset value with all distributions reinvested and do not reflect the effect of sales charges. |
| (4) | The administrator and sub-adviser reimbursed certain operating expenses (equal to 0.05%, 0.19%, 0.27% and 0.13% of average daily net assets for the years ended September 30, 2020, 2019, 2018 and 2017, respectively). Absent this reimbursement, total return would be lower. |
| | | | |
| | 10 | | See Notes to Financial Statements. |
Eaton Vance
Atlanta Capital Focused Growth Fund
March 31, 2021
Financial Highlights — continued
| | | | | | | | | | | | | | | | | | | | | | | | |
| | | Class C | |
| | |
| | | Six Months Ended
March 31, 2021
(Unaudited) | | | Year Ended September 30, | |
| | | 2020 | | | 2019 | | | 2018 | | | 2017 | | | 2016 | |
| | | | | | | |
Net asset value — Beginning of period | | $ | 12.990 | | | $ | 10.630 | | | $ | 10.590 | | | $ | 12.750 | | | $ | 12.540 | | | $ | 13.840 | |
| | | | | | |
| Income (Loss) From Operations | | | | | | | | | | | | | | | | | | | | | | | | |
| | | | | | |
Net investment loss(1) | | $ | (0.081 | ) | | $ | (0.117 | ) | | $ | (0.082 | ) | | $ | (0.098 | ) | | $ | (0.095 | ) | | $ | (0.090 | ) |
| | | | | | |
Net realized and unrealized gain | | | 1.535 | | | | 2.493 | | | | 1.642 | | | | 2.484 | | | | 2.092 | | | | 1.365 | |
| | | | | | |
Total income from operations | | $ | 1.454 | | | $ | 2.376 | | | $ | 1.560 | | | $ | 2.386 | | | $ | 1.997 | | | $ | 1.275 | |
| | | | |
| Less Distributions | | | | | | | | | | | | | | | | | |
| | | | | | |
From net realized gain | | $ | (0.084 | ) | | $ | (0.016 | ) | | $ | (1.520 | ) | | $ | (4.546 | ) | | $ | (1.787 | ) | | $ | (2.575 | ) |
| | | | | | |
Total distributions | | $ | (0.084 | ) | | $ | (0.016 | ) | | $ | (1.520 | ) | | $ | (4.546 | ) | | $ | (1.787 | ) | | $ | (2.575 | ) |
| | | | | | |
Net asset value — End of period | | $ | 14.360 | | | $ | 12.990 | | | $ | 10.630 | | | $ | 10.590 | | | $ | 12.750 | | | $ | 12.540 | |
| | | | | | |
Total Return(2) | | | 11.21 | %(3) | | | 22.38 | %(4) | | | 18.02 | %(4) | | | 26.01 | %(4) | | | 18.41 | %(4) | | | 9.52 | % |
| | | | |
| Ratios/Supplemental Data | | | | | | | | | | | | | | | | | |
| | | | | | |
Net assets, end of period (000’s omitted) | | $ | 32,945 | | | $ | 30,580 | | | $ | 9,245 | | | $ | 2,326 | | | $ | 2,194 | | | $ | 3,157 | |
| | | | | | |
Ratios (as a percentage of average daily net assets): | | | | | | | | | | | | | | | | | | | | | | | | |
| | | | | | |
Expenses | | | 1.80 | %(5) | | | 1.80 | %(4) | | | 1.83 | %(4) | | | 2.00 | %(4) | | | 2.02 | %(4) | | | 1.96 | % |
| | | | | | |
Net investment loss | | | (1.17 | )%(5) | | | (1.01 | )% | | | (0.82 | )% | | | (0.96 | )% | | | (0.80 | )% | | | (0.71 | )% |
| | | | | | |
Portfolio Turnover | | | 8 | %(3) | | | 23 | % | | | 18 | % | | | 14 | % | | | 28 | % | | | 39 | % |
| (1) | Computed using average shares outstanding. |
| (2) | Returns are historical and are calculated by determining the percentage change in net asset value with all distributions reinvested and do not reflect the effect of sales charges. |
| (4) | The administrator and sub-adviser reimbursed certain operating expenses (equal to 0.05%, 0.19%, 0.27% and 0.17% of average daily net assets for the years ended September 30, 2020, 2019, 2018 and 2017, respectively). Absent this reimbursement, total return would be lower. |
| | | | |
| | 11 | | See Notes to Financial Statements. |
Eaton Vance
Atlanta Capital Focused Growth Fund
March 31, 2021
Financial Highlights — continued
| | | | | | | | | | | | | | | | | | | | | | | | |
| | | Class I | |
| | |
| | | Six Months Ended
March 31, 2021
(Unaudited) | | | Year Ended September 30, | |
| | | 2020 | | | 2019 | | | 2018 | | | 2017 | | | 2016 | |
| | | | | | | |
Net asset value — Beginning of period | | $ | 12.400 | | | $ | 10.050 | | | $ | 10.010 | | | $ | 12.210 | | | $ | 12.010 | | | $ | 13.350 | |
| | | | | | |
| Income (Loss) From Operations | | | | | | | | | | | | | | | | | | | | | | | | |
| | | | | | |
Net investment income (loss)(1) | | $ | (0.011 | ) | | $ | (0.000 | )(2) | | $ | 0.017 | | | $ | 0.003 | | | $ | 0.024 | | | $ | 0.039 | |
| | | | | | |
Net realized and unrealized gain | | | 1.465 | | | | 2.368 | | | | 1.543 | | | | 2.343 | | | | 1.993 | | | | 1.318 | |
| | | | | | |
Total income from operations | | $ | 1.454 | | | $ | 2.368 | | | $ | 1.560 | | | $ | 2.346 | | | $ | 2.017 | | | $ | 1.357 | |
| | | | |
| Less Distributions | | | | | | | | | | | | | | | | | |
| | | | | | |
From net investment income | | $ | — | | | $ | (0.001 | ) | | $ | — | | | $ | — | | | $ | (0.030 | ) | | $ | (0.050 | ) |
| | | | | | |
From net realized gain | | | (0.084 | ) | | | (0.017 | ) | | | (1.520 | ) | | | (4.546 | ) | | | (1.787 | ) | | | (2.647 | ) |
| | | | | | |
Total distributions | | $ | (0.084 | ) | | $ | (0.018 | ) | | $ | (1.520 | ) | | $ | (4.546 | ) | | $ | (1.817 | ) | | $ | (2.697 | ) |
| | | | | | |
Net asset value — End of period | | $ | 13.770 | | | $ | 12.400 | | | $ | 10.050 | | | $ | 10.010 | | | $ | 12.210 | | | $ | 12.010 | |
| | | | | | |
Total Return(3) | | | 11.74 | %(4) | | | 23.60 | %(5) | | | 19.22 | %(5) | | | 27.21 | %(5) | | | 19.58 | %(5) | | | 10.66 | % |
| | | | |
| Ratios/Supplemental Data | | | | | | | | | | | | | | | | | |
| | | | | | |
Net assets, end of period (000’s omitted) | | $ | 296,529 | | | $ | 271,918 | | | $ | 90,874 | | | $ | 7,150 | | | $ | 7,826 | | | $ | 12,780 | |
| | | | | | |
Ratios (as a percentage of average daily net assets): | | | | | | | | | | | | | | | | | | | | | | | | |
| | | | | | |
Expenses | | | 0.80 | %(6) | | | 0.80 | %(5) | | | 0.82 | %(5) | | | 1.00 | %(5) | | | 1.02 | %(5) | | | 0.96 | % |
| | | | | | |
Net investment income (loss) | | | (0.17 | )%(6) | | | (0.00 | )%(7) | | | 0.18 | % | | | 0.03 | % | | | 0.21 | % | | | 0.32 | % |
| | | | | | |
Portfolio Turnover | | | 8 | %(4) | | | 23 | % | | | 18 | % | | | 14 | % | | | 28 | % | | | 39 | % |
| (1) | Computed using average shares outstanding. |
| (2) | Amount is less than $(0.0005). |
| (3) | Returns are historical and are calculated by determining the percentage change in net asset value with all distributions reinvested. |
| (5) | The administrator and sub-adviser reimbursed certain operating expenses (equal to 0.05%, 0.19%, 0.27% and 0.16% of average daily net assets for the years ended September 30, 2020, 2019, 2018 and 2017, respectively). Absent this reimbursement, total return would be lower. |
| (7) | Amount is less than (0.005)%. |
| | | | |
| | 12 | | See Notes to Financial Statements. |
Eaton Vance
Atlanta Capital Focused Growth Fund
March 31, 2021
Notes to Financial Statements (Unaudited)
1 Significant Accounting Policies
Eaton Vance Atlanta Capital Focused Growth Fund (the Fund) is a non-diversified series of Eaton Vance Growth Trust (the Trust). The Trust is a Massachusetts business trust registered under the Investment Company Act of 1940, as amended (the 1940 Act), as an open-end management investment company. The Fund’s investment objective is to seek long-term capital growth. The Fund offers three classes of shares. Class A shares are generally sold subject to a sales charge imposed at time of purchase. Class C shares are sold at net asset value and are generally subject to a contingent deferred sales charge (see Note 5). Effective January 25, 2019, Class C shares generally automatically convert to Class A shares ten years after their purchase and, effective November 5, 2020, automatically convert to Class A shares eight years after their purchase as described in the Fund’s prospectus. Class I shares are sold at net asset value and are not subject to a sales charge. Each class represents a pro-rata interest in the Fund, but votes separately on class-specific matters and (as noted below) is subject to different expenses. Realized and unrealized gains and losses and net investment income and losses, other than class-specific expenses, are allocated daily to each class of shares based on the relative net assets of each class to the total net assets of the Fund. Each class of shares differs in its distribution plan and certain other class-specific expenses.
The following is a summary of significant accounting policies of the Fund. The policies are in conformity with accounting principles generally accepted in the United States of America (U.S. GAAP). The Fund is an investment company and follows accounting and reporting guidance in the Financial Accounting Standards Board (FASB) Accounting Standards Codification Topic 946.
A Investment Valuation — The following methodologies are used to determine the market value or fair value of investments.
Equity Securities. Equity securities listed on a U.S. securities exchange generally are valued at the last sale or closing price on the day of valuation or, if no sales took place on such date, at the mean between the closing bid and ask prices on the exchange where such securities are principally traded. Equity securities listed on the NASDAQ Global or Global Select Market generally are valued at the NASDAQ official closing price. Unlisted or listed securities for which closing sales prices or closing quotations are not available are valued at the mean between the latest available bid and ask prices.
Affiliated Fund. The Fund may invest in Eaton Vance Cash Reserves Fund, LLC (Cash Reserves Fund), an affiliated investment company managed by Eaton Vance Management (EVM). While Cash Reserves Fund is not a registered money market mutual fund, it conducts all of its investment activities in accordance with the requirements of Rule 2a-7 under the 1940 Act. Investments in Cash Reserves Fund are valued at the closing net asset value per unit on the valuation day. Cash Reserves Fund generally values its investment securities based on available market quotations provided by a third party pricing service.
Fair Valuation. Investments for which valuations or market quotations are not readily available or are deemed unreliable are valued at fair value using methods determined in good faith by or at the direction of the Trustees of the Fund in a manner that most fairly reflects the security’s “fair value”, which is the amount that the Fund might reasonably expect to receive for the security upon its current sale in the ordinary course. Each such determination is based on a consideration of relevant factors, which are likely to vary from one pricing context to another. These factors may include, but are not limited to, the type of security, the existence of any contractual restrictions on the security’s disposition, the price and extent of public trading in similar securities of the issuer or of comparable companies or entities, quotations or relevant information obtained from broker/dealers or other market participants, information obtained from the issuer, analysts, and/or the appropriate stock exchange (for exchange-traded securities), an analysis of the company’s or entity’s financial statements, and an evaluation of the forces that influence the issuer and the market(s) in which the security is purchased and sold.
B Investment Transactions — Investment transactions for financial statement purposes are accounted for on a trade date basis. Realized gains and losses on investments sold are determined on the basis of identified cost.
C Income — Dividend income is recorded on the ex-dividend date for dividends received in cash and/or securities.
D Federal Taxes — The Fund’s policy is to comply with the provisions of the Internal Revenue Code applicable to regulated investment companies and to distribute to shareholders each year substantially all of its net investment income, and all or substantially all of its net realized capital gains. Accordingly, no provision for federal income or excise tax is necessary.
As of March 31, 2021, the Fund had no uncertain tax positions that would require financial statement recognition, de-recognition, or disclosure. The Fund files a U.S. federal income tax return annually after its fiscal year-end, which is subject to examination by the Internal Revenue Service for a period of three years from the date of filing.
E Expenses — The majority of expenses of the Trust are directly identifiable to an individual fund. Expenses which are not readily identifiable to a specific fund are allocated taking into consideration, among other things, the nature and type of expense and the relative size of the funds.
F Use of Estimates — The preparation of the financial statements in conformity with U.S. GAAP requires management to make estimates and assumptions that affect the reported amounts of assets and liabilities at the date of the financial statements and the reported amounts of income and expense during the reporting period. Actual results could differ from those estimates.
G Indemnifications — Under the Trust’s organizational documents, its officers and Trustees may be indemnified against certain liabilities and expenses arising out of the performance of their duties to the Fund. Under Massachusetts law, if certain conditions prevail, shareholders of a Massachusetts business trust (such as the Trust) could be deemed to have personal liability for the obligations of the Trust. However, the Trust’s Declaration of Trust contains an express disclaimer of liability on the part of Fund shareholders and the By-laws provide that the Trust shall assume, upon request by the shareholder, the
Eaton Vance
Atlanta Capital Focused Growth Fund
March 31, 2021
Notes to Financial Statements (Unaudited) — continued
defense on behalf of any Fund shareholders. Moreover, the By-laws also provide for indemnification out of Fund property of any shareholder held personally liable solely by reason of being or having been a shareholder for all loss or expense arising from such liability. Additionally, in the normal course of business, the Fund enters into agreements with service providers that may contain indemnification clauses. The Fund’s maximum exposure under these arrangements is unknown as this would involve future claims that may be made against the Fund that have not yet occurred.
H Interim Financial Statements — The interim financial statements relating to March 31, 2021 and for the six months then ended have not been audited by an independent registered public accounting firm, but in the opinion of the Fund’s management, reflect all adjustments, consisting only of normal recurring adjustments, necessary for the fair presentation of the financial statements.
2 Distributions to Shareholders and Income Tax Information
It is the present policy of the Fund to make at least one distribution annually (normally in December) of all or substantially all of its net investment income and to distribute annually all or substantially all of its net realized capital gains. Distributions to shareholders are recorded on the ex-dividend date. Distributions are declared separately for each class of shares. Shareholders may reinvest income and capital gain distributions in additional shares of the same class of the Fund at the net asset value as of the ex-dividend date or, at the election of the shareholder, receive distributions in cash. Distributions to shareholders are determined in accordance with income tax regulations, which may differ from U.S. GAAP. As required by U.S. GAAP, only distributions in excess of tax basis earnings and profits are reported in the financial statements as a return of capital. Permanent differences between book and tax accounting relating to distributions are reclassified to paid-in capital. For tax purposes, distributions from short-term capital gains are considered to be from ordinary income.
The cost and unrealized appreciation (depreciation) of investments of the Fund at March 31, 2021, as determined on a federal income tax basis, were as follows:
| | | | |
| |
Aggregate cost | | $ | 272,731,891 | |
| |
Gross unrealized appreciation | | $ | 111,951,996 | |
| |
Gross unrealized depreciation | | | — | |
| |
Net unrealized appreciation | | $ | 111,951,996 | |
3 Investment Adviser Fee and Other Transactions with Affiliates
The investment adviser fee is earned by Boston Management and Research (BMR) as compensation for investment advisory services rendered to the Fund. On March 1, 2021, Morgan Stanley acquired Eaton Vance Corp. (the “Transaction”) and BMR became an indirect, wholly-owned subsidiary of Morgan Stanley. In connection with the Transaction, the Fund entered into a new investment advisory agreement (the “New Agreement”) with BMR, which took effect on March 1, 2021. Pursuant to the New Agreement (and the Fund’s investment advisory agreement with BMR in effect prior to March 1, 2021), the fee is computed at an annual rate of 0.65% of the Fund’s average daily net assets up to $500 million and is payable monthly. On net assets of $500 million and over, the annual fee is reduced. For the six months ended March 31, 2021, the investment adviser fee amounted to $1,221,791 or 0.65% (annualized) of the Fund’s average daily net assets. EVM, an affiliate of BMR and, effective March 1, 2021, an indirect, wholly-owned subsidiary of Morgan Stanley, serves as administrator of the Fund, but receives no compensation.
Pursuant to an investment sub-advisory agreement, BMR has delegated the investment management of the Fund to Atlanta Capital Management Company, LLC (Atlanta Capital), an affiliate of BMR and, effective March 1, 2021, an indirect, wholly-owned subsidiary of Morgan Stanley. In connection with the Transaction, BMR entered into a new sub-advisory agreement with Atlanta Capital, which took effect on March 1, 2021. BMR pays Atlanta Capital a portion of its investment adviser fee for sub-advisory services provided to the Fund. The Fund may invest its cash in Cash Reserves Fund. EVM does not currently receive a fee for advisory services provided to Cash Reserves Fund.
EVM and Atlanta Capital have agreed to reimburse the Fund’s expenses to the extent that total annual operating expenses (relating to ordinary operating expenses only) exceed 1.05%, 1.80% and 0.80% of the Fund’s average daily net assets for Class A, Class C and Class I, respectively. This agreement may be changed or terminated after January 31, 2022. Pursuant to this agreement, EVM and Atlanta Capital reimbursed no operating expenses for the six months ended March 31, 2021.
EVM provides sub-transfer agency and related services to the Fund pursuant to a Sub-Transfer Agency Support Services Agreement. For the six months ended March 31, 2021, EVM earned $10,716 from the Fund pursuant to such agreement, which is included in transfer and dividend disbursing agent fees on the Statement of Operations. The Fund was informed that Eaton Vance Distributors, Inc. (EVD), an affiliate of EVM and the Fund’s principal underwriter, received $11,830 as its portion of the sales charge on sales of Class A shares for the six months ended March 31, 2021. EVD also received distribution and service fees from Class A and Class C shares (see Note 4) and contingent deferred sales charges (see Note 5).
Eaton Vance
Atlanta Capital Focused Growth Fund
March 31, 2021
Notes to Financial Statements (Unaudited) — continued
Trustees and officers of the Fund who are members of EVM’s or BMR’s organizations receive remuneration for their services to the Fund out of the investment adviser fee. Trustees of the Fund who are not affiliated with the investment adviser and administrator may elect to defer receipt of all or a percentage of their annual fees in accordance with the terms of the Trustees Deferred Compensation Plan. For the six months ended March 31, 2021, no significant amounts have been deferred. Certain officers and Trustees of the Fund are officers of the above organizations.
4 Distribution Plans
The Fund has in effect a distribution plan for Class A shares (Class A Plan) pursuant to Rule 12b-1 under the 1940 Act. Pursuant to the Class A Plan, the Fund pays EVD a distribution and service fee of 0.25% per annum of its average daily net assets attributable to Class A shares for distribution services and facilities provided to the Fund by EVD, as well as for personal services and/or the maintenance of shareholder accounts. Distribution and service fees paid or accrued to EVD for the six months ended March 31, 2021 amounted to $67,236 for Class A shares.
The Fund also has in effect a distribution plan for Class C shares (Class C Plan) pursuant to Rule 12b-1 under the 1940 Act. Pursuant to the Class C Plan, the Fund pays EVD amounts equal to 0.75% per annum of its average daily net assets attributable to Class C shares for providing ongoing distribution services and facilities to the Fund. For the six months ended March 31, 2021, the Fund paid or accrued to EVD $120,085 for Class C shares.
Pursuant to the Class C Plan, the Fund also makes payments of service fees to EVD, financial intermediaries and other persons in amounts equal to 0.25% per annum of its average daily net assets attributable to that class. Service fees paid or accrued are for personal services and/or the maintenance of shareholder accounts. They are separate and distinct from the sales commissions and distribution fees payable to EVD. Service fees paid or accrued for the six months ended March 31, 2021 amounted to $40,028 for Class C shares.
Distribution and service fees are subject to the limitations contained in the Financial Industry Regulatory Authority Rule 2341(d).
5 Contingent Deferred Sales Charges
A contingent deferred sales charge (CDSC) of 1% generally is imposed on redemptions of Class C shares made within 12 months of purchase. Class A shares may be subject to a 1% CDSC if redeemed within 18 months of purchase (depending on the circumstances of purchase). Generally, the CDSC is based upon the lower of the net asset value at date of redemption or date of purchase. No charge is levied on shares acquired by reinvestment of dividends or capital gain distributions. For the six months ended March 31, 2021, the Fund was informed that EVD received approximately $5,000 of CDSCs paid by Class C shareholders and no CDSCs paid by Class A shareholders.
6 Purchases and Sales of Investments
Purchases and sales of investments, other than short-term obligations, aggregated $29,640,738 and $44,935,896, respectively, for the six months ended March 31, 2021.
7 Shares of Beneficial Interest
The Fund’s Declaration of Trust permits the Trustees to issue an unlimited number of full and fractional shares of beneficial interest (without par value). Such shares may be issued in a number of different series (such as the Fund) and classes. Transactions in Fund shares were as follows:
| | | | | | | | |
| Class A | | Six Months Ended
March 31, 2021
(Unaudited) | | | Year Ended
September 30, 2020 | |
| | |
Sales | | | 467,761 | | | | 2,598,542 | |
| | |
Issued to shareholders electing to receive payments of distributions in Fund shares | | | 18,639 | | | | 4,206 | |
| | |
Redemptions | | | (658,262 | ) | | | (2,673,204 | ) |
| | |
Converted from Class C shares | | | 36,571 | | | | 11,395 | |
| | |
Net decrease | | | (135,291 | ) | | | (59,061 | ) |
Eaton Vance
Atlanta Capital Focused Growth Fund
March 31, 2021
Notes to Financial Statements (Unaudited) — continued
| | | | | | | | |
| Class C | | Six Months Ended
March 31, 2021
(Unaudited) | | | Year Ended
September 30, 2020 | |
| | |
Sales | | | 272,569 | | | | 1,765,571 | |
| | |
Issued to shareholders electing to receive payments of distributions in Fund shares | | | 13,843 | | | | 1,903 | |
| | |
Redemptions | | | (305,236 | ) | | | (270,935 | ) |
| | |
Converted to Class A shares | | | (40,180 | ) | | | (12,458 | ) |
| | |
Net increase (decrease) | | | (59,004 | ) | | | 1,484,081 | |
| | |
| Class I | | Six Months Ended
March 31, 2021
(Unaudited) | | | Year Ended
September 30, 2020 | |
| | |
Sales | | | 5,057,837 | | | | 26,551,307 | |
| | |
Issued to shareholders electing to receive payments of distributions in Fund shares | | | 139,515 | | | | 30,879 | |
| | |
Redemptions | | | (5,586,735 | ) | | | (13,700,568 | ) |
| | |
Net increase (decrease) | | | (389,383 | ) | | | 12,881,618 | |
8 Line of Credit
The Fund participates with other portfolios and funds managed by EVM and its affiliates in an $800 million unsecured line of credit agreement with a group of banks, which is in effect through October 26, 2021. Borrowings are made by the Fund solely for temporary purposes related to redemptions and other short-term cash needs. Interest is charged to the Fund based on its borrowings at an amount above either the Eurodollar rate or Federal Funds rate. In addition, a fee computed at an annual rate of 0.15% on the daily unused portion of the line of credit is allocated among the participating portfolios and funds at the end of each quarter. In connection with the renewal of the agreement in October 2020, an upfront fee and arrangement fee totaling $950,000 was incurred that was allocated to the participating portfolios and funds. Because the line of credit is not available exclusively to the Fund, it may be unable to borrow some or all of its requested amounts at any particular time. The Fund did not have any significant borrowings or allocated fees during the six months ended March 31, 2021.
9 Investments in Affiliated Funds
At March 31, 2021, the value of the Fund’s investment in affiliated funds was $11,847,411, which represents 3.1% of the Fund’s net assets. Transactions in affiliated funds by the Fund for the six months ended March 31, 2021 were as follows:
| | | | | | | | | | | | | | | | | | | | | | | | | | | | | | | | |
Name of
affiliated fund | | Value,
beginning
of period | | | Purchases | | | Sales
proceeds | | | Net
realized
gain (loss) | | | Change in
unrealized
appreciation
(depreciation) | | | Value, end
of period | | | Dividend
income | | | Units, end
of period | |
|
Short-Term Investments | |
| | | | | | | | |
Eaton Vance Cash Reserves Fund, LLC | | $ | 9,923,038 | | | $ | 58,326,425 | | | $ | (56,402,052 | ) | | $ | 188 | | | $ | (188 | ) | | $ | 11,847,411 | | | $ | 3,752 | | | | 11,847,411 | |
10 Fair Value Measurements
Under generally accepted accounting principles for fair value measurements, a three-tier hierarchy to prioritize the assumptions, referred to as inputs, is used in valuation techniques to measure fair value. The three-tier hierarchy of inputs is summarized in the three broad levels listed below.
| • | | Level 1 – quoted prices in active markets for identical investments |
| • | | Level 2 – other significant observable inputs (including quoted prices for similar investments, interest rates, prepayment speeds, credit risk, etc.) |
| • | | Level 3 – significant unobservable inputs (including a fund’s own assumptions in determining the fair value of investments) |
Eaton Vance
Atlanta Capital Focused Growth Fund
March 31, 2021
Notes to Financial Statements (Unaudited) — continued
In cases where the inputs used to measure fair value fall in different levels of the fair value hierarchy, the level disclosed is determined based on the lowest level input that is significant to the fair value measurement in its entirety. The inputs or methodology used for valuing securities are not necessarily an indication of the risk associated with investing in those securities.
At March 31, 2021, the hierarchy of inputs used in valuing the Fund’s investments, which are carried at value, were as follows:
| | | | | | | | | | | | | | | | |
| Asset Description | | Level 1 | | | Level 2 | | | Level 3 | | | Total | |
| | | | |
Common Stocks | | $ | 372,836,476 | * | | $ | — | | | $ | — | | | $ | 372,836,476 | |
| | | | |
Short-Term Investments | | | — | | | | 11,847,411 | | | | — | | | | 11,847,411 | |
| | | | |
Total Investments | | $ | 372,836,476 | | | $ | 11,847,411 | | | $ | — | | | $ | 384,683,887 | |
| * | The level classification by major category of investments is the same as the category presentation in the Portfolio of Investments. |
11 Risks and Uncertainties
Pandemic Risk
An outbreak of respiratory disease caused by a novel coronavirus was first detected in China in late 2019 and subsequently spread internationally. This coronavirus has resulted in closing borders, enhanced health screenings, changes to healthcare service preparation and delivery, quarantines, cancellations, disruptions to supply chains and customer activity, as well as general concern and uncertainty. Health crises caused by outbreaks, such as the coronavirus outbreak, may exacerbate other pre-existing political, social and economic risks and disrupt normal market conditions and operations. The impact of this outbreak has negatively affected the worldwide economy, the economies of individual countries, individual companies, and the market in general, and may continue to do so in significant and unforeseen ways, as may other epidemics and pandemics that may arise in the future. Any such impact could adversely affect the Fund’s performance, or the performance of the securities in which the Fund invests.
Eaton Vance
Atlanta Capital Focused Growth Fund
March 31, 2021
Joint Special Meeting of Shareholders (Unaudited)
Eaton Vance Atlanta Capital Focused Growth Fund (the “Fund”) held a Joint Special Meeting of Shareholders with certain other Eaton Vance funds on February 18, 2021 and adjourned until February 26, 2021 for the following purposes: (1) to approve a new investment advisory agreement with Boston Management and Research to serve as the Fund’s investment adviser (“Proposal 1”); and (2) to approve a new investment sub-advisory agreement with Atlanta Capital Management Company, LLC to serve as the Fund’s investment sub-adviser (“Proposal 2”). The shareholder meeting results are as follows:
| | | | | | | | | | | | | | | | |
| | | Number of Shares(1) | |
| | | For | | | Against | | | Abstain(2) | | | Broker
Non-Votes(2) | |
| | | | |
Proposal 1 | | | 13,413,969.682 | | | | 191,691.294 | | | | 1,026,078.761 | | | | 0 | |
| | | | |
Proposal 2 | | | 13,409,532.416 | | | | 199,879.572 | | | | 1,022,327.748 | | | | 0 | |
| (1) | Fractional shares were voted proportionately. |
| (2) | Abstentions and broker non-votes (i.e., shares for which a broker returns a proxy but for which (i) the beneficial owner has not voted and (ii) the broker holding the shares does not have discretionary authority to vote on the particular matter) were treated as shares that were present at the meeting for purposes of establishing a quorum, but had the effect of a negative vote on Proposal 1 and Proposal 2. |
Eaton Vance
Atlanta Capital Focused Growth Fund
March 31, 2021
Board of Trustees’ Contract Approval
Overview of the Contract Review Process
Even though the following description of the Board’s (as defined below) consideration of investment advisory and, as applicable, sub-advisory agreements covers multiple funds, for purposes of this shareholder report, the description is only relevant as to Eaton Vance Atlanta Capital Focused Growth Fund.
| | | | |
| Fund | | Investment Adviser | | Investment Sub-Adviser |
| | |
Eaton Vance Atlanta Capital Focused Growth Fund | | Boston Management and Research | | Atlanta Capital Management Company, LLC |
At a meeting held on November 24, 2020 (the “November Meeting”), the Board of each Eaton Vance open-end Fund and portfolios in which each such Fund invests, as applicable (each, a “Fund” and, collectively, the “Funds”), including a majority of the Board members (the “Independent Trustees”) who are not “interested persons” (as defined in the Investment Company Act of 1940 (the “1940 Act”)) of the Funds, Eaton Vance Management (“EVM”) or Boston Management and Research (“BMR” and, together with EVM, the “Advisers”), voted to approve a new investment advisory agreement between each Fund and either EVM or BMR (the “New Investment Advisory Agreements”) and, for certain Funds, a new investment sub-advisory agreement between an Adviser and the applicable Sub-Adviser (the “New Investment Sub-Advisory Agreements”(1) and, together with the New Investment Advisory Agreements, the “New Agreements”), each of which is intended to go into effect upon the completion of the Transaction (as defined below), as more fully described below. In voting its approval of the New Agreements at the November Meeting, the Board relied on an order issued by the Securities and Exchange Commission in response to the impacts of the COVID-19 pandemic that provided temporary relief from the in-person meeting requirements under Section 15 of the 1940 Act.
In voting its approval of the New Agreements, the Board of each Fund relied upon the recommendation of its Contract Review Committee, which is a committee comprised exclusively of Independent Trustees. Prior to and during meetings leading up to the November Meeting, the Contract Review Committee reviewed and discussed information furnished by the Advisers, the Sub-Advisers, and Morgan Stanley, as requested by the Independent Trustees, that the Contract Review Committee considered reasonably necessary to evaluate the terms of the New Agreements and to form its recommendation. Such information included, among other things, the terms and anticipated impacts of Morgan Stanley’s pending acquisition of Eaton Vance Corp. (the “Transaction”) on the Funds and their shareholders. In addition to considering information furnished specifically to evaluate the impact of the Transaction on the Funds and their respective shareholders, the Board and its Contract Review Committee also considered information furnished for prior meetings of the Board and its committees, including information provided in connection with the annual contract review process for the Funds, which most recently culminated in April 2020 (the “2020 Annual Approval Process”).
The Board of each Fund, including the Independent Trustees, concluded that the applicable New Investment Advisory Agreement and, as applicable, New Investment Sub-Advisory Agreement, including the fees payable thereunder, was fair and reasonable, and it voted to approve the New Investment Advisory Agreement and, as applicable, New Investment Sub-Advisory Agreement and to recommend that shareholders do so as well.
Shortly after the announcement of the Transaction, the Board, including all of the Independent Trustees, met with senior representatives from the Advisers and Morgan Stanley at its meeting held on October 13, 2020 to discuss certain aspects of the Transaction and the expected impacts of the Transaction on the Funds and their shareholders. As part of the Board’s evaluation process, counsel to the Independent Trustees, on behalf of the Contract Review Committee, requested additional information to assist the Independent Trustees in their evaluation of the New Agreements and the implications of the Transaction, as well as other contractual arrangements that may be affected by the Transaction. The Contract Review Committee considered information furnished by the Advisers and Morgan Stanley, their respective affiliates, and, as applicable, the Sub-Advisers during meetings on November 5, 2020, November 10, 2020, November 13, 2020, November 17, 2020 and November 24, 2020.
During its meetings on November 10, 2020 and November 17, 2020, the Contract Review Committee further discussed the approval of the New Agreements with senior representatives of the Advisers, the Affiliated Sub-Advisers, and Morgan Stanley. The representatives from the Advisers, the Affiliated Sub-Advisers, and Morgan Stanley each made presentations to, and responded to questions from, the Independent Trustees. The Contract Review Committee considered the Advisers’, the Affiliated Sub-Advisers’ and Morgan Stanley’s responses related to the Transaction and specifically to the Funds, as well as information received in connection with the 2020 Annual Approval Process, with respect to its evaluation of the New Agreements. Among other information, the Board considered:
Information about the Transaction and its Terms
| • | | Information about the material terms and conditions, and expected impacts, of the Transaction that relate to the Funds, including the expected impacts on the businesses conducted by the Advisers, the Affiliated Sub-Advisers and Eaton Vance Distributors, Inc., as the distributor of Fund shares; |
| (1) | With respect to certain of the Funds, the applicable Adviser is currently a party to a sub-advisory agreement (collectively, the “Current Sub-Advisory Agreements”) with Atlanta Capital Management Company, LLC (“Atlanta Capital”), BMO Global Asset Management (Asia) Limited, Eaton Vance Advisers International Ltd. (“EVAIL”), Goldman Sachs Asset Management, L.P., Hexavest Inc. (“Hexavest”), Parametric Portfolio Associates LLC (“Parametric”) or Richard Bernstein Advisors LLC (collectively, the “Sub-Advisers” and, with respect to Atlanta Capital, EVAIL, Hexavest and Parametric, each an affiliate of the Advisers, the “Affiliated Sub-Advisers”). Accordingly, references to the “Sub-Advisers,” the “Affiliated Sub-Advisers” or the “New Sub-Advisory Agreements” are not applicable to all Funds. |
Eaton Vance
Atlanta Capital Focused Growth Fund
March 31, 2021
Board of Trustees’ Contract Approval — continued
| | • | | Information about the advantages of the Transaction as they relate to the Funds and their shareholders; |
| | • | | A commitment that the Funds would not bear any expenses, directly or indirectly, in connection with the Transaction; |
| | • | | A commitment that, for a period of three years after the Closing, at least 75% of each Fund’s Board members must not be “interested persons” (as defined in the 1940 Act) of the investment adviser (or predecessor investment adviser, if applicable) pursuant to Section 15(f)(1)(A) of the 1940 Act; |
| | • | | A commitment that Morgan Stanley would use its reasonable best efforts to ensure that it did not impose any “unfair burden” (as that term is used in section 15(f)(1)(B) of the 1940 Act) on the Funds as a result of the Transaction; |
| | • | | Information with respect to personnel and/or other resources of the Advisers and their affiliates, including the Affiliated Sub-Advisers, as a result of the Transaction, as well as any expected changes to compensation, including any retention-based compensation intended to incentivize key personnel at the Advisers and their affiliates, including the Affiliated Sub-Advisers; |
| | • | | Information regarding any changes that are expected with respect to the Funds’ slate of officers as a result of the Transaction; |
Information about Morgan Stanley
| | • | | Information about Morgan Stanley’s overall business, including information about the advisory, brokerage and related businesses that Morgan Stanley operates; |
| | • | | Information about Morgan Stanley’s financial condition, including its access to capital and other resources required to support the investment advisory businesses related to the Funds; |
| | • | | Information on how the Funds are expected to fit within Morgan Stanley’s overall business strategy, and any changes that Morgan Stanley contemplates implementing to the Funds in the short- or long-term following the closing of the Transaction (the “Closing”); |
| | • | | Information regarding risk management functions at Morgan Stanley and its affiliates, including how existing risk management protocols and procedures may impact the Funds and/or the businesses of the Advisers and their affiliates, including the Affiliated Sub-Advisers, as they relate to the Funds; |
| | • | | Information on the anticipated benefits of the Transaction to the Funds with respect to potential additional distribution capabilities and the ability to access new markets and customer segments through Morgan Stanley’s distribution network, including, in particular, its institutional client base; |
| | • | | Information regarding the financial condition and reputation of Morgan Stanley, its worldwide presence, experience as a fund sponsor and manager, commitment to maintain a high level of cooperation with, and support to, the Funds, strong client service capabilities, and relationships in the asset management industry; |
Information about the New Agreements for Funds
| | • | | A representation that, after the Closing, all of the Funds will continue to be advised by their current Adviser and Sub-Adviser, as applicable; |
| | • | | Information regarding the terms of the New Agreements, including certain changes as compared to the current investment advisory agreement between each Fund and its Adviser (collectively, the “Current Advisory Agreements”) and, as applicable, the current investment sub-advisory agreement between a Fund and a Sub-Adviser (together with the Current Advisory Agreements, the “Current Agreements”); |
| | • | | Information confirming that the fee rates payable under the New Agreements are not changed as compared to the Current Agreements; |
| | • | | A representation that the New Agreements will not cause any diminution in the nature, extent and quality of services provided by the Advisers and the Sub-Advisers to the Funds and their respective shareholders, including with respect to compliance and other non-advisory services; |
Information about Fund Performance, Fees and Expenses
| | • | | A report from an independent data provider comparing the investment performance of each Fund (including, as relevant, total return data, income data, Sharpe ratios and information ratios) to the investment performance of comparable funds and, as applicable, benchmark indices, over various time periods as of the 2020 Annual Approval Process, as well as performance information as of a more recent date; |
| | • | | A report from an independent data provider comparing each Fund’s total expense ratio (and its components) to those of comparable funds as of the 2020 Annual Approval Process, as well as fee and expense information as of a more recent date; |
| | • | | In certain instances, data regarding investment performance relative to customized groups of peer funds and blended indices identified by the Advisers in consultation with the Portfolio Management Committee of the Board as of the 2020 Annual Approval Process, as well as corresponding performance information as of a more recent date; |
| | • | | Comparative information concerning the fees charged and services provided by the Adviser and the Sub-Adviser to each Fund in managing other accounts (which may include other mutual funds, collective investment funds and institutional accounts) using investment strategies and techniques similar to those used in managing such Fund(s), if any; |
| | • | | Profitability analyses of the Advisers and the Affiliated Sub-Advisers, as applicable, with respect to each of the Funds as of the 2020 Annual Approval Process, as well as information regarding the impact of the Transaction on profitability; |
Information about Portfolio Management and Trading
| | • | | Descriptions of the investment management services currently provided and expected to be provided to each Fund after the Transaction, as well as each of the Funds’ investment strategies and policies; |
| | • | | The procedures and processes used to determine the fair value of Fund assets, when necessary, and actions taken to monitor and test the effectiveness of such procedures and processes; |
Eaton Vance
Atlanta Capital Focused Growth Fund
March 31, 2021
Board of Trustees’ Contract Approval — continued
| | • | | Information about any changes to the policies and practices of the Advisers and, as applicable, each Fund’s Sub-Adviser with respect to trading, including their processes for seeking best execution of portfolio transactions; |
| | • | | Information regarding the impact on trading and access to capital markets associated with the Funds’ affiliations with Morgan Stanley and its affiliates, including potential restrictions with respect to the Funds’ ability to execute portfolio transactions with Morgan Stanley and its affiliates; |
Information about the Advisers and the Sub-Advisers
| | • | | Information about the financial results and condition of the Advisers and the Affiliated Sub-Advisers since the culmination of the 2020 Annual Approval Process and any material changes in financial condition that are reasonably expected to occur before and after the Closing; |
| | • | | Information regarding contemplated changes to the individual investment professionals whose responsibilities include portfolio management and investment research for the Funds, and, for portfolio managers and certain other investment professionals, information relating to their responsibilities with respect to managing other mutual funds and investment accounts, as applicable, post-Closing; |
| | • | | The Code of Ethics of the Advisers and their affiliates, including the Affiliated Sub-Advisers, together with information relating to compliance with, and the administration of, such codes; |
| | • | | Policies and procedures relating to proxy voting and the handling of corporate actions and class actions; |
| | • | | Information concerning the resources devoted to compliance efforts undertaken by the Advisers and their affiliates, including the Affiliated Sub-Advisers, including descriptions of their various compliance programs and their record of compliance; |
| | • | | Information concerning the business continuity and disaster recovery plans of the Advisers and their affiliates, including the Affiliated Sub-Advisers; |
| | • | | A description of the Advisers’ oversight of the Sub-Advisers, including with respect to regulatory and compliance issues, investment management and other matters; |
Other Relevant Information
| | • | | Information concerning the nature, cost and character of the administrative and other non-investment advisory services provided by the Advisers and their affiliates; |
| | • | | Information concerning oversight of the relationship with the custodian, subcustodians and fund accountants by EVM and/or administrator to each of the Funds; |
| | • | | Confirmation that the Advisers intend to continue to manage the Funds in a manner materially consistent with each Fund’s current investment objective(s) and principal investment strategies; |
| | • | | Information regarding Morgan Stanley’s commitment to maintaining competitive compensation arrangements to attract and retain highly qualified personnel; |
| | • | | Confirmation that the Advisers’ current senior management teams have indicated their strong support of the Transaction; and |
| | • | | Information regarding the fact that Morgan Stanley and Eaton Vance Corp. will each derive benefits from the Transaction and that, as a result, they have a financial interest in the matters that were being considered. |
As indicated above, the Board and its Contract Review Committee also considered information received at its regularly scheduled meetings throughout the year, which included information from portfolio managers and other investment professionals of the Advisers and the Sub-Advisers regarding investment and performance matters, and considered various investment and trading strategies used in pursuing the Funds’ investment objectives. The Board also received information regarding risk management techniques employed in connection with the management of the Funds. The Board and its committees evaluated issues pertaining to industry and regulatory developments, compliance procedures, fund governance and other issues with respect to the Funds, and received and participated in reports and presentations provided by the Advisers and their affiliates, including the Affiliated Sub-Advisers, with respect to such matters.
The Contract Review Committee was advised throughout the evaluation process by Goodwin Procter LLP, independent legal counsel for the Independent Trustees. The members of the Contract Review Committee, with the advice of such counsel, exercised their own business judgment in determining the material factors to be considered in evaluating the New Agreements and the weight to be given to each such factor. The conclusions reached with respect to the New Agreements were based on a comprehensive evaluation of all the information provided and not any single factor. Moreover, each Independent Trustee may have placed varying emphasis on particular factors in reaching conclusions with respect to the New Agreements.
Nature, Extent and Quality of Services
In considering whether to approve the New Agreements, the Board evaluated the nature, extent and quality of services currently provided to each Fund by the Advisers and, as applicable, the Sub-Advisers under the Current Agreements. In evaluating the nature, extent and quality of services to be provided by the Advisers and the Sub-Advisers under the New Agreements, the Board considered, among other information, the expected impact, if any, of the Transaction on the operations, facilities, organization and personnel of the Advisers and the Sub-Advisers, and that Morgan Stanley and the Advisers have advised the Board that, following the Transaction, there is not expected to be any diminution in the nature, extent and quality of services provided by the Advisers and the Sub-Advisers, as applicable, to the Funds and their shareholders, including compliance and other non-advisory services, and that there are not expected to be any changes in portfolio management personnel as a result of the Transaction.
Eaton Vance
Atlanta Capital Focused Growth Fund
March 31, 2021
Board of Trustees’ Contract Approval — continued
The Board also considered the financial resources of Morgan Stanley and the Advisers and the importance of having a Fund manager with, or with access to, significant organizational and financial resources. The Board considered the benefits to the Funds of being part of a larger combined organization with greater financial resources following the Transaction, particularly during periods of market disruptions and volatility. In this regard, the Board considered information provided by Morgan Stanley regarding its business and operating structure, scale of operation, leadership and reputation, distribution capabilities, and financial condition, as well as information on how the Funds are expected to fit within Morgan Stanley’s overall business strategy and any changes that Morgan Stanley contemplates in the short- or long-term following the Closing. The Board also noted Morgan Stanley’s and the Advisers’ commitment to keep the Board apprised of developments with respect to its long-term integration plans for the Advisers, the Affiliated Sub-Advisers, and existing Morgan Stanley affiliates and their respective personnel.
The Board considered the Advisers’ and the Sub-Advisers’ management capabilities and investment processes in light of the types of investments held by each Fund, including the education, experience and number of investment professionals and other personnel who provide portfolio management, investment research, and similar services to each Fund. In particular, the Board considered the abilities and experience of the Advisers’ and, as applicable, the Sub-Advisers’ investment professionals in implementing each Fund’s investment strategies. The Board also took into account the resources dedicated to portfolio management and other services, the compensation methods of the Advisers and other factors, including the reputation and resources of the Advisers to recruit and retain highly qualified research, advisory and supervisory investment professionals. With respect to the recruitment and retention of key personnel, the Board noted information from Morgan Stanley and the Advisers regarding the benefits of joining Morgan Stanley. In addition, the Board considered the time and attention devoted to the Funds by senior management, as well as the infrastructure, operational capabilities and support staff in place to assist in the portfolio management and operations of the Funds, including the provision of administrative services. With respect to the foregoing, the Board also considered information from the Advisers and Morgan Stanley regarding the anticipated impact of the Transaction on such matters. The Board also considered the business-related and other risks to which the Advisers or their affiliates may be subject in managing the Funds and in connection with the Transaction.
The Board considered the compliance programs of the Advisers and relevant affiliates thereof, including the Affiliated Sub-Advisers. The Board considered compliance and reporting matters regarding, among other things, personal trading by investment professionals, disclosure of portfolio holdings, late trading, frequent trading, portfolio valuation, business continuity and the allocation of investment opportunities. The Board also considered the responses of the Advisers and their affiliates to requests in recent years from regulatory authorities, such as the Securities and Exchange Commission and the Financial Industry Regulatory Authority. The Board also considered certain information relating to the compliance record of Morgan Stanley and its affiliates, including information requests in recent years from regulatory authorities. With respect to the foregoing, including the compliance programs of the Advisers and the Sub-Advisers, the Board noted information regarding the impacts of the Transaction, as well as the Advisers’ and Morgan Stanley’s commitment to keep the Board apprised of developments with respect to its long-term integration plans for the Advisers, the Affiliated Sub-Advisers and existing Morgan Stanley affiliates and their respective personnel.
The Board considered other administrative services provided and to be provided or overseen by the Advisers and their affiliates, including transfer agency and accounting services. The Board evaluated the benefits to shareholders of investing in a fund that is a part of a large fund complex offering exposure to a variety of asset classes and investment disciplines, as well as the ability, in many cases, to exchange an investment among different funds without incurring additional sales charges. The Board noted information that the Transaction was not expected to have any material impact on such matters in the near-term.
In evaluating the nature, extent and quality of the services to be provided under the New Agreements, the Board also considered investment performance information provided for each Fund in connection with the 2020 Annual Approval Process, as well as information provided as of a more recent date. In this regard, the Board compared each Fund’s investment performance to that of comparable funds identified by an independent data provider (the peer group), as well as appropriate benchmark indices and, for certain Funds, a custom peer group of similarly managed funds. The Board also considered, where applicable, Fund-specific performance explanations based on criteria established by the Board in connection with the 2020 Annual Approval Process and, where applicable, performance explanations as of a more recent date. In addition to the foregoing information, it was also noted that the Board has received and discussed with management information throughout the year at periodic intervals comparing each Fund’s performance against applicable benchmark indices and peer groups. In addition, the Board considered each Fund’s performance in light of overall financial market conditions. Where a Fund’s relative underperformance to its peers was significant during one or more specified periods, the Board noted the explanation from the applicable Adviser concerning the Fund’s relative performance versus its peer group.
After consideration of the foregoing factors, among others, and based on their review of the materials provided and the assurances received from, and recommendations of, the Advisers and Morgan Stanley, the Board determined that the Transaction was not expected to adversely affect the nature, extent and quality of services provided to the Funds by the Advisers and their affiliates, including the Affiliated Sub-Advisers, and that the Transaction was not expected to have an adverse effect on the ability of the Advisers and their affiliates, including the Affiliated Sub-Advisers, to provide those services. The Board concluded that the nature, extent and quality of services expected to be provided by the Advisers and the Sub-Advisers, taken as a whole, are appropriate and expected to be consistent with the terms of the New Agreements.
Management Fees and Expenses
The Board considered contractual fee rates payable by each Fund for advisory and administrative services (referred to collectively as “management fees”) in connection with the 2020 Annual Approval Process, as well as information provided as of a more recent date. As part of its review, the Board considered each Fund’s management fees and total expense ratio over various periods, as compared to those of comparable funds, before and after giving effect to any
Eaton Vance
Atlanta Capital Focused Growth Fund
March 31, 2021
Board of Trustees’ Contract Approval — continued
undertaking to waive fees or reimburse expenses. The Board also considered factors, and, where applicable, certain Fund-specific factors, that had an impact on a Fund’s total expense ratio relative to comparable funds, as identified by the Advisers in response to inquiries from the Contract Review Committee. The Board considered that the New Agreements do not change a Fund’s management fee rate or the computation method for calculating such fees, including any separately executed permanent contractual management fee reduction currently in place for the Fund.
The Board also received and considered, where applicable, information about the services offered and the fee rates charged by the Advisers and the Sub-Advisers to other types of accounts with investment objectives and strategies that are substantially similar to and/or managed in a similar investment style as a Fund. In this regard, the Board received information about the differences in the nature and scope of services the Advisers and the Sub-Advisers, as applicable, provide to the Funds as compared to other types of accounts and the material differences in compliance, reporting and other legal burdens and risks to the Advisers and such Sub-Advisers as between each Fund and other types of accounts.
After considering the foregoing information, and in light of the nature, extent and quality of the services expected to be provided by the Advisers and the Sub-Advisers, the Board concluded that the management fees charged for advisory and related services are reasonable with respect to its approval of the New Agreements.
Profitability and “Fall-Out” Benefits
During the 2020 Annual Approval Process, the Board considered the level of profits realized by the Advisers and relevant affiliates thereof, including the Affiliated Sub-Advisers, in providing investment advisory and administrative services to the Funds and to all Eaton Vance funds as a group. The Board considered the level of profits realized without regard to marketing support or other payments by the Advisers and their affiliates to third parties in respect of distribution or other services. In light of the foregoing factors and the nature, extent and quality of the services rendered, the profits realized by the Advisers and their affiliates, including the Sub-Advisers, were not deemed to be excessive by the Board.
The Board noted that Morgan Stanley and the Advisers are expected to realize, over time, cost savings from the Transaction based on eliminating duplicate corporate overhead expenses. The Board considered, however, information from the Advisers and Morgan Stanley that such cost savings are not expected to be realized immediately upon the Closing and that, accordingly, there are currently no specific expected changes in the levels of profitability associated with the advisory and other services provided to the Funds that are contemplated as a result of the Transaction. The Board noted that it will continue to receive information regarding profitability during its annual contract review processes, including the extent to which cost savings and/or other efficiencies result in changes to profitability levels.
The Board also considered direct or indirect fall-out benefits received by the Advisers and their affiliates, including the Affiliated Sub-Advisers, in connection with their respective relationships with the Funds, including the benefits of research services that may be available to the Advisers and their affiliates as a result of securities transactions effected for the Funds and other investment advisory clients. In evaluating the fall-out benefits to be received by the Advisers and their affiliates under the New Agreements, the Board considered whether the Transaction would have an impact on the fall-out benefits currently realized by the Advisers and their affiliates in connection with services provided pursuant to the Current Advisory Agreements.
The Board of each Fund considered that Morgan Stanley may derive reputational and other benefits from its ability to use the names of the Advisers and their affiliates in connection with operating and marketing the Funds. The Board considered that the Transaction, if completed, would significantly increase Morgan Stanley’s assets under management and expand Morgan Stanley’s investment capabilities.
Economies of Scale
The Board also considered the extent to which the Advisers and their affiliates, on the one hand, and the Funds, on the other hand, can expect to realize benefits from economies of scale as the assets of the Funds increase. The Board acknowledged the difficulty in accurately measuring the benefits resulting from economies of scale, if any, with respect to the management of any specific Fund or group of funds. As part of the 2020 Annual Approval Process, the Board reviewed data summarizing the increases and decreases in the assets of the Funds and of all Eaton Vance funds as a group over various time periods, and evaluated the extent to which the total expense ratio of each Fund and the profitability of the Advisers and their affiliates may have been affected by such increases or decreases.
The Board noted that Morgan Stanley and the Advisers are expected to benefit from possible growth of the Funds resulting from enhanced distribution capabilities, including with respect to the Funds’ potential access to Morgan Stanley’s institutional client base. Based upon the foregoing, the Board concluded that the Funds currently share in the benefits from economies of scale, if any, when they are realized by the Advisers, and that the Transaction is not expected to impede a Fund from continuing to benefit from any future economies of scale realized by its Adviser.
Conclusion
Based on its consideration of the foregoing, and such other information it deemed relevant, including the factors and conclusions described above, the Contract Review Committee recommended to the Board approval of the New Agreements. Based on the recommendation of the Contract Review Committee, the Board, including a majority of the Independent Trustees, unanimously voted to approve the New Agreements for the Funds and recommended that shareholders approve the New Agreements.
Eaton Vance
Atlanta Capital Focused Growth Fund
March 31, 2021
Officers and Trustees
Officers
Eric A. Stein
President
Deidre E. Walsh
Vice President
Maureen A. Gemma
Secretary and Chief Legal Officer
James F. Kirchner
Treasurer
Richard F. Froio
Chief Compliance Officer
Trustees
William H. Park
Chairperson
Thomas E. Faust Jr.*
Mark R. Fetting
Cynthia E. Frost
George J. Gorman
Valerie A. Mosley
Helen Frame Peters
Keith Quinton
Marcus L. Smith
Susan J. Sutherland
Scott E. Wennerholm
Eaton Vance Funds
| | |
| Privacy Notice | | April 2021 |
| | |
| |
| FACTS | | WHAT DOES EATON VANCE DO WITH YOUR
PERSONAL INFORMATION? |
| | | |
| |
| | |
| Why? | | Financial companies choose how they share your personal information. Federal law gives consumers the right to limit some but not all sharing. Federal law also requires us to tell you how we collect, share, and protect your personal information. Please read this notice carefully to understand what we do. |
| | |
| | | |
| What? | | The types of personal information we collect and share depend on the product or service you have with us. This information can include: ∎ Social Security number and income ∎ investment experience and risk tolerance ∎ checking account number and wire transfer instructions |
| | |
| | | |
| How? | | All financial companies need to share customers’ personal information to run their everyday business. In the section below, we list the reasons financial companies can share their customers’ personal information; the reasons Eaton Vance chooses to share; and whether you can limit this sharing. |
| | |
| | | |
| | | | |
Reasons we can share your
personal information | | Does Eaton Vance share? | | Can you limit this sharing? |
| For our everyday business purposes — such as to process your transactions, maintain your account(s), respond to court orders and legal investigations, or report to credit bureaus | | Yes | | No |
| For our marketing purposes — to offer our products and services to you | | Yes | | No |
| For joint marketing with other financial companies | | No | | We don’t share |
| For our investment management affiliates’ everyday business purposes — information about your transactions, experiences, and creditworthiness | | Yes | | Yes |
| For our affiliates’ everyday business purposes — information about your transactions and experiences | | Yes | | No |
| For our affiliates’ everyday business purposes — information about your creditworthiness | | No | | We don’t share |
| For our investment management affiliates to market to you | | Yes | | Yes |
| For our affiliates to market to you | | No | | We don’t share |
| For nonaffiliates to market to you | | No | | We don’t share |
| | |
| To limit our sharing | | Call toll-free 1-800-262-1122 or email: EVPrivacy@eatonvance.com Please note: If you are a new customer, we can begin sharing your information 30 days from the date we sent this notice. When you are no longer our customer, we continue to share your information as described in this notice. However, you can contact us at any time to limit our sharing. |
| | |
| | | |
| | |
| Questions? | | Call toll-free 1-800-262-1122 or email: EVPrivacy@eatonvance.com |
| | |
| | | |
Eaton Vance Funds
| | |
| Privacy Notice — continued | | April 2021 |
| | |
| Who we are |
| Who is providing this notice? | | Eaton Vance Management, Eaton Vance Distributors, Inc., Eaton Vance Trust Company, Eaton Vance Management (International) Limited, Eaton Vance Advisers International Ltd., Eaton Vance Global Advisors Limited, Eaton Vance Management’s Real Estate Investment Group, Boston Management and Research, Calvert Research and Management, Eaton Vance and Calvert Fund Families and our investment advisory affiliates (“Eaton Vance”) (see Investment Management Affiliates definition below) |
| What we do |
| How does Eaton Vance protect my personal information? | | To protect your personal information from unauthorized access and use, we use security measures that comply with federal law. These measures include computer safeguards and secured files and buildings. We have policies governing the proper handling of customer information by personnel and requiring third parties that provide support to adhere to appropriate security standards with respect to such information. |
| How does Eaton Vance collect my personal information? | | We collect your personal information, for example, when you ∎ open an account or make deposits or withdrawals from your account ∎ buy securities from us or make a wire transfer ∎ give us your contact information We also collect your personal information from others, such as credit bureaus, affiliates, or other companies. |
| Why can’t I limit all sharing? | | Federal law gives you the right to limit only ∎ sharing for affiliates’ everyday business purposes — information about your creditworthiness ∎ affiliates from using your information to market to you ∎ sharing for nonaffiliates to market to you State laws and individual companies may give you additional rights to limit sharing. See below for more on your rights under state law. |
| Definitions |
| Investment Management Affiliates | | Eaton Vance Investment Management Affiliates include registered investment advisers, registered broker-dealers, and registered and unregistered funds. Investment Management Affiliates does not include entities associated with Morgan Stanley Wealth Management, such as Morgan Stanley Smith Barney LLC and Morgan Stanley & Co. |
| Affiliates | | Companies related by common ownership or control. They can be financial and nonfinancial companies. ∎ Our affiliates include companies with a Morgan Stanley name and financial companies such as Morgan Stanley Smith Barney LLC and Morgan Stanley & Co. |
| Nonaffiliates | | Companies not related by common ownership or control. They can be financial and nonfinancial companies. ∎ Eaton Vance does not share with nonaffiliates so they can market to you. |
| Joint marketing | | A formal agreement between nonaffiliated financial companies that together market financial products or services to you. ∎ Eaton Vance doesn’t jointly market. |
| Other important information |
Vermont: Except as permitted by law, we will not share personal information we collect about Vermont residents with Nonaffiliates unless you provide us with your written consent to share such information. California: Except as permitted by law, we will not share personal information we collect about California residents with Nonaffiliates and we will limit sharing such personal information with our Affiliates to comply with California privacy laws that apply to us. |
Eaton Vance Funds
IMPORTANT NOTICES
Delivery of Shareholder Documents. The Securities and Exchange Commission (SEC) permits funds to deliver only one copy of shareholder documents, including prospectuses, proxy statements and shareholder reports, to fund investors with multiple accounts at the same residential or post office box address. This practice is often called “householding” and it helps eliminate duplicate mailings to shareholders. Eaton Vance, or your financial intermediary, may household the mailing of your documents indefinitely unless you instruct Eaton Vance, or your financial intermediary, otherwise. If you would prefer that your Eaton Vance documents not be householded, please contact Eaton Vance at 1-800-262-1122, or contact your financial intermediary. Your instructions that householding not apply to delivery of your Eaton Vance documents will typically be effective within 30 days of receipt by Eaton Vance or your financial intermediary.
Portfolio Holdings. Each Eaton Vance Fund and its underlying Portfolio(s) (if applicable) files a schedule of portfolio holdings on Part F to Form N-PORT with the SEC. Certain information filed on Form N-PORT may be viewed on the Eaton Vance website at www.eatonvance.com, by calling Eaton Vance at 1-800-262-1122 or in the EDGAR database on the SEC’s website at www.sec.gov.
Proxy Voting. From time to time, funds are required to vote proxies related to the securities held by the funds. The Eaton Vance Funds or their underlying Portfolios (if applicable) vote proxies according to a set of policies and procedures approved by the Funds’ and Portfolios’ Boards. You may obtain a description of these policies and procedures and information on how the Funds or Portfolios voted proxies relating to portfolio securities during the most recent 12-month period ended June 30, without charge, upon request, by calling 1-800-262-1122 and by accessing the SEC’s website at www.sec.gov.
This Page Intentionally Left Blank
Investment Adviser
Boston Management and Research
Two International Place
Boston, MA 02110
Investment Sub-Adviser
Atlanta Capital Management Company, LLC
1075 Peachtree Street NE
Suite 2100
Atlanta, GA 30309
Administrator
Eaton Vance Management
Two International Place
Boston, MA 02110
Principal Underwriter*
Eaton Vance Distributors, Inc.
Two International Place
Boston, MA 02110
(617) 482-8260
Custodian
State Street Bank and Trust Company
State Street Financial Center, One Lincoln Street
Boston, MA 02111
Transfer Agent
BNY Mellon Investment Servicing (US) Inc.
Attn: Eaton Vance Funds
P.O. Box 9653
Providence, RI 02940-9653
(800) 262-1122
Fund Offices
Two International Place
Boston, MA 02110
| * | FINRA BrokerCheck. Investors may check the background of their Investment Professional by contacting the Financial Industry Regulatory Authority (FINRA). FINRA BrokerCheck is a free tool to help investors check the professional background of current and former FINRA-registered securities firms and brokers. FINRA BrokerCheck is available by calling 1-800-289-9999 and at www.FINRA.org. The FINRA BrokerCheck brochure describing this program is available to investors at www.FINRA.org. |

7725 3.31.21

Eaton Vance
Atlanta Capital Select Equity Fund
Semiannual Report
March 31, 2021

Commodity Futures Trading Commission Registration. The Commodity Futures Trading Commission (“CFTC”) has adopted regulations that subject registered investment companies and advisers to regulation by the CFTC if a fund invests more than a prescribed level of its assets in certain CFTC-regulated instruments (including futures, certain options and swap agreements) or markets itself as providing investment exposure to such instruments. The investment adviser has claimed an exclusion from the definition of “commodity pool operator” under the Commodity Exchange Act with respect to its management of the Fund. Accordingly, neither the Fund nor the adviser with respect to the operation of the Fund is subject to CFTC regulation. Because of its management of other strategies, the Fund’s adviser is registered with the CFTC as a commodity pool operator. The adviser is also registered as a commodity trading advisor.
Fund shares are not insured by the FDIC and are not deposits or other obligations of, or guaranteed by, any depository institution. Shares are subject to investment risks, including possible loss of principal invested.
This report must be preceded or accompanied by a current summary prospectus or prospectus. Before investing, investors should consider carefully the investment objective, risks, and charges and expenses of a mutual fund. This and other important information is contained in the summary prospectus and prospectus, which can be obtained from a financial intermediary. Prospective investors should read the prospectus carefully before investing. For further information, please call 1-800-262-1122.
Semiannual Report March 31, 2021
Eaton Vance
Atlanta Capital Select Equity Fund
Eaton Vance
Atlanta Capital Select Equity Fund
March 31, 2021
Performance1,2
Portfolio Managers William O. Bell IV, CFA, W. Matthew Hereford, CFA and Charles B. Reed, CFA, each of Atlanta Capital Management Company, LLC
| | | | | | | | | | | | | | | | | | | | | | | | |
| % Average Annual Total Returns | | Class
Inception Date | | | Performance
Inception Date | | | Six Months | | | One Year | | | Five Years | | | Since
Inception | |
| | | | | | |
Class A at NAV | | | 01/03/2012 | | | | 01/03/2012 | | | | 19.69 | % | | | 45.47 | % | | | 15.07 | % | | | 14.97 | % |
Class A with 5.75% Maximum Sales Charge | | | — | | | | — | | | | 12.79 | | | | 37.13 | | | | 13.72 | | | | 14.23 | |
Class C at NAV | | | 03/19/2013 | | | | 01/03/2012 | | | | 19.21 | | | | 44.40 | | | | 14.20 | | | | 14.22 | |
Class C with 1% Maximum Sales Charge | | | — | | | | — | | | | 18.21 | | | | 43.40 | | | | 14.20 | | | | 14.22 | |
Class I at NAV | | | 01/03/2012 | | | | 01/03/2012 | | | | 19.83 | | | | 45.83 | | | | 15.35 | | | | 15.25 | |
Class R6 at NAV | | | 02/01/2017 | | | | 01/03/2012 | | | | 19.82 | | | | 45.88 | | | | 15.40 | | | | 15.27 | |
|
| |
| | | | | | |
Russell 1000® Index | | | — | | | | — | | | | 20.41 | % | | | 60.59 | % | | | 16.65 | % | | | 15.58 | % |
| | | | | | |
| % Total Annual Operating Expense Ratios3 | | | | | | | | Class A | | | Class C | | | Class I | | | Class R6 | |
| | | | | | |
Gross | | | | | | | | | | | 1.06 | % | | | 1.81 | % | | | 0.81 | % | | | 0.76 | % |
Net | | | | | | | | | | | 1.05 | | | | 1.80 | | | | 0.80 | | | | 0.75 | |
Fund Profile
Sector Allocation (% of net assets)4
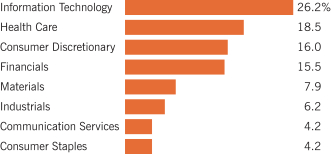
Top 10 Holdings (% of net assets)4
| | | | |
White Mountains Insurance Group, Ltd. | | | 7.3 | % |
| |
Fiserv, Inc. | | | 6.3 | |
| |
TJX Cos., Inc. (The) | | | 6.1 | |
| |
CDW Corp. | | | 5.1 | |
| |
Global Payments, Inc. | | | 4.7 | |
| |
Teleflex, Inc. | | | 4.5 | |
| |
Cooper Cos., Inc. (The) | | | 4.3 | |
| |
Alphabet, Inc., Class C | | | 4.2 | |
| |
Markel Corp. | | | 4.2 | |
| |
U.S. Bancorp | | | 4.0 | |
| |
Total | | | 50.7 | % |
See Endnotes and Additional Disclosures in this report.
Past performance is no guarantee of future results. Returns are historical and are calculated by determining the percentage change in net asset value (NAV) or offering price (as applicable) with all distributions reinvested. Investment return and principal value will fluctuate so that shares, when redeemed, may be worth more or less than their original cost. Performance for periods less than or equal to one year is cumulative. Performance is for the stated time period only; due to market volatility, current Fund performance may be lower or higher than the quoted return. For performance as of the most recent month-end, please refer to eatonvance.com.
Eaton Vance
Atlanta Capital Select Equity Fund
March 31, 2021
Endnotes and Additional Disclosures
| 1 | Russell 1000® Index is an unmanaged index of 1,000 U.S. large-cap stocks. Unless otherwise stated, index returns do not reflect the effect of any applicable sales charges, commissions, expenses, taxes or leverage, as applicable. It is not possible to invest directly in an index. |
| 2 | Total Returns at NAV do not include applicable sales charges. If sales charges were deducted, the returns would be lower. Total Returns shown with maximum sales charge reflect the stated maximum sales charge. Unless otherwise stated, performance does not reflect the deduction of taxes on Fund distributions or redemptions of Fund shares. |
Performance prior to the inception date of a class may be linked to the performance of an older class of the Fund. This linked performance is adjusted for any applicable sales charge, but is not adjusted for class expense differences. If adjusted for such differences, the performance would be different. The performance of Class C is linked to Class A and the performance of Class R6 is linked to Class I. Performance since inception for an index, if presented, is the performance since the Fund’s or oldest share class’ inception, as applicable. Performance presented in the Financial Highlights included in the financial statements is not linked.
| 3 | Source: Fund prospectus. Net expense ratios reflect a contractual expense reimbursement that continues through 1/31/22. Without the reimbursement, performance would have been lower. The expense ratios for the current reporting period can be found in the Financial Highlights section of this report. |
| 4 | Excludes cash and cash equivalents. |
Fund profile subject to change due to active management.
Eaton Vance
Atlanta Capital Select Equity Fund
March 31, 2021
Fund Expenses
Example: As a Fund shareholder, you incur two types of costs: (1) transaction costs, including sales charges (loads) on purchases and redemption fees (if applicable); and (2) ongoing costs, including management fees; distribution and/or service fees; and other Fund expenses. This Example is intended to help you understand your ongoing costs (in dollars) of Fund investing and to compare these costs with the ongoing costs of investing in other mutual funds. The Example is based on an investment of $1,000 invested at the beginning of the period and held for the entire period (October 1, 2020 – March 31, 2021).
Actual Expenses: The first section of the table below provides information about actual account values and actual expenses. You may use the information in this section, together with the amount you invested, to estimate the expenses that you paid over the period. Simply divide your account value by $1,000 (for example, an $8,600 account value divided by $1,000 = 8.6), then multiply the result by the number in the first section under the heading entitled “Expenses Paid During Period” to estimate the expenses you paid on your account during this period.
Hypothetical Example for Comparison Purposes: The second section of the table below provides information about hypothetical account values and hypothetical expenses based on the actual Fund expense ratio and an assumed rate of return of 5% per year (before expenses), which is not the actual Fund return. The hypothetical account values and expenses may not be used to estimate the actual ending account balance or expenses you paid for the period. You may use this information to compare the ongoing costs of investing in your Fund and other funds. To do so, compare this 5% hypothetical example with the 5% hypothetical examples that appear in the shareholder reports of the other funds.
Please note that the expenses shown in the table are meant to highlight your ongoing costs only and do not reflect any transactional costs, such as sales charges (loads) or redemption fees (if applicable). Therefore, the second section of the table is useful in comparing ongoing costs only, and will not help you determine the relative total costs of owning different funds. In addition, if these transactional costs were included, your costs would be higher.
| | | | | | | | | | | | | | | | |
| | | Beginning
Account Value
(10/1/20) | | | Ending
Account Value
(3/31/21) | | | Expenses Paid
During Period*
(10/1/20 – 3/31/21) | | | Annualized Expense
Ratio | |
| | | | |
Actual | | | | | | | | | | | | | | | | |
Class A | | $ | 1,000.00 | | | $ | 1,196.90 | | | $ | 5.70 | | | | 1.04 | % |
Class C | | $ | 1,000.00 | | | $ | 1,192.10 | | | $ | 9.78 | | | | 1.79 | % |
Class I | | $ | 1,000.00 | | | $ | 1,198.30 | | | $ | 4.33 | | | | 0.79 | % |
Class R6 | | $ | 1,000.00 | | | $ | 1,198.20 | | | $ | 4.11 | | | | 0.75 | % |
| | | | | |
Hypothetical | | | | | | | | | | | | | | | | |
(5% return per year before expenses) | | | | | | | | | | | | | | | | |
Class A | | $ | 1,000.00 | | | $ | 1,019.70 | | | $ | 5.24 | | | | 1.04 | % |
Class C | | $ | 1,000.00 | | | $ | 1,016.00 | | | $ | 9.00 | | | | 1.79 | % |
Class I | | $ | 1,000.00 | | | $ | 1,021.00 | | | $ | 3.98 | | | | 0.79 | % |
Class R6 | | $ | 1,000.00 | | | $ | 1,021.20 | | | $ | 3.78 | | | | 0.75 | % |
| * | Expenses are equal to the Fund’s annualized expense ratio for the indicated Class, multiplied by the average account value over the period, multiplied by 182/365 (to reflect the one-half year period). The Example assumes that the $1,000 was invested at the net asset value per share determined at the close of business on September 30, 2020. |
Eaton Vance
Atlanta Capital Select Equity Fund
March 31, 2021
Portfolio of Investments (Unaudited)
| | | | | | | | |
| Common Stocks — 98.7% | |
| Security | | Shares | | | Value | |
|
| Banks — 4.0% | |
| | |
U.S. Bancorp | | | 732,706 | | | $ | 40,525,969 | |
| |
| | | | $ | 40,525,969 | |
|
| Beverages — 2.8% | |
| | |
Diageo PLC ADR | | | 173,162 | | | $ | 28,434,932 | |
| |
| | | | $ | 28,434,932 | |
|
| Chemicals — 3.6% | |
| | |
Sherwin-Williams Co. (The) | | | 49,359 | | | $ | 36,427,436 | |
| |
| | | | $ | 36,427,436 | |
|
| Construction Materials — 2.6% | |
| | |
Martin Marietta Materials, Inc. | | | 80,015 | | | $ | 26,870,637 | |
| |
| | | | $ | 26,870,637 | |
|
| Containers & Packaging — 1.7% | |
| | |
Ball Corp. | | | 201,207 | | | $ | 17,050,281 | |
| |
| | | | $ | 17,050,281 | |
|
| Electrical Equipment — 2.1% | |
| | |
AMETEK, Inc. | | | 166,427 | | | $ | 21,257,721 | |
| |
| | | | $ | 21,257,721 | |
|
| Electronic Equipment, Instruments & Components — 5.1% | |
| | |
CDW Corp. | | | 309,041 | | | $ | 51,223,546 | |
| |
| | | | $ | 51,223,546 | |
|
| Food Products — 1.4% | |
| | |
Nestle S.A. ADR(1) | | | 126,951 | | | $ | 14,156,306 | |
| |
| | | | $ | 14,156,306 | |
|
| Health Care Equipment & Supplies — 16.2% | |
| | |
Cooper Cos., Inc. (The) | | | 112,931 | | | $ | 43,375,668 | |
| | |
Danaher Corp. | | | 86,748 | | | | 19,525,240 | |
| | |
DENTSPLY SIRONA, Inc. | | | 399,798 | | | | 25,511,110 | |
| | |
STERIS PLC | | | 156,915 | | | | 29,889,169 | |
| | |
Teleflex, Inc. | | | 109,883 | | | | 45,651,991 | |
| |
| | | | $ | 163,953,178 | |
| | | | | | | | |
| Security | | Shares | | | Value | |
|
| Hotels, Restaurants & Leisure — 3.0% | |
| | |
Aramark | | | 793,554 | | | $ | 29,980,470 | |
| |
| | | | $ | 29,980,470 | |
|
| Insurance — 11.5% | |
| | |
Markel Corp.(2) | | | 37,401 | | | $ | 42,622,928 | |
| | |
White Mountains Insurance Group, Ltd. | | | 65,919 | | | | 73,493,093 | |
| |
| | | | $ | 116,116,021 | |
|
| Interactive Media & Services — 4.2% | |
| | |
Alphabet, Inc., Class C(2) | | | 20,739 | | | $ | 42,901,318 | |
| |
| | | | $ | 42,901,318 | |
|
| IT Services — 19.5% | |
| | |
Fidelity National Information Services, Inc. | | | 150,734 | | | $ | 21,194,708 | |
| | |
Fiserv, Inc.(2) | | | 535,677 | | | | 63,766,990 | |
| | |
Global Payments, Inc. | | | 235,789 | | | | 47,530,347 | |
| | |
GoDaddy, Inc., Class A(2) | | | 452,517 | | | | 35,124,369 | |
| | |
Visa, Inc., Class A | | | 142,922 | | | | 30,260,875 | |
| |
| | | | $ | 197,877,289 | |
|
| Life Sciences Tools & Services — 2.3% | |
| | |
Thermo Fisher Scientific, Inc. | | | 51,636 | | | $ | 23,565,638 | |
| |
| | | | $ | 23,565,638 | |
|
| Professional Services — 4.1% | |
| | |
TransUnion | | | 258,048 | | | $ | 23,224,320 | |
| | |
Verisk Analytics, Inc. | | | 106,413 | | | | 18,802,113 | |
| |
| | | | $ | 42,026,433 | |
|
| Software — 1.6% | |
| | |
Autodesk, Inc.(2) | | | 57,135 | | | $ | 15,834,965 | |
| |
| | | | $ | 15,834,965 | |
|
| Specialty Retail — 13.0% | |
| | |
O’Reilly Automotive, Inc.(2) | | | 66,974 | | | $ | 33,972,562 | |
| | |
Ross Stores, Inc. | | | 302,842 | | | | 36,313,784 | |
| | |
TJX Cos., Inc. (The) | | | 933,930 | | | | 61,779,469 | |
| |
| | | | $ | 132,065,815 | |
| |
Total Common Stocks (identified cost $664,524,213) | | | $ | 1,000,267,955 | |
| | | | |
| | 5 | | See Notes to Financial Statements. |
Eaton Vance
Atlanta Capital Select Equity Fund
March 31, 2021
Portfolio of Investments (Unaudited) — continued
| | | | | | | | |
| Short-Term Investments — 1.3% | |
| Description | | Units | | | Value | |
| | |
Eaton Vance Cash Reserves Fund, LLC, 0.10%(3) | | | 13,235,003 | | | $ | 13,235,003 | |
| |
Total Short-Term Investments
(identified cost $13,235,003) | | | $ | 13,235,003 | |
| |
Total Investments — 100.0%
(identified cost $677,759,216) | | | $ | 1,013,502,958 | |
| |
Other Assets, Less Liabilities — (0.0)%(4) | | | $ | (241,632 | ) |
| |
Net Assets — 100.0% | | | $ | 1,013,261,326 | |
The percentage shown for each investment category in the Portfolio of Investments is based on net assets.
| (1) | All or a portion of this security was on loan at March 31, 2021. The aggregate market value of securities on loan at March 31, 2021 was $33,453. |
| (2) | Non-income producing security. |
| (3) | Affiliated investment company, available to Eaton Vance portfolios and funds, which invests in high quality, U.S. dollar denominated money market instruments. The rate shown is the annualized seven-day yield as of March 31, 2021. |
| (4) | Amount is less than (0.05)%. |
Abbreviations:
| | | | |
| | |
| ADR | | – | | American Depositary Receipt |
| | | | |
| | 6 | | See Notes to Financial Statements. |
Eaton Vance
Atlanta Capital Select Equity Fund
March 31, 2021
Statement of Assets and Liabilities (Unaudited)
| | | | |
| Assets | | March 31, 2021 | |
| |
Unaffiliated investments, at value including $33,453 of securities on loan (identified cost, $664,524,213) | | $ | 1,000,267,955 | |
| |
Affiliated investment, at value (identified cost, $13,235,003) | | | 13,235,003 | |
| |
Dividends receivable | | | 645,124 | |
| |
Dividends receivable from affiliated investment | | | 1,443 | |
| |
Receivable for Fund shares sold | | | 3,523,375 | |
| |
Tax reclaims receivable | | | 197,014 | |
| |
Total assets | | $ | 1,017,869,914 | |
|
| Liabilities | |
| |
Payable for Fund shares redeemed | | $ | 3,657,011 | |
| |
Payable to affiliates: | | | | |
| |
Investment adviser and administration fee | | | 589,246 | |
| |
Distribution and service fees | | | 63,129 | |
| |
Other | | | 171 | |
| |
Accrued expenses | | | 299,031 | |
| |
Total liabilities | | $ | 4,608,588 | |
| |
Net Assets | | $ | 1,013,261,326 | |
|
| Sources of Net Assets | |
| |
Paid-in capital | | $ | 647,153,836 | |
| |
Distributable earnings | | | 366,107,490 | |
| |
Total | | $ | 1,013,261,326 | |
| |
| Class A Shares | | | | |
| |
Net Assets | | $ | 87,064,540 | |
| |
Shares Outstanding | | | 2,788,205 | |
| |
Net Asset Value and Redemption Price Per Share | | | | |
| |
(net assets ÷ shares of beneficial interest outstanding) | | $ | 31.23 | |
| |
Maximum Offering Price Per Share | | | | |
| |
(100 ÷ 94.25 of net asset value per share) | | $ | 33.14 | |
|
| Class C Shares | |
| |
Net Assets | | $ | 52,764,766 | |
| |
Shares Outstanding | | | 1,805,733 | |
| |
Net Asset Value and Offering Price Per Share* | | | | |
| |
(net assets ÷ shares of beneficial interest outstanding) | | $ | 29.22 | |
|
| Class I Shares | |
| |
Net Assets | | $ | 847,701,894 | |
| |
Shares Outstanding | | | 26,533,135 | |
| |
Net Asset Value, Offering Price and Redemption Price Per Share | | | | |
| |
(net assets ÷ shares of beneficial interest outstanding) | | $ | 31.95 | |
|
| Class R6 Shares | |
| |
Net Assets | | $ | 25,730,126 | |
| |
Shares Outstanding | | | 803,481 | |
| |
Net Asset Value, Offering Price and Redemption Price Per Share | | | | |
| |
(net assets ÷ shares of beneficial interest outstanding) | | $ | 32.02 | |
On sales of $50,000 or more, the offering price of Class A shares is reduced.
| * | Redemption price per share is equal to the net asset value less any applicable contingent deferred sales charge. |
| | | | |
| | 7 | | See Notes to Financial Statements. |
Eaton Vance
Atlanta Capital Select Equity Fund
March 31, 2021
Statement of Operations (Unaudited)
| | | | |
| Investment Income | | Six Months Ended March 31, 2021 | |
| |
Dividends | | $ | 2,980,268 | |
| |
Dividends from affiliated investment | | | 10,388 | |
| |
Securities lending income, net | | | 110 | |
| |
Total investment income | | $ | 2,990,766 | |
|
| Expenses | |
| |
Investment adviser and administration fee | | $ | 3,368,196 | |
| |
Distribution and service fees | | | | |
| |
Class A | | | 102,369 | |
| |
Class C | | | 253,472 | |
| |
Trustees’ fees and expenses | | | 25,848 | |
| |
Custodian fee | | | 117,470 | |
| |
Transfer and dividend disbursing agent fees | | | 225,529 | |
| |
Legal and accounting services | | | 28,384 | |
| |
Printing and postage | | | 30,395 | |
| |
Registration fees | | | 52,552 | |
| |
Miscellaneous | | | 26,067 | |
| |
Total expenses | | $ | 4,230,282 | |
| |
Net investment loss | | $ | (1,239,516 | ) |
|
| Realized and Unrealized Gain (Loss) | |
| |
Net realized gain (loss) — | | | | |
| |
Investment transactions | | $ | 31,360,299 | |
| |
Net realized gain | | $ | 31,360,299 | |
| |
Change in unrealized appreciation (depreciation) — | | | | |
| |
Investments | | $ | 143,406,606 | |
| |
Net change in unrealized appreciation (depreciation) | | $ | 143,406,606 | |
| |
Net realized and unrealized gain | | $ | 174,766,905 | |
| |
Net increase in net assets from operations | | $ | 173,527,389 | |
| | | | |
| | 8 | | See Notes to Financial Statements. |
Eaton Vance
Atlanta Capital Select Equity Fund
March 31, 2021
Statements of Changes in Net Assets
| | | | | | | | |
| Increase (Decrease) in Net Assets | | Six Months Ended
March 31, 2021
(Unaudited) | | | Year Ended
September 30, 2020 | |
| | |
From operations — | | | | | | | | |
| | |
Net investment loss | | $ | (1,239,516 | ) | | $ | (655,843 | ) |
| | |
Net realized gain | | | 31,360,299 | | | | 41,128,426 | |
| | |
Net change in unrealized appreciation (depreciation) | | | 143,406,606 | | | | 13,278,974 | |
| | |
Net increase in net assets from operations | | $ | 173,527,389 | | | $ | 53,751,557 | |
| | |
Distributions to shareholders — | | | | | | | | |
| | |
Class A | | $ | (2,687,346 | ) | | $ | (710,247 | ) |
| | |
Class C | | | (1,737,010 | ) | | | (372,027 | ) |
| | |
Class I | | | (26,777,021 | ) | | | (5,067,461 | ) |
| | |
Class R6 | | | (763,566 | ) | | | (240,915 | ) |
| | |
Total distributions to shareholders | | $ | (31,964,943 | ) | | $ | (6,390,650 | ) |
| | |
Transactions in shares of beneficial interest — | | | | | | | | |
| | |
Proceeds from sale of shares | | | | | | | | |
| | |
Class A | | $ | 10,619,751 | | | $ | 30,894,593 | |
| | |
Class C | | | 8,095,423 | | | | 24,061,229 | |
| | |
Class I | | | 120,213,011 | | | | 525,718,724 | |
| | |
Class R6 | | | 3,796,363 | | | | 12,806,672 | |
| | |
Net asset value of shares issued to shareholders in payment of distributions declared | | | | | | | | |
| | |
Class A | | | 2,234,863 | | | | 592,067 | |
| | |
Class C | | | 1,275,972 | | | | 264,400 | |
| | |
Class I | | | 19,796,272 | | | | 3,938,288 | |
| | |
Class R6 | | | 690,573 | | | | 217,601 | |
| | |
Cost of shares redeemed | | | | | | | | |
| | |
Class A | | | (12,756,596 | ) | | | (41,799,756 | ) |
| | |
Class C | | | (7,303,620 | ) | | | (11,394,433 | ) |
| | |
Class I | | | (162,330,749 | ) | | | (285,152,500 | ) |
| | |
Class R6 | | | (3,768,197 | ) | | | (12,371,668 | ) |
| | |
Net asset value of shares converted | | | | | | | | |
| | |
Class A | | | 2,397,790 | | | | 1,523,888 | |
| | |
Class C | | | (2,397,790 | ) | | | (1,523,888 | ) |
| | |
Net increase (decrease) in net assets from Fund share transactions | | $ | (19,436,934 | ) | | $ | 247,775,217 | |
| | |
Net increase in net assets | | $ | 122,125,512 | | | $ | 295,136,124 | |
|
| Net Assets | |
| | |
At beginning of period | | $ | 891,135,814 | | | $ | 595,999,690 | |
| | |
At end of period | | $ | 1,013,261,326 | | | $ | 891,135,814 | |
| | | | |
| | 9 | | See Notes to Financial Statements. |
Eaton Vance
Atlanta Capital Select Equity Fund
March 31, 2021
Financial Highlights
| | | | | | | | | | | | | | | | | | | | | | | | |
| | | Class A | |
| | |
| | | Six Months Ended
March 31, 2021
(Unaudited) | | | Year Ended September 30, | |
| | | 2020 | | | 2019 | | | 2018 | | | 2017 | | | 2016 | |
| | | | | | | |
Net asset value — Beginning of period | | $ | 26.970 | | | $ | 25.680 | | | $ | 23.050 | | | $ | 19.980 | | | $ | 17.590 | | | $ | 16.320 | |
| | | | | | |
| Income (Loss) From Operations | | | | | | | | | | | | | | | | | | | | | | | | |
| | | | | | |
Net investment loss(1) | | $ | (0.063 | ) | | $ | (0.071 | ) | | $ | (0.030 | ) | | $ | (0.051 | ) | | $ | (0.034 | ) | | $ | (0.054 | ) |
| | | | | | |
Net realized and unrealized gain | | | 5.307 | | | | 1.612 | | | | 3.567 | | | | 3.448 | | | | 2.427 | | | | 1.870 | |
| | | | | | |
Total income from operations | | $ | 5.244 | | | $ | 1.541 | | | $ | 3.537 | | | $ | 3.397 | | | $ | 2.393 | | | $ | 1.816 | |
| | | | |
| Less Distributions | | | | | | | | | | | | | | | | | |
| | | | | | |
From net realized gain | | $ | (0.984 | ) | | $ | (0.251 | ) | | $ | (0.907 | ) | | $ | (0.327 | ) | | $ | (0.003 | ) | | $ | (0.546 | ) |
| | | | | | |
Total distributions | | $ | (0.984 | ) | | $ | (0.251 | ) | | $ | (0.907 | ) | | $ | (0.327 | ) | | $ | (0.003 | ) | | $ | (0.546 | ) |
| | | | | | |
Net asset value — End of period | | $ | 31.230 | | | $ | 26.970 | | | $ | 25.680 | | | $ | 23.050 | | | $ | 19.980 | | | $ | 17.590 | |
| | | | | | |
Total Return(2) | | | 19.69 | %(3) | | | 6.03 | %(4) | | | 16.23 | %(4) | | | 17.20 | %(4) | | | 13.67 | %(4) | | | 11.23 | %(4) |
| | | | |
| Ratios/Supplemental Data | | | | | | | | | | | | | | | | | |
| | | | | | |
Net assets, end of period (000’s omitted) | | $ | 87,065 | | | $ | 72,953 | | | $ | 78,208 | | | $ | 46,288 | | | $ | 84,692 | | | $ | 72,865 | |
| | | | | | |
Ratios (as a percentage of average daily net assets): | | | | | | | | | | | | | | | | | | | | | | | | |
| | | | | | |
Expenses | | | 1.04 | %(5) | | | 1.05 | %(4) | | | 1.05 | %(4) | | | 1.05 | %(4) | | | 1.10 | %(4) | | | 1.20 | %(4) |
| | | | | | |
Net investment loss | | | (0.42 | )%(5) | | | (0.28 | )% | | | (0.13 | )% | | | (0.24 | )% | | | (0.18 | )% | | | (0.32 | )% |
| | | | | | |
Portfolio Turnover | | | 8 | %(3) | | | 18 | % | | | 18 | % | | | 3 | % | | | 14 | % | | | 16 | % |
| (1) | Computed using average shares outstanding. |
| (2) | Returns are historical and are calculated by determining the percentage change in net asset value with all distributions reinvested and do not reflect the effect of sales charges. |
| (4) | The investment adviser, administrator and sub-adviser reimbursed certain operating expenses (equal to 0.01%, 0.02%, 0.04%, 0.07% and 0.05% of average daily net assets for the years ended September 30, 2020, 2019, 2018, 2017 and 2016, respectively). Absent this reimbursement, total return would be lower. |
| | | | |
| | 10 | | See Notes to Financial Statements. |
Eaton Vance
Atlanta Capital Select Equity Fund
March 31, 2021
Financial Highlights — continued
| | | | | | | | | | | | | | | | | | | | | | | | |
| | | Class C | |
| | |
| | | Six Months Ended
March 31, 2021
(Unaudited) | | | Year Ended September 30, | |
| | | 2020 | | | 2019 | | | 2018 | | | 2017 | | | 2016 | |
| | | | | | | |
Net asset value — Beginning of period | | $ | 25.390 | | | $ | 24.360 | | | $ | 22.080 | | | $ | 19.290 | | | $ | 17.110 | | | $ | 16.000 | |
| | | | | | |
| Income (Loss) From Operations | | | | | | | | | | | | | | | | | | | | | | | | |
| | | | | | |
Net investment loss(1) | | $ | (0.164 | ) | | $ | (0.246 | ) | | $ | (0.195 | ) | | $ | (0.196 | ) | | $ | (0.168 | ) | | $ | (0.175 | ) |
| | | | | | |
Net realized and unrealized gain | | | 4.978 | | | | 1.527 | | | | 3.382 | | | | 3.313 | | | | 2.351 | | | | 1.831 | |
| | | | | | |
Total income from operations | | $ | 4.814 | | | $ | 1.281 | | | $ | 3.187 | | | $ | 3.117 | | | $ | 2.183 | | | $ | 1.656 | |
| | | | |
| Less Distributions | | | | | | | | | | | | | | | | | |
| | | | | | |
From net realized gain | | $ | (0.984 | ) | | $ | (0.251 | ) | | $ | (0.907 | ) | | $ | (0.327 | ) | | $ | (0.003 | ) | | $ | (0.546 | ) |
| | | | | | |
Total distributions | | $ | (0.984 | ) | | $ | (0.251 | ) | | $ | (0.907 | ) | | $ | (0.327 | ) | | $ | (0.003 | ) | | $ | (0.546 | ) |
| | | | | | |
Net asset value — End of period | | $ | 29.220 | | | $ | 25.390 | | | $ | 24.360 | | | $ | 22.080 | | | $ | 19.290 | | | $ | 17.110 | |
| | | | | | |
Total Return(2) | | | 19.21 | %(3) | | | 5.28 | %(4) | | | 15.32 | %(4) | | | 16.36 | %(4) | | | 12.76 | %(4) | | | 10.49 | %(4) |
| | | | |
| Ratios/Supplemental Data | | | | | | | | | | | | | | | | | |
| | | | | | |
Net assets, end of period (000’s omitted) | | $ | 52,765 | | | $ | 46,117 | | | $ | 32,809 | | | $ | 24,222 | | | $ | 22,588 | | | $ | 19,479 | |
| | | | | | |
Ratios (as a percentage of average daily net assets): | | | | | | | | | | | | | | | | | | | | | | | | |
| | | | | | |
Expenses | | | 1.79 | %(5) | | | 1.80 | %(4) | | | 1.80 | %(4) | | | 1.80 | %(4) | | | 1.85 | %(4) | | | 1.95 | %(4) |
| | | | | | |
Net investment loss | | | (1.18 | )%(5) | | | (1.01 | )% | | | (0.89 | )% | | | (0.96 | )% | | | (0.93 | )% | | | (1.05 | )% |
| | | | | | |
Portfolio Turnover | | | 8 | %(3) | | | 18 | % | | | 18 | % | | | 3 | % | | | 14 | % | | | 16 | % |
| (1) | Computed using average shares outstanding. |
| (2) | Returns are historical and are calculated by determining the percentage change in net asset value with all distributions reinvested and do not reflect the effect of sales charges. |
| (4) | The investment adviser, administrator and sub-adviser reimbursed certain operating expenses (equal to 0.01%, 0.02%, 0.04%, 0.07% and 0.05% of average daily net assets for the years ended September 30, 2020, 2019, 2018, 2017 and 2016, respectively). Absent this reimbursement, total return would be lower. |
| | | | |
| | 11 | | See Notes to Financial Statements. |
Eaton Vance
Atlanta Capital Select Equity Fund
March 31, 2021
Financial Highlights — continued
| | | | | | | | | | | | | | | | | | | | | | | | |
| | | Class I | |
| | |
| | | Six Months Ended
March 31, 2021
(Unaudited) | | | Year Ended September 30, | |
| | | 2020 | | | 2019 | | | 2018 | | | 2017 | | | 2016 | |
| | | | | | | |
Net asset value — Beginning of period | | $ | 27.540 | | | $ | 26.150 | | | $ | 23.400 | | | $ | 20.220 | | | $ | 17.760 | | | $ | 16.430 | |
| | | | | | |
| Income (Loss) From Operations | | | | | | | | | | | | | | | | | | | | | | | | |
| | | | | | |
Net investment income (loss)(1) | | $ | (0.028 | ) | | $ | (0.002 | ) | | $ | 0.028 | | | $ | 0.009 | | | $ | 0.015 | | | $ | (0.007 | ) |
| | | | | | |
Net realized and unrealized gain | | | 5.422 | | | | 1.643 | | | | 3.629 | | | | 3.498 | | | | 2.448 | | | | 1.883 | |
| | | | | | |
Total income from operations | | $ | 5.394 | | | $ | 1.641 | | | $ | 3.657 | | | $ | 3.507 | | | $ | 2.463 | | | $ | 1.876 | |
| | | | |
| Less Distributions | | | | | | | | | | | | | | | | | |
| | | | | | |
From net realized gain | | $ | (0.984 | ) | | $ | (0.251 | ) | | $ | (0.907 | ) | | $ | (0.327 | ) | | $ | (0.003 | ) | | $ | (0.546 | ) |
| | | | | | |
Total distributions | | $ | (0.984 | ) | | $ | (0.251 | ) | | $ | (0.907 | ) | | $ | (0.327 | ) | | $ | (0.003 | ) | | $ | (0.546 | ) |
| | | | | | |
Net asset value — End of period | | $ | 31.950 | | | $ | 27.540 | | | $ | 26.150 | | | $ | 23.400 | | | $ | 20.220 | | | $ | 17.760 | |
| | | | | | |
Total Return(2) | | | 19.83 | %(3) | | | 6.30 | %(4) | | | 16.51 | %(4) | | | 17.49 | %(4) | | | 13.93 | %(4) | | | 11.58 | %(4) |
| | | | |
| Ratios/Supplemental Data | | | | | | | | | | | | | | | | | |
| | | | | | |
Net assets, end of period (000’s omitted) | | $ | 847,702 | | | $ | 750,584 | | | $ | 464,862 | | | $ | 294,066 | | | $ | 252,429 | | | $ | 168,322 | |
| | | | | | |
Ratios (as a percentage of average daily net assets): | | | | | | | | | | | | | | | | | | | | | | | | |
| | | | | | |
Expenses | | | 0.79 | %(5) | | | 0.80 | %(4) | | | 0.80 | %(4) | | | 0.80 | %(4) | | | 0.85 | %(4) | | | 0.95 | %(4) |
| | | | | | |
Net investment income (loss) | | | (0.18 | )%(5) | | | (0.01 | )% | | | 0.12 | % | | | 0.04 | % | | | 0.08 | % | | | (0.04 | )% |
| | | | | | |
Portfolio Turnover | | | 8 | %(3) | | | 18 | % | | | 18 | % | | | 3 | % | | | 14 | % | | | 16 | % |
| (1) | Computed using average shares outstanding. |
| (2) | Returns are historical and are calculated by determining the percentage change in net asset value with all distributions reinvested. |
| (4) | The investment adviser, administrator and sub-adviser reimbursed certain operating expenses (equal to 0.01%, 0.02%, 0.04%, 0.07% and 0.05% of average daily net assets for the years ended September 30, 2020, 2019, 2018, 2017 and 2016, respectively). Absent this reimbursement, total return would be lower. |
| | | | |
| | 12 | | See Notes to Financial Statements. |
Eaton Vance
Atlanta Capital Select Equity Fund
March 31, 2021
Financial Highlights — continued
| | | | | | | | | | | | | | | | | | | | |
| | | Class R6 | |
| | |
| | | Six Months Ended
March 31, 2021
(Unaudited) | | | Year Ended September 30, | |
| | | 2020 | | | 2019 | | | 2018 | | | 2017(1) | |
| | | | | | |
Net asset value — Beginning of period | | $ | 27.600 | | | $ | 26.190 | | | $ | 23.420 | | | $ | 20.230 | | | $ | 18.230 | |
| | | | | |
| Income (Loss) From Operations | | | | | | | | | | | | | | | | | | | | |
| | | | | |
Net investment income (loss)(2) | | $ | (0.020 | ) | | $ | 0.011 | | | $ | 0.039 | | | $ | 0.025 | | | $ | 0.040 | |
| | | | | |
Net realized and unrealized gain | | | 5.424 | | | | 1.650 | | | | 3.638 | | | | 3.492 | | | | 1.960 | |
| | | | | |
Total income from operations | | $ | 5.404 | | | $ | 1.661 | | | $ | 3.677 | | | $ | 3.517 | | | $ | 2.000 | |
| | | |
| Less Distributions | | | | | | | | | | | | | |
| | | | | |
From net realized gain | | $ | (0.984 | ) | | $ | (0.251 | ) | | $ | (0.907 | ) | | $ | (0.327 | ) | | $ | — | |
| | | | | |
Total distributions | | $ | (0.984 | ) | | $ | (0.251 | ) | | $ | (0.907 | ) | | $ | (0.327 | ) | | $ | — | |
| | | | | |
Net asset value — End of period | | $ | 32.020 | | | $ | 27.600 | | | $ | 26.190 | | | $ | 23.420 | | | $ | 20.230 | |
| | | | | |
Total Return(3) | | | 19.82 | %(4) | | | 6.37 | %(5) | | | 16.58 | %(5) | | | 17.59 | %(5) | | | 10.97 | %(4)(5) |
| | | |
| Ratios/Supplemental Data | | | | | | | | | | | | | |
| | | | | |
Net assets, end of period (000’s omitted) | | $ | 25,730 | | | $ | 21,482 | | | $ | 20,121 | | | $ | 14,603 | | | $ | 11 | |
| | | | | |
Ratios (as a percentage of average daily net assets): | | | | | | | | | | | | | | | | | | | | |
| | | | | |
Expenses | | | 0.75 | %(6) | | | 0.75 | %(5) | | | 0.75 | %(5) | | | 0.75 | %(5) | | | 0.75 | %(5)(6) |
| | | | | |
Net investment income (loss) | | | (0.13 | )%(6) | | | 0.04 | % | | | 0.17 | % | | | 0.11 | % | | | 0.32 | %(6) |
| | | | | |
Portfolio Turnover | | | 8 | %(4) | | | 18 | % | | | 18 | % | | | 3 | % | | | 14 | %(7) |
| (1) | For the period from the commencement of operations, February 1, 2017, to September 30, 2017. |
| (2) | Computed using average shares outstanding. |
| (3) | Returns are historical and are calculated by determining the percentage change in net asset value with all distributions reinvested. |
| (5) | The investment adviser, administrator and sub-adviser reimbursed certain operating expenses (equal to 0.01%, 0.02%, 0.04% and 0.06% of average daily net assets for the years ended September 30, 2020, 2019, 2018 and the period from the commencement of operations, February 1, 2017, to September 30, 2017, respectively). Absent this reimbursement, total return would be lower. |
| (7) | For the Fund’s year ended September 30, 2017. |
| | | | |
| | 13 | | See Notes to Financial Statements. |
Eaton Vance
Atlanta Capital Select Equity Fund
March 31, 2021
Notes to Financial Statements (Unaudited)
1 Significant Accounting Policies
Eaton Vance Atlanta Capital Select Equity Fund (the Fund) is a non-diversified series of Eaton Vance Growth Trust (the Trust). The Trust is a Massachusetts business trust registered under the Investment Company Act of 1940, as amended (the 1940 Act), as an open-end management investment company. The Fund’s investment objective is to seek long-term capital growth. The Fund offers four classes of shares. Class A shares are generally sold subject to a sales charge imposed at time of purchase. Class C shares are sold at net asset value and are generally subject to a contingent deferred sales charge (see Note 5). Effective January 25, 2019, Class C shares generally automatically convert to Class A shares ten years after their purchase and, effective November 5, 2020, automatically convert to Class A shares eight years after their purchase as described in the Fund’s prospectus. Class I and Class R6 shares are sold at net asset value and are not subject to a sales charge. Each class represents a pro-rata interest in the Fund, but votes separately on class-specific matters and (as noted below) is subject to different expenses. Realized and unrealized gains and losses and net investment income and losses, other than class-specific expenses, are allocated daily to each class of shares based on the relative net assets of each class to the total net assets of the Fund. Sub-accounting, recordkeeping and similar administrative fees payable to financial intermediaries, which are a component of transfer and dividend disbursing agent fees on the Statement of Operations, are not allocated to Class R6 shares. Each class of shares differs in its distribution plan and certain other class-specific expenses.
The following is a summary of significant accounting policies of the Fund. The policies are in conformity with accounting principles generally accepted in the United States of America (U.S. GAAP). The Fund is an investment company and follows accounting and reporting guidance in the Financial Accounting Standards Board (FASB) Accounting Standards Codification Topic 946.
A Investment Valuation — The following methodologies are used to determine the market value or fair value of investments.
Equity Securities. Equity securities listed on a U.S. securities exchange generally are valued at the last sale or closing price on the day of valuation or, if no sales took place on such date, at the mean between the closing bid and ask prices on the exchange where such securities are principally traded. Equity securities listed on the NASDAQ Global or Global Select Market generally are valued at the NASDAQ official closing price. Unlisted or listed securities for which closing sales prices or closing quotations are not available are valued at the mean between the latest available bid and ask prices.
Affiliated Fund. The Fund may invest in Eaton Vance Cash Reserves Fund, LLC (Cash Reserves Fund), an affiliated investment company managed by Eaton Vance Management (EVM). While Cash Reserves Fund is not a registered money market mutual fund, it conducts all of its investment activities in accordance with the requirements of Rule 2a-7 under the 1940 Act. Investments in Cash Reserves Fund are valued at the closing net asset value per unit on the valuation day. Cash Reserves Fund generally values its investment securities based on available market quotations provided by a third party pricing service.
Other. Investments in registered investment companies (including money market funds) that do not trade on an exchange are valued at the net asset value per share on the valuation day.
Fair Valuation. Investments for which valuations or market quotations are not readily available or are deemed unreliable are valued at fair value using methods determined in good faith by or at the direction of the Trustees of the Fund in a manner that most fairly reflects the security’s “fair value”, which is the amount that the Fund might reasonably expect to receive for the security upon its current sale in the ordinary course. Each such determination is based on a consideration of relevant factors, which are likely to vary from one pricing context to another. These factors may include, but are not limited to, the type of security, the existence of any contractual restrictions on the security’s disposition, the price and extent of public trading in similar securities of the issuer or of comparable companies or entities, quotations or relevant information obtained from broker/dealers or other market participants, information obtained from the issuer, analysts, and/or the appropriate stock exchange (for exchange-traded securities), an analysis of the company’s or entity’s financial statements, and an evaluation of the forces that influence the issuer and the market(s) in which the security is purchased and sold.
B Investment Transactions — Investment transactions for financial statement purposes are accounted for on a trade date basis. Realized gains and losses on investments sold are determined on the basis of identified cost.
C Income — Dividend income is recorded on the ex-dividend date for dividends received in cash and/or securities. However, if the ex-dividend date has passed, certain dividends from foreign securities are recorded as the Fund is informed of the ex-dividend date. Withholding taxes on foreign dividends and capital gains have been provided for in accordance with the Fund’s understanding of the applicable countries’ tax rules and rates.
D Federal Taxes — The Fund’s policy is to comply with the provisions of the Internal Revenue Code applicable to regulated investment companies and to distribute to shareholders each year substantially all of its net investment income, and all or substantially all of its net realized capital gains. Accordingly, no provision for federal income or excise tax is necessary.
As of March 31, 2021, the Fund had no uncertain tax positions that would require financial statement recognition, de-recognition, or disclosure. The Fund files a U.S. federal income tax return annually after its fiscal year-end, which is subject to examination by the Internal Revenue Service for a period of three years from the date of filing.
E Expenses — The majority of expenses of the Trust are directly identifiable to an individual fund. Expenses which are not readily identifiable to a specific fund are allocated taking into consideration, among other things, the nature and type of expense and the relative size of the funds.
Eaton Vance
Atlanta Capital Select Equity Fund
March 31, 2021
Notes to Financial Statements (Unaudited) — continued
F Use of Estimates — The preparation of the financial statements in conformity with U.S. GAAP requires management to make estimates and assumptions that affect the reported amounts of assets and liabilities at the date of the financial statements and the reported amounts of income and expense during the reporting period. Actual results could differ from those estimates.
G Indemnifications — Under the Trust’s organizational documents, its officers and Trustees may be indemnified against certain liabilities and expenses arising out of the performance of their duties to the Fund. Under Massachusetts law, if certain conditions prevail, shareholders of a Massachusetts business trust (such as the Trust) could be deemed to have personal liability for the obligations of the Trust. However, the Trust’s Declaration of Trust contains an express disclaimer of liability on the part of Fund shareholders and the By-laws provide that the Trust shall assume, upon request by the shareholder, the defense on behalf of any Fund shareholders. Moreover, the By-laws also provide for indemnification out of Fund property of any shareholder held personally liable solely by reason of being or having been a shareholder for all loss or expense arising from such liability. Additionally, in the normal course of business, the Fund enters into agreements with service providers that may contain indemnification clauses. The Fund’s maximum exposure under these arrangements is unknown as this would involve future claims that may be made against the Fund that have not yet occurred.
H Interim Financial Statements — The interim financial statements relating to March 31, 2021 and for the six months then ended have not been audited by an independent registered public accounting firm, but in the opinion of the Fund’s management, reflect all adjustments, consisting only of normal recurring adjustments, necessary for the fair presentation of the financial statements.
2 Distributions to Shareholders and Income Tax Information
It is the present policy of the Fund to make at least one distribution annually (normally in December) of all or substantially all of its net investment income and to distribute annually all or substantially all of its net realized capital gains. Distributions to shareholders are recorded on the ex-dividend date. Distributions are declared separately for each class of shares. Shareholders may reinvest income and capital gain distributions in additional shares of the same class of the Fund at the net asset value as of the ex-dividend date or, at the election of the shareholder, receive distributions in cash. Distributions to shareholders are determined in accordance with income tax regulations, which may differ from U.S. GAAP. As required by U.S. GAAP, only distributions in excess of tax basis earnings and profits are reported in the financial statements as a return of capital. Permanent differences between book and tax accounting relating to distributions are reclassified to paid-in capital. For tax purposes, distributions from short-term capital gains are considered to be from ordinary income.
The cost and unrealized appreciation (depreciation) of investments of the Fund at March 31, 2021, as determined on a federal income tax basis, were as follows:
| | | | |
| |
Aggregate cost | | $ | 677,514,659 | |
| |
Gross unrealized appreciation | | $ | 337,382,671 | |
| |
Gross unrealized depreciation | | | (1,394,372 | ) |
| |
Net unrealized appreciation | | $ | 335,988,299 | |
3 Investment Adviser and Administration Fee and Other Transactions with Affiliates
The investment adviser and administration fee is earned by EVM as compensation for investment advisory and administrative services rendered to the Fund. On March 1, 2021, Morgan Stanley acquired Eaton Vance Corp. (the “Transaction”) and EVM became an indirect, wholly-owned subsidiary of Morgan Stanley. In connection with the Transaction, the Fund entered into a new investment advisory and administrative agreement (the “New Agreement”) with EVM, which took effect on March 1, 2021. The Fund’s prior fee reduction agreement was incorporated into the New Agreement. Pursuant to the New Agreement (and the Fund’s investment advisory and administrative agreement with EVM in effect prior to March 1, 2021), the investment adviser and administration fee is computed at an annual rate of 0.70% of the Fund’s average daily net assets up to $500 million, 0.675% on net assets of $500 million but less than $1 billion, 0.65% on net assets of $1 billion but less than $2.5 billion and at reduced rates on average daily net assets of $2.5 billion or more, and is payable monthly. For the six months ended March 31, 2021, the investment adviser and administration fee amounted to $3,368,196 or 0.69% (annualized) of the Fund’s average daily net assets.
Pursuant to an investment sub-advisory agreement, EVM has delegated the investment management of the Fund to Atlanta Capital Management Company, LLC (Atlanta Capital), an affiliate of EVM and, effective March 1, 2021, an indirect, wholly-owned subsidiary of Morgan Stanley. In connection with the Transaction, EVM entered into a new sub-advisory agreement with Atlanta Capital, which took effect on March 1, 2021. EVM pays Atlanta Capital a portion of its investment adviser and administration fee for sub-advisory services provided to the Fund. The Fund may invest its cash in Cash Reserves Fund. EVM does not currently receive a fee for advisory services provided to Cash Reserves Fund.
EVM and Atlanta Capital have agreed to reimburse the Fund’s expenses to the extent that total annual operating expenses (relating to ordinary operating expenses only) exceed 1.05%, 1.80%, 0.80% and 0.75% of the Fund’s average daily net assets for Class A, Class C, Class I and Class R6, respectively.
Eaton Vance
Atlanta Capital Select Equity Fund
March 31, 2021
Notes to Financial Statements (Unaudited) — continued
This agreement may be changed or terminated after January 31, 2022. Pursuant to this agreement, EVM and Atlanta Capital reimbursed no operating expenses for the six months ended March 31, 2021.
EVM provides sub-transfer agency and related services to the Fund pursuant to a Sub-Transfer Agency Support Services Agreement. For the six months ended March 31, 2021, EVM earned $3,472 from the Fund pursuant to such agreement, which is included in transfer and dividend disbursing agent fees on the Statement of Operations. The Fund was informed that Eaton Vance Distributors, Inc. (EVD), an affiliate of EVM and the Fund’s principal underwriter, received $3,850 as its portion of the sales charge on sales of Class A shares for the six months ended March 31, 2021. EVD also received distribution and service fees from Class A and Class C shares (see Note 4) and contingent deferred sales charges (see Note 5).
Trustees and officers of the Fund who are members of EVM’s organization receive remuneration for their services to the Fund out of the investment adviser and administration fee. Trustees of the Fund who are not affiliated with EVM may elect to defer receipt of all or a percentage of their annual fees in accordance with the terms of the Trustees Deferred Compensation Plan. For the six months ended March 31, 2021, no significant amounts have been deferred. Certain officers and Trustees of the Fund are officers of EVM.
4 Distribution Plans
The Fund has in effect a distribution plan for Class A shares (Class A Plan) pursuant to Rule 12b-1 under the 1940 Act. Pursuant to the Class A Plan, the Fund pays EVD a distribution and service fee of 0.25% per annum of its average daily net assets attributable to Class A shares for distribution services and facilities provided to the Fund by EVD, as well as for personal services and/or the maintenance of shareholder accounts. Distribution and service fees paid or accrued to EVD for the six months ended March 31, 2021 amounted to $102,369 for Class A shares.
The Fund also has in effect a distribution plan for Class C shares (Class C Plan) pursuant to Rule 12b-1 under the 1940 Act. Pursuant to the Class C Plan, the Fund pays EVD amounts equal to 0.75% per annum of its average daily net assets attributable to Class C shares for providing ongoing distribution services and facilities to the Fund. For the six months ended March 31, 2021, the Fund paid or accrued to EVD $190,104 for Class C shares.
Pursuant to the Class C Plan, the Fund also makes payments of service fees to EVD, financial intermediaries and other persons in amounts equal to 0.25% per annum of its average daily net assets attributable to that class. Service fees paid or accrued are for personal services and/or the maintenance of shareholder accounts. They are separate and distinct from the sales commissions and distribution fees payable to EVD. Service fees paid or accrued for the six months ended March 31, 2021 amounted to $63,368 for Class C shares.
Distribution and service fees are subject to the limitations contained in the Financial Industry Regulatory Authority Rule 2341(d).
5 Contingent Deferred Sales Charges
A contingent deferred sales charge (CDSC) of 1% generally is imposed on redemptions of Class C shares made within 12 months of purchase. Class A shares may be subject to a 1% CDSC if redeemed within 18 months of purchase (depending on the circumstances of purchase). Generally, the CDSC is based upon the lower of the net asset value at date of redemption or date of purchase. No charge is levied on shares acquired by reinvestment of dividends or capital gain distributions. For the six months ended March 31, 2021, the Fund was informed that EVD received approximately $3,000 of CDSCs paid by Class C shareholders and no CDSCs paid by Class A shareholders.
6 Purchases and Sales of Investments
Purchases and sales of investments, other than short-term obligations, aggregated $79,751,074 and $121,471,116, respectively, for the six months ended March 31, 2021.
7 Shares of Beneficial Interest
The Fund’s Declaration of Trust permits the Trustees to issue an unlimited number of full and fractional shares of beneficial interest (without par value). Such shares may be issued in a number of different series (such as the Fund) and classes. Transactions in Fund shares were as follows:
| | | | | | | | |
| Class A | | Six Months Ended March 31, 2021
(Unaudited) | | | Year Ended
September 30, 2020 | |
| | |
Sales | | | 354,735 | | | | 1,206,068 | |
| | |
Issued to shareholders electing to receive payments of distributions in Fund shares | | | 76,379 | | | | 22,486 | |
| | |
Redemptions | | | (428,599 | ) | | | (1,631,151 | ) |
| | |
Converted from Class C shares | | | 80,907 | | | | 61,397 | |
| | |
Net increase (decrease) | | | 83,422 | | | | (341,200 | ) |
Eaton Vance
Atlanta Capital Select Equity Fund
March 31, 2021
Notes to Financial Statements (Unaudited) — continued
| | | | | | | | |
| Class C | | Six Months Ended
March 31, 2021
(Unaudited) | | | Year Ended
September 30, 2020 | |
| | |
Sales | | | 290,317 | | | | 1,005,442 | |
| | |
Issued to shareholders electing to receive payments of distributions in Fund shares | | | 46,483 | | | | 10,606 | |
| | |
Redemptions | | | (261,430 | ) | | | (481,234 | ) |
| | |
Converted to Class A shares | | | (86,075 | ) | | | (65,053 | ) |
| | |
Net increase (decrease) | | | (10,705 | ) | | | 469,761 | |
| | |
| Class I | | Six Months Ended
March 31, 2021
(Unaudited) | | | Year Ended
September 30, 2020 | |
| | |
Sales | | | 3,954,134 | | | | 20,519,960 | |
| | |
Issued to shareholders electing to receive payments of distributions in Fund shares | | | 661,861 | | | | 146,787 | |
| | |
Redemptions | | | (5,334,801 | ) | | | (11,192,686 | ) |
| | |
Net increase (decrease) | | | (718,806 | ) | | | 9,474,061 | |
| | |
| Class R6 | | Six Months Ended March 31, 2021
(Unaudited) | | | Year Ended September 30, 2020 | |
| | |
Sales | | | 126,944 | | | | 490,778 | |
| | |
Issued to shareholders electing to receive payments of distributions in Fund shares | | | 23,042 | | | | 8,098 | |
| | |
Redemptions | | | (124,870 | ) | | | (488,814 | ) |
| | |
Net increase | | | 25,116 | | | | 10,062 | |
8 Line of Credit
The Fund participates with other portfolios and funds managed by EVM and its affiliates in an $800 million unsecured line of credit agreement with a group of banks, which is in effect through October 26, 2021. Borrowings are made by the Fund solely for temporary purposes related to redemptions and other short-term cash needs. Interest is charged to the Fund based on its borrowings at an amount above either the Eurodollar rate or Federal Funds rate. In addition, a fee computed at an annual rate of 0.15% on the daily unused portion of the line of credit is allocated among the participating portfolios and funds at the end of each quarter. In connection with the renewal of the agreement in October 2020, an upfront fee and arrangement fee totaling $950,000 was incurred that was allocated to the participating portfolios and funds. Because the line of credit is not available exclusively to the Fund, it may be unable to borrow some or all of its requested amounts at any particular time. The Fund did not have any significant borrowings or allocated fees during the six months ended March 31, 2021.
9 Securities Lending Agreement
The Fund has established a securities lending agreement with State Street Bank and Trust Company (SSBT) as securities lending agent in which the Fund lends portfolio securities to qualified borrowers in exchange for collateral consisting of either cash or securities issued or guaranteed by the U.S. government or its agencies or instrumentalities in an amount at least equal to the market value of the securities on loan. The market value of securities loaned is determined daily and any additional required collateral is delivered to the Fund on the next business day. Cash collateral is invested in the State Street Navigator Securities Lending Government Money Market Portfolio, a money market fund registered under the 1940 Act. The Fund earns interest on the amount invested but it must pay (and at times receive from) the broker a loan rebate fee computed as a varying percentage of the collateral received. For security loans secured by non-cash collateral, the Fund earns a negotiated lending fee from the borrower. A portion of the income earned by the Fund from its investment of cash collateral, net of rebate fees, and lending fees received is allocated to SSBT for its services as lending agent and the portion allocated to the Fund is presented as securities lending income, net on the Statement of Operations. Non-cash collateral is held by the lending agent on behalf of the Fund and cannot be sold or re-pledged by the Fund; accordingly, such collateral is not reflected in the Statement of Assets and Liabilities.
Eaton Vance
Atlanta Capital Select Equity Fund
March 31, 2021
Notes to Financial Statements (Unaudited) — continued
The Fund is subject to possible delay in the recovery of loaned securities. Pursuant to the securities lending agreement, SSBT has provided indemnification to the Fund in the event of default by a borrower with respect to a loan. The Fund bears the risk of loss with respect to the investment of cash collateral.
At March 31, 2021, the value of the securities loaned (all common stock) and the value of the collateral received, which exceeded the value of the securities loaned, amounted to $33,453 and $34,564, respectively. Collateral received was comprised of U.S. government and/or agencies securities. The securities lending transactions have no contractual maturity date and each of the Fund and borrower has the option to terminate a loan at any time.
10 Investments in Affiliated Funds
At March 31, 2021, the value of the Fund’s investment in affiliated funds was $13,235,003, which represents 1.3% of the Fund’s net assets. Transactions in affiliated funds by the Fund for the six months ended March 31, 2021 were as follows:
| | | | | | | | | | | | | | | | | | | | | | | | | | | | | | | | |
Name of
affiliated fund | | Value,
beginning
of period | | | Purchases | | | Sales
proceeds | | | Net
realized
gain (loss) | | | Change in
unrealized
appreciation
(depreciation) | | | Value, end
of period | | | Dividend
income | | | Units, end
of period | |
|
Short-Term Investments | |
| | | | | | | | |
Eaton Vance Cash Reserves Fund, LLC | | $ | 23,292,874 | | | $ | 101,422,506 | | | $ | (111,480,377 | ) | | $ | — | | | $ | — | | | $ | 13,235,003 | | | $ | 10,388 | | | | 13,235,003 | |
11 Fair Value Measurements
Under generally accepted accounting principles for fair value measurements, a three-tier hierarchy to prioritize the assumptions, referred to as inputs, is used in valuation techniques to measure fair value. The three-tier hierarchy of inputs is summarized in the three broad levels listed below.
| • | | Level 1 – quoted prices in active markets for identical investments |
| • | | Level 2 – other significant observable inputs (including quoted prices for similar investments, interest rates, prepayment speeds, credit risk, etc.) |
| • | | Level 3 – significant unobservable inputs (including a fund’s own assumptions in determining the fair value of investments) |
In cases where the inputs used to measure fair value fall in different levels of the fair value hierarchy, the level disclosed is determined based on the lowest level input that is significant to the fair value measurement in its entirety. The inputs or methodology used for valuing securities are not necessarily an indication of the risk associated with investing in those securities.
At March 31, 2021, the hierarchy of inputs used in valuing the Fund’s investments, which are carried at value, were as follows:
| | | | | | | | | | | | | | | | |
| Asset Description | | Level 1 | | | Level 2 | | | Level 3 | | | Total | |
| | | | |
Common Stocks | | $ | 1,000,267,955 | * | | $ | — | | | $ | — | | | $ | 1,000,267,955 | |
| | | | |
Short-Term Investments | | | — | | | | 13,235,003 | | | | — | | | | 13,235,003 | |
| | | | |
Total Investments | | $ | 1,000,267,955 | | | $ | 13,235,003 | | | $ | — | | | $ | 1,013,502,958 | |
| * | The level classification by major category of investments is the same as the category presentation in the Portfolio of Investments. |
12 Risks and Uncertainties
Pandemic Risk
An outbreak of respiratory disease caused by a novel coronavirus was first detected in China in late 2019 and subsequently spread internationally. This coronavirus has resulted in closing borders, enhanced health screenings, changes to healthcare service preparation and delivery, quarantines, cancellations, disruptions to supply chains and customer activity, as well as general concern and uncertainty. Health crises caused by outbreaks, such as the coronavirus outbreak, may exacerbate other pre-existing political, social and economic risks and disrupt normal market conditions and operations. The impact of this outbreak has negatively affected the worldwide economy, the economies of individual countries, individual companies, and the market in general, and may continue to do so in significant and unforeseen ways, as may other epidemics and pandemics that may arise in the future. Any such impact could adversely affect the Fund’s performance, or the performance of the securities in which the Fund invests.
Eaton Vance
Atlanta Capital Select Equity Fund
March 31, 2021
Joint Special Meeting of Shareholders (Unaudited)
Eaton Vance Atlanta Capital Select Equity Fund (the “Fund”) held a Joint Special Meeting of Shareholders with certain other Eaton Vance funds on February 18, 2021 for the following purposes: (1) to approve a new investment advisory and administrative agreement with Eaton Vance Management to serve as the Fund’s investment adviser and administrator (“Proposal 1”); and (2) to approve a new investment sub-advisory agreement with Atlanta Capital Management Company, LLC to serve as the Fund’s investment sub-adviser (“Proposal 2”). The shareholder meeting results are as follows:
| | | | | | | | | | | | | | | | |
| | | Number of Shares(1) | |
| | | For | | | Against | | | Abstain(2) | | | Broker
Non-Votes(2) | |
| | | | |
Proposal 1 | | | 21,757,262.810 | | | | 80,616.516 | | | | 361,814.045 | | | | 0 | |
| | | | |
Proposal 2 | | | 21,732,467.321 | | | | 97,253.308 | | | | 369,972.743 | | | | 0 | |
| (1) | Fractional shares were voted proportionately. |
| (2) | Abstentions and broker non-votes (i.e., shares for which a broker returns a proxy but for which (i) the beneficial owner has not voted and (ii) the broker holding the shares does not have discretionary authority to vote on the particular matter) were treated as shares that were present at the meeting for purposes of establishing a quorum, but had the effect of a negative vote on Proposal 1 and Proposal 2. |
Eaton Vance
Atlanta Capital Select Equity Fund
March 31, 2021
Board of Trustees’ Contract Approval
Overview of the Contract Review Process
Even though the following description of the Board’s (as defined below) consideration of investment advisory and, as applicable, sub-advisory agreements covers multiple funds, for purposes of this shareholder report, the description is only relevant as to Eaton Vance Atlanta Capital Select Equity Fund.
| | | | |
| Fund | | Investment Adviser | | Investment Sub-Adviser |
| | |
Eaton Vance Atlanta Capital Select Equity Fund | | Eaton Vance Management | | Atlanta Capital Management Company, LLC |
At a meeting held on November 24, 2020 (the “November Meeting”), the Board of each Eaton Vance open-end Fund and portfolios in which each such Fund invests, as applicable (each, a “Fund” and, collectively, the “Funds”), including a majority of the Board members (the “Independent Trustees”) who are not “interested persons” (as defined in the Investment Company Act of 1940 (the “1940 Act”)) of the Funds, Eaton Vance Management (“EVM”) or Boston Management and Research (“BMR” and, together with EVM, the “Advisers”), voted to approve a new investment advisory agreement between each Fund and either EVM or BMR (the “New Investment Advisory Agreements”) and, for certain Funds, a new investment sub-advisory agreement between an Adviser and the applicable Sub-Adviser (the “New Investment Sub-Advisory Agreements”(1) and, together with the New Investment Advisory Agreements, the “New Agreements”), each of which is intended to go into effect upon the completion of the Transaction (as defined below), as more fully described below. In voting its approval of the New Agreements at the November Meeting, the Board relied on an order issued by the Securities and Exchange Commission in response to the impacts of the COVID-19 pandemic that provided temporary relief from the in-person meeting requirements under Section 15 of the 1940 Act.
In voting its approval of the New Agreements, the Board of each Fund relied upon the recommendation of its Contract Review Committee, which is a committee comprised exclusively of Independent Trustees. Prior to and during meetings leading up to the November Meeting, the Contract Review Committee reviewed and discussed information furnished by the Advisers, the Sub-Advisers, and Morgan Stanley, as requested by the Independent Trustees, that the Contract Review Committee considered reasonably necessary to evaluate the terms of the New Agreements and to form its recommendation. Such information included, among other things, the terms and anticipated impacts of Morgan Stanley’s pending acquisition of Eaton Vance Corp. (the “Transaction”) on the Funds and their shareholders. In addition to considering information furnished specifically to evaluate the impact of the Transaction on the Funds and their respective shareholders, the Board and its Contract Review Committee also considered information furnished for prior meetings of the Board and its committees, including information provided in connection with the annual contract review process for the Funds, which most recently culminated in April 2020 (the “2020 Annual Approval Process”).
The Board of each Fund, including the Independent Trustees, concluded that the applicable New Investment Advisory Agreement and, as applicable, New Investment Sub-Advisory Agreement, including the fees payable thereunder, was fair and reasonable, and it voted to approve the New Investment Advisory Agreement and, as applicable, New Investment Sub-Advisory Agreement and to recommend that shareholders do so as well.
Shortly after the announcement of the Transaction, the Board, including all of the Independent Trustees, met with senior representatives from the Advisers and Morgan Stanley at its meeting held on October 13, 2020 to discuss certain aspects of the Transaction and the expected impacts of the Transaction on the Funds and their shareholders. As part of the Board’s evaluation process, counsel to the Independent Trustees, on behalf of the Contract Review Committee, requested additional information to assist the Independent Trustees in their evaluation of the New Agreements and the implications of the Transaction, as well as other contractual arrangements that may be affected by the Transaction. The Contract Review Committee considered information furnished by the Advisers and Morgan Stanley, their respective affiliates, and, as applicable, the Sub-Advisers during meetings on November 5, 2020, November 10, 2020, November 13, 2020, November 17, 2020 and November 24, 2020.
During its meetings on November 10, 2020 and November 17, 2020, the Contract Review Committee further discussed the approval of the New Agreements with senior representatives of the Advisers, the Affiliated Sub-Advisers, and Morgan Stanley. The representatives from the Advisers, the Affiliated Sub-Advisers, and Morgan Stanley each made presentations to, and responded to questions from, the Independent Trustees. The Contract Review Committee considered the Advisers’, the Affiliated Sub-Advisers’ and Morgan Stanley’s responses related to the Transaction and specifically to the Funds, as well as information received in connection with the 2020 Annual Approval Process, with respect to its evaluation of the New Agreements. Among other information, the Board considered:
Information about the Transaction and its Terms
| • | | Information about the material terms and conditions, and expected impacts, of the Transaction that relate to the Funds, including the expected impacts on the businesses conducted by the Advisers, the Affiliated Sub-Advisers and Eaton Vance Distributors, Inc., as the distributor of Fund shares; |
| (1) | With respect to certain of the Funds, the applicable Adviser is currently a party to a sub-advisory agreement (collectively, the “Current Sub-Advisory Agreements”) with Atlanta Capital Management Company, LLC (“Atlanta Capital”), BMO Global Asset Management (Asia) Limited, Eaton Vance Advisers International Ltd. (“EVAIL”), Goldman Sachs Asset Management, L.P., Hexavest Inc. (“Hexavest”), Parametric Portfolio Associates LLC (“Parametric”) or Richard Bernstein Advisors LLC (collectively, the “Sub-Advisers” and, with respect to Atlanta Capital, EVAIL, Hexavest and Parametric, each an affiliate of the Advisers, the “Affiliated Sub-Advisers”). Accordingly, references to the “Sub-Advisers,” the “Affiliated Sub-Advisers” or the “New Sub-Advisory Agreements” are not applicable to all Funds. |
Eaton Vance
Atlanta Capital Select Equity Fund
March 31, 2021
Board of Trustees’ Contract Approval — continued
| | • | | Information about the advantages of the Transaction as they relate to the Funds and their shareholders; |
| | • | | A commitment that the Funds would not bear any expenses, directly or indirectly, in connection with the Transaction; |
| | • | | A commitment that, for a period of three years after the Closing, at least 75% of each Fund’s Board members must not be “interested persons” (as defined in the 1940 Act) of the investment adviser (or predecessor investment adviser, if applicable) pursuant to Section 15(f)(1)(A) of the 1940 Act; |
| | • | | A commitment that Morgan Stanley would use its reasonable best efforts to ensure that it did not impose any “unfair burden” (as that term is used in section 15(f)(1)(B) of the 1940 Act) on the Funds as a result of the Transaction; |
| | • | | Information with respect to personnel and/or other resources of the Advisers and their affiliates, including the Affiliated Sub-Advisers, as a result of the Transaction, as well as any expected changes to compensation, including any retention-based compensation intended to incentivize key personnel at the Advisers and their affiliates, including the Affiliated Sub-Advisers; |
| | • | | Information regarding any changes that are expected with respect to the Funds’ slate of officers as a result of the Transaction; |
Information about Morgan Stanley
| | • | | Information about Morgan Stanley’s overall business, including information about the advisory, brokerage and related businesses that Morgan Stanley operates; |
| | • | | Information about Morgan Stanley’s financial condition, including its access to capital and other resources required to support the investment advisory businesses related to the Funds; |
| | • | | Information on how the Funds are expected to fit within Morgan Stanley’s overall business strategy, and any changes that Morgan Stanley contemplates implementing to the Funds in the short- or long-term following the closing of the Transaction (the “Closing”); |
| | • | | Information regarding risk management functions at Morgan Stanley and its affiliates, including how existing risk management protocols and procedures may impact the Funds and/or the businesses of the Advisers and their affiliates, including the Affiliated Sub-Advisers, as they relate to the Funds; |
| | • | | Information on the anticipated benefits of the Transaction to the Funds with respect to potential additional distribution capabilities and the ability to access new markets and customer segments through Morgan Stanley’s distribution network, including, in particular, its institutional client base; |
| | • | | Information regarding the financial condition and reputation of Morgan Stanley, its worldwide presence, experience as a fund sponsor and manager, commitment to maintain a high level of cooperation with, and support to, the Funds, strong client service capabilities, and relationships in the asset management industry; |
Information about the New Agreements for Funds
| | • | | A representation that, after the Closing, all of the Funds will continue to be advised by their current Adviser and Sub-Adviser, as applicable; |
| | • | | Information regarding the terms of the New Agreements, including certain changes as compared to the current investment advisory agreement between each Fund and its Adviser (collectively, the “Current Advisory Agreements”) and, as applicable, the current investment sub-advisory agreement between a Fund and a Sub-Adviser (together with the Current Advisory Agreements, the “Current Agreements”); |
| | • | | Information confirming that the fee rates payable under the New Agreements are not changed as compared to the Current Agreements; |
| | • | | A representation that the New Agreements will not cause any diminution in the nature, extent and quality of services provided by the Advisers and the Sub-Advisers to the Funds and their respective shareholders, including with respect to compliance and other non-advisory services; |
Information about Fund Performance, Fees and Expenses
| | • | | A report from an independent data provider comparing the investment performance of each Fund (including, as relevant, total return data, income data, Sharpe ratios and information ratios) to the investment performance of comparable funds and, as applicable, benchmark indices, over various time periods as of the 2020 Annual Approval Process, as well as performance information as of a more recent date; |
| | • | | A report from an independent data provider comparing each Fund’s total expense ratio (and its components) to those of comparable funds as of the 2020 Annual Approval Process, as well as fee and expense information as of a more recent date; |
| | • | | In certain instances, data regarding investment performance relative to customized groups of peer funds and blended indices identified by the Advisers in consultation with the Portfolio Management Committee of the Board as of the 2020 Annual Approval Process, as well as corresponding performance information as of a more recent date; |
| | • | | Comparative information concerning the fees charged and services provided by the Adviser and the Sub-Adviser to each Fund in managing other accounts (which may include other mutual funds, collective investment funds and institutional accounts) using investment strategies and techniques similar to those used in managing such Fund(s), if any; |
| | • | | Profitability analyses of the Advisers and the Affiliated Sub-Advisers, as applicable, with respect to each of the Funds as of the 2020 Annual Approval Process, as well as information regarding the impact of the Transaction on profitability; |
Information about Portfolio Management and Trading
| | • | | Descriptions of the investment management services currently provided and expected to be provided to each Fund after the Transaction, as well as each of the Funds’ investment strategies and policies; |
| | • | | The procedures and processes used to determine the fair value of Fund assets, when necessary, and actions taken to monitor and test the effectiveness of such procedures and processes; |
Eaton Vance
Atlanta Capital Select Equity Fund
March 31, 2021
Board of Trustees’ Contract Approval — continued
| | • | | Information about any changes to the policies and practices of the Advisers and, as applicable, each Fund’s Sub-Adviser with respect to trading, including their processes for seeking best execution of portfolio transactions; |
| | • | | Information regarding the impact on trading and access to capital markets associated with the Funds’ affiliations with Morgan Stanley and its affiliates, including potential restrictions with respect to the Funds’ ability to execute portfolio transactions with Morgan Stanley and its affiliates; |
Information about the Advisers and the Sub-Advisers
| | • | | Information about the financial results and condition of the Advisers and the Affiliated Sub-Advisers since the culmination of the 2020 Annual Approval Process and any material changes in financial condition that are reasonably expected to occur before and after the Closing; |
| | • | | Information regarding contemplated changes to the individual investment professionals whose responsibilities include portfolio management and investment research for the Funds, and, for portfolio managers and certain other investment professionals, information relating to their responsibilities with respect to managing other mutual funds and investment accounts, as applicable, post-Closing; |
| | • | | The Code of Ethics of the Advisers and their affiliates, including the Affiliated Sub-Advisers, together with information relating to compliance with, and the administration of, such codes; |
| | • | | Policies and procedures relating to proxy voting and the handling of corporate actions and class actions; |
| | • | | Information concerning the resources devoted to compliance efforts undertaken by the Advisers and their affiliates, including the Affiliated Sub-Advisers, including descriptions of their various compliance programs and their record of compliance; |
| | • | | Information concerning the business continuity and disaster recovery plans of the Advisers and their affiliates, including the Affiliated Sub-Advisers; |
| | • | | A description of the Advisers’ oversight of the Sub-Advisers, including with respect to regulatory and compliance issues, investment management and other matters; |
Other Relevant Information
| | • | | Information concerning the nature, cost and character of the administrative and other non-investment advisory services provided by the Advisers and their affiliates; |
| | • | | Information concerning oversight of the relationship with the custodian, subcustodians and fund accountants by EVM and/or administrator to each of the Funds; |
| | • | | Confirmation that the Advisers intend to continue to manage the Funds in a manner materially consistent with each Fund’s current investment objective(s) and principal investment strategies; |
| | • | | Information regarding Morgan Stanley’s commitment to maintaining competitive compensation arrangements to attract and retain highly qualified personnel; |
| | • | | Confirmation that the Advisers’ current senior management teams have indicated their strong support of the Transaction; and |
| | • | | Information regarding the fact that Morgan Stanley and Eaton Vance Corp. will each derive benefits from the Transaction and that, as a result, they have a financial interest in the matters that were being considered. |
As indicated above, the Board and its Contract Review Committee also considered information received at its regularly scheduled meetings throughout the year, which included information from portfolio managers and other investment professionals of the Advisers and the Sub-Advisers regarding investment and performance matters, and considered various investment and trading strategies used in pursuing the Funds’ investment objectives. The Board also received information regarding risk management techniques employed in connection with the management of the Funds. The Board and its committees evaluated issues pertaining to industry and regulatory developments, compliance procedures, fund governance and other issues with respect to the Funds, and received and participated in reports and presentations provided by the Advisers and their affiliates, including the Affiliated Sub-Advisers, with respect to such matters.
The Contract Review Committee was advised throughout the evaluation process by Goodwin Procter LLP, independent legal counsel for the Independent Trustees. The members of the Contract Review Committee, with the advice of such counsel, exercised their own business judgment in determining the material factors to be considered in evaluating the New Agreements and the weight to be given to each such factor. The conclusions reached with respect to the New Agreements were based on a comprehensive evaluation of all the information provided and not any single factor. Moreover, each Independent Trustee may have placed varying emphasis on particular factors in reaching conclusions with respect to the New Agreements.
Nature, Extent and Quality of Services
In considering whether to approve the New Agreements, the Board evaluated the nature, extent and quality of services currently provided to each Fund by the Advisers and, as applicable, the Sub-Advisers under the Current Agreements. In evaluating the nature, extent and quality of services to be provided by the Advisers and the Sub-Advisers under the New Agreements, the Board considered, among other information, the expected impact, if any, of the Transaction on the operations, facilities, organization and personnel of the Advisers and the Sub-Advisers, and that Morgan Stanley and the Advisers have advised the Board that, following the Transaction, there is not expected to be any diminution in the nature, extent and quality of services provided by the Advisers and the Sub-Advisers, as applicable, to the Funds and their shareholders, including compliance and other non-advisory services, and that there are not expected to be any changes in portfolio management personnel as a result of the Transaction.
Eaton Vance
Atlanta Capital Select Equity Fund
March 31, 2021
Board of Trustees’ Contract Approval — continued
The Board also considered the financial resources of Morgan Stanley and the Advisers and the importance of having a Fund manager with, or with access to, significant organizational and financial resources. The Board considered the benefits to the Funds of being part of a larger combined organization with greater financial resources following the Transaction, particularly during periods of market disruptions and volatility. In this regard, the Board considered information provided by Morgan Stanley regarding its business and operating structure, scale of operation, leadership and reputation, distribution capabilities, and financial condition, as well as information on how the Funds are expected to fit within Morgan Stanley’s overall business strategy and any changes that Morgan Stanley contemplates in the short- or long-term following the Closing. The Board also noted Morgan Stanley’s and the Advisers’ commitment to keep the Board apprised of developments with respect to its long-term integration plans for the Advisers, the Affiliated Sub-Advisers, and existing Morgan Stanley affiliates and their respective personnel.
The Board considered the Advisers’ and the Sub-Advisers’ management capabilities and investment processes in light of the types of investments held by each Fund, including the education, experience and number of investment professionals and other personnel who provide portfolio management, investment research, and similar services to each Fund. In particular, the Board considered the abilities and experience of the Advisers’ and, as applicable, the Sub-Advisers’ investment professionals in implementing each Fund’s investment strategies. The Board also took into account the resources dedicated to portfolio management and other services, the compensation methods of the Advisers and other factors, including the reputation and resources of the Advisers to recruit and retain highly qualified research, advisory and supervisory investment professionals. With respect to the recruitment and retention of key personnel, the Board noted information from Morgan Stanley and the Advisers regarding the benefits of joining Morgan Stanley. In addition, the Board considered the time and attention devoted to the Funds by senior management, as well as the infrastructure, operational capabilities and support staff in place to assist in the portfolio management and operations of the Funds, including the provision of administrative services. With respect to the foregoing, the Board also considered information from the Advisers and Morgan Stanley regarding the anticipated impact of the Transaction on such matters. The Board also considered the business-related and other risks to which the Advisers or their affiliates may be subject in managing the Funds and in connection with the Transaction.
The Board considered the compliance programs of the Advisers and relevant affiliates thereof, including the Affiliated Sub-Advisers. The Board considered compliance and reporting matters regarding, among other things, personal trading by investment professionals, disclosure of portfolio holdings, late trading, frequent trading, portfolio valuation, business continuity and the allocation of investment opportunities. The Board also considered the responses of the Advisers and their affiliates to requests in recent years from regulatory authorities, such as the Securities and Exchange Commission and the Financial Industry Regulatory Authority. The Board also considered certain information relating to the compliance record of Morgan Stanley and its affiliates, including information requests in recent years from regulatory authorities. With respect to the foregoing, including the compliance programs of the Advisers and the Sub-Advisers, the Board noted information regarding the impacts of the Transaction, as well as the Advisers’ and Morgan Stanley’s commitment to keep the Board apprised of developments with respect to its long-term integration plans for the Advisers, the Affiliated Sub-Advisers and existing Morgan Stanley affiliates and their respective personnel.
The Board considered other administrative services provided and to be provided or overseen by the Advisers and their affiliates, including transfer agency and accounting services. The Board evaluated the benefits to shareholders of investing in a fund that is a part of a large fund complex offering exposure to a variety of asset classes and investment disciplines, as well as the ability, in many cases, to exchange an investment among different funds without incurring additional sales charges. The Board noted information that the Transaction was not expected to have any material impact on such matters in the near-term.
In evaluating the nature, extent and quality of the services to be provided under the New Agreements, the Board also considered investment performance information provided for each Fund in connection with the 2020 Annual Approval Process, as well as information provided as of a more recent date. In this regard, the Board compared each Fund’s investment performance to that of comparable funds identified by an independent data provider (the peer group), as well as appropriate benchmark indices and, for certain Funds, a custom peer group of similarly managed funds. The Board also considered, where applicable, Fund-specific performance explanations based on criteria established by the Board in connection with the 2020 Annual Approval Process and, where applicable, performance explanations as of a more recent date. In addition to the foregoing information, it was also noted that the Board has received and discussed with management information throughout the year at periodic intervals comparing each Fund’s performance against applicable benchmark indices and peer groups. In addition, the Board considered each Fund’s performance in light of overall financial market conditions. Where a Fund’s relative underperformance to its peers was significant during one or more specified periods, the Board noted the explanation from the applicable Adviser concerning the Fund’s relative performance versus its peer group.
After consideration of the foregoing factors, among others, and based on their review of the materials provided and the assurances received from, and recommendations of, the Advisers and Morgan Stanley, the Board determined that the Transaction was not expected to adversely affect the nature, extent and quality of services provided to the Funds by the Advisers and their affiliates, including the Affiliated Sub-Advisers, and that the Transaction was not expected to have an adverse effect on the ability of the Advisers and their affiliates, including the Affiliated Sub-Advisers, to provide those services. The Board concluded that the nature, extent and quality of services expected to be provided by the Advisers and the Sub-Advisers, taken as a whole, are appropriate and expected to be consistent with the terms of the New Agreements.
Management Fees and Expenses
The Board considered contractual fee rates payable by each Fund for advisory and administrative services (referred to collectively as “management fees”) in connection with the 2020 Annual Approval Process, as well as information provided as of a more recent date. As part of its review, the Board considered each Fund’s management fees and total expense ratio over various periods, as compared to those of comparable funds, before and after giving effect to any
Eaton Vance
Atlanta Capital Select Equity Fund
March 31, 2021
Board of Trustees’ Contract Approval — continued
undertaking to waive fees or reimburse expenses. The Board also considered factors, and, where applicable, certain Fund-specific factors, that had an impact on a Fund’s total expense ratio relative to comparable funds, as identified by the Advisers in response to inquiries from the Contract Review Committee. The Board considered that the New Agreements do not change a Fund’s management fee rate or the computation method for calculating such fees, including any separately executed permanent contractual management fee reduction currently in place for the Fund.
The Board also received and considered, where applicable, information about the services offered and the fee rates charged by the Advisers and the Sub-Advisers to other types of accounts with investment objectives and strategies that are substantially similar to and/or managed in a similar investment style as a Fund. In this regard, the Board received information about the differences in the nature and scope of services the Advisers and the Sub-Advisers, as applicable, provide to the Funds as compared to other types of accounts and the material differences in compliance, reporting and other legal burdens and risks to the Advisers and such Sub-Advisers as between each Fund and other types of accounts.
After considering the foregoing information, and in light of the nature, extent and quality of the services expected to be provided by the Advisers and the Sub-Advisers, the Board concluded that the management fees charged for advisory and related services are reasonable with respect to its approval of the New Agreements.
Profitability and “Fall-Out” Benefits
During the 2020 Annual Approval Process, the Board considered the level of profits realized by the Advisers and relevant affiliates thereof, including the Affiliated Sub-Advisers, in providing investment advisory and administrative services to the Funds and to all Eaton Vance funds as a group. The Board considered the level of profits realized without regard to marketing support or other payments by the Advisers and their affiliates to third parties in respect of distribution or other services. In light of the foregoing factors and the nature, extent and quality of the services rendered, the profits realized by the Advisers and their affiliates, including the Sub-Advisers, were not deemed to be excessive by the Board.
The Board noted that Morgan Stanley and the Advisers are expected to realize, over time, cost savings from the Transaction based on eliminating duplicate corporate overhead expenses. The Board considered, however, information from the Advisers and Morgan Stanley that such cost savings are not expected to be realized immediately upon the Closing and that, accordingly, there are currently no specific expected changes in the levels of profitability associated with the advisory and other services provided to the Funds that are contemplated as a result of the Transaction. The Board noted that it will continue to receive information regarding profitability during its annual contract review processes, including the extent to which cost savings and/or other efficiencies result in changes to profitability levels.
The Board also considered direct or indirect fall-out benefits received by the Advisers and their affiliates, including the Affiliated Sub-Advisers, in connection with their respective relationships with the Funds, including the benefits of research services that may be available to the Advisers and their affiliates as a result of securities transactions effected for the Funds and other investment advisory clients. In evaluating the fall-out benefits to be received by the Advisers and their affiliates under the New Agreements, the Board considered whether the Transaction would have an impact on the fall-out benefits currently realized by the Advisers and their affiliates in connection with services provided pursuant to the Current Advisory Agreements.
The Board of each Fund considered that Morgan Stanley may derive reputational and other benefits from its ability to use the names of the Advisers and their affiliates in connection with operating and marketing the Funds. The Board considered that the Transaction, if completed, would significantly increase Morgan Stanley’s assets under management and expand Morgan Stanley’s investment capabilities.
Economies of Scale
The Board also considered the extent to which the Advisers and their affiliates, on the one hand, and the Funds, on the other hand, can expect to realize benefits from economies of scale as the assets of the Funds increase. The Board acknowledged the difficulty in accurately measuring the benefits resulting from economies of scale, if any, with respect to the management of any specific Fund or group of funds. As part of the 2020 Annual Approval Process, the Board reviewed data summarizing the increases and decreases in the assets of the Funds and of all Eaton Vance funds as a group over various time periods, and evaluated the extent to which the total expense ratio of each Fund and the profitability of the Advisers and their affiliates may have been affected by such increases or decreases.
The Board noted that Morgan Stanley and the Advisers are expected to benefit from possible growth of the Funds resulting from enhanced distribution capabilities, including with respect to the Funds’ potential access to Morgan Stanley’s institutional client base. Based upon the foregoing, the Board concluded that the Funds currently share in the benefits from economies of scale, if any, when they are realized by the Advisers, and that the Transaction is not expected to impede a Fund from continuing to benefit from any future economies of scale realized by its Adviser.
Conclusion
Based on its consideration of the foregoing, and such other information it deemed relevant, including the factors and conclusions described above, the Contract Review Committee recommended to the Board approval of the New Agreements. Based on the recommendation of the Contract Review Committee, the Board, including a majority of the Independent Trustees, unanimously voted to approve the New Agreements for the Funds and recommended that shareholders approve the New Agreements.
Eaton Vance
Atlanta Capital Select Equity Fund
March 31, 2021
Officers and Trustees
Officers
Eric A. Stein
President
Deidre E. Walsh
Vice President
Maureen A. Gemma
Secretary and Chief Legal Officer
James F. Kirchner
Treasurer
Richard F. Froio
Chief Compliance Officer
Trustees
William H. Park
Chairperson
Thomas E. Faust Jr.*
Mark R. Fetting
Cynthia E. Frost
George J. Gorman
Valerie A. Mosley
Helen Frame Peters
Keith Quinton
Marcus L. Smith
Susan J. Sutherland
Scott E. Wennerholm
Eaton Vance Funds
| | |
| Privacy Notice | | April 2021 |
| | |
| |
| FACTS | | WHAT DOES EATON VANCE DO WITH YOUR
PERSONAL INFORMATION? |
| | | |
| |
| | |
| Why? | | Financial companies choose how they share your personal information. Federal law gives consumers the right to limit some but not all sharing. Federal law also requires us to tell you how we collect, share, and protect your personal information. Please read this notice carefully to understand what we do. |
| | |
| | | |
| What? | | The types of personal information we collect and share depend on the product or service you have with us. This information can include: ∎ Social Security number and income ∎ investment experience and risk tolerance ∎ checking account number and wire transfer instructions |
| | |
| | | |
| How? | | All financial companies need to share customers’ personal information to run their everyday business. In the section below, we list the reasons financial companies can share their customers’ personal information; the reasons Eaton Vance chooses to share; and whether you can limit this sharing. |
| | |
| | | |
| | | | |
Reasons we can share your
personal information | | Does Eaton Vance share? | | Can you limit this sharing? |
| For our everyday business purposes — such as to process your transactions, maintain your account(s), respond to court orders and legal investigations, or report to credit bureaus | | Yes | | No |
| For our marketing purposes — to offer our products and services to you | | Yes | | No |
| For joint marketing with other financial companies | | No | | We don’t share |
| For our investment management affiliates’ everyday business purposes — information about your transactions, experiences, and creditworthiness | | Yes | | Yes |
| For our affiliates’ everyday business purposes — information about your transactions and experiences | | Yes | | No |
| For our affiliates’ everyday business purposes — information about your creditworthiness | | No | | We don’t share |
| For our investment management affiliates to market to you | | Yes | | Yes |
| For our affiliates to market to you | | No | | We don’t share |
| For nonaffiliates to market to you | | No | | We don’t share |
| | |
| To limit our sharing | | Call toll-free 1-800-262-1122 or email: EVPrivacy@eatonvance.com Please note: If you are a new customer, we can begin sharing your information 30 days from the date we sent this notice. When you are no longer our customer, we continue to share your information as described in this notice. However, you can contact us at any time to limit our sharing. |
| | |
| | | |
| | |
| Questions? | | Call toll-free 1-800-262-1122 or email: EVPrivacy@eatonvance.com |
| | |
| | | |
Eaton Vance Funds
| | |
| Privacy Notice — continued | | April 2021 |
| | |
| Who we are |
| Who is providing this notice? | | Eaton Vance Management, Eaton Vance Distributors, Inc., Eaton Vance Trust Company, Eaton Vance Management (International) Limited, Eaton Vance Advisers International Ltd., Eaton Vance Global Advisors Limited, Eaton Vance Management’s Real Estate Investment Group, Boston Management and Research, Calvert Research and Management, Eaton Vance and Calvert Fund Families and our investment advisory affiliates (“Eaton Vance”) (see Investment Management Affiliates definition below) |
| What we do |
| How does Eaton Vance protect my personal information? | | To protect your personal information from unauthorized access and use, we use security measures that comply with federal law. These measures include computer safeguards and secured files and buildings. We have policies governing the proper handling of customer information by personnel and requiring third parties that provide support to adhere to appropriate security standards with respect to such information. |
| How does Eaton Vance collect my personal information? | | We collect your personal information, for example, when you ∎ open an account or make deposits or withdrawals from your account ∎ buy securities from us or make a wire transfer ∎ give us your contact information We also collect your personal information from others, such as credit bureaus, affiliates, or other companies. |
| Why can’t I limit all sharing? | | Federal law gives you the right to limit only ∎ sharing for affiliates’ everyday business purposes — information about your creditworthiness ∎ affiliates from using your information to market to you ∎ sharing for nonaffiliates to market to you State laws and individual companies may give you additional rights to limit sharing. See below for more on your rights under state law. |
| Definitions |
| Investment Management Affiliates | | Eaton Vance Investment Management Affiliates include registered investment advisers, registered broker-dealers, and registered and unregistered funds. Investment Management Affiliates does not include entities associated with Morgan Stanley Wealth Management, such as Morgan Stanley Smith Barney LLC and Morgan Stanley & Co. |
| Affiliates | | Companies related by common ownership or control. They can be financial and nonfinancial companies. ∎ Our affiliates include companies with a Morgan Stanley name and financial companies such as Morgan Stanley Smith Barney LLC and Morgan Stanley & Co. |
| Nonaffiliates | | Companies not related by common ownership or control. They can be financial and nonfinancial companies. ∎ Eaton Vance does not share with nonaffiliates so they can market to you. |
| Joint marketing | | A formal agreement between nonaffiliated financial companies that together market financial products or services to you. ∎ Eaton Vance doesn’t jointly market. |
| Other important information |
Vermont: Except as permitted by law, we will not share personal information we collect about Vermont residents with Nonaffiliates unless you provide us with your written consent to share such information. California: Except as permitted by law, we will not share personal information we collect about California residents with Nonaffiliates and we will limit sharing such personal information with our Affiliates to comply with California privacy laws that apply to us. |
Eaton Vance Funds
IMPORTANT NOTICES
Delivery of Shareholder Documents. The Securities and Exchange Commission (SEC) permits funds to deliver only one copy of shareholder documents, including prospectuses, proxy statements and shareholder reports, to fund investors with multiple accounts at the same residential or post office box address. This practice is often called “householding” and it helps eliminate duplicate mailings to shareholders. Eaton Vance, or your financial intermediary, may household the mailing of your documents indefinitely unless you instruct Eaton Vance, or your financial intermediary, otherwise. If you would prefer that your Eaton Vance documents not be householded, please contact Eaton Vance at 1-800-262-1122, or contact your financial intermediary. Your instructions that householding not apply to delivery of your Eaton Vance documents will typically be effective within 30 days of receipt by Eaton Vance or your financial intermediary.
Portfolio Holdings. Each Eaton Vance Fund and its underlying Portfolio(s) (if applicable) files a schedule of portfolio holdings on Part F to Form N-PORT with the SEC. Certain information filed on Form N-PORT may be viewed on the Eaton Vance website at www.eatonvance.com, by calling Eaton Vance at 1-800-262-1122 or in the EDGAR database on the SEC’s website at www.sec.gov.
Proxy Voting. From time to time, funds are required to vote proxies related to the securities held by the funds. The Eaton Vance Funds or their underlying Portfolios (if applicable) vote proxies according to a set of policies and procedures approved by the Funds’ and Portfolios’ Boards. You may obtain a description of these policies and procedures and information on how the Funds or Portfolios voted proxies relating to portfolio securities during the most recent 12-month period ended June 30, without charge, upon request, by calling 1-800-262-1122 and by accessing the SEC’s website at www.sec.gov.
Investment Adviser and Administrator
Eaton Vance Management
Two International Place
Boston, MA 02110
Investment Sub-Adviser
Atlanta Capital Management Company, LLC
1075 Peachtree Street NE
Suite 2100
Atlanta, GA 30309
Principal Underwriter*
Eaton Vance Distributors, Inc.
Two International Place
Boston, MA 02110
(617) 482-8260
Custodian
State Street Bank and Trust Company
State Street Financial Center, One Lincoln Street
Boston, MA 02111
Transfer Agent
BNY Mellon Investment Servicing (US) Inc.
Attn: Eaton Vance Funds
P.O. Box 9653
Providence, RI 02940-9653
(800) 262-1122
Fund Offices
Two International Place
Boston, MA 02110
| * | FINRA BrokerCheck. Investors may check the background of their Investment Professional by contacting the Financial Industry Regulatory Authority (FINRA). FINRA BrokerCheck is a free tool to help investors check the professional background of current and former FINRA-registered securities firms and brokers. FINRA BrokerCheck is available by calling 1-800-289-9999 and at www.FINRA.org. The FINRA BrokerCheck brochure describing this program is available to investors at www.FINRA.org. |

7782 3.31.21
Not required in this filing.
| Item 3. | Audit Committee Financial Expert |
Not required in this filing.
| Item 4. | Principal Accountant Fees and Services |
Not required in this filing.
| Item 5. | Audit Committee of Listed Registrants |
Not applicable.
| Item 6. | Schedule of Investments |
Please see schedule of investments contained in the Report to Stockholders included under Item 1 of this Form N-CSR.
| Item 7. | Disclosure of Proxy Voting Policies and Procedures for Closed-End Management Investment Companies |
Not applicable.
| Item 8. | Portfolio Managers of Closed-End Management Investment Companies |
Not applicable.
| Item 9. | Purchases of Equity Securities by Closed-End Management Investment Company and Affiliated Purchasers |
Not applicable.
| Item 10. | Submission of Matters to a Vote of Security Holders |
No material changes.
| Item 11. | Controls and Procedures |
(a) It is the conclusion of the registrant’s principal executive officer and principal financial officer that the effectiveness of the registrant’s current disclosure controls and procedures (such disclosure controls and procedures having been evaluated within 90 days of the date of this filing) provide reasonable assurance that the information required to be disclosed by the registrant has been recorded, processed, summarized and reported within the time period specified in the Commission’s rules and forms and that the information required to be disclosed by the registrant has been accumulated and communicated to the registrant’s principal executive officer and principal financial officer in order to allow timely decisions regarding required disclosure.
(b) There have been no changes in the registrant’s internal controls over financial reporting during the second fiscal quarter of the period covered by this report that has materially affected, or is reasonably likely to materially affect, the registrant’s internal control over financial reporting.
| Item 12. | Disclosure of Securities Lending Activities for Closed-End Management Investment Companies |
Not applicable.
Signatures
Pursuant to the requirements of the Securities Exchange Act of 1934 and the Investment Company Act of 1940, the registrant has duly caused this report to be signed on its behalf by the undersigned, thereunto duly authorized.
| | |
| Eaton Vance Growth Trust |
| |
| By: | | /s/ Eric A. Stein |
| | Eric A. Stein |
| | President |
| |
| Date: | | May 24, 2021 |
Pursuant to the requirements of the Securities Exchange Act of 1934 and the Investment Company Act of 1940, this report has been signed below by the following persons on behalf of the registrant and in the capacities and on the dates indicated.
| | |
| By: | | /s/ James F. Kirchner |
| | James F. Kirchner |
| | Treasurer |
| |
| Date: | | May 24, 2021 |
| |
| By: | | /s/ Eric A. Stein |
| | Eric A. Stein |
| | President |
| |
| Date: | | May 24, 2021 |