UNITED STATES
SECURITIES AND EXCHANGE COMMISSION
Washington, D.C. 20549
Form N-CSR
CERTIFIED SHAREHOLDER REPORT OF REGISTERED
MANAGEMENT INVESTMENT COMPANIES
Investment Company Act File Number: 811-01241
Eaton Vance Growth Trust
(Exact Name of Registrant as Specified in Charter)
Two International Place, Boston, Massachusetts 02110
(Address of Principal Executive Offices)
Deidre E. Walsh
Two International Place, Boston, Massachusetts 02110
(Name and Address of Agent for Services)
(617) 482-8260
(Registrant’s Telephone Number)
August 31
Date of Fiscal Year End
February 28, 2022
Date of Reporting Period
Item 1. Reports to Stockholders
Eaton Vance
Greater China Growth Fund
Semiannual Report
February 28, 2022
Commodity Futures Trading Commission Registration. The Commodity Futures Trading Commission (“CFTC”) has adopted regulations that subject registered investment companies and advisers to regulation by the CFTC if a fund invests more than a prescribed level of its assets in certain CFTC-regulated instruments (including futures, certain options and swap agreements) or markets itself as providing investment exposure to such instruments. The investment adviser has claimed an exclusion from the definition of “commodity pool operator” under the Commodity Exchange Act with respect to its management of the Fund. Accordingly, neither the Fund nor the adviser with respect to the operation of the Fund is subject to CFTC regulation. Because of its management of other strategies, the Fund's adviser is registered with the CFTC as a commodity pool operator. The adviser is also registered as a commodity trading advisor.
Fund shares are not insured by the FDIC and are not deposits or other obligations of, or guaranteed by, any depository institution. Shares are subject to investment risks, including possible loss of principal invested.
This report must be preceded or accompanied by a current summary prospectus or prospectus. Before investing, investors should consider carefully the investment objective, risks, and charges and expenses of a mutual fund. This and other important information is contained in the summary prospectus and prospectus, which can be obtained from a financial intermediary. Prospective investors should read the prospectus carefully before investing. For further information, please call 1-800-262-1122.
Semiannual Report February 28, 2022
Eaton Vance
Greater China Growth Fund
Eaton Vance
Greater China Growth Fund
February 28, 2022
Performance
Portfolio Manager(s) Amay Hattangadi, CFA and Leon Sun, CFA each of Morgan Stanley Investment Management Company (MSIM Company)
| % Average Annual Total Returns1,2 | Class
Inception Date | Performance
Inception Date | Six Months | One Year | Five Years | Ten Years |
| Class A at NAV | 10/28/1992 | 10/28/1992 | (12.25)% | (20.64)% | 9.77% | 7.39% |
| Class A with 5.75% Maximum Sales Charge | — | — | (17.30) | (25.20) | 8.48 | 6.76 |
| Class C at NAV | 12/28/1993 | 10/28/1992 | (12.57) | (21.20) | 9.01 | 6.79 |
| Class C with 1% Maximum Sales Charge | — | — | (13.40) | (21.95) | 9.01 | 6.79 |
| Class I at NAV | 10/01/2009 | 10/28/1992 | (12.15) | (20.44) | 10.09 | 7.70 |
|
| MSCI Golden Dragon Index | — | — | (11.87)% | (20.40)% | 8.55% | 6.82% |
| % Total Annual Operating Expense Ratios3 | Class A | Class C | Class I |
| | 1.43% | 2.18% | 1.18% |
See Endnotes and Additional Disclosures in this report.
Past performance is no guarantee of future results. Returns are historical and are calculated by determining the percentage change in net asset value (NAV) or offering price (as applicable) with all distributions reinvested. Investment return and principal value will fluctuate so that shares, when redeemed, may be worth more or less than their original cost. Performance for periods less than or equal to one year is cumulative. Performance is for the stated time period only; due to market volatility, current Fund performance may be lower or higher than the quoted return. For performance as of the most recent month-end, please refer to eatonvance.com.
Eaton Vance
Greater China Growth Fund
February 28, 2022
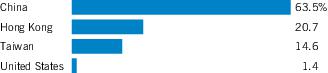
| Regional Allocation (% of net assets) |
| Sector Allocation (% of net assets)* |
| * | Excludes cash and cash equivalents. |
| Top 10 Holdings (% of net assets)* |
| Taiwan Semiconductor Manufacturing Co., Ltd. | 14.6% |
| Tencent Holdings, Ltd. | 12.9 |
| AIA Group, Ltd. | 11.6 |
| China Mengniu Dairy Co., Ltd. | 3.6 |
| Meituan, Class B | 3.2 |
| China Merchants Bank Co., Ltd., Class H | 2.6 |
| Wuxi Biologics Cayman, Inc. | 2.6 |
| China Tourism Group Duty Free Corp., Ltd., Class A | 2.5 |
| ANTA Sports Products, Ltd. | 2.5 |
| Pinduoduo, Inc. ADR | 2.5 |
| Total | 58.6% |
| * | Excludes cash and cash equivalents. |
Eaton Vance
Greater China Growth Fund
February 28, 2022
Endnotes and Additional Disclosures
| 1 | MSCI Golden Dragon Index is an unmanaged index of common stocks traded in China, Hong Kong and Taiwan. MSCI indexes are net of foreign withholding taxes. Source: MSCI. MSCI data may not be reproduced or used for any other purpose. MSCI provides no warranties, has not prepared or approved this report, and has no liability hereunder. Unless otherwise stated, index returns do not reflect the effect of any applicable sales charges, commissions, expenses, taxes or leverage, as applicable. It is not possible to invest directly in an index. |
| 2 | Total Returns at NAV do not include applicable sales charges. If sales charges were deducted, the returns would be lower. Total Returns shown with maximum sales charge reflect the stated maximum sales charge. Unless otherwise stated, performance does not reflect the deduction of taxes on Fund distributions or redemptions of Fund shares.Effective November 5, 2020, Class C shares automatically convert to Class A shares eight years after purchase. The average annual total returns listed for Class C reflect conversion to Class A shares after eight years. Prior to November 5, 2020, Class C shares automatically converted to Class A shares ten years after purchase. |
| 3 | Source: Fund prospectus. The expense ratios for the current reporting period can be found in the Financial Highlights section of this report. |
| | Fund profile subject to change due to active management. |
Eaton Vance
Greater China Growth Fund
February 28, 2022
Example
As a Fund shareholder, you incur two types of costs: (1) transaction costs, including sales charges (loads) on purchases and redemption fees (if applicable); and (2) ongoing costs, including management fees; distribution and/or service fees; and other Fund expenses. This Example is intended to help you understand your ongoing costs (in dollars) of Fund investing and to compare these costs with the ongoing costs of investing in other mutual funds. The Example is based on an investment of $1,000 invested at the beginning of the period and held for the entire period (September 1, 2021 to February 28, 2022).
Actual Expenses
The first section of the table below provides information about actual account values and actual expenses. You may use the information in this section, together with the amount you invested, to estimate the expenses that you paid over the period. Simply divide your account value by $1,000 (for example, an $8,600 account value divided by $1,000 = 8.6), then multiply the result by the number in the first section under the heading entitled “Expenses Paid During Period” to estimate the expenses you paid on your account during this period.
Hypothetical Example for Comparison Purposes
The second section of the table below provides information about hypothetical account values and hypothetical expenses based on the actual Fund expense ratio and an assumed rate of return of 5% per year (before expenses), which is not the actual Fund return. The hypothetical account values and expenses may not be used to estimate the actual ending account balance or expenses you paid for the period. You may use this information to compare the ongoing costs of investing in your Fund and other funds. To do so, compare this 5% hypothetical example with the 5% hypothetical examples that appear in the shareholder reports of the other funds.
Please note that the expenses shown in the table are meant to highlight your ongoing costs only and do not reflect any transactional costs, such as sales charges (loads) or redemption fees (if applicable). Therefore, the second section of the table is useful in comparing ongoing costs only, and will not help you determine the relative total costs of owning different funds. In addition, if these transactional costs were included, your costs would be higher.
| | Beginning
Account Value
(9/1/21) | Ending
Account Value
(2/28/22) | Expenses Paid
During Period*
(9/1/21 – 2/28/22) | Annualized
Expense
Ratio |
| Actual | | | | |
| Class A | $1,000.00 | $ 877.50 | $ 7.22** | 1.55% |
| Class C | $1,000.00 | $ 874.30 | $10.64** | 2.29% |
| Class I | $1,000.00 | $ 878.50 | $ 6.01** | 1.29% |
| |
| Hypothetical | | | | |
| (5% return per year before expenses) | | | | |
| Class A | $1,000.00 | $1,017.11 | $ 7.75** | 1.55% |
| Class C | $1,000.00 | $1,013.44 | $11.43** | 2.29% |
| Class I | $1,000.00 | $1,018.40 | $ 6.46** | 1.29% |
| * | Expenses are equal to the Fund's annualized expense ratio for the indicated Class, multiplied by the average account value over the period, multiplied by 181/365 (to reflect the one-half year period). The Example assumes that the $1,000 was invested at the net asset value per share determined at the close of business on August 31, 2021. |
| ** | Absent an allocation of certain expenses to an affiliate, expenses would be higher. |
Eaton Vance
Greater China Growth Fund
February 28, 2022
Portfolio of Investments (Unaudited)
| Security | Shares | Value |
| China — 62.5% |
| Automobiles — 1.3% |
| Nio, Inc. ADR(1) | | 45,228 | $ 1,033,008 |
| | | | $ 1,033,008 |
| Banks — 2.6% |
| China Merchants Bank Co., Ltd., Class H | | 252,500 | $ 2,128,400 |
| | | | $ 2,128,400 |
| Beverages — 3.7% |
| Kweichow Moutai Co., Ltd., Class A | | 3,800 | $ 1,081,664 |
| Nongfu Spring Co., Ltd., Class H(2) | | 156,800 | 983,373 |
| Wuliangye Yibin Co., Ltd., Class A | | 32,100 | 972,591 |
| | | | $ 3,037,628 |
| Biotechnology — 1.6% |
| Innovent Biologics, Inc.(1)(2) | | 296,500 | $ 1,338,099 |
| | | | $ 1,338,099 |
| Electrical Equipment — 1.6% |
| NARI Technology Co., Ltd., Class A | | 231,320 | $ 1,306,805 |
| | | | $ 1,306,805 |
| Entertainment — 2.7% |
| Bilibili, Inc., Class Z(1) | | 23,600 | $ 737,273 |
| Mango Excellent Media Co., Ltd. | | 265,100 | 1,445,836 |
| | | | $ 2,183,109 |
| Food Products — 3.7% |
| Anjoy Foods Group Co., Ltd., Class A | | 58,300 | $ 1,144,694 |
| Foshan Haitian Flavouring & Food Co., Ltd., Class A | | 64,896 | 1,023,711 |
| Guangdong Haid Group Co., Class A | | 82,298 | 862,318 |
| | | | $ 3,030,723 |
| Health Care Equipment & Supplies — 1.5% |
| Shenzhen Mindray Bio-Medical Electronics Co., Ltd., Class A | | 24,400 | $ 1,269,975 |
| | | | $ 1,269,975 |
| Health Care Providers & Services — 3.6% |
| Aier Eye Hospital Group Co., Ltd., Class A | | 233,336 | $ 1,350,405 |
| Security | Shares | Value |
| Health Care Providers & Services (continued) |
| Hygeia Healthcare Holdings Co., Ltd.(2) | | 299,600 | $ 1,635,644 |
| | | | $ 2,986,049 |
| Household Durables — 3.2% |
| Gree Electric Appliances, Inc., Class A | | 273,446 | $ 1,595,793 |
| Midea Group Co., Ltd., Class A | | 94,900 | 1,009,049 |
| | | | $ 2,604,842 |
| Insurance — 0.5% |
| Ping An Insurance (Group) Co. of China, Ltd., Class H | | 53,000 | $ 410,944 |
| | | | $ 410,944 |
| Interactive Media & Services — 12.9% |
| Tencent Holdings, Ltd. | | 195,500 | $ 10,549,436 |
| | | | $10,549,436 |
| Internet & Direct Marketing Retail — 6.1% |
| JD.com, Inc., Class A(3)(4) | | 9,480 | $ 338,626 |
| Meituan, Class B(1)(2) | | 118,000 | 2,621,389 |
| Pinduoduo, Inc. ADR(1) | | 38,758 | 2,009,990 |
| | | | $ 4,970,005 |
| Life Sciences Tools & Services — 2.6% |
| Wuxi Biologics Cayman, Inc.(1)(2) | | 253,500 | $ 2,096,804 |
| | | | $ 2,096,804 |
| Machinery — 1.6% |
| Jiangsu Hengrui Medicine Co., Ltd. | | 123,600 | $ 1,318,653 |
| | | | $ 1,318,653 |
| Real Estate Management & Development — 1.3% |
| Ke Holdings, Inc. ADR(1) | | 56,191 | $ 1,090,667 |
| | | | $ 1,090,667 |
| Semiconductors & Semiconductor Equipment — 1.3% |
| LONGi Green Energy Technology Co., Ltd. | | 87,300 | $ 1,087,657 |
| | | | $ 1,087,657 |
| Specialty Retail — 4.5% |
| China Tourism Group Duty Free Corp., Ltd., Class A | | 63,700 | $ 2,059,314 |
| Pop Mart International Group Ltd.(2) | | 317,600 | 1,592,652 |
| | | | $ 3,651,966 |
| Textiles, Apparel & Luxury Goods — 6.2% |
| ANTA Sports Products, Ltd. | | 134,800 | $ 2,058,827 |
6
See Notes to Financial Statements.
Eaton Vance
Greater China Growth Fund
February 28, 2022
Portfolio of Investments (Unaudited) — continued
| Security | Shares | Value |
| Textiles, Apparel & Luxury Goods (continued) |
| Li Ning Co., Ltd. | | 140,000 | $ 1,398,341 |
| Shenzhou International Group Holdings, Ltd. | | 95,300 | 1,600,717 |
| | | | $ 5,057,885 |
Total China
(identified cost $47,971,002) | | | $51,152,655 |
| Hong Kong — 20.7% |
| Beverages — 2.3% |
| China Resources Beer Holdings Co., Ltd. | | 242,000 | $ 1,918,915 |
| | | | $ 1,918,915 |
| Food Products — 3.6% |
| China Mengniu Dairy Co., Ltd. | | 451,000 | $ 2,932,590 |
| | | | $ 2,932,590 |
| Hotels, Restaurants & Leisure — 3.2% |
| Galaxy Entertainment Group, Ltd.(1) | | 276,000 | $ 1,539,316 |
| Sands China, Ltd.(1) | | 397,200 | 1,047,607 |
| | | | $ 2,586,923 |
| Insurance — 11.6% |
| AIA Group, Ltd. | | 917,200 | $ 9,524,063 |
| | | | $ 9,524,063 |
Total Hong Kong
(identified cost $8,088,624) | | | $16,962,491 |
| Taiwan — 14.6% |
| Semiconductors & Semiconductor Equipment — 14.6% |
| Taiwan Semiconductor Manufacturing Co., Ltd. | | 557,839 | $ 11,993,291 |
Total Taiwan
(identified cost $3,981,582) | | | $11,993,291 |
Total Common Stocks
(identified cost $60,041,208) | | | $80,108,437 |
| Equity-Linked Securities — 1.0%(5) |
| Security | Shares | Value |
| China — 1.0% |
| Leader Harmonious Drive Systems Co., Ltd., 10/12/22(6) | | 37,818 | $ 806,570 |
Total Equity-Linked Securities
(identified cost $785,733) | | | $ 806,570 |
| Short-Term Investments — 1.4% |
| Description | Units | Value |
| Eaton Vance Cash Reserves Fund, LLC, 0.09%(7) | | 1,170,954 | $ 1,170,837 |
Total Short-Term Investments
(identified cost $1,170,837) | | | $ 1,170,837 |
Total Investments — 100.2%
(identified cost $61,997,778) | | | $82,085,844 |
| Other Assets, Less Liabilities — (0.2)% | | | $ (197,359) |
| Net Assets — 100.0% | | | $81,888,485 |
| The percentage shown for each investment category in the Portfolio of Investments is based on net assets. |
| (1) | Non-income producing security. |
| (2) | Security exempt from registration under Rule 144A of the Securities Act of 1933, as amended. These securities may be sold in certain transactions in reliance on an exemption from registration (normally to qualified institutional buyers). At February 28, 2022, the aggregate value of these securities is $10,267,961 or 12.5% of the Fund's net assets. |
| (3) | For fair value measurement disclosure purposes, security is categorized as Level 3 (see Note 11). |
| (4) | Restricted security (see Note 8). |
| (5) | Security whose performance, including redemption at maturity, is linked to the price of the underlying equity security. The investment is subject to credit risk of the issuing financial institution (UBS AG) in addition to the market risk of the underlying security. |
| (6) | Security exempt from registration under Regulation S of the Securities Act of 1933, as amended, which exempts from registration securities offered and sold outside the United States. Security may not be offered or sold in the United States except pursuant to an exemption from, or in a transaction not subject to, the registration requirements of the Securities Act of 1933, as amended. At February 28, 2022, the aggregate value of these securities is $806,570 or 1.0% of the Fund's net assets. |
| (7) | Affiliated investment company, available to Eaton Vance portfolios and funds, which invests in high quality, U.S. dollar denominated money market instruments. The rate shown is the annualized seven-day yield as of February 28, 2022. |
| Abbreviations: |
| ADR | – American Depositary Receipt |
7
See Notes to Financial Statements.
Eaton Vance
Greater China Growth Fund
February 28, 2022
Statement of Assets and Liabilities (Unaudited)
| | February 28, 2022 |
| Assets | |
| Unaffiliated investments, at value (identified cost $60,826,941) | $ 80,915,007 |
| Affiliated investment, at value (identified cost $1,170,837) | 1,170,837 |
| Dividends receivable | 344,524 |
| Dividends receivable from affiliated investment | 32 |
| Receivable for investments sold | 344,524 |
| Receivable for Fund shares sold | 62,698 |
| Receivable from affiliate | 7,838 |
| Total assets | $82,845,460 |
| Liabilities | |
| Payable for investments purchased | $ 689,048 |
| Payable for Fund shares redeemed | 118,225 |
| Due to custodian — foreign currency, at value (identified cost $938) | 277 |
| Payable to affiliates: | |
| Investment adviser fee | 49,512 |
| Administration fee | 9,902 |
| Distribution and service fees | 14,669 |
| Accrued expenses | 75,342 |
| Total liabilities | $ 956,975 |
| Net Assets | $81,888,485 |
| Sources of Net Assets | |
| Paid-in capital | $ 53,695,344 |
| Distributable earnings | 28,193,141 |
| Net Assets | $81,888,485 |
| Class A Shares | |
| Net Assets | $ 67,734,261 |
| Shares Outstanding | 3,022,687 |
Net Asset Value and Redemption Price Per Share
(net assets ÷ shares of beneficial interest outstanding) | $ 22.41 |
Maximum Offering Price Per Share
(100 ÷ 94.25 of net asset value per share) | $ 23.78 |
| Class C Shares | |
| Net Assets | $ 1,243,278 |
| Shares Outstanding | 60,275 |
Net Asset Value and Offering Price Per Share*
(net assets ÷ shares of beneficial interest outstanding) | $ 20.63 |
| Class I Shares | |
| Net Assets | $ 12,910,946 |
| Shares Outstanding | 568,776 |
Net Asset Value, Offering Price and Redemption Price Per Share
(net assets ÷ shares of beneficial interest outstanding) | $ 22.70 |
| On sales of $50,000 or more, the offering price of Class A shares is reduced. |
| * | Redemption price per share is equal to the net asset value less any applicable contingent deferred sales charge. |
8
See Notes to Financial Statements.
Eaton Vance
Greater China Growth Fund
February 28, 2022
Statement of Operations (Unaudited)
| | Six Months Ended |
| | February 28, 2022 |
| Investment Income | |
| Dividend income (net of foreign taxes withheld of $44,610) | $ 719,796 |
| Dividend income from affiliated investment | 1,129 |
| Total investment income | $ 720,925 |
| Expenses | |
| Investment adviser fee | $ 388,030 |
| Administration fee | 73,136 |
| Distribution and service fees: | |
| Class A | 99,873 |
| Class C | 6,837 |
| Trustees’ fees and expenses | 2,406 |
| Custodian fee | 29,260 |
| Transfer and dividend disbursing agent fees | 66,873 |
| Legal and accounting services | 34,618 |
| Printing and postage | 13,912 |
| Registration fees | 24,481 |
| Miscellaneous | 8,346 |
| Total expenses | $ 747,772 |
| Deduct: | |
| Allocation of expenses to affiliate | $ 12,668 |
| Total expense reductions | $ 12,668 |
| Net expenses | $ 735,104 |
| Net investment loss | $ (14,179) |
| Realized and Unrealized Gain (Loss) | |
| Net realized gain (loss): | |
| Investment transactions | $ 12,300,827 |
| Investment transactions - affiliated investment | (470) |
| Foreign currency transactions | (34,027) |
| Net realized gain | $ 12,266,330 |
| Change in unrealized appreciation (depreciation): | |
| Investments | $ (24,326,802) |
| Foreign currency | (739) |
| Net change in unrealized appreciation (depreciation) | $(24,327,541) |
| Net realized and unrealized loss | $(12,061,211) |
| Net decrease in net assets from operations | $(12,075,390) |
9
See Notes to Financial Statements.
Eaton Vance
Greater China Growth Fund
February 28, 2022
Statements of Changes in Net Assets
| | Six Months Ended
February 28, 2022
(Unaudited) | Year Ended
August 31, 2021 |
| Increase (Decrease) in Net Assets | | |
| From operations: | | |
| Net investment income (loss) | $ (14,179) | $ 10,813 |
| Net realized gain | 12,266,330 | 3,349,462 |
| Net change in unrealized appreciation (depreciation) | (24,327,541) | 5,294,424 |
| Net increase (decrease) in net assets from operations | $ (12,075,390) | $ 8,654,699 |
| Distributions to shareholders: | | |
| Class A | $ (3,954,941) | $ (8,497,659) |
| Class C | (76,647) | (160,991) |
| Class I | (1,004,963) | (1,872,237) |
| Total distributions to shareholders | $ (5,036,551) | $ (10,530,887) |
| Transactions in shares of beneficial interest: | | |
| Class A | $ (2,883,784) | $ 346,393 |
| Class C | 41,426 | (827,559) |
| Class I | (8,448,172) | 7,644,623 |
| Net increase (decrease) in net assets from Fund share transactions | $ (11,290,530) | $ 7,163,457 |
| Net increase (decrease) in net assets | $ (28,402,471) | $ 5,287,269 |
| Net Assets | | |
| At beginning of period | $110,290,956 | $ 105,003,687 |
| At end of period | $ 81,888,485 | $110,290,956 |
10
See Notes to Financial Statements.
Eaton Vance
Greater China Growth Fund
February 28, 2022
| | Class A |
| | | Year Ended August 31, |
| | Six Months Ended
February 28, 2022
(Unaudited) | 2021 | 2020 | 2019 | 2018 | 2017 |
| Net asset value — Beginning of period | $ 26.870 | $ 27.280 | $ 23.200 | $ 24.560 | $ 25.480 | $ 20.380 |
| Income (Loss) From Operations | | | | | | |
| Net investment income (loss)(1) | $ (0.007) | $ (0.015) | $ 0.086 | $ 0.094 | $ 0.094 | $ 0.168 |
| Net realized and unrealized gain (loss) | (3.139) | 2.383 | 4.785 | 0.604 | 1.861 | 5.111 |
| Total income (loss) from operations | $ (3.146) | $ 2.368 | $ 4.871 | $ 0.698 | $ 1.955 | $ 5.279 |
| Less Distributions | | | | | | |
| From net investment income | $ — | $ (0.072) | $ (0.074) | $ (0.153) | $ (0.165) | $ (0.179) |
| From net realized gain | (1.314) | (2.706) | (0.717) | (1.905) | (2.710) | — |
| Total distributions | $ (1.314) | $ (2.778) | $ (0.791) | $ (2.058) | $ (2.875) | $ (0.179) |
| Net asset value — End of period | $22.410 | $26.870 | $27.280 | $23.200 | $24.560 | $25.480 |
| Total Return(2) | (12.25)% (3)(4) | 8.48% | 21.44% | 3.65% | 7.69% | 26.19% (3) |
| Ratios/Supplemental Data | | | | | | |
| Net assets, end of period (000's omitted) | $ 67,734 | $ 84,359 | $ 85,096 | $ 78,942 | $ 72,953 | $ 75,137 |
| Ratios (as a percentage of average daily net assets): | | | | | | |
| Expenses | 1.55% (3)(5) | 1.73% | 1.80% | 1.83% | 1.82% | 1.91% (3) |
| Net investment income (loss) | (0.06)% (5) | (0.05)% | 0.36% | 0.41% | 0.36% | 0.78% |
| Portfolio Turnover | 62% (4) | 10% | 9% | 17% | 12% | 14% |
| (1) | Computed using average shares outstanding. |
| (2) | Returns are historical and are calculated by determining the percentage change in net asset value with all distributions reinvested and do not reflect the effect of sales charges. |
| (3) | The administrator and/or investment adviser and sub-adviser reimbursed certain operating expenses (equal to 0.03% and 0.05% of average daily net assets for the six months ended February 28, 2022 and the year ended August 31, 2017, respectively). Absent this reimbursement, total return would be lower. |
| (4) | Not annualized. |
| (5) | Annualized. |
11
See Notes to Financial Statements.
Eaton Vance
Greater China Growth Fund
February 28, 2022
Financial Highlights — continued
| | Class C |
| | | Year Ended August 31, |
| | Six Months Ended
February 28, 2022
(Unaudited) | 2021 | 2020 | 2019 | 2018 | 2017 |
| Net asset value — Beginning of period | $ 24.930 | $ 25.350 | $ 21.690 | $ 23.090 | $ 24.120 | $ 19.400 |
| Income (Loss) From Operations | | | | | | |
| Net investment loss(1) | $ (0.090) | $ (0.206) | $ (0.106) | $ (0.170) | $ (0.090) | $ (0.018) |
| Net realized and unrealized gain (loss) | (2.896) | 2.227 | 4.483 | 0.675 | 1.770 | 4.877 |
| Total income (loss) from operations | $ (2.986) | $ 2.021 | $ 4.377 | $ 0.505 | $ 1.680 | $ 4.859 |
| Less Distributions | | | | | | |
| From net investment income | $ — | $ — | $ — | $ — | $ — | $ (0.139) |
| From net realized gain | (1.314) | (2.441) | (0.717) | (1.905) | (2.710) | — |
| Total distributions | $ (1.314) | $ (2.441) | $ (0.717) | $ (1.905) | $ (2.710) | $ (0.139) |
| Net asset value — End of period | $20.630 | $24.930 | $25.350 | $21.690 | $23.090 | $24.120 |
| Total Return(2) | (12.57)% (3)(4) | 7.74% | 20.59% | 2.94% | 6.93% | 25.27% (3) |
| Ratios/Supplemental Data | | | | | | |
| Net assets, end of period (000’s omitted) | $ 1,243 | $ 1,460 | $ 2,261 | $ 3,736 | $ 12,163 | $ 12,855 |
| Ratios (as a percentage of average daily net assets): | | | | | | |
| Expenses | 2.29% (3)(5) | 2.43% | 2.50% | 2.53% | 2.52% | 2.62% (3) |
| Net investment loss | (0.78)% (5) | (0.77)% | (0.47)% | (0.80)% | (0.37)% | (0.09)% |
| Portfolio Turnover | 62% (4) | 10% | 9% | 17% | 12% | 14% |
| (1) | Computed using average shares outstanding. |
| (2) | Returns are historical and are calculated by determining the percentage change in net asset value with all distributions reinvested and do not reflect the effect of sales charges. |
| (3) | The administrator and/or investment adviser and sub-adviser reimbursed certain operating expenses (equal to 0.03% and 0.05% of average daily net assets for the six months ended February 28, 2022 and the year ended August 31, 2017, respectively). Absent this reimbursement, total return would be lower. |
| (4) | Not annualized. |
| (5) | Annualized. |
12
See Notes to Financial Statements.
Eaton Vance
Greater China Growth Fund
February 28, 2022
Financial Highlights — continued
| | Class I |
| | | Year Ended August 31, |
| | Six Months Ended
February 28, 2022
(Unaudited) | 2021 | 2020 | 2019 | 2018 | 2017 |
| Net asset value — Beginning of period | $ 27.170 | $ 27.550 | $ 23.420 | $ 24.790 | $ 25.680 | $ 20.500 |
| Income (Loss) From Operations | | | | | | |
| Net investment income(1) | $ 0.017 | $ 0.094 | $ 0.109 | $ 0.302 | $ 0.168 | $ 0.281 |
| Net realized and unrealized gain (loss) | (3.173) | 2.383 | 4.883 | 0.466 | 1.889 | 5.096 |
| Total income (loss) from operations | $ (3.156) | $ 2.477 | $ 4.992 | $ 0.768 | $ 2.057 | $ 5.377 |
| Less Distributions | | | | | | |
| From net investment income | $ — | $ (0.151) | $ (0.145) | $ (0.233) | $ (0.237) | $ (0.197) |
| From net realized gain | (1.314) | (2.706) | (0.717) | (1.905) | (2.710) | — |
| Total distributions | $ (1.314) | $ (2.857) | $ (0.862) | $ (2.138) | $ (2.947) | $ (0.197) |
| Net asset value — End of period | $22.700 | $27.170 | $27.550 | $23.420 | $24.790 | $25.680 |
| Total Return(2) | (12.15)% (3)(4) | 8.81% | 21.81% | 3.94% | 8.06% | 26.48% (3) |
| Ratios/Supplemental Data | | | | | | |
| Net assets, end of period (000’s omitted) | $ 12,911 | $ 24,472 | $ 17,646 | $ 21,552 | $ 9,875 | $ 11,067 |
| Ratios (as a percentage of average daily net assets): | | | | | | |
| Expenses | 1.29% (3)(5) | 1.43% | 1.50% | 1.53% | 1.52% | 1.61% (3) |
| Net investment income | 0.13% (5) | 0.32% | 0.45% | 1.29% | 0.64% | 1.29% |
| Portfolio Turnover | 62% (4) | 10% | 9% | 17% | 12% | 14% |
| (1) | Computed using average shares outstanding. |
| (2) | Returns are historical and are calculated by determining the percentage change in net asset value with all distributions reinvested. |
| (3) | The administrator and/or investment adviser and sub-adviser reimbursed certain operating expenses (equal to 0.03% and 0.05% of average daily net assets for the six months ended February 28, 2022 and the year ended August 31, 2017, respectively). Absent this reimbursement, total return would be lower. |
| (4) | Not annualized. |
| (5) | Annualized. |
13
See Notes to Financial Statements.
Eaton Vance
Greater China Growth Fund
February 28, 2022
Notes to Financial Statements (Unaudited)
1 Significant Accounting Policies
Eaton Vance Greater China Growth Fund (the Fund) is a non-diversified series of Eaton Vance Growth Trust (the Trust). The Trust is a Massachusetts business trust registered under the Investment Company Act of 1940, as amended (the 1940 Act), as an open-end management investment company. The Fund’s investment objective is to seek long-term capital appreciation. The Fund offers three classes of shares. Class A shares are generally sold subject to a sales charge imposed at time of purchase. Class C shares are sold at net asset value and are generally subject to a contingent deferred sales charge (see Note 5). Effective January 25, 2019, Class C shares generally automatically convert to Class A shares ten years after their purchase and, effective November 5, 2020, automatically convert to Class A shares eight years after their purchase as described in the Fund’s prospectus. Class I shares are sold at net asset value and are not subject to a sales charge. Each class represents a pro-rata interest in the Fund, but votes separately on class-specific matters and (as noted below) is subject to different expenses. Realized and unrealized gains and losses and net investment income and losses, other than class-specific expenses, are allocated daily to each class of shares based on the relative net assets of each class to the total net assets of the Fund. Each class of shares differs in its distribution plan and certain other class-specific expenses.
The following is a summary of significant accounting policies of the Fund. The policies are in conformity with accounting principles generally accepted in the United States of America (U.S. GAAP). The Fund is an investment company and follows accounting and reporting guidance in the Financial Accounting Standards Board (FASB) Accounting Standards Codification Topic 946.
A Investment Valuation—The following methodologies are used to determine the market value or fair value of investments.
Equity Securities. Equity securities listed on a U.S. securities exchange generally are valued at the last sale or closing price on the day of valuation or, if no sales took place on such date, at the mean between the closing bid and ask prices on the exchange where such securities are principally traded. Equity securities listed on the NASDAQ National Market System are valued at the NASDAQ official closing price. Unlisted or listed securities for which closing sales prices or closing quotations are not available are valued at the mean between the latest available bid and ask prices. Equity-linked securities are generally valued based on the value of the underlying equity security or instrument.
Foreign Securities and Currencies. Foreign securities and currencies are valued in U.S. dollars, based on foreign currency exchange rate quotations supplied by a third party pricing service. The pricing service uses a proprietary model to determine the exchange rate. Inputs to the model include reported trades and implied bid/ask spreads. The daily valuation of exchange-traded foreign securities generally is determined as of the close of trading on the principal exchange on which such securities trade. Events occurring after the close of trading on foreign exchanges may result in adjustments to the valuation of foreign securities to more accurately reflect their fair value as of the close of regular trading on the New York Stock Exchange. When valuing foreign equity securities that meet certain criteria, the Fund's Trustees have approved the use of a fair value service that values such securities to reflect market trading that occurs after the close of the applicable foreign markets of comparable securities or other instruments that have a strong correlation to the fair-valued securities.
Affiliated Fund. The Fund may invest in Eaton Vance Cash Reserves Fund, LLC (Cash Reserves Fund), an affiliated investment company managed by Eaton Vance Management (EVM). While Cash Reserves Fund is not a registered money market mutual fund, it conducts all of its investment activities in accordance with the requirements of Rule 2a-7 under the 1940 Act. Investments in Cash Reserves Fund are valued at the closing net asset value per unit on the valuation day. Cash Reserves Fund generally values its investment securities based on available market quotations provided by a third party pricing service.
Fair Valuation. Investments for which valuations or market quotations are not readily available or are deemed unreliable are valued at fair value using methods determined in good faith by or at the direction of the Trustees of the Fund in a manner that most fairly reflects the security’s “fair value”, which is the amount that the Fund might reasonably expect to receive for the security upon its current sale in the ordinary course. Each such determination is based on a consideration of relevant factors, which are likely to vary from one pricing context to another. These factors may include, but are not limited to, the type of security, the existence of any contractual restrictions on the security’s disposition, the price and extent of public trading in similar securities of the issuer or of comparable companies or entities, quotations or relevant information obtained from broker/dealers or other market participants, information obtained from the issuer, analysts, and/or the appropriate stock exchange (for exchange-traded securities), an analysis of the company’s or entity’s financial statements, and an evaluation of the forces that influence the issuer and the market(s) in which the security is purchased and sold.
B Investment Transactions—Investment transactions for financial statement purposes are accounted for on a trade date basis. Realized gains and losses on investments sold are determined on the basis of identified cost.
C Income—Dividend income is recorded on the ex-dividend date for dividends received in cash and/or securities. However, if the ex-dividend date has passed, certain dividends from foreign securities are recorded as the Fund is informed of the ex-dividend date. Withholding taxes on foreign dividends and capital gains have been provided for in accordance with the Fund's understanding of the applicable countries’ tax rules and rates.
D Federal Taxes—The Fund’s policy is to comply with the provisions of the Internal Revenue Code applicable to regulated investment companies and to distribute to shareholders each year substantially all of its net investment income, and all or substantially all of its net realized capital gains. Accordingly, no provision for federal income or excise tax is necessary.
Eaton Vance
Greater China Growth Fund
February 28, 2022
Notes to Financial Statements (Unaudited) — continued
As of February 28, 2022, the Fund had no uncertain tax positions that would require financial statement recognition, de-recognition, or disclosure. The Fund files a U.S. federal income tax return annually after its fiscal year-end, which is subject to examination by the Internal Revenue Service for a period of three years from the date of filing.
E Expenses—The majority of expenses of the Trust are directly identifiable to an individual fund. Expenses which are not readily identifiable to a specific fund are allocated taking into consideration, among other things, the nature and type of expense and the relative size of the funds.
F Foreign Currency Translation—Investment valuations, other assets, and liabilities initially expressed in foreign currencies are translated each business day into U.S. dollars based upon current exchange rates. Purchases and sales of foreign investment securities and income and expenses denominated in foreign currencies are translated into U.S. dollars based upon currency exchange rates in effect on the respective dates of such transactions. Recognized gains or losses on investment transactions attributable to changes in foreign currency exchange rates are recorded for financial statement purposes as net realized gains and losses on investments. That portion of unrealized gains and losses on investments that results from fluctuations in foreign currency exchange rates is not separately disclosed.
G Equity-Linked Securities— Equity-linked securities are primarily used as an alternative means to more efficiently and effectively access the securities markets of emerging market countries and may also be known as participation notes, equity swaps, and zero strike calls and warrants. Equity-linked securities are privately issued securities whose investment results are designed to correspond generally to the performance of a specified stock index or “basket” of stocks, or a single stock. The Fund deposits an amount of cash with its custodian (or broker, if legally permitted) in an amount near or equal to the selling price of the underlying security in exchange for an equity-linked security. Upon sale, the Fund receives cash from the broker or custodian equal to the current value of the underlying security, less transactional costs. Aside from market risk of the underlying security, there is the risk that the issuer of an equity-linked security may default on its obligation under the security. In addition, the Fund may be unable to close out such a transaction with the other party or obtain an offsetting position with any other party, at any time prior to the end of the term of the underlying agreement. Income received on equity-linked securities is recorded as dividend income.
H Use of Estimates—The preparation of the financial statements in conformity with U.S. GAAP requires management to make estimates and assumptions that affect the reported amounts of assets and liabilities at the date of the financial statements and the reported amounts of income and expense during the reporting period. Actual results could differ from those estimates.
I Indemnifications—Under the Trust’s organizational documents, its officers and Trustees may be indemnified against certain liabilities and expenses arising out of the performance of their duties to the Fund. Under Massachusetts law, if certain conditions prevail, shareholders of a Massachusetts business trust (such as the Trust) could be deemed to have personal liability for the obligations of the Trust. However, the Trust’s Declaration of Trust contains an express disclaimer of liability on the part of Fund shareholders and the By-laws provide that the Trust shall assume, upon request by the shareholder, the defense on behalf of any Fund shareholders. Moreover, the By-laws also provide for indemnification out of Fund property of any shareholder held personally liable solely by reason of being or having been a shareholder for all loss or expense arising from such liability. Additionally, in the normal course of business, the Fund enters into agreements with service providers that may contain indemnification clauses. The Fund’s maximum exposure under these arrangements is unknown as this would involve future claims that may be made against the Fund that have not yet occurred.
J Interim Financial Statements—The interim financial statements relating to February 28, 2022 and for the six months then ended have not been audited by an independent registered public accounting firm, but in the opinion of the Fund’s management, reflect all adjustments, consisting only of normal recurring adjustments, necessary for the fair presentation of the financial statements.
2 Distributions to Shareholders and Income Tax Information
It is the present policy of the Fund to make at least one distribution annually (normally in December) of all or substantially all of its net investment income and to distribute annually all or substantially all of its net realized capital gains. Distributions to shareholders are recorded on the ex-dividend date. Distributions are declared separately for each class of shares. Shareholders may reinvest income and capital gain distributions in additional shares of the same class of the Fund at the net asset value as of the ex-dividend date or, at the election of the shareholder, receive distributions in cash. Distributions to shareholders are determined in accordance with income tax regulations, which may differ from U.S. GAAP. As required by U.S. GAAP, only distributions in excess of tax basis earnings and profits are reported in the financial statements as a return of capital. Permanent differences between book and tax accounting relating to distributions are reclassified to paid-in capital. For tax purposes, distributions from short-term capital gains are considered to be from ordinary income.
Eaton Vance
Greater China Growth Fund
February 28, 2022
Notes to Financial Statements (Unaudited) — continued
The cost and unrealized appreciation (depreciation) of investments of the Fund at February 28, 2022, as determined on a federal income tax basis, were as follows:
| Aggregate cost | $ 63,317,119 |
| Gross unrealized appreciation | $ 27,169,970 |
| Gross unrealized depreciation | (8,401,245) |
| Net unrealized appreciation | $ 18,768,725 |
3 Investment Adviser Fee and Other Transactions with Affiliates
The investment adviser fee is earned by Boston Management and Research (BMR), an indirect, wholly-owned subsidiary of Morgan Stanley, as compensation for investment advisory services rendered to the Fund. Pursuant to the investment advisory agreement between the Fund and BMR, and an amendment to the agreement that took effect on October 1, 2021, the investment adviser fee is computed at an annual rate as a percentage of average daily net assets as follows and is payable monthly:
| Average Daily Net Assets | Annual Fee Rate
(Prior to October 1, 2021) | Annual Fee Rate
(Effective October 1, 2021) |
| Up to $500 million | 1.000% | 0.750% |
| $500 million but less than $1 billion | 0.910% | 0.700% |
| $1 billion but less than $1.5 billion | 0.830% | 0.675% |
| $1.5 billion but less than $2 billion | 0.750% | 0.675% |
| $2 billion but less than $3 billion | 0.660% | 0.660% |
| $3 billion and over | 0.580% | 0.580% |
For the six months ended February 28, 2022, the investment adviser fee amounted to $388,030 or 0.80% (annualized) of the Fund's average daily net assets. Pursuant to an investment sub-advisory agreement effective October 1, 2021, BMR has delegated the investment management of the Fund to Morgan Stanley Investment Management Company (MSIM Company), a wholly-owned subsidiary of Morgan Stanley. BMR pays MSIM Company a portion of its investment adviser fee for sub-advisory services provided to the Fund. Prior to October 1, 2021, BMR delegated the investment management of the Fund to BMO Global Asset Management (Asia) Limited pursuant to an investment sub-advisory agreement and paid it a portion of its investment adviser fee for sub-advisory services provided to the Fund. The Fund may invest its cash in Cash Reserves Fund. EVM does not currently receive a fee for advisory services provided to Cash Reserves Fund.
The administration fee is earned by EVM, an affiliate of BMR and an indirect, wholly-owned subsidiary of Morgan Stanley, for administering the business affairs of the Fund and is computed at an annual rate of 0.15% of the Fund’s average daily net assets. For the six months ended February 28, 2022, the administration fee amounted to $73,136.
Effective October 1, 2021, EVM has agreed to reimburse the Fund’s expenses to the extent that total annual operating expenses (relating to ordinary operating expenses only) exceed 1.50%, 2.25% and 1.25% of the Fund’s average daily net assets for Class A, Class C and Class I, respectively. This agreement may be changed or terminated after December 31, 2022. Pursuant to this agreement, EVM was allocated $12,668 of the Fund’s operating expenses for the six months ended February 28, 2022.
EVM provides sub-transfer agency and related services to the Fund pursuant to a Sub-Transfer Agency Support Services Agreement. For the six months ended February 28, 2022, EVM earned $20,925 from the Fund pursuant to such agreement, which is included in transfer and dividend disbursing agent fees on the Statement of Operations. The Fund was informed that Eaton Vance Distributors, Inc. (EVD), an affiliate of EVM and the Fund's principal underwriter, received $651 as its portion of the sales charge on sales of Class A shares for the six months ended February 28, 2022. EVD also received distribution and service fees from Class A and Class C shares (see Note 4).
Trustees and officers of the Fund who are members of EVM’s or BMR's organizations receive remuneration for their services to the Fund out of the investment adviser fee. Trustees of the Fund who are not affiliated with the investment adviser and administrator may elect to defer receipt of all or a percentage of their annual fees in accordance with the terms of the Trustees Deferred Compensation Plan. For the six months ended February 28, 2022, no significant amounts have been deferred. Certain officers and Trustees of the Fund are officers of the above organizations.
Eaton Vance
Greater China Growth Fund
February 28, 2022
Notes to Financial Statements (Unaudited) — continued
4 Distribution Plans
The Fund has in effect a distribution plan for Class A shares (Class A Plan) pursuant to Rule 12b-1 under the 1940 Act. Pursuant to the Class A Plan, the Fund pays EVD a distribution and service fee of 0.25% per annum (0.30% per annum prior to October 1, 2021 when the distribution and service fee rate was reduced) of its average daily net assets attributable to Class A shares for distribution services and facilities provided to the Fund by EVD, as well as for personal services and/or the maintenance of shareholder accounts. Distribution and service fees paid or accrued to EVD for the six months ended February 28, 2022 amounted to $99,873, representing 0.26% (annualized) of the average daily net assets attributable to Class A shares.
The Fund also has in effect a distribution plan for Class C shares (Class C Plan) pursuant to Rule 12b-1 under the 1940 Act. Pursuant to the Class C Plan, the Fund pays EVD amounts equal to 0.75% per annum of its average daily net assets attributable to Class C shares for providing ongoing distribution services and facilities to the Fund. For the six months ended February 28, 2022, the Fund paid or accrued to EVD $5,128 for Class C shares.
Pursuant to the Class C Plan, the Fund also makes payments of service fees to EVD, financial intermediaries and other persons in amounts equal to 0.25% per annum of its average daily net assets attributable to that class. Service fees paid or accrued are for personal services and/or the maintenance of shareholder accounts. They are separate and distinct from the sales commissions and distribution fees payable to EVD. Service fees paid or accrued for the six months ended February 28, 2022 amounted to $1,709 for Class C shares.
Distribution and service fees are subject to the limitations contained in the Financial Industry Regulatory Authority Rule 2341(d).
5 Contingent Deferred Sales Charges
A contingent deferred sales charge (CDSC) of 1% generally is imposed on redemptions of Class C shares made within 12 months of purchase. Class A shares may be subject to a 1% CDSC if redeemed within 18 months of purchase (depending on the circumstances of purchase). Generally, the CDSC is based upon the lower of the net asset value at date of redemption or date of purchase. No charge is levied on shares acquired by reinvestment of dividends or capital gain distributions. For the six months ended February 28, 2022, the Fund was informed that EVD received no CDSCs paid by Class A and Class C shareholders.
6 Purchases and Sales of Investments
Purchases and sales of investments, other than equity-linked securities and short-term obligations, aggregated $58,029,302 and $70,577,243, respectively, for the six months ended February 28, 2022. Purchases and sales of equity-linked securities aggregated $785,733 and none, respectively, for the six months ended February 28, 2022.
7 Shares of Beneficial Interest
The Fund’s Declaration of Trust permits the Trustees to issue an unlimited number of full and fractional shares of beneficial interest (without par value). Such shares may be issued in a number of different series (such as the Fund) and classes. Transactions in Fund shares were as follows:
| | Six Months Ended
February 28, 2022
(Unaudited) | | Year Ended
August 31, 2021 |
| | Shares | Amount | | Shares | Amount |
| Class A | | | | | |
| Sales | 29,393 | $ 742,903 | | 109,913 | $ 3,181,391 |
| Issued to shareholders electing to receive payments of distributions in Fund shares | 137,723 | 3,474,746 | | 271,889 | 7,449,769 |
| Redemptions | (286,269) | (7,153,921) | | (386,517) | (11,016,250) |
| Converted from Class C shares | 2,154 | 52,488 | | 24,781 | 731,483 |
| Net increase (decrease) | (116,999) | $ (2,883,784) | | 20,066 | $ 346,393 |
Eaton Vance
Greater China Growth Fund
February 28, 2022
Notes to Financial Statements (Unaudited) — continued
| | Six Months Ended
February 28, 2022
(Unaudited) | | Year Ended
August 31, 2021 |
| | Shares | Amount | | Shares | Amount |
| Class C | | | | | |
| Sales | 2,382 | $ 56,201 | | 6,240 | $ 172,348 |
| Issued to shareholders electing to receive payments of distributions in Fund shares | 3,295 | 76,647 | | 6,301 | 160,991 |
| Redemptions | (1,648) | (38,934) | | (16,496) | (429,415) |
| Converted to Class A shares | (2,330) | (52,488) | | (26,673) | (731,483) |
| Net increase (decrease) | 1,699 | $ 41,426 | | (30,628) | $ (827,559) |
| Class I | | | | | |
| Sales | 242,798 | $ 6,394,935 | | 417,497 | $ 12,257,559 |
| Issued to shareholders electing to receive payments of distributions in Fund shares | 38,837 | 992,290 | | 66,465 | 1,837,752 |
| Redemptions | (613,651) | (15,835,397) | | (223,753) | (6,450,688) |
| Net increase (decrease) | (332,016) | $ (8,448,172) | | 260,209 | $ 7,644,623 |
8 Restricted Securities
At February 28, 2022, the Fund owned the following security (representing 0.4% of net assets) which was restricted as to public resale and not registered under the Securities Act of 1933 (excluding Rule 144A securities). The Fund has limited registration rights with respect to this security. The value of restricted securities is determined based on valuations provided by brokers when available, or if not available, they are valued at fair value using methods determined in good faith by or at the direction of the Trustees.
| Description | Date(s) of
Acquisition | Shares | Cost | Value |
| Common Stocks | | | | |
| JD.com, Inc., Class A | 1/20/2022 | 9,480 | $ 345,832 | $ 338,626 |
| Total Common Stocks | | | $345,832 | $338,626 |
| Total Restricted Securities | | | $345,832 | $338,626 |
9 Line of Credit
The Fund participates with other portfolios and funds managed by EVM and its affiliates in an $800 million unsecured line of credit agreement with a group of banks, which is in effect through October 25, 2022. Borrowings are made by the Fund solely for temporary purposes related to redemptions and other short-term cash needs. Interest is charged to the Fund based on its borrowings at an amount above either the Secured Overnight Financing Rate (SOFR) or Federal Funds rate. In addition, a fee computed at an annual rate of 0.15% on the daily unused portion of the line of credit is allocated among the participating portfolios and funds at the end of each quarter. In connection with the renewal of the agreement in October 2021, an arrangement fee totaling $150,000 was incurred that was allocated to the participating portfolios and funds. Because the line of credit is not available exclusively to the Fund, it may be unable to borrow some or all of its requested amounts at any particular time. The Fund did not have any significant borrowings or allocated fees during the six months ended February 28, 2022.
Eaton Vance
Greater China Growth Fund
February 28, 2022
Notes to Financial Statements (Unaudited) — continued
10 Investments in Affiliated Funds
At February 28, 2022, the value of the Fund's investment in affiliated funds was $1,170,837, which represents 1.4% of the Fund's net assets. Transactions in affiliated funds by the Fund for the six months ended February 28, 2022 were as follows:
| Name | Value,
beginning
of period | Purchases | Sales
proceeds | Net
realized
gain (loss) | Change in
unrealized
appreciation
(depreciation) | Value, end
of period | Dividend
income | Units, end
of period |
| Short-Term Investments |
| Eaton Vance Cash Reserves Fund, LLC | $ — | $36,705,853 | $(35,534,546) | $(470) | $ — | $1,170,837 | $1,129 | 1,170,954 |
11 Fair Value Measurements
Under generally accepted accounting principles for fair value measurements, a three-tier hierarchy to prioritize the assumptions, referred to as inputs, is used in valuation techniques to measure fair value. The three-tier hierarchy of inputs is summarized in the three broad levels listed below.
| • | Level 1 – quoted prices in active markets for identical investments |
| • | Level 2 – other significant observable inputs (including quoted prices for similar investments, interest rates, prepayment speeds, credit risk, etc.) |
| • | Level 3 – significant unobservable inputs (including a fund’s own assumptions in determining the fair value of investments) |
In cases where the inputs used to measure fair value fall in different levels of the fair value hierarchy, the level disclosed is determined based on the lowest level input that is significant to the fair value measurement in its entirety. The inputs or methodology used for valuing securities are not necessarily an indication of the risk associated with investing in those securities.
At February 28, 2022, the hierarchy of inputs used in valuing the Fund's investments, which are carried at value, were as follows:
| Asset Description | Level 1 | Level 2 | Level 3* | Total |
| Common Stocks: | | | | |
| Communication Services | $ — | $ 12,732,545 | $ — | $ 12,732,545 |
| Consumer Discretionary | 3,042,998 | 16,523,005 | 338,626 | 19,904,629 |
| Consumer Staples | — | 10,919,856 | — | 10,919,856 |
| Financials | — | 12,063,407 | — | 12,063,407 |
| Health Care | — | 7,690,927 | — | 7,690,927 |
| Industrials | — | 2,625,458 | — | 2,625,458 |
| Information Technology | — | 13,080,948 | — | 13,080,948 |
| Real Estate | 1,090,667 | — | — | 1,090,667 |
| Total Common Stocks | $4,133,665 | $75,636,146** | $338,626 | $80,108,437 |
| Equity-Linked Securities | $ — | $ 806,570 | $ — | $ 806,570 |
| Short-Term Investments | — | 1,170,837 | — | 1,170,837 |
| Total Investments | $4,133,665 | $77,613,553 | $338,626 | $82,085,844 |
| * | None of the unobservable inputs for Level 3 assets, individually or collectively, had a material impact on the Fund. |
| ** | Includes foreign equity securities whose values were adjusted to reflect market trading of comparable securities or other correlated instruments that occurred after the close of trading in their applicable foreign markets. |
Level 3 investments at the beginning and/or end of the period in relation to net assets were not significant and accordingly, a reconciliation of Level 3 assets for the six months ended February 28, 2022 is not presented.
Eaton Vance
Greater China Growth Fund
February 28, 2022
Notes to Financial Statements (Unaudited) — continued
12 Risks and Uncertainties
Risks Associated with Foreign Investments
Foreign investments can be adversely affected by political, economic and market developments abroad, including the imposition of economic and other sanctions by the United States or another country. There may be less publicly available information about foreign issuers because they may not be subject to reporting practices, requirements or regulations comparable to those to which United States companies are subject. Foreign markets may be smaller, less liquid and more volatile than the major markets in the United States. Trading in foreign markets typically involves higher expense than trading in the United States. The Fund may have difficulties enforcing its legal or contractual rights in a foreign country. Securities that trade or are denominated in currencies other than the U.S. dollar may be adversely affected by fluctuations in currency exchange rates.
The securities markets in the China region, which includes Hong Kong, China and Taiwan, are impacted by the economies of countries in the region, which differ from the U.S. economy in various ways, such as structure, general development, government involvement, wealth distribution, interest rates, rate of growth of gross national product, rate of inflation, capital reinvestment, resource self-sufficiency and balance of payments position. As export-driven economies, the economies of countries in the China region are affected by developments in the economies and governmental actions of their principal trading partners, such as the imposition of trading restrictions and tariffs. China’s governmental actions and the actions of other governments can also have a significant effect on the economic conditions in the China region or a particular issuer or industry, which could adversely affect the value and liquidity of investments. A government may restrict investment in companies or industries considered important to national interests, intervene in the financial markets, maintain strict currency controls, or impose repatriation restrictions. Although larger and/or more established than many emerging markets, markets in the China region carry the high levels of risk associated with emerging markets.
Pandemic Risk
An outbreak of respiratory disease caused by a novel coronavirus was first detected in China in late 2019 and subsequently spread internationally. This coronavirus has resulted in closing borders, enhanced health screenings, changes to healthcare service preparation and delivery, quarantines, cancellations, disruptions to supply chains and customer activity, as well as general concern and uncertainty. Health crises caused by outbreaks, such as the coronavirus outbreak, may exacerbate other pre-existing political, social and economic risks and disrupt normal market conditions and operations. The impact of this outbreak has negatively affected the worldwide economy, the economies of individual countries, individual companies, and the market in general, and may continue to do so in significant and unforeseen ways, as may other epidemics and pandemics that may arise in the future. Any such impact could adversely affect the Fund's performance, or the performance of the securities in which the Fund invests.
Eaton Vance
Greater China Growth Fund
February 28, 2022
| Officers |
Eric A. Stein
President | Jill R. Damon
Secretary |
Deidre E. Walsh
Vice President and Chief Legal Officer | Richard F. Froio
Chief Compliance Officer |
James F. Kirchner
Treasurer | |
George J. Gorman
Chairperson | |
| Alan C. Bowser* | |
| Thomas E. Faust Jr.** | |
| Mark R. Fetting | |
| Cynthia E. Frost | |
| Valerie A. Mosley | |
| William H. Park | |
| Helen Frame Peters | |
| Keith Quinton | |
| Marcus L. Smith | |
| Susan J. Sutherland | |
| Scott E. Wennerholm | |
| Nancy A. Wiser* | |
| * | Mr. Bowser and Ms. Wiser began serving as Trustees effective April 4, 2022. |
| ** | Interested Trustee |
| FACTS | WHAT DOES EATON VANCE DO WITH YOUR
PERSONAL INFORMATION? |
| Why? | Financial companies choose how they share your personal information. Federal law gives consumers the right to limit some but not all sharing. Federal law also requires us to tell you how we collect, share, and protect your personal information. Please read this notice carefully to understand what we do. |
| |
| What? | The types of personal information we collect and share depend on the product or service you have with us. This information can include:■ Social Security number and income
■ investment experience and risk tolerance
■ checking account number and wire transfer instructions |
| |
| How? | All financial companies need to share customers’ personal information to run their everyday business. In the section below, we list the reasons financial companies can share their customers’ personal information; the reasons Eaton Vance chooses to share; and whether you can limit this sharing. |
Reasons we can share your
personal information | Does Eaton Vance
share? | Can you limit
this sharing? |
| For our everyday business purposes — such as to process your transactions, maintain your account(s), respond to court orders and legal investigations, or report to credit bureaus | Yes | No |
| For our marketing purposes — to offer our products and services to you | Yes | No |
| For joint marketing with other financial companies | No | We don’t share |
| For our investment management affiliates’ everyday business purposes — information about your transactions, experiences, and creditworthiness | Yes | Yes |
| For our affiliates’ everyday business purposes — information about your transactions and experiences | Yes | No |
| For our affiliates’ everyday business purposes — information about your creditworthiness | No | We don’t share |
| For our investment management affiliates to market to you | Yes | Yes |
| For our affiliates to market to you | No | We don’t share |
| For nonaffiliates to market to you | No | We don’t share |
To limit our
sharing | Call toll-free 1-800-262-1122 or email: EVPrivacy@eatonvance.comPlease note:If you are a new customer, we can begin sharing your information 30 days from the date we sent this notice. When you are no longer our customer, we continue to share your information as described in this notice. However, you can contact us at any time to limit our sharing. |
| Questions? | Call toll-free 1-800-262-1122 or email: EVPrivacy@eatonvance.com |
| Privacy Notice — continued | April 2021 |
| Who we are |
| Who is providing this notice? | Eaton Vance Management, Eaton Vance Distributors, Inc., Eaton Vance Trust Company, Eaton Vance Management (International) Limited, Eaton Vance Advisers International Ltd., Eaton Vance Global Advisors Limited, Eaton Vance Management’s Real Estate Investment Group, Boston Management and Research, Calvert Research and Management, Eaton Vance and Calvert Fund Families and our investment advisory affiliates (“Eaton Vance”) (see Investment Management Affiliates definition below) |
| What we do |
How does Eaton Vance
protect my personal
information? | To protect your personal information from unauthorized access and use, we use security measures that comply with federal law. These measures include computer safeguards and secured files and buildings. We have policies governing the proper handling of customer information by personnel and requiring third parties that provide support to adhere to appropriate security standards with respect to such information. |
How does Eaton Vance
collect my personal
information? | We collect your personal information, for example, when you■ open an account or make deposits or withdrawals from your account
■ buy securities from us or make a wire transfer
■ give us your contact informationWe also collect your personal information from others, such as credit bureaus, affiliates, or other companies. |
| Why can’t I limit all sharing? | Federal law gives you the right to limit only■ sharing for affiliates’ everyday business purposes — information about your creditworthiness
■ affiliates from using your information to market to you
■ sharing for nonaffiliates to market to youState laws and individual companies may give you additional rights to limit sharing. See below for more on your rights under state law. |
| Definitions |
Investment Management
Affiliates | Eaton Vance Investment Management Affiliates include registered investment advisers, registered broker- dealers, and registered and unregistered funds. Investment Management Affiliates does not include entities associated with Morgan Stanley Wealth Management, such as Morgan Stanley Smith Barney LLC and Morgan Stanley & Co. |
| Affiliates | Companies related by common ownership or control. They can be financial and nonfinancial companies.■ Our affiliates include companies with a Morgan Stanley name and financial companies such as Morgan Stanley Smith Barney LLC and Morgan Stanley & Co. |
| Nonaffiliates | Companies not related by common ownership or control. They can be financial and nonfinancial companies.■ Eaton Vance does not share with nonaffiliates so they can market to you. |
| Joint marketing | A formal agreement between nonaffiliated financial companies that together market financial products or services to you.■ Eaton Vance doesn’t jointly market. |
| Other important information |
| Vermont: Except as permitted by law, we will not share personal information we collect about Vermont residents with Nonaffiliates unless you provide us with your written consent to share such information.California: Except as permitted by law, we will not share personal information we collect about California residents with Nonaffiliates and we will limit sharing such personal information with our Affiliates to comply with California privacy laws that apply to us. |
Delivery of Shareholder Documents. The Securities and Exchange Commission (SEC) permits funds to deliver only one copy of shareholder documents, including prospectuses, proxy statements and shareholder reports, to fund investors with multiple accounts at the same residential or post office box address. This practice is often called “householding” and it helps eliminate duplicate mailings to shareholders. Eaton Vance, or your financial intermediary, may household the mailing of your documents indefinitely unless you instruct Eaton Vance, or your financial intermediary, otherwise. If you would prefer that your Eaton Vance documents not be householded, please contact Eaton Vance at 1-800-262-1122, or contact your financial intermediary. Your instructions that householding not apply to delivery of your Eaton Vance documents will typically be effective within 30 days of receipt by Eaton Vance or your financial intermediary.
Portfolio Holdings. Each Eaton Vance Fund and its underlying Portfolio(s) (if applicable) files a schedule of portfolio holdings on Part F to Form N-PORT with the SEC. Certain information filed on Form N-PORT may be viewed on the Eaton Vance website at www.eatonvance.com, by calling Eaton Vance at 1-800-262-1122 or in the EDGAR database on the SEC’s website at www.sec.gov.
Proxy Voting. From time to time, funds are required to vote proxies related to the securities held by the funds. The Eaton Vance Funds or their underlying Portfolios (if applicable) vote proxies according to a set of policies and procedures approved by the Funds’ and Portfolios’ Boards. You may obtain a description of these policies and procedures and information on how the Funds or Portfolios voted proxies relating to portfolio securities during the most recent 12-month period ended June 30, without charge, upon request, by calling 1-800-262-1122 and by accessing the SEC’s website at www.sec.gov.
Investment Adviser
Boston Management and Research
Two International Place
Boston, MA 02110
Investment Sub-Adviser
Morgan Stanley Investment Management Company
23 Church Street, 16-01 Capital Square
Singapore 049481
Administrator
Eaton Vance Management
Two International Place
Boston, MA 02110
Principal Underwriter*
Eaton Vance Distributors, Inc.
Two International Place
Boston, MA 02110
(617) 482-8260
Custodian
State Street Bank and Trust Company
State Street Financial Center, One Lincoln Street
Boston, MA 02111
Transfer Agent
BNY Mellon Investment Servicing (US) Inc.
Attn: Eaton Vance Funds
P.O. Box 9653
Providence, RI 02940-9653
(800) 262-1122
Fund Offices
Two International Place
Boston, MA 02110
* FINRA BrokerCheck. Investors may check the background of their Investment Professional by contacting the Financial Industry Regulatory Authority (FINRA). FINRA BrokerCheck is a free tool to help investors check the professional background of current and former FINRA-registered securities firms and brokers. FINRA BrokerCheck is available by calling 1-800-289-9999 and at www.FINRA.org. The FINRA BrokerCheck brochure describing this program is available to investors at www.FINRA.org.
Eaton Vance
Richard Bernstein All Asset Strategy Fund
Semiannual Report
February 28, 2022
Commodity Futures Trading Commission Registration. The Commodity Futures Trading Commission (“CFTC”) has adopted regulations that subject registered investment companies and advisers to regulation by the CFTC if a fund invests more than a prescribed level of its assets in certain CFTC-regulated instruments (including futures, certain options and swap agreements) or markets itself as providing investment exposure to such instruments. The investment adviser has claimed an exclusion from the definition of “commodity pool operator” under the Commodity Exchange Act with respect to its management of the Fund. Accordingly, neither the Fund nor the adviser with respect to the operation of the Fund is subject to CFTC regulation. Because of its management of other strategies, the Fund's adviser is registered with the CFTC as a commodity pool operator. The adviser is also registered as a commodity trading advisor.
Fund shares are not insured by the FDIC and are not deposits or other obligations of, or guaranteed by, any depository institution. Shares are subject to investment risks, including possible loss of principal invested.
This report must be preceded or accompanied by a current summary prospectus or prospectus. Before investing, investors should consider carefully the investment objective, risks, and charges and expenses of a mutual fund. This and other important information is contained in the summary prospectus and prospectus, which can be obtained from a financial intermediary. Prospective investors should read the prospectus carefully before investing. For further information, please call 1-800-262-1122.
Semiannual Report February 28, 2022
Eaton Vance
Richard Bernstein All Asset Strategy Fund
Eaton Vance
Richard Bernstein All Asset Strategy Fund
February 28, 2022
Performance
Portfolio Manager(s) Richard Bernstein, Matthew Griswold, CFA, Henry Timmons, CFA and Dan Suzuki, CFA, each of Richard Bernstein Advisors LLC
| % Average Annual Total Returns1,2 | Class
Inception Date | Performance
Inception Date | Six Months | One Year | Five Years | Ten Years |
| Class A at NAV | 09/30/2011 | 09/30/2011 | (3.70)% | 1.96% | 5.20% | 5.61% |
| Class A with 5.75% Maximum Sales Charge | — | — | (9.24) | (3.87) | 3.97 | 4.98 |
| Class C at NAV | 09/30/2011 | 09/30/2011 | (4.04) | 1.20 | 4.41 | 4.98 |
| Class C with 1% Maximum Sales Charge | — | — | (4.96) | 0.24 | 4.41 | 4.98 |
| Class I at NAV | 09/30/2011 | 09/30/2011 | (3.57) | 2.20 | 5.47 | 5.88 |
|
| Bloomberg U.S. Aggregate Bond Index | — | — | (4.07)% | (2.64)% | 2.71% | 2.47% |
| MSCI ACWI Index | — | — | (5.26) | 7.81 | 11.43 | 9.83 |
| Blended Index | — | — | (4.47) | 1.54 | 6.41 | 5.58 |
| % Total Annual Operating Expense Ratios3 | Class A | Class C | Class I |
| | 1.41% | 2.16% | 1.16% |
See Endnotes and Additional Disclosures in this report.
Past performance is no guarantee of future results. Returns are historical and are calculated by determining the percentage change in net asset value (NAV) or offering price (as applicable) with all distributions reinvested. Investment return and principal value will fluctuate so that shares, when redeemed, may be worth more or less than their original cost. Performance for periods less than or equal to one year is cumulative. Performance is for the stated time period only; due to market volatility, current Fund performance may be lower or higher than the quoted return. For performance as of the most recent month-end, please refer to eatonvance.com.
Eaton Vance
Richard Bernstein All Asset Strategy Fund
February 28, 2022
| Asset Allocation (% of net assets)* |
| * | The Fund may obtain exposure to certain market segments through investments in exchange-traded funds (ETFs). For purposes of the chart, the Fund’s investments in ETFs are included based on the portfolio composition of each ETF. |
| Country Allocation (% of net assets)* |
| * | The Fund may obtain exposure to certain market segments through investments in exchange-traded funds (ETFs). For purposes of the chart, the Fund’s investments in ETFs are included based on the portfolio composition of each ETF. |
| Top 10 Holdings (% of net assets)** |
| VanEck Emerging Markets High Yield Bond ETF | 8.0% |
| ProShares Investment Grade-Interest Rate Hedged ETF | 5.0 |
| First Trust Low Duration Opportunities ETF | 4.9 |
| PIMCO 0-5 Year High Yield Corporate Bond Index Exchange-Traded Fund | 4.3 |
| WisdomTree Floating Rate Treasury Fund | 3.9 |
| Apple, Inc. | 1.8 |
| Microsoft Corp. | 1.4 |
| U.S. Treasury Notes, 2.375%, 5/15/29 | 1.3 |
| U.S. Treasury Bonds, 4.375%, 11/15/39 | 1.3 |
| iShares MSCI Taiwan ETF | 1.2 |
| Total | 33.1% |
| ** | Excludes cash and cash equivalents. |
Eaton Vance
Richard Bernstein All Asset Strategy Fund
February 28, 2022
Endnotes and Additional Disclosures
| 1 | Bloomberg U.S. Aggregate Bond Index is an unmanaged index of domestic investment-grade bonds, including corporate, government and mortgage-backed securities. MSCI ACWI Index is an unmanaged free-float-adjusted, market-capitalization-weighted index designed to measure the equity market performance of developed and emerging markets. MSCI indexes are net of foreign withholding taxes. Source: MSCI. MSCI data may not be reproduced or used for any other purpose. MSCI provides no warranties, has not prepared or approved this report, and has no liability hereunder. The Blended Index consists of 60% Bloomberg U.S. Aggregate Bond Index and 40% MSCI ACWI Index, rebalanced monthly. Unless otherwise stated, index returns do not reflect the effect of any applicable sales charges, commissions, expenses, taxes or leverage, as applicable. It is not possible to invest directly in an index. |
| 2 | Total Returns at NAV do not include applicable sales charges. If sales charges were deducted, the returns would be lower. Total Returns shown with maximum sales charge reflect the stated maximum sales charge. Unless otherwise stated, performance does not reflect the deduction of taxes on Fund distributions or redemptions of Fund shares. |
| 3 | Source: Fund prospectus. The expense ratios for the current reporting period can be found in the Financial Highlights section of this report. |
| | Fund profile subject to change due to active management. |
Eaton Vance
Richard Bernstein All Asset Strategy Fund
February 28, 2022
Example
As a Fund shareholder, you incur two types of costs: (1) transaction costs, including sales charges (loads) on purchases and redemption fees (if applicable); and (2) ongoing costs, including management fees; distribution and/or service fees; and other Fund expenses. This Example is intended to help you understand your ongoing costs (in dollars) of Fund investing and to compare these costs with the ongoing costs of investing in other mutual funds. The Example is based on an investment of $1,000 invested at the beginning of the period and held for the entire period (September 1, 2021 to February 28, 2022).
Actual Expenses
The first section of the table below provides information about actual account values and actual expenses. You may use the information in this section, together with the amount you invested, to estimate the expenses that you paid over the period. Simply divide your account value by $1,000 (for example, an $8,600 account value divided by $1,000 = 8.6), then multiply the result by the number in the first section under the heading entitled “Expenses Paid During Period” to estimate the expenses you paid on your account during this period.
Hypothetical Example for Comparison Purposes
The second section of the table below provides information about hypothetical account values and hypothetical expenses based on the actual Fund expense ratio and an assumed rate of return of 5% per year (before expenses), which is not the actual Fund return. The hypothetical account values and expenses may not be used to estimate the actual ending account balance or expenses you paid for the period. You may use this information to compare the ongoing costs of investing in your Fund and other funds. To do so, compare this 5% hypothetical example with the 5% hypothetical examples that appear in the shareholder reports of the other funds.
Please note that the expenses shown in the table are meant to highlight your ongoing costs only and do not reflect any transactional costs, such as sales charges (loads) or redemption fees (if applicable). Therefore, the second section of the table is useful in comparing ongoing costs only, and will not help you determine the relative total costs of owning different funds. In addition, if these transactional costs were included, your costs would be higher.
| | Beginning
Account Value*
(9/1/21) | Ending
Account Value
(2/28/22) | Expenses Paid
During Period*
(9/1/21 – 2/28/22) | Annualized
Expense
Ratio |
| Actual | | | | |
| Class A | $1,000.00 | $ 963.00 | $5.74 | 1.18% |
| Class C | $1,000.00 | $ 959.60 | $9.38 | 1.93% |
| Class I | $1,000.00 | $ 964.30 | $4.53 | 0.93% |
| |
| Hypothetical | | | | |
| (5% return per year before expenses) | | | | |
| Class A | $1,000.00 | $1,018.94 | $5.91 | 1.18% |
| Class C | $1,000.00 | $1,015.22 | $9.64 | 1.93% |
| Class I | $1,000.00 | $1,020.18 | $4.66 | 0.93% |
| * | Expenses are equal to the Fund's annualized expense ratio for the indicated Class, multiplied by the average account value over the period, multiplied by 181/365 (to reflect the one-half year period). The Example assumes that the $1,000 was invested at the net asset value per share determined at the close of business on August 31, 2021. |
Eaton Vance
Richard Bernstein All Asset Strategy Fund
February 28, 2022
Portfolio of Investments (Unaudited)
| Security | Shares | Value |
| Aerospace & Defense — 0.3% |
| Boeing Co. (The)(1) | | 4,142 | $ 850,518 |
| Northrop Grumman Corp. | | 4,065 | 1,797,299 |
| | | | $ 2,647,817 |
| Air Freight & Logistics — 0.5% |
| Expeditors International of Washington, Inc. | | 10,334 | $ 1,068,122 |
| FedEx Corp. | | 3,330 | 740,159 |
| United Parcel Service, Inc., Class B | | 12,230 | 2,573,437 |
| | | | $ 4,381,718 |
| Airlines — 0.2% |
| Alaska Air Group, Inc.(1) | | 18,946 | $ 1,063,628 |
| Southwest Airlines Co.(1) | | 21,432 | 938,722 |
| | | | $ 2,002,350 |
| Automobiles — 0.9% |
| General Motors Co.(1) | | 14,502 | $ 677,533 |
| Honda Motor Co., Ltd. | | 27,700 | 841,551 |
| Tesla, Inc.(1) | | 4,285 | 3,729,792 |
| Toyota Motor Corp. | | 65,100 | 1,191,081 |
| Volkswagen AG, PFC Shares | | 4,383 | 861,600 |
| | | | $ 7,301,557 |
| Banks — 5.5% |
| Bank of America Corp. | | 50,248 | $ 2,220,962 |
| Bank of Nova Scotia (The) | | 24,667 | 1,787,506 |
| BNP Paribas S.A. | | 21,426 | 1,243,233 |
| Cadence Bank | | 26,105 | 825,440 |
| Cathay General Bancorp | | 27,358 | 1,286,647 |
| Citigroup, Inc. | | 21,814 | 1,292,043 |
| Commonwealth Bank of Australia | | 24,061 | 1,632,381 |
| Community Bank System, Inc. | | 11,408 | 832,100 |
| CVB Financial Corp. | | 36,966 | 871,658 |
| First Financial Bancorp | | 38,790 | 953,458 |
| First Interstate BancSystem, Inc., Class A | | 18,470 | 749,882 |
| First Merchants Corp. | | 36,360 | 1,590,386 |
| Fulton Financial Corp. | | 53,873 | 970,791 |
| Glacier Bancorp, Inc. | | 15,712 | 870,445 |
| Heartland Financial USA, Inc. | | 17,157 | 851,330 |
| Home BancShares, Inc. | | 36,236 | 848,285 |
| Independent Bank Group, Inc. | | 11,676 | 900,803 |
| JPMorgan Chase & Co. | | 19,284 | 2,734,471 |
| Mizuho Financial Group, Inc. | | 60,400 | 796,019 |
| Security | Shares | Value |
| Banks (continued) |
| National Australia Bank, Ltd. | | 66,204 | $ 1,390,485 |
| NBT Bancorp, Inc. | | 23,892 | 916,736 |
| Old National Bancorp | | 45,817 | 837,535 |
| Pacific Premier Bancorp, Inc. | | 21,960 | 850,072 |
| PNC Financial Services Group, Inc. (The) | | 4,805 | 957,396 |
| Royal Bank of Canada | | 21,216 | 2,346,900 |
| Sandy Spring Bancorp, Inc. | | 22,124 | 1,041,819 |
| Shizuoka Bank, Ltd. (The) | | 101,000 | 746,709 |
| Sumitomo Mitsui Financial Group, Inc. | | 19,000 | 673,783 |
| Sumitomo Mitsui Trust Holdings, Inc. | | 24,600 | 874,087 |
| Toronto-Dominion Bank (The) | | 28,181 | 2,274,046 |
| Truist Financial Corp. | | 22,496 | 1,399,701 |
| U.S. Bancorp | | 13,983 | 790,599 |
| UMB Financial Corp. | | 10,589 | 1,078,596 |
| United Bankshares, Inc. | | 22,055 | 807,654 |
| Valley National Bancorp | | 78,406 | 1,095,332 |
| Wells Fargo & Co. | | 39,777 | 2,122,899 |
| WesBanco, Inc. | | 41,795 | 1,527,189 |
| Westpac Banking Corp. | | 70,202 | 1,160,175 |
| | | | $ 46,149,553 |
| Beverages — 0.8% |
| Asahi Group Holdings, Ltd. | | 14,600 | $ 588,955 |
| Coca-Cola Co. (The) | | 31,206 | 1,942,261 |
| Diageo PLC | | 28,921 | 1,432,814 |
| Kirin Holdings Co., Ltd. | | 55,100 | 916,063 |
| PepsiCo, Inc. | | 10,052 | 1,645,914 |
| | | | $ 6,526,007 |
| Biotechnology — 0.3% |
| Amgen, Inc. | | 5,732 | $ 1,298,183 |
| Biogen, Inc.(1) | | 3,379 | 713,003 |
| Gilead Sciences, Inc. | | 8,927 | 539,191 |
| | | | $ 2,550,377 |
| Building Products — 0.3% |
| Daikin Industries, Ltd. | | 3,700 | $ 683,777 |
| Kingspan Group PLC | | 8,400 | 820,362 |
| Simpson Manufacturing Co., Inc. | | 7,506 | 889,536 |
| | | | $ 2,393,675 |
| Capital Markets — 1.1% |
| Bank of New York Mellon Corp. (The) | | 20,065 | $ 1,066,455 |
| BlackRock, Inc. | | 1,014 | 754,305 |
| Charles Schwab Corp. (The) | | 12,627 | 1,066,477 |
| CME Group, Inc. | | 2,642 | 624,912 |
6
See Notes to Financial Statements.
Eaton Vance
Richard Bernstein All Asset Strategy Fund
February 28, 2022
Portfolio of Investments (Unaudited) — continued
| Security | Shares | Value |
| Capital Markets (continued) |
| FactSet Research Systems, Inc. | | 2,663 | $ 1,081,418 |
| Hong Kong Exchanges & Clearing, Ltd. | | 22,600 | 1,095,120 |
| Intercontinental Exchange, Inc. | | 8,735 | 1,119,128 |
| Partners Group Holding AG | | 553 | 747,539 |
| S&P Global, Inc. | | 3,909 | 1,468,611 |
| | | | $ 9,023,965 |
| Chemicals — 2.8% |
| Air Liquide S.A. | | 11,839 | $ 1,966,518 |
| Air Products and Chemicals, Inc. | | 1,947 | 460,076 |
| Air Water, Inc.(2) | | 55,500 | 808,002 |
| Akzo Nobel NV | | 11,053 | 1,051,606 |
| Arkema S.A. | | 8,131 | 1,078,310 |
| Asahi Kasei Corp. | | 94,700 | 888,743 |
| BASF SE | | 12,457 | 829,465 |
| Eastman Chemical Co. | | 12,240 | 1,450,073 |
| Ecolab, Inc. | | 10,654 | 1,877,874 |
| Ems-Chemie Holding AG | | 1,596 | 1,578,653 |
| Givaudan S.A. | | 392 | 1,636,759 |
| Linde PLC | | 10,485 | 3,074,621 |
| Novozymes A/S, Class B | | 14,356 | 942,222 |
| PPG Industries, Inc. | | 8,831 | 1,178,497 |
| Sherwin-Williams Co. (The) | | 3,111 | 818,597 |
| Shin-Etsu Chemical Co., Ltd. | | 8,500 | 1,327,599 |
| Sika AG | | 4,982 | 1,653,200 |
| Symrise AG | | 8,408 | 1,000,103 |
| | | | $ 23,620,918 |
| Commercial Services & Supplies — 0.1% |
| Brink's Co. (The) | | 9,542 | $ 668,512 |
| Securitas AB, Class B | | 26,897 | 325,639 |
| | | | $ 994,151 |
| Communications Equipment — 0.2% |
| Cisco Systems, Inc. | | 23,755 | $ 1,324,816 |
| | | | $ 1,324,816 |
| Construction & Engineering — 0.2% |
| Eiffage S.A. | | 4,734 | $ 482,224 |
| Kandenko Co., Ltd. | | 116,300 | 884,353 |
| | | | $ 1,366,577 |
| Consumer Finance — 0.2% |
| Aeon Financial Service Co., Ltd.(2) | | 49,200 | $ 506,739 |
| Security | Shares | Value |
| Consumer Finance (continued) |
| American Express Co. | | 8,303 | $ 1,615,266 |
| | | | $ 2,122,005 |
| Containers & Packaging — 0.1% |
| Sonoco Products Co. | | 14,521 | $ 852,673 |
| | | | $ 852,673 |
| Diversified Consumer Services — 0.1% |
| InvoCare, Ltd. | | 103,588 | $ 976,206 |
| | | | $ 976,206 |
| Diversified Financial Services — 0.3% |
| Berkshire Hathaway, Inc., Class B(1) | | 8,462 | $ 2,720,110 |
| | | | $ 2,720,110 |
| Diversified Telecommunication Services — 0.2% |
| AT&T, Inc. | | 42,841 | $ 1,014,904 |
| Verizon Communications, Inc. | | 10,781 | 578,616 |
| | | | $ 1,593,520 |
| Electric Utilities — 0.4% |
| Enel SpA | | 103,066 | $ 759,487 |
| Iberdrola S.A. | | 80,354 | 911,663 |
| NextEra Energy, Inc. | | 12,678 | 992,307 |
| Southern Co. (The) | | 13,416 | 868,955 |
| | | | $ 3,532,412 |
| Electrical Equipment — 0.2% |
| AMETEK, Inc. | | 6,028 | $ 782,374 |
| Eaton Corp. PLC | | 5,895 | 909,540 |
| | | | $ 1,691,914 |
| Electronic Equipment, Instruments & Components — 0.2% |
| Canon Marketing Japan, Inc. | | 24,600 | $ 514,148 |
| Hexagon AB, Class B | | 57,694 | 779,427 |
| Keyence Corp. | | 1,500 | 709,501 |
| | | | $ 2,003,076 |
| Energy Equipment & Services — 0.5% |
| Halliburton Co. | | 55,065 | $ 1,846,329 |
| Tenaris S.A. | | 167,499 | 2,158,605 |
| | | | $ 4,004,934 |
7
See Notes to Financial Statements.
Eaton Vance
Richard Bernstein All Asset Strategy Fund
February 28, 2022
Portfolio of Investments (Unaudited) — continued
| Security | Shares | Value |
| Entertainment — 0.2% |
| Walt Disney Co. (The)(1) | | 13,010 | $ 1,931,465 |
| | | | $ 1,931,465 |
| Equity Real Estate Investment Trusts (REITs) — 0.4% |
| American Tower Corp. | | 3,207 | $ 727,572 |
| Crown Castle International Corp. | | 5,008 | 834,283 |
| Equinix, Inc. | | 1,097 | 778,574 |
| ProLogis, Inc. | | 6,250 | 911,562 |
| | | | $ 3,251,991 |
| Food & Staples Retailing — 1.0% |
| Aeon Co., Ltd.(2) | | 36,500 | $ 826,860 |
| Costco Wholesale Corp. | | 2,995 | 1,555,154 |
| Loblaw Cos., Ltd. | | 18,837 | 1,469,360 |
| Performance Food Group Co.(1) | | 19,981 | 1,119,735 |
| SAN-A Co., Ltd.(2) | | 14,700 | 545,812 |
| Seven & i Holdings Co., Ltd.(2) | | 20,700 | 1,007,215 |
| Tsuruha Holdings, Inc. | | 4,700 | 377,855 |
| Walmart, Inc. | | 6,925 | 935,983 |
| Yaoko Co., Ltd.(2) | | 16,300 | 933,933 |
| | | | $ 8,771,907 |
| Food Products — 1.5% |
| AAK AB | | 65,737 | $ 1,196,060 |
| Calbee, Inc.(2) | | 21,100 | 474,449 |
| Darling Ingredients, Inc.(1) | | 21,328 | 1,545,853 |
| Ezaki Glico Co., Ltd. | | 28,000 | 955,202 |
| House Foods Group, Inc. | | 35,400 | 915,173 |
| Kagome Co., Ltd. | | 34,500 | 921,013 |
| Kewpie Corp. | | 42,100 | 898,649 |
| MEIJI Holdings Co., Ltd. | | 11,400 | 684,205 |
| Nestle S.A. | | 16,445 | 2,142,713 |
| Nisshin Seifun Group, Inc. | | 42,500 | 603,247 |
| Saputo, Inc. | | 23,295 | 570,842 |
| Simply Good Foods Co. (The)(1) | | 36,899 | 1,462,307 |
| | | | $ 12,369,713 |
| Health Care Equipment & Supplies — 0.7% |
| Abbott Laboratories | | 14,240 | $ 1,717,629 |
| Becton, Dickinson and Co. | | 2,823 | 765,823 |
| Edwards Lifesciences Corp.(1) | | 6,975 | 783,781 |
| Intuitive Surgical, Inc.(1) | | 3,801 | 1,103,544 |
| Medtronic PLC | | 8,998 | 944,700 |
| Stryker Corp. | | 3,303 | 869,845 |
| | | | $ 6,185,322 |
| Security | Shares | Value |
| Health Care Providers & Services — 0.9% |
| Cigna Corp. | | 3,969 | $ 943,749 |
| CVS Health Corp. | | 10,400 | 1,077,960 |
| HCA Healthcare, Inc. | | 3,509 | 878,338 |
| Humana, Inc. | | 1,365 | 592,847 |
| Quest Diagnostics, Inc. | | 5,101 | 669,608 |
| Ryman Healthcare, Ltd.(2) | | 72,431 | 492,667 |
| UnitedHealth Group, Inc. | | 5,603 | 2,666,300 |
| | | | $ 7,321,469 |
| Hotels, Restaurants & Leisure — 0.3% |
| Flutter Entertainment PLC(1) | | 3,869 | $ 557,167 |
| J D Wetherspoon PLC(1) | | 54,501 | 635,040 |
| La Francaise des Jeux SAEM(3) | | 20,657 | 856,280 |
| McDonald's Corp. | | 3,770 | 922,783 |
| | | | $ 2,971,270 |
| Household Durables — 0.1% |
| Sony Group Corp. | | 7,600 | $ 776,509 |
| | | | $ 776,509 |
| Household Products — 0.5% |
| Henkel AG & Co. KGaA | | 15,069 | $ 1,158,612 |
| Kimberly-Clark Corp. | | 4,432 | 576,825 |
| Procter & Gamble Co. (The) | | 7,596 | 1,184,140 |
| Reckitt Benckiser Group PLC | | 10,759 | 911,041 |
| | | | $ 3,830,618 |
| Industrial Conglomerates — 0.4% |
| 3M Co. | | 5,247 | $ 779,966 |
| General Electric Co. | | 8,726 | 833,420 |
| Siemens AG | | 5,562 | 783,588 |
| Smiths Group PLC | | 32,780 | 668,731 |
| | | | $ 3,065,705 |
| Insurance — 1.7% |
| Aflac, Inc. | | 17,242 | $ 1,053,314 |
| AIA Group, Ltd. | | 140,600 | 1,459,968 |
| Allianz SE | | 9,130 | 2,058,060 |
| Aon PLC, Class A | | 3,699 | 1,080,626 |
| AXA S.A. | | 19,916 | 538,879 |
| Dai-ichi Life Holdings, Inc. | | 38,000 | 789,189 |
| Marsh & McLennan Cos., Inc. | | 5,319 | 826,626 |
| MS&AD Insurance Group Holdings, Inc. | | 25,500 | 862,836 |
| Muenchener Rueckversicherungs-Gesellschaft AG | | 1,789 | 490,789 |
| Progressive Corp. (The) | | 11,632 | 1,232,178 |
| Swiss Life Holding AG | | 2,805 | 1,711,547 |
8
See Notes to Financial Statements.
Eaton Vance
Richard Bernstein All Asset Strategy Fund
February 28, 2022
Portfolio of Investments (Unaudited) — continued
| Security | Shares | Value |
| Insurance (continued) |
| Tokio Marine Holdings, Inc. | | 10,300 | $ 586,081 |
| Zurich Insurance Group AG | | 3,337 | 1,531,670 |
| | | | $ 14,221,763 |
| Interactive Media & Services — 1.6% |
| Alphabet, Inc., Class A(1) | | 1,800 | $ 4,862,052 |
| Alphabet, Inc., Class C(1) | | 1,852 | 4,996,363 |
| Meta Platforms, Inc., Class A(1) | | 14,272 | 3,011,820 |
| Tencent Holdings, Ltd. | | 14,100 | 760,854 |
| | | | $ 13,631,089 |
| Internet & Direct Marketing Retail — 0.9% |
| Amazon.com, Inc.(1) | | 2,403 | $ 7,380,238 |
| JD.com, Inc., Class A(4)(5) | | 671 | 23,968 |
| | | | $ 7,404,206 |
| IT Services — 1.0% |
| Amdocs, Ltd. | | 8,111 | $ 638,336 |
| Fidelity National Information Services, Inc. | | 6,569 | 625,566 |
| Fiserv, Inc.(1) | | 4,882 | 476,825 |
| Mastercard, Inc., Class A | | 2,446 | 882,566 |
| Nexi SpA(1)(2)(3) | | 39,711 | 542,371 |
| Otsuka Corp. | | 11,400 | 442,816 |
| Shopify, Inc., Class A(1) | | 1,247 | 865,688 |
| Sopra Steria Group SACA | | 4,293 | 765,643 |
| TIS, Inc. | | 27,100 | 641,420 |
| Visa, Inc., Class A | | 11,259 | 2,433,295 |
| | | | $ 8,314,526 |
| Life Sciences Tools & Services — 0.5% |
| Danaher Corp. | | 3,285 | $ 901,437 |
| Illumina, Inc.(1) | | 1,779 | 581,021 |
| Mettler-Toledo International, Inc.(1) | | 638 | 898,776 |
| Thermo Fisher Scientific, Inc. | | 3,188 | 1,734,272 |
| | | | $ 4,115,506 |
| Machinery — 0.4% |
| Indutrade AB | | 42,915 | $ 949,339 |
| Mueller Industries, Inc. | | 26,569 | 1,515,762 |
| PACCAR, Inc. | | 8,381 | 769,460 |
| Traton SE | | 20,857 | 425,991 |
| | | | $ 3,660,552 |
| Security | Shares | Value |
| Media — 0.1% |
| Fuji Media Holdings, Inc. | | 48,400 | $ 525,320 |
| | | | $ 525,320 |
| Multiline Retail — 0.3% |
| Big Lots, Inc. | | 18,119 | $ 629,816 |
| Dollarama, Inc. | | 16,364 | 845,635 |
| Pan Pacific International Holdings Corp. | | 25,800 | 422,296 |
| Target Corp. | | 3,535 | 706,187 |
| | | | $ 2,603,934 |
| Multi-Utilities — 0.4% |
| Dominion Energy, Inc. | | 11,454 | $ 910,937 |
| National Grid PLC | | 75,542 | 1,142,147 |
| NorthWestern Corp.(2) | | 19,750 | 1,194,480 |
| | | | $ 3,247,564 |
| Oil, Gas & Consumable Fuels — 2.3% |
| Chevron Corp. | | 18,107 | $ 2,607,408 |
| ConocoPhillips | | 11,368 | 1,078,369 |
| Exxon Mobil Corp. | | 35,096 | 2,752,228 |
| Galp Energia SGPS S.A., Class B | | 115,777 | 1,281,571 |
| Hess Corp. | | 15,291 | 1,545,308 |
| ONEOK, Inc. | | 17,847 | 1,165,409 |
| Pioneer Natural Resources Co. | | 9,794 | 2,346,642 |
| Repsol S.A. | | 121,410 | 1,575,421 |
| Royal Dutch Shell PLC | | 39,775 | 1,048,898 |
| Suncor Energy, Inc. | | 67,351 | 2,059,586 |
| TC Energy Corp. | | 22,945 | 1,232,785 |
| Valero Energy Corp. | | 10,843 | 905,499 |
| | | | $ 19,599,124 |
| Paper and Forest Products — 0.1% |
| Mondi PLC | | 40,460 | $ 848,910 |
| | | | $ 848,910 |
| Personal Products — 0.6% |
| Beiersdorf AG | | 8,756 | $ 887,578 |
| Edgewell Personal Care Co. | | 24,778 | 884,079 |
| Kao Corp. | | 16,900 | 790,022 |
| Kose Corp.(2) | | 5,400 | 619,052 |
| L'Oreal S.A. | | 2,967 | 1,172,927 |
| Unilever PLC | | 17,493 | 878,708 |
| | | | $ 5,232,366 |
| Pharmaceuticals — 1.8% |
| Bayer AG | | 6,498 | $ 375,344 |
9
See Notes to Financial Statements.
Eaton Vance
Richard Bernstein All Asset Strategy Fund
February 28, 2022
Portfolio of Investments (Unaudited) — continued
| Security | Shares | Value |
| Pharmaceuticals (continued) |
| Bristol-Myers Squibb Co. | | 8,348 | $ 573,257 |
| Eli Lilly & Co. | | 5,860 | 1,464,707 |
| Johnson & Johnson | | 18,734 | 3,083,054 |
| Merck & Co., Inc. | | 8,604 | 658,894 |
| Novo Nordisk A/S, Class B | | 17,471 | 1,807,959 |
| Pfizer, Inc. | | 52,564 | 2,467,354 |
| Roche Holding AG PC | | 6,578 | 2,491,308 |
| Sanofi | | 11,110 | 1,161,356 |
| Zoetis, Inc. | | 4,313 | 835,213 |
| | | | $ 14,918,446 |
| Professional Services — 0.2% |
| AFRY AB | | 19,925 | $ 378,826 |
| Recruit Holdings Co., Ltd. | | 13,300 | 561,395 |
| Teleperformance SE | | 3,190 | 1,183,688 |
| | | | $ 2,123,909 |
| Real Estate Management & Development — 0.1% |
| Nexity S.A. | | 21,705 | $ 855,564 |
| | | | $ 855,564 |
| Road & Rail — 1.5% |
| Central Japan Railway Co. | | 2,900 | $ 391,837 |
| CSX Corp. | | 90,894 | 3,082,216 |
| J.B. Hunt Transport Services, Inc. | | 14,121 | 2,865,574 |
| Norfolk Southern Corp. | | 8,340 | 2,139,377 |
| Old Dominion Freight Line, Inc. | | 4,771 | 1,498,237 |
| Union Pacific Corp. | | 10,956 | 2,694,628 |
| | | | $ 12,671,869 |
| Semiconductors & Semiconductor Equipment — 1.2% |
| ASML Holding NV | | 1,735 | $ 1,160,756 |
| Intel Corp. | | 28,347 | 1,352,152 |
| NVIDIA Corp. | | 13,516 | 3,295,877 |
| QUALCOMM, Inc. | | 6,460 | 1,111,055 |
| Taiwan Semiconductor Manufacturing Co., Ltd. ADR | | 27,076 | 2,897,403 |
| | | | $ 9,817,243 |
| Software — 1.8% |
| Adobe, Inc.(1) | | 1,526 | $ 713,680 |
| ANSYS, Inc.(1) | | 1,943 | 629,901 |
| Constellation Software, Inc. | | 516 | 869,632 |
| Microsoft Corp. | | 39,237 | 11,723,623 |
| Security | Shares | Value |
| Software (continued) |
| Oracle Corp. | | 13,008 | $ 988,218 |
| VMware, Inc., Class A | | 3,756 | 440,654 |
| | | | $ 15,365,708 |
| Specialty Retail — 0.5% |
| Bilia AB, Class A(2) | | 44,656 | $ 579,896 |
| Home Depot, Inc. (The) | | 7,097 | 2,241,446 |
| Industria de Diseno Textil S.A. | | 17,060 | 445,023 |
| TJX Cos., Inc. (The) | | 13,103 | 866,108 |
| | | | $ 4,132,473 |
| Technology Hardware, Storage & Peripherals — 1.9% |
| Apple, Inc. | | 95,036 | $ 15,692,344 |
| Samsung Electronics Co., Ltd. GDR | | 394 | 591,071 |
| | | | $ 16,283,415 |
| Textiles, Apparel & Luxury Goods — 0.2% |
| NIKE, Inc., Class B | | 6,191 | $ 845,381 |
| Swatch Group AG (The) | | 2,653 | 815,841 |
| | | | $ 1,661,222 |
| Thrifts & Mortgage Finance — 0.3% |
| Capitol Federal Financial, Inc. | | 106,044 | $ 1,158,000 |
| Washington Federal, Inc. | | 48,486 | 1,725,132 |
| | | | $ 2,883,132 |
| Tobacco — 0.2% |
| Japan Tobacco, Inc. | | 43,800 | $ 805,533 |
| Philip Morris International, Inc. | | 11,064 | 1,118,238 |
| | | | $ 1,923,771 |
| Trading Companies & Distributors — 0.8% |
| Brenntag SE | | 10,953 | $ 918,217 |
| Bunzl PLC | | 17,838 | 704,918 |
| Fastenal Co. | | 14,534 | 747,920 |
| ITOCHU Corp. | | 29,100 | 948,328 |
| Mitsubishi Corp. | | 25,700 | 864,129 |
| Mitsui & Co., Ltd. | | 91,100 | 2,271,369 |
| | | | $ 6,454,881 |
| Wireless Telecommunication Services — 0.2% |
| SoftBank Corp. | | 61,900 | $ 782,068 |
10
See Notes to Financial Statements.
Eaton Vance
Richard Bernstein All Asset Strategy Fund
February 28, 2022
Portfolio of Investments (Unaudited) — continued
| Security | Shares | Value |
| Wireless Telecommunication Services (continued) |
| SoftBank Group Corp. | | 12,500 | $ 560,950 |
| T-Mobile US, Inc.(1) | | 6,064 | 747,146 |
| | | | $ 2,090,164 |
Total Common Stocks
(identified cost $253,356,802) | | | $354,842,957 |
| Exchange-Traded Funds — 30.0% |
| Security | Shares | Value |
| Equity Funds — 3.0% |
| iShares MSCI China ETF(2) | | 123,606 | $ 7,244,547 |
| iShares MSCI South Korea ETF(2) | | 109,300 | 7,914,413 |
| iShares MSCI Taiwan ETF(2) | | 154,400 | 9,869,248 |
| | | | $ 25,028,208 |
| Fixed Income Funds — 27.0% |
| First Trust Low Duration Opportunities ETF | | 836,828 | $ 41,448,091 |
| iShares 10+ Year Investment Grade Corporate Bond ETF(2) | | 116,000 | 7,401,960 |
| PIMCO 0-5 Year High Yield Corporate Bond Index Exchange-Traded Fund | | 377,800 | 36,578,596 |
| ProShares Investment Grade-Interest Rate Hedged ETF | | 589,300 | 42,459,065 |
| VanEck Emerging Markets High Yield Bond ETF(2) | | 3,295,000 | 67,382,750 |
| WisdomTree Floating Rate Treasury Fund | | 1,306,000 | 32,819,780 |
| | | | $228,090,242 |
Total Exchange-Traded Funds
(identified cost $268,573,205) | | | $253,118,450 |
| U.S. Treasury Obligations — 8.8% |
| Security | Principal
Amount
(000's omitted) | Value |
| U.S. Treasury Bonds: | | | |
| 1.125%, 5/15/40 | $ | 2,189 | $ 1,821,478 |
| 1.125%, 8/15/40 | | 4,622 | 3,830,761 |
| 3.875%, 8/15/40 | | 5,183 | 6,510,711 |
| 4.375%, 11/15/39 | | 7,989 | 10,670,084 |
| U.S. Treasury Notes: | | | |
| 0.625%, 5/15/30 | | 6,786 | 6,168,989 |
| 1.50%, 2/15/30 | | 7,493 | 7,320,895 |
| 2.375%, 5/15/29 | | 10,529 | 10,925,894 |
| 2.625%, 2/15/29 | | 8,964 | 9,435,100 |
| 2.875%, 5/15/28 | | 4,006 | 4,255,542 |
| 2.875%, 8/15/28 | | 5,210 | 5,544,889 |
| Security | Principal
Amount
(000's omitted) | Value |
| U.S. Treasury Notes: (continued) | | | |
| 3.125%, 11/15/28 | $ | 7,534 | $ 8,150,985 |
Total U.S. Treasury Obligations
(identified cost $82,261,547) | | | $ 74,635,328 |
| Short-Term Investments — 20.9% |
| Description | Units | Value |
| Eaton Vance Cash Reserves Fund, LLC, 0.09%(6) | | 162,886,021 | $ 162,869,733 |
Total Affiliated Fund
(identified cost $162,870,600) | | | $162,869,733 |
| Securities Lending Collateral — 1.6% |
| Security | Shares | Value |
| State Street Navigator Securities Lending Government Money Market Portfolio, 0.06%(7) | | 13,527,793 | $ 13,527,793 |
Total Securities Lending Collateral
(identified cost $13,527,793) | | | $ 13,527,793 |
Total Short-Term Investments
(identified cost $176,398,393) | | | $176,397,526 |
Total Investments — 101.7%
(identified cost $780,589,947) | | | $858,994,261 |
| Other Assets, Less Liabilities — (1.7)% | | | $ (14,660,803) |
| Net Assets — 100.0% | | | $844,333,458 |
| The percentage shown for each investment category in the Portfolio of Investments is based on net assets. |
| (1) | Non-income producing security. |
| (2) | All or a portion of this security was on loan at February 28, 2022. The aggregate market value of securities on loan at February 28, 2022 was $18,565,162. |
| (3) | Security exempt from registration under Rule 144A of the Securities Act of 1933, as amended. These securities may be sold in certain transactions in reliance on an exemption from registration (normally to qualified institutional buyers). At February 28, 2022, the aggregate value of these securities is $1,398,651 or 0.2% of the Fund's net assets. |
| (4) | For fair value measurement disclosure purposes, security is categorized as Level 3 (see Note 12). |
| (5) | Restricted security (see Note 8). |
| (6) | Affiliated investment company, available to Eaton Vance portfolios and funds, which invests in high quality, U.S. dollar denominated money market instruments. The rate shown is the annualized seven-day yield as of February 28, 2022. |
11
See Notes to Financial Statements.
Eaton Vance
Richard Bernstein All Asset Strategy Fund
February 28, 2022
Portfolio of Investments (Unaudited) — continued
| (7) | Represents investment of cash collateral received in connection with securities lending. |
| Country Concentration of Portfolio |
| Country | Percentage
of Net Assets | Value |
| United States | 56.7% | $478,669,598 |
| Japan | 4.2 | 35,735,873 |
| Canada | 1.7 | 14,321,980 |
| Switzerland | 1.7 | 14,309,230 |
| United Kingdom | 1.3 | 11,345,828 |
| France | 1.3 | 11,304,622 |
| Germany | 1.2 | 9,789,347 |
| Australia | 0.6 | 5,159,247 |
| Sweden | 0.5 | 4,209,187 |
| Ireland | 0.4 | 3,231,769 |
| Spain | 0.3 | 2,932,107 |
| Taiwan | 0.3 | 2,897,403 |
| Denmark | 0.3 | 2,750,181 |
| Hong Kong | 0.3 | 2,555,088 |
| Netherlands | 0.3 | 2,212,362 |
| Italy | 0.2 | 1,301,858 |
| Portugal | 0.1 | 1,281,571 |
| China | 0.1 | 784,822 |
| South Korea | 0.1 | 591,071 |
| New Zealand | 0.1 | 492,667 |
| Exchange-Traded Funds | 30.0 | 253,118,450 |
| Total Investments | 101.7% | $858,994,261 |
| Abbreviations: |
| ADR | – American Depositary Receipt |
| GDR | – Global Depositary Receipt |
| PC | – Participation Certificate |
| PFC Shares | – Preference Shares |
12
See Notes to Financial Statements.
Eaton Vance
Richard Bernstein All Asset Strategy Fund
February 28, 2022
Statement of Assets and Liabilities (Unaudited)
| | February 28, 2022 |
| Assets | |
| Unaffiliated investments, at value including $18,565,162 of securities on loan (identified cost $617,719,347) | $ 696,124,528 |
| Affiliated investment, at value (identified cost $162,870,600) | 162,869,733 |
| Foreign currency, at value (identified cost $1,220) | 1,288 |
| Dividends and interest receivable | 911,850 |
| Dividends receivable from affiliated investment | 7,233 |
| Receivable for investments sold | 24,386 |
| Receivable for Fund shares sold | 1,085,650 |
| Securities lending income receivable | 14,889 |
| Tax reclaims receivable | 253,849 |
| Total assets | $861,293,406 |
| Liabilities | |
| Collateral for securities loaned | $ 13,527,793 |
| Payable for investments purchased | 48,772 |
| Payable for Fund shares redeemed | 2,547,364 |
| Payable to affiliates: | |
| Investment adviser and administration fee | 541,065 |
| Distribution and service fees | 88,238 |
| Accrued expenses | 206,716 |
| Total liabilities | $ 16,959,948 |
| Net Assets | $844,333,458 |
| Sources of Net Assets | |
| Paid-in capital | $ 761,275,045 |
| Distributable earnings | 83,058,413 |
| Net Assets | $844,333,458 |
| Class A Shares | |
| Net Assets | $ 115,954,385 |
| Shares Outstanding | 7,836,081 |
Net Asset Value and Redemption Price Per Share
(net assets ÷ shares of beneficial interest outstanding) | $ 14.80 |
Maximum Offering Price Per Share
(100 ÷ 94.25 of net asset value per share) | $ 15.70 |
| Class C Shares | |
| Net Assets | $ 84,302,331 |
| Shares Outstanding | 5,821,828 |
Net Asset Value and Offering Price Per Share*
(net assets ÷ shares of beneficial interest outstanding) | $ 14.48 |
| Class I Shares | |
| Net Assets | $ 644,076,742 |
| Shares Outstanding | 43,327,894 |
Net Asset Value, Offering Price and Redemption Price Per Share
(net assets ÷ shares of beneficial interest outstanding) | $ 14.87 |
| On sales of $50,000 or more, the offering price of Class A shares is reduced. |
| * | Redemption price per share is equal to the net asset value less any applicable contingent deferred sales charge. |
13
See Notes to Financial Statements.
Eaton Vance
Richard Bernstein All Asset Strategy Fund
February 28, 2022
Statement of Operations (Unaudited)
| | Six Months Ended |
| | February 28, 2022 |
| Investment Income | |
| Dividend income (net of foreign taxes withheld of $128,352) | $ 8,923,277 |
| Dividend income from affiliated investment | 24,804 |
| Interest income | 330,602 |
| Securities lending income, net | 51,266 |
| Total investment income | $ 9,329,949 |
| Expenses | |
| Investment adviser and administration fee | $ 3,558,760 |
| Distribution and service fees: | |
| Class A | 145,359 |
| Class C | 452,964 |
| Trustees’ fees and expenses | 21,522 |
| Custodian fee | 119,502 |
| Transfer and dividend disbursing agent fees | 191,052 |
| Legal and accounting services | 29,579 |
| Printing and postage | 21,945 |
| Registration fees | 32,073 |
| Miscellaneous | 8,622 |
| Total expenses | $ 4,581,378 |
| Net investment income | $ 4,748,571 |
| Realized and Unrealized Gain (Loss) | |
| Net realized gain (loss): | |
| Investment transactions | $ 22,393,607 |
| Investment transactions - affiliated investment | (4,458) |
| Foreign currency transactions | (112,031) |
| Capital gain distributions received | 88,641 |
| Net realized gain | $ 22,365,759 |
| Change in unrealized appreciation (depreciation): | |
| Investments | $ (59,033,239) |
| Investments - affiliated investment | (867) |
| Foreign currency | (8,024) |
| Net change in unrealized appreciation (depreciation) | $(59,042,130) |
| Net realized and unrealized loss | $(36,676,371) |
| Net decrease in net assets from operations | $(31,927,800) |
14
See Notes to Financial Statements.
Eaton Vance
Richard Bernstein All Asset Strategy Fund
February 28, 2022
Statements of Changes in Net Assets
| | Six Months Ended
February 28, 2022
(Unaudited) | Year Ended
August 31, 2021 |
| Increase (Decrease) in Net Assets | | |
| From operations: | | |
| Net investment income | $ 4,748,571 | $ 7,408,313 |
| Net realized gain | 22,365,759 | 22,411,785 |
| Net change in unrealized appreciation (depreciation) | (59,042,130) | 50,399,936 |
| Net increase (decrease) in net assets from operations | $ (31,927,800) | $ 80,220,034 |
| Distributions to shareholders: | | |
| Class A | $ (6,140,478) | $ (2,975,278) |
| Class C | (4,238,367) | (2,138,196) |
| Class I | (35,703,092) | (17,709,119) |
| Total distributions to shareholders | $ (46,081,937) | $ (22,822,593) |
| Transactions in shares of beneficial interest: | | |
| Class A | $ 8,057,617 | $ 13,016,353 |
| Class C | (3,280,743) | (12,173,497) |
| Class I | 38,599,802 | 74,888,327 |
| Net increase in net assets from Fund share transactions | $ 43,376,676 | $ 75,731,183 |
| Net increase (decrease) in net assets | $ (34,633,061) | $133,128,624 |
| Net Assets | | |
| At beginning of period | $ 878,966,519 | $ 745,837,895 |
| At end of period | $844,333,458 | $878,966,519 |
15
See Notes to Financial Statements.
Eaton Vance
Richard Bernstein All Asset Strategy Fund
February 28, 2022
| | Class A |
| | | Year Ended August 31, |
| | Six Months Ended
February 28, 2022
(Unaudited) | 2021 | 2020 | 2019 | 2018 | 2017 |
| Net asset value — Beginning of period | $ 16.210 | $ 15.140 | $ 14.370 | $ 15.110 | $ 14.330 | $ 13.060 |
| Income (Loss) From Operations | | | | | | |
| Net investment income(1) | $ 0.077 | $ 0.127 | $ 0.097 | $ 0.161 | $ 0.157 | $ 0.156 |
| Net realized and unrealized gain (loss) | (0.644) | 1.390 | 1.284 | (0.542) | 0.934 | 1.176 |
| Total income (loss) from operations | $ (0.567) | $ 1.517 | $ 1.381 | $ (0.381) | $ 1.091 | $ 1.332 |
| Less Distributions | | | | | | |
| From net investment income | $ (0.139) | $ (0.084) | $ (0.191) | $ (0.071) | $ (0.154) | $ (0.062) |
| From net realized gain | (0.704) | (0.363) | (0.420) | (0.288) | (0.157) | — |
| Total distributions | $ (0.843) | $ (0.447) | $ (0.611) | $ (0.359) | $ (0.311) | $ (0.062) |
| Net asset value — End of period | $ 14.800 | $ 16.210 | $15.140 | $14.370 | $15.110 | $14.330 |
| Total Return(2) | (3.70)% (3) | 10.23% | 9.93% | (2.43)% | 7.67% | 10.24% |
| Ratios/Supplemental Data | | | | | | |
| Net assets, end of period (000's omitted) | $115,954 | $118,419 | $ 97,873 | $ 76,453 | $ 87,728 | $ 84,551 |
| Ratios (as a percentage of average daily net assets): | | | | | | |
| Expenses | 1.18% (4) | 1.18% | 1.21% | 1.22% | 1.20% | 1.26% |
| Net investment income | 1.00% (4) | 0.82% | 0.68% | 1.14% | 1.05% | 1.15% |
| Portfolio Turnover | 6% (3) | 63% | 70% | 85% | 44% | 41% |
| (1) | Computed using average shares outstanding. |
| (2) | Returns are historical and are calculated by determining the percentage change in net asset value with all distributions reinvested and do not reflect the effect of sales charges. |
| (3) | Not annualized. |
| (4) | Annualized. |
16
See Notes to Financial Statements.
Eaton Vance
Richard Bernstein All Asset Strategy Fund
February 28, 2022
Financial Highlights — continued
| | Class C |
| | | Year Ended August 31, |
| | Six Months Ended
February 28, 2022
(Unaudited) | 2021 | 2020 | 2019 | 2018 | 2017 |
| Net asset value — Beginning of period | $ 15.810 | $ 14.780 | $ 14.030 | $ 14.790 | $ 14.030 | $ 12.830 |
| Income (Loss) From Operations | | | | | | |
| Net investment income (loss)(1) | $ 0.019 | $ 0.008 | $ (0.010) | $ 0.054 | $ 0.045 | $ 0.053 |
| Net realized and unrealized gain (loss) | (0.630) | 1.351 | 1.258 | (0.531) | 0.920 | 1.147 |
| Total income (loss) from operations | $ (0.611) | $ 1.359 | $ 1.248 | $ (0.477) | $ 0.965 | $ 1.200 |
| Less Distributions | | | | | | |
| From net investment income | $ (0.015) | $ — | $ (0.078) | $ — | $ (0.048) | $ — |
| From net realized gain | (0.704) | (0.329) | (0.420) | (0.283) | (0.157) | — |
| Total distributions | $ (0.719) | $ (0.329) | $ (0.498) | $ (0.283) | $ (0.205) | $ — |
| Net asset value — End of period | $14.480 | $15.810 | $ 14.780 | $ 14.030 | $ 14.790 | $ 14.030 |
| Total Return(2) | (4.04)% (3) | 9.34% | 9.14% | (3.16)% | 6.91% | 9.35% |
| Ratios/Supplemental Data | | | | | | |
| Net assets, end of period (000’s omitted) | $ 84,302 | $ 95,493 | $101,075 | $121,049 | $141,787 | $124,228 |
| Ratios (as a percentage of average daily net assets): | | | | | | |
| Expenses | 1.93% (4) | 1.93% | 1.96% | 1.97% | 1.95% | 2.01% |
| Net investment income (loss) | 0.25% (4) | 0.05% | (0.07)% | 0.39% | 0.31% | 0.40% |
| Portfolio Turnover | 6% (3) | 63% | 70% | 85% | 44% | 41% |
| (1) | Computed using average shares outstanding. |
| (2) | Returns are historical and are calculated by determining the percentage change in net asset value with all distributions reinvested and do not reflect the effect of sales charges. |
| (3) | Not annualized. |
| (4) | Annualized. |
17
See Notes to Financial Statements.
Eaton Vance
Richard Bernstein All Asset Strategy Fund
February 28, 2022
Financial Highlights — continued
| | Class I |
| | | Year Ended August 31, |
| | Six Months Ended
February 28, 2022
(Unaudited) | 2021 | 2020 | 2019 | 2018 | 2017 |
| Net asset value — Beginning of period | $ 16.300 | $ 15.220 | $ 14.440 | $ 15.190 | $ 14.390 | $ 13.130 |
| Income (Loss) From Operations | | | | | | |
| Net investment income(1) | $ 0.097 | $ 0.167 | $ 0.133 | $ 0.199 | $ 0.196 | $ 0.192 |
| Net realized and unrealized gain (loss) | (0.646) | 1.392 | 1.294 | (0.552) | 0.952 | 1.164 |
| Total income (loss) from operations | $ (0.549) | $ 1.559 | $ 1.427 | $ (0.353) | $ 1.148 | $ 1.356 |
| Less Distributions | | | | | | |
| From net investment income | $ (0.177) | $ (0.116) | $ (0.227) | $ (0.109) | $ (0.191) | $ (0.096) |
| From net realized gain | (0.704) | (0.363) | (0.420) | (0.288) | (0.157) | — |
| Total distributions | $ (0.881) | $ (0.479) | $ (0.647) | $ (0.397) | $ (0.348) | $ (0.096) |
| Net asset value — End of period | $ 14.870 | $ 16.300 | $ 15.220 | $ 14.440 | $ 15.190 | $ 14.390 |
| Total Return(2) | (3.57)% (3) | 10.47% | 10.24% | (2.22)% | 8.04% | 10.40% |
| Ratios/Supplemental Data | | | | | | |
| Net assets, end of period (000’s omitted) | $644,077 | $665,055 | $546,890 | $467,649 | $563,130 | $415,089 |
| Ratios (as a percentage of average daily net assets): | | | | | | |
| Expenses | 0.93% (4) | 0.93% | 0.96% | 0.97% | 0.95% | 1.01% |
| Net investment income | 1.24% (4) | 1.06% | 0.92% | 1.40% | 1.32% | 1.40% |
| Portfolio Turnover | 6% (3) | 63% | 70% | 85% | 44% | 41% |
| (1) | Computed using average shares outstanding. |
| (2) | Returns are historical and are calculated by determining the percentage change in net asset value with all distributions reinvested. |
| (3) | Not annualized. |
| (4) | Annualized. |
18
See Notes to Financial Statements.
Eaton Vance
Richard Bernstein All Asset Strategy Fund
February 28, 2022
Notes to Financial Statements (Unaudited)
1 Significant Accounting Policies
Eaton Vance Richard Bernstein All Asset Strategy Fund (the Fund) is a diversified series of Eaton Vance Growth Trust (the Trust). The Trust is a Massachusetts business trust registered under the Investment Company Act of 1940, as amended (the 1940 Act), as an open-end management investment company. The Fund’s investment objective is total return. The Fund offers three classes of shares. Class A shares are generally sold subject to a sales charge imposed at time of purchase. Class C shares are sold at net asset value and are generally subject to a contingent deferred sales charge (see Note 5). Effective January 25, 2019, Class C shares generally automatically convert to Class A shares ten years after their purchase and, effective November 5, 2020, automatically convert to Class A shares eight years after their purchase as described in the Fund’s prospectus. Class I shares are sold at net asset value and are not subject to a sales charge. Each class represents a pro-rata interest in the Fund, but votes separately on class-specific matters and (as noted below) is subject to different expenses. Realized and unrealized gains and losses and net investment income and losses, other than class-specific expenses, are allocated daily to each class of shares based on the relative net assets of each class to the total net assets of the Fund. Each class of shares differs in its distribution plan and certain other class-specific expenses.
The following is a summary of significant accounting policies of the Fund. The policies are in conformity with accounting principles generally accepted in the United States of America (U.S. GAAP). The Fund is an investment company and follows accounting and reporting guidance in the Financial Accounting Standards Board (FASB) Accounting Standards Codification Topic 946.
A Investment Valuation—The following methodologies are used to determine the market value or fair value of investments.
Equity Securities. Equity securities (common stocks and exchange-traded funds) listed on a U.S. securities exchange generally are valued at the last sale or closing price on the day of valuation or, if no sales took place on such date, at the mean between the closing bid and ask prices on the exchange where such securities are principally traded. Equity securities listed on the NASDAQ National Market System are valued at the NASDAQ official closing price. Unlisted or listed securities for which closing sales prices or closing quotations are not available are valued at the mean between the latest available bid and ask prices.
Debt Obligations. Debt obligations are generally valued on the basis of valuations provided by third party pricing services, as derived from such services’ pricing models. Inputs to the models may include, but are not limited to, reported trades, executable bid and ask prices, broker/dealer quotations, prices or yields of securities with similar characteristics, interest rates, anticipated prepayments, benchmark curves or information pertaining to the issuer, as well as industry and economic events. The pricing services may use a matrix approach, which considers information regarding securities with similar characteristics to determine the valuation for a security. Short-term debt obligations purchased with a remaining maturity of sixty days or less for which a valuation from a third party pricing service is not readily available may be valued at amortized cost, which approximates fair value.
Foreign Securities and Currencies. Foreign securities and currencies are valued in U.S. dollars, based on foreign currency exchange rate quotations supplied by a third party pricing service. The pricing service uses a proprietary model to determine the exchange rate. Inputs to the model include reported trades and implied bid/ask spreads. The daily valuation of exchange-traded foreign securities generally is determined as of the close of trading on the principal exchange on which such securities trade. Events occurring after the close of trading on foreign exchanges may result in adjustments to the valuation of foreign securities to more accurately reflect their fair value as of the close of regular trading on the New York Stock Exchange. When valuing foreign equity securities that meet certain criteria, the Fund's Trustees have approved the use of a fair value service that values such securities to reflect market trading that occurs after the close of the applicable foreign markets of comparable securities or other instruments that have a strong correlation to the fair-valued securities.
Affiliated Fund. The Fund may invest in Eaton Vance Cash Reserves Fund, LLC (Cash Reserves Fund), an affiliated investment company managed by Eaton Vance Management (EVM). While Cash Reserves Fund is not a registered money market mutual fund, it conducts all of its investment activities in accordance with the requirements of Rule 2a-7 under the 1940 Act. Investments in Cash Reserves Fund are valued at the closing net asset value per unit on the valuation day. Cash Reserves Fund generally values its investment securities based on available market quotations provided by a third party pricing service.
Other. Investments in registered investment companies (including money market funds) that do not trade on an exchange are valued at the net asset value per share on the valuation day.
Fair Valuation. Investments for which valuations or market quotations are not readily available or are deemed unreliable are valued at fair value using methods determined in good faith by or at the direction of the Trustees of the Fund in a manner that most fairly reflects the security’s “fair value”, which is the amount that the Fund might reasonably expect to receive for the security upon its current sale in the ordinary course. Each such determination is based on a consideration of relevant factors, which are likely to vary from one pricing context to another. These factors may include, but are not limited to, the type of security, the existence of any contractual restrictions on the security’s disposition, the price and extent of public trading in similar securities of the issuer or of comparable companies or entities, quotations or relevant information obtained from broker/dealers or other market participants, information obtained from the issuer, analysts, and/or the appropriate stock exchange (for exchange-traded securities), an analysis of the company’s or entity’s financial statements, and an evaluation of the forces that influence the issuer and the market(s) in which the security is purchased and sold.
B Investment Transactions—Investment transactions for financial statement purposes are accounted for on a trade date basis. Realized gains and losses on investments sold are determined on the basis of identified cost.
Eaton Vance
Richard Bernstein All Asset Strategy Fund
February 28, 2022
Notes to Financial Statements (Unaudited) — continued
C Income—Dividend income is recorded on the ex-dividend date for dividends received in cash and/or securities. However, if the ex-dividend date has passed, certain dividends from foreign securities are recorded as the Fund is informed of the ex-dividend date. Distributions from investment companies are recorded as dividend income, capital gains or return of capital based on the nature of the distribution. Withholding taxes on foreign dividends and capital gains have been provided for in accordance with the Fund's understanding of the applicable countries’ tax rules and rates. In consideration of recent decisions rendered by European courts, the Fund has filed additional tax reclaims for previously withheld taxes on dividends earned in certain European Union countries. These filings are subject to various administrative and judicial proceedings within these countries. Due to the uncertainty as to the ultimate resolution of these proceedings, the likelihood of receipt of these reclaims, and the potential timing of payment, no amounts are reflected in the financial statements for such outstanding reclaims. Interest income is recorded on the basis of interest accrued, adjusted for amortization of premium or accretion of discount.
D Federal Taxes— The Fund's policy is to comply with the provisions of the Internal Revenue Code applicable to regulated investment companies and to distribute to shareholders each year substantially all of its net investment income, and all or substantially all of its net realized capital gains. Accordingly, no provision for federal income or excise tax is necessary.
As of February 28, 2022, the Fund had no uncertain tax positions that would require financial statement recognition, de-recognition, or disclosure. The Fund files a U.S. federal income tax return annually after its fiscal year-end, which is subject to examination by the Internal Revenue Service for a period of three years from the date of filing.
E Expenses—The majority of expenses of the Trust are directly identifiable to an individual fund. Expenses which are not readily identifiable to a specific fund are allocated taking into consideration, among other things, the nature and type of expense and the relative size of the funds. Expenses do not include the Fund’s pro rata share of the indirect expenses borne by the Fund from its investments in exchange-traded funds.
F Foreign Currency Translation—Investment valuations, other assets, and liabilities initially expressed in foreign currencies are translated each business day into U.S. dollars based upon current exchange rates. Purchases and sales of foreign investment securities and income and expenses denominated in foreign currencies are translated into U.S. dollars based upon currency exchange rates in effect on the respective dates of such transactions. Recognized gains or losses on investment transactions attributable to changes in foreign currency exchange rates are recorded for financial statement purposes as net realized gains and losses on investments. That portion of unrealized gains and losses on investments that results from fluctuations in foreign currency exchange rates is not separately disclosed.
G Use of Estimates—The preparation of the financial statements in conformity with U.S. GAAP requires management to make estimates and assumptions that affect the reported amounts of assets and liabilities at the date of the financial statements and the reported amounts of income and expense during the reporting period. Actual results could differ from those estimates.
H Indemnifications—Under the Trust’s organizational documents, its officers and Trustees may be indemnified against certain liabilities and expenses arising out of the performance of their duties to the Fund. Under Massachusetts law, if certain conditions prevail, shareholders of a Massachusetts business trust (such as the Trust) could be deemed to have personal liability for the obligations of the Trust. However, the Trust’s Declaration of Trust contains an express disclaimer of liability on the part of Fund shareholders and the By-laws provide that the Trust shall assume, upon request by the shareholder, the defense on behalf of any Fund shareholders. Moreover, the By-laws also provide for indemnification out of Fund property of any shareholder held personally liable solely by reason of being or having been a shareholder for all loss or expense arising from such liability. Additionally, in the normal course of business, the Fund enters into agreements with service providers that may contain indemnification clauses. The Fund’s maximum exposure under these arrangements is unknown as this would involve future claims that may be made against the Fund that have not yet occurred.
I Interim Financial Statements—The interim financial statements relating to February 28, 2022 and for the six months then ended have not been audited by an independent registered public accounting firm, but in the opinion of the Fund’s management, reflect all adjustments, consisting only of normal recurring adjustments, necessary for the fair presentation of the financial statements.
2 Distributions to Shareholders and Income Tax Information
It is the present policy of the Fund to make at least one distribution annually (normally in December) of all or substantially all of its net investment income and to distribute annually all or substantially all of its net realized capital gains. Distributions to shareholders are recorded on the ex-dividend date. Distributions are declared separately for each class of shares. Shareholders may reinvest income and capital gain distributions in additional shares of the same class of the Fund at the net asset value as of the ex-dividend date or, at the election of the shareholder, receive distributions in cash. Distributions to shareholders are determined in accordance with income tax regulations, which may differ from U.S. GAAP. As required by U.S. GAAP, only distributions in excess of tax basis earnings and profits are reported in the financial statements as a return of capital. Permanent differences between book and tax accounting relating to distributions are reclassified to paid-in capital. For tax purposes, distributions from short-term capital gains are considered to be from ordinary income.
Eaton Vance
Richard Bernstein All Asset Strategy Fund
February 28, 2022
Notes to Financial Statements (Unaudited) — continued
The cost and unrealized appreciation (depreciation) of investments of the Fund at February 28, 2022, as determined on a federal income tax basis, were as follows:
| Aggregate cost | $ 781,071,762 |
| Gross unrealized appreciation | $ 112,212,683 |
| Gross unrealized depreciation | (34,290,184) |
| Net unrealized appreciation | $ 77,922,499 |
3 Investment Adviser and Administration Fee and Other Transactions with Affiliates
The investment adviser and administration fee is earned by EVM, an indirect, wholly-owned subsidiary of Morgan Stanley, as compensation for investment advisory and administrative services rendered to the Fund. The fee is computed at an annual rate as a percentage of the Fund’s average daily net assets as follows and is payable monthly:
| Average Daily Net Assets | Annual Fee Rate |
| Up to $500 million | 0.850% |
| $500 million but less than $1 billion | 0.800% |
| $1 billion but less than $2.5 billion | 0.775% |
| $2.5 billion but less than $5 billion | 0.750% |
| $5 billion and over | 0.730% |
For the six months ended February 28, 2022, the investment adviser and administration fee amounted to $3,558,760 or 0.83% (annualized) of the Fund’s average daily net assets. Pursuant to an investment sub-advisory agreement, EVM has delegated the investment management of the Fund to Richard Bernstein Advisors LLC (RBA). EVM pays RBA a portion of its investment adviser and administration fee for sub-advisory services provided to the Fund. The Fund may invest its cash in Cash Reserves Fund. EVM does not currently receive a fee for advisory services provided to Cash Reserves Fund.
EVM provides sub-transfer agency and related services to the Fund pursuant to a Sub-Transfer Agency Support Services Agreement. For the six months ended February 28, 2022, EVM earned $12,757 from the Fund pursuant to such agreement, which is included in transfer and dividend disbursing agent fees on the Statement of Operations. The Fund was informed that Eaton Vance Distributors, Inc. (EVD), an affiliate of EVM and the Fund’s principal underwriter, received $5,147 as its portion of the sales charge on sales of Class A shares for the six months ended February 28, 2022. The Fund was informed that Morgan Stanley affiliated broker-dealers, which may be deemed to be affiliates of EVM and EVD, also received a portion of the sales charge on sales of Class A shares for the six months ended February 28, 2022 in the amount of $2,050. EVD also received distribution and service fees from Class A and Class C shares (see Note 4) and contingent deferred sales charges (see Note 5).
Trustees and officers of the Fund who are members of EVM’s organization receive remuneration for their services to the Fund out of the investment adviser and administration fee. Trustees of the Fund who are not affiliated with EVM may elect to defer receipt of all or a percentage of their annual fees in accordance with the terms of the Trustees Deferred Compensation Plan. For the six months ended February 28, 2022, no significant amounts have been deferred. Certain officers and Trustees of the Fund are officers of EVM.
4 Distribution Plans
The Fund has in effect a distribution plan for Class A shares (Class A Plan) pursuant to Rule 12b-1 under the 1940 Act. Pursuant to the Class A Plan, the Fund pays EVD a distribution and service fee of 0.25% per annum of its average daily net assets attributable to Class A shares for distribution services and facilities provided to the Fund by EVD, as well as for personal services and/or the maintenance of shareholder accounts. Distribution and service fees paid or accrued to EVD for the six months ended February 28, 2022 amounted to $145,359 for Class A shares.
The Fund also has in effect a distribution plan for Class C shares (Class C Plan) pursuant to Rule 12b-1 under the 1940 Act. Pursuant to the Class C Plan, the Fund pays EVD amounts equal to 0.75% per annum of its average daily net assets attributable to Class C shares for providing ongoing distribution services and facilities to the Fund. For the six months ended February 28, 2022, the Fund paid or accrued to EVD $339,723 for Class C shares.
Eaton Vance
Richard Bernstein All Asset Strategy Fund
February 28, 2022
Notes to Financial Statements (Unaudited) — continued
Pursuant to the Class C Plan, the Fund also makes payments of service fees to EVD, financial intermediaries and other persons in amounts equal to 0.25% per annum of its average daily net assets attributable to that class. Service fees paid or accrued are for personal services and/or the maintenance of shareholder accounts. They are separate and distinct from the sales commissions and distribution fees payable to EVD. Service fees paid or accrued for the six months ended February 28, 2022 amounted to $113,241 for Class C shares.
Distribution and service fees are subject to the limitations contained in the Financial Industry Regulatory Authority Rule 2341(d).
5 Contingent Deferred Sales Charges
A contingent deferred sales charge (CDSC) of 1% generally is imposed on redemptions of Class C shares made within 12 months of purchase. Class A shares may be subject to a 1% CDSC if redeemed within 18 months of purchase (depending on the circumstances of purchase). Generally, the CDSC is based upon the lower of the net asset value at date of redemption or date of purchase. No charge is levied on shares acquired by reinvestment of dividends or capital gain distributions. For the six months ended February 28, 2022, the Fund was informed that EVD received approximately $500 and $5,000 of CDSCs paid by Class A and Class C shareholders, respectively.
6 Purchases and Sales of Investments
Purchases and sales of investments, other than short-term obligations, aggregated $44,840,473 and $193,861,144, respectively, for the six months ended February 28, 2022.
7 Shares of Beneficial Interest
The Fund’s Declaration of Trust permits the Trustees to issue an unlimited number of full and fractional shares of beneficial interest (without par value). Such shares may be issued in a number of different series (such as the Fund) and classes. Transactions in Fund shares were as follows:
| | Six Months Ended
February 28, 2022
(Unaudited) | | Year Ended
August 31, 2021 |
| | Shares | Amount | | Shares | Amount |
| Class A | | | | | |
| Sales | 818,688 | $ 12,717,510 | | 1,757,239 | $ 27,204,715 |
| Issued to shareholders electing to receive payments of distributions in Fund shares | 240,481 | 3,698,597 | | 117,856 | 1,784,346 |
| Redemptions | (693,492) | (10,908,188) | | (1,354,951) | (20,944,182) |
| Converted from Class C shares | 164,359 | 2,549,698 | | 321,417 | 4,971,474 |
| Net increase | 530,036 | $ 8,057,617 | | 841,561 | $ 13,016,353 |
| Class C | | | | | |
| Sales | 355,774 | $ 5,413,360 | | 1,017,811 | $ 15,427,834 |
| Issued to shareholders electing to receive payments of distributions in Fund shares | 210,589 | 3,175,685 | | 106,998 | 1,588,915 |
| Redemptions | (615,177) | (9,320,090) | | (1,597,341) | (24,218,772) |
| Converted to Class A shares | (168,185) | (2,549,698) | | (329,144) | (4,971,474) |
| Net decrease | (216,999) | $ (3,280,743) | | (801,676) | $ (12,173,497) |
| Class I | | | | | |
| Sales | 6,163,026 | $ 96,114,662 | | 11,618,284 | $ 180,319,034 |
| Issued to shareholders electing to receive payments of distributions in Fund shares | 1,716,595 | 26,504,235 | | 808,813 | 12,285,864 |
| Redemptions | (5,358,768) | (84,019,095) | | (7,563,984) | (117,716,571) |
| Net increase | 2,520,853 | $ 38,599,802 | | 4,863,113 | $ 74,888,327 |
Eaton Vance
Richard Bernstein All Asset Strategy Fund
February 28, 2022
Notes to Financial Statements (Unaudited) — continued
8 Restricted Securities
At February 28, 2022, the Fund owned the following security (representing less than 0.05% of net assets) which was restricted as to public resale and not registered under the Securities Act of 1933 (excluding Rule 144A securities). The Fund has limited registration rights with respect to this security. The value of restricted securities is determined based on valuations provided by brokers when available, or if not available, they are valued at fair value using methods determined in good faith by or at the direction of the Trustees.
| Description | Date(s) of
Acquisition | Shares | Cost | Value |
| Common Stocks | | | | |
| JD.com, Inc., Class A | 1/20/22 | 671 | $ 24,478 | $ 23,968 |
| Total Common Stocks | | | $24,478 | $23,968 |
| Total Restricted Securities | | | $24,478 | $23,968 |
9 Line of Credit
The Fund participates with other portfolios and funds managed by EVM and its affiliates in an $800 million unsecured line of credit agreement with a group of banks, which is in effect through October 25, 2022. Borrowings are made by the Fund solely for temporary purposes related to redemptions and other short-term cash needs. Interest is charged to the Fund based on its borrowings at an amount above either the Secured Overnight Financing Rate (SOFR) or Federal Funds rate. In addition, a fee computed at an annual rate of 0.15% on the daily unused portion of the line of credit is allocated among the participating portfolios and funds at the end of each quarter. In connection with the renewal of the agreement in October 2021, an arrangement fee totaling $150,000 was incurred that was allocated to the participating portfolios and funds. Because the line of credit is not available exclusively to the Fund, it may be unable to borrow some or all of its requested amounts at any particular time. The Fund did not have any significant borrowings or allocated fees during the six months ended February 28, 2022.
10 Securities Lending Agreement
The Fund has established a securities lending agreement with State Street Bank and Trust Company (SSBT) as securities lending agent in which the Fund lends portfolio securities to qualified borrowers in exchange for collateral consisting of either cash or securities issued or guaranteed by the U.S. government or its agencies or instrumentalities in an amount at least equal to the market value of the securities on loan. The market value of securities loaned is determined daily and any additional required collateral is delivered to the Fund on the next business day. Cash collateral is invested in the State Street Navigator Securities Lending Government Money Market Portfolio, a money market fund registered under the 1940 Act. The Fund earns interest on the amount invested but it must pay (and at times receive from) the broker a loan rebate fee computed as a varying percentage of the collateral received. For security loans secured by non-cash collateral, the Fund earns a negotiated lending fee from the borrower. A portion of the income earned by the Fund from its investment of cash collateral, net of rebate fees, and lending fees received is allocated to SSBT for its services as lending agent and the portion allocated to the Fund is presented as securities lending income, net on the Statement of Operations. Non-cash collateral is held by the lending agent on behalf of the Fund and cannot be sold or re-pledged by the Fund; accordingly, such collateral is not reflected in the Statement of Assets and Liabilities.
The Fund is subject to possible delay in the recovery of loaned securities. Pursuant to the securities lending agreement, SSBT has provided indemnification to the Fund in the event of default by a borrower with respect to a loan. The Fund bears the risk of loss with respect to the investment of cash collateral.
At February 28, 2022, the value of the securities loaned and the value of the collateral received, which exceeded the value of the securities loaned, amounted to $18,565,162 and $19,295,901, respectively. Collateral received was comprised of cash of $13,527,793 and U.S. government and/or agencies securities of $5,768,108. The securities lending transactions have no contractual maturity date and each of the Fund and borrower has the option to terminate a loan at any time.
Eaton Vance
Richard Bernstein All Asset Strategy Fund
February 28, 2022
Notes to Financial Statements (Unaudited) — continued
The following table provides a breakdown of securities lending transactions accounted for as secured borrowings, the obligations by class of collateral pledged, and the remaining contractual maturity of those transactions as of February 28, 2022.
| | Remaining Contractual Maturity of the Transactions |
| | Overnight and
Continuous | <30 days | 30 to 90 days | >90 days | Total |
| Common Stocks | $ 1,505,122 | $ — | $ — | $ — | $ 1,505,122 |
| Exchange-Traded Funds | 12,022,671 | — | — | — | 12,022,671 |
| Total | $13,527,793 | $ — | $ — | $ — | $13,527,793 |
The carrying amount of the liability for collateral for securities loaned at February 28, 2022 approximated its fair value. If measured at fair value, such liability would have been considered as Level 2 in the fair value hierarchy (see Note 12) at February 28, 2022.
11 Investments in Affiliated Funds
At February 28, 2022, the value of the Fund's investment in affiliated funds was $162,869,733, which represents 19.3% of the Fund's net assets. Transactions in affiliated funds by the Fund for the six months ended February 28, 2022 were as follows:
| Name | Value,
beginning
of period | Purchases | Sales
proceeds | Net
realized
gain (loss) | Change in
unrealized
appreciation
(depreciation) | Value, end
of period | Dividend
income | Units, end
of period |
| Short-Term Investments |
| Eaton Vance Cash Reserves Fund, LLC | $9,749,850 | $206,574,670 | $(53,449,462) | $(4,458) | $(867) | $162,869,733 | $24,804 | 162,886,021 |
12 Fair Value Measurements
Under generally accepted accounting principles for fair value measurements, a three-tier hierarchy to prioritize the assumptions, referred to as inputs, is used in valuation techniques to measure fair value. The three-tier hierarchy of inputs is summarized in the three broad levels listed below.
| • | Level 1 – quoted prices in active markets for identical investments |
| • | Level 2 – other significant observable inputs (including quoted prices for similar investments, interest rates, prepayment speeds, credit risk, etc.) |
| • | Level 3 – significant unobservable inputs (including a fund’s own assumptions in determining the fair value of investments) |
In cases where the inputs used to measure fair value fall in different levels of the fair value hierarchy, the level disclosed is determined based on the lowest level input that is significant to the fair value measurement in its entirety. The inputs or methodology used for valuing securities are not necessarily an indication of the risk associated with investing in those securities.
At February 28, 2022, the hierarchy of inputs used in valuing the Fund's investments, which are carried at value, were as follows:
| Asset Description | Level 1 | Level 2 | Level 3* | Total |
| Common Stocks: | | | | |
| Communication Services | $ 17,142,366 | $ 2,629,192 | $ — | $ 19,771,558 |
| Consumer Discretionary | 18,844,919 | 8,958,490 | 23,968 | 27,827,377 |
| Consumer Staples | 16,010,691 | 22,643,691 | — | 38,654,382 |
| Energy | 17,539,563 | 6,064,495 | — | 23,604,058 |
| Financials | 56,225,239 | 20,895,289 | — | 77,120,528 |
| Health Care | 28,762,486 | 6,328,634 | — | 35,091,120 |
| Industrials | 29,208,407 | 14,246,711 | — | 43,455,118 |
Eaton Vance
Richard Bernstein All Asset Strategy Fund
February 28, 2022
Notes to Financial Statements (Unaudited) — continued
| Asset Description (continued) | Level 1 | Level 2 | Level 3* | Total |
| Information Technology | $ 46,961,631 | $ 6,147,153 | $ — | $ 53,108,784 |
| Materials | 9,712,411 | 15,610,090 | — | 25,322,501 |
| Real Estate | 3,251,991 | 855,564 | — | 4,107,555 |
| Utilities | 3,966,679 | 2,813,297 | — | 6,779,976 |
| Total Common Stocks | $247,626,383 | $107,192,606** | $23,968 | $354,842,957 |
| Exchange-Traded Funds | $ 253,118,450 | $ — | $ — | $ 253,118,450 |
| U.S. Treasury Obligations | — | 74,635,328 | — | 74,635,328 |
| Short-Term Investments: | | | | |
| Affiliated Fund | — | 162,869,733 | — | 162,869,733 |
| Securities Lending Collateral | 13,527,793 | — | — | 13,527,793 |
| Total Investments | $514,272,626 | $344,697,667 | $23,968 | $858,994,261 |
| * | None of the unobservable inputs for Level 3 assets, individually or collectively, had a material impact on the Fund. |
| ** | Includes foreign equity securities whose values were adjusted to reflect market trading of comparable securities or other correlated instruments that occurred after the close of trading in their applicable foreign markets. |
Level 3 investments at the beginning and/or end of the period in relation to net assets were not significant and accordingly, a reconciliation of Level 3 assets for the six months ended February 28, 2022 is not presented.
13 Risks and Uncertainties
Risks Associated with Foreign Investments
Foreign investments can be adversely affected by political, economic and market developments abroad, including the imposition of economic and other sanctions by the United States or another country. There may be less publicly available information about foreign issuers because they may not be subject to reporting practices, requirements or regulations comparable to those to which United States companies are subject. Foreign markets may be smaller, less liquid and more volatile than the major markets in the United States. Trading in foreign markets typically involves higher expense than trading in the United States. The Fund may have difficulties enforcing its legal or contractual rights in a foreign country. Securities that trade or are denominated in currencies other than the U.S. dollar may be adversely affected by fluctuations in currency exchange rates.
Pandemic Risk
An outbreak of respiratory disease caused by a novel coronavirus was first detected in China in late 2019 and subsequently spread internationally. This coronavirus has resulted in closing borders, enhanced health screenings, changes to healthcare service preparation and delivery, quarantines, cancellations, disruptions to supply chains and customer activity, as well as general concern and uncertainty. Health crises caused by outbreaks, such as the coronavirus outbreak, may exacerbate other pre-existing political, social and economic risks and disrupt normal market conditions and operations. The impact of this outbreak has negatively affected the worldwide economy, the economies of individual countries, individual companies, and the market in general, and may continue to do so in significant and unforeseen ways, as may other epidemics and pandemics that may arise in the future. Any such impact could adversely affect the Fund's performance, or the performance of the securities in which the Fund invests.
Eaton Vance
Richard Bernstein All Asset Strategy Fund
February 28, 2022
| Officers |
Eric A. Stein
President | Jill R. Damon
Secretary |
Deidre E. Walsh
Vice President and Chief Legal Officer | Richard F. Froio
Chief Compliance Officer |
James F. Kirchner
Treasurer | |
George J. Gorman
Chairperson | |
| Alan C. Bowser* | |
| Thomas E. Faust Jr.** | |
| Mark R. Fetting | |
| Cynthia E. Frost | |
| Valerie A. Mosley | |
| William H. Park | |
| Helen Frame Peters | |
| Keith Quinton | |
| Marcus L. Smith | |
| Susan J. Sutherland | |
| Scott E. Wennerholm | |
| Nancy A. Wiser* | |
| * | Mr. Bowser and Ms. Wiser began serving as Trustees effective April 4, 2022. |
| ** | Interested Trustee |
| FACTS | WHAT DOES EATON VANCE DO WITH YOUR
PERSONAL INFORMATION? |
| Why? | Financial companies choose how they share your personal information. Federal law gives consumers the right to limit some but not all sharing. Federal law also requires us to tell you how we collect, share, and protect your personal information. Please read this notice carefully to understand what we do. |
| |
| What? | The types of personal information we collect and share depend on the product or service you have with us. This information can include:■ Social Security number and income
■ investment experience and risk tolerance
■ checking account number and wire transfer instructions |
| |
| How? | All financial companies need to share customers’ personal information to run their everyday business. In the section below, we list the reasons financial companies can share their customers’ personal information; the reasons Eaton Vance chooses to share; and whether you can limit this sharing. |
Reasons we can share your
personal information | Does Eaton Vance
share? | Can you limit
this sharing? |
| For our everyday business purposes — such as to process your transactions, maintain your account(s), respond to court orders and legal investigations, or report to credit bureaus | Yes | No |
| For our marketing purposes — to offer our products and services to you | Yes | No |
| For joint marketing with other financial companies | No | We don’t share |
| For our investment management affiliates’ everyday business purposes — information about your transactions, experiences, and creditworthiness | Yes | Yes |
| For our affiliates’ everyday business purposes — information about your transactions and experiences | Yes | No |
| For our affiliates’ everyday business purposes — information about your creditworthiness | No | We don’t share |
| For our investment management affiliates to market to you | Yes | Yes |
| For our affiliates to market to you | No | We don’t share |
| For nonaffiliates to market to you | No | We don’t share |
To limit our
sharing | Call toll-free 1-800-262-1122 or email: EVPrivacy@eatonvance.comPlease note:If you are a new customer, we can begin sharing your information 30 days from the date we sent this notice. When you are no longer our customer, we continue to share your information as described in this notice. However, you can contact us at any time to limit our sharing. |
| Questions? | Call toll-free 1-800-262-1122 or email: EVPrivacy@eatonvance.com |
| Privacy Notice — continued | April 2021 |
| Who we are |
| Who is providing this notice? | Eaton Vance Management, Eaton Vance Distributors, Inc., Eaton Vance Trust Company, Eaton Vance Management (International) Limited, Eaton Vance Advisers International Ltd., Eaton Vance Global Advisors Limited, Eaton Vance Management’s Real Estate Investment Group, Boston Management and Research, Calvert Research and Management, Eaton Vance and Calvert Fund Families and our investment advisory affiliates (“Eaton Vance”) (see Investment Management Affiliates definition below) |
| What we do |
How does Eaton Vance
protect my personal
information? | To protect your personal information from unauthorized access and use, we use security measures that comply with federal law. These measures include computer safeguards and secured files and buildings. We have policies governing the proper handling of customer information by personnel and requiring third parties that provide support to adhere to appropriate security standards with respect to such information. |
How does Eaton Vance
collect my personal
information? | We collect your personal information, for example, when you■ open an account or make deposits or withdrawals from your account
■ buy securities from us or make a wire transfer
■ give us your contact informationWe also collect your personal information from others, such as credit bureaus, affiliates, or other companies. |
| Why can’t I limit all sharing? | Federal law gives you the right to limit only■ sharing for affiliates’ everyday business purposes — information about your creditworthiness
■ affiliates from using your information to market to you
■ sharing for nonaffiliates to market to youState laws and individual companies may give you additional rights to limit sharing. See below for more on your rights under state law. |
| Definitions |
Investment Management
Affiliates | Eaton Vance Investment Management Affiliates include registered investment advisers, registered broker- dealers, and registered and unregistered funds. Investment Management Affiliates does not include entities associated with Morgan Stanley Wealth Management, such as Morgan Stanley Smith Barney LLC and Morgan Stanley & Co. |
| Affiliates | Companies related by common ownership or control. They can be financial and nonfinancial companies.■ Our affiliates include companies with a Morgan Stanley name and financial companies such as Morgan Stanley Smith Barney LLC and Morgan Stanley & Co. |
| Nonaffiliates | Companies not related by common ownership or control. They can be financial and nonfinancial companies.■ Eaton Vance does not share with nonaffiliates so they can market to you. |
| Joint marketing | A formal agreement between nonaffiliated financial companies that together market financial products or services to you.■ Eaton Vance doesn’t jointly market. |
| Other important information |
| Vermont: Except as permitted by law, we will not share personal information we collect about Vermont residents with Nonaffiliates unless you provide us with your written consent to share such information.California: Except as permitted by law, we will not share personal information we collect about California residents with Nonaffiliates and we will limit sharing such personal information with our Affiliates to comply with California privacy laws that apply to us. |
Delivery of Shareholder Documents. The Securities and Exchange Commission (SEC) permits funds to deliver only one copy of shareholder documents, including prospectuses, proxy statements and shareholder reports, to fund investors with multiple accounts at the same residential or post office box address. This practice is often called “householding” and it helps eliminate duplicate mailings to shareholders. Eaton Vance, or your financial intermediary, may household the mailing of your documents indefinitely unless you instruct Eaton Vance, or your financial intermediary, otherwise. If you would prefer that your Eaton Vance documents not be householded, please contact Eaton Vance at 1-800-262-1122, or contact your financial intermediary. Your instructions that householding not apply to delivery of your Eaton Vance documents will typically be effective within 30 days of receipt by Eaton Vance or your financial intermediary.
Portfolio Holdings. Each Eaton Vance Fund and its underlying Portfolio(s) (if applicable) files a schedule of portfolio holdings on Part F to Form N-PORT with the SEC. Certain information filed on Form N-PORT may be viewed on the Eaton Vance website at www.eatonvance.com, by calling Eaton Vance at 1-800-262-1122 or in the EDGAR database on the SEC’s website at www.sec.gov.
Proxy Voting. From time to time, funds are required to vote proxies related to the securities held by the funds. The Eaton Vance Funds or their underlying Portfolios (if applicable) vote proxies according to a set of policies and procedures approved by the Funds’ and Portfolios’ Boards. You may obtain a description of these policies and procedures and information on how the Funds or Portfolios voted proxies relating to portfolio securities during the most recent 12-month period ended June 30, without charge, upon request, by calling 1-800-262-1122 and by accessing the SEC’s website at www.sec.gov.
This Page Intentionally Left Blank
This Page Intentionally Left Blank
This Page Intentionally Left Blank
Investment Adviser and Administrator
Eaton Vance Management
Two International Place
Boston, MA 02110
Investment Sub-Adviser
Richard Bernstein Advisors LLC
1251 Avenue of the Americas
Suite 4102
New York, NY 10020
Principal Underwriter*
Eaton Vance Distributors, Inc.
Two International Place
Boston, MA 02110
(617) 482-8260
Custodian
State Street Bank and Trust Company
State Street Financial Center, One Lincoln Street
Boston, MA 02111
Transfer Agent
BNY Mellon Investment Servicing (US) Inc.
Attn: Eaton Vance Funds
P.O. Box 9653
Providence, RI 02940-9653
(800) 262-1122
Fund Offices
Two International Place
Boston, MA 02110
* FINRA BrokerCheck. Investors may check the background of their Investment Professional by contacting the Financial Industry Regulatory Authority (FINRA). FINRA BrokerCheck is a free tool to help investors check the professional background of current and former FINRA-registered securities firms and brokers. FINRA BrokerCheck is available by calling 1-800-289-9999 and at www.FINRA.org. The FINRA BrokerCheck brochure describing this program is available to investors at www.FINRA.org.
Eaton Vance
Richard Bernstein Equity
Strategy Fund
Semiannual Report
February 28, 2022
Commodity Futures Trading Commission Registration. The Commodity Futures Trading Commission (“CFTC”) has adopted regulations that subject registered investment companies and advisers to regulation by the CFTC if a fund invests more than a prescribed level of its assets in certain CFTC-regulated instruments (including futures, certain options and swap agreements) or markets itself as providing investment exposure to such instruments. The investment adviser has claimed an exclusion from the definition of “commodity pool operator” under the Commodity Exchange Act with respect to its management of the Fund. Accordingly, neither the Fund nor the adviser with respect to the operation of the Fund is subject to CFTC regulation. Because of its management of other strategies, the Fund's adviser is registered with the CFTC as a commodity pool operator. The adviser is also registered as a commodity trading advisor.
Fund shares are not insured by the FDIC and are not deposits or other obligations of, or guaranteed by, any depository institution. Shares are subject to investment risks, including possible loss of principal invested.
This report must be preceded or accompanied by a current summary prospectus or prospectus. Before investing, investors should consider carefully the investment objective, risks, and charges and expenses of a mutual fund. This and other important information is contained in the summary prospectus and prospectus, which can be obtained from a financial intermediary. Prospective investors should read the prospectus carefully before investing. For further information, please call 1-800-262-1122.
Semiannual Report February 28, 2022
Eaton Vance
Richard Bernstein Equity Strategy Fund
Eaton Vance
Richard Bernstein Equity Strategy Fund
February 28, 2022
Performance
Portfolio Manager(s) Richard Bernstein, Matthew Griswold, CFA, Henry Timmons, CFA and Dan Suzuki, CFA, each of Richard Bernstein Advisors LLC
| % Average Annual Total Returns1,2 | Class
Inception Date | Performance
Inception Date | Six Months | One Year | Five Years | Ten Years |
| Class A at NAV | 10/12/2010 | 10/12/2010 | (3.21)% | 7.85% | 10.37% | 10.19% |
| Class A with 5.75% Maximum Sales Charge | — | — | (8.77) | 1.64 | 9.06 | 9.54 |
| Class C at NAV | 10/12/2010 | 10/12/2010 | (3.59) | 7.06 | 9.54 | 9.53 |
| Class C with 1% Maximum Sales Charge | — | — | (4.45) | 6.11 | 9.54 | 9.53 |
| Class I at NAV | 10/12/2010 | 10/12/2010 | (3.11) | 8.10 | 10.64 | 10.47 |
|
| MSCI ACWI Index | — | — | (5.26)% | 7.81% | 11.43% | 9.83% |
| % Total Annual Operating Expense Ratios3 | Class A | Class C | Class I |
| | 1.27% | 2.02% | 1.02% |
See Endnotes and Additional Disclosures in this report.
Past performance is no guarantee of future results. Returns are historical and are calculated by determining the percentage change in net asset value (NAV) or offering price (as applicable) with all distributions reinvested. Investment return and principal value will fluctuate so that shares, when redeemed, may be worth more or less than their original cost. Performance for periods less than or equal to one year is cumulative. Performance is for the stated time period only; due to market volatility, current Fund performance may be lower or higher than the quoted return. For performance as of the most recent month-end, please refer to eatonvance.com.
Eaton Vance
Richard Bernstein Equity Strategy Fund
February 28, 2022
| Country Allocation (% of net assets)* |
| * | The Fund may obtain exposure to certain market segments through investments in exchange-traded funds (ETFs). For purposes of the chart, the Fund’s investments in ETFs are included based on the portfolio composition of each ETF. |
| Equity Sector Allocation (% of net assets)* |
| * | The Fund may obtain exposure to certain market segments through investments in exchange-traded funds (ETFs). For purposes of the chart, the Fund’s investments in ETFs are included based on the portfolio composition of each ETF. |
| Top 10 Holdings (% of net assets)** |
| Apple, Inc. | 4.2% |
| Microsoft Corp. | 3.4 |
| iShares MSCI Taiwan ETF | 2.7 |
| Amazon.com, Inc. | 2.1 |
| iShares MSCI South Korea ETF | 1.9 |
| iShares MSCI China ETF | 1.6 |
| Alphabet, Inc., Class A | 1.4 |
| Alphabet, Inc., Class C | 1.1 |
| NVIDIA Corp. | 1.1 |
| Tesla, Inc. | 1.0 |
| Total | 20.5% |
| ** | Excludes cash and cash equivalents. |
Eaton Vance
Richard Bernstein Equity Strategy Fund
February 28, 2022
Endnotes and Additional Disclosures
| 1 | MSCI ACWI Index is an unmanaged free-float-adjusted, market-capitalization-weighted index designed to measure the equity market performance of developed and emerging markets. MSCI indexes are net of foreign withholding taxes. Source: MSCI. MSCI data may not be reproduced or used for any other purpose. MSCI provides no warranties, has not prepared or approved this report, and has no liability hereunder. Unless otherwise stated, index returns do not reflect the effect of any applicable sales charges, commissions, expenses, taxes or leverage, as applicable. It is not possible to invest directly in an index. |
| 2 | Total Returns at NAV do not include applicable sales charges. If sales charges were deducted, the returns would be lower. Total Returns shown with maximum sales charge reflect the stated maximum sales charge. Unless otherwise stated, performance does not reflect the deduction of taxes on Fund distributions or redemptions of Fund shares. |
| 3 | Source: Fund prospectus. The expense ratios for the current reporting period can be found in the Financial Highlights section of this report. |
| | Fund profile subject to change due to active management. |
Eaton Vance
Richard Bernstein Equity Strategy Fund
February 28, 2022
Example
As a Fund shareholder, you incur two types of costs: (1) transaction costs, including sales charges (loads) on purchases and redemption fees (if applicable); and (2) ongoing costs, including management fees; distribution and/or service fees; and other Fund expenses. This Example is intended to help you understand your ongoing costs (in dollars) of Fund investing and to compare these costs with the ongoing costs of investing in other mutual funds. The Example is based on an investment of $1,000 invested at the beginning of the period and held for the entire period (September 1, 2021 to February 28, 2022).
Actual Expenses
The first section of the table below provides information about actual account values and actual expenses. You may use the information in this section, together with the amount you invested, to estimate the expenses that you paid over the period. Simply divide your account value by $1,000 (for example, an $8,600 account value divided by $1,000 = 8.6), then multiply the result by the number in the first section under the heading entitled “Expenses Paid During Period” to estimate the expenses you paid on your account during this period.
Hypothetical Example for Comparison Purposes
The second section of the table below provides information about hypothetical account values and hypothetical expenses based on the actual Fund expense ratio and an assumed rate of return of 5% per year (before expenses), which is not the actual Fund return. The hypothetical account values and expenses may not be used to estimate the actual ending account balance or expenses you paid for the period. You may use this information to compare the ongoing costs of investing in your Fund and other funds. To do so, compare this 5% hypothetical example with the 5% hypothetical examples that appear in the shareholder reports of the other funds.
Please note that the expenses shown in the table are meant to highlight your ongoing costs only and do not reflect any transactional costs, such as sales charges (loads) or redemption fees (if applicable). Therefore, the second section of the table is useful in comparing ongoing costs only, and will not help you determine the relative total costs of owning different funds. In addition, if these transactional costs were included, your costs would be higher.
| | Beginning
Account Value
(9/1/21) | Ending
Account Value
(2/28/22) | Expenses Paid
During Period*
(9/1/21 – 2/28/22) | Annualized
Expense
Ratio |
| Actual | | | | |
| Class A | $1,000.00 | $ 967.90 | $5.76 | 1.18% |
| Class C | $1,000.00 | $ 964.10 | $9.40 | 1.93% |
| Class I | $1,000.00 | $ 968.90 | $4.54 | 0.93% |
| |
| Hypothetical | | | | |
| (5% return per year before expenses) | | | | |
| Class A | $1,000.00 | $1,018.94 | $5.91 | 1.18% |
| Class C | $1,000.00 | $1,015.22 | $9.64 | 1.93% |
| Class I | $1,000.00 | $1,020.18 | $4.66 | 0.93% |
| * | Expenses are equal to the Fund's annualized expense ratio for the indicated Class, multiplied by the average account value over the period, multiplied by 181/365 (to reflect the one-half year period). The Example assumes that the $1,000 was invested at the net asset value per share determined at the close of business on August 31, 2021. |
Eaton Vance
Richard Bernstein Equity Strategy Fund
February 28, 2022
Portfolio of Investments (Unaudited)
| Security | Shares | Value |
| Aerospace & Defense — 1.1% |
| Boeing Co. (The)(1) | | 7,826 | $ 1,606,991 |
| Lockheed Martin Corp. | | 3,934 | 1,706,569 |
| Northrop Grumman Corp. | | 6,372 | 2,817,316 |
| Raytheon Technologies Corp. | | 16,990 | 1,744,873 |
| Thales S.A. | | 12,529 | 1,432,351 |
| | | | $ 9,308,100 |
| Air Freight & Logistics — 1.1% |
| C.H. Robinson Worldwide, Inc. | | 17,404 | $ 1,682,619 |
| Expeditors International of Washington, Inc. | | 19,904 | 2,057,277 |
| FedEx Corp. | | 8,076 | 1,795,053 |
| United Parcel Service, Inc., Class B | | 17,938 | 3,774,514 |
| | | | $ 9,309,463 |
| Airlines — 0.4% |
| Alaska Air Group, Inc.(1) | | 34,123 | $ 1,915,665 |
| Southwest Airlines Co.(1) | | 40,514 | 1,774,513 |
| | | | $ 3,690,178 |
| Auto Components — 0.2% |
| Cie Generale des Etablissements Michelin SCA | | 13,654 | $ 1,879,576 |
| | | | $ 1,879,576 |
| Automobiles — 1.6% |
| General Motors Co.(1) | | 23,623 | $ 1,103,667 |
| Honda Motor Co., Ltd. | | 45,100 | 1,370,178 |
| Tesla, Inc.(1) | | 9,885 | 8,604,201 |
| Toyota Motor Corp. | | 115,300 | 2,109,549 |
| | | | $ 13,187,595 |
| Banks — 11.8% |
| Atlantic Union Bankshares Corp. | | 46,133 | $ 1,874,384 |
| Bank of America Corp. | | 133,794 | 5,913,695 |
| Bank of Nova Scotia (The) | | 48,154 | 3,489,503 |
| BankUnited, Inc. | | 43,563 | 1,925,485 |
| BNP Paribas S.A. | | 42,794 | 2,483,101 |
| Cadence Bank | | 236,499 | 7,478,098 |
| Cathay General Bancorp | | 71,898 | 3,381,363 |
| Citigroup, Inc. | | 42,863 | 2,538,775 |
| Columbia Banking System, Inc. | | 40,398 | 1,479,779 |
| Commonwealth Bank of Australia | | 46,906 | 3,182,265 |
| Community Bank System, Inc. | | 30,086 | 2,194,473 |
| Security | Shares | Value |
| Banks (continued) |
| CVB Financial Corp. | | 78,936 | $ 1,861,311 |
| First Financial Bancorp | | 82,708 | 2,032,963 |
| First Horizon Corp. | | 112,713 | 2,646,501 |
| Fulton Financial Corp. | | 114,617 | 2,065,398 |
| Glacier Bancorp, Inc. | | 40,247 | 2,229,684 |
| Hilltop Holdings, Inc. | | 51,451 | 1,590,865 |
| Home BancShares, Inc. | | 83,567 | 1,956,303 |
| Independent Bank Group, Inc. | | 25,489 | 1,966,476 |
| JPMorgan Chase & Co. | | 36,466 | 5,170,879 |
| Mizuho Financial Group, Inc. | | 98,300 | 1,295,508 |
| National Australia Bank, Ltd. | | 128,757 | 2,704,288 |
| Old National Bancorp | | 124,003 | 2,266,775 |
| Pacific Premier Bancorp, Inc. | | 51,132 | 1,979,320 |
| Royal Bank of Canada | | 41,292 | 4,567,693 |
| Shizuoka Bank, Ltd. (The) | | 164,400 | 1,215,436 |
| SouthState Corp. | | 21,077 | 1,896,930 |
| Sumitomo Mitsui Financial Group, Inc. | | 56,300 | 1,996,525 |
| Sumitomo Mitsui Trust Holdings, Inc. | | 40,000 | 1,421,280 |
| Toronto-Dominion Bank (The) | | 55,779 | 4,501,046 |
| Truist Financial Corp. | | 43,795 | 2,724,925 |
| U.S. Bancorp | | 37,916 | 2,143,771 |
| UMB Financial Corp. | | 24,611 | 2,506,876 |
| United Bankshares, Inc. | | 49,983 | 1,830,377 |
| Valley National Bancorp | | 232,858 | 3,253,026 |
| Wells Fargo & Co. | | 76,667 | 4,091,718 |
| Westpac Banking Corp. | | 136,470 | 2,255,336 |
| | | | $100,112,131 |
| Beverages — 1.9% |
| Asahi Group Holdings, Ltd. | | 35,500 | $ 1,432,047 |
| Britvic PLC | | 136,160 | 1,561,736 |
| Coca-Cola Co. (The) | | 65,853 | 4,098,691 |
| Diageo PLC | | 54,565 | 2,703,278 |
| Kirin Holdings Co., Ltd. | | 109,600 | 1,822,150 |
| PepsiCo, Inc. | | 26,321 | 4,309,800 |
| | | | $ 15,927,702 |
| Biotechnology — 0.5% |
| Amgen, Inc. | | 13,030 | $ 2,951,034 |
| Gilead Sciences, Inc. | | 14,614 | 882,686 |
| | | | $ 3,833,720 |
| Building Products — 0.5% |
| Daikin Industries, Ltd. | | 8,000 | $ 1,478,436 |
| Kingspan Group PLC | | 25,698 | 2,509,724 |
| | | | $ 3,988,160 |
6
See Notes to Financial Statements.
Eaton Vance
Richard Bernstein Equity Strategy Fund
February 28, 2022
Portfolio of Investments (Unaudited) — continued
| Security | Shares | Value |
| Capital Markets — 1.2% |
| BlackRock, Inc. | | 3,429 | $ 2,550,799 |
| Hong Kong Exchanges & Clearing, Ltd. | | 44,100 | 2,136,938 |
| Moody's Corp. | | 6,984 | 2,249,058 |
| Morgan Stanley(2) | | 18,369 | 1,666,803 |
| Partners Group Holding AG | | 1,400 | 1,892,504 |
| | | | $ 10,496,102 |
| Chemicals — 5.1% |
| Air Liquide S.A. | | 24,986 | $ 4,150,302 |
| Air Products and Chemicals, Inc. | | 8,502 | 2,009,023 |
| Air Water, Inc.(3) | | 100,100 | 1,457,315 |
| Akzo Nobel NV | | 14,153 | 1,346,546 |
| Arkema S.A. | | 14,645 | 1,942,179 |
| Asahi Kasei Corp. | | 170,600 | 1,601,051 |
| BASF SE | | 22,436 | 1,493,929 |
| Ecolab, Inc. | | 11,393 | 2,008,130 |
| Ems-Chemie Holding AG | | 3,263 | 3,227,534 |
| Givaudan S.A. | | 1,172 | 4,893,576 |
| Linde PLC | | 14,715 | 4,315,027 |
| Nippon Shokubai Co., Ltd. | | 26,400 | 1,287,351 |
| NOF Corp. | | 41,700 | 1,814,132 |
| Novozymes A/S, Class B | | 25,857 | 1,697,062 |
| PPG Industries, Inc. | | 12,793 | 1,707,226 |
| Shin-Etsu Chemical Co., Ltd. | | 13,700 | 2,139,777 |
| Sika AG | | 14,489 | 4,807,952 |
| Symrise AG | | 15,299 | 1,819,763 |
| | | | $ 43,717,875 |
| Commercial Services & Supplies — 0.3% |
| Securitas AB, Class B | | 123,582 | $ 1,496,192 |
| Waste Management, Inc. | | 8,853 | 1,278,373 |
| | | | $ 2,774,565 |
| Communications Equipment — 0.3% |
| Cisco Systems, Inc. | | 51,887 | $ 2,893,738 |
| | | | $ 2,893,738 |
| Construction & Engineering — 0.3% |
| Eiffage S.A. | | 21,746 | $ 2,215,134 |
| | | | $ 2,215,134 |
| Construction Materials — 0.2% |
| CRH PLC | | 38,857 | $ 1,766,370 |
| | | | $ 1,766,370 |
| Security | Shares | Value |
| Consumer Finance — 0.4% |
| Aeon Financial Service Co., Ltd.(3) | | 101,800 | $ 1,048,496 |
| American Express Co. | | 12,901 | 2,509,761 |
| | | | $ 3,558,257 |
| Containers & Packaging — 0.5% |
| AptarGroup, Inc. | | 9,421 | $ 1,148,231 |
| Huhtamaki Oyj | | 34,360 | 1,252,245 |
| Sonoco Products Co. | | 29,777 | 1,748,505 |
| | | | $ 4,148,981 |
| Diversified Financial Services — 0.4% |
| Berkshire Hathaway, Inc., Class B(1) | | 11,101 | $ 3,568,416 |
| | | | $ 3,568,416 |
| Diversified Telecommunication Services — 0.7% |
| AT&T, Inc. | | 59,453 | $ 1,408,442 |
| Liberty Latin America, Ltd., Class C(1) | | 186,956 | 1,886,386 |
| Swisscom AG | | 1,746 | 1,045,875 |
| Verizon Communications, Inc. | | 22,653 | 1,215,786 |
| | | | $ 5,556,489 |
| Electric Utilities — 0.9% |
| Duke Energy Corp. | | 13,525 | $ 1,358,045 |
| Enel SpA | | 193,905 | 1,428,874 |
| Iberdrola S.A. | | 150,409 | 1,706,478 |
| NextEra Energy, Inc. | | 21,850 | 1,710,200 |
| Southern Co. (The) | | 21,861 | 1,415,937 |
| | | | $ 7,619,534 |
| Electrical Equipment — 0.7% |
| AMETEK, Inc. | | 13,315 | $ 1,728,154 |
| Eaton Corp. PLC | | 13,323 | 2,055,605 |
| Emerson Electric Co. | | 20,763 | 1,929,298 |
| | | | $ 5,713,057 |
| Electronic Equipment, Instruments & Components — 0.7% |
| Canon Marketing Japan, Inc. | | 52,000 | $ 1,086,817 |
| Hexagon AB, Class B | | 213,003 | 2,877,601 |
| Keyence Corp. | | 2,400 | 1,135,201 |
| Kyocera Corp. | | 17,600 | 1,012,933 |
| | | | $ 6,112,552 |
| Energy Equipment & Services — 1.0% |
| Halliburton Co. | | 166,136 | $ 5,570,540 |
7
See Notes to Financial Statements.
Eaton Vance
Richard Bernstein Equity Strategy Fund
February 28, 2022
Portfolio of Investments (Unaudited) — continued
| Security | Shares | Value |
| Energy Equipment & Services (continued) |
| NOV, Inc. | | 96,990 | $ 1,663,379 |
| Technip Energies NV ADR(1) | | 85,677 | 951,871 |
| | | | $ 8,185,790 |
| Entertainment — 0.6% |
| Netflix, Inc.(1) | | 3,633 | $ 1,433,291 |
| Walt Disney Co. (The)(1) | | 25,613 | 3,802,506 |
| | | | $ 5,235,797 |
| Equity Real Estate Investment Trusts (REITs) — 1.0% |
| American Tower Corp. | | 5,248 | $ 1,190,614 |
| Crown Castle International Corp. | | 8,195 | 1,365,205 |
| Equinix, Inc. | | 1,786 | 1,267,578 |
| Primary Health Properties PLC | | 879,192 | 1,592,694 |
| ProLogis, Inc. | | 10,172 | 1,483,586 |
| Segro PLC | | 112,470 | 1,955,971 |
| | | | $ 8,855,648 |
| Food & Staples Retailing — 1.4% |
| Aeon Co., Ltd.(3) | | 72,800 | $ 1,649,188 |
| Loblaw Cos., Ltd. | | 42,809 | 3,339,271 |
| Seven & i Holdings Co., Ltd.(3) | | 41,300 | 2,009,564 |
| Walmart, Inc. | | 22,939 | 3,100,435 |
| Yaoko Co., Ltd. | | 32,800 | 1,879,324 |
| | | | $ 11,977,782 |
| Food Products — 3.0% |
| AAK AB | | 74,534 | $ 1,356,119 |
| Associated British Foods PLC | | 51,739 | 1,323,788 |
| Cranswick PLC | | 32,176 | 1,510,425 |
| Ezaki Glico Co., Ltd. | | 55,800 | 1,903,580 |
| House Foods Group, Inc. | | 70,500 | 1,822,591 |
| Kagome Co., Ltd. | | 68,600 | 1,831,348 |
| Kerry Group PLC, Class A | | 12,198 | 1,453,259 |
| Kewpie Corp. | | 83,900 | 1,790,893 |
| MEIJI Holdings Co., Ltd. | | 19,800 | 1,188,356 |
| Mondelez International, Inc., Class A | | 22,836 | 1,495,301 |
| Nestle S.A. | | 48,581 | 6,329,896 |
| Nisshin Seifun Group, Inc. | | 122,700 | 1,741,608 |
| Saputo, Inc. | | 88,320 | 2,164,276 |
| | | | $ 25,911,440 |
| Health Care Equipment & Supplies — 1.8% |
| Abbott Laboratories | | 16,464 | $ 1,985,888 |
| Becton, Dickinson and Co. | | 10,916 | 2,961,293 |
| Edwards Lifesciences Corp.(1) | | 23,112 | 2,597,095 |
| Security | Shares | Value |
| Health Care Equipment & Supplies (continued) |
| Intuitive Surgical, Inc.(1) | | 11,046 | $ 3,206,985 |
| Medtronic PLC | | 25,618 | 2,689,634 |
| Stryker Corp. | | 5,401 | 1,422,353 |
| | | | $ 14,863,248 |
| Health Care Providers & Services — 2.0% |
| Anthem, Inc. | | 7,993 | $ 3,611,637 |
| Cigna Corp. | | 6,730 | 1,600,259 |
| CVS Health Corp. | | 16,086 | 1,667,314 |
| HCA Healthcare, Inc. | | 5,713 | 1,430,021 |
| Humana, Inc. | | 6,036 | 2,621,556 |
| Quest Diagnostics, Inc. | | 8,630 | 1,132,860 |
| UnitedHealth Group, Inc. | | 11,072 | 5,268,833 |
| | | | $ 17,332,480 |
| Hotels, Restaurants & Leisure — 1.2% |
| Booking Holdings, Inc.(1) | | 645 | $ 1,401,101 |
| Evolution AB(4) | | 16,519 | 1,894,053 |
| McDonald's Corp. | | 11,541 | 2,824,891 |
| Resorttrust, Inc. | | 135,600 | 2,289,774 |
| Starbucks Corp. | | 18,191 | 1,669,752 |
| | | | $ 10,079,571 |
| Household Durables — 0.2% |
| Sony Group Corp. | | 12,400 | $ 1,266,935 |
| | | | $ 1,266,935 |
| Household Products — 1.4% |
| Colgate-Palmolive Co. | | 17,988 | $ 1,384,177 |
| Henkel AG & Co. KGaA | | 25,073 | 1,927,791 |
| Kimberly-Clark Corp. | | 9,787 | 1,273,778 |
| Procter & Gamble Co. (The) | | 38,028 | 5,928,185 |
| Reckitt Benckiser Group PLC | | 18,809 | 1,592,691 |
| | | | $ 12,106,622 |
| Industrial Conglomerates — 1.0% |
| 3M Co. | | 10,984 | $ 1,632,772 |
| General Electric Co. | | 16,480 | 1,574,005 |
| Honeywell International, Inc. | | 8,102 | 1,537,355 |
| Siemens AG | | 14,387 | 2,026,874 |
| Smiths Group PLC | | 73,039 | 1,490,037 |
| | | | $ 8,261,043 |
| Insurance — 5.6% |
| Aflac, Inc. | | 39,535 | $ 2,415,193 |
| AIA Group, Ltd. | | 262,400 | 2,724,721 |
8
See Notes to Financial Statements.
Eaton Vance
Richard Bernstein Equity Strategy Fund
February 28, 2022
Portfolio of Investments (Unaudited) — continued
| Security | Shares | Value |
| Insurance (continued) |
| Allianz SE | | 15,355 | $ 3,461,283 |
| Allstate Corp. (The) | | 9,993 | 1,222,743 |
| American International Group, Inc. | | 24,311 | 1,488,806 |
| Aon PLC, Class A | | 7,862 | 2,296,805 |
| Arthur J. Gallagher & Co. | | 16,854 | 2,666,134 |
| ASR Nederland NV | | 78,080 | 3,374,694 |
| AXA S.A. | | 103,320 | 2,795,592 |
| Dai-ichi Life Holdings, Inc. | | 79,700 | 1,655,221 |
| Marsh & McLennan Cos., Inc. | | 18,563 | 2,884,876 |
| MS&AD Insurance Group Holdings, Inc. | | 41,500 | 1,404,223 |
| Muenchener Rueckversicherungs-Gesellschaft AG | | 9,951 | 2,729,929 |
| Progressive Corp. (The) | | 30,987 | 3,282,453 |
| Sampo Oyj, Class A | | 30,319 | 1,430,587 |
| Swiss Life Holding AG | | 10,703 | 6,530,727 |
| Travelers Cos., Inc. (The) | | 13,951 | 2,397,200 |
| Zurich Insurance Group AG | | 6,932 | 3,181,760 |
| | | | $ 47,942,947 |
| Interactive Media & Services — 3.2% |
| Alphabet, Inc., Class A(1) | | 4,293 | $ 11,595,994 |
| Alphabet, Inc., Class C(1) | | 3,545 | 9,563,772 |
| Meta Platforms, Inc., Class A(1) | | 28,989 | 6,117,549 |
| | | | $ 27,277,315 |
| Internet & Direct Marketing Retail — 2.3% |
| Alibaba Group Holding, Ltd. ADR(1) | | 13,001 | $ 1,367,575 |
| Amazon.com, Inc.(1) | | 5,946 | 18,261,712 |
| | | | $ 19,629,287 |
| IT Services — 2.0% |
| Amdocs, Ltd. | | 17,485 | $ 1,376,070 |
| Bechtle AG | | 23,268 | 1,193,559 |
| Cognizant Technology Solutions Corp., Class A | | 21,873 | 1,883,921 |
| Fidelity National Information Services, Inc. | | 11,831 | 1,126,666 |
| Mastercard, Inc., Class A | | 2,700 | 974,214 |
| Otsuka Corp. | | 23,700 | 920,592 |
| Shopify, Inc., Class A(1) | | 2,661 | 1,847,311 |
| Sopra Steria Group SACA | | 9,501 | 1,694,474 |
| TIS, Inc. | | 58,900 | 1,394,082 |
| Visa, Inc., Class A | | 21,878 | 4,728,273 |
| | | | $ 17,139,162 |
| Life Sciences Tools & Services — 0.8% |
| Danaher Corp. | | 7,443 | $ 2,042,434 |
| Security | Shares | Value |
| Life Sciences Tools & Services (continued) |
| Illumina, Inc.(1) | | 5,736 | $ 1,873,377 |
| Thermo Fisher Scientific, Inc. | | 4,656 | 2,532,864 |
| | | | $ 6,448,675 |
| Machinery — 1.3% |
| Caterpillar, Inc. | | 7,223 | $ 1,354,890 |
| Deere & Co. | | 4,200 | 1,512,084 |
| Illinois Tool Works, Inc. | | 6,404 | 1,385,441 |
| Knorr-Bremse AG | | 18,315 | 1,614,651 |
| Mueller Industries, Inc. | | 31,330 | 1,787,377 |
| PACCAR, Inc. | | 20,379 | 1,870,996 |
| Stadler Rail AG(3) | | 49,361 | 1,904,497 |
| | | | $ 11,429,936 |
| Marine — 0.2% |
| Kirby Corp.(1) | | 23,917 | $ 1,558,193 |
| | | | $ 1,558,193 |
| Media — 0.4% |
| Comcast Corp., Class A | | 43,528 | $ 2,035,369 |
| Fuji Media Holdings, Inc. | | 104,200 | 1,130,957 |
| | | | $ 3,166,326 |
| Metals & Mining — 0.5% |
| Acerinox S.A. | | 161,549 | $ 2,053,885 |
| Rio Tinto, Ltd. | | 21,173 | 1,825,896 |
| | | | $ 3,879,781 |
| Multiline Retail — 0.7% |
| Big Lots, Inc. | | 42,783 | $ 1,487,137 |
| Dollar General Corp. | | 5,595 | 1,109,712 |
| Dollarama, Inc. | | 34,863 | 1,801,599 |
| Target Corp. | | 5,756 | 1,149,876 |
| | | | $ 5,548,324 |
| Multi-Utilities — 0.4% |
| Dominion Energy, Inc. | | 18,674 | $ 1,485,143 |
| National Grid PLC | | 141,590 | 2,140,752 |
| | | | $ 3,625,895 |
| Oil, Gas & Consumable Fuels — 5.9% |
| Chevron Corp. | | 38,314 | $ 5,517,216 |
| ConocoPhillips | | 30,001 | 2,845,895 |
| Exxon Mobil Corp. | | 103,330 | 8,103,139 |
| Hess Corp. | | 56,250 | 5,684,625 |
9
See Notes to Financial Statements.
Eaton Vance
Richard Bernstein Equity Strategy Fund
February 28, 2022
Portfolio of Investments (Unaudited) — continued
| Security | Shares | Value |
| Oil, Gas & Consumable Fuels (continued) |
| Idemitsu Kosan Co., Ltd. | | 102,800 | $ 2,755,712 |
| Kinder Morgan, Inc. | | 87,187 | 1,517,054 |
| ONEOK, Inc. | | 32,144 | 2,099,003 |
| Pioneer Natural Resources Co. | | 13,146 | 3,149,782 |
| Repsol S.A. | | 382,582 | 4,964,398 |
| Royal Dutch Shell PLC | | 120,614 | 3,180,686 |
| Royal Dutch Shell PLC ADR | | 40,504 | 2,122,005 |
| Suncor Energy, Inc. | | 214,683 | 6,564,981 |
| Valero Energy Corp. | | 19,530 | 1,630,950 |
| | | | $ 50,135,446 |
| Paper and Forest Products — 0.2% |
| Mondi PLC | | 76,463 | $ 1,604,305 |
| | | | $ 1,604,305 |
| Personal Products — 1.2% |
| Beiersdorf AG | | 27,236 | $ 2,760,858 |
| Edgewell Personal Care Co. | | 44,873 | 1,601,069 |
| Estee Lauder Cos., Inc. (The), Class A | | 4,484 | 1,328,744 |
| Kao Corp. | | 33,700 | 1,575,369 |
| L'Oreal S.A. | | 5,509 | 2,177,841 |
| Unilever PLC | | 23,093 | 1,160,007 |
| | | | $ 10,603,888 |
| Pharmaceuticals — 4.0% |
| Bayer AG | | 28,385 | $ 1,639,602 |
| Bristol-Myers Squibb Co. | | 36,600 | 2,513,322 |
| Eli Lilly & Co. | | 13,203 | 3,300,090 |
| Johnson & Johnson | | 37,790 | 6,219,100 |
| Merck & Co., Inc. | | 25,096 | 1,921,852 |
| Novartis AG | | 16,795 | 1,476,136 |
| Novo Nordisk A/S, Class B | | 38,198 | 3,952,859 |
| Pfizer, Inc. | | 92,426 | 4,338,476 |
| Roche Holding AG PC | | 11,052 | 4,185,761 |
| Sanofi | | 33,055 | 3,455,322 |
| Zoetis, Inc. | | 7,062 | 1,367,556 |
| | | | $ 34,370,076 |
| Professional Services — 0.4% |
| Recruit Holdings Co., Ltd. | | 21,700 | $ 915,961 |
| Teleperformance SE | | 7,220 | 2,679,068 |
| | | | $ 3,595,029 |
| Real Estate Management & Development — 0.6% |
| Iguatemi S.A.(1) | | 3 | $ 11 |
| Mitsubishi Estate Co., Ltd. | | 112,800 | 1,722,261 |
| Security | Shares | Value |
| Real Estate Management & Development (continued) |
| Sun Hung Kai Properties, Ltd. | | 157,500 | $ 1,831,061 |
| Vonovia SE | | 26,648 | 1,414,556 |
| | | | $ 4,967,889 |
| Road & Rail — 2.7% |
| CSX Corp. | | 137,022 | $ 4,646,416 |
| J.B. Hunt Transport Services, Inc. | | 9,036 | 1,833,675 |
| Knight-Swift Transportation Holdings, Inc. | | 35,817 | 1,951,310 |
| Norfolk Southern Corp. | | 17,028 | 4,368,023 |
| Old Dominion Freight Line, Inc. | | 9,839 | 3,089,741 |
| Seino Holdings Co., Ltd. | | 87,400 | 914,310 |
| Union Pacific Corp. | | 23,478 | 5,774,414 |
| | | | $ 22,577,889 |
| Semiconductors & Semiconductor Equipment — 2.5% |
| ASML Holding NV | | 3,858 | $ 2,581,094 |
| Intel Corp. | | 34,478 | 1,644,601 |
| Micron Technology, Inc. | | 23,030 | 2,046,446 |
| NVIDIA Corp. | | 37,716 | 9,197,046 |
| Taiwan Semiconductor Manufacturing Co., Ltd. ADR | | 52,354 | 5,602,401 |
| | | | $ 21,071,588 |
| Software — 4.3% |
| Adobe, Inc.(1) | | 3,233 | $ 1,512,010 |
| Constellation Software, Inc. | | 1,075 | 1,811,733 |
| Microsoft Corp. | | 95,286 | 28,470,504 |
| Oracle Corp. | | 33,833 | 2,570,293 |
| SAP SE | | 10,289 | 1,160,640 |
| VMware, Inc., Class A | | 8,115 | 952,052 |
| | | | $ 36,477,232 |
| Specialty Retail — 1.2% |
| Home Depot, Inc. (The) | | 16,642 | $ 5,256,043 |
| Industria de Diseno Textil S.A. | | 70,800 | 1,846,872 |
| TJX Cos., Inc. (The) | | 18,374 | 1,214,522 |
| WH Smith PLC(1) | | 87,180 | 1,886,291 |
| | | | $ 10,203,728 |
| Technology Hardware, Storage & Peripherals — 4.3% |
| Apple, Inc. | | 215,244 | $ 35,541,089 |
| Samsung Electronics Co., Ltd. GDR | | 859 | 1,288,654 |
| | | | $ 36,829,743 |
10
See Notes to Financial Statements.
Eaton Vance
Richard Bernstein Equity Strategy Fund
February 28, 2022
Portfolio of Investments (Unaudited) — continued
| Security | Shares | Value |
| Textiles, Apparel & Luxury Goods — 0.2% |
| NIKE, Inc., Class B | | 14,363 | $ 1,961,268 |
| | | | $ 1,961,268 |
| Thrifts & Mortgage Finance — 0.2% |
| Capitol Federal Financial, Inc. | | 190,804 | $ 2,083,580 |
| | | | $ 2,083,580 |
| Tobacco — 0.6% |
| British American Tobacco PLC | | 45,038 | $ 1,973,876 |
| Japan Tobacco, Inc. | | 87,200 | 1,603,709 |
| Philip Morris International, Inc. | | 18,363 | 1,855,948 |
| | | | $ 5,433,533 |
| Trading Companies & Distributors — 1.1% |
| Brenntag SE | | 49,143 | $ 4,119,780 |
| ITOCHU Corp. | | 47,400 | 1,544,700 |
| Mitsubishi Corp. | | 41,800 | 1,405,469 |
| Mitsui & Co., Ltd. | | 85,500 | 2,131,746 |
| | | | $ 9,201,695 |
| Wireless Telecommunication Services — 0.3% |
| SoftBank Corp. | | 124,600 | $ 1,574,244 |
| SoftBank Group Corp. | | 27,700 | 1,243,065 |
| | | | $ 2,817,309 |
Total Common Stocks
(identified cost $540,192,778) | | | $787,034,090 |
| Exchange-Traded Funds — 6.2% |
| Security | Shares | Value |
| Equity Funds — 6.2% |
| iShares MSCI China ETF(3) | | 231,252 | $ 13,553,680 |
| iShares MSCI South Korea ETF(3) | | 220,000 | 15,930,200 |
| iShares MSCI Taiwan ETF | | 360,000 | 23,011,200 |
Total Exchange-Traded Funds
(identified cost $56,504,881) | | | $ 52,495,080 |
| Short-Term Investments — 3.5% |
| Description | Units | Value |
| Eaton Vance Cash Reserves Fund, LLC, 0.09%(5) | | 10,286,526 | $ 10,285,497 |
Total Affiliated Fund
(identified cost $10,285,497) | | | $ 10,285,497 |
| Securities Lending Collateral — 2.3% |
| Security | Shares | Value |
| State Street Navigator Securities Lending Government Money Market Portfolio, 0.06%(6) | | 19,323,282 | $ 19,323,282 |
Total Securities Lending Collateral
(identified cost $19,323,282) | | | $ 19,323,282 |
Total Short-Term Investments
(identified cost $29,608,779) | | | $ 29,608,779 |
Total Investments — 102.2%
(identified cost $626,306,438) | | | $869,137,949 |
| Other Assets, Less Liabilities — (2.2)% | | | $ (18,657,863) |
| Net Assets — 100.0% | | | $850,480,086 |
| The percentage shown for each investment category in the Portfolio of Investments is based on net assets. |
| (1) | Non-income producing security. |
| (2) | Represents an investment in an issuer that is deemed to be an affiliate. |
| (3) | All or a portion of this security was on loan at February 28, 2022. The aggregate market value of securities on loan at February 28, 2022 was $24,237,204. |
| (4) | Security exempt from registration under Rule 144A of the Securities Act of 1933, as amended. These securities may be sold in certain transactions in reliance on an exemption from registration (normally to qualified institutional buyers). At February 28, 2022, the aggregate value of these securities is $1,894,053 or 0.2% of the Fund's net assets. |
| (5) | Affiliated investment company, available to Eaton Vance portfolios and funds, which invests in high quality, U.S. dollar denominated money market instruments. The rate shown is the annualized seven-day yield as of February 28, 2022. |
| (6) | Represents investment of cash collateral received in connection with securities lending. |
11
See Notes to Financial Statements.
Eaton Vance
Richard Bernstein Equity Strategy Fund
February 28, 2022
Portfolio of Investments (Unaudited) — continued
| Country Concentration of Portfolio |
| Country | Percentage
of Net Assets | Value |
| United States | 60.8% | $517,216,996 |
| Japan | 8.2 | 69,988,964 |
| Switzerland | 4.6 | 39,476,218 |
| United Kingdom | 3.8 | 32,113,569 |
| Canada | 3.5 | 30,087,413 |
| France | 3.3 | 27,856,811 |
| Germany | 3.2 | 27,363,215 |
| Spain | 1.2 | 10,571,633 |
| Ireland | 1.2 | 10,474,592 |
| Australia | 1.2 | 9,967,785 |
| Sweden | 0.9 | 7,623,965 |
| Netherlands | 0.9 | 7,302,334 |
| Hong Kong | 0.8 | 6,692,720 |
| Denmark | 0.7 | 5,649,921 |
| Taiwan | 0.7 | 5,602,401 |
| Finland | 0.3 | 2,682,832 |
| Chile | 0.2 | 1,886,386 |
| Italy | 0.2 | 1,428,874 |
| China | 0.2 | 1,367,575 |
| South Korea | 0.1 | 1,288,654 |
| Brazil | 0.0 (1) | 11 |
| Exchange-Traded Funds | 6.2 | 52,495,080 |
| Total Investments | 102.2% | $869,137,949 |
| (1) | Amount is less than 0.05%. |
| Abbreviations: |
| ADR | – American Depositary Receipt |
| GDR | – Global Depositary Receipt |
| PC | – Participation Certificate |
12
See Notes to Financial Statements.
Eaton Vance
Richard Bernstein Equity Strategy Fund
February 28, 2022
Statement of Assets and Liabilities (Unaudited)
| | February 28, 2022 |
| Assets | |
| Unaffiliated investments, at value including $24,237,204 of securities on loan (identified cost $615,550,265) | $ 857,185,649 |
| Affiliated investments, at value (identified cost $10,756,173) | 11,952,300 |
| Foreign currency, at value (identified cost $11,422) | 11,367 |
| Dividends receivable | 1,196,690 |
| Dividends receivable from affiliated investments | 737 |
| Receivable for Fund shares sold | 534,589 |
| Securities lending income receivable | 18,752 |
| Tax reclaims receivable | 502,081 |
| Total assets | $871,402,165 |
| Liabilities | |
| Collateral for securities loaned | $ 19,323,282 |
| Payable for Fund shares redeemed | 764,828 |
| Payable to affiliates: | |
| Investment adviser and administration fee | 550,393 |
| Distribution and service fees | 71,474 |
| Accrued expenses | 212,102 |
| Total liabilities | $ 20,922,079 |
| Net Assets | $850,480,086 |
| Sources of Net Assets | |
| Paid-in capital | $ 605,667,404 |
| Distributable earnings | 244,812,682 |
| Net Assets | $850,480,086 |
| Class A Shares | |
| Net Assets | $ 191,009,755 |
| Shares Outstanding | 10,443,008 |
Net Asset Value and Redemption Price Per Share
(net assets ÷ shares of beneficial interest outstanding) | $ 18.29 |
Maximum Offering Price Per Share
(100 ÷ 94.25 of net asset value per share) | $ 19.41 |
| Class C Shares | |
| Net Assets | $ 43,208,714 |
| Shares Outstanding | 2,407,289 |
Net Asset Value and Offering Price Per Share*
(net assets ÷ shares of beneficial interest outstanding) | $ 17.95 |
| Class I Shares | |
| Net Assets | $ 616,261,617 |
| Shares Outstanding | 33,653,987 |
Net Asset Value, Offering Price and Redemption Price Per Share
(net assets ÷ shares of beneficial interest outstanding) | $ 18.31 |
| On sales of $50,000 or more, the offering price of Class A shares is reduced. |
| * | Redemption price per share is equal to the net asset value less any applicable contingent deferred sales charge. |
13
See Notes to Financial Statements.
Eaton Vance
Richard Bernstein Equity Strategy Fund
February 28, 2022
Statement of Operations (Unaudited)
| | Six Months Ended |
| | February 28, 2022 |
| Investment Income | |
| Dividend income (net of foreign taxes withheld of $231,499) | $ 8,197,780 |
| Dividend income from affiliated investments | 31,103 |
| Securities lending income, net | 81,016 |
| Total investment income | $ 8,309,899 |
| Expenses | |
| Investment adviser and administration fee | $ 3,693,350 |
| Distribution and service fees: | |
| Class A | 243,036 |
| Class C | 249,652 |
| Trustees’ fees and expenses | 22,607 |
| Custodian fee | 131,086 |
| Transfer and dividend disbursing agent fees | 188,666 |
| Legal and accounting services | 30,012 |
| Printing and postage | 22,543 |
| Registration fees | 27,085 |
| Miscellaneous | 28,301 |
| Total expenses | $ 4,636,338 |
| Net investment income | $ 3,673,561 |
| Realized and Unrealized Gain (Loss) | |
| Net realized gain (loss): | |
| Investment transactions | $ 27,748,627 |
| Investment transactions - affiliated investments | (1,273) |
| Foreign currency transactions | (245,114) |
| Capital gain distributions received | 132,151 |
| Net realized gain | $ 27,634,391 |
| Change in unrealized appreciation (depreciation): | |
| Investments | $ (58,523,867) |
| Investments - affiliated investments | (251,472) |
| Foreign currency | (10,208) |
| Net change in unrealized appreciation (depreciation) | $(58,785,547) |
| Net realized and unrealized loss | $(31,151,156) |
| Net decrease in net assets from operations | $(27,477,595) |
14
See Notes to Financial Statements.
Eaton Vance
Richard Bernstein Equity Strategy Fund
February 28, 2022
Statements of Changes in Net Assets
| | Six Months Ended
February 28, 2022
(Unaudited) | Year Ended
August 31, 2021 |
| Increase (Decrease) in Net Assets | | |
| From operations: | | |
| Net investment income | $ 3,673,561 | $ 6,351,678 |
| Net realized gain | 27,634,391 | 76,481,542 |
| Net change in unrealized appreciation (depreciation) | (58,785,547) | 91,258,324 |
| Net increase (decrease) in net assets from operations | $ (27,477,595) | $174,091,544 |
| Distributions to shareholders: | | |
| Class A | $ (23,016,927) | $ (4,144,424) |
| Class C | (5,604,507) | (1,207,416) |
| Class I | (78,326,922) | (15,176,052) |
| Total distributions to shareholders | $(106,948,356) | $ (20,527,892) |
| Transactions in shares of beneficial interest: | | |
| Class A | $ 21,557,199 | $ 9,711,986 |
| Class C | (4,427,767) | (22,867,856) |
| Class I | 46,114,921 | 8,340,162 |
| Net increase (decrease) in net assets from Fund share transactions | $ 63,244,353 | $ (4,815,708) |
| Net increase (decrease) in net assets | $ (71,181,598) | $148,747,944 |
| Net Assets | | |
| At beginning of period | $ 921,661,684 | $ 772,913,740 |
| At end of period | $ 850,480,086 | $921,661,684 |
15
See Notes to Financial Statements.
Eaton Vance
Richard Bernstein Equity Strategy Fund
February 28, 2022
| | Class A |
| | | Year Ended August 31, |
| | Six Months Ended
February 28, 2022
(Unaudited) | 2021 | 2020 | 2019 | 2018 | 2017 |
| Net asset value — Beginning of period | $ 21.350 | $ 17.830 | $ 16.500 | $ 17.590 | $ 16.720 | $ 14.810 |
| Income (Loss) From Operations | | | | | | |
| Net investment income(1) | $ 0.068 | $ 0.123 | $ 0.093 | $ 0.100 | $ 0.082 | $ 0.115 |
| Net realized and unrealized gain (loss) | (0.649) | 3.853 | 2.675 | (0.386) | 1.731 | 2.290 |
| Total income (loss) from operations | $ (0.581) | $ 3.976 | $ 2.768 | $ (0.286) | $ 1.813 | $ 2.405 |
| Less Distributions | | | | | | |
| From net investment income | $ (0.367) | $ (0.084) | $ (0.155) | $ (0.003) | $ (0.045) | $ (0.120) |
| From net realized gain | (2.112) | (0.372) | (1.283) | (0.801) | (0.898) | (0.375) |
| Total distributions | $ (2.479) | $ (0.456) | $ (1.438) | $ (0.804) | $ (0.943) | $ (0.495) |
| Net asset value — End of period | $ 18.290 | $ 21.350 | $ 17.830 | $ 16.500 | $ 17.590 | $ 16.720 |
| Total Return(2) | (3.21)% (3) | 22.71% | 17.89% | (1.29)% | 11.01% | 16.63% |
| Ratios/Supplemental Data | | | | | | |
| Net assets, end of period (000's omitted) | $191,010 | $198,721 | $156,477 | $117,095 | $138,250 | $144,164 |
| Ratios (as a percentage of average daily net assets): | | | | | | |
| Expenses | 1.18% (4) | 1.21% | 1.26% | 1.26% | 1.23% | 1.25% |
| Net investment income | 0.68% (4) | 0.63% | 0.57% | 0.62% | 0.47% | 0.74% |
| Portfolio Turnover | 11% (3) | 31% | 29% | 69% | 43% | 24% |
| (1) | Computed using average shares outstanding. |
| (2) | Returns are historical and are calculated by determining the percentage change in net asset value with all distributions reinvested and do not reflect the effect of sales charges. |
| (3) | Not annualized. |
| (4) | Annualized. |
16
See Notes to Financial Statements.
Eaton Vance
Richard Bernstein Equity Strategy Fund
February 28, 2022
Financial Highlights — continued
| | Class C |
| | | Year Ended August 31, |
| | Six Months Ended
February 28, 2022
(Unaudited) | 2021 | 2020 | 2019 | 2018 | 2017 |
| Net asset value — Beginning of period | $ 20.900 | $ 17.500 | $ 16.210 | $ 17.350 | $ 16.500 | $ 14.610 |
| Income (Loss) From Operations | | | | | | |
| Net investment loss(1) | $ (0.006) | $ (0.029) | $ (0.025) | $ (0.020) | $ (0.047) | $ (0.001) |
| Net realized and unrealized gain (loss) | (0.643) | 3.801 | 2.617 | (0.386) | 1.703 | 2.267 |
| Total income (loss) from operations | $ (0.649) | $ 3.772 | $ 2.592 | $ (0.406) | $ 1.656 | $ 2.266 |
| Less Distributions | | | | | | |
| From net investment income | $ (0.189) | $ — | $ (0.019) | $ — | $ — | $ (0.001) |
| From net realized gain | (2.112) | (0.372) | (1.283) | (0.734) | (0.806) | (0.375) |
| Total distributions | $ (2.301) | $ (0.372) | $ (1.302) | $ (0.734) | $ (0.806) | $ (0.376) |
| Net asset value — End of period | $17.950 | $20.900 | $17.500 | $ 16.210 | $ 17.350 | $ 16.500 |
| Total Return(2) | (3.59)% (3) | 21.88% | 16.96% | (2.05)% | 10.15% | 15.80% |
| Ratios/Supplemental Data | | | | | | |
| Net assets, end of period (000’s omitted) | $ 43,209 | $ 54,977 | $ 67,549 | $124,789 | $163,931 | $164,218 |
| Ratios (as a percentage of average daily net assets): | | | | | | |
| Expenses | 1.93% (4) | 1.96% | 2.01% | 2.01% | 1.98% | 2.00% |
| Net investment loss | (0.06)% (4) | (0.15)% | (0.16)% | (0.13)% | (0.27)% | (0.01)% |
| Portfolio Turnover | 11% (3) | 31% | 29% | 69% | 43% | 24% |
| (1) | Computed using average shares outstanding. |
| (2) | Returns are historical and are calculated by determining the percentage change in net asset value with all distributions reinvested and do not reflect the effect of sales charges. |
| (3) | Not annualized. |
| (4) | Annualized. |
17
See Notes to Financial Statements.
Eaton Vance
Richard Bernstein Equity Strategy Fund
February 28, 2022
Financial Highlights — continued
| | Class I |
| | | Year Ended August 31, |
| | Six Months Ended
February 28, 2022
(Unaudited) | 2021 | 2020 | 2019 | 2018 | 2017 |
| Net asset value — Beginning of period | $ 21.400 | $ 17.850 | $ 16.530 | $ 17.630 | $ 16.760 | $ 14.840 |
| Income (Loss) From Operations | | | | | | |
| Net investment income(1) | $ 0.093 | $ 0.171 | $ 0.134 | $ 0.141 | $ 0.128 | $ 0.156 |
| Net realized and unrealized gain (loss) | (0.653) | 3.870 | 2.667 | (0.393) | 1.730 | 2.300 |
| Total income (loss) from operations | $ (0.560) | $ 4.041 | $ 2.801 | $ (0.252) | $ 1.858 | $ 2.456 |
| Less Distributions | | | | | | |
| From net investment income | $ (0.418) | $ (0.119) | $ (0.198) | $ (0.047) | $ (0.090) | $ (0.161) |
| From net realized gain | (2.112) | (0.372) | (1.283) | (0.801) | (0.898) | (0.375) |
| Total distributions | $ (2.530) | $ (0.491) | $ (1.481) | $ (0.848) | $ (0.988) | $ (0.536) |
| Net asset value — End of period | $ 18.310 | $ 21.400 | $ 17.850 | $ 16.530 | $ 17.630 | $ 16.760 |
| Total Return(2) | (3.11)% (3) | 23.09% | 18.11% | (1.06)% | 11.27% | 16.99% |
| Ratios/Supplemental Data | | | | | | |
| Net assets, end of period (000’s omitted) | $616,262 | $667,963 | $548,888 | $540,946 | $722,505 | $597,452 |
| Ratios (as a percentage of average daily net assets): | | | | | | |
| Expenses | 0.93% (4) | 0.96% | 1.01% | 1.01% | 0.98% | 1.00% |
| Net investment income | 0.93% (4) | 0.87% | 0.83% | 0.87% | 0.74% | 1.00% |
| Portfolio Turnover | 11% (3) | 31% | 29% | 69% | 43% | 24% |
| (1) | Computed using average shares outstanding. |
| (2) | Returns are historical and are calculated by determining the percentage change in net asset value with all distributions reinvested. |
| (3) | Not annualized. |
| (4) | Annualized. |
18
See Notes to Financial Statements.
Eaton Vance
Richard Bernstein Equity Strategy Fund
February 28, 2022
Notes to Financial Statements (Unaudited)
1 Significant Accounting Policies
Eaton Vance Richard Bernstein Equity Strategy Fund (the Fund) is a diversified series of Eaton Vance Growth Trust (the Trust). The Trust is a Massachusetts business trust registered under the Investment Company Act of 1940, as amended (the 1940 Act), as an open-end management investment company. The Fund’s investment objective is to seek total return. The Fund offers three classes of shares. Class A shares are generally sold subject to a sales charge imposed at time of purchase. Class C shares are sold at net asset value and are generally subject to a contingent deferred sales charge (see Note 5). Effective January 25, 2019, Class C shares generally automatically convert to Class A shares ten years after their purchase and, effective November 5, 2020, automatically convert to Class A shares eight years after their purchase as described in the Fund’s prospectus. Class I shares are sold at net asset value and are not subject to a sales charge. Each class represents a pro-rata interest in the Fund, but votes separately on class-specific matters and (as noted below) is subject to different expenses. Realized and unrealized gains and losses and net investment income and losses, other than class-specific expenses, are allocated daily to each class of shares based on the relative net assets of each class to the total net assets of the Fund. Each class of shares differs in its distribution plan and certain other class-specific expenses.
The following is a summary of significant accounting policies of the Fund. The policies are in conformity with accounting principles generally accepted in the United States of America (U.S. GAAP). The Fund is an investment company and follows accounting and reporting guidance in the Financial Accounting Standards Board (FASB) Accounting Standards Codification Topic 946.
A Investment Valuation—The following methodologies are used to determine the market value or fair value of investments.
Equity Securities. Equity securities (common stocks and exchange-traded funds) listed on a U.S. securities exchange generally are valued at the last sale or closing price on the day of valuation or, if no sales took place on such date, at the mean between the closing bid and ask prices on the exchange where such securities are principally traded. Equity securities listed on the NASDAQ National Market System are valued at the NASDAQ official closing price. Unlisted or listed securities for which closing sales prices or closing quotations are not available are valued at the mean between the latest available bid and ask prices.
Foreign Securities and Currencies. Foreign securities and currencies are valued in U.S. dollars, based on foreign currency exchange rate quotations supplied by a third party pricing service. The pricing service uses a proprietary model to determine the exchange rate. Inputs to the model include reported trades and implied bid/ask spreads. The daily valuation of exchange-traded foreign securities generally is determined as of the close of trading on the principal exchange on which such securities trade. Events occurring after the close of trading on foreign exchanges may result in adjustments to the valuation of foreign securities to more accurately reflect their fair value as of the close of regular trading on the New York Stock Exchange. When valuing foreign equity securities that meet certain criteria, the Fund's Trustees have approved the use of a fair value service that values such securities to reflect market trading that occurs after the close of the applicable foreign markets of comparable securities or other instruments that have a strong correlation to the fair-valued securities.
Affiliated Fund. The Fund may invest in Eaton Vance Cash Reserves Fund, LLC (Cash Reserves Fund), an affiliated investment company managed by Eaton Vance Management (EVM). While Cash Reserves Fund is not a registered money market mutual fund, it conducts all of its investment activities in accordance with the requirements of Rule 2a-7 under the 1940 Act. Investments in Cash Reserves Fund are valued at the closing net asset value per unit on the valuation day. Cash Reserves Fund generally values its investment securities based on available market quotations provided by a third party pricing service.
Other. Investments in registered investment companies (including money market funds) that do not trade on an exchange are valued at the net asset value per share on the valuation day.
Fair Valuation. Investments for which valuations or market quotations are not readily available or are deemed unreliable are valued at fair value using methods determined in good faith by or at the direction of the Trustees of the Fund in a manner that most fairly reflects the security’s “fair value”, which is the amount that the Fund might reasonably expect to receive for the security upon its current sale in the ordinary course. Each such determination is based on a consideration of relevant factors, which are likely to vary from one pricing context to another. These factors may include, but are not limited to, the type of security, the existence of any contractual restrictions on the security’s disposition, the price and extent of public trading in similar securities of the issuer or of comparable companies or entities, quotations or relevant information obtained from broker/dealers or other market participants, information obtained from the issuer, analysts, and/or the appropriate stock exchange (for exchange-traded securities), an analysis of the company’s or entity’s financial statements, and an evaluation of the forces that influence the issuer and the market(s) in which the security is purchased and sold.
B Investment Transactions— Investment transactions for financial statement purposes are accounted for on a trade date basis. Realized gains and losses on investments sold are determined on the basis of identified cost.
C Income—Dividend income is recorded on the ex-dividend date for dividends received in cash and/or securities. However, if the ex-dividend date has passed, certain dividends from foreign securities are recorded as the Fund is informed of the ex-dividend date. Distributions from investment companies are recorded as dividend income, capital gains or return of capital based on the nature of the distribution. Withholding taxes on foreign dividends and capital gains have been provided for in accordance with the Fund's understanding of the applicable countries’ tax rules and rates. In consideration of recent decisions rendered by European courts, the Fund has filed additional tax reclaims for previously withheld taxes on dividends earned in certain European Union countries. These filings are subject to various administrative and judicial proceedings within these countries. Due to the uncertainty as to the
Eaton Vance
Richard Bernstein Equity Strategy Fund
February 28, 2022
Notes to Financial Statements (Unaudited) — continued
ultimate resolution of these proceedings, the likelihood of receipt of these reclaims, and the potential timing of payment, no amounts are reflected in the financial statements for such outstanding reclaims.
D Federal Taxes— The Fund's policy is to comply with the provisions of the Internal Revenue Code applicable to regulated investment companies and to distribute to shareholders each year substantially all of its net investment income, and all or substantially all of its net realized capital gains. Accordingly, no provision for federal income or excise tax is necessary.
As of February 28, 2022, the Fund had no uncertain tax positions that would require financial statement recognition, de-recognition, or disclosure. The Fund files a U.S. federal income tax return annually after its fiscal year-end, which is subject to examination by the Internal Revenue Service for a period of three years from the date of filing.
E Expenses—The majority of expenses of the Trust are directly identifiable to an individual fund. Expenses which are not readily identifiable to a specific fund are allocated taking into consideration, among other things, the nature and type of expense and the relative size of the funds. Expenses do not include the Fund’s pro rata share of the indirect expenses borne by the Fund from its investments in exchange-traded funds.
F Foreign Currency Translation—Investment valuations, other assets, and liabilities initially expressed in foreign currencies are translated each business day into U.S. dollars based upon current exchange rates. Purchases and sales of foreign investment securities and income and expenses denominated in foreign currencies are translated into U.S. dollars based upon currency exchange rates in effect on the respective dates of such transactions. Recognized gains or losses on investment transactions attributable to changes in foreign currency exchange rates are recorded for financial statement purposes as net realized gains and losses on investments. That portion of unrealized gains and losses on investments that results from fluctuations in foreign currency exchange rates is not separately disclosed.
G Use of Estimates—The preparation of the financial statements in conformity with U.S. GAAP requires management to make estimates and assumptions that affect the reported amounts of assets and liabilities at the date of the financial statements and the reported amounts of income and expense during the reporting period. Actual results could differ from those estimates.
H Indemnifications—Under the Trust’s organizational documents, its officers and Trustees may be indemnified against certain liabilities and expenses arising out of the performance of their duties to the Fund. Under Massachusetts law, if certain conditions prevail, shareholders of a Massachusetts business trust (such as the Trust) could be deemed to have personal liability for the obligations of the Trust. However, the Trust’s Declaration of Trust contains an express disclaimer of liability on the part of Fund shareholders and the By-laws provide that the Trust shall assume, upon request by the shareholder, the defense on behalf of any Fund shareholders. Moreover, the By-laws also provide for indemnification out of Fund property of any shareholder held personally liable solely by reason of being or having been a shareholder for all loss or expense arising from such liability. Additionally, in the normal course of business, the Fund enters into agreements with service providers that may contain indemnification clauses. The Fund’s maximum exposure under these arrangements is unknown as this would involve future claims that may be made against the Fund that have not yet occurred.
I Interim Financial Statements—The interim financial statements relating to February 28, 2022 and for the six months then ended have not been audited by an independent registered public accounting firm, but in the opinion of the Fund’s management, reflect all adjustments, consisting only of normal recurring adjustments, necessary for the fair presentation of the financial statements.
2 Distributions to Shareholders and Income Tax Information
It is the present policy of the Fund to make at least one distribution annually (normally in December) of all or substantially all of its net investment income and to distribute annually all or substantially all of its net realized capital gains. Distributions to shareholders are recorded on the ex-dividend date. Distributions are declared separately for each class of shares. Shareholders may reinvest income and capital gain distributions in additional shares of the same class of the Fund at the net asset value as of the ex-dividend date or, at the election of the shareholder, receive distributions in cash. Distributions to shareholders are determined in accordance with income tax regulations, which may differ from U.S. GAAP. As required by U.S. GAAP, only distributions in excess of tax basis earnings and profits are reported in the financial statements as a return of capital. Permanent differences between book and tax accounting relating to distributions are reclassified to paid-in capital. For tax purposes, distributions from short-term capital gains are considered to be from ordinary income.
Eaton Vance
Richard Bernstein Equity Strategy Fund
February 28, 2022
Notes to Financial Statements (Unaudited) — continued
The cost and unrealized appreciation (depreciation) of investments of the Fund at February 28, 2022, as determined on a federal income tax basis, were as follows:
| Aggregate cost | $ 627,701,295 |
| Gross unrealized appreciation | $ 266,456,742 |
| Gross unrealized depreciation | (25,020,088) |
| Net unrealized appreciation | $ 241,436,654 |
3 Investment Adviser and Administration Fee and Other Transactions with Affiliates
The investment adviser and administration fee is earned by EVM, an indirect, wholly-owned subsidiary of Morgan Stanley, as compensation for investment advisory and administrative services rendered to the Fund. The fee is computed at an annual rate as a percentage of the Fund’s average daily net assets as follows and is payable monthly:
| Average Daily Net Assets | Annual Fee Rate |
| Up to $500 million | 0.850% |
| $500 million but less than $1 billion | 0.800% |
| $1 billion but less than $2.5 billion | 0.775% |
| $2.5 billion but less than $5 billion | 0.750% |
| $5 billion and over | 0.730% |
For the six months ended February 28, 2022, the investment adviser and administration fee amounted to $3,693,350 or 0.83% (annualized) of the Fund’s average daily net assets. Pursuant to an investment sub-advisory agreement, EVM has delegated the investment management of the Fund to Richard Bernstein Advisors LLC (RBA). EVM pays RBA a portion of its investment adviser and administration fee for sub-advisory services provided to the Fund. The Fund may invest its cash in Cash Reserves Fund. EVM does not currently receive a fee for advisory services provided to Cash Reserves Fund.
EVM provides sub-transfer agency and related services to the Fund pursuant to a Sub-Transfer Agency Support Services Agreement. For the six months ended February 28, 2022, EVM earned $7,058 from the Fund pursuant to such agreement, which is included in transfer and dividend disbursing agent fees on the Statement of Operations. The Fund was informed that Eaton Vance Distributors, Inc. (EVD), an affiliate of EVM and the Fund’s principal underwriter, received $3,885 as its portion of the sales charge on sales of Class A shares for the six months ended February 28, 2022. The Fund was informed that Morgan Stanley affiliated broker-dealers, which may be deemed to be affiliates of EVM and EVD, also received a portion of the sales charge on sales of Class A shares for the six months ended February 28, 2022 in the amount of less than $100. EVD also received distribution and service fees from Class A and Class C shares (see Note 4) and contingent deferred sales charges (see Note 5).
Trustees and officers of the Fund who are members of EVM’s organization receive remuneration for their services to the Fund out of the investment adviser and administration fee. Trustees of the Fund who are not affiliated with EVM may elect to defer receipt of all or a percentage of their annual fees in accordance with the terms of the Trustees Deferred Compensation Plan. For the six months ended February 28, 2022, no significant amounts have been deferred. Certain officers and Trustees of the Fund are officers of EVM.
4 Distribution Plans
The Fund has in effect a distribution plan for Class A shares (Class A Plan) pursuant to Rule 12b-1 under the 1940 Act. Pursuant to the Class A Plan, the Fund pays EVD a distribution and service fee of 0.25% per annum of its average daily net assets attributable to Class A shares for distribution services and facilities provided to the Fund by EVD, as well as for personal services and/or the maintenance of shareholder accounts. Distribution and service fees paid or accrued to EVD for the six months ended February 28, 2022 amounted to $243,036 for Class A shares.
The Fund also has in effect a distribution plan for Class C shares (Class C Plan) pursuant to Rule 12b-1 under the 1940 Act. Pursuant to the Class C Plan, the Fund pays EVD amounts equal to 0.75% per annum of its average daily net assets attributable to Class C shares for providing ongoing distribution services and facilities to the Fund. For the six months ended February 28, 2022, the Fund paid or accrued to EVD $187,239 for Class C shares.
Eaton Vance
Richard Bernstein Equity Strategy Fund
February 28, 2022
Notes to Financial Statements (Unaudited) — continued
Pursuant to the Class C Plan, the Fund also makes payments of service fees to EVD, financial intermediaries and other persons in amounts equal to 0.25% per annum of its average daily net assets attributable to that class. Service fees paid or accrued are for personal services and/or the maintenance of shareholder accounts. They are separate and distinct from the sales commissions and distribution fees payable to EVD. Service fees paid or accrued for the six months ended February 28, 2022 amounted to $62,413 for Class C shares.
Distribution and service fees are subject to the limitations contained in the Financial Industry Regulatory Authority Rule 2341(d).
5 Contingent Deferred Sales Charges
A contingent deferred sales charge (CDSC) of 1% generally is imposed on redemptions of Class C shares made within 12 months of purchase. Class A shares may be subject to a 1% CDSC if redeemed within 18 months of purchase (depending on the circumstances of purchase). Generally, the CDSC is based upon the lower of the net asset value at date of redemption or date of purchase. No charge is levied on shares acquired by reinvestment of dividends or capital gain distributions. For the six months ended February 28, 2022, the Fund was informed that EVD received approximately $2,000 of CDSCs paid by Class C shareholders and no CDSCs paid by Class A shareholders.
6 Purchases and Sales of Investments
Purchases and sales of investments, other than short-term obligations, aggregated $101,259,206 and $144,675,123, respectively, for the six months ended February 28, 2022.
7 Shares of Beneficial Interest
The Fund’s Declaration of Trust permits the Trustees to issue an unlimited number of full and fractional shares of beneficial interest (without par value). Such shares may be issued in a number of different series (such as the Fund) and classes. Transactions in Fund shares were as follows:
| | Six Months Ended
February 28, 2022
(Unaudited) | | Year Ended
August 31, 2021 |
| | Shares | Amount | | Shares | Amount |
| Class A | | | | | |
| Sales | 909,091 | $ 17,640,332 | | 1,259,226 | $ 24,453,555 |
| Issued to shareholders electing to receive payments of distributions in Fund shares | 624,933 | 11,936,222 | | 112,554 | 2,069,861 |
| Redemptions | (661,223) | (13,168,690) | | (1,469,157) | (28,691,189) |
| Converted from Class C shares | 262,973 | 5,149,335 | | 626,600 | 11,879,759 |
| Net increase | 1,135,774 | $ 21,557,199 | | 529,223 | $ 9,711,986 |
| Class C | | | | | |
| Sales | 175,857 | $ 3,397,862 | | 294,735 | $ 5,678,601 |
| Issued to shareholders electing to receive payments of distributions in Fund shares | 224,032 | 4,207,333 | | 52,029 | 941,717 |
| Redemptions | (355,457) | (6,883,627) | | (935,799) | (17,608,415) |
| Converted to Class A shares | (268,233) | (5,149,335) | | (638,877) | (11,879,759) |
| Net decrease | (223,801) | $ (4,427,767) | | (1,227,912) | $ (22,867,856) |
| Class I | | | | | |
| Sales | 3,980,738 | $ 77,840,087 | | 6,200,703 | $ 120,270,519 |
| Issued to shareholders electing to receive payments of distributions in Fund shares | 2,040,633 | 38,996,495 | | 392,683 | 7,225,360 |
| Redemptions | (3,583,109) | (70,721,661) | | (6,121,586) | (119,155,717) |
| Net increase | 2,438,262 | $ 46,114,921 | | 471,800 | $ 8,340,162 |
Eaton Vance
Richard Bernstein Equity Strategy Fund
February 28, 2022
Notes to Financial Statements (Unaudited) — continued
8 Line of Credit
The Fund participates with other portfolios and funds managed by EVM and its affiliates in an $800 million unsecured line of credit agreement with a group of banks, which is in effect through October 25, 2022. Borrowings are made by the Fund solely for temporary purposes related to redemptions and other short-term cash needs. Interest is charged to the Fund based on its borrowings at an amount above either the Secured Overnight Financing Rate (SOFR) or Federal Funds rate. In addition, a fee computed at an annual rate of 0.15% on the daily unused portion of the line of credit is allocated among the participating portfolios and funds at the end of each quarter. In connection with the renewal of the agreement in October 2021, an arrangement fee totaling $150,000 was incurred that was allocated to the participating portfolios and funds. Because the line of credit is not available exclusively to the Fund, it may be unable to borrow some or all of its requested amounts at any particular time. The Fund did not have any significant borrowings or allocated fees during the six months ended February 28, 2022.
9 Securities Lending Agreement
The Fund has established a securities lending agreement with State Street Bank and Trust Company (SSBT) as securities lending agent in which the Fund lends portfolio securities to qualified borrowers in exchange for collateral consisting of either cash or securities issued or guaranteed by the U.S. government or its agencies or instrumentalities in an amount at least equal to the market value of the securities on loan. The market value of securities loaned is determined daily and any additional required collateral is delivered to the Fund on the next business day. Cash collateral is invested in the State Street Navigator Securities Lending Government Money Market Portfolio, a money market fund registered under the 1940 Act. The Fund earns interest on the amount invested but it must pay (and at times receive from) the broker a loan rebate fee computed as a varying percentage of the collateral received. For security loans secured by non-cash collateral, the Fund earns a negotiated lending fee from the borrower. A portion of the income earned by the Fund from its investment of cash collateral, net of rebate fees, and lending fees received is allocated to SSBT for its services as lending agent and the portion allocated to the Fund is presented as securities lending income, net on the Statement of Operations. Non-cash collateral is held by the lending agent on behalf of the Fund and cannot be sold or re-pledged by the Fund; accordingly, such collateral is not reflected in the Statement of Assets and Liabilities.
The Fund is subject to possible delay in the recovery of loaned securities. Pursuant to the securities lending agreement, SSBT has provided indemnification to the Fund in the event of default by a borrower with respect to a loan. The Fund bears the risk of loss with respect to the investment of cash collateral.
At February 28, 2022, the value of the securities loaned and the value of the collateral received, which exceeded the value of the securities loaned, amounted to $24,237,204 and $25,301,301, respectively. Collateral received was comprised of cash of $19,323,282 and U.S. government and/or agencies securities of $5,978,019. The securities lending transactions have no contractual maturity date and each of the Fund and borrower has the option to terminate a loan at any time.
The following table provides a breakdown of securities lending transactions accounted for as secured borrowings, the obligations by class of collateral pledged, and the remaining contractual maturity of those transactions as of February 28, 2022.
| | Remaining Contractual Maturity of the Transactions |
| | Overnight and
Continuous | <30 days | 30 to 90 days | >90 days | Total |
| Common Stocks | $ 2,754,631 | $ — | $ — | $ — | $ 2,754,631 |
| Exchange-Traded Funds | 16,568,651 | — | — | — | 16,568,651 |
| Total | $19,323,282 | $ — | $ — | $ — | $19,323,282 |
The carrying amount of the liability for collateral for securities loaned at February 28, 2022 approximated its fair value. If measured at fair value, such liability would have been considered as Level 2 in the fair value hierarchy (see Note 11) at February 28, 2022.
Eaton Vance
Richard Bernstein Equity Strategy Fund
February 28, 2022
Notes to Financial Statements (Unaudited) — continued
10 Investments in Affiliated Issuers and Funds
At February 28, 2022, the value of the Fund's investment in affiliated issuers and funds was $11,952,300, which represents 1.4% of the Fund's net assets. Transactions in affiliated issuers and funds by the Fund for the six months ended February 28, 2022 were as follows:
| Name | Value,
beginning
of period | Purchases | Sales
proceeds | Net
realized
gain (loss) | Change in
unrealized
appreciation
(depreciation) | Value, end
of period | Dividend
income | Shares/
Units, end
of period |
| Common Stocks |
| Morgan Stanley | $1,918,275 | $ — | $ — | $ — | $ (251,472) | $ 1,666,803 | $ 25,717 | 18,369 |
| Short-Term Investments |
| Eaton Vance Cash Reserves Fund, LLC | 7,013,549 | 64,160,778 | (60,887,557) | (1,273) | — | 10,285,497 | 5,386 | 10,286,526 |
| Total | | | | $(1,273) | $(251,472) | $11,952,300 | $31,103 | |
11 Fair Value Measurements
Under generally accepted accounting principles for fair value measurements, a three-tier hierarchy to prioritize the assumptions, referred to as inputs, is used in valuation techniques to measure fair value. The three-tier hierarchy of inputs is summarized in the three broad levels listed below.
| • | Level 1 – quoted prices in active markets for identical investments |
| • | Level 2 – other significant observable inputs (including quoted prices for similar investments, interest rates, prepayment speeds, credit risk, etc.) |
| • | Level 3 – significant unobservable inputs (including a fund’s own assumptions in determining the fair value of investments) |
In cases where the inputs used to measure fair value fall in different levels of the fair value hierarchy, the level disclosed is determined based on the lowest level input that is significant to the fair value measurement in its entirety. The inputs or methodology used for valuing securities are not necessarily an indication of the risk associated with investing in those securities.
At February 28, 2022, the hierarchy of inputs used in valuing the Fund's investments, which are carried at value, were as follows:
| Asset Description | Level 1 | Level 2 | Level 3 | Total |
| Common Stocks: | | | | |
| Communication Services | $ 39,059,095 | $ 4,994,141 | $ — | $ 44,053,236 |
| Consumer Discretionary | 49,213,056 | 14,543,228 | — | 63,756,284 |
| Consumer Staples | 31,879,675 | 50,081,292 | — | 81,960,967 |
| Energy | 47,420,440 | 10,900,796 | — | 58,321,236 |
| Financials | 116,841,019 | 50,920,414 | — | 167,761,433 |
| Health Care | 62,138,519 | 14,709,680 | — | 76,848,199 |
| Industrials | 63,743,512 | 29,878,930 | — | 93,622,442 |
| Information Technology | 104,178,368 | 16,345,647 | — | 120,524,015 |
| Materials | 12,936,142 | 42,181,170 | — | 55,117,312 |
| Real Estate | 5,306,983 | 8,516,554 | — | 13,823,537 |
| Utilities | 5,969,325 | 5,276,104 | — | 11,245,429 |
| Total Common Stocks | $538,686,134 | $248,347,956* | $ — | $787,034,090 |
| Exchange-Traded Funds | $ 52,495,080 | $ — | $ — | $ 52,495,080 |
| Short-Term Investments: | | | | |
| Affiliated Fund | — | 10,285,497 | — | 10,285,497 |
Eaton Vance
Richard Bernstein Equity Strategy Fund
February 28, 2022
Notes to Financial Statements (Unaudited) — continued
| Asset Description (continued) | Level 1 | Level 2 | Level 3 | Total |
| Securities Lending Collateral | $ 19,323,282 | $ — | $ — | $ 19,323,282 |
| Total Investments | $610,504,496 | $258,633,453 | $ — | $869,137,949 |
| * | Includes foreign equity securities whose values were adjusted to reflect market trading of comparable securities or other correlated instruments that occurred after the close of trading in their applicable foreign markets. |
12 Risks and Uncertainties
Risks Associated with Foreign Investments
Foreign investments can be adversely affected by political, economic and market developments abroad, including the imposition of economic and other sanctions by the United States or another country. There may be less publicly available information about foreign issuers because they may not be subject to reporting practices, requirements or regulations comparable to those to which United States companies are subject. Foreign markets may be smaller, less liquid and more volatile than the major markets in the United States. Trading in foreign markets typically involves higher expense than trading in the United States. The Fund may have difficulties enforcing its legal or contractual rights in a foreign country. Securities that trade or are denominated in currencies other than the U.S. dollar may be adversely affected by fluctuations in currency exchange rates.
Pandemic Risk
An outbreak of respiratory disease caused by a novel coronavirus was first detected in China in late 2019 and subsequently spread internationally. This coronavirus has resulted in closing borders, enhanced health screenings, changes to healthcare service preparation and delivery, quarantines, cancellations, disruptions to supply chains and customer activity, as well as general concern and uncertainty. Health crises caused by outbreaks, such as the coronavirus outbreak, may exacerbate other pre-existing political, social and economic risks and disrupt normal market conditions and operations. The impact of this outbreak has negatively affected the worldwide economy, the economies of individual countries, individual companies, and the market in general, and may continue to do so in significant and unforeseen ways, as may other epidemics and pandemics that may arise in the future. Any such impact could adversely affect the Fund’s performance, or the performance of the securities in which the Fund invests.
Eaton Vance
Richard Bernstein Equity Strategy Fund
February 28, 2022
| Officers |
Eric A. Stein
President | Jill R. Damon
Secretary |
Deidre E. Walsh
Vice President and Chief Legal Officer | Richard F. Froio
Chief Compliance Officer |
James F. Kirchner
Treasurer | |
George J. Gorman
Chairperson | |
| Alan C. Bowser* | |
| Thomas E. Faust Jr.** | |
| Mark R. Fetting | |
| Cynthia E. Frost | |
| Valerie A. Mosley | |
| William H. Park | |
| Helen Frame Peters | |
| Keith Quinton | |
| Marcus L. Smith | |
| Susan J. Sutherland | |
| Scott E. Wennerholm | |
| Nancy A. Wiser* | |
| * | Mr. Bowser and Ms. Wiser began serving as Trustees effective April 4, 2022. |
| ** | Interested Trustee |
| FACTS | WHAT DOES EATON VANCE DO WITH YOUR
PERSONAL INFORMATION? |
| Why? | Financial companies choose how they share your personal information. Federal law gives consumers the right to limit some but not all sharing. Federal law also requires us to tell you how we collect, share, and protect your personal information. Please read this notice carefully to understand what we do. |
| |
| What? | The types of personal information we collect and share depend on the product or service you have with us. This information can include:■ Social Security number and income
■ investment experience and risk tolerance
■ checking account number and wire transfer instructions |
| |
| How? | All financial companies need to share customers’ personal information to run their everyday business. In the section below, we list the reasons financial companies can share their customers’ personal information; the reasons Eaton Vance chooses to share; and whether you can limit this sharing. |
Reasons we can share your
personal information | Does Eaton Vance
share? | Can you limit
this sharing? |
| For our everyday business purposes — such as to process your transactions, maintain your account(s), respond to court orders and legal investigations, or report to credit bureaus | Yes | No |
| For our marketing purposes — to offer our products and services to you | Yes | No |
| For joint marketing with other financial companies | No | We don’t share |
| For our investment management affiliates’ everyday business purposes — information about your transactions, experiences, and creditworthiness | Yes | Yes |
| For our affiliates’ everyday business purposes — information about your transactions and experiences | Yes | No |
| For our affiliates’ everyday business purposes — information about your creditworthiness | No | We don’t share |
| For our investment management affiliates to market to you | Yes | Yes |
| For our affiliates to market to you | No | We don’t share |
| For nonaffiliates to market to you | No | We don’t share |
To limit our
sharing | Call toll-free 1-800-262-1122 or email: EVPrivacy@eatonvance.comPlease note:If you are a new customer, we can begin sharing your information 30 days from the date we sent this notice. When you are no longer our customer, we continue to share your information as described in this notice. However, you can contact us at any time to limit our sharing. |
| Questions? | Call toll-free 1-800-262-1122 or email: EVPrivacy@eatonvance.com |
| Privacy Notice — continued | April 2021 |
| Who we are |
| Who is providing this notice? | Eaton Vance Management, Eaton Vance Distributors, Inc., Eaton Vance Trust Company, Eaton Vance Management (International) Limited, Eaton Vance Advisers International Ltd., Eaton Vance Global Advisors Limited, Eaton Vance Management’s Real Estate Investment Group, Boston Management and Research, Calvert Research and Management, Eaton Vance and Calvert Fund Families and our investment advisory affiliates (“Eaton Vance”) (see Investment Management Affiliates definition below) |
| What we do |
How does Eaton Vance
protect my personal
information? | To protect your personal information from unauthorized access and use, we use security measures that comply with federal law. These measures include computer safeguards and secured files and buildings. We have policies governing the proper handling of customer information by personnel and requiring third parties that provide support to adhere to appropriate security standards with respect to such information. |
How does Eaton Vance
collect my personal
information? | We collect your personal information, for example, when you■ open an account or make deposits or withdrawals from your account
■ buy securities from us or make a wire transfer
■ give us your contact informationWe also collect your personal information from others, such as credit bureaus, affiliates, or other companies. |
| Why can’t I limit all sharing? | Federal law gives you the right to limit only■ sharing for affiliates’ everyday business purposes — information about your creditworthiness
■ affiliates from using your information to market to you
■ sharing for nonaffiliates to market to youState laws and individual companies may give you additional rights to limit sharing. See below for more on your rights under state law. |
| Definitions |
Investment Management
Affiliates | Eaton Vance Investment Management Affiliates include registered investment advisers, registered broker- dealers, and registered and unregistered funds. Investment Management Affiliates does not include entities associated with Morgan Stanley Wealth Management, such as Morgan Stanley Smith Barney LLC and Morgan Stanley & Co. |
| Affiliates | Companies related by common ownership or control. They can be financial and nonfinancial companies.■ Our affiliates include companies with a Morgan Stanley name and financial companies such as Morgan Stanley Smith Barney LLC and Morgan Stanley & Co. |
| Nonaffiliates | Companies not related by common ownership or control. They can be financial and nonfinancial companies.■ Eaton Vance does not share with nonaffiliates so they can market to you. |
| Joint marketing | A formal agreement between nonaffiliated financial companies that together market financial products or services to you.■ Eaton Vance doesn’t jointly market. |
| Other important information |
| Vermont: Except as permitted by law, we will not share personal information we collect about Vermont residents with Nonaffiliates unless you provide us with your written consent to share such information.California: Except as permitted by law, we will not share personal information we collect about California residents with Nonaffiliates and we will limit sharing such personal information with our Affiliates to comply with California privacy laws that apply to us. |
Delivery of Shareholder Documents. The Securities and Exchange Commission (SEC) permits funds to deliver only one copy of shareholder documents, including prospectuses, proxy statements and shareholder reports, to fund investors with multiple accounts at the same residential or post office box address. This practice is often called “householding” and it helps eliminate duplicate mailings to shareholders. Eaton Vance, or your financial intermediary, may household the mailing of your documents indefinitely unless you instruct Eaton Vance, or your financial intermediary, otherwise. If you would prefer that your Eaton Vance documents not be householded, please contact Eaton Vance at 1-800-262-1122, or contact your financial intermediary. Your instructions that householding not apply to delivery of your Eaton Vance documents will typically be effective within 30 days of receipt by Eaton Vance or your financial intermediary.
Portfolio Holdings. Each Eaton Vance Fund and its underlying Portfolio(s) (if applicable) files a schedule of portfolio holdings on Part F to Form N-PORT with the SEC. Certain information filed on Form N-PORT may be viewed on the Eaton Vance website at www.eatonvance.com, by calling Eaton Vance at 1-800-262-1122 or in the EDGAR database on the SEC’s website at www.sec.gov.
Proxy Voting. From time to time, funds are required to vote proxies related to the securities held by the funds. The Eaton Vance Funds or their underlying Portfolios (if applicable) vote proxies according to a set of policies and procedures approved by the Funds’ and Portfolios’ Boards. You may obtain a description of these policies and procedures and information on how the Funds or Portfolios voted proxies relating to portfolio securities during the most recent 12-month period ended June 30, without charge, upon request, by calling 1-800-262-1122 and by accessing the SEC’s website at www.sec.gov.
This Page Intentionally Left Blank
This Page Intentionally Left Blank
This Page Intentionally Left Blank
Investment Adviser and Administrator
Eaton Vance Management
Two International Place
Boston, MA 02110
Investment Sub-Adviser
Richard Bernstein Advisors LLC
1251 Avenue of the Americas
Suite 4102
New York, NY 10020
Principal Underwriter*
Eaton Vance Distributors, Inc.
Two International Place
Boston, MA 02110
(617) 482-8260
Custodian
State Street Bank and Trust Company
State Street Financial Center, One Lincoln Street
Boston, MA 02111
Transfer Agent
BNY Mellon Investment Servicing (US) Inc.
Attn: Eaton Vance Funds
P.O. Box 9653
Providence, RI 02940-9653
(800) 262-1122
Fund Offices
Two International Place
Boston, MA 02110
* FINRA BrokerCheck. Investors may check the background of their Investment Professional by contacting the Financial Industry Regulatory Authority (FINRA). FINRA BrokerCheck is a free tool to help investors check the professional background of current and former FINRA-registered securities firms and brokers. FINRA BrokerCheck is available by calling 1-800-289-9999 and at www.FINRA.org. The FINRA BrokerCheck brochure describing this program is available to investors at www.FINRA.org.
Eaton Vance
Worldwide Health Sciences Fund
Semiannual Report
February 28, 2022
Commodity Futures Trading Commission Registration. The Commodity Futures Trading Commission (“CFTC”) has adopted regulations that subject registered investment companies and advisers to regulation by the CFTC if a fund invests more than a prescribed level of its assets in certain CFTC-regulated instruments (including futures, certain options and swap agreements) or markets itself as providing investment exposure to such instruments. The investment adviser has claimed an exclusion from the definition of “commodity pool operator” under the Commodity Exchange Act with respect to its management of the Fund. Accordingly, neither the Fund nor the adviser with respect to the operation of the Fund is subject to CFTC regulation. Because of its management of other strategies, the Fund's adviser is registered with the CFTC as a commodity pool operator. The adviser is also registered as a commodity trading advisor.
Fund shares are not insured by the FDIC and are not deposits or other obligations of, or guaranteed by, any depository institution. Shares are subject to investment risks, including possible loss of principal invested.
This report must be preceded or accompanied by a current summary prospectus or prospectus. Before investing, investors should consider carefully the investment objective, risks, and charges and expenses of a mutual fund. This and other important information is contained in the summary prospectus and prospectus, which can be obtained from a financial intermediary. Prospective investors should read the prospectus carefully before investing. For further information, please call 1-800-262-1122.
Semiannual Report February 28, 2022
Eaton Vance
Worldwide Health Sciences Fund
Eaton Vance
Worldwide Health Sciences Fund
February 28, 2022
Performance
Portfolio Manager(s) Jason Kritzer, CFA, of Eaton Vance Management and Samantha Pandolfi, CFA, of Eaton Vance Advisers International Ltd.
| % Average Annual Total Returns1,2 | Class
Inception Date | Performance
Inception Date | Six Months | One Year | Five Years | Ten Years |
| Class A at NAV | 07/26/1985 | 07/26/1985 | (4.76)% | 13.63% | 12.51% | 13.85% |
| Class A with 5.75% Maximum Sales Charge | — | — | (10.23) | 7.10 | 11.20 | 13.17 |
| Class C at NAV | 01/05/1998 | 07/26/1985 | (5.08) | 12.83 | 11.68 | 13.17 |
| Class C with 1% Maximum Sales Charge | — | — | (5.96) | 11.83 | 11.68 | 13.17 |
| Class I at NAV | 10/01/2009 | 07/26/1985 | (4.65) | 13.87 | 12.81 | 14.13 |
| Class R at NAV | 09/08/2003 | 07/26/1985 | (4.84) | 13.35 | 12.24 | 13.56 |
|
| MSCI World Health Care Index | — | — | (5.73)% | 12.35% | 11.91% | 13.07% |
| S&P 500® Index | — | — | (2.62) | 16.39 | 15.16 | 14.58 |
| % Total Annual Operating Expense Ratios3 | Class A | Class C | Class I | Class R |
| Gross | 1.17% | 1.92% | 0.92% | 1.42% |
| Net | 1.16 | 1.91 | 0.91 | 1.41 |
See Endnotes and Additional Disclosures in this report.
Past performance is no guarantee of future results. Returns are historical and are calculated by determining the percentage change in net asset value (NAV) or offering price (as applicable) with all distributions reinvested. Investment return and principal value will fluctuate so that shares, when redeemed, may be worth more or less than their original cost. Performance for periods less than or equal to one year is cumulative. Performance is for the stated time period only; due to market volatility, current Fund performance may be lower or higher than the quoted return. For performance as of the most recent month-end, please refer to eatonvance.com.
Eaton Vance
Worldwide Health Sciences Fund
February 28, 2022
| Sector Allocation (% of net assets)* |
| * | Excludes cash and cash equivalents. |
| Country Allocation (% of net assets) |
| Top 10 Holdings (% of net assets)* |
| UnitedHealth Group, Inc. | 8.2% |
| Johnson & Johnson | 7.9 |
| AbbVie, Inc. | 6.2 |
| Roche Holding AG PC | 5.5 |
| AstraZeneca PLC | 4.4 |
| Eli Lilly & Co. | 4.4 |
| Thermo Fisher Scientific, Inc. | 4.2 |
| Danaher Corp. | 3.8 |
| Novo Nordisk A/S, Class B | 3.8 |
| Sanofi | 3.7 |
| Total | 52.1% |
| * | Excludes cash and cash equivalents. |
Eaton Vance
Worldwide Health Sciences Fund
February 28, 2022
Endnotes and Additional Disclosures
| 1 | MSCI World Health Care Index is an unmanaged index of health care sector equities within the MSCI World Index. MSCI indexes are net of foreign withholding taxes. Source: MSCI. MSCI data may not be reproduced or used for any other purpose. MSCI provides no warranties, has not prepared or approved this report, and has no liability hereunder. S&P 500® Index is an unmanaged index of large-cap stocks commonly used as a measure of U.S. stock market performance. S&P Dow Jones Indices are a product of S&P Dow Jones Indices LLC (“S&P DJI”) and have been licensed for use. S&P® and S&P 500® are registered trademarks of S&P DJI; Dow Jones® is a registered trademark of Dow Jones Trademark Holdings LLC (“Dow Jones”); S&P DJI, Dow Jones and their respective affiliates do not sponsor, endorse, sell or promote the Fund, will not have any liability with respect thereto and do not have any liability for any errors, omissions, or interruptions of the S&P Dow Jones Indices. Unless otherwise stated, index returns do not reflect the effect of any applicable sales charges, commissions, expenses, taxes or leverage, as applicable. It is not possible to invest directly in an index. |
| 2 | Total Returns at NAV do not include applicable sales charges. If sales charges were deducted, the returns would be lower. Total Returns shown with maximum sales charge reflect the stated maximum sales charge. Unless otherwise stated, performance does not reflect the deduction of taxes on Fund distributions or redemptions of Fund shares.Effective November 5, 2020, Class C shares automatically convert to Class A shares eight years after purchase. The average annual total returns listed for Class C reflect conversion to Class A shares after eight years. Prior to November 5, 2020, Class C shares automatically converted to Class A shares ten years after purchase. |
| 3 | Source: Fund prospectus. Net expense ratios reflect a contractual expense reimbursement that continues through 12/31/22. The expense ratios for the current reporting period can be found in the Financial Highlights section of this report. Performance reflects expenses waived and/or reimbursed, if applicable. Without such waivers and/or reimbursements, performance would have been lower. |
| | Fund profile subject to change due to active management. |
Eaton Vance
Worldwide Health Sciences Fund
February 28, 2022
Example
As a Fund shareholder, you incur two types of costs: (1) transaction costs, including sales charges (loads) on purchases and redemption fees (if applicable); and (2) ongoing costs, including management fees; distribution and/or service fees; and other Fund expenses. This Example is intended to help you understand your ongoing costs (in dollars) of Fund investing and to compare these costs with the ongoing costs of investing in other mutual funds. The Example is based on an investment of $1,000 invested at the beginning of the period and held for the entire period (September 1, 2021 to February 28, 2022).
Actual Expenses
The first section of the table below provides information about actual account values and actual expenses. You may use the information in this section, together with the amount you invested, to estimate the expenses that you paid over the period. Simply divide your account value by $1,000 (for example, an $8,600 account value divided by $1,000 = 8.6), then multiply the result by the number in the first section under the heading entitled “Expenses Paid During Period” to estimate the expenses you paid on your account during this period.
Hypothetical Example for Comparison Purposes
The second section of the table below provides information about hypothetical account values and hypothetical expenses based on the actual Fund expense ratio and an assumed rate of return of 5% per year (before expenses), which is not the actual Fund return. The hypothetical account values and expenses may not be used to estimate the actual ending account balance or expenses you paid for the period. You may use this information to compare the ongoing costs of investing in your Fund and other funds. To do so, compare this 5% hypothetical example with the 5% hypothetical examples that appear in the shareholder reports of the other funds.
Please note that the expenses shown in the table are meant to highlight your ongoing costs only and do not reflect any transactional costs, such as sales charges (loads) or redemption fees (if applicable). Therefore, the second section of the table is useful in comparing ongoing costs only, and will not help you determine the relative total costs of owning different funds. In addition, if these transactional costs were included, your costs would be higher.
| | Beginning
Account Value
(9/1/21) | Ending
Account Value
(2/28/22) | Expenses Paid
During Period*
(9/1/21 – 2/28/22) | Annualized
Expense
Ratio |
| Actual | | | | |
| Class A | $1,000.00 | $ 952.40 | $5.95** | 1.23% |
| Class C | $1,000.00 | $ 949.20 | $9.57** | 1.98% |
| Class I | $1,000.00 | $ 953.50 | $4.75** | 0.98% |
| Class R | $1,000.00 | $ 951.60 | $7.16** | 1.48% |
| |
| Hypothetical | | | | |
| (5% return per year before expenses) | | | | |
| Class A | $1,000.00 | $1,018.70 | $6.16** | 1.23% |
| Class C | $1,000.00 | $1,014.98 | $9.89** | 1.98% |
| Class I | $1,000.00 | $1,019.94 | $4.91** | 0.98% |
| Class R | $1,000.00 | $1,017.46 | $7.40** | 1.48% |
| * | Expenses are equal to the Fund's annualized expense ratio for the indicated Class, multiplied by the average account value over the period, multiplied by 181/365 (to reflect the one-half year period). The Example assumes that the $1,000 was invested at the net asset value per share determined at the close of business on August 31, 2021. |
| ** | Absent an allocation of certain expenses to affiliates, expenses would be higher. |
Eaton Vance
Worldwide Health Sciences Fund
February 28, 2022
Portfolio of Investments (Unaudited)
| Security | Shares | Value |
| Biotechnology — 11.2% |
| AbbVie, Inc. | | 462,317 | $ 68,316,583 |
| Abcam PLC(1) | | 237,947 | 3,980,019 |
| argenx SE ADR(1) | | 14,886 | 4,282,851 |
| Blueprint Medicines Corp.(1) | | 51,234 | 3,102,219 |
| CSL, Ltd. | | 101,354 | 19,269,830 |
| Moderna, Inc.(1) | | 16,712 | 2,566,963 |
| Neurocrine Biosciences, Inc.(1) | | 210,577 | 18,924,555 |
| Travere Therapeutics, Inc.(1) | | 121,514 | 3,312,472 |
| | | | $ 123,755,492 |
| Containers & Packaging — 0.5% |
| AptarGroup, Inc. | | 44,675 | $ 5,444,989 |
| | | | $ 5,444,989 |
| Health Care Equipment — 15.8% |
| Abbott Laboratories | | 322,792 | $ 38,935,171 |
| Boston Scientific Corp.(1) | | 417,769 | 18,452,857 |
| Edwards Lifesciences Corp.(1) | | 158,830 | 17,847,727 |
| Envista Holdings Corp.(1) | | 311,021 | 14,929,008 |
| Fisher & Paykel Healthcare Corp., Ltd. | | 306,830 | 5,765,952 |
| Inari Medical, Inc.(1) | | 151,170 | 13,299,937 |
| Intuitive Surgical, Inc.(1) | | 117,429 | 34,093,161 |
| Straumann Holding AG | | 4,413 | 7,009,888 |
| Tandem Diabetes Care, Inc.(1) | | 99,362 | 11,191,142 |
| Teleflex, Inc. | | 39,117 | 13,155,438 |
| | | | $ 174,680,281 |
| Health Care Services — 2.3% |
| Accolade, Inc.(1) | | 267,242 | $ 4,805,011 |
| Agiliti, Inc.(1) | | 702,673 | 12,655,141 |
| R1 RCM, Inc.(1) | | 275,354 | 7,486,875 |
| | | | $ 24,947,027 |
| Health Care Supplies — 3.2% |
| Alcon, Inc. | | 223,253 | $ 17,247,980 |
| Asahi Intecc Co., Ltd. | | 255,800 | 5,523,571 |
| Cooper Cos., Inc. (The) | | 29,764 | 12,174,071 |
| | | | $ 34,945,622 |
| Health Care Technology — 1.9% |
| JMDC, Inc.(1) | | 173,100 | $ 9,607,184 |
| Security | Shares | Value |
| Health Care Technology (continued) |
| Veeva Systems, Inc., Class A(1) | | 46,863 | $ 10,733,970 |
| | | | $ 20,341,154 |
| Life Sciences Tools & Services — 11.6% |
| Danaher Corp. | | 153,702 | $ 42,177,366 |
| Lonza Group AG | | 24,002 | 16,607,028 |
| PolyPeptide Group AG(1)(2) | | 74,841 | 6,645,680 |
| Thermo Fisher Scientific, Inc. | | 86,027 | 46,798,688 |
| Waters Corp.(1) | | 50,487 | 15,990,747 |
| | | | $ 128,219,509 |
| Managed Health Care — 10.6% |
| Anthem, Inc. | | 58,532 | $ 26,447,684 |
| UnitedHealth Group, Inc. | | 190,296 | 90,556,158 |
| | | | $ 117,003,842 |
| Pharmaceuticals — 42.1% |
| AstraZeneca PLC | | 402,232 | $ 48,889,823 |
| Bristol-Myers Squibb Co. | | 550,361 | 37,793,290 |
| Dechra Pharmaceuticals PLC | | 138,439 | 7,634,844 |
| Eli Lilly & Co. | | 193,820 | 48,445,309 |
| Johnson & Johnson | | 530,197 | 87,254,520 |
| Merck & Co., Inc. | | 229,777 | 17,596,323 |
| Novartis AG | | 136,602 | 12,006,141 |
| Novo Nordisk A/S, Class B | | 405,795 | 41,993,048 |
| Pfizer, Inc. | | 359,209 | 16,861,270 |
| Roche Holding AG PC | | 159,632 | 60,457,957 |
| Royalty Pharma PLC, Class A | | 320,270 | 12,573,800 |
| Sanofi | | 393,094 | 41,091,099 |
| Zoetis, Inc. | | 167,945 | 32,522,549 |
| | | | $ 465,119,973 |
Total Common Stocks
(identified cost $688,463,235) | | | $1,094,457,889 |
| Convertible Preferred Stocks — 0.2% |
| Security | Shares | Value |
| Biotechnology — 0.2% |
| Caris Life Sciences, Inc., Series D(1)(3)(4) | | 370,370 | $ 2,622,219 |
Total Convertible Preferred Stocks
(identified cost $3,000,000) | | | $ 2,622,219 |
6
See Notes to Financial Statements.
Eaton Vance
Worldwide Health Sciences Fund
February 28, 2022
Portfolio of Investments (Unaudited) — continued
| Exchange-Traded Funds — 0.4% |
| Security | Shares | Value |
| Equity Funds — 0.4% |
| iShares Global Healthcare ETF | | 51,490 | $ 4,295,296 |
Total Exchange-Traded Funds
(identified cost $4,423,696) | | | $ 4,295,296 |
| Short-Term Investments — 0.1% |
| Description | Units | Value |
| Eaton Vance Cash Reserves Fund, LLC, 0.09%(5) | | 955,315 | $ 955,219 |
Total Short-Term Investments
(identified cost $955,315) | | | $ 955,219 |
Total Investments — 99.9%
(identified cost $696,842,246) | | | $1,102,330,623 |
| Other Assets, Less Liabilities — 0.1% | | | $ 1,383,472 |
| Net Assets — 100.0% | | | $1,103,714,095 |
| The percentage shown for each investment category in the Portfolio of Investments is based on net assets. |
| (1) | Non-income producing security. |
| (2) | Security exempt from registration under Rule 144A of the Securities Act of 1933, as amended. These securities may be sold in certain transactions in reliance on an exemption from registration (normally to qualified institutional buyers). At February 28, 2022, the aggregate value of these securities is $6,645,680 or 0.6% of the Fund's net assets. |
| (3) | For fair value measurement disclosure purposes, security is categorized as Level 3 (see Note 11). |
| (4) | Restricted security (see Note 8). |
| (5) | Affiliated investment company, available to Eaton Vance portfolios and funds, which invests in high quality, U.S. dollar denominated money market instruments. The rate shown is the annualized seven-day yield as of February 28, 2022. |
| Country Concentration of Portfolio |
| Country | Percentage
of Net Assets | Value |
| United States | 71.0% | $784,094,312 |
| Switzerland | 10.3 | 113,328,994 |
| United Kingdom | 6.6 | 73,078,486 |
| Denmark | 3.8 | 41,993,048 |
| France | 3.7 | 41,091,099 |
| Australia | 1.8 | 19,269,830 |
| Japan | 1.4 | 15,130,755 |
| New Zealand | 0.5 | 5,765,952 |
| Netherlands | 0.4 | 4,282,851 |
| Exchange-Traded Funds | 0.4 | 4,295,296 |
| Total Investments | 99.9% | $1,102,330,623 |
| Abbreviations: |
| ADR | – American Depositary Receipt |
| PC | – Participation Certificate |
7
See Notes to Financial Statements.
Eaton Vance
Worldwide Health Sciences Fund
February 28, 2022
Statement of Assets and Liabilities (Unaudited)
| | February 28, 2022 |
| Assets | |
| Unaffiliated investments, at value (identified cost $695,886,931) | $ 1,101,375,404 |
| Affiliated investment, at value (identified cost $955,315) | 955,219 |
| Dividends receivable | 1,795,100 |
| Dividends receivable from affiliated investment | 67 |
| Receivable for Fund shares sold | 491,230 |
| Tax reclaims receivable | 1,987,723 |
| Receivable from affiliates | 23,636 |
| Total assets | $1,106,628,379 |
| Liabilities | |
| Payable for Fund shares redeemed | $ 730,983 |
| Payable to affiliates: | |
| Investment adviser fee | 1,494,295 |
| Administration fee | 126,355 |
| Distribution and service fees | 211,878 |
| Accrued expenses | 350,773 |
| Total liabilities | $ 2,914,284 |
| Net Assets | $1,103,714,095 |
| Sources of Net Assets | |
| Paid-in capital | $ 684,012,775 |
| Distributable earnings | 419,701,320 |
| Net Assets | $1,103,714,095 |
| Class A Shares | |
| Net Assets | $ 779,886,622 |
| Shares Outstanding | 58,320,658 |
Net Asset Value and Redemption Price Per Share
(net assets ÷ shares of beneficial interest outstanding) | $ 13.37 |
Maximum Offering Price Per Share
(100 ÷ 94.25 of net asset value per share) | $ 14.19 |
| Class C Shares | |
| Net Assets | $ 47,705,094 |
| Shares Outstanding | 3,505,457 |
Net Asset Value and Offering Price Per Share*
(net assets ÷ shares of beneficial interest outstanding) | $ 13.61 |
| Class I Shares | |
| Net Assets | $ 208,269,179 |
| Shares Outstanding | 15,075,895 |
Net Asset Value, Offering Price and Redemption Price Per Share
(net assets ÷ shares of beneficial interest outstanding) | $ 13.81 |
| Class R Shares | |
| Net Assets | $ 67,853,200 |
| Shares Outstanding | 4,669,608 |
Net Asset Value, Offering Price and Redemption Price Per Share
(net assets ÷ shares of beneficial interest outstanding) | $ 14.53 |
| On sales of $50,000 or more, the offering price of Class A shares is reduced. |
| * | Redemption price per share is equal to the net asset value less any applicable contingent deferred sales charge. |
8
See Notes to Financial Statements.
Eaton Vance
Worldwide Health Sciences Fund
February 28, 2022
Statement of Operations (Unaudited)
| | Six Months Ended |
| | February 28, 2022 |
| Investment Income | |
| Dividend income (net of foreign taxes withheld of $14,686) | $ 6,346,153 |
| Dividend income from affiliated investment | 566 |
| Total investment income | $ 6,346,719 |
| Expenses | |
| Investment adviser fee | $ 3,982,469 |
| Administration fee | 856,558 |
| Distribution and service fees: | |
| Class A | 1,012,078 |
| Class C | 259,340 |
| Class R | 170,990 |
| Trustees’ fees and expenses | 29,036 |
| Custodian fee | 145,535 |
| Transfer and dividend disbursing agent fees | 504,325 |
| Legal and accounting services | 38,400 |
| Printing and postage | 44,576 |
| Registration fees | 34,184 |
| Miscellaneous | 30,318 |
| Total expenses | $ 7,107,809 |
| Deduct: | |
| Allocation of expenses to affiliates | $ 80,603 |
| Total expense reductions | $ 80,603 |
| Net expenses | $ 7,027,206 |
| Net investment loss | $ (680,487) |
| Realized and Unrealized Gain (Loss) | |
| Net realized gain (loss): | |
| Investment transactions | $ 32,407,019 |
| Investment transactions - affiliated investment | (169) |
| Foreign currency transactions | 13,257 |
| Net realized gain | $ 32,420,107 |
| Change in unrealized appreciation (depreciation): | |
| Investments | $ (87,629,669) |
| Investments - affiliated investment | (96) |
| Foreign currency | (30,148) |
| Net change in unrealized appreciation (depreciation) | $(87,659,913) |
| Net realized and unrealized loss | $(55,239,806) |
| Net decrease in net assets from operations | $(55,920,293) |
9
See Notes to Financial Statements.
Eaton Vance
Worldwide Health Sciences Fund
February 28, 2022
Statements of Changes in Net Assets
| | Six Months Ended
February 28, 2022
(Unaudited) | Year Ended
August 31, 2021 |
| Increase (Decrease) in Net Assets | | |
| From operations: | | |
| Net investment income (loss) | $ (680,487) | $ 3,173,201 |
| Net realized gain | 32,420,107 | 96,984,237 |
| Net change in unrealized appreciation (depreciation) | (87,659,913) | 126,846,043 |
| Net increase (decrease) in net assets from operations | $ (55,920,293) | $ 227,003,481 |
| Distributions to shareholders: | | |
| Class A | $ (66,291,888) | $ (53,425,016) |
| Class C | (3,766,261) | (3,333,250) |
| Class I | (17,276,987) | (13,675,899) |
| Class R | (4,963,619) | (3,772,416) |
| Total distributions to shareholders | $ (92,298,755) | $ (74,206,581) |
| Transactions in shares of beneficial interest: | | |
| Class A | $ 32,698,868 | $ (16,785,232) |
| Class C | (1,929,109) | (13,840,974) |
| Class I | 13,626,368 | 1,128,566 |
| Class R | 5,920,489 | 737,557 |
| Net increase (decrease) in net assets from Fund share transactions | $ 50,316,616 | $ (28,760,083) |
| Net increase (decrease) in net assets | $ (97,902,432) | $ 124,036,817 |
| Net Assets | | |
| At beginning of period | $ 1,201,616,527 | $ 1,077,579,710 |
| At end of period | $1,103,714,095 | $1,201,616,527 |
10
See Notes to Financial Statements.
Eaton Vance
Worldwide Health Sciences Fund
February 28, 2022
| | Class A |
| | | Year Ended August 31, |
| | Six Months Ended
February 28, 2022
(Unaudited) | 2021 | 2020 | 2019 | 2018 | 2017 |
| Net asset value — Beginning of period | $ 15.260 | $ 13.380 | $ 11.610 | $ 11.700 | $ 10.710 | $ 11.140 |
| Income (Loss) From Operations | | | | | | |
| Net investment income (loss)(1) | $ (0.008) | $ 0.040 | $ 0.061 | $ 0.069 | $ 0.033 | $ (0.002) |
| Net realized and unrealized gain (loss) | (0.676) | 2.795 | 2.377 | 0.413 | 1.248 | 0.733 |
| Total income (loss) from operations | $ (0.684) | $ 2.835 | $ 2.438 | $ 0.482 | $ 1.281 | $ 0.731 |
| Less Distributions | | | | | | |
| From net investment income | $ (0.035) | $ (0.066) | $ (0.072) | $ (0.035) | $ — | $ — |
| From net realized gain | (1.171) | (0.889) | (0.596) | (0.537) | (0.291) | (1.161) |
| Total distributions | $ (1.206) | $ (0.955) | $ (0.668) | $ (0.572) | $ (0.291) | $ (1.161) |
| Net asset value — End of period | $ 13.370 | $ 15.260 | $ 13.380 | $ 11.610 | $ 11.700 | $ 10.710 |
| Total Return(2)(3) | (4.76)% (4) | 22.58% | 21.74% | 4.35% | 12.31% | 8.50% |
| Ratios/Supplemental Data | | | | | | |
| Net assets, end of period (000's omitted) | $779,887 | $853,051 | $761,814 | $698,865 | $654,296 | $707,485 |
| Ratios (as a percentage of average daily net assets):(5) | | | | | | |
| Expenses (3) | 1.23% (6) | 1.16% | 1.22% | 1.09% | 1.06% | 1.30% |
| Net investment income (loss) | (0.12)% (6) | 0.30% | 0.50% | 0.61% | 0.31% | (0.02)% |
| Portfolio Turnover of the Portfolio(7) | — | — | — | 32% | 37% | 36% |
| Portfolio Turnover of the Fund | 13% (4) | 32% | 38% | 3% (8) | — | — |
| (1) | Computed using average shares outstanding. |
| (2) | Returns are historical and are calculated by determining the percentage change in net asset value with all distributions reinvested and do not reflect the effect of sales charges. |
| (3) | The investment adviser, sub-adviser(s) and administrator reimbursed certain operating expenses (equal to 0.01%, 0.01%, 0.04%, 0.07%, 0.06% and 0.05% of average daily net assets for the six months ended February 28, 2022 and the years ended August 31, 2021, 2020, 2019, 2018 and 2017, respectively). Absent this reimbursement, total return would be lower. |
| (4) | Not annualized. |
| (5) | Includes the Fund’s share of the Portfolio’s allocated expenses for the period while the Fund was investing in the Portfolio. |
| (6) | Annualized. |
| (7) | Portfolio turnover represents the rate of portfolio activity for the period while the Fund was investing in the Portfolio. |
| (8) | For the period from August 12, 2019 through August 31, 2019 when the Fund was making investments directly in securities. |
| References to Portfolio herein are to Worldwide Health Sciences Portfolio, a Massachusetts business trust in which the Fund invested all of its investable assets prior to the close of business on August 9, 2019 and which had the same investment objective and policies as the Fund during such period. |
11
See Notes to Financial Statements.
Eaton Vance
Worldwide Health Sciences Fund
February 28, 2022
Financial Highlights — continued
| | Class C |
| | | Year Ended August 31, |
| | Six Months Ended
February 28, 2022
(Unaudited) | 2021 | 2020 | 2019 | 2018 | 2017 |
| Net asset value — Beginning of period | $ 15.440 | $ 13.500 | $ 11.690 | $ 11.770 | $ 10.850 | $ 11.350 |
| Income (Loss) From Operations | | | | | | |
| Net investment loss(1) | $ (0.063) | $ (0.065) | $ (0.032) | $ (0.040) | $ (0.048) | $ (0.079) |
| Net realized and unrealized gain (loss) | (0.681) | 2.836 | 2.384 | 0.437 | 1.259 | 0.740 |
| Total income (loss) from operations | $ (0.744) | $ 2.771 | $ 2.352 | $ 0.397 | $ 1.211 | $ 0.661 |
| Less Distributions | | | | | | |
| From net realized gain | $ (1.086) | $ (0.831) | $ (0.542) | $ (0.477) | $ (0.291) | $ (1.161) |
| Total distributions | $ (1.086) | $ (0.831) | $ (0.542) | $ (0.477) | $ (0.291) | $ (1.161) |
| Net asset value — End of period | $13.610 | $15.440 | $13.500 | $11.690 | $ 11.770 | $ 10.850 |
| Total Return(2)(3) | (5.08)% (4) | 21.68% | 20.70% | 3.54% | 11.49% | 7.67% |
| Ratios/Supplemental Data | | | | | | |
| Net assets, end of period (000’s omitted) | $ 47,705 | $ 56,172 | $ 62,657 | $ 63,886 | $177,727 | $204,069 |
| Ratios (as a percentage of average daily net assets):(5) | | | | | | |
| Expenses (3) | 1.98% (6) | 1.91% | 1.97% | 1.84% | 1.81% | 2.05% |
| Net investment loss | (0.87)% (6) | (0.47)% | (0.26)% | (0.35)% | (0.45)% | (0.76)% |
| Portfolio Turnover of the Portfolio(7) | — | — | — | 32% | 37% | 36% |
| Portfolio Turnover of the Fund | 13% (4) | 32% | 38% | 3% (8) | — | — |
| (1) | Computed using average shares outstanding. |
| (2) | Returns are historical and are calculated by determining the percentage change in net asset value with all distributions reinvested and do not reflect the effect of sales charges. |
| (3) | The investment adviser, sub-adviser(s) and administrator reimbursed certain operating expenses (equal to 0.01%, 0.01%, 0.04%, 0.07%, 0.06% and 0.05% of average daily net assets for the six months ended February 28, 2022 and the years ended August 31, 2021, 2020, 2019, 2018 and 2017, respectively). Absent this reimbursement, total return would be lower. |
| (4) | Not annualized. |
| (5) | Includes the Fund’s share of the Portfolio’s allocated expenses for the period while the Fund was investing in the Portfolio. |
| (6) | Annualized. |
| (7) | Portfolio turnover represents the rate of portfolio activity for the period while the Fund was investing in the Portfolio. |
| (8) | For the period from August 12, 2019 through August 31, 2019 when the Fund was making investments directly in securities. |
| References to Portfolio herein are to Worldwide Health Sciences Portfolio, a Massachusetts business trust in which the Fund invested all of its investable assets prior to the close of business on August 9, 2019 and which had the same investment objective and policies as the Fund during such period. |
12
See Notes to Financial Statements.
Eaton Vance
Worldwide Health Sciences Fund
February 28, 2022
Financial Highlights — continued
| | Class I |
| | | Year Ended August 31, |
| | Six Months Ended
February 28, 2022
(Unaudited) | 2021 | 2020 | 2019 | 2018 | 2017 |
| Net asset value — Beginning of period | $ 15.740 | $ 13.770 | $ 11.930 | $ 12.010 | $ 10.960 | $ 11.340 |
| Income (Loss) From Operations | | | | | | |
| Net investment income(1) | $ 0.010 | $ 0.077 | $ 0.094 | $ 0.098 | $ 0.061 | $ 0.025 |
| Net realized and unrealized gain (loss) | (0.698) | 2.881 | 2.443 | 0.424 | 1.280 | 0.756 |
| Total income (loss) from operations | $ (0.688) | $ 2.958 | $ 2.537 | $ 0.522 | $ 1.341 | $ 0.781 |
| Less Distributions | | | | | | |
| From net investment income | $ (0.071) | $ (0.099) | $ (0.101) | $ (0.065) | $ — | $ — |
| From net realized gain | (1.171) | (0.889) | (0.596) | (0.537) | (0.291) | (1.161) |
| Total distributions | $ (1.242) | $ (0.988) | $ (0.697) | $ (0.602) | $ (0.291) | $ (1.161) |
| Net asset value — End of period | $ 13.810 | $ 15.740 | $ 13.770 | $ 11.930 | $ 12.010 | $ 10.960 |
| Total Return(2)(3) | (4.65)% (4) | 22.89% | 22.04% | 4.60% | 12.59% | 8.82% |
| Ratios/Supplemental Data | | | | | | |
| Net assets, end of period (000’s omitted) | $208,269 | $221,892 | $192,629 | $169,013 | $173,054 | $173,116 |
| Ratios (as a percentage of average daily net assets):(5) | | | | | | |
| Expenses (3) | 0.98% (6) | 0.91% | 0.97% | 0.84% | 0.81% | 1.05% |
| Net investment income | 0.14% (6) | 0.55% | 0.75% | 0.84% | 0.56% | 0.24% |
| Portfolio Turnover of the Portfolio(7) | — | — | — | 32% | 37% | 36% |
| Portfolio Turnover of the Fund | 13% (4) | 32% | 38% | 3% (8) | — | — |
| (1) | Computed using average shares outstanding. |
| (2) | Returns are historical and are calculated by determining the percentage change in net asset value with all distributions reinvested. |
| (3) | The investment adviser, sub-adviser(s) and administrator reimbursed certain operating expenses (equal to 0.01%, 0.01%, 0.04%, 0.07%, 0.06% and 0.05% of average daily net assets for the six months ended February 28, 2022 and the years ended August 31, 2021, 2020, 2019, 2018 and 2017, respectively). Absent this reimbursement, total return would be lower. |
| (4) | Not annualized. |
| (5) | Includes the Fund’s share of the Portfolio’s allocated expenses for the period while the Fund was investing in the Portfolio. |
| (6) | Annualized. |
| (7) | Portfolio turnover represents the rate of portfolio activity for the period while the Fund was investing in the Portfolio. |
| (8) | For the period from August 12, 2019 through August 31, 2019 when the Fund was making investments directly in securities. |
| References to Portfolio herein are to Worldwide Health Sciences Portfolio, a Massachusetts business trust in which the Fund invested all of its investable assets prior to the close of business on August 9, 2019 and which had the same investment objective and policies as the Fund during such period. |
13
See Notes to Financial Statements.
Eaton Vance
Worldwide Health Sciences Fund
February 28, 2022
Financial Highlights — continued
| | Class R |
| | | Year Ended August 31, |
| | Six Months Ended
February 28, 2022
(Unaudited) | 2021 | 2020 | 2019 | 2018 | 2017 |
| Net asset value — Beginning of period | $ 16.450 | $ 14.350 | $ 12.400 | $ 12.460 | $ 11.410 | $ 11.810 |
| Income (Loss) From Operations | | | | | | |
| Net investment income (loss)(1) | $ (0.028) | $ 0.008 | $ 0.033 | $ 0.042 | $ 0.008 | $ (0.029) |
| Net realized and unrealized gain (loss) | (0.727) | 3.008 | 2.547 | 0.440 | 1.333 | 0.790 |
| Total income (loss) from operations | $ (0.755) | $ 3.016 | $ 2.580 | $ 0.482 | $ 1.341 | $ 0.761 |
| Less Distributions | | | | | | |
| From net investment income | $ — | $ (0.027) | $ (0.034) | $ (0.005) | $ — | $ — |
| From net realized gain | (1.165) | (0.889) | (0.596) | (0.537) | (0.291) | (1.161) |
| Total distributions | $ (1.165) | $ (0.916) | $ (0.630) | $ (0.542) | $ (0.291) | $ (1.161) |
| Net asset value — End of period | $14.530 | $16.450 | $14.350 | $12.400 | $12.460 | $11.410 |
| Total Return(2)(3) | (4.84)% (4) | 22.24% | 21.46% | 4.07% | 12.08% | 8.25% |
| Ratios/Supplemental Data | | | | | | |
| Net assets, end of period (000’s omitted) | $ 67,853 | $ 70,502 | $ 60,480 | $ 57,674 | $ 60,883 | $ 61,724 |
| Ratios (as a percentage of average daily net assets):(5) | | | | | | |
| Expenses (3) | 1.48% (6) | 1.41% | 1.47% | 1.34% | 1.31% | 1.55% |
| Net investment income (loss) | (0.36)% (6) | 0.05% | 0.25% | 0.35% | 0.07% | (0.27)% |
| Portfolio Turnover of the Portfolio(7) | — | — | — | 32% | 37% | 36% |
| Portfolio Turnover of the Fund | 13% (4) | 32% | 38% | 3% (8) | — | — |
| (1) | Computed using average shares outstanding. |
| (2) | Returns are historical and are calculated by determining the percentage change in net asset value with all distributions reinvested. |
| (3) | The investment adviser, sub-adviser(s) and administrator reimbursed certain operating expenses (equal to 0.01%, 0.01%, 0.04%, 0.07%, 0.06% and 0.05% of average daily net assets for the six months ended February 28, 2022 and the years ended August 31, 2021, 2020, 2019, 2018 and 2017, respectively). Absent this reimbursement, total return would be lower. |
| (4) | Not annualized. |
| (5) | Includes the Fund’s share of the Portfolio’s allocated expenses for the period while the Fund was investing in the Portfolio. |
| (6) | Annualized. |
| (7) | Portfolio turnover represents the rate of portfolio activity for the period while the Fund was investing in the Portfolio. |
| (8) | For the period from August 12, 2019 through August 31, 2019 when the Fund was making investments directly in securities. |
| References to Portfolio herein are to Worldwide Health Sciences Portfolio, a Massachusetts business trust in which the Fund invested all of its investable assets prior to the close of business on August 9, 2019 and which had the same investment objective and policies as the Fund during such period. |
14
See Notes to Financial Statements.
Eaton Vance
Worldwide Health Sciences Fund
February 28, 2022
Notes to Financial Statements (Unaudited)
1 Significant Accounting Policies
Eaton Vance Worldwide Health Sciences Fund (the Fund) is a diversified series of Eaton Vance Growth Trust (the Trust). The Trust is a Massachusetts business trust registered under the Investment Company Act of 1940, as amended (the 1940 Act), as an open-end management investment company. The Fund’s investment objective is to seek long-term capital growth by investing in a worldwide and diversified portfolio of health sciences companies. The Fund offers four classes of shares. Class A shares are generally sold subject to a sales charge imposed at time of purchase. Class C shares are sold at net asset value and are generally subject to a contingent deferred sales charge (see Note 5). Effective January 25, 2019, Class C shares generally automatically convert to Class A shares ten years after their purchase and, effective November 5, 2020, automatically convert to Class A shares eight years after their purchase as described in the Fund’s prospectus. Class I and Class R shares are sold at net asset value and are not subject to a sales charge. Each class represents a pro-rata interest in the Fund, but votes separately on class-specific matters and (as noted below) is subject to different expenses. Realized and unrealized gains and losses and net investment income and losses, other than class-specific expenses, are allocated daily to each class of shares based on the relative net assets of each class to the total net assets of the Fund. Each class of shares differs in its distribution plan and certain other class-specific expenses.
The following is a summary of significant accounting policies of the Fund. The policies are in conformity with accounting principles generally accepted in the United States of America (U.S. GAAP). The Fund is an investment company and follows accounting and reporting guidance in the Financial Accounting Standards Board (FASB) Accounting Standards Codification Topic 946.
A Investment Valuation—The following methodologies are used to determine the market value or fair value of investments.
Equity Securities. Equity securities (common stocks and exchange-traded funds) listed on a U.S. securities exchange generally are valued at the last sale or closing price on the day of valuation or, if no sales took place on such date, at the mean between the closing bid and ask prices on the exchange where such securities are principally traded. Equity securities listed on the NASDAQ National Market System are valued at the NASDAQ official closing price. Unlisted or listed securities for which closing sales prices or closing quotations are not available are valued at the mean between the latest available bid and ask prices.
Foreign Securities and Currencies. Foreign securities and currencies are valued in U.S. dollars, based on foreign currency exchange rate quotations supplied by a third party pricing service. The pricing service uses a proprietary model to determine the exchange rate. Inputs to the model include reported trades and implied bid/ask spreads. The daily valuation of exchange-traded foreign securities generally is determined as of the close of trading on the principal exchange on which such securities trade. Events occurring after the close of trading on foreign exchanges may result in adjustments to the valuation of foreign securities to more accurately reflect their fair value as of the close of regular trading on the New York Stock Exchange. When valuing foreign equity securities that meet certain criteria, the Fund's Trustees have approved the use of a fair value service that values such securities to reflect market trading that occurs after the close of the applicable foreign markets of comparable securities or other instruments that have a strong correlation to the fair-valued securities.
Affiliated Fund. The Fund may invest in Eaton Vance Cash Reserves Fund, LLC (Cash Reserves Fund), an affiliated investment company managed by Eaton Vance Management (EVM). While Cash Reserves Fund is not a registered money market mutual fund, it conducts all of its investment activities in accordance with the requirements of Rule 2a-7 under the 1940 Act. Investments in Cash Reserves Fund are valued at the closing net asset value per unit on the valuation day. Cash Reserves Fund generally values its investment securities based on available market quotations provided by a third party pricing service.
Fair Valuation. Investments for which valuations or market quotations are not readily available or are deemed unreliable are valued at fair value using methods determined in good faith by or at the direction of the Trustees of the Fund in a manner that most fairly reflects the security’s “fair value”, which is the amount that the Fund might reasonably expect to receive for the security upon its current sale in the ordinary course. Each such determination is based on a consideration of relevant factors, which are likely to vary from one pricing context to another. These factors may include, but are not limited to, the type of security, the existence of any contractual restrictions on the security’s disposition, the price and extent of public trading in similar securities of the issuer or of comparable companies or entities, quotations or relevant information obtained from broker/dealers or other market participants, information obtained from the issuer, analysts, and/or the appropriate stock exchange (for exchange-traded securities), an analysis of the company’s or entity’s financial statements, and an evaluation of the forces that influence the issuer and the market(s) in which the security is purchased and sold.
B Investment Transactions— Investment transactions for financial statement purposes are accounted for on a trade date basis. Realized gains and losses on investments sold are determined on the basis of identified cost.
C Income—Dividend income is recorded on the ex-dividend date for dividends received in cash and/or securities. However, if the ex-dividend date has passed, certain dividends from foreign securities are recorded as the Fund is informed of the ex-dividend date. Withholding taxes on foreign dividends and capital gains have been provided for in accordance with the Fund's understanding of the applicable countries’ tax rules and rates. In consideration of recent decisions rendered by European courts, the Fund has filed additional tax reclaims for previously withheld taxes on dividends earned in certain European Union countries. These filings are subject to various administrative and judicial proceedings within these countries. Due to the uncertainty as to the ultimate resolution of these proceedings, the likelihood of receipt of these reclaims, and the potential timing of payment, no amounts are reflected in the financial statements for such outstanding reclaims. Distributions from investment companies are recorded as dividend income, capital gains or return of capital based on the nature of the distribution.
Eaton Vance
Worldwide Health Sciences Fund
February 28, 2022
Notes to Financial Statements (Unaudited) — continued
D Federal Taxes— The Fund's policy is to comply with the provisions of the Internal Revenue Code applicable to regulated investment companies and to distribute to shareholders each year substantially all of its net investment income, and all or substantially all of its net realized capital gains. Accordingly, no provision for federal income or excise tax is necessary.
As of February 28, 2022, the Fund had no uncertain tax positions that would require financial statement recognition, de-recognition, or disclosure. The Fund files a U.S. federal income tax return annually after its fiscal year-end, which is subject to examination by the Internal Revenue Service for a period of three years from the date of filing.
E Expenses—The majority of expenses of the Trust are directly identifiable to an individual fund. Expenses which are not readily identifiable to a specific fund are allocated taking into consideration, among other things, the nature and type of expense and the relative size of the funds.
F Foreign Currency Translation—Investment valuations, other assets, and liabilities initially expressed in foreign currencies are translated each business day into U.S. dollars based upon current exchange rates. Purchases and sales of foreign investment securities and income and expenses denominated in foreign currencies are translated into U.S. dollars based upon currency exchange rates in effect on the respective dates of such transactions. Recognized gains or losses on investment transactions attributable to changes in foreign currency exchange rates are recorded for financial statement purposes as net realized gains and losses on investments. That portion of unrealized gains and losses on investments that results from fluctuations in foreign currency exchange rates is not separately disclosed.
G Use of Estimates—The preparation of the financial statements in conformity with U.S. GAAP requires management to make estimates and assumptions that affect the reported amounts of assets and liabilities at the date of the financial statements and the reported amounts of income and expense during the reporting period. Actual results could differ from those estimates.
H Indemnifications—Under the Trust’s organizational documents, its officers and Trustees may be indemnified against certain liabilities and expenses arising out of the performance of their duties to the Fund. Under Massachusetts law, if certain conditions prevail, shareholders of a Massachusetts business trust (such as the Trust) could be deemed to have personal liability for the obligations of the Trust. However, the Trust’s Declaration of Trust contains an express disclaimer of liability on the part of Fund shareholders and the By-laws provide that the Trust shall assume, upon request by the shareholder, the defense on behalf of any Fund shareholders. Moreover, the By-laws also provide for indemnification out of Fund property of any shareholder held personally liable solely by reason of being or having been a shareholder for all loss or expense arising from such liability. Additionally, in the normal course of business, the Fund enters into agreements with service providers that may contain indemnification clauses. The Fund’s maximum exposure under these arrangements is unknown as this would involve future claims that may be made against the Fund that have not yet occurred.
I Interim Financial Statements—The interim financial statements relating to February 28, 2022 and for the six months then ended have not been audited by an independent registered public accounting firm, but in the opinion of the Fund’s management, reflect all adjustments, consisting only of normal recurring adjustments, necessary for the fair presentation of the financial statements.
2 Distributions to Shareholders and Income Tax Information
It is the present policy of the Fund to make at least one distribution annually (normally in December) of all or substantially all of its net investment income and to distribute annually all or substantially all of its net realized capital gains. Distributions to shareholders are recorded on the ex-dividend date. Distributions are declared separately for each class of shares. Shareholders may reinvest income and capital gain distributions in additional shares of the same class of the Fund at the net asset value as of the ex-dividend date or, at the election of the shareholder, receive distributions in cash. Distributions to shareholders are determined in accordance with income tax regulations, which may differ from U.S. GAAP. As required by U.S. GAAP, only distributions in excess of tax basis earnings and profits are reported in the financial statements as a return of capital. Permanent differences between book and tax accounting relating to distributions are reclassified to paid-in capital. For tax purposes, distributions from short-term capital gains are considered to be from ordinary income.
The cost and unrealized appreciation (depreciation) of investments of the Fund at February 28, 2022, as determined on a federal income tax basis, were as follows:
| Aggregate cost | $ 708,310,010 |
| Gross unrealized appreciation | $ 412,128,342 |
| Gross unrealized depreciation | (18,107,729) |
| Net unrealized appreciation | $ 394,020,613 |
Eaton Vance
Worldwide Health Sciences Fund
February 28, 2022
Notes to Financial Statements (Unaudited) — continued
3 Investment Adviser Fee and Other Transactions with Affiliates
The investment adviser fee is earned by EVM, an indirect, wholly-owned subsidiary of Morgan Stanley, as compensation for investment advisory services rendered to the Fund. The fee is computed at an annual rate as a percentage of the Fund’s average daily net assets as follows and is payable monthly:
| Average Daily Net Assets | Annual Fee Rate |
| Up to $500 million | 0.675% |
| $500 million but less than $1 billion | 0.590% |
| $1 billion but less than $1.5 billion | 0.520% |
| $1.5 billion but less than $2 billion | 0.490% |
| $2 billion but less than $2.5 billion | 0.470% |
| $2.5 billion and over | 0.450% |
In addition, EVM’s fee is subject to an upward or downward performance adjustment of up to 0.15% (annually) of the average daily net assets of the Fund depending on whether, and to what extent, the investment performance of the Fund differs by at least one percentage point from the record of the MSCI World Health Care Index over a 36-month performance period. For the six months ended February 28, 2022, the investment adviser fee, including an upward performance adjustment of $455,191, amounted to $3,982,469 or 0.70% (annualized) of the Fund’s average daily net assets. Pursuant to an investment sub-advisory agreement, EVM has delegated a portion of the investment management of the Fund to Eaton Vance Advisers International Ltd. (EVAIL), an affiliate of EVM and an indirect, wholly-owned subsidiary of Morgan Stanley. EVM pays EVAIL a portion of its investment adviser fee for sub advisory services provided to the Fund. The Fund may invest its cash in Cash Reserves Fund. EVM does not currently receive a fee for advisory services provided to Cash Reserves Fund.
The administration fee is earned by EVM for administering the business affairs of the Fund and is computed at an annual rate of 0.15% of the Fund’s average daily net assets. For the six months ended February 28, 2022, the administration fee amounted to $856,558.
EVM and EVAIL have agreed to reimburse the Fund’s expenses to the extent that total annual operating expenses (relating to ordinary operating expenses only and excluding such expenses as borrowing costs, taxes or litigation expenses and any performance-based adjustment to an asset-based investment advisory fee) exceed 1.15%, 1.90%, 0.90% and 1.40% of the Fund’s average daily net assets for Class A, Class C, Class I and Class R, respectively. This agreement may be changed or terminated after December 31, 2022. Pursuant to this agreement, EVM and EVAIL were allocated $80,603 in total of the Fund’s operating expenses for the six months ended February 28, 2022.
EVM provides sub-transfer agency and related services to the Fund pursuant to a Sub-Transfer Agency Support Services Agreement. For the six months ended February 28, 2022, EVM earned $103,458 from the Fund pursuant to such agreement, which is included in transfer and dividend disbursing agent fees on the Statement of Operations. The Fund was informed that Eaton Vance Distributors, Inc. (EVD), an affiliate of EVM and the Fund’s principal underwriter, received $23,316 as its portion of the sales charge on sales of Class A shares for the six months ended February 28, 2022. EVD also received distribution and service fees from Class A, Class C and Class R shares (see Note 4) and contingent deferred sales charges (see Note 5).
Trustees and officers of the Fund who are members of EVM’s organization receive remuneration for their services to the Fund out of the investment adviser fee. Trustees of the Fund who are not affiliated with the investment adviser may elect to defer receipt of all or a percentage of their annual fees in accordance with the terms of the Trustees Deferred Compensation Plan. For the six months ended February 28, 2022, no significant amounts have been deferred. Certain officers and Trustees of the Fund are officers of EVM.
4 Distribution Plans
The Fund has in effect a distribution plan for Class A shares (Class A Plan) pursuant to Rule 12b-1 under the 1940 Act. Pursuant to the Class A Plan, the Fund pays EVD a distribution and service fee of 0.25% per annum of its average daily net assets attributable to Class A shares for distribution services and facilities provided to the Fund by EVD, as well as for personal services and/or the maintenance of shareholder accounts. Distribution and service fees paid or accrued to EVD for the six months ended February 28, 2022 amounted to $1,012,078 for Class A shares.
The Fund also has in effect distribution plans for Class C shares (Class C Plan) and Class R shares (Class R Plan) pursuant to Rule 12b-1 under the 1940 Act. Pursuant to the Class C Plan, the Fund pays EVD amounts equal to 0.75% per annum of its average daily net assets attributable to Class C shares for providing ongoing distribution services and facilities to the Fund. For the six months ended February 28, 2022, the Fund paid or accrued to EVD $194,505 for Class C shares.
The Class R Plan requires the Fund to pay EVD an amount up to 0.50% per annum of its average daily net assets attributable to Class R shares for providing ongoing distribution services and facilities to the Fund. The Trustees of the Trust have currently limited Class R distribution payments to 0.25% per annum of the average daily net assets attributable to Class R shares. For the six months ended February 28, 2022, the Fund paid or accrued to EVD $85,495 for Class R shares.
Eaton Vance
Worldwide Health Sciences Fund
February 28, 2022
Notes to Financial Statements (Unaudited) — continued
Pursuant to the Class C and Class R Plans, the Fund also makes payments of service fees to EVD, financial intermediaries and other persons in amounts equal to 0.25% per annum of its average daily net assets attributable to that class. Service fees paid or accrued are for personal services and/or the maintenance of shareholder accounts. They are separate and distinct from the sales commissions and distribution fees payable to EVD. Service fees paid or accrued for the six months ended February 28, 2022 amounted to $64,835 and $85,495 for Class C and Class R shares, respectively.
Distribution and service fees are subject to the limitations contained in the Financial Industry Regulatory Authority Rule 2341(d).
5 Contingent Deferred Sales Charges
A contingent deferred sales charge (CDSC) of 1% generally is imposed on redemptions of Class C shares made within 12 months of purchase. Class A shares may be subject to a 1% CDSC if redeemed within 18 months of purchase (depending on the circumstances of purchase). Generally, the CDSC is based upon the lower of the net asset value at date of redemption or date of purchase. No charge is levied on shares acquired by reinvestment of dividends or capital gain distributions. For the six months ended February 28, 2022, the Fund was informed that EVD received approximately $300 and $1,000 of CDSCs paid by Class A and Class C shareholders, respectively.
6 Purchases and Sales of Investments
Purchases and sales of investments, other than short-term obligations, aggregated $145,949,396 and $186,896,071, respectively, for the six months ended February 28, 2022.
7 Shares of Beneficial Interest
The Fund’s Declaration of Trust permits the Trustees to issue an unlimited number of full and fractional shares of beneficial interest (without par value). Such shares may be issued in a number of different series (such as the Fund) and classes. Transactions in Fund shares were as follows:
| | Six Months Ended
February 28, 2022
(Unaudited) | | Year Ended
August 31, 2021 |
| | Shares | Amount | | Shares | Amount |
| Class A | | | | | |
| Sales | 1,140,939 | $ 16,029,718 | | 1,640,981 | $ 21,927,586 |
| Issued to shareholders electing to receive payments of distributions in Fund shares | 4,271,900 | 59,208,531 | | 3,737,791 | 47,731,596 |
| Redemptions | (3,265,055) | (46,343,858) | | (7,164,403) | (96,475,782) |
| Converted from Class C shares | 273,671 | 3,804,477 | | 743,573 | 10,031,368 |
| Net increase (decrease) | 2,421,455 | $ 32,698,868 | | (1,042,058) | $(16,785,232) |
| Class C | | | | | |
| Sales | 125,812 | $ 1,835,746 | | 349,289 | $ 4,752,650 |
| Issued to shareholders electing to receive payments of distributions in Fund shares | 261,484 | 3,694,767 | | 250,176 | 3,252,290 |
| Redemptions | (249,514) | (3,655,145) | | (866,480) | (11,814,546) |
| Converted to Class A shares | (269,486) | (3,804,477) | | (735,613) | (10,031,368) |
| Net decrease | (131,704) | $ (1,929,109) | | (1,002,628) | $(13,840,974) |
| Class I | | | | | |
| Sales | 1,228,500 | $ 17,706,808 | | 2,122,499 | $ 29,559,582 |
| Issued to shareholders electing to receive payments of distributions in Fund shares | 993,064 | 14,210,739 | | 840,206 | 11,048,703 |
| Redemptions | (1,240,740) | (18,291,179) | | (2,854,920) | (39,479,719) |
| Net increase | 980,824 | $ 13,626,368 | | 107,785 | $ 1,128,566 |
Eaton Vance
Worldwide Health Sciences Fund
February 28, 2022
Notes to Financial Statements (Unaudited) — continued
| | Six Months Ended
February 28, 2022
(Unaudited) | | Year Ended
August 31, 2021 |
| | Shares | Amount | | Shares | Amount |
| Class R | | | | | |
| Sales | 410,514 | $ 6,414,577 | | 574,171 | $ 8,342,378 |
| Issued to shareholders electing to receive payments of distributions in Fund shares | 328,900 | 4,956,530 | | 272,796 | 3,764,588 |
| Redemptions | (354,521) | (5,450,618) | | (777,383) | (11,369,409) |
| Net increase | 384,893 | $ 5,920,489 | | 69,584 | $ 737,557 |
8 Restricted Securities
At February 28, 2022, the Fund owned the following security (representing 0.2% of net assets) which was restricted as to public resale and not registered under the Securities Act of 1933 (excluding Rule 144A securities). The Fund has limited registration rights with respect to this security. The value of restricted securities is determined based on valuations provided by brokers when available, or if not available, they are valued at fair value using methods determined in good faith by or at the direction of the Trustees.
| Description | Date(s) of
Acquisition | Shares | Cost | Value |
| Convertible Preferred Stocks | | | | |
| Caris Life Sciences, Inc., Series D | 5/12/21 | 370,370 | $ 3,000,000 | $ 2,622,219 |
| Total Convertible Preferred Stocks | | | $3,000,000 | $2,622,219 |
| Total Restricted Securities | | | $3,000,000 | $2,622,219 |
9 Line of Credit
The Fund participates with other portfolios and funds managed by EVM and its affiliates in an $800 million unsecured line of credit agreement with a group of banks, which is in effect through October 25, 2022. Borrowings are made by the Fund solely for temporary purposes related to redemptions and other short-term cash needs. Interest is charged to the Fund based on its borrowings at an amount above either the Secured Overnight Financing Rate (SOFR) or Federal Funds rate. In addition, a fee computed at an annual rate of 0.15% on the daily unused portion of the line of credit is allocated among the participating portfolios and funds at the end of each quarter. In connection with the renewal of the agreement in October 2021, an arrangement fee totaling $150,000 was incurred that was allocated to the participating portfolios and funds. Because the line of credit is not available exclusively to the Fund, it may be unable to borrow some or all of its requested amounts at any particular time. The Fund did not have any significant borrowings or allocated fees during the six months ended February 28, 2022.
10 Investments in Affiliated Funds
At February 28, 2022, the value of the Fund's investment in affiliated funds was $955,219, which represents 0.1% of the Fund's net assets. Transactions in affiliated funds by the Fund for the six months ended February 28, 2022 were as follows:
| Name | Value,
beginning
of period | Purchases | Sales
proceeds | Net
realized
gain (loss) | Change in
unrealized
appreciation
(depreciation) | Value, end
of period | Dividend
income | Units, end
of period |
| Short-Term Investments |
| Eaton Vance Cash Reserves Fund, LLC | $6,140,576 | $55,362,578 | $(60,547,670) | $(169) | $(96) | $955,219 | $566 | 955,315 |
Eaton Vance
Worldwide Health Sciences Fund
February 28, 2022
Notes to Financial Statements (Unaudited) — continued
11 Fair Value Measurements
Under generally accepted accounting principles for fair value measurements, a three-tier hierarchy to prioritize the assumptions, referred to as inputs, is used in valuation techniques to measure fair value. The three-tier hierarchy of inputs is summarized in the three broad levels listed below.
| • | Level 1 – quoted prices in active markets for identical investments |
| • | Level 2 – other significant observable inputs (including quoted prices for similar investments, interest rates, prepayment speeds, credit risk, etc.) |
| • | Level 3 – significant unobservable inputs (including a fund’s own assumptions in determining the fair value of investments) |
In cases where the inputs used to measure fair value fall in different levels of the fair value hierarchy, the level disclosed is determined based on the lowest level input that is significant to the fair value measurement in its entirety. The inputs or methodology used for valuing securities are not necessarily an indication of the risk associated with investing in those securities.
At February 28, 2022, the hierarchy of inputs used in valuing the Fund's investments, which are carried at value, were as follows:
| Asset Description | Level 1 | Level 2 | Level 3* | Total |
| Common Stocks: | | | | |
| Biotechnology | $ 100,505,643 | $ 23,249,849 | $ — | $ 123,755,492 |
| Containers & Packaging | 5,444,989 | — | — | 5,444,989 |
| Health Care Equipment | 161,904,441 | 12,775,840 | — | 174,680,281 |
| Health Care Services | 24,947,027 | — | — | 24,947,027 |
| Health Care Supplies | 12,174,071 | 22,771,551 | — | 34,945,622 |
| Health Care Technology | 10,733,970 | 9,607,184 | — | 20,341,154 |
| Life Sciences Tools & Services | 104,966,801 | 23,252,708 | — | 128,219,509 |
| Managed Health Care | 117,003,842 | — | — | 117,003,842 |
| Pharmaceuticals | 253,047,061 | 212,072,912 | — | 465,119,973 |
| Total Common Stocks | $790,727,845 | $303,730,044 ** | $ — | $1,094,457,889 |
| Convertible Preferred Stocks | $ — | $ — | $ 2,622,219 | $ 2,622,219 |
| Exchange-Traded Funds | 4,295,296 | — | — | 4,295,296 |
| Short-Term Investments | — | 955,219 | — | 955,219 |
| Total Investments | $795,023,141 | $304,685,263 | $2,622,219 | $1,102,330,623 |
| * | None of the unobservable inputs for Level 3 assets, individually or collectively, had a material impact on the Fund. |
| ** | Includes foreign equity securities whose values were adjusted to reflect market trading of comparable securities or other correlated instruments that occurred after the close of trading in their applicable foreign markets. |
Level 3 investments at the beginning and/or end of the period in relation to net assets were not significant and accordingly, a reconciliation of Level 3 assets for the six months ended February 28, 2022 is not presented.
12 Risks and Uncertainties
Risks Associated with Foreign Investments
Foreign investments can be adversely affected by political, economic and market developments abroad, including the imposition of economic and other sanctions by the United States or another country. There may be less publicly available information about foreign issuers because they may not be subject to reporting practices, requirements or regulations comparable to those to which United States companies are subject. Foreign markets may be smaller, less liquid and more volatile than the major markets in the United States. Trading in foreign markets typically involves higher expense than trading in the United States. The Fund may have difficulties enforcing its legal or contractual rights in a foreign country. Securities that trade or are denominated in currencies other than the U.S. dollar may be adversely affected by fluctuations in currency exchange rates.
Concentration of Risk
As the Fund invests a significant portion of its assets in pharmaceutical, biotechnology, life sciences, and health care equipment and services companies, it may be affected by developments that adversely affect such companies. These developments include product obsolescence, the failure of a company to
Eaton Vance
Worldwide Health Sciences Fund
February 28, 2022
Notes to Financial Statements (Unaudited) — continued
develop new products and the expiration of patent rights. The value of the Fund’s interests can also be impacted by regulatory activities that affect health sciences companies. The Fund has historically held approximately 60 stocks or less at any one time; therefore, it is more sensitive to developments affecting particular stocks than would be a more broadly diversified fund.
Pandemic Risk
An outbreak of respiratory disease caused by a novel coronavirus was first detected in China in late 2019 and subsequently spread internationally. This coronavirus has resulted in closing borders, enhanced health screenings, changes to healthcare service preparation and delivery, quarantines, cancellations, disruptions to supply chains and customer activity, as well as general concern and uncertainty. Health crises caused by outbreaks, such as the coronavirus outbreak, may exacerbate other pre-existing political, social and economic risks and disrupt normal market conditions and operations. The impact of this outbreak has negatively affected the worldwide economy, the economies of individual countries, individual companies, and the market in general, and may continue to do so in significant and unforeseen ways, as may other epidemics and pandemics that may arise in the future. Any such impact could adversely affect the Fund's performance, or the performance of the securities in which the Fund invests.
Eaton Vance
Worldwide Health Sciences Fund
February 28, 2022
| Officers |
Eric A. Stein
President | Jill R. Damon
Secretary |
Deidre E. Walsh
Vice President and Chief Legal Officer | Richard F. Froio
Chief Compliance Officer |
James F. Kirchner
Treasurer | |
George J. Gorman
Chairperson | |
| Alan C. Bowser* | |
| Thomas E. Faust Jr.** | |
| Mark R. Fetting | |
| Cynthia E. Frost | |
| Valerie A. Mosley | |
| William H. Park | |
| Helen Frame Peters | |
| Keith Quinton | |
| Marcus L. Smith | |
| Susan J. Sutherland | |
| Scott E. Wennerholm | |
| Nancy A. Wiser* | |
| * | Mr. Bowser and Ms. Wiser began serving as Trustees effective April 4, 2022. |
| ** | Interested Trustee |
| FACTS | WHAT DOES EATON VANCE DO WITH YOUR
PERSONAL INFORMATION? |
| Why? | Financial companies choose how they share your personal information. Federal law gives consumers the right to limit some but not all sharing. Federal law also requires us to tell you how we collect, share, and protect your personal information. Please read this notice carefully to understand what we do. |
| |
| What? | The types of personal information we collect and share depend on the product or service you have with us. This information can include:■ Social Security number and income
■ investment experience and risk tolerance
■ checking account number and wire transfer instructions |
| |
| How? | All financial companies need to share customers’ personal information to run their everyday business. In the section below, we list the reasons financial companies can share their customers’ personal information; the reasons Eaton Vance chooses to share; and whether you can limit this sharing. |
Reasons we can share your
personal information | Does Eaton Vance
share? | Can you limit
this sharing? |
| For our everyday business purposes — such as to process your transactions, maintain your account(s), respond to court orders and legal investigations, or report to credit bureaus | Yes | No |
| For our marketing purposes — to offer our products and services to you | Yes | No |
| For joint marketing with other financial companies | No | We don’t share |
| For our investment management affiliates’ everyday business purposes — information about your transactions, experiences, and creditworthiness | Yes | Yes |
| For our affiliates’ everyday business purposes — information about your transactions and experiences | Yes | No |
| For our affiliates’ everyday business purposes — information about your creditworthiness | No | We don’t share |
| For our investment management affiliates to market to you | Yes | Yes |
| For our affiliates to market to you | No | We don’t share |
| For nonaffiliates to market to you | No | We don’t share |
To limit our
sharing | Call toll-free 1-800-262-1122 or email: EVPrivacy@eatonvance.comPlease note:If you are a new customer, we can begin sharing your information 30 days from the date we sent this notice. When you are no longer our customer, we continue to share your information as described in this notice. However, you can contact us at any time to limit our sharing. |
| Questions? | Call toll-free 1-800-262-1122 or email: EVPrivacy@eatonvance.com |
| Privacy Notice — continued | April 2021 |
| Who we are |
| Who is providing this notice? | Eaton Vance Management, Eaton Vance Distributors, Inc., Eaton Vance Trust Company, Eaton Vance Management (International) Limited, Eaton Vance Advisers International Ltd., Eaton Vance Global Advisors Limited, Eaton Vance Management’s Real Estate Investment Group, Boston Management and Research, Calvert Research and Management, Eaton Vance and Calvert Fund Families and our investment advisory affiliates (“Eaton Vance”) (see Investment Management Affiliates definition below) |
| What we do |
How does Eaton Vance
protect my personal
information? | To protect your personal information from unauthorized access and use, we use security measures that comply with federal law. These measures include computer safeguards and secured files and buildings. We have policies governing the proper handling of customer information by personnel and requiring third parties that provide support to adhere to appropriate security standards with respect to such information. |
How does Eaton Vance
collect my personal
information? | We collect your personal information, for example, when you■ open an account or make deposits or withdrawals from your account
■ buy securities from us or make a wire transfer
■ give us your contact informationWe also collect your personal information from others, such as credit bureaus, affiliates, or other companies. |
| Why can’t I limit all sharing? | Federal law gives you the right to limit only■ sharing for affiliates’ everyday business purposes — information about your creditworthiness
■ affiliates from using your information to market to you
■ sharing for nonaffiliates to market to youState laws and individual companies may give you additional rights to limit sharing. See below for more on your rights under state law. |
| Definitions |
Investment Management
Affiliates | Eaton Vance Investment Management Affiliates include registered investment advisers, registered broker- dealers, and registered and unregistered funds. Investment Management Affiliates does not include entities associated with Morgan Stanley Wealth Management, such as Morgan Stanley Smith Barney LLC and Morgan Stanley & Co. |
| Affiliates | Companies related by common ownership or control. They can be financial and nonfinancial companies.■ Our affiliates include companies with a Morgan Stanley name and financial companies such as Morgan Stanley Smith Barney LLC and Morgan Stanley & Co. |
| Nonaffiliates | Companies not related by common ownership or control. They can be financial and nonfinancial companies.■ Eaton Vance does not share with nonaffiliates so they can market to you. |
| Joint marketing | A formal agreement between nonaffiliated financial companies that together market financial products or services to you.■ Eaton Vance doesn’t jointly market. |
| Other important information |
| Vermont: Except as permitted by law, we will not share personal information we collect about Vermont residents with Nonaffiliates unless you provide us with your written consent to share such information.California: Except as permitted by law, we will not share personal information we collect about California residents with Nonaffiliates and we will limit sharing such personal information with our Affiliates to comply with California privacy laws that apply to us. |
Delivery of Shareholder Documents. The Securities and Exchange Commission (SEC) permits funds to deliver only one copy of shareholder documents, including prospectuses, proxy statements and shareholder reports, to fund investors with multiple accounts at the same residential or post office box address. This practice is often called “householding” and it helps eliminate duplicate mailings to shareholders. Eaton Vance, or your financial intermediary, may household the mailing of your documents indefinitely unless you instruct Eaton Vance, or your financial intermediary, otherwise. If you would prefer that your Eaton Vance documents not be householded, please contact Eaton Vance at 1-800-262-1122, or contact your financial intermediary. Your instructions that householding not apply to delivery of your Eaton Vance documents will typically be effective within 30 days of receipt by Eaton Vance or your financial intermediary.
Portfolio Holdings. Each Eaton Vance Fund and its underlying Portfolio(s) (if applicable) files a schedule of portfolio holdings on Part F to Form N-PORT with the SEC. Certain information filed on Form N-PORT may be viewed on the Eaton Vance website at www.eatonvance.com, by calling Eaton Vance at 1-800-262-1122 or in the EDGAR database on the SEC’s website at www.sec.gov.
Proxy Voting. From time to time, funds are required to vote proxies related to the securities held by the funds. The Eaton Vance Funds or their underlying Portfolios (if applicable) vote proxies according to a set of policies and procedures approved by the Funds’ and Portfolios’ Boards. You may obtain a description of these policies and procedures and information on how the Funds or Portfolios voted proxies relating to portfolio securities during the most recent 12-month period ended June 30, without charge, upon request, by calling 1-800-262-1122 and by accessing the SEC’s website at www.sec.gov.
This Page Intentionally Left Blank
This Page Intentionally Left Blank
This Page Intentionally Left Blank
Investment Adviser and Administrator
Eaton Vance Management
Two International Place
Boston, MA 02110
Investment Sub-Adviser
Eaton Vance Advisers International Ltd.
125 Old Broad Street
London, EC2N 1AR
United Kingdom
Principal Underwriter*
Eaton Vance Distributors, Inc.
Two International Place
Boston, MA 02110
(617) 482-8260
Custodian
State Street Bank and Trust Company
State Street Financial Center, One Lincoln Street
Boston, MA 02111
Transfer Agent
BNY Mellon Investment Servicing (US) Inc.
Attn: Eaton Vance Funds
P.O. Box 9653
Providence, RI 02940-9653
(800) 262-1122
Fund Offices
Two International Place
Boston, MA 02110
* FINRA BrokerCheck. Investors may check the background of their Investment Professional by contacting the Financial Industry Regulatory Authority (FINRA). FINRA BrokerCheck is a free tool to help investors check the professional background of current and former FINRA-registered securities firms and brokers. FINRA BrokerCheck is available by calling 1-800-289-9999 and at www.FINRA.org. The FINRA BrokerCheck brochure describing this program is available to investors at www.FINRA.org.
Item 2. Code of Ethics
Not required in this filing.
Item 3. Audit Committee Financial Expert
Not required in this filing.
Item 4. Principal Accountant Fees and Services
Not required in this filing.
Item 5. Audit Committee of Listed Registrants
Not applicable.
Item 6. Schedule of Investments
Please see schedule of investments contained in the Report to Stockholders included under Item 1 of this Form N-CSR.
Item 7. Disclosure of Proxy Voting Policies and Procedures for Closed-End Management Investment Companies
Not applicable.
Item 8. Portfolio Managers of Closed-End Management Investment Companies
Not applicable.
Item 9. Purchases of Equity Securities by Closed-End Management Investment Company and Affiliated Purchasers
Not applicable.
Item 10. Submission of Matters to a Vote of Security Holders
No material changes.
Item 11. Controls and Procedures
(a) It is the conclusion of the registrant’s principal executive officer and principal financial officer that the effectiveness of the registrant’s current disclosure controls and procedures (such disclosure controls and procedures having been evaluated within 90 days of the date of this filing) provide reasonable assurance that the information required to be disclosed by the registrant has been recorded, processed, summarized and reported within the time period specified in the Commission’s rules and forms and that the information required to be disclosed by the registrant has been accumulated and communicated to the registrant’s principal executive officer and principal financial officer in order to allow timely decisions regarding required disclosure.
(b) There have been no changes in the registrant’s internal controls over financial reporting during the period covered by this report that has materially affected, or is reasonably likely to materially affect, the registrant’s internal control over financial reporting.
Item 12. Disclosure of Securities Lending Activities for Closed-End Management Investment Companies
Not applicable.
Item 13. Exhibits
Signatures
Pursuant to the requirements of the Securities Exchange Act of 1934 and the Investment Company Act of 1940, the registrant has duly caused this report to be signed on its behalf by the undersigned, thereunto duly authorized.
Eaton Vance Growth Trust
| | |
| By: | | /s/ Eric A. Stein |
| | Eric A. Stein |
| | President |
Date: April 25, 2022
Pursuant to the requirements of the Securities Exchange Act of 1934 and the Investment Company Act of 1940, this report has been signed below by the following persons on behalf of the registrant and in the capacities and on the dates indicated.
| | |
| By: | | /s/ James F. Kirchner |
| | James F. Kirchner |
| | Treasurer |
| |
| Date: | | April 25, 2022 |
| |
| By: | | /s/ Eric A. Stein |
| | Eric A. Stein |
| | President |
| |
| Date: | | April 25, 2022 |