UNITED STATES
SECURITIES AND EXCHANGE COMMISSION
Washington, D.C. 20549
Form N-CSR
CERTIFIED SHAREHOLDER REPORT OF REGISTERED
MANAGEMENT INVESTMENT COMPANIES
Investment Company Act File Number: 811-01241
Eaton Vance Growth Trust
(Exact Name of Registrant as Specified in Charter)
Two International Place, Boston, Massachusetts 02110
(Address of Principal Executive Offices)
Deidre E. Walsh
Two International Place, Boston, Massachusetts 02110
(Name and Address of Agent for Services)
(617) 482-8260
(Registrant’s Telephone Number)
November 30
Date of Fiscal Year End
May 31, 2023
Date of Reporting Period
Item 1. Reports to Stockholders
Eaton Vance
Focused Global Opportunities Fund
Semiannual Report
May 31, 2023
Commodity Futures Trading Commission Registration. The Commodity Futures Trading Commission (“CFTC”) has adopted regulations that subject registered investment companies and advisers to regulation by the CFTC if a fund invests more than a prescribed level of its assets in certain CFTC-regulated instruments (including futures, certain options and swap agreements) or markets itself as providing investment exposure to such instruments. The investment adviser has claimed an exclusion from the definition of “commodity pool operator” under the Commodity Exchange Act with respect to its management of the Fund. Accordingly, neither the Fund nor the adviser with respect to the operation of the Fund is subject to CFTC regulation. Because of its management of other strategies, the Fund's adviser is registered with the CFTC as a commodity pool operator. The adviser is also registered as a commodity trading advisor.
Fund shares are not insured by the FDIC and are not deposits or other obligations of, or guaranteed by, any depository institution. Shares are subject to investment risks, including possible loss of principal invested.
This report must be preceded or accompanied by a current summary prospectus or prospectus. Before investing, investors should consider carefully the investment objective, risks, and charges and expenses of a mutual fund. This and other important information is contained in the summary prospectus and prospectus, which can be obtained from a financial intermediary. Prospective investors should read the prospectus carefully before investing. For further information, please call 1-800-262-1122.
Semiannual Report May 31, 2023
Eaton Vance
Focused Global Opportunities Fund
Eaton Vance
Focused Global Opportunities Fund
May 31, 2023
Performance
Portfolio Manager(s) Christopher M. Dyer, CFA, of Eaton Vance Advisers International Ltd.
| % Average Annual Total Returns1,2 | Class
Inception Date | Performance
Inception Date | Six Months | One Year | Five Years | Since
Inception |
| Class A at NAV | 12/14/2021 | 12/17/2015 | 6.45% | 5.32% | 8.71% | 8.81% |
| Class A with 5.25% Maximum Sales Charge | — | — | 0.83 | (0.18) | 7.55 | 8.03 |
| Class I at NAV | 12/17/2015 | 12/17/2015 | 6.64 | 5.28 | 8.73 | 8.82 |
|
| MSCI World Index | — | — | 3.92% | 2.07% | 7.78% | 9.24% |
| % Total Annual Operating Expense Ratios3 | Class A | Class I |
| Gross | 2.91% | 2.66% |
| Net | 1.20 | 0.95 |
See Endnotes and Additional Disclosures in this report.
Past performance is no guarantee of future results. Returns are historical and are calculated by determining the percentage change in net asset value (NAV) or offering price (as applicable) with all distributions reinvested. Furthermore, returns do not reflect the deduction of taxes that shareholders may have to pay on Fund distributions or upon the redemption of Fund shares. Investment return and principal value will fluctuate so that shares, when redeemed, may be worth more or less than their original cost. Performance for periods less than or equal to one year is cumulative. Performance is for the stated time period only; due to market volatility, current Fund performance may be lower or higher than the quoted return. For performance as of the most recent month-end, please refer to eatonvance.com.
Eaton Vance
Focused Global Opportunities Fund
May 31, 2023
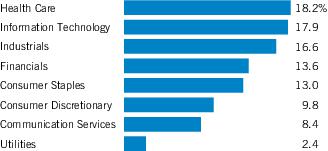
| Sector Allocation (% of net assets)1 |
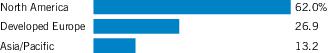
| Geographic Allocation (% of net assets) |
| Top 10 Holdings (% of net assets)1 |
| Microsoft Corp. | 7.2% |
| Alphabet, Inc., Class A | 4.6 |
| Nestle S.A. | 3.9 |
| Amazon.com, Inc. | 3.8 |
| Coca-Cola Co. (The) | 3.5 |
| JPMorgan Chase & Co. | 3.4 |
| Visa, Inc., Class A | 3.4 |
| Mondelez International, Inc., Class A | 3.2 |
| Danaher Corp. | 2.8 |
| Sanofi | 2.7 |
| Total | 38.5% |
Footnotes:
| 1 | Excludes cash and cash equivalents. |
Eaton Vance
Focused Global Opportunities Fund
May 31, 2023
Endnotes and Additional Disclosures
| 1 | MSCI World Index is an unmanaged index of equity securities in the developed markets. MSCI indexes are net of foreign withholding taxes. Source: MSCI. MSCI data may not be reproduced or used for any other purpose. MSCI provides no warranties, has not prepared or approved this report, and has no liability hereunder. Unless otherwise stated, index returns do not reflect the effect of any applicable sales charges, commissions, expenses, taxes or leverage, as applicable. It is not possible to invest directly in an index. |
| 2 | Total Returns at NAV do not include applicable sales charges. If sales charges were deducted, the returns would be lower. Total Returns shown with maximum sales charge reflect the stated maximum sales charge. Unless otherwise stated, performance does not reflect the deduction of taxes on Fund distributions or redemptions of Fund shares.Performance prior to the inception date of a class may be linked to the performance of an older class of the Fund. This linked performance is adjusted for any applicable sales charge, but is not adjusted for class expense differences. If adjusted for such differences, the performance would be different. The performance of Class A is linked to Class I. Performance since inception for an index, if presented, is the performance since the Fund’s or oldest share class’ inception, as applicable. Performance presented in the Financial Highlights included in the financial statements is not linked. |
| 3 | Source: Fund prospectus. Net expense ratios reflect a contractual expense reimbursement that continues through 3/31/24. The expense ratios for the current reporting period can be found in the Financial Highlights section of this report. Performance reflects expenses waived and/or reimbursed, if applicable. Without such waivers and/or reimbursements, performance would have been lower. |
| | Fund profile subject to change due to active management. |
Eaton Vance
Focused Global Opportunities Fund
May 31, 2023
Example
As a Fund shareholder, you incur two types of costs: (1) transaction costs, including sales charges (loads) on purchases; and (2) ongoing costs, including management fees; distribution and/or service fees; and other Fund expenses. This Example is intended to help you understand your ongoing costs (in dollars) of Fund investing and to compare these costs with the ongoing costs of investing in other mutual funds. The Example is based on an investment of $1,000 invested at the beginning of the period and held for the entire period (December 1, 2022 to May 31, 2023).
Actual Expenses
The first section of the table below provides information about actual account values and actual expenses. You may use the information in this section, together with the amount you invested, to estimate the expenses that you paid over the period. Simply divide your account value by $1,000 (for example, an $8,600 account value divided by $1,000 = 8.6), then multiply the result by the number in the first section under the heading entitled “Expenses Paid During Period” to estimate the expenses you paid on your account during this period.
Hypothetical Example for Comparison Purposes
The second section of the table below provides information about hypothetical account values and hypothetical expenses based on the actual Fund expense ratio and an assumed rate of return of 5% per year (before expenses), which is not the actual Fund return. The hypothetical account values and expenses may not be used to estimate the actual ending account balance or expenses you paid for the period. You may use this information to compare the ongoing costs of investing in your Fund and other funds. To do so, compare this 5% hypothetical example with the 5% hypothetical examples that appear in the shareholder reports of the other funds.
Please note that the expenses shown in the table are meant to highlight your ongoing costs only and do not reflect any transactional costs, such as sales charges (loads). Therefore, the second section of the table is useful in comparing ongoing costs only, and will not help you determine the relative total costs of owning different funds. In addition, if these transactional costs were included, your costs would be higher.
| | Beginning
Account Value
(12/1/22) | Ending
Account Value
(5/31/23) | Expenses Paid
During Period*
(12/1/22 – 5/31/23) | Annualized
Expense
Ratio |
| Actual | | | | |
| Class A | $1,000.00 | $1,064.50 | $6.28** | 1.22% |
| Class I | $1,000.00 | $1,066.40 | $5.00** | 0.97% |
| |
| Hypothetical | | | | |
| (5% return per year before expenses) | | | | |
| Class A | $1,000.00 | $1,018.85 | $6.14** | 1.22% |
| Class I | $1,000.00 | $1,020.10 | $4.89** | 0.97% |
| * | Expenses are equal to the Fund's annualized expense ratio for the indicated Class, multiplied by the average account value over the period, multiplied by 182/365 (to reflect the one-half year period). The Example assumes that the $1,000 was invested at the net asset value per share determined at the close of business on November 30, 2022. |
| ** | Absent an allocation of certain expenses to affiliates, expenses would be higher. |
Eaton Vance
Focused Global Opportunities Fund
May 31, 2023
Portfolio of Investments (Unaudited)
| Security | Shares | Value |
| Australia — 2.3% |
| CSL, Ltd. | | 900 | $ 179,241 |
| | | | $ 179,241 |
| Denmark — 2.1% |
| Novo Nordisk A/S, Class B | | 1,020 | $ 164,150 |
| | | | $ 164,150 |
| France — 8.1% |
| LVMH Moet Hennessy Louis Vuitton SE | | 179 | $ 156,505 |
| Safran S.A. | | 953 | 138,418 |
| Sanofi | | 2,080 | 212,216 |
| Schneider Electric SE | | 713 | 123,348 |
| | | | $ 630,487 |
| Germany — 2.1% |
| Siemens AG | | 972 | $ 159,955 |
| | | | $ 159,955 |
| Hong Kong — 2.2% |
| AIA Group, Ltd. | | 17,785 | $ 170,971 |
| | | | $ 170,971 |
| India — 2.1% |
| HDFC Bank, Ltd. ADR | | 2,513 | $ 161,837 |
| | | | $ 161,837 |
| Japan — 5.1% |
| Dentsu Group, Inc. | | 3,295 | $ 105,639 |
| Keyence Corp. | | 211 | 102,288 |
| Nihon M&A Center Holdings, Inc. | | 10,566 | 73,869 |
| Recruit Holdings Co., Ltd. | | 3,787 | 115,853 |
| | | | $ 397,649 |
| Netherlands — 1.9% |
| ASML Holding NV | | 199 | $ 143,942 |
| | | | $ 143,942 |
| Spain — 4.1% |
| Amadeus IT Group S.A.(1) | | 1,900 | $ 136,354 |
| Iberdrola S.A. | | 15,128 | 184,740 |
| | | | $ 321,094 |
| Security | Shares | Value |
| Switzerland — 7.7% |
| Nestle S.A. | | 2,549 | $ 302,149 |
| Roche Holding AG PC | | 527 | 167,854 |
| TE Connectivity, Ltd. | | 1,026 | 125,664 |
| | | | $ 595,667 |
| Taiwan — 1.5% |
| Taiwan Semiconductor Manufacturing Co., Ltd. ADR | | 1,148 | $ 113,181 |
| | | | $ 113,181 |
| United Kingdom — 0.9% |
| RELX PLC | | 2,128 | $ 66,552 |
| | | | $ 66,552 |
| United States — 59.8% |
| Alphabet, Inc., Class A(1) | | 2,887 | $ 354,726 |
| Amazon.com, Inc.(1) | | 2,448 | 295,180 |
| AMETEK, Inc. | | 999 | 144,925 |
| Boston Scientific Corp.(1) | | 3,643 | 187,542 |
| CDW Corp. | | 917 | 157,440 |
| Citigroup, Inc. | | 4,449 | 197,180 |
| Coca-Cola Co. (The) | | 4,557 | 271,870 |
| Danaher Corp. | | 958 | 219,976 |
| Dollar Tree, Inc.(1) | | 1,356 | 182,897 |
| GXO Logistics, Inc.(1) | | 3,392 | 189,681 |
| Ingersoll Rand, Inc. | | 2,082 | 117,966 |
| Intuit, Inc. | | 446 | 186,927 |
| Intuitive Surgical, Inc.(1) | | 427 | 131,448 |
| JPMorgan Chase & Co. | | 1,928 | 261,649 |
| Microsoft Corp. | | 1,694 | 556,293 |
| Mondelez International, Inc., Class A | | 3,395 | 249,227 |
| TJX Cos., Inc. (The) | | 2,201 | 169,015 |
| Verisk Analytics, Inc. | | 704 | 154,253 |
| Visa, Inc., Class A | | 1,172 | 259,047 |
| Walt Disney Co. (The)(1) | | 2,146 | 188,762 |
| Zoetis, Inc. | | 916 | 149,317 |
| | | | $4,625,321 |
Total Common Stocks
(identified cost $5,961,615) | | | $7,730,047 |
6
See Notes to Financial Statements.
Eaton Vance
Focused Global Opportunities Fund
May 31, 2023
Portfolio of Investments (Unaudited) — continued
| Short-Term Investments — 2.2% |
| Security | Shares | Value |
| Morgan Stanley Institutional Liquidity Funds - Government Portfolio, Institutional Class, 5.00%(2) | | 170,619 | $ 170,619 |
Total Short-Term Investments
(identified cost $170,619) | | | $ 170,619 |
| | | |
Total Investments — 102.1%
(identified cost $6,132,234) | | | $7,900,666 |
| Other Assets, Less Liabilities — (2.1)% | | | $ (165,404) |
| Net Assets — 100.0% | | | $7,735,262 |
| The percentage shown for each investment category in the Portfolio of Investments is based on net assets. |
| (1) | Non-income producing security. |
| (2) | May be deemed to be an affiliated investment company. The rate shown is the annualized seven-day yield as of May 31, 2023. |
| Sector Classification of Portfolio |
| Sector | Percentage
of Net Assets | Value |
| Health Care | 18.2% | $1,411,744 |
| Information Technology | 17.9 | 1,385,735 |
| Industrials | 16.6 | 1,284,820 |
| Financials | 13.6 | 1,050,684 |
| Consumer Staples | 13.0 | 1,006,143 |
| Consumer Discretionary | 9.8 | 757,054 |
| Communication Services | 8.4 | 649,127 |
| Utilities | 2.4 | 184,740 |
| Short-Term Investments | 2.2 | 170,619 |
| Total Investments | 102.1% | $7,900,666 |
| Abbreviations: |
| ADR | – American Depositary Receipt |
| PC | – Participation Certificate |
7
See Notes to Financial Statements.
Eaton Vance
Focused Global Opportunities Fund
May 31, 2023
Statement of Assets and Liabilities (Unaudited)
| | May 31, 2023 |
| Assets | |
| Unaffiliated investments, at value (identified cost $5,961,615) | $ 7,730,047 |
| Affiliated investment, at value (identified cost $170,619) | 170,619 |
| Dividends receivable | 16,849 |
| Dividends receivable from affiliated investment | 612 |
| Receivable for investments sold | 85,243 |
| Receivable for Fund shares sold | 13,369 |
| Tax reclaims receivable | 8,749 |
| Receivable from affiliates | 8,537 |
| Total assets | $8,034,025 |
| Liabilities | |
| Payable for investments purchased | $ 229,941 |
| Payable for Fund shares redeemed | 13,257 |
| Payable to affiliates: | |
| Investment adviser and administration fee | 5,304 |
| Distribution and service fees | 4 |
| Trustees' fees | 370 |
| Accrued expenses | 49,887 |
| Total liabilities | $ 298,763 |
| Net Assets | $7,735,262 |
| Sources of Net Assets | |
| Paid-in capital | $ 5,954,746 |
| Distributable earnings | 1,780,516 |
| Net Assets | $7,735,262 |
| Class A Shares | |
| Net Assets | $ 20,814 |
| Shares Outstanding | 1,421 |
Net Asset Value and Redemption Price Per Share
(net assets ÷ shares of beneficial interest outstanding) | $ 14.65 |
Maximum Offering Price Per Share
(100 ÷ 94.75 of net asset value per share) | $ 15.46 |
| Class I Shares | |
| Net Assets | $ 7,714,448 |
| Shares Outstanding | 526,947 |
Net Asset Value, Offering Price and Redemption Price Per Share
(net assets ÷ shares of beneficial interest outstanding) | $ 14.64 |
| On sales of $50,000 or more, the offering price of Class A shares is reduced. |
8
See Notes to Financial Statements.
Eaton Vance
Focused Global Opportunities Fund
May 31, 2023
Statement of Operations (Unaudited)
| | Six Months Ended |
| | May 31, 2023 |
| Investment Income | |
| Dividend income (net of foreign taxes withheld of $5,756) | $ 63,437 |
| Dividend income from affiliated investment | 1,775 |
| Non-cash dividend income | 4,648 |
| Total investment income | $ 69,860 |
| Expenses | |
| Investment adviser and administration fee | $ 33,281 |
| Distribution and service fees: | |
| Class A | 23 |
| Trustees’ fees and expenses | 602 |
| Custodian fee | 11,551 |
| Transfer and dividend disbursing agent fees | 1,323 |
| Legal and accounting services | 17,095 |
| Printing and postage | 2,030 |
| Registration fees | 19,390 |
| Interest expense and fees | 1,019 |
| Miscellaneous | 3,974 |
| Total expenses | $ 90,288 |
| Deduct: | |
| Waiver and/or reimbursement of expenses by affiliates | $ 49,782 |
| Total expense reductions | $ 49,782 |
| Net expenses | $ 40,506 |
| Net investment income | $ 29,354 |
| Realized and Unrealized Gain (Loss) | |
| Net realized gain (loss): | |
| Investment transactions | $ 34,522 |
| Foreign currency transactions | 701 |
| Net realized gain | $ 35,223 |
| Change in unrealized appreciation (depreciation): | |
| Investments | $ 444,639 |
| Foreign currency | 44 |
| Net change in unrealized appreciation (depreciation) | $444,683 |
| Net realized and unrealized gain | $479,906 |
| Net increase in net assets from operations | $509,260 |
9
See Notes to Financial Statements.
Eaton Vance
Focused Global Opportunities Fund
May 31, 2023
Statements of Changes in Net Assets
| | Six Months Ended
May 31, 2023
(Unaudited) | Year Ended
November 30, 2022 |
| Increase (Decrease) in Net Assets | | |
| From operations: | | |
| Net investment income | $ 29,354 | $ 46,050 |
| Net realized gain | 35,223 | 109,561 |
| Net change in unrealized appreciation (depreciation) | 444,683 | (941,350) |
| Net increase (decrease) in net assets from operations | $ 509,260 | $ (785,739) |
| Distributions to shareholders: | | |
| Class A | $ (282) | $ (868)(1) |
| Class I | (175,579) | (751,865) |
| Total distributions to shareholders | $ (175,861) | $ (752,733) |
| Transactions in shares of beneficial interest: | | |
| Class A | $ 2,882 | $ 19,082(1) |
| Class I | (2,449,684) | 3,065,908 |
| Net increase (decrease) in net assets from Fund share transactions | $(2,446,802) | $3,084,990 |
| Net increase (decrease) in net assets | $(2,113,403) | $1,546,518 |
| Net Assets | | |
| At beginning of period | $ 9,848,665 | $ 8,302,147 |
| At end of period | $ 7,735,262 | $9,848,665 |
| (1) | For the period from the commencement of operations, December 14, 2021, to November 30, 2022. |
10
See Notes to Financial Statements.
Eaton Vance
Focused Global Opportunities Fund
May 31, 2023
| | Class A |
| | Six Months Ended
May 31, 2023
(Unaudited) | Period Ended
November 30, 2022(1) |
| Net asset value — Beginning of period | $ 14.000 | $ 17.460 |
| Income (Loss) From Operations | | |
| Net investment income(2) | $ 0.037 | $ 0.041 |
| Net realized and unrealized gain (loss) | 0.841 | (1.985) |
| Total income (loss) from operations | $ 0.878 | $ (1.944) |
| Less Distributions | | |
| From net investment income | $ (0.040) | $ (0.081) |
| From net realized gain | (0.188) | (1.435) |
| Total distributions | $ (0.228) | $ (1.516) |
| Net asset value — End of period | $14.650 | $14.000 |
| Total Return(3)(4) | 6.45% (5) | (12.48)% (5) |
| Ratios/Supplemental Data | | |
| Net assets, end of period (000’s omitted) | $ 21 | $ 17 |
| Ratios (as a percentage of average daily net assets): | | |
| Expenses (4) | 1.22% (6)(7)(8) | 1.20% (6)(7) |
| Net investment income | 0.52% (6) | 0.31% (6) |
| Portfolio Turnover | 11% (5) | 29% (9) |
| (1) | For the period from the commencement of operations, December 14, 2021, to November 30, 2022. |
| (2) | Computed using average shares outstanding. |
| (3) | Returns are historical and are calculated by determining the percentage change in net asset value with all distributions reinvested and do not reflect the effect of sales charges. |
| (4) | The investment adviser and administrator and sub-adviser reimbursed certain operating expenses (equal to 1.20% and 1.71% of average daily net assets for the six months ended May 31, 2023 and the period ended November 30, 2022, respectively). Absent this reimbursement, total return would be lower. |
| (5) | Not annualized. |
| (6) | Annualized. |
| (7) | Includes a reduction by the investment adviser of a portion of its investment adviser and administration fee due to the Fund’s investment in the Liquidity Fund (equal to less than 0.005% of average daily net assets for the six months ended May 31, 2023 and the period ended November 30, 2022). |
| (8) | Includes interest expense of 0.02%. |
| (9) | For the year ended November 30, 2022. |
11
See Notes to Financial Statements.
Eaton Vance
Focused Global Opportunities Fund
May 31, 2023
Financial Highlights — continued
| | Class I |
| | Six Months Ended
May 31, 2023
(Unaudited) | Year Ended November 30, |
| | 2022 | 2021 | 2020 | 2019 | 2018 |
| Net asset value — Beginning of period | $ 13.990 | $ 17.250 | $ 13.780 | $ 12.420 | $ 11.530 | $ 11.830 |
| Income (Loss) From Operations | | | | | | |
| Net investment income(1) | $ 0.050 | $ 0.083 | $ 0.029 | $ 0.068 | $ 0.103 | $ 0.142 |
| Net realized and unrealized gain (loss) | 0.851 | (1.827) | 3.492 | 1.419 | 1.648 | (0.015) |
| Total income (loss) from operations | $ 0.901 | $ (1.744) | $ 3.521 | $ 1.487 | $ 1.751 | $ 0.127 |
| Less Distributions | | | | | | |
| From net investment income | $ (0.063) | $ (0.081) | $ (0.051) | $ (0.127) | $ (0.120) | $ (0.120) |
| From net realized gain | (0.188) | (1.435) | — | — | (0.741) | (0.307) |
| Total distributions | $ (0.251) | $ (1.516) | $ (0.051) | $ (0.127) | $ (0.861) | $ (0.427) |
| Net asset value — End of period | $14.640 | $13.990 | $17.250 | $13.780 | $12.420 | $11.530 |
| Total Return(2)(3) | 6.64% (4) | (11.48)% | 25.62% | 12.06% | 17.28% | 1.06% |
| Ratios/Supplemental Data | | | | | | |
| Net assets, end of period (000’s omitted) | $ 7,714 | $ 9,832 | $ 8,302 | $ 5,801 | $ 5,186 | $ 4,350 |
| Ratios (as a percentage of average daily net assets): | | | | | | |
| Expenses (3) | 0.97% (5)(6)(7) | 0.95% (7) | 0.95% | 0.95% | 0.96% (6) | 0.95% |
| Net investment income | 0.71% (5) | 0.58% | 0.18% | 0.55% | 0.92% | 1.20% |
| Portfolio Turnover | 11% (4) | 29% | 57% | 54% | 46% | 82% |
| (1) | Computed using average shares outstanding. |
| (2) | Returns are historical and are calculated by determining the percentage change in net asset value with all distributions reinvested. |
| (3) | The investment adviser and administrator and sub-adviser reimbursed certain operating expenses (equal to 1.20%, 1.71%, 1.37%, 1.95%, 2.07% and 2.32% of average daily net assets for the six months ended May 31, 2023 and the years ended November 30, 2022, 2021, 2020, 2019 and 2018, respectively). Absent this reimbursement, total return would be lower. |
| (4) | Not annualized. |
| (5) | Annualized. |
| (6) | Includes interest expense of 0.02% and 0.01% for the six months ended May 31, 2023 and the year ended November 30, 2019, respectively. |
| (7) | Includes a reduction by the investment adviser of a portion of its investment adviser and administration fee due to the Fund’s investment in the Liquidity Fund (equal to less than 0.005% of average daily net assets for the six months ended May 31, 2023 and the period ended November 30, 2022). |
12
See Notes to Financial Statements.
Eaton Vance
Focused Global Opportunities Fund
May 31, 2023
Notes to Financial Statements (Unaudited)
1 Significant Accounting Policies
Eaton Vance Focused Global Opportunities Fund (the Fund) is a diversified series of Eaton Vance Growth Trust (the Trust). The Trust is a Massachusetts business trust registered under the Investment Company Act of 1940, as amended (the 1940 Act), as an open-end management investment company. The Fund’s investment objective is to seek long-term capital appreciation. The Fund offers two classes of shares. Class A shares are generally sold subject to a sales charge imposed at time of purchase. Class I shares are sold at net asset value and are not subject to a sales charge. Each class represents a pro-rata interest in the Fund, but votes separately on class-specific matters and (as noted below) is subject to different expenses. Realized and unrealized gains and losses and net investment income and losses, other than class-specific expenses, are allocated daily to each class of shares based on the relative net assets of each class to the total net assets of the Fund. Each class of shares differs in its distribution plan and certain other class-specific expenses.
The following is a summary of significant accounting policies of the Fund. The policies are in conformity with accounting principles generally accepted in the United States of America (U.S. GAAP). The Fund is an investment company and follows accounting and reporting guidance in the Financial Accounting Standards Board (FASB) Accounting Standards Codification Topic 946.
A Investment Valuation—The following methodologies are used to determine the market value or fair value of investments.
Equity Securities. Equity securities listed on a U.S. securities exchange generally are valued at the last sale or closing price on the day of valuation or, if no sales took place on such date, at the mean between the closing bid and ask prices on the exchange where such securities are principally traded. Equity securities listed on the NASDAQ National Market System are valued at the NASDAQ official closing price. Unlisted or listed securities for which closing sales prices or closing quotations are not available are valued at the mean between the latest available bid and ask prices.
Foreign Securities and Currencies. Foreign securities and currencies are valued in U.S. dollars, based on foreign currency exchange rate quotations supplied by a third party pricing service. The pricing service uses a proprietary model to determine the exchange rate. Inputs to the model include reported trades and implied bid/ask spreads. The daily valuation of exchange-traded foreign securities generally is determined as of the close of trading on the principal exchange on which such securities trade. Events occurring after the close of trading on foreign exchanges may result in adjustments to the valuation of foreign securities to more accurately reflect their fair value as of the close of regular trading on the New York Stock Exchange. When valuing foreign equity securities that meet certain criteria, the Fund's Trustees have approved the use of a fair value service that values such securities to reflect market trading that occurs after the close of the applicable foreign markets of comparable securities or other instruments that have a strong correlation to the fair-valued securities.
Other. Investments in management investment companies (including money market funds) that do not trade on an exchange are valued at the net asset value as of the close of each business day.
Fair Valuation. In connection with Rule 2a-5 of the 1940 Act, the Trustees have designated the Fund’s investment adviser as its valuation designee. Investments for which valuations or market quotations are not readily available or are deemed unreliable are valued by the investment adviser, as valuation designee, at fair value using methods that most fairly reflect the security’s “fair value”, which is the amount that the Fund might reasonably expect to receive for the security upon its current sale in the ordinary course. Each such determination is based on a consideration of relevant factors, which are likely to vary from one pricing context to another. These factors may include, but are not limited to, the type of security, the existence of any contractual restrictions on the security’s disposition, the price and extent of public trading in similar securities of the issuer or of comparable companies or entities, quotations or relevant information obtained from broker/dealers or other market participants, information obtained from the issuer, analysts, and/or the appropriate stock exchange (for exchange-traded securities), an analysis of the company’s or entity’s financial statements, and an evaluation of the forces that influence the issuer and the market(s) in which the security is purchased and sold.
B Investment Transactions—Investment transactions for financial statement purposes are accounted for on a trade date basis. Realized gains and losses on investments sold are determined on the basis of identified cost.
C Income—Dividend income is recorded on the ex-dividend date for dividends received in cash and/or securities. However, if the ex-dividend date has passed, certain dividends from foreign securities are recorded as the Fund is informed of the ex-dividend date. Non-cash dividends are recorded at the fair value of the securities received. Withholding taxes on foreign dividends and capital gains have been provided for in accordance with the Fund’s understanding of the applicable countries’ tax rules and rates.
D Federal Taxes—The Fund’s policy is to comply with the provisions of the Internal Revenue Code applicable to regulated investment companies and to distribute to shareholders each year substantially all of its net investment income, and all or substantially all of its net realized capital gains. Accordingly, no provision for federal income or excise tax is necessary.
As of May 31, 2023, the Fund had no uncertain tax positions that would require financial statement recognition, de-recognition, or disclosure. The Fund files a U.S. federal income tax return annually after its fiscal year-end, which is subject to examination by the Internal Revenue Service for a period of three years from the date of filing.
E Expenses—The majority of expenses of the Trust are directly identifiable to an individual fund. Expenses which are not readily identifiable to a specific fund are allocated taking into consideration, among other things, the nature and type of expense and the relative size of the funds.
Eaton Vance
Focused Global Opportunities Fund
May 31, 2023
Notes to Financial Statements (Unaudited) — continued
F Foreign Currency Translation—Investment valuations, other assets, and liabilities initially expressed in foreign currencies are translated each business day into U.S. dollars based upon current exchange rates. Purchases and sales of foreign investment securities and income and expenses denominated in foreign currencies are translated into U.S. dollars based upon currency exchange rates in effect on the respective dates of such transactions. Recognized gains or losses on investment transactions attributable to changes in foreign currency exchange rates are recorded for financial statement purposes as net realized gains and losses on investments. That portion of unrealized gains and losses on investments that results from fluctuations in foreign currency exchange rates is not separately disclosed.
G Use of Estimates—The preparation of the financial statements in conformity with U.S. GAAP requires management to make estimates and assumptions that affect the reported amounts of assets and liabilities at the date of the financial statements and the reported amounts of income and expense during the reporting period. Actual results could differ from those estimates.
H Indemnifications—Under the Trust’s organizational documents, its officers and Trustees may be indemnified against certain liabilities and expenses arising out of the performance of their duties to the Fund. Under Massachusetts law, if certain conditions prevail, shareholders of a Massachusetts business trust (such as the Trust) could be deemed to have personal liability for the obligations of the Trust. However, the Trust’s Declaration of Trust contains an express disclaimer of liability on the part of Fund shareholders and the By-laws provide that the Trust shall assume, upon request by the shareholder, the defense on behalf of any Fund shareholders. Moreover, the By-laws also provide for indemnification out of Fund property of any shareholder held personally liable solely by reason of being or having been a shareholder for all loss or expense arising from such liability. Additionally, in the normal course of business, the Fund enters into agreements with service providers that may contain indemnification clauses. The Fund’s maximum exposure under these arrangements is unknown as this would involve future claims that may be made against the Fund that have not yet occurred.
I Interim Financial Statements—The interim financial statements relating to May 31, 2023 and for the six months then ended have not been audited by an independent registered public accounting firm, but in the opinion of the Fund’s management, reflect all adjustments, consisting only of normal recurring adjustments, necessary for the fair presentation of the financial statements.
2 Distributions to Shareholders and Income Tax Information
It is the present policy of the Fund to make at least one distribution annually (normally in December) of all or substantially all of its net investment income and to distribute annually all or substantially all of its net realized capital gains. Distributions to shareholders are recorded on the ex-dividend date. Distributions are declared separately for each class of shares. Shareholders may reinvest income and capital gain distributions in additional shares of the same class of the Fund at the net asset value as of the ex-dividend date or, at the election of the shareholder, receive distributions in cash. Distributions to shareholders are determined in accordance with income tax regulations, which may differ from U.S. GAAP. As required by U.S. GAAP, only distributions in excess of tax basis earnings and profits are reported in the financial statements as a return of capital. Permanent differences between book and tax accounting relating to distributions are reclassified to paid-in capital. For tax purposes, distributions from short-term capital gains are considered to be from ordinary income.
The cost and unrealized appreciation (depreciation) of investments of the Fund at May 31, 2023, as determined on a federal income tax basis, were as follows:
| Aggregate cost | $6,183,294 |
| Gross unrealized appreciation | $ 1,995,706 |
| Gross unrealized depreciation | (278,334) |
| Net unrealized appreciation | $1,717,372 |
Eaton Vance
Focused Global Opportunities Fund
May 31, 2023
Notes to Financial Statements (Unaudited) — continued
3 Investment Adviser and Administration Fee and Other Transactions with Affiliates
The investment adviser and administration fee is earned by Eaton Vance Management (EVM), an indirect, wholly-owned subsidiary of Morgan Stanley, as compensation for investment advisory and administrative services rendered to the Fund. The fee is computed at an annual rate as a percentage of the Fund’s average daily net assets as follows and is payable monthly:
| Average Daily Net Assets | Annual Fee Rate |
| Up to $500 million | 0.800% |
| $500 million but less than $1 billion | 0.775% |
| $1 billion but less than $2.5 billion | 0.750% |
| $2.5 billion but less than $5 billion | 0.730% |
| $5 billion and over | 0.715% |
For the six months ended May 31, 2023, the investment adviser and administration fee amounted to $33,281 or 0.80% (annualized) of the Fund’s average daily net assets. Pursuant to an investment sub-advisory agreement, EVM has delegated the investment management of the Fund to Eaton Vance Advisers International Ltd. (EVAIL), an affiliate of EVM and an indirect, wholly-owned subsidiary of Morgan Stanley. EVM pays EVAIL a portion of its investment adviser and administration fee for sub-advisory services provided to the Fund. The Fund may invest in a money market fund, the Institutional Class of the Morgan Stanley Institutional Liquidity Funds - Government Portfolio (the “Liquidity Fund”), an open-end management investment company managed by Morgan Stanley Investment Management Inc., a wholly-owned subsidiary of Morgan Stanley. The investment adviser and administration fee paid by the Fund is reduced by an amount equal to its pro-rata share of the advisory and administration fees paid by the Fund due to its investment in the Liquidity Fund. For the six months ended May 31, 2023, the investment adviser and administration fee paid was reduced by $60 relating to the Fund’s investment in the Liquidity Fund.
EVM and EVAIL have agreed to reimburse the Fund’s expenses to the extent that total annual operating expenses (relating to ordinary operating expenses only and excluding expenses such as brokerage commissions, acquired fund fees and expenses of unaffiliated funds, borrowing costs, taxes or litigation expenses) exceed 1.20% and 0.95% of the Fund’s average daily net assets for Class A and Class I, respectively. This agreement may be changed or terminated after March 31, 2024. Pursuant to this agreement, EVM and EVAIL were allocated $49,722 in total of the Fund’s operating expenses for the six months ended May 31, 2023.
EVM provides sub-transfer agency and related services to the Fund pursuant to a Sub-Transfer Agency Support Services Agreement. For the six months ended May 31, 2023, EVM earned $56 from the Fund pursuant to such agreement, which is included in transfer and dividend disbursing agent fees on the Statement of Operations. The Fund was informed that Eaton Vance Distributors, Inc. (EVD), an affiliate of EVM and the Fund’s principal underwriter, received no sales charge on sales of Class A shares for the six months ended May 31, 2023. EVD received distribution and service fees from Class A shares (see Note 4).
Trustees and officers of the Fund who are members of EVM’s organization receive remuneration for their services to the Fund out of the investment adviser and administration fee. Trustees of the Fund who are not affiliated with EVM may elect to defer receipt of all or a percentage of their annual fees in accordance with the terms of the Trustees Deferred Compensation Plan. For the six months ended May 31, 2023, no significant amounts have been deferred. Certain officers and Trustees of the Fund are officers of EVM.
4 Distribution Plan
The Fund has in effect a distribution plan for Class A shares (Class A Plan) pursuant to Rule 12b-1 under the 1940 Act. Pursuant to the Class A Plan, the Fund pays EVD a distribution and service fee of 0.25% per annum of its average daily net assets attributable to Class A shares for distribution services and facilities provided to the Fund by EVD, as well as for personal services and/or the maintenance of shareholder accounts. Distribution and service fees paid or accrued to EVD for the six months ended May 31, 2023 amounted to $23 for Class A shares.
Distribution and service fees are subject to the limitations contained in the Financial Industry Regulatory Authority Rule 2341(d).
5 Contingent Deferred Sales Charges
Class A shares may be subject to a 1% contingent deferred sales charge (CDSC) if redeemed within 12 months of purchase (depending on the circumstances of purchase). Generally, the CDSC is based upon the lower of the net asset value at date of redemption or date of purchase. No charge is levied on shares acquired by reinvestment of dividends or capital gain distributions. For the six months ended May 31, 2023, the Fund was informed that EVD received no CDSCs paid by Class A shareholders.
Eaton Vance
Focused Global Opportunities Fund
May 31, 2023
Notes to Financial Statements (Unaudited) — continued
6 Purchases and Sales of Investments
Purchases and sales of investments, other than short-term obligations, aggregated $915,208 and $3,495,998, respectively, for the six months ended May 31, 2023.
7 Shares of Beneficial Interest
The Fund’s Declaration of Trust permits the Trustees to issue an unlimited number of full and fractional shares of beneficial interest (without par value). Such shares may be issued in a number of different series (such as the Fund) and classes. Transactions in Fund shares were as follows:
| | Six Months Ended
May 31, 2023
(Unaudited) | | Year Ended
November 30, 2022(1) |
| | Shares | Amount | | Shares | Amount |
| Class A | | | | | |
| Sales | 185 | $ 2,600 | | 1,163 | $ 18,214 |
| Issued to shareholders electing to receive payments of distributions in Fund shares | 21 | 282 | | 52 | 868 |
| Net increase | 206 | $ 2,882 | | 1,215 | $ 19,082 |
| Class I | | | | | |
| Sales | 22,051 | $ 309,075 | | 264,722 | $ 3,660,472 |
| Issued to shareholders electing to receive payments of distributions in Fund shares | 13,322 | 175,579 | | 45,348 | 751,865 |
| Redemptions | (211,003) | (2,934,338) | | (88,763) | (1,346,429) |
| Net increase (decrease) | (175,630) | $(2,449,684) | | 221,307 | $ 3,065,908 |
| (1) | For Class A, for the period from the commencement of operations, December 14, 2021, to November 30, 2022. |
At May 31, 2023, EVM owned 85.1% of the value of the outstanding shares of the Fund.
8 Line of Credit
The Fund participates with other portfolios and funds managed by EVM and its affiliates in a $725 million unsecured revolving line of credit agreement with a group of banks, which is in effect through October 24, 2023. Borrowings are made by the Fund solely for temporary purposes related to redemptions and other short-term cash needs. Interest is charged to the Fund based on its borrowings at an amount above either the Secured Overnight Financing Rate (SOFR) or Federal Funds rate. In addition, a fee computed at an annual rate of 0.15% on the daily unused portion of the line of credit is allocated among the participating portfolios and funds at the end of each quarter. In connection with the renewal of the agreement in October 2022, an arrangement fee totaling $150,000 was incurred that was allocated to the participating portfolios and funds. Because the line of credit is not available exclusively to the Fund, it may be unable to borrow some or all of its requested amounts at any particular time. The Fund did not have any significant borrowings or allocated fees during the six months ended May 31, 2023.
Eaton Vance
Focused Global Opportunities Fund
May 31, 2023
Notes to Financial Statements (Unaudited) — continued
9 Affiliated Investments
At May 31, 2023, the value of the Fund's investment in funds that may be deemed to be affiliated was $170,619, which represents 2.2% of the Fund's net assets. Transactions in such investments by the Fund for the six months ended May 31, 2023 were as follows:
| Name | Value,
beginning
of period | Purchases | Sales
proceeds | Net
realized
gain (loss) | Change in
unrealized
appreciation
(depreciation) | Value, end
of period | Dividend
income | Shares,
end of period |
| Short-Term Investments |
| Liquidity Fund | $60,947 | $724,770 | $(615,098) | $ — | $ — | $170,619 | $1,775 | 170,619 |
10 Fair Value Measurements
Under generally accepted accounting principles for fair value measurements, a three-tier hierarchy to prioritize the assumptions, referred to as inputs, is used in valuation techniques to measure fair value. The three-tier hierarchy of inputs is summarized in the three broad levels listed below.
| • | Level 1 – quoted prices in active markets for identical investments |
| • | Level 2 – other significant observable inputs (including quoted prices for similar investments, interest rates, prepayment speeds, credit risk, etc.) |
| • | Level 3 – significant unobservable inputs (including a fund's own assumptions in determining the fair value of investments) |
In cases where the inputs used to measure fair value fall in different levels of the fair value hierarchy, the level disclosed is determined based on the lowest level input that is significant to the fair value measurement in its entirety. The inputs or methodology used for valuing securities are not necessarily an indication of the risk associated with investing in those securities.
At May 31, 2023, the hierarchy of inputs used in valuing the Fund's investments, which are carried at value, were as follows:
| Asset Description | Level 1 | Level 2 | Level 3 | Total |
| Common Stocks: | | | | |
| Asia/Pacific | $ 275,018 | $ 747,861 | $ — | $ 1,022,879 |
| Developed Europe | 125,664 | 1,956,183 | — | 2,081,847 |
| North America | 4,625,321 | — | — | 4,625,321 |
| Total Common Stocks | $5,026,003 | $ 2,704,044* | $ — | $7,730,047 |
| Short-Term Investments | $ 170,619 | $ — | $ — | $ 170,619 |
| Total Investments | $5,196,622 | $ 2,704,044 | $ — | $7,900,666 |
| * | Includes foreign equity securities whose values were adjusted to reflect market trading of comparable securities or other correlated instruments that occurred after the close of trading in their applicable foreign markets. |
11 Risks and Uncertainties
Risks Associated with Foreign Investments
Foreign investments can be adversely affected by political, economic and market developments abroad, including the imposition of economic and other sanctions by the United States or another country. There may be less publicly available information about foreign issuers because they may not be subject to reporting practices, requirements or regulations comparable to those to which United States companies are subject. Foreign markets may be smaller, less liquid and more volatile than the major markets in the United States. Trading in foreign markets typically involves higher expense than trading in the United States. The Fund may have difficulties enforcing its legal or contractual rights in a foreign country. Securities that trade or are denominated in currencies other than the U.S. dollar may be adversely affected by fluctuations in currency exchange rates.
Eaton Vance
Focused Global Opportunities Fund
May 31, 2023
Notes to Financial Statements (Unaudited) — continued
12 Plan of Reorganization
At a joint special meeting of shareholders held on April 27, 2023, shareholders of the Fund approved the reorganization of the Fund into the Calvert Global Equity Fund, a newly created series of Calvert Management Series, pursuant to an Agreement and Plan of Reorganization. The reorganization is expected to occur on or around September 15, 2023, or such other date as the parties to the Agreement and Plan of Reorganization may agree.
Eaton Vance
Focused Global Opportunities Fund
May 31, 2023
Joint Special Meeting of Shareholders (Unaudited)
Eaton Vance Focused Global Opportunities Fund (the “Fund”) held a Special Meeting of Shareholders on April 27, 2023 for the following purpose: To consider and act upon a proposal to approve an Agreement and Plan of Reorganization, pursuant to which the Fund will transfer all of its assets to Calvert Global Equity Fund in exchange for shares of Calvert Global Equity Fund and the assumption by Calvert Global Equity Fund of all of the liabilities of the Fund. The shareholder meeting results are as follows:
| | Number of Shares | |
| For | Against | Abstain |
| 532,385 | 568 | 475 |
Eaton Vance
Focused Global Opportunities Fund
May 31, 2023
| Officers |
Eric A. Stein
President | Nicholas S. Di Lorenzo
Secretary |
Deidre E. Walsh
Vice President and Chief Legal Officer | Richard F. Froio
Chief Compliance Officer |
James F. Kirchner
Treasurer | |
George J. Gorman
Chairperson | |
| Alan C. Bowser | |
| Thomas E. Faust Jr.* | |
| Mark R. Fetting | |
| Cynthia E. Frost | |
| Valerie A. Mosley | |
| Anchal Pachnanda*(1) | |
| Keith Quinton | |
| Marcus L. Smith | |
| Susan J. Sutherland | |
| Scott E. Wennerholm | |
| Nancy A. Wiser | |
| * | Interested Trustee |
| (1) | Ms. Pachnanda began serving as Trustee effective April 1, 2023. |
| FACTS | WHAT DOES EATON VANCE DO WITH YOUR
PERSONAL INFORMATION? |
| Why? | Financial companies choose how they share your personal information. Federal law gives consumers the right to limit some but not all sharing. Federal law also requires us to tell you how we collect, share, and protect your personal information. Please read this notice carefully to understand what we do. |
| |
| What? | The types of personal information we collect and share depend on the product or service you have with us. This information can include:■ Social Security number and income
■ investment experience and risk tolerance
■ checking account number and wire transfer instructions |
| |
| How? | All financial companies need to share customers’ personal information to run their everyday business. In the section below, we list the reasons financial companies can share their customers’ personal information; the reasons Eaton Vance chooses to share; and whether you can limit this sharing. |
Reasons we can share your
personal information | Does Eaton Vance
share? | Can you limit
this sharing? |
| For our everyday business purposes — such as to process your transactions, maintain your account(s), respond to court orders and legal investigations, or report to credit bureaus | Yes | No |
| For our marketing purposes — to offer our products and services to you | Yes | No |
| For joint marketing with other financial companies | No | We don’t share |
| For our investment management affiliates’ everyday business purposes — information about your transactions, experiences, and creditworthiness | Yes | Yes |
| For our affiliates’ everyday business purposes — information about your transactions and experiences | Yes | No |
| For our affiliates’ everyday business purposes — information about your creditworthiness | No | We don’t share |
| For our investment management affiliates to market to you | Yes | Yes |
| For our affiliates to market to you | No | We don’t share |
| For nonaffiliates to market to you | No | We don’t share |
To limit our
sharing | Call toll-free 1-800-262-1122 or email: EVPrivacy@eatonvance.comPlease note:If you are a new customer, we can begin sharing your information 30 days from the date we sent this notice. When you are no longer our customer, we continue to share your information as described in this notice. However, you can contact us at any time to limit our sharing. |
| Questions? | Call toll-free 1-800-262-1122 or email: EVPrivacy@eatonvance.com |
| Privacy Notice — continued | April 2021 |
| Who we are |
| Who is providing this notice? | Eaton Vance Management, Eaton Vance Distributors, Inc., Eaton Vance Trust Company, Eaton Vance Management (International) Limited, Eaton Vance Advisers International Ltd., Eaton Vance Global Advisors Limited, Eaton Vance Management’s Real Estate Investment Group, Boston Management and Research, Calvert Research and Management, Eaton Vance and Calvert Fund Families and our investment advisory affiliates (“Eaton Vance”) (see Investment Management Affiliates definition below) |
| What we do |
How does Eaton Vance
protect my personal
information? | To protect your personal information from unauthorized access and use, we use security measures that comply with federal law. These measures include computer safeguards and secured files and buildings. We have policies governing the proper handling of customer information by personnel and requiring third parties that provide support to adhere to appropriate security standards with respect to such information. |
How does Eaton Vance
collect my personal
information? | We collect your personal information, for example, when you■ open an account or make deposits or withdrawals from your account
■ buy securities from us or make a wire transfer
■ give us your contact informationWe also collect your personal information from others, such as credit bureaus, affiliates, or other companies. |
| Why can’t I limit all sharing? | Federal law gives you the right to limit only■ sharing for affiliates’ everyday business purposes — information about your creditworthiness
■ affiliates from using your information to market to you
■ sharing for nonaffiliates to market to youState laws and individual companies may give you additional rights to limit sharing. See below for more on your rights under state law. |
| Definitions |
Investment Management
Affiliates | Eaton Vance Investment Management Affiliates include registered investment advisers, registered broker- dealers, and registered and unregistered funds. Investment Management Affiliates does not include entities associated with Morgan Stanley Wealth Management, such as Morgan Stanley Smith Barney LLC and Morgan Stanley & Co. |
| Affiliates | Companies related by common ownership or control. They can be financial and nonfinancial companies.■ Our affiliates include companies with a Morgan Stanley name and financial companies such as Morgan Stanley Smith Barney LLC and Morgan Stanley & Co. |
| Nonaffiliates | Companies not related by common ownership or control. They can be financial and nonfinancial companies.■ Eaton Vance does not share with nonaffiliates so they can market to you. |
| Joint marketing | A formal agreement between nonaffiliated financial companies that together market financial products or services to you.■ Eaton Vance doesn’t jointly market. |
| Other important information |
| Vermont: Except as permitted by law, we will not share personal information we collect about Vermont residents with Nonaffiliates unless you provide us with your written consent to share such information.California: Except as permitted by law, we will not share personal information we collect about California residents with Nonaffiliates and we will limit sharing such personal information with our Affiliates to comply with California privacy laws that apply to us. |
Delivery of Shareholder Documents. The Securities and Exchange Commission (SEC) permits funds to deliver only one copy of shareholder documents, including prospectuses, proxy statements and shareholder reports, to fund investors with multiple accounts at the same residential or post office box address. This practice is often called “householding” and it helps eliminate duplicate mailings to shareholders. Eaton Vance, or your financial intermediary, may household the mailing of your documents indefinitely unless you instruct Eaton Vance, or your financial intermediary, otherwise. If you would prefer that your Eaton Vance documents not be householded, please contact Eaton Vance at 1-800-262-1122, or contact your financial intermediary. Your instructions that householding not apply to delivery of your Eaton Vance documents will typically be effective within 30 days of receipt by Eaton Vance or your financial intermediary.
Portfolio Holdings. Each Eaton Vance Fund and its underlying Portfolio(s) (if applicable) files a schedule of portfolio holdings on Part F to Form N-PORT with the SEC. Certain information filed on Form N-PORT may be viewed on the Eaton Vance website at www.eatonvance.com, by calling Eaton Vance at 1-800-262-1122 or in the EDGAR database on the SEC’s website at www.sec.gov.
Proxy Voting. From time to time, funds are required to vote proxies related to the securities held by the funds. The Eaton Vance Funds or their underlying Portfolios (if applicable) vote proxies according to a set of policies and procedures approved by the Funds’ and Portfolios’ Boards. You may obtain a description of these policies and procedures and information on how the Funds or Portfolios voted proxies relating to portfolio securities during the most recent 12-month period ended June 30, without charge, upon request, by calling 1-800-262-1122 and by accessing the SEC’s website at www.sec.gov.
This Page Intentionally Left Blank
Investment Adviser and Administrator
Eaton Vance Management
Two International Place
Boston, MA 02110
Investment Sub-Adviser
Eaton Vance Advisers International Ltd.
125 Old Broad Street
London, EC2N 1AR
United Kingdom
Principal Underwriter*
Eaton Vance Distributors, Inc.
Two International Place
Boston, MA 02110
(617) 482-8260
Custodian
State Street Bank and Trust Company
One Congress Street, Suite 1
Boston, MA 02114-2016
Transfer Agent
BNY Mellon Investment Servicing (US) Inc.
Attn: Eaton Vance Funds
P.O. Box 534439
Pittsburgh, PA 15253-4439
(800) 262-1122
Fund Offices
Two International Place
Boston, MA 02110
* FINRA BrokerCheck. Investors may check the background of their Investment Professional by contacting the Financial Industry Regulatory Authority (FINRA). FINRA BrokerCheck is a free tool to help investors check the professional background of current and former FINRA-registered securities firms and brokers. FINRA BrokerCheck is available by calling 1-800-289-9999 and at www.FINRA.org. The FINRA BrokerCheck brochure describing this program is available to investors at www.FINRA.org.
Eaton Vance
International Small-Cap Fund
Semiannual Report
May 31, 2023
Commodity Futures Trading Commission Registration. The Commodity Futures Trading Commission (“CFTC”) has adopted regulations that subject registered investment companies and advisers to regulation by the CFTC if a fund invests more than a prescribed level of its assets in certain CFTC-regulated instruments (including futures, certain options and swap agreements) or markets itself as providing investment exposure to such instruments. The investment adviser has claimed an exclusion from the definition of “commodity pool operator” under the Commodity Exchange Act with respect to its management of the Fund. Accordingly, neither the Fund nor the adviser with respect to the operation of the Fund is subject to CFTC regulation. Because of its management of other strategies, the Fund's adviser is registered with the CFTC as a commodity pool operator. The adviser is also registered as a commodity trading advisor.
Fund shares are not insured by the FDIC and are not deposits or other obligations of, or guaranteed by, any depository institution. Shares are subject to investment risks, including possible loss of principal invested.
This report must be preceded or accompanied by a current summary prospectus or prospectus. Before investing, investors should consider carefully the investment objective, risks, and charges and expenses of a mutual fund. This and other important information is contained in the summary prospectus and prospectus, which can be obtained from a financial intermediary. Prospective investors should read the prospectus carefully before investing. For further information, please call 1-800-262-1122.
Semiannual Report May 31, 2023
Eaton Vance
International Small-Cap Fund
Eaton Vance
International Small-Cap Fund
May 31, 2023
Performance
Portfolio Manager(s) Aidan M. Farrell of MSIM Fund Management (Ireland) Limited (MSIM FMIL)
| % Average Annual Total Returns1,2 | Class
Inception Date | Performance
Inception Date | Six Months | One Year | Five Years | Since
Inception |
| Class A at NAV | 12/16/2015 | 12/16/2015 | 0.90% | (3.59)% | 0.52% | 5.16% |
| Class A with 5.25% Maximum Sales Charge | — | — | (4.42) | (8.66) | (0.56) | 4.41 |
| Class I at NAV | 12/16/2015 | 12/16/2015 | 1.05 | (3.36) | 0.77 | 5.41 |
|
| MSCI World ex USA Small Cap Index | — | — | 3.02% | (5.16)% | 0.87% | 5.21% |
| % Total Annual Operating Expense Ratios3 | Class A | Class I |
| Gross | 1.45% | 1.20% |
| Net | 1.32 | 1.07 |
See Endnotes and Additional Disclosures in this report.
Past performance is no guarantee of future results. Returns are historical and are calculated by determining the percentage change in net asset value (NAV) or offering price (as applicable) with all distributions reinvested. Furthermore, returns do not reflect the deduction of taxes that shareholders may have to pay on Fund distributions or upon the redemption of Fund shares. Investment return and principal value will fluctuate so that shares, when redeemed, may be worth more or less than their original cost. Performance for periods less than or equal to one year is cumulative. Performance is for the stated time period only; due to market volatility, current Fund performance may be lower or higher than the quoted return. For performance as of the most recent month-end, please refer to eatonvance.com.
Eaton Vance
International Small-Cap Fund
May 31, 2023
| Sector Allocation (% of net assets)1 |
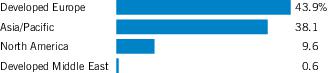
| Geographic Allocation (% of net assets) |
| Top 10 Holdings (% of net assets)1 |
| iShares MSCI Hong Kong ETF | 1.6% |
| ATS Corp. | 1.6 |
| Diploma PLC | 1.5 |
| Games Workshop Group PLC | 1.5 |
| Azelis Group NV | 1.5 |
| BE Semiconductor Industries NV | 1.4 |
| Greggs PLC | 1.4 |
| Volution Group PLC | 1.4 |
| DiscoverIE Group PLC | 1.4 |
| IMCD NV | 1.4 |
| Total | 14.7% |
Footnotes:
| 1 | Excludes cash and cash equivalents. |
Eaton Vance
International Small-Cap Fund
May 31, 2023
Endnotes and Additional Disclosures
| 1 | MSCI World ex USA Small Cap Index is an unmanaged index of small-cap equity securities in the developed markets, excluding the United States. MSCI indexes are net of foreign withholding taxes. Source: MSCI. MSCI data may not be reproduced or used for any other purpose. MSCI provides no warranties, has not prepared or approved this report, and has no liability hereunder. Unless otherwise stated, index returns do not reflect the effect of any applicable sales charges, commissions, expenses, taxes or leverage, as applicable. It is not possible to invest directly in an index. |
| 2 | Total Returns at NAV do not include applicable sales charges. If sales charges were deducted, the returns would be lower. Total Returns shown with maximum sales charge reflect the stated maximum sales charge. Unless otherwise stated, performance does not reflect the deduction of taxes on Fund distributions or redemptions of Fund shares. Performance since inception for an index, if presented, is the performance since the Fund’s or oldest share class’ inception, as applicable. |
| 3 | Source: Fund prospectus. Net expense ratios reflect a contractual expense reimbursement that continues through 3/31/24. The expense ratios for the current reporting period can be found in the Financial Highlights section of this report. Performance reflects expenses waived and/or reimbursed, if applicable. Without such waivers and/or reimbursements, performance would have been lower. |
| | Fund profile subject to change due to active management. |
Eaton Vance
International Small-Cap Fund
May 31, 2023
Example
As a Fund shareholder, you incur two types of costs: (1) transaction costs, including sales charges (loads) on purchases; and (2) ongoing costs, including management fees; distribution and/or service fees; and other Fund expenses. This Example is intended to help you understand your ongoing costs (in dollars) of Fund investing and to compare these costs with the ongoing costs of investing in other mutual funds. The Example is based on an investment of $1,000 invested at the beginning of the period and held for the entire period (December 1, 2022 to May 31, 2023).
Actual Expenses
The first section of the table below provides information about actual account values and actual expenses. You may use the information in this section, together with the amount you invested, to estimate the expenses that you paid over the period. Simply divide your account value by $1,000 (for example, an $8,600 account value divided by $1,000 = 8.6), then multiply the result by the number in the first section under the heading entitled “Expenses Paid During Period” to estimate the expenses you paid on your account during this period.
Hypothetical Example for Comparison Purposes
The second section of the table below provides information about hypothetical account values and hypothetical expenses based on the actual Fund expense ratio and an assumed rate of return of 5% per year (before expenses), which is not the actual Fund return. The hypothetical account values and expenses may not be used to estimate the actual ending account balance or expenses you paid for the period. You may use this information to compare the ongoing costs of investing in your Fund and other funds. To do so, compare this 5% hypothetical example with the 5% hypothetical examples that appear in the shareholder reports of the other funds.
Please note that the expenses shown in the table are meant to highlight your ongoing costs only and do not reflect any transactional costs, such as sales charges (loads). Therefore, the second section of the table is useful in comparing ongoing costs only, and will not help you determine the relative total costs of owning different funds. In addition, if these transactional costs were included, your costs would be higher.
| | Beginning
Account Value
(12/1/22) | Ending
Account Value
(5/31/23) | Expenses Paid
During Period*
(12/1/22 – 5/31/23) | Annualized
Expense
Ratio |
| Actual | | | | |
| Class A | $1,000.00 | $1,009.00 | $6.51** | 1.30% |
| Class I | $1,000.00 | $1,010.50 | $5.26** | 1.05% |
| |
| Hypothetical | | | | |
| (5% return per year before expenses) | | | | |
| Class A | $1,000.00 | $1,018.45 | $6.54** | 1.30% |
| Class I | $1,000.00 | $1,019.70 | $5.29** | 1.05% |
| * | Expenses are equal to the Fund's annualized expense ratio for the indicated Class, multiplied by the average account value over the period, multiplied by 182/365 (to reflect the one-half year period). The Example assumes that the $1,000 was invested at the net asset value per share determined at the close of business on November 30, 2022. |
| ** | Absent an allocation of certain expenses to affiliates, expenses would be higher. |
Eaton Vance
International Small-Cap Fund
May 31, 2023
Portfolio of Investments (Unaudited)
| Security | Shares | Value |
| Australia — 8.6% |
| Bapcor, Ltd. | | 89,006 | $ 356,877 |
| BlueScope Steel, Ltd. | | 14,498 | 174,848 |
| carsales.com, Ltd. | | 51,812 | 781,901 |
| Data#3, Ltd. | | 129,701 | 597,051 |
| Dexus | | 54,059 | 288,632 |
| Dicker Data, Ltd. | | 110,870 | 615,754 |
| Evolution Mining, Ltd. | | 132,174 | 297,980 |
| IGO, Ltd. | | 30,849 | 286,501 |
| Lynas Rare Earths, Ltd. (1) | | 22,847 | 111,514 |
| Northern Star Resources, Ltd. | | 37,275 | 315,227 |
| Steadfast Group, Ltd. | | 180,221 | 694,756 |
| Westgold Resources, Ltd.(1) | | 150,339 | 152,085 |
| WiseTech Global, Ltd. | | 6,293 | 305,850 |
| | | | $ 4,978,976 |
| Austria — 1.4% |
| ams-OSRAM AG(1) | | 43,470 | $ 320,316 |
| BAWAG Group AG(1)(2) | | 10,872 | 474,655 |
| | | | $ 794,971 |
| Belgium — 2.0% |
| Azelis Group NV | | 34,265 | $ 840,772 |
| VGP NV | | 3,054 | 303,319 |
| | | | $ 1,144,091 |
| Canada — 8.6% |
| Agnico Eagle Mines, Ltd. | | 4,684 | $ 238,358 |
| ARC Resources, Ltd. | | 39,041 | 470,505 |
| ATS Corp.(1) | | 20,777 | 909,902 |
| CAE, Inc.(1) | | 11,735 | 239,973 |
| Granite Real Estate Investment Trust | | 11,134 | 653,359 |
| Keyera Corp. | | 16,442 | 366,993 |
| Killam Apartment Real Estate Investment Trust | | 49,896 | 643,227 |
| Pan American Silver Corp. | | 7,395 | 112,709 |
| Peyto Exploration & Development Corp. | | 37,930 | 305,955 |
| Quebecor, Inc., Class B | | 15,712 | 374,657 |
| TMX Group, Ltd. | | 5,913 | 643,613 |
| | | | $ 4,959,251 |
| Denmark — 0.7% |
| Topdanmark A/S | | 7,331 | $ 380,907 |
| | | | $ 380,907 |
| Security | Shares | Value |
| France — 1.2% |
| IPSOS | | 14,304 | $ 700,971 |
| | | | $ 700,971 |
| Germany — 2.1% |
| Encavis AG(1) | | 15,038 | $ 243,895 |
| Jenoptik AG | | 19,994 | 667,590 |
| LEG Immobilien SE(1) | | 5,759 | 299,940 |
| | | | $ 1,211,425 |
| Israel — 0.6% |
| Amot Investments, Ltd. | | 73,370 | $ 360,914 |
| | | | $ 360,914 |
| Italy — 5.5% |
| Amplifon SpA | | 12,088 | $ 419,296 |
| BFF Bank SpA(2) | | 75,153 | 780,530 |
| DiaSorin SpA | | 2,135 | 220,516 |
| FinecoBank Banca Fineco SpA | | 35,400 | 472,879 |
| MARR SpA | | 38,591 | 603,015 |
| Moncler SpA | | 9,929 | 675,739 |
| | | | $ 3,171,975 |
| Japan — 27.0% |
| As One Corp. | | 11,367 | $ 432,806 |
| Asahi Intecc Co., Ltd. | | 26,737 | 509,488 |
| Azbil Corp. | | 9,387 | 296,343 |
| BayCurrent Consulting, Inc. | | 12,942 | 473,046 |
| Chiba Bank, Ltd. (The) | | 100,199 | 625,153 |
| Cosmos Pharmaceutical Corp. | | 7,124 | 676,922 |
| Daiseki Co., Ltd. | | 13,731 | 352,569 |
| Dip Corp. | | 24,823 | 598,940 |
| Fukuoka Financial Group, Inc. | | 30,419 | 563,801 |
| Goldwin, Inc. | | 7,005 | 588,298 |
| Hoshizaki Corp. | | 8,166 | 293,221 |
| JMDC, Inc. | | 9,297 | 379,830 |
| Kobe Bussan Co., Ltd. | | 8,098 | 223,183 |
| Kose Corp. | | 4,938 | 494,946 |
| Kyoritsu Maintenance Co., Ltd. | | 13,970 | 491,402 |
| LaSalle Logiport REIT | | 613 | 738,383 |
| Lion Corp. | | 56,514 | 545,363 |
| Mitsubishi Research Institute, Inc. | | 9,573 | 351,230 |
| Mitsui Fudosan Logistics Park, Inc. | | 185 | 666,056 |
| Miura Co., Ltd. | | 21,516 | 570,468 |
| Nihon M&A Center Holdings, Inc. | | 40,220 | 281,187 |
| Nissan Chemical Corp. | | 10,095 | 437,923 |
| NOF Corp. | | 11,518 | 489,668 |
6
See Notes to Financial Statements.
Eaton Vance
International Small-Cap Fund
May 31, 2023
Portfolio of Investments (Unaudited) — continued
| Security | Shares | Value |
| Japan (continued) |
| Nomura Co., Ltd. | | 62,894 | $ 419,539 |
| Sakata Seed Corp. | | 17,170 | 480,083 |
| Sanwa Holdings Corp. | | 52,903 | 615,227 |
| Sumco Corp. | | ��� 46,768 | 665,711 |
| T Hasegawa Co., Ltd. | | 22,681 | 489,337 |
| Tosei Corp. | | 48,730 | 581,957 |
| USS Co., Ltd. | | 38,752 | 629,740 |
| Yamaha Corp. | | 16,641 | 658,283 |
| | | | $15,620,103 |
| Luxembourg — 0.2% |
| APERAM S.A. | | 4,533 | $ 148,982 |
| | | | $ 148,982 |
| Netherlands — 3.9% |
| BE Semiconductor Industries NV | | 7,425 | $ 820,986 |
| Euronext NV(2) | | 9,478 | 632,421 |
| IMCD NV | | 5,195 | 783,082 |
| | | | $ 2,236,489 |
| New Zealand — 1.7% |
| EBOS Group, Ltd. | | 21,980 | $ 556,252 |
| Spark New Zealand, Ltd. | | 132,811 | 412,219 |
| | | | $ 968,471 |
| Norway — 1.5% |
| Entra ASA(2) | | 36,342 | $ 315,159 |
| SmartCraft ASA(1) | | 254,722 | 465,883 |
| TGS ASA | | 8,667 | 119,123 |
| | | | $ 900,165 |
| Portugal — 0.7% |
| NOS SGPS S.A. | | 105,613 | $ 390,007 |
| | | | $ 390,007 |
| Singapore — 0.8% |
| Daiwa House Logistics Trust | | 1,087,439 | $ 458,458 |
| | | | $ 458,458 |
| Spain — 1.5% |
| Acciona S.A. | | 2,484 | $ 402,598 |
| Inmobiliaria Colonial Socimi S.A. | | 81,699 | 479,684 |
| | | | $ 882,282 |
| Security | Shares | Value |
| Sweden — 5.6% |
| AddTech AB, Class B | | 31,449 | $ 647,098 |
| Boliden AB(1) | | 6,053 | 184,930 |
| Bravida Holding AB(2) | | 59,748 | 584,874 |
| Indutrade AB | | 20,885 | 493,044 |
| Lagercrantz Group AB, Class B | | 31,900 | 387,105 |
| Sdiptech AB, Class B(1) | | 28,866 | 673,295 |
| SSAB AB, Class B | | 44,168 | 273,917 |
| | | | $ 3,244,263 |
| Switzerland — 0.7% |
| Galenica AG(2) | | 5,471 | $ 428,002 |
| | | | $ 428,002 |
| United Kingdom — 16.9% |
| Abcam PLC, ADR(1) | | 42,910 | $ 692,997 |
| Bellway PLC | | 6,967 | 196,263 |
| Capricorn Energy PLC | | 55,089 | 133,945 |
| Cranswick PLC | | 19,344 | 779,523 |
| Diploma PLC | | 23,811 | 898,989 |
| DiscoverIE Group PLC | | 79,858 | 787,185 |
| Games Workshop Group PLC | | 7,154 | 843,521 |
| Grainger PLC | | 102,806 | 318,168 |
| Greggs PLC | | 24,428 | 816,462 |
| JTC PLC(2) | | 82,054 | 713,877 |
| Judges Scientific PLC | | 6,009 | 727,182 |
| Nomad Foods, Ltd.(1) | | 16,009 | 272,953 |
| Shaftesbury Capital PLC | | 264,743 | 396,199 |
| St. James's Place PLC | | 45,188 | 629,159 |
| Volution Group PLC | | 143,959 | 801,599 |
| Watches of Switzerland Group PLC(1)(2) | | 29,425 | 246,069 |
| Wise PLC, Class A(1) | | 76,378 | 553,476 |
| | | | $ 9,807,567 |
| United States — 1.0% |
| Autoliv, Inc. | | 6,959 | $ 567,159 |
| | | | $ 567,159 |
Total Common Stocks
(identified cost $51,350,907) | | | $53,355,429 |
| Exchange-Traded Funds — 4.7% |
| Security | Shares | Value |
| Equity Funds — 4.7% |
| iShares MSCI EAFE Small-Cap ETF | | 9,848 | $ 573,055 |
| iShares MSCI Hong Kong ETF | | 49,978 | 947,083 |
7
See Notes to Financial Statements.
Eaton Vance
International Small-Cap Fund
May 31, 2023
Portfolio of Investments (Unaudited) — continued
| Security | Shares | Value |
| Equity Funds (continued) |
| iShares MSCI Singapore ETF | | 35,976 | $ 674,910 |
| iShares S&P/TSX SmallCap Index ETF | | 40,960 | 525,616 |
Total Exchange-Traded Funds
(identified cost $3,021,276) | | | $ 2,720,664 |
| Short-Term Investments — 3.0% |
| Security | Shares | Value |
| Morgan Stanley Institutional Liquidity Funds - Government Portfolio, Institutional Class, 5.00%(3) | | 1,713,865 | $ 1,713,865 |
Total Short-Term Investments
(identified cost $1,713,865) | | | $ 1,713,865 |
| | | |
Total Investments — 99.9%
(identified cost $56,086,048) | | | $57,789,958 |
| Other Assets, Less Liabilities — 0.1% | | | $ 84,642 |
| Net Assets — 100.0% | | | $57,874,600 |
| The percentage shown for each investment category in the Portfolio of Investments is based on net assets. |
| (1) | Non-income producing security. |
| (2) | Security exempt from registration under Rule 144A of the Securities Act of 1933, as amended. These securities may be sold in certain transactions in reliance on an exemption from registration (normally to qualified institutional buyers). At May 31, 2023, the aggregate value of these securities is $4,175,587 or 7.2% of the Fund's net assets. |
| (3) | May be deemed to be an affiliated investment company. The rate shown is the annualized seven-day yield as of May 31, 2023. |
| Abbreviations: |
| ADR | – American Depositary Receipt |
| Sector Classification of Portfolio |
| Sector | Percentage
of Net Assets | Value |
| Industrials | 20.7% | $11,991,192 |
| Financials | 12.4 | 7,165,227 |
| Real Estate | 11.2 | 6,503,455 |
| Consumer Discretionary | 10.5 | 6,069,813 |
| Information Technology | 9.5 | 5,493,819 |
| Consumer Staples | 7.1 | 4,075,988 |
| Materials | 6.4 | 3,713,979 |
| Health Care | 6.3 | 3,639,187 |
| Exchange-Traded Funds | 4.7 | 2,720,664 |
| Communication Services | 4.6 | 2,659,755 |
| Energy | 2.4 | 1,396,521 |
| Utilities | 1.1 | 646,493 |
| Short-Term Investments | 3.0 | 1,713,865 |
| Total Investments | 99.9% | $57,789,958 |
8
See Notes to Financial Statements.
Eaton Vance
International Small-Cap Fund
May 31, 2023
Statement of Assets and Liabilities (Unaudited)
| | May 31, 2023 |
| Assets | |
| Unaffiliated investments, at value (identified cost $54,372,183) | $ 56,076,093 |
| Affiliated investment, at value (identified cost $1,713,865) | 1,713,865 |
| Foreign currency, at value (identified cost $20,825) | 20,872 |
| Dividends receivable | 132,960 |
| Dividends receivable from affiliated investment | 5,192 |
| Tax reclaims receivable | 52,770 |
| Total assets | $58,001,752 |
| Liabilities | |
| Payable for Fund shares redeemed | $ 10,999 |
| Payable to affiliates: | |
| Investment adviser and administration fee | 45,266 |
| Distribution and service fees | 245 |
| Trustees' fees | 1,406 |
| Other | 3,164 |
| Accrued expenses | 66,072 |
| Total liabilities | $ 127,152 |
| Net Assets | $57,874,600 |
| Sources of Net Assets | |
| Paid-in capital | $ 60,859,418 |
| Accumulated loss | (2,984,818) |
| Net Assets | $57,874,600 |
| Class A Shares | |
| Net Assets | $ 1,109,575 |
| Shares Outstanding | 92,315 |
Net Asset Value and Redemption Price Per Share
(net assets ÷ shares of beneficial interest outstanding) | $ 12.02 |
Maximum Offering Price Per Share
(100 ÷ 94.75 of net asset value per share) | $ 12.69 |
| Class I Shares | |
| Net Assets | $ 56,765,025 |
| Shares Outstanding | 4,706,747 |
Net Asset Value, Offering Price and Redemption Price Per Share
(net assets ÷ shares of beneficial interest outstanding) | $ 12.06 |
| On sales of $50,000 or more, the offering price of Class A shares is reduced. |
9
See Notes to Financial Statements.
Eaton Vance
International Small-Cap Fund
May 31, 2023
Statement of Operations (Unaudited)
| | Six Months Ended |
| | May 31, 2023 |
| Investment Income | |
| Dividend income (net of foreign taxes withheld of $93,466) | $ 1,014,964 |
| Dividend income from affiliated investment | 26,562 |
| Total investment income | $ 1,041,526 |
| Expenses | |
| Investment adviser and administration fee | $ 263,467 |
| Distribution and service fees: | |
| Class A | 1,432 |
| Trustees’ fees and expenses | 2,056 |
| Custodian fee | 22,258 |
| Transfer and dividend disbursing agent fees | 3,614 |
| Legal and accounting services | 15,350 |
| Printing and postage | 1,996 |
| Registration fees | 18,298 |
| Miscellaneous | 5,249 |
| Total expenses | $ 333,720 |
| Deduct: | |
| Waiver and/or reimbursement of expenses by affiliates | $ 25,827 |
| Total expense reductions | $ 25,827 |
| Net expenses | $ 307,893 |
| Net investment income | $ 733,633 |
| Realized and Unrealized Gain (Loss) | |
| Net realized gain (loss): | |
| Investment transactions | $ (1,944,962) |
| Foreign currency transactions | (6,854) |
| Net realized loss | $(1,951,816) |
| Change in unrealized appreciation (depreciation): | |
| Investments | $ 1,844,195 |
| Foreign currency | (5,655) |
| Net change in unrealized appreciation (depreciation) | $ 1,838,540 |
| Net realized and unrealized loss | $ (113,276) |
| Net increase in net assets from operations | $ 620,357 |
10
See Notes to Financial Statements.
Eaton Vance
International Small-Cap Fund
May 31, 2023
Statements of Changes in Net Assets
| | Six Months Ended
May 31, 2023
(Unaudited) | Year Ended
November 30, 2022 |
| Increase (Decrease) in Net Assets | | |
| From operations: | | |
| Net investment income | $ 733,633 | $ 811,831 |
| Net realized loss | (1,951,816) | (2,753,544) |
| Net change in unrealized appreciation (depreciation) | 1,838,540 | (12,502,076) |
| Net increase (decrease) in net assets from operations | $ 620,357 | $(14,443,789) |
| Distributions to shareholders: | | |
| Class A | $ (10,863) | $ (41,567) |
| Class I | (613,137) | (4,506,072) |
| Total distributions to shareholders | $ (624,000) | $ (4,547,639) |
| Transactions in shares of beneficial interest: | | |
| Class A | $ 19,852 | $ 505,079 |
| Class I | 1,355,820 | 993,061 |
| Net increase in net assets from Fund share transactions | $ 1,375,672 | $ 1,498,140 |
| Net increase (decrease) in net assets | $ 1,372,029 | $(17,493,288) |
| Net Assets | | |
| At beginning of period | $ 56,502,571 | $ 73,995,859 |
| At end of period | $57,874,600 | $ 56,502,571 |
11
See Notes to Financial Statements.
Eaton Vance
International Small-Cap Fund
May 31, 2023
| | Class A |
| | Six Months Ended
May 31, 2023
(Unaudited) | Year Ended November 30, |
| | 2022 | 2021 | 2020 | 2019 | 2018 |
| Net asset value — Beginning of period | $ 12.030 | $ 15.960 | $ 13.790 | $ 12.670 | $ 11.790 | $ 13.440 |
| Income (Loss) From Operations | | | | | | |
| Net investment income(1) | $ 0.136 | $ 0.125 | $ 0.065 | $ 0.037 | $ 0.131 | $ 0.138 |
| Net realized and unrealized gain (loss) | (0.031) | (3.141) | 2.221 | 1.287 | 1.233 | (1.329) |
| Total income (loss) from operations | $ 0.105 | $ (3.016) | $ 2.286 | $ 1.324 | $ 1.364 | $ (1.191) |
| Less Distributions | | | | | | |
| From net investment income | $ (0.115) | $ (0.198) | $ (0.116) | $ (0.204) | $ (0.096) | $ (0.202) |
| From net realized gain | — | (0.716) | — | — | (0.388) | (0.257) |
| Total distributions | $ (0.115) | $ (0.914) | $ (0.116) | $ (0.204) | $ (0.484) | $ (0.459) |
| Net asset value — End of period | $12.020 | $12.030 | $15.960 | $13.790 | $12.670 | $11.790 |
| Total Return(2)(3) | 0.90% (4) | (20.24)% | 16.66% | 10.54% | 12.37% | (9.22)% |
| Ratios/Supplemental Data | | | | | | |
| Net assets, end of period (000’s omitted) | $ 1,110 | $ 1,090 | $ 703 | $ 1,417 | $ 1,717 | $ 1,511 |
| Ratios (as a percentage of average daily net assets): | | | | | | |
| Expenses (3) | 1.30% (5)(6) | 1.36% (6) | 1.40% | 1.40% | 1.40% | 1.40% |
| Net investment income | 2.26% (5) | 0.99% | 0.42% | 0.30% | 1.12% | 1.05% |
| Portfolio Turnover | 21% (4) | 51% | 59% | 61% | 70% | 65% |
| (1) | Computed using average shares outstanding. |
| (2) | Returns are historical and are calculated by determining the percentage change in net asset value with all distributions reinvested and do not reflect the effect of sales charges. |
| (3) | The investment adviser and administrator and sub-adviser reimbursed certain operating expenses (equal to 0.09%, 0.07%, 0.01%, 0.16%, 0.21% and 0.26% of average daily net assets for the six months ended May 31, 2023 and the years ended November 30, 2022, 2021, 2020, 2019 and 2018, respectively). Absent this reimbursement, total return would be lower. |
| (4) | Not annualized. |
| (5) | Annualized. |
| (6) | Includes a reduction by the investment adviser of a portion of its investment adviser and administration fee due to the Fund’s investment in the Liquidity Fund (equal to less than 0.005% of average daily net assets for the six months ended May 31, 2023 and the year ended November 30, 2022). |
12
See Notes to Financial Statements.
Eaton Vance
International Small-Cap Fund
May 31, 2023
Financial Highlights — continued
| | Class I |
| | Six Months Ended
May 31, 2023
(Unaudited) | Year Ended November 30, |
| | 2022 | 2021 | 2020 | 2019 | 2018 |
| Net asset value — Beginning of period | $ 12.070 | $ 16.030 | $ 13.850 | $ 12.720 | $ 11.840 | $ 13.470 |
| Income (Loss) From Operations | | | | | | |
| Net investment income(1) | $ 0.152 | $ 0.171 | $ 0.131 | $ 0.074 | $ 0.161 | $ 0.143 |
| Net realized and unrealized gain (loss) | (0.031) | (3.169) | 2.200 | 1.289 | 1.242 | (1.311) |
| Total income (loss) from operations | $ 0.121 | $ (2.998) | $ 2.331 | $ 1.363 | $ 1.403 | $ (1.168) |
| Less Distributions | | | | | | |
| From net investment income | $ (0.131) | $ (0.246) | $ (0.151) | $ (0.233) | $ (0.135) | $ (0.205) |
| From net realized gain | — | (0.716) | — | — | (0.388) | (0.257) |
| Total distributions | $ (0.131) | $ (0.962) | $ (0.151) | $ (0.233) | $ (0.523) | $ (0.462) |
| Net asset value — End of period | $12.060 | $12.070 | $16.030 | $13.850 | $12.720 | $11.840 |
| Total Return(2)(3) | 1.05% (4) | (20.05)% | 16.86% | 10.82% | 12.73% | (9.03)% |
| Ratios/Supplemental Data | | | | | | |
| Net assets, end of period (000’s omitted) | $ 56,765 | $ 55,413 | $ 73,293 | $ 49,028 | $ 42,132 | $ 31,389 |
| Ratios (as a percentage of average daily net assets): | | | | | | |
| Expenses (3) | 1.05% (5)(6) | 1.11% (6) | 1.15% | 1.15% | 1.15% | 1.15% |
| Net investment income | 2.51% (5) | 1.35% | 0.82% | 0.61% | 1.37% | 1.08% |
| Portfolio Turnover | 21% (4) | 51% | 59% | 61% | 70% | 65% |
| (1) | Computed using average shares outstanding. |
| (2) | Returns are historical and are calculated by determining the percentage change in net asset value with all distributions reinvested. |
| (3) | The investment adviser and administrator and sub-adviser reimbursed certain operating expenses (equal to 0.09%, 0.07%, 0.01%, 0.16%, 0.21% and 0.26% of average daily net assets for the six months ended May 31, 2023 and the years ended November 30, 2022, 2021, 2020, 2019 and 2018, respectively). Absent this reimbursement, total return would be lower. |
| (4) | Not annualized. |
| (5) | Annualized. |
| (6) | Includes a reduction by the investment adviser of a portion of its investment adviser and administration fee due to the Fund’s investment in the Liquidity Fund (equal to less than 0.005% of average daily net assets for the six months ended May 31, 2023 and the year ended November 30, 2022). |
13
See Notes to Financial Statements.
Eaton Vance
International Small-Cap Fund
May 31, 2023
Notes to Financial Statements (Unaudited)
1 Significant Accounting Policies
Eaton Vance International Small-Cap Fund (the Fund) is a diversified series of Eaton Vance Growth Trust (the Trust). The Trust is a Massachusetts business trust registered under the Investment Company Act of 1940, as amended (the 1940 Act), as an open-end management investment company. The Fund’s investment objective is to seek long-term capital appreciation. The Fund offers two classes of shares. Class A shares are generally sold subject to a sales charge imposed at time of purchase. Class I shares are sold at net asset value and are not subject to a sales charge. Each class represents a pro-rata interest in the Fund, but votes separately on class-specific matters and (as noted below) is subject to different expenses. Realized and unrealized gains and losses and net investment income and losses, other than class-specific expenses, are allocated daily to each class of shares based on the relative net assets of each class to the total net assets of the Fund. Each class of shares differs in its distribution plan and certain other class-specific expenses.
The following is a summary of significant accounting policies of the Fund. The policies are in conformity with accounting principles generally accepted in the United States of America (U.S. GAAP). The Fund is an investment company and follows accounting and reporting guidance in the Financial Accounting Standards Board (FASB) Accounting Standards Codification Topic 946.
A Investment Valuation—The following methodologies are used to determine the market value or fair value of investments.
Equity Securities. Equity securities listed on a U.S. securities exchange generally are valued at the last sale or closing price on the day of valuation or, if no sales took place on such date, at the mean between the closing bid and ask prices on the exchange where such securities are principally traded. Equity securities listed on the NASDAQ National Market System are valued at the NASDAQ official closing price. Unlisted or listed securities for which closing sales prices or closing quotations are not available are valued at the mean between the latest available bid and ask prices.
Foreign Securities and Currencies. Foreign securities and currencies are valued in U.S. dollars, based on foreign currency exchange rate quotations supplied by a third party pricing service. The pricing service uses a proprietary model to determine the exchange rate. Inputs to the model include reported trades and implied bid/ask spreads. The daily valuation of exchange-traded foreign securities generally is determined as of the close of trading on the principal exchange on which such securities trade. Events occurring after the close of trading on foreign exchanges may result in adjustments to the valuation of foreign securities to more accurately reflect their fair value as of the close of regular trading on the New York Stock Exchange. When valuing foreign equity securities that meet certain criteria, the Fund's Trustees have approved the use of a fair value service that values such securities to reflect market trading that occurs after the close of the applicable foreign markets of comparable securities or other instruments that have a strong correlation to the fair-valued securities.
Other. Investments in management investment companies (including money market funds) that do not trade on an exchange are valued at the net asset value as of the close of each business day.
Fair Valuation. In connection with Rule 2a-5 of the 1940 Act, the Trustees have designated the Fund’s investment adviser as its valuation designee. Investments for which valuations or market quotations are not readily available or are deemed unreliable are valued by the investment adviser, as valuation designee, at fair value using methods that most fairly reflect the security’s “fair value”, which is the amount that the Fund might reasonably expect to receive for the security upon its current sale in the ordinary course. Each such determination is based on a consideration of relevant factors, which are likely to vary from one pricing context to another. These factors may include, but are not limited to, the type of security, the existence of any contractual restrictions on the security’s disposition, the price and extent of public trading in similar securities of the issuer or of comparable companies or entities, quotations or relevant information obtained from broker/dealers or other market participants, information obtained from the issuer, analysts, and/or the appropriate stock exchange (for exchange-traded securities), an analysis of the company’s or entity’s financial statements, and an evaluation of the forces that influence the issuer and the market(s) in which the security is purchased and sold.
B Investment Transactions—Investment transactions for financial statement purposes are accounted for on a trade date basis. Realized gains and losses on investments sold are determined on the basis of identified cost.
C Income—Dividend income is recorded on the ex-dividend date for dividends received in cash and/or securities. However, if the ex-dividend date has passed, certain dividends from foreign securities are recorded as the Fund is informed of the ex-dividend date. Withholding taxes on foreign dividends and capital gains have been provided for in accordance with the Fund's understanding of the applicable countries’ tax rules and rates. Distributions from investment companies are recorded as dividend income, capital gains or return of capital based on the nature of the distribution.
D Federal Taxes—The Fund's policy is to comply with the provisions of the Internal Revenue Code applicable to regulated investment companies and to distribute to shareholders each year substantially all of its net investment income, and all or substantially all of its net realized capital gains. Accordingly, no provision for federal income or excise tax is necessary.
As of May 31, 2023, the Fund had no uncertain tax positions that would require financial statement recognition, de-recognition, or disclosure. The Fund files a U.S. federal income tax return annually after its fiscal year-end, which is subject to examination by the Internal Revenue Service for a period of three years from the date of filing.
E Expenses—The majority of expenses of the Trust are directly identifiable to an individual fund. Expenses which are not readily identifiable to a specific fund are allocated taking into consideration, among other things, the nature and type of expense and the relative size of the funds.
Eaton Vance
International Small-Cap Fund
May 31, 2023
Notes to Financial Statements (Unaudited) — continued
F Foreign Currency Translation—Investment valuations, other assets, and liabilities initially expressed in foreign currencies are translated each business day into U.S. dollars based upon current exchange rates. Purchases and sales of foreign investment securities and income and expenses denominated in foreign currencies are translated into U.S. dollars based upon currency exchange rates in effect on the respective dates of such transactions. Recognized gains or losses on investment transactions attributable to changes in foreign currency exchange rates are recorded for financial statement purposes as net realized gains and losses on investments. That portion of unrealized gains and losses on investments that results from fluctuations in foreign currency exchange rates is not separately disclosed.
G Use of Estimates—The preparation of the financial statements in conformity with U.S. GAAP requires management to make estimates and assumptions that affect the reported amounts of assets and liabilities at the date of the financial statements and the reported amounts of income and expense during the reporting period. Actual results could differ from those estimates.
H Indemnifications—Under the Trust’s organizational documents, its officers and Trustees may be indemnified against certain liabilities and expenses arising out of the performance of their duties to the Fund. Under Massachusetts law, if certain conditions prevail, shareholders of a Massachusetts business trust (such as the Trust) could be deemed to have personal liability for the obligations of the Trust. However, the Trust’s Declaration of Trust contains an express disclaimer of liability on the part of Fund shareholders and the By-laws provide that the Trust shall assume, upon request by the shareholder, the defense on behalf of any Fund shareholders. Moreover, the By-laws also provide for indemnification out of Fund property of any shareholder held personally liable solely by reason of being or having been a shareholder for all loss or expense arising from such liability. Additionally, in the normal course of business, the Fund enters into agreements with service providers that may contain indemnification clauses. The Fund’s maximum exposure under these arrangements is unknown as this would involve future claims that may be made against the Fund that have not yet occurred.
I Interim Financial Statements—The interim financial statements relating to May 31, 2023 and for the six months then ended have not been audited by an independent registered public accounting firm, but in the opinion of the Fund’s management, reflect all adjustments, consisting only of normal recurring adjustments, necessary for the fair presentation of the financial statements.
2 Distributions to Shareholders and Income Tax Information
It is the present policy of the Fund to make at least one distribution annually (normally in December) of all or substantially all of its net investment income and to distribute annually all or substantially all of its net realized capital gains. Distributions to shareholders are recorded on the ex-dividend date. Distributions are declared separately for each class of shares. Shareholders may reinvest income and capital gain distributions in additional shares of the same class of the Fund at the net asset value as of the ex-dividend date or, at the election of the shareholder, receive distributions in cash. Distributions to shareholders are determined in accordance with income tax regulations, which may differ from U.S. GAAP. As required by U.S. GAAP, only distributions in excess of tax basis earnings and profits are reported in the financial statements as a return of capital. Permanent differences between book and tax accounting relating to distributions are reclassified to paid-in capital. For tax purposes, distributions from short-term capital gains are considered to be from ordinary income.
At November 30, 2022, the Fund, for federal income tax purposes, had deferred capital losses of $2,663,234 which would reduce its taxable income arising from future net realized gains on investment transactions, if any, to the extent permitted by the Internal Revenue Code, and thus would reduce the amount of distributions to shareholders, which would otherwise be necessary to relieve the Fund of any liability for federal income or excise tax. The deferred capital losses are treated as arising on the first day of the Fund’s next taxable year and retain the same short-term or long-term character as when originally deferred. Of the deferred capital losses at November 30, 2022, $2,663,234 are short-term.
The cost and unrealized appreciation (depreciation) of investments of the Fund at May 31, 2023, as determined on a federal income tax basis, were as follows:
| Aggregate cost | $ 56,887,053 |
| Gross unrealized appreciation | $ 6,471,025 |
| Gross unrealized depreciation | (5,568,120) |
| Net unrealized appreciation | $ 902,905 |
Eaton Vance
International Small-Cap Fund
May 31, 2023
Notes to Financial Statements (Unaudited) — continued
3 Investment Adviser and Administration Fee and Other Transactions with Affiliates
The investment adviser and administration fee is earned by Eaton Vance Management (EVM), an indirect, wholly-owned subsidiary of Morgan Stanley, as compensation for investment advisory and administrative services rendered to the Fund. The investment adviser and administration fee is computed at an annual rate as a percentage of the Fund’s average daily net assets as follows and is payable monthly:
| Average Daily Net Assets | Annual Fee Rate |
| Up to $500 million | 0.900% |
| $500 million but less than $1 billion | 0.850% |
| $1 billion but less than $2.5 billion | 0.825% |
| $2.5 billion but less than $5 billion | 0.800% |
| $5 billion and over | 0.780% |
For the six months ended May 31, 2023, the investment adviser and administration fee amounted to $263,467 or 0.90% (annualized) of the Fund’s average daily net assets. Pursuant to an investment sub-advisory agreement, EVM has delegated the investment management of the Fund to Eaton Vance Advisers International Ltd. (EVAIL), an affiliate of EVM and an indirect wholly-owned subsidiary of Morgan Stanley. EVAIL uses the portfolio management, research and other resources of its affiliate, MSIM Fund Management (Ireland) Limited (MSIM FMIL), to render investment advisory services to the Fund. MSIM FMIL has entered into a Memorandum of Understanding with EVAIL pursuant to which MSIM FMIL is considered a participating affiliate of the sub-adviser as that term is used in relief granted by the staff of the U.S. Securities and Exchange Commission allowing U.S. registered investment advisers to use portfolio management or research resources of unregistered advisory affiliates subject to the supervision of a U.S. registered adviser. EVM pays EVAIL a portion of its investment adviser and administration fee for sub-advisory services provided to the Fund. The Fund may invest in a money market fund, the Institutional Class of the Morgan Stanley Institutional Liquidity Funds - Government Portfolio (the "Liquidity Fund"), an open-end management investment company managed by Morgan Stanley Investment Management Inc., a wholly-owned subsidiary of Morgan Stanley. The investment adviser and administration fee paid by the Fund is reduced by an amount equal to its pro-rata share of the advisory and administration fees paid by the Fund due to its investment in the Liquidity Fund. For the six months ended May 31, 2023, the investment adviser and administration fee paid was reduced by $976 relating to the Fund’s investment in the Liquidity Fund.
EVM and EVAIL have agreed to reimburse the Fund’s expenses to the extent that total annual operating expenses (relating to ordinary operating expenses only and excluding such expenses as brokerage commissions, acquired fund fees and expenses of unaffiliated funds, borrowing costs, taxes or litigation expenses) exceed 1.30% and 1.05% of the Fund’s average daily net assets for Class A and Class I, respectively, through March 31, 2024. Thereafter, the reimbursement may be changed or terminated at any time. Pursuant to this agreement, EVM and EVAIL were allocated $24,851 in total of the Fund’s operating expenses for the six months ended May 31, 2023.
EVM provides sub-transfer agency and related services to the Fund pursuant to a Sub-Transfer Agency Support Services Agreement. For the six months ended May 31, 2023, EVM earned $1,088 from the Fund pursuant to such agreement, which is included in transfer and dividend disbursing agent fees on the Statement of Operations. The Fund was informed that Eaton Vance Distributors, Inc. (EVD), an affiliate of EVM and the Fund’s principal underwriter, received no sales charges on sales of Class A shares for the six months ended May 31, 2023. EVD received distribution and service fees from Class A shares (see Note 4).
Trustees and officers of the Fund who are members of EVM’s organization receive remuneration for their services to the Fund out of the investment adviser and administration fee. Trustees of the Fund who are not affiliated with EVM may elect to defer receipt of all or a percentage of their annual fees in accordance with the terms of the Trustees Deferred Compensation Plan. For the six months ended May 31, 2023, no significant amounts have been deferred. Certain officers and Trustees of the Fund are officers of EVM.
4 Distribution Plan
The Fund has in effect a distribution plan for Class A shares (Class A Plan) pursuant to Rule 12b-1 under the 1940 Act. Pursuant to the Class A Plan, the Fund pays EVD a distribution and service fee of 0.25% per annum of its average daily net assets attributable to Class A shares for distribution services and facilities provided to the Fund by EVD, as well as for personal services and/or the maintenance of shareholder accounts. Distribution and service fees paid or accrued to EVD for the six months ended May 31, 2023 amounted to $1,432 for Class A shares.
Distribution and service fees are subject to the limitations contained in the Financial Industry Regulatory Authority Rule 2341(d).
Eaton Vance
International Small-Cap Fund
May 31, 2023
Notes to Financial Statements (Unaudited) — continued
5 Contingent Deferred Sales Charges
Class A shares may be subject to a 1% contingent deferred sales charge (CDSC) if redeemed within 12 months of purchase (depending on the circumstances of purchase). Generally, the CDSC is based upon the lower of the net asset value at date of redemption or date of purchase. No charge is levied on shares acquired by reinvestment of dividends or capital gain distributions. For the six months ended May 31, 2023, the Fund was informed that EVD received no CDSCs paid by Class A shareholders.
6 Purchases and Sales of Investments
Purchases and sales of investments, other than short-term obligations, aggregated $13,301,098 and $12,083,168, respectively, for the six months ended May 31, 2023.
7 Shares of Beneficial Interest
The Fund’s Declaration of Trust permits the Trustees to issue an unlimited number of full and fractional shares of beneficial interest (without par value). Such shares may be issued in a number of different series (such as the Fund) and classes. Transactions in Fund shares were as follows:
| | Six Months Ended
May 31, 2023
(Unaudited) | | Year Ended
November 30, 2022 |
| | Shares | Amount | | Shares | Amount |
| Class A | | | | | |
| Sales | 8,538 | $ 102,785 | | 57,659 | $ 640,603 |
| Issued to shareholders electing to receive payments of distributions in Fund shares | 729 | 8,475 | | 2,643 | 41,567 |
| Redemptions | (7,535) | (91,408) | | (13,775) | (177,091) |
| Net increase | 1,732 | $ 19,852 | | 46,527 | $ 505,079 |
| Class I | | | | | |
| Sales | 312,378 | $ 3,737,316 | | 1,005,433 | $ 13,884,660 |
| Issued to shareholders electing to receive payments of distributions in Fund shares | 52,675 | 613,137 | | 286,100 | 4,506,072 |
| Redemptions | (248,014) | (2,994,633) | | (1,275,435) | (17,397,671) |
| Net increase | 117,039 | $ 1,355,820 | | 16,098 | $ 993,061 |
At May 31, 2023, EVM and donor advised and pooled income funds (established and maintained by a public charity) managed by EVM owned in the aggregate 75.5% of the value of the outstanding shares of the Fund.
8 Line of Credit
The Fund participates with other portfolios and funds managed by EVM and its affiliates in a $725 million unsecured revolving line of credit agreement with a group of banks, which is in effect through October 24, 2023. Borrowings are made by the Fund solely for temporary purposes related to redemptions and other short-term cash needs. Interest is charged to the Fund based on its borrowings at an amount above either the Secured Overnight Financing Rate (SOFR) or Federal Funds rate. In addition, a fee computed at an annual rate of 0.15% on the daily unused portion of the line of credit is allocated among the participating portfolios and funds at the end of each quarter. In connection with the renewal of the agreement in October 2022, an arrangement fee totaling $150,000 was incurred that was allocated to the participating portfolios and funds. Because the line of credit is not available exclusively to the Fund, it may be unable to borrow some or all of its requested amounts at any particular time. The Fund did not have any significant borrowings or allocated fees during the six months ended May 31, 2023.
Eaton Vance
International Small-Cap Fund
May 31, 2023
Notes to Financial Statements (Unaudited) — continued
9 Affiliated Investments
At May 31, 2023, the value of the Fund's investment in funds that may be deemed to be affiliated was $1,713,865, which represents 3.0% of the Fund's net assets. Transactions in such investments by the Fund for the six months ended May 31, 2023 were as follows:
| Name | Value,
beginning
of period | Purchases | Sales
proceeds | Net
realized
gain (loss) | Change in
unrealized
appreciation
(depreciation) | Value, end
of period | Dividend
income | Shares,
end of period |
| Short-Term Investments |
| Liquidity Fund | $1,443,827 | $9,809,169 | $(9,539,131) | $ — | $ — | $1,713,865 | $26,562 | 1,713,865 |
10 Fair Value Measurements
Under generally accepted accounting principles for fair value measurements, a three-tier hierarchy to prioritize the assumptions, referred to as inputs, is used in valuation techniques to measure fair value. The three-tier hierarchy of inputs is summarized in the three broad levels listed below.
| • | Level 1 – quoted prices in active markets for identical investments |
| • | Level 2 – other significant observable inputs (including quoted prices for similar investments, interest rates, prepayment speeds, credit risk, etc.) |
| • | Level 3 – significant unobservable inputs (including a fund's own assumptions in determining the fair value of investments) |
In cases where the inputs used to measure fair value fall in different levels of the fair value hierarchy, the level disclosed is determined based on the lowest level input that is significant to the fair value measurement in its entirety. The inputs or methodology used for valuing securities are not necessarily an indication of the risk associated with investing in those securities.
At May 31, 2023, the hierarchy of inputs used in valuing the Fund's investments, which are carried at value, were as follows:
| Asset Description | Level 1 | Level 2 | Level 3 | Total |
| Common Stocks: | | | | |
| Asia/Pacific | $ — | $ 22,026,008 | $ — | $ 22,026,008 |
| Developed Europe | 965,950 | 24,476,147 | — | 25,442,097 |
| Developed Middle East | — | 360,914 | — | 360,914 |
| North America | 5,526,410 | — | — | 5,526,410 |
| Total Common Stocks | $ 6,492,360 | $ 46,863,069* | $ — | $53,355,429 |
| Exchange-Traded Funds | $ 2,720,664 | $ — | $ — | $ 2,720,664 |
| Short-Term Investments | 1,713,865 | — | — | 1,713,865 |
| Total Investments | $ 10,926,889 | $ 46,863,069 | $ — | $57,789,958 |
| * | Includes foreign equity securities whose values were adjusted to reflect market trading of comparable securities or other correlated instruments that occurred after the close of trading in their applicable foreign markets. |
11 Risks and Uncertainties
Risks Associated with Foreign Investments
Foreign investments can be adversely affected by political, economic and market developments abroad, including the imposition of economic and other sanctions by the United States or another country. There may be less publicly available information about foreign issuers because they may not be subject to reporting practices, requirements or regulations comparable to those to which United States companies are subject. Foreign markets may be smaller, less liquid and more volatile than the major markets in the United States. Trading in foreign markets typically involves higher expense than trading in the United States. The Fund may have difficulties enforcing its legal or contractual rights in a foreign country. Securities that trade or are denominated in currencies other than the U.S. dollar may be adversely affected by fluctuations in currency exchange rates.
Eaton Vance
International Small-Cap Fund
May 31, 2023
| Officers |
Eric A. Stein
President | Nicholas S. Di Lorenzo
Secretary |
Deidre E. Walsh
Vice President and Chief Legal Officer | Richard F. Froio
Chief Compliance Officer |
James F. Kirchner
Treasurer | |
George J. Gorman
Chairperson | |
| Alan C. Bowser | |
| Thomas E. Faust Jr.* | |
| Mark R. Fetting | |
| Cynthia E. Frost | |
| Valerie A. Mosley | |
| Anchal Pachnanda*(1) | |
| Keith Quinton | |
| Marcus L. Smith | |
| Susan J. Sutherland | |
| Scott E. Wennerholm | |
| Nancy A. Wiser | |
| * | Interested Trustee |
| (1) | Ms. Pachnanda began serving as Trustee effective April 1, 2023. |
| FACTS | WHAT DOES EATON VANCE DO WITH YOUR
PERSONAL INFORMATION? |
| Why? | Financial companies choose how they share your personal information. Federal law gives consumers the right to limit some but not all sharing. Federal law also requires us to tell you how we collect, share, and protect your personal information. Please read this notice carefully to understand what we do. |
| |
| What? | The types of personal information we collect and share depend on the product or service you have with us. This information can include:■ Social Security number and income
■ investment experience and risk tolerance
■ checking account number and wire transfer instructions |
| |
| How? | All financial companies need to share customers’ personal information to run their everyday business. In the section below, we list the reasons financial companies can share their customers’ personal information; the reasons Eaton Vance chooses to share; and whether you can limit this sharing. |
Reasons we can share your
personal information | Does Eaton Vance
share? | Can you limit
this sharing? |
| For our everyday business purposes — such as to process your transactions, maintain your account(s), respond to court orders and legal investigations, or report to credit bureaus | Yes | No |
| For our marketing purposes — to offer our products and services to you | Yes | No |
| For joint marketing with other financial companies | No | We don’t share |
| For our investment management affiliates’ everyday business purposes — information about your transactions, experiences, and creditworthiness | Yes | Yes |
| For our affiliates’ everyday business purposes — information about your transactions and experiences | Yes | No |
| For our affiliates’ everyday business purposes — information about your creditworthiness | No | We don’t share |
| For our investment management affiliates to market to you | Yes | Yes |
| For our affiliates to market to you | No | We don’t share |
| For nonaffiliates to market to you | No | We don’t share |
To limit our
sharing | Call toll-free 1-800-262-1122 or email: EVPrivacy@eatonvance.comPlease note:If you are a new customer, we can begin sharing your information 30 days from the date we sent this notice. When you are no longer our customer, we continue to share your information as described in this notice. However, you can contact us at any time to limit our sharing. |
| Questions? | Call toll-free 1-800-262-1122 or email: EVPrivacy@eatonvance.com |
| Privacy Notice — continued | April 2021 |
| Who we are |
| Who is providing this notice? | Eaton Vance Management, Eaton Vance Distributors, Inc., Eaton Vance Trust Company, Eaton Vance Management (International) Limited, Eaton Vance Advisers International Ltd., Eaton Vance Global Advisors Limited, Eaton Vance Management’s Real Estate Investment Group, Boston Management and Research, Calvert Research and Management, Eaton Vance and Calvert Fund Families and our investment advisory affiliates (“Eaton Vance”) (see Investment Management Affiliates definition below) |
| What we do |
How does Eaton Vance
protect my personal
information? | To protect your personal information from unauthorized access and use, we use security measures that comply with federal law. These measures include computer safeguards and secured files and buildings. We have policies governing the proper handling of customer information by personnel and requiring third parties that provide support to adhere to appropriate security standards with respect to such information. |
How does Eaton Vance
collect my personal
information? | We collect your personal information, for example, when you■ open an account or make deposits or withdrawals from your account
■ buy securities from us or make a wire transfer
■ give us your contact informationWe also collect your personal information from others, such as credit bureaus, affiliates, or other companies. |
| Why can’t I limit all sharing? | Federal law gives you the right to limit only■ sharing for affiliates’ everyday business purposes — information about your creditworthiness
■ affiliates from using your information to market to you
■ sharing for nonaffiliates to market to youState laws and individual companies may give you additional rights to limit sharing. See below for more on your rights under state law. |
| Definitions |
Investment Management
Affiliates | Eaton Vance Investment Management Affiliates include registered investment advisers, registered broker- dealers, and registered and unregistered funds. Investment Management Affiliates does not include entities associated with Morgan Stanley Wealth Management, such as Morgan Stanley Smith Barney LLC and Morgan Stanley & Co. |
| Affiliates | Companies related by common ownership or control. They can be financial and nonfinancial companies.■ Our affiliates include companies with a Morgan Stanley name and financial companies such as Morgan Stanley Smith Barney LLC and Morgan Stanley & Co. |
| Nonaffiliates | Companies not related by common ownership or control. They can be financial and nonfinancial companies.■ Eaton Vance does not share with nonaffiliates so they can market to you. |
| Joint marketing | A formal agreement between nonaffiliated financial companies that together market financial products or services to you.■ Eaton Vance doesn’t jointly market. |
| Other important information |
| Vermont: Except as permitted by law, we will not share personal information we collect about Vermont residents with Nonaffiliates unless you provide us with your written consent to share such information.California: Except as permitted by law, we will not share personal information we collect about California residents with Nonaffiliates and we will limit sharing such personal information with our Affiliates to comply with California privacy laws that apply to us. |
Delivery of Shareholder Documents. The Securities and Exchange Commission (SEC) permits funds to deliver only one copy of shareholder documents, including prospectuses, proxy statements and shareholder reports, to fund investors with multiple accounts at the same residential or post office box address. This practice is often called “householding” and it helps eliminate duplicate mailings to shareholders. Eaton Vance, or your financial intermediary, may household the mailing of your documents indefinitely unless you instruct Eaton Vance, or your financial intermediary, otherwise. If you would prefer that your Eaton Vance documents not be householded, please contact Eaton Vance at 1-800-262-1122, or contact your financial intermediary. Your instructions that householding not apply to delivery of your Eaton Vance documents will typically be effective within 30 days of receipt by Eaton Vance or your financial intermediary.
Portfolio Holdings. Each Eaton Vance Fund and its underlying Portfolio(s) (if applicable) files a schedule of portfolio holdings on Part F to Form N-PORT with the SEC. Certain information filed on Form N-PORT may be viewed on the Eaton Vance website at www.eatonvance.com, by calling Eaton Vance at 1-800-262-1122 or in the EDGAR database on the SEC’s website at www.sec.gov.
Proxy Voting. From time to time, funds are required to vote proxies related to the securities held by the funds. The Eaton Vance Funds or their underlying Portfolios (if applicable) vote proxies according to a set of policies and procedures approved by the Funds’ and Portfolios’ Boards. You may obtain a description of these policies and procedures and information on how the Funds or Portfolios voted proxies relating to portfolio securities during the most recent 12-month period ended June 30, without charge, upon request, by calling 1-800-262-1122 and by accessing the SEC’s website at www.sec.gov.
This Page Intentionally Left Blank
This Page Intentionally Left Blank
Investment Adviser and Administrator
Eaton Vance Management
Two International Place
Boston, MA 02110
Investment Sub-Adviser
Eaton Vance Advisers International Ltd.
125 Old Broad Street
London, EC2N 1AR
United Kingdom
Principal Underwriter*
Eaton Vance Distributors, Inc.
Two International Place
Boston, MA 02110
(617) 482-8260
Custodian
State Street Bank and Trust Company
One Congress Street, Suite 1
Boston, MA 02114-2016
Transfer Agent
BNY Mellon Investment Servicing (US) Inc.
Attn: Eaton Vance Funds
P.O. Box 534439
Pittsburgh, PA 15253-4439
(800) 262-1122
Fund Offices
Two International Place
Boston, MA 02110
* FINRA BrokerCheck. Investors may check the background of their Investment Professional by contacting the Financial Industry Regulatory Authority (FINRA). FINRA BrokerCheck is a free tool to help investors check the professional background of current and former FINRA-registered securities firms and brokers. FINRA BrokerCheck is available by calling 1-800-289-9999 and at www.FINRA.org. The FINRA BrokerCheck brochure describing this program is available to investors at www.FINRA.org.
Item 2. Code of Ethics
Not required in this filing.
Item 3. Audit Committee Financial Expert
Not required in this filing.
Item 4. Principal Accountant Fees and Services
Not required in this filing.
Item 5. Audit Committee of Listed Registrants
Not applicable.
Item 6. Schedule of Investments
Please see schedule of investments contained in the Report to Stockholders included under Item 1 of this Form N-CSR.
Item 7. Disclosure of Proxy Voting Policies and Procedures for Closed-End Management Investment Companies
Not applicable.
Item 8. Portfolio Managers of Closed-End Management Investment Companies
Not applicable.
Item 9. Purchases of Equity Securities by Closed-End Management Investment Company and Affiliated Purchasers
Not applicable.
Item 10. Submission of Matters to a Vote of Security Holders
No material changes.
Item 11. Controls and Procedures
(a) It is the conclusion of the registrant’s principal executive officer and principal financial officer that the effectiveness of the registrant’s current disclosure controls and procedures (such disclosure controls and procedures having been evaluated within 90 days of the date of this filing) provide reasonable assurance that the information required to be disclosed by the registrant has been recorded, processed, summarized and reported within the time period specified in the Commission’s rules and forms and that the information required to be disclosed by the registrant has been accumulated and communicated to the registrant’s principal executive officer and principal financial officer in order to allow timely decisions regarding required disclosure.
(b) There have been no changes in the registrant’s internal controls over financial reporting during the period covered by this report that has materially affected, or is reasonably likely to materially affect, the registrant’s internal control over financial reporting.
Item 12. Disclosure of Securities Lending Activities for Closed-End Management Investment Companies
Not applicable.
Item 13. Exhibits
Signatures
Pursuant to the requirements of the Securities Exchange Act of 1934 and the Investment Company Act of 1940, the registrant has duly caused this report to be signed on its behalf by the undersigned, thereunto duly authorized.
Eaton Vance Growth Trust
| | |
| By: | | /s/ Eric A. Stein |
| | Eric A. Stein |
| | President |
Date: July 25, 2023
Pursuant to the requirements of the Securities Exchange Act of 1934 and the Investment Company Act of 1940, this report has been signed below by the following persons on behalf of the registrant and in the capacities and on the dates indicated.
| | |
| By: | | /s/ James F. Kirchner |
| | James F. Kirchner |
| | Treasurer |
Date: July 25, 2023
| | |
| By: | | /s/ Eric A. Stein |
| | Eric A. Stein |
| | President |
Date: July 25, 2023