UNITED STATES
SECURITIES AND EXCHANGE COMMISSION
Washington, D.C. 20549
Form N-CSR
CERTIFIED SHAREHOLDER REPORT OF REGISTERED
MANAGEMENT INVESTMENT COMPANIES
Investment Company Act File Number: 811-01241
Eaton Vance Growth Trust
(Exact Name of Registrant as Specified in Charter)
One Post Office Square, Boston, Massachusetts 02109
(Address of Principal Executive Offices)
Deidre E. Walsh
One Post Office Square, Boston, Massachusetts 02109
(Name and Address of Agent for Services)
(617) 482-8260
(Registrant’s Telephone Number)
September 30
Date of Fiscal Year End
March 31, 2024
Date of Reporting Period
Item 1. Reports to Stockholders
Eaton Vance
Atlanta Capital SMID-Cap Fund
Semiannual Report
March 31, 2024
Commodity Futures Trading Commission Registration. The Commodity Futures Trading Commission (“CFTC”) has adopted regulations that subject registered investment companies and advisers to regulation by the CFTC if a fund invests more than a prescribed level of its assets in certain CFTC-regulated instruments (including futures, certain options and swap agreements) or markets itself as providing investment exposure to such instruments. The investment adviser has claimed an exclusion from the definition of “commodity pool operator” under the Commodity Exchange Act with respect to its management of the Fund. Accordingly, neither the Fund nor the adviser with respect to the operation of the Fund is subject to CFTC regulation. Because of its management of other strategies, the Fund's adviser is registered with the CFTC as a commodity pool operator. The adviser is also registered as a commodity trading advisor.
Fund shares are not insured by the FDIC and are not deposits or other obligations of, or guaranteed by, any depository institution. Shares are subject to investment risks, including possible loss of principal invested.
This report must be preceded or accompanied by a current summary prospectus or prospectus. Before investing, investors should consider carefully the investment objective, risks, and charges and expenses of a mutual fund. This and other important information is contained in the summary prospectus and prospectus, which can be obtained from a financial intermediary. Prospective investors should read the prospectus carefully before investing. For further information, please call 1-800-262-1122.
Semiannual Report March 31, 2024
Eaton Vance
Atlanta Capital SMID-Cap Fund
Eaton Vance
Atlanta Capital SMID-Cap Fund
March 31, 2024
Performance
Portfolio Manager(s) Charles B. Reed, CFA, William O. Bell IV, CFA and W. Matthew Hereford, CFA, each of Atlanta Capital Management Company, LLC
| % Average Annual Total Returns1,2 | Class
Inception Date | Performance
Inception Date | Six Months | One Year | Five Years | Ten Years |
| Class A at NAV | 11/28/2003 | 04/30/2002 | 21.48% | 23.48% | 12.15% | 12.09% |
| Class A with 5.25% Maximum Sales Charge | — | — | 15.10 | 17.01 | 10.95 | 11.49 |
| Class C at NAV | 10/01/2009 | 04/30/2002 | 21.04 | 22.58 | 11.32 | 11.43 |
| Class C with 1% Maximum Deferred Sales Charge | — | — | 20.04 | 21.58 | 11.32 | 11.43 |
| Class I at NAV | 04/30/2002 | 04/30/2002 | 21.65 | 23.80 | 12.44 | 12.38 |
| Class R at NAV | 08/03/2009 | 04/30/2002 | 21.34 | 23.19 | 11.88 | 11.82 |
| Class R6 at NAV | 07/01/2014 | 04/30/2002 | 21.66 | 23.86 | 12.51 | 12.47 |
|
| Russell 2500™Index | — | — | 21.20% | 21.43% | 9.89% | 8.83% |
| Russell 2000® Index | — | — | 19.94 | 19.71 | 8.10 | 7.57 |
| % Total Annual Operating Expense Ratios3 | Class A | Class C | Class I | Class R | Class R6 |
| | 1.14% | 1.89% | 0.89% | 1.39% | 0.82% |
See Endnotes and Additional Disclosures in this report.
Past performance is no guarantee of future results. Returns are historical and are calculated by determining the percentage change in net asset value (NAV) or offering price (as applicable) with all distributions reinvested. Furthermore, returns do not reflect the deduction of taxes that shareholders may have to pay on Fund distributions or upon the redemption of Fund shares. Investment return and principal value will fluctuate so that shares, when redeemed, may be worth more or less than their original cost. Performance for periods less than or equal to one year is cumulative. Performance is for the stated time period only; due to market volatility, current Fund performance may be lower or higher than the quoted return. For performance as of the most recent month-end, please refer to eatonvance.com.
Eaton Vance
Atlanta Capital SMID-Cap Fund
March 31, 2024
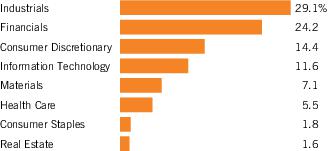
| Sector Allocation (% of net assets)1 |
| Top 10 Holdings (% of net assets)1 |
| W.R. Berkley Corp. | 4.9% |
| Carlisle Cos., Inc. | 4.9 |
| Morningstar, Inc. | 3.2 |
| GoDaddy, Inc., Class A | 3.1 |
| Brown & Brown, Inc. | 3.0 |
| Markel Group, Inc. | 2.9 |
| CACI International, Inc., Class A | 2.8 |
| Booz Allen Hamilton Holding Corp. | 2.8 |
| RPM International, Inc. | 2.6 |
| LKQ Corp. | 2.6 |
| Total | 32.8% |
Footnotes:
| 1 | Excludes cash and cash equivalents. |
Eaton Vance
Atlanta Capital SMID-Cap Fund
March 31, 2024
Endnotes and Additional Disclosures
| 1 | Russell 2500™ Index is an unmanaged index of approximately 2,500 small- and mid-cap U.S. stocks. Russell 2000® Index is an unmanaged index of 2,000 U.S. small-cap stocks. Unless otherwise stated, index returns do not reflect the effect of any applicable sales charges, commissions, expenses, taxes or leverage, as applicable. It is not possible to invest directly in an index. |
| 2 | Total Returns at NAV do not include applicable sales charges. If sales charges were deducted, the returns would be lower. Total Returns shown with maximum sales charge reflect the stated maximum sales charge. Unless otherwise stated, performance does not reflect the deduction of taxes on Fund distributions or redemptions of Fund shares.Performance prior to the inception date of a class may be linked to the performance of an older class of the Fund. This linked performance is adjusted for any applicable sales charge, but is not adjusted for class expense differences. If adjusted for such differences, the performance would be different. The performance of Class R6 is linked to Class I. Performance presented in the Financial Highlights included in the financial statements is not linked.Effective November 5, 2020, Class C shares automatically convert to Class A shares eight years after purchase. The average annual total returns listed for Class C reflect conversion to Class A shares after eight years. Prior to November 5, 2020, Class C shares automatically converted to Class A shares ten years after purchase. |
| 3 | Source: Fund prospectus. The expense ratios for the current reporting period can be found in the Financial Highlights section of this report. Performance reflects expenses waived and/or reimbursed, if applicable. Without such waivers and/or reimbursements, performance would have been lower. |
| | Fund profile subject to change due to active management. |
Eaton Vance
Atlanta Capital SMID-Cap Fund
March 31, 2024
Example
As a Fund shareholder, you incur two types of costs: (1) transaction costs, including sales charges (loads) on purchases; and (2) ongoing costs, including management fees; distribution and/or service fees; and other Fund expenses. This Example is intended to help you understand your ongoing costs (in dollars) of Fund investing and to compare these costs with the ongoing costs of investing in other mutual funds. The Example is based on an investment of $1,000 invested at the beginning of the period and held for the entire period (October 1, 2023 to March 31, 2024).
Actual Expenses
The first section of the table below provides information about actual account values and actual expenses. You may use the information in this section, together with the amount you invested, to estimate the expenses that you paid over the period. Simply divide your account value by $1,000 (for example, an $8,600 account value divided by $1,000 = 8.6), then multiply the result by the number in the first section under the heading entitled “Expenses Paid During Period” to estimate the expenses you paid on your account during this period.
Hypothetical Example for Comparison Purposes
The second section of the table below provides information about hypothetical account values and hypothetical expenses based on the actual Fund expense ratio and an assumed rate of return of 5% per year (before expenses), which is not the actual Fund return. The hypothetical account values and expenses may not be used to estimate the actual ending account balance or expenses you paid for the period. You may use this information to compare the ongoing costs of investing in your Fund and other funds. To do so, compare this 5% hypothetical example with the 5% hypothetical examples that appear in the shareholder reports of the other funds.
Please note that the expenses shown in the table are meant to highlight your ongoing costs only and do not reflect any transactional costs, such as sales charges (loads). Therefore, the second section of the table is useful in comparing ongoing costs only, and will not help you determine the relative total costs of owning different funds. In addition, if these transactional costs were included, your costs would be higher.
| | Beginning
Account Value
(10/1/23) | Ending
Account Value
(3/31/24) | Expenses Paid
During Period*
(10/1/23 – 3/31/24) | Annualized
Expense
Ratio |
| Actual | | | | |
| Class A | $1,000.00 | $1,214.80 | $ 6.26 | 1.13% |
| Class C | $1,000.00 | $1,210.40 | $10.39 | 1.88% |
| Class I | $1,000.00 | $1,216.50 | $ 4.93 | 0.89% |
| Class R | $1,000.00 | $1,213.40 | $ 7.64 | 1.38% |
| Class R6 | $1,000.00 | $1,216.60 | $ 4.49 | 0.81% |
| |
| Hypothetical | | | | |
| (5% return per year before expenses) | | | | |
| Class A | $1,000.00 | $1,019.35 | $ 5.70 | 1.13% |
| Class C | $1,000.00 | $1,015.60 | $ 9.47 | 1.88% |
| Class I | $1,000.00 | $1,020.55 | $ 4.50 | 0.89% |
| Class R | $1,000.00 | $1,018.10 | $ 6.96 | 1.38% |
| Class R6 | $1,000.00 | $1,020.95 | $ 4.09 | 0.81% |
| * | Expenses are equal to the Fund’s annualized expense ratio for the indicated Class, multiplied by the average account value over the period, multiplied by 183/366 (to reflect the one-half year period). The Example assumes that the $1,000 was invested at the net asset value per share determined at the close of business on September 30, 2023. |
Eaton Vance
Atlanta Capital SMID-Cap Fund
March 31, 2024
Portfolio of Investments (Unaudited)
| Security | Shares | Value |
| Aerospace & Defense — 1.4% |
| Hexcel Corp. | | 2,665,405 | $ 194,174,754 |
| | | | $ 194,174,754 |
| Banks — 1.2% |
| Columbia Banking System, Inc. | | 3,266,157 | $ 63,200,138 |
| Prosperity Bancshares, Inc. | | 1,467,639 | 96,541,293 |
| | | | $ 159,741,431 |
| Building Products — 7.9% |
| Advanced Drainage Systems, Inc. | | 475,787 | $ 81,949,553 |
| Carlisle Cos., Inc. | | 1,691,734 | 662,905,968 |
| Lennox International, Inc. | | 678,679 | 331,711,148 |
| | | | $ 1,076,566,669 |
| Capital Markets — 8.4% |
| Affiliated Managers Group, Inc. | | 1,636,405 | $ 274,048,745 |
| FactSet Research Systems, Inc. | | 267,462 | 121,532,058 |
| Morningstar, Inc. | | 1,434,185 | 442,259,629 |
| SEI Investments Co. | | 4,259,526 | 306,259,919 |
| | | | $ 1,144,100,351 |
| Chemicals — 2.6% |
| RPM International, Inc. | | 2,966,558 | $ 352,872,074 |
| | | | $ 352,872,074 |
| Consumer Staples Distribution & Retail — 1.8% |
| Casey's General Stores, Inc. | | 780,452 | $ 248,534,939 |
| | | | $ 248,534,939 |
| Containers & Packaging — 4.5% |
| AptarGroup, Inc. | | 2,304,203 | $ 331,551,770 |
| Avery Dennison Corp. | | 921,461 | 205,716,168 |
| Ball Corp. | | 1,172,536 | 78,982,025 |
| | | | $ 616,249,963 |
| Distributors — 3.7% |
| LKQ Corp. | | 6,504,139 | $ 347,386,064 |
| Pool Corp. | | 385,439 | 155,524,637 |
| | | | $ 502,910,701 |
| Security | Shares | Value |
| Diversified Consumer Services — 1.0% |
| Service Corp. International | | 1,766,212 | $ 131,070,593 |
| | | | $ 131,070,593 |
| Electronic Equipment, Instruments & Components — 2.0% |
| Trimble, Inc.(1) | | 4,356,859 | $ 280,407,445 |
| | | | $ 280,407,445 |
| Financial Services — 3.2% |
| Jack Henry & Associates, Inc. | | 749,353 | $ 130,185,097 |
| WEX, Inc.(1) | | 1,302,965 | 309,493,276 |
| | | | $ 439,678,373 |
| Ground Transportation — 4.0% |
| J.B. Hunt Transport Services, Inc. | | 1,212,630 | $ 241,616,527 |
| Landstar System, Inc. | | 1,579,397 | 304,444,566 |
| | | | $ 546,061,093 |
| Health Care Equipment & Supplies — 4.0% |
| Envista Holdings Corp.(1)(2) | | 9,678,610 | $ 206,928,682 |
| Teleflex, Inc.(3) | | 1,483,367 | 335,493,114 |
| | | | $ 542,421,796 |
| Health Care Providers & Services — 0.5% |
| Henry Schein, Inc.(1)(3) | | 891,905 | $ 67,356,666 |
| | | | $ 67,356,666 |
| Hotels, Restaurants & Leisure — 3.8% |
| Aramark | | 8,971,146 | $ 291,741,668 |
| Choice Hotels International, Inc.(3) | | 1,806,542 | 228,256,582 |
| | | | $ 519,998,250 |
| Insurance — 11.4% |
| Brown & Brown, Inc. | | 4,624,509 | $ 404,829,518 |
| Kinsale Capital Group, Inc. | | 161,381 | 84,683,066 |
| Markel Group, Inc.(1) | | 262,848 | 399,917,975 |
| W.R. Berkley Corp. | | 7,519,014 | 664,981,598 |
| | | | $ 1,554,412,157 |
| IT Services — 3.1% |
| GoDaddy, Inc., Class A(1) | | 3,555,939 | $ 422,018,841 |
| | | | $ 422,018,841 |
| Life Sciences Tools & Services — 1.1% |
| Bio-Techne Corp. | | 2,094,770 | $ 147,450,860 |
| | | | $ 147,450,860 |
6
See Notes to Financial Statements.
Eaton Vance
Atlanta Capital SMID-Cap Fund
March 31, 2024
Portfolio of Investments (Unaudited) — continued
| Security | Shares | Value |
| Machinery — 4.1% |
| Graco, Inc. | | 1,550,857 | $ 144,943,095 |
| IDEX Corp. | | 787,756 | 192,228,219 |
| Nordson Corp. | | 817,252 | 224,368,364 |
| | | | $ 561,539,678 |
| Marine Transportation — 1.8% |
| Kirby Corp.(1) | | 2,606,248 | $ 248,427,559 |
| | | | $ 248,427,559 |
| Professional Services — 9.8% |
| Booz Allen Hamilton Holding Corp. | | 2,576,579 | $ 382,467,387 |
| Broadridge Financial Solutions, Inc. | | 907,841 | 185,980,307 |
| CACI International, Inc., Class A(1) | | 1,010,743 | 382,899,771 |
| FTI Consulting, Inc.(1) | | 791,852 | 166,518,557 |
| TransUnion | | 2,755,182 | 219,863,523 |
| | | | $ 1,337,729,545 |
| Real Estate Management & Development — 1.6% |
| Jones Lang LaSalle, Inc.(1) | | 1,106,672 | $ 215,900,641 |
| | | | $ 215,900,641 |
| Software — 6.5% |
| Blackbaud, Inc.(1) | | 2,361,550 | $ 175,085,317 |
| Dolby Laboratories, Inc., Class A(2) | | 4,107,659 | 344,098,594 |
| Manhattan Associates, Inc.(1) | | 713,481 | 178,534,351 |
| Tyler Technologies, Inc.(1) | | 431,168 | 183,250,712 |
| | | | $ 880,968,974 |
| Specialty Retail — 3.0% |
| Burlington Stores, Inc.(1) | | 1,290,499 | $ 299,640,963 |
| Ulta Beauty, Inc.(1) | | 199,621 | 104,377,828 |
| | | | $ 404,018,791 |
| Textiles, Apparel & Luxury Goods — 2.9% |
| Columbia Sportswear Co.(3) | | 2,792,195 | $ 226,670,390 |
| Deckers Outdoor Corp.(1) | | 184,838 | 173,980,616 |
| | | | $ 400,651,006 |
Total Common Stocks
(identified cost $6,663,132,536) | | | $12,995,263,150 |
| Short-Term Investments — 4.7% |
| Security | Shares | Value |
| Morgan Stanley Institutional Liquidity Funds - Government Portfolio, Institutional Class, 5.22%(4) | | 644,572,262 | $ 644,572,262 |
Total Short-Term Investments
(identified cost $644,572,262) | | | $ 644,572,262 |
Total Investments — 100.0%
(identified cost $7,307,704,798) | | | $13,639,835,412 |
| Other Assets, Less Liabilities — (0.0)%(5) | | | $ (1,400,488) |
| Net Assets — 100.0% | | | $13,638,434,924 |
| The percentage shown for each investment category in the Portfolio of Investments is based on net assets. |
| (1) | Non-income producing security. |
| (2) | Affiliated company (see Note 10). |
| (3) | All or a portion of this security was on loan at March 31, 2024. The aggregate market value of securities on loan at March 31, 2024 was $38,177,681. |
| (4) | May be deemed to be an affiliated investment company. The rate shown is the annualized seven-day yield as of March 31, 2024. |
| (5) | Amount is less than (0.05)%. |
7
See Notes to Financial Statements.
Eaton Vance
Atlanta Capital SMID-Cap Fund
March 31, 2024
Statement of Assets and Liabilities (Unaudited)
| | March 31, 2024 |
| Assets | |
| Unaffiliated investments, at value (identified cost $6,130,736,671) — including $38,177,681 of securities on loan | $ 12,444,235,874 |
| Affiliated investments, at value (identified cost $1,176,968,127) | 1,195,599,538 |
| Dividends receivable | 2,294,698 |
| Dividends receivable from affiliated investments | 2,640,656 |
| Receivable for Fund shares sold | 20,491,924 |
| Securities lending income receivable | 4,937 |
| Trustees' deferred compensation plan | 194,475 |
| Total assets | $13,665,462,102 |
| Liabilities | |
| Payable for Fund shares redeemed | $ 14,866,536 |
| Payable to affiliates: | |
| Investment adviser fee | 8,682,878 |
| Distribution and service fees | 453,153 |
| Trustees' deferred compensation plan | 194,475 |
| Accrued expenses | 2,830,136 |
| Total liabilities | $ 27,027,178 |
| Net Assets | $13,638,434,924 |
| Sources of Net Assets | |
| Paid-in capital | $ 7,188,120,047 |
| Distributable earnings | 6,450,314,877 |
| Net Assets | $13,638,434,924 |
| Class A Shares | |
| Net Assets | $ 1,075,778,872 |
| Shares Outstanding | 30,876,441 |
Net Asset Value and Redemption Price Per Share
(net assets ÷ shares of beneficial interest outstanding) | $ 34.84 |
Maximum Offering Price Per Share
(100 ÷ 94.75 of net asset value per share) | $ 36.77 |
| Class C Shares | |
| Net Assets | $ 42,600,788 |
| Shares Outstanding | 1,479,857 |
Net Asset Value and Offering Price Per Share*
(net assets ÷ shares of beneficial interest outstanding) | $ 28.79 |
| Class I Shares | |
| Net Assets | $ 7,110,108,167 |
| Shares Outstanding | 171,298,308 |
Net Asset Value, Offering Price and Redemption Price Per Share
(net assets ÷ shares of beneficial interest outstanding) | $ 41.51 |
| Class R Shares | |
| Net Assets | $ 467,691,073 |
| Shares Outstanding | 14,269,563 |
Net Asset Value, Offering Price and Redemption Price Per Share
(net assets ÷ shares of beneficial interest outstanding) | $ 32.78 |
8
See Notes to Financial Statements.
Eaton Vance
Atlanta Capital SMID-Cap Fund
March 31, 2024
Statement of Assets and Liabilities (Unaudited) — continued
| | March 31, 2024 |
| Class R6 Shares | |
| Net Assets | $4,942,256,024 |
| Shares Outstanding | 117,800,206 |
Net Asset Value, Offering Price and Redemption Price Per Share
(net assets ÷ shares of beneficial interest outstanding) | $ 41.95 |
| On sales of $50,000 or more, the offering price of Class A shares is reduced. |
| * | Redemption price per share is equal to the net asset value less any applicable contingent deferred sales charge. |
9
See Notes to Financial Statements.
Eaton Vance
Atlanta Capital SMID-Cap Fund
March 31, 2024
Statement of Operations (Unaudited)
| | Six Months Ended |
| | March 31, 2024 |
| Investment Income | |
| Dividend income | $ 50,709,386 |
| Dividend income from affiliated investments | 16,369,925 |
| Securities lending income, net | 40,217 |
| Total investment income | $ 67,119,528 |
| Expenses | |
| Investment adviser fee | $ 47,163,268 |
| Distribution and service fees: | |
| Class A | 1,211,702 |
| Class C | 175,272 |
| Class R | 1,070,396 |
| Trustees’ fees and expenses | 54,250 |
| Custodian fee | 791,287 |
| Transfer and dividend disbursing agent fees | 3,411,231 |
| Legal and accounting services | 342,748 |
| Printing and postage | 220,051 |
| Registration fees | 158,069 |
| Miscellaneous | 181,002 |
| Total expenses | $ 54,779,276 |
| Deduct: | |
| Waiver and/or reimbursement of expenses by affiliates | $ 417,811 |
| Total expense reductions | $ 417,811 |
| Net expenses | $ 54,361,465 |
| Net investment income | $ 12,758,063 |
| Realized and Unrealized Gain (Loss) | |
| Net realized gain (loss): | |
| Investment transactions | $ 159,751,091 |
| Net realized gain | $ 159,751,091 |
| Change in unrealized appreciation (depreciation): | |
| Investments | $ 2,267,269,813 |
| Investments - affiliated investments | (40,293,191) |
| Net change in unrealized appreciation (depreciation) | $2,226,976,622 |
| Net realized and unrealized gain | $2,386,727,713 |
| Net increase in net assets from operations | $2,399,485,776 |
10
See Notes to Financial Statements.
Eaton Vance
Atlanta Capital SMID-Cap Fund
March 31, 2024
Statements of Changes in Net Assets
| | Six Months Ended
March 31, 2024
(Unaudited) | Year Ended
September 30, 2023 |
| Increase (Decrease) in Net Assets | | |
| From operations: | | |
| Net investment income | $ 12,758,063 | $ 11,221,552 |
| Net realized gain | 159,751,091 | 422,057,178 |
| Net change in unrealized appreciation (depreciation) | 2,226,976,622 | 943,104,841 |
| Net increase in net assets from operations | $ 2,399,485,776 | $ 1,376,383,571 |
| Distributions to shareholders: | | |
| Class A | $ (29,730,524) | $ (108,934,039) |
| Class C | (1,254,901) | (4,260,378) |
| Class I | (176,209,094) | (499,140,366) |
| Class R | (13,798,264) | (48,760,578) |
| Class R6 | (117,426,433) | (331,101,134) |
| Total distributions to shareholders | $ (338,419,216) | $ (992,196,495) |
| Transactions in shares of beneficial interest: | | |
| Class A | $ 14,736,793 | $ (19,194,346) |
| Class C | 4,801,438 | 1,246,644 |
| Class I | 169,924,870 | 833,476,653 |
| Class R | (4,341,771) | 9,623,772 |
| Class R6 | 460,973,867 | 351,159,926 |
| Net increase in net assets from Fund share transactions | $ 646,095,197 | $ 1,176,312,649 |
| Net increase in net assets | $ 2,707,161,757 | $ 1,560,499,725 |
| Net Assets | | |
| At beginning of period | $ 10,931,273,167 | $ 9,370,773,442 |
| At end of period | $13,638,434,924 | $10,931,273,167 |
11
See Notes to Financial Statements.
Eaton Vance
Atlanta Capital SMID-Cap Fund
March 31, 2024
| | Class A |
| | Six Months Ended
March 31, 2024
(Unaudited) | Year Ended September 30, |
| | 2023 | 2022 | 2021 | 2020 | 2019 |
| Net asset value — Beginning of period | $ 29.590 | $ 28.950 | $ 36.680 | $ 30.690 | $ 34.740 | $ 34.450 |
| Income (Loss) From Operations | | | | | | |
| Net investment loss(1) | $ (0.003) | $ (0.038) | $ (0.096) | $ (0.160) | $ (0.088) | $ (0.088) |
| Net realized and unrealized gain (loss) | 6.233 | 4.220 | (3.307) | 9.835 | (1.586) | 2.526 |
| Total income (loss) from operations | $ 6.230 | $ 4.182 | $ (3.403) | $ 9.675 | $ (1.674) | $ 2.438 |
| Less Distributions | | | | | | |
| From net realized gain | $ (0.980) | $ (3.542) | $ (4.327) | $ (3.685) | $ (2.376) | $ (2.148) |
| Total distributions | $ (0.980) | $ (3.542) | $ (4.327) | $ (3.685) | $ (2.376) | $ (2.148) |
| Net asset value — End of period | $ 34.840 | $ 29.590 | $ 28.950 | $ 36.680 | $ 30.690 | $ 34.740 |
| Total Return(2) | 21.48% (3) | 14.42% | (10.60)% | 34.78% | (5.21)% | 8.29% |
| Ratios/Supplemental Data | | | | | | |
| Net assets, end of period (000’s omitted) | $1,075,779 | $899,628 | $897,642 | $1,347,594 | $1,360,610 | $1,764,848 |
| Ratios (as a percentage of average daily net assets): | | | | | | |
| Expenses | 1.13% (4)(5) | 1.14% (5) | 1.14% (5) | 1.14% | 1.17% | 1.17% |
| Net investment loss | (0.02)% (4) | (0.13)% | (0.29)% | (0.46)% | (0.29)% | (0.28)% |
| Portfolio Turnover | 3% (3) | 14% | 7% | 9% | 21% | 16% |
| (1) | Computed using average shares outstanding. |
| (2) | Returns are historical and are calculated by determining the percentage change in net asset value with all distributions reinvested and do not reflect the effect of sales charges. |
| (3) | Not annualized. |
| (4) | Annualized. |
| (5) | Includes a reduction by the investment adviser of a portion of its adviser fee due to the Fund’s investment in the Liquidity Fund (equal to less than 0.01% of average daily net assets for the six months ended March 31, 2024 and less than 0.005% of average daily net assets for the years ended September 30, 2023 and 2022). |
12
See Notes to Financial Statements.
Eaton Vance
Atlanta Capital SMID-Cap Fund
March 31, 2024
Financial Highlights — continued
| | Class C |
| | Six Months Ended
March 31, 2024
(Unaudited) | Year Ended September 30, |
| | 2023 | 2022 | 2021 | 2020 | 2019 |
| Net asset value — Beginning of period | $ 24.690 | $ 24.840 | $ 32.290 | $ 27.620 | $ 31.700 | $ 31.870 |
| Income (Loss) From Operations | | | | | | |
| Net investment loss(1) | $ (0.102) | $ (0.220) | $ (0.300) | $ (0.371) | $ (0.290) | $ (0.298) |
| Net realized and unrealized gain (loss) | 5.176 | 3.612 | (2.823) | 8.726 | (1.429) | 2.276 |
| Total income (loss) from operations | $ 5.074 | $ 3.392 | $ (3.123) | $ 8.355 | $ (1.719) | $ 1.978 |
| Less Distributions | | | | | | |
| From net realized gain | $ (0.974) | $ (3.542) | $ (4.327) | $ (3.685) | $ (2.361) | $ (2.148) |
| Total distributions | $ (0.974) | $ (3.542) | $ (4.327) | $ (3.685) | $ (2.361) | $ (2.148) |
| Net asset value — End of period | $28.790 | $24.690 | $24.840 | $32.290 | $ 27.620 | $ 31.700 |
| Total Return(2) | 21.04% (3) | 13.54% | (11.25)% | 33.76% | (5.89)% | 7.46% |
| Ratios/Supplemental Data | | | | | | |
| Net assets, end of period (000’s omitted) | $ 42,601 | $ 32,259 | $ 31,131 | $ 45,010 | $101,804 | $181,257 |
| Ratios (as a percentage of average daily net assets): | | | | | | |
| Expenses | 1.88% (4)(5) | 1.89% (5) | 1.89% (5) | 1.89% | 1.92% | 1.92% |
| Net investment loss | (0.77)% (4) | (0.87)% | (1.04)% | (1.21)% | (1.03)% | (1.03)% |
| Portfolio Turnover | 3% (3) | 14% | 7% | 9% | 21% | 16% |
| (1) | Computed using average shares outstanding. |
| (2) | Returns are historical and are calculated by determining the percentage change in net asset value with all distributions reinvested and do not reflect the effect of sales charges. |
| (3) | Not annualized. |
| (4) | Annualized. |
| (5) | Includes a reduction by the investment adviser of a portion of its adviser fee due to the Fund’s investment in the Liquidity Fund (equal to less than 0.01% of average daily net assets for the six months ended March 31, 2024 and less than 0.005% of average daily net assets for the years ended September 30, 2023 and 2022). |
13
See Notes to Financial Statements.
Eaton Vance
Atlanta Capital SMID-Cap Fund
March 31, 2024
Financial Highlights — continued
| | Class I |
| | Six Months Ended
March 31, 2024
(Unaudited) | Year Ended September 30, |
| | 2023 | 2022 | 2021 | 2020 | 2019 |
| Net asset value — Beginning of period | $ 35.100 | $ 33.690 | $ 41.880 | $ 34.480 | $ 38.710 | $ 38.030 |
| Income (Loss) From Operations | | | | | | |
| Net investment income (loss)(1) | $ 0.042 | $ 0.046 | $ (0.014) | $ (0.080) | $ (0.012) | $ (0.009) |
| Net realized and unrealized gain (loss) | 7.422 | 4.906 | (3.849) | 11.165 | (1.767) | 2.837 |
| Total income (loss) from operations | $ 7.464 | $ 4.952 | $ (3.863) | $ 11.085 | $ (1.779) | $ 2.828 |
| Less Distributions | | | | | | |
| From net investment income | $ (0.041) | $ — | $ — | $ — | $ (0.015) | $ — |
| From net realized gain | (1.013) | (3.542) | (4.327) | (3.685) | (2.436) | (2.148) |
| Total distributions | $ (1.054) | $ (3.542) | $ (4.327) | $ (3.685) | $ (2.451) | $ (2.148) |
| Net asset value — End of period | $ 41.510 | $ 35.100 | $ 33.690 | $ 41.880 | $ 34.480 | $ 38.710 |
| Total Return(2) | 21.65% (3) | 14.69% | (10.36)% | 35.08% | (4.95)% | 8.55% |
| Ratios/Supplemental Data | | | | | | |
| Net assets, end of period (000’s omitted) | $7,110,108 | $5,855,449 | $4,809,702 | $5,667,586 | $5,185,675 | $6,906,251 |
| Ratios (as a percentage of average daily net assets): | | | | | | |
| Expenses | 0.89% (4)(5) | 0.89% (5) | 0.88% (5) | 0.88% | 0.92% | 0.92% |
| Net investment income (loss) | 0.22% (4) | 0.13% | (0.04)% | (0.20)% | (0.04)% | (0.03)% |
| Portfolio Turnover | 3% (3) | 14% | 7% | 9% | 21% | 16% |
| (1) | Computed using average shares outstanding. |
| (2) | Returns are historical and are calculated by determining the percentage change in net asset value with all distributions reinvested. |
| (3) | Not annualized. |
| (4) | Annualized. |
| (5) | Includes a reduction by the investment adviser of a portion of its adviser fee due to the Fund’s investment in the Liquidity Fund (equal to less than 0.01% of average daily net assets for the six months ended March 31, 2024 and less than 0.005% of average daily net assets for the years ended September 30, 2023 and 2022). |
14
See Notes to Financial Statements.
Eaton Vance
Atlanta Capital SMID-Cap Fund
March 31, 2024
Financial Highlights — continued
| | Class R |
| | Six Months Ended
March 31, 2024
(Unaudited) | Year Ended September 30, |
| | 2023 | 2022 | 2021 | 2020 | 2019 |
| Net asset value — Beginning of period | $ 27.920 | $ 27.550 | $ 35.190 | $ 29.660 | $ 33.710 | $ 33.580 |
| Income (Loss) From Operations | | | | | | |
| Net investment loss(1) | $ (0.040) | $ (0.106) | $ (0.172) | $ (0.238) | $ (0.161) | $ (0.162) |
| Net realized and unrealized gain (loss) | 5.874 | 4.018 | (3.141) | 9.453 | (1.528) | 2.440 |
| Total income (loss) from operations | $ 5.834 | $ 3.912 | $ (3.313) | $ 9.215 | $ (1.689) | $ 2.278 |
| Less Distributions | | | | | | |
| From net realized gain | $ (0.974) | $ (3.542) | $ (4.327) | $ (3.685) | $ (2.361) | $ (2.148) |
| Total distributions | $ (0.974) | $ (3.542) | $ (4.327) | $ (3.685) | $ (2.361) | $ (2.148) |
| Net asset value — End of period | $ 32.780 | $ 27.920 | $ 27.550 | $ 35.190 | $ 29.660 | $ 33.710 |
| Total Return(2) | 21.34% (3) | 14.15% | (10.82)% | 34.41% | (5.43)% | 8.01% |
| Ratios/Supplemental Data | | | | | | |
| Net assets, end of period (000’s omitted) | $467,691 | $402,022 | $387,000 | $504,892 | $480,822 | $588,076 |
| Ratios (as a percentage of average daily net assets): | | | | | | |
| Expenses | 1.38% (4)(5) | 1.39% (5) | 1.39% (5) | 1.39% | 1.42% | 1.42% |
| Net investment loss | (0.27)% (4) | (0.37)% | (0.54)% | (0.70)% | (0.54)% | (0.53)% |
| Portfolio Turnover | 3% (3) | 14% | 7% | 9% | 21% | 16% |
| (1) | Computed using average shares outstanding. |
| (2) | Returns are historical and are calculated by determining the percentage change in net asset value with all distributions reinvested. |
| (3) | Not annualized. |
| (4) | Annualized. |
| (5) | Includes a reduction by the investment adviser of a portion of its adviser fee due to the Fund’s investment in the Liquidity Fund (equal to less than 0.01% of average daily net assets for the six months ended March 31, 2024 and less than 0.005% of average daily net assets for the years ended September 30, 2023 and 2022). |
15
See Notes to Financial Statements.
Eaton Vance
Atlanta Capital SMID-Cap Fund
March 31, 2024
Financial Highlights — continued
| | Class R6 |
| | Six Months Ended
March 31, 2024
(Unaudited) | Year Ended September 30, |
| | 2023 | 2022 | 2021 | 2020 | 2019 |
| Net asset value — Beginning of period | $ 35.480 | $ 34.000 | $ 42.200 | $ 34.690 | $ 38.930 | $ 38.200 |
| Income (Loss) From Operations | | | | | | |
| Net investment income (loss)(1) | $ 0.058 | $ 0.070 | $ 0.011 | $ (0.051) | $ 0.019 | $ 0.023 |
| Net realized and unrealized gain (loss) | 7.490 | 4.952 | (3.884) | 11.246 | (1.774) | 2.855 |
| Total income (loss) from operations | $ 7.548 | $ 5.022 | $ (3.873) | $ 11.195 | $ (1.755) | $ 2.878 |
| Less Distributions | | | | | | |
| From net investment income | $ (0.065) | $ — | $ — | $ — | $ (0.049) | $ — |
| From net realized gain | (1.013) | (3.542) | (4.327) | (3.685) | (2.436) | (2.148) |
| Total distributions | $ (1.078) | $ (3.542) | $ (4.327) | $ (3.685) | $ (2.485) | $ (2.148) |
| Net asset value — End of period | $ 41.950 | $ 35.480 | $ 34.000 | $ 42.200 | $ 34.690 | $ 38.930 |
| Total Return(2) | 21.66% (3) | 14.77% | (10.30)% | 35.19% | (4.85)% | 8.64% |
| Ratios/Supplemental Data | | | | | | |
| Net assets, end of period (000’s omitted) | $4,942,256 | $3,741,916 | $3,245,298 | $4,498,054 | $3,834,042 | $3,638,192 |
| Ratios (as a percentage of average daily net assets): | | | | | | |
| Expenses | 0.81% (4)(5) | 0.82% (5) | 0.82% (5) | 0.81% | 0.82% | 0.82% |
| Net investment income (loss) | 0.30% (4) | 0.20% | 0.03% | (0.13)% | 0.06% | 0.07% |
| Portfolio Turnover | 3% (3) | 14% | 7% | 9% | 21% | 16% |
| (1) | Computed using average shares outstanding. |
| (2) | Returns are historical and are calculated by determining the percentage change in net asset value with all distributions reinvested. |
| (3) | Not annualized. |
| (4) | Annualized. |
| (5) | Includes a reduction by the investment adviser of a portion of its adviser fee due to the Fund’s investment in the Liquidity Fund (equal to less than 0.01% of average daily net assets for the six months ended March 31, 2024 and less than 0.005% of average daily net assets for the years ended September 30, 2023 and 2022). |
16
See Notes to Financial Statements.
Eaton Vance
Atlanta Capital SMID-Cap Fund
March 31, 2024
Notes to Financial Statements (Unaudited)
1 Significant Accounting Policies
Eaton Vance Atlanta Capital SMID-Cap Fund (the Fund) is a diversified series of Eaton Vance Growth Trust (the Trust). The Trust is a Massachusetts business trust registered under the Investment Company Act of 1940, as amended (the 1940 Act), as an open-end management investment company. The Fund’s investment objective is to seek long-term capital growth. The Fund offers five classes of shares. Class A shares are generally sold subject to a sales charge imposed at time of purchase. Class C shares are sold at net asset value and are generally subject to a contingent deferred sales charge (see Note 5). Effective November 5, 2020, Class C shares automatically convert to Class A shares eight years after their purchase as described in the Fund’s prospectus. Class I, Class R and Class R6 shares are sold at net asset value and are not subject to a sales charge. Each class represents a pro rata interest in the Fund, but votes separately on class-specific matters and (as noted below) is subject to different expenses. Realized and unrealized gains and losses and net investment income and losses, other than class-specific expenses, are allocated daily to each class of shares based on the relative net assets of each class to the total net assets of the Fund. Sub-accounting, recordkeeping and similar administrative fees payable to financial intermediaries, which are a component of transfer and dividend disbursing agent fees on the Statement of Operations, are not allocated to Class R6 shares. Each class of shares differs in its distribution plan and certain other class-specific expenses.
The following is a summary of significant accounting policies of the Fund. The policies are in conformity with accounting principles generally accepted in the United States of America (U.S. GAAP). The Fund is an investment company and follows accounting and reporting guidance in the Financial Accounting Standards Board (FASB) Accounting Standards Codification Topic 946.
A Investment Valuation—The following methodologies are used to determine the market value or fair value of investments.
Equity Securities. Equity securities listed on a U.S. securities exchange generally are valued at the last sale or closing price on the day of valuation or, if no sales took place on such date, at the mean between the closing bid and ask prices on the exchange where such securities are principally traded. Equity securities listed on the NASDAQ National Market System are valued at the NASDAQ official closing price. Unlisted or listed securities for which closing sales prices or closing quotations are not available are valued at the mean between the latest available bid and ask prices.
Other. Investments in management investment companies (including money market funds) that do not trade on an exchange are valued at the net asset value as of the close of each business day.
Fair Valuation. In connection with Rule 2a-5 of the 1940 Act, the Trustees have designated the Fund’s investment adviser as its valuation designee. Investments for which valuations or market quotations are not readily available or are deemed unreliable are valued by the investment adviser, as valuation designee, at fair value using methods that most fairly reflect the security’s “fair value”, which is the amount that the Fund might reasonably expect to receive for the security upon its current sale in the ordinary course. Each such determination is based on a consideration of relevant factors, which are likely to vary from one pricing context to another. These factors may include, but are not limited to, the type of security, the existence of any contractual restrictions on the security’s disposition, the price and extent of public trading in similar securities of the issuer or of comparable companies or entities, quotations or relevant information obtained from broker/dealers or other market participants, information obtained from the issuer, analysts, and/or the appropriate stock exchange (for exchange-traded securities), an analysis of the company’s or entity’s financial statements, and an evaluation of the forces that influence the issuer and the market(s) in which the security is purchased and sold.
B Investment Transactions—Investment transactions for financial statement purposes are accounted for on a trade date basis. Realized gains and losses on investments sold are determined on the basis of identified cost.
C Income—Dividend income is recorded on the ex-dividend date for dividends received in cash and/or securities.
D Federal Taxes—The Fund's policy is to comply with the provisions of the Internal Revenue Code applicable to regulated investment companies and to distribute to shareholders each year substantially all of its net investment income, and all or substantially all of its net realized capital gains. Accordingly, no provision for federal income or excise tax is necessary.
As of March 31, 2024, the Fund had no uncertain tax positions that would require financial statement recognition, de-recognition, or disclosure. The Fund files a U.S. federal income tax return annually after its fiscal year-end, which is subject to examination by the Internal Revenue Service for a period of three years from the date of filing.
E Expenses—The majority of expenses of the Trust are directly identifiable to an individual fund. Expenses which are not readily identifiable to a specific fund are allocated taking into consideration, among other things, the nature and type of expense and the relative size of the funds.
F Use of Estimates—The preparation of the financial statements in conformity with U.S. GAAP requires management to make estimates and assumptions that affect the reported amounts of assets and liabilities at the date of the financial statements and the reported amounts of income and expense during the reporting period. Actual results could differ from those estimates.
G Indemnifications—Under the Trust’s organizational documents, its officers and Trustees may be indemnified against certain liabilities and expenses arising out of the performance of their duties to the Fund. Under Massachusetts law, if certain conditions prevail, shareholders of a Massachusetts business trust (such as the Trust) could be deemed to have personal liability for the obligations of the Trust. However, the Trust’s Declaration of Trust contains an express disclaimer of liability on the part of Fund shareholders and the By-laws provide that the Trust shall assume, upon request by the shareholder, the
Eaton Vance
Atlanta Capital SMID-Cap Fund
March 31, 2024
Notes to Financial Statements (Unaudited) — continued
defense on behalf of any Fund shareholders. Moreover, the By-laws also provide for indemnification out of Fund property of any shareholder held personally liable solely by reason of being or having been a shareholder for all loss or expense arising from such liability. Additionally, in the normal course of business, the Fund enters into agreements with service providers that may contain indemnification clauses. The Fund’s maximum exposure under these arrangements is unknown as this would involve future claims that may be made against the Fund that have not yet occurred.
H Interim Financial Statements—The interim financial statements relating to March 31, 2024 and for the six months then ended have not been audited by an independent registered public accounting firm, but in the opinion of the Fund’s management, reflect all adjustments, consisting only of normal recurring adjustments, necessary for the fair presentation of the financial statements.
2 Distributions to Shareholders and Income Tax Information
It is the present policy of the Fund to make at least one distribution annually (normally in December) of all or substantially all of its net investment income and to distribute annually all or substantially all of its net realized capital gains. Distributions to shareholders are recorded on the ex-dividend date. Distributions are declared separately for each class of shares. Shareholders may reinvest income and capital gain distributions in additional shares of the same class of the Fund at the net asset value as of the ex-dividend date or, at the election of the shareholder, receive distributions in cash. Distributions to shareholders are determined in accordance with income tax regulations, which may differ from U.S. GAAP. As required by U.S. GAAP, only distributions in excess of tax basis earnings and profits are reported in the financial statements as a return of capital. Permanent differences between book and tax accounting relating to distributions are reclassified to paid-in capital. For tax purposes, distributions from short-term capital gains are considered to be from ordinary income.
The cost and unrealized appreciation (depreciation) of investments of the Fund at March 31, 2024, as determined on a federal income tax basis, were as follows:
| Aggregate cost | $7,308,766,756 |
| Gross unrealized appreciation | $ 6,377,840,647 |
| Gross unrealized depreciation | (46,771,991) |
| Net unrealized appreciation | $6,331,068,656 |
3 Investment Adviser Fee and Other Transactions with Affiliates
The investment adviser fee is earned by Boston Management and Research (BMR), an indirect, wholly-owned subsidiary of Morgan Stanley, as compensation for investment advisory services rendered to the Fund. The fee is computed at an annual rate as a percentage of the Fund’s average daily net assets as follows and is payable monthly:
| Average Daily Net Assets | Annual Fee Rate |
| Up to $500 million | 1.0000% |
| $500 million but less than $1 billion | 0.9375% |
| $1 billion but less than $2.5 billion | 0.8750% |
| $2.5 billion but less than $5 billion | 0.8125% |
| $5 billion but less than $7.5 billion | 0.7500% |
| $7.5 billion but less than $10 billion | 0.7200% |
| $10 billion but less than $15 billion | 0.7100% |
| $15 billion and over | 0.6900% |
For the six months ended March 31, 2024, the investment adviser fee amounted to $47,163,268 or 0.78% (annualized) of the Fund’s average daily net assets. Eaton Vance Management (EVM), an affiliate of BMR and an indirect, wholly-owned subsidiary of Morgan Stanley, serves as administrator of the Fund, but receives no compensation. Pursuant to an investment sub-advisory agreement, BMR has delegated the investment management of the Fund to Atlanta Capital Management Company, LLC (Atlanta Capital), an affiliate of BMR and an indirect, wholly-owned subsidiary of Morgan Stanley. BMR pays Atlanta Capital a portion of its investment adviser fee for sub-advisory services provided to the Fund.
The Fund may invest in a money market fund, the Institutional Class of the Morgan Stanley Institutional Liquidity Funds - Government Portfolio (the “Liquidity Fund”), an open-end management investment company managed by Morgan Stanley Investment Management Inc., a wholly-owned subsidiary of
Eaton Vance
Atlanta Capital SMID-Cap Fund
March 31, 2024
Notes to Financial Statements (Unaudited) — continued
Morgan Stanley. The investment adviser fee paid by the Fund is reduced by an amount equal to its pro rata share of the advisory and administration fees paid by the Fund due to its investment in the Liquidity Fund. For the six months ended March 31, 2024, the investment adviser fee paid was reduced by $417,811 relating to the Fund’s investment in the Liquidity Fund.
EVM provides sub-transfer agency and related services to the Fund pursuant to a Sub-Transfer Agency Support Services Agreement. For the six months ended March 31, 2024, EVM earned $152,597 from the Fund pursuant to such agreement, which is included in transfer and dividend disbursing agent fees on the Statement of Operations. The Fund was informed that Eaton Vance Distributors, Inc. (EVD), an affiliate of EVM and the Fund’s principal underwriter, received $18,056 as its portion of the sales charge on sales of Class A shares for the six months ended March 31, 2024. The Fund was informed that Morgan Stanley affiliated broker-dealers, which may be deemed to be affiliates of BMR, EVM and EVD, also received a portion of the sales charge on sales of Class A shares for the six months ended March 31, 2024 in the amount of $12,649. EVD also received distribution and service fees from Class A, Class C and Class R shares (see Note 4) and contingent deferred sales charges (see Note 5).
Trustees and officers of the Fund who are members of EVM’s or BMR’s organizations receive remuneration for their services to the Fund out of the investment adviser fee. Trustees of the Fund who are not affiliated with the investment adviser and administrator may elect to defer receipt of all or a percentage of their annual fees in accordance with the terms of the Trustees Deferred Compensation Plan. Certain officers and Trustees of the Fund are officers of the above organizations.
4 Distribution Plans
The Fund has in effect a distribution plan for Class A shares (Class A Plan) pursuant to Rule 12b-1 under the 1940 Act. Pursuant to the Class A Plan, the Fund pays EVD a distribution and service fee of 0.25% per annum of its average daily net assets attributable to Class A shares for distribution services and facilities provided to the Fund by EVD, as well as for personal services and/or the maintenance of shareholder accounts. Distribution and service fees paid or accrued to EVD for the six months ended March 31, 2024 amounted to $1,211,702 for Class A shares.
The Fund also has in effect distribution plans for Class C shares (Class C Plan) and Class R shares (Class R Plan) pursuant to Rule 12b-1 under the 1940 Act. Pursuant to the Class C Plan, the Fund pays EVD amounts equal to 0.75% per annum of its average daily net assets attributable to Class C shares for providing ongoing distribution services and facilities to the Fund. For the six months ended March 31, 2024, the Fund paid or accrued to EVD $131,454 for Class C shares.
The Class R Plan requires the Fund to pay EVD an amount up to 0.50% per annum of its average daily net assets attributable to Class R shares for providing ongoing distribution services and facilities to the Fund. The Trustees of the Trust have currently limited Class R distribution payments to 0.25% per annum of the average daily net assets attributable to Class R shares. For the six months ended March 31, 2024, the Fund paid or accrued to EVD $535,198 for Class R shares.
Pursuant to the Class C and Class R Plans, the Fund also makes payments of service fees to EVD, financial intermediaries and other persons in amounts equal to 0.25% per annum of its average daily net assets attributable to that class. Service fees paid or accrued are for personal services and/or the maintenance of shareholder accounts. They are separate and distinct from the sales commissions and distribution fees payable to EVD. Service fees paid or accrued for the six months ended March 31, 2024 amounted to $43,818 and $535,198 for Class C and Class R shares, respectively.
Distribution and service fees are subject to the limitations contained in the Financial Industry Regulatory Authority Rule 2341(d).
5 Contingent Deferred Sales Charges
A contingent deferred sales charge (CDSC) of 1% generally is imposed on redemptions of Class C shares made within 12 months of purchase. Class A shares may be subject to a 1% CDSC if redeemed within 12 months of purchase (depending on the circumstances of purchase). Generally, the CDSC is based upon the lower of the net asset value at date of redemption or date of purchase. No charge is levied on shares acquired by reinvestment of dividends or capital gain distributions. For the six months ended March 31, 2024, the Fund was informed that EVD received less than $100 and $2,532 of CDSCs paid by Class A and Class C shareholders, respectively.
6 Purchases and Sales of Investments
Purchases and sales of investments, other than short-term obligations, aggregated $503,544,513 and $341,064,652, respectively, for the six months ended March 31, 2024.
Eaton Vance
Atlanta Capital SMID-Cap Fund
March 31, 2024
Notes to Financial Statements (Unaudited) — continued
7 Shares of Beneficial Interest
The Fund’s Declaration of Trust permits the Trustees to issue an unlimited number of full and fractional shares of beneficial interest (without par value). Such shares may be issued in a number of different series (such as the Fund) and classes. Transactions in Fund shares, including direct exchanges pursuant to share class conversions, were as follows:
| | Six Months Ended
March 31, 2024
(Unaudited) | | Year Ended
September 30, 2023 |
| | Shares | Amount | | Shares | Amount |
| Class A | | | | | |
| Sales | 3,718,698 | $ 117,609,212 | | 5,397,814 | $ 161,627,707 |
| Issued to shareholders electing to receive payments of distributions in Fund shares | 808,968 | 24,997,127 | | 3,195,166 | 94,736,673 |
| Redemptions | (4,054,904) | (127,869,546) | | (9,193,404) | (275,558,726) |
| Net increase (decrease) | 472,762 | $ 14,736,793 | | (600,424) | $ (19,194,346) |
| Class C | | | | | |
| Sales | 370,492 | $ 9,963,930 | | 312,192 | $ 7,828,750 |
| Issued to shareholders electing to receive payments of distributions in Fund shares | 45,706 | 1,169,609 | | 163,715 | 4,074,859 |
| Redemptions | (242,895) | (6,332,101) | | (422,798) | (10,656,965) |
| Net increase | 173,303 | $ 4,801,438 | | 53,109 | $ 1,246,644 |
| Class I | | | | | |
| Sales | 22,469,252 | $ 847,838,810 | | 47,988,171 | $ 1,682,249,685 |
| Issued to shareholders electing to receive payments of distributions in Fund shares | 4,070,362 | 149,707,925 | | 11,781,967 | 413,664,849 |
| Redemptions | (22,049,865) | (827,621,865) | | (35,711,998) | (1,262,437,881) |
| Net increase | 4,489,749 | $ 169,924,870 | | 24,058,140 | $ 833,476,653 |
| Class R | | | | | |
| Sales | 423,822 | $ 12,528,574 | | 814,773 | $ 23,061,461 |
| Issued to shareholders electing to receive payments of distributions in Fund shares | 473,428 | 13,772,010 | | 1,735,882 | 48,656,759 |
| Redemptions | (1,028,168) | (30,642,355) | | (2,195,722) | (62,094,448) |
| Net increase (decrease) | (130,918) | $ (4,341,771) | | 354,933 | $ 9,623,772 |
| Class R6 | | | | | |
| Sales | 18,479,565 | $ 693,591,944 | | 24,698,126 | $ 873,551,426 |
| Issued to shareholders electing to receive payments of distributions in Fund shares | 2,603,198 | 96,760,875 | | 7,395,231 | 262,234,878 |
| Redemptions | (8,750,477) | (329,378,952) | | (22,075,945) | (784,626,378) |
| Net increase | 12,332,286 | $ 460,973,867 | | 10,017,412 | $ 351,159,926 |
Eaton Vance
Atlanta Capital SMID-Cap Fund
March 31, 2024
Notes to Financial Statements (Unaudited) — continued
8 Line of Credit
The Fund participates with other portfolios and funds managed by EVM and its affiliates in a $650 million unsecured revolving line of credit agreement with a group of banks, which is in effect through October 22, 2024. In connection with the renewal of the agreement on October 24, 2023, the borrowing limit was decreased from $725 million. Borrowings are made by the Fund solely for temporary purposes related to redemptions and other short-term cash needs. Interest is charged to the Fund based on its borrowings at an amount above either the Secured Overnight Financing Rate (SOFR) or Federal Funds rate. In addition, a fee computed at an annual rate of 0.15% on the daily unused portion of the line of credit is allocated among the participating portfolios and funds at the end of each quarter. In connection with the renewal of the agreement in October 2023, an arrangement fee of $150,000 was incurred that was allocated to the participating portfolios and funds. Because the line of credit is not available exclusively to the Fund, it may be unable to borrow some or all of its requested amounts at any particular time. The Fund did not have any significant borrowings or allocated fees during the six months ended March 31, 2024.
9 Securities Lending Agreement
The Fund has established a securities lending agreement with State Street Bank and Trust Company (SSBT) as securities lending agent in which the Fund lends portfolio securities to qualified borrowers in exchange for collateral consisting of either cash or securities issued or guaranteed by the U.S. government or its agencies or instrumentalities in an amount at least equal to the market value of the securities on loan. The market value of securities loaned is determined daily and any additional required collateral is delivered to the Fund on the next business day. Cash collateral is invested in the State Street Navigator Securities Lending Government Money Market Portfolio, a money market fund registered under the 1940 Act. The Fund earns interest on the amount invested but it must pay (and at times receive from) the broker a loan rebate fee computed as a varying percentage of the collateral received. For security loans secured by non-cash collateral, the Fund earns a negotiated lending fee from the borrower. A portion of the income earned by the Fund from its investment of cash collateral, net of rebate fees, and lending fees received is allocated to SSBT for its services as lending agent and the portion allocated to the Fund is presented as securities lending income, net on the Statement of Operations. Non-cash collateral is held by the lending agent on behalf of the Fund and cannot be sold or re-pledged by the Fund; accordingly, such collateral is not reflected in the Statement of Assets and Liabilities.
The Fund is subject to possible delay in the recovery of loaned securities. Pursuant to the securities lending agreement, SSBT has provided indemnification to the Fund in the event of default by a borrower with respect to a loan. The Fund bears the risk of loss with respect to the investment of cash collateral.
At March 31, 2024, the value of the securities loaned and the value of the collateral received, which exceeded the value of the securities loaned, amounted to $38,177,681 and $39,204,428, respectively. Collateral received was comprised of U.S. government and/or agencies securities. The securities lending transactions have no contractual maturity date and each of the Fund and borrower has the option to terminate a loan at any time.
10 Affiliated Investments
An affiliated company is a company in which a fund has a direct or indirect ownership of, control of, or voting power of 5 percent or more of the outstanding voting shares, or a company that is under common ownership or control with a fund. At March 31, 2024, the value of the Fund's investments in affiliated companies and funds was $1,195,599,538, which represents 8.8% of the Fund's net assets. Transactions in affiliated companies and funds by the Fund for the six months ended March 31, 2024 were as follows:
| Name | Value,
beginning
of period | Purchases | Sales
proceeds | Net realized
gain (loss) | Change in
unrealized
appreciation
(depreciation) | Value, end
of period | Dividend
income | Shares,
end of period |
| Common Stocks* |
| Dolby Laboratories, Inc., Class A | $261,376,336 | $ 66,471,591 | $ — | $ — | $ 16,250,667 | $ 344,098,594 | $ 1,978,625 | 4,107,659 |
| Envista Holdings Corp. | 225,856,466 | 37,616,074 | — | — | (56,543,858) | 206,928,682 | — | 9,678,610 |
| Short-Term Investments |
| Liquidity Fund | 485,557,136 | 696,219,825 | (537,204,699) | — | — | 644,572,262 | 14,391,300 | 644,572,262 |
| Total | | | | $ — | $(40,293,191) | $1,195,599,538 | $16,369,925 | |
| * | The related industry is the same as the presentation in the Portfolio of Investments. |
Eaton Vance
Atlanta Capital SMID-Cap Fund
March 31, 2024
Notes to Financial Statements (Unaudited) — continued
11 Fair Value Measurements
Under generally accepted accounting principles for fair value measurements, a three-tier hierarchy to prioritize the assumptions, referred to as inputs, is used in valuation techniques to measure fair value. The three-tier hierarchy of inputs is summarized in the three broad levels listed below.
| • | Level 1 – quoted prices in active markets for identical investments |
| • | Level 2 – other significant observable inputs (including quoted prices for similar investments, interest rates, prepayment speeds, credit risk, etc.) |
| • | Level 3 – significant unobservable inputs (including a fund's own assumptions in determining the fair value of investments) |
In cases where the inputs used to measure fair value fall in different levels of the fair value hierarchy, the level disclosed is determined based on the lowest level input that is significant to the fair value measurement in its entirety. The inputs or methodology used for valuing securities are not necessarily an indication of the risk associated with investing in those securities.
At March 31, 2024, the hierarchy of inputs used in valuing the Fund's investments, which are carried at fair value, were as follows:
| Asset Description | Level 1 | Level 2 | Level 3 | Total |
| Common Stocks | $ 12,995,263,150* | $ — | $ — | $ 12,995,263,150 |
| Short-Term Investments | 644,572,262 | — | — | 644,572,262 |
| Total Investments | $ 13,639,835,412 | $ — | $ — | $13,639,835,412 |
| * | The level classification by major category of investments is the same as the category presentation in the Portfolio of Investments. |
Eaton Vance
Atlanta Capital SMID-Cap Fund
March 31, 2024
| Officers |
Kenneth A. Topping
President | Nicholas S. Di Lorenzo
Secretary |
Deidre E. Walsh
Vice President and Chief Legal Officer | Laura T. Donovan
Chief Compliance Officer |
James F. Kirchner
Treasurer | |
George J. Gorman
Chairperson | |
| Alan C. Bowser | |
| Mark R. Fetting | |
| Cynthia E. Frost | |
| Valerie A. Mosley | |
| Anchal Pachnanda* | |
| Keith Quinton | |
| Marcus L. Smith | |
| Susan J. Sutherland | |
| Scott E. Wennerholm | |
| Nancy A. Wiser | |
| U.S. Customer Privacy Notice | March 2024 |
| FACTS | WHAT DOES EATON VANCE DO WITH YOUR PERSONAL INFORMATION? |
| Why? | Financial companies choose how they share your personal information. Federal law gives consumers the right to limit some but not all sharing. Federal law also requires us to tell you how we collect, share, and protect your personal information. Please read this notice carefully to understand what we do. |
| |
| What? | The types of personal information we collect and share depend on the product or service you have with us. This information can include:■ Social Security number and income
■ investment experience and risk tolerance
■ checking account information and wire transfer instructions |
| |
| How? | All financial companies need to share customers’ personal information to run their everyday business. In the section below, we list the reasons financial companies can share their customers’ personal information; the reasons Eaton Vance chooses to share; and whether you can limit this sharing. |
| Reasons we can share your personal information | Does Eaton Vance
share? | Can you limit
this sharing? |
| For our everyday business purposes — such as to process your transactions, maintain your account(s), respond to court orders and legal investigations, or report to credit bureaus | Yes | No |
| For our marketing purposes — to offer our products and services to you | Yes | No |
| For joint marketing with other financial companies | No | We don’t share |
| For our affiliates’ everyday business purposes — information about your transactions and experiences | Yes | No* |
| For our affiliates’ everyday business purposes — information about your creditworthiness | Yes | Yes* |
| For our affiliates to market to you | Yes | Yes* |
| For nonaffiliates to market to you | No | We don’t share |
To limit our
sharing | Call toll-free 1-800-262-1122 or email: EVPrivacy@eatonvance.comPlease note:If you are a new customer, we can begin sharing your information 30 days from the date we sent this notice. When you are no longer our customer, we continue to share your information as described in this notice. However, you can contact us at any time to limit our sharing. |
| Questions? | Call toll-free 1-800-262-1122 or email: EVPrivacy@eatonvance.com |
| U.S. Customer Privacy Notice — continued | March 2024 |
| Who we are |
| Who is providing this notice? | Eaton Vance Management and our investment management affiliates (“Eaton Vance”) (see Affiliates definition below.) |
| What we do |
How does Eaton Vance
protect my personal
information? | To protect your personal information from unauthorized access and use, we use security measures that comply with federal law. These measures include computer safeguards and secured files and buildings. We have policies governing the proper handling of customer information by personnel and requiring third parties that provide support to adhere to appropriate security standards with respect to such information. |
How does Eaton Vance
collect my personal
information? | We collect your personal information, for example, when you■ open an account or make deposits or withdrawals from your account
■ buy securities from us or make a wire transfer
■ give us your contact informationWe also collect your personal information from others, such as credit bureaus, affiliates, or other companies. |
| Why can’t I limit all sharing? | Federal law gives you the right to limit only■ sharing for affiliates’ everyday business purposes — information about your creditworthiness
■ affiliates from using your information to market to you
■ sharing for nonaffiliates to market to youState laws and individual companies may give you additional rights to limit sharing. (See below for more on your rights under state law.) |
What happens when I limit
sharing for an account I hold
jointly with someone else? | Your choices will apply to everyone on your account. |
| Definitions |
| Affiliates | Companies related by common ownership or control. They can be financial and nonfinancial companies.■ Our affiliates include registered investment advisers such as Eaton Vance Management, Eaton Vance Advisers International Ltd., Boston Management and Research, Calvert Research and Management, Parametric Portfolio Associates LLC, Atlanta Capital Management Company LLC, Morgan Stanley Investment Management Inc., Morgan Stanley Investment Management Co.; registered broker-dealers such as Morgan Stanley Distributors Inc. and Eaton Vance Distributors, Inc. (together, the “Investment Management Affiliates”); and companies with a Morgan Stanley name and financial companies such as Morgan Stanley Smith Barney LLC and Morgan Stanley & Co. (the “Morgan Stanley Affiliates”). |
| Nonaffiliates | Companies not related by common ownership or control. They can be financial and nonfinancial companies.■ Eaton Vance does not share with nonaffiliates so they can market to you. |
| Joint marketing | A formal agreement between nonaffiliated financial companies that together market financial products or services to you.■ Eaton Vance does not jointly market. |
| U.S. Customer Privacy Notice — continued | March 2024 |
| Other important information |
| *PLEASE NOTE: Eaton Vance does not share your creditworthiness information or your transactions and experiences information with the Morgan Stanley Affiliates, nor does Eaton Vance enable the Morgan Stanley Affiliates to market to you. Your opt outs will prevent Eaton Vance from sharing your creditworthiness information with the Investment Management Affiliates and will prevent the Investment Management Affiliates from marketing their products to you.Vermont: Except as permitted by law, we will not share personal information we collect about Vermont residents with Nonaffiliates unless you provide us with your written consent to share such information.California: Except as permitted by law, we will not share personal information we collect about California residents with Nonaffiliates and we will limit sharing such personal information with our Affiliates to comply with California privacy laws that apply to us. |
Delivery of Shareholder Documents. The Securities and Exchange Commission (SEC) permits funds to deliver only one copy of shareholder documents, including prospectuses, proxy statements and shareholder reports, to fund investors with multiple accounts at the same residential or post office box address. This practice is often called “householding” and it helps eliminate duplicate mailings to shareholders. Eaton Vance, or your financial intermediary, may household the mailing of your documents indefinitely unless you instruct Eaton Vance, or your financial intermediary, otherwise. If you would prefer that your Eaton Vance documents not be householded, please contact Eaton Vance at 1-800-262-1122, or contact your financial intermediary. Your instructions that householding not apply to delivery of your Eaton Vance documents will typically be effective within 30 days of receipt by Eaton Vance or your financial intermediary.
Portfolio Holdings. Each Eaton Vance Fund and its underlying Portfolio(s) (if applicable) files a schedule of portfolio holdings on Part F to Form N-PORT with the SEC. Certain information filed on Form N-PORT may be viewed on the Eaton Vance website at www.eatonvance.com, by calling Eaton Vance at 1-800-262-1122 or in the EDGAR database on the SEC’s website at www.sec.gov.
Proxy Voting. From time to time, funds are required to vote proxies related to the securities held by the funds. The Eaton Vance Funds or their underlying Portfolios (if applicable) vote proxies according to a set of policies and procedures approved by the Funds’ and Portfolios’ Boards. You may obtain a description of these policies and procedures and information on how the Funds or Portfolios voted proxies relating to portfolio securities during the most recent 12-month period ended June 30, without charge, upon request, by calling 1-800-262-1122 and by accessing the SEC’s website at www.sec.gov.
Tailored Shareholder Reports. Effective January 24, 2023, the SEC adopted rule and form amendments to require open-end mutual funds and ETFs to transmit concise and visually engaging streamlined annual and semiannual reports to shareholders that highlight key information. Other information, including financial statements, will no longer appear in a streamlined shareholder report but must be available online, delivered free of charge upon request, and filed on a semiannual basis on Form N-CSR. The rule and form amendments have a compliance date of July 24, 2024. At this time, management is evaluating the impact of these amendments on the shareholder reports for the Eaton Vance Funds.
This Page Intentionally Left Blank
Investment Adviser
Boston Management and Research
One Post Office Square
Boston, MA 02109
Investment Sub-Adviser
Atlanta Capital Management Company, LLC
1075 Peachtree Street NE
Suite 2100
Atlanta, GA 30309
Administrator
Eaton Vance Management
One Post Office Square
Boston, MA 02109
Principal Underwriter*
Eaton Vance Distributors, Inc.
One Post Office Square
Boston, MA 02109
(617) 482-8260
Custodian
State Street Bank and Trust Company
One Congress Street, Suite 1
Boston, MA 02114-2016
Transfer Agent
BNY Mellon Investment Servicing (US) Inc.
Attn: Eaton Vance Funds
P.O. Box 534439
Pittsburgh, PA 15253-4439
(800) 262-1122
Fund Offices
One Post Office Square
Boston, MA 02109
* FINRA BrokerCheck. Investors may check the background of their Investment Professional by contacting the Financial Industry Regulatory Authority (FINRA). FINRA BrokerCheck is a free tool to help investors check the professional background of current and former FINRA-registered securities firms and brokers. FINRA BrokerCheck is available by calling 1-800-289-9999 and at www.FINRA.org. The FINRA BrokerCheck brochure describing this program is available to investors at www.FINRA.org.
Eaton Vance
Atlanta Capital
Focused Growth Fund
Semiannual Report
March 31, 2024
Commodity Futures Trading Commission Registration. The Commodity Futures Trading Commission (“CFTC”) has adopted regulations that subject registered investment companies and advisers to regulation by the CFTC if a fund invests more than a prescribed level of its assets in certain CFTC-regulated instruments (including futures, certain options and swap agreements) or markets itself as providing investment exposure to such instruments. The investment adviser has claimed an exclusion from the definition of “commodity pool operator” under the Commodity Exchange Act with respect to its management of the Fund. Accordingly, neither the Fund nor the adviser with respect to the operation of the Fund is subject to CFTC regulation. Because of its management of other strategies, the Fund's adviser is registered with the CFTC as a commodity pool operator. The adviser is also registered as a commodity trading advisor.
Fund shares are not insured by the FDIC and are not deposits or other obligations of, or guaranteed by, any depository institution. Shares are subject to investment risks, including possible loss of principal invested.
This report must be preceded or accompanied by a current summary prospectus or prospectus. Before investing, investors should consider carefully the investment objective, risks, and charges and expenses of a mutual fund. This and other important information is contained in the summary prospectus and prospectus, which can be obtained from a financial intermediary. Prospective investors should read the prospectus carefully before investing. For further information, please call 1-800-262-1122.
Semiannual Report March 31, 2024
Eaton Vance
Atlanta Capital Focused Growth Fund
Eaton Vance
Atlanta Capital Focused Growth Fund
March 31, 2024
Performance
Portfolio Manager(s) Joseph B. Hudepohl, CFA, Robert R. Walton, Jr., CFA, Jeffrey A. Miller, CFA and Lance V. Garrison, CFA, each of Atlanta Capital Management Company, LLC
| % Average Annual Total Returns1,2 | Class
Inception Date | Performance
Inception Date | Six Months | One Year | Five Years | Ten Years |
| Class A at NAV | 11/28/2003 | 04/30/2002 | 20.70% | 24.89% | 15.32% | 14.39% |
| Class A with 5.25% Maximum Sales Charge | — | — | 14.35 | 18.31 | 14.10 | 13.78 |
| Class C at NAV | 05/02/2011 | 04/30/2002 | 20.25 | 23.96 | 14.48 | 13.70 |
| Class C with 1% Maximum Deferred Sales Charge | — | — | 19.25 | 22.96 | 14.48 | 13.70 |
| Class I at NAV | 04/30/2002 | 04/30/2002 | 20.83 | 25.23 | 15.62 | 14.67 |
| Class R6 at NAV | 06/30/2023 | 04/30/2002 | 20.86 | 25.26 | 15.62 | 14.67 |
|
| Russell 1000® Growth Index | — | — | 27.19% | 39.00% | 18.50% | 15.97% |
| % Total Annual Operating Expense Ratios3 | Class A | Class C | Class I | Class R6 |
| | 1.03% | 1.78% | 0.78% | 0.70% |
See Endnotes and Additional Disclosures in this report.
Past performance is no guarantee of future results. Returns are historical and are calculated by determining the percentage change in net asset value (NAV) or offering price (as applicable) with all distributions reinvested. Furthermore, returns do not reflect the deduction of taxes that shareholders may have to pay on Fund distributions or upon the redemption of Fund shares. Investment return and principal value will fluctuate so that shares, when redeemed, may be worth more or less than their original cost. Performance for periods less than or equal to one year is cumulative. Performance is for the stated time period only; due to market volatility, current Fund performance may be lower or higher than the quoted return. For performance as of the most recent month-end, please refer to eatonvance.com.
Eaton Vance
Atlanta Capital Focused Growth Fund
March 31, 2024
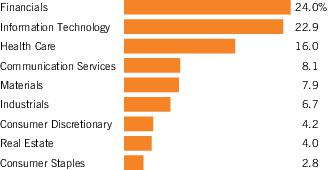
| Sector Allocation (% of net assets)1 |
| Top 10 Holdings (% of net assets)1 |
| Alphabet, Inc., Class C | 8.1% |
| Visa, Inc., Class A | 7.5 |
| Microsoft Corp. | 7.0 |
| Thermo Fisher Scientific, Inc. | 6.1 |
| Danaher Corp. | 5.9 |
| Mastercard, Inc., Class A | 5.3 |
| Intuit, Inc. | 4.8 |
| Amphenol Corp., Class A | 4.5 |
| TJX Cos., Inc. | 4.2 |
| Zoetis, Inc. | 4.1 |
| Total | 57.5% |
Footnotes:
| 1 | Excludes cash and cash equivalents. |
Eaton Vance
Atlanta Capital Focused Growth Fund
March 31, 2024
Endnotes and Additional Disclosures
| 1 | Russell 1000® Growth Index is an unmanaged index of U.S. large-cap growth stocks. Unless otherwise stated, index returns do not reflect the effect of any applicable sales charges, commissions, expenses, taxes or leverage, as applicable. It is not possible to invest directly in an index. |
| 2 | Total Returns at NAV do not include applicable sales charges. If sales charges were deducted, the returns would be lower. Total Returns shown with maximum sales charge reflect the stated maximum sales charge. Unless otherwise stated, performance does not reflect the deduction of taxes on Fund distributions or redemptions of Fund shares.Effective November 5, 2020, Class C shares automatically convert to Class A shares eight years after purchase. The average annual total returns listed for Class C reflect conversion to Class A shares after eight years. Prior to November 5, 2020, Class C shares automatically converted to Class A shares ten years after purchase.Performance prior to the inception date of a class may be linked to the performance of an older class of the Fund. This linked performance is adjusted for any applicable sales charge, but is not adjusted for class expense differences. If adjusted for such differences, the performance would be different. The performance of Class R6 is linked to Class I. Performance presented in the Financial Highlights included in the financial statements is not linked. |
| 3 | Source: Fund prospectus. The expense ratios for the current reporting period can be found in the Financial Highlights section of this report. Performance reflects expenses waived and/or reimbursed, if applicable. Without such waivers and/or reimbursements, performance would have been lower. |
| | Fund profile subject to change due to active management. |
Eaton Vance
Atlanta Capital Focused Growth Fund
March 31, 2024
Example
As a Fund shareholder, you incur two types of costs: (1) transaction costs, including sales charges (loads) on purchases; and (2) ongoing costs, including management fees; distribution and/or service fees; and other Fund expenses. This Example is intended to help you understand your ongoing costs (in dollars) of Fund investing and to compare these costs with the ongoing costs of investing in other mutual funds. The Example is based on an investment of $1,000 invested at the beginning of the period and held for the entire period (October 1, 2023 to March 31, 2024).
Actual Expenses
The first section of the table below provides information about actual account values and actual expenses. You may use the information in this section, together with the amount you invested, to estimate the expenses that you paid over the period. Simply divide your account value by $1,000 (for example, an $8,600 account value divided by $1,000 = 8.6), then multiply the result by the number in the first section under the heading entitled “Expenses Paid During Period” to estimate the expenses you paid on your account during this period.
Hypothetical Example for Comparison Purposes
The second section of the table below provides information about hypothetical account values and hypothetical expenses based on the actual Fund expense ratio and an assumed rate of return of 5% per year (before expenses), which is not the actual Fund return. The hypothetical account values and expenses may not be used to estimate the actual ending account balance or expenses you paid for the period. You may use this information to compare the ongoing costs of investing in your Fund and other funds. To do so, compare this 5% hypothetical example with the 5% hypothetical examples that appear in the shareholder reports of the other funds.
Please note that the expenses shown in the table are meant to highlight your ongoing costs only and do not reflect any transactional costs, such as sales charges (loads). Therefore, the second section of the table is useful in comparing ongoing costs only, and will not help you determine the relative total costs of owning different funds. In addition, if these transactional costs were included, your costs would be higher.
| | Beginning
Account Value
(10/1/23) | Ending
Account Value
(3/31/24) | Expenses Paid
During Period*
(10/1/23 – 3/31/24) | Annualized
Expense
Ratio |
| Actual | | | | |
| Class A | $1,000.00 | $1,207.00 | $5.63 | 1.02% |
| Class C | $1,000.00 | $1,202.50 | $9.75 | 1.77% |
| Class I | $1,000.00 | $1,208.30 | $4.25 | 0.77% |
| Class R6 | $1,000.00 | $1,208.60 | $4.03 | 0.73% |
| |
| Hypothetical | | | | |
| (5% return per year before expenses) | | | | |
| Class A | $1,000.00 | $1,019.90 | $5.15 | 1.02% |
| Class C | $1,000.00 | $1,016.15 | $8.92 | 1.77% |
| Class I | $1,000.00 | $1,021.15 | $3.89 | 0.77% |
| Class R6 | $1,000.00 | $1,021.35 | $3.69 | 0.73% |
| * | Expenses are equal to the Fund’s annualized expense ratio for the indicated Class, multiplied by the average account value over the period, multiplied by 183/366 (to reflect the one-half year period). The Example assumes that the $1,000 was invested at the net asset value per share determined at the close of business on September 30, 2023. |
Eaton Vance
Atlanta Capital Focused Growth Fund
March 31, 2024
Portfolio of Investments (Unaudited)
| Security | Shares | Value |
| Capital Markets — 5.8% |
| Intercontinental Exchange, Inc. | | 186,392 | $ 25,615,853 |
| S&P Global, Inc. | | 110,805 | 47,141,987 |
| | | | $ 72,757,840 |
| Chemicals — 7.9% |
| Ecolab, Inc. | | 215,207 | $ 49,691,296 |
| Linde PLC | | 106,614 | 49,503,013 |
| | | | $ 99,194,309 |
| Consumer Staples Distribution & Retail — 2.8% |
| Dollar General Corp. | | 224,255 | $ 34,997,235 |
| | | | $ 34,997,235 |
| Electronic Equipment, Instruments & Components — 4.5% |
| Amphenol Corp., Class A | | 487,431 | $ 56,225,166 |
| | | | $ 56,225,166 |
| Financial Services — 16.4% |
| Fiserv, Inc.(1) | | 157,445 | $ 25,162,860 |
| Mastercard, Inc., Class A | | 137,950 | 66,432,581 |
| PayPal Holdings, Inc.(1) | | 300,121 | 20,105,106 |
| Visa, Inc., Class A | | 335,896 | 93,741,856 |
| | | | $ 205,442,403 |
| Insurance — 1.8% |
| Marsh & McLennan Cos., Inc. | | 110,666 | $ 22,794,983 |
| | | | $ 22,794,983 |
| Interactive Media & Services — 8.1% |
| Alphabet, Inc., Class C(1) | | 669,533 | $ 101,943,095 |
| | | | $ 101,943,095 |
| IT Services — 4.8% |
| Gartner, Inc.(1) | | 101,061 | $ 48,172,747 |
| VeriSign, Inc.(1) | | 62,963 | 11,932,118 |
| | | | $ 60,104,865 |
| Life Sciences Tools & Services — 12.0% |
| Danaher Corp. | | 296,084 | $ 73,938,097 |
| Thermo Fisher Scientific, Inc. | | 131,129 | 76,213,486 |
| | | | $ 150,151,583 |
| Security | Shares | Value |
| Machinery — 3.2% |
| Xylem, Inc. | | 312,231 | $ 40,352,734 |
| | | | $ 40,352,734 |
| Pharmaceuticals — 4.1% |
| Zoetis, Inc. | | 300,525 | $ 50,851,835 |
| | | | $ 50,851,835 |
| Professional Services — 3.4% |
| Verisk Analytics, Inc. | | 183,191 | $ 43,183,614 |
| | | | $ 43,183,614 |
| Software — 13.6% |
| Adobe, Inc.(1) | | 45,519 | $ 22,968,887 |
| Intuit, Inc. | | 92,141 | 59,891,650 |
| Microsoft Corp. | | 208,525 | 87,730,638 |
| | | | $ 170,591,175 |
| Specialized REITs — 4.0% |
| American Tower Corp. | | 256,041 | $ 50,591,141 |
| | | | $ 50,591,141 |
| Specialty Retail — 4.2% |
| TJX Cos., Inc. | | 523,541 | $ 53,097,528 |
| | | | $ 53,097,528 |
Total Common Stocks
(identified cost $827,770,803) | | | $1,212,279,506 |
| Short-Term Investments — 3.5% |
| Security | Shares | Value |
| Morgan Stanley Institutional Liquidity Funds - Government Portfolio, Institutional Class, 5.22%(2) | | 43,791,264 | $ 43,791,264 |
Total Short-Term Investments
(identified cost $43,791,264) | | | $ 43,791,264 |
Total Investments — 100.1%
(identified cost $871,562,067) | | | $1,256,070,770 |
| Other Assets, Less Liabilities — (0.1)% | | | $ (1,092,576) |
| Net Assets — 100.0% | | | $1,254,978,194 |
Eaton Vance
Atlanta Capital Focused Growth Fund
March 31, 2024
Portfolio of Investments (Unaudited) — continued
| The percentage shown for each investment category in the Portfolio of Investments is based on net assets. |
| (1) | Non-income producing security. |
| (2) | May be deemed to be an affiliated investment company. The rate shown is the annualized seven-day yield as of March 31, 2024. |
| Abbreviations: |
| REITs | – Real Estate Investment Trusts |
Eaton Vance
Atlanta Capital Focused Growth Fund
March 31, 2024
Statement of Assets and Liabilities (Unaudited)
| | March 31, 2024 |
| Assets | |
| Unaffiliated investments, at value (identified cost $827,770,803) | $ 1,212,279,506 |
| Affiliated investments, at value (identified cost $43,791,264) | 43,791,264 |
| Cash | 155,321 |
| Dividends receivable | 369,695 |
| Dividends receivable from affiliated investments | 130,263 |
| Receivable for Fund shares sold | 3,098,079 |
| Trustees' deferred compensation plan | 28,491 |
| Total assets | $1,259,852,619 |
| Liabilities | |
| Payable for Fund shares redeemed | $ 3,691,092 |
| Payable to affiliates: | |
| Investment adviser fee | 661,196 |
| Distribution and service fees | 63,700 |
| Trustees' deferred compensation plan | 28,491 |
| Accrued expenses | 429,946 |
| Total liabilities | $ 4,874,425 |
| Net Assets | $1,254,978,194 |
| Sources of Net Assets | |
| Paid-in capital | $ 860,669,859 |
| Distributable earnings | 394,308,335 |
| Net Assets | $1,254,978,194 |
| Class A Shares | |
| Net Assets | $ 87,075,181 |
| Shares Outstanding | 4,182,106 |
Net Asset Value and Redemption Price Per Share
(net assets ÷ shares of beneficial interest outstanding) | $ 20.82 |
Maximum Offering Price Per Share
(100 ÷ 94.75 of net asset value per share) | $ 21.97 |
| Class C Shares | |
| Net Assets | $ 54,446,481 |
| Shares Outstanding | 2,952,785 |
Net Asset Value and Offering Price Per Share*
(net assets ÷ shares of beneficial interest outstanding) | $ 18.44 |
| Class I Shares | |
| Net Assets | $ 1,106,089,153 |
| Shares Outstanding | 60,978,664 |
Net Asset Value, Offering Price and Redemption Price Per Share
(net assets ÷ shares of beneficial interest outstanding) | $ 18.14 |
| Class R6 Shares | |
| Net Assets | $ 7,367,379 |
| Shares Outstanding | 406,117 |
Net Asset Value, Offering Price and Redemption Price Per Share
(net assets ÷ shares of beneficial interest outstanding) | $ 18.14 |
| On sales of $50,000 or more, the offering price of Class A shares is reduced. |
| * | Redemption price per share is equal to the net asset value less any applicable contingent deferred sales charge. |
8
See Notes to Financial Statements.
Eaton Vance
Atlanta Capital Focused Growth Fund
March 31, 2024
Statement of Operations (Unaudited)
| | Six Months Ended |
| | March 31, 2024 |
| Investment Income | |
| Dividend income | $ 4,542,731 |
| Dividend income from affiliated investments | 853,300 |
| Total investment income | $ 5,396,031 |
| Expenses | |
| Investment adviser fee | $ 3,660,568 |
| Distribution and service fees: | |
| Class A | 102,699 |
| Class C | 241,697 |
| Trustees’ fees and expenses | 38,537 |
| Custodian fee | 131,174 |
| Transfer and dividend disbursing agent fees | 439,338 |
| Legal and accounting services | 83,852 |
| Printing and postage | 42,981 |
| Registration fees | 64,704 |
| Miscellaneous | 19,928 |
| Total expenses | $ 4,825,478 |
| Deduct: | |
| Waiver and/or reimbursement of expenses by affiliates | $ 24,688 |
| Total expense reductions | $ 24,688 |
| Net expenses | $ 4,800,790 |
| Net investment income | $ 595,241 |
| Realized and Unrealized Gain (Loss) | |
| Net realized gain (loss): | |
| Investment transactions | $ 13,146,374 |
| Net realized gain | $ 13,146,374 |
| Change in unrealized appreciation (depreciation): | |
| Investments | $ 203,267,251 |
| Net change in unrealized appreciation (depreciation) | $203,267,251 |
| Net realized and unrealized gain | $216,413,625 |
| Net increase in net assets from operations | $217,008,866 |
9
See Notes to Financial Statements.
Eaton Vance
Atlanta Capital Focused Growth Fund
March 31, 2024
Statements of Changes in Net Assets
| | Six Months Ended
March 31, 2024
(Unaudited) | Year Ended
September 30, 2023 |
| Increase (Decrease) in Net Assets | | |
| From operations: | | |
| Net investment income | $ 595,241 | $ 585,791 |
| Net realized gain | 13,146,374 | 4,781,507 |
| Net change in unrealized appreciation (depreciation) | 203,267,251 | 127,028,605 |
| Net increase in net assets from operations | $ 217,008,866 | $ 132,395,903 |
| Distributions to shareholders: | | |
| Class A | $ (229,352) | $ (144,961) |
| Class C | (107,788) | (91,351) |
| Class I | (5,972,825) | (1,740,579) |
| Class R6 | (3,506) | — |
| Total distributions to shareholders | $ (6,313,471) | $ (1,976,891) |
| Transactions in shares of beneficial interest: | | |
| Class A | $ (5,019,444) | $ 11,087,343 |
| Class C | 3,186,294 | 7,514,224 |
| Class I | (2,887,499) | 346,882,405 |
| Class R6(1) | 6,892,304 | 50,000 |
| Net increase in net assets from Fund share transactions | $ 2,171,655 | $ 365,533,972 |
| Net increase in net assets | $ 212,867,050 | $ 495,952,984 |
| Net Assets | | |
| At beginning of period | $ 1,042,111,144 | $ 546,158,160 |
| At end of period | $1,254,978,194 | $1,042,111,144 |
| (1) | For the period from the commencement of operations, June 30, 2023, to September 30, 2023. |
10
See Notes to Financial Statements.
Eaton Vance
Atlanta Capital Focused Growth Fund
March 31, 2024
| | Class A |
| | Six Months Ended
March 31, 2024
(Unaudited) | Year Ended September 30, |
| | 2023 | 2022 | 2021 | 2020 | 2019 |
| Net asset value — Beginning of period | $ 17.300 | $ 14.490 | $ 18.260 | $ 14.260 | $ 11.580 | $ 11.320 |
| Income (Loss) From Operations | | | | | | |
| Net investment loss(1) | $ (0.008) | $ (0.019) | $ (0.058) | $ (0.065) | $ (0.031) | $ (0.008) |
| Net realized and unrealized gain (loss) | 3.584 | 2.868 | (3.338) | 4.149 | 2.727 | 1.788 |
| Total income (loss) from operations | $ 3.576 | $ 2.849 | $ (3.396) | $ 4.084 | $ 2.696 | $ 1.780 |
| Less Distributions | | | | | | |
| From net realized gain | $ (0.056) | $ (0.039) | $ (0.374) | $ (0.084) | $ (0.016) | $ (1.520) |
| Total distributions | $ (0.056) | $ (0.039) | $ (0.374) | $ (0.084) | $ (0.016) | $ (1.520) |
| Net asset value — End of period | $20.820 | $17.300 | $14.490 | $18.260 | $14.260 | $11.580 |
| Total Return(2) | 20.70% (3) | 19.68% | (19.05)% | 28.75% | 23.31% (4) | 18.91% (4) |
| Ratios/Supplemental Data | | | | | | |
| Net assets, end of period (000’s omitted) | $ 87,075 | $ 77,009 | $ 55,454 | $ 70,818 | $ 51,523 | $ 42,531 |
| Ratios (as a percentage of average daily net assets): | | | | | | |
| Expenses | 1.02% (5)(6) | 1.03% (6) | 1.03% (6) | 1.03% | 1.05% (4) | 1.10% (4) |
| Net investment loss | (0.09)% (5) | (0.11)% | (0.33)% | (0.39)% | (0.25)% | (0.08)% |
| Portfolio Turnover | 7% (3) | 10% | 7% | 18% | 23% | 18% |
| (1) | Computed using average shares outstanding. |
| (2) | Returns are historical and are calculated by determining the percentage change in net asset value with all distributions reinvested and do not reflect the effect of sales charges. |
| (3) | Not annualized. |
| (4) | The administrator and sub-adviser reimbursed certain operating expenses (equal to 0.05% and 0.19% of average daily net assets for the years ended September 30, 2020 and 2019, respectively). Absent this reimbursement, total return would be lower. |
| (5) | Annualized. |
| (6) | Includes a reduction by the investment adviser of a portion of its adviser and administration fee due to the Fund’s investment in the Liquidity Fund (equal to less than 0.005% of average daily net assets for the six months ended March 31, 2024, less than 0.01% of average daily net assets for the year ended September 30, 2023 and less than 0.005% of average daily net assets for the year ended September 30, 2022). |
11
See Notes to Financial Statements.
Eaton Vance
Atlanta Capital Focused Growth Fund
March 31, 2024
Financial Highlights — continued
| | Class C |
| | Six Months Ended
March 31, 2024
(Unaudited) | Year Ended September 30, |
| | 2023 | 2022 | 2021 | 2020 | 2019 |
| Net asset value — Beginning of period | $ 15.370 | $ 12.980 | $ 16.500 | $ 12.990 | $ 10.630 | $ 10.590 |
| Income (Loss) From Operations | | | | | | |
| Net investment loss(1) | $ (0.072) | $ (0.128) | $ (0.168) | $ (0.171) | $ (0.117) | $ (0.082) |
| Net realized and unrealized gain (loss) | 3.180 | 2.557 | (2.978) | 3.765 | 2.493 | 1.642 |
| Total income (loss) from operations | $ 3.108 | $ 2.429 | $ (3.146) | $ 3.594 | $ 2.376 | $ 1.560 |
| Less Distributions | | | | | | |
| From net realized gain | $ (0.038) | $ (0.039) | $ (0.374) | $ (0.084) | $ (0.016) | $ (1.520) |
| Total distributions | $ (0.038) | $ (0.039) | $ (0.374) | $ (0.084) | $ (0.016) | $ (1.520) |
| Net asset value — End of period | $18.440 | $15.370 | $12.980 | $16.500 | $12.990 | $10.630 |
| Total Return(2) | 20.25% (3) | 18.73% | (19.58)% | 27.78% | 22.38% (4) | 18.02% (4) |
| Ratios/Supplemental Data | | | | | | |
| Net assets, end of period (000’s omitted) | $ 54,446 | $ 42,583 | $ 29,326 | $ 38,017 | $ 30,580 | $ 9,245 |
| Ratios (as a percentage of average daily net assets): | | | | | | |
| Expenses | 1.77% (5)(6) | 1.78% (6) | 1.78% (6) | 1.78% | 1.80% (4) | 1.83% (4) |
| Net investment loss | (0.84)% (5) | (0.86)% | (1.08)% | (1.14)% | (1.01)% | (0.82)% |
| Portfolio Turnover | 7% (3) | 10% | 7% | 18% | 23% | 18% |
| (1) | Computed using average shares outstanding. |
| (2) | Returns are historical and are calculated by determining the percentage change in net asset value with all distributions reinvested and do not reflect the effect of sales charges. |
| (3) | Not annualized. |
| (4) | The administrator and sub-adviser reimbursed certain operating expenses (equal to 0.05% and 0.19% of average daily net assets for the years ended September 30, 2020 and 2019, respectively). Absent this reimbursement, total return would be lower. |
| (5) | Annualized. |
| (6) | Includes a reduction by the investment adviser of a portion of its adviser and administration fee due to the Fund’s investment in the Liquidity Fund (equal to less than 0.005% of average daily net assets for the six months ended March 31, 2024, less than 0.01% of average daily net assets for the year ended September 30, 2023 and less than 0.005% of average daily net assets for the year ended September 30, 2022). |
12
See Notes to Financial Statements.
Eaton Vance
Atlanta Capital Focused Growth Fund
March 31, 2024
Financial Highlights — continued
| | Class I |
| | Six Months Ended
March 31, 2024
(Unaudited) | Year Ended September 30, |
| | 2023 | 2022 | 2021 | 2020 | 2019 |
| Net asset value — Beginning of period | $ 15.100 | $ 12.630 | $ 15.910 | $ 12.400 | $ 10.050 | $ 10.010 |
| Income (Loss) From Operations | | | | | | |
| Net investment income (loss)(1) | $ 0.014 | $ 0.020 | $ (0.011) | $ (0.021) | $ (0.000)(2) | $ 0.017 |
| Net realized and unrealized gain (loss) | 3.123 | 2.494 | (2.895) | 3.615 | 2.368 | 1.543 |
| Total income (loss) from operations | $ 3.137 | $ 2.514 | $ (2.906) | $ 3.594 | $ 2.368 | $ 1.560 |
| Less Distributions | | | | | | |
| From net investment income | $ (0.015) | $ (0.005) | $ — | $ — | $ (0.001) | $ — |
| From net realized gain | (0.082) | (0.039) | (0.374) | (0.084) | (0.017) | (1.520) |
| Total distributions | $ (0.097) | $ (0.044) | $ (0.374) | $ (0.084) | $ (0.018) | $ (1.520) |
| Net asset value — End of period | $ 18.140 | $ 15.100 | $ 12.630 | $ 15.910 | $ 12.400 | $10.050 |
| Total Return(3) | 20.83% (4) | 19.92% | (18.78)% | 29.11% | 23.60% (5) | 19.22% (5) |
| Ratios/Supplemental Data | | | | | | |
| Net assets, end of period (000’s omitted) | $1,106,089 | $922,471 | $461,378 | $419,658 | $271,918 | $ 90,874 |
| Ratios (as a percentage of average daily net assets): | | | | | | |
| Expenses | 0.77% (6)(7) | 0.78% (7) | 0.78% (7) | 0.78% | 0.80% (5) | 0.82% (5) |
| Net investment income (loss) | 0.16% (6) | 0.13% | (0.07)% | (0.14)% | (0.00)% (8) | 0.18% |
| Portfolio Turnover | 7% (4) | 10% | 7% | 18% | 23% | 18% |
| (1) | Computed using average shares outstanding. |
| (2) | Amount is less than $(0.0005). |
| (3) | Returns are historical and are calculated by determining the percentage change in net asset value with all distributions reinvested. |
| (4) | Not annualized. |
| (5) | The administrator and sub-adviser reimbursed certain operating expenses (equal to 0.05% and 0.19% of average daily net assets for the years ended September 30, 2020 and 2019, respectively). Absent this reimbursement, total return would be lower. |
| (6) | Annualized. |
| (7) | Includes a reduction by the investment adviser of a portion of its adviser and administration fee due to the Fund’s investment in the Liquidity Fund (equal to less than 0.005% of average daily net assets for the six months ended March 31, 2024, less than 0.01% of average daily net assets for the year ended September 30, 2023 and less than 0.005% of average daily net assets for the year ended September 30, 2022). |
| (8) | Amount is less than (0.005)%. |
13
See Notes to Financial Statements.
Eaton Vance
Atlanta Capital Focused Growth Fund
March 31, 2024
Financial Highlights — continued
| | Class R6 |
| | Six Months Ended
March 31, 2024
(Unaudited) | Period Ended
September 30, 2023(1) |
| Net asset value — Beginning of period | $ 15.100 | $ 15.500 |
| Income (Loss) From Operations | | |
| Net investment income(2) | $ 0.009 | $ 0.002 |
| Net realized and unrealized gain (loss) | 3.132 | (0.402) |
| Total income (loss) from operations | $ 3.141 | $ (0.400) |
| Less Distributions | | |
| From net investment income | $ (0.019) | $ — |
| From net realized gain | (0.082) | — |
| Total distributions | $ (0.101) | $ — |
| Net asset value — End of period | $18.140 | $15.100 |
| Total Return(3) | 20.86% (4) | (2.58)% (4) |
| Ratios/Supplemental Data | | |
| Net assets, end of period (000’s omitted) | $ 7,367 | $ 49 |
| Ratios (as a percentage of average daily net assets): | | |
| Expenses | 0.73% (5)(6) | 0.70% (5)(6) |
| Net investment income | 0.10% (6) | 0.05% (6) |
| Portfolio Turnover | 7% (4) | 10% (7) |
| (1) | For the period from the commencement of operations, June 30, 2023, to September 30, 2023. |
| (2) | Computed using average shares outstanding. |
| (3) | Returns are historical and are calculated by determining the percentage change in net asset value with all distributions reinvested. |
| (4) | Not annualized. |
| (5) | Includes a reduction by the investment adviser of a portion of its adviser fee due to the Fund’s investment in the Liquidity Fund (equal to less than 0.005% of average daily net assets for the six months ended March 31, 2024 and the period ended September 30, 2023). |
| (6) | Annualized. |
| (7) | For the year ended September 30, 2023. |
14
See Notes to Financial Statements.
Eaton Vance
Atlanta Capital Focused Growth Fund
March 31, 2024
Notes to Financial Statements (Unaudited)
1 Significant Accounting Policies
Eaton Vance Atlanta Capital Focused Growth Fund (the Fund) is a non-diversified series of Eaton Vance Growth Trust (the Trust). The Trust is a Massachusetts business trust registered under the Investment Company Act of 1940, as amended (the 1940 Act), as an open-end management investment company. The Fund’s investment objective is to seek long-term capital growth. The Fund offers four classes of shares. Class A shares are generally sold subject to a sales charge imposed at time of purchase. Class C shares are sold at net asset value and are generally subject to a contingent deferred sales charge (see Note 5). Effective November 5, 2020, Class C shares automatically convert to Class A shares eight years after their purchase as described in the Fund’s prospectus. Class I and Class R6 shares are sold at net asset value and are not subject to a sales charge. Each class represents a pro rata interest in the Fund, but votes separately on class-specific matters and (as noted below) is subject to different expenses. Realized and unrealized gains and losses and net investment income and losses, other than class-specific expenses, are allocated daily to each class of shares based on the relative net assets of each class to the total net assets of the Fund. Sub-accounting, recordkeeping and similar administrative fees payable to financial intermediaries, which are a component of transfer and dividend disbursing agent fees on the Statement of Operations, are not allocated to Class R6 shares. Each class of shares differs in its distribution plan and certain other class-specific expenses.
The following is a summary of significant accounting policies of the Fund. The policies are in conformity with accounting principles generally accepted in the United States of America (U.S. GAAP). The Fund is an investment company and follows accounting and reporting guidance in the Financial Accounting Standards Board (FASB) Accounting Standards Codification Topic 946.
A Investment Valuation—The following methodologies are used to determine the market value or fair value of investments.
Equity Securities. Equity securities listed on a U.S. securities exchange generally are valued at the last sale or closing price on the day of valuation or, if no sales took place on such date, at the mean between the closing bid and ask prices on the exchange where such securities are principally traded. Equity securities listed on the NASDAQ National Market System are valued at the NASDAQ official closing price. Unlisted or listed securities for which closing sales prices or closing quotations are not available are valued at the mean between the latest available bid and ask prices.
Other. Investments in management investment companies (including money market funds) that do not trade on an exchange are valued at the net asset value as of the close of each business day.
Fair Valuation. In connection with Rule 2a-5 of the 1940 Act, the Trustees have designated the Fund’s investment adviser as its valuation designee. Investments for which valuations or market quotations are not readily available or are deemed unreliable are valued by the investment adviser, as valuation designee, at fair value using methods that most fairly reflect the security’s “fair value”, which is the amount that the Fund might reasonably expect to receive for the security upon its current sale in the ordinary course. Each such determination is based on a consideration of relevant factors, which are likely to vary from one pricing context to another. These factors may include, but are not limited to, the type of security, the existence of any contractual restrictions on the security’s disposition, the price and extent of public trading in similar securities of the issuer or of comparable companies or entities, quotations or relevant information obtained from broker/dealers or other market participants, information obtained from the issuer, analysts, and/or the appropriate stock exchange (for exchange-traded securities), an analysis of the company’s or entity’s financial statements, and an evaluation of the forces that influence the issuer and the market(s) in which the security is purchased and sold.
B Investment Transactions—Investment transactions for financial statement purposes are accounted for on a trade date basis. Realized gains and losses on investments sold are determined on the basis of identified cost.
C Income—Dividend income is recorded on the ex-dividend date for dividends received in cash and/or securities.
D Federal Taxes—The Fund's policy is to comply with the provisions of the Internal Revenue Code applicable to regulated investment companies and to distribute to shareholders each year substantially all of its net investment income, and all or substantially all of its net realized capital gains. Accordingly, no provision for federal income or excise tax is necessary.
As of March 31, 2024, the Fund had no uncertain tax positions that would require financial statement recognition, de-recognition, or disclosure. The Fund files a U.S. federal income tax return annually after its fiscal year-end, which is subject to examination by the Internal Revenue Service for a period of three years from the date of filing.
E Expenses—The majority of expenses of the Trust are directly identifiable to an individual fund. Expenses which are not readily identifiable to a specific fund are allocated taking into consideration, among other things, the nature and type of expense and the relative size of the funds.
F Use of Estimates—The preparation of the financial statements in conformity with U.S. GAAP requires management to make estimates and assumptions that affect the reported amounts of assets and liabilities at the date of the financial statements and the reported amounts of income and expense during the reporting period. Actual results could differ from those estimates.
G Indemnifications—Under the Trust’s organizational documents, its officers and Trustees may be indemnified against certain liabilities and expenses arising out of the performance of their duties to the Fund. Under Massachusetts law, if certain conditions prevail, shareholders of a Massachusetts business trust (such as the Trust) could be deemed to have personal liability for the obligations of the Trust. However, the Trust’s Declaration of Trust contains an express disclaimer of liability on the part of Fund shareholders and the By-laws provide that the Trust shall assume, upon request by the shareholder, the
Eaton Vance
Atlanta Capital Focused Growth Fund
March 31, 2024
Notes to Financial Statements (Unaudited) — continued
defense on behalf of any Fund shareholders. Moreover, the By-laws also provide for indemnification out of Fund property of any shareholder held personally liable solely by reason of being or having been a shareholder for all loss or expense arising from such liability. Additionally, in the normal course of business, the Fund enters into agreements with service providers that may contain indemnification clauses. The Fund’s maximum exposure under these arrangements is unknown as this would involve future claims that may be made against the Fund that have not yet occurred.
H Interim Financial Statements—The interim financial statements relating to March 31, 2024 and for the six months then ended have not been audited by an independent registered public accounting firm, but in the opinion of the Fund’s management, reflect all adjustments, consisting only of normal recurring adjustments, necessary for the fair presentation of the financial statements.
2 Distributions to Shareholders and Income Tax Information
It is the present policy of the Fund to make at least one distribution annually (normally in December) of all or substantially all of its net investment income and to distribute annually all or substantially all of its net realized capital gains. Distributions to shareholders are recorded on the ex-dividend date. Distributions are declared separately for each class of shares. Shareholders may reinvest income and capital gain distributions in additional shares of the same class of the Fund at the net asset value as of the ex-dividend date or, at the election of the shareholder, receive distributions in cash. Distributions to shareholders are determined in accordance with income tax regulations, which may differ from U.S. GAAP. As required by U.S. GAAP, only distributions in excess of tax basis earnings and profits are reported in the financial statements as a return of capital. Permanent differences between book and tax accounting relating to distributions are reclassified to paid-in capital. For tax purposes, distributions from short-term capital gains are considered to be from ordinary income.
The cost and unrealized appreciation (depreciation) of investments of the Fund at March 31, 2024, as determined on a federal income tax basis, were as follows:
| Aggregate cost | $875,178,641 |
| Gross unrealized appreciation | $ 387,199,954 |
| Gross unrealized depreciation | (6,307,825) |
| Net unrealized appreciation | $380,892,129 |
3 Investment Adviser Fee and Other Transactions with Affiliates
The investment adviser fee is earned by Boston Management and Research (BMR), an indirect, wholly-owned subsidiary of Morgan Stanley, as compensation for investment advisory services rendered to the Fund. The fee is computed at an annual rate as a percentage of the Fund’s average daily net assets as follows and is payable monthly:
| Average Daily Net Assets | Annual Fee Rate |
| Up to $500 million | 0.650% |
| $500 million but less than $1 billion | 0.625% |
| $1 billion but less than $2.5 billion | 0.600% |
| $2.5 billion and over | 0.575% |
For the six months ended March 31, 2024, the investment adviser fee amounted to $3,660,568 or 0.63% (annualized) of the Fund’s average daily net assets. Eaton Vance Management (EVM), an affiliate of BMR and an indirect, wholly-owned subsidiary of Morgan Stanley, serves as administrator of the Fund, but receives no compensation. Pursuant to an investment sub-advisory agreement, BMR has delegated the investment management of the Fund to Atlanta Capital Management Company, LLC (Atlanta Capital), an affiliate of BMR and an indirect, wholly-owned subsidiary of Morgan Stanley. BMR pays Atlanta Capital a portion of its investment adviser fee for sub-advisory services provided to the Fund.
The Fund may invest in a money market fund, the Institutional Class of the Morgan Stanley Institutional Liquidity Funds - Government Portfolio (the “Liquidity Fund”), an open-end management investment company managed by Morgan Stanley Investment Management Inc., a wholly-owned subsidiary of Morgan Stanley. The investment adviser fee paid by the Fund is reduced by an amount equal to its pro-rata share of the advisory and administration fees paid by the Fund due to its investment in the Liquidity Fund. For the six months ended March 31, 2024, the investment adviser fee paid was reduced by $24,688 relating to the Fund’s investment in the Liquidity Fund.
Eaton Vance
Atlanta Capital Focused Growth Fund
March 31, 2024
Notes to Financial Statements (Unaudited) — continued
EVM provides sub-transfer agency and related services to the Fund pursuant to a Sub-Transfer Agency Support Services Agreement. For the six months ended March 31, 2024, EVM earned $55,973 from the Fund pursuant to such agreement, which is included in transfer and dividend disbursing agent fees on the Statement of Operations. The Fund was informed that Eaton Vance Distributors, Inc. (EVD), an affiliate of EVM and the Fund’s principal underwriter, received $22,751 as its portion of the sales charge on sales of Class A shares for the six months ended March 31, 2024. EVD also received distribution and service fees from Class A and Class C shares (see Note 4) and contingent deferred sales charges (see Note 5).
Trustees and officers of the Fund who are members of EVM’s or BMR's organizations receive remuneration for their services to the Fund out of the investment adviser fee. Trustees of the Fund who are not affiliated with the investment adviser and administrator may elect to defer receipt of all or a percentage of their annual fees in accordance with the terms of the Trustees Deferred Compensation Plan. Certain officers and Trustees of the Fund are officers of the above organizations.
4 Distribution Plans
The Fund has in effect a distribution plan for Class A shares (Class A Plan) pursuant to Rule 12b-1 under the 1940 Act. Pursuant to the Class A Plan, the Fund pays EVD a distribution and service fee of 0.25% per annum of its average daily net assets attributable to Class A shares for distribution services and facilities provided to the Fund by EVD, as well as for personal services and/or the maintenance of shareholder accounts. Distribution and service fees paid or accrued to EVD for the six months ended March 31, 2024 amounted to $102,699 for Class A shares.
The Fund also has in effect a distribution plan for Class C shares (Class C Plan) pursuant to Rule 12b-1 under the 1940 Act. Pursuant to the Class C Plan, the Fund pays EVD amounts equal to 0.75% per annum of its average daily net assets attributable to Class C shares for providing ongoing distribution services and facilities to the Fund. For the six months ended March 31, 2024, the Fund paid or accrued to EVD $181,273 for Class C shares.
Pursuant to the Class C Plan, the Fund also makes payments of service fees to EVD, financial intermediaries and other persons in amounts equal to 0.25% per annum of its average daily net assets attributable to that class. Service fees paid or accrued are for personal services and/or the maintenance of shareholder accounts. They are separate and distinct from the sales commissions and distribution fees payable to EVD. Service fees paid or accrued for the six months ended March 31, 2024 amounted to $60,424 for Class C shares.
Distribution and service fees are subject to the limitations contained in the Financial Industry Regulatory Authority Rule 2341(d).
5 Contingent Deferred Sales Charges
A contingent deferred sales charge (CDSC) of 1% generally is imposed on redemptions of Class C shares made within 12 months of purchase. Class A shares may be subject to a 1% CDSC if redeemed within 12 months of purchase (depending on the circumstances of purchase). Generally, the CDSC is based upon the lower of the net asset value at date of redemption or date of purchase. No charge is levied on shares acquired by reinvestment of dividends or capital gain distributions. For the six months ended March 31, 2024, the Fund was informed that EVD received $2,016 and $3,764 of CDSCs paid by Class A and Class C shareholders, respectively.
6 Purchases and Sales of Investments
Purchases and sales of investments, other than short-term obligations, aggregated $79,662,414 and $92,889,693, respectively, for the six months ended March 31, 2024.
Eaton Vance
Atlanta Capital Focused Growth Fund
March 31, 2024
Notes to Financial Statements (Unaudited) — continued
7 Shares of Beneficial Interest
The Fund’s Declaration of Trust permits the Trustees to issue an unlimited number of full and fractional shares of beneficial interest (without par value). Such shares may be issued in a number of different series (such as the Fund) and classes. Transactions in Fund shares, including direct exchanges pursuant to share class conversions, were as follows:
| | Six Months Ended
March 31, 2024
(Unaudited) | | Year Ended
September 30, 2023 |
| | Shares | Amount | | Shares | Amount |
| Class A | | | | | |
| Sales | 782,396 | $ 14,901,324 | | 1,339,900 | $ 22,868,433 |
| Issued to shareholders electing to receive payments of distributions in Fund shares | 11,731 | 224,177 | | 8,706 | 141,828 |
| Redemptions | (1,062,598) | (20,144,945) | | (723,812) | (11,922,918) |
| Net increase (decrease) | (268,471) | $ (5,019,444) | | 624,794 | $ 11,087,343 |
| Class C | | | | | |
| Sales | 439,044 | $ 7,556,354 | | 860,735 | $ 12,645,891 |
| Issued to shareholders electing to receive payments of distributions in Fund shares | 6,343 | 107,569 | | 6,263 | 91,129 |
| Redemptions | (262,731) | (4,477,629) | | (356,664) | (5,222,796) |
| Net increase | 182,656 | $ 3,186,294 | | 510,334 | $ 7,514,224 |
| Class I | | | | | |
| Sales | 9,740,884 | $ 163,060,600 | | 41,525,209 | $ 594,783,326 |
| Issued to shareholders electing to receive payments of distributions in Fund shares | 356,622 | 5,934,199 | | 122,387 | 1,735,449 |
| Redemptions | (10,213,418) | (171,882,298) | | (17,094,833) | (249,636,370) |
| Net increase (decrease) | (115,912) | $ (2,887,499) | | 24,552,763 | $ 346,882,405 |
| Class R6(1) | | | | | |
| Sales | 441,472 | $ 7,576,564 | | 3,226 | $ 50,000 |
| Issued to shareholders electing to receive payments of distributions in Fund shares | 211 | 3,506 | | — | — |
| Redemptions | (38,792) | (687,766) | | — | — |
| Net increase | 402,891 | $ 6,892,304 | | 3,226 | $ 50,000 |
| (1) | For the period from the commencement of operations, June 30, 2023, to September 30, 2023. |
8 Line of Credit
The Fund participates with other portfolios and funds managed by EVM and its affiliates in a $650 million unsecured revolving line of credit agreement with a group of banks, which is in effect through October 22, 2024. In connection with the renewal of the agreement on October 24, 2023, the borrowing limit was decreased from $725 million. Borrowings are made by the Fund solely for temporary purposes related to redemptions and other short-term cash needs. Interest is charged to the Fund based on its borrowings at an amount above either the Secured Overnight Financing Rate (SOFR) or Federal Funds rate. In addition, a fee computed at an annual rate of 0.15% on the daily unused portion of the line of credit is allocated among the participating portfolios and funds at the end of each quarter. In connection with the renewal of the agreement in October 2023, an arrangement fee of $150,000 was incurred that was allocated to the participating portfolios and funds. Because the line of credit is not available exclusively to the Fund, it may be unable to borrow some or all of its requested amounts at any particular time. The Fund did not have any significant borrowings or allocated fees during the six months ended March 31, 2024.
Eaton Vance
Atlanta Capital Focused Growth Fund
March 31, 2024
Notes to Financial Statements (Unaudited) — continued
9 Affiliated Investments
At March 31, 2024, the value of the Fund's investment in funds that may be deemed to be affiliated was $43,791,264, which represents 3.5% of the Fund's net assets. Transactions in such investments by the Fund for the six months ended March 31, 2024 were as follows:
| Name | Value,
beginning
of period | Purchases | Sales
proceeds | Net realized
gain (loss) | Change in
unrealized
appreciation
(depreciation) | Value, end
of period | Dividend
income | Shares,
end of period |
| Short-Term Investments |
| Liquidity Fund | $33,062,058 | $142,149,033 | $(131,419,827) | $ — | $ — | $43,791,264 | $853,300 | 43,791,264 |
10 Fair Value Measurements
Under generally accepted accounting principles for fair value measurements, a three-tier hierarchy to prioritize the assumptions, referred to as inputs, is used in valuation techniques to measure fair value. The three-tier hierarchy of inputs is summarized in the three broad levels listed below.
| • | Level 1 – quoted prices in active markets for identical investments |
| • | Level 2 – other significant observable inputs (including quoted prices for similar investments, interest rates, prepayment speeds, credit risk, etc.) |
| • | Level 3 – significant unobservable inputs (including a fund's own assumptions in determining the fair value of investments) |
In cases where the inputs used to measure fair value fall in different levels of the fair value hierarchy, the level disclosed is determined based on the lowest level input that is significant to the fair value measurement in its entirety. The inputs or methodology used for valuing securities are not necessarily an indication of the risk associated with investing in those securities.
At March 31, 2024, the hierarchy of inputs used in valuing the Fund's investments, which are carried at fair value, were as follows:
| Asset Description | Level 1 | Level 2 | Level 3 | Total |
| Common Stocks | $ 1,212,279,506* | $ — | $ — | $ 1,212,279,506 |
| Short-Term Investments | 43,791,264 | — | — | 43,791,264 |
| Total Investments | $ 1,256,070,770 | $ — | $ — | $1,256,070,770 |
| * | The level classification by major category of investments is the same as the category presentation in the Portfolio of Investments. |
Eaton Vance
Atlanta Capital Focused Growth Fund
March 31, 2024
| Officers |
Kenneth A. Topping
President | Nicholas S. Di Lorenzo
Secretary |
Deidre E. Walsh
Vice President and Chief Legal Officer | Laura T. Donovan
Chief Compliance Officer |
James F. Kirchner
Treasurer | |
George J. Gorman
Chairperson | |
| Alan C. Bowser | |
| Mark R. Fetting | |
| Cynthia E. Frost | |
| Valerie A. Mosley | |
| Anchal Pachnanda* | |
| Keith Quinton | |
| Marcus L. Smith | |
| Susan J. Sutherland | |
| Scott E. Wennerholm | |
| Nancy A. Wiser | |
| U.S. Customer Privacy Notice | March 2024 |
| FACTS | WHAT DOES EATON VANCE DO WITH YOUR PERSONAL INFORMATION? |
| Why? | Financial companies choose how they share your personal information. Federal law gives consumers the right to limit some but not all sharing. Federal law also requires us to tell you how we collect, share, and protect your personal information. Please read this notice carefully to understand what we do. |
| |
| What? | The types of personal information we collect and share depend on the product or service you have with us. This information can include:■ Social Security number and income
■ investment experience and risk tolerance
■ checking account information and wire transfer instructions |
| |
| How? | All financial companies need to share customers’ personal information to run their everyday business. In the section below, we list the reasons financial companies can share their customers’ personal information; the reasons Eaton Vance chooses to share; and whether you can limit this sharing. |
| Reasons we can share your personal information | Does Eaton Vance
share? | Can you limit
this sharing? |
| For our everyday business purposes — such as to process your transactions, maintain your account(s), respond to court orders and legal investigations, or report to credit bureaus | Yes | No |
| For our marketing purposes — to offer our products and services to you | Yes | No |
| For joint marketing with other financial companies | No | We don’t share |
| For our affiliates’ everyday business purposes — information about your transactions and experiences | Yes | No* |
| For our affiliates’ everyday business purposes — information about your creditworthiness | Yes | Yes* |
| For our affiliates to market to you | Yes | Yes* |
| For nonaffiliates to market to you | No | We don’t share |
To limit our
sharing | Call toll-free 1-800-262-1122 or email: EVPrivacy@eatonvance.comPlease note:If you are a new customer, we can begin sharing your information 30 days from the date we sent this notice. When you are no longer our customer, we continue to share your information as described in this notice. However, you can contact us at any time to limit our sharing. |
| Questions? | Call toll-free 1-800-262-1122 or email: EVPrivacy@eatonvance.com |
| U.S. Customer Privacy Notice — continued | March 2024 |
| Who we are |
| Who is providing this notice? | Eaton Vance Management and our investment management affiliates (“Eaton Vance”) (see Affiliates definition below.) |
| What we do |
How does Eaton Vance
protect my personal
information? | To protect your personal information from unauthorized access and use, we use security measures that comply with federal law. These measures include computer safeguards and secured files and buildings. We have policies governing the proper handling of customer information by personnel and requiring third parties that provide support to adhere to appropriate security standards with respect to such information. |
How does Eaton Vance
collect my personal
information? | We collect your personal information, for example, when you■ open an account or make deposits or withdrawals from your account
■ buy securities from us or make a wire transfer
■ give us your contact informationWe also collect your personal information from others, such as credit bureaus, affiliates, or other companies. |
| Why can’t I limit all sharing? | Federal law gives you the right to limit only■ sharing for affiliates’ everyday business purposes — information about your creditworthiness
■ affiliates from using your information to market to you
■ sharing for nonaffiliates to market to youState laws and individual companies may give you additional rights to limit sharing. (See below for more on your rights under state law.) |
What happens when I limit
sharing for an account I hold
jointly with someone else? | Your choices will apply to everyone on your account. |
| Definitions |
| Affiliates | Companies related by common ownership or control. They can be financial and nonfinancial companies.■ Our affiliates include registered investment advisers such as Eaton Vance Management, Eaton Vance Advisers International Ltd., Boston Management and Research, Calvert Research and Management, Parametric Portfolio Associates LLC, Atlanta Capital Management Company LLC, Morgan Stanley Investment Management Inc., Morgan Stanley Investment Management Co.; registered broker-dealers such as Morgan Stanley Distributors Inc. and Eaton Vance Distributors, Inc. (together, the “Investment Management Affiliates”); and companies with a Morgan Stanley name and financial companies such as Morgan Stanley Smith Barney LLC and Morgan Stanley & Co. (the “Morgan Stanley Affiliates”). |
| Nonaffiliates | Companies not related by common ownership or control. They can be financial and nonfinancial companies.■ Eaton Vance does not share with nonaffiliates so they can market to you. |
| Joint marketing | A formal agreement between nonaffiliated financial companies that together market financial products or services to you.■ Eaton Vance does not jointly market. |
| U.S. Customer Privacy Notice — continued | March 2024 |
| Other important information |
| *PLEASE NOTE: Eaton Vance does not share your creditworthiness information or your transactions and experiences information with the Morgan Stanley Affiliates, nor does Eaton Vance enable the Morgan Stanley Affiliates to market to you. Your opt outs will prevent Eaton Vance from sharing your creditworthiness information with the Investment Management Affiliates and will prevent the Investment Management Affiliates from marketing their products to you.Vermont: Except as permitted by law, we will not share personal information we collect about Vermont residents with Nonaffiliates unless you provide us with your written consent to share such information.California: Except as permitted by law, we will not share personal information we collect about California residents with Nonaffiliates and we will limit sharing such personal information with our Affiliates to comply with California privacy laws that apply to us. |
Delivery of Shareholder Documents. The Securities and Exchange Commission (SEC) permits funds to deliver only one copy of shareholder documents, including prospectuses, proxy statements and shareholder reports, to fund investors with multiple accounts at the same residential or post office box address. This practice is often called “householding” and it helps eliminate duplicate mailings to shareholders. Eaton Vance, or your financial intermediary, may household the mailing of your documents indefinitely unless you instruct Eaton Vance, or your financial intermediary, otherwise. If you would prefer that your Eaton Vance documents not be householded, please contact Eaton Vance at 1-800-262-1122, or contact your financial intermediary. Your instructions that householding not apply to delivery of your Eaton Vance documents will typically be effective within 30 days of receipt by Eaton Vance or your financial intermediary.
Portfolio Holdings. Each Eaton Vance Fund and its underlying Portfolio(s) (if applicable) files a schedule of portfolio holdings on Part F to Form N-PORT with the SEC. Certain information filed on Form N-PORT may be viewed on the Eaton Vance website at www.eatonvance.com, by calling Eaton Vance at 1-800-262-1122 or in the EDGAR database on the SEC’s website at www.sec.gov.
Proxy Voting. From time to time, funds are required to vote proxies related to the securities held by the funds. The Eaton Vance Funds or their underlying Portfolios (if applicable) vote proxies according to a set of policies and procedures approved by the Funds’ and Portfolios’ Boards. You may obtain a description of these policies and procedures and information on how the Funds or Portfolios voted proxies relating to portfolio securities during the most recent 12-month period ended June 30, without charge, upon request, by calling 1-800-262-1122 and by accessing the SEC’s website at www.sec.gov.
Tailored Shareholder Reports. Effective January 24, 2023, the SEC adopted rule and form amendments to require open-end mutual funds and ETFs to transmit concise and visually engaging streamlined annual and semiannual reports to shareholders that highlight key information. Other information, including financial statements, will no longer appear in a streamlined shareholder report but must be available online, delivered free of charge upon request, and filed on a semiannual basis on Form N-CSR. The rule and form amendments have a compliance date of July 24, 2024. At this time, management is evaluating the impact of these amendments on the shareholder reports for the Eaton Vance Funds.
Investment Adviser
Boston Management and Research
One Post Office Square
Boston, MA 02109
Investment Sub-Adviser
Atlanta Capital Management Company, LLC
1075 Peachtree Street NE
Suite 2100
Atlanta, GA 30309
Administrator
Eaton Vance Management
One Post Office Square
Boston, MA 02109
Principal Underwriter*
Eaton Vance Distributors, Inc.
One Post Office Square
Boston, MA 02109
(617) 482-8260
Custodian
State Street Bank and Trust Company
One Congress Street, Suite 1
Boston, MA 02114-2016
Transfer Agent
BNY Mellon Investment Servicing (US) Inc.
Attn: Eaton Vance Funds
P.O. Box 534439
Pittsburgh, PA 15253-4439
(800) 262-1122
Fund Offices
One Post Office Square
Boston, MA 02109
*FINRA BrokerCheck. Investors may check the background of their Investment Professional by contacting the Financial Industry Regulatory Authority (FINRA). FINRA BrokerCheck is a free tool to help investors check the professional background of current and former FINRA-registered securities firms and brokers. FINRA BrokerCheck is available by calling 1-800-289-9999 and at www.FINRA.org. The FINRA BrokerCheck brochure describing this program is available to investors at www.FINRA.org.
Eaton Vance
Atlanta Capital Select Equity Fund
Semiannual Report
March 31, 2024
Commodity Futures Trading Commission Registration. The Commodity Futures Trading Commission (“CFTC”) has adopted regulations that subject registered investment companies and advisers to regulation by the CFTC if a fund invests more than a prescribed level of its assets in certain CFTC-regulated instruments (including futures, certain options and swap agreements) or markets itself as providing investment exposure to such instruments. The investment adviser has claimed an exclusion from the definition of “commodity pool operator” under the Commodity Exchange Act with respect to its management of the Fund. Accordingly, neither the Fund nor the adviser with respect to the operation of the Fund is subject to CFTC regulation. Because of its management of other strategies, the Fund's adviser is registered with the CFTC as a commodity pool operator. The adviser is also registered as a commodity trading advisor.
Fund shares are not insured by the FDIC and are not deposits or other obligations of, or guaranteed by, any depository institution. Shares are subject to investment risks, including possible loss of principal invested.
This report must be preceded or accompanied by a current summary prospectus or prospectus. Before investing, investors should consider carefully the investment objective, risks, and charges and expenses of a mutual fund. This and other important information is contained in the summary prospectus and prospectus, which can be obtained from a financial intermediary. Prospective investors should read the prospectus carefully before investing. For further information, please call 1-800-262-1122.
Semiannual Report March 31, 2024
Eaton Vance
Atlanta Capital Select Equity Fund
Eaton Vance
Atlanta Capital Select Equity Fund
March 31, 2024
Performance
Portfolio Manager(s) William O. Bell IV, CFA, W. Matthew Hereford, CFA and Charles B. Reed, CFA, each of Atlanta Capital Management Company, LLC
| % Average Annual Total Returns1,2 | Class
Inception Date | Performance
Inception Date | Six Months | One Year | Five Years | Ten Years |
| Class A at NAV | 01/03/2012 | 01/03/2012 | 21.25% | 27.52% | 12.74% | 11.79% |
| Class A with 5.25% Maximum Sales Charge | — | — | 14.89 | 20.83 | 11.52 | 11.19 |
| Class C at NAV | 03/19/2013 | 01/03/2012 | 20.84 | 26.58 | 11.90 | 11.13 |
| Class C with 1% Maximum Deferred Sales Charge | — | — | 19.84 | 25.58 | 11.90 | 11.13 |
| Class I at NAV | 01/03/2012 | 01/03/2012 | 21.41 | 27.83 | 13.02 | 12.08 |
| Class R6 at NAV | 02/01/2017 | 01/03/2012 | 21.43 | 27.87 | 13.07 | 12.11 |
|
| Russell 1000® Index | — | — | 23.49% | 29.87% | 14.74% | 12.67% |
| % Total Annual Operating Expense Ratios3 | Class A | Class C | Class I | Class R6 |
| Gross | 1.06% | 1.81% | 0.81% | 0.76% |
| Net | 1.05 | 1.80 | 0.80 | 0.75 |
See Endnotes and Additional Disclosures in this report.
Past performance is no guarantee of future results. Returns are historical and are calculated by determining the percentage change in net asset value (NAV) or offering price (as applicable) with all distributions reinvested. Furthermore, returns do not reflect the deduction of taxes that shareholders may have to pay on Fund distributions or upon the redemption of Fund shares. Investment return and principal value will fluctuate so that shares, when redeemed, may be worth more or less than their original cost. Performance for periods less than or equal to one year is cumulative. Performance is for the stated time period only; due to market volatility, current Fund performance may be lower or higher than the quoted return. For performance as of the most recent month-end, please refer to eatonvance.com.
Eaton Vance
Atlanta Capital Select Equity Fund
March 31, 2024
| Sector Allocation (% of net assets)1 |
| Top 10 Holdings (% of net assets)1 |
| Fiserv, Inc. | 7.5% |
| White Mountains Insurance Group Ltd. | 7.0 |
| CDW Corp. | 6.2 |
| TJX Cos., Inc. | 6.2 |
| Alphabet, Inc., Class C | 5.8 |
| Markel Group, Inc. | 5.3 |
| GoDaddy, Inc., Class A | 5.1 |
| Gartner, Inc. | 5.0 |
| Global Payments, Inc. | 4.8 |
| Martin Marietta Materials, Inc. | 4.3 |
| Total | 57.2% |
Footnotes:
| 1 | Excludes cash and cash equivalents. |
Eaton Vance
Atlanta Capital Select Equity Fund
March 31, 2024
Endnotes and Additional Disclosures
| 1 | Russell 1000® Index is an unmanaged index of 1,000 U.S. large-cap stocks. Unless otherwise stated, index returns do not reflect the effect of any applicable sales charges, commissions, expenses, taxes or leverage, as applicable. It is not possible to invest directly in an index. |
| 2 | Total Returns at NAV do not include applicable sales charges. If sales charges were deducted, the returns would be lower. Total Returns shown with maximum sales charge reflect the stated maximum sales charge. Unless otherwise stated, performance does not reflect the deduction of taxes on Fund distributions or redemptions of Fund shares.Effective November 5, 2020, Class C shares automatically convert to Class A shares eight years after purchase. The average annual total returns listed for Class C reflect conversion to Class A shares after eight years. Prior to November 5, 2020, Class C shares automatically converted to Class A shares ten years after purchase.Performance prior to the inception date of a class may be linked to the performance of an older class of the Fund. This linked performance is adjusted for any applicable sales charge, but is not adjusted for class expense differences. If adjusted for such differences, the performance would be different. The performance of Class R6 is linked to Class I. Performance presented in the Financial Highlights included in the financial statements is not linked. |
| 3 | Source: Fund prospectus. Net expense ratios reflect a contractual expense reimbursement that continues through 2/1/25. The expense ratios for the current reporting period can be found in the Financial Highlights section of this report. Performance reflects expenses waived and/or reimbursed, if applicable. Without such waivers and/or reimbursements, performance would have been lower. |
| | Fund profile subject to change due to active management. |
Eaton Vance
Atlanta Capital Select Equity Fund
March 31, 2024
Example
As a Fund shareholder, you incur two types of costs: (1) transaction costs, including sales charges (loads) on purchases; and (2) ongoing costs, including management fees; distribution and/or service fees; and other Fund expenses. This Example is intended to help you understand your ongoing costs (in dollars) of Fund investing and to compare these costs with the ongoing costs of investing in other mutual funds. The Example is based on an investment of $1,000 invested at the beginning of the period and held for the entire period (October 1, 2023 to March 31, 2024).
Actual Expenses
The first section of the table below provides information about actual account values and actual expenses. You may use the information in this section, together with the amount you invested, to estimate the expenses that you paid over the period. Simply divide your account value by $1,000 (for example, an $8,600 account value divided by $1,000 = 8.6), then multiply the result by the number in the first section under the heading entitled “Expenses Paid During Period” to estimate the expenses you paid on your account during this period.
Hypothetical Example for Comparison Purposes
The second section of the table below provides information about hypothetical account values and hypothetical expenses based on the actual Fund expense ratio and an assumed rate of return of 5% per year (before expenses), which is not the actual Fund return. The hypothetical account values and expenses may not be used to estimate the actual ending account balance or expenses you paid for the period. You may use this information to compare the ongoing costs of investing in your Fund and other funds. To do so, compare this 5% hypothetical example with the 5% hypothetical examples that appear in the shareholder reports of the other funds.
Please note that the expenses shown in the table are meant to highlight your ongoing costs only and do not reflect any transactional costs, such as sales charges (loads). Therefore, the second section of the table is useful in comparing ongoing costs only, and will not help you determine the relative total costs of owning different funds. In addition, if these transactional costs were included, your costs would be higher.
| | Beginning
Account Value
(10/1/23) | Ending
Account Value
(3/31/24) | Expenses Paid
During Period*
(10/1/23 – 3/31/24) | Annualized
Expense
Ratio |
| Actual | | | | |
| Class A | $1,000.00 | $1,212.50 | $5.81** | 1.05% |
| Class C | $1,000.00 | $1,208.40 | $9.94** | 1.80% |
| Class I | $1,000.00 | $1,214.10 | $4.43** | 0.80% |
| Class R6 | $1,000.00 | $1,214.30 | $4.15** | 0.75% |
| |
| Hypothetical | | | | |
| (5% return per year before expenses) | | | | |
| Class A | $1,000.00 | $1,019.75 | $5.30** | 1.05% |
| Class C | $1,000.00 | $1,016.00 | $9.07** | 1.80% |
| Class I | $1,000.00 | $1,021.00 | $4.04** | 0.80% |
| Class R6 | $1,000.00 | $1,021.25 | $3.79** | 0.75% |
| * | Expenses are equal to the Fund’s annualized expense ratio for the indicated Class, multiplied by the average account value over the period, multiplied by 183/366 (to reflect the one-half year period). The Example assumes that the $1,000 was invested at the net asset value per share determined at the close of business on September 30, 2023. |
| ** | Absent an allocation of certain expenses to affiliate(s), expenses would be higher. |
Eaton Vance
Atlanta Capital Select Equity Fund
March 31, 2024
Portfolio of Investments (Unaudited)
| Security | Shares | Value |
| Capital Markets — 1.9% |
| S&P Global, Inc. | | 35,452 | $ 15,083,053 |
| | | | $ 15,083,053 |
| Chemicals — 2.2% |
| Sherwin-Williams Co. | | 50,442 | $ 17,520,020 |
| | | | $ 17,520,020 |
| Construction Materials — 4.3% |
| Martin Marietta Materials, Inc. | | 56,583 | $ 34,738,567 |
| | | | $ 34,738,567 |
| Containers & Packaging — 1.5% |
| Ball Corp. | | 175,944 | $ 11,851,588 |
| | | | $ 11,851,588 |
| Electrical Equipment — 2.4% |
| AMETEK, Inc. | | 106,105 | $ 19,406,605 |
| | | | $ 19,406,605 |
| Electronic Equipment, Instruments & Components — 8.3% |
| CDW Corp. | | 194,566 | $ 49,766,091 |
| Trimble, Inc.(1) | | 253,811 | 16,335,276 |
| | | | $ 66,101,367 |
| Financial Services — 15.5% |
| Fiserv, Inc.(1) | | 377,008 | $ 60,253,419 |
| Global Payments, Inc. | | 285,655 | 38,180,647 |
| Visa, Inc., Class A | | 91,229 | 25,460,189 |
| | | | $123,894,255 |
| Food Products — 1.4% |
| Nestle SA ADR(2) | | 102,774 | $ 10,914,599 |
| | | | $ 10,914,599 |
| Health Care Equipment & Supplies — 6.3% |
| STERIS PLC | | 107,209 | $ 24,102,727 |
| Teleflex, Inc. | | 116,806 | 26,418,013 |
| | | | $ 50,520,740 |
| Insurance — 12.3% |
| Markel Group, Inc.(1) | | 28,031 | $ 42,648,606 |
| Security | Shares | Value |
| Insurance (continued) |
| White Mountains Insurance Group Ltd. | | 31,241 | $ 56,055,726 |
| | | | $ 98,704,332 |
| Interactive Media & Services — 5.8% |
| Alphabet, Inc., Class C(1) | | 304,570 | $ 46,373,828 |
| | | | $ 46,373,828 |
| IT Services — 10.1% |
| Gartner, Inc.(1) | | 83,477 | $ 39,790,982 |
| GoDaddy, Inc., Class A(1) | | 345,147 | 40,962,046 |
| | | | $ 80,753,028 |
| Life Sciences Tools & Services — 4.0% |
| Danaher Corp. | | 47,863 | $ 11,952,349 |
| Thermo Fisher Scientific, Inc. | | 35,268 | 20,498,114 |
| | | | $ 32,450,463 |
| Professional Services — 4.7% |
| Broadridge Financial Solutions, Inc. | | 37,382 | $ 7,658,077 |
| TransUnion | | 214,265 | 17,098,347 |
| Verisk Analytics, Inc. | | 55,302 | 13,036,340 |
| | | | $ 37,792,764 |
| Software — 2.6% |
| Adobe, Inc.(1) | | 18,612 | $ 9,391,615 |
| Autodesk, Inc.(1) | | 45,488 | 11,845,985 |
| | | | $ 21,237,600 |
| Specialty Retail — 13.9% |
| O'Reilly Automotive, Inc.(1) | | 26,307 | $ 29,697,446 |
| Ross Stores, Inc. | | 219,036 | 32,145,723 |
| TJX Cos., Inc. | | 485,266 | 49,215,678 |
| | | | $111,058,847 |
Total Common Stocks
(identified cost $371,701,535) | | | $778,401,656 |
6
See Notes to Financial Statements.
Eaton Vance
Atlanta Capital Select Equity Fund
March 31, 2024
Portfolio of Investments (Unaudited) — continued
| Short-Term Investments — 2.8% |
| Security | Shares | Value |
| Morgan Stanley Institutional Liquidity Funds - Government Portfolio, Institutional Class, 5.22%(3) | | 22,721,537 | $ 22,721,537 |
Total Short-Term Investments
(identified cost $22,721,537) | | | $ 22,721,537 |
Total Investments — 100.0%
(identified cost $394,423,072) | | | $801,123,193 |
| Other Assets, Less Liabilities — (0.0)%(4) | | | $ (29,600) |
| Net Assets — 100.0% | | | $801,093,593 |
| The percentage shown for each investment category in the Portfolio of Investments is based on net assets. |
| (1) | Non-income producing security. |
| (2) | All or a portion of this security was on loan at March 31, 2024. The aggregate market value of securities on loan at March 31, 2024 was $10,620. |
| (3) | May be deemed to be an affiliated investment company. The rate shown is the annualized seven-day yield as of March 31, 2024. |
| (4) | Amount is less than (0.05)%. |
| Abbreviations: |
| ADR | – American Depositary Receipt |
7
See Notes to Financial Statements.
Eaton Vance
Atlanta Capital Select Equity Fund
March 31, 2024
Statement of Assets and Liabilities (Unaudited)
| | March 31, 2024 |
| Assets | |
| Unaffiliated investments, at value (identified cost $371,701,535) — including $10,620 of securities on loan | $ 778,401,656 |
| Affiliated investments, at value (identified cost $22,721,537) | 22,721,537 |
| Cash | 173,477 |
| Dividends receivable | 56,583 |
| Dividends receivable from affiliated investments | 105,973 |
| Receivable for Fund shares sold | 1,051,553 |
| Securities lending income receivable | 18 |
| Tax reclaims receivable | 146,478 |
| Receivable from affiliates | 23,348 |
| Trustees' deferred compensation plan | 29,508 |
| Total assets | $802,710,131 |
| Liabilities | |
| Payable for Fund shares redeemed | $ 827,451 |
| Payable to affiliates: | |
| Investment adviser and administration fee | 459,438 |
| Distribution and service fees | 46,144 |
| Trustees' deferred compensation plan | 29,508 |
| Accrued expenses | 253,997 |
| Total liabilities | $ 1,616,538 |
| Net Assets | $801,093,593 |
| Sources of Net Assets | |
| Paid-in capital | $ 373,693,666 |
| Distributable earnings | 427,399,927 |
| Net Assets | $801,093,593 |
| Class A Shares | |
| Net Assets | $ 82,994,602 |
| Shares Outstanding | 2,433,757 |
Net Asset Value and Redemption Price Per Share
(net assets ÷ shares of beneficial interest outstanding) | $ 34.10 |
Maximum Offering Price Per Share
(100 ÷ 94.75 of net asset value per share) | $ 35.99 |
| Class C Shares | |
| Net Assets | $ 33,986,651 |
| Shares Outstanding | 1,104,224 |
Net Asset Value and Offering Price Per Share*
(net assets ÷ shares of beneficial interest outstanding) | $ 30.78 |
| Class I Shares | |
| Net Assets | $ 677,099,628 |
| Shares Outstanding | 19,177,485 |
Net Asset Value, Offering Price and Redemption Price Per Share
(net assets ÷ shares of beneficial interest outstanding) | $ 35.31 |
8
See Notes to Financial Statements.
Eaton Vance
Atlanta Capital Select Equity Fund
March 31, 2024
Statement of Assets and Liabilities (Unaudited) — continued
| | March 31, 2024 |
| Class R6 Shares | |
| Net Assets | $7,012,712 |
| Shares Outstanding | 197,794 |
Net Asset Value, Offering Price and Redemption Price Per Share
(net assets ÷ shares of beneficial interest outstanding) | $ 35.45 |
| On sales of $50,000 or more, the offering price of Class A shares is reduced. |
| * | Redemption price per share is equal to the net asset value less any applicable contingent deferred sales charge. |
9
See Notes to Financial Statements.
Eaton Vance
Atlanta Capital Select Equity Fund
March 31, 2024
Statement of Operations (Unaudited)
| | Six Months Ended |
| | March 31, 2024 |
| Investment Income | |
| Dividend income | $ 1,785,553 |
| Dividend income from affiliated investments | 423,406 |
| Securities lending income, net | 2,844 |
| Total investment income | $ 2,211,803 |
| Expenses | |
| Investment adviser and administration fee | $ 2,601,515 |
| Distribution and service fees: | |
| Class A | 100,812 |
| Class C | 167,314 |
| Trustees’ fees and expenses | 24,548 |
| Custodian fee | 88,591 |
| Transfer and dividend disbursing agent fees | 214,332 |
| Legal and accounting services | 51,566 |
| Printing and postage | 25,661 |
| Registration fees | 35,623 |
| Miscellaneous | 19,552 |
| Total expenses | $ 3,329,514 |
| Deduct: | |
| Waiver and/or reimbursement of expenses by affiliates | $ 63,880 |
| Total expense reductions | $ 63,880 |
| Net expenses | $ 3,265,634 |
| Net investment loss | $ (1,053,831) |
| Realized and Unrealized Gain (Loss) | |
| Net realized gain (loss): | |
| Investment transactions | $ 22,732,080 |
| Net realized gain | $ 22,732,080 |
| Change in unrealized appreciation (depreciation): | |
| Investments | $ 125,082,531 |
| Net change in unrealized appreciation (depreciation) | $125,082,531 |
| Net realized and unrealized gain | $147,814,611 |
| Net increase in net assets from operations | $146,760,780 |
10
See Notes to Financial Statements.
Eaton Vance
Atlanta Capital Select Equity Fund
March 31, 2024
Statements of Changes in Net Assets
| | Six Months Ended
March 31, 2024
(Unaudited) | Year Ended
September 30, 2023 |
| Increase (Decrease) in Net Assets | | |
| From operations: | | |
| Net investment loss | $ (1,053,831) | $ (1,146,229) |
| Net realized gain | 22,732,080 | 23,285,257 |
| Net change in unrealized appreciation (depreciation) | 125,082,531 | 109,597,379 |
| Net increase in net assets from operations | $146,760,780 | $131,736,407 |
| Distributions to shareholders: | | |
| Class A | $ (2,209,642) | $ (5,124,789) |
| Class C | (987,434) | (2,469,246) |
| Class I | (16,261,078) | (36,608,467) |
| Class R6 | (153,914) | (248,103) |
| Total distributions to shareholders | $ (19,612,068) | $ (44,450,605) |
| Transactions in shares of beneficial interest: | | |
| Class A | $ (7,827,853) | $ 3,425,859 |
| Class C | (3,438,990) | (8,416,803) |
| Class I | (26,994,320) | (16,900,320) |
| Class R6 | 366,965 | 2,398,795 |
| Net decrease in net assets from Fund share transactions | $ (37,894,198) | $ (19,492,469) |
| Net increase in net assets | $ 89,254,514 | $ 67,793,333 |
| Net Assets | | |
| At beginning of period | $ 711,839,079 | $ 644,045,746 |
| At end of period | $801,093,593 | $711,839,079 |
11
See Notes to Financial Statements.
Eaton Vance
Atlanta Capital Select Equity Fund
March 31, 2024
| | Class A |
| | Six Months Ended
March 31, 2024
(Unaudited) | Year Ended September 30, |
| | 2023 | 2022 | 2021 | 2020 | 2019 |
| Net asset value — Beginning of period | $ 28.890 | $ 25.630 | $ 32.700 | $ 26.970 | $ 25.680 | $ 23.050 |
| Income (Loss) From Operations | | | | | | |
| Net investment loss(1) | $ (0.072) | $ (0.092) | $ (0.115) | $ (0.127) | $ (0.071) | $ (0.030) |
| Net realized and unrealized gain (loss) | 6.115 | 5.105 | (4.874) | 6.841 | 1.612 | 3.567 |
| Total income (loss) from operations | $ 6.043 | $ 5.013 | $ (4.989) | $ 6.714 | $ 1.541 | $ 3.537 |
| Less Distributions | | | | | | |
| From net realized gain | $ (0.833) | $ (1.753) | $ (2.081) | $ (0.984) | $ (0.251) | $ (0.907) |
| Total distributions | $ (0.833) | $ (1.753) | $ (2.081) | $ (0.984) | $ (0.251) | $ (0.907) |
| Net asset value — End of period | $34.100 | $28.890 | $25.630 | $32.700 | $26.970 | $25.680 |
| Total Return(2) | 21.25% (3)(4) | 19.95% (4) | (16.13)% | 25.32% | 6.03% (4) | 16.23% (4) |
| Ratios/Supplemental Data | | | | | | |
| Net assets, end of period (000’s omitted) | $ 82,995 | $ 77,342 | $ 64,515 | $ 87,943 | $ 72,953 | $ 78,208 |
| Ratios (as a percentage of average daily net assets): | | | | | | |
| Expenses | 1.05% (4)(5)(6) | 1.05% (4)(6) | 1.04% (6) | 1.03% | 1.05% (4) | 1.05% (4) |
| Net investment loss | (0.46)% (5) | (0.33)% | (0.39)% | (0.40)% | (0.28)% | (0.13)% |
| Portfolio Turnover | 1% (3) | 1% | 9% | 11% | 18% | 18% |
| (1) | Computed using average shares outstanding. |
| (2) | Returns are historical and are calculated by determining the percentage change in net asset value with all distributions reinvested and do not reflect the effect of sales charges. |
| (3) | Not annualized. |
| (4) | The investment adviser, administrator and sub-adviser reimbursed certain operating expenses (equal to 0.01%, 0.01%, 0.01% and 0.02% of average daily net assets for the six months ended March 31, 2024 and the years ended September 30, 2023, 2020 and 2019, respectively). Absent this reimbursement, total return would be lower. |
| (5) | Annualized. |
| (6) | Includes a reduction by the investment adviser of a portion of its adviser and administration fee due to the Fund’s investment in the Liquidity Fund (equal to less than 0.005% of average daily net assets for the six months ended March 31, 2024 and the years ended September 30, 2023 and 2022). |
12
See Notes to Financial Statements.
Eaton Vance
Atlanta Capital Select Equity Fund
March 31, 2024
Financial Highlights — continued
| | Class C |
| | Six Months Ended
March 31, 2024
(Unaudited) | Year Ended September 30, |
| | 2023 | 2022 | 2021 | 2020 | 2019 |
| Net asset value — Beginning of period | $ 26.240 | $ 23.600 | $ 30.480 | $ 25.390 | $ 24.360 | $ 22.080 |
| Income (Loss) From Operations | | | | | | |
| Net investment loss(1) | $ (0.171) | $ (0.278) | $ (0.315) | $ (0.341) | $ (0.246) | $ (0.195) |
| Net realized and unrealized gain (loss) | 5.544 | 4.671 | (4.484) | 6.415 | 1.527 | 3.382 |
| Total income (loss) from operations | $ 5.373 | $ 4.393 | $ (4.799) | $ 6.074 | $ 1.281 | $ 3.187 |
| Less Distributions | | | | | | |
| From net realized gain | $ (0.833) | $ (1.753) | $ (2.081) | $ (0.984) | $ (0.251) | $ (0.907) |
| Total distributions | $ (0.833) | $ (1.753) | $ (2.081) | $ (0.984) | $ (0.251) | $ (0.907) |
| Net asset value — End of period | $30.780 | $26.240 | $23.600 | $30.480 | $25.390 | $24.360 |
| Total Return(2) | 20.84% (3)(4) | 18.99% (4) | (16.72)% | 24.35% | 5.28% (4) | 15.32% (4) |
| Ratios/Supplemental Data | | | | | | |
| Net assets, end of period (000’s omitted) | $ 33,987 | $ 32,070 | $ 36,518 | $ 51,206 | $ 46,117 | $ 32,809 |
| Ratios (as a percentage of average daily net assets): | | | | | | |
| Expenses | 1.80% (4)(5)(6) | 1.80% (4)(6) | 1.79% (6) | 1.78% | 1.80% (4) | 1.80% (4) |
| Net investment loss | (1.21)% (5) | (1.09)% | (1.14)% | (1.16)% | (1.01)% | (0.89)% |
| Portfolio Turnover | 1% (3) | 1% | 9% | 11% | 18% | 18% |
| (1) | Computed using average shares outstanding. |
| (2) | Returns are historical and are calculated by determining the percentage change in net asset value with all distributions reinvested and do not reflect the effect of sales charges. |
| (3) | Not annualized. |
| (4) | The investment adviser, administrator and sub-adviser reimbursed certain operating expenses (equal to 0.01%, 0.01%, 0.01% and 0.02% of average daily net assets for the six months ended March 31, 2024 and the years ended September 30, 2023, 2020 and 2019, respectively). Absent this reimbursement, total return would be lower. |
| (5) | Annualized. |
| (6) | Includes a reduction by the investment adviser of a portion of its adviser and administration fee due to the Fund’s investment in the Liquidity Fund (equal to less than 0.005% of average daily net assets for the six months ended March 31, 2024 and the years ended September 30, 2023 and 2022). |
13
See Notes to Financial Statements.
Eaton Vance
Atlanta Capital Select Equity Fund
March 31, 2024
Financial Highlights — continued
| | Class I |
| | Six Months Ended
March 31, 2024
(Unaudited) | Year Ended September 30, |
| | 2023 | 2022 | 2021 | 2020 | 2019 |
| Net asset value — Beginning of period | $ 29.850 | $ 26.370 | $ 33.500 | $ 27.540 | $ 26.150 | $ 23.400 |
| Income (Loss) From Operations | | | | | | |
| Net investment income (loss)(1) | $ (0.034) | $ (0.023) | $ (0.043) | $ (0.052) | $ (0.002) | $ 0.028 |
| Net realized and unrealized gain (loss) | 6.327 | 5.256 | (5.006) | 6.996 | 1.643 | 3.629 |
| Total income (loss) from operations | $ 6.293 | $ 5.233 | $ (5.049) | $ 6.944 | $ 1.641 | $ 3.657 |
| Less Distributions | | | | | | |
| From net realized gain | $ (0.833) | $ (1.753) | $ (2.081) | $ (0.984) | $ (0.251) | $ (0.907) |
| Total distributions | $ (0.833) | $ (1.753) | $ (2.081) | $ (0.984) | $ (0.251) | $ (0.907) |
| Net asset value — End of period | $ 35.310 | $ 29.850 | $ 26.370 | $ 33.500 | $ 27.540 | $ 26.150 |
| Total Return(2) | 21.41% (3)(4) | 20.24% (4) | (15.92)% | 25.64% | 6.30% (4) | 16.51% (4) |
| Ratios/Supplemental Data | | | | | | |
| Net assets, end of period (000’s omitted) | $677,100 | $596,813 | $540,296 | $799,388 | $750,584 | $464,862 |
| Ratios (as a percentage of average daily net assets): | | | | | | |
| Expenses | 0.80% (4)(5)(6) | 0.80% (4)(6) | 0.79% (6) | 0.78% | 0.80% (4) | 0.80% (4) |
| Net investment income (loss) | (0.21)% (5) | (0.08)% | (0.14)% | (0.16)% | (0.01)% | 0.12% |
| Portfolio Turnover | 1% (3) | 1% | 9% | 11% | 18% | 18% |
| (1) | Computed using average shares outstanding. |
| (2) | Returns are historical and are calculated by determining the percentage change in net asset value with all distributions reinvested. |
| (3) | Not annualized. |
| (4) | The investment adviser, administrator and sub-adviser reimbursed certain operating expenses (equal to 0.01%, 0.01%, 0.01% and 0.02% of average daily net assets for the six months ended March 31, 2024 and the years ended September 30, 2023, 2020 and 2019, respectively). Absent this reimbursement, total return would be lower. |
| (5) | Annualized. |
| (6) | Includes a reduction by the investment adviser of a portion of its adviser and administration fee due to the Fund’s investment in the Liquidity Fund (equal to less than 0.005% of average daily net assets for the six months ended March 31, 2024 and the years ended September 30, 2023 and 2022). |
14
See Notes to Financial Statements.
Eaton Vance
Atlanta Capital Select Equity Fund
March 31, 2024
Financial Highlights — continued
| | Class R6 |
| | Six Months Ended
March 31, 2024
(Unaudited) | Year Ended September 30, |
| | 2023 | 2022 | 2021 | 2020 | 2019 |
| Net asset value — Beginning of period | $ 29.960 | $ 26.450 | $ 33.580 | $ 27.600 | $ 26.190 | $ 23.420 |
| Income (Loss) From Operations | | | | | | |
| Net investment income (loss)(1) | $ (0.024) | $ (0.004) | $ (0.066) | $ (0.037) | $ 0.011 | $ 0.039 |
| Net realized and unrealized gain (loss) | 6.347 | 5.267 | (4.983) | 7.001 | 1.650 | 3.638 |
| Total income (loss) from operations | $ 6.323 | $ 5.263 | $ (5.049) | $ 6.964 | $ 1.661 | $ 3.677 |
| Less Distributions | | | | | | |
| From net realized gain | $ (0.833) | $ (1.753) | $ (2.081) | $ (0.984) | $ (0.251) | $ (0.907) |
| Total distributions | $ (0.833) | $ (1.753) | $ (2.081) | $ (0.984) | $ (0.251) | $ (0.907) |
| Net asset value — End of period | $35.450 | $29.960 | $26.450 | $33.580 | $27.600 | $26.190 |
| Total Return(2) | 21.43% (3)(4) | 20.30% (4) | (15.88)% | 25.66% | 6.37% (4) | 16.58% (4) |
| Ratios/Supplemental Data | | | | | | |
| Net assets, end of period (000’s omitted) | $ 7,013 | $ 5,614 | $ 2,716 | $ 27,577 | $ 21,482 | $ 20,121 |
| Ratios (as a percentage of average daily net assets): | | | | | | |
| Expenses | 0.75% (4)(5)(6) | 0.75% (4)(6) | 0.74% (6) | 0.74% | 0.75% (4) | 0.75% (4) |
| Net investment income (loss) | (0.15)% (5) | (0.01)% | (0.20)% | (0.11)% | 0.04% | 0.17% |
| Portfolio Turnover | 1% (3) | 1% | 9% | 11% | 18% | 18% |
| (1) | Computed using average shares outstanding. |
| (2) | Returns are historical and are calculated by determining the percentage change in net asset value with all distributions reinvested. |
| (3) | Not annualized. |
| (4) | The investment adviser, administrator and sub-adviser reimbursed certain operating expenses (equal to 0.01%, 0.01%, 0.01% and 0.02% of average daily net assets for the six months ended March 31, 2024 and the years ended September 30, 2023, 2020 and 2019, respectively). Absent this reimbursement, total return would be lower. |
| (5) | Annualized. |
| (6) | Includes a reduction by the investment adviser of a portion of its adviser and administration fee due to the Fund’s investment in the Liquidity Fund (equal to less than 0.005% of average daily net assets for the six months ended March 31, 2024 and the years ended September 30, 2023 and 2022). |
15
See Notes to Financial Statements.
Eaton Vance
Atlanta Capital Select Equity Fund
March 31, 2024
Notes to Financial Statements (Unaudited)
1 Significant Accounting Policies
Eaton Vance Atlanta Capital Select Equity Fund (the Fund) is a non-diversified series of Eaton Vance Growth Trust (the Trust). The Trust is a Massachusetts business trust registered under the Investment Company Act of 1940, as amended (the 1940 Act), as an open-end management investment company. The Fund’s investment objective is to seek long-term capital growth. The Fund offers four classes of shares. Class A shares are generally sold subject to a sales charge imposed at time of purchase. Class C shares are sold at net asset value and are generally subject to a contingent deferred sales charge (see Note 5). Effective November 5, 2020, Class C shares automatically convert to Class A shares eight years after their purchase as described in the Fund’s prospectus. Class I and Class R6 shares are sold at net asset value and are not subject to a sales charge. Each class represents a pro rata interest in the Fund, but votes separately on class-specific matters and (as noted below) is subject to different expenses. Realized and unrealized gains and losses and net investment income and losses, other than class-specific expenses, are allocated daily to each class of shares based on the relative net assets of each class to the total net assets of the Fund. Sub-accounting, recordkeeping and similar administrative fees payable to financial intermediaries, which are a component of transfer and dividend disbursing agent fees on the Statement of Operations, are not allocated to Class R6 shares. Each class of shares differs in its distribution plan and certain other class-specific expenses.
The following is a summary of significant accounting policies of the Fund. The policies are in conformity with accounting principles generally accepted in the United States of America (U.S. GAAP). The Fund is an investment company and follows accounting and reporting guidance in the Financial Accounting Standards Board (FASB) Accounting Standards Codification Topic 946.
A Investment Valuation—The following methodologies are used to determine the market value or fair value of investments.
Equity Securities. Equity securities listed on a U.S. securities exchange generally are valued at the last sale or closing price on the day of valuation or, if no sales took place on such date, at the mean between the closing bid and ask prices on the exchange where such securities are principally traded. Equity securities listed on the NASDAQ National Market System are valued at the NASDAQ official closing price. Unlisted or listed securities for which closing sales prices or closing quotations are not available are valued at the mean between the latest available bid and ask prices.
Other. Investments in management investment companies (including money market funds) that do not trade on an exchange are valued at the net asset value as of the close of each business day.
Fair Valuation. In connection with Rule 2a-5 of the 1940 Act, the Trustees have designated the Fund’s investment adviser as its valuation designee. Investments for which valuations or market quotations are not readily available or are deemed unreliable are valued by the investment adviser, as valuation designee, at fair value using methods that most fairly reflect the security’s “fair value”, which is the amount that the Fund might reasonably expect to receive for the security upon its current sale in the ordinary course. Each such determination is based on a consideration of relevant factors, which are likely to vary from one pricing context to another. These factors may include, but are not limited to, the type of security, the existence of any contractual restrictions on the security’s disposition, the price and extent of public trading in similar securities of the issuer or of comparable companies or entities, quotations or relevant information obtained from broker/dealers or other market participants, information obtained from the issuer, analysts, and/or the appropriate stock exchange (for exchange-traded securities), an analysis of the company’s or entity’s financial statements, and an evaluation of the forces that influence the issuer and the market(s) in which the security is purchased and sold.
B Investment Transactions—Investment transactions for financial statement purposes are accounted for on a trade date basis. Realized gains and losses on investments sold are determined on the basis of identified cost.
C Income—Dividend income is recorded on the ex-dividend date for dividends received in cash and/or securities. However, if the ex-dividend date has passed, certain dividends from foreign securities are recorded as the Fund is informed of the ex-dividend date. Withholding taxes on foreign dividends and capital gains have been provided for in accordance with the Fund's understanding of the applicable countries' tax rules and rates.
D Federal Taxes—The Fund's policy is to comply with the provisions of the Internal Revenue Code applicable to regulated investment companies and to distribute to shareholders each year substantially all of its net investment income, and all or substantially all of its net realized capital gains. Accordingly, no provision for federal income or excise tax is necessary.
As of March 31, 2024, the Fund had no uncertain tax positions that would require financial statement recognition, de-recognition, or disclosure. The Fund files a U.S. federal income tax return annually after its fiscal year-end, which is subject to examination by the Internal Revenue Service for a period of three years from the date of filing.
E Expenses—The majority of expenses of the Trust are directly identifiable to an individual fund. Expenses which are not readily identifiable to a specific fund are allocated taking into consideration, among other things, the nature and type of expense and the relative size of the funds.
F Use of Estimates—The preparation of the financial statements in conformity with U.S. GAAP requires management to make estimates and assumptions that affect the reported amounts of assets and liabilities at the date of the financial statements and the reported amounts of income and expense during the reporting period. Actual results could differ from those estimates.
G Indemnifications—Under the Trust’s organizational documents, its officers and Trustees may be indemnified against certain liabilities and expenses arising out of the performance of their duties to the Fund. Under Massachusetts law, if certain conditions prevail, shareholders of a Massachusetts business
Eaton Vance
Atlanta Capital Select Equity Fund
March 31, 2024
Notes to Financial Statements (Unaudited) — continued
trust (such as the Trust) could be deemed to have personal liability for the obligations of the Trust. However, the Trust’s Declaration of Trust contains an express disclaimer of liability on the part of Fund shareholders and the By-laws provide that the Trust shall assume, upon request by the shareholder, the defense on behalf of any Fund shareholders. Moreover, the By-laws also provide for indemnification out of Fund property of any shareholder held personally liable solely by reason of being or having been a shareholder for all loss or expense arising from such liability. Additionally, in the normal course of business, the Fund enters into agreements with service providers that may contain indemnification clauses. The Fund’s maximum exposure under these arrangements is unknown as this would involve future claims that may be made against the Fund that have not yet occurred.
H Interim Financial Statements—The interim financial statements relating to March 31, 2024 and for the six months then ended have not been audited by an independent registered public accounting firm, but in the opinion of the Fund’s management, reflect all adjustments, consisting only of normal recurring adjustments, necessary for the fair presentation of the financial statements.
2 Distributions to Shareholders and Income Tax Information
It is the present policy of the Fund to make at least one distribution annually (normally in December) of all or substantially all of its net investment income and to distribute annually all or substantially all of its net realized capital gains. Distributions to shareholders are recorded on the ex-dividend date. Distributions are declared separately for each class of shares. Shareholders may reinvest income and capital gain distributions in additional shares of the same class of the Fund at the net asset value as of the ex-dividend date or, at the election of the shareholder, receive distributions in cash. Distributions to shareholders are determined in accordance with income tax regulations, which may differ from U.S. GAAP. As required by U.S. GAAP, only distributions in excess of tax basis earnings and profits are reported in the financial statements as a return of capital. Permanent differences between book and tax accounting relating to distributions are reclassified to paid-in capital. For tax purposes, distributions from short-term capital gains are considered to be from ordinary income.
At September 30, 2023, the Fund had a late year ordinary loss of $781,240 which it has elected to defer to the following taxable year pursuant to income tax regulations. Late year ordinary losses represent certain specified losses realized in that portion of a taxable year after October 31 that are treated as ordinary for tax purposes plus ordinary losses attributable to that portion of a taxable year after December 31.
The cost and unrealized appreciation (depreciation) of investments of the Fund at March 31, 2024, as determined on a federal income tax basis, were as follows:
| Aggregate cost | $394,619,983 |
| Gross unrealized appreciation | $ 409,680,906 |
| Gross unrealized depreciation | (3,177,696) |
| Net unrealized appreciation | $406,503,210 |
3 Investment Adviser and Administration Fee and Other Transactions with Affiliates
The investment adviser and administration fee is earned by Eaton Vance Management (EVM), an indirect, wholly-owned subsidiary of Morgan Stanley, as compensation for investment advisory and administrative services rendered to the Fund. The fee is computed at an annual rate as a percentage of the Fund’s average daily net assets as follows and is payable monthly:
| Average Daily Net Assets | Annual Fee Rate |
| Up to $500 million | 0.700% |
| $500 million but less than $1 billion | 0.675% |
| $1 billion but less than $2.5 billion | 0.650% |
| $2.5 billion but less than $5 billion | 0.630% |
| $5 billion and over | 0.615% |
For the six months ended March 31, 2024, the investment adviser and administration fee amounted to $2,601,515 or 0.69% (annualized) of the Fund’s average daily net assets. Pursuant to an investment sub-advisory agreement, EVM has delegated the investment management of the Fund to Atlanta Capital Management Company, LLC (Atlanta Capital), an affiliate of EVM and an indirect, wholly-owned subsidiary of Morgan Stanley. EVM pays Atlanta Capital a portion of its investment adviser and administration fee for sub-advisory services provided to the Fund.
Eaton Vance
Atlanta Capital Select Equity Fund
March 31, 2024
Notes to Financial Statements (Unaudited) — continued
The Fund may invest in a money market fund, the Institutional Class of the Morgan Stanley Institutional Liquidity Funds - Government Portfolio (the “Liquidity Fund”), an open-end management investment company managed by Morgan Stanley Investment Management Inc., a wholly-owned subsidiary of Morgan Stanley. The investment adviser and administration fee paid by the Fund is reduced by an amount equal to its pro rata share of the advisory and administration fees paid by the Fund due to its investment in the Liquidity Fund. For the six months ended March 31, 2024, the investment adviser and administration fee paid was reduced by $12,148 relating to the Fund’s investment in the Liquidity Fund.
EVM and Atlanta Capital have agreed to reimburse the Fund’s expenses to the extent that total annual operating expenses (relating to ordinary operating expenses only and excluding expenses such as brokerage commissions, acquired fund fees and expenses of unaffiliated funds, borrowing costs, taxes or litigation expenses) exceed 1.05%, 1.80%, 0.80% and 0.75% of the Fund’s average daily net assets for Class A, Class C, Class I and Class R6, respectively. This agreement may be changed or terminated after February 1, 2025. Pursuant to this agreement, EVM and Atlanta Capital were allocated $51,732 in total of the Fund's operating expenses for the six months ended March 31, 2024.
EVM provides sub-transfer agency and related services to the Fund pursuant to a Sub-Transfer Agency Support Services Agreement. For the six months ended March 31, 2024, EVM earned $19,206 from the Fund pursuant to such agreement, which is included in transfer and dividend disbursing agent fees on the Statement of Operations. The Fund was informed that Eaton Vance Distributors, Inc. (EVD), an affiliate of EVM and the Fund's principal underwriter, received $1,219 as its portion of the sales charge on sales of Class A shares for the six months ended March 31, 2024. The Fund was informed that Morgan Stanley affiliated broker-dealers, which may be deemed to be affiliates of EVM and EVD, also received a portion of the sales charge on sales of Class A shares for the six months ended March 31, 2024 in the amount of $938. EVD also received distribution and service fees from Class A and Class C shares (see Note 4) and contingent deferred sales charges (see Note 5).
Trustees and officers of the Fund who are members of EVM’s organization receive remuneration for their services to the Fund out of the investment adviser and administration fee. Trustees of the Fund who are not affiliated with EVM may elect to defer receipt of all or a percentage of their annual fees in accordance with the terms of the Trustees Deferred Compensation Plan. Certain officers and Trustees of the Fund are officers of EVM.
4 Distribution Plans
The Fund has in effect a distribution plan for Class A shares (Class A Plan) pursuant to Rule 12b-1 under the 1940 Act. Pursuant to the Class A Plan, the Fund pays EVD a distribution and service fee of 0.25% per annum of its average daily net assets attributable to Class A shares for distribution services and facilities provided to the Fund by EVD, as well as for personal services and/or the maintenance of shareholder accounts. Distribution and service fees paid or accrued to EVD for the six months ended March 31, 2024 amounted to $100,812 for Class A shares.
The Fund also has in effect a distribution plan for Class C shares (Class C Plan) pursuant to Rule 12b-1 under the 1940 Act. Pursuant to the Class C Plan, the Fund pays EVD amounts equal to 0.75% per annum of its average daily net assets attributable to Class C shares for providing ongoing distribution services and facilities to the Fund. For the six months ended March 31, 2024, the Fund paid or accrued to EVD $125,485 for Class C shares.
Pursuant to the Class C Plan, the Fund also makes payments of service fees to EVD, financial intermediaries and other persons in amounts equal to 0.25% per annum of its average daily net assets attributable to that class. Service fees paid or accrued are for personal services and/or the maintenance of shareholder accounts. They are separate and distinct from the sales commissions and distribution fees payable to EVD. Service fees paid or accrued for the six months ended March 31, 2024 amounted to $41,829 for Class C shares.
Distribution and service fees are subject to the limitations contained in the Financial Industry Regulatory Authority Rule 2341(d).
5 Contingent Deferred Sales Charges
A contingent deferred sales charge (CDSC) of 1% generally is imposed on redemptions of Class C shares made within 12 months of purchase. Class A shares may be subject to a 1% CDSC if redeemed within 12 months of purchase (depending on the circumstances of purchase). Generally, the CDSC is based upon the lower of the net asset value at date of redemption or date of purchase. No charge is levied on shares acquired by reinvestment of dividends or capital gain distributions. For the six months ended March 31, 2024, the Fund was informed that EVD received $422 of CDSCs paid by Class C shareholders and no CDSCs paid by Class A shareholders.
6 Purchases and Sales of Investments
Purchases and sales of investments, other than short-term obligations, aggregated $6,119,881 and $73,713,064, respectively, for the six months ended March 31, 2024.
Eaton Vance
Atlanta Capital Select Equity Fund
March 31, 2024
Notes to Financial Statements (Unaudited) — continued
7 Shares of Beneficial Interest
The Fund’s Declaration of Trust permits the Trustees to issue an unlimited number of full and fractional shares of beneficial interest (without par value). Such shares may be issued in a number of different series (such as the Fund) and classes. Transactions in Fund shares, including direct exchanges pursuant to share class conversions, were as follows:
| | Six Months Ended
March 31, 2024
(Unaudited) | | Year Ended
September 30, 2023 |
| | Shares | Amount | | Shares | Amount |
| Class A | | | | | |
| Sales | 220,831 | $ 6,963,610 | | 914,187 | $ 24,544,226 |
| Issued to shareholders electing to receive payments of distributions in Fund shares | 63,868 | 1,953,099 | | 154,452 | 4,219,638 |
| Redemptions | (528,312) | (16,744,562) | | (908,142) | (25,338,005) |
| Net increase (decrease) | (243,613) | $ (7,827,853) | | 160,497 | $ 3,425,859 |
| Class C | | | | | |
| Sales | 51,214 | $ 1,459,147 | | 121,593 | $ 3,073,377 |
| Issued to shareholders electing to receive payments of distributions in Fund shares | 27,910 | 771,975 | | 73,015 | 1,823,188 |
| Redemptions | (196,879) | (5,670,112) | | (520,196) | (13,313,368) |
| Net decrease | (117,755) | $ (3,438,990) | | (325,588) | $ (8,416,803) |
| Class I | | | | | |
| Sales | 1,635,079 | $ 52,795,468 | | 4,989,915 | $ 141,123,940 |
| Issued to shareholders electing to receive payments of distributions in Fund shares | 401,586 | 12,706,193 | | 996,963 | 28,084,462 |
| Redemptions | (2,856,243) | (92,495,981) | | (6,479,413) | (186,108,722) |
| Net decrease | (819,578) | $(26,994,320) | | (492,535) | $ (16,900,320) |
| Class R6 | | | | | |
| Sales | 21,292 | $ 710,374 | | 97,961 | $ 2,791,025 |
| Issued to shareholders electing to receive payments of distributions in Fund shares | 2,807 | 89,139 | | 4,159 | 117,522 |
| Redemptions | (13,705) | (432,548) | | (17,407) | (509,752) |
| Net increase | 10,394 | $ 366,965 | | 84,713 | $ 2,398,795 |
8 Line of Credit
The Fund participates with other portfolios and funds managed by EVM and its affiliates in a $650 million unsecured revolving line of credit agreement with a group of banks, which is in effect through October 22, 2024. In connection with the renewal of the agreement on October 24, 2023, the borrowing limit was decreased from $725 million. Borrowings are made by the Fund solely for temporary purposes related to redemptions and other short-term cash needs. Interest is charged to the Fund based on its borrowings at an amount above either the Secured Overnight Financing Rate (SOFR) or Federal Funds rate. In addition, a fee computed at an annual rate of 0.15% on the daily unused portion of the line of credit is allocated among the participating portfolios and funds at the end of each quarter. In connection with the renewal of the agreement in October 2023, an arrangement fee of $150,000 was incurred that was allocated to the participating portfolios and funds. Because the line of credit is not available exclusively to the Fund, it may be unable to borrow some or all of its requested amounts at any particular time. The Fund did not have any significant borrowings or allocated fees during the six months ended March 31, 2024.
Eaton Vance
Atlanta Capital Select Equity Fund
March 31, 2024
Notes to Financial Statements (Unaudited) — continued
9 Securities Lending Agreement
The Fund has established a securities lending agreement with State Street Bank and Trust Company (SSBT) as securities lending agent in which the Fund lends portfolio securities to qualified borrowers in exchange for collateral consisting of either cash or securities issued or guaranteed by the U.S. government or its agencies or instrumentalities in an amount at least equal to the market value of the securities on loan. The market value of securities loaned is determined daily and any additional required collateral is delivered to the Fund on the next business day. Cash collateral is invested in the State Street Navigator Securities Lending Government Money Market Portfolio, a money market fund registered under the 1940 Act. The Fund earns interest on the amount invested but it must pay (and at times receive from) the broker a loan rebate fee computed as a varying percentage of the collateral received. For security loans secured by non-cash collateral, the Fund earns a negotiated lending fee from the borrower. A portion of the income earned by the Fund from its investment of cash collateral, net of rebate fees, and lending fees received is allocated to SSBT for its services as lending agent and the portion allocated to the Fund is presented as securities lending income, net on the Statement of Operations. Non-cash collateral is held by the lending agent on behalf of the Fund and cannot be sold or re-pledged by the Fund; accordingly, such collateral is not reflected in the Statement of Assets and Liabilities.
The Fund is subject to possible delay in the recovery of loaned securities. Pursuant to the securities lending agreement, SSBT has provided indemnification to the Fund in the event of default by a borrower with respect to a loan. The Fund bears the risk of loss with respect to the investment of cash collateral.
At March 31, 2024, the total value of securities on loan was $10,620 and the total value of collateral received was $11,031, comprised of U.S. government and/or agencies securities. The securities lending transactions have no contractual maturity date and each of the Fund and borrower has the option to terminate a loan at any time.
10 Affiliated Investments
At March 31, 2024, the value of the Fund's investment in funds that may be deemed to be affiliated was $22,721,537, which represents 2.8% of the Fund's net assets. Transactions in such investments by the Fund for the six months ended March 31, 2024 were as follows:
| Name | Value,
beginning
of period | Purchases | Sales
proceeds | Net realized
gain (loss) | Change in
unrealized
appreciation
(depreciation) | Value, end
of period | Dividend
income | Shares,
end of period |
| Short-Term Investments |
| Liquidity Fund | $14,265,889 | $68,571,266 | $(60,115,618) | $ — | $ — | $22,721,537 | $423,406 | 22,721,537 |
11 Fair Value Measurements
Under generally accepted accounting principles for fair value measurements, a three-tier hierarchy to prioritize the assumptions, referred to as inputs, is used in valuation techniques to measure fair value. The three-tier hierarchy of inputs is summarized in the three broad levels listed below.
| • | Level 1 – quoted prices in active markets for identical investments |
| • | Level 2 – other significant observable inputs (including quoted prices for similar investments, interest rates, prepayment speeds, credit risk, etc.) |
| • | Level 3 – significant unobservable inputs (including a fund's own assumptions in determining the fair value of investments) |
In cases where the inputs used to measure fair value fall in different levels of the fair value hierarchy, the level disclosed is determined based on the lowest level input that is significant to the fair value measurement in its entirety. The inputs or methodology used for valuing securities are not necessarily an indication of the risk associated with investing in those securities.
At March 31, 2024, the hierarchy of inputs used in valuing the Fund's investments, which are carried at fair value, were as follows:
| Asset Description | Level 1 | Level 2 | Level 3 | Total |
| Common Stocks | $ 778,401,656* | $ — | $ — | $ 778,401,656 |
| Short-Term Investments | 22,721,537 | — | — | 22,721,537 |
| Total Investments | $ 801,123,193 | $ — | $ — | $801,123,193 |
| * | The level classification by major category of investments is the same as the category presentation in the Portfolio of Investments. |
Eaton Vance
Atlanta Capital Select Equity Fund
March 31, 2024
| Officers |
Kenneth A. Topping
President | Nicholas S. Di Lorenzo
Secretary |
Deidre E. Walsh
Vice President and Chief Legal Officer | Laura T. Donovan
Chief Compliance Officer |
James F. Kirchner
Treasurer | |
George J. Gorman
Chairperson | |
| Alan C. Bowser | |
| Mark R. Fetting | |
| Cynthia E. Frost | |
| Valerie A. Mosley | |
| Anchal Pachnanda* | |
| Keith Quinton | |
| Marcus L. Smith | |
| Susan J. Sutherland | |
| Scott E. Wennerholm | |
| Nancy A. Wiser | |
| U.S. Customer Privacy Notice | March 2024 |
| FACTS | WHAT DOES EATON VANCE DO WITH YOUR PERSONAL INFORMATION? |
| Why? | Financial companies choose how they share your personal information. Federal law gives consumers the right to limit some but not all sharing. Federal law also requires us to tell you how we collect, share, and protect your personal information. Please read this notice carefully to understand what we do. |
| |
| What? | The types of personal information we collect and share depend on the product or service you have with us. This information can include:■ Social Security number and income
■ investment experience and risk tolerance
■ checking account information and wire transfer instructions |
| |
| How? | All financial companies need to share customers’ personal information to run their everyday business. In the section below, we list the reasons financial companies can share their customers’ personal information; the reasons Eaton Vance chooses to share; and whether you can limit this sharing. |
| Reasons we can share your personal information | Does Eaton Vance
share? | Can you limit
this sharing? |
| For our everyday business purposes — such as to process your transactions, maintain your account(s), respond to court orders and legal investigations, or report to credit bureaus | Yes | No |
| For our marketing purposes — to offer our products and services to you | Yes | No |
| For joint marketing with other financial companies | No | We don’t share |
| For our affiliates’ everyday business purposes — information about your transactions and experiences | Yes | No* |
| For our affiliates’ everyday business purposes — information about your creditworthiness | Yes | Yes* |
| For our affiliates to market to you | Yes | Yes* |
| For nonaffiliates to market to you | No | We don’t share |
To limit our
sharing | Call toll-free 1-800-262-1122 or email: EVPrivacy@eatonvance.comPlease note:If you are a new customer, we can begin sharing your information 30 days from the date we sent this notice. When you are no longer our customer, we continue to share your information as described in this notice. However, you can contact us at any time to limit our sharing. |
| Questions? | Call toll-free 1-800-262-1122 or email: EVPrivacy@eatonvance.com |
| U.S. Customer Privacy Notice — continued | March 2024 |
| Who we are |
| Who is providing this notice? | Eaton Vance Management and our investment management affiliates (“Eaton Vance”) (see Affiliates definition below.) |
| What we do |
How does Eaton Vance
protect my personal
information? | To protect your personal information from unauthorized access and use, we use security measures that comply with federal law. These measures include computer safeguards and secured files and buildings. We have policies governing the proper handling of customer information by personnel and requiring third parties that provide support to adhere to appropriate security standards with respect to such information. |
How does Eaton Vance
collect my personal
information? | We collect your personal information, for example, when you■ open an account or make deposits or withdrawals from your account
■ buy securities from us or make a wire transfer
■ give us your contact informationWe also collect your personal information from others, such as credit bureaus, affiliates, or other companies. |
| Why can’t I limit all sharing? | Federal law gives you the right to limit only■ sharing for affiliates’ everyday business purposes — information about your creditworthiness
■ affiliates from using your information to market to you
■ sharing for nonaffiliates to market to youState laws and individual companies may give you additional rights to limit sharing. (See below for more on your rights under state law.) |
What happens when I limit
sharing for an account I hold
jointly with someone else? | Your choices will apply to everyone on your account. |
| Definitions |
| Affiliates | Companies related by common ownership or control. They can be financial and nonfinancial companies.■ Our affiliates include registered investment advisers such as Eaton Vance Management, Eaton Vance Advisers International Ltd., Boston Management and Research, Calvert Research and Management, Parametric Portfolio Associates LLC, Atlanta Capital Management Company LLC, Morgan Stanley Investment Management Inc., Morgan Stanley Investment Management Co.; registered broker-dealers such as Morgan Stanley Distributors Inc. and Eaton Vance Distributors, Inc. (together, the “Investment Management Affiliates”); and companies with a Morgan Stanley name and financial companies such as Morgan Stanley Smith Barney LLC and Morgan Stanley & Co. (the “Morgan Stanley Affiliates”). |
| Nonaffiliates | Companies not related by common ownership or control. They can be financial and nonfinancial companies.■ Eaton Vance does not share with nonaffiliates so they can market to you. |
| Joint marketing | A formal agreement between nonaffiliated financial companies that together market financial products or services to you.■ Eaton Vance does not jointly market. |
| U.S. Customer Privacy Notice — continued | March 2024 |
| Other important information |
| *PLEASE NOTE: Eaton Vance does not share your creditworthiness information or your transactions and experiences information with the Morgan Stanley Affiliates, nor does Eaton Vance enable the Morgan Stanley Affiliates to market to you. Your opt outs will prevent Eaton Vance from sharing your creditworthiness information with the Investment Management Affiliates and will prevent the Investment Management Affiliates from marketing their products to you.Vermont: Except as permitted by law, we will not share personal information we collect about Vermont residents with Nonaffiliates unless you provide us with your written consent to share such information.California: Except as permitted by law, we will not share personal information we collect about California residents with Nonaffiliates and we will limit sharing such personal information with our Affiliates to comply with California privacy laws that apply to us. |
Delivery of Shareholder Documents. The Securities and Exchange Commission (SEC) permits funds to deliver only one copy of shareholder documents, including prospectuses, proxy statements and shareholder reports, to fund investors with multiple accounts at the same residential or post office box address. This practice is often called “householding” and it helps eliminate duplicate mailings to shareholders. Eaton Vance, or your financial intermediary, may household the mailing of your documents indefinitely unless you instruct Eaton Vance, or your financial intermediary, otherwise. If you would prefer that your Eaton Vance documents not be householded, please contact Eaton Vance at 1-800-262-1122, or contact your financial intermediary. Your instructions that householding not apply to delivery of your Eaton Vance documents will typically be effective within 30 days of receipt by Eaton Vance or your financial intermediary.
Portfolio Holdings. Each Eaton Vance Fund and its underlying Portfolio(s) (if applicable) files a schedule of portfolio holdings on Part F to Form N-PORT with the SEC. Certain information filed on Form N-PORT may be viewed on the Eaton Vance website at www.eatonvance.com, by calling Eaton Vance at 1-800-262-1122 or in the EDGAR database on the SEC’s website at www.sec.gov.
Proxy Voting. From time to time, funds are required to vote proxies related to the securities held by the funds. The Eaton Vance Funds or their underlying Portfolios (if applicable) vote proxies according to a set of policies and procedures approved by the Funds’ and Portfolios’ Boards. You may obtain a description of these policies and procedures and information on how the Funds or Portfolios voted proxies relating to portfolio securities during the most recent 12-month period ended June 30, without charge, upon request, by calling 1-800-262-1122 and by accessing the SEC’s website at www.sec.gov.
Tailored Shareholder Reports. Effective January 24, 2023, the SEC adopted rule and form amendments to require open-end mutual funds and ETFs to transmit concise and visually engaging streamlined annual and semiannual reports to shareholders that highlight key information. Other information, including financial statements, will no longer appear in a streamlined shareholder report but must be available online, delivered free of charge upon request, and filed on a semiannual basis on Form N-CSR. The rule and form amendments have a compliance date of July 24, 2024. At this time, management is evaluating the impact of these amendments on the shareholder reports for the Eaton Vance Funds.
This Page Intentionally Left Blank
This Page Intentionally Left Blank
This Page Intentionally Left Blank
Investment Adviser and Administrator
Eaton Vance Management
One Post Office Square
Boston, MA 02109
Investment Sub-Adviser
Atlanta Capital Management Company, LLC
1075 Peachtree Street NE
Suite 2100
Atlanta, GA 30309
Principal Underwriter*
Eaton Vance Distributors, Inc.
One Post Office Square
Boston, MA 02109
(617) 482-8260
Custodian
State Street Bank and Trust Company
One Congress Street, Suite 1
Boston, MA 02114-2016
Transfer Agent
BNY Mellon Investment Servicing (US) Inc.
Attn: Eaton Vance Funds
P.O. Box 534439
Pittsburgh, PA 15253-4439
(800) 262-1122
Fund Offices
One Post Office Square
Boston, MA 02109
* FINRA BrokerCheck. Investors may check the background of their Investment Professional by contacting the Financial Industry Regulatory Authority (FINRA). FINRA BrokerCheck is a free tool to help investors check the professional background of current and former FINRA-registered securities firms and brokers. FINRA BrokerCheck is available by calling 1-800-289-9999 and at www.FINRA.org. The FINRA BrokerCheck brochure describing this program is available to investors at www.FINRA.org.
Item 2. Code of Ethics
Not required in this filing.
Item 3. Audit Committee Financial Expert
Not required in this filing.
Item 4. Principal Accountant Fees and Services
Not required in this filing.
Item 5. Audit Committee of Listed Registrants
Not applicable.
Item 6. Schedule of Investments
Please see schedule of investments contained in the Report to Stockholders included under Item 1 of this Form N-CSR.
Item 7. Disclosure of Proxy Voting Policies and Procedures for Closed-End Management Investment Companies
Not applicable.
Item 8. Portfolio Managers of Closed-End Management Investment Companies
Not applicable.
Item 9. Purchases of Equity Securities by Closed-End Management Investment Company and Affiliated Purchasers
Not applicable.
Item 10. Submission of Matters to a Vote of Security Holders
No material changes.
Item 11. Controls and Procedures
(a) It is the conclusion of the registrant’s principal executive officer and principal financial officer that the effectiveness of the registrant’s current disclosure controls and procedures (such disclosure controls and procedures having been evaluated within 90 days of the date of this filing) provide reasonable assurance that the information required to be disclosed by the registrant has been recorded, processed, summarized and reported within the time period specified in the Commission’s rules and forms and that the information required to be disclosed by the registrant has been accumulated and communicated to the registrant’s principal executive officer and principal financial officer in order to allow timely decisions regarding required disclosure.
(b) There have been no changes in the registrant’s internal controls over financial reporting during the second fiscal quarter of the period covered by this report that has materially affected, or is reasonably likely to materially affect, the registrant’s internal control over financial reporting.
Item 12. Disclosure of Securities Lending Activities for Closed-End Management Investment Companies
Not applicable.
Item 13. Exhibits
Signatures
Pursuant to the requirements of the Securities Exchange Act of 1934 and the Investment Company Act of 1940, the registrant has duly caused this report to be signed on its behalf by the undersigned, thereunto duly authorized.
| | |
| Eaton Vance Growth Trust |
| |
| By: | | /s/ Kenneth A. Topping |
| | Kenneth A. Topping |
| | Principal Executive Officer |
Date: May 17, 2024
Pursuant to the requirements of the Securities Exchange Act of 1934 and the Investment Company Act of 1940, this report has been signed below by the following persons on behalf of the registrant and in the capacities and on the dates indicated.
| | |
| By: | | /s/ James F. Kirchner |
| | James F. Kirchner |
| | Principal Financial Officer |
| |
| Date: | | May 17, 2024 |
| |
| By: | | /s/ Kenneth A. Topping |
| | Kenneth A. Topping |
| | Principal Executive Officer |
| |
| Date: | | May 17, 2024 |