UNITED STATES
SECURITIES AND EXCHANGE COMMISSION
WASHINGTON, D.C. 20549
FORM 20-F
| ¨ | REGISTRATION STATEMENT PURSUANT TO SECTION 12(b) OR 12(g) OF THE SECURITIES EXCHANGE ACT OF 1934 |
OR
| x | ANNUAL REPORT PURSUANT TO SECTION 13 OR 15(d) OF THE SECURITIES EXCHANGE ACT OF 1934 |
For the fiscal year ended December 31, 2012
OR
| ¨ | TRANSITION REPORT PURSUANT TO SECTION 13 OR 15(d) OF THE SECURITIES EXCHANGE ACT OF 1934 |
For the transition period from to
OR
| ¨ | SHELL COMPANY REPORT PURSUANT TO SECTION 13 OR 15(d) OF THE SECURITIES EXCHANGE ACT OF 1934 |
Date of event requiring this shell company report
Commission file number 001-31930
ATLATSA RESOURCES CORPORATION
(Exact name of Registrant as specified in its charter)
NOT APPLICABLE
(Translation of Registrant’s name into English)
BRITISH COLUMBIA, CANADA
(Jurisdiction of incorporation or organization)
Suite 1020, 800 West Pender Street
Vancouver, British Columbia, Canada, V6C 2V6
(Address of principal executive offices)
De Wet Schutte; Tel-27-11-779-6830; Fax-27-11-883-0836
4th Floor, 82 Grayston Drive, Sandton, Johannesburg, 2146, South Africa
(Name, Telephone, E-mail, and/or Facsimile number and Address of Company Contact Person)
Securities registered or to be registered pursuant to Section 12(b) of the Act:
| | |
Title of Each Class | | Name of each exchange on which registered |
| Common Shares without par value | | NYSE Amex Equities |
Securities registered or to be registered pursuant to Section 12(g) of the Act: None
Securities for which there is a reporting obligation pursuant to Section 15(d) of the Act: None
Number of outstanding shares of Registrant’s only class of common stock as of December 31, 2012:
201,888,472 common shares without par value
Indicate by check mark whether Registrant is a well-known seasoned issuer, as defined in Rule 405 of the Securities Act Yes ¨ No x
If this report is an annual or transition report, indicate by check mark if Registrant is not required to file reports pursuant to Section 13 or 15(d) of the Securities Exchange Act of 1934. Yes ¨ No x
Indicate by check mark whether the Registrant (1) has filed all reports required to be filed by Sections 13 or 15(d) of the Securities Exchange Act of 1934 during the preceding 12 months (or for such shorter period that the registrant was required to file such reports), and (2) has been subject to such filing requirements for the past 90 days. Yes x No ¨
Indicate by check mark whether the Registrant (1) has submitted electronically and posted on its corporate Web site, if any, every Interactive Data File required to be submitted and posted pursuant to Rule 405 of Regulation S-T (§232.405 of this chapter) during the preceding 12 months (or for such period that the registrant was required to submit and post such files). Yes ¨ No ¨
Indicate by check mark whether Registrant is a large accelerated filer, an accelerated filer, or a non-accelerated filer. See definition of “accelerated filer and large accelerated filer” in Rule 12b-2 of the Exchange Act
| | | | |
| Large accelerated Filer ¨ | | Accelerated Filer x | | Non-accelerated Filer ¨ |
Indicate by check mark which basis of accounting the Registrant has used to prepare the financial statements included in this filing:
| | | | |
| U.S. GAAP ¨ | | International Financial Reporting Standards as issued by the International Accounting Standards Board x | | Other ¨ |
If “Other” has been check in response to the previous question, by check mark which financial statement item Registrant has elected to follow: Item 17 ¨ Item 18 ¨
If this is an annual report, indicate by check mark whether Registrant is a shell company (as defined in Rule 12b-2 of the Exchange Act). Yes ¨ No x
TABLE OF CONTENTS
3
GENERAL MATTERS
In this Annual Report on Form 20-F for the fiscal year ended December 31, 2012 (“Annual Report”), all references to the “Company” or to “Atlatsa” refer to Atlatsa Resources Corporation and its subsidiaries, unless the context clearly requires otherwise. Certain terms used herein are defined in the text and others are included in the glossary of terms. See “Glossary of Terms”.
Atlatsa uses the Canadian dollar as its reporting currency. All references in this document to “CAD”, “dollars” or “$” are to Canadian dollars, unless otherwise indicated. On February 28, 2013 the noon exchange rate for Canadian dollars as reported by the Bank of Canada was CAD 1.00 = USD 0.972. On February 28, 2013 the noon exchange rate for South African Rand as reported by the Bank of Canada was ZAR8.97 = USD 1.00. See also Item 3 - “Key Information” for more detailed currency and conversion information.
Except as noted, the information set forth in this Annual Report is as of March 28, 2013 and all information included in this document should only be considered correct as of such date.
This Annual Report is dated March 28, 2013.
CAUTIONARY NOTE REGARDING FORWARD-LOOKING STATEMENTS
This Annual Report includes certain statements that may be deemed “forward-looking statements” or “forward-looking information” within the meaning of applicable securities laws. All statements in this Annual Report, other than statements of historical facts, that address the proposed Bokoni Group (as defined below) restructuring and refinancing transaction, potential acquisitions, future production, reserve potential, exploration drilling, exploitation activities and events or developments that Atlatsa expects, are forward-looking statements. These statements appear in a number of different places in this Annual Report and can be identified by words such as “anticipates”, “estimates”, “projects”, “expects”, “intends”, “believes”, “plans”, “will”, “could”, “may”, “projects”, or their negatives or other comparable words. Such forward-looking statements involve known and unknown risks, uncertainties and other factors that may cause the Company’s actual results, performance or achievements to be materially different from any future results, performance or achievements that may be expressed or implied by such forward-looking statements. Examples of such forward-looking statements include, but are not limited to:
| | • | | Bokoni Mine is expected to achieve production levels similar to previous years. |
| | • | | The Company expects to be able to continue its financing strategy on favorable terms. |
| | • | | The Company expects the Bokoni Group restructuring and refinancing transaction to be implemented on favourable terms. |
Atlatsa believes that such forward-looking statements are based on material factors and reasonable assumptions, including assumptions that: the proposed Restructure Plan will be completed on favourable terms and in a timely manner; the Bokoni Mine (as defined below) will increase production levels from the previous years; the Ga-Phasha, Project (as defined below; also described below under ITEM 4 “Restructure Plan” and 4.D. Property, Plants and Equipment); the Boikgantsho Project (as defined below; also described below under ITEM 4 “Restructure Plan” and 4.D. Property, Plants and Equipment); the Kwanda Project (as defined below; also described below under 4.D. Property, Plants and Equipment and Platreef project exploration results will continue to be positive; contracted parties provide goods and/or services on the agreed timeframes; equipment necessary for construction and development is available as scheduled and does not incur unforeseen breakdowns; no material labor slowdowns or strikes are incurred; plant and equipment functions as specified; geological or financial parameters do not necessitate future mine plan changes; and no geological or technical problems occur.
Forward-looking statements, however, are not guarantees of future performance and actual results or developments may differ materially from those projected in forward-looking statements. Factors that could cause actual results to differ materially from those in forward looking statements include the failure to implement the proposed Bokoni Group restructuring and refinancing transaction on favorable terms, or at all, labor disputes, fluctuations in market prices, the levels of exploitation and exploration successes, changes in and the effect of government policies with respect to mining and natural resource exploration and exploitation, continued availability of capital and financing, general economic, market or business conditions, failure of plant, equipment or processes to operate as anticipated, accidents, industrial unrest and strikes, political instability, insurrection or war, the effect of HIV/AIDS on labor force availability and turnover, and delays in obtaining government approvals. These factors and other risk factors that could cause actual results to differ materially from those in forward-looking statements are described in further detail under Item 3D “Risk Factors” in this Annual Report.
Atlatsa advises you that these cautionary remarks expressly qualify in their entirety all forward-looking statements in this Annual Report. The Company assumes no obligation to update its forward-looking statements to reflect actual results, changes in assumptions or changes in other factors affecting such statements, except as required by law. You should carefully review the cautionary statements and risk factors contained in this and other documents that the Company files from time to time with, or
4
furnishes to, the United States Securities and Exchange Commission (the “SEC”) and the applicable Canadian securities regulators.
CAUTIONARY NOTE TO U.S. INVESTORS
This Annual Report uses the terms “measured resources” and “indicated resources”. The Company advises investors that while those terms are recognized and required by Canadian regulations, the SEC does not recognize them. The requirements of National Instrument 43-101 Standard of Disclosure for Mineral Projects (“NI 43-101”) for identification of “reserves” are also not the same as those of the SEC, and reserves reported by the Company in compliance with NI 43-101 may not qualify as “reserves” under SEC standards. Under U.S. standards, mineralization may not be classified as a “reserve” unless the determination has been made that the mineralization could be economically and legally produced or extracted at the time the reserve determination is made. Investors are cautioned not to assume that any part or all of mineral deposits in these categories will ever be converted into reserves.
This Annual Report also uses the term “inferred resources”. The Company advises investors that while this term is recognized and required by Canadian regulations, the SEC does not recognize it. “Inferred resources” have a great amount of uncertainty as to their existence, and as to their economic and legal feasibility. It cannot be assumed that all or any part of a mineral resource will ever be upgraded to a higher category. Under Canadian rules, estimates of inferred resources may not form the basis of economic studies, except in rare cases. Investors are cautioned not to assume that any part or all of an inferred resource exists, or is economically or legally mineable.
In addition, disclosure of “contained ounces” in a mineral resource is permitted disclosure under Canadian regulations. However, the SEC normally only permits issuers to report mineralization that does not constitute “reserves” by SEC standards as in place for tonnage and grade, without reference to unit measures.
Investors should refer to the disclosure under the heading “Resource Category (Classification) Definitions” in the “Glossary of Terms” below.
CAUTIONARY NOTE TO READERS CONCERNING TECHNICAL REVIEW OF BOKONI MINE, GA-PHASHA PROJECT AND BOIKGANTSHO PROJECT
The following are the principal risk factors and uncertainties which, in management’s opinion, are likely to most directly affect the conclusions of the technical review of Bokoni Mine, Ga-Phasha Project and Boikgantsho Project. Some of the mineralized material classified as a measured and indicated resource has been used in the cash flow analysis. For U.S. mining standards, a full feasibility study would be required, which would require more detailed studies. Additionally, all necessary mining permits would be required in order to classify this part of Bokoni Mine’s, Ga-Phasha Project’s and Boikgantsho Project’s mineralized material as a mineral reserve. There can be no assurance that this mineralized material will become classifiable as a reserve and there is no assurance as to the amount, if any, which might ultimately qualify as a reserve or what the grade of such reserve amounts would be. Data is not complete and cost estimates have been developed, in part, based on the expertise of the individuals participating in the preparation of the technical review and on costs at projects believed to be comparable, and not based on firm price quotes. Costs, including design, procurement, construction and on-going operating costs and metal recoveries could be materially different from those contained in the technical review. There can be no assurance that mining can be conducted at the rates and grades assumed in the technical review. There can be no assurance that the infrastructure facilities can be developed on a timely and cost-effective basis. Energy risks include the potential for significant increases in the cost of fuel and electricity, and fluctuation in the availability of electricity. Projected metal prices have been used for the technical review. The prices of these metals are historically volatile, and the Company has no control of or influence on the prices, which are determined in international markets. There can be no assurance that the prices of platinum, palladium, rhodium, gold, copper and nickel will continue at current levels or that they will not decline below the prices assumed in the technical review. Prices for these commodities have been below the price ranges assumed in the technical report at times during the past ten years, and for extended periods of time. The expansion projects described herein will require major financing; probably a combination of debt and equity financing. There can be no assurance that debt and/or equity financing will be available on acceptable terms or at all. A significant increase in costs of capital could materially adversely affect the value and feasibility of constructing the expansions. Other general risks include those ordinary to large construction projects, including the general uncertainties inherent in engineering and construction cost, the need to comply with generally increasing environmental obligations, and accommodation of local and community concerns. The economics are sensitive to the currency exchange rates, which have been subject to large fluctuations in the last several years. See also Item 3.D. “Risk factors”.
5
GLOSSARY OF TERMS
Certain terms used in this Annual Report are defined as follows:
| | |
A Preference Shares | | Cumulative redeemable preference shares in the authorized capital of Plateau. |
| |
Affiliate | | As ascribed thereto in theSecurities Act(British Columbia), as amended, except as otherwise provided herein. |
| |
Anglo Platinum | | Anglo American Platinum Limited, a public company incorporated under the laws of South Africa and whose common shares are listed on the JSE, and includes its subsidiaries where the context requires. |
| |
Asset Sale | | The proposed sale of Atlatsa’s interest in the Asset Sale Properties to RPM pursuant to the Boikgantsho Asset Sale Agreement and the Ga-Phasha Asset Sale Agreement. |
| |
Asset Sale Agreements | | Collectively the Ga-Phasha Asset Sale Agreement and the Boikgantsho Asset Sale Agreement |
| |
Asset Sale Properties | | The properties that are to be transferred under the Asset Sale Agreements |
| |
Atlatsa or the Company | | Atlatsa Resources Corporation (previously Anooraq Resources Corporation), a corporation incorporated under the laws of the Province of British Columbia and listed on the TSX-V, the JSE and the NYSE MKT, and includes its subsidiaries where the context requires. |
| |
Atlatsa Shareholders Agreement | | The shareholders agreement between Pelawan, Atlatsa, the Pelawan Trust and Plateau, dated as of June 12, 2009, which has replaced the Pelawan Reverse Take-Over Share Exchange Agreement between Pelawan and Atlatsa made as of January 21, 2004 and as amended from time to time, the Pelawan Reverse Take-Over Shareholders Agreement between Pelawan, Atlatsa and the Pelawan Trust made as of September 19, 2004 and the settlement agreement between the Company and Pelawan, dated as of December 28, 2006, as of July 1, 2009, the effective date of the Bokoni Transaction. |
| |
Atlatsa Holdings | | Atlatsa Holdings (Proprietary) Limited, a private company incorporated under the laws of South Africa. Formerly known as Pelawan. |
| |
B1 Preference Shares | | Cumulative convertible preference shares in the authorized capital of Pelawan SPV. |
| |
B2 Preference Shares | | Cumulative convertible redeemable preference shares in the capital of Plateau. |
| |
BEE | | Black Economic Empowerment, as envisaged pursuant to the Mineral Development Act and related legislation and guidelines, being a strategy aimed at substantially increasing participation by HDPs at all levels in the economy of South Africa. BEE is aimed at redressing the imbalances of the past caused by the Apartheid system in South Africa, by seeking to substantially and equitably increase the ownership and management of South Africa’s resources by the majority of its citizens and so ensure broader and more meaningful participation in the economy by HDPs. |
| |
Beneficial Shareholder | | A Shareholder who beneficially owns and holds Common Shares through a broker (or some other intermediary) and who does not hold Common Shares in his, her or its own name. |
| |
Board of Directors or Board | | The board of directors of Atlatsa. |
| |
Boikgantsho Asset Sale Agreement | | The sale of assets agreement to be entered into in 2013 between RPM and Boikgantsho pursuant to which RPM will purchase and Boikgantsho will sell the Boikgantsho Project assets. |
| |
Boikgantsho Project | | The Boikgantsho PGM project, located on the Northern Limb of the Bushveld Complex in South Africa, on the Drenthe and Witrivier farms, and the northern portion of the Overysel |
6
| | |
| | farm. |
| |
Boikgantsho | | Boikgantsho Platinum Mine (Proprietary) Limited, a private company incorporated under the laws of South Africa which holds the mineral title in respect of the Boikgantsho Project. |
| |
Bokoni Mine | | Bokoni Platinum Mines (Proprietary) Limited, a private company incorporated under the laws of South Africa, formerly named Richtrau No. 177 (Proprietary) Limited and which is a wholly owned subsidiary of Holdco. A PGM mine, located on the Eastern Limb of the Bushveld Complex in South Africa on the Diamond, Wintersveld, Jagdlust, Middelpunt, Umkoanesstad and Zeekoegat farms, formerly named the Lebowa Platinum Mine. |
| |
Bokoni Transaction | | The transaction pursuant to which the Company acquired an effective 51% interest in Bokoni Mine and an additional 1% interest in the Ga-Phasha Project, Boikgantsho Project and Kwanda Project pursuant to the acquisition by Plateau of 51% of the shares in, and claims on shareholders loan account against, Holdco (which, following implementation of the transaction, owns 100% of Bokoni Mine, and 100% of Ga-Phasha, Boikgantsho and Kwanda, for an aggregate cash consideration of $327 million (ZAR2.6 billion). The transaction was also previously known as the “Lebowa Transaction”. |
| |
Bokoni Transaction Agreements | | The Boikgantsho Sale of Rights Agreement, the Kwanda Sale of Rights Agreement, the Plateau Sale of Boikgantsho Shares and Claims Agreement, the Plateau Sale of Kwanda Shares Agreement, the Plateau Sale of Ga-Phasha Shares and Claims Agreement, the Holdco Sale of Shares Agreement, the Holdco Shareholders Agreement and the Phase 3 Implementation Agreement, and any amendments to such agreements, collectively. |
| |
Bokoni Group | | Holdco and all of its subsidiaries. |
| |
Common Shares | | Common shares without par value in the capital of the Company. |
| |
Debt Conversion | | The issuance by Atlatsa to Anglo Platinum of 125,000 Common Shares to settle ZAR 750 million ($87.4 million) of the outstanding debt owed by Atlatsa to Anglo Platinum under the New Debt Facility. |
| |
Debt Facility | | The Senior Debt Facility with Standard Chartered Bank plc, made available to Plateau Resources amounting to $94.4 million (ZAR750 million), including capitalised interest up to a maximum of three years or $31.5 million (ZAR250 million). On April 28, 2011, the amounts outstanding under this facility were acquired by RPM, who increased the facility to $117.1 million (ZAR930 million). |
| |
Debt Refinancing Transactions | | As set forth under “Restructuring Transactions”. |
| |
Disinterested Shareholders | | In respect of any resolution, all Shareholders except those Shareholders that have an interest in that resolution and in the case of the resolutions to approve the Asset Sale and the Debt Refinancing Transactions. |
| |
DMR | | The Government of South Africa acting through the Minister of Mineral Resources and the Department of Mineral Resources and their respective successors and delegates. |
| |
Elemental Symbols | | Pt – Platinum; Pd – Palladium; Au – Gold; Ag – Silver; Cu – Copper; Cr – Chromium; Ni – Nickel; Pb – Lead; Rh – Rhodium; Ru – Ruthenium. |
| |
EBIT | | Earnings before interest and taxes. |
| |
Farm | | A term commonly used in South Africa to describe the area of a mineral interest. |
| |
Ga-Phasha Project | | The Ga-Phasha PGM project, located on the Eastern Limb of the Bushveld Complex in South Africa, on the Paschaskraal, Klipfontein, Avoca and De Kamp farms. |
7
| | |
Ga-Phasha /GPM | | Ga-Phasha Platinum Mine (Proprietary) Limited, a private company incorporated under the laws of South Africa which, as of July 1, 2009, is a wholly owned subsidiary of Holdco and which owns the Ga-Phasha Project. |
| |
Ga-Phasha Asset Sale Agreement | | The sale of a portion of a mining right agreement to be entered into in 2013 between RPM and Ga-Phasha pursuant to which RPM will purchase and Ga-Phasha will sell the Eastern section of the Ga-Phasha Project, comprised of Paschaskraal and De Kamp farms. |
| |
Ga-Phasha Mining Right | | The converted mining right granted to Ga-Phasha over the area comprising the farms Avoca, De Kamp, Klipfontein and Paschaskraal |
| |
Ga-Phasha Sale Assets | | The portion of the Ga-Phasha Mining Right relating to the Eastern section of the Ga-Phasha Project, comprising the Paschaskraal and De Kamp farms. |
| |
HDP | | A “historically disadvantaged person” as contemplated in the Mineral Development Act, being a person who was discriminated against under the Apartheid system, and includes certain trusts and companies in which such persons have interests, as contemplated in the Holdco Shareholders Agreement. |
| |
HDSI | | Hunter Dickinson Services Inc., a corporation incorporated under the laws of Canada. |
| |
Holdco | | Bokoni Holdings (Proprietary) Limited, a private company incorporated under the laws of South Africa, formerly named Richtrau No. 179 (Proprietary) Limited. |
| |
Holdco Shareholders Agreement | | The Shareholders’ Agreement entered into between Plateau, RPM and Holdco, dated March 28, 2008, as amended on May 6, 2009, to govern the relationship between Plateau and RPM as shareholders of Holdco. |
| |
IASB | | International Accounting Standards Board. |
| |
Implementation Agreement | | The implementation agreement entered into between Atlatsa, NIC Resources, Inc. N2C Resources Inc., RPM, Plateau, Bokoni Holdco and Bokoni Mine relating to the implementation of the closing of the Restructuring Transactions, including all condition precedents thereto. |
| |
Interim Implementation Agreement | | The amendment and interim implementation agreement entered into between Atlatsa, N2C Resources Inc., RPM, Plateau, Bokoni Holdco and Bokoni Mine relating to Phase One of the Restructure Plan. |
| |
Intermediaries | | Brokers, investment firms, cleaning houses and similar entities that own and hold Common Shares on behalf of Beneficial Shareholders. |
| |
JIBAR | | Johannesburg Interbank Agreed Rate. |
| |
JSE | | JSE Limited, a company incorporated in accordance with the laws of South Africa, licensed as an exchange under the South African Securities Services Act, 2004. |
| |
Ktp | | Kilo tonnes per month. |
| |
Kwanda Project | | The Kwanda PGM Project, located on the Northern Limb of the Bushveld Complex in South Africa, on 12 farms. |
| |
Kwanda | | Kwanda Platinum Mine (Proprietary) Limited, a private company incorporated under the laws of South Africa which, as of July 1, 2009, is a wholly owned subsidiary of Holdco and owns the Kwanda Project. |
8
| | |
Lebowa | | Lebowa Platinum Mines (Proprietary) Limited, a private company incorporated under the laws of South Africa. |
| |
Minxcon | | Minxcon (Pty) Limited, a private company incorporated under the laws of South Africa. |
| |
MPH | | Middlepunt Hill |
| |
Mineral Development Act | | The Mineral and Petroleum Resources Development Act, 2002 (South Africa). |
| |
Mining Charter | | The Broad Based Socio-Economic Empowerment Charter for the South African mining industry, signed by the DMR, the South African Chamber of Mines and others on October 11, 2002. |
| |
N1C | | N1C Resources Inc., a wholy owned subsidiary of Atlatsa incorporated on December 2, 1999 under the laws of the Cayman Islands. |
| |
N2C | | N2C Resources Inc., a wholly owned indirect subsidiary of Atlatsa incorporated on December 2, 1999 under the laws of the Cayman Islands. |
| |
New Debt Facility | | The new senior term loan and revolving facility agreement to be signed between, among others, Atlatsa, Plateau and RPM, pursuant to which RPM will make available to Plateau a senior term loan and revolving facility in a total amount of up to ZAR1.55 billion ($181.7 million). |
| |
NYSE Amex | | NYSE Amex Equities, formerly the American Stock Exchange. |
| |
OCSF | | Operating Cash Flow Shortfall Facility. |
| |
Pelawan | | Pelawan Investments (Proprietary) Limited, a private company incorporated under the laws of South Africa. |
| |
Pelawan Lock-Up Amendments | | The amendment agreement entered into between Atlatsa, Plateau and Atlatsa Holdings pursuant to which Atlatsa Holdings has agreed, subject to the completion of the Restructuring Transactions, to an extension of its lock-up undertakings contained in the Pelawan Shareholders Agreement. |
| |
Pelawan Shareholders Agreement | | The shareholders agreement between Atlatsa, Plateau, the Pelawan Trust and Atlatsa Holdings dated June 12, 2009. |
| |
Pelawan SPV | | The Pelawan Finance SPV Proprietary Limited, a special purpose vehicle established by, and wholly-owned subsidiary of, Atlatsa Holdings. |
| |
Pelawan Trust | | The independent South African trust established in accordance with a trust deed dated September 2, 2004, the trustees of which are Andre Visser, Tumelo Motsisi and Asna Chris Harold Motaung. |
| |
PGM | | Platinum group metals, comprising platinum, palladium, rhodium, ruthenium, osmium and iridium. |
| |
Plateau | | Plateau Resources (Proprietary) Limited, a private company incorporated under the laws of South Africa, being an indirect wholly owned subsidiary of Atlatsa. |
| |
Platreef Properties | | The Platreef PGM properties located on the Northern Limb of the Bushveld Complex in South Africa, which includes the Kwanda, Boikgantsho and Rietfontein projects. |
| |
Registered Shareholder | | A Shareholder whose name appears on Atlatsa’s central security register as a registered holder of Common Shares as of the Record Date. |
| |
Related Party Transactions | | The Asset Sale and the Debt Refinancing Transactions. |
| |
Restructuring Transactions | | The Asset Sale and the Debt Refinancing Transactions. |
9
| | |
Royalty Act | | The Mineral and Petroleum Resources Royalty Act, Act No 28 of 2008, in relation to royalties to be levied by the South African state in respect of the transfer of mineral or petroleum resources. |
| |
RPM | | Rustenburg Platinum Mines Limited, a public company incorporated under the laws of South Africa, being a wholly owned subsidiary of Anglo Platinum. |
| |
SEDAR | | System for Electronic Document Analysis and Retrieval. |
| |
Senior Debt Facility | | The existing senior term loan facility provided by RPM to Plateau in connection with the Bokoni Transaction in the principal amount of $58.6 million (ZAR500 million) and amended on September 28, 2012 to increase the total amount available to facilitate the repayment of amounts owed to Anglo Platinum under the OCSF and A Preference Share Facility at this date with the effect that all outstanding debt was consolidated into one single facility. |
| |
South Africa | | The Republic of South Africa. |
| |
tpm | | tonnes per month |
| |
TSX-V | | TSX Venture Exchange. |
| |
Transition date | | The Company’s transition date for converting to IFRS, which was January 1, 2008. |
| |
ZAR | | South African Rand, the currency of South Africa. |
Geological/Exploration Terms
| | |
4E grade | | The 4E grade is the sum of the grade of Pt, Pd, Rh and Au. |
| |
Chromitite | | An igneous rock composed mostly of the mineral chromite and found in ultramafic to mafic layered intrusions. |
| |
Feldspar | | A group of abundant rock-forming minerals, the most widespread of any mineral group and constituting 60% of the earth’s crust. |
| |
Feldspathic | | Containing feldspar as a principal ingredient. |
| |
Gabbro | | Course grained mafic igneous rock. |
| |
Lithology | | Rock composition and structure. |
| |
Mafic | | Composed of dark ferromagnesian minerals. |
| |
Mineral Deposit | | A deposit of mineralization that may or may not be ore. Under SEC rules, a mineral reserves or ore is determined by a full feasibility study, and mineralization may not be classified as a “reserve” unless the determination has been made that the mineralization could be economically and legally extracted or produced at the time the reserve determination is made. Under Canadian rules, mineral reserves may be determined by a preliminary feasibility study. |
| |
Mineralized Material | | A mineralized body that has been delineated by appropriately spaced drilling and/or underground sampling to support a sufficient tonnage and average grade of metals to warrant further exploration. Such a deposit does not qualify as a reserve until a comprehensive evaluation based upon unit cost, grade, recoveries, and other material factors conclude legal and economic feasibility. Mineralization classified as “inferred”, is a classification that is acceptable under Canadian regulations (see “Resource Category (Classification) Definitions” below) but cannot be used in a feasibility study and is not recognized by the SEC. |
| |
Norite | | A coarse-grained plutonic rock in which the chief constituent is basic plagioclase feldspar (labradorite) and the dominant mafic mineral is orthopyroxene (hypersthene). |
| |
Pyroxenite | | A medium or coarse-grained rock consisting essentially of pyroxene, a common rock forming mineral. |
10
| | |
SAMREC Code | | South African Code for Reporting of Mineral Resources and Mineral Reserves. |
| |
Technical Report | | Means a report prepared and filed in accordance with National Instrument 43-101 on the Company’s profile with the Canadian Security Administrators on SEDAR at www.sedar.com. |
Resource Category (Classification) Definitions
| | |
Mineral Reserve | | Canadian National Instrument 43-101 Standards of Disclosure for Mineral Projects (“NI 43-101”) states that the terms “mineral reserve”, “proven mineral reserve” and “probable mineral reserve” have the meanings ascribed to those terms by the Canadian Institute of Mining, Metallurgy and Petroleum as the CIM Definition Standards on Mineral Resources and Mineral Reserves adopted by CIM Council, as amended (“CIM Standards”). CIM Standards defines a “Mineral Reserve” as the economically mineable part of a Measured or Indicated Mineral Resource demonstrated by at least a preliminary feasibility study. This study must include adequate information on mining, processing, metallurgical, and economic and other relevant factors that demonstrate, at the time of reporting, that economic extraction can be justified. A Mineral Reserve includes diluting materials and allowances for losses that may occur when the material is mined. |
| |
| | Mineral reserves are subdivided in order of increasing confidence into Probable Mineral Reserves and Proven Mineral Reserves. A Probable Mineral Reserve has a lower level of confidence than a Proven Mineral Reserve. |
| |
| | (1) A “Proven Mineral Reserve” is the economically mineable part of a Measured Mineral Resource demonstrated by at least a preliminary feasibility study. This study must include adequate information on mining, processing, metallurgical, economic, and other relevant factors that demonstrate, at the time of reporting, that economic extraction is justified. |
| |
| | (2) A “Probable Mineral Reserve” is the economically mineable part of an Indicated and, in some circumstances, a Measured Mineral Resource demonstrated by at least a preliminary feasibility study. This study must include adequate information on mining, processing, metallurgical, economic, and other relevant factors that demonstrate, at the time of reporting, that economic extraction can be justified. |
| |
| | Industry Guide 7 – “Description of Property by Issuers Engaged or to be Engaged in Significant Mining Operations” (“Industry Guide 7”) of the SEC defines a “reserve” as that part of a mineral deposit which could be economically and legally extracted or produced at the time of the reserve determination. See “Cautionary Note to U.S. Investors”. |
| |
Mineral Resource | | NI 43-101 states that the terms “mineral resource”, “inferred mineral resource”, “indicated mineral resource” and “measured mineral resource” have the meanings ascribed in those terms by CIM Standards. CIM Standards defines a “Mineral Resource” as a concentration or occurrence of diamonds, natural solid inorganic material, or natural solid fossilized organic material including base and precious metals, coal, and industrial minerals in or on the Earth’s crust in such form and quantity and of such a grade or quality that it has reasonable prospects for economic extraction. The location, quantity, grade, geological characteristics and continuity of a Mineral Resource are known, estimated or interpreted from specific geological evidence and knowledge. |
| |
| | Mineral Resources are sub-divided, in order of increasing geological confidence, into Inferred, Indicated and Measured categories. An Inferred Mineral Resource has a lower level of confidence than that applied to an Indicated Mineral Resource. An Indicated Mineral Resource has a higher level of confidence than an Inferred Mineral Resource but has a lower level of confidence than a Measured Mineral Resource. |
11
| | |
| | (1)Measured Mineral Resource. A “Measured Mineral Resource” is that part of a Mineral Resource for which quantity, grade or quality, densities, shape and other physical characteristics are so well established that they can be estimated with confidence sufficient to allow the appropriate application of technical and economic parameters, to support production planning and evaluation of the economic viability of the deposit. The estimate is based on detailed and reliable exploration, sampling and testing information gathered through appropriate techniques from locations such as outcrops, trenches, pits, workings and drill holes that are spaced closely enough to confirm both geological and grade continuity. |
| |
| | (2)Indicated Mineral Resource.An “Indicated Mineral Resource” is that part of a Mineral Resource for which quantity, grade or quality, densities, shape and physical characteristics can be estimated with a level of confidence sufficient to allow the appropriate application of technical and economic parameters, to support mine planning and evaluation of the economic viability of the deposit. The estimate is based on detailed and reliable exploration and testing information gathered through appropriate techniques from locations such as outcrops, trenches, pits, workings and drill holes that are spaced closely enough for geological and grade continuity to be reasonably assumed. Mineralization may be classified as an Indicated Mineral Resource by the qualified person, as such term is defined in NI 43-101 (“QP”), when the nature, quality, quantity and distribution of data are such as to allow confident interpretation of the geological framework and to reasonably assume the continuity of mineralization. An Indicated Mineral Resource estimate is of sufficient quality to support a Preliminary Feasibility Study which can serve as the basis for major development decisions. |
| |
| | (3)Inferred Mineral Resource.An “Inferred Mineral Resource” is that part of a Mineral Resource for which quantity and grade or quality can be estimated on the basis of geological evidence and limited sampling and reasonably assumed, but not verified, geological and grade continuity. The estimate is based on limited information and sampling gathered through appropriate techniques from locations such as outcrops, trenches, pits, workings and drill holes. Due to the uncertainty that may be attached to Inferred Mineral Resources, it cannot be assumed that all or any part of an Inferred Mineral Resource will be upgraded to an Indicated or Measured Mineral Resource as a result of continued exploration. Confidence in the estimate is insufficient to allow the meaningful application of technical and economic parameters or to enable an evaluation of economic viability worthy of public disclosure. Inferred Mineral Resources must be excluded from estimates forming the basis of feasibility or other economic studies. |
| |
| | Mineralization or other natural material of economic interest may be classified as a Measured Mineral Resource by the QP when the nature, quality, quantity and distribution of data are such that the tonnage and grade of the mineralization can be estimated to within close limits and that variation from the estimate would not significantly affect potential economic viability. This category requires a high level of confidence in, and understanding of, the geology and controls of the mineral deposit. |
| |
| | Industry Guide 7 does not define or recognize resources. As used in this Annual Report, “mineral resources” are as defined in NI 43-101. See “Cautionary Note to U.S. Investors”. |
12
Currency and Measurement
All currency amounts in this Annual Report are stated in Canadian dollars unless otherwise indicated. See “Item 3 – Key Information”.
Conversion of metric units into imperial equivalents is as follows:
| | | | | | |
Metric Units | | Multiply
by | | | Imperial
Units |
hectares | | | 2.471 | | | = acres |
meters | | | 3.281 | | | = feet |
kilometers | | | 0.621 | | | = miles (5,280 feet) |
grams | | | 0.032 | | | = ounces (troy) |
tonnes | | | 1.102 | | | = tons (short) (2,000 lbs) |
grams/tonne | | | 0.029 | | | = ounces (troy)/ton |
13
PART I
| ITEM 1 | IDENTITY OF DIRECTORS, SENIOR MANAGEMENT AND ADVISERS |
Not applicable.
14
| ITEM 2 | OFFER STATISTICS AND EXPECTED TIMETABLE |
Not applicable.
15
| | 3.A. | Selected Financial Data |
The following selected consolidated financial data should be read in conjunction with “Item 5 – Operating and Financial Review and Prospects” and the audited consolidated financial statements, the accompanying notes and other financial information included elsewhere in this Annual Report.
The selected consolidated financial data set forth below for the years ended as at December 31, 2012 and 2011 and for each of the years in the three-year period ended December 31, 2012 have been derived from the Company’s audited consolidated financial statements included in Item 18 of this Annual Report.
Selected consolidated financial data as at December 31, 2011, 2010 and 2009 and for each of the years ended December 31, 2011, 2010 and 2009 have been derived from the Company’s previously filed audited consolidated financial statements not included in this document.
The selected consolidated financial data as at December 31, 2012 and 2011 and for each of the years in the three-year period ended December 31, 2012 should be read in conjunction with, and are qualified in their entirety by reference to, the Company’s audited consolidated financial statements included in Item 18.
The audited consolidated financial statements from which the following financial data have been derived were prepared in accordance with International Financial Reporting Standards (“IFRS”), as issued by the IASB.
| | | | | | | | |
| | | Year ended | |
| | | December 31,
2012 | | | December 31,
2011 | |
| | | (CAD in thousands) | |
| | | (Except per share info and
weighted average shares in issue) | |
Consolidated statement of comprehensive loss information: | | | | | | | | |
Revenue | | | 117,557 | | | | 144,407 | |
Operating loss | | | (2,548 | ) | | | (89,233 | ) |
Net loss | | | (95,567 | ) | | | (147,865 | ) |
Loss attributable to owners of Atlatsa | | | (18,718 | ) | | | (81,929 | ) |
| | |
Statement of financial position data: | | | | | | | | |
Total assets | | | 814,065 | | | | 893,009 | |
Total equity | | | 205,257 | | | | (28,085 | ) |
Share capital | | | 71,967 | | | | 71,967 | |
| | |
Per share information (CAD cents) | | | | | | | | |
Basic loss per share | | | 4 cents | | | | 19 cents | |
Diluted loss per share | | | 4 cents | | | | 19 cents | |
| | |
Weighted average shares in issue (number): | | | | | | | | |
Average shares outstanding – basic | | | 424,791,411 | | | | 424,783,603 | |
Average shares outstanding – diluted | | | 424,791,411 | | | | 424,783,603 | |
No dividends have been declared for any of the periods above.
16
| | | | | | | | | | | | |
| | | Year ended | |
| | | December 31,
2010 | | | December 31,
2009 | | | December 31,
2008 | |
| | | (CAD in thousands) | |
| | | (Except per share info and weighted average shares
in issue) | |
Consolidated statement of comprehensive loss information: | | | | | | | | | | | | |
Revenue | | | 148,287 | | | | 62,628 | | | | — | |
Operating loss | | | (44,541 | ) | | | (39,383 | ) | | | (12,066 | ) |
Net loss | | | (93,659 | ) | | | (51,781 | ) | | | (13,840 | ) |
Loss attributable to owners of Atlatsa | | | (51,721 | ) | | | (35,532 | ) | | | (13,970 | ) |
| | | |
Statement of financial position data: | | | | | | | | | | | | |
Total assets | | | 1,092,106 | | | | 1,014,215 | | | | 12,899 | |
Total equity | | | 121,366 | | | | 209,508 | | | | (3,603 | ) |
Share capital | | | 71,853 | | | | 71,713 | | | | 54,948 | |
| | | |
Per share information (CAD cents) | | | | | | | | | | | | |
Basic loss per share | | | 12 cents | | | | 12 cents | | | | 8 cents | |
Diluted loss per share | | | 12 cents | | | | 12 cents | | | | 8 cents | |
| | | |
Weighted average shares in issue (number): | | | | | | | | | | | | |
Average shares outstanding – basic | | | 424,665,314 | | | | 305,971,455 | | | | 185,775,361 | |
Average shares outstanding – diluted | | | 424,665,314 | | | | 305,971,455 | | | | 185,775,361 | |
No dividends have been declared for any of the periods above.
Exchange rate information
The following table sets forth, for the U.S. dollars, expressed in Canadian dollars, (i) the average of the exchange rates in effect during each period, and (ii) the high and low exchange rates during each period.
| | | | | | | | | | | | |
The U.S. dollar expressed in Canadian dollars for the year ended December 31, or the respective
month (1)(2)(3) | | Average | | | High | | | Low | |
| | | |
2008 | | | 1.06 | | | | 1.29 | | | | 0.98 | |
2009 | | | 1.15 | | | | 1.31 | | | | 1.03 | |
2010 | | | 1.03 | | | | 1.08 | | | | 0.99 | |
2011 | | | 0.99 | | | | 1.06 | | | | 0.94 | |
2012 | | | 1.00 | | | | 1.04 | | | | 0.97 | |
September 2012 | | | 0.98 | | | | 0.99 | | | | 0.97 | |
October 2012 | | | 0.99 | | | | 1.00 | | | | 0.98 | |
November 2012 | | | 1.00 | | | | 1.00 | | | | 0.99 | |
December 2012 | | | 0.99 | | | | 1.00 | | | | 0.98 | |
January 2013 | | | 0.99 | | | | 1.01 | | | | 0.98 | |
February 2013 | | | 1.01 | | | | 1.03 | | | | 1.00 | |
| (1) | The average exchange rates for each full year are calculated using the average exchange rate on the last day of each month during the period. The average exchange rate for each month is calculated using the average of the daily exchange rates during the period. |
| (2) | Based on noon buying rates as published by the Bank of Canada. |
| (3) | The average rates for 2013 have been calculated with information up to February 28, 2013. |
17
The following table sets forth, for ZAR, expressed in Canadian dollar, (i) the average of the exchange rates in effect during each period, and (ii) high and low exchange rates during each period.
| | | | | | | | | | | | |
ZAR expressed in Canadian dollars for the year ended December 31, or the respective month (1)(2) | | Average | | | High | | | Low | |
| | | |
2008 | | | 0.123 | | | | 0.151 | | | | 0.110 | |
2009 | | | 0.136 | | | | 0.150 | | | | 0.120 | |
2010 | | | 0.141 | | | | 0.151 | | | | 0.133 | |
2011 | | | 0.137 | | | | 0.149 | | | | 0.123 | |
2012 | | | 0.122 | | | | 0.132 | | | | 0.111 | |
September 2012 | | | 0.119 | | | | 0.120 | | | | 0.117 | |
October 2012 | | | 0.114 | | | | 0.118 | | | | 0.111 | |
November 2012 | | | 0.113 | | | | 0.115 | | | | 0.111 | |
December 2012 | | | 0.115 | | | | 0.117 | | | | 0.112 | |
January 2013 | | | 0.113 | | | | 0.116 | | | | 0.110 | |
February 2012 | | | 0.114 | | | | 0.116 | | | | 0.112 | |
The average exchange rates for each full year are calculated using the average exchange rate on the last day of each month during the period. The average exchange rate for each month is calculated using the average of the daily exchange rates during the period.
| (1) | Based on noon buying rates as published by the Bank of Canada. |
| (2) | The average rates for 2013 have been calculated with information up to February 28, 2013. |
| | | | | | | | | | | | |
ZAR expressed in U.S. dollars for the year ended December 31, or the respective month (1)(2) | | Average | | | High | | | Low | |
| | | |
2008 | | | 0.122 | | | | 0.148 | | | | 0.089 | |
2009 | | | 0.156 | | | | 0.138 | | | | 0.094 | |
2010 | | | 0.137 | | | | 0.152 | | | | 0.125 | |
2011 | | | 0.138 | | | | 0.152 | | | | 0.117 | |
2012 | | | 0.122 | | | | 0.134 | | | | 0.111 | |
September 2012 | | | 0.121 | | | | 0.123 | | | | 0.119 | |
October 2012 | | | 0.116 | | | | 0.120 | | | | 0.114 | |
November 2012 | | | 0.114 | | | | 0.116 | | | | 0.111 | |
December 2012 | | | 0.116 | | | | 0.118 | | | | 0.113 | |
January 2013 | | | 0.114 | | | | 0.118 | | | | 0.110 | |
February 2013 | | | 0.113 | | | | 0.114 | | | | 0.111 | |
The average exchange rates for each full year are calculated using the average exchange rate on the last day of each month during the period. The average exchange rate for each month is calculated using the average of the daily exchange rates during the period.
| (1) | Based on noon buying rates as published by the Bank of Canada. |
| (2) | The average rates for 2012 have been calculated with information up to February 28, 2013. |
| | 3.B. | Capitalization and Indebtedness |
Not applicable.
| | 3.C. | Reasons for the Offer and Use of Proceeds |
Not applicable.
18
Investment in mining companies such as Atlatsa is highly speculative and subject to numerous and substantial risks.
The Company faces risks in executing its business plan and achieving revenues. The following risks are the known, material risks that the Company faces. If any of these risks occur, the Company’s business, operating results, cash flows and financial condition could be seriously harmed and, under certain circumstances, the Company may not be able to continue business operations as a going concern. Additional risks not currently known to the Company or that the Company currently deems immaterial may also materially and adversely affect the Company’s business, operating results, cash flows and financial condition.
In addition to the risks described below, see “Cautionary Note to Readers Concerning Technical Review of Bokoni Mine, Ga-Phasha Project and Boikgantsho Project” for a discussion of the principal risks and uncertainties which, in management’s opinion, are likely to most directly affect the conclusions of the technical review of each of the Bokoni Mine, the Ga-Phasha Project and the Boikgantsho Project.
Industry Risks
Bokoni Mine’s operations and profits have been and may be adversely affected by union activity and new and existing labor laws
There has been an increase in union activity in South Africa and, in recent years, there have been new labor laws introduced or amendments to existing labor laws that impose additional obligations or grant additional rights to workers, thereby increasing compliance and other costs. In fiscal 2012, labor unrest had a material adverse impact on Bokoni Mine’s operations, production and financial performance. The occurrence of any such events in the future could have further negative impacts upon financial performance and condition.
Greater union activity, including the entry of rival unions, has resulted in more frequent industrial disputes, including violent protests and clashes with police authorities, and has impacted labor negotiations. In the second half of fiscal 2012, there was heightened labor unrest in the South African Mining industry. A number of unions in various industries have threathened to or have recently gone on strike, causing work stoppages and production losses. As a result, on September 27, 2012, South Africa’s soverign debt credit rating, along with the credit ratings of a number of the country’s leading mining companies was downgraded.
In the event that Bokoni Mines experiences strikes or work stoppages, delays, sabotage, go-slow actions, lower productivity levels than envisaged or any other industrial relations related interruptions or increased employment related costs due to union or employee activity, these may have a material adverse effect on it business, production levels, production targets, results of operations, financial condition and reputation and future prospects. In addition lower levels of mining activity can have a longer term impact on production levels and operating costs, particularly since mining conditions can deteriorate during extended periods without production.
See “Illegal Strike Action at Bokoni Mine”.
Cost of compliance with, or changes in, current and future governmental regulations may have a material adverse effect on the Company’s business, operating results, cash flows and financial condition
The exploration and mining activities of Atlatsa are subject to various South African national, provincial and local laws governing prospecting, development, production, taxes, labor standards and occupational health, mine safety, toxic substance and other matters. Exploration activities and mining are also subject to various national, provincial and local laws and regulations relating to the protection of the environment. These laws mandate, among other things, the maintenance of certain air and water quality standards, and land reclamation. These laws also set forth limitations on the generation, transportation, storage and disposal of solid and hazardous waste. No assurance can be given that new rules and regulations will not be enacted or that existing rules and regulations will not be applied in a manner which could limit or curtail production or development. Amendments to current laws and regulations governing operations and activities of exploration, mining and milling or more stringent implementation thereof could have a material adverse effect on Atlatsa’s business, results of operation and financial condition.
Metal price volatility may render continued commercial production at the Bokoni Mine uneconomic
Atlatsa’s business is strongly affected by the world market price of PGM. PGM prices can be subject to volatile price movements, which can be material and can occur over short periods of time and are affected by numerous factors, all of which are beyond Atlatsa’s control. Industry factors that may affect PGM prices are as follows: the demand in the automotive sectors; industrial and jewellery demand; central bank lending, sales and purchases of PGM; speculative trading; and costs of and levels
19
of global PGM production by producers of PGM. PGM prices may also be affected by macroeconomic factors, including: expectations of the future rate of inflation; the strength of, and confidence in, the U.S. dollar, the currency in which the price of PGM is generally quoted, and other currencies; interest rates; and global or regional, political or economic uncertainties.
In the future, if PGM market prices were to drop and the prices realized by Atlatsa on PGM sales were to decrease significantly and remain at such a level for any substantial period, Atlatsa’s profitability and cash flows would be negatively affected. Depending on the market price of PGM, Atlatsa may determine that it is not economically feasible to continue commercial production at the Bokoni Mine, which would have an adverse impact on Atlatsa’s financial performance and results of operations. In such a circumstance, Atlatsa may also curtail or suspend some or all of its exploration activities, with the result that depleted reserves are not replaced.
Price volatility and the unavailability of other commodities may adversely affect the timing and cost of the Company’s projects
The profitability of Atlatsa’s business is affected by the market prices of commodities produced as products and by-products at Atlatsa’s mines, such as platinum, palladium, rhodium, gold, nickel and certain other base metals, as well as the cost and availability of commodities which are consumed or otherwise used in connection with Atlatsa’s operations and projects, including, but not limited to, diesel fuel, natural gas, electricity, water, steel and concrete. Prices of such commodities can be subject to volatile price movements, which can be material and can occur over short periods of time, and are affected by factors that are beyond Atlatsa’s control. An increase in the cost, or decrease in the availability, of construction materials such as steel and concrete may affect the timing and cost of Atlatsa’s projects. If Atlatsa’s proceeds from the sale of by-products were to decrease significantly, or the costs of certain commodities consumed or otherwise used in connection with Atlatsa’s operations and projects were to increase, or their availability to decrease significantly and remain at such levels for a substantial period of time, Atlatsa may determine that it is not economically feasible to continue commercial production at some or all of Atlatsa’s operations or the development of some or all of Atlatsa’s current projects, which could have an adverse impact on Atlatsa.
The Company is required to obtain and renew governmental permits in order to conduct mining operations, which is often a costly and time-consuming process
The Company’s current and anticipated future operations, including continued production at the Bokoni Mine, and further exploration or the development of new projects, require permits from various governmental authorities. Obtaining or renewing governmental permits is a complex and time-consuming process. The duration and success of permitting efforts are contingent upon many variables not within the Company’s control, including the interpretation of requirements implemented by the applicable permitting authority. The Company may not be able to obtain or renew permits that are necessary to its operations, or the cost to obtain or renew permits may exceed the Company’s expectations. Failure to comply with permits may disrupt the Company’s operations. Any unexpected delays or costs associated with the permitting process could delay the development or impede the operation of a mine, which could materially adversely affect the Company’s revenues and future growth.
A shortage of electricity and high electricity prices could adversely affect the Company’s ability to operate its business
The National Energy Regulator of South Africa (“NERSA”) revised Eskom’s (South African national power supplier) power tariff increase during February 2013. The effect of its revision is that power tariff increases in South Africa will be increased as follows:
2013 - 2018: 8%
The Bokoni Mine operations are currently mining at relatively shallow depths with no major refrigeration requirements expected for the next 30 years of mining. Power costs currently comprise approximately 4% (varying summer and winter tariffs) of total operating costs at the mine operations. The Bokoni Mine continues to focus efforts on power usage reduction initiatives as part of the efficiency improvement initiatives currently being implemented at the operations.
The Bokoni Mine is also dependent on power generated by Eskom. In the past number of years, there has been an increase in the number of electricity supply interruptions, resulting mainly from recent economic growth exceeding expectations and delayed investments in infrastructure upgrades and development. Although Eskom has announced a number of short- and long-term mitigation plans, there can be no assurance that the Company will not experience power supply interruptions.
The above increases in prices and possible supply interruptions may have a material adverse effect on Atlatsa’s business, results of operations and financial condition.
20
Deterioration of economic conditions may adversely affect our business, operating results, cash flows and financial condition
The prices of PGM are volatile, and are affected by numerous economic factors beyond Atlatsa’s control. The level of interest rates, the rate of inflation, world supply of PGM and stability of exchange rates can all cause fluctuations in these prices. Such external economic factors are in turn influenced by changes in international investment patterns, monetary systems and political developments. The prices of PGM have fluctuated in recent years, and future significant price declines could cause commercial production to be uneconomic and may have a material adverse effect on Atlatsa’s business, results of operations and financial condition.
Changes to the regulatory environment have been proposed that would significantly affect the mining industry in South Africa
The mining industry in South Africa, where the Company’s projects are located, is subject to extensive government regulation. The regulatory environment is developing, lacks clarity in a number of areas and is subject to interpretation, review and amendment as the mining industry is further developed and liberalized. In addition, the regulatory process entails a public comment process, which makes the outcome of the legislation uncertain and may cause delays in the regulatory process. A number of significant matters have not been finalized, including the legislation dealing with beneficiation. Mineral beneficiation has become one of the major drivers in advancing the empowerment of historically disadvantaged communities in South Africa. It also presents opportunities for development of new entrepreneurs in large and small mining industries. Atlatsa cannot predict the outcome or timing of any amendments or modifications to applicable regulations or the interpretation thereof, the release of new regulations or their impact on its business.
In October 2002, the South African government enacted the Mineral Development Act that deals with the state’s policy towards the future of ownership of minerals rights and the procedures for conducting mining transactions in South Africa. The Mineral Development Act is an ambitious statute with wide-ranging objectives, including sustainable development and the promotion of equitable access to South Africa’s mineral wealth by the inclusion of HDP into the industry. The Mineral Development Act came into effect in May 2004.
In December 2012, proposed revisions were made to the Mineral Development Act and the Company is currently in the process of evaluating any potential impact on its business.
The South African government issues permits and licences for prospecting and mining rights to applicants using a “scorecard” approach. Applicants need to demonstrate their eligibility for consideration based upon the number of credits accumulated in terms of quantifiable ownership transformation criteria, such as employment equity and human resource development.
Future amendments to, and interpretations of, the economic empowerment initiatives by the South African Government and the South African courts could adversely affect the business of Atlatsa and its operations and financial condition.
The risks associated with mining and processing pose operational and environmental risks that may not be covered by insurance and may increase costs
The mining industry is subject to significant risks and hazards, including environmental hazards, industrial accidents, unusual or unexpected geological conditions, labor force disruptions, civil strife, unavailability of materials and equipment, weather conditions, pit wall failures, rock bursts, cave-ins, flooding, seismic activity, water conditions and precious metal losses, most of which are beyond Atlatsa’s control. These risks and hazards could result in the following: damage to, or destruction of, mineral properties or producing facilities; personal injury or death; environmental damage; delays in mining; and monetary losses and possible legal liability. As a result, production may fall below historic or estimated levels and Atlatsa may incur significant costs or experience significant delays that could have a material adverse effect on Atlatsa’s financial performance, liquidity and results of operation.
No assurance can be given that the Company’s insurance will cover such risks and hazards, that the insurance will continue to be available, that it will be available at economically feasible premiums, or that Atlatsa will maintain such insurance. In addition, Atlatsa does not have coverage for certain environmental losses and other risks, as such coverage cannot be purchased at a commercially reasonable cost. The lack of, or insufficiency of, insurance coverage could adversely affect Atlatsa’s cash flow and overall profitability.
The Company’s property interests and operations are subject to political risks and uncertainties associated with investment in a foreign country
South Africa has recently undergone major constitutional changes to effect majority rule, and affecting mineral title. Accordingly, all laws may be considered relatively new, resulting in risks such as possible misinterpretation of new laws, unilateral modification of mining or exploration rights, operating restrictions, increased taxes and royalties, environmental
21
regulation, mine safety and other risks arising out of a new sovereignty over mining, any or all of which could have an adverse impact upon Atlatsa. Atlatsa’s operations may also be affected in varying degrees by political and economic instability, terrorism, crime, extreme fluctuations in currency exchange rates, and inflation.
Changes, if any, in mining or investment policies or shifts in political attitude in South Africa may adversely affect Atlatsa’s operations or likelihood of future profitability. Operations may be affected in varying degrees by government regulations with respect to, but not limited to, restrictions on production, price controls, export controls, currency remittance, income taxes, royalties, expropriation of property, foreign investment, maintenance of claims, environmental legislation, land use, land claims of local people, water use and mine safety. For instance, the South African government enacted the Royalty Act, which came into operation on March 1, 2010. The Royalty Act imposes a royalty payable to the South African government by businesses based upon financial profits made through the transfer of mineral resources. As the Bokoni Mine produces metal-in-concentrate, a royalty is payable to the South African government between 0.5% and 7% of gross sales of unrefined mineral resources. Although this royalty payable has been taken into consideration with regard to the Company’s current budgeting and other financial planning processes, any future change in the royalties payable could have a material adverse effect on our results of operations and financial condition.
The Company is subject to extensive environmental legislation and the costs of complying with these applicable laws and regulations may be significant
Environmental legislation is evolving in a manner that will require stricter standards and enforcement, increased fines and penalties for non-compliance, more stringent environmental assessments of proposed projects and a heightened degree of responsibility for companies and their officers, directors and employees. There can be no assurance that future changes to environmental regulation, if any, will not adversely affect Atlatsa’s operations. Environmental hazards may exist on the properties in which Atlatsa holds interests which are unknown to Atlatsa at present and which have been caused by previous or existing owners or operators of the properties. Furthermore, compliance with environmental reclamation, closure and other requirements may involve significant costs and other liabilities. In particular, Atlatsa’s operations and exploration activities are subject to South African national and provincial laws and regulations governing protection of the environment. These laws are continually changing and, in general, are becoming more restrictive.
Fluctuations in foreign currency exchange rates in relation to the United States dollar may have an adverse effect on the Company’s operating results
Atlatsa conducts operations in currencies other than United States or Canadian dollars. Of particular significance is the fact that Atlatsa’s operations in South Africa are almost entirely paid for in ZAR, which has historically devalued against the United States dollar as well as the Canadian dollar.
The price of PGM is denominated in United States dollars and, accordingly, Atlatsa’s revenues, if any, are linked to the United States dollars. In order to earn or maintain property interests, certain of Atlatsa’s payments are to be made in ZAR. As a result, fluctuations in the United States dollar against the ZAR could have a material adverse effect on Atlatsa’s financial results, which are reported in Canadian dollars.
Atlatsa’s share price is volatile
The market price of a publicly traded stock, especially a resource company like Atlatsa, is affected by many variables not directly related to the mining and exploration success of Atlatsa, including the market for junior resource stocks, the strength of the economy generally, the availability and attractiveness of alternative investments, and the breadth of the public market for the stock. The effect of these and other factors on the market price of the common shares suggests Atlatsa’s share price will continue to be volatile.
There are uncertainties as to title matters in the mining industry. Any defects in such title could cause the Company to lose its rights in mineral properties and jeopardize its operations.
Title to mining properties is subject to potential claims by third parties claiming an interest in them. The mineral properties may be subject to previous unregistered agreements or transfers, and title may be affected by undetected defects or changes in mineral tenure laws. The Company’s mineral interests consist of mineral claims, which have not been surveyed, and therefore, the precise area and location of such claims or rights may be in doubt. The failure to comply with all applicable laws and regulations, including the failure to pay taxes or to carry out and file assessment work, may invalidate title to portions of the properties where the mineral rights are held by Atlatsa.
The Company faces intense competition in the mining industry
The mineral exploration and mining business is competitive in all of its phases. Atlatsa competes with numerous other companies and individuals, including competitors with greater financial, technical and other resources than Atlatsa, in the
22
search for and the acquisition of attractive mineral properties and the recruitment and retention of skilled labor. Atlatsa’s ability to acquire properties in the future will depend not only on its ability to develop its present properties, but also on its ability to select and acquire suitable producing properties or prospects for mineral exploration. There is no assurance that Atlatsa will continue to be able to compete successfully with its competitors in acquiring such properties or prospects. Further, Atlatsa has encountered increased competition from other mining companies in its efforts to hire experienced mining professionals. Competition for skilled personnel at all levels is currently very intense, particularly in the mining processing and engineering disciplines. If Atlatsa is unable to recruit and retain qualified employees, this could result in interruptions or decreases in Atlatsa’s production or exploration activities that could have a material adverse effect on its results of operations, financial condition and cash flows.
Business Risks
Failure to repay long term borrowings and the level of indebtedness may adversely affect the Company as a going concern
As of February 28, 2013, Atlatsa had cash and cash equivalents of approximately $4.7 million and capital leases and loans and borrowings of approximately $591 million. There can be no assurance that Atlatsa will be successful in repaying all of its indebtedness. Atlatsa’s level of indebtedness could have important consequences for its operations, including:
| • | | The Company will need to use a large portion of its cash flow to repay principal and pay interest on its debt, which will reduce the amount of funds available to finance its operations and other business activities; and |
| • | | The Company’s debt level may limit its ability to pursue other business opportunities, borrow money for operations or capital expenditures in the future, or implement its business strategy. |
Atlatsa expects to obtain the funds to pay its operational and capital expenditures in 2013 through its future cash flows from the Bokoni Mine operations as well as available facilities from the Consolidated Debt Facility which came into effect on September 28, 2012 as a part of Phase One of its Restructure Plan, see “Restructure Plan” under Item 4, as well as Section 1.13 “Financial Instruments and Risk Management - Debt Arrangements” and Section 1.2 under subheading “Restructure Plan” in the Company’s Management Discussion and Analysis for the fiscal year ended December 31, 2012 (filed on March 28, 2013).
The Company is dependent on the current facility in place provided by Anglo Platinum as well as stable production from the Bokoni Mine. The funds available from this facility are expected to meet the Group’s projected cash flow requirements until approximately May 2013.
These conditions give rise to a material uncertainty which may cast significant doubt about the Company’s ability to continue as a going concern and, therefore that it may be unable to realize its assets and discharge its liabilities in the normal course of business. For details regarding the Company’s proposed Restructure Plan, which is intended to address the foregoing issues, see Item 4 “Restructure Plan” and Item 5 “Operating and Financial Review and Prospects”.
Atlatsa’s ability to meet its payment obligations will depend on its future financial performance, which will be affected by financial, business, economic and other factors. Atlatsa will not be able to control many of these factors, such as economic conditions in the markets in which it operates. Atlatsa cannot be certain that its existing capital resources and future cash flows from operations will be sufficient to allow it to pay principal and interest on Atlatsa’s debt and meet its other obligations. If these amounts are insufficient or if there is a contravention of its debt covenants, Atlatsa may be required to refinance all or part of its existing debt, sell assets, borrow more money or issue additional equity.
Atlatsa has no history of realising net earnings
Atlatsa has a long history of losses and there can be no assurance that Atlatsa will achieve or sustain profitability. Atlatsa has not paid any dividends on its shares since incorporation. Atlatsa anticipates that it will retain future earnings and other cash resources for the future operation and development of its business. Atlatsa does not intend to declare or pay any cash dividends in the foreseeable future. Payment of any future dividends is at the discretion of Atlatsa’s board of directors after taking into account many factors including Atlatsa’s operating results, financial conditions and anticipated cash needs.
Capital structure and ability to raise new equity
23
Atlatsa’s ability to raise new equity in the equity capital markets is subject to the mandatory requirement that Atlatsa Holdings, its majority BEE shareholder, retain a 51% fully diluted shareholding in the Company up until December 31, 2020, as required by covenants given by Atlatsa Holdings and Atlatsa in favour of the SARB and Anglo Platinum; post transaction. The ability of Atlatsa to access the bank public debt or equity capital markets on an efficient basis may be constrained by the dislocation in the credit markets, capital and/or liquidity constraints in the banking markets and equity conditions at the time of issuance.
The Company may not meet its production level and operating cost estimates and, if it does not, its results of operations may be adversely affected
Atlatsa prepares estimates of future production, cash costs and capital costs of production for particular operations. No assurance can be given that such estimates will be achieved. Failure to achieve production or cost estimates or material increases in costs could have an adverse impact on Atlatsa’s future cash flows, profitability, results of operations and financial condition.
Atlatsa’s actual production and costs may vary from estimates for a variety of reasons, including the following: actual ore mined varying from estimates of grade, tonnage, dilution and metallurgical and other characteristics; short-term operating factors relating to the ore reserves, such as the need for sequential development of orebodies and the processing of new or different ore grades; revisions to mine plans; risks and hazards associated with mining; natural phenomena, such as inclement weather conditions, water availability, floods, and earthquakes; and unexpected labor shortages or strikes. Costs of production may also be affected by a variety of factors, including: changing waste-to-ore ratios, ore grade metallurgy, labor costs, the cost of commodities, safety related stoppages, general inflationary pressures and currency exchange rates.
The loss of key personnel and workforce unavailability could harm the Company’s mining operations and projects
Atlatsa is dependent on a relatively small number of key employees (such as the Chief Executive Officer and the Chief Financial Officer), the loss of any of whom could have an adverse effect on Atlatsa. The Company also does not maintain any “key person” insurance.
HIV/AIDS is prevalent in Southern Africa. Employees or contractors of the Company may have or could contract this potentially deadly virus. There has been a steady emigration of skilled personnel from South Africa in recent years. Generally, the prevalence of HIV/AIDS could cause lost employee man hours and the emigration of skilled employees could adversely affect Atlatsa’s ability to retain its employees.
Atlatsa is dependent on a workforce which is heavily unionised with approximately 95% of the workforce belonging to three competing unions. This poses a risk in that union disputes may give rise to industrial action and work stoppages, including strikes, from time to time. Communication and negotiating forums have been established with all unions participating therein.
See “Illegal Strike Action at Bokoni Mine”
Delays or under delivery on projects may adversely affect the Company’s ability to sustain or increase the Company’s present level of production
Atlatsa’s ability to sustain or increase its present levels of PGM production is dependent on the success of its projects. There are many risks and unknowns inherent in all projects. For example, the economic feasibility of projects is based upon many factors, including the following: the accuracy of reserve estimates; metallurgical recoveries with respect to PGM and by-products; capital and operating costs of such projects; the future prices of the relevant minerals; and the ability to secure appropriate financing for product development. Projects also require the successful completion of feasibility studies, the resolution of various fiscal, tax and royalty matters, the issuance of necessary governmental permits and the acquisition of satisfactory surface or other land rights. It may also be necessary for Atlatsa to, among other things, find or generate suitable sources of power and water for a project, ensure that appropriate community infrastructure is developed by third parties to support the project, and secure appropriate financing to fund these expenditures.
The capital expenditures and time required to develop new mines or other projects are considerable and changes in costs or construction schedules can affect project economics. Thus, it is possible that actual costs may increase significantly and economic returns may differ materially from Atlatsa’s estimates, that metal prices may decrease significantly, or that Atlatsa could fail to obtain the satisfactory resolution of fiscal and tax matters or the governmental approvals necessary for the operation of a project or obtain project financing on acceptable terms and conditions or at all, in which case, the project may not proceed, either on its original timing, or at all. It is not unusual in the mining industry for new mining operations to experience unexpected problems during the start-up phase, resulting in delays and requiring more capital than anticipated.
24
Mineral reserves and resources are only estimates, and there can be no assurance that the estimated reserves and resources are accurate or that the Company will achieve indicated levels of PGM recovery
Atlatsa’s mineral reserves and mineral resources are estimates, and no assurance can be given that the estimated reserves and resources are accurate or that the indicated level of PGM or any other mineral will be produced. Such estimates are, in large part, based on interpretations of geological data obtained from drill holes and other sampling techniques. Actual mineralization or formations may be different from those predicted. Further, it may take many years from the initial phase of drilling before production is possible, and during that time the economic feasibility of exploiting a discovery may change.
The SEC does not permit United States mining companies in their filings with the SEC to disclose estimates other than mineral reserves. However this Annual Report also contains resource estimates, which are required by NI 43-101. Mineral resource estimates that do not qualify as reserves are based, in many instances, on limited and widely spaced drill hole information, which is not necessarily indicative of the conditions between and around drill holes. Accordingly, such mineral resource estimates may require revision as more drilling information becomes available or as actual production experience is gained. No assurance can be given that any part or all of Atlatsa’s mineral resources not already qualifying as reserves will be converted into reserves. See “Cautionary Note to Investors Concerning Estimates of Measured and Indicated Resources”, “Cautionary Note to Investors Concerning Estimates of Inferred Resources” and “Cautionary Note to U.S. Investors”. Market price fluctuations of PGM, as well as increased production and capital costs or reduced recovery rates, may render Atlatsa’s proven and probable reserves unprofitable to develop at a particular site or sites for periods of time or may render mineral reserves containing relatively lower grade mineralization uneconomic. Moreover, short-term operating factors relating to the mineral reserves, such as the need for the orderly development of orebodies or the processing of new or different ore grades, may cause mineral reserves to be reduced or Atlatsa to be unprofitable in any particular accounting period. Estimated reserves may have to be recalculated based on actual production experience. Any of these factors may require Atlatsa to reduce its mineral reserves and resources, which could have a negative impact on Atlatsa’s financial results. Failure to obtain or maintain necessary permits or government approvals or changes to applicable legislation could also cause Atlatsa to reduce its reserves. There is also no assurance that Atlatsa will achieve indicated levels of PGM recovery or obtain the prices assumed in determining such reserves.
There is no certainty that the Company’s future exploration and development activities will be commercially successful
The exploration for and development of mineral deposits involves significant risks, which even a combination of careful evaluation, experience and knowledge may not eliminate. Few properties explored are ultimately developed into producing mines. Significant expenditures may be required to locate and establish mineral reserves, to develop metallurgical processes and to construct mining and processing facilities at a particular site. It is impossible to ensure that the current exploration programs planned by Atlatsa will result in a profitable commercial mining operation. Significant capital investment is required to achieve commercial production from successful exploration efforts.
The commercial viability of a mineral deposit is dependent upon a number of factors. These include deposit attributes such as size, grade and proximity to infrastructure, current and future metal prices (which can be cyclical), and government regulations, including those relating to prices, taxes, royalties, land tenure, land use, importing and exporting of minerals and necessary supplies and environmental protection. The complete effect of these factors, either alone or in combination, cannot be entirely predicted, and their impact may result in Atlatsa not receiving an adequate return on invested capital.
The Company’s current exploration projects may not result in discoveries of commercial recoverable quantities of ore
The Kwanda Project is in the exploration stage as opposed to the development stage and has no known body of economic mineralization. The known mineralization at the Kwanda Project has not been determined to be ore. There can be no assurance that commercially mineable ore bodies exist. There is no certainty that any expenditure made in the exploration of the Company’s undeveloped mineral properties will result in discoveries of commercially recoverable quantities of ore. Such assurance will require completion of final comprehensive feasibility studies and, possibly, further associated exploration and other work that concludes a potential mine at each of these projects is likely to be economic. In order to carry out exploration and development programs of any economic ore body and place it into commercial production, the Company must raise substantial additional funding.
Enforcement of judgments or bringing actions inside the United States against the Company or its directors and officers may be difficult for U.S. investors
The Company is a Canadian corporation, with its principal place of business in South Africa. A majority of the Company’s directors and officers and some or all of the experts named in this Annual Report are not residents of the United States and substantially all of the Company’s assets and the assets of a majority of the Company’s directors and officers and the experts named in this Annual Report are located outside the United States. Consequently, it may be difficult for U.S. investors to effect service of process within the United States upon the Company or its directors or officers or such experts who are not residents of the United States, or to rely in the United States upon judgments of courts of the United States predicated upon civil liabilities under United States securities laws. Investors should not assume that courts outside of the United States (1) would enforce judgments of United States courts obtained in actions against the Company or such directors, officers or experts
25
predicated upon the civil liability provisions of the U.S. federal securities laws or the securities or “blue sky” laws of any state within the United States or (2) would enforce, in original actions, liabilities against the Company or such directors, officers or experts predicated upon the U.S. federal securities laws or any such state securities or “blue sky” laws.
Failure to replace depleted reserves will result in declining production levels over the long term
The Bokoni Mine is Atlatsa’s only producing property. Atlatsa must seek to expand the operating areas of the Bokoni Mine and develop other properties to replace reserves depleted by production to maintain production levels over the long term. Reserves also can be replaced by expanding known orebodies, locating new deposits or making acquisitions. Exploration is highly speculative in nature. Atlatsa’s exploration projects involve many risks and may be unsuccessful. Once a site with mineralization is discovered, it may take several years from the initial phases of drilling until production is possible, during which time the economic feasibility of production may change. Substantial expenditures are required to establish proven and probable reserves and to construct mining and processing facilities. As a result, there is no assurance that current or future exploration programs will be successful. There is a risk that depletion of reserves will not be offset by expansion, discoveries or acquisitions. The mineral base of Atlatsa may decline if reserves are mined without adequate development and replacement, and Atlatsa may not be able to sustain production beyond the current life of mine, based on current production rates and development.
The Company is subject to exchange control regulations that may affect its ability to transfer assets to or from its foreign subsidiaries and to fund its operations efficiently
South African law provides for exchange control regulations that restrict the export of capital. The exchange control regulations, which are administered by the South African Reserve Bank (“SARB”), regulate transactions involving South African residents, including legal entities, and limit a South African company’s ability to borrow from and repay loans to non-residents and to provide guarantees for the obligations of its affiliates with regard to funds obtained from non-residents.
A portion of the Company’s funding for its South African operations consist of loans advanced to its South African subsidiaries from subsidiaries that are non-residents of South Africa. The Company is in compliance with SARB regulations and is therefore not subject to restrictions on the ability of its South African subsidiaries to transfer funds to the Company or to other subsidiaries. In addition, the SARB has introduced various measures in recent years to relax the exchange controls in South Africa to entice foreign investment in the country. However, if more burdensome exchange controls were proposed or adopted by the SARB in the future, or if the Company was unable to comply with existing SARB regulations, such exchange control regulations could restrict the ability of the Company and its subsidiaries to repatriate funds needed to effectively finance the Company’s operations. Any such limitations, or the perception that such limitations could exist in the future, could have an adverse impact on the Company’s business and share price.
Risks relating to indebtedness relating to the Bokoni Transaction
Since the completion of the Bokoni Transaction, Atlatsa’s debt owing to Anglo Platinum increased from ZAR3.3 billion ($489 million) in July 2009 to ZAR4.9 billion ($575.1 million) as at December 31, 2012, including capitalized interest during that period. As a result, Atlatsa’s statement of financial position is highly leveraged, which management considers undesirable. In April 2011, Anglo Platinum agreed to assume the Debt Facility then held by SCB in order to facilitate Anglo Platinum providing the Debt Facility to Atlatsa on more favourable terms. The parties have agreed to the key terms of the Restructure Plan, of which Phase One was implemented on September 28, 2012. See Item 4 “Restructure Plan”. Under the proposed Restructure Plan the new restructured debt will only be repayable once the Company generates sufficient free cash flow, however there is no assurance the Restructure Plan will be completed in a timely manner, if at all.
The Group incurred a net loss for the year ended 31 December 2012 of $95.6 million (2011: $147.8 million) and as of that date its total assets exceeded its total liabilities by $205.3 million (2011: ($28.1 million)).
Anglo Platinum has currently extended financial support until 31 August 2013.
These conditions above give rise to a material uncertainty which may cast significant doubt about the Company’s ability to continue as a going concern and, therefore that it may be unable to realise its assets and discharge its liabilities in the normal course of business.
Failure to complete the proposed Restructure Plan will have an adverse impact on Atlatsa’s statement of financial position and financial condition.
26
Risks relating to the Restructure Plan of the Company and the Bokoni Group
The Restructuring Transactions are subject to the risk that it may not be completed on the terms negotiated in a timely manner, or at all. The completion of the Restructuring Transactions are subject to a number of conditions precedent, certain of which are outside the control of the Company, including the approval of the TSX-V, NYSE MKT and the JSE and the approval of the Company’s shareholders by the requisite disinterested majority. There can be no certainty, nor can the Company provide any assurance, that these conditions will be satisfied or, if satisfied, when they will be satisfied in a timely manner, if at all.
Failure to complete the Restructuring Transactions would have a material adverse impact on the financial condition of the Company and may negatively impact the Company’s share price.
For more information on the Restructuring Transactions, see the discussion in Section 4A under the heading “Restructure Plan”.
Disputes or disagreements with third parties who jointly own many of the Company’s assets could adversely affect our business, operating results, cash flows and financial condition
Atlatsa holds the bulk of its assets through Plateau’s 51% ownership of Holdco, the remaining 49% being held by Anglo Platinum. Plateau’s interests in these projects are subject to the risks normally associated with the joint ownership of operations. The existence or occurrence of one or more of the following circumstances and events could have a material adverse impact on Plateau’s profitability or the viability of its interests held through Holdco, which could have a material adverse impact on Atlatsa’s future cash flows, earnings, results of operations and financial condition: (i) disagreement with Anglo Platinum on how to proceed with exploration programs and how to develop and operate mines efficiently; (ii) inability of Atlatsa and Anglo Platinum to meet their obligations in respect of jointly owned properties; and (iii) litigation between Atlatsa and Anglo Platinum regarding jointly owned property. Future disputes and disagreements with business partners could adversely affect the business of Atlatsa and its operations and financial condition.
There may be adverse U.S. federal income tax consequences to U.S. shareholders if Atlatsa is or becomes a “passive foreign investment company” under the U.S. Internal Revenue Code.
If Atlatsa is classified as a passive foreign investment company (“PFIC”) for any taxable year during which a U.S. Holder holds common shares, certain adverse U.S. federal income tax rules could apply to that person. Atlatsa believes that it was not a PFIC in the 2012 taxable year, but has not made a determination as to its PFIC status for the 2013 taxable year or any future year. U.S. Holders should carefully read “Taxation—Material U.S. Federal Income Tax Considerations—Passive Foreign Investment Company Rules” for more information and consult their independent tax advisors regarding the likelihood and consequences of Atlatsa being treated as a PFIC for U.S. federal income tax purposes.
The Company is dependent on third parties
Atlatsa’s sole revenue stream is currently derived from the sale of PGM metal-in-concentrate produced at the Bokoni Mine. All of this metal-in-concentrate is sold to RPM pursuant to a sale of concentrate agreement. Atlatsa relies on RPM as its sole revenue source, and its success in part depends on RPM performing its obligations under the sale of concentrate agreement. While not anticipated, there can be no assurance that RPM will be able to, or will, perform its obligations under the sale of concentrate agreement in the future.
27
| ITEM 4 | INFORMATION ON THE COMPANY |
| 4.A. | History and development of the Company |
| 1. | Name, Address and Incorporation; Trading Markets |
Atlatsa Resources Corporation (formerly known as Anooraq Resources Corporation) was incorporated on April 19, 1983 under the laws of the Province of British Columbia, Canada. The Company was transitioned under theBusiness Corporations Act(British Columbia) on June 11, 2004, on which date the Company altered its Notice of Articles to change its authorized share structure from 200,000,000 common shares without par value to an unlimited number of common shares without par value.
The Company’s registered office is Suite 1300 – 777 Dunsmuir Street, Vancouver, British Columbia, Canada V7Y 1K2, telephone (604) 643-7100, facsimile (604) 643-7900. The South African head office of the Company is located at 4th Floor – 82 Grayston Drive, Off Esterhysen Lane, Sandton, South Africa 2146, telephone: +27 11 883 0831, facsimile: +27 11 883 0836.
The Company’s common shares are listed for trading on the TSX-V (symbol ATL) and NYSE Amex (symbol ATL). In 2006, Atlatsa affected an inward listing on the Johannesburg Stock Exchange Limited and began trading on the Johannesburg Stock Exchange on December 19, 2006 under the trading symbol of ARQ (now ATL).
| 2. | General Development of the Business |
For the period 1983 to June 30, 2009, the Company was primarily an exploration company and, therefore, did not have any significant operating assets.
On July 1, 2009, the Company acquired 51% of the Bokoni Mine and also took operational control of Bokoni Mine. This was the first operating asset acquired by the Company that generated revenue. There was therefore a significant increase in the asset base of the Company as revenue generating assets were effectively acquired.
In the year ended December 31, 2010 (“Fiscal 2010”) and the year ended December 31, 2011 (“Fiscal 2011”), Atlatsa focused on implementing the foundation for its turnaround strategy at the Bokoni Mine operations. From an operational perspective, Fiscal 2010 and Fiscal 2011 was a challenge with many of the foundational initiatives associated with the turnaround having to be implemented. The key areas of focus within the operations were:
| | • | | improving safety performance; |
| | • | | cash cost cutting initiatives; |
| | • | | improving productivity levels and efficiencies; |
| | • | | increasing development to create more mining flexibility to allow for production build up; |
| | • | | increasing concentrator plant milling capacity in line with expansion plans for Bokoni Mine; and |
| | • | | implementing key capital projects to maintain and grow production. |
In Fiscal 2012 the Company appointed a new management team at Bokoni Mine, effective February, 2012.
The new management team, in conjunction with Atlatsa and Anglo Platinum initiated a detailed review of the technical assumptions and operational plan underlying the 2009 Bokoni Transaction and its associated financing structure. The review resulted in Atlatsa and Anglo Platinum agreeing to a new strategic approach and operating plan for the Bokoni Group, as well as a recapitalization and refinancing plan to facilitate its new growth plan to be implemented pursuant to the Restructuring Plan. A summary of the Restructuring Plan and its key benefits for Atlatsa are set out below:-
New Operating Plan
The review has determined to scale the Bokoni Mine as a 160,000 tpm operation in the near term, in line with its installed processing capacity. Accordingly, material capital expenditure associated with the proposed UG2 expansion plans at Bokoni Mine, estimated at ZAR2.3 billion (US$ 269.6 million) has been deferred, having regard to the near term outlook for PGM market fundamentals.
In an effort to reduce unit operating costs the review identified certain potential open cast project opportunities at the Bokoni Mine which, subject to final regulatory approvals, will be exploited into the future. This will allow the Bokoni Mine to fill its processing capacity in the near term, whilst its underground mining operations build up from 100,000 tpm (current) to 160,000 tpm in the medium term.
28
The new operating plan will result in Bokoni Mine becoming a predominantly Merensky Reef producer, accounting for approximately 75% of its total estimated production in the medium term.
The new operating plan at Bokoni Mine is considered a lower risk, less capital intensive and more conservative plan from both an operational and financing perspective.
Recapitalization and Refinancing
The net effect of the Restructuring Transactions will result in a significant reduction in the Company’s debt as well as its cost of borrowings and create a more sustainable financing plan for the Company going forward See “Restructure Plan” under Item 4.
| 3. | Summary Corporate History and Intercorporate Relationships |
From 1996 to mid-1999, the Company’s mineral exploration was focused on metal prospects located in Mexico. In October 1999, the Company refocused its exploration on a South African platinum group metals project, the Platreef Project. The Company has two active Cayman Islands subsidiaries, N1C and N2C. These two subsidiaries were incorporated on December 2, 1999 under the laws of the Cayman Islands. The Company holds 100% of the shares of N1C, which in turn holds 100% of the N2C shares. N2C holds 100% of the shares of Plateau, a private South African mining corporation acquired by Atlatsa on August 28, 2001. Atlatsa holds its assets and interests in South Africa through Plateau.
In September 2004, the Company and Atlatsa Holdings, a private South African company, completed a transaction combining their respective PGM assets, comprising the Company’s PGM projects on the Northern and Western Limbs of the “Bushveld Igneous Complex” and Atlatsa Holding’s 50% participation interest in the Ga-Phasha Project (previously known as “Paschaskraal”) on the Eastern Limb of the Bushveld in the Republic of South Africa.
Pursuant to the terms of the Pelawan transaction, which constituted a reverse take-over under the policies of the TSX-V, the Company acquired Atlatsa Holding’s rights to its 50% participation interest in the Ga-Phasha Project in return for 91.2 million Atlatsa common shares (63% of the total outstanding shares in Atlatsa at that time) and a cash payment of $2.4 million (ZAR15.7 million). By completing the RTO with Atlatsa Holdings, Atlatsa reconstituted itself as a BEE company in South Africa with a view to positioning itself for greater opportunities within the South African mineral sector. This strategy was successful in 2007 when Atlatsa announced a major BEE transaction with Anglo Platinum pursuant to which the two corporations determined to combine all of their existing joint venture interests, together with 100% of Anglo Platinum’s Bokoni Mine (formerly Lebowa), under a new group structure, the Bokoni Group, of which Atlatsa controls 51% and has management control over all operations, and Anglo Platinum retains a 49% minority interest in the Bokoni Group. The Bokoni Transaction was completed on July 1, 2009.
See the “Restructure Plan”for details of the joint announcement released by Atlatsa and Anglo Platinum on February 2, 2012 and subsequent developments.
Bokoni Mine
2009 represented the most important year in Atlatsa’s history. With effect from July 1, 2009, the Company transformed from an exploration and development company into a PGM producer through the Bokoni Transaction.
Rationale for the Bokoni Transaction
The Bokoni Transaction was a step towards Atlatsa’s objective to become a significant “mine-to-market” PGM company with a substantial and diversified PGM asset base, including production, development and exploration assets. The Bokoni Transaction is the first stage of advancing the Company’s PGM production strategy, and has resulted in the Company controlling refined production of 147,600 4E ounces and a significant estimated mineral resource base of approximately 200 million PGM ounces (measured, indicated and inferred), the third-largest PGM mineral resource base in South Africa, based on comparison with public information on declared resources by other companies.
The acquisition of a further 1% interest in the Ga-Phasha Project, Boikgantsho Project and Kwanda Project furthered Atlatsa’s strategy to control the management and development of those projects.
Through the Pelawan Trust shareholding, Atlatsa currently has a BEE shareholding of approximately 57% and, pursuant to the Atlatsa Shareholders Agreement, the shareholding of the Pelawan Trust (or any other historically disadvantaged person, as defined in the Pelawan Agreements, participating in the trust) in Atlatsa cannot be diluted to below the shareholding threshold of 51% required under South African law.
29
Atlatsa is also pursuing its mine-to-market strategy through a sale of concentrate agreement entered into between Bokoni Mine and RPM on June 26, 2009 (the “Concentrate Agreement”) in respect of concentrate produced at Bokoni Mine. The Concentrate Agreement has a term of five years until July 1, 2014 and is renewable, at Atlatsa’s election, for a further period of five years (refer to Section 4A “Restructure Plan”). In addition, Atlatsa, through Ga-Phasha, entered into a limited off-take agreement with Anglo Platinum in respect of concentrate produced from the Ga-Phasha Project. This off-take agreement has an initial term of ten years and is renewable, at Atlatsa’s election, for a further period of ten years. Pursuant to the Ga-Phasha Project off-take provisions in the Holdco Shareholders Agreement (the “Ga-Phasha off-take agreement”), should Atlatsa elect to extend the Ga-Phasha off-take agreement with Anglo Platinum beyond the initial term, then Atlatsa may exercise options to acquire an ownership interest in Anglo Platinum’s Polokwane smelter complex (the “smelter options”). The first smelter option entitles Atlatsa to acquire an ownership interest in the Polokwane smelter complex equal to the percentage ratio that the concentrate feed from the Ga-Phasha properties bears to the design capacity of the Polokwane smelter complex, for a purchase consideration of ZAR1.00, plus any restructuring costs that may be required to facilitate this acquisition. The option is exercisable within 30 days after the commencement of the second ten year period of the Ga-Phasha off-take agreement. The second smelter option entitles Atlatsa to acquire an additional ownership interest in the Polokwane smelter equal to the percentage ratio that the attributable concentrate feed produced by the whole of the Atlatsa group, other than from the Ga-Phasha properties, bears to the design capacity of the Polokwane smelter, for a purchase consideration equal to the equivalent percentage of the replacement cost of the smelter, less pro-rated wear and tear. This option is exercisable within the first five years of the second ten year period of the Ga-Phasha off-take agreement. Polokwane smelter design capacity is to treat approximately 1.6 million platinum ounces per year.
Ownership Structure
The simplified corporate structure of the Company’s and Anglo Platinum’s interest in the Bokoni Mine and the Boikgantsho Project, Ga-Phasha Project and Kwanda Project, is as follows:
30
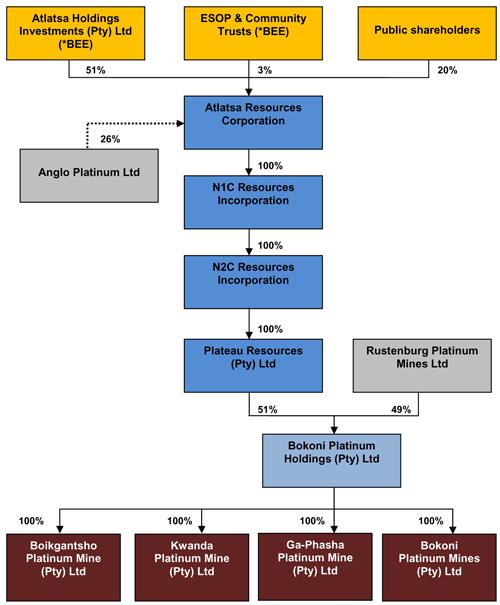
| * | BEE = Black Economic Empowerment |
The above simplified corporate structure is illustrated on a fully diluted share basis, assuming conversion of the B preference shares.
Additional Commercial Terms of the Bokoni Transaction
Prior to July 1, 2009, Bokoni Mine acted as contractor to Lebowa, conducting all mining operations in respect of the Bokoni Mine. As of July 1, 2009 the contractor arrangement terminated. In light of Atlatsa’s mine-to-market strategy, Atlatsa, through Bokoni Mine, entered into the Concentrate Agreement with RPM in respect of concentrate produced at the Bokoni Mine and entered into the Ga-Phasha off-take agreement with respect to concentrate that may be produced at the Ga-Phasha Project.
The rehabilitation trust provision in respect of the Bokoni Mine was transferred from the Anglo Platinum fund to the Bokoni Environmental Rehabilitation Trust. Anglo Platinum provided the trust guarantees in respect of the above mentioned trust until July 1, 2010. Subsequent to this, management considered alternative insurance products. Anglo Platinum offered to continue the guarantee at favorable terms and management accepted their proposal. The current guarantee is still in place until June 30, 2013. Management intends to renegotiate this guarantee before June 30, 2013. In connection with the Bokoni Transaction, the Company also entered into the Bokoni Platinum Mine ESOP Trust and the Atlatsa Community Participation Trust (see below
31
under “Share Ownership Trusts” for further information regarding the Bokoni Platinum Mine ESOP Trust and the Atlatsa Community Participation Trust).
Management and Funding of Operations
The Holdco Shareholders Agreement between Plateau and RPM governs the relationship between Plateau and RPM, as shareholders of Holdco, and with respect to management of Holdco and its subsidiaries, including the Bokoni Mine.
Plateau is entitled to nominate the majority of the directors of Holdco and Bokoni Mine, and has undertaken that the majority of such nominees will be HDPs. Atlatsa has given certain undertakings to Anglo Platinum in relation to the maintenance of its status as an HDP controlled group, pursuant to the Holdco Shareholders Agreement.
Pursuant to the Holdco Shareholders Agreement, the board of directors of Holdco, which is controlled by Atlatsa, has the right to call for shareholder contributions, either by way of a shareholder loan or equity. If a shareholder should default on an equity cash call, the other shareholder may increase its equity interest in Holdco by funding the entire cash call, provided that, until the expiry of a period from the closing date of the Bokoni Transaction until the earlier of (i) the date on which the BEE credits attributable to the Anglo Platinum Ltd group and/or arising as a result of the Bokoni Transaction become legally secure, and (ii) the date on which 74% of the scheduled capital repayments due by Plateau to RPM , pursuant to the Debt Facility are made in accordance with the debt repayment profile of the Debt Facility (the “Initial Period”), Plateau’s shareholding in Holdco cannot be diluted for default in respect of equity contributions.
Pursuant to the terms of shared services agreements, Anglo Platinum provides certain services to the Bokoni Mine at a cost that is no greater than the costs charged to any other Anglo American plc group company for the same or similar services. The Company, through Plateau, provides certain management services to the Bokoni Mine pursuant to service agreements entered into with effect from July 1, 2009. The Company and Anglo Platinum intend to renegotiate the management services arrangements in conjunction with the proposed restructuring and refinancing transaction. See “Restructure Plan”.
The Holdco Shareholders Agreement also governs the initial sale of concentrate from the Ga-Phasha Project upon commencement of production pursuant to the terms described above.
Consolidated Debt Facility
Initially, from July 1, 2009, in order for Plateau to meet any required shareholder contributions in respect of operating or capital expenditure cash shortfalls at Bokoni Mine during the initial three year ramp up phase at Bokoni, RPM provided Plateau with an OCSF (the “Plateau OCSF”) which could be drawn up to a maximum of $87.9 million (ZAR750 million) and was subject to certain annual draw down restrictions, in terms of quantum, during the first three years. The Plateau OCSF bore fixed interest at a rate of 15.84%, compounded quarterly in arrears. The OCSF loan was originally payable in semi-annual instalments starting January 31, 2013 to the extent cash was available after payment of the Debt Facility and the RPM funding loan. The terms were revised such that repayment was deferred by one year from January 31, 2013 to January 31, 2014. On 28 September 2012, Atlatsa entered into an Amendment and Interim Implementation Agreement with RPM resulting in Atlatsa implementing the first phase of the broader restructuring, recapitalization and refinancing transaction, which was first announced in a news release, dated February 2, 2012.
The first phase of the Restructure Plan involved an amendment to the terms of the Senior Term Loan Facilities Agreement (now a consolidated facility) dated June 12, 2009 between Plateau, as borrower and RPM, as lender to increase the total loan facility available by approximately $310.6 million (ZAR2.65 billion). The additional loan proceeds were used to repay the existing OCSF and fund share subscriptions by Plateau into Bokoni Holdco and by Bokoni Holdco into Bokoni Mine (the “Share Subscriptions”) for the purpose of repayment of certain existing loan facilities by Plateau, Bokoni Holdco and Bokoni Mine. See “Restructure Plan”
The interest rate payable on the debt owing was reduced to an annual effective rate of 6.27% (linked to the 3-month JIBAR) from the previous effective rate of 12.31%.
Special Shareholder Arrangements
Atlatsa has given certain undertakings to Anglo Platinum in relation to the maintenance of its status as an HDP controlled company pursuant to the Holdco Shareholders Agreement. During the Initial Period, Plateau is required to ensure that, among other things: (i) HDPs effectively own, through Plateau, its subsidiaries and its controlling shareholders (i.e. the Atlatsa Control Structure), at least 26% of the business of Holdco, measured on a see-through basis; (ii) a majority of the directors of Holdco are HDPs; and (iii) a majority of the directors of Atlatsa Holdings are HDPs. At any time during the term of the Holdco Shareholders Agreement, if a change in control of Holdco occurs, Plateau is required to “remedy” the change by either restoring the status quo or procuring that the change is superseded by a further transaction that results in the acquisition of control of Atlatsa Holdings by HDPs who were beneficial owners of Atlatsa Holdings as at the date of signature of the Holdco
32
Shareholders Agreement, or involves such shareholders expropriating the defaulting shareholder’s interest (with no attendant change in control). If Plateau fails to do so within the period specified in the Holdco Shareholders Agreement, RPM will be entitled to compel the purchase by Plateau of RPM’s interests in Holdco for fair market value.
Financing of the Bokoni Transaction
The Company financed the Bokoni Transaction at the Plateau level through a combination of the Debt Facility provided by Standard Chartered Bank (“SCB”) and a vendor finance facility provided by Anglo Platinum, through its wholly owned subsidiary, RPM (the “Vendor Finance Facility”). In addition, the Company secured an agreement with RPM whereby RPM provides Plateau with the OCSF of up to a maximum of $87.9 million (ZAR750 million) and access to RPM’s attributable share of the Holdco cash flows (“the standby facility”) up to a maximum of 80% of all free cash flow generated from the Bokoni Mine to meet its repayment obligations under the terms of the Debt Facility.
Plateau secured the Debt Facility with SCB for an amount of up to $87.9 million (ZAR750 million), including capitalized interest up to a maximum of three years or $29.3 million (ZAR250 million). On July 1, 2009, SCB advanced $58.6 million (ZAR500 million) to Plateau, and interest amounting to $16.7 million (ZAR142.8 million) has been rolled up through April 28, 2011.
The Debt Facility was repayable in 12 semi-annual instalments, with the first payment due on January 31, 2013. Interest was calculated at a variable rate linked to the 3 month JIBAR plus applicable margin and mandatory cost (11.345% at April 28, 2011).
The total amount of the interest payable on the notional amount of the Debt Facility of $58.6 million (ZAR500 million) drawn down on July 1, 2009 was hedged with effect from July 1, 2009 until July 31, 2012.
The Debt Facility had a term of 108 months from July 1, 2009. Pursuant to the Bokoni Holdco Shareholders Agreement (as defined above), if Plateau’s cash flows derived from Bokoni Holdco were insufficient to meet its debt repayment obligations under the Debt Facility, RPM was obligated, pursuant to the standby loan facility, to provide Plateau a portion of its entitlement to the Bokoni Holdco cash flows such that Plateau can utilize up to 80% of all free cash flows generated from Bokoni Holdco for this purpose.
On December 11, 2009, 34% of the Debt Facility was syndicated to First Rand Bank Limited, acting through its RMB division.
Effective as of April 28, 2011 RPM acquired the outstanding amounts from SCB and RMB (the “Senior Lenders”) in full. RPM also assumed all of the rights and obligations of the Senior Lenders under the Debt Facility and the commencement of re-payments has was deferred by one year from 31 January 2013 to 31 January 2014. RPM has waived the financial covenants of the 2009 Senior Debt Facility as of 30 June 2012 until 31 August 2013.
| 2. | Vendor Finance Facility |
RPM provided the Vendor Finance Facility to Plateau consisting of a cash component of $140.6 million (ZAR1.2 billion) and a share settled component (the “Share-Settled Financing”) amounting to $128.9 million (ZAR1.1 billion).
See “Restructure Plan” for a discussion of the impact of the proposed restructuring and refinancing transaction on the above facilities.
Cash component
In terms of the cash component of the Vendor Finance Facility, RPM subscribed for cumulative redeemable preference shares in the capital of Plateau (the “Plateau Preferred A Shares”) for an aggregate sum of $140.6 million (ZAR1.2 billion). These shares are cumulative mandatory redeemable shares which attract a fixed annual cumulative dividend of 12% (fixed quarterly cumulative dividend of 11.49%). Atlatsa is obligated to redeem the outstanding amount, including undeclared dividends which should have been declared within six years (July 1, 2015) of issue, to the extent that Atlatsa is in the position to redeem the shares. Any preference shares not redeemed in six years (at July 1, 2015) automatically roll over and must be finally redeemed nine years after issue (at July 1, 2018).
During the three year period prior to the initial maturity date (between July 1, 2012 and July 1, 2015), Plateau will be required to undertake a mandatory debt refinancing and use 100% of such external funding raised to settle the following amounts owing by Plateau to RPM at such time, in the following order: (i) any outstanding amounts owing to RPM in respect of the Standby Loan Facility (ii) any outstanding amounts owing to RPM in respect of the Plateau OCSF and (iii) any amount owing to RPM in respect of the Plateau Preferred “A” Shares. Plateau is obliged to undertake the refinancing process but, if the debt is not re-
33
financeable based upon the debt capital markets at that time (between July 1, 2012 and July 1, 2015), then there is no sanction on Plateau and all debt will automatically roll over until it is repayable in full by no later than July 1, 2018.
See “Restructure Plan” for a discussion of the impact of the Restructuring Transaction on this facility.
Share Settled Financing – The B preference shares
In terms of the Share Settled Financing component, Atlatsa Holdings, the majority shareholder of Atlatsa, established a wholly owned subsidiary, the Pelawan SPV and transferred 56,691,303 Atlatsa common shares to the Pelawan SPV. RPM subscribed for convertible preferred shares in the capital of the SPV (the “SPV Preferred Shares”) for an aggregate sum of $138.5 million (ZAR1.1 billion). Atlatsa Holdings encumbered its shareholding in the Pelawan SPV in favor of RPM as security for the obligations of the Pelawan SPV pursuant to the SPV Preferred Shares.
The Pelawan SPV subscribed for two different classes of convertible “B” preferred shares in Plateau for $128.9 million (ZAR1.1 billion), each such class being convertible into common shares in the capital of Plateau (“Plateau common shares”) and entitling the holder to a special dividend in cash, which, upon receipt, will immediately be used to subscribe for additional Plateau common shares (“The “B” preference shares”). The “B” preference shares bear no interest and carry no rights to preference dividends.
Pursuant to the agreement between the Pelawan SPV and Atlatsa (the “Exchange Agreement”), upon Plateau issuing Plateau common shares to the SPV, Atlatsa will take delivery of all Plateau common shares held by the SPV and, in consideration therefor, issue to the Pelawan SPV such number of Atlatsa common shares that have a value equal to the value of such Plateau common shares. The total number of Atlatsa common shares to be issued on implementation of the Share Settled Financing arrangement is 227.4 million common shares. Once the “B” preference shares have been converted into Atlatsa common shares, the Company will have fully diluted shares outstanding equal to 429 million common shares of one class (not including any other Atlatsa common shares that may hereafter be issued).
The SPV Preferred Shares are convertible in one or more tranches into common shares in the capital of the SPV (“SPV common shares”) immediately upon demand by RPM, upon the earlier of (i) the date of receipt by the Pelawan SPV of a conversion notice from RPM and (ii) July 1, 2018. Upon such date, RPM will become entitled to a special dividend in cash, which will immediately be used to subscribe for SPV common shares. Upon the Pelawan SPV converting the SPV Preferred Shares to Pelawan SPV common shares and RPM subscribing for additional SPV common shares as a result of the special dividend, the SPV will immediately undertake a share buyback of all SPV common shares held by RPM and will settle the buyback consideration by delivering 115.8 million Atlatsa common shares to RPM.
As and when RPM issues a conversion notice as described above, in order to prevent the dilution of the Atlatsa Holdings’ interest in Atlatsa below the minimum 51% threshold as required by South African law, the Pelawan SPV will require Plateau to convert sufficient convertible preferred shares in the capital of Plateau into Plateau common shares. Immediately thereafter, Atlatsa will take delivery of such Plateau common shares and issue such number of common shares (in an aggregate amount of 111.6 million common shares) to the Pelawan SPV pursuant to the Exchange Agreement. Such common shares will be held by the Pelawan SPV and will be subject to a lock-in that will prevent the Pelawan SPV and Atlatsa Holdings from disposing of such shareholding for so long as Atlatsa Holdings is required to maintain a minimum 51% shareholding in Atlatsa.
The final result of the Share Settled Financing is that: (i) RPM funded a payment of $128.9 million (ZAR1.1 billion) to Plateau whereby RPM will ultimately receive a total of 115.8 million common shares in Atlatsa; and (ii) Atlatsa Holdings will receive 111.6 million common shares in Atlatsa.
RPM will be able to trade its 115.8 million Atlatsa common shares on an unrestricted basis, subject to applicable securities laws. RPM is not bound by any contractual lock-ins or restrictions in respect of any of the Company’s common shares which it will hold. It will, however, prior to disposing of any such common shares, engage in a consultative process with Atlatsa, and endeavor to dispose of such common shares in Atlatsa in a reasonable manner. Neither Atlatsa Holdings nor any of shareholders of Atlatsa Holdings have any pre-emptive rights in respect of RPM’s common shares in Atlatsa.
See “Restructure Plan” for a discussion of the impact of the Restructuring Transactions on the “B” preference shares whereby RPM has agreed to convert its “B” preference shares in accordance with their terms and upon such conversion, to sell the resulting 115.8 million Atlatsa common shares to Atlatsa Holdings.
34
Impact of the Bokoni Transaction
As a result of the Bokoni Transaction:
| | • | | the Company became a significant HDP managed and controlled PGM producer and supplier of PGM concentrate, together with exploration and mining development projects; |
| | • | | the Company established effective management control over all of its PGM assets, which assets comprise in total, in excess of 200 million PGM ounces (measured, indicated and inferred), constituting the third-largest PGM resource base in South Africa (based on publically reported information regarding estimated PGM resources of other South African companies); |
| | • | | the Company gained effective control of its existing PGM exploration projects, the Ga Phasha Project, the Boikgantsho Project and the Kwanda Project; and |
| | • | | the Company secured funding to expand its targeted production base from approximately 150,000 PGM ounces in 2009 to 270,000 PGM ounces per annum by 2014. |
Share Ownership Trusts
The purpose of the Bokoni Platinum Mine ESOP Trust and the Atlatsa Community Participation Trust (the “Share Ownership Trusts”) is to provide the employees of Bokoni Mine and the members of the communities affected by Atlatsa’s operations, respectively, with the opportunity to participate in, and benefit from, Atlatsa’s success.
On July 1, 2009, Anglo Platinum donated $15.4 million (ZAR103.8 million) to the Atlatsa Community Participation Trust, of which $10.9 million (ZAR73.6 million) was used to subscribe for 9,799,505 common shares of Atlatsa. The balance of Anglo Platinum’s contribution will be used to assist the communities impacted by Bokoni Mine over the forthcoming periods.
Anglo Platinum contributed an amount of $6.8 million (ZAR45.6 million) to the Bokoni Platinum Mine ESOP Trust (“ESOP Trust”) to facilitate its establishment, and approximately $5 million (ZAR33.8 million) of this amount was utilized by the ESOP Trust to subscribe for 4,497,062 common shares of Atlatsa. The ESOP Trust is consolidated by Atlatsa as a special purpose entity.
The Share Ownership Trusts subscribed for the common shares at a subscription price equal to $1.11, being the closing price of the common shares on the TSX-V on June 12, 2009, the day prior to the announcement of the revised Bokoni Transaction terms. As a result of the subscription by the Share Ownership Trusts, Atlatsa received proceeds of approximately $16 million (ZAR108 million). The Share Ownership Trusts hold the common shares along with other investments for the purpose of making distributions to their beneficiaries in accordance with their governing trust deeds.
Restructure Plan
On February 2, 2012 the Company and Anglo Platinum announced that they had concluded a term sheet for certain aspects of the Restructure Plan.
Subsequent to announcing the material terms of the Restructure Plan, in February 2012, the Company announced that it, together with Anglo Platinum and Bokoni Mine management, had undertaken a strategic review of the Bokoni Mine operations in order to assess the optimal mine plan for the Bokoni Mine going forward. This review process was recently completed and the parties are currently in discussion surrounding the optimal financing strategy to support such mine plan.
On September 28, 2012, the Company announced that it, together with Anglo Platinum, had completed Phase One of the Restructure Plan, whereby the Company consolidated the 2009 Senior Debt Facility, the OCSF and “A” Preference Share Facility, such that the OCSF and the “A” Preference Share Facility were repaid in full and lowered its cost of borrowing. Certain of the transactions completed as part of Phase One of the Restructure Plan are “Related Party Transactions” pursuant to Multilateral Instrument 61-101 –Protection of Minority Securityholders Interest in Special Transactions. Readers are referred to the Material Change report of the Company dated September 27, 2012, for more information regarding the related party aspects of Phase One, including details of exemptions from valuation and shareholder approval requirements relied on by Atlatsa.
Pursuant to Phase One of the Restructure Plan, the OCSF payable to RPM was repaid in full on September 28, 2012 and the principal amount outstanding as at that date was $0, as the full amount outstanding on September 28, 2012 was consolidated into the 2009 Senior Debt Facility. Post consolidation of the OCSF into the 2009 Senior Debt Facility, the OCSF remained in place and available to the Company and the total facility available to the Company was $61.6 (ZAR 525.2 million). As of December 31, 2012, the amount remaining available to the Company for further draw downs was $52 million (ZAR 443.6 million), and a principal amount of $ 10 million (ZAR 81.7 million) had been drawn down since the debt consolidation, which has been added to the principle amount outstanding under the 2009 Senior Debt Facility.
As at December 31, 2012 Platinum and the Company were in negotiations surrounding various transactions comprising phase two of the Restructure Plan (“Phase Two”), including the finalization of definitive transaction agreements. Phase Two will include the
35
sale and transfer of the Company’s interest in the Boikgantsho Project and the Eastern section of the Ga-Phasha Project to Anglo Platinum for a net consideration of $199.2 million (ZAR1.7 billion) and the further refinancing of the 2009 Senior Debt Facility into a New Debt Facility and working capital facility, a further reduction of the outstanding debt owed to RPM, and certain capital Restructuring Transactions. These negotiations are taking into consideration the results of the Bokoni Mine review and its associated financing requirements. The illegal strike action at the Bokoni Mine during Q4 2012 and its financial implications for the Bokoni Group has also been taken into consideration when finalizing Phase Two of the Restructure Plan.
Subsequent to year-end, on March 27, 2013, execution of definitive agreements for Phase Two of the Restructure Plan was announced. In addition to the transactions above, Anglo Platinum is subscribing for 125 million Atlatsa common shares for $87.9million (ZAR750 million). Atlatsa will apply such proceeds to repay a portion of the Senior Debt Facility outstanding. The net effect of the Restructure Plan after giving effort to Phase Two of the Restructure Plan is that the Company’s debt owing to RPM will be reduced by approximately $288.1 million (ZAR2,450 million). In addition to this debt reduction, Anglo Platinum has agreed to make additional facilities available to the Company to finance the Bokoni Mine operational and project plan going forward as per the new agreements under the Senior Loan Facility. RPM will also convert all “B” Preference shares, into Atlatsa common shares. Atlatsa Holdings has agreed to acquire 115.8 million Atlatsa common shares from RPM on a vendor financed basis, resulting in Atlatsa Holdings owing $54.3 million (ZAR463 million) to RPM, to be repaid in stages by December 31, 2020. This also includes an extension of the Concentrate Agreement until 2020.
Atlatsa Holdings will provide security to Anglo Platinum in relation to the Vendor Finance Facility by way of a pledge and cession of its entire shareholding in Atlatsa, which shares remain subject to a lock-in arrangement through to 2020. Should Atlatsa Holdings be unable to meet its minimum repayment commitments in terms of the Vendor Finance Facility repayment obligations between 2018 to 2020, Atlatsa will have a discretionary right, with no obligation, to step in and remedy such obligation in order to protect its BEE shareholding status, subject to commercial terms being agreed between Atlatsa Holdings and Atlatsa for that purpose.
As at December 31, 2012 the Phase Two of the Restructure Plan has not been completed and at the date of this MD&A, the proposed transactions have been announced but completion is conditional upon the satisfaction (or waiver) of various conditions precedent, including:
| | • | | the receipt of the approval of the South African Competition Authorities; |
| | • | | obtaining Atlatsa shareholders approvals; |
| | • | | the receipt of the approval of the Disinterested Shareholders of Atlatsa for each of the Related Party Transactions; |
| | • | | the receipt of approvals of the applicable regulatory authorities; |
| | • | | the receipt by RPM, and to the extent necessary, each of its shareholders, of the written unconditional consent of the United Kingdom Treasury in respect of the Restructuring Plan; |
| | • | | RPM acquiring unconditional title to the Asset Sale Properties. This would include obtaining Ministerial consent in respect of The Mineral and Petroleum Resources Royalty Act for transfer of the mineral rights to RPM; and |
| | • | | the Phase Two Restructure Plan transaction agreements becoming unconditional through the satisfaction of all other conditions precedent (except to the extent that the completion of any one transaction is conditional upon the completion of the other transactions). |
For additional information on the Restructure Plan refer to the press releases of Atlatsa dated February 2, 2012, March 15, 2012, March 30, 2012, May 3, 2012, June 15, 2012, July 26, 2012, September 7, 2012, September 27, 2012, October 2, 2012, October 22, 2012, December 3,2012 and January 21, 2013 and March 27, 2013 as well as the material change reports filed on February 13, 2012 and September 27, 2012, all of which are available on SEDAR at www.sedar.com.
Illegal Strike action at Bokoni Mine
On October 1, 2012, employees at the Bokoni Mine embarked on illegal and unprotected strike action.
All strike shifts were treated as NO WORK NO PAY shifts at Bokoni Mine.
All striking employees (approximately 2300) were dismissed on November 8, 2012.
Further to interventions from Community leaders and other interested or affected parties dismissed employees were provided with an opportunity to be re-instated if they returned to work by 7 December, 2012.
A final return to work agreement was reached with the three recognised Unions at Bokoni Mine ( NUM, UASA and TAWUSA) for employees to return to work based on the following:
| | • | | re-instatement of dismissed employees, |
| | • | | $234.4 (ZAR2,000) signing bonus payment; and |
| | • | | implementation of a $46.9 (ZAR400) monthly travelling allowance to qualifying employees. |
Employees were re-instated on December 7, 2012.
36
A summary of financial losses incurred due to the illegal strike action are as follows:
| | • | | damage to property and assets – $1.1 million(ZAR9.4 million); additional costs incurred such as legal fees, security costs and overtime for essential services amounting to $3.2 million (ZAR27.1 million); |
| | • | | the Company estimated that Bokoni Mine lost approximately 35,500 PGM oz (4E) of production in Q4 2012. |
An insurance claim for recovery of certain actual losses incurred as a result of the illegal strike action has been lodged with SASRIA (South African Special Risk Insurance Association) in accordance with the Company’s insurance policy.
Given the level of intimidation and threats of violence by persons engaging in the illegal strike, the Bokoni Mine had been unable to resume normal operations and there had been no operating activity at the Bokoni Mine between October 1, 2012 through to December 7, 2012, other than essential services which were conducted throughout the strike period.
The financial and operational implications of the illegal strike had a negative impact on the Company’s operational and financial performance for Q4 2012, and was taken into consideration between Anglo Platinum and the Company in their final analysis of Phase Two of the Company’s Restructure Plan.
Atlatsa’s Business Strategy and Principal Activities
Principal Activities
Atlatsa is engaged in mining, exploration and development of mineral deposits located in the Bushveld Igneous Complex (“BIC”), South Africa. The BIC is the world’s largest platinum producing geological region, producing in excess of 75% of annual primary platinum supply to international markets.
The major market for PGMs remains the automotive sector where varied combinations of platinum, palladium and rhodium are used in autocatalytic converters which reduce the effects of harmful emissions generated by automobiles. Management believes that the automotive sector, to which the PGM complex is tied, showed signs of improvements in Fiscal 2012, with China overtaking the United States in consumer demand and the United States consumer demand beginning to show signs of an upward trend in Fiscal 2012. However, the debt crisis in Europe over shadowed these improvements and speculative trading in PGM continued to adversely influence PGM spot prices during 2012. Increased vehicle emission control standards internationally, together with continued growth and industrialization in China, India, Brazil, Russia and Indonesia are expected to provide growth opportunity for demand growth in the automotive PGM market.
Demand for jewellery again represented a substantial portion of global platinum demand in 2012. It has historically been highly price elastic. Management expects the demand for platinum jewellery to grow in 2013 because of higher expected Chinese demand.
Atlatsa derives its revenues from PGM production through the sale of metal-in-concentrate produced at the Bokoni Mine to RPM in terms of a dedicated concentrate sale agreement. The Bokoni Mine produces a metal-in-concentrate, all of which is sold to RPM pursuant to the Concentrate Agreement. The Concentrate Agreement has an initial five year term to July 1, 2014 and Plateau has the right to extend the Concentrate Agreement for a further five year term to July 1, 2019. Refer to Section 4A “Restructure Plan” for details of the joint announcement by Atlatsa and Anglo Platinum released February 2, 2012 which includes, amongst others, the proposed extension of the Concentrate Agreement through to 2020 on the same terms and conditions. This metal-in-concentrate contains various payable metals, the most material of which are precious metals, being platinum, palladium, rhodium and gold, as well as base metals, containing copper and nickel. On delivery of the Bokoni Mine metal-in-concentrate to Anglo Platinum, metal assays are performed in order to assess metal content and Anglo Platinum then pays Atlatsa for such metal-in-concentrate based on a formula relating to spot metal pricing, less smelting and refining charges, as well as penalties (if applicable). Revenue from the sale of concentrate, which is Atlatsa’s sole revenue stream, for Fiscal 2012 was $117.6 million (ZAR963.6 million) compared to Fiscal 2011 of $144.4 million (ZAR1,055.6 million).
There are three major PGM producers in South Africa with smelting and refining capacity in South Africa, producing in excess of 80% of total PGM production from South Africa. The balance of production comes from smaller PGM producers, the majority of which produce and sell metal-in-concentrate to one of the three major producers for smelting and refining in terms of an off-take agreement.
Underground mining operations in South Africa are labor intensive with 60% of operational expenditure at the Bokoni Mine applied to labor. The Bokoni Mine has approximately 3,500 employees and approximately 1,600 contractors. The mine employees are represented by three labor unions and wage negotiations are generally held every two years with a one to two year wage accord being agreed subsequent to such negotiations.
The Company believes that its relative competitiveness within the PGM sector remains poised to improve. The Company holds a relative advantage at its operations as its average reserve grade of 4.92 grams per tonne (“g/t”) (PGM) is greater than the South African PGM grade average of 3.5 g/t. It also holds an advantage in respect of mining depth, as the Company mines at an average mining depth of approximately 300 metres below surface, while many other operations in South Africa are operating at 1,000 metres below depth. The Company projects that this advantage, together with established infrastructure at the Bokoni Mine operations and the fact that the Bokoni Mine operations have a 75% fixed cost base, is expected to result in the Company decreasing its unit cash cost relative to industry standard once the operations begin to produce increased PGM volumes during the anticipated 2013 to 2016 expansion growth phase at Bokoni Mine. The biggest challenge for the Bokoni Mine operations remains its low productivity and efficiency rates. These low efficiencies are largely attributable to a lack of mining flexibility at the Bokoni Mine operations, an issue which the Company is working on improving through an intensive development programme which will establish a number of spare mining panels at the operations and create mining flexibility for stoping teams.
Business Strategy
The Company’s business strategy going forward is to optimise its business plan for the development of the Bokoni Mine on a cost effective basis to generate maximum returns for its stakeholders on a responsible basis.
In order to achieve its business strategy, in 2012 the Company embarked on a detailed review of all of the technical, operational and financing assumptions associated with the historical life of mine plan and financing strategy at Bokoni Mine.
Further to completion of such review the Company determined that such plan required revision, both from an operational and financial perspective having regard to micro and macro fundamental factors affecting both the Bokoni Mine, as well as the PGM industry outlook in general. Accordingly, the Company, together with Anglo Platinum, determined to implement a Restructure Plan for both the Bokoni Mine, as well as the Company See “Restructure Plan” under Item 4. On implementation of the Restructure Plan the Company will be better positioned to achieve its intended business strategy on a more conservative and sustainable basis going forward.
37
The Company will continue to review its business strategy and, in particular, the proposed size and scale of the Bokoni Mine operations, on a continuous basis, having regard to the operational and financial performance at Bokoni Mine, as well as macro fundamental and economic assumptions and outlook for the PGM sector in the short, medium and long term.
Mining and Exploration in South Africa
The South African mining sector has undergone a series of significant legislative changes in the past decade.
Atlatsa has been advised by the DMR that the Bokoni Group has received conversion of all of its mining rights, as well as its prospecting rights into new order rights. A “new order” mining right is a limited real right that may be enforced against third parties and once granted the South African government has a limited power to interfere in the right. Failure to respect to such a right could give rise to criminal liability, a civil claim for damages or an administrative justice action.
The Royalty Act
The South African government has enacted the Royalty Act, which imposes a royalty payable to the South African government by business based upon financial profits made through the transfer of mineral resources. The legislation was passed on November 17, 2008 and came into operation on March 1, 2010.
As a result of the legislation resulting from this Royalty Act, a royalty will be levied for the benefit of the National Revenue Fund of the government of the Republic of South Africa. The amount levied is based on a percentage calculated by a formula, up to a maximum of 5% on gross sales of refined mineral resources and 7% on gross sales of unrefined mineral resources.
The ultimate royalty to be charged is formula-based, varying according to the profitability of mining operations. As the Bokoni Mine produces metal-in-concentrate (unrefined mineral resources) the minimum royalty payable with effect from March 1, 2010 is 0.5% of gross sales and the maximum royalty payable is 7% of gross sales, based on the following formula:
Royalty percentage payable on gross sales of unrefined metal produced = 0.5 + [(EBIT x 9)/gross sales]. The calculated royalty tax percentage for Bokoni Mine was the minimum percentage of 0.5% (2011: 0.5%). For the 12 months ended December 31, 2012 the royalty expense was $0.5 million as compared to $0.6 million for the 12 months ended December 31, 2011.
Other
The Company concluded a number of agreements with respect to services at the Bokoni Mine with RPM, a wholly owned subsidiary of Anglo Platinum and 49% shareholder in Holdco, on March 28, 2008. These agreements were amended on May 13, 2009 and include a limited off-take agreement whereby the Bokoni Mine sells the concentrate produced at the mine to RPM at market related prices.
Pursuant to the terms of various shared services agreements, the Anglo American plc group of companies are currently providing certain operational services to the Bokoni Mine at a cost that is no greater than the costs charged to any other Anglo American plc company for the same or similar services. See “Restructure Plan” for proposed operational arrangement.
The Bokoni Mine has approximately 5,000 employees (including approximately 1,600 contractors), including approximately 9 of who may be considered senior management.
Information on mineral rights and prospecting and mining permits is provided in Item 4.D. “Property, Plants and Equipment”.
| 4.C. | Organizational Structure |
Below is a list of the Company’s subsidiaries.
| | | | | | | | | | |
| Company | | Country of
Incorporation | | 2012 | | | 2011 | |
| | | |
N1C Resources Incorporation | | Cayman Islands | | | 100 | % | | | 100 | % |
| | | |
Atlatsa Minera Mexicana ^ | | Mexico | | | — | | | | — | |
| | | |
N2C Resources Incorporation * | | Cayman Islands | | | 100 | % | | | 100 | % |
38
| | | | | | | | | | |
| | | |
Plateau Resources (Proprietary) Limited * | | South Africa | | | 100 | % | | | 100 | % |
| | | |
Bokoni Holdings (Proprietary) Limited * | | South Africa | | | 51 | % | | | 51 | % |
| | | |
Bokoni Mine (Proprietary) Limited * | | South Africa | | | 51 | % | | | 51 | % |
| | | |
Boikgantsho (Proprietary) Limited * | | South Africa | | | 51 | % | | | 51 | % |
| | | |
Kwanda (Proprietary) Limited * | | South Africa | | | 51 | % | | | 51 | % |
| | | |
Ga-Phasha (Proprietary) Limited * | | South Africa | | | 51 | % | | | 51 | % |
| | | |
Lebowa Platinum Mine Limited * # | | South Africa | | | 51 | % | | | 51 | % |
| | | |
Middlepunt Hill Management Services (Proprietary) Limited * # | | South Africa | | | 51 | % | | | 51 | % |
| ^- | Entity has been liquidated |
| #- | These entities are dormant |
39
| 4.D. | Property, Plants and Equipment |
Atlatsa holds interests in properties located in the Republic of South Africa in a geological province known as the Bushveld Complex, as shown in Figure 1.
Figure 1. Location of the Bokoni Mine, Ga-Phasha and Kwanda Properties
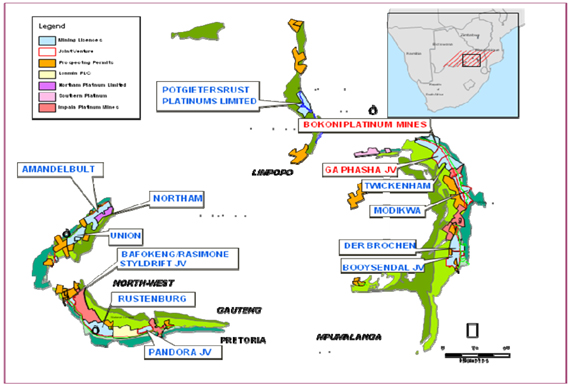
Regional Geology
The Bushveld Complex was formed when a large igneous body was emplaced in the earth’s crust. As the magma slowly cooled, silicate, sulphide, oxide and other minerals crystallized, forming texturally and mineralogically distinctive layers. During this process PGM, nickel and copper (usually occurring with, or as, sulphide minerals) became sufficiently enriched to form mineralized horizons. As a result, the Bushveld Complex plays host to layered PGM deposits, usually with significant nickel and copper contents.
Many of the layers within the Complex, including the economically important horizons, are continuous over tens of kilometers. However, the uniformity of the Merensky and UG2 horizons is disrupted in places by small circular depressions known as potholes.
In the Western and Eastern Bushveld Complex, PGM mineralization is currently extracted from two main horizons within the layered sequence of intrusive rocks: the Merensky Reef and the UG2 chromitite (a layer consisting largely of the mineral chromite). The UG2 layer lies below and essentially sub-parallel to the Merensky Reef but the two units are separated by 15 to 400 m of intervening layered intrusive rocks. The Merensky Reef is platinum rich relative to the UG2, where platinum and palladium occur in more or less equal proportions. The UG2 typically contains significantly more rhodium than the Merensky Reef (i.e. 10% or more of total PGM in places). The Platreef occurs on the Northern Limb of the Complex. It is 100 to 250 m thick. The Platreef is mineralogically similar to the Merensky Reef but its platinum palladium ratios, at ~1:1, are more like those in the UG2 horizon.
40
The Bokoni Mine
The following technical information (page 39 to page 54) is derived from the technical report by Minxcon, written in compliance with NI 43-101 and the Canadian Institute of Mining and Metallurgy (“CIM”) Definition Standards, which describes the Bokoni Mine mineral exploration, development and mining production. The January 2012 Technical Report is based on a detailed technical review of work performed by others and completed by the following independent qualified persons: HL. King, M.Sc (Geol.), G.D.Eng (Geostats), Pr.Sci.Nat., D. van Heerden, B.Eng (Min.Eng.), M.Comm. (Bus.Admin.), ECSA, MSAIMM, AMMSA, NJ. Odendaal, B.Sc.(Geol.), B.Sc.(Min.Econ.), M.Sc.(Min.Eng.), Pr.Sci.Nat., FSAIMM, MGSSA, MAusIMM, D. Clemente, NHD (Ext.Met.), GCC, MMMMA, FSAIMM.
Location and Property Description
The Bokoni Mine is located in the Sekhukhuneland District of the Limpopo Province of South Africa, approximately 80 km southeast of Polokwane, the provincial capital city, and approximately 330 km northeast of the city of Johannesburg. The area is serviced by a tarred road between Polokwane and Burgersfort. There is direct access along a service road from the Bokoni Mine to the main tarred road.
The Bokoni Mine is an operating mine located on the north-eastern limb of the BIC, to the north of and adjacent to the Ga-Phasha Project. The mining operations consists of a vertical shaft and three decline shaft systems to access underground mine development on the Merensky and UG2 Reef horizons.
The Mineral Resources and Mineral Reserves on the above properties are located within the Merensky and the UG2, which outcrop and sub crop on these properties and underlie the properties, dipping from the east towards the west. The Measured and Indicated Resources are primarily located in the shallow areas above 650 m while the balance of the Mineral Resource is located in the deeper areas below 650 m and is classified as inferred resources. Similarly, the majority of the Proven and Probable Reserves are located less than 650 m below the surface. Figure 2 illustrates the locations of the areas covered by the mining licenses according to South African Surveyor General’s plans. Traditionally, South African mining rights are issued over complete properties (farms) or portions thereof.
Mineral Rights
The Bokoni Mine property consists of two “new order” mining licenses covering an area of 15,459.78 hectares. The Bokoni Mine mining area, together with license numbers and expiry dates are presented in Table 1 below.
Table 1: Bokoni Mine’s Mining License Areas.
| | | | | | | | | | | | | | |
Property | | Area (ha) | | | Old Order
License
No. | | Original
Expiry Date | | Date
Conversion
Granted | | New Order License
Number | | Valid For |
Middelpunt 420 KS | | | 1 544.91 | | | 06/2003 | | 17/12/2025 | | 12/05/2008 | | LP 30/5/1/2/59/MR | | Up to 30 years |
Diamand 422 KS | | | 2 238.65 | | | | | | |
Umkoanesstad 419 KS | | | 2 635.10 | | | | | | |
Zeekkoegat 421 KS | | | 2 127.69 | | | | | | |
Brakfontein 464 KS | | | 2 391.04 | | | | | | |
Wintersveld 417 KS | | | 2 459.75 | | | 23/2003 | | 26/11/2013 | | 12/05/2008 | | LP 30/5/1/2/65/MR | | |
Jagdlust 418KS | | | 2 062.63 | | | | | | |
| | | | | | | | | | | | | | |
Total | | | 15 459.77 | | | |
| | | | | | | | | | | | | | |
Surface rights
The surface overlying the Bokoni Mine is owned by the South African government, and tenure to the required areas are currently held through various surface right permits (“SRPs”) in terms of Section 90 of the Mining Rights Act of 1967 and lease agreements. Pursuant to Item 9 in Schedule II to the Mineral Development Act, such SRPs will remain in force and attach to converted mining rights. Such SRPs have been re-registered in accordance with the requirements of Item 9.
Surface structures
In addition to the various mine shafts, the Bokoni Mine’s surface structures include:
| | • | | The mine buildings including: offices, change-houses and hostel facilities; |
| | • | | Workshops, compressor houses and stores; |
| | • | | Concentrators (which includes milling); and |
| | • | | Tailings dams and waste rock dumps. |
41
Figure 2 is a plan indicating the Bokoni Mine’s surface infrastructure and mining licenses
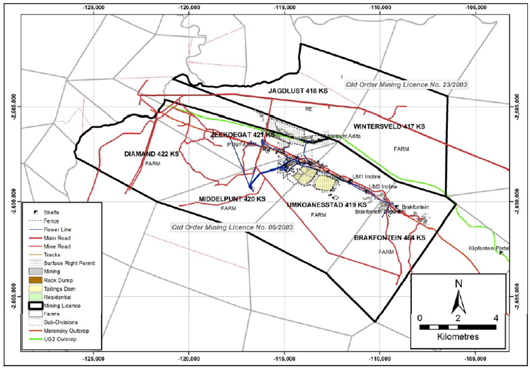
Access, Climate and Topography
The Bokoni Mine is located on an undulating plain between a range of hills in the north and a range of low mountains in the south. The plain is bisected by the Rapholo River, a major river in the area, which joins the Olifants River further downstream.
The average altitude of the plain is 800 meters above mean sea-level (“mamsl”) and the average altitude of the adjacent mountains is 1,600 mamsl. The plain, hills and mountains are sparsely vegetated with grasses, shrubs and occasional small trees with stunted growth. The vegetation is a result of both the arid climate and over-grazing by cattle and sheep.
There is some subsistence agriculture in the adjacent areas which is limited to small family farmed maize fields. There are notable expanses of bare soil on the surrounding properties and erosion is evident along water-courses in the area.
The Bokoni Mine is accessed from the R35 provincial all-weather road between Polokwane, the capital of Limpopo Province and Burgersfort, a town to the south-east in the neighbouring province of Mpumalanga. The nearest railway stations are at Polokwane and Steelpoort 80 km and 100 km away, respectively. However, rail is not the preferred means of transport and all stores and equipment are delivered by road-truck to the Bokoni Mine.
The nearest commercial (domestic) airport is at Polokwane but the Bokoni Mine has a private heliport which is available for emergency evacuation if required.
The nearest large town is Polokwane, which is a modern and developing town providing housing, schooling, health care, shopping, commercial and government administrative facilities.
Many of the Bokoni Mine employees reside in Polokwane in company-owned or privately-owned suburban housing and commute to the Bokoni Mine by company bus or by private vehicle. The remaining employees are housed in a mine residential ‘village’ at the Bokoni Mine, while some staff reside in local private dwellings in the surrounding rural area.
The Sekhukhuneland District of the Limpopo Province has a typical arid, temperate Southern African climate. In the summer (September/October to March/April) day-time temperatures can reach the mid to high 30°C cooling to just below 20°C overnight. Rainfall occurs between November and March and annually can be between 300 millimetres (“mm”) and 500 mm.
Winter temperatures can be below 10°C overnight but warming to the mid-20s in the daytime. Winter is characterized by clear skies and summer by clear skies with isolated clouds. In both cases the vast majority (70% or greater) of days can be classified
42
as ‘sunny’. Extreme weather conditions occur only a few times a year and can include mist, high wind with dust, thunderstorms and occasional hail. The mine operates twelve months per year and is not affected by climate and weather.
Infrastructure
Power
The Bokoni Mine’s electricity requirements are provided directly from Eskom, the South African national power utility. The mine has a contract with Eskom that guarantees a notified maximum demand of 40 MVA but the actual steady state use is around 30 MVA. Eskom supplies all power to site via the Middelpunt 132/22 kV substation. In-feed to this substation is via two separate and independent 132 kV overhead line structures, each from a different substation on the Eskom grid. There is thus true ring / dual feed to site.
The power supply lines to site are robust, but there are concerns about generation at a national level. Reliability of supply was formerly good, but difficulties began to be experienced with the capacity of Eskom to meet national demand in the second half of 2007. This culminated in many South African mines having to shut down operations for a few days in January 2008, owing to the near-collapse of the national power grid. The situation has since been normalized, and appears to have stabilized for now, although in the long term there is ongoing concern as to whether Eskom will successfully meet demand in future years.
Huge power price increases have been experienced recently, and are likely to continue for some years, as funding for new generation projects are funded by the consumer.
NERSA revised Eskom’s power tariff increase during February 2013. The effect of its revision is that power tariff increases in South Africa will be increased as follows:
2013 - 2018: 8%
The Bokoni Mine continues to focus efforts on power usage reduction initiatives as part of the efficiency improvement initiatives currently being implemented at the operations.
Water
The Bokoni Mine is supplied with raw water from the Olifants River via the Lebalelo Pipeline which was constructed and is operated by a Water Users Association predominantly made up of mines in the area. Additional water is available from the dewatering of the mines. Potable water is supplied from five boreholes supplying 30 to 50 kl per day. It is pumped into a Braithwaite tank for storage and then used on site. There is also a filtration plant used as a backup to meet plant service water needs. It is unlikely that the Bokoni Mine will suffer business interruption losses due to water shortages.
Tailings dams
There are two tailings dams at the Bokoni Mine, the Merensky tailings dam and the UG2 tailings dam, both of which are located near the Concentrators. The Merensky tailings dam has an area of approximately 70 ha and the UG2 tailings dam has an area of approximately 63 ha.
The current tailings dams have a combined capacity of 170 kilo tonnes per month (“ktp”) at a maximum rate of rise of 2.5 m per annum. This is adequate for current production levels.
Waste rock dumps
Waste rock dumps are located adjacent to the various shafts to accommodate the broken waste rock hoisted from underground. The inert waste rock is used for construction and in future may be used to clad the slopes of the tailings dams.
Personnel
Organisational structure and compliment
The Bokoni Mine’s organisational structure is similar to other South African mines, whereby production is divided into the departments of mining, engineering and services. Services include mineral resource management, finance, human resources, health and safety and the concentrator. Each department is managed by a head of department who reports to the general manager.
As required by South African statute, various persons are legally appointed to their positions, including the mine manager and his immediate subordinates as well as the engineering manager and his subordinates. Appointed managers are obliged to ensure that the mining activities are carried out according to the Minerals Act regulations and/or codes of practice/standard procedures drafted and adopted by the Bokoni Mine.
43
The Bokoni Mine at December 31, 2012 employed a total of 5,032 people across all disciplines and in all categories, as shown in Table 2 below.
Table 2. The Bokoni Mine employee compliment
| | | | | | |
Patterson Grade | | Description | | Actual | |
A | | Semi-skilled: General workers | | | 486 | |
B | | Skilled: Artisan and miners | | | 2,471 | |
C | | Supervisor: Foremen | | | 442 | |
D | | Middle Management | | | 73 | |
E | | Senior Management | | | 7 | |
F | | Contractors | | | 1553 | |
| | | | | | |
TOTAL | | | | | 5,032 | |
| | | | | | |
The above labour compliment includes all personnel necessary for the current operations.
Ee “Illegal Strike Action at Bokoni Mine”
Employment policy
The Bokoni Mine’s employment policy is to include all core skills from rock-face to manager as permanent ‘payroll’ employees. An agreement was reached with unions to the effect that contract labour would be utilised on UM2 shaft, which has a limited life of mine, in order to enable the mine to use its own employees on the build up of production on the long life Brakfontein mine.
The Bokoni Mine, however, continues to employ contractors in certain non-core activities.
Skills shortage and development
The Bokoni Mine suffers from the industry-wide skills shortage, particularly in the mining processing and engineering disciplines. Currently the Bokoni Mine has a Skills Retention Policy which includes various initiatives to retain employees with scarce skills including retention allowances. The skills shortage as at December 31, 2012 is summarised in Table 3.
Table 3. Current Bokoni Mine critical skills shortage
| | | | | | | | | | | | |
Description | | Actual | | | Required | | | Shortage | |
Shift Supervisors | | | 51 | | | | 64 | | | | 13 | |
Miners | | | 84 | | | | 86 | | | | 2 | |
Mine Overseers | | | 12 | | | | 14 | | | | 2 | |
Artisans | | | 99 | | | | 117 | | | | 18 | |
Engineers | | | 3 | | | | 4 | | | | 1 | |
Mining Managers | | | 3 | | | | 3 | | | | 0 | |
| | | | | | | | | | | | |
Total | | | 252 | | | | 288 | | | | 36 | |
| | | | | | | | | | | | |
The skills shortage is also being addressed through training and development.The Bokoni Mine has a Mining and Engineering Learnership programme and Cadetship in order to train miners. Targeted recruitment continues to take place at the mine.
The Bokoni Mine training centre has been accredited by the Mining Qualifications Authority (“MQA”). The first intake of Rock Breaker level 1and 2 is scheduled for the first week of March 2013. A total of 45 learners have been planned.
In-house and legal compliance training takes place for all core occupations and also for Learner Shift Supervisor programme. The mine no longer utilises Anglo Platinum training facilities. The Bokoni Mine has an Adult Basic Education and Training programme and an HIV/AIDS Wellness programme in place. The local community also benefits from these programmes.
Bokoni Mine has also signed Service Level Agreements and Memorandum of Understanding with accredited training providers such as FET Colleges to provide portable skills through mining and engineering related courses.
Bokoni Mine also received an accreditation to provide Occupational Health and Safety for Safety training by the MQA. This includes COMSOC 1 and 2 in addition to the normal health and safety training.
44
History
The production history for the last three years is shown in Table 4 below.
Table 4. Production summary for the past three years
| | | | | | | | | | | | |
| | | 2010 | | | 2011 | | | 2012 | |
Tonnes Milled | | | 1,044,084 | | | | 1,047,401 | | | | 863,677 | |
4E In Situ Grade | | | 5.04 | | | | 4.83 | | | | 4.79 | |
4E Oz Produced | | | 116,164 | | | | 113,625 | | | | 102,761 | |
NB: The production statistics for 2012 reflect 9 months of production. There was no normal production in Q4 2012 due to illegal industrial action.
Geology
Regional geology
The BIC is situated in the northern half of South Africa and exists as an ellipse-shaped body consisting of five lobes. The BIC is the world’s largest known ultramafic igneous intrusion that extends approximately 450 km east to west and approximately 250 km north to south and forms parts of Limpopo, North-West Province, Gauteng Province and the Mpumalanga Province. It is estimated to have been formed approximately 2,000 million years ago (Ma). The BIC is host to PGM mineralisation in addition to chrome, vanadium, nickel and copper.
The five lobes are referred to as the Western, Eastern, Northern (includes both the Potgietersrus and Villa Nora compartments), South-Eastern, and Far-Western areas. The latter occurs as a limb-like extension to the west of the BIC and mainly comprises rocks of the Marginal and Lower zones, with some Critical and Main zone development. The South-Eastern BIC is completely covered by sedimentary successions of the Karoo Supergroup, while the remaining four lobes are variably exposed with some areas under extensive soil cover.
The Merensky and UG2 are products of primary magmatic mineralization within the BIC.
45
Figure 3. Regional geological setting – Bushveld Igneous Complex
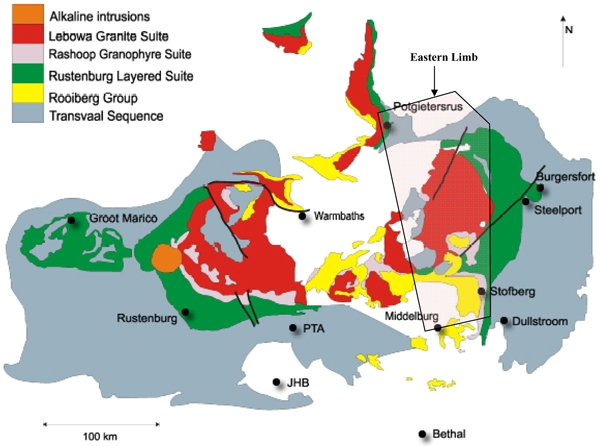
Local Geology
The Bokoni Mine is located on the northern extremity of the Eastern Limb of the BIC. The platiniferous horizons of economic significance occur within the Merensky and the UG2 horizons. PGM mineralization is specifically located within the Merensky horizon and the UG2 horizon, which forms part of the Upper Critical zone of the Rustenburg Layered Suite.
Both horizons sub crop and in some instances outcrop in the project area along a 16.5 km strike length. The BIC layering dips from northeast to southwest at approximately 25º in the north-western areas (Zeekoegat), and gradually decreases to approximately 18º in the south-eastern area (Brakfontein). The general structural geology is characterized by northeast and east trending dykes and faults with associated conjugated joint sets.
The mining area is located within the farms, Zeekoegat, Middelpunt, Umkoanestad and Brakfontein. The north-eastern portion of the mining area is located below a range of pyroxenite hills and the south-western portion is below the valley floor and is overlain by black turf.
The Merensky is a feldspathic pyroxenite reef horizon and is stratigraphically situated 350 m above the UG2 and is near the top of the Upper Critical Zone. The Merensky is located below the three to six meter thick Merensky Pyroxenite layer and above the Merensky Norite layers. Two thin chromite stringers are discontinuously developed with the upper stringer positioned 20 cm to 25 cm from the Merensky Pyroxenite hanging-wall contact, and the lower stringer located on or just above the Merensky Pyroxenite’s basal contact. In the absence of a consistently developed chromite stringer, the upper contact of the Merensky Pyroxenite layer assists to define the top position of the Merensky horizon and is a guide for sampling purposes and on-reef mining. The Merensky hanging wall stratigraphic sequence is typified by medium to coarse grained feldspathic lithologies, ranging in composition from mela-norites to anorthosites. The Merensky footwall stratigraphic sequence has a sharp footwall contact, usually marked by the lower chromite stringer. While the top contact tends to be planar, the basal contact is undulating as a result of thermo-chemical erosion of the more mafic Merensky lithologies with their underlying felsic lithologies. This contact is often associated with a thin anorthosite layer (approximately 3 cm thick) that probably formed as a secondary reaction product of thermal erosion.
46
The UG2 is stratigraphically situated approximately 350 m below the Merensky and is separated by a series of well layered sequences. The UG2 is comprised mainly of this well defined chromitite layer together with minor hanging wall and or footwall constituents. The average width of the UG2 is 70 cm. It is overlain by a medium-grained poikilitic feldspathic pyroxenite that averages 9.85 m in width, and hosts a variable number (generally up to four) of very thin chromitite layers. The position of these stringers is important to the mining of the UG2. The UG2 is underlain by a pegmatoidal feldspathic pyroxenite layer of approximately 0.75 m in width which is commonly host to disseminated chromite and some base metal sulphide occurrence within close proximity to the UG2. The UG2 elevation isopachs indicate a relatively undisturbed tabular and gently dipping layer. UG2 widths generally increase to the west from an average of 67 cm on Umkoanestad to 74 cm on Zeekoegat. There is no evidence of severe undulations to this layer that would adversely affect the planned mining method. Severe undulations of the UG2 are known to hamper mining by increasing dilution and off-reef mining.
Potholes are magmatic disturbances of the reef plane that are generally deep eroded depressions that have serious structural implications in respect of reef continuity. Merensky potholes, including those at the Bokoni Mine, have been well documented. Current indications are that potholes account for approximately 16% of the estimated total geological loss of 20%.
As with the Merensky, the UG2 is known to be affected by potholes. UG2 potholes typically have a “soup-bowl” profile. The characteristics of normal UG2 are not preserved in the Bokoni Mine potholes and the succession often occurs as a variably thickened feldspathic pyroxenite package, containing disrupted and discontinuous chromitite layers. As a result, grades within potholes are highly erratic and, invariably, sub-economic. UG2 potholes at the Bokoni Mine are commonly destructive and are not economically mineable. Geological pothole losses for the UG2 are estimated at 9% of the estimated total geological loss of 15% for the Bokoni Mine UG2.
The weathered overburden (soil and calcrete) depth across the Bokoni Mine is highly variable ranging from no overburden in the rocky outcrops and hill areas, to in excess of 50 m in the valley areas. The average overburden depths below surface are Zeekoegat 10 m, Middelpunt 22 m, Umkoanestad (valley) 30 m, Umkoanestad (mountain) 2 m and Brakfontein 40 m. The depth of oxidation may be reasonably estimated by adding 25 m to the overburden depth. A mineralogical study by Paetz & Reinecke (Dec 2002) has confirmed that the depth of oxidation in the vicinity of the Vertical Shaft is approximately 40 m.
The geological structure at the Bokoni Mine is not complicated with faulting. According to existing workings, minor faulting is expected to occur, and would consist of dextral and sinistral strike-slip faults, normal and reverse dip-slip faults and faults with more complex combinations of these components. Displacements are expected to be small, at generally£ 1 m. Major conjugate joint set orientations were measured from strong macro-lineament features evident from an aeromagnetic survey image and land satellite imagery which provided orientations in the order of 99° and 159°. Joint sets may result in poor ground conditions for mining but are not considered a geological loss.
An airborne aeromagnetic survey has successfully identified three to four swarms of northeast striking dolerite dykes. Post-mineralization dyke occurrences are noted on the Zeekoegat, Middelpunt and Umkoanestad farms. Current underground workings at Umkoanestad have intersected dykes up to 10 m wide. No serious problems were encountered during mining through these features, and no significant displacements were noted to be associated with them. The estimated geological loss associated with dykes across the property is 4 %. The aeromagnetic response to these features exaggerates the actual width dimension. Not all dykes have magnetic responses and a few (very minor proportion) east-west orientated dykes are known to have no magnetic response.
The BIC stratigraphy is sometimes affected by randomly occurring, late-stage replacement pegmatite bodies. These pegmatite bodies have a range of compositions from highly ultramafic to felsic. The Bokoni Mine is no exception to the occurrence of these geological features, but is noted to have minimal evidence for the more mafic replacement pegmatites. Geological losses are estimated at less than 3 % for replacement pegmatites.
Exploration
The geological exploration and evaluation process involves reconnaissance, planning, diamond drilling, core logging and sampling, trenching and sampling, soil sampling, aeromagnetics, ground magnetics, mapping, processing, interpreting and modelling.
The Bokoni Mine has been the focus of various exploration activities since 1964, with six phases of exploration having been carried out, all involving diamond drilling. Activities have centred on the Merensky, and only since 1999 has considerable focus been directed at the UG2.
The UG2 has limited exposure along the hills located along the northern boundary of the Bokoni Mine. Where the outcrop exists on the Umkoanestad and Wintersveld farms, it has been mapped. A number of dolerite dykes outcrop in these hills and have also been mapped. During 2002, a trenching program was conducted along the western UG2 outcrop areas on the Zeekoegat farm. Twenty-six trenches were excavated across this property, resulting in an accurately mapped UG2 sub crop position.
47
Routine underground exploration is conducted by means of mapping and diamond drilling. This serves to enhance the detail of geological information as the mine is developed.
Limited surface exploration was performed during 2012 in order to investigate opencast potential on the Klipfontein and Zeegoegat mineral properties. The explorations consisted of limited surface diamond core drilling and trench sampling.
Mineralization
Merensky mineralization
At the Bokoni Mine the mineralisation within the Merensky occurs at both the upper and lower chromitite stringers. Most of the PGMs are associated with the upper chromite stringer and often extend over wider intervals to below the chromite stringer. Mineralisation associated with the lower chromite stringer at the base of the Merensky is generally over a very narrow interval and is sometimes absent. High PGM grades are often associated with the lower chromite stringer, but due to its greater separation from the upper stringer, it was not included in the Mineral Resource estimates. The Merensky has visible base metal sulphides (commonly pyrite and pyrrhotite) and, as a result, may have viable concentrations of copper and nickel.
PGMs are commonly associated with base metal sulphides and are associated with the silicate and chromite minerals. The relative proportions of PGM content for the Merensky are colloquially known as the ‘prill split’. Prill splits are determined as part of the Mineral Resource estimation process. At the Bokoni Mine, the Merensky PGM prill split is Pt 61%, Pd 29%, Rh 4% and Au 6%.
UG2 mineralization
The UG2 mineralisation is comprised mainly of PGM accumulations that are hosted within the chromitite layers and have variable occurrences in the immediate footwall rocks, but very little in the hanging wall rocks. A 95 cm resource cut in most instances allows for the complete extraction of the mineral content. In the case of the presence of internal lenses (bifurcation) of pyroxenite, anorthosite or norite, the resource cut width may have to be increased to ensure that the UG2 is completely extracted.
The PGM mineralization occurs in solid solution with sulphides, sulpharsenides, arsenides, bismuthides, tellurides, bismuthotellurides and alloys. PGM-sulphides, tellurides, and alloys are the main constituents of mineralization in the UG2. The PGM prill split for the UG2 is broadly Pt 42%, Pd 46%, Rh 9%, and Au 2%.
Drilling
At the Bokoni Mine, after reconnaissance and planning, borehole drilling sites are identified using GPS technology and then drilled by a reputable South African contract drilling company. All diamond drilling of recent years has ensured intersections for both the Merensky and UG2 are drilled. The Merensky and UG2 are separated by some 350m of intermediate stratigraphy.
Surface drill holes are distributed across the Bokoni Mine mining licence area, with a closer drill grid spacing across the Brakfontein property. This is due to the targeting of the Brakfontein Merensky project and its associated study level requirements for obtaining higher confidence levels. The deeper areas have appropriately increased the drill grid spacing and are confirming the presence of the Merensky horizon.
Underground drilling is conducted ahead of the mining face to determine continuity of the reef, intersect gasses and water ahead of the mining face and to identify geological structures that may impact on mining.
Sampling and Analysis
Core logging and sampling
Core logging is undertaken by qualified geologists where all boreholes and their deflections are accurately logged in terms of lithology, mineralisation, alteration and structure. Logging details are entered directly into a database, making use of the Sable software package designed for this purpose. Geotechnical and structural logging is also carried out by geotechnical staff and structural geologists.
During the logging process, the sampling interval through the mineralised succession is determined and individual samples measured, marked-off and numbered according to standards. Sampling is done continuously throughout the sample section. Measurements and marking of sample lengths/widths are carried out according to the Bokoni Mine standards.
48
Once the sampling and logging of the boreholes is completed, the remaining core is stored on core racks. The sample intervals and numbers are replicated onto the remaining core surface for reference, and future re-sampling if necessary. The sampling data is fully documented and recorded on site, with records of all sampling maintained.
The sampled borehole core (intersections of Merensky and UG2) is then assayed for individual PGM content, as well as density and Cu and Ni contents.
Underground sampling
All on-reef development is sampled. The interval between sections is a minimum of 10 m and a maximum of 20 m. Advanced strike gully (“ASG”) sampling is done at 20 m intervals. ASG samples are approximately 30 m apart in the true dip direction. This creates a pseudo grid of 20 m by 30 m.
The sampler is responsible for accurately recording the true distance of the sampled sections from underground survey pegs. Underground sampling is typically done by means of cutting channels using a rotary diamond saw machine powered by compressed air.
The sampler records all geological features such as reef characteristics, prominent alterations, hanging wall or footwall, faults or dykes, potholes or major rolls and occurrences of reef left in the hanging wall or footwall. Deviations and anomalies are reported to the responsible geologist.
Each sample is carefully placed in a clean plastic bag and a bar coded sampling ticket is pasted on the bag and closed. Samples are captured in the Mineral Resources Management database by the sampler on the same day. The sampler is responsible for ensuring that his sections are captured correctly.
Sample preparation, analyses, and security
A variety of analytical techniques have previously been used in assaying samples. Since 2000, diamond core samples have been sent to Anglo Research (previously Anglo American Research Laboratory) in Crown Mines where they are analysed for PGMs, Ni and Cu. The laboratory is operated by a subsidiary of Anglo American and is International Standards Organisation 17025 accredited.
Core samples are cut, split, bagged and checked against accompanying sample requisition sheets and sample descriptions by the geology department after which they are dispatched for analysis.
Samples are analysed for Pt, Pd and Au using fire assay (lead-collector and gold as co-collector) with inductively coupled plasma (“ICP”) finish. 3E is Pt+Pd+Au, for Rh (where 3E is greater than 1.5 g/t) using fire assay (lead collector and palladium as co-collector) with ICP finish and Cu and Ni using X-ray fluorescent analysis. Density is measured using Grabner pycnometer.
The laboratory has a comprehensive assay quality control system that includes blanks, certified reference materials, in-house reference materials, and twin streaming/replicate analyses.
Care is taken during the handling of samples to avoid potential cross-contamination or misplacement of samples. High and low grade materials are processed in completely separate areas throughout the laboratory, using dedicated and clearly labelled equipment. Samples are weighed and checked upon receipt. Quarry quartz is crushed and milled between individual batches to avoid any possible carry-over. This quartz is analysed with the batch and this data reported on during progress meetings.
Apart from basic sample preparation, there is currently no analytical laboratory at the Bokoni Mine. The Bokoni Mine utilises the facilities at the Polokwane Smelter Complex (for assays of the mill feed, tailings and underground samples) and AR (assays of concentrate samples).
Bokoni Mine Operations
Mining operations began in 1969, initiated by Anglovaal, a traditional South African Mining House and OK Bazaars, a South African chain store. In 1970, the mine was sold to Rustenburg Platinum Mines, a subsidiary of JCI Limited (the historic mining house) in which Anglo American held a significant interest. In the mid-1990’s, JCI Limited was unbundled and its platinum interests listed separately as Lebowa, which later merged with other Anglo mines to become Anglo Platinum Limited.
The Bokoni Mine produces both Merensky and UG2 ore. Merensky production originated at the Vertical Shaft operations and was subsequently expanded to include the UM2 Decline operations and most recently the Brakfontein Shaft. UG2 production
49
commenced in 2001 at the Middelpunt Hill operations, via a number of adits and has recently developed into underground operation at the Middelpunt Hill.
The mining operation consists of a vertical shaft and three decline shaft systems to access underground mine development on the Merensky and UG2 reef horizons. The Bokoni Mine has installed road, water and power infrastructure, as well as two processing concentrators, sufficient to meet its operational requirements up to completion of its first phase growth plans in 2014. The Bokoni Mine has an extensive shallow ore body, capable of supporting a life-of-mine plan that is estimated to exceed 39 years. Current mining operations are being conducted at shallow depths, on average 200m below surface. This benefits the Bokoni Mine’s operations in that there are no major refrigeration (and consequent power) requirements at shallower mining depths.
The Bokoni Mine’s production for Fiscal 2012 averaged 95,000 tpm of ore for the nine months ended September 2012 from its UG2 and Merensky reef horizons. Production in Q4 2012 was impacted by illegal industrial action. UG2 production is mined exclusively from MPH which consists of four adits and two underground levels. Merensky ore is produced from three shafts, namely: Vertical shaft, UM2 shaft and Brakfontein shaft. The Vertical shaft, which started in 1973, is the oldest of the three shafts and currently accounts for the bulk of the Merensky production. Production at Vertical shaft is expected to be maintained at 35,000 tpm for the medium term. Merensky production from the UM2 shaft is expected to be maintained at its current production levels of 10,000 tpm over the next three years. The new Brakfontein shaft is in a ramp up phase and is planned to increase from its current production levels of 30,000 tpm, to a steady state production level of 120,000 tpm by 2018 (previously 2016 – extended as a result of a change in the life-of-mine plan). On completion of the initial ramp up phase to 2016, it is anticipated that the Bokoni Mine will produce 160,000 tpm of ore (240,000 PGM ounces per annum) consisting of 120,000 tpm from the Merensky reef and 40,000 tpm from the UG2 reef.
Given the magnitude of the Bokoni Mine’s ore body, lying open at depth with its numerous attack points, management is of the view that the Bokoni Mine has the potential to be developed into a 240,000 tpm (265,000 PGM ounces per annum) steady state operation in the medium to longer term.
The older Vertical and UM2 shafts make use of conventional mining methods for narrow tabular ore bodies. Ore broken in stopes is transported laterally by means of track bound equipment and then hoisted through a vertical shaft system at Vertical shaft and an incline shaft system at UM2 shaft. The Bokoni Mine will invest in maintenance of infrastructure at Vertical shaft to sustain mining at current rates for the next four to five years. Additional opportunities, such as vamping, will be employed to supplement volumes from these shafts. Further opportunities to increase the life-of-mine of these shafts will also be investigated in the short to medium term.
The new Brakfontein shaft is being developed on a semi-mechanized basis, using a hybrid mining method, whereby ore broken in stopes is loaded directly onto a strike conveyor belt and taken out of the mine through a main decline conveyer belt system. This results in less human intervention in the hoisting process and a resultant lower unit operating cost of production. Development of haulages and crosscuts are effected by means of mechanized mining methods, and stoping is conducted using hand held electric drilling machines.
The MPH shaft is in the process of converting the transport of broken ore from its current mechanized hauling system to a conveyor belt transport system similar to that of Brakfontein shaft. Vamping opportunities in the older adit areas are being investigated to supplement underground mining production.
The Bokoni Mine, at the current metal prices and U.S. Dollar exchange rate against the ZAR, is cash flow negative at an operational level (before depreciation and interest expense) as a result of the ramp up phase of the mine and operational issues (underperformance at certain shafts) currently being experienced. Management expects the Bokoni Mine to become cash flow positive after capital expenditure towards the end of 2015 if production levels increase and the commodity prices for the PGM basket and U.S. Dollar exchange rate against the ZAR continue at current levels. See “Cautionary Note Regarding Forward-Looking Statements”.
When Atlatsa took management control of the Bokoni Mine in 2009, the Company determined that the production rate should be increased significantly from levels of around 85 000 tonnes per month (tpm) to around 160 000 tpm, in order to reflect the true quality and scale of the Bokoni Mine mineral resource. The planned growth in production was to be achieved by realising the planned production ramp up at the newly developed Brakfontein merensky project.The Bokoni Mine was expected to increase production from 115 000 4E PGM ounces to 180 000 4E PGM ounces by 2014.
However, the original ramp up profile has proven difficult to achieve due to a number of technical and leadership challenges at Bokoni Mine, resulting in production remaining flat over the last two years under Atlatsa management. As a consequence, Atlatsa and its 49% interest partner, Anglo Platinum, undertook a strategic review of the Bokoni Holding Group, as well as key technical and financial assumptions informing the Bokoni Transaction. The outcome of the review resulted in a new strategic plan for the Bokoni Holdings Group, that would look to continue with production ramp up at the Brakfontein Shaft to 120 ktpm and grow production to 45 ktpm at the Middelpunt Hill Shaft. Whilst the Brakfontein and Middelpunt Hill projects are being
50
developed to steady state operations tonnage will be supplement from Vertical and UM2 shafts at a rate of 40 ktpm and the remained of the mill gap being supplemented from opencast surface sources.
Figure 4. LOM planned ore production
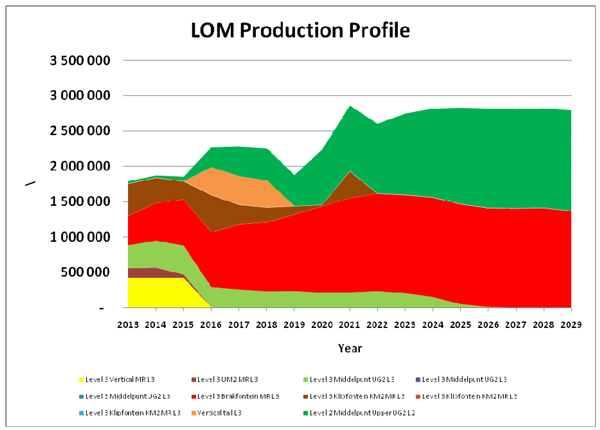
The Bokoni Mine lease area is extensive, covering some 15,500 ha including a strike length of almost 16.5 km and a dip length of almost 10 km. The Merensky and UG2 mineralized horizons are in the order of 300 m apart and either outcrop (in the hills) or sub crop (in the valleys) and extend to depths beyond 2,000 m below surface, towards the south-western boundary.
The above-mentioned extent of the Bokoni Mine requires a tailored depletion strategy, including various phases. Therefore the mining rights area has been divided into a series of mining blocks according to strike length, of approximately 6 km and depth, no more than nine production levels per shaft system.
The Bokoni Mine’s current depletion plan includes a generic access strategy which proposes a system of declines and vertical shafts to exploit the mining blocks. Initial access to the shallow Merensky and UG2 horizons is by means of separate decline shaft systems. These decline shaft systems will facilitate mining to a depth of approximately 650 m below surface. From the lowest level, vertical shafts will be raise-bored to surface and equipped to provide men and material access plus ventilation so that mining can continue to deeper levels. The access infrastructure is depicted in figure 5 below.
51
Figure 5. Bokoni Mine LOM infrastructure
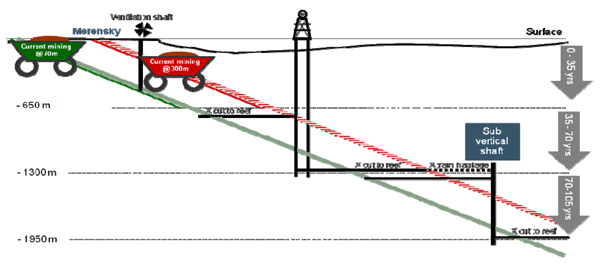
Various mining methods are employed at the Bokoni Mine. All stoping operations are conducted by means of hand held drills, with the removal of ore from stope panels done by means of scrapers and winches. Conventional development is conducted at Vertical and UM2 shafts. Development at Brakfontein and Middelpunt Hill is done by mobile Trackless equipment. Horizontal transport of ore is done by means of track bound locomotives at Vertical shaft and UM2 shafts. At Brakfontein, and increasingly at Middelpunt Hill, ore from stopes is tipped directly on conveyor belts that transport the ore horizontally and vertically out the mine. The use of load and haul trackless equipment is used extensively to move broken waste and ore to tips at Middelpunt Hill and Brakfontein.
Merensky ore is currently produced from the Vertical shaft and an inclined shaft on the adjacent Umkoanestad property (UM2 Inclined shaft). Production from these shafts is currently being phased out primarily because of the long distances between the shafts and the working places, and current Merensky production of 45,000 tpm is expected to be replaced by production from the Brakfontein Merensky Project (BRK Merensky Project), which is located in the south-eastern extremity of the Bokoni Mine.
Currently, UG2 ore is produced exclusively from the Middelpunt Hill shaft, which comprises a number of adits and underground development. Production from the adits will be exhausted in the near future and UG2 production will be replaced by production from underground development. Production at Middelpunt Hill is currently 35,000 tpm and will be increased to a steady state level of 120,000 tpm by 2020.
The Bokoni Mine currently has two concentrator plants, one for the processing of ore from the Merensky ore and the other for the processing of ore from the UG2. These concentrators are situated adjacent to one another close to the Vertical shaft.
The Merensky concentrator (capacity 100 ktp) is currently dedicated to processing Merensky ore from the Vertical shaft, UM2 Inclined shaft and Brakfontein shaft. The UG2 concentrator (capacity 65 ktp) is dedicated to processing ore from the Middelpunt Hill UG2 adits and decline. Capacity at the UG2 concentrator is planned to be increased by 100,000 tpm by 2015.
Merensky MF3 Plant
The current 100 ktp Merensky concentrator, built in 1990/91 was upgraded in 2009 from 85 ktp to 100 ktp. The concentrator includes three milling stages with inter-stage flotation circuits. By today’s standards, the Merensky concentrator employs older technology but nevertheless maintains high operating efficiencies and availability.
UG2 MF2 Plant
The 65 ktp UG2 concentrator includes two milling stages with inter-stage flotation circuits (MF2). It is a dedicated concentrator, constructed in 2000 to treat UG2 ore that has subsequently been mined at the Middelpunt Hill adits. The UG2 concentrator can treat Merensky ore and tests conducted, indicated that acceptable recoveries on Merensky Reef was achieved. Approximately 20 ktp of Merensky ore will be treated in the UG2 concentrator when Merensky production reaches a steady state of 120 ktp. The UG2 concentrator is located adjacent to the Merensky concentrator and is similarly well maintained, providing good operating availability.
Merensky and UG2 concentrates are stored separately ahead of the common Larox concentrate filter. Filtration is conducted on a campaign basis and the capacity is adequate for current production.
52
Merensky concentrate is filtered to a moisture content of about 5% and UG2 concentrate to about 14%. The difference is due to the different particle sizes of the products. The smelter requires a moisture content of less than 15%, therefore in both cases the concentrate is within the moisture specification.
All of the Bokoni Mine’s concentrate is currently supplied to Anglo Platinum’s Polokwane Smelter Complex pursuant to an agreement between the Bokoni Mine and Anglo Platinum (through RPM). The Refiner (RPM) pays Bokoni Mine monthly for Bokoni Mine’s concentrate. The price payable is based on a fixed market-related percentage of the equivalent ZAR price for the various metals for the preceding month, taking into account the costs of smelting and refining to be incurred by RPM.
As per common practise in concentrate sale agreements, various penalties, for concentrate not meeting the agreed specification, are provided for in the off-take agreement and are deductible from the price payable for concentrate. These costs include penalties for excess moisture or chrome and concentrate grade below 185 g/tonne (4E).
Estimates of Mineralization
The Mineral Resource and Reserve estimates are compiled in accordance with the SAMREC Code.
Cautionary Note to Investors Concerning Estimates of Measured and Indicated Resources
This Annual Report uses the terms “measured resources” and “indicated resources”. Atlatsa advises investors that while those terms are recognized and required by Canadian regulations, the SEC does not recognize them. Investors are cautioned not to assume that any part or all of mineral deposits in these categories will ever be converted into reserves.
Cautionary Note to Investors Concerning Estimates of Inferred Resources
This Annual Report uses the term “inferred resources”. Atlatsa advises investors that while this term is recognized and required by Canadian regulations, the SEC does not recognize it. “Inferred resources” have a great amount of uncertainty as to their existence, and as to their economic and legal feasibility. It cannot be assumed that all or any part of a mineral resource will ever be upgraded to a higher category. Under Canadian rules, estimates of Inferred Mineral Resources may not form the basis of economic studies, except in rare cases. Investors are cautioned not to assume that any part or all of an inferred resource exists, or is economically or legally mineable.
See the “Cautionary Note to U.S. Investors”.
Investors should refer to the disclosure under the heading “Resource Category (Classification) Definition” in the “Glossary of Terms”.
Mineral Resource and Mineral Reserve estimates are reported as follows for the Bokoni Mine properties (including the existing Bokoni Mine, and planned project expansions at Brakfontein and Middlepunt). Mineral Resources (Remaining Resources) are also reported for the regions outside of the existing mine plans and project expansion plans but within the Bokoni Mine properties.
The annual Mineral Resource and Reserve Statement for the Bokoni Mine were updated as of December 31, 2012. The QPs responsible for the updating of the mineral resource is Mr G. Mitchell Pri. Sci. Nat., Mr A. Deiss, Pri. Sci. Nat. and Dr W.D. Northrop., (Independent consultants at ExplorMine). The QP responsible for updating the mineral reserve is Mr. B. Reddy, Pri. Sci. Nat. (Executive: Mineral strategy and exploration at Atlatsa). In the opinion of the QPs, there are no material changes in the resource and reserve estimates of 2012 as compared to the 2011 mineral resource and reserve estimates as quoted in the Technical report.
The Mineral Resource and Reserve Estimates as at December 31, 2012 are shown in Tables 3 and 4 below. Mineral Resource estimates in the tables include Mineral Reserves. There have been no material changes in the Mineral Resource and Reserve year on year. The major difference is due to depletion by mining activities over the last year.
53
Table 5: Mineral Reserves Tabulation for the Bokoni Mine as at December 31, 2012
| | | | | | | | | | | | | | | | | | | | | | | | | | | | | | | | | | | | | | | | | | | | |
Bokoni Platinum Mine | | Total | | | Attributable to Atlatsa
Resources | | | Pt
Grade
g/t | | | Pd
Grade
g/t | | | Rh
Grade
g/t | | | Au
Grade
g/t | |
| | | | | Reef
type | | Mt | | | Grade
4E g/t | | | Containing
4E Moz | | | Attributable
% | | | Mt | | | Grade
4E g/t | | | | | |
| Ore Reserves | | Proved | | MR | | | 21.2 | | | | 4.08 | | | | 2.8 | | | | 51.0 | | | | 10.8 | | | | 4.08 | | | | 1.68 | | | | 1.99 | | | | 0.34 | | | | 0.07 | |
| | Probable | | MR | | | 8.1 | | | | 3.67 | | | | 1.0 | | | | 51.0 | | | | 4.1 | | | | 3.67 | | | | 1.51 | | | | 1.79 | | | | 0.30 | | | | 0.07 | |
| | | | | | | | | | | | | | | | | | | | | | | | | | | | | | | | | | | | | | | | | | | | |
| | Total Reserve | | MR | | | 29.3 | | | | 3.97 | | | | 3.7 | | | | 51.0 | | | | 14.9 | | | | 3.97 | | | | 1.63 | | | | 1.94 | | | | 0.33 | | | | 0.07 | |
| | | | | | | | | | | | | | | | | | | | | | | | | | | | | | | | | | | | | | | | | | | | |
| | | | | | |
Bokoni Platinum Mine | | Total | | | Attributable to Atlatsa
Resources | | | Pt
Grade
g/t | | | Pd
Grade
g/t | | | Rh
Grade
g/t | | | Au
Grade
g/t | |
| | | | | Reef
type | | Mt | | | Grade
4E g/t | | | Containing
4E Moz | | | Attributable
% | | | Mt | | | Grade
4E g/t | | | | | |
| Ore Reserves | | Proved | | UG2 | | | 17.0 | | | | 5.50 | | | | 3.0 | | | | 51.0 | | | | 8.7 | | | | 5.50 | | | | 2.27 | | | | 2.69 | | | | 0.45 | | | | 0.10 | |
| | Probable | | UG2 | | | 20.8 | | | | 5.26 | | | | 3.5 | | | | 51.0 | | | | 10.6 | | | | 5.26 | | | | 2.17 | | | | 2.57 | | | | 0.43 | | | | 0.10 | |
| | | | | | | | | | | | | | | | | | | | | | | | | | | | | | | | | | | | | | | | | | | | |
| | Total Reserve | | UG2 | | | 37.8 | | | | 5.37 | | | | 6.5 | | | | 51.0 | | | | 19.3 | | | | 5.37 | | | | 2.21 | | | | 2.62 | | | | 0.44 | | | | 0.10 | |
| | | | | | | | | | | | | | | | | | | | | | | | | | | | | | | | | | | | | | | | | | | | |
Notes:
| (1) | The QP responsible for the compilation of the mineral reserves is B. Reddy, B.Sc. Pri Sci. Nat., Executive : Mineral Resource Management at Atlatsa. |
| (2) | The mineral reserves are inclusive of dilution and recovery factors. |
| (3) | The grade indicated is the mill delivered grade. |
A cut-off grade of 2.58 g/t for the Merensky Reef was applied.
A cut-off grade of 3.23 g/t for the UG2 Reef was applied.
| (4) | Metal price assumptions of US$1,500/oz platinum, US$478/oz palladium, US$2,000/oz rhodium and US$1,200/oz gold were used in the estimation of mineral reserves. |
| (5) | 4E is the sum of platinum (Pt), palladium (Pd), rhodium (Rh) and gold (Au). |
Table 6: Mineral Resources Tabulation for the Bokoni Mine as at December 31, 2012
| | | | | | | | | | | | | | | | | | | | | | | | | | | | | | | | | | | | | | | | | | | | |
Bokoni Platinum Mine | | Total | | | Attributable to Atlatsa
Resources | | | 3Pt
grade
g/t | | | Pd
grade
g/t | | | Rh
grade
g/t | | | Au
grade
g/t | |
| | | | | Reef
type | | Mt | | | Grade
4E g/t | | | Containing
4E Moz | | | Attributable
% | | | Mt | | | Grade
4E g/t | | | | | |
| Mineral Resources | | Measured | | MR | | | 42.8 | | | | 5.16 | | | | 7.1 | | | | 51.0 | | | | 21.8 | | | | 5.16 | | | | 3.17 | | | | 1.51 | | | | 0.18 | | | | 0.31 | |
| | Indicated | | MR | | | 53.6 | | | | 4.88 | | | | 8.4 | | | | 51.0 | | | | 27.3 | | | | 4.88 | | | | 3.00 | | | | 1.42 | | | | 0.18 | | | | 0.29 | |
| | Meas + Ind | | MR | | | 96.3 | | | | 5.01 | | | | 15.5 | | | | 51.0 | | | | 49.1 | �� | | | 5.01 | | | | 3.07 | | | | 1.46 | | | | 0.18 | | | | 0.30 | |
| | Inferred | | MR | | | 128.8 | | | | 4.89 | | | | 20.2 | | | | 51.0 | | | | 65.7 | | | | 4.89 | | | | 3.02 | | | | 1.41 | | | | 0.17 | | | | 0.30 | |
| | | | | | | | | | | | | | | | | | | | | | | | | | | | | | | | | | | | | | | | | | | | |
| | Total Resource | | MR | | | 225.1 | | | | 4.94 | | | | 35.8 | | | | 51.0 | | | | 114.8 | | | | 4.94 | | | | 3.04 | | | | 1.43 | | | | 0.17 | | | | 0.30 | |
| | | | | | | | | | | | | | | | | | | | | | | | | | | | | | | | | | | | | | | | | | | | |
| | | | | | |
Bokoni Platinum Mine | | Total | | | Attributable to Atlatsa
Resources | | | Pt
grade
g/t | | | Pd
grade
g/t | | | Rh
grade
g/t | | | Au
grade
g/t | |
| | | | | Reef
type | | Mt | | | Grade
4E g/t | | | Containing
4E Moz | | | Attributable
% | | | Mt | | | Grade
4E g/t | | | | | |
| Mineral Resources | | Measured | | UG2 | | | 96.3 | | | | 6.50 | | | | 20.1 | | | | 51.0 | | | | 49.1 | | | | 6.50 | | | | 2.68 | | | | 3.17 | | | | 0.53 | | | | 0.12 | |
| | Indicated | | UG2 | | | 124.3 | | | | 6.30 | | | | 25.2 | | | | 51.0 | | | | 63.4 | | | | 6.30 | | | | 2.62 | | | | 3.04 | | | | 0.53 | | | | 0.11 | |
| | Meas + Ind | | UG2 | | | 220.6 | | | | 6.39 | | | | 45.3 | | | | 51.0 | | | | 112.5 | | | | 6.39 | | | | 2.64 | | | | 3.10 | | | | 0.53 | | | | 0.11 | |
| | Inferred | | UG2 | | | 147.6 | | | | 6.40 | | | | 30.4 | | | | 51.0 | | | | 75.3 | | | | 6.40 | | | | 2.61 | | | | 3.15 | | | | 0.52 | | | | 0.12 | |
| | | | | | | | | | | | | | | | | | | | | | | | | | | | | | | | | | | | | | | | | | | | |
| | Total Resource | | UG2 | | | 368.2 | | | | 6.39 | | | | 75.7 | | | | 51.0 | | | | 187.8 | | | | 6.39 | | | | 2.63 | | | | 3.12 | | | | 0.53 | | | | 0.12 | |
| | | | | | | | | | | | | | | | | | | | | | | | | | | | | | | | | | | | | | | | | | | | |
Notes:
| (1) | The QPs responsible for the compilation of the mineral resources are G. Mitchell Pri. Sci. Nat., A. Deiss Pri. Sci. Nat. and Dr. W. Northrop. All QPs are independent consultants to Atlatsa. |
| (2) | The mineral resources are inclusive of mineral reserves. |
| (3) | The mineral resources are inclusive of dilution and recovery factors. |
| (4) | A cut-off grade of 2.58 g/t for the Merensky Reef was applied. |
54
A cut-off grade of 3.23 g/t for the UG2 Reef was applied.
| (5) | Metal price assumptions of US$1,500/oz platinum, US$478/oz palladium, US$2,000/oz rhodium and US$1,200/oz gold were used in the estimation of mineral resources. |
| (6) | 4E is the sum of platinum (Pt), palladium (Pd), rhodium (Rh) and gold (Au). |
Estimation Methods
The Mineral Resource estimates for precious and base metal grades, thickness, density take a practical mining width cut into account. The total 4E PGM grade is the summation of the individual prill split grades for Pt, Pd Rh and Au.
The modelling procedure adopted was as follows:
| | • | | the overall dip per farm was used to calculate the true reef thickness. Dip corrections were applied for true mining cut thickness per area, taking average dip angles into account: |
| | |
Zeekoegat and Diamand: | | 25° |
Middelpunt: | | 22° |
Umkoanestad: | | 18° |
Brakfontein: | | 16° |
| | • | | Modelling was completed using Datamine mining software in two dimensions. |
| | • | | The validated boreholes and underground samples were combined, compared and investigated geostatistically in order to characterize and optimise the estimation process. |
| | • | | Statistical and variogram analyses were completed. |
| | • | | The reef was investigated for the presence of distinct geological and statistical domains. |
| | • | | The ordinary kriging estimation technique was used for estimation of all the variables. |
| | • | | For the block model estimates, block size dimensions of 250 m by 250 m were used within and immediately adjacent to workings. The block dimension for the remainder of the area was 500 m by 500 m. |
| | • | | A minimum of seven and a maximum of thirty samples were required within the search ellipse for interpolation. This was kept the same for all variables. |
| | • | | The resource tonnages were estimated using kriged density and thickness estimates, modified by dip correction factor and geological loss factor. |
| | • | | The Mineral Resource estimates used for mine planning and reporting are contained in a block model that is a combination of the kriged hangingwall, channel and footwall layer estimates, weighted according to the kriged density and respective thicknesses. |
| | • | | The Mineral Resource estimate considers optimum stope width cuts. |
No geotechnical considerations were necessary for consideration during resource estimation due to the absence of chromite stringers or other sharp lithological contacts located in the direct hanging wall of the Merensky.
The Mineral Resource Management (MRM) underground sampling database and the Sable borehole database data were used for resource estimation. The Sable database has provision for storing prill, density and base metal analysis whereas the underground sample sections (MRM) can only store 4E grades. All data used was converted to WGS84 (LO31) format in 2003.
No PGM correction factor was applied to the borehole or underground sample values.
Where samples have missing density values the mean density values per rock type were assigned and then used during compositing and estimation. Assigned values were not used for statistical analysis or variogram modeling. The Resource and Reserve conversion factors used for the estimation are shown in table 7 below
Table 7: Resource and Reserve conversion factors
| | | | | | | | | | | | | | | | | | | | | | | | | | | | |
Reef Type | | Geological
Loss | | | Dip | | | Pillar
Losses | | | Extraction
% | | | Dilution
by
Mining
Activities | | | MCF | | | Off
Reef
Dilution | |
UG2 | | | 11 | % | | | 21 | o | | | 10.6 | % | | | 89.4 | % | | | 6 | % | | | 94.2 | % | | | 5.7 | % |
Merensky | | | 17.5 | % | | | 22.8 | o | | | 6.9 | % | | | 93.1 | % | | | 7.9 | % | | | 97 | % | | | 5.7 | % |
Known issues that materially affect mineral resources and mineral reserves
The Company is currently unaware of any issues that materially affect these Mineral Resources and Mineral Reserves. The Bokoni Mine has successfully mined and processed Merensky Reef and UG2 and have economically produced 4E concentrate for the last twenty five years.
A complete risk assessment for Mineral Resource and Reserve estimates is undertaken annually. The assessment is based upon the SAMREC codes Appendix 1 checklist and provides the competent persons with a comprehensive understanding of the risks that may affect their estimates. The risk assessment is an initial step identifying risk items that require elimination, mitigation or tolerance of the risk, after which action is taken, and controls are implemented for monitoring progress. The risk assessment follows a standard method of a semi-quantitative measurement based on the concept of risk as a product of probability and consequence.
Tax and Royalties
The current South African Income tax regime for companies applies to Bokoni Mine and includes the following tax regime:
| | • | | Company income tax rate of 28 % on taxable income. |
| | • | | Secondary tax on companies (“STC”), a tax on dividends declared, of 10%, until March 2012, after which STC is abolished and replaced with 15% withholding tax. |
The South African mining sector enjoys immediate tax relief on capital expenditure i.e. capital expenditure can be off-set against taxable profit in the year it is incurred (or can be carried forward to create a tax shield) i.e. capital expenditure is not depreciated or amortized for tax purposes.
The South African government has enacted the Royalty Act, which imposes a royalty payable to the South African government by business based upon financial profits made through the transfer of mineral resources. The legislation was passed on November 17, 2008 and came into operation on March 1, 2010.
As a result of the legislation resulting from this Royalty Act, a royalty will be levied for the benefit of the National Revenue Fund of the government of the Republic of South Africa. The amount levied is based on a percentage calculated by a formula, up to a maximum of 5% on gross sales of refined mineral resources and 7% on gross sales of unrefined mineral resources.
The ultimate royalty to be charged is formula-based, varying according to the profitability of mining operations. As the Bokoni Mine produces metal-in-concentrate (unrefined mineral resources) the minimum royalty payable with effect from March 1, 2010 is 0.5% of gross sales and the maximum royalty payable is 7% of gross sales, based on the following formula:
Royalty percentage payable on gross sales of unrefined metal produced = 0.5 + [(EBIT x 9)/gross sales]. The calculated royalty tax percentage for Bokoni Mine was the minimum percentage of 0.5% (2010 0.5%). For the 12 months ended December 31, 2012 the royalty expense was $0.5 million as compared to $0.6 million for the 12 months ended December 31, 2011.
Life of Mine
The Life of Mine (“LOM”) strategy entails the mining of both the UG2 and Merensky reefs from the various shafts. The UG2 reef will be mined at Middelpunt Hill shaft, whilst the Merensky reef will be mined at Vertical shaft, UM2 shaft and Brakfontein shaft. The LOM for Bokoni Mine is in excess of 30 years.
The current LOM plan increased from about 1.48 Mtpa in 2013 to a steady state level of approximately 2.7 Mtpa by 2017 and maintained till 2029 without any further replacement projects. Replacement projects are earmarked to maintain the production profile from 2030.
Plans for Expansion
Current production levels at Bokoni Mine are approximately 100 ktpm of ore from its UG2 and Merensky horizons. UG2 production is exclusively from the Middelpunt Hill operations, which consists of four adits and a decline system that access two underground levels. Merensky production is from the Brakfontein, Vertical and UM2 Shafts.
Production at the Vertical and UM2 shafts are expected to be scaled down over the next three to five years and Merensky production will be exclusively from the Brakfontein operations. Production at Brakfontein is expected to be ramped from from its current level of 30 ktpm to 120 ktpm over the next five to seven years.
56
UG2 production at Middelpunt is expected to be ramped up to 45 ktpm with the next three years by continuing with the underground decline to access another level.
The planned production increase results from the development of Atlatsa’s existing proven and probable reserves. No new surface infrastructure is required for the expansion as this is derived from development of the underground infrastructure at the existing Brakfontein and Middlepunt Hill shafts.
There are a number of opportunities to increase production by the development of new shafts at Zeekoegat and mining UG2 from the Brakfontein infrastructure. Bokoni Mine also has extensive resources at depth, below the current Vertical and UM2 operations.
Environmental liabilities and matters
The Bokoni Mine had environmental liabilities estimated at $9.8 million at December 31, 2012.
The Company intends to finance the ultimate rehabilitation costs from the money invested in environmental trust funds, ongoing contributions, as well as the proceeds on sale of assets and metals from plant clean-up at the time of mine closure.
The Company currently had $3.3 million invested in Environmental Rehabilitation Trust Funds at December 31, 2012.
The South African National Environmental Management Act 107 of 1998 (“NEMA”), which applies to all prospecting and mining operations, requires that these operations are carried out in accordance with generally accepted principles of sustainable development. It is a NEMA requirement that an applicant for a mining right must make prescribed financial provision for the rehabilitation or management of negative environmental impacts, which must be reviewed annually. The financial provisions deal with anticipated costs for:
| | • | | planned decommissioning and closure; and |
| | • | | post closure management of residual and latent environmental impacts. |
The shortfall of $6.5 million between the funds invested in the environmental trust fund and the estimated rehabilitation cost is funded through guarantees from Anglo Platinum and will be re-negotiated in June 2013.
Atlatsa’s mining and exploration activities are subject to extensive environmental laws and regulations. These laws and regulations are continually changing and are generally becoming more restrictive. The Company has incurred, and expects to incur in future, expenditures to comply with such laws and regulations, but cannot predict the full amount of such future expenditures. Estimated future reclamation costs are based principally on current legal and regulatory requirements.
Currently, the most significant environmental liabilities that have been identified at Bokoni Mine are dust generation from the tailings dams and seepage of contaminated water from the settling dams.
The consolidated Merensky tailings dam at the Bokoni Mine has been identified as a major source of dust in this relatively arid area. At present, some remedial steps have been undertaken to allay the dust and these include partial vegetation of the slopes of the dam as well as constructing wind-screens on the top of the dam. Both are considered inadequate and in the longer term as legislation becomes stricter it is expected that the slopes and top of the tailings dams will have to be clad with rock and/or adequately vegetated.
Initial shallow underground mining at the Bokoni Mine intersected both weathered and fractured overlying aquifers. Therefore, there is an ongoing seepage of ground water into the workings from the Rapholo River. In addition, water from the decant water catchment dam below the tailings dam also seeps into the workings. Total ingress is in the order of 11,000 cubic metres per day. Subsequently there is on-going pumping of a significant amount of water out of the mines and into surface settling dams. Currently, the existing Water Usage Licence (“WUL”), granted in October 2008, permits discharge up to 1.9 million cubic metres of water annually into the Rapholo River until April 2009. The Bokoni Mine requested an amendment to the WUL, which was declined by the Department of Water Affairs, but an appeal was submitted to the water tribunal. Currently a water study is in progress to update the water model for the mine, to increase the understanding of the aquifer. No water was discharged into the Rapholo River during 2012.
57
The Ga-Phasha Project
The following technical information (page 57 to page 64) is derived from the technical report by ExplorMine Consultants, written in compliance with NI 43-101 and the CIM Definition Standards, which describes the Ga-Phasha Project’s mineral exploration. The March 2012 Technical Report is based on a detailed technical review of work performed by others and completed by the following independent qualified persons: A. Deiss, B.Sc.(Hons), Pr.Sci.Nat., MSAIMM, B. Northrop, PhD, GDE, Pr.Sci.Nat., FGSSA, FSAIMM, G. Mitchell, B.Sc.(Hons), B.Com, Pr.Sci.Nat., MSAIMM, MGSSA.
Agreements
Atlatsa holds a 51% interest in the Ga-Phasha property through Holdco as described under Item 4.A. above. The Ga-Phasha Project will be divided into an eastern section comprising the farms Pashaskraal and Avoca and a western section comprising the farms Klipfontein and De Kamp. On completion of the refinancing transaction, referred to under Item 4 under “Restructure Plan”, the eastern portion of the Ga-Phasha Project will be sold to Anglo Platinum and the western portion will be incorporated into the adjacent Bokoni Mine.
Location and Property Description
The Ga-Phasha Project is located on the Eastern Limb of the BIC in South Africa, approximately 45 km north northwest of the Limpopo Province town of Steelpoort and 250 km northeast of Johannesburg. The property consists of four farms, covering an area of approximately 9,700 ha, held by GPM, a wholly owned subsidiary of Bokoni Holdings.
The Ga-Phasha Project area is located on the northern extremity of the Eastern Limb of the BIC. The platiniferous horizons of interest at the Ga-Phasha Project area are the Merensky and the UG2 reefs, located in lithologies of the Critical Zone of the Rustenburg Layered Suite. In the Eastern Limb, the Critical Zone is developed over about 150 km of strike length in three areas separated by regional faulted systems. The Merensky Reef and UG2 outcrop over about 130 km, but also occur in down-faulted blocks and erosional outliers. In the Eastern Limb, the Merensky Reef comprises a facies somewhat different when compared to the equivalent reef that is developed within the Western Limb. In common, however, is the fact that in both the Eastern and Western Limbs, the mineralisation is hosted within the pyroxenite and between relatively narrow (2 mm to 5 mm) chromitite layers. The chromitite forms useful mining contacts that visually define the position of the orebody.
Distinctive pegmatoidal pyroxenite, such as that which contains the bulk of the mineralisation of the Merensky Reef in the Western Limb is present beneath the lower chromitite stringer in the Eastern Limb and, while this unit does contain elevated Platinum Group Elements (“PGE”) grades, the bulk of the continuous mineralisation is located within non-pegmatoidal (“porphyritic”) pyroxenite, but between two chromitite stringers.
Both the Merensky Reef and UG2 Reef horizons subcrop and in some instances outcrop in the area along a northwest-southeast trending strike length. The BIC layering dips from northeast to southwest at approximately 14º to 18º. The general structural geology is characterised by north-northeast and west-east trending dykes and faults with associated conjugated joint sets.
Several structural and lithological features occur locally in the Ga-Phasha Project area which remove or result in the disruption of normal Merensky and UG2 Reef occurrence and mineralisation, these include:
| | • | | Potholes which occur in both the Merensky and UG2 Reefs |
| | • | | Bifurcation recorded only in the UG2 Reef horizon |
| | • | | Dykes including dolerite, diabase, lamprophyre and syenite dykes |
| | • | | Structural breaks including faults, shears and joints |
| | • | | Alteration features including veins and alteration zones |
| | • | | Pegmatiods and dunite replacement of the reefs |
The origin of the PGE’s in the Merensky and UG2 Chromitite remains contentious and several hypotheses explain some of the features observed.
The mining and exploration techniques employed at Bokoni Mine are well established within the BIC style mineralisation. PGM mineralisation includes platinum (Pt), palladium (Pd), rhodium (Rh), ruthenium (Ru), osmium (Os) and iridium (Ir). The precious metals gold (Au) and silver (Ag) and the base metals chrome (Cr), iron (Fe,) cobalt (Co), nickel (Ni) and copper (Cu) are often associated with PGM metals.
A combination of desurveyed surface borehole reef intercepts, previous structural interpretations, topography and an interpreted aeromagnetic survey was used by ExplorMine to complete a first principles structural interpretation. The top contacts, as determined during the reef coding process, of the Merensky and UG2 Reefs were wireframed as continuous surfaces honouring intersections.
58
Utilising boundary polygons and the reef intersections, wireframe surfaces were gridded. Mother surface boreholes were always used as the dominant indication of the surface as these intersections have downhole surveys. Where the mother borehole intersection was not available the next sequential intersection was utilised.
Figure 6. Mineral Rights Holdings, Ga-Phasha Project Area
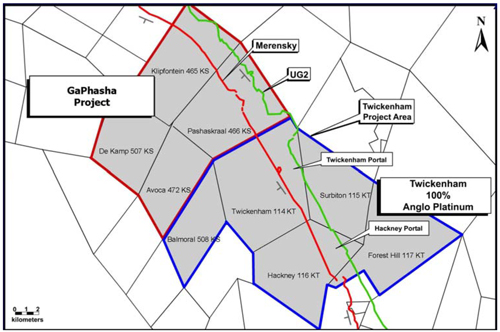
A new order mining right (LP 30/5/1/2/2/108MR) for the farms De Kamp 507KS, Avoca 472KS, Klipfontein 465KS, Portion 1 and remaining extent of Paschaskraal 466KS is in place.
Surface rights on Paschaskraal 466KS, Klipfontein 465KS, De Kamp 507KS and Avoca 473KS are held by the state in trust for local tribal authorities.
There are no known environmental liabilities that the Company is aware of relating to the Ga-Phasha project.
Accessibility, Climate, Local Resources, Infrastructure and Physiography
The Ga-Phasha site is located in a region of sparse development with little infrastructure. Access to the site is gained via gravel roads from Steelpoort or Burgersfort to the southeast and from Polokwane approximately 80 km to the northwest. Ga-Phasha is also accessible from the adjacent Bokoni Mine.
Recent development at the neighbouring Twickenham-Hackney mine has improved the local infrastructure considerably. This includes paved roads, power lines, and water supplies.
The climatic conditions of the Ga-Phasha area are typical of the Limpopo Province. Summer day temperatures are warm to hot, averaging 26 to 30 degrees celsius, and the winter months are moderate to cool. The area is considered semi-arid, with annual rainfall of approximately 529 mm per annum, which is below the average rainfall for South Africa. The rainy season extends over the summer months of October through April.
The general topography of the area is defined by a relatively flat valley, flanked by pronounced north-west to south-east trending mountain ranges that are located on the north-eastern and south-western sections of the property. Extensive settlements have been developed at the foot of both these mountain ranges. The area between the villages where the land is flatter has been broken up into small farming units or plots for cultivating crops.
59
History
The Ga-Phasha and adjacent Bokoni Mine have undergone several ownership and name changes since commissioning. The present day Bokoni Mine was commissioned as Atok Platinum Mine (Pty) Limited by Anglo Transvaal Consolidated Mines (“Anglovaal”) in 1969 and was subsequently acquired together with the Ga-Phasha Project area by RPM in 1977. RPM was a subsidiary of Johannesburg Consolidated Investments Limited (“JCI”), in which Anglo American Corporation (“AAC”) held a significant equity interest.
In the mid-1990s, JCI was ‘unbundled’ and its platinum interests were listed separately as Lebowa, which was later merged with Anglo Platinum’s other mines to become a wholly owned subsidiary of Anglo Platinum.
In 2008, Atlatsa entered into a Transaction Framework Agreement with Anglo Platinum, whereby Anglo Platinum sold to Atlatsa an effective 51% of Lebowa and an additional 1% interest in each of the Ga-Phasha, Boikgantsho and Kwanda Joint Venture Projects, resulting in Atlatsa holding a controlling interest in each of these projects, for a total cash consideration of ZAR3.6 billion. Lebowa was later renamed Bokoni Mine.
Anglovaal drilled 15 shallow Merensky Reef boreholes on the farm Klipfontein during the 1960’s. An extensive trenching programme along the UG2 Reef outcrop comprising 30 trenches was also conducted. The results of these programmes were obtained by RPM as part of the procurement of Anglovaal’s Atok interests.
The farm Paschaskraal had been the focus of Anglovaal’s drilling program in the 1960’s prior to the acquisition of the mineral rights by RPM and included boreholes to intersect the Merensky Reef. JCI/RPM had, however, secured significant mineral rights over properties held in trust by the South African Government for various indigenous tribes on the Eastern Limb and exploration was progressed in order to determine the geological extent and characteristics of the Merensky and UG2 mineralisation. In the 1980’s, JCI drilled additional boreholes to intersect the UG2 and Merensky Reefs.
Significant interest in the Eastern Limb was initiated in 1999 and was driven by the increasing demand (and robust forecast of demand) for PGMs. Since 2001, Anglo Platinum exploration activities have continued with a number of major exploration drilling programmes and related activities after a strategic decision to increase total PGM production. The UG2 was identified as a major target in the Ga-Phasha Project area.
Recent exploration activities by Anglo Platinum (up to 2008) have included the upgrading of the geological mineral resources for the area and diamond drilling to improve the overall coverage.
Several sets of exploration and mining data and associated sampling and assay data have been acquired over time in the Ga-Phasha Project area by previous and current owners. The standards applicable to the collection and interpretation of these data have largely remained consistent. The exploration data includes the following:
| | • | | Underground channel sampling (sourced from Bokoni Mine) |
| | • | | Surface geological mapping |
| | • | | Underground geological mapping (sourced from Bokoni Mine) |
Diamond drilling represents the largest exploration datasets for the Ga-Phasha Project area.
The bulk of the surface drilling in the Ga-Phasha Project area has been conducted during ownership of Anglo Platinum. Anglo Platinum employed contractors to conduct the drilling activity although diamond core logging and sampling was conducted by Anglo Platinum staff at the Driekop Exploration Base (located approximately 50 km southeast of Bokoni Mine). No single drilling contractor was used to complete the drilling and contracts were put out to tender at the beginning of each exploration phase.
There has been a considerable amount of exploration on the Klipfontein and Paschaskraal farms by past operators such as JCI, Anglovaal and Anglo Platinum, with well over 300 drill holes completed.
Initial metallurgical test work by Anglo Platinum showed a very good flotation response with negligible effects from dilution and with platinum group element recoveries ranging from 92.7% to 96.5%. The good flotation response was attributed to the predominant association of PGM with base metal sulphides, which are coarser than those present in UG2 in the western Bushveld. Nickel, copper and sulphur recoveries were good for UG2 type ore, namely: 14 to 24% nickel, 77 to 86% copper and 83 to 90% sulphur.
In 2002, Anglo Platinum completed an economic study on the UG2 deposit (equivalent to a preliminary assessment because inferred resources were also used). This study envisioned an underground mine very similar to that being developed on the
60
neighboring Twickenham Farm, using down dip semi mechanized reef mining and access by twin shaft declines. Each decline shaft comprises three barrels: a decline ramp for equipment, a conveyor decline, and a chairlift decline for moving personnel. Ore was to be treated at the Twickenham concentrator. Based on twin declines producing 100,000 tpm from the UG2 Reef only, Anglo Platinum concluded the project was an attractive investment and subsequently encouraged BEE group participation.
In February 2004, Atlatsa commissioned a resource estimate for the Ga-Phasha Project utilizing drill hole information made available by Anglo Platinum from 299 drill holes drilled between 1966 and 2002. For the farms Paschaskraal and Klipfontein for the Merensky Reef, the resource estimation excluded the first 40 meters below surface, which is considered as an oxidized zone. Specific Gravity for the Merensky Reef was 3.1 and the UG2 Reef was 4.25. A 40% geological loss factor was applied, which includes 10% for faulting, 15% for potholes, 10% for intrusions and 5% for iron replacement bodies.
The Avoca and De Kamp farms adjoin Paschaskraal and Klipfontein on the down dip side of the UG2 and Merensky Reefs. No boreholes were drilled on these farms, but it could be assumed that the reefs developed on Paschaskraal/Klipfontein farms would be developed on Avoca and De Kamp.
At a 2 g/t 4PGM cut-off the Merensky Reef estimates were:
| | • | | Measured and indicated resources of 43.2 million tonnes grading 4.39 g/t 4PGM. |
| | • | | Inferred resources of 39.8 million tonnes grading 4.28 g/t 4PGM on the Paschaskraal and Klipfontein farms. |
| | • | | Inferred resources of 97.6 million tonnes grading 4.34 g/t 4PGM on the Avoca and DeKamp farms. |
At a 4 g/t 4PGM cut-off, the UG2 Reef estimates were:
| | • | | Measured and indicated resources of 65.7 million tonnes grading 6.97 g/t 4PGM. |
| | • | | Inferred resources of 33.9 million tonnes grading 7.20 g/t 4PGM on the Paschaskraal and Klipfontein farms. |
| | • | | Inferred resources of 77.6 million tonnes grading 7.05 g/t 4PGM on the Avoca and DeKamp farms. |
To June 2006, the drill hole database comprised of 127 Merensky drill holes and 322 UG2 drill holes. Of these, 116 parent drill holes intersected the Merensky Reef (inclusive of deflections there are 257 Merensky Reef intersections) and 230 parent drill holes intersected the UG2 Reef (inclusive of deflections there are a total 616 UG2 reef intersections). These databases were used to estimate the mineral resources. Measured, indicated and inferred resources in the UG2 deposit, and indicated and inferred resources in the Merensky Reef deposit increased from the 2004 estimates above.
Atlatsa and Anglo Platinum undertook a property review in 2006. Several approaches were considered to optimize mining of the deposits at Ga-Phasha. UG2 was identified as the primary focus for development and the Merensky reef as warranting further study through additional drilling programs. As a result of this work, Atlatsa and Anglo Platinum agreed on the parameters for a pre-feasibility study for the Project. Refer to the Technical Report titled “The Mineral Resource Estimate for the Merensky and UG2 Reefs for the Ga-Phasha Project Area, Limpopo Province, Republic of South Africa” dated March 30, 2012 by the QPs A.Deiss, B. Northrop and G. Mitchell.
Geological Setting and Mineralization
The Ga-Phasha Project area is underlain by rocks of the Upper Critical and Main Zones. The Main Zone is comprised of gabbros and ferro gabbros (iron and magnesium rich igneous rocks).
The two platinum bearing horizons at Ga-Phasha are the UG2 chromitite and the Merensky Reef, both of which occur within the Upper Critical Zone. The sequence strikes northwest southeast and dips in a westerly direction towards the center of the Bushveld Complex. The dip decreases on a regional scale from approximately 30 degrees in the north to approximately 10 degrees in the south. In general, the Reefs are separated by a package of norites and anorthosites, averaging some 390 m in thickness.
The UG2 Reef is a chromitite layer that hosts PGM and some base metal sulphides. Mineralization occurs throughout the UG2 Reef chromitite with usually significantly higher values associated with the hanging wall and footwall contacts. Mineralization may also occur within the footwall pyroxenite, mainly associated with disseminated chromite and chromitite stringers/lenses, with grades of up to 10 g/t 4PGM. The hanging wall units do not contain significant PGM values although values in excess of 5 g/t can occur where associated with the chromitite stringers or disseminated chromitite.
The feldspathic pyroxenite rocks within the Merensky package host chromite, base and precious metal sulphide accumulations. PGE mineralization occurs as discrete metals that are typically associated with and enclosed within the base metal sulphides and silicates. There is a strong association of the PGMs with the chromitite stringers usually demarcating the upper and lower contacts of the Reef, with higher grades at the contacts.
61
Sampling and Analysis, and Security of Samples
The following is a summary of the core logging and sampling procedures used by Anglo Platinum. Core logging is undertaken by qualified geologists on site at the Driekop Exploration Base, where all boreholes and their deflections are accurately logged in terms of lithology, mineralization, alteration and structure. Specialized geotechnical and structural logging is also carried out by rock engineering and structural geologists. After the bagging of samples on site at the Driekop core yard, the samples are transported to Anglo Platinum Research Centre (“ARC”) in Germiston, near Johannesburg, by 3 ton Dyna or pickup truck. ARC processed the samples from pre-2000 drilling. Post-2000 samples are processed by Anglo American Research Laboratory (“AARL”). When transported to AARL, the samples are delivered by ARC staff and vehicles.
Generally the recovered reef intersections of Merensky Reef and UG2 are assayed for 4PGM (Pt, Pd, Rh, Au) and Cu and Ni contents. Individual Pt, Pd, Rh and Au contents of each sample were determined.
ARC Procedures
All samples are duplicated and run on an A and B stream at different times. Internal Quality control occurs with every batch. ARC did not use blanks, and integrated an internal Quality Control sampling once a week. Comparative results from A and B streams are available.
All samples were pulverized to 80% +/-5% <75 microns. For Fire Assay – 4 elements (Pb collector), there is loss of PGM and these results then often required a correction factor to be applied. In the borehole database, samples assayed using Pb collector fire assay methods are not corrected. The precious metal concentration is reported as the sum of Pt, Pd, Rh, and Au. For Fire Assay-ICP, silver is used to collect Pd, Pt, and Au, and Pd is used to collect Rh. Using the Ag/Pd collectors reduces random losses of the PGM, providing a more precise analysis as well as a lower detection limit.
AARL Procedures
Samples are crushed in a jaw crusher to 2 mm. The entire sample is then milled to 85% – 75 microns or finer. An eight minute milling time is required. For Atomic Absorption, pulped samples are digested with a triple acid attack with perchloric, nitric and hydrofluoric acids. The acid attack is performed three times after which the solutions are transferred to 100 ml flasks and read on the Atomic Absorption Spectrometry for Cu and Ni. Four per cent of the samples are replicated. Two blanks and three reference standards are included in every batch.
Prior to X-ray fluorescence analyses, pulped samples are mixed with a styrene – wax binder (SASMU) and milled to mix in the binder and further reduce particle sizes. The samples are pressed into briquettes. The briquettes are read on the AARL PW 1404 X-ray Fluorescope for Cu and Ni. Mineralogical effects are evident in the briquettes – hence separate ‘type’ calibrations are critical for UG2 and Merensky type samples. Approximately 5% on the samples are replicated. Two reference materials are analyzed with every batch (max 100).
For Fire Assay and ICP, all assays are done in duplicate and the average of acceptable replicate pairs is reported. Samples are weighed out and mixed with an appropriate flux for the material type. Silver is used as a co-collector. The samples are fire assayed and the prills (material remaining from this process) are dissolved in aqua regia and read on the inductively coupled plasma (“ICP”) spectrometer for Pt, Pd and Au. One blank and two reference materials are analyzed with every worksheet.
For Rhodium, all assays are done in duplicate and the average of acceptable replicate pairs is reported. Samples are weighed out and mixed with an appropriate flux for the material type. Palladium is used as a co-collector. The samples are fire assayed and the prills (material remaining from this process) dissolved in aqua regia and read on the ICP for Rh. One blank and two reference materials are analyzed with every worksheet (maximum thirty five).
AARL, anISO 17025 registered company, has a comprehensive quality control system that includes blanks, certified reference materials, in-house reference materials, and twin streaming/replicate analyses.
Estimates of Mineralization
All the estimates in this section are for 100% of the resource base. Atlatsa currently has a 51% economic interest in these resources.
62
Cautionary Note to Investors Concerning Estimates of Measured and Indicated Resources
This Annual Report uses the terms “measured resources” and “indicated resources”. Atlatsa advises investors that while those terms are recognized and required by Canadian regulations, the SEC does not recognize them. Investors are cautioned not to assume that any part or all of mineral deposits in these categories will ever be converted into reserves.
Cautionary Note to Investors Concerning Estimates of Inferred Resources
This Annual Report uses the term “inferred resources”. Atlatsa advises investors that while this term is recognized and required by Canadian regulations, the SEC does not recognize it. “Inferred resources” have a great amount of uncertainty as to their existence, and as to their economic and legal feasibility. It cannot be assumed that all or any part of a mineral resource will ever be upgraded to a higher category. Under Canadian rules, estimates of Inferred Mineral Resources may not form the basis of economic studies, except in rare cases. Investors are cautioned not to assume that any part or all of an inferred resource exists, or is economically or legally mineable.
See the “Cautionary Note to U.S. Investors”.
Investors should refer to the disclosure under the heading “Resource Category (Classification) Definition” in the “Glossary of Terms”.
The Mineral Resource Estimate has been updated and is detailed in the Technical Report titled, “ The Mineral Resource Estimate for the Merensky and UG2 Reefs for the Ga-Phasha Project Area, Limpopo Province, Republic of South Africa” dated March 30, 2012 by the QPs A. Deiss, B. Northrop and G. Mitchell.
ExplorMine Consultants was commissioned by Atlatsa Resources Corporation (“Atlatsa”) to complete a National Instrument 43-101 Technical Report following the principles of the Canadian Institute of Mining, Metallurgy and Petroleum (“CIM”) Definition Standards on Mineral Resources and Mineral Reserves (“CIM Definition Standards”), in support of obligations in terms of Canadian Securities Regulatory Authorities.
The Mineral Resource estimation is based on historic borehole and mining (chip sampling) data collected since the 1960’s to present. The Report has been prepared based on a technical review by ExplorMine Consultants over a ten month period from December 2009 to October 2010 and in October 2011. The effective date of the Technical Report is March 30, 2012. The Technical Report is available on SEDAR at www.sedar.com and EDGAR at www.sec.gov, filed on March 30, 2012.
The tables below summarise the Mineral Resource Estimation.
| | | | | | | | | | | | | | | | | | | | | | | | | | | | | | | | | | | | | | | | | | | | | | | | | | | | |
Ga-Phasha <75 degrees rock temperature | | Total | | | Attributable to Atlatsa | | | Pt
grade
g/t | | | Pd
grade
g/t | | | Rh
grade
g/t | | | Au
grade
g/t | | | Cu
grade
% | | | Ni
grade
% | |
| | | | | Reef type | | Mt | | | Grade
4E g/t | | | Containing
4E Moz | | | Attributable
% | | | Mt | | | Grade
4E g/t | | | | | | | |
| Mineral Resources | | Measured | | MR | | | 20.1 | | | | 4.52 | | | | 2.9 | | | | 51.0 | | | | 10.3 | | | | 4.52 | | | | 2.73 | | | | 1.35 | | | | 0.15 | | | | 0.30 | | | | 0.08 | | | | 0.21 | |
| | Indicated | | MR | | | 37.7 | | | | 4.97 | | | | 6.0 | | | | 51.0 | | | | 19.2 | | | | 4.97 | | | | 3.04 | | | | 1.44 | | | | 0.18 | | | | 0.31 | | | | 0.08 | | | | 0.21 | |
| | Meas + Ind | | MR | | | 57.8 | | | | 4.82 | | | | 9.0 | | | | 51.0 | | | | 29.5 | | | | 4.82 | | | | 2.93 | | | | 1.41 | | | | 0.17 | | | | 0.31 | | | | 0.08 | | | | 0.21 | |
| | Inferred | | MR | | | 178.3 | | | | 5.32 | | | | 30.5 | | | | 51.0 | | | | 90.9 | | | | 5.32 | | | | 3.25 | | | | 1.60 | | | | 0.18 | | | | 0.30 | | | | 0.09 | | | | 0.22 | |
| | | | | | | | | | | | | | | | | | | | | | | | | | | | | | | | | | | | | | | | | | | | | | | | | | | | |
| | Total Resource | | MR | | | 236.1 | | | | 5.20 | | | | 39.5 | | | | 51.0 | | | | 120.4 | | | | 5.20 | | | | 3.17 | | | | 1.55 | | | | 0.18 | | | | 0.30 | | | | 0.08 | | | | 0.22 | |
| | | | | | | | | | | | | | | | | | | | | | | | | | | | | | | | | | | | | | | | | | | | | | | | | | | | |
| | | | | | | | |
Ga-Phasha <75 degrees rock temperature | | Total | | | Attributable to Atlatsa | | | Pt
grade
g/t | | | Pd
grade
g/t | | | Rh
grade
g/t | | | Au
grade
g/t | | | Cu
grade
% | | | Ni
grade
% | |
| | | | | Reef type | | Mt | | | Grade
4E g/t | | | Containing
4E Moz | | | Attributable
% | | | Mt | | | Grade
4E g/t | | | | | | | |
| Mineral Resources | | Measured | | UG2 | | | 40.4 | | | | 6.00 | | | | 7.8 | | | | 51.0 | | | | 20.6 | | | | 6.00 | | | | 2.53 | | | | 2.86 | | | | 0.51 | | | | 0.10 | | | | 0.03 | | | | 0.15 | |
| | Indicated | | UG2 | | | 60.8 | | | | 5.84 | | | | 11.4 | | | | 51.0 | | | | 31.0 | | | | 5.84 | | | | 2.46 | | | | 2.79 | | | | 0.50 | | | | 0.10 | | | | 0.03 | | | | 0.15 | |
| | Meas + Ind | | UG2 | | | 101.2 | | | | 5.90 | | | | 19.2 | | | | 51.0 | | | | 51.6 | | | | 5.90 | | | | 2.49 | | | | 2.82 | | | | 0.50 | | | | 0.10 | | | | 0.03 | | | | 0.15 | |
| | Inferred | | UG2 | | | 209.8 | | | | 6.25 | | | | 42.2 | | | | 51.0 | | | | 106.9 | | | | 6.25 | | | | 2.61 | | | | 3.00 | | | | 0.54 | | | | 0.10 | | | | 0.04 | | | | 0.16 | |
| | | | | | | | | | | | | | | | | | | | | | | | | | | | | | | | | | | | | | | | | | | | | | | | | | | | |
| | Total Resource | | UG2 | | | 311.0 | | | | 6.10 | | | | 61.4 | | | | 51.0 | | | | 158.5 | | | | 6.10 | | | | 2.56 | | | | 2.92 | | | | 0.52 | | | | 0.10 | | | | 0.04 | | | | 0.15 | |
| | | | | | | | | | | | | | | | | | | | | | | | | | | | | | | | | | | | | | | | | | | | | | | | | | | | |
Notes:
| (1) | The QPs responsible for the compilation of the mineral resources are G. Mitchell Pri. Sci. Nat., A. Deiss Pri. Sci. Nat. and Dr. W. Northrop. All QPs are independent consultants to Atlatsa. |
| (2) | The mineral resources are inclusive of mineral reserves. |
| (3) | The mineral resources are inclusive of dilution and recovery factors. |
| (4) | A cut-off grade of 2.58 g/t for the Merensky Reef was applied. |
A cut-off grade of 3.23 g/t for the UG2 Reef was applied.
63
| (5) | Metal price assumptions of US$1,500/oz platinum, US$478/oz palladium, US$2,000/oz rhodium and US$1,200/oz gold were used in the estimation of mineral resources. |
| (6) | 4E is the sum of platinum (Pt), palladium (Pd), rhodium (Rh) and gold (Au). |
* Oxidised Mineral Resources are included in the estimate as follows: Merensky Reef 7.98 Mt at 4.28 4E g/t and 1.10 Moz 4E UG2 Reef 7.79 Mt at 5.98 4E g/t and 1.50 Moz 4E
# Mineral Resources above 75oC virgin rock temperature (greater than 2400 m below surface): Merensky Reef 0.45 Mt at 4.90 4E g/t and 0.07 Moz 4E
The QPs do not consider changes from the previous report to be material.
Exploration and Development
Atlatsa and Anglo Platinum have completed a high level technical review to determine the optimal extraction strategy for the contiguous Bokoni Mine and Ga-Phasha orebodies. The results of the review indicated that optimal extraction of the Ga-Phasha orebody would be to realise synergistic opportunities with the Bokoni and Twickenham Mines. It was for this reason that Atlatsa and Anglo Platinum agreed to divide the Ga-Phasha Project into and eastern and western section that could be incorporated into Anglo Platinum’s Twickenham Mine and the Bokoni Mine, respectively. The western portion of Ga-Phasha (Klipfontein and De Kamp farms) will be exploited in the future via the Brakfontein infrastructure.
See Item 4 “Restructure Plan” for information on the proposed sale of the Eastern Portion of the Ga-Phasha Project to Anglo Platinum.
The Platreef Project
Agreements
Atlatsa holds a 51% interest in the Kwanda and Boikgantsho Projects through Holdco. Further details of Atlatsa’s interests in the Central Block and Rietfontein properties are given under Location and Property Description below.
Location and Property Description
The Platreef Project is located near the town of Mokopane (formerly Potgietersrust) in South Africa, approximately 275 km northeast of Johannesburg. The property holdings comprise all or parts of twenty mineral properties, totaling 37,492 ha. The Platreef Project is divided into four geographical regions: the North Block, the Central Block, the Rietfontein Block and the South Block (Table 10 and Figure 7), further described below. The Drenthe and Witrivier farms are part of the Boikgantsho Project. The North and South Blocks fall under the Kwanda Project.
No surface rights have been secured on the properties to date. Once the required area has been established, it would be necessary to negotiate a purchase agreement with the surface rights owner(s). Prices are expected to range between ZAR2,000/ha ($294/ha) and ZAR5,000/ha ($736/ha) depending on the infrastructure required to be developed on the farms.
Figure 7. Property Holdings, Platreef Properties
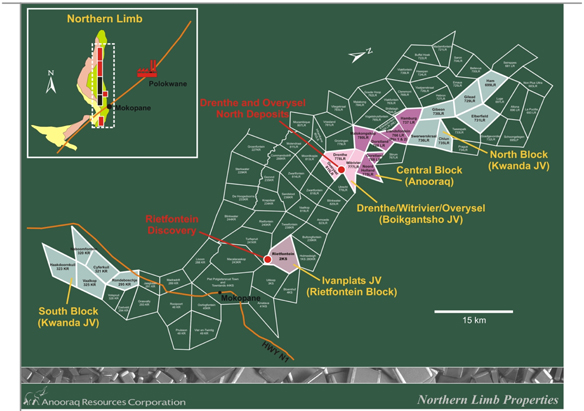
64
Prospecting or mineral rights held by Atlatsa, through Plateau Resources, including its 51% ownership of Bokoni Platinum Holdings is listed in table 8 below:
Table 8. Platreef Mineral Rights
| | | | |
Property or Farm | | Type and status of mineral rights | | Duration of New Order prospecting right |
Kwanda North: Ham 699 LR Gilead 729 LR Elberfield 731 LR Gideon 730 LR Chlun 735 LR Swerweskraal 736 LR | | New order prospecting rights have been granted. They are held jointly by Plateau and RPM. | | This right commenced on December 11, 2007, and endures for 5 years to December 10, 2012. |
| | |
Kwanda South: Rondeboschje 295 KR Cyferkuil 321 KR Haakdoornkuil 323 KR Vaalkop 325 KR Naboomfontein 320 KR | | These apply to PGMs and extend also to gold, silver, copper and nickel. | | This right commenced on July 23, 2008 and endures for 5 years to July 22, 2013. |
| | |
Central Block: Portion 2 of the Farm Elandsfontein 766 LR Malokongskop 780 LR Portion 1 of the farm Elandsfontein LR Hamburg 737 LR Portion 2 (a portion of portion 1) of Dorstland 768 LR Portion 3 (a portion of portion 1) of Dorstland 768 LR Noord Holland 775 LR Mineral Area 1, excluding Mineral Area 2, on the Remaining Extent of Dorstland 768 LR Remaining Extent of Portion 1 of Dorstland 768 LR | | New order prospecting rights have been granted to Plateau. Dortsland and Malokongskop cover all minerals and oil and gas. Noord Holland Right does not include oil and gas. Portion 1 of Elandsfontein 766 LR and Hamburg 737 LR, includes all minerals. | | Portion 2 of Elandsfontein 766 LR Portions 2, 3 and the Remaining Extent of Portion 1 and Mineral Area 1 of Dorstland 768 LR Remaining Extent and Portions 1 and 2 of Noord Holland 775 LR Portion 1 of Elandsfontein 766 LR and Hamburg 737 LR rights commenced March 20, 2007, and endure for 5 years to March 19, 2012. As of March 30, 2012, renewal applications have been submitted and awaiting response. Malokongskop 780 LR right commenced on November 28, 2006 and endures for 5 years to November 27, 2011. As of March 30, 2012, renewal applications have been submitted and awaiting response. |
| | |
Boikgantsho: Drenthe 778 LR Remaining Extent of the Farm Witrivier 77 LR Portion 1 of the Farm Witrivier 77 LR | | New order prospecting rights have been granted to Plateau. Drenthe includes all minerals. | | The Witrivier right commenced on March 20, 2007 and endures for 5 years to March 19, 2012. As of March 30, 2012, renewal applications have been submitted and awaiting response. The Drenthe right commenced on November 28, 2006 and endures for 5 years to November 27, 2011. As of March 30, 2012, renewal applications have been submitted and awaiting response. |
| | |
Rietfontein Block: Rietfontein 2 KS | | New order prospecting right has been granted to Plateau. It includes all mineral except precious stones and oil and gas. | | This right commenced on November 28, 2006 and endures for 5 years to November 27, 2011. As of March 30, 2012, renewal applications have been submitted and awaiting response. |
65
Atlatsa holds interests in mineral rights (or “farms”) over 37,000 ha that make up the Central Block, the Rietfontein Block, the Boikgantsho and Kwanda Projects, collectively, known as the Platreef Properties.
Rietfontein Block
The Company has entered into a settlement agreement effective December 11, 2009 with Ivanhoe Nickel & Platinum Ltd. (“Ivanplats”) to replace and supersede the 2001 agreement relating to the Rietfontein property located on the northern limb of the BIC in South Africa. The 2001 agreement granted Ivanplats the right to earn a 50% interest in the Rietfontein property through expenditure related to exploration activities undertaken in accordance with approved technical programs.
The settlement agreement settles the arbitration process relating to disagreements with respect to the exploration activities undertaken at the Rietfontein property. Salient terms of the agreement are as follows:
| | • | | Both parties abandon their respective claims under dispute forming the subject matter of arbitration. |
| | • | | The existing joint venture (“JV”) between the parties is amended such that the current Rietfontein JV is extended to incorporate a defined area of Ivanplats’ adjacent Turfspruit mineral property. Both parties retain their existing prospecting rights in respect of mineral properties in their own names but make these rights and technical information available to the extended JV (“the Extended JV”). |
| | • | | Atlatsa will be entitled to appoint a member to the Extended JV technical committee and all technical programmes going forward will be carried out with input from Atlatsa. |
| | • | | Atlatsa is awarded a 6% free carried interest in the Extended JV, provided that the Extended JV contemplates an open pit mining operation, incorporating the Rietfontein mineral property. Atlatsa has no financial obligations under the Extended JV terms and Ivanplats is required to fund the entire exploration programme to feasibility study with no financial recourse to Atlatsa. On delivery of the feasibility study Atlatsa may elect to either: |
| | • | | Retain a participating interest in the Extended JV and finance its pro rata share of the project development going forward; or |
| | • | | Relinquish its participating interest in the Extended JV in consideration for a 5% net smelter return royalty in respect of mineral products extracted from those areas of the Rietfontein mineral property forming part of the Extended JV mineral properties. |
Central Block
The Central Block consists of five farms or portions thereof, acquired by Atlatsa, through its wholly-owned South African subsidiary Plateau, prior to its joint ventures with Anglo Platinum. It also includes one portion of the Dorstland farm acquired by way of an agreement with RPM. Dorstland 768LR was acquired through an agreement with Pinnacle Resources in 1999. Rights to the other farms or portions are administered by the Department of Mineral Resources (“DMR”).
The Company is currently evaluating its approach to properties on the Central Block, which may include potential joint venture relationships with third party exploration companies.
Kwanda Project (North Block and South Block)
On May 16, 2002, Atlatsa, through its wholly-owned South African subsidiary, Plateau completed a joint venture agreement with RPM for the right to acquire up to an 80% interest in twelve PGM properties located on the Northern Limb of the Bushveld Complex.
As of July 1, 2009, the joint venture terminated and Kwanda Platinum Mine Proprietary Limited, a wholly owned subsidiary of Holdco, owns the respective interest in and assets relating to the Kwanda Project. As a result of the completion of the Bokoni Transaction, Atlatsa effectively owns 51% of the Kwanda Project.
The Company intends to continue with its existing prospecting programs at the Kwanda mineral properties in 2012 at a cost of approximately $0.2 million.
Boikgantsho Project (Drenthe, Witrivier and Overysel North)
The following technical information (page 63 to page 71) is derived from the technical report by Kai Batla Minerals Industry Consultants, written in compliance with NI 43-101 and the CIM Definition Standards, which describes the Boikgantsho Project’s mineral exploration. The January 2012 Technical Report is based on a detailed technical review of work performed by others and completed by the following independent qualified persons: DS. Ferreira, Bsc.(Geology), BEng.(Mining), Pr.Sci.Nat., A. Bisnath, PhD (Geology), MGSSA, Pr.Sci.Nat.
Agreements
Atlatsa holds a 51% interest in the Boikgantsho property through Holdco as described under Item 4.1. above. On completion of the refinancing transaction, referred to under Item 4 under “Restructure Plan”, the Boikgantsho Project will be sold to Anglo Platinum.
66
In 2010, Atlatsa engaged the services of TWP Projects (The Basil Read Group) and Kai Batla Minerals Industry Consultants to complete an updated mineral resource and reserve estimate for the Boikgantsho Project. Kai Batla relogged several drillholes and re-sampled several holes in order to verify the reliability of the existing assay database. The re-assaying results demonstrated that the current assay database could be duplicated and thus could be used in estimating a South African Code for Reporting of Mineral Resources and Mineral Reserves (“SAMREC Code”) and Canadian Institute of Mining and Metallurgy (“CIM”) compliant mineral resource model.
The re-logging was done under the guidance of Dr. Andrew Mitchell who initiated a new interpretation of the geology. A new geological model was then constructed and a new mineral resource was estimated into it. The results for the Mineral Resource estimate are shown below at a Pt cut-off grade of 0.5g/t.
Measured and Indicated Mineral Resources – 0.5g/t Pt Cut-off
| | | | | | | | | | | | | | | | | | | | | | | | | | | | |
Category | | Tonnes | | | Pt
(g/t) | | | Pd
(g/t) | | | Au
(g/t) | | | PGMAU
(g/t) | | | Ni
(%) | | | Cu
(%) | |
Measured | | | 25,346,000 | | | | 0.70 | | | | 0.66 | | | | 0.07 | | �� | | 1.43 | | | | 0.15 | | | | 0.11 | |
Indicated | | | 61,751,000 | | | | 0.80 | | | | 0.84 | | | | 0.08 | | | | 1.72 | | | | 0.10 | | | | 0.07 | |
| | | | | | | | | | | | | | | | | | | | | | | | | | | | |
TOTAL | | | 87,097,000 | | | | 0.77 | | | | 0.79 | | | | 0.08 | | | | 1.63 | | | | 0.11 | | | | 0.09 | |
| | | | | | | | | | | | | | | | | | | | | | | | | | | | |
The QP responsible for the updating of the mineral resource is Mr D. Ferreira, B.Sc. Pri Sci. Nat. D. Ferreira is an independent consultant to Atlatsa.
See the “Cautionary Note to U.S. Investors”.
Accessibility, Climate, Local Resources, Infrastructure and Physiography
The project-area is readily accessible via the main N1 expressway from Johannesburg to the city of Mokopane (Potgietersrus), which is approximately 35km south of the project area. Access from Mokopane to the project area is via paved provincial roads. Individual farms, if not directly accessible from provincial roads, are well served by a comprehensive network of well-maintained dirt roads and farm tracks.
The climate at the project area is typical of the South African Highveld; maximum temperatures in summer between 27°C to 32°C and minimum temperatures during winters rarely below -4°C.
Precipitation is typically in the form of thunderstorms throughout summer. Although sudden downpours pose some risk of flooding in low-lying areas, most South African mines are exposed to this weather and precautionary measures are routine on most operations. The average annual rainfall is within the range of 380mm to 700mm, with the peak of the rainy season occurring in January. Winters are typically dry and sunny, while moderate climate means that exploration and mining operations can be undertaken throughout the year, without extraordinary measures.
History
Exploration on the Platreef Project prior to the involvement of Plateau in 1998 had been sporadic in spite of numerous historic drill holes in identifying extensive PGM mineralization on the Farm Drenthe 778LR.
Rietfontein Block
Drilling by Ivanplats to test the Platreef Project target on Rietfontein began in July 2002. Thirty-six vertical core holes were drilled at spacing’s of 100 to 200 metre intervals along strike and 50 to 150 metres across the width of the Platreef Project pyroxenite. A further 31 diamond drill holes, totalling 6,374 metres, were drilled in 2003. This drilling has outlined a zone of PGM mineralization in the Platreef Project over a strike length of 1,600 metres on Farm Rietfontein, adjacent to the Turfspruit boundary.
Kwanda Project
In 2002, Plateau carried out an integrated exploration program of airborne geophysics, grid geochemistry and geological mapping in the area, tracing a pyroxenite unit that hosts a PGM deposit on an adjacent farm for six kilometres on the South Block property. A diamond drilling program, comprising 15 holes (2,465 metres) conducted in 2003 did not encounter significant PGM mineralization. An airborne geophysical survey was flown over the Platreef Project, including the North Block during the same period.
Boikgantsho Project
In 1969, Chrome Corporation Ltd. completed 19 diamond drill holes for which no data are available (Gain, 1982). Subsequently Union Carbide, Mining Corporation and JCI-RPM diamond drilled on Drenthe. Many of these holes were shallow and either did not penetrate the PGM-bearing Platreef or were terminated before the complete Platreef succession was intersected. Much of the Union Carbide and Mining Corporation core was not sampled. JCI’s diamond drill hole DRN2 on the southern portion of Drenthe was collared within the Main Zone of the Bushveld Complex and intersected the Critical Zone (Platreef) before being terminated in the underlying basement granite footwall. Despite hole DRN2 encountering 5.61 g/t PGM,
67
0.17% Cu and 0.27% Ni over a width of 3.78 m, within a broader zone grading 4.15 g/t PGM over 9.7m (Davenport, 1999) no follow-up work was undertaken.
In July 1998, Plateau Resources (Pty) Ltd. completed eight diamond drill holes on the southern half of the farm Drenthe to target the PGM mineralization intersected by JCI’s hole DRN 2. All eight of these holes cut significant intervals of PGM mineralization within the Platreef. Recent and historic drilling programs have therefore substantiated the existence of widely distributed PGM mineralization at shallow depths along the full two kilometer length of the Platreef on the farm Drenthe. Unfortunately, geological and assay records for these holes are unavailable.
In late 2003, the Boikgantsho Joint venture was established to explore the Drenthe, Witrivier and the northern part of Overysel farms. In 2004, Atlatsa as operator completed 36,478 m of infill and step out drilling on the three farms, significantly increasing the size of the Drenthe deposit and identifying a second deposit on the northern part of Overysel farm. Drilling to September 2004 outlined total indicated resources in the two deposits of 176.6 million tonnes grading 1.35 g/t 3PGM and 0.13% nickel, and additional inferred resources in the two deposits of 104.1 million tonnes grading 1.23 g/t 3PGM and 0.14% nickel, both estimated at a $20 gross metal value per tonne (GMV/t) cut-off.
In June 2005, two exploration holes were drilled on the farm Swerwerskraal, for a total of 535.1 meters. Although Platreef-like rocks were intersected, only sporadic thin intervals of PGM mineralization were encountered in these drillholes.
In 2010, Atlatsa approached Kai Batla Mineral Industry Consultants (“Kai Batla”) to update the 2005 mineral resource estimate. This program involved re-logging a number of drillholes under the guidance of Dr. Andrew Mitchell, and a number of re-assays in order to assess whether the data could be replicated and utilized to produce a compliant mineral resource model. No additional drilling was done throughout this study.
Geological Setting and Mineralization
The Bushveld Complex (“BC”) is an extremely large, saucer–shaped, layered igneous intrusion occurring in the northern part of the country within the boundaries of South Africa. The BC is the world‘s largest known ultramafic igneous intrusion, and extends approximately 450km east to west and approximately 250km north to south. It occupies parts of Limpopo Province, North-West Province, Gauteng Province and the Mpumalanga Province. It is estimated to have been formed approximately 2,000 million years ago (“Ma”). The BC is host to PGM mineralization in addition to chrome, vanadium, nickel and copper.
The five lobes are referred to as the Western, Eastern, Northern (includes both the Potgietersrus and Villa Nora compartments), South-Eastern, and Far-Western areas. The South-Eastern BC is completely covered by sedimentary successions of the Karoo Supergroup, while the remaining four lobes are variably exposed with some areas under extensive soil cover; see Figure 8.0
Figure 8.0: Geological Map of the Bushveld Complex
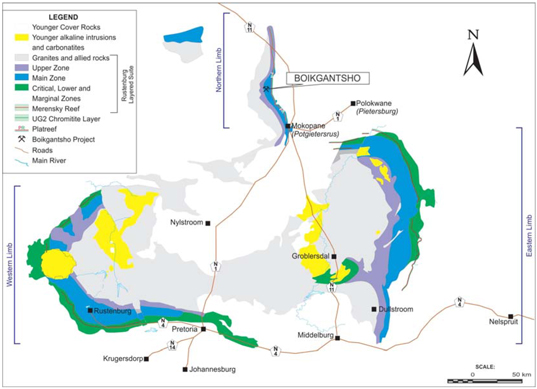
68
The main lithologies of the Platreef are a relatively fine-grained gabbronoritic suite, designated PLR1 for logging purposes and a suite of olivine-bearing harzburgitic to olivine orthopyroxenitic rocks, designated PLR2. Within PLR1 there are substantial variations in modal contents of plagioclase and clinopyroxene, resulting in a spectrum of rocks ranging from websterite through to norite. In addition, recrystallization textures, including coarse-grained, pegmatoidal lithologies, commonly occur at the contacts between PLR1 and PLR2.
Although igneous layering within the Platreef is obvious, individual layers appear to pinch out or expand in thickness over short intervals, and over strike extents of 50 to 100m it is usually only possible to identify very broad stratigraphic divisions, in contrast to the regularity of the Critical Zone seen in the eastern and western lobes of the Bushveld Complex. There is clear evidence of repeated intrusion of the various magma lineages from which the Platreef crystallized, and their complicated relationships with one another were no doubt exacerbated by the proximity of the floor contact. Floor rock xenoliths add to the difficulty of interpreting the stratigraphy. It is also possible that many heterogeneous zones are not layers at all, but simply disconnected, irregular patches of contamination or recrystallisation within a specific unit.
The Platreef, and to a lesser extent the Main Zone, are cut by thin granitic veins or dykelets. Although volumetrically insignificant, they are widespread throughout the sequence. These dykelets vary in attitude, dipping between 45° and 70°, although the strike and dip direction have yet to be determined as they are only known from drill core. The younger but thicker sheets of Bushveld Granite, identified in drill core on northern Drenthe, typically also dip at 45° but steepen to 70° locally. Consideration of their distribution and lensoid shape on the geological map suggests that they may represent large scale ‘tension-gash’ infillings, within a sinistral offset regime. The azimuth of this possible ‘shear’ parallels that of the major fault on Overysel as well as the other minor faults shown on the geological map, although no major displacement of the floor contact was identified in this region.
The much younger thick diabase dyke that cuts the sequence in drill hole PR-10 is known from outcrop to strike southwest-northeast and dip to the southeast at 70°. A similar dyke encountered in drill holes on Witrivier (e.g. in hole PR-132) appears to have the same general dip and from its aeromagnetic signature has a similar southwest-northeast strike. The scattered, thinner diabase dykes, periodically intersected during drilling (e.g. in hole PR-9), probably parallel this orientation.
In a study of the distribution of mineralization and the geological model, Von Bargen (2000) interpreted several faults in the southern Drenthe block, based on changes in dip of the Hanging Wall-Platreef contact. The extensive drilling programme conducted since then has highlighted several other potential fault zones, particularly on northern Drenthe and Witrivier, although these are largely based on changes in dip of the putative Platreef-Footwall contact between adjacent cross sections, which may in many cases be related to ductile, rather than brittle, deformation. Apart from the small number of additional faults indicated on the geological map, it is considered unlikely, given the density of drilling (particularly on Drenthe), that there are any other major offsets to the Platreef unit.
Sampling and Analysis, and Security of Samples
As of December 2005 Atlatsa had completed 372 diamond drillholes in the ‘PR’ series. These included 35 holes (PR-01 to PR-35) in 2000, 3 holes in 2002 (PR-36 to PR-38) 12 holes (PR-39 to PR-50) in 2003 184 holes (PR-51 to 234) in 2004 and 138 (PR-235 to 372) in 2005. On the Drenthe farm, eight “DT” series core holes were completed by Plateau Resources in 1998, and were examined during an Atlatsa due diligence level investigation in 1999. The platinum and palladium results reported by Plateau Resources (Pty) Ltd. were substantiated (Rebagliati and Titley, 1999) during this review. Information on previous Platreef drillholes have been compiled from sources believed to be reliable; however, the sampling and analytical methods are generally not known.
The original Atlatsa sampling and analytical protocols are set out in a core-logging manual (Titley, 2000). This manual also has suggested protocols for geotechnical and geological logging, specific gravity measurements, core photography, data compilation and verification. Some minor modifications were made to the original guidelines as the program progressed in order to improve operational efficiency.
The boxed core was picked up at the drill rig and transported to a secure core logging facility near Mokopane for core photography, geotechnical logging, geological logging, sample selection, quality control designation and sampling by Atlatsa personnel. The average recovery for all drill run intervals cored by Atlatsa is 92.7% (year 2000 drillholes) and 98.2% (2002-2003 drillholes) and 92.3% (2004 drillholes). Within the mineralized intervals, (>1000 ppb PGM), the average core recovery is 95.0% (year 2000 drillholes) and 98.2% (2002-2003 drillholes), 96.3% (2004 drillholes) and 96.9% (2005 drillholes). Specific Gravity (“SG”; Bulk Density) measurements of core were taken from every second mineralized sample interval. The average SG for the mineralized intervals is 3.01 (year 2000 drillholes) and 3.06 (year 2002 drillholes), 3.00 (2004 drillholes) and 3.04 (2005 drillholes).
The whole of the Platreef sequence was sampled, with the vast majority of samples being 1.0m in length. Samples did not straddle lithological boundaries, as defined in the geological log. In highly mineralized or lithologically complex zones, some samples of less than 1.0m in length were taken. Conversely, only very rarely did sample intervals exceed 1.0m. This might have occurred where ‘breaking’ the sample at 1.0 meter would have left only a small interval e.g. ~20cm of core at the bottom (downhole) end of a lithological unit. As this would not provide sufficient sample for analysis, then it would be included in the previous sample interval. Where this ‘process’ resulted in longer sample remnants, e.g. 30cm or more, then the remaining interval would be broken into two approximately equal lengths, i.e. a 1.30m interval at the bottom end of a lithological unit would be split into two samples of 65cm length. Normally sampling was extended several meters into the granitic footwall as
69
well. In 2005, sampling was also extended to the Hanging Wall Norite, which was sampled in its entirety. Although any obvious sulphide mineralization in the Hanging Wall was always sampled in previous years, the norite sequence is largely devoid of visible mineralization and was not usually sampled prior to 2005. Nevertheless, this norite would form a substantial proportion of any waste rock pile, so data was collected to provide some indication of potential ARD behavior, should a mining operation prove feasible. Samples in the Hanging Wall were typically 2m in length.
Samples were taken by sawing the core in half lengthwise with a diamond blade. The average length-wise half-split sample provided approximately 2.0kg of material. In 2000, the samples were transported to Set Point Laboratories (“SPL”), which incorporates the former Bergstrom & Bakker, Goldlabs and Rocklabs, at 46 Chadwick Avenue, Wynberg, South Africa. The remaining half core was returned to the boxes and stored at the secure Atlatsa storage facility. In 2002, 2003 and 2004, the samples were delivered to SPL’s laboratory at Mokopane for sample preparation. In 2002 and 2003, the prepared samples were shipped to SPL’s analytical laboratory, which moved to Isando in 2003. In 2004 and 2005, the prepared pulps were shipped by air freight to Acme Analytical Laboratories in Vancouver, Canada, for analysis.
203 boreholes, amounting to 41,900 m, were re-logged during the exercise conducted by Kai Batla. This included most of the available drill holes for which continuous core was available. Prior to logging, the core was meter-marked with white paint, because the original markings were no longer legible in many cases. Logging was done according to set protocols, with specific attention being paid to three main lithologies (Fig. 4), these being the relatively coarse-grained Main Zone norite and the two main lithologies of the Platreef, PLR1 (a relatively fine-grained websterite to gabbronorite) and PLR2 (serpentinized olivine-rich lithologies ranging from olivine orthopyroxenite through harzburgite to dunite).
Additional attention was paid to calc-silicate and granite footwall xenoliths. PGE and Cu concentration profiles of all the boreholes were drawn up from existing assay data as an aid to logging (Fig. 5), these being particularly useful in identifying units in which base metal sulphides were to be expected. Logging data were captured on specified logging sheets (Appendix 1); using codes laid out in Appendix 2, and were then transcribed to Excel spreadsheets before being captured on the database. Once boreholes had been meter marked and logged, they were photographed in their entirety.
The main lithologies in the Platreef are shown in Figure 1 to Figure 3, and comprise:
The Main Zone norite consists of orthopyroxene and plagioclase with variable amounts of clinopyroxene, and is medium to coarse-grained.
The PLR1 gabbronorite to websterite suite is considerably finer-grained than the Main Zone norite. Grey orthopyroxene macrocrysts occur within a fine-grained greenish brown matrix of gabbro (plagioclase + clinopyroxene). Being closely associated with the PLR2 intrusions, PLR1 commonly displays recrystallisation textures (pegmatoids etc.),
The PLR2 harzburgite consists of large (2 - 5cm) pale grey orthopyroxene oikocrysts and small black serpentinized olivine.
Figure 1.0 Main Zone Norite
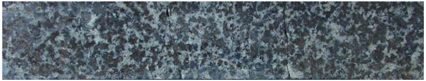
Figure 2.0 PLR1 Gabbronorite
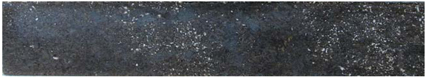
Figure 3.0 PLR2 Harzburgite
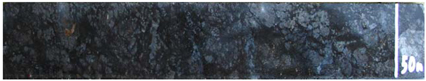
Borehole PR-096 was selected for whole-rock analysis to establish the differences between the various lithologies. A set of 23 samples, covering Main Zone norites, PLR1 gabbronorites and PLR2 harzburgites was submitted to the University of KwaZulu-Natal for whole-rock major and trace element analysis by XRF spectrometry. CIPW Norms were calculated from the major element data as an aid to rock classification. Summary data are plotted in Fig. 6. The results show the Main Zone norite to
70
have higher concentrations of the plagioclase-compatible elements (e.g. Al, Na, K, Sr) than other lithologies for a given height (see the plot of Sr in Fig. 6).
An unexpected result of the CIPW norm calculations is that, apart from the two lowermost samples, the Main Zone in this borehole is not really norite at all, but rather gabbronorite, containing generally in excess of 10% total normative clinopyroxene. Closer inspection of the core reveals this to be true, with cumulus orthopyroxene grains mantled by clinopyroxene in many cases, giving them a somewhat “ragged” outline. The term “norite” has, however, been retained for the Main Zone rocks, as this is the term used when logging protocols were set up.
Figure 4.0 Borehole PR-096
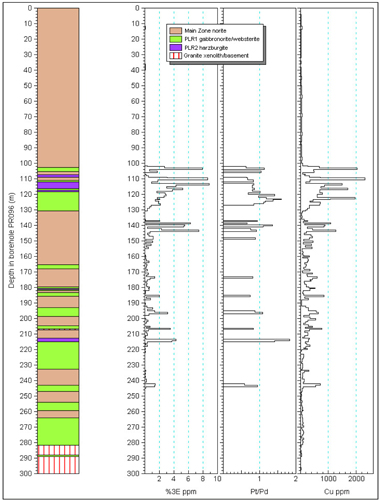
The figure above shows a representative example of borehole PGE and Cu profiles used as an aid to logging. Cu, in particular, is a guide to the presence of metal sulphides. The results of the logging are illustrated in the stratigraphic column on the left side of the diagram.
Figure 5.0 Cr/V ratio and Sr concentration in borehole PR-096 from whole-rock XRF analysis
71
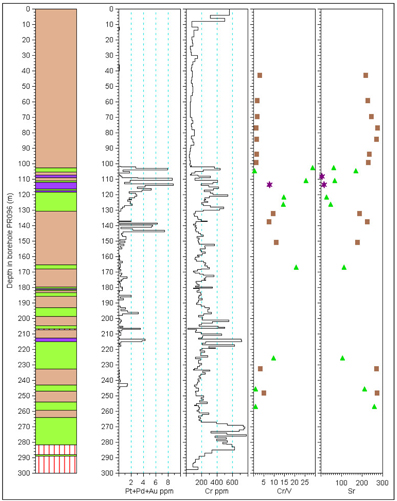
In the figure above, brown squares represent Main Zone norite samples, green triangles PLR1 gabbronorite, and purple stars PLR2 harzburgite. Pt+Pd+Au and Cr profiles are from Atlatsa’s original assay database.
Sample Preparation
Sample preparation work completed at SPL included: drying, crushing (to 90% < 1.7mm) and pulverization (to 90% < 75µm) of regular mainstream samples, insertion of Atlatsa’s standard reference material samples, and splitting out of duplicate samples for in-line analysis at the primary assay laboratory and check analysis at a second laboratory. In 2000, 2002 and 2003, the duplicate samples were analyzed at the SGS Springs laboratory and SGS Lakefield (in South Africa). In 2004 and 2005, the duplicate samples were analyzed by SPL.
Analyses and Security
The following outline describes the analytical protocol used. Six analytical laboratories were used by Atlatsa for the 2000-2005 drill programs:
SPL – Set Point Laboratories, 46 Chadwick Avenue, Wynberg, South Africa. The “primary lab” did all regular mainstream and in-line duplicate analysis in 2000, 2002 and 2003. SPL did all the inter-laboratory duplicate analysis in 2004 and 2005.
SGS – SGS South Africa (Pty) Limited, Springs, South Africa. Performed inter-laboratory duplicate analyses for holes PR-001 through PR-024.
LK – SGS Lakefield Research Africa (Pty) Limited, 58 Melville Street, Booysens, Johannesburg, South Africa. Performed inter-laboratory duplicate analysis for holes PR-025 through PR-035.
72
PL - Performance Laboratories (Pty) Limited, Deep Shaft Road, Krugersdorp, South Africa. Did standard reference material preparation, homogenization and splitting (Analytical portion of their work sub-contracted to SGS).
BC – Bondar Clegg Canada Limited, 130 Pemberton Avenue, North Vancouver, Canada. Round robin analysis of standard reference samples.
Acme – Acme Analytical Laboratories, 852 East Hastings St., Vancouver, Canada, was the “primary lab” for all regular mainstream samples in 2004 and 2005 and performed round robin analysis of standard reference samples.
ALS Chemex laboratory, 212 Brooksbank Ave., North Vancouver, Canada. Round robin analysis of standard reference samples and some selected duplicates in 2004 and 2005.
All regular, in-line duplicate and inserted Atlatsa standard precious metal analyses for drillholes PR-001 through PR-050 were performed by SPL. All regular, in-line duplicate and inserted Atlatsa standard precious metals analyses for drillholes PR-051 through PR-372 were performed by Acme.
Instructions to each laboratory, delivery to each laboratory and reception of the samples at each laboratory were maintained with signatures of the relevant persons involved at each stage. Sample identification tags were recorded prior to shipping and were then recorded once received by each particular laboratory.
Any batch of samples awaiting transport to the laboratory was kept in locked storage at site. The storage area was under 24hr security supervision.
Mineral Resource Estimates
Previous Mineral Resource Estimates
In late 2004, a Mineral Resource estimate was prepared by Geologix (Pty) Ltd. based on a geological model also prepared by Geologix; see Table 9. The Qualified Person responsible for the declaration of the Mineral Resource for Boikgantsho was D. van der Heever, Pri.Sci.Nat.
Table 9.0 Mineral Resource as Reported by Geologix – December 20041
| | | | | | | | | | | | | | | | | | | | | | | | | | |
AREA | | Category | | Tonnes | | | Pt
(g/t) | | | Pd
(g/t) | | | Au
(g/t) | | | Ni
(%) | | | Cu
(%) | |
Drenthe | | Indicated | | | 132,239,500 | | | | 0.53 | | | | 0.62 | | | | 0.09 | | | | 0.14 | | | | 0.09 | |
| | Inferred | | | 88,640,000 | | | | 0.49 | | | | 0.58 | | | | 0.09 | | | | 0.15 | | | | 0.09 | |
| | | | | | | |
Overysel North Segment 1 | | Indicated | | | 8,985,000 | | | | 0.71 | | | | 0.93 | | | | 0.10 | | | | 0.08 | | | | 0.05 | |
| | Inferred | | | 1,750,000 | | | | 0.59 | | | | 0.85 | | | | 0.09 | | | | 0.08 | | | | 0.05 | |
Overysel North Segment 2 | | Indicated | | | 35,436,500 | | | | 0.66 | | | | 0.85 | | | | 0.10 | | | | 0.10 | | | | 0.06 | |
| | Inferred | | | 13,693,500 | | | | 0.66 | | | | 0.88 | | | | 0.10 | | | | 0.11 | | | | 0.07 | |
| | | | | | | |
Totals | | Indicated | | | 176,661,000 | | | | 0.57 | | | | 0.69 | | | | 0.09 | | | | 0.13 | | | | 0.08 | |
| | | | | | | | | | | | | | | | | | | | | | | | | | |
| | Inferred | | | 104,084,000 | | | | 0.52 | | | | 0.63 | | | | 0.09 | | | | 0.14 | | | | 0.09 | |
| | | | | | | | | | | | | | | | | | | | | | | | | | |
| (1) | The mineral resources are inclusive of dilution and recovery factors. |
| (2) | A cut-off grade of 2.58 g/t for the Merensky Reef was applied. |
A cut-off grade of 3.23 g/t for the UG2 Reef was applied.
| (3) | Metal price assumptions of US$1,500/oz platinum, US$478/oz palladium, US$2,000/oz rhodium and US$1,200/oz gold were used in the estimation of mineral resources. |
| (4) | The 4E elements is the sum of platinum (Pt), palladium (Pd), rhodium (Rh) and gold (Au). |
| (5) | Mineral resources that are not mineral reserves do not have demonstrated economic viability. |
| (6) | Gross Metal Value per tonne (GMV/t) is sum of Pt, Pd, Au, Cu and Ni grades multiplied by the following metal prices: |
Pt – US$650/oz; Pd – US$250/oz; Au – US$375/oz; Ni – US$4/lb; Cu – US$1/lb.
| (7) | G.J. van der Heever, Pr.Sci.Nat., of GeoLogix, an independent QP, is responsible for the resource estimate. The resource estimate is described in December 2004 and March 2005 technical reports, filed on SEDAR. |
73
Cautionary Note to Investors Concerning Estimates of Measured and Indicated Resources
This Annual Report uses the terms “measured resources” and “indicated resources”. Atlatsa advises investors that while those terms are recognized and required by Canadian regulations, the SEC does not recognize them. Investors are cautioned not to assume that any part or all of mineral deposits in these categories will ever be converted into reserves.
Cautionary Note to Investors Concerning Estimates of Inferred Resources
This Annual Report uses the term “inferred resources”. Atlatsa advises investors that while this term is recognized and required by Canadian regulations, the SEC does not recognize it. “Inferred resources” have a great amount of uncertainty as to their existence, and as to their economic and legal feasibility. It cannot be assumed that all or any part of a mineral resource will ever be upgraded to a higher category. Under Canadian rules, estimates of Inferred Mineral Resources may not form the basis of economic studies, except in rare cases. Investors are cautioned not to assume that any part or all of an inferred resource exists, or is economically or legally mineable. See the “Cautionary Note to U.S. Investors”.
In 2011 Atlatsa approached TWP to complete some preliminary analysis of the economics of the deposit for open pit and resource planning. This was done using the following parameters:
| | • | | Pt selling price of US$1,803/oz, |
| | • | | Pd selling price of US$788.60/oz, |
| | • | | Au selling price of US$1,438.14/oz, |
| | • | | Ni selling price of US$11.26/lb, |
| | • | | Cu selling price of US$4.37/lb, |
| | • | | Assuming a total mining cost of ZAR23.11/tonned mined, |
| | • | | Assuming a fixed processing cost of ZAR13.66/tonne, |
| | • | | Assuming a variable processing cost of ZAR69.98/tonne, |
| | • | | Recoveries of 80% for Pt and Pd, 77% for Au, 71% for Ni and 66% for Cu. |
The breakeven grade was calculated to be 0.5g/t for Pt. Hence, resource results were tabulated at the 0.5g/t Pt thresholds and are presented below in Table 1 for Measured and Indicated Resources, and in Table 11 for Inferred Mineral Resources. The resources tabulated have been truncated to the rock/overburden interface; this interface was previously modeled as a digital terrain model (“DTM”) using the lithological tagging in the drillhole dataset.
Recall that PGMAU refers to the arithmetic addition of Pt, Pd and Au grades.
Table 10.0 Mineral Resource Totals – Measured and Indicated at a 0.5g/t PGMAU Cut-off
| | | | | | | | | | | | | | | | | | | | | | | | | | | | |
Category | | Tonnes | | | Pt
(g/t) | | | Pd
(g/t) | | | Au
(g/t) | | | PGMAU
(g/t) | | | Ni
(%) | | | Cu
(%) | |
Measured | | | 25,346,000 | | | | 0.70 | | | | 0.66 | | | | 0.07 | | | | 1.43 | | | | 0.15 | | | | 0.11 | |
Indicated | | | 61,751,000 | | | | 0.80 | | | | 0.84 | | | | 0.08 | | | | 1.72 | | | | 0.10 | | | | 0.07 | |
| | | | | | | | | | | | | | | | | | | | | | | | | | | | |
Total | | | 87,097,000 | | | | 0.77 | | | | 0.78 | | | | 0.07 | | | | 1.63 | | | | 0.11 | | | | 0.09 | |
| | | | | | | | | | | | | | | | | | | | | | | | | | | | |
Table 11.0 Mineral Resource Totals – Inferred at a 0.5g/t PGMAU Cut-off
| | | | | | | | | | | | | | | | | | | | | | | | | | | | | | |
Cut-off
Grade
Pt (g/t) | | | Tonnes | | | Pt
(g/t) | | | Pd
(g/t) | | | Au
(g/t) | | | PGMAU
(g/t) | | | Ni
(%) | | | Cu
(%) | |
| | 0.50 | | | | 41,155,000 | | | | 0.76 | | | | 0.65 | | | | 0.06 | | | | 1.47 | | | | 0.10 | | | | 0.07 | |
The QP responsible for the updating of the mineral resource is Mr D. Ferreira, B.Sc. Pri Sci. Nat. D. Ferreira is an independent consultant to Atlatsa.
Exploration and Development
Boikgantsho Project
Historically, significant exploration drilling has been conducted at the project site which has led to the declaration of a Mineral Resource in the indicated and inferred categories. This Mineral Resource was the basis of a high level preliminary evaluation undertaken by Atlatsa and published in February 2005. Though the preliminary evaluation was at a level where definitive economic evaluation could not be carried out, the results of the work undertaken showed that the project value was significant enough to warrant further study. A review of the scoping study has been completed. A prefeasibility study was initiated in May 2010 and has been temporarily postponed due to the pending transaction with Anglo Platinum.
See Item 4 “Restructure Plan” for details regarding the proposed sale of this project to Anglo Platinum.
Kwanda and Central Block Projects
The Group intends to continue with its existing prospecting programs at the Kwanda mineral properties in 2013 at a cost of approximately $0.2 million.
74
| ITEM 4A | UNRESOLVED STAFF COMMENTS |
None.
75
| ITEM 5 | OPERATING AND FINANCIAL REVIEW AND PROSPECTS |
Overview
The audited consolidated financial statements have been prepared in accordance with International Financial Reporting Standards (IFRS) as issued by the IASB. The Company adopted IFRS as of January 1, 2009.
The Group incurred a net loss for the year ended December 31, 2012 of $95.6 million (2011: $147.9 million) and as of that date its total assets exceeded its total liabilities by $205.3 million (2011: ($28.1 million)). The Company continues to incur losses.
The Company embarked on a restructuring and recapitalising plan during 2012 and on September 28, 2012 Phase One of the restructuring plan was completed. The effect was a consolidation of all loan facilities into one facility at a more favourable interest rate of 6.27% compared to 12.31% of the previous facility. The funds available from this facility are expected to meet the Group’s projected cash flow requirements until approximately June 2013. The Company is currently engaged in negotiations with Anglo Platinum to implement Phase Two of the plan to reduce the debt by $287.1 million (ZAR2.45 billion) and for additional funds to be made available from Anglo Platinum to meet the Group’s projected cash flow requirements until approximately the end of 2015. Under the proposed plan the new restructured debt will only be repayable once the Company generates sufficient free cash flow.
Anglo Platinum has currently extended financial support until August 31, 2013.
These conditions above give rise to a material uncertainty which may cast significant doubt about the ability of the Company and its subsidiaries to continue as a going concern and, therefore that they may be unable to realise its assets and discharge its liabilities in the normal course of business. See Section 1.12 “Liquidity” in the Management Discussion and Analysis for the fiscal year ended December 31, 2012 (filed on March 28, 2013).
Atlatsa’s audited consolidated financial statements however are prepared on the basis of accounting policies applicable to a going concern. This basis presumes that debt restructuring and accompanying funding arrangements as described above are successfully negotiated and approved by the shareholders by June 2013.
Subsequent to the completion of the initial acquisition of the Bokoni Mine (Effective July 1, 2009) by the Company, on February 2, 2012, Atlatsa and Anglo Platinum announced the material terms of the Restructure Plan for the Bokoni Group. This includes financing for ongoing operations, and the Company expects that the implementation of this transaction together with existing debt facilities will provide adequate resources to fund its activities and pay its liabilities in the foreseeable future. Subsequent to announcing the material terms of the Restructure Plan the Company announced that it, together with Anglo Platinum and Bokoni Mine management, had undertaken a strategic review of the Bokoni Mine operations in order to assess the optimal mine plan for Bokoni Mine going forward. This review process was completed and the parties are currently in discussion surrounding the optimal financing strategy to support such mine plan.On September 28, 2012 the Company announced that it, together with Anglo Platinum, had completed Phase One of the Restructure Plan, whereby the Company consolidated all of its debt owing to Anglo Platinum into the Consolidated Debt Facility and lowered its cost of borrowing. Refer to Section 4A “Restructure Plan”.
For additional details with respect to historical exchange rates, see Item 3 - “Key Information”. The outlook for Atlatsa’s assets primarily relates to the outlook for platinum group metals. For information relating to the historical prices for platinum group metals, see Item 5D - “Trend Information” below.
Key drivers of the Company’s operating results and principle factors affecting its operating results
The principal uncertainties and variables facing the Company’s business and, therefore, the key drivers of its operating results are:
| | • | | The prices of PGM metals, which fluctuates widely in U.S. dollars and ZAR; |
| | • | | The production tonnages and PGM content thereof, impacting on the amount of PGM metals the Company produces, at its operations; |
| | • | | The cost of producing the PGM metals as a result of mining efficiencies; and |
| | • | | General economic factors, such as exchange rate fluctuations and inflation, and factors affecting mining operations, particularly in South Africa. |
| | • | | Refinancing of the current debt structure |
76
PGM prices
The Company’s revenues are derived primarily from the sale of PGM metals produced at the Bokoni Mine. As a result, the Company’s operating results are directly related to the prices of these PGM metals, which can fluctuate widely and are affected by numerous factors beyond the Company’s control, including industrial and jewelry demand, expectations with respect to the rate of inflation, the strength of the U.S. dollar (the currency in which the prices of the PGM metals are generally quoted) and of other currencies, interest rates, forward sales by producers, global or regional political or economic events, and production and cost levels in major PGM-producing regions such as South Africa. As a general rule, the Company sells the PGM metals produced at the market prices to obtain the maximum benefit from prevailing PGM metal prices.
The movements in the U.S. dollar PGM spot price for 2012, 2011 and 2010 are indicated in the following table:
| | | | | | | | | | | | |
Monthly average basket PGM prices | | 2012 fiscal year | | | 2011 fiscal year | | | % change | |
Lowest PGM price during the fiscal year | | US$ | 1,015 | | | US$ | 1,112 | | | | (9 | %) |
Highest PGM price during the fiscal year | | US$ | 1,202 | | | US$ | 1,515 | | | | (21 | %) |
Average PGM price during the year | | US$ | 1,105 | | | US$ | 1,381 | | | | (20 | %) |
PGM price at end of the year | | US$ | 1,120 | | | US$ | 1,141 | | | | (2 | %) |
PGM price at beginning of the year | | US$ | 1,105 | | | US$ | 1,435 | | | | (23 | %) |
| | | | | | | | | | | | |
Monthly average basket PGM prices | | 2011 fiscal year | | | 2010 fiscal year | | | % change | |
Lowest PGM price during the fiscal year | | US$ | 1,112 | | | US$ | 1,127 | | | | (1 | %) |
Highest PGM price during the fiscal year | | US$ | 1,515 | | | US$ | 1,452 | | | | 4 | % |
Average PGM price during the year | | US$ | 1,381 | | | US$ | 1,256 | | | | 10 | % |
PGM price at end of the year | | US$ | 1,141 | | | US$ | 1,452 | | | | (21 | %) |
PGM price at beginning of the year | | US$ | 1,435 | | | US$ | 1,127 | | | | 27 | % |
Based on Atlatsa’s 2012 PGM production, the approximate sensitivity of its revenue to a 10% increase or decrease in the 2012 average market PGM price is a $11.3 million (ZAR93 million) increase or decrease in revenue.
PGM production and operating costs
Production from the Bokoni Mine for Fiscal 2012 totaled 863,675 tonnes and 102,671 4E ounces at an average yield of 4.21. Refer to Item 5A. “Operating Results” for the production statistics of the Bokoni Mine.
The Company’s costs and expenses consist primarily of operating costs, royalties and depreciation. Operating costs include labor, contractor services, stores, electricity and other related costs, incurred in the production of PGM metals. Labor is the largest component of operating costs consisting 41% of direct operating costs at the Bokoni Mine in Fiscal 2012. This amount is normally approximately 50% of operating costs but was lower in 2012 as a result of the strike action at Bokoni Mine. See “Illegal Strike Action at Bokoni Mine”.
General economic factors
The Bokoni Mine is situated in South Africa and the Company is exposed to a number of factors, which could affect its profitability, such as exchange rate fluctuations, inflation and other risks relating to South Africa. In conducting its mining operations, the Company recognizes the inherent risks and uncertainties of the industry, and the wasting nature of the assets.
Effect of exchange rate fluctuations
For Fiscal 2012, 100% of the Company’s revenues were generated from the Bokoni Mine in South Africa. During this period the U.S. dollar strengthened by 12% against the ZAR. As the price of PGM metals are denominated in U.S. dollars and the Company realizes its revenues in ZAR, the appreciation of the U.S. dollar against the ZAR increases the Company’s profitability, whereas the depreciation of the U.S. dollar against the ZAR reduces its profitability.
Currency hedging
Atlatsa does not engage in any hedging operations with respect to currency or in-situ minerals. Funds in excess of Atlatsa’s immediate needs are invested in short term near-cash investments pending the requirements for the funds. In addition, the Company has cash and certain liabilities denominated in ZAR. As a result, the Company is subject to foreign exchange risk from fluctuations in foreign exchange rates. The Company has not entered into any derivative or other financial instruments to mitigate this foreign exchange risk.
77
Effect of inflation
South Africa went through a period of increased inflation along with other world markets in 2008. The South African inflation rate stabilized in fiscal 2009 and the CPI (“Consumer Price Inflation”) index was 5.7% in December 2012 (2011: 6.1%). The Company’s operating costs are directly impacted by inflation.
South African political, economic and other factors
The Company operates only in South Africa, and its mining activities in South Africa are subject to, amongst others, the following laws and regulations:
| | • | | The Broad-based Black Economic Empowerment Act; |
| | • | | The Mineral and Petroleum Resources Development Act (MPRDA); |
| | • | | The Mineral and Petroleum Royalty Act. |
The Company is also subject to various local, national and regional safety, health and environmental laws and regulations. Refer to Item 3.D. (Risk Factors) and Item 4.B. (Business Overview – Mining and Exploration in South Africa) for a detailed discussion on the political, economic and other factors affecting South African companies.
78
| | | | | | | | | | | | |
Consolidated statements of financial position | | As at
December 31,
2012 | | | As at
December 31,
2011 | | | As at
December 31,
2010 | |
| | | |
Total assets | | $ | 814,065,329 | | | $ | 893,008,966 | | | $ | 1,092,106,255 | |
| | | |
Non-current liabilities ( including short-term portion of loans and borrowings) | | $ | 587,919,471 | | | $ | 897,968,643 | | | $ | 938,895,976 | |
| | | |
Consolidated statements of comprehensive income | | Year ended
December 31,
2012 | | | Year ended
December 31,
2011 | | | Year ended
December 31,
2010 | |
| | | |
Revenue | | $ | 117,557,331 | | | $ | 144,406,716 | | | $ | 148,286,833 | |
| | | |
Cost of sales | | ($ | 195,387,551 | ) | | ($ | 209,966,805 | ) | | ($ | 173,151,188 | ) |
| | | | | | | | | | | | |
| | | |
Gross loss | | ($ | 77,830,220 | ) | | ($ | 65,560,089 | ) | | ($ | 24,864,355 | ) |
| | | | | | | | | | | | |
| | | | | | | | | | | | |
| | | | | | | | | | | | |
| | | |
Loss for the year | | ($ | 95,566,870 | ) | | ($ | 147,864,548 | ) | | ($ | 93,658,806 | ) |
| | | | | | | | | | | | |
| | | |
Basic and diluted loss per share | | $ | 0.04 | | | $ | 0.19 | | | $ | 0.12 | |
| | | | | | | | | | | | |
| | | |
Weighted average number of common shares outstanding | | | 424,791,411 | | | | 424,783,603 | | | | 424,665,314 | |
| | | | | | | | | | | | |
With effect from July 1, 2009, Atlatsa transformed from an exploration and development company into a PGM producer as detailed in Atlatsa’s Amended Business Acquisition Report, dated September 28, 2010 (furnished to the SEC on Form 6-K on February 1, 2011). This transformation was achieved through the Bokoni Transaction. The Bokoni Transaction is discussed in detail in Item 4.A.
Highlights
Consolidated Statements of Financial Position
Fiscal 2012 compared to Fiscal 2011
The decrease in total assets of $78.9 million is primarily due to the effect of translating property, plant and equipment of the South African subsidiaries from ZAR to $, which equates to $55.4 million and a decrease in trade and other receivables of $23.8 million.
The decrease in non-current liabilities of $310 million is largely due to the recognition of a fair value gain of $215.5 million on the Consolidated Debt Facility, translating loans and borrowings of the South African subsidiaries equating to a foreign exchange difference of $53.2 million, settlement of the “A” Preference shares between RPM and Holdco of $198.5 million, drawdowns of $72.8 million and interest accrued of $84.5 million.
Fiscal 2011 compared to Fiscal 2010
The decrease in total assets of $199.1 million is primarily due to the effect of translating property, plant and equipment of the South African subsidiaries from ZAR to $, which equates to $161.7 million and the reduction in cash and cash equivalents of $9.8 million.
The decrease in total non-current liabilities, including the short-term portion of the loans and borrowings, is primarily due to the effect of translating the non-current liabilities of the South African subsidiaries from ZAR to $, as well as a reduction in the deferred tax liability. This decrease was partially offset by the increase in the loans and borrowings due to the interest accrued on the A Preference Share Facility, 2009 Senior Debt Facility and Operating Cash Shortfall Facility (“OCSF”), as well as the drawdowns made on the OCSF during Fiscal 2011.
Consolidated Statements of Comprehensive Income
Fiscal 2012 compared to Fiscal 2011
The decrease in revenue is due to lost production from October 1, 2012 to mid December 2012 as a result of an unprotected strike at the Bokoni Mine resulting in approximately 35,500 PGM oz (4E) of production being lost in Q4 2012. The PGM basket price was also 12% lower in 2012 in comparison to 2011.
79
The loss for Fiscal 2012 decreased by $52.3 million from the previous year. The loss per share decreased from 19 cents to 7 cents as at December 31, 2012. The decreased loss is due to the recognition of a fair value gain as a result of the various sources of debt being consolidated into a single facility as a result of Phase One of the Restructure Plan, lower interest charge as a result of the revised terms on the Consolidated Debt Facility and a deteriotion in the exchange rate.
Revenue
The Bokoni mine concentrator milled 863,675 tonnes in Fiscal 2012, which is 18% lower than the 1,047,401 tonnes milled in Fiscal 2011. As a result of the decreased tonnes milled, the Bokoni Mine produced less 4E ounces than in Fiscal 2011, mostly due to the strike in Q4 2012.
| | • | | Revenue from the sale of concentrate for Fiscal 2012 was $117.6 million (ZAR964 million) compared to Fiscal 2011 of $144.4 million (ZAR1,055.6 million). The decrease of $27 million (19%) is mainly due to a lower production of 4E ounces; |
| | • | | 4E ounces produced in Fiscal 2012 produced 102,671 ounces compared to 113,625 ounces (-9.6%) in Fiscal 2011. |
| | • | | The PGM basket price (US$) for Fiscal 2012 was 12% lower than the basket price achieved for Fiscal 2011. The basket price for Fiscal 2012 was US$1,221/oz (ZAR9,978/oz) compared to US$1,380/oz (ZAR10,028/oz) for Fiscal 2011 |
Cost of sales of $195 million for Fiscal 2012 was $14.6 million (-6.94%) lower than Fiscal 2011’s cost of sales of $209.9 million. The main reasons were as follows:
| | • | | Labor costs for Fiscal 2012 decreased by 6% ($5.3 million) compared to Fiscal 2011 which is attributable to the weakening of the ZAR by 12%. Labor costs in ZAR for Fiscal 2012 increased by 5% (ZAR32 million) compared to Fiscal 2011. The increase is mainly as a result of: |
| | • | | an increase in January 2012 of 8% in annual salaries for monthly and total package employees; |
| | • | | an increase in July 2012 of 9% for union members and officers and monthly-daily paid employees (both basic salary as well as allowances); |
| | • | | the impact of the salary increases on the leave pay provision adjusted in January and July of each year; |
| | • | | an increase in bonus payments; |
| | • | | a 1% increase in enrolled labour as well as a change in staff mix; |
| | • | | the provision for retention bonuses; and |
| | • | | the above increases were partially reduced as a result of employees that were not paid as a result of the unprotected strike in Q4 2012. |
| | • | | Labor costs for Q4 2012 decreased by $7 million (-31%) compared to Q4 2011. The unprotected strike was handled on a “no work – no pay” basis, which contributed mainly to the decrease in labour costs compared to the prior year. Included in the labour cost for Q4 2012 were strike-related overtime of $0.2 million and the payment of loyalty bonuses and sign-on bonuses of $0.9 million. |
| | • | | Contractor costs for Fiscal 2012 decreased by $3.3 million (-18.5%) compared to Fiscal 2011. The decrease was mainly due to development work at Brakfontein that now falls within the capital footprint and lower maintenance cost on the load haul dump fleet, partially offset by additional contractor cost at the Vertical shaft for re- and sub-development and production driven contractor cost increases at the UM2 shaft. In Q4 2012 the decrease was driven by the effect of the unprotected strike during this quarter. |
| | • | | Storage costs for Fiscal 2012 decreased by $4.3 million (-13%) compared to Fiscal 2011. The increase was driven by increased tonnes delivered (8%) and increased square meters (10%). The storage costs associated with development are more expensive than stoping costs. Equipping costs increased to improve the flexibility at the various shafts and engineering costs increased, mainly due to increased maintenance to the trackless machines at MPH and Brakfontein. This was offset by implementing better cost controls. The unprotected strike experienced at the mine during Q4 2012 affected the production performance severely, which led to the savings in stores costs compared to the prior year. |
| | • | | Utility costs for Fiscal 2012 increased by $0.1 million (1.6%) compared to Fiscal 2011. The annual increase from Eskom (South African national power supplier) accounted for majority of this increase, but was offset by the fact that the Bokoni Mine did not operate during Q4 2012. |
| | • | | Sundry costs for Fiscal 2012 increased by $2.4 million (12.5%) compared to Fiscal 2011. |
| | • | | Additional expenses in Q4 2012, included strike-related costs for security, accommodation, food, printing and legal fees of $2.2 million. |
| | • | | Changes in inventory for Fiscal 2012 increased by $0.8 million compared to Fiscal 2011. |
| | • | | Depreciation for Fiscal 2012 decreased by $5 million compared to Fiscal 2011. |
| | • | | The above cost variances were impacted by a weakening of 12% in the average ZAR to $ exchange rate. |
On a cost per tonne basis, production cost for Fiscal 2012 was US$187.3 (ZAR1,535) per tonne as compared to US$163.4 (ZAR1,194) per tonne for Fiscal 2011, a US$ increase of 15% (increase of 29% in ZAR, which is the functional currency of the Bokoni Mine). The increase is a result of the reasons discussed above.
| | • | | Finance expenses of $82.8 million (Fiscal 2011 – $92.0 million) |
The increase in the OCSF draw downs and compounded interest on the funding loan facilities contributed to an increased interest expense until September 28, 2012. As a result of Phase One of the Restructure Plan, interest incurred for Q4 2012 amounted to $12.8 million compared to $21.7 million in Q4 2011.
Refer to note 18 of the annual consolidated financial statements (available on SEDAR) for details of the individual liabilities to which the finance expense relate.
| | • | | Income tax expense of $10.6 million (Fiscal 2011 - $32.7 million Income tax credit) |
Taxable losses and deductible expenditure incurred by the Bokoni Group in Fiscal 2011, resulted in a reduction in the deferred tax liabilities during the year. In Fiscal 2012, a deferred tax expense arose as a result of the recognition of the
80
fair value gain to reflect Phase One of the Restructure Plan. Refer to note 28 of the notes to the annual consolidated financial statements for a reconciliation of the income tax for the periods. The primary reason for the difference between the statutory tax rate of 25% and the effective tax rate of (12.44%) during Fiscal 2012 is as a result of the fair value gain on the loans not being taxable and non-deductible expenditure, including preference share dividends which are not tax deductible.
Tax losses that would result in deferred tax assets and a reduction in the tax expense have not been recognised as it is not expected that the subsidiaries that the losses relate to will have future taxable income to utilise the tax losses.
The average ZAR to $ exchange rate for Fiscal 2012 was ZAR8.19=$1, a weakening of 12% compared to the average exchange rate for Fiscal 2011 of ZAR7.32=$1.
On revenue, the average realized ZAR/US$ exchange rate for Fiscal 2012 was ZAR8.17=US$1 compared to the average exchange rate for Fiscal 2011 of ZAR7.26 = US$1 (a weakening of the ZAR against the US$ of 12%).
Total capital expenditure for Fiscal 2012 was $38.9 million (as opposed to $28.7 million for Fiscal 2011), comprising 46.8% sustaining capital and 53.2% project expansion capital (as opposed to 50% sustaining capital and 50% project expansion capital for Fiscal 2011).
The Fiscal 2012 calculated royalty tax percentage for Bokoni Mine was the minimum percentage of 0.5% (Fiscal 2011 0.5%), and the resulting royalty expense for Fiscal 2012 amounted to $0.5 million ($0.6 million for Fiscal 2011).
Fiscal 2011 compared to Fiscal 2010
The loss for Fiscal 2011 increased from $93.7 million in the previous year to $147.9 million. The loss per share increased from 12 cents to 19 cents as at December 31, 2011. The increased loss is due to lower production and escalating costs at Bokoni Mine, as well as increased finance expenses.
The major contributors to the increase in the loss to $147.9 million for Fiscal 2011 were:
| | • | | A gross loss from mining activities of $65.6 million (Fiscal 2010 - $24.9 million). |
Revenue for Fiscal 2011 was $144.4 million (ZAR1,055.6 million) compared to Fiscal 2010 of $148.3 million (ZAR1,052.4 million). The decrease in revenue of 3% is mainly as a result of the decrease in 4E ounces produced.
Although tonnes milled for Fiscal 2011 remained relatively the same as compared to Fiscal 2010, lower grades and recoveries led to ounces produced for Fiscal 2011 being 2% lower than Fiscal 2010.
Partially offsetting the result of decreased production, the PGM basket price for Fiscal 2011 was 10% higher than the basket price achieved for Fiscal 2010. The basket price for Fiscal 2011 was US$1,380/oz (ZAR10,028/oz) compared to US$1,257/oz (ZAR9,207/oz) for Fiscal 2010. The average platinum price of US$1,720/oz for Fiscal 2011 was 7% higher than the average platinum price of US$1,611/oz for Fiscal 2010.
Cost of sales of $209.9 million for Fiscal 2011 was $36.7 million higher than the $173.2 million for Fiscal 2010, mainly as a result of:
| | • | | Labor cost increasing due to increases in labor numbers, annual salary increases, overtime hours and bonus payments. |
| | • | | Increasing use of third party companies contracted to carry out re- and sub-development depending on management’s production and development planning requirements. |
| | • | | Increases in storage costs based predominately on inflationary increases, panel equipping costs, increase on liner and mechanical critical spares and tonnes milled. |
| | • | | Utility costs increased due to annual tariff increases. |
| | • | | Depreciation charges based on the unit of production method moving in line with production as well as additional depreciation when capital work-in-progress was capitalized (with specific reference to the capitalization of the Brakfontein Project in the second quarter of 2010). |
81
On a cost per tonne basis, production cost for Fiscal 2011 was US$164 (ZAR1,194) per tonne as compared to US$ 135 (ZAR989) per tonne for Fiscal 2010, a US$ increase of 21% (increase of 21% in ZAR, which is the functional currency of Bokoni Mine).
| | • | | Finance expenses of $92.0 million (Fiscal 2010 – $67.5 million) |
Due to the compounding effect of the interest on the A preference Share Facility, the 2009 Senior Debt Facility and the OCSF, the reduction of capitalized interest expense, as well as the drawdowns made on the OCSF during Fiscal 2011, the finance expenses increased in Fiscal 2011. Refer to note 18 of the annual consolidated financial statements (available on SEDAR) for details of the individual liabilities to which the finance expense relate.
| | • | | Income tax (credit) of $32.7 million (Fiscal 2010 - $17.3 million) |
Taxable losses and deductible expenditures incurred by the Bokoni Group in Fiscal 2011, resulted in a reduction in the deferred tax liabilities during the year. Refer to note 28 of the notes to the annual consolidated financial statements for a reconciliation of the income tax for the periods. The difference between the statutory tax rate of 26.5% and the effective tax rate of 17.76% during Fiscal 2011 is primarily due to non-deductible expenditure, including preference share dividends which are not tax deductible.
The average ZAR to $ exchange rate for Fiscal 2012 was ZAR8.20=$1, a weakening of 12% compared to the average exchange rate for Fiscal 2011 of ZAR7.33=$1.
On revenue, the average realized ZAR/US$ exchange rate for Fiscal 2011 was ZAR7.26=US$1 compared to the average exchange rate for Fiscal 2010 of ZAR7.32 = US$1 (a strengthening of the ZAR against the US$ of 1%).
For Fiscal 2011 total capital expenditure was $28.7 million (as opposed to $28.2 million for Fiscal 2010), comprising of 50% sustaining capital and 50% project expansion capital (as opposed to 14% sustaining capital and 86% project expansion capital for Fiscal 2010).
For Fiscal 2011 the royalty expense was $0.6 million as compared to $0.5 million for Fiscal 2010.
Safety
There were no fatal accidents during Fiscal 2012. Atlatsa’s LTIFR improved to 0.93 in Fiscal 2012 from 1.87 in Fiscal 2011. Management remains committed to safety at the operations. Active engagement with the South African Department of Mineral Resources on safety matters continues.
Development
Total development metres decreased by 28% from Fiscal 2011 to Fiscal 2012.
The recovered grade improved by 9% from 2011 to 2012 and can be largely attributed to improved performance at the concentrator.
82
Bokoni Mine production statistics
| | | | | | | | | | | | | | | | | | | | | | | | | | |
| | | | | 2012
12
months | | | %
Change | | | 2011
12 months | | | 2011
12 months | | | %
Change | | | 2010
12 months | |
4E oz produced | | Oz | | | 102,671 | | | | (10 | ) | | | 113,625 | | | | 113,625 | | | | (2 | ) | | | 116,164 | |
Tonnes milled | | T | | | 863,675 | | | | (18 | ) | | | 1,047,401 | | | | 1,047,401 | | | | — | | | | 1,044,084 | |
Recovered grade | | g/t milled,4E | | | 4.21 | | | | 9 | | | | 3.86 | | | | 3.86 | | | | (6 | ) | | | 4.12 | |
UG2 mined to total output | | % | | | 34.07 | | | | 5 | | | | 32.6 | | | | 32.6 | | | | 1 | | | | 32.2 | |
Development meters | | M | | | 7,550 | | | | 28 | | | | 10,549 | | | | 10,549 | | | | 3 | | | | 10,292 | |
ZAR/t operating cost/tonne milled | | ZAR/t | | | 1,535 | | | | (29 | ) | | | 1,194 | | | | 1,194 | | | | (21 | ) | | | 989 | |
ZAR/4E operating cost/4E oz | | ZAR/4E oz | | | 12,902 | | | | (17 | ) | | | 11,009 | | | | 11,009 | | | | (24 | ) | | | 8,888 | |
| | | | | | | | | | | | | | | | | | | | | | | | | | |
Total labor (mine operations) | | Number | | | 5032 | | | | (5 | ) | | | 5,324 | | | | 5,324 | | | | 4 | | | | 5,116 | |
| | | | | | | | | | | | | | | | | | | | | | | | | | |
The above information relates to the Bokoni Mine segment of the Company. The Projects segment relates to the Company’s exploration projects and did not generate any revenue.
Discussion of Last Eight Quarterly Results
| | | | | | | | | | | | | | | | | | | | | | | | | | | | | | | | |
$ Million * | | Dec 31,
2012 | | | Sep 30,
2012 | | | Jun 30,
2012 | | | Mar 31,
2012 | | | Dec 31,
2011 | | | Sep 30,
2011 | | | Jun 30,
2011 | | | Mar 31,
2011 | |
Revenue | | | 0.8 | | | | 43.9 | | | | 38.7 | | | | 34.1 | | | | 32.5 | | | | 45.3 | | | | 35.9 | | | | 30.7 | |
Cost of sales | | | (35.5 | ) | | | (54.1 | ) | | | (52.4 | ) | | | (53.4 | ) | | | (51.1 | ) | | | (55.0 | ) | | | (56.2 | ) | | | (47.6 | ) |
| | | | | | | | | | | | | | | | | | | | | | | | | | | | | | | | |
Gross loss | | | (34.7 | ) | | | (10.2 | ) | | | (13.7 | ) | | | (19.3 | ) | | | (18.7 | ) | | | (9.7 | ) | | | (20.3 | ) | | | (16.9 | ) |
| | | | | | | | | | | | | | | | | | | | | | | | | | | | | | | | |
| | | | | | | | |
Loss for the period | | | (63.7 | ) | | | (49.8 | ) | | | (40.4 | ) | | | (41.3 | ) | | | (35.6 | ) | | | (30.1 | ) | | | (46.1 | ) | | | (36.1 | ) |
| | | | | | | | |
Basic and dilutedearnings/( loss) per share ($) | | | (0.10 | ) | | | 0.16 | | | | (0.05 | ) | | | (0.05 | ) | | | (0.04 | ) | | | (0.04 | ) | | | (0.07 | ) | | | (0.04 | ) |
Weighted number of common shares outstanding (million) | | | 425 | | | | 425 | | | | 425 | | | | 425 | | | | 425 | | | | 425 | | | | 425 | | | | 425 | |
| * | Data for all presented periods was prepared in accordance with IFRS. |
Atlatsa is continuing its efforts to grow production (Phase 1 expansion program at the Bokoni Mine) in order to achieve Atlatsa’s long-term goal of achieving a monthly production of 160,000 tonnes per month in the medium term.
All of the above factors contributed to the increase in revenue to a high of $45.3 million for Q3 2011 to an all-time low of only $0.8 million in Q4 2012. Fluctuation in revenue between the quarters is mainly a result of fluctuation in production and varying PGM basket prices and exchange rates, including:
| | • | | Production has varied from period to period predominately as a result of production efficiencies, potholing and safety stoppages and the illegal strike in Q4 2012. Revenue is also impacted by concentrate grade and chrome penalties respectively. Production levels reached a high of 38,819 4E ounces during Q3 2012 and a low of 2,045 4E ounces during Q4 2012. This 95% variance indicates the extreme production volatility experienced during the eight quarter periods referred to in the table above. |
| | • | | PGM basket prices are derived from the relevant market supply and demand that exists at that particular point in time. For the eight quarter periods referred to in the table above, the PGM basket price varied from a high of US$1,457 for the three months ended March 31, 2011 to a low of US$1,172 for Q3 2012. This 20% variance indicates the volatility of the PGM basket price to fluctuations. |
| | • | | Due to the fact that the PGM basket price is quoted in US$, the revenue for each specific period is significantly dependent on the fluctuations of the ZAR against the US$. The ZAR’s strongest quarterly average position against the US$ was experienced during the second quarter of Fiscal 2011 at an exchange rate of ZAR6.80 = US$1 and the weakest during Q3 2012, which was ZAR8.27 = US$1. The 25.3% variance indicates the volatility of the ZAR against the US$ to exchange rate fluctuations. |
83
The period to period variations in cost of sales are mainly as a result of:
| | • | | Labor cost varying due to changes in labor numbers, annual salary increases, overtime hours and bonus payments. |
| | • | | Varying use of contractors depending on management’s production and development planning requirements. |
| | • | | Fluctuations in storage costs based predominately on tonnes milled. |
| | • | | Utility costs varying between winter and summer tariffs, and are also subject to annual tariff increases. |
| | • | | Depreciation charges based on the unit of production method moving in line with production as well as additional depreciation when capital work-in-progress is capitalized (with specific reference to the capitalization of the Brakfontein Project in the second quarter of Fiscal 2010). |
| | • | | Fluctuations in the exchange rate; as the functional currency of Bokoni Mine is in ZAR; all reporting takes place in Canadian $; therefore the cost of sales are also impacted by the weakening of the ZAR. |
The increased finance cost, as a result of the drawdowns on the OCSF and the continuing compounding of the interest on the loans and borrowings has contributed to the increase in the quarterly loss during the previous eight quarters.
A discussion of the Registrant’s critical accounting policies can be found in Section 1.11 of its Management Discussion and Analysis for the fiscal year ended December 31, 2012 (filed on March 28, 2013) available on SEDAR at www.sedar.com and EDGAR at www.sec.gov.
New standards and interpretations not yet adopted
A discussion of the Registrant’s changes in accounting policies can be found in Section 1.12 of its Management Discussion and Analysis for the fiscal year ended December 31, 2012 (filed on March 28, 2013).
| | B. | Liquidity and Capital Resources |
Refer to Section 1.12 and 1.13 of the Management Discussion and Analysis for the fiscal year ended December 31, 2012 (filed on March 28, 2013).
Financial Instruments
Interest rate hedging
The Company currently does not use any financial or derivative instruments for hedging or similar purposes.
Material Commitments for Capital Expenditures
At December 31, 2012, the Company had commitments for capital expenditures of $3.4 million relating primarily to mine development and infrastructure costs for the Bokoni Mine.
| | C. | Research and Development, Patents and Licenses, etc. |
Atlatsa is a resource-expenditure based corporation and, accordingly, does not have a program of intellectual property development or research and development programs generally.
Outlook
2012 remained another volatile and challenging year for the PGM sector, with the Rand PGM basket price remaining relatively flat during the period, compounded by above inflation cost increases in South Africa, largely associated with power utility and wage increases stemming from illegal strike action and subsequent wage settlements concluded amongst major South African PGM producers.
The South African PGM sector in 2012 was marred by a series of illegal, unprotected and often violent labour strikes across the industry which resulted in a significant loss of life, damage to property and loss of production during the period. During the year AMCU (Association of Mine and Construction workers Union), a relative newcomer in the sector, displaced NUM (National Union of Mineworkers) as the dominant Labour Union amongst the major South African PGM producers.
As a result of the strike contamination within the sector and consequent above inflation wage settlements, many PGM producers in South Africa were forced to re-assess their existing capital expansion programmes and a number of expansion projects were either deferred or cancelled as a result of these reviews. In addition, certain mining operations were curtailed and in January,
84
2013 Anglo Platinum, South Africa’s largest PGM producer, announced its intention to curtail certain operations within its Rustenberg mining complex, which would result in approximately 400,000 Platinum ounces of production being removed from market supply and approximately 14,000 job losses within the sector. This announcement has been met with resistance from both the South African government and labour unions.
In addition to the South African specific issues affecting the PGM sector referred to above, the fundamentals for the PGM metals remained under pressure during 2012 as a result of continued weak demand within the European region automotive sector (largely affecting Platinum), increased supply from recycling activities and spot PGM price volatility, dominated by speculative investment demand (predominantly through Exchange Traded Funds). PGM jewellery demand remained buoyant throughout the year with Chinese demand being the major demand component.
The labour situation within the South African mining sector as well as the risk for further supply disruptions resulting from labour related unrest remains high, with the South African government and certain labour unions advocating for collective bargaining amongst all PGM producers, leading into 2013 wage negotiations due to commence in July, 2013. AMCU, now the largest representative labour union within the sector, has indicated that it will not participate in a collective bargaining process, despite having signed an industry peace accord motivated by the South African Minister of Minerals in early 2013.
A large part of the PGM fundamentals for 2013 will depend on the outcome of the proposed Anglo Platinum restructure plan (and potential removal of approximately 10% of South African platinum supply from the market as a consequence), together with the outcome of the 2013 wage negotiation process in mid 2013.
Should a significant portion of South African supply be removed from the market as a result of the Anglo Platinum restructure plan then this, together with production cutbacks from other South African producers, as well as the announced deferral or cancellation of certain PGM expansion projects in South Africa, should bode well for underlying platinum metal price support in the near, medium and long term. This market supply change, together with a continued depreciation in the ZAR/US$ exchange rate which has weakened the Rand significantly during Q4 2012 and Q1 2013, should support a more positive outlook for the Rand PGM basket price and create for a more balanced market going forward.
Annual Trends
The PGM basket price (in US$) for Fiscal 2012 was 12% lower than the basket price achieved in Fiscal 2011. The US$ platinum price was 9% lower in Fiscal 2012 compared to Fiscal 2011.
The average ZAR:US$ exchange rate demonstrated a weakening of the ZAR of 12% compared to the average exchange rate during Fiscal 2011.
| | E. | Off-Balance Sheet Arrangements |
The Company does not have any off-balance sheet arrangements that have or are reasonably likely to have a current or future effect on its financial condition, changes in financial condition, revenues or expenses, results of operations, liquidity, capital expenditures or capital resources that is material to investors.
| | F. | Tabular Disclosure of Contractual Obligations |
Refer to Section 1.13 of the Management Discussion and Analysis for the fiscal year ended December 31, 2012 (filed on March 28, 2013).
The safe harbor provided in Section 27A of the Securities Act and Section 21E of the Exchange Act applies to forward-looking information provided pursuant to Item 5.E and F above. See “Cautionary Note Regarding Forward-Looking Statements” in the introduction to this Annual Report.
85
| ITEM 6 | DIRECTORS, SENIOR MANAGEMENT AND EMPLOYEES |
| | A. | Directors and Senior Management |
Name and Occupation
The information as to the number of common shares beneficially owned, controlled or directed shown below is not within the knowledge of the management of the Company and has been furnished by the respective nominees as reported in their filings at http://www.sedar.com.
The following table states the name, province or state, and country of residence of each of the directors and executive officers of the Company as at March 28, 2013, the positions and offices presently held by them and the period or periods of time during which each has served as a directors of the Company. Each director’s terms of office expires at the next annual general meeting of the shareholders of the Company.
| | | | | | | | | | |
Name, position with the Company and province or state and
country of residence | | Period(s) as a Director or Officer
of the Company | | Common
shares
beneficially
owned,
controlled or
directed (1)
(2) | | | B3
Preference
shares (1) (3) | |
| | | |
Fikile Tebogo De Buck (6) (7) (9) (11) Non-Executive Director Gauteng | | Since November 2008 | | | Nil | | | | | |
| | | |
Anu Dhir (6) (8) (9) (10) (11) Lead Independent Non-Executive Director Ontario, Canada | | Since July 2008 | | | Nil | | | | | |
| | | |
Harold Motaung Director, CEO Gauteng, South Africa | | Director since September 2004 Chief Executive Officer since April 2011 | | | 19,764,462 | (4) | | | 18,972,000 | (4) |
| | | |
Tumelo Motsisi Director and Chairman Gauteng, South Africa | | Since September 2004 | | | 28,535,143 | (5) | | | 26,784,000 | (5) |
| | | |
Rizelle Sampson (9) Non-Executive Director Gauteng, South Africa | | Since September 2004 | | | Nil | | | | | |
| | | |
Joel Kesler Executive: Corporate and Business Development Gauteng, South Africa | | Since March 2010 | | | 959,361 | | | | | |
| | | |
De Wet Schutte CFO Gauteng, South Africa | | Since May 2010 | | | Nil | | | | | |
| | | |
Patrick Cooke (6) (7) (8) (11) Non-Executive Director Gauteng, South Africa | | Since February 2012 | | | 3,500 | | | | | |
| | | |
Bava Reddy Executive: Mineral Strategy | | Since October 2008 | | | Nil | | | | | |
Notes:
| (1) | The information as to number of common shares beneficially owned controlled or directed is not within the knowledge of the management of the Company and has been furnished by the respective nominees as reported in their filings at www.sedi.ca. |
| (2) | Directors personally own or control a total of 49,258,966 common shares which represent approximately 24.4% of the current outstanding shares. The directors also hold 9,431,000 options (see “Incentive Plan Awards – Option-based Awards”). |
| (3) | Directors indirectly own or control a total of 45,756,000 of the total 111,600,000 B3 preference shares which represent approximately 22.7% of the current outstanding shares on a as converted basis. |
86
| (4) | Indirect holdings being 170 of the 1,000 ordinary shares in the issued and outstanding share capital of Atlatsa Holdings (Proprietary) Limited, multiplied by the number of common shares of Atlatsa (115,496,438) held by the Pelawan Trust and direct holdings of 130,068 shares. |
| (5) | Indirect holdings being 240 of the 1,000 ordinary shares in the issued and outstanding share capital of Atlatsa Holdings (Proprietary) Limited, multiplied by the number of common shares of Atlatsa (115,496,438) held by the Pelawan Trust and direct holdings of 815,998 shares. |
| (6) | Member of the Audit and Risk Committee. |
| (7) | Member of the Nominating and Governance Committee. |
| (8) | Member of the Compensation Committee. |
| (9) | Member of the Sustainable Development and Health and Safety Committee. |
| (10) | Member of the Investment Committee. |
| (11) | Member of the Special Committee. |
Additional details including the principal occupation for the past five years of the above directors are as follows:
FIKILE TEBOGO DE BUCK, BA, FCCA – Director
Ms. De Buck is a Fellow of the Association of Chartered Certified Accountants FCCA (UK) and has extensive experience in business operations and financial affairs with companies in the mining sector. She holds a Bachelor of Arts degree in Economics and Accounting from the University of Swaziland. Ms. De Buck is currently a non-exeutive director and the lead independent director of Harmony Gold Mining Company Ltd and is a member of various board committees of Harmony including the Audit Committee. She is also a non-executive director of Clientele Limited. She has also served in various positions at the Council for Medical Schemes in South Africa.
Ms. De Buck is, or was within the past 5 years, an officer and/or director of the following public companies:
| | | | | | |
Company | | Positions
Held | | From | | To |
Atlatsa Resources Corporation | | Director | | November 2008 | | Present |
Harmony Gold Company Limited | | Director | | April 2006 | | Present |
Clientele Limited | | Director | | November 2012 | | Present |
Clientele Life | | Director | | November 2012 | | Present |
ANU DHIR, BA, JD – Director
Anu Dhir holds a Bachelor of Arts degree from the University of Toronto and a law degree (Juris Doctor) from Quinnipiac University, Connecticut, United States. Ms. Dhir has extensive experience in international business, operations and legal affairs in private equity and publicly-held companies in the mining, oil and gas and technology sectors. Ms. Dhir served as Vice President, Corporate Development and Company Secretary at Katanga Mining Limited, a TSX-listed company and is currently Managing Director of Miniqs Limited, a private group primarily interested in resource projects that have the capability to grow into major producing operations. Ms. Dhir is a non-executive director of Great Basin Gold Limited, a TSX-listed company engaged in gold mining and Frontier Rare Earths Limited, a TSX-listed company that is focused on rare earth elements.
During the past five years, Ms. Dhir is, or has been, a director of the following public companies:
| | | | | | |
Company | | Positions Held | | From | | To |
Atlatsa Resources Corporation | | Director | | July 2008 | | Present |
Katanga Mining Limited | | Director | | March 2004 | | November 2004 |
| | Vice President, Corporate
Development | | January 2006 | | October 2009 |
Compass Asset Management | | Director | | June 2009 | | December 2012 |
Miniqs Limited | | Director and Officer | | March 2010 | | Present |
Frontier Rare Earths Limited | | Director | | November 2010 | | Present |
Great Basin Gold Limited | | Director | | May 2011 | | Present |
87
A. H. C. HAROLD MOTAUNG, BSc, MBA – CEO and Director
Harold Motaung was previously employed at the Free State and Vaal River operations of Anglo American Corporation of South Africa Limited for six years as a mining engineer and as a production supervisor. Mr. Motaung then moved to the South African Government’s Department of Minerals and Energy (DME) as a director within the Mine Inspectorate. As a Deputy Chief Inspector, he was responsible for implementing the Mine, Health and Safety Act. Subsequently he was appointed Chief Director within the Mine Inspectorate. His portfolio included the gold, platinum and coal regions of South Africa.
In Mr. Motaung’s capacity as a Chief Director of the Mine Inspectorate, he was appointed on numerous boards of government–associated institutions including the National Nuclear Reactor, the Deep Mining Board and the Mining Qualifications Authority. Mr. Motaung also chaired the Mines Research Board, which administered a mining safety fund. Mr. Motaung also represented the South African government in a number of international and bi-national engagements with foreign countries, and was a member of the DME executive team responsible for the briefs and presentations at the Parliamentary Portfolio Committee on the status of minerals and energy within the country, which culminated in the enactment of the Minerals Development Act. Mr. Motaung left the DME to establish a mining and geological consultancy, African Minerals Professionals (Pty) Limited. Mr. Motaung has been a director of Atlatsa since September 2004 and is not a director of any other public companies. Mr. Motaung is a founding member of Atlatsa Holdings, the controlling shareholder of Atlatsa. Recently he was appointed and served on the board of Mintek as the non-executive chairman.
Mr. Motaung has been a director of the Company since September 2004, and the CEO of the Company since April 2011.
During the past five years, Mr. Motaung is, or has been, a director of the following public companies:
| | | | | | |
Company | | Positions
Held | | From | | To |
Atlatsa Resources Corporation | | Director | | September 2008 | | Present |
TUMELO M. MOTSISI, BA, LLM, MBA – Executive Chairman and Director
Tumelo Motsisi is a prominent South African businessperson with experience in the South African financial services, mining and energy sectors. Between 1994 and 1998 he was employed first as a senior manager and then as a director within the Negotiated Benefits Consultants division of Alexander Forbes, a South African financial services company.
In 1998 he established Kopano Ke Matla Investment Company, the investment arm of South Africa’s largest trade union federation, the Congress of South African Trade Unions. He was subsequently appointed as the CEO of Kopano Ke Matla. Mr. Motsisi also served as Executive Chairperson of Prosperity Holdings, a financial services company established between Kopano Ke Matla, NBC Financial Services and Peregrine Holdings. Mr. Motsisi is a member and director of several South African companies. Mr. Motsisi is a founding member of Atlatsa Holdings, the controlling shareholder of Atlatsa. Mr. Motsisi has been a director of Atlatsa since September 2004 and is not a director of any other public companies.
During the past five years, Mr. Motsisi is, or has been, a director of the following public companies:
| | | | | | |
Company | | Positions
Held | | From | | To |
Atlatsa Resources Corporation | | Director | | September 2008 | | Present |
RIZELLE M. SAMPSON, H. Dip Education – Director
Ms. Sampson is a South African citizen and holds a Certificate in Corporate Finance from the University of London (School of Economics), a Certificate in Telecommunications Policy, Regulation and Management from the University of Witwatersrand and a Higher Diploma in Education from the University of the Western Cape.
Following positions as a Portfolio Administrator (Institutional Clients) at Investec Asset Managers, Chief of Staff at the Ministry of Communications and Manager (Office of the CEO) at Sentech Ltd, she co-founded African Footprint Investment Holdings (Pty) Ltd (“AFIH”), an investment holding company that is mainly black woman owned and managed. Ms. Sampson represents AFIH on the board of Tellumat (Pty) Ltd. She is also a trustee of the Sentech Educational Fund Advisory Board and a non-executive director of IPSA Group Plc.
During the past five years, Ms. Sampson is, or has been a director of the following public companies:
88
| | | | | | |
Company | | Positions
Held | | From | | To |
Atlatsa Resources Corporation | | Director | | September 2004 | | Present |
Independent Power Southern Africa (IPSA) Group PLC | | Director | | January 2009 | | Present |
Diesel Power Open Cast Mining | | Director | | June 2010 | | Resigned in 2012 |
PATRICK COOKE, B.COM (WITS), CA (SA) – Director
Patrick Cooke has over 40 years’ professional experience as a chartered accountant and management consultant. Mr. Cooke was responsible for listing two companies on the main board of the JSE and was the financial director of a third JSE-listed company. His industry experience is wide, having been involved in mineral information technology, wholesale fast moving consumer goods, financial and professional services companies. He was appointed a non-executive director of Sallies Limited in October 2009 and, with effect from February 1, 2010, was appointed Financial Director, Chief Operating Officer and Acting Chief Executive Officer. He resigned from all positions at Sallies Limited with effect from January 2012.
During the past five years, Mr. Cooke is, or has been a director of the following public companies:
| | | | | | |
Company | | Positions
Held | | From | | To |
Atlatsa Resources Corporation | | Director | | February 2012 | | Present |
Great Basin Gold Limited | | Director | | April2006 | | Present |
Sallies Limited | | Director | | August 2009 | | December 2011 |
Pangea Diamondfields Limited | | Director | | January 2006 | | December 2008 |
JOEL KESLER, B.COM, LLB (CUM LAUDE) UCT – Executive: Corporate and Business Development
Joel Kesler is a South African qualified lawyer with significant experience in mining finance business and corporate development. He currently serves on Atlatsa’s Chief Commercial Officer and is responsible for the Company’s corporate and business strategy, corporate finance and corporate communications. He also serves as corporate secretary to the Company. Mr. Kesler is not a director of any public companies.
DE WET SCHUTTE, B.COM (HONS), CA (SA) – CFO
De Wet Schutte is a chartered accountant with significant experience in mining, corporate finance and business development. Mr. Schutte previously held executive positions at Renova Investments, Harmony Gold Mining Ltd. and Mittal Steel, with responsibilities covering corporate transactions, project development and financial reporting in a listed environment. Mr. Schutte is not a director of any public companies.
BAVA REDDY, BSc. (Hons), GDE, Pr. Sci. Nat. – Executive: Mineral Strategy
Bava Reddy is a geologist by training with more than 17 years experience in the South African Minerals Industry. Mr Reddy held a number of positions in the Mineral Resources Management field at AngloGold and Harmony Gold Mining Limited. He was the General Manager at Harmony Gold’s Target Mine before joining Atlatsa Resources. He is responsible for all Technical and Mineral Resource Development aspects of Atlatsa’s Exploration and Mining Projects. Mr. Reddy is not a director of any public companies.
COMPENSATION DISCUSSION AND ANALYSIS
Compensation Committee
The Company has a Compensation Committee to assist the Board of Directors in carrying out its responsibilities relating to executive and director compensation. The Compensation Committee has the following duties, responsibilities and authority:
| | (a) | To recommend to the Board of Directors the form and amount of compensation to be paid by the Company to the Directors, including compensation to be paid in consideration of a director acting on a committee of the Board of Directors. |
| | (b) | To review and approve corporate goals and objectives relating to the compensation of the Company’s executive officers, including the Chairman, CEO, CFO and other senior officers (collectively, the “Officers”) if applicable. The Compensation Committee evaluates the performance of the Officers in light of those goals and review and recommend to the Board the Officers’ annual compensation and incentive or equity plan participation levels and bases of participation. Recommendations of compensation include salary, bonus, and other incentive compensation. |
| | (c) | To review and recommend to the Board on an annual basis the evaluation process and compensation structure for the Company’s other employees. |
89
| | (d) | Based upon input and recommendations from the Officers, to review the Company’s incentive compensation plans and recommend changes in such plans to the Board of Directors as needed and to review and submit to the Board of Directors recommendations concerning new incentive compensation plans. |
| | (e) | To administer the Company’s stock option and other equity based compensation plans and determine the grants of stock options and other equity based compensation. |
| | (f) | To prepare and publish any annual executive compensation report in the Company’s annual information form or proxy statement. |
The Compensation Committee is composed of Anu Dhir (the Committee Chairperson) and Patrick Cooke (appointed 3 May 2012), both of whom are independent directors. During the 2012 financial year, the committee met three times and the proceedings at such meetings were documented in the form of meeting minutes.
In this section “Named Executive Officer” (or “NEO”) means each of the following individuals:
| | (d) | each of the three most highly compensated executive officers, or the three most highly compensated individuals acting in a similar capacity, other than the Chairman, CEO and CFO, at the end of the most recently completed financial year whose total compensation was, individually, more than $150,000 for that financial year; and |
| | (e) | each individual who would be a NEO under paragraph (c) but for the fact that the individual was neither an executive officer of the Company, nor acting in a similar capacity, at December 31, 2012. |
Report on Executive Compensation
The Board assumes responsibility for reviewing and monitoring the long-range compensation strategy for the senior management of the Company although the Compensation Committee guides it in this role. As part of its mandate, the Board determines the type and amount of compensation for the Company’s executive officers. In addition, the Board reviews the methodology utilized by the Company for setting salaries of employees throughout the organization.
The Company’s Compensation Committee receives competitive market information on compensation levels for executives. The Company’s compensation policies and programs are designed to be competitive with similar mining companies and to recognize and reward executive performance consistent with the success of the Company’s business.
Philosophy and Objectives
The compensation program for the senior management of the Company is designed to ensure that the level and form of compensation achieves certain objectives, including:
| | (a) | attracting and retaining talented, qualified and effective executives; |
| | (b) | motivating the short and long-term performance of these executives; and |
| | (c) | better aligning their interests with those of the Company’s Shareholders. |
In compensating its senior management, the Company has employed a combination of base salary, bonus compensation and equity participation through its stock option plan.
Base Salary
In the Board’s view, paying base salaries that are competitive in the markets in which the Company operates is a first step to attracting and retaining talented, qualified and effective executives. The NEOs are paid a salary in order to ensure that the compensation package offered by the Company is in line with that offered by other companies in our industry, and as an immediate means of rewarding the NEO for efforts expended on behalf of the Company.
90
The salary to be paid to a particular NEO is determined by gathering competitive salary information on comparable companies within the industry from a variety of sources, including surveys conducted by independent consultants and national and international sources of such listed information. Currently, the Company relies on Anglo Platinum for this information, and Anglo Platinum uses PE Corporate Services (Pty) Ltd and Global Remuneration Solutions (Pty) Ltd to provide this information. Payment of a cash salary fits within the objective of the compensation program since it rewards the NEO for performance of his or her duties and responsibilities. Salaries of executive officers are reviewed annually by the Board of Directors.
Bonus Compensation
The Board considers performance, shareholder benefits, competitive factors and other matters in awarding bonuses. No other bonus arrangements have been agreed although certain NEOs may be awarded bonus compensation in 2013 based on objectives to be agreed by the Board. The Company is currently in the process of compiling a remuneration policy in order to determine such bonus payments.
Equity Participation
The Company has in place the Stock Option Plan dated for reference May 21, 2004, as amended June 17, 2005 and again on June 15, 2009. The terms of the Plan are described below at “Stock Option Plan”. The Stock Option Plan is designed to foster and promote the long-term financial success of the Company by strengthening the ability of the Company to attract and retain highly competent directors, employees and consultants, motivate performance through incentive compensation, promote greater alignment of interests between employees and shareholders in creating long-term shareholder value, and enable employees to participate in the long-term growth and financial success of the Company. Stock options are granted taking into account a number of factors, including the amount and term of options previously granted, base salary and bonuses and competitive factors. The Compensation Committee administers the stock option plan, generally granting options annually to directors, management, employees and consultants, and to individuals commencing employment with the Company. Previous grants are taken into account when considering new grants.
Given the evolving nature of the Company’s business, the Board continues to review and redesign the overall compensation plan for NEO’s so as to continue to address the objectives identified above.
SUMMARY COMPENSATION TABLE OF NEO’S at 31 DECEMBER 2012
| | | | | | | | | | | | | | | | | | | | | | | | | | | | | | |
| | | | | | | | | | | Non-equity incentive
plan compensation | | | | | | | | | | |
Name | | Year | | Salary
($)
(1) | | | Option based
awards
($)
(2) | | | Annual
incentive
plans
($) | | | Long-term
incentive
plans
($) | | | Pension,
provident
and medical
value
($) | | | All Other
Compensation
($) | | | Total
Compensation
($) | |
Tumelo Motsisi(1) (4)
Director Executive Chairman | | 2012
2011 2010 | |
| 428,297
412,648 373,384 |
| |
| Nil
Nil Nil |
| |
| Nil
Nil Nil |
| |
| Nil
Nil Nil |
| |
| 97,315
60,643 55,233 |
| |
| 21,311
24,025 21,699 |
| |
| 546,923
497,316 450,316 |
|
| | | | | | | | |
Harold Motaung(1) (3) (4)
Director and CEO | | 2012
2011 2010 | |
| 436,526
403,644 294,023 |
| |
| Nil
Nil Nil |
| |
| Nil
Nil Nil |
| |
| Nil
Nil Nil |
| |
| 101,527
59,383 44,122 |
| |
| 29,256
37,979 23,351 |
| |
| 567,309
501,006 361,496 |
|
| | | | | | | | |
Joel Kesler(1)
Executive: Corporate Business Development | | 2012
2011 2010 | |
| 326,510
291,135 267,658 |
| |
| Nil
Nil Nil |
| |
| Nil
Nil Nil |
| |
| Nil
Nil Nil |
| |
| 79,501
43,632 40,431 |
| |
| 36,721
34,214 26,429 |
| |
| 442,732
368,981 334,518 |
|
| | | | | | | | |
Bava Reddy
Executive: Mineral strategy and Exploration | | 2012
2011 2010 | |
| 219,589
226,979 214,732 |
| |
| Nil
Nil Nil |
| |
| Nil
Nil Nil |
| |
| Nil
Nil Nil |
| |
| 58,081
34,075 32,429 |
| |
| 22,336
25,711 19,436 |
| |
| 300,006
286,765 266,597 |
|
| | | | | | | | |
DeWet Schutte(1) (5)
CFO | | 2012
2011 2010 | |
| 362,914
350,716 310,288 |
| |
| Nil
Nil 610,491 |
| |
| Nil
Nil Nil |
| |
| Nil
Nil Nil |
| |
| 81,527
49,103 29,687 |
| |
| 3,587
7,825 689 |
| |
| 448,028
407,644 951,155 |
|
91
Notes:
| (1) | Compensation of certain of the Company’s South African executives is payable in Canadian dollars but is paid to each executive in ZAR at a month end exchange rate at the time. For the purpose of the annual amount the ZAR value for the year has been converted at 1 CAD = ZAR8.20, being the average 2012 rate. The preceding years are converted at the respective annual average exchange rate. |
| (2) | The options granted in the 2010 financial year were granted pursuant to the Stock Option Plan. (See “Stock Option Plan”). For compensation purposes, the Black-Scholes option valuation model has been used to determine the fair value on the date of grant. The Black-Scholes option valuation is determined using the expected life of the stock option, expected volatility of the Company’s common share price, expected dividend yield, and risk-free interest rate. |
| (3) | Mr. Motaung was appointed as CEO in April 2011. |
| (4) | The NEOs who are also directors do not receive any compensation in their capacity as directors of the Company. |
| (5) | Mr. Schutte was appointed Acting CFO in December 2009 and was appointed as CFO with effect from May 1, 2010. |
Incentive Plan Awards – Option-based Awards
The Company currently has an option-based awards plan and a share appreciation rights scheme in place for certain employees. At the annual and extraordinary general meeting of the shareholders of the Company held on June 15, 2009 all the share options issued was approved for repricing to $1.29. The following table sets out all option-based awards outstanding as at December 31, 2012 for each NEO:
| | | | | | | | | | | | |
NAME | | Option-based Awards |
| | Number of
securities
underlying
unexercised
options
(#) | | | Option
exercise
price
($) | | | Option expiration date | | Value of
unexercised
in-the-money
options(1)
($) |
Tumelo Motsisi | |
| 525,000
800,000 |
| |
| 1.29
0.84 |
| | June 30, 2013
November 30, 2016 | | Nil
Nil |
Harold Motaung | | | 510,000 | | | | 0.84 | | | November 30, 2016 | | Nil |
Joel Kesler | |
| 525,000
570,000 |
| |
| 1.29
0.84 |
| | June 30, 2013
November 30, 2016 | | Nil
Nil |
Bava Reddy | |
| 550,000
570,000 |
| |
| 0.96
0.84 |
| | June 25, 2014
November 30, 2016 | | Nil
Nil |
De Wet Schutte | | | 500,000 | | | | 1.61 | | | May 1, 2017 | | Nil |
Notes:
| (1) | The value at December 31, 2012 is calculated by determining the difference between the closing price of the Company’s common shares at December 31, 2012 ($0.14) underlying the option on the TSX-V and the exercise price of the options. |
Incentive Plan Awards – Value Vested or Earned During the Year
The following table sets out all incentive plans (value vested or earned) during the year ended December 31, 2012, for each NEO:
| | | | |
NAME | | Option based
awards - Value
vested during
the year(1) | | Non-equity
incentive plan
compensation –
value earned
during year |
Tumelo Motsisi | | Nil | | Nil |
Harold Motaung | | Nil | | Nil |
Joel Kesler | | Nil | | Nil |
De Wet Schutte | | Nil | | Nil |
Bava Reddy | | Nil | | Nil |
92
Notes:
| (1) | These amounts represent the aggregate dollar value that would have been realized if the options under the option-based award had been exercised on the vesting date. The value of each amount has been determined by taking the difference between the market price of the option at date of exercise and the exercise or base price of the option under the option-based award on the vest date. |
Stock Option Plan
As noted above, the only equity compensation plan which the Company has in place is the Stock Option Plan which was previously approved by Shareholders on May 21, 2004, as amended June 17, 2005 and again on June 15, 2009. Amendments to the Stock Option Plan were approved by Atlatsa shareholders at the annual and extraordinary general meeting of the Company held on June 15, 2009. Such amendments to be implemented in respect of the Stock Option Plan and the outstanding stock options are as follows:
| | (a) | to reprice 8.061 million currently outstanding stock options to decrease the exercise price of such stock options to $1.29, including stock options granted to certain insiders of the Company pursuant to the Repricing; and |
| | (b) | to amend the Company’s current stock option plan to increase the maximum number of common shares that may be issued pursuant to the stock option plan from 18,300,000 to 32,600,000 common shares less the 8,464,000 shares previously issued on exercise of options under the Plan, resulting in an increase in the number of common shares available for issuance pursuant to stock option grants made following the annual and extraordinary general meeting of the Company held on June 15, 2009 to 16,300,000 common shares. |
Repricing
On June 15, 2009, the exercise price of the outstanding stock options of the Company was reduced to $1.29, which was determined in accordance the requirements of the TSX-V. The Board of Directors determined that the repricing was desirable to the Company in order to reflect current market value of the Company’s common shares and to incentivize the management and employees of the Company and to better align their interests with the interests of the Company.
Issue of new options
During the 2012 year the Company issued no share options.
The terms of the outstanding stock options at December 31, 2012 are as follows:
| | | | | | | | | | | | | | | | |
Expiry date | | Option
price | | | Number of
options
outstanding | | | Number of
options vested | | | Weighted
average life
(years) | |
June 25, 2013 | | $ | 1.29 | # | | | 916,000 | | | | 916,000 | | | | 0.5 | |
June 30, 2013 | | $ | 1.29 | # | | | 1,410,000 | | | | 1,410,000 | | | | 0.5 | |
June 25, 2014 | | $ | 0.96 | | | | 562,000 | | | | 562,000 | | | | 1.5 | |
November 30, 2016 | | $ | 0.84 | | | | 4,545,000 | | | | 4,545,000 | | | | 3.9 | |
May 1, 2017 | | $ | 1.61 | | | | 500,000 | | | | 333,000 | | | | 4.3 | |
Total | | | | | | | 7,933,000 | | | | 7,766,000 | | | | | |
| | | | | | | | | | | | | | | | |
Weighted average exercise price | | | | | | $ | 1.03 | | | $ | 1.05 | | | | | |
# - The options were re-priced to $1.29 on June 30, 2009.
The Stock Option Plan is administered by the Compensation Committee of the Board of Directors. The Stock Option Plan provides that options will be issued to directors, officers, employees or consultants of the Company or a subsidiary of the Company. All options typically expire five years after the date of grant of such options.
Eligible Optionee’s
Under TSX-V policies, to be eligible for the issuance of a stock option under the Stock Option Plan, an optionee must either be an employee, director, officer, consultant or an employee of a company providing management or other services to the Company or its subsidiary at the time the option is granted.
Options may be granted only to an individual or to a company that is wholly owned by individuals eligible for an option grant. If the option is granted to a company, the Company must provide the TSX-V with an undertaking that it will not permit any
93
transfer of its shares, nor issue further shares, to any other individual or entity as long as the stock option remains in effect without the consent of the TSX-V.
Material Terms of the Plan
The following is a summary of the material terms of the Stock Option Plan:
| | (a) | all options granted under the Stock Option Plan are non-assignable and non-transferable; |
| | (b) | for stock options granted to employees or service providers (inclusive of management company employees), the Company is required to represent that the proposed optionee is a bona fide employee or service provider (inclusive of a management company employee), as the case may be, of the Company or of any of its subsidiaries; |
| | (c) | options have a maximum term of ten years; although to date options have generally expired five years after the date of grant. Options terminate 30 days following the termination of the optionee’s employment or other relationship with the Company, except in the case of retirement or death. In the case of retirement, options terminate 30 to 90 days, at management’s discretion, following retirement. In the case of death, options terminate at the earlier of one year after the event or the expiry of the option. Vesting of options is at the discretion of the Compensation Committee at the time the options are granted; and |
| | (d) | the minimum exercise price of an option granted under the Stock Option Plan must not be less than the closing price for shares of the Company as traded on the TSX-V on the last trading day before the date that the option is granted less allowable discounts as permitted by TSX-V (depending on the price at the time of grant). |
The following table sets out equity compensation plan information as at December 31, 2012:
| | | | | | | | | | | | |
| | | Number of securities to be
issued upon exercise of
outstanding options,
warrants and rights | | | Weighted average exercise
price of outstanding
options, warrants and
rights | | | Number of securities remaining
available for future issuance under
equity compensation plans (excluding
securities reflected in column (a)) | |
Plan Category | | (a) | | | (b) | | | (c) | |
Equity compensation plans approved by security holders – (the Share Plan) | | | 7,933,000 | | | | 1.03 | | | | 24,667,000 | |
Equity compensation plans not approved by security holders | | | — | | | | — | | | | — | |
| | | | | | | | | | | | |
Total | | | 7,933,000 | | | | 1.03 | | | | 24,667,000 | |
| | | | | | | | | | | | |
PENSION AND PROVIDENT PLAN BENEFITS
The full time employees of the Company at the corporate offices belong to the Alexander Forbes Retirement Fund (Provident and Pension sections). The Company contributes 14% of the basic salaries of the employees on a monthly basis to the fund.
The employees of the Bokoni Mine belong to the following funds depending on their position:
| | • | | The Company contributes 14% of the basic salaries of certain employees to the Anglo Platinum Group Provident Fund. |
| | • | | The Company contributes 14% of the basic salaries of certain employees to the Anglo Platinum Mines Retirement Fund. |
Membership of these retirement funds is compulsory in all cases.
| | | | | | | | | | | | | | | | |
Provident Fund | | | | | | | | | | | | |
Name | | Accumulated value at
January 1, 2012 | | | Total growth
earned/interest
earned (employer
contribution) | | | Net Employer
Contributions | | | Accumulated value
at December 31,
2012 | |
| | | ($) | | | ($) | | | ($) | | | ($) | |
Tumelo Motsisi | | | 175,846 | | | | 36,508 | | | | 50,751 | | | | 263,105 | |
Harold Motaung | | | 150,845 | | | | 32,013 | | | | 50,746 | | | | 233,604 | |
Joel Kesler | | | 127,492 | | | | 26,675 | | | | 41,788 | | | | 195,955 | |
Bava Reddy | | | 91,570 | | | | 19,090 | | | | 27,720 | | | | 138,380 | |
De Wet Schutte | | | 64,011 | | | | 15,274 | | | | 42,150 | | | | 121,435 | |
94
| | | | | | | | | | | | | | | | |
Pension Fund | |
Name | | Accumulated value at
January 1, 2012 | | | Total growth
earned/interest
earned (employer
contribution) | | | Net Employer
Contributions | | | Accumulated value
at December 31,
2012 | |
| | | | |
| | | ($) | | | ($) | | | ($) | | | ($) | |
Tumelo Motsisi | | | 102,699 | | | | 21,313 | | | | 29,521 | | | | 153,534 | |
Harold Motaung | | | 88,111 | | | | 18,695 | | | | 29,604 | | | | 136,409 | |
Joel Kesler | | | 74,458 | | | | 15,559 | | | | 24,068 | | | | 114,086 | |
Bava Reddy | | | 53,464 | | | | 11,138 | | | | 16,062 | | | | 80,664 | |
De Wet Schutte | | | 37,427 | | | | 8,917 | | | | 24,442 | | | | 70,785 | |
EMPLOYMENT CONTRACTS, TERMINATION AND CHANGE IN CONTROL BENEFITS
Written contracts are in place between the Company and Harold Motaung, Bava Reddy and De Wet Schutte. There are no written employment contracts in place between the Company and Tumelo Motsisi and Joel Kesler. The Company is currently in the process of compiling a remuneration policy, and as part of this process the written employment contracts between the Company and NEOs will also be reviewed or implemented, as applicable.
It is not expected that there will be any written contracts between the Company and any independent non-executive directors which are appointed to the Board.
There are no compensatory plans or arrangements with the NEOs that entitle a NEO to receive more than $100,000 from the Company as a result of the resignation, retirement or any other termination of employment of the NEOs’ employment, a change in control of the Company or its subsidiaries or a change of the NEOs’ responsibilities following a change in control.
Written employment contracts between the Company and the Company’s NEOs provide for compensation payable under certain circumstances following termination or a change in control, inclusive of the following:
| | • | | a 30 day notice period applies; |
| | • | | payment of annual holiday leave; |
| | • | | in terms of the stock option plan, all vested stock options held by the employee may be exercised within 90 days of termination. |
INDEPENDENT DIRECTOR COMPENSATION
Each director of the Company, who is not an executive officer, but an independent director, namely, Sipho Nkosi (resigned July 31, 2012, Wayne Kirk (resigned January 31, 2012), Fikile Tebogo De Buck, Rizelle Sampson, Anu Dhir and Patrick Cooke (appointed February 1, 2012) are paid an annual director’s fee of $45,000, plus an additional fee of $15,000 for the Audit Committee Chairperson and $11,000 for other Committee Chairpersons. Members attending the Audit Committee are paid an annual amount of $8,000 and members attending other committees are paid $7,000 per annum. Special committee members are paid $450 per hour. Executive officers do not receive additional compensation for serving as directors.
There is no written or oral contract between the Company or any of its subsidiaries and any executive or non-executive director relating to remuneration or fees payable or restraint payments.
The compensation provided to the directors, excluding a director who is included in disclosure for an NEO for the Company’s most recently completed financial year of December 31, 2012 is:
| | | | | | | | | | | | | | |
Name of Director(6) | | Fees earned
($)(1) | | | Option-
based
awards
($) | | Bonus
Shares | | Non-equity
incentive
plan
compensation | | Total
($) | |
Anu Dhir(2) | | | 89,083 | | | Nil | | Nil | | Nil | | | 89,083 | |
Fikile De Buck(3)(4) | | | 74,500 | | | Nil | | Nil | | Nil | | | 74,500 | |
Wayne Kirk(10) | | | Nil | | | Nil | | Nil | | Nil | | | Nil | |
Sipho Nkosi(9) | | | 21,417 | | | Nil | | Nil | | Nil | | | 21,417 | |
Rizelle Sampson(8) | | | 56,000 | | | Nil | | Nil | | Nil | | | 56,000 | |
Patrick Cooke(5)(7) | | | 80,917 | | | Nil | | Nil | | Nil | | | 80,917 | |
95
Notes:
| (1) | Includes all fees awarded, earned, paid or payable in cash for services as a director, including annual retainer fees, committee, chair and meeting fees. |
| (2) | Anu Dhir joined the Company as a director in July 2008, was appointed Lead Independent Director in 2012 and is the Chairperson of the Compensation Commitee. |
| (3) | Fikile De Buck joined the Company as a director in September 2008. |
| (4) | Audit Committee Chairperson. |
| (5) | Nominating and Governance Committee Chairperson. |
| (6) | Directors who are also NEO’s and receive compensation for services as directors are included in the NEO summary compensation table. |
| (7) | Patrick Cooke joined the Company as a director in February 2013. |
| (8) | Rizelle Sampson joined the Company as a director in September 2004 and is the Chairperson of the Health and Safety Committee. |
| (9) | Sipho Nkosi resigned in July 2012. |
| (10) | Wayne Kirk resigned in January 2012. |
The following table sets out all option-based awards outstanding as at December 31, 2012, for each director, excluding a director who is already set out in disclosure for a NEO for the Company:
| | | | | | | | | | | | |
NAME | | Option-based Awards |
| | Number of
securities
underlying
unexercised
options (#) | | | Option
exercise
price ($) | | | Option expiration date | | Value of
unexercised
in-the-money
options(1)
($) |
Rizelle Sampson | |
| 240,000
150,000 |
| |
| 1.29
0.84 |
| | October 15, 2012
November 30, 2016 | | Nil
Nil |
Anu Dhir | |
| 120,000
150,000 |
| |
| 1.29
0.84 |
| | June 25, 2013
November 30, 2016 | | Nil
Nil |
Fikile De Buck | | | 100,000 | | | | 0.84 | | | November 30, 2016 | | Nil |
Patrick Cooke | | | Nil | | | | Nil | | | Nil | | Nil |
Note:
| (1) | The value at December 31, 2012 is calculated by determining the difference between the closing price of the Company’s common shares on December 31, 2011 ($0.14) underlying the option on the TSX -V the exercise price of the options. |
The following table sets out all incentive plans (value vested or earned) during the year ended December 31, 2012, for each director, excluding a director who is already set out in disclosure for a NEO for the Company:
| | | | |
NAME | | Option based
awards -Value
vested during the
year(1) | | Non-equity based
incentive
compensation –
Value earned
during year |
Rizelle Sampson | | Nil | | Nil |
Anu Dhir | | Nil | | Nil |
Fikile De Buck | | Nil | | Nil |
Patrick Cooke | | Nil | | Nil |
Note:
| (1) | These amounts represent the aggregate dollar value that would have been realized if the options under the option-based award had been exercised on the vesting date. The value of each amount has been determined by taking the difference between the market price of the option at date of exercise and the exercise or base price of the option under the option-based award on the vest date. |
96
Compensation Transactions
Atlatsa has implemented the following compensation transactions, which were approved by Shareholders on June 15, 2009:
| | (a) | Completion bonuses payable by Atlatsa to Tumelo Motsisi, Harold Motaung, Joel Kesler and Iemrahn Hassen (previous CFO) in connection with the completion of the Bokoni Transaction in common shares instead of cash. Each of the aforementioned individuals played pivotal roles in respect of the Bokoni Transaction; and |
The completion bonuses were as follows:
| | | | | | | | |
Name and Position | | Amount of
Completion Bonus
Payable
$ | | | Number of common
shares Issued
(Issue price $1.11) | |
Tumelo Motsisi, Executive Chairman | | | 175,350 | | | | 157,973 | |
Harold Motaung, Chief Executive Officer and Director | | | 144,375 | | | | 130,068 | |
Joel Kesler, Executive: Corporate and Business Development | | | 127,575 | | | | 114,932 | |
Iemrahn Hassen, Previous CFO | | | 59,125 | | | | 53,266 | |
| | | | | | | | |
Total | | | 506,425 | | | | 456,239 | |
| | | | | | | | |
| | (b) | Compensate Ronald Thiessen, Scott Cousens, Robert Dickinson(previous directors of the Company), Joel Kesler and Tumelo Motsisi for the exercise of a portion of their vested and outstanding stock options in order to provide the Company with working capital, notwithstanding that the exercise of such stock options was prior to their expiry date of December 2010, and for their undertaking not to dispose of the common shares acquired through the exercise of the stock options until the market for common shares stabilised, which is expected to be on the closing date of the Bokoni Transaction. Such compensation was settled by the issuance of common shares. |
The Company settled the completion bonuses through the issuance of common shares to each of the above persons at an issuance price equal to $1.11, being the closing price of the common shares on the TSX-V on the business day immediately prior to the announcement of the Bokoni Transaction and related transactions on May 14, 2009.
The Company agreed with such directors and officer that they would be compensated for the cost of the early exercise of the stock options and restriction on trading by the payment of an amount equal to the aggregate of interest at 13% per annum, from June 25, 2008 (being the date of exercise of the stock options) to the closing date of the Bokoni Transaction on (i) the exercise price of the stock options, and (ii) the tax payable by such directors and officers in respect of the exercise of the stock options (“Option Compensation”).
The details of the stock options exercised and the compensation in respect thereof is as follows:
| | | | | | | | | | | | | | | | |
Name | | Number of Stock
Options Exercised | | | Exercise Price | | | Amount of
Option
Compensation | | | Number of Common
Shares Issued
(Issue price $1.11) | |
Tumelo Motsisi, Executive Chairman | | | 525,000 | | | $ | 1.40 | | | | 147,658 | | | | 133,025 | |
Joel Kesler, Executive: Corporate and Business Development | | | 525,000 | | | $ | 1.40 | | | | 140,336 | | | | 126,429 | |
The Company settled the Option Compensation through the issuance of common shares to each of the above persons at an issuance price equal to $1.11, being the closing price of the common shares on the TSX-V on the business day immediately prior to the announcement of the Bokoni Transaction and related transactions on May 14, 2009.
97
Item 6.A. above sets out each directors’ and officers’ date of expiration of their current term of office, as applicable, and the period during which such person has served in that office.
There are no written contracts between the Company and any independent non-executive directors which are appointed to the Board.
Directors are considered to be independent if they have no direct or indirect material relationship with the Company. A “material relationship” is a relationship which could, in the view of the Company’s Board of Directors, be reasonably expected to interfere with the exercise of a director’s independent judgment. Examples of such material relationships include employment relationships, officer positions, and recent employment by the auditors and like matters. The majority of the directors are independent directors. The Company’s Corporate Governance Policies and Procedures Manual, which governs the conduct of the Board of Directors, is available on the Company’s website at http://www.atlatsa.com. Information on the Company’s website is not a part of this Annual Report.
The Canadian Securities Administrators’ corporate governance guidance suggests that independent directors hold regularly scheduled meetings at which non-independent directors and members of management are not in attendance. The Board believes it is important that the Board of Directors regularly meet without management of the Company, but has also determined that open and candid discussion among independent directors is not necessarily inhibited by the presence of the non-independent directors and their exclusion from such meetings is not always warranted. No formal meeting of the independent directors were held during 2012.
The Board currently does not have an independent Chair, but has appointed a lead independent director. The Board facilitates its independent supervision over management in several ways including the holding of regular board meetings and committee meetings, informal discussions among independent directors and management and by retaining independent consultants where it deems necessary. With the exception of the Investment Committee, each of the standing board committees is also solely comprised of independent directors. Independent supervision is also achieved by the formation of special committees of the independent directors to oversee any matters in which non-independent directors who are members of management may have an interest. In addition, the Board of Directors has direct access to the Company’s external auditors, legal counsel and to any of the Company’s officers.
The independent members of the Board of Directors of the Company for Fiscal 2012 were Fikile De Buck, Anu Dhir, Wayne Kirk (resigned January 31, 2012), Sipho Nkosi (resigned July 2012) , Rizelle Sampson and Patrick Cooke (appointed February 1, 2012).
The non-independent directors for Fiscal 2012 were Harold Motaung (President and CEO) and Tumelo Motsisi (Chairman of the Board).
The following table sets forth the record of attendance of board and committee meetings by directors for the 12 months ended December 31, 2012.
| | | | | | | | | | |
Director | | Board Meetings | | Audit Committee | | Nominating and
Governance
Committee | | Compensation
Committee | | Sustainable Development
and Health and Safety
Committee |
Anu Dhir(3)(4)(5)(10)(11)(13) | | 6 of 6 | | 4 of 4 | | Not applicable | | 3 of 3 | | 3 of 3 |
Fikile De Buck(1)(5)(6)(10)(11) | | 5 of 6 | | 4 of 4 | | 3 of 3 | | Not applicable | | 3 of 3 |
Harold Motaung | | 6 of 6 | | Not applicable | | Not applicable | | Not applicable | | Not applicable |
Tumelo Motsisi(7) | | 6 of 6 | | Not applicable | | Not applicable | | Not applicable | | Not applicable |
Sipho Nkosi(3)(6) | | 2 of 6 | | Not applicable | | 1 of 3 | | 1 of 3 | | Not applicable |
Rizelle Sampson(8) | | 5 of 6 | | Not applicable | | Not applicable | | Not applicable | | 3 of 3 |
| Patrick Cooke(2)(3)(5)(6)(9(12)) | | 6 of 6 | | 4 of 4 | | 3 of 3 | | 3 of 3 | | Not applicable |
Notes:
| (1) | Audit Committee Chairperson. |
| (2) | Nominating and Governance Committee Chairperson. |
| (3) | Member of the Compensation Committee. |
| (4) | Compensation Committee Chairperson. |
| (5) | Member of the Audit Committee. |
| (6) | Member of the Nominating and Governance Committee. |
| (7) | Chairperson of the Atlatsa Board of Directors. |
| (8) | Chairperson of the Sustainable Development and Health and Safety Committee. |
| (9) | Chairperson of the Special Committee. |
| (10) | Member of the Special Committee. |
98
| (11) | Member of the Sustainable Development and Health and Safety Committee. |
| (12) | Member of the Investment Committee. |
| (13) | Chairperson of the Investment Committee. |
| (14) | Lead independent Director. |
| 2. | Orientation and Continuing Education |
The Company has traditionally retained experienced mining people as directors and hence the orientation needed is minimized. When new directors are appointed, they are acquainted with the Company’s mineral projects and the expectations of directors. Board meetings generally include presentations by the Company’s senior management and project staff in order to give the directors full insight into the Company’s operations.
| 3. | Ethical Business Conduct |
The Board has adopted a formal ethics policy, that applies to all directors, officers and employees of the Company, included in Section B-3 to the Company’s Corporate Governance Policies and Procedures Manual, which is available for download from the Company’s website (www.atlatsa.com). Information on the Company’s website is not a part of this Annual Report. The Board also believes that the fiduciary duties placed on individual directors by the Company’s governing corporate legislation and the common law and the restrictions placed by applicable corporate legislation on an individual directors’ participation in decisions of the Board in which the director has an interest have been sufficient to ensure that the Board operates independently of management and in the best interests of the Company.
Compliance with the Code of Ethics is monitored by the Nomination and Governance Committee. No departures from the code were identified by the Nominating and Governance Committee during Fiscal 2012. The Board has a number of policies in place designed to ensure that directors exercise independent judgment in matters where a director or officer has a material interest. In those circumstances, the relevant director and officer must declare their interest and in the case of a director, refrain from voting, and the Nominating and Governance Committee considers any interested party transactions in advance of their consideration by the Board.
| 4. | Nomination of Directors |
The Board considers its size each year when it considers the directors to recommend to the Shareholders for election at the annual meeting of Shareholders, taking into account the number required to carry out the Board’s duties effectively and to maintain a diversity of views and experience. The Board has a Nominating and Governance Committee, though the full Board retains responsibility for the recommendation of directors to the Shareholders for election.
The Board recognises the lack of mining experience of the Board and is currently in conjunction with completing the refinancing exercise, searching for two suitable persons to be appointed as directors
The Compensation Committee considers compensation for the directors and senior executive officers and submits its compensation recommendations to the Board for approval.
The Board has not adopted descriptions for the positions of Board chairman, and the chairman for each of the board committees, but, as at the date of this Annual Report, the roles and responsibilities for the board and for each of the board committees has been described in the Company’s Corporate Governance Policies and Procedures Manual dated June 1, 2010, which is available on the Company’s website at www.atlatsa.com.
Audit and Risk Committee
The Audit and Risk Committee is an important element of the Board’s system of monitoring and control. The Audit Committee meets at least four times a year. All the members of the Audit Committee are independent non-executive directors, financially literate and have extensive Audit Committee experience. Current members of the Audit Committee are Fikile Tebogo De Buck (chair), Anu Dhir and Patrick Cooke. Wayne Kirk resigned from being a member of the Audit Committee on January 31, 2012. Patrick Cooke was appointed to serve on the Audit Committee as from February 1, 2012.
99
The Chairman of the Board, the CEO, CFO, the internal auditors (outsourced function) and external auditors attend Audit Committee meetings on invitation.
The Audit Committee has been established primarily to assist the Board in overseeing:
| | • | | the quality and integrity of the Company’s financial statements (including group financial statements) and public disclosures in respect thereof; |
| | • | | the qualification and independence of the external auditors for Atlatsa; |
| | • | | the scope and effectiveness of the external audit function for Atlatsa; |
| | • | | the effectiveness of the Company’s internal controls; |
| | • | | compliance with legal and regulatory requirements to the extent that it might have an impact on financial statements; and |
In addition to the responsibilities above, the Atlatsa Board has appointed the Audit and RiskCommittee to perform on behalf of all South African subsidiaries of Atlatsa, the functions listed in section 94(7) of the South African Companies Act.
The Board has delegated extensive powers in accordance with the South African Companies Act, King III and US corporate governance requirements to the Audit and Risk Committee to perform the above functions. In line with these requirements, the Audit and Risk Committee has, among other things, determined which categories of non-audit services provided by the external auditors should be pre-approved by the Audit Committee.
The Audit Committee meets regularly with the Company’s external auditors and managers to consider risk assessment and management, to review the audit plans of the external auditors, and to review accounting, auditing, financial reporting, corporate governance and compliance matters. The Audit Committee approves the external auditors’ engagement letter on the terms, nature and scope of the audit function and the audit fee. Interim and annual results of the Company and trading statements of the Company are reviewed by the audit committee before publication. The audit committee usually makes recommendations and refers matters for information or approval to the Board.
Both the Audit Committee and the Board are satisfied that the independence of the external auditors is not in any way impaired or compromised.
The text of the audit committee’s charter is available on SEDAR at www.sedar.com.
Nominating and Governance Committee
Members: Patrick Cooke (Chair), Fikile Tebogo De Buck. Sipho Nkosi resigned from being a member in July 2012. Wayne Kirk resigned from being a member of the Nominating and Governance Committee on January 31, 2012. Patrick Cooke was appointed to serve on the Nominating and Governance Committee as from February 1, 2012, and to act as Chairperson of this committee.
The committee is currently comprised of two non-executive directors, all of whom are independent.
The Nomination and Governance Committee’s functions include reviewing and making recommendations to the Board on the Company’s general corporate governance framework, the composition and performance of the Board and its committees, appointment of directors and group executive committee members, legal compliance and the Company’s ethics policy and programs.
Compensation Committee
Members: Anu Dhir (Chair) and Patrick Cooke and met three times in 2012.
Sipho Nkosi resigned from the committee in July 2012.
100
All the members of the committee, including the chair, are independent non-executive directors. In line with the recommendations of King III, the CEO attends the meetings of the committee at the request of the committee, but is requested to leave the meeting before any decisions are made.
The committee evaluates and monitors Atlatsa’s remuneration philosophy and practices, ensures that they are consistent with sound governance principles and management systems and are aligned with the Company’s approach to risk management, in that inappropriate risk taking is not incentivized.
Other key terms of reference set out in the mandate of the committee include:
| | • | | providing guidance on the evaluation of the performance of NEO’s; |
| | • | | determining and recommending to the Board, the remuneration of NEO’s and directors, whose remuneration is subject to shareholder approval; |
| | • | | reviewing and approving total guaranteed package values including the annual short term and long term incentives granted to executive management; |
| | • | | reviewing and approving proposals for annual salary adjustments and proposed changes to benefit fund rules across the Company; |
| | • | | approving the principles, formulae applied and Company performance targets as well as the achievement thereof on which short-term and long-term incentives are based; |
| | • | | reviewing and approving the terms and conditions of the executive directors’ service agreements; and |
| | • | | annually assessing the performance of the committee and the committee members. |
Sustainable Development and Health and Safety Committee
Members: Fikile De Buck, Anu Dhir and Rizelle Sampson (Chairperson).
The Sustainable Development Committee meets at least four times a year, or more frequently as circumstances dictate.
The objective of the Sustainable Development Committee is to assist the board in ensuring that we are and remain a committed socially responsible corporate citizen. The committee’s primary role is to supplement, support, advise and provide guidance on the effectiveness or otherwise of management’s efforts in respect of sustainable development.
The committee considers the following sustainable development issues: occupational health, safety, HIV/Aids, social investment and environmental management.
Investment Committee
Members: Anu Dhir (Chairperson), Tumelo Motsisi
The committee meets as and when investment opportunities are identified. During Fiscal 2012, no meetings were held.
The primary purpose of the Investment Committee is to consider projects, acquisitions and the disposal of assets in line with the Company’s overall strategy. This includes performing such other investment related functions as may be designated by the Board from time to time, considering the viability of the capital project and/or acquisition and/or disposal and the effect it may have on the Company’s cash flow, as well as whether these will fit the Company’s overall strategy. This committee’s remit includes ensuring that due diligence procedures are followed when acquiring or disposing of assets.
Special Committee
Members: Fikile De Buck, Patrick Cooke (Chairperson) and Anu Dhir
101
The primary purpose of the Special Committee is to evaluate unusual/special transactions that occur on an ad-hoc basis. The committee came into effect to address the Company’s re-financing and re-structuring plan. (See Restructure Plan).
The Board monitors the adequacy of information given to directors, communication between the Board and management, and the strategic direction and processes of the Board and committees. The Board and its committees have initiated a self-assessment process.
The Board is satisfied with the overall project and corporate achievements of the Company and believes this reflects well on the Board and its practices.
At December 31, 2012, Atlatsa had no direct employees in Canada. There were 12 employees in South Africa who provide administrative and compliance functions to the Company. The Company has, in the past, received many of its services from HDSI. HDSI provided administrative, compliance and management services to Atlatsa, pursuant to an administrative services agreement dated for reference December 31, 1996. Substantially all of the administrative, compliance and management services have now been transitioned to South Africa.
The Company outsources many of its functions to professional consultancy and advisory firms.
Bokoni Mine has approximately 5,000 employees (including 1,600 contractors), including approximately 7 of whom may be considered senior management.
Underground mining operations in South Africa are labor intensive with 60% of operational expenditure at the Bokoni Mine applied to labor. The mine employees are represented by three labor unions and wage negotiations are generally held every two years with a one to two year wage accord being agreed subsequent to such negotiations. The labor agreements in place with the three labor unions do not expire until June 30, 2013. See “Illegal Strike Action at Bokoni Mine”.
Item 6.A. above sets out the names of members of the Board of Directors, all major offices and positions with the Company and any of its significant affiliates each holds as of December 31, 2012, each nominee’s principal occupation, the period of time during which each has been a director of the Company and the number of common shares beneficially owned by each, directly or indirectly, or over which each exercised control or direction.
Item 6.B. above sets out information regarding options granted to members of the Board of Directors and describes arrangements for involving employees in the capital of the Company.
| | F. | Cease Trade Orders, Bankruptcies, Penalties and Sanctions |
Corporate Cease Trade Orders
To the knowledge of the Board of Directors, no director or executive officer of the Company is, at the date hereof, or was within the ten years before the date hereof, a director, chief executive officer or chief financial officer of any company that: (i) was subject to a cease trade order or similar order, or an order that denied the relevant company access to any exemption under securities legislation, that was in effect for a period of more than 30 consecutive days, that was issued while that person was acting in the capacity as director, chief executive officer or chief financial officer; or (ii) was subject to a cease trade or similar order, or an order that denied the relevant company access to any exemption under securities legislation, that was in effect for a period of more than 30 consecutive days, that was issued after that person ceased to be a director, chief executive officer or chief financial officer and which resulted from an event that occurred while that person was acting in the capacity as director, chief executive officer or chief financial officer.
102
Bankruptcies
To the knowledge of the Board of Directors, no director or executive officer of the Company, or shareholder holding a sufficient number of securities of the Company to effect materially the control of the Company: (i) is, at the date hereof, or has been within the ten years before the date hereof, a director or executive officer of any company that, while that person was acting in that capacity, or within a year of that person ceasing to act in that capacity, became bankrupt, made a proposal under any legislation relating to bankruptcy or insolvency or was subject to or instituted any proceedings, arrangement or compromise with creditors or has a receiver, receiver manager or trustee appointed to hold its assets; or (ii) has, within the ten years before the date hereof, become bankrupt, made a proposal under any legislation relating to bankruptcy or insolvency, or became subject to or instituted any proceedings, arrangement or compromise with creditors or had a receiver, receiver manager or trustee appointed to hold such persons assets.
Penalties or Sanctions
To the knowledge of the Board of Directors, no director of executive officer of the Company, or a shareholder holding a sufficient number of Securities of the Company to affect materially the control of the Company has been subject to any penalties or sanctions imposed by a court relating to securities legislation or by a securities regulatory authority has entered into a settlement agreement with a securities authority or any other penalties or sanctions imposed by a court or regulatory body that would likely be considered important to a reasonable investor in making an investment decision.
To the best of Atlatsa’s knowledge, no actual or potential conflict of interest exists between Atlatsa, or any subsidiary, and any director or officer of Atlatsa or any subsidiary.
103
| ITEM 7 | MAJOR SHAREHOLDERS AND RELATED PARTY TRANSACTIONS |
Atlatsa’s securities are recorded on the books of its transfer agent in registered form, however, the majority of such shares are registered in the name of intermediaries such as brokerage houses and clearing houses on behalf of their respective brokerage clients, and Atlatsa does not have knowledge of or access to information about of the beneficial owners thereof. To the best of its knowledge, Atlatsa is not directly or indirectly owned or controlled by a foreign government. On May 21, 2004, shareholders of the Company approved an increase in the authorized share capital from 200,000,000 common shares without par value to an unlimited number of common shares without par value.
Under the British ColumbiaSecurities Actinsiders (generally officers, directors, and holders of 10% or more of Atlatsa’s shares) are required to file insider reports of changes in their ownership within ten days of a trade in Atlatsa’s securities. Copies of such reports are available for public inspection at the offices of the British Columbia Securities Commission, 9th Floor, 701 West Georgia Street, Vancouver, British Columbia V7Y 1L2 (phone (604) 899-6500) or at Canadian Securities Administrators website for Insiders’ Disclosure, www.sedi.ca.
As at March 28, 2013, to the knowledge of the directors and executive officers of Atlatsa, the only persons who beneficially own, directly or indirectly, or control or direct, five percent (5%) or more of the issued and outstanding Atlatsa Shares are as follows:
| | | | | | | | |
Shareholder Name and Address | | Number of
Shares Held | | | Percentage of
Issued
Common
Shares | |
The Pelawan Trust, as Trustee (1) Atlatsa Holdings Investments (Proprietary) Limited, as Beneficiary 4th Floor, 82 Grayston Drive Sandton, 2196, South Africa | | | 115,496,438 | | |
| 57.2
| %
(4) |
Mr. Tumelo M. Motsisi (2) 4th Floor, 82 Grayston Drive Sandton, South Africa | |
| 28,535,143
(27,719,145 as part of the 115,496,438
shown above, see note 2 below |
) | | | 14.1 | % |
Mr. C. Harold Motaung 4th Floor, 82 Grayston Drive Sandton, South Africa | |
| 19,764,462
(19,634,394 as part of the 115,496,438
shown above, see note 3 below |
) | | | 9.8 | % |
| (1) | These shares are registered in the name of Pelawan Trust, which holds such shares in trust for Atlatsa Holdings pursuant to escrow arrangements described in Item 4.A.2. “Summary Corporate History and Intercorporate Relationships” above. |
| (2) | Indirect holdings being 240 of the 1,000 ordinary shares in the issued and outstanding share capital of Atlatsa Holdings, multiplied by the number of common shares of Atlatsa (115,496,438) held by the Pelawan Trust. Therefore, 27,719,145 of these shares are held as an indirect interest in the 115,496,438 shares shown above. |
| (3) | Indirect holdings being 170 of the 1,000 ordinary shares in the issued and outstanding share capital of Atlatsa Holdings, multiplied by the number of common shares of Atlatsa (115,496,438) held by the Pelawan Trust. Therefore, 19,634,394 of these shares are held as an indirect interest in the 115,496,438 shares shown above. |
| (4) | The percentage is pre-conversion of the B preference shares. Refer to Section 4A “Structure of Ownership Following the Bokoni Transaction” for the percentage holding of the Pelawan Trust in Atlatsa post-conversion of the B preference shares. |
No major shareholders have different voting rights.
As noted in the table above, the Company is indirectly controlled by Atlatsa Holdings as a result of the Pelawan transaction (see Item 4.A.2. – “Summary Corporate History and Intercorporate Relationships”, above).
The information in the table above was supplied by Computershare Trust Company of Canada, the Company’s registrar and transfer agent, and by the individuals themselves.
104
As of February 15, 2013, the number of registered shareholders of record (and the number and percentage of shares held by such shareholders) is as follows:
| | | | | | | | | | | | |
| Location | | Number of registered
shareholders of record | | | Number of
shares | | | Percentage of
total shares | |
Canada | | | 32 | | | | 160,763,078 | | | | 79.63 | % |
United States | | | 25 | | | | 41,110,395 | | | | 20.36 | % |
Other | | | 1 | | | | 15,000 | | | | .01 | % |
| | | 58 | | | | 201,888,473 | | | | 100.00 | % |
Pursuant to the Bokoni Transaction at July 1, 2009, the Company issued 4,497,062 common shares to the Bokoni Platinum Mine ESOP Trust and 9,799,505 to the Atlatsa Community Participation Trust and as a result of the compensation arrangements the Company issued 806,898 common shares to directors and officers.
As of March 27, 2013 the Company has 201,888,473 common shares outstanding.
Shares registered in intermediaries are assumed to be held by residents of the same country in which the clearing house is located.
| | B. | Related Party Transactions |
Refer to Section 1.15 of the Management Discussion and Analysis for the fiscal year ended December 31, 2012 (filed on March 28, 2013).
| | C. | Interests of Experts and Counsel |
No technical experts named in this Annual Report have any registered or beneficial interest, directly or indirectly in any securities or property of Atlatsa or any of Atlatsa’s affiliates or associates.
105
| ITEM 8 | FINANCIAL INFORMATION |
| | 8.A. | Consolidated Statements and Other Financial Information |
Effective January 1, 2009, the Company adopted IFRS following approval from the Canadian Securities Administrators under National Instrument 52-107, Acceptable Accounting Principles, Auditing Standards and Reporting Currency. The consolidated financial statements have been prepared in compliance with IFRS as issued by the IASB.
Legal Proceedings
As of March 28, 2013, there are no material legal or arbitration proceedings against Atlatsa or any of its subsidiaries, nor, to the knowledge of Atlatsa, are such proceedings pending or threatened that may have or have had in the previous 12 months a material effect on Atlatsa’s financial position.
As of March 28, 2013, no penalties or sanctions have been imposed against Atlatsa by a court relating to securities legislation or by a securities regulatory authority, nor has Atlatsa entered into any settlement agreements with a court relating to securities legislation or with a securities regulatory authority.
Dividend Policy
The Company has not paid any dividends on its outstanding common shares since its incorporation and does not anticipate that it will do so in the foreseeable future. All funds of Atlatsa are being retained to fund current operations at the Bokoni Mine, to service current debt facilities and for exploration of its projects.
Refer to note 37 of the audited consolidated financial statements for events after the reporting date.
106
| ITEM 9 | THE OFFER AND LISTING |
| | A. | Offer and Listing Details |
High and Low Market Prices and Volume Traded
| | | | | | | | | | | | | | | | | | | | | | | | | | | | | | | | | | | | |
| | | TSX Exchange: ATL-V | | | NYSE Amex: ATL | | | JSE: ATL-J | |
| | | High | | | Low | | | Volume | | | High | | | Low | | | Volume | | | High | | | Low | | | Volume | |
| | | CAD | | | CAD | | | | USD | | | USD | | | | ZAR | | | ZAR | | |
| | | | | | | | | |
Annual | | | | | | | | | | | | | | | | | | | | | | | | | | | | | | | | | | | | |
2012 | | | 0.66 | | | | 0.12 | | | | 3,759,845 | | | | 0.63 | | | | 0.11 | | | | 27,159,321 | | | | 4.73 | | | | 1.15 | | | | 5,940,344 | |
2011 | | | 1.58 | | | | 0.33 | | | | 8,361,610 | | | | 1.66 | | | | 0.31 | | | | 62,512,721 | | | | 11.50 | | | | 3.30 | | | | 6,904,276 | |
2010 | | | 1.80 | | | | 0.88 | | | | 18,174,583 | | | | 1.78 | | | | 0.82 | | | | 111,519,392 | | | | 13.20 | | | | 6.00 | | | | 7,537,498 | |
2009 | | | 1.48 | | | | 0.33 | | | | 7,854,533 | | | | 1.35 | | | | 0.26 | | | | 40,090,858 | | | | 10.00 | | | | 2.70 | | | | 5,364,691 | |
2008 | | | 4.69 | | | | 0.22 | | | | 12,098,579 | | | | 4.82 | | | | 0.14 | | | | 37,606,637 | | | | 34.00 | | | | 2.95 | | | | 8,925,372 | |
| | | | | | | | | |
By Quarter | | | | | | | | | | | | | | | | | | | | | | | | | | | | | | | | | | | | |
Calendar 2008 | | | | | | | | | | | | | | | | | | | | | | | | | | | | | | | | | | | | |
First Quarter | | | 4.69 | | | | 2.80 | | | | 4,561,016 | | | | 4.82 | | | | 2.77 | | | | 16,161,275 | | | | 34.00 | | | | 18.50 | | | | 2,880,825 | |
Second Quarter | | | 3.96 | | | | 2.63 | | | | 2,241,544 | | | | 3.94 | | | | 2.56 | | | | 7,397,330 | | | | 31.30 | | | | 21.00 | | | | 1,964,166 | |
Third Quarter | | | 2.95 | | | | 0.86 | | | | 1,738,684 | | | | 2.91 | | | | 1.01 | | | | 6,599,411 | | | | 23.00 | | | | 9.00 | | | | 2,040,993 | |
Fourth Quarter | | | 1.11 | | | | 0.22 | | | | 3,557,335 | | | | 1.10 | | | | 0.14 | | | | 7,448,621 | | | | 9.18 | | | | 2.95 | | | | 2,039,388 | |
| | | | | | | | | |
Calendar 2009 | | | | | | | | | | | | | | | | | | | | | | | | | | | | | | | | | | | | |
First Quarter | | | 0.88 | | | | 0.33 | | | | 1,779,558 | | | | 0.73 | | | | 0.26 | | | | 7,104,349 | | | | 6.15 | | | | 2.70 | | | | 1,819,226 | |
Second Quarter | | | 1.48 | | | | 0.81 | | | | 2,255,729 | | | | 1.35 | | | | 0.60 | | | | 17,360,268 | | | | 10.00 | | | | 5.00 | | | | 2,216,331 | |
Third Quarter | | | 1.10 | | | | 0.80 | | | | 1,679,328 | | | | 1.06 | | | | 0.72 | | | | 8,853,514 | | | | 7.95 | | | | 5.70 | | | | 782,139 | |
Fourth Quarter | | | 0.99 | | | | 0.78 | | | | 2,139,918 | | | | 0.95 | | | | 0.72 | | | | 6,772,727 | | | | 7.50 | | | | 6.00 | | | | 546,995 | |
| | | | | | | | | |
Calendar 2010 | | | | | | | | | | | | | | | | | | | | | | | | | | | | | | | | | | | | |
First Quarter | | | 1.65 | | | | 0.92 | | | | 5,054,515 | | | | 1.56 | | | | 0.83 | | | | 28,192,280 | | | | 12.00 | | | | 6.25 | | | | 1,087,172 | |
Second Quarter | | | 1.80 | | | | 1.07 | | | | 4,030,067 | | | | 1.78 | | | | 1.00 | | | | 28,920,366 | | | | 13.20 | | | | 8.00 | | | | 1,542,686 | |
Third Quarter | | | 1.21 | | | | 0.88 | | | | 2,578,830 | | | | 1.24 | | | | 0.82 | | | | 15,987,136 | | | | 9.25 | | | | 6.00 | | | | 2,405,711 | |
Fourth Quarter | | | 1.66 | | | | 0.95 | | | | 6,511,171 | | | | 1.69 | | | | 0.92 | | | | 38,419,610 | | | | 10.62 | | | | 6.71 | | | | 2,501,929 | |
| | | | | | | | | |
Calendar 2011 | | | | | | | | | | | | | | | | | | | | | | | | | | | | | | | | | | | | |
First Quarter | | | 1.58 | | | | 0.91 | | | | 2,955,381 | | | | 1.66 | | | | 0.93 | | | | 21,133,516 | | | | 11.50 | | | | 7.01 | | | | 2,004,419 | |
Second Quarter | | | 1.25 | | | | 0.58 | | | | 2,701,173 | | | | 1.35 | | | | 0.59 | | | | 24,459,222 | | | | 8.68 | | | | 4.50 | | | | 2,430,448 | |
Third Quarter | | | 0.73 | | | | 0.48 | | | | 1,761,687 | | | | 0.78 | | | | 0.42 | | | | 10,672,991 | | | | 5.70 | | | | 3.50 | | | | 1,772,344 | |
Fourth Quarter | | | 0.63 | | | | 0.33 | | | | 943,369 | | | | 0.67 | | | | 0.31 | | | | 6,246,992 | | | | 5.00 | | | | 3.30 | | | | 697,065 | |
| | | | | | | | | |
Calendar 2012 | | | | | | | | | | | | | | | | | | | | | | | | | | | | | | | | | | | | |
First Quarter | | | 0.66 | | | | 0.37 | | | | 1,414,401 | | | | 0.63 | | | | 0.38 | | | | 405,554 | | | | 4.73 | | | | 3.30 | | | | 1,742,747 | |
Second Quarter | | | 0.41 | | | | 0.19 | | | | 405,554 | | | | 0.44 | | | | 0.11 | | | | 6,375,131 | | | | 3.68 | | | | 1.70 | | | | 1,816,802 | |
Third Quarter | | | 0.24 | | | | 0.12 | | | | 1,087,967 | | | | 0.27 | | | | 0.12 | | | | 8,042,528 | | | | 2.05 | | | | 1.20 | | | | 1,791,563 | |
Fourth Quarter | | | 0.24 | | | | 0.14 | | | | 851,923 | | | | 0.24 | | | | 0.11 | | | | 5,253,315 | | | | 1.79 | | | | 1.15 | | | | 589,232 | |
| | | | | | | | | |
Monthly | | | | | | | | | | | | | | | | | | | | | | | | | | | | | | | | | | | | |
September 2012 | | | 0.24 | | | | 0.13 | | | | 615,152 | | | | 0.27 | | | | 0.12 | | | | 6,331,460 | | | | 1.70 | | | | 1.37 | | | | 429,064 | |
October 2012 | | | 0.24 | | | | 0.14 | | | | 215,511 | | | | 0.24 | | | | 0.15 | | | | 804,536 | | | | 1.79 | | | | 1.38 | | | | 276,947 | |
November 2012 | | | 0.19 | | | | 0.14 | | | | 321,708 | | | | 0.20 | | | | 0.11 | | | | 919,343 | | | | 1.60 | | | | 1.20 | | | | 160,634 | |
December 2012 | | | 0.2 | | | | 0.14 | | | | 314,704 | | | | 0.19 | | | | 0.12 | | | | 3,529,136 | | | | 1.70 | | | | 1.15 | | | | 151,651 | |
January 2013 | | | 0.19 | | | | 0.14 | | | | 110,965 | | | | 0.20 | | | | 0.15 | | | | 3,976,061 | | | | 2.10 | | | | 1.45 | | | | 369,931 | |
February 2013 | | | 0.27 | | | | 0.17 | | | | 1,028,205 | | | | 0.23 | | | | 0.16 | | | | 3,984,993 | | | | 2.15 | | | | 1.54 | | | | 688,260 | |
Not applicable.
Atlatsa’s common shares are listed and posted for trading in Canada on the TSX-V under the symbol ATL. Atlatsa’s common shares have traded on the TSX-V (and its predecessors, the Canadian Venture Exchange and the Vancouver Stock Exchange) since September 24, 1987 under ARQ until the Company changed its name to Atlatsa on 14 May 2012. Until March 12, 2004, Atlatsa’s common shares traded in the United States on the Over-The-Counter Bulletin Board (“OTCBB”) under the symbol ARQ.RF. Commencing March 15, 2004, Atlatsa’s common shares have traded in the United States on NYSE Amex under the symbol ANO and from 14 May 2012, ATL. Atlatsa’s common shares also commenced trading on the Johannesburg Stock Exchange in South Africa under the symbol ARQ in December 2006 and from 14 May 2012 under ATL.
107
Not applicable.
Not applicable.
Not applicable.
The following table sets out the number of securities of the Company held, to the knowledge of the management of the Company, in escrow as of March 30, 2012 and the percentage that number represents of the outstanding securities of that class.
| | | | | | | | |
Designation of Class | | Number of Securities held
in Escrow | | | Approximate Percentage of Class | |
Common shares (1) | | | 58,805,135 | | | | 29 | % (4) (5) |
Common shares (2) | | | 56,691,303 | | | | 28 | % (4) (6) |
“B3” preference shares (3) | | | 111,600 | | | | 100 | % (7) (8) |
Notes:
| (1) | These shares are registered in the name of the Pelawan Trust, which holds such shares in trust for Pelawan pursuant to escrow arrangements described in “The Acquisition - Description of Lockup Arrangements for Consideration Shares” in the August 2004 Circular. The total number of shares held by the Pelawan Trust at March 28, 2013 was 115.5 million. |
| (2) | Pursuant to implementation of the Bokoni Transaction, Atlatsa Holdings, the sole beneficiary of the Pelawan Trust, which is the controlling shareholder of Atlatsa, established a special purpose vehicle as a wholly owned subsidiary of Atlatsa Holdings (the “Pelawan SPV”) and transferred 56,691,303 of its Atlatsa shareholding to the Pelawan SPV as security for the B2 and B3 preference shares. These shares remain subject to the lockup arrangements described in Note 1 above. |
| (3) | The Pelawan SPV holds 111,600 B3 preference shares which are ultimately convertible into 111.6 million Atlatsa common shares. These shares, once converted, remain subject to the lockup arrangements described in Note 1 above. |
| (4) | This percentage disclosed relates to the number of shares held in escrow, divided by the number of common shares outstanding, before dilution, as at March 28, 2013, being 201,888,473. |
| (5) | The percentage of class on a fully diluted basis relating to the shares described in Note 1 is 14%. The percentage of class on a fully diluted basis has been calculated as the number of shares in escrow, divided by the diluted weighted average number of common shares as at February 28, 2013, being 424,791,411. |
| (6) | The percentage of class on a fully diluted basis relating to the shares described in Note 2 is 13%. The percentage of class on a fully diluted basis has been calculated as the number of shares in escrow, divided by the diluted weighted average number of common shares as at February 28, 2013, being 424,791,411. |
| (7) | The “B3” preference shares held in escrow represent the only outstanding “B3” preference shares as of December 31, 2012, so the percentage of class on a pre-conversion non-diluted basis is 100%. |
| (8) | The percentage of class on a post-conversion fully diluted basis is 27%. The calculation was determined as the number of shares in escrow after conversion, being 111,600,000, divided by the diluted weighted average number of common shares as at February 28, 2013, being 424,791,411. |
108
| ITEM 10 | ADDITIONAL INFORMATION |
Common shares
The authorized share capital of the Company consists of an unlimited number of common shares without par value.
The issued share capital of the Company consists of 201,888,473 common shares, without par value, as at December 31, 2012 and 201,888,473 as at February 28, 2013.
Each common share carries one vote at all meetings of shareholders, participates rateably in any dividend declared by the directors and carries the right to receive a proportionate share of the assets of the Company available for distribution to holders of common shares in the event of a liquidation, dissolution or winding-up of the Company. The holders of common shares have no pre-emptive or conversion rights.
Preference shares
115,800 B2 Convertible preference shares (authorized and issued) of $0.1481 each and 111,600 B3 Convertible preference shares (authorized and issued) of $0.1481 were issued during the year ended December 31, 2009.
The final effects of the share settled financing completed in connection with the Bokoni Transaction will result in RPM receiving a fixed number of 115.8 million common shares of Atlatsa and Atlatsa Holdings, Atlatsa’s controlling shareholder, receiving a fixed number of 111.6 million common shares of Atlatsa.
These preference shares are convertible upon the earlier of the date of receipt of a conversion notice from RPM and July 1, 2018.
A dividend will be declared on the last business day immediately prior to the conversion date, in terms of a formula set out in the preference share subscription agreement.
| | B. | Memorandum and Articles of Association |
Atlatsa’s Articles and Memorandum are filed with the British Columbia Registrar of Companies under Certificate of Incorporation No. 262963. A copy of the Articles and Memorandum was filed with Atlatsa’s initial registration on Form 20-F filed in March 2000.
The Company was transitioned under theBusiness Corporations Act (British Columbia) (the “BCA”) on June 11, 2004, on which date the Company altered its Notice of Articles (which replaced the Memorandum) to change its authorized share structure from 200,000,000 common shares without par value to an unlimited number of common shares without par value.
Objects and Purposes
Atlatsa’s Articles do not specify objects or purposes. Under British Columbia law, a British Columbia company has all the legal powers of a natural person. British Columbia companies may not undertake certain limited business activities (for example, operating as a trust company or railroad) without alterations to its form of articles and specific government consent.
Directors – Powers and Limitations
Atlatsa’s Articles do not specify a maximum number of directors but do specify that the Company shall have a minimum of three directors while the Company is a public company. The number of directors is determined annually by the shareholders at the annual general meeting of shareholders and all directors are elected at that time; there are no staggered directorships. Under the Articles the directors are entitled between successive annual general meetings to appoint one or more additional directors but not more than one-third of the number of directors fixed pursuant to the Articles and in effect at the last general meeting at which directors were elected. Directors automatically retire at each annual general meeting and such directors may be re-elected by the shareholders entitled to vote thereat.
Under the Articles, a director who is, in any way, directly or indirectly interested in a proposed contract or transaction with Atlatsa or who holds any office or possesses any property whereby, directly or indirectly, a duty or interest might be created which would conflict with his duty or interest as a director shall declare the nature and extent of his interest in such contract or
109
transaction. A director shall not vote in respect of any such contract or transaction with the Company in which he is interested and if he should vote his vote shall not be counted but he shall be counted in the quorum present at the meeting. Similarly, under the BCA directors are obligated to abstain from voting to approve a contract or transaction in which they have a disclosable interest (generally contracts or transactions in which they have a material interest) after fully disclosing such interest, otherwise they are liable to account to the Company for any profits that accrue to the directors as a result of such contract or transaction. Therefore, directors must abstain in such circumstances both under the Articles and under the BCA. Directors’ compensation is not a matter on which they must abstain.
Directors must be of the age of majority (18), and meet eligibility criteria, including not being mentally infirm, not being an undischarged bankrupt, and not having fraud related convictions in the previous five years. There is no mandatory retirement age either under Atlatsa’s Articles or under the BCA. Directors need not own any shares of Atlatsa in order to qualify as directors.
Directors’ borrowing powers are not restricted but the directors may not authorize Atlatsa to make a payment to purchase or redeem its share if doing so would render it insolvent.
Rights of Common Shareholders
Dividends may be declared by the Board out of available assets and are paid ratably to holders of common shares. No dividend may be paid if Atlatsa is, or would thereby become, insolvent.
Each Atlatsa share is entitled to one vote on matters to which common shares ordinarily vote including the election of directors, appointment of auditors and approval of corporate changes and other matters requiring shareholder approval.
Atlatsa has no redeemable securities authorized or issued.
There are no pre-emptive rights applicable to Atlatsa which provide a right to any person to participate in offerings of Atlatsa’s securities.
All common shares of Atlatsa participate ratably in any available assets in the event of a winding up or other liquidation.
Changes to Rights of Common Shareholders
Certain changes to the Articles and Notice of Articles of Atlatsa require a “special resolution”, being a resolution passed by not less than 75% of the shares voted in person or by proxy at a duly convened shareholders meeting. Certain corporate changes, including amalgamation with another company, sale of substantially all of Atlatsa’s assets, and redomiciling out of the jurisdiction of British Columbia, not only require such 75% approval but generally also give rise to a dissent right, which is the right to be paid an agreed amount for a shareholder’s shares if the required special resolution is actually passed and Atlatsa elects to proceed with the matter notwithstanding receipt of dissent notices. A notice of a shareholders meeting at which such an action is intended to be effected must include a statement advising of the dissent right. Dissent provisions are governed by the BCA and not by the Articles of the Company.
Shareholders Meetings
Shareholders meetings are only peripherally governed by the Articles of the Company, with most shareholder protections contained in theSecurities Act (British Columbia) and the BCA. The Articles provide that Atlatsa will hold an annual general meeting once in every calendar year and not more than 13 months since the last meeting and provide for certain procedural matters and rules of order with respect to conduct of the meeting. TheSecurities Act (British Columbia) and the BCA superimpose requirements that generally provide that shareholders meetings require advance notification within prescribed times and which govern the content and timing of mailing to shareholders of information circulars and proxies, as well as other matters typically governed by securities legislation. This legislation specifies the disclosure requirements for various corporate actions, background information on the nominees for election of directors, executive compensation paid in the previous year and full details of any unusual meeting matters. Generally, registered shareholders of Atlatsa as of the record date set in respect of a shareholders meeting are entitled to vote at the meeting and any adjournment thereof.
No Limitation on Foreign Ownership
There are no limitations under Atlatsa’s Articles or in the BCA on the right of persons who are not citizens of Canada to hold or vote common shares. (See also Item 10D – “Exchange Controls”, below.)
110
Change in Control
Atlatsa has not implemented any shareholders’ rights or other “poison pill” protection against possible take-over. Atlatsa does not have any agreements which are triggered by a take-over or other change of control. There are no provisions in its Articles triggered by or affected by a change in outstanding shares which gives rise to a change in control.
Share Ownership Reporting
The Articles of Atlatsa do not require disclosure of share ownership. Share ownership of director nominees must be reported annually in proxy materials sent to Atlatsa’s shareholders. There are no requirements under British Columbia corporate law to report ownership of shares of Atlatsa but theSecurities Act (British Columbia) requires disclosure of trading by insiders (including holders of 10% of voting shares) within 10 days of the trade. Controlling shareholders (generally those in excess of 20% of outstanding shares) must provide seven days advance notice of share sales.
Except for contracts entered into in the ordinary course of business, the only material contracts entered into by Atlatsa in the two fiscal years immediately preceding this Annual Report are the following:
| (i) | Deloitte Mining Shared Service Centre Master Services Agreement between Plateau and Halonet Investments (Pty) Ltd (Trading as Deloitte Mining Shared Service Centre (Pty) Ltd) dated January 17, 2010 – This agreement relates to the services to be rendered surrounding the new SAP system and other IT related aspects to be supplied by the Deloitte Mining Shared Service Centre. |
| (ii) | Shareholder’s Agreement between Deloitte Consulting (Pty) Ltd and Plateau Resources (Pty) Ltd and Halonet Investments (Pty) Ltd dated October 29, 2010 – This agreement relates to the financing of the new SAP system. The agreement resulted in a loan of $3.4 million (ZAR23 million) from Deloitte Consulting (Pty) Ltd to Plateau, which bears interest at prime plus 2% and is payable in quarterly instalments, which commenced March 31, 2011. |
Atlatsa is a corporation registered in Province of British Columbia, Canada. There is no law or governmental decree or regulation in Canada that restricts the export or import of capital, or affects the remittance of dividends, interest or other payments to a non-resident holder of common shares, other than withholding tax requirements. Any such remittances to United States residents are generally subject to withholding tax. (See Item 10E – “Taxation”, below).
There is no limitation imposed by the laws of Canada or by the charter or other constituent documents of Atlatsa on the right of a non-resident to hold or vote the common shares, other than as provided in theInvestment Canada Act (Canada) (the “Investment Act”). The following discussion summarizes the material features of theInvestment Act for a non-resident who proposes to acquire a controlling number of common shares. It is general only, it is not a substitute for independent advice from an investor’s own advisor, and it does not anticipate statutory or regulatory amendments. Atlatsa does not believe theInvestment Act will have any effect on it or on its non-Canadian shareholders due to a number of factors, including the nature of its operations and Atlatsa’s relatively small capitalization.
TheInvestment Act generally prohibits implementation of a reviewable investment by an individual, government or agency thereof, corporation, partnership, trust or joint venture (each an “entity”) that is not a “Canadian” as defined in theInvestment Act (a “non-Canadian”), unless after review the Director of Investments appointed by the minister responsible for theInvestment Act is satisfied that the investment is likely to be of net benefit to Canada. The size and nature of a proposed transaction may give rise to an obligation to notify the Director to seek an advance ruling. An investment in the common shares by a non-Canadian other than a “WTO Investor” (as that term is defined in theInvestment Act and which term includes entities which are nationals of or are controlled by nationals of member states of the World Trade Organization) when Atlatsa was not controlled by a WTO Investor, would be reviewable under theInvestment Act if it was an investment to acquire control of Atlatsa and the value of the assets of Atlatsa, as determined in accordance with the regulations promulgate one third under the Investment Act, was $5 million or more, or if an order for review was made by the federal cabinet on the grounds that the investment related to Canada’s cultural heritage or national identity, regardless of the value of the assets of Atlatsa. An investment in the common shares by a WTO Investor, or by a non-Canadian when Atlatsa was controlled by a WTO Investor, would be reviewable under theInvestment Act if it was an investment to acquire control of Atlatsa and the value of the assets of Atlatsa, as determined in accordance with the regulations promulgated under theInvestment Act, was not less than a specified amount, which for 2008 is CAD 295 million. A non-Canadian would acquire control of Atlatsa for the purposes of theInvestment Act if the non-Canadian acquired a majority of the common shares. The acquisition of less than a majority but one third or more of the common shares
111
would be presumed to be an acquisition of control of Atlatsa unless it could be established that, on the acquisition, Atlatsa was not controlled in fact by the acquirer through the ownership of the common shares.
The foregoing assumes Atlatsa will not engage in the production of uranium or own an interest in a producing uranium property in Canada, provide any financial service or transportation service or engage in a “cultural business”, as the rules governing these businesses are different.
Certain transactions relating to the common shares would be exempt from theInvestment Act, including
| (a) | an acquisition of the common shares by a person in the ordinary course of that person’s business as a trader or dealer in securities, |
| (b) | an acquisition of control of Atlatsa in connection with the realization of security granted for a loan or other financial assistance and not for a purpose related to the provisions of theInvestment Act, and |
| (c) | an acquisition of control of Atlatsa by reason of an amalgamation, merger, consolidation or corporate reorganization following which the ultimate direct or indirect control in fact of Atlatsa, through the ownership of the common shares, remained unchanged. |
Material Canadian Federal Income Tax Consequences for United States Residents
The following, in management’s understanding, summarizes the principal Canadian federal income tax consequences generally applicable to the holding and disposition of common shares by a holder (in this summary, a “U.S. Holder”) who, at all relevant times, (a) for the purposes of theIncome Tax Act (Canada) (the “Tax Act”), is not resident in Canada, deals at arm’s length with Atlatsa, holds the common shares as capital property and does not use or hold the common shares in the course of carrying on, or otherwise in connection with, a business in Canada, and (b) for the purposes of the Canada-United States Tax Convention, 1980 (the “Treaty”), is a resident solely of the United States, has never been a resident of Canada, and has not held or used (and does not hold or use) common shares in connection with a permanent establishment or fixed base in Canada. This summary does not apply to traders or dealers in securities, persons who acquired their common shares in a transaction considered for purposes of the Tax Act to be an adventure or concern in the nature of trade, limited liability companies, tax-exempt entities, insurers, financial institutions (including those to which the mark-to-market provisions of the Tax Act apply), or any other U.S. Holder to which special considerations apply.
This summary is based on the current provisions of the Tax Act including all regulations there under, the Treaty, all proposed amendments to the Tax Act, the regulations and the Treaty publicly announced by or on behalf of the Minister of Finance to the date hereof, and the current published administrative practices of the Canada Revenue Agency. It has been assumed that all currently proposed amendments will be enacted as proposed and that there will be no other relevant change in any governing law or administrative practice, although no assurances can be given in these respects. This summary does not take into account provincial, U.S., state or other foreign income tax law or practice. The tax consequences to any particular U.S. Holder will vary according to the status of that holder as an individual, trust, corporation or other entity, the jurisdictions in which that holder is subject to taxation, and generally according to that holder’s particular circumstances. Accordingly, this summary is not, and is not to be construed as, Canadian tax advice to any particular U.S. Holder. U.S. Holders should consult with their own tax advisors for advice with respect to their own particular circumstances.
Dividends
Dividends paid or credited or deemed to be paid or credited to a U.S. Holder by Atlatsa will normally be subject to Canadian withholding tax. Under the Treaty, the rate of withholding tax on dividends paid to a U.S. Holder that is entitled to full benefits under the Treaty and that beneficially owns such dividends is generally limited to 15% of the gross amount of the dividend (or 5% if the U.S. Holder is a corporation and beneficially owns at least 10% of Atlatsa’s voting shares). Atlatsa will be required to withhold the applicable withholding tax from any such dividend and remit it to the Canadian government for the U.S. Holder’s account.
Disposition
A U.S. Holder is not subject to tax under the Tax Act in respect of a gain realized on the disposition of a Common Share (other than to Atlatsa) provided that the share is not “taxable Canadian property” to the holder thereof. If the common shares are listed on a designated stock exchange, which currently includes the American Stock Exchange, a Common Share generally will not be taxable Canadian property to a U.S. Holder if, at any time during the 60 months preceding the disposition, the U.S. Holder or
112
persons with whom the U.S. Holder did not deal at arm’s length alone or together owned 25% or more of Atlatsa’s issued shares of any class or series and more than 50% of the fair market value of the Common Share was derived directly or indirectly from one or any combination of: (i) real or immovable property situated in Canada; (ii) Canadian resource properties (as defined in the Tax Act); (iii) timber resource properties (as defined in the Tax Act); or (iv) options in respect of, interests in or rights in the properties described in (i) to (iii) above.
A U.S. Holder whose common shares do constitute taxable Canadian property, and who might therefore be liable for Canadian income tax under the Tax Act on a disposition or deemed disposition of such shares, will generally be relieved from such liability under the Treaty (assuming the U.S. Holder is entitled to full benefits under the Treaty) unless the value of the shares of the Company at the time of disposition is derived principally from real property situated in Canada within the meaning of the Treaty. Management of Atlatsa believes that the value of Atlatsa’s common shares is not currently derived principally from real property situated in Canada. U.S. Holders whose common shares are taxable Canadian property should consult their own advisors regarding filing and other Canadian federal tax considerations.
United States Tax Consequences
Material U.S. Federal Income Tax Considerations
The following discussion summarizes the material U.S. federal income tax consequences of the acquisition, ownership and disposition of the common shares. It applies only to U.S. Holders (as defined below) that acquire and hold the common shares as capital assets (generally, property held for investment purposes). This discussion does not address all the U.S. federal income tax considerations that may be relevant to U.S. Holders in light of their particular circumstances or to holders subject to special rules, including brokers, dealers in securities or currencies, traders in securities that elect to use a mark-to-market method of accounting for securities holdings, tax-exempt organizations (including private foundations), insurance companies, banks, thrifts and other financial institutions, real estate investment trusts, regulated investment companies, persons liable for the alternative minimum tax, persons that hold an interest in an entity that holds the common shares, persons that own, or have owned, directly, indirectly or constructively 10% or more (by vote or value) of Atlatsa’s voting shares for U.S. federal income tax purposes, persons holding the common shares as part of a hedging transaction, wash sale, straddle, conversion transaction or other integrated transaction for U.S. federal income tax purposes, persons entering into a “constructive sale” with respect to the common shares for U.S. federal income tax purposes, persons that have a functional currency for U.S. federal income tax purposes other than the U.S. dollar, certain former citizens or long-term residents of the United States, or entities classified as partnerships for U.S. federal income tax purposes. Furthermore, it does not address any aspect of any non-U.S., state, local or estate or gift taxation or the 3.8% tax imposed on certain net investment income.
This discussion is based on the Internal Revenue Code of 1986, as amended (“the Code”), administrative pronouncements, judicial decisions and final, temporary and proposed U.S. Treasury regulations, in each case as in effect on the date hereof, and any of which are subject to change (possibly on a retroactive basis), or differing interpretations, so as to result in U.S. federal income tax consequences different from those discussed herein.
U.S. Holders should consult their tax advisers regarding the application of the U.S. federal income tax, estate and gift, and alternative minimum tax laws, as well as any consequences arising under the laws of any non-U.S., state and local tax jurisdiction.
For purposes of this discussion, a “U.S. Holder” is a beneficial owner of the common shares that, for U.S. federal income tax purposes, is (i) an individual who is a citizen or resident of the United States, (ii) a corporation, or other entity taxable as a corporation, created or organized under the laws of the United States or any political subdivision thereof, (iii) an estate the income of which is subject to U.S. federal income taxation regardless of its source, or (iv) a trust, if the trust validly elects to be treated as a U.S. person for U.S. federal income tax purposes, or if (A) a court within the United States is able to exercise primary supervision over its administration and (B) one or more U.S. persons have the authority to control all of the substantial decisions of the trust.
If a partnership, or any other entity or arrangement that is treated as a partnership for U.S. federal tax income tax purposes, holds the common shares, the U.S. federal income tax treatment of a partner in the partnership will generally depend on the status of the partner and on the activities of the partnership. Partnerships that hold the common shares and partners in such partnerships should consult their tax advisers as to the particular U.S. federal income tax consequences of acquiring, owning and disposing of the common shares.
Distributions on common shares
In general, subject to the passive foreign investment company (“PFIC”) rules discussed below, the gross amount of any distributions made to a U.S. Holder on the common shares (including amounts withheld to pay Canadian withholding taxes) will constitute a dividend for U.S. federal income tax purposes to the extent paid out of Atlatsa’s current or accumulated earnings and profits, as determined for U.S. federal income tax purposes. A distribution in excess of Atlatsa’s current and accumulated earnings and profits will be treated as a non-taxable return of capital to the extent of the U.S. Holder’s adjusted basis in the common shares on which the distribution is paid and as a capital gain to the extent it exceeds that basis.
113
A distribution on the common shares will generally be foreign-source income for U.S. foreign tax credit purposes, and should generally constitute “passive category income.” A U.S. Holder may be eligible, subject to a number of complex limitations, to claim a foreign tax credit in respect of any Canadian withholding taxes imposed on dividends received on the common shares. A U.S. Holder who does not elect to claim a foreign tax credit for foreign income tax withheld may instead deduct the taxes withheld, but only for a year in which the holder elects to do so for all creditable foreign income taxes. The foreign tax credit rules are complex, and U.S. Holders are urged to consult their own tax advisers regarding the availability of the foreign tax credit based on their particular circumstances.
Provided that Atlatsa is not treated as a PFIC for the taxable years ending December 31, 2012 and 2013, Atlatsa should be considered a “qualified foreign corporation,” and therefore distributions, if any, to non-corporate U.S. Holders that are treated as dividends should qualify for a reduced rate of tax for dividends received on or before December 31, 2013. As discussed below, Atlatsa believes that it was not a PFIC for the 2012 taxable year but has not made a determination of its PFIC status for the 2013 taxable year. If Atlatsa is a PFIC under the rules discussed below, distributions will be taxable at the higher ordinary income tax rates. Dividends on common shares will not be eligible for the dividends received deduction generally available to U.S. Holders that are corporations.
The amount of any dividend paid to U.S. Holders in Canadian dollars (including amounts withheld to pay Canadian withholding taxes) will be includible in income in a U.S. dollar amount calculated by reference to the exchange rate in effect on the date of receipt, regardless of whether the dividend is in fact converted into U.S. dollars. If the dividend is converted into U.S. dollars on the date of receipt, a U.S. Holder should not be required to recognize foreign currency exchange gain or loss in respect of the dividend income. A U.S. Holder may have foreign currency exchange gain or loss if the dividend is converted into U.S. dollars after the date of receipt. In general, foreign currency exchange gain or loss will be treated as U.S.-source ordinary gain or loss for foreign tax credit purposes.
Sale, Redemption, or other Taxable Disposition of common shares
In general, a U.S. Holder will recognize gain or loss upon the sale, redemption, or other taxable disposition of the common shares equal to the difference between the amount realized and the U.S. Holder’s adjusted tax basis in its common shares. Gain or loss recognized by a U.S. Holder will generally be treated as U.S.-source gain or loss. Subject to the PFIC rules discussed below, gain or loss on the disposition of common shares will be capital gain or loss and will be long-term capital gain or loss if the U.S. Holder held the common shares for more than one year. An individual U.S. Holder may be entitled to preferential rates of taxation for net long-term capital gains; the deductibility of capital losses is limited under the Code.
Passive Foreign Investment Company Rules
A non-U.S. corporation will be considered a PFIC for any taxable year in which (1) 75% or more of its gross income is “passive income” under the PFIC rules or (2) 50% or more of the average quarterly value of its assets produce (or are held for the production of) “passive income.” For this purpose, “passive income” generally includes interest, dividends, rents, royalties, certain gains from the sale of commodities and certain gains. Interest, dividends, rents and royalties received from a related person (within the meaning of the PFIC rules) are excluded from passive income to the extent such payments are properly allocable to the active income of such related person. Moreover, for purposes of determining if the non-U.S. corporation is a PFIC, if the non-U.S. corporation owns, directly or indirectly, at least 25%, by value, of the shares of another corporation, it will be treated as if it holds directly its proportionate share of the assets and receives directly its proportionate share of the income of such other corporation. If a corporation is treated as a PFIC with respect to a U.S. Holder for any taxable year, the corporation will continue to be treated as a PFIC with respect to that U.S. Holder in all succeeding taxable years, regardless of whether the corporation continues to meet the PFIC requirements in such years, unless certain elections are made.
The determination as to whether a non-U.S. corporation is a PFIC is based on the application of complex U.S. federal income tax rules, which are subject to differing interpretations, and the determination will depend on the composition of the income, expenses and assets of the non-U.S. corporation from time to time and the nature of the activities performed by its officers and employees. Based on the expected composition of Atlatsa’s assets and income, and the way it operates its business, Atlatsa believes that it was not a PFIC for 2011 and has not made a determination of its PFIC status for the 2012 taxable year or any future taxable year. Atlatsa’s actual PFIC status for any taxable year is uncertain and cannot be determined until after the end of such taxable year.
If Atlatsa is classified as a PFIC, a U.S. Holder that does not make any of the elections described below would be required to report any gain on the disposition of any common shares as ordinary income, rather than as capital gain, and to compute the tax liability on the gain and any “Excess Distribution” (as defined below) received in respect of the common shares as if such items had been earned ratably over each day in the U.S. Holder’s holding period (or a portion thereof) for the common shares. The amounts allocated to the taxable year during which the gain is realized or distribution is made, and to any taxable years in such U.S. Holder’s holding period that are before the first taxable year in which Atlatsa is treated as a PFIC with respect to the U.S. Holder, would be included in the U.S. Holder’s gross income as ordinary income for the taxable year of the gain or distribution. The amount allocated to each other taxable year would be taxed as ordinary income at the highest tax rate in effect for the U.S. Holder in that other taxable year and would be subject to an interest charge as if the income tax liabilities had been due with respect to each such prior year. For purposes of these rules, gifts, exchanges pursuant to corporate reorganizations and use of the common shares as security for a loan may be treated as a taxable disposition of the common shares. An “Excess Distribution” is the amount by which distributions during a taxable year in respect of a Common Share exceed 125% of the average amount of
114
distributions in respect thereof during the three preceding taxable years (or, if shorter, the U.S. Holder’s holding period for the common shares).
Certain additional adverse tax rules will apply to a U.S. Holder for any taxable year in which Atlatsa is treated as a PFIC with respect to such U.S. Holder and any subsidiary of Atlatsa is also treated as a PFIC (a “Subsidiary PFIC”). In such a case, the U.S. Holder will generally be deemed to own its proportionate interest (by value) in any Subsidiary PFIC and be subject to the PFIC rules described above with respect to the Subsidiary PFIC regardless of such U.S. Holder’s percentage ownership in Atlatsa.
The adverse tax consequences described above may be mitigated if a U.S. Holder makes a timely “qualified electing fund” election (a “QEF election”) with respect to its interest in the PFIC. Consequently, if Atlatsa were to be classified as a PFIC, it would likely be advantageous for a U.S. Holder to elect to treat Atlatsa as a “qualified electing fund” (a “QEF”) with respect to such U.S. Holder in the first year in which it holds the common shares. If a U.S. Holder makes a timely QEF election with respect to Atlatsa, the electing U.S. Holder would be required in each taxable year to include in gross income (i) as ordinary income, the U.S. Holder’s pro rata share of the ordinary earnings of Atlatsa and (ii) as capital gain, the U.S. Holder’s pro rata share of the net capital gain (if any) of Atlatsa, whether or not the ordinary earnings or net capital gain are distributed. An electing U.S. Holder’s basis in the common shares will be increased to reflect the amount of any taxed but undistributed income. Distributions of income that had previously been taxed will result in a corresponding reduction of basis in the common shares and will not be taxed again as distributions to the U.S. Holder.
A QEF election made with respect to Atlatsa will not apply to any Subsidiary PFIC; a QEF election must be made separately for each Subsidiary PFIC (in which case the treatment described above would apply to such Subsidiary PFIC). If a U.S. Holder makes a timely QEF election with respect to a Subsidiary PFIC, it would be required in each taxable year to include in gross income its pro rata share of the ordinary earnings and net capital gain of such Subsidiary PFIC, but may not receive a distribution of such income. Such a U.S. Holder may, subject to certain limitations, elect to defer payment of current U.S. federal income tax on such amounts, subject to an interest charge (which would not be deductible if the U.S. Holder were an individual).
For any taxable year in which it determines that it is a PFIC, Atlatsa intends to make available to U.S. Holders, upon request and in accordance with applicable procedures, a “PFIC Annual Information Statement” with respect to Atlatsa and any subsidiary that Atlatsa has determined is likely a PFIC and in which Atlatsa owns, directly or indirectly, greater than 50% of such subsidiary’s total aggregate voting power. The “PFIC Annual Information Statement” may be used by U.S. Holders for purposes of complying with the reporting requirements applicable to a QEF election with respect to Atlatsa and any such Subsidiary PFIC. Atlatsa will make available the annual information statement in such a case.
Alternatively, if Atlatsa were to be classified as a PFIC, a U.S. Holder could also avoid certain of the rules described above by making a mark-to-market election (instead of a QEF election), provided the common shares are treated as regularly traded on a qualified exchange or other market within the meaning of the applicable Treasury regulations. However, a U.S. Holder will not be permitted to make a mark-to-market election with respect to a Subsidiary PFIC. U.S. Holders should consult their tax advisers regarding the potential availability and consequences of a mark-to-market election.
During any taxable year in which Atlatsa or any Subsidiary PFIC is treated as a PFIC with respect to a U.S. Holder and in which such holder recognizes gain or receives an Excess Distribution with respect to its ownership in the entity or entities, that U.S. Holder must file U.S. Internal Revenue Service (“IRS”) Form 8621. Legislation enacted in 2010 creates an additional annual filing requirement for U.S. persons who are shareholders in a PFIC. The legislation does not describe what information will be required to be included in the additional annual filing, but rather grants the Secretary of the U.S. Treasury authority to decide what information must be included in such annual filing. The U.S. Department of the Treasury and the IRS have suspended the obligation to report such additional information until the IRS releases the relevant forms. U.S. Holders should consult their tax advisers concerning annual filing requirements.
Information Reporting and Backup Withholding Requirement
In general, information reporting requirements will apply to payments of dividends, as well as on proceeds from the sale, redemption or other taxable disposition of the common shares paid within the U.S. (and in certain cases, outside the U.S.) to U.S. Holders other than certain exempt recipients (such as corporations). In addition, backup withholding may apply to such amounts if a U.S. Holder fails to furnish a correct Taxpayer Identification Number on IRS Form W-9 (or substitute IRS Form W-9) or otherwise fails to comply with applicable requirements. Amounts withheld under the backup withholding rules are not an additional tax and may be refunded or credited against the U.S. Holder’s U.S. federal income tax liability, provided that certain required information is furnished to the IRS in a timely manner.
Certain U.S. Holders are required to report information relating to an interest in the common shares, subject to exceptions (including an exception for common shares held in accounts maintained by certain financial institutions), by attaching a complete IRS Form 8938, Statement of Specified Foreign Financial Assets, with its tax return for each year in which it held an interest in the common shares. U.S. Holders should consult their tax advisers regarding information reporting requirements relating to their ownership of the common shares.
| | F. | Dividends and Paying Agents |
115
Not applicable.
Not applicable.
Exhibits attached to this Annual Report are also available for viewing at the offices of Atlatsa, 4th Floor – 82 Grayston Drive, Off Esterhuysen Lane, Sandton, South Africa 2146, telephone: +27 11 883 0831, facsimile: +27 11 883 0836. Copies of Atlatsa’s financial statements, management discussion and analysis, and other continuous disclosure documents required under theSecurities Act (British Columbia) are available for viewing on SEDAR at www.sedar.com. Additional information, including directors and officers remuneration and indebtedness, principal holders of Atlatsa’s securities and securities authorized for issuance under the Company’s Stock Option Plan, is contained in Atlatsa’s information circular for its most recent annual meeting of security holders that involved the election of directors.
Atlatsa has two subsidiary companies incorporated in the Cayman Islands and one incorporated in South Africa. The articles of these companies do not have unusual provisions which would adversely affect Atlatsa’s ability to exercise control over them as their parent company.
| | J. | Registrar and Transfer Agent |
Computershare Trust Company of Canada (100 University Avenue, 9th Floor, Toronto, Ontario, M5J 2Y1) and Computershare Investor Services (Pty) Limited. (Ground Floor, 70 Marshall Street, Johannesburg, 2001) are the co-transfer agents and co-registrars for the common shares of Atlatsa.
116
| ITEM 11 | QUANTITATIVE AND QUALITATIVE DISCLOSURES ABOUT MARKET RISK |
The Company is exposed to various market risks associated with its underlying assets, liabilities and anticipated transactions. The Company continuously monitors these exposures and enters into derivative financial instruments to reduce these risks. The Company does not enter into derivative transactions on a speculative basis. All fair values have been determined using current market pricing models. Refer to Item 18 “Financial Statements – Note 4.3(iii) – Derivative financial instruments, including hedge accounting “of the audited consolidated financial statements for an overview of the Company’s derivative financial instruments.
The principal market risks (i.e. the risk of losses arising from adverse movements in market rates and prices) to which the Company is exposed are:
| | • | | foreign exchange rates applicable on conversion of foreign currency transactions as well as on conversion of assets and liabilities to ZAR; |
| | • | | commodity prices, mainly 4E Group metals; and |
| | • | | interest rates on debt and cash deposits. |
Refer to Item 18 ‘‘Financial Statements—Note 6– Financial risk management’’ of the audited consolidated financial statements for a qualitative and quantitative discussion of the Company’s exposure to these market risks.
117
| ITEM 12 | DESCRIPTION OF SECURITIES OTHER THAN EQUITY SECURITIES |
Not applicable.
118
PART II
| ITEM 13 | DEFAULTS, DIVIDEND ARREARAGES AND DELINQUENCIES |
There has been no material default in the payment or interest on the Company’s outstanding indebtedness since the date of filing of its last annual report on Form 20-F.
Not applicable.
119
| ITEM 14 | MATERIAL MODIFICATIONS TO THE RIGHTS OF SECURITY HOLDERS AND USE OF PROCEEDS |
| A. | There have been no material modifications to the instruments defining the rights of holders of any class of registered securities since the date of filing of the Company’s last annual report on Form 20-F. |
120
| ITEM 15 | CONTROLS AND PROCEDURES |
| | (a) | Disclosure controls and procedures |
The Company’s Chief Executive Officer and Chief Financial Officer, based on their evaluation of the effectiveness of the Company’s disclosure controls and procedures (required by paragraph (b) of 17 CFR 240.13a-15) as of the end of the period covered by this annual report on Form 20-F, have concluded that, as of such date, the Company’s disclosure controls and procedures were effective.
See Section 1.21 “Internal Controls over Financial Reporting – Disclosure Controls and Procedures” in the Management Discussion and Analysis for the fiscal year ended December 31, 2012 (filed on March 28, 2013).
| | (b) | Management’s annual report on internal control over financial reporting |
See Section 1.21 “Internal Controls over Financial Reporting” in the Management Discussion and Analysis for the fiscal year ended December 31, 2012 (filed on March 28, 2013).
| | (c) | The effectiveness of internal control over financial reporting as of December 31, 2012 was audited by KPMG Inc., independent registered public accounting firm, as stated in their report on page 126 of this Annual Report. |
| | (d) | Changes in internal control over financial reporting |
No changes in internal controls over financial reporting occurred during the period covered by this Annual Report that have materially affected, or are reasonably likely to materially affect, the Company’s internal control over financial reporting.
121
ITEM 16
| ITEM 16.A. | Audit and Risk Committee Financial Expert |
Composition of the Audit Committee
The current members of the Audit and Risk Committee are Anu Dhir, Fikile De Buck and Patrick Cooke. Wayne Kirk resigned from the Audit and Risk Committee as of January 31, 2012. Patrick Cooke was appointed as a member of the Audit and RiskCommittee as from February 1, 2012. All of the members of the Audit Committee are independent (as such term is defined in Rule 10A-3 under the Exchange Act) and all members are considered to be financially literate. Ms. De Buck is a Chartered Certified Accountant and Mr. Cooke is a Chartered Accountant, hence both are considered to be “financial experts” in terms of the requirement for the composition of Audit Committees.
Relevant Education and Experience
Disclosure respecting the education and experience of the Audit Committee is provided in their biographies above. As a result of their education and experience, each member of the Audit Committee has familiarity with, an understanding of, or experience in:
| | • | | the accounting principles used by the Company to prepare its financial statements, and the ability to assess the general application of those principles in connection with estimates, accruals and reserves; |
| | • | | reviewing or evaluating financial statements that present a breadth and level of complexity of accounting issues that are generally comparable to the breadth and complexity of issues that can reasonably be expected to be raised by the Company’s financial statements, and |
| | • | | an understanding of internal controls and procedures for financial reporting. Ms. De Buck is a Fellow of the Association of Chartered Certified Accountants FCCA (UK) and Mr. Cooke is a Chartered Accountant of South Africa CA (SA). Ms. Dhir has extensive experience in international business, operations and legal affairs in private equity and publicly-held companies in the mining, oil and gas, and technology sectors. |
The Company has adopted a Code of Ethics that applies to the Company’s CEO, the CFO, other members of senior management and to employees and consultants generally which is included in the corporate governance policies and procedures manual amended by the Board of the Company in January 1, 2010 (The “Code of Ethics”). As adopted, the Company’s Code of Ethics sets forth standards that are designed, among other things, to prevent wrongdoing and to promote:
| | • | | honest and ethical conduct, including the ethical handling of actual or apparent conflicts of interest between personal and professional relationships; |
| | • | | full, fair, accurate, timely and understandable disclosure in reports and documents that the Company files with, or submits to, the SEC and in other public communications made by the Company; |
| | • | | compliance with applicable governmental laws, rules and regulations; |
| | • | | the prompt internal reporting of violations of the Code of Ethics to an appropriate person or persons identified in the Code of Ethics; and |
| | • | | accountability for adherence to the Code of Ethics. |
If any person becomes aware of a breach, or suspected breach, of the Code of Ethics, that person must report it immediately to his or her manager and the Company’s corporate secretary for action. If this is inappropriate or uncomfortable for the individual, the breach, or suspected breach, should be reported to another member of the senior management team and the corporate secretary for action. The Code of Ethics forms part of the conditions of employment for every one of the Company’s employees and officers, and also applies to its directors and contractors. Failure to comply with the Code of Ethics can result in disciplinary action including, where appropriate, dismissal.
The Corporate Governance Policies and Procedures Manual is available for download from the Company’s website (www.atlatsa.com).
| ITEM 16.C. | Principal Accountant Fees and Services |
The Company’s auditors, KPMG Inc., an independent registered public accounting firm, have not provided any material non-audit services.
122
Pre-Approval Policies and Procedures
The Company has procedures for the review and pre-approval of any services performed by its auditors. The procedures require that all proposed engagements of its auditors for audit and non-audit services be submitted to the Audit Committee for approval prior to the beginning of any such services. The Audit Committee considers such requests and, if acceptable to a majority of the Audit Committee members, pre-approves such audit and non-audit services by a resolution authorizing management to engage the Company’s auditors for such audit and non-audit services, with set maximum monetary amounts for each itemized service. During such deliberations, the Audit Committee assesses, among other factors, whether the services requested would be considered “prohibited services” as contemplated by the regulations of the SEC, and whether the services requested and the fees related to such services could impair the independence of the auditors.
External Auditor Service Fees
The Audit Committee has reviewed the nature and amount of the audit and non-audit services provided by KPMG to the Company to ensure auditor independence. Fees incurred with KPMG for audit and non-audit services in the last two fiscal years are outlined in the following table.
| | | | | | | | | | | | | | | | |
Services: | | Year ended
December 31 2012 | | | % Pre-approved by
Audit Committee | | | Year ended
December 31 2011 | | | % Pre-approved by
Audit Committee | |
Audit Fees (1) | | | 514,905 | | | | 100 | | | $ | 550,806 | | | | 100 | |
Audit-Related Fees (2) | | | — | | | | 100 | | | $ | 47,298 | | | | 100 | |
Tax fees (3) | | | 197,136 | | | | 100 | | | $ | 70,330 | | | | 100 | |
All Other | | | — | | | | 100 | | | $ | 6,840 | | | | 100 | |
| | | | | | | | | | | | | | | | |
| | | 712,041 | | | | 100 | | | $ | 675,274 | | | | 100 | |
| | | | | | | | | | | | | | | | |
Note:
| (1) | Audit fees consist of fees billed for the annual audit services engagement and other audit services, which are those services that only the Company’s external auditor reasonably can provide, and include audits, interim reviews, comfort letters and consents, other attest services related to the audit or regulatory filings, and services associated with the filing of documents with regulatory authorities. |
| (2) | Audit-related fees consist of fees billed for assurance and related services that are reasonably related to the performance of the audit or review of the Company’s financial statements or that are traditionally performed by the external auditor, and include consultations related to financial accounting and reporting matters and standards, and other periodic reports. |
| (3) | Tax fees consist of fees billed for professional services rendered for tax compliance (including income and royalty tax payable), tax advice and tax planning. |
| ITEM 16.D. | Exemptions from Listing Standards for Audit Committees |
Not applicable.
| ITEM 16.E. | Purchases of Equity Securities by the Issuer and Affiliated Purchasers |
None.
| ITEM 16.F. | Change in Registrant’s Certifying Accountant |
Not applicable.
| ITEM 16.G. | Corporate Governance |
The Company’s corporate governance practices do not differ in any significant way from those practices followed by domestic companies under the listing standards of the NYSE Amex. The Company has also not sought or received any waivers from the requirements of the NYSE Amex.
| ITEM 16.N. | Mine Safety Disclosure |
Not applicable
123
| ITEM 17 | FINANCIAL STATEMENTS |
Not applicable – see Item 18.
124
| ITEM 18 | FINANCIAL STATEMENTS |
The following attached financial statements are incorporated herein:
| | 1. | Report of the Independent Registered Public Accounting Firm (KPMG Inc.) on the consolidated statements of financial position as at December 31, 2012 and 2011 and the consolidated statements of comprehensive income, changes in equity, cash flows for the years ended December 31, 2012, 2011 and 2010 and the effectiveness of internal controls over financial reporting. |
| | 2. | Consolidated statements of financial position as at December 31, 2012 and 2011. |
| | 3. | Consolidated statements of comprehensive income for the years ended December 31, 2012, 2011 and 2010. |
| | 4. | Consolidated statements of changes in equity for the years ended December 31, 2012, 2011 and 2010. |
| | 5. | Consolidated statements of cash flows for the years ended December 31, 2012, 2011 and 2010. |
| | 6. | Notes to the consolidated financial statements for the years ended December 31, 2012, 2011 and 2010. |
125
Report of Independent Registered Public Accounting Firm
To the Shareholders of Atlatsa Resources Corporation
We have audited the accompanying consolidated statements of financial position of Atlatsa Resources Corporation (the “Corporation”) as of December 31, 2012 and 2011, and the related consolidated statements of comprehensive income, changes in equity and cash flows for each of the years in the three-year period ended December 31, 2012. We also have audited the Corporation’s internal control over financial reporting as of December 31, 2012, based on criteria established in Internal Control—Integrated Framework issued by the Committee of Sponsoring Organizations of the Treadway Commission (COSO). The Corporation’s management is responsible for these consolidated financial statements, for maintaining effective internal control over financial reporting, and for its assessment of the effectiveness of internal control over financial reporting, included in the accompanying management’s report on internal control over financial reporting. Our responsibility is to express an opinion on these consolidated financial statements and express an opinion on the Corporation’s internal control over financial reporting based on our audits.
We conducted our audits in accordance with the standards of the Public Company Accounting Oversight Board (United States). Those standards require that we plan and perform the audits to obtain reasonable assurance about whether the financial statements are free of material misstatement and whether effective internal control over financial reporting was maintained in all material respects.
Our audits of the consolidated financial statements included examining, on a test basis, evidence supporting the amounts and disclosures in the financial statements, assessing the accounting principles used and significant estimates made by management, and evaluating the overall financial statement presentation. Our audit of internal control over financial reporting included obtaining an understanding of internal control over financial reporting, assessing the risk that a material weakness exists, and testing and evaluating the design and operating effectiveness of internal control based on the assessed risk. Our audits also included performing such other procedures as we considered necessary in the circumstances. We believe that our audits provide a reasonable basis for our opinions.
A company’s internal control over financial reporting is a process designed to provide reasonable assurance regarding the reliability of financial reporting and the preparation of financial statements for external purposes in accordance with generally accepted accounting principles. A company’s internal control over financial reporting includes those policies and procedures that (1) pertain to the maintenance of records that, in reasonable detail, accurately and fairly reflect the transactions and dispositions of the assets of the company; (2) provide reasonable assurance that transactions are recorded as necessary to permit preparation of financial statements in accordance with generally accepted accounting principles, and that receipts and expenditures of the company are being made only in accordance with authorizations of management and directors of the company; and (3) provide reasonable assurance regarding prevention or timely detection of unauthorized acquisition, use, or disposition of the company’s assets that could have a material effect on the financial statements.
Because of its inherent limitations, internal control over financial reporting may not prevent or detect misstatements. Also, projections of any evaluation of effectiveness to future periods are subject to the risk that controls may become inadequate because of changes in conditions, or that the degree of compliance with the policies or procedures may deteriorate.
In our opinion, the consolidated financial statements referred to above present fairly, in all material respects, the financial position of Atlatsa Resources Corporation as of December 31, 2012 and 2011, and the results of its operations and cash flows for each of the years in the three-year period ended December 31, 2012, in conformity with International Financial Reporting Standards as issued by the International Accounting Standards Board. Also in our opinion, Atlatsa Resources Corporation maintained, in all material respects, effective internal control over financial reporting as of December 31, 2012, based on criteria established in Internal Control—Integrated Framework issued by the Committee of Sponsoring Organizations of the Treadway Commission.
The accompanying consolidated financial statements have been prepared assuming that the Corporation will continue as a going concern. As discussed in note 2 to the consolidated financial statements, the Corporation has suffered recurring losses from operations and has a net capital deficiency that raise substantial doubt about its ability to continue as a going concern. Management’s plans in regard to these matters are also described in note 2. The consolidated financial statements do not include any adjustments that might result from the outcome of this uncertainty.
|
KPMG Inc. |
Registered Auditors |
|
Johannesburg, South Africa |
March 28, 2013 |
126
ATLATSA RESOURCES CORPORATION
Consolidated Statements of Financial Position
As at 31 December 2012 and 2011
(Expressed in Canadian Dollars, unless otherwise stated)
| | | | | | | | | | |
| | | Note | | 2012 | | | 2011 | |
Assets | | | | | | | | | | |
| | | |
Non-current assets | | | | | | | | | | |
| | | |
Property, plant and equipment | | 7 | | | 748,456,905 | | | | 798,924,420 | |
Capital work-in-progress | | 8 | | | 20,027,764 | | | | 20,826,290 | |
Intangible assets | | 9 | | | 801,928 | | | | 1,895,205 | |
Mineral property interests | | 10 | | | 8,036,659 | | | | 8,268,783 | |
Goodwill | | 11 | | | 10,234,394 | | | | 10,994,115 | |
Platinum Producers’ Environmental Trust | | 12 | | | 3,250,760 | | | | 2,927,591 | |
Other non-current assets | | | | | 231,425 | | | | 367,825 | |
| | | | | | | | | | |
Total non-current assets | | | | | 791,039,835 | | | | 844,204,229 | |
| | | | | | | | | | |
Current assets | | | | | | | | | | |
| | | |
Assets classified as held for sale | | 10 | | | 3,867,259 | | | | 4,101,654 | |
Inventories | | 13 | | | 769,447 | | | | 787,084 | |
Trade and other receivables | | 14 | | | 3,272,400 | | | | 27,048,591 | |
Current tax receivable | | | | | — | | | | 136,109 | |
Cash and cash equivalents | | 15 | | | 14,580,886 | | | | 15,945,008 | |
Restricted cash | | 16 | | | 535,502 | | | | 786,291 | |
| | | | | | | | | | |
| | | |
Total current assets | | | | | 23,025,494 | | | | 48,804,737 | |
| | | | | | | | | | |
| | | |
Total assets | | | | | 814,065,329 | | | | 893,008,966 | |
| | | | | | | | | | |
| | | |
Equity and Liabilities | | | | | | | | | | |
| | | |
Equity | | | | | | | | | | |
| | | |
Share capital | | 17 | | | 71,967,083 | | | | 71,967,083 | |
Treasury shares | | 17 | | | (4,991,726 | ) | | | (4,991,726 | ) |
Convertible preference shares | | 17 | | | 162,910,000 | | | | 162,910,000 | |
Foreign currency translation reserve | | | | | (9,797,657 | ) | | | (11,238,333 | ) |
Share-based payment reserve | | | | | 25,285,851 | | | | 24,042,711 | |
Accumulated loss | | | | | (264,166,155 | ) | | | (245,448,316 | ) |
| | | | | | | | | | |
| | | |
Total equity attributable to equity holders of the Company | | | | | (18,792,604 | ) | | | (2,758,581 | ) |
| | | |
Non-controlling interest | | | | | 224,049,827 | | | | (25,326,683 | ) |
| | | | | | | | | | |
| | | |
Total equity | | | | | 205,257,223 | | | | (28,085,264 | ) |
| | | | | | | | | | |
| | | |
Liabilities | | | | | | | | | | |
| | | |
Non-current liabilities | | | | | | | | | | |
| | | |
Loans and borrowings | | 18 | | | 434,968,189 | | | | 744,456,487 | |
Deferred taxation | | 19 | | | 142,341,072 | | | | 144,032,213 | |
Provisions | | 20 | | | 9,786,479 | | | | 8,383,708 | |
| | | | | | | | | | |
| | | |
Total non-current liabilities | | | | | 587,095,740 | | | | 896,872,408 | |
| | | | | | | | | | |
| | | |
Current liabilities | | | | | | | | | | |
| | | |
Trade and other payables | | 21 | | | 20,888,635 | | | | 23,125,587 | |
Short-term portion of loans and borrowings | | 18 | | | 823,731 | | | | 1,096,235 | |
| | | | | | | | | | |
| | | |
Total current liabilities | | | | | 21,712,366 | | | | 24,221,822 | |
| | | | | | | | | | |
| | | |
Total liabilities | | | | | 608,808,106 | | | | 921,094,230 | |
| | | | | | | | | | |
| | | |
Total equity and liabilities | | | | | 814,065,329 | | | | 893,008,966 | |
| | | | | | | | | | |
The accompanying notes are an integral part of these consolidated financial statements.
Approved by the Board of Directors on 28 March 2013
| | |
/s/ Harold Motaung | | /s/ Fikile De Buck |
| |
Harold Motaung (Director) | | Fikile De Buck (Director) |
127
ATLATSA RESOURCES CORPORATION
Consolidated Statements of Comprehensive Income
For the years ended 31 December 2012, 2011 and 2010
(Expressed in Canadian Dollars, unless otherwise stated)
| | | | | | | | | | | | | | |
| | | Note | | 2012 | | | 2011 | | | 2010 | |
| | | | |
Revenue | | 22 | | | 117,557,331 | | | | 144,406,716 | | | | 148,286,833 | |
Cost of sales | | 23 | | | (195,387,551 | ) | | | (209,966,805 | ) | | | (173,151,188 | ) |
| | | | | | | | | | | | | | |
| | | | |
Gross loss | | | | | (77,830,220 | ) | | | (65,560,089 | ) | | | (24,864,355 | ) |
| | | | |
Administrative expenses | | | | | (14,589,526 | ) | | | (23,788,855 | ) | | | (18,291,753 | ) |
Transaction costs | | | | | (822,621 | ) | | | — | | | | (1,811,294 | ) |
Other income | | | | | 105,177 | | | | 116,191 | | | | 426,617 | |
Fair value gain on consolidated facility | | 24 | | | 90,589,136 | | | | — | | | | — | |
| | | | | | | | | | | | | | |
| | | | |
Operating (loss) | | | | | (2,548,054 | ) | | | (89,232,753 | ) | | | (44,540,785 | ) |
| | | | |
Finance income | | 25 | | | 382,262 | | | | 745,590 | | | | 1,113,642 | |
Finance expense | | 26 | | | (82,837,200 | ) | | | (92,044,884 | ) | | | (67,521,703 | ) |
| | | | | | | | | | | | | | |
| | | | |
Net finance expense | | | | | (82,454,938 | ) | | | (91,299,294 | ) | | | (66,408,061 | ) |
| | | | | | | | | | | | | | |
| | | | |
Loss before income tax | | 27 | | | (85,002,992 | ) | | | (180,532,047 | ) | | | (110,948,846 | ) |
| | | | |
Income tax | | 28 | | | (10,563,878 | ) | | | 32,667,499 | | | | 17,290,040 | |
| | | | | | | | | | | | | | |
| | | | |
Loss for the year | | | | | (95,566,870 | ) | | | (147,864,548 | ) | | | (93,658,806 | ) |
| | | | | | | | | | | | | | |
| | | | |
Other comprehensive (loss)/income | | | | | | | | | | | | | | |
| | | | |
Foreign currency translation differences for foreign operations | | | | | 2,415,302 | | | | (7,913,856 | ) | | | 6,237,524 | |
| | | | |
Effective portion of changes in fair value of cash flow hedges | | | | | — | | | | 1,602,501 | | | | (3,121,650 | ) |
| | | | |
Reclassification to profit or loss on settlement of cash flow hedge | | | | | — | | | | 2,521,654 | | | | — | |
| | | | | | | | | | | | | | |
Other comprehensive (loss)/income for the year, net of income tax | | 29 | | | 2,415,302 | | | | (3,789,701 | ) | | | 3,115,874 | |
| | | | | | | | | | | | | | |
| | | | |
Total comprehensive loss for the year | | | | | (93,151,568 | ) | | | (151,654,249 | ) | | | (90,542,932 | ) |
| | | | | | | | | | | | | | |
| | | | |
Loss attributable to: | | | | | | | | | | | | | | |
| | | | |
Owners of the Company | | | | | (18,717,839 | ) | | | (81,928,814 | ) | | | (51,721,410 | ) |
| | | | |
Non-controlling interest | | | | | (76,849,031 | ) | | | (65,935,734 | ) | | | (41,937,396 | ) |
| | | | | | | | | | | | | | |
| | | | |
Loss for the year | | | | | (95,566,870 | ) | | | (147,864,548 | ) | | | (93,658,806 | ) |
| | | | | | | | | | | | | | |
| | | | |
Total comprehensive loss attributable to: | | | | | | | | | | | | | | |
| | | | |
Owners of the Company | | | | | (17,236,373 | ) | | | (83,923,552 | ) | | | (50,921,216 | ) |
| | | | |
Non-controlling interest | | | | | (75,915,195 | ) | | | (67,730,697 | ) | | | (39,621,716 | ) |
| | | | | | | | | | | | | | |
| | | | |
Total comprehensive loss for the year | | | | | (93,151,568 | ) | | | (151,654,249 | ) | | | (90,542,932 | ) |
| | | | | | | | | | | | | | |
| | | | |
Basic and diluted loss per share | | 30 | | | (4 cents | ) | | | (19 cents | ) | | | (12 cents | ) |
The accompanying notes are an integral part of these consolidated financial statements.
128
ATLATSA RESOURCES CORPORATION
Consolidated Statements of Changes in Equity
For the years ended 31 December 2012, 2011 and 2010
(Expressed in Canadian Dollars, unless otherwise stated)
| | | | | | | | | | | | | | | | | | | | | | | | | | | | | | | | | | | | | | | | | | | | | | | | | | | | |
| | | | | | Attributable to equity holders of the Company | | | | | | | |
| | | | | | Share capital | | | Treasury shares | | | Convertible
preference
shares | | | Foreign
currency
translation
reserve | | | Share-
based
payment
reserve | | | Hedging
reserve | | | Accumulated
loss | | | Total | | | Non-
controlling
interest | | | Total equity | |
| | | Note | | | Number of
shares | | | Amount | | | Number
of shares | | | Amount | | | | | | | | | |
Balance at 1 January 2010 | | | | | | | 201,743,472 | | | | 71,713,114 | | | | (4,497,062 | ) | | | (4,991,726 | ) | | | 162,910,000 | | | | (9,390,899 | ) | | | 19,770,786 | | | | (731,293 | ) | | | (111,798,092 | ) | | | 127,481,890 | | | | 82,025,730 | | | | 209,507,620 | |
| | | | | | | | | | | | | | | | | | | | | | | | | | | | | | | | | | | | | | | | | | | | | | | | | | | | |
Total comprehensive loss for the year | | | | | | | | | | | | | | | | | | | | | | | | | | | | | | | | | | | | | | | | | | | | | | | | | | | | |
Loss for the year | | | | | | | — | | | | — | | | | — | | | | — | | | | — | | | | — | | | | — | | | | — | | | | (51,721,410 | ) | | | (51,721,410 | ) | | | (41,937,396 | ) | | | (93,658,806 | ) |
Total other comprehensive loss | | | 29 | | | | — | | | | — | | | | — | | | | — | | | | — | | | | 4,193,056 | | | | — | | | | (3,392,862 | ) | | | — | | | | 800,194 | | | | 2,315,680 | | | | 3,115,874 | |
| | | | | | | | | | | | | | | | | | | | | | | | | | | | | | | | | | | | | | | | | | | | | | | | | | | | |
Total comprehensive loss for the year | | | | | | | — | | | | — | | | | — | | | | — | | | | — | | | | 4,193,056 | | | | — | | | | (3,392,862 | ) | | | (51,721,410 | ) | | | (50,921,216 | ) | | | (39,621,716 | ) | | | (90,542,932 | ) |
| | | | | | | | | | | | | | | | | | | | | | | | | | | | | | | | | | | | | | | | | | | | | | | | | | | | |
Transactions with owners, recognised directly in equity | | | | | | | | | | | | | | | | | | | | | | | | | | | | | | | | | | | | | | | | | | | | | | | | | | | | |
Contributions by and distributions to owners | | | | | | | | | | | | | | | | | | | | | | | | | | | | | | | | | | | | | | | | | | | | | | | | | | | | |
Common shares issued | | | | | | | 70,000 | | | | 139,474 | | | | — | | | | — | | | | — | | | | — | | | | (71,665 | ) | | | — | | | | — | | | | 67,809 | | | | — | | | | 67,809 | |
Share-based payment transactions | | | | | | | — | | | | — | | | | — | | | | — | | | | — | | | | — | | | | 2,333,450 | | | | — | | | | — | | | | 2,333,450 | | | | — | | | | 2,333,450 | |
| | | | | | | | | | | | | | | | | | | | | | | | | | | | | | | | | | | | | | | | | | | | | | | | | | | | |
Total contributions by and distributions to owners | | | | | | | 70,000 | | | | 139,474 | | | | — | | | | — | | | | — | | | | — | | | | 2,261,785 | | | | — | | | | — | | | | 2,401,259 | | | | — | | | | 2,401,259 | |
| | | | | | | | | | | | | | | | | | | | | | | | | | | | | | | | | | | | | | | | | | | | | | | | | | | | |
Balance at 31 December 2010 | | | | | | | 201,813,472 | | | | 71,852,588 | | | | (4,497,062 | ) | | | (4,991,726 | ) | | | 162,910,000 | | | | (5,197,843 | ) | | | 22,032,571 | | | | (4,124,155 | ) | | | (163,519,502 | ) | | | 78,961,933 | | | | 42,404,014 | | | | 121,365,947 | |
| | | | | | | | | | | | | | | | | | | | | | | | | | | | | | | | | | | | | | | | | | | | | | | | | | | | |
Total comprehensive loss for the year | | | | | | | | | | | | | | | | | | | | | | | | | | | | | | | | | | | | | | | | | | | | | | | | | | | | |
Loss for the year | | | | | | | — | | | | — | | | | — | | | | — | | | | — | | | | — | | | | — | | | | | | | | (81,928,814 | ) | | | (81,928,814 | ) | | | (65,935,734 | ) | | | (147,864,548 | ) |
Total other comprehensive loss | | | 29 | | | | — | | | | — | | | | — | | | | — | | | | — | | | | (6,040,490 | ) | | | (78,403 | ) | | | 4,124,155 | | | | — | | | | (1,994,738 | ) | | | (1,794,963 | ) | | | (3,789,701 | ) |
| | | | | | | | | | | | | | | | | | | | | | | | | | | | | | | | | | | | | | | | | | | | | | | | | | | | |
Total comprehensive loss for the year | | | | | | | — | | | | — | | | | — | | | | — | | | | — | | | | (6,040,490 | ) | | | (78,403 | ) | | | 4,124,155 | | | | (81,928,814 | ) | | | (83,923,552 | ) | | | (67,730,697 | ) | | | (151,654,249 | ) |
| | | | | | | | | | | | | | | | | | | | | | | | | | | | | | | | | | | | | | | | | | | | | | | | | | | | |
Transactions with owners, recognised directly in equity | | | | | | | | | | | | | | | | | | | | | | | | | | | | | | | | | | | | | | | | | | | | | | | | | | | | |
Contributions by and distributions to owners | | | | | | | | | | | | | | | | | | | | | | | | | | | | | | | | | | | | | | | | | | | | | | | | | | | | |
Common shares issued | | | | | | | 75,000 | | | | 114,495 | | | | — | | | | — | | | | — | | | | — | | | | (51,495 | ) | | | — | | | | — | | | | 63,000 | | | | — | | | | 63,000 | |
Share-based payment transactions | | | | | | | — | | | | — | | | | — | | | | — | | | | — | | | | — | | | | 2,140,038 | | | | — | | | | — | | | | 2,140,038 | | | | — | | | | 2,140,038 | |
| | | | | | | | | | | | | | | | | | | | | | | | | | | | | | | | | | | | | | | | | | | | | | | | | | | | |
Total contributions by and distributions to owners | | | | | | | 75,000 | | | | 114,495 | | | | — | | | | — | | | | — | | | | — | | | | 2,088,543 | | | | — | | | | — | | | | 2,203,038 | | | | — | | | | 2,203,038 | |
| | | | | | | | | | | | | | | | | | | | | | | | | | | | | | | | | | | | | | | | | | | | | | | | | | | | |
Balance at 31 December 2011 | | | | | | | 201,888,472 | | | | 71,967,083 | | | | (4,497,062 | ) | | | (4,991,726 | ) | | | 162,910,000 | | | | (11,238,333 | ) | | | 24,042,711 | | | | — | | | | (245,448,316 | ) | | | (2,758,581 | ) | | | (25,326,683 | ) | | | (28,085,264 | ) |
| | | | | | | | | | | | | | | | | | | | | | | | | | | | | | | | | | | | | | | | | | | | | | | | | | | | |
Acquisition of shares in Bokoni Platinum Holdings (Pty) Ltd | | | 24 | | | | — | | | | — | | | | — | | | | — | | | | — | | | | — | | | | — | | | | — | | | | — | | | | — | | | | 197,477,602 | | | | 197,477,602 | |
Total comprehensive loss for the year | | | | | | | | | | | | | | | | | | | | | | | | | | | | | | | | | | | | | | | | | | | | | | | | | | | | |
Loss for the year | | | | | | | — | | | | — | | | | — | | | | — | | | | — | | | | — | | | | — | | | | — | | | | (18,717,839 | ) | | | (18,717,839 | ) | | | (76,849,031 | ) | | | (95,566,870 | ) |
Total other comprehensive loss | | | 29 | | | | — | | | | — | | | | — | | | | — | | | | — | | | | 1,440,676 | | | | 40,790 | | | | — | | | | — | | | | 1,481,466 | | | | 933,836 | | | | 2,415,302 | |
| | | | | | | | | | | | | | | | | | | | | | | | | | | | | | | | | | | | | | | | | | | | | | | | | | | | |
Total comprehensive loss for the year | | | | | | | — | | | | — | | | | — | | | | — | | | | — | | | | 1,440,676 | | | | 40,790 | | | | — | | | | (18,717,839 | ) | | | (17,236,373 | ) | | | (75,915,195 | ) | | | (93,151,568 | ) |
| | | | | | | | | | | | | | | | | | | | | | | | | | | | | | | | | | | | | | | | | | | | | | | | | | | | |
Transactions with owners, recognised directly in equity | | | | | | | | | | | | | | | | | | | | | | | | | | | | | | | | | | | | | | | | | | | | | | | | | | | | |
Contributions by and distributions to owners | | | | | | | | | | | | | | | | | | | | | | | | | | | | | | | | | | | | | | | | | | | | | | | | | | | | |
Common shares issued | | | | | | | — | | | | — | | | | — | | | | — | | | | — | | | | — | | | | — | | | | — | | | | — | | | | — | | | | — | | | | — | |
Fair value gain on de-recognition of debt facility in relation to the first phase of debt restructuring | | | 24 | | | | — | | | | — | | | | — | | | | — | | | | — | | | | — | | | | — | | | | — | | | | — | | | | — | | | | 127,814,103 | | | | 127,814,103 | |
Share-based payment transactions | | | | | | | — | | | | — | | | | — | | | | — | | | | — | | | | — | | | | 1,202,350 | | | | — | | | | — | | | | 1,202,350 | | | | — | | | | 1,202,350 | |
| | | | | | | | | | | | | | | | | | | | | | | | | | | | | | | | | | | | | | | | | | | | | | | | | | | | |
Total contributions by and distributions to owners | | | | | | | — | | | | — | | | | — | | | | — | | | | — | | | | — | | | | 1,202,350 | | | | — | | | | — | | | | 1,202,350 | | | | 127,814,103 | | | | 129,016,453 | |
| | | | | | | | | | | | | | | | | | | | | | | | | | | | | | | | | | | | | | | | | | | | | | | | | | | | |
Balance at 31 December 2012 | | | | | | | 201,888,472 | | | | 71,967,083 | | | | (4,497,062 | ) | | | (4,991,726 | ) | | | 162,910,000 | | | | (9,797,657 | ) | | | 25,285,851 | | | | — | | | | (264,166,155 | ) | | | (18,792,604 | ) | | | 224,049,827 | | | | 205,257,227 | |
| | | | | | | | | | | | | | | | | | | | | | | | | | | | | | | | | | | | | | | | | | | | | | | | | | | | |
The accompanying notes are an integral part of these consolidated financial statements.
129
ATLATSA RESOURCES CORPORATION
Notes to the Consolidated Financial Statements
For the years ended 31 December 2012, 2011 and 2010
(Expressed in Canadian Dollars, unless otherwise stated)
| | | | | | | | | | | | | | | | |
| | | Note | | | 2012 | | | 2011 | | | 2010 | |
Cash flows from operating activities | | | | | | | | | | | | | | | | |
Cash receipts from customers | | | | | | | 140,085,828 | | | | 148,279,469 | | | | 138,546,181 | |
Cash paid to suppliers and employees | | | | | | | (171,351,040 | ) | | | (189,597,810 | ) | | | (154,336,968 | ) |
| | | | | | | | | | | | | | | | |
Cash utilised by operations | | | 31 | | | | (31,265,212 | ) | | | (41,318,341 | ) | | | (15,790,787 | ) |
Interest received | | | | | | | 296,187 | | | | 544,825 | | | | 985,573 | |
Interest paid | | | | | | | (158 | ) | | | (510,447 | ) | | | (13,731 | ) |
Tax paid | | | | | | | (2,079,516 | ) | | | — | | | | (299,394 | ) |
| | | | | | | | | | | | | | | | |
Cash utilised by operating activities | | | | | | | (33,048,699 | ) | | | (41,283,963 | ) | | | (15,118,339 | ) |
| | | | | | | | | | | | | | | | |
| | | | |
Cash flows from investing activities | | | | | | | | | | | | | | | | |
Investment in environmental trusts | | | | | | | (461,681 | ) | | | (505,440 | ) | | | — | |
Acquisition of property, plant and equipment | | | 7 | | | | (2,563 | ) | | | (2,238 | ) | | | (494,095 | ) |
Acquisition of capital work-in-progress | | | 8 | | | | (38,917,145 | ) | | | (28,678,042 | ) | | | (28,193,472 | ) |
Acquisition of intangible assets | | | 9 | | | | — | | | | (236,304 | ) | | | (3,328,100 | ) |
Other | | | | | | | — | | | | — | | | | (335,800 | ) |
| | | | | | | | | | | | | | | | |
Cash utilised by investing activities | | | | | | | (39,381,389 | ) | | | (29,422,024 | ) | | | (32,351,467 | ) |
| | | | | | | | | | | | | | | | |
| | | | |
Cash flows from financing activities | | | | | | | | | | | | | | | | |
Loans and borrowings raised – OCSF | | | 18 | | | | 72,872,141 | | | | 68,543,022 | | | | 41,382,644 | |
Loans and borrowings raised – Funding loan | | | 18 | | | | 315,612,211 | | | | — | | | | — | |
Acquisition of shares in Bokoni Platinum Holdings (Pty) Ltd | | | | | | | 197,477,614 | | | | 63,000 | | | | 67,809 | |
Settlement of interest rate swap | | | | | | | — | | | | (3,691,604 | ) | | | — | |
“A” Preference shares repaid | | | | | | | (401,782,311 | ) | | | — | | | | — | |
Loans repaid – OCSF | | | | | | | (110,074,287 | ) | | | — | | | | — | |
Loans repaid – Funding loan | | | | | | | (1,233,228 | ) | | | — | | | | — | |
Interest-free loan raised | | | 18 | | | | — | | | | — | | | | 599,442 | |
Loans repaid – Interest-free Loan | | | 18 | | | | — | | | | — | | | | (590,537 | ) |
Other loans repaid | | | 18 | | | | (1,048,243 | ) | | | (716,371 | ) | | | — | |
| | | | | | | | | | | | | | | | |
Cash generated from financing activities | | | | | | | 71,823,897 | | | | 64,198,047 | | | | 41,459,358 | |
| | | | | | | | | | | | | | | | |
Effect of foreign currency translation | | | | | | | (757,931 | ) | | | (3,311,642 | ) | | | 827,527 | |
| | | | | | | | | | | | | | | | |
Net decrease in cash and cash equivalents | | | | | | | (1,364,122 | ) | | | (9,819,582 | ) | | | (5,182,921 | ) |
Cash and cash equivalents, beginning of the year | | | | | | | 15,945,008 | | | | 25,764,590 | | | | 30,947,511 | |
| | | | | | | | | | | | | | | | |
Cash and cash equivalents, end of the year | | | 15 | | | | 14,580,886 | | | | 15,945,008 | | | | 25,764,590 | |
| | | | | | | | | | | | | | | | |
The accompanying notes are an integral part of these consolidated financial statements.
130
ATLATSA RESOURCES CORPORATION
Notes to the Consolidated Financial Statements
For the years ended 31 December 2012, 2011 and 2010
(Expressed in Canadian Dollars, unless otherwise stated)
Atlatsa Resources Corporation (“Company” or “Atlatsa”) is incorporated in the Province of British Columbia, Canada. The Company has a primary listing on the TSX Venture Exchange (“TSX-V”) and a secondary listing on the New York Stock Exchange (“NYSE”) and the JSE Limited (“JSE”). The consolidated financial statements of the Company as at 31 December 2012 and 2011 and for the years ended 31 December 2012, 2011 and 2010 comprise the Company and its subsidiaries (together referred to as the “Group” and individually as “Group entities”) and the Group’s interest in associates, special purpose entities and jointly controlled entities. Its principal business activity is the mining and exploration of Platinum Group Metals (“PGM”) through its mineral property interests. The Company focuses on mineral property interests located in the Republic of South Africa in the Bushveld Complex. Atlatsa operates in South Africa through its wholly-owned subsidiary Plateau Resources Proprietary Limited (“Plateau”) which owns the Group’s various mineral property interests and conducted the Group’s business in South Africa.
The Group incurred a net loss for the year ended 31 December 2012 of $95.6 million (2011: $147.9 million) and as of that date its total assets exceeded its total liabilities by $205.3 million (2011: total liabilities exceeded total assets by $28.1 million). The company continues to incur losses.
The company embarked on a restructuring and recapitalising plan during 2012 and on 28 September 2012 the first phase of the restructuring plan was completed. The effect was a consolidation of all loan facilities into one facility at a more favourable interest rate of 6.27% compared to 12.31% of the previous facility. The funds available from this facility are expected to meet the Group’s projected cash flow requirements until approximately May 2013. The company is currently engaged in negotiations with Anglo American Platinum Limited (“Anglo”) to implement the second phase of the plan to reduce the debt by $287.1 million (ZAR2.45 billion) and for additional funds to be made available from Anglo to meet the Group’s projected cash flow requirements until approximately the end of 2015. Under the proposed plan the new restructured debt will only be repayable once the company generates sufficient free cash flow.
Anglo has currently extended financial support until 31 August 2013.
The financial statements are prepared on the basis of accounting policies applicable to a going concern. This basis presumes that debt restructuring and accompanying funding arrangements as described above are successfully negotiated and approved by the shareholders by June 2013, refer to note 37.
In the event that the negotiations are not successful, these conditions give rise to a material uncertainty which may cast significant doubt about the ability of the Company and its subsidiaries to continue as going concerns and, therefore that they may be unable to realise their assets and discharge their liabilities in the normal course of business.
| 3.1 | Statement of compliance |
The consolidated financial statements have been prepared in accordance with International Financial Reporting Standards (“IFRS”) as issued by the International Accounting Standards Board.
The consolidated financial statements have been prepared on the historical cost basis as set out in the accounting policies below. Certain items, including derivative financial instruments, are stated at fair value.
| 3.3 | Use of estimates and judgements |
The preparation of the consolidated financial statements in accordance with IFRS requires management to make judgements, estimates and assumptions that affect the application of accounting policies and the reported amounts of assets, liabilities, income and expenses. Actual results may differ from these estimates.
Estimates and underlying assumptions are reviewed on an ongoing basis. Revisions to accounting estimates are recognised in the period in which the estimates are revised and in any future periods affected.
Information about critical judgements in applying accounting policies that have the most significant effect on the amounts recognised in the consolidated financial statements is included in the notes to the financial statements where applicable.
131
ATLATSA RESOURCES CORPORATION
Notes to the Consolidated Financial Statements
For the years ended 31 December 2012, 2011 and 2010
(Expressed in Canadian Dollars, unless otherwise stated)
These consolidated financial statements are presented in (unless stated otherwise) Canadian Dollars (“$”), which is also the Company’s functional currency. All financial information presented in $ has been rounded to the nearest dollar, except when otherwise indicated.
The accounting policies set out below are applied consistently to all years presented in these consolidated financial statements and have been applied consistently by Group entities.
| 4.1 | Basis for consolidation |
All business combinations are accounted for by applying the acquisition method.
Control is the power to govern the financial and operating policies of an entity so as to obtain benefits from its activities. In assessing control, consideration is given to potential voting rights that are currently exercisable. The acquisition date is the date on which control is transferred to the acquirer. Judgment is applied in determining the acquisition date and determining whether control is transferred from one party to another.
Goodwill is measured as the fair value of the consideration transferred including the recognised amount of any non-controlling interest in the acquiree, less the net recognised amount (generally fair value) of the identifiable assets acquired and liabilities assumed, all measured at the acquisition date. To the extent that the fair value exceeds the consideration transferred, the excess is recognised in profit or loss.
Consideration transferred includes the fair values of the assets transferred, liabilities incurred by the Group to the previous owners of the acquiree, and equity interests issued by the Group. Consideration transferred also includes the fair value of any contingent consideration and share-based payment awards of the acquiree that are replaced mandatorily in the business combination.
A contingent liability of the acquiree is assumed in a business combination only if such a liability represents a present obligation and arises from a past event, and its fair value can be measured reliably.
Non-controlling interest is measured at its proportionate interest in the fair value of the identifiable net assets of the acquiree.
Transaction costs incurred in connection with a business combination, such as legal fees, due diligence fees and other professional and consulting fees are expensed as incurred, unless it is debt related. Directly attributable transaction costs related to debt instruments are capitalised.
If the Group obtains control over one or more entities that are not businesses, then the bringing together of those entities are not business combinations. The cost of acquisition is allocated among the individual identifiable assets and liabilities of such entities, based on their relative fair values at the date of acquisition. Such transactions do not give rise to goodwill and no non- controlling interest is recognised.
| (ii) | Acquisitions of non-controlling interests |
Acquisitions of non-controlling interests are accounted for as transactions with equity holders in their capacity as equity holders and therefore no goodwill is recognised as a result of such transactions.
Subsidiaries are entities controlled by the Group. The financial statements of subsidiaries are included in the consolidated financial statements from the date that control commences until the date that control ceases. The accounting policies of subsidiaries have been changed where necessary to align them with the policies adopted by the Group.
| (iv) | Investments in jointly controlled entities (equity accounted investees) |
Jointly controlled entities are those entities over whose activities the Group has joint control, established by contractual agreement and requiring unanimous consent for strategic financial and operating decisions.
Investments in jointly controlled entities are accounted for using the equity method (“equity accounted investees”) and are recognised initially at cost. The Group’s equity investment includes goodwill identified on acquisition, net of any accumulated impairment losses. The consolidated financial statements include the Group’s share of the income and expenses and equity movements of equity accounted investees, after adjustments to align accounting policies with those of the Group, from the date that significant influence or joint control commences until the date that significant influence or joint control
132
ATLATSA RESOURCES CORPORATION
Notes to the Consolidated Financial Statements
For the years ended 31 December 2012, 2011 and 2010
(Expressed in Canadian Dollars, unless otherwise stated)
ceases. When the Group’s share of losses exceeds its interest in an equity accounted investee, the carrying amount of that interest, including any long-term investments, is reduced to nil, and the recognition of further losses is discontinued except to the extent that the Group has an obligation or has made payments on behalf of the investee.
| (v) | Special purpose entities |
A Special Purpose Entity (“SPE”) is consolidated if, based on an evaluation of the substance of its relationship with the Group and the SPE’s risks and rewards, the Group concludes that it controls the SPE. SPE’s controlled by the Group were established under terms that impose strict limitations on the decision-making powers of the SPE’s management and that result in the Group receiving the majority of the benefits related to the SPE’s operations and net assets, being exposed to the majority of risks incident to the SPE’s activities, and retaining the majority of the residual or ownership risks related to the SPE’s or their assets.
| (vi) | Transactions eliminated on consolidation |
Intra-group balances and transactions, and any unrealised income and expenses arising from intra-group transactions, are eliminated in preparing the consolidated financial statements. Unrealised gains arising from transactions with equity accounted investees are eliminated against the investment to the extent of the Group’s interest in the investee. Unrealised losses are eliminated in the same way as unrealised gains, but only to the extent that there is no evidence of impairment.
| (i) | Foreign currency transactions |
Transactions in foreign currencies are translated to the respective functional currencies of Group entities at exchange rates at the date of the transactions. Monetary assets and liabilities denominated in foreign currencies at the reporting date are translated to the functional currency at the exchange rate at that date. The foreign currency gain or loss on monetary items is the difference between amortised cost in the functional currency at the beginning of the year, adjusted for effective interest and payments during the year, and the amortised cost in foreign currency translated at the exchange rate at the end of the year. Such gains and losses are recognised in profit or loss.
Non-monetary assets and liabilities denominated in foreign currencies that are measured at fair value are retranslated to the functional currency at the exchange rate at the date that the fair value was determined. Non-monetary items in a foreign currency that are measured in terms of historical cost are translated using the exchange rate at the date of the transaction. Foreign currency differences arising on retranslation are recognised in profit or loss, except for differences arising on the retranslation of available-for-sale equity investments, a financial liability designated as a hedge of the net investment in a foreign operation that is effective, or qualifying cash flow hedges, which are recognised in other comprehensive income.
The financial results of Group entities that have a functional currency different from the presentation currency are translated into the presentation currency. The presentation currency of the Company is Canadian Dollars. Income and expenditure transactions of foreign operations are translated at the average rate of exchange for the year except for significant individual transactions which are translated at the rate of exchange in effect at the transaction date. All assets and liabilities, including fair value adjustments and goodwill arising on acquisition, are translated at the rate of exchange ruling at the reporting date.
Foreign currency differences are recognised in other comprehensive income, and presented in the foreign currency translation reserve (“FCTR”) in equity. However, if the foreign operation is a non-wholly owned subsidiary, then the relevant proportion of the translation difference is allocated to non-controlling interests.
When the settlement of a monetary item receivable from or payable to a foreign operation is neither planned nor likely in the foreseeable future, foreign exchange gains and losses arising from such a monetary item are considered to form part of the net investment in a foreign operation and are recognised in other comprehensive income and are included in the foreign currency translation reserve.
On disposal of part or all of the operations, the proportionate share of the related cumulative gains and losses previously recognised in the FCTR through the statement of comprehensive income are included in determining the profit or loss on disposal of that operation recognised in profit or loss.
133
ATLATSA RESOURCES CORPORATION
Notes to the Consolidated Financial Statements
For the years ended 31 December 2012, 2011 and 2010
(Expressed in Canadian Dollars, unless otherwise stated)
| (i) | Non-derivative financial assets |
Non-derivative financial assets comprise loans and receivables.
Loans and receivables are recognised on the date of origination. All other financial assets are recognised initially on the trade date at which the Group becomes a party to the contractual provisions of the instrument.
Financial assets are derecognised when the contractual rights to the cash flows from the asset expire, or the Group transfers the rights to receive the contractual cash flows on the financial asset in a transaction in which substantially all the risks and rewards of ownership of the financial assets are transferred. Any interest in transferred financial assets that is created or retained is recognised as a separate asset or liability.
Financial assets and financial liabilities are offset and the net amount presented in the statement of financial position when, and only when, the Group has a legal right to offset the amounts and intends either to settle on a net basis or to realise the asset and settle the liability simultaneously.
Loans and receivables
Loans and receivables are financial assets with fixed or determinable payments that are not quoted in an active market. Such assets are recognised initially at fair value plus any directly attributable transaction costs. Subsequent to initial recognition loans and receivables are measured at amortised cost using the effective interest method, less any impairment losses.
Loans and receivables comprise trade and other receivables, restricted cash, investment in the Platinum Producer’s Environmental Trust and cash and cash equivalents.
Cash and cash equivalents comprise cash balances and call deposits with original maturities of three months or less. Bank overdrafts that are repayable on demand and form an integral part of the Group’s cash management are included as a component of cash and cash equivalents for the purpose of the statement of cash flows.
| (ii) | Non-derivative financial liabilities |
The Group initially recognises debt securities issued and subordinated liabilities on the date that they originated. All other financial liabilities are recognised initially on the trade date at which the Group becomes a party to the contractual provisions of the instrument.
Financial liabilities are derecognised when the contractual obligations are discharged, cancelled or expire.
Non-derivative financial liabilities comprise loans and borrowings, bank overdrafts, trade and other payables.
Financial liabilities are recognised initially at fair value plus any directly attributable transaction costs. Subsequent to initial recognition these financial liabilities are measured at amortised cost using the effective interest method.
| (iii) | Derivative financial instruments, including hedge accounting |
The Group held derivative financial instruments to hedge its interest rate risk exposures. Embedded derivatives are separated from the host contract and accounted for separately if the economic characteristics and risks of the host contract and the embedded derivative are not closely related, a separate instrument with the same terms as the embedded derivative would meet the definition of a derivative, and the combined instrument is not measured at fair value through profit or loss.
On initial designation of the hedge, the Group formally documents the relationship between the hedging instrument(s) and hedged item(s), including the risk management objectives and strategy in undertaking the hedge transaction, together with the methods that will be used to assess the effectiveness of the hedging relationship. The Group makes an assessment, both at the inception of the hedge relationship as well as on an ongoing basis, whether the hedging instruments are expected to be “highly effective” in offsetting the changes in the fair value or cash flows of the respective hedged items during the year for which the hedge is designated, and whether the actual results of each hedge are within a range of 80-125 percent. For a cash flow hedge of a forecast transaction, the transaction should be highly probable to occur and should present an exposure to variations in cash flows that could ultimately affect reported net income.
Derivatives are recognised initially at fair value; attributable transaction costs are recognised in profit or loss as incurred. Subsequent to initial recognition, derivatives are measured at fair value, and changes therein are accounted for as described below.
134
ATLATSA RESOURCES CORPORATION
Notes to the Consolidated Financial Statements
For the years ended 31 December 2012, 2011 and 2010
(Expressed in Canadian Dollars, unless otherwise stated)
Cash flow hedges
When a derivative is designated as the hedging instrument in a hedge of the variability in cash flows attributable to particular risk associated with a recognised asset or liability or a highly probable forecast transaction that could affect profit or loss, the effective portion of changes in the fair value of the derivative is recognised in other comprehensive income and presented in the hedging reserve in equity. The amount recognised in other comprehensive income is removed and included in profit or loss in the same period as the hedged cash flows affects profit or loss under the same line item in the statement of comprehensive income as the hedged item. Any ineffective portion of changes in the fair value of the derivative is recognised immediately in profit or loss.
If the hedging instrument no longer meets the criteria for hedge accounting, expires or is sold, terminated, exercised, or the designation is revoked, then hedge accounting is discontinued prospectively. The cumulative gain or loss previously recognised in other comprehensive income and presented in the hedging reserve in equity remains there until the forecast transaction affects profit or loss. When the hedged item is a non-financial asset, the amount recognised in other comprehensive income is transferred to the carrying amount of the asset when the asset is recognised. If the forecast transaction is no longer expected to occur, then the balance in other comprehensive income is recognised immediately in profit or loss. In other cases the amount recognised in other comprehensive income is transferred to profit or loss in the same period that the hedged item affects profit or loss.
Separate embedded derivatives
Changes in the fair value of separated embedded derivatives are recognised immediately in profit or loss.
Other derivatives
When a derivative financial instrument is not held for trading purposes and is not designated in a qualifying hedge relationship, all changes in its fair value are recognised immediately in profit or loss.
Common shares
Common shares are classified as equity. Incremental costs directly attributable to the issue of common shares and share options are recognised as a deduction from equity, net of any tax effects.
Preference share capital
Preference share capital is classified as equity if it is non-redeemable, redeemable for a fixed number of the Company’s shares, or redeemable only at the Company’s option, and any dividends are discretionary. Dividends thereon are recognised as distributions within equity upon approval by the Company’s Board of Directors.
Preference share capital is classified as a liability if it is redeemable on a specific date or at the option of the holders, or if dividend payments are not discretionary. Dividends thereon are recognised as finance expense in profit or loss as accrued.
Treasury shares
Shares issued to subsidiaries or SPE’s are reflected as treasury shares on consolidation.
| 4.4 | Accounting for borrowing costs |
In respect of borrowing costs relating to qualifying assets the Group capitalises borrowing costs that are directly attributable to the acquisition, construction or production of a qualifying asset as part of the cost of that asset. The Group has capitalised borrowing costs with respect to property, plant and equipment under construction.
| 4.5 | Property, plant and equipment |
Mining assets, including mine development cost and infrastructure costs, mine plant facilities and buildings are measured at historical cost less accumulated depreciation and impairment losses.
Mining assets are capitalised to capital work-in-progress and transferred to mining property, plant and equipment when the mining venture reaches commercial production.
Capitalised mine development and infrastructure costs include expenditure incurred to develop new mining operations and to expand the capacity of the mine to the extent that it gives rise to future economic benefit. Costs include borrowing costs capitalised during the construction period where qualifying expenditure is financed by borrowings, the cost of materials and
135
ATLATSA RESOURCES CORPORATION
Notes to the Consolidated Financial Statements
For the years ended 31 December 2012, 2011 and 2010
(Expressed in Canadian Dollars, unless otherwise stated)
direct labour, any other costs directly attributable to bringing the asset to a working condition for its intended use as well as an estimate of the costs of dismantling and removing the items and restoring the site on which they are located. Items of mining property, plant and equipment, excluding capitalised mine development and infrastructure costs, are depreciated on a straight-line basis over their expected useful life. Capitalised mine development and infrastructure are depreciated on a units of production basis. Depreciation is charged on mining assets from the date on which they are available for use.
When parts of an item of property, plant and equipment have different useful lives, they are accounted for as separate items (major components) of property, plant and equipment.
Property, plant and equipment are depreciated over their estimated useful lives as follows:
| | |
| Mine development and infrastructure | | units of production |
Plant and equipment | | 1 – 30 years |
Buildings | | 5 – 30 years |
Motor vehicles | | 1 – 5 years |
Furniture and fittings | | 1 – 10 years |
Items of property, plant and equipment that are withdrawn from use, or have no reasonable prospect of being recovered through use or sale, are regularly identified and written off.
The assets’ residual values, depreciation methods and useful lives are reviewed, and adjusted if appropriate, at each reporting date.
Non-mining assets are measured at historical cost less accumulated depreciation and impairment losses. Depreciation is charged on the straight-line basis over the useful lives of these assets.
Subsequent expenditure relating to an item of property, plant and equipment is capitalised when it is probable that future economic benefits from the use of the assets will be increased.
Repairs and maintenance are recognised in profit or loss during the period in which they are incurred.
Gains and losses on disposal of property, plant and equipment are determined by comparing the proceeds from disposal with the carrying amount of the asset and are recognised net within profit or loss.
Goodwill is measured at cost less accumulated impairment losses and is not amortised. In respect of equity accounted investees, the carrying amount of goodwill is included in the carrying amount of the investment, and an impairment loss on such an investment is not allocated to any asset, including goodwill, that forms part of the carrying amount of the equity accounted investee.
| (ii) | Other intangible assets |
Other intangible assets include mineral property interests (refer note 4.18 below) and purchased software. These intangible assets are recognised if it is probable that future economic benefits will flow to the entity from the intangible assets and the costs of the intangible assets can be reliably measured.
Mineral property interests are carried at cost less impairment losses.
Purchased software is stated at cost less amortisation and impairment losses and is amortised on a straight line basis over its estimated useful life. The amortisation method and estimated useful life are reviewed at least annually.
136
ATLATSA RESOURCES CORPORATION
Notes to the Consolidated Financial Statements
For the years ended 31 December 2012, 2011 and 2010
(Expressed in Canadian Dollars, unless otherwise stated)
The carrying amounts of the Group’s non-financial assets, other than inventories and deferred tax assets, are reviewed at each reporting date to determine whether there is any indication of impairment. If any such indication exists, then the asset’s recoverable amount is estimated. For goodwill and intangible assets that have indefinite lives or that are not yet available for use, the recoverable amount is estimated each year at the same time.
The recoverable amount of an asset or cash-generating unit is the greater of its value in use and its fair value less costs to sell. In assessing value in use, the estimated future cash flows are discounted to their present value using a pre-tax discount rate that reflects current market assessments of the time value of money and the risks specific to the asset. For the purpose of impairment testing, assets are grouped together into the smallest group of assets that generates cash inflows from continuing use that are largely independent of the cash inflows of other assets or groups of assets (the “cash-generating unit”). The goodwill acquired in a business combination, for the purpose of impairment testing, is allocated to cash-generating units that are expected to benefit from the synergies of the combination.
An impairment loss is recognised if the carrying amount of an asset or its cash-generating units exceeds its estimated recoverable amount. Impairment losses are recognised in profit or loss. Impairment losses recognised in respect of cash- generating units are allocated first to reduce the carrying amount of any goodwill allocated to the units and then to reduce the carrying amounts of the other assets in the unit (group of units) on a pro rata basis.
An impairment loss in respect of goodwill is not reversed. In respect of other assets, impairment losses recognised in prior years are assessed at each reporting date for any indications that the loss has decreased or no longer exists. An impairment loss is reversed if there has been a change in the estimates used to determine the recoverable amount. An impairment loss is reversed only to the extent that the asset’s carrying amount does not exceed the carrying amount that would have been determined, net of depreciation or amortisation, if no impairment loss had been recognised.
| (ii) | Financial assets (including receivables) |
A financial asset not measured at fair value through profit or loss is assessed at each reporting date to determine whether there is objective evidence that it is impaired. A financial asset is impaired if objective evidence indicates that a loss event has occurred after the initial recognition of the asset, and that the loss event had a negative effect on the estimated future cash flows of that asset that can be estimated reliably.
The Group considers evidence of impairment for loans and receivables at both a specific asset and collective level. All individually significant assets are assessed for specific impairment. Those found not to be specifically impaired are then collectively assessed for any impairment that has been incurred but not yet identified. Assets that are not individually significant are collectively assessed for impairment by grouping together assets with similar risk characteristics. In assessing collective impairment the Group uses historical trends of the probability of default, the timing of recoveries and the amount of loss incurred, adjusted for management’s judgment as to whether current economic and credit conditions are such that the actual losses are likely to be greater or less that suggested by historical trends.
An impairment loss in respect of a financial asset measured at amortised cost is calculated as the difference between its carrying amount and the present value of the estimated future cash flows discounted at the asset’s original effective interest rate. Losses are recognised in profit or loss and reflected in an allowance account against receivables. Interest on the impaired asset continues to be recognised through the unwinding of the discount. When a subsequent event causes the amount of impairment loss to decrease, the decrease in impairment loss is reversed through profit or loss.
Inventories, comprising ore stockpiles and consumables, are measured at the lower of cost and net realisable value.
The cost of inventories is based on the average cost of ore in stockpiles and comprises all costs incurred to the stage immediately prior to stockpiling, including costs of extraction and crushing, as well as processing costs associated with ore stockpiles, based on the relevant stage of production.
Net realisable value is the estimated selling price in the ordinary course of business, less the estimated costs of completion and selling expenses.
137
ATLATSA RESOURCES CORPORATION
Notes to the Consolidated Financial Statements
For the years ended 31 December 2012, 2011 and 2010
(Expressed in Canadian Dollars, unless otherwise stated)
| (i) | Defined contribution plans |
A defined contribution plan is a post-employment benefit plan under which an entity pays fixed contributions into a separate entity and will have no legal or constructive obligation to pay further amounts. Obligations for contributions to defined contribution pension plans are recognised as an employee benefit expense in profit or loss in the years during which services are rendered by employees. Prepaid contributions are recognised as an asset to the extent that a cash refund or a reduction in future payments is available. Contributions to a defined contribution plan that are due more than 12 months after the end of the year in which the employees render the service are discounted to their present value.
| (ii) | Short-term employee benefits |
Short-term employee benefit obligations are measured on an undiscounted basis and are expensed as the related service is provided.
A liability is recognised for the amount expected to be paid under short-term cash bonus or profit-sharing plans if the Group has a present legal or constructive obligation to pay this amount as a result of past service provided by the employee, and the obligation can be estimated reliably.
| (iii) | Share-based payment transactions |
The grant date fair value of share-based payment awards granted to employees is recognised as an employee cost, with a corresponding increase in equity, over the period that the employees unconditionally become entitled to the awards. The amount recognised as an expense is adjusted to reflect the number of awards for which the related service and non-market vesting conditions are expected to be met, such that the amount ultimately recognised as an expense is based on the number of awards that do meet the related service and non-market performance conditions at the vesting date.
For share-based payment awards with non-vesting conditions, the grant date fair value of the share-based payment is measured to reflect such conditions and there is no true-up for differences between expected and actual outcomes.
The fair value of the amount payable to employees in respect of the share appreciation rights (SARs), which are settled in cash, is recognised as an expense with a corresponding increase in liabilities over the period that the employees unconditionally become entitled to payment. The liability is remeasured at each reporting date and at settlement date. Any changes in the fair value of the liability are recognised as employee costs in profit or loss.
Share-based payment arrangements in which the Group receives goods or services as consideration for its own equity instruments are accounted for as equity-settled share-based payment transactions, regardless of how the equity instruments are obtained by the Group.
Termination benefits are recognised as an expense as and when the Group is committed demonstrably, without realistic possibility of withdrawal, to a formal detailed plan to either terminate employment before the normal retirement date, or to provide termination benefits as a result of an offer made to encourage voluntary redundancy.
Termination benefits for voluntary redundancies are recognised as an expense if the Group has made an offer of voluntary redundancy, it is probable that the offer will be accepted, and the number of acceptances can be estimated reliably.
If benefits are payable more than 12 months after the reporting year, the benefits are discounted to their present value.
A provision is recognised if, as a result of a past event, the Group has a present legal or constructive obligation that can be estimated reliably and it is probable that an outflow of economic benefits will be required to settle the obligation. Provisions are determined by discounting the expected future cash flows at a pre-tax rate that reflects current market assessments of the time value of money and the risks specific to the liability. The unwinding of the discount is recognised as finance expense (“notional interest”).
Provisions are reviewed at each reporting date and adjusted to reflect the current best estimate. If it is no longer probable that an outflow of economic benefits will be required, the provision is reversed.
138
ATLATSA RESOURCES CORPORATION
Notes to the Consolidated Financial Statements
For the years ended 31 December 2012, 2011 and 2010
(Expressed in Canadian Dollars, unless otherwise stated)
| (i) | Environmental rehabilitation provisions |
Estimated environmental provisions, comprising pollution control, rehabilitation and mine closure, are based on the Group’s environmental policy taking into account current technological, environmental and regulatory requirements. The provision for rehabilitation is recognised as and when the environmental liability arises. To the extent that the obligations relate to the construction of an asset, they are capitalised as part of the cost of those assets. The effect of subsequent changes to assumptions in estimating an obligation for which the provision was recognised as part of the cost of the asset is adjusted against the asset. Any subsequent changes to an obligation which did not relate to the initial construction of a related asset are recognised in profit or loss.
A provision for restructuring is recognised when the Group has approved a detailed and formal restructuring plan, and the restructuring has either commenced or has been announced publically. Future operating losses are not provided for.
| 4.11 | Platinum Producers’ Environmental Trust |
The Group contributes to the Platinum Producers’ Environmental Trust annually. The trust was created to fund the estimated cost of pollution control, rehabilitation and mine closure at the end of the lives of the Group’s mines. Contributions are determined on the basis of the estimated environmental obligation over the life of a mine. Contributions made are reflected in non-current investments held by the Platinum Producers’ Environmental Trust. Interest earned on monies paid to rehabilitation trust funds is accrued on a time proportion basis and is recognised as finance income.
Revenue arising from the sale of metals and intermediary products is recognised when the price is determinable, the product has been delivered in accordance with the terms of the contract, the significant risks and rewards of ownership have been transferred to the customer and collection of the sales price is reasonably assured. These criteria are typically met when the concentrate reaches the smelter.
Revenue from the sale of metals and intermediary products in the course of ordinary activities is measured at the fair value of the consideration received or receivable. Revenue further excludes value-added tax and mining royalties.
| (i) | Operating leases - Lessor |
Operating lease income is recognised as income on a straight-line basis over the lease term.
Initial direct costs incurred in negotiating and arranging operating leases are added to the carrying amount of the leased asset and recognised as an expense over the lease term on the same basis as the lease income. Income for leases is disclosed under other income in profit or loss.
| (ii) | Operating leases - Lessee |
Operating lease payments are recognised as an expense on a straight-line basis over the lease term. The difference between the amounts recognised as an expense and the contractual payments are recognised as an operating lease liability. This liability is not discounted.
Any contingent rents are expensed in the period they are incurred.
| 4.14 | Finance income and finance expense |
Finance income comprises interest income on funds invested and interest received on loans and receivables. Interest income is recognised as it accrues in profit or loss, using the effective interest method.
Finance expense comprises interest expense on borrowings, unwinding of the discount on provisions, dividends on preference shares classified as liabilities and gains/losses on hedging instruments that are recognised in profit or loss. Borrowing costs that are not directly attributable to the acquisition, construction or production of a qualifying asset are recognised in profit or loss using the effective interest method.
Foreign currency gains and losses are reported on a net basis.
139
ATLATSA RESOURCES CORPORATION
Notes to the Consolidated Financial Statements
For the years ended 31 December 2012, 2011 and 2010
(Expressed in Canadian Dollars, unless otherwise stated)
Income tax expense comprises current and deferred tax. Current tax and deferred tax are recognised in profit or loss except to the extent that it relates to a business combination, or items recognised directly in equity or in other comprehensive income.
Current tax is the expected tax payable or receivable on the taxable income or loss for the year, using tax rates enacted or substantively enacted at the reporting date, and any adjustment to tax payable in respect of previous years.
Deferred tax is recognised in respect of temporary differences between the carrying amounts of assets and liabilities for financial reporting purposes and the amounts used for taxation purposes. Deferred tax is not recognised for the following temporary differences: the initial recognition of assets or liabilities in a transaction that is not a business combination and that affects neither accounting nor taxable profit or loss, and differences relating to investments in subsidiaries and jointly controlled entities to the extent that it is probable that they will not reverse in the foreseeable future. In addition, deferred tax is not recognised for taxable temporary differences arising on the initial recognition of goodwill. The Group is able to control the timing of the reversal of the temporary differences. The ability to control the timing of reversal is a key part of the recognition exemption from recognizing deferred tax related to temporary differences related to investment in subsidiaries, associate and jointly controlled entities.
Deferred tax is measured at the tax rates that are expected to be applied to temporary differences when they reverse, based on the laws that have been enacted or substantively enacted by the reporting date. Deferred tax assets and liabilities are offset if there is a legally enforceable right to offset current tax liabilities and assets, and they relate to income taxes levied by the same tax authority on the same taxable entity, or on different tax entities, but they intend to settle current tax liabilities and assets on a net basis or their tax assets and liabilities will be realised simultaneously.
A deferred tax asset is recognised for unused tax losses, tax credits and deductible temporary differences, to the extent that it is probable that future taxable profits will be available against which they can be utilised. Deferred tax assets are reviewed at each reporting date and are reduced to the extent that it is no longer probable that the related tax benefit will be realised.
| 4.16 | Earnings/(Loss) per share |
The Group presents basic and diluted earnings/(loss) per share (“EPS”) data for its common shares. Basic EPS is calculated by dividing the profit or loss attributable to owners of the Company by the weighted average number of common shares outstanding during the year, adjusted for own shares held. Diluted EPS is determined by adjusting the profit or loss attributable to owners of the Company and the weighted average number of common shares outstanding, adjusted for own shares held and for the effects of all dilutive potential common shares, which include share options granted to employees.
An operating segment is a component of the Group that engages in business activities from which it may earn revenues and incur expenses, including revenues and expenses that relate to transactions with any of the Group’s other components. All operating segments’ operating results are reviewed regularly by the Group’s Chief Executive Officer (who is considered the chief operating decision maker) to make decisions about resources to be allocated to the segment and assess its performance, and for which discrete financial information is available.
| 4.18 | Exploration expenditure and mineral property interests |
The acquisitions of mineral property interests are initially measured at cost. Mineral property acquisition costs and development expenditures incurred subsequent to the determination of the feasibility of mining operations and approval of development by the Group are capitalised until the property to which they relate is placed into production, sold or allowed to lapse.
Exploration and evaluation costs incurred prior to determination of the feasibility of mining operations are expensed as incurred. Re-imbursement of previously expensed exploration and evaluation costs are recognised as other income in profit or loss.
Mineral property acquisition costs include the cash consideration and the fair market value of shares issued for mineral property interests pursuant to the terms of the relevant agreements. These costs will be amortised over the estimated life of the property following commencement of commercial production, or written off if the property is sold, allowed to lapse, or when an impairment of value has been determined to have occurred.
| 4.19 | Non-current assets held for sale or distribution |
Non-current assets, or disposal groups comprising assets and liabilities, that are expected to be recovered primarily through sale or distribution rather than through continuing use, are classified as held for sale or distribution. Immediately before classification as held for sale or distribution, the assets, or components of a disposal group are remeasured in accordance with the Group’s accounting policies. Thereafter generally the assets, or disposal group, are measured at the lower of their carrying amount and fair value less costs to sell. An impairment loss on a disposal group first is allocated to goodwill, and then to remaining assets and
140
ATLATSA RESOURCES CORPORATION
Notes to the Consolidated Financial Statements
For the years ended 31 December 2012, 2011 and 2010
(Expressed in Canadian Dollars, unless otherwise stated)
liabilities on a pro rata basis, except that no loss is allocated to inventories and deferred tax assets, which continue to be measured in accordance with the Group’s accounting policies.
Impairment losses on initial classification as held for sale or distribution and subsequent gains and losses on remeasurement are recognised in profit or loss. Gains are not recognised in excess of any cumulative impairment loss.
Once classified as held for sale or distribution, intangible assets and property, plant and equipment are no longer amortised or depreciated.
| 4.20 | New standards and interpretations |
Standards and interpretations issued but not yet effective and applicable to the Group:
| • | | IAS 19,Employee benefits: Defined benefit plans(effective 1 January 2013) |
| • | | IAS 27,Separate Financial Statements(effective 1 January 2013) |
| • | | IAS 28,Investment in Associates and Joint ventures(effective 1 January 2013) |
| • | | IAS 32,Offsetting Financial Assets and Financial Liabilities (effective 1 January 2014) |
| • | | Amendment to IFRS 7,Disclosures – Offsetting Financial Assets and Financial Liabilities (effective 1 January 2013) |
| • | | IFRS 9,Financial Instruments (effective 1 January 2015) |
| • | | IFRS 9,Additions to IFRS 9 Financial instruments (effective 1 January 2015) |
| • | | IFRS 10,Consolidated Financial Statements (effective 1 January 2013) |
| • | | IFRS 11,Joint Arrangements(effective 1 January 2013) |
| • | | IFRS 12,Disclosure of Interests in Other Entities(effective 1 January 2013) |
| • | | IFRS 13,Fair Value Measurement(effective 1 January 2013) |
| • | | Amendment to IFRS 10, IFRS 11 and IFRS 12,Consolidated Financial Statements, Joint Arrangements and Disclosure of Interests in Other Entities: Transition Guidance (Effective 1 January 2013) |
| • | | IFRIC 20,Stripping costs in the Production Phase of a Surface Mine(effective 1 January 2013) |
| • | | 7 individual amendments to 5 standards,Improvements to International Financial Reporting Standards 2012(effective 1 January 2013) |
The Group is currently evaluating the impact, if any, that these new standards will have on the consolidated financial statements.
Standards and interpretations adopted in the current year by the Group:
| • | | Amendment to IAS1,Presentation of Financial Statements: Presentation of Items of Other Comprehensive Income |
| • | | Amendments to IAS 12,Deferred Tax: Recovery of Underlying assets |
There was no significant impact on these consolidated financial statements as a result of adopting these standards and interpretations as IAS1 refers to the presentation which is already reflected and the amendments to IAS 12 is not applicable.
| 5. | DETERMINATION OF FAIR VALUES |
A number of the Group’s accounting policies and disclosures require the determination of fair value, for both financial and non- financial assets and liabilities. Fair values have been determined for measurement and/or disclosure purposes based on the following methods. When applicable, further information about the assumptions made in determining fair values is disclosed in the notes specific to that asset or liability.
| 5.1 | Property, plant and equipment |
The fair value of property, plant and equipment recognised as a result of a business combination is based on market values. The market value of property is the estimated amount for which a property could be exchanged on the date of valuation between a willing buyer and a willing seller in an arm’s length transaction after proper marketing wherein the parties had each acted knowledgeably and willingly. The fair value of items of plant, equipment, fixtures and fittings is based on the market approach and cost approach using quoted market prices for similar items when available and replacement cost when appropriate.
The fair value of mining rights included in property, plant and equipment acquired as part of a business combination is determined using the multi-year excess earnings method, whereby the subject asset is valued after deducting a fair return on all other assets that are part of creating the related cash flows.
141
ATLATSA RESOURCES CORPORATION
Notes to the Consolidated Financial Statements
For the years ended 31 December 2012, 2011 and 2010
(Expressed in Canadian Dollars, unless otherwise stated)
| 5.2 | Mineral property interest |
The fair value of mineral property interests acquired in a business combination is determined using a market comparative approach. In applying a market comparative approach, a selection of appropriate historic transactions is used to determine an average transaction value.
| 5.3 | Trade and other receivables |
The fair value of trade and other receivables is estimated as the present value of future cash flows, discounted at the market rate of interest at the reporting date. This fair value is determined for disclosure purposes.
The fair value of interest rate swaps is based on the fair value of the cash flows of the swap using the ZAR zero-coupon swap curve and the fair value of the projected shifted cash flows discounted using the shifted zero-coupon rates.
Fair values reflect the credit risk of the instrument and exclude the credit risk of the Group entity and counterparty when appropriate.
| 5.5 | Non-derivative financial liabilities |
Fair value is calculated based on the present value of future principal and interest cash flows, discounted at the market rate of interest at the reporting date. This fair value is determined for disclosure purposes.
| 5.6 | Share-based payment transactions |
The fair value of the employee share options is measured using the Black-Scholes option pricing model. Measurement inputs include share price on measurement date, exercise price of the instrument, expected volatility (based on weighted average historic volatility adjusted for changes expected due to publicly available information), weighted average expected life of the instruments (based on historical experience and general option holder behaviour), expected dividends, and the risk-free interest rate (based on government bonds). Service and non-market performance conditions attached to the transactions are not taken into account in determining fair value.
The fair value of the cash-settled SARs is measured using the binomial valuation model. Measurement inputs include share price on measurement date, strike price of the instrument, expected volatility (based on weighted average historic volatility adjusted for changes expected due to publicly available information), vesting, expiry and exercise dates, expected dividends and the risk free interest rate (based on the Bond Exchange of South Africa).
| 5.7 | Equity and debt securities |
The fair value of equity and debt securities is determined by reference to their quoted closing bid price at reporting date, or if unquoted, determined using a valuation technique such as market multiples and discounted cash flow analysis using expected future cash flows and a market-related discount rate.
| 5.8 | Other non-derivative financial liabilities |
Fair value, which is determined for disclosure purposes, is calculated based on the present value of future principal and interest cash flows, discounted at the market rate of interest at the reporting date.
| 6. | FINANCIAL RISK MANAGEMENT |
The Board of Directors has overall responsibility for the establishment and oversight of the Group’s risk management framework.
The Group’s risk management policies are established to identify and analyse the risks faced by the Group, to set appropriate risk limits and controls, and to monitor risks and adherence to limits. Risk management policies and systems are reviewed regularly to reflect changes in market conditions and the Group’s activities. The Group, through its training and management standards and procedures, aims to develop a disciplined and constructive control environment in which all employees understand their roles and obligations.
Overview
The Group has exposure to the following risks from its use of financial instruments:
142
ATLATSA RESOURCES CORPORATION
Notes to the Consolidated Financial Statements
For the years ended 31 December 2012, 2011 and 2010
(Expressed in Canadian Dollars, unless otherwise stated)
This note presents information about the Group’s exposure to each of the above risks, the Group’s objectives, policies and processes for measuring and managing risk and the Group’s management of capital. Further quantitative disclosures are included throughout these consolidated financial statements.
Credit risk is the risk of financial loss to the Group if a customer or counterparty to a financial instrument fails to meet its contractual obligations, and arises principally from the Group’s receivables from customers, and cash and equivalents. Management has evaluated treasury counterparty risk and does not expect any treasury counterparties to fail in meeting their obligations.
Trade and other receivables
Trade receivables represents sale of concentrate to Rustenburg Platinum Mines Limited (“RPM”) in terms of a concentrate off-take agreement. The carrying value represents the maximum credit risk exposure. The Group has no collateral against these receivables.
100% of the Group’s revenue is generated in South Africa from sale of concentrate by Bokoni Mine to RPM.
Cash and cash equivalents
At times when the Group’s cash position is positive, cash deposits are made with financial institutions having superior local credit ratings.
Liquidity risk is the risk that the Group will not be able to meet its financial obligations as they fall due. The Group ensures that there is sufficient capital in order to meet short term business requirements, after taking into account cash flows from operations and the Group’s holdings of cash and cash equivalents. This is facilitated via the Senior Term Facility, as amended on September 26, 2012. The Group’s cash and cash equivalents are invested in business accounts which are available on demand.
The Group operates in South Africa and is subject to currency exchange controls administered by the South African Reserve Bank (“SARB”). South African law provides for exchange control regulations that restrict the export of capital. The exchange control regulations, which are administered by SARB, regulate transactions involving South African residents, including legal entities, and limit a South African company’s ability to borrow from and repay loans to non-residents and to provide guarantees for the obligations of its affiliates with regard to funds obtained from non-residents.
A portion of the Company’s funding for its South African operations consist of loans advanced to its South African subsidiaries from subsidiaries that are non-residents of South Africa. The Company is in compliance with SARB regulations and is therefore not subject to restrictions on the ability of its South African subsidiaries to transfer funds to the Company or to other subsidiaries. In addition, the SARB has introduced various measures in recent years to relax the exchange controls in South Africa to entice foreign investment in the country. However, if more burdensome exchange controls were proposed or adopted by the SARB in the future, or if the Company was unable to comply with existing SARB regulations, such exchange control regulations could restrict the ability of the Company and its subsidiaries to repatriate funds needed to effectively finance the Company’s operations.
The maturity profile of the contractual undiscounted cash flows of financial instruments, including scheduled interest payments on loans and borrowings, at 31 December were as follows:
| | | | | | | | | | | | | | | | | | | | | | | | |
| | | 2013 | | | 2014 | | | 2015 | | | 2016 | | | Thereafter | | | Total | |
2012 | | | | | | | | | | | | | | | | | | | | | | | | |
| | | | | | |
Non-derivative financial liabilities | | | | | | | | | | | | | | | | | | | | | | | | |
| | | | | | |
Loans and borrowings | | | 754,531 | | | | 4,142,905 | | | | 562,335 | | | | 190,021,619 | | | | 562,416,835 | | | | 757,898,225 | |
Trade and other payables | | | 14,319,136 | | | | — | | | | — | | | | — | | | | — | | | | 14,319,136 | |
| | | | | | | | | | | | | | | | | | | | | | | | |
Total 2012 | | | 15,073,667 | | | | 4,142,905 | | | | 562,335 | | | | 190,021,619 | | | | 562,416,835 | | | | 772,217,361 | |
| | | | | | | | | | | | | | | | | | | | | | | | |
143
ATLATSA RESOURCES CORPORATION
Notes to the Consolidated Financial Statements
For the years ended 31 December 2012, 2011 and 2010
(Expressed in Canadian Dollars, unless otherwise stated)
| | | | | | | | | | | | | | | | | | | | | | | | |
| | | 2012 | | | 2013 | | | 2014 | | | 2015 | | | Thereafter | | | Total | |
2011 | | | | | | | | | | | | | | | | | | | | | | | | |
Loans and borrowings | | | 1,027,035 | | | | 4,201,292 | | | | 44,553,903 | | | | 44,553,903 | | | | 1,510,996,207 | | | | 1,605,332,340 | |
Trade and other payables | | | 13,497,013 | | | | — | | | | — | | | | — | | | | — | | | | 13,497,013 | |
| | | | | | | | | | | | | | | | | | | | | | | | |
Total 2011 | | | 14,524,048 | | | | 4,201,292 | | | | 44,553,903 | | | | 44,553,903 | | | | 1,510,996,207 | | | | 1,618,829,353 | |
| | | | | | | | | | | | | | | | | | | | | | | | |
As a result of the Group acquiring the Bokoni business during 2009, the Group had secured loan facilities with Standard Chartered Bank plc (“Standard Chartered”) and RPM. Standard Chartered provided a loan of $58.6 million (ZAR500 million) and RPM provided a loan of $56.3 million (ZAR480 million) to the Group which was subject to interest rate risk. On 28 April 2011, the Standard Chartered loan was ceded to RPM with revisions to certain terms of the loan including a reduction in the interest rate to 3 month JIBAR plus 4% (9.585% at 31 December 2011) from a 3 month JIBAR plus applicable margin (4.5%) and mandatory cost (1.27%) (refer to note18).
The Group previously entered into an interest rate swap arrangement with Standard Chartered to fix the variable interest rate on $58.6 million (ZAR500 million) of the principal amount of the loan at 14.695% which arrangement was settled on 28 April 2011 with funding obtained from RPM. This funding has the same terms as the debt ceded to RPM and is also subject to interest rate risk.
On 28 September 2012, Atlatsa entered into an Amendment and Interim Implementation Agreement pursuant to which Atlatsa implemented the first phase of the broader restructuring, recapitalization and refinancing transaction, which was first announced by Atlatsa in a news release dated February 2, 2012.The first phase of the Restructure Plan involved an amendment to the terms of the Senior Term Loan Facilities Agreement (now a consolidated facility) dated June 12, 2009 between Plateau, as borrower and RPM, as lender to increase the total loan facility available by approximately $310.6 million (ZAR2.65 billion). The additional loan proceeds were used to repay the existing OCSF and fund share subscriptions by Plateau into Bokoni Platinum Holdings Proprietary Limited (“Bokoni Holdco”) and by Bokoni Holdco into Bokoni Mine (the “Share Subscriptions”) for the purpose of repayment of certain existing loan facilities by Plateau, Bokoni Holdco and Bokoni Mine.
The interest rate payable on the debt owing will be reduced to an annual effective rate of 6.27% (linked to the 3-month JIBAR) from the current effective rate of 12.31%. These revised loans are also subject to interest rate risk.
The method used in the sensitivity analysis is to assume a change in basis points. A 100 basis point increase in the interest rate at 31 December 2012 on the RPM loans would have changed the loss for the year by approximately $2,478,813 (2011: ($1,210,659)) and a 100 basis point decrease by ($3,694,508) (2011: $1,210,659). This analysis assumes that all other variables remain constant.
| (iv) | Foreign currency risk |
The Group, from time to time, enters into transactions for the purchase of supplies and services denominated in foreign currency. As a result, the Group is subject to foreign exchange risk from fluctuations in foreign exchange rates. The Group has not entered into any derivative or other financial instruments to mitigate this foreign exchange risk.
Within the Group, certain loans between Group entities amounting to $50.6 million (2011: $49.9 million) are exposed to foreign exchange fluctuations. The method used in the sensitivity analysis is to assume a change in the $/ZAR exchange rate. The closing ZAR to $ exchange rate for the year ending 31 December 2012 was ZAR8.53 (2011:ZAR7.94). A 10% change in the $/ZAR exchange rate at 31 December 2012 would have resulted in an increase/decrease of $5.1 million (2011: $5.0 million) in equity. The Group has no significant external exposure to foreign exchange risk. All loans and borrowings are denominated in ZAR (refer note 18).
The value of the Group’s revenue and resource properties depends on the prices of PGM’s and their outlook. The Group does not hedge its exposure to commodity price risk. PGM prices historically have fluctuated widely and are affected by numerous factors outside of the Group’s control, including, but not limited to, industrial and retail demand, forward sales by producers and speculators, levels of worldwide production, and short-term changes in supply and demand because of hedging activities.
| (vi) | Capital risk management |
The primary objective of managing the Group’s capital is to ensure that there is sufficient capital available to support the funding and operating requirements of the Group in a way that optimises the cost of capital, maximizes shareholders’ returns, matches the current strategic business plan and ensures that the Group remains in a sound financial position.
144
ATLATSA RESOURCES CORPORATION
Notes to the Consolidated Financial Statements
For the years ended 31 December 2012, 2011 and 2010
(Expressed in Canadian Dollars, unless otherwise stated)
The Group manages and makes adjustments to the capital structure which consists of debt and equity as and when borrowings mature or when funding is required. This may take the form of raising equity, market or bank debt or hybrids thereof. The Group may also adjust the amount of dividends paid, sell assets to reduce debt or schedule projects to manage the capital structure. Atlatsa ’s ability to raise new equity in the equity capital markets is subject to the mandatory requirement that Atlatsa Holdings Proprietary Limited (“Atlatsa Holdings”) (formerly Pelawan Investments Proprietary Limited), its majority Black Economic Empowerment (“BEE “) shareholder, retain a 51% fully diluted shareholding in the Company up until 1 January 2015, as required by covenants given by Atlatsa Holdings and Atlatsa in favour of the Department of Mineral Resources (“DMR”), the SARB and Anglo.
There were no changes to the Group’s approach to capital management during the year.
| (vii) | Summary of the carrying value of the Group’s financial instruments |
| | | | | | | | |
| At 31 December 2012 | | Loans and
receivables | | | Financial
liabilities at
amortised cost | |
Platinum Producers’ Environmental Trust | | | 3,250,760 | | | | — | |
Trade and other receivables | | | 1,154,526 | | | | — | |
Cash and cash equivalents | | | 14,580,886 | | | | — | |
Restricted cash | | | 535,502 | | | | — | |
Loans and borrowings | | | 230,283 | | | | 435,791,920 | |
Trade and other payables | | | — | | | | 14,319,136 | |
| | | | | | | | |
| At 31 December 2011 | | Loans and
receivables | | | Financial
liabilities at
amortised cost | |
Platinum Producers’ Environmental Trust | | | 2,927,591 | | | | — | |
Trade and other receivables | | | 24,999,127 | | | | — | |
Cash and cash equivalents | | | 15,945,008 | | | | — | |
Restricted cash | | | 786,291 | | | | — | |
Loans and borrowings | | | 367,178 | | | | 745,552,722 | |
Trade and other payables | | | — | | | | 13,497,013 | |
The loans and borrowings carrying value (financial liabilities at amortised cost) compared to fair value is as follows:
| | | | | | | | | | | | | | | | |
| | | 2012 | | | 2011 | |
| | | Carrying
value | | | Fair value | | | Carrying
value | | | Fair value | |
Loans and borrowings | | | 435,791,920 | | | | 435,791,920 | | | | 745,552,722 | | | | 822,304,338 | |
The fair value of all other non-derivative financial instruments approximates carrying value due to the short-term to maturity.
The contractual value of the loans and borrowings (financial liabilities at amortised cost) at 31 December 2012 was $554,659,611 (ZAR4,732,590,541) (2011:$745,552,722 (ZAR5,921,784,925)).
145
ATLATSA RESOURCES CORPORATION
Notes to the Consolidated Financial Statements
For the years ended 31 December 2012, 2011 and 2010
(Expressed in Canadian Dollars, unless otherwise stated)
| 7. | PROPERTY, PLANT AND EQUIPMENT |
Summary
| | | | | | | | |
| | | 2012 | | | 2011 | |
Cost | | | | | | | | |
Balance at beginning of year | | | 876,764,628 | | | | 1,032,647,854 | |
Additions | | | 2,563 | | | | 2,238 | |
Transferred from capital work-in-progress | | | 40,632,355 | | | | 17,168,350 | |
Disposals | | | (934 | ) | | | (1,087,212 | ) |
Adjustment to rehabilitation assets | | | 1,391,080 | | | | 1,050,670 | |
Effect of translation | | | (62,240,040 | ) | | | (173,017,272 | ) |
| | | | | | | | |
Closing Balance | | | 856,549,652 | | | | 876,764,628 | |
| | | | | | | | |
Accumulated depreciation and impairment losses | | | | | | | | |
Balance at beginning of year | | | 77,840,208 | | | | 47,741,321 | |
Depreciation for the year | | | 37,091,152 | | | | 42,075,759 | |
Disposals | | | (353 | ) | | | (748,144 | ) |
Effect of translation | | | (6,838,260 | ) | | | (11,228,728 | ) |
| | | | | | | | |
Closing Balance | | | 108,092,747 | | | | 77,840,208 | |
| | | | | | | | |
Carrying value | | | 748,456,905 | | | | 798,924,420 | |
| | | | | | | | |
| | | | | | | | | | | | | | | | | | | | | | | | |
2012 | | Total | | | Mining
Development
and
Infrastructure | | | Plant and
Equipment | | | Buildings | | | Motor
Vehicles | | | Furniture
and
Fittings | |
| | | | | | |
Cost | | | | | | | | | | | | | | | | | | | | | | | | |
Balance at beginning of year | | | 876,764,628 | | | | 723,436,727 | | | | 99,012,259 | | | | 50,028,250 | | | | 3,708,511 | | | | 578,881 | |
Additions | | | 2,563 | | | | — | | | | — | | | | — | | | | — | | | | 2,563 | |
Transferred from capital work-in-progress | | | 40,632,355 | | | | 34,744,984 | | | | 5,158,567 | | | | 123,021 | | | | 595,206 | | | | 10,577 | |
Disposals | | | (934 | ) | | | — | | | | — | | | | — | | | | (934 | ) | | | — | |
Adjustment to rehabilitation assets | | | 1,391,080 | | | | 1,391,080 | | | | — | | | | — | | | | — | | | | — | |
| | | | | | |
Effect of translation | | | (62,240,040 | ) | | | (51,413,006 | ) | | | (7,044,951 | ) | | | (3,461,915 | ) | | | (279,649 | ) | | | (40,519 | ) |
| | | | | | | | | | | | | | | | | | | | | | | | |
Closing Balance | | | 856,549,652 | | | | 708,159,785 | | | | 97,125,875 | | | | 46,689,356 | | | | 4,023,134 | | | | 551,502 | |
| | | | | | | | | | | | | | | | | | | | | | | | |
| | | | | | |
Accumulated depreciation and impairment losses | | | | | | | | | | | | | | | | | | | | | | | | |
Balance at beginning of year | | | 77,840,208 | | | | 64,473,077 | | | | 7,812,645 | | | | 2,941,882 | | | | 2,198,682 | | | | 413,922 | |
Depreciation for the year | | | 37,091,152 | | | | 27,506,955 | | | | 6,113,731 | | | | 2,603,784 | | | | 772,849 | | | | 93,833 | |
Disposals | | | (353 | ) | | | — | | | | — | | | | — | | | | (353 | ) | | | — | |
Effect of translation | | | (6,838,260 | ) | | | (5,537,489 | ) | | | (780,413 | ) | | | (305,735 | ) | | | (182,328 | ) | | | (32,295 | ) |
| | | | | | | | | | | | | | | | | | | | | | | | |
Closing Balance | | | 108,092,747 | | | | 86,442,543 | | | | 13,145,963 | | | | 5,239,931 | | | | 2,788,850 | | | | 475,460 | |
| | | | | | | | | | | | | | | | | | | | | | | | |
Carrying Value | | | 748,456,905 | | | | 621,717,242 | | | | 83,979,912 | | | | 41,449,425 | | | | 1,234,284 | | | | 76,042 | |
| | | | | | | | | | | | | | | | | | | | | | | | |
146
ATLATSA RESOURCES CORPORATION
Notes to the Consolidated Financial Statements
For the years ended 31 December 2012, 2011 and 2010
(Expressed in Canadian Dollars, unless otherwise stated)
| | | | | | | | | | | | | | | | | | | | | | | | |
2011 | | Total | | | Mining
Development
and
Infrastructure | | | Plant and
Equipment | | | Buildings | | | Motor
Vehicles | | | Furniture
and
Fittings | |
Cost | | | | | | | | | | | | | | | | | | | | | | | | |
Balance at beginning of year | | | 1,032,647,854 | | | | 849,610,976 | | | | 117,821,913 | | | | 60,002,112 | | | | 4,521,033 | | | | 691,820 | |
Additions | | | 2,238 | | | | — | | | | — | | | | — | | | | — | | | | 2,238 | |
Transferred from capital work-in-progress | | | 17,168,350 | | | | 16,309,016 | | | | 842,437 | | | | — | | | | 16,897 | | | | — | |
Disposals | | | (1,087,212 | ) | | | (1,004,020 | ) | | | — | | | | — | | | | (83,192 | ) | | | — | |
Adjustment to rehabilitation assets | | | 1,050,670 | | | | 1,050,670 | | | | — | | | | — | | | | — | | | | — | |
Effect of translation | | | (173,017,272 | ) | | | (142,529,915 | ) | | | (19,652,091 | ) | | | (9,973,862 | ) | | | (746,227 | ) | | | (115,177 | ) |
| | | | | | | | | | | | | | | | | | | | | | | | |
Closing Balance | | | 876,764,628 | | | | 723,436,727 | | | | 99,012,259 | | | | 50,028,250 | | | | 3,708,511 | | | | 578,881 | |
| | | | | | | | | | | | | | | | | | | | | | | | |
Accumulated depreciation and impairment losses | | | | | | | | | | | | | | | | | | | | | | | | |
Balance at beginning of year | | | 47,741,321 | | | | 43,172,561 | | | | 1,989,265 | | | | 483,279 | | | | 1,733,011 | | | | 363,205 | |
Depreciation for the year | | | 42,075,759 | | | | 31,624,591 | | | | 6,686,843 | | | | 2,758,749 | | | | 884,868 | | | | 120,708 | |
Disposals | | | (748,144 | ) | | | (682,274 | ) | | | — | | | | — | | | | (65,870 | ) | | | — | |
Effect of translation | | | (11,228,728 | ) | | | (9,641,801 | ) | | | (863,463 | ) | | | (300,146 | ) | | | (353,327 | ) | | | (69,991 | ) |
| | | | | | | | | | | | | | | | | | | | | | | | |
Closing Balance | | | 77,840,208 | | | | 64,473,077 | | | | 7,812,645 | | | | 2,941,882 | | | | 2,198,682 | | | | 413,922 | |
| | | | | | | | | | | | | | | | | | | | | | | | |
Carrying Value | | | 798,924,420 | | | | 658,963,650 | | | | 91,199,614 | | | | 47,086,368 | | | | 1,509,829 | | | | 164,959 | |
| | | | | | | | | | | | | | | | | | | | | | | | |
Certain assets are encumbered (refer to note 18).
The recoverable amount of mining assets and goodwill reviewed for impairment is determined based on value-in-use calculations. All mining assets and goodwill are allocated to one cash-generating-unit (“CGU”). Key assumptions relating to this valuation include the discount rate and cash flows used to determine the value-in-use. Future cash flows are estimated based on financial budgets approved by management which is based on the mine’s life-of-mine plan. Management determines the expected performance of the mine based on past performance and its expectations of market developments which are incorporated into a life-of-mine plan.
Key assumptions used in the value-in-use calculation of the impairment assessment of mining assets were the following:
| | • | | Life-of-mine – 31 years |
| | • | | South African real discount rate – 9.64% (the weighted average cost of capital for Bokoni) |
| | • | | Range of PGM prices – based on market expectations. Initial price of US$1,735/oz for platinum in 2013 with US inflation parity from 2017 onwards. |
| | • | | South African inflation – based on market expectations. Long-term inflation rate of 6.10% |
| | • | | Production of 4E ounces starts at 197,101 ounces in 2013, building up to 412,000 ounces in 2020 and gradually scales down towards the end of the life of mine. |
147
ATLATSA RESOURCES CORPORATION
Notes to the Consolidated Financial Statements
For the years ended 31 December 2012, 2011 and 2010
(Expressed in Canadian Dollars, unless otherwise stated)
| 8. | CAPITAL WORK-IN-PROGRESS |
Capital work-in-progress consists of mine development and infrastructure costs relating to the Bokoni Mine and will be transferred to property, plant and equipment when the relevant projects are commissioned.
| | | | | | | | |
| | | 2012 | | | 2011 | |
Balance at beginning of year | | | 20,826,290 | | | | 10,311,973 | |
Additions | | | 38,917,145 | | | | 28,678,042 | |
Transfer to property, plant and equipment | | | (40,632,355 | ) | | | (17,168,350 | ) |
Capitalisation of borrowing costs | | | 2,382,069 | | | | 1,777,431 | |
Effect of translation | | | (1,465,385 | ) | | | (2,772,806 | ) |
| | | | | | | | |
| | | 20,027,764 | | | | 20,826,290 | |
| | | | | | | | |
Capital work-in-progress is funded through cash generated from operations and available loan facilities (refer note 18).
| | | | | | | | |
Cost | | | | | | | | |
Balance at beginning of year | | | 3,113,175 | | | | 3,473,000 | |
Additions | | | — | | | | 236,304 | |
Effect of translation | | | (215,128 | ) | | | (596,129 | ) |
| | | | | | | | |
Balance at end of year | | | 2,898,047 | | | | 3,113,175 | |
| | | | | | | | |
Accumulated amortisation and impairment losses | | | | | | | | |
Balance at beginning of year | | | 1,217,970 | | | | 192,944 | |
Amortisation for the year | | | 1,001,726 | | | | 1,148,618 | |
Effect of translation | | | (123,577 | ) | | | (123,592 | ) |
| | | | | | | | |
Balance at end of year | | | 2,096,119 | | | | 1,217,970 | |
| | | | | | | | |
Carrying value | | | 801,928 | | | | 1,895,205 | |
| | | | | | | | |
The intangible asset relates to the implementation of a SAP system throughout the Group during 2011. The asset is amortised on a straight line basis over three years.
| 10. | MINERAL PROPERTY INTERESTS |
| | | | | | | | |
Balance at beginning of year | | | 12,370,437 | | | | 13,716,383 | |
Effect of translation | | | (466,519 | ) | | | (1,345,946 | ) |
| | | | | | | | |
| | | 11,903,918 | | | | 12,370,437 | |
Assets classified as available for sale: | | | | | | | | |
Ga-Phasha | | | (3,836,670 | ) | | | (4,068,794 | ) |
Boikgantsho | | | (30,589 | ) | | | (32,860 | ) |
| | | | | | | | |
| | | (3,867,259 | ) | | | (4,101,654 | ) |
| | | | | | | | |
| | | 8,036,659 | | | | 8,268,783 | |
| | | | | | | | |
The Group’s mineral property interest consists of various early stage exploration projects as detailed below:
Ga-Phasha
In January 2004, Atlatsa and Atlatsa Holdings combined their respective PGM assets, comprising Atlatsa ’s Northern and Western Limb PGM projects and Atlatsa Holding’s 50% participation interest in the Ga-Phasha Project (“Ga-Phasha Project”) on the Eastern Limb of the Bushveld Complex in South Africa. The Ga-Phasha Project property consists of four farms – Portion 1 of Paschaskraal 466KS, and the whole of farms Klipfontein 465KS, De Kamp 507KS and Avoca 472KS – covering an area of approximately 9,700 hectares.
As of 1 July 2009, the joint venture agreements terminated and Ga-Phasha Platinum Mines Proprietary Limited (“GPM”), a
148
ATLATSA RESOURCES CORPORATION
Notes to the Consolidated Financial Statements
For the years ended 31 December 2012, 2011 and 2010
(Expressed in Canadian Dollars, unless otherwise stated)
wholly-owned subsidiary of Bokoni Holdco, acquired the respective interest in the assets relating to the Ga-Phasha Project. Atlatsa owns an effective 51% interest in the Ga-Phasha Project.
Atlatsa increased its interest in the GPM exploration project assets from 50% to 51% on 1 July 2009.
The mineral title relating to the Ga-Phasha Project is held by GPM.
During 2011, the Group’s management committed to a plan to sell two (Pashaskraal and De Kamp) of the four farms in Ga-Phasha as part of the refinancing and restructuring plan of the Group (refer note 38). Efforts to sell these mineral properties have commenced and a sale is expected during 2013. The disposal relates to the projects segment.
Platreef
As of 1 July 2009, the Group holds an effective 51% in Platreef properties located on the Northern Limb of the Bushveld Igneous Complex (“BIC”) in South Africa. The Group has received conversion to new order prospecting rights in respect of all Platreef mineral properties.
Boikgantsho
As of 1 July 2009, the Boikgantsho joint venture agreements terminated and Boikgantsho Platinum Mine Proprietary Limited (“BPM”), a private company incorporated under the laws of South Africa, a wholly-owned subsidiary of Bokoni Holdco, acquired the interest in and assets relating to the Boikgantsho Project (“Boikgantsho Project”). Atlatsa owns an effective 51% interest in the Drenthe 778LR (“Drenthe”) and Witrivier 777LR (“Witrivier”) farms and a portion of Mogalakwena’s adjacent Overysel 815LR farm. These farms are located on the Northern Limb of the Bushveld Complex. The Group has received new order prospecting rights in respect of the Drenthe and Witrivier mineral properties which have been transferred to BPM.
During 2011, the Group’s management committed to a plan to sell the BPM asset as part of the refinancing and restructuring plan of the Group (refer note 38). Efforts to sell these mineral properties have commenced and a sale is expected during 2013. The disposal relates to the projects segment.
Kwanda
As of 1 July 2009, the Kwanda joint venture agreements terminated and Kwanda Platinum Mine Proprietary Limited, a private company incorporated under the laws of South Africa, a wholly-owned subsidiary of Bokoni Holdco, acquired the interest in assets relating to the Kwanda Project (“Kwanda Project”). Atlatsa owns an effective 51% interest in this project. The Group received conversion to new order prospecting rights for the Kwanda North and Kwanda South properties.
Rietfontein
The Group has entered into a settlement agreement (the “Agreement”) effective 11 December 2009 with Ivanhoe Nickel & Platinum Ltd. (“Ivanplats”) to replace and supersede the 2001 agreement relating to the Rietfontein property located on the Northern Limb of the BIC. The Agreement settles the arbitration process relating to disagreements with respect to the exploration activities undertaken at the Rietfontein property. Salient terms of the new Agreement are as follows:
| | • | | Both parties abandon their respective claims under dispute forming the subject matter of arbitration. |
| | • | | The existing joint venture (“JV”) between the parties is amended such that the current Rietfontein JV is extended to incorporate a defined area of Ivanplats’ adjacent Turfspruit mineral property. Both parties retain their existing prospecting rights in respect of mineral properties in their own names but make these rights and technical information available to the extended JV (“the Extended JV”). |
| | • | | Atlatsa will be entitled to appoint a member to the Extended JV technical committee and all technical programmes going forward will be carried out with input from Atlatsa. |
| | • | | Atlatsa is awarded a 6% free carried interest in the Extended JV, provided that the Extended JV contemplates an open pit mining operation, incorporating the Rietfontein mineral property. Atlatsa has no financial obligations under the Extended JV terms and Ivanplats is required to fund the entire exploration programme to feasibility study with no financial recourse to Atlatsa. On delivery of the feasibility study, Atlatsa may elect to either: |
| | • | | Retain a participating interest of 6% in the Extended JV and finance its pro rata share of the project development going forward; or |
| | • | | Relinquish its participating interest of 6% in the Extended JV in consideration for a 5% net smelter return royalty in respect of mineral products extracted from those areas of the Rietfontein mineral property forming part of the Extended JV mineral properties. |
149
ATLATSA RESOURCES CORPORATION
Notes to the Consolidated Financial Statements
For the years ended 31 December 2012, 2011 and 2010
(Expressed in Canadian Dollars, unless otherwise stated)
| | | | | | | | |
| | | 2012 | | | 2011 | |
Balance at beginning of the year | | | 10,994,115 | | | | 13,185,952 | |
Effect of translation | | | (759,721 | ) | | | (2,191,837 | ) |
| | | | | | | | |
| | | 10,234,394 | | | | 10,994,115 | |
| | | | | | | | |
For impairment considerations, refer note 7. The goodwill relates to the acquisition of Bokoni Mine.
| 12. | PLATINUM PRODUCERS’ ENVIRONMENTAL TRUST |
The Group contributes to the Platinum Producers’ Environmental Trust annually. The Trust was created to fund the estimated cost of pollution control, rehabilitation and mine closure at the end of the lives of the Group’s mines. Contributions are determined on the basis of the estimated environmental obligation over the life of a mine. The Group’s share of the cash deposits made is reflected in non-current cash deposits held by Platinum Producers’ Environmental Trust.
The non-current cash deposits are restricted in use as it is to be used exclusively for pollution control, rehabilitation and mine closure at the end of lives of the Group’s mines.
| | | | | | | | |
Consumables and ore stock piles | | | 769,447 | | | | 787,084 | |
| | | | | | | | |
| 14. | TRADE AND OTHER RECEIVABLES |
| | | | | | | | |
Financial assets | | | | | | | | |
Trade receivables | | | 913,558 | | | | 24,230,043 | |
Other trade receivables | | | 240,968 | | | | 769,084 | |
| | | | | | | | |
| | | 1,154,526 | | | | 24,999,127 | |
Non-financial assets | | | | | | | | |
Prepayments | | | 1,213,925 | | | | 1,385,976 | |
Lease debtor | | | — | | | | 1,925 | |
Value added tax | | | 564,953 | | | | 2,014 | |
Employee receivables | | | 337,901 | | | | 657,564 | |
Other receivables | | | 1,095 | | | | 1,985 | |
| | | | | | | | |
| | | 3,272,400 | | | | 27,048,591 | |
| | | | | | | | |
The Group has one major customer with an outstanding account within the agreed payment terms. As a result, no allowance for impairment losses has been recognised.
| 15. | CASH AND CASH EQUIVALENTS |
| | | | | | | | |
Bank balances | | | 14,530,030 | | | | 15,927,937 | |
Cash on hand | | | 50,856 | | | | 17,071 | |
| | | | | | | | |
| | | 14,580,886 | | | | 15,945,008 | |
| | | | | | | | |
| | | | | | | | |
Restricted cash – ESOP Trust | | | 535,502 | | | | 786,291 | |
| | | | | | | | |
Restricted cash consist of cash and cash equivalents held by the Bokoni Platinum Mine ESOP Trust, a consolidated SPE, which is not available to fund operations.
During the year there was no cash distribution to beneficiaries in terms of the trust deed (2011: $386,191 (ZAR3,067,439)).
150
ATLATSA RESOURCES CORPORATION
Notes to the Consolidated Financial Statements
For the years ended 31 December 2012, 2011 and 2010
(Expressed in Canadian Dollars, unless otherwise stated)
Authorised and issued
| | | | | | | | |
| | | 2012 | | | 2011 | |
| | | Number of shares | |
Common shares with no par value | | | 201,888,472 | | | | 201,888,472 | |
B2 Convertible Preference shares of $0.1481 (ZAR1) each | | | 115,800 | | | | 115,800 | |
B3 Convertible Preference shares of $0.1481 (ZAR1) each | | | 111,600 | | | | 111,600 | |
The Company’s authorised share capital consists of an unlimited number of common shares without par value. During 2009 cumulative convertible redeemable “B” preference shares were issued to facilitate the acquisition of the 51% shareholding in Bokoni Holdco.
| | | | | | | | |
Share capital | | | | | | | | |
Share capital | | | 74,150,116 | | | | 74,150,116 | |
Share issue costs | | | (2,183,033 | ) | | | (2,183,033 | ) |
| | | | | | | | |
| | | 71,967,083 | | | | 71,967,083 | |
| | | | | | | | |
Treasury shares | | | 4,991,726 | | | | 4,991,726 | |
| | | | | | | | |
Treasury shares relate to shares held by the ESOP Trust in Atlatsa, which is consolidated by the Group.
| | | | | | | | |
Preference shares | | | | | | | | |
B2 Convertible Preference shares | | | 17,150 | | | | 17,150 | |
B3 Convertible Preference shares | | | 16,528 | | | | 16,528 | |
Share premium | | | 162,876,322 | | | | 162,876,322 | |
| | | | | | | | |
| | | 162,910,000 | | | | 162,910,000 | |
| | | | | | | | |
$162.9 million (ZAR 1.1 billion) was raised through share-settled financing with the issue of cumulative mandatory convertible “B” preference shares (“B Prefs”) to RPM and a subsidiary of Atlatsa Holdings to finance the 51% acquisition in Bokoni Holdco on 1 July 2009. The final effects of the share settled financing will result in RPM receiving a fixed number of 115.8 million common shares of Atlatsa and Atlatsa Holdings, Atlatsa’s controlling shareholder, receiving a fixed number of 111.6 million common shares.
These preference shares are convertible upon the earlier of the date of receipt of a conversion notice from RPM and 1 July 2018.
A dividend will be declared on the last business day immediately prior to the conversion date, in terms of a formula set out in the preference share subscription agreement.
151
ATLATSA RESOURCES CORPORATION
Notes to the Consolidated Financial Statements
For the years ended 31 December 2012, 2011 and 2010
(Expressed in Canadian Dollars, unless otherwise stated)
| | | | | | | | |
| | | 2012 | | | 2011 | |
Redeemable “A” preference shares (related party) | | | — | | | | 392,191,315 | |
RPM – Funding loans (related party) | | | — | | | | 172,650,283 | |
RPM – Consolidated facility (related party) | | | 430,570,710 | | | | — | |
RPM – OCSF (related party) | | | — | | | | 172,991,980 | |
RPM – Interest free loan (related party) | | | 3,388,374 | | | | 3,639,900 | |
RPM – commitment fees (related party) | | | — | | | | 1,298,865 | |
Other | | | 1,832,836 | | | | 2,780,379 | |
| | | | | | | | |
| | | 435,791,920 | | | | 745,552,722 | |
Short-term portion | | | | | | | | |
Other | | | (823,731 | ) | | | (1,096,235 | ) |
| | | | | | | | |
| | | (823,731 | ) | | | (1,096,235 | ) |
| | | | | | | | |
Non-current liabilities | | | 434,968,189 | | | | 744,456,487 | |
| | | | | | | | |
The carrying value of the Group’s loans and borrowings changed during the year as follows:
| | | | | | | | |
Balance at beginning of the year | | | 745,552,722 | | | | 716,936,362 | |
Loan from RPM – OCSF | | | 72,872,141 | | | | 64,851,418 | |
Loan repaid - RPM | | | (111,307,515 | ) | | | — | |
Loans repaid - other | | | (1,048,243 | ) | | | (716,317 | ) |
Commitment fee capitalised | | | (82,457 | ) | | | (394,063 | ) |
Finance expenses accrued | | | 84,546,911 | | | | 88,648,310 | |
Funding loan raised – RPM (related party) | | | 315,612,211 | | | | 3,691,604 | |
Redemption of A Preference shares | | | (401,782,311 | ) | | | — | |
Capitalisation transaction costs written-off | | | — | | | | 3,834,378 | |
Commitment fee liability | | | 82,457 | | | | 394,063 | |
Interest rate swap adjustment | | | — | | | | 355,852 | |
De-recognition of OCSF and Senior funding loan | | | (682,365,807 | ) | | | — | |
Recognition of consolidated facility | | | 682,365,807 | | | | — | |
Fair value gain on recognition of consolidated facility and subsequent adjustments | | | (215,470,758 | ) | | | — | |
Other | | | — | | | | 86,938 | |
Effect of translation | | | (53,183,238 | ) | | | (132,135,823 | ) |
| | | | | | | | |
Balance at end of the year | | | 435,791,920 | | | | 745,552,722 | |
Short-term portion | | | | | | | | |
Other | | | (823,731 | ) | | | (1,096,235 | ) |
| | | | | | | | |
| | | (823,731 | ) | | | (1,096,235 | ) |
| | | | | | | | |
Non-current portion | | | 434,928,189 | | | | 744,456,487 | |
| | | | | | | | |
152
ATLATSA RESOURCES CORPORATION
Notes to the Consolidated Financial Statements
For the years ended 31 December 2012, 2011 and 2010
(Expressed in Canadian Dollars, unless otherwise stated)
The fair value gain on recognition of consolidated facility and subsequent adjustments is made up of the following:
| | | | | | | | |
| | | 2012 | | | 2011 | |
Day 1 gain – owners of the company | | | (102,291,808 | ) | | | — | |
Day 1 gain – Non-controlling interest (refer note 24) | | | (127,814,103 | ) | | | — | |
Subsequent adjustments* (refer note 24) | | | 14,635,153 | | | | — | |
| | | | | | | | |
| | | (215,470,758 | ) | | | — | |
| | | | | | | | |
| * | The subsequent adjustments relate to changes in estimate due to cash flows used in the fair value calculation. |
The terms and conditions for the outstanding borrowings at 31 December 2012 are as follows:
Senior Term Loan Facility (now recognised as part of the “Consolidated facility”)
On 28 April 2011, the Senior Term Loan Facility with Standard Chartered Bank (“SCB”) and FirstRand Bank acting through its division, Rand Merchant Bank (“RMB”) was ceded to Anglo through its subsidiary, RPM. The outstanding interest rate swap was settled with funding obtained from RPM.
The debt ceded to RPM had similar terms as the Senior Term Loan Facility except for certain revisions. The revised terms of the loan was a reduction in the interest rate from a 3 month JIBAR plus applicable margin (4.5%) and mandatory cost (11.735% at 31 December 2010) to 3 month JIBAR plus 4% (9.575% at 31 December 2011). The total facility had also been increased from $94.4 million (ZAR750 million) to $117.1 million (ZAR930 million). The commencement of re-payments was then deferred by one year from 31 January 2013 to 31 January 2014. RPM also waived the loan covenants on the debt as of 31 December 2011 and until 31 January 2013.
On 28 September 2012, Atlatsa entered into an Amendment and Interim Implementation Agreement pursuant to which Atlatsa implemented the first phase of the broader restructuring, recapitalization and refinancing transaction, which was first announced by Atlatsa in a news release dated 2 February 2012.
The first phase of the Restructure Plan involved an amendment to the terms of the Senior Term Loan Facilities Agreement (now a consolidated facility) dated 12 June 2009 between Plateau, as borrower and RPM, as lender to increase the total loan facility available by approximately $310.6 million (ZAR2.65 billion). The additional loan proceeds were used to repay the existing OCSF and fund share subscriptions by Plateau into Bokoni Holdco and by Bokoni Holdco into Bokoni Mine (the “Share Subscriptions”) for the purpose of repayment of certain existing loan facilities by Plateau, Bokoni Holdco and Bokoni Mine.
The interest rate payable on the debt owing will be reduced to an annual effective rate of 6.27% (linked to the 3-month JIBAR) from the current effective rate of 12.31%. Due to the significant change in the terms of the loan, the Senior Term Loan Facility was derecognised and a new loan recognised at fair value – the Consolidated facility.
RPM - Funding Loans (now recognised as part of the “Consolidated facility”)
This loan was between RPM and Bokoni Holdco and consisted of the retention of the original RPM loans for an amount of $56.3 million (ZAR480.3 million)
As a result of the changes to the Senior Term Loan Facility, the commencement of the repayments of the $56.3 million was also deferred by one year from 31 January 2013 to 31 January 2014 and is payable in semi-annual instalments. The unpaid principal balance would bear interest at the interest rate and on the same terms as the revised Senior Term Loan Facility ceded by SCB to Anglo. The total facility had also been increased from $84.4 million (ZAR720 million) to $104.7 million (ZAR893 million).
On 28 September 2012, the loan was derecognised as a result of the significant change in the terms of the loan and a new loan was recognised at fair value – now called the Consolidated facility.
RPM – OCSF (now recognised as part of the “Consolidated facility”)
Under the Operating Cash flow Shortfall Facility (“OCSF”), if funds are requested by Bokoni (and authorised by Bokoni Holdco), RPM shall advance such funds directly to Bokoni. At 31 December 2012, $200.8 million (ZAR1.71 billion) of the available $252.8 million (ZAR2.16 billion) has been advanced by RPM. The remaining facility may be utilised only for the purposes of operating or capital expenditure cash shortfalls at Bokoni. In addition, RPM has extended the terms of the OCSF facility to fund cash shortfalls up to 31 January 2013.
The OCSF Loan was originally payable in semi-annual instalments starting 31 January 2013 to the extent cash is available after payment of the Senior Term Facility and the RPM funding loan. The unpaid principal balance on the OCSF will bear interest at a fixed rate of 15.84%, compounded quarterly in arrears. Based on the revised terms on the Senior Facility with RPM, repayment will also be deferred by one year from 31 January 2013 to 31 January 2014.
153
ATLATSA RESOURCES CORPORATION
Notes to the Consolidated Financial Statements
For the years ended 31 December 2012, 2011 and 2010
(Expressed in Canadian Dollars, unless otherwise stated)
On 28 September 2012, the loan was derecognised as a result of the significant change in the terms of the loan and a new loan was recognised at fair value – now called the Consolidated facility
RPM – Standby Facility
The Group secured an agreement with RPM to access RPM’s attributable share of the Bokoni Holdco cash flows (“the Standby Facility”) up to a maximum of 29% of all free cash flow generated from the Bokoni Mine to meet its repayment obligations in terms of the Senior Term Loan Facility. This facility will bear interest at the prime rate of interest in South Africa (currently 9%). The standby facility has a final maturity date on 1 July 2018. As at 31 December 2012, no draw-down was made on the standby facility.
RPM – Interest-free loan
This loan is between RPM and Bokoni Holdco. The loan is interest-free and repayable 12 months and 1 day after requested by RPM.
Other
This loan is between Plateau and the Deloitte Mining Shared Service Centre (“DMSSC”) relating to the financing of the new SAP system (refer note 9). The loan bears interest at prime (8.5% at 31 December 2012) plus 2% and is payable in quarterly instalments starting 31 March 2011.
Security
The Senior Term Loan Facility is secured through various security instruments, guarantees and undertakings provided by the Group against 51% of the cash flows generated by the Bokoni Mine, together with 51% of the Bokoni Mine asset base. The Standby Facility, OCSF and the “A” preference shares rank behind the Senior Term Loan Facility for security purposes.
Refer note 38 for events after the reporting date.
The Group’s debt is denominated in ZAR, which is translated to the presentation currency of the Company.
Deferred tax liabilities and assets on the statement of financial position relate to the following:
| | | | | | | | |
| | | 2012 | | | 2011 | |
Deferred tax liabilities | | | | | | | | |
Property plant and equipment (including capital work-in-progress) | | | 214,355,251 | | | | 228,912,376 | |
Prepayments | | | 289,060 | | | | 339,869 | |
Environmental trust fund contributions | | | 742,633 | | | | 664,358 | |
Inventories | | | — | | | | 220,384 | |
Fair value gain on consolidated debt facility | | | 20,552,705 | | | | | |
| | | | | | | | |
Gross deferred tax liability | | | 235,939,649 | | | | 230,136,987 | |
Deferred tax assets | | | | | | | | |
Provision for environmental liabilities | | | (2,740,214 | ) | | | (2,347,438 | ) |
Unredeemed capital expenditure | | | (41,839,861 | ) | | | (34,485,988 | ) |
Accrual for employee leave liabilities | | | (1,080,158 | ) | | | (1,924,872 | ) |
Liability for share-based compensation | | | (154,345 | ) | | | (165,801 | ) |
Calculated tax losses | | | (47,783,999 | ) | | | (47,180,675 | ) |
| | | | | | | | |
Gross deferred tax asset | | | (93,598,577 | ) | | | (86,104,774 | ) |
| | | | | | | | |
Net deferred tax liability | | | 142,341,072 | | | | 144,032,213 | |
| | | | | | | | |
154
ATLATSA RESOURCES CORPORATION
Notes to the Consolidated Financial Statements
For the years ended 31 December 2012, 2011 and 2010
(Expressed in Canadian Dollars, unless otherwise stated)
The movement in the net deferred tax liability recognised in the statement of financial position is as follows:
| | | | | | | | |
| | | 2012 | | | 2011 | |
Balance at beginning of year | | | 144,032,213 | | | | 208,805,557 | |
Current year | | | 6,049,415 | | | | (32,667,499 | ) |
Prior year adjustment | | | 2,530,794 | | | | — | |
Fair value gain recognised directly in equity | | | 34,261,529 | | | | — | |
Effect of translation | | | (44,552,879 | ) | | | (32,105,845 | ) |
| | | | | | | | |
| | | 142,341,072 | | | | 144,032,213 | |
| | | | | | | | |
As at 31 December the Group had not recognised the following net deferred tax assets:
| | | | | | | | |
Deferred tax assets | | | 16,098,160 | | | | 13,736,801 | |
The unrecognised temporary differences are: | | | | | | | | |
Unredeemed capital expenditure | | | 1,644,438 | | | | 1,766,508 | |
Tax losses | | | 12,930,100 | | | | 12,052,145 | |
Other deductible temporary differences | | | 2,536,651 | | | | 2,426,322 | |
Foreign exchange losses | | | (1,013,029 | ) | | | (2,508,174 | ) |
| | | | | | | | |
| | | 16,098,160 | | | | 13,736,801 | |
| | | | | | | | |
Deferred tax assets have not been recognised for the above temporary differences as it is not probable that the respective Group entities to which they relate will generate future taxable income against which to utilise the temporary differences.
Gross calculated tax losses expire as follows:
| | | | | | | | |
2012-2016 | | | — | | | | (4,456,781 | ) |
2013-2017 | | | (4,456,781 | ) | | | — | |
Thereafter | | | (11,271,792 | ) | | | (9,939,500 | ) |
Indefinitely | | | (200,495,074 | ) | | | (140,157,235 | ) |
| | | | | | | | |
| | | (216,223,647 | ) | | | (154,553,516 | ) |
| | | | | | | | |
| | | | | | | | |
Non-current provisions | | | | | | | | |
Rehabilitation provision | | | | | | | | |
Balance at beginning of the year | | | 8,383,708 | | | | 8,184,494 | |
Capitalised to property, plant and equipment | | | 1,391,080 | | | | 1,050,670 | |
Unwinding of interest | | | 672,204 | | | | 644,045 | |
Effect of translation | | | (660,513 | ) | | | (1,495,501 | ) |
| | | | | | | | |
Balance at end of year | | | 9,786,479 | | | | 8,383,708 | |
| | | | | | | | |
Future net obligations | | | | | | | | |
Undiscounted rehabilitation cost | | | 13,511,417 | | | | 12,963,704 | |
Amount invested in environmental trust fund (refer note 12) | | | (3,250,760 | ) | | | (2,927,591 | ) |
| | | | | | | | |
Total future net obligation - Undiscounted | | | 10,260,657 | | | | 10,036,113 | |
| | | | | | | | |
The Group intends to finance the ultimate rehabilitation costs from the money invested in environmental trust funds, ongoing contributions as well as the proceeds on sale of assets and metals from plant clean-up at the time of mine closure.
155
ATLATSA RESOURCES CORPORATION
Notes to the Consolidated Financial Statements
For the years ended 31 December 2012, 2011 and 2010
(Expressed in Canadian Dollars, unless otherwise stated)
Key assumptions used in determining the provision:
| | | | | | | | |
| | | 2012 | | | 2011 | |
Discount period | | | 27.5 years | | | | 20 years | |
South African discount rate (risk free rate) | | | 7.2 | % | | | 8.4 | % |
South African inflation | | | 6.0 | % | | | 5.2 | % |
The method used in the sensitivity analysis is to assume a change in basis points. The change in basis point is applied to one variable while the other variable remains constant.
| | | | | | | | |
| | | 2012 | | | | 2011 | |
| Sensitivity – change in provision | | Inflation rate
(discount rate
constant) | | | Inflation rate
(discount rate
constant) | |
1% increase | | | 2,883,347 | | | | 1,866,759 | |
1% decrease | | | (2,245,647 | ) | | | (1,558,336 | ) |
| | |
| | | Discount rate
(inflation rate
constant) | | | Discount rate
(inflation rate
constant) | |
1% increase | | | (2,204,478 | ) | | | (1,307,110 | ) |
1% decrease | | | 2,875,672 | | | | 1,545,655 | |
| 21. | TRADE AND OTHER PAYABLES |
| | | | | | | | |
Financial liabilities | | | | | | | | |
Trade payables | | | 4,737,638 | | | | 7,508,854 | |
Other payables | | | 9,581,498 | | | | 5,988,159 | |
| | | | | | | | |
| | | 14,319,136 | | | | 13,497,013 | |
Non-financial liabilities | | | | | | | | |
Payroll accruals | | | 1,579,747 | | | | 1,546,767 | |
Leave liabilities | | | 4,504,703 | | | | 7,328,438 | |
Share-appreciation rights | | | 376,648 | | | | 404,607 | |
Lease accrual | | | 2,690 | | | | 53,667 | |
Other accruals | | | — | | | | 6,847 | |
Deferred income | | | — | | | | 9,596 | |
Value added tax | | | 105,711 | | | | 278,652 | |
| | | | | | | | |
| | | 20,888,635 | | | | 23,125,587 | |
| | | | | | | | |
Revenue from mining operations by commodity:
| | | | | | | | | | | | |
| | | 2012 | | | 2011 | | | 2010 | |
Platinum | | | 72,048,362 | | | | 85,146,242 | | | | 89,250,257 | |
Palladium | | | 19,887,921 | | | | 23,999,481 | | | | 20,185,949 | |
Rhodium | | | 6,097,887 | | | | 9,910,678 | | | | 14,033,214 | |
Nickel | | | 9,870,789 | | | | 14,414,240 | | | | 15,120,505 | |
Other | | | 9,652,372 | | | | 10,936,075 | | | | 9,696,908 | |
| | | | | | | | | | | | |
| | | 117,557,331 | | | | 144,406,716 | | | | 148,286,833 | |
| | | | | | | | | | | | |
Revenue consists of the sale of concentrate to RPM (a related party).
156
ATLATSA RESOURCES CORPORATION
Notes to the Consolidated Financial Statements
For the years ended 31 December 2012, 2011 and 2010
(Expressed in Canadian Dollars, unless otherwise stated)
Cost of sales includes:
| | | | | | | | | | | | |
| | | 2012 | | | 2011 | | | 2010 | |
Labour costs | | | 80,915,283 | | | | 86,226,560 | | | | 79,399,203 | |
Stores costs | | | 29,147,878 | | | | 33,519,868 | | | | 25,468,848 | |
Power and compressed air | | | 12,057,211 | | | | 11,871,488 | | | | 9,619,321 | |
Contractors cost | | | 14,723,372 | | | | 18,059,940 | | | | 9,171,193 | |
Other costs | | | 21,581,660 | | | | 19,174,646 | | | | 17,135,596 | |
Inventory movement | | | (38,257 | ) | | | (855,227 | ) | | | 1,084,930 | |
Depreciation | | | 37,000,404 | | | | 41,969,530 | | | | 31,272,097 | |
| | | | | | | | | | | | |
| | | 195,387,551 | | | | 209,966,805 | | | | 173,151,188 | |
| | | | | | | | | | | | |
| 24. | FAIR VALUE GAIN ON CONSOLIDATED FACILITY |
On 28 September 2012 Atlatsa and Anglo announced the completion of the first phase (“Phase One”) of the restructure plan for the refinancing, recapitalisation and restructure of the Group. In terms of Phase One of the Restructure Plan, the Senior Term Loan Facilities Agreement dated 12 June 2009 (the “2009 Senior Debt Facility”) between the Company as borrower, and RPM as lender, was amended to increase the total amount available, and this amount was utilised to repay the amounts owed to Anglo under the Operating Cash Shortfall Facility (“OCSF”).
Atlatsa and Anglo subscribed for ordinary share capital in Bokoni Holdco ($205,537,924 and $197,477,602 respectively) and the proceeds were used to redeem the existing “A” Preference Share Facility that was outstanding to RPM. These transactions resulted in all outstanding debt owing to Anglo being consolidated into one single facility (the “Consolidated Debt Facility”) on terms and conditions agreed between the parties, including an interest rate adjustment, which lowered the Company’s cost of borrowing from an effective annual cash flow interest rate of 12,31% to 6.27% (linked to the 3 month JIBAR rate – 5.13% at 31 December 2012).
As a result of this debt consolidation and associated interest rate adjustment the Company has recognised a fair value gain of $90,589,136 (ZAR742,533,902) in its 2012 financial statements, representing the fair value difference between the Company’s new costs of borrowing under the Consolidated Debt Facility when compared to a market related cost of borrowing available to the Company.
| | | | | | | | | | | | | | | | |
| | | Through
profit/loss
(Owners of the
Company) | | | Through
profit/loss
(Non-
Controlling
interest) | | | Total –
through
profit/loss | | | Directly in
equity (Non-
controlling
interest) | |
Day 1 fair value gain on Consolidated Debt Facility | | | 102,291,808 | | | | — | | | | 102,291,808 | | | | 127,814,103 | |
Effect of translation | | | 2,932,480 | | | | — | | | | 2,932,480 | | | | — | |
Movement – subsequent measurement | | | (10,725,589 | ) | | | (3,909,563 | ) | | | (14,635,152 | ) | | | — | |
| | | | | | | | | | | | | | | | |
| | | 94,498,699 | | | | (3,909,563 | ) | | | 90,589,136 | | | | 127,814,103 | |
| | | | | | | | | | | | | | | | |
The subsequent measurement adjustment relates to revised estimates of payments and receipts (cash flows) by the end of 31 December 2012 as compared to cash flows used in computing the fair value at 28 September 2012.
| | | | | | | | | | | | |
Interest received – Financial assets at amortised cost | | | | | | | | | | | | |
Platinum Producers’ Environmental Trust | | | 85,312 | | | | 82,685 | | | | 108,504 | |
Bank accounts | | | 296,950 | | | | 662,905 | | | | 1,005,138 | |
| | | | | | | | | | | | |
| | | 382,262 | | | | 745,590 | | | | 1,113,642 | |
| | | | | | | | | | | | |
157
ATLATSA RESOURCES CORPORATION
Notes to the Consolidated Financial Statements
For the years ended 31 December 2012, 2011 and 2010
(Expressed in Canadian Dollars, unless otherwise stated)
| | | | | | | | | | | | |
| | | 2012 | | | 2011 | | | 2010 | |
Financial liabilities at amortised cost | | | | | | | | | | | | |
Bank and short-term facilities | | | — | | | | — | | | | 13,617 | |
“A” Preference shares (related party) | | | 33,258,103 | | | | 47,409,220 | | | | 39,661,792 | |
OCSF and funding facilities (related party) | | | 24,209,389 | | | | 30,903,663 | | | | 22,779,618 | |
Senior Term Loan Facility (related party) | | | 12,274,479 | | | | 9,132,826 | | | | 11,512,806 | |
Consolidated debt facility | | | 14,180,371 | | | | — | | | | — | |
Interest on fair value of interest rate swap | | | — | | | | 546,169 | | | | (195,702 | ) |
Other | | | 244,314 | | | | 702,438 | | | | 563,219 | |
| | | | | | | | | | | | |
| | | 84,166,656 | | | | 88,694,316 | | | | 74,335,350 | |
| | | | | | | | | | | | |
Non-financial liabilities | | | | | | | | | | | | |
Notional interest – rehabilitation provision | | | 672,204 | | | | 644,045 | | | | 515,626 | |
Commitment fees on OCSF | | | 380,409 | | | | 631,838 | | | | 310,177 | |
Transaction costs | | | — | | | | 3,852,116 | | | | 631,929 | |
| | | | | | | | | | | | |
| | | 1,052,613 | | | | 5,127,999 | | | | 1,457,732 | |
| | | | | | | | | | | | |
| | | |
Total finance costs before interest capitalised | | | 85,219,269 | | | | 93,822,315 | | | | 75,793,082 | |
Interest capitalised | | | (2,382,069 | ) | | | (1,777,431 | ) | | | (8,271,379 | ) |
| | | | | | | | | | | | |
Total finance costs | | | 82,837,200 | | | | 92,044,884 | | | | 67,521,703 | |
| | | | | | | | | | | | |
The capitalisation rate used to determine the amount of borrowing costs eligible for capitalisation during the year is 12.6% (2011: 12.4%).
| 27. | LOSS BEFORE INCOME TAX |
Loss before income tax as stated includes the following:
| | | | | | | | | | | | |
Operating lease expense – buildings | | | 227,869 | | | | 275,450 | | | | 387,131 | |
Restructuring costs | | | — | | | | 44,323 | | | | 1,784,452 | |
Share-based payment expense – equity settled | | | 309,769 | | | | 2,140,038 | | | | 2,185,812 | |
Share-based payments expense – cash settled | | | (389,858 | ) | | | (437,152 | ) | | | 145,199 | |
Bonus settled via shares | | | — | | | | — | | | | 895,625 | |
Interest rate swap fair value | | | — | | | | 2,550,958 | | | | (636,529 | ) |
Depreciation and amortisation | | | 38,092,878 | | | | 43,224,377 | | | | 13,557,111 | |
| | | | | | | | | | | | |
SA normal taxation | | | | | | | | | | | | |
Current tax – prior year | | | 162,375 | | | | — | | | | — | |
Deferred tax – prior year | | | 6,069,415 | | | | — | | | | (1,578,080 | ) |
Deferred tax – current year | | | 2,530,794 | | | | 32,667,499 | | | | 18,868,120 | |
Securities Transfer Tax | | | 1,801,294 | | | | — | | | | — | |
| | | | | | | | | | | | |
| | | 10,563,878 | | | | 32,667,499 | | | | 17,290,040 | |
| | | | | | | | | | | | |
158
ATLATSA RESOURCES CORPORATION
Notes to the Consolidated Financial Statements
For the years ended 31 December 2012, 2011 and 2010
(Expressed in Canadian Dollars, unless otherwise stated)
Tax rate reconciliation:
| | | | | | | | | | | | |
| | | 2012 | | | 2011 | | | 2010 | |
Statutory Canadian tax rate | | | 25 | % | | | 26.50 | % | | | 28.5 | % |
Other disallowed expenditure | | | 0.96 | % | | | (0.17 | %) | | | (0.13 | %) |
Transaction costs disallowed | | | (0.20 | %) | | | (0.57 | %) | | | (0.63 | %) |
Preference dividends disallowed | | | (10.96 | %) | | | (6.92 | %) | | | (8.89 | %) |
Equity settled share based compensation | | | (0.51 | %) | | | (0.32 | %) | | | (1.10 | %) |
Investment income not taxable | | | 0.03 | % | | | 0.01 | % | | | 0.03 | % |
Tax adjustments – prior year | | | (7.32 | %) | | | — | | | | (1.45 | %) |
Deferred tax assets not recognised | | | (2.27 | %) | | | (1.81 | %) | | | (0.47 | %) |
Securities Transfer Tax | | | (2.12 | %) | | | | | | | | |
Recoupment of finance expense | | | (18.17 | %) | | | | | | | | |
Effect of rate differences | | | 3.12 | % | | | 1.04 | % | | | (0.28 | %) |
| | | | | | | | | | | | |
Effective taxation rate | | | (12.44 | %) | | | 17.76 | % | | | 15.58 | % |
| | | | | | | | | | | | |
| 29. | OTHER COMPREHENSIVE INCOME NET OF INCOME TAX |
Components of other comprehensive income:
| | | | | | | | | | | | |
Foreign currency translation differences for foreign operations | | | 2,415,302 | | | | (7,913,856 | ) | | | 6,237,524 | |
Effective portion of changes in fair value of cash flow hedges | | | — | | | | 1,602,501 | | | | (3,121,650 | ) |
Reclassification to profit or loss on settlement of cash flow hedge | | | — | | | | 2,521,654 | | | | — | |
| | | | | | | | | | | | |
| | | 2,415,302 | | | | (3,789,701 | ) | | | 3,115,874 | |
| | | | | | | | | | | | |
| | | |
Attributable to: | | | | | | | | | | | | |
Owners of the Company | | | 1,481,466 | | | | (1,994,738 | ) | | | 800,194 | |
Non-controlling interest * | | | 933,836 | | | | (1,794,963 | ) | | | 2,315,680 | |
| | | | | | | | | | | | |
| | | 2,415,302 | | | | (3,789,701 | ) | | | 3,115,874 | |
| | | | | | | | | | | | |
| *- | Relates to the foreign currency translation differences for foreign operations in 2012, 2011 and 2010. |
The calculation of basic loss per share for the year ended 31 December 2012 was based on the loss attributable to owners of the Company of $18,717,839 (2011: $81,928,814; 2010: $51,721,410), and a weighted average number of common shares of 424,791,411 (2011: 424,783,603; 2010: 424,665,314).
At 31 December 2012, 2011 and 2010, share options were excluded in determining diluted weighted average number of common shares as their effect would have been anti-dilutive.
| | | | | | | | | | | | |
Issued common shares at 1 January | | | 201,888,473 | | | | 201,813,473 | | | | 201,813,472 | |
Effect of shares issued in financial year | | | — | | | | 67,192 | | | | 18,904 | |
Treasury shares | | | (4,497,062 | ) | | | (4,497,062 | ) | | | (4,497,062 | ) |
Convertible “B” Preference shares - issued on 1 July 2009 | | | 227,400,000 | | | | 227,400,000 | | | | 227,400,400 | |
| | | | | | | | | | | | |
Weighted average number of common shares at 31 December | | | 424,791,411 | | | | 424,783,603 | | | | 424,665,314 | |
| | | | | | | | | | | | |
The basic and diluted loss per share for the year ended 31 December 2012 was 4 cents (2011: 19 cents; 2010:12 cents).
159
ATLATSA RESOURCES CORPORATION
Notes to the Consolidated Financial Statements
For the years ended 31 December 2012, 2011 and 2010
(Expressed in Canadian Dollars, unless otherwise stated)
| 31. | CASH UTILISED BY OPERATIONS |
| | | | | | | | | | | | |
| | | 2012 | | | 2011 | | | 2010 | |
Loss before income tax | | | (85,002,992 | ) | | | (180,532,047 | ) | | | (110,948,846 | ) |
Adjustments for: | | | | | | | | | | | | |
Finance expense | | | 82,837,200 | | | | 92,044,884 | | | | 67,521,703 | |
Finance income | | | (382,262 | ) | | | (745,590 | ) | | | (1,113,642 | ) |
Non-cash items: | | | | | | | | | | | | |
Depreciation and amortisation | | | 38,092,878 | | | | 43,224,377 | | | | 31,577,561 | |
Equity-settled share-based compensation | | | 1,346,509 | | | | 2,140,038 | | | | 2,333,450 | |
Loss on disposal of property, plant and equipment | | | 581 | | | | 339,068 | | | | 45,179 | |
Derivative (profit)/loss | | | — | | | | — | | | | (223,727 | ) |
Settlement of cash flow hedge | | | — | | | | 2,550,958 | | | | — | |
Fair value gain on recognition of new facility | | | (90,589,136 | ) | | | — | | | | — | |
Impairment of assets | | | — | | | | — | | | | 345,123 | |
Other | | | — | | | | 69,200 | | | | 135 | |
| | | | | | | | | | | | |
Cash utilised before ESOP transactions | | | (53,697,222 | ) | | | (40,909,112 | ) | | | (10,463,064 | ) |
ESOP cash transactions (restricted cash) | | | 312,510 | | | | 836,081 | | | | — | |
| | | | | | | | | | | | |
Cash utilised before working capital changes | | | (53,384,712 | ) | | | (40,073,031 | ) | | | (10,463,064 | ) |
Working capital changes | | | | | | | | | | | | |
Decrease/(increase) in trade and other receivables (i) | | | 22,816,980 | | | | 3,357,055 | | | | (8,719,410 | ) |
(Decrease)/increase in trade and other payables (ii) | | | (659,223 | ) | | | (3,747,138 | ) | | | 2,306,757 | |
(Increase)/decrease in inventories (iii) | | | (38,257 | ) | | | (855,227 | ) | | | 1,084,930 | |
| | | | | | | | | | | | |
Cash utilised by operations | | | (31,265,212 | ) | | | (41,318,341 | ) | | | (15,790,787 | ) |
| | | | | | | | | | | | |
| (i) | Decrease/(increase) in trade and other receivables |
| | | | | | | | | | | | |
Opening balance | | | 27,048,591 | | | | 36,190,110 | | | | 23,466,503 | |
Closing balance | | | (3,272,400 | ) | | | (27,048,591 | ) | | | (36,190,110 | ) |
| | | | | | | | | | | | |
Movement for the year | | | 23,776,191 | | | | 9,141,519 | | | | (12,723,607 | ) |
Effect of translation | | | (959,211 | ) | | | (5,784,464 | ) | | | 4,004,197 | |
| | | | | | | | | | | | |
| | | 22,816,980 | | | | 3,357,055 | | | | (8,719,410 | ) |
| | | | | | | | | | | | |
| (ii) | (Decrease)/increase in trade and other payables |
| | | | | | | | | | | | |
Opening balance | | | (23,125,587 | ) | | | (31,844,332 | ) | | | (26,948,647 | ) |
Closing balance | | | 20,888,631 | | | | 23,125,587 | | | | 31,844,332 | |
| | | | | | | | | | | | |
Movement for the year | | | (2,236,956 | ) | | | (8,718,745 | ) | | | 4,895,685 | |
Effect of translation | | | 1,577,733 | | | | 4,971,607 | | | | (2,588,928 | ) |
| | | | | | | | | | | | |
| | | (659,223 | ) | | | (3,747,138 | ) | | | 2,306,757 | |
| | | | | | | | | | | | |
160
ATLATSA RESOURCES CORPORATION
Notes to the Consolidated Financial Statements
For the years ended 31 December 2012, 2011 and 2010
(Expressed in Canadian Dollars, unless otherwise stated)
| (iii) | (Increase)/decrease in inventories |
| | | | | | | | | | | | |
| | | 2012 | | | 2011 | | | 2010 | |
Opening balance | | | 787,084 | | | | — | | | | 1,091,860 | |
Closing balance | | | (769,447 | ) | | | (787,084 | ) | | | — | |
| | | | | | | | | | | | |
Movement for the year | | | (17,637 | ) | | | (787,084 | ) | | | 1,091,860 | |
Effect of translation | | | (20,620 | ) | | | (68,143 | ) | | | (6,930 | ) |
| | | | | | | | | | | | |
| | | (38,257 | ) | | | (855,227 | ) | | | 1,084,930 | |
| | | | | | | | | | | | |
The Group has two reportable segments as described below. These segments are managed separately based on the nature of operations. For each of the segments, the Group’s CEO (the Group’s chief operating decision maker) reviews internal management reports monthly. The following summary describes the operations in each of the Group’s reportable segments:
| | • | | Bokoni Mine - Mining of PGM’s. |
| | • | | Projects - Mining exploration in Boikgantsho, Kwanda, and Ga-Phasha exploration projects. |
The majority of operations and functions are performed in South Africa. An insignificant portion of administrative functions are performed in the Company’s country of domicile.
The CEO considers earnings before net finance expense, income tax, depreciation and amortisation (“EBITDA”) to be an appropriate measure of each segment’s performance. Accordingly, the EBITDA for each segment has been included. All external revenue is generated by the Bokoni Mine segment.
| | | | | | | | | | | | | | | | | | | | | | | | | | | | |
| | | 31 December 2012 | | | 31 December 2011 | |
| | | Bokoni Mine | | | Projects | | | Total | | | Bokoni Mine | | | Projects | | | Total | | | Note | |
Revenue | | | 117,557,331 | | | | — | | | | 117,557,331 | | | | 144,406,716 | | | | — | | | | 144,406,716 | | | | | |
Cost of sales | | | (196,735,768 | ) | | | — | | | | (196,735,768 | ) | | | (212,137,181 | ) | | | — | | | | (212,137,181 | ) | | | (i | ) |
EBITDA | | | (60,985,577 | ) | | | (36,943 | ) | | | (61,022,520 | ) | | | (36,767,412 | ) | | | (632,855 | ) | | | (37,400,267 | ) | | | (ii | ) |
Loss before income tax | | | (170,083,832 | ) | | | (36,943 | ) | | | (170,120,775 | ) | | | (163,883,532 | ) | | | (632,855 | ) | | | (164,516,387 | ) | | | (iii | ) |
Income tax | | | 14,049,927 | | | | — | | | | 14,049,927 | | | | 30,006,122 | | | | — | | | | 30,006,122 | | | | (iv | ) |
Depreciation | | | (35,567,022 | ) | | | — | | | | (35,567,022 | ) | | | (41,020,865 | ) | | | — | | | | (41,020,865 | ) | | | (v | ) |
Finance income | | | 280,872 | | | | — | | | | 280,872 | | | | 281,868 | | | | — | | | | 281,868 | | | | (vi | ) |
Finance expense | | | (73,812,106 | ) | | | — | | | | (73,812,106 | ) | | | (86,377,123 | ) | | | — | | | | (86,377,123 | ) | | | (vii | ) |
Total assets | | | 827,304,772 | | | | 114,373,668 | | | | 941,678,440 | | | | 901,154,720 | | | | 9,703,357 | | | | 910,858,077 | | | | (viii | ) |
Additions to non-current assets | | | 38,917,145 | | | | — | | | | 38,917,145 | | | | 268,678,042 | | | | — | | | | 268,678,042 | | | | (ix | ) |
Total Liabilities | | | (270,285,274 | ) | | | (13,877,671 | ) | | | (284,162,945 | ) | | | (770,025,392 | ) | | | (14,862,260 | ) | | | (784,887,652 | ) | | | (x | ) |
| | | | | | | | | | | | | | | | | | | | | | | | | | | | |
Reconciliations of reportable segment cost of sales, EBITDA, loss before income tax, income tax, depreciation, finance income, finance expense, assets, addition to non-current assets and liabilities:
| | | | | | | | | | |
| | | | | 2012 | | | 2011 | |
| | | |
(i) | | Cost of sales | | | | | | | | |
| | | |
| | Total cost of sales for reportable segments | | | (196,735,768 | ) | | | (212,137,181 | ) |
| | Corporate and consolidation adjustments | | | 1,348,217 | | | | 2,170,376 | |
| | | | | | | | | | |
| | Consolidated cost of sales | | | (195,387,551 | ) | | | (209,966,805 | ) |
| | | | | | | | | | |
161
ATLATSA RESOURCES CORPORATION
Notes to the Consolidated Financial Statements
For the years ended 31 December 2012, 2011 and 2010
(Expressed in Canadian Dollars, unless otherwise stated)
| | | | | | | | | | |
| | | | | 2012 | | | 2011 | |
(ii) | | EBITDA | | | | | | | | |
| | | |
| | Total EBITDA for reportable segments | | | (61,022,520 | ) | | | (37,400,267 | ) |
| | Net finance expense | | | (82,454,938 | ) | | | (91,299,294 | ) |
| | Depreciation and amortisation | | | (38,092,878 | ) | | | (43,224,377 | ) |
| | Corporate and consolidation adjustments | | | 96,567,344 | | | | (8,608,109 | ) |
| | | | | | | | | | |
| | Consolidated loss before income tax | | | (85,002,992 | ) | | | (180,532,047 | ) |
| | | | | | | | | | |
| | | |
(iii) | | Loss before income tax | | | | | | | | |
| | | |
| | Total loss before tax for reportable segments | | | (170,120,775 | ) | | | (164,516,387 | ) |
| | Corporate and consolidation adjustments | | | 85,117,783 | | | | (16,015,660 | ) |
| | | | | | | | | | |
| | Consolidated loss before income tax | | | (85,002,992 | ) | | | (180,532,047 | ) |
| | | | | | | | | | |
| | | |
(iv) | | Income tax | | | | | | | | |
| | | |
| | Taxation for reportable segments | | | 14,049,927 | | | | 30,006,122 | |
| | Corporate and consolidation adjustments | | | (24,613,805 | ) | | | 2,661,377 | |
| | | | | | | | | | |
| | Consolidated taxation | | | (10,563,878 | ) | | | 32,667,499 | |
| | | | | | | | | | |
| | | |
(v) | | Depreciation | | | | | | | | |
| | | |
| | Depreciation for reportable segments | | | (35,567,022 | ) | | | (41,020,865 | ) |
| | Corporate and consolidation adjustments | | | (2,525,856 | ) | | | (2,203,512 | ) |
| | | | | | | | | | |
| | Consolidated depreciation | | | (38,092,878 | ) | | | (43,224,377 | ) |
| | | | | | | | | | |
| | | |
(vi) | | Finance income | | | | | | | | |
| | | |
| | Finance income for reportable segments | | | 280,872 | | | | 281,868 | |
| | Corporate and consolidation adjustments | | | 101,390 | | | | 463,722 | |
| | | | | | | | | | |
| | Consolidated finance income | | | 382,262 | | | | 745,590 | |
| | | | | | | | | | |
| | | |
(vii) | | Finance expenses | | | | | | | | |
| | | |
| | Finance expense for reportable segments | | | (73,812,106 | ) | | | (86,377,123 | ) |
| | Corporate and consolidation adjustments | | | (9,025,094 | ) | | | (5,667,761 | ) |
| | | | | | | | | | |
| | Consolidated finance expense | | | (82,837,200 | ) | | | (92,044,884 | ) |
| | | | | | | | | | |
| | | |
(viii) | | Total assets | | | | | | | | |
| | | |
| | Assets for reportable segments | | | 941,678,440 | | | | 910,858,077 | |
| | Corporate and consolidation adjustments | | | (127,613,111 | ) | | | (17,849,111 | ) |
| | | | | | | | | | |
| | Consolidated assets | | | 814,065,329 | | | | 893,008,966 | |
| | | | | | | | | | |
| | | |
(ix) | | Additions to non-current assets | | | | | | | | |
| | | |
| | Additions to non-current assets for reportable segments | | | 38,917,145 | | | | 28,678,042 | |
| | Corporate and consolidation adjustments | | | 21,010 | | | | 238,542 | |
| | | | | | | | | | |
| | Consolidated additions to non-current assets | | | 38,938,155 | | | | 28,916,584 | |
| | | | | | | | | | |
| | | |
(x) | | Total liabilities | | | | | | | | |
| | | |
| | Liabilities for reportable segments | | | (284,162,945 | ) | | | (784,887,652 | ) |
| | Corporate and consolidation adjustments | | | (324,645,161 | ) | | | (136,206,578 | ) |
| | | | | | | | | | |
| | Consolidated liabilities | | | (608,808,106 | ) | | | (921,094,230 | ) |
| | | | | | | | | | |
162
ATLATSA RESOURCES CORPORATION
Notes to the Consolidated Financial Statements
For the years ended 31 December 2012, 2011 and 2010
(Expressed in Canadian Dollars, unless otherwise stated)
| 33.1 | Equity-settled options |
The Group has a share option plan approved by the shareholders that allows it to grant options, subject to regulatory terms and approval, to its directors, employees, officers, and consultants to acquire up to 32,600,000 (2011: 32,600,000) common shares. As at 31 December 2012, 7,933,000 options were outstanding and 24,667,000 options remained available to be granted. On 30 June 2009 the Company obtained shareholder and stock exchange approval to decrease the exercise price to C$1.29 per option for 8,061,000 share options, including stock options granted to certain insiders of the Company pursuant to repricing. The exercise price of each option is set by the Board of Directors at the time of grant but cannot be less than the market price (less permissible discounts) on the TSX Venture Exchange. Options have a term of up to a maximum of ten years (however, the Company has historically granted options for up to a term of five years), and terminate 30 to 90 days following the termination of the optionee’s employment or term of engagement, except in the case of retirement or death. Vesting of options is at the discretion of the Board of Directors at the time the options are granted. The continuity of share purchase options is as follows:
| | | | | | | | | | | | |
| | | Weighted average
exercise price | | | Number of options | | | Contractual
weighted average
remaining life
(years) | |
Balance - 31 December 2010 | | $ | 1.11 | | | | 13,241,000 | | | | 3.97 | |
Granted | | | — | | | | — | | | | | |
Exercised | | | 0.84 | | | | (75,000 | ) | | | | |
Cancelled | | | 1.05 | | | | (593,333 | ) | | | | |
Expired | | | 1.24 | | | | (410,000 | ) | | | | |
| | | | | | | | | | | | |
Balance – 31 December 2011 | | $ | 1.11 | | | | 12,162,667 | | | | 2.89 | |
Granted | | | — | | | | — | | | | | |
Exercised | | | — | | | | — | | | | | |
Cancelled | | | 1.09 | | | | (246,667 | ) | | | | |
Expired | | | 1.27 | | | | (3,983,000 | ) | | | | |
| | | | | | | | | | | | |
Balance – 31 December 2012 | | $ | 1.03 | | | | 7,933,000 | | | | 2.14 | |
| | | | | | | | | | | | |
Options outstanding and exercisable at 31 December 2012 were as follows:
| | | | | | | | | | | | | | | | |
Expiry date | | Option price | | | Number of
options
outstanding | | | Number of
options
vested | | | Weighted
average life
(years) | |
25 June 2013 | | $ | 1.29 | # | | | 916,000 | | | | 916,000 | | | | 0.5 | |
30 June 2013 | | $ | 1.29 | # | | | 1,410,000 | | | | 1,410,000 | | | | 0.5 | |
25 June 2014 | | $ | 0.96 | | | | 562,000 | | | | 562,000 | | | | 1.5 | |
30 November 2016 | | $ | 0.84 | | | | 4,545,000 | | | | 4,545,000 | | | | 3.9 | |
1 May 2017 | | $ | 1.61 | | | | 500,000 | | | | 333,000 | | | | 4.3 | |
| | | | | | | | | | | | | | | | |
Total | | | | | | | 7,933,00 | | | | 7,766,000 | | | | | |
| | | | | | | | | | | | | | | | |
Weighted average exercise price | | | | | | $ | 1.03 | | | $ | 1.05 | | | | | |
| # - | The options were re-priced to $1.29 on 30 June 2009 |
The exercise prices of all share purchase options granted during the year were equal to or greater than the market price at the grant date. Using the Black-Scholes option pricing model with the assumptions noted below, the estimated fair value of all options granted have been reflected in the statement of changes in equity.
The share-based payments expense recognised during the year ended 31 December 2012 was $309,769 (2011: $1,156,036; 2010: $2,333,450).
163
ATLATSA RESOURCES CORPORATION
Notes to the Consolidated Financial Statements
For the years ended 31 December 2012, 2011 and 2010
(Expressed in Canadian Dollars, unless otherwise stated)
The assumptions used to estimate the fair value of options granted during the year were:
| | | | | | | | | | | | |
| | | 2012 | | | 2011 | | | 2010 | |
Canadian risk- free interest rate | | | 2.8 | % | | | 2.8 | % | | | 3 | % |
Expected life | | | 5-7 years | | | | 5-7 years | | | | 5-7 years | |
Volatility | | | 83 | % | | | 83 | % | | | 83 | % |
Forfeiture rate | | | 0 | % | | | 0 | % | | | 0 | % |
Expected dividends | | | Nil | | | | Nil | | | | Nil | |
The volatility of the shares was calculated over the expected life of the option. Volatility was calculated by using available historical information on the share price for Atlatsa equal to the expected life of the scheme.
The risk free rate for periods within the contractual term of the share right is based on the Government of Canada benchmark bond yield.
| 33.2 | Cash-settled share-based payments |
The Group also currently has a scheme in place to award SARs to recognise the contributions of senior staff to the Group’s financial position and performance and to retain key employees. These SARs are linked to the share price of the Group on the JSE and are settled in cash on the exercise date.
A third of the SARs granted are exercisable annually from the grant date with an expiry date of 4 years from the grant date. The offer price of these SARs equaled the closing market price of the underlying shares on the trading date immediately preceding the granting of the SARs.
| | | | | | | | | | | | |
Share appreciation rights granted (all unvested at year-end) | | | 17,324,869 | | | | 6,294,869 | | | | 3,737,103 | |
| | | |
Vesting year of unvested share appreciation rights: | | | | | | | | | | | | |
| | | |
Vested already | | | 1,997,268 | | | | — | | | | — | |
Within one year | | | 5,636,401 | | | | 2,396,801 | | | | 1,575,035 | |
One to two years | | | 5,273,200 | | | | 2,025,134 | | | | 1,575,035 | |
Two to three years | | | 4,418,000 | | | | 1,872,934 | | | | 587,033 | |
| | | | | | | | | | | | |
Total number of shares unvested | | | 17,324,869 | | | | 6,294,869 | | | | 3,737,103 | |
| | | | | | | | | | | | |
The value of the SARs expensed in the year ended 31 December 2012 was calculated as $ Nil (2011: $437,152; 2010: $947,176; 2009: $145,199).
The assumptions used to estimate the fair value of the SARS granted during the year were:
| | | | | | | | | | | | |
South African risk-free rate | | | 4.9% - 5.8 | % | | | 6.4 | % | | | 6.7 | % |
Volatility | | | 82% - 106 | % | | | 85.1 | % | | | 82% - 86 | % |
Forfeiture rate | | | 0 | % | | | 0 | % | | | 0 | % |
Expected dividends | | | Nil | | | | Nil | | | | Nil | |
The only vesting conditions for the scheme are that the employees should be in the employment of the Group.
The volatility of the shares were calculated with the equally weighted standard approach of calculating volatility by using available historical information on the share price for Atlatsa equal to the term to maturity of the scheme.
The risk-free rate for periods within the contractual term of the share right is based on the South African Government Bonds in effect at the time.
| 33.3 | Bonus settled via shares |
The Group issued 806,898 shares to key members of management at a cost of $895,625 during the year ended 31 December 2009 as consideration for finalising the acquisition as discussed in note 33 (2012, 2011 and 2010: Nil).
164
ATLATSA RESOURCES CORPORATION
Notes to the Consolidated Financial Statements
For the years ended 31 December 2012, 2011 and 2010
(Expressed in Canadian Dollars, unless otherwise stated)
| 33.4 | Bokoni Platinum Mine ESOP Trust |
Prior to the acquisition of Bokoni on 1 July 2009, certain employees of Bokoni were part of the Anglo Group Employee Empowerment Scheme (“Kotula Scheme”). When Atlatsa acquired Bokoni, Anglo American Platinum Limited and Atlatsa replaced the Kotula Scheme with the Bokoni Platinum Mine ESOP Trust (“ESOP Trust”), which has similar participation benefits to the Kotula Scheme.
The purpose of the ESOP Trust scheme is to incentivize and retain employees, promote BEE and increase broad-based and effective participation in the equity of Atlatsa by historically disadvantaged persons.
The ESOP Trust holds and utilises ordinary shares in Atlatsa (refer note 17) for the benefit of the beneficiaries.
Any units that the employees held in the Kotula Scheme were exchanged into units in the ESOP Trust at a ratio of 15 units in the ESOP Trust for every Kotula unit held. The remaining units in the ESOP Trust are allocated to the employees in five equal annual installments beginning 31 March 2010 and for the next four years thereafter. Employees will receive an equal allocation of units. Any units held by a beneficiary that are forfeited shall be added back to the number of unallocated units available for future allocation.
The ESOP Trust shall dispose of the shares held in Atlatsa to the beneficiaries as follows:
| | • | | One third shall vest in proportion to the beneficiaries units on 16 May 2013; |
| | • | | Half of the remaining balance of ordinary shares will vest in proportion to their interest on 16 May 2014; and |
| | • | | The remaining balance of ordinary shares will vest in proportion to their interest on 16 May 2015. |
The trustees (acting as agent on behalf of the beneficiaries) shall dispose of and sell as many shares as will be necessary to settle all taxes payable by the beneficiaries. The beneficiaries may also direct the trustees to sell the distribution shares on behalf of the beneficiaries and the proceeds of such sale, net of all expenses, shall be distributed to the beneficiaries.
If a beneficiary’s employment is terminated due to death, retrenchment, retirement, disability or ill-health, Bokoni will pay a cash amount equal to the fair value of the beneficiary’s units to the beneficiary who will then cease to be a beneficiary of the ESOP Trust. The units will be transferred to Bokoni who will become a beneficiary of the ESOP Trust. Where the beneficiary’s employment is terminated prior to the termination date for any other reason, the beneficiary shall forfeit all his rights under the scheme. The forfeited units will be added back to the number of unallocated units for future allocation.
At 31 December the following units were allocated:
| | | | | | | | | | | | |
| | | 2012 | | | 2011 | | | 2010 | |
Total units available for allocation | | | 70,000,000 | | | | 70,000,000 | | | | 70,000,000 | |
Allocation 1 July 2009 | | | (20,078,634 | ) | | | (20,078,634 | ) | | | (20,078,634 | ) |
Allocation 31 March 2010 | | | (10,282,759 | ) | | | (10,282,759 | ) | | | (10,282,759 | ) |
Allocation 31 March 2011 | | | (10,666,586 | ) | | | (10,666,586 | ) | | | — | |
| | | | | | | | | | | | |
Total units available for allocation at 31 December | | | 28,972,021 | | | | 28,972,021 | | | | 39,638,607 | |
| | | | | | | | | | | | |
Units forfeited | | | 1,535,309 | | | | 1,535,309 | | | | 1,492,429 | |
Forfeiture rate | | | 5 | % | | | 5 | % | | | 5 | % |
Expected dividends | | | Nil | | | | Nil | | | | Nil | |
Exercise price | | | Nil | | | | Nil | | | | Nil | |
Share price at grant date (ZAR) | | | 7.00 | | | | 7.00 | | | | 11.10 | |
The share-based payment expense recognised during the year ended 31 December 2012 was $877,546 (2011: $984,002; 2010: Nil).
There are no contingencies that the directors are aware of at the reporting date.
165
ATLATSA RESOURCES CORPORATION
Notes to the Consolidated Financial Statements
For the years ended 31 December 2012, 2011 and 2010
(Expressed in Canadian Dollars, unless otherwise stated)
Relationships
| | |
Related party | | Nature of relationship |
| |
RPM | | The Group concluded a number of shared services agreements between Bokoni mine and RPM, a wholly owned subsidiary of Anglo 49% shareholder in Bokoni Holdco. Pursuant to the terms of various shared services agreements, the Anglo group of companies will continue to provide certain services to Bokoni Mines at a cost that is no greater than the costs charged to any other Anglo group company for the same or similar services. It is anticipated that, as Atlatsa builds its internal capacity, and makes the transformation to a fully operational PGM producer, these services will be phased out and replaced either with internal services or third party services. RPM also provides debt funding to the Group and purchases all of the Group’s PGM concentrate. |
| |
Atlatsa Holdings | | Atlatsa Holdings is the Company’s controlling shareholder. |
| |
Key management | | All directors directly involved in the Atlatsa Group and certain members of top management at Bokoni and Plateau. |
Related party balances
| | | | | | | | | | |
| | | | | 2012 | | | 2011 | |
RPM | | Loans and Borrowings (refer note 18) | | | (433,959,084 | ) | | | (742,772,344 | ) |
| | Trade and other payables | | | (1,149,533 | ) | | | (5,384,861 | ) |
| | Trade and other receivables | | | 913,558 | | | | 24,230,043 | |
| | Convertible preference shares (refer note 17) | | | | | | | | |
Atlatsa Holdings | | Convertible preference shares (refer note 17) | | | | | | | | |
Related party transactions
| | | | | | | | | | |
RPM | | Revenue (refer note 22 ) | | | (117,557,331 | ) | | | (144,406,715 | ) |
| | Finance expense (before interest capitalised) | | | 81,115,550 | | | | 84,762,114 | |
| | Administration expenses | | | 661,494 | | | | 1,272,406 | |
| | Cost of sales | | | 45,901,635 | | | | 40,967,150 | |
| | Costs capitalised to capital work-in-progress | | | 7,851,315 | | | | 7,852,805 | |
| | Fair value gain on Consolidated Debt Facility (refer note 24) | | | 90,589,136 | | | | — | |
Included in non-controlling interest is a fair value gain on de-recognition of the debt facility between Bokoni Holdco and RPM of $127,814,103.
Also refer to note 37 for a proposed transaction with Anglo, RPM’s holding company.
Key Management Compensation
Remuneration for executive directors and key management
| | | | | | | | |
- Salaries | | | 3,483,677 | | | | 3,998,042 | |
- Short-term benefits | | | 723,609 | | | | 1,094,315 | |
- Restructuring | | | — | | | | 76,334 | |
- Share options | | | 259,387 | | | | 994,729 | |
- Cash settled share-based payments | | | — | | | | (437,152 | ) |
- Remuneration for non-executives | | | 334,985 | | | | 304,454 | |
| | | | | | | | |
| | | 4,801,658 | | | | 6,030,722 | |
| | | | | | | | |
166
ATLATSA RESOURCES CORPORATION
Notes to the Consolidated Financial Statements
For the years ended 31 December 2012, 2011 and 2010
(Expressed in Canadian Dollars, unless otherwise stated)
| | | | | | | | |
| | | 2012 | | | 2011 | |
Contracted for | | | 3,417,123 | | | | 32,761,664 | |
Not yet contracted for | | | 10,831,638 | | | | 38,474,167 | |
| | | | | | | | |
Authorised capital expenditure | | | 14,248,761 | | | | 71,235,831 | |
| | | | | | | | |
The committed expenditures relate to property, plant and equipment and will be funded through cash generated from operations and available loan facilities.
| 37. | EVENTS AFTER THE REPORTING DATE |
On 27 March 2013, Phase Two and thus completion of the Restructure Plan was announced. Phase Two involves Anglo subscribing for 125 million ordinary shares of the Company for $87.9million (ZAR750 million), the sale of Boikgantsho and the Eastern section of Ga-Phasha for an effective consideration of ZAR 1.7 billion ($199.2 million) as well as the capitalization of debt between Bokoni Holdco and RPM. The net effect after Phase Two of the Restructure Plan is that the Company’s debt owing to RPM will reduce by approximately $287.1 million (ZAR2,450 million) plus the debt owing between Bokoni Holdco and RPM ($91.3 million (ZAR 778.7 million) at 31 December 2012).
In addition to this debt reduction, Anglo Platinum has agreed to make additional facilities available to the Company to finance the Bokoni Mine operational and project plan going forward as per the new agreements under the Consolidated Facility. The Company will also convert all “B” Preference shares, into Atlatsa common shares. Atlatsa Holdings has agreed to acquire 115.8 million Atlatsa common shares from RPM on a vendor finance basis, resulting in Atlatsa Holdings owing $54.3 million (ZAR463 million) to RPM, to be repaid in stages by 31 December 2020. This also includes an extension of the Concentrate Sale Agreement until 2020.
The net effect of the recapitalization and refinancing plan for Atlatsa is a significant reduction in the Company’s debt.
The Restructure Plan is conditional upon the satisfaction (or waiver) of various conditions precedent, including:
| | • | | the receipt of the approval of the South African Competition Authorities; |
| | • | | obtaining shareholder approval from Atlatsa shareholders; |
| | • | | the receipt of the approval of the Disinterested Shareholders of Atlatsa for each of the Related Party Transactions; |
| | • | | the receipt of approvals of the applicable regulatory authorities; |
| | • | | the Asset Sale Agreements becoming unconditional, except insofar as they may be conditional on the Implementation Agreement becoming unconditional; |
| | • | | the New Debt Facility Agreement becoming unconditional, except insofar as it may be conditional on the Implementation Agreement becoming unconditional; |
| | • | | the receipt by RPM, and to the extent necessary, each of its shareholders, of the written unconditional consent of the United Kingdom Treasury in respect of the Restructuring Plan; |
| | • | | RPM acquiring unconditional title to the Asset Sale Properties. This would include obtaining Ministerial consent in respect of The Mineral and Petroleum Resources Royalty Act for transfer of the mineral rights to RPM; and |
| | • | | the Phase Two Restructure Plan Transaction agreements becoming unconditional through the satisfaction of all other conditions precedent (except to the extent that the completion of any one transaction is conditional upon the completion of the other transactions). |
Employee costs included in loss for the year are as follows:
| | | | | | | | | | | | |
| | | 2012 | | | 2011 | | | 2010 | |
Salaries and wages and other benefits | | | 83,552,252 | | | | 90,109,090 | | | | 82,309,144 | |
Retirement benefit costs | | | 366,621 | | | | 442,633 | | | | 372,975 | |
Medical aid contributions | | | 14,570 | | | | 17,853 | | | | 14,088 | |
Employment termination costs | | | — | | | | 44,323 | | | | 56,486 | |
Share-based compensation – equity-settled | | | 1,329,857 | | | | 1,991,277 | | | | 2,333,450 | |
Share-based compensation – cash-settled | | | — | | | | (437,152 | ) | | | 947,176 | |
| | | | | | | | | | | | |
| | | 85,263,300 | | | | 92,168,024 | | | | 86,033,319 | |
| | | | | | | | | | | | |
167
ATLATSA RESOURCES CORPORATION
Notes to the Consolidated Financial Statements
For the years ended 31 December 2012, 2011 and 2010
(Expressed in Canadian Dollars, unless otherwise stated)
The following are the shareholdings of the Company in the various group entities:
| | | | | | | | | | |
| Company | | Country of Incorporation | | 2012 | | | 2011 | |
N1C Resources Incorporation | | Cayman Islands | | | 100 | % | | | 100 | % |
N2C Resources Incorporation * | | Cayman Islands | | | 100 | % | | | 100 | % |
Plateau Resources Proprietary Limited * | | South Africa | | | 100 | % | | | 100 | % |
Bokoni Holdings Proprietary Limited * | | South Africa | | | 51 | % | | | 51 | % |
Bokoni Mine Proprietary Limited * | | South Africa | | | 51 | % | | | 51 | % |
Boikgantsho Proprietary Limited * | | South Africa | | | 51 | % | | | 51 | % |
Kwanda Proprietary Limited * | | South Africa | | | 51 | % | | | 51 | % |
Ga-Phasha Proprietary Limited * | | South Africa | | | 51 | % | | | 51 | % |
Lebowa Platinum Mine Limited * # | | South Africa | | | 51 | % | | | 51 | % |
Middlepunt Hill Management Services Proprietary Limited * # | | South Africa | | | 51 | % | | | 51 | % |
| #- | These entities are dormant |
168
ITEM 19EXHIBITS
The following exhibits are filed as part of this Annual Report:
| | |
Number | | Document |
| |
| 1. | | Articles of the Company.(1) |
| |
| 4.01 | | Joint Venture Agreement between PPL and Plateau dated November 25, 2003.(2) |
| |
| 4.02 | | Share Exchange Agreement between Pelawan and Atlatsa dated January 21, 2004.(2) |
| |
| 4.03 | | Shareholders Agreement between Pelawan, Atlatsa and the Pelawan Trust made as of September 19, 2004.(3) |
| |
| 4.04 | | Term Loan Agreement between Rustenburg Mines Limited and Plateau Resources (Pty) Limited signed on October 31, 2006.(4) |
| |
| 4.05 | | The Settlement Agreement between Pelawan, Atlatsa and the Pelawan Trust made as of December 28, 2006.(4) |
| |
| 4.06 | | Amending Agreement between Pelawan, Atlatsa and the Pelawan Trust, dated as of December 20, 2007.(6) |
| |
| 4.07 | | Sale of Concentrate Agreement between RPM and Bokoni Mine, dated December 21, 2007.(6) |
| |
| 4.09 | | Phase 3 Implementation Agreement between RPM, Plateau and Holdco dated March 28, 2008, as amended on May 13, 2009.(6) |
| |
| 4.10 | | Holdco Sale of Shares Agreement amongst Plateau, RPM and Anglo Platinum, dated March 28, 2008, as amended on May 13, 2009.(6) |
| |
| 4.11 | | Sale of Rights Agreement amongst RPM, Plateau and Boikgantsho Platinum Mine (Proprietary) Limited, dated March 28, 2008, as amended on May 13, 2009.(6) |
| |
| 4.12 | | Sale of Rights Agreement amongst RPM, Plateau and Kwanda Platinum Mine (Proprietary) Limited (formerly Richtrau No. 207 (Proprietary) Limited), dated March 28, 2008, as amended on May 13, 2009.(6) |
| |
| 4.13 | | Holdco Shareholders Agreement among Plateau Resources and Rustenburg Platinum Mines and Richtrau 179 (Pty) Ltd dated March 28, 2008.(6) |
| |
| 4.14 | | Umbrella Services Agreement amongst Anglo Platinum, Atlatsa and Holdco, dated March 28, 2008.(6) |
| |
| 4.15 | | Term Loan Agreement between Rustenburg Mines Limited and Plateau Resources (Pty) Limited signed on November 23, 2008.(6) |
| |
| 4.16 | | Atlatsa Shareholders Agreement among Atlatsa Resources Corporation and Pelawan Investments and the Pelawan Trust dated June 12, 2009.(6) |
| |
| 4.17 | | Exchange Agreement among Atlatsa, Plateau and Central Plaza Investments 78 (Pty) (to be renamed Pelawan Finance SPV (Pty) Limited) dated June 12, 2009.(6) |
| |
| 4.18 | | Global Intercreditor Agreement between Atlatsa, Plateau, Micawber 634 (Pty) Limited and Micawber 603 (Pty) Limited, Rustenburg Platinum Mines Limited, Standard Chartered Bank and Tumelo Motsisi and Harold Motaung on behalf of the Pelawan Dividend Trust dated |
169
| | |
| | June 12, 2009.(6) |
| |
| 4.19 | | Senior Term Loan Facilities Agreement dated June 12, 2009 between Plateau, Standard Chartered Bank and Micawber 634 (Pty) Limited.(6) |
| |
| 4.20 | | Standby Loan Facility Agreement between Plateau and Rustenburg Platinum Mines Limited dated June 12, 2009.(6) |
| |
| 4.21 | | RPM Funding Loan Agreement between Rustenburg Platinum Mines Limited and Holdco dated June 12, 2009.(6) |
| |
| 4.22 | | RPM Plateau A Preference Share Subscription Agreement between Plateau, N2C Resources Inc. and Rustenburg Platinum Mines dated June 12, 2009.(6) |
| |
| 4.23 | | Plateau Funding Loan Agreement between Plateau and Holdco dated June 12, 2009.(6) |
| |
| 4.24 | | Operating Cash Flow Shortfall Loan Facility Agreement between Plateau and Rustenburg Platinum Mines Limited dated June 12, 2009.(6) |
| |
| 4.25 | | Opco Funding Loan Agreement between Holdco and Richtrau No. 177 (Pty) Limited dated June 12, 2009.(6) |
| |
| 4.26 | | Conversion Implementation Agreement between the Pelawan Trust, Central Plaza Investments 78 (Pty) (to be remained Pelawan Finance SPV (Pty) Limited), Pelawan Investments (Pty) Ltd, Atlatsa, Plateau and Rustenburg Platinum Mines Limited dated June 26, 2009.(6) |
| |
| 4.27 | | RPM Funding Common Terms Agreement between, inter alia, Rustenburg Platinum Mines Limited, Plateau, Central Plaza Investments 78 (Pty) Limited and Atlatsa dated June 12, 2009.(6) |
| |
| 8.1 | | List of Subsidiaries.(8) |
| |
| 11.1 | | Code of Ethics.(2) |
| |
| 12.1 | | Certification of Chief Executive Officer pursuant to Section 302 of the Sarbanes-Oxley Act of 2002.* |
| |
| 12.2 | | Certification of Chief Financial Officer pursuant to Section 302 of the Sarbanes-Oxley Act of 2002.* |
| |
| 13.1 | | Certification of Chief Executive Officer and Chief Financial Officer pursuant to 18 U.S.C. Section 1350, as adopted pursuant to Section 906 of the Sarbanes-Oxley Act of 2002.* |
| |
| 15.1 | | Corporate Governance Policies and Procedures Manual issued as of November 22, 2007.(5) |
Notes:
170
| (1) | Incorporated by reference to Atlatsa’s Annual Report on Form 20-F for the year ended October 31, 2000. |
| (2) | Incorporated by reference to Atlatsa’s Annual Report on Form 20-F for the year ended October 31, 2003. |
| (3) | Incorporated by reference to Atlatsa’s Annual Report on Form 20-F for the year ended December 31, 2004. |
| (4) | Incorporated by reference to Atlatsa’s Annual Report on Form 20-F for the year ended December 31, 2006. |
| (5) | Incorporated by reference to Atlatsa’s Annual Report on Form 20-F for the year ended December 31, 2007. |
| (6) | Incorporated by reference to Atlatsa’s Annual Report on Form 20-F for the year ended December 31, 2008. |
| (7) | Incorporated by reference to Atlatsa’s Annual Report on Form 20-F for the year ended December 31, 2009 |
| (8) | Incorporated by reference to Atlatsa’s Annual Report on Form 20-F for the year ended December 31, 2011 |
171
SIGNATURES
The Registrant hereby certifies that it meets all of the requirements for filing on Form 20-F and that it has duly caused and authorized the undersigned to sign this annual report on its behalf.
| | | | | | |
| | | | | ATLATSA RESOURCES CORPORATION |
| | | |
DATED: March 28, 2013 | | | | By: | | /s/ De Wet Schutte |
| | | | | | De Wet Schutte |
| | | | | | Chief Financial Officer |
172
INDEX TO EXHIBITS
| | |
| 1. | | Articles of the Company.(1) |
| |
| 4.01 | | Joint Venture Agreement between PPL and Plateau dated November 25, 2003.(2) |
| |
| 4.02 | | Share Exchange Agreement between Pelawan and Atlatsa dated January 21, 2004.(2) |
| |
| 4.03 | | Shareholders Agreement between Pelawan, Atlatsa and the Pelawan Trust made as of September 19, 2004.(3) |
| |
| 4.04 | | Term Loan Agreement between Rustenburg Mines Limited and Plateau Resources (Pty) Limited signed on October 31, 2006. (4) |
| |
| 4.05 | | The Settlement Agreement between Pelawan, Atlatsa and the Pelawan Trust made as of December 28, 2006.(4) |
| |
| 4.06 | | Amending Agreement between Pelawan, Atlatsa and the Pelawan Trust, dated as of December 20, 2007.(6) |
| |
| 4.07 | | Sale of Concentrate Agreement between RPM and Bokoni Mine, dated December 21, 2007.(6) |
| |
| 4.09 | | Phase 3 Implementation Agreement between RPM, Plateau and Holdco dated March 28, 2008, as amended on May 13, 2009. (6) |
| |
| 4.10 | | Holdco Sale of Shares Agreement amongst Plateau, RPM and Anglo Platinum, dated March 28, 2008, as amended on May 13, 2009.(6) |
| |
| 4.11 | | Sale of Rights Agreement amongst RPM, Plateau and Boikgantsho Platinum Mine (Proprietary) Limited, dated March 28, 2008, as amended on May 13, 2009.(6) |
| |
| 4.12 | | Sale of Rights Agreement amongst RPM, Plateau and Kwanda Platinum Mine (Proprietary) Limited (formerly Richtrau No. 207 (Proprietary) Limited), dated March 28, 2008, as amended on May 13, 2009.(6) |
| |
| 4.13 | | Holdco Shareholders Agreement among Plateau Resources and Rustenburg Platinum Mines and Richtrau 179 (Pty) Ltd dated March 28, 2008.(6) |
| |
| 4.14 | | Umbrella Services Agreement amongst Anglo Platinum, Atlatsa and Holdco, dated March 28, 2008.(6) |
| |
| 4.15 | | Term Loan Agreement between Rustenburg Mines Limited and Plateau Resources (Pty) Limited signed on November 23, 2008.(6) |
| |
| 4.16 | | Atlatsa Shareholders Agreement among Atlatsa Resources Corporation and Pelawan Investments and the Pelawan Trust dated June 12, 2009.(6) |
| |
| 4.17 | | Exchange Agreement among Atlatsa, Plateau and Central Plaza Investments 78 (Pty) (to be renamed Pelawan Finance SPV (Pty) Limited) dated June 12, 2009.(6) |
| |
| 4.18 | | Global Intercreditor Agreement between Atlatsa, Plateau, Micawber 634 (Pty) Limited and Micawber 603 (Pty) Limited, Rustenburg Platinum Mines Limited, Standard Chartered Bank and Tumelo Motsisi and Harold Motaung on behalf of the Pelawan Dividend Trust dated June 12, 2009.(6) |
| |
| 4.19 | | Senior Term Loan Facilities Agreement dated June 12, 2009 between Plateau, Standard |
173
| | |
| | Chartered Bank and Micawber 634 (Pty) Limited.(6) |
| |
| 4.20 | | Standby Loan Facility Agreement between Plateau and Rustenburg Platinum Mines Limited dated June 12, 2009.(6) |
| |
| 4.21 | | RPM Funding Loan Agreement between Rustenburg Platinum Mines Limited and Holdco dated June 12, 2009.(6) |
| |
| 4.22 | | RPM Plateau A Preference Share Subscription Agreement between Plateau, N2C Resources Inc. and Rustenburg Platinum Mines dated June 12, 2009.(6) |
| |
| 4.23 | | Plateau Funding Loan Agreement between Plateau and Holdco dated June 12, 2009.(6) |
| |
| 4.24 | | Operating Cash Flow Shortfall Loan Facility Agreement between Plateau and Rustenburg Platinum Mines Limited dated June 12, 2009.(6) |
| |
| 4.25 | | Opco Funding Loan Agreement between Holdco and Richtrau No. 177 (Pty) Limited dated June 12, 2009.(6) |
| |
| 4.26 | | Conversion Implementation Agreement between the Pelawan Trust, Central Plaza Investments 78 (Pty) (to be remained Pelawan Finance SPV (Pty) Limited), Pelawan Investments (Pty) Ltd, Atlatsa, Plateau and Rustenburg Platinum Mines Limited dated June 26, 2009.(6) |
| |
| 4.27 | | RPM Funding Common Terms Agreement between, inter alia, Rustenburg Platinum Mines Limited, Plateau, Central Plaza Investments 78 (Pty) Limited and Atlatsa dated June 12, 2009.(6) |
| |
| 8.1 | | List of Subsidiaries. (8) |
| |
| 11.1 | | Code of Ethics.(2) |
| |
| 12.1 | | Certification of Chief Executive Officer pursuant to Section 302 of the Sarbanes-Oxley Act of 2002.* |
| |
| 12.2 | | Certification of Chief Financial Officer pursuant to Section 302 of the Sarbanes-Oxley Act of 2002.* |
| |
| 13.1 | | Certification of Chief Executive Officer and Chief Financial Officer pursuant to 18 U.S.C. Section 1350, as adopted pursuant to Section 906 of the Sarbanes-Oxley Act of 2002.* |
| |
| 15.1 | | Corporate Governance Policies and Procedures Manual issued as of November 22, 2007.(5) |
Notes:
| (1) | Incorporated by reference to Atlatsa’s Annual Report on Form 20-F for the year ended October 31, 2000. |
| (2) | Incorporated by reference to Atlatsa’s Annual Report on Form 20-F for the year ended October 31, 2003. |
| (3) | Incorporated by reference to Atlatsa’s Annual Report on Form 20-F for the year ended December 31, 2004. |
| (4) | Incorporated by reference to Atlatsa’s Annual Report on Form 20-F for the year ended December 31, 2006. |
174
| (5) | Incorporated by reference to Atlatsa’s Annual Report on Form 20-F for the year ended December 31, 2007. |
| (6) | Incorporated by reference to Atlatsa’s Annual Report on Form 20-F for the year ended December 31, 2008. |
| (7) | Incorporated by reference to Atlatsa’s Annual Report on Form 20-F for the year ended December 31, 2009 |
| (8) | Incorporated by reference to Atlatsa’s Annual Report on Form 20-F for the year ended December 31, 2011 |
175