united states
securities and exchange commission
washington, d.c. 20549
form n-csr
certified shareholder report of registered management
investment companies
Investment Company Act file number 811-08037
AdvisorOne Funds
(Exact name of registrant as specified in charter)
17605 Wright Street, Omaha, NE 68130
(Address of principal executive offices) (Zip code)
Gemini Fund Services, LLC., 81 Arkay Drive., Hauppauge, NY 11788
(Name and address of agent for service)
Registrant's telephone number, including area code: 402-493-3313
Date of fiscal year end: 4/30
Date of reporting period: 10/31/15
Item 1. Reports to Stockholders.
| 1 |

| 2 |
| 3 |
| 4 |
| 5 |
| 6 |
| 7 |
| 8 |
| 9 |
| 10 |

| 11 |
| 12 |
| 13 |
| 14 |
| 15 |
| 16 |
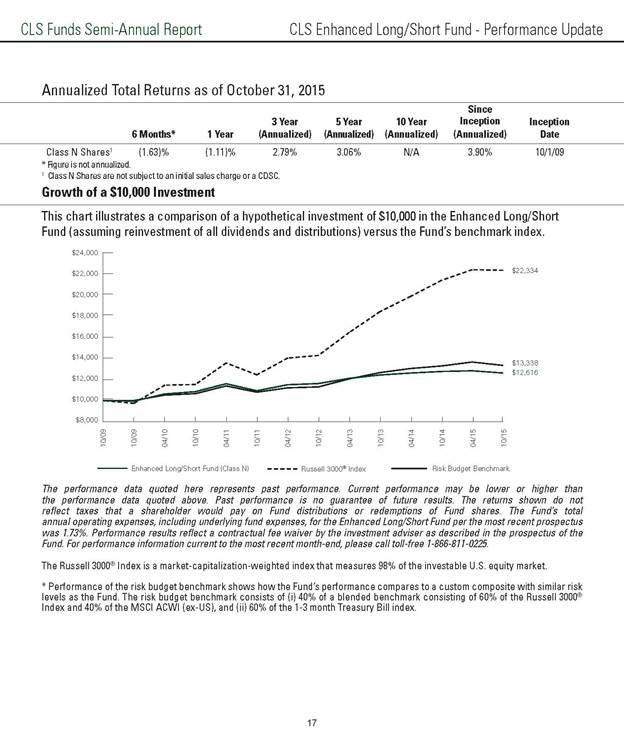
| 17 |
| 18 |
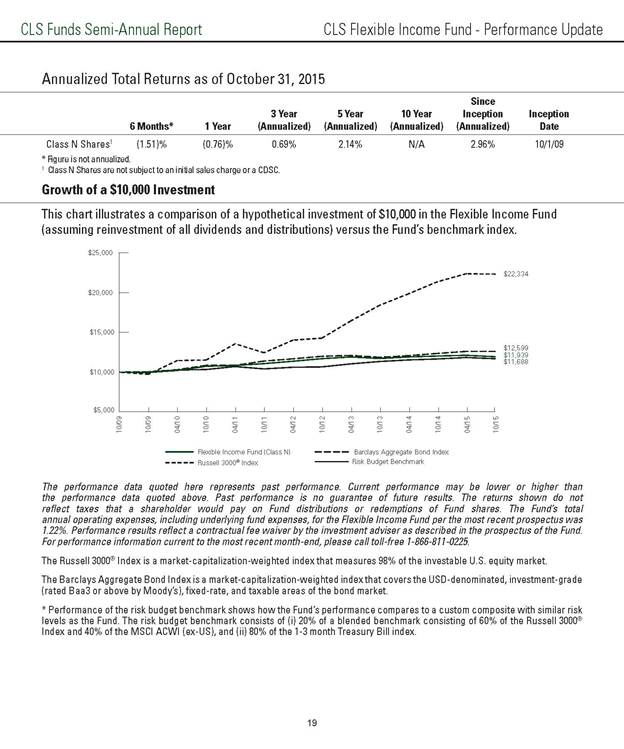
| 19 |
| 20 |
| 21 |
| 22 |
| 23 |
| 24 |
| 25 |
| CLS Funds Semi-Annual Report | ||||
| Schedule of Investments - Global Diversified Equity Fund (Unaudited) | ||||
| October 31, 2015 | ||||
| Shares | Value | |||
| Equity Funds - 99.40% | ||||
| Developed International - 37.56% | ||||
| iShares Core MSCI Europe ETF | 500,000 | $ 21,940,000 | ||
| iShares MSCI ACWI ex US ETF | 279,229 | 11,618,719 | ||
| iShares MSCI EAFE ETF | 503,800 | 30,787,218 | ||
| iShares MSCI Eurozone ETF | 297,100 | 10,948,135 | ||
| iShares MSCI Italy Capped ETF + | 96,000 | 1,421,760 | ||
| iShares MSCI Japan ETF | 842,500 | 10,379,600 | ||
| iShares MSCI United Kingdom ETF + | 150,000 | 2,620,500 | ||
| PowerShares International Dividend Achievers Portfolio + | 1,391,498 | 21,582,134 | ||
| Vanguard FTSE Europe ETF | 356,000 | 18,540,480 | ||
| Vanguard FTSE Pacific ETF | 269,000 | 15,534,750 | ||
| Vanguard Total International Stock ETF | 700,000 | 32,963,000 | ||
| WisdomTree Global ex-U.S. Quality Dividend Growth Fund | 52,000 | 2,400,320 | ||
| 180,736,616 | ||||
| Emerging Markets - 11.99% | ||||
| iShares Core MSCI Emerging Markets ETF | 175,200 | 7,417,968 | ||
| iShares MSCI Emerging Markets ETF + | 128,700 | 4,487,769 | ||
| iShares MSCI Russia Capped ETF | 295,000 | 3,752,400 | ||
| Morgan Stanley China A Share Fund, Inc. | 97,967 | 2,459,951 | ||
| SPDR S&P Emerging Asia Pacific ETF | 125,000 | 9,772,500 | ||
| Vanguard FTSE Emerging Markets ETF | 50,000 | 1,742,000 | ||
| WisdomTree Emerging Markets High Dividend Fund | 798,525 | 28,076,139 | ||
| 57,708,727 | ||||
| Global Equity - 8.45% | ||||
| Fidelity MSCI Energy Index ETF + | 275,000 | 5,326,750 | ||
| iShares Global 100 ETF + | 257,200 | 19,418,600 | ||
| iShares Global Energy ETF | 500,000 | 15,895,000 | ||
| 40,640,350 | ||||
| Large Cap Core - 12.76% | ||||
| iShares MSCI USA Momentum Factor ETF + | 52,000 | 3,806,400 | ||
| PowerShares S&P 500 High Quality Portfolio + | 100,000 | 2,345,000 | ||
| SPDR Health Care Select Sector Fund + | 218,600 | 15,594,924 | ||
| Vanguard Dividend Appreciation ETF | 504,016 | 39,671,100 | ||
| 61,417,424 | ||||
| Large Cap Growth - 24.33% | ||||
| Fidelity MSCI Information Technology Index ETF + | 71,000 | 2,376,370 | ||
| iShares MSCI USA Quality Factor ETF | 543,840 | 35,719,411 | ||
| iShares Russell 1000 Growth ETF + | 215,900 | 21,825,331 | ||
| iShares Russell Top 200 Growth ETF + | 204,500 | 11,092,080 | ||
| SPDR Technology Select Sector Fund + | 865,000 | 37,757,250 | ||
| Vanguard Information Technology ETF + | 75,000 | 8,284,500 | ||
| 117,054,942 | ||||
| Large Cap Value - 4.31% | ||||
| SPDR Financial Select Sector SPDR Fund | 740,100 | 17,821,608 | ||
| SPDR S&P Global Natural Resources ETF | 82,000 | 2,935,600 | ||
| 20,757,208 | ||||
| Total Equity Funds (cost $417,314,649) | 478,315,267 | |||
| 24 |
| CLS Funds Semi-Annual Report | ||||
| Schedule of Investments - Global Diversified Equity Fund (Unaudited) (Continued) | ||||
| October 31, 2015 | ||||
| Shares | Value | |||
| Money Market Funds - 0.76% | ||||
| Short-Term Cash - 0.76% | ||||
| Federated Prime Cash Obligations Fund Institutional Class, 0.09% ** | 3,672,997 | $ 3,672,997 | ||
| Total Money Market Funds (cost $3,672,997) | 3,672,997 | |||
| Collateral for Securities Loaned - 5.66% | ||||
| Dreyfus Government Cash Management Istitutional Class, 0.01% * | 3,745,009 | 3,745,009 | ||
| Milestone Treasury Obligations Fund Institutional Class, 0.01% * ^ | 23,500,000 | 23,500,000 | ||
| Total Collateral for Securities Loaned (cost $27,245,009) | 27,245,009 | |||
| Total Investments (cost $448,232,655) - 105.82% | $ 509,233,273 | |||
| Liabilities in Excess of Other Assets - Net - (5.82)% | (28,022,332) | |||
| NET ASSETS - 100.00% | $ 481,210,941 | |||
| + All or a portion of this security is on loan. Total loaned securities had a value of $26,549,349 at October 31, 2015. | ||||
| * Money Market Fund; Interest rate reflects seven-day effective yield on October 31, 2015. | ||||
| ^ Represtents affiliated issuer | ||||
| ACWI - All Country World Index | ||||
| EAFE - Europe, Australasia, Far East | ||||
| ETF - Exchange Traded Fund | ||||
| FTSE - Financial Times Stock Exchange | ||||
| MSCI - Morgan Stanley Capital International | ||||
| SPDR - Standard & Poors' Depositary Receipts | ||||
| 25 |
| CLS Funds Semi-Annual Report | ||||
| Schedule of Investments - Growth and Income Fund (Unaudited) | ||||
| October 31, 2015 | ||||
| Shares | Value | |||
| Bond Funds - 41.71% | ||||
| High Yield Bonds - 0.57% | ||||
| SPDR Blackstone / GSO Senior Loan ETF | 44,816 | $ 2,135,034 | ||
| Intermediate/Long-Term Bonds - 22.76% | ||||
| Fidelity Total Bond ETF + | 65,000 | 3,171,350 | ||
| iShares iBoxx $ Investment Grade Corporate Bond ETF | 70,800 | 8,242,536 | ||
| iShares TIPS Bond ETF | 287,000 | 31,845,520 | ||
| PIMCO Total Return Active ETF + | 353,668 | 37,580,762 | ||
| Schwab U.S. TIPs ETF * | 35,000 | 1,884,400 | ||
| Vanguard Intermediate-Term Corporate Bond ETF | 22,500 | 1,922,175 | ||
| 84,646,743 | ||||
| International Bonds - 6.97% | ||||
| PIMCO Global Advantage Inflation-Linked Bond Active ETF | 100,000 | 4,109,000 | ||
| PowerShares Emerging Markets Sovereign Debt Portfolio + | 743,958 | 20,853,143 | ||
| Templeton Global Income Fund | 146,395 | 955,959 | ||
| 25,918,102 | ||||
| Short-Term Bonds - 11.41% | ||||
| iShares Floating Rate Bond ETF | 477,800 | 24,085,898 | ||
| PIMCO Enhanced Short Maturity Active ETF | 166,100 | 16,756,168 | ||
| SPDR Nuveen Barclays Short Term Municipal Bond ETF | 65,000 | 1,587,300 | ||
| 42,429,366 | ||||
| Total Bond Funds (cost $155,783,712) | 155,129,245 | |||
| Equity Funds - 57.05% | ||||
| Alternative - 1.63% | ||||
| AdvisorShares Ranger Equity Bear ETF * | 150,000 | 1,577,985 | ||
| IQ Merger Arbitrage ETF * | 40,000 | 1,102,800 | ||
| WisdomTree Managed Futures Strategy Fund * | 81,932 | 3,384,611 | ||
| 6,065,396 | ||||
| Balanced - 0.29% | ||||
| PowerShares CEF Income Composite Portfolio + | 50,000 | 1,094,500 | ||
| Commodity Funds - 2.12% | ||||
| GreenHaven Continuous Commodity Index Fund * + | 132,000 | 2,613,600 | ||
| PowerShares DB Agriculture Fund * | 26,608 | 566,218 | ||
| PowerShares DB Commodity Index Tracking Fund * + | 310,000 | 4,712,000 | ||
| 7,891,818 | ||||
| Developed International - 18.96% | ||||
| FlexShares International Quality Dividend Index Fund | 77,000 | 1,761,760 | ||
| iShares Europe ETF + | 355,000 | 14,991,650 | ||
| iShares MSCI EAFE Minimum Volatility ETF + | 180,888 | 11,906,048 | ||
| iShares MSCI Eurozone ETF + | 133,100 | 4,904,735 | ||
| iShares MSCI Japan ETF | 765,000 | 9,424,800 | ||
| PowerShares International Dividend Achievers Portfolio | 908,700 | 14,093,937 | ||
| PowerShares S&P International Developed Low Volatility Portfolio | 7,000 | 209,440 | ||
| Vanguard FTSE All-World ex-US ETF | 145,000 | 6,594,600 | ||
| Vanguard FTSE Europe ETF | 104,000 | 5,416,320 | ||
| WisdomTree Global ex-U.S. Quality Dividend Growth Fund | 26,000 | 1,200,160 | ||
| 70,503,450 | ||||
| Emerging Markets - 5.74% | ||||
| iShares MSCI Emerging Markets Minimum Volatility ETF + | 53,000 | 2,774,020 | ||
| iShares MSCI Russia Capped ETF | 150,000 | 1,908,000 | ||
| Morgan Stanley China A Share Fund, Inc. | 78,689 | 1,975,881 | ||
| PowerShares FTSE RAFI Emerging Markets Portfolio + | 52,800 | 809,424 | ||
| SPDR S&P Emerging Asia Pacific ETF | 65,000 | 5,081,700 | ||
| WisdomTree Emerging Markets High Dividend Fund | 250,000 | 8,790,000 | ||
| 21,339,025 | ||||
| CLS Funds Semi-Annual Report | ||||
| 26 |
| Schedule of Investments - Growth and Income Fund (Unaudited) (Continued) | ||||
| October 31, 2015 | ||||
| Shares | Value | |||
| Inverse Equity - 2.26% | ||||
| ProShares Short Russell2000 * | 137,168 | $ 8,408,398 | ||
| Large Cap Core - 9.52% | ||||
| PowerShares S&P 500 High Quality Portfolio + | 228,000 | 5,346,600 | ||
| SPDR Health Care Select Sector Fund | 74,700 | 5,329,098 | ||
| Vanguard Dividend Appreciation ETF | 314,300 | 24,738,553 | ||
| 35,414,251 | ||||
| Large Cap Growth - 12.35% | ||||
| iShares MSCI USA Quality Factor ETF + | 395,113 | 25,951,022 | ||
| Market Vectors Gold Miners ETF | 140,000 | 2,094,400 | ||
| Powershares QQQ Trust Series 1 | 44,100 | 4,997,853 | ||
| SPDR Technology Select Sector Fund | 209,000 | 9,122,850 | ||
| Vanguard Information Technology ETF + | 34,000 | 3,755,640 | ||
| 45,921,765 | ||||
| Large Cap Value - 4.10% | ||||
| SPDR Energy Select Sector Fund + | 93,000 | 6,326,790 | ||
| SPDR Financial Select Sector Fund | 370,607 | 8,924,217 | ||
| 15,251,007 | ||||
| Small/Mid-Cap Growth - 0.08% | ||||
| SPDR S&P Oil & Gas Equipment & Services ETF + | 15,693 | 312,918 | ||
| Total Equity Funds (cost $193,155,070) | 212,202,528 | |||
| Money Market Funds - 1.58% | ||||
| Short-Term Cash - 1.58% | ||||
| Federated Prime Cash Obligations Fund Institutional Class, 0.09% ** | 5,880,805 | 5,880,805 | ||
| Total Money Market Funds (cost $5,880,805) | 5,880,805 | |||
| Collateral for Securities Loaned - 10.48% | ||||
| Dreyfus Government Cash Management Istitutional Class, 0.01% ** | 963,016 | 963,016 | ||
| Milestone Treasury Obligations Fund Institutional Class, 0.01% ** ^ | 38,000,000 | 38,000,000 | ||
| Total Collateral for Securities Loaned (cost $38,963,016) | 38,963,016 | |||
| Total Investments (cost $393,782,603) - 110.82% | $ 412,175,594 | |||
| Liabilities in Excess of Other Assets - Net - (10.82)% | (40,248,839) | |||
| NET ASSETS - 100.00% | $ 371,926,755 | |||
| + All or a portion of this security is on loan. Total loaned securities had a value of $38,092,213 at October 31, 2015. | ||||
| * Non-income producing security. | ||||
| ** Money Market Fund; Interest rate reflects seven-day effective yield on October 31, 2015. | ||||
| ^ Represtents affiliated issuer | ||||
| DB - Deutsche Bank | ||||
| EAFE - Europe, Australasia, Far East | ||||
| ETF - Exchange Traded Fund | ||||
| FTSE - Financial Times Stock Exchange | ||||
| MSCI - Morgan Stanley Capital International | ||||
| RAFI - Research Affiliates | ||||
| SPDR - Standard & Poors' Depositary Receipts | ||||
| TIPS - Treasury Inflation-Protected Securities | ||||
| 27 |
| CLS Funds Semi-Annual Report | |||||
| Schedule of Investments - Global Growth Fund (Unaudited) | |||||
| October 31, 2015 | |||||
| Shares | Value | ||||
| Bond Funds - 19.87% | |||||
| High Yield Bonds - 3.30% | |||||
| PIMCO 0-5 Year High Yield Corporate Bond Index ETF + | 53,700 | $ 5,204,067 | |||
| SPDR Barclays Short Term High Yield Bond ETF | 121,500 | 3,316,950 | |||
| 8,521,017 | |||||
| International Bond - 3.49% | |||||
| iShares JP Morgan USD Emerging Markets Bond ETF + | 53,465 | 5,800,952 | |||
| Vanguard Total International Bond ETF | 60,000 | 3,190,800 | |||
| 8,991,752 | |||||
| Short-Term Bonds - 13.08% | |||||
| iShares Floating Rate Bond ETF | 334,641 | 16,869,253 | |||
| PIMCO Enhanced Short Maturity Active ETF | 167,359 | 16,883,176 | |||
| 33,752,429 | |||||
| Total Bond Funds (cost $52,333,897) | 51,265,198 | ||||
| Equity Funds - 78.72% | |||||
| Commodity Funds - 2.51% | |||||
| iShares S&P GSCI Commodity Indexed Trust * + | 217,500 | 3,712,725 | |||
| PowerShares DB Agriculture Fund * | 130,000 | 2,766,400 | |||
| 6,479,125 | |||||
| Currency - 0.48% | |||||
| PowerShares DB US Dollar Index Bullish Fund * + | 49,000 | 1,237,250 | |||
| Developed International - 23.41% | |||||
| Deutsche X-trackers MSCI EAFE Hedged Equity ETF | 105,000 | 2,927,400 | |||
| iShares MSCI Canada ETF + | 172,100 | 4,095,980 | |||
| iShares MSCI EAFE ETF + | 277,220 | 16,940,914 | |||
| iShares MSCI Italy Capped ETF | 87,000 | 1,288,470 | |||
| iShares MSCI United Kingdom ETF + | 114,500 | 2,000,315 | |||
| Schwab International Equity ETF | 90,000 | 2,625,300 | |||
| Vanguard FTSE All-World ex-US ETF | 220,800 | 10,041,984 | |||
| Vanguard FTSE Europe ETF | 151,100 | 7,869,288 | |||
| WisdomTree Europe Hedged Equity Fund | 70,500 | 4,284,990 | |||
| WisdomTree International SmallCap Dividend Fund + | 26,000 | 1,512,940 | |||
| WisdomTree Japan Hedged Equity Fund | 128,000 | 6,821,120 | |||
| 60,408,701 | |||||
| Emerging Markets - 7.36% | |||||
| EGShares Beyond BRICs ETF | 17,503 | 288,449 | |||
| iShares MSCI All Country Asia ex Japan ETF + | 45,500 | 2,570,295 | |||
| iShares MSCI Frontier 100 ETF + | 90,979 | 2,432,779 | |||
| iShares MSCI Mexico Capped ETF | 43,400 | 2,374,848 | |||
| Vanguard FTSE Emerging Markets ETF | 325,000 | 11,323,000 | |||
| 18,989,371 | |||||
| Global Equity - 1.78% | |||||
| iShares Global Energy ETF | 42,600 | 1,354,254 | |||
| iShares Global Healthcare ETF + | 31,000 | 3,233,300 | |||
| 4,587,554 | |||||
| 28 |
| CLS Funds Semi-Annual Report | |||||
| Schedule of Investments - Global Growth Fund (Unaudited) (Continued) | |||||
| October 31, 2015 | |||||
| Shares | Value | ||||
| Large Cap Core - 9.82% | |||||
| Market Vectors Morningstar Wide Moat ETF + | 79,600 | $ 2,398,348 | |||
| SPDR Industrial Select Sector Fund + | 70,700 | 3,836,889 | |||
| SPDR Materials Select Sector Fund + | 49,700 | 2,250,416 | |||
| Vanguard Health Care ETF + | 58,850 | 7,705,230 | |||
| Vanguard Large-Cap ETF + | 37,690 | 3,593,742 | |||
| Vanguard Total Stock Market ETF | 52,060 | 5,545,952 | |||
| 25,330,577 | |||||
| Large Cap Growth - 16.90% | |||||
| iShares North American Tech-Software ETF + | 51,000 | 5,271,870 | |||
| iShares Russell 1000 Growth ETF | 54,740 | 5,533,667 | |||
| Powershares QQQ Trust Series 1 | 143,370 | 16,248,122 | |||
| Vanguard Growth ETF + | 89,910 | 9,826,264 | |||
| Vanguard Information Technology ETF | 47,650 | 5,263,419 | |||
| Vanguard Mega Cap Growth ETF + | 17,200 | 1,468,708 | |||
| 43,612,050 | |||||
| Large Cap Value - 12.67% | |||||
| PowerShares KBW Bank Portfolio + | 36,000 | 1,348,200 | |||
| SPDR Dow Jones Industrial Average ETF Trust | 45,511 | 8,032,236 | |||
| SPDR Energy Select Sector Fund + | 105,430 | 7,172,403 | |||
| SPDR Financial Select Sector Fund | 670,450 | 16,144,436 | |||
| 32,697,275 | |||||
| Small/Mid Cap Core - 3.79% | |||||
| iShares Russell Mid-Cap ETF | 17,230 | 2,844,845 | |||
| Vanguard Small-Cap ETF + | 60,750 | 6,930,360 | |||
| 9,775,205 | |||||
| Total Equity Funds (cost $180,319,432) | 203,117,108 | ||||
| Money Market Funds - 0.45% | |||||
| Short-Term Cash - 0.45% | |||||
| Federated Prime Cash Obligations Fund Insittutional Class, 0.09% ** | 1,145,562 | 1,145,562 | |||
| Total Money Market Funds (cost $1,145,562) | 1,145,562 | ||||
| 29 |
| CLS Funds Semi-Annual Report | |||||
| Schedule of Investments - Global Growth Fund (Unaudited) (Continued) | |||||
| October 31, 2015 | |||||
| Shares | Value | ||||
| Collateral for Securities Loaned - 21.76% | |||||
| Dreyfus Government Cash Management Istitutional Class, 0.01% ** | 4,250,152 | $ 4,250,152 | |||
| Milestone Treasury Obligations Fund Institutional Class, 0.01% ** ^ | 51,900,000 | 51,900,000 | |||
| Total Collateral for Securities Loaned (cost $56,150,152) | 56,150,152 | ||||
| Total Investments (cost $289,949,043) - 120.80% | $ 311,678,020 | ||||
| Liabilities in Excess of Other Assets - Net - (20.80)% | (53,666,497) | ||||
| NET ASSETS - 100.00% | $ 258,011,523 | ||||
| + All or a portion of this security is on loan. Total loaned securities had a value of $54,963,454 at October 31, 2015. | |||||
| * Non-income producing security. | |||||
| ** Money Market Fund; Interest rate reflects seven-day effective yield on October 31, 2015. | |||||
| ^ Represtents affiliated issuer | |||||
| BRIC - Brazil, Russia, India and China | |||||
| DB - Deutsche Bank | |||||
| EAFE - Europe, Australasia, Far East | |||||
| ETF - Exchange Traded Fund | |||||
| FTSE - Financial Times Stock Exchange | |||||
| GSCI - Goldman Sachs Commodity Index | |||||
| MSCI - Morgan Stanley Capital International | |||||
| SPDR - Standard & Poors' Depositary Receipts | |||||
| 30 |
| CLS Funds Semi-Annual Report | ||||
| Schedule of Investments - Domestic Equity Fund (Unaudited) | ||||
| October 31, 2015 | ||||
| Shares | Value | |||
| Equity Funds - 99.31% | ||||
| Large Cap Core - 44.93% | ||||
| First Trust NASDAQ Technology Dividend Index Fund | 27,000 | $ 713,340 | ||
| Guggenheim S&P 500 Equal Weight ETF + | 11,000 | 865,700 | ||
| iShares MSCI USA Momentum Factor ETF + | 53,000 | 3,879,600 | ||
| iShares U.S. Healthcare ETF | 5,000 | 750,150 | ||
| Market Vectors Morningstar Wide Moat ETF + | 30,000 | 903,900 | ||
| 7,112,690 | ||||
| Large Cap Growth - 21.23% | ||||
| iShares MSCI USA Quality Factor ETF + | 37,000 | 2,430,160 | ||
| iShares North American Tech-Software ETF + | 9,000 | 930,330 | ||
| 3,360,490 | ||||
| Large Cap Value - 19.42% | ||||
| iShares MSCI USA Minimum Volatility ETF + | 19,000 | 797,240 | ||
| iShares Russell 1000 Value ETF | 20,000 | 2,005,800 | ||
| SPDR Energy Select Sector Fund | 4,000 | 272,120 | ||
| . | 3,075,160 | |||
| Small/Mid Cap Core - 3.96% | ||||
| WisdomTree SmallCap Earnings Fund | 8,000 | 627,520 | ||
| Small/Mid Cap Value - 9.77% | ||||
| Guggenheim S&P 500 Pure Value ETF + | 19,000 | 977,930 | ||
| SPDR S&P Insurance ETF + | 8,000 | 569,200 | ||
| 1,547,130 | ||||
| Total Equity Funds (cost $14,445,494) | 15,722,990 | |||
| Collateral for Securities Loaned - 26.67% | ||||
| Dreyfus Government Cash Management Institutional Class, 0.01% * | 4,222,146 | 4,222,146 | ||
| Total Collateral for Securities Loaned (cost $4,222,146) | 4,222,146 | |||
| Total Investments (cost $18,667,640) - 125.98% | $ 19,945,136 | |||
| Liabilities in Excess of Other Assets - Net - (25.98)% | (4,113,461) | |||
| NET ASSETS - 100.00% | $ 15,831,675 | |||
| + All or a portion of this security is on loan. Total loaned securities had a value of $4,134,332 at October 31, 2015. | ||||
| * Money Market Fund; Interest rate reflects seven-day effective yield on October 31, 2015. | ||||
| ETF - Exchange Traded Fund | ||||
| MSCI - Morgan Stanley Capital International | ||||
| SPDR - Standard & Poors' Depositary Receipts | ||||
| 31 |
| CLS Funds Semi-Annual Report | ||||
| Schedule of Investments - International Equity Fund (Unaudited) | ||||
| October 31, 2015 | ||||
| Shares | Value | |||
| Equity Funds - 99.01% | ||||
| Developed International - 68.33% | ||||
| Deutsche X-trackers MSCI EAFE Hedged Equity ETF | 35,500 | $ 989,740 | ||
| iShares International Select Dividend ETF + | 12,800 | 383,744 | ||
| iShares MSCI Canada ETF + | 17,200 | 409,360 | ||
| iShares MSCI EAFE Minimum Volatility ETF | 15,800 | 1,039,956 | ||
| iShares MSCI Europe Minimum Volatility ETF + | 41,000 | 994,250 | ||
| iShares MSCI Israel Capped ETF + | 9,700 | 488,686 | ||
| iShares MSCI Japan ETF | 9,400 | 115,808 | ||
| iShares MSCI Japan Minimum Volatility ETF | 18,500 | 1,053,575 | ||
| iShares MSCI New Zealand Capped ETF | 4,200 | 152,607 | ||
| iShares MSCI Singapore ETF | 25,600 | 284,672 | ||
| iShares MSCI United Kingdom ETF + | 14,800 | 258,556 | ||
| SPDR S&P International Consumer Discretionary Sector ETF | 4,800 | 183,379 | ||
| WisdomTree International Hedged Quality Dividend Growth Fund | 10,000 | 267,300 | ||
| 6,621,633 | ||||
| Emerging Markets - 30.68% | ||||
| Global X MSCI Argentina ETF | 8,500 | 169,660 | ||
| Global X MSCI Nigeria ETF | 59,000 | 461,380 | ||
| iShares MSCI All Peru Capped ETF | 11,500 | 264,270 | ||
| iShares MSCI Brazil Capped ETF | 5,400 | 123,498 | ||
| iShares MSCI Emerging Markets Minimum Volatility ETF | 19,100 | 999,694 | ||
| iShares MSCI Malaysia ETF + | 44,300 | 455,847 | ||
| iShares MSCI South Korea Capped ETF | 4,500 | 244,710 | ||
| iShares MSCI Thailand Capped ETF + | 3,900 | 254,163 | ||
| 2,973,222 | ||||
| Total Equity Funds (cost $9,602,748) | 9,594,855 | |||
| Collateral for Securities Loaned - 26.46% | ||||
| Dreyfus Government Cash Management Institutional Class, 0.01% * | 2,564,804 | 2,564,804 | ||
| Total Collateral for Securities Loaned (cost $2,564,804) | 2,564,804 | |||
| Total Investments (cost $12,167,552) - 125.47% | $ 12,159,659 | |||
| Liabilities in Excess of Other Assets - Net - (25.47)% | (2,468,660) | |||
| NET ASSETS - 100.00% | $ 9,690,999 | |||
| + All or a portion of this security is on loan. Total loaned securities had a value of $2,500,915 at October 31, 2015. | ||||
| * Money Market Fund; Interest rate reflects seven-day effective yield on October 31, 2015. | ||||
| EAFE - Europe, Australasia, Far East | ||||
| ETF - Exchange Traded Fund | ||||
| MSCI - Morgan Stanley Capital International | ||||
| SPDR - Standard & Poors' Depositary Receipts | ||||
| 32 |
| CLS Funds Semi-Annual Report | ||||
| Schedule of Investments - Enhanced Long/Short Fund (Unaudited) | ||||
| October 31, 2015 | ||||
| Shares | Value | |||
| Equity Funds - 98.23% | ||||
| Developed International - 14.40% | ||||
| iShares MSCI EAFE ETF | 70,000 | $ 1,666,000 | ||
| iShares MSCI Canada ETF | 194,200 | 11,867,562 | ||
| 13,533,562 | ||||
| Emerging Markets - 1.84% | ||||
| iShares Latin America 40 ETF | 32,000 | 758,080 | ||
| iShares MSCI Emerging Markets ETF + | 28,000 | 976,360 | ||
| 1,734,440 | ||||
| Inverse Equity - 30.79% | ||||
| ProShares Short Dow30 * | 443,600 | 9,985,436 | ||
| ProShares Short Russell2000 * + | 68,000 | 4,168,400 | ||
| ProShares Short S&P500 * | 714,000 | 14,779,800 | ||
| 28,933,636 | ||||
| Large Cap Core - 28.69% | ||||
| iShares Core S&P 500 ETF + | 24,000 | 5,017,200 | ||
| SPDR Consumer Staples Select Sector Fund | 18,000 | 897,840 | ||
| SPDR Industrial Select Sector Fund | 40,000 | 2,170,800 | ||
| SPDR S&P 500 ETF Trust + | 82,500 | 17,154,225 | ||
| Vanguard Health Care ETF + | 13,200 | 1,728,276 | ||
| 26,968,341 | ||||
| Large Cap Growth - 6.75% | ||||
| Powershares QQQ Trust Series 1 + | 45,550 | 5,162,181 | ||
| SPDR Technology Select Sector Fund | 27,000 | 1,178,550 | ||
| 6,340,731 | ||||
| Large Cap Value - 11.53% | ||||
| SPDR Dow Jones Industrial Average ETF Trust + | 32,000 | 5,647,680 | ||
| SPDR Energy Select Sector Fund + | 19,000 | 1,292,570 | ||
| SPDR Financial Select Sector Fund | 40,000 | 963,200 | ||
| SPDR S&P Bank ETF + | 85,000 | 2,931,650 | ||
| 10,835,100 | ||||
| Small/Mid Cap Core - 4.23% | ||||
| iShares Russell 2000 ETF + | 26,000 | 2,998,840 | ||
| SPDR S&P MidCap 400 ETF Trust | 3,700 | 972,027 | ||
| 3,970,867 | ||||
| Total Equity Funds (cost $95,145,384) | 92,316,677 | |||
| Money Market Funds - 2.03% | ||||
| Federated Prime Cash Obligations Fund Institutional Class, 0.09% ** | 1,909,009 | 1,909,009 | ||
| Total Money Market Funds (cost $1,909,009) | 1,909,009 | |||
| Total Investments (cost $97,054,393) - 100.26% | $ 94,225,686 | |||
| Liabilities in Excess of Other Assets - Net - (0.26)% | (243,365) | |||
| NET ASSETS - 100.00% | $ 93,982,321 | |||
| + Subject to written options. | ||||
| * Non-income producing security. | ||||
| ** Money Market Fund; Interest rate reflects seven-day effective yield on October 31, 2015. | ||||
| The market value of securities held to cover written call options at October 31, 2015 was $30,342,480. | ||||
| EAFE - Europe, Australasia, Far East | ||||
| ETF - Exchange Traded Fund | ||||
| MSCI - Morgan Stanley Capital International | ||||
| SPDR - Standard & Poors' Depositary Receipts | ||||
| 33 |
| CLS Funds Semi-Annual Report | ||||
| Schedule of Investments - Enhanced Long/Short Fund (Unaudited) (Continued) | ||||
| October 31, 2015 | ||||
| Contracts** | Value | |||
| Schedule of Call Options Written * | ||||
| iShares Core S&P 500 ETF | 50 | $ 2,500 | ||
| November 2015, Exercise Price $215.00 | ||||
| iShares MSCI Emerging Markets ETF | 50 | 100 | ||
| November 2015, Exercise Price $38.00 | ||||
| iShares MSCI Emerging Markets ETF | 100 | 200 | ||
| November 2015, Exercise Price $39.00 | ||||
| iShares Russell 2000 ETF | 65 | 455 | ||
| November 2015, Exercise Price $122.00 | ||||
| iShares Russell 2000 ETF | 65 | 195 | ||
| November 2015, Exercise Price $123.00 | ||||
| Powershares QQQ Trust Series 1 | 120 | 22,920 | ||
| November 2015, Exercise Price $113.00 | ||||
| Powershares QQQ Trust Series 1 | 120 | 16,080 | ||
| November 2015, Exercise Price $114.00 | ||||
| Powershares QQQ Trust Series 1 | 100 | 8,700 | ||
| November 2015, Exercise Price $115.00 | ||||
| Powershares QQQ Trust Series 1 | 65 | 1,755 | ||
| November 2015, Exercise Price $117.50 | ||||
| ProShares Short Russell2000 | 135 | 2,700 | ||
| November 2015, Exercise Price $68.00 | ||||
| ProShares Short Russell2000 | 135 | 2,700 | ||
| November 2015, Exercise Price $69.00 | ||||
| SPDR Dow Jones Industrial Average ETF Trust | 65 | 4,030 | ||
| November 2015, Exercise Price $180.00 | ||||
| SPDR Dow Jones Industrial Average ETF Trust | 65 | 2,275 | ||
| November 2015, Exercise Price $181.00 | ||||
| SPDR Dow Jones Industrial Average ETF Trust | 65 | 1,430 | ||
| November 2015, Exercise Price $182.50 | ||||
| SPDR Energy Select Sector Fund | 40 | 320 | ||
| November 2015, Exercise Price $74.00 | ||||
| SPDR Energy Select Sector Fund | 50 | 100 | ||
| November 2015, Exercise Price $75.00 | ||||
| SPDR Energy Select Sector Fund | 50 | 125 | ||
| November 2015, Exercise Price $76.00 | ||||
| SPDR S&P 500 ETF Trust | 150 | 10,950 | ||
| November 2015, Exercise Price $212.00 | ||||
| SPDR S&P 500 ETF Trust | 150 | 7,350 | ||
| November 2015, Exercise Price $213.00 | ||||
| SPDR S&P 500 ETF Trust | 150 | 4,800 | ||
| November 2015, Exercise Price $214.50 | ||||
| SPDR S&P 500 ETF Trust | 150 | 3,750 | ||
| November 2015, Exercise Price $215.50 | ||||
| SPDR S&P 500 ETF Trust | 150 | 1,950 | ||
| November 2015, Exercise Price $216.50 | ||||
| SPDR S&P Bank ETF | 150 | 3,000 | ||
| November 2015, Exercise Price $36.00 | ||||
| Vanguard Health Care ETF | 40 | 2,900 | ||
| November 2015, Exercise Price $135.00 | ||||
| Total Call Options Written (proceeds $30,557) | $ 101,285 | |||
| * Non-income producing security. | ||||
| ** Each option contract allows the holder of the option to purchase or sell 100 shares of the underlying security. | ||||
| 34 |
| CLS Funds Semi-Annual Report | ||||
| Schedule of Investments - Flexible Income Fund (Unaudited) | ||||
| October 31, 2015 | ||||
| Shares | Value | |||
| Bond Funds - 82.52% | ||||
| High Yield Bonds - 19.32% | ||||
| iShares iBoxx $ High Yield Corporate Bond ETF + | 101,080 | $ 8,649,416 | ||
| Peritus High Yield ETF | 50,444 | 1,827,082 | ||
| PIMCO 0-5 Year High Yield Corporate Bond Index ETF + | 56,295 | 5,455,548 | ||
| PowerShares Senior Loan Portfolio + | 434,800 | 10,000,400 | ||
| SPDR Barclays Short Term High Yield Bond ETF + | 252,775 | 6,900,758 | ||
| SPDR Blackstone / GSO Senior Loan ETF + | 42,500 | 2,024,700 | ||
| 34,857,904 | ||||
| Intermediate/Long-Term Bonds - 37.62% | ||||
| iShares 3-7 Year Treasury Bond ETF + | 41,200 | 5,105,092 | ||
| iShares 20+ Year Treasury Bond ETF + | 11,000 | 1,350,580 | ||
| iShares Core U.S. Aggregate Bond ETF | 90,626 | 9,919,016 | ||
| iShares Core US Credit Bond ETF | 33,450 | 3,641,033 | ||
| iShares iBoxx $ Investment Grade Corporate Bond ETF | 18,725 | 2,179,964 | ||
| iShares Intermediate Credit Bond ETF | 90,380 | 9,833,344 | ||
| iShares National AMT-Free Muni Bond ETF | 31,275 | 3,431,180 | ||
| iShares TIPS Bond ETF | 67,548 | 7,495,126 | ||
| PIMCO Total Return Active ETF + | 47,901 | 5,089,960 | ||
| SPDR Doubleline Total Return Tactical ETF + | 41,100 | 2,031,984 | ||
| Vanguard Intermediate-Term Corporate Bond ETF + | 94,483 | 8,071,683 | ||
| Vanguard Mortgage-Backed Securities ETF + | 41,000 | 2,184,480 | ||
| Vanguard Total Bond Market ETF | 92,385 | 7,556,169 | ||
| 67,889,611 | ||||
| International Bond - 6.98% | ||||
| iShares Emerging Markets Local Currency Bond ETF + | 52,400 | 2,163,591 | ||
| iShares JP Morgan USD Emerging Markets Bond ETF + | 65,350 | 7,090,475 | ||
| SPDR DB International Government Inflation-Protected Bond ETF | 63,675 | 3,351,215 | ||
| 12,605,281 | ||||
| Short-Term Bonds - 18.60% | ||||
| iShares 1-3 Year Treasury Bond ETF | 17,541 | 1,488,003 | ||
| iShares Floating Rate Bond ETF | 62,678 | 3,159,598 | ||
| PIMCO 1-5 Year U.S. TIPS Index ETF + | 71,372 | 3,679,940 | ||
| PIMCO Enhanced Short Maturity Active ETF + | 171,117 | 17,262,283 | ||
| SPDR Nuveen Barclays Short Term Municipal Bond ETF | 139,255 | 3,400,607 | ||
| Vanguard Short-Term Corporate Bond ETF | 57,375 | 4,571,640 | ||
| 33,562,071 | ||||
| Total Bond Funds (cost $153,141,470) | 148,914,867 | |||
| Equity Funds - 9.33% | ||||
| Commodity - 0.83% | ||||
| United States Commodity Index Fund * + | 35,500 | 1,489,935 | ||
| Currency - 1.23% | ||||
| PowerShares DB US Dollar Index Bullish Fund * + | 88,000 | 2,222,000 | ||
| Developed International - 0.86% | ||||
| iShares MSCI EAFE ETF | 12,500 | 763,875 | ||
| iShares MSCI EAFE Value ETF + | 16,000 | 786,880 | ||
| 1,550,755 | ||||
| 35 |
| CLS Funds Semi-Annual Report | ||||
| Schedule of Investments - Flexible Income Fund (Unaudited) (Continued) | ||||
| October 31, 2015 | ||||
| Shares | Value | |||
| Emerging Markets - 0.23% | ||||
| Vanguard FTSE Emerging Markets ETF | 12,000 | $ 418,080 | ||
| Large Cap Core - 1.76% | ||||
| iShares Core S&P 500 ETF | 15,200 | 3,177,560 | ||
| Large Cap Growth - 0.24% | ||||
| Vanguard Growth ETF | 4,000 | 437,160 | ||
| Large Cap Value - 1.21% | ||||
| PowerShares S&P 500 Low Volatility Portfolio + | 26,800 | 1,028,048 | ||
| Vanguard High Dividend Yield ETF | 17,000 | 1,154,640 | ||
| 2,182,688 | ||||
| Preferred Security - 2.97% | ||||
| iShares US Preferred Stock ETF + | 46,775 | 1,836,386 | ||
| PowerShares Financial Preferred Portfolio + | 119,461 | 2,216,002 | ||
| PowerShares Preferred Portfolio + | 88,700 | 1,313,647 | ||
| 5,366,035 | ||||
| Total Equity Funds (cost $16,348,737) | 16,844,213 | |||
| Principal ($) | Value | |||
| U.S. Government and Agency Obligations - 7.77% | ||||
| Fannie Mae, 3.50%, due 12/1/2030 | $ 313,813 | 330,851 | ||
| Fannie Mae, 3.50%, due 7/1/2032 | 632,663 | 667,085 | ||
| Fannie Mae, 4.00%, due 2/1/2040 | 332,244 | 354,023 | ||
| Fannie Mae, 4.00%, due 10/1/2040 | 302,640 | 322,842 | ||
| Fannie Mae, 4.00%, due 6/1/2041 | 544,143 | 580,708 | ||
| Fannie Mae, 4.00%, due 9/1/2041 | 671,173 | 716,379 | ||
| Fannie Mae, 4.00%, due 12/1/2041 | 402,161 | 429,437 | ||
| Fannie Mae, 5.00%, due 11/1/2039 | 374,782 | 418,075 | ||
| Fannie Mae, 5.00%, due 2/1/2040 | 590,478 | 654,543 | ||
| Fannie Mae, 5.50%, due 12/1/2039 | 256,786 | 289,249 | ||
| Fannie Mae, 5.50%, due 4/1/2040 | 339,627 | 379,565 | ||
| Fannie Mae, 6.00%, due 12/1/2035 | 358,913 | 409,702 | ||
| Fannie Mae, 6.00%, due 12/1/2038 | 125,694 | 142,414 | ||
| Federal Home Loan Banks, 2.90%, due 4/20/2017 | 144,738 | 148,245 | ||
| Federal Home Loan Mortgage Corp., 2.00%, due 3/12/2020 | 1,000,000 | 1,019,670 | ||
| Federal Home Loan Mortgage Corp., 5.40%, due 3/17/2021 | 750,000 | 763,982 | ||
| Federal National Mortgage Association, 2.00%, due 8/28/2020 | 1,000,000 | 1,011,399 | ||
| Freddie Mac Gold Pool, 4.50%, due 2/1/2041 | 372,003 | 404,550 | ||
| Freddie Mac Gold Pool, 5.50%, due 6/1/2034 | 337,121 | 375,710 | ||
| Freddie Mac Gold Pool, 6.00%, due 5/1/2037 | 117,109 | 132,794 | ||
| Freddie Mac Gold Pool, 6.50%, due 4/1/2039 | 166,432 | 190,337 | ||
| Government National Mortgage Association, 3.50%, due 7/16/2039 | 161,833 | 168,109 | ||
| Government National Mortgage Association, 4.00%, due 2/20/2039 | 365,095 | 376,484 | ||
| United States Treasury Note/Bond, 4.25%, due 11/15/2017 | 2,500,000 | 2,674,592 | ||
| United States Treasury Note/Bond, 4.50%, due 5/15/2017 | 1,000,000 | 1,059,329 | ||
| Total U.S. Government and Agency Obligations (cost $13,554,335) | 14,020,074 | |||
| 36 |
| CLS Funds Semi-Annual Report | ||||
| Schedule of Investments - Flexible Income Fund (Unaudited) (Continued) | ||||
| October 31, 2015 | ||||
| Shares | Value | |||
| Money Market Funds - 0.36% | ||||
| Short-Term Cash - 0.36% | ||||
| Federated Prime Cash Obligations Fund Institutional Class, 0.09% ** | 650,825 | $ 650,825 | ||
| Total Money Market Funds (cost $650,825) | 650,825 | |||
| Collateral for Securities Loaned - 22.44% | ||||
| Dreyfus Government Cash Management Institutional Class, 0.01% ** | 6,490,306 | 6,490,306 | ||
| Milestone Treasury Obligations Fund Institutional Class, 0.01% ** ^ | 34,000,000 | 34,000,000 | ||
| Total Collateral for Securities Loaned (cost $40,490,306) | 40,490,306 | |||
| Total Investments (cost $224,195,673) - 122.42% | $ 220,920,285 | |||
| Liabilities in Excess of Other Assets - Net - (22.42)% | (40,465,940) | |||
| NET ASSETS - 100.00% | $ 180,454,345 | |||
| + All or a portion of this security is on loan. Total loaned securities had a value of $39,621,246 at October 31, 2015. | ||||
| * Non-income producing security. | ||||
| ** Money Market Fund; Interest rate reflects seven-day effective yield on October 31, 2015. | ||||
| ^ Represtents affiliated issuer | ||||
| AMT - Alternative Minimum Tax | ||||
| DB - Deutsche Bank | ||||
| EAFE - Europe, Australasia, Far East | ||||
| ETF - Exchange Traded Fund | ||||
| FTSE - Financial Times Stock Exchange | ||||
| MSCI - Morgan Stanley Capital International | ||||
| SPDR - Standard & Poors' Depositary Receipts | ||||
| TIPS - Treasury Inflation-Protected Securities | ||||
| 37 |
| CLS Funds Semi-Annual Report | ||||
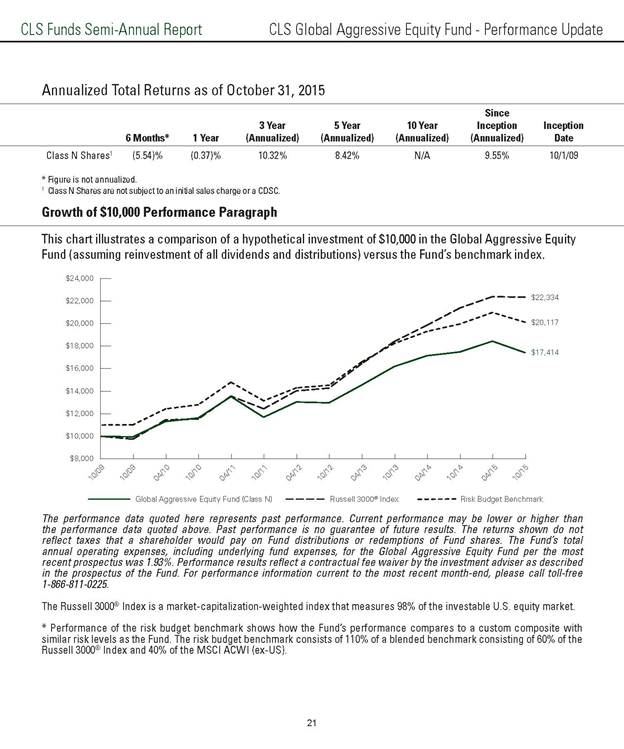
| Schedule of Investments - Global Aggressive Equity Fund (Unaudited) | ||||
| October 31, 2015 | ||||
| Shares | Value | |||
| Equity Funds - 99.92% | ||||
| Alternative - 7.55% | ||||
| ProShares Large Cap Core Plus | 92,000 | $ 4,610,120 | ||
| WisdomTree Managed Futures Strategy Fund * | 40,000 | 1,652,400 | ||
| 6,262,520 | ||||
| Developed International - 25.57% | ||||
| Deutsche X-trackers MSCI Europe Hedged Equity ETF | 80,000 | 2,132,800 | ||
| Deutsche X-trackers MSCI Japan Hedged Equity ETF + | 126,000 | 4,983,300 | ||
| First Trust Dorsey Wright International Focus 5 ETF + | 215,000 | 3,951,700 | ||
| iShares International Select Dividend ETF + | 52,000 | 1,558,960 | ||
| iShares MSCI Europe Financials ETF | 63,000 | 1,355,130 | ||
| iShares MSCI Ireland Capped ETF | 50,000 | 1,972,000 | ||
| iShares MSCI United Kingdom ETF + | 83,000 | 1,450,010 | ||
| WisdomTree Europe SmallCap Dividend Fund + | 68,000 | 3,810,720 | ||
| 21,214,620 | ||||
| Emerging Markets - 6.15% | ||||
| Global X China Financials ETF | 33,000 | 488,730 | ||
| iShares MSCI All Country Asia ex Japan ETF + | 17,500 | 988,575 | ||
| iShares MSCI India ETF | 24,000 | 683,520 | ||
| iShares MSCI South Korea Capped ETF | 7,000 | 380,660 | ||
| Market Vectors Vietnam ETF + | 22,000 | 373,120 | ||
| SPDR S&P Emerging Asia Pacific ETF | 28,000 | 2,189,040 | ||
| 5,103,645 | ||||
| Global Equity - 3.15% | ||||
| Fidelity MSCI Energy Index ETF + | 21,000 | 406,770 | ||
| PowerShares Global Listed Private Equity Portfolio | 201,000 | 2,206,980 | ||
| 2,613,750 | ||||
| Large Cap Core - 19.19% | ||||
| First Trust NASDAQ Technology Dividend Index Fund | 198,000 | 5,231,160 | ||
| Guggenheim S&P 500 Equal Weight ETF + | 43,500 | 3,423,450 | ||
| Market Vectors Morningstar Wide Moat ETF + | 241,000 | 7,261,330 | ||
| 15,915,940 | ||||
| Large Cap Growth - 11.71% | ||||
| iShares U.S. Oil Equipment & Services ETF + | 24,000 | 969,600 | ||
| iShares PHLX Semiconductor ETF + | 49,000 | 4,387,460 | ||
| Market Vectors Gold Miners ETF | 37,000 | 553,520 | ||
| Powershares Dynamic Pharmaceuticals Portfolio + | 54,000 | 3,803,220 | ||
| 9,713,800 | ||||
| Large Cap Value - 2.51% | ||||
| First Trust Capital Strength ETF + | 54,000 | 2,080,080 | ||
| Small/Mid Cap Core - 3.68% | ||||
| Guggenheim Spin-Off ETF | 74,000 | 3,050,280 | ||
| Small/Mid Cap Growth - 8.69% | ||||
| First Trust US IPO Index Fund | 48,000 | 2,500,320 | ||
| iShares U.S. Medical Devices ETF + | 39,500 | 4,709,190 | ||
| 7,209,510 | ||||
| 38 |
| CLS Funds Semi-Annual Report | ||||
| Schedule of Investments - Global Aggressive Equity Fund (Unaudited) (Continued) | ||||
| October 31, 2015 | ||||
| Shares | Value | |||
| Small/Mid Cap Value - 11.72% | ||||
| Guggenheim Shipping ETF + | 109,000 | $ 1,693,827 | ||
| Guggenheim Timber ETF | 162,000 | 3,973,860 | ||
| iShares U.S. Insurance ETF | 77,500 | 4,056,583 | ||
| 9,724,270 | ||||
| Total Equity Funds (cost $71,063,684) | 82,888,415 | |||
| Collateral for Securities Loaned - 29.71% | ||||
| Dreyfus Government Cash Management Institutional Class, 0.01% ** | 13,640,981 | 13,640,981 | ||
| Milestone Treasury Obligations Fund Institutional Class, 0.01% ** ^ | 11,000,000 | 11,000,000 | ||
| Total Collateral for Securities Loaned (cost $24,640,981) | 24,640,981 | |||
| Total Investments (cost $95,704,665) - 129.63% | $ 107,529,396 | |||
| Liabilities in Excess of Other Assets - Net - (29.63)% | (24,579,173) | |||
| NET ASSETS - 100.00% | $ 82,950,223 | |||
| + All or a portion of this security is on loan. Total loaned securities had a value of $24,099,473 at October 31, 2015. | ||||
| * Non-income producing security. | ||||
| ** Money Market Fund; Interest rate reflects seven-day effective yield on October 31, 2015. | ||||
| ^ Represtents affiliated issuer | ||||
| ETF - Exchange Traded Fund | ||||
| IPO - Initial Public Offering | ||||
| MSCI - Morgan Stanley Capital International | ||||
| PHLX - Philadelphia Stock Exchange | ||||
| SPDR - Standard & Poors' Depositary Receipts | ||||
| 39 |
| CLS Funds Semi-Annual Report | ||||
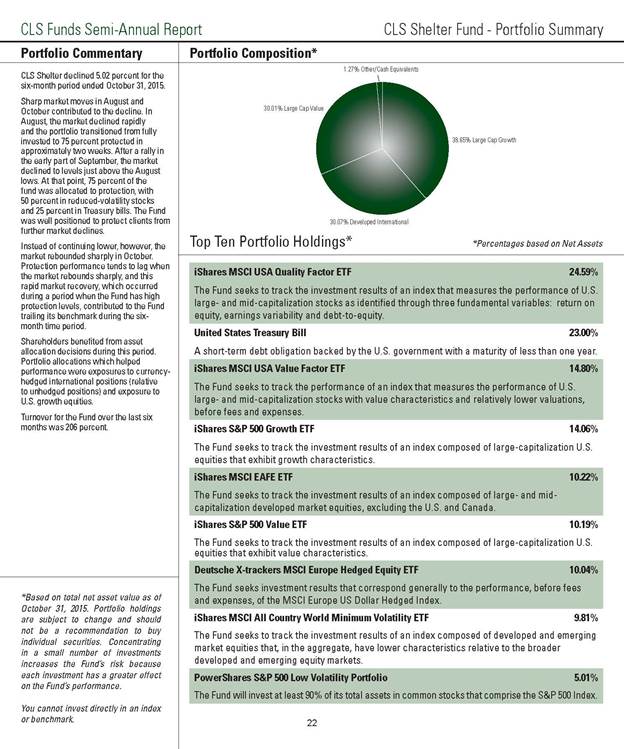
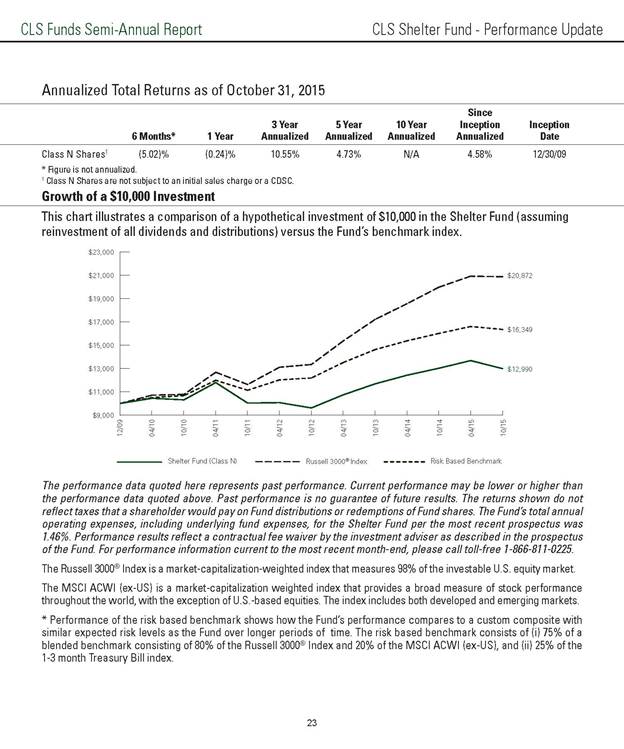
| Schedule of Investments - Shelter Fund (Unaudited) | ||||
| October 31, 2015 | ||||
| Shares | Value | |||
| Equity Funds - 98.73% | ||||
| Developed International - 30.07% | ||||
| Deutsche X-trackers MSCI Europe Hedged Equity ETF | 360,000 | $ 9,597,600 | ||
| iShares MSCI All Country World Minimum Volatility ETF | 133,000 | 9,385,810 | ||
| iShares MSCI EAFE ETF | 160,000 | 9,777,600 | ||
| 28,761,010 | ||||
| Large Cap Growth - 38.65% | ||||
| iShares MSCI USA Quality Factor ETF + | 358,000 | 23,513,440 | ||
| iShares S&P 500 Growth ETF | 114,000 | 13,450,860 | ||
| 36,964,300 | ||||
| Large Cap Value - 30.01% | ||||
| iShares MSCI USA Value Factor ETF + | 220,000 | 14,154,800 | ||
| iShares S&P 500 Value ETF | 108,000 | 9,744,840 | ||
| PowerShares S&P 500 Low Volatility Portfolio + | 125,000 | 4,795,000 | ||
| 28,694,640 | ||||
| Total Equity Funds (cost $92,133,080) | 94,419,950 | |||
| Principal ($) | Value | |||
| U.S. Government Securities - 23.00% | ||||
| U.S. Treasury Bill: 0.00%, 11/02/15 | $ 22,000,000 | 22,000,006 | ||
| Total U.S. Government (cost $22,000,006) | 22,000,006 | |||
| Shares | Value | |||
| Money Market Funds - 1.01% | ||||
| Short-Term Cash - 1.01% | ||||
| Federated Prime Cash Obligations Fund Institutional Class, 0.09% * | 968,382 | 968,382 | ||
| Total Money Market Funds (cost $968,382) | 968,382 | |||
| Collateral for Securities Loaned - 9.59% | ||||
| Dreyfus Government Cash Management Institutional Class, 0.01% * | 9,170,856 | 9,170,856 | ||
| Total Collateral for Securities Loaned (cost $9,170,856) | 9,170,856 | |||
| Total Investments (cost $124,272,324) - 132.33% | $ 126,559,194 | |||
| Liabilities in Excess of Other Assets - Net - (32.33)% | (30,920,759) | |||
| NET ASSETS - 100.00% | $ 95,638,435 | |||
| + All or a portion of this security is on loan. Total loaned securities had a value of $8,970,426 at October 31, 2015. | ||||
| * Money Market Fund; Interest rate reflects seven-day effective yield on October 31, 2015. | ||||
| EAFE - Europe, Australasia, Far East | ||||
| ETF - Exchange Traded Fund | ||||
| MSCI - Morgan Stanley Capital International | ||||
| 40 |
| CLS Funds Semi-Annual Report | |||||
| Statements of Assets and Liabilities (Unaudited) | |||||
| October 31, 2015 | |||||
| Global | Growth and | Global | Domestic | International | |
| Diversified | Income | Growth | Equity | Equity | |
| Assets: | Equity Fund | Fund | Fund | Fund | Fund |
| Investments, at cost | $ 424,732,655 | $ 355,782,603 | $ 238,049,043 | $ 18,667,640 | $ 12,167,552 |
| Affiliated Investments, at cost | 23,500,000 | 38,000,000 | 51,900,000 | - | - |
| Investments in securities, at value * | $ 485,733,273 | $ 374,175,594 | $ 259,778,020 | $ 19,945,136 | $ 12,159,659 |
| Affiliated Investments in securities, at value | 23,500,000 | 38,000,000 | 51,900,000 | - | - |
| Receivable for securities sold | 25,420,732 | 21,069,649 | 3,003,476 | 201,226 | 235,296 |
| Receivable for fund shares sold | 336,094 | 286,491 | 210,894 | - | 4,279 |
| Receivable for security lending | 54,741 | 105,204 | 39,090 | 11,151 | 4,103 |
| Interest and dividends receivable | - | 7,930 | 3,622 | - | - |
| Receivable due from advisor | - | - | - | 5,157 | 7,194 |
| Prepaid expenses and other assets | 24,926 | 20,308 | 11,794 | 10,663 | 12,705 |
| Total Assets | 535,069,766 | 433,665,176 | 314,946,896 | 20,173,333 | 12,423,236 |
| Liabilities: | |||||
| Securities lending collateral (Note 7) | 27,245,009 | 38,963,016 | 56,150,152 | 4,222,146 | 2,564,804 |
| Due to custodian | - | - | - | 35,374 | 79,938 |
| Payable for securities purchased | 25,203,220 | 21,685,303 | - | - | - |
| Payable for fund shares redeemed | 878,500 | 686,547 | 495,153 | 22,698 | 18,472 |
| Accrued advisory fees | 281,541 | 217,697 | 136,435 | - | - |
| Fees payable to other affiliates | 78,443 | 65,867 | 54,335 | 19,139 | 21,162 |
| Accrued distribution (12b-1) fees | 1,913 | - | - | - | - |
| Call options written, at fair value (premiums | |||||
| received $0, $0, $0, $0, $0) | - | - | - | - | - |
| Accrued expenses and other liabilities | 170,199 | 119,991 | 99,298 | 42,301 | 47,861 |
| Total Liabilities | 53,858,825 | 61,738,421 | 56,935,373 | 4,341,658 | 2,732,237 |
| Net Assets | $ 481,210,941 | $ 371,926,755 | $ 258,011,523 | $ 15,831,675 | $ 9,690,999 |
| Net Assets: | |||||
| Paid in capital ($0 par value, unlimited | $ 404,886,706 | $ 347,919,140 | $ 225,632,463 | $ 9,754,196 | $ 10,284,700 |
| shares authorized) | |||||
| Undistributed net investment income (loss) | 5,129,439 | 3,609,765 | 2,766,913 | 245,495 | 164,904 |
| Accumulated net realized gain (loss) | |||||
| on investments and written options | 10,194,178 | 2,004,859 | 7,883,170 | 4,554,488 | (750,712) |
| Net unrealized appreciation (depreciation) | |||||
| on investments and written options | 61,000,618 | 18,392,991 | 21,728,977 | 1,277,496 | (7,893) |
| Net Assets | $ 481,210,941 | $ 371,926,755 | $ 258,011,523 | $ 15,831,675 | $ 9,690,999 |
| Class C Shares: | |||||
| Net assets | $ 2,368,014 | $ - | $ - | $ - | $ - |
| Net asset value and offering price per share | |||||
| (Net assets ÷ Total shares of beneficial | |||||
| interest outstanding)** | $ 16.04 | $ - | $ - | $ - | $ - |
| Total shares outstanding at end of year | 147,600 | - | - | - | - |
| Class N Shares: | |||||
| Net assets | $ 478,842,927 | $ 371,926,755 | $ 258,011,523 | $ 15,831,675 | $ 9,690,999 |
| Net asset value, offering price, and redemption | |||||
| price per share | |||||
| (Net assets ÷ Total shares of beneficial | |||||
| interest outstanding) | $ 17.13 | $ 10.59 | $ 11.08 | $ 9.34 | $ 4.16 |
| Total shares outstanding at end of year | 27,952,854 | 35,112,949 | 23,293,340 | 1,694,853 | 2,330,843 |
| * Includes Securities Loaned $26,549,349; $38,092,213; $54,963,454; $4,134,332; $2,500,915. | |||||
| ** Redemption price is equal to net asset value less any applicable contingent deferred sales charge. | |||||
Refer to the Notes to Financials Statements at the back of this Report for further information regarding the values set forth above.
| 41 |
| CLS Funds Semi-Annual Report | ||||
| Statements of Assets and Liabilities (Unaudited)(Continued) | ||||
| October 31, 2015 | ||||
| Enhanced | Flexible | Global | ||
| Long/Short | Income | Aggressive | Shelter | |
| Assets: | Fund | Fund | Equity Fund | Fund |
| Investments, at cost | $ 97,054,393 | $ 190,195,673 | $ 84,704,665 | $ 124,272,324 |
| Affiliated Investments, at cost | - | 34,000,000 | 11,000,000 | - |
| Investments in securities, at value * | $ 94,225,686 | $ 186,920,285 | $ 96,529,396 | $ 126,559,194 |
| Affiliated Investments in securities, at value | - | 34,000,000 | 11,000,000 | - |
| Receivable for securities sold | - | 5,293,035 | 466,619 | 34,509,887 |
| Receivable for fund shares sold | 57,038 | 101,530 | 41,680 | 244,950 |
| Receivable for security lending | - | 64,784 | 41,854 | 14,939 |
| Interest and dividends receivable | 2,547 | 106,324 | - | - |
| Receivable due from advisor | - | - | - | - |
| Prepaid expenses and other assets | 20,178 | 21,850 | 20,716 | 11,410 |
| Total Assets | 94,305,449 | 226,507,808 | 108,100,265 | 161,340,380 |
| Liabilities: | ||||
| Securities lending collateral (Note 7) | - | 40,490,306 | 24,640,981 | 9,170,856 |
| Due to custodian | - | - | 236,427 | - |
| Payable for securities purchased | - | 5,271,079 | - | 56,151,962 |
| Payable for fund shares redeemed | 114,780 | 148,728 | 159,210 | 246,879 |
| Accrued advisory fees | 29,564 | 40,689 | 34,305 | 49,066 |
| Fees payable to other affiliates | 44,487 | 36,134 | 35,553 | 29,408 |
| Accrued distribution (12b-1) fees | - | - | - | - |
| Call options written, at fair value (premiums | ||||
| received $30,557,$0, $0, $0) | 101,285 | - | - | - |
| Accrued expenses and other liabilities | 33,012 | 66,527 | 43,566 | 53,774 |
| Total Liabilities | 323,128 | 46,053,463 | 25,150,042 | 65,701,945 |
| Net Assets | $ 93,982,321 | $ 180,454,345 | $ 82,950,223 | $ 95,638,435 |
| Net Assets: | ||||
| Paid in capital ($0 par value, unlimited | $ 97,775,788 | $ 183,739,259 | $ 67,256,005 | $ 86,507,970 |
| shares authorized) | ||||
| Undistributed net investment income (loss) | (5,260) | 533,644 | 1,064,011 | 1,186,987 |
| Accumulated net realized gain (loss) | ||||
| on investments and written options | (888,772) | (543,170) | 2,805,476 | 5,656,608 |
| Net unrealized appreciation (depreciation) | ||||
| on investments and written options | (2,899,435) | (3,275,388) | 11,824,731 | 2,286,870 |
| Net Assets | $ 93,982,321 | $�� 180,454,345 | $ 82,950,223 | $ 95,638,435 |
| Class C Shares: | ||||
| Net assets | $ - | $ - | $ - | $ - |
| Net asset value and offering price per share | ||||
| (Net assets ÷ Total shares of beneficial | ||||
| interest outstanding) | $ - | $ - | $ - | $ - |
| Total shares outstanding at end of year | - | - | - | - |
| Class N Shares: | ||||
| Net assets | $ 93,982,321 | $ 180,454,345 | $ 82,950,223 | $ 95,638,435 |
| Net asset value, offering price, and redemption | ||||
| price per share | ||||
| (Net assets ÷ Total shares of beneficial | ||||
| interest outstanding) | $ 10.36 | $ 10.10 | $ 12.97 | $ 12.68 |
| Total shares outstanding at end of year | 9,073,686 | 17,861,616 | 6,397,284 | 7,540,631 |
| * Includes Securities Loaned $0; $39,621,246; $24,099,473; $8,970,426. | ||||
Refer to the Notes to Financials Statements at the back of this Report for further information regarding the values set forth above.
| 42 |
| CLS Funds Semi-Annual Report | |||||
| Statements of Operations (Unaudited) | |||||
| For the Six Months Ended October 31, 2015 | |||||
| Global | Growth and | Global | Domestic | International | |
| Diversified | Income | Growth | Equity | Equity | |
| Equity Fund | Fund | Fund | Fund | Fund | |
| Investment Income: | |||||
| Interest income | $ 3,449 | $ 2,339 | $ 506 | $ 50 | $ 25 |
| Dividend income | 7,828,565 | 4,578,029 | 2,839,106 | 130,324 | 182,487 |
| Securities lending income-net * | 294,220 | 509,528 | 317,369 | 84,033 | 49,415 |
| Total investment income | 8,126,234 | 5,089,896 | 3,156,981 | 214,407 | 231,927 |
| Expenses: | |||||
| Investment advisory fees | 1,951,792 | 1,485,273 | 1,041,197 | 65,390 | 43,838 |
| Shareholder Service Fees | 647,562 | 495,091 | 347,066 | 21,797 | 14,613 |
| Distribution fees (12b-1) - Class C Shares | 12,144 | - | - | - | - |
| Administration fees | 177,730 | 149,181 | 118,964 | 18,773 | 18,011 |
| Transfer agent fees | 97,517 | 86,738 | 99,773 | 13,322 | 15,761 |
| Accounting fees | 45,069 | 35,840 | 29,919 | 13,537 | 13,537 |
| Printing and postage expense | 33,412 | 20,999 | 27,434 | 7,650 | 1,709 |
| Registration & filing fees | 22,562 | 13,538 | 12,534 | 12,534 | 12,534 |
| Professional fees | 20,403 | 14,342 | 12,468 | 9,877 | 12,139 |
| Custodian fees | 18,068 | 11,589 | 8,901 | - | - |
| Insurance expense | 17,257 | 10,131 | 7,622 | 620 | 1,380 |
| Chief compliance officer fees | 7,607 | 4,238 | 3,195 | 1,185 | 1,869 |
| Trustees' fees | 6,769 | 6,769 | 5,265 | 6,919 | 6,518 |
| Miscellaneous fees and expenses | 2,632 | 2,106 | 2,405 | 906 | 1,572 |
| Total expenses before waivers | 3,060,524 | 2,335,835 | 1,716,743 | 172,510 | 143,481 |
| Expenses waived | (63,729) | (61,269) | (122,517) | (72,387) | (76,458) |
| Net Expenses | 2,996,795 | 2,274,566 | 1,594,226 | 100,123 | 67,023 |
| Net Investment Income | 5,129,439 | 2,815,330 | 1,562,755 | 114,284 | 164,904 |
| Net Realized and Unrealized Gain (Loss) | |||||
| on Investments: | |||||
| Net realized gain (loss) on: | |||||
| Investments | (4,786,086) | 2,651,673 | (95,376) | 117,714 | (720,403) |
| Options written | - | - | - | - | - |
| Total net realized gain (loss) | (4,786,086) | 2,651,673 | (95,376) | 117,714 | (720,403) |
| Net change in unrealized | |||||
| depreciation on investments | (35,580,396) | (20,871,166) | (14,777,734) | (227,587) | (905,470) |
| Net change in unrealized | |||||
| depreciation on written options | - | - | - | - | - |
| Net Realized and Unrealized Loss | |||||
| on Investments | (40,366,482) | (18,219,493) | (14,873,110) | (109,873) | (1,625,873) |
| Net Increase (Decrease) in Net Assets | |||||
| Resulting from Operations | $ (35,237,043) | $ (15,404,163) | $(13,310,355) | $ 4,411 | $ (1,460,969) |
| * A portion of securities lending income is from affilicated securites | |||||
Refer to the Notes to Financials Statements at the back of this Report for further information regarding the values set forth above.
| 43 |
| CLS Funds Semi-Annual Report | |||||
| Statements of Operations (Unaudited)(Continued) | |||||
| For the Six Months Ended October 31, 2015 | |||||
| Enhanced | Flexible | Global | |||
| Long/Short | Income | Aggressive | Shelter | ||
| Fund | Fund | Equity Fund | Fund | ||
| Investment Income: | |||||
| Interest income | $ 309 | $ 197,190 | $ 33 | $ 1,156 | |
| Dividend income | 699,212 | 2,262,401 | 1,134,446 | 1,066,880 | |
| Securities lending income-net * | - | 384,069 | 333,782 | 74,508 | |
| Total investment income | 699,521 | 2,843,660 | 1,468,261 | 1,142,544 | |
| Expenses: | |||||
| Investment advisory fees | 324,540 | 378,900 | 344,403 | 363,085 | |
| Shareholder Service Fees | 124,823 | 236,813 | 114,801 | 121,028 | |
| Distribution fees (12b-1) - Class C Shares | - | - | - | - | |
| Administration fees | 51,714 | 90,849 | 48,059 | 30,445 | |
| Transfer agent fees | 82,727 | 84,531 | 51,139 | 11,031 | |
| Accounting fees | 20,935 | 25,509 | 20,209 | 22,270 | |
| Printing and postage expense | 8,127 | 10,523 | 12,228 | 3,832 | |
| Registration & filing fees | 12,534 | 12,784 | 12,283 | 11,531 | |
| Professional fees | 8,136 | 10,014 | 8,226 | 7,725 | |
| Custodian fees | 3,587 | 6,083 | 3,576 | 2,769 | |
| Insurance expense | 2,915 | 5,380 | 2,606 | 1,954 | |
| Chief compliance officer fees | 1,268 | 2,212 | 1,363 | 558 | |
| Trustees' fees | 6,868 | 6,268 | 5,766 | 6,518 | |
| Miscellaneous fees and expenses | 1,654 | 2,006 | 1,831 | 502 | |
| Total expenses before waivers | 649,828 | 871,872 | 626,490 | 583,248 | |
| Expenses waived | (126,020) | (114,615) | (99,342) | (27,100) | |
| Net Expenses | 523,808 | 757,257 | 527,148 | 556,148 | |
| Net Investment Income | 175,713 | 2,086,403 | 941,113 | 586,396 | |
| Net Realized and Unrealized Gain (Loss) | |||||
| on Investments: | |||||
| Net realized gain (loss) on: | |||||
| Investments | (624,336) | (70,058) | 98,727 | 5,366,403 | |
| Options written | 303,078 | - | - | - | |
| Total net realized gain (loss) | (321,258) | (70,058) | 98,727 | 5,366,403 | |
| Net change in unrealized | |||||
| depreciation on investments | (1,483,545) | (4,615,000) | (6,575,602) | (10,859,514) | |
| Net change in unrealized | |||||
| depreciation on written options | (75,632) | - | - | - | |
| Net Realized and Unrealized Loss | |||||
| on Investments | (1,880,435) | (4,685,058) | (6,476,875) | (5,493,111) | |
| Net Decrease in Net Assets | |||||
| Resulting from Operations | $ (1,704,722) | $ (2,598,655) | $ (5,535,762) | $ (4,906,715) | |
| * A portion of securities lending income is from affilicated securites | |||||
Refer to the Notes to Financials Statements at the back of this Report for further information regarding the values set forth above.
| 44 |
| CLS Funds Semi-Annual Report | |||||
| Statements of Changes in Net Assets | |||||
| Global Diversified Equity Fund | Growth and Income Fund | ||||
| Six Months Ended | Six Months Ended | ||||
| October 31, 2015 | Year Ended | October 31, 2015 | Year Ended | ||
| (Unaudited) | April 30, 2015 | (Unaudited) | April 30, 2015 | ||
| Increase (Decrease) in Net Assets: | |||||
| From Operations: | |||||
| Net investment income | $ 5,129,439 | $ 6,323,606 | $ 2,815,330 | $ 4,958,057 | |
| Net realized gain (loss) on investments | (4,786,086) | 30,579,215 | 2,651,673 | (52,550) | |
| Net realized loss on securities sold short | - | - | - | - | |
| Net realized gain on written options | - | - | - | - | |
| Distributions of realized gains | |||||
| by underlying investment companies | - | - | - | 11,140 | |
| Net change in unrealized appreciation | |||||
| (depreciation) on investments | (35,580,396) | (1,212,660) | (20,871,166) | 7,968,705 | |
| Net change in unrealized appreciation | |||||
| on securities sold short | - | - | - | - | |
| Net change in unrealized | |||||
| depreciation on written options | - | - | - | - | |
| Net increase (decrease) in net assets | |||||
| resulting from operations | (35,237,043) | 35,690,161 | (15,404,163) | 12,885,352 | |
| From Distributions to Shareholders: | |||||
| From Net Investment Income: | |||||
| Class N | - | (10,722,764) | - | (4,114,557) | |
| From Net Realized Gains: | |||||
| Class N | - | (5,383,486) | - | (3,030,552) | |
| Total Dividends and Distributions | |||||
| to Shareholders | - | (16,106,250) | - | (7,145,109) | |
| From Fund Share Transactions (Note 6) | (53,633,973) | 63,793,985 | (36,154,727) | 112,160,361 | |
| Total Increase (Decrease) in Net Assets | (88,871,016) | 83,377,896 | (51,558,890) | 117,900,604 | |
| Net Assets: | |||||
| Beginning of year | 570,081,957 | 486,704,061 | 423,485,645 | 305,585,041 | |
| End of year | $ 481,210,941 | $ 570,081,957 | $ 371,926,755 | $ 423,485,645 | |
| Undistributed net investment income | |||||
| at end of year | $ 5,129,439 | $ - | $ 3,609,765 | $ 794,435 | |
Refer to the Notes to Financials Statements at the back of this Report for further information regarding the values set forth above.
| 45 |
| CLS Funds Semi-Annual Report | |||||
| Statements of Changes in Net Assets (Continued) | |||||
| Global Growth Fund | Domestic Equity Fund | ||||
| Six Months Ended | Six Months Ended | ||||
| October 31, 2015 | Year Ended | October 31, 2015 | Year Ended | ||
| (Unaudited) | April 30, 2015 | (Unaudited) | April 30, 2015 | ||
| Increase (Decrease) in Net Assets: | |||||
| From Operations: | |||||
| Net investment income | $ 1,562,755 | $ 3,180,710 | $ 114,284 | $ 1,142,937 | |
| Net realized gain (loss) on investments | (95,376) | 9,590,633 | 117,714 | 35,378,249 | |
| Net realized loss on securities sold short | - | - | - | - | |
| Net realized gain on written options | - | - | - | - | |
| Distributions of realized gains | |||||
| by underlying investment companies | - | 598,146 | - | - | |
| Net change in unrealized appreciation | |||||
| (depreciation) on investments | (14,777,734) | 1,993,131 | (227,587) | (31,603,774) | |
| Net change in unrealized appreciation | |||||
| on securities sold short | - | - | - | - | |
| Net change in unrealized | |||||
| depreciation on written options | - | - | - | - | |
| Net increase (decrease) in net assets | |||||
| resulting from operations | (13,310,355) | 15,362,620 | 4,411 | 4,917,412 | |
| From Distributions to Shareholders: | |||||
| From Net Investment Income: | |||||
| Class N | - | (3,380,594) | - | (249,492) | |
| From Net Realized Gains: | |||||
| Class N | - | (2,078,342) | - | (7,187,148) | |
| Total Dividends and Distributions | |||||
| to Shareholders | - | (5,458,936) | - | (7,436,640) | |
| From Fund Share Transactions (Note 6) | (28,362,126) | 55,353,431 | (3,257,291) | (142,516,115) | |
| Total Increase (Decrease) in Net Assets | (41,672,481) | 65,257,115 | (3,252,880) | (145,035,343) | |
| Net Assets: | |||||
| Beginning of year | 299,684,004 | 234,426,889 | 19,084,555 | 164,119,898 | |
| End of year | $ 258,011,523 | $ 299,684,004 | $ 15,831,675 | $ 19,084,555 | |
| Undistributed net investment income | |||||
| at end of year | $ 2,766,913 | $ 1,204,158 | $ 245,495 | $ 131,211 | |
Refer to the Notes to Financials Statements at the back of this Report for further information regarding the values set forth above.
| 46 |
| CLS Funds Semi-Annual Report | |||||
| Statements of Changes in Net Assets (Continued) | |||||
| International Equity Fund | Enhanced Long/Short Fund | ||||
| Six Months Ended | Six Months Ended | ||||
| October 31, 2015 | Year Ended | October 31, 2015 | Year Ended | ||
| (Unaudited) | April 30, 2015 | (Unaudited) | April 30, 2015 | ||
| Increase (Decrease) in Net Assets: | |||||
| From Operations: | |||||
| Net investment income | $ 164,904 | $ 1,276,904 | $ 175,713 | $ 266,714 | |
| Net realized gain (loss) on investments | (720,403) | 30,771,892 | (624,336) | 3,733,407 | |
| Net realized loss on securities sold short | - | (590,969) | - | - | |
| Net realized gain on written options | - | - | 303,078 | 163,995 | |
| Distributions of realized gains | |||||
| by underlying investment companies | - | 5,873 | - | - | |
| Net change in unrealized appreciation | |||||
| (depreciation) on investments | (905,470) | (27,466,751) | (1,483,545) | (2,578,882) | |
| Net change in unrealized appreciation | |||||
| on securities sold short | - | 297,122 | - | - | |
| Net change in unrealized | |||||
| depreciation on written options | - | - | (75,632) | (1,320) | |
| Net increase (decrease) in net assets | |||||
| resulting from operations | (1,460,969) | 4,294,071 | (1,704,722) | 1,583,914 | |
| From Distributions to Shareholders: | |||||
| From Net Investment Income: | |||||
| Class N | - | (353,823) | (180,973) | (529,695) | |
| From Net Realized Gains: | |||||
| Class N | - | (9,373,942) | - | (805,368) | |
| Total Dividends and Distributions | |||||
| to Shareholders | - | (9,727,765) | (180,973) | (1,335,063) | |
| From Fund Share Transactions (Note 6) | (2,731,674) | (235,913,843) | (9,350,133) | 12,313,172 | |
| Total Increase (Decrease) in Net Assets | (4,192,643) | (241,347,537) | (11,235,828) | 12,562,023 | |
| Net Assets: | |||||
| Beginning of year | 13,883,642 | 255,231,179 | 105,218,149 | 92,656,126 | |
| End of year | $ 9,690,999 | $ 13,883,642 | $ 93,982,321 | $ 105,218,149 | |
| Undistributed net investment income (loss) | |||||
| at end of year | $ 164,904 | $ - | $ (5,260) | $ - | |
Refer to the Notes to Financials Statements at the back of this Report for further information regarding the values set forth above.
| 47 |
| CLS Funds Semi-Annual Report | |||||
| Statements of Changes in Net Assets (Continued) | |||||
| Flexible Income Fund | Global Aggressive Equity Fund | ||||
| Six Months Ended | Six Months Ended | ||||
| October 31, 2015 | Year Ended | October 31, 2015 | Year Ended | ||
| (Unaudited) | April 30, 2015 | (Unaudited) | April 30, 2015 | ||
| Increase (Decrease) in Net Assets: | |||||
| From Operations: | |||||
| Net investment income | $ 2,086,403 | $ 4,132,703 | $ 941,113 | $ 1,754,816 | |
| Net realized gain (loss) on investments | (70,058) | (314,072) | 98,727 | 4,848,721 | |
| Net realized loss on securities sold short | - | - | - | - | |
| Net realized gain on written options | - | - | - | - | |
| Distributions of realized gains | |||||
| by underlying investment companies | - | 71,613 | - | 41,980 | |
| Net change in unrealized appreciation | |||||
| (depreciation) on investments | (4,615,000) | (579,000) | (6,575,602) | 862,012 | |
| Net change in unrealized appreciation | |||||
| on securities sold short | - | - | - | - | |
| Net change in unrealized | |||||
| depreciation on written options | - | - | - | - | |
| Net increase (decrease) in net assets | |||||
| resulting from operations | (2,598,655) | 3,311,244 | (5,535,762) | 7,507,529 | |
| From Distributions to Shareholders: | |||||
| From Net Investment Income: | |||||
| Class N | (2,098,959) | (4,115,620) | - | (1,630,879) | |
| From Net Realized Gains: | |||||
| Class N | - | - | - | (3,748,331) | |
| Total Dividends and Distributions | |||||
| to Shareholders | (2,098,959) | (4,115,620) | - | (5,379,210) | |
| From Fund Share Transactions (Note 6) | (12,548,209) | 34,504,051 | (12,714,615) | 6,896,185 | |
| Total Increase (Decrease) in Net Assets | (17,245,823) | 33,699,675 | (18,250,377) | 9,024,504 | |
| Net Assets: | |||||
| Beginning of year | 197,700,168 | 164,000,493 | 101,200,600 | 92,176,096 | |
| End of year | $ 180,454,345 | $ 197,700,168 | $ 82,950,223 | $ 101,200,600 | |
| Undistributed net investment income | |||||
| at end of year | $ 533,644 | $ 546,200 | $ 1,064,011 | $ 122,898 | |
Refer to the Notes to Financials Statements at the back of this Report for further information regarding the values set forth above.
| 48 |
| CLS Funds Semi-Annual Report | |||
| Statements of Changes in Net Assets (Continued) | |||
| Shelter Fund | |||
| Six Months Ended | |||
| October 31, 2015 | Year Ended | ||
| (Unaudited) | April 30, 2015 | ||
| Increase (Decrease) in Net Assets: | |||
| From Operations: | |||
| Net investment income | $ 586,396 | $ 842,672 | |
| Net realized gain (loss) on investments | 5,366,403 | 312,679 | |
| Net realized loss on securities sold short | - | - | |
| Net realized gain on written options | - | - | |
| Distributions of realized gains | |||
| by underlying investment companies | - | - | |
| Net change in unrealized appreciation | |||
| (depreciation) on investments | (10,859,514) | 6,979,296 | |
| Net change in unrealized appreciation | |||
| on securities sold short | - | - | |
| Net change in unrealized | |||
| depreciation on written options | - | - | |
| Net increase (decrease) in net assets | |||
| resulting from operations | (4,906,715) | 8,134,647 | |
| From Distributions to Shareholders: | |||
| From Net Investment Income: | |||
| Class N | - | (630,936) | |
| From Net Realized Gains: | |||
| Class N | - | - | |
| Total Dividends and Distributions | |||
| to Shareholders | - | (630,936) | |
| From Fund Share Transactions (Note 6) | 2,304,398 | 21,423,379 | |
| Total Increase (Decrease) in Net Assets | (2,602,317) | 28,927,090 | |
| Net Assets: | |||
| Beginning of year | 98,240,752 | 69,313,662 | |
| End of year | $ 95,638,435 | $ 98,240,752 | |
| Undistributed net investment income | |||
| at end of year | $ 1,186,987 | $ 600,591 | |
Refer to the Notes to Financials Statements at the back of this Report for further information regarding the values set forth above.
| 49 |
| CLS Funds Semi-Annual Report | ||||||||||||
| Financial Highlights | ||||||||||||
| Global Diversified Equity Fund | ||||||||||||
| Selected data based on a share outstanding throughout each year indicated. | ||||||||||||
| Class C Shares | ||||||||||||
| Six Months | ||||||||||||
| Ended | ||||||||||||
| October 31, | Fiscal Years Ending April 30, | |||||||||||
| 2015 | 2015 | 2014 | 2013 | 2012 | 2011 | |||||||
| (Unaudited) | ||||||||||||
| Net asset value, beginning of period | $ 17.17 | $ 16.56 | $ 14.53 | $ 13.00 | $ 13.73 | $ 11.80 | ||||||
| Income (loss) from investment operations: | ||||||||||||
| Net investment income (loss) (a) (b) | 0.10 | 0.03 | (0.04) | (0.04) | (0.05) | (0.07) | ||||||
| Net realized and unrealized gain (loss) | ||||||||||||
| on investments | (1.23) | 0.92 | 2.07 | 1.57 | (0.68) | 2.00 | ||||||
| Total income (loss) from | ||||||||||||
| investment operations | (1.13) | 0.95 | 2.03 | 1.53 | (0.73) | 1.93 | ||||||
| Less distributions from: | ||||||||||||
| Net investment income | - | (0.17) | - | - | - | - | ||||||
| Net realized gain | - | (0.17) | - | - | - | - | ||||||
| Total distributions from net investment | ||||||||||||
| income and net realized gains | - | (0.34) | - | - | - | - | ||||||
| Net asset value, end of period | $ 16.04 | $ 17.17 | $ 16.56 | $ 14.53 | $ 13.00 | $ 13.73 | ||||||
| Total return (c) | (6.58)% | (f) | 5.79% | 13.97% | 11.77% | (5.32)% | 16.36% | |||||
| Ratios and Supplemental Data: | ||||||||||||
| Net assets, end of year (in 000's) | $ 2,368 | $ 2,572 | $ 2,689 | $ 2,971 | $ 3,146 | $ 3,963 | ||||||
| Ratio of expenses to | ||||||||||||
| average net assets (d) | 1.91% | (e) | 2.15% | 2.15% | 2.15% | 2.15% | 2.15% | |||||
| Ratio of expenses to average net assets | ||||||||||||
| before waivers and reimbursements (d) | 1.91% | (e) | 2.17% | 2.18% | 2.18% | 2.17% | 2.17% | |||||
| Ratio of net investment income (loss) to | ||||||||||||
| average net assets (b) | 1.21% | (e) | 0.21% | (0.23)% | (0.28)% | (0.41)% | (0.56)% | |||||
| Portfolio turnover rate | 32% | (f) | 33% | 27% | 69% | 19% | 53% | |||||
| (a) Net investment income (loss) has been calculated using the average shares method, which more appropriately presents the per share data for the year. | ||||||||||||
| (b) Recognition of net investment income by the Fund is affected by the timing of the declaration of dividends by the underlying investment companies in which the Fund invests. | ||||||||||||
| (c) Total returns are historical and assume changes in share price, reinvestment of dividends and capital gains distributions, and assume no sales charge. Had the Advisor and Gemini Fund Services, LLC ("GFS") not absorbed a portion of the expenses, total returns would have been lower. | ||||||||||||
| (d) Does not include the expenses of the investment companies in which the Fund invests. | ||||||||||||
| (e) Annualized for periods less than one year. | ||||||||||||
| (f) Not annualized. | ||||||||||||
Refer to the Notes to Financials Statements at the back of this Report for further information regarding the values set forth above.
| 50 |
| CLS Funds Semi-Annual Report | ||||||||||||
| Financial Highlights | ||||||||||||
| Global Diversified Equity Fund | ||||||||||||
| Selected data based on a share outstanding throughout each year indicated. | ||||||||||||
| Class N Shares | ||||||||||||
| Six Months | ||||||||||||
| Ended | ||||||||||||
| October 31, | Fiscal Years Ending April 30, | |||||||||||
| 2015 | 2015 | 2014 | 2013 | 2012 | 2011 | |||||||
| (Unaudited) | ||||||||||||
| Net asset value, beginning of period | $ 18.26 | $ 17.61 | $ 15.43 | $ 13.72 | $ 14.44 | $ 12.34 | ||||||
| Income (loss) from investment operations: | ||||||||||||
| Net investment income (a) (b) | 0.17 | 0.21 | 0.13 | 0.10 | 0.08 | 0.06 | ||||||
| Net realized and unrealized gain (loss) | ||||||||||||
| on investments | (1.30) | 0.95 | 2.17 | 1.67 | (0.71) | 2.09 | ||||||
| Total income (loss) from | ||||||||||||
| investment operations | (1.13) | 1.16 | 2.30 | 1.77 | (0.63) | 2.15 | ||||||
| Less distributions from: | . | . | ||||||||||
| Net investment income | - | (0.34) | (0.12) | (0.06) | (0.09) | (0.05) | ||||||
| Net realized gains | - | (0.17) | - | - | - | - | ||||||
| Total distributions from net investment | ||||||||||||
| income and net realized gains | - | (0.51) | (0.12) | (0.06) | (0.09) | (0.05) | ||||||
| Net asset value, end of period | $ 17.13 | $ 18.26 | $ 17.61 | $ 15.43 | $ 13.72 | $ 14.44 | ||||||
| Total return (c) | (6.19)% | (f) | 6.68% | 14.93% | 12.91% | (4.31)% | 17.47% | |||||
| Ratios and Supplemental Data: | ||||||||||||
| Net assets, end of year (in 000's) | $ 478,843 | $ 567,510 | $ 484,015 | $ 483,612 | $ 500,675 | $ 572,587 | ||||||
| Ratio of expenses to | ||||||||||||
| average net assets (d) | 1.15% | (e) | 1.15% | 1.15% | 1.15% | 1.15% | 1.15% | |||||
| Ratio of expenses to average net assets | ||||||||||||
| before waivers and reimbursements (d) | 1.17% | (e) | 1.17% | 1.18% | 1.18% | 1.17% | 1.17% | |||||
| Ratio of net investment income to | ||||||||||||
| average net assets (b) | 1.96% | (e) | 1.19% | 0.78% | 0.72% | 0.59% | 0.46% | |||||
| Portfolio turnover rate | 32% | (f) | 33% | 27% | 69% | 19% | 53% | |||||
| (a) Net investment income has been calculated using the average shares method, which more appropriately presents the per share data for the year. | ||||||||||||
| (b) Recognition of net investment income by the Fund is affected by the timing of the declaration of dividends by the underlying investment companies in which the Fund invests. | ||||||||||||
| (c) Total returns are historical and assume changes in share price, reinvestment of dividends and capital gains distributions, and assume no sales charge. Had the Advisor and GFS not absorbed a portion of the expenses, total returns would have been lower. | ||||||||||||
| (d) Does not include the expenses of the investment companies in which the Fund invests. | ||||||||||||
| (e) Annualized for periods less than one year. | ||||||||||||
| (f) Not annualized. | ||||||||||||
Refer to the Notes to Financials Statements at the back of this Report for further information regarding the values set forth above.
| 51 |
| CLS Funds Semi-Annual Report | ||||||||||||
| Financial Highlights | ||||||||||||
| Growth and Income Fund | ||||||||||||
| Selected data based on a share outstanding throughout each year indicated. | ||||||||||||
| Class N Shares | ||||||||||||
| Six Months | ||||||||||||
| Ended | ||||||||||||
| October 31, | Fiscal Years Ending April 30, | |||||||||||
| 2015 | 2015 | 2014 | 2013 | 2012 | 2011 | |||||||
| (Unaudited) | ||||||||||||
| Net asset value, beginning of period | $ 10.99 | $ 10.82 | $ 10.94 | $ 10.10 | $ 10.21 | $ 9.31 | ||||||
| Income (loss) from investment operations: | ||||||||||||
| Net investment income (a) (b) | 0.08 | 0.14 | 0.09 | 0.19 | 0.20 | 0.23 | ||||||
| Net realized and unrealized gain (loss) | ||||||||||||
| on investments | (0.48) | 0.22 | 0.56 | 0.83 | (0.10) | 0.91 | ||||||
| Total income (loss) from | ||||||||||||
| investment operations | (0.40) | 0.36 | 0.65 | 1.02 | 0.10 | 1.14 | ||||||
| Less distributions from: | ||||||||||||
| Net investment income | - | (0.11) | (0.31) | (0.18) | (0.21) | (0.24) | ||||||
| Net realized gains | - | (0.08) | (0.46) | - | - | - | ||||||
| Total distributions from net investment | ||||||||||||
| income and net realized gains | - | (0.19) | (0.77) | (0.18) | (0.21) | (0.24) | ||||||
| Net asset value, end of period | $ 10.59 | $ 10.99 | $ 10.82 | $ 10.94 | $ 10.10 | $ 10.21 | ||||||
| Total return (c) | (3.64)% | (f) | 3.31% | 6.08% | 10.20% | 1.12% | 12.42% | |||||
| Ratios and Supplemental Data: | ||||||||||||
| Net assets, end of year (in 000's) | $ 371,927 | $ 423,486 | $ 305,585 | $ 300,478 | $ 278,309 | $ 256,329 | ||||||
| Ratio of expenses to | ||||||||||||
| average net assets (d) | 1.15% | (e) | 1.15% | 1.15% | 1.15% | 1.15% | 1.15% | |||||
| Ratio of expenses to average net assets | ||||||||||||
| before waivers and reimbursements (d) | 1.17% | (e) | 1.19% | 1.23% | 1.22% | 1.22% | 1.23% | |||||
| Ratio of net investment income to | ||||||||||||
| average net assets (b) | 1.41% | (e) | 1.33% | 0.82% | 1.83% | 2.09% | 2.38% | |||||
| Portfolio turnover rate | 22% | (f) | 31% | 39% | 89% | 13% | 27% | |||||
| (a) Net investment income has been calculated using the average shares method, which more appropriately presents the per share data for the year. | ||||||||||||
| (b) Recognition of net investment income by the Fund is affected by the timing of the declaration of dividends by the underlying investment companies in which the Fund invests. | ||||||||||||
| (c) Total returns are historical and assume changes in share price, reinvestment of dividends and capital gains distributions, and assume no sales charge. Had the Advisor and GFS not absorbed a portion of the expenses, total returns would have been lower. | ||||||||||||
| (d) Does not include the expenses of the investment companies in which the Fund invests. | ||||||||||||
| (e) Annualized for periods less than one year. | ||||||||||||
| (f) Not annualized. | ||||||||||||
Refer to the Notes to Financials Statements at the back of this Report for further information regarding the values set forth above.
| 52 |
| CLS Funds Semi-Annual Report | ||||||||||||
| Financial Highlights | ||||||||||||
| Global Growth Fund | ||||||||||||
| Selected data based on a share outstanding throughout each year indicated. | ||||||||||||
| Class N Shares | ||||||||||||
| Six Months | ||||||||||||
| Ended | ||||||||||||
| October 31, | Fiscal Years Ending April 30, | |||||||||||
| 2015 | 2015 | 2014 | 2013 | 2012 | 2011 | |||||||
| (Unaudited) | ||||||||||||
| Net asset value, beginning of period | $ 11.59 | $ 11.17 | $ 10.91 | $ 9.81 | $ 10.22 | $ 8.92 | ||||||
| Income (loss) from investment operations: | ||||||||||||
| Net investment income (a) (b) | 0.06 | 0.13 | 0.09 | 0.15 | 0.16 | 0.16 | ||||||
| Net realized and unrealized gain (loss) | ||||||||||||
| on investments | (0.57) | 0.50 | 1.10 | 1.06 | (0.41) | 1.31 | ||||||
| Total income (loss) from | ||||||||||||
| investment operations | (0.51) | 0.63 | 1.19 | 1.21 | (0.25) | 1.47 | ||||||
| Less distributions from: | ||||||||||||
| Net investment income | - | (0.13) | (0.38) | (0.11) | (0.16) | (0.17) | ||||||
| Net realized gains | - | (0.08) | (0.55) | - | - | - | ||||||
| Total distributions from net investment | ||||||||||||
| income and net realized gains | - | (0.21) | (0.93) | (0.11) | (0.16) | (0.17) | ||||||
| Net asset value, end of period | $ 11.08 | $ 11.59 | $ 11.17 | $ 10.91 | $ 9.81 | $ 10.22 | ||||||
| Total return (c) | (4.40)% | (f) | 5.64% | 11.04% | 12.43% | (2.31)% | 16.57% | |||||
| Ratios and Supplemental Data: | ||||||||||||
| Net assets, end of year (in 000's) | $ 258,012 | $ 299,684 | $ 234,427 | $ 225,393 | $ 230,562 | $ 240,800 | ||||||
| Ratio of expenses to | ||||||||||||
| average net assets (d) | 1.15% | (e) | 1.15% | 1.15% | 1.15% | 1.15% | 1.15% | |||||
| Ratio of expenses to average net assets | ||||||||||||
| before waivers and reimbursements (d) | 1.23% | (e) | 1.24% | 1.28% | 1.27% | 1.27% | 1.25% | |||||
| Ratio of net investment income (loss) to | ||||||||||||
| average net assets (b) | 1.12% | (e) | 1.16% | 0.81% | 1.45% | 1.68% | 1.74% | |||||
| Portfolio turnover rate | 11% | (f) | 29% | 46% | 69% | 33% | 26% | |||||
| (a) Net investment income has been calculated using the average shares method, which more appropriately presents the per share data for the year. | ||||||||||||
| (b) Recognition of net investment income by the Fund is affected by the timing of the declaration of dividends by the underlying investment companies in which the Fund invests. | ||||||||||||
| (c) Total returns are historical and assume changes in share price, reinvestment of dividends and capital gains distributions, and assume no sales charge. Had the Advisor and GFS not absorbed a portion of the expenses, total returns would have been lower. | ||||||||||||
| (d) Does not include the expenses of the investment companies in which the Fund invests. | ||||||||||||
| (e) Annualized for periods less than one year. | ||||||||||||
| (f) Not annualized. | ||||||||||||
Refer to the Notes to Financials Statements at the back of this Report for further information regarding the values set forth above.
| 53 |
| CLS Funds Semi-Annual Report | ||||||||||||
| Financial Highlights | ||||||||||||
| Domestic Equity Fund | ||||||||||||
| Selected data based on a share outstanding throughout each year indicated. | ||||||||||||
| Class N Shares | ||||||||||||
| Six Months | ||||||||||||
| Ended | ||||||||||||
| October 31, | Fiscal Years Ending April 30, | |||||||||||
| 2015 | 2015 | 2014 | 2013 | 2012 | 2011 | |||||||
| (Unaudited) | ||||||||||||
| Net asset value, beginning of period | $ 9.31 | $ 12.84 | $ 11.98 | $ 10.95 | $ 11.29 | $ 9.48 | ||||||
| Income (loss) from investment operations: | ||||||||||||
| Net investment income (a) (b) | 0.06 | 0.18 | 0.08 | 0.09 | 0.06 | 0.05 | ||||||
| Net realized and unrealized gain (loss) on | ||||||||||||
| on investments | (0.03) | 1.03 | 1.45 | 1.00 | (0.34) | 1.82 | ||||||
| Total income (loss) from | ||||||||||||
| investment operations | 0.03 | 1.21 | 1.53 | 1.09 | (0.28) | 1.87 | ||||||
| Less distributions from: | ||||||||||||
| Net investment income | - | (0.16) | (0.20) | (0.06) | (0.06) | (0.06) | ||||||
| Net realized gains | - | (4.58) | (0.47) | - | - | - | ||||||
| Total distributions from net investment | ||||||||||||
| income and net realized gains | - | (4.74) | (0.67) | (0.06) | (0.06) | (0.06) | ||||||
| Net asset value, end of period | $ 9.34 | $ 9.31 | $ 12.84 | $ 11.98 | $ 10.95 | $ 11.29 | ||||||
| Total return (c) | 0.32% | (f) | 9.96% | 12.90% | 10.03% | (2.43)% | 19.80% | |||||
| Ratios and Supplemental Data: | ||||||||||||
| Net assets, end of year (in 000's) | $ 15,832 | $ 19,085 | $ 164,120 | $ 166,821 | $ 173,670 | $ 191,297 | ||||||
| Ratio of expenses to | ||||||||||||
| average net assets (d) | 1.15% | (e) | 1.15% | 1.15% | 1.15% | 1.15% | 1.15% | |||||
| Ratio of expenses to average net assets | ||||||||||||
| before waivers and reimbursements (d) | 1.97% | (e) | 1.43% | 1.30% | 1.27% | 1.26% | 1.26% | |||||
| Ratio of net investment income to | ||||||||||||
| average net assets (b) | 1.30% | (e) | 1.39% | 0.65% | 0.83% | 0.57% | 0.53% | |||||
| Portfolio turnover rate | 26% | (f) | 37% | 39% | 60% | 43% | 25% | |||||
| (a) Net investment income has been calculated using the average shares method, which more appropriately presents the per share data for the year. | ||||||||||||
| (b) Recognition of net investment income by the Fund is affected by the timing of the declaration of dividends by the underlying investment companies in which the Fund invests. | ||||||||||||
| (c) Total returns are historical and assume changes in share price, reinvestment of dividends and capital gains distributions, and assume no sales charge. Had the Advisor and GFS not absorbed a portion of the expenses, total returns would have been lower. | ||||||||||||
| (d) Does not include the expenses of the investment companies in which the Fund invests. | ||||||||||||
| (e) Annualized for periods less than one year. | ||||||||||||
| (f) Not annualized. | ||||||||||||
Refer to the Notes to Financials Statements at the back of this Report for further information regarding the values set forth above.
| 54 |
| CLS Funds Semi-Annual Report | ||||||||||||
| Financial Highlights | ||||||||||||
| International Equity Fund | ||||||||||||
| Selected data based on a share outstanding throughout each year indicated. | ||||||||||||
| Class N Shares | ||||||||||||
| Six Months | ||||||||||||
| Ended | ||||||||||||
| October 31, | Fiscal Years Ending April 30, | |||||||||||
| 2015 | 2015 | 2014 | 2013 | 2012 | 2011 | |||||||
| (Unaudited) | ||||||||||||
| Net asset value, beginning of period | $ 4.68 | $ 10.61 | $ 10.75 | $ 10.16 | $ 10.48 | $ 9.17 | ||||||
| Income (loss) from investment operations: | ||||||||||||
| Net investment income (a) (b) | 0.06 | 0.11 | 0.08 | 0.10 | 0.09 | 0.11 | ||||||
| Net realized and unrealized gain (loss) | ||||||||||||
| on investments | (0.58) | 0.33 | 0.73 | 0.77 | (0.12) | 1.32 | ||||||
| Total income (loss) from | ||||||||||||
| investment operations | (0.52) | 0.44 | 0.81 | 0.87 | (0.03) | 1.43 | ||||||
| Less distributions from: | ||||||||||||
| Net investment income | - | (0.23) | (0.08) | (0.09) | (0.10) | (0.12) | ||||||
| Net realized gains | - | (6.14) | (0.87) | (0.19) | (0.19) | - | ||||||
| Total distributions from net investment | ||||||||||||
| income and net realized gains | - | (6.37) | (0.95) | (0.28) | (0.29) | (0.12) | ||||||
| Net asset value, end of period | $ 4.16 | $ 4.68 | $ 10.61 | $ 10.75 | $ 10.16 | $ 10.48 | ||||||
| Total return (c) | (11.11)% | (h) | 9.82% | 7.75% | 8.66% | (0.09)% | 15.72% | |||||
| Ratios and Supplemental Data: | ||||||||||||
| Net assets, end of year (in 000's) | $ 9,691 | $ 13,884 | $ 255,231 | $ 248,326 | $ 233,472 | $ 229,715 | ||||||
| Ratio of expenses to average net | ||||||||||||
| assets, excluding dividends from securities | ||||||||||||
| sold short and interest expense (d) | 1.15% | (g) | 1.15% | (e) | 1.15% | (e) | 1.15% | 1.15% | 1.15% | |||
| Ratio of expenses to average net assets before | ||||||||||||
| waivers and reimbursements, excluding | ||||||||||||
| dividends from securities sold short | ||||||||||||
| and interest expense (d) | 2.44% | (g) | 1.37% | (f) | 1.25% | (f) | 1.24% | 1.24% | 1.24% | |||
| Ratio of net investment income to | ||||||||||||
| average net assets (b) | 2.81% | (g) | 1.06% | 0.72% | 0.93% | 0.91% | 1.17% | |||||
| Portfolio turnover rate | 145% | (h) | 45% | 44% | 84% | 46% | 22% | |||||
| (a) Net investment income has been calculated using the average shares method, which more appropriately presents the per share data for the year. | ||||||||||||
| (b) Recognition of net investment income by the Fund is affected by the timing of the declaration of dividends by the underlying investment companies in which the Fund invests. | ||||||||||||
| (c) Total returns are historical and assume changes in share price, reinvestment of dividends and capital gains distributions, and assume no sales charge. Had the Advisor and GFS not absorbed a portion of the expenses, total returns would have been lower. | ||||||||||||
| (d) Does not include the expenses of the investment companies in which the Fund invests. | ||||||||||||
| (e) Including dividends from securities sold short and interest expense, the ratio of net expenses to average net assets | ||||||||||||
| would have been 1.19% for the year ended April 30, 2015 and 1.23% for the year ended April 30, 2014. | ||||||||||||
| (f) Including dividends from securities sold short and interest expense, the ratio of net expenses to average net assets | ||||||||||||
| would have been 1.41% for the year ended April 30, 2015 and 1.33% for the year ended April 30, 2014. | ||||||||||||
| (g) Annualized for periods less than one year. | ||||||||||||
| (h) Not annualized. | ||||||||||||
Refer to the Notes to Financials Statements at the back of this Report for further information regarding the values set forth above.
| 55 |
| CLS Funds Semi-Annual Report | ||||||||||||
| Financial Highlights | ||||||||||||
| Enhanced Long/Short Fund | ||||||||||||
| Selected data based on a share outstanding throughout each period indicated. | ||||||||||||
| Class N Shares | ||||||||||||
| Six Months | ||||||||||||
| Ended | ||||||||||||
| October 31, | Fiscal Years Ending April 30, | |||||||||||
| 2015 | 2015 | 2014 | 2013 | 2012 | 2011 | |||||||
| (Unaudited) | ||||||||||||
| Net asset value, beginning of period | $ 10.54 | $ 10.51 | $ 10.49 | $ 10.16 | $ 11.11 | $ 10.58 | ||||||
| Income (loss) from investment operations: | ||||||||||||
| Net investment income (a) (b) | 0.02 | 0.03 | 0.02 | 0.06 | 0.09 | 0.11 | ||||||
| Net realized and unrealized gain (loss) | ||||||||||||
| on investments | (0.18) | 0.14 | 0.42 | 0.47 | (0.22) | 0.83 | ||||||
| Total income (loss) from | ||||||||||||
| investment operations | (0.16) | 0.17 | 0.44 | 0.53 | (0.13) | 0.94 | ||||||
| Less distributions from: | ||||||||||||
| Net investment income | (0.02) | (0.06) | (0.02) | (0.07) | (0.35) | (0.11) | ||||||
| Net realized gains | - | (0.08) | (0.40) | (0.09) | (0.47) | (0.30) | ||||||
| Return of capital | - | - | - | (0.04) | - | - | ||||||
| Total distributions from net investment income, | ||||||||||||
| net realized gains and return of capital | (0.02) | (0.14) | (0.42) | (0.20) | (0.82) | (0.41) | ||||||
| Net asset value, end of period | $ 10.36 | $ 10.54 | $ 10.51 | $ 10.49 | $ 10.16 | $ 11.11 | ||||||
| Total return (c) | (1.63)% | (f) | 1.59% | 4.18% | 5.22% | (0.83)% | 9.11% | |||||
| Ratios and Supplemental Data: | ||||||||||||
| Net assets, end of year (in 000's) | $ 93,982 | $ 105,218 | $ 92,656 | $ 95,267 | $ 81,665 | $ 88,164 | ||||||
| Ratio of expenses to | ||||||||||||
| average net assets (d) | 1.05% | (e) | 1.05% | 1.05% | 1.05% | 1.05% | 1.05% | |||||
| Ratio of expenses to average net assets | ||||||||||||
| before waivers and reimbursements (d) | 1.29% | (e) | 1.31% | 1.37% | 1.36% | 1.26% | 1.36% | |||||
| Ratio of net investment income to | ||||||||||||
| average net assets (b) | 0.35% | (e) | 0.27% | 0.18% | 0.60% | 0.89% | 1.02% | |||||
| Portfolio turnover rate | 13% | (f) | 68% | 58% | 51% | 184% | 86% | |||||
| (a) Net investment income has been calculated using the average shares method, which more appropriately presents the per share data for the period. | ||||||||||||
| (b) Recognition of net investment income by the Fund is affected by the timing of the declaration of dividends by the underlying investment companies in which the Fund invests. | ||||||||||||
| (c) Total returns are historical and assume changes in share price, reinvestment of dividends and capital gains distributions, and assume no sales charge. Had the Advisor and GFS not absorbed a portion of the expenses, total returns would have been lower. | ||||||||||||
| (d) Does not include the expenses of the investment companies in which the Fund invests. | ||||||||||||
| (e) Not annualized. | ||||||||||||
| (f) Annualized for periods less than one year. | ||||||||||||
Refer to the Notes to Financials Statements at the back of this Report for further information regarding the values set forth above.
| 56 |
| CLS Funds Semi-Annual Report | ||||||||||||
| Financial Highlights | ||||||||||||
| Flexible Income Fund | ||||||||||||
| Selected data based on a share outstanding throughout each period indicated. | ||||||||||||
| Class N Shares | ||||||||||||
| Six Months | ||||||||||||
| Ended | ||||||||||||
| October 31, | Fiscal Years Ending April 30, | |||||||||||
| 2015 | 2015 | 2014 | 2013 | 2012 | 2011 | |||||||
| (Unaudited) | ||||||||||||
| Net asset value, beginning of period | $ 10.35 | $ 10.40 | $ 10.76 | $ 10.58 | $ 10.37 | $ 10.11 | ||||||
| Income (loss) from investment operations: | ||||||||||||
| Net investment income (a) (b) | 0.11 | 0.23 | 0.22 | 0.26 | 0.28 | 0.32 | ||||||
| Net realized and unrealized gain (loss) | ||||||||||||
| on investments | (0.24) | (0.05) | (0.23) | 0.23 | 0.22 | 0.29 | ||||||
| Total income (loss) from | ||||||||||||
| investment operations | (0.13) | 0.18 | (0.01) | 0.49 | 0.50 | 0.61 | ||||||
| Less distributions from: | ||||||||||||
| Net investment income | (0.12) | (0.23) | (0.22) | (0.26) | (0.29) | (0.32) | ||||||
| Net realized gains | - | - | (0.13) | (0.05) | - | (0.03) | ||||||
| Total distributions from net investment | ||||||||||||
| income and net realized gains | (0.12) | (0.23) | (0.35) | (0.31) | (0.29) | (0.35) | ||||||
| Net asset value, end of period | $ 10.10 | $ 10.35 | $ 10.40 | $ 10.76 | $ 10.58 | $ 10.37 | ||||||
| Total return (c) | (1.51)% | (f) | 1.75% | (0.01)% | 4.76% | 4.94% | 6.10% | |||||
| Ratios and Supplemental Data: | ||||||||||||
| Net assets, end of year (in 000's) | $ 180,454 | $ 197,700 | $ 164,000 | $ 166,348 | $ 143,125 | $ 107,627 | ||||||
| Ratio of expenses to | ||||||||||||
| average net assets (d) | 0.80% | (e) | 0.80% | 0.80% | 0.80% | 0.80% | 0.80% | |||||
| Ratio of expenses to average net assets | ||||||||||||
| before waivers and reimbursements (d) | 0.91% | (e) | 0.93% | 0.97% | 0.98% | 0.98% | 1.01% | |||||
| Ratio of net investment income to | ||||||||||||
| average net assets (b) | 2.19% | (e) | 2.24% | 2.08% | 2.40% | 2.71% | 3.07% | |||||
| Portfolio turnover rate | 9% | (f) | 5% | 24% | 51% | 8% | 10% | |||||
| (a) Net investment income has been calculated using the average shares method, which more appropriately presents the per share data for the period. | ||||||||||||
| (b) Recognition of net investment income by the Fund is affected by the timing of the declaration of dividends by the underlying investment companies in which the Fund invests. | ||||||||||||
| (c) Total returns are historical and assume changes in share price, reinvestment of dividends and capital gains distributions, and assume no sales charge. Had the Adviser and GFS not absorbed a portion of the expenses, total returns would have been lower. | ||||||||||||
| (d) Does not include the expenses of the investment companies in which the Fund invests. | ||||||||||||
| (e) Not annualized. | ||||||||||||
Refer to the Notes to Financials Statements at the back of this Report for further information regarding the values set forth above.
| 57 |
| CLS Funds Semi-Annual Report | ||||||||||||
| Financial Highlights | ||||||||||||
| Global Aggressive Equity Fund | ||||||||||||
| Selected data based on a share outstanding throughout each period indicated. | ||||||||||||
| Class N Shares | ||||||||||||
| Six Months | ||||||||||||
| Ended | ||||||||||||
| October 31, | Fiscal Years Ending April 30, | |||||||||||
| 2015 | 2015 | 2014 | 2013 | 2012 | 2011 | |||||||
| (Unaudited) | ||||||||||||
| Net asset value, beginning of period | $ 13.73 | $ 13.47 | $ 13.37 | $ 12.52 | $ 13.37 | $ 11.25 | ||||||
| Income (loss) from investment operations: | ||||||||||||
| Net investment income (a) (b) | 0.14 | 0.24 | 0.08 | 0.05 | 0.05 | 0.04 | ||||||
| Net realized and unrealized gain (loss) | ||||||||||||
| on investments | (0.90) | 0.74 | 2.26 | 1.35 | (0.57) | 2.15 | ||||||
| Total income (loss) from | ||||||||||||
| investment operations | (0.76) | 0.98 | 2.34 | 1.40 | (0.52) | 2.19 | ||||||
| Less distributions from: | ||||||||||||
| Net investment income | - | (0.22) | (0.23) | (0.05) | - | (0.05) | ||||||
| Net realized gains | - | (0.50) | (2.01) | (0.50) | (0.33) | (0.02) | ||||||
| Total distributions from net investment | ||||||||||||
| income and net realized gains | - | (0.72) | (2.24) | (0.55) | (0.33) | (0.07) | ||||||
| Net asset value, end of period | $ 12.97 | $ 13.73 | $ 13.47 | $ 13.37 | $ 12.52 | $ 13.37 | ||||||
| Total return (c) | (5.54)% | (f) | 7.50% | 17.87% | 11.55% | (3.54)% | 19.50% | |||||
| Ratios and Supplemental Data: | ||||||||||||
| Net assets, end of year (in 000's) | $ 82,950 | $ 101,201 | $ 92,176 | $ 90,657 | $ 83,544 | $ 89,200 | ||||||
| Ratio of expenses to | ||||||||||||
| average net assets (d) | 1.15% | (e) | 1.15% | 1.15% | 1.15% | 1.15% | 1.15% | |||||
| Ratio of expenses to average net assets | ||||||||||||
| before waivers and reimbursements (d) | 1.36% | (e) | 1.36% | 1.37% | 1.38% | 1.37% | 1.35% | |||||
| Ratio of net investment income to | ||||||||||||
| average net assets (b) | 2.04% | (e) | 1.81% | 0.61% | 0.42% | 0.40% | 0.37% | |||||
| Portfolio turnover rate | 12% | (f) | 50% | 24% | 162% | 49% | 42% | |||||
| (a) Net investment income has been calculated using the average shares method, which more appropriately presents the per share data for the period. | ||||||||||||
| (b) Recognition of net investment income by the Fund is affected by the timing of the declaration of dividends by the underlying investment companies in which the Fund invests. | ||||||||||||
| (c) Total returns are historical and assume changes in share price, reinvestment of dividends and capital gains distributions, and assume no sales charge. Had the Advisor and GFS not absorbed a portion of the expenses, total returns would have been lower. | ||||||||||||
| (d) Does not include the expenses of the investment companies in which the Fund invests. | ||||||||||||
| (e) Not annualized. | ||||||||||||
| (f) Annualized for periods less than one year. | ||||||||||||
Refer to the Notes to Financials Statements at the back of this Report for further information regarding the values set forth above.
| 58 |
| CLS Funds Semi-Annual Report | ||||||||||||
| Financial Highlights | ||||||||||||
| Shelter Fund | ||||||||||||
| Selected data based on a share outstanding throughout each period indicated. | ||||||||||||
| Class N Shares | ||||||||||||
| Six Months | ||||||||||||
| Ended | ||||||||||||
| October 31, | Fiscal Years Ending April 30, | |||||||||||
| 2015 | 2015 | 2014 | 2013 | 2012 | 2011 | |||||||
| (Unaudited) | ||||||||||||
| Net asset value, beginning of period | $ 13.35 | $ 12.21 | $ 10.59 | $ 9.93 | $ 11.74 | $ 10.44 | ||||||
| Income (loss) from investment operations: | ||||||||||||
| Net investment income (loss) (a) (b) | 0.08 | 0.13 | 0.09 | 0.04 | (0.02) | 0.04 | ||||||
| Net realized and unrealized gain (loss) | ||||||||||||
| on investments | (0.75) | 1.10 | 1.57 | 0.62 | (1.70) | 1.31 | ||||||
| Total income (loss) from | ||||||||||||
| investment operations | (0.67) | 1.23 | 1.66 | 0.66 | (1.72) | 1.35 | ||||||
| Less distributions from: | ||||||||||||
| Net investment income | - | (0.09) | (0.04) | - | - | (0.05) | ||||||
| Net realized gains | - | - | - | - | (0.09) | - | ||||||
| Total distributions from net investment | ||||||||||||
| income and net realized gains | - | (0.09) | (0.04) | - | (0.09) | (0.05) | ||||||
| Net asset value, end of period | $ 12.68 | $ 13.35 | $ 12.21 | $ 10.59 | $ 9.93 | $ 11.74 | ||||||
| Total return (c) | (5.02)% | (f) | 10.11% | 15.66% | 6.65% | (14.60)% | 12.95% | |||||
| Ratios and Supplemental Data: | ||||||||||||
| Net assets, end of year (in 000's) | $ 95,638 | $ 98,241 | $ 69,314 | $ 42,828 | $ 63,207 | $ 57,492 | ||||||
| Ratio of expenses to | ||||||||||||
| average net assets (d) | 1.15% | (e) | 1.15% | 1.15% | 1.15% | 1.15% | 1.15% | |||||
| Ratio of expenses to average net assets | ||||||||||||
| before waivers and reimbursements (d) | 1.20% | (e) | 1.27% | 1.37% | 1.37% | 1.29% | 1.34% | |||||
| Ratio of net investment income (loss) to | ||||||||||||
| average net assets (b) | 1.20% | (e) | 0.99% | 0.75% | 0.39% | (0.15)% | 0.37% | |||||
| Portfolio turnover rate | 206% | (f) | 106% | 158% | 291% | 311% | 89% | |||||
| (a) Net investment income (loss) has been calculated using the average shares method, which more appropriately presents the per share data for the period. | ||||||||||||
| (b) Recognition of net investment income by the Fund is affected by the timing of the declaration of dividends by the underlying investment companies in which the Fund invests. | ||||||||||||
| (c) Total returns are historical and assume changes in share price, reinvestment of dividends and capital gains distributions, and assume no sales charge. Had the Adviser and GFS not absorbed a portion of the expenses, total returns would have been lower. | ||||||||||||
| (d) Does not include the expenses of the investment companies in which the Fund invests. | ||||||||||||
| (e) Not annualized. | ||||||||||||
| (f) Annualized for periods less than one year. | ||||||||||||
Refer to the Notes to Financials Statements at the back of this Report for further information regarding the values set forth above.
| 59 |
CLS Funds Semi-Annual Report
Notes to Financial Statements (Unaudited)
October 31, 2015
| 1. | Organization |
CLS Funds (the “Trust” or the “Funds”) was organized as a Delaware Business Trust in December 1996 and is registered under the Investment Company Act of 1940 (the “1940 Act”), as amended, as an open-end management investment company. The CLS Global Diversified Equity Fund, CLS Growth and Income Fund, CLS Global Growth Fund, CLS Domestic Equity Fund, CLS International Equity Fund, CLS Enhanced Long/Short Fund, CLS Flexible Income Fund, CLS Global Aggressive Equity Fund, and CLS Shelter Fund (collectively the “Funds” and each individually a “Fund”) are each a diversified series of the Trust.
Fund The primary investment objective of each Fund is as follows:
| CLS Global Diversified Equity Fund | Long-term growth of capital without regard to current income |
| CLS Growth and Income Fund | Combination of current income and growth of capital |
| CLS Global Growth Fund | Total return, consisting of capital growth and income |
| CLS Domestic Equity Fund | Long-term growth of capital without regard to current income |
| CLS International Equity Fund | Growth of capital and current income |
| CLS Enhanced Long/Short Fund | Total return, consisting of capital growth and income |
| CLS Flexible Income Fund | Total return, consisting of capital growth and income, consistent with preservation of capital |
CLS Global Aggressive Equity Fund CLS Shelter Fund | Long-term growth
Limiting the impact of large equity market declines. The Fund's secondary investment objective is growth of capital. |
The Funds offer the following classes of shares:
Class Funds Offering Class
| Class C | CLS Global Diversified Equity Fund |
| Class N | CLS Global Diversified Equity Fund, CLS Growth and Income Fund, CLS Global Growth Fund, CLS Domestic Equity Fund, CLS International Equity Fund, CLS Enhanced Long/Short Fund, CLS Flexible Income Fund, CLS Global Aggressive Equity Fund, and CLS Shelter Fund |
Class C Shares are offered subject to a 1.00% contingent deferred sales charge applied to redemptions occurring within eighteen months of purchase. Class N shares are offered at net asset value.
| 60 |
CLS Funds Semi-Annual Report
Notes to Financial Statements (Unaudited)(Continued)
October 31, 2015
| 2. | Summary of Significant Accounting Policies |
The following is a summary of significant accounting policies followed by the Funds in the preparation of their financial statements. These policies are in conformity with accounting principles generally accepted in the United States of America (“GAAP”). The preparation of financial statements requires management to make estimates and assumptions that affect the reported amounts of assets and liabilities and disclosure of contingent assets and liabilities at the date of the financial statements and the reported amounts of income and expenses for the year. Actual results could differ from those estimates. The Fund follows the specialized accounting and reporting requirements under GAAP that are applicable to investment companies.
Security Valuation – Securities listed on an exchange are valued at the last reported sale price at the close of the regular trading session of the exchange on the business day the value is being determined, or in the case of securities listed on NASDAQ at the NASDAQ Official Closing Price (“NOCP”). In the absence of a sale such securities shall be valued at the mean between the current bid and ask prices on the primary exchange on the day of valuation. Exchange traded options, futures and options on futures are valued at the settlement price determined by the exchange. Short-term investments that mature in 60 days or less may be valued at amortized cost, provided such valuations represent fair value. Debt securities (other than short-term obligations) are valued each day by an independent pricing service approved by the Trust’s Board of Trustees (the “Board”) based on methods which include consideration of: yields or prices of securities of comparable quality, coupon, maturity and type, indications as to values from dealers, and general market conditions or market quotations from a major market maker in the securities.
The Funds may hold securities, such as private investments, interests in commodity pools, other non-traded securities or temporarily illiquid securities, for which market quotations are not readily available or are determined to be unreliable. These securities will be valued using the “fair value” procedures approved by the Board. The Board has delegated execution of these procedures to a fair value team composed of one or more representatives from each of the (i) Trust, (ii) administrator, and (iii) advisor. The team may also enlist third party consultants such as an audit firm or valuation consultant on an as-needed basis to assist in determining a security-specific fair value. The Board reviews and ratifies the execution of this process and the resultant fair value prices at least quarterly to assure the process produces reliable results.
Fair Valuation Process – As noted above, the fair value team is composed of one or more representatives from each of the (i) Trust, (ii) administrator, and (iii) advisor. The applicable investments are valued collectively via inputs from each of these groups. For example, fair value determinations are required for the following securities: (i) securities for which market quotations are insufficient or not readily available on a particular business day (including securities for which there is a short and temporary lapse in the provision of a price by the regular pricing source), (ii) securities for which, in the judgment of the advisor, the prices or values available do not represent the fair value of the instrument. Factors which may cause the advisor to make such a judgment include, but are not limited to, the following: only a bid price or an ask price is available; the spread
| 61 |
CLS Funds Semi-Annual Report
Notes to Financial Statements (Unaudited)(Continued)
October 31, 2015
between bid and ask prices is substantial; the frequency of sales; the thinness of the market; the size of reported trades; and actions of the securities markets, such as the suspension or limitation of trading; (iii) securities determined to be illiquid; (iv) securities with respect to which an event that will affect the value thereof has occurred (a “significant event”) since the closing prices were established on the principal exchange on which they are traded, but prior to a Fund’s calculation of its net asset value. Specifically, interests in commodity pools or managed futures pools are valued on a daily basis by reference to the closing market prices of each futures contract or other asset held by a pool, as adjusted for pool expenses. Restricted or illiquid securities, such as private placements or non-traded securities are valued via inputs from the advisor based upon the current bid for the security from two or more independent dealers or other parties reasonably familiar with the facts and circumstances of the security (who should take into consideration all relevant factors as may be appropriate under the circumstances). If the advisor is unable to obtain a current bid from such independent dealers or other independent parties, the fair value team shall determine the fair value of such security using the following factors: (i) the type of security; (ii) the cost at date of purchase; (iii) the size and nature of a Fund’s holdings; (iv) the discount from market value of unrestricted securities of the same class at the time of purchase and subsequent thereto; (v) information as to any transactions or offers with respect to the security; (vi) the nature and duration of restrictions on disposition of the security and the existence of any registration rights; (vii) how the yield of the security compares to similar securities of companies of similar or equal creditworthiness; (viii) the level of recent trades of similar or comparable securities; (ix) the liquidity characteristics of the security; (x) current market conditions; and (xi) the market value of any securities into which the security is convertible or exchangeable.
Valuation of Fund of Funds - The Funds may invest in portfolios of open-end or closed-end investment companies (the “Underlying Funds”). The Underlying Funds value securities in their portfolios for which market quotations are readily available at their market values (generally the last reported sale price) and all other securities and assets at their fair value to the methods established by the board of directors of the Underlying Funds.
Open-ended investment companies are valued at their respective net asset values as reported by such investment companies. The shares of many closed-end investment companies, after their initial public offering, frequently trade at a price per share, which is different than the net asset value per share. The difference represents a market premium or market discount of such shares. There can be no assurances that the market discount or market premium on shares of any closed-end investment company purchased by the Funds will not change.
The Funds utilize various methods to measure the fair value of all of its investments on a recurring basis. GAAP establishes a hierarchy that prioritizes inputs to valuation methods. The three levels of input are:
Level 1 – Unadjusted quoted prices in active markets for identical assets and liabilities that a Fund has the ability to access.
| 62 |
CLS Funds Semi-Annual Report
Notes to Financial Statements (Unaudited)(Continued)
October 31, 2015
Level 2 – Observable inputs other than quoted prices included in Level 1 that are observable for the asset or liability, either directly or indirectly. These inputs may include quoted prices for the identical instrument in an inactive market, prices for similar instruments, interest rates, prepayment speeds, credit risk, yield curves, default rates and similar data.
Level 3 – Unobservable inputs for the asset or liability, to the extent relevant observable inputs are not available, representing a Fund’s own assumptions about the assumptions a market participant would use in valuing the asset or liability, and would be based on the best information available.
The availability of observable inputs can vary from security to security and is affected by a wide variety of factors, including, for example, the type of security, whether the security is new and not yet established in the marketplace, the liquidity of markets, and other characteristics particular to the security. To the extent that valuation is based on models or inputs that are less observable or unobservable in the market, the determination of fair value requires more judgment.
Accordingly, the degree of judgment exercised in determining fair value is greatest for instruments categorized in Level 3.
The inputs used to measure fair value may fall into different levels of the fair value hierarchy. In such cases, for disclosure purposes, the level in the fair value hierarchy within which the fair value measurement falls in its entirety, is determined based on the lowest level input that is significant to the fair value measurement in its entirety.
The inputs or methodology used for valuing securities are not necessarily an indication of the risk associated with investing in those securities. The following table summarizes the inputs used as of October 31, 2015 for the Funds’ investments measured at fair value:
CLS Global Diversified Equity Fund
| Assets | Level 1 | Level 2 | Level 3 | Total |
| Equity Funds | $ 478,315,267 | $ - | $ - | $ 478,315,267 |
| Money Market Funds | 3,672,997 | - | - | 3,672,997 |
| Collateral for Securities Loaned | 27,245,009 | - | - | 27,245,009 |
| Total | $ 509,233,273 | $ - | $ - | $ 509,233,273 |
| 63 |
CLS Funds Semi-Annual Report
Notes to Financial Statements (Unaudited)(Continued)
October 31, 2015
CLS Growth and Income Fund
| Assets | Level 1 | Level 2 | Level 3 | Total |
| Bond Funds | $ 155,129,245 | $ - | $ - | $ 155,129,245 |
| Equity Funds | 212,202,528 | - | - | 212,202,528 |
| Money Market Funds | 5,880,805 | - | - | 5,880,805 |
| Collateral for Securities Loaned | 38,963,016 | - | 38,963,016 | |
| Total | $ 412,175,594 | $ - | $ - | $ 412,175,594 |
CLS Global Growth Fund
| Assets | Level 1 | Level 2 | Level 3 | Total |
| Bond Funds | $ 51,265,198 | $ - | $ - | $ 51,265,198 |
| Equity Funds | 203,117,108 | - | - | 203,117,108 |
| Money Market Funds | 1,145,562 | - | - | 1,145,562 |
| Collateral for Securities Loaned | 56,150,152 | - | 56,150,152 | |
| Total | $ 311,678,020 | $ - | $ - | $ 311,678,020 |
CLS Domestic Equity Fund
| Assets | Level 1 | Level 2 | Level 3 | Total |
| Equity Funds | $ 15,722,990 | $ - | $ - | $ 15,722,990 |
| Collateral for Securities Loaned | 4,222,146 | - | - | 4,222,146 |
| Total | $ 19,945,136 | $ - | $ - | $ 19,945,136 |
CLS International Equity Fund
| Assets | Level 1 | Level 2 | Level 3 | Total |
| Equity Funds | $ 9,594,855 | $ - | $ - | $ 9,594,855 |
| Collateral for Securities Loaned | 2,564,804 | - | - | 2,564,804 |
| Total | $ 12,159,659 | $ - | $ - | $ 12,159,659 |
| 64 |
CLS Funds Semi-Annual Report
Notes to Financial Statements (Unaudited)(Continued)
October 31, 2015
CLS Enhanced Long/Short Fund
| Assets | Level 1 | Level 2 | Level 3 | Total |
| Equity Funds | $ 92,316,677 | $ - | $ - | $ 92,316,677 |
| Money Market Funds | 1,909,009 | - | - | 1,909,009 |
| Total | $ 94,225,686 | $ - | $ - | $ 94,225,686 |
| Liabilities | Level 1 | Level 2 | Level 3 | Total |
| Written Options | $ 87,360 | $ 13,925 | $ - | $ 101,285 |
| Total | $ 87,360 | $ 13,925 | $ - | $ 101,285 |
CLS Flexible Income Fund
| Assets | Level 1 | Level 2 | Level 3 | Total |
| Bond Funds | $ 148,914,867 | $ - | $ - | $ 148,914,867 |
| Equity Funds | 16,844,213 | - | - | 16,844,213 |
| U.S. Government & Agency Obligations | - | 14,020,074 | - | 14,020,074 |
| Money Market Funds | 650,825 | - | - | 650,825 |
| Collateral for Securities Loaned | 40,490,306 | - | - | 40,490,306 |
| Total | $ 206,900,211 | $ 14,020,074 | $ - | $ 220,920,285 |
CLS Global Aggressive Equity Fund
| Assets | Level 1 | Level 2 | Level 3 | Total |
| Equity Funds | $ 82,888,415 | $ - | $ - | $ 82,888,415 |
| Collateral for Securities Loaned | 24,640,981 | �� - | - | 24,640,981 |
| Total | $ 107,529,396 | $ - | $ - | $ 107,529,396 |
CLS Shelter Fund
| Assets | Level 1 | Level 2 | Level 3 | Total |
| Equity Funds | $ 94,419,950 | $ - | $ - | $ 94,419,950 |
| U.S. Government Securities | - | 22,000,006 | 22,000,006 | |
| Money Market Funds | 968,382 | - | - | 968,382 |
| Collateral for Securities Loaned | 9,170,856 | - | - | 9,170,856 |
| Total | $ 104,559,188 | $ 22,000,006 | $ - | $ 126,559,194 |
The Funds did not hold any Level 3 securities during the period. There were no transfers into or out of Level 1 & Level 2 during the period. It is the Funds’ policy to recognize transfers between Level 1 & Level 2 at the end of the reporting period.
Refer to the Schedules of Investments for security classifications.
| 65 |
CLS Funds Semi-Annual Report
Notes to Financial Statements (Unaudited)(Continued)
October 31, 2015
Foreign Currency Translations
The accounting records of the Funds are maintained in U.S. dollars. Investment securities and other assets and liabilities denominated in a foreign currency, and income receipts and expense payments are translated into U.S. dollars at the prevailing exchange rate on the respective dates of the transactions. Purchases and sales of securities are translated into U.S. dollars at the contractual currency rates established at the approximate time of the trade.
Net realized gains and losses on foreign currency transactions represent net gains and losses from currency realized between the trade and settlement dates on securities transactions and the difference between income accrued versus income received. The effects of changes in foreign currency exchange rates on investments in securities are included with the net realized and unrealized gain or loss on investment securities.
Exchange Traded Funds
The Funds may invest in exchange traded funds (“ETFs”). ETFs are a type of index fund bought and sold on a securities exchange. An ETF trades like common stock and represents a fixed portfolio of securities designed to track the performance and dividend yield of a particular domestic or foreign market index. A Fund may purchase an ETF to temporarily gain exposure to a portion of the U.S. or a foreign market while awaiting purchase of underlying securities. The risks of owning an ETF generally reflect the risks of owning the underlying securities they are designed to track, although the lack of liquidity on an ETF could result in it being more volatile. Additionally, ETFs have fees and expenses that reduce their value.
Exchange Traded Notes
The Funds may invest in exchange traded notes (“ETNs”). ETNs are a type of debt security that is linked to the performance of underlying securities. The risks of owning ETNs generally reflect the risks of owning the underlying securities they are designed to track. In addition, ETNs are subject to credit risk generally to the same extent as debt securities.
The Funds are subject to equity price risk in the normal course of pursuing their investment objectives and may purchase or sell options to help hedge against this risk.
The Funds may write call options only if they (i) own an offsetting position in the underlying security or (ii) have an absolute or immediate right to acquire that security without additional cash consideration or exchange of other securities held in its portfolio.
When a Fund writes a call option, an amount equal to the premium received is included in the statement of assets and liabilities as a liability. The amount of the liability is subsequently marked-to-market to reflect the current market value of the option. If an option expires on its stipulated expiration date or if a Fund enters into a closing purchase transaction, a gain or loss is realized. If a written call option is exercised, a gain or loss is realized for the sale of the underlying security and the proceeds from the sale are increased by the premium originally received. As writer of an option,
| 66 |
CLS Funds Semi-Annual Report
Notes to Financial Statements (Unaudited)(Continued)
October 31, 2015
a Fund has no control over whether the option will be exercised and, as a result, retains the market risk of an unfavorable change in the price of the security underlying the written option.
The Funds may purchase put and call options. Put options are purchased to hedge against a decline in the value of securities held in a Fund’s portfolio. If such a decline occurs, the put options will permit the Fund to sell the securities underlying such options at the exercise price, or to close out the options at a profit. The premium paid for a put or call option plus any transaction costs will reduce the benefit, if any, realized by the Fund upon exercise of the option, and, unless the price of the underlying security rises or declines sufficiently, the option may expire worthless to the Fund. In addition, in the event that the price of the security in connection with which an option was purchased moves in a direction favorable to the Fund, the benefits realized by the Fund as a result of such favorable movement will be reduced by the amount of the premium paid for the option and related transaction costs. Written and purchased options are non-income producing securities. With purchased options, there is minimal counterparty credit risk to the Funds since these options are exchange traded and the exchange’s clearinghouse, as counterparty to all exchange traded options, guarantees against a possible default.
For the six months ended October 31, 2015, the CLS Enhanced Long/Short Fund had options written located on the Statements of Assets and Liabilities in the liabilities section in the amount of $101,285.
The notional value of the derivative instruments outstanding as of October 31, 2015 as disclosed in the Portfolio of Investments and the amounts realized and changes in unrealized gains and losses on derivative instruments during the period as disclosed below and within the Statement of Operations serve as indicators of the volume of derivative activity for the Fund.
| Fair Value of | Net Realized | Change in Unrealized | |||||
| Liability Derivatives | Gain | Depreciation | |||||
| CLS Enhanced Long/Short Fund | $ 101,285 | $ 303,078 | $ (75,632) | ||||
As of October 31, 2015, portfolio securities valued at $30,342,480 were held in escrow by the custodian for call options written for the CLS Enhanced Long/Short Fund.
The number of option contracts written and the premiums received during the six months ended October 31, 2015, were as follows:
| CLS Enhanced Long/Short Fund | ||
| Number of Contracts | Premiums Received | |
| Options outstanding, beginning of period | 757 | $ 8,462 |
| Options written | 30,259 | 357,366 |
| Options exercised | (992) | (12,440) |
| Options expired | (26,042) | (301,178) |
| Options closed | (1,702) | (21,653) |
| Options outstanding, end of period | 2,280 | $ 30,557 |
| 67 |
CLS Funds Semi-Annual Report
Notes to Financial Statements (Unaudited)(Continued)
October 31, 2015
Offsetting of Financial Assets and Derivative Assets
The following table presents the Fund’s liability derivatives available for offset under a master netting arrangement net of collateral pledged as of October 31, 2015.
CLS Enhanced Long/Short Fund
| Liabilities: | Gross Amounts of Assets Presented in the Statement of Assets & Liabilities | ||||||
| Description | Gross Amounts of Recognized Liabilities | Financial Instruments Pledged | Cash Collateral Pledged | Net Amount of Assets | |||
| Options Written Contracts | $ 101,285 | (1) | $ 101,285 | (2) | $ - | $ - | |
| Total | $ 101,285 | $ 101,285 | $ - | $ - | |||
(1) Written options at value as presented in the Schedule of Investments.
(2) The amount is limited to the derivative liability balance and accordingly, does not include excess collateral pledged.
Income Taxes
It is each Fund's policy to comply with all sections of the Internal Revenue Code applicable to regulated investment companies and to distribute all of its taxable income and gains to its shareholders and therefore, no provision for federal income tax has been made. Each Fund is treated as a separate taxpayer for federal income tax purposes.
The Funds recognize the tax benefits of uncertain tax positions only where the position is “more likely than not” to be sustained assuming examination by tax authorities. Management has analyzed the Funds’ tax positions, and has concluded that no liability for unrecognized tax benefits should be recorded related to uncertain tax positions taken on returns filed for open tax years (2013-2015), or expected to be taken in the Funds’ 2016 tax returns. The Funds identified their major tax jurisdictions as U.S. Federal, Nebraska and foreign jurisdictions where the Funds make significant investments; however, the Funds are not aware of any tax positions for which it is reasonably possible that the total amounts of unrecognized tax benefits will change materially in the next twelve months.
Security Transactions and Related Income
Investment security transactions are accounted for on a trade date basis. Cost is determined and gains and losses are based upon the specific identification method for both financial statement and Federal income tax purposes. Dividend income is recorded on the ex-dividend date and interest income is recorded on the accrual basis. Purchase discounts and premiums on securities are accreted and amortized over the life of the respective securities.
| 68 |
CLS Funds Semi-Annual Report
Notes to Financial Statements (Unaudited)(Continued)
October 31, 2015
Expenses
Expenses of the Trust that are directly identifiable to a specific Fund, are charged to that Fund. Expenses, which are not readily identifiable to a specific Fund, are allocated in such a manner as deemed equitable, taking into consideration the nature and type of expense and the relative sizes of the Funds. Each Fund’s income, expenses (other than the class specific distribution fees) and realized and unrealized gains and losses are allocated proportionally each day between the classes based upon the relative net assets of each class.
Distributions to Shareholders
Income will normally be declared and distributed annually for all of the Funds with exception of Enhanced Long/Short and Flexible Income. Income will normally be declared and distributed quarterly for Enhanced Long/Short and monthly for Flexible Income. The Funds declare and pay net realized capital gains, if any, annually. The character of income and gains to be distributed is determined in accordance with income tax regulations which may differ from accounting principles generally accepted in the United States of America. These differences are primarily due to the treatment of wash sale losses, grantor trust and partnership income.
Indemnification
The Trust indemnifies its Officers and Trustees for certain liabilities that may arise from the performance of their duties to the Trust. Additionally, in the normal course of business, the Funds enter into contracts that contain a variety of representations and warranties and which provide general indemnities. A Fund’s maximum exposure under these arrangements is unknown, as this would involve future claims that may be made against the Funds that have not yet occurred. However, based on experience, the Trust expects the risk of loss due to these warranties and indemnities to be remote.
| 3. | Fees and Compensation Paid to Affiliates and Other Parties |
Advisory Fees
The Trust has entered into an Investment Advisory Agreement with CLS Investments, LLC (the “Advisor”, formerly Clarke Lanzen Skalla Investment Firm, LLC), a subsidiary of NorthStar Financial Services Group, LLC. As compensation for the services rendered, facilities furnished, and expenses borne by the Advisor, the Funds will pay the Advisor a fee accrued daily and paid monthly, at the annualized rate of 0.75% of net assets for all Funds with the exception of CLS Enhanced Long/Short and CLS Flexible Income. The rates these Funds will pay are as follows: CLS Enhanced Long/Short, 0.65%; and CLS Flexible Income, 0.40%.
The Trustees have adopted a Shareholder Servicing Plan with respect to the Class N Shares of the Funds (“Class N Plan”). The Class N Plan allows each of the Funds to use part of its assets for the payment of certain shareholder servicing expenses, including administrative or other shareholder support services. For these services under the Class N Plan, the Funds pay CLS an amount equal to 0.25% of average net assets attributable to Class N Shares, as applicable, of the respective Funds on an annualized basis. CLS shall use monies to compensate other parties that have entered into shareholder servicing agreements with CLS with respect to the servicing of Fund shares.
| 69 |
CLS Funds Semi-Annual Report
Notes to Financial Statements (Unaudited)(Continued)
October 31, 2015
The Advisor has contractually agreed to waive or limit its management fees and to reimburse expenses, other than expenses relating to dividends on short sales, interest expense, indirect fees and expenses of underlying funds, and extraordinary or non-recurring expenses, through December 31, 2016, so that the annual operating expenses of the Funds do not exceed the percentage of the average daily net assets as indicated below:
| Expense Limitation | |
| Class C (CLS Global Diversified Equity Only) | 2.15% |
Class N (CLS Global Diversified Equity, CLS Growth and Income, CLS Global Growth, CLS Domestic Equity, CLS International Equity, CLS Global Aggressive Equity and CLS Shelter) | 1.15% |
| Class N (CLS Enhanced Long/Short) | 1.05% |
| Class N (CLS Flexible Income) | 0.80% |
The waivers and reimbursements, if any, of the Advisor’s fees for the six months ended October 31, 2015, were as follows:
| Fund | Waiver/Reimbursement | ||
| CLS Global Diversified Equity Fund | $63,729 | ||
| CLS Growth and Income Fund | 61,269 | ||
| CLS Global Growth Fund | 122,517 | ||
| CLS Domestic Equity Fund | 72,387 | ||
| CLS International Equity Fund | 76,458 | ||
| CLS Enhanced Long/Short Fund | 126,020 | ||
| CLS Flexible Income Fund | 114,615 | ||
| CLS Global Aggressive Equity Fund | 99,342 | ||
| CLS Shelter Fund | 27,100 | ||
Fees waived or expenses reimbursed may be recouped by the Advisor from a Fund for a period up to three years from the date the fee or expense was waived or reimbursed. However, no recoupment payment will be made by a Fund if it would result in the Fund exceeding the contractual expense limitation described above. During the six months ended October 31, 2015, the Advisor recaptured no fees for prior period expense waivers/reimbursements from the Funds. The table
| 70 |
CLS Funds Semi-Annual Report
Notes to Financial Statements (Unaudited)(Continued)
October 31, 2015
below contains the amounts of fee waivers and expense reimbursements subject to recapture by the Advisor through April 30 of the years indicated:
| Fund | 2016 | 2017 | 2018 | Total |
| CLS Global Diversified Equity Fund | $ 137,119 | $ 152,064 | $ 100,527 | $ 389,710 |
| CLS Growth and Income Fund | 194,887 | 236,881 | 146,025 | 577,793 |
| CLS Global Growth Fund | 262,685 | 310,466 | 255,228 | 828,379 |
| CLS Domestic Equity Fund | 207,898 | 247,462 | 224,289 | 679,649 |
| CLS International Equity Fund | 208,419 | 247,165 | 262,496 | 718,080 |
| CLS Enhanced Long/Short Fund | 264,841 | 302,329 | 259,564 | 826,734 |
| CLS Flexible Income Fund | 258,414 | 279,009 | 235,410 | 772,833 |
| CLS Global Aggressive Equity Fund | 186,451 | 205,128 | 204,172 | 595,751 |
| CLS Shelter Fund | 110,528 | 114,933 | 102,029 | 327,490 |
Administration, Fund Accounting, Transfer Agent, Custody Administration Fees
Gemini Fund Services, LLC (“GFS”), an affiliate of the Distributor and Advisor, provides administration, fund accounting, and transfer agent services to the Trust. Pursuant to a separate servicing agreement with GFS, the Funds pay GFS customary fees for providing administration, fund accounting, and transfer agency services to the Fund. Certain officers of the Trust are also officers of GFS, and are not paid any fees directly by the Fund for serving in such capacities.
In addition, certain affiliates of the Distributor provide ancillary services to the Funds as follows:
Blu Giant, LLC (“Blu Giant”), an affiliate of GFS, the Distributor and the Advisor, provides EDGAR conversion and filing services as well as print management services for the Fund on an ad-hoc basis. For the provision of these services, Blu Giant receives customary fees from the Fund.
Chief Compliance Officer
Northern Lights Compliance Services, LLC (“NLCS”), an affiliate of GFS, the Distributor and the Advisor, provides a Chief Compliance Officer to the Trust, as well as related compliance services, pursuant to a consulting agreement between NLCS and the Trust. Under the terms of such agreement, NLCS receives customary fees from the Funds.
Distributor
The distributor of the Funds is Northern Lights Distributors, LLC (the “Distributor”), an affiliate of the Advisor. The Trust, with respect to the Funds, has adopted a Distribution Plan pursuant to Rule 12b-1 under the 1940 Act (the “Plan”). The Plan provides for the payment of a distribution fee to the Distributor at an annualized rate of 1.00% of the average daily net assets attributable to Class C shares. During the six months ended October 31, 2015, the Global Diversified Equity Fund Class C shares incurred $12,144 pursuant to the Plan. Class N shares do not pay any 12b-1 distribution fees, but pay the Advisor 0.25% for payments to third parties for shareholder services.
| 71 |
CLS Funds Semi-Annual Report
Notes to Financial Statements (Unaudited)(Continued)
October 31, 2015
Trustees Fees
The Trust pays each Trustee of the Trust who was not an interested person a flat fee of $24,000 per year plus $6,000 for an in-person quarterly meeting or $1,000 per quarter if participating in the meeting by telephone. In every instance, the cost of the fees are to be allocated among the participating Funds in accordance with a formula that takes into account the overall asset size of each affected Fund. The Trust also reimburses the Trustees for travel and other expenses incurred in attending meetings of the Board. Officers of the Trust and Trustees who are interested persons of the Trust do not receive any direct compensation from the Trust.
Certain officers of the Trust are officers of GFS, NLCS, the Advisor and/or the Distributor.
| 4. | Aggregate Unrealized Appreciation and Depreciation |
The identified cost of investments in securities (including written options and short sales) owned by each Fund for federal income tax purposes, and their respective gross unrealized appreciation and depreciation at October 31, 2015, were as follows:
| Gross | Gross | Net Unrealized | |||||
| Tax | Unrealized | Unrealized | Appreciation/ | ||||
| Cost | Appreciation | Depreciation | (Depreciation) | ||||
| CLS Global Diversified Equity Fund | $ 449,184,953 | $ 66,774,172 | $ (6,725,852) | $ 60,048,320 | |||
| CLS Growth and Income Fund | 393,888,578 | 23,545,494 | (5,258,478) | 18,287,016 | |||
| CLS Global Growth Fund | 288,752,979 | 31,116,434 | (8,191,393) | 22,925,041 | |||
| CLS Domestic Equity Fund | 18,667,640 | 1,441,562 | (164,066) | 1,277,496 | |||
| CLS International Equity Fund | 12,197,861 | 184,881 | (223,083) | (38,202) | |||
| CLS Enhanced Long/Short Fund | 100,924,650 | 2,593,145 | (9,393,394) | (6,800,249) | |||
| CLS Flexible Income Fund | 224,097,104 | 2,563,886 | (5,740,705) | (3,176,819) | |||
| CLS Global Aggressive Equity Fund | 95,733,104 | 13,037,159 | (1,240,867) | 11,796,292 | |||
| CLS Shelter Fund | 124,368,216 | 2,288,114 | (97,136) | 2,190,978 |
5. Investment Transactions
The cost of purchases and the proceeds from sales of investments, other than short-term securities, for the six months ended October 31, 2015, were as follows:
| 72 |
CLS Funds Semi-Annual Report
Notes to Financial Statements (Unaudited)(Continued)
October 31, 2015
| Purchases | Sales | ||
| CLS Global Diversified Equity Fund | $ 162,249,801 | $ 213,188,369 | |
| CLS Growth and Income Fund | 87,251,701 | 121,168,015 | |
| CLS Global Growth Fund | 29,257,337 | 58,747,702 | |
| CLS Domestic Equity Fund | 4,523,602 | 7,597,538 | |
| CLS International Equity Fund | 16,847,124 | 19,493,524 | |
| CLS Enhanced Long/Short Fund | 13,073,456 | 22,283,665 | |
| CLS Flexible Income Fund | 16,095,760 | 24,978,535 | |
| CLS Global Aggressive Equity Fund | 10,694,265 | 22,507,867 | |
| CLS Shelter Fund | 186,224,126 | 182,548,455 |
| 6. | Shareholders’ Transactions |
At October 31, 2015, the Funds had an unlimited number of shares authorized. Following is a summary of shareholder transactions for each Fund:
| Period Ended | Year Ended | ||||
| October 31, 2015 | April 30, 2015 | ||||
| CLS Global Diversified Equity Fund | Shares | Dollars | Shares | Dollars | |
| Class C Shares: | |||||
| Shares Sold | 1,709 | $ 28,232 | 5,676 | $ 95,954 | |
| Shares issued to shareholders | |||||
| in reinvestment | - | - | 2,961 | 49,245 | |
| Shares redeemed | (3,873) | (64,229) | (21,235) | (360,798) | |
| Net decrease | (2,164) | $ (35,997) | (12,598) | $ (215,599) | |
| CLS Global Diversified Equity Fund | Shares | Dollars | Shares | Dollars | |
| Class N Shares: | |||||
| Shares Sold | 1,666,414 | $ 28,986,236 | 11,118,956 | $ 198,983,558 | |
| Shares issued to shareholders | |||||
| in reinvestment | - | - | 904,094 | 15,948,227 | |
| Shares redeemed | (4,784,809) | (82,584,212) | (8,440,538) | (150,922,201) | |
| Net increase (decrease) | (3,118,395) | $ (53,597,976) | 3,582,512 | $ 64,009,584 | |
| 73 |
CLS Funds Semi-Annual Report
Notes to Financial Statements (Unaudited)(Continued)
October 31, 2015
| Period Ended | Year Ended | ||||
| October 31, 2015 | April 30, 2015 | ||||
| CLS Growth and Income Fund | Shares | Dollars | Shares | Dollars | |
| Class N Shares: | |||||
| Shares Sold | 2,507,610 | $ 26,789,516 | 17,878,070 | $ 194,936,991 | |
| Shares issued to shareholders | |||||
| in reinvestment | - | - | 658,483 | 7,091,862 | |
| Shares redeemed | (5,924,871) | (62,944,243) | (8,245,061) | (89,868,492) | |
| Net increase (decrease) | (3,417,261) | $ (36,154,727) | 10,291,492 | $ 112,160,361 | |
| CLS Global Growth Fund | Shares | Dollars | Shares | Dollars | |
| Class N Shares: | |||||
| Shares Sold | 1,353,478 | $ 15,206,171 | 10,738,225 | $ 122,089,615 | |
| Shares issued to shareholders | |||||
| in reinvestment | - | - | 482,726 | 5,421,011 | |
| Shares redeemed | (3,911,259) | (43,568,297) | (6,354,328) | (72,157,195) | |
| Net increase (decrease) | (2,557,781) | $ (28,362,126) | 4,866,623 | $ 55,353,431 | |
| CLS Domestic Equity Fund | Shares | Dollars | Shares | Dollars | |
| Class N Shares: | |||||
| Shares Sold | 78,878 | $ 726,003 | 812,912 | $ 10,120,271 | |
| Shares issued to shareholders | |||||
| in reinvestment | - | - | 803,359 | 7,374,839 | |
| Shares redeemed | (433,922) | (3,983,294) | (12,343,907) | (160,011,224) | |
| Net decrease | (355,044) | $ (3,257,291) | (10,727,636) | $ (142,516,114) | |
| CLS International Equity Fund | Shares | Dollars | Shares | Dollars | |
| Class N Shares: | |||||
| Shares Sold | 101,206 | $ 440,025 | 1,948,273 | $ 19,537,163 | |
| Shares issued to shareholders | |||||
| in reinvestment | - | - | 2,250,903 | 9,633,863 | |
| Shares redeemed | (739,729) | (3,171,699) | (25,282,532) | (265,084,870) | |
| Net decrease | (638,523) | $ (2,731,674) | (21,083,356) | $ (235,913,844) |
| 74 |
CLS Funds Semi-Annual Report
Notes to Financial Statements (Unaudited)(Continued)
October 31, 2015
| Period Ended | Year Ended | ||||
| October 31, 2015 | April 30, 2015 | ||||
| CLS Enhanced Long/Short Fund | Shares | Dollars | Shares | Dollars | |
| Class N Shares: | |||||
| Shares Sold | 732,071 | $ 7,609,007 | 3,540,742 | $ 37,300,128 | |
| Shares issued to shareholders | |||||
| in reinvestment | 17,143 | 179,298 | 126,177 | 1,318,641 | |
| Shares redeemed | (1,654,027) | (17,138,438) | (2,500,457) | (26,305,597) | |
| Net increase (decrease) | (904,813) | $ (9,350,133) | 1,166,462 | $ 12,313,172 | |
| CLS Flexible Income Fund | Shares | Dollars | Shares | Dollars | |
| Class N Shares: | |||||
| Shares Sold | 1,787,149 | $ 18,212,416 | 7,497,797 | $ 77,816,983 | |
| Shares issued to shareholders | |||||
| in reinvestment | 206,483 | 2,093,607 | 396,686 | 4,106,800 | |
| Shares redeemed | (3,227,514) | (32,854,232) | (4,572,366) | (47,419,732) | |
| Net increase (decrease) | (1,233,882) | $ (12,548,209) | 3,322,117 | $ 34,504,051 | |
| CLS Global Aggressive Equity Fund | Shares | Dollars | Shares | Dollars | |
| Class N Shares: | |||||
| Shares Sold | 258,886 | $ 3,439,822 | 2,374,587 | $ 31,921,108 | |
| Shares issued to shareholders | |||||
| in reinvestment | - | - | 408,255 | 5,376,724 | |
| Shares redeemed | (1,233,818) | (16,154,437) | (2,252,116) | (30,401,647) | |
| Net increase (decrease) | (974,932) | $ (12,714,615) | 530,726 | $ 6,896,185 | |
| CLS Shelter Fund | Shares | Dollars | Shares | Dollars | |
| Class N Shares: | |||||
| Shares Sold | 1,318,563 | $ 16,995,879 | 3,056,521 | $ 39,108,035 | |
| Shares issued to shareholders | |||||
| in reinvestment | - | - | 48,534 | 630,934 | |
| Shares redeemed | (1,134,625) | (14,691,481) | (1,426,024) | (18,315,590) | |
| Net increase | 183,938 | $ 2,304,398 | 1,679,031 | $ 21,423,379 |
| 7. | Securities Lending |
CLS Global Diversified Equity Fund, CLS Growth and Income Fund, CLS Global Growth Fund, CLS Domestic Equity Fund, CLS International Equity Fund, CLS Flexible Income Fund, CLS Global Aggressive Equity Fund and CLS Shelter Fund have entered into a securities lending arrangement with The Bank of New York Mellon (the “Lending Agent”). Under the terms of the agreement, the Funds are authorized to loan securities through the Lending Agent to approved third-party borrowers. In exchange, the Fund receives cash collateral in the amount of at least 102% of the value of the securities loaned. The value of securities loaned is disclosed in a footnote on the statement of Assets & Liabilities and on the Schedule of Investments. Securities lending income is disclosed in the Funds’ Statements of Operations. Although risk is mitigated by the collateral, the Funds could experience a delay in recovering their securities and possible loss of income or value if the Borrower fails to return them.
| 75 |
CLS Funds Semi-Annual Report
Notes to Financial Statements (Unaudited)(Continued)
October 31, 2015
The Funds may invest the cash collateral received in connection with securities lending transactions in the Milestone Treasury Obligations Fund. The Milestone Treasury Obligations Fund, is deemed an affiliate of the Trust and is managed by CLS Investments, LLC. The Funds receive compensation relating to the lending of the Funds’ securities.
| Gross Amounts not offset in the Statement of Assets & Liabilities | |||||||
| Fund | Gross Amounts Recognized in Statements of Assets & Liabilities | Financial Instruments Pledged | Cash Collateral Pledged | Net Amount of Assets | |||
| CLS Global Diversified Equity Fund | $ 27,245,009 | (1) | $ 27,245,009 | (2) | $ - | $ - | |
| CLS Growth and Income Fund | 38,963,016 | (1) | 38,963,016 | (2) | - | - | |
| CLS Global Growth Fund | 56,150,152 | (1) | 56,150,152 | (2) | - | - | |
| CLS Domestic Equity Fund | 4,222,146 | (1) | 4,222,146 | (2) | - | - | |
| CLS International Equity Fund | 2,564,804 | (1) | 2,564,804 | (2) | - | - | |
| CLS Flexible Income Fund | 40,490,306 | (1) | 40,490,306 | (2) | - | - | |
| CLS Global Aggressive Equity Fund | 24,640,981 | (1) | 24,640,981 | (2) | - | - | |
| CLS Shelter Fund | 9,170,856 | (1) | 9,170,856 | (2) | - | - | |
(1) Collateral for Securities Loaned at value as presented in the Schedule of Investments.
(2) The amount is limited to the liability balance and accordingly, does not include excess collateral pledged.
| 8. | Beneficial Ownership |
The beneficial ownership, either directly or indirectly, of more than 25% of voting securities of a fund creates a presumption of control of the Fund, under Section 2(a)(9) of the 1940 Act. As of October 31, 2015, Nationwide Trust Company held the following voting securities for the sole benefit of customers and may be deemed to control the Funds:
| CLS Global Diversified Equity Fund | 30.91% |
| CLS Growth and Income Fund | 29.21% |
| CLS Global Growth Fund | 31.32% |
| CLS Domestic Equity Fund | 41.33% |
| CLS International Equity Fund | 46.34% |
| CLS Enhanced Long/Short Fund | 28.55% |
| CLS Flexible Income Fund | 26.69% |
| CLS Global Aggressive Equity Fund | 39.59% |
| 76 |
CLS Funds Semi-Annual Report
Notes to Financial Statements (Unaudited)(Continued)
October 31, 2015
| 9. | Distributions to Shareholders and Tax Components of Capital |
The tax character of distributions paid during the fiscal years ended April 30, 2015 and April 30, 2014 was as follows:
| For the year ended April 30, 2015: | ||||||
| Ordinary | Long-Term | |||||
| Portfolio | Income | Capital Gains | Total | |||
| CLS Global Diversified Equity Fund | $ 9,862,039 | $ 6,244,211 | $ 16,106,250 | |||
| CLS Growth and Income Fund | 4,114,557 | 3,030,552 | 7,145,109 | |||
| CLS Global Growth Fund | 3,113,963 | 2,344,973 | 5,458,936 | |||
| CLS Domestic Equity Fund | 368,516 | 7,068,125 | 7,436,641 | |||
| CLS International Equity Fund | 787,595 | 8,940,169 | 9,727,764 | |||
| CLS Enhanced Long/Short Fund | 586,792 | 748,271 | 1,335,063 | |||
| CLS Flexible Income Fund | 4,115,620 | - | 4,115,620 | |||
| CLS Global Aggressive Equity Fund | 1,735,518 | 3,643,692 | 5,379,210 | |||
| CLS Shelter Fund | 630,936 | - | 630,936 | |||
| For the year ended April 30, 2014: | ||||||||
| Ordinary | Long-Term | Return of | ||||||
| Portfolio | Income | Capital Gains | Capital | Total | ||||
| CLS Global Diversified Equity Fund | $ 3,395,804 | $ - | $ - | $ 3,395,804 | ||||
| CLS Growth and Income Fund | 5,159,963 | 15,243,740 | - | 20,403,703 | ||||
| CLS Global Growth Fund | 6,404,709 | 11,939,892 | - | 18,344,601 | ||||
| CLS Domestic Equity Fund | 2,308,273 | 6,193,613 | - | 8,501,886 | ||||
| CLS International Equity Fund | 1,838,765 | 19,696,221 | - | 21,534,986 | ||||
| CLS Enhanced Long/Short Fund | 1,406,894 | 2,188,741 | - | 3,595,635 | ||||
| CLS Flexible Income Fund | 3,583,109 | 1,904,828 | - | 5,487,937 | ||||
| CLS Global Aggressive Equity Fund | 1,528,987 | 12,199,327 | - | 13,728,314 | ||||
| CLS Shelter Fund | 178,166 | - | - | 178,166 | ||||
As of April 30, 2015, the components of accumulated earnings/ (deficit) on a tax basis were as follows:
| Undistributed | Undistributed | Post October | Capital Loss | Other | Unrealized | Total | ||||||||
| Ordinary | Long-Term | Loss and | Carry | Book/Tax | Appreciation/ | Accumulated | ||||||||
| Portfolio | Income | Capital Gains | Late Year Loss | Forwards | Differences | (Depreciation) | Earnings/(Deficits) | |||||||
| CLS Global Diversified Fund | $ - | $ 15,932,562 | $ - | $ - | $ - | $ 95,628,716 | $ 111,561,278 | |||||||
| CLS Growth and Income Fund | 795,196 | - | (541,600) | - | - | 39,158,182 | 39,411,778 | |||||||
| CLS Global Growth Fund | - | 7,986,640 | - | - | - | 37,702,775 | 45,689,415 | |||||||
| CLS Domestic Equity Fund | 298,694 | 4,269,291 | - | - | - | 1,505,083 | 6,073,068 | |||||||
| CLS International Equity Fund | - | - | - | - | - | 867,268 | 867,268 | |||||||
| CLS Enhanced Long/Short Fund | 351,277 | 3,074,960 | - | - | (92,937) | (5,241,072) | (1,907,772) | |||||||
| CLS Flexible Income Fund | 446,592 | - | (330,721) | (141,352) | - | 1,438,181 | 1,412,700 | |||||||
| CLS Global Aggressive Equity Fund | 122,898 | 2,735,188 | - | - | - | 18,371,894 | 21,229,980 | |||||||
| CLS Shelter Fund | 600,591 | 386,097 | - | - | - | 13,050,492 | 14,037,180 |
| 77 |
CLS Funds Semi-Annual Report
Notes to Financial Statements (Unaudited)(Continued)
October 31, 2015
The difference between book basis and tax basis undistributed net investment income/(loss), accumulated net realized gain/(loss), and unrealized appreciation/(depreciation) from investments is primarily attributable to the tax deferral of losses on wash sales and straddles, and adjustments for partnerships. In addition, the amount under other book/tax differences for CLS Enhanced Long/Short Fund is primarily attributable to the tax deferral of losses on straddles.
Capital losses incurred after October 31 within the fiscal year are deemed to arise on the first business day of the following fiscal year for tax purposes. The Funds incurred and elected to defer such capital losses as follows:
| Post October | ||
| Portfolio | Losses | |
| CLS Flexible Income Fund | $ 330,721 | |
| CLS Growth and Income Fund | 541,600 | |
At April 30, 2015, the CLS Flexible Income Fund had capital loss carry forwards for federal income tax purposes available to offset future capital gains as follows:
| Portfolio | 2018 | Non-Expiring Short-Term | Non-Expiring Long-Term | Total | ||||
| CLS Flexible Income Fund | $ - | $ 141,352 | $ - | $ 141,352 |
Permanent book and tax differences, primarily attributable to the reclass of ordinary income distributions, and adjustments for equalization, paydowns, partnerships and non-deductible expenses, resulted in reclassifications for the following funds for the year ended April 30, 2015 as follows:
| Paid | Undistributed | Undistributed | |||
| In | Ordinary | Long-Term | |||
| Portfolio | Capital | Income (Loss) | Gains (Loss) | ||
| CLS Global Diversified Equity Fund | $ - | $ 577,664 | $ (577,664) | ||
| CLS Growth and Income Fund | (4,943) | (146,776) | 151,719 | ||
| CLS Global Growth Fund | - | 1,243,791 | (1,243,791) | ||
| CLS Domestic Equity Fund | 25,255,328 | (886,833) | (24,368,495) | ||
| CLS International Equity Fund | 27,139,417 | (968,184) | (26,171,233) | ||
| CLS Enhanced Long/Short Fund | - | 262,981 | (262,981) | ||
| CLS Flexible Income Fund | - | 73,146 | (73,146) | ||
| CLS Global Aggressive Equity Fund | - | (1,039) | 1,039 |
| 78 |
CLS Funds Semi-Annual Report
Notes to Financial Statements (Unaudited)(Continued)
October 31, 2015
| 10. | New Accounting Pronouncements |
In May 2015, the FASB issued Accounting Standards Update (“ASU”) No. 2015-07 “Disclosure for Investments in Certain Entities that Calculate Net Asset Value per Share (or Its Equivalent)”. The amendments in ASU No. 2015-07 remove the requirement to categorize within the fair value hierarchy investments measured using the NAV practical expedient. The ASU also removes certain disclosure requirements for investments that qualify, but do not utilize, the NAV practical expedient. The amendments in the ASU are effective for fiscal years beginning after December 15, 2015, and interim periods within those fiscal years. Management is currently evaluating the impact these changes will have on the Funds’ financial statements and related disclosures.
| 11. | Subsequent Events |
Subsequent events after the date of the Statement of Assets and Liabilities have been evaluated through the date the financial statements were issued. Effective January 19, 2016, the CLS Domestic Equity and the CLS Enhanced Long/Short Fund will be closed and all outstanding shares redeemed. Management has concluded that there are no other material items requiring adjustment or disclosure in the financial statements.
| 79 |
CLS Funds Semi-Annual Report
Shareholder Expense Example (Unaudited)
As a shareholder of the Funds you may incur two types of costs: (1) transaction costs, including contingent deferred sales charges on redemptions and (2) ongoing costs, including management fees; distribution and/or service (12b-1 fees) fees; and other Fund expenses. This Example is intended to help you understand your ongoing costs (in dollars) of investing in each Fund and to compare these costs with the ongoing costs of investing in other mutual funds.
This Example is based on an investment of $1,000 invested at the beginning of the period and held for the entire period as indicated below.
Actual Expenses: The first section of the table provides information about actual account values and actual expenses. You may use the information in this line, together with the amount you invested, to estimate the expenses that you paid over the period. Simply divide your account value by $1,000 (for example, an $8,600 account value divided by $1,000 = 8.6), then multiply the result by the applicable number under the heading entitled “Expenses Paid During the Period” to estimate the expenses you paid on your account during the period.
Hypothetical Examples for Comparison Purposes: The second section of the table below provides information about hypothetical account values and hypothetical expenses based on each Fund’s actual expense ratio and an assumed rate of return of 5% per year before expenses, which is not the Fund’s actual return. The hypothetical account values and expenses may not be used to estimate the actual ending account balance or expenses you paid for the period. You may use this information to compare the ongoing costs of investing in the Fund and other funds. To do so, compare this 5% hypothetical example with the 5% hypothetical examples that appear in the shareholder reports of the other funds.
Please note that the expenses shown in the table are meant to highlight your ongoing costs only and do not reflect any transactional costs, such as sales charges (loads), or contingent deferred sales charges on redemptions. Therefore, the second section of the table is useful in comparing ongoing costs only, and will not help you determine the relative total costs of owning different funds. In addition, if these transactional costs were included, your costs would have been higher.
| Beginning Account Value | Ending Account Value | Expense Ratio (Annualized) | Expenses Paid During the Period | ||
| 5/1/2015 | 10/31/2015 | ||||
| CLS Global Diversified Fund | |||||
| Actual: | |||||
| Class C | $ 1,000.00 | $ 934.20 | 1.91% | $ 9.32 | * |
| Class N | 1,000.00 | 938.10 | 1.15% | 5.62 | * |
| Hypothetical (5% return before expenses): | |||||
| Class C | 1,000.00 | 1,015.57 | 1.91% | 9.71 | * |
| Class N | 1,000.00 | 1,019.41 | 1.15% | 5.85 | * |
| CLS Growth and Income Fund | |||||
| Actual | 1,000.00 | 963.60 | 1.15% | 5.69 | * |
| Hypothetical (5% return before expenses): | 1,000.00 | 1,019.41 | 1.15% | 5.85 | * |
*Expenses are equal to the Fund’s respective annual expense ratios for the most recent six month period, multiplied
by the average account value over the period, multiplied by 184/365.
| 80 |
CLS Funds Semi-Annual Report
Shareholder Expense Example (Unaudited)(Continued)
| Beginning Account Value | Ending Account Value | Expense Ratio (Annualized) | Expenses Paid During the Period | ||
| 5/1/2015 | 10/31/2015 | ||||
| CLS Global Growth Fund | |||||
| Actual | $ 1,000.00 | $ 956.00 | 1.15% | $ 5.67 | * |
| Hypothetical (5% return before expenses): | 1,000.00 | 1,019.41 | 1.15% | 5.85 | * |
| CLS Domestic Equity Fund | |||||
| Actual | 1,000.00 | 1,003.20 | 1.15% | 5.81 | * |
| Hypothetical (5% return before expenses): | 1,000.00 | 1,019.41 | 1.15% | 5.85 | * |
| CLS International Equity Fund | |||||
| Actual | 1,000.00 | 888.90 | 1.15% | 5.48 | * |
| Hypothetical (5% return before expenses): | 1,000.00 | 1,019.41 | 1.15% | 5.85 | * |
| CLS Enhanced Long/Short Fund | |||||
| Actual | 1,000.00 | 983.70 | 1.05% | 5.25 | * |
| Hypothetical (5% return before expenses): | 1,000.00 | 1,019.91 | 1.05% | 5.35 | * |
| CLS Flexible Income Fund | |||||
| Actual | 1,000.00 | 984.90 | 0.80% | 4.00 | * |
| Hypothetical (5% return before expenses): | 1,000.00 | 1,021.17 | 0.80% | 4.08 | * |
| CLS Global Aggressive Equity Fund | |||||
| Actual | 1,000.00 | 944.60 | 1.15% | 5.64 | * |
| Hypothetical (5% return before expenses): | 1,000.00 | 1,019.41 | 1.15% | 5.85 | * |
| CLS Shelter Fund | |||||
| Actual | 1,000.00 | 949.80 | 1.15% | 5.65 | * |
| Hypothetical (5% return before expenses): | 1,000.00 | 1,019.41 | 1.15% | 5.85 | * |
*Expenses are equal to the Fund’s respective annual expense ratios for the most recent six month period, multiplied
by the average account value over the period, multiplied by 184/365.
| 81 |

| Rev. June 2015 | |||||
| FACTS | WHAT DOES ADVISORONE FUNDS (“ADVISORONE”) DO WITH YOUR PERSONAL INFORMATION? | ||||
| Why? | Financial companies choose how they share your personal information. Federal law gives consumers the right to limit some but not all sharing. Federal law also requires us to tell you how we collect, share, and protect your personal information. Please read this notice carefully to understand what we do. | ||||
| What? | The types of personal information we collect and share depend on the product or service you have with us. This information can include: | ||||
· Social Security number · Employment information · Account balances | · Account transactions · Income · Investment experience | ||||
| When you are no longer our customer, we continue to share your information as described in this notice. | |||||
| How? | All financial companies need to share a customer’s personal information to run their everyday business - to process transactions, maintain customer accounts, and report to credit bureaus. In the section below, we list the reasons financial companies can share their customer's personal information; the reasons AdvisorOne chooses to share; and whether you can limit this sharing. | ||||
| Reasons we can share your personal information | Does AdvisorOne share? | Can you limit this sharing? | |||
| For our everyday business purposes -- such as to process your transactions, maintain your account(s), respond to court orders and legal investigations, or report to credit bureaus | Yes | No | |||
| For our marketing purposes -- to offer our products and services to you | Yes | No | |||
| For joint marketing with other financial companies | Yes | No | |||
| For our affiliates’ everyday business purposes -- information about your transactions and experiences | Yes | No | |||
| For our affiliates’ everyday business purposes -- information about your creditworthiness | No | We don't share | |||
| For nonaffiliates to market to you | No | We don't share | |||
| Questions? | Call (866) 811-0225 or go to www.advisoronefunds.com | ||||
| 82 |
| Page 2 | ||||
| Who we are | ||||
| Who is providing this notice? | AdvisorOne Funds | |||
| What we do | ||||
| How does AdvisorOne protect my personal information? | To protect your personal information from unauthorized access and use, we use security measures that comply with federal law. These measures include computer safeguards and secured files and buildings. | |||
| How does AdvisorOne collect my personal information? | We collect your personal information, for example, when you | |||
· open an account · give us your income information · provide employment information | · provide account information · give us your contact information | |||
| We also collect your personal information from others, such as credit bureaus, affiliates, or other companies. | ||||
| Why can’t I limit all sharing? | Federal law gives you the right to limit only · sharing for affiliates’ everyday business purposes—information about your creditworthiness · affiliates from using your information to market to you · sharing for nonaffiliates to market to you State laws and individual companies may give you additional rights to limit sharing. | |||
| Definitions | ||||
| Affiliates | Companies related by common ownership or control. They can be financial and nonfinancial companies. The following companies may be considered affiliates of AdvisorOne: · CLS Investments, LLC · NorthStar Financial Services Group, LLC · Blu Giant, LLC · Gemini Alternative Funds, LLC · Gemini Hedge Fund Services, LLC · Gemini Fund Services, LLC · Northern Lights Compliance Services, LLC · Northern Lights Distributors, LLC · Orion Advisor Services, LLC · Constellation Trust Company · NorthStar Topco, LLC · NorthStar CTC Holdings, Inc. | |||
| Nonaffiliates | Companies not related by common ownership or control. They can be financial and nonfinancial companies. · AdvisorOne does not share with nonaffiliates so they can market to you. | |||
| Joint marketing | A formal agreement between nonaffiliated financial companies that together market financial products and services to you. · Our joint marketing partners include other financial service companies. | |||
| 83 |
THIS PAGE INTENTIONALLY LEFT BLANK
| 84 |
PROXY VOTING POLICY
Information regarding how the Funds voted proxies relating to portfolio securities for the most recent twelve month period ended June 30 as well as a description of the policies and procedures that the Funds use to determine how to vote proxies is available without charge, upon request, by calling 1-866-811-0225 or by referring to the Securities and Exchange Commission’s (“SEC”) website at http://www.sec.gov.
PORTFOLIO HOLDINGS
The Funds file their complete schedule of portfolio holdings with the SEC for the first and third quarters of each fiscal year on Form N-Q. Form N-Q is available on the SEC’s website at http://www.sec.gov and may be reviewed and copied at the SEC’s Public Reference Room in Washington, DC (1-800-SEC-0330). The information on Form N-Q is available without charge, upon request, by calling 1-866-811-0225.
| 85 |

Item 2. Code of Ethics. Not required for semi-annual reports.
Item 3. Audit Committee Financial Expert. Not required for semi-annual reports.
Item 4. Principal Accountant Fees and Services. Not required for semi-annual reports.
Item 5. Audit Committee of Listed Companies. Not applicable to open-end investment companies.
Item 6. Schedule of Investments. Schedule of investments in securities of unaffiliated issuers is included under Item 1.
Item 7. Disclosure of Proxy Voting Policies and Procedures for Closed-End Funds. Not applicable to open-end investment companies.
Item 8. Portfolio Managers of Closed-End Funds. Not applicable to open-end investment companies.
Item 9. Purchases of Equity Securities by Closed-End Funds. Not applicable to open-end investment companies.
Item 10. Submission of Matters to a Vote of Security Holders. None
Item 11. Controls and Procedures.
(a) Based on an evaluation of the registrant’s disclosure controls and procedures as of a date within 90 days of filing date of this Form N-CSR, the disclosure controls and procedures are reasonably designed to ensure that the information required in filings on Forms N-CSR is recorded, processed, summarized, and reported on a timely basis.
(b) There were no significant changes in the registrant’s internal control over financial reporting that occurred during the registrant’s last fiscal half-year that have materially affected, or are reasonably likely to materially affect, the registrant’s internal control over financial reporting.
Item 12. Exhibits.
(a)(1) Not required for semi-annual reports.
(a)(2) Certifications required by Section 302 of the Sarbanes-Oxley Act of 2002 (and Item 11(a)(2) of Form N-CSR) are filed herewith..
(a)(3) Not applicable.
(b) Certifications required by Section 906 of the Sarbanes-Oxley Act of 2002 (and Item 11(b) of Form N-CSR) are filed herewith.
SIGNATURES
Pursuant to the requirements of the Securities Exchange Act of 1934 and the Investment Company Act of 1940, the registrant has duly caused this report to be signed on its behalf by the undersigned, thereunto duly authorized.
(Registrant) AdvisorOne Funds
By (Signature and Title)
/s/ Ryan Beach, Principal Executive Officer/President
Ryan Beach, Principal Executive Officer/ President
Date 1/8/16
Pursuant to the requirements of the Securities Exchange Act of 1934 and the Investment Company Act of 1940, this report has been signed below by the following persons on behalf of the registrant and in the capacities and on the dates indicated.
By (Signature and Title)
/s/ Ryan Beach, Principal Executive Officer/President
Ryan Beach, Principal Executive Officer/President
Date 1/8/16
By (Signature and Title)
/s/ Brian Curley
Brian Curley, Principal Financial Officer/Treasurer
Date 1/8/16