united states
securities and exchange commission
washington, d.c. 20549
form n-csr
certified shareholder report of registered management
investment companies
Investment Company Act file number 811-08037
AdvisorOne Funds
(Exact name of registrant as specified in charter)
17605 Wright Street, Omaha, NE 68130
(Address of principal executive offices) (Zip code)
Gemini Fund Services, LLC., 81 Arkay Drive., Hauppauge, NY 11788
(Name and address of agent for service)
Registrant's telephone number, including area code: 402-493-3313
Date of fiscal year end: 4/30
Date of reporting period: 10/31/17
Item 1. Reports to Stockholders.
| AdvisorOne Funds Semi-Annual Report |
| Table of Contents | ||
| Letter from the Portfolio Management Team | 1 | |
| CLS Global Aggressive Equity Fund | ||
| Portfolio Summary | 4 | |
| Performance Update | 5 | |
| CLS Global Diversified Equity Fund | ||
| Portfolio Summary | 6 | |
| Performance Update | 7 | |
| CLS Growth and Income Fund | ||
| Portfolio Summary | 8 | |
| Performance Update | 9 | |
| CLS Flexible Income Fund | ||
| Portfolio Summary | 10 | |
| Performance Update | 11 | |
| CLS International Equity Fund | ||
| Portfolio Summary | 12 | |
| Performance Update | 13 | |
| CLS Shelter Fund | ||
| Portfolio Summary | 14 | |
| Performance Update | 15 | |
| Schedule of Investments | ||
| CLS Global Aggressive Equity Fund | 16 | |
| CLS Global Diversified Equity Fund | 18 | |
| CLS Growth and Income Fund | 20 | |
| CLS Flexible Income Fund | 22 | |
| CLS International Equity Fund | 25 | |
| CLS Shelter Fund | 26 |
i
| AdvisorOne Funds Semi-Annual Report |
| Table of Contents (Continued) | ||
| Statements of Assets and Liabilities | 27 | |
| Statements of Operations | 29 | |
| Statements of Changes in Net Assets | ||
| CLS Global Aggressive Equity Fund | 31 | |
| CLS Global Diversified Equity Fund | 31 | |
| CLS Growth and Income Fund | 32 | |
| CLS Flexible Income Fund | 32 | |
| CLS International Equity Fund | 33 | |
| CLS Shelter Fund | 33 | |
| Financial Highlights | ||
| CLS Global Aggressive Equity Fund | 34 | |
| CLS Global Diversified Equity Fund | 35 | |
| CLS Growth and Income Fund | 36 | |
| CLS Flexible Income Fund | 37 | |
| CLS International Equity Fund | 38 | |
| CLS Shelter Fund | 39 | |
| Notes to Financial Statements | 40 | |
| Shareholder Expense Example | 60 | |
| Supplemental Information | 62 |
ii
| AdvisorOne Funds Semi-Annual Report |
Letter from the Portfolio Management Team
Dear Shareholders:
The last six months have been profitable for globally diversified portfolios. The U.S. stock market has continued to generate above-average returns, and international markets have been even stronger. Emerging market equities have led the way, and even bonds have generated slightly positive returns, while continuing to benefit portfolios through diversification.
Over the six-month period that ended October 31, 2017, the overall U.S. market, as defined by the Russell 3000 (an index composed of the 3,000 largest U.S. stocks), gained 8.92%. The S&P 500 (an index of 500 large-capitalization companies widely used as a benchmark for larger companies) gained 9.10%, and the Russell 2000 (an index composed of the 2,000 smallest companies on the Russell 3000 and used as a benchmark for smaller companies) gained more than 8%.
Overseas, the MSCI EAFE (an index of developed markets) was up 10.74%, while the MSCI Emerging Markets (an index for emerging markets) gained 16.14%.
The Bloomberg Barclays U.S. Aggregate Bond Index (a proxy for the U.S. investment-grade bond market) was up 1.58%.
We believe the current economic environment works well with our style of investing at CLS Investments. As the advisor for the AdvisorOne Funds, we strongly believe Risk-Budgeted, global, balanced portfolios help investors succeed over time. This simple approach may make sense for many investors, and since international markets still have lagged the U.S. (over the last 10 years, for instance, emerging markets have been mostly unchanged), we believe this style of investing should continue to outperform in the years ahead.
1
| AdvisorOne Funds Semi-Annual Report |
The CLS Approach
| 1) | Helping Investors Succeed |
We believe Risk-Budgeted, global, balanced portfolios, along with clear and transparent communication, help investors achieve success. If portfolios behave as expected, investors are more likely to stay the course with their investment plans.
| 2) | Global |
We believe diversification across domestic and international markets could provide smoother returns and ultimately higher risk-adjusted performance than domestic-only portfolios over time.
| 3) | Balanced |
We believe multi-asset allocations — and managing the proper balance between assets depending on a portfolio’s mandate — work for investors. Smoother returns can translate into better investor experiences and results.
We also believe in the power of teamwork and discipline. All AdvisorOne Funds are team-managed using disciplined processes that are key to long-term success.
Investment Outlook
As active, multi-asset allocators, we build our various portfolios around the CLS Investment Themes. These themes are approved by the CLS Investment Committee and guide our approach to managing the AdvisorOne Funds.
Current CLS Investment Themes
| • | Global Value |
| o | What It Means: We emphasize value stocks around the world — from emerging markets to financial stocks. |
| o | Impact On Year-To-Date Performance: The emerging markets tilt has provided a huge boost, but the relatively light exposure to FANG stocks (Facebook, Amazon, Netflix and Google) and the overweight to financials have not helped. |
| o | Outlook and Positioning: We are still in favor of this theme. Since we now have more attractive buying points (buying points were not as favorable earlier this year as value worked well to close 2016), look for increased exposure to value stocks in the months ahead. |
2
| AdvisorOne Funds Semi-Annual Report |
| • | Smart Beta |
| a. | What It Means: We are heavy users of smart beta ETFs in CLS portfolios. Smart beta ETFs emphasize equity factors, such as quality, value, momentum, and credit and duration in fixed income. We believe emphasizing smart beta ETFs can help enhance returns and manage risk better than traditional market-cap-weighted ETFs. |
| b. | Impact On Year-To-Date Performance: On balance, this theme has not worked given our weights in value-based smart beta ETFs. However, we have seen positive contributions from non-value smart beta ETFs this year. |
| c. | Outlook and Positioning: We are still in favor of smart beta. As with global value, we now have more attractive buying points, so look for increased exposure in the months ahead. |
| • | Creative Diversification |
| a. | What It Means: Low interest rates present a challenge when looking to diversify equity-dominated portfolios with fixed income. However, we overcame this by actively managing our fixed-income exposures, including the maturities, credit qualities, and sectors of our holdings. We also used alternatives, including commodities. |
| b. | Impact On Year-To-Date Performance: While we have seen positive contributions from our overall fixed-income positioning (particularly within our actively managed, fixed-income ETFs), our exposure to commodities has not helped. |
| c. | Outlook and Positioning: We are still in favor of this theme. We will continue our fixed income positioning, including the heavy use of actively managed, fixed-income ETFs, and we will likely increase our commodity positions in the near future. |
Thank you for your trust and confidence in managing your funds.
Sincerely,
CLS Investments Portfolio Management Team
Investors cannot directly invest in an index and unmanaged index returns do not reflect any fees, expenses or sales charges. Past performance does not guarantee future results and there is no assurance that the Fund will achieve its investment objective.
3240-CLS-11/20/2017
9557-NLD-11/28/2017
3
| AdvisorOne Funds Semi-Annual Report |
CLS Global Aggressive Equity Fund - Portfolio Summary
Portfolio Commentary
CLS Global Aggressive Equity gained 10.29% over the six-month period ending October 31, 2017. The Fund has a Risk Budget of 110 (over time, it assumes 110% of the risk of a diversified stock portfolio consisting of 60% domestic equities and 40% international equities).
The Fund trailed its benchmark during this period. Strong performance from technology companies, specifically semiconductors, contributed positively to performance. Overseas positioning in Asia and parts of Europe were also positive for performance. Value-oriented allocations in energy and consumer sectors weighed on performance.
The largest portfolio tilts remain in technology, health care, and financials. Regionally, Europe and Asian countries (both emerging and developed) remain overweight positions.
Turnover for the Fund over the past six months was 16%.
| * | Based on total net asset value as of October 31, 2017. Portfolio holdings are subject to change and should not be a recommendation to buy individual securities. Concentrating in a small number of investments increases the Fund’s risk because each investment has a greater effect on the Fund’s performance. |
Investors cannot directly invest in an index and unmanaged index returns do not reflect any fees, expenses or sales charges. Past performance does not guarantee future results and there is no assurance that the Fund will achieve its investment objective.
Portfolio Composition*
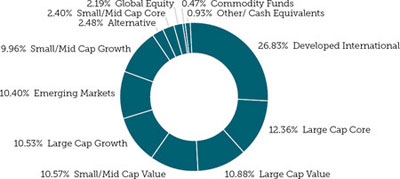
*Percentages based on Net Assets
| Top Ten Portfolio Holdings* | ||
| VanEck Vectors Morningstar Wide Moat ETF | 5.26% | |
| The Fund is a rules-based, equal weighted index intended to offer exposure to the 20 most attractively price companies with sustainable competitive advantages. | ||
| iShares PHLX Semiconductor ETF | 4.72% | |
| The Fund seeks to track the investment results of an index composed of U.S. equities in the semiconductor sector. | ||
| First Trust NASDAQ Technology Dividend Index Fund | 4.17% | |
| The Fund seeks investment results that correspond generally to the price and yield (before the Fund’s fees and expenses) of an equity index called the NASDAQ Technology Dividend Index. | ||
| iShares U.S. Financial Services ETF | 4.15% | |
| The Fund seeks to track the investment results of an index composed of U.S. equities in the financial sector. | ||
| iShares MSCI All Country Asia ex Japan ETF | 3.83% | |
| The Fund seeks to track the investment results of an index composed of Asian equities, excluding Japan. | ||
| First Trust Dorsey Wright International Focus 5 ETF | 3.78% | |
| The Fund seeks to provide targeted exposure to the five First Trust sector and industry based ETFs that Dorsey, Wright & Associates (DWA) believes offer the greatest potential to outperform the other ETFs in the selection universe and that satisfy trading volume and liquidity requirements. | ||
| WisdomTree Europe SmallCap Dividend Fund | 3.76% | |
| The Fund seeks to track the investment results of dividend-paying small-cap companies in the European equity market. | ||
| iShares Edge MSCI International Value Factor ETF | 3.65% | |
| The Fund seeks to track the investment results of an index composed of international developed large- and mid-capitalization stocks with value characteristics and relatively lower valuations. | ||
| iShares U.S. Insurance ETF | 3.45% | |
| The Fund seeks to track the investment results of an index composed of U.S. equities in the insurance sector. | ||
| iShares Currency Hedged MSCI Japan ETF | 3.37% | |
| The Fund seeks to track the investment results of an index composed of large- and mid-capitalization Japanese equities while mitigating exposure to fluctuations between the value of the Japanese yen and the U.S. dollar. | ||
3240-CLS-11/20/2017
9557-NLD-11/28/2017
4
| AdvisorOne Funds Semi-Annual Report |
CLS Global Aggressive Equity Fund - Performance Update
Annualized Total Returns as of October 31, 2017
| Since | |||||||
| 3 Year | 5 Year | 10 Year | Inception | Inception | |||
| 6 Months | 1 Year | (Annualized) | (Annualized) | (Annualized) | (Annualized) | Date | |
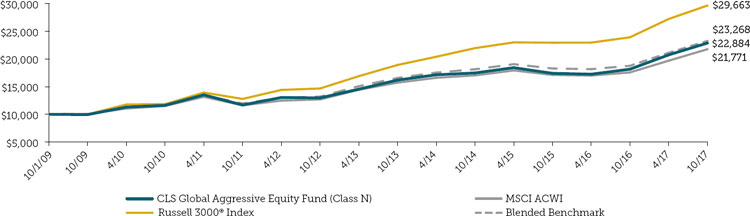
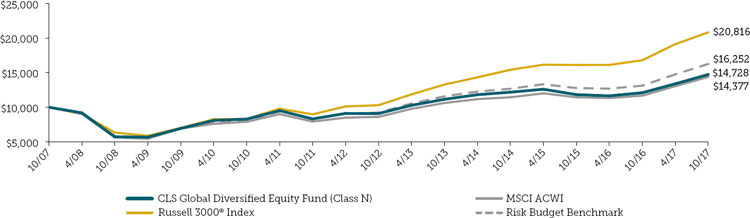
| Class N Shares1 | 10.29% | 26.03% | 9.40% | 12.03% | N/A | 10.79% | 10/1/09 |
| Russell 3000® Index | 8.92% | 23.98% | 10.53% | 15.12% | N/A | 14.40% | 10/1/09 |
| MSCI ACWI | 10.24% | 23.20% | 7.92% | 10.80% | N/A | 9.53% | 10/1/09 |
| 1 | Class N Shares are not subject to an initial sales charge or a CDSC. |
Growth of a $10,000 Investment
This chart illustrates a comparison of a hypothetical investment of $10,000 in the CLS Global Aggressive Equity Fund (assuming reinvestment of all dividends and distributions) versus the Fund’s benchmark index.
The performance data quoted here represents past performance. Current performance may be lower or higher than the performance data quoted above. Past performance is no guarantee of future results. The returns shown do not reflect taxes that a shareholder would pay on Fund distributions or redemptions of Fund shares. The Fund’s total annual operating expenses, including underlying fund expenses, for the CLS Global Aggressive Equity Fund per the most recent prospectus was 1.88%. CLS has contractually agreed to limit total operating expenses at least through August 31, 2018, so that Class N Share direct expenses (not including expenses relating to dividends on short sales, interest expense, indirect fees and expenses of Underlying Funds and extraordinary or non-recurring expenses) do not exceed 1.25% of average daily net assets. The Fund’s performance over the periods shown above would have been lower had the advisor not waived fees and/or reimbursed expenses. For performance information current to the most recent month-end, please call toll-free 1-866-811-0225.
The Russell 3000® Index is a market-capitalization-weighted index that measures 98% of the investable U.S. equity market.
The MSCI ACWI Index represents the Modern Index Strategy and captures all sources of equity returns in 23 developed and 24 emerging markets.
The MSCI ACWI Index is being added to replace the Russell 3000® Index as the Fund’s primary broad-based index because the MSCI ACWI Index is a better benchmark for the Fund’s performance as it more representative of the global investment methodology of the Fund’s equity portfolio.
The MSCI ACWI (ex-US) is an index that provides a broad measure of stock performance throughout the world, with the exception of U.S.-based equities. The index includes both developed and emerging markets.
Performance of the risk budget benchmark shows how the Fund’s performance compares to an index with similar investment strategies and underlying holdings as the Fund. The risk budget benchmark consists of (i) 110% of a blended benchmark consisting of 60% of the Russell 3000® Index and 40% of the MSCI ACWI (ex-US).
5
| AdvisorOne Funds Semi-Annual Report |
| CLS Global Diversified Equity Fund - Portfolio Summary |
Portfolio Commentary
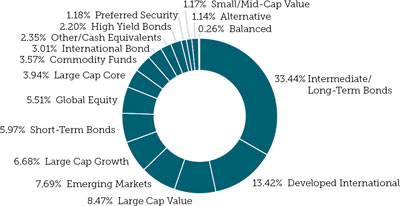
CLS Global Diversified Equity returned 10.03% for the six-month period ending October 31, 2017. The Fund has a Risk Budget of 100 (over time, it is expected to be approximately as risky as a diversified stock portfolio consisting of 60% domestic equities and 40% international equities).
The Fund performed in line with its benchmark during this time frame. Exposure to the domestic technology sector, the momentum factor, and emerging and developed Asia contributed positively to performance. Exposure to agriculture, domestic small-cap value, and emerging Europe detracted from performance during the period.
Regarding our equity positioning among sectors, the largest sector tilt remains technology and financials. Within regional positioning, the largest tilt remains Asia, both developed and emerging. Financials and developed Asian equities continue to look attractive on a number of relative valuation, momentum, and fundamental characteristics.
Turnover for the Fund over the last six months was 12%.
| * | Based on total net asset value as of October 31, 2017. Portfolio holdings are subject to change and should not be a recommendation to buy individual securities. Concentrating in a small number of investments increases the Fund’s risk because each investment has a greater effect on the Fund’s performance. |
Investors cannot directly invest in an index and unmanaged index returns do not reflect any fees, expenses or sales charges. Past performance does not guarantee future results and there is no assurance that the Fund will achieve its investment objective.
Portfolio Composition*
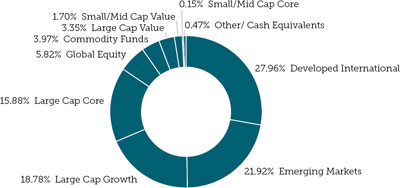
*Percentages based on Net Assets
| Top Ten Portfolio Holdings* | ||
| SPDR S&P Emerging Markets Dividend ETF | 8.72% | |
| The Fund seeks to provide investment results that, before fees and expenses, correspond generally to the total return performance of the S&P® Emerging Markets Dividend Opportunities Index. | ||
| SPDR Technology Select Sector Fund | 8.67% | |
| The Fund seeks to provide investment results that, before expenses, correspond generally to the price and yield performance of the Technology Select Sector Index. | ||
| JPMorgan Diversified Return International Equity ETF | 8.05% | |
| The Fund seeks to track the FTSE Developed ex North America Diversified Factor Index, which was developed in partnership between FTSE and JP MorganVanguard. | ||
| iShares Edge MSCI USA Quality Factor ETF | 7.33% | |
| The Fund seeks to track the investment results of an index that measures the performance of U.S. large- and mid-capitalization stocks as identified through three fundamental variables: return on equity, earnings variability and debt-to-equity. | ||
| iShares Global Healthcare ETF | 5.41% | |
| The Fund seeks to track the investment results of an index composed of global equities in the healthcare sector. | ||
| Vanguard FTSE Europe ETF | 5.38% | |
| The Fund seeks to track the performance of a benchmark index that measures the investment return of stocks issued by companies located in the major markets of Europe. | ||
| iShares Edge MSCI USA Momentum Factor ETF | 4.62% | |
| The Fund seeks to track the performance of an index that measures the performance of U.S. large- and mid-capitalization stocks exhibiting relatively higher momentum characteristics, before fees and expenses. | ||
| iShares MSCI EAFE Value ETF | 4.43% | |
| The Fund seeks to track the investment results of an index composed of developed market equities, excluding the U.S. and Canada, that exhibit value characteristics. | ||
| SPDR S&P Emerging Asia Pacific ETF | 4.26% | |
| The Fund seeks to provide investment results that, before fees and expenses, correspond generally to the total return performance of the S&P® Asia Pacific Emerging BMI Index. | ||
| Vanguard Dividend Appreciation ETF | 4.20% | |
| The Fund seeks to track the performance of the NASDAQ US Dividend Achievers Select Index. | ||
| 3240-CLS-11/20/2017 |
| 9557-NLD-11/28/2017 |
6
| AdvisorOne Funds Semi-Annual Report |
| CLS Global Diversified Equity Fund - Performance Update |
| Annualized Total Returns as of October 31, 2017 |
| 3 Year | 5 Year | 10 Year | ||||
| 6 Months | 1 Year | (Annualized) | (Annualized) | (Annualized) | ||
| Class N Shares1 | 10.03% | 21.81% | 6.56% | 10.14% | 3.95% | |
| Russell 3000® Index | 8.92% | 23.98% | 10.53% | 15.12% | 7.61% | |
| MSCI ACWI | 10.24% | 23.20% | 7.92% | 10.80% | 3.70% | |
| 1 | Class N Shares are not subject to an initial sales charge or a CDSC. |
Growth of a $10,000 Investment
This chart illustrates a comparison of a hypothetical investment of $10,000 in the CLS Global Diversified Equity Fund (assuming reinvestment of all dividends and distributions) versus the Fund’s benchmark index.
The performance data quoted here represents past performance. Current performance may be lower or higher than the performance data quoted above. Past performance is no guarantee of future results. The returns shown do not reflect taxes that a shareholder would pay on Fund distributions or redemptions of Fund shares. The Fund’s total annual operating expenses, including underlying fund expenses, for the CLS Global Diversified Equity Fund per the most recent prospectus was 1.52%. CLS has contractually agreed to limit total operating expenses at least through August 31, 2018, so that Class N Share direct expenses (not including expenses relating to dividends on short sales, interest expense, indirect fees and expenses of Underlying Funds and extraordinary or non-recurring expenses) do not exceed 1.25% of average daily net assets. The Fund’s performance would be lower had the advisor not waived fees and/or reimbursed expenses. For performance information current to the most recent month-end, please call toll-free 1-866-811-0225.
The Russell 3000® Index is a market-capitalization-weighted index that measures 98% of the investable U.S. equity market.
The MSCI ACWI Index represents the Modern Index Strategy and captures all sources of equity returns in 23 developed and 24 emerging markets.
The MSCI ACWI Index is being added to replace the Russell 3000® Index as the Fund’s primary broad-based index because the MSCI ACWI Index is a better benchmark for the Fund’s performance as it more representative of the global investment methodology of the Fund’s equity portfolio.
The MSCI ACWI (ex-US) is an index that provides a broad measure of stock performance throughout the world, with the exception of U.S.-based equities. The index includes both developed and emerging markets.
Performance of the risk budget benchmark shows how the Fund’s performance compares to an index with similar investment strategies and underlying holdings as the Fund. The blended benchmark consists of 60% of the Russell 3000® Index and 40% of the MSCI ACWI (ex-US).
7
| AdvisorOne Funds Semi-Annual Report |
| CLS Growth and Income Fund - Portfolio Summary |
Portfolio Commentary
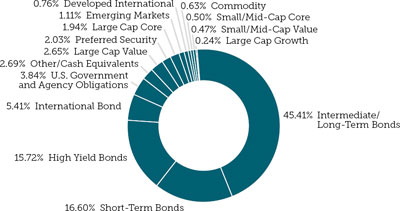
CLS Growth and Income returned 5.49% for the six-month period ending October 31, 2017. The Fund has a Risk Budget of 55 (over time, it is approximately 55% as risky as a diversified stock portfolio consisting of 60% domestic equities and 40% international equities).
The Fund underperformed its benchmark during this time frame. Exposure to the domestic technology sector, global solar power, and emerging and developed Asia contributed to performance, while exposure to inflation protection, uranium, and domestic value-oriented companies detracted. The Fund’s interest-rate sensitivity was lower than the overall bond market.
The largest sector tilts are financials and technology. Within regional positioning, the largest tilt remains Asia, both developed and emerging, and Australia. Financials and developed Asian equities continue to look attractive on a number of relative valuation, momentum, and fundamental characteristics.
Turnover for the Fund over the last six months was 4%.
| * | Based on total net asset value as of October 31, 2017. Portfolio holdings are subject to change and should not be a recommendation to buy individual securities. Concentrating in a small number of investments increases the Fund’s risk because each investment has a greater effect on the Fund’s performance. |
Investors cannot directly invest in an index and unmanaged index returns do not reflect any fees, expenses or sales charges. Past performance does not guarantee future results and there is no assurance that the Fund will achieve its investment objective.
Portfolio Composition*
*Percentages based on Net Assets
| Top Ten Portfolio Holdings* | ||
| iShares TIPS Bond ETF | 9.61% | |
| The Fund seeks results that correspond generally to the price and yield performance, before fees and expenses, of the inflation-protected sector of the U.S. Treasury market as defined by the Barclays U.S. Treasury Inflation Protected Securities (TIPS) Index (Series-L). | ||
| PIMCO Active Bond ETF | 7.54% | |
| The Fund is a diversified portfolio of high quality bonds that are actively managed in an effort to maximize return in a risk-controlled framework. | ||
| SPDR Doubleline Total Return Tactical ETF | 6.20% | |
| The Fund seeks to maximize total return. | ||
| iShares Edge MSCI USA Value Factor ETF | 5.98% | |
| The Fund seeks to track the performance of an index that measures the performance of U.S. large- and mid-capitalization stocks with value characteristics and relatively lower valuations, before fees and expenses. | ||
| PIMCO Enhanced Short Maturity Active ETF | 5.65% | |
| The Fund seeks maximum current income, consistent with preservation of capital and daily liquidity. | ||
| Fidelity Total Bond ETF | 5.09% | |
| The Fund seeks to provide a high level of current income. The fund normally invests at least 80% of its assets in debt securities of all types and repurchase agreements for those securities. | ||
| iShares Edge MSCI USA Momentum Factor ETF | 3.73% | |
| The Fund seeks to track the performance of an index that measures the performance of U.S. large- and mid-capitalization stocks exhibiting relatively higher momentum characteristics, before fees and expenses. | ||
| PowerShares FTSE RAFI Emerging Markets Portfolio | 3.45% | |
| The Fund is designed to track the performance of the largest Emerging Market equities, selected based on the following four fundamental measures of firm size: book value, cash flow, sales and dividends. | ||
| iShares Edge MSCI USA Quality Factor ETF | 3.24% | |
| The Fund seeks to track the investment results of an index that measures the performance of U.S. large- and mid-capitalization stocks as identified through three fundamental variables: return on equity, earnings variability and debt-to-equity. | ||
| iShares MSCI EAFE Value ETF | 3.12% | |
| The Fund seeks to track the investment results of an index composed of developed market equities, excluding the U.S. and Canada, that exhibit value characteristics. | ||
| 3240-CLS-11/20/2017 |
| 9557-NLD-11/28/2017 |
8
| AdvisorOne Funds Semi-Annual Report |
| CLS Growth and Income Fund - Performance Update |
| Annualized Total Returns as of October 31, 2017 |
| 3 Year | 5 Year | 10 Year | ||||||||
| 6 Months | 1 Year | (Annualized) | (Annualized) | (Annualized) | ||||||
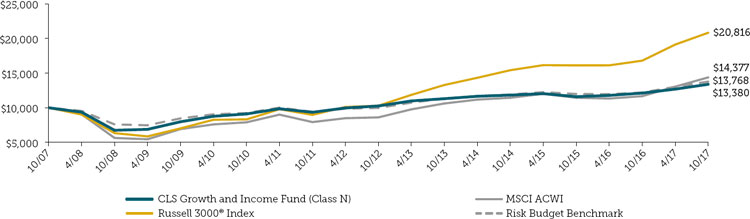
| Class N Shares1 | 5.49% | 10.44% | 4.21% | 5.47% | 2.95% | |||||
| Russell 3000® Index | 8.92% | 23.98% | 10.53% | 15.12% | 7.61% | |||||
| MSCI ACWI | 10.24% | 23.20% | 7.92% | 10.80% | 3.70% | |||||
| 1 | Class N Shares are not subject to an initial sales charge or a CDSC. |
Growth of a $10,000 Investment
This chart illustrates a comparison of a hypothetical investment of $10,000 in the CLS Growth and Income Fund (assuming reinvestment of all dividends and distributions) versus the Fund’s benchmark index.
The performance data quoted here represents past performance. Current performance may be lower or higher than the performance data quoted above. Past performance is no guarantee of future results. The returns shown do not reflect taxes that a shareholder would pay on Fund distributions or redemptions of Fund shares. The Fund’s total annual operating expenses, including underlying fund expenses, for the CLS Growth and Income Fund per the most recent prospectus was 1.60%. CLS has contractually agreed to limit total operating expenses at least through August 31, 2018, so that Class N Share direct expenses (not including expenses relating to dividends on short sales, interest expense, indirect fees and expenses of Underlying Funds and extraordinary or non-recurring expenses) do not exceed 1.25% of average daily net assets. The Fund’s performance as shown above would have been lower had the advisor not waived fees and/or reimbursed expenses. For performance information current to the most recent month-end, please call toll-free 1-866-811-0225.
The Russell 3000® Index is a market-capitalization-weighted index that measures 98% of the investable U.S. equity market.
The MSCI ACWI Index represents the Modern Index Strategy and captures all sources of equity returns in 23 developed and 24 emerging markets.
The MSCI ACWI Index is being added to replace the Russell 3000® Index as the Fund’s primary broad-based index because the MSCI ACWI Index is a better benchmark for the Fund’s performance as it more representative of the global investment methodology of the Fund’s equity portfolio.
The MSCI ACWI (ex-US) is an index that provides a broad measure of stock performance throughout the world, with the exception of U.S.-based equities. The index includes both developed and emerging markets.
The 1-3 Month Treasury Bill Index includes all publicly issued zero-coupon U.S. Treasury Bills that have a remaining maturity of less than 3 months and more than 1 month, are rated investment grade, and have $250 million or more of outstanding face value.
Performance of the risk budget benchmark shows how the Fund’s performance compares to an index with similar investment strategies and underlying holdings as the Fund. The risk budget benchmark consists of (i) 55% of a blended benchmark consisting of 60% of the Russell 3000® Index and 40% of the MSCI ACWI (ex-US), and (ii) 45% of the 1-3 Month Treasury Bill Index. The weightings against this benchmark are consistent with the risk level of the Fund and these indexes are utilized to reflect the Fund’s broad exposure to the global equity market.
9
| AdvisorOne Funds Semi-Annual Report |
| CLS Flexible Income Fund - Portfolio Summary |
Portfolio Commentary
CLS Flexible Income returned 1.58% for the six-month period ending October 31, 2017. The Fund has a Risk Budget of 20 (over time, it is approximately 20% as risky as a diversified stock portfolio consisting of 60% domestic equities and 40% international equities).
The Fund underperformed its benchmark during the time frame, with high-yield bonds, emerging market bonds, and global equities helping performance. Treasury bonds and commodities detracted from performance during the period.
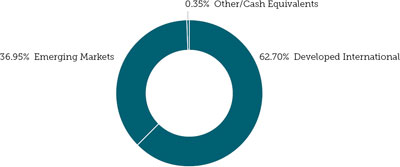
The Fund has increased exposure to high-quality bonds, short-duration bonds, and value-oriented equities and reduced exposure to international bonds, high-yield bonds, and senior, secured bank loans. In terms of sector positioning, the largest overweight remains to corporate bonds. The Fund also has notable overweights to municipal bonds, mortgage-backed bonds, and international bonds. The Fund is underweight to Treasury bonds. We expect short-term interest rates to continue to grind higher, and there are signs inflation is on the rise. This expectation has led to a modestly below-benchmark duration position for the Fund.
Turnover for the Fund over the last six months was 11%.
| * | Based on total net asset value as of October 31, 2017. Portfolio holdings are subject to change and should not be a recommendation to buy individual securities. Concentrating in a small number of investments increases the Fund’s risk because each investment has a greater effect on the Fund’s performance. |
Investors cannot directly invest in an index and unmanaged index returns do not reflect any fees, expenses or sales charges. Past performance does not guarantee future results and there is no assurance that the Fund will achieve its investment objective.
Portfolio Composition*
*Percentages based on Net Assets
| Top Ten Portfolio Holdings* | ||
| PIMCO Enhanced Short Maturity Active ETF | 8.05% | |
| The Fund seeks maximum current income, consistent with preservation of capital and daily liquidity. | ||
| SPDR Doubleline Total Return Tactical ETF | 6.78% | |
| The Fund seeks to maximize total return. | ||
| iShares Core U.S. Aggregate Bond ETF | 4.63% | |
| The Fund seeks to track the investment results of an index composed of the total U.S. investment-grade bond market. | ||
| iShares 1-3 Year Treasury Bond ETF | 4.51% | |
| The Fund seeks to track the investment results of an index composed of U.S. Treasury bonds with remaining maturities between one and three years. | ||
| iShares TIPS Bond ETF | 4.38% | |
| The Fund seeks results that correspond generally to the price and yield performance, before fees and expenses, of the inflation-protected sector of the U.S. Treasury market as defined by the Barclays U.S. Treasury Inflation Protected Securities (TIPS) Index (Series-L). | ||
| Vanguard Total Bond Market ETF | 4.11% | |
| The Fund seeks to track the performance of a broad, market-weighted bond index. | ||
| Vanguard Intermediate-Term Corporate Bond ETF | 3.52% | |
| The Fund seeks to track the performance of a market-weighted corporate bond index with an intermediate-term dollar-weighted average maturity. | ||
| iShares Intermediate Credit Bond ETF | 3.44% | |
| The Fund seeks to track the investment results of an index composed of U.S. dollar- denominated, investment-grade corporate, sovereign, supranational, local authority and non-U.S. agency bonds with remaining maturities between one and ten years. | ||
| PowerShares Senior Loan Portfolio | 3.37% | |
| The Fund seeks investment results that generally correspond to the price and yield of S&P/LSTA U.S. Leverages Loan 100 Index. | ||
| iShares 3-7 Year Treasury Bond ETF | 3.21% | |
| The Fund seeks to track the investment results of an index composed of U.S. Treasury bonds with remaining maturities between three and seven years. | ||
3240-CLS-11/20/2017
9557-NLD-11/28/2017
10
| AdvisorOne Funds Semi-Annual Report |
| CLS Flexible Income Fund - Performance Update |
| Annualized Total Returns as of October 31, 2017 |
| Since | ||||||||||||||
| 3 Year | 5 Year | 10 Year | Inception | Inception | ||||||||||
| 6 Months | 1 Year | (Annualized) | (Annualized) | (Annualized) | (Annualized) | Date | ||||||||
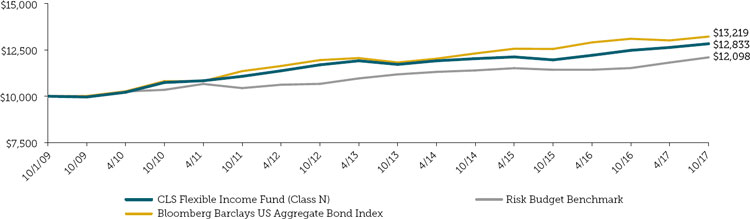
| Class N Shares1 | 1.58% | 2.84% | 2.18% | 1.87% | N/A | 3.13% | 10/1/09 | |||||||
| Bloomberg Barclays US Aggregate Bond Index | 1.58% | 0.90% | 2.40% | 2.04% | N/A | 3.51% | 10/1/09 |
| 1 | Class N Shares are not subject to an initial sales charge or a CDSC. |
Growth of a $10,000 Investment
This chart illustrates a comparison of a hypothetical investment of $10,000 in the CLS Flexible Income Fund (assuming reinvestment of all dividends and distributions) versus the Fund’s benchmark index.
The performance data quoted here represents past performance. Current performance may be lower or higher than the performance data quoted above. Past performance is no guarantee of future results. The returns shown do not reflect taxes that a shareholder would pay on Fund distributions or redemptions of Fund shares. The Fund’s total annual operating expenses, including underlying fund expenses, for the CLS Flexible Income Fund per the most recent prospectus was 1.31%. CLS has contractually agreed to limit total operating expenses at least through August 31, 2018, so that Class N Share direct expenses (not including expenses relating to dividends on short sales, interest expense, indirect fees and expenses of Underlying Funds and extraordinary or non-recurring expenses) do not exceed 0.90% of average daily net assets. The Fund’s performance as shown above would have been lower had the advisor not waived fees and/or reimbursed expenses. For performance information current to the most recent month-end, please call toll-free 1-866-811-0225.
The Bloomberg Barclays US Aggregate Bond Index is a market-capitalization-weighted index that covers the USD-denominated, investment-grade (rated Baa3 or above by Moody’s), fixed-rate, and taxable areas of the bond market. Prior to August 24, 2016, the index was known as Barclays Aggregate Bond Index.
The Russell 3000® Index is a market-capitalization-weighted index that measures 98% of the investable U.S. equity market.
The MSCI ACWI (ex-US) is an index that provides a broad measure of stock performance throughout the world, with the exception of U.S.-based equities. The index includes both developed and emerging markets.
The 1-3 Month Treasury Bill Index includes all publicly issued zero-coupon U.S. Treasury Bills that have a remaining maturity of less than 3 months and more than 1 month, are rated investment grade, and have $250 million or more of outstanding face value.
Performance of the risk budget benchmark shows how the Fund’s performance compares to an index with similar investment strategies and underlying holdings as the Fund. The risk budget benchmark consists of (i) 20% of a blended benchmark consisting of 60% of the Russell 3000® Index and 40% of the MSCI ACWI (ex-US), and (ii) 80% of the 1-3 Month Treasury Bill Index.
11
| AdvisorOne Funds Semi-Annual Report |
| CLS International Equity Fund - Portfolio Summary |
Portfolio Commentary
CLS International Equity generated a return of 10.67% for the six-month period ending October 31, 2017. The Fund consists primarily of international equities and is not Risk-Budgeted; however, it is managed with risk considerations and a focus on delivering higher incremental income relative to its benchmark. The portfolio management methodology is quantitatively driven through the use of fundamental risk factors.
The Fund trailed its benchmark during this time frame. Allocations to the value factor and individual country allocations within Latin America and Europe hurt performance. Individual country allocations within Asia and the momentum factor exposures helped performance.
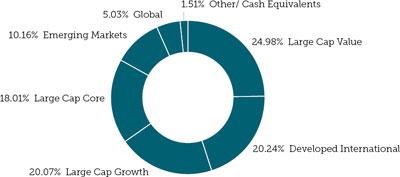
At the end of October, the Fund continued to be overweight to emerging markets, particularly within Asia and Latin America. The Fund was notably underweight to Japan and the United Kingdom. The factor allocations are positioned toward value and momentum.
Turnover for the Fund over the last six months was 51%.
| * | Based on total net asset value as of October 31, 2017. Portfolio holdings are subject to change and should not be a recommendation to buy individual securities. Concentrating in a small number of investments increases the Fund’s risk because each investment has a greater effect on the Fund’s performance. |
Investors cannot directly invest in an index and unmanaged index returns do not reflect any fees, expenses or sales charges. Past performance does not guarantee future results and there is no assurance that the Fund will achieve its investment objective.
Portfolio Composition*
*Percentages based on Net Assets
| Top Ten Portfolio Holdings* | ||
| iShares MSCI EAFE Value ETF | 12.24% | |
| The Fund seeks to track the investment results of an index composed of developed market equities, excluding the U.S. and Canada, that exhibit value characteristics. | ||
| PowerShares DWA Emerging Markets Momentum Portfolio | 12.08% | |
| The Fund seeks investment results that generally correspond (before fees and expenses) to the price and yield of the Dorsey Wright® Emerging Markets Technical Leaders Index. | ||
| iShares Edge MSCI International Momentum Factor ETF | 8.70% | |
| The Fund seeks to track the performance of an index that measures the performance of large- and mid-capitalization developed international stocks exhibiting relatively higher momentum characteristics, before fees and expenses. | ||
| Schwab Fundamental Emerging Markets | ||
| Large Company Index ETF | 5.18% | |
| The Fund seeks to track as closely as possible, before fees and expenses, the total return of the Russell RAFI Emerging Markets Large Company Index. | ||
| PowerShares FTSE RAFI Developed Markets ex-U.S. Portfolio | 4.42% | |
| The Fund seeks investment results that generally correspond (before fees and expenses) to the price and yield of the FTSE RAFI Developed ex- U.S. 1000 Index. | ||
| iShares MSCI Taiwan Capped ETF | 4.21% | |
| The Fund seeks to track the investment results of an index composed of Taiwanese equities. | ||
| iShares MSCI Singapore Capped ETF | 4.18% | |
| The Fund seeks to track the investment results of an index composed of Singaporean equities. | ||
| iShares MSCI Spain Capped ETF | 4.06% | |
| The Fund seeks to track the investment results of an index composed of Spanish equities. | ||
| iShares MSCI Israel Capped ETF | 3.54% | |
| The Fund seeks to track the investment results of a broad-based index composed of Israeli equities. | ||
| iShares MSCI Italy Capped ETF | 3.50% | |
| The Fund seeks to track the investment results of an index composed of Italian equities. | ||
| 3240-CLS-11/20/2017 |
| 9557-NLD-11/28/2017 |
12
| AdvisorOne Funds Semi-Annual Report |
| CLS International Equity Fund - Performance Update |
| Annualized Total Returns as of October 31, 2017 |
| 3 Year | 5 Year | 10 Year | ||||||||
| 6 Months | 1 Year | (Annualized) | (Annualized) | (Annualized) | ||||||
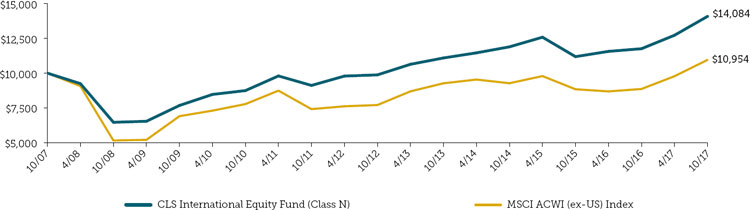
| Class N Shares1 | 10.67% | 19.77% | 5.80% | 7.36% | 3.48% | |||||
| MSCI ACWI (ex-US) | 12.02% | 23.64% | 5.71% | 7.29% | 0.92% |
| 1 | Class N Shares are not subject to an initial sales charge or a CDSC. |
Growth of a $10,000 Investment
This chart illustrates a comparison of a hypothetical investment of $10,000 in the CLS International Equity Fund (assuming reinvestment of all dividends and distributions) versus the Fund’s benchmark index.
The performance data quoted here represents past performance. Current performance may be lower or higher than the performance data quoted above. Past performance is no guarantee of future results. The returns shown do not reflect taxes that a shareholder would pay on Fund distributions or redemptions of Fund shares. The Fund’s total annual operating expenses, including underlying fund expenses, for the CLS International Equity Fund per the most recent prospectus was 2.53%. CLS has contractually agreed to limit total operating expenses at least through August 31, 2018, so that Class N Share direct expenses (not including expenses relating to dividends on short sales, interest expense, indirect fees and expenses of Underlying Funds and extraordinary or non-recurring expenses) do not exceed 1.25% of average daily net assets. The Fund’s performance as shown above would have been lower had the advisor not waived fees and/or reimbursed expenses. For performance information current to the most recent month-end, please call toll-free 1-866-811-0225.
The MSCI ACWI (ex-US) is a market-capitalization weighted index that provides a broad measure of stock performance throughout the world, with the exception of U.S.-based equities. The index includes both developed and emerging markets.
13
| AdvisorOne Funds Semi-Annual Report |
| CLS Shelter Fund - Portfolio Summary |
Portfolio Commentary
CLS Shelter returned 8.85% for the six-month period ending October 31, 2017. The Fund has a blended benchmark consisting of 75% global equities and 25% Treasury bills. The global equity portion of the benchmark is represented by a blend of 80% domestic equities (Russell 3000 Index) and 20% international equities (MSCI ACWI ex-U.S. index). Treasury bills are represented by the Bloomberg Barclays 1-3 Month U.S. Treasury Bill Index.
During this time frame, upward-trending markets kept the Fund invested mostly in a diversified portfolio of stocks with the exception of the first 17 days of the period. The protected portion of the allocation peaked at 5% only for a short period of time, and the Fund was fully invested in diversified equities for the rest of the period.
The Fund began the period with 5% invested in reduced volatility stocks and 95% in diversified stocks. It stayed at that level only until May 17, at which point the Fund reallocated fully back into diversified stocks. Markets rallied from that point, and the Fund stayed fully invested in diversified stocks for the remainder of the period. It should be noted the Fund had three step-ups in protection, locking in gains.
Performance for the period was driven primarily by the Fund’s higher allocation to equities relative to its benchmark. International equities, particularly emerging markets, were the most beneficial to the portfolio, while value and mid-cap exposure detracted from performance during the period.
Turnover for the Fund over the last six months was 14% as volatility has been low. The Fund rebalanced as necessary to accommodate cash flows throughout the period.
| * | Based on total net asset value as of October 31, 2017. Portfolio holdings are subject to change and should not be a recommendation to buy individual securities. Concentrating in a small number of investments increases the Fund’s risk because each investment has a greater effect on the Fund’s performance. |
Investors cannot directly invest in an index and unmanaged index returns do not reflect any fees, expenses or sales charges. Past performance does not guarantee future results and there is no assurance that the Fund will achieve its investment objective.
Portfolio Composition*
*Percentages based on Net Assets
| Top Portfolio Holdings* | ||
| iShares Edge MSCI USA Quality Factor ETF | 19.29% | |
| The Fund seeks to track the investment results of an index that measures the performance of U.S. large- and mid-capitalization stocks as identified through three fundamental variables: return on equity, earnings variability and debt-to-equity. | ||
| Guggenheim S&P 500 Equal Weight ETF | 17.31% | |
| The Fund seeks to replicate as closely as possible the performance of the S&P 500 Equal Weight Index, before fees and expenses, on a daily basis. | ||
| iShares Edge MSCI USA Value Factor ETF | 14.41% | |
| The Fund seeks to track the performance of an index that measures the performance of U.S. large- and mid-capitalization stocks with value characteristics and relatively lower valuations, before fees and expenses. | ||
| iShares Core MSCI Emerging Markets ETF | 9.77% | |
| The Fund seeks to track the investment results of an index composed of large-, mid- and small-capitalization emerging market equities. | ||
| iShares Core MSCI EAFE ETF | 9.75% | |
| The Fund seeks to track the investment results of an index composed of large-, mid- and small-capitalization developed market equities, excluding the U.S. and Canada. | ||
| iShares MSCI EAFE Value ETF | 9.69% | |
| The Fund seeks to track the investment results of an index composed of developed market equities, excluding the U.S. and Canada, that exhibit value characteristics. | ||
| Guggenheim S&P 500 Pure Value ETF | 9.59% | |
| The Fund seeks to replicate as closely as possible, before fees and expenses, the performance of the S&P 500 Pure Value Index. | ||
| iShares MSCI ACWI ETF | 4.84% | |
| The Fund seeks to track the investment results of an index composed of large and mid-capitalization developed and emerging market equities. | ||
| 3240-CLS-11/20/2017 |
| 9557-NLD-11/28/2017 |
14
| AdvisorOne Funds Semi-Annual Report |
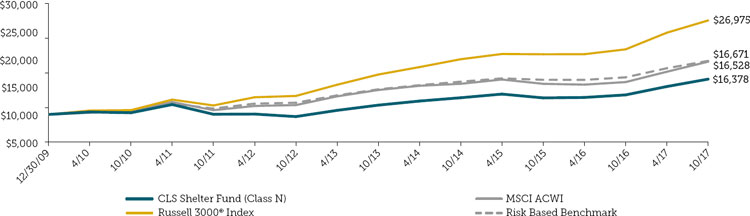
| CLS Shelter Fund - Performance Update |
| Annualized Total Returns as of October 31, 2017 |
| Since | ||||||||||||||
| 3 Year | 5 Year | 10 Year | Inception | Inception | ||||||||||
| 6 Months | 1 Year | (Annualized) | (Annualized) | (Annualized) | (Annualized) | Date | ||||||||
| Class N Shares1 | 8.85% | 21.04% | 7.94% | 11.24% | N/A | 6.50% | 12/30/09 | |||||||
| Russell 3000® Index | 8.92% | 23.98% | 10.53% | 15.12% | N/A | 13.50% | 12/30/09 | |||||||
| MSCI ACWI | 10.24% | 23.20% | 7.92% | 10.80% | N/A | 8.92% | 12/30/09 | |||||||
| 1 | Class N Shares are not subject to an initial sales charge or a CDSC. |
Growth of a $10,000 Investment
This chart illustrates a comparison of a hypothetical investment of $10,000 in the CLS Shelter Fund (assuming reinvestment of all dividends and distributions) versus the Fund’s benchmark index.
The performance data quoted here represents past performance. Current performance may be lower or higher than the performance data quoted above. Past performance is no guarantee of future results. The returns shown do not reflect taxes that a shareholder would pay on Fund distributions or redemptions of Fund shares. The Fund’s total annual operating expenses, including underlying fund expenses, for the CLS Shelter Fund per the most recent prospectus was 1.44%. CLS has contractually agreed to limit total operating expenses at least through August 31, 2018, so that Class N Share direct expenses (not including expenses relating to dividends on short sales, interest expense, indirect fees and expenses of Underlying Funds and extraordinary or non-recurring expenses) do not exceed 1.25% of average daily net assets. The Fund’s performance shown above would have been lower had the advisor not waived fees and/or reimbursed expenses. For performance information current to the most recent month-end, please call toll-free 1-866-811-0225.
The Russell 3000® Index is a market-capitalization-weighted index that measures 98% of the investable U.S. equity market.
The MSCI ACWI Index represents the Modern Index Strategy and captures all sources of equity returns in 23 developed and 24 emerging markets.
The MSCI ACWI Index is being added to replace the Russell 3000® Index as the Fund’s primary broad-based index because the MSCI ACWI Index is a better benchmark for the Fund’s performance as it more representative of the global investment methodology of the Fund’s equity portfolio.
The MSCI ACWI (ex-US) is an index that provides a broad measure of stock performance throughout the world, with the exception of U.S.-based equities. The index includes both developed and emerging markets.
The 1-3 Month Treasury Bill Index includes all publicly issued zero-coupon U.S. Treasury Bills that have a remaining maturity of less than 3 months and more than 1 month, are rated investment grade, and have $250 million or more of outstanding face value.
Performance of the risk based benchmark shows how the Fund’s performance compares to an index with similar investment strategies and underlying holdings as the Fund. The risk based benchmark consists of (i) 75% of a blended benchmark consisting of 80% of the Russell 3000® Index and 20% of the MSCI ACWI (ex-US), and (ii) 25% of the 1-3 Month Treasury Bill Index.
15
| AdvisorOne Funds Semi-Annual Report |
| Schedule of Investments - CLS Global Aggressive Equity Fund (Unaudited) |
| October 31, 2017 |
| Shares | Fair Value ($) | |||||||
| Equity Funds - 99.07% | ||||||||
| Alternative - 2.48% | ||||||||
| JPMorgan Diversified Alternatives ETF | 160,000 | $ | 4,182,400 | |||||
| Commodity Funds - 0.47% | ||||||||
| Teucrium Sugar Fund * + | 22,000 | 214,500 | ||||||
| Teucrium Wheat Fund * + | 45,000 | 279,000 | ||||||
| United States Natural Gas Fund LP * + | 50,000 | 299,000 | ||||||
| 792,500 | ||||||||
| Developed International - 26.83% | ||||||||
| First Trust Dorsey Wright International Focus 5 ETF + | 363,000 | 7,869,840 | ||||||
| iShares Currency Hedged MSCI Japan ETF + | 214,000 | 7,019,200 | ||||||
| iShares Edge MSCI International Value Factor ETF ^ + | 293,000 | 7,597,490 | ||||||
| iShares MSCI Australia ETF | 164,500 | 3,734,150 | ||||||
| iShares MSCI Austria Capped ETF + | 142,000 | 3,386,700 | ||||||
| iShares MSCI Europe Financials ETF | 200,000 | 4,630,000 | ||||||
| WisdomTree Europe SmallCap Dividend Fund + | 113,000 | 7,832,030 | ||||||
| X-trackers MSCI Europe Hedged Equity ETF | 111,000 | 3,213,450 | ||||||
| 45,282,860 | ||||||||
| Emerging Markets - 10.40% | ||||||||
| Hartford Multifactor Emerging Markets ETF ^ + | 138,000 | 3,416,880 | ||||||
| iShares MSCI All Country Asia ex Japan ETF + | 106,000 | 7,982,860 | ||||||
| iShares MSCI India ETF | 63,304 | 2,231,150 | ||||||
| SPDR S&P Emerging Asia Pacific ETF + | 38,000 | 3,917,800 | ||||||
| 17,548,690 | ||||||||
| Global - 2.19% | ||||||||
| Cambria Global Value ETF + | 147,100 | 3,696,623 | ||||||
| Large Cap Core - 12.36% | ||||||||
| First Trust NASDAQ Technology Dividend Index Fund + | 253,000 | 8,682,960 | ||||||
| VanEck Vectors Morningstar Wide Moat ETF + | 271,000 | 10,967,370 | ||||||
| VanEck Vectors Pharmaceutical ETF + | 22,000 | 1,214,400 | ||||||
| 20,864,730 | ||||||||
| Large Cap Growth - 10.53% | ||||||||
| Fidelity Momentum Factor ETF ^ + | 153,000 | 4,666,148 | ||||||
| iShares PHLX Semiconductor ETF + | 57,000 | 9,845,040 | ||||||
| VanEck Vectors Retail ETF ^ + | 40,000 | 3,263,200 | ||||||
| 17,774,388 | ||||||||
| Large Cap Value - 10.88% | ||||||||
| Fidelity Value Factor ETF ^ + | 148,000 | 4,591,108 | ||||||
| iShares U.S. Financial Services ETF + | 70,000 | 8,651,300 | ||||||
| John Hancock Multifactor Consumer Staples ETF ^ + | 200,000 | 5,130,000 | ||||||
| 18,372,408 | ||||||||
| Small/Mid Cap Core - 2.40% | ||||||||
| Guggenheim S&P Spin-Off ETF + | 79,000 | 4,046,380 | ||||||
| 16 | Refer to the Notes to Financial Statements in this Report for further information regarding the values set forth above. |
| AdvisorOne Funds Semi-Annual Report |
| Schedule of Investments - CLS Global Aggressive Equity Fund (Unaudited) (Continued) |
| October 31, 2017 |
| Shares | Fair Value ($) | |||||||
| Small/Mid Cap Growth - 9.96% | ||||||||
| First Trust US Equity Opportunities ETF + | 63,000 | $ | 4,149,810 | |||||
| iShares Nasdaq Biotechnology ETF + | 12,500 | 3,927,250 | ||||||
| iShares U.S. Medical Devices ETF + | 39,500 | 6,814,540 | ||||||
| SPDR S&P Biotech ETF + | 23,000 | 1,923,720 | ||||||
| 16,815,320 | ||||||||
| Small/Mid Cap Value - 10.57% | ||||||||
| First Trust Energy AlphaDEX Fund + | 350,000 | 4,966,500 | ||||||
| Guggenheim Solar ETF | 22,000 | 527,560 | ||||||
| Guggenheim MSCI Global Timber + | 102,000 | 3,188,520 | ||||||
| iShares U.S. Insurance ETF + | 109,500 | 7,198,530 | ||||||
| US Global Jets ETF + | 67,000 | 1,970,470 | ||||||
| 17,851,580 | ||||||||
| Total Equity Funds (cost $131,037,547) | 167,227,879 | |||||||
| Money Market Funds - 0.26% | ||||||||
| Short-Term Cash - 0.26% | ||||||||
| Federated Prime Cash Obligations Fund Institutional Class, 0.91% ** | 435,050 | 435,050 | ||||||
| Total Money Market Funds (cost $435,050) | 435,050 | |||||||
| Collateral for Securities Loaned - 22.52% | ||||||||
| Milestone Treasury Obligations Fund Institutional Class, 0.86% ** ^ | 38,000,000 | 38,000,000 | ||||||
| U.S. Treasury Bill, 4/26/2018 - 9/13/2018 | 1,588 | 1,571 | ||||||
| U.S. Treasury Notes, 0.750% 7/31/2018 | 16,013 | 15,966 | ||||||
| Total Collateral for Securities Loaned (cost $38,017,537) | 38,017,537 | |||||||
| Total Investments (cost $169,490,134) - 121.85% | $ | 205,680,466 | ||||||
| Liabilities Less Other Assets - Net - (21.85)% | (36,881,408 | ) | ||||||
| NET ASSETS - 100.00% | $ | 168,799,058 | ||||||
| + | All or a portion of this security is on loan. Total loaned securities had a value of $32,770,056 at October 31, 2017. |
| * | Non-income producing security. |
| ** | Money Market Fund; Interest rate reflects seven-day effective yield on October 31, 2017. |
| ^ | Affiliated issuer. |
ETF - Exchange Traded Fund
LP - Limited Partnership
MSCI - Morgan Stanley Capital International
PHLX - Philadelphia Stock Exchange
SPDR - Standard & Poors’ Depositary Receipts
| 17 | Refer to the Notes to Financial Statements in this Report for further information regarding the values set forth above. |
| AdvisorOne Funds Semi-Annual Report |
| Schedule of Investments - CLS Global Diversified Equity Fund (Unaudited) |
| October 31, 2017 |
| Shares | Fair Value ($) | |||||||
| Equity Funds - 99.53% | ||||||||
| Commodity Funds - 3.97% | ||||||||
| PowerShares DB Agriculture Fund * + | 380,000 | $ | 7,387,200 | |||||
| PowerShares DB Commodity Index Tracking Fund * | 674,000 | 10,790,740 | ||||||
| 18,177,940 | ||||||||
| Developed International - 27.96% | ||||||||
| First Trust Europe AlphaDEX Fund + | 105,000 | 4,017,300 | ||||||
| iShares MSCI EAFE Value ETF | 385,952 | 21,223,501 | ||||||
| iShares MSCI Europe Financials ETF + | 365,000 | 8,449,750 | ||||||
| iShares MSCI Italy Capped ETF + | 186,000 | 5,758,560 | ||||||
| iShares MSCI Spain Capped ETF + | 147,000 | 4,974,480 | ||||||
| JPMorgan Diversified Return International Equity ETF + | 650,000 | 38,577,500 | ||||||
| Vanguard FTSE Europe ETF | 440,000 | 25,784,000 | ||||||
| Vanguard FTSE Pacific ETF + | 269,000 | 19,139,350 | ||||||
| 127,924,441 | ||||||||
| Emerging Markets - 21.92% | ||||||||
| Goldman Sachs ActiveBeta Emerging Markets Equity ETF + | 514,000 | 17,784,400 | ||||||
| iShares MSCI Russia Capped ETF | 147,500 | 4,880,775 | ||||||
| Schwab Fundamental Emerging Markets Large Company Index ETF + | 524,700 | 15,436,674 | ||||||
| SPDR S&P Emerging Asia Pacific ETF | 198,000 | 20,413,800 | ||||||
| SPDR S&P Emerging Markets Dividend ETF ^ | 1,375,000 | 41,786,250 | ||||||
| 100,301,899 | ||||||||
| Global - 5.82% | ||||||||
| Cambria Global Value ETF | 28,000 | 703,640 | ||||||
| iShares Global Healthcare ETF + | 234,000 | 25,941,240 | ||||||
| 26,644,880 | ||||||||
| Large Cap Core - 15.88% | ||||||||
| Davis Select Financial ETF * + ^ | 525,000 | 12,232,500 | ||||||
| iShares Edge MSCI USA Momentum Factor ETF + | 220,521 | 22,162,360 | ||||||
| SPDR SSGA Gender Diversity Index ETF + ^ | 257,000 | 18,100,510 | ||||||
| Vanguard Dividend Appreciation ETF + | 208,016 | 20,131,788 | ||||||
| 72,627,158 | ||||||||
| Large Cap Growth - 18.78% | ||||||||
| Fidelity MSCI Information Technology Index ETF + | 71,000 | 3,520,890 | ||||||
| iShares Edge MSCI USA Quality Factor ETF + | 442,557 | 35,134,600 | ||||||
| SPDR Technology Select Sector Fund | 660,000 | 41,547,000 | ||||||
| Vanguard Information Technology ETF | 35,000 | 5,713,050 | ||||||
| 85,915,540 | ||||||||
| Large Cap Value - 3.35% | ||||||||
| iShares Edge MSCI USA Value Factor ETF | 100,000 | 7,934,000 | ||||||
| SPDR S&P Global Natural Resources ETF | 157,500 | 7,394,625 | ||||||
| 15,328,625 | ||||||||
| Small/Mid Cap Core - 0.15% | ||||||||
| Royce Value Trust, Inc. | 41,612 | 664,128 | ||||||
| Small/Mid Cap Value - 1.70% | ||||||||
| First Trust Financial AlphaDEX Fund + | 256,000 | 7,772,160 | ||||||
| Total Equity Funds (cost $353,521,114) | 455,356,771 | |||||||
| 18 | Refer to the Notes to Financial Statements in this Report for further information regarding the values set forth above. |
| AdvisorOne Funds Semi-Annual Report |
| Schedule of Investments - CLS Global Diversified Equity Fund (Unaudited) (Continued) |
| October 31, 2017 |
| Shares | Fair Value ($) | |||||||
| Money Market Funds - 0.46% | ||||||||
| Short-Term Cash - 0.46% | ||||||||
| Federated Prime Cash Obligations Fund Institutional Class, 0.91% ** | 2,093,678 | $ | 2,093,678 | |||||
| Total Money Market Funds (cost $2,093,678) | 2,093,678 | |||||||
| Collateral for Securities Loaned - 4.58% | ||||||||
| Dreyfus Government Cash Management Institutional Class, 0.93% ** | 3,473,531 | 3,473,531 | ||||||
| Milestone Treasury Obligations Fund Institutional Class, 0.86% ** ^ | 17,500,000 | 17,500,000 | ||||||
| Total Collateral for Securities Loaned (cost $20,973,531) | 20,973,531 | |||||||
| Total Investments (cost $376,588,323) - 104.57% | $ | 478,423,980 | ||||||
| Liabilities Less Other Assets - Net - (4.57)% | (20,913,570 | ) | ||||||
| NET ASSETS - 100.00% | $ | 457,510,410 | ||||||
| + | All or a portion of this security is on loan. Total loaned securities had a value of $20,518,404 at October 31, 2017. |
| * | Non-income producing security. |
| ** | Money Market Fund; Interest rate reflects seven-day effective yield on October 31, 2017. |
| ^ | Affiliated issuer. |
DB - Deutsche Bank
EAFE - Europe, Australasia, Far East
ETF - Exchange Traded Fund
FTSE - Financial Times Stock Exchange
MSCI - Morgan Stanley Capital International
SPDR - Standard & Poors’ Depositary Receipts
SSGA - State Street Global Advisors
| 19 | Refer to the Notes to Financial Statements in this Report for further information regarding the values set forth above. |
| AdvisorOne Funds Semi-Annual Report |
| Schedule of Investments - CLS Growth and Income Fund (Unaudited) |
| October 31, 2017 |
| Shares | Fair Value ($) | |||||||
| Bond Funds - 45.80% | ||||||||
| High Yield Bonds - 2.20% | ||||||||
| SPDR Blackstone / GSO Senior Loan ETF + | 154,816 | $ | 7,358,404 | |||||
| VanEck Vectors High-Yield Municipal Index ETF | 87,772 | 2,738,486 | ||||||
| 10,096,890 | ||||||||
| Intermediate/Long-Term Bonds - 33.44% | ||||||||
| Fidelity Total Bond ETF + ^ | 489,963 | 24,654,938 | ||||||
| First Trust TCW Opportunistic Fixed Income ETF + ^ | 75,000 | 3,801,000 | ||||||
| iShares 3-7 Year Treasury Bond ETF + | 95,000 | 11,696,400 | ||||||
| iShares TIPS Bond ETF + | 409,400 | 46,589,720 | ||||||
| PIMCO Active Bond ETF + | 343,114 | 36,538,210 | ||||||
| SPDR Doubleline Total Return Tactical ETF | 611,922 | 30,027,013 | ||||||
| 153,307,281 | ||||||||
| International Bond - 3.01% | ||||||||
| PowerShares Emerging Markets Sovereign Debt Portfolio | 433,958 | 12,853,836 | ||||||
| Templeton Global Income Fund | 146,395 | 969,135 | ||||||
| 13,822,971 | ||||||||
| Preferred Security - 1.18% | ||||||||
| iShares US Preferred Stock ETF + | 140,000 | 5,388,600 | ||||||
| Short-Term Bonds - 5.97% | ||||||||
| PIMCO Enhanced Short Maturity Active ETF + | 268,702 | 27,367,299 | ||||||
| Total Bond Funds (cost $208,630,810) | 209,983,041 | |||||||
| Equity Funds - 51.85% | ||||||||
| Alternative - 1.14% | ||||||||
| JPMorgan Diversified Alternatives ETF | 200,000 | 5,228,000 | ||||||
| Balanced - 0.26% | ||||||||
| PowerShares CEF Income Composite Portfolio | 50,000 | 1,199,000 | ||||||
| Commodity Funds - 3.57% | ||||||||
| PowerShares DB Agriculture Fund * | 112,500 | 2,187,000 | ||||||
| PowerShares DB Commodity Index Tracking Fund * + | 885,000 | 14,168,850 | ||||||
| 16,355,850 | ||||||||
| Developed International - 13.42% | ||||||||
| iShares Edge MSCI Min Vol EAFE ETF + | 110,973 | 7,965,642 | ||||||
| iShares MSCI EAFE Value ETF | 275,000 | 15,122,250 | ||||||
| iShares MSCI Europe Financials ETF + | 259,000 | 5,995,850 | ||||||
| iShares MSCI Japan ETF + | 131,250 | 7,697,812 | ||||||
| iShares MSCI Pacific ex Japan ETF | 248,000 | 11,581,600 | ||||||
| Vanguard FTSE Europe ETF | 225,000 | 13,185,000 | ||||||
| 61,548,154 | ||||||||
| Emerging Markets - 7.69% | ||||||||
| iShares Core MSCI Emerging Markets ETF + | 175,200 | 9,772,656 | ||||||
| iShares MSCI Mexico Capped ETF + | 21,000 | 1,056,930 | ||||||
| iShares MSCI Russia Capped ETF | 75,000 | 2,481,750 | ||||||
| Morgan Stanley China A Share Fund, Inc. + | 172,308 | 4,197,423 | ||||||
| PowerShares FTSE RAFI Emerging Markets Portfolio + | 772,800 | 16,700,208 | ||||||
| SPDR S&P Emerging Asia Pacific ETF | 10,000 | 1,031,000 | ||||||
| 35,239,967 | ||||||||
| 20 | Refer to the Notes to Financial Statements in this Report for further information regarding the values set forth above. |
| AdvisorOne Funds Semi-Annual Report |
| Schedule of Investments - CLS Growth and Income Fund (Unaudited) (Continued) |
| October 31, 2017 |
| Shares | Fair Value ($) | |||||||
| Global - 5.51% | ||||||||
| FlexShares Global Upstream Natural Resources Index Fund + | 470,000 | $ | 14,880,200 | |||||
| Global X Uranium ETF + | 150,084 | 1,792,003 | ||||||
| iShares Global Healthcare ETF | 77,500 | 8,591,650 | ||||||
| 25,263,853 | ||||||||
| Large Cap Core - 3.94% | ||||||||
| iShares Edge MSCI USA Momentum Factor ETF + | 180,000 | 18,090,000 | ||||||
| Large Cap Growth - 6.68% | ||||||||
| iShares Edge MSCI USA Quality Factor ETF + | 197,613 | 15,688,496 | ||||||
| SPDR Technology Select Sector Fund | 149,000 | 9,379,550 | ||||||
| Vanguard Information Technology ETF | 34,000 | 5,549,820 | ||||||
| 30,617,866 | ||||||||
| Large Cap Value - 8.47% | ||||||||
| iShares Edge MSCI USA Value Factor ETF | 365,000 | 28,959,100 | ||||||
| SPDR Financial Select Sector Fund | 370,607 | 9,858,146 | ||||||
| 38,817,246 | ||||||||
| Small/Mid Cap Value - 1.17% | ||||||||
| Guggenheim Solar ETF + | 224,093 | 5,373,750 | ||||||
| Total Equity Funds (cost $193,864,947) | 237,733,686 | |||||||
| Money Market Funds - 2.41% | ||||||||
| Short-Term Cash - 2.41% | ||||||||
| Federated Prime Cash Obligations Fund Institutional Class, 0.91% ** | 11,059,500 | 11,059,500 | ||||||
| Total Money Market Funds (cost $11,059,500) | 11,059,500 | |||||||
| Collateral for Securities Loaned - 5.53% | ||||||||
| Dreyfus Government Cash Management Institutional Class, 0.93% ** | 2,374,901 | 2,374,901 | ||||||
| Milestone Treasury Obligations Fund Institutional Class, 0.86% ** ^ | 17,900,000 | 17,900,000 | ||||||
| U.S. TIP Notes/Bonds, 0.125% - 2.375%, 4/15/2018 - 2/15/2045 | 1,267,705 | 1,398,925 | ||||||
| U.S. Treasury Bill, 8/10/2017 | 24,792 | 24,716 | ||||||
| U.S. Treasury Notes/Bonds, 1.000% - 6.250%, 9/15/2018 - 5/15/2046 | 3,630,813 | 3,679,921 | ||||||
| Total Collateral for Securities Loaned (cost $25,378,463) | 25,378,463 | |||||||
| Total Investments (cost $438,933,720) - 105.59% | $ | 484,154,690 | ||||||
| Liabilities Less Other Assets - Net - (5.59)% | (25,646,697 | ) | ||||||
| NET ASSETS - 100.00% | $ | 458,507,993 | ||||||
| + | All or a portion of this security is on loan. Total loaned securities had a value of $24,785,313 at October 31, 2017. |
| * | Non-income producing security. |
| ** | Money Market Fund; Interest rate reflects seven-day effective yield on October 31, 2017. |
| ^ | Affiliated issuer. |
CEF - Closed End Fund
DB - Deutsche Bank
EAFE - Europe, Australasia, Far East
ETF - Exchange Traded Fund
FTSE - Financial Times Stock Exchange
MSCI - Morgan Stanley Capital International
RAFI - Research Affiliates
SPDR - Standard & Poors’ Depositary Receipts
TIPS - Treasury Inflation-Protected Securities
| 21 | Refer to the Notes to Financial Statements in this Report for further information regarding the values set forth above. |
| AdvisorOne Funds Semi-Annual Report |
| Schedule of Investments - CLS Flexible Income Fund (Unaudited) |
| October 31, 2017 |
| Shares | Fair Value ($) | |||||||
| Bond Funds - 85.17% | ||||||||
| High Yield Bonds - 15.72% | ||||||||
| BlackRock Corporate High Yield Fund, Inc. + | 78,416 | $ | 876,691 | |||||
| iShares iBoxx $ High Yield Corporate Bond ETF + | 88,080 | 7,792,438 | ||||||
| PIMCO 0-5 Year High Yield Corporate Bond Index ETF + | 56,295 | 5,710,002 | ||||||
| PowerShares Senior Loan Portfolio | 398,550 | 9,214,476 | ||||||
| SPDR Blackstone / GSO Senior Loan ETF | 82,500 | 3,921,225 | ||||||
| SPDR Bloomberg Barclays Short Term High Yield Bond ETF + | 216,775 | 6,052,358 | ||||||
| VanEck Vectors High-Yield Municipal Index ETF + | 80,755 | 2,519,556 | ||||||
| 36,086,746 | ||||||||
| Intermediate/Long-Term Bonds - 45.41% | ||||||||
| iShares 3-7 Year Treasury Bond ETF | 71,200 | 8,766,144 | ||||||
| iShares 20+ Year Treasury Bond ETF + | 37,500 | 4,667,250 | ||||||
| iShares Core U.S. Aggregate Bond ETF | 115,626 | 12,657,578 | ||||||
| iShares Intermediate Credit Bond ETF + | 85,380 | 9,384,970 | ||||||
| iShares National Muni Bond ETF + | 31,275 | 3,464,019 | ||||||
| iShares TIPS Bond ETF | 105,048 | 11,954,462 | ||||||
| iShares US Credit Bond ETF + | 33,450 | 3,746,065 | ||||||
| NuShares Enhanced Yield US Aggregate Bond ETF + | 66,400 | 1,635,432 | ||||||
| PIMCO Active Bond ETF | 59,909 | 6,379,709 | ||||||
| SPDR Doubleline Total Return Tactical ETF | 377,519 | 18,524,857 | ||||||
| Vanguard Intermediate-Term Corporate Bond ETF + | 109,483 | 9,629,030 | ||||||
| Vanguard Mortgage-Backed Securities ETF + | 41,000 | �� | 2,161,930 | |||||
| Vanguard Total Bond Market ETF | 137,385 | 11,233,972 | ||||||
| 104,205,418 | ||||||||
| International Bond - 5.41% | ||||||||
| iShares JP Morgan EM Local Currency Bond ETF * + | 27,400 | 1,284,786 | ||||||
| iShares JP Morgan USD Emerging Markets Bond ETF + | 40,350 | 4,690,687 | ||||||
| PowerShares Emerging Markets Sovereign Debt Portfolio | 217,561 | 6,444,157 | ||||||
| 12,419,630 | ||||||||
| Preferred Security - 2.03% | ||||||||
| iShares US Preferred Stock ETF | 86,775 | 3,339,970 | ||||||
| PowerShares Preferred Portfolio + | 88,700 | 1,326,952 | ||||||
| 4,666,922 | ||||||||
| Short-Term Bonds - 16.60% | ||||||||
| iShares 1-3 Year Treasury Bond ETF | 146,115 | 12,317,494 | ||||||
| Janus Henderson Short Duration Income ETF + | 75,000 | 3,779,250 | ||||||
| PIMCO Enhanced Short Maturity Active ETF + | 215,922 | 21,991,656 | ||||||
| 38,088,400 | ||||||||
| Total Bond Funds (cost $195,318,552) | 195,467,116 | |||||||
| Equity Funds - 8.30% | ||||||||
| Commodity Funds - 0.63% | ||||||||
| United States Commodity Index Fund * | 35,500 | 1,454,790 | ||||||
| Developed International - 0.76% | ||||||||
| iShares MSCI EAFE ETF | 12,500 | 870,375 | ||||||
| iShares MSCI EAFE Value ETF | 16,000 | 879,840 | ||||||
| 1,750,215 | ||||||||
| 22 | Refer to the Notes to Financial Statements in this Report for further information regarding the values set forth above. |
| AdvisorOne Funds Semi-Annual Report |
| Schedule of Investments - CLS Flexible Income Fund (Unaudited) (Continued) |
| October 31, 2017 |
| Shares | Fair Value ($) | |||||||
| Emerging Markets - 1.11% | ||||||||
| Vanguard FTSE Emerging Markets ETF | 57,000 | $ | 2,543,910 | |||||
| Large Cap Core - 1.94% | ||||||||
| iShares Core S&P 500 ETF + | 17,160 | 4,441,180 | ||||||
| Large Cap Growth - 0.24% | ||||||||
| Vanguard Growth ETF + | 4,000 | 546,360 | ||||||
| Large Cap Value - 2.65% | ||||||||
| Fidelity MSCI Financials Index ETF + | 62,000 | 2,417,380 | ||||||
| SPDR Financial Select Sector Fund | 19,200 | 510,720 | ||||||
| Vanguard High Dividend Yield ETF | 17,000 | 1,402,160 | ||||||
| Vanguard Value ETF + | 17,105 | 1,738,723 | ||||||
| 6,068,983 | ||||||||
| Small/Mid Cap Core - 0.50% | ||||||||
| Royce Value Trust, Inc. + | 72,035 | 1,149,679 | ||||||
| Small/Mid Cap Value - 0.47% | ||||||||
| Alerian MLP ETF + | 99,500 | 1,066,640 | ||||||
| Total Equity Funds (cost $16,686,714) | 19,021,757 | |||||||
| Principal ($) | Fair Value ($) | |||||||
| U.S. Government and Agency Obligations - 3.84% | ||||||||
| Fannie Mae Pool, 3.50%, due 12/1/2030 | $ | 196,056 | 203,088 | |||||
| Fannie Mae Pool, 3.50%, due 7/1/2032 | 425,069 | 443,146 | ||||||
| Fannie Mae Pool, 4.00%, due 2/1/2040 | 229,281 | 242,116 | ||||||
| Fannie Mae Pool, 4.00%, due 10/1/2040 | 187,510 | 197,778 | ||||||
| Fannie Mae Pool, 4.00%, due 6/1/2041 | 363,598 | 383,387 | ||||||
| Fannie Mae Pool, 4.00%, due 9/1/2041 | 406,528 | 428,557 | ||||||
| Fannie Mae Pool, 4.00%, due 12/1/2041 | 253,523 | 267,321 | ||||||
| Fannie Mae Pool, 5.00%, due 11/1/2039 | 225,446 | 248,632 | ||||||
| Fannie Mae Pool, 5.00%, due 2/1/2040 | 319,891 | 347,901 | ||||||
| Fannie Mae Pool, 5.50%, due 12/1/2039 | 143,727 | 160,109 | ||||||
| Fannie Mae Pool, 5.50%, due 4/1/2040 | 177,967 | 197,443 | ||||||
| Fannie Mae Pool, 6.00%, due 12/1/2035 | 222,242 | 253,231 | ||||||
| Fannie Mae Pool, 6.00%, due 12/1/2038 | 70,805 | 79,462 | ||||||
| Federal Home Loan Mortgage Corp., 2.00%, due 3/12/2020 | 1,000,000 | 1,004,745 | ||||||
| Federal National Mortgage Association, 2.00%, due 8/28/2020 | 1,000,000 | 1,005,952 | ||||||
| Freddie Mac Gold Pool, 4.50%, due 2/1/2041 | 239,676 | 257,044 | ||||||
| Freddie Mac Gold Pool, 5.50%, due 6/1/2034 | 171,181 | 190,952 | ||||||
| Freddie Mac Gold Pool, 6.00%, due 5/1/2037 | 66,617 | 75,512 | ||||||
| Freddie Mac Gold Pool, 6.50%, due 4/1/2039 | 85,308 | 94,672 | ||||||
| Government National Mortgage Association, 3.50%, due 7/16/2039 | 82,203 | 83,932 | ||||||
| Government National Mortgage Association, 4.00%, due 2/20/2039 | 142,231 | 146,501 | ||||||
| United States Treasury Note/Bond, 4.25%, due 11/15/2017 | 2,500,000 | 2,503,032 | ||||||
| Total U.S. Government and Agency Obligations (cost $8,687,061) | 8,814,513 | |||||||
| 23 | Refer to the Notes to Financial Statements in this Report for further information regarding the values set forth above. |
| AdvisorOne Funds Semi-Annual Report |
| Schedule of Investments - CLS Flexible Income Fund (Unaudited) (Continued) |
| October 31, 2017 |
| Shares | Fair Value ($) | |||||||
| Money Market Funds - 2.71% | ||||||||
| Short-Term Cash - 2.71% | ||||||||
| Federated Prime Cash Obligations Fund Institutional Class, 0.91% ** | 6,226,777 | $ | 6,226,777 | |||||
| Total Money Market Funds (cost $6,226,777) | 6,226,777 | |||||||
| Collateral for Securities Loaned - 18.92% | ||||||||
| Dreyfus Government Cash Management Institutional Class, 0.93% ** | 9,446,528 | 9,446,528 | ||||||
| Milestone Treasury Obligations Fund Institutional Class, 0.86% ** ^ | 29,500,000 | 29,500,000 | ||||||
| U.S. TIP Notes/Bonds, 0.125% - 2.375%, 4/15/2018 - 2/15/2045 | 1,113,482 | 1,228,737 | ||||||
| U.S. Treasury Bill, 2/8/2018 | 21,776 | 21,709 | ||||||
| U.S. Treasury Notes/Bonds, 1.000% - 6.250%, 6/15/2018 - 5/15/2046 | 3,189,104 | 3,232,234 | ||||||
| Total Collateral for Securities Loaned (cost $43,429,208) | 43,429,208 | |||||||
| Total Investments (cost $270,348,312) - 118.94% | $ | 272,959,371 | ||||||
| Liabilities Less Other Assets - Net - (18.94)% | (43,456,856 | ) | ||||||
| NET ASSETS - 100.00% | $ | 229,502,515 | ||||||
| + | All or a portion of this security is on loan. Total loaned securities had a value of $42,480,045 at October 31, 2017. |
| * | Non-income producing security. |
| ** | Money Market Fund; Interest rate reflects seven-day effective yield on October 31, 2017. |
| ^ | Affiliated issuer. |
EAFE - Europe, Australasia, Far East
EM - Emerging Markets
ETF - Exchange Traded Fund
FTSE - Financial Times Stock Exchange
MLP - Master Limited Partnership
MSCI - Morgan Stanley Capital International
SPDR - Standard & Poors’ Depositary Receipts
TIPS - Treasury Inflation-Protected Security
| 24 | Refer to the Notes to Financial Statements in this Report for further information regarding the values set forth above. |
| AdvisorOne Funds Semi-Annual Report |
| Schedule of Investments - CLS International Equity Fund (Unaudited) |
| October 31, 2017 |
| Shares | Fair Value ($) | |||||||
| Equity Funds - 99.65% | ||||||||
| Developed International - 62.70% | ||||||||
| iShares Edge MSCI International Momentum Factor + ^ | 177,900 | $ | 5,473,983 | |||||
| iShares MSCI Australia ETF | 43,700 | 991,990 | ||||||
| iShares MSCI Canada ETF | 22,000 | 633,380 | ||||||
| iShares MSCI Denmark Capped ETF + | 23,000 | 1,573,660 | ||||||
| iShares MSCI EAFE Value ETF | 140,000 | 7,698,600 | ||||||
| iShares MSCI France ETF | 26,700 | 838,113 | ||||||
| iShares MSCI Israel Capped ETF + | 45,000 | 2,225,700 | ||||||
| iShares MSCI Italy Capped ETF | 71,100 | 2,201,256 | ||||||
| iShares MSCI Singapore Capped ETF + | 103,000 | 2,629,590 | ||||||
| iShares MSCI Spain Capped ETF + | 75,500 | 2,554,920 | ||||||
| iShares MSCI Sweden Capped ETF | 16,500 | 587,070 | ||||||
| iShares MSCI Switzerland Capped ETF + | 20,500 | 707,865 | ||||||
| iShares MSCI United Kingdom ETF + | 24,500 | 858,970 | ||||||
| PowerShares FTSE RAFI Developed Markets ex-U.S. Portfolio + | 62,000 | 2,778,220 | ||||||
| 31,753,317 | ||||||||
| Emerging Markets - 36.95% | ||||||||
| iShares MSCI Chile Capped ETF + | 27,900 | 1,426,806 | ||||||
| iShares MSCI Malaysia ETF + | 56,100 | 1,804,176 | ||||||
| iShares MSCI Mexico Capped ETF + | 26,800 | 1,348,844 | ||||||
| iShares MSCI Taiwan Capped ETF + | 69,500 | 2,647,950 | ||||||
| PowerShares DWA Emerging Markets Momentum Portfolio + | 389,000 | 7,601,060 | ||||||
| Schwab Fundamental Emerging Markets Large Company Index ETF + | 110,800 | 3,259,736 | ||||||
| SPDR S&P China ETF | 5,900 | 623,984 | ||||||
| 18,712,556 | ||||||||
| Total Equity Funds (cost $46,006,956) | 50,465,873 | |||||||
| Money Market Funds - 0.41% | ||||||||
| Short-Term Cash - 0.41% | ||||||||
| Federated Prime Cash Obligations Fund Institutional Class, 0.91% * | 206,012 | 206,012 | ||||||
| Total Money Market Funds (cost $206,012) | 206,012 | |||||||
| Collateral for Securities Loaned - 24.11% | ||||||||
| Dreyfus Government Cash Management Institutional Class, 0.93% * | 12,082,793 | 12,082,793 | ||||||
| U.S. TIP Notes/Bonds, 0.125% - 2.375%, 4/15/2018 - 2/15/2045 | 30,749 | 33,932 | ||||||
| U.S. Treasury Bill, 2/8/2018 | 601 | 599 | ||||||
| U.S. Treasury Notes/Bonds, 1.000% - 6.250%, 6/15/2018 - 5/15/2046 | 88,069 | 89,260 | ||||||
| Total Collateral for Securities Loaned (cost $12,206,584) | 12,206,584 | |||||||
| Total Investments (cost $58,419,551) - 124.17% | $ | 62,878,469 | ||||||
| Liabilities Less Other Assets - Net - (24.17)% | (12,237,455 | ) | ||||||
| NET ASSETS - 100.00% | $ | 50,641,014 | ||||||
| + | All or a portion of this security is on loan. Total loaned securities had a value of $11,855,838 at October 31, 2017. |
| * | Money Market Fund; Interest rate reflects seven-day effective yield on October 31, 2017. |
| ^ | Affiliated issuer. |
EAFE - Europe, Australasia, Far East
ETF - Exchange Traded Fund
FTSE - Financial Times Stock Exchange
MSCI - Morgan Stanley Capital International
RAFI - Research Affiliates
SPDR - Standard & Poors’ Depositary Receipts
TIPS - Treasury Inflation-Protected Securities
| 25 | Refer to the Notes to Financial Statements in this Report for further information regarding the values set forth above. |
| AdvisorOne Funds Semi-Annual Report |
| Schedule of Investments - CLS Shelter Fund (Unaudited) |
| October 31, 2017 |
| Shares | Fair Value ($) | |||||||
| Equity Funds - 98.49% | ||||||||
| Developed International - 20.24% | ||||||||
| iShares Core MSCI EAFE ETF | 251,000 | $ | 16,377,750 | |||||
| iShares MSCI EAFE Value ETF | 296,000 | 16,277,040 | ||||||
| 32,654,790 | ||||||||
| Emerging Markets - 10.16% | ||||||||
| iShares Core MSCI Emerging Markets ETF + | 294,000 | 16,399,320 | ||||||
| Global - 5.03% | ||||||||
| iShares MSCI ACWI ETF | 115,500 | 8,119,650 | ||||||
| Large Cap Core - 18.01% | ||||||||
| Guggenheim S&P 500 Equal Weight ETF + | 301,000 | 29,070,580 | ||||||
| Large Cap Growth - 20.07% | ||||||||
| iShares Edge MSCI USA Quality Factor ETF | 408,000 | 32,391,120 | ||||||
| Large Cap Value - 24.98% | ||||||||
| Guggenheim S&P 500 Pure Value ETF | 258,009 | 16,107,502 | ||||||
| iShares Edge MSCI USA Value Factor ETF | 305,000 | 24,198,700 | ||||||
| 40,306,202 | ||||||||
| Total Equity Funds (cost $135,248,140) | 158,941,662 | |||||||
| Money Market Funds - 1.47% | ||||||||
| Federated Prime Cash Obligations Fund Institutional Class, 0.91% * | 2,368,181 | 2,368,181 | ||||||
| Total Money Market Funds (cost $2,368,181) | 2,368,181 | |||||||
| Collateral for Securities Loaned - 3.92% | ||||||||
| Dreyfus Government Cash Management Institutional Class, 0.93% * | 699,349 | 699,349 | ||||||
| U.S. TIP Notes/Bonds, 0.125% - 2.375%, 4/15/2018 - 2/15/2045 | 1,398,123 | 1,542,842 | ||||||
| U.S. Treasury Bill, 2/8/2018 | 27,343 | 27,258 | ||||||
| U.S. Treasury Notes/Bonds, 1.000% - 6.250%, 6/15/2018 - 5/15/2046 | 4,004,338 | 4,058,497 | ||||||
| Total Collateral for Securities Loaned (cost $6,327,946) | 6,327,946 | |||||||
| Total Investments (cost $143,944,267) - 103.88% | $ | 167,637,789 | ||||||
| Liabilities Less Other Assets - Net - (3.88)% | (6,268,674 | ) | ||||||
| NET ASSETS - 100.00% | $ | 161,369,115 | ||||||
| + | All or a portion of this security is on loan. Total loaned securities had a value of $6,198,847 at October 31, 2017. |
| * | Money Market Fund; Interest rate reflects seven-day effective yield on October 31, 2017. |
ACWI - All Country World Index
EAFE - Europe, Australasia, Far East
ETF - Exchange Traded Fund
MSCI - Morgan Stanley Capital International
TIPS - Treasury Inflation-Protected Securities
| 26 | Refer to the Notes to Financial Statements in this Report for further information regarding the values set forth above. |
| AdvisorOne Funds Semi-Annual Report |
| Statements of Assets and Liabilities (Unaudited) |
| October 31, 2017 |
| CLS Global | CLS Global | CLS | ||||||||||
| Aggressive | Diversified | Growth and | ||||||||||
| Assets: | Equity Fund | Equity Fund | Income Fund | |||||||||
| Unaffiliated investments, at cost | $ | 104,707,214 | $ | 295,669,758 | $ | 393,018,613 | ||||||
| Affiliated Investments, at cost | 64,782,920 | 80,918,565 | 45,915,107 | |||||||||
| Unaffiliated investments in securities, at value * | $ | 139,015,640 | $ | 388,804,720 | $ | 437,798,752 | ||||||
| Affiliated Investments in securities, at value | 66,664,826 | 89,619,260 | 46,355,938 | |||||||||
| Receivable for securities sold | 2,592,215 | — | — | |||||||||
| Receivable for fund shares sold | 62,515 | 828,434 | 360,999 | |||||||||
| Receivable for security lending | 48,094 | 60,615 | 46,344 | |||||||||
| Interest and dividends receivable | 460 | 1,262 | 59,371 | |||||||||
| Prepaid expenses and other assets | 22,358 | 24,935 | 23,819 | |||||||||
| Total Assets | 208,406,108 | 479,339,226 | 484,645,223 | |||||||||
| Liabilities: | ||||||||||||
| Securities lending collateral (Note 8) | 38,017,537 | 20,973,531 | 25,378,463 | |||||||||
| Accrued advisory fees | 99,749 | 293,909 | 302,327 | |||||||||
| Payable for securities purchased | 1,280,000 | — | — | |||||||||
| Payable for fund shares redeemed | 140,941 | 393,567 | 297,399 | |||||||||
| Accrued shareholder servicing fees | 33,265 | 95,497 | 96,705 | |||||||||
| Payable to affiliates | 18,341 | 41,874 | 37,425 | |||||||||
| Accrued expenses and other liabilities | 17,217 | 30,438 | 24,911 | |||||||||
| Total Liabilities | 39,607,050 | 21,828,816 | 26,137,230 | |||||||||
| Net Assets | $ | 168,799,058 | $ | 457,510,410 | $ | 458,507,993 | ||||||
| Net Assets: | ||||||||||||
| Paid in capital ($0 par value, unlimited shares authorized) | $ | 125,802,330 | $ | 321,306,140 | $ | 392,924,656 | ||||||
| Undistributed net investment income | 243,520 | 292,389 | 3,540,065 | |||||||||
| Accumulated net realized gain on investments | 6,562,876 | 34,076,224 | 16,822,302 | |||||||||
| Net unrealized appreciation on investments | 36,190,332 | 101,835,657 | 45,220,970 | |||||||||
| Net Assets | $ | 168,799,058 | $ | 457,510,410 | $ | 458,507,993 | ||||||
| Class N Shares: | ||||||||||||
| Net assets | $ | 168,799,058 | $ | 457,510,410 | $ | 458,507,993 | ||||||
| Net asset value, offering price, and redemption price per share (Net assets ÷ Total shares of beneficial interest outstanding) | $ | 15.86 | $ | 19.74 | $ | 11.73 | ||||||
| Total shares outstanding at end of period | 10,642,440 | 23,176,404 | 39,078,598 | |||||||||
| * | Includes Securities Loaned $32,770,056; $20,518,404; and $24,785,313. |
| 27 | Refer to the Notes to Financial Statements in this Report for further information regarding the values set forth above. |
| AdvisorOne Funds Semi-Annual Report |
| Statements of Assets and Liabilities (Unaudited) (Continued) |
| October 31, 2017 |
| CLS | CLS | |||||||||||
| Flexible | International | CLS | ||||||||||
| Assets: | Income Fund | Equity Fund | Shelter Fund | |||||||||
| Unaffiliated investments, at cost | $ | 240,848,312 | $ | 53,106,000 | $ | 143,944,267 | ||||||
| Affiliated Investments, at cost | 29,500,000 | 5,313,551 | — | |||||||||
| Unaffiliated investments in securities, at value * | $ | 243,459,371 | $ | 57,404,486 | $ | 167,637,789 | ||||||
| Affiliated Investments in securities, at value | 29,500,000 | 5,473,983 | — | |||||||||
| Receivable for securities sold | — | — | — | |||||||||
| Receivable for fund shares sold | 104,061 | 16,846 | 244,477 | |||||||||
| Receivable for security lending | 42,353 | 13,605 | 5,244 | |||||||||
| Interest and dividends receivable | 74,305 | 235 | 1,912 | |||||||||
| Prepaid expenses and other assets | 24,054 | 12,073 | 20,182 | |||||||||
| Total Assets | 273,204,144 | 62,921,228 | 167,909,604 | |||||||||
| Liabilities: | ||||||||||||
| Securities lending collateral (Note 8) | 43,429,208 | 12,206,584 | 6,327,946 | |||||||||
| Accrued advisory fees | 68,088 | 21,418 | 99,007 | |||||||||
| Payable for securities purchased | — | — | — | |||||||||
| Payable for fund shares redeemed | 116,227 | 33,145 | 56,179 | |||||||||
| Accrued shareholder servicing fees | 48,497 | 8,001 | 30,371 | |||||||||
| Payable to affiliates | 21,392 | 2,477 | 10,012 | |||||||||
| Accrued expenses and other liabilities | 18,217 | 8,589 | 16,974 | |||||||||
| Total Liabilities | 43,701,629 | 12,280,214 | 6,540,489 | |||||||||
| Net Assets | $ | 229,502,515 | $ | 50,641,014 | $ | 161,369,115 | ||||||
| Net Assets: | ||||||||||||
| Paid in capital ($0 par value, unlimited shares authorized) | $ | 228,002,109 | $ | 43,744,258 | $ | 135,132,709 | ||||||
| Undistributed net investment income | 506,389 | 304,296 | 839,379 | |||||||||
| Accumulated net realized gain (loss) on investments | (1,617,042 | ) | 2,133,542 | 1,703,505 | ||||||||
| Net unrealized appreciation on investments | 2,611,059 | 4,458,918 | 23,693,522 | |||||||||
| Net Assets | $ | 229,502,515 | $ | 50,641,014 | $ | 161,369,115 | ||||||
| Class N Shares: | ||||||||||||
| Net assets | $ | 229,502,515 | $ | 50,641,014 | $ | 161,369,115 | ||||||
| Net asset value, offering price, and redemption price per share (Net assets ÷ Total shares of beneficial interest outstanding) | $ | 10.32 | $ | 4.98 | $ | 14.26 | ||||||
| Total shares outstanding at end of period | 22,228,592 | 10,163,672 | 11,315,640 | |||||||||
| * | Includes Securities Loaned $42,480,045; $11,855,838; and $6,198,847. |
| 28 | Refer to the Notes to Financial Statements in this Report for further information regarding the values set forth above. |
| AdvisorOne Funds Semi-Annual Report |
| Statements of Operations (Unaudited) |
| For the Six Months Ended October 31, 2017 |
| CLS Global | CLS Global | CLS | ||||||||||
| Aggressive | Diversified | Growth and | ||||||||||
| Equity Fund | Equity Fund | Income Fund | ||||||||||
| Investment Income: | ||||||||||||
| Interest income | $ | 8,587 | $ | 20,385 | $ | 41,790 | ||||||
| Dividend income - Unaffiliated | 1,108,729 | 3,335,489 | 5,196,503 | |||||||||
| Dividend income - Affiliated | 187,148 | 1,266,117 | 352,202 | |||||||||
| Securities lending income-net * | 416,524 | 458,547 | 423,357 | |||||||||
| Total Investment Income | 1,720,988 | 5,080,538 | 6,013,852 | |||||||||
| Expenses: | ||||||||||||
| Investment advisory fees | 617,504 | 1,681,127 | 1,703,134 | |||||||||
| Shareholder Service Fees: | ||||||||||||
| Class N | 205,835 | 560,376 | 567,711 | |||||||||
| Administration fees | 75,053 | 161,941 | 156,460 | |||||||||
| Transfer agent fees | 26,712 | 32,336 | 33,147 | |||||||||
| Trustees’ fees | 19,530 | 17,529 | 19,238 | |||||||||
| Accounting fees | 19,504 | 33,701 | 36,567 | |||||||||
| Registration & filing fees | 13,055 | 14,187 | 14,665 | |||||||||
| Printing and postage expense | 12,855 | 31,624 | 15,247 | |||||||||
| Professional fees | 11,022 | 12,492 | 13,904 | |||||||||
| Custodian fees | 6,373 | 17,780 | 17,390 | |||||||||
| Chief compliance officer fees | 5,052 | 7,102 | 7,847 | |||||||||
| Insurance expense | 4,842 | 10,161 | 13,515 | |||||||||
| Miscellaneous fees and expenses | 2,191 | 2,958 | 1,435 | |||||||||
| Total Expenses | 1,019,528 | 2,583,314 | 2,600,260 | |||||||||
| Plus: Recapture of fees previously waived by the Advisor | — | — | 11,595 | |||||||||
| Less: Fees waived and expenses reimbursed by Advisor | (72,406 | ) | (4,937 | ) | — | |||||||
| Net Expenses | 947,122 | 2,578,377 | 2,611,855 | |||||||||
| Net Investment Income | 773,866 | 2,502,161 | 3,401,997 | |||||||||
| Net Realized and Unrealized Gain (Loss) on Investments: | ||||||||||||
| Net realized gain on: | ||||||||||||
| Investments - Unaffiliated | 4,426,715 | 13,114,696 | 1,097,965 | |||||||||
| Investments - Affiliated | — | — | 564,272 | |||||||||
| Total net realized gain | 4,426,715 | 13,114,696 | 1,662,237 | |||||||||
| Net change in unrealized appreciation (depreciation) on: | ||||||||||||
| Investments - Unaffiliated | 9,218,540 | 28,925,852 | 19,203,138 | |||||||||
| Investments - Affiliated | 1,657,745 | (2,001,130 | ) | 59,603 | ||||||||
| Total net change in unrealized appreciation | 10,876,285 | 26,924,722 | 19,262,741 | |||||||||
| Net Realized and Unrealized Gain on Investments | 15,303,000 | 40,039,418 | 20,924,978 | |||||||||
| Net Increase in Net Assets Resulting from Operations | $ | 16,076,866 | $ | 42,541,579 | $ | 24,326,975 | ||||||
| * | A portion of securities lending income is from affiliated issuer. |
| 29 | Refer to the Notes to Financial Statements in this Report for further information regarding the values set forth above. |
| AdvisorOne Funds Semi-Annual Report |
| Statements of Operations (Unaudited) (Continued) |
| For the Six Months Ended October 31, 2017 |
| CLS | CLS | |||||||||||
| Flexible | International | CLS | ||||||||||
| Income Fund | Equity Fund | Shelter Fund | ||||||||||
| Investment Income: | ||||||||||||
| Interest income | $ | 179,708 | $ | 1,608 | $ | 11,013 | ||||||
| Dividend income - Unaffiliated | 3,095,515 | 539,999 | 1,621,968 | |||||||||
| Dividend income - Affiliated | — | — | — | |||||||||
| Securities lending income-net * | 320,478 | 79,711 | 42,273 | |||||||||
| Total Investment Income | 3,595,701 | 621,318 | 1,675,254 | |||||||||
| Expenses: | ||||||||||||
| Investment advisory fees | 461,079 | 187,542 | 544,488 | |||||||||
| Shareholder Service Fees: | ||||||||||||
| Class N | 288,174 | 62,514 | 174,267 | |||||||||
| Administration fees | 101,496 | 25,339 | 63,164 | |||||||||
| Transfer agent fees | 34,663 | 20,003 | 4,966 | |||||||||
| Trustees’ fees | 15,540 | 15,841 | 18,304 | |||||||||
| Accounting fees | 23,159 | 11,370 | 19,266 | |||||||||
| Registration & filing fees | 13,089 | 13,958 | 13,023 | |||||||||
| Printing and postage expense | 12,553 | 7,700 | 3,349 | |||||||||
| Professional fees | 11,674 | 8,523 | 10,406 | |||||||||
| Custodian fees | 9,154 | 1,424 | 5,318 | |||||||||
| Chief compliance officer fees | 6,204 | 4,228 | 4,466 | |||||||||
| Insurance expense | 6,911 | 1,455 | 3,954 | |||||||||
| Miscellaneous fees and expenses | 2,719 | 1,662 | 2,746 | |||||||||
| Total Expenses | 986,415 | 361,559 | 867,717 | |||||||||
| Plus: Recapture of fees previously waived by the Advisor | — | — | — | |||||||||
| Less: Fees waived and expenses reimbursed by Advisor | (64,228 | ) | (73,939 | ) | (31,842 | ) | ||||||
| Net Expenses | 922,187 | 287,620 | 835,875 | |||||||||
| Net Investment Income | 2,673,514 | 333,698 | 839,379 | |||||||||
| Net Realized and Unrealized Gain (Loss) on Investments: | ||||||||||||
| Net realized gain (loss) on: | ||||||||||||
| Investments - Unaffiliated | (474,887 | ) | 2,136,282 | 1,478,661 | ||||||||
| Investments - Affiliated | — | — | — | |||||||||
| Total net realized gain (loss) | (474,887 | ) | 2,136,282 | 1,478,661 | ||||||||
| Net change in unrealized appreciation (depreciation) on: | ||||||||||||
| Investments - Unaffiliated | 1,530,060 | 2,535,134 | 9,957,329 | |||||||||
| Investments - Affiliated | — | (2,823 | ) | — | ||||||||
| Total net change in unrealized appreciation | 1,530,060 | 2,532,311 | 9,957,329 | |||||||||
| Net Realized and Unrealized Gain on Investments | 1,055,173 | 4,668,593 | 11,435,990 | |||||||||
| Net Increase in Net Assets Resulting from Operations | $ | 3,728,687 | $ | 5,002,291 | $ | 12,275,369 | ||||||
| * | A portion of securities lending income is from affiliated issuer. |
| 30 | Refer to the Notes to Financial Statements in this Report for further information regarding the values set forth above. |
| AdvisorOne Funds Semi-Annual Report |
| Statements of Changes in Net Assets |
| CLS Global Aggressive | CLS Global Diversified | |||||||||||||||
| Equity Fund | Equity Fund | |||||||||||||||
| Six Months | Six Months | |||||||||||||||
| Ended | Ended | |||||||||||||||
| October 31, 2017 | Year Ended | October 31, 2017 | Year Ended | |||||||||||||
| (Unaudited) | April 30, 2017 | (Unaudited) | April 30, 2017 | |||||||||||||
| Increase (Decrease) in Net Assets: | ||||||||||||||||
| From Operations: | ||||||||||||||||
| Net investment income | $ | 773,866 | $ | 1,390,663 | $ | 2,502,161 | $ | 7,001,485 | ||||||||
| Net realized gain on investments | 4,426,715 | 2,556,364 | 13,114,696 | 30,307,175 | ||||||||||||
| Distributions of realized gains by underlying investment companies | — | 124,021 | — | 56,427 | ||||||||||||
| Net change in unrealized appreciation on investments | 10,876,285 | 15,516,869 | 26,924,722 | 21,996,980 | ||||||||||||
| Net increase in net assets resulting from operations | 16,076,866 | 19,587,917 | 42,541,579 | 59,362,067 | ||||||||||||
| From Distributions to Shareholders: | ||||||||||||||||
| From Net Investment Income | — | (1,388,651 | ) | — | (12,054,919 | ) | ||||||||||
| From Net Realized Gains | — | (1,104,946 | ) | — | (2,157,476 | ) | ||||||||||
| Total Dividends and Distributions to Shareholders | — | (2,493,597 | ) | — | (14,212,395 | ) | ||||||||||
| From Fund Share Transactions (Note 7) | (6,524,097 | ) | 41,707,554 | (19,969,495 | ) | (37,142,380 | ) | |||||||||
| Total Increase in Net Assets | 9,552,769 | 58,801,874 | 22,572,084 | 8,007,292 | ||||||||||||
| Net Assets: | ||||||||||||||||
| Beginning of year/period | 159,246,289 | 100,444,415 | 434,938,326 | 426,931,034 | ||||||||||||
| End of year/period | $ | 168,799,058 | $ | 159,246,289 | $ | 457,510,410 | $ | 434,938,326 | ||||||||
| Undistributed net investment income (loss) at end of year/period | $ | 243,520 | $ | (530,346 | ) | $ | 292,389 | $ | (2,209,772 | ) | ||||||
| 31 | Refer to the Notes to Financial Statements in this Report for further information regarding the values set forth above. |
| AdvisorOne Funds Semi-Annual Report |
| Statements of Changes in Net Assets (Continued) |
| CLS Growth | CLS Flexible | |||||||||||||||
| and Income Fund | Income Fund | |||||||||||||||
| Six Months | Six Months | |||||||||||||||
| Ended | Ended | |||||||||||||||
| October 31, 2017 | Year Ended | October 31, 2017 | Year Ended | |||||||||||||
| (Unaudited) | April 30, 2017 | (Unaudited) | April 30, 2017 | |||||||||||||
| Increase (Decrease) in Net Assets: | ||||||||||||||||
| From Operations: | ||||||||||||||||
| Net investment income | $ | 3,401,997 | $ | 6,283,971 | $ | 2,673,514 | $ | 4,563,647 | ||||||||
| Net realized gain (loss) on investments | 1,662,237 | 13,510,204 | (474,887 | ) | 376,266 | |||||||||||
| Distributions of realized gains by underlying investment companies | — | 30,239 | — | 52,639 | ||||||||||||
| Net change in unrealized appreciation on investments | 19,262,741 | 6,967,177 | 1,530,060 | 1,785,020 | ||||||||||||
| Net increase in net assets resulting from operations | 24,326,975 | 26,791,591 | 3,728,687 | 6,777,572 | ||||||||||||
| From Distributions to Shareholders: | ||||||||||||||||
| From Net Investment Income | — | (6,312,499 | ) | (2,691,565 | ) | (4,755,543 | ) | |||||||||
| From Net Realized Gains | — | (747,167 | ) | — | — | |||||||||||
| Total Dividends and Distributions to Shareholders | — | (7,059,666 | ) | (2,691,565 | ) | (4,755,543 | ) | |||||||||
| From Fund Share Transactions (Note 7) | (11,578,434 | ) | 60,418,255 | 323,369 | 31,516,605 | |||||||||||
| Total Increase in Net Assets | 12,748,541 | 80,150,180 | 1,360,491 | 33,538,634 | ||||||||||||
| Net Assets: | ||||||||||||||||
| Beginning of year/period | 445,759,452 | 365,609,272 | 228,142,024 | 194,603,390 | ||||||||||||
| End of year/period | $ | 458,507,993 | $ | 445,759,452 | $ | 229,502,515 | $ | 228,142,024 | ||||||||
| Undistributed net investment income at end of year/period | $ | 3,540,065 | $ | 138,068 | $ | 506,389 | $ | 524,440 | ||||||||
| 32 | Refer to the Notes to Financial Statements in this Report for further information regarding the values set forth above. |
| AdvisorOne Funds Semi-Annual Report |
| Statements of Changes in Net Assets (Continued) |
| CLS International | CLS | |||||||||||||||
| Equity Fund | Shelter Fund | |||||||||||||||
| Six Months | Six Months | |||||||||||||||
| Ended | Ended | |||||||||||||||
| October 31, 2017 | Year Ended | October 31, 2017 | Year Ended | |||||||||||||
| (Unaudited) | April 30, 2017 | (Unaudited) | April 30, 2017 | |||||||||||||
| Increase (Decrease) in Net Assets: | ||||||||||||||||
| From Operations: | ||||||||||||||||
| Net investment income | $ | 333,698 | $ | 360,187 | $ | 839,379 | $ | 886,813 | ||||||||
| Net realized gain on investments | 2,136,282 | 1,115,903 | 1,478,661 | 4,843,884 | ||||||||||||
| Distributions of realized gains by underlying investment companies | — | — | — | — | ||||||||||||
| Net change in unrealized appreciation on investments | 2,532,311 | 916,910 | 9,957,329 | 9,414,042 | ||||||||||||
| Net increase in net assets resulting from operations | 5,002,291 | 2,393,000 | 12,275,369 | 15,144,739 | ||||||||||||
| From Distributions to Shareholders: | ||||||||||||||||
| From Net Investment Income | — | (297,017 | ) | — | (977,412 | ) | ||||||||||
| From Net Realized Gains | — | (156,182 | ) | — | (1,560,749 | ) | ||||||||||
| Total Dividends and Distributions to Shareholders | — | (453,199 | ) | — | (2,538,161 | ) | ||||||||||
| From Fund Share Transactions (Note 7) | (3,005,062 | ) | 26,950,540 | 19,715,911 | 22,442,367 | |||||||||||
| Total Increase in Net Assets | 1,997,229 | 28,890,341 | 31,991,280 | 35,048,945 | ||||||||||||
| Net Assets: | ||||||||||||||||
| Beginning of year/period | 48,643,785 | 19,753,444 | 129,377,835 | 94,328,890 | ||||||||||||
| End of year/period | $ | 50,641,014 | $ | 48,643,785 | $ | 161,369,115 | $ | 129,377,835 | ||||||||
| Undistributed net investment income (loss) at end of year/period | $ | 304,296 | $ | (29,402 | ) | $ | 839,379 | $ | — | |||||||
| 33 | Refer to the Notes to Financial Statements in this Report for further information regarding the values set forth above. |
| AdvisorOne Funds Semi-Annual Report |
| Financial Highlights |
| CLS Global Aggressive Equity Fund |
| Selected data based on a share outstanding throughout each period indicated. |
| Class N Shares | ||||||||||||||||||||||||
| Six Months | ||||||||||||||||||||||||
| Ended | ||||||||||||||||||||||||
| October 31, | Fiscal Years Ending April 30, | |||||||||||||||||||||||
| 2017 | 2017 | 2016 | 2015 | 2014 | 2013 | |||||||||||||||||||
| (Unaudited) | ||||||||||||||||||||||||
| Net asset value, beginning of period | $ | 14.38 | $ | 12.26 | $ | 13.73 | $ | 13.47 | $ | 13.37 | $ | 12.52 | ||||||||||||
| Income (loss) from investment operations: | ||||||||||||||||||||||||
| Net investment income(a)(b) | 0.07 | 0.17 | 0.26 | 0.24 | 0.08 | 0.05 | ||||||||||||||||||
| Net realized and unrealized gain (loss) on investments | 1.41 | 2.29 | (1.14 | ) | 0.74 | 2.26 | 1.35 | |||||||||||||||||
| Total income (loss) from investment operations | 1.48 | 2.46 | (0.88 | ) | 0.98 | 2.34 | 1.40 | |||||||||||||||||
| Less distributions from: | ||||||||||||||||||||||||
| Net investment income | — | (0.19 | ) | (0.25 | ) | (0.22 | ) | (0.23 | ) | (0.05 | ) | |||||||||||||
| Net realized gains | — | (0.15 | ) | (0.34 | ) | (0.50 | ) | (2.01 | ) | (0.50 | ) | |||||||||||||
| Total distributions from net investment income and net realized gains | — | (0.34 | ) | (0.59 | ) | (0.72 | ) | (2.24 | ) | (0.55 | ) | |||||||||||||
| Net asset value, end of period | $ | 15.86 | $ | 14.38 | $ | 12.26 | $ | 13.73 | $ | 13.47 | $ | 13.37 | ||||||||||||
| Total return(c) | 10.29 | % (f) | 20.23 | % | (6.39 | )% | 7.50 | % | 17.87 | % | 11.55 | % | ||||||||||||
| Ratios and Supplemental Data: | ||||||||||||||||||||||||
| Net assets, end of period (in 000’s) | $ | 168,799 | $ | 159,246 | $ | 100,444 | $ | 101,201 | $ | 92,176 | $ | 90,657 | ||||||||||||
| Ratio of net expenses to average net assets after expense reimbursement(d) | 1.15 | % (e) | 1.15 | % | 1.15 | % | 1.15 | % | 1.15 | % | 1.15 | % | ||||||||||||
| Ratio of expenses to average net assets before waivers and reimbursements(d) | 1.24 | % (e) | 1.40 | % | 1.38 | % | 1.36 | % | 1.37 | % | 1.38 | % | ||||||||||||
| Ratio of net investment income to average net assets(b) | 0.94 | % (e) | 1.30 | % | 2.10 | % | 1.81 | % | 0.61 | % | 0.42 | % | ||||||||||||
| Portfolio turnover rate | 16 | % (f) | 32 | % | 35 | % | 50 | % | 24 | % | 162 | % | ||||||||||||
| (a) | Net investment income has been calculated using the average shares method, which more appropriately presents the per share data for the period. |
| (b) | Recognition of net investment income by the Fund is affected by the timing of the declaration of dividends by the underlying investment companies in which the Fund invests. |
| (c) | Total returns are historical and assume changes in share price, reinvestment of dividends and capital gains distributions, and assume no sales charge. Had the Advisor not waived a portion of the Fund’s expenses, total returns would have been lower. |
| (d) | Does not include the expenses of the investment companies in which the Fund invests. |
| (e) | Annualized for periods less than one year. |
| (f) | Not annualized. |
| 34 | Refer to the Notes to Financial Statements in this Report for further information regarding the values set forth above. |
| AdvisorOne Funds Semi-Annual Report |
| Financial Highlights |
| CLS Global Diversified Equity Fund |
| Selected data based on a share outstanding throughout each period indicated. |
| Class N Shares | ||||||||||||||||||||||||
| Six Months | ||||||||||||||||||||||||
| Ended | ||||||||||||||||||||||||
| October 31, | Fiscal Years Ending April 30, | |||||||||||||||||||||||
| 2017 | 2017 | 2016 | 2015 | 2014 | 2013 | |||||||||||||||||||
| (Unaudited) | ||||||||||||||||||||||||
| Net asset value, beginning of period | $ | 17.94 | $ | 16.15 | $ | 18.26 | $ | 17.61 | $ | 15.43 | $ | 13.72 | ||||||||||||
| Income (loss) from investment operations: | ||||||||||||||||||||||||
| Net investment income(a)(b) | 0.11 | 0.28 | 0.27 | 0.21 | 0.13 | 0.10 | ||||||||||||||||||
| Net realized and unrealized gain (loss) on investments | 1.69 | 2.09 | (1.66 | ) | 0.95 | 2.17 | 1.67 | |||||||||||||||||
| Total income (loss) from investment operations | 1.80 | 2.37 | (1.39 | ) | 1.16 | 2.30 | 1.77 | |||||||||||||||||
| Less distributions from: | ||||||||||||||||||||||||
| Net investment income | — | (0.49 | ) | (0.13 | ) | (0.34 | ) | (0.12 | ) | (0.06 | ) | |||||||||||||
| Net realized gains | — | (0.09 | ) | (0.59 | ) | (0.17 | ) | — | — | |||||||||||||||
| Total distributions from net investment income and net realized gains | — | (0.58 | ) | (0.72 | ) | (0.51 | ) | (0.12 | ) | (0.06 | ) | |||||||||||||
| Net asset value, end of period | $ | 19.74 | $ | 17.94 | $ | 16.15 | $ | 18.26 | $ | 17.61 | $ | 15.43 | ||||||||||||
| Total return(c) | 10.03 | % (f) | 14.95 | % | (7.59 | )% | 6.68 | % | 14.93 | % | 12.91 | % | ||||||||||||
| Ratios and Supplemental Data: | ||||||||||||||||||||||||
| Net assets, end of period (in 000’s) | $ | 457,510 | $ | 434,938 | $ | 424,701 | $ | 567,510 | $ | 484,015 | $ | 483,612 | ||||||||||||
| Ratio of net expenses to average net assets after expense reimbursement(d) | 1.15 | % (e) | 1.15 | % | 1.15 | % | 1.15 | % | 1.15 | % | 1.15 | % | ||||||||||||
| Ratio of expenses to average net assets before waivers and reimbursements(d) | 1.15 | % (e) | 1.20 | % | 1.19 | % | 1.17 | % | 1.18 | % | 1.18 | % | ||||||||||||
| Ratio of net investment income to average net assets(b) | 1.12 | % (e) | 1.64 | % | 1.59 | % | 1.19 | % | 0.78 | % | 0.72 | % | ||||||||||||
| Portfolio turnover rate | 12 | % (f) | 41 | % | 58 | % | 33 | % | 27 | % | 69 | % | ||||||||||||
| (a) | Net investment income has been calculated using the average shares method, which more appropriately presents the per share data for the period. |
| (b) | Recognition of net investment income by the Fund is affected by the timing of the declaration of dividends by the underlying investment companies in which the Fund invests. |
| (c) | Total returns are historical and assume changes in share price, reinvestment of dividends and capital gains distributions, and assume no sales charge. Had the Advisor not waived a portion of the Fund’s expenses, total returns would have been lower. |
| (d) | Does not include the expenses of the investment companies in which the Fund invests. |
| (e) | Annualized for periods less than one year. |
| (f) | Not annualized. |
| 35 | Refer to the Notes to Financial Statements in this Report for further information regarding the values set forth above. |
| AdvisorOne Funds Semi-Annual Report |
| Financial Highlights |
| CLS Growth and Income Fund |
| Selected data based on a share outstanding throughout each period indicated. |
| Class N Shares | ||||||||||||||||||||||||
| Six Months | ||||||||||||||||||||||||
| Ended | ||||||||||||||||||||||||
| October 31, | Fiscal Years Ending April 30, | |||||||||||||||||||||||
| 2017 | 2017 | 2016 | 2015 | 2014 | 2013 | |||||||||||||||||||
| (Unaudited) | ||||||||||||||||||||||||
| Net asset value, beginning of period | $ | 11.12 | $ | 10.55 | $ | 10.99 | $ | 10.82 | $ | 10.94 | $ | 10.10 | ||||||||||||
| Income (loss) from investment operations: | ||||||||||||||||||||||||
| Net investment income(a)(b) | 0.09 | 0.19 | 0.15 | 0.14 | 0.09 | 0.19 | ||||||||||||||||||
| Net realized and unrealized gain (loss) on investments | 0.52 | 0.61 | (0.40 | ) | 0.22 | 0.56 | 0.83 | |||||||||||||||||
| Total income (loss) from investment operations | 0.61 | 0.80 | (0.25 | ) | 0.36 | 0.65 | 1.02 | |||||||||||||||||
| Less distributions from: | ||||||||||||||||||||||||
| Net investment income | — | (0.21 | ) | (0.13 | ) | (0.11 | ) | (0.31 | ) | (0.18 | ) | |||||||||||||
| Net realized gains | — | (0.02 | ) | (0.06 | ) | (0.08 | ) | (0.46 | ) | — | ||||||||||||||
| Total distributions from net investment income and net realized gains | — | (0.23 | ) | (0.19 | ) | (0.19 | ) | (0.77 | ) | (0.18 | ) | |||||||||||||
| Net asset value, end of period | $ | 11.73 | $ | 11.12 | $ | 10.55 | $ | 10.99 | $ | 10.82 | $ | 10.94 | ||||||||||||
| Total return(c) | 5.49 | % (f) | 7.68 | % | (2.14 | )% | 3.31 | % | 6.08 | % | 10.20 | % | ||||||||||||
| Ratios and Supplemental Data: | ||||||||||||||||||||||||
| Net assets, end of period (in 000’s) | $ | 458,508 | $ | 445,759 | $ | 365,609 | $ | 423,486 | $ | 305,585 | $ | 300,478 | ||||||||||||
| Ratio of net expenses to average net assets after expense reimbursement/recapture(d) | 1.15 | % (e) | 1.15 | % | 1.15 | % | 1.15 | % | 1.15 | % | 1.15 | % | ||||||||||||
| Ratio of expenses to average net assets before waivers and reimbursements/recapture(d) | 1.14 | % (e) | 1.21 | % | 1.19 | % | 1.19 | % | 1.23 | % | 1.22 | % | ||||||||||||
| Ratio of net investment income to average net assets(b) | 1.50 | % (e) | 1.75 | % | 1.42 | % | 1.33 | % | 0.82 | % | 1.83 | % | ||||||||||||
| Portfolio turnover rate | 4 | % (f) | 45 | % | 56 | % | 31 | % | 39 | % | 89 | % | ||||||||||||
| (a) | Net investment income has been calculated using the average shares method, which more appropriately presents the per share data for the period. |
| (b) | Recognition of net investment income by the Fund is affected by the timing of the declaration of dividends by the underlying investment companies in which the Fund invests. |
| (c) | Total returns are historical and assume changes in share price, reinvestment of dividends and capital gains distributions, and assume no sales charge. Had the Advisor not waived a portion of the Fund’s expenses, total returns would have been lower. |
| (d) | Does not include the expenses of the investment companies in which the Fund invests. |
| (e) | Annualized for periods less than one year. |
| (f) | Not annualized. |
| 36 | Refer to the Notes to Financial Statements in this Report for further information regarding the values set forth above. |
| AdvisorOne Funds Semi-Annual Report |
| Financial Highlights |
| CLS Flexible Income Fund |
| Selected data based on a share outstanding throughout each period indicated. |
| Class N Shares | ||||||||||||||||||||||||
| Six Months | ||||||||||||||||||||||||
| Ended | ||||||||||||||||||||||||
| October 31, | Fiscal Years Ending April 30, | |||||||||||||||||||||||
| 2017 | 2017 | 2016 | 2015 | 2014 | 2013 | |||||||||||||||||||
| (Unaudited) | ||||||||||||||||||||||||
| Net asset value, beginning of period | $ | 10.28 | $ | 10.18 | $ | 10.35 | $ | 10.40 | $ | 10.76 | $ | 10.58 | ||||||||||||
| Income (loss) from investment operations: | ||||||||||||||||||||||||
| Net investment income(a)(b) | 0.12 | 0.24 | 0.24 | 0.23 | 0.22 | 0.26 | ||||||||||||||||||
| Net realized and unrealized gain (loss) on investments | 0.04 | 0.11 | (0.17 | ) | (0.05 | ) | (0.23 | ) | 0.23 | |||||||||||||||
| Total income (loss) from investment operations | 0.16 | 0.35 | 0.07 | 0.18 | (0.01 | ) | 0.49 | |||||||||||||||||
| Less distributions from: | ||||||||||||||||||||||||
| Net investment income | (0.12 | ) | (0.25 | ) | (0.24 | ) | (0.23 | ) | (0.22 | ) | (0.26 | ) | ||||||||||||
| Net realized gains | — | — | — | — | (0.13 | ) | (0.05 | ) | ||||||||||||||||
| Total distributions from net investment income and net realized gains | (0.12 | ) | (0.25 | ) | (0.24 | ) | (0.23 | ) | (0.35 | ) | (0.31 | ) | ||||||||||||
| Net asset value, end of period | $ | 10.32 | $ | 10.28 | $ | 10.18 | $ | 10.35 | $ | 10.40 | $ | 10.76 | ||||||||||||
| Total return(c) | 1.58 | % (f) | 3.48 | % | 0.71 | % | 1.75 | % | (0.01 | )% | 4.76 | % | ||||||||||||
| Ratios and Supplemental Data: | ||||||||||||||||||||||||
| Net assets, end of period (in 000’s) | $ | 229,503 | $ | 228,142 | $ | 194,603 | $ | 197,700 | $ | 164,000 | $ | 166,348 | ||||||||||||
| Ratio of net expenses to average net assets after expense reimbursement(d) | 0.80 | % (e) | 0.80 | % | 0.80 | % | 0.80 | % | 0.80 | % | 0.80 | % | ||||||||||||
| Ratio of expenses to average net assets before waivers and reimbursements(d) | 0.86 | % (e) | �� | 0.99 | % | 0.94 | % | 0.93 | % | 0.97 | % | 0.98 | % | |||||||||||
| Ratio of net investment income to average net assets(b) | 2.32 | % (e) | 2.35 | % | 2.33 | % | 2.24 | % | 2.08 | % | 2.40 | % | ||||||||||||
| Portfolio turnover rate | 11 | % (f) | 9 | % | 19 | % | 5 | % | 24 | % | 51 | % | ||||||||||||
| (a) | Net investment income has been calculated using the average shares method, which more appropriately presents the per share data for the period. |
| (b) | Recognition of net investment income by the Fund is affected by the timing of the declaration of dividends by the underlying investment companies in which the Fund invests. |
| (c) | Total returns are historical and assume changes in share price, reinvestment of dividends and capital gains distributions, and assume no sales charge. Had the Advisor not waived a portion of the Fund’s expenses, total returns would have been lower. |
| (d) | Does not include the expenses of the investment companies in which the Fund invests. |
| (e) | Annualized for periods less than one year. |
| (f) | Not annualized. |
| 37 | Refer to the Notes to Financial Statements in this Report for further information regarding the values set forth above. |
| AdvisorOne Funds Semi-Annual Report |
| Financial Highlights |
| CLS International Equity Fund |
| Selected data based on a share outstanding throughout each period indicated. |
| Class N Shares | ||||||||||||||||||||||||
| Six Months | ||||||||||||||||||||||||
| Ended | ||||||||||||||||||||||||
| October 31, | Fiscal Years Ending April 30, | |||||||||||||||||||||||
| 2017 | 2017 | 2016 | 2015 | 2014 | 2013 | |||||||||||||||||||
| (Unaudited) | ||||||||||||||||||||||||
| Net asset value, beginning of period | $ | 4.50 | $ | 4.19 | $ | 4.68 | $ | 10.61 | $ | 10.75 | $ | 10.16 | ||||||||||||
| Income (loss) from investment operations: | ||||||||||||||||||||||||
| Net investment income(a)(b) | 0.03 | 0.07 | 0.10 | 0.11 | 0.08 | 0.10 | ||||||||||||||||||
| Net realized and unrealized gain (loss) on investments | 0.45 | 0.34 | (0.48 | ) | 0.33 | 0.73 | 0.77 | |||||||||||||||||
| Total income (loss) from investment operations | 0.48 | 0.41 | (0.38 | ) | 0.44 | 0.81 | 0.87 | |||||||||||||||||
| Less distributions from: | ||||||||||||||||||||||||
| Net investment income | — | (0.07 | ) | (0.11 | ) | (0.23 | ) | (0.08 | ) | (0.09 | ) | |||||||||||||
| Net realized gains | — | (0.03 | ) | — | (6.14 | ) | (0.87 | ) | (0.19 | ) | ||||||||||||||
| Total distributions from net investment income and net realized gains | — | (0.10 | ) | (0.11 | ) | (6.37 | ) | (0.95 | ) | (0.28 | ) | |||||||||||||
| Net asset value, end of period | $ | 4.98 | $ | 4.50 | $ | 4.19 | $ | 4.68 | $ | 10.61 | $ | 10.75 | ||||||||||||
| Total return(c) | 10.67 | % (h) | 10.03 | % | (8.11 | )% | 9.82 | % | 7.75 | % | 8.66 | % | ||||||||||||
| Ratios and Supplemental Data: | ||||||||||||||||||||||||
| Net assets, end of period (in 000’s) | $ | 50,641 | $ | 48,644 | $ | 19,753 | $ | 13,884 | $ | 255,231 | $ | 248,326 | ||||||||||||
| Ratio of expenses to average net assets, excluding dividends from securities sold short and interest expense(d) | 1.15 | % (g) | 1.15 | % | 1.15 | % | 1.15 | % (e) | 1.15 | % (e) | 1.15 | % | ||||||||||||
| Ratio of expenses to average net assets before waivers and reimbursements, excluding dividends from securities sold short and interest expense(d) | 1.45 | % (g) | 2.07 | % | 2.21 | % | 1.37 | % (f) | 1.25 | % (f) | 1.24 | % | ||||||||||||
| Ratio of net investment income to average net assets(b) | 1.33 | % (g) | 1.62 | % | 2.55 | % | 1.06 | % | 0.72 | % | 0.93 | % | ||||||||||||
| Portfolio turnover rate | 51 | % (h) | 155 | % | 230 | % | 45 | % | 44 | % | 84 | % | ||||||||||||
| (a) | Net investment income has been calculated using the average shares method, which more appropriately presents the per share data for the period. |
| (b) | Recognition of net investment income by the Fund is affected by the timing of the declaration of dividends by the underlying investment companies in which the Fund invests. |
| (c) | Total returns are historical and assume changes in share price, reinvestment of dividends and capital gains distributions, and assume no sales charge. Had the Advisor not waived a portion of the Fund’s expenses, total returns would have been lower. |
| (d) | Does not include the expenses of the investment companies in which the Fund invests. |
| (e) | Including dividends from securities sold short and interest expense, the ratio of net expenses to average net assets would have been 1.19% for the year ended April 30, 2015 and 1.23% for the year ended April 30, 2014. |
| (f) | Including dividends from securities sold short and interest expense, the ratio of net expenses to average net assets would have been 1.41% for the year ended April 30, 2015 and 1.33% for the year ended April 30, 2014. Had the Advisor not waived a portion of the Fund’s expenses, total returns would have been lower. |
| (g) | Annualized for periods less than one year. |
| (h) | Not annualized. |
| 38 | Refer to the Notes to Financial Statements in this Report for further information regarding the values set forth above. |
| AdvisorOne Funds Semi-Annual Report |
| Financial Highlights |
| CLS Shelter Fund |
| Selected data based on a share outstanding throughout each period indicated. |
| Class N Shares | ||||||||||||||||||||||||
| Six Months | ||||||||||||||||||||||||
| Ended | ||||||||||||||||||||||||
| October 31, | Fiscal Years Ending April 30, | |||||||||||||||||||||||
| 2017 | 2017 | 2016 | 2015 | 2014 | 2013 | |||||||||||||||||||
| (Unaudited) | ||||||||||||||||||||||||
| Net asset value, beginning of period | $ | 13.10 | $ | 11.65 | $ | 13.35 | $ | 12.21 | $ | 10.59 | $ | 9.93 | ||||||||||||
| Income (loss) from investment operations: | ||||||||||||||||||||||||
| Net investment income(a)(b) | 0.08 | 0.10 | 0.15 | 0.13 | 0.09 | 0.04 | ||||||||||||||||||
| Net realized and unrealized gain (loss) on investments | 1.08 | 1.64 | (0.75 | ) | 1.10 | 1.57 | 0.62 | |||||||||||||||||
| Total income (loss) from investment operations | 1.16 | 1.74 | (0.60 | ) | 1.23 | 1.66 | 0.66 | |||||||||||||||||
| Less distributions from: | ||||||||||||||||||||||||
| Net investment income | — | (0.11 | ) | (0.22 | ) | (0.09 | ) | (0.04 | ) | — | ||||||||||||||
| Net realized gains | — | (0.18 | ) | (0.88 | ) | — | — | — | ||||||||||||||||
| Total distributions from net investment income and net realized gains | — | (0.29 | ) | (1.10 | ) | (0.09 | ) | (0.04 | ) | — | ||||||||||||||
| Net asset value, end of period | $ | 14.26 | $ | 13.10 | $ | 11.65 | $ | 13.35 | $ | 12.21 | $ | 10.59 | ||||||||||||
| Total return(c) | 8.85 | % (f) | 15.11 | % | (4.43 | )% | 10.11 | % | 15.66 | % | 6.65 | % | ||||||||||||
| Ratios and Supplemental Data: | ||||||||||||||||||||||||
| Net assets, end of period (in 000’s) | $ | 161,369 | $ | 129,378 | $ | 94,329 | $ | 98,241 | $ | 69,314 | $ | 42,828 | ||||||||||||
| Ratio of net expenses to average net assets after expense reimbursement(d) | 1.15 | % (e) | 1.15 | % | 1.15 | % | 1.15 | % | 1.15 | % | 1.15 | % | ||||||||||||
| Ratio of expenses to average net assets before waivers and reimbursements(d) | 1.19 | % (e) | 1.24 | % | 1.24 | % | 1.27 | % | 1.37 | % | 1.37 | % | ||||||||||||
| Ratio of net investment income to average net assets(b) | 1.15 | % (e) | 0.83 | % | 1.19 | % | 0.99 | % | 0.75 | % | 0.39 | % | ||||||||||||
| Portfolio turnover rate | 14 | % (f) | 147 | % | 346 | % | 106 | % | 158 | % | 291 | % | ||||||||||||
| (a) | Net investment income has been calculated using the average shares method, which more appropriately presents the per share data for the period. |
| (b) | Recognition of net investment income by the Fund is affected by the timing of the declaration of dividends by the underlying investment companies in which the Fund invests. |
| (c) | Total returns are historical and assume changes in share price, reinvestment of dividends and capital gains distributions, and assume no sales charge. Had the Advisor not waived a portion of the Fund’s expenses, total returns would have been lower. |
| (d) | Does not include the expenses of the investment companies in which the Fund invests. |
| (e) | Annualized for periods less than one year. |
| (f) | Not annualized. |
| 39 | Refer to the Notes to Financial Statements in this Report for further information regarding the values set forth above. |
| AdvisorOne Funds Semi-Annual Report |
| Notes to Financial Statements (Unaudited) |
| October 31, 2017 |
| 1. | Organization |
AdvisorOne Funds (the “Trust” or the “Funds”) was organized as a Delaware Business Trust in December 1996 and is registered under the Investment Company Act of 1940 (the “1940 Act”), as amended, as an open-end management investment company. The CLS Global Aggressive Equity Fund, CLS Global Diversified Equity Fund, CLS Growth and Income Fund, CLS Flexible Income Fund, CLS International Equity Fund and CLS Shelter Fund, collectively the “Funds” and each individually a “Fund” are each a diversified series of the Trust. The Funds each offer an unlimited number of shares of beneficial interest without par value. The Funds offer Class N shares.
| Fund | The primary investment objective of each Fund is as follows: |
| CLS Global Aggressive Equity Fund | Long-term growth |
| CLS Global Diversified Equity Fund | Long-term growth of capital without regard to current income |
| CLS Growth and Income Fund | Combination of current income and growth of capital |
| CLS Flexible Income Fund | Total return, consisting of capital growth and income, consistent with preservation of capital |
| CLS International Equity Fund | Growth of capital and current income |
| CLS Shelter Fund | Limiting the impact of large equity market declines. The Fund’s secondary investment objective is growth of capital. |
| 2. | Summary of Significant Accounting Policies |
The following is a summary of significant accounting policies followed by the Funds in the preparation of their financial statements. These policies are in conformity with accounting principles generally accepted in the United States of America (“GAAP”). The preparation of financial statements requires management to make estimates and assumptions that affect the reported amounts of assets and liabilities and disclosure of contingent assets and liabilities at the date of the financial statements and the reported amounts of income and expenses for the year. Actual results could differ from those estimates. The Funds are investment companies and accordingly follow the investment companies accounting and reporting guidance of the Financial Accounting Standards Board (FASB) Accounting Standard Codification Topic 946 “Financial Services – Investment Companies” including FASB Accounting Standard Update ASU 2013-08.
Security Valuation – Securities listed on an exchange are valued at the last reported sale price at the close of the regular trading session of the exchange on the business day the value is being determined, or in the case of securities listed on NASDAQ at the NASDAQ Official Closing Price (“NOCP”). In the absence of a sale such securities shall be valued at the mean between the current bid and ask prices on the primary exchange on the day of valuation. Short-term investments that mature in 60 days or less may be valued at amortized cost, provided such valuations represent fair
40
| AdvisorOne Funds Semi-Annual Report |
| Notes to Financial Statements (Unaudited) (Continued) |
| October 31, 2017 |
value. Under the amortized cost method, a portfolio instrument is valued at cost and any premium or discount is amortized to maturity. Amortization of premium and accretion of market discount are charged to income. Debt securities (other than short-term obligations) are valued each day by an independent pricing service approved by the Trust’s Board of Trustees (the “Board”) based on methods which include consideration of: yields or prices of securities of comparable quality, coupon, maturity and type, indications as to values from dealers, and general market conditions or market quotations from a major market maker in the securities.
The Funds may hold securities, such as private investments, interests in commodity pools, other non-traded securities or temporarily illiquid securities, for which market quotations are not readily available or are determined to be unreliable. These securities will be valued using the “fair value” procedures approved by the Board. The Board has delegated execution of these procedures to a fair value team composed of one or more representatives from each of the (i) Trust, (ii) administrator, and (iii) advisor. The team may also enlist third party consultants such as a valuation specialist at a public accounting firm, valuation consultant or financial officer of a security issuer on an as-needed basis to assist in determining a security-specific fair value. The Board reviews and ratifies the execution of this process and the resultant fair value prices at least quarterly to assure the process produces reliable results.
Fair Valuation Process – As noted above, the fair value team is composed of one or more representatives from each of the (i) Trust, (ii) Administrator, and (iii) Advisor. The applicable investments are valued collectively via inputs from each of these groups. For example, fair value determinations are required for the following securities: (i) securities for which market quotations are insufficient or not readily available on a particular business day (including securities for which there is a short and temporary lapse in the provision of a price by the regular pricing source), (ii) securities for which, in the judgment of the advisor, the prices or values available do not represent the fair value of the instrument. Factors which may cause the advisor to make such a judgment include, but are not limited to, the following: only a bid price or an ask price is available; the spread between bid and ask prices is substantial; the frequency of sales; the thinness of the market; the size of reported trades; and actions of the securities markets, such as the suspension or limitation of trading; (iii) securities determined to be illiquid; (iv) securities with respect to which an event that will affect the value thereof has occurred (a “significant event”) since the closing prices were established on the principal exchange on which they are traded, but prior to a Fund’s calculation of its net asset value. Specifically, interests in commodity pools or managed futures pools are valued on a daily basis by reference to the closing market prices of each futures contract or other asset held by a pool, as adjusted for pool expenses. Restricted or illiquid securities, such as private placements or non-traded securities are valued via inputs from the advisor based upon the current bid for the security from two or more independent dealers or other parties reasonably familiar with the facts and circumstances of the security (who should take into consideration all relevant factors as may
41
| AdvisorOne Funds Semi-Annual Report |
| Notes to Financial Statements (Unaudited) (Continued) |
| October 31, 2017 |
be appropriate under the circumstances). If the advisor is unable to obtain a current bid from such independent dealers or other independent parties, the fair value team shall determine the fair value of such security using the following factors: (i) the type of security; (ii) the cost at date of purchase; (iii) the size and nature of a Fund’s holdings; (iv) the discount from market value of unrestricted securities of the same class at the time of purchase and subsequent thereto; (v) information as to any transactions or offers with respect to the security; (vi) the nature and duration of restrictions on disposition of the security and the existence of any registration rights; (vii) how the yield of the security compares to similar securities of companies of similar or equal creditworthiness; (viii) the level of recent trades of similar or comparable securities; (ix) the liquidity characteristics of the security; (x) current market conditions; and (xi) the market value of any securities into which the security is convertible or exchangeable.
Valuation of Fund of Funds – The Funds may invest in portfolios of open-end or closed-end investment companies (the “Underlying Funds”). The Underlying Funds value securities in their portfolios for which market quotations are readily available at their market values (generally the last reported sale price) and all other securities and assets at their fair value to the methods established by the board of directors of the Underlying Funds.
Open-ended investment companies are valued at their respective net asset values as reported by such investment companies. The shares of many closed-end investment companies, after their initial public offering, frequently trade at a price per share, which is different than the net asset value per share. The difference represents a market premium or market discount of such shares. There can be no assurances that the market discount or market premium on shares of any closed-end investment company purchased by their Funds will not change.
The Funds utilize various methods to measure the fair value of all of its investments on a recurring basis. GAAP establishes a hierarchy that prioritizes inputs to valuation methods. The three levels of input are:
Level 1 – Unadjusted quoted prices in active markets for identical assets and liabilities that a Fund has the ability to access.
Level 2 – Observable inputs other than quoted prices included in Level 1 that are observable for the asset or liability, either directly or indirectly. These inputs may include quoted prices for the identical instrument in an inactive market, prices for similar instruments, interest rates, prepayment speeds, credit risk, yield curves, default rates and similar data.
42
| AdvisorOne Funds Semi-Annual Report |
| Notes to Financial Statements (Unaudited) (Continued) |
| October 31, 2017 |
Level 3 – Unobservable inputs for the asset or liability, to the extent relevant observable inputs are not available, representing a Fund’s own assumptions about the assumptions a market participant would use in valuing the asset or liability, and would be based on the best information available. The availability of observable inputs can vary from security to security and is affected by a wide variety of factors, including, for example, the type of security, whether the security is new and not yet established in the marketplace, the liquidity of markets, and other characteristics particular to the security. To the extent that valuation is based on models or inputs that are less observable or unobservable in the market, the determination of fair value requires more judgment.
Accordingly, the degree of judgment exercised in determining fair value is greatest for instruments categorized in Level 3.
The inputs used to measure fair value may fall into different levels of the fair value hierarchy. In such cases, for disclosure purposes, the level in the fair value hierarchy within which the fair value measurement falls in its entirety, is determined based on the lowest level input that is significant to the fair value measurement in its entirety.
The inputs or methodology used for valuing securities are not necessarily an indication of the risk associated with investing in those securities. The following table summarizes the inputs used as of October 31, 2017 for the Funds’ investments measured at fair value:
CLS Global Aggressive Equity Fund
| Assets * | Level 1 | Level 2 | Level 3 | Total | ||||||||||||
| Equity Funds | $ | 167,227,879 | $ | — | $ | — | $ | 167,227,879 | ||||||||
| Money Market Funds | 435,050 | — | — | 435,050 | ||||||||||||
| Collateral for Securities Loaned | 38,000,000 | 17,537 | — | 38,017,537 | ||||||||||||
| Total | $ | 205,662,929 | $ | 17,537 | $ | — | $ | 205,680,466 | ||||||||
| CLS Global Diversified Equity Fund | ||||||||||||||||
| Assets * | Level 1 | Level 2 | Level 3 | Total | ||||||||||||
| Equity Funds | $ | 455,356,771 | $ | — | $ | — | $ | 455,356,771 | ||||||||
| Money Market Funds | 2,093,678 | — | — | 2,093,678 | ||||||||||||
| Collateral for Securities Loaned | 20,973,531 | — | — | 20,973,531 | ||||||||||||
| Total | $ | 478,423,980 | $ | — | $ | — | $ | 478,423,980 | ||||||||
43
| AdvisorOne Funds Semi-Annual Report |
| Notes to Financial Statements (Unaudited) (Continued) |
| October 31, 2017 |
CLS Growth and Income Fund
| Assets * | Level 1 | Level 2 | Level 3 | Total | ||||||||||||
| Bond Funds | $ | 209,983,041 | $ | — | $ | — | $ | 209,983,041 | ||||||||
| Equity Funds | 237,733,686 | — | — | 237,733,686 | ||||||||||||
| Money Market Funds | 11,059,500 | — | — | 11,059,500 | ||||||||||||
| Collateral for Securities Loaned | 20,274,901 | 5,103,562 | — | 25,378,463 | ||||||||||||
| Total | $ | 479,051,128 | $ | 5,103,562 | $ | — | $ | 484,154,690 | ||||||||
| CLS Flexible Income Fund | ||||||||||||||||
| Assets * | Level 1 | Level 2 | Level 3 | Total | ||||||||||||
| Bond Funds | $ | 195,467,116 | $ | — | $ | — | $ | 195,467,116 | ||||||||
| Equity Funds | 19,021,757 | — | — | 19,021,757 | ||||||||||||
| U.S. Government & Agency Obligations | — | 8,814,513 | — | 8,814,513 | ||||||||||||
| Money Market Funds | 6,226,777 | — | — | 6,226,777 | ||||||||||||
| Collateral for Securities Loaned | 38,946,528 | 4,482,680 | — | 43,429,208 | ||||||||||||
| Total | $ | 259,662,178 | $ | 13,297,193 | $ | — | $ | 272,959,371 | ||||||||
| CLS International Equity Fund | ||||||||||||||||
| Assets * | Level 1 | Level 2 | Level 3 | Total | ||||||||||||
| Equity Funds | $ | 50,465,873 | $ | — | $ | — | $ | 50,465,873 | ||||||||
| Money Market Funds | 206,012 | — | — | 206,012 | ||||||||||||
| Collateral for Securities Loaned | 12,082,793 | 123,791 | — | 12,206,584 | ||||||||||||
| Total | $ | 62,754,678 | $ | 123,791 | $ | — | $ | 62,878,469 | ||||||||
| CLS Shelter Fund | ||||||||||||||||
| Assets * | Level 1 | Level 2 | Level 3 | Total | ||||||||||||
| Equity Funds | $ | 158,941,662 | $ | — | $ | — | $ | 158,941,662 | ||||||||
| Money Market Funds | 2,368,181 | — | — | 2,368,181 | ||||||||||||
| Collateral for Securities Loaned | 699,349 | 5,628,597 | — | 6,327,946 | ||||||||||||
| Total | $ | 162,009,192 | $ | 5,628,597 | $ | — | $ | 167,637,789 | ||||||||
The Funds did not hold any Level 3 securities during the period. There were no transfers into or out of any level during the period. It is the Funds’ policy to recognize transfers between Level 1 & Level 2 at the end of the reporting period.
| * | Refer to the Schedules of Investments for security classifications. |
44
| AdvisorOne Funds Semi-Annual Report |
| Notes to Financial Statements (Unaudited) (Continued) |
| October 31, 2017 |
Exchange Traded Funds
The Funds may invest in exchange traded funds (“ETFs”). ETFs are a type of index fund bought and sold on a securities exchange. An ETF trades like common stock and represents a fixed portfolio of securities designed to track the performance and dividend yield of a particular domestic or foreign market index. A Fund may purchase an ETF to temporarily gain exposure to a portion of the U.S. or a foreign market while awaiting purchase of underlying securities. The risks of owning an ETF generally reflect the risks of owning the underlying securities they are designed to track, although the lack of liquidity on an ETF could result in it being more volatile. Additionally, ETFs have fees and expenses that reduce their value.
Income Taxes
It is each Fund’s policy to comply with all sections of the Internal Revenue Code applicable to regulated investment companies and to distribute all of its taxable income and gains to its shareholders and therefore, no provision for federal income tax has been made. Each Fund is treated as a separate taxpayer for federal income tax purposes.
The Funds recognize the tax benefits of uncertain tax positions only where the position is “more likely than not” to be sustained assuming examination by tax authorities. Management has analyzed the Funds’ tax positions, and has concluded that no liability for unrecognized tax benefits should be recorded related to uncertain tax positions taken on returns filed for open tax years (2015-2017), or expected to be taken in the Funds’ 2018 tax returns. The Funds identified their major tax jurisdictions as U.S. Federal, Nebraska and foreign jurisdictions where the Funds make significant investments; however, the Funds are not aware of any tax positions for which it is reasonably possible that the total amounts of unrecognized tax benefits will change materially in the next twelve months.
Security Transactions and Related Income
Investment security transactions are accounted for on a trade date basis. Cost is determined and gains and losses are based upon the specific identification method for both financial statement and Federal income tax purposes. Dividend income is recorded on the ex-dividend date and interest income is recorded on an accrual basis. Purchase discounts and premiums on securities are accreted and amortized over the life of the respective securities.
Expenses
Expenses of the Trust that are directly identifiable to a specific Fund, are charged to that Fund. Expenses, which are not readily identifiable to a specific Fund, are allocated in such a manner as deemed equitable, taking into consideration the nature and type of expense and the relative sizes of the Funds. Each Fund’s income, expenses (other than the class specific distribution and shareholder service fees) and realized and unrealized gains and losses are allocated proportionally each day between the classes based upon the relative net assets of each class.
45
| AdvisorOne Funds Semi-Annual Report |
| Notes to Financial Statements (Unaudited) (Continued) |
| October 31, 2017 |
Distributions to Shareholders
Income will normally be declared and distributed at least annually for all Funds with the exception of the CLS Flexible Income Fund. Income will normally be declared and distributed monthly for the CLS Flexible Income Fund. The Funds declare and pay net realized capital gains, if any, annually. The character of income and gains to be distributed is determined in accordance with income tax regulations which may differ from GAAP. These differences are primarily due to the treatment of wash sale losses, grantor trust and partnership income.
Indemnification
The Trust indemnifies its officers and Trustees for certain liabilities that may arise from the performance of their duties to the Trust. Additionally, in the normal course of business, the Funds enter into contracts that contain a variety of representations and warranties and which provide general indemnities. A Fund’s maximum exposure under these arrangements is unknown, as this would involve future claims that may be made against the Funds that have not yet occurred. However, based on experience, the Trust expects the risk of loss due to these warranties and indemnities to be remote.
| 3. | Investment Advisory Agreement and Transactions with Affiliates |
Advisory Fees
The Trust has entered into an Investment Advisory Agreement with CLS Investments, LLC (the “Advisor”, formerly Clarke Lanzen Skalla Investment Firm, LLC), a subsidiary of NorthStar Financial Services Group, LLC. As compensation for the services rendered, facilities furnished, and expenses borne by the Advisor, the Funds will pay the Advisor a fee accrued daily and paid monthly, at the annualized rate of 0.75% of net assets for CLS Global Aggressive Equity Fund, CLS Global Diversified Equity Fund, CLS Growth and Income Fund, CLS International Equity Fund, and CLS Shelter Fund; CLS Flexible Income at the annualized rate of 0.40%.
The Trustees have adopted a Shareholder Servicing Plan with respect to the Class N Shares (“Shareholder Servicing Plan”). The Shareholder Servicing Plan allows each of the Funds to use part of its assets for the payment of certain shareholder servicing expenses, including administrative or other shareholder support services. For these services under the Shareholder Servicing Plan, the Funds pay CLS an amount up to 0.25% of average net assets attributable to Class N Shares, of the respective Funds on an annualized basis. CLS shall use monies to compensate other parties that have entered into shareholder servicing agreements with CLS with respect to the servicing of Fund shares.
46
| AdvisorOne Funds Semi-Annual Report |
| Notes to Financial Statements (Unaudited) (Continued) |
| October 31, 2017 |
The Advisor has contractually agreed to waive or limit its management fees and to reimburse expenses, other than expenses relating to dividends on short sales, interest expense, indirect fees and expenses of underlying funds, and extraordinary or non-recurring expenses, through August 31, 2018, so that the annual operating expenses of the Funds do not exceed the percentage of the average daily net assets as indicated below:
| Expense Limitation | ||
| Class N | ||
| CLS Global Aggressive Equity | ||
| CLS Global Diversified Equity | ||
| CLS Growth and Income | 1.25% | |
| CLS International Equity | ||
| CLS Shelter | ||
| Class N | 0.90% | |
| CLS Flexible Income |
The waivers and reimbursements, if any, of the Advisor’s fees pursuant to this contractual agreement for the six months ended October 31, 2017, were as follows:
| Fund | Waiver/Reimbursement | |||
| CLS Global Aggressive Equity Fund | $ | 72,406 | ||
| CLS Global Diversified Equity Fund | 4,937 | |||
| CLS Flexible Income Fund | 64,228 | |||
| CLS International Equity Fund | 73,939 | |||
| CLS Shelter Fund | 31,842 | |||
Fees waived or expenses reimbursed may be recouped by the Advisor from a Fund for a period up to three years from the date the fee or expense was waived or reimbursed. However, no recoupment payment will be made by a Fund if it would result in the Fund exceeding the contractual expense limitation described above. During the six months ended October 31, 2017, the Advisor recaptured $11,595 from the CLS Growth and Income Fund for prior period expense waivers/reimbursements, no other expense waivers/reimbursements were recaptured from the other Funds. The table below contains the amounts of fee waivers and expense reimbursements subject to recapture by the Advisor through April 30 of the years indicated:
| Fund | 2018 | 2019 | 2020 | Total | ||||||||||||
| CLS Global Aggressive Equity Fund | $ | 204,172 | $ | 216,606 | $ | 262,430 | $ | 683,208 | ||||||||
| CLS Global Diversified Equity Fund | 100,527 | 184,484 | 199,886 | 484,897 | ||||||||||||
| CLS Growth and Income Fund | 134,430 | 162,615 | 203,858 | 500,903 | ||||||||||||
| CLS Flexible Income Fund | 235,410 | 272,835 | 359,396 | 867,641 | ||||||||||||
| CLS International Equity Fund | 262,496 | 151,643 | 204,960 | 619,099 | ||||||||||||
| CLS Shelter Fund | 102,029 | 84,181 | 94,615 | 280,825 | ||||||||||||
47
| AdvisorOne Funds Semi-Annual Report |
| Notes to Financial Statements (Unaudited) (Continued) |
| October 31, 2017 |
Distributor
The distributor of the Funds is Northern Lights Distributors, LLC (the “Distributor”), an affiliate of the advisor, serves as principal underwriter for each Fund of the Trust and maintains all records required to be maintained pursuant to the Fund’s Shareholder Services Plan.
Administration, Fund Accounting, Transfer Agent, Custody Administration Fees
Gemini Fund Services, LLC (“GFS”) an affiliate of the Advisor and Distributor, provides administration, fund accounting, and transfer agent services to the Trust. Pursuant to a separate servicing agreement with GFS, the Funds pay GFS customary fees for providing administration, fund accounting, and transfer agency services to the Funds. Certain officers of the Trust are also officers of GFS, and are not paid any fees directly by the Funds for serving in such capacities.
In addition, certain affiliates of the distributor provide ancillary services to the Funds as follows:
Blu Giant, LLC (“Blu Giant”), an affiliate of the Distributor, GFS and the Advisor, provides EDGAR conversion and filing services as well as print management services for the Funds on an ad-hoc basis. For the provision of these services, Blu Giant receives customary fees from the Funds.
Chief Compliance Officer
Northern Lights Compliance Services, LLC (“NLCS”), an affiliate of the Distributor, GFS and the Advisor, provides a Chief Compliance Officer to the Trust, as well as related compliance services, pursuant to a consulting agreement between NLCS and the Trust. Under the terms of such agreement, NLCS receives customary fees from the Funds.
Trustees Fees
The Trust pays each Trustee of the Trust who was not an interested person an annual fee of $50,000 per year paid in quarterly installments. In every instance, the cost of the fees are to be allocated among the participating Funds in accordance with a formula that takes into account the overall asset size of each affected Fund. The Trust also reimburses the Trustees for travel and other expenses incurred in attending meetings of the Board. Officers of the Trust and Trustees who are interested persons of the Trust do not receive any direct compensation from the Trust.
48
| AdvisorOne Funds Semi-Annual Report |
| Notes to Financial Statements (Unaudited) (Continued) |
| October 31, 2017 |
| 4. | Aggregate Unrealized Appreciation and Depreciation |
The identified cost of investments in securities (including written options and short sales) owned by each Fund for federal income tax purposes, and their respective gross unrealized appreciation and depreciation at October 31, 2017, were as follows:
| Gross | Gross | Net Unrealized | ||||||||||||||
| Unrealized | Unrealized | Appreciation/ | ||||||||||||||
| Fund | Tax Cost | Appreciation | Depreciation | (Depreciation) | ||||||||||||
| CLS Global Aggressive Equity Fund | $ | 170,020,480 | $ | 35,703,544 | $ | (43,558 | ) | $ | 35,659,986 | |||||||
| CLS Global Diversified Equity Fund | 378,972,020 | 99,689,052 | (237,092 | ) | 99,451,960 | |||||||||||
| CLS Growth and Income Fund | 439,915,885 | 45,021,579 | (782,774 | ) | 44,238,805 | |||||||||||
| CLS Flexible Income Fund | 270,080,252 | 5,217,025 | (2,337,906 | ) | 2,879,119 | |||||||||||
| CLS International Equity Fund | 58,422,292 | 4,638,599 | (182,422 | ) | 4,456,177 | |||||||||||
| CLS Shelter Fund | 143,944,267 | 23,693,522 | — | 23,693,522 | ||||||||||||
| 5. | Investment Transactions |
The cost of purchases and the proceeds from sales of investments, other than short-term securities, for the six months ended October 31, 2017, were as follows:
| Fund | Purchases | Sales | ||||||
| CLS Global Aggressive Equity Fund | $ | 24,998,051 | $ | 26,807,481 | ||||
| CLS Global Diversified Equity Fund | 50,822,421 | 67,608,254 | ||||||
| CLS Growth and Income Fund | 18,393,513 | 24,192,866 | ||||||
| CLS Flexible Income Fund | 24,671,371 | 24,001,551 | ||||||
| CLS International Equity Fund | 25,076,907 | 27,219,367 | ||||||
| CLS Shelter Fund | 40,454,455 | 19,841,183 | ||||||
| 6. | Investments in Affiliated Companies |
An affiliated company is a company in which a Fund has ownership of at least 5% of the voting securities. Companies that are affiliates at October 31, 2017 are noted in the Funds’ Portfolio of Investments. Transactions during the year with companies that are affiliates or were affiliates at the beginning of the year are as follows:
49
| AdvisorOne Funds Semi-Annual Report |
| Notes to Financial Statements (Unaudited) (Continued) |
| October 31, 2017 |
CLS Global Aggressive Equity
| Change in | Shares | |||||||||||||||||||||||||||||||||
| Value- | Dividends | Realized | Unrealized | Value- | held at | |||||||||||||||||||||||||||||
| Beginning | Sales | Credited | Gain | Appreciation/ | End | End of | ||||||||||||||||||||||||||||
| CUSIP | Description | of Period | Purchases | Proceeds | to Income | (Loss) | (Depreciation) | of Period | Period | |||||||||||||||||||||||||
| 00764F383 | Milestone Treasury Obligations Fund | $ | 36,000,000 | $ | 2,000,000 | $ | — | $ | — | $ | — | $ | — | $ | 38,000,000 | 38,000,000 | ||||||||||||||||||
| 316092782 | Fidelity Value Factor ETF | — | 4,279,085 | — | 39,179 | — | 312,023 | 4,591,108 | 148,000 | |||||||||||||||||||||||||
| 316092816 | Fidelity Momentum Factor ETF | — | 4,277,948 | — | 27,765 | — | 388,200 | 4,666,148 | 153,000 | |||||||||||||||||||||||||
| 46435G409 | iShares Edge MSCI International Value Factor ETF | 6,952,890 | — | — | 89,963 | — | 644,600 | 7,597,490 | 293,000 | |||||||||||||||||||||||||
| 46641Q803 | JP Morgan Diversified Alternatives ETF | 4,188,800 | — | — | — | — | (6,400 | ) | 4,182,400 | 160,000 | ||||||||||||||||||||||||
| 47804J875 | John Hancock Multifactor Consumer Staples ETF | — | 5,113,250 | — | — | — | 16,750 | 5,130,000 | 200,000 | |||||||||||||||||||||||||
| 518416201 | Hartford Multifactor Emerging Markets ETF | 1,021,642 | 2,173,407 | — | 30,242 | — | 221,831 | 3,416,880 | 138,000 | |||||||||||||||||||||||||
| 92189F684 | Van Eck Vectors Retail ETF | 2,357,120 | 884,510 | — | — | — | 21,570 | 3,263,200 | 40,000 | |||||||||||||||||||||||||
| Total | $ | 50,520,452 | $ | 18,728,200 | $ | — | $ | 187,149 | $ | — | $ | 1,598,574 | $ | 70,847,226 | 39,132,000 | |||||||||||||||||||
50
| AdvisorOne Funds Semi-Annual Report |
| Notes to Financial Statements (Unaudited) (Continued) |
| October 31, 2017 |
| CLS Global Diversified Equity |
| Change in | Shares | |||||||||||||||||||||||||||||||||
| Value- | Dividends | Realized | Unrealized | Value- | held at | |||||||||||||||||||||||||||||
| Beginning | Sales | Credited | Gain | Appreciation/ | End | End of | ||||||||||||||||||||||||||||
| CUSIP | Description | of Period | Purchases | Proceeds | to Income | (Loss) | (Depreciation) | of Period | Period | |||||||||||||||||||||||||
| 00764F383 | Milestone Treasury Obligations Fund | $ | 43,800,000 | $ | — | $ | 26,300,000 | $ | — | $ | — | $ | — | $ | 17,500,000 | 17,500,000 | ||||||||||||||||||
| 23908L108 | Davis Select Financial ETF | 1,155,550 | 10,086,200 | — | — | — | 990,750 | 12,232,500 | 525,000 | |||||||||||||||||||||||||
| 46641Q209 | JPMorgan Diversified Return International Equity ETF | 35,113,000 | — | — | — | — | 3,464,500 | 38,577,500 | 525,000 | |||||||||||||||||||||||||
| 78463X301 | SPDR S&P Emerging Asia Pacific ETF | 17,317,080 | — | — | 78,891 | — | 3,096,720 | 20,413,800 | 198,000 | |||||||||||||||||||||||||
| 78463X533 | SPDR S&P Emerging Markets Dividend ETF | 40,837,500 | — | — | 1,106,227 | — | 948,750 | 41,786,250 | 1,375,000 | |||||||||||||||||||||||||
| 78468R747 | SPDR SSGA Gender Diversity Index ETF | 463,120 | 16,580,000 | — | 159,889 | — | 1,057,390 | 18,100,510 | 257,000 | |||||||||||||||||||||||||
| Total | $ | 138,686,250 | $ | 26,666,200 | $ | 26,300,000 | $ | 1,345,007 | $ | — | $ | 9,558,110 | $ | 148,610,560 | 20,380,000 | |||||||||||||||||||
51
| AdvisorOne Funds Semi-Annual Report |
| Notes to Financial Statements (Unaudited) (Continued) |
| October 31, 2017 |
| CLS Growth and Income |
| Change in | Shares | |||||||||||||||||||||||||||||||||
| Value- | Dividends | Realized | Unrealized | Value- | held at | |||||||||||||||||||||||||||||
| Beginning | Sales | Credited | Gain | Appreciation/ | End | End of | ||||||||||||||||||||||||||||
| CUSIP | Description | of Period | Purchases | Proceeds | to Income | (Loss) | (Depreciation) | of Period | Period | |||||||||||||||||||||||||
| 00764F383 | Milestone Treasury Obligations Fund | $ | 31,900,000 | $ | — | $ | 14,000,000 | $ | — | $ | — | $ | — | $ | 17,900,000 | 17,900,000 | ||||||||||||||||||
| 316188309 | Fidelity Total Bond ETF | 24,561,845 | — | — | 306,227 | — | 93,093 | 24,654,938 | 489,963 | |||||||||||||||||||||||||
| 33740F805 | First Trust TCW Opportunistic Fixed Income ETF | 3,786,750 | — | — | 45,975 | — | 14,250 | 3,801,000 | 75,000 | |||||||||||||||||||||||||
| 46641Q803 | JPMorgan Diversified Alternatives ETF | 5,236,000 | — | — | — | — | (8,000 | ) | 5,228,000 | 200,000 | ||||||||||||||||||||||||
| Total | $ | 65,484,595 | $ | — | $ | 14,000,000 | $ | 352,202 | $ | — | $ | 99,343 | $ | 51,583,938 | 18,664,963 | |||||||||||||||||||
| CLS Flexible Income | ||||||||||||||||||||||||||||||||||
| Change in | Shares | |||||||||||||||||||||||||||||||||
| Value- | Dividends | Realized | Unrealized | Value- | held at | |||||||||||||||||||||||||||||
| Beginning | Sales | Credited | Gain | Appreciation/ | End | End of | ||||||||||||||||||||||||||||
| CUSIP | Description | of Period | Purchases | Proceeds | to Income | (Loss) | (Depreciation) | of Period | Period | |||||||||||||||||||||||||
| 00764F383 | Milestone Treasury Obligations Fund | $ | 23,500,000 | $ | 6,000,000 | $ | — | $ | — | $ | — | $ | — | $ | 29,500,000 | 29,500,000 | ||||||||||||||||||
| Total | $ | 23,500,000 | $ | 6,000,000 | $ | — | $ | — | $ | — | $ | — | $ | 29,500,000 | 29,500,000 | |||||||||||||||||||
| CLS International Equity | ||||||||||||||||||||||||||||||||||
| Change in | Shares | |||||||||||||||||||||||||||||||||
| Value- | Dividends | Realized | Unrealized | Value- | held at | |||||||||||||||||||||||||||||
| Beginning | Sales | Credited | Gain | Appreciation/ | End | End of | ||||||||||||||||||||||||||||
| CUSIP | Description | of Period | Purchases | Proceeds | to Income | (Loss) | (Depreciation) | of Period | Period | |||||||||||||||||||||||||
| 00764F383 | Milestone Treasury Obligations Fund | $ | 8,600,000 | $ | — | $ | 8,600,000 | $ | — | $ | — | $ | — | $ | — | — | ||||||||||||||||||
| 46434V449 | iShares Edge MSCI International Momentum Factor | — | 5,313,551 | — | — | — | 160,432 | 5,473,983 | 177,900 | |||||||||||||||||||||||||
| Total | $ | 8,600,000 | $ | 5,313,551 | $ | 8,600,000 | $ | $ | — | $ | — | $ | 160,432 | $ | 5,473,983 | 177,900 | ||||||||||||||||||
52
| AdvisorOne Funds Semi-Annual Report |
| Notes to Financial Statements (Unaudited) (Continued) |
| October 31, 2017 |
| 7. | Shareholders’ Transactions |
As of October 31, 2017, the Funds had an unlimited number of shares authorized. Following is a summary of shareholder transactions for each Fund:
| Six Months Ended | Year Ended | |||||||||||||||
| October 31, 2017 | April 30, 2017 | |||||||||||||||
| CLS Global Aggressive Equity Fund | Shares | Dollars | Shares | Dollars | ||||||||||||
| Class N Shares: | ||||||||||||||||
| Shares Sold | 737,773 | $ | 11,106,369 | 5,144,894 | $ | 71,704,711 | ||||||||||
| Shares issued to shareholders in reinvestment | — | — | 186,920 | 2,491,647 | ||||||||||||
| Shares redeemed | (1,171,755 | ) | (17,630,466 | ) | (2,446,941 | ) | (32,488,804 | ) | ||||||||
| Net increase (decrease) | (433,982 | ) | $ | (6,524,097 | ) | 2,884,873 | $ | 41,707,554 | ||||||||
| CLS Global Diversified Equity Fund | Shares | Dollars | Shares | Dollars | ||||||||||||
| Class C Shares: | ||||||||||||||||
| Shares Sold | — | $ | — | 690 | $ | 10,573 | ||||||||||
| Shares issued to shareholders in reinvestment | — | — | — | — | ||||||||||||
| Shares redeemed | — | — | (147,927 | ) | (2,345,111 | ) | ||||||||||
| Net decrease | — | $ | — | (147,237 | ) | $ | (2,334,538 | ) | ||||||||
| CLS Global Diversified Equity Fund | Shares | Dollars | Shares | Dollars | ||||||||||||
| Class N Shares: | ||||||||||||||||
| Shares Sold | 1,580,138 | $ | 29,666,276 | 5,262,955 | $ | 89,574,348 | ||||||||||
| Shares issued to shareholders in reinvestment | — | — | 851,764 | 14,173,354 | ||||||||||||
| Shares redeemed | (2,651,685 | ) | (49,635,771 | ) | (8,158,126 | ) | (138,555,544 | ) | ||||||||
| Net decrease | (1,071,547 | ) | $ | (19,969,495 | ) | (2,043,407 | ) | $ | (34,807,842 | ) | ||||||
| CLS Growth and Income Fund | Shares | Dollars | Shares | Dollars | ||||||||||||
| Class N Shares: | ||||||||||||||||
| Shares Sold | 2,923,534 | $ | 33,284,187 | 14,911,550 | $ | 163,116,323 | ||||||||||
| Shares issued to shareholders in reinvestment | — | — | 661,842 | 7,048,616 | ||||||||||||
| Shares redeemed | (3,947,820 | ) | (44,862,621 | ) | (10,140,737 | ) | (109,746,684 | ) | ||||||||
| Net increase (decrease) | (1,024,286 | ) | $ | (11,578,434 | ) | 5,432,655 | $ | 60,418,255 | ||||||||
53
| AdvisorOne Funds Semi-Annual Report |
| Notes to Financial Statements (Unaudited) (Continued) |
| October 31, 2017 |
| Six Months Ended | Year Ended | |||||||||||||||
| October 31, 2017 | April 30, 2017 | |||||||||||||||
| CLS Flexible Income Fund | Shares | Dollars | Shares | Dollars | ||||||||||||
| Class N Shares: | ||||||||||||||||
| Shares Sold | 1,993,647 | $ | 20,577,720 | 7,992,803 | $ | 81,734,165 | ||||||||||
| Shares issued to shareholders in reinvestment | 260,276 | 2,684,483 | 464,382 | 4,748,554 | ||||||||||||
| Shares redeemed | (2,224,095 | ) | (22,938,834 | ) | (5,365,745 | ) | (54,966,114 | ) | ||||||||
| Net increase | 29,828 | $ | 323,369 | 3,091,440 | $ | 31,516,605 | ||||||||||
| CLS International Equity Fund | Shares | Dollars | Shares | Dollars | ||||||||||||
| Class N Shares: | ||||||||||||||||
| Shares Sold | 710,827 | $ | 3,377,534 | 7,594,616 | $ | 33,398,259 | ||||||||||
| Shares issued to shareholders in reinvestment | — | — | 108,781 | 444,913 | ||||||||||||
| Shares redeemed | (1,349,395 | ) | (6,382,596 | ) | (1,617,274 | ) | (6,892,632 | ) | ||||||||
| Net increase (decrease) | (638,568 | ) | $ | (3,005,062 | ) | 6,086,123 | $ | 26,950,540 | ||||||||
| CLS Shelter Fund | Shares | Dollars | Shares | Dollars | ||||||||||||
| Class N Shares: | ||||||||||||||||
| Shares Sold | 2,411,500 | $ | 32,935,776 | 3,733,748 | $ | 46,624,772 | ||||||||||
| Shares issued to shareholders in reinvestment | — | — | 203,764 | 2,526,673 | ||||||||||||
| Shares redeemed | (971,372 | ) | (13,219,865 | ) | (2,161,039 | ) | (26,709,078 | ) | ||||||||
| Net increase | 1,440,128 | $ | 19,715,911 | 1,776,473 | $ | 22,442,367 | ||||||||||
| 8. | Securities Lending |
The CLS Global Aggressive Equity Fund, CLS Global Diversified Equity Fund, CLS Growth and Income Fund, CLS Flexible Income Fund, CLS International Equity Fund, and CLS Shelter Fund have entered into a securities lending arrangement with The Bank of New York Mellon (the “Lending Agent”). Under the terms of the agreement, the Funds are authorized to loan securities through the Lending Agent to approved third-party borrowers. In exchange, the Funds receive cash collateral in the amount of at least 102% of the value of the securities loaned. The value of securities loaned is disclosed in a footnote on the statement of Assets & Liabilities and on the Schedule of Investments. Securities lending income is disclosed in the Funds’ Statements of Operations. Although risk is mitigated by the collateral, the Funds could experience a delay in recovering their securities and possible loss of income or value if the Borrower fails to return them.
The Lending Agent may invest the cash collateral received in connection with securities lending transactions in the Milestone Treasury Obligations Fund. The Milestone Treasury Obligations Fund is deemed an affiliate of the Trust and is managed by CLS Investments, LLC. The Milestone Treasury Obligations Fund is registered under the 1940 Act as an open end investment company, is subject to Rule 2a-7 under the 190 Act, which CLS may receive an investment advisory fee of up to 0.10% on an annualized basis of the average daily net assets of the Milestone Treasury Obligations Fund.
54
| AdvisorOne Funds Semi-Annual Report |
| Notes to Financial Statements (Unaudited) (Continued) |
| October 31, 2017 |
The Portfolio has adopted the disclosure provisions of FASB Accounting Standards Update No. 2014-11 (“ASU No. 2014-11”), “Transfers & Servicing (Topic 860): Repurchase-to-Maturity Transactions, Repurchase Financings, and Disclosures.” ASU No. 2014-11 is intended to provide increased transparency about the types of collateral pledged in securities lending transactions and other similar transactions that are accounted for as secured borrowing.
The following table displays a breakdown of transactions accounted for as secured borrowings, the gross obligations by class of collateral pledged, and the remaining contractual maturity of those transactions as of October 31, 2017:
| CLS Global Aggressive Equity | Remaining Contractual Maturity of the Agreements as of October 31, 2017 | |||||||||||||||||||
| Overnight and | Between | |||||||||||||||||||
| Securities Lending Transactions | Continuous | < 30 days | 30 & 90 days | > 90 days | Total | |||||||||||||||
| Exchange Traded Funds | $ | 32,770,056 | $ | — | $ | — | $ | — | $ | 32,770,056 | ||||||||||
| Total Borrowings | $ | 32,770,056 | $ | — | $ | — | $ | — | $ | 32,770,056 | ||||||||||
| Gross amount of recognized liabilities for securities lending transactions | $ | 32,770,056 | ||||||||||||||||||
| CLS Global Diversified Equity | Remaining Contractual Maturity of the Agreements as of October 31, 2017 | |||||||||||||||||||
| Overnight and | Between | |||||||||||||||||||
| Securities Lending Transactions | Continuous | < 30 days | 30 & 90 days | > 90 days | Total | |||||||||||||||
| Exchange Traded Funds | $ | 20,518,404 | $ | — | $ | — | $ | — | $ | 20,518,404 | ||||||||||
| Total Borrowings | $ | 20,518,404 | $ | — | $ | — | $ | — | $ | 20,518,404 | ||||||||||
| Gross amount of recognized liabilities for securities lending transactions | $ | 20,518,404 | ||||||||||||||||||
| CLS Growth and Income | Remaining Contractual Maturity of the Agreements as of October 31, 2017 | |||||||||||||||||||
| Overnight and | Between | |||||||||||||||||||
| Securities Lending Transactions | Continuous | < 30 days | 30 & 90 days | > 90 days | Total | |||||||||||||||
| Exchange Traded Funds | $ | 24,785,313 | $ | — | $ | — | $ | — | $ | 24,785,313 | ||||||||||
| Total Borrowings | $ | 24,785,313 | $ | — | $ | — | $ | — | $ | 24,785,313 | ||||||||||
| Gross amount of recognized liabilities for securities lending transactions | $ | 24,785,313 | ||||||||||||||||||
| CLS Flexible Income | Remaining Contractual Maturity of the Agreements as of October 31, 2017 | |||||||||||||||||||
| Overnight and | Between | |||||||||||||||||||
| Securities Lending Transactions | Continuous | < 30 days | 30 & 90 days | > 90 days | Total | |||||||||||||||
| Exchange Traded Funds | $ | 42,480,045 | $ | — | $ | — | $ | — | $ | 42,480,045 | ||||||||||
| Total Borrowings | $ | 42,480,045 | $ | — | $ | — | $ | — | $ | 42,480,045 | ||||||||||
| Gross amount of recognized liabilities for securities lending transactions | $ | 42,480,045 | ||||||||||||||||||
55
| AdvisorOne Funds Semi-Annual Report |
| Notes to Financial Statements (Unaudited) (Continued) |
| October 31, 2017 |
| CLS International Equity | Remaining Contractual Maturity of the Agreements as of October 31, 2017 | |||||||||||||||||||
| Overnight and | Between | |||||||||||||||||||
| Securities Lending Transactions | Continuous | < 30 days | 30 & 90 days | > 90 days | Total | |||||||||||||||
| Exchange Traded Funds | $ | 11,855,838 | $ | — | $ | — | $ | — | $ | 11,855,838 | ||||||||||
| Total Borrowings | $ | 11,855,838 | $ | — | $ | — | $ | — | $ | 11,855,838 | ||||||||||
| Gross amount of recognized liabilities for securities lending transactions | $ | 11,855,838 | ||||||||||||||||||
| CLS Shelter | Remaining Contractual Maturity of the Agreements as of October 31, 2017 | |||||||||||||||||||
| Overnight and | Between | |||||||||||||||||||
| Securities Lending Transactions | Continuous | < 30 days | 30 & 90 days | > 90 days | Total | |||||||||||||||
| Exchange Traded Funds | $ | 6,198,847 | $ | — | $ | — | $ | — | $ | 6,198,847 | ||||||||||
| Total Borrowings | $ | 6,198,847 | $ | — | $ | — | $ | — | $ | 6,198,847 | ||||||||||
| Gross amount of recognized liabilities for securities lending transactions | $ | 6,198,847 | ||||||||||||||||||
Securities Lending income represents a portion of total investment income and may not continue in the future due to market conditions.
| Gross Amounts | Gross Amounts not offset in the | |||||||||||||||
| Recognized | Statement of Assets & Liabilities | |||||||||||||||
| in Statements | Financial | Cash | ||||||||||||||
| of Assets & | Instruments | Collateral | Net Amount | |||||||||||||
| Fund | Liabilities | Pledged | Pledged | of Assets | ||||||||||||
| CLS Global Aggressive Equity Fund | $ | 32,770,056 | (1) | $ | 32,770,056 | (2) | $ | — | $ | — | ||||||
| CLS Global Diversified Equity Fund | 20,518,404 | (1) | 20,518,404 | (2) | — | — | ||||||||||
| CLS Growth and Income Fund | 24,785,313 | (1) | 24,785,313 | (2) | — | — | ||||||||||
| CLS Flexible Income Fund | 42,480,045 | (1) | 42,480,045 | (2) | — | — | ||||||||||
| CLS International Equity Fund | 11,855,838 | (1) | 11,855,838 | (2) | — | — | ||||||||||
| CLS Shelter Fund | 6,198,847 | (1) | 6,198,847 | (2) | — | — | ||||||||||
| (1) | Collateral for Securities Loaned at value as presented in the Schedule of Investments. |
| (2) | The amount is limited to the liability balance and accordingly, does not include excess collateral pledged. |
56
| AdvisorOne Funds Semi-Annual Report |
| Notes to Financial Statements (Unaudited) (Continued) |
| October 31, 2017 |
| 9. | Beneficial Ownership |
The beneficial ownership, either directly or indirectly, of more than 25% of voting securities of a fund creates a presumption of control of the Fund, under Section 2(a)(9) of the 1940 Act. As of October 31, 2017, Nationwide Trust Company held the following voting securities for the sole benefit of customers and may be deemed to control the Funds:
| Fund | |
| CLS Global Aggressive Equity Fund | 28.68% |
| CLS Global Diversified Equity Fund | 25.00% |
| CLS International Equity Fund | 29.04% |
| 10. | Distributions to Shareholders and Tax Components of Capital |
The tax character of distributions for the following periods were as follows:
For the year ended April 30, 2017:
| Long-Term | ||||||||||||
| Portfolio | Ordinary Income | Capital Gains | Total | |||||||||
| CLS Global Aggressive Equity Fund | $ | 1,669,367 | $ | 824,230 | $ | 2,493,597 | ||||||
| CLS Global Diversified Equity Fund | 11,074,151 | 3,138,244 | 14,212,395 | |||||||||
| CLS Growth and Income Fund | 6,312,499 | 747,167 | 7,059,666 | |||||||||
| CLS Flexible Income Fund | 4,755,543 | — | 4,755,543 | |||||||||
| CLS International Equity Fund | 422,792 | 30,407 | 453,199 | |||||||||
| CLS Shelter Fund | 2,538,161 | — | 2,538,161 | |||||||||
For the year ended April 30, 2016:
| Long-Term | ||||||||||||
| Portfolio | Ordinary Income | Capital Gains | Total | |||||||||
| CLS Global Aggressive Equity Fund | $ | 2,087,040 | $ | 2,860,912 | $ | 4,947,952 | ||||||
| CLS Global Diversified Equity Fund | 3,472,351 | 15,932,562 | 19,404,913 | |||||||||
| CLS Growth and Income Fund | 4,928,971 | 2,385,105 | 7,314,076 | |||||||||
| CLS Flexible Income Fund | 4,518,964 | — | 4,518,964 | |||||||||
| CLS International Equity Fund | 525,700 | — | 525,700 | |||||||||
| CLS Shelter Fund | 1,725,147 | 6,560,236 | 8,285,383 | |||||||||
57
| AdvisorOne Funds Semi-Annual Report |
| Notes to Financial Statements (Unaudited) (Continued) |
| October 31, 2017 |
As of April 30, 2017, the components of accumulated earnings/(deficit) on a tax basis were as follows:
| Post | ||||||||||||||||||||||||||||
| October | Capital | Total | ||||||||||||||||||||||||||
| Undistributed | Undistributed | Loss and | Loss | Other | Unrealized | Accumulated | ||||||||||||||||||||||
| Ordinary | Long-Term | Late Year | Carry | Book/Tax | Appreciation/ | Earnings/ | ||||||||||||||||||||||
| Portfolio | Income | Capital Gains | Loss | Forwards | Differences | (Depreciation) | (Deficits) | |||||||||||||||||||||
| CLS Global Aggressive Equity Fund | $ | 516,421 | $ | 1,619,740 | $ | — | $ | — | $ | — | $ | 24,783,701 | $ | 26,919,862 | ||||||||||||||
| CLS Global Diversified Fund | — | 21,135,453 | — | — | — | 72,527,238 | 93,662,691 | |||||||||||||||||||||
| CLS Growth and Income Fund | 4,021,573 | 12,258,725 | — | — | — | 24,976,064 | 41,256,362 | |||||||||||||||||||||
| CLS Flexible Income Fund | 255,654 | — | — | (1,141,429 | ) | — | 1,349,059 | 463,284 | ||||||||||||||||||||
| CLS International Equity Fund | 22,821 | — | (52,223 | ) | — | — | 1,923,867 | 1,894,465 | ||||||||||||||||||||
| CLS Shelter Fund | 224,844 | — | — | — | — | 13,736,193 | 13,961,037 | |||||||||||||||||||||
The difference between book basis and tax basis undistributed net investment income, accumulated net realized gain/(loss), and unrealized appreciation/(depreciation) from investments is primarily attributable to the tax deferral of losses on wash sales, and adjustments for partnerships and C-Corporation return of capital distributions. In addition, the amount listed under other book/tax differences is primarily attributable to dividends payable.
Late year losses incurred after December 31 within the fiscal year are deemed to arise on the first business day of the following fiscal year for tax purposes. The Funds incurred and elected to defer such late year losses as follows:
| Portfolio | Late Year Losses | |||
| CLS International Equity Fund | $ | 52,223 | ||
58
| AdvisorOne Funds Semi-Annual Report |
| Notes to Financial Statements (Unaudited) (Continued) |
| October 31, 2017 |
At April 30, 2017, the Funds had capital loss carry forwards for federal income tax purposes available to offset future capital gains as follows:
| Non-Expiring | Non-Expiring | |||||||||||
| Portfolio | Short-Term | Long-Term | Total | |||||||||
| CLS Flexible Income Fund | $ | 250,786 | $ | 890,643 | $ | 1,141,429 | ||||||
Permanent book and tax differences, primarily attributable to the reclassification of Fund distributions, and adjustments for paydowns and partnerships, resulted in reclassifications for the year ended April 30, 2017 as follows:
| Undistributed | Undistributed | |||||||||||
| Portfolio | Paid In Capital | Ordinary Income (Loss) | Long-Term Gains (Loss) | |||||||||
| CLS Global Aggressive Equity Fund | $ | — | $ | (532,358 | ) | $ | 532,358 | |||||
| CLS Global Diversified Equity Fund | — | (1,281,750 | ) | 1,281,750 | ||||||||
| CLS Growth and Income Fund | — | (1,622,157 | ) | 1,622,157 | ||||||||
| CLS Flexible Income Fund | — | 53,545 | (53,545 | ) | ||||||||
| CLS International Equity Fund | — | (92,572 | ) | 92,572 | ||||||||
| CLS Shelter Fund | — | 90,599 | (90,599 | ) | ||||||||
| 11. | Subsequent Events |
Subsequent events after the date of the Statement of Assets and Liabilities have been evaluated through the date the financial statements were issued. Management has concluded that there are no material items requiring adjustment or disclosure in the financial statements.
59
| AdvisorOne Funds Semi-Annual Report |
Shareholder Expense Example (Unaudited)
As a shareholder of the Funds you may incur two types of costs: (1) transaction costs, including contingent deferred sales charges on redemptions and (2) ongoing costs, including management fees; distribution and/or service (12b-1 fees) fees; and other Fund expenses. This Example is intended to help you understand your ongoing costs (in dollars) of investing in each Fund and to compare these costs with the ongoing costs of investing in other mutual funds.
This Example is based on an investment of $1,000 invested at the beginning of the period and held for the entire period as indicated below.
Actual Expenses: The first section of the table provides information about actual account values and actual expenses. You may use the information in this line, together with the amount you invested, to estimate the expenses that you paid over the period. Simply divide your account value by $1,000 (for example, an $8,600 account value divided by $1,000 = 8.6), then multiply the result by the applicable number under the heading entitled “Expenses Paid During the Period” to estimate the expenses you paid on your account during the period.
Hypothetical Examples for Comparison Purposes: The second section of the table below provides information about hypothetical account values and hypothetical expenses based on each Fund’s actual expense ratio and an assumed rate of return of 5% per year before expenses, which is not the Fund’s actual return. The hypothetical account values and expenses may not be used to estimate the actual ending account balance or expenses you paid for the period. You may use this information to compare the ongoing costs of investing in the Fund and other funds. To do so, compare this 5% hypothetical example with the 5% hypothetical examples that appear in the shareholder reports of the other funds.
Please note that the expenses shown in the table are meant to highlight your ongoing costs only and do not reflect any transactional costs, such as sales charges (loads), or contingent deferred sales charges on redemptions. Therefore, the second section of the table is useful in comparing ongoing costs only, and will not help you determine the relative total costs of owning different funds. In addition, if these transactional costs were included, your costs would have been higher.
60
| AdvisorOne Funds Semi-Annual Report |
Shareholder Expense Example (Unaudited) (Continued)
| Beginning | Ending | Expense | Expenses | |||||||||||||
| Account Value | Account Value | Ratio | Paid During | |||||||||||||
| 5/1/2017 | 10/31/2017 | (Annualized) | the Period | |||||||||||||
| CLS Global Aggressive Equity Fund | ||||||||||||||||
| Actual | $ | 1,000.00 | $ | 1,102.90 | 1.15 | % | $ | 6.10 | * | |||||||
| Hypothetical (5% return before expenses): | 1,000.00 | 1,019.41 | 1.15 | % | 5.85 | * | ||||||||||
| CLS Global Diversified Fund | ||||||||||||||||
| Actual: | 1,000.00 | 1,100.30 | 1.15 | % | 6.09 | * | ||||||||||
| Hypothetical (5% return before expenses): | 1,000.00 | 1,019.41 | 1.15 | % | 5.85 | * | ||||||||||
| CLS Growth and Income Fund | ||||||||||||||||
| Actual | 1,000.00 | 1,054.90 | 1.15 | % | 5.96 | * | ||||||||||
| Hypothetical (5% return before expenses): | 1,000.00 | 1,019.41 | 1.15 | % | 5.85 | * | ||||||||||
| CLS Flexible Income Fund | ||||||||||||||||
| Actual | 1,000.00 | 1,015.80 | 0.80 | % | 4.06 | * | ||||||||||
| Hypothetical (5% return before expenses): | 1,000.00 | 1,021.17 | 0.80 | % | 4.08 | * | ||||||||||
| CLS International Equity Fund | ||||||||||||||||
| Actual | 1,000.00 | 1,106.70 | 1.15 | % | 6.11 | * | ||||||||||
| Hypothetical (5% return before expenses): | 1,000.00 | 1,019.41 | 1.15 | % | 5.85 | * | ||||||||||
| CLS Shelter Fund | ||||||||||||||||
| Actual | 1,000.00 | 1,088.50 | 1.15 | % | 6.05 | * | ||||||||||
| Hypothetical (5% return before expenses): | 1,000.00 | 1,019.41 | 1.15 | % | 5.85 | * | ||||||||||
| * | Expenses are equal to each Fund’s respective annual expense ratios for the most recent six month period, multiplied by the average account value over the period, multiplied by 184/365. |
61
| AdvisorOne Funds Semi-Annual Report |
Supplemental Information (Unaudited)
Renewal of Advisory Agreement
At a regular meeting (the “Meeting”) of the Board of Trustees (the “Board” or the “Trustees”) of the AdvisorOne Funds (the “Trust”) held on April 20, 2017, the Board, including those Trustees who are not “interested persons” as that term is defined in the Investment Company Act of 1940, as revised (the “Independent Trustees”), considered the renewal of the Investment Advisory Agreement between the Trust and CLS Investments, LLC (“CLS”) on behalf of the CLS Global Diversified Equity Fund, CLS Growth and Income Fund, CLS International Equity Fund, CLS Global Aggressive Equity, CLS Flexible Income, and CLS Shelter Fund (individually, each a “Fund” and collectively, the “Funds”) (“Advisory Agreement”).
The Board reviewed and discussed written materials that were provided by CLS in advance of the Meeting, CLS’s oral presentation and other information that the Board received at the Meeting. The Board relied upon the advice of independent legal counsel and their own business judgment in determining the material factors to be considered in evaluating the Advisory Agreement and the weight to be given to each such factor. The conclusions reached by the Trustees were based on a comprehensive evaluation of all of the information provided and were not the result of any one factor. Moreover, each Trustee may have afforded different weight to the various factors in reaching his conclusions with respect to the Advisory Agreement.
Nature, extent and quality of services. As to the nature, extent, and quality of the services provided by CLS to the Funds, the Trustees reviewed materials provided by CLS related to the Advisory Agreement, including a description of the manner in which investment decisions are made and executed, and discussed the benefits of the professional personnel performing services for the Funds, including the team of individuals that primarily monitor and execute the investment process, noting their decades of combined experience. The Board noted changes in the CLS portfolio management team. Management discussed the quality of backgrounds of CLS personnel and the depth of their experience. The Trustees noted their appreciation for the number of CFAs managing the Funds. The Trustees expressed confidence in the portfolio management team, citing the consistent portfolio management process that the CIO has achieved. The Board noted the fiduciary duty commitment of CFAs and that CLS appears to have embraced a culture of compliance that is strong and consistent. The Board then discussed the quality of CLS’s compliance personnel and the compliance tools utilized to oversee CLS’s management of the Funds. Additionally, the Board received satisfactory written responses from CLS with respect to a series of important questions, including whether CLS was involved in any lawsuits or pending regulatory actions. The Board discussed the extent of CLS’s rigorous investment analysis process and CLS’s willingness to invest the necessary resources to ensure portfolio managers have the tools necessary to conduct their research. The Board stated their
62
| AdvisorOne Funds Semi-Annual Report |
Supplemental Information (Unaudited) (Continued)
appreciation of CLS’s willingness to make management available to the Independent Trustees when requested and their willingness to re-examine strategies when necessary for benefits of shareholders. The Board reviewed the financial information provided by CLS and concluded that CLS has the financial resources to meet its obligations to the Funds. The Trustees viewed the overall services provided by CLS as satisfactory.
Performance. The Board reviewed information on the investment performance of the Funds versus their respective benchmark for the one-year, five-year, ten-year, and since inception periods, as applicable. They also reviewed the performance of each Fund compared to its Morningstar category and discussed the relative performance in the context of fund turnover, volatility and long term track record. In addition to the data provided by CLS as part of the 15(c) materials, the Board also reviewed the quarterly performance data provided by CLS. The Board discussed the positive direction of investment performance relative to each Fund’s respective benchmark. They noted that under the CIO’s leadership, the Board had seen a more positive contribution to overall performance and they appreciated the controlled risk environment he had installed. They also noted that CLS had done well at managing risk and communicating the risk characteristics of the Funds to investors. The Board noted that generally, performance in the near term had been strong and, while certain Funds have underperformed since inception, recent performance had a positive impact on long term performance metrics. The Board also noted recent strong performance relative to the Funds’ peer groups. Regarding performance relative to each Fund’s index-based benchmark, the Board discussed the differences between an index and an actively managed product and agreed that indexes were less relevant than performance of other actively managed products. With regards to performance, the Board also noted the following:
| ● | Global Aggressive Equity outperformed its peer group and Morningstar category over the one-year, five-year, and since inception time frames. The Fund had a four-star Morningstar rating, the Fund’s returns were in the top 23% of its peer group over the three-year time period and in the top 30% over the five-year time period, and had a risk adjusted rating in the top 26% of its peer group over the three-year time period and in the top 27% over the five-year time period. |
| ● | Global Diversified Equity outperformed its peer group over the one-year time frame and its Morningstar category over the one-year, ten-year, and since inception time frames. The Fund had a three-star Morningstar rating, the Fund’s returns were in the top 52% of its peer group over the three-year time period, in the top 68% over the five-year time period, and in the top 39% over the ten-year time period, and had a risk adjusted rating in the top 50% of its peer group over the three-year time period, in the top 64% over the five-year time period, and in the top 41% over the ten-year time period. |
63
| AdvisorOne Funds Semi-Annual Report |
Supplemental Information (Unaudited) (Continued)
| ● | Growth and Income outperformed its peer group over the one-year and five-year time frames and its Morningstar category over the one-year time frame. The Fund had a two-star Morningstar rating, the Fund’s returns were in the top 71% of its peer group over the three-year time period, in the top 60% over the five-year time period, and in the top 88% over the ten-year time period, and had a risk adjusted rating in the top 71% of its peer group over the three-year time period, in the top 66% over the five-year time period, and in the top 92% over the ten-year time period. The Fund’s standard deviation for the ten-year time period was 10.43, while the Fund’s standard deviation over the five-year time period was 5.70 and 5.73 over the three-year time period, which indicated that CLS had decreased risk and become more consistent over the previous five years. |
| ● | Flexible Income outperformed its peer group, Morningstar category, and benchmark over the one-year time frame and had outperformed its benchmark over the five-year time frame and since the Fund’s inception. The Fund had a two-star Morningstar rating, the Fund’s returns were in the top 77% of its peer group over the three-year time period and in the top 70% over the five-year time period, and had a risk adjusted rating in the top 77% of its peer group over the three-year time period and in the top 69% over the five-year time period. |
| ● | International Equity outperformed its peer group and Morningstar category over the one-year, ten-year, and since inception time frames and had outperformed its benchmark over the five-year and ten-year time frames and since the inception of the Fund. The Fund had a five-star Morningstar rating, the Fund’s returns were in the top 7% of its peer group over the three-year time period, in the top 58% over the five-year time period, and in the top 9% over the ten-year time period, and had a risk adjusted rating in the top 7% of its peer group over the three-year time period, in the top 31% over the five-year time period, and in the top 5% over the ten-year time period. |
| ● | Shelter outperformed its peer group, Morningstar category, and benchmark over the one-year time frame, outperformed its peer group and Morningstar category over the five-year time frame, and outperformed its peer group since the inception of the Fund. The Fund had a five-star Morningstar rating, the Fund’s returns were in the top 2% of its peer group over the three-year time period and in the top 3% over the five-year time period, and had a risk adjusted rating in the top 1% of its peer group over the three-year time period and in the top 3% over the five-year time period. |
After further discussion and based upon the information noted above and the information provided by CLS about each Fund’s performance versus its respective benchmark for the one-year, five-year, and since inception periods, and in some cases, ten-year performance data, the Board concluded that performance for each Fund was reasonable.
64
| AdvisorOne Funds Semi-Annual Report |
Supplemental Information (Unaudited) (Continued)
Fees and Expenses. The Board reviewed the advisory fees and expense ratios of the Funds relative to each Fund’s peer group and Morningstar category and noted that each Fund’s gross advisory fee and net expense ratio were generally in line with the average fee of the respective Fund peer group. They discussed the advisory fee of Growth and Income, which was materially higher than the Morningstar category average, noting that the category average is not particularly helpful because there was a significant range due to the variability of the funds within the category. They also noted that the Fund compared better to its Morningstar category when comparing its fee against the median fee. The Board also noted the Fund’s gross expense ratio was lower than the Morningstar category average. In addition to the advisory fees, the Board discussed and noted that CLS receives shareholder servicing fees with respect to the class N shares of the Core Funds pursuant to the Shareholder Servicing Plan which was adopted by the Board, all of which is paid to third party service providers. The Board then reviewed the contractual fee agreements for each Fund, which stated that CLS had agreed to waive or limit its management fees and/or reimburse expenses at least through August 31, 2018 so that the total operating expenses of the Core Funds do not exceed specified limits, and the Board found such arrangements to be beneficial to shareholders. The Board concluded that overall the total expense ratios of each Fund are very competitive, and that the advisory fee waivers continued to benefit each Fund. The Board concluded that the advisory fee paid by each Fund was reasonable.
Profitability. The Board considered the profits realized by CLS in connection with the operation of each Fund, and whether the amount of profit is a fair entrepreneurial profit for the management of the Fund. The Board also considered the income and other benefits realized by CLS affiliates from activities and services provided to the Funds. The Board reviewed CLS’s financial statements as of December 31, 2016 and noted there were no adverse material changes in the financial condition of CLS since the approval of the Advisory Agreement at the January 19, 2017 meeting. The Trustees reviewed the profitability analysis provided by CLS, and concluded that to the extent CLS earned a profit from a Fund, the profits appeared reasonable and not excessive.
Economies of Scale. The Board considered whether economies of scale have been attained with respect to the management of the Funds, and whether there is potential for realization of any further economies of scale. After discussion, it was the consensus of the Board that, because of the current size of each Fund, CLS continues to waive a portion of its advisory fee for all Funds in order to maintain the expense cap, and therefore the Board will not request any changes to the management fee structure. After further discussion, representatives of CLS and the Board agreed that economies of scale would be re-evaluated in the future.
Conclusion. Having requested and received such information from CLS as the Board believed to be reasonably necessary to evaluate the terms of the Advisory Agreement, and as assisted by the advice of independent counsel, the Board, including a majority of the Independent Trustees, determined that the terms of the Advisory Agreement were reasonable and renewal of the Advisory Agreement was in the best interests of each Fund and its shareholders.
65
THIS PAGE INTENTIONALLY LEFT BLANK
66
| AdvisorOne Funds Semi-Annual Report |
Proxy Voting Policy
Information regarding how the Funds voted proxies relating to portfolio securities for the most recent twelve month period ended June 30 as well as a description of the policies and procedures that the Funds use to determine how to vote proxies is available without charge, upon request, by calling 1-866-811-0225 or by referring to the Securities and Exchange Commission’s (“SEC”) website at http://www.sec.gov.
Portfolio Holdings
The Funds file their complete schedule of portfolio holdings with the SEC for the first and third quarters of each fiscal year on Form N-Q. Form N-Q is available on the SEC’s website at http://www.sec.gov and may be reviewed and copied at the SEC’s Public Reference Room in Washington, DC (1-800-SEC-0330). The information on Form N-Q is available without charge, upon request, by calling 1-866-811-0225.
67
ABOUT CLS
CLS Investments (CLS) is a third party investment manager, ETF strategist, and long-time trusted partner in the financial industry. CLS’s extensive risk management experience, active asset allocation approach, and customizable strategy offerings have led clients to entrust their portfolios to CLS since 1989.
Through CLS’s partnership structure, your financial advisor maintains a direct relationship with you, while CLS’s portfolio management and analytics teams take on the day-to-day research, trading, and operations required to manage your account. Together, you and your advisor use the tools CLS provides to determine the investing strategy, investment types, and risk tolerance level most appropriate for you. Your advisor provides this information to CLS so we can accordingly make timely active asset allocation decisions within your portfolio. Through this mutually beneficial connection, CLS enhances your advisor’s service to you.
| 1989 |
| Founded |
| $8.3B* |
| Assets Under Management |
| 35K+ |
| CLS clients |
| 12 |
| Portfolio managers & analysts |
| 155+ |
| Years of combined investment management experience |
| *As of 10/31/2017 |

| 888.455.4244 | CLSinvest.com | Follow us: @clsinvestments |
Item 2. Code of Ethics. Not required for semi-annual reports.
Item 3. Audit Committee Financial Expert. Not required for semi-annual reports.
Item 4. Principal Accountant Fees and Services. Not required for semi-annual reports.
Item 5. Audit Committee of Listed Companies. Not applicable to open-end investment companies.
Item 6. Schedule of Investments. Schedule of investments in securities of unaffiliated issuers is included under Item 1.
Item 7. Disclosure of Proxy Voting Policies and Procedures for Closed-End Funds. Not applicable to open-end investment companies.
Item 8. Portfolio Managers of Closed-End Funds. Not applicable to open-end investment companies.
Item 9. Purchases of Equity Securities by Closed-End Funds. Not applicable to open-end investment companies.
Item 10. Submission of Matters to a Vote of Security Holders. None
Item 11. Controls and Procedures.
(a) Based on an evaluation of the registrant’s disclosure controls and procedures as of a date within 90 days of filing date of this Form N-CSR, the disclosure controls and procedures are reasonably designed to ensure that the information required in filings on Forms N-CSR is recorded, processed, summarized, and reported on a timely basis.
(b) There were no significant changes in the registrant’s internal control over financial reporting that occurred during the registrant’s last fiscal half-year that have materially affected, or are reasonably likely to materially affect, the registrant’s internal control over financial reporting.
Item 12. Exhibits.
(a)(1) Not required for semi-annual reports.
(a)(2) Certifications required by Section 302 of the Sarbanes-Oxley Act of 2002 (and Item 11(a)(2) of Form N-CSR) are filed herewith..
(a)(3) Not applicable.
(b) Certifications required by Section 906 of the Sarbanes-Oxley Act of 2002 (and Item 11(b) of Form N-CSR) are filed herewith.
SIGNATURES
Pursuant to the requirements of the Securities Exchange Act of 1934 and the Investment Company Act of 1940, the registrant has duly caused this report to be signed on its behalf by the undersigned, thereunto duly authorized.
(Registrant) AdvisorOne Funds
By (Signature and Title)
/s/ Ryan Beach, Principal Executive Officer/President
Ryan Beach, Principal Executive Officer/ President
Date 1/5/18
Pursuant to the requirements of the Securities Exchange Act of 1934 and the Investment Company Act of 1940, this report has been signed below by the following persons on behalf of the registrant and in the capacities and on the dates indicated.
By (Signature and Title)
/s/ Ryan Beach, Principal Executive Officer/President
Ryan Beach, Principal Executive Officer/President
Date 1/5/18
By (Signature and Title)
/s/ Daniel Applegarth
Daniel Applegarth, Principal Financial Officer/Treasurer
Date 1/5/18