UNITED STATES
SECURITIES AND EXCHANGE COMMISSION
Washington, D.C. 20549 |
CERTIFIED SHAREHOLDER REPORT OF REGISTERED
MANAGEMENT INVESTMENT COMPANIES
Investment Company Act file number 811-08043
The Berkshire Funds
(Exact name of registrant as specified in charter) |
475 Milan Drive, Suite #103
San Jose, CA 95134-2453 |
(Address of principal executive offices) (Zip code)
Malcolm R. Fobes III
The Berkshire Funds
475 Milan Drive, Suite #103
San Jose, CA 95134-2453
(Name and address of agent for service)
1-408-526-0707
Registrant's telephone number, including area code |
Date of fiscal year end: December 31
Date of reporting period: December 31, 2021 |
Item 1. Report to Stockholders.
This report is provided for the general information of the Berkshire Funds shareholders. It is not authorized for distribution unless preceded or accompanied by an effective Prospectus, which contains more complete information about the Berkshire Funds. Please read it carefully before you invest.
In recent years, returns have sustained significant gains and losses due to market volatility in the technology sector. Due to market volatility, current performance may be lower than the figures shown. Call 877.526.0707 or visit www.berkshirefunds.com for more current performance information. Past performance is no guarantee of future results and investment results and principal value will fluctuate so that shares, when redeemed, may be worth more or less than their original cost. The returns shown do not reflect the deduction of taxes that a shareholder would pay on Fund distributions or the redemption of Fund shares. Total return includes reinvestment of dividends and capital gain distributions.
The Dow Jones Industrial Average is a measurement of general market price movement for 30 widely-held stocks primarily listed on the New York Stock Exchange. The S&P 500® Index is a registered trademark of Standard & Poor’s Corporation and is a market-weighted index of common stock prices for 500 large U.S. companies. The Nasdaq Composite Index is a capitalization-weighted index of over 5,000 common stocks listed on the Nasdaq Stock Market. Each index represents an unmanaged, broad-based basket of stocks. These indices are typically used as benchmarks for overall market performance.
Portfolio composition is subject to change at any time and references to specific securities, industries and sectors are not recommendations to purchase or sell any particular security.
The Fund’s distributor is Arbor Court Capital, LLC.
FUND OVERVIEW
December 31, 2021 (unaudited)
PERFORMANCE COMPARISON (Average annual total returns as of 12/31/21)
| | 1 Year | 3 Year | 5 Year | 10 Year |
| |
| Berkshire Focus Fund | –1.38% | 38.67% | 33.41% | 23.29% |
|
| S&P 500® Index | 28.71% | 26.07% | 18.47% | 16.55% |
| Dow Jones Industrial Average | 20.95% | 18.49% | 15.51% | 14.21% |
| Nasdaq Composite Index | 22.18% | 34.26% | 24.97% | 20.96% |
| NET ASSETS | |
| 12/31/21 | $747.4 Million |
| TOP TEN STOCK HOLDINGS(1) |
| Tesla, Inc. | 11.00% |
| Marvell Technology, Inc. | 7.00% |
| Zscaler, Inc. | 5.19% |
| Arista Networks, Inc. | 4.87% |
| Fortinet, Inc. | 4.81% |
| Palo Alto Networks, Inc. | 4.71% |
| Applied Materials, Inc. | 4.59% |
| Silvergate Capital Corp. (Class A) | 4.52% |
| Snowflake Inc. (Class A) | 4.37% |
| NVIDIA Corp. | 4.23% |
| |
| TOP TEN SECTORS(3) | |
| Business Software & Services | 32.16% |
| Cybersecurity Equipment & Services | 14.71% |
| Semiconductor | 14.22% |
| Automobile Manufacturer | 13.02% |
| Semiconductor Equipment | 6.94% |
| Internet Services | 5.24% |
| Communication Equipment | 4.87% |
| Banks | 4.52% |
| Specialty Industrial Machinery | 2.35% |
| Entertainment | 2.07% |
| (1) | Stated as a percentage of total net assets as of 12/31/21. The holdings information provided should not be construed as a recommendation to purchase or sell a particular security and may not be representative of the Fund’s current or future investments. |
| |
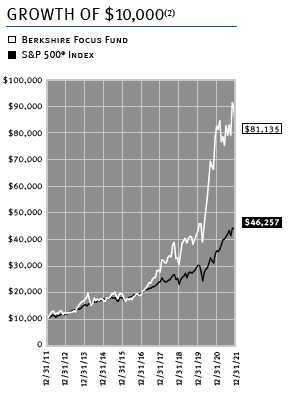
| (2) | This chart assumes an initial investment of $10,000 made on 12/31/11. Past performance does not guarantee future results. Investment return and principal value will fluctuate so that shares, when redeemed, may be worth more or less than their original cost. All returns reflect reinvested dividends but do not reflect the impact of taxes. |
| |
| (3) | Stated as a percentage of total net assets as of 12/31/21. The holdings by sector are presented to illustrate examples of the sectors in which the Fund has bought securities and may not be representative of the Fund’s current or future investments. |
| |
| | This Fund concentrates its investments in the technology industry. As a result, the Fund is subject to greater risk than more diversified funds because of its concentration of investments in fewer companies and certain segments of a single industry. |
| |
1
Berkshire Focus Fund
Performance and Portfolio Discussion
12/31/2021
2

Dear Fellow Shareholders,
For the twelve-month period ended December 31, 2021, the Berkshire Focus Fund underperformed its primary benchmark index. The Fund generated a total return of -1.38% while the S&P 500® Index—which we consider to be the Fund’s primary benchmark index—produced a total return of +28.71% over the same period. For comparative purposes, the Dow Jones Industrial Average posted a return of -+20.95% and the Nasdaq Composite Index generated a return of +22.18% for the year. A $10,000 investment in our Fund over 10 years starting on December 31, 2011 grew to $81,135. This was a +23.29% average annual compounded return. A $10,000 investment in the S&P 500® over the same period grew to $46,257. This was a +16.55% average annual compounded return.
Amid a confluence of events not seen in decades, economic and financial market developments gyrated and morphed daily in 2021. The Biden administration delivered two additional rounds of fiscal stimulus at the beginning of the year. Then, as the vaccine rollout picked up in the spring, the U.S. economy accelerated from recovery mode back to expansion. By the summer and fall, inflationary pressures were seemingly everywhere. U.S. inflation hit a 39-year high in November, with prices up 6.8% from a year before, as measured by the Consumer Price Index (CPI). Strong demand for goods combined with supply-chain and transportation bottlenecks, while transitory, lasted longer than many anticipated. Meanwhile, higher prices associated with labor-market, semiconductor chip shortages, and elevated energy costs continue to stoke inflationary pressures. By the end of the year, the Federal Reserve pivoted by signaling its intent to raise interest rates and taper quantitative easing in 2022. Against this backdrop, the major U.S. equity markets managed to post strong double-digit gains for the year, highlighted by considerable intra-period volatility along the way.
U.S. equity markets, led by high-growth and technology stocks, staged a strong rally at the beginning of the first quarter that lasted into mid-February. Fueling the advance was the accelerated rollout of the COVID-19 vaccination effort, strong consumer and government spending, and favorable outlook for U.S. economic growth. The yield on the 10-year U.S. Treasury note almost doubled from .90% at the beginning of the period, to 1.75% by the end of March. Reopening demand and significant supply-chain restraints throughout the economy fueled expectations for much higher inflation. This in turn, increased concerns the Federal Reserve may be forced to raise interest rates. Not surprisingly, the near-record move in interest rates ignited a steep sell-off in high-growth and technology stocks as surging Treasury yields had an outsized negative impact on valuations. In the second quarter there was considerable market volatility; leadership rotated between growth-oriented stocks and the more cyclically driven value opportunities. A retreat of the 10-year U.S. Treasury yield led to the reemergence in leadership of growth stocks by mid-May. U.S. equity markets resumed their upward climb until the end of June as both the S&P 500® and the NASDAQ Composite index set all-time highs.
U.S. stock markets continued their advance during the third quarter as growth companies once again outperformed their value counterparts. However, stocks fell from their record-highs near quarter end over continued uncertainty surrounding the impact of the COVID-19 Delta variant on underlying economic growth, and the prospect for rising inflation and interest rates. In addition, news that one of China’s largest property developers, Evergrande, would likely default on its debt payments destabilized financial markets and fueled concerns of a potential financial contagion. Surging Treasury yields sparked a sharp sell-off in shares of high-growth and technology companies, triggering a powerful rotation back into value stocks at the end of the quarter. U.S. equities recorded solid gains during the fourth quarter after overcoming a late-November sell-off in reaction to the new Omicron COVID-19 variant’s proliferation across the globe. The rapid spread of the variant led to the largest increase in U.S. COVID-19 cases since the onset of the pandemic, prompting a flurry of new restrictions and cancellations. Inflation continued to surge against the backdrop of labor shortages, rising energy prices, and high demand for goods and services. The trifecta of the Dow Jones Industrial Average, S&P 500® and the Nasdaq Composite index finished the year at, or near all-time highs.
Looking at the portfolio, our investments in Hubspot (HUBS), NVIDIA (NVDA), MongoDB (MDB), Tesla (TSLA), Snowflake (SNOW) and Zscaler (ZS) were all contributors to the Fund’s performance. However, some of our investments detracted from the Fund’s performance—these included Block (SQ), Paypal (PYPL), Pinterest (PINS), Roku (ROKU), Sea Ltd. (SEA) and Snap (SNAP).
Thank you for your confidence and continued investment in the Berkshire Focus Fund.

Malcolm R. Fobes III
Chairman and Chief Investment Officer |
Audited Financial Statements
12/31/2021
4
PORTFOLIO OF INVESTMENTS
December 31, 2021
| Shares | | | Value |
| |
| | COMMON STOCKS – 100.10% | $ | 748,160,543 |
| | (Cost $681,029,625) | | |
| |
| | AUTOMOBILE MANUFACTURER – 13.02% | | 97,304,563 |
| 361,300 | Ford Motor Company | | 7,504,201 |
| 10 | Li Auto, Inc. – ADR* | | 321 |
| 10 | NIO, Inc. – ADR* | | 317 |
| 10 | Rivian Automotive, Inc.* | | 1,037 |
| 77,830 | Tesla, Inc.* | | 82,249,187 |
| 150,000 | XPeng, Inc. – ADR* | | 7,549,500 |
| |
| | BANKS – 4.52% | | 33,816,547 |
| 10 | Signature Bank | | 3,235 |
| 228,160 | Silvergate Capital Corp. (Class A)* | | 33,813,312 |
| |
| | BUSINESS SOFTWARE & SERVICES – 32.16% | | 240,348,261 |
| 10 | Adobe, Inc.* | | 5,671 |
| 39,180 | Atlassian Corporation PLC – (Class A) (United Kingdom)* | | 14,938,942 |
| 10 | Bill.com Holdings, Inc.* | | 2,491 |
| 10 | Cloudflare, Inc. (Class A)* | | 1,315 |
| 148,570 | Datadog, Inc. (Class A)* | | 26,461,803 |
| 138,550 | DigitalOcean Holdings, Inc.* | | 11,129,721 |
| 423,510 | Digital Turbine, Inc.* | | 25,829,875 |
| 10 | DocuSign, Inc.* | | 1,523 |
| 10 | Domo, Inc. (Class B)* | | 496 |
| 40,210 | Hubspot, Inc.* | | 26,504,421 |
| 10 | Intuit, Inc. | | 6,432 |
| 10 | Microsoft Corp. | | 3,363 |
| 55,670 | MongoDB, Inc. (Class A)* | | 29,468,915 |
| 10 | Palantir Technologies, Inc.* | | 182 |
| 10 | Paychex, Inc. | | 1,365 |
| 10 | Paycom Software, Inc.* | | 4,152 |
| 10 | Paylocity Holding Corp. | | 2,362 |
| 10 | ServiceNow, Inc.* | | 6,491 |
| 96,320 | Snowflake, Inc. (Class A)* | | 32,628,400 |
| 225,200 | The Trade Desk, Inc. (Class A)* | | 20,637,328 |
| 10 | Twilio, Inc. (Class A)* | | 2,633 |
| 157,360 | Unity Software, Inc.* | | 22,500,906 |
| 10 | Workday, Inc. (Class A)* | | 2,732 |
| 470,510 | ZoomInfo Technologies, Inc.* | | 30,206,742 |
| |
| | COMMUNICATION EQUIPMENT – 4.87% | | 36,406,125 |
| 253,260 | Arista Networks, Inc.* | | 36,406,125 |
| |
| | COMMUNICATION SERVICES – 0.00% | | 3,713 |
| 10 | RingCentral, Inc. (Class A)* | | 1,874 |
| 10 | Zoom Video Communications, Inc.* | | 1,839 |
| |
| | CONSUMER ELECTRONICS – 0.00% | | 1,776 |
| 10 | Apple, Inc. | | 1,776 |
| |
| |
| | *Non-Income Producing | | |
| | ADR – American Depositary Receipt | | |
| |
| | (see accompanying notes to financial statements) | | |
5
PORTFOLIO OF INVESTMENTS (CONTINUED)
December 31, 2021
| Shares | | | Value |
| |
| | CYBERSECURITY EQUIPMENT & SERVICES – 14.71% | $ | 109,963,474 |
| 10 | CrowdStrike Holdings, Inc. (Class A)* | | 2,047 |
| 100,090 | Fortinet, Inc.* | | 35,972,346 |
| 10 | Okta, Inc. (Class A)* | | 2,242 |
| 63,180 | Palo Alto Networks, Inc.* | | 35,176,097 |
| 10 | SentinelOne, Inc. (Class A)* | | 505 |
| 120,780 | Zscaler, Inc.* | | 38,810,237 |
| |
| | ENTERTAINMENT – 2.07% | | 15,476,567 |
| 10 | Netflix, Inc.* | | 6,024 |
| 149,900 | Roblox Corp.* | | 15,463,684 |
| 10 | Roku, Inc. (Class A)* | | 2,282 |
| 10 | Sea Ltd. (Singapore)* | | 2,237 |
| 10 | Spotify Technology S.A. – (Luxembourg)* | | 2,340 |
| |
| | HEALTHCARE – 0.00% | | 2,040 |
| 10 | Doximity, Inc. (Class A)* | | 501 |
| 10 | OptimizeRx Corp.* | | 621 |
| 10 | Teladoc Health, Inc.* | | 918 |
| |
| | INTERNET SERVICES – 5.24% | | 39,141,105 |
| 10 | Airbnb, Inc. (Class A)* | | 1,665 |
| 10 | Alphabet, Inc. (Class A)* | | 28,970 |
| 10 | Amazon.com, Inc.* | | 33,343 |
| 10 | Carvana Co. (Class A)* | | 2,318 |
| 10 | Chewy, Inc. (Class A)* | | 590 |
| 79,980 | Coinbase Global, Inc.* | | 20,184,553 |
| 10 | Etsy, Inc.* | | 2,189 |
| 8,460 | MercadoLibre, Inc. (Argentina)* | | 11,407,464 |
| 10 | Opendoor Technologies, Inc.* | | 146 |
| 5,430 | Shopify, Inc. (Class A) (Canada)* | | 7,479,228 |
| 10 | Zillow Group, Inc.* | | 639 |
| |
| | INTERNET SOCIAL MEDIA – 0.00% | | 4,629 |
| 10 | Meta Platforms, Inc. (Class A)* | | 3,363 |
| 10 | Pinterest, Inc. (Class A)* | | 364 |
| 10 | Snap, Inc. (Class A)* | | 470 |
| 10 | Twitter, Inc.* | | 432 |
| |
| | IT FINANCIAL SERVICES – 0.00% | | 8,100 |
| 10 | Affirm Holdings, Inc. (Class A)* | | 1,006 |
| 10 | Block, Inc. (Class A)* | | 1,615 |
| 10 | Mastercard, Inc. (Class A) | | 3,593 |
| 10 | PayPal Holdings, Inc.* | | 1,886 |
| |
| | SEMICONDUCTOR – 14.22% | | 106,299,159 |
| 10 | Advanced Micro Devices, Inc.* | | 1,439 |
| 10 | Ambarella, Inc.* | | 2,029 |
| 10 | Broadcom, Inc. | | 6,654 |
| 598,160 | Marvell Technology, Inc. | | 52,333,018 |
| 107,480 | NVIDIA Corp. | | 31,610,943 |
| 328,930 | ON Semiconductor Corp. | | 22,340,926 |
| 10 | QUALCOMM Inc. | | 1,829 |
| 10 | Taiwan Semiconductor Manufacturing Company Ltd. – ADR | | 1,203 |
| 10 | Wolfspeed, Inc.* | | 1,118 |
| |
| |
| | *Non-Income Producing | | |
| | ADR – American Depositary Receipt | | |
| |
| |
| | (see accompanying notes to financial statements) | | |
6
PORTFOLIO OF INVESTMENTS (CONTINUED)
December 31, 2021
| Shares | | | Value | |
| |
| | SEMICONDUCTOR EQUIPMENT – 6.94% | $ | 51,854,144 | |
| 218,000 | Applied Materials, Inc. | | 34,304,480 | |
| 10 | ASML Holding N.V. – ADR | | 7,961 | |
| 24,390 | Lam Research Corp. | | 17,540,068 | |
| 10 | Teradyne, Inc. | | 1,635 | |
| |
| | SPECIALTY INDUSTRIAL MACHINERY – 2.35% | | 17,530,065 | |
| 115,140 | Kornit Digital Ltd. (Israel)* | | 17,530,065 | |
| |
| | SPORTS ENTERTAINMENT & GAMING – 0.00% | | 275 | |
| 10 | DraftKings, Inc. (Class A)* | | 275 | |
| |
| | EXCHANGE TRADED FUNDS – 0.00% | | 7,068 | |
| | (Cost $2,128) | | | |
| 10 | Invesco QQQ ETF | | 3,980 | |
| 10 | VanEck Semiconductor ETF | | 3,088 | |
| |
| |
| | TOTAL INVESTMENT SECURITIES – 100.10% | | 748,167,611 | |
| | (Cost $681,031,753) | | | |
| |
| | LIABILITIES IN EXCESS OF OTHER ASSETS – (0.10%) | | (743,563 | ) |
| |
| | NET ASSETS – 100.00% | $ | 747,424,048 | |
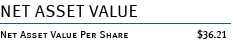
| | Equivalent to $36.21 per share | | | |
| |
| |
| | *Non-Income Producing | | | |
| | ADR – American Depositary Receipt | | | |
| |
| | (see accompanying notes to financial statements) | | | |
7
STATEMENT OF ASSETS AND LIABILITIES
December 31, 2021
| ASSETS | | |
| Investment securities: | | |
| At cost | $ | 681,031,753 |
| At value | $ | 748,167,611 |
| Cash | | 10,000 |
| Receivable for dividends | | 24 |
| Receivable for securities sold | | 76,325,601 |
| Receivable for capital shares sold | | 421,755 |
| Total Assets | | 824,924,991 |
| |
| |
| LIABILITIES | | |
| Payable for securities purchased | | 73,291,194 |
| Payable for capital shares redeemed | | 1,150,112 |
| Payable to affiliate (Note 5) | | 1,242,747 |
| Payable for line of credit | | 1,813,306 |
| Payable for interest expense | | 3,584 |
| Total Liabilities | | 77,500,943 |
| |
| |
| NET ASSETS | $ | 747,424,048 |
| |
| |
| Net assets consist of: | | |
| Paid-in capital | $ | 735,306,340 |
| Total distributable earnings | | 12,117,708 |
| Net Assets | $ | 747,424,048 |
| |
| Shares of beneficial interest issued and outstanding | | |
| (unlimited number of shares authorized, without par value) | | 20,640,354 |
| |
| Net asset value and offering price per share | $ | 36.21 |
| |
| Minimum redemption price per share* | $ | 35.49 |
*The Fund will impose a 2.00% redemption fee on shares redeemed within 90 calendar days or less of purchase.
(see accompanying notes to financial statements)
8
STATEMENT OF OPERATIONS
For the Year Ended December 31, 2021
| INVESTMENT INCOME | | | |
| Dividends (net of foreign withholding taxes of $5) | $ | 224,918 | |
| Total investment income | | 224,918 | |
| |
| EXPENSES | | | |
| Investment advisory fees (Note 5) | | 12,863,466 | |
| Administration fees (Note 5) | | 3,374,292 | |
| Interest expense | | 64,367 | |
| Total Expenses | | 16,302,125 | |
| |
| NET INVESTMENT LOSS | | (16,077,207 | ) |
| |
| |
| NET REALIZED AND UNREALIZED | | | |
| LOSS ON INVESTMENTS | | | |
| Net realized gain from security transactions | | 29,024,061 | |
| Net change in unrealized appreciation on investments | | (41,286,069 | ) |
| |
| NET REALIZED AND UNREALIZED | | | |
| LOSS ON INVESTMENTS | | (12,262,008 | ) |
| |
| NET DECREASE IN NET ASSETS | | | |
| FROM OPERATIONS | $ | (28,339,215 | ) |
| |
| |
| (see accompanying notes to financial statements) | | | |
9
STATEMENTS OF CHANGES IN NET ASSETS
For the Years Ended December 31, 2021 and December 31, 2020
| | | Year | | | Year | |
| | | Ended | | | Ended | |
| | | 12/31/21 | | | 12/31/20 | |
| |
| FROM OPERATIONS: | | | | | | |
| Net investment loss | $ | (16,077,207 | ) | $ | (9,689,056 | ) |
| Net realized gains from security transactions | | 29,024,061 | | | 323,856,373 | |
| Net change in unrealized appreciation on investments | | (41,286,069 | ) | | 81,655,326 | |
| Net increase (decrease) in net assets from operations | | (28,339,215 | ) | | 395,822,643 | |
| |
| |
| FROM DISTRIBUTIONS: | | | | | | |
| Distributions | | (124,507,055 | ) | | (163,782,562 | ) |
| |
| |
| FROM CAPITAL SHARE TRANSACTIONS: | | | | | | |
| Proceeds from shares sold | | 259,706,979 | | | 536,900,709 | |
| Proceeds from reinvested distributions | | 122,659,086 | | | 162,440,038 | |
| Proceeds from redemption fees (Note 6) | | 912,767 | | | 1,540,086 | |
| Payments for shares redeemed | | (426,540,892 | ) | | (317,057,653 | ) |
| Net increase (decrease) in net assets from | | | | | | |
| capital share transactions | | (43,262,060 | ) | | 383,823,180 | |
| |
| |
| TOTAL INCREASE (DECREASE) IN NET ASSETS | | (196,108,330 | ) | | 615,863,261 | |
| |
| |
| NET ASSETS: | | | | | | |
| Beginning of period | | 943,532,378 | | | 327,669,117 | |
| End of period | $ | 747,424,048 | | $ | 943,532,378 | |
| |
| |
| CAPITAL SHARE ACTIVITY: | | | | | | |
| Shares sold | | 5,805,987 | | | 15,124,881 | |
| Shares reinvested | | 3,325,897 | | | 3,675,945 | |
| Shares redeemed | | (10,053,126 | ) | | (9,135,469 | ) |
| Net increase (decrease) in shares outstanding | | (921,242 | ) | | 9,665,357 | |
| Shares outstanding, beginning of period | | 21,561,596 | | | 11,896,239 | |
| Shares outstanding, end of period | | 20,640,354 | | | 21,561,596 | |
| |
| |
| |
| |
| (see accompanying notes to financial statements) | | | | | | |
10
FINANCIAL HIGHLIGHTS
Selected Per Share Data and Ratios for a Share Outstanding Throughout Each Year
| | | Year | | | Year | | | Year | | | Year | | | Year | |
| | | Ended | | | Ended | | | Ended | | | Ended | | | Ended | |
| | | 12/31/21 | | | 12/31/20 | | | 12/31/19 | | | 12/31/18 | | | 12/31/17 | |
| |
| NET ASSET VALUE, | | | | | | | | | | | | | | | |
| BEGINNING OF YEAR | $ | 43.76 | | $ | 27.54 | | $ | 22.33 | | $ | 21.47 | | $ | 18.11 | |
| |
| INCOME FROM INVESTMENT OPERATIONS: | | | | | | | | | | | | | | | |
| Net investment loss(a) | | (0.82 | ) | | (0.64 | ) | | (0.45 | ) | | (0.31 | ) | | (0.35 | ) |
| Net realized and unrealized gains | | | | | | | | | | | | | | | |
| on investments | | 0.29 | (b) | | 26.04 | | | 9.51 | | | 2.36 | (b) | | 8.37 | |
| Total from investment operations | | (0.53 | ) | | 25.40 | | | 9.06 | | | 2.05 | | | 8.02 | |
| |
| Proceeds from redemption fees | | 0.05 | | | 0.10 | | | 0.06 | | | 0.08 | | | 0.00 | (f) |
| |
| LESS DISTRIBUTIONS: | | | | | | | | | | | | | | | |
| Distributions from net realized gains | | (7.07 | ) | | (9.28 | ) | | (3.91 | ) | | (1.27 | ) | | (4.66 | ) |
| Total distributions | | (7.07 | ) | | (9.28 | ) | | (3.91 | ) | | (1.27 | ) | | (4.66 | ) |
| |
| NET ASSET VALUE, | | | | | | | | | | | | | | | |
| END OF YEAR | $ | 36.21 | | $ | 43.76 | | $ | 27.54 | | $ | 22.33 | | $ | 21.47 | |
| |
| |
| TOTAL RETURN(c) | | (1.38 | %) | | 92.26 | % | | 40.63 | % | | 10.02 | % | | 44.07 | % |
| |
| |
| |
| SUPPLEMENTAL DATA AND RATIOS: | | | | | | | | | | | | | | | |
| Net assets at end of year (thousands) | $ | 747,424 | | $ | 943,532 | | $ | 327,669 | | $ | 151,966 | | $ | 74,564 | |
| |
| Ratio of expenses to average net assets(d) | | 1.90 | % | | 1.92 | % | | 1.95 | % | | 1.97 | % | | 2.02 | % |
| Ratio of net investment loss to | | | | | | | | | | | | | | | |
| average net assets | | (1.87 | %) | | (1.70 | %) | | (1.56 | %) | | (1.20 | %) | | (1.54 | %) |
| |
| Portfolio turnover rate(e) | | 1,424.8 | % | | 1,599.1 | % | | 980.3 | % | | 595.6 | % | | 385.0 | % |
(a) Net investment loss was calculated using the average shares outstanding method.
(b) Net realized and unrealized gain on investments per share is a balancing amount necessary to reconcile
the change in net asset value per share for the period, and may not reconcile with the net realized and
unrealized gain (loss) on investments in the statement of operations.
(c) Total return represents the rate that the investor would have earned or (lost) on an investment in the Fund
assuming reinvestment of dividends.
(d) The ratio of expenses to average net assets includes federal excise tax and interest expense. The ratios
excluding federal excise tax and interest expense would be 1.89%, 1.91%, 1.95%, 1.96% and 1.99%, respectively.
(e) Portfolio turnover is greater than most funds due to the investment style of the Fund.
(f) Less than $0.005 per share.
(see accompanying notes to financial statements)
11
NOTES TO FINANCIAL STATEMENTS
December 31, 2021
1. Organization
The Berkshire Focus Fund (the “Fund”) is a non-diversified series of The Berkshire Funds (the “Trust”), an open-end management investment company registered under the Investment Company Act of 1940, as amended (the “1940 Act”). The Trust was organized as a Delaware business trust on November 25, 1996. The Fund commenced operations on July 1, 1997. The Fund’s investment objective is to seek long-term growth of capital primarily through investments in equity securities.
2. Significant Accounting Policies
The Fund is an investment company and accordingly follows the investment company accounting and reporting guidance of the Financial Accounting Standards Board (“FASB”) Accounting Standards Codification Topic 946 Financial Services – Investment Companies. The financial statements are prepared in conformity with accounting principles generally accepted in the United States of America (“GAAP”).
The following is a summary of the Trust’s significant accounting policies:
Cash — The Fund maintains cash at its custodian which, at times, may exceed United States federally insured limits.
Securities valuation — The Fund’s portfolio securities are valued as of the close of the regular session of trading on the New York Stock Exchange (the “NYSE”), normally 4:00 p.m., Eastern time. Securities which are traded on stock exchanges or are quoted by Nasdaq are valued at the last reported sale price as of the close of the regular session of trading on the NYSE, or, if not traded, at the most recent bid price. Securities which are traded in the over-the-counter market, and which are not quoted by Nasdaq, are valued at the most recent bid price, as obtained from one or more of the major market makers for such securities. Generally, if the security is traded in an active market and is valued at its last sales price, the security is categorized as a Level 1 security (described below), and if an equity security is valued by the pricing service at its last bid, it is generally categorized as a Level 2 security. Securities for which market quotations are not readily available are valued at their fair value as determined in good faith in accordance with consistently applied procedures established by and under the general supervision of the Board of Trustees and are categorized in Level 1, 2, or Level 3 when appropriate.
The Trust has adopted accounting standards which establish an authoritative definition of fair value and set out a hierarchy for measuring fair value. These standards require additional disclosures about the various inputs and valuation techniques used to develop the measurements of fair value and a discussion of changes in valuation techniques and related inputs
12
NOTES TO FINANCIAL STATEMENTS
December 31, 2021
during the period. These standards define fair value as the price that would be received to sell an asset or paid to transfer a liability in an orderly transaction between market participants at the measurement date. The fair value hierarchy is organized into three levels based upon the assumptions (referred to as “inputs”) used in pricing the asset or liability. These standards state that “observable inputs” reflect the assumptions market participants would use in pricing the asset or liability based on market data obtained from independent sources and “unobservable inputs” reflect an entity's own assumptions about the assumptions market participants would use in pricing the asset or liability. These inputs are summarized in the three broad levels listed below: Level 1 – Quoted prices in active markets for identical securities.
Level 2 – Other significant observable inputs (including quoted prices for similar securities, interest rates, prepayment speeds, credit risk, etc.).
Level 3 – Significant unobservable inputs (including the Fund’s own assumptions in determining the fair value of investments).
The inputs or methodology used for valuing securities are not necessarily an indication of the risk associated with investing in those securities.
The following is a summary of the inputs used to value the Fund’s investments as of December 31, 2021:
| | Level 1 | Level 2 | Level 3 | Total |
| Common Stocks | | | | |
| Business Software & Services | $240,348,261 | – | – | $240,348,261 |
| Cybersecurity Equipment & Services | 109,963,474 | – | – | 109,963,474 |
| Semiconductor | 106,299,159 | – | – | 106,299,159 |
| Automobile Manufacturer | 97,304,563 | – | – | 97,304,563 |
| Semiconductor Equipment | 51,854,144 | – | – | 51,854,144 |
| Internet Services | 39,141,105 | – | – | 39,141,105 |
| Communication Equipment | 36,406,125 | – | – | 36,406,125 |
| Banks | 33,816,547 | – | – | 33,816,547 |
| Specialty Industrial Machinery | 17,530,065 | – | – | 17,530,065 |
| Entertainment | 15,476,567 | – | – | 15,476,567 |
| IT Financial Services | 8,100 | – | – | 8,100 |
| Internet Social Media | 4,629 | – | – | 4,629 |
| Communication Services | 3,713 | – | – | 3,713 |
| Healthcare | 2,040 | – | – | 2,040 |
| Consumer Electronics | 1,776 | – | – | 1,776 |
| Sports Entertainment & Gaming | 275 | – | – | 275 |
| Total Common Stocks | 748,160,543 | – | – | 748,160,543 |
| Exchange Traded Funds | 7,068 | – | – | 7,068 |
| Total Investment Securities | $ 748,167,611 | – | – | $ 748,167,611 |
The Fund did not hold any Level 3 securities during the fiscal year ended December 31, 2021. The Fund did not hold any derivative instruments during the reporting period.
13
NOTES TO FINANCIAL STATEMENTS
December 31, 2021
Investment income — Dividend income is recorded on the ex-dividend date. Interest income, if any, is accrued as earned.
Distributions to shareholders — Distributions to shareholders arising from net investment income and net realized capital gains, if any, are distributed at least once each year. Distributions to shareholders are recorded on the ex-dividend date. The Fund may utilize earnings and profits distributed to shareholders on redemptions of shares as part of the dividends paid deduction. Dividends from net investment income and capital gain distributions are determined in accordance with income tax regulations, which may differ from GAAP.
Security transactions — Security transactions are accounted for on the trade date for financial reporting purposes. Securities sold are determined on a specific identification basis.
Estimates — The financial statements are prepared in accordance with GAAP, which requires management to make estimates and assumptions that affect the reported amounts of assets and liabilities and disclosure of contingent assets and liabilities at the date of the financial statements and the reported amounts of increases and decreases in net assets from operations during the reporting period. Actual results could differ from those estimates.
Federal income tax — The Fund intends to comply with the requirements of Subchapter M of the Internal Revenue Code (the “Code”) necessary to qualify as a regulated investment company. As provided therein, in any fiscal year in which the Fund so qualifies and distributes at least 90% of its taxable net income, the Fund (but not the shareholders) will be relieved of federal income tax on the income distributed. Accordingly, no provision for income taxes has been made.
As of and during the fiscal year ended December 31, 2021, the Fund did not have a liability for any unrecognized tax benefits. The Fund recognizes interest and penalties, if any, related to unrecognized tax benefits as other expense on the statement of operations. During the year, the Fund did not incur any tax-related interest or penalties.
In order to avoid imposition of the excise tax applicable to regulated investment companies, it is also the Fund’s intention to declare as dividends in each calendar year at least 98% of its net investment income and 98.2% of its net realized capital gains plus undistributed amounts from prior years.
Other — The treatment for financial reporting purposes of distributions made to shareholders during the year from net investment income or net realized capital gains may differ from their ultimate treatment for federal income tax purposes. These differences are caused primarily by differences in the timing of the recognition of certain components of income, expense or realized capital gain for federal income tax purposes. Where such differences are permanent in nature, they are reclassified in the components of the net assets based on their ultimate characterization for federal income tax purposes. Any such reclassifications will have no effect on net assets, results of operations or net asset value per share of the Fund. Effective September 30, 2019, the Fund elected a tax year-end of September 30. For the tax year ended September 30, 2021 and the fiscal year December 31, 2021, the following permanent adjustments were recorded.
14
NOTES TO FINANCIAL STATEMENTS
December 31, 2021
Such adjustments were attributed to the use of equalization for tax purposes:
| Paid-in capital | $ 40,644,454 |
| Total distributable earnings | (40,644,454) |
3. Investment Transactions
Purchases and sales of investment securities (excluding short-term instruments) for the year ended December 31, 2021 were $12,139,667,756 and $12,320,732,542, respectively. There were no purchases or sales of U.S. Government securities for the Fund.
4. Tax Information
For Federal income tax purposes, as of December 31, 2021, the cost of investments, and gross appreciation/depreciation was as follows:
| Federal income tax cost | $ 728,000,719 |
| Gross unrealized appreciation | $ 78,102,707 |
| Gross unrealized depreciation | (57,935,815) |
| Net unrealized appreciation | $ 20,166,892 |
The cost basis of investments for tax and financial reporting purposes differed primarily due to wash sales.
There was a short-term capital gains distribution paid in the amount of $117,677,220, and a long-term capital gains distribution in the amount of $6,829,835 for the fiscal year ended December 31, 2021. Also there was a short-term capital gains distribution paid in the amount of $163,782,562 for the fiscal year ended December 31, 2020. Short-term capital gain distributions are considered ordinary income distributions for tax purposes.
As of the tax year ended September 30, 2021, the components of distributable earnings on a tax basis were as follows:
| Undistributed ordinary income | $ 117,677,223 |
| Undistributed long-term gains | 6,829,838 |
| Net unrealized depreciation | (7,194,323) |
| Total distributable earnings | $ 117,312,738 |
5. Related Party Transactions, Investment Advisory and Administrative Fees Certain Officers and Trustees of the Trust are also Officers and Directors of Berkshire Capital Holdings, Inc. (“Berkshire Capital”). The non-interested Trustees of the Fund were paid $90,000 in Trustee fees and expenses directly by Berkshire Capital during the fiscal year ended December 31, 2021.
The Fund has an Investment Advisory Agreement (the “Advisory Agreement”) and a separate Administration Agreement with Berkshire Capital. Under the Advisory Agreement, Berkshire Capital will determine what securities will be purchased, retained or sold by the Fund on the basis of a continuous review of the portfolio. For the services it provides under the Advisory Agreement, Berkshire Capital receives a fee accrued each calendar day (including weekends and holidays) at a rate of 1.50% per annum of the daily net assets of the Fund.
15
NOTES TO FINANCIAL STATEMENTS
December 31, 2021
Under the Administration Agreement, Berkshire Capital renders all administrative and supervisory services of the Fund, as well as facilities furnished and expenses assumed except for interest and taxes. For these services, Berkshire Capital receives a fee at the annual rate of 0.50% of the Fund’s average daily net assets up to $50 million, 0.45% of average net assets from $50 million to $200 million, 0.40% of average net assets from $200 million to $500 million, 0.35% of average net assets from $500 million to $1 billion and 0.30% of average net assets in excess of $1 billion. Such fee is computed as a percentage of the Fund’s daily net assets and is accrued each calendar day (including weekends and holidays). For the fiscal year ended December 31, 2021, Berkshire Capital was paid an investment advisory fee of $12,863,466 and an administration fee of $3,374,292 from the Fund. The amount due to Berkshire Capital for these fees at December 31, 2021 totaled $1,242,747.
6. Redemption Fee
The Fund may impose a redemption fee of 2.00% on shares held for 90 days or less. For the fiscal year ended December 31, 2021, proceeds from redemption fees were $912,767.
7. Beneficial Ownership
The beneficial ownership, either directly or indirectly, of more than 25% of the voting securities of a fund creates a presumption of control of the Fund, under Section 2(a)(9) of the Investment Company Act of 1940. At December 31, 2021, National Financial Services Corp. beneficially owned, in aggregate, 56.90% of the Fund.
8. COVID-19 Risks
Unexpected local, regional or global events, such as war; acts of terrorism; financial, political or social disruptions; natural, environmental or man-made disasters; the spread of infectious illnesses or other public health issues; and recessions and depressions could have a significant impact on the Fund and its investments and may impair market liquidity. Such events can cause investor fear, which can adversely affect the economies of nations, regions and the market in general, in ways that cannot necessarily be foreseen. An outbreak of infectious respiratory illness known as COVID-19, which is caused by a novel coronavirus (SARS-CoV-2), was first detected in China in December 2019 and subsequently spread globally. This coronavirus has resulted in, among other things, travel restrictions, closed international borders, enhanced health screenings at ports of entry and elsewhere, disruption of and delays in healthcare service preparation and delivery, prolonged quarantines, significant disruptions to business operations, market closures, cancellations and restrictions, supply chain disruptions, lower consumer demand, and significant volatility and declines in global financial markets, as well as general concern and uncertainty. The impact of COVID-19 has adversely affected, and other infectious illness outbreaks that may arise in the future could adversely affect, the economies of many nations and the entire global economy, individual issuers and capital markets in ways that cannot necessarily be foreseen.
16
NOTES TO FINANCIAL STATEMENTS
December 31, 2021
Public health crises caused by the COVID-19 outbreak may exacerbate other pre-existing political, social and economic risks in certain countries or globally. The duration of the COVID-19 outbreak and its effects cannot be determined with certainty.
9. Revolving Credit Agreement
The Trust entered into a Revolving Credit Agreement (the “Loan Agreement”) between the Trust and its custodian, The Huntington National Bank, N.A. The Fund may not borrow money or purchase securities on margin except for temporary or emergency (not leveraging) purposes, including the meeting of redemption requests that might otherwise require the untimely disposition of securities. The maximum amount that the Fund is permitted to borrow is the lesser of: (i) $10,000,000 or (ii) 10% of the Fund's daily market value and is secured by the securities in the Fund. The maximum interest rate of such loans is set at a rate per annum equal to the London Interbank Offered Rate subject to a .50% floor, plus 1.75% per annum, subject to an Annual Fee and an Unused Fee. The Annual Fee for the Loan Agreement is equal to 1/8 of one percent (1.00%) of the Loan Amount of $10,000,000 and the Unused Fee is equal to 1/8 of one percent (1.00%) of the excess of the Loan Amount over the outstanding principal balance of the loan. Prior to February 10, 2021, the maximum amount that the Fund was permitted to borrow was the lessor of: (i) $5,000,000 or (ii) 10% of the Fund’s daily market value. During the fiscal year ended December 31, 2021, the Fund had an average loan balance of $1,376,263 and paid an average interest rate of 2.25% . Additionally, the maximum borrowing during the period was $10,000,000, which occurred on multiple days during the year. As of December 31, 2021, there was an outstanding loan balance of $1,813,306. No compensating balances are required. The loan matures on August 16, 2022.
10. Concentration of Sector Risk
If a Fund has significant investments in the securities of issuers in industries within a particular sector, any development affecting that sector will have a greater impact on the value of the net assets of the Fund than would be the case if the Fund did not have significant investments in that sector. In addition, this may increase the risk of loss of an investment in the Fund and increase the volatility of the Fund’s NAV per share. From time to time, circumstances may affect a particular sector and the companies within such sector. For instance, economic or market factors, regulation or deregulation, and technological or other developments may negatively impact all companies in a particular sector and therefore the value of a Fund’s portfolio will be adversely affected. As of December 31, 2021, the Fund had 32.16% of the value of its net assets invested in stocks within the Business Software and Services sector.
11. Subsequent Events
In preparing these financial statements, management has performed an evaluation of subsequent events after December 31, 2021 through the date these financial statements were issued and determined that there were no significant subsequent events that would require adjustment to or additional disclosure in the financial statements.
17
REPORT OF INDEPENDENT REGISTERED PUBLIC ACCOUNTING FIRM
TO THE SHAREHOLDERS OF BERKSHIRE FOCUS FUND AND
BOARD OF TRUSTEES OF THE BERKSHIRE FUNDS
Opinion on the Financial Statements
We have audited the accompanying statement of assets and liabilities, including the portfolio of investments, of Berkshire Focus Fund (the “Fund”), a series of The Berkshire Funds, as of December 31, 2021, the related statement of operations for the year then ended, the statements of changes in net assets for each of the two years in the period then ended, the related notes, and the financial highlights for each of the five years in the period then ended (collectively referred to as the “financial statements”). In our opinion, the financial statements present fairly, in all material respects, the financial position of the Fund as of December 31, 2021, the results of its operations for the year then ended, the changes in net assets for each of the two years in the period then ended, and the financial highlights for each of the five years in the period then ended, in conformity with accounting principles generally accepted in the United States of America.
Basis for Opinion
These financial statements are the responsibility of the Fund’s management. Our responsibility is to express an opinion on the Fund’s financial statements based on our audits. We are a public accounting firm registered with the Public Company Accounting Oversight Board (United States) (“PCAOB”) and are required to be independent with respect to the Fund in accordance with the U.S. federal securities laws and the applicable rules and regulations of the Securities and Exchange Commission and the PCAOB.
We conducted our audits in accordance with the standards of the PCAOB. Those standards require that we plan and perform the audit to obtain reasonable assurance about whether the financial statements are free of material misstatement whether due to error or fraud.
Our audits included performing procedures to assess the risks of material misstatement of the financial statements, whether due to error or fraud, and performing procedures that respond to those risks. Such procedures included examining, on a test basis, evidence regarding the amounts and disclosures in the financial statements. Our procedures included confirmation of securities owned as of December 31, 2021 by correspondence with the custodian and brokers. Our audits also included evaluating the accounting principles used and significant estimates made by management, as well as evaluating the overall presentation of the financial statements. We believe that our audits provide a reasonable basis for our opinion.
We have served as the Fund’s auditor since 2004.

18
ADDITIONAL INFORMATION
(unaudited)
EXPENSE EXAMPLE
As a shareholder of the Fund, you incur two types of costs: (1) transaction costs, and (2) ongoing costs, including advisory fees, administrative fees and interest expense. This Example is intended to help you understand your ongoing costs (in dollars) of investing in the Fund and to compare these costs with the ongoing costs of investing in other mutual funds. The Example is based on investment of $1,000 invested in the Fund on July 1, 2021 and held through December 31, 2021.
Actual Expenses
The first line of the table on the following page provides information about actual account values and actual expenses. Although the Fund charges no sales load or transaction fees, you will be assessed fees for outgoing wire transfers, returned checks and stop payment orders at prevailing rates charged by Mutual Shareholder Services, LLC, the Fund’s transfer agent. If you request that a redemption be made by wire transfer, currently a $20.00 fee is charged by the Fund’s transfer agent. IRA accounts will be charged an $8.00 annual maintenance fee. If shares are redeemed within 90 days of purchase from the Fund, the shares are subject to a 2% redemption fee. To the extent the Fund invests in shares of other investment companies as part of its investment strategy, you will indirectly bear your proportionate share of any fees and expenses charged by the underlying funds in which the Fund invests in addition to the expenses of the Fund. Actual expenses of the underlying funds are expected to vary among the various underlying funds. These expenses are not included in the example. The example includes advisory fees, administrative fees and other Fund expenses. However, the example does not include portfolio trading commissions and related expenses and other extraordinary expenses as determined under generally accepted accounting principles. You may use the information in this line, together with the amount you invested, to estimate the expenses that you paid over the period. Simply divide your account value by $1,000 (for example, an $8,600 account value divided by $1,000 = 8.6), then multiply the result by the number in the first line under the heading entitled “Expenses Paid During Period” to estimate the expenses you paid on your account during this period.
Hypothetical Example for Comparison Purposes
The second line of the table provides information about hypothetical account values and hypothetical expenses based on the Fund’s actual expense ratio and an assumed rate of return of 5% per year before expenses, which is not the Fund's actual return. The hypothetical account values and expenses may not be used to estimate the actual ending account balance or expenses you paid for the period. You may use this information to compare the ongoing costs of investing in the Fund and other funds. To do so, compare this 5% hypothetical example with the 5%
19
ADDITIONAL INFORMATION
(unaudited) |
hypothetical examples that appear in the shareholder reports of the other funds. Please note that the expenses shown in the table are meant to highlight your ongoing costs only and do not reflect any transactional costs, such as redemption fees or the charges by Mutual Shareholder Services, LLC as described above, or the expenses of the underlying funds. Therefore, the second line of the table is useful in comparing ongoing costs only, and will not help you determine the relative total costs of owning different funds. In addition, if these transactional costs were included, your costs would have been higher.
| | | | Expenses Paid |
| | Beginning | Ending | During the Period* |
| | Account Value | Account Value | July 1, 2021 to |
| | July 1, 2021 | December 31, 2021 | December 31, 2021 |
| Actual | $1,000.00 | $985.75 | $9.56 |
| Hypothetical | $1,000.00 | $1,051.58 | $9.70 |
| (5% annual return before expenses) | | |
*Expenses are equal to the Fund’s annualized expense ratio of 1.91%, multiplied by the average account value over the period, multiplied by 184/365 to reflect the one-half year period.
Proxy Voting Guidelines
Berkshire Capital Holdings, Inc., the Fund’s Adviser, is responsible for exercising the voting rights associated with the securities held by the Fund. A description of the policies and procedures used by the Adviser in fulfilling this responsibility and a record of the Fund’s proxy votes for the most recent twelve month period ended June 30, are available without charge, upon request, by calling toll free 1-877-526-0707. They are also available on the Securities and Exchange Commission’s (“SEC”) website at www.sec.gov.
Quarterly Filing of Portfolio Holdings
The Fund publicly files its complete schedule of portfolio holdings with the SEC for the first and third quarters of each fiscal year on Form N-PORT. The Fund’s Forms N-PORT are available on the SEC’s website at www.sec.gov. Copies of the Fund’s Forms N-PORT are also available, without charge, by calling the Fund toll free 1-877-526-0707.
20
ADDITIONAL INFORMATION
(unaudited) |
Liquidity Risk Management Program
During the fiscal year ended December 31, 2021, the Board reviewed the Fund’s liquidity risk management program, adopted pursuant to Rule 22e-4 under the Investment Company Act. The program is overseen by the Adviser, who has delegated certain responsibilities for managing the program to a liquidity program administrator (the “LPA”). The LPA reported that it had assessed, managed and reviewed the program for the Fund taking into consideration several factors including the liquidity of the Fund’s portfolio investments and the market, trading or investment specific considerations that may reasonably affect a security’s classification as a liquid investment. The LPA certified that the program was adequate, effectively implemented and needed no changes at that time.
21
ADDITIONAL INFORMATION
(unaudited) |
Trustee and Officer Information
The business and affairs of the Fund are managed under the direction of the Fund’s Board of Trustees. Information pertaining to the Trustees and Officers of the Fund is set forth below. The SAI includes additional information about the Fund’s Trustees and Officers and is available without charge, upon request, by calling toll-free 1-877-526-0707.
Interested Trustees and Officers
| | | | | Number of | |
| | | Term of | | portfolios in | |
| | | office and | Principal | fund complex | |
| Name, address and | Position(s) held | length of | occupation during | overseen by | Other directorships |
| Year of Birth | with trust | time served | past five years | trustee | held by trustee |
| |
| Malcolm R. Fobes III* | Trustee, President, | Indefinite; | Chairman and CEO; | 1 | Independent Director; |
| 475 Milan Drive | Treasurer, Secretary, | Since 1996 | Berkshire Capital | | United States |
| Suite #103 | Chief Investment | | Holdings, Inc. | | Commodity Funds, |
| San Jose, CA 95134 | Officer and Chief | | 1993 to present | | LLC |
| Year of Birth: 1964 | Financial Officer | | | | |
| |
| Sothara Chin | Chief Compliance | Indefinite; | Managing Member, | N/A | N/A |
| 475 Milan Drive | Officer | Since 2021 | Fit Compliance LLC | | |
| Suite #103 | | | 2016 to present | | |
| San Jose, CA 95134 | | | | | |
| Year of Birth: 1966 | | | | | |
* Trustees who are considered “interested persons” as defined in Section 2(a)(19) of the Investment Company Act of 1940
by virtue of their affiliation with the Investment Adviser. |
Disinterested Trustees
| | | | | Number of | |
| | | Term of | | portfolios in | |
| | | office and | Principal | fund complex | |
| Name, address and | Position held | length of | occupation during | overseen by | Other directorships |
| Year of Birth | with trust | time served | past five years | trustee | held by trustee |
| |
| Andrew W. Broer | Independent Trustee | Indefinite; | Manager, Data Center | 1 | None |
| 475 Milan Drive | | Since 1998 | Tools and Monitoring, | | |
| Suite #103 | | | Apple, Inc. | | |
| San Jose, CA 95134 | | | 2014 to present | | |
| Year of Birth: 1965 | | | | | |
| |
| Peter M. Robinson | Independent Trustee | Indefinite; | Murdoch Distinguished | 1 | Independent Director; |
| 475 Milan Drive | | Since 2020 | Policy Fellow at the | | United States |
| Suite #103 | | | Hoover Institution and | | Commodity Funds, |
| San Jose, CA 95134 | | | editor of Hoover's | | LLC |
| Year of Birth: 1957 | | | quarterly journal, | | |
| | | | the Hoover Digest, | | |
| | | | 1993 to present | | |
| |
| David A. White | Independent Trustee | Indefinite; | Executive Director, | 1 | None |
| 475 Milan Drive | | Since 2020 | Internal Audit/Risk | | |
| Suite #103 | | | Management, Gilead | | |
| San Jose, CA 95134 | | | Sciences, Inc., June 2020 | | |
| Year of Birth: 1967 | | | to present; Executive | | |
| | | | Director, North America | | |
| | | | Controller, Gilead | | |
| | | | Sciences, Inc., Aug. 2016 | | |
| | | | to May 2020, Senior | | |
| | | | Director, North America | | |
| | | | Controller, Aug, 2016 to | | |
| | | | Nov. 2018 | | |
22
ADDITIONAL INFORMATION
(unaudited)
APPROVAL OF INVESTMENT ADVISORY AGREEMENT
The Board of Trustees (the “Trustees” or the “Board”), including a majority of the Trustees who are not “interested persons” of the Trust (the “Independent Trustees”), approved the continuation of the Investment Advisory Agreement (the “Advisory Agreement”) with Berkshire Capital Holdings, Inc. (the “Adviser”) at a meeting on held December 4, 2021.
The Trustees were assisted by experienced independent legal counsel throughout the contract review process. The Independent Trustees discussed the proposed continuance in executive session with such counsel at which no representatives of the Adviser were present. The Independent Trustees relied upon the advice of independent legal counsel and their own business judgment in determining the material factors to be considered in evaluating the Advisory Agreement and the weight to be given to each such factor. Among other factors, the Trustees considered the Fund’s performance; the nature, extent and quality of the services provided; the costs of the services provided; any profits realized by the Adviser; the extent to which economies of scale will be realized as the Fund grows; and whether fees reflect those economies of scale. The conclusions reached by the Independent Trustees were based on a comprehensive evaluation of all of the information provided and were not the result of any one factor. Moreover, each Independent Trustee may have afforded different weight to the various factors in reaching his conclusions with respect to the Advisory Agreement.
At the December 4, 2021 Board meeting, a representative of the Adviser referred the Trustees to the materials that had been provided to them for purposes of their consideration of the Advisory Agreement. He summarized the services provided by the Adviser to the Fund and he reported that there were no material changes in the structure or relationships of the Adviser. The representative next reviewed with the Trustees the average total returns of the Fund through October 31, 2021 (year-to-date, 1-year, 3-years, 5-years, 10-years and 15-years), and the expense ratios and management fees of the Fund in comparison with funds in the Morningstar Technology Fund category (the “Category”), and a group of no-load Morningstar Technology Funds with net assets ranging from $250 million to $2 billion (the “Peer Group”). He also reviewed comparisons of the Fund’s performance with its benchmark indices, as well as the Category and Peer Group. He noted that he had provided the Adviser’s balance sheet and income statement to the Trustees prior to the meeting. He then led a discussion regarding the Adviser’s profitability, indicating a profit margin at the time of analysis.
Investment Performance
The Trustees then considered the investment performance of the Fund over various periods of time ended October 31, 2021 as compared to its benchmark indices and the Category and Peer Group. The Trustees noted that the Fund had outperformed its benchmark indices over the 3-year, 5-year, 10-year and 15-year periods ended October 31, 2021, remarking in particular that the performance of the Fund for every period relevant to the benchmark indices had been outstanding, except in the year-to-date and 1-year period where the Fund underperformed its benchmark indices. The data also showed that the Fund outperformed its Category and Peer Group averages for the 3-year, 5-year and 10-year periods; and underperformed in the year-to-date and 1-year periods. Based on this review, the Trustees concluded that the current and historical performance of the Fund, as managed by the Investment Adviser, was satisfactory.
23
ADDITIONAL INFORMATION
(unaudited)
Nature, Extent and Quality of Services Provided by the Investment Adviser
The Trustees then reviewed the nature, quality and scope of current and anticipated services provided by the Adviser under the Advisory Agreement. The Trustees discussed the Adviser’s experience and the capabilities of the Adviser’s portfolio manager. For example, the Trustees reviewed and discussed the Adviser’s Form ADV and internal compliance policies, as well as the experience of the Adviser as investment adviser or sub-adviser to other investment companies. In addition to the above considerations, the Trustees reviewed and considered a description of the Adviser’s portfolio and brokerage transactions, noting that the Adviser received no soft dollars. Based on this review, the Trustees concluded that the range and quality of services to be provided by the Adviser to the Fund were appropriate and continued to support its original selection of the Adviser.
Costs of Services Provided
The Trustees next reviewed the terms of the Advisory Agreement and the Administration Agreement, concluding after discussion with independent counsel that it was appropriate to consider them together, given that the Adviser was performing all services under the agreements and that the Administration Agreement called for the Adviser to pay substantially all of the Fund’s expenses (except for the investment advisory fee, interest and taxes). The Trustees concluded that it would be putting form over substance to treat the two agreements separately. The representative of the Adviser then reviewed the advisory fee and expense ratio for the Fund and compared the fee and expense ratio with the advisory fees and expense ratios of the Fund’s Category and Peer Group. He noted that the expense ratio was more meaningful than the actual advisory fee ratio because the agreements have a “universal fee” structure where the Adviser pays substantially all of the expenses of the Fund and is compensated with a higher fee. The representative further noted that most of the funds in the comparative data do not share this structure.
After discussion, the Trustees agreed that, instead of comparing actual advisory fees, it was more appropriate to compare net expense ratios, due to the universal fee structure. The Trustees further noted that some of the funds in the comparative data were one class of a fund that had many classes and, thus, benefit from economies of scale provided by the other classes. The Trustees noted that the Fund’s net expense ratio was at the top of the Peer Group and near the top of the Category, but within the range of the Category.
At this point, the representative added that the work involved in running the Fund was significantly higher than for most other funds because of the extreme volatility of high-growth and technology stocks. He stated that he is actively managing the Fund’s portfolio every day, using a time-intensive process to follow news regarding each of the stocks in the portfolio and stocks that he is considering for the portfolio. He estimated that a net positive performance of the Fund is generated by his doing trading “on the edges,” which he believes allows the Fund to take advantage of short-term movements in particular stock prices. The Trustees recognized the benefit of the Adviser’s active management of the Fund and, based on their review, concluded that the cost of services provided by the Adviser was appropriate.
24
ADDITIONAL INFORMATION
(unaudited)
Profitability of the Adviser
The Trustees next considered an analysis of the profitability of the Advisor from the fees payable under the Advisory Agreement and the Administration Agreement. In addition, the Trustees reviewed the financial condition of the Investment Advisor for 2020 and through October 2021, as well as information from a Management Practice, Inc. (“MPI”) 2019 profitability analysis of 16 publicly-reported asset managers. A representative of the Advisor reviewed the profitability analysis of the Advisor with the Trustees, noting that as no rent expenses and no payroll expenses were deducted through October 2021, the Advisor’s profitability was significantly overstated. The Trustees remarked that the Advisor’s level of profitability was above the average pre-tax operating margins reported in the MPI analysis before considering certain expenses. They also note that the profitability for equity funds was generally significantly higher and that after including the Advisor’s expected payroll expense for 2021 the Advisor’s profitability was in the acceptable range.
Economies of Scale
The Trustees next considered whether the Fund has appropriately benefitted from any economies of scale, and whether there is potential for realization of any further economies of scale. The representative of the Adviser reminded the Trustees that the Adviser’s fees under the Administration Agreement contain breakpoints and noted that the Fund was already receiving the benefit of the fee reduction at the third break point. The Trustees acknowledged that the Adviser was entitled to reasonable profits and indicated that the existing breakpoints are, and should continue to pass on the benefits of economies of scale to shareholders.
Conclusion
At this point, the Trustees indicated that it was their consensus that the information presented and the discussion of the information were adequate for making a determination regarding the renewal of the Advisory Agreement. As to the nature, extent and quality of services provided by the Adviser, the Trustees expressed their common opinion that the Adviser provides excellent services to the Fund and that the extent of the services is consistent with the Board’s expectations. They complimented the Adviser on the Fund’s outstanding relative performance over the last fifteen years. The Trustees then concluded that, based on their review of the fees and overall expense comparisons, as well as all information relating to the profitability of the Adviser, that the advisory and administration fees were reasonable and that the arrangements were not generating excessive profits to the Adviser. The Trustees further concluded that the existing fee breakpoints would make the Adviser’s fees reflective of economies of scale.
After further discussion, and based upon all of the above-mentioned factors and their related conclusions, with no single factor or conclusion being determinative and with each Trustee not necessarily attributing the same weight to each factor, the Trustees unanimously determined that the continuation of the Advisory Agreement for an additional year was in the best interests of the Fund and its shareholders.
25

Item 2. Code of Ethics.
The registrant has adopted a code of ethics that applies to the registrant’s principal executive officer and principal financial officer. The registrant has not made any substantive amendments to its code of ethics during the period covered by this report. The registrant has not granted any waivers from any provisions of the code of ethics during the period covered by this report.
The registrant undertakes to provide to any person without charge, upon request, a copy of its code of ethics by mail when they call the registrant at 1-877-526-0707.
Item 3. Audit Committee Financial Expert.
The registrant’s Board of Trustees has determined that David A. White is an audit committee finical expert. Mr. White is independent for purposes of this Item 3.
Item 4. Principal Accountant Fees and Services.
(a-d) The following table details the aggregate fees billed for each of the last two fiscal years for audit fees, audit-related fees, tax fees and other fees by the principal accountant to the registrant. The principal accountant has provided no services to the adviser or any entity controlled by, or under common control with the adviser that provides ongoing services to the registrant.
| | FYE 12/31/21 | FYE 12/31/20 |
| Audit Fees | $15,500 | $14,500 |
| Audit-Related Fees | $0 | $0 |
| Tax Fees | $6,500 | $6,500 |
| All Other Fees | $0 | $0 |
Nature of Tax Fees: preparation of Excise Tax Statement, 1120 RIC, and review of year end dividend calculation.
(e) (1) The audit committee approves all audit and non-audit related services and, therefore, has not adopted pre-approval policies and procedures described in paragraph (c)(7) of Rule 2-01 of Regulation S-X.
(e) (2) None of the services described in paragraph (b) through (d) of this Item were approved by the audit committee pursuant to paragraph (c)(7)(i)(C) of Rule 2-01 of Regulation S-X.
(f) All of the principal accountant’s hours spent on auditing the registrant’s financial statements were attributed to work performed by full-time permanent employees of the principal accountant.
(g) The following table indicates the aggregate non-audit fees billed by the registrant’s principal accountant for services to the registrant, the registrant’s investment adviser (not sub-adviser), and any entity controlling, controlled by, or under common control with the adviser that provides ongoing services to the registrant, for the last two years.
| Non-Audit Fees | FYE 12/31/21 | FYE 12/31/20 |
| Registrant | $6,500 | $6,500 |
| Registrant’s Investment Adviser | $0 | $0 |
(h) The principal accountant provided no services to the investment adviser or any entity controlling, controlled by, or under common control with the adviser that provides ongoing services to the registrant.
Item 5. Audit Committee of Listed Registrants.
Not applicable to registrants who are not listed issuers (as defined in Rule 10A-3 under the Securities Exchange Act of 1934).
(a) Not applicable. Schedule filed with Item 1.
(b) Not applicable.
Item 7. Disclosure of Proxy Voting Policies and Procedures for Closed-End Management Investment Companies.
Not applicable to open-end investment companies.
Item 8. Portfolio Managers of Closed-End Management Investment Companies.
Not applicable to open-end investment companies.
Item 9. Purchases of Equity Securities by Closed-End Management Investment Company and Affiliated Purchasers.
Not applicable to open-end investment companies.
Item 10. Submission of Matters to a Vote of Security Holders.
Not Applicable.
Item 11. Controls and Procedures.
(a) The Registrant’s president and chief financial officer concluded that the disclosure controls and procedures (as defined in Rule 30a-3(c) under the Act (17 CFR 270.30a -3(c))) as of a date within 90 days of the filing date of the report that includes the disclosure required by this paragraph, based on the evaluation of these controls and procedures required by Rule 30a-3(b) under the Act (17 CFR 270.30a -3(b)) and Rules 13a-15(b) or 15d-15(b) under the Exchange Act (17 CFR 240.13a -15(b) or 240.15d -15(b)).
(b) There were no changes in the registrant’s internal control over financial reporting (as defined in Rule 30a-3(d) under the Act (17 CFR 270.30a -3(d)) that occurred during the period covered by this report that has materially affected, or is reasonably likely to materially affect, the registrant’s internal control over financial reporting.
Item 12. Disclosure of Securities Lending Activities for Closed-End Management Investment Companies.
Not Applicable.
Item 13. Exhibits.
| (a) | (1) Code of Ethics. Incorporated by reference to the Registrant’s Form N-CSR filed March 1, 2004. |
| |
| | (2) | A separate certification for each principal executive officer and principal financial officer pursuant to Section 302 of the Sarbanes-Oxley Act of 2002. Filed herewith. |
| |
| | (3) | Not applicable. |
| |
| | (4) | Not applicable. |
| |
| (b) | Certifications pursuant to Section 906 of the Sarbanes-Oxley Act of 2002. Filed herewith. |
| |
SIGNATURES
Pursuant to the requirements of the Securities Exchange Act of 1934 and the Investment Company Act of 1940, the registrant has duly caused this report to be signed on its behalf by the undersigned, thereunto duly authorized.
The Berkshire Funds
By /s/ Malcolm R. Fobes III
Malcolm R. Fobes III
President and Treasurer
Date 3/7/22 |
Pursuant to the requirements of the Securities Exchange Act of 1934 and the Investment Company Act of 1940, this report has been signed below by the following persons on behalf of the registrant and in the capacities and on the dates indicated.
By /s/ Malcolm R. Fobes III
Malcolm R. Fobes III
President and Treasurer
Date 3/7/22 |