Management’s Discussion of Performance
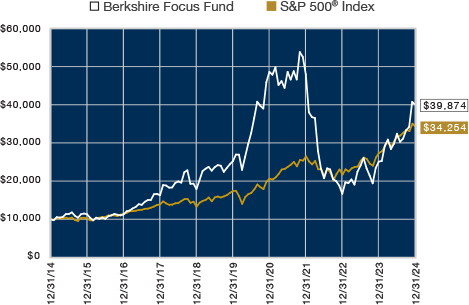
For the twelve-month period ended December 31, 2024, the Berkshire Focus Fund significantly outperformed its primary benchmark index. The Fund generated a total return of 59.16% while the S&P 500® Index—which we consider to be the Fund’s primary benchmark index—produced a total return of 25.02% over the same period. A $10,000 investment in our Fund over 10 years starting on December 31, 2014, grew to $39,874. This was a +14.83% average annual compounded return. A $10,000 investment in the S&P 500® over the same period grew to $34,254. This was a +13.10% average annual compounded return.
U.S. equity markets delivered another extraordinary performance in 2024, building on the strong returns of the previous year. The S&P 500® Index set 57 new all-time highs during the period fueled by investor optimism for artificial intelligence (AI), moderating inflation, and expectations the Federal Reserve would cut interest rates in the latter half of the year. Stock markets exploded upwards following Donald Trump’s victory in November on optimism the new administration would usher in a pro-business, pro-growth environment led by deregulation, income tax reform, corporate tax cuts, increased infrastructure spending and other initiatives. Stocks extended their upward trajectory into early December, yet they lost their momentum by the end of the year as the often observed “Santa Claus” rally was nowhere to be found.
Our investments in NVIDIA (NVDA), Broadcom (AVGO), Carvana (CVNA), Marvell (MRVL), Meta (META), MicroStrategy (MSTR), Tesla (TSLA) and Taiwan Semiconductor (TSM) were all contributors to the Fund’s performance during the period. However, some of our investments detracted from the Fund’s performance—these included Advanced Micro Devices (AMD), ASML (ASML), MongoDB (MDB) and Western Digital (WDC). New significant additions to the portfolio in the second half were AppLovin (APP), Astera Labs (ALAB), Credo Technology (CRDO), Reddit (RDDT), Robinhood (HOOD), Palantir (PLTR) and Vertiv (VRT).
Fund Statistics
Net Assets: $276.4 million
Portfolio Holdings: 22
Portfolio Turnover: 2481.8%
Total Advisory Fees Paid: $3,638,688
In order to reduce expenses, we will deliver a single copy of prospectuses, proxies, financial reports, and other communication to shareholders with the same residential address, provided they have the same last name or we reasonably believe them to be members of the same family. Unless we are notified otherwise, we will continue to send you only one copy of these materials for as long as you remain a shareholder of the Fund. If you would like to receive individual mailings, please call 1-877-526-0707 and we will begin sending you separate copies of these materials within 30 days after we receive your request.
For additional information about the Fund, including its Prospectus, Statement of Additional Information, financial statements, holdings and proxy information, please visit www.berkshirefunds.com.
| Item 6. Investments | | |
| | | | | |
| Berkshire Focus Fund | | |
| PORTFOLIO OF INVESTMENTS | | |
| December 31, 2024 | | |
| | | | | |
| Shares | | | | Value |
| | | | | |
| | | COMMON STOCKS - 100.14% | | $ 276,732,016 |
| | | (Cost $252,449,303) | | |
| | | | | |
| | | AUTOMOBILE MANUFACTURERS - 6.91% | | 19,085,611 |
| 10 | | Rivian Automotive, Inc. (Class A) * | | 133 |
| 47,260 | | Tesla, Inc. * | | 19,085,478 |
| | | | | |
| | | BUSINESS SOFTWARE & SERVICES - 14.87% | 41,088,716 |
| 10 | | Adobe, Inc. * | | 4,447 |
| 35,590 | | AppLovin Corporation (Class A) * | | 11,525,110 |
| 10 | | BILL Holdings, Inc. * | | 847 |
| 10 | | Cadence Design Systems, Inc. * | | 3,005 |
| 88,570 | | Cloudflare, Inc. (Class A) * | | 9,537,218 |
| 73,200 | | Datadog, Inc. (Class A) * | | 10,459,548 |
| 10 | | Elastic N.V. (Netherlands) * | | 991 |
| 10 | | GitLab Inc. (Class A) * | | 564 |
| 10 | | HubSpot, Inc. * | | 6,968 |
| 10 | | Impinj, Inc. * | | 1,453 |
| 10 | | Intuit, Inc. | | 6,285 |
| 10 | | Microsoft Corp. | | 4,215 |
| 10 | | monday.com Ltd. (Israel) * | | 2,354 |
| 10 | | MongoDB, Inc. (Class A) * | | 2,328 |
| 10 | | Oracle Corp. | | 1,666 |
| 125,780 | | Palantir Technologies Inc. (Class A) * | | 9,512,741 |
| 10 | | Samsara Inc. (Class A) * | | 437 |
| 10 | | ServiceNow, Inc. * | | 10,601 |
| 10 | | Snowflake Inc. (Class A) * | | 1,544 |
| 10 | | Synopsys, Inc. * | | 4,854 |
| 10 | | Toast, Inc. (Class A) * | | 365 |
| 10 | | The Trade Desk, Inc. (Class A) * | | 1,175 |
| | | | | |
| | | CAPITAL MARKETS - 4.70% | | 12,978,031 |
| 348,310 | | Robinhood Markets, Inc. (Class A) * | | 12,978,031 |
| | | | | |
| | | COMMUNICATION EQUIPMENT - 13.93% | | 38,499,936 |
| 76,950 | | Arista Networks, Inc. * | | 8,505,283 |
| 121,350 | | Astera Labs, Inc. * | | 16,072,807 |
| 68,720 | | Ciena Corporation * | | 5,828,143 |
| 10 | | Coherent Corp. * | | 947 |
| 120,410 | | Credo Technology Group Holding Ltd * | | 8,092,756 |
| | | | | |
| | | COMPUTER HARDWARE - 0.00% | | 3,828 |
| 10 | | Dell Technologies, Inc. - Class C | | 1,152 |
| 10 | | NetApp, Inc. | | 1,161 |
| 10 | | Pure Storage, Inc. (Class A) * | | 614 |
| 10 | | Super Micro Computer, Inc. * | | 305 |
| 10 | | Western Digital Corporation * | | 596 |
| | | | | |
| | | CONSUMER ELECTRONICS - 0.00% | | 2,504 |
| 10 | | Apple, Inc. | | 2,504 |
| | | | | |
| | | CRYPTOCURRENCY - 0.00% | | 5,882 |
| 10 | | CleanSpark, Inc. * | | 92 |
| 10 | | Coinbase Global, Inc. (Class A) * | | 2,483 |
| 10 | | Core Scientific, Inc. * | | 141 |
| 10 | | Marathon Holdings, Inc. * | | 168 |
| 10 | | MicroStrategy, Inc. (Class A) * | | 2,896 |
| 10 | | Riot Platforms, Inc. * | | 102 |
| | | | | |
| | | CYBERSECURITY EQUIPMENT & SERVICES - 2.94% | 8,129,020 |
| 23,730 | | CrowdStrike Holdings, Inc. (Class A) * | | 8,119,457 |
| 10 | | CyberArk Software Ltd. (Israel) * | | 3,332 |
| 10 | | Okta, Inc. (Class A) * | | 788 |
| 20 | | Palo Alto Networks, Inc. * | | 3,639 |
| 10 | | Zscaler, Inc. * | | 1,804 |
| | | | | |
| | | DRUG MANUFACTURERS - 0.00% | | 8,580 |
| 10 | | Eli Lilly and Company | | 7,720 |
| 10 | | Novo Nordisk A/S - ADR | | 860 |
| | | | | |
| | | ELECTRIC UTILITIES - 0.00% | | 2,237 |
| 10 | | Constellation Energy Corporation | | 2,237 |
| | | | | |
| | | ELECTRICAL EQUIPMENT - 3.01% | | 8,315,270 |
| 10 | | Eaton Corporation plc (Ireland) | | 3,319 |
| 73,150 | | Vertiv Holdings Co (Class A) | | 8,310,572 |
| 10 | | Vistra Corp. | | 1,379 |
| | | | | |
| | | ENTERTAINMENT - 0.00% | | 14,709 |
| 10 | | Netflix, Inc. * | | 8,913 |
| 10 | | Roblox Corporation (Class A) * | | 579 |
| 10 | | Roku, Inc. (Class A) * | | 743 |
| 10 | | Spotify Technology S.A. - (Luxembourg) * | | 4,474 |
| | | | | |
| | | HOTELS, RESTAURANTS & LEISURE - 0.00% | 1,731 |
| 10 | | CAVA Group, Inc. * | | 1,128 |
| 10 | | Chipotle Mexican Grill, Inc. * | | 603 |
| | | | | |
| | | INTERNET SERVICES - 9.40% | | 25,970,714 |
| 10 | | Airbnb, Inc. (Class A) * | | 1,314 |
| 10 | | Alphabet, Inc. (Class A) | | 1,893 |
| 79,910 | | Amazon.com, Inc. * | | 17,531,455 |
| 10 | | Booking Holdings Inc. | | 49,684 |
| 10 | | Carvana Co. (Class A) * | | 2,034 |
| 10 | | Global-E Online Ltd. (Israel) * | | 545 |
| 10 | | MercadoLibre, Inc. (Argentina) * | | 17,004 |
| 78,680 | | Shopify Inc. (Class A) (Canada) * | | 8,366,044 |
| 10 | | Zillow Group, Inc. (Class C) * | | 741 |
| | | | | |
| | | INTERNET SOCIAL MEDIA - 7.79% | | 21,517,587 |
| 22,500 | | Meta Platforms, Inc. (Class A) | | 13,173,975 |
| 51,050 | | Reddit, Inc. (Class A) * | | 8,343,612 |
| | | | | |
| | | IT FINANCIAL SERVICES - 7.37% | | 20,363,157 |
| 177,370 | | Affirm Holdings, Inc. (Class A) * | | 10,801,833 |
| 10 | | Block Inc. (Class A) * | | 850 |
| 620,810 | | SoFi Technologies, Inc. * | | 9,560,474 |
| | | | | |
| | | PERSONAL DEFENSE EQUIPMENT - 0.00% | | 5,943 |
| 10 | | Axon Enterprise, Inc. * | | 5,943 |
| | | | | |
| | | SEMICONDUCTORS - 29.21% | | 80,717,743 |
| 10 | | Advanced Micro Devices, Inc. * | | 1,208 |
| 10 | | Arm Holdings plc - ADR * | | 1,234 |
| 71,810 | | Broadcom Inc. | | 16,648,430 |
| 76,100 | | Marvell Technology, Inc. | | 8,405,245 |
| 10 | | Micron Technology, Inc. | | 842 |
| 10 | | Monolithic Power Systems, Inc. | | 5,917 |
| 290,360 | | NVIDIA Corp. | | 38,992,444 |
| 10 | | ON Semiconductor Corporation * | | 631 |
| 10 | | QUALCOMM Inc. | | 1,536 |
| 84,360 | | Taiwan Semiconductor Manufacturing Company Limited - ADR | 16,660,256 |
| | | | | |
| | | SEMICONDUCTOR EQUIPMENT - 0.01% | | 15,580 |
| 10 | | Applied Materials, Inc. | | 1,626 |
| 10 | | ASML Holding N.V. - ADR | | 6,931 |
| 10 | | KLA Corporation | | 6,301 |
| 10 | | Lam Research Corporation | | 722 |
| | | | | |
| | | SPORTS ENTERTAINMENT & GAMING - 0.00% | 2,956 |
| 10 | | DraftKings Inc. (Class A) * | | 372 |
| 10 | | Flutter Entertainment plc (Ireland) * | | 2,584 |
| | | | | |
| | | TRANSPORT NETWORKS - 0.00% | | 2,281 |
| 10 | | DoorDash, Inc. (Class A) * | | 1,678 |
| 10 | | Uber Technologies, Inc. * | | 603 |
| | | | | |
| | | EXCHANGE TRADED FUNDS - 0.00% | | 9,066 |
| | | (Cost $2,834) | | |
| 10 | | Invesco QQQ ETF | | 5,112 |
| 10 | | iShares® Bitcoin Trust * | | 531 |
| 10 | | iShares® Expanded Tech-Software Sector ETF * | 1,001 |
| 10 | | VanEck Semiconductor ETF | | 2,422 |
| | | | | |
| | | TOTAL INVESTMENT SECURITIES - 100.14% | 276,741,082 |
| | | (Cost $252,452,137) | | |
| | | | | |
| | | LIABILITIES IN EXCESS OF OTHER ASSETS - (0.14%) | (376,488) |
| | | | | |
| | | NET ASSETS - 100.00% | | $ 276,364,594 |
| | | Equivalent to $30.24 Per Share | | |
| | | | | |
| | | | | |
| | | | | |
| | | | | |
| | | | | |
| | | | | |
| | | * Non-income producing. | | |
| | | ADR - American Depositary Receipt. | | |
| | | The accompanying notes are an integral part of these financial statements. |
| NOTES TO FINANCIAL STATEMENTS |
| December 31, 2024 |
| | | | | | | | | | |
| 1. Organization | | | | | | | | | |
The Berkshire Focus Fund (the “Fund”) is a non-diversified series of The Berkshire Funds (the “Trust”), an open-end management investment company registered under the Investment Company Act of 1940, as amended (the “1940 Act”). The Trust was organized as a Delaware business trust on November 25, 1996. The Fund commenced operations on July 1, 1997. The Fund’s investment objective is to seek long-term growth of capital primarily through investments in equity securities.
|
| | | | | | | | | | |
2. Significant Accounting Policies
| | | | | | | | | |
The Fund is an investment company and accordingly follows the investment company accounting and reporting guidance of the Financial Accounting Standards Board (“FASB”) Accounting Standards Codification Topic 946 Financial Services – Investment Companies. The financial statements are prepared in conformity with accounting principles generally accepted in the United States of America (“GAAP”).
|
| | | | | | | | | | |
| The Fund is deemed to be an individual reporting segment and is not part of a consolidated reporting entity. The objective and strategy of the Fund is used by the investment manager to make investment decisions, and the results of the operations, as shown in the statements of operations and the financial highlights for the Fund is the information utilized for its day-to-day management. The Fund is party to the expense agreements as disclosed in the notes to the financial statements and resources are not allocated based on performance measurements. Due to the significance of oversight and their role, the Adviser is deemed to be the Chief Operating Decision Maker. |
| | | | | | | | | | |
The following is a summary of the Trust’s significant accounting policies:
| | | | | |
| | | | | | | | | | |
Cash — The Fund maintains cash at its custodian which, at times, may exceed United States federally insured limits.
|
| | | | | | | | | | |
Securities valuation — The Fund’s portfolio securities generally are valued by using market quotations but may be valued on the basis of prices furnished by a pricing service when the Valuation Committee believes such prices accurately reflect the fair market value of such securities. Securities that are traded on any stock exchange or on the NASDAQ over-the-counter market are generally valued by the pricing service at the last quoted sale price. Lacking a last sale price, an equity security is generally valued by the pricing service at its last bid price. Generally, if the security is traded in an active market and is valued at its last sales price, the security is categorized as a Level 1 security (described below), and if an equity security is valued by the pricing service at its last bid, it is generally categorized as a Level 2 security. When market quotations are not readily available, when the Valuation Committee determines that the market quotation or the price provided by the pricing service does not accurately reflect the current market value, or when restricted or illiquid securities are being valued, such securities are valued in good faith by the Valuation Committee, in accordance with the Trust’s Valuation and Fair Value Pricing Policies and Procedures and are categorized as level 2 or level 3, when appropriate. The Trust's Valuation Committee shall consist of the Trust’s independent trustees, and the Fund portfolio manager as a non-voting member.
|
| | | | | | | | | | |
In accordance with the Trust's Valuation and Fair Value Pricing Policies and Procedures which were established in accordance with Rule 2a-5 of the 1940 Act, it is incumbent upon the Valuation Committee to consider all appropriate factors relevant to the value of securities for which market quotations are not readily available. No single standard for determining fair value can be established, since fair value depends upon the circumstances of each individual case. As a general principle, the current fair value of an issue of securities being valued by the Valuation Committee would appear to be the amount that the owner might reasonably expect to receive for them upon their current sale. Methods that are in accordance with this principle may, for example, be based on (i) a multiple of earnings; (ii) a discount from market of a similar freely traded security (including a derivative security or a basket of securities traded on other markets, exchanges or among dealers); or (iii) yield to maturity with respect to debt issues, or a combination of these or other methods.
|
| | | | | | | | | | |
The Trust has adopted accounting standards which establish an authoritative definition of fair value and set out a hierarchy for measuring fair value. These standards require additional disclosures about the various inputs and valuation techniques used to develop the measurements of fair value and a discussion of changes in valuation techniques and related inputs during the period. These standards define fair value as the price that would be received to sell an asset or paid to transfer a liability in an orderly transaction between market participants at the measurement date. The fair value hierarchy is organized into three levels based upon the assumptions (referred to as “inputs”) used in pricing the asset or liability. These standards state that “observable inputs” reflect the assumptions market participants would use in pricing the asset or liability based on market data obtained from independent sources and “unobservable inputs” reflect an entity's own assumptions about the assumptions market participants would use in pricing the asset or liability. These inputs are summarized in the three broad levels listed below:
|
| | | | | | | | | | |
Level 1 – Unadjusted quoted prices in active markets for identical securities that the Fund has the ability to access.
|
| | | | | | | | | | |
Level 2 – Other significant observable inputs (including quoted prices for similar securities, interest rates, prepayment speeds, credit risk, etc.).
|
| | | | | | | | | | |
Level 3 – Significant unobservable inputs (including the Fund’s Valuation Committee's own assumptions in determining the fair value of investments).
|
| | | | | | | | | | |
The inputs or methodology used for valuing securities are not necessarily an indication of the risk associated with investing in those securities.
|
| | | | | | | | | | |
The following is a summary of the inputs used to value the Fund’s investments as of December 31, 2024:
|
| | | | | | | | | | |
| | | Level 1 | | Level 2 | | Level 3 | | Total | |
| Common Stock | | | | | | | | | |
| Semiconductors | | $ 80,717,743 | | - | | - | | $ 80,717,743 | |
| Business Software & Services | | 41,088,716 | | - | | - | | 41,088,716 | |
| Communication Equipment | | 38,499,936 | | - | | - | | 38,499,936 | |
| Internet Services | | 25,970,714 | | - | | - | | 25,970,714 | |
| Internet Social Media | | 21,517,587 | | - | | - | | 21,517,587 | |
| IT Financial Services | | 20,363,157 | | - | | - | | 20,363,157 | |
| Automobile Manufacturers | | 19,085,611 | | - | | - | | 19,085,611 | |
| Capital Markets | | 12,978,031 | | - | | - | | 12,978,031 | |
| Electrical Equipment | | 8,315,270 | | - | | - | | 8,315,270 | |
| Cybersecurity Equipment & Services | | 8,129,020 | | - | | - | | 8,129,020 | |
| Semiconductor Equipment | | 15,580 | | - | | - | | 15,580 | |
| Entertainment | | 14,709 | | - | | - | | 14,709 | |
| Drug Manufacturers | | 8,580 | | - | | - | | 8,580 | |
| Personal Defense Equipment | | 5,943 | | - | | - | | 5,943 | |
| Cryptocurrency | | 5,882 | | - | | - | | 5,882 | |
| Computer Hardware | | 3,828 | | - | | - | | 3,828 | |
| Sports Entertainment & Gaming | | 2,956 | | - | | - | | 2,956 | |
| Consumer Electronics | | 2,504 | | - | | - | | 2,504 | |
| Transport Networks | | 2,281 | | - | | - | | 2,281 | |
| Electric Utilities | | 2,237 | | - | | - | | 2,237 | |
| Hotels, Restaurants & Leisure | | 1,731 | | - | | - | | 1,731 | |
| Total Common Stocks | | 276,732,016 | | - | | - | | 276,732,016 | |
| Exchange Traded Funds | | 9,066 | | - | | - | | 9,066 | |
| Total Investment Securities | | $ 276,741,082 | | - | | - | | $ 276,741,082 | |
| | | | | | | | | | |
| The Fund did not hold any Level 3 securities during the fiscal year ended December 31, 2024. |
| | | | | | | | | | |
| The Fund did not hold any derivative instruments during the reporting period. |
| | | | | | | | | | |
Investment income — Dividend income is recorded on the ex-dividend date. Interest income, if any, is accrued as earned using the effective interest method.
|
| | | | | | | | | | |
Distributions to shareholders — Distributions to shareholders arising from net investment income and net realized capital gains, if any, are distributed at least once each year. Distributions to shareholders are recorded on the ex-dividend date. The Fund may utilize earnings and profits distributed to shareholders on redemptions of shares as part of the dividends paid deduction. Dividends from net investment income and capital gain distributions are determined in accordance with income tax regulations, which may differ from GAAP.
|
| | | | | | | | | | |
Security transactions — Security transactions are accounted for on the trade date for financial reporting purposes. Securities sold are determined on a specific identification basis.
|
| | | | | | | | | | |
Estimates — The financial statements are prepared in accordance with GAAP, which requires management to make estimates and assumptions that affect the reported amounts of assets and liabilities and disclosure of contingent assets and liabilities at the date of the financial statements and the reported amounts of increases and decreases in net assets from operations during the reporting period. Actual results could differ from those estimates.
|
| | | | | | | | | | |
Federal income tax — The Fund complies and intends to continue to comply with the requirements of Subchapter M of the Internal Revenue Code (the “Code”) necessary to qualify as a regulated investment company. As provided therein, in any fiscal year in which the Fund so qualifies and distributes at least 90% of its taxable net income, the Fund (but not the shareholders) will be relieved of federal income tax on the income distributed. Accordingly, no provision for income taxes has been made.
|
| | | | | | | | | | |
As of and during the fiscal year ended December 31, 2024, the Fund did not have a liability for any unrecognized tax benefits. The Fund recognizes interest and penalties, if any, related to unrecognized tax benefits as other expense on the statement of operations. During the year, the Fund did not incur any tax-related interest or penalties.
|
| | | | | | | | | | |
In order to avoid imposition of the excise tax applicable to regulated investment companies, it is also the Fund’s intention to declare as dividends in each calendar year at least 98% of its net investment income and 98.2% of its net realized capital gains plus undistributed amounts from prior years.
|
| | | | | | | | | | |
Other — The treatment for financial reporting purposes of distributions made to shareholders during the year from net investment income or net realized capital gains may differ from their ultimate treatment for federal income tax purposes. These differences are caused primarily by differences in the timing of the recognition of certain components of income, expense or realized capital gain for federal income tax purposes. Where such differences are permanent in nature, they are reclassified in the components of the net assets based on their ultimate characterization for federal income tax purposes. Any such reclassifications will have no effect on net assets, results of operations or net asset value per share of the Fund. Effective September 30, 2019, the Fund elected a tax year-end of September 30. For the tax year ended September 30, 2024 and the fiscal year December 31, 2024, the following permanent adjustment was recorded.
|
| | | | | | | | | | |
The adjustment was primarily related to the reclassification of net operating loss:
|
| | | | | | | | | | |
| Paid-In Capital | | ($4,239,793) | | | | | | | |
| Total Distributable Earnings | | $4,239,793 | | | | | | | |
| | | | | | | | | | |
| 3. Investment Transactions |
Purchases and sales of investment securities (excluding short-term instruments) for the fiscal year ended December 31, 2024, were $5,955,553,092 and $6,015,703,148 respectively. There were no purchases or sales of U.S. Government securities for the Fund.
|
| | | | | | | | | | |
4. Tax Information
| | | | | | | | | |
For Federal income tax purposes, as of December 31, 2024, the cost of investments, and gross appreciation/depreciation was as follows:
|
| | | | | | | | | | |
| Federal Income Tax Cost | | $270,351,627 | | | | | | | |
| Gross Unrealized Appreciation | | 28,723,084 | | | | | | | |
| Gross Unrealized Depreciation | | (22,333,629) | | | | | | | |
| Net Unrealized Appreciation | | $6,389,455 | | | | | | | |
| | | | | | | | | | |
The cost basis of investments for tax and financial reporting purposes differed primarily due to wash sales.
|
| | | | | | | | | | |
There were no distributions paid during the fiscal years ended December 31, 2024 and 2023.
|
| | | | | | | | | | |
As of the tax year ended September 30, 2024, the components of distributable earnings (accumulated deficit) on a tax basis were as follows:
|
| | | | | | | | | | |
| Accumulated Capital and Other Losses | | ($256,852,623) | | | | | | | |
| Net Unrealized Appreciation | | 6,342,591 | | | | | | | |
| Total Accumulated Deficit | | ($250,510,032) | | | | | | | |
| | | | | | | | | | |
As of tax year ended September 30, 2024, accumulated capital and other losses included the following:
|
| | | | | | | | | | |
| Deferred Interest Expense | | ($90,507) | | | | | | | |
| Deferred Late Year Ordinary Losses | | ($3,000,029) | | | | | | | |
| Short-Term Capital Loss Carryforward | | ($252,010,641) | | | | | | | |
| Long-Term Capital Loss Carryforward | | ($1,751,446) | | | | | | | |
| | | | | | | | | | |
Under current tax law, late year ordinary losses incurred after December 31 of a fund’s tax year end may be deferred and treated as occurring on the first business day of the following year for tax purposes. The capital loss carryforward has no expiration. During the tax year ended September 30, 2024, the Fund utilized $56,062,019 of short-term capital loss carryforwards.
|
| | | | | | | | | | |
| 5. Related Party Transactions, Investment Advisory and Administrative Fees | | | | | |
Certain Officers and Trustees of the Trust are also Officers and Directors of Berkshire Capital Holdings, Inc. (“Berkshire Capital”). The non-interested Trustees of the Fund were paid $90,000 in Trustee fees and expenses directly by Berkshire Capital during the fiscal year ended December 31, 2024.
|
| | | | | | | | | | |
The Chief Compliance Officer ("CCO") of the Fund was paid $24,000, in CCO fees for the fiscal year ended December 31, 2024, by the Adviser.
|
| | | | | | | | | | |
The Fund has an Investment Advisory Agreement (the “Advisory Agreement”) and a separate Administration Agreement with Berkshire Capital. Under the Advisory Agreement, Berkshire Capital will determine what securities will be purchased, retained or sold by the Fund on the basis of a continuous review of the portfolio. For the services it provides under the Advisory Agreement, Berkshire Capital receives a fee accrued each calendar day (including weekends and holidays) at a rate of 1.50% per annum of the daily net assets of the Fund.
|
| | | | | | | | | | |
Under the Administration Agreement, Berkshire Capital renders all administrative and supervisory services of the Fund, as well as facilities furnished and expenses assumed except for interest and taxes. For these services, Berkshire Capital receives a fee at the annual rate of 0.50% of the Fund’s average daily net assets up to $50 million, 0.45% of average net assets from $50 million to $200 million, 0.40% of average net assets from $200 million to $500 million, 0.35% of average net assets from $500 million to $1 billion and 0.30% of average net assets in excess of $1 billion. Such fee is computed as a percentage of the Fund’s daily net assets and is accrued each calendar day (including weekends and holidays). For the fiscal year ended December 31, 2024, Berkshire Capital was paid an investment advisory fee of $3,638,688 and an administration fee of $1,095,314 from the Fund. The amount due to Berkshire Capital for these fees at December 31, 2024, totaled $478,004.
|
| | | | | | | | | | |
6. Redemption Fee
| | | | | | | | | |
The Fund may impose a redemption fee of 2.00% on shares held for 90 days or less. For the fiscal year ended December 31, 2024, proceeds from redemption fees were $85,913.
|
| | | | | | | | | | |
7. Beneficial Ownership
| | | | | | | | | |
The beneficial ownership, either directly or indirectly, of more than 25% of the voting securities of a fund creates a presumption of control of the Fund, under Section 2(a)(9) of the 1940 Act. At December 31, 2024, National Financial Services Corp. beneficially owned, in aggregate, 52.59% of the Fund.
|
| | | | | | | | | | |
8. Market Developments, Events, and Risks
| | | | | | | |
Unexpected local, regional or global events, such as war; acts of terrorism; financial, political or social disruptions; natural, environmental or man-made disasters; the spread of infectious illnesses or other public health issues; and recessions and depressions could have a significant impact on the Fund and its investments and may impair market liquidity. Such events can cause investor fear, which can adversely affect the economies of nations, regions and the market in general, in ways that cannot necessarily be foreseen.
|
| | | | | | | | | | |
9. Revolving Credit Agreement
| | | | | | | | | |
The Trust entered into a Revolving Credit Agreement (the “Loan Agreement”) between the Trust and its custodian, The Huntington National Bank, N.A. The Fund may not borrow money or purchase securities on margin except for temporary or emergency (not leveraging) purposes, including the meeting of redemption requests that might otherwise require the untimely disposition of securities. The maximum amount that the Fund is permitted to borrow is the lesser of: (i) $3,000,000 or (ii) 10% of the Fund's daily market value and is secured by the securities in the Fund. The maximum interest rate of such loans is set at a rate per annum equal to the Term Secured Overnight Financing Rate subject to a 0.25% floor, plus 1.85% per annum, subject to an Annual Fee and an Unused Fee. The Annual Fee for the Loan Agreement is equal to 1/8 of one percent (1.00%) of the Loan Amount of $3,000,000 and the Unused Fee is equal to 1/8 of one percent (1.00%) of the excess of the Loan Amount over the outstanding principal balance of the loan. During the fiscal year ended December 31, 2024, the Fund had an average loan balance of $280,697 and paid an average interest rate of 7.02%. Additionally, the maximum borrowing during the period was $1,756,674, which occurred on June 12, 2024. As of December 31, 2024, there was an outstanding loan balance of $237,819 and the interest rate was 6.25% . No compensating balances are required. The loan matures on August 12, 2025, per agreement.
|
| | | | | | | | | | |
10. Concentration of Sector Risk
| | | | | | | | | |
If a Fund has significant investments in the securities of issuers in industries within a particular sector, any development affecting that sector will have a greater impact on the value of the net assets of the Fund than would be the case if the Fund did not have significant investments in that sector. In addition, this may increase the risk of loss of an investment in the Fund and increase the volatility of the Fund’s NAV per share. From time to time, circumstances may affect a particular sector and the companies within such sector. For instance, economic or market factors, regulation or deregulation, and technological or other developments may negatively impact all companies in a particular sector and therefore the value of a Fund’s portfolio will be adversely affected. As of December 31, 2024, the Fund had 29.21% of the value of its net assets invested in stocks within the Semiconductor sector.
|
| | | | | | | | | | |
11. Subsequent Events
| | | | | | | | | |
In preparing these financial statements, management has performed an evaluation of subsequent events after December 31, 2024, through the date these financial statements were issued and determined that there were no significant subsequent events that would require adjustment to or additional disclosure in the financial statements.
|
| Item 11. Statement Regarding Basis for Approval of Investment Advisory Contract. |
| | | | | | | | | | |
| The Board of Trustees (the “Trustees” or the “Board”), including a majority of the Trustees who are not “interested persons” of the Trust (the “Independent Trustees”), approved the continuation of the Investment Advisory Agreement (the “Advisory Agreement”) with Berkshire Capital Holdings, Inc. (the “Adviser”) at a meeting held on December 14, 2024. |
| | | | | | | | | | |
| The Trustees were assisted by experienced independent legal counsel throughout the contract review process. The Independent Trustees discussed the proposed continuance in executive session with such counsel at which time no representatives of the Adviser were present. The Independent Trustees relied upon the advice of independent legal counsel and their own business judgment in determining the material factors to be considered in evaluating the Advisory Agreement and the weight to be given to each such factor. Among other factors, the Independent Trustees considered the Fund’s performance; the nature, extent and quality of the services provided; the costs of the services provided; any profits realized by the Adviser; the extent to which economies of scale will be realized as the Fund grows; and whether fees reflect those economies of scale. The conclusions reached by the Independent Trustees were based on a comprehensive evaluation of all of the information provided and were not the result of any one factor. Moreover, each Independent Trustee may have afforded different weight to the various factors in reaching his conclusions with respect to the Advisory Agreement. |
| | | | | | | | | | |
| Prior to the executive session, a representative of the Adviser referred the Independent Trustees to the materials that had been provided to them for purposes of their consideration of the Advisory Agreement. He summarized the services provided by the Adviser to the Fund and he reported that there were no material changes in the structure or relationships of the Adviser. The representative next reviewed with the Trustees the average total returns of the Fund through quarter end September 30, 2024 (year-to-date, 1-year, 3-years, 5-years, 10-years and 15-years), month end November 30, 2024 (year-to-date), and the expense ratios and management fees of the Fund in comparison with funds in the Morningstar Technology Fund category (the “Category”), and a group of no-load Morningstar Technology Funds with net assets ranging from $40 million to $700 million (the “Peer Group”). He also reviewed comparisons of the Fund’s performance with its benchmark indices, as well as the Category and Peer Group. He noted that he had provided the Adviser’s balance sheet and income statement to the Independent Trustees prior to the meeting. He then led a discussion regarding the Adviser’s profitability, indicating a profit margin at the time of analysis. |
| | | | | | | | | | |
| Investment Performance | | | | | | | |
| The Independent Trustees considered the short-term and long-term investment performance of the Fund over various periods of time for the quarter ended September 30, 2024, and month end November 30, 2024, as compared to its benchmark indices and the Category and Peer Group. The Independent Trustees noted the Fund had outperformed its primary benchmark index, the S&P 500®, over the year-to-date, 1-year and 15-year periods, remarking in particular the year-to-date and 1-year performance of the Fund relevant to the primary benchmark index had been outstanding. The Fund underperformed its benchmark indices over the 3-year, 5-year, and 10-year periods. The data also showed the Fund outperformed its Category and Peer Group averages for the year-to-date and 1-year periods; and underperformed its Category and Peer Group averages for the 3-year, 5-year and 10-year periods. |
| | | | | | | | | | |
| The Trustees determined the Adviser was delivering acceptable performance results consistent with the long-term investment strategies being pursued by the Fund. Based on this review, the Independent Trustees concluded that the performance of the Adviser was acceptable for the purposes of approving the Advisory Agreement. |
| | | | | | | | | | |
| Nature, Extent and Quality of Services Provided by the Investment Adviser | | |
| The Trustees then reviewed the nature, quality and scope of current and anticipated services provided by the Adviser under the Advisory Agreement. The Trustees discussed the Adviser’s experience and the capabilities of the Adviser’s portfolio manager. For example, the Trustees reviewed and discussed the Adviser’s Form ADV and internal compliance policies, as well as the experience of the Adviser as investment adviser. In addition to the above considerations, the Trustees reviewed and considered a description of the Adviser’s portfolio and brokerage transactions, noting that the Adviser received no soft dollars. Based on this review, the Trustees concluded that the range and quality of services to be provided by the Adviser to the Fund were appropriate and continued to support its original selection of the Adviser. |
| | | | | | | | | | |
| Costs of Services Provided | | | | | | | |
| The Trustees next reviewed the terms of the Advisory Agreement and the Administration Agreement, concluding after discussion with independent counsel that it was appropriate to consider them together, given that the Adviser was performing all services under the agreements and that the Administration Agreement called for the Adviser to pay substantially all of the Fund’s expenses (except for the investment advisory fee, interest and taxes). The Trustees concluded that it would be putting form over substance to treat the two agreements separately. The representative of the Adviser then reviewed the advisory fee and expense ratio for the Fund and compared the fee and expense ratio with the advisory fees and expense ratios of the Fund’s Category and Peer Group. He noted that the expense ratio was more meaningful than the actual advisory fee ratio because the agreements have a “universal fee” structure where the Adviser pays substantially all of the expenses of the Fund and is compensated with a higher fee. The representative further noted that most of the funds in the comparative data do not share this structure. |
| | | | | | | | | | |
| After discussion, the Trustees agreed that, instead of comparing actual advisory fees, it was more appropriate to compare net expense ratios, due to the universal fee structure. The Trustees further noted that some of the funds in the comparative data were one class of a fund that had many classes and, thus, benefit from economies of scale provided by the other classes. The Trustees noted that the Fund’s net expense ratio was at the top of the Peer Group and near the top of the Category, but within the range of the Category. |
| | | | | | | | | | |
| At this point, the representative added that the work involved in running the Fund was significantly higher than for most other funds because of the extreme volatility of high-growth and technology stocks. He stated that he actively managed the Fund’s portfolio every day, and used a time-intensive process to follow news regarding each of the stocks in the portfolio and stocks that he considered for the portfolio. He estimated that a net positive performance of the Fund was generated by his doing trading “on the edges,” which he believed allowed the Fund to take advantage of short-term movements in particular stock prices. The Trustees recognized the benefit of the Adviser’s active management of the Fund and based on their review, concluded that the cost of services provided by the Adviser was appropriate. |
| | | | | | | | | | |
| Profitability of the Adviser | | | | | | | |
| The Trustees next considered an analysis of the profitability of the Adviser from the fees payable under the Advisory Agreement and the Administration Agreement. In addition, the Trustees reviewed the financial condition of the Investment Adviser for 2024, as well as information from a Management Practice, Inc. (“MPI”) 2019 profitability analysis of 16 publicly reported asset managers. A representative of the Adviser reviewed the profitability analysis of the Adviser with the Trustees, noting that as no rent expenses and no payroll expenses were deducted through September 30, 2024, the Adviser’s profitability was significantly overstated. The Trustees remarked that the Adviser’s level of profitability was above the median pre-tax operating margins reported in the MPI analysis before considering certain expenses. They also note that the profitability for equity funds was generally significantly higher, and that after including the Adviser’s expected payroll expense for 2024 the Adviser’s profitability was within the acceptable range. |
| | | | | | | | | | |
| Economies of Scale | | | | | | | |
| The Trustees next considered whether the Fund has appropriately benefitted from any economies of scale, and whether there is potential for realization of any further economies of scale. The representative of the Adviser reminded the Trustees that the Adviser’s fees under the Administration Agreement contain breakpoints and noted that the Fund was already receiving the benefit of the fee reduction at the third break point. The Trustees acknowledged that the Adviser was entitled to reasonable profits and indicated that the existing breakpoints are, and should continue to pass on the benefits of economies of scale to shareholders. |
| | | | | | | | | | |
| Conclusion | | | | | | | | |
| At this point, the Trustees indicated that it was their consensus that the information presented, and the discussion of the information were adequate for making a determination regarding the renewal of the Advisory Agreement. As to the nature, extent and quality of services provided by the Adviser, the Trustees expressed their common opinion that the Adviser provides excellent services to the Fund and that the extent of the services is consistent with the Board’s expectations. They complimented the Adviser on the Fund’s outstanding relative outperform-ance year-to-date, 1-year, and over the last 15 years. The Trustees then concluded that, based on their review of the fees and overall expense comparisons, as well as all information relating to the profitability of the Adviser, that the advisory and administration fees were reasonable and that the arrangements were not generating excessive profits to the Adviser. The Trustees further concluded that the existing fee breakpoints would make the Adviser’s fees reflective of economies of scale. |
| | | | | | | | | | |
| After further discussion and based upon all of the above-mentioned factors and their related conclusions, with no single factor or conclusion being determinative and with each Trustee not necessarily attributing the same weight to each factor, the Trustees unanimously determined that the continuation of the Advisory Agreement for an additional year was in the best interests of the Fund and its shareholders. |