UNITED STATES
SECURITIES AND EXCHANGE COMMISSION
Washington, D.C. 20549
CERTIFIED SHAREHOLDER REPORT OF REGISTERED
MANAGEMENT INVESTMENT COMPANIES
Investment Company Act file number 811-08043
The Berkshire Funds
(Exact name of registrant as specified in charter)
475 Milan Drive, Suite #103
San Jose, CA 95134-2453
(Address of principal executive offices) (Zip code)
Malcolm R. Fobes III
The Berkshire Funds
475 Milan Drive, Suite #103
San Jose, CA 95134-2453
(Name and address of agent for service) |
1-408-526-0707
Registrant's telephone number, including area code
Date of fiscal year end: December 31
Date of reporting period: June 30, 2022
Item 1. Report to Stockholders.
This report is provided for the general information of the Berkshire Funds shareholders. It is not authorized for distribution unless preceded or accompanied by an effective Prospectus, which contains more complete information about the Berkshire Funds. Please read it carefully before you invest.
In recent years, returns have sustained significant gains and losses due to market volatility in the technology sector. Due to market volatility, current performance may be lower than the figures shown. Call 877.526.0707 or visit www.berkshirefunds.com for more current performance information. Past performance is no guarantee of future results and investment results and principal value will fluctuate so that shares, when redeemed, may be worth more or less than their original cost. The returns shown do not reflect the deduction of taxes that a shareholder would pay on Fund distributions or the redemption of Fund shares. Total return includes reinvestment of dividends and capital gain distributions.
The Dow Jones Industrial Average is a measurement of general market price movement for 30 widely-held stocks primarily listed on the New York Stock Exchange. The S&P 500® Index is a registered trademark of Standard & Poor’s Corporation and is a market-weighted index of common stock prices for 500 large U.S. companies. The Nasdaq Composite Index is a capitalization-weighted index of over 5,000 common stocks listed on the Nasdaq Stock Market. Each index represents an unmanaged, broad-based basket of stocks. These indices are typically used as benchmarks for overall market performance.
Portfolio composition is subject to change at any time and references to specific securities, industries and sectors are not recommendations to purchase or sell any particular security.
The Fund’s distributor is Arbor Court Capital, LLC.
FUND OVERVIEW
June 30, 2022 (unaudited)
PERFORMANCE COMPARISON (Average annual total returns as of 6/30/22)
| | | YTD(1) | | 1 Year | | 3 Year | | 5 Year | | 10 Year | |
| |
| Berkshire Focus Fund | | –56.59% | | –57.21% | | –4.22% | | 8.48% | | 11.18% | |
| |
| S&P 500® Index | | –19.96% | | –10.62% | | 10.60% | | 11.31% | | 12.96% | |
| Dow Jones Industrial Average | | –14.44% | | –9.05% | | 7.24% | | 9.98% | | 11.70% | |
| Nasdaq Composite Index | | –29.23% | | –23.43% | | 12.18% | | 13.47% | | 15.40% | |
| NET ASSETS | | | |
| 6/30/22 | $259.9 Million |
| |
| |
| TOP 10 HOLDINGS(2) | | |
| Tesla, Inc. | | 14.02 | % |
| Snowflake, Inc. (Class A) | | 7.97 | % |
| MongoDB, Inc. (Class A) | | 7.93 | % |
| Datadog, Inc. (Class A) | | 5.99 | % |
| Cloudflare, Inc. (Class A) | | 5.46 | % |
| CrowdStrike Holdings, Inc. (Class A) | 4.96 | % |
| Atlassian Corporation Plc (Class A) | 4.93 | % |
| Hubspot, Inc. | | 4.93 | % |
| Block, Inc. (Class A) | | 4.58 | % |
| BYD Company Ltd. – ADR | | 4.38 | % |
| |
| |
| TOP 10 SECTORS(4) | | | |
| Business Software & Services | 47.69 | % |
| Automobile Manufacturer | | 21.24 | % |
| Cybersecurity Equipment & Services | 10.52 | % |
| IT Financial Services | | 4.58 | % |
| Communication Services | | 4.00 | % |
| Internet Services | | 3.74 | % |
| Semiconductor | | 2.96 | % |
| Data Storage | | 2.84 | % |
| Entertainment | | 2.48 | % |
| Semiconductor Equipment | | 0.01 | % |
NET ASSET VALUE
Net Asset Value Per Share $15.72
| (1) | Not annualized for periods of less than one full year. |
| |
| (2) | Stated as a percentage of total net assets as of 6/30/22. The holdings information provided should not be construed as a recommendation to purchase or sell a particular security and may not be representative of the fund’s current or future investments. |
| |
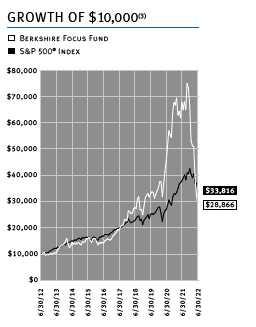
| (3) | This chart assumes an initial investment of $10,000 made on 6/30/12. Past performance does not guarantee future results. Investment return and principal value will fluctuate so that shares, when redeemed, may be worth more or less than their original cost. All returns reflect reinvested dividends but do not reflect the impact of taxes. |
| |
| (4) | Stated as a percentage of total net assets as of 6/30/22. The holdings by sector are presented to illustrate examples of the sectors in which the fund has bought securities and may not be representative of the Fund’s current or future investments. |
| |
| | The Fund’s total annual operating expense ratio of 1.90% is reflective of the information disclosed in the Fund’s prospectus dated May 1, 2022. The total annual operating expense ratio may not agree to the expense ratio in this report due to the use of breakpoints and interest expense incurred. |
| |
| | This Fund concentrates its investments in the technology industry. As a result, the fund is subject to greater risk than more diversified funds because of its concentration of investments in fewer companies and certain segments of a single industry. |
| |
1
Berkshire Focus Fund
Performance and Portfolio Discussion
6/30/2022
2

Dear Fellow Shareholders,
For the six-month period ended June 30, 2022, the Berkshire Focus Fund underperformed its primary benchmark index. The Fund generated a total return of –56.59% while the S&P 500® Index—which we consider to be the Fund’s primary benchmark index—produced a total return of –19.96% over the same period. For comparative purposes, the Dow Jones Industrial Average posted a return of –14.44% and the Nasdaq Composite Index generated a return of –29.23% during the first half. A $10,000 investment in our Fund over 10 years starting on June 30, 2012, grew to $28,866. This was a +11.18% average annual compounded return. A $10,000 investment in the S&P 500®over the same period grew to $33,816. This was a +12.96% average annual compounded return.
“The error of optimism dies in the crisis, but in dying it gives birth to an error of pessimism. This new error is born, not of an infant, but a giant.”
– A.C. Pigou, Cambridge Economist, 1920
In the first quarter, U.S. equity markets pulled back sharply as high-growth and technology stocks bore the brunt of the selloff while Energy and safe-haven sectors were relatively insulated. Interest rates and inflation fears weighed heavily on investor sentiment early in the quarter over worries that the Fed was “behind the curve” and would have to act aggressively when raising rates to curb inflation. The Consumer Price Index (CPI) rose 7.9% in February compared to last year, marking the fastest annual jump since 1982—this took out January's previous 40-year high rate of 7.5%. Stocks extended their retreat on February 24th in reaction to Russia’s large-scale military attack on Ukraine. Market sentiment was extremely bearish as the Russia-Ukraine conflict began to aggravate existing inflation concerns, resulting in the prospect of an even more aggressive Fed. Additionally, the strong sanctions on Russia that followed increased angst about supply chains already stressed by the coronavirus. The Energy sector remained the winner during the period after the U.S. and U.K. announced simultaneous bans on Russian oil imports, exasperating already-tight oil markets and pushing WTI crude to an intraday high of $130. Fed officials increased interest rates by .25% following the March 17th meeting, their first hike since 2018. Equities rebounded in mid-March, reacting positively after Fed Chairman Powell signaled the central bank would “proceed carefully” with future interest rate hikes. Stocks were on the defensive for the remainder of the period as persistent geopolitical headwinds squared off against bargain hunters stepping in to buy beaten-up shares.
Turning to the second quarter, stock markets were unable to shake-off persistent worries about accelerating inflation, rising interest rates and continued fallout from the war in Ukraine. In addition, fears of a 1970s-style “stagflation” period of low growth combined with high inflation began to give way to new concerns; that the Fed would be unable to achieve a “soft landing,” pushing the economy into recession as happened in the early 1980s. Investors, faced with a seemingly endless stream of negative news turned apocalyptically bearish, igniting several broad sell-offs in April and May. The stock market decline turned into a rout by mid-June as the uber-hawkish Fed increased its cadence of interest rate hikes. The central bank raised benchmark interest rates by .50% in May and an additional .75% percent in June. Unnerved, equity markets attempted to bounce back by the end of the quarter after reaching extreme technically-oversold levels. The sharp decline in stocks during the period inflicted heavy damage to the S&P 500® Index which ended the first half of the year down 19.96% —its worst percentage decline in over 50 years. Meanwhile, the Nasdaq Composite Index fared even worse down 29.23%, as high-growth and technology stocks were left in tatters.
Looking at the portfolio, our investments in Enphase (ENPH) and Celsius (CELH) were contributors to the Fund’s performance. However, some of our investments detracted from the Fund’s performance—these included Tesla (TSLA), Datadog (DDOG), MongoDB (MDB), NVIDIA (NVDA), Snowflake (SNOW) and The Trade Desk (TTD). New significant additions to the portfolio in the second-half were Bill.com (BILL), BYD Company (BYDDY), Cloudflare (NET), CrowdStrike (CRWD), Pure Storage (PSTG) and Wolfspeed (WOLF).
Looking ahead, we remain very optimistic about the long-term prospects for the U.S. equity markets—especially the technology sector. As a result, you can expect us to remain committed to our aggressive, high-growth style of investing just as we have in the past. We thank you for your confidence and continued investment in the Berkshire Focus Fund.

Malcolm R. Fobes III
Chairman and Chief Investment Officer
Financial Statements
(unaudited)
6/30/2022
4
| PORTFOLIO OF INVESTMENTS |
| June 30, 2022 (unaudited) |
| |
| |
| |
| |
| Shares | | | Value |
| |
| | COMMON STOCKS – 100.06% | $ | 260,042,558 |
| | (Cost $265,421,370) | | |
| |
| | AUTOMOBILE MANUFACTURER – 21.24% | | 55,192,680 |
| 141,410 | BYD Company Ltd. – ADR | | 11,380,677 |
| 10 | Li Auto, Inc. – ADR* | | 383 |
| 339,420 | NIO, Inc. – ADR* | | 7,372,202 |
| 10 | Polestar Automotive Holding UK PLC (Class A) – ADR* | | 88 |
| 10 | Rivian Automotive, Inc. (Class A)* | | 257 |
| 54,110 | Tesla, Inc.* | | 36,438,756 |
| 10 | XPeng, Inc. – ADR* | | 317 |
| |
| | BANKS – 0.00% | | 2,327 |
| 10 | Signature Bank | | 1,792 |
| 10 | Silvergate Capital Corp. (Class A)* | | 535 |
| |
| | BEVERAGES – 0.00% | | 653 |
| 10 | Celsius Holdings, Inc.* | | 653 |
| |
| |
| | BUSINESS SOFTWARE & SERVICES – 47.69% | | 123,936,710 |
| 10 | Adobe, Inc.* | | 3,661 |
| 68,370 | Atlassian Corporation Plc – (Class A) (United Kingdom)* | | 12,812,538 |
| 93,770 | Bill.com Holdings, Inc.* | | 10,309,074 |
| 10 | Cadence Design Systems, Inc.* | | 1,500 |
| 324,150 | Cloudflare, Inc. (Class A)* | | 14,181,562 |
| 163,370 | Datadog, Inc. (Class A)* | | 15,559,359 |
| 217,940 | DigitalOcean Holdings, Inc.* | | 9,013,998 |
| 10 | Digital Turbine, Inc.* | | 175 |
| 10 | Domo, Inc. (Class B)* | | 278 |
| 42,600 | Hubspot, Inc.* | | 12,807,690 |
| 10 | Intuit, Inc. | | 3,854 |
| 10 | Microsoft Corp. | | 2,568 |
| 79,400 | MongoDB, Inc. (Class A)* | | 20,604,300 |
| 10 | Palantir Technologies, Inc. (Class A)* | | 91 |
| 10 | Paychex, Inc. | | 1,139 |
| 10 | Paycom Software, Inc.* | | 2,801 |
| 10 | Paylocity Holding Corp.* | | 1,744 |
| 16,640 | ServiceNow, Inc.* | | 7,912,653 |
| 148,970 | Snowflake, Inc. (Class A)* | | 20,715,768 |
| 10 | The Trade Desk, Inc. (Class A)* | | 419 |
| 10 | Twilio, Inc. (Class A)* | | 838 |
| 10 | Unity Software, Inc.* | | 368 |
| 10 | ZoomInfo Technologies, Inc.* | | 332 |
| |
| | CHINA INTERNET SERVICES – 0.00% | | 1,137 |
| 10 | Alibaba Group Holding Ltd. – ADR* | | 1,137 |
| |
| | COMMUNICATION EQUIPMENT – 0.00% | | 937 |
| 10 | Arista Networks, Inc.* | | 937 |
| |
| | COMMUNICATION SERVICES – 4.00% | | 10,387,794 |
| 96,210 | Zoom Video Communications, Inc. (Class A)* | | 10,387,794 |
| |
| | CONSUMER ELECTRONICS – 0.00% | | 1,367 |
| 10 | Apple, Inc. | | 1,367 |
| |
| |
| | *Non-Income Producing | | |
| | ADR – American Depositary Receipt | | |
| |
| | (see accompanying notes to financial statements) | | |
5
| PORTFOLIO OF INVESTMENTS (CONTINUED) |
| June 30, 2022 (unaudited) |
| |
| |
| |
| Shares | | | | Value |
| |
| | CYBERSECURITY EQUIPMENT & SERVICES – 10.52% | $ | 27,331,890 |
| 76,420 | CrowdStrike Holdings, Inc. (Class A)* | | | 12,881,355 |
| 10 | CyberArk Software Ltd.* | | | 1,280 |
| 50 | Fortinet, Inc.* | | | 2,829 |
| 72,410 | Okta, Inc. (Class A)* | | | 6,545,864 |
| 10 | Palo Alto Networks, Inc.* | | | 4,939 |
| 52,810 | Zscaler, Inc.* | | | 7,895,623 |
| |
| | DATA STORAGE – 2.84% | | | 7,386,226 |
| 287,290 | Pure Storage, Inc. (Class A)* | | | 7,386,226 |
| |
| | ENTERTAINMENT – 2.48% | | | 6,458,140 |
| 10 | Roblox Corp. (Class A)* | | | 329 |
| 78,600 | Roku, Inc. (Class A)* | | | 6,456,204 |
| 10 | Sea Ltd. (Singapore)* | | | 669 |
| 10 | Spotify Technology S.A. – (Luxembourg)* | | | 938 |
| |
| | HEALTHCARE – 0.00% | | | 680 |
| 10 | Doximity, Inc. (Class A)* | | | 348 |
| 10 | Teladoc Health, Inc.* | | | 332 |
| |
| | INTERNET SERVICES – 3.74% | | | 9,733,813 |
| 10 | Airbnb, Inc. (Class A)* | | | 891 |
| 10 | Alphabet, Inc. (Class A)* | | | 21,793 |
| 200 | Amazon.com, Inc.* | | | 21,242 |
| 10 | Carvana Co. (Class A)* | | | 226 |
| 10 | Chewy, Inc. (Class A)* | | | 347 |
| 10 | Coinbase Global, Inc. (Class A)* | | | 470 |
| 10 | DoorDash, Inc. (Class A)* | | | 642 |
| 10 | Etsy, Inc.* | | | 732 |
| 15,210 | MercadoLibre, Inc. (Argentina)* | | | 9,686,793 |
| 10 | Opendoor Technologies, Inc.* | | | 47 |
| 10 | Shopify, Inc. (Class A) (Canada)* | | | 312 |
| 10 | Zillow Group, Inc. (Class C)* | | | 318 |
| |
| | INTERNET SOCIAL MEDIA – 0.00% | | | 1,926 |
| 10 | Meta Platforms, Inc. (Class A)* | | | 1,613 |
| 10 | Pinterest, Inc. (Class A)* | | | 182 |
| 10 | Snap, Inc. (Class A)* | | | 131 |
| |
| | IT FINANCIAL SERVICES – 4.58% | | | 11,894,618 |
| 10 | Affirm Holdings, Inc. (Class A)* | | | 181 |
| 193,520 | Block, Inc. (Class A)* | | | 11,893,739 |
| 10 | PayPal Holdings, Inc.* | | | 698 |
| |
| | SEMICONDUCTOR – 2.96% | | | 7,695,256 |
| 10 | Advanced Micro Devices, Inc.* | | | 765 |
| 10 | Ambarella, Inc.* | | | 655 |
| 10 | Broadcom, Inc. | | | 4,858 |
| 10 | Marvell Technology, Inc. | | | 435 |
| 10 | NVIDIA Corp. | | | 1,516 |
| 10 | ON Semiconductor Corp.* | | | 503 |
| 10 | QUALCOMM Inc. | | | 1,277 |
| 10 | Taiwan Semiconductor Manufacturing Company Ltd. – ADR | | | 818 |
| 121,110 | Wolfspeed, Inc.* | | | 7,684,429 |
| |
| |
| | *Non-Income Producing | | | |
| | ADR – American Depositary Receipt | | | |
| |
| |
| | (see accompanying notes to financial statements) | | | |
6
| PORTFOLIO OF INVESTMENTS (CONTINUED) |
| June 30, 2022 (unaudited) |
| |
| |
| |
| Shares | | | Value | |
| |
| | SEMICONDUCTOR EQUIPMENT – 0.01% | $ | 14,018 | |
| 10 | Applied Materials, Inc. | | 910 | |
| 10 | ASML Holding N.V. – ADR | | 4,759 | |
| 10 | KLA Corp. | | 3,191 | |
| 10 | Lam Research Corp. | | 4,262 | |
| 10 | Teradyne, Inc. | | 896 | |
| |
| | SOLAR ENERGY – 0.00% | | 1,952 | |
| 10 | Enphase Energy, Inc.* | | 1,952 | |
| |
| | SPECIALTY INDUSTRIAL MACHINERY – 0.00% | | 317 | |
| 10 | Kornit Digital Ltd. (Israel)* | | 317 | |
| |
| | SPORTS ENTERTAINMENT & GAMING – 0.00% | | 117 | |
| 10 | DraftKings, Inc. (Class A)* | | 117 | |
| |
| | EXCHANGE TRADED FUNDS – 0.00% | | 4,840 | |
| | (Cost $2,128) | | | |
| 10 | Invesco QQQ ETF | | 2,803 | |
| 10 | VanEck Semiconductor ETF | | 2,037 | |
| |
| |
| | TOTAL INVESTMENT SECURITIES – 100.06% | | 260,047,398 | |
| | (Cost $265,423,498) | | | |
| |
| | LIABILITIES IN EXCESS OF OTHER ASSETS – (0.06%) | | (148,951 | ) |
| |
| | NET ASSETS – 100.00% | $ | 259,898,447 | |
| | Equivalent to $15.72 per share | | | |
| |
| |
| | *non-income producing | | | |
| | adr – american depositary receipt | | | |
| |
| | (see accompanying notes to financial statements) | | | |
7
| STATEMENT OF ASSETS AND LIABILITIES |
| June 30, 2022 (unaudited) |
| |
| |
| |
| |
| ASSETS | | | |
| Investment securities: | | | |
| At cost | $ | 265,423,498 | |
| At value | $ | 260,047,398 | |
| Cash | | 278,136 | |
| Receivable for dividends | | 2,326 | |
| Receivable for securities sold | | 11,289,465 | |
| Receivable for capital shares sold | | 114,827 | |
| Total Assets | | 271,732,152 | |
| |
| |
| LIABILITIES | | | |
| Payable for securities purchased | | 11,159,746 | |
| Payable for capital shares redeemed | | 228,704 | |
| Payable to affiliate (Note 5) | | 443,047 | |
| Payable for interest expense | | 2,208 | |
| Total Liabilities | | 11,833,705 | |
| |
| |
| NET ASSETS | $ | 259,898,447 | |
| |
| |
| Net assets consist of: | | | |
| Paid-in capital | $ | 627,181,244 | |
| Total accumulated deficit | | (367,282,797 | ) |
| Net Assets | $ | 259,898,447 | |
| |
| Shares of beneficial interest issued and outstanding | | | |
| (unlimited number of shares authorized, without par value) | | 16,530,436 | |
| |
| Net asset value and offering price per share | $ | 15.72 | |
| |
| Minimum redemption price per share* | $ | 15.41 | |
| |
| |
| *The Fund will impose a 2.00% redemption fee on shares redeemed within 90 calendar days or less of purchase. | |
| |
| |
| (see accompanying notes to financial statements) | | | |
8
| STATEMENT OF OPERATIONS |
| For the Six Month Period Ended June 30, 2022 (unaudited) |
| |
| |
| |
| |
| INVESTMENT INCOME | | | | |
| Dividends (net of foreign withholding taxes of $1) | $ | 46,752 | |
| Total investment income | | | 46,752 | |
| |
| EXPENSES | | | | |
| Investment advisory fees (Note 5) | | | 3,252,989 | |
| Administration fees (Note 5) | | | 923,347 | |
| Interest expense | | | 21,725 | |
| Total Expenses | | | 4,198,061 | |
| |
| NET INVESTMENT LOSS | | | (4,151,309 | ) |
| |
| |
| NET REALIZED AND UNREALIZED | | | | |
| LOSS ON INVESTMENTS | | | | |
| Net realized loss from security transactions | | | (302,737,238 | ) |
| Net change in unrealized depreciation on investments | | | (72,511,958 | ) |
| |
| NET REALIZED AND UNREALIZED | | | | |
| LOSS ON INVESTMENTS | | | (375,249,196 | ) |
| |
| NET DECREASE IN NET ASSETS | | | | |
| FROM OPERATIONS | $ | (379,400,505 | ) |
| |
| |
| (see accompanying notes to financial statements) | | | | |
9
| STATEMENTS OF CHANGES IN NET ASSETS |
| For the Periods Ended June 30, 2022 (unaudited) and December 31, 2021 |
| |
| | | Six Months | | | | Year | |
| | | Ended | | | | Ended | |
| | | 6/30/22 | | | | 12/31/21 | |
| | | (unaudited) | | | | | |
| FROM OPERATIONS: | | | | | | | |
| Net investment loss | $ | (4,151,309 | ) | $ | (16,077,207 | ) |
| Net realized gains (losses) from security transactions | (302,737,238 | ) | | | 29,024,061 | |
| Net change in unrealized appreciation | | | | | | | |
| (depreciation) on investments | | (72,511,958 | ) | | | (41,286,069 | ) |
| Net decrease in net assets from operations | | (379,400,505 | ) | | | (28,339,215 | ) |
| |
| |
| FROM DISTRIBUTIONS: | | | | | | | |
| Distributions | | – | | | | (124,507,055 | ) |
| |
| |
| FROM CAPITAL SHARE TRANSACTIONS: | | | | | | | |
| Proceeds from shares sold | | 30,086,504 | | | | 259,706,979 | |
| Proceeds from reinvested distributions | | – | | | | 122,659,086 | |
| Proceeds from redemption fees (Note 6) | | 141,397 | | | | 912,767 | |
| Payments for shares redeemed | | (138,352,997 | ) | | | (426,540,892 | ) |
| Net decrease in net assets from capital share transactions | (108,125,096 | ) | | | (43,262,060 | ) |
| |
| |
| TOTAL DECREASE IN NET ASSETS | | (487,525,601 | ) | | | (196,108,330 | ) |
| |
| |
| NET ASSETS: | | | | | | | |
| Beginning of period | | 747,424,048 | | | | 943,532,378 | |
| End of period | $ | 259,898,447 | | $ | 747,424,048 | |
| |
| |
| CAPITAL SHARE ACTIVITY: | | | | | | | |
| Shares sold | | 1,218,087 | | | | 5,805,987 | |
| Shares reinvested | | – | | | | 3,325,897 | |
| Shares redeemed | | (5,328,005 | ) | | | (10,053,126 | ) |
| Net decrease in shares outstanding | | (4,109,918 | ) | | | (921,242 | ) |
| Shares outstanding, beginning of period | | 20,640,354 | | | | 21,561,596 | |
| Shares outstanding, end of period | | 16,530,436 | | | | 20,640,354 | |
| |
| |
| |
| |
| (see accompanying notes to financial statements) | | | | | | | |
10
| FINANCIAL HIGHLIGHTS |
| Selected Per Share Data and Ratios for a Share Outstanding Throughout Each Period |
| |
| |
| |
| |
| | | Six Months | | | Year | | | Year | | | Year | | | Year | | | Year | |
| | | Ended | | | Ended | | | Ended | | | Ended | | | Ended | | | Ended | |
| | | 6/30/22 | | | 12/31/21 | | | 12/31/20 | | | 12/31/19 | | | 12/31/18 | | | 12/31/17 | |
| | | (unaudited) | | | | | | | | | | | | | | | | |
| NET ASSET VALUE, | | | | | | | | | | | | | | | | | | |
| BEGINNING OF PERIOD | $ | 36.21 | | $ | 43.76 | | $ | 27.54 | | $ | 22.33 | | $ | 21.47 | | $ | 18.11 | |
| |
| INCOME FROM INVESTMENT OPERATIONS: | | | | | | | | | | | | | | | | | | |
| Net investment loss(a) | | (0.23 | ) | | (0.82 | ) | | (0.64 | ) | | (0.45 | ) | | (0.31 | ) | | (0.35 | ) |
| Net realized and unrealized gains | | | | | | | | | | | | | | | | | | |
| (losses) on investments | | (20.27 | ) | | 0.29 | (b) | | 26.04 | | | 9.51 | | | 2.36 | (b) | | 8.37 | |
| Total from investment operations | | (20.50 | ) | | (0.53 | ) | | 25.40 | | | 9.06 | | | 2.05 | | | 8.02 | |
| |
| Proceeds from redemption fees | | .0.01 | | | 0.05 | | | 0.10 | | | 0.06 | | | 0.08 | | | 0.00 | (h) |
| |
| LESS DISTRIBUTIONS: | | | | | | | | | | | | | | | | | | |
| Distributions from net realized gains | | 0.00 | | | (7.07 | ) | | (9.28 | ) | | (3.91 | ) | | (1.27 | ) | | (4.66 | ) |
| Total distributions | | 0.00 | | | (7.07 | ) | | (9.28 | ) | | (3.91 | ) | | (1.27 | ) | | (4.66 | ) |
| |
| NET ASSET VALUE, | | | | | | | | | | | | | | | | | | |
| END OF PERIOD | $ | 15.72 | | $ | 36.21 | | $ | 43.76 | | $ | 27.54 | | $ | 22.33 | | $ | 21.47 | |
| |
| |
| TOTAL RETURN (c) | | (56.59 | %)(f) | | (1.38 | %) | | 92.26 | % | | 40.63 | % | | 10.02 | % | | 44.07 | % |
| |
| |
| |
| SUPPLEMENTAL DATA AND RATIOS: | | | | | | | | | | | | | | | | | | |
| Net assets at end of period (thousands) | $ | 259,898 | | $ | 747,424 | | $ | 943,532 | | $ | 327,669 | | $ | 151,966 | | $ | 74,564 | |
| |
| Ratio of expenses to average net assets(d) | | 1.94 | %(g) | | 1.90 | % | | 1.92 | % | | 1.95 | % | | 1.97 | % | | 2.02 | % |
| Ratio of net investment loss to | | | | | | | | | | | | | | | | | | |
| average net assets | | (1.91 | %)(g) | | (1.87 | %) | | (1.70 | %) | | (1.56 | %) | | (1.20 | %) | | (1.54 | %) |
| |
| Portfolio turnover rate(e) | | 850.2 | %(f) | | 1424.8 | % | | 1599.1 | % | | 980.3 | % | | 595.6 | % | | 385.0 | % |
(a) Net investment loss was calculated using the average shares outstanding method.
(b) Net realized and unrealized gain on investments per share is a balancing amount necessary to reconcile the change in net asset value per share for the period, and may not reconcile with the net realized and unrealized gain (loss) on investments in the Statement of Operations.
(c) Total return represents the rate that the investor would have earned or (lost) on an investment in the Fund assuming reinvestment of dividends.
(d) The ratio of expenses to average net assets includes federal excise tax and interest expense. The ratios excluding federal excise tax and interest expense would be 1.93%, 1.89%, 1.91%, 1.95%, 1.96% and 1.99%, respectively.
(e) Portfolio turnover is greater than most funds due to the investment style of the Fund.
(f) Not annualized for periods of less than one full year.
(g) Annualized for periods of less than one full year.
(h) Less than $0.005 per share.
| | (see accompanying notes to financial statements) |
11
NOTES TO FINANCIAL STATEMENTS
June 30, 2022 (unaudited)
1. Organization
The Berkshire Focus Fund (the “Fund”) is a non-diversified series of The Berkshire Funds (the “Trust”), an open-end management investment company registered under the Investment Company Act of 1940, as amended (the “1940 Act”). The Trust was organized as a Delaware business trust on November 25, 1996. The Fund commenced operations on July 1, 1997. The Fund’s investment objective is to seek long-term growth of capital primarily through investments in equity securities.
2. Significant Accounting Policies
The Fund is an investment company and accordingly follows the investment company accounting and reporting guidance of the Financial Accounting Standards Board (“FASB”) Accounting Standards Codification Topic 946 Financial Services – Investment Companies. The financial statements are prepared in conformity with accounting principles generally accepted in the United States of America (“GAAP”).
The following is a summary of the Trust’s significant accounting policies:
Cash — The Fund maintains cash at its custodian which, at times, may exceed United States federally insured limits.
Securities valuation — The Fund’s portfolio securities are valued as of the close of the regular session of trading on the New York Stock Exchange (the “NYSE”), normally 4:00 p.m., Eastern time. Securities which are traded on stock exchanges or are quoted by Nasdaq are valued at the last reported sale price as of the close of the regular session of trading on the NYSE, or, if not traded, at the most recent bid price. Securities which are traded in the over-the-counter market, and which are not quoted by Nasdaq, are valued at the most recent bid price, as obtained from one or more of the major market makers for such securities. Generally, if the security is traded in an active market and is valued at its last sales price, the security is categorized as a Level 1 security (described below), and if an equity security is valued by the pricing service at its last bid, it is generally categorized as a Level 2 security. Securities for which market quotations are not readily available are valued at their fair value as determined in good faith in accordance with consistently applied procedures established by and under the general supervision of the Board of Trustees and are categorized in Level 1, 2, or Level 3 when appropriate.
The Trust has adopted accounting standards which establish an authoritative definition of fair value and set out a hierarchy for measuring fair value. These standards require additional disclosures about the various inputs and valuation techniques used to develop the measurements of fair value and a discussion of changes in valuation techniques and related inputs during the period. These standards define fair value as the price that would be received to sell an asset or paid to transfer a liability in an orderly transaction between market participants at
12
NOTES TO FINANCIAL STATEMENTS
June 30, 2022 (unaudited)
the measurement date. The fair value hierarchy is organized into three levels based upon the assumptions (referred to as “inputs”) used in pricing the asset or liability. These standards state that “observable inputs” reflect the assumptions market participants would use in pricing the asset or liability based on market data obtained from independent sources and “unobservable inputs” reflect an entity's own assumptions about the assumptions market participants would use in pricing the asset or liability. These inputs are summarized in the three broad levels listed below:
Level 1 – Quoted prices in active markets for identical securities.
Level 2 – Other significant observable inputs (including quoted prices for similar securities, interest rates, prepayment speeds, credit risk, etc.).
Level 3 – Significant unobservable inputs (including the Fund’s own assumptions in determining the fair value of investments).
The inputs or methodology used for valuing securities are not necessarily an indication of the risk associated with investing in those securities.
The following is a summary of the inputs used to value the Fund’s investments as of June 30, 2022:
| | | Level 1 | Level 2 | Level 3 | | Total |
| Common Stocks | | | | | | |
| Business Software & Services | $ | 123,936,710 | – | – | $ | 123,936,710 |
| Automobile Manufacturer | | 55,192,680 | – | – | | 55,192,680 |
| Cybersecurity Equipment & Services | | 27,331,890 | – | – | | 27,331,890 |
| IT Financial Services | | 11,894,618 | – | – | | 11,894,618 |
| Communication Services | | 10,387,794 | – | – | | 10,387,794 |
| Internet Services | | 9,733,813 | – | – | | 9,733,813 |
| Semiconductor | | 7,695,256 | – | – | | 7,695,256 |
| Data Storage | | 7,386,226 | – | – | | 7,386,226 |
| Entertainment | | 6,458,140 | – | – | | 6,458,140 |
| Semiconductor Equipment | | 14,018 | – | – | | 14,018 |
| Banks | | 2,327 | – | – | | 2,327 |
| Solar Energy | | 1,952 | – | – | | 1,952 |
| Internet Social Media | | 1,926 | – | – | | 1,926 |
| Consumer Electronics | | 1,367 | – | – | | 1,367 |
| China Internet Services | | 1,137 | – | – | | 1,137 |
| Communication Equipment | | 937 | – | – | | 937 |
| Healthcare | | 680 | – | – | | 680 |
| Beverages | | 653 | – | – | | 653 |
| Specialty Industrial Machinery | | 317 | – | – | | 317 |
| Sports Entertainment & Gaming | | 117 | – | – | | 117 |
| Total Common Stocks | | 260,042,558 | – | – | | 260,042,558 |
| Exchange Traded Funds | | 4,840 | – | – | | 4,840 |
| Total Investment Securities | $ | 260,047,398 | – | – | $ | 260,047,398 |
The Fund did not hold any Level 3 securities during the six month period ended June 30, 2022. The Fund did not hold any derivative instruments during the reporting period.
13
NOTES TO FINANCIAL STATEMENTS
June 30, 2022 (unaudited)
Investment income — Dividend income is recorded on the ex-dividend date. Interest income, if any, is accrued as earned.
Distributions to shareholders — Distributions to shareholders arising from net investment income and net realized capital gains, if any, are distributed at least once each year. Distributions to shareholders are recorded on the ex-dividend date. The Fund may utilize earnings and profits distributed to shareholders on redemptions of shares as part of the dividends paid deduction. Dividends from net investment income and capital gain distributions are determined in accordance with income tax regulations, which may differ from GAAP.
Security transactions — Security transactions are accounted for on the trade date for financial reporting purposes. Securities sold are determined on a specific identification basis.
Estimates — The financial statements are prepared in accordance with GAAP, which requires management to make estimates and assumptions that affect the reported amounts of assets and liabilities and disclosure of contingent assets and liabilities at the date of the financial statements and the reported amounts of increases and decreases in net assets from operations during the reporting period. Actual results could differ from those estimates.
Federal income tax — The Fund intends to comply with the requirements of Subchapter M of the Internal Revenue Code (the “Code”) necessary to qualify as a regulated investment company. As provided therein, in any fiscal year in which the Fund so qualifies and distributes at least 90% of its taxable net income, the Fund (but not the shareholders) will be relieved of federal income tax on the income distributed. Accordingly, no provision for income taxes has been made.
As of and during the six month period ended June 30, 2022, the Fund did not have a liability for any unrecognized tax benefits. The Fund recognizes interest and penalties, if any, related to unrecognized tax benefits as other expense on the statement of operations. During the six month period, the Fund did not incur any tax-related interest or penalties.
In order to avoid imposition of the excise tax applicable to regulated investment companies, it is also the Fund’s intention to declare as dividends in each calendar year at least 98% of its net investment income and 98.2% of its net realized capital gains plus undistributed amounts from prior years.
Other — The treatment for financial reporting purposes of distributions made to shareholders during the year from net investment income or net realized capital gains may differ from their ultimate treatment for federal income tax purposes. These differences are caused primarily by differences in the timing of the recognition of certain components of income, expense or realized capital gain for federal income tax purposes. Where such differences are permanent in nature, they are reclassified in the components of the net assets based on their ultimate characterization for federal income tax purposes. Any such reclassifications will have no effect on net assets, results of operations or net asset value per share of the Fund. Effective September 30, 2019, the Fund elected a tax year-end of September 30. For the tax year ended September 30, 2021 and the fiscal year December 31, 2021, the following permanent adjustments were recorded.
14
NOTES TO FINANCIAL STATEMENTS
June 30, 2022 (unaudited)
Such adjustments were attributed to the use of equalization for tax purposes:
| Paid-in capital | | $40,644,454 | |
| Total distributable earnings | | (40,644,454 | ) |
3. Investment Transactions
Purchases and sales of investment securities (excluding short-term instruments) for the six month period ended June 30, 2022, were $3,915,184,603 and $4,028,055,620 respectively. There were no purchases or sales of U.S. Government securities for the Fund.
4. Tax Information
For Federal income tax purposes, as of December 31, 2021, the cost of investments, and gross appreciation/depreciation was as follows:
| Federal income tax cost | $ | 728,000,719 | |
| Gross unrealized appreciation | $ | 78,102,707 | |
| Gross unrealized depreciation | | (57,935,815 | ) |
| Net unrealized appreciation | $ | (20,166,892 | |
The cost basis of investments for tax and financial reporting purposes differed primarily due to wash sales.
There was no distribution paid during the six month period ended June 30, 2022. Also there was a short-term capital gains distribution paid in the amount of $117,677,220, and a long-term capital gains distribution in the amount of $6,829,835 for the fiscal year ended December 31, 2021. Short-term capital gain distributions are considered ordinary income distributions for tax purposes.
As of the tax year ended September 30, 2021, the components of distributable earnings on a tax basis were as follows:
| Undistributed ordinary income | $ | 117,677,223 | |
| Undistributed long-term gains | | 6,829,838 | |
| Net unrealized depreciation | | (7,194,323 | ) |
| Total distributable earnings | $ | 117,312,738 | |
5. Related Party Transactions, Investment Advisory and Administrative Fees
Certain Officers and Trustees of the Trust are also Officers and Directors of Berkshire Capital Holdings, Inc. (“Berkshire Capital”). The non-interested Trustees of the Fund were paid $45,000 in Trustee fees and expenses directly by Berkshire Capital during the six month period ended June 30, 2022.
The Fund has an Investment Advisory Agreement (the “Advisory Agreement”) and a separate Administration Agreement with Berkshire Capital. Under the Advisory Agreement, Berkshire Capital will determine what securities will be purchased, retained or sold by the Fund on the basis of a continuous review of the portfolio. For the services it provides under the Advisory Agreement, Berkshire Capital receives a fee accrued each calendar day (including weekends and holidays) at a rate of 1.50% per annum of the daily net assets of the Fund.
15
NOTES TO FINANCIAL STATEMENTS
June 30, 2022 (unaudited)
Under the Administration Agreement, Berkshire Capital renders all administrative and supervisory services of the Fund, as well as facilities furnished and expenses assumed except for interest and taxes. For these services, Berkshire Capital receives a fee at the annual rate of 0.50% of the Fund’s average daily net assets up to $50 million, 0.45% of average net assets from $50 million to $200 million, 0.40% of average net assets from $200 million to $500 million, 0.35% of average net assets from $500 million to $1 billion and 0.30% of average net assets in excess of $1 billion. Such fee is computed as a percentage of the Fund’s daily net assets and is accrued each calendar day (including weekends and holidays). For the six month period ended June 30, 2022, Berkshire Capital was paid an investment advisory fee of $3,252,989 and an administration fee of $923,347 from the Fund. The amount due to Berkshire Capital for these fees at June 30, 2022, totaled $443,047.
6. Redemption Fee
The Fund may impose a redemption fee of 2.00% on shares held for 90 days or less. For the six month period ended June 30, 2022, proceeds from redemption fees were $141,397.
7. Beneficial Ownership
The beneficial ownership, either directly or indirectly, of more than 25% of the voting securities of a fund creates a presumption of control of the Fund, under Section 2(a)(9) of the Investment Company Act of 1940. At June 30, 2022, National Financial Services Corp. beneficially owned, in aggregate, 56.53% of the Fund.
8. COVID-19 Risks
Unexpected local, regional or global events, such as war; acts of terrorism; financial, political or social disruptions; natural, environmental or man-made disasters; the spread of infectious illnesses or other public health issues; and recessions and depressions could have a significant impact on the Fund and its investments and may impair market liquidity. Such events can cause investor fear, which can adversely affect the economies of nations, regions and the market in general, in ways that cannot necessarily be foreseen. The impact of COVID-19 has adversely affected, and other infectious illness outbreaks that may arise in the future could adversely affect, the economies of many nations and the entire global economy, individual issuers and capital markets in ways that cannot necessarily be foreseen. Public health crises caused by the COVID-19 outbreak may exacerbate other pre-existing political, social and economic risks in certain countries or globally. The duration of the COVID-19 outbreak and its effects cannot be determined with certainty.
9. Revolving Credit Agreement
The Trust entered into a Revolving Credit Agreement (the “Loan Agreement”) between the Trust and its custodian, The Huntington National Bank, N.A. The Fund may not borrow money or
16
NOTES TO FINANCIAL STATEMENTS
June 30, 2022 (unaudited)
purchase securities on margin except for temporary or emergency (not leveraging) purposes, including the meeting of redemption requests that might otherwise require the untimely disposition of securities. The maximum amount that the Fund is permitted to borrow is the lesser of: (i) $10,000,000 or (ii) 10% of the Fund's daily market value and is secured by the securities in the Fund. The maximum interest rate of such loans is set at a rate per annum equal to the London Interbank Offered Rate subject to a .50% floor, plus 1.75% per annum, subject to an Annual Fee and an Unused Fee. The Annual Fee for the Loan Agreement is equal to 1/8 of one percent (1.00%) of the Loan Amount of $10,000,000 and the Unused Fee is equal to 1/8 of one percent (1.00%) of the excess of the Loan Amount over the outstanding principal balance of the loan. During the six month period ended June 30, 2022, the Fund had an average loan balance of $1,378,353 and paid an average interest rate of 2.39% . Additionally, the maximum borrowing during the period was $10,000,000, which occurred on multiple days during the period. As of June 30, 2022, there was no outstanding loan balance. No compensating balances are required. The loan matures on August 16, 2022.
10. Concentration of Sector Risk
If a Fund has significant investments in the securities of issuers in industries within a particular sector, any development affecting that sector will have a greater impact on the value of the net assets of the Fund than would be the case if the Fund did not have significant investments in that sector. In addition, this may increase the risk of loss of an investment in the Fund and increase the volatility of the Fund’s NAV per share. From time to time, circumstances may affect a particular sector and the companies within such sector. For instance, economic or market factors, regulation or deregulation, and technological or other developments may negatively impact all companies in a particular sector and therefore the value of a Fund’s portfolio will be adversely affected. As of June 30, 2022, the Fund had 47.69% of the value of its net assets invested in stocks within the Business Software and Services sector.
11. Cash Holdings
For cash management purposes, the Fund may concentrate cash with the Fund's custodian. This may result in cash balances exceeding the Federal Deposit Insurance Corporation ("FDIC") insurance limits. As of June 30, 2022, the Fund held $278,136 in cash at Huntington National Bank, that exceeded the FDIC insurance limit of $250,000.
12. Subsequent Events
In preparing these financial statements, management has performed an evaluation of subsequent events after June 30, 2022, through the date these financial statements were issued and determined that there were no significant subsequent events that would require adjustment to or additional disclosure in the financial statements.
17
ADDITIONAL INFORMATION
(unaudited) |
As a shareholder of the Fund, you incur two types of costs: (1) transaction costs, and (2) ongoing costs, including advisory fees, administrative fees and interest expense. This Example is intended to help you understand your ongoing costs (in dollars) of investing in the Fund and to compare these costs with the ongoing costs of investing in other mutual funds. The Example is based on investment of $1,000 invested in the Fund on January 1, 2022, and held through June 30, 2022.
Actual Expenses
The first line of the table on the following page provides information about actual account values and actual expenses. Although the Fund charges no sales load or transaction fees, you will be assessed fees for outgoing wire transfers, returned checks and stop payment orders at prevailing rates charged by Mutual Shareholder Services, LLC, the Fund’s transfer agent. If you request that a redemption be made by wire transfer, currently a $20.00 fee is charged by the Fund’s transfer agent. IRA accounts will be charged an $8.00 annual maintenance fee. If shares are redeemed within 90 days of purchase from the Fund, the shares are subject to a 2% redemption fee. To the extent the Fund invests in shares of other investment companies as part of its investment strategy, you will indirectly bear your proportionate share of any fees and expenses charged by the underlying funds in which the Fund invests in addition to the expenses of the Fund. Actual expenses of the underlying funds are expected to vary among the various underlying funds. These expenses are not included in the example. The example includes advisory fees, administrative fees and other Fund expenses. However, the example does not include portfolio trading commissions and related expenses and other extraordinary expenses as determined under generally accepted accounting principles. You may use the information in this line, together with the amount you invested, to estimate the expenses that you paid over the period. Simply divide your account value by $1,000 (for example, an $8,600 account value divided by $1,000 = 8.6), then multiply the result by the number in the first line under the heading entitled “Expenses Paid During Period” to estimate the expenses you paid on your account during this period.
Hypothetical Example for Comparison Purposes
The second line of the table provides information about hypothetical account values and hypothetical expenses based on the Fund’s actual expense ratio and an assumed rate of return of 5% per year before expenses, which is not the Fund's actual return. The hypothetical account values and expenses may not be used to estimate the actual ending account balance or expenses you paid for the period. You may use this information to compare the ongoing costs of investing in the Fund and other funds. To do so, compare this 5% hypothetical example with the 5%
18
ADDITIONAL INFORMATION
(unaudited) |
hypothetical examples that appear in the shareholder reports of the other funds. Please note that the expenses shown in the table are meant to highlight your ongoing costs only and do not reflect any transactional costs, such as redemption fees or the charges by Mutual Shareholder Services, LLC as described above, or the expenses of the underlying funds. Therefore, the second line of the table is useful in comparing ongoing costs only, and will not help you determine the relative total costs of owning different funds. In addition, if these transactional costs were included, your costs would have been higher.
| | | | | | | Expenses Paid |
| | | Beginning | | Ending | | During the Period* |
| | | Account Value | | Account Value | | January 1, 2022 to |
| | | January 1, 2022 | | June 30, 2022 | | June 30, 2022 |
| Actual | | $1,000.00 | | $434.13 | | $6.90 |
| |
| Hypothetical | | $1,000.00 | | $1,051.17 | | $9.69 |
| (5% annual return before expenses) | | | | |
*Expenses are equal to the Fund’s annualized expense ratio of 1.94%, multiplied by the average account value over the period, multiplied by 181/365 to reflect the one-half year period.
Proxy Voting Guidelines
Berkshire Capital Holdings, Inc., the Fund’s Adviser, is responsible for exercising the voting rights associated with the securities held by the Fund. A description of the policies and procedures used by the Adviser in fulfilling this responsibility and Form N-PX, which is a record of the Fund’s proxy votes for the most recent twelve month period ended June 30, are available without charge, upon request, by calling toll free 1-877-526-0707. They are also available on the Securities and Exchange Commission’s (“SEC”) website at www.sec.gov.
Quarterly Filing of Portfolio Holdings
The Fund publicly files its complete schedule of portfolio holdings with the SEC for the first and third quarters of each fiscal year on Form N-PORT. The Fund’s Forms N-PORT are available on the SEC’s website at www.sec.gov. Copies of the Fund’s Forms N-PORT are also available, without charge, by calling the Fund toll free 1-877-526-0707.
19
Item 2. Code of Ethics.
Not applicable for semi-annual reports.
Item 3. Audit Committee Financial Expert.
Not applicable for semi-annual reports.
Item 4. Principal Accountant Fees and Services.
Not applicable for semi-annual reports.
Item 5. Audit Committee of Listed Registrants.
Not applicable to registrants who are not listed issuers (as defined in Rule 10A-3 under the Securities Exchange Act of 1934).
Item 6. Investments.
(a) Not applicable. Schedule of Investments is included as part of the report to shareholders filed under Item 1 of this Form.
(b) Not applicable.
Item 7. Disclosure of Proxy Voting Policies and Procedures for Closed-End Management Investment Companies.
Not applicable to open-end investment companies.
Item 8. Portfolio Managers of Closed-End Management Investment Companies.
Not applicable to open-end investment companies.
Item 9. Purchases of Equity Securities by Closed-End Management Investment Company and Affiliated Purchasers.
Not applicable to open-end investment companies.
Item 10. Submission of Matters to a Vote of Security Holders.
Not Applicable.
Item 11. Controls and Procedures.
(a) Disclose the conclusions of the registrant’s principal executive and principal financial officers, or persons performing similar functions, regarding the effectiveness of the registrant’s disclosure controls and procedures (as defined in Rule 30a-3(c) under the Act (17 CFR 270.30a -3(c))) as of a date within 90 days of the filing date of the report that includes the disclosure required by this paragraph, based on the evaluation of these controls and procedures required by Rule 30a-3(b) under the Act (17 CFR 270.30a -3(b))
and Rules 13a-15(b) or 15d-15(b) under the Exchange Act (17 CFR 240.13a -15(b) or 240.15d -15(b)).
(b) There were no changes in the Registrant's internal control over financial reporting (as defined in Rule 30a-3(d) under the Act) that occurred during the second fiscal quarter of the period covered by this report that has materially affected, or is reasonably likely to materially affect, the Registrant's internal control over financial reporting.
Item 12. Disclosure of Securities Lending Activities for Closed-End Management Investment Companies.
Not Applicable.
Item 13. Exhibits.
(a)(1) Code of Ethics. Not applicable.
(a)(2) Certifications pursuant to Section 302 of the Sarbanes-Oxley Act of 2002. Filed herewith.
(a)(3) Not applicable.
(a)(4) Not applicable.
(b) Certification pursuant to Section 906 of the Sarbanes-Oxley Act of 2002. Filed herewith.
Pursuant to the requirements of the Securities Exchange Act of 1934 and the Investment Company Act of 1940, the registrant has duly caused this report to be signed on its behalf by the undersigned, thereunto duly authorized.
| | By: /s/ Malcolm R. Fobes III
Malcolm R. Fobes III
President and Treasurer |
Pursuant to the requirements of the Securities Exchange Act of 1934 and the Investment Company Act of 1940, this report has been signed below by the following persons on behalf of the registrant and in the capacities and on the dates indicated.
| | By: /s/ Malcolm R. Fobes III
Malcolm R. Fobes III
President and Treasurer
Date: 9/2/22 |