Management’s Discussion of Performance

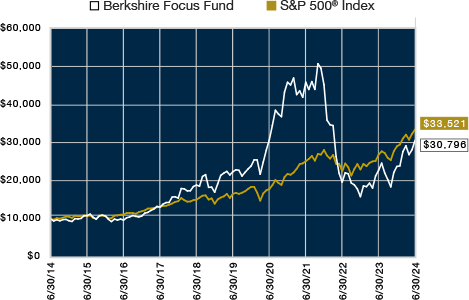
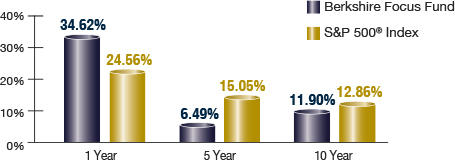
For the six-month period ended June 30, 2024, the Berkshire Focus Fund outperformed its primary benchmark index. The Fund generated a total return of 28.95% while the S&P 500® Index—which we consider to be the Fund’s primary benchmark index—produced a total return of 15.29% over the same period. A $10,000 investment in our Fund over 10 years starting on June 30, 2014, grew to $30,796. This was a +11.90% average annual compounded return. A $10,000 investment in the S&P 500® over the same period grew to $33,521. This was a +12.86% average annual compounded return.
U.S. equity markets extended their upward climb in the first half of 2024. The S&P 500® and NASDAQ Composite both reached a new all-time high in July. Underpinning the advance were robust corporate earnings and hopes that moderating inflation might allow the Federal Reserve to cut interest rates in September. Stock market returns were extremely narrowed in breadth however, driven largely by a handful of mega-cap growth stocks (the so-called “Magnificent Seven”). We remain particularly excited about the opportunities in artificial intelligence (AI), which has driven our overweight allocation in software, semiconductors, and the cloud. We believe both the prospect for falling interest rates over the coming year and healthy corporate earnings growth will continue to drive Fund performance, albeit we might well expect some consolidation in markets near term given such a strong start to the year.
Our investments in NVIDIA (NVDA), Broadcom (AVGO), Meta Platforms (META), and Eli Lilly (LLY) were contributors to the Fund’s performance. However, some of our investments detracted from the Fund’s performance—these included DoorDash (DASH), DraftKings (DKNG), Block (SQ) and Tesla (TSLA). New significant additions to the portfolio in the first half were Apple (AAPL), Arista Networks (ANET), Microsoft (MSFT), Palantir (PLTR), and Taiwan Semiconductor (TSM).
Fund Statistics
Net Assets: $246.8 million
Portfolio Holdings: 22
Portfolio Turnover: 1197.1%
Total Advisory Fees Paid: $1,763,012
In order to reduce expenses, we will deliver a single copy of prospectuses, proxies, financial reports, and other communication to shareholders with the same residential address, provided they have the same last name or we reasonably believe them to be members of the same family. Unless we are notified otherwise, we will continue to send you only one copy of these materials for as long as you remain a shareholder of the Fund. If you would like to receive individual mailings, please call 1-877-526-0707 and we will begin sending you separate copies of these materials within 30 days after we receive your request.
For additional information about the Fund, including its Prospectus, Statement of Additional Information, financial statements, holdings and proxy information, please visit www.berkshirefunds.com.
| Berkshire Focus Fund | | |
| PORTFOLIO OF INVESTMENTS | | |
| June 30, 2024 (Unaudited) | | |
| | | | | |
| Shares | | | | Value |
| | | | | |
| | | COMMON STOCKS - 100.20% | | $ 247,298,190 |
| | | (Cost $225,771,241) | | |
| | | | | |
| | | AUTOMOBILE MANUFACTURERS - 4.02% | | 9,919,858 |
| 10 | | Rivian Automotive, Inc. (Class A) * | | 134 |
| 50,130 | | Tesla, Inc. * | | 9,919,724 |
| | | | | |
| | | BEVERAGES - 0.00% | | 571 |
| 10 | | Celsius Holdings, Inc. * | | 571 |
| | | | | |
| | | BUSINESS SOFTWARE & SERVICES - 18.48% | | 45,608,701 |
| 10 | | Adobe, Inc. * | | 5,555 |
| 10 | | AppLovin Corporation (Class A) * | | 832 |
| 10 | | Cadence Design Systems, Inc. * | | 3,077 |
| 179,550 | | Cloudflare, Inc. (Class A) * | | 14,872,126 |
| 10 | | Datadog, Inc. (Class A) * | | 1,297 |
| 10 | | GitLab Inc. (Class A) * | | 497 |
| 10 | | HubSpot, Inc. * | | 5,898 |
| 10 | | Impinj, Inc. * | | 1,568 |
| 10 | | Intuit, Inc. | | 6,572 |
| 27,150 | | Microsoft Corp. | | 12,134,692 |
| 10 | | monday.com Ltd. (Israel) * | | 2,408 |
| 10 | | MongoDB, Inc. (Class A) * | | 2,500 |
| 247,340 | | Palantir Technologies Inc. (Class A) * | | 6,265,122 |
| 10 | | Samsara Inc. (Class A) * | | 337 |
| 10 | | ServiceNow, Inc. * | | 7,867 |
| 10 | | Snowflake Inc. (Class A) * | | 1,351 |
| 10 | | Synopsys, Inc. * | | 5,951 |
| 10 | | Toast, Inc. (Class A) * | | 258 |
| 125,840 | | The Trade Desk, Inc. (Class A) * | | 12,290,793 |
| | | | | |
| | | COMMUNICATION EQUIPMENT - 8.60% | | 21,233,080 |
| 42,840 | | Arista Networks, Inc. * | | 15,014,563 |
| 85,820 | | Coherent Corp. * | | 6,218,517 |
| | | | | |
| | | COMPUTER HARDWARE - 7.99% | | 19,720,860 |
| 34,760 | | Dell Technologies, Inc. - Class C | | 4,793,752 |
| 10 | | NetApp, Inc. | | 1,288 |
| 115,750 | | Pure Storage, Inc. (Class A) * | | 7,432,308 |
| 10 | | Super Micro Computer, Inc. * | | 8,194 |
| 98,790 | | Western Digital Corporation * | | 7,485,318 |
| | | | | |
| | | CONSUMER ELECTRONICS - 4.92% | | 12,138,031 |
| 57,630 | | Apple, Inc. | | 12,138,031 |
| | | | | |
| | | CRYPTOCURRENCY - 0.01% | | 16,672 |
| 10 | | CleanSpark, Inc. * | | 159 |
| 10 | | Coinbase Global, Inc. (Class A) * | | 2,222 |
| 10 | | Marathon Digital Holdings, Inc. * | | 198 |
| 10 | | Micro Strategy, Inc. (Class A) * | | 13,775 |
| 10 | | Riot Platforms, Inc. * | | 91 |
| 10 | | Robinhood Markets, Inc. (Class A) * | | 227 |
| | | | | |
| | | CYBERSECURITY EQUIPMENT & SERVICES - 4.05% | 9,987,250 |
| 26,040 | | CrowdStrike Holdings, Inc. (Class A) * | | 9,978,268 |
| 10 | | CyberArk Software Ltd. (Israel) * | | 2,734 |
| 10 | | Okta, Inc. (Class A) * | | 936 |
| 10 | | Palo Alto Networks, Inc. * | | 3,390 |
| 10 | | Zscaler, Inc. * | | 1,922 |
| | | | | |
| | | DRUG MANUFACTURERS - 6.05% | | 14,931,143 |
| 16,490 | | Eli Lilly and Company | | 14,929,716 |
| 10 | | Novo Nordisk A/S - ADR | | 1,427 |
| | | | | |
| | | ELECTRICAL EQUIPMENT - 0.00% | | 4,861 |
| 10 | | Eaton Corporation plc (Ireland) | | 3,135 |
| 10 | | Vertiv Holdings Co (Class A) | | 866 |
| 10 | | Vistra Corp. | | 860 |
| | | | | |
| | | ENTERTAINMENT - 0.00% | | 10,858 |
| 10 | | Netflix, Inc. * | | 6,749 |
| 10 | | Roblox Corporation (Class A) * | | 372 |
| 10 | | Roku, Inc. (Class A) * | | 599 |
| 10 | | Spotify Technology S.A. - (Luxembourg) * | | 3,138 |
| | | | | |
| | | HOTELS, RESTAURANTS & LEISURE - 0.03% | | 71,868 |
| 10 | | Booking Holdings Inc. | | 39,615 |
| 10 | | CAVA Group, Inc. * | | 928 |
| 500 | | Chipotle Mexican Grill, Inc. * | | 31,325 |
| | | | | |
| | | INTERNET SERVICES - 7.03% | | 17,347,428 |
| 10 | | Airbnb, Inc. (Class A) * | | 1,516 |
| 10 | | Alphabet, Inc. (Class A) | | 1,822 |
| 89,650 | | Amazon.com, Inc. * | | 17,324,863 |
| 10 | | Carvana Co. (Class A) * | | 1,287 |
| 10 | | Global-E Online Ltd. (Israel) * | | 363 |
| 10 | | MercadoLibre, Inc. (Argentina) * | | 16,434 |
| 10 | | Opendoor Technologies Inc. * | | 18 |
| 10 | | Shopify Inc. (Class A) (Canada) * | | 661 |
| 10 | | Zillow Group, Inc. (Class C) * | | 464 |
| | | | | |
| | | INTERNET SOCIAL MEDIA - 4.92% | | 12,137,016 |
| 24,070 | | Meta Platforms, Inc. (Class A) | | 12,136,575 |
| 10 | | Pinterest, Inc. (Class A) * | | 441 |
| | | | | |
| | | IT FINANCIAL SERVICES - 0.00% | | 1,013 |
| 10 | | Affirm Holdings, Inc. (Class A) * | | 302 |
| 10 | | Block Inc. (Class A) * | | 645 |
| 10 | | SoFi Technologies, Inc. * | | 66 |
| | | | | |
| | | SEMICONDUCTOR - 29.18% | | 72,027,958 |
| 10 | | Advanced Micro Devices, Inc. * | | 1,622 |
| 46,290 | | Arm Holdings plc - ADR * | | 7,573,970 |
| 9,450 | | Broadcom Inc. | | 15,172,258 |
| 10 | | Marvell Technology, Inc. | | 699 |
| 56,260 | | Micron Technology, Inc. | | 7,399,878 |
| 10 | | Monolithic Power Systems, Inc. | | 8,217 |
| 218,110 | | NVIDIA Corp. | | 26,945,309 |
| 10 | | ON Semiconductor Corporation * | | 686 |
| 10 | | QUALCOMM Inc. | | 1,992 |
| 85,860 | | Taiwan Semiconductor Manufacturing Company Limited - ADR | | 14,923,327 |
| | | | | |
| | | SEMICONDUCTOR EQUIPMENT - 4.92% | | 12,138,825 |
| 10 | | Applied Materials, Inc. | | 2,360 |
| 10 | | ASML Holding N.V. - ADR | | 10,227 |
| 10 | | KLA Corporation | | 8,245 |
| 11,380 | | Lam Research Corporation | | 12,117,993 |
| | | | | |
| | | SPORTS ENTERTAINMENT & GAMING - 0.00% | | 382 |
| 10 | | DraftKings Inc. (Class A) * | | 382 |
| | | | | |
| | | TRANSPORT NETWORKS - 0.00% | | 1,815 |
| 10 | | DoorDash, Inc. (Class A) * | | 1,088 |
| 10 | | Uber Technologies, Inc. * | | 727 |
| | | | | |
| | | EXCHANGE TRADED FUNDS - 0.00% | | 7,739 |
| | | (Cost $1,894) | | |
| 10 | | Invesco QQQ ETF | | 4,791 |
| 10 | | iShares® Bitcoin Trust * | | 341 |
| 10 | | VanEck Semiconductor ETF | | 2,607 |
| | | | | |
| | | TOTAL INVESTMENT SECURITIES - 100.20% | | 247,305,929 |
| | | (Cost $225,773,135) | | |
| | | | | |
| | | LIABILITIES IN EXCESS OF OTHER ASSETS - (0.20%) | (483,844) |
| | | | | |
| | | NET ASSETS - 100.00% | | $ 246,822,085 |
| | | Equivalent to $24.50 Per Share | | |
| | | | | |
| | | * Non-income producing. | | |
| | | ADR - American Depositary Receipt. | | |
| | | The accompanying notes are an integral part of these financial statements. | |
| NOTES TO FINANCIAL STATEMENTS |
| June 30, 2024 |
| (Unaudited) |
| | | | | | | | | | |
| 1. Organization | | | | | | | | | |
The Berkshire Focus Fund (the “Fund”) is a non-diversified series of The Berkshire Funds (the “Trust”), an open-end management investment company registered under the Investment Company Act of 1940, as amended (the “1940 Act”). The Trust was organized as a Delaware business trust on November 25, 1996. The Fund commenced operations on July 1, 1997. The Fund’s investment objective is to seek long-term growth of capital primarily through investments in equity securities.
|
| | | | | | | | | | |
2. Significant Accounting Policies
| | | | | | | | | |
The Fund is an investment company and accordingly follows the investment company accounting and reporting guidance of the Financial Accounting Standards Board (“FASB”) Accounting Standards Codification Topic 946 Financial Services – Investment Companies. The financial statements are prepared in conformity with accounting principles generally accepted in the United States of America (“GAAP”).
|
| | | | | | | | | | |
The following is a summary of the Trust’s significant accounting policies:
| | | | | |
| | | | | | | | | | |
Cash — The Fund maintains cash at its custodian which, at times, may exceed United States federally insured limits.
|
| | | | | | | | | | |
Securities valuation — The Fund’s portfolio securities generally are valued by using market quotations but may be valued on the basis of prices furnished by a pricing service when the Valuation Committee believes such prices accurately reflect the fair market value of such securities. Securities that are traded on any stock exchange or on the NASDAQ over-the-counter market are generally valued by the pricing service at the last quoted sale price. Lacking a last sale price, an equity security is generally valued by the pricing service at its last bid price. Generally, if the security is traded in an active market and is valued at its last sales price, the security is categorized as a Level 1 security (described below), and if an equity security is valued by the pricing service at its last bid, it is generally categorized as a Level 2 security. When market quotations are not readily available, when the Valuation Committee determines that the market quotation or the price provided by the pricing service does not accurately reflect the current market value, or when restricted or illiquid securities are being valued, such securities are valued in good faith by the Valuation Committee, in accordance with the Trust’s Valuation and Fair Value Pricing Policies and Procedures and are categorized as level 2 or level 3, when appropriate. The Trust's Valuation Committee shall consist of the Trust’s independent trustees, and the Fund portfolio manager as a non-voting member.
|
| | | | | | | | | | |
In accordance with the Trust's Valuation and Fair Value Pricing Policies and Procedures which were established in accordance with Rule 2a-5 of the 1940 Act, it is incumbent upon the Valuation Committee to consider all appropriate factors relevant to the value of securities for which market quotations are not readily available. No single standard for determining fair value can be established, since fair value depends upon the circumstances of each individual case. As a general principle, the current fair value of an issue of securities being valued by the Valuation Committee would appear to be the amount that the owner might reasonably expect to receive for them upon their current sale. Methods that are in accordance with this principle may, for example, be based on (i) a multiple of earnings; (ii) a discount from market of a similar freely traded security (including a derivative security or a basket of securities traded on other markets, exchanges or among dealers); or (iii) yield to maturity with respect to debt issues, or a combination of these or other methods.
|
| | | | | | | | | | |
The Trust has adopted accounting standards which establish an authoritative definition of fair value and set out a hierarchy for measuring fair value. These standards require additional disclosures about the various inputs and valuation techniques used to develop the measurements of fair value and a discussion of changes in valuation techniques and related inputs during the period. These standards define fair value as the price that would be received to sell an asset or paid to transfer a liability in an orderly transaction between market participants at the measurement date. The fair value hierarchy is organized into three levels based upon the assumptions (referred to as “inputs”) used in pricing the asset or liability. These standards state that “observable inputs” reflect the assumptions market participants would use in pricing the asset or liability based on market data obtained from independent sources and “unobservable inputs” reflect an entity's own assumptions about the assumptions market participants would use in pricing the asset or liability. These inputs are summarized in the three broad levels listed below:
|
| | | | | | | | | | |
Level 1 – Unadjusted quoted prices in active markets for identical securities that the Fund has the ability to access.
|
| | | | | | | | | | |
Level 2 – Other significant observable inputs (including quoted prices for similar securities, interest rates, prepayment speeds, credit risk, etc.).
|
| | | | | | | | | | |
Level 3 – Significant unobservable inputs (including the Fund’s Valuation Committee's own assumptions in determining the fair value of investments).
|
| | | | | | | | | | |
The inputs or methodology used for valuing securities are not necessarily an indication of the risk associated with investing in those securities.
|
| | | | | | | | | | |
The following is a summary of the inputs used to value the Fund’s investments as of June 30, 2024:
|
| | | | | | | | | | |
| | | Level 1 | | Level 2 | | Level 3 | | Total | |
| Common Stock | | | | | | | | | |
| Semiconductor | | $ 72,027,958 | | - | | - | | $ 72,027,958 | |
| Business Software & Services | | 45,608,701 | | - | | - | | 45,608,701 | |
| Communication Equipment | | 21,233,080 | | - | | - | | 21,233,080 | |
| Computer Hardware | | 19,720,860 | | - | | - | | 19,720,860 | |
| Internet Services | | 17,347,428 | | - | | - | | 17,347,428 | |
| Drug Manufacturers | | 14,931,143 | | - | | - | | 14,931,143 | |
| Semiconductor Equipment | | 12,138,825 | | - | | - | | 12,138,825 | |
| Consumer Electronics | | 12,138,031 | | - | | - | | 12,138,031 | |
| Internet Social Media | | 12,137,016 | | - | | - | | 12,137,016 | |
| Cybersecurity Equipment & Services | 9,987,250 | | - | | - | | 9,987,250 | |
| Automobile Manufacturer | | 9,919,858 | | - | | - | | 9,919,858 | |
| Hotels, Restaurants & Leisure | | 71,868 | | - | | - | | 71,868 | |
| Cryptocurrency | | 16,672 | | - | | - | | 16,672 | |
| Entertainment | | 10,858 | | - | | - | | 10,858 | |
| Electrical Equipment | | 4,861 | | - | | - | | 4,861 | |
| Transport Networks | | 1,815 | | - | | - | | 1,815 | |
| IT Financial Services | | 1,013 | | - | | - | | 1,013 | |
| Beverages | | 571 | | - | | - | | 571 | |
| Sports Entertainment & Gaming | | 382 | | - | | - | | 382 | |
| Total Common Stocks | | 247,298,190 | | - | | - | | 247,298,190 | |
| Exchange Traded Funds | | 7,739 | | - | | - | | 7,739 | |
| Total Investment Securities | | $ 247,305,929 | | - | | - | | $ 247,305,929 | |
| | | | | | | | | | |
| The Fund did not hold any Level 3 securities during the six month period ended June 30, 2024. |
| | | | | | | | | | |
| The Fund did not hold any derivative instruments during the reporting period. |
| | | | | | | | | | |
Investment income — Dividend income is recorded on the ex-dividend date. Interest income, if any, is accrued as earned.
|
| | | | | | | | | | |
Distributions to shareholders — Distributions to shareholders arising from net investment income and net realized capital gains, if any, are distributed at least once each year. Distributions to shareholders are recorded on the ex-dividend date. The Fund may utilize earnings and profits distributed to shareholders on redemptions of shares as part of the dividends paid deduction. Dividends from net investment income and capital gain distributions are determined in accordance with income tax regulations, which may differ from GAAP.
|
| | | | | | | | | | |
Security transactions — Security transactions are accounted for on the trade date for financial reporting purposes. Securities sold are determined on a specific identification basis.
|
| | | | | | | | | | |
Estimates — The financial statements are prepared in accordance with GAAP, which requires management to make estimates and assumptions that affect the reported amounts of assets and liabilities and disclosure of contingent assets and liabilities at the date of the financial statements and the reported amounts of increases and decreases in net assets from operations during the reporting period. Actual results could differ from those estimates.
|
| | | | | | | | | | |
Federal income tax — The Fund intends to comply with the requirements of Subchapter M of the Internal Revenue Code (the “Code”) necessary to qualify as a regulated investment company. As provided therein, in any fiscal year in which the Fund so qualifies and distributes at least 90% of its taxable net income, the Fund (but not the shareholders) will be relieved of federal income tax on the income distributed. Accordingly, no provision for income taxes has been made.
|
| | | | | | | | | | |
As of and during the six month period ended June 30, 2024, the Fund did not have a liability for any unrecognized tax benefits. The Fund recognizes interest and penalties, if any, related to unrecognized tax benefits as other expense on the statement of operations. During the year, the Fund did not incur any tax-related interest or penalties.
|
| | | | | | | | | | |
In order to avoid imposition of the excise tax applicable to regulated investment companies, it is also the Fund’s intention to declare as dividends in each calendar year at least 98% of its net investment income and 98.2% of its net realized capital gains plus undistributed amounts from prior years.
|
| | | | | | | | | | |
Other — The treatment for financial reporting purposes of distributions made to shareholders during the year from net investment income or net realized capital gains may differ from their ultimate treatment for federal income tax purposes. These differences are caused primarily by differences in the timing of the recognition of certain components of income, expense or realized capital gain for federal income tax purposes. Where such differences are permanent in nature, they are reclassified in the components of the net assets based on their ultimate characterization for federal income tax purposes. Any such reclassifications will have no effect on net assets, results of operations or net asset value per share of the Fund. Effective September 30, 2019, the Fund elected a tax year-end of September 30. For the tax year ended September 30, 2023 and the fiscal year December 31, 2023, the following permanent adjustment was recorded.
|
| | | | | | | | | | |
The adjustment was primarily related to the reclassification of net operating loss:
|
| | | | | | | | | | |
| Paid-In Capital | | $ (6,415,762) | | | | | | | |
| Total Distributable Earnings | | $ 6,415,762 | | | | | | | |
| | | | | | | | | | |
| 3. Investment Transactions |
Purchases and sales of investment securities (excluding short-term instruments) for the six month period ended June 30, 2024, were $2,796,679,858 and $2,831,658,839 respectively. There were no purchases or sales of U.S. Government securities for the Fund.
|
| | | | | | | | | | |
4. Tax Information
| | | | | | | | | |
For Federal income tax purposes, as of December 31, 2023, the cost of investments, and gross appreciation/depreciation was as follows:
|
| | | | | | | | | | |
| Federal Income Tax Cost | | $ 243,963,657 | | | | | | | |
| Gross Unrealized Appreciation | | $ 24,835,747 | | | | | | | |
| Gross Unrealized Depreciation | | (47,480,321) | | | | | | | |
| Net Unrealized Depreciation | | $ (22,644,574) | | | | | | | |
| | | | | | | | | | |
The cost basis of investments for tax and financial reporting purposes differed primarily due to wash sales.
|
| | | | | | | | | | |
There were no distributions paid during the six month period ended June 30, 2024 or the fiscal year ended December 31, 2023.
|
| | | | | | | | | | |
As of the tax year ended September 30, 2023, the components of distributable earnings on a tax basis were as follows:
|
| | | | | | | | | | |
| Accumulated Capital and Other Losses | | $ (311,346,315) | | | | | | | |
| Net Unrealized Depreciation | | (41,161,942) | | | | | | | |
| Total Accumulated Deficit | | $ (352,508,257) | | | | | | | |
| | | | | | | | | | |
As of tax year ended September 30, 2023, accumulated capital and other losses included the following:
|
| | | | | | | | | | |
| Deferred Interest Expense | | $ 58,324 | | | | | | | |
| Deferred Late Year Ordinary Losses | | $ 3,215,331 | | | | | | | |
| Short-Term Capital Loss Carryforward | | $ 308,072,660 | | | | | | | |
| | | | | | | | | | |
Under current tax law, late year ordinary losses incurred after December 31 of a fund’s tax fiscal year end may be deferred and treated as occurring on the first business day of the following fiscal year for tax purposes. The capital loss carryforward has no expiration.
|
| | | | | | | | | | |
| 5. Related Party Transactions, Investment Advisory and Administrative Fees | | | | | |
Certain Officers and Trustees of the Trust are also Officers and Directors of Berkshire Capital Holdings, Inc. (“Berkshire Capital”). The non-interested Trustees of the Fund were paid $45,000 in Trustee fees and expenses directly by Berkshire Capital during the six month period ended June 30, 2024.
|
| | | | | | | | | | |
The Fund has an Investment Advisory Agreement (the “Advisory Agreement”) and a separate Administration Agreement with Berkshire Capital. Under the Advisory Agreement, Berkshire Capital will determine what securities will be purchased, retained or sold by the Fund on the basis of a continuous review of the portfolio. For the services it provides under the Advisory Agreement, Berkshire Capital receives a fee accrued each calendar day (including weekends and holidays) at a rate of 1.50% per annum of the daily net assets of the Fund.
|
| | | | | | | | | | |
Under the Administration Agreement, Berkshire Capital renders all administrative and supervisory services of the Fund, as well as facilities furnished and expenses assumed except for interest and taxes. For these services, Berkshire Capital receives a fee at the annual rate of 0.50% of the Fund’s average daily net assets up to $50 million, 0.45% of average net assets from $50 million to $200 million, 0.40% of average net assets from $200 million to $500 million, 0.35% of average net assets from $500 million to $1 billion and 0.30% of average net assets in excess of $1 billion. Such fee is computed as a percentage of the Fund’s daily net assets and is accrued each calendar day (including weekends and holidays). For the six month period ended June 30, 2024, Berkshire Capital was paid an investment advisory fee of $1,763,012 and an administration fee of $532,294 from the Fund. The amount due to Berkshire Capital for these fees at June 30, 2024, totaled $396,041.
|
| | | | | | | | | | |
6. Redemption Fee
| | | | | | | | | |
The Fund may impose a redemption fee of 2.00% on shares held for 90 days or less. For the six month period ended June 30, 2024, proceeds from redemption fees were $49,424.
|
| | | | | | | | | | |
7. Beneficial Ownership
| | | | | | | | | |
The beneficial ownership, either directly or indirectly, of more than 25% of the voting securities of a fund creates a presumption of control of the Fund, under Section 2(a)(9) of the 1940 Act. At June 30, 2024, National Financial Services Corp. beneficially owned, in aggregate, 52.48% of the Fund, and Charles Schwab & Co. Inc. beneficially owned, in aggregate, 25.63% of the Fund.
|
| | | | | | | | | | |
8. Market Developments, Events, and Risks
| | | | | | | |
Unexpected local, regional or global events, such as war; acts of terrorism; financial, political or social disruptions; natural, environmental or man-made disasters; the spread of infectious illnesses or other public health issues; and recessions and depressions could have a significant impact on the Fund and its investments and may impair market liquidity. Such events can cause investor fear, which can adversely affect the economies of nations, regions and the market in general, in ways that cannot necessarily be foreseen.
|
| | | | | | | | | | |
9. Revolving Credit Agreement
| | | | | | | | | |
The Trust entered into a Revolving Credit Agreement (the “Loan Agreement”) between the Trust and its custodian, The Huntington National Bank, N.A. The Fund may not borrow money or purchase securities on margin except for temporary or emergency (not leveraging) purposes, including the meeting of redemption requests that might otherwise require the untimely disposition of securities. The maximum amount that the Fund is permitted to borrow is the lesser of: (i) $3,000,000 or (ii) 10% of the Fund's daily market value and is secured by the securities in the Fund. The maximum interest rate of such loans is set at a rate per annum equal to the Term Secured Overnight Financing Rate subject to a .25% floor, plus 1.85% per annum, subject to an Annual Fee and an Unused Fee. The Annual Fee for the Loan Agreement is equal to 1/8 of one percent (1.00%) of the Loan Amount of $3,000,000 and the Unused Fee is equal to 1/8 of one percent (1.00%) of the excess of the Loan Amount over the outstanding principal balance of the loan. During the six month period ended June 30, 2024, the Fund had an average loan balance of $411,566 and paid an average interest rate of 7.18%. Additionally, the maximum borrowing during the period was $1,756,674, which occurred on June 12, 2024. As of June 30, 2024, there was an outstanding loan balance of $109,798 and the interest rate was 7.18% . No compensating balances are required. The loan matures on August 13, 2025, per agreement.
|
| | | | | | | | | | |
10. Concentration of Sector Risk
| | | | | | | | | |
If a Fund has significant investments in the securities of issuers in industries within a particular sector, any development affecting that sector will have a greater impact on the value of the net assets of the Fund than would be the case if the Fund did not have significant investments in that sector. In addition, this may increase the risk of loss of an investment in the Fund and increase the volatility of the Fund’s NAV per share. From time to time, circumstances may affect a particular sector and the companies within such sector. For instance, economic or market factors, regulation or deregulation, and technological or other developments may negatively impact all companies in a particular sector and therefore the value of a Fund’s portfolio will be adversely affected. As of June 30, 2024, the Fund had 29.18% of the value of its net assets invested in stocks within the Semiconductor sector.
|
| | | | | | | | | | |
11. Subsequent Events
| | | | | | | | | |
In preparing these financial statements, management has performed an evaluation of subsequent events after June 30, 2024, through the date these financial statements were issued and determined that there were no significant subsequent events that would require adjustment to or additional disclosure in the financial statements.
|