


Searchable text section of graphics shown above
Exhibit 99.1
[LOGO]
PRUDENTIAL EQUITY GROUP
TECHNOLOGY MEETING
OCTOBER 27, 2005
ED BRAUN
CHAIRMAN AND CEO
1
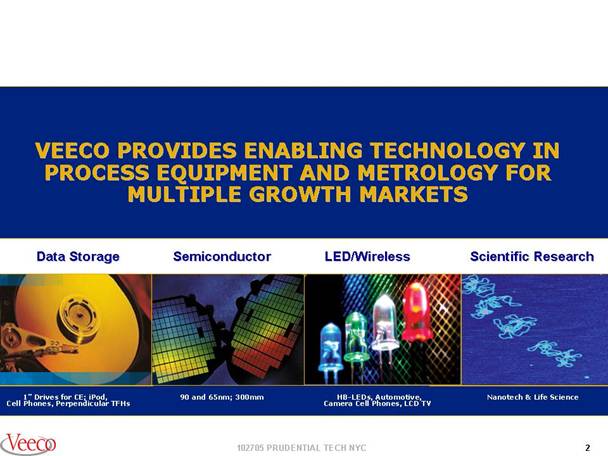
VEECO PROVIDES ENABLING TECHNOLOGY IN PROCESS EQUIPMENT AND METROLOGY FOR MULTIPLE GROWTH MARKETS
Data Storage
[PICTURE]
1" Drives for CE; iPod, Cell Phones, Perpendicular TFHs
Semiconductor
[PICTURE]
90 and 65nm; 300mm
LED/Wireless
[PICTURE]
HB-LEDs, Automotive, Camera Cell Phones, LCD TV
Scientific Research
[PICTURE]
Nanotech & Life Science
[LOGO]
2
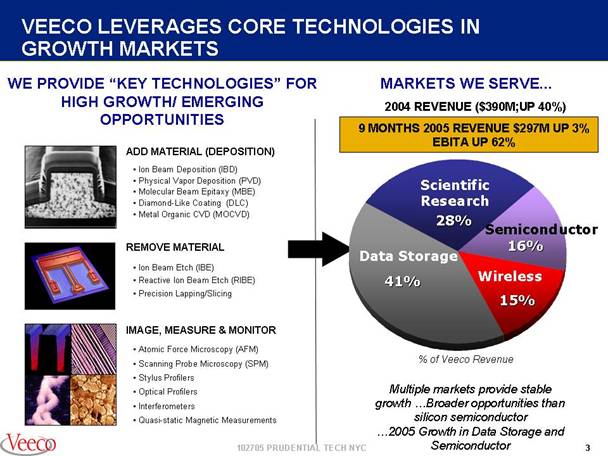
VEECO LEVERAGES CORE TECHNOLOGIES IN GROWTH MARKETS
WE PROVIDE “KEY TECHNOLOGIES” FOR HIGH GROWTH/ EMERGING OPPORTUNITIES
[PICTURE]
ADD MATERIAL (DEPOSITION)
- Ion Beam Deposition (IBD)
- Physical Vapor Deposition (PVD)
- Molecular Beam Epitaxy (MBE)
- Diamond-Like Coating (DLC)
- Metal Organic CVD (MOCVD)
[PICTURE]
REMOVE MATERIAL
- Ion Beam Etch (IBE)
- Reactive Ion Beam Etch (RIBE)
- Precision Lapping/Slicing
[PICTURE]
IMAGE, MEASURE & MONITOR
- Atomic Force Microscopy (AFM)
- Scanning Probe Microscopy (SPM)
- Stylus Profilers
- Optical Profilers
- Interferometers
- Quasi-static Magnetic Measurements
MARKETS WE SERVE...
2004 REVENUE ($390M;UP 40%)
9 MONTHS 2005 REVENUE $297M UP 3%
EBITA UP 62%
[CHART]
% of Veeco Revenue
Multiple markets provide stable growth …Broader opportunities than silicon semiconductor …2005 Growth in Data Storage and Semiconductor
3
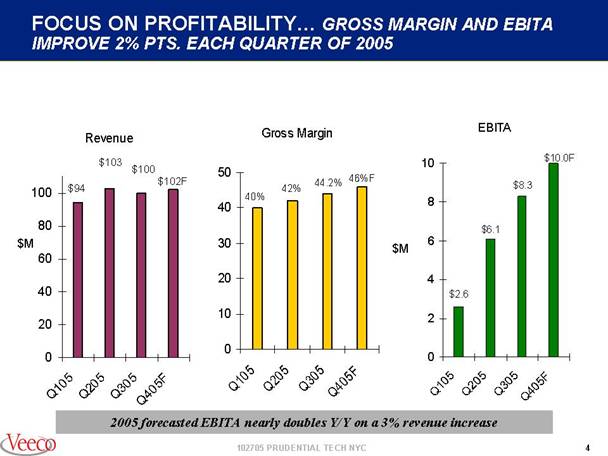
FOCUS ON PROFITABILITY… GROSS MARGIN AND EBITA IMPROVE 2% PTS. EACH QUARTER OF 2005
[GRAPH]
2005 forecasted EBITA nearly doubles Y/Y on a 3% revenue increase
4
ENABLING SOLUTIONS ADDRESS COMMON CHALLENGES ACROSS MULTIPLE END-MARKETS
Process Equipment
Enabling Solutions
- Ion Beam Etch & Deposition
- Physical Vapor Deposition
- Molecular Beam Epitaxy
- Metal Organic CVD
- Diamond-Like Carbon
- Lapping, Dicing & Slicing
Metrology
- Automated Atomic Force Microscopes
- Research AFMs and SPMs
- Stylus Profilers/Optical Interferometers
Core leadership technologies, capable of R&D and manufacturing applications, key to multi-market penetration
[CHART]
5
VEECO INVESTMENT THEMES
- In the post PC era… handheld wireless/mobility and connectivity are the next market “driver”…the convergence of microdrives, HB-LEDs, color displays, and wireless technology will enable a wave of new high volume, digital consumer electronics for mass markets…”Miniature” hard drives are a significant enabler
- High cell phone penetration..1.5B units now…3B units by 2009…are a model base for new video, text messaging, music applications…bringing the desktop PC experience to a new class of handheld devices
- Veeco’s diverse market strategy and product technology mix allows us a broader customer base than most other semi equipment companies
- Veeco well-positioned to benefit from growth in “converging” data storage, semiconductor, HB-LED display opportunities…based on Veeco’s core technologies
6
VEECO SERVES INDUSTRY LEADERS IN MULTIPLE MARKETS
MARKETS |
| PRODUCTS |
| CUSTOMERS |
Data Storage |
| #1 Equipment Supplier for TFMHs; |
| [LOGOS] |
LED/Wireless |
| Only Broad line Equipment and Metrology Supplier |
| [LOGOS] |
Semiconductor |
| #1 3D AFM Metrology |
| [LOGOS] |
Scientific Research |
| #1 AFMs, SPMs and Optical Profilers |
| [LOGOS] |
7
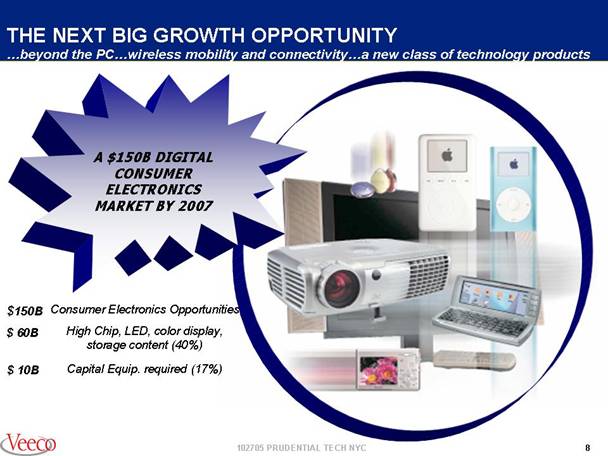
THE NEXT BIG GROWTH OPPORTUNITY
…beyond the PC…wireless mobility and connectivity…a new class of technology products
A $150B DIGITAL CONSUMER ELECTRONICS MARKET BY 2007
$150B |
| Consumer Electronics Opportunities |
$60B |
| High Chip, LED, color display, storage content (40%) |
$10B |
| Capital Equip. required (17%) |
[PICTURE]
8
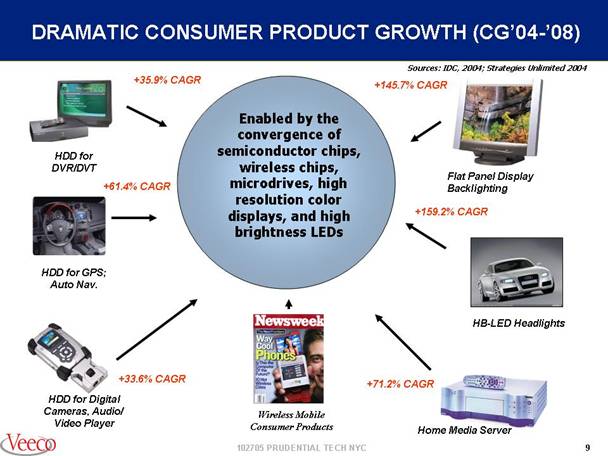
DRAMATIC CONSUMER PRODUCT GROWTH (CG’04-’08)
Sources: IDC, 2004; Strategies Unlimited 2004
Enabled by the convergence of semiconductor chips, wireless chips, microdrives, high resolution color displays, and high brightness LEDs
+35.9% CAGR
[PICTURE]
HDD for DVR/DVT
+61.4% CAGR
[PICTURE]
HDD for GPS; Auto Nav.
+33.6% CAGR
[PICTURE]
HDD for Digital Cameras, Audio/Video Player
+145.7% CAGR
[PICTURE]
Flat Panel Display Backlighting
+159.2% CAGR
[PICTURE]
HB-LED Headlights
+71.2% CAGR
[PICTURE]
Home Media Server
[PICTURE]
Wireless Mobile
Consumer Products
9
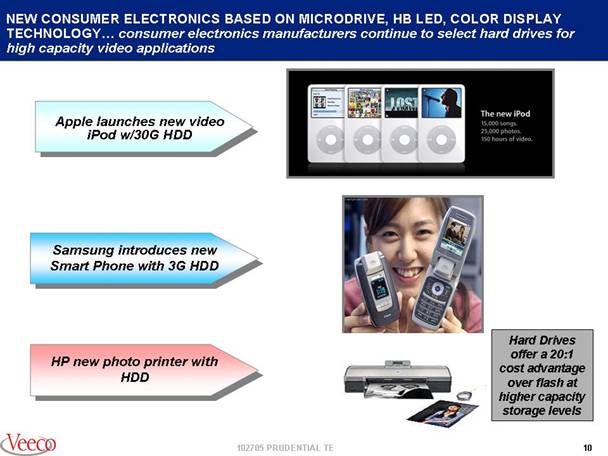
NEW CONSUMER ELECTRONICS BASED ON MICRODRIVE, HB LED, COLOR DISPLAY TECHNOLOGY… consumer electronics manufacturers continue to select hard drives for high capacity video applications
Apple launches new video iPod w/30G HDD |
| [PICTURE] |
Samsung introduces new Smart Phone with 3G HDD |
| [PICTURE] |
HP new photo printer with HDD |
| [PICTURE] |
Hard Drives offer a 20:1 cost advantage over flash at higher capacity storage levels
10
VEECO’S 2005
FINANCIAL MODEL
Updated 10/24/05
Revenue (by Business Segment)
Gross Margin
Profitability
11
THE 2005 REVENUE MODEL by Business Segment
PROJECTED REVENUE/PRODUCT MIX CHANGE FOR 2005 (updated 10/24/05)
|
|
|
|
|
|
|
|
|
| CURRENT 2005 |
| |||
|
| Original Guidance (January ‘05) |
|
|
| FORECAST |
| |||||||
|
| 2004 |
| 2005 CHANGE |
| 2005 RANGE |
| DRIVEN BY |
| (10/24/05) |
| |||
Ion Beam and Mechanical Equipment (IBE/IBD/Slider) |
| $134M |
| +15 TO +18 | % | $154M TO $158M |
| Strong Consumer Electronics Data Storage Growth |
| $160M |
| +19 | % | |
Epitaxial Equipment (MOCVD/MBE) |
| $93M |
| -24 TO -27 | % | $68M TO $71M |
| 2005 LED industry decline |
| $60M |
| -36 | % | |
Metrology (Auto AFM/Research AFM and Optical) |
| $163M |
| +3 TO +5 | % | $168M TO $171M |
| Growth in Auto AFM (up 25%) and Optical Metrology |
| $180M |
| +10 | % | |
Total |
| $390M |
|
|
| $390M TO $400M |
| Overall Veeco up ~3% |
|
|
| $400M +3% IN LINE WITH PLAN |
| |
Revenue mix change favors Veeco’s higher gross margin products (Ion Beam and Metrology)
12
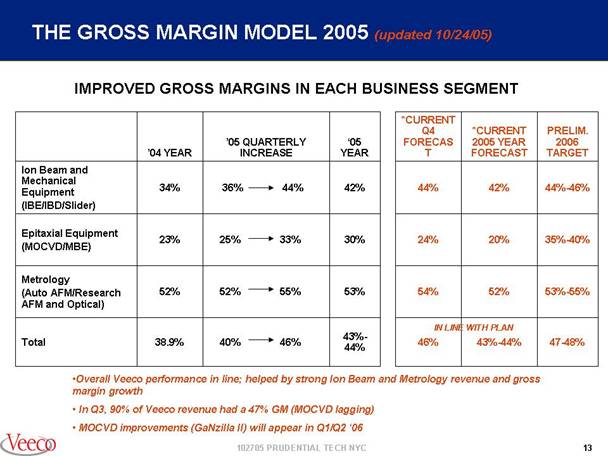
THE GROSS MARGIN MODEL 2005 (updated 10/24/05)
IMPROVED GROSS MARGINS IN EACH BUSINESS SEGMENT
|
|
|
|
|
|
|
|
|
| *CURRENT |
| *CURRENT |
| PRELIM. |
|
|
|
|
| ‘05 QUARTERLY INCREASE |
| ‘05 |
| Q4 |
| 2005 YEAR |
| 2006 |
| ||
|
| ‘04 YEAR |
|
| YEAR |
| FORECAST |
| FORECAST |
| TARGET |
| |||
Ion Beam and Mechanical Equipment (IBE/IBD/Slider) |
| 34 | % | 36 % - 44% |
| 42 | % | 44 | % | 42 | % | 44-46 | % | ||
Epitaxial Equipment (MOCVD/MBE) |
| 23 | % | 25 % - 33% |
| 30 | % | 24 | % | 20 | % | 35-40 | % | ||
Metrology (Auto AFM/Research AFM and Optical) |
| 52 | % | 52 % - 55% |
| 53 | % | 54 | % | 52 | % | 53-55 | % | ||
|
|
|
|
|
|
|
|
|
| IN LINE WITH PLAN |
| ||||
Total |
| 38.9 | % | 40 % - 46% |
| 43-44 | % | 46 | % | 43-44 | % | 47-48 | % | ||
- Overall Veeco performance in line; helped by strong Ion Beam and Metrology revenue and gross margin growth
- In Q3, 90% of Veeco revenue had a 47% GM (MOCVD lagging)
- MOCVD improvements (GaNzilla II) will appear in Q1/Q2 ‘06
13
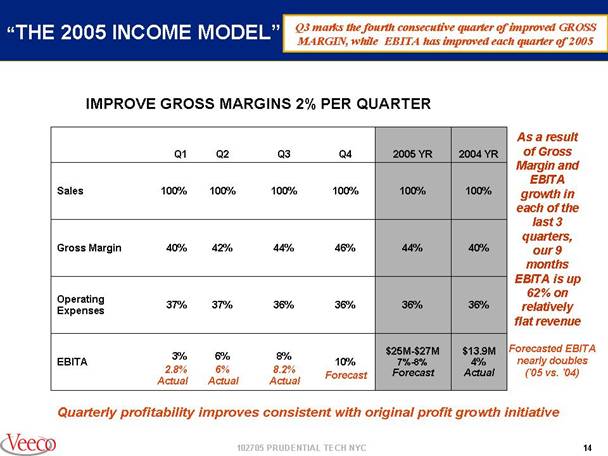
“THE 2005 INCOME MODEL”
Q3 marks the fourth consecutive quarter of improved GROSS MARGIN, while EBITA has improved each quarter of 2005
IMPROVE GROSS MARGINS 2% PER QUARTER
|
| Q1 |
| Q2 |
| Q3 |
| Q4 |
| 2005 YR |
| 2004 YR |
|
Sales |
| 100 | % | 100 | % | 100 | % | 100 | % | 100 | % | 100 | % |
Gross Margin |
| 40 | % | 42 | % | 44 | % | 46 | % | 44 | % | 40 | % |
Operating Expenses |
| 37 | % | 37 | % | 36 | % | 36 | % | 36 | % | 36 | % |
EBITA |
| 3 | % | 6 | % | 8 | % | 10 | % | $25M-$27M |
| $13.9M | % |
As a result of Gross Margin and EBITA growth in ) each of the last 3 quarters, our 9 months EBITA is up 62% on relatively flat revenue
Forecasted EBITA nearly doubles (‘05 vs. ‘04)
Quarterly profitability improves consistent with original profit growth initiative
14
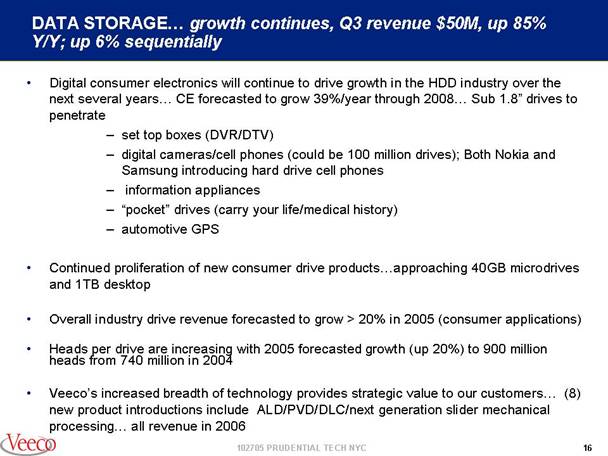
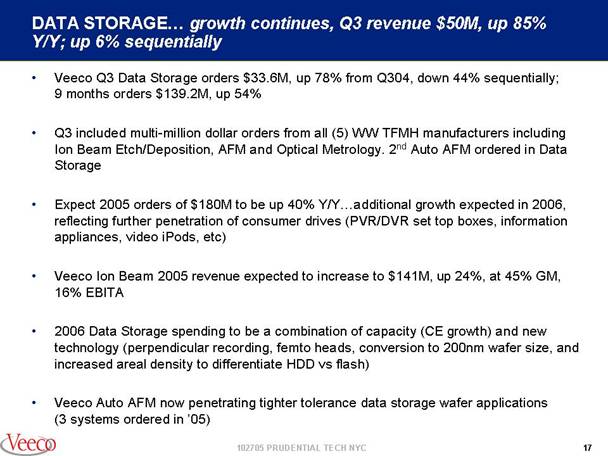
DATA STORAGE… growth continues, Q3 revenue $50M, up 85% Y/Y; up 6% sequentially
- Digital consumer electronics will continue to drive growth in the HDD industry over the next several years… CE forecasted to grow 39%/year through 2008… Sub 1.8” drives to penetrate
· set top boxes (DVR/DTV)
· digital cameras/cell phones (could be 100 million drives); Both Nokia and Samsung introducing hard drive cell phones
· information appliances
· “pocket” drives (carry your life/medical history)
· automotive GPS
- Continued proliferation of new consumer drive products…approaching 40GB microdrives and 1TB desktop
- Overall industry drive revenue forecasted to grow > 20% in 2005 (consumer applications)
- Heads per drive are increasing with 2005 forecasted growth (up 20%) to 900 million heads from 740 million in 2004
- Veeco’s increased breadth of technology provides strategic value to our customers… (8) new product introductions include ALD/PVD/DLC/next generation slider mechanical processing… all revenue in 2006
16
- Veeco Q3 Data Storage orders $33.6M, up 78% from Q304, down 44% sequentially; 9 months orders $139.2M, up 54%
- Q3 included multi-million dollar orders from all (5) WW TFMH manufacturers including Ion Beam Etch/Deposition, AFM and Optical Metrology. 2nd Auto AFM ordered in Data Storage
- Expect 2005 orders of $180M to be up 40% Y/Y…additional growth expected in 2006, reflecting further penetration of consumer drives (PVR/DVR set top boxes, information appliances, video iPods, etc)
- Veeco Ion Beam 2005 revenue expected to increase to $141M, up 24%, at 45% GM, 16% EBITA
- 2006 Data Storage spending to be a combination of capacity (CE growth) and new technology (perpendicular recording, femto heads, conversion to 200nm wafer size, and increased areal density to differentiate HDD vs flash)
- Veeco Auto AFM now penetrating tighter tolerance data storage wafer applications (3 systems ordered in ‘05)
17
DATA STORAGE-MULTI YEAR INVESTMENT IN CAPACITY AND NEW TECHNOLOGY… provides Veeco with continued growth
15% Industry Growth Forecasted for HDD Industry Through 2007
|
| 2003 |
| 2004 |
| 2005 |
| 2006 |
| 2007 |
| ‘04-’09 CG |
|
Industry HDD Production Growth |
| 250 |
| 306 |
| 373 |
| 426 |
| 475 |
|
|
|
(units M) |
| — |
| 17 | % | 22 | % | 14 | % | 11 | % | 15 | % |
Industry HDD Revenue Growth |
| 22.0 |
| 23.0 |
| 27.3 |
| 30.2 |
| 33.3 |
|
|
|
($B) |
| — |
| 4 | % | 18.6 | % | 10.9 | % | 10 | % | 11.7 | % |
Veeco Data Storage Revenue ($M) |
| $90.6M |
| $123.9M |
| $175M F |
| $200M F |
| $230M F |
| ‘04-’07 |
|
Growth |
| -6 | % | +36 | % | +41 | % | +10-+15 | % | +10-+15 | % | +23 CG | % |
Market conditions |
| No areal density investment |
| Areal Density Growth 30% per year GMR |
| Consumer Electronics with embedded storage (1” drive) Higher areal density |
| -Perpendicular recording (‘07 in manufacturing) |
|
|
| ||
New Products |
|
|
|
|
| New Nexus IBE/IBD/DLC product intro TMR |
| -New Slider Tools (saws/lapping) |
|
|
| ||
18
CONSUMER APPLICATIONS ENABLE EXPONENTIAL HARD DRIVE GROWTH… unit growth to double and triple
[CHART]
Source : Hitachi GST Estimate
19
DATA STORAGE HARD DRIVE GROWTH
CONSUMER ELECTRONICS ADOPTION
Growth in CE and traditional computer markets
[GRAPH]
Source: IDC Mar2005
|
| CAGR |
|
Consumer Electronics |
| 39 | % |
Traditional (PC, Laptop, Enterprise) |
| 9 | % |
Total |
| 15 | % |
Industry shipment of PC’s grew 15% in September quarter
20
DATA STORAGE HOME OF THE (NEAR) FUTURE
By 2010 each household will include 10 HDD’s*
Mobile Applications
New Microdrive (.85 dia.) [PICTURE]
MP4 Video [PICTURE]
Laptop [PICTURE]
MP3 Music (i.e., iPod) [PICTURE]
Mobile Phone [PICTURE]
Automobile GPS Navigation [PICTURE]
Home Applications
Home Media Server [PICTURE]
TiVo/DVR [PICTURE]
Entertainment Centers/PCs [PICTURE]
Game (Xbox, PlayStation, etc) [PICTURE]
* Source: Hitachi Global Storage Technologies
21
DATA STORAGE…Hard Disk Drive Unit Growth…Consumer Electronics Segment Will Approach Size Of Computer Market Segment
[CHART]
22
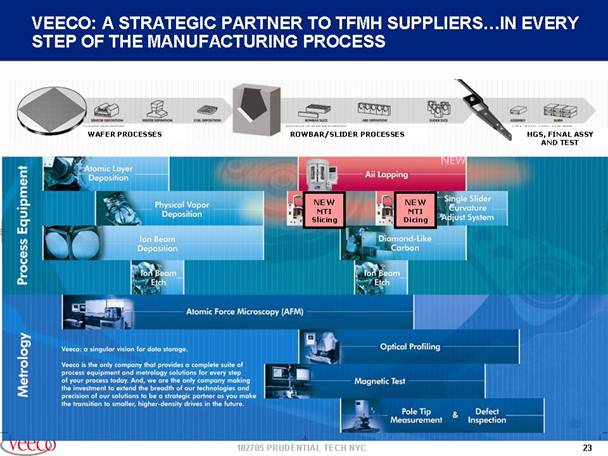
VEECO: A STRATEGIC PARTNER TO TFMH SUPPLIERS…IN EVERY STEP OF THE MANUFACTURING PROCESS
[CHART]
[CHART]
23
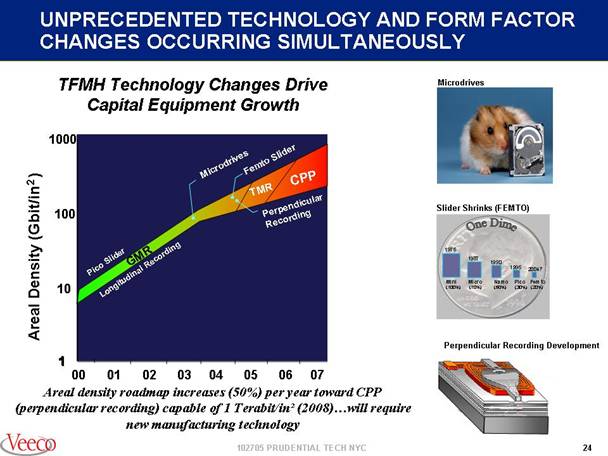
UNPRECEDENTED TECHNOLOGY AND FORM FACTOR CHANGES OCCURRING SIMULTANEOUSLY
TFMH Technology Changes Drive Capital Equipment Growth
[CHART]
Areal density roadmap increases (50%) per year toward CPP (perpendicular recording) capable of 1 Terabit/in² (2008)…will require new manufacturing technology
Microdrives
[PICTURE]
Slider Shrinks (FEMTO)
[PICTURE]
Perpendicular Recording Development
[PICTURE]
24
NEXT GENERATION THIN FILM HEAD STACKS… demand new materials, thinner films and tighter interfaces
[CHART]
25
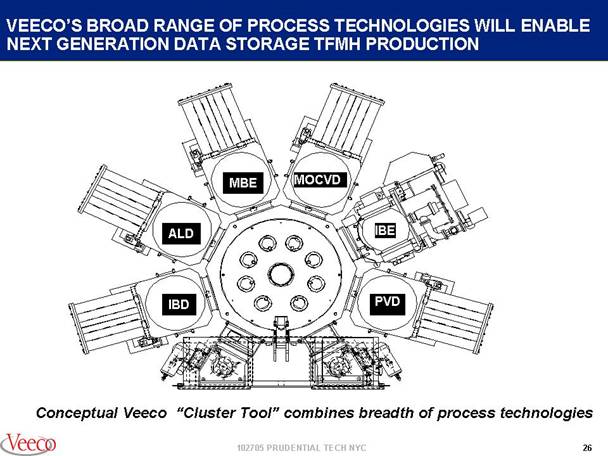
VEECO’S BROAD RANGE OF PROCESS TECHNOLOGIES WILL ENABLE NEXT GENERATION DATA STORAGE TFMH PRODUCTION
[CHART]
Conceptual Veeco “Cluster Tool” combines breadth of process technologies
26
IN SEMICONDUCTOR …Q3 revenue $12.2M, up 18% Y/Y; 9 months revenue $46.5M, up 19%
- Despite our initial 2005 expectations of an industry-wide Semi Capex softening…we see continued world wide acceptance of our Auto AFM in Wafer Fabs for 90nm and 70nm, 300M applications
- Veeco Auto AFM 2005 revenue expected to reach $50M, up 25% y/y, with 54% GM and 22% EBITA (2005 EBITA will triple y/y); Total Veeco AFM revenue expected to be $129M (up 10%) with 20% EBITA
- In general, our AFM sales will be paced by leading edge 90/70 nm deployment in 2005
- KLA, a key competitor, has withdrawn their Auto AFM product (beta site units have been returned)
- Strong customer acceptance of Veeco’s X1D and X3D AFM products for etch/CMP/lithography applications
- New interest in line edge roughness, side wall angle and litho CD control…at 90/70 nm nodes
28
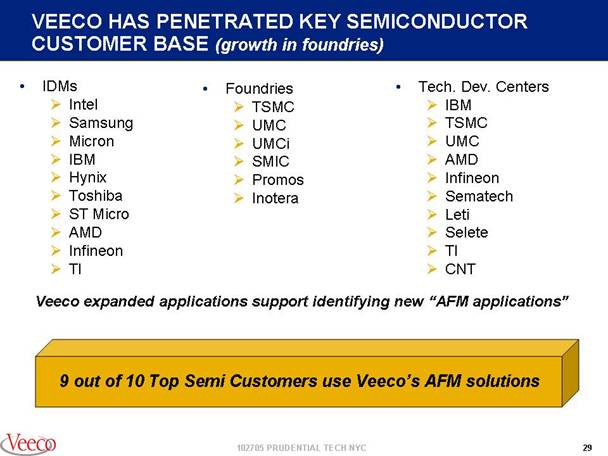
VEECO HAS PENETRATED KEY SEMICONDUCTOR CUSTOMER BASE (growth in foundries)
· IDMs
Intel
Samsung
Micron
IBM
Hynix
Toshiba
ST Micro
AMD
Infineon
TI
· Foundries
TSMC
UMC
UMCi
SMIC
Promos
Inotera
· Tech. Dev. Centers
IBM
TSMC
UMC
AMD
Infineon
Sematech
Leti
Selete
TI
CNT
Veeco expanded applications support identifying new “AFM applications”
9 out of 10 Top Semi Customers use Veeco’s AFM solutions
29
VEECO’S SEMICONDUCTOR OPPORTUNITY: SHRINKING DIMENSIONS REQUIRE 3D METROLOGY
- Veeco has the broadest line of 3D AFM non-destructive Metrology solutions
- Our goal is to be a step ahead of industry roadmap…90…65…45nm
- Top 10 semi device manufacturers have at least one AFM in line wafer fab — 300 systems installed…TAM 10 per fab
- Veeco tip development roadmap addresses leading edge 45nm and 25nm applications
26nm lines in R&D sample
[PICTURE]
Veeco Dimension X3D and 65nm scan
30
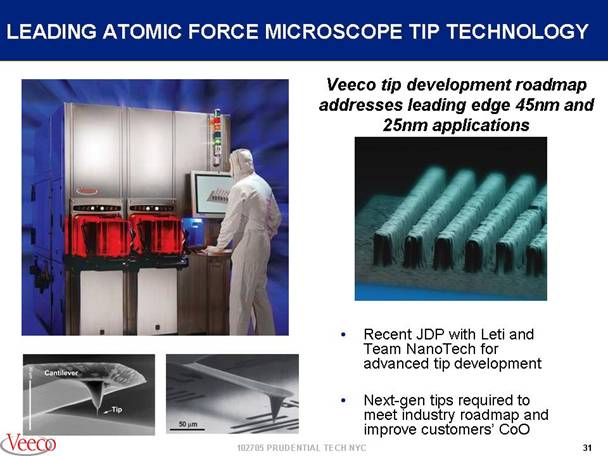
LEADING ATOMIC FORCE MICROSCOPE TIP TECHNOLOGY
Veeco tip development roadmap addresses leading edge 45nm and 25nm applications
[PICTURE]
- Recent JDP with Leti and Team NanoTech for advanced tip development
- Next-gen tips required to meet industry roadmap and improve customers’ CoO
31
AFM APPLICATIONS ‘LAB-TO-FAB’
RESEARCH & SCIENTIFIC (installed base >7000 systems)
[PICTURE]
Topography
[PICTURE]
Atomic Scale Meas.
(Copper seed layer)
Magnetics
[PICTURE]
Polarization Meas.
(BiFeO3 spheres)
Life Science
[PICTURE]
Non-destructive
(SARS virus)
Nano ‘Pull / Position”
[PICTURE]
Nano-manipulation
& PicoForce
PRODUCTION FAB (installed base >300 systems; Data Storage applications emerging)
[PICTURE]
CMP
[PICTURE]
Etch
[PICTURE]
Litho Resist
[PICTURE]
Litho Masks
[PICTURE]
32
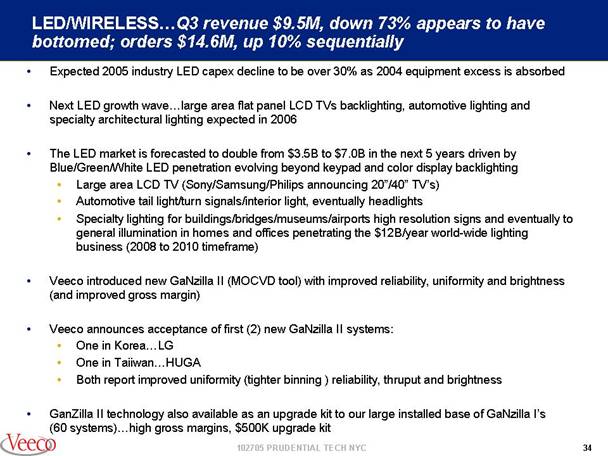
LED/WIRELESS…Q3 revenue $9.5M, down 73% appears to have bottomed; orders $14.6M, up 10% sequentially
- Expected 2005 industry LED capex decline to be over 30% as 2004 equipment excess is absorbed
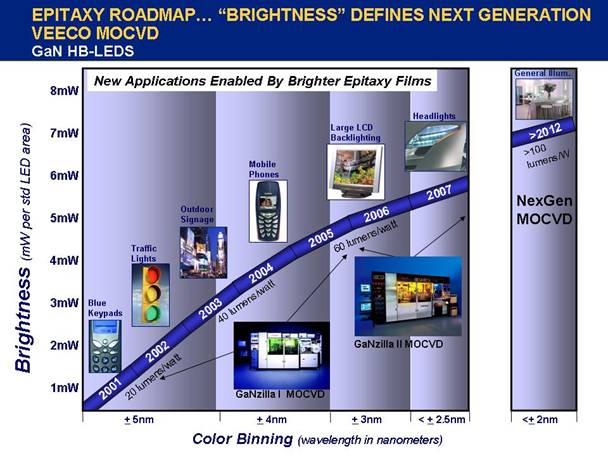
- Next LED growth wave…large area flat panel LCD TVs backlighting, automotive lighting and specialty architectural lighting expected in 2006
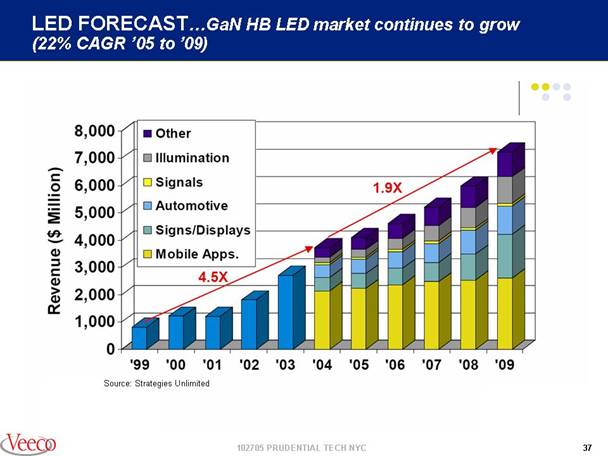
- The LED market is forecasted to double from $3.5B to $7.0B in the next 5 years driven by Blue/Green/White LED penetration evolving beyond keypad and color display backlighting
· Large area LCD TV (Sony/Samsung/Philips announcing 20”/40” TV’s)
· Automotive tail light/turn signals/interior light, eventually headlights
· Specialty lighting for buildings/bridges/museums/airports high resolution signs and eventually to general illumination in homes and offices penetrating the $12B/year world-wide lighting business (2008 to 2010 timeframe)
- Veeco introduced new GaNzilla II (MOCVD tool) with improved reliability, uniformity and brightness (and improved gross margin)
- Veeco announces acceptance of first (2) new GaNzilla II systems:
· One in Korea…LG
· One in Taiiwan…HUGA
· Both report improved uniformity (tighter binning ) reliability, thruput and brightness
- GanZilla II technology also available as an upgrade kit to our large installed base of GaNzilla I’s (60 systems)…high gross margins, $500K upgrade kit
34
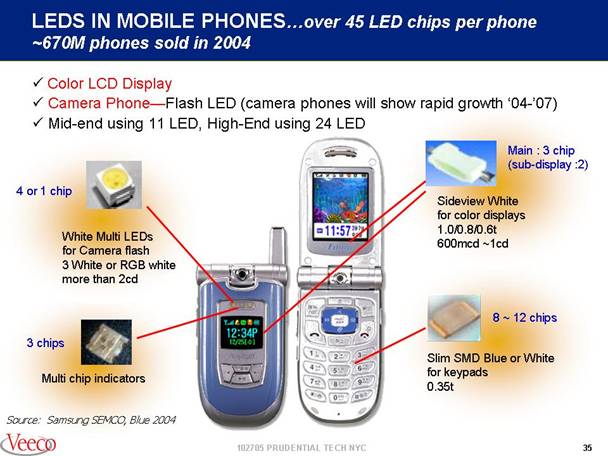
LEDS IN MOBILE PHONES…over 45 LED chips per phone ~670M phones sold in 2004
- Color LCD Display
- Camera Phone—Flash LED (camera phones will show rapid growth ‘04-’07)
- Mid-end using 11 LED, High-End using 24 LED
4 or 1 chip
[PICTURE]
White Multi LEDs for Camera flash
3 White or RGB white more than 2cd
3 chips
[PICTURE]
Multi chip indicators
[PICTURE]
Main : 3 chip (sub-display :2)
[PICTURE]
Sideview White for color displays
1.0/0.8/0.6t
600mcd ~1cd
8 ~ 12 chips
[PICTURE]
Slim SMD Blue or White for keypads
0.35t
35
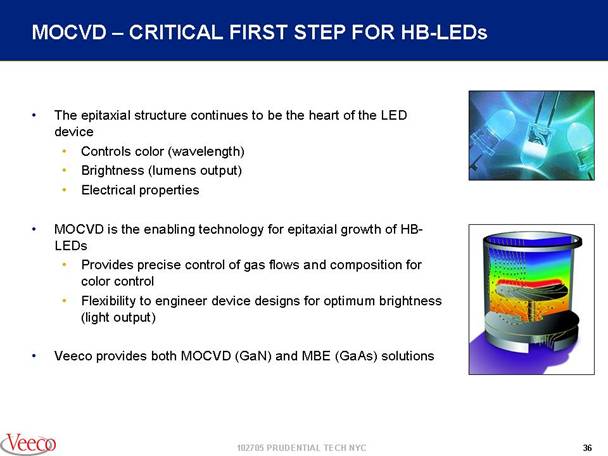
MOCVD — CRITICAL FIRST STEP FOR HB-LEDs
- The epitaxial structure continues to be the heart of the LED device
· Controls color (wavelength)
· Brightness (lumens output)
· Electrical properties
- MOCVD is the enabling technology for epitaxial growth of HBLEDs
· Provides precise control of gas flows and composition for color control
· Flexibility to engineer device designs for optimum brightness (light output)
- Veeco provides both MOCVD (GaN) and MBE (GaAs) solutions
[PICTURE]
36
LED FORECAST…GaN HB LED market continues to grow (22% CAGR ‘05 to ‘09)
[GRAPH]
Source: Strategies Unlimited
37
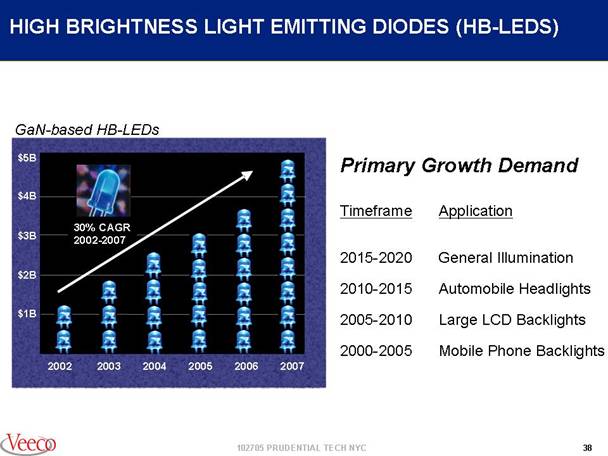
HIGH BRIGHTNESS LIGHT EMITTING DIODES (HB-LEDS)
GaN-based HB-LEDs
[GRAPH]
Primary Growth Demand
Timeframe |
| Application |
2015-2020 |
| General Illumination |
2010-2015 |
| Automobile Headlights |
2005-2010 |
| Large LCD Backlights |
2000-2005 |
| Mobile Phone Backlights |
38
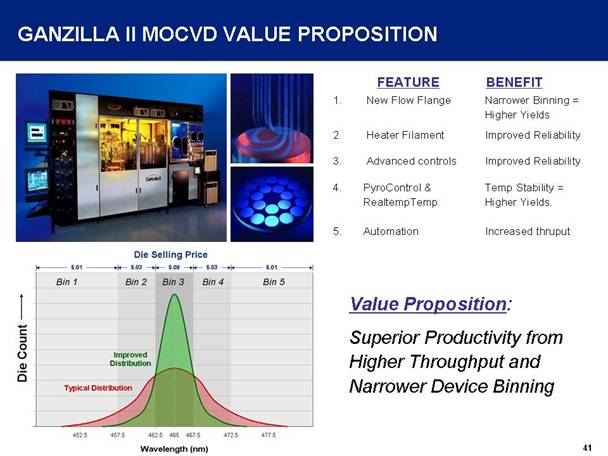
GANZILLA II MOCVD VALUE PROPOSITION
[PICTURE]
|
| FEATURE |
| BENEFIT |
1. |
| New Flow Flange |
| Narrower Binning = Higher Yields |
2. |
| Heater Filament |
| Improved Reliability |
3. |
| Advanced controls |
| Improved Reliability |
4. |
| PyroControl & RealtempTemp |
| Temp Stability = Higher Yields. |
5. |
| Automation |
| Increased thruput |
[GRAPH]
Value Proposition:
Superior Productivity from Higher Throughput and Narrower Device Binning
41
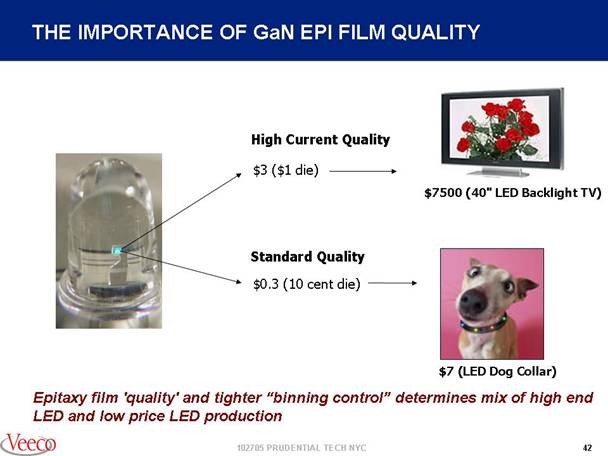
THE IMPORTANCE OF GaN EPI FILM QUALITY
[PICTURE]
High Current Quality
$3 ($1 die)
[PICTURE]
$7500 (40” LED Backlight TV)
Standard Quality
$0.3 (10 cent die)
[PICTURE]
$7 (LED Dog Collar)
Epitaxy film ‘quality’ and tighter “binning control” determines mix of high end LED and low price LED production
42
KEY LED APPLICATIONS
Mobile Appliances
[PICTURE]
Cell phones
PDAs
Flashlights
57% growth in LEDs for backlighting in 2004
Expected growth for white “flash” LED and other small displays
Outdoor Signage
[PICTURE]
Large displays
Traffic signals
Storefront lighting
Signage displays continue to become larger and more dynamic
Beijing 2008 Olympics driving adoption in China
LCD Backlighting
[PICTURE]
Flat Panel TVs
Laptops
Retail Display
Color rendering significantly higher than CCFL (100% NTSC)
Adopted for high-end TV units; will increase penetration as price falls
Automotive Lighting
[PICTURE]
Headlamps
Dashboard
Heads up displays
60 million light vehicles produced per year; only 40% use LEDs
Headlamps and DRL will be introduced as brightness continues to increase
General Illumination
[PICTURE]
Interior lighting
Industrial
Event lighting
5% of LED market in 2004, growing fast
Flexibility of light quality and color drives novel applications
5-10 years before major adoption into general lighting
43
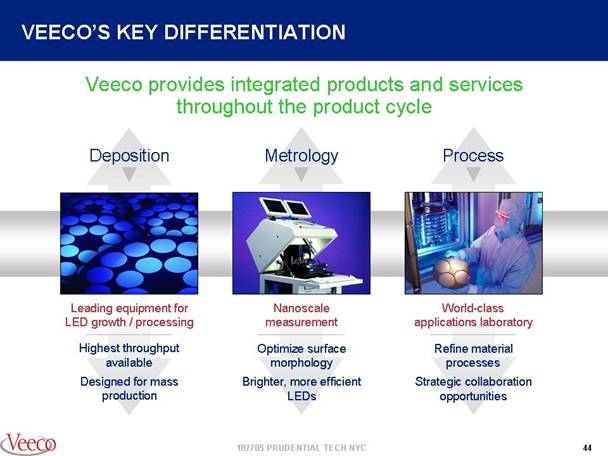
VEECO’S KEY DIFFERENTIATION
Veeco provides integrated products and services throughout the product cycle
Deposition
[PICTURE]
Leading equipment for LED growth / processing
Highest throughput available
Designed for mass production
Metrology
[PICTURE]
Nanoscale measurement
Optimize surface morphology
Brighter, more efficient LEDs
Process
[PICTURE]
World-class applications laboratory
Refine material processes
Strategic collaboration opportunities
44
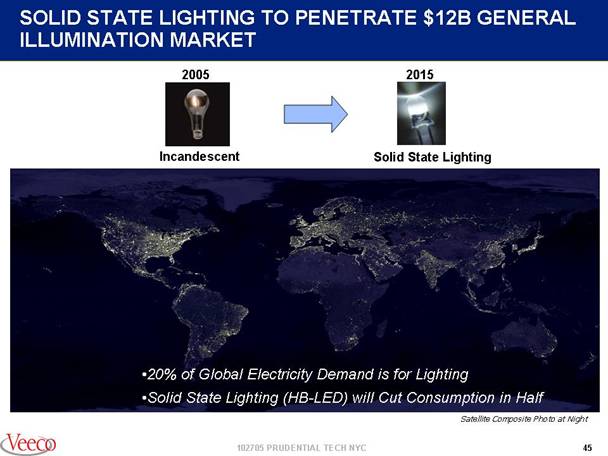
SOLID STATE LIGHTING TO PENETRATE $12B GENERAL ILLUMINATION MARKET
2005
[PICTURE]
Incandescent
2015
[PICTURE]
Solid State Lighting
[PICTURE]
· 20% of Global Electricity Demand is for Lighting
· Solid State Lighting (HB-LED) will Cut Consumption in Half Satellite Composite Photo at Night
45
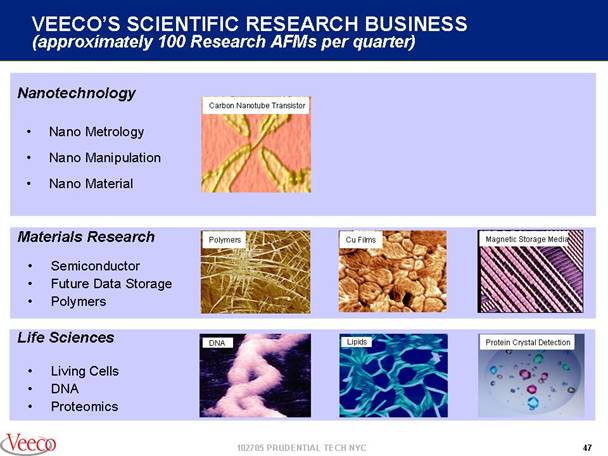
VEECO’S SCIENTIFIC RESEARCH BUSINESS (approximately 100 Research AFMs per quarter)
Nanotechnology
- Nano Metrology
- Nano Manipulation
- Nano Material
Carbon Nanotube Transistor
[PICTURE]
Materials Research
- Semiconductor
- Future Data Storage
- Polymers
Polymers
[PICTURE]
Cu Films
[PICTURE]
Magnetic Storage Media
[PICTURE]
Life Sciences
- Living Cells
- DNA
- Proteomics
DNA
[PICTURE]
Lipids
[PICTURE]
Protein Crystal Detection
[PICTURE]
47
SCIENTIFIC RESEARCH… Q3 revenue $28.3M, up 11% Y/Y; up 12% sequentially…(orders $25.1M, down 3% sequentially)
- Veeco initiates a new management focus in nanomaterial and life science instrumentation…to accelerate growth of our profitable “table top” AFM/Optical instrument business…beyond material science base
- Our nine months revenue for Research AFM/Optical is $96M, up 7% at approximately 50% Gross Margin and 17% EBITA
48
WHY THE FOCUS ON “NANO-BIO”?
- Life Science Instrumentation is fastest growing portion of analytical instrumentation business
· Forecasted to grow 29% CAGR from 2003-2008 (versus 6% overall for the analytical instrumentation market)
- Nanomaterials: $35B market by 2020 ($200M in 2002)
- Industry lacks nanoscale metrology standards: a key bottleneck in development and manufacturing of commercial nano and bio-materials
- Veeco believes that the “nano-bio” instrumentation market is a large growth opportunity — should surpass GNP, electronic industry and information technology growth rates — and we are aligning our new product development programs to this area
49
NANOTECHNOLOGY “All The World’s Industry Is In Its Path”
[CHART]
AFMs Image, Measure and Manipulate Nanoscale Structures
[PICTURE]
50
NANOMATERIALS
- Nanomaterials: $35B market by 2020 ($200M in 2002)
- Industry lacks nanoscale metrology standards: a key bottleneck in development and manufacturing of commercial nanomaterials
Veeco and Dow receive a $6M NIST/ ATP to Develop New Nanotechnology tools
51
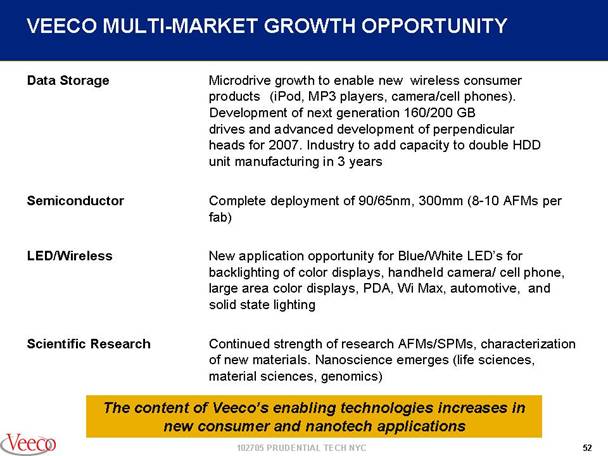
VEECO MULTI-MARKET GROWTH OPPORTUNITY
Data Storage |
| Microdrive growth to enable new wireless consumer products (iPod, MP3 players, camera/cell phones). Development of next generation 160/200 GB drives and advanced development of perpendicular heads for 2007. Industry to add capacity to double HDD unit manufacturing in 3 years |
Semiconductor |
| Complete deployment of 90/65nm, 300mm (8-10 AFMs per fab) |
LED/Wireless |
| New application opportunity for Blue/White LED’s for backlighting of color displays, handheld camera/ cell phone, large area color displays, PDA, Wi Max, automotive, and solid state lighting |
Scientific Research |
| Continued strength of research AFMs/SPMs, characterization of new materials. Nanoscience emerges (life sciences, material sciences, genomics) |
The content of Veeco’s enabling technologies increases in new consumer and nanotech applications
52
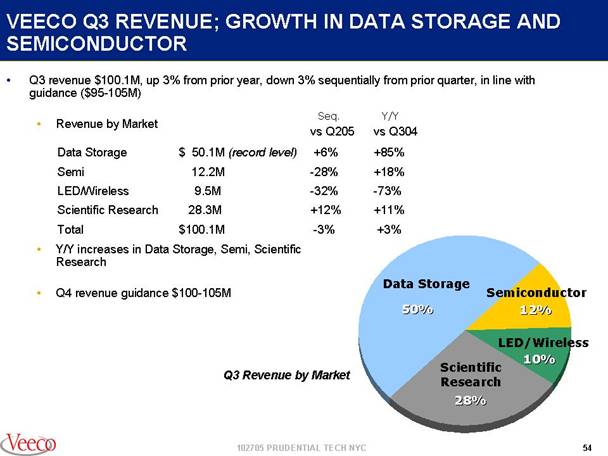
VEECO Q3 REVENUE; GROWTH IN DATA STORAGE AND SEMICONDUCTOR
· Q3 revenue $100.1M, up 3% from prior year, down 3% sequentially from prior quarter, in line with guidance ($95-105M)
·
Revenue by Market |
|
|
| vs Q205 Seq. |
| vs Q304 Y/Y |
|
Data Storage |
| $50.1M (record level) |
| +6 | % | +85 | % |
Semi |
| 12.2M |
| -28 | % | +18 | % |
LED/Wireless |
| 9.5M |
| -32 | % | -73 | % |
Scientific Research |
| 28.3M |
| +12 | % | +11 | % |
Total |
| $100.1M |
| -3 | % | +3 | % |
- Y/Y increases in Data Storage, Semi, Scientific Research
- Q4 revenue guidance $100-105M
[CHART]
Q3 Revenue by Market
54
VEECO 9 MONTHS REVENUE …double digit growth in Data Storage and Semi; decline in LED/Wireless
· 9 months revenue $297.3M, up 3% Y/Y; Semiconductor and Data Storage increase
Data Storage |
| $123.1M |
| up |
| 31 | % |
Semiconductor |
| 46.5 |
| up |
| 19 | % |
LED/Wireless |
| 45.6 |
| down |
| 37 | % |
Scientific Research |
| 82.1 |
| flat |
|
|
|
Total |
| $297.3M |
| up |
| 3 | % |
[CHART]
9 Months Revenue by Market
55
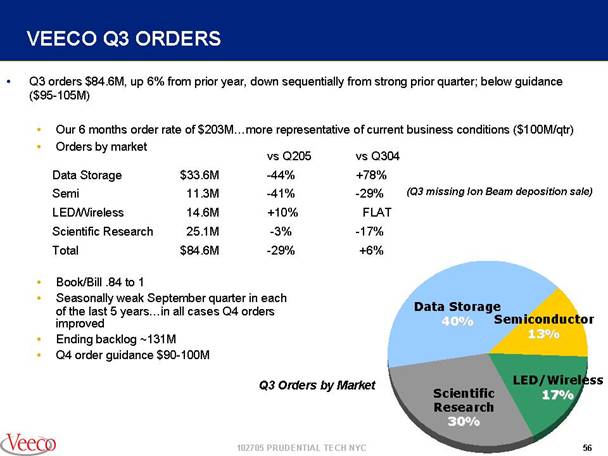
VEECO Q3 ORDERS
· Q3 orders $84.6M, up 6% from prior year, down sequentially from strong prior quarter; below guidance ($95-105M)
- Our 6 months order rate of $203M…more representative of current business conditions ($100M/qtr)
- Orders by market
|
|
|
| vs Q205 |
| vs Q304 |
|
|
|
Data Storage |
| $33.6M |
| -44 | % | +78 | % |
|
|
Semi |
| 11.3M |
| -41 |
| -29 | % | (Q3 missing Ion Beam deposition sale) |
|
LED/Wireless |
| 14.6M |
| +10 | % | FLAT | % |
|
|
Scientific Research |
| 25.1M |
| -3 |
| -17 |
|
|
|
Total |
| $84.6M |
| -29 | % | +6 | % |
|
|
- Book/Bill .84 to 1
- Seasonally weak September quarter in each of the last 5 years…in all cases Q4 orders improved
- Ending backlog ~131M
- Q4 order guidance $90-100M
[CHART]
Q3 Orders by Market
56
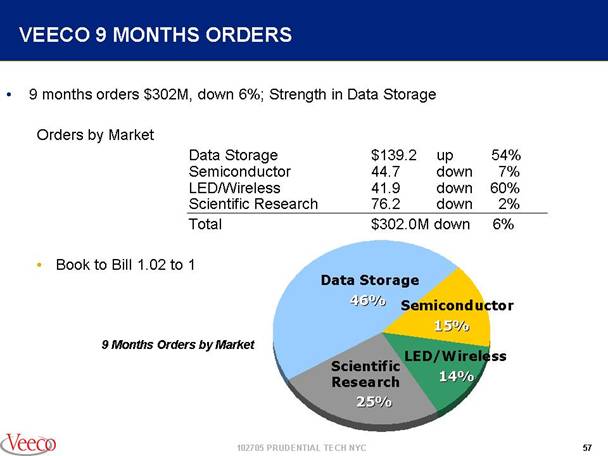
VEECO 9 MONTHS ORDERS
· 9 months orders $302M, down 6%; Strength in Data Storage
Orders by Market
Data Storage |
| $139.2M |
| up |
| 54 | % |
Semiconductor |
| 44.7 |
| down |
| 7 | % |
LED/Wireless |
| 41.9 |
| down |
| 60 | % |
Scientific Research |
| 76.2 |
| down |
| 2 | % |
Total |
| $302.0M |
| down |
| 6 | % |
· Book to Bill 1.02 to 1
[CHART]
9 Months Orders by Market
57
Q3 PROFITABILITY IMPROVEMENT… tracking Gross Margin and EBITA profit growth plan
- Q3 EBITA $8.3M up 36% sequentially, up 10 times prior year Q304, in line with 2% per quarter improvement… to 8% of revenue
- 9 months EBITA $16.9M, up 62% Y/Y
- EPS excluding amortization $.14 vs. ($.02) Q304
· above $.08 to $.13 guidance
· Above $.12 street consensus
- GAAP EPS $.05, in line with guidance…positive net income $1.6M
- Gross Margin 44.2%, 2.2 GM points above Q2…in line with improvement plan, 8 GM points above prior year 36.4%
- Operating Expenses $36M, down from prior quarter…in line with plan, 36% of revenue
- Cash flow was a positive $2.3M for the quarter
- Balance Sheet cash increased to $111.7M as of September 2005
- Accounts Receivable DSO’s were 61 days
- Inventory decreased $1.0M to $99.5M
58
STRONG VEECO BALANCE SHEET
($ IN MILLIONS) |
| September 30, 2005 |
| Dec. 31, 2004 |
|
Cash and Investments |
| $111.7 |
| $100.3 |
|
Working Capital |
| 221.8 |
| 216.8 |
|
Fixed Assets |
| 70.4 |
| 73.5 |
|
Total Assets |
| 566.1 |
| 576.9 |
|
Long-Term Debt |
| 229.3 |
| 229.6 |
|
Shareholders’ Equity |
| $246.4 |
| $252.4 |
|
59
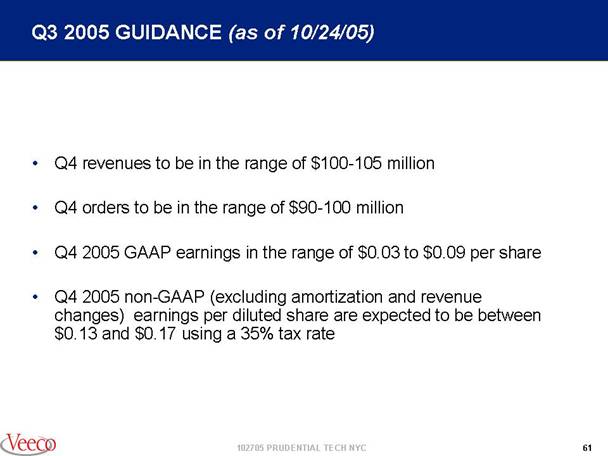
Q3 2005 GUIDANCE (as of 10/24/05)
- Q4 revenues to be in the range of $100-105 million
- Q4 orders to be in the range of $90-100 million
- Q4 2005 GAAP earnings in the range of $0.03 to $0.09 per share
- Q4 2005 non-GAAP (excluding amortization and revenue changes) earnings per diluted share are expected to be between $0.13 and $0.17 using a 35% tax rate
61
SAFE HARBOR STATEMENT
- To the extent that this presentation discusses expectations about market condition, market acceptance and future sales of Veeco’s products, Veeco’s future financial performance, or otherwise makes statements about the future, such statements are forward-looking and are subject to a number of risks and uncertainties that could cause actual results to differ materially from the statements made. These factors include the challenges of continuing weakness in end market conditions and the cyclical nature of the telecommunications/wireless, data storage, semiconductor and research markets, risks associated with integrating acquired businesses and the acceptance of new products by individual customers and by the marketplace and other factors discussed in the Business Description and Management’s Discussion and Analysis sections of Veeco’s Annual Report on Form 10-K, subsequent Quarterly Reports on Form 10-Q and current reports on Form 8-K .
62
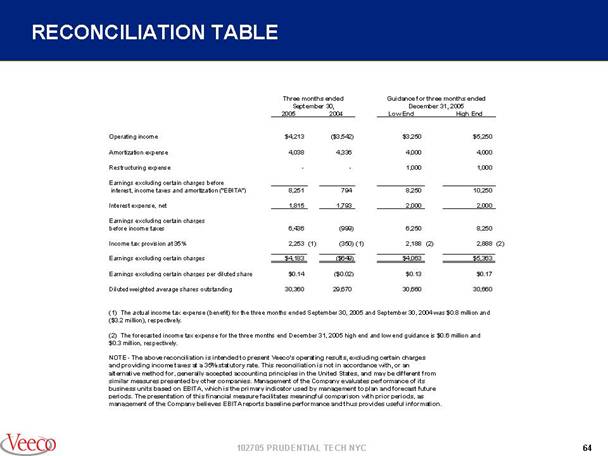
RECONCILIATION TABLE
|
| Three months ended |
| Guidance for three months ended |
| ||||||||||
|
|
|
| ||||||||||||
|
| 2005 |
| 2004 |
| Low End |
| High End |
| ||||||
Operating income |
| $ | 4,213 |
| $ | (3,542 | ) | $ | 3,250 |
| $ | 5,250 |
| ||
Amortization expense |
| 4,038 |
| 4,336 |
| 4,000 |
| 4,000 |
| ||||||
Restructuring expense |
| — |
| — |
| 1,000 |
| 1,000 |
| ||||||
Earnings excluding certain charges before interest, income taxes and amortization (“EBITA”) |
| 8,251 |
| 794 |
| 8,250 |
| 10,250 |
| ||||||
Interest expense, net |
| 1,815 |
| 1,793 |
| 2,000 |
| 2,000 |
| ||||||
Earnings excluding certain charges before income taxes |
| 6,436 |
| (999 | ) | 6,250 |
| 8,250 |
| ||||||
Income tax provision at 35% |
| 2,253 | (1) | (350 | )(1) | 2,188 | (2) | 2,888 |
| ||||||
Earnings excluding certain charges |
| $ | 4,183 |
| $ | (649 | ) | $ | 4,063 |
| $ | 5,363 |
| ||
Earnings excluding certain charges per diluted share |
| $ | 0.14 |
| ($0.02 | ) | $ | 0.13 |
| $ | 0.17 |
| |||
Diluted weighted average shares outstanding |
| 30,360 |
| 29,670 |
| 30,660 |
| 30,660 |
| ||||||
(1) The actual income tax expense (benefit) for the three months ended September 30, 2005 and September 30, 2004 was $0.8 million and ($3.2 million), respectively.
(2) The forecasted income tax expense for the three months end December 31, 2005 high end and low end guidance is $0.6 million and $0.3 million, respectively.
NOTE - The above reconciliation is intended to present Veeco’s operating results, excluding certain charges and providing income taxes at a 35% statutory rate. This reconciliation is not in accordance with, or an alternative method for, generally accepted accounting principles in the United States, and may be different from similar measures presented by other companies. Management of the Company evaluates performance of its business units based on EBITA, which is the primary indicator used by management to plan and forecast future periods. The presentation of this financial measure facilitates meaningful comparison with prior periods, as management of the Company believes EBITA reports baseline performance and thus provides useful information.
64
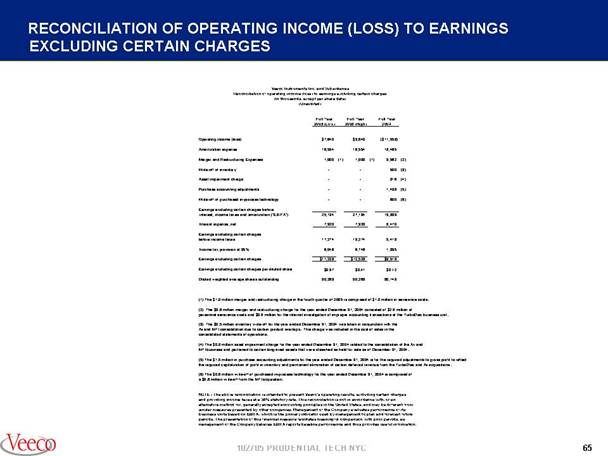
RECONCILIATION OF OPERATING INCOME (LOSS) TO EARNINGS
EXCLUDING CERTAIN CHARGES
Veeco Instruments Inc. and Subsidiaries
Reconciliation of operating income (loss) to earnings excluding certain charges
(In thousands, except per share data)
(Unaudited)
|
| Full Year |
| Full Year |
| Full Year |
| ||||||
|
| 2005 (Low) |
| 2005 (High) |
| 2004 |
| ||||||
|
|
|
|
|
|
|
| ||||||
Operating income (loss) |
| $ | 7,640 |
| $ | 9,640 |
| $ | (11,558 | ) | |||
Amortization expense |
| 16,554 |
| 16,554 |
| 18,465 |
| ||||||
Merger and Restructuring Expenses |
| 1,000 | (1) | 1,000 | (1) | 3,562 | (2) | ||||||
Write-off of inventory |
| — |
| — |
| 500 | (3) | ||||||
Asset impairment charge |
| — |
| — |
| 816 | (4) | ||||||
Purchase accounting adjustments |
| — |
| — |
| 1,498 | (5) | ||||||
Write-off of purchased in-process technology |
| — |
| — |
| 600 | (6) | ||||||
Earnings excluding certain charges before interest, income taxes and amortization (“EBITA”) |
| 25,194 |
| 27,194 |
| 13,883 |
| ||||||
Interest expense, net |
| 7,920 |
| 7,920 |
| 8,470 |
| ||||||
Earnings excluding certain charges before income taxes |
| 17,274 |
| 19,274 |
| 5,413 |
| ||||||
Income tax provision at 35% |
| 6,046 |
| 6,746 |
| 1,895 |
| ||||||
Earnings excluding certain charges |
| $ | 11,228 |
| $ | 12,528 |
| $ | 3,518 |
| |||
Earnings excluding certain charges per diluted share |
| $ | 0.37 |
| $ | 0.41 |
| $ | 0.12 |
| |||
Diluted weighted average shares outstanding |
| 30,269 |
| 30,269 |
| 30,143 |
| ||||||
(1) The $1.0 million merger and restructuring charge in the fourth quarter of 2005 is comprised of $1.0 million in severance costs.
(2) The $3.6 million merger and restructuring charge for the year ended December 31, 2004 consisted of $2.8 million of personnel severance costs and $0.8 million for the internal investigation of improper accounting transactions at the TurboDisc business unit.
(3) The $0.5 million inventory write-off for the year ended December 31, 2004 was taken in conjunction with the Aii and MTI consolidation due to certain product overlaps. This charge was included in the cost of sales in the consolidated statements of operations.
(4) The $0.8 million asset impairment charge for the year ended December 31, 2004 related to the consolidation of the Aii and MTI business and pertained to certain long-lived assets that were classified as held for sale as of December 31, 2004.
(5) The $1.5 million in purchase accounting adjustments for the year ended December 31, 2004 is for the required adjustments to gross profit to reflect the required capitalization of profit in inventory and permanent elimination of certain deferred revenue from the TurboDisc and Aii acquisitions.
(6) The $0.6 million write-off of purchased in-process technology for the year ended December 31, 2004 is comprised of a $0.6 million write-off from the MTI acquisition.
NOTE - The above reconciliation is intended to present Veeco’s operating results, excluding certain charges and providing income taxes at a 35% statutory rate. This reconciliation is not in accordance with, or an alternative method for, generally accepted accounting principles in the United States, and may be different from similar measures presented by other companies. Management of the Company evaluates performance of its business units based on EBITA, which is the primary indicator used by management to plan and forecast future periods. The presentation of this financial measure facilitates meaningful comparison with prior periods, as management of the Company believes EBITA reports baseline performance and thus provides useful information.
65