Exhibit 99.2
| Q4 2021 Financial Results Conference Call Copyright © 2022 Veeco Instruments Inc. All Rights Reserved. 1 Veeco (Nasdaq: VECO) February 16, 2022 Q4 & FY 2021 Financial Results Conference Call |

| Q4 2021 Financial Results Conference Call Copyright © 2022 Veeco Instruments Inc. All Rights Reserved. 2 2 Safe Harbor This presentation contains “forward - looking statements”, within the meaning of the safe harbor provisions of the U .. S .. Private Securities Litigation Reform Act of 1995 , as amended, that are based on management’s expectations, estimates, projections and assumptions .. Words such as “expects,” “anticipates,” “plans,” “believes,” “scheduled,” “estimates” and variations of these words and similar expressions are intended to identify forward - looking statements .. Forward - looking statements include, but are not limited to, those regarding anticipated growth and trends in our businesses and markets, industry outlooks and demand drivers, our investment and growth strategies, our development of new products and technologies, our business outlook for current and future periods, the impact of the COVID - 19 pandemic, our ongoing transformation initiative and the effects thereof on our operations and financial results ; and other statements that are not historical facts .. These statements and their underlying assumptions are subject to risks and uncertainties and are not guarantees of future performance .. Factors that could cause actual results to differ materially from those expressed or implied by such statements include, without limitation : the level of demand for our products ; global economic and industry conditions ; the effects of regional or global health epidemics, including the effects of the COVID - 19 pandemic on the Company’s operations and on those of our customers and suppliers ; global trade issues, including the ongoing trade disputes between the U .. S .. and China, and changes in trade and export license policies ; our dependency on third - party suppliers and outsourcing partners ; the timing of customer orders ; our ability to develop, deliver and support new products and technologies ; our ability to expand our current markets, increase market share and develop new markets ; the concentrated nature of our customer base ; our ability to obtain and protect intellectual property rights in key technologies ; our ability to achieve the objectives of operational and strategic initiatives and attract, motivate and retain key employees ; the variability of results among products and end - markets, and our ability to accurately forecast future results, market conditions, and customer requirements ; the impact of our indebtedness, including our convertible senior notes and our capped call transactions ; and other risks and uncertainties described in our SEC filings on Forms 10 - K, 10 - Q and 8 - K, and from time - to - time in our other SEC reports .. All forward - looking statements speak only to management’s expectations, estimates, projections and assumptions as of the date of this presentation .. The Company does not undertake any obligation to update or publicly revise any forward - looking statements to reflect events, circumstances or changes in expectations after the date of this presentation .. |
| Q4 2021 Financial Results Conference Call Copyright © 2022 Veeco Instruments Inc. All Rights Reserved. 3 CEO Overview Bill Miller |

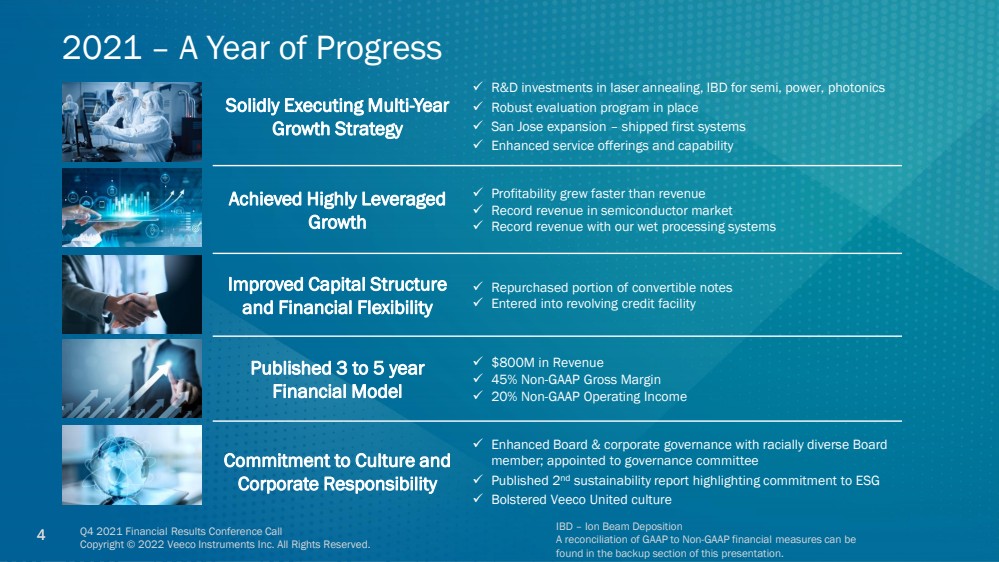
| Q4 2021 Financial Results Conference Call Copyright © 2022 Veeco Instruments Inc. All Rights Reserved. 4 4 2021 – A Year of Progress Solidly Executing Multi - Year Growth Strategy ✓ R&D investments in laser annealing, IBD for semi, power, photonics ✓ Robust evaluation program in place ✓ San Jose expansion – shipped first systems ✓ Enhanced service offerings and capability Achieved Highly Leveraged Growth ✓ Profitability grew faster than revenue ✓ Record revenue in semiconductor market ✓ Record revenue with our wet processing systems Improved Capital Structure and Financial Flexibility ✓ Repurchased portion of convertible notes ✓ Entered into revolving credit facility Published 3 to 5 year Financial Model ✓ $800M in Revenue ✓ 45% Non - GAAP Gross Margin ✓ 20% Non - GAAP Operating Income Commitment to Culture and Corporate Responsibility ✓ Enhanced Board & corporate governance with racially diverse Board member; appointed to governance committee ✓ Published 2 nd sustainability report highlighting commitment to ESG ✓ Bolstered Veeco United culture IBD – Ion Beam Deposition A reconciliation of GAAP to Non - GAAP financial measures can be found in the backup section of this presentation. |
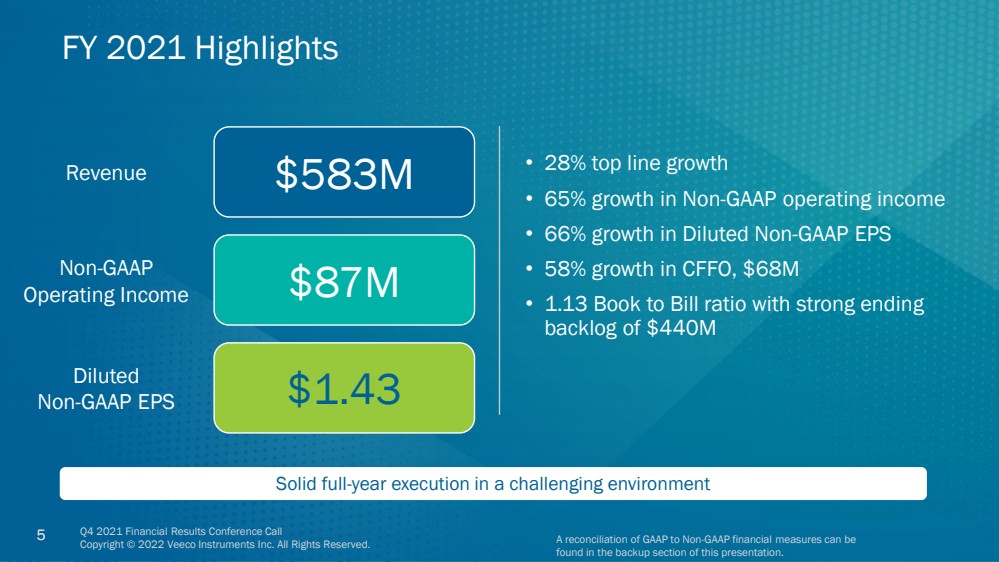
| Q4 2021 Financial Results Conference Call Copyright © 2022 Veeco Instruments Inc. All Rights Reserved. 5 5 FY 2021 Highlights $583M $87M $1.43 Revenue Non - GAAP Operating Income Diluted Non - GAAP EPS • 28% top line growth • 65% growth in Non - GAAP operating income • 66% growth in Diluted Non - GAAP EPS • 58% growth in CFFO, $68M • 1.13 Book to Bill ratio with strong ending backlog of $440M Solid full - year execution in a challenging environment A reconciliation of GAAP to Non - GAAP financial measures can be found in the backup section of this presentation. |
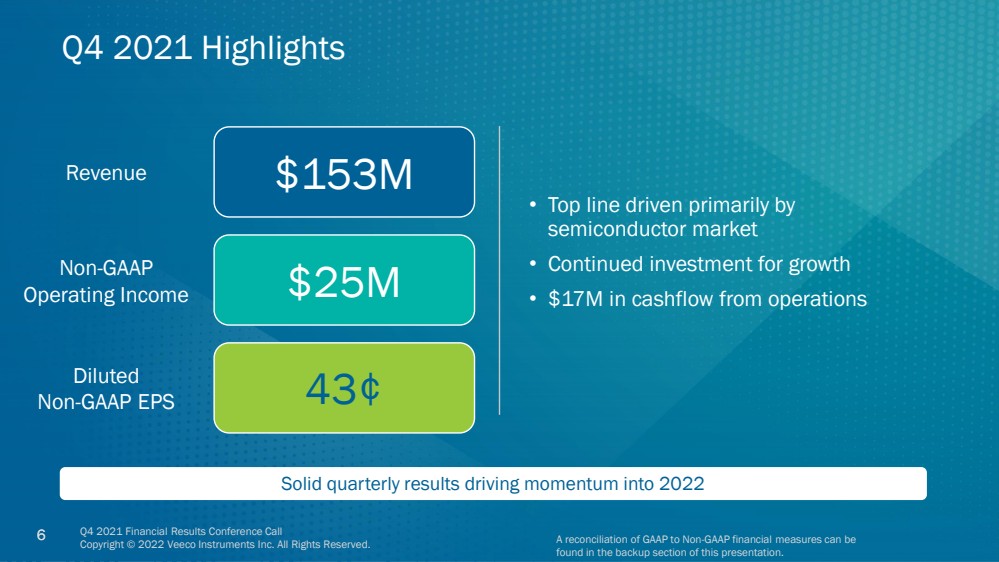
| Q4 2021 Financial Results Conference Call Copyright © 2022 Veeco Instruments Inc. All Rights Reserved. 6 6 Q4 2021 Highlights $153M $25M 43¢ Revenue Non - GAAP Operating Income Diluted Non - GAAP EPS • Top line driven primarily by semiconductor market • Continued investment for growth • $17M in cashflow from operations Solid quarterly results driving momentum into 2022 A reconciliation of GAAP to Non - GAAP financial measures can be found in the backup section of this presentation. |
| Q4 2021 Financial Results Conference Call Copyright © 2022 Veeco Instruments Inc. All Rights Reserved. 7 CFO Financial Review John Kiernan |

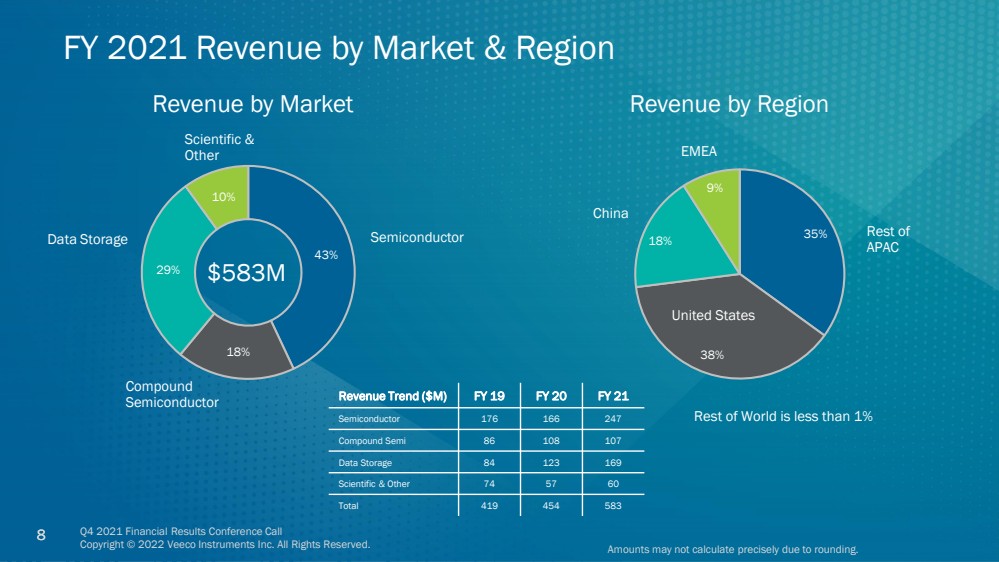
| Q4 2021 Financial Results Conference Call Copyright © 2022 Veeco Instruments Inc. All Rights Reserved. 8 8 FY 2021 Revenue by Market & Region 43% 18% 29% 10% Revenue by Market Revenue by Region Scientific & Other Semiconductor Compound Semiconductor Data Storage 35% 38% 18% 9% EMEA China United States Rest of APAC $583M Revenue Trend ($M) FY 19 FY 20 FY 21 Semiconductor 176 166 247 Compound Semi 86 108 107 Data Storage 84 123 169 Scientific & Other 74 57 60 Total 419 454 583 Rest of World is less than 1% Amounts may not calculate precisely due to rounding. |
| Q4 2021 Financial Results Conference Call Copyright © 2022 Veeco Instruments Inc. All Rights Reserved. 9 9 Q4 2021 Revenue by Market & Region 43% 23% 24% 10% Revenue by Market Revenue by Region Scientific & Other Semiconductor Compound Semiconductor Data Storage 26% 37% 25% 12% EMEA China United States Rest of APAC $153M Revenue Trend ($M) Q4 20 Q3 21 Q4 21 Semiconductor 57 76 65 Compound Semi 45 23 35 Data Storage 19 39 36 Scientific & Other 17 11 16 Total 139 150 153 Rest of World is less than 1% Amounts may not calculate precisely due to rounding. |

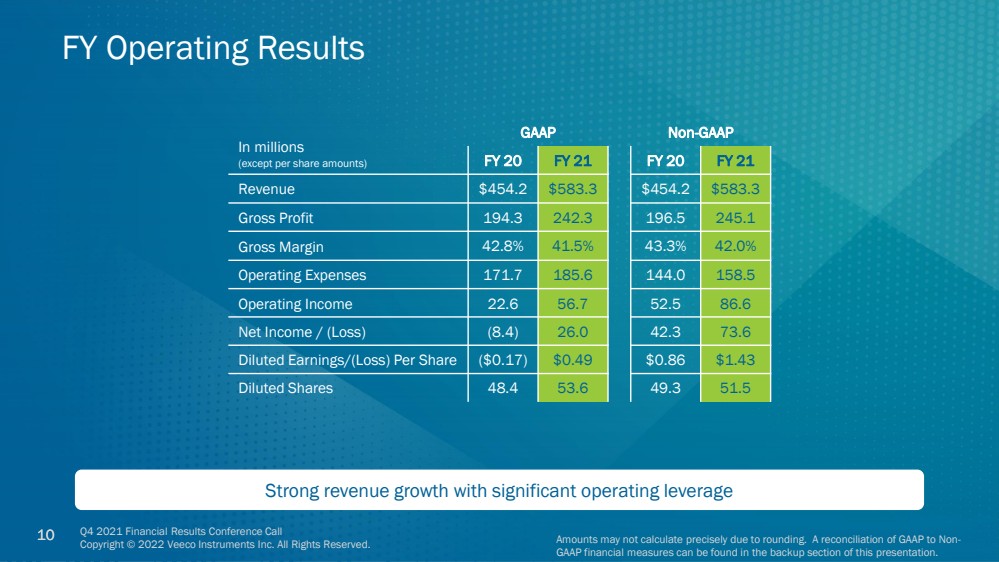
| Q4 2021 Financial Results Conference Call Copyright © 2022 Veeco Instruments Inc. All Rights Reserved. 10 10 FY Operating Results In millions (except per share amounts) GAAP Non - GAAP FY 20 FY 21 FY 20 FY 21 Revenue $454.2 $583.3 $454.2 $583.3 Gross Profit 194.3 242.3 196.5 245.1 Gross Margin 42.8% 41.5% 43.3% 42.0% Operating Expenses 171.7 185.6 144.0 158.5 Operating Income 22.6 56.7 52.5 86.6 Net Income / (Loss) (8.4) 26.0 42.3 73.6 Diluted Earnings/(Loss) Per Share ($0.17) $0.49 $0.86 $1.43 Diluted Shares 48.4 53.6 49.3 51.5 Amounts may not calculate precisely due to rounding. A reconciliation of GAAP to Non - GAAP financial measures can be found in the backup section of this presentation. Strong revenue growth with significant operating leverage |
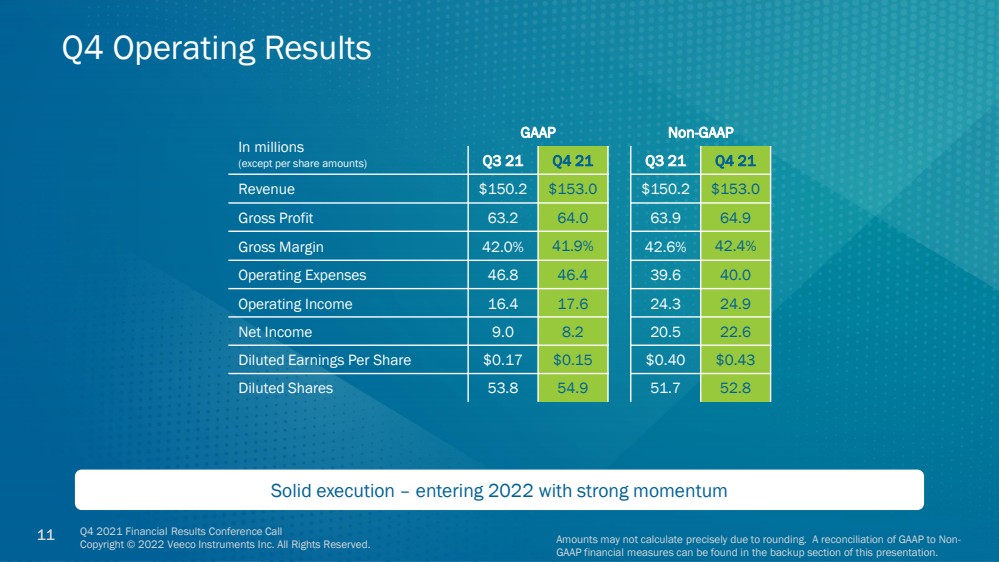
| Q4 2021 Financial Results Conference Call Copyright © 2022 Veeco Instruments Inc. All Rights Reserved. 11 11 Q4 Operating Results In millions (except per share amounts) GAAP Non - GAAP Q3 21 Q4 21 Q3 21 Q4 21 Revenue $150.2 $153.0 $150.2 $153.0 Gross Profit 63.2 64.0 63.9 64.9 Gross Margin 42.0% 41.9% 42.6% 42.4% Operating Expenses 46.8 46.4 39.6 40.0 Operating Income 16.4 17.6 24.3 24.9 Net Income 9.0 8.2 20.5 22.6 Diluted Earnings Per Share $0.17 $0.15 $0.40 $0.43 Diluted Shares 53.8 54.9 51.7 52.8 Amounts may not calculate precisely due to rounding. A reconciliation of GAAP to Non - GAAP financial measures can be found in the backup section of this presentation. Solid execution – entering 2022 with strong momentum |
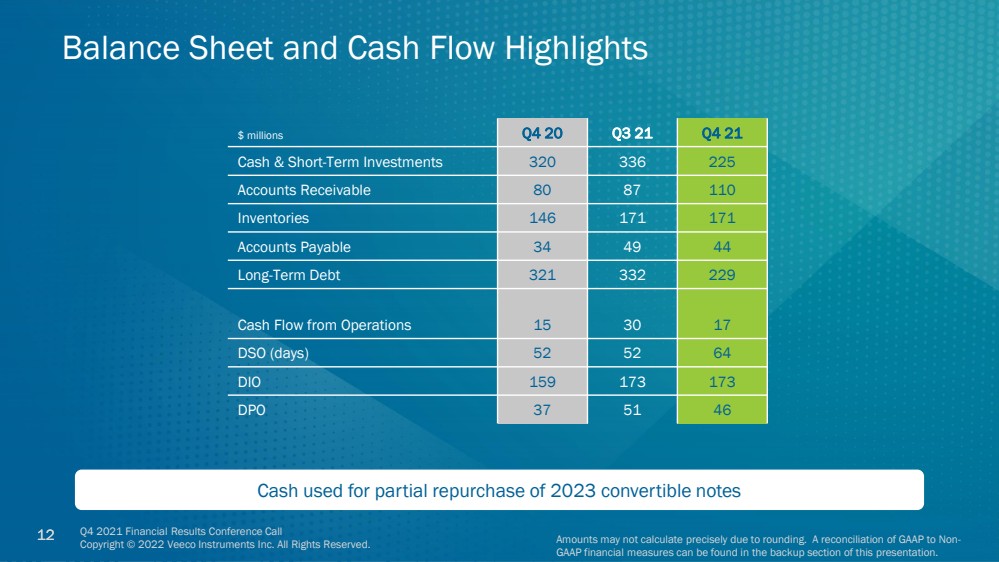
| Q4 2021 Financial Results Conference Call Copyright © 2022 Veeco Instruments Inc. All Rights Reserved. 12 12 Balance Sheet and Cash Flow Highlights $ millions Q4 20 Q3 21 Q4 21 Cash & Short - Term Investments 320 336 225 Accounts Receivable 80 87 110 Inventories 146 171 171 Accounts Payable 34 49 44 Long - Term Debt 321 332 229 Cash Flow from Operations 15 30 17 DSO (days) 52 52 64 DIO 159 173 173 DPO 37 51 46 Amounts may not calculate precisely due to rounding. A reconciliation of GAAP to Non - GAAP financial measures can be found in the backup section of this presentation. Cash used for partial repurchase of 2023 convertible notes |
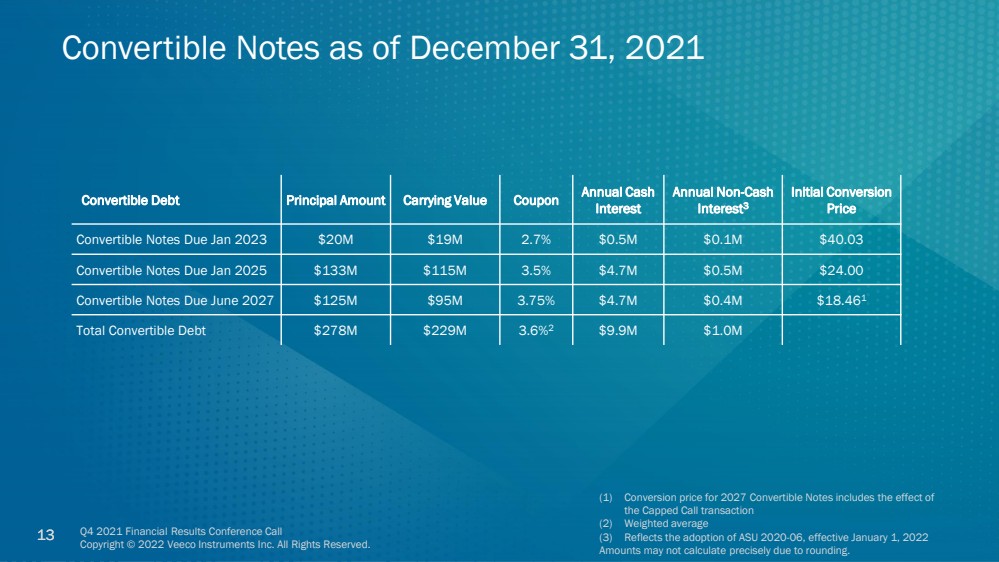
| Q4 2021 Financial Results Conference Call Copyright © 2022 Veeco Instruments Inc. All Rights Reserved. 13 13 Convertible Notes as of December 31, 2021 (1) Conversion price for 2027 Convertible Notes includes the effect of the Capped Call transaction (2) Weighted average (3) Reflects the adoption of ASU 2020 - 06, effective January 1, 2022 Amounts may not calculate precisely due to rounding. Convertible Debt Principal Amount Carrying Value Coupon Annual Cash Interest Annual Non - Cash Interest 3 Initial Conversion Price Convertible Notes Due Jan 2023 $20M $19M 2.7% $0.5M $0.1M $40.03 Convertible Notes Due Jan 2025 $133M $115M 3.5% $4.7M $0.5M $24.00 Convertible Notes Due June 2027 $125M $95M 3.75% $4.7M $0.4M $18.46 1 Total Convertible Debt $278M $229M 3.6% 2 $9.9M $1.0M |
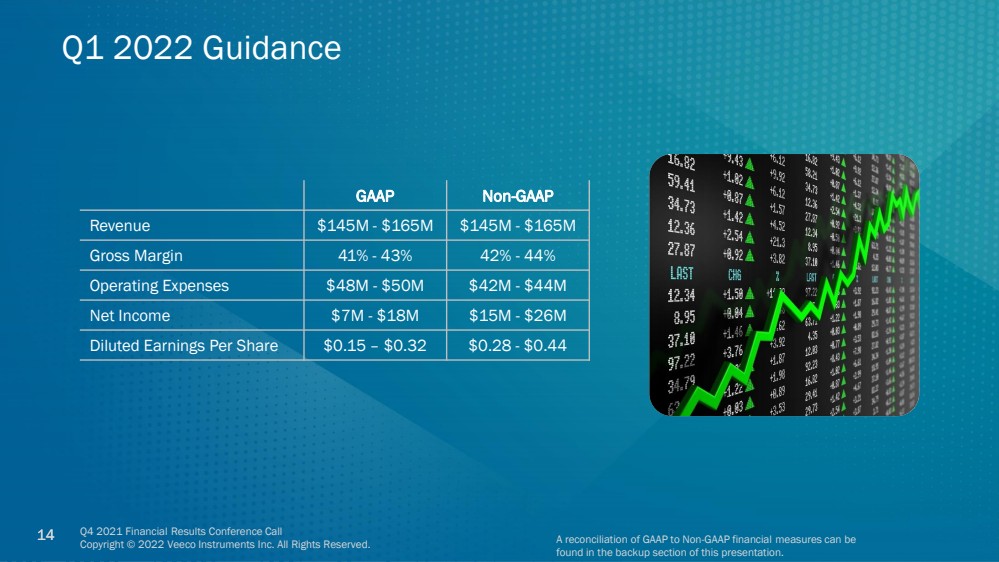
| Q4 2021 Financial Results Conference Call Copyright © 2022 Veeco Instruments Inc. All Rights Reserved. 14 14 Q1 2022 Guidance GAAP Non - GAAP Revenue $145M - $165M $145M - $165M Gross Margin 41% - 43% 42% - 44% Operating Expenses $48M - $50M $42M - $44M Net Income $7M - $18M $15M - $26M Diluted Earnings Per Share $0.15 – $0.32 $0.28 - $0.44 A reconciliation of GAAP to Non - GAAP financial measures can be found in the backup section of this presentation. |
| Q4 2021 Financial Results Conference Call Copyright © 2022 Veeco Instruments Inc. All Rights Reserved. 15 Market Update Bill Miller |
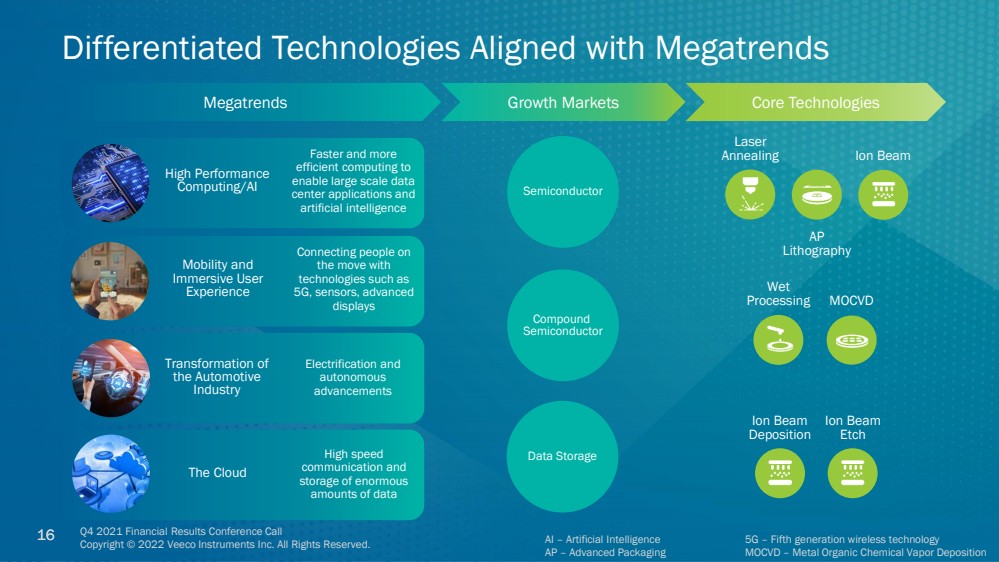
| Q4 2021 Financial Results Conference Call Copyright © 2022 Veeco Instruments Inc. All Rights Reserved. 16 16 Mobility and Immersive User Experience Connecting people on the move with technologies such as 5G, sensors, advanced displays The Cloud High speed communication and storage of enormous amounts of data Differentiated Technologies Aligned with Megatrends Compound Semiconductor Semiconductor Growth Markets Core Technologies Megatrends Laser Annealing AP Lithography Ion Beam Wet Processing MOCVD Transformation of the Automotive Industry Electrification and autonomous advancements High Performance Computing/AI Faster and more efficient computing to enable large scale data center applications and artificial intelligence Data Storage Ion Beam Deposition Ion Beam Etch AI – Artificial Intelligence 5G – Fifth generation wireless technology AP – Advanced Packaging MOCVD – Metal Organic Chemical Vapor Deposition |
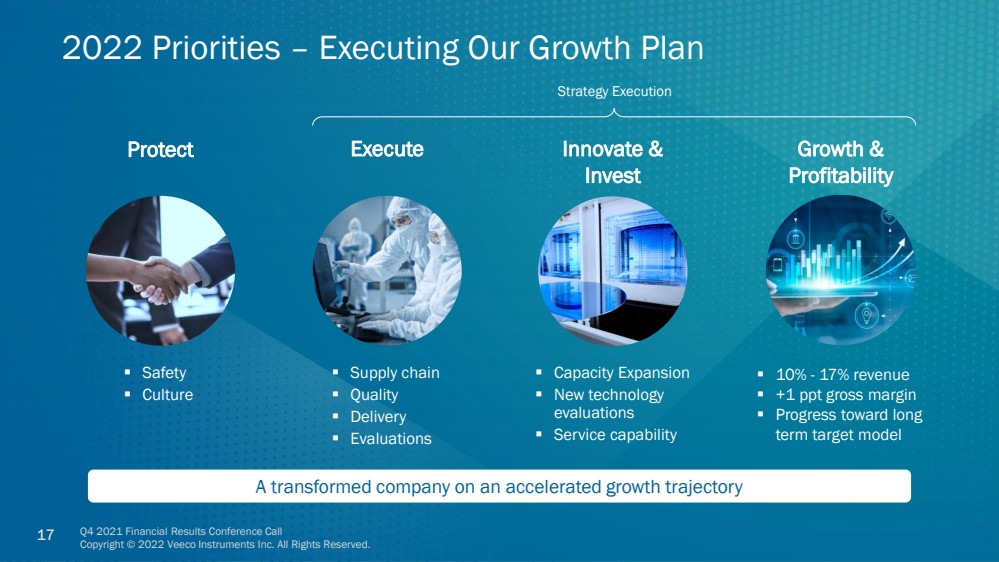
| Q4 2021 Financial Results Conference Call Copyright © 2022 Veeco Instruments Inc. All Rights Reserved. 17 17 2022 Priorities – Executing Our Growth Plan Protect ▪ Capacity Expansion ▪ New technology evaluations ▪ Service capability ▪ Safety ▪ Culture ▪ 10% - 17% revenue ▪ +1 ppt gross margin ▪ Progress toward long term target model ▪ Supply chain ▪ Quality ▪ Delivery ▪ Evaluations Growth & Profitability A transformed company on an accelerated growth trajectory Execute Innovate & Invest Strategy Execution |
| Q4 2021 Financial Results Conference Call Copyright © 2022 Veeco Instruments Inc. All Rights Reserved. 18 Thank You Q&A |

| Q4 2021 Financial Results Conference Call Copyright © 2022 Veeco Instruments Inc. All Rights Reserved. 19 Backup and Financial Tables |

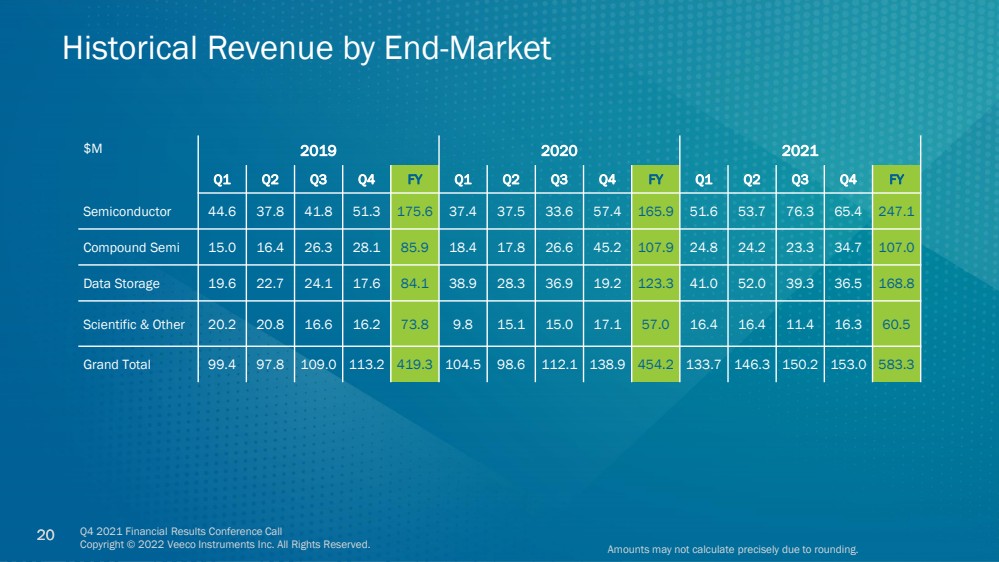
| Q4 2021 Financial Results Conference Call Copyright © 2022 Veeco Instruments Inc. All Rights Reserved. 20 20 Historical Revenue by End - Market $M 2019 2020 2021 Q1 Q2 Q3 Q4 FY Q1 Q2 Q3 Q4 FY Q1 Q2 Q3 Q4 FY Semiconductor 44.6 37.8 41.8 51.3 175.6 37.4 37.5 33.6 57.4 165.9 51.6 53.7 76.3 65.4 247.1 Compound Semi 15.0 16.4 26.3 28.1 85.9 18.4 17.8 26.6 45.2 107.9 24.8 24.2 23.3 34.7 107.0 Data Storage 19.6 22.7 24.1 17.6 84.1 38.9 28.3 36.9 19.2 123.3 41.0 52.0 39.3 36.5 168.8 Scientific & Other 20.2 20.8 16.6 16.2 73.8 9.8 15.1 15.0 17.1 57.0 16.4 16.4 11.4 16.3 60.5 Grand Total 99.4 97.8 109.0 113.2 419.3 104.5 98.6 112.1 138.9 454.2 133.7 146.3 150.2 153.0 583.3 Amounts may not calculate precisely due to rounding. |
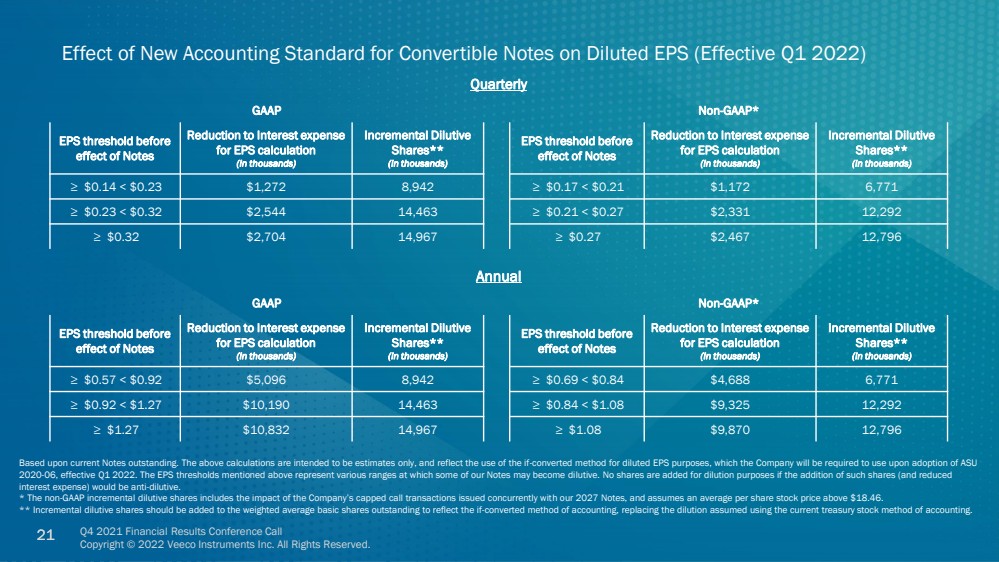
| Q4 2021 Financial Results Conference Call Copyright © 2022 Veeco Instruments Inc. All Rights Reserved. 21 21 Effect of New Accounting Standard for Convertible Notes on Diluted EPS (Effective Q1 2022) Based upon current Notes outstanding. The above calculations are intended to be estimates only, and reflect the use of the if - co nverted method for diluted EPS purposes, which the Company will be required to use upon adoption of ASU 2020 - 06, effective Q1 2022. The EPS thresholds mentioned above represent various ranges at which some of our Notes may become di lutive. No shares are added for dilution purposes if the addition of such shares (and reduced interest expense) would be anti - dilutive. * The non - GAAP incremental dilutive shares includes the impact of the Company’s capped call transactions issued concurrently wit h our 2027 Notes, and assumes an average per share stock price above $18.46. ** Incremental dilutive shares should be added to the weighted average basic shares outstanding to reflect the if - converted meth od of accounting, replacing the dilution assumed using the current treasury stock method of accounting. Quarterly GAAP Non - GAAP* EPS threshold before effect of Notes Reduction to Interest expense for EPS calculation (in thousands) Incremental Dilutive Shares** (in thousands) EPS threshold before effect of Notes Reduction to Interest expense for EPS calculation (in thousands) Incremental Dilutive Shares** (in thousands) ≥ $0.14 < $0.23 $1,272 8,942 ≥ $0.17 < $0.21 $1,172 6,771 ≥ $0.23 < $0.32 $2,544 14,463 ≥ $0.21 < $0.27 $2,331 12,292 ≥ $0.32 $2,704 14,967 ≥ $0.27 $2,467 12,796 Annual GAAP Non - GAAP* EPS threshold before effect of Notes Reduction to Interest expense for EPS calculation (in thousands) Incremental Dilutive Shares** (in thousands) EPS threshold before effect of Notes Reduction to Interest expense for EPS calculation (in thousands) Incremental Dilutive Shares** (in thousands) ≥ $0.57 < $0.92 $5,096 8,942 ≥ $0.69 < $0.84 $4,688 6,771 ≥ $0.92 < $1.27 $10,190 14,463 ≥ $0.84 < $1.08 $9,325 12,292 ≥ $1.27 $10,832 14,967 ≥ $1.08 $9,870 12,796 |
| Q4 2021 Financial Results Conference Call Copyright © 2022 Veeco Instruments Inc. All Rights Reserved. 22 22 Note on Reconciliation Tables These tables include financial measures adjusted for the impact of certain items ; these financial measures are therefore not calculated in accordance with U .. S .. generally accepted accounting principles (“GAAP”) .. These Non - GAAP financial measures exclude items such as : share - based compensation expense ; charges relating to restructuring initiatives ; non - cash asset impairments ; certain other non - operating gains and losses ; and acquisition - related items such as transaction costs, non - cash amortization of acquired intangible assets, incremental transaction - related compensation, and certain integration costs .. These Non - GAAP financial measures may be different from Non - GAAP financial measures used by other companies .. Non - GAAP financial measures should not be considered a substitute for, or superior to, measures of financial performance prepared in accordance with GAAP .. By excluding these items, Non - GAAP financial measures are intended to facilitate meaningful comparisons to historical operating results, competitors' operating results, and estimates made by securities analysts .. Management is evaluated on key performance metrics including Non - GAAP Operating Income, which is used to determine management incentive compensation as well as to forecast future periods .. These Non - GAAP financial measures may be useful to investors in allowing for greater transparency of supplemental information used by management in its financial and operational decision - making .. In addition, similar Non - GAAP financial measures have historically been reported to investors ; the inclusion of comparable numbers provides consistency in financial reporting .. Investors are encouraged to review the reconciliation of the Non - GAAP financial measures used in this news release to their most directly comparable GAAP financial measures .. |
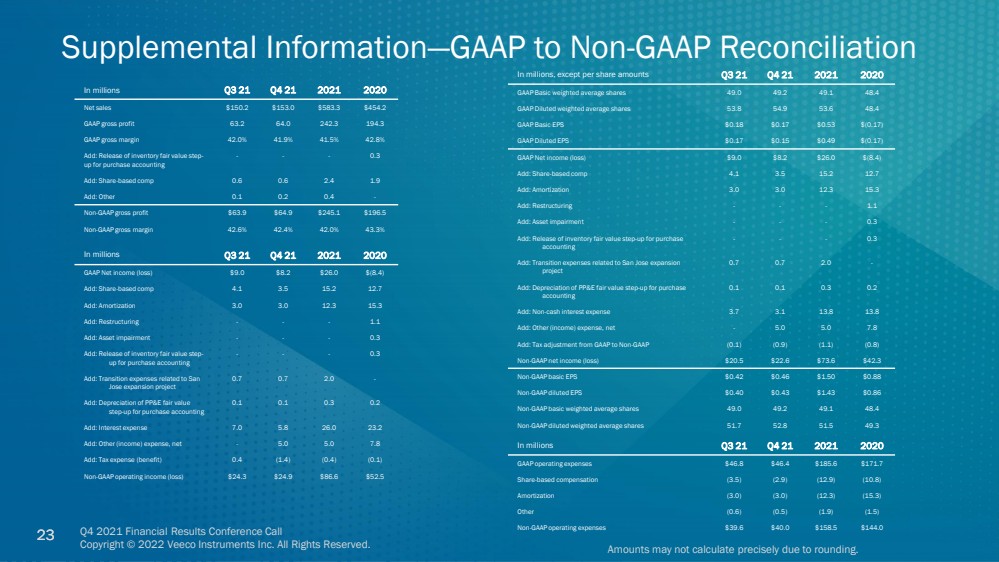
| Q4 2021 Financial Results Conference Call Copyright © 2022 Veeco Instruments Inc. All Rights Reserved. 23 23 Supplemental Information — GAAP to Non - GAAP Reconciliation In millions Q3 21 Q4 21 2021 2020 Net sales $150.2 $153.0 $583.3 $454.2 GAAP gross profit 63.2 64.0 242.3 194.3 GAAP gross margin 42.0% 41.9% 41.5% 42.8% Add: Release of inventory fair value step - up for purchase accounting - - - 0.3 Add: Share - based comp 0.6 0.6 2.4 1.9 Add: Other 0.1 0.2 0.4 - Non - GAAP gross profit $63.9 $64.9 $245.1 $196.5 Non - GAAP gross margin 42.6% 42.4% 42.0% 43.3% In millions Q3 21 Q4 21 2021 2020 GAAP Net income (loss) $9.0 $8.2 $26.0 $(8.4) Add: Share - b ased comp 4.1 3.5 15.2 12.7 Add: Amortization 3.0 3.0 12.3 15.3 Add: Restructuring - - - 1.1 Add: Asset impairment - - - 0.3 Add: Release of inventory fair value step - up for purchase accounting - - - 0.3 Add: Transition expenses related to San Jose expansion project 0.7 0.7 2.0 - Add: Depreciation of PP&E fair value step - up for purchase accounting 0.1 0.1 0.3 0.2 Add: Interest expense 7.0 5.8 26.0 23.2 Add: Other (income) expense, net - 5.0 5.0 7.8 Add: Tax expense (benefit) 0.4 (1.4) (0.4) (0.1) Non - GAAP operating income (loss) $24.3 $24.9 $86.6 $52.5 In millions, except per share amounts Q3 21 Q4 21 2021 2020 GAAP Basic weighted average shares 49.0 49.2 49.1 48.4 GAAP Diluted weighted average shares 53.8 54.9 53.6 48.4 GAAP Basic EPS $0.18 $0.17 $0.53 $(0.17) GAAP Diluted EPS $0.17 $0.15 $0.49 $(0.17) GAAP Net income (loss) $9.0 $8.2 $26.0 $(8.4) Add: Share - based comp 4.1 3.5 15.2 12.7 Add: Amortization 3.0 3.0 12.3 15.3 Add: Restructuring - - - 1.1 Add: Asset impairment - - - 0.3 Add: Release of inventory fair value step - up for purchase accounting - - - 0.3 Add: Transition expenses related to San Jose expansion project 0.7 0.7 2.0 - Add: Depreciation of PP&E fair value step - up for purchase accounting 0.1 0.1 0.3 0.2 Add: Non - cash interest expense 3.7 3.1 13.8 13.8 Add: Other (income) expense, net - 5.0 5.0 7.8 Add: Tax adjustment from GAAP to Non - GAAP (0.1) (0.9) (1.1) (0.8) Non - GAAP net income (loss) $20.5 $22.6 $73.6 $42.3 Non - GAAP basic EPS $0.42 $0.46 $1.50 $0.88 Non - GAAP diluted EPS $0.40 $0.43 $1.43 $0.86 Non - GAAP basic weighted average shares 49.0 49.2 49.1 48.4 Non - GAAP diluted weighted average shares 51.7 52.8 51.5 49.3 In millions Q3 21 Q4 21 2021 2020 GAAP operating expenses $46.8 $46.4 $185.6 $171.7 Share - based compensation (3.5) (2.9) (12.9) (10.8) Amortization (3.0) (3.0) (12.3) (15.3) Other (0.6) (0.5) (1.9) (1.5) Non - GAAP operating expenses $39.6 $40.0 $158.5 $144.0 Amounts may not calculate precisely due to rounding. |
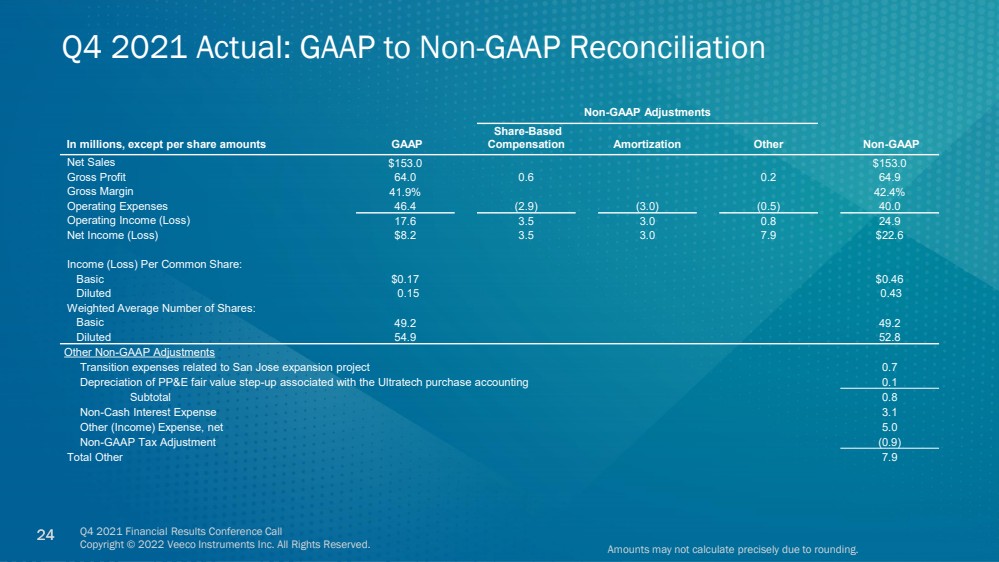
| Q4 2021 Financial Results Conference Call Copyright © 2022 Veeco Instruments Inc. All Rights Reserved. 24 24 Q4 2021 Actual: GAAP to Non - GAAP Reconciliation Non - GAAP Adjustments In millions, except per share amounts GAAP Share - Based Compensation Amortization Other Non - GAAP Net Sales $153.0 $153.0 Gross Profit 64.0 0.6 0.2 64.9 Gross Margin 41.9% 42.4% Operating Expenses 46.4 (2.9) (3.0) (0.5) 40.0 Operating Income (Loss) 17.6 3.5 3.0 0.8 24.9 Net Income (Loss) $8.2 3.5 3.0 7.9 $22.6 Income (Loss) Per Common Share: Basic $0.17 $0.46 Diluted 0.15 0.43 Weighted Average Number of Shares: Basic 49.2 49.2 Diluted 54.9 52.8 Other Non - GAAP Adjustments Transition expenses related to San Jose expansion project 0.7 Depreciation of PP&E fair value step - up associated with the Ultratech purchase accounting 0.1 Subtotal 0.8 Non - Cash Interest Expense 3.1 Other (Income) Expense, net 5.0 Non - GAAP Tax Adjustment (0.9) Total Other 7.9 Amounts may not calculate precisely due to rounding. |
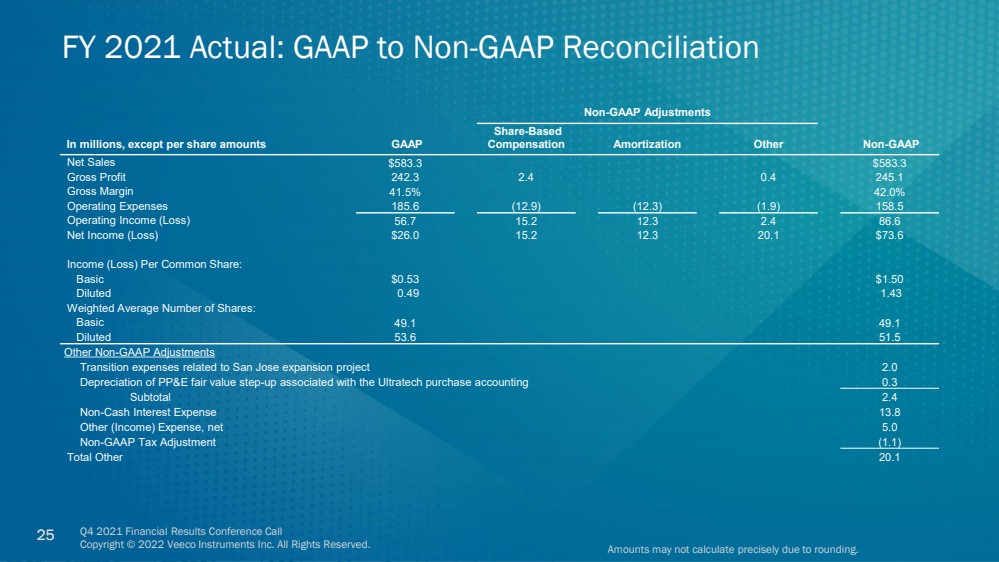
| Q4 2021 Financial Results Conference Call Copyright © 2022 Veeco Instruments Inc. All Rights Reserved. 25 25 FY 2021 Actual: GAAP to Non - GAAP Reconciliation Non - GAAP Adjustments In millions, except per share amounts GAAP Share - Based Compensation Amortization Other Non - GAAP Net Sales $583.3 $583.3 Gross Profit 242.3 2.4 0.4 245.1 Gross Margin 41.5% 42.0% Operating Expenses 185.6 (12.9) (12.3) (1.9) 158.5 Operating Income (Loss) 56.7 15.2 12.3 2.4 86.6 Net Income (Loss) $26.0 15.2 12.3 20.1 $73.6 Income (Loss) Per Common Share: Basic $0.53 $1.50 Diluted 0.49 1.43 Weighted Average Number of Shares: Basic 49.1 49.1 Diluted 53.6 51.5 Other Non - GAAP Adjustments Transition expenses related to San Jose expansion project 2.0 Depreciation of PP&E fair value step - up associated with the Ultratech purchase accounting 0.3 Subtotal 2.4 Non - Cash Interest Expense 13.8 Other (Income) Expense, net 5.0 Non - GAAP Tax Adjustment (1.1) Total Other 20.1 Amounts may not calculate precisely due to rounding. |
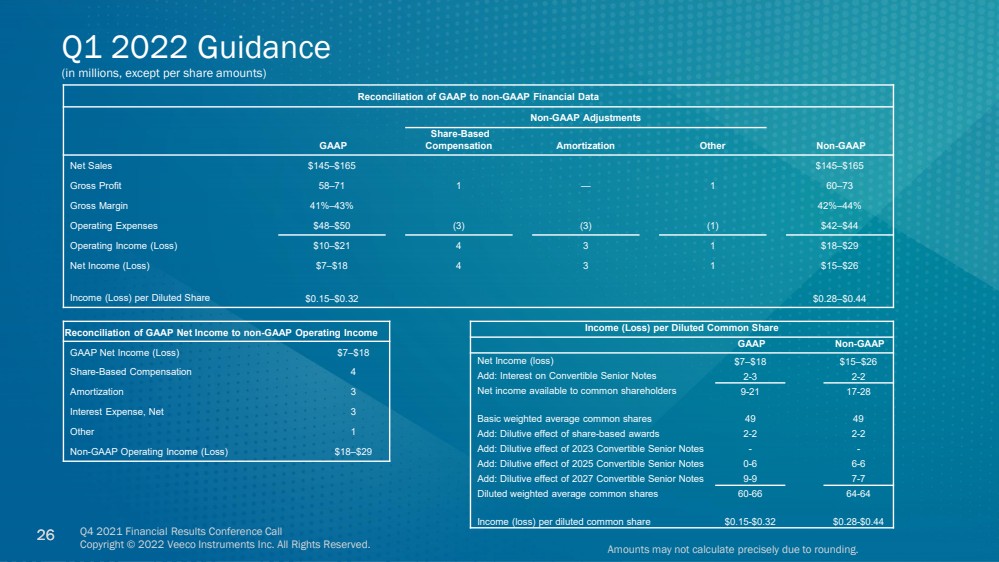
| Q4 2021 Financial Results Conference Call Copyright © 2022 Veeco Instruments Inc. All Rights Reserved. 26 26 Reconciliation of GAAP to non - GAAP Financial Data Non - GAAP Adjustments GAAP Share - Based Compensation Amortization Other Non - GAAP Net Sales $145 – $165 $145 – $165 Gross Profit 58 – 71 1 — 1 60 – 73 Gross Margin 41% – 43% 42% – 44% Operating Expenses $48 – $50 (3) (3) (1) $42 – $44 Operating Income (Loss) $10 – $21 4 3 1 $18 – $29 Net Income (Loss) $7 – $18 4 3 1 $15 – $26 Income (Loss) per Diluted Share $0.15 – $0.32 $0.28 – $0.44 Q1 2022 Guidance (in millions, except per share amounts) Amounts may not calculate precisely due to rounding. Income (Loss) per Diluted Common Share GAAP Non - GAAP Net Income (loss) $7 – $18 $15 – $26 Add: Interest on Convertible Senior Notes 2 - 3 2 - 2 Net income available to common shareholders 9 - 21 17 - 28 Basic weighted average common shares 49 49 Add: Dilutive effect of share - based awards 2 - 2 2 - 2 Add: Dilutive effect of 2023 Convertible Senior Notes - - Add: Dilutive effect of 2025 Convertible Senior Notes 0 - 6 6 - 6 Add: Dilutive effect of 2027 Convertible Senior Notes 9 - 9 7 - 7 Diluted weighted average common shares 60 - 66 64 - 64 Income (loss) per diluted common share $0.15 - $0.32 $0.28 - $0.44 Reconciliation of GAAP Net Income to non - GAAP Operating Income GAAP Net Income (Loss) $7 – $18 Share - Based Compensation 4 Amortization 3 Interest Expense, Net 3 Other 1 Non - GAAP Operating Income (Loss) $18 – $29 |