UNITED STATES
SECURITIES AND EXCHANGE COMMISSION
Washington, D.C. 20549
FORM N-CSR
CERTIFIED SHAREHOLDER REPORT OF REGISTERED
MANAGEMENT INVESTMENT COMPANIES
Investment Company Act file number: 811-08039
Third Avenue Trust
(Exact name of registrant as specified in charter)
| 622 Third Avenue, 32nd Floor, New York, NY | 10017 |
| (Address of principal executive offices) | (Zip code) |
| W. James Hall III, General Counsel, 622 Third Avenue, New York, NY | 10017 |
| (Name and address of agent for service) | |
Registrant’s telephone number, including area code: 800-443-1021
Date of fiscal year end: October 31, 2014
Date of reporting period: October 31, 2014
Form N-CSR is to be used by management investment companies to file reports with the Commission not later than 10 days after the transmission to stockholders of any report that is required to be transmitted to stockholders under Rule 30e-1 under the Investment Company Act of 1940 (17 CFR 270.30e-1). The Commission may use the information provided on Form N-CSR in its regulatory, disclosure review, inspection, and policymaking roles.
A registrant is required to disclose the information specified by Form N-CSR, and the Commission will make this information public. A registrant is not required to respond to the collection of information contained in Form N-CSR unless the Form displays a currently valid Office of Management and Budget (“OMB”) control number. Please direct comments concerning the accuracy of the information collection burden estimate and any suggestions for reducing the burden to Secretary, Securities and Exchange Commission, 100 F Street, NE, Washington, DC 20549-0609. The OMB has reviewed this collection of information under the clearance requirements of 44 U.S.C. § 3507.
Item 1. Reports to Stockholders.
The Trust’s annual report transmitted to shareholders pursuant to Rule 30e-1 under the Investment Company Act of 1940, as amended (the “1940 Act”), is as follows:
![]()
Third Avenue Value Fund
Third Avenue Small-Cap Value Fund
Third Avenue Real Estate Value Fund
Third Avenue International Value Fund
Third Avenue Focused Credit Fund
ANNUAL REPORT

OCTOBER 31, 2014
THIRD AVENUE FUNDS
Privacy Policy
Third Avenue Funds (the “Funds”) respect your right to privacy. We also know that you expect us to conduct and process your business in an accurate and efficient manner. To do so, we must collect and maintain certain personal information about you. This is the information we collect from you on applications or other forms and from the transactions you make with us, our affiliates, or third parties. We do not disclose any information about you or any of our former customers to anyone, except to our affiliates (which may include the Funds’ affiliated money management entities) and service providers, or as otherwise permitted by law. To protect your personal information, we permit access only by authorized employees. Be assured that we maintain physical, electronic and procedural safeguards that comply with federal standards to guard your personal information.
Proxy Voting Policies and Procedures
The Funds have delegated the voting of proxies relating to their voting securities to the Funds’ investment adviser pursuant to the adviser’s proxy voting guidelines. A description of these proxy voting guidelines and procedures, as well as information relating to how a Fund voted proxies relating to portfolio securities during the most recent 12-month period ended June 30, is available by August 31 each year (i) without charge, upon request, by calling (800) 443-1021, (ii) at the website of the Securities and Exchange Commission (“SEC”) at http://www.sec.gov, and (iii) on the Funds’ website www.thirdave.com.
Schedule of Portfolio Holdings—Form N-Q
The Funds file their complete schedule of portfolio holdings with the SEC for the first and third quarters of each fiscal year on Form N-Q. The Funds’ Form N-Q is available on the SEC’s website at http://www.sec.gov, and may be reviewed and copied at the SEC’s Public Reference Room in Washington, DC. Information on the operation of the Public Reference Room may be obtained by calling 1-800-SEC-0330.
Third Avenue Trust
Third Avenue Value Fund
Portfolio Management Discussion
October 31, 2014 (Unaudited)
At October 31, 2014, the audited net asset values attributable to each of the 569,966 common shares outstanding of the Third Avenue Value Fund Investor Class and 35,707,495 common shares outstanding of Third Avenue Value Fund Institutional Class were $59.54 and $59.69 per share, respectively. This compares with audited net asset values at October 31, 2013 of $55.93 and $55.93 per share, respectively, adjusted for a subsequent distribution to shareholders.
| Average Annual Returns for the periods | ||||||||||||||||||||
| ended October 31, 2014 | ||||||||||||||||||||
| One Year ended 10/31/14 | Three Year | Five Year | Ten Year | Since Inception | ||||||||||||||||
| Third Avenue Value Fund Investor Class† | 6.45 | % | 13.45 | % | N/A | N/A | 7.39 | % | ||||||||||||
| Third Avenue Value Fund Institutional Class^ | 6.70 | % | 13.72 | % | 8.71 | % | 5.61 | % | 11.81 | % | ||||||||||
| MSCI World Index‡ | 9.25 | % | 15.02 | % | 12.02 | % | 7.52 | % | 7.99 | % | ||||||||||
| S&P 500 Index‡ | 17.27 | % | 19.77 | % | 16.69 | % | 8.20 | % | 10.48 | % | ||||||||||
| † | Investor Class commenced investment operations on December 31, 2009. |
| ^ | Institutional Class commenced investment operations on November 1, 1990. |
| ‡ | The date used to calculate the Since Inception performance for the index is the inception date of the Institutional Class. |
The Third Avenue Value Fund Institutional Class (the “Fund”) generated positive 6.70% returns over the last fiscal year but underperformed its benchmark, the MSCI World Index, which returned 9.25% over the same period. We continue to be positive about the outlook for our portfolio positions, despite our disappointment in recent performance. Our investment theses on portfolio positions and our investment philosophy have not been compromised. The companies continue to be very strong businesses and continue to trade at large discounts to our conservative estimates of net asset value. We have been buyers of several of these existing positions during the recent market weakness, adding to several positions in the Fund.
The top performers in the Fund during the year were: Cavco Industries, Inc., Covanta Holding Corp. and Intel Corp. We invested in Intel common stock in early 2013 when the shares sold off meaningfully on investor fears of a poor near term outlook due to weak PC end-user demand and general macro related weakness in IT spending. In our view, these were shorter term, macro related concerns. The strengths of Intel showed through in its second quarter 2014 earnings report which benefitted from an improvement in PC demand, helped by upgrades driven by the expiration of support for Windows XP and a realized 11% increase in pricing in its data center offerings, where Intel continues to be the market leader. We closed this position at a profit as the discount gap narrowed.
Positions that detracted from performance over the fiscal year included: Daiwa Securities Group Inc., Lehman Brothers Holdings, Inc., SIPA Claims and AGCO Corp. AGCO is a pure-play agricultural company dedicated to farm machinery, grain storage solutions and protein production equipment. It maintains an investment grade balance sheet, is highly cash generative, and has been consistently profitable. Its current valuation is depressed due to near term concerns regarding farmers’ incomes as well as general volatility in commodity markets.
The Fund added 14 new names during the year. Valmont Industries, Inc., General Motors Co., CBS Corp., Class B, and Brookdale Senior Living, Inc. are the most recent additions. Valmont is the leader in mechanized irrigation equipment with 40% market share. This is a well-capitalized, well-positioned company which we were able to purchase at a discount to our conservatively estimated Net Asset Value as a result of pricing pressure stemming from temporary demand/supply imbalances both in the agricultural and utilities sectors.
The Fund sold off eight names during the year, including Henderson Land Development Co., Ltd., Intel Corp. and Tellabs Inc. The Fund’s Tellabs, Inc. position was eliminated as full value was reached due to its takeover by private equity company Marlin Equity Partners.
THE INFORMATION IN THE PORTFOLIO MANAGEMENT DISCUSSION REPRESENTS A FACTUAL OVERVIEW OF THE FUND’S PERFORMANCE AND IS NOT INTENDED TO BE A FORECAST OF FUTURE EVENTS, A GUARANTEE OF FUTURE RESULTS NOR INVESTMENT ADVICE. VIEWS EXPRESSED ARE THOSE OF THE INVESTMENT TEAM AND MAY DIFFER FROM THOSE OF OTHER INVESTMENT TEAMS OR THE FIRM AS A WHOLE. ALSO, PLEASE NOTE THAT ANY DISCUSSION OF THE PORTFOLIO’S HOLDINGS, THE FUND’S PERFORMANCE, AND THE INVESTMENT TEAM’S VIEWS ARE AS OF OCTOBER 31, 2014, AND ARE SUBJECT TO CHANGE.
The Fund’s performance may be influenced by a foreign country’s political, social and economic situation. Other risks include currency fluctuations, less liquidity, lack of efficient trading markets, and different auditing and legal standards. These risks may result in more volatility for the Fund. These and other risks are described more fully in the Fund’s prospectus.
| 1 |
Third Avenue Trust
Third Avenue Value Fund
Portfolio Management Discussion (continued)
October 31, 2014 (Unaudited)
Third Avenue Value Fund is offered by prospectus only. The prospectus contains more complete information on advisory fees, distribution charges, and other expenses and should be read carefully before investing or sending money. Past performance is no guarantee of future results. Investment return and principal value will fluctuate so that an investor’s shares, when redeemed, may be worth more or less than original cost. The Fund’s returns should be viewed in light of its investment policy and objectives and quality of its portfolio securities and the periods selected. M.J. Whitman LLC Distributor.
If you should have any questions, or for updated information (including performance data current to the most recent month-end) or a copy of our prospectus, please call 1-800-443-1021 or go to our web site at www.thirdave.com. Current performance may be lower or higher than performance quoted.
The MSCI World Index is a free float-adjusted market capitalization weighted index that is designed to measure the equity market performance of 23 of the world’s most developed markets. The S&P 500 Index is a widely recognized benchmark of U.S. stock market performance that is dominated by the stocks of large U.S. companies. The MSCI World Index and the S&P 500 Index are not securities that can be purchased or sold, and their total returns are reflective of unmanaged portfolios. The returns include reinvestment of all distributions.
| 2 |
Third Avenue Trust
Third Avenue Value Fund – Investor Class
Comparison of a $10,000 Investment
(Unaudited)
Performance Illustration
COMPARISON OF CHANGE IN VALUE OF A $10,000 INVESTMENT IN THIRD AVENUE VALUE FUND – INVESTOR CLASS (TVFVX),
THE MSCI WORLD INDEX AND THE STANDARD & POOR’S 500 INDEX (S&P 500 INDEX)
FROM INCEPTION OF THE FUND (12/31/09) THROUGH OCTOBER 31, 2014
| Average Annual Total Return | ||||
| Since Inception | ||||
| 1 Year | 3 Years | (12/31/09) | ||
| 6.45% | 13.45% | 7.39% | ||
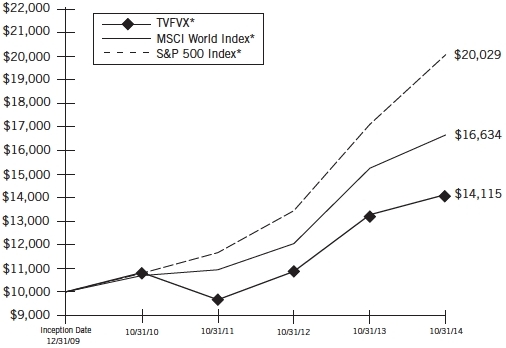
| * | Includes reinvestment of all distributions. |
As with all mutual funds, past performance does not indicate future results. Performance may reflect fee waivers, expense offset arrangement and/or recovery. Total return would have been lower if the Adviser had not waived certain expenses. Conversely, total return would have been higher if the Adviser had not recovered previously waived expenses. Also, the returns shown in the graph and table do not reflect the deduction of taxes that a shareholder would pay on fund distributions or the redemption of fund shares.
| 3 |
Third Avenue Trust
Third Avenue Value Fund – Institutional Class
Comparison of a $10,000 Investment
(Unaudited)
Performance Illustration
COMPARISON OF CHANGE IN VALUE OF A $10,000 INVESTMENT IN THIRD AVENUE VALUE FUND – INSTITUTIONAL CLASS (TAVFX),
THE MSCI WORLD INDEX AND THE STANDARD & POOR’S 500 INDEX (S&P 500 INDEX)
FOR THE TEN YEARS ENDED OCTOBER 31, 2014
| Average Annual Total Return | ||||||
| 1 Year | 3 Years | 5 Years | 10 Years | |||
| 6.70% | 13.72% | 8.71% | 5.61% | |||
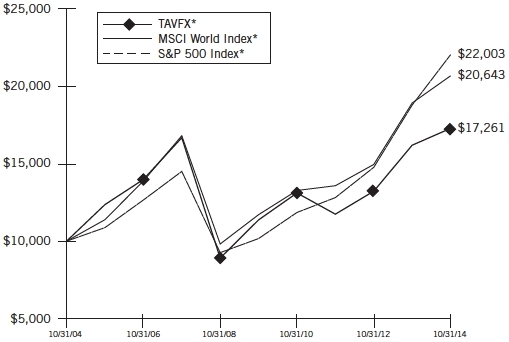
| * | Includes reinvestment of all distributions. |
As with all mutual funds, past performance does not indicate future results. Performance may reflect fee waivers, expense offset arrangement and/or recovery. Total return would have been lower if the Adviser had not waived certain expenses. Conversely, total return would have been higher if the Adviser had not recovered previously waived expenses. Also, the returns shown in the graph and table do not reflect the deduction of taxes that a shareholder would pay on fund distributions or the redemption of fund shares.
| 4 |
Third Avenue Trust
Third Avenue Value Fund
Industry Diversification
(Unaudited)
The summary of the Fund’s investments as of October 31, 2014 is as follows:

The accompanying notes are an integral part of the financial statements.
| 5 |
Third Avenue Trust
Third Avenue Value Fund
Portfolio of Investments
at October 31, 2014
| Principal Amount ($) | Security† | Value (Note 1) | ||||||
| Corporate Bonds & Notes - 0.21% | ||||||||
| Consumer Products - 0.21% | ||||||||
| 21,505,076 | Home Products International, Inc., 2nd Lien, Convertible, 6.000% Payment-in-kind Interest, due 3/20/17 (b) (c) (d) (e) | $ | 4,507,464 | |||||
| Total Corporate Bonds & Notes (Cost $21,505,076) | 4,507,464 | |||||||
| Claims - 0.75% | ||||||||
| Securities Brokerage - 0.75% | ||||||||
| 63,101,500 | Lehman Brothers Holdings, Inc., SIPA Claims (a) | 16,210,775 | ||||||
| Total Claims (Cost $15,775,375) | 16,210,775 | |||||||
| Shares | ||||||||
| Common Stocks & Warrants - 95.08% | ||||||||
| Agricultural Equipment - 2.25% | ||||||||
| 1,101,513 | AGCO Corp. | 48,808,041 | ||||||
| Asset Management - 7.70% | ||||||||
| 3,034,813 | Bank of New York Mellon Corp. (The) | 117,507,959 | ||||||
| 1,007,504 | Brookfield Asset Management, Inc., Class A (Canada) | 49,337,471 | ||||||
| 166,845,430 | ||||||||
| Automotive - 6.48% | ||||||||
| 417,265 | Cie Generale des Etablissements Michelin (France) | 36,179,107 | ||||||
| 1,406,100 | General Motors Co. | 44,151,540 | ||||||
| 1,292,093 | Toyota Industries Corp. (Japan) | 59,931,489 | ||||||
| 140,262,136 | ||||||||
| Consumer Discretionary - 1.76% | ||||||||
| 616,405 | Target Corp. | 38,106,157 | ||||||
| Consumer Products - 0.00% | ||||||||
| 526,368 | Home Products International, Inc.(a)(b)(c)(d) | — | ||||||
| Depository Institutions - 7.45% | ||||||||
| 1,817,049 | Comerica, Inc. | 86,745,919 | ||||||
| 5,644,398 | KeyCorp. | 74,506,054 | ||||||
| 161,251,973 | ||||||||
| Diversified Holding Companies - 10.31% | ||||||||
| 3,990,000 | Cheung Kong Holdings, Ltd. (Hong Kong) | 70,794,762 | ||||||
| 658,302 | Investor AB, Class B (Sweden) | 23,553,610 | ||||||
| 151,543,880 | Lai Sun Garment International, Ltd. (Hong Kong) (a) (c) | 22,667,634 | ||||||
| 561,726 | Pargesa Holding S.A. (Switzerland) | 43,640,824 | ||||||
| 12,988,000 | Wheelock & Co., Ltd. (Hong Kong) | 62,552,214 | ||||||
| 223,209,044 | ||||||||
| Financial Insurance - 0.01% | ||||||||
| 37 | Manifold Capital LLC (a) (b) (c) (d) | 259,000 | ||||||
| Industrials - 1.04% | ||||||||
| 165,180 | Valmont Industries, Inc. | 22,492,561 | ||||||
| Shares | Security† | Value (Note 1) | ||||||
| Insurance & Reinsurance - 6.51% | ||||||||
| 108,073 | Alleghany Corp. (a) | $ | 48,014,672 | |||||
| 962,488 | Loews Corp. | 41,964,477 | ||||||
| 127,500 | Olympus Re Holdings, Ltd. (Bermuda) (a) (b) (d) | 40,800 | ||||||
| 81,699 | White Mountains Insurance Group, Ltd. (Bermuda) | 51,055,339 | ||||||
| 141,075,288 | ||||||||
| Manufactured Housing - 5.27% | ||||||||
| 1,566,626 | Cavco Industries, Inc. (a) (c) | 114,160,037 | ||||||
| Materials - 2.46% | ||||||||
| 2,285,500 | Canfor Corp. (Canada) (a) | 53,211,055 | ||||||
| Media & Entertainment - 2.03% | ||||||||
| 809,000 | CBS Corp., Class B, Non Voting Shares | 43,863,980 | ||||||
| Non-U.S. Real Estate Operating Companies - 2.74% | ||||||||
| 11,781,000 | Hang Lung Group, Ltd. (Hong Kong) | 59,245,663 | ||||||
| Oil & Gas Production & Services - 11.67% | ||||||||
| 1,132,000 | Apache Corp. | 87,390,400 | ||||||
| 1,245,606 | Devon Energy Corp. | 74,736,360 | ||||||
| 1,524,802 | Total S.A. (France) | 90,610,297 | ||||||
| 252,737,057 | ||||||||
| Securities Brokerage - 3.50% | ||||||||
| 9,883,700 | Daiwa Securities Group, Inc. (Japan) | 75,761,101 | ||||||
| Semiconductor & Related - 2.11% | ||||||||
| 2,336,868 | NVIDIA Corp. | 45,662,401 | ||||||
| Senior Housing - 1.28% | ||||||||
| 822,000 | Brookdale Senior Living, Inc. (a) | 27,709,620 | ||||||
| Software - 2.66% | ||||||||
| 2,322,155 | Symantec Corp. | 57,635,887 | ||||||
| Steel & Specialty Steel - 3.90% | ||||||||
| 1,180,432 | POSCO, ADR (South Korea) | 84,471,714 | ||||||
| Telecommunications - 2.70% | ||||||||
| 17,628,928 | Vodafone Group PLC (United Kingdom) | 58,460,404 | ||||||
| U.S. Real Estate Operating Companies - 5.18% | ||||||||
| 1,221,894 | Tejon Ranch Co. (a) (c) | 36,876,761 | ||||||
| 200,255 | Tejon Ranch Co., Warrants, expire 8/31/16 (a) (c) | 420,535 | ||||||
| 2,214,890 | Weyerhaeuser Co. (f) | 74,996,175 | ||||||
| 112,293,471 | ||||||||
| Utilities - 6.07% | ||||||||
| 5,956,007 | Covanta Holding Corp. | 131,449,074 | ||||||
| Total Common Stocks & Warrants (Cost $1,680,328,235) | 2,058,971,094 | |||||||
The accompanying notes are an integral part of the financial statements.
| 6 |
Third Avenue Trust
Third Avenue Value Fund
Portfolio of Investments (continued)
at October 31, 2014
| Investment Amount ($) | Security† | Value (Note 1) | ||||||
| Limited Partnerships - 0.00%# | ||||||||
| Insurance & Reinsurance - 0.00%# | ||||||||
| 1,805,000 | Insurance Partners II Equity Fund, L.P. (a)(b) | $ | 92,941 | |||||
| Total Limited Partnerships (Cost $0) | 92,941 | |||||||
| Total Investment Portfolio - 96.04% (Cost $1,717,608,686) | 2,079,782,274 | |||||||
| Other Assets less Liabilities - 3.96% | 85,707,697 | |||||||
| NET ASSETS - 100.00% | $ | 2,165,489,971 | ||||||
Notes:
ADR: American Depositary Receipt.
SIPA: Securities Investor Protection Act of 1970.
| (a) | Non-income producing security. |
| (b) | Fair-valued security. |
| (c) | Affiliated issuers - as defined under the Investment Company Act of 1940 (ownership of 5% or more of the outstanding voting securities of these issuers). |
| (d) | Security subject to restrictions on resale. |
| Shares/ Principal Amount ($) | Issuer | Acquisition Date | Cost | Market Value Per Unit | ||||||||||
| 526,368 | Home Products International, Inc. | 5/30/07 | $ | 54,667,471 | $0.00 | |||||||||
| $ | 21,505,076 | Home Products International, Inc. 2nd Lien, Convertible, 6.000% Payment-in-kind Interest, due 3/20/17 | 3/16/07-10/2/14 | 21,505,076 | 20.96 | |||||||||
| 37 | Manifold Capital LLC | 9/24/97-11/10/06 | 37,712,514 | 7,000.00 | ||||||||||
| 127,500 | Olympus Re Holdings, Ltd. | 12/20/01 | 11,911,136 | 0.32 | ||||||||||
| At October 31, 2014, these restricted securities had a total market value of $4,807,264 or 0.22% of net assets of the Fund. |
| (e) | Payment-in-kind (“PIK”) security. Income may be paid in additional securities. |
| (f) | Security is a Real Estate Investment Trust. |
| † | U.S. issuer unless otherwise noted. |
| # | Amount represents less than 0.01% of total net assets. |
Country Concentration
| % of Net Assets | ||||
| United States | 57.18 | % | ||
| Hong Kong | 9.94 | |||
| Japan | 6.27 | |||
| France | 5.85 | |||
| Canada | 4.74 | |||
| South Korea | 3.90 | |||
| United Kingdom | 2.70 | |||
| Bermuda | 2.36 | |||
| Switzerland | 2.01 | |||
| Sweden | 1.09 | |||
| Total | 96.04 | % | ||
Schedule of Written Options
| Number of Contracts | Security | Expiration Date | Strike Price | Value | |||||
| 2,000 | CBS Corp., Class B, Non Voting Shares, Put (Premiums received $315,500) | 11/22/14 | $52.50 | $206,000 | |||||
The accompanying notes are an integral part of the financial statements.
| 7 |
Third Avenue Trust
Third Avenue Small-Cap Value Fund
Portfolio Management Discussion
October 31, 2014 (Unaudited)
At October 31, 2014, the audited net asset values attributable to each of the 351,223 common shares outstanding of the Third Avenue Small-Cap Value Fund Investor Class and 18,041,377 common shares outstanding of the Third Avenue Small-Cap Value Fund Institutional Class were $28.18 and $28.27 per share, respectively. This compares with audited net asset values at October 31, 2013 of $26.33 and $26.35 per share, respectively, adjusted for a subsequent distribution to shareholders.
| Average Annual Returns for the periods | ||||||||||||||||||||
| ended October 31, 2014 | ||||||||||||||||||||
| One Year ended 10/31/14 | Three Year | Five Year | Ten Year | Since Inception | ||||||||||||||||
| Third Avenue Small-Cap Value Fund Investor Class† | 6.85 | % | 15.31 | % | N/A | N/A | 11.90 | % | ||||||||||||
| Third Avenue Small-Cap Value Fund Institutional Class^ | 7.09 | % | 15.57 | % | 13.18 | % | 6.85 | % | 9.07 | % | ||||||||||
| Russell 2000 Index‡ | 8.06 | % | 18.18 | % | 17.39 | % | 8.67 | % | 8.66 | % | ||||||||||
| Russell 2000 Value Index‡ | 7.89 | % | 17.94 | % | 16.15 | % | 7.81 | % | 9.74 | % | ||||||||||
| S&P Small Cap 600 Index‡ | 9.29 | % | 19.97 | % | 19.24 | % | 9.88 | % | 10.62 | % | ||||||||||
| † | Investor Class commenced investment operations on December 31, 2009. |
| ^ | Institutional Class commenced investment operations on April 1, 1997. |
| ‡ | The date used to calculate the Since Inception performance for the index is the inception date of the Institutional Class. |
The Third Avenue Small-Cap Value Fund Institutional Class (the “Fund”) generated a positive 7.09% return over the last fiscal year but slightly underperformed its benchmark. The Russell 2000 Value Index return was 7.89% over the same period.
The top performers in the Fund for the year were: Multi-Color Corp., Susser Holdings Corp. and Legg Mason, Inc. Susser is the second-largest independent convenience store operator and motor fuel distributer in the state of Texas and one of the largest company-operated convenience store chains in the US. Susser stock outperformed as Energy Transfer Partners L.P. acquired the company.
Positions that detracted from performance over the fiscal year were: Dundee Corp., Stepan Co. and Blucora Inc. Dundee Corp. is a holding company based in Toronto, Canada with wealth management, real estate and resources holdings. Dundee Corp.’s share performance has been weak in the most recent period, though it is hard to pinpoint any single business line or set of data points that accounts for that performance. We view the share price decline as a widening of an already attractive discount.
Portfolio activity reduced the total number of portfolio holdings, increasing portfolio concentration. However, the Fund added 18 new names, including Genpact Ltd., SunCoke Energy, Inc. and CSG Systems Intl., Inc. Genpact underperformed the broader equity markets in 2013 as management’s forecasted growth, while solid, fell short of raised expectations. Genpact, founded as the captive offshore outsourcing business for General Electric, is adding and diversifying revenue sources as it weans its way off of its former parent. We believe it is poised to benefit from healthy longer term demand trends for outsourcing. Genpact enjoys long-term customer contracts that generate a high proportion of recurring revenues and a strong balance sheet that generates ample cash flow to promote downside protection and flexibility for new growth opportunities.
The Fund sold out of 33 names during the year, reflecting our view that the market prices for these holdings had risen to close to our estimate of Net Asset Value or were replaced with better risk versus reward opportunities. Dispositions included Tellabs Inc., Segro PLC, Wacker Neuson SE and Pioneer Energy Services Corp. The Fund’s Tellabs Inc. position was eliminated as full value was reached due to its takeover by private equity company Marlin Equity Partners.
THE INFORMATION IN THE PORTFOLIO MANAGEMENT DISCUSSION REPRESENTS A FACTUAL OVERVIEW OF THE FUND’S PERFORMANCE AND IS NOT INTENDED TO BE A FORECAST OF FUTURE EVENTS, A GUARANTEE OF FUTURE RESULTS NOR INVESTMENT ADVICE. VIEWS EXPRESSED ARE THOSE OF THE INVESTMENT TEAM AND MAY DIFFER FROM THOSE OF OTHER INVESTMENT TEAMS OR THE FIRM AS A WHOLE. ALSO, PLEASE NOTE THAT ANY DISCUSSION OF THE PORTFOLIO’S HOLDINGS, THE FUND’S PERFORMANCE, AND THE INVESTMENT TEAM’S VIEWS ARE AS OF OCTOBER 31, 2014, AND ARE SUBJECT TO CHANGE.
Small-cap companies carry additional risks because their share prices may be more volatile, and their securities may be less liquid than larger, more established companies. Such investments may increase the risk of greater price fluctuations. These and other risks are described more fully in the Fund’s prospectus.
Third Avenue Small-Cap Value Fund is offered by prospectus only. The prospectus contains more complete information on advisory fees, distribution charges, and other expenses and should be read carefully before investing or sending money. Past performance is no guarantee of future results. Investment return and principal value will fluctuate so that an investor’s shares, when redeemed, may be worth more or less than original cost. The Fund’s returns should be viewed in light of its investment policy and objectives and quality of its portfolio securities and the periods selected. M.J. Whitman LLC Distributor.
| 8 |
Third Avenue Trust
Third Avenue Small-Cap Value Fund
Portfolio Management Discussion (continued)
October 31, 2014 (Unaudited)
If you should have any questions, or for updated information (including performance data current to the most recent month-end) or a copy of our prospectus, please call 1-800-443-1021 or go to our web site at www.thirdave.com. Current performance may be lower or higher than performance quoted.
The Russell 2000 Index measures the performance of small companies. The Russell 2000 Value Index measures the performance of those Russell 2000 companies with lower price-to-book ratios and lower forecasted growth values. The S&P Small Cap 600 Index is a small cap index that covers approximately 3% of the U.S. equities market and consists of companies that meet specific inclusion criteria to ensure that they are investable and financially viable. The Russell 2000 Index, the Russell 2000 Value Index, and the S&P Small Cap 600 Index are not securities that can be purchased or sold, and their total returns are reflective of unmanaged portfolios. The returns include reinvestment of all distributions.
| 9 |
Third Avenue Trust
Third Avenue Small-Cap Value Fund – Investor Class
Comparison of a $10,000 Investment
(Unaudited)
Performance Illustration
COMPARISON OF CHANGE IN VALUE OF A $10,000 INVESTMENT IN THIRD AVENUE SMALL-CAP VALUE FUND – INVESTOR CLASS (TVSVX),
THE RUSSELL 2000 INDEX, THE RUSSELL 2000 VALUE INDEX AND THE S&P SMALL CAP 600 INDEX
FROM INCEPTION OF THE FUND (12/31/09) THROUGH OCTOBER 31, 2014
| Average Annual Total Return | ||||||||||
| 1 Year | 3 Years | Since Inception (12/31/09) | ||||||||
| 6.85 | % | 15.31 | % | 11.90 | % | |||||

| * | Includes reinvestment of all distributions. |
As with all mutual funds, past performance does not indicate future results. Performance may reflect fee waivers, expense offset arrangement and/or recovery. Total return would have been lower if the Adviser had not waived certain expenses. Conversely, total return would have been higher if the Adviser had not recovered previously waived expenses. Also, the returns shown in the graph and table do not reflect the deduction of taxes that a shareholder would pay on fund distributions or the redemption of fund shares.
| 10 |
Third Avenue Trust
Third Avenue Small-Cap Value Fund – Institutional Class
Comparison of a $10,000 Investment
(Unaudited)
Performance Illustration
COMPARISON OF CHANGE IN VALUE OF A $10,000 INVESTMENT IN THIRD AVENUE SMALL-CAP VALUE FUND – INSTITUTIONAL CLASS (TASCX),
THE RUSSELL 2000 INDEX, THE RUSSELL 2000 VALUE INDEX AND THE S&P SMALL CAP 600 INDEX
FOR THE TEN YEARS ENDED OCTOBER 31, 2014
| Average Annual Total Return | ||||||||||||||
| 1 Year | 3 Years | 5 Years | 10 Years | |||||||||||
| 7.09 | % | 15.57 | % | 13.18 | % | 6.85 | % | |||||||
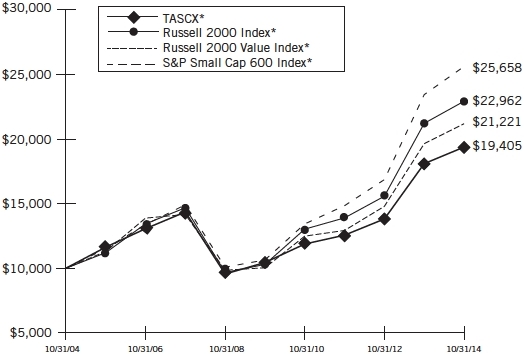
| * | Includes reinvestment of all distributions. |
As with all mutual funds, past performance does not indicate future results. Performance may reflect fee waivers, expense offset arrangement and/or recovery. Total return would have been lower if the Adviser had not waived certain expenses. Conversely, total return would have been higher if the Adviser had not recovered previously waived expenses. Also, the returns shown in the graph and table do not reflect the deduction of taxes that a shareholder would pay on fund distributions or the redemption of fund shares.
| 11 |
Third Avenue Trust
Third Avenue Small-Cap Value Fund
Industry Diversification
(Unaudited)
The summary of the Fund’s investments as of October 31, 2014 is as follows:

The accompanying notes are an integral part of the financial statements.
| 12 |
Third Avenue Trust
Third Avenue Small-Cap Value Fund
Portfolio of Investments
at October 31, 2014
| Shares | Security† | Value (Note 1) | ||||||
| Common Stocks - 99.49% | ||||||||
| Asset Management - 2.15% | ||||||||
| 214,432 | Legg Mason, Inc. | $ | 11,150,464 | |||||
| Auto Parts and Services - 3.05% | ||||||||
| 239,800 | Cooper Tire & Rubber Co. | 7,723,958 | ||||||
| 205,504 | Standard Motor Products, Inc. | 8,121,518 | ||||||
| 15,845,476 | ||||||||
| Bank & Thrifts - 8.70% | ||||||||
| 89,071 | City National Corp. | 7,010,778 | ||||||
| 172,239 | Commerce Bancshares, Inc. | 7,795,537 | ||||||
| 85,900 | Cullen/Frost Bankers, Inc. | 6,941,579 | ||||||
| 169,563 | Prosperity Bancshares, Inc. | 10,239,910 | ||||||
| 154,801 | UMB Financial Corp. | 9,223,044 | ||||||
| 404,375 | Valley National Bankcorp | 4,035,662 | ||||||
| 45,246,510 | ||||||||
| Chemicals & Industrial Materials - 3.53% | ||||||||
| 188,024 | Stepan Co. | 8,325,703 | ||||||
| 420,036 | SunCoke Energy, Inc. (a) | 10,038,860 | ||||||
| 18,364,563 | ||||||||
| Consulting and Information Technology Services - 8.49% | ||||||||
| 175,189 | ExlService Holdings, Inc. (a) | 4,903,540 | ||||||
| 286,592 | FTI Consulting, Inc. (a) | 11,572,585 | ||||||
| 637,466 | Genpact Ltd. (Bermuda) (a) | 11,187,528 | ||||||
| 168,903 | ICF International, Inc. (a) | 6,137,935 | ||||||
| 119,665 | Syntel, Inc. (a) | 10,364,186 | ||||||
| 44,165,774 | ||||||||
| Consumer Products and Services - 2.43% | ||||||||
| 147,715 | CST Brands, Inc. | 5,650,099 | ||||||
| 153,458 | VCA, Inc. (a) | 6,993,081 | ||||||
| 12,643,180 | ||||||||
| Diversified Holding Companies - 6.59% | ||||||||
| 63,408 | Ackermans & van Haaren NV (Belgium) | 7,905,440 | ||||||
| 579,165 | Dundee Corp., Class A (Canada) (a) | 8,211,753 | ||||||
| 1,980,031 | JZ Capital Partners, Ltd. (Guernsey) | 13,319,091 | ||||||
| 203,082 | Leucadia National Corp. | 4,829,290 | ||||||
| 34,265,574 | ||||||||
| Electronic Components - 3.74% | ||||||||
| 95,456 | Anixter International, Inc. | 8,129,987 | ||||||
| 202,611 | Ingram Micro, Inc., Class A (a) | 5,438,079 | ||||||
| 258,850 | Insight Enterprises, Inc. (a) | 5,888,837 | ||||||
| 19,456,903 | ||||||||
| Energy Services - 3.75% | ||||||||
| 243,879 | Era Group, Inc. (a) | 5,704,330 | ||||||
| 77,326 | SEACOR Holdings, Inc. (a) | 6,375,529 | ||||||
| 96,552 | SemGroup Corp., Class A | 7,410,366 | ||||||
| 19,490,225 | ||||||||
| Forest Products & Paper - 1.47% | ||||||||
| 302,611 | P.H. Glatfelter Co. | 7,634,875 | ||||||
| Shares | Security† | Value (Note 1) | ||||||
| Healthcare - 2.98% | ||||||||
| 211,700 | Patterson Cos., Inc. | $ | 9,126,387 | |||||
| 55,907 | Teleflex, Inc. | 6,380,107 | ||||||
| 15,506,494 | ||||||||
| Industrial Capital Equipment Manufacturers - 3.58% | ||||||||
| 250,500 | Barnes Group, Inc. | 9,158,280 | ||||||
| 421,279 | Rofin-Sinar Technologies, Inc. (a) | 9,432,437 | ||||||
| 18,590,717 | ||||||||
| Industrial Equipment - 7.87% | ||||||||
| 257,200 | Actuant Corp., Class A | 8,150,668 | ||||||
| 126,606 | Alamo Group, Inc. | 5,423,801 | ||||||
| 112,871 | EnerSys, Inc. | 7,088,299 | ||||||
| 263,921 | LSB Industries, Inc. (a) | 9,904,955 | ||||||
| 127,523 | Regal-Beloit Corp. | 9,050,307 | ||||||
| 67,398 | Tredegar Corp. | 1,281,910 | ||||||
| 40,899,940 | ||||||||
| Industrial Services - 15.97% | ||||||||
| 215,957 | ABM Industries, Inc. | 5,969,051 | ||||||
| 113,800 | Clean Harbors, Inc. (a) | 5,647,894 | ||||||
| 162,718 | Cubic Corp. | 7,849,516 | ||||||
| 440,861 | Darling Ingredients, Inc. (a) | 7,759,154 | ||||||
| 245,483 | EMCOR Group, Inc. | 10,833,165 | ||||||
| 202,246 | Multi-Color Corp. | 9,970,728 | ||||||
| 407,544 | Tetra Tech, Inc. | 10,926,255 | ||||||
| 120,710 | UniFirst Corp. | 13,466,408 | ||||||
| 257,019 | World Fuel Services Corp. | 10,599,464 | ||||||
| 83,021,635 | ||||||||
| Industrials - 0.59% | ||||||||
| 74,000 | United Stationers, Inc. | 3,090,980 | ||||||
| Insurance & Reinsurance - 6.16% | ||||||||
| 20,143 | Alleghany Corp. (a) | 8,949,132 | ||||||
| 121,590 | Arch Capital Group, Ltd. (Bermuda) (a) | 6,847,949 | ||||||
| 311,085 | HCC Insurance Holdings, Inc. | 16,235,526 | ||||||
| 32,032,607 | ||||||||
| Media - 1.89% | ||||||||
| 129,726 | Madison Square Garden, Co. (The), Class A (a) | 9,828,042 | ||||||
| Metals Manufacturing - 1.92% | ||||||||
| 66,648 | Encore Wire Corp. | 2,528,625 | ||||||
| 107,276 | Kaiser Aluminum Corp. | 7,461,046 | ||||||
| 9,989,671 | ||||||||
| Securities Trading Services - 0.94% | ||||||||
| 111,048 | Broadridge Financial Solutions, Inc. | 4,878,339 | ||||||
| Software and Services - 8.14% | ||||||||
| 614,387 | Allscripts Healthcare Solutions, Inc. (a) | 8,429,390 | ||||||
| 352,298 | CSG Systems International, Inc. | 9,339,420 | ||||||
| 206,607 | InterDigital, Inc. | 10,212,584 | ||||||
| 554,455 | Progress Software Corp. (a) | 14,360,384 | ||||||
| 42,341,778 | ||||||||
The accompanying notes are an integral part of the financial statements.
| 13 |
Third Avenue Trust
Third Avenue Small-Cap Value Fund
Portfolio of Investments (continued)
at October 31, 2014
| Shares | Security† | Value (Note 1) | ||||||
| Common Stocks (continued) | ||||||||
| U.S. Real Estate Investment Trust - 1.31% | ||||||||
| 189,619 | Tanger Factory Outlet Centers Inc. | $ | 6,782,672 | |||||
| U.S. Real Estate Operating Companies - 4.24% | ||||||||
| 143,227 | Alico, Inc. | 5,285,076 | ||||||
| 203,867 | Brookdale Senior Living, Inc. (a) | 6,872,357 | ||||||
| 151,065 | Forestar Group, Inc. (a) | 2,636,084 | ||||||
| 84,239 | Vail Resorts, Inc. | 7,274,880 | ||||||
| 22,068,397 | ||||||||
| Total Common Stocks (Cost $392,335,656) | 517,294,816 | |||||||
| Total Investment Portfolio - 99.49% (Cost $392,335,656) | 517,294,816 | |||||||
| Other Assets less Liabilities - 0.51% | 2,656,056 | |||||||
| NET ASSETS - 100.00% | $ | 519,950,872 | ||||||
Notes:
| (a) | Non-income producing security. |
| † | U.S. issuer unless otherwise noted. |
Country Concentration
| % of Net Assets | ||||
| United States | 90.36 | % | ||
| Bermuda | 3.47 | |||
| Guernsey | 2.56 | |||
| Canada | 1.58 | |||
| Belgium | 1.52 | |||
| Total | 99.49 | % | ||
The accompanying notes are an integral part of the financial statements.
| 14 |
Third Avenue Trust
Third Avenue Real Estate Value Fund
Portfolio Management Discussion
October 31, 2014 (Unaudited)
At October 31, 2014, the audited net asset values attributable to each of the 11,552,175 common shares outstanding of the Third Avenue Real Estate Value Fund Investor Class and 89,450,144 common shares outstanding of the Third Avenue Real Estate Value Fund Institutional Class were $31.84 and $32.05 per share, respectively. This compares with audited net asset values at October 31, 2013 of $28.74 and $28.86 per share, respectively, adjusted for a subsequent distribution to shareholders.
| Average Annual Returns for the periods ended October 31, 2014 | ||||||||||||||||||||
| One Year ended 10/31/14 | Three Year | Five Year | Ten Year | Since Inception | ||||||||||||||||
| Third Avenue Real Estate Value Fund Investor Class† | 10.84 | % | 18.34 | % | N/A | N/A | 12.94 | % | ||||||||||||
| Third Avenue Real Estate Value Fund Institutional Class^ | 11.11 | % | 18.63 | % | 13.70 | % | 7.44 | % | 11.89 | % | ||||||||||
| FTSE EPRA/NAREIT Developed Index‡ | 10.66 | % | 13.55 | % | 12.95 | % | 8.06 | % | 10.89 | % | ||||||||||
| † | Investor Class commenced investment operations on December 31, 2009. |
| ^ | Institutional Class commenced investment operations on September 17, 1998. |
| ‡ | The date used to calculate the Since Inception performance for the index is the inception date of the Institutional Class. |
Third Avenue Real Estate Value Fund Institutional Class (the “Fund”) generated 11.11% returns over the last fiscal year, outperforming its benchmark. The FTSE EPRA/NAREIT Developed Index returned 10.66% over the same period.
The largest contributors to performance during the fiscal year were the common stocks of Songbird Estates PLC, and Cheung Kong Holdings, Ltd. and the private equity of Newhall Holding Co. LLC. Songbird Estates is a UK based holding company that is the controlling shareholder of the Canary Wharf Group (“Canary Wharf”), a UK based real estate operating company that owns more than 7 million square feet of class-A office and retail space and also controls the largest development pipeline in London with 11 million square feet of entitlements. During the year, the value of Canary Wharf’s development pipeline began to be recognized and Songbird’s stock increased by more than 60%. Newhall is a land development company based in the US that owns more than 30,000 acres in Los Angeles County that are entitled for more than 20,000 residential homesites, and in excess of 600 acres of commercial development. During the year, fundamentals for the residential markets in Southern California improved as excess inventory was absorbed, sales activity picked up, and residential prices increased in most sub-markets. Given this backdrop, Newhall’s units increased in price during the year. Cheung Kong is a Hong Kong based holding company with investments in property, power, infrastructure, and other private equity like holdings. During the year the company monetized some of its non-core investments, paid shareholders a special dividend, and began to see the benefits of some of the contrarian investments it made in Europe over the past few years. As a result, the stock price responded favorably, increasing by more than 23% during the fiscal year.
The three largest detractors to performance during the year were Tejon Ranch Co., Inmobiliaria Colonial S.A. and Wheelock & Co., Ltd. Despite the negative performance during the fiscal year, our long-term investment theses for all three investments remain intact as each company continues to have a strong financial position, trades at a discount to our estimate of net asset value, and has prospects to increase its net asset value by 10% or more per year when looking out over the next three to five years. For example, Inmobiliaria Colonial, a Spanish real estate operating company, declined in price during the period however remains incredibly well positioned when looking out over the medium to long term. This is a result of the company raising more than 1.3 billion Euro of capital during the past year to reduce its debt levels and position the company to benefit from leasing up its portfolio which sits nearly 20% vacant today. As the company executes on filling this vacant space, it is our expectation that the cash flows and underlying value of the portfolio will increase from current levels.
Generally speaking, real estate securities have had strong performance over the past five years. The Fund is therefore utilizing its flexible mandate to get exposure to securities that are more likely to exhibit inefficient pricing than those in the broader real estate indices. For instance, recent portfolio activity included initiating positions in Zions Bancorporation and Realogy Holdings Corp., both non-traditional real estate companies. Zions is a bank holding company with more than 50% of its loans secured by real estate. It also has a very attractive geographic footprint with its core business located in Utah, Texas and Coastal California. Realogy is the largest residential brokerage company in the US; it is involved with roughly one in every four residential transactions. In addition to these two new positions, the Fund has initiated eight positions and closed eight positions over the last fiscal year.
After taking into account recent activity, the Fund’s invested capital remains concentrated in the pockets of the real estate universe that offer tremendous value, including the US residential markets, companies with entitlements for new developments in well-located markets, small and mid-sized property companies that could be acquisition targets, and other special situations. The Fund also continues to have about 15% of its capital in Cash & Equivalents. This “dry powder” should serve to cushion the Fund’s returns in a down market as well as provide the capital necessary to add other attractive investments as opportunities arise.
| 15 |
Third Avenue Trust
Third Avenue Real Estate Value Fund
Portfolio Management Discussion (continued)
October 31, 2014 (Unaudited)
THE INFORMATION IN THE PORTFOLIO MANAGEMENT DISCUSSION REPRESENTS A FACTUAL OVERVIEW OF THE FUND’S PERFORMANCE AND IS NOT INTENDED TO BE A FORECAST OF FUTURE EVENTS, A GUARANTEE OF FUTURE RESULTS NOR INVESTMENT ADVICE. VIEWS EXPRESSED ARE THOSE OF THE INVESTMENT TEAM AND MAY DIFFER FROM THOSE OF OTHER INVESTMENT TEAMS OR THE FIRM AS A WHOLE. ALSO, PLEASE NOTE THAT ANY DISCUSSION OF THE PORTFOLIO’S HOLDINGS, THE FUND’S PERFORMANCE, AND THE INVESTMENT TEAM’S VIEWS ARE AS OF OCTOBER 31, 2014, AND ARE SUBJECT TO CHANGE.
Real estate investments may be subject to special risks, including risks related to general and local economic conditions, and changes in real estate values that may have negative effects on issuers related to the real estate industry. The Fund’s investments in small and medium capitalization stocks may experience more volatility than larger capitalization stocks. These and other risks are described more fully in the Fund’s prospectus.
Third Avenue Real Estate Value Fund is offered by prospectus only. The prospectus contains more complete information on advisory fees, distribution charges, and other expenses and should be read carefully before investing or sending money. Past performance is no guarantee of future results. Investment return and principal value will fluctuate so that an investor’s shares, when redeemed, may be worth more or less than original cost. The Fund’s returns should be viewed in light of its investment policy and objectives and quality of its portfolio securities and the periods selected. M.J. Whitman LLC Distributor.
If you should have any questions, or for updated information (including performance data current to the most recent month-end) or a copy of our prospectus, please call 1-800-443-1021 or go to our web site at www.thirdave.com. Current performance may be lower or higher than performance quoted.
The FTSE EPRA/NAREIT Developed Index is designed to reflect the stock performance of companies engaged in specific aspects of the North American, European and Asian Real Estate markets. The FTSE EPRA/NAREIT Developed Index is not a security that can be purchased or sold, and its total returns are reflective of unmanaged portfolios. The returns include reinvestment of all distributions.
| 16 |
Third Avenue Trust
Third Avenue Real Estate Value Fund – Investor Class
Comparison of a $10,000 Investment
(Unaudited)
Performance Illustration
COMPARISON OF CHANGE IN VALUE OF A $10,000 INVESTMENT IN THIRD AVENUE REAL ESTATE VALUE FUND – INVESTOR CLASS (TVRVX)
AND THE FTSE EPRA/NAREIT DEVELOPED INDEX
FROM INCEPTION OF THE FUND (12/31/09) THROUGH OCTOBER 31, 2014
Average Annual Total Return
| Since Inception | ||||
| 1 Year | 3 Years | (12/31/09) | ||
| 10.84% | 18.34% | 12.94% |
| * | Includes reinvestment of all distributions. |
As with all mutual funds, past performance does not indicate future results. Performance may reflect fee waivers, expense offset arrangement and/or recovery. Total return would have been lower if the Adviser had not waived certain expenses. Conversely, total return would have been higher if the Adviser had not recovered previously waived expenses. Also, the returns shown in the graph and table do not reflect the deduction of taxes that a shareholder would pay on fund distributions or the redemption of fund shares.
| 17 |
Third Avenue Trust
Third Avenue Real Estate Value Fund – Institutional Class
Comparison of a $10,000 Investment
(Unaudited)
Performance Illustration
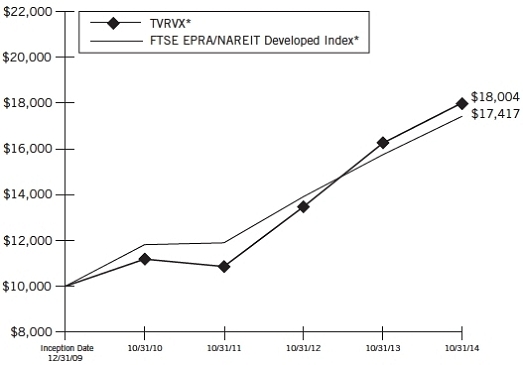
COMPARISON OF CHANGE IN VALUE OF A $10,000 INVESTMENT IN THIRD AVENUE REAL ESTATE VALUE FUND – INSTITUTIONAL CLASS (TAREX)
AND THE FTSE EPRA/NAREIT DEVELOPED INDEX
FOR THE TEN YEARS ENDED OCTOBER 31, 2014
Average Annual Total Return
| 1 Year | 3 Years | 5 Years | 10 Years | |||
| 11.11% | 18.63% | 13.70% | 7.44% |

| * | Includes reinvestment of all distributions. |
As with all mutual funds, past performance does not indicate future results. Performance may reflect fee waivers, expense offset arrangement and/or recovery. Total return would have been lower if the Adviser had not waived certain expenses. Conversely, total return would have been higher if the Adviser had not recovered previously waived expenses. Also, the returns shown in the graph and table do not reflect the deduction of taxes that a shareholder would pay on fund distributions or the redemption of fund shares.
| 18 |
Third Avenue Trust
Third Avenue Real Estate Value Fund
Industry Diversification
(Unaudited)
The summary of the Fund’s investments as of October 31, 2014 is as follows:
![]()
The accompanying notes are an integral part of the financial statements.
| 19 |
Third Avenue Trust
Third Avenue Real Estate Value Fund
Portfolio of Investments
at October 31, 2014
| Principal | Value | ||||||||
| Amount | Security† | (Note 1) | |||||||
| Term Loans - 0.11% | |||||||||
| Non-U.S. Real Estate Operating Companies - 0.11% | |||||||||
| Concrete Investment I, Term Loan (Netherlands): | |||||||||
| 50,450 | EUR | Tranche A2, 2.007%, due 3/31/16 (d)(g) | $ | 63,221 | |||||
| 19,273 | EUR | Tranche A3, 2.007%, due 3/31/16 (d)(g) | 24,152 | ||||||
| Concrete Investment II, Term Loan (Netherlands): | |||||||||
| 34,283 | EUR | Tranche A2, 2.007%, due 3/31/16 (d)(g) | 42,961 | ||||||
| 4,818 | EUR | Tranche A3, 2.007%, due 3/31/16 (d)(g) | 6,038 | ||||||
| IVG Immobilien AG, Term Loan (Netherlands): | |||||||||
| 1,029,107 | EUR | Tranche A1, 9.506%, due 9/30/17 (d)(g) | 1,289,624 | ||||||
| 1,525,378 | EUR | Tranche A2, 9.506%, due 9/30/17 (d)(g) | 1,911,526 | ||||||
| Total Term Loans (Cost $3,631,007) | 3,337,522 | ||||||||
| Shares | |||||||||
| Common Stocks & Warrants - 80.03% | |||||||||
| Banks - 4.68% | |||||||||
| 1,939,049 | PNC Financial Services Group, Inc., Warrants, expire 12/31/18 (a) | 46,304,490 | |||||||
| 1,156,551 | Wells Fargo & Co., Warrants, expire 10/28/18 (a) | 24,819,585 | |||||||
| 2,773,300 | Zions Bancorporation | 80,342,501 | |||||||
| 151,466,576 | |||||||||
| Forest Products & Paper - 6.72% | |||||||||
| 1,735,200 | Rayonier, Inc. (c) | 58,077,144 | |||||||
| 4,706,158 | Weyerhaeuser Co. (c) | 159,350,510 | |||||||
| 217,427,654 | |||||||||
| Lodging & Hotels - 3.97% | |||||||||
| 6,117,746 | Hersha Hospitality Trust (c) | 44,598,368 | |||||||
| 450,000 | Hyatt Hotels Corp., Class A (a) | 26,649,000 | |||||||
| 6,302,119 | Millennium & Copthorne Hotels PLC (United Kingdom) | 57,262,663 | |||||||
| 128,510,031 | |||||||||
| Non-U.S. Real Estate Consulting/Management - 2.24% | |||||||||
| 6,002,254 | Countrywide PLC (United Kingdom) | 43,976,074 | |||||||
| 2,752,003 | Savills PLC (United Kingdom) | 28,351,196 | |||||||
| 72,327,270 | |||||||||
| Non-U.S. Real Estate Investment Trusts - 10.61% | |||||||||
| 72,421,056 | Dexus Property Group (Australia) | 77,114,187 | |||||||
| 366,031 | Gecina S.A. (France) | 49,538,651 | |||||||
| 9,910,908 | Hammerson PLC (United Kingdom) | 97,187,526 | |||||||
| 8,839,052 | Segro PLC (United Kingdom) | 53,759,399 | |||||||
| 800,000 | Wereldhave N.V. (Netherlands) | 65,564,731 | |||||||
| 343,164,494 | |||||||||
| Non-U.S. Real Estate Operating Companies - 24.94% | |||||||||
| 1,546,126 | Brookfield Asset Management, Inc., Class A (Canada) | 75,713,790 | |||||||
| 7,018,000 | Cheung Kong Holdings, Ltd. (Hong Kong) | 124,520,712 | |||||||
| 10,998,950 | City Developments Ltd. (Singapore) | 80,906,108 | |||||||
| 3,888,963 | Globe Trade Centre S.A. (Poland) (a) | 7,017,747 | |||||||
| 8,377,000 | Hang Lung Properties Ltd. (Hong Kong) | 26,140,487 | |||||||
| Shares | Security† | Value (Note 1) | |||||
| Non-U.S. Real Estate Operating Companies - (continued) | |||||||
| 10,438,657 | Henderson Land Development Co., Ltd. (Hong Kong) | $ | 70,464,620 | ||||
| 11,373,967 | Hysan Development Co., Ltd. (Hong Kong) | 51,845,513 | |||||
| 135,653,174 | Inmobiliaria Colonial S.A. (Spain) (a) | 95,536,390 | |||||
| 21,869,072 | Quintain Estates & Development PLC (United Kingdom) (a) | 28,686,715 | |||||
| 25,312,837 | Songbird Estates PLC (United Kingdom) (a) | 106,293,507 | |||||
| 11,760,055 | Westfield Corp. (Australia) (c) | 81,963,142 | |||||
| 11,975,500 | Wheelock & Co., Ltd. (Hong Kong) | 57,675,857 | |||||
| 806,764,588 | |||||||
| Real Estate Consulting/Management - 2.01% | |||||||
| 1,584,200 | Realogy Holdings Corp. (a) | 64,968,042 | |||||
| Retail-Building Products - 2.97% | |||||||
| 1,681,330 | Lowe’s Cos., Inc. | 96,172,076 | |||||
| Senior Housing - 1.95% | |||||||
| 1,873,595 | Brookdale Senior Living, Inc. (a) | 63,158,888 | |||||
| U.S. Real Estate Investment Trusts - 14.68% | |||||||
| 3,460,150 | Equity Commonwealth | 92,420,607 | |||||
| 5,208,031 | First Industrial Realty Trust, Inc. | 101,712,845 | |||||
| 1,179,882 | Post Properties, Inc. | 66,002,599 | |||||
| 2,515,510 | Starwood Waypoint Residential Trust (b) | 65,856,052 | |||||
| 1,829,978 | Tanger Factory Outlet Centers, Inc. | 65,458,313 | |||||
| 760,194 | Vornado Realty Trust. | 83,226,039 | |||||
| 474,676,455 | |||||||
| U.S. Real Estate Operating Companies - 5.26% | |||||||
| 5,846,798 | Forest City Enterprises, Inc., Class A (a) | 122,139,610 | |||||
| 941,627 | Tejon Ranch Co. (a) | 28,418,303 | |||||
| 139,089 | Tejon Ranch Co., Warrants, expire 8/31/16 (a) | 292,087 | |||||
| 3,369,445 | Trinity Place Holdings, Inc. (a) (d) (e) | 19,295,656 | |||||
| 170,145,656 | |||||||
| Total Common Stocks & Warrants (Cost $1,936,010,870) | 2,588,781,730 | ||||||
| Preferred Stocks - 1.05% | |||||||
| Non-U.S. Real Estate Operating Companies - 1.05% | |||||||
| 189,696 | Concrete Investment II SCA (Luxembourg) (a) | 33,993,569 | |||||
| Total Preferred Stocks (Cost $27,535,807) | 33,993,569 | ||||||
| Units | |||||||
| Private Equities - 3.12% | |||||||
| U.S. Real Estate Operating Companies - 3.12% | |||||||
| 28,847,217 | Newhall Holding Co. LLC, Class A Units (a) (b) | 100,965,259 | |||||
| Total Private Equities (Cost $75,516,192) | 100,965,259 | ||||||
The accompanying notes are an integral part of the financial statements.
| 20 |
Third Avenue Trust
Third Avenue Real Estate Value Fund
Portfolio of Investments (continued)
at October 31, 2014
| Notional Amount | Security† | Value (Note 1) | |||||||
| Purchased Options - 0.07% | |||||||||
| Foreign Currency Put Options - 0.07% (a) | |||||||||
| 46,000,000 | AUD | Australian Currency, strike 0.9250 AUD, expire 11/6/14 | $ | 2,114,137 | |||||
| 35,000,000 | AUD | Australian Currency, strike 0.8593 AUD, expire 12/4/14 | 121,002 | ||||||
| Total Purchased Options (Cost $634,536) | 2,235,139 | ||||||||
| Principal Amount ($) | |||||||||
| Short Term Investments - 3.09% | |||||||||
| U.S. Government Obligations - 3.09% | |||||||||
| 100,000,000 | U.S. Treasury Bills, 0.02%#, due 11/6/14 | 99,999,792 | |||||||
| Total Short Term Investments (Cost $99,999,792) | 99,999,792 | ||||||||
| Total Investment Portfolio - 87.47% (Cost $2,143,328,204) | 2,829,313,011 | ||||||||
| Other Assets less Liabilities - 12.53% (f) | 405,369,989 | ||||||||
| NET ASSETS - 100.00% | $ | 3,234,683,000 | |||||||
Notes:
AUD: Australian Dollar.
EUR: Euro.
| (a) | Non-income producing security. |
| (b) | Affiliated issuers - as defined under the Investment Company Act of 1940 (ownership of 5% or more of the outstanding voting securities of these issuers). |
| (c) | Security is a Real Estate Investment Trust. |
| (d) | Fair-valued security. |
| (e) | Security subject to restrictions on resale. |
| Market | ||||||||||
| Value | ||||||||||
| Shares | Issuer | Acquisition Date | Cost | Per Unit | ||||||
| 3,369,445 | Trinity Place Holdings, Inc. | 10/2/13-11/6/13 | $13,477,776 | $5.73 |
| At October 31, 2014, the restricted security had a total market value of $19,295,656 or 0.60% of net assets of the Fund. | |
| (f) | Includes restricted cash pledged to and received from counterparty as collateral management for forward foreign currency contracts and options. |
| (g) | Variable rate security. The rate disclosed is in effect as of October 31, 2014. |
| † | U.S. issuer unless otherwise noted. |
| # | Annualized yield at date of purchase. |
| Country Concentration | ||||
| % of Net Assets | ||||
| United States* | 46.69 | % | ||
| United Kingdom | 12.85 | |||
| Hong Kong | 10.22 | |||
| Australia | 4.99 | |||
| Spain | 2.95 | |||
| Singapore | 2.50 | |||
| Canada | 2.34 | |||
| Netherlands | 2.13 | |||
| France | 1.53 | |||
| Luxembourg | 1.05 | |||
| Poland | 0.22 | |||
| Total | 87.47 | % | ||
* Includes cash equivalents.
Schedule of Written Options
| Notional Amount/ | |||||||||||||
| Number of | Expiration | ||||||||||||
| Contracts | Security | Date | Strike Price | Value | |||||||||
| 46,000,000 | AUD | Australian Currency, Call | 11/6/14 | 0.9400AUD | $ | — | |||||||
| 35,000,000 | AUD | Australian Currency, Call | 12/4/14 | 0.8730AUD | 415,566 | ||||||||
| 4,600 | Lennar Corp., Put | 11/22/14 | $37.00 | 50,600 | |||||||||
| 5,400 | Lennar Corp., Put | 11/22/14 | $38.00 | 64,800 | |||||||||
| 4,000 | Realogy Holdings Corp., Put | 11/22/14 | $32.50 | 50,000 | |||||||||
| (Premiums received $2,526,543) | $ | 580,966 | |||||||||||
AUD: Australian Dollar.
Schedule of Forward Foreign Currency Contracts
| Settlement | Settlement | Value at | Unrealized | ||||||||||||
| Contracts to Sell | Counterparty | Date | Value | 10/31/14 | Appreciation | ||||||||||
| 96,683,000 | EUR | Goldman Sachs & Co. | 11/26/14 | $122,275,203 | $121,177,901 | $1,097,302 | |||||||||
| 96,683,000 | EUR | Morgan Stanley & Co. LLC | 11/26/14 | 122,284,417 | 121,177,901 | 1,106,516 | |||||||||
| $2,203,818 |
EUR: Euro.
The accompanying notes are an integral part of the financial statements.
| 21 |
Third Avenue Trust
Third Avenue International Value Fund
Portfolio Management Discussion
October 31, 2014 (Unaudited)
At October 31, 2014, the audited net asset values attributable to each of the 697,613 common shares outstanding of the Third Avenue International Value Fund Investor Class and 19,260,527 common shares outstanding of the Third Avenue International Value Fund Institutional Class were $17.58 and $17.63 per share, respectively. This compares with audited net asset values at October 31, 2013 of $19.74 and $19.74 per share, respectively, adjusted for a subsequent distribution to shareholders.
| Average Annual Returns for the periods | |||||||||||||||
| ended October 31, 2014 | |||||||||||||||
| One Year ended | Three | Five | Ten | Since | |||||||||||
| 10/31/14 | Year | Year | Year | Inception | |||||||||||
| Third Avenue International Value Fund Investor Class† | (10.96 | %) | 5.92 | % | N/A | N/A | 3.67 | % | |||||||
| Third Avenue International Value Fund Institutional Class^ | (10.79 | %) | 6.16 | % | 4.45 | % | 4.71 | % | 8.36 | % | |||||
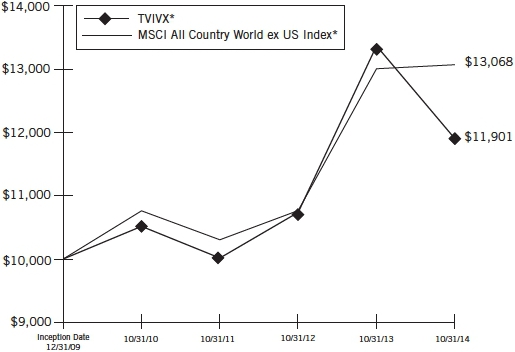
| MSCI All Country World ex US Index‡ | 0.49 | % | 8.25 | % | 6.55 | % | 7.06 | % | 7.72 | % | |||||
| † | Investor Class commenced investment operations on December 31, 2009. |
| ^ | Institutional Class commenced investment operations on December 31, 2001. |
| ‡ | The date used to calculate the Since Inception performance for the index is the inception date of the Institutional Class. |
Third Avenue International Value Fund Institutional Class (the “Fund”) generated -10.79% returns over the last fiscal year, underperforming its benchmark. The MSCI All Country World ex-US Index returned 0.49% over the same period.
Much of the Fund’s underperformance can be attributed to its overweight to German equity, which had poor performance over the period. In addition, the depreciation of the Euro relative to the USD, the underperformance of small caps and the broad based decline in commodity related stocks weighed on portfolio performance.
The top performers in the Fund were: Weyerhaeuser Co., Netia S.A. and Segro PLC. Weyerhaeuser, the second largest owner of timberlands in the US, is a Real Estate Investment Trust which also incorporates wood products and wood fiber businesses. This company is benefiting from a recovery in the US housing market, which albeit slow, continues to expand at a healthy pace. Weyerhaeuser is also uniquely well positioned to provide much needed timber and lumber to fast growing Asian markets. Weyerhaeuser recently merged and spun out its home building business, WRECO, to TRI Pointe Homes, realizing significant value for what had been an underperforming asset.
Positions that detracted from performance over the fiscal year were: Straits Trading Co. Ltd., Vard Holdings Ltd. and Petroleum Geo-Services ASA (PGS). Straits Trading continues its transformation from a holding and investment company with disparate assets into an integrated real estate investment firm. While those who understand its direction have been able to appreciate its important milestones, it may take more time for the value creation occurring within Straits to be widely understood. The Fund has closed the position at a profit.
Portfolio activity has been a main focus during the past year. We added seven investments and disposed of 14. The seven new names are: Antofagasta PLC., Arcos Dorados Holdings Inc., BinckBank N.V., Capstone Mining Corp., PGS, Santos Brasil Participacoes S.A. and Vard Holdings Ltd. Arcos Dorados is the world’s largest McDonald’s franchisee, holding the exclusive rights to own, operate and grant franchises of McDonald’s restaurants in twenty Latin American countries. Significant headwinds on emerging market economies and currencies have created interesting investment opportunities in the region. While all of Arcos Dorados’ revenues are denominated in a variety of local currencies, the company reports its financial results in US dollars. Thus, local currency weakness has had a negative impact on Arcos Dorados’ reported earnings and shares declined substantially over the past three years. What depreciating currencies obscure, however, is Arcos Dorados’ outstanding operating performance in local currency terms, meaning before they are translated into US dollars, its reporting currency. Arcos Dorados’ depressed valuation suggests that investors are not giving the company credit for the high returns on capital it continues to generate and the considerable increases in business value it continues to create in constant currency terms. Investors are also overlooking an outstanding management team as well as the fact that long-term fundamentals of the Latin American market remain quite favorable. The dispositions include Straits Trading, Netia and Allianz.
| 22 |
Third Avenue Trust
Third Avenue International Value Fund
Portfolio Management Discussion (continued)
October 31, 2014 (Unaudited)
THE INFORMATION IN THE PORTFOLIO MANAGEMENT DISCUSSION REPRESENTS A FACTUAL OVERVIEW OF THE FUND’S PERFORMANCE AND IS NOT INTENDED TO BE A FORECAST OF FUTURE EVENTS, A GUARANTEE OF FUTURE RESULTS NOR INVESTMENT ADVICE. VIEWS EXPRESSED ARE THOSE OF THE INVESTMENT TEAM AND MAY DIFFER FROM THOSE OF OTHER INVESTMENT TEAMS OR THE FIRM AS A WHOLE. ALSO, PLEASE NOTE THAT ANY DISCUSSION OF THE PORTFOLIO’S HOLDINGS, THE FUND’S PERFORMANCE, AND THE INVESTMENT TEAM’S VIEWS ARE AS OF OCTOBER 31, 2014, AND ARE SUBJECT TO CHANGE.
The Fund’s performance may be influenced by a foreign country’s political, social and economic situation. Other risks include currency fluctuations, less liquidity, lack of efficient trading markets, and different auditing and legal standards. These risks may result in more volatility for the Fund. These and other risks are described more fully in the Fund’s prospectus.
Third Avenue International Value Fund is offered by prospectus only. The prospectus contains more complete information on advisory fees, distribution charges, and other expenses and should be read carefully before investing or sending money. Past performance is no guarantee of future results. Investment return and principal value will fluctuate so that an investor’s shares, when redeemed, may be worth more or less than original cost. The Fund’s returns should be viewed in light of its investment policy and objectives and quality of its portfolio securities and the periods selected. M.J. Whitman LLC Distributor.
If you should have any questions, or for updated information (including performance data current to the most recent month-end) or a copy of our prospectus, please call 1-800-443-1021 or go to our web site at www.thirdave.com. Current performance may be lower or higher than performance quoted.
The MSCI All Country World ex US Index is an unmanaged index of common stocks and includes securities representative of the market structure of over 50 developed and emerging market countries (other than the United States) in North America, Europe, Latin America and the Asian Pacific Region. This index is not a security that can be purchased or sold, and its total returns are reflective of unmanaged portfolios. The returns include reinvestment of all distributions.
| 23 |
Third Avenue Trust
Third Avenue International Value Fund – Investor Class
Comparison of a $10,000 Investment
(Unaudited)
Performance Illustration
COMPARISON OF CHANGE IN VALUE OF A $10,000 INVESTMENT IN THIRD AVENUE INTERNATIONAL VALUE FUND – INVESTOR CLASS (TVIVX)
AND THE MSCI ALL COUNTRY WORLD EX US INDEX
FROM INCEPTION OF THE FUND (12/31/09) THROUGH OCTOBER 31, 2014
Average Annual Total Return
| 1 Year | 3 Years | Since Inception (12/31/09) | ||
| (10.96%) | 5.92% | 3.67% |
| * | Includes reinvestment of all distributions. |
As with all mutual funds, past performance does not indicate future results. Performance may reflect fee waivers, expense offset arrangement and/or recovery. Total return would have been lower if the Adviser had not waived certain expenses. Conversely, total return would have been higher if the Adviser had not recovered previously waived expenses. Also, the returns shown in the graph and table do not reflect the deduction of taxes that a shareholder would pay on fund distributions or the redemption of fund shares.
| 24 |
Third Avenue Trust
Third Avenue International Value Fund – Institutional Class
Comparison of a $10,000 Investment
(Unaudited)
Performance Illustration
COMPARISON OF CHANGE IN VALUE OF A $10,000 INVESTMENT IN THIRD AVENUE INTERNATIONAL VALUE FUND – INSTITUTIONAL CLASS (TAVIX)
AND THE MSCI ALL COUNTRY WORLD EX US INDEX
FOR THE TEN YEARS ENDED OCTOBER 31, 2014
Average Annual Total Return
| 1 Year | 3 Years | 5 Years | 10 Years | ||
| (10.79%) | 6.16% | 4.45% | 4.71% |

| * | Includes reinvestment of all distributions. |
As with all mutual funds, past performance does not indicate future results. Performance may reflect fee waivers, expense offset arrangement and/or recovery. Total return would have been lower if the Adviser had not waived certain expenses. Conversely, total return would have been higher if the Adviser had not recovered previously waived expenses. Also, the returns shown in the graph and table do not reflect the deduction of taxes that a shareholder would pay on fund distributions or the redemption of fund shares.
| 25 |
Third Avenue Trust
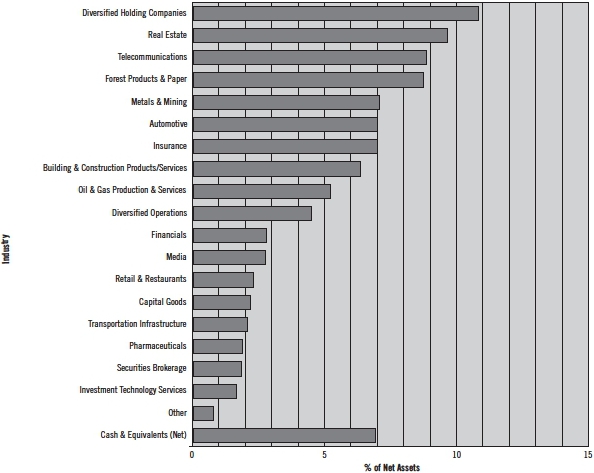
Third Avenue International Value Fund
Industry Diversification
(Unaudited)
The summary of the Fund’s investments as of October 31, 2014 is as follows:
The accompanying notes are an integral part of the financial statements.
| 26 |
Third Avenue Trust
Third Avenue International Value Fund
Portfolio of Investments
at October 31, 2014
| Shares | Security† | Value (Note 1) | ||||||
| Common Stocks - 93.11% | ||||||||
| Automotive - 6.99% | ||||||||
| 167,974 | Daimler AG (Germany) | $ | 13,057,090 | |||||
| 201,823 | LEONI AG (Germany) | 11,545,533 | ||||||
| 24,602,623 | ||||||||
| Building & Construction Products/ Services - 6.34% | ||||||||
| 10,350,426 | Tenon, Ltd. (New Zealand) (a) (b) | 13,917,610 | ||||||
| 378,215 | Titan Cement Co. S.A. (Greece) | 8,384,345 | ||||||
| 22,301,955 | ||||||||
| Capital Goods - 2.19% | ||||||||
| 252,888 | Nexans S.A. (France) (a) | 7,715,082 | ||||||
| Diversified Holding Companies - 10.80% | ||||||||
| 6,054,307 | GP Investments, Ltd., BDR (Brazil) (a) (b) | 12,241,042 | ||||||
| 488,433 | Leucadia National Corp. | 11,614,937 | ||||||
| 181,761 | Pargesa Holding S.A. (Switzerland) | 14,121,119 | ||||||
| 37,977,098 | ||||||||
| Diversified Operations - 4.47% | ||||||||
| 1,240,200 | Hutchison Whampoa, Ltd. (Hong Kong) | 15,720,091 | ||||||
| Financials - 2.76% | ||||||||
| 980,237 | BinckBank N.V. (Netherlands) | 9,705,451 | ||||||
| Forest Products & Paper - 8.71% | ||||||||
| 57,024,696 | Rubicon, Ltd. (New Zealand) (a) (b) | 15,224,425 | ||||||
| 455,543 | Weyerhaeuser Co. (c) | 15,424,686 | ||||||
| 30,649,111 | ||||||||
| Household Appliances - 0.76% | ||||||||
| 137,425 | De’Longhi S.p.A. (Italy) | 2,683,093 | ||||||
| Insurance - 6.97% | ||||||||
| 48,366 | Munich Re (Germany) | 9,506,644 | ||||||
| 24,007 | White Mountains Insurance Group, Ltd. (Bermuda) | 15,002,454 | ||||||
| 24,509,098 | ||||||||
| Investment Technology Services - 1.64% | ||||||||
| 158,118 | Otsuka Corp. (Japan) | 5,757,424 | ||||||
| Media - 2.74% | ||||||||
| 394,829 | Vivendi S.A. (France) | 9,635,829 | ||||||
| Metals & Mining - 7.05% | ||||||||
| 982,963 | Antofagasta PLC (Chile) | 11,046,383 | ||||||
| 7,347,212 | Capstone Mining Corp. (Canada) (a) | 13,755,040 | ||||||
| 24,801,423 | ||||||||
| Oil & Gas Production & Services - 5.19% | ||||||||
| 2,071,199 | Petroleum Geo-Services ASA (Norway) | 10,271,626 | ||||||
| 15,000,000 | Vard Holdings Ltd. (Singapore) (a) | 7,997,976 | ||||||
| 18,269,602 | ||||||||
| Pharmaceuticals - 1.85% | ||||||||
| 70,402 | Sanofi (France) | 6,498,592 | ||||||
| Real Estate - 9.64% | ||||||||
| 2,119,551 | Atrium European Real Estate, Ltd. (Austria) | 11,099,893 | ||||||
| 141,000 | Mitsui Fudosan Co., Ltd. (Japan) | 4,402,916 | ||||||
| 2,571,313 | Oberoi Realty Ltd. (India) | 10,272,689 | ||||||
| 1,339,326 | Segro PLC (United Kingdom) (c) | 8,145,824 | ||||||
| 33,921,322 | ||||||||
| Shares | Security† | Value (Note 1) | ||||||
| Retail & Restaurants - 2.28% | ||||||||
| 1,301,100 | Arcos Dorados Holdings, Inc. Class A (Argentina) | $ | 8,014,776 | |||||
| Securities Brokerage - 1.82% | ||||||||
| 833,600 | Daiwa Securities Group, Inc. (Japan) | 6,389,758 | ||||||
| Telecommunications - 8.85% | ||||||||
| 4,545,484 | Telefonica Deutschland Holding AG (Germany) | 22,334,669 | ||||||
| 2,655,947 | Vodafone Group PLC (United Kingdom) | 8,807,554 | ||||||
| 31,142,223 | ||||||||
| Transportation Infrastructure - 2.06% | ||||||||
| 1,134,002 | Santos Brasil Participacoes S.A. (Brazil) | 7,230,813 | ||||||
| Total Common Stocks (Cost $335,581,304) | 327,525,364 | |||||||
| Total Investment Portfolio - 93.11% (Cost $ 335,581,304) | 327,525,364 | |||||||
| Other Assets less Liabilities - 6.89% | 24,238,572 | |||||||
| NET ASSETS - 100.00% | $ | 351,763,936 | ||||||
Notes:
BDR: Brazilian Depositary Receipt.
| (a) | Non-income producing security. |
| (b) | Affiliated issuers - as defined under the Investment Company Act of 1940 (ownership of 5% or more of the outstanding voting securities of these issuers). |
| (c) | Security is a Real Estate Investment Trust. |
| † | U.S. issuer unless otherwise noted. |
Country Concentration
| % of Net Assets | ||||
| Germany | 16.05 | % | ||
| New Zealand | 8.28 | |||
| United States | 7.69 | |||
| France | 6.78 | |||
| Brazil | 5.54 | |||
| United Kingdom | 4.82 | |||
| Japan | 4.70 | |||
| Hong Kong | 4.47 | |||
| Bermuda | 4.27 | |||
| Switzerland | 4.01 | |||
| Canada | 3.91 | |||
| Austria | 3.16 | |||
| Chile | 3.14 | |||
| India | 2.92 | |||
| Norway | 2.92 | |||
| Netherlands | 2.76 | |||
| Greece | 2.38 | |||
| Argentina | 2.28 | |||
| Singapore | 2.27 | |||
| Italy | 0.76 | |||
| Total | 93.11 | % | ||
The accompanying notes are an integral part of the financial statements.
| 27 |
Third Avenue Trust
Third Avenue Focused Credit Fund
Portfolio Management Discussion
October 31, 2014 (Unaudited)
At October 31, 2014, the audited net asset values attributable to each of the 86,771,905 common shares outstanding of the Third Avenue Focused Credit Fund Investor Class and 193,282,560 common shares outstanding of the Third Avenue Focused Credit Fund Institutional Class were $10.61 and $10.60 per share, respectively. This compares with audited net asset values at October 31, 2013 of $10.28 and $10.25 per share, respectively, adjusted for subsequent distributions to shareholders.
| Average Annual Returns for the periods ended October 31, 2014 | ||||||||||||||||
| One Year ended 10/31/14 | Three Year | Five Year | Since Inception (8/31/09) | |||||||||||||
| Third Avenue Focused Credit Fund Investor Class | 2.67 | % | 9.48 | % | 9.04 | % | 9.26 | % | ||||||||
| Third Avenue Focused Credit Fund Institutional Class | 2.93 | % | 9.76 | % | 9.27 | % | 9.50 | % | ||||||||
| Barclays Capital U.S. Corporate High Yield Index | 5.82 | % | 9.39 | % | 10.44 | % | 11.65 | % | ||||||||
| Credit Suisse Leveraged Loan Index | 3.77 | % | 6.11 | % | 6.59 | % | 7.17 | % | ||||||||
Third Avenue Focused Credit Fund Institutional Class (the “Fund”) generated a 2.93% return over the last fiscal year, underperforming the Barclays Capital U.S. Corporate High Yield Index and the Credit Suisse Leveraged Loan Index which returned 5.82% and 3.77%, respectively.
The top performers in the Fund were: Energy Future Holdings Corp., Cengage Learning Acquisitions, Inc. and Nuveen Investments, Inc. Energy Future Intermediate Holdings Co. LLC, an electrical utilities company headquartered in Texas, filed for bankruptcy earlier in 2014. The filing has provided more clarity to the restructuring process, benefitting the bonds. Nuveen Investments, a Chicago based, diversified investment manager offers institutions and high net worth individuals mutual funds, separate accounts and other products. Nuveen, one of the longest dated and largest holdings of the Fund, was purchased by TIAA CREF. As a result of this transaction, and due to the strong credit of the purchaser, Nuveen’s bonds rallied. At that point we sold out of all of our bonds.
Positions that detracted from performance over the fiscal year were: Altegrity, Inc., NII Capital Corp., and Global Geophysical Services, Inc. Altegrity is a global, diversified risk and information services company serving commercial customers and government entities. The company includes three major business segments and operates via three main subsidiaries. Altegrity’s bonds struggled as the security subsidiary lost two government contracts. NII Capital Corp. is a mobile communication services provider operating under the Nextel brand in Latin America. The company filed for bankruptcy in September as its business has been struggling with fierce competition in Brazil and Mexico.
During the year the Fund added and sold off several investments, many from the same issuer. New positions include Affinion Group, Inc., Sun Products Corp. and Western Express, Inc. It is worth expanding on Affinion as this is now a core position of the Fund. Affinion is a global leader in consumer membership, insurance and loyalty products. Affinion’s US membership business has been under pressure, due to a pullback by large financial institutions. We purchased Affinion’s bonds in the 70s-80s. While the company was free cash flow positive, investors were worried about the company’s ability to refinance its 2015 maturities. At the end of 2013, we participated in negotiations which extended maturities from 2015 to 2018. As a result of these negotiations, the Fund obtained new notes with higher coupons, better collateral coverage, stronger covenants and an ownership stake in the company. The company has five years of runway to grow its loyalty and international business and turn around its membership division and we have an investment with a lower probability of default at better terms. The Fund’s dispositions include Radio One, Inc., Sprint Capital Corp. and Shingle Springs Tribal Gaming Authority.
| 28 |
Third Avenue Trust
Third Avenue Focused Credit Fund
Portfolio Management Discussion (continued)
October 31, 2014 (Unaudited)
THE INFORMATION IN THE PORTFOLIO MANAGEMENT DISCUSSION REPRESENTS A FACTUAL OVERVIEW OF THE FUND’S PERFORMANCE AND IS NOT INTENDED TO BE A FORECAST OF FUTURE EVENTS, A GUARANTEE OF FUTURE RESULTS NOR INVESTMENT ADVICE. VIEWS EXPRESSED ARE THOSE OF THE INVESTMENT TEAM AND MAY DIFFER FROM THOSE OF OTHER INVESTMENT TEAMS OR THE FIRM AS A WHOLE. ALSO, PLEASE NOTE THAT ANY DISCUSSION OF THE PORTFOLIO’S HOLDINGS, THE FUND’S PERFORMANCE, AND THE INVESTMENT TEAM’S VIEWS ARE AS OF OCTOBER 31, 2014, AND ARE SUBJECT TO CHANGE.
The Fund’s investments in high-yield and distressed securities may expose the Fund to greater risks than if the Fund only owned higher-grade securities. The value of high-yield, lower quality securities is affected by the creditworthiness of the issuers of the securities and by general economic and specific industry conditions. Issuers of high-yield securities are not as strong financially as those with higher credit ratings, so the securities are usually considered speculative investments. These and other risks are described more fully in the Fund’s prospectus.
Third Avenue Focused Credit Fund is offered by prospectus only. The prospectus contains more complete information on advisory fees, distribution charges, and other expenses and should be read carefully before investing or sending money. Past performance is no guarantee of future results. Investment return and principal value will fluctuate so that an investor’s shares, when redeemed, may be worth more or less than original cost. The Fund’s returns should be viewed in light of its investment policy and objectives and quality of its portfolio securities and the periods selected. M.J. Whitman LLC Distributor.
If you should have any questions, or for updated information (including performance data current to the most recent month-end) or a copy of our prospectus, please call 1-800-443-1021 or go to our web site at www.thirdave.com. Current performance may be lower or higher than performance quoted.
The Barclays Capital U.S. Corporate High Yield Index comprises issues that have at least $150 million par value outstanding, a maximum credit rating of Ba1 or BB+ (including defaulted issues) and at least one year to maturity. The Credit Suisse Leveraged Loan Index is designed to mirror the investible universe of the $US-denominated leveraged loan market. The Barclays Capital U.S. Corporate High Yield Index and the Credit Suisse Leveraged Loan Index are not securities that can be purchased or sold, and their total returns are reflective of unmanaged portfolios. The returns include reinvestment of all distributions.
| 29 |
Third Avenue Trust
Third Avenue Focused Credit Fund
Comparison of a $10,000 Investment
(Unaudited)
Performance Illustration
COMPARISON OF CHANGE IN VALUE OF A $10,000 INVESTMENT IN THIRD AVENUE FOCUSED CREDIT FUND—INVESTOR CLASS (TFCVX),
THIRD AVENUE FOCUSED CREDIT FUND—INSTITUTIONAL CLASS (TFCIX),
THE BARCLAYS CAPITAL U.S. CORPORATE HIGH YIELD INDEX AND THE CREDIT SUISSE LEVERAGED LOAN INDEX
FROM INCEPTION OF THE FUND (8/31/09) THROUGH OCTOBER 31, 2014
| Average Annual Total Return | ||||||||
| Since Inception | ||||||||
| Fund | 1 Year | 3 Years | 5 Years | (8/31/09) | ||||
| TFCVX | 2.67% | 9.48% | 9.04% | 9.26% | ||||
| TFCIX | 2.93% | 9.76% | 9.27% | 9.50% | ||||
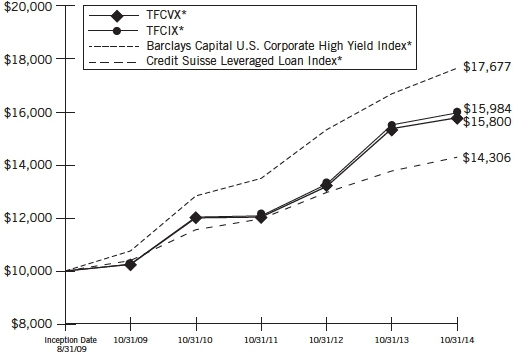
| * | Includes reinvestment of all distributions. |
As with all mutual funds, past performance does not indicate future results. Performance may reflect fee waivers, expense offset arrangement and/or recovery. Total return would have been lower if the Adviser had not waived certain expenses. Conversely, total return would have been higher if the Adviser had not recovered previously waived expenses. Also, the returns shown in the graph and table do not reflect the deduction of taxes that a shareholder would pay on fund distributions or the redemption of fund shares.
| 30 |
Third Avenue Trust
Third Avenue Focused Credit Fund
Industry Diversification
(Unaudited)
The summary of the Fund’s investments as of October 31, 2014 is as follows:

The accompanying notes are an integral part of the financial statements.
| 31 |
Third Avenue Trust
Third Avenue Focused Credit Fund
Portfolio of Investments
at October 31, 2014
| Principal | Value | ||||||||
| Amount‡/Units | Security† | (Note 1) | |||||||
| Corporate Bonds & Notes - 65.00% | |||||||||
| Chemicals - 2.71% | |||||||||
| 118,199,570 | Reichhold Industries, Inc., 9.000% Cash or 11.000% Payment-in-kind Interest, due 5/18/17 (a)(g) | $ | 65,009,764 | ||||||
| 15,390,000 | Vertellus Specialties, Inc., 9.375%, due 10/1/15 (a) | 15,505,425 | |||||||
| 80,515,189 | |||||||||
| Consumer Products - 5.59% | |||||||||
| Ideal Standard International S.A. (Luxembourg): | |||||||||
| 28,614,938 | EUR | Series B, 11.750% Cash or 17.750% Payment-in-kind Interest, due 5/1/18 (g) | 33,527,948 | ||||||
| 27,991,455 | EUR | Series C, 11.750% Cash or 17.750% Payment-in-kind Interest, due 5/1/18 (e)(g) | 28,237,348 | ||||||
| 140,000,000 | Sun Products Corp. (The), 7.750%, due 3/15/21 (a) | 104,300,000 | |||||||
| 166,065,296 | |||||||||
| Energy - 5.03% | |||||||||
| 8,500,000 | American Eagle Energy Corp., 11.000%, due 9/1/19 (a) | 7,607,500 | |||||||
| 20,000,000 | Endeavour International Corp., due 3/1/18* | 14,700,000 | |||||||
| Global Geophysical Services, Inc.*: | |||||||||
| 45,925,000 | due 5/1/17 | 5,281,375 | |||||||
| 15,599,000 | due 5/1/17 | 1,676,893 | |||||||
| Hercules Offshore, Inc.: | |||||||||
| 11,000,000 | 10.250%, due 4/1/19 (a) | 8,002,500 | |||||||
| 32,380,000 | 8.750%, due 7/15/21 (a) | 21,047,000 | |||||||
| 3,000,000 | 7.500%, due 10/1/21 (a) | 1,882,500 | |||||||
| 5,000,000 | 6.750%, due 4/1/22 (a) | 2,956,250 | |||||||
| 20,150,000 | IronGate Energy Services LLC, 11.000%, due 7/1/18 (a) | 19,444,750 | |||||||
| 3,000,000 | Lone Pine Resources, Inc., Escrow, due 2/15/17 (b)* | — | |||||||
| New Gulf Resources LLC/NGR Finance Corp.: | |||||||||
| 10,000,000 | 11.750%, due 5/15/19 (a) | 9,350,000 | |||||||
| 5,000,000 | 10.000% Cash or 12.000% Payment-in-kind Interest, due 11/15/19 (a)(g) | 3,700,000 | |||||||
| 8,000,000 | Niska Gas Storage Canada ULC / Niska Gas Storage Canada Finance Corp., 6.500%, due 4/1/19 (Canada) (a) | 5,990,000 | |||||||
| Platinum Energy Solutions, Inc.: | |||||||||
| 2,090,633 | 1st Lien, 11.000%, due 10/1/18 (a)(b)(c) | 2,090,633 | |||||||
| 4,876,227 | 2nd Lien, 12.000%, Cash or 14.000% Payment-in-kind Interest, due 10/1/20 (a)(b)(g) | 4,876,227 | |||||||
| Quicksilver Resources, Inc.: | |||||||||
| 12,000,000 | 9.125%, due 8/15/19 | 6,060,000 | |||||||
| 22,847,000 | 11.000%, due 7/1/21 | 11,766,205 | |||||||
| 25,000,000 | CAD | Southern Pacific Resource Corp., 8.750%, due 1/25/18 (Canada) (a) | 6,876,359 | ||||||
| 17,500 | ^ | US Shale Solutions, Inc., 12.500%, due 9/1/17 (a) | 16,012,500 | ||||||
| 149,320,692 | |||||||||
| Financials - 4.10% | |||||||||
| 30,000,000 | CNG Holdings, Inc., 9.375%, due 5/15/20 (a) | 22,875,000 | |||||||
| 51,500,000 | DFC Finance Corp., 10.500%, due 6/15/20 (a) | 50,598,750 | |||||||
| Principal | Value | ||||||||
| Amount‡ | Security† | (Note 1) | |||||||
| Financials (continued) | |||||||||
| Lehman Brothers Holdings, Inc.*: | |||||||||
| 31,000,000 | due 9/26/08 | $ | 4,572,500 | ||||||
| 17,185,861 | due 10/14/08 | 2,534,915 | |||||||
| 10,000,000 | due 10/22/08 | 1,475,000 | |||||||
| 25,000,000 | due 11/24/08 | 3,687,500 | |||||||
| 12,205,000 | due 12/23/08 | 1,800,238 | |||||||
| 97,000,000 | due 3/23/09 | 14,307,500 | |||||||
| 6,771,301 | due 4/3/09 | 998,767 | |||||||
| 30,000,000 | due 1/14/11 | 4,462,500 | |||||||
| 10,000,000 | due 1/24/13 | 1,487,500 | |||||||
| 50,000,000 | due 9/26/14 | 7,687,500 | |||||||
| 7,113,000 | due 2/9/17 | 1,040,276 | |||||||
| 15,000,000 | EUR | Lehman Brothers Treasury Co. B.V., due 6/25/10 (Netherlands)* | 4,417,349 | ||||||
| 121,945,295 | |||||||||
| Food & Beverage - 1.32% | |||||||||
| 40,755,000 | American Seafoods Group LLC/American Seafoods Finance, Inc., 10.750%, due 5/15/16 (a) | 39,328,575 | |||||||
| Gaming & Entertainment - 3.10% | |||||||||
| 105,000,000 | Caesars Entertainment Operating Co., Inc., 10.000%, due 12/15/18 | 15,487,500 | |||||||
| Codere Finance Luxembourg S.A. (Luxembourg)*: | |||||||||
| 55,878,000 | EUR | due 6/15/15 | 42,014,060 | ||||||
| 26,910,000 | due 2/15/19 (a) | 16,415,100 | |||||||
| 18,258,582 | Majestic Star Casino, LLC, 12.500% Cash or 14.500% Payment-in-kind Interest, due 12/1/16 (a)(g) | 18,258,582 | |||||||
| 92,175,242 | |||||||||
| Healthcare - 4.24% | |||||||||
| 79,800,000 | 21st Century Oncology, Inc., 9.875%, due 4/15/17 | 77,007,000 | |||||||
| InVentiv Health, Inc.: | |||||||||
| 42,136,000 | 10.000% Cash or 12.000% Payment-in-kind Interest, due 8/15/18 (a)(g) | 38,133,080 | |||||||
| 14,927,000 | 11.000%, due 8/15/18 (a) | 10,672,805 | |||||||
| 125,812,885 | |||||||||
| Home Construction - 2.10% | |||||||||
| New Enterprise Stone & Lime Co., Inc.: | |||||||||
| 20,700,292 | 5.000% Cash and 8.000% Payment-in-kind Interest, due 3/15/18 (g) | 22,252,814 | |||||||
| 41,458,000 | 11.000%, due 9/1/18 | 40,006,970 | |||||||
| 62,259,784 | |||||||||
| Manufacturing - 3.20% | |||||||||
| 31,000,000 | Euramax International, Inc., 9.500%, due 4/1/16 | 30,457,500 | |||||||
| 68,000,000 | Liberty Tire Recycling LLC, 11.000%, due 10/1/16 (a) | 64,600,000 | |||||||
| 95,057,500 | |||||||||
| Media/Cable - 6.92% | |||||||||
| 43,000,000 | Cengage Learning Acquisitions, Inc., Escrow, due 4/15/20 (b)* | — | |||||||
| 166,951,484 | iHeartCommunications Inc., 12.000% Cash plus 2.000% Payment-in-kind Interest, due 2/1/21 (g) | 145,665,170 | |||||||
The accompanying notes are an integral part of the financial statements.
| 32 |
Third Avenue Trust
Third Avenue Focused Credit Fund
Portfolio of Investments (continued)
at October 31, 2014
| Principal | Value | ||||||||
| Amount‡ | Security† | (Note 1) | |||||||
| Corporate Bonds & Notes (continued) | |||||||||
| Media/Cable (continued) | |||||||||
| LBI Media, Inc.: | |||||||||
| 25,000,000 | 10.000%, due 4/15/19 (a) | $ | 26,000,000 | ||||||
| 33,694,375 | 13.500%, due 4/15/20 (a) | 33,862,847 | |||||||
| 205,528,017 | |||||||||
| Metals & Mining - 5.74% | |||||||||
| 61,500,000 | CAD | Allied Nevada Gold Corp., 8.750%, due 6/1/19 (a) | 29,193,470 | ||||||
| 6,700,000 | American Gilsonite Co., 11.500%, due 9/1/17 (a) | 7,001,500 | |||||||
| 48,957,000 | EUR | Boats Investments Netherlands B.V., 11.000% Payment-in-kind Interest, due 3/31/17 (Netherlands) (g) | 48,439,372 | ||||||
| New World Resources N.V. (Netherlands): | |||||||||
| 34,966,026 | EUR | 8.000% Cash or 11.000% Payment-in-kind Interest, due 4/7/20 (a)(g) | 34,177,747 | ||||||
| 13,403,643 | EUR | 4.000% Cash or 8.000% Payment-in-kind Interest, due 10/7/20 (a)(g) | 7,474,556 | ||||||
| 37,500,000 | Noranda Aluminum Acquisition Corp., 11.000%, due 6/1/19 | 37,875,000 | |||||||
| 23,500,000 | Walter Energy, Inc., 8.500%, due 4/15/21 | 6,345,000 | |||||||
| 170,506,645 | |||||||||
| Retailers - 3.19% | |||||||||
| Claire’s Stores, Inc.: | |||||||||
| 2,500,000 | 8.875%, due 3/15/19 | 2,143,750 | |||||||
| 115,250,000 | 7.750%, due 6/1/20 (a) | 81,251,250 | |||||||
| 15,526,000 | J.C. Penney Corp., Inc., 6.375%, due 10/15/36 | 11,295,165 | |||||||
| 94,690,165 | |||||||||
| Services - 7.29% | |||||||||
| 120,998,706 | Affinion Group Holdings, Inc., 13.750% Cash or 14.500% Payment-in-kind Interest, due 9/15/18 (a)(g) | 99,823,932 | |||||||
| 41,552,020 | Affinion Investment LLC, 13.500%, due 8/15/18 (a) | 35,319,217 | |||||||
| Altegrity, Inc.: | |||||||||
| 35,740,000 | 13.000% Payment-in-kind Interest, due 7/1/20 (a)(g) | 15,189,500 | |||||||
| 120,871,840 | 12.000% Cash and 2.000% Payment-in-kind Interest, due 7/1/20 (a)(g) | 51,370,532 | |||||||
| 20,000,000 | SunGard Availability Services Capital Inc., 8.750%, due 4/1/22 (a) | 14,800,000 | |||||||
| 216,503,181 | |||||||||
| Technology - 0.92% | |||||||||
| 20,000,000 | Avaya, Inc., 10.500%, due 3/1//21 (a) | 17,625,000 | |||||||
| 4,954,085 | First Data Holdings, Inc., 14.500% Payment-in-kind Interest, due 9/24/19 (a)(g) | 5,260,000 | |||||||
| 28,118,000 | THQ, Inc., due 8/15/14* | 4,358,290 | |||||||
| 27,243,290 | |||||||||
| Telecommunications - 1.00% | |||||||||
| Nortel Networks Ltd. (Canada)*: | |||||||||
| 5,000,000 | due 4/15/12 | 4,881,250 | |||||||
| 21,667,000 | due 7/15/16 | 24,700,380 | |||||||
| 29,581,630 | |||||||||
| Transportation Services - 3.86% | |||||||||
| 40,000,000 | Ceva Group PLC, 9.000%, due 9/1/21 (United Kingdom) (a) | 38,500,000 | |||||||
| Principal | Value | ||||||||
| Amount‡ | Security† | (Note 1) | |||||||
| Transportation Services (continued) | |||||||||
| 85,000,000 | Western Express, Inc., 12.500%, due 4/15/15 (a) | $ | 76,075,000 | ||||||
| 114,575,000 | |||||||||
| Utilities - 4.69% | |||||||||
| 20,000,000 | Coso Geothermal Power Holdings LLC, 7.000%, due 7/15/26 (a) | 10,273,606 | |||||||
| 4,000,000 | Energy Future Holdings Corp., due 11/15/34* | 3,260,000 | |||||||
| 100,065,046 | Energy Future Intermediate Holdings Co. LLC./ EFIH Finance, Inc., due 12/1/18* (a) | 115,324,966 | |||||||
| Texas Competitive Electric Holdings Co. LLC / TCEH Finance, Inc.*: | |||||||||
| 60,000,000 | due 11/1/15 | 6,300,000 | |||||||
| 40,000,000 | due 11/1/16 | 4,200,000 | |||||||
| 139,358,572 | |||||||||
| Total Corporate Bonds & Notes (Cost $2,134,627,387) | 1,930,466,958 | ||||||||
| Term Loans - 10.61% | |||||||||
| Chemicals - 2.77% | |||||||||
| 33,388,000 | Reichhold Holdings International B.V., DIP Loan, 12.000%, due 2/17/15 (Netherlands) (b) | 33,388,000 | |||||||
| 24,550,000 | Reichhold Holdings Inc., DIP Loan, 12.000%, due 2/17/15 (b) | 24,550,000 | |||||||
| 25,000,000 | Vertellus Specialties, Inc., Term Loan, 10.500%, due 10/10/19 (c) | 24,250,000 | |||||||
| 82,188,000 | |||||||||
| Energy - 1.83% | |||||||||
| 40,703,101 | Global Geophysical Services, Inc., OID, DIP Loan B, 12.000%, due 5/1/15 (b)(c) | 40,703,101 | |||||||
| 15,000,000 | Templar Energy LLC, Term Loan B, 2nd Lien, 8.500%, due 11/25/20 (c) | 13,678,125 | |||||||
| 54,381,226 | |||||||||
| Financials - 0.07% | |||||||||
| Concrete Investment I, Term Loan (Netherlands): | |||||||||
| 32,255 | EUR | Tranche A2, 2.007%, due 3/31/16 (b)(c) | 40,420 | ||||||
| 12,322 | EUR | Tranche A3, 2.007%, due 3/31/16 (b)(c) | 15,442 | ||||||
| Concrete Investment II, Term Loan (Netherlands): | |||||||||
| 21,918 | EUR | Tranche A2, 2.007%, due 3/31/16 (b)(c) | 27,467 | ||||||
| 3,081 | EUR | Tranche A3, 2.007%, due 3/31/16 (b)(c) | 3,860 | ||||||
| IVG Immobilien AG, Term Loan (Netherlands): | |||||||||
| 657,954 | EUR | Tranche A1, 9.506%, due 9/30/17 (b)(c) | 824,514 | ||||||
| 986,105 | EUR | Tranche A2, 9.506%, due 9/30/17 (b)(c) | 1,235,736 | ||||||
| 2,147,439 | |||||||||
| Gaming & Entertainment - 0.66% | |||||||||
| 20,000,000 | Land Holdings LLC, Term Loan, 12.000%, due 6/27/20 (c) | 19,600,000 | |||||||
| Healthcare - 0.72% | |||||||||
| 22,300,139 | Rural/Metro Corp., Term Loan, 8.000% Cash and 1.000% Payment-in-kind Interest, due 6/30/18 (c)(g) | 21,296,632 | |||||||
| Retailers - 1.06% | |||||||||
| 17,000,000 | Gymboree Corp., Term Loan, 1st Lien, 5.000%, due 2/23/18 (c) | 10,724,161 | |||||||
| 26,886,694 | Weight Watchers International, Inc., Term Loan, 4.000%, due 4/2/20 (c) | 20,885,207 | |||||||
| 31,609,368 | |||||||||
The accompanying notes are an integral part of the financial statements.
| 33 |
Third Avenue Trust
Third Avenue Focused Credit Fund
Portfolio of Investments (continued)
at October 31, 2014
| Principal | Value | ||||||||
| Amount ‡ | Security† | (Note 1) | |||||||
| Term Loans (continued) | |||||||||
| Services - 1.13% | |||||||||
| 74,052,531 | Education Management LLC, Term Loan C2, 1st Lien, 5.250%, due 6/1/16 (c) | $ | 33,693,901 | ||||||
| Utilities - 2.37% | |||||||||
| Longview Power LLC*: | |||||||||
| 6,725,151 | DIP Loan, 9.000%, due 11/27/15 (b)(c) | 16,743,783 | |||||||
| 53,047,387 | Term Loan, due 3/1/14 | 34,480,802 | |||||||
| 29,429,232 | Term Loan, due 10/31/17 | 19,129,000 | |||||||
| 70,353,585 | |||||||||
| Total Term Loans (Cost $329,622,689) | 315,270,151 | ||||||||
| Claims - 3.43% | |||||||||
| Financials - 3.11% | |||||||||
| 360,000,000 | Lehman Brothers, Inc., SIPA Claims (d) | 92,484,000 | |||||||
| Food & Beverage - 0.32% | |||||||||
| Pescanova S.A. (Spain): | |||||||||
| 188,150,508 | EUR | Ordinary Claims, due 12/31/40 (d) | 9,431,221 | ||||||
| 1,803,190 | EUR | Subordinate Claim, due 12/31/40 (b)(d) | — | ||||||
| 9,431,221 | |||||||||
| Total Claims (Cost $130,384,817) | 101,915,221 | ||||||||
| Municipal Bonds - 0.14% | |||||||||
| Gaming & Entertainment - 0.07% | |||||||||
| 5,200,000 | New York City, NY, Industrial Development Agency Civic Facility Revenue, Bronx Parking Development Co. LLC OID, due 10/1/37* | 2,028,000 | |||||||
| Utilities - 0.07% | |||||||||
| 4,000,000 | Puerto Rico Electric Power Authority, 7.000%, due 7/1/33 | 2,000,080 | |||||||
| Total Municipal Bonds (Cost $4,793,642) | 4,028,080 | ||||||||
| Shares | |||||||||
| Convertible Preferred Stocks - 0.53% | |||||||||
| Transportation - 0.53% | |||||||||
| 4,435 | CEVA Holdings LLC, Series A-1 (d)(e) | 5,810,138 | |||||||
| 10,196 | CEVA Holdings LLC, Series A-2 (d)(e) | 9,813,332 | |||||||
| 15,623,470 | |||||||||
| Total Convertible Preferred Stocks (Cost $17,733,658) | 15,623,470 | ||||||||
| Preferred Stocks - 1.98% | |||||||||
| Energy - 0.11% | |||||||||
| 1,122,431 | Lone Pine Resources, Inc. (Canada) (b)(d) | 3,120,358 | |||||||
| Financials - 1.87% | |||||||||
| 120,774 | Concrete Investment II SCA (Luxembourg) (d) | 21,642,730 | |||||||
| 100,000 | Federal Home Loan Mortgage Corp., 5.300% (d) | 571,000 | |||||||
| 60,000 | Federal Home Loan Mortgage Corp., Series G (c)(d) | 365,400 | |||||||
| 89,283 | Federal Home Loan Mortgage Corp., Series H, 5.100% (d) | 603,553 | |||||||
| Value | ||||||||
| Shares | Security† | (Note 1) | ||||||
| Financials (continued) | ||||||||
| 63,188 | Federal Home Loan Mortgage Corp., Series K, 5.790% (d) | $ | 413,250 | |||||
| 52,500 | Federal Home Loan Mortgage Corp., Series L (c)(d) | 315,525 | ||||||
| 207,640 | Federal Home Loan Mortgage Corp., Series M (c)(d) | 1,260,894 | ||||||
| 23,500 | Federal Home Loan Mortgage Corp., Series N (c)(d) | 152,515 | ||||||
| 336,223 | Federal Home Loan Mortgage Corp., Series P, 6.000% (d) | 2,131,654 | ||||||
| 224,580 | Federal Home Loan Mortgage Corp., Series R, 5.700% (d) | 1,513,669 | ||||||
| 165,000 | Federal Home Loan Mortgage Corp., Series S (c)(d) | 1,021,350 | ||||||
| 100,000 | Federal Home Loan Mortgage Corp., Series U, 5.900% (d) | 319,000 | ||||||
| 637,722 | Federal Home Loan Mortgage Corp., Series V, 5.570% (d) | 2,015,202 | ||||||
| 392,089 | Federal Home Loan Mortgage Corp., Series W, 5.660% (d) | 1,239,001 | ||||||
| 203,813 | Federal Home Loan Mortgage Corp., Series X, 6.020% (d) | 642,011 | ||||||
| 100,000 | Federal Home Loan Mortgage Corp., Series Y, 6.550% (d) | 344,000 | ||||||
| 500,000 | Federal Home Loan Mortgage Corp., Series Z, 8.375% (c)(d) | 2,125,000 | ||||||
| 96,750 | Federal National Mortgage Association, Series H, 5.810% (d) | 603,720 | ||||||
| 478,000 | Federal National Mortgage Association, Series M, 4.750% (d) | 3,041,275 | ||||||
| 1,293,000 | Federal National Mortgage Association, Series 0, 7.000% (c)(d) | 8,404,500 | ||||||
| 100,000 | Federal National Mortgage Association, Series P (c)(d) | 312,000 | ||||||
| 564,650 | Federal National Mortgage Association, Series S, 8.250% (c)(d) | 2,399,762 | ||||||
| 750,000 | Federal National Mortgage Association, Series T, 8.250% (d) | 4,237,500 | ||||||
| 55,674,511 | ||||||||
| Total Preferred Stocks (Cost $61,098,389) | 58,794,869 | |||||||
| Private Equities - 0.54% | ||||||||
| Automotive - 0.36% | ||||||||
| 10,000,000 | International Automotive Components Group LLC. (d) | 10,625,000 | ||||||
| Consumer Products - 0.15% | ||||||||
| 1,451,633,736,280 | Ideal Standard International Equity S.A. Alpecs (Luxembourg) (d)(e) | 4,354,901 | ||||||
| Energy - 0.03% | ||||||||
| 19,700 | Thunderbird Resources L.P. (b)(d)(i) | 1,043,306 | ||||||
| Total Private Equities (Cost $15,149,957) | 16,023,207 | |||||||
The accompanying notes are an integral part of the financial statements.
| 34 |
Third Avenue Trust
Third Avenue Focused Credit Fund
Portfolio of Investments (continued)
at October 31, 2014
| Value | ||||||||
| Shares | Security† | (Note 1) | ||||||
| Common Stocks & Warrants - 7.31% | ||||||||
| Chemicals - 2.43% | ||||||||
| 867,448 | MPM Holdings, Inc. (d) | $ | 28,625,784 | |||||
| 1,310,842 | MPM Holdings, Inc., Restricted Shares (d)(e) | 43,257,786 | ||||||
| 478,500 | Phosphate Holdings, Inc. (d)(f) | 148,335 | ||||||
| 72,031,905 | ||||||||
| Energy - 0.82% | ||||||||
| 4,000,000 | Forest Oil Corp. (d) | 3,240,000 | ||||||
| 124,461 | Geokinetics Holdings USA, Inc. (d)(e) | 12,757,252 | ||||||
| 374,199 | Lone Pine Resources, Inc. (b)(d) | — | ||||||
| 374,199 | Lone Pine Resources Canada Ltd. (Canada) (b)(d) | 973,263 | ||||||
| 1,122,431 | Lone Pine Resources, Inc. Multiple Voting Shares (b)(d) | — | ||||||
| 5,000 | New Gulf Resources LLC, Warrants (d) | 962,500 | ||||||
| 50,000 | Platinum Energy Solutions, Inc. (b)(d)(e) | 1,208,500 | ||||||
| 10,874 | Platinum Energy Solutions, Inc., Warrants (b)(d)(e) | — | ||||||
| 63,924 | Thunderbird Resources Equity, Inc. (b)(d) | 5,292,262 | ||||||
| 24,433,777 | ||||||||
| Financials - 1.27% | ||||||||
| 3,725,000 | Federal Home Loan Mortgage Corp. (d) | 7,673,500 | ||||||
| 1,700,000 | Rescap Liquidating Trust | 27,030,000 | ||||||
| 1,407,040 | WMI Holdings Corp. (d) | 3,025,136 | ||||||
| 37,728,636 | ||||||||
| Gaming & Entertainment - 0.47% | ||||||||
| 999,955 | Isle of Capri Casinos, Inc. (d) | 7,429,666 | ||||||
| 255,200 | Pinnacle Entertainment, Inc. (d) | 6,540,776 | ||||||
| 13,970,442 | ||||||||
| Media/Cable - 1.20% | ||||||||
| 971,678 | Cengage Learning Holdings II, Inc. (d) | 27,206,984 | ||||||
| 2,311,360 | Radio One, Inc., Class D (d)(f) | 5,755,286 | ||||||
| 681,637 | Spanish Broadcasting System, Inc., Class A (d)(f) | 2,746,997 | ||||||
| 35,709,267 | ||||||||
| Metals & Mining - 0.66% | ||||||||
| 711,375 | AK Steel Holding Corp. (d) | 5,385,109 | ||||||
| 1,961,723 | Allied Nevada Gold Corp. (d) | 2,726,795 | ||||||
| 1,500,000 | Noranda Aluminum Holding Corp. | 6,615,000 | ||||||
| 1,954,569 | Tembec, Inc. (Canada) (d) | 4,959,911 | ||||||
| 19,686,815 | ||||||||
| Services - 0.17% | ||||||||
| 499,061 | Affinion Group, Inc., Warrants, Series A (d) | 748,592 | ||||||
| 6,422,764 | Affinion Group, Inc., Warrants, Series B (d) | 256,911 | ||||||
| 225,000 | Kelly Services, Inc., Class A | 3,966,750 | ||||||
| 4,972,253 | ||||||||
| Transportation - 0.15% | ||||||||
| 4,710 | CEVA Holdings LLC (d)(e) | 4,533,288 | ||||||
| Utilities - 0.14% | ||||||||
| 32,549,441 | EME Reorganization Trust | 4,231,427 | ||||||
| Total Common Stocks & Warrants (Cost $227,044,490) | 217,297,810 | |||||||
| Value | ||||||||
| Shares | Security† | (Note 1) | ||||||
| Closed-End Funds - 3.05% | ||||||||
| Financials - 3.05% | ||||||||
| 344,343 | Ares Dynamic Credit Allocation Fund, Inc. | $ | 5,805,623 | |||||
| 2,052,559 | BlackRock Corporate High Yield Fund, Inc. | 24,322,824 | ||||||
| 886,926 | BlackRock Credit Allocation Income Trust | 12,008,978 | ||||||
| 393,556 | Deutsche High Income Opportunities Fund, Inc. | 5,671,142 | ||||||
| 765,074 | First Trust High Income Long/Short Fund | 13,151,622 | ||||||
| 504,626 | Neuberger Berman High Yield Strategies Fund, Inc. | 6,640,878 | ||||||
| 655,108 | New America High Income Fund, Inc. (The) | 6,256,281 | ||||||
| 612,153 | Western Asset High Yield Defined Opportunity Fund, Inc. | 10,210,712 | ||||||
| 1,207,569 | Western Asset Managed High Income Fund, Inc. | 6,616,271 | ||||||
| Total Closed-End Funds (Cost $91,649,113) | 90,684,331 | |||||||
| Total Investment Portfolio - 92.59% (Cost $3,012,104,142) | 2,750,104,097 | |||||||
| Other Assets less Liabilities - 7.41% (h) | 219,917,324 | |||||||
| NET ASSETS - 100.00% | $ | 2,970,021,421 | ||||||
Notes:
| CAD: | Canadian Dollar. |
| DIP: | Debtor-In-Possession. |
| EUR: | Euro. |
| OID: | Original Issue Discount. |
| SIPA: | Securities Investor Protection Act of 1970. |
| (a) | Security is exempt from registration under Rule 144A of the Securities Act of 1933. This security may be resold in transactions that are exempt from registration, normally to qualified institutional buyers. |
| (b) | Fair-valued security. |
| (c) | Variable rate security. The rate disclosed is in effect as of October 31, 2014. |
| (d) | Non-income producing security. |
| (e) | Security subject to restrictions on resale. |
| Shares/ Principal Amount | Issuer | Acquisition Date | Cost | Market Value Per Unit | |||||||||||
| 1,451,633,736,280 | Alpecs S.A. | 10/31/14 | 4,421,661 | $ | 0.00 | * | |||||||||
| 4,710 | CEVA Holdings LLC | 5/29/13 | 5,355,643 | 962.48 | |||||||||||
| 4,435 | CEVA Holdings LLC, Series A-1, Convertible Pfd. | 5/29/13 | 4,435,224 | 1,310.06 | |||||||||||
| 10,196 | CEVA Holdings LLC, Series A-2, Convertible Pfd. | 5/29/13 | 13,298,434 | 962.47 | |||||||||||
| 124,461 | Geokinetics Holdings USA, Inc. | 5/22/13-5/14/14 | 13,060,780 | 102.50 | |||||||||||
| 27,991,455 | EUR | Ideal Standard International S.A., Series C, 11.750% Cash or 15.750% Payment-in-kind Interest, due 5/1/18 | 10/31/14 | 32,073,171 | 100.88 | ||||||||||
| 1,310,842 | MPM Holdings, Inc., Restricted Shares | 10/24/14 | 21,367,809 | 33.00 | |||||||||||
| 50,000 | Platinum Energy Solutions, Inc. | 10/4/13 | 1,486,746 | 24.17 | |||||||||||
| 10,874 | Platinum Energy Solutions, Inc., Warrants | 10/4/13 | 9,743 | 0.00 | |||||||||||
EUR: Euro.
*Amount less than $0.01.
At October 31, 2014, these restricted securities had a total market value of $109,972,545, or 3.70% of net assets of the Fund.
The accompanying notes are an integral part of the financial statements.
| 35 |
Third Avenue Trust
Third Avenue Focused Credit Fund
Portfolio of Investments (continued)
at October 31, 2014
| (f) | Affiliated issuers - as defined under the Investment Company Act of 1940 (ownership of 5% or more of the outstanding voting securities of these issuers). |
| (g) | Payment-in-kind (“PIK”) security. Income may be paid in additional securities or cash at the discretion of the issuer. |
| (h) | A portion is segregated for future fund commitment. |
| (i) | Security is held in the blocker. |
| * | Issuer in default. |
| ^ | Expressed in units. |
| † | U.S. issuer unless otherwise noted. |
| ‡ | Denominated in U.S. Dollars unless otherwise noted. |
Country Concentration
| % of Net Assets | |||||
| United States | 79.95 | % | |||
| Luxembourg | 4.92 | ||||
| Netherlands | 4.38 | ||||
| Canada | 1.73 | ||||
| United Kingdom | 1.29 | ||||
| Spain | 0.32 | ||||
| Total | 92.59 | % | |||
Schedule of Forward Foreign Currency Contracts
| Contracts to Sell | Counterparty | Settlement Date | Settlement Value | Value at 10/31/14 | Unrealized Appreciation | |||||||||||||
| 49,000,000 | CAD | Goldman Sachs & Co. | 11/26/14 | $ | 43,729,646 | $ | 43,448,601 | $ | 281,045 | |||||||||
| 70,000,000 | EUR | Goldman Sachs & Co. | 11/26/14 | 88,526,354 | 87,734,690 | 791,664 | ||||||||||||
| 70,000,000 | EUR | JPMorgan Chase Bank, N.A. | 11/26/14 | 88,570,804 | 87,734,690 | 836,114 | ||||||||||||
| 20,000,000 | EUR | Macquarie Bank, Ltd. | 11/26/14 | 25,293,000 | 25,067,055 | 225,945 | ||||||||||||
| $ | 2,134,768 | |||||||||||||||||
| CAD: | Canadian Dollar. |
| EUR: | Euro. |
The accompanying notes are an integral part of the financial statements.
| 36 |
[This page intentionally left blank.]
Third Avenue Trust
Statement of Assets and Liabilities
For the Year Ended October 31, 2014
| Value Fund | Small-Cap Value Fund | Real Estate Value Fund | |||||||||||
| Assets: | |||||||||||||
| Investments at value (Notes 1 and 5): | |||||||||||||
| Unaffiliated issuers† | $ | 1,900,890,843 | $ | 517,294,816 | $ | 2,660,256,561 | |||||||
| Affiliated issuers‡ | 178,891,431 | — | 166,821,311 | ||||||||||
| Total investments# | 2,079,782,274 | 517,294,816 | 2,827,077,872 | ||||||||||
| Cash | 92,626,718 | 2,919,745 | 355,275,085 | ||||||||||
| Dividends and interest receivable | 4,035,533 | 573,461 | 3,137,046 | ||||||||||
| Receivable for securities sold | 70,314 | 165,405 | — | ||||||||||
| Restricted cash pledged to counterparty for collateral management | 300,000 | — | 50,540,000 | ||||||||||
| Receivable for fund shares sold | 124,355 | 24,579 | 4,599,091 | ||||||||||
| Foreign currency at value^ | — | — | — | ||||||||||
| Purchased foreign currency options* | — | — | 2,235,139 | ||||||||||
| Unrealized appreciation for forward foreign currency contracts | — | — | 2,203,818 | ||||||||||
| Other assets | 131,181 | 41,744 | 160,579 | ||||||||||
| Other receivables | — | — | 657,204 | ||||||||||
| Total assets | 2,177,070,375 | 521,019,750 | 3,245,885,834 | ||||||||||
| Liabilities: | |||||||||||||
| Written equity options at value** | 206,000 | — | 165,400 | ||||||||||
| Written foreign currency options at value*** | — | — | 415,566 | ||||||||||
| Payable for securities purchased | 5,549,606 | — | 2,742,313 | ||||||||||
| Payable for fund shares redeemed | 3,445,561 | 436,626 | 2,839,551 | ||||||||||
| Restricted cash received from counterparty for collateral management | — | — | 1,861,709 | ||||||||||
| Payable to Adviser (Note 3) | 1,639,719 | 386,367 | 2,373,719 | ||||||||||
| Auditing and tax fees payable | 170,080 | 90,720 | 108,210 | ||||||||||
| Payable for shareholder servicing fees (Note 3) | 255,687 | 56,840 | 409,123 | ||||||||||
| Foreign capital tax payable | — | — | — | ||||||||||
| Other Liabilities^ | — | — | 20,094 | ||||||||||
| Distribution fees payable (Note 6) | 12,486 | 11,277 | 43,750 | ||||||||||
| Payable to trustees and officers | 17,257 | 3,605 | 21,015 | ||||||||||
| Accrued expenses | 284,008 | 83,443 | 202,384 | ||||||||||
| Total liabilities | 11,580,404 | 1,068,878 | 11,202,834 | ||||||||||
| Net assets | $ | 2,165,489,971 | $ | 519,950,872 | $ | 3,234,683,000 | |||||||
| Summary of net assets: | |||||||||||||
| Capital stock, $0.001 par value | $ | 1,657,439,919 | $ | 300,897,105 | $ | 2,464,435,043 | |||||||
| Accumulated undistributed net investment income/(distributions in excess of net investment income) | 71,992,748 | (5,660,013 | ) | 24,181,494 | |||||||||
| Accumulated net realized gain/(loss) on investments and foreign currency transactions | 73,832,462 | 99,768,375 | 55,924,431 | ||||||||||
| Net unrealized appreciation on investments and translation of foreign currency denominated assets and liabilities | 362,224,842 | 124,945,405 | 690,142,032 | ||||||||||
| Net assets applicable to capital shares outstanding | $ | 2,165,489,971 | $ | 519,950,872 | $ | 3,234,683,000 | |||||||
| Investor Class: | |||||||||||||
| Net assets | $ | 33,935,659 | $ | 9,897,953 | $ | 367,833,588 | |||||||
| Outstanding shares of beneficial interest, unlimited number of shares authorized | 569,966 | 351,223 | 11,552,175 | ||||||||||
| Net asset value, offering and redemption price per share± | $59.54 | $28.18 | $31.84 | ||||||||||
| Institutional Class: | |||||||||||||
| Net assets | $ | 2,131,554,312 | $ | 510,052,919 | $ | 2,866,849,412 | |||||||
| Outstanding shares of beneficial interest, unlimited number of shares authorized | 35,707,495 | 18,041,377 | 89,450,144 | ||||||||||
| Net asset value, offering and redemption price per share± | $59.69 | $28.27 | $32.05 | ||||||||||
| † | Cost of unaffiliated issuers | $ | 1,481,571,146 | $ | 392,335,656 | $ | 1,997,843,470 | ||||||
| ‡ | Cost of affiliated issuers | $ | 236,037,540 | $ | — | $ | 144,850,198 | ||||||
| # | Total cost | $ | 1,717,608,686 | $ | 392,335,656 | $ | 2,142,693,668 | ||||||
| ^ | Cost of foreign currency | $ | — | $ | — | $ | — | ||||||
| * | Cost of purchased foreign currency options | $ | — | $ | — | $ | 634,536 | ||||||
| ** | Premiums received for written equity options | $ | (315,500 | ) | $ | — | $ | (1,892,007 | ) | ||||
| *** | Premiums received for written foreign currency options | $ | — | $ | — | $ | (634,536 | ) | |||||
| ± | Redemption price is gross of redemption fees (Note 7) | ||||||||||||
The accompanying notes are an integral part of the financial statements.
| 38 |
| International Value Fund | Focused Credit Fund | |||||
| $ | 286,142,287 | $ | 2,741,453,479 | |||
| 41,383,077 | 8,650,618 | |||||
| 327,525,364 | 2,750,104,097 | |||||
| 6,237,809 | 196,648,386 | |||||
| 2,979,088 | 65,384,869 | |||||
| 16,439,035 | 4,513,688 | |||||
| — | — | |||||
| 158,212 | 4,858,065 | |||||
| 3,775 | 786,488 | |||||
| — | — | |||||
| — | 2,134,768 | |||||
| 52,545 | 188,128 | |||||
| — | 963,380 | |||||
| 353,395,828 | 3,025,581,869 | |||||
| — | — | |||||
| — | — | |||||
| — | 44,891,454 | |||||
| 552,929 | 4,374,559 | |||||
| — | — | |||||
| 464,837 | 1,912,911 | |||||
| 91,615 | 192,053 | |||||
| 58,926 | 215,905 | |||||
| 312,287 | 143,002 | |||||
| — | 3,284,890 | |||||
| 5,275 | 349,925 | |||||
| 3,338 | 18,794 | |||||
| 142,685 | 176,955 | |||||
| 1,631,892 | 55,560,448 | |||||
| $ | 351,763,936 | $ | 2,970,021,421 | |||
| $ | 357,331,187 | $ | 3,135,338,592 | |||
| 17,976,710 | 82,237,153 | |||||
| (14,936,867 | ) | 13,057,343 | ||||
| (8,607,094 | ) | (260,611,667 | ) | |||
| $ | 351,763,936 | $ | 2,970,021,421 | |||
| $ | 12,265,927 | $ | 920,914,073 | |||
| 697,613 | 86,771,905 | |||||
| $17.58 | $10.61 | |||||
| $ | 339,498,009 | $ | 2,049,107,348 | |||
| 19,260,527 | 193,282,560 | |||||
| $17.63 | $10.60 | |||||
| $ | 288,787,261 | $ | 3,004,695,930 | |||
| $ | 46,794,043 | $ | 7,408,212 | |||
| $ | 335,581,304 | $ | 3,012,104,142 | |||
| $ | 3,838 | $ | 786,488 | |||
| $ | — | $ | — | |||
| $ | — | $ | — | |||
| $ | — | $ | — | |||
The accompanying notes are an integral part of the financial statements.
| 39 |
Third Avenue Trust
Statement of Operations
For the Year Ended October 31, 2014
| Value Fund | Small-Cap Value Fund | Real Estate Value Fund | |||||||||||
| Investment Income: | |||||||||||||
| Dividends - unaffiliated issuers* | $ | 88,567,888 | $ | 5,641,614 | $ | 76,441,475 | |||||||
| Dividends - affiliated issuers (Note 5) | — | — | 322,827 | ||||||||||
| Interest - unaffiliated issuers | 37,743 | 3,365 | 142,633 | ||||||||||
| Interest - affiliated issuers (Note 5) | — | — | — | ||||||||||
| Interest - payment-in-kind securities unaffiliated issuers (Note 1) | — | — | — | ||||||||||
| Interest - payment-in-kind securities affiliated issuers (Notes 1 and 5) | 1,234,479 | — | — | ||||||||||
| Other income | 137,544 | — | 70,631 | ||||||||||
| Total investment income | 89,977,654 | 5,644,979 | 76,977,566 | ||||||||||
| Expenses: | |||||||||||||
| Investment advisory fees (Note 3) | 21,976,830 | 5,465,902 | 23,817,568 | ||||||||||
| Shareholder servicing fees (Note 3) | 2,149,632 | 545,000 | 2,751,579 | ||||||||||
| Transfer agent fees | 646,998 | 263,604 | 461,155 | ||||||||||
| Trustees’ and officers’ fees and expenses | 291,016 | 72,825 | 271,045 | ||||||||||
| Reports to shareholders | 195,213 | 53,789 | 304,665 | ||||||||||
| Custodian fees | 190,135 | 27,371 | 193,342 | ||||||||||
| Accounting fees | 180,372 | 51,520 | 195,080 | ||||||||||
| Auditing and tax fees | 151,028 | 80,516 | 95,711 | ||||||||||
| Administration fees (Note 3) | 134,303 | 33,403 | 145,552 | ||||||||||
| Insurance | 105,194 | 26,996 | 83,032 | ||||||||||
| Distribution fees (Note 6) | 94,267 | 29,381 | 713,177 | ||||||||||
| Legal fees | 79,104 | 4,998 | 206,738 | ||||||||||
| Registration and filing fees | 74,363 | 38,821 | 109,832 | ||||||||||
| Interest | — | — | — | ||||||||||
| Miscellaneous | 134,144 | 36,935 | 154,104 | ||||||||||
| Total expenses | 26,402,599 | 6,731,061 | 29,502,580 | ||||||||||
| Less: Expenses waived (Note 3) | — | — | — | ||||||||||
| Expenses reduced by custodian fee expense offset arrangement (Note 3) | (131,137 | ) | (4,333 | ) | (193,342 | ) | |||||||
| Net expenses | 26,271,462 | 6,726,728 | 29,309,238 | ||||||||||
| Net investment income/(loss) | 63,706,192 | (1,081,749 | ) | 47,668,328 | |||||||||
| Realized and unrealized gain/(loss) on investments, written options and foreign currency transactions: | |||||||||||||
| Net realized gain on investments - unaffiliated issuers# | 146,065,083 | 103,626,275 | 58,826,479 | ||||||||||
| Net realized gain/(loss) on investments - affiliated issuers | 5,887,394 | — | — | ||||||||||
| Net realized gain on written equity options | — | — | 370,495 | ||||||||||
| Net realized gain/(loss) on foreign currency transactions | (309,294 | ) | 2,463 | 15,227,191 | |||||||||
| Net change in unrealized appreciation/(depreciation) on investments | (48,958,299 | ) | (61,111,690 | ) | 145,156,972 | ||||||||
| Net change in unrealized appreciation/(depreciation) on written equity options | 109,500 | — | 1,726,607 | ||||||||||
| Net change in unrealized appreciation/(depreciation) on translation of other assets and liabilities denominated in foreign currency | (114,419 | ) | (33,979 | ) | 8,384,294 | ||||||||
| Net change in deferred taxes on unrealized appreciation | — | — | — | ||||||||||
| Net gain/(loss) on investments and foreign currency transactions | 102,679,965 | 42,483,069 | 229,692,038 | ||||||||||
| Net increase/(decrease) in net assets resulting from operations | $ | 166,386,157 | $ | 41,401,320 | $ | 277,360,366 | |||||||
| * | Net of foreign withholding taxes of | $ | 2,257,688 | $ | 22,023 | $ | 1,810,635 | ||||||
| # | Net of foreign capital gains tax of | $ | — | $ | — | $ | — | ||||||
The accompanying notes are an integral part of the financial statements.
| 40 |
| International Value Fund | Focused Credit Fund | |||||
| $ | 31,332,734 | $ | 6,296,214 | |||
| — | — | |||||
| 304 | 247,278,297 | |||||
| — | — | |||||
| — | 40,930,089 | |||||
| — | — | |||||
| 2,992 | 1,294,988 | |||||
| 31,336,030 | 295,799,588 | |||||
| 10,896,871 | 21,083,384 | |||||
| 700,001 | 1,436,578 | |||||
| 224,001 | 186,974 | |||||
| 119,901 | 261,788 | |||||
| 124,739 | 200,051 | |||||
| 297,144 | 115,847 | |||||
| 81,015 | 275,834 | |||||
| 77,200 | 177,532 | |||||
| 47,946 | 154,611 | |||||
| 45,378 | 63,381 | |||||
| 67,051 | 2,959,116 | |||||
| 23,031 | 469,796 | |||||
| 45,965 | 233,914 | |||||
| — | 987,830 | |||||
| 70,028 | 93,100 | |||||
| 12,820,271 | 28,699,736 | |||||
| (517,819 | ) | — | ||||
| (30,906 | ) | (112,846 | ) | |||
| 12,271,546 | 28,586,890 | |||||
| 19,064,484 | 267,212,698 | |||||
| 94,214,067 | 19,124,304 | |||||
| (6,862,826 | ) | — | ||||
| — | — | |||||
| (2,769,091 | ) | 13,614,505 | ||||
| (160,409,707 | ) | (310,528,061 | ) | |||
| — | — | |||||
| (439,693 | ) | 3,618,547 | ||||
| (106,159 | ) | (143,002 | ) | |||
| (76,373,409 | ) | (274,313,707 | ) | |||
| $ | (57,308,925 | ) | $ | (7,101,009 | ) | |
| $ | 1,241,890 | $ | — | |||
| $ | 349,749 | $ | — | |||
The accompanying notes are an integral part of the financial statements.
| 41 |
Third Avenue Trust
Statements of Changes in Net Assets
| Value Fund | Small-Cap Value Fund | |||||||||||||||||||
| For the Year Ended October 31, 2014 | For the Year Ended October 31, 2013 | For the Year Ended October 31, 2014 | For the Year Ended October 31, 2013 | |||||||||||||||||
| Operations: | ||||||||||||||||||||
| Net investment income/(loss) | $ | 63,706,192 | $ | 38,144,508 | $ | (1,081,749 | ) | $ | 4,003,053 | |||||||||||
| Net realized gain | 151,643,183 | 200,578,894 | 103,628,738 | 41,069,148 | ||||||||||||||||
| Net change in unrealized appreciation/(depreciation) | (48,963,218 | ) | 292,412,333 | (61,145,669 | ) | 131,673,113 | ||||||||||||||
| Net increase/(decrease) in net assets resulting from operations | $ | 166,386,157 | $ | 531,135,735 | $ | 41,401,320 | $ | 176,745,314 | ||||||||||||
| Dividends and Distributions to Shareholders from: | ||||||||||||||||||||
| Net investment income: | ||||||||||||||||||||
| Investor Class | (1,149,550 | ) | (662,490 | ) | — | (56,749 | ) | |||||||||||||
| Institutional Class | (84,085,744 | ) | (67,040,237 | ) | (849,043 | ) | (5,943,573 | ) | ||||||||||||
| Net realized gains: | ||||||||||||||||||||
| Investor Class | — | — | (750,926 | ) | (182,590 | ) | ||||||||||||||
| Institutional Class | — | — | (40,845,424 | ) | (14,015,569 | ) | ||||||||||||||
| Decrease in net assets from dividends and distributions | (85,235,294 | ) | (67,702,727 | ) | (42,445,393 | ) | (20,198,481 | ) | ||||||||||||
| Capital Share Transactions: | ||||||||||||||||||||
| Proceeds from sale of shares | 88,843,094 | 108,651,386 | 20,936,904 | 39,489,467 | ||||||||||||||||
| Net asset value of shares issued in reinvestment of dividends and distributions | 80,139,122 | 62,685,199 | 41,203,254 | 19,454,567 | ||||||||||||||||
| Redemption fees | 13,858 | 37,496 | 3,629 | 9,098 | ||||||||||||||||
| Cost of shares redeemed | (716,104,569 | ) | (631,116,635 | ) | (220,855,475 | ) | (185,694,079 | ) | ||||||||||||
| Net increase/(decrease) in net assets resulting from capital share transactions | (547,108,495 | ) | (459,742,554 | ) | (158,711,688 | ) | (126,740,947 | ) | ||||||||||||
| Net increase/(decrease) in net assets | (465,957,632 | ) | 3,690,454 | (159,755,761 | ) | 29,805,886 | ||||||||||||||
| Net assets at beginning of year | 2,631,447,603 | 2,627,757,149 | 679,706,633 | 649,900,747 | ||||||||||||||||
| Net assets at end of year* | $ | 2,165,489,971 | $ | 2,631,447,603 | $ | 519,950,872 | $ | 679,706,633 | ||||||||||||
| * Including accumulated undistributed net investment income/ (distributions in excess of net investment income) of | $ | 71,992,748 | $ | 65,156,179 | $ | (5,660,013 | ) | $ | (6,399,388 | ) | ||||||||||
The accompanying notes are an integral part of the financial statements.
| 42 |
| Real Estate Value Fund | International Value Fund | Focused Credit Fund | ||||||||||||||||||||||||
| For the Year Ended October 31, 2014 | For the Year Ended October 31, 2013 | For the Year Ended October 31, 2014 | For the Year Ended October 31, 2013 | For the Year Ended October 31, 2014 | For the Year Ended October 31, 2013 | |||||||||||||||||||||
| $ | 47,668,328 | $ | 12,064,503 | $ | 19,064,484 | $ | 17,225,059 | $ | 267,212,698 | $ | 101,268,989 | |||||||||||||||
| 74,424,165 | 45,935,939 | 84,582,150 | 112,356,026 | 32,738,809 | 35,623,309 | |||||||||||||||||||||
| 155,267,873 | 303,563,601 | (160,955,559 | ) | 145,848,472 | (307,052,516 | ) | 40,390,810 | |||||||||||||||||||
| $ | 277,360,366 | $ | 361,564,043 | $ | (57,308,925 | ) | $ | 275,429,557 | $ | (7,101,009 | ) | $ | 177,283,108 | |||||||||||||
| (1,571,043 | ) | (1,984,170 | ) | (394,709 | ) | (132,718 | ) | (81,551,899 | ) | (33,907,910 | ) | |||||||||||||||
| (20,726,891 | ) | (55,413,731 | ) | (15,699,040 | ) | (10,467,684 | ) | (114,190,590 | ) | (59,015,537 | ) | |||||||||||||||
| (2,422,235 | ) | (3,241,659 | ) | — | — | — | — | |||||||||||||||||||
| (27,463,643 | ) | (85,265,725 | ) | — | — | — | — | |||||||||||||||||||
| (52,183,812 | ) | (145,905,285 | ) | (16,093,749 | ) | (10,600,402 | ) | (195,742,489 | ) | (92,923,447 | ) | |||||||||||||||
| 1,206,714,273 | 502,790,138 | 51,854,263 | 125,757,821 | 2,639,140,846 | 1,046,386,244 | |||||||||||||||||||||
| 49,667,615 | 137,806,815 | 14,817,419 | 9,818,297 | 165,082,808 | 77,209,559 | |||||||||||||||||||||
| 70,645 | 65,503 | 16,624 | 40,511 | 250,689 | 144,354 | |||||||||||||||||||||
| (402,672,506 | ) | (450,890,690 | ) | (899,641,397 | ) | (337,115,088 | ) | (1,400,052,915 | ) | (424,364,998 | ) | |||||||||||||||
| 853,780,027 | 189,771,766 | (832,953,091 | ) | (201,498,459 | ) | 1,404,421,428 | 699,375,159 | |||||||||||||||||||
| 1,078,956,581 | 405,430,524 | (906,355,765 | ) | 63,330,696 | 1,201,577,930 | 783,734,820 | ||||||||||||||||||||
| 2,155,726,419 | 1,750,295,895 | 1,258,119,701 | 1,194,789,005 | 1,768,443,491 | 984,708,671 | |||||||||||||||||||||
| $ | 3,234,683,000 | $ | 2,155,726,419 | $ | 351,763,936 | $ | 1,258,119,701 | $ | 2,970,021,421 | $ | 1,768,443,491 | |||||||||||||||
| $ | 24,181,494 | $ | (13,767,666 | ) | $ | 17,976,710 | $ | 12,726,420 | $ | 82,237,153 | $ | 26,719,035 | ||||||||||||||
The accompanying notes are an integral part of the financial statements.
| 43 |
Third Avenue Trust
Statement of Cash Flows
For the Year Ended October 31, 2014
| Focused Credit Fund | |||||
| Cash Flows from Operating Activities: | |||||
| Net decrease in net assets resulting from operations | $ | (7,101,009 | ) | ||
| Adjustments to reconcile net decrease in net assets resulting from operations to net cash used by operating activities: | |||||
| Purchases of long-term securities* | (2,600,204,918 | ) | |||
| Purchases of short-term securities | (54,461,720 | ) | |||
| Proceeds from sales and paydowns of long-term securities** | 1,336,207,523 | ||||
| Decrease in restricted cash pledged to counterparty for collateral management | 2,930,000 | ||||
| Net change in unrealized (appreciation)/depreciation on investment securities and deferred taxes | 310,671,063 | ||||
| Net realized gains from investment transactions | (19,124,304 | ) | |||
| Amortization of premium and discount - net | (66,099,283 | ) | |||
| Increase in interest and dividends receivable | (31,774,299 | ) | |||
| Payment-in-kind interest income and other non-cash receipt of income | (66,268,938 | ) | |||
| Net change in unrealized (appreciation)/depreciation on forward foreign currency contracts | (4,229,113 | ) | |||
| Increase in foreign currency held | (786,488 | ) | |||
| Increase in prepaid expenses, other assets and other receivables | (1,030,219 | ) | |||
| Increase in payable to Adviser | 840,396 | ||||
| Increase in accrued expenses and other liabilities | 3,269,938 | ||||
| Net Cash Used by Operating Activities | (1,197,161,371 | ) | |||
| Cash Flows from Financing Activities: | |||||
| Proceeds from issuance of shares | 2,640,572,511 | ||||
| Cash payments on shares redeemed net of redemption fees | (1,395,921,397 | ) | |||
| Distributions paid to shareholders | (30,659,681 | ) | |||
| Net Cash Provided by Financing Activities | 1,213,991,433 | ||||
| Cash: | |||||
| Net change in cash | 16,830,062 | ||||
| Cash at beginning of year | 179,818,324 | ||||
| Cash at end of year | $ | 196,648,386 | |||
| Cash Flow Information: | |||||
| Cash paid for interest | $ | 987,830 | |||
| Noncash Investing and Financing Activities: | |||||
| Capital shares issued in reinvestment of distributions paid to shareholders | $ | 165,082,808 | |||
| Noncash investment transactions - Mergers, restructurings, dividend reinvestments and payment-in-kind interest income | 572,581,024 | ||||
| * | Includes amounts for investments in securities sold short of $9,094,518. |
| ** | Includes amounts for investments in securities sold short of $9,562,468. |
The accompanying notes are an integral part of the financial statements.
| 44 |
Third Avenue Trust
Financial Highlights
Selected data (for a share outstanding throughout each period) and ratios are as follows:
| Third Avenue Value Fund | ||||||||||||||||||||||
| Years Ended October 31, | For the Period Ended October 31, | |||||||||||||||||||||
| 2014 | 2013 | 2012 | 2011 | 2010* | ||||||||||||||||||
| Investor Class: | ||||||||||||||||||||||
| Net asset value, beginning of period | $57.73 | $48.47 | $44.00 | $50.09 | $46.32 | |||||||||||||||||
| Income/(loss) from investment operations: | ||||||||||||||||||||||
| Net investment income@ | 1.39 | ± | 0.61 | ** | 0.27 | 0.37 | 0.59 | |||||||||||||||
| Net gain/(loss) on investment transactions (both realized and unrealized) | 2.22 | 3 | 9.89 | 3 | 4.99 | 2 | (5.56 | )2 | 3.18 | 1 | ||||||||||||
| Total from investment operations | 3.61 | 10.50 | 5.26 | (5.19 | ) | 3.77 | ||||||||||||||||
| Less dividends and distributions to shareholders: | ||||||||||||||||||||||
| Dividends from net investment income | (1.80 | ) | (1.24 | ) | (0.79 | ) | (0.90 | ) | — | |||||||||||||
| Total dividends and distributions | (1.80 | ) | (1.24 | ) | (0.79 | ) | (0.90 | ) | — | |||||||||||||
| Net asset value, end of period | $59.54 | $57.73 | $48.47 | $44.00 | $50.09 | |||||||||||||||||
| Total return4 | 6.45 | % | 22.07 | % | 12.36 | % | (10.62 | %) | 8.16 | %5 | ||||||||||||
| Ratios/Supplemental Data: | ||||||||||||||||||||||
| Net assets, end of period (in thousands) | $ | 33,936 | $ | 36,811 | $ | 25,796 | $ | 25,547 | $ | 18,553 | ||||||||||||
| Ratio of expenses to average net assets | ||||||||||||||||||||||
| Before fee waivers/expense offset arrangement/recovery | 1.33 | % | 1.35 | % | 1.36 | % | 1.38 | % | 1.46 | %6 | ||||||||||||
| After fee waivers/expense offset arrangement/recovery7 | 1.32 | % | 1.35 | %† | 1.40 | %† | 1.40 | %† | 1.40 | %6# | ||||||||||||
| Ratio of net investment income to average net assets | 2.36 | %± | 1.15 | %** | 0.61 | % | 0.75 | % | 1.54 | %6 | ||||||||||||
| Portfolio turnover rate | 31 | % | 21 | % | 16 | % | 6 | % | 2 | %5 | ||||||||||||
| 1 | Includes redemption fees of $0.04 per share. |
| 2 | Includes redemption fees of $0.01 per share. |
| 3 | Includes redemption fees of less than $0.01 per share. |
| 4 | Performance figures may reflect fee waivers, expense offset arrangement and/or recovery of previously waived fees. Past performance is no guarantee of future results. Total return would have been lower if the Adviser had not waived certain expenses. Conversely, total return would have been higher if the Adviser had not recovered previously waived expenses. Total return is calculated assuming an initial investment made at the net asset value at the beginning of the period, reinvestment of all dividends and distributions at net asset value during the period and redemption on the last day of the period and is not annualized. |
| 5 | Not annualized. |
| 6 | Annualized. |
| 7 | As a result of an expense limitation, the ratio of expenses (exclusive of taxes, interest, brokerage commissions, acquired fund fees and expenses, and extraordinary items) to average net assets will not exceed 1.40%. |
| † | The Adviser recovered a portion of its previously waived fees. |
| # | The Adviser waived a portion of its fees. |
| * | Period from December 31, 2009 (commencement of operations) through October 31, 2010. |
| ** | Investment income per share reflects a special dividend received during the period which amounted to $0.44 per share. Excluding the special dividend, the ratio of net investment income to average net assets would have been 0.33%. |
| ± | Investment income per share reflects special dividends received during the period which amounted to $0.41 per share. Excluding the special dividends, the ratio of net investment income to average net assets would have been 1.67%. |
| @ | Calculated based on the average number of shares outstanding during the period. |
The accompanying notes are an integral part of the financial statements.
| 45 |
Third Avenue Trust
Financial Highlights
Selected data (for a share outstanding throughout each year) and ratios are as follows:
| Third Avenue Value Fund | |||||||||||||||||||||
| Years Ended October 31, | |||||||||||||||||||||
| 2014 | 2013 | 2012 | 2011 | 2010 | |||||||||||||||||
| Institutional Class: | |||||||||||||||||||||
| Net asset value, beginning of year | $57.86 | $48.53 | $44.08 | $50.13 | $44.60 | ||||||||||||||||
| Income/(loss) from investment operations: | |||||||||||||||||||||
| Net investment income@ | 1.53 | ± | 0.77 | ** | 0.37 | 0.43 | 0.71 | ||||||||||||||
| Net gain/(loss) on investment transactions (both realized and unrealized)1 | 2.23 | 9.87 | 4.98 | (5.51 | ) | 5.96 | |||||||||||||||
| Total from investment operations | 3.76 | 10.64 | 5.35 | (5.08 | ) | 6.67 | |||||||||||||||
| Less dividends and distributions to shareholders: | |||||||||||||||||||||
| Dividends from net investment income | (1.93 | ) | (1.31 | ) | (0.90 | ) | (0.97 | ) | (1.14 | ) | |||||||||||
| Total dividends and distributions | (1.93 | ) | (1.31 | ) | (0.90 | ) | (0.97 | ) | (1.14 | ) | |||||||||||
| Net asset value, end of year | $59.69 | $57.86 | $48.53 | $44.08 | $50.13 | ||||||||||||||||
| Total return2 | 6.70 | % | 22.40 | % | 12.61 | % | (10.42 | %) | 15.25 | % | |||||||||||
| Ratios/Supplemental Data: | |||||||||||||||||||||
| Net assets, end of year (in thousands) | $ | 2,131,554 | $ | 2,594,637 | $ | 2,601,961 | $ | 3,451,647 | $ | 5,040,109 | |||||||||||
| Ratio of expenses to average net assets | |||||||||||||||||||||
| Before fee waivers/expense offset arrangement/recovery | 1.08 | % | 1.10 | % | 1.11 | % | 1.13 | % | 1.19 | % | |||||||||||
| After fee waivers/expense offset arrangement/recovery3 | 1.07 | % | 1.10 | %† | 1.15 | %† | 1.15 | %† | 1.15 | %# | |||||||||||
| Ratio of net investment income to average net assets | 2.61 | %± | 1.45 | %** | 0.83 | % | 0.86 | % | 1.55 | % | |||||||||||
| Portfolio turnover rate | 31 | % | 21 | % | 16 | % | 6 | % | 2 | % | |||||||||||
| 1 | Includes redemption fees of less than $0.01 per share. |
| 2 | Performance figures may reflect fee waivers, expense offset arrangement and/or recovery of previously waived fees. Past performance is no guarantee of future results. Total return would have been lower if the Adviser had not waived certain expenses. Conversely, total return would have been higher if the Adviser had not recovered previously waived expenses. Total return is calculated assuming an initial investment made at the net asset value at the beginning of the period, reinvestment of all dividends and distributions at net asset value during the period and redemption on the last day of the period and is not annualized. |
| 3 | As a result of an expense limitation, the ratio of expenses (exclusive of taxes, interest, brokerage commissions, acquired fund fees and expenses, and extraordinary items) to average net assets will not exceed 1.15% effective December 31, 2009. |
| † | The Adviser recovered a portion of its previously waived fees. |
| # | The Adviser waived a portion of its fees. |
| ** | Investment income per share reflects a special dividend received during the period which amounted to $0.44 per share. Excluding the special dividend, the ratio of net investment income to average net assets would have been 0.63%. |
| ± | Investment income per share reflects special dividends received during the period which amounted to $0.41 per share. Excluding the special dividends, the ratio of net investment income to average net assets would have been 1.92%. |
| @ | Calculated based on the average number of shares outstanding during the year. |
The accompanying notes are an integral part of the financial statements.
| 46 |
Third Avenue Trust
Financial Highlights
Selected data (for a share outstanding throughout each period) and ratios are as follows:
| Third Avenue Small-Cap Value Fund | ||||||||||||||||||||||
| For the Period | ||||||||||||||||||||||
| Ended | ||||||||||||||||||||||
| Years Ended October 31, | October 31, | |||||||||||||||||||||
| 2014 | 2013 | 2012 | 2011 | 2010* | ||||||||||||||||||
| Investor Class: | ||||||||||||||||||||||
| Net asset value, beginning of period | $28.10 | $22.13 | $20.25 | $19.35 | $18.19 | |||||||||||||||||
| Income/(loss) from investment operations: | ||||||||||||||||||||||
| Net investment income/(loss)@ | (0.11 | ) | 0.06 | ** | (0.04 | ) | (0.01 | ) | 0.02 | |||||||||||||
| Net gain on investment transactions (both realized and unrealized) | 1.96 | 2 | 6.57 | 2 | 2.01 | 2 | 1.10 | 1 | 1.14 | 2 | ||||||||||||
| Total from investment operations | 1.85 | 6.63 | 1.97 | 1.09 | 1.16 | |||||||||||||||||
| Less dividends and distributions to shareholders: | ||||||||||||||||||||||
| Dividends from net investment income | — | (0.16 | ) | (0.02 | ) | (0.19 | ) | — | ||||||||||||||
| Distributions from realized gains | (1.77 | ) | (0.50 | ) | (0.07 | ) | — | — | ||||||||||||||
| Total dividends and distributions | (1.77 | ) | (0.66 | ) | (0.09 | ) | (0.19 | ) | — | |||||||||||||
| Net asset value, end of period | $28.18 | $28.10 | $22.13 | $20.25 | $19.35 | |||||||||||||||||
| Total return3 | 6.85 | % | 30.74 | % | 9.77 | % | 5.58 | % | 6.38 | %4 | ||||||||||||
| Ratios/Supplemental Data: | ||||||||||||||||||||||
| Net assets, end of period (in thousands) | $ | 9,898 | $ | 11,995 | $ | 8,216 | $ | 7,490 | $ | 4,505 | ||||||||||||
| Ratio of expenses to average net assets | ||||||||||||||||||||||
| Before fee waivers/expense offset arrangement/recovery | 1.35 | % | 1.37 | % | 1.38 | % | 1.39 | % | 1.42 | %5 | ||||||||||||
| After fee waivers/expense offset arrangement/recovery6 | 1.35 | % | 1.37 | % | 1.38 | %† | 1.40 | %† | 1.40 | %5# | ||||||||||||
| Ratio of net investment income/(loss) to average net assets | (0.41 | %) | 0.25 | %** | (0.18 | %) | (0.07 | %) | 0.10 | %5 | ||||||||||||
| Portfolio turnover rate | 40 | % | 39 | % | 33 | % | 34 | % | 9 | %4 | ||||||||||||
| 1 | Includes redemption fees of $0.02 per share. |
| 2 | Includes redemption fees of less than $0.01 per share. |
| 3 | Performance figures may reflect fee waivers, expense offset arrangement and/or recovery of previously waived fees. Past performance is no guarantee of future results. Total return would have been lower if the Adviser had not waived certain expenses. Conversely, total return would have been higher if the Adviser had not recovered previously waived expenses. Total return is calculated assuming an initial investment made at the net asset value at the beginning of the period, reinvestment of all dividends and distributions at net asset value during the period and redemption on the last day of the period and is not annualized. |
| 4 | Not annualized. |
| 5 | Annualized. |
| 6 | As a result of an expense limitation, the ratio of expenses (exclusive of taxes, interest, brokerage commissions, acquired fund fees and expenses, and extraordinary items) to average net assets will not exceed 1.40%. |
| † | The Adviser recovered a portion of its previously waived fees. |
| # | The Adviser waived a portion of its fees. |
| * | Period from December 31, 2009 (commencement of operations) through October 31, 2010. |
| ** | Investment income per share reflects special dividends received during the period which amounted to $0.11 per share. Excluding the special dividends, the ratio of net investment income/(loss) to average net assets would have been (0.18%). |
| @ | Calculated based on the average number of shares outstanding during the period. |
The accompanying notes are an integral part of the financial statements.
| 47 |
Third Avenue Trust
Financial Highlights
Selected data (for a share outstanding throughout each year) and ratios are as follows:
| Third Avenue Small-Cap Value Fund | |||||||||||||||||||||
| Years Ended October 31, | |||||||||||||||||||||
| 2014 | 2013 | 2012 | 2011 | 2010 | |||||||||||||||||
| Institutional Class: | |||||||||||||||||||||
| Net asset value, beginning of year | $28.16 | $22.18 | $20.30 | $19.38 | $17.17 | ||||||||||||||||
| Income/(loss) from investment operations: | |||||||||||||||||||||
| Net investment income/(loss)@ | (0.05 | ) | 0.15 | ** | 0.01 | 0.03 | 0.12 | ||||||||||||||
| Net gain on investment transactions (both realized and unrealized)1 | 1.97 | 6.54 | 2.01 | 1.10 | 2.23 | ||||||||||||||||
| Total from investment operations | 1.92 | 6.69 | 2.02 | 1.13 | 2.35 | ||||||||||||||||
| Less dividends and distributions to shareholders: | |||||||||||||||||||||
| Dividends from net investment income | (0.04 | ) | (0.21 | ) | (0.07 | ) | (0.21 | ) | (0.14 | ) | |||||||||||
| Distributions from realized gains | (1.77 | ) | (0.50 | ) | (0.07 | ) | — | — | |||||||||||||
| Total dividends and distributions | (1.81 | ) | (0.71 | ) | (0.14 | ) | (0.21 | ) | (0.14 | ) | |||||||||||
| Net asset value, end of year | $28.27 | $28.16 | $22.18 | $20.30 | $19.38 | ||||||||||||||||
| Total return2 | 7.09 | % | 31.05 | % | 9.99 | % | 5.80 | % | 13.73 | % | |||||||||||
| Ratios/Supplemental Data: | |||||||||||||||||||||
| Net assets, end of year (in thousands) | $ | 510,053 | $ | 667,712 | $ | 641,684 | $ | 794,495 | $ | 1,050,173 | |||||||||||
| Ratio of expenses to average net assets | |||||||||||||||||||||
| Before fee waivers/expense offset arrangement/recovery | 1.10 | % | 1.12 | % | 1.13 | % | 1.14 | % | 1.16 | % | |||||||||||
| After fee waivers/expense offset arrangement/recovery3 | 1.10 | % | 1.12 | % | 1.13 | %† | 1.15 | %† | 1.14 | %# | |||||||||||
| Ratio of net investment income/(loss) to average net assets | (0.17 | %) | 0.62 | %** | 0.07 | % | 0.15 | % | 0.65 | % | |||||||||||
| Portfolio turnover rate | 40 | % | 39 | % | 33 | % | 34 | % | 9 | % | |||||||||||
| 1 | Includes redemption fees of less than $0.01 per share. |
| 2 | Performance figures may reflect fee waivers, expense offset arrangement and/or recovery of previously waived fees. Past performance is no guarantee of future results. Total return would have been lower if the Adviser had not waived certain expenses. Conversely, total return would have been higher if the Adviser had not recovered previously waived expenses. Total return is calculated assuming an initial investment made at the net asset value at the beginning of the period, reinvestment of all dividends and distributions at net asset value during the period and redemption on the last day of the period and is not annualized. |
| 3 | As a result of an expense limitation, the ratio of expenses (exclusive of taxes, interest, brokerage commissions, acquired fund fees and expenses, and extraordinary items) to average net assets will not exceed 1.15% effective December 31, 2009. |
| † | The Adviser recovered a portion of its previously waived fees. |
| # | The Adviser waived a portion of its fees. |
| ** | Investment income per share reflects special dividends received during the period which amounted to $0.11 per share. Excluding the special dividends, the ratio of net investment income to average net assets would have been 0.19%. |
| @ | Calculated based on the average number of shares outstanding during the year. |
The accompanying notes are an integral part of the financial statements.
| 48 |
Third Avenue Trust
Financial Highlights
Selected data (for a share outstanding throughout each period) and ratios are as follows:
| Third Avenue Real Estate Value Fund | ||||||||||||||||||||||
| For the Period | ||||||||||||||||||||||
| Ended | ||||||||||||||||||||||
| Years Ended October 31, | October 31, | |||||||||||||||||||||
| 2014 | 2013 | 2012 | 2011 | 2010* | ||||||||||||||||||
| Investor Class: | ||||||||||||||||||||||
| Net asset value, beginning of period | $29.40 | $26.53 | $21.40 | $22.90 | $20.47 | |||||||||||||||||
| Income/(loss) from investment operations: | ||||||||||||||||||||||
| Net investment income@ | 0.50 | ± | 0.10 | 0.16 | 0.02 | 0.40 | ||||||||||||||||
| Net gain/(loss) on investment transactions (both realized and unrealized)1 | 2.60 | 4.99 | 4.97 | (0.63 | ) | 2.03 | ||||||||||||||||
| Total from investment operations | 3.10 | 5.09 | 5.13 | (0.61 | ) | 2.43 | ||||||||||||||||
| Less dividends and distributions to shareholders: | ||||||||||||||||||||||
| Dividends from net investment income | (0.26 | ) | (0.84 | ) | — | (0.89 | ) | — | ||||||||||||||
| Distributions from realized gains | (0.40 | ) | (1.38 | ) | — | — | — | |||||||||||||||
| Total dividends and distributions | (0.66 | ) | (2.22 | ) | — | (0.89 | ) | — | ||||||||||||||
| Net asset value, end of period | $31.84 | $29.40 | $26.53 | $21.40 | $22.90 | |||||||||||||||||
| Total return2 | 10.84 | % | 20.61 | % | 23.97 | % | (2.89 | %) | 11.87 | %3 | ||||||||||||
| Ratios/Supplemental Data: | ||||||||||||||||||||||
| Net assets, end of period (in thousands) | $ | 367,834 | $ | 145,169 | $ | 60,684 | $ | 48,327 | $ | 28,594 | ||||||||||||
| Ratio of expenses to average net assets | ||||||||||||||||||||||
| Before fee waivers/expense offset arrangement/recovery | 1.34 | % | 1.34 | % | 1.34 | % | 1.38 | % | 1.44 | %4 | ||||||||||||
| After fee waivers/expense offset arrangement/recovery5 | 1.33 | % | 1.33 | % | 1.34 | % | 1.40 | %† | 1.40 | %4# | ||||||||||||
| Ratio of net investment income to average net assets | 1.63 | %± | 0.36 | % | 0.68 | % | 0.11 | % | 2.27 | %4 | ||||||||||||
| Portfolio turnover rate | 14 | % | 13 | % | 4 | % | 32 | % | 26 | %3 | ||||||||||||
| 1 | Includes redemption fees of less than $0.01 per share. |
| 2 | Performance figures may reflect fee waivers, expense offset arrangement and/or recovery of previously waived fees. Past performance is no guarantee of future results. Total return would have been lower if the Adviser had not waived certain expenses. Conversely, total return would have been higher if the Adviser had not recovered previously waived expenses. Total return is calculated assuming an initial investment made at the net asset value at the beginning of the period, reinvestment of all dividends and distributions at net asset value during the period and redemption on the last day of the period and is not annualized. |
| 3 | Not annualized. |
| 4 | Annualized. |
| 5 | As a result of an expense limitation, the ratio of expenses (exclusive of taxes, interest, brokerage commissions, acquired fund fees and expenses, and extraordinary items) to average net assets will not exceed 1.40%. |
| † | The Adviser recovered previously waived fees. |
| # | The Adviser waived a portion of its fees. |
| * | Period from December 31, 2009 (commencement of operations) through October 31, 2010. |
| ± | Investment income per share reflects a special dividend received during the period which amounted to $0.06 per share. Excluding the special dividend, the ratio of net investment income to average net assets would have been 1.43%. |
| @ | Calculated based on the average number of shares outstanding during the period. |
The accompanying notes are an integral part of the financial statements.
| 49 |
Third Avenue Trust
Financial Highlights
Selected data (for a share outstanding throughout each year) and ratios are as follows:
| Third Avenue Real Estate Value Fund | |||||||||||||||||||||
| Years Ended October 31, | |||||||||||||||||||||
| 2014 | 2013 | 2012 | 2011 | 2010 | |||||||||||||||||
| Institutional Class: | |||||||||||||||||||||
| Net asset value, beginning of year | $29.56 | $26.66 | $21.45 | $22.93 | $19.86 | ||||||||||||||||
| Income/(loss) from investment operations: | |||||||||||||||||||||
| Net investment income@ | 0.56 | ± | 0.18 | 0.22 | 0.06 | 0.44 | |||||||||||||||
| Net gain/(loss) on investment transactions (both realized and unrealized) | 2.63 | 1 | 4.99 | 1 | 4.99 | 1 | (0.62 | )1 | 2.89 | 2 | |||||||||||
| Total from investment operations | 3.19 | 5.17 | 5.21 | (0.56 | ) | 3.33 | |||||||||||||||
| Less dividends and distributions to shareholders: | |||||||||||||||||||||
| Dividends from net investment income | (0.30 | ) | (0.89 | ) | — | (0.92 | ) | (0.26 | ) | ||||||||||||
| Distributions from realized gains | (0.40 | ) | (1.38 | ) | — | — | — | ||||||||||||||
| Total dividends and distributions | (0.70 | ) | (2.27 | ) | — | (0.92 | ) | (0.26 | ) | ||||||||||||
| Net asset value, end of year | $32.05 | $29.56 | $26.66 | $21.45 | $22.93 | ||||||||||||||||
| Total return3 | 11.11 | % | 20.87 | % | 24.29 | % | (2.66 | %) | 16.94 | % | |||||||||||
| Ratios/Supplemental Data: | |||||||||||||||||||||
| Net assets, end of year (in thousands) | $ | 2,866,849 | $ | 2,010,557 | $ | 1,689,612 | $ | 1,579,121 | $ | 1,652,647 | |||||||||||
| Ratio of expenses to average net assets | |||||||||||||||||||||
| Before fee waivers/expense offset arrangement/recovery | 1.09 | % | 1.09 | % | 1.09 | % | 1.13 | % | 1.18 | % | |||||||||||
| After fee waivers/expense offset arrangement/recovery4 | 1.08 | % | 1.08 | % | 1.09 | % | 1.15 | %† | 1.14 | %# | |||||||||||
| Ratio of net investment income to average net assets | 1.82 | %± | 0.65 | % | 0.96 | % | 0.26 | % | 2.09 | % | |||||||||||
| Portfolio turnover rate | 14 | % | 13 | % | 4 | % | 32 | % | 26 | % | |||||||||||
| 1 | Includes redemption fees of less than $0.01 per share. |
| 2 | Includes redemption fees of $0.01 per share. |
| 3 | Performance figures may reflect fee waivers, expense offset arrangement and/or recovery of previously waived fees. Past performance is no guarantee of future results. Total return would have been lower if the Adviser had not waived certain expenses. Conversely, total return would have been higher if the Adviser had not recovered previously waived expenses. Total return is calculated assuming an initial investment made at the net asset value at the beginning of the period, reinvestment of all dividends and distributions at net asset value during the period and redemption on the last day of the period and is not annualized. |
| 4 | As a result of an expense limitation, the ratio of expenses (exclusive of taxes, interest, brokerage commissions, acquired fund fees and expenses, and extraordinary items) to average net assets will not exceed 1.15% effective December 31, 2009. |
| † | The Adviser recovered previously waived fees. |
| # | The Adviser waived a portion of its fees. |
| ± | Investment income per share reflects a special dividend received during the period which amounted to $0.06 per share. Excluding the special dividend, the ratio of net investment income to average net assets would have been 1.62%. |
| @ | Calculated based on the average number of shares outstanding during the year. |
The accompanying notes are an integral part of the financial statements.
| 50 |
Third Avenue Trust
Financial Highlights
Selected data (for a share outstanding throughout each period) and ratios are as follows:
| Third Avenue International Value Fund | ||||||||||||||||||||||
| For the Period | ||||||||||||||||||||||
| Ended | ||||||||||||||||||||||
| Years Ended October 31, | October 31, | |||||||||||||||||||||
| 2014 | 2013 | 2012 | 2011 | 2010* | ||||||||||||||||||
| Investor Class: | ||||||||||||||||||||||
| Net asset value, beginning of period | $19.96 | $16.14 | $15.29 | $16.31 | $15.51 | |||||||||||||||||
| Income/(loss) from investment operations: | ||||||||||||||||||||||
| Net investment income@ | 0.39 | ± | 0.25 | ** | 0.08 | 0.09 | 0.32 | |||||||||||||||
| Net gain/(loss) on investment transactions (both realized and unrealized)1 | (2.55 | ) | 3.68 | 0.99 | (0.85 | ) | 0.48 | |||||||||||||||
| Total from investment operations | (2.16 | ) | 3.93 | 1.07 | (0.76 | ) | 0.80 | |||||||||||||||
| Less dividends and distributions to shareholders: | �� | |||||||||||||||||||||
| Dividends from net investment income | (0.22 | ) | (0.11 | ) | (0.22 | ) | (0.26 | ) | — | |||||||||||||
| Total dividends and distributions | (0.22 | ) | (0.11 | ) | (0.22 | ) | (0.26 | ) | — | |||||||||||||
| Net asset value, end of period | $17.58 | $19.96 | $16.14 | $15.29 | $16.31 | |||||||||||||||||
| Total return2 | (10.96 | %) | 24.49 | % | 7.20 | % | (4.76 | %) | 5.16 | %4 | ||||||||||||
| Ratios/Supplemental Data: | ||||||||||||||||||||||
| Net assets, end of period (in thousands) | $ | 12,266 | $ | 35,013 | $ | 18,533 | $ | 13,997 | $ | 6,920 | ||||||||||||
| Ratio of expenses to average net assets | ||||||||||||||||||||||
| Before fee waivers and expense offset arrangement | 1.71 | % | 1.69 | % | 1.69 | % | 1.69 | % | 1.77 | %5 | ||||||||||||
| After fee waivers and expense offset arrangement3# | 1.65 | % | 1.65 | % | 1.65 | % | 1.65 | % | 1.65 | %5 | ||||||||||||
| Ratio of net investment income to average net assets | 1.99 | %± | 1.37 | %** | 0.53 | % | 0.56 | % | 2.55 | %5 | ||||||||||||
| Portfolio turnover rate | 22 | % | 11 | % | 20 | % | 24 | % | 13 | %4 | ||||||||||||
| 1 | Includes redemption fees of less than $0.01 per share. |
| 2 | Performance figures may reflect fee waivers and/or expense offset arrangement. Past performance is no guarantee of future results. In the absence of fee waivers and/or expense offset arrangement, the total return would have been lower. Total return is calculated assuming an initial investment made at the net asset value at the beginning of the period, reinvestment of all dividends and distributions at net asset value during the period and redemption on the last day of the period and is not annualized. |
| 3 | As a result of an expense limitation, the ratio of expenses (exclusive of taxes, interest, brokerage commissions, acquired fund fees and expenses, and extraordinary items) to average net assets will not exceed 1.65%. |
| 4 | Not annualized. |
| 5 | Annualized. |
| # | The Adviser waived a portion of its fees. |
| * | Period from December 31, 2009 (commencement of operations) through October 31, 2010. |
| ** | Investment income per share reflects a special dividend received during the period which amounted to $0.15 per share. Excluding the special dividend, the ratio of net investment income to average net assets would have been 0.53%. |
| ± | Investment income per share reflects special dividends received during the period which amounted to $0.12 per share. Excluding the special dividends, the ratio of net investment income to average net assets would have been 1.39%. |
| @ | Calculated based on the average number of shares outstanding during the period. |
The accompanying notes are an integral part of the financial statements.
| 51 |
Third Avenue Trust
Financial Highlights
Selected data (for a share outstanding throughout each year) and ratios are as follows:
| Third Avenue International Value Fund | |||||||||||||||||||||
| Years Ended October 31, | |||||||||||||||||||||
| 2014 | 2013 | 2012 | 2011 | 2010 | |||||||||||||||||
| Institutional Class: | |||||||||||||||||||||
| Net asset value, beginning of year | $20.00 | $16.16 | $15.33 | $16.33 | $15.18 | ||||||||||||||||
| Income/(loss) from investment operations: | |||||||||||||||||||||
| Net investment income@ | 0.43 | ± | 0.25 | ** | 0.12 | 0.10 | 0.24 | ||||||||||||||
| Net gain/(loss) on investment transactions (both realized and unrealized)1 | (2.54 | ) | 3.74 | 0.97 | (0.81 | ) | 1.09 | ||||||||||||||
| Total from investment operations | (2.11 | ) | 3.99 | 1.09 | (0.71 | ) | 1.33 | ||||||||||||||
| Less dividends and distributions to shareholders: | |||||||||||||||||||||
| Dividends from net investment income | (0.26 | ) | (0.15 | ) | (0.26 | ) | (0.29 | ) | (0.18 | ) | |||||||||||
| Total dividends and distributions | (0.26 | ) | (0.15 | ) | (0.26 | ) | (0.29 | ) | (0.18 | ) | |||||||||||
| Net asset value, end of year | $17.63 | $20.00 | $16.16 | $15.33 | $16.33 | ||||||||||||||||
| Total return2 | (10.79 | %) | 24.89 | % | 7.39 | % | (4.51 | %) | 8.84 | % | |||||||||||
| Ratios/Supplemental Data: | |||||||||||||||||||||
| Net assets, end of year (in thousands) | $ | 339,498 | $ | 1,223,107 | $ | 1,176,256 | $ | 1,277,674 | $ | 1,517,296 | |||||||||||
| Ratio of expenses to average net assets | |||||||||||||||||||||
| Before fee waivers and expense offset arrangement | 1.46 | % | 1.44 | % | 1.44 | % | 1.44 | % | 1.51 | % | |||||||||||
| After fee waivers and expense offset arrangement3# | 1.40 | % | 1.40 | % | 1.40 | % | 1.40 | % | 1.40 | % | |||||||||||
| Ratio of net investment income to average net assets | 2.19 | %± | 1.40 | %** | 0.80 | % | 0.58 | % | 1.58 | % | |||||||||||
| Portfolio turnover rate | 22 | % | 11 | % | 20 | % | 24 | % | 13 | % | |||||||||||
| 1 | Includes redemption fees of less than $0.01 per share. |
| 2 | Performance figures may reflect fee waivers and/or expense offset arrangement. Past performance is no guarantee of future results. In the absence of fee waivers and/or expense offset arrangement, the total return would have been lower. Total return is calculated assuming an initial investment made at the net asset value at the beginning of the period, reinvestment of all dividends and distributions at net asset value during the period and redemption on the last day of the period and is not annualized. |
| 3 | As a result of an expense limitation, the ratio of expenses (exclusive of taxes, interest, brokerage commissions, acquired fund fees and expenses, and extraordinary items) to average net assets will not exceed 1.40%. |
| # | The Adviser waived a portion of its fees. |
| ** | Investment income per share reflects a special dividend received during the period which amounted to $0.15 per share. Excluding the special dividend, the ratio of net investment income to average net assets would have been 0.56%. |
| ± | Investment income per share reflects special dividends received during the period which amounted to $0.12 per share. Excluding the special dividends, the ratio of net investment income to average net assets would have been 1.59%. |
| @ | Calculated based on the average number of shares outstanding during the year. |
The accompanying notes are an integral part of the financial statements.
| 52 |
Third Avenue Trust
Financial Highlights
Selected data (for a share outstanding throughout each year) and ratios are as follows:
| Third Avenue Focused Credit Fund | |||||||||||||||||||||
| Years Ended October 31, | |||||||||||||||||||||
| 2014 | 2013 | 2012 | 2011 | 2010 | |||||||||||||||||
| Investor Class: | |||||||||||||||||||||
| Net asset value, beginning of year | $11.08 | $10.25 | $10.51 | $11.36 | $10.25 | ||||||||||||||||
| Income/(loss) from investment operations: | |||||||||||||||||||||
| Net investment income@ | 1.09 | 0.88 | 0.76 | 0.85 | 0.83 | ||||||||||||||||
| Net gain/(loss) on investment transactions (both realized and unrealized) | (0.76 | )1 | 0.78 | 1 | 0.13 | 1 | (0.81 | )2 | 0.89 | 3 | |||||||||||
| Total from investment operations | 0.33 | 1.66 | 0.89 | 0.04 | 1.72 | ||||||||||||||||
| Less dividends and distributions to shareholders: | |||||||||||||||||||||
| Dividends from net investment income | (0.80 | ) | (0.83 | ) | (0.69 | ) | (0.79 | ) | (0.60 | ) | |||||||||||
| Distributions from realized gains | — | — | (0.46 | ) | (0.10 | ) | (0.01 | ) | |||||||||||||
| Total dividends and distributions | (0.80 | ) | (0.83 | ) | (1.15 | ) | (0.89 | ) | (0.61 | ) | |||||||||||
| Net asset value, end of year | $10.61 | $11.08 | $10.25 | $10.51 | $11.36 | ||||||||||||||||
| Total return4 | 2.67 | % | 16.61 | % | 9.60 | % | 0.24 | % | 17.19 | % | |||||||||||
| Ratios/Supplemental Data: | |||||||||||||||||||||
| Net assets, end of year (in thousands) | $ | 920,914 | $ | 752,422 | $ | 335,216 | $ | 338,098 | $ | 248,975 | |||||||||||
| Ratio of expenses to average net assets | |||||||||||||||||||||
| Before fee waivers/expense offset arrangement/recovery | 1.16 | % | 1.16 | % | 1.14 | % | 1.18 | % | 1.20 | % | |||||||||||
| After fee waivers/expense offset arrangement/recovery5 | 1.15 | % | 1.16 | % | 1.14 | % | 1.18 | % | 1.21 | %† | |||||||||||
| Before interest expense | 1.13 | % | 1.16 | % | 1.14 | % | 1.18 | % | 1.21 | %† | |||||||||||
| Ratio of net investment income to average net assets | 9.35 | % | 8.12 | % | 7.61 | % | 7.64 | % | 7.69 | % | |||||||||||
| Portfolio turnover rate | 53 | % | 58 | % | 72 | % | 105 | % | 129 | % | |||||||||||
| 1 | Includes redemption fees of less than $0.01 per share. |
| 2 | Includes redemption fees of $0.01 per share. |
| 3 | Includes redemption fees of $0.02 per share. |
| 4 | Performance figures may reflect fee waivers, expense offset arrangement and/or recovery of previously waived fees. Past performance is no guarantee of future results. Total return would have been lower if the Adviser had not waived certain expenses. Conversely, total return would have been higher if the Adviser had not recovered previously waived expenses. Total return is calculated assuming an initial investment made at the net asset value at the beginning of the period, reinvestment of all dividends and distributions at net asset value during the period and redemption on the last day of the period and is not annualized. |
| 5 | As a result of an expense limitation, the ratio of expenses (exclusive of taxes, interest, brokerage commissions, acquired fund fees and expenses, and extraordinary items) to average net assets will not exceed 1.40%. Effective March 11, 2011, the expense limitation has been reduced to 1.20%. |
| † | The Adviser recovered previously waived fees. |
| @ | Calculated based on the average number of shares outstanding during the year. |
The accompanying notes are an integral part of the financial statements.
| 53 |
Third Avenue Trust
Financial Highlights
Selected data (for a share outstanding throughout each year) and ratios are as follows:
| Third Avenue Focused Credit Fund | |||||||||||||||||||||
| Years Ended October 31, | |||||||||||||||||||||
| 2014 | 2013 | 2012 | 2011 | 2010 | |||||||||||||||||
| Institutional Class: | |||||||||||||||||||||
| Net asset value, beginning of year | $11.07 | $10.24 | $10.50 | $11.36 | $10.26 | ||||||||||||||||
| Income/(loss) from investment operations: | |||||||||||||||||||||
| Net investment income@ | 1.12 | 0.92 | 0.79 | 0.88 | 0.86 | ||||||||||||||||
| Net gain/(loss) on investment transactions (both realized and unrealized)1 | (0.77 | ) | 0.77 | 0.13 | (0.83 | ) | 0.87 | ||||||||||||||
| Total from investment operations | 0.35 | 1.69 | 0.92 | 0.05 | 1.73 | ||||||||||||||||
| Less dividends and distributions to shareholders: | |||||||||||||||||||||
| Dividends from net investment income | (0.82 | ) | (0.86 | ) | (0.72 | ) | (0.81 | ) | (0.62 | ) | |||||||||||
| Distributions from realized gains | — | — | (0.46 | ) | (0.10 | ) | (0.01 | ) | |||||||||||||
| Total dividends and distributions | (0.82 | ) | (0.86 | ) | (1.18 | ) | (0.91 | ) | (0.63 | ) | |||||||||||
| Net asset value, end of year | $10.60 | $11.07 | $10.24 | $10.50 | $11.36 | ||||||||||||||||
| Total return2 | 2.93 | % | 16.91 | % | 9.89 | % | 0.37 | % | 17.38 | % | |||||||||||
| Ratios/Supplemental Data: | |||||||||||||||||||||
| Net assets, end of year (in thousands) | $ | 2,049,107 | $ | 1,016,021 | $ | 649,492 | $ | 765,467 | $ | 759,666 | |||||||||||
| Ratio of expenses to average net assets | |||||||||||||||||||||
| Before fee waivers/expense offset arrangement/recovery | 0.92 | % | 0.91 | % | 0.89 | % | 0.92 | % | 0.93 | % | |||||||||||
| After fee waivers/expense offset arrangement/recovery3 | 0.92 | % | 0.91 | % | 0.89 | % | 0.92 | % | 0.94 | %† | |||||||||||
| Before interest expense | 0.88 | % | 0.91 | % | 0.89 | % | 0.92 | % | 0.94 | %† | |||||||||||
| Ratio of net investment income to average net assets | 9.62 | % | 8.48 | % | 7.94 | % | 7.87 | % | 7.99 | % | |||||||||||
| Portfolio turnover rate | 53 | % | 58 | % | 72 | % | 105 | % | 129 | % | |||||||||||
| 1 | Includes redemption fees of less than $0.01 per share. |
| 2 | Performance figures may reflect fee waivers, expense offset arrangement and/or recovery of previously waived fees. Past performance is no guarantee of future results. Total return would have been lower if the Adviser had not waived certain expenses. Conversely, total return would have been higher if the Adviser had not recovered previously waived expenses. Total return is calculated assuming an initial investment made at the net asset value at the beginning of the period, reinvestment of all dividends and distributions at net asset value during the period and redemption on the last day of the period and is not annualized. |
| 3 | As a result of an expense limitation, the ratio of expenses (exclusive of taxes, interest, brokerage commissions, acquired fund fees and expenses, and extraordinary items) to average net assets will not exceed 0.95%. |
| † | The Adviser recovered previously waived fees. |
| @ | Calculated based on the average number of shares outstanding during the year. |
The accompanying notes are an integral part of the financial statements.
| 54 |
Third Avenue Trust
Notes to Financial Statements
October 31, 2014
1. SUMMARY OF ORGANIZATION AND SIGNIFICANT ACCOUNTING POLICIES
Organization:
Third Avenue Trust (the “Trust”) is an open-end, management investment company organized as a Delaware business trust pursuant to a Trust Instrument dated October 31, 1996. The Trust currently consists of five non-diversified (within the meaning of Section 5(b)(2) of the Investment Company Act), separate investment series: Third Avenue Value Fund, Third Avenue Small-Cap Value Fund, Third Avenue Real Estate Value Fund, Third Avenue International Value Fund and Third Avenue Focused Credit Fund (each a “Fund” and, collectively, the “Funds”). Third Avenue Management LLC (the “Adviser”) provides investment advisory services to each of the Funds in the Trust. The Funds seek to achieve their investment objectives by adhering to a strict value discipline when selecting securities and other instruments. Each Fund has a distinct investment approach.
Third Avenue Value Fund seeks to achieve its investment objective of long-term capital appreciation mainly by acquiring common stocks of well-financed companies (meaning companies with high quality assets and conservative levels of liabilities) at a discount to what the Adviser believes is their intrinsic value. The Fund may invest in companies of any market capitalization. The Fund may also acquire senior securities, such as convertible securities, preferred stocks and debt instruments (including high-yield and distressed securities that may be in default and may have any or no credit rating), that the Adviser believes are undervalued. The Fund invests in both domestic and foreign securities.
Third Avenue Small-Cap Value Fund seeks to achieve its investment objective of long-term capital appreciation mainly by acquiring equity securities, including common stocks and convertible securities, of well-financed (meaning companies with high quality assets and conservative levels of liabilities) small companies at a discount to what the Adviser believes is their intrinsic value. Under normal circumstances, the Fund expects to invest at least 80% of its net assets (plus the amount of any borrowing for investment purposes) in securities of companies that are considered small. The Fund considers a “small company” to be one whose market capitalization is within the range of capitalizations during the most recent 12-month period of companies in the Russell 2000 Index, the S&P Small Cap 600 Index or the Dow Jones Wilshire U.S. Small-Cap Index at the time of investment (based on month-end data). The Fund may also acquire senior securities, such as preferred stocks and debt instruments (including high-yield and distressed securities that may be in default and may have any or no credit rating), that the Adviser believes are undervalued. The Fund invests in both domestic and foreign securities.
Third Avenue Real Estate Value Fund seeks to achieve its investment objective of long-term capital appreciation primarily by investing in equity securities, including common stocks and convertible securities, of well-financed (meaning companies with high quality assets and conservative levels of liabilities) real estate and real estate-related companies, or in companies which own significant real estate assets or derive a significant portion of gross revenues or net profits from real estate-related companies at the time of investment (“real estate companies”). The Fund seeks to acquire these securities at a discount to what the Adviser believes is their intrinsic value. Under normal circumstances, at least 80% of the Fund’s net assets (plus the amount of any borrowing for investment purposes) will be invested in securities of real estate companies. The Fund may invest in companies of any market capitalization. The Fund may also acquire senior securities, such as preferred stocks and debt instruments (including high-yield, distressed and mortgage-backed securities that may be in default and may have any or no credit rating) of real estate companies or loans secured by real estate that the Adviser believes have above-average yield potential. The Fund invests in both domestic and foreign securities.
Third Avenue International Value Fund seeks to achieve its investment objective of long-term capital appreciation primarily by acquiring equity securities, including common stocks and convertible securities, of well-financed companies (meaning companies with high quality assets and conservative levels of liabilities) located outside of the United States. While the Fund may invest in companies located anywhere in the world, it currently expects that most of its assets will be invested in the more developed countries and, under normal circumstances, at least 80% of its net assets (plus the amount of any borrowing for investment purposes) will be invested in securities of issuers located outside of the United States at the time of investment. The Fund may also acquire senior securities, such as preferred stocks and debt instruments (including high-yield and distressed securities that may be in default and may have any or no credit rating), that the Adviser believes are undervalued.
Third Avenue Focused Credit Fund seeks to achieve its investment objective of long-term total return mainly by investing in bonds and other types of credit instruments and intends to invest a substantial amount of its assets in credit instruments that are rated below investment grade by some or all relevant independent rating agencies, including Moody’s Investors Service, Inc., Standard & Poor’s Ratings Services and Fitch Ratings. Under normal circumstances, at least 80% of the Fund’s net assets (plus the amount of any borrowing for investment purposes) will be invested in bonds and other types of credit instruments. Credit instruments include high-yield bonds (commonly known as “junk bonds” or “junk debt”), bank debt, convertible bonds or preferred stock, loans made to bankrupt companies (including debtor-in-possession loans), loans made to refinance distressed companies and other types of debt instruments. In making these investments, the Adviser will seek to purchase instruments that the Adviser believes are undervalued. The Fund may have significant investments in distressed and defaulted securities and intends to focus on a relatively small number of issuers. The Fund may also purchase equity securities or hold significant positions in equity or other assets that the Fund receives as part of a reorganization process, and may hold those assets until such time as the Adviser believes that a disposition is most advantageous.
| 55 |
Third Avenue Trust
Notes to Financial Statements (continued)
October 31, 2014
Because of the Funds’ disciplined and deliberate investing approach, there may be times when a Fund will have a significant cash position. A substantial cash position can adversely impact Fund performance in certain market conditions, and may make it more difficult for a Fund to achieve its investment objective.
Accounting policies:
The policies described below are followed consistently by the Funds in the preparation of their financial statements in conformity with accounting principles generally accepted in the United States of America (“U.S. GAAP”). The Trust is an investment company and, accordingly, follows the investment company accounting and reporting guidance of the Financial Accounting Standards Board Accounting Standards Codification (“FASB ASC”) Topic 946-Investment Companies, which is part of U.S. GAAP.
The preparation of financial statements in accordance with U.S. GAAP requires management to make estimates and assumptions that affect the reported amounts and disclosures. Actual results could differ from those estimates.
Security valuation:
Generally, the Funds’ investments are valued at market value. Securities traded on a principal stock exchange, including The NASDAQ Stock Market, Inc. (“NASDAQ”), are valued at the last quoted sales price, the NASDAQ official closing price, or in the absence of closing sales prices on that day, securities are valued at the mean between the closing bid and asked price. In accordance with procedures approved by the Trust’s Board of Trustees (the “Board”), the Funds have retained a third party provider that, under certain circumstances, applies a statistical model to provide fair value pricing for foreign equity securities with principal markets that are no longer open when a Fund calculates its net asset value (“NAV”), and certain events have occurred after the principal markets have closed but prior to the time as of which the Funds compute their NAVs. Debt instruments with maturities greater than 60 days, including floating rate loan securities, are valued on the basis of prices obtained from a pricing service approved as reliable by the Board or otherwise pursuant to policies and procedures approved by the Board. Investments in derivative instruments are valued independently by service providers or by broker quotes based on pricing models. Short-term cash investments are valued at cost, plus accrued interest, which approximates market value. Short-term debt securities with 60 days or less to maturity may be valued at amortized cost.
The Adviser has established a Valuation Committee (the “Committee”) which is responsible for overseeing the pricing and valuation of all securities held in the Funds. The Committee operates under pricing and valuation policies and procedures established by the Adviser and approved by the Board, including pricing policies which set forth the mechanisms and processes to be employed on a daily basis to implement these policies and procedures. In particular, the pricing policies describe how to determine market quotations for securities and other instruments. The Committee’s responsibilities include: 1) fair value and liquidity determinations (and oversight of any third parties to whom any responsibility for fair value and liquidity determinations is delegated), and 2) regular monitoring of the Adviser’s pricing and valuation policies and procedures and modification or enhancement of these policies and procedures (or recommendation of the modification of these policies and procedures) as the Committee believes appropriate.
Each Fund may invest up to 15% of its total net assets in securities which are not readily marketable, including those which are restricted as to disposition under applicable securities laws (“restricted securities”). Restricted securities and other securities and assets for which market quotations are not readily available are valued at “fair value”, as determined in good faith by the Committee as authorized by the Board, under procedures established by the Board. At October 31, 2014, such securities had a total fair value of $4,900,205 or 0.23% of net assets of Third Avenue Value Fund, $22,633,178 or 0.70% of net assets of Third Avenue Real Estate Value Fund, and $136,136,872 or 4.58% of net assets of Third Avenue Focused Credit Fund. There were no fair valued securities for Third Avenue Small-Cap Value Fund and Third Avenue International Value Fund at October 31, 2014. Among the factors that may be considered by the Committee in determining fair value are: the type of security, trading in unrestricted securities of the same issuer, the financial condition of the issuer, the percentage of the Fund’s beneficial ownership of the issuer’s common stocks and debt securities, comparable multiples of similar issuers, the operating results of the issuer and the discount from market value of any similar unrestricted securities of the issuer at the time of purchase and liquidation values of the issuer. The fair values determined in accordance with these procedures may differ significantly from the amounts which would be realized upon disposition of the securities.
Fair value measurements:
In accordance with FASB ASC 820-10, Fair Value Measurements and Disclosures, the Funds disclose the fair value of their investments in a hierarchy that prioritizes the inputs to valuation techniques used to measure the fair value. Fair value is defined as the price that a Fund would receive upon selling an investment in an orderly transaction to an independent buyer in the principal or most advantageous market for the investment under current market conditions. The hierarchy gives the highest priority to valuations based upon unadjusted quoted prices in active markets for identical assets or liabilities (Level 1 measurement) and the lowest priority to valuations based upon unobservable inputs that are significant to the valuation (Level 3 measurements). The three levels of the fair value hierarchy are as follows:
• Level 1 — Inputs that reflect unadjusted quoted prices in active markets for identical assets or liabilities that the Funds have the ability to access at the measurement date;
| 56 |
Third Avenue Trust
Notes to Financial Statements (continued)
October 31, 2014
• Level 2 — Inputs other than quoted prices that are observable for the asset or liability either directly or indirectly, including inputs in markets that are not considered to be active;
• Level 3 — Significant unobservable inputs (including the Funds’ own assumptions in determining the fair value of investments)
A financial instrument’s level within the fair value hierarchy is based on the lowest level of any input both individually and in aggregate that is significant to the fair value measurement. However, the determination of what constitutes “observable” requires significant judgment by the Funds. The Funds consider observable data to be market data which is readily available, regularly distributed or updated, reliable and verifiable, not proprietary, and provided by independent sources that are actively involved in the relevant market. The inputs or methodology used for valuing investments are not necessarily an indication of the risk associated with investing in those investments.
The Funds use valuation techniques to measure fair value that are consistent with the market approach and/or income approach, depending on the type of security and the particular circumstance. The market approach uses prices and other relevant information generated by market transactions involving identical or comparable securities. The income approach uses valuation techniques to discount estimated future cash flows to present value.
The following are certain inputs and techniques that the Funds generally use to evaluate how to classify each major category of assets and liabilities for Level 2 and Level 3, in accordance with U.S. GAAP.
Equity Securities (Common Stocks, Preferred Stocks, and Warrants)—Equity securities traded in inactive markets and certain foreign equity securities are valued using inputs which include broker-dealer quotes, recently executed transactions adjusted for changes in the benchmark index, or evaluated price quotes received from independent pricing services or brokers that take into account the integrity of the market sector and issuer, the individual characteristics of the security, and information received from broker-dealers and other market sources pertaining to the issuer or security. To the extent that these inputs are observable, the values of equity securities are categorized as Level 2. To the extent that these inputs are unobservable, the values are categorized as Level 3.
U.S. Government Obligations—U.S. Government obligations are valued by independent pricing services based on pricing models that evaluate the mean between the most recently quoted bid and ask price. The models also take into consideration data received from active market makers and broker-dealers, yield curves, and the spread over comparable U.S. Government issues. The spreads change daily in response to market conditions and are generally obtained from the new issue market and broker-dealer sources. To the extent that these inputs are observable, the values of U.S. Government obligations are categorized as Level 2. To the extent that these inputs are unobservable, the values are categorized as Level 3.
Corporate Bonds & Notes—Corporate bonds and notes are generally comprised of two main categories: investment grade bonds and high yield bonds. Investment grade bonds are valued by independent pricing services or brokers using various inputs and techniques, which include broker-dealer quotations, live trading levels, recently executed transactions in securities of the issuer or comparable issuers, and option adjusted spread models that include base curve and spread curve inputs. Adjustments to individual bonds can be applied to recognize trading differences compared to other bonds issued by the same issuer. High yield bonds are valued by independent pricing services or brokers based primarily on broker-dealer quotations from relevant market makers and recently executed transactions in securities of the issuer or comparable issuers. The broker-dealer quotations received are supported by credit analysis of the issuer that takes into consideration credit quality assessments, daily trading activity, and the activity of the underlying equities, listed bonds and sector specific trends. To the extent that these inputs are observable, the values of corporate bonds and notes are categorized as Level 2. To the extent that these inputs are unobservable, the values are categorized as Level 3.
Forward Foreign Currency Contracts—Forward foreign currency contracts are valued by independent pricing services using various inputs and techniques, which include broker-dealer quotations, actual trading information and foreign currency exchange rates gathered from leading market makers and foreign currency exchange trading centers throughout the world. To the extent that these inputs are observable, the values of forward foreign currency contracts are categorized as Level 2. To the extent that these inputs are unobservable, the values are categorized as Level 3.
Claims—Claims are valued by brokers based on pricing models that take into account, among other factors, both cash and non-cash assets. The valuation is derived from expected cash flow of the claims and the non-cash assets, which include all real estate, private equity or other securities within the estate. To the extent that these inputs are observable, the values of the claims are categorized as Level 2. To the extent that these inputs are unobservable, the values are categorized as Level 3.
Term Loans—Term loans are valued by independent pricing services based on the average of evaluated quoted prices received from multiple dealers or valued relative to other benchmark securities when broker-dealer quotes are unavailable. Inputs may include quoted prices for similar investments in active markets, interest rates, coupon rates, yield curves, option adjusted spreads, default rates, credit spreads and other unique security features in order to estimate the relevant cash flows which is then discounted to calculate fair values. To the extent that these inputs are observable, the values of term loans are categorized as Level 2. To the extent that these inputs are unobservable, the values are categorized as Level 3.
Municipal Bonds—Municipal bonds are valued by independent pricing services based on pricing models that take into account, among other factors, information received from market makers and broker-dealers, current trades, bid-ask lists, offerings, market movements, the callability of
| 57 |
Third Avenue Trust
Notes to Financial Statements (continued)
October 31, 2014
the bond, state of issuance, benchmark yield curves, and bond insurance. To the extent that these inputs are observable, the values of municipal bonds are categorized as Level 2. To the extent that these inputs are unobservable, the values are categorized as Level 3.
Options (Written and Purchased)—Options are valued by independent pricing services or by brokers based on pricing models that take into account, among other factors, foreign exchange rate, time until expiration, and volatility of the underlying foreign currency security. To the extent that these inputs are observable, the values of options are categorized as Level 2. To the extent that these inputs are unobservable, the values are categorized as Level 3.
The following is a summary by level of inputs used to value the Funds’ investments as of October 31, 2014:
| Third Avenue Value Fund | Third Avenue Small-Cap Value Fund | Third Avenue Real Estate Value Fund | Third Avenue International Value Fund | Third Avenue Focused Credit Fund | ||||||||||||||||
| Level 1: Quoted Prices† | ||||||||||||||||||||
| Investments in Securities: | ||||||||||||||||||||
| Common Stocks & Warrants: | ||||||||||||||||||||
| Building & Construction Products/Services | $ | — | $ | — | $ | — | $ | 8,384,345 | $ | — | ||||||||||
| Chemicals | — | — | — | — | 148,335 | |||||||||||||||
| Diversified Holding Companies | 223,209,044 | 20,946,483 | — | 37,977,098 | — | |||||||||||||||
| Energy | — | — | — | — | 3,240,000 | |||||||||||||||
| Financials | — | — | — | 9,705,451 | 37,728,636 | |||||||||||||||
| Forest Products & Paper | — | 7,634,875 | 217,427,654 | 15,424,686 | — | |||||||||||||||
| Insurance & Reinsurance | 141,034,488 | 32,032,607 | — | — | — | |||||||||||||||
| Non-U.S. Real Estate Operating Companies | 59,245,663 | — | 806,764,588 | — | — | |||||||||||||||
| Services | — | — | — | — | 3,966,750 | |||||||||||||||
| U.S. Real Estate Operating Companies | 112,293,471 | 22,068,397 | 150,850,000 | — | — | |||||||||||||||
| Other | 1,522,888,628 | 421,293,363 | 1,394,443,832 | 226,891,749 | 73,597,951 | |||||||||||||||
| Preferred Stocks: | ||||||||||||||||||||
| Financials | — | — | — | — | 26,856,155 | |||||||||||||||
| Closed-End Funds: | ||||||||||||||||||||
| Financials | — | — | — | — | 90,684,331 | |||||||||||||||
| Total for Level 1 Securities | 2,058,671,294 | 503,975,725 | 2,569,486,074 | 298,383,329 | 236,222,158 | |||||||||||||||
| Level 2: Other Significant Observable Inputs† | ||||||||||||||||||||
| Investments in Securities: | ||||||||||||||||||||
| Common Stocks: | ||||||||||||||||||||
| Building & Construction Products/Services | — | — | — | 13,917,610 | — | |||||||||||||||
| Diversified Holding Companies | — | 13,319,091 | — | — | — | |||||||||||||||
| Forest Products & Paper | — | — | — | 15,224,425 | — | |||||||||||||||
| Preferred Stocks: | ||||||||||||||||||||
| Financials | — | — | — | — | 7,175,626 | |||||||||||||||
| Debt Securities issued by the U.S. Treasury and other government corporations and agencies: | ||||||||||||||||||||
| Municipal Bonds | — | — | — | — | 4,028,080 | |||||||||||||||
| Corporate Bonds & Notes | — | — | — | — | 1,799,711,709 | |||||||||||||||
| Term Loans | — | — | — | — | 103,231,394 | |||||||||||||||
| Claims | 16,210,775 | — | — | — | 92,484,000 | |||||||||||||||
| Purchased Options: | ||||||||||||||||||||
| Foreign Currency Put Options | — | — | 2,235,139 | — | — | |||||||||||||||
| Short Term Investments: | ||||||||||||||||||||
| U.S. Government Obligations | — | — | 99,999,792 | — | — | |||||||||||||||
| Total for Level 2 Securities | 16,210,775 | 13,319,091 | 102,234,931 | 29,142,035 | 2,006,630,809 | |||||||||||||||
| 58 |
Third Avenue Trust
Notes to Financial Statements (continued)
October 31, 2014
Summary by level of inputs (continued)
| Third Avenue Value Fund | Third Avenue Small-Cap Value Fund | Third Avenue Real Estate Value Fund | Third Avenue International Value Fund | Third Avenue Focused Credit Fund | ||||||||||||||||
| Level 3: Significant Unobservable Inputs | ||||||||||||||||||||
| Investments in Securities: | ||||||||||||||||||||
| Common Stocks & Warrants: | ||||||||||||||||||||
| Chemicals | $ | — | $ | — | $ | — | $ | — | $ | 71,883,570 | ||||||||||
| Consumer Products | — | * | — | — | — | — | ||||||||||||||
| Energy | — | — | — | — | 21,193,777 | * | ||||||||||||||
| Financial Insurance | 259,000 | — | — | — | — | |||||||||||||||
| Insurance & Reinsurance | 40,800 | — | — | — | — | |||||||||||||||
| Services | — | — | — | — | 1,005,503 | |||||||||||||||
| Transportation | — | — | — | — | 4,533,288 | |||||||||||||||
| U.S. Real Estate Operating Companies | — | — | 19,295,656 | — | — | |||||||||||||||
| Limited Partnerships: | ||||||||||||||||||||
| Insurance & Reinsurance | 92,941 | — | — | — | — | |||||||||||||||
| Convertible Preferred Stocks: | ||||||||||||||||||||
| Transportation | — | — | — | — | 15,623,470 | |||||||||||||||
| Preferred Stocks: | ||||||||||||||||||||
| Energy | — | — | — | — | 3,120,358 | |||||||||||||||
| Financials | — | — | — | — | 21,642,730 | |||||||||||||||
| Non-U.S. Real Estate Operating Companies | — | — | 33,993,569 | — | — | |||||||||||||||
| Corporate Bonds & Notes | 4,507,464 | — | — | — | 130,755,249 | * | ||||||||||||||
| Term Loans | — | — | 3,337,522 | — | 212,038,757 | |||||||||||||||
| Claims | — | — | — | — | 9,431,221 | * | ||||||||||||||
| Private Equities: | ||||||||||||||||||||
| Automotive | — | — | — | — | 10,625,000 | |||||||||||||||
| Consumer Products | — | — | — | — | 4,354,901 | |||||||||||||||
| Energy | — | — | — | — | 1,043,306 | |||||||||||||||
| U.S. Real Estate Operating Companies | — | — | 100,965,259 | — | — | |||||||||||||||
| Total for Level 3 Securities | 4,900,205 | — | 157,592,006 | — | 507,251,130 | |||||||||||||||
| Total Value of Investments | $ | 2,079,782,274 | $ | 517,294,816 | $ | 2,829,313,011 | $ | 327,525,364 | $ | 2,750,104,097 | ||||||||||
| Investments in Other Financial Instruments: | ||||||||||||||||||||
| Level 1: Quoted Prices | ||||||||||||||||||||
| Written Equity Options | $ | — | $ | — | $ | (165,400 | ) | $ | — | $ | — | |||||||||
| Level 2: Other Significant Observable Inputs | ||||||||||||||||||||
| Written Foreign Currency Options | — | — | (415,566 | ) | — | — | ||||||||||||||
| Written Equity Options | (206,000 | ) | — | — | — | — | ||||||||||||||
| Forward Foreign Currency Contracts - Assets | — | — | 2,203,818 | — | 2,134,768 | |||||||||||||||
| Total Market Value or Appreciation/(Depreciation) of Other Financial Instruments | $ | (206,000 | ) | $ | — | $ | 1,622,852 | $ | — | $ | 2,134,768 | |||||||||
| † | The value of security that was transferred from Level 1 on October 31, 2013 to Level 2 on October 31, 2014 for Third Avenue Small-Cap Value Fund was $13,969,145. The transfer was due to decrease in trading activities at period end. The values of securities that were transferred from Level 1 on October 31, 2013 to Level 2 on October 31, 2014 for Third Avenue International Value Fund and Third Avenue Focused Credit Fund were $12,635,038 and $3,310,650, respectively. The transfers were due to lack of quoted prices in active markets at period end. |
| * | Includes investments fair valued at zero. |
Please refer to the Portfolios of Investments for industry specifics of the portfolio holdings.
Transfers from Level 1 to Level 2, or from Level 2 to Level 1 are recorded utilizing values as of the beginning of the period.
| 59 |
Third Avenue Trust
Notes to Financial Statements (continued)
October 31, 2014
Following is a reconciliation of Level 3 investments for which significant unobservable inputs were used to determine fair value:
Third Avenue Value Fund
| Common Stocks | Corporate Bonds & Notes | Limited Partnerships | Total | |||||||||||||
| Balance as of 10/31/13 (fair value) | ||||||||||||||||
| Consumer Products | $ | 26,318 | $ | 3,691,276 | $ | — | $ | 3,717,594 | ||||||||
| Financial Insurance | 812,000 | — | — | 812,000 | ||||||||||||
| Insurance & Reinsurance | 65,025 | — | 169,492 | 234,517 | ||||||||||||
| Manufacturing Housing | 85,815,088 | — | — | 85,815,088 | ||||||||||||
| Transfer out of Level 3^ | ||||||||||||||||
| Manufacturing Housing | (85,815,088 | ) | — | — | (85,815,088 | ) | ||||||||||
| Payment-in-kind | ||||||||||||||||
| Consumer Products | — | 1,234,479 | — | 1,234,479 | ||||||||||||
| Return of capital | ||||||||||||||||
| Financial Insurance | (629,000 | ) | — | — | (629,000 | ) | ||||||||||
| Insurance & Reinsurance | (33,206 | ) | — | (32,494 | ) | (65,700 | ) | |||||||||
| Net change in unrealized gain/(loss) | ||||||||||||||||
| Consumer Products | (26,318 | ) | (418,291 | ) | — | (444,609 | ) | |||||||||
| Financial Insurance | 76,000 | — | — | 76,000 | ||||||||||||
| Insurance & Reinsurance | 8,981 | — | (92,475 | ) | (83,494 | ) | ||||||||||
| Net realized gain/(loss) | ||||||||||||||||
| Insurance & Reinsurance | — | — | 48,418 | 48,418 | ||||||||||||
| Balance as of 10/31/14 (fair value) | ||||||||||||||||
| Consumer Products | — | * | 4,507,464 | — | 4,507,464 | |||||||||||
| Financial Insurance | 259,000 | — | — | 259,000 | ||||||||||||
| Insurance & Reinsurance | 40,800 | — | 92,941 | 133,741 | ||||||||||||
| Manufacturing Housing | — | — | — | — | ||||||||||||
| Total | $ | 299,800 | $ | 4,507,464 | $ | 92,941 | $ | 4,900,205 | ||||||||
| Net change in unrealized gain/(loss) related to securities still held as of October 31, 2014 | $ | (452,103 | ) | |||||||||||||
| ^ | Transfer out is recorded utilizing value as of the beginning of the period. The transfer is due to security no longer restricted at period end. |
| * | Investments fair valued at zero. |
Third Avenue Real Estate Value Fund
| Common Stocks | Preferred Stocks | Private Equities | Term Loans | Total | |||||||||||||||||
| Balance as of 10/31/13 (fair value) | |||||||||||||||||||||
| U.S. Real Estate Operating Companies | $ | 16,751,774 | $ | — | $ | 91,229,323 | $ | — | $ | 107,981,097 | |||||||||||
| Purchases | |||||||||||||||||||||
| Non-U.S. Real Estate Operating Companies | — | 27,535,807 | — | 3,653,068 | 31,188,875 | ||||||||||||||||
| Sales | |||||||||||||||||||||
| Non-U.S. Real Estate Operating Companies | — | — | — | (20,453 | ) | (20,453 | ) | ||||||||||||||
| Net change in unrealized gain/(loss) | |||||||||||||||||||||
| Non-U.S. Real Estate Operating Companies | — | 6,457,762 | — | (293,486 | ) | 6,164,276 | |||||||||||||||
| U.S. Real Estate Operating Companies | 2,543,882 | — | 9,735,936 | — | 12,279,818 | ||||||||||||||||
| Net realized gain/(loss) | |||||||||||||||||||||
| Non-U.S. Real Estate Operating Companies | — | — | — | (1,607 | ) | (1,607 | ) | ||||||||||||||
| Balance as of 10/31/14 (fair value) | |||||||||||||||||||||
| Non-U.S. Real Estate Operating Companies | — | 33,993,569 | — | 3,337,522 | 37,331,091 | ||||||||||||||||
| U.S. Real Estate Operating Companies | 19,295,656 | — | 100,965,259 | — | 120,260,915 | ||||||||||||||||
| Total | $ | 19,295,656 | $ | 33,993,569 | $ | 100,965,259 | $ | 3,337,522 | $ | 157,592,006 | |||||||||||
| Net change in unrealized gain/(loss) related to securities still held as of October 31, 2014 | $ | 18,444,094 | |||||||||||||||||||
| 60 |
Third Avenue Trust
Notes to Financial Statements (continued)
October 31, 2014
Third Avenue Focused Credit Fund
| Corporate Bonds & Notes | Term Loans | Common Stocks and Warrants | Preferred and Convertible Preferred Stocks | Private Equities and Claims | Total | |||||||||||||||||||
| Balance as of 10/31/13 (fair value) | ||||||||||||||||||||||||
| Aerospace | $ | — | $ | 2,488,160 | $ | — | $ | — | $ | — | $ | 2,488,160 | ||||||||||||
| Energy | 5,242,313 | — | 14,377,272 | * | — | — | 19,619,585 | |||||||||||||||||
| Financials | — | — | — | 6,113,114 | (a) | 556,847 | (c) | 6,669,961 | ||||||||||||||||
| Healthcare | — | 3,001,947 | — | — | — | 3,001,947 | ||||||||||||||||||
| Metals & Mining | — | 1,360,000 | — | 14,248,607 | (a) | — | 15,608,607 | |||||||||||||||||
| Technology | 7,873,040 | — | — | — | — | 7,873,040 | ||||||||||||||||||
| Transportation | — | — | 4,592,162 | 14,320,558 | (b) | — | 18,912,720 | |||||||||||||||||
| Transfer in level 3^ | ||||||||||||||||||||||||
| Healthcare | — | 22,187,588 | — | — | — | 22,187,588 | ||||||||||||||||||
| Utilities | — | 47,454,429 | — | — | — | 47,454,429 | ||||||||||||||||||
| Purchases | ||||||||||||||||||||||||
| Automotive | — | — | — | — | 8,800,000 | (c) | 8,800,000 | |||||||||||||||||
| Chemicals | — | 54,461,720 | 77,181,727 | — | — | 131,643,447 | ||||||||||||||||||
| Consumer Products | 65,468,900 | — | — | — | 4,421,661 | (c) | 69,890,561 | |||||||||||||||||
| Energy | 25,397,001 | † | 39,482,008 | 7,459,933 | † | 1,496,576 | (a) | 1,969,982 | (c) | 75,805,500 | ||||||||||||||
| Financials | — | 2,349,298 | — | 17,525,643 | (a) | — | 19,874,941 | |||||||||||||||||
| Food & Beverage | — | — | — | — | 30,796,067 | †(d) | 30,796,067 | |||||||||||||||||
| Gaming & Entertainment | — | 19,600,000 | — | — | — | 19,600,000 | ||||||||||||||||||
| Healthcare | — | 5,622,075 | — | — | — | 5,622,075 | ||||||||||||||||||
| Media/Cable | — | † | — | — | — | — | — | |||||||||||||||||
| Metals & Mining | 47,612,652 | — | — | — | — | 47,612,652 | ||||||||||||||||||
| Services | — | — | 2,095,119 | — | — | 2,095,119 | ||||||||||||||||||
| Utilities | — | 9,750,151 | — | — | — | 9,750,151 | ||||||||||||||||||
| Sales | ||||||||||||||||||||||||
| Aerospace | — | (2,787,514 | ) | — | — | — | (2,787,514 | ) | ||||||||||||||||
| Energy | (7,237,500 | ) | — | (41,888 | ) | — | — | (7,279,388 | ) | |||||||||||||||
| Financials | — | (13,077 | ) | — | (6,325,076 | )(a) | (556,847 | )(c) | (6,895,000 | ) | ||||||||||||||
| Healthcare | — | (9,946,499 | ) | — | — | — | (9,946,499 | ) | ||||||||||||||||
| Metals & Mining | — | (1,700,000 | ) | — | (14,040,735 | )(a) | — | (15,740,735 | ) | |||||||||||||||
| Services | — | — | (2,243,407 | ) | — | — | (2,243,407 | ) | ||||||||||||||||
| Bond discount | ||||||||||||||||||||||||
| Chemicals | — | 617,751 | — | — | — | 617,751 | ||||||||||||||||||
| Energy | 37,320 | 611,629 | — | — | — | 648,949 | ||||||||||||||||||
| Gaming & Entertainment | — | 16,574 | — | — | — | 16,574 | ||||||||||||||||||
| Healthcare | — | 286,059 | — | — | — | 286,059 | ||||||||||||||||||
| Metals & Mining | 102,306 | 99,961 | — | — | — | 202,267 | ||||||||||||||||||
| Payment-in-kind | ||||||||||||||||||||||||
| Energy | 535,945 | — | — | — | — | 535,945 | ||||||||||||||||||
| Healthcare | — | 187,137 | — | — | — | 187,137 | ||||||||||||||||||
| 61 |
Third Avenue Trust
Notes to Financial Statements (continued)
October 31, 2014
Third Avenue Focused Credit Fund (continued)
| Corporate Bonds & Notes | Term Loans | Common Stocks and Warrants | Preferred and Convertible Preferred Stocks | Private Equities and Claims | Total | |||||||||||||||||||
| Net change in unrealized gain/(loss) | ||||||||||||||||||||||||
| Aerospace | $ | — | $ | 3,342,564 | $ | — | $ | — | $ | — | $ | 3,342,564 | ||||||||||||
| Automotive | — | — | — | — | 1,825,000 | (c) | 1,825,000 | |||||||||||||||||
| Chemicals | — | 2,858,529 | (5,298,157 | ) | — | — | (2,439,628 | ) | ||||||||||||||||
| Consumer Products | (3,703,604 | ) | — | — | — | (66,760 | )(c) | (3,770,364 | ) | |||||||||||||||
| Energy | (952,928 | ) | 609,464 | (570,161 | ) | 1,623,782 | (a) | (926,676 | )(c) | (216,519 | ) | |||||||||||||
| Financials | — | (187,755 | ) | — | 3,527,238 | (a) | 25,573 | (c) | 3,365,056 | |||||||||||||||
| Food & Beverage | — | — | — | — | (21,364,846 | )(d) | (21,364,846 | ) | ||||||||||||||||
| Gaming & Entertainment | — | (16,574 | ) | — | — | — | (16,574 | ) | ||||||||||||||||
| Healthcare | — | (394,395 | ) | — | — | — | (394,395 | ) | ||||||||||||||||
| Metals & Mining | (6,062,655 | ) | 28,029 | — | 762,659 | (a) | — | (5,271,967 | ) | |||||||||||||||
| Services | — | — | (109,022 | ) | — | — | (109,022 | ) | ||||||||||||||||
| Technology | (3,514,750 | ) | — | — | — | — | (3,514,750 | ) | ||||||||||||||||
| Transportation | — | — | (58,874 | ) | 1,302,912 | (b) | — | 1,244,038 | ||||||||||||||||
| Utilities | — | 13,149,005 | — | — | — | 13,149,005 | ||||||||||||||||||
| Net realized gain/(loss) | ||||||||||||||||||||||||
| Aerospace | — | (3,043,210 | ) | — | — | — | (3,043,210 | ) | ||||||||||||||||
| Energy | (42,791 | ) | — | (31,379 | ) | — | — | (74,170 | ) | |||||||||||||||
| Financials | — | (1,027 | ) | — | 801,811 | (a) | (25,573 | )(c) | 775,211 | |||||||||||||||
| Healthcare | — | 352,720 | — | — | — | 352,720 | ||||||||||||||||||
| Metals & Mining | — | 212,010 | — | (970,531 | )(a) | — | (758,521 | ) | ||||||||||||||||
| Services | — | — | 1,262,813 | — | — | 1,262,813 | ||||||||||||||||||
| Balance as of 10/31/14 (fair value) | ||||||||||||||||||||||||
| Aerospace | — | — | — | — | — | — | ||||||||||||||||||
| Automotive | — | — | — | — | 10,625,000 | (c) | 10,625,000 | |||||||||||||||||
| Chemicals | — | 57,938,000 | 71,883,570 | — | — | 129,821,570 | ||||||||||||||||||
| Consumer Products | 61,765,296 | — | — | — | 4,354,901 | (c) | 66,120,197 | |||||||||||||||||
| Energy | 22,979,360 | † | 40,703,101 | 21,193,777 | * | 3,120,358 | (a) | 1,043,306 | (c) | 89,039,902 | ||||||||||||||
| Financials | — | 2,147,439 | — | 21,642,730 | (a) | — | 23,790,169 | |||||||||||||||||
| Food & Beverage | — | — | — | — | 9,431,221 | *(d) | 9,431,221 | |||||||||||||||||
| Gaming & Entertainment | — | 19,600,000 | — | — | — | 19,600,000 | ||||||||||||||||||
| Healthcare | — | 21,296,632 | — | — | — | 21,296,632 | ||||||||||||||||||
| Media/Cable | — | * | — | — | — | — | — | |||||||||||||||||
| Metals & Mining | 41,652,303 | — | — | — | — | 41,652,303 | ||||||||||||||||||
| Services | — | — | 1,005,503 | — | — | 1,005,503 | ||||||||||||||||||
| Technology | 4,358,290 | — | — | — | — | 4,358,290 | ||||||||||||||||||
| Transportation | — | — | 4,533,288 | 15,623,470 | (b) | — | 20,156,758 | |||||||||||||||||
| Utilities | — | 70,353,585 | — | — | — | 70,353,585 | ||||||||||||||||||
| Total | $ | 130,755,249 | $ | 212,038,757 | $ | 98,616,138 | $ | 40,386,558 | $ | 25,454,428 | $ | 507,251,130 | ||||||||||||
| Net change in unrealized gain/(loss) related to securities still held as of October 31, 2014 | $ | (17,741,376 | ) | |||||||||||||||||||||
| ^ | Transfers out are recorded utilizing values as of the beginning of the period. The transfers are due to decrease in trading activities at period end. |
| * | Includes investments fair valued at zero. |
| † | Investments acquired through corporate actions with zero cost. |
| (a) | Preferred Stocks |
| (b) | Convertible Preferred Stocks |
| (c) | Private Equities |
| (d) | Claims |
| 62 |
Third Avenue Trust
Notes to Financial Statements (continued)
October 31, 2014
Quantitative Information about Level 3 Fair Value Measurements
(amounts in thousands)
| Third Avenue Value Fund | Fair Value at 10/31/14 | Valuation Technique(s) | Unobservable Inputs(s) | Range (Weighted Average) | ||||||||
| Other (b) | $4,900 | |||||||||||
| Third Avenue Real Estate Value Fund | Fair Value at 10/31/14 | Valuation Technique(s) | Unobservable Inputs(s) | Range (Weighted Average) | ||||||||
| Private Equities | $100,965 | Broker Quote | # | $3.50 | ||||||||
| Preferred Stocks | 33,994 | Broker Quote | # | $179.20 | ||||||||
| Common Stocks | 19,296 | Option Pricing Model (a) | Share volatility | 0.58% (N/A) | ||||||||
| Term Loans | 3,337 | Book Value | Restructuring value | 1.0x (1.0x) | ||||||||
| $157,592 | ||||||||||||
| Third Avenue Focused Credit Fund | Fair Value at 10/31/14 | Valuation Technique(s) | Unobservable Inputs(s) | Range | ||||||||
| Corporate Bonds | $123,788 | Broker Quote | # | $15.50-$915.00 | ||||||||
| Term Loans | 100,788 | Book Value | Restructuring value | 1.0x (1.0x) | ||||||||
| Term Loans | 94,506 | Broker Quote | # | $65.00-$98.00 | ||||||||
| Common Stocks | 89,174 | Broker Quote | # | $33.00-$962.48 | ||||||||
| Preferred Stocks | 21,643 | Broker Quote | # | $179.20 | ||||||||
| Term Loans | 16,744 | Book Value | Restructuring value | $248.97 | ||||||||
| Convertible Preferred Stocks | 15,623 | Broker Quote | # | $962.47-$1,310.06 | ||||||||
| Private Equities | 14,980 | Broker Quote | # | $0.00*-$1.06 | ||||||||
| Claims | 9,431 | Broker Quote | # | $5.01 | ||||||||
| Corporate Bonds | 6,967 | Book Value | Restructuring value | 1.0x (1.0x) | ||||||||
| Other (b) | 13,607 | |||||||||||
| $507,251 | ||||||||||||
| # | Valuation techniques and significant unobservable inputs used by third-party pricing vendors or brokers, which are described in Note 1, were not provided to the Adviser. The appropriateness of fair values for these securities is based on results of back testing, broker due diligence, unchanged price review and consideration of macro or security specific events. | |
| (a) | Represents amounts used when the reporting entity has determined that market participants would take into account premiums and discounts, as applicable, when pricing the investments. | |
| (b) | Includes securities less than 0.50% within each respective Fund. | |
| * | Amount less than $0.01. | |
| The significant unobservable inputs used in the fair value measurement of the Funds’ investments are listed above. Generally, a change in the assumptions used in any input in isolation may be accompanied by a change in another input. Significant changes in any of the unobservable inputs may significantly impact the fair value measurement. The impact is based on the relationship between each unobservable input and the fair value measurement. Significant increases (decreases) in enterprise multiples may increase (decrease) the fair value measurement. Significant increases (decreases) in the discount for marketability may decrease (increase) the fair value measurement. | ||
Security transactions and investment income:
Security transactions for financial statement purposes are accounted for on a trade date basis. Dividend income is recorded on the ex-dividend date or, for certain foreign dividends, as soon as the Funds become aware of the dividends. Interest income is determined on the basis of coupon interest accrued using the effective interest method which adjusts for amortization of premiums and accretion of discounts. Dividend income on the Statement of Operations are shown net of any foreign taxes withheld on income from foreign securities. Payments received from certain investments held by the Funds may be comprised of dividends, capital gains and return of capital. The Funds originally estimate the expected classification of such payments. These amounts may subsequently be reclassified upon receipt of information from the issuer. Realized gains and losses from securities transactions are recorded on an identified cost basis.
Foreign currency translation and foreign investments:
The books and records of the Funds are maintained in U.S. dollars. Foreign currency amounts are translated into U.S. dollars as follows:
| • | Investments and assets and liabilities denominated in foreign currencies: At the prevailing rates of exchange on the valuation date. | |
| • | Investment transactions and investment income: At the prevailing rates of exchange on the date of such transactions. |
The net assets of the Funds are presented at market values using the foreign exchange rates at the close of the period. The Funds do not generally isolate that portion of the results of operations arising as a result of changes in the foreign exchange rates from the fluctuations arising from changes in the market prices of the investments held.
Similarly, the Funds do not isolate the effect of changes in foreign exchange rates from the fluctuations arising from changes in the market prices of investments sold during the period. Accordingly, realized and unrealized foreign currency gains/(losses) are included in the reported net realized gain/(loss) and unrealized appreciation/(depreciation) on investments transactions and balances.
| 63 |
Third Avenue Trust
Notes to Financial Statements (continued)
October 31, 2014
Net realized gains/(losses) on foreign currency transactions represent net foreign exchange gains/(losses) from foreign currency exchange contracts, disposition of foreign currencies, currency gains or losses realized between the trade and settlement dates on securities transactions, and the difference between the amount of investment income and foreign withholding taxes recorded on the Funds’ books and the U.S. dollar equivalent amounts actually received or paid. Net unrealized currency gains/(losses) from valuing foreign currency denominated assets and liabilities at period end exchange rates are reflected as a component of net unrealized appreciation/(depreciation) on the Statement of Assets and Liabilities. The change in net unrealized currency gains/(losses) for the period is reflected on the Statement of Operations.
Pursuant to U.S. federal income tax regulations, gains and losses from certain foreign currency transactions and the foreign currency portion of gains and losses realized on sales and maturities of foreign denominated debt securities are generally treated as ordinary income.
Payment-in-kind securities:
The Funds may invest in payment-in-kind securities (“PIKs”). PIKs give the issuer the option at each interest payment date of making interest payments in either cash or additional debt securities. Those additional debt securities usually have the same terms, including maturity dates and interest rates, and associated risks as the original bonds. The daily market quotations of the original bonds may include the accrued interest (referred to as a “dirty” price) and require a pro-rata adjustment from the unrealized appreciation or depreciation on investments to interest receivable on the Statement of Assets and Liabilities.
For the year ended October 31, 2014, the total in-kind payments with respect to PIK securities that were received by the Third Avenue Value Fund and the Third Avenue Focused Credit Fund in the amounts of $1,234,479 or 1.37% of total investment income and $40,930,089 or 13.84% of total investment income, respectively, are shown as a separate line item on the Statement of Operations.
Term loans:
The Funds typically invest in loans which are structured and administered by a third party entity (the “Agent”) that acts on behalf of a group of lenders that make or hold interests in the loan. These securities generally pay interest at rates which are periodically pre-determined by reference to a base lending rate plus a premium. These base lending rates are generally either the lending rate offered by one or more major European banks, such as the London Interbank Offered Rate (“LIBOR”) or the prime rate offered by one or more major United States banks, or the certificate of deposit rate.
These securities are generally considered to be restricted, as the Funds are ordinarily contractually obligated to receive approval from the Agent bank and/or borrower prior to disposition. Remaining maturities of term loans may be less than the stated maturities shown as a result of contractual or optional payments by the borrower. Such prepayments cannot be predicted with certainty. The interest rate disclosed reflects the rate in effect on October 31, 2014.
Forward foreign currency contracts:
The Funds may be exposed to foreign currency risks associated with portfolio investments and therefore may use forward foreign currency contracts to hedge or manage these exposures. The Funds also may buy forward foreign currency contracts to gain exposure to currencies. Forward foreign currency contracts are valued at the forward rate and are marked-to-market daily. The change in market value is included in unrealized appreciation/(depreciation) on investments and foreign currency translations. When the contract is closed, the Funds record a realized gain or loss equal to the difference between the value of the contract at the time it was opened and the value at the time it was closed.
The use of forward foreign currency contracts does not eliminate fluctuations in the underlying prices of the Funds’ portfolio securities, but it does establish a rate of exchange that can be achieved in the future. Although forward foreign currency contracts limit the risk of loss due to a decline in the value of the hedged currency, they also limit any potential gain that might result should the value of the currency increase. In addition, the Funds could be exposed to risks if the counterparties to the contracts are unable to meet the terms of their contracts.
During the year ended October 31, 2014, Third Avenue Value Fund, Third Avenue Real Estate Value Fund and Third Avenue Focused Credit Fund used forward foreign currency contracts for hedging against foreign currency risks. As of October 31, 2014, the Third Avenue Value Fund no longer held any forward foreign currency contracts.
Option contracts:
The Funds may purchase and sell (“write”) put and call options on various instruments including investments, indices, and foreign currency to manage and hedge exchange rate risks within their portfolios and also to gain long or short exposure to the underlying instruments.
An option contract gives the buyer the right, but not the obligation, to buy (call) or sell (put) an underlying item at a fixed exercise price on a certain date or during a specified period. The cost of the underlying instruments acquired through the exercise of a call option is increased by the premiums paid. The proceeds from the underlying instruments sold through the exercise of a purchased put option are decreased by the premiums paid. Investments in over-the-counter option contracts require the Funds to fair value or mark-to market the options on a daily basis, which reflects the change in the market value of the contracts at the close of each day’s trading. The cost of purchased options that expire unexercised are treated by the Funds, on expiration date, as realized losses on investments or foreign currency transactions.
| 64 |
Third Avenue Trust
Notes to Financial Statements (continued)
October 31, 2014
When the Funds write an option, an amount equal to the premium received by the Funds is recorded as a liability and is subsequently adjusted to the current fair value of the option written. Premiums received from writing options that expire unexercised are treated by the Funds, on the expiration date, as realized gains on written options or foreign currency. The difference between the premium and the amount paid on effecting a closing purchase transaction, including brokerage commissions, is also treated as a realized gain, or, if the premium is less than the amount paid for the closing purchase transaction, as a realized loss. If a call option is exercised, the premium is added to the proceeds from the sale of the underlying security or currency in determining whether the Funds have a realized gain or loss. If a put option is exercised, the premium reduces the cost basis of the security or currency purchased by the Funds. In purchasing and writing options, the Funds bear the market risk of an unfavorable change in the price of the underlying security or the risk that the Funds may not be able to enter into a closing transaction due to an illiquid market. Exercise of a written option could result in the Funds purchasing a security or currency at a price different from the current market value. The Funds may execute transactions in both listed and over-the-counter options. Listed options involve minimal counterparty risk since listed options are guaranteed against default by the exchange on which they trade. When purchasing over-the-counter options, the Funds bear the risk of economic loss from counterparty default, equal to the market value of the option.
During the year ended October 31, 2014, Third Avenue Real Estate Value Fund and Third Avenue International Value Fund used purchased options on foreign currency for hedging purposes and/or to protect against losses in foreign currencies. As of October 31, 2014, the Third Avenue International Value Fund no longer held any purchased options on foreign currency.
During the year ended October 31, 2014, Third Avenue Value Fund used written put options on equities to gain long exposure to the underlying instruments and enhance the yield of the Fund. Third Avenue Real Estate Value Fund used written call options on foreign currency for hedging purposes and written put options on equities to gain long exposure to the underlying instruments.
Summary of derivatives information:
The following tables present the value of derivatives held as of October 31, 2014, by their primary underlying risk exposure and respective location on the Statements of Assets and Liabilities:
Third Avenue Value Fund
| Derivative Contract | Statement of Assets and Liabilities Location | Options | |||||||
| Liabilities: | |||||||||
| Equity contracts | Written equity options at value | $ | (206,000) | ||||||
Third Avenue Real Estate Value Fund
| Derivative Contract | Statement of Assets and Liabilities Location | Options | Forward Foreign Currency Contracts | |||||||||||
| Assets: | ||||||||||||||
| Foreign currency contracts | Purchased foreign currency options | $ | 2,235,139 | $ | — | |||||||||
| Foreign currency contracts | Unrealized appreciation for forward foreign currency contracts | — | 2,203,818 | |||||||||||
| Total | $ | 2,235,139 | $ | 2,203,818 | ||||||||||
| Liabilities: | ||||||||||||||
| Equity contracts | Written equity options at value | $ | (165,400 | ) | $ | — | ||||||||
| Foreign currency contracts | Written foreign currency options at value | (415,566 | ) | — | ||||||||||
| Total | $ | (580,966 | ) | $ | — | |||||||||
Third Avenue Focused Credit Fund
| Derivative Contract | Statement of Assets and Liabilities Location | Forward Foreign Currency Contracts | |||||||
| Assets: | |||||||||
| Foreign currency contracts | Unrealized appreciation for forward foreign currency contracts | $ 2,134,768 | |||||||
| 65 |
Third Avenue Trust
Notes to Financial Statements (continued)
October 31, 2014
The following tables present the effect of derivatives on the Statement of Operations during the year ended October 31, 2014, by primary risk exposure:
Third Avenue Value Fund
| Amount of Change in Unrealized Appreciation/(Depreciation) on Derivatives Recognized in Income | ||||||||||||||||||
| Written | ||||||||||||||||||
| Derivative Contract | Options | |||||||||||||||||
| Equity contracts | $ 109,500 | (a) | ||||||||||||||||
| Amount of Realized Gain/(Loss) on Derivatives Recognized in Income | ||||||||||||||||||
| Forward Foreign | ||||||||||||||||||
| Derivative Contract | Currency Contracts | |||||||||||||||||
| Foreign currency contracts | $(34,804 | )(c) | ||||||||||||||||
| Third Avenue Real Estate Value Fund | ||||||||||||||||||
| Amount of Realized Gain/(Loss) on Derivatives Recognized in Income | ||||||||||||||||||
| Purchased | Written | Forward Foreign | ||||||||||||||||
| Derivative Contract | Options | Options | Currency Contracts | Total | ||||||||||||||
| Equity contracts | $ | — | $ | 370,495 | (b) | $ | — | $ | 370,495 | |||||||||
| Foreign currency contracts | (3,054,594 | )(c) | 1,547,764 | (c) | 18,293,699 | (c) | 16,786,869 | |||||||||||
| Total | $ | (3,054,594 | ) | $ | 1,918,259 | $ | 18,293,699 | $ | 17,157,364 | |||||||||
| Amount of Change in Unrealized Appreciation/(Depreciation) on Derivatives Recognized in Income | ||||||||||||||||||
| Purchased | Written | Forward Foreign | ||||||||||||||||
| Derivative Contract | Options | Options | Currency Contracts | Total | ||||||||||||||
| Equity contracts | $ | — | $ | 1,726,607 | (a) | $ | — | $ | 1,726,607 | |||||||||
| Foreign currency contracts | 3,191,679 | (d) | 2,101,522 | (d) | 3,099,194 | (d) | 8,392,395 | |||||||||||
| Total | $ | 3,191,679 | $ | 3,828,129 | $ | 3,099,194 | $ | 10,119,002 | ||||||||||
| Third Avenue International Value Fund | ||||||||||||||||||
| Amount of Realized Gain/(Loss) on Derivatives Recognized in Income | ||||||||||||||||||
| Purchased | ||||||||||||||||||
| Derivative Contract | Options | |||||||||||||||||
| Foreign currency contracts | $(2,729,117 | )(c) | ||||||||||||||||
| Third Avenue Focused Credit Fund | ||||||||||||||||||
| Amount of Realized Gain/(Loss) on Derivatives Recognized in Income | ||||||||||||||||||
| Forward Foreign | ||||||||||||||||||
| Derivative Contract | Currency Contracts | |||||||||||||||||
| Foreign currency contracts | $19,611,428 | (c) | ||||||||||||||||
| Amount of Change in Unrealized Appreciation/(Depreciation) on Derivatives Recognized in Income | ||||||||||||||||||
| Forward Foreign | ||||||||||||||||||
| Derivative Contract | Currency Contracts | |||||||||||||||||
| Foreign currency contracts | $4,229,113 | (d) | ||||||||||||||||
| (a) | Included in “Net change in unrealized appreciation/(depreciation) on written equity options”. |
| (b) | Included in “Net realized gain on written equity options”. |
| (c) | Included in “Net realized gain/(loss) on foreign currency transactions”. |
| (d) | Included in “Net change in unrealized appreciation/(depreciation) on translation of other assets and liabilities denominated in foreign currency”. |
| 66 |
Third Avenue Trust
Notes to Financial Statements (continued)
October 31, 2014
Derivatives volume:
The tables below disclose the volume of the Funds’ forward foreign currency contracts and options activities during the year ended October 31, 2014 (amounts denominated in U.S. Dollars unless otherwise noted, except number of contracts). Please refer to the tables in the Summary of derivatives information for derivative-related gains and losses associated with volume activity (measured at each month-end).
| Third Avenue | Third Avenue | Third Avenue | |||||||||||||||
| Third Avenue | Real Estate | International | Focused | ||||||||||||||
| Value Fund | Value Fund | Value Fund | Credit Fund | ||||||||||||||
| Exchange Traded Equity Options: | |||||||||||||||||
| Average Ending Value Written | — | 16,820 | — | — | |||||||||||||
| OTC Equity Options: | |||||||||||||||||
| Average Ending Value Written | 15,846 | — | — | — | |||||||||||||
| Foreign Currency Options: | |||||||||||||||||
| Average Notional Balance Purchased | — | 105,576,923 | AUD | 115,083,282 | EUR | — | |||||||||||
| Average Notional Balance Purchased | — | — | 61,634,462 | JPY | — | ||||||||||||
| Average Notional Balance Written | — | 105,576,923 | AUD | — | — | ||||||||||||
| Forward Foreign Currency Contracts: | |||||||||||||||||
| Average Settlement Value Purchased | — | — | — | 13,056,456 | |||||||||||||
| Average Settlement Value Sold | 750,056 | 161,457,659 | — | 240,685,298 | |||||||||||||
| AUD: Australian Dollar | |||||||||||||||||
| EUR: Euro | |||||||||||||||||
| JPY: Japanese Yen |
Floating rate obligations:
The Funds may invest in debt securities with interest payments or maturity values that are not fixed, but float in conjunction with an underlying index or price. These securities may be backed by corporate issuers. The indices and prices upon which such securities can be based include interest rates and currency rates. Floating rate securities pay interest according to a coupon which is reset periodically.
Dividends and distributions to shareholders:
The amount of dividends and distributions paid to shareholders from net investment income and net realized capital gains on sales of securities, respectively are determined in accordance with U.S. federal income tax law and regulations which may differ from U.S. GAAP. Such dividends and distributions are recorded on the ex-dividend date. The majority of dividends and capital gains distributions from a Fund may be automatically reinvested into additional shares of that Fund, based upon the discretion of the Fund’s shareholders.
Income tax information:
The Funds have complied and intend to continue to comply with the requirements of the Internal Revenue Code applicable to regulated investment companies, and each Fund intends to distribute all of its taxable net investment income and net realized capital gains, if any, to its shareholders. Therefore, no provision for U.S. federal income taxes is included on the accompanying financial statements.
Income, including gains, from investments in foreign securities received by the Funds may be subject to income, withholding or other taxes imposed by foreign countries.
Management has analyzed the tax positions taken on the Funds’ U.S. federal income tax returns for all open tax years (generally the current and prior three tax years), and has concluded that no provision for U.S. federal income tax is required in the Funds’ financial statements. This conclusion may be subject to future review and adjustment at a later date based upon factors including, but not limited to, on-going analyses of and changes to tax laws, regulations and interpretations thereof. The Funds are subject to possible examination by the relevant taxing authorities for tax years for which the applicable statutes of limitations have not expired.
Expense allocation:
Expenses attributable to a specific Fund are charged to that Fund. Expenses attributable to the Trust are generally allocated using the ratio of each Fund’s average net assets relative to the total average net assets of the Trust. Certain expenses are shared with Third Avenue Variable Series Trust, an affiliated fund group. Such costs are allocated using the ratio of the Funds’ average net assets relative to the total average net assets of the Funds and Third Avenue Variable Series Trust.
Share class accounting:
Investment income, common expenses and realized/unrealized gains/(losses) on investments are allocated to the two classes of shares of each Fund on the basis of daily net assets of each class. Fees relating to a specific class are charged directly to that share class.
| 67 |
Third Avenue Trust
Notes to Financial Statements (continued)
October 31, 2014
Trustees’ and officers’ fees:
The Trust does not pay any fees to its officers for their services as such, except for the Chief Compliance Officer, and the Associate Director of Compliance, to whom the Trust paid $321,046 for the year ended October 31, 2014. The Trust does pay, together with Third Avenue Variable Series Trust, Trustees who are not affiliated with the Adviser a fee of $5,000 for each meeting of the Board that each Trustee attends, in addition to reimbursing all Trustees for travel and incidental expenses incurred by them in connection with their attendance at meetings. If a special meeting is required, Trustees will each receive $2,500. The Trust, together with Third Avenue Variable Series Trust, also pays each independent Trustee an annual retainer of $65,000 (the lead independent Trustee receives an additional retainer of $12,000). The Trustees on the Audit Committee each receive $2,000 for each audit committee meeting and the audit committee chairman receives an annual retainer of $6,000.
2. INVESTMENTS
Purchases and sales/conversions:
The aggregate cost of purchases and aggregate proceeds from sales and conversions of investments, excluding short-term investments, from unaffiliated and affiliated issuers (as defined in the Investment Company Act of 1940 as ownership of 5% or more of the outstanding voting securities of these issuers) for the year ended October 31, 2014 were as follows:
| Purchases | Sales | |||||||
| Third Avenue Value Fund: | ||||||||
| Affiliated | $ | 2,947,994 | $ | 25,618,906 | ||||
| Unaffiliated | 656,355,543 | 969,164,377 | ||||||
| Third Avenue Small-Cap Value Fund: | ||||||||
| Unaffiliated | 232,221,743 | 369,868,370 | ||||||
| Third Avenue Real Estate Value Fund: | ||||||||
| Affiliated | 69,334,006 | — | ||||||
| Unaffiliated | 939,030,051 | 310,355,231 | ||||||
| Third Avenue International Value Fund: | ||||||||
| Affiliated | — | 8,160,793 | ||||||
| Unaffiliated | 177,224,416 | 902,017,330 | ||||||
| Third Avenue Focused Credit Fund: | ||||||||
| Affiliated | 3,034,982 | — | ||||||
| Unaffiliated | 2,630,264,919 | 1,335,913,961 | ||||||
Written options transactions during the period are summarized as follows:
Third Avenue Value Fund
| Equity Options Written | ||||||||
| Number of Contracts | | Premiums Received | ||||||
| Options outstanding at October 31, 2013 | — | $ | — | |||||
| Options written | 2,000 | 315,500 | ||||||
| Options outstanding at October 31, 2014 | 2,000 | $ | 315,500 | |||||
Third Avenue Real Estate Value Fund
| Currency Options Written | Equity Options Written | |||||||||||||||
| Notional Amount ‡ | Premiums Received | Number of Contracts | Premiums Received | |||||||||||||
| Options outstanding at October 31, 2013 | 128,000,000 | $ | 2,040,020 | — | $ | — | ||||||||||
| Options written | 493,000,000 | 4,830,954 | 18,261 | 2,262,502 | ||||||||||||
| Options terminated in closing purchase transactions | (294,500,000 | ) | (3,363,408 | ) | — | — | ||||||||||
| Options exercised | (83,500,000 | ) | (1,090,002 | ) | — | — | ||||||||||
| Options expired | (162,000,000 | ) | (1,783,028 | ) | (4,261 | ) | (370,495 | ) | ||||||||
| Options outstanding at October 31, 2014 | 81,000,000 | $ | 634,536 | 14,000 | $ | 1,892,007 | ||||||||||
| ‡ | In Australian Dollars. |
| 68 |
Third Avenue Trust
Notes to Financial Statements (continued)
October 31, 2014
3. INVESTMENT ADVISORY SERVICES, ADMINISTRATION AND SERVICE FEE AGREEMENTS AND EXPENSE OFFSET ARRANGEMENT
Each Fund has an Investment Advisory Agreement with the Adviser for investment advice and certain management functions. The terms of the Investment Advisory Agreements provide the annual advisory fees based on the total average daily net assets for the Funds which are indicated as below. These fees are calculated daily and paid monthly.
| Fund | Annual Management Fee | |
| Third Avenue Value Fund | 0.90% | |
| Third Avenue Small-Cap Value Fund | 0.90% | |
| Third Avenue Real Estate Value Fund | 0.90% | |
| Third Avenue International Value Fund | 1.25% | |
| Third Avenue Focused Credit Fund | 0.75% |
Additionally, the Adviser pays certain expenses on behalf of the Funds which are partially reimbursed by the Funds, including service fees due to third parties, the compensation expense for the Funds’ Chief Compliance Officer and the Associate Director of Compliance and other miscellaneous expenses. At October 31, 2014, Third Avenue Value Fund, Third Avenue Small-Cap Value Fund, Third Avenue Real Estate Value Fund, Third Avenue International Value Fund and Third Avenue Focused Credit Fund had amounts payable to the Adviser of $4,753, $3,127, $19,208, $2,451 and $81,263, respectively, for reimbursement of expenses paid by the Adviser.
Under current arrangements, whenever, in any fiscal year, each Fund’s normal operating expenses, including the investment advisory fee, but excluding taxes, interest, brokerage commissions, acquired fund fees and expenses, and extraordinary items, exceeds the expense limitation based on each Fund’s average daily net assets, the Adviser has agreed to waive a portion of its advisory fees and/or reimburse each Fund in an amount equal to that excess. This arrangement is set to expire on February 28, 2015, subject to annual renewal. The expense limitations for each Fund are disclosed in its corresponding Financial Highlights. Below are the corresponding contingent liabilities to the Adviser in effect as of October 31, 2014:
| October 31, 2012 | Expenses Waived through Fiscal Periods ending October 31, 2013 | October 31, 2014 | |||||||
| Subject to Repayment until October 31, | |||||||||
| Fund | Expiration Date | 2015 | 2016 | 2017 | |||||
| Third Avenue International Value Fund | 2/28/2015 | $384,146 | $383,912 | $517,819 | |||||
The waived fees and reimbursed expenses may be paid to the Adviser during the following three-year period after the end of the fiscal year in which an expense is waived or reimbursed by the Adviser, to the extent that the payment of such fees and expenses would not cause a Fund to exceed the limitations disclosed in the corresponding financial highlights. These expense limitations can be terminated at any time.
The Trust has entered into an Administration Agreement with the Adviser pursuant to which the Adviser, as administrator, is responsible for providing various administrative services to the Trust. The Adviser has in turn entered into a Sub-Administration Agreement with BNY Mellon Investment Servicing (U.S.) Inc. (“BNY Mellon”) pursuant to which BNY Mellon provides certain of these administrative services on behalf of the Adviser. Each Fund pays the Adviser a fee calculated at an annual rate of 0.0055% of the average daily net assets of each respective Fund for such services. The Adviser pays BNY Mellon an annual sub-administration fee for sub-administration services provided to the Trust equal to $199,778.
Both the Trust and the Adviser have entered into agreements with financial intermediaries to provide recordkeeping, processing, shareholder communications and other services to customers of the intermediaries investing in the Funds and have agreed to compensate the intermediaries for providing those services. Certain of those services would be provided by the Funds if the shares of each customer were registered directly with the Funds’ transfer agent. Accordingly, the Funds have agreed to reimburse a portion of the intermediary fees paid by the Adviser pursuant to provisions adopted by the Board. Each Fund pays a portion of the intermediary fees attributable to shares of the Fund not exceeding the estimated expense the Fund would have paid its transfer agent had each customer’s shares been registered directly with the transfer agent instead of held through the intermediary accounts. The Adviser pays the remainder of the fees. The fees incurred by the Funds are reflected as shareholder servicing fees in the Statements of Operations. For the year ended October 31, 2014, such fees amounted to $2,149,632 for Third Avenue Value Fund, $545,000 for Third Avenue Small-Cap Value Fund, $2,751,579 for Third Avenue Real Estate Value Fund, $700,001 for Third Avenue International Value Fund and $1,436,578 for Third Avenue Focused Credit Fund.
The Funds have an expense offset arrangement in connection with their custodian contract. Credits realized as a result of uninvested cash balances are used to reduce a portion of the Funds’ custodian expenses. The following amounts are the reduction of expenses due to this arrangement for the year ended October 31, 2014. These amounts are reflected as “Expenses reduced by custodian fee expense offset arrangement” in the Statements of Operations.
| 69 |
Third Avenue Trust
Notes to Financial Statements (continued)
October 31, 2014
| Fund | Custody Credit | |||
| Third Avenue Value Fund | $131,137 | |||
| Third Avenue Small-Cap Value Fund | 4,333 | |||
| Third Avenue Real Estate Value Fund | 193,342 | |||
| Third Avenue International Value Fund | 30,906 | |||
| Third Avenue Focused Credit Fund | 112,846 | |||
4. LINE OF CREDIT
Each Fund and Third Avenue Variable Series Trust are participants in a single committed, unsecured $100,000,000 line of credit with The Bank of Nova Scotia, to be used only for temporary or emergency purposes. The interest on the loan is calculated at a variable rate based on the LIBOR, Federal Funds or Prime Rates. A commitment fee of 0.10% per annum of the available line of credit is charged, of which each participating Fund and Third Avenue Variable Series Trust pays its pro rata share, based on the ratio of its individual net assets to the net assets of all participants at the time the fee is due and payable. The fee is paid quarterly in arrears and is included in “Miscellaneous” expenses in the Statement of Operations. Because all of the Funds in Third Avenue Trust and Third Avenue Variable Series Trust participate, there is no assurance that an individual Fund will have access to all or any part of the $100,000,000 at any particular time. During the period from April 23, 2014 (commencement of line of credit agreement) to October 31, 2014, there were no loans outstanding under the line of credit.
5. RELATED PARTY TRANSACTIONS
Investment in affiliates:
A summary of the Funds’ transactions in securities of affiliated issuers for the year ended October 31, 2014 is set forth below:
Third Avenue Value Fund
| Name of Issuer: | Shares/ Principal Amount Held at Oct. 31, 2013 | Gross Purchases and Additions | Gross Sales and Reductions | Shares/ Principal Amount Held at Oct. 31, 2014 | Value at Oct. 31, 2014 | Investment Income Nov. 1, 2013 - Oct. 31, 2014 | ||||||||||||||
| Cavco Industries, Inc.†* | 1,537,742 | — | 1,537,742 | 1 | — | $ | — | $ | — | |||||||||||
| Cavco Industries, Inc. | 271,366 | 1,537,742 | 1 | 242,482 | 1,566,626 | 114,160,037 | — | |||||||||||||
| Home Products International, Inc. | 526,368 | — | — | 526,368 | — | — | ||||||||||||||
| Home Products International, Inc., 2nd Lien, Convertible, 6.000% Payment-in-kind Interest, due 3/20/17 | 20,270,597 | 1,234,479 | 2 | — | 21,505,076 | 4,507,464 | 1,234,479 | 2 | ||||||||||||
| Lai Sun Garment International, Ltd. | 171,393,000 | 27,422,880 | 3 | 47,272,000 | 151,543,880 | 22,667,634 | — | |||||||||||||
| Manifold Capital LLC | 37 | — | — | 37 | 259,000 | — | ||||||||||||||
| Sycamore Networks, Inc.* | 3,480,368 | — | 3,480,368 | — | — | — | ||||||||||||||
| Tejon Ranch Co. | 1,221,894 | — | — | 1,221,894 | 36,876,761 | — | ||||||||||||||
| Tejon Ranch Co., Warrants, expire 8/31/16 | 200,255 | — | — | 200,255 | 420,535 | — | ||||||||||||||
| Tellabs, Inc.* | 24,934,737 | — | 24,934,737 | 4 | — | — | — | |||||||||||||
| Total Affiliates | $ | 178,891,431 | $ | 1,234,479 | ||||||||||||||||
| 1 | Exchange of shares. |
| 2 | Payment-in-kind interest. |
| 3 | Exercise of rights. |
| 4 | Tender offer. |
| † | Restricted security subject to restrictions on resale. |
| * | As of October 31, 2014, no longer an affiliate. |
| 70 |
Third Avenue Trust
Notes to Financial Statements (continued)
October 31, 2014
Third Avenue Real Estate Value Fund
| Name of Issuer: | Shares/Units Held at Oct. 31, 2013 | Gross Purchases and Additions | Gross Sales and Reductions | Shares/Units Held at Oct. 31, 2014 | Value at Oct. 31, 2014 | Investment Income Nov. 1, 2013 - Oct. 31, 2014 | |||||||||||||||||||
| Consolidated-Tomoka Land Co.* | 500,500 | — | 500,500 | — | $ | — | $ | — | |||||||||||||||||
| Newhall Holding Co. LLC, Class A Units | 28,847,217 | — | — | 28,847,217 | 100,965,259 | — | |||||||||||||||||||
| Starwood Waypoint Residential Trust** | — | 2,515,510 | — | 2,515,510 | 65,856,052 | 322,827 | |||||||||||||||||||
| Thomas Properties Group, Inc.* | 7,354,979 | — | 7,354,979 | 1 | — | — | — | ||||||||||||||||||
| Total Affiliates | $ | 166,821,311 | $ | 322,827 | |||||||||||||||||||||
| 1 | Merger. |
| * | As of October 31, 2014, no longer an affiliate. |
| ** | As of October 31, 2013, not an affiliate. |
Third Avenue International Value Fund
| Name of Issuer: | Shares Held at Oct. 31, 2013 | Gross Purchases and Additions | Gross Sales and Reductions | Shares Held at Oct. 31, 2014 | Value at Oct. 31, 2014 | Investment Income Nov. 1, 2013 - Oct. 31, 2014 | |||||||||||||||||||
| Boardroom, Ltd.* | 22,522,784 | — | 22,522,784 | — | $ | — | $ | — | |||||||||||||||||
| GP Investments, Ltd., BDR | 8,734,788 | — | 2,680,481 | 6,054,307 | 12,241,042 | — | |||||||||||||||||||
| Netia S.A.* | 33,297,746 | — | 33,297,746 | — | — | — | |||||||||||||||||||
| Rubicon, Ltd. | 67,993,649 | — | 10,968,953 | 57,024,696 | 15,224,425 | — | |||||||||||||||||||
| Straits Trading Co. Ltd.* | 26,437,649 | — | 26,437,649 | — | — | — | |||||||||||||||||||
| Tenon, Ltd. | 10,405,851 | — | 55,425 | 10,350,426 | 13,917,610 | — | |||||||||||||||||||
| Total Affiliates | $ | 41,383,077 | $ | — | |||||||||||||||||||||
BDR: Brazilian Depositary Receipt
| * | As of October 31, 2014, no longer an affiliate. |
Third Avenue Focused Credit Fund
| Name of Issuer: | Shares/ Principal Amount Held at Oct. 31, 2013 | Gross Purchases and Additions | Gross Sales and Reductions | Shares/ Principal Amount Held at Oct. 31, 2014 | Value at Oct. 31, 2014 | Investment Income Nov. 1, 2013 - Oct. 31, 2014 | |||||||||||||||||||
| Phosphate Holdings, Inc. | 478,500 | — | — | 478,500 | $ | 148,335 | $ | — | |||||||||||||||||
| Radio One, Inc., 12.500%, due 5/24/16* | 39,000,690 | — | 39,000,690 | — | — | — | |||||||||||||||||||
| Radio One, Inc., Class D | 1,980,578 | 330,782 | — | 2,311,360 | 5,755,286 | — | |||||||||||||||||||
| Spanish Broadcasting System, Inc., 12.500% due 4/15/17* | 22,000,000 | 2,000,000 | 24,000,000 | — | — | — | |||||||||||||||||||
| Spanish Broadcasting System, Inc., Class A | 382,686 | 298,951 | — | 681,637 | 2,746,997 | — | |||||||||||||||||||
| Total Affiliates | $ | 8,650,618 | $ | — | |||||||||||||||||||||
| * | As of October 31, 2014, no longer an affiliate. |
Certain employees of the Adviser serve as members of the board of directors of companies in which the Funds have investments. As a result of such service, for the year ended October 31, 2014, the Funds received the following board member fees from these companies that board members employed by the Adviser agreed to have paid directly to the benefit of the Funds. These fees are included in “Other Income” on the accompanying Statements of Operations.
| Fund | Fees | |||
| Third Avenue Value Fund | $ | 117,463 | ||
| Third Avenue Real Estate Value Fund | 38,999 | |||
6. DISTRIBUTION EXPENSES
The Board has adopted a distribution plan (the “Plan”) pursuant to Rule 12b-1 under the Investment Company Act. The Plan provides that, as compensation for distribution and related services provided to Third Avenue Value Fund Investor Class (“TVFVX”), Third Avenue Small-Cap Value Fund Investor Class (“TVSVX”), Third Avenue Real Estate Value Fund Investor Class (“TVRVX”), Third Avenue International Value Fund Investor Class (“TVIVX”), and Third Avenue Focused Credit Fund Investor Class (“TFCVX”), each Fund’s Investor Class accrues a fee calculated at the annual rate of 0.25% of average daily net assets of the class. Such fees may be paid to institutions that provide distribution services. The amount of fees paid during any period may be more or less than the cost of distribution and other services provided. Financial Industry Regulatory Authority (“FINRA”) rules impose a ceiling on the cumulative distribution fees paid.
| 71 |
Third Avenue Trust
Notes to Financial Statements (continued)
October 31, 2014
For the year ended October 31, 2014, distribution expenses were as follows:
| Fund | Distribution Fees | |||
| Third Avenue Value Fund | $ | 94,267 | ||
| Third Avenue Small-Cap Value Fund | 29,381 | |||
| Third Avenue Real Estate Value Fund | 713,177 | |||
| Third Avenue International Value Fund | 67,051 | |||
| Third Avenue Focused Credit Fund | 2,959,116 | |||
7. CAPITAL SHARE TRANSACTIONS
Each Fund is authorized to issue an unlimited number of shares of each class of beneficial interest with $0.001 par value.
Transactions in capital stock of each class were as follows:
Third Avenue Value Fund:
| For the Year Ended October 31, 2014 | For the Year Ended October 31, 2013 | |||||||||||||||
| Investor Class | Investor Class | |||||||||||||||
| Shares | Amount | Shares | Amount | |||||||||||||
| Shares sold | 128,958 | $ | 7,522,597 | 236,398 | $ | 12,612,994 | ||||||||||
| Shares issued upon reinvestment of dividends and distributions | 19,744 | 1,110,369 | 13,142 | 647,390 | ||||||||||||
| Shares redeemed* | (216,421 | ) | (12,890,194 | ) | (144,111 | ) | (7,622,451 | ) | ||||||||
| Net increase/(decrease) | (67,719 | ) | $ | (4,257,228 | ) | 105,429 | $ | 5,637,933 | ||||||||
| For the Year Ended October 31, 2014 | For the Year Ended October 31, 2013 | |||||||||||||||
| Institutional Class | Institutional Class | |||||||||||||||
| Shares | Amount | Shares | Amount | |||||||||||||
| Shares sold | 1,394,237 | $ | 81,320,497 | 1,820,186 | $ | 96,038,392 | ||||||||||
| Shares issued upon reinvestment of dividends and distributions | 1,404,457 | 79,028,753 | 1,259,150 | 62,037,809 | ||||||||||||
| Shares redeemed* | (11,933,084 | ) | (703,200,517 | ) | (11,850,032 | ) | (623,456,688 | ) | ||||||||
| Net decrease | (9,134,390 | ) | $ | (542,851,267 | ) | (8,770,696 | ) | $ | (465,380,487 | ) | ||||||
| Third Avenue Small-Cap Value Fund: | ||||||||||||||||
| For the Year Ended October 31, 2014 | For the Year Ended October 31, 2013 | |||||||||||||||
| Investor Class | Investor Class | |||||||||||||||
| Shares | Amount | Shares | Amount | |||||||||||||
| Shares sold | 97,022 | $ | 2,676,320 | 130,796 | $ | 3,254,427 | ||||||||||
| Shares issued upon reinvestment of dividends and distributions | 27,798 | 749,981 | 10,644 | 237,778 | ||||||||||||
| Shares redeemed* | (200,461 | ) | (5,455,727 | ) | (85,830 | ) | (2,122,174 | ) | ||||||||
| Net increase/(decrease) | (75,641 | ) | $ | (2,029,426 | ) | 55,610 | $ | 1,370,031 | ||||||||
| For the Year Ended October 31, 2014 | For the Year Ended October 31, 2013 | |||||||||||||||
| Institutional Class | Institutional Class | |||||||||||||||
| Shares | Amount | Shares | Amount | |||||||||||||
| Shares sold | 665,083 | $ | 18,260,584 | 1,478,630 | $ | 36,235,040 | ||||||||||
| Shares issued upon reinvestment of dividends and distributions | 1,498,269 | 40,453,273 | 860,196 | 19,216,789 | ||||||||||||
| Shares redeemed* | (7,835,804 | ) | (215,396,119 | ) | (7,558,576 | ) | (183,562,807 | ) | ||||||||
| Net decrease | (5,672,452 | ) | $ | (156,682,262 | ) | (5,219,750 | ) | $ | (128,110,978 | ) | ||||||
| 72 |
Third Avenue Trust
Notes to Financial Statements (continued)
October 31, 2014
Third Avenue Real Estate Value Fund:
| For the Year Ended October 31, 2014 | For the Year Ended October 31, 2013 | |||||||||||||||
| Investor Class | Investor Class | |||||||||||||||
| Shares | Amount | Shares | Amount | |||||||||||||
| Shares sold | 9,071,471 | $ | 271,817,715 | 3,223,891 | $ | 88,684,390 | ||||||||||
| Shares issued upon reinvestment of dividends and distributions | 140,095 | 3,963,299 | 206,129 | 5,171,770 | ||||||||||||
| Shares redeemed* | (2,597,093 | ) | (79,984,262 | ) | (779,847 | ) | (20,986,092 | ) | ||||||||
| Net increase | 6,614,473 | $ | 195,796,752 | 2,650,173 | $ | 72,870,068 | ||||||||||
| For the Year Ended October 31, 2014 | For the Year Ended October 31, 2013 | |||||||||||||||
| Institutional Class | Institutional Class | |||||||||||||||
| Shares | Amount | Shares | Amount | |||||||||||||
| Shares sold | 30,409,505 | $ | 934,896,558 | 15,341,907 | $ | 414,105,748 | ||||||||||
| Shares issued upon reinvestment of dividends and distributions | 1,608,740 | 45,704,316 | 5,269,569 | 132,635,045 | ||||||||||||
| Shares redeemed* | (10,577,919 | ) | (322,617,599 | ) | (15,986,629 | ) | (429,839,095 | ) | ||||||||
| Net increase | 21,440,326 | $ | 657,983,275 | 4,624,847 | $ | 116,901,698 | ||||||||||
Third Avenue International Value Fund:
| For the Year Ended October 31, 2014 | For the Year Ended October 31, 2013 | |||||||||||||||
| Investor Class | Investor Class | |||||||||||||||
| Shares | Amount | Shares | Amount | |||||||||||||
| Shares sold | 308,783 | $ | 6,102,443 | 762,336 | $ | 13,688,140 | ||||||||||
| Shares issued upon reinvestment of dividends and distributions | 19,726 | 389,379 | 7,774 | 131,765 | ||||||||||||
| Shares redeemed* | (1,384,742 | ) | (27,293,669 | ) | (164,894 | ) | (2,955,523 | ) | ||||||||
| Net increase/(decrease) | (1,056,233 | ) | $ | (20,801,847 | ) | 605,216 | $ | 10,864,382 | ||||||||
| For the Year Ended October 31, 2014 | For the Year Ended October 31, 2013 | |||||||||||||||
| Institutional Class | Institutional Class | |||||||||||||||
| Shares | Amount | Shares | Amount | |||||||||||||
| Shares sold | 2,308,070 | $ | 45,751,820 | 6,247,580 | $ | 112,069,681 | ||||||||||
| Shares issued upon reinvestment of dividends and distributions | 730,534 | 14,428,040 | 571,476 | 9,686,532 | ||||||||||||
| Shares redeemed* | (44,920,114 | ) | (872,331,104 | ) | (18,461,777 | ) | (334,119,054 | ) | ||||||||
| Net decrease | (41,881,510 | ) | $ | (812,151,244 | ) | (11,642,721 | ) | $ | (212,362,841 | ) | ||||||
| 73 |
Third Avenue Trust
Notes to Financial Statements (continued)
October 31, 2014
Third Avenue Focused Credit Fund:
| For the Year Ended October 31, 2014 | For the Year Ended October 31, 2013 | |||||||||||||||
| Investor Class | Investor Class | |||||||||||||||
| Shares | Amount | Shares | Amount | |||||||||||||
| Shares sold | 84,897,396 | $ | 986,124,742 | 45,395,691 | $ | 496,920,185 | ||||||||||
| Shares issued upon reinvestment of dividends and distributions | 6,954,244 | 80,285,714 | 3,040,119 | 32,842,155 | ||||||||||||
| Shares redeemed* | (72,968,925 | ) | (860,699,914 | ) | (13,244,809 | ) | (143,844,871 | ) | ||||||||
| Net increase | 18,882,715 | $ | 205,710,542 | 35,191,001 | $ | 385,917,469 | ||||||||||
| For the Year Ended October 31, 2014 | For the Year Ended October 31, 2013 | |||||||||||||||
| Institutional Class | Institutional Class | |||||||||||||||
| Shares | Amount | Shares | Amount | |||||||||||||
| Shares sold | 140,734,447 | $ | 1,653,016,104 | 50,142,269 | $ | 549,466,059 | ||||||||||
| Shares issued upon reinvestment of dividends and distributions | 7,400,932 | 84,797,094 | 4,117,795 | 44,367,404 | ||||||||||||
| Shares redeemed* | (46,620,041 | ) | (539,102,312 | ) | (25,906,733 | ) | (280,375,773 | ) | ||||||||
| Net increase | 101,515,338 | $ | 1,198,710,886 | 28,353,331 | $ | 313,457,690 | ||||||||||
| * | Redemption fees are netted with redemption amounts. |
Third Avenue Value Fund, Third Avenue Small-Cap Value Fund, Third Avenue Real Estate Value Fund, Third Avenue International Value Fund, and Third Avenue Focused Credit Fund charge a redemption fee of 1%, 1%, 1%, 2%, and 2%, respectively, for shares redeemed or exchanged for shares of another Fund within 60 days or less of the purchase date.
8. COMMITMENTS AND CONTINGENCIES
At October 31, 2014, Third Avenue Focused Credit Fund had the following commitments and contingencies:
| Issuer | Type | Amount of Commitment | Funded Commitment | Value of Segregated Securities | ||||||||||
| Longview Power LLC | Debtor-In-Possession Loan | $13,818,803 | $6,725,151 | $7,093,652 |
In the normal course of business, the Funds enter into contracts that contain a variety of representations and warranties and which provide general indemnifications. The Funds’ maximum exposure under these arrangements is unknown, as this would involve future claims that may be made against the Funds that have not yet occurred. However, based on experience, the Funds expect the risk of loss to be remote.
Third Avenue Focused Credit Fund is a plaintiff in two separate litigations each pertaining to counterparties not performing their contractual obligations. The Fund is seeking damages from both counterparties.
Third Avenue Focused Credit Fund is a defendant in an action initiated by the issuer of bonds currently held by the Fund pertaining to the validity of a notice of default sent to the issuer. The Fund expects the risk of any loss from this action to be remote.
9. RISKS RELATING TO CERTAIN INVESTMENTS
Foreign securities:
Investments in the securities of foreign issuers may involve investment risks different from those of U.S. issuers including possible political or economic instability of the country of the issuer, the difficulty of predicting international trade patterns, the possibility of currency exchange controls, the possible imposition of foreign taxes on income from and transactions in such instruments, the possible establishment of foreign controls, the possible seizure or nationalization of foreign deposits or assets, or the adoption of other foreign government restrictions that might adversely affect the foreign securities held by the Funds. Foreign securities may also be subject to greater fluctuations in price than securities of domestic corporations or the U.S. Government.
High yield debt:
The Funds may invest in high yield, lower grade debt (sometimes referred to as “junk bonds”). The market values of these higher yielding debt securities tend to be more sensitive to economic conditions and individual corporate developments than those of higher rated securities. In addition, the secondary market for these bonds is generally less liquid.
| 74 |
Third Avenue Trust
Notes to Financial Statements (continued)
October 31, 2014
Claims:
An investment in claims is speculative and carries a high degree of risk. Claims are illiquid instruments which generally do not pay interest. Claims may also be allowed or disallowed in whole or part. If allowed, they may be settled by a pro-rata distribution of the assets of the estate. The markets in claims are not regulated by federal securities laws or the SEC. Because claims are unsecured, holders of claims may have a lower priority in terms of payment than certain other creditors in a bankruptcy proceeding.
Credit and interest rate risk:
The market value of debt securities is affected by changes in prevailing interest rates and the perceived credit quality of the issuer. When prevailing interest rates fall or perceived credit quality improves, the market value of the affected debt securities generally rises. Conversely, when interest rates rise or perceived credit quality weakens, the market value of the affected debt securities generally declines.
Market risk:
Prices of securities (and stocks in particular) have historically fluctuated. The value of the Funds will similarly fluctuate and you could lose money.
Counterparty risk:
The Funds are exposed to counterparty risk, or the risk that an institution or other entity with which the Funds have unsettled or open transactions will default. The potential loss to the Funds could exceed the value of the financial assets recorded in the Funds’ financial statements. Financial assets, which potentially expose the Funds to counterparty risk, consist principally of cash due from counterparties and investments. The Adviser seeks to minimize the Funds’ counterparty risk by performing reviews of each counterparty and by minimizing concentration of counterparty risk by undertaking transactions with multiple customers and counterparties on recognized and reputable exchanges. Delivery of securities sold is only made once the Funds have received payment. Payment is made on a purchase once the securities have been delivered by the counterparty. The trade will fail if either party fails to meet its obligation.
At October 31, 2014, the Funds had counterparty concentration of credit risk primarily with Goldman Sachs International, JPMorgan Chase Bank, N.A., Macquarie Bank Ltd. and Morgan Stanley Capital Services LLC.
The Funds are party to International Swaps and Derivatives Association, Inc. Master Agreements (“ISDA Master Agreements”) with select counterparties that govern transactions, over-the-counter derivatives and foreign exchange contracts entered into by the Funds and those counterparties. The ISDA Master Agreements contain provisions for general obligations, representations, agreements, collateral and events of default or termination. Events of termination include conditions that may entitle counterparties to elect to terminate early and cause settlement of all outstanding transactions under the applicable ISDA Master Agreement. Any election to terminate early could be material to the financial statements of the Funds.
The considerations and factors surrounding the settlement of certain purchases and sales made on a delayed-delivery basis are governed by Master Securities Forward Transaction Agreements (“Master Forward Agreements”) between the Funds and select counterparties. The Master Forward Agreements maintain provisions for, among other things, initiation and confirmation, payment and transfer, events of default, termination, and maintenance of collateral.
The counterparty risk associated with certain contracts may be reduced by master netting arrangements to the extent that if an event of default occurs, all amounts with the counterparty are terminated and settled on a net basis. The Funds’ overall exposure to counterparty risk with respect to transactions subject to master netting arrangements can change substantially within a short period, as it is affected by each transaction subject to the arrangement.
Collateral requirements:
For derivatives traded under an ISDA Master Agreement and/or Master Forward Agreement, the collateral requirements are typically calculated by netting the mark-to-market amount for each transaction under such agreement and comparing that amount to the value of any collateral currently pledged by the Fund and the counterparty.
Cash collateral that has been pledged to cover obligations of a Fund and cash collateral received from the counterparty, if any, is reported separately on the Statement of Assets and Liabilities as cash pledged as collateral and cash received as collateral, respectively. Non-cash collateral pledged by the Fund, if any, is noted in the Schedule of Investments. Generally, the amount of collateral due from or to a party has to exceed a minimum transfer amount threshold (e.g. $500,000) before a transfer is required, which is determined at the close of business of a Fund and any additional required collateral is delivered to/pledged by a Fund on the next business day. Typically, a Fund and its counterparties are not permitted to sell, re-pledge or use the collateral they receive. To the extent amounts due to a Fund from its counterparties are not fully collateralized, contractually or otherwise, a Fund bears the risk of loss from counterparty non-performance. The Funds attempt to mitigate counterparty risk by entering into agreements only with counterparties that it believes have the financial resources to honor their obligations and by monitoring the financial stability of those counterparties.
| 75 |
Third Avenue Trust
Notes to Financial Statements (continued)
October 31, 2014
For financial reporting purposes, the Funds do not offset derivative assets and derivative liabilities that are subject to netting arrangements in the Statement of Assets and Liabilities.
Third Avenue Value Fund
At October 31, 2014, the Fund’s derivative assets and liabilities (by type) on a gross basis are as follows:
| Assets | Liabilities | |||||||
| Derivative Financial Instruments: | ||||||||
| Options | $ | — | $ | 206,000 | ||||
| Total derivative assets and liabilities in the Statement of Assets and Liabilities | — | 206,000 | ||||||
| Derivatives not subject to a master netting agreement or similar agreement (“MNA”) | — | — | ||||||
| Total derivative assets and liabilities subject to a MNA | $ | — | $ | 206,000 | ||||
The following tables present the Fund’s derivative liabilities by counterparty net of amounts available for offset under a MNA and net of the related collateral pledged by the Fund as of October 31, 2014:
| Amount of Liabilities | Derivatives | Non-cash | Cash | Net Amount | ||||||||||||||||
| Subject to a MNA by | Available | Collateral | Collateral | of Derivative | ||||||||||||||||
| Counterparty | Counterparty | for Offset1 | Pledged2 | Pledged2 | Liabilities | |||||||||||||||
| Morgan Stanley Capital Services LLC | $206,000 | $ | — | $ | — | $ | (206,000 | ) | $ | — |
| 1 | The amount of derviatives for offset is limited to the amount of assets and/or liabilites that are subject to a MNA. |
| 2 | Excess of collateral pledged to the individual counterparty may not be shown for financial reporting purposes. |
Third Avenue Real Estate Value Fund
At October 31, 2014, the Fund’s derivative assets and liabilities (by type) on a gross basis are as follows:
| Assets | Liabilities | |||||||
| Derivative Financial Instruments: | ||||||||
| Options | $ | 2,235,139 | $ | 580,966 | ||||
| Forward Foreign Currency Contracts | 2,203,818 | — | ||||||
| Total derivative assets and liabilities in the Statement of Assets and Liabilities | 4,438,957 | 580,966 | ||||||
| Derivatives not subject to a master netting agreement or similar agreement (“MNA”) | — | (165,400 | ) | |||||
| Total derivative assets and liabilities subject to a MNA | $ | 4,438,957 | $ | 415,566 | ||||
The following tables present the Fund’s derivative assets by counterparty net of amounts available for offset under a MNA and net of the related collateral received by the Fund as of October 31, 2014:
| Amount of Assets | Derivatives | Non-cash | Cash | Net Amount | ||||||||||||||||||
| Subject to a MNA by | Available | Collateral | Collateral | of Derivative | ||||||||||||||||||
| Counterparty | Counterparty | for Offset1 | Received2 | Received2 | Assets3 | |||||||||||||||||
| Goldman Sachs International | $ | 1,218,304 | $ | (415,566 | ) | $ | — | $ | — | $ | 802,738 | |||||||||||
| Macquarie Bank Ltd. | 2,114,137 | — | — | — | 2,114,137 | |||||||||||||||||
| Morgan Stanley Capital Services LLC | 1,106,516 | — | — | — | 1,106,516 | |||||||||||||||||
| $ | 4,438,957 | $ | (415,566 | ) | $ | — | $ | — | $ | 4,023,391 | ||||||||||||
| 1 | The amount of derviatives for offset is limited to the amount of assets and/or liabilities that are subject to a MNA. |
| 2 | Excess of collateral received from the individual counterparty may not be shown for financial reporting purposes. |
| 3 | Net amount represents the net amount receivable from the counterparty in the event of default. |
The following tables present the Fund’s derivative liabilities by counterparty net of amounts available for offset under a MNA and net of the related collateral pledged by the Fund as of October 31, 2014:
| Amount of Liabilities | Derivatives | Non-cash | Cash | Net Amount | ||||||||||||||||||
| Subject to a MNA by | Available | Collateral | Collateral | of Derivative | ||||||||||||||||||
| Counterparty | Counterparty | for Offset1 | Pledged2 | Pledged2 | Liabilities | |||||||||||||||||
| Goldman Sachs International | $415,566 | $ | (415,566 | ) | $ | — | $ | — | $ | — | ||||||||||||
| Macquarie Bank Ltd. | — | — | — | — | — | |||||||||||||||||
| $415,566 | $ | (415,566 | ) | $ | — | $ | — | $ | — | |||||||||||||
| 1 | The amount of derviatives for offset is limited to the amount of assets and/or liabilites that are subject to a MNA. |
| 2 | Excess of collateral pledged to the individual counterparty may not be shown for financial reporting purposes. |
| 76 |
Third Avenue Trust
Notes to Financial Statements (continued)
October 31, 2014
Third Avenue Focused Credit Fund
At October 31, 2014, the Fund’s derivative assets and liabilities (by type) on a gross basis are as follows:
| Assets | Liabilities | |||||||
| Derivative Financial Instruments: | ||||||||
| Forward Foreign Currency Contracts | $ | 2,134,768 | $ | — | ||||
| Total derivative assets and liabilities in the Statement of Assets and Liabilities | 2,134,768 | — | ||||||
| Derivatives not subject to a master netting agreement or similar agreement (“MNA”) | — | — | ||||||
| Total derivative assets and liabilities subject to a MNA | $ | 2,134,768 | $ | — | ||||
The following tables present the Fund’s derivative assets by counterparty net of amounts available for offset under a MNA and net of the related collateral received by the Fund as of October 31, 2014:
| Amount of Assets | Derivatives | Non-cash | Cash | Net Amount | ||||||||||||||||||
| Subject to a MNA by | Available | Collateral | Collateral | of Derivative | ||||||||||||||||||
| Counterparty | Counterparty | for Offset1 | Received2 | Received2 | Assets3 | |||||||||||||||||
| Goldman Sachs International | $1,072,709 | $ | — | $ | — | $ | — | $ | 1,072,709 | |||||||||||||
| JPMorgan Chase Bank N.A. | 836,114 | — | — | — | 836,114 | |||||||||||||||||
| Macquarie Bank Ltd. | 225,945 | — | — | — | 225,945 | |||||||||||||||||
| $2,134,768 | $ | — | $ | — | $ | — | $ | 2,134,768 | ||||||||||||||
| 1 | The amount of derviatives for offset is limited to the amount of assets and/or liabilites that are subject to a MNA. |
| 2 | Excess of collateral received from the individual counterparty may not be shown for financial reporting purposes. |
| 3 | Net amount represents the net amount receivable from the counterparty in the event of default. |
Loans and other direct debt instruments:
The Funds may invest in loans and other direct debt instruments issued by corporate borrowers. These loans represent amounts owed to lenders or lending syndicates (loans and loan participations) or to other parties. Direct debt instruments may involve a risk of loss in case of default or insolvency of the borrower and may offer less legal protection to the Fund in the event of fraud or misrepresentation. In addition, loan participations involve a risk of insolvency of the lending bank or other financial intermediary. The markets in loans are not regulated by federal securities laws or the SEC.
Cash concentration:
The Funds’ cash balances are held at a major regional U.S. bank. The Funds’ cash balances, which typically exceed Federal Deposit Insurance Corporation insurance coverage, subject the Funds to a concentration of credit risk. The Funds regularly monitor the credit ratings of this financial institution in order to mitigate the credit risk that exists with the balances in excess of insured amounts.
Off-balance sheet risk:
The Fund enters into derivatives which may represent off-balance sheet risk. Off-balance sheet risk exists when the maximum potential loss on a particular investment is greater than the value of such investment as reflected in the Statement of Assets and Liabilities.
Fund concentration:
The Funds hold relatively concentrated portfolios that may contain fewer securities or industries than the portfolios of other mutual funds. Holding a relatively concentrated portfolio may increase the risk that the value of a Fund could decrease because of the poor performance of one or a few investments. Additionally, the Funds may encounter some difficulty in liquidating securities of concentrated positions.
Liquidity risk:
The Funds hold investments in private debt instruments, restricted securities, and securities having substantial market and/or credit risk which may be difficult to sell at certain periods of time and thus may not be able to dispose of at the value the Fund places on them. At October 31, 2014, the percentages of such securities in each Fund as determined by the Adviser are: Third Avenue Value Fund, 0.22%; Third Avenue Small-Cap Value Fund, 2.56%; Third Avenue Real Estate Value Fund, 3.89%; Third Avenue International Value Fund, 8.28%; Third Avenue Focused Credit Fund, 14.25%.
10. FEDERAL INCOME TAXES
The amount of dividends and distributions paid by the Funds from net investment income and net realized capital gains are determined in accordance with U.S. federal income tax law and regulations which may differ from U.S. GAAP. Such dividends and distributions are recorded by the Funds on the ex-dividend date. In order to present accumulated undistributed net investment income (loss), accumulated net realized gain (loss) on investments and foreign currency transactions and capital stock on the Statement of Assets and Liabilities that more closely represent their tax character, certain adjustments have been made. “Book/tax” differences are either temporary or permanent in nature. To the extent these differences are permanent in nature, such amounts are reclassified within the capital accounts based on their tax-basis treatment. Temporary differences do not require reclassification. Permanent differences are primarily due to reclassification of certain transactions involving foreign
| 77 |
Third Avenue Trust
Notes to Financial Statements (continued)
October 31, 2014
securities and currencies, investments in passive foreign investment companies, real estate investment trusts (“REITs”) and partnerships, the difference in the treatment of amortization of discount on certain debt instruments, certain derivative instruments and other book to tax adjustments. Net investment income (loss), net realized capital gain (loss) on investments and foreign currency transactions and net assets were not affected by these changes. For the year ended October 31, 2014, the adjustments were as follows:
| Increase/(Decrease) to Capital Stock | Increase/(Decrease) to Accumulated Net Investment Income (Loss) | Increase/(Decrease) to Undistributed Net Realized Gain (Loss) on Investments and Foreign Currency Transactions | |||||||||||
| Third Avenue Value Fund | $ | 4,137 | $ | 28,365,671 | $ | (28,369,808 | ) | ||||||
| Third Avenue Small-Cap Value Fund | — | 2,670,167 | (2,670,167 | ) | |||||||||
| Third Avenue Real Estate Value Fund | (18 | ) | 12,578,766 | (12,578,748 | ) | ||||||||
| Third Avenue International Value Fund | — | 2,279,555 | (2,279,555 | ) | |||||||||
| Third Avenue Focused Credit Fund | 1,563 | (15,952,091 | ) | 15,950,528 | |||||||||
| The tax character of dividends and distributions paid during the year ended October 31, 2014 was as follows: | |||||||||||||
| Ordinary Income | Net Capital Gains | Total | |||||||||||
| Third Avenue Value Fund | $ | 85,235,294 | $ | — | $ | 85,235,294 | |||||||
| Third Avenue Small-Cap Value Fund (a) | 9,492,508 | 32,952,885 | 42,445,393 | ||||||||||
| Third Avenue Real Estate Value Fund (a) | 42,288,878 | 9,894,934 | 52,183,812 | ||||||||||
| Third Avenue International Value Fund | 16,093,749 | — | 16,093,749 | ||||||||||
| Third Avenue Focused Credit Fund | 195,742,489 | — | 195,742,489 | ||||||||||
| The tax character of dividends and distributions paid during the fiscal year ended October 31, 2013 was as follows: | |||||||||||||
| Ordinary Income | Net Capital Gains | Total | |||||||||||
| Third Avenue Value Fund | $ | 67,702,727 | $ | — | $ | 67,702,727 | |||||||
| Third Avenue Small-Cap Value Fund (a) | 8,725,103 | 11,473,378 | 20,198,481 | ||||||||||
| Third Avenue Real Estate Value Fund (a) | 67,790,507 | 78,114,778 | 145,905,285 | ||||||||||
| Third Avenue International Value Fund | 10,600,402 | — | 10,600,402 | ||||||||||
| Third Avenue Focused Credit Fund | 92,923,447 | — | 92,923,447 | ||||||||||
| At October 31, 2014, the accumulated undistributed earnings on a tax basis were: | |||||||||||||
| Undistributed Ordinary Income | Net Capital Gains | ||||||||||||
| Third Avenue Value Fund | $ | 77,254,402 | $ | 37,729,056 | |||||||||
| Third Avenue Small-Cap Value Fund (a) | 11,288,803 | 89,194,521 | |||||||||||
| Third Avenue Real Estate Value Fund (a) | 49,021,269 | 62,884,383 | |||||||||||
| Third Avenue International Value Fund | 21,457,154 | — | |||||||||||
| Third Avenue Focused Credit Fund (a) | 44,914,557 | — | |||||||||||
This differs from the amount shown on the Statement of Assets and Liabilities primarily due to cumulative timing differences.
| (a) | Includes short-term capital gains, which are taxed as ordinary income. |
For the year ended October 31, 2014, certain Funds generated net capital gains which were offset by prior year capital loss carryforwards as follows:
| Third Avenue Value Fund | $ | 85,425,077 | ||||||||||
| Third Avenue International Value Fund | 83,809,583 | |||||||||||
| Third Avenue Focused Credit Fund | 38,021,473 |
The Regulated Investment Company Modernization Act of 2010 generally allows capital losses incurred in a taxable year beginning after December 22, 2010 (“post-enactment year”) to be carried forward for an unlimited period to the extent not utilized. However, any capital loss carryforward generated in a post-enactment year must be carried forward to offset subsequent year net capital gains before any capital loss carryforward from a pre-enactment year can be used. This may increase the risk that a capital loss generated in a pre-enactment year will expire unutilized. Additionally, post-enactment capital loss carryforwards will retain their character as either short-term or long-term capital losses.
| 78 |
Third Avenue Trust
Notes to Financial Statements (continued)
October 31, 2014
As of October 31, 2014, Third Avenue International Value Fund has a capital loss carryforward which should be available to offset certain capital gains generated in future years as follows:
| Capital Losses incurred in a pre-enactment year | Short-Term | Long-Term | ||||||
| Expiration Date | ||||||||
| 10/31/2018 | $ | 11,954,748 | $ | — | ||||
| $ | 11,954,748 | — | ||||||
| Capital Losses incurred in a post-enactment year | ||||||||
| No Expiration Date | — | — | ||||||
| Total | $ | 11,954,748 | $ | — | ||||
No distributions of capital gains are expected to be paid to shareholders of the Third Avenue International Value Fund until either net capital gains in excess of such carryforward is recognized or such carryforward expires. It is uncertain whether the Fund will be able to realize the full benefit of pre-enactment year capital loss carryforward prior to its expiration date.
The U.S. federal income tax basis of the Funds’ investments and the total unrealized appreciation/(depreciation) as of October 31, 2014 were as follows:
| Tax Basis of Investments | Appreciation | (Depreciation) | Total Unrealized Appreciation/ (Depreciation) | Other Cost Basis Adjustments | Total Net Unrealized Appreciation/ (Depreciation) | |||||||||||||||||||
| Third Avenue Value Fund | $ | 1,686,766,939 | $ | 527,993,036 | $ | (134,977,701 | ) | $ | 393,015,335 | $ | 51,254 | $ | 393,066,589 | |||||||||||
| Third Avenue Small-Cap Value Fund | 398,710,615 | 127,741,369 | (9,157,168 | ) | 118,584,201 | (13,755 | ) | 118,570,446 | ||||||||||||||||
| Third Avenue Real Estate Value Fund | 2,172,924,115 | 707,626,906 | (51,238,010 | ) | 656,388,896 | 1,953,407 | 658,342,303 | |||||||||||||||||
| Third Avenue International Value Fund | 342,043,874 | 55,360,261 | (69,878,771 | ) | (14,518,510 | ) | (551,154 | ) | (15,069,664 | ) | ||||||||||||||
| Third Avenue Focused Credit Fund | 2,959,589,433 | 260,321,958 | (469,807,294 | ) | (209,485,336 | ) | (746,390 | ) | (210,231,726 | ) | ||||||||||||||
The difference between book and tax basis total unrealized appreciation/(depreciation) on investments and foreign currency transactions is primarily attributable to deferred losses on wash sales, mark-to-market treatment of investments in certain passive foreign investment companies, investments in REITs and partnerships, differences in the treatment of amortization of discount on certain debt instruments and other timing differences. Other cost basis adjustments are primarily attributable to unrealized appreciation/(depreciation) on certain derivatives, net unrealized appreciation/ (depreciation) on receivables and payables on foreign currency and other book to tax differences.
11. SUBSEQUENT EVENTS
The Adviser has evaluated the impact of all subsequent events on the Funds through the date the financial statements were issued, and has determined that there were no events, except those listed below, that would require additional disclosure in the Funds’ financial statements.
On December 9, 2014, the Funds made the following per share distribution to shareholders of record on December 8, 2014. This information should not be used in completing your income tax returns as it may not represent final tax information.
| Ordinary Income | Short-Term Capital Gains | Long-Term Capital Gains | |||||||||
| Third Avenue Value Fund Institutional Class | $ | 2.2541 | $ | — | $ | 1.0638 | |||||
| Third Avenue Value Fund Investor Class | 2.0899 | — | 1.0638 | ||||||||
| Third Avenue Small-Cap Value Fund Institutional Class | — | 0.6554 | 4.9544 | ||||||||
| Third Avenue Small-Cap Value Fund Investor Class | — | 0.6554 | 4.9544 | ||||||||
| Third Avenue Real Estate Value Fund Institutional Class | 0.5079 | — | 0.6263 | ||||||||
| Third Avenue Real Estate Value Fund Investor Class | 0.4397 | — | 0.6263 | ||||||||
| Third Avenue International Value Fund Institutional Class | 1.2014 | — | — | ||||||||
| Third Avenue International Value Fund Investor Class | 1.1112 | — | — | ||||||||
| Third Avenue Focused Credit Fund Institutional Class | 0.2775 | 0.0575 | — | ||||||||
| Third Avenue Focused Credit Fund Investor Class | 0.2716 | 0.0575 | — | ||||||||
| 79 |
Third Avenue Trust
Report of Independent Registered Public Accounting Firm
To the Trustees and Shareholders of
Third Avenue Trust
In our opinion, the accompanying statements of assets and liabilities, including the portfolios of investments, and the related statements of operations, of cash flows, and of changes in net assets and the financial highlights present fairly, in all material respects, the financial position of Third Avenue Value Fund, Third Avenue Small-Cap Value Fund, Third Avenue Real Estate Value Fund, Third Avenue International Value Fund and Third Avenue Focused Credit Fund (collectively constituting Third Avenue Trust, hereafter referred to as the “Trust”) at October 31, 2014, the results of each of their operations and cash flows (Third Avenue Focused Credit Fund only) for the year then ended, the changes in each of their net assets for each of the two years in the period then ended and the financial highlights for each of the periods presented, in conformity with accounting principles generally accepted in the United States of America. These financial statements and financial highlights (hereafter referred to as “financial statements”) are the responsibility of the Trust’s management; our responsibility is to express an opinion on these financial statements based on our audits. We conducted our audits of these financial statements in accordance with the standards of the Public Company Accounting Oversight Board (United States). Those standards require that we plan and perform the audit to obtain reasonable assurance about whether the financial statements are free of material misstatement. An audit includes examining, on a test basis, evidence supporting the amounts and disclosures in the financial statements, assessing the accounting principles used and significant estimates made by management, and evaluating the overall financial statement presentation. We believe that our audits, which included confirmation of securities at October 31, 2014 by correspondence with the custodian, agent banks and brokers, and the application of alternative auditing procedures where securities purchased had not been received, provide a reasonable basis for our opinion.
PricewaterhouseCoopers LLP
New York, New York
December 30, 2014
| 80 |
Third Avenue Trust
Annual Renewal of Investment Advisory Agreements
October 31, 2014 (Unaudited)
At a meeting of the Board of Trustees of the Trust (the “Board”) held on June 4-5, 2014, the Trustees, by a unanimous vote (including a separate vote of those Trustees who are not “interested persons” (as the term is defined in the Investment Company Act) (the “Independent Trustees”)), approved the renewal of each Fund’s Investment Advisory Agreement (collectively, the “Agreements”). Prior to voting on the Agreements, the Independent Trustees met separately with their independent legal counsel for a discussion of the Adviser’s presentation and materials referred to below.
In advance of the meeting, the Independent Trustees, through their independent legal counsel, requested extensive materials, and the Adviser provided them, to assist the Board in considering the renewal of the Agreements. The Independent Trustees also constituted an ad hoc committee to work with representatives of the Adviser to evaluate the adequacy and extent of the information to be provided for their consideration. This committee communicated frequently with the Adviser’s representatives and independent legal counsel. At its June 4, 2014 meeting, the Board engaged in a detailed discussion of the materials with the Adviser. In considering the Agreements, the Trustees did not identify any single overriding factor and instead considered all factors collectively. As a part of their decision-making process, the Trustees considered information derived from their multi-year service on the Trust’s Board and their familiarity with the Adviser and its investment process. Among other things, they noted that the Adviser has managed each Fund since its inception, and expressed their belief that a long-term relationship with a capable, conscientious adviser is in the best interest of the Funds. The following is a summary of the discussions and conclusions regarding the material factors that formed the basis for the Board’s approval.
Factors Considered
A. Financial Condition of the Adviser; Advisory Fees; Profitability
The Trustees received a presentation from representatives of the Adviser, including a report prepared by Lipper Inc., and reviewed, among other things:
| 1. | the financial condition of the Adviser to determine that the Adviser is solvent and sufficiently well capitalized to perform its ongoing responsibilities to the Funds; | |
| 2. | the information sources and methodology used in the selection of funds included in the comparison universe and the competitive fund group used in comparative analyses of each Fund’s advisory fees and expense ratios and in analyzing the Fund’s performance; | |
| 3. | each Fund’s advisory fee and total expenses versus those of the comparison universe and competitive fund group, focusing on the total expense ratio of each Fund and the funds in its respective comparison universe and competitive fund group; | |
| 4. | performance analyses of each Fund and funds in its comparative universe and competitive fund group; | |
| 5. | a comparison of fees paid to the Adviser versus fees paid by similar funds advised and sub-advised by the Adviser, as well as any similar separate advisory accounts; | |
| 6. | information presented in respect of economies of scale, noting that each Fund’s assets had declined significantly over the last five years (except for the Focused Credit Fund, which has had sharply increasing assets since inception in 2009 and a lower expense ratio in 2013 than 2010 and the Real Estate Value Fund, which has had a steady increase in assets since 2009 and a lower expense ratio in 2013 than 2009); that the Adviser has agreed to waive its fees and/or reimburse expenses to maintain an expense limitation for each Fund; and the extensive resources that the Adviser continues to dedicate to its business even while Fund assets generally have declined in recent years; | |
| 7. | the profitability to the Adviser resulting from each Agreement (including the fall-out benefits noted below), reviewing the dollar amount of expenses allocated and revenue received by the Adviser and the method used to determine such expenses and corresponding profit; and | |
| 8. | fallout benefits, including (i) fees for providing administrative services and (ii) research services received by the Adviser in connection with executing Fund portfolio transactions. |
B. Description of Personnel and Services Provided by the Adviser
The Trustees reviewed with representatives of the Adviser, and considered:
| 1. | the nature, extent and quality of services rendered to the Funds, including the Adviser’s investment, senior management and operational personnel (and additions to them), and the oversight of day-to-day operations of the Funds provided by the Adviser; | |
| 2. | the Adviser’s research and portfolio management capabilities, particularly the intensive research undertaken in connection with the Adviser’s deep value philosophy; and | |
| 3. | the value added over time through the Adviser’s active management style that includes participation in corporate restructurings and other activist investments. |
| 81 |
Third Avenue Trust
Annual Renewal of Investment Advisory Agreements (continued)
October 31, 2014 (Unaudited)
C. Investment Performance of the Funds and Adviser
| 1. | The Trustees reviewed total return information for each Fund versus the comparison universe and competitive funds group for various periods. The Trustees also reviewed information pertaining to the Funds’ risk-adjusted performance and risk measures. |
Conclusions
The Trustees concluded that the nature, extent and quality of the services provided by the Adviser are adequate and appropriate. The Trustees considered and evaluated each Fund’s performance over various time periods in light of market conditions, the Adviser’s investing style and circumstances particular to that Fund. The Trustees understood the relevant circumstances and the efforts the Adviser was making to improve performance over time. They also considered the advisory fee and expense ratio of each Fund and evaluated the comparisons to those of funds in the comparable universe and competitive fund group and the performance analysis, as discussed in the Adviser’s presentation.
The Trustees discussed the Adviser’s profitability, and it was noted that the profitability percentage for each Fund was well below the maximum profitability levels found in relevant court cases upholding board approval of particular advisory agreements. The Trustees concluded that in light of considerations noted above, each Fund’s fee paid to the Adviser was reasonable, although for certain Funds the Trustees agreed to continue to closely monitor the Funds’ performance, fees and expenses. The Trustees also considered the advisory fees charged for similar funds advised and sub-advised by the Adviser, as well as any separate advisory accounts, and reviewed the nature of the services provided and differences, from the Adviser’s perspective, in managing the Funds as compared to advisory services provided to other advised and sub-advised funds and any separate accounts. The Trustees recognized that differences in fees paid were consistent with the differences in services provided by the Adviser.
The Trustees considered whether material economies of scale are present and, if present, are shared with the Funds and considered each Fund’s fee structure and the extensive resources that the Adviser dedicates to its investment advisory process to the benefit of the Funds. The Trustees concluded that, because of declining overall assets in the Funds, other than the Focused Credit and Real Estate Value Funds, material economies of scale were not present to be shared with the Funds. For the Focused Credit and Real Estate Value Funds, the Trustees concluded that each was capacity constrained and, given the considerable resources devoted to their management, their management fees reflected an appropriate sharing of economies of scale.
| 82 |
Third Avenue Trust
Management of the Trust
(Unaudited)
Information pertaining to the Trustees and officers of the Trust is set forth below. The fund complex includes five portfolios in the Third Avenue Trust and one portfolio in the Third Avenue Variable Series Trust. The Statement of Additional Information (SAI) includes additional information about the Trustees and is available upon request, without charge, by calling (800) 443-1021.
Interested Trustees
| Name, Date of Birth & Address | Term of Office and Length of Time Served* | Position(s) Held With Registrant | Principal Occupation(s) During Past 5 Years | Other Directorships held by Trustee | ||||
Martin J. Whitman** DOB: September 1924 | Trustee since 11/90 | Chairman and Trustee | Chairman (3/90 to Present) (5 funds) of Third Avenue Trust; Chairman (7/99 to Present) of Third Avenue Variable Series Trust; Co-Chief Investment Officer (2003 to 2010) of Third Avenue Management LLC; CEO, President and Director (10/74 to Present) of Martin J. Whitman & Co., Inc. (formerly M.J. Whitman & Co. Inc.) (private investment company); Distinguished Management Fellow (1972 to 2007) of the Yale School of Management at Yale University; Chartered Financial Analyst. | Director (1991 to 2011) of Nabors Industries, Inc. (international oil drilling services). | ||||
David M. Barse** DOB: June 1962 | Trustee since 9/01 | President, CEO and Trustee | President (5/98 to Present), Trustee (9/01 to Present), CEO (9/03 to Present) (5 funds) of Third Avenue Trust; President (7/99 to Present), Trustee (9/01 to Present) and CEO (9/03 to Present) of Third Avenue Variable Series Trust; CEO (4/03 to Present), President (2/98 to 9/12) of Third Avenue Management LLC; CEO (7/99 to Present), President (6/95 to Present), Director (1/95 to Present) of M.J. Whitman, Inc. and its successor, M.J. Whitman LLC (registered broker-dealer); Director (5/13 to Present) of Third Avenue Capital Plc.; President of two other funds advised by Third Avenue Management LLC (6/99 to Present). | Director (7/96 to Present) of Covanta Holding Corp. (utilities/waste management); Trustee (3/01 to Present) of Manifold Capital Holdings, Inc. (credit enhancement) Board Member (7/12 to Present) of the Big Apple chapter of the World President’s Organization; Director (1/08 to Present) of Third Avenue Management Private Foundation. |
| 83 |
Third Avenue Trust
Management of the Trust (continued)
(Unaudited)
Independent Trustees
Correspondence intended for any Independent Trustee may be sent to: Third Avenue Management LLC, 622 Third Avenue, 32nd Floor, New York, NY 10017.
| Name & Date of Birth | Term of Office and Length of Time Served* | Position(s) Held With Registrant | Principal Occupation(s) During Past 5 Years | Other Directorships held by Trustee | ||||
| Jack W. Aber DOB: September 1937 | Trustee since 8/02 | Trustee | Professor Emeritus of Finance, Boston University School of Management (2012 to Present); Professor of Finance of Boston University School of Management (1972 to 2012). | Trustee, The AMG Funds (1999 to 2013) (43 portfolios); and Trustee of Appleton Growth Fund (2001 to Present); Trustee of Aston Funds (2010 to Present) (25 portfolios); Trustee of Third Avenue Variable Series Trust (8/02 to Present). | ||||
| William E. Chapman, II DOB: September 1941 | Trustee since 8/02 | Trustee | President and Owner (1998 to Present) of Longboat Retirement Planning Solutions (consulting firm); part-time employee delivering retirement and investment education seminars (1/00 to 11/09) for Hewitt Associates, LLC (consulting firm). | Trustee, The AMG Funds (1999 to Present) (43 portfolios); Director of Harding, Loevner Funds, Inc. (2008 to Present) (6 portfolios); Trustee of Aston Funds (2010 to Present) (25 portfolios); Trustee (5/02 to 6/13) of Bowdoin College; Director, The Mutual Fund Directors Forum (2010 to Present); Director, Sarasota Memorial Healthcare Foundation (2011 to Present).Trustee of Third Avenue Variable Series Trust (8/02 to Present). | ||||
| Lucinda Franks DOB: July 1946 | Trustee since 2/98 | Trustee | Journalist and author (1969 to Present). | Trustee of Third Avenue Variable Series Trust (7/99 to Present). | ||||
| Edward J. Kaier DOB: September 1945 | Trustee since 8/02 | Trustee | Partner (7/07 to Present) at Teeters Harvey Gilboy & Kaier LLP (law firm). | Trustee, The AMG Funds (1999 to Present) (43 portfolios); and Trustee of Aston Funds (2010 to Present) (25 portfolios); Trustee of Third Avenue Variable Series Trust (8/02 to Present). |
| 84 |
Third Avenue Trust
Management of the Trust (continued)
(Unaudited)
Independent Trustees
| Name & Date of Birth | Term of Office and Length of Time Served* | Position(s) Held With Registrant | Principal Occupation(s) During Past 5 Years | Other Directorships held by Trustee | ||||
| Eric Rakowski DOB: June 1958 | Trustee since 8/02 | Trustee | Professor (1990 to Present) at University of California at Berkeley School of Law. | Trustee, The AMG Funds (1999 to Present) (43 portfolios); Director of Harding, Loevner Funds, Inc. (2008 to Present) (6 portfolios); Trustee of Aston Funds (2010 to Present) (25 portfolios); Trustee of Third Avenue Variable Series Trust (8/02 to Present). | ||||
| Martin Shubik DOB: March 1926 | Trustee since 11/90 | Trustee | Seymour H. Knox Professor (1975 to 2007) of Mathematical Institutional Economics, Yale University; Emeritus (2007 to Present). | Trustee of Third Avenue Variable Series Trust (7/99 to Present). | ||||
| Charles C. Walden DOB: July 1944 | Trustee since 5/96 | Trustee | President and Owner (2006 to Present) of Sound Capital Associates, LLC (consulting firm); Chartered Financial Analyst. | Director, Special Opportunities Fund, Inc. (2009 to Present). Trustee of Third Avenue Variable Series Trust (7/99 to Present). |
| * | Each trustee serves until his successor is duly elected and qualified. |
| ** | Messrs. Whitman and Barse are “interested trustees” of the Trust due to their employment with and indirect ownership interests in the Adviser and the Distributor, M.J. Whitman LLC. |
| 85 |
Third Avenue Trust
Management of the Trust (continued)
(Unaudited)
Principal Trust Officers Who Are Not Trustees
| Name, Date of Birth & Address | Position(s) Held With Registrant | Principal Occupation(s) During Past 5 Years | Other Directorships held by Officer | |||
| Vincent J. Dugan DOB: September 1965 622 Third Avenue New York, NY 10017 | Treasurer and CFO | Treasurer and Chief Financial Officer (CFO) (9/04 to Present) (5 funds) of Third Avenue Trust; Treasurer and CFO (9/04 to Present) of Third Avenue Variable Series Trust; Chief Operating Officer (COO) and CFO (8/04 to Present) of Third Avenue Management LLC; COO and CFO (8/04 to Present) of Third Avenue Holdings Delaware LLC; COO and CFO (8/04 to Present) of M.J. Whitman LLC and subsidiaries; COO and CFO (8/04 to Present) of certain other funds advised by Third Avenue Management LLC (8/04 to Present). | N/A | |||
| Michael A. Buono DOB: May 1967 622 Third Avenue New York, NY 10017 | Controller | Controller (5/06 to Present) (5 funds) of Third Avenue Trust, Third Avenue Variable Series Trust, Third Avenue Management LLC and M.J. Whitman LLC and subsidiaries. | N/A | |||
| W. James Hall III DOB: July 1964 622 Third Avenue New York, NY 10017 | General Counsel | General Counsel and Secretary (6/00 to Present) (5 funds) of Third Avenue Trust; General Counsel and Secretary (9/00 to Present) of Third Avenue Variable Series Trust; General Counsel and Secretary (9/00 to Present) of EQSF Advisers, Inc., and its successor, Third Avenue Management LLC; General Counsel and Secretary (5/00 to Present) of M.J. Whitman, Inc. and its successor, M.J. Whitman LLC; General Counsel and Secretary of certain other funds advised by Third Avenue Management LLC (7/02 to Present). | N/A | |||
| Joseph J. Reardon DOB: April 1960 622 Third Avenue New York, NY 10017 | Chief Compliance Officer | Chief Compliance Officer (4/05 to Present) (5 funds) of Third Avenue Trust, Third Avenue Variable Series Trust and Third Avenue Management LLC. | N/A |
| 86 |
Third Avenue Funds
Schedule of Shareholder Expenses
(Unaudited)
As a shareholder of a Fund, you incur two types of costs: (1) transaction costs, such as redemption fees; and (2) ongoing costs, including management fees, shareholder servicing fees, distribution fees (if applicable) and other Fund expenses. This example is intended to help you understand your ongoing costs (in dollars) of investing in the Fund and to compare these costs with the ongoing costs of investing in other mutual funds.
The example is based on an investment of $1,000 invested at the beginning of the period, May 1, 2014, and held for the six month period ended October 31, 2014.
Actual Expenses
For each Class of each Fund in the table below, the first line provides information about actual account values and actual expenses. You may use the information in this line, together with the amount you invested, to estimate the expenses that you paid over the period. Simply divide your account value by $1,000 (for example, an $8,600 account value divided by $1,000 = 8.6), then multiply the result by the number in the first line under the heading entitled “Expenses Paid During the Period” to estimate the expenses you paid on your account during this period.
Hypothetical Example for Comparison Purposes
The second line of each Class in the table below provides information about hypothetical account values and hypothetical expenses based on the Class’ actual expense ratio and an assumed rate of return of 5% per year before expenses, which is not the Class’ actual return. The hypothetical account values and expenses may not be used to estimate the actual ending account balance or expenses you paid for the period. You may use this information to compare the ongoing costs of investing in the Class of the Fund and other funds. To do so, compare this 5% hypothetical example with the 5% hypothetical examples that appear in the shareholder reports of the other funds.
Please note that the expenses shown in the table are meant to highlight your ongoing costs only and do not reflect any transactional costs, such as redemption fees. Therefore, the second line of each Class in the table is useful in comparing ongoing costs only, and will not help you determine the relative total costs of owning different funds. In addition, if these transactional costs were included, your costs would have been higher. The examples also assume all dividends and distributions have been reinvested.
| Expenses Paid | |||||||||||||||||||||
| Beginning | Ending | During the Period | |||||||||||||||||||
| Account Value | Account Value | May 1, 2014 to | Annualized | ||||||||||||||||||
| May 1, 2014 | October 31, 2014 | October 31, 2014* | Expense Ratio | ||||||||||||||||||
| Third Avenue Value Fund | |||||||||||||||||||||
| Investor Class | |||||||||||||||||||||
| Actual | $ | 1,000.00 | $ | 1,019.70 | $ | 6.72 | 1.32 | % | |||||||||||||
| Hypothetical | $ | 1,000.00 | $ | 1,018.55 | $ | 6.72 | 1.32 | % | |||||||||||||
| Institutional Class | |||||||||||||||||||||
| Actual | $ | 1,000.00 | $ | 1,020.90 | $ | 5.45 | 1.07 | % | |||||||||||||
| Hypothetical | $ | 1,000.00 | $ | 1,019.81 | $ | 5.45 | 1.07 | % | |||||||||||||
| Third Avenue Small-Cap Value Fund | |||||||||||||||||||||
| Investor Class | |||||||||||||||||||||
| Actual | $ | 1,000.00 | $ | 1,035.30 | $ | 6.93 | 1.35 | % | |||||||||||||
| Hypothetical | $ | 1,000.00 | $ | 1,018.40 | $ | 6.87 | 1.35 | % | |||||||||||||
| Institutional Class | |||||||||||||||||||||
| Actual | $ | 1,000.00 | $ | 1,036.70 | $ | 5.65 | 1.10 | % | |||||||||||||
| Hypothetical | $ | 1,000.00 | $ | 1,019.66 | $ | 5.60 | 1.10 | % | |||||||||||||
| Third Avenue Real Estate Value Fund | |||||||||||||||||||||
| Investor Class | |||||||||||||||||||||
| Actual | $ | 1,000.00 | $ | 1,039.80 | $ | 6.94 | 1.35 | % | |||||||||||||
| Hypothetical | $ | 1,000.00 | $ | 1,018.40 | $ | 6.87 | 1.35 | % | |||||||||||||
| Institutional Class | |||||||||||||||||||||
| Actual | $ | 1,000.00 | $ | 1,041.30 | $ | 5.66 | 1.10 | % | |||||||||||||
| Hypothetical | $ | 1,000.00 | $ | 1,019.66 | $ | 5.60 | 1.10 | % | |||||||||||||
| Third Avenue International Value Fund | |||||||||||||||||||||
| Investor Class | |||||||||||||||||||||
| Actual | $ | 1,000.00 | $ | 882.10 | $ | 7.83 | 1.65 | % | |||||||||||||
| Hypothetical | $ | 1,000.00 | $ | 1,016.89 | $ | 8.39 | 1.65 | % | |||||||||||||
| Institutional Class | |||||||||||||||||||||
| Actual | $ | 1,000.00 | $ | 883.20 | $ | 6.65 | 1.40 | % | |||||||||||||
| Hypothetical | $ | 1,000.00 | $ | 1,018.15 | $ | 7.12 | 1.40 | % | |||||||||||||
| Third Avenue Focused Credit Fund | |||||||||||||||||||||
| Investor Class | |||||||||||||||||||||
| Actual | $ | 1,000.00 | $ | 918.40 | $ | 5.56 | 1.15 | % | |||||||||||||
| Hypothetical | $ | 1,000.00 | $ | 1,019.41 | $ | 5.85 | 1.15 | % | |||||||||||||
| Institutional Class | |||||||||||||||||||||
| Actual | $ | 1,000.00 | $ | 919.60 | $ | 4.35 | 0.90 | % | |||||||||||||
| Hypothetical | $ | 1,000.00 | $ | 1,020.67 | $ | 4.58 | 0.90 | % | |||||||||||||
| * | Expenses (net of fee waivers and expense offset arrangement) are equal to the Class’s annualized expense ratio, multiplied by the average account value over the period, multiplied by the number of days in the most recent fiscal year (184) divided by 365. |
| 87 |
Third Avenue Trust
Federal Tax Status of Dividends and Distributions
(Unaudited)
The following information represents the tax status of dividends and distributions paid by the Funds during the fiscal year ended October 31, 2014. This information is presented to meet regulatory requirements and no current action on your part is required. The information and distributions reported below will differ from the information and distributions taxable to shareholders for the calendar year ending December 31, 2014.
The Funds are required to designate the portion of any distributions made to shareholders during their fiscal year beginning on November 1, 2013 and ending on October 31, 2014 that were from capital gains. Depending upon your instructions, distributions from the Funds were either paid to you in cash or reinvested into your account.
During the fiscal year-ended October 31, 2014 Third Avenue Small Cap-Value Fund’s per-share distributions to Investor class shareholders consisted of $0.367 from short-term capital gain and $1.40 from long-term capital gain. Distributions to Institutional Class shareholders consisted of $0.037 from net investment income, $0.367 from short-term capital gains and $1.40 from long-term capital gains. Distributions from short-term capital gain are treated as ordinary income for U.S. federal income tax purposes.
During the fiscal year-ended October 31, 2014 Third Avenue Real Estate Value Fund’s per-share distributions to Investor Class shareholders consisted of $0.261 from net investment income, $0.269 from short-term capital gains and $0.133 from long-term capital gain. Distributions to Institutional Class shareholders consisted of $0.304 from net investment income, $0.269 from short-term capital gains and $0.133 from long-term capital gain. Distributions from short-term capital gain are treated as ordinary income for U.S. federal income tax purposes.
For the fiscal year ended October 31, 2014, the designations below are applicable to the ordinary income dividends paid by each Fund in accordance with Section 854 of the Internal Revenue Code.
| Qualified | Dividends Received | ||||||||
| Dividend Income | Deduction | ||||||||
| for Individuals | for Corporations | ||||||||
| Third Avenue Value Fund | $33,655,226 | 23.13 | % | ||||||
| Third Avenue Small-Cap Value Fund | 5,202,674 | 43.51 | % | ||||||
| Third Avenue Real Estate Value Fund | 13,442,805 | 2.67 | % | ||||||
| Third Avenue International Value Fund | 17,230,018 | 7.60 | % | ||||||
The following Funds intend to elect to pass through to shareholders the income taxes paid to foreign countries which may be eligible for the foreign tax credit in accordance with Section 853 of the Internal Revenue Code. Gross foreign source income and foreign tax expenses for the year ended October 31, 2014 are as follows:
| Gross Foreign | Foreign Tax | ||||||||
| Source Income | Pass Through | ||||||||
| Third Avenue International Value Fund | $32,576,097 | $1,591,640 | |||||||
Information necessary to complete your income tax returns for the calendar year ending December 31, 2014 will be issued by the Funds in the early part of 2015.
| 88 |
[This Page Intentionally Left Blank]
[This Page Intentionally Left Blank]
[This Page Intentionally Left Blank]
This publication does not constitute an offer or solicitation of any transaction in any securities. Any recommendation contained herein may not be suitable for all investors. Information contained in this publication has been obtained from sources we believe to be reliable, but cannot be guaranteed.
The information in these portfolio manager letters represents the opinions of the individual portfolio manager and is not intended to be a forecast of future events, a guarantee of future results or investment advice. Views expressed are those of the portfolio manager and may differ from those of other portfolio managers or of the firm as a whole. Also, please note that any discussion of the Funds’ holdings, the Funds’ performance, and the portfolio managers’ views are as of October 31, 2014 (except as otherwise stated), and are subject to change without notice.
Certain information contained in the following letters constitute “forward-looking statements,” which can be identified by the use of forward-looking terminology such as “may,” “will,” “should,” “expect,” “anticipate,” “project,” “estimate,” “intend,” “continue” or “believe,” or the negatives thereof (such as “may not,” “should not,” “are not expected to,” etc.) or other variations thereon or comparable terminology. Due to various risks and uncertainties, actual events or results or the actual performance of any fund may differ materially from those reflected or contemplated in such forward-looking statement.
Third Avenue Funds are offered by prospectus only. Prospectuses contain more complete information on advisory fees, distribution charges, and other expenses and should be read carefully before investing or sending money. Please read the prospectus and carefully consider investment objectives, risks, charges and expenses before you send money. Past performance is no guarantee of future results. Investment return and principal value will fluctuate so that an investor’s shares, when redeemed, may be worth more or less than original cost.
If you should have any questions, please call 1-800-443-1021, or visit our web site at: www.thirdave.com, for the most recent month-end performance data or a copy of the Funds’ prospectus. Current performance results may be lower or higher than performance numbers quoted in certain letters to shareholders.
M.J. Whitman LLC, Distributor. Date of first use of portfolio manager commentary: November 26, 2014.
| BOARD OF TRUSTEES | |
| Jack W. Aber | Eric Rakowski |
| David M. Barse | Martin Shubik |
| William E. Chapman, II | Charles C. Walden |
| Lucinda Franks | Martin J. Whitman |
| Edward J. Kaier | |
OFFICERS
Martin J. Whitman — Chairman of the Board
David M. Barse — President, Chief Executive Officer
Vincent J. Dugan — Chief Financial Officer, Treasurer
Michael A. Buono — Controller
W. James Hall — General Counsel, Secretary
Joseph J. Reardon — Chief Compliance Officer
TRANSFER AGENT
BNY Mellon Investment Servicing (U.S.) Inc.
P.O. Box 9802
Providence, RI 02940-8002
610-239-4600
800-443-1021 (toll-free)
INVESTMENT ADVISER
Third Avenue Management LLC
622 Third Avenue
New York, NY 10017
INDEPENDENT REGISTERED PUBLIC ACCOUNTING FIRM
PricewaterhouseCoopers LLP
300 Madison Avenue
New York, NY 10017
CUSTODIAN
JPMorgan Chase Bank, N.A.
14201 Dallas Parkway, 2nd Floor
Dallas, TX 75254
ABOUT THIRD AVENUE MANAGEMENT
Third Avenue Management LLC is a New York-based global asset manager that has adhered to a proven
value investment philosophy since its founding in 1986. Third Avenue’s disciplined approach seeks to
maximize long-term, risk-adjusted returns by focusing on corporate financial stability, and price conscious,
opportunistic security selection throughout the capital structure.
If you would like further information about Third Avenue Funds,
please contact your relationship manager or email clientservice@thirdave.com

622 Third Avenue, 31st floor | New York, New York 10017
www.thirdave.com
Item 2. Code of Ethics.
At October 31, 2014, the Trust had a code of ethics (the “Code of Ethics”) that applies to its principal executive officer and principal financial officer. This Code of Ethics is attached as Exhibit (a) (1) hereto.
Item 3. Audit Committee Financial Expert.
The Trust’s Board of Trustees has determined that Messrs. Jack Aber, Martin Shubik and Charles Walden, members of the Audit Committee of the Board, are “audit committee financial experts” (“ACFE”) as defined by the Securities and Exchange Commission (“SEC”) and has designated Mr. Aber as the Committee’s ACFE. Each of Messrs. Aber, Shubik and Walden are “independent” as defined by the SEC for purposes of ACFE determinations. Under applicable securities laws, a person who is determined to be an ACFE will not be deemed an “expert” for any purpose, including without limitation for the purposes of Section 11 of the Securities Act of 1933, as a result of being designated or identified as an ACFE. The designation or identification of a person as an ACFE does not impose on such person any duties, obligations, or liabilities that are greater than the duties, obligations, and liabilities imposed on such person as a member of the Audit Committee and Board of Trustees in the absence of such designation or identification.
Item 4. Principal Accountant Fees and Services.
(a) Audit Fees. The aggregate fees billed for each of the last two fiscal years for professional services rendered by the Trust’s principal accountant for the audit of the Trust’s annual financial statements or services that are normally provided by the accountant in connection with statutory and regulatory filings or engagements for those fiscal years were $355,000, including out of pocket expenses of approximately $7,000, for the fiscal year ended October 31, 2014 and $334,000, including out of pocket expenses of approximately $7,000, for the fiscal year ended October 31, 2013.
(b) Audit-Related Fees. There were no fees billed in each of the last two fiscal years for assurance and related services by the Trust’s principal accountant that are reasonably related to the performance of the audit of the Trust’s financial statements and are not reported above in Item 4(a). There were no audit-related services provided to the Trust’s investment adviser or any entity controlling, controlled by, or under common control with the Trust’s investment adviser that provides ongoing services to the Trust (“Service
Affiliates”) during each of the last two years that were required to be pre-approved by the Trust’s Audit Committee.
(c) Tax Fees. The aggregate fees billed in each of the last two fiscal years for professional services rendered by the Trust’s principal accountant for tax compliance, tax advice and tax planning were $265,000 for the fiscal year ended October 31, 2014 and $249,200 for the fiscal year ended October 31, 2013. These services related to the preparation of tax returns and the review of tax-related issues. There were no tax services provided to Service Affiliates during each of the last two fiscal years that were required to be pre-approved by the Trust’s Audit Committee.
(d) All Other Fees. There were no fees billed in each of the last two fiscal years for products and services provided by the Trust’s principal accountant, other than the services reported above in Items 4(a) through (c). There were no other services provided to Service Affiliates during each of the last two fiscal years that were required to be pre-approved by the Trust’s Audit Committee.
(e) Audit Committee Pre-Approval Policies and Procedures.
(i) The Audit Committee pre-approves the Trust’s accountant’s engagement for audit and non-audit services to the Trust and certain non-audit services to the Service Affiliates on a case-by-case basis. Pre-approval considerations include whether the proposed services are compatible with maintaining the accountant’s independence.
(ii) There were no services provided to the Trust or Service Affiliates during the last two fiscal years for which the pre-approval requirement was waived pursuant to paragraph (c)(7)(i)(C) of Rule 2-01 of Regulation S-X.
(f) Not Applicable.
(g) The aggregate non-audit fees billed by the Trust’s accountant for services rendered to the Trust and Service Affiliates for each of the last two fiscal years were $265,000 for the fiscal year ended October 31, 2014 and $249,200 for the fiscal year ended October 31, 2013.
(h) The Audit Committee has considered whether the provision of non-audit services to the Service Affiliates that were not pre-approved pursuant to paragraph (c)(7)(ii) of Rule 2-01 of Regulation S-X is compatible with maintaining the independence of the Trust’s accountant.
Item 5. Audit Committee of Listed Registrants.
Not applicable.
Item 6. Schedule of Investments.
Not applicable.
Item 7. Disclosure of Proxy Voting Policies and Procedures for Closed-End Management Investment Companies.
Not applicable.
Item 8. Portfolio Managers of Closed-End Management Investment Companies.
Not applicable.
Item 9. Purchase of Equity Securities by Closed-End Management Investment Company and Affiliated Purchasers.
Not applicable.
Item 10. Submission of Matters to a Vote of Security Holders.
Not applicable.
Item 11. Controls and Procedures.
(a) The Trust’s principal executive officer and principal financial officer have evaluated the Trust’s disclosure controls and procedures within 90 days of this filing and have concluded that the Trust’s disclosure controls and procedures are reasonably designed to ensure that information required to be disclosed by the Trust in this Form N-CSR is recorded, processed, summarized, and reported within the required time periods and that information required to be disclosed by the Trust in the report that it files or submits on Form N-CSR is accumulated and communicated to the Trust’s management, including its principal executive and principal financial officers, as appropriate to allow timely decisions regarding required disclosure.
(b) The Trust’s principal executive officer and principal financial officer are aware of no changes in the Trust’s internal control over financial reporting that occurred during the second fiscal quarter of the period covered by this report that have materially affected, or are reasonably likely to materially affect, the Trust’s internal control over financial reporting.
Item 12. Exhibits.
| (a)(1) | Code of Ethics |
| (a)(2) | Certifications pursuant to Rule 30a-2(a) under the 1940 Act. |
| (a) (3) | Not applicable |
| (b) | Certifications pursuant to Rule 30a-2(b) under the 1940 Act. |
SIGNATURES
Pursuant to the requirements of the Securities Exchange Act of 1934 and the 1940 Act, the registrant has duly caused this report to be signed on its behalf by the undersigned, thereunto duly authorized.
(Registrant) Third Avenue Trust
| By: | /s/ David M. Barse |
| Name: | David M. Barse |
| Title: | Principal Executive Officer |
| Date: | December 30, 2014 |
Pursuant to the requirements of the Securities Exchange Act of 1934 and the 1940 Act, this report has been signed by the following persons on behalf of the registrant and in the capacities and on the dates indicated.
| By: | /s/ David M. Barse |
| Name: | David M. Barse |
| Title: | Principal Executive Officer |
| Date: | December 30, 2014 |
| By: | /s/ Vincent J. Dugan |
| Name: | Vincent J. Dugan |
| Title: | Principal Financial Officer |
| Date: | December 30, 2014 |