UNITED STATES
SECURITIES AND EXCHANGE COMMISSION
Washington, D.C. 20549
FORM N-CSR
CERTIFIED SHAREHOLDER REPORT OF REGISTERED
MANAGEMENT INVESTMENT COMPANIES
Investment Company Act file number: 811-08039
Third Avenue Trust
(Exact name of registrant as specified in charter)
| 622 Third Avenue, 32nd Floor, New York, NY | 10017 | |
| (Address of principal executive offices) | (Zip code) |
| W. James Hall III, General Counsel, 622 Third Avenue, New York, NY 10017 | ||
| (Name and address of agent for service) | ||
Registrant’s telephone number, including area code: 800-443-1021
Date of fiscal year end: October 31, 2015
Date of reporting period: October 31, 2015
Form N-CSR is to be used by management investment companies to file reports with the Commission not later than 10 days after the transmission to stockholders of any report that is required to be transmitted to stockholders under Rule 30e-1 under the Investment Company Act of 1940 (17 CFR 270.30e-1). The Commission may use the information provided on Form N-CSR in its regulatory, disclosure review, inspection, and policymaking roles.
A registrant is required to disclose the information specified by Form N-CSR, and the Commission will make this information public. A registrant is not required to respond to the collection of information contained in Form N-CSR unless the Form displays a currently valid Office of Management and Budget (“OMB”) control number. Please direct comments concerning the accuracy of the information collection burden estimate and any suggestions for reducing the burden to Secretary, Securities and Exchange Commission, 100 F Street, NE, Washington, DC 20549-0609. The OMB has reviewed this collection of information under the clearance requirements of 44 U.S.C. § 3507.
Item 1. Reports to Stockholders.
The Trust’s annual report transmitted to shareholders pursuant to Rule 30e-1 under the Investment Company Act of 1940, as amended (the “1940 Act”), is as follows:
![]()
Third Avenue Value Fund
Third Avenue Small-Cap Value Fund
Third Avenue Real Estate Value Fund
Third Avenue International Value Fund
Third Avenue Focused Credit Fund
ANNUAL REPORT
![]()
OCTOBER 31, 2015
THIRD AVENUE FUNDS
Privacy Policy
Third Avenue Funds (the “Funds”) respect your right to privacy. We also know that you expect us to conduct and process your business in an accurate and efficient manner. To do so, we must collect and maintain certain personal information about you. This is the information we collect from you on applications or other forms and from the transactions you make with us, our affiliates, or third parties. We do not disclose any information about you or any of our former customers to anyone, except to our affiliates (which may include the Funds’ affiliated money management entities) and service providers, or as otherwise permitted by law. To protect your personal information, we permit access only by authorized employees. Be assured that we maintain physical, electronic and procedural safeguards that comply with federal standards to guard your personal information.
Proxy Voting Policies and Procedures
The Funds have delegated the voting of proxies relating to their voting securities to the Funds’ investment adviser pursuant to the adviser’s proxy voting guidelines. A description of these proxy voting guidelines and procedures, as well as information relating to how a Fund voted proxies relating to portfolio securities during the most recent 12-month period ended June 30, is available by August 31 each year (i) without charge, upon request, by calling (800) 443-1021, (ii) at the website of the Securities and Exchange Commission (“SEC”) at http://www.sec.gov, and (iii) on the Funds’ website www.thirdave.com.
Schedule of Portfolio Holdings—Form N-Q
The Funds file their complete schedule of portfolio holdings with the SEC for the first and third quarters of each fiscal year on Form N-Q. The Funds’ Form N-Q is available on the SEC’s website at http://www.sec.gov, and may be reviewed and copied at the SEC’s Public Reference Room in Washington, DC. Information on the operation of the Public Reference Room may be obtained by calling 1-800-SEC-0330.
Third Avenue Trust
Third Avenue Value Fund
Portfolio Management Discussion
October 31, 2015 (Unaudited)
At October 31, 2015, the audited net asset values attributable to each of the 534,168 common shares outstanding of the Third Avenue Value Fund Investor Class and 30,482,521 common shares outstanding of the Third Avenue Value Fund Institutional Class were $54.22 and $54.35 per share, respectively. This compares with audited net asset values at October 31, 2014 of $56.39 and $56.38 per share, respectively, adjusted for a subsequent distribution to shareholders.
| Average Annual Returns for the periods | |||||||||||||||||||||
| ended October 31, 2015 | |||||||||||||||||||||
| One Year ended | Three | Five | Ten | Since | |||||||||||||||||
| 10/31/15 | Year | Year | Year | Inception | |||||||||||||||||
| Third Avenue Value Fund Investor Class† | (3.90 | %) | 7.69 | % | 4.64 | % | N/A | 5.37 | % | ||||||||||||
| Third Avenue Value Fund Institutional Class^ | (3.64 | %) | 7.96 | % | 4.89 | % | 3.02% | 11.15 | % | ||||||||||||
| MSCI World Index‡ | 2.33 | % | 12.24 | % | 9.76 | % | 6.38% | 7.76 | % | ||||||||||||
| S&P 500 Index‡ | 5.20 | % | 16.20 | % | 14.33 | % | 7.85% | 10.26 | % | ||||||||||||
| † | Investor Class commenced investment operations on December 31, 2009. |
| ^ | Institutional Class commenced investment operations on November 1, 1990. |
| ‡ | The date used to calculate the Since Inception performance for the index is the inception date of the Institutional Class. |
The Third Avenue Value Fund (the “Fund”) generated -3.90% and -3.64% returns for the investor and institutional share classes, respectively, over the fiscal year ended October 31, 2015. The MSCI World Index returned 2.33% over the same period. As we reflect on the past twelve months, clearly we are disappointed with the negative returns. As we look at our portfolio, the detractors can be distilled into two distinct groups, companies that have direct Energy or Materials exposure that correlated with the downdraft in commodity prices over the last year, and a separate group of high conviction companies that we believe continue to compound long-term value but were severely punished by the markets as they weathered short term bumps. We believe that long term returns are ultimately driven by company fundamentals, which remain strong for the companies in the portfolio. We have high conviction in our philosophy and process, and high confidence our portfolio will deliver superior results over time.
The top performers in the Fund during the year were Cavco Industries, Inc., NVIDIA Corp. and White Mountains Insurance Group, Ltd. White Mountains Insurance (WTM) is a specialty insurer/reinsurer. WTM is trading at book value despite an overcapitalized balanced sheet, distinguished track record of compounding book value and a solid management team. The company continues to generate strong underwriting results. During the third quarter of the year a high-profile competitor, Chubb Group, was acquired by Ace Limited at a price of 1.8 times book, which far exceeds White Mountains’ current valuation.
The largest detractors from performance over the fiscal year were POSCO, Canfor Corp. and Brookdale Senior Living, Inc. Canfor is a leading integrated forest products company based in Vancouver, focused primarily on the timber and wood products business. Like most timber companies, Canfor has been impacted by global economic factors including currency exchange, the slowdown in China and a slower than expected recovery of the US housing market.
Portfolio activity over the year included the reorganization of Cheung Kong Holdings, Ltd. which resulted in two companies—CK Hutchison Holdings, Ltd. and Cheung Kong Property Holdings, Ltd. CK Hutchison Holdings (formerly Cheung Kong) completed a corporate restructuring led by Chairman Li Ka-Shing in June 2015. In connection with the restructuring, CK Hutchison spun-off its property holdings into a separately listed company (Cheung Kong Property) and purchased the shares that it didn’t already own of the industrial holding company Hutchison Whampoa, which was also a portfolio holding. CK Hutchison Holdings is now a multinational conglomerate comprised of Telecom, Infrastructure/Energy, Retail and ports assets. Although the transactions amounted to a reshuffling of the assets, the enhanced disclosures and reduced complexity of the structures have created impressive shareholder value. Since the restructuring was announced in January, the value of the combined pieces has risen significantly. We believe that there are more possibilities for value creation as CK Hutchison’s exposure to European telecom should benefit from consolidation in the region. The focused entities now can be more nimble to pursue opportunistic acquisitions. In addition, we believe there is a good chance these assets could be split up again in the future, further enhancing shareholder value. CK Hutchison Holdings still trades at a discount to our conservative net asset value estimate. As a standalone company, Cheung Kong Property is a pure-play real estate operating company with one of the most dominant property platforms in Asia. It will remain incredibly well-financed and is more than 30% owned by the Li family. The stock prices for CK Hutchison and Cheung Kong Property have responded favorably but we believe there is significantly more value to be recognized going forward.
The Fund added several new names during the year including senior bonds issued by BreitBurn Energy Partners L.P., and equities in PNC Financial Services Group, Inc., Anixter International, Inc., Masco Corp., Kingfisher PLC and Baxalta, Inc. Kingfisher is the largest home improvement retailer in Europe with market leadership positions in the UK, France and Poland. Kingfisher operates through its B&Q and Screwfix brands in the UK and its Castorama and Brico Depot brands in France. The company has a JV in Turkey and operations in Russia, Spain, and Portugal, and it recently
| 1 |
Third Avenue Trust
Third Avenue Value Fund
Portfolio Management Discussion (continued)
October 31, 2015 (Unaudited)
expanded its Screwfix brand into Germany. At 8.5 times EBITDA, we believe that Kingfisher is undervalued and poised for long-term earnings growth driven by both restructuring efforts and underlying market improvement. The company is well capitalized, having lowered its leverage dramatically since the 2009 global financial crisis and is currently rated BBB. Kingfisher has lost market share in its UK business to lower cost discount retailers over the last 5 years. The company has recently moved to address these issues, spearheaded by the promotion of Veronique Laury—who successfully led the turnaround at the company’s French Castorama unit—to CEO. Laury’s restructuring plan involves closing down unprofitable stores and reducing its footprint, implementing common sourcing across its geographies to gain better pricing power and efficiency; and regaining market share by shifting from promotional pricing to everyday low pricing. Laury brings a credible plan to the table after executing at Castorama in France, where margins are almost double that of the UK.
Dispositions over the year included Target Corp., Daiwa Securities Group, Inc., Compagnie Generale des Etablissements Michelin SCA and Valmont Industries, Inc. Dispositions reflected our view that the market price for these holdings had risen to close to our estimate of Net Asset Value or were replaced with better risk vs. reward opportunities.
The portfolio currently trades at an attractive price to book ratio relative to its index and we believe it provides exposure to numerous investments with resource conversion potential, exposure to improving US housing and overcapitalized financials just beginning to benefit from a stronger US economy.
THE INFORMATION IN THE PORTFOLIO MANAGEMENT DISCUSSION REPRESENTS A FACTUAL OVERVIEW OF THE FUND’S PERFORMANCE AND IS NOT INTENDED TO BE A FORECAST OF FUTURE EVENTS, A GUARANTEE OF FUTURE RESULTS NOR INVESTMENT ADVICE. VIEWS EXPRESSED ARE THOSE OF THE INVESTMENT TEAM AND MAY DIFFER FROM THOSE OF OTHER INVESTMENT TEAMS OR THE FIRM AS A WHOLE. ALSO, PLEASE NOTE THAT ANY DISCUSSION OF THE PORTFOLIO’S HOLDINGS, THE FUND’S PERFORMANCE, AND THE INVESTMENT TEAM’S VIEWS ARE AS OF OCTOBER 31, 2015, AND ARE SUBJECT TO CHANGE.
The Fund’s performance may be influenced by a foreign country’s political, social and economic situation. Other risks include currency fluctuations, less liquidity, lack of efficient trading markets, and different auditing and legal standards. These risks may result in more volatility for the Fund. These and other risks are described more fully in the Fund’s prospectus.
Third Avenue Value Fund is offered by prospectus only. The prospectus contains more complete information on advisory fees, distribution charges, and other expenses and should be read carefully before investing or sending money. Past performance is no guarantee of future results. Investment return and principal value will fluctuate so that an investor’s shares, when redeemed, may be worth more or less than original cost. The Fund’s returns should be viewed in light of its investment policy and objectives and quality of its portfolio securities and the periods selected. M.J. Whitman LLC Distributor.
If you should have any questions, or for updated information (including performance data current to the most recent month-end) or a copy of our prospectus, please call 1-800-443-1021 or go to our web site at www.thirdave.com. Current performance may be lower or higher than performance quoted.
The MSCI World Index is a free float-adjusted market capitalization weighted index that is designed to measure the equity market performance of 23 of the world’s most developed markets. The S&P 500 Index is a widely recognized benchmark of U.S. stock market performance that is dominated by the stocks of large U.S. companies. The MSCI World Index and the S&P 500 Index are not securities that can be purchased or sold, and their total returns are reflective of unmanaged portfolios. The returns include reinvestment of all distributions.
| 2 |
Third Avenue Trust
Third Avenue Value Fund - Investor Class
Comparison of a $10,000 Investment
(Unaudited)
Performance Illustration
COMPARISON OF CHANGE IN VALUE OF A $10,000 INVESTMENT IN THIRD AVENUE VALUE FUND – INVESTOR CLASS (TVFVX),
THE MSCI WORLD INDEX AND THE STANDARD & POOR’S 500 INDEX (S&P 500 INDEX)
FROM INCEPTION OF THE FUND (12/31/09) THROUGH OCTOBER 31, 2015
Average Annual Total Return
| Since Inception | ||||||||||||||
| 1 Year | 3 Years | 5 Years | (12/31/09) | |||||||||||
| (3.90 | %) | 7.69 | % | 4.64 | % | 5.37% | ||||||||

| * | Includes reinvestment of all distributions. |
As with all mutual funds, past performance does not indicate future results. Performance may reflect fee waivers, expense offset arrangement and/or recovery. Total return would have been lower if the Adviser had not waived certain expenses. Conversely, total return would have been higher if the Adviser had not recovered previously waived expenses. Also, the returns shown in the graph and table do not reflect the deduction of taxes that a shareholder would pay on fund distributions or the redemption of fund shares.
| 3 |
Third Avenue Trust
Third Avenue Value Fund - Institutional Class
Comparison of a $10,000 Investment
(Unaudited)
Performance Illustration
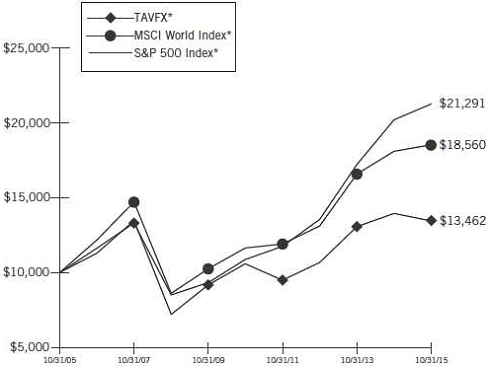
COMPARISON OF CHANGE IN VALUE OF A $10,000 INVESTMENT IN THIRD AVENUE VALUE FUND – INSTITUTIONAL CLASS (TAVFX),
THE MSCI WORLD INDEX AND THE STANDARD & POOR’S 500 INDEX (S&P 500 INDEX)
FOR THE TEN YEARS ENDED OCTOBER 31, 2015
Average Annual Total Return
| 1 Year | 3 Years | 5 Years | 10 Years | |||||||||||
| (3.64 | %) | 7.96 | % | 4.89 | % | 3.02 | % | |||||||
| * | Includes reinvestment of all distributions. |
As with all mutual funds, past performance does not indicate future results. Performance may reflect fee waivers, expense offset arrangement and/or recovery. Total return would have been lower if the Adviser had not waived certain expenses. Conversely, total return would have been higher if the Adviser had not recovered previously waived expenses. Also, the returns shown in the graph and table do not reflect the deduction of taxes that a shareholder would pay on fund distributions or the redemption of fund shares.
| 4 |
Third Avenue Trust
Third Avenue Value Fund
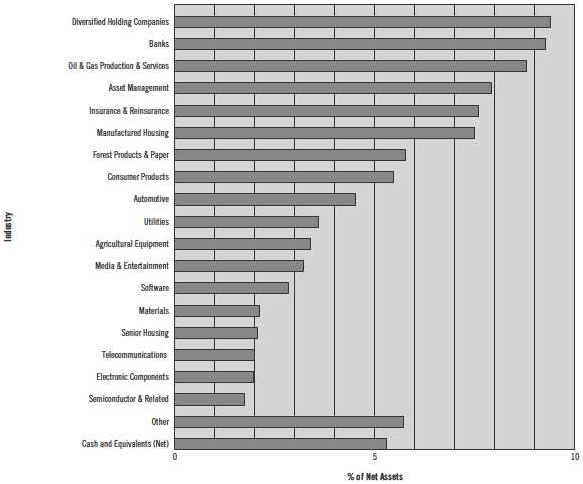
Industry Diversification
(Unaudited)
The summary of the Fund’s investments as of October 31, 2015 is as follow:
The accompanying notes are an integral part of the financial statements.
| 5 |
Third Avenue Trust
Third Avenue Value Fund
Portfolio of Investments
at October 31, 2015
| Principal | Value | |||||||
| Amount ($) | Security† | (Note 1) | ||||||
| Corporate Bonds & Notes - 1.54% | ||||||||
| Consumer Products - 0.89% | ||||||||
| 22,814,735 | Home Products International, Inc., 2nd Lien, Convertible, 6.000% Payment-in-kind Interest, due 3/20/17 (a)(b)(c)(d) | $ | 15,069,133 | |||||
| Oil & Gas Production & Services - 0.65% | ||||||||
| 28,717,000 | BreitBurn Energy Partners L.P./ BreitBurn Finance Corp., 7.875%, due 4/15/22 | 10,912,460 | ||||||
| Total Corporate Bonds & Notes (Cost $41,608,481) | 25,981,593 | |||||||
| Shares | ||||||||
| Common Stocks & Warrants - 93.18% | ||||||||
| Agricultural Equipment - 3.38% | ||||||||
| 1,178,413 | AGCO Corp. | 57,023,405 | ||||||
| Asset Management - 7.90% | ||||||||
| 2,279,413 | Bank of New York Mellon Corp. (The) | 94,937,552 | ||||||
| 1,091,856 | Brookfield Asset Management, Inc., Class A (Canada) | 38,182,204 | ||||||
| 133,119,756 | ||||||||
| Automotive - 4.50% | ||||||||
| 1,298,800 | General Motors Co. | 45,341,108 | ||||||
| 573,893 | Toyota Industries Corp. (Japan) | 30,485,242 | ||||||
| 75,826,350 | ||||||||
| Banks - 9.25% | ||||||||
| 1,757,349 | Comerica, Inc. | 76,268,947 | ||||||
| 2,086,998 | KeyCorp | 25,920,515 | ||||||
| 595,800 | PNC Financial Services Group, Inc. (The) | 53,776,908 | ||||||
| 155,966,370 | ||||||||
| Consumer Products - 4.57% | ||||||||
| 526,368 | Home Products International, Inc. (a)(c)(d)(e) | — | ||||||
| 5,755,230 | Kingfisher PLC (United Kingdom) | 31,327,800 | ||||||
| 1,574,130 | Masco Corp. | 45,649,770 | ||||||
| 76,977,570 | ||||||||
| Diversified Holding Companies - 9.39% | ||||||||
| 3,990,000 | CK Hutchison Holdings, Ltd. (Hong Kong) | 54,826,078 | ||||||
| 1,032,304 | Investor AB, Class B (Sweden) | 38,350,954 | ||||||
| 75,133,880 | Lai Sun Garment International, Ltd. (Hong Kong) | 9,306,186 | ||||||
| 421,832 | Pargesa Holding S.A. (Switzerland) | 26,800,596 | ||||||
| 6,203,000 | Wheelock & Co., Ltd. (Hong Kong) | 29,011,786 | ||||||
| 158,295,600 | ||||||||
| Electronic Components - 1.97% | ||||||||
| 483,800 | Anixter International, Inc. (e) | 33,179,004 | ||||||
| Financial Insurance - 0.02% | ||||||||
| 37 | Manifold Capital LLC (a)(c)(d)(e) | 389,302 | ||||||
| Forest Products & Paper - 5.76% | ||||||||
| 3,308,210 | Weyerhaeuser Co., REIT | 97,029,799 | ||||||
| Insurance & Reinsurance - 7.59% | ||||||||
| 81,573 | Alleghany Corp. (e) | 40,482,233 | ||||||
| Value | ||||||||
| Shares | Security† | (Note 1) | ||||||
| Insurance & Reinsurance (continued) | ||||||||
| 797,288 | Loews Corp. | $ | 29,069,120 | |||||
| 73,999 | White Mountains Insurance Group, Ltd. (Bermuda) | 58,459,210 | ||||||
| 128,010,563 | ||||||||
| Manufactured Housing - 7.48% | ||||||||
| 1,279,481 | Cavco Industries, Inc. (d)(e) | 126,156,827 | ||||||
| Materials - 2.11% | ||||||||
| 2,514,800 | Canfor Corp. (Canada)(e) | 35,579,535 | ||||||
| Media & Entertainment - 3.21% | ||||||||
| 1,164,700 | CBS Corp., Class B, Non-Voting Shares | 54,181,844 | ||||||
| Non-U.S. Real Estate Operating Companies - 1.67% | ||||||||
| 3,990,000 | Cheung Kong Property Holdings, Ltd. (Hong Kong) | 28,056,538 | ||||||
| Oil & Gas Production & Services - 8.14% | ||||||||
| 924,800 | Apache Corp. | 43,585,824 | ||||||
| 726,506 | Devon Energy Corp. | 30,462,396 | ||||||
| 1,299,649 | Total S.A. (France) | 63,090,243 | ||||||
| 137,138,463 | ||||||||
| Pharmaceuticals - 0.95% | ||||||||
| 464,033 | Baxalta, Inc. | 15,990,577 | ||||||
| Semiconductor & Related - 1.74% | ||||||||
| 1,036,268 | NVIDIA Corp. | 29,398,923 | ||||||
| Senior Housing - 2.06% | ||||||||
| 1,660,700 | Brookdale Senior Living, Inc. (e) | 34,725,237 | ||||||
| Software - 2.84% | ||||||||
| 2,322,155 | Symantec Corp. | 47,836,393 | ||||||
| Steel & Specialty Steel - 1.44% | ||||||||
| 607,832 | POSCO, ADR (South Korea) | 24,331,515 | ||||||
| Telecommunications - 1.98% | ||||||||
| 10,123,456 | Vodafone Group PLC (United Kingdom) | 33,436,370 | ||||||
| U.S. Real Estate Operating Companies - 1.64% | ||||||||
| 1,221,894 | Tejon Ranch Co. (d)(e) | 27,529,272 | ||||||
| 200,255 | Tejon Ranch Co., Warrants, expire 8/31/16 (d)(e) | 23,159 | ||||||
| 27,552,431 | ||||||||
| Utilities - 3.59% | ||||||||
| 3,606,707 | Covanta Holding Corp. | 60,448,409 | ||||||
| Total Common Stocks & Warrants (Cost $1,386,477,081) | 1,570,650,781 | |||||||
The accompanying notes are an integral part of the financial statements.
| 6 |
Third Avenue Trust
Third Avenue Value Fund
Portfolio of Investments (continued)
at October 31, 2015
| Investment | Value | |||||||
| Amount ($) | Security† | (Note 1) | ||||||
| Limited Partnerships – 0.00%(f) | ||||||||
| Insurance & Reinsurance - 0.00%(f) | ||||||||
| 1,805,000 | Insurance Partners II Equity Fund, L.P. (a)(e) | $ | 34,315 | |||||
| Total Limited Partnerships (Cost $0) | 34,315 | |||||||
| Total Investment Portfolio - 94.72% (Cost $1,428,085,562) | 1,596,666,689 | |||||||
| Other Assets less Liabilities - 5.28% | 89,065,640 | |||||||
| NET ASSETS - 100.00% | $ | 1,685,732,329 | ||||||
| Notes: | |
| (a) | Fair-valued security. |
| (b) | Payment-in-kind (“PIK”) security. Income may be paid as additional securities. |
| (c) | Security subject to restrictions on resale. |
| Shares/ | Market | |||||||||||||
| Principal | Aquisition | Value | ||||||||||||
| Amount($) | Issuer | Date | Cost | Per Unit | ||||||||||
| 526,368 | Home Products International, Inc. | 5/30/07 | $ | 54,667,471 | $ | 0.00 | ||||||||
| $ | 22,814,735 | Home Products International, Inc., 2nd Lien, Convertible, 6.000% Payment-in-kind Interest, due 3/20/17 | 3/16/07 - 10/18/15 | 22,814,735 | 66.05 | |||||||||
| 37 | Manifold Capital LLC | 9/24/97-11/10/06 | 37,712,514 | 10,521.68 | ||||||||||
| At October 31, 2015, these restricted securities had a total market value of $15,458,435 or 0.91% of net assets of the Fund. | |
| (d) | Affiliated issuers - as defined under the Investment Company Act of 1940 (ownership of 5% or more of the outstanding voting securities of these issuers). |
| (e) | Non-income producing security. |
| (f) | Amount represents less than 0.01% of net assets. |
| † | U.S. issuer unless otherwise noted. |
| ADR: American Depositary Receipt. | |
| REIT: Real Estate Investment Trust. | |
Country Concentration
| % of | ||||
| Net Assets | ||||
| United States | 64.98 | % | ||
| Hong Kong | 7.19 | |||
| Canada | 4.38 | |||
| United Kingdom | 3.84 | |||
| France | 3.74 | |||
| Bermuda | 3.47 | |||
| Sweden | 2.28 | |||
| Japan | 1.81 | |||
| Switzerland | 1.59 | |||
| South Korea | 1.44 | |||
| Total | 94.72 | % | ||
Schedule of Written Options
| Number | Expiration | |||||||||||
| of Contracts | Security | Date | Strike Price | Value | ||||||||
| 3,171 | NVIDIA Corp., Call | 11/20/15 | 30.0000 USD | $ | (215,628 | ) | ||||||
| (Premiums received $214,962) | ||||||||||||
The accompanying notes are an integral part of the financial statements.
| 7 |
Third Avenue Trust
Third Avenue Small-Cap Value Fund
Portfolio Management Discussion
October 31, 2015 (Unaudited)
At October 31, 2015, the audited net asset values attributable to each of the 421,003 common shares outstanding of the Third Avenue Small-Cap Value Fund Investor Class and 17,321,807 common shares outstanding of the Third Avenue Small-Cap Value Fund Institutional Class were $22.28 and $22.42 per share, respectively. This compares with audited net asset values at October 31, 2014 of $22.57 and $22.66 per share, respectively, adjusted for a subsequent distribution to shareholders.
| Average Annual Returns for the periods ended October 31, 2015 | |||||||||||||||||||||
| One Year Ended 10/31/15 | Three Year | Five Year | Ten Year | Since Inception | |||||||||||||||||
| Third Avenue Small-Cap Value Fund Investor Class† | (1.49 | %) | 11.23 | % | 9.78 | % | N/A | 9.48 | % | ||||||||||||
| Third Avenue Small-Cap Value Fund Institutional Class^ | (1.27 | %) | 11.48 | % | 10.02 | % | 5.11% | 8.49 | % | ||||||||||||
| Russell 2000 Index‡ | 0.34 | % | 13.90 | % | 12.06 | % | 7.47% | 8.19 | % | ||||||||||||
| Russell 2000 Value Index‡ | (2.88 | %) | 11.65 | % | 10.53 | % | 6.19% | 9.02 | % | ||||||||||||
| S&P Small Cap 600 Index‡ | 2.85 | % | 16.06 | % | 14.44 | % | 8.64% | 10.19 | % | ||||||||||||
| † | Investor Class commenced investment operations on December 31, 2009. |
| ^ | Institutional Class commenced investment operations on April 1, 1997. |
| ‡ | The date used to calculate the Since Inception performance for the index is the inception date of the Institutional Class. |
The Third Avenue Small-Cap Value Fund (the “Fund”) generated -1.49% and -1.27% returns for the investor and institutional share classes, respectively, over the last fiscal year ended October 31, 2015. The Russell 2000 Value Index returned -2.88% over the same period. As long term, patient investors, we believe that the key driver of outperformance lies in the ability of a company to compound its book value growth at double digit rates over time. We are optimistic about the holdings in the portfolio, as the companies have the financial strength, the market position, and track records of compounding value. Furthermore, many companies in the portfolio have opportunities to unlock value, beyond the operational improvement. Most importantly, we feel that the portfolio is further protected on the down side because the holdings are selling at below our appraisal of intrinsic values.
The top performers in the Fund for the year were HCC Insurance Holdings, Inc., Genpact Ltd. and Multi-Color Corp. Specialty insurer HCC was the subject of a takeover by the Japanese insurance group Tokio Marine. The acquisition of HCC was announced in June at a 37% premium and closed in October. Genpact, founded as the captive offshore outsourcing business for General Electric, is adding and diversifying revenue sources as it weans its way off of its former parent. We believe it is poised to benefit from healthy longer term demand trends for outsourcing. Genpact enjoys long-term customer contracts that generate a high proportion of recurring revenues and a strong balance sheet that generates ample cash flow to promote downside protection and flexibility for new growth opportunities.
The largest detractors from performance over the fiscal year were SunCoke Energy, Inc., Dundee Corp. and LSB Industries, Inc. SunCoke owns and operates coke producing plants, a raw material used in the steel making process was hurt by the very weak steel industry. Despite having long term, take-or-pay contracts, the weak volume of its customers such as AK Steel and US Steel has forced SunCoke to idle its plants and report losses. LSB Industries was hit by both a large construction delay and cost overrun at its El Dorado Expansion project and the continuing weakness of fertilizer prices. El Dorado Chemical division manufactures a variety of agrochemical and industrial acids such as sulfuric and nitric. Management wanted to expand its ammonia and nitric acids capacities. The expansion plan was originally projected to cost about $430 million and expected to generate about $100 million in incremental EBITDA, but construction delays have increased costs to $850 million. The additional cost overrun amounts to about $19 a share. We view each of these companies as very well capitalized and solidly managed, and while the near-term outlook for these companies may be challenging, we maintain our positive, albeit contrarian, long-term view of each company and its prospects to deliver attractive returns to shareholders.
The Fund added several new names during the year. New positions include DSW, Inc., Interfor Corp., Visteon Corp. and 1-800-Flowers.com, Inc. Visteon is a US based automotive electronics supplier which is going through a very interesting transformation that we believe will ultimately result in the creation of value for shareholders. Visteon transformed itself from a company with multiple business lines into a singularly focused automotive electronics company. Most recently, Visteon divested its climate control business and is in the process of selling its interior business. The company expects to return $2.50 billion to $2.75 billion of cash to shareholders over the next year via a series of buybacks and special dividends, in a very tax efficient manner, with the remainder of the proceeds to be used for growth and some debt reduction. Visteon has a very strong balance sheet with a large net cash position—close to 60% of its market cap is in cash and it has solid growth prospects longer term. Visteon acquired Johnson Controls’ automotive electronics business last year, and is already benefiting from an increase in business wins and rewins. In addition to increased sales opportunities, there are cost synergies from this acquisition along with other opportunities to reduce operational overhead. We believe that the transformation of Visteon positions it very well to compound growth going forward as A/THE market leader in cockpit electronics and connected car solutions, and to exploit cost synergies and operational efficiencies from its recent acquisition.
| 8 |
Third Avenue Trust
Third Avenue Small-Cap Value Fund
Portfolio Management Discussion (continued)
October 31, 2015 (Unaudited)
The Fund sold out of 21 names during the year, reflecting our view that the market price for these holdings had risen to close to our estimate of Net Asset Value or were replaced with better risk vs. reward opportunities. The two largest dispositions were HCC Insurance Holdings, Inc. and InterDigital, Inc.
We are excited about the positioning of the Fund as we move on to the next fiscal year, with several fundamental positions exposed to the improving US housing recovery, and overcapitalized and asset sensitive regional banks.
THE INFORMATION IN THE PORTFOLIO MANAGEMENT DISCUSSION REPRESENTS A FACTUAL OVERVIEW OF THE FUND’S PERFORMANCE AND IS NOT INTENDED TO BE A FORECAST OF FUTURE EVENTS, A GUARANTEE OF FUTURE RESULTS NOR INVESTMENT ADVICE. VIEWS EXPRESSED ARE THOSE OF THE INVESTMENT TEAM AND MAY DIFFER FROM THOSE OF OTHER INVESTMENT TEAMS OR THE FIRM AS A WHOLE. ALSO, PLEASE NOTE THAT ANY DISCUSSION OF THE PORTFOLIO’S HOLDINGS, THE FUND’S PERFORMANCE, AND THE INVESTMENT TEAM’S VIEWS ARE AS OF OCTOBER 31, 2015, AND ARE SUBJECT TO CHANGE.
Small-cap companies carry additional risks because their share prices may be more volatile, and their securities may be less liquid than larger, more established companies. Such investments may increase the risk of greater price fluctuations. These and other risks are described more fully in the Fund’s prospectus.
Third Avenue Small-Cap Value Fund is offered by prospectus only. The prospectus contains more complete information on advisory fees, distribution charges, and other expenses and should be read carefully before investing or sending money. Past performance is no guarantee of future results. Investment return and principal value will fluctuate so that an investor’s shares, when redeemed, may be worth more or less than original cost. The Fund’s returns should be viewed in light of its investment policy and objectives and quality of its portfolio securities and the periods selected. M.J. Whitman LLC Distributor.
If you should have any questions, or for updated information (including performance data current to the most recent month-end) or a copy of our prospectus, please call 1-800-443-1021 or go to our web site at www.thirdave.com. Current performance may be lower or higher than performance quoted.
The Russell 2000 Index measures the performance of small companies. The Russell 2000 Value Index measures the performance of those Russell 2000 companies with lower price-to-book ratios and lower forecasted growth values. The S&P Small Cap 600 Index is a small cap index that covers approximately 3% of the U.S. equities market and consists of companies that meet specific inclusion criteria to ensure that they are investable and financially viable. The Russell 2000 Index, the Russell 2000 Value Index, and the S&P Small Cap 600 Index are not securities that can be purchased or sold, and their total returns are reflective of unmanaged portfolios. The returns include reinvestment of all distributions.
| 9 |
Third Avenue Trust
Third Avenue Small-Cap Value Fund - Investor Class
Comparison of a $10,000 Investment
(Unaudited)
Performance Illustration
COMPARISON OF CHANGE IN VALUE OF A $10,000 INVESTMENT IN THIRD AVENUE SMALL-CAP VALUE FUND – INVESTOR
CLASS (TVSVX), THE RUSSELL 2000 INDEX, THE RUSSELL 2000 VALUE INDEX AND THE S&P SMALL CAP 600 INDEX
FROM INCEPTION OF THE FUND (12/31/09) THROUGH OCTOBER 31, 2015
Average Annual Total Return
| Since Inception | ||||||||||||||
| 1 Year | 3 Years | 5 Years | (12/31/09) | |||||||||||
| (1.49%) | 11.23% | 9.78% | 9.48% | |||||||||||
![]()
| * | Includes reinvestment of all distributions. |
As with all mutual funds, past performance does not indicate future results. Performance may reflect fee waivers, expense offset arrangement and/or recovery. Total return would have been lower if the Adviser had not waived certain expenses. Conversely, total return would have been higher if the Adviser had not recovered previously waived expenses. Also, the returns shown in the graph and table do not reflect the deduction of taxes that a shareholder would pay on fund distributions or the redemption of fund shares.
| 10 |
Third Avenue Trust
Third Avenue Small-Cap Value Fund - Institutional Class
Comparison of a $10,000 Investment
(Unaudited)
Performance Illustration
COMPARISON OF CHANGE IN VALUE OF A $10,000 INVESTMENT IN THIRD AVENUE SMALL-CAP VALUE FUND – INSTITUTIONAL
CLASS (TASCX), THE RUSSELL 2000 INDEX, THE RUSSELL 2000 VALUE INDEX AND THE S&P SMALL CAP 600 INDEX
FOR THE TEN YEARS ENDED OCTOBER 31, 2015
Average Annual Total Return
| 1 Year | 3 Years | 5 Years | 10 Years | |||||||||||
| (1.27%) | 11.48% | 10.02% | 5.11% | |||||||||||
![]()
| * | Includes reinvestment of all distributions. |
As with all mutual funds, past performance does not indicate future results. Performance may reflect fee waivers, expense offset arrangement and/or recovery. Total return would have been lower if the Adviser had not waived certain expenses. Conversely, total return would have been higher if the Adviser had not recovered previously waived expenses. Also, the returns shown in the graph and table do not reflect the deduction of taxes that a shareholder would pay on fund distributions or the redemption of fund shares.
| 11 |
Third Avenue Trust
Third Avenue Small-Cap Value Fund
Industry Diversification
(Unaudited)
The summary of the Fund’s investments as of October 31, 2015 is as follow:
![]()
The accompanying notes are an integral part of the financial statements.
| 12 |
Third Avenue Trust
Third Avenue Small-Cap Value Fund
Portfolio of Investments
at October 31, 2015
| Shares | Security† | Value (Note 1) | ||||||
| Common Stocks - 95.56% | ||||||||
| Asset Management - 1.86% | ||||||||
| 165,132 | Legg Mason, Inc. | $ | 7,389,657 | |||||
| Auto Parts and Services - 5.91% | ||||||||
| 155,700 | Dorman Products, Inc. (a) | 7,268,076 | ||||||
| 198,704 | Standard Motor Products, Inc. | 8,792,652 | ||||||
| 68,164 | Visteon Corp. (a) | 7,434,647 | ||||||
| 23,495,375 | ||||||||
| Bank & Thrifts - 12.51% | ||||||||
| 61,171 | City National Corp. | 5,480,922 | ||||||
| 198,650 | Commerce Bancshares, Inc. | 9,048,507 | ||||||
| 109,300 | Cullen/Frost Bankers, Inc. | 7,480,492 | ||||||
| 136,663 | Prosperity Bancshares, Inc. | 7,021,745 | ||||||
| 197,022 | Southside Bancshares, Inc. | 5,299,892 | ||||||
| 159,391 | UMB Financial Corp. | 7,822,910 | ||||||
| 724,175 | Valley National Bancorp | 7,603,838 | ||||||
| 49,758,306 | ||||||||
| Business Services - 2.16% | ||||||||
| 285,433 | Viad Corp. | 8,594,388 | ||||||
| Consulting and Information Technology Services - 8.37% | ||||||||
| 235,192 | FTI Consulting, Inc. (a) | 7,998,880 | ||||||
| 424,566 | Genpact, Ltd. (Bermuda) (a) | 10,520,746 | ||||||
| 194,303 | ICF International, Inc. (a) | 5,959,273 | ||||||
| 187,830 | Syntel, Inc. (a) | 8,835,523 | ||||||
| 33,314,422 | ||||||||
| Consumer Products and Services - 5.50% | ||||||||
| 651,082 | 1-800-Flowers.com, Inc., Class A (a) | 6,465,244 | ||||||
| 194,815 | CST Brands, Inc. | 6,999,703 | ||||||
| 153,458 | VCA, Inc. (a) | 8,404,895 | ||||||
| 21,869,842 | ||||||||
| Diversified Holding Companies - 2.04% | ||||||||
| 1,320,162 | JZ Capital Partners, Ltd. (Guernsey) | 8,115,166 | ||||||
| Electronic Components - 5.29% | ||||||||
| 112,056 | Anixter International, Inc. (a) | 7,684,800 | ||||||
| 208,011 | Ingram Micro, Inc., Class A | 6,194,568 | ||||||
| 282,750 | Insight Enterprises, Inc. (a) | 7,181,850 | ||||||
| 21,061,218 | ||||||||
| Energy Exploration and Production - 1.10% | ||||||||
| 121,851 | Noble Energy, Inc. | 4,367,140 | ||||||
| Energy Services - 1.19% | ||||||||
| 103,752 | SemGroup Corp., Class A | 4,725,903 | ||||||
| Forest Products & Paper - 2.11% | ||||||||
| 552,105 | Interfor Corp. (Canada) (a) | 5,244,069 | ||||||
| 162,111 | PH Glatfelter Co. | 3,144,953 | ||||||
| 8,389,022 | ||||||||
| Healthcare - 3.17% | ||||||||
| 109,000 | Patterson Cos., Inc. | 5,166,600 | ||||||
| 55,907 | Teleflex, Inc. | 7,435,631 | ||||||
| 12,602,231 | ||||||||
| Shares | Security† | Value (Note 1) | ||||||
| Home Building - 2.30% | ||||||||
| 383,534 | WCI Communities, Inc. (a) | $ | 9,162,627 | |||||
| Industrial Capital Equipment Manufacturers - 3.70% | ||||||||
| 262,200 | Barnes Group, Inc. | 9,856,098 | ||||||
| 36,579 | Rofin-Sinar Technologies, Inc. (a) | 1,059,328 | ||||||
| 112,566 | SPX Flow, Inc. (a) | 3,815,987 | ||||||
| 14,731,413 | ||||||||
| Industrial Equipment - 4.89% | ||||||||
| 162,006 | Alamo Group, Inc. | 7,601,321 | ||||||
| 115,967 | CIRCOR International, Inc. | 5,325,205 | ||||||
| 64,171 | EnerSys | 3,913,789 | ||||||
| 166,321 | LSB Industries, Inc. (a) | 2,602,924 | ||||||
| 19,443,239 | ||||||||
| Industrial Services - 12.24% | ||||||||
| 102,857 | ABM Industries, Inc. | 2,921,139 | ||||||
| 157,218 | Cubic Corp. | 7,051,227 | ||||||
| 166,383 | EMCOR Group, Inc. | 8,032,971 | ||||||
| 87,346 | Multi-Color Corp. | 6,799,013 | ||||||
| 115,900 | MYR Group, Inc. (a) | 2,607,750 | ||||||
| 345,644 | Tetra Tech, Inc. | 9,297,823 | ||||||
| 35,910 | UniFirst Corp. | 3,773,064 | ||||||
| 185,119 | World Fuel Services Corp. | 8,230,391 | ||||||
| 48,713,378 | ||||||||
| Insurance & Reinsurance - 1.66% | ||||||||
| 13,343 | Alleghany Corp. (a) | 6,621,731 | ||||||
| Metals Manufacturing - 2.19% | ||||||||
| 107,276 | Kaiser Aluminum Corp. | 8,720,466 | ||||||
| Retailers - 1.88% | ||||||||
| 299,900 | DSW, Inc., Class A | 7,479,506 | ||||||
| Securities Trading/Processing Services - 3.03% | ||||||||
| 111,048 | Broadridge Financial Solutions, Inc. | 6,616,240 | ||||||
| 44,400 | DST Systems, Inc. | 5,423,460 | ||||||
| 12,039,700 | ||||||||
| Software and Services - 5.16% | ||||||||
| 296,787 | Allscripts Healthcare Solutions, Inc. (a) | 4,172,825 | ||||||
| 301,398 | CSG Systems International, Inc. | 10,102,861 | ||||||
| 257,355 | Progress Software Corp. (a) | 6,248,579 | ||||||
| 20,524,265 | ||||||||
| Specialty Pharmaceuticals - 0.53% | ||||||||
| 49,933 | ANI Pharmaceuticals, Inc. (a) | 2,089,197 | ||||||
| Transportation - 1.25% | ||||||||
| 76,172 | Kirby Corp. (a) | 4,973,270 | ||||||
| U.S. Real Estate Investment Trusts - 1.07% | ||||||||
| 122,119 | Tanger Factory Outlet Centers, Inc. | 4,268,059 | ||||||
| U.S. Real Estate Operating Companies - 4.45% | ||||||||
| 143,227 | Alico, Inc. | 6,114,361 | ||||||
| 257,367 | Brookdale Senior Living, Inc. (a) | 5,381,544 | ||||||
The accompanying notes are an integral part of the financial statements.
| 13 |
Third Avenue Trust
Third Avenue Small-Cap Value Fund
Portfolio of Investments (continued)
at October 31, 2015
| Shares | Security† | Value (Note 1) | ||||||
| Common Stocks (continued) | ||||||||
| U.S. Real Estate Operating Companies (continued) | ||||||||
| 54,539 | Vail Resorts, Inc. | $ | 6,226,717 | |||||
| 17,722,622 | ||||||||
| Total Common Stocks (Cost $307,927,094) | 380,172,143 | |||||||
| Total Investment Portfolio - 95.56% (Cost $307,927,094) | 380,172,143 | |||||||
| Other Assets less Liabilities - 4.44% | 17,648,340 | |||||||
| NET ASSETS - 100.00% | $ | 397,820,483 | ||||||
Notes:
| (a) | Non-income producing security. |
| † | U.S. issuer unless otherwise noted. |
Country Concentration
| % of Net Assets | ||||
| United States | 89.56 | % | ||
| Bermuda | 2.64 | |||
| Guernsey | 2.04 | |||
| Canada | 1.32 | |||
| Total | 95.56 | % | ||
The accompanying notes are an integral part of the financial statements.
| 14 |
Third Avenue Trust
Third Avenue Real Estate Value Fund
Portfolio Management Discussion
October 31, 2015 (Unaudited)
At October 31, 2015, the audited net asset values attributable to each of the 14,081,558 common shares outstanding of the Third Avenue Real Estate Value Fund Investor Class and 96,495,612 common shares outstanding of the Third Avenue Real Estate Value Fund Institutional Class were $31.14 and $31.36 per share, respectively. This compares with audited net asset values at October 31, 2014 of $30.77 and $30.91 per share, respectively, adjusted for a subsequent distribution to shareholders.
| Average Annual Returns for the periods ended October 31, 2015 | ||||||||||||||||||||
| One Year ended 10/31/15 | Three Year | Five Year | Ten Year | Since Inception | ||||||||||||||||
| Third Avenue Real Estate Value Fund Investor Class† | 1.12 | % | 10.57 | % | 10.23 | % | N/A | 10.82 | % | |||||||||||
| Third Avenue Real Estate Value Fund Institutional Class^ | 1.37 | % | 10.83 | % | 10.50 | % | 5.88% | 11.24 | % | |||||||||||
| FTSE EPRA/NAREIT Developed Index‡ | 2.68 | % | 8.74 | % | 8.64 | % | 6.33% | 10.39 | % | |||||||||||
| † | Investor Class commenced investment operations on December 31, 2009. |
| ^ | Institutional Class commenced investment operations on September 17, 1998. |
| ‡ | The date used to calculate the Since Inception performance for the index is the inception date of the Institutional Class. |
The Third Avenue Real Estate Value Fund (the “Fund”) generated returns of 1.12% and 1.37% for the investor share class and the institutional share class, respectively, over the last fiscal year ended October 31, 2015. The FTSE EPRA/NAREIT Developed Index returned 2.68% over the same period. The second half of the fiscal year was particularly volatile for most equity securities and the real estate sector was not immune. A number of our portfolio holdings were impacted by the broad based market decline. However, recent volatility has very little to do with corporate fundamentals in our view and has instead resulted in an opportunity to deploy capital at significant discounts to long-term value.
The largest contributors to performance during the year were the common stocks of Songbird Estates PLC, Lowe’s Cos., Inc. and First Industrial Realty Trust, Inc. First Industrial Realty is a US REIT that owns and operates industrial real estate properties in North America. The company has been reducing its leverage levels and recently received an investment grade credit rating for the first time since the global financial crisis. In addition, the company trades at a significant discount to our conservatively estimated NAV as well as to private market values for similar portfolios. Should the discount remain, it would not be inconceivable that First Industrial undertake a resource conversion.
The three largest detractors to performance during the year were Brookdale Senior Living, Inc., Rayonier, Inc. and City Developments Ltd. The Fund used the weakness in the security prices of Rayonier and City Developments as an opportunity to increase its position size as the pillars of our investment theses remain intact. Both companies continue to have strong balance sheets, the ability to compound book value growth, and are now at even wider discounts to our conservative estimate of intrinsic value.
Additional portfolio activity over the year included the reorganization of Cheung Kong Holdings, Ltd., a Hong Kong based holding company that was a long-time holding in the Fund and split into two more focused companies— CK Hutchison Holdings, Ltd. and Cheung Kong Property Holdings, Ltd. CK Hutchison Holdings is now a multinational conglomerate comprised of telecom, infrastructure/energy, retail and ports assets whereas Cheung Kong Property Holdings is a pure-play real estate company and one of the dominant property companies in Asia. Although the transactions amounted to a reshuffling of the assets, the enhanced disclosures and reduced complexity of the structures have created impressive shareholder value. Since the restructuring was announced in January, the value of the combined pieces has risen significantly. After the reorganization, the Fund exited CK Hutchison and increased its investment in Cheung Kong Property which remains incredibly well-financed, is more than 30% owned by Li Ka-Shing, and is positioned to compound book value at above-average rates over the medium term.
The Fund also initiated positions in Macerich Co., Global Logistic Properties, Ltd., Hang Lung Group, Ltd., Kennedy-Wilson Holdings, Inc. and Globe Trade Center S.A. The largest new investment during the year was the common stock of the Macerich Co. (Macerich). Macerich is a US REIT that owns the fourth most valuable mall portfolio in North America with a particular concentration of market dominant malls in key East Coast markets (e.g., New York City, Washington, D.C.) as well as one of the strongest positions on the West Coast (e.g., California, Arizona, Oregon). Nearly a year ago, Simon Property Group—the largest mall owner globally—purchased a 4% stake in Macerich and launched a bid to buy the entire company for $96 per share. This offer was ultimately rejected by the Board, and led to Macerich’s stock price falling sharply, allowing the Fund to swiftly purchase shares at prices well below private market values making it a top five position.
Since rejecting Simon’s bid, Macerich has made improvements to its corporate governance and it recently sold stakes in nine of its malls to institutional investors at prices representing an implied cap rate of nearly 4%. The transaction represents great execution and will generate nearly $6 billion of gross proceeds which Macerich will return to shareholders through a special dividend as well as a $1.25 billion share repurchase program. Should Macerich’s stock price not respond to these moves, it is not inconceivable that some other type of corporate activity could result. In the meantime, Macerich’s
| 15 |
Third Avenue Trust
Third Avenue Real Estate Value Fund
Portfolio Management Discussion (continued)
October 31, 2015 (Unaudited)
business continues to perform quite well despite weaker results from some of the department store retailers and the continued rise of e-commerce. The company is generating industry leading cash flow growth, largely due to its top performing West Coast properties, and progressing on a number of value creating retail-led urban development and redevelopment projects that should only increase the appeal of Macerich’s portfolio over time.
The Fund also added to a number of existing investments during the year including: businesses that are positioned to compound capital at above average rates over the next three to five years largely through well-located developments projects including Westfield Corp. and Forest City Enterprises, Inc.; businesses that have strong ties to the recovering US residential markets such as Weyerhaeuser Co.; and special situation investments, including First Industrial Realty Trust, Inc., a US REITs that own valuable platforms and trades at prices materially below their private market values as outlined above.
Other portfolio activity included Songbird Estates PLC and Quintain Estates & Development PLC being eliminated from the Portfolio as they were taken over by private equity firms at significant premiums. The Fund also sold positions in CK Hutchison, Starwood Waypoint Residential Trust, Hersha Hospitality Trust and Hang Lung Properties Ltd. over the year.
After taking into account the most recent activity, the portfolio remains concentrated in select pockets of the real estate universe that we believe still offer tremendous value, such as companies with undervalued development pipelines, exposure to the US and UK residential markets, as well as other special situation investment opportunities. As a result, we believe the portfolio is well positioned for a potential increase in interest rates as it has a selection of undervalued companies with extremely strong financial positions and healthy cash balances to take advantage of any unexpected market volatility.
THE INFORMATION IN THE PORTFOLIO MANAGEMENT DISCUSSION REPRESENTS A FACTUAL OVERVIEW OF THE FUND’S PERFORMANCE AND IS NOT INTENDED TO BE A FORECAST OF FUTURE EVENTS, A GUARANTEE OF FUTURE RESULTS NOR INVESTMENT ADVICE. VIEWS EXPRESSED ARE THOSE OF THE INVESTMENT TEAM AND MAY DIFFER FROM THOSE OF OTHER INVESTMENT TEAMS OR THE FIRM AS A WHOLE. ALSO, PLEASE NOTE THAT ANY DISCUSSION OF THE PORTFOLIO’S HOLDINGS, THE FUND’S PERFORMANCE, AND THE INVESTMENT TEAM’S VIEWS ARE AS OF OCTOBER 31, 2015, AND ARE SUBJECT TO CHANGE.
Real estate investments may be subject to special risks, including risks related to general and local economic conditions, and changes in real estate values that may have negative effects on issuers related to the real estate industry. The Fund’s investments in small and medium capitalization stocks may experience more volatility than larger capitalization stocks. These and other risks are described more fully in the Fund’s prospectus.
Third Avenue Real Estate Value Fund is offered by prospectus only. The prospectus contains more complete information on advisory fees, distribution charges, and other expenses and should be read carefully before investing or sending money. Past performance is no guarantee of future results. Investment return and principal value will fluctuate so that an investor’s shares, when redeemed, may be worth more or less than original cost. The Fund’s returns should be viewed in light of its investment policy and objectives and quality of its portfolio securities and the periods selected. M.J. Whitman LLC Distributor.
If you should have any questions, or for updated information (including performance data current to the most recent month-end) or a copy of our prospectus, please call 1-800-443-1021 or go to our web site at www.thirdave.com. Current performance may be lower or higher than performance quoted.
The FTSE EPRA/NAREIT Developed Index is designed to reflect the stock performance of companies engaged in specific aspects of the North American, European and Asian Real Estate markets. The FTSE EPRA/NAREIT Developed Index is not a security that can be purchased or sold, and its total returns are reflective of unmanaged portfolios. The returns include reinvestment of all distributions.
| 16 |
Third Avenue Trust
Third Avenue Real Estate Value Fund - Investor Class
Comparison of a $10,000 Investment
(Unaudited)
Performance Illustration
COMPARISON OF CHANGE IN VALUE OF A $10,000 INVESTMENT IN THIRD AVENUE REAL ESTATE FUND – INVESTOR CLASS (TVRVX)
AND THE FTSE EPRA/NAREIT DEVELOPED INDEX
FROM INCEPTION OF THE FUND (12/31/09) THROUGH OCTOBER 31, 2015
Average Annual Total Return
| Since Inception | |||
| 1 Year | 3 Years | 5 Years | (12/31/09) |
| 1.12% | 10.57% | 10.23% | 10.82% |
![]()
| * | Includes reinvestment of all distributions. |
As with all mutual funds, past performance does not indicate future results. Performance may reflect fee waivers, expense offset arrangement and/or recovery. Total return would have been lower if the Adviser had not waived certain expenses. Conversely, total return would have been higher if the Adviser had not recovered previously waived expenses. Also, the returns shown in the graph and table do not reflect the deduction of taxes that a shareholder would pay on fund distributions or the redemption of fund shares.
| 17 |
Third Avenue Trust
Third Avenue Real Estate Value Fund - Institutional Class
Comparison of a $10,000 Investment
(Unaudited)
Performance Illustration
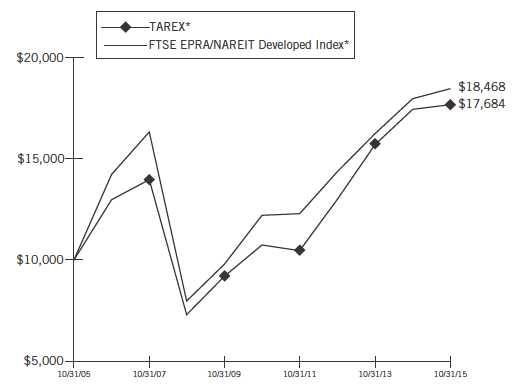
COMPARISON OF CHANGE IN VALUE OF A $10,000 INVESTMENT IN THIRD AVENUE REAL ESTATE VALUE FUND – INSTITUTIONAL
CLASS (TAREX) AND THE FTSE EPRA/NAREIT DEVELOPED INDEX
FOR THE TEN YEARS ENDED OCTOBER 31, 2015
Average Annual Total Return
| 1 Year | 3 Years | 5 Years | 10 Years |
| 1.37% | 10.83% | 10.50% | 5.88% |
| * | Includes reinvestment of all distributions. |
As with all mutual funds, past performance does not indicate future results. Performance may reflect fee waivers, expense offset arrangement and/or recovery. Total return would have been lower if the Adviser had not waived certain expenses. Conversely, total return would have been higher if the Adviser had not recovered previously waived expenses. Also, the returns shown in the graph and table do not reflect the deduction of taxes that a shareholder would pay on fund distributions or the redemption of fund shares.
| 18 |
Third Avenue Trust
Third Avenue Real Estate Value Fund
Industry Diversification
(Unaudited)
The summary of the Fund’s investments as of October 31, 2015 is as follow:
![]()
The accompanying notes are an integral part of the financial statements.
| 19 |
Third Avenue Trust
Third Avenue Real Estate Value Fund
Portfolio of Investments
at October 31, 2015
| Principal | Value | |||||||||
| Amount | Security† | (Note 1) | ||||||||
| Term Loans - 0.09% | ||||||||||
| Non-U.S. Real Estate Operating Companies - 0.09% | ||||||||||
| Concrete Investment I, Term Loan (Luxembourg): | ||||||||||
| 50,450 | EUR | Tranche A2, 2.000% Cash or Payment-in-kind Interest, due 7/31/16 (a)(b)(c) | $ | 55,477 | ||||||
| 19,273 | EUR | Tranche A3, 2.000% Cash or Payment-in-kind Interest, due 7/31/16 (a)(b)(c) | 21,194 | |||||||
| Concrete Investment II, Term Loan (Luxembourg): | ||||||||||
| 34,719 | EUR | Tranche A2, 2.000% Cash or Payment-in-kind Interest, due 7/31/16 (a)(b)(c) | 38,179 | |||||||
| 4,818 | EUR | Tranche A3, 2.000% Cash or Payment-in-kind Interest, due 7/31/16 (a)(b)(c) | 5,299 | |||||||
| IVG Immobilien AG, Term Loan (Germany): | ||||||||||
| 1,136,047 | EUR | Tranche A1, 9.500% Cash or Payment-in-kind Interest, due 9/1/17 (a)(b)(c) | 1,249,254 | |||||||
| 1,676,942 | EUR | Tranche A2, 9.500% Cash or Payment-in-kind Interest, due 9/1/17 (a)(b)(c) | 1,844,049 | |||||||
| Total Term Loans (Cost $3,922,545) | 3,213,452 | |||||||||
| Shares | ||||||||||
| Common Stocks & Warrants - 86.83% | ||||||||||
| Banks - 4.73% | ||||||||||
| 2,452,249 | PNC Financial Services Group, Inc., Warrants, expire 12/31/18 (d) | 60,619,595 | ||||||||
| 1,156,551 | Wells Fargo & Co., Warrants, expire 10/28/18 (d) | 23,420,158 | ||||||||
| 2,773,300 | Zions Bancorporation | 79,787,841 | ||||||||
| 163,827,594 | ||||||||||
| Forest Products & Paper - 8.60% | ||||||||||
| 5,173,900 | Rayonier, Inc., REIT | 117,188,835 | ||||||||
| 6,159,258 | Weyerhaeuser Co., REIT | 180,651,037 | ||||||||
| 297,839,872 | ||||||||||
| Lodging & Hotels - 2.12% | ||||||||||
| 450,000 | Hyatt Hotels Corp., Class A (d) | 22,680,000 | ||||||||
| 6,848,517 | Millennium & Copthorne Hotels PLC (United Kingdom) | 50,856,056 | ||||||||
| 73,536,056 | ||||||||||
| Non-U.S. Real Estate Consulting/Management - 2.36% | ||||||||||
| 6,002,254 | Countrywide PLC (United Kingdom) | 43,026,579 | ||||||||
| 2,752,003 | Savills PLC (United Kingdom) | 38,860,991 | ||||||||
| 81,887,570 | ||||||||||
| Non-U.S. Real Estate Investment Trusts - 10.22% | ||||||||||
| 12,070,176 | Dexus Property Group (Australia) | 66,619,955 | ||||||||
| 366,031 | Gecina S.A. (France) | 46,851,710 | ||||||||
| Shares | Security† | Value (Note 1) | ||||||||
| Non-U.S. Real Estate Investment Trusts (continued) | ||||||||||
| 10,346,121 | Hammerson PLC (United Kingdom) | $ | 101,518,561 | |||||||
| 8,839,052 | Segro PLC (United Kingdom) | 61,290,707 | ||||||||
| 1,249,353 | Wereldhave N.V. (Netherlands) | 78,007,283 | ||||||||
| 354,288,216 | ||||||||||
| Non-U.S. Real Estate Operating Companies - 28.23% | ||||||||||
| 2,702,489 | Brookfield Asset Management, Inc., Class A (Canada) | 94,506,040 | ||||||||
| 16,586,500 | Cheung Kong Property Holdings, Ltd. (Hong Kong) | 116,631,519 | ||||||||
| 16,833,650 | City Developments, Ltd. (Singapore) | 95,409,509 | ||||||||
| 57,480,900 | Global Logistic Properties, Ltd. (Singapore) | 91,910,355 | ||||||||
| 14,967,134 | Globe Trade Centre S.A. (Poland) (d) | 26,027,441 | ||||||||
| 4,639,811 | Globe Trade Centre S.A., Class K (Poland) (d) | 8,068,507 | ||||||||
| 21,341,000 | Hang Lung Group, Ltd. (Hong Kong) | 77,510,019 | ||||||||
| 16,888,122 | Henderson Land Development Co., Ltd. (Hong Kong) | 108,184,561 | ||||||||
| 11,373,967 | Hysan Development Co., Ltd. (Hong Kong) | 50,555,204 | ||||||||
| 142,749,614 | Inmobiliaria Colonial S.A. (Spain) (d) | 105,800,919 | ||||||||
| 17,788,546 | Westfield Corp., REIT (Australia) | 130,021,176 | ||||||||
| 15,680,500 | Wheelock & Co., Ltd. (Hong Kong) | 73,338,596 | ||||||||
| 977,963,846 | ||||||||||
| Real Estate Consulting/Management - 1.79% | ||||||||||
| 1,584,200 | Realogy Holdings Corp. (d) | 61,942,220 | ||||||||
| Retail-Building Products - 2.57% | ||||||||||
| 1,206,930 | Lowe’s Cos., Inc. | 89,107,642 | ||||||||
| Senior Housing - 0.54% | ||||||||||
| 892,295 | Brookdale Senior Living, Inc. (d) | 18,657,888 | ||||||||
| U.S. Real Estate Investment Trusts - 19.50% | ||||||||||
| 3,460,150 | Equity Commonwealth (d) | 99,340,906 | ||||||||
| 7,021,031 | First Industrial Realty Trust, Inc. (e) | 152,215,952 | ||||||||
| 1,821,862 | Macerich Co. (The) | 154,384,586 | ||||||||
| 1,253,782 | Post Properties, Inc. | 74,900,937 | ||||||||
| 2,031,678 | Tanger Factory Outlet Centers, Inc. | 71,007,146 | ||||||||
| 1,231,594 | Vornado Realty Trust | 123,836,777 | ||||||||
| 675,686,304 | ||||||||||
| U.S. Real Estate Operating Companies - 6.17% | ||||||||||
| 7,023,431 | Forest City Enterprises, Inc., Class A (d) | 155,217,825 | ||||||||
| 703,900 | Kennedy-Wilson Holdings, Inc. | 17,259,628 | ||||||||
| 941,627 | Tejon Ranch Co. (d) | 21,214,856 | ||||||||
| 139,089 | Tejon Ranch Co., Warrants, expire 8/31/16 (d) | 16,086 | ||||||||
| 3,369,445 | Trinity Place Holdings, Inc. (a)(d)(f) | 19,909,988 | ||||||||
| 213,618,383 | ||||||||||
| Total Common Stocks & Warrants (Cost $2,487,869,891) | 3,008,355,591 | |||||||||
| Preferred Stocks - 1.10% | ||||||||||
| Non-U.S. Real Estate Operating Companies - 1.10% | ||||||||||
| 294,770 | Concrete Investment II SCA (Luxembourg) (d) | 38,086,911 | ||||||||
| Total Preferred Stocks (Cost $41,943,570) | 38,086,911 | |||||||||
The accompanying notes are an integral part of the financial statements.
| 20 |
Third Avenue Trust
Third Avenue Real Estate Value Fund
Portfolio of Investments (continued)
at October 31, 2015
| Value | ||||||||||
| Units | Security† | (Note 1) | ||||||||
| Private Equities - 3.17% | ||||||||||
| U.S. Real Estate Operating Companies - 3.17% | ||||||||||
| 28,847,217 | Newhall Holding Co. LLC, Class A Units (d)(e) | $ | 109,980,014 | |||||||
| Total Private Equities (Cost $75,516,192) | 109,980,014 | |||||||||
| Notional | ||||||||||
| Amount‡ | ||||||||||
| Purchased Options - 0.07% | ||||||||||
| Foreign Currency Put Options - 0.01% | ||||||||||
| 46,000,000 | AUD | Australian Currency, strike 0.6575 AUD, expire 11/10/15 (d) | 56 | |||||||
| 42,000,000 | AUD | Australian Currency, strike 0.6897 AUD, expire 12/10/15 (d) | 155,308 | |||||||
| 155,364 | ||||||||||
| Foreign Currency Call Options - 0.06% | ||||||||||
| 380,000,000 | U.S. Currency, strike 8.1400 HKD, expire 8/1/17 (d) | 2,196,476 | ||||||||
| Total Purchased Options (Cost $1,586,575) | 2,351,840 | |||||||||
| Principal | ||||||||||
| Amount($) | ||||||||||
| Short-Term Investments - 5.77% | ||||||||||
| U.S. Government Obligations - 5.77% | ||||||||||
| 200,000,000 | U.S. Treasury Bills, 0.010-0.120%, due 11/19/15-12/10/15 (g) | 199,992,667 | ||||||||
| Total Short-Term Investments (Cost $199,992,667) | 199,992,667 | |||||||||
| Total Investment Portfolio - 97.03% (Cost $2,810,831,440) | 3,361,980,475 | |||||||||
| Other Assets less Liabilities - 2.97% (h) | 102,811,159 | |||||||||
| NET ASSETS - 100.00% | $ | 3,464,791,634 | ||||||||
Notes:
| (a) | Fair-valued security. |
| (b) | Payment-in-kind (“PIK”) security. Income may be paid as additional securities or cash at the discretion of the issuer. |
| (c) | Variable rate security. The rate disclosed is in effect as of October 31, 2015. |
| (d) | Non-income producing security. |
| (e) | Affiliated issuers - as defined under the Investment Company Act of 1940 (ownership of 5% or more of the outstanding voting securities of these issuers). |
| (f) | Security subject to restrictions on resale. |
| Aquisition | Market Value | |||||||
| Shares | Issuer | Date | Cost | Per Unit | ||||
| 3,369,445 | Trinity Place Holdings, Inc. | 10/2/13 - 11/6/13 | $13,477,776 | $5.91 |
| At October 31, 2015, the restricted security had a total market value of $19,909,988 or 0.57% of net assets of the Fund. | |
| (g) | Annualized yield at date of purchase. |
| (h) | Includes restricted cash pledged to and received from counterparties as collateral management for forward foreign currency contracts and options. |
| ‡ | Denominated in U.S. Dollars unless otherwise noted. |
| † | U.S. issuer unless otherwise noted. |
AUD: Australian Dollar.
EUR: Euro.
HKD: Hong Kong Dollar.
REIT: Real Estate Investment Trust.
Country Concentration
| % of | ||||
| Net Assets | ||||
| United States* | 53.50 | % | ||
| Hong Kong | 12.36 | |||
| United Kingdom | 8.53 | |||
| Australia | 5.68 | |||
| Singapore | 5.41 | |||
| Spain | 3.05 | |||
| Canada | 2.73 | |||
| Netherlands | 2.25 | |||
| France | 1.35 | |||
| Luxembourg | 1.10 | |||
| Poland | 0.98 | |||
| Germany | 0.09 | |||
| Total | 97.03 | % | ||
| * | Includes cash equivalents. |
Schedule of Written Options
| Notional | Expiration | |||||||||||
| Amount | Security | Date | Strike Price | Value | ||||||||
| 46,000,000 AUD | Australian Currency, Call | 11/10/15 | 0.7300 AUD | $ | (50,987 | ) | ||||||
| 42,000,000 AUD | Australian Currency, Call | 12/10/15 | 0.7600 AUD | (19,803 | ) | |||||||
| (Premiums received $304,075) | $ | (70,790 | ) | |||||||||
AUD: Australian Dollar.
Schedule of Forward Foreign Currency Contracts
| Settlement | Settlement | Value at | Unrealized | |||||||||||||
| Contracts to Sell | Counterparty | Date | Value | 10/31/15 | Appreciation | |||||||||||
| 123,660,000 EUR | Goldman Sachs & Co. | 11/25/15 | $ | 136,952,362 | $ | 136,025,412 | $ | 926,950 | ||||||||
| 123,660,000 EUR | Morgan Stanley & Co. LLC | 11/25/15 | 136,911,962 | 136,025,412 | 886,550 | |||||||||||
| $ | 1,813,500 | |||||||||||||||
EUR: Euro.
The accompanying notes are an integral part of the financial statements.
| 21 |
Third Avenue Trust
Third Avenue International Value Fund
Portfolio Management Discussion
October 31, 2015 (Unaudited)
At October 31, 2015, the audited net asset values attributable to each of the 390,847 common shares outstanding of the Third Avenue International Value Fund Investor Class and 12,789,395 common shares outstanding of the Third Avenue International Value Fund Institutional Class were $15.29 and $15.29 per share, respectively. This compares with audited net asset values at October 31, 2014 of $16.47 and $16.43 per share, respectively, adjusted for a subsequent distribution to shareholders.
| Average Annual Returns for the periods ended October 31, 2015 | ||||||||||||||||||||
| One Year ended 10/31/15 | Three Year | Five Year | Ten Year | Since Inception | ||||||||||||||||
| Third Avenue International Value Fund Investor Class† | (7.24 | %) | 0.93 | % | 0.98 | % | N/A | 1.71 | % | |||||||||||
| Third Avenue International Value Fund Institutional Class^ | (6.97 | %) | 1.20 | % | 1.23 | % | 2.06% | 7.17 | % | |||||||||||
| MSCI All Country World ex US Index‡ | (4.26 | %) | 5.14 | % | 3.06 | % | 4.62% | 6.81 | % | |||||||||||
| † | Investor Class commenced investment operations on December 31, 2009. |
| ^ | Institutional Class commenced investment operations on December 31, 2001. |
| ‡ | The date used to calculate the Since Inception performance for the index is the inception date of the Institutional Class. |
The Third Avenue International Value Fund (the “Fund”) generated -7.24% and -6.97% returns for the investor share class and institutional share class, respectively, for the fiscal year ended October 31, 2015. The MSCI All Country World ex US Index returned -4.26% over the same period. Much of the Fund’s underperformance can be attributed the Fund’s exposure to base metals, oil services and Brazilian based investments. Our copper mining companies continued to negatively impact performance as global sentiment towards the metal and this class of company continued to deteriorate in this fifth year of cyclical downturn. With similar sentiment surrounding them, our oil and gas related investments were also poor performers during the year. Our investments in Brazil have suffered from an increasingly challenging macroeconomic and political environment which has affected each of our three investments in ways specific to each business. In no case has the long-term value of any of our businesses been diminished, i.e., suffered a permanent impairment, and in each case the impact from the depreciating Brazilian Real has been the primary source of negative investment returns. Recent performance has not changed our investment thesis on the companies in the portfolio, which is based on a careful analysis each companies’ fundamental characteristics.
The largest detractors from performance over the fiscal year were Capstone Mining Corp., Arcos Dorados Holdings, Inc. and Vard Holdings Ltd. Each one represents the major market dislocations that have affected Fund performance. Capstone is a North American copper producer, the company’s stock sold off due to macro concerns on copper pricing and despite an improving production profile and declining costs. We believe the company has ample liquidity to manage through lower copper prices and its capital expenditure program is coming to a close. Arcos Dorados is the world’s largest McDonald’s franchisee, holding the exclusive rights to own, operate and grant franchises of McDonald’s restaurants in 20 Latin American countries. The company’s stock has experienced significant volatility over the past 12 months, mostly as a result of the broader economic malaise in Brazil, and obscuring Arcos Dorados’ admirable operating performance and management, high returns on capital and the increases in business value it continues to create in constant currency terms. Vard is a Norwegian designer and builder of offshore and specialized vessels used in the offshore oil and gas exploration and production industry. While the near-term outlook for these companies may be challenging we maintain our very positive, albeit contrarian, long-term view of each company and its prospects to deliver attractive returns to shareholders.
The top performers in the Fund during the year were Tenon, Ltd., Telefonica Deutschland Holding AG and White Mountains Insurance Group, Ltd. Tenon is a New Zealand based, but US focused, wood products (moldings) business, benefiting from the recovery in US housing starts and renovation markets as well resource conversion events that will simplify its complex ownership structure. It is a special situation type of investment where potential sale or merger activity is an integral part of our investment thesis. Tenon is undergoing a strategic review of its business in conjunction with Deutsche Craigs and Deutsche Bank. The underlying goal of the review—as stated by the company’s Chairman—is to maximize “risk-adjusted” return to shareholders (language is suggestive of a sale). The company has recently announced that is has been approached by third parties and that any offers (should they materialize) will be considered in the context of its review. The company’s stock responded well to the announcements, thus contributing positively to portfolio performance.
Portfolio activity over the year included a reorganization involving our holding in Hutchison Whampoa, Ltd. Led by Chairman Li Ka-Shing, the restructuring included a merger of Cheung Kong Holdings, Ltd. with its subsidiary Hutchison Whampoa, forming newly created company CK Hutchison Holdings, Ltd., which subsequently spun-off its extensive real estate holdings to form Cheung Kong Property Holdings, Ltd. The result was the creation of two new portfolio companies — CK Hutchison Holdings and Cheung Kong Property Holdings. CK Hutchison Holdings is now a multinational conglomerate comprised of telecom, infrastructure/energy, retail and ports assets. Although the transactions amounted to a reshuffling of the assets, the enhanced disclosures and reduced complexity of the structures have created impressive shareholder value. Since the restructuring was announced in January, the value of the combined pieces has risen significantly. We believe that there are more possibilities for value creation as CK
| 22 |
Third Avenue Trust
Third Avenue International Value Fund
Portfolio Management Discussion (continued)
October 31, 2015 (Unaudited)
Hutchison’s exposure to European telecom should benefit from consolidation in the region. In addition, we believe there is a good chance these assets could be split up again in the future, further enhancing shareholder value. CK Hutchison Holdings still trades at a discount to our conservative net asset value estimate. As a standalone company, Cheung Kong Property is a pure-play real estate operating company with one of the most dominant property platforms in Asia. It will remain extremely well-financed. The stock price for CK Hutchison and Cheung Kong Property have responded favorably but we believe there is significantly more value to be recognized going forward as the re-focused entities are more nimble and in better position to pursue opportunities.
We added 11 positions and disposed of 10 positions during the year. New companies in the portfolio include Cosan Ltd., Global Logistic Properties, Ltd., C&C Group PLC, CNH Industrial N.V. and Amec Foster Wheeler PLC. Global Logistic Properties is a real estate operating company based in Singapore which owns the premier industrial real estate platform in Asia, with dominant portfolios in China and Japan. The company operates in one of the most attractive segments of global real estate, is well financed with high quality assets and low debt levels. The stock trades at a discount to a conservative estimate of net asset value (NAV), and management is positioned to increase NAV by raising rents at existing properties, undertaking additional development, and further expanding its formidable asset management platform. The dispositions include GP Investments, Ltd., Sanofi and Munich Reinsurance Company.
The Third Avenue International Value strategy employs a high conviction investment approach, with a strong commitment to finding unique sources of value. As a result, the Portfolio is highly concentrated and heavily populated by names that are not found in broad based indices, as evidenced by its high active share relative to the MSCI All Country World ex US Index. The current portfolio offers very attractive valuations relative to the index, as well as exposure to numerous event-driven/special situation investments with low correlation to the market.
THE INFORMATION IN THE PORTFOLIO MANAGEMENT DISCUSSION REPRESENTS A FACTUAL OVERVIEW OF THE FUND’S PERFORMANCE AND IS NOT INTENDED TO BE A FORECAST OF FUTURE EVENTS, A GUARANTEE OF FUTURE RESULTS NOR INVESTMENT ADVICE. VIEWS EXPRESSED ARE THOSE OF THE INVESTMENT TEAM AND MAY DIFFER FROM THOSE OF OTHER INVESTMENT TEAMS OR THE FIRM AS A WHOLE. ALSO, PLEASE NOTE THAT ANY DISCUSSION OF THE PORTFOLIO’S HOLDINGS, THE FUND’S PERFORMANCE, AND THE INVESTMENT TEAM’S VIEWS ARE AS OF OCTOBER 31, 2015, AND ARE SUBJECT TO CHANGE.
The Fund’s performance may be influenced by a foreign country’s political, social and economic situation. Other risks include currency fluctuations, less liquidity, lack of efficient trading markets, and different auditing and legal standards. These risks may result in more volatility for the Fund. These and other risks are described more fully in the Fund’s prospectus.
Third Avenue International Value Fund is offered by prospectus only. The prospectus contains more complete information on advisory fees, distribution charges, and other expenses and should be read carefully before investing or sending money. Past performance is no guarantee of future results. Investment return and principal value will fluctuate so that an investor’s shares, when redeemed, may be worth more or less than original cost. The Fund’s returns should be viewed in light of its investment policy and objectives and quality of its portfolio securities and the periods selected. M.J. Whitman LLC Distributor.
If you should have any questions, or for updated information (including performance data current to the most recent month-end) or a copy of our prospectus, please call 1-800-443-1021 or go to our web site at www.thirdave.com. Current performance may be lower or higher than performance quoted.
The MSCI All Country World ex US Index is an unmanaged index of common stocks and includes securities representative of the market structure of over 50 developed and emerging market countries (other than the United States) in North America, Europe, Latin America and the Asian Pacific Region. This index is not a security that can be purchased or sold, and its total returns are reflective of unmanaged portfolios. The returns include reinvestment of all distributions.
| 23 |
Third Avenue Trust
Third Avenue International Value Fund - Investor Class
Comparison of a $10,000 Investment
(Unaudited)
Performance Illustration
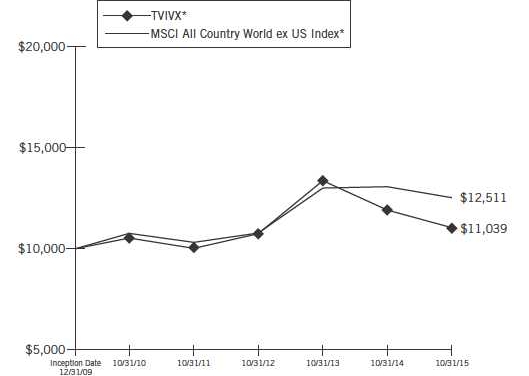
COMPARISON OF CHANGE IN VALUE OF A $10,000 INVESTMENT IN THIRD AVENUE INTERNATIONAL VALUE FUND – INVESTOR CLASS (TVIVX) AND THE MSCI ALL COUNTRY WORLD EX US INDEX
FROM INCEPTION OF THE FUND (12/31/09) THROUGH OCTOBER 31, 2015
Average Annual Total Return
| Since Inception | |||
| 1 Year | 3 Years | 5 Years | (12/31/09) |
| (7.24%) | 0.93% | 0.98% | 1.71% |
| * | Includes reinvestment of all distributions. |
As with all mutual funds, past performance does not indicate future results. Performance may reflect fee waivers, expense offset arrangement and/or recovery. Total return would have been lower if the Adviser had not waived certain expenses. Conversely, total return would have been higher if the Adviser had not recovered previously waived expenses. Also, the returns shown in the graph and table do not reflect the deduction of taxes that a shareholder would pay on fund distributions or the redemption of fund shares.
| 24 |
Third Avenue Trust
Third Avenue International Value Fund - Institutional Class
Comparison of a $10,000 Investment
(Unaudited)
Performance Illustration
COMPARISON OF CHANGE IN VALUE OF A $10,000 INVESTMENT IN THIRD AVENUE INTERNATIONAL VALUE FUND – INSTITUTIONAL CLASS (TAVIX) AND THE MSCI ALL COUNTRY WORLD EX US INDEX
FOR THE TEN YEARS ENDED OCTOBER 31, 2015
Average Annual Total Return
| 1 Year | 3 Years | 5 Years | 10 Years |
| (6.97%) | 1.20% | 1.23% | 2.06% |

| * | Includes reinvestment of all distributions. |
As with all mutual funds, past performance does not indicate future results. Performance may reflect fee waivers, expense offset arrangement and/or recovery. Total return would have been lower if the Adviser had not waived certain expenses. Conversely, total return would have been higher if the Adviser had not recovered previously waived expenses. Also, the returns shown in the graph and table do not reflect the deduction of taxes that a shareholder would pay on fund distributions or the redemption of fund shares.
| 25 |
Third Avenue Trust
Third Avenue International Value Fund
Industry Diversification
(Unaudited)
The summary of the Fund’s investments as of October 31, 2015 is as follow:
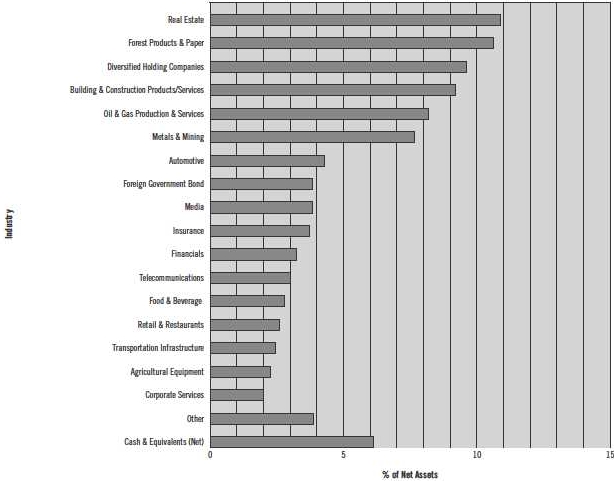
The accompanying notes are an integral part of the financial statements.
| 26 |
Third Avenue Trust
Third Avenue International Value Fund
Portfolio of Investments
at October 31, 2015
| Principal Amount‡ | Security† | Value (Note 1) | ||||||
| Corporate Bonds & Notes - 2.55% | ||||||||
| Oil & Gas Production & Services - 2.55% | ||||||||
| 6,300,000 | Petroleum Geo-Services ASA, 7.375%, due 12/15/18 (Norway) (a) | $ | 5,142,375 | |||||
| Total Corporate Bonds & Notes (Cost $5,672,217) | 5,142,375 | |||||||
| Foreign Government Bonds - 3.82% | ||||||||
| 11,000,000 | SGD | Singapore Government Bond, 0.500% due 4/1/18 (Singapore) | 7,698,979 | |||||
| Total Foreign Government Bonds (Cost $7,931,343) | 7,698,979 | |||||||
| Shares | ||||||||
| Common Stocks - 87.50% | ||||||||
| Agricultural Equipment - 2.25% | ||||||||
| 668,300 | CNH Industrial N.V. (Netherlands) | 4,537,757 | ||||||
| Automotive - 4.28% | ||||||||
| 50,880 | Daimler AG (Germany) | 4,418,388 | ||||||
| 103,111 | Leoni AG (Germany) | 4,210,024 | ||||||
| 8,628,412 | ||||||||
| Building & Construction Products/Services - 9.18% | ||||||||
| 9,750,898 | Tenon, Ltd. (New Zealand) (b) | 18,487,869 | ||||||
| Capital Goods - 1.94% | ||||||||
| 98,344 | Nexans S.A. (France) (c) | 3,915,354 | ||||||
| Corporate Services - 2.00% | ||||||||
| 903,436 | Prosegur Cia de Seguridad S.A. (Spain) | 4,023,528 | ||||||
| Diversified Holding Companies - 9.58% | ||||||||
| 375,684 | CK Hutchison Holdings, Ltd. (Hong Kong) | 5,162,226 | ||||||
| 1,168,600 | Cosan Ltd., Class A (Bermuda) | 4,090,100 | ||||||
| 236,633 | Leucadia National Corp. | 4,735,026 | ||||||
| 83,591 | Pargesa Holding S.A. (Switzerland) | 5,310,855 | ||||||
| 19,298,207 | ||||||||
| Engineering and Construction - 1.92% | ||||||||
| 352,546 | Amec Foster Wheeler PLC (United Kingdom) | 3,864,158 | ||||||
| Financials - 3.23% | ||||||||
| 736,924 | BinckBank N.V. (Netherlands) | 6,500,698 | ||||||
| Food & Beverage - 2.79% | ||||||||
| 1,410,092 | C&C Group PLC (Ireland) | 5,628,707 | ||||||
| Forest Products & Paper - 10.60% | ||||||||
| 330,100 | Interfor Corp. (Canada) (c) | 3,135,395 | ||||||
| 56,796,558 | Rubicon, Ltd. (New Zealand) (b)(c) | 12,691,710 | ||||||
| 188,643 | Weyerhaeuser Co., REIT | 5,532,899 | ||||||
| 21,360,004 | ||||||||
| Insurance - 3.73% | ||||||||
| 9,519 | White Mountains Insurance Group, Ltd. (Bermuda) | 7,520,010 | ||||||
| Media - 3.82% | ||||||||
| 319,060 | Vivendi S.A. (France) | 7,688,975 | ||||||
| Shares | Security† | Value (Note 1) | ||||||
| Metals & Mining - 7.65% | ||||||||
| 873,604 | Antofagasta PLC (United Kingdom) | $ | 7,090,592 | |||||
| 10,528,312 | Capstone Mining Corp. (Canada) (c) | 5,394,592 | ||||||
| 868,500 | Lundin Mining Corp. (Canada) (c) | 2,929,095 | ||||||
| 15,414,279 | ||||||||
| Oil & Gas Production & Services - 5.64% | ||||||||
| 1,824,564 | Petroleum Geo-Services ASA (Norway) | 7,597,384 | ||||||
| 13,899,800 | Vard Holdings, Ltd. (Singapore) (c) | 3,770,379 | ||||||
| 11,367,763 | ||||||||
| Real Estate - 10.86% | ||||||||
| 1,680,770 | Atrium European Real Estate, Ltd. (Jersey) | 6,967,937 | ||||||
| 442,684 | Cheung Kong Property Holdings, Ltd. (Hong Kong) | 3,112,827 | ||||||
| 3,565,400 | Global Logistic Properties, Ltd. (Singapore) | 5,700,975 | ||||||
| 129,833 | Millennium & Copthorne Hotels PLC (United Kingdom) | 964,120 | ||||||
| 1,175,892 | Oberoi Realty, Ltd. (India) | 5,142,110 | ||||||
| 21,887,969 | ||||||||
| Retail & Restaurants - 2.58% | ||||||||
| 1,686,100 | Arcos Dorados Holdings, Inc., Class A (British Virgin Islands) | 5,193,188 | ||||||
| Telecommunications - 2.99% | ||||||||
| 936,451 | Telefonica Deutschland Holding AG (Germany) | 6,030,325 | ||||||
| Transportation Infrastructure - 2.46% | ||||||||
| 1,339,889 | Santos Brasil Participacoes S.A. (Brazil) | 4,964,804 | ||||||
| Total Common Stocks (Cost $217,031,588) | 176,312,007 | |||||||
| Total Investment Portfolio - 93.87% (Cost $230,635,148) | 189,153,361 | |||||||
| Other Assets less Liabilities - 6.13% | 12,346,545 | |||||||
| NET ASSETS - 100.00% | $ | 201,499,906 | ||||||
Notes:
| (a) | Security is exempt from registration under Rule 144A of the Securities Act of 1933. This security may be resold in transactions that are exempt from registration, normally to qualified institutional buyers. |
| (b) | Affiliated issuers - as defined under the Investment Company Act of 1940 (ownership of 5% or more of the outstanding voting securities of these issuers). |
| (c) | Non-income producing security. |
| † | U.S. issuer unless otherwise noted. |
| ‡ | Denominated in U.S. Dollars unless otherwise noted. |
REIT: Real Estate Investment Trust.
SGD: Singapore Dollar.
The accompanying notes are an integral part of the financial statements.
| 27 |
Third Avenue Trust
Third Avenue International Value Fund
Portfolio of Investments (continued)
at October 31, 2015
Country Concentration
| % of Net Assets | ||||
| New Zealand | 15.47 | % | ||
| Singapore | 8.52 | |||
| Germany | 7.27 | |||
| Norway | 6.32 | |||
| United Kingdom | 5.91 | |||
| Bermuda | 5.76 | |||
| France | 5.76 | |||
| Canada | 5.69 | |||
| Netherlands | 5.48 | |||
| United States | 5.10 | |||
| Hong Kong | 4.11 | |||
| Jersey | 3.46 | |||
| Ireland | 2.79 | |||
| Switzerland | 2.64 | |||
| British Virgin Islands | 2.58 | |||
| India | 2.55 | |||
| Brazil | 2.46 | |||
| Spain | 2.00 | |||
| Total | 93.87 | % | ||
The accompanying notes are an integral part of the financial statements.
| 28 |
Third Avenue Trust
Third Avenue Focused Credit Fund
Portfolio Management Discussion
October 31, 2015 (Unaudited)
At October 31, 2015, the audited net asset values attributable to each of the 52,665,369 common shares outstanding of the Third Avenue Focused Credit Fund Investor Class and 122,244,671 common shares outstanding of the Third Avenue Focused Credit Fund Institutional Class were $7.84 and $7.82 per share, respectively. This compares with audited net asset values at October 31, 2014 of $9.77 and $9.73 per share, respectively, adjusted for subsequent distributions to shareholders.
| Average Annual Returns for the periods ended October 31, 2015 | ||||||||||||||||
| One Year Ended 10/31/15 | Three Year | Five Year | Since Inception (8/31/09) | |||||||||||||
| Third Avenue Focused Credit Fund Investor Class | (19.41 | %) | (1.18 | %) | 1.17% | 4.00 | % | |||||||||
| Third Avenue Focused Credit Fund Institutional Class | (19.20 | %) | (0.93 | %) | 1.41% | 4.24 | % | |||||||||
| Barclays Capital U.S Corporate High Yield Index | (1.94 | %) | 4.15 | % | 6.18% | 9.32 | % | |||||||||
| Credit Suisse Leveraged Loan Index | 0.81 | % | 3.60 | % | 4.52% | 6.11 | % | |||||||||
The Third Avenue Focused Credit Fund (the “Fund”) generated -19.41% and -19.20% returns for the investor and institutional share classes, respectively, for the fiscal year end October 31, 2015. The Barclays Capital U.S. Corporate High Yield Index and the Credit Suisse Leveraged Loan Index returned -1.94% and 0.81%, respectively for the same period. The Fund’s performance can be attributed to a combination of some investments with permanent impairments (which we have exited), some investments that are going through what we believe are temporary headwinds, and for the most part to the dramatic dislocation between prices—weak—and fundamentals—strong—experienced in the high yield and stressed and distressed credit markets over the past year. The confluence of a number of macro events (rout in oil/commodities, uncertainty regarding the timing of the US Fed interest rate liftoff, slowdown in China/emerging markets, among others) has had a negative impact on market sentiment and market technicals. We believe that there is substantial upside to the portfolio as the market re-focuses on company fundamentals.
The top performers in the Fund during the year were Caesars Entertainment Operating Co., Inc., Corporate Risk Holdings LLC and Liberty Tire Recycling. Corporate Risk Holdings (formerly Altegrity) and Liberty Tire are examples of companies that have restructured within the past year. Altegrity filed for bankruptcy early in 2015 and completed its corporate restructuring during the year. The Fund received both equity and bonds in the new entity, now named Corporate Risk Holdings, which comprise two very healthy enterprises, Kroll and HireRight. Similarly, the Fund received equity in Liberty Tire Recycling Holdco as part of the company’s restructuring.
The largest detractors from performance over the fiscal year were Affinion Group, Inc., iHeart Communications, Inc. and Global Geophysical Services, Inc. Affinion Group is one of the world’s leading loyalty and customer engagement solutions companies. Affinion has recently restructured, and we believe it is on better footing to begin growing. iHeart is among the largest names in the distressed market. Its bonds were trading above par before the market turmoil. As the market dislocation ensued, this credit has traded down significantly even though there has been no fundamental change in the business. In Global Geophysical Services, our investment thesis has been impaired, mainly as a result of the dramatic drop in commodity prices.
During the year the Fund added several new positions including Intelsat. Intelsat operates the world’s largest satellite services business, providing a critical layer in the global communications infrastructure. Intelsat provides diversified communication services to the world’s leading media companies, telecommunications operators, and data service provides, among others. It is also the leading provider of commercial satellite capacity to the US government and other select military organizations and their contractors. This is a company the Fund has owned in the past, when it was private. The company owns what we believe is the best real estate in the galaxy and charges high margins for it. It has a four year backlog which reduces uncertainty over its future revenue; as revenue is booked when the order is received, before satellites are sent to orbit. It is a large, liquid issuance and we expect it will be a performing credit but we are positioned in the fulcrum security in case it defaults. Our two main risks in this investment come from a potential change in satellite technology and increase in competition.
The Fund sold off several names, including American Seafoods Group LLC., Endeavour International Corp. and Momentive, and our bonds in Western Express Inc. were paid off.
The Fund’s underperformance can be attributed to market technicals, a few permanent impairments, and some investments which are undergoing what we believe are temporary impairments. We believe there is significant upside in the Fund as the fundamentals of the credits in the portfolio are healthy and positioned to capture significant upside as market conditions normalize.
| 29 |
Third Avenue Trust
Third Avenue Focused Credit Fund
Portfolio Management Discussion (continued)
October 31, 2015 (Unaudited)
THE INFORMATION IN THE PORTFOLIO MANAGEMENT DISCUSSION REPRESENTS A FACTUAL OVERVIEW OF THE FUND’S PERFORMANCE AND IS NOT INTENDED TO BE A FORECAST OF FUTURE EVENTS, A GUARANTEE OF FUTURE RESULTS NOR INVESTMENT ADVICE. VIEWS EXPRESSED ARE THOSE OF THE INVESTMENT TEAM AND MAY DIFFER FROM THOSE OF OTHER INVESTMENT TEAMS OR THE FIRM AS A WHOLE. ALSO, PLEASE NOTE THAT ANY DISCUSSION OF THE PORTFOLIO’S HOLDINGS, THE FUND’S PERFORMANCE, AND THE INVESTMENT TEAM’S VIEWS ARE AS OF OCTOBER 31, 2015, AND ARE SUBJECT TO CHANGE.
The Fund’s investments in high-yield and distressed securities may expose the Fund to greater risks than if the Fund only owned higher-grade securities. The value of high-yield, lower quality securities is affected by the creditworthiness of the issuers of the securities and by general economic and specific industry conditions. Issuers of high-yield securities are not as strong financially as those with higher credit ratings, so the securities are usually considered speculative investments. These and other risks are described more fully in the Fund’s prospectus.
If you should have any questions, or for updated information (including performance data current to the most recent month-end), please call 1-800-443-1021 or go to our web site at www.thirdave.com. Current performance may be lower or higher than performance quoted.
The Barclays Capital U.S. Corporate High Yield Index comprises issues that have at least $150 million par value outstanding, a maximum credit rating of Ba1 or BB+ (including defaulted issues) and at least one year to maturity. The Credit Suisse Leveraged Loan Index is designed to mirror the investible universe of the $US-denominated leveraged loan market. The Barclays Capital U.S. Corporate High Yield Index and the Credit Suisse Leveraged Loan Index are not securities that can be purchased or sold, and their total returns are reflective of unmanaged portfolios. The returns include reinvestment of all distributions.
| 30 |
Third Avenue Trust
Third Avenue Focused Credit Fund
Comparison of a $10,000 Investment
(Unaudited)
Performance Illustration
COMPARISON OF CHANGE IN VALUE OF A $10,000 INVESTMENT IN THIRD AVENUE FOCUSED CREDIT FUND – INVESTOR CLASS
(TFCVX), THIRD AVENUE FOCUSED CREDIT FUND – INSTITUTIONAL CLASS (TFCIX),
THE BARCLAYS CAPITAL U.S. CORPORATE HIGH YIELD INDEX AND THE CREDIT SUISSE LEVERAGED LOAN INDEX
FROM INCEPTION OF THE FUND (8/31/09) THROUGH OCTOBER 31, 2015
Average Annual Total Return
| Fund | 1 Year | 3 Years | 5 Years | Since Inception (8/31/09) |
| TFCVX | (19.41%) | (1.18%) | 1.17% | 4.00% |
| TFCIX | (19.20%) | (0.93%) | 1.41% | 4.24% |
 | ||||
| * | Includes reinvestment of all distributions. |
As with all mutual funds, past performance does not indicate future results. Performance may reflect fee waivers, expense offset arrangement and/or recovery. Total return would have been lower if the Adviser had not waived certain expenses. Conversely, total return would have been higher if the Adviser had not recovered previously waived expenses. Also, the returns shown in the graph and table do not reflect the deduction of taxes that a shareholder would pay on fund distributions or the redemption of fund shares.
| 31 |
Third Avenue Trust
Third Avenue Focused Credit Fund
Industry Diversification
(Unaudited)
The summary of the Fund’s investments as of October 31, 2015 is as follow:

The accompanying notes are an integral part of the financial statements.
| 32 |
Third Avenue Trust
Third Avenue Focused Credit Fund
Portfolio of Investments
at October 31, 2015
| Principal Amount‡ | Security† | Value (Note 1) | ||||||
| Corporate Bonds & Notes - 44.63% | ||||||||
| Chemicals - 0.00% | ||||||||
| 17,478,774 | Reichhold Industries, Inc., due 5/8/17 (a)(b)(c)(d) | $ | — | |||||
| Consumer Products - 4.91% | ||||||||
| Ideal Standard International S.A. (Luxembourg): | ||||||||
| 27,905,497 | EUR | Series B, 11.750% Cash or 15.750% Payment-in-kind Interest, due 5/1/18 (b)(d)(e) | 30,686,288 | |||||
| 33,180,416 | EUR | Series C, 11.750% Cash or 17.750% Payment-in-kind Interest, due 5/1/18 (b)(d)(e)(f) | 36,486,855 | |||||
| 67,173,143 | ||||||||
| Energy - 3.69% | ||||||||
| 8,500,000 | American Eagle Energy Corp., due 9/1/19 (a)(c) | 2,337,500 | ||||||
| 19,800,000 | CHC Helicopter S.A., 9.250%, due 10/15/20 (Luxembourg) | 11,385,000 | ||||||
| Global Geophysical Services, Inc., Escrow: | ||||||||
| 15,599,000 | due 5/1/14 (b)(c)(d) | — | ||||||
| 45,925,000 | due 5/1/17 (b)(c)(d) | — | ||||||
| Hercules Offshore, Inc.: | ||||||||
| 10,000,000 | due 4/1/19 (a)(c) | 2,050,000 | ||||||
| 32,380,000 | due 7/15/21 (a)(c) | 6,637,900 | ||||||
| 3,000,000 | due 10/1/21 (a)(c) | 585,000 | ||||||
| 5,000,000 | due 4/1/22 (a)(c) | 975,000 | ||||||
| 20,150,000 | IronGate Energy Services LLC, 11.000%, due 7/1/18 (a) | 12,493,000 | ||||||
| 20,000,000 | Linn Energy LLC / Linn Energy Finance Corp., 8.625%, due 4/15/20 | 5,300,000 | ||||||
| 3,000,000 | Lone Pine Resources, Inc., Escrow, due 2/15/17 (b)(c) | — | ||||||
| 10,000,000 | McDermott International, Inc., 8.000%, due 5/1/21 (Panama) (a) | 8,650,000 | ||||||
| 10,106,000 | CAD | Southern Pacific Resource Corp., due 1/25/18 (Canada) (a)(c) | 88,427 | |||||
| 50,501,827 | ||||||||
| Financials - 0.51% | ||||||||
| 10,000,000 | DFC Finance Corp., 10.500%, due 6/15/20 (a) | 6,950,000 | ||||||
| Gaming & Entertainment - 3.33% | ||||||||
| 40,000,000 | Caesars Entertainment Operating Co., Inc., due 12/15/18 (c) | 12,000,000 | ||||||
| Codere Finance Luxembourg S.A. (Luxembourg): | ||||||||
| 29,878,000 | EUR | due 6/15/15 (c) | 23,984,407 | |||||
| 14,410,000 | due 2/15/19 (a)(c) | 9,582,650 | ||||||
| 45,567,057 | ||||||||
| Healthcare - 2.05% | ||||||||
| InVentiv Health, Inc.: | ||||||||
| 20,420,000 | 10.000% Cash or 12.000% Payment-in-kind Interest, due 8/15/18 (a)(e) | 20,317,900 | ||||||
| Principal Amount‡ | Security† | Value (Note 1) | ||||||
| Healthcare (continued) | ||||||||
| InVentiv Health, Inc.: | ||||||||
| 8,000,000 | 10.000%, due 8/15/18 (a) | $ | 7,800,000 | |||||
| 28,117,900 | ||||||||
| Home Construction - 2.89% | ||||||||
| 46,312,000 | New Enterprise Stone & Lime Co., Inc., 11.000%, due 9/1/18 | 39,596,760 | ||||||
| Manufacturing - 3.96% | ||||||||
| 5,400,000 | Euramax International, Inc., 12.000%, due 8/15/20 (a) | 5,265,000 | ||||||
| 48,958,986 | Liberty Tire Recycling LLC, 2nd Lien, 11.000% Payment-in-kind Interest, due 3/31/21 (a)(b)(d)(e)(g) | 48,958,986 | ||||||
| 54,223,986 | ||||||||
| Media/Cable - 4.64% | ||||||||
| 43,000,000 | Cengage Learning Acquisitions, Inc., Escrow, due 4/15/20 (b)(c) | — | ||||||
| 153,015,000 | iHeartCommunications, Inc., 12.000% Cash plus 2.000% Payment-in-kind Interest, due 2/1/21 (e) | 63,501,225 | ||||||
| 63,501,225 | ||||||||
| Metals & Mining - 3.75% | ||||||||
| 5,000,000 | AK Steel Corp., 7.625%, due 10/1/21 | 2,400,000 | ||||||
| 65,268,137 | EUR | Boats Investments Netherlands B.V., 11.000% Payment-in-kind Interest, due 3/31/17 (Netherlands) (e) | 22,608,220 | |||||
| New World Resources N.V. (Netherlands): | ||||||||
| 36,889,156 | EUR | 8.000% Cash or 11.000% Payment-in-kind Interest, due 4/7/20 (a)(e) | 17,341,611 | |||||
| 13,403,642 | EUR | 4.000% Cash or 8.000% Payment-in-kind Interest, due 10/7/20 (a)(e) | 442,180 | |||||
| 37,000,000 | Noranda Aluminum Acquisition Corp., 11.000%, due 6/1/19 | 8,510,000 | ||||||
| 51,302,011 | ||||||||
| Paper & Related Products - 0.14% | ||||||||
| 10,000,000 | Verso Paper Holdings LLC / Verso Paper, Inc., 11.750%, due 1/15/19 | 1,900,000 | ||||||
| Retailers - 2.56% | ||||||||
| Claire’s Stores, Inc.: | ||||||||
| 2,500,000 | 8.875%, due 3/15/19 | 1,025,000 | ||||||
| 115,250,000 | 7.750%, due 6/1/20 (a) | 33,998,750 | ||||||
| 35,023,750 | ||||||||
| Services - 6.65% | ||||||||
| 142,019,553 | Affinion Group Holdings, Inc., 13.750% Cash or 14.500% Payment-in-kind Interest, due 9/15/18 (e) | 38,345,280 | ||||||
| 41,552,020 | Affinion Investments LLC, 13.500%, due 8/15/18 | 19,113,929 | ||||||
| Altegrity, Inc., Escrow: | ||||||||
| 120,047,350 | due 7/1/20 (b)(c)(d) | — | ||||||
| 36,181,786 | due 7/1/20 (b)(c)(d) | — | ||||||
The accompanying notes are an integral part of the financial statements.
| 33 |
Third Avenue Trust
Third Avenue Focused Credit Fund
Portfolio of Investments (continued)
at October 31, 2015
| Principal Amount‡ | Security† | Value (Note 1) | ||||||
| Corporate Bonds & Notes (continued) | ||||||||
| Services (continued) | ||||||||
| 33,658,828 | Corporate Risk Holdings LLC, 11.500% Cash or 13.500% Payment-in-kind Interest, due 1/2/20 (a)(b)(d)(e) | $ | 33,658,828 | |||||
| 91,118,037 | ||||||||
| Technology - 1.23% | ||||||||
| Advanced Micro Devices, Inc.: | ||||||||
| 6,250,000 | 6.750%, due 3/1/19 | 4,843,750 | ||||||
| 12,500,000 | 7.000%, due 7/1/24 | 8,812,500 | ||||||
| 28,118,000 | THQ, Inc., due 8/15/30 (c) | 3,233,570 | ||||||
| 16,889,820 | ||||||||
| Telecommunications - 2.08% | ||||||||
| 48,000,000 | Intelsat Luxembourg S.A., 7.750%, due 6/1/21 (Luxembourg) | 28,560,000 | ||||||
| Transportation Services - 1.26% | ||||||||
| 20,000,000 | CEVA Group PLC, 9.000%, due 9/1/21 (United Kingdom) (a) | 17,200,000 | ||||||
| Utilities - 0.98% | ||||||||
| 4,000,000 | Energy Future Holdings Corp., due 11/15/34 (c) | 3,980,000 | ||||||
| Texas Competitive Electric Holdings Co. LLC / TCEH Finance, Inc.: | ||||||||
| 60,000,000 | due 11/1/15 (c) | 5,700,000 | ||||||
| 40,000,000 | due 11/1/16 (c) | 3,800,000 | ||||||
| 13,480,000 | ||||||||
| Total Corporate Bonds & Notes (Cost $1,059,326,632) | 611,105,516 | |||||||
| Term Loans - 6.18% | ||||||||
| Chemicals - 1.95% | ||||||||
| Reichhold Holdings International B.V. (Netherlands): | ||||||||
| 4,421,726 | DIP Loan, 12.000% Cash or 14.000% Payment-in-kind Interest, due 3/31/17 (b)(d)(e) | 4,421,726 | ||||||
| 2,667,984 | Term Loan, 15.000% Cash or Payment-in-kind Interest, due 3/31/17 (b)(d)(e) | 2,667,984 | ||||||
| 1,900,212 | Reichhold LLC II, DIP Loan, 12.000% Cash or 14.000% Payment-in-kind Interest, due 3/31/17 (b)(d)(e) | 1,900,212 | ||||||
| 19,949,622 | Vertellus Specialties, Inc., Term Loan B, 10.500%, due 10/10/19 (h) | 17,755,164 | ||||||
| 26,745,086 | ||||||||
| Energy - 0.73% | ||||||||
| 15,599,464 | Global Geophysical Services, Inc., Term Loan B, 15.500% Cash or Payment-in-kind Interest, due 8/9/17 (b)(d)(e) | 7,799,732 | ||||||
| 5,000,000 | Templar Energy LLC, Term Loan B, 2nd Lien, 8.500%, due 11/25/20 (h) | 2,200,000 | ||||||
| 9,999,732 | ||||||||
| Principal Amount‡ | Security† | Value (Note 1) | ||||||
| Financials - 0.15% | ||||||||
| Concrete Investment I, Term Loan (Luxembourg): | ||||||||
| 32,255 | EUR | Tranche A2, 2.000% Cash or Payment-in-kind Interest, due 7/31/16 (b)(e)(h) | $ | 35,469 | ||||
| 12,322 | EUR | Tranche A3, 2.000% Cash or Payment-in-kind Interest, due 7/31/16 (b)(e)(h) | 13,550 | |||||
| Concrete Investment II, Term Loan (Luxembourg): | ||||||||
| 22,197 | EUR | Tranche A2, 2.000% Cash or Payment-in-kind Interest, due 7/31/16 (b)(e)(h) | 24,409 | |||||
| 3,081 | EUR | Tranche A3, 2.000% Cash or Payment-in-kind Interest, due 7/31/16 (b)(e)(h) | 3,388 | |||||
| IVG Immobilien AG, Term Loan (Germany): | ||||||||
| 726,325 | EUR | Tranche A1, 9.500% Cash or Payment-in-kind Interest, due 9/1/17 (b)(e)(h) | 798,704 | |||||
| 1,084,086 | EUR | Tranche A2, 9.500% Cash or Payment-in-kind Interest, due 9/1/17 (b)(e)(h) | 1,192,115 | |||||
| 2,067,635 | ||||||||
| Gaming & Entertainment - 1.22% | ||||||||
| 17,422,866 | Majestic Star Casino LLC, Term Loan, 1st Lien, 12.500% Cash or 14.500% Payment-in-kind Interest, due 6/1/20 (e) | 16,725,951 | ||||||
| Manufacturing - 1.51% | ||||||||
| 22,194,375 | Liberty Tire Recycling Holdco, LLC, Term Loan B, 9.000%, due 7/7/20 (d)(h) | 20,696,255 | ||||||
| Media/Cable - 0.25% | ||||||||
| 4,974,424 | Getty Images, Inc., Term Loan, 1st Lien, 4.750%, due 10/18/19 | 3,341,157 | ||||||
| Services - 0.37% | ||||||||
| Education Management II LLC: | ||||||||
| 8,875,618 | Term Loan A, 5.500%, due 7/2/20 (h) | 2,751,441 | ||||||
| 15,539,418 | Term Loan B, 8.500% Cash or Payment-in-kind Interest, due 7/2/20 (e)(h) | 2,253,216 | ||||||
| 5,004,657 | ||||||||
| Total Term Loans (Cost $109,114,665) | 84,580,473 | |||||||
| Municipal Bonds - 0.11% | ||||||||
| Gaming & Entertainment - 0.11% | ||||||||
| 5,200,000 | New York City, NY, Industrial Development Agency Civic Facility Revenue, Bronx Parking Development Co. LLC OID, due 10/1/37 (c) | 1,560,000 | ||||||
| Total Municipal Bonds (Cost $3,058,314) | 1,560,000 | |||||||
The accompanying notes are an integral part of the financial statements.
| 34 |
Third Avenue Trust
Third Avenue Focused Credit Fund
Portfolio of Investments (continued)
at October 31, 2015
| Shares | Security† | Value (Note 1) | ||||||
| Convertible Preferred Stocks - 0.70% | ||||||||
| Services - 0.02% | ||||||||
| 118,341 | Education Management Corp., Class A-1 (g) | $ | 355,023 | |||||
| Transportation Services - 0.68% | ||||||||
| 4,435 | CEVA Holdings LLC, Series A-1 (Marshall Islands)(f)(g) | 3,448,384 | ||||||
| 10,196 | CEVA Holdings LLC, Series A-2 (Marshall Islands)(f)(g) | 5,820,028 | ||||||
| 9,268,412 | ||||||||
| Total Convertible Preferred Stocks (Cost $26,000,752) | 9,623,435 | |||||||
| Preferred Stocks - 2.74% | ||||||||
| Energy - 0.15% | ||||||||
| 1,122,431 | Lone Pine Resources, Inc. (Canada)(b)(g) | 2,143,843 | ||||||
| Financials - 2.59% | ||||||||
| 100,000 | Federal Home Loan Mortgage Corp., 5.300% (g) | 790,000 | ||||||
| 60,000 | Federal Home Loan Mortgage Corp., Series G (g)(h) | 369,000 | ||||||
| 89,283 | Federal Home Loan Mortgage Corp., Series H, 5.100% (g) | 562,483 | ||||||
| 63,188 | Federal Home Loan Mortgage Corp., Series K, 5.790% (g) | 442,316 | ||||||
| 52,500 | Federal Home Loan Mortgage Corp., Series L (g)(h) | 299,775 | ||||||
| 207,640 | Federal Home Loan Mortgage Corp., Series M (g)(h) | 1,196,526 | ||||||
| 23,500 | Federal Home Loan Mortgage Corp., Series N (g)(h) | 140,060 | ||||||
| 336,223 | Federal Home Loan Mortgage Corp., Series P, 6.000% (g) | 2,272,867 | ||||||
| 224,580 | Federal Home Loan Mortgage Corp., Series R, 5.700% (g) | 1,520,407 | ||||||
| 165,000 | Federal Home Loan Mortgage Corp., Series S (g)(h) | 1,074,150 | ||||||
| 100,000 | Federal Home Loan Mortgage Corp., Series U, 5.900% (g) | 346,000 | ||||||
| 637,722 | Federal Home Loan Mortgage Corp., Series V, 5.570% (g) | 2,244,781 | ||||||
| 392,089 | Federal Home Loan Mortgage Corp., Series W, 5.660% (g) | 1,960,445 | ||||||
| 203,813 | Federal Home Loan Mortgage Corp., Series X, 6.020% (g) | 754,108 | ||||||
| 100,000 | Federal Home Loan Mortgage Corp., Series Y, 6.550% (g) | 408,250 | ||||||
| 96,750 | Federal National Mortgage Association, Series H, 5.810% (g) | 708,210 | ||||||
| 478,000 | Federal National Mortgage Association, Series M, 4.750% (g) | 3,351,975 | ||||||
| 1,293,000 | Federal National Mortgage Association, Series O (g)(h) | 11,307,285 | ||||||
| 100,000 | Federal National Mortgage Association, Series P (g)(h) | 345,000 | ||||||
| Shares | Security† | Value (Note 1) | ||||||
| Financials (continued) | ||||||||
| 750,000 | Federal National Mortgage Association, Series T, 8.250% (g) | $ | 5,325,000 | |||||
| 35,418,638 | ||||||||
| Total Preferred Stocks (Cost $40,583,843) | 37,562,481 | |||||||
| Private Equities - 1.92% | ||||||||
| Automotive - 0.31% | ||||||||
| 10,000,000 | International Automotive Components Group North America, LLC, Class B (g) | 4,250,000 | ||||||
| Chemicals - 1.07% | ||||||||
| 29,055 | Reichhold Cayman L.P. (Cayman Islands)(b)(d)(g) | 14,643,720 | ||||||
| Consumer Products - 0.50% | ||||||||
| 1,451,633,736,282 | Ideal Standard International Equity S.A. Alpecs (Luxembourg)(b)(d)(f)(g) | 6,864,045 | ||||||
| Energy - 0.04% | ||||||||
| 19,700 | Thunderbird Resources L.P. (b)(g)(i) | 487,769 | ||||||
| Total Private Equities (Cost $30,651,290) | 26,245,534 | |||||||
| Common Stocks & Warrants - 13.39% | ||||||||
| Chemicals - 0.00%(j) | ||||||||
| 478,500 | Phosphate Holdings, Inc. (d)(g) | 15,767 | ||||||
| Energy - 1.20% | ||||||||
| 124,461 | Geokinetics Holdings USA, Inc. (b)(f)(g) | 11,252,519 | ||||||
| 3,786,564 | Global Geophysical Services, Inc. (b)(d)(g) | — | ||||||
| 262,913 | Global Geophysical Services, Inc., Warrants (b)(d)(g) | — | ||||||
| 374,199 | Lone Pine Resources Canada, Ltd. (Canada) (b)(g) | 606,203 | ||||||
| 374,199 | Lone Pine Resources, Inc. (b)(g) | — | ||||||
| 1,122,431 | Lone Pine Resources, Inc., Multiple Voting Shares (b)(g) | — | ||||||
| 5,000 | New Gulf Resources LLC, Warrants (g) | 125,000 | ||||||
| 50,000 | Platinum Energy Holdings, Inc. (b)(f)(g) | 947,500 | ||||||
| 10,874 | Platinum Energy Holdings, Inc., Warrants (b)(f)(g) | — | ||||||
| 53 | Thunderbird Resources Equity, Inc. (b)(g) | 3,561,788 | ||||||
| 16,493,010 | ||||||||
| Financials - 0.27% | ||||||||
| 1,663,900 | Federal Home Loan Mortgage Corp. (g) | 3,677,219 | ||||||
| Manufacturing - 1.59% | ||||||||
| 3,430,293 | LTR Holdings, Inc. (b)(d)(g) | 21,782,361 | ||||||
| 45,000 | LTR Holdings, Inc., Warrants, expire 12/12/19 (b)(d)(g) | — | ||||||
| 21,782,361 | ||||||||
| Media/Cable - 0.65% | ||||||||
| 2,311,360 | Radio One, Inc., Class D (d)(g) | 4,969,424 | ||||||
| 681,637 | Spanish Broadcasting System, Inc., Class A (d)(g) | 3,892,147 | ||||||
| 8,861,571 | ||||||||
The accompanying notes are an integral part of the financial statements.
| 35 |
Third Avenue Trust
Third Avenue Focused Credit Fund
Portfolio of Investments (continued)
at October 31, 2015
| Shares | Security† | Value (Note 1) | ||||||
| Common Stocks & Warrants (continued) | ||||||||
| Metals & Mining - 0.04% | ||||||||
| 333,434 | Noranda Aluminum Holding Corp. | $ | 573,506 | |||||
| Services - 6.58% | ||||||||
| 499,061 | Affinion Group, Inc., Warrants, Series A (b)(g) | — | ||||||
| 6,422,764 | Affinion Group, Inc., Warrants, Series B (b)(g) | — | ||||||
| 31,594 | Corporate Risk Holdings Corp. (b)(d)(g) | — | ||||||
| 6,248,652 | Corporate Risk Holdings I, Inc. (d)(g) | 89,043,291 | ||||||
| 106,353,817 | Education Management Corp. (a)(g) | 1,063,538 | ||||||
| 90,106,829 | ||||||||
| Technology - 0.04% | ||||||||
| 250,000 | Advanced Micro Devices, Inc. (g) | 530,000 | ||||||
| Transportation Services - 0.19% | ||||||||
| 4,710 | CEVA Holdings LLC (Marshall Islands) (f)(g) | 2,649,324 | ||||||
| Utilities - 2.83% | ||||||||
| 4,550,000 | Longview Intermediate Holdings C, LLC (d)(g) | 38,675,000 | ||||||
| Total Common Stocks & Warrants (Cost $227,775,168) | 183,364,587 | |||||||
| Closed-End Funds - 3.38% | ||||||||
| Financials - 3.38% | ||||||||
| 253,978 | Ares Dynamic Credit Allocation Fund, Inc. | 3,647,124 | ||||||
| 771,648 | BlackRock Corporate High Yield Fund, Inc. | 8,017,423 | ||||||
| 319,530 | BlackRock Credit Allocation Income Trust | 4,003,711 | ||||||
| 534,195 | First Trust High Income Long/Short Fund | 7,991,557 | ||||||
| 425,826 | Neuberger Berman High Yield Strategies Fund, Inc. | 4,552,080 | ||||||
| 595,362 | New America High Income Fund, Inc. (The) | 4,935,551 | ||||||
| 562,522 | Western Asset High Yield Defined Opportunity Fund, Inc. | 8,308,450 | ||||||
| 1,025,669 | Western Asset Managed High Income Fund, Inc. | 4,861,671 | ||||||
| Total Closed-End Funds (Cost $53,982,926) | 46,317,567 | |||||||
| Exchange Traded Funds - 1.47% | ||||||||
| Financials - 1.47% | ||||||||
| 234,741 | iShares iBoxx $ High Yield Corporate Bond ETF | 20,086,787 | ||||||
| Total Exchange Traded Funds (Cost $20,084,170) | 20,086,787 | |||||||
| Principal Amount($) | Security | Value (Note 1) | ||||||
| Short-Term Investments - 10.96% | ||||||||
| U.S. Government Obligations - 10.96% | ||||||||
| 150,000,000 | U.S. Treasury Bills, 0.000% - 0.120%, due 11/19/15-11/27/15(k) | $ | 149,999,458 | |||||
| Total Short-Term Investments (Cost $149,999,458) | 149,999,458 | |||||||
| Total Investment Portfolio - 85.48% (Cost $1,720,577,218) | 1,170,445,838 | |||||||
| Other Assets less Liabilities - 14.52% (l) | 198,769,635 | |||||||
| NET ASSETS - 100.00% | $ | 1,369,215,473 | ||||||
Notes:
| (a) | Security is exempt from registration under Rule 144A of the Securities Act of 1933. This security may be resold in transactions that are exempt from registration, normally to qualified institutional buyers. |
| (b) | Fair-valued security. |
| (c) | Issue in default. |
| (d) | Affiliated issuers - as defined under the Investment Company Act of 1940 (ownership of 5% or more of the outstanding voting securities of these issuers). |
| (e) | Payment-in-kind (“PIK”) security. Income may be paid as additional securities or cash at the discretion of the issuer. |
| (f) | Security subject to restrictions on resale. |
| Shares/ Principal Amount1 | Issuer | Aquisition Date | Cost | Market Value Per Unit | |||||||||||
| 4,710 | CEVA Holdings LLC | 5/29/13 | $ | 5,355,643 | $ | 562.49 | |||||||||
| 4,435 | CEVA Holdings LLC, Series A-1, Convertible Preferred | 5/29/13 | 4,435,224 | 777.54 | |||||||||||
| 10,196 | CEVA Holdings LLC, Series A-2, Convertible Preferred | 5/29/13 | 13,298,434 | 570.81 | |||||||||||
| 124,461 | Geokinetics Holdings USA, Inc. | 5/22/13-5/14/14 | 13,060,780 | 90.41 | |||||||||||
| 1,451,633,736,282 | Ideal Standard International Equity S.A. Alpecs | 10/31/14 | 9,915,530 | 0.00 | 2 | ||||||||||
| 33,180,416 | EUR | Ideal Standard International S.A., Series C 11.750% Cash or 17.750% Payment-in-kind Interest, due 5/1/18 | 10/31/14-5/1/15 | 40,075,533 | 109.97 | ||||||||||
| 50,000 | Platinum Energy Holdings, Inc. | 10/4/13 | 1,225,746 | 18.95 | |||||||||||
| 10,874 | Platinum Energy Holdings, Inc., Warrants | 10/4/13 | 9,743 | 0.00 | |||||||||||
| EUR: Euro. | ||
| 1) | Denominated in U.S. Dollars unless otherwise noted. | |
| 2) | Amount less than $0.01. | |
| At October 31, 2015, these restricted securities had a total market value of $67,468,655 or 4.93% of net assets of the Fund. | ||
| (g) | Non-income producing security. |
| (h) | Variable rate security. The rate disclosed is in effect as of October 31, 2015. |
| (i) | Security is held in the blocker, created to hold the investment for the Fund. |
| (j) | Amount represents less than 0.01% of net assets. |
| (k) | Annualized yield at date of purchase. |
| (l) | A portion is segregated for future fund commitments. |
| † | U.S. issuer unless otherwise noted. |
| ‡ | Denominated in U.S. Dollars unless otherwise noted. |
| CAD: | Canadian Dollar. |
| DIP: | Debtor-In-Possession. |
| EUR: | Euro. |
| OID: | Original Issue Discount. |
The accompanying notes are an integral part of the financial statements.
| 36 |
Third Avenue Trust
Third Avenue Focused Credit Fund
Portfolio of Investments (continued)
at October 31, 2015
Country Concentration
| % of Net Assets | ||||
| United States* | 67.05 | % | ||
| Luxembourg | 10.78 | |||
| Netherlands | 3.47 | |||
| United Kingdom | 1.26 | |||
| Cayman Islands | 1.07 | |||
| Marshall Islands | 0.87 | |||
| Panama | 0.63 | |||
| Canada | 0.21 | |||
| Germany | 0.14 | |||
| Total | 85.48 | % | ||
* Includes cash equivalents.
Schedule of Forward Foreign Currency Contracts
| Settlement | Settlement | Value at | Unrealized | |||||||||||||
| Contracts to Sell | Counterparty | Date | Value | 10/31/15 | Appreciation | |||||||||||
| 54,000,000 EUR | Goldman Sachs & Co. | 11/25/15 | $ | 59,804,525 | $ | 59,399,744 | $ | 404,781 | ||||||||
| 54,000,000 EUR | JPMorgan Chase Bank, N.A. | 11/25/15 | 59,802,948 | 59,399,744 | 403,204 | |||||||||||
| 20,000,000 EUR | Macquarie Bank, Ltd. | 11/25/15 | 22,145,200 | 21,999,904 | 145,296 | |||||||||||
| $ | 953,281 | |||||||||||||||
EUR: Euro.
The accompanying notes are an integral part of the financial statements.
| 37 |
Third Avenue Trust
Statement of Assets and Liabilities
October 31, 2015
| Value Fund | Small-Cap Value Fund | Real Estate Value Fund | |||||||||||
| Assets: | |||||||||||||
| Investments at value (Notes 1 and 5): | |||||||||||||
| Unaffiliated issuers† | $ | 1,427,498,996 | $ | 380,172,143 | $ | 3,097,432,669 | |||||||
| Affiliated issuers‡ | 169,167,693 | — | 262,195,966 | ||||||||||
| Total investments# | 1,596,666,689 | 380,172,143 | 3,359,628,635 | ||||||||||
| Cash | 80,011,726 | 22,626,915 | 160,704,145 | ||||||||||
| Dividends and interest receivable | 3,779,795 | 465,436 | 3,240,524 | ||||||||||
| Receivables for securities sold | 9,024,384 | 3,660,781 | 50,937,906 | ||||||||||
| Restricted cash pledged to counterparty for collateral management | — | — | 30,000 | ||||||||||
| Restricted cash for unfunded commitments | — | — | — | ||||||||||
| Receivables for fund shares sold | 77,816 | 46,031 | 2,944,122 | ||||||||||
| Foreign currency at value^ | — | — | 19,961 | ||||||||||
| Purchased foreign currency options* | — | — | 2,351,840 | ||||||||||
| Unrealized appreciation for forward foreign currency contracts | — | — | 1,813,500 | ||||||||||
| Other assets | 95,283 | 35,728 | 178,881 | ||||||||||
| Other receivables | — | — | — | ||||||||||
| Total assets | 1,689,655,693 | 407,007,034 | 3,581,849,514 | ||||||||||
| Liabilities: | |||||||||||||
| Written equity options at value** | 215,628 | — | — | ||||||||||
| Written foreign currency options at value*** | — | — | 70,790 | ||||||||||
| Unrealized depreciation on unfunded commitments | — | — | — | ||||||||||
| Payable for securities purchased | — | 8,543,873 | 99,998,417 | ||||||||||
| Payable for fund shares redeemed | 1,909,282 | 148,799 | 3,449,095 | ||||||||||
| Restricted cash received from counterparty for collateral management | — | — | 10,070,000 | ||||||||||
| Payable to Adviser (Note 3) | 1,265,247 | 304,317 | 2,652,914 | ||||||||||
| Payable for shareholder servicing fees (Note 3) | 154,694 | 37,072 | 380,336 | ||||||||||
| Foreign capital tax payable | — | — | — | ||||||||||
| Distribution fees payable (Note 6) | 12,254 | 11,507 | 12,420 | ||||||||||
| Payables to trustees and officers | 15,203 | 3,585 | 24,237 | ||||||||||
| Accrued expenses | 351,056 | 137,398 | 399,671 | ||||||||||
| Total liabilities | 3,923,364 | 9,186,551 | 117,057,880 | ||||||||||
| Net assets | $ | 1,685,732,329 | $ | 397,820,483 | $ | 3,464,791,634 | |||||||
| Summary of net assets: | |||||||||||||
| Capital stock, $0.001 par value, | $ | 1,359,294,914 | $ | 282,718,967 | $ | 2,770,297,605 | |||||||
| Accumulated undistributed net investment income/(distributions in excess of net investment income) | 24,844,336 | (3,626,380 | ) | 2,348,429 | |||||||||
| Accumulated net realized gain/(loss) on investments and foreign currency transactions | 133,054,892 | 46,534,801 | 138,967,476 | ||||||||||
| Net unrealized appreciation/(depreciation) on investments, unfunded commitments and translation of foreign currency denominated assets and liabilities | 168,538,187 | 72,193,095 | 553,178,124 | ||||||||||
| Net assets applicable to capital shares outstanding | $ | 1,685,732,329 | $ | 397,820,483 | $ | 3,464,791,634 | |||||||
| Investor Class | |||||||||||||
| Net assets | $ | 28,963,470 | $ | 9,379,216 | $ | 438,506,069 | |||||||
| Outstanding shares of beneficial interest, unlimited number of shares authorized | 534,168 | 421,003 | 14,081,558 | ||||||||||
| Net asset value, offering and redemption price per share± | $ | 54.22 | $ | 22.28 | $ | 31.14 | |||||||
| Institutional Class | |||||||||||||
| Net assets | $ | 1,656,768,859 | $ | 388,441,267 | $ | 3,026,285,565 | |||||||
| Outstanding shares of beneficial interest, unlimited number of shares authorized | 30,482,521 | 17,321,807 | 96,495,612 | ||||||||||
| Net asset value, offering and redemption price per share± | $ | 54.35 | $ | 22.42 | $ | 31.36 | |||||||
| † | Cost of unaffiliated issuers | $ | 1,224,818,548 | $ | 307,927,094 | $ | 2,646,318,329 | ||||||
| ‡ | Cost of affiliated issuers | $ | 203,267,014 | $ | — | $ | 162,926,536 | ||||||
| # | Total cost | $ | 1,428,085,562 | $ | 307,927,094 | $ | 2,809,244,865 | ||||||
| ^ | Cost of foreign currency | $ | — | $ | — | $ | 19,923 | ||||||
| * | Cost of purchased foreign currency options | $ | — | $ | — | $ | 1,586,575 | ||||||
| ** | Premiums received for written equity options | $ | 214,962 | $ | — | $ | — | ||||||
| *** | Premiums received for written foreign currency options | $ | — | $ | — | $ | 304,075 | ||||||
| ± | Redemption price is gross of redemption fees (Note 7) | ||||||||||||
The accompanying notes are an integral part of the financial statements.
| 38 |
| International Value Fund | Focused Credit Fund | |||||
| $ | 157,973,782 | $ | 803,283,217 | |||
| 31,179,579 | 367,162,621 | |||||
| 189,153,361 | 1,170,445,838 | |||||
| 11,326,861 | 60,354,954 | |||||
| 2,689,722 | 25,559,785 | |||||
| 616,893 | 26,649,418 | |||||
| — | — | |||||
| — | 88,348,925 | |||||
| 6,578 | 8,998,682 | |||||
| 4,200 | — | |||||
| — | — | |||||
| — | 953,281 | |||||
| 38,205 | 137,757 | |||||
| — | 1,889,925 | |||||
| 203,835,820 | 1,383,338,565 | |||||
| — | — | |||||
| — | — | |||||
| — | 4,646,437 | |||||
| 1,539,814 | — | |||||
| 385,630 | 7,694,888 | |||||
| — | — | |||||
| 227,931 | 897,996 | |||||
| 27,793 | 122,546 | |||||
| — | 107,941 | |||||
| 3,791 | 127,357 | |||||
| 2,162 | 18,555 | |||||
| 148,793 | 507,372 | |||||
| 2,335,914 | 14,123,092 | |||||
| $ | 201,499,906 | $ | 1,369,215,473 | |||
| $ | 245,590,450 | $ | 2,196,744,951 | |||
| (3,143,658 | ) | 37,817,211 | ||||
| 868,932 | (311,414,083 | ) | ||||
| (41,815,818 | ) | (553,932,606 | ) | |||
| $ | 201,499,906 | $ | 1,369,215,473 | |||
| $ | 5,976,786 | $ | 412,669,924 | |||
| 390,847 | 52,665,369 | |||||
| $ | 15.29 | $ | 7.84 | |||
| $ | 195,523,120 | $ | 956,545,549 | |||
| 12,789,395 | 122,244,671 | |||||
| $ | 15.29 | $ | 7.82 | |||
| $ | 200,405,913 | $ | 1,324,017,631 | |||
| $ | 30,229,235 | $ | 396,559,587 | |||
| $ | 230,635,148 | $ | 1,720,577,218 | |||
| $ | 4,216 | $ | — | |||
| $ | — | $ | — | |||
| $ | — | $ | — | |||
| $ | — | $ | — | |||
The accompanying notes are an integral part of the financial statements.
| 39 |
Third Avenue Trust
Statement of Operations
For the Year Ended October 31, 2015
| Value Fund | Small-Cap Value Fund | Real Estate Value Fund | |||||||||||
| Investment Income: | |||||||||||||
| Dividends - unaffiliated issuers* | $ | 32,748,479 | $ | 4,428,460 | $ | 39,057,444 | |||||||
| Dividends - affiliated issuers (Note 5) | — | — | 2,886,516 | ||||||||||
| Interest - unaffiliated issuers | 1,349,249 | — | 332,016 | ||||||||||
| Interest - affiliated issuers (Note 5) | — | — | — | ||||||||||
| Interest - payment-in-kind unaffiliated issuers (Note 1) | — | — | — | ||||||||||
| Interest - payment-in-kind affiliated issuers (Notes 1 and 5) | 1,309,659 | — | — | ||||||||||
| Other income | 101,496 | — | 76,647 | ||||||||||
| Total investment income | 35,508,883 | 4,428,460 | 42,352,623 | ||||||||||
| Expenses: | |||||||||||||
| Investment advisory fees (Note 3) | 17,316,469 | 4,093,411 | 31,013,615 | ||||||||||
| Shareholder servicing fees (Note 3) | 1,672,000 | 430,001 | 4,236,978 | ||||||||||
| Auditing and tax fees | 132,699 | 80,801 | 95,801 | ||||||||||
| Transfer agent fees | 578,799 | 242,099 | 453,401 | ||||||||||
| Reports to shareholders | 256,999 | 66,999 | 472,001 | ||||||||||
| Accounting fees | 158,601 | 49,101 | 269,000 | ||||||||||
| Administration fees (Note 3) | 105,822 | 25,016 | 189,528 | ||||||||||
| Custodian fees | 126,480 | 13,445 | 334,612 | ||||||||||
| Trustees’ and officers’ fees and expenses | 229,718 | 54,677 | 382,437 | ||||||||||
| Insurance | 84,393 | 20,536 | 111,189 | ||||||||||
| Legal fees | 97,601 | 31,001 | 62,001 | ||||||||||
| Distribution fees (Note 6) | 82,201 | 25,171 | 1,053,073 | ||||||||||
| Registration and filing fees | 73,282 | 39,392 | 101,009 | ||||||||||
| Miscellaneous | 135,000 | 37,498 | 242,503 | ||||||||||
| Total expenses | 21,050,064 | 5,209,148 | 39,017,148 | ||||||||||
| Less: Expenses waived (Note 3) | — | — | — | ||||||||||
| Expenses reduced by custodian fee expense offet arrangement (Note 3) | (38,479 | ) | (4,443 | ) | (105,613 | ) | |||||||
| Net expenses | 21,011,585 | 5,204,705 | 38,911,535 | ||||||||||
| Net investment income/(loss) | 14,497,298 | (776,245 | ) | 3,441,088 | |||||||||
| Realized and unrealized gain/(loss) on investments, written options, unfunded commitments and foreign currency transactions: | |||||||||||||
| Net realized gain/(loss) on investments - unaffiliated issuers# | 108,948,158 | 50,579,591 | 124,784,715 | ||||||||||
| Net realized gain/(loss) on investments - affiliated issuers | 6,152,084 | — | — | ||||||||||
| Net realized gain on written equity options | 315,500 | — | 1,892,007 | ||||||||||
| Net realized gain/(loss) on foreign currency transactions | (36,922 | ) | (4,038 | ) | 44,013,353 | ||||||||
| Net change in unrealized appreciation/(depreciation) on investments | (193,592,461 | ) | (52,714,111 | ) | (134,000,434 | ) | |||||||
| Net change in unrealized depreciation on written equity options | (110,166 | ) | — | (1,726,607 | ) | ||||||||
| Net change in unrealized depreciation on unfunded commitments | — | — | — | ||||||||||
| Net change in unrealized appreciation/(depreciation) on translation of other assets and liabilities denominated in foreign currency | 15,972 | (38,199 | ) | (1,236,867 | ) | ||||||||
| Net change in unrealized appreciation on deferred taxes | — | — | — | ||||||||||
| Net increase/(decrease) on investments and foreign currency transactions | (78,307,835 | ) | (2,176,757 | ) | 33,726,167 | ||||||||
| Net increase/(decrease) in net assets resulting from operations | $ | (63,810,537 | ) | $ | (2,953,002 | ) | $ | 37,167,255 | |||||
| * | Net of foreign withholding taxes of | $ | 1,555,270 | $ | — | $ | 2,021,768 | ||||||
| # | Net of foreign capital gains tax of | $ | — | $ | — | $ | — | ||||||
The accompanying notes are an integral part of the financial statements.
| 40 |
| International Value Fund | Focused Credit Fund | |||||
| $ | 5,000,663 | $ | 10,194,934 | |||
| 331,281 | — | |||||
| 432,437 | 151,527,521 | |||||
| — | 5,570,689 | |||||
| — | 41,909,833 | |||||
| — | 15,542,688 | |||||
| 5,973 | 542,632 | |||||
| 5,770,354 | 225,288,297 | |||||
| 3,259,105 | 17,095,571 | |||||
| 312,000 | 1,480,000 | |||||
| 82,300 | 286,501 | |||||
| 197,402 | 183,399 | |||||
| 33,000 | 325,000 | |||||
| 50,922 | 253,199 | |||||
| 14,340 | 125,367 | |||||
| 63,422 | 88,380 | |||||
| 32,820 | 289,651 | |||||
| 21,627 | 122,217 | |||||
| 18,998 | 730,000 | |||||
| 19,593 | 1,680,121 | |||||
| 38,523 | 152,600 | |||||
| 78,501 | 165,999 | |||||
| 4,222,553 | 22,978,005 | |||||
| (547,840 | ) | — | ||||
| (4,923 | ) | (57,929 | ) | |||
| 3,669,790 | 22,920,076 | |||||
| 2,100,564 | 202,368,221 | |||||
| 14,457,041 | (351,540,078 | ) | ||||
| 545,996 | (37,634,697 | ) | ||||
| — | — | |||||
| (267,965 | ) | 30,534,545 | ||||
| (33,425,847 | ) | (288,131,335 | ) | |||
| — | — | |||||
| — | (4,646,437 | ) | ||||
| (89,302 | ) | (578,228 | ) | |||
| 306,425 | 35,061 | |||||
| (18,473,652 | ) | (651,961,169 | ) | |||
| $ | (16,373,088 | ) | $ | (449,592,948 | ) | |
| $ | 345,276 | $ | — | |||
| $ | 98,978 | $ | — | |||
The accompanying notes are an integral part of the financial statements.
| 41 |
Third Avenue Trust
Statement of Changes in Net Assets
| Value Fund | Small-Cap Value Fund | |||||||||||||||||||
| For the Year Ended October 31, 2015 | For the Year Ended October 31, 2014 | For the Year Ended October 31, 2015 | For the Year Ended October 31, 2014 | |||||||||||||||||
| Operations: | ||||||||||||||||||||
| Net investment income/(loss) | $ | 14,497,298 | $ | 63,706,192 | $ | (776,245 | ) | $ | (1,081,749 | ) | ||||||||||
| Net realized gain/(loss) | 115,378,820 | 151,643,183 | 50,575,553 | 103,628,738 | ||||||||||||||||
| Net change in unrealized appreciation/(depreciation) | (193,686,655 | ) | (48,963,218 | ) | (52,752,310 | ) | (61,145,669 | ) | ||||||||||||
| Net increase/(decrease) in net assets resulting from operations | (63,810,537 | ) | 166,386,157 | (2,953,002 | ) | 41,401,320 | ||||||||||||||
| Dividends and Distributions to Shareholders from: | ||||||||||||||||||||
| Net investment income: | ||||||||||||||||||||
| Investor Class | (1,186,004 | ) | (1,149,550 | ) | — | — | ||||||||||||||
| Institutional Class | (78,815,872 | ) | (84,085,744 | ) | — | (849,043 | ) | |||||||||||||
| Net realized gains: | ||||||||||||||||||||
| Investor Class | (603,699 | ) | — | (2,033,716 | ) | (750,926 | ) | |||||||||||||
| Institutional Class | (37,196,364 | ) | — | (98,965,533 | ) | (40,845,424 | ) | |||||||||||||
| Decrease in net assets from dividends and distributions | (117,801,939 | ) | (85,235,294 | ) | (100,999,249 | ) | (42,445,393 | ) | ||||||||||||
| Capital Share Transactions: | ||||||||||||||||||||
| Proceeds from sale of shares | 38,010,116 | 88,843,094 | 13,806,220 | 20,936,904 | ||||||||||||||||
| Net asset value of shares issued in reinvestment of dividends and distributions | 109,844,922 | 80,139,122 | 97,559,755 | 41,203,254 | ||||||||||||||||
| Redemption fees | 8,120 | 13,858 | 1,757 | 3,629 | ||||||||||||||||
| Cost of shares redeemed | (446,008,324 | ) | (716,104,569 | ) | (129,545,870 | ) | (220,855,475 | ) | ||||||||||||
| Net increase/(decrease) in net assets resulting from capital share transactions | (298,145,166 | ) | (547,108,495 | ) | (18,178,138 | ) | (158,711,688 | ) | ||||||||||||
| Net increase/(decrease) in net assets | (479,757,642 | ) | (465,957,632 | ) | (122,130,389 | ) | (159,755,761 | ) | ||||||||||||
| Net assets at beginning of year | 2,165,489,971 | 2,631,447,603 | 519,950,872 | 679,706,633 | ||||||||||||||||
| Net assets at end of year* | $ | 1,685,732,329 | $ | 2,165,489,971 | $ | 397,820,483 | $ | 519,950,872 | ||||||||||||
| * Including accumulated undistributed net investment income/(distributions in excess of net investment income) of | $ | 24,844,336 | $ | 71,992,748 | $ | (3,626,380 | ) | $ | (5,660,013 | ) | ||||||||||
The accompanying notes are an integral part of the financial statements.
| 42 |
| Real Estate Value Fund | International Value Fund | Focused Credit Fund | ||||||||||||||||||||||||||
| For the Year Ended October 31, 2015 | For the Year Ended October 31, 2014 | For the Year Ended October 31, 2015 | For the Year Ended October 31, 2014 | For the Year Ended October 31, 2015 | For the Year Ended October 31, 2014 | |||||||||||||||||||||||
| $ | 3,441,088 | $ | 47,668,328 | $ | 2,100,564 | $ | 19,064,484 | $ | 202,368,221 | $ | 267,212,698 | |||||||||||||||||
| 170,690,075 | 74,424,165 | 14,735,072 | 84,582,150 | (358,640,230 | ) | 32,738,809 | ||||||||||||||||||||||
| (136,963,908 | ) | 155,267,873 | (33,208,724 | ) | (160,955,559 | ) | (293,320,939 | ) | (307,052,516 | ) | ||||||||||||||||||
| 37,167,255 | 277,360,366 | (16,373,088 | ) | (57,308,925 | ) | (449,592,948 | ) | (7,101,009 | ) | |||||||||||||||||||
| (5,176,771 | ) | (1,571,043 | ) | (704,920 | ) | (394,709 | ) | (57,754,614 | ) | (81,551,899 | ) | |||||||||||||||||
| (44,946,068 | ) | (20,726,891 | ) | (21,445,285 | ) | (15,699,040 | ) | (139,515,610 | ) | (114,190,590 | ) | |||||||||||||||||
| (7,373,691 | ) | (2,422,235 | ) | — | — | (4,768,998 | ) | — | ||||||||||||||||||||
| (55,424,653 | ) | (27,463,643 | ) | — | — | (10,581,494 | ) | — | ||||||||||||||||||||
| (112,921,183 | ) | (52,183,812 | ) | (22,150,205 | ) | (16,093,749 | ) | (212,620,716 | ) | (195,742,489 | ) | |||||||||||||||||
| 1,052,314,450 | 1,206,714,273 | 10,309,129 | 51,854,263 | 883,975,358 | 2,639,140,846 | |||||||||||||||||||||||
| 106,285,274 | 49,667,615 | 21,124,596 | 14,817,419 | 184,106,567 | 165,082,808 | |||||||||||||||||||||||
| 83,278 | 70,645 | 9,521 | 16,624 | 197,253 | 250,689 | |||||||||||||||||||||||
| (852,820,440 | ) | (402,672,506 | ) | (143,183,983 | ) | (899,641,397 | ) | (2,006,871,462 | ) | (1,400,052,915 | ) | |||||||||||||||||
| 305,862,562 | 853,780,027 | (111,740,737 | ) | (832,953,091 | ) | (938,592,284 | ) | 1,404,421,428 | ||||||||||||||||||||
| 230,108,634 | 1,078,956,581 | (150,264,030 | ) | (906,355,765 | ) | (1,600,805,948 | ) | 1,201,577,930 | ||||||||||||||||||||
| 3,234,683,000 | 2,155,726,419 | 351,763,936 | 1,258,119,701 | 2,970,021,421 | 1,768,443,491 | |||||||||||||||||||||||
| $ | 3,464,791,634 | $ | 3,234,683,000 | $ | 201,499,906 | $ | 351,763,936 | $ | 1,369,215,473 | $ | 2,970,021,421 | |||||||||||||||||
| $ | 2,348,429 | $ | 24,181,494 | $ | (3,143,658 | ) | $ | 17,976,710 | $ | 37,817,211 | $ | 82,237,153 | ||||||||||||||||
The accompanying notes are an integral part of the financial statements.
| 43 |
Third Avenue Trust
Statement of Cash Flows
For the Year Ended October 31, 2015
| Focused Credit Fund | ||||
| Cash Flows from Operating Activities: | ||||
| Net decrease in net assets resulting from operations | $ | (449,592,948 | ) | |
| Adjustments to reconcile net decrease in net assets resulting from operations to net cash provided by operating activities: | ||||
| Purchases of long-term securities | (1,069,438,401 | ) | ||
| Proceeds from sales and paydowns of long-term securities | 2,092,228,723 | |||
| Purchases of short-term securities | (1,831,622,818 | ) | ||
| Proceeds from sales of short-term securities | 1,756,561,835 | |||
| Net change in unrealized (appreciation)/depreciation on investments, unfunded commitments and deferred taxes | 292,742,711 | |||
| Net realized losses from investment transactions | 389,174,775 | |||
| Payment-in-kind interest income and other non-cash receipt of income | (62,221,486 | ) | ||
| Amoritization of premium and discount - net | (50,182,888 | ) | ||
| Increase in restricted cash for unfunded commitments | (88,348,925 | ) | ||
| Decrease in interest and dividends recievable | 39,825,084 | |||
| Decrease in foreign currency held | 786,488 | |||
| Increase in prepaid expenses, other assets and other receivables | (876,174 | ) | ||
| Net change in unrealized (appreciation)/depreciation on forward foreign currency contracts | 1,181,487 | |||
| Decrease in payable to Adviser | (1,014,915 | ) | ||
| Decrease in accrued expenses and other liabilities | (3,462,692 | ) | ||
| Net Cash Provided by Operating Activities | 1,015,739,856 | |||
| Cash Flows from Financing Activities: | ||||
| Proceeds from issuance of shares | 879,834,741 | |||
| Cash payments on shares redeemed net of redemption fees | (2,003,353,880 | ) | ||
| Distributions paid to shareholders | (28,514,149 | ) | ||
| Net Cash Used by Financing Activities | (1,152,033,288 | ) | ||
| Cash: | ||||
| Net change in cash | (136,293,432 | ) | ||
| Cash at beginning of year | 196,648,386 | |||
| Cash at end of year | $ | 60,354,954 | ||
| Noncash Investing and Financing Activities: | ||||
| Capital shares issued in reinvestment of distributions paid to shareholders | $ | 184,106,567 | ||
| Noncash investment transactions - Mergers, restructurings, dividend reinvestments and payment-in-kind interest income | 69,252,060 | |||
The accompanying notes are an integral part of the financial statements.
| 44 |
Third Avenue Trust
Financial Highlights
Selected data (for share outstanding throughout each period) and ratios are as follows:
| Third Avenue Value Fund | |||||||||||||||||||||||||
| Years Ended October 31, | |||||||||||||||||||||||||
| 2015 | 2014 | 2013 | 2012 | 2011 | |||||||||||||||||||||
| Investor Class: | |||||||||||||||||||||||||
| Net asset value, beginning of period | $ | 59.54 | $ | 57.73 | $ | 48.47 | $ | 44.00 | $ | 50.09 | |||||||||||||||
| Income/(loss) from investment operations: | |||||||||||||||||||||||||
| Net investment income@ | 0.29 | 1.39 | ± | 0.61 | ** | 0.27 | 0.37 | ||||||||||||||||||
| Net gain/(loss) on investment transactions (both realized and unrealized) | (2.46 | )1 | 2.22 | 1 | 9.89 | 1 | 4.99 | 2 | (5.56 | )2 | |||||||||||||||
| Total from investment operations | (2.17 | ) | 3.61 | 10.50 | 5.26 | (5.19 | ) | ||||||||||||||||||
| Less dividends and distributions to shareholders: | |||||||||||||||||||||||||
| Dividends from net investment income | (2.09 | ) | (1.80 | ) | (1.24 | ) | (0.79 | ) | (0.90 | ) | |||||||||||||||
| Distributions from net realized gain | (1.06 | ) | — | — | — | — | |||||||||||||||||||
| Total dividends and distributions | (3.15 | ) | (1.80 | ) | (1.24 | ) | (0.79 | ) | (0.90 | ) | |||||||||||||||
| Net asset value, end of period | $ | 54.22 | $ | 59.54 | $ | 57.73 | $ | 48.47 | $ | 44.00 | |||||||||||||||
| Total return3 | (3.90 | %) | 6.45 | % | 22.07 | % | 12.36 | % | (10.62 | %) | |||||||||||||||
| Ratios/Supplemental Data: | |||||||||||||||||||||||||
| Net assets, end of period (in thousands) | $ | 28,963 | $ | 33,936 | $ | 36,811 | $ | 25,796 | $ | 25,547 | |||||||||||||||
| Ratio of expenses to average net assets | |||||||||||||||||||||||||
| Before fee waivers/expense offset arrangement/recovery | 1.34 | % | 1.33 | % | 1.35 | % | 1.36 | % | 1.38 | % | |||||||||||||||
| After fee waivers/expense offset arrangement/recovery4 | 1.34 | % | 1.32 | % | 1.35 | %† | 1.40 | %† | 1.40 | %† | |||||||||||||||
| Ratio of net investment income to average net assets | 0.52 | % | 2.36 | %± | 1.15 | %** | 0.61 | % | 0.75 | % | |||||||||||||||
| Portfolio turnover rate | 24 | % | 31 | % | 21 | % | 16 | % | 6 | % | |||||||||||||||
| 1 | Includes redemption fees of less than $0.01 per share. |
| 2 | Includes redemption fees of $0.01 per share. |
| 3 | Performance figures may reflect fee waivers, expense offset arrangement and/or recovery of previously waived fees. Past performance is no guarantee of future results. Total return would have been lower if the Adviser had not waived certain expenses. Conversely, total return would have been higher if the Adviser had not recovered previously waived expenses. Total return is calculated assuming an initial investment made at the net asset value at the beginning of the period, reinvestment of all dividends and distributions at net asset value during the period and redemption on the last day of the period and is not annualized. |
| 4 | As a result of an expense limitation, the ratio of expenses (exclusive of taxes, interest, brokerage commissions, acquired fund fees and expenses, and extraordinary items) to average net assets will not exceed 1.40%. |
| @ | Calculated based on the average number of shares outstanding during the period. |
| ± | Investment income per share reflects special dividends received during the period which amounted to $0.41 per share. Excluding the special dividends, the ratio of net investment income to average net assets would have been 1.67%. |
| ** | Investment income per share reflects a special dividend received during the period which amounted to $0.44 per share. Excluding the special dividend, the ratio of net investment income to average net assets would have been 0.33%. |
| † | The Adviser recovered a portion of its previously waived fees. |
The accompanying notes are an integral part of the financial statements.
| 45 |
Third Avenue Trust
Financial Highlights
Selected data (for share outstanding throughout each period) and ratios are as follows:
| Third Avenue Value Fund | |||||||||||||||||||||||||
| Years Ended October 31, | |||||||||||||||||||||||||
| 2015 | 2014 | 2013 | 2012 | 2011 | |||||||||||||||||||||
| Institutional Class: | |||||||||||||||||||||||||
| Net asset value, beginning of period | $ | 59.69 | $ | 57.86 | $ | 48.53 | $ | 44.08 | $ | 50.13 | |||||||||||||||
| Income/(loss) from investment operations: | |||||||||||||||||||||||||
| Net investment income@ | 0.43 | 1.53 | ± | 0.77 | ** | 0.37 | 0.43 | ||||||||||||||||||
| Net gain/(loss) on investment transactions (both realized and unrealized)1 | (2.46 | ) | 2.23 | 9.87 | 4.98 | (5.51 | ) | ||||||||||||||||||
| Total from investment operations | (2.03 | ) | 3.76 | 10.64 | 5.35 | (5.08 | ) | ||||||||||||||||||
| Less dividends and distributions to shareholders: | |||||||||||||||||||||||||
| Dividends from net investment income | (2.25 | ) | (1.93 | ) | (1.31 | ) | (0.90 | ) | (0.97 | ) | |||||||||||||||
| Distributions from net realized gain | (1.06 | ) | — | — | — | — | |||||||||||||||||||
| Total dividends and distributions | (3.31 | ) | (1.93 | ) | (1.31 | ) | (0.90 | ) | (0.97 | ) | |||||||||||||||
| Net asset value, end of period | $ | 54.35 | $ | 59.69 | $ | 57.86 | $ | 48.53 | $ | 44.08 | |||||||||||||||
| Total return2 | (3.64 | %) | 6.70 | % | 22.40 | % | 12.61 | % | (10.42 | %) | |||||||||||||||
| Ratios/Supplemental Data: | |||||||||||||||||||||||||
| Net assets, end of period (in thousands) | $ | 1,656,769 | $ | 2,131,554 | $ | 2,594,637 | $ | 2,601,961 | $ | 3,451,647 | |||||||||||||||
| Ratio of expenses to average net assets | |||||||||||||||||||||||||
| Before fee waivers/expense offset arrangement/recovery | 1.09 | % | 1.08 | % | 1.10 | % | �� | 1.11 | % | 1.13 | % | ||||||||||||||
| After fee waivers/expense offset arrangement/recovery3 | 1.09 | % | 1.07 | % | 1.10 | %† | 1.15 | %† | 1.15 | %† | |||||||||||||||
| Ratio of net investment income to average net assets | 0.76 | % | 2.61 | %± | 1.45 | %** | 0.83 | % | 0.86 | % | |||||||||||||||
| Portfolio turnover rate | 24 | % | 31 | % | 21 | % | 16 | % | 6 | % | |||||||||||||||
| 1 | Includes redemption fees of less than $0.01 per share. |
| 2 | Performance figures may reflect fee waivers, expense offset arrangement and/or recovery of previously waived fees. Past performance is no guarantee of future results. Total return would have been lower if the Adviser had not waived certain expenses. Conversely, total return would have been higher if the Adviser had not recovered previously waived expenses. Total return is calculated assuming an initial investment made at the net asset value at the beginning of the period, reinvestment of all dividends and distributions at net asset value during the period and redemption on the last day of the period and is not annualized. |
| 3 | As a result of an expense limitation, the ratio of expenses (exclusive of taxes, interest, brokerage commissions, acquired fund fees and expenses, and extraordinary items) to average net assets will not exceed 1.15% effective December 31, 2009. |
| @ | Calculated based on the average number of shares outstanding during the period. |
| ± | Investment income per share reflects special dividends received during the period which amounted to $0.41 per share. Excluding the special dividends, the ratio of net investment income to average net assets would have been 1.92%. |
| ** | Investment income per share reflects a special dividend received during the period which amounted to $0.44 per share. Excluding the special dividend, the ratio of net investment income to average net assets would have been 0.63%. |
| † | The Adviser recovered a portion of its previously waived fees. |
The accompanying notes are an integral part of the financial statements.
| 46 |
Third Avenue Trust
Financial Highlights
Selected data (for share outstanding throughout each period) and ratios are as follows:
| Third Avenue Small-Cap Value Fund | |||||||||||||||||||||||||
| Years Ended October 31, | |||||||||||||||||||||||||
| 2015 | 2014 | 2013 | 2012 | 2011 | |||||||||||||||||||||
| Investor Class: | |||||||||||||||||||||||||
| Net asset value, beginning of period | $ | 28.18 | $ | 28.10 | $ | 22.13 | $ | 20.25 | $ | 19.35 | |||||||||||||||
| Income/(loss) from investment operations: | |||||||||||||||||||||||||
| Net investment income/(loss)@ | (0.10 | ) | (0.11 | ) | 0.06 | ** | (0.04 | ) | (0.01 | ) | |||||||||||||||
| Net gain/(loss) on investment transactions (both realized and unrealized) | (0.19 | )1 | 1.96 | 1 | 6.57 | 1 | 2.01 | 1 | 1.10 | 2 | |||||||||||||||
| Total from investment operations | (0.29 | ) | 1.85 | 6.63 | 1.97 | 1.09 | |||||||||||||||||||
| Less dividends and distributions to shareholders: | |||||||||||||||||||||||||
| Dividends from net investment income | — | — | (0.16 | ) | (0.02 | ) | (0.19 | ) | |||||||||||||||||
| Distributions from net realized gain | (5.61 | ) | (1.77 | ) | (0.50 | ) | (0.07 | ) | — | ||||||||||||||||
| Total dividends and distributions | (5.61 | ) | (1.77 | ) | (0.66 | ) | (0.09 | ) | (0.19 | ) | |||||||||||||||
| Net asset value, end of period | $ | 22.28 | $ | 28.18 | $ | 28.10 | $ | 22.13 | $ | 20.25 | |||||||||||||||
| Total return3 | (1.49 | %) | 6.85 | % | 30.74 | % | 9.77 | % | 5.58 | % | |||||||||||||||
| Ratios/Supplemental Data: | |||||||||||||||||||||||||
| Net assets, end of period (in thousands) | $ | 9,379 | $ | 9,898 | $ | 11,995 | $ | 8,216 | $ | 7,490 | |||||||||||||||
| Ratio of expenses to average net assets | |||||||||||||||||||||||||
| Before fee waivers/expense offset arrangement/recovery | 1.39 | % | 1.35 | % | 1.37 | % | 1.38 | % | 1.39 | % | |||||||||||||||
| After fee waivers/expense offset arrangement/recovery4 | 1.39 | % | 1.35 | % | 1.37 | % | 1.38 | %† | 1.40 | %† | |||||||||||||||
| Ratio of net investment income/(loss) to average net assets | (0.42 | %) | (0.41 | %) | 0.25 | %** | (0.18 | %) | (0.07 | %) | |||||||||||||||
| Portfolio turnover rate | 29 | % | 40 | % | 39 | % | 33 | % | 34 | % | |||||||||||||||
| 1 | Includes redemption fees of less than $0.01 per share. |
| 2 | Includes redemption fees of $0.02 per share. |
| 3 | Performance figures may reflect fee waivers, expense offset arrangement and/or recovery of previously waived fees. Past performance is no guarantee of future results. Total return would have been lower if the Adviser had not waived certain expenses. Conversely, total return would have been higher if the Adviser had not recovered previously waived expenses. Total return is calculated assuming an initial investment made at the net asset value at the beginning of the period, reinvestment of all dividends and distributions at net asset value during the period and redemption on the last day of the period and is not annualized. |
| 4 | As a result of an expense limitation, the ratio of expenses (exclusive of taxes, interest, brokerage commissions, acquired fund fees and expenses, and extraordinary items) to average net assets will not exceed 1.40%. |
| @ | Calculated based on the average number of shares outstanding during the period. |
| ** | Investment income per share reflects special dividends received during the period which amounted to $0.11 per share. Excluding the special dividends, the ratio of net investment income/(loss) to average net assets would have been (0.18%). |
| † | The Adviser recovered a portion of its previously waived fees. |
The accompanying notes are an integral part of the financial statements.
| 47 |
Third Avenue Trust
Financial Highlights
Selected data (for share outstanding throughout each period) and ratios are as follows:
| Third Avenue Small-Cap Value Fund | |||||||||||||||||||||||||
| Years Ended October 31, | |||||||||||||||||||||||||
| 2015 | 2014 | 2013 | 2012 | 2011 | |||||||||||||||||||||
| Institutional Class: | |||||||||||||||||||||||||
| Net asset value, beginning of period | $ | 28.27 | $ | 28.16 | $ | 22.18 | $ | 20.30 | $ | 19.38 | |||||||||||||||
| Income/(loss) from investment operations: | |||||||||||||||||||||||||
| Net investment income/(loss)@ | (0.04 | ) | (0.05 | ) | 0.15 | ** | 0.01 | 0.03 | |||||||||||||||||
| Net gain/(loss) on investment transactions (both realized and unrealized)1 | (0.20 | ) | 1.97 | 6.54 | 2.01 | 1.10 | |||||||||||||||||||
| Total from investment operations | (0.24 | ) | 1.92 | 6.69 | 2.02 | 1.13 | |||||||||||||||||||
| Less dividends and distributions to shareholders: | |||||||||||||||||||||||||
| Dividends from net investment income | — | (0.04 | ) | (0.21 | ) | (0.07 | ) | (0.21 | ) | ||||||||||||||||
| Distributions from net realized gain | (5.61 | ) | (1.77 | ) | (0.50 | ) | (0.07 | ) | — | ||||||||||||||||
| Total dividends and distributions | (5.61 | ) | (1.81 | ) | (0.71 | ) | (0.14 | ) | (0.21 | ) | |||||||||||||||
| Net asset value, end of period | $ | 22.42 | $ | 28.27 | $ | 28.16 | $ | 22.18 | $ | 20.30 | |||||||||||||||
| Total return2 | (1.27 | %) | 7.09 | % | 31.05 | % | 9.99 | % | 5.80 | % | |||||||||||||||
| Ratios/Supplemental Data: | |||||||||||||||||||||||||
| Net assets, end of period (in thousands) | $ | 388,441 | $ | 510,053 | $ | 667,712 | $ | 641,684 | $ | 794,495 | |||||||||||||||
| Ratio of expenses to average net assets | |||||||||||||||||||||||||
| Before fee waivers/expense offset arrangement/recovery | 1.14 | % | 1.10 | % | 1.12 | % | 1.13 | % | 1.14 | % | |||||||||||||||
| After fee waivers/expense offset arrangement/recovery3 | 1.14 | % | 1.10 | % | 1.12 | % | 1.13 | %† | 1.15 | %† | |||||||||||||||
| Ratio of net investment income/(loss) to average net assets | (0.16 | %) | (0.17 | %) | 0.62 | %** | 0.07 | % | 0.15 | % | |||||||||||||||
| Portfolio turnover rate | 29 | % | 40 | % | 39 | % | 33 | % | 34 | % | |||||||||||||||
| 1 | Includes redemption fees of less than $0.01 per share. |
| 2 | Performance figures may reflect fee waivers, expense offset arrangement and/or recovery of previously waived fees. Past performance is no guarantee of future results. Total return would have been lower if the Adviser had not waived certain expenses. Conversely, total return would have been higher if the Adviser had not recovered previously waived expenses. Total return is calculated assuming an initial investment made at the net asset value at the beginning of the period, reinvestment of all dividends and distributions at net asset value during the period and redemption on the last day of the period and is not annualized. |
| 3 | As a result of an expense limitation, the ratio of expenses (exclusive of taxes, interest, brokerage commissions, acquired fund fees and expenses, and extraordinary items) to average net assets will not exceed 1.15% effective December 31, 2009. |
| @ | Calculated based on the average number of shares outstanding during the period. |
| ** | Investment income per share reflects special dividends received during the period which amounted to $0.11 per share. Excluding the special dividends, the ratio of net investment income to average net assets would have been 0.19%. |
| † | The Adviser recovered a portion of its previously waived fees. |
The accompanying notes are an integral part of the financial statements.
| 48 |
Third Avenue Trust
Financial Highlights
Selected data (for share outstanding throughout each period) and ratios are as follows:
| Third Avenue Real Estate Value Fund | |||||||||||||||||||||||||
| Years Ended October 31, | |||||||||||||||||||||||||
| 2015 | 2014 | 2013 | 2012 | 2011 | |||||||||||||||||||||
| Investor Class: | |||||||||||||||||||||||||
| Net asset value, beginning of period | $ | 31.84 | $ | 29.40 | $ | 26.53 | $ | 21.40 | $ | 22.90 | |||||||||||||||
| Income/(loss) from investment operations: | |||||||||||||||||||||||||
| Net investment income/(loss)@ | (0.04 | ) | 0.50 | ± | 0.10 | 0.16 | 0.02 | ||||||||||||||||||
| Net gain/(loss) on investment transactions (both realized and unrealized)1 | 0.41 | 2.60 | 4.99 | 4.97 | (0.63 | ) | |||||||||||||||||||
| Total from investment operations | 0.37 | 3.10 | 5.09 | 5.13 | (0.61 | ) | |||||||||||||||||||
| Less dividends and distributions to shareholders: | |||||||||||||||||||||||||
| Dividends from net investment income | (0.44 | ) | (0.26 | ) | (0.84 | ) | — | (0.89 | ) | ||||||||||||||||
| Distributions from net realized gain | (0.63 | ) | (0.40 | ) | (1.38 | ) | — | — | |||||||||||||||||
| Total dividends and distributions | (1.07 | ) | (0.66 | ) | (2.22 | ) | — | (0.89 | ) | ||||||||||||||||
| Net asset value, end of period | $ | 31.14 | $ | 31.84 | $ | 29.40 | $ | 26.53 | $ | 21.40 | |||||||||||||||
| Total return2 | 1.12 | % | 10.84 | % | 20.61 | % | 23.97 | % | (2.89 | %) | |||||||||||||||
| Ratios/Supplemental Data: | |||||||||||||||||||||||||
| Net assets, end of period (in thousands) | $ | 438,506 | $ | 367,834 | $ | 145,169 | $ | 60,684 | $ | 48,327 | |||||||||||||||
| Ratio of expenses to average net assets | |||||||||||||||||||||||||
| Before fee waivers/expense offset arrangement/recovery | 1.35 | % | 1.34 | % | 1.34 | % | 1.34 | % | 1.38 | % | |||||||||||||||
| After fee waivers/expense offset arrangement/recovery3 | 1.35 | % | 1.33 | % | 1.33 | % | 1.34 | % | 1.40 | %† | |||||||||||||||
| Ratio of net investment income/(loss) to average net assets | (0.11 | %) | 1.63 | %± | 0.36 | % | 0.68 | % | 0.11 | % | |||||||||||||||
| Portfolio turnover rate | 17 | % | 14 | % | 13 | % | 4 | % | 32 | % | |||||||||||||||
| 1 | Includes redemption fees of less than $0.01 per share. |
| 2 | Performance figures may reflect fee waivers, expense offset arrangement and/or recovery of previously waived fees. Past performance is no guarantee of future results. Total return would have been lower if the Adviser had not waived certain expenses. Conversely, total return would have been higher if the Adviser had not recovered previously waived expenses. Total return is calculated assuming an initial investment made at the net asset value at the beginning of the period, reinvestment of all dividends and distributions at net asset value during the period and redemption on the last day of the period and is not annualized. |
| 3 | As a result of an expense limitation, the ratio of expenses (exclusive of taxes, interest, brokerage commissions, acquired fund fees and expenses, and extraordinary items) to average net assets will not exceed 1.40%. |
| @ | Calculated based on the average number of shares outstanding during the period. |
| ± | Investment income per share reflects a special dividend received during the period which amounted to $0.06 per share. Excluding the special dividend, the ratio of net investment income to average net assets would have been 1.43%. |
| † | The Adviser recovered previously waived fees. |
The accompanying notes are an integral part of the financial statements.
| 49 |
Third Avenue Trust
Financial Highlights
Selected data (for share outstanding throughout each period) and ratios are as follows:
| Third Avenue Real Estate Value Fund | |||||||||||||||||||||||||
| Years Ended October 31, | |||||||||||||||||||||||||
| 2015 | 2014 | 2013 | 2012 | 2011 | |||||||||||||||||||||
| Institutional Class: | |||||||||||||||||||||||||
| Net asset value, beginning of period | $ | 32.05 | $ | 29.56 | $ | 26.66 | $ | 21.45 | $ | 22.93 | |||||||||||||||
| Income/(loss) from investment operations: | |||||||||||||||||||||||||
| Net investment income@ | 0.04 | 0.56 | ± | 0.18 | 0.22 | 0.06 | |||||||||||||||||||
| Net gain/(loss) on investment transactions (both realized and unrealized)1 | 0.41 | 2.63 | 4.99 | 4.99 | (0.62 | ) | |||||||||||||||||||
| Total from investment operations | 0.45 | 3.19 | 5.17 | 5.21 | (0.56 | ) | |||||||||||||||||||
| Less dividends and distributions to shareholders: | |||||||||||||||||||||||||
| Dividends from net investment income | (0.51 | ) | (0.30 | ) | (0.89 | ) | — | (0.92 | ) | ||||||||||||||||
| Distributions from net realized gain | (0.63 | ) | (0.40 | ) | (1.38 | ) | — | — | |||||||||||||||||
| Total dividends and distributions | (1.14 | ) | (0.70 | ) | (2.27 | ) | — | (0.92 | ) | ||||||||||||||||
| Net asset value, end of period | $ | 31.36 | $ | 32.05 | $ | 29.56 | $ | 26.66 | $ | 21.45 | |||||||||||||||
| Total return2 | 1.37 | % | 11.11 | % | 20.87 | % | 24.29 | % | (2.66 | %) | |||||||||||||||
| Ratios/Supplemental Data: | |||||||||||||||||||||||||
| Net assets, end of period (in thousands) | $ | 3,026,286 | $ | 2,866,849 | $ | 2,010,557 | $ | 1,689,612 | $ | 1,579,121 | |||||||||||||||
| Ratio of expenses to average net assets | |||||||||||||||||||||||||
| Before fee waivers/expense offset arrangement/recovery | 1.10 | % | 1.09 | % | 1.09 | % | 1.09 | % | 1.13 | % | |||||||||||||||
| After fee waivers/expense offset arrangement/recovery3 | 1.10 | % | 1.08 | % | 1.08 | % | 1.09 | % | 1.15 | %† | |||||||||||||||
| Ratio of net investment income to average net assets | 0.13 | % | 1.82 | %± | 0.65 | % | 0.96 | % | 0.26 | % | |||||||||||||||
| Portfolio turnover rate | 17 | % | 14 | % | 13 | % | 4 | % | 32 | % | |||||||||||||||
| 1 | Includes redemption fees of less than $0.01 per share. |
| 2 | Performance figures may reflect fee waivers, expense offset arrangement and/or recovery of previously waived fees. Past performance is no guarantee of future results. Total return would have been lower if the Adviser had not waived certain expenses. Conversely, total return would have been higher if the Adviser had not recovered previously waived expenses. Total return is calculated assuming an initial investment made at the net asset value at the beginning of the period, reinvestment of all dividends and distributions at net asset value during the period and redemption on the last day of the period and is not annualized. |
| 3 | As a result of an expense limitation, the ratio of expenses (exclusive of taxes, interest, brokerage commissions, acquired fund fees and expenses, and extraordinary items) to average net assets will not exceed 1.15% effective December 31, 2009. |
| @ | Calculated based on the average number of shares outstanding during the period. |
| ± | Investment income per share reflects a special dividend received during the period which amounted to $0.06 per share. Excluding the special dividend, the ratio of net investment income to average net assets would have been 1.62%. |
| † | The Adviser recovered previously waived fees. |
The accompanying notes are an integral part of the financial statements.
| 50 |
Third Avenue Trust
Financial Highlights
Selected data (for share outstanding throughout each period) and ratios are as follows:
| Third Avenue International Value Fund | |||||||||||||||||||||||||
| Years Ended October 31, | |||||||||||||||||||||||||
| 2015 | 2014 | 2013 | 2012 | 2011 | |||||||||||||||||||||
| Investor Class: | |||||||||||||||||||||||||
| Net asset value, beginning of period | $ | 17.58 | $ | 19.96 | $ | 16.14 | $ | 15.29 | $ | 16.31 | |||||||||||||||
| Income/(loss) from investment operations: | |||||||||||||||||||||||||
| Net investment income@ | 0.08 | 0.39 | ± | 0.25 | ** | 0.08 | 0.09 | ||||||||||||||||||
| Net gain/(loss) on investment transactions (both realized and unrealized)1 | (1.26 | ) | (2.55 | ) | 3.68 | 0.99 | (0.85 | ) | |||||||||||||||||
| Total from investment operations | (1.18 | ) | (2.16 | ) | 3.93 | 1.07 | (0.76 | ) | |||||||||||||||||
| Less dividends and distributions to shareholders: | |||||||||||||||||||||||||
| Dividends from net investment income | (1.11 | ) | (0.22 | ) | (0.11 | ) | (0.22 | ) | (0.26 | ) | |||||||||||||||
| Total dividends and distributions | (1.11 | ) | (0.22 | ) | (0.11 | ) | (0.22 | ) | (0.26 | ) | |||||||||||||||
| Net asset value, end of period | $ | 15.29 | $ | 17.58 | $ | 19.96 | $ | 16.14 | $ | 15.29 | |||||||||||||||
| Total return2 | (7.24 | %) | (10.96 | %) | 24.49 | % | 7.20 | % | (4.76 | %) | |||||||||||||||
| Ratios/Supplemental Data: | |||||||||||||||||||||||||
| Net assets, end of period (in thousands) | $ | 5,977 | $ | 12,266 | $ | 35,013 | $ | 18,533 | $ | 13,997 | |||||||||||||||
| Ratio of expenses to average net assets | |||||||||||||||||||||||||
| Before fee waivers and expense offset arrangement | 1.86 | % | 1.71 | % | 1.69 | % | 1.69 | % | 1.69 | % | |||||||||||||||
| After fee waivers and expense offset arrangement3, # | 1.65 | % | 1.65 | % | 1.65 | % | 1.65 | % | 1.65 | % | |||||||||||||||
| Ratio of net investment income to average net assets | 0.50 | % | 1.99 | %± | 1.37 | %** | 0.53 | % | 0.56 | % | |||||||||||||||
| Portfolio turnover rate | 25 | % | 22 | % | 11 | % | 20 | % | 24 | % | |||||||||||||||
| 1 | Includes redemption fees of less than $0.01 per share. |
| 2 | Performance figures may reflect fee waivers and/or expense offset arrangement. Past performance is no guarantee of future results. In the absence of fee waivers and/or expense offset arrangement, the total return would have been lower. Total return is calculated assuming an initial investment made at the net asset value at the beginning of the period, reinvestment of all dividends and distributions at net asset value during the period and redemption on the last day of the period and is not annualized. |
| 3 | As a result of an expense limitation, the ratio of expenses (exclusive of taxes, interest, brokerage commissions, acquired fund fees and expenses, and extraordinary items) to average net assets will not exceed 1.65%. |
| @ | Calculated based on the average number of shares outstanding during the period. |
| ± | Investment income per share reflects special dividends received during the period which amounted to $0.12 per share. Excluding the special dividends, the ratio of net investment income to average net assets would have been 1.39%. |
| ** | Investment income per share reflects a special dividend received during the period which amounted to $0.15 per share. Excluding the special dividend, the ratio of net investment income to average net assets would have been 0.53%. |
| # | The Adviser waived a portion of its fees. |
The accompanying notes are an integral part of the financial statements.
| 51 |
Third Avenue Trust
Financial Highlights
Selected data (for share outstanding throughout each period) and ratios are as follows:
| Third Avenue International Value Fund | |||||||||||||||||||||||||
| Years Ended October 31, | |||||||||||||||||||||||||
| 2015 | 2014 | 2013 | 2012 | 2011 | |||||||||||||||||||||
| Institutional Class: | |||||||||||||||||||||||||
| Net asset value, beginning of period | $ | 17.63 | $ | 20.00 | $ | 16.16 | $ | 15.33 | $ | 16.33 | |||||||||||||||
| Income/(loss) from investment operations: | |||||||||||||||||||||||||
| Net investment income@ | 0.13 | 0.43 | ± | 0.25 | ** | 0.12 | 0.10 | ||||||||||||||||||
| Net gain/(loss) on investment transactions (both realized and unrealized)1 | (1.27 | ) | (2.54 | ) | 3.74 | 0.97 | (0.81 | ) | |||||||||||||||||
| Total from investment operations | (1.14 | ) | (2.11 | ) | 3.99 | 1.09 | (0.71 | ) | |||||||||||||||||
| Less dividends and distributions to shareholders: | |||||||||||||||||||||||||
| Dividends from net investment income | (1.20 | ) | (0.26 | ) | (0.15 | ) | (0.26 | ) | (0.29 | ) | |||||||||||||||
| Total dividends and distributions | (1.20 | ) | (0.26 | ) | (0.15 | ) | (0.26 | ) | (0.29 | ) | |||||||||||||||
| Net asset value, end of period | $ | 15.29 | $ | 17.63 | $ | 20.00 | $ | 16.16 | $ | 15.33 | |||||||||||||||
| Total return2 | (6.97 | %) | (10.79 | %) | 24.89 | % | 7.39 | % | (4.51 | %) | |||||||||||||||
| Ratios/Supplemental Data: | |||||||||||||||||||||||||
| Net assets, end of period (in thousands) | $ | 195,523 | $ | 339,498 | $ | 1,223,107 | $ | 1,176,256 | $ | 1,277,674 | |||||||||||||||
| Ratio of expenses to average net assets | |||||||||||||||||||||||||
| Before fee waivers and expense offset arrangement | 1.61 | % | 1.46 | % | 1.44 | % | 1.44 | % | 1.44 | % | |||||||||||||||
| After fee waivers and expense offset arrangement3, # | 1.40 | % | 1.40 | % | 1.40 | % | 1.40 | % | 1.40 | % | |||||||||||||||
| Ratio of net investment income to average net assets | 0.82 | % | 2.19 | %± | 1.40 | %** | 0.80 | % | 0.58 | % | |||||||||||||||
| Portfolio turnover rate | 25 | % | 22 | % | 11 | % | 20 | % | 24 | % | |||||||||||||||
| 1 | Includes redemption fees of less than $0.01 per share. |
| 2 | Performance figures may reflect fee waivers and/or expense offset arrangement. Past performance is no guarantee of future results. In the absence of fee waivers and/or expense offset arrangement, the total return would have been lower. Total return is calculated assuming an initial investment made at the net asset value at the beginning of the period, reinvestment of all dividends and distributions at net asset value during the period and redemption on the last day of the period and is not annualized. |
| 3 | As a result of an expense limitation, the ratio of expenses (exclusive of taxes, interest, brokerage commissions, acquired fund fees and expenses, and extraordinary items) to average net assets will not exceed 1.40%. |
| @ | Calculated based on the average number of shares outstanding during the period. |
| ± | Investment income per share reflects special dividends received during the period which amounted to $0.12 per share. Excluding the special dividends, the ratio of net investment income to average net assets would have been 1.59%. |
| ** | Investment income per share reflects a special dividend received during the period which amounted to $0.15 per share. Excluding the special dividend, the ratio of net investment income to average net assets would have been 0.56%. |
| # | The Adviser waived a portion of its fees. |
The accompanying notes are an integral part of the financial statements.
| 52 |
Third Avenue Trust
Financial Highlights
Selected data (for share outstanding throughout each period) and ratios are as follows:
| Third Avenue Focused Credit Fund | |||||||||||||||||||||||||
| Years Ended October 31, | |||||||||||||||||||||||||
| 2015 | 2014 | 2013 | 2012 | 2011 | |||||||||||||||||||||
| Investor Class: | |||||||||||||||||||||||||
| Net asset value, beginning of period | $ | 10.61 | $ | 11.08 | $ | 10.25 | $ | 10.51 | $ | 11.36 | |||||||||||||||
| Income/(loss) from investment operations: | |||||||||||||||||||||||||
| Net investment income@ | 0.81 | 1.09 | 0.88 | 0.76 | 0.85 | ||||||||||||||||||||
| Net gain/(loss) on investment transactions (both realized and unrealized) | (2.74 | )1 | (0.76 | )1 | 0.78 | 1 | 0.13 | 1 | (0.81 | )2 | |||||||||||||||
| Total from investment operations | (1.93 | ) | 0.33 | 1.66 | 0.89 | 0.04 | |||||||||||||||||||
| Less dividends and distributions to shareholders: | |||||||||||||||||||||||||
| Dividends from net investment income | (0.78 | ) | (0.80 | ) | (0.83 | ) | (0.69 | ) | (0.79 | ) | |||||||||||||||
| Distributions from net realized gain | (0.06 | ) | — | — | (0.46 | ) | (0.10 | ) | |||||||||||||||||
| Total dividends and distributions | (0.84 | ) | (0.80 | ) | (0.83 | ) | (1.15 | ) | (0.89 | ) | |||||||||||||||
| Net asset value, end of period | $ | 7.84 | $ | 10.61 | $ | 11.08 | $ | 10.25 | $ | 10.51 | |||||||||||||||
| Total return3 | (19.41 | %) | 2.67 | % | 16.61 | % | 9.60 | % | 0.24 | % | |||||||||||||||
| Ratios/Supplemental Data: | |||||||||||||||||||||||||
| Net assets, end of period (in thousands) | $ | 412,670 | $ | 920,914 | $ | 752,422 | $ | 335,216 | $ | 338,098 | |||||||||||||||
| Ratio of expenses to average net assets | |||||||||||||||||||||||||
| Before fee waivers/expense offset arrangement/recovery | 1.18 | % | 1.16 | % | 1.16 | % | 1.14 | % | 1.18 | % | |||||||||||||||
| After fee waivers/expense offset arrangement/recovery4 | 1.18 | % | 1.15 | % | 1.16 | % | 1.14 | % | 1.18 | % | |||||||||||||||
| Before interest expense | 1.18 | % | 1.13 | % | 1.16 | % | 1.14 | % | 1.18 | % | |||||||||||||||
| Ratio of net investment income to average net assets | 8.71 | % | 9.35 | % | 8.12 | % | 7.61 | % | 7.64 | % | |||||||||||||||
| Portfolio turnover rate | 48 | % | 53 | % | 58 | % | 72 | % | 105 | % | |||||||||||||||
| 1 | Includes redemption fees of less than $0.01 per share. |
| 2 | Includes redemption fees of $0.01 per share. |
| 3 | Performance figures may reflect fee waivers, expense offset arrangement and/or recovery of previously waived fees. Past performance is no guarantee of future results. Total return would have been lower if the Adviser had not waived certain expenses. Conversely, total return would have been higher if the Adviser had not recovered previously waived expenses. Total return is calculated assuming an initial investment made at the net asset value at the beginning of the period, reinvestment of all dividends and distributions at net asset value during the period and redemption on the last day of the period and is not annualized. |
| 4 | As a result of an expense limitation, the ratio of expenses (exclusive of taxes, interest, brokerage commissions, acquired fund fees and expenses, and extraordinary items) to average net assets will not exceed 1.40%. Effective March 11, 2011, the expense limitation has been reduced to 1.20%. |
| @ | Calculated based on the average number of shares outstanding during the period. |
The accompanying notes are an integral part of the financial statements.
| 53 |
Third Avenue Trust
Financial Highlights
Selected data (for share outstanding throughout each period) and ratios are as follows:
| Third Avenue Focused Credit Fund | |||||||||||||||||||||||||
| Years Ended October 31, | |||||||||||||||||||||||||
| 2015 | 2014 | 2013 | 2012 | 2011 | |||||||||||||||||||||
| Institutional Class: | |||||||||||||||||||||||||
| Net asset value, beginning of period | $ | 10.60 | $ | 11.07 | $ | 10.24 | $ | 10.50 | $ | 11.36 | |||||||||||||||
| Income/(loss) from investment operations: | |||||||||||||||||||||||||
| Net investment income@ | 0.83 | 1.12 | 0.92 | 0.79 | 0.88 | ||||||||||||||||||||
| Net gain/(loss) on investment transactions (both realized and unrealized)1 | (2.74 | ) | (0.77 | ) | 0.77 | 0.13 | (0.83 | ) | |||||||||||||||||
| Total from investment operations | (1.91 | ) | 0.35 | 1.69 | 0.92 | 0.05 | |||||||||||||||||||
| Less dividends and distributions to shareholders: | |||||||||||||||||||||||||
| Dividends from net investment income | (0.81 | ) | (0.82 | ) | (0.86 | ) | (0.72 | ) | (0.81 | ) | |||||||||||||||
| Distributions from net realized gain | (0.06 | ) | — | — | (0.46 | ) | (0.10 | ) | |||||||||||||||||
| Total dividends and distributions | (0.87 | ) | (0.82 | ) | (0.86 | ) | (1.18 | ) | (0.91 | ) | |||||||||||||||
| Net asset value, end of period | $ | 7.82 | $ | 10.60 | $ | 11.07 | $ | 10.24 | $ | 10.50 | |||||||||||||||
| Total return2 | (19.20 | %) | 2.93 | % | 16.91 | % | 9.89 | % | 0.37 | % | |||||||||||||||
| Ratios/Supplemental Data: | |||||||||||||||||||||||||
| Net assets, end of period (in thousands) | $ | 956,546 | $ | 2,049,107 | $ | 1,016,021 | $ | 649,492 | $ | 765,467 | |||||||||||||||
| Ratio of expenses to average net assets | |||||||||||||||||||||||||
| Before fee waivers/expense offset arrangement/recovery | 0.93 | % | 0.92 | % | 0.91 | % | 0.89 | % | 0.92 | % | |||||||||||||||
| After fee waivers/expense offset arrangement/recovery3 | 0.93 | % | 0.92 | % | 0.91 | % | 0.89 | % | 0.92 | % | |||||||||||||||
| Before interest expense | 0.93 | % | 0.88 | % | 0.91 | % | 0.89 | % | 0.92 | % | |||||||||||||||
| Ratio of net investment income to average net assets | 8.95 | % | 9.62 | % | 8.48 | % | 7.94 | % | 7.87 | % | |||||||||||||||
| Portfolio turnover rate | 48 | % | 53 | % | 58 | % | 72 | % | 105 | % | |||||||||||||||
| 1 | Includes redemption fees of less than $0.01 per share. |
| 2 | Performance figures may reflect fee waivers, expense offset arrangement and/or recovery of previously waived fees. Past performance is no guarantee of future results. Total return would have been lower if the Adviser had not waived certain expenses. Conversely, total return would have been higher if the Adviser had not recovered previously waived expenses. Total return is calculated assuming an initial investment made at the net asset value at the beginning of the period, reinvestment of all dividends and distributions at net asset value during the period and redemption on the last day of the period and is not annualized. |
| 3 | As a result of an expense limitation, the ratio of expenses (exclusive of taxes, interest, brokerage commissions, acquired fund fees and expenses, and extraordinary items) to average net assets will not exceed 0.95%. |
| @ | Calculated based on the average number of shares outstanding during the period. |
The accompanying notes are an integral part of the financial statements.
| 54 |
Third Avenue Trust
Notes to Financial Statements
October 31, 2015
1. SUMMARY OF ORGANIZATION AND SIGNIFICANT ACCOUNTING POLICIES
Organization:
Third Avenue Trust (the “Trust”) is an open-end, management investment company organized as a Delaware business trust pursuant to a Trust Instrument dated October 31, 1996. The Trust currently consists of five non-diversified (within the meaning of Section 5(b)(2) of the Investment Company Act), separate investment series: Third Avenue Value Fund, Third Avenue Small-Cap Value Fund, Third Avenue Real Estate Value Fund, Third Avenue International Value Fund and Third Avenue Focused Credit Fund (each a “Fund” and, collectively, the “Funds”). Third Avenue Management LLC (the “Adviser”) provides investment advisory services to each of the Funds in the Trust. The Funds seek to achieve their investment objectives by adhering to a strict value discipline when selecting securities and other instruments. Each Fund has a distinct investment approach.
Third Avenue Value Fund seeks to achieve its long-term capital appreciation objective mainly by acquiring common stocks of well-financed companies (meaning companies with high quality assets and conservative levels of liabilities) at a discount to what the Adviser believes is their intrinsic value. The Fund may invest in companies of any market capitalization. The Fund may also acquire senior securities, such as convertible securities, preferred stocks and debt instruments (including high-yield and distressed securities that may be in default and may have any or no credit rating), that the Adviser believes are undervalued. The Fund invests in both domestic and foreign securities.
Third Avenue Small-Cap Value Fund seeks to achieve its long-term capital appreciation objective mainly by acquiring equity securities, including common stocks and convertible securities, of well-financed (meaning companies with high quality assets and conservative levels of liabilities) small companies at a discount to what the Adviser believes is their intrinsic value. Under normal circumstances, the Fund expects to invest at least 80% of its net assets (plus the amount of any borrowing for investment purposes) in securities of companies that are considered small. The Fund considers a “small company” to be one whose market capitalization is within the range of capitalizations during the most recent 12-month period (as measured each calendar quarter end) of companies in the Russell 2000 Index, the S&P Small Cap 600 Index or the Dow Jones Wilshire U.S. Small-Cap Index at the time of investment (based on month-end data). The Fund may also acquire senior securities, such as preferred stocks and debt instruments (including high-yield and distressed securities that may be in default and may have any or no credit rating), that the Adviser believes are undervalued. The Fund invests in both domestic and foreign securities.
Third Avenue Real Estate Value Fund seeks to achieve its long-term capital appreciation objective primarily by investing in equity securities, including common stocks and convertible securities, of well-financed (meaning companies with high quality assets and conservative levels of liabilities) real estate and real estate-related companies, or in companies which own significant real estate assets or derive a significant portion of gross revenues or net profits from real estate-related companies at the time of investment (“real estate companies”). The Fund seeks to acquire these securities at a discount to what the Adviser believes is their intrinsic value. Under normal circumstances, at least 80% of the Fund’s net assets (plus the amount of any borrowing for investment purposes) will be invested in securities of real estate and real estate-related companies. The Fund may invest in companies of any market capitalization. The Fund may also acquire senior securities, such as preferred stocks and debt instruments (including high-yield, distressed and mortgage-backed securities that may be in default and may have any or no credit rating) of real estate companies or loans secured by real estate or real estate-related companies that the Adviser believes have above-average yield potential. The Fund invests in both domestic and foreign securities.
Third Avenue International Value Fund seeks to achieve its long-term capital appreciation objective primarily by acquiring equity securities, including common stocks and convertible securities, of well-financed companies (meaning companies with high quality assets and conservative levels of liabilities) located outside of the United States. While the Fund may invest in companies located anywhere in the world, it currently expects that most of its assets will be invested in the more developed countries and, under normal circumstances, at least 80% of its net assets (plus the amount of any borrowing for investment purposes) will be invested in securities of issuers located outside of the United States at the time of investment. The Fund may also acquire senior securities, such as preferred stocks and debt instruments (including high-yield and distressed securities that may be in default and may have any or no credit rating), that the Adviser believes are undervalued.
Third Avenue Focused Credit Fund seeks to achieve its long-term total return objective mainly by investing in bonds and other types of credit instruments and intends to invest a substantial amount of its assets in credit instruments that are rated below investment grade by some or all relevant independent rating agencies, including Moody’s Investors Service, Inc., Standard & Poor’s Ratings Services and Fitch Ratings. Under normal circumstances, at least 80% of the Fund’s net assets (plus the amount of any borrowing for investment purposes) will be invested in bonds and other types of credit instruments. Credit instruments include high-yield bonds (commonly known as “junk bonds” or “junk debt”), bank debt, convertible bonds or preferred stock, loans made to bankrupt companies (including debtor-in-possession loans), loans made to refinance distressed companies and other types of debt instruments. In making these investments, the Adviser will seek to purchase instruments that the Adviser believes are undervalued. The Fund may have significant investments in distressed and defaulted securities and intends to focus on a relatively small number of issuers. The Fund may also purchase equity securities or hold significant positions in equity or other assets that the Fund receives as part of a reorganization process, and may hold those assets until such time as the Adviser believes that a disposition is most advantageous.
| 55 |
Third Avenue Trust
Notes to Financial Statements (continued)
October 31, 2015
Because of the Funds’ disciplined and deliberate investing approach, there may be times when a Fund will have a significant cash position. A substantial cash position can adversely impact Fund performance in certain market conditions, and may make it more difficult for a Fund to achieve its investment objective.
Accounting policies:
The policies described below are followed consistently by the Funds in the preparation of their financial statements in conformity with accounting principles generally accepted in the United States of America (“U.S. GAAP”). The Trust is an investment company and, accordingly, follows the investment company accounting and reporting guidance of the Financial Accounting Standards Board Accounting Standards Codification (“FASB ASC”) Topic 946-Investment Companies, which is part of U.S. GAAP.
The preparation of financial statements in accordance with U.S. GAAP requires management to make estimates and assumptions that affect the reported amounts and disclosures. Actual results could differ from those estimates.
Security valuation:
Generally, the Funds’ investments are valued at market value. Securities traded on a principal stock exchange, including The NASDAQ Stock Market, Inc. (“NASDAQ”), are valued at the last quoted sales price, the NASDAQ official closing price, or in the absence of closing sales prices on that day, securities are valued at the mean between the closing bid and asked price. In accordance with procedures approved by the Trust’s Board of Trustees (the “Board”), the Funds have retained a third party provider that, under certain circumstances, applies a statistical model to provide fair value pricing for foreign equity securities with principal markets that are no longer open when a Fund calculates its net asset value (“NAV”), and certain events have occurred after the principal markets have closed but prior to the time as of which the Funds compute their NAVs. Debt instruments with maturities greater than 60 days, including floating rate loan securities, are valued on the basis of prices obtained from a pricing service approved as reliable by the Board or otherwise pursuant to policies and procedures approved by the Board. Investments in derivative instruments are valued independently by service providers or by broker quotes based on pricing models. Short-term cash investments are valued at cost, plus accrued interest, which approximates market value. Short-term debt securities with 60 days or less to maturity may be valued at amortized cost.
The Adviser has established a Valuation Committee (the “Committee”) which is responsible for overseeing the pricing and valuation of all securities held in the Funds. The Committee operates under pricing and valuation policies and procedures established by the Adviser and approved by the Board, including pricing policies which set forth the mechanisms and processes to be employed on a daily basis to implement these policies and procedures. In particular, the pricing policies describe how to determine market quotations for securities and other instruments. The Committee’s responsibilities include: 1) fair value and liquidity determinations (and oversight of any third parties to whom any responsibility for fair value and liquidity determinations is delegated), and 2) regular monitoring of the Adviser’s pricing and valuation policies and procedures and modification or enhancement of these policies and procedures (or recommendation of the modification of these policies and procedures) as the Committee believes appropriate.
Each Fund may invest up to 15% of its total net assets in securities which are not readily marketable, including those which are restricted as to disposition under applicable securities laws (“restricted securities”). Restricted securities and other securities and assets for which market quotations are not readily available are valued at “fair value”, as determined in good faith by the Committee as authorized by the Board, under procedures established by the Board. At October 31, 2015, such securities had a total fair value of $15,492,750 or 0.92% of net assets of Third Avenue Value Fund, $23,123,440 or 0.67% of net assets of Third Avenue Real Estate Value Fund, and $230,937,994 or 16.87% of net assets of Third Avenue Focused Credit Fund. There were no fair valued securities for Third Avenue Small-Cap Value Fund and Third Avenue International Value Fund at October 31, 2015. Among the factors that may be considered by the Committee in determining fair value are: the type of security, trading in unrestricted securities of the same issuer, the financial condition of the issuer, the percentage of the Fund’s beneficial ownership of the issuer’s common stocks and debt securities, comparable multiples of similar issuers, the operating results of the issuer and the discount from market value of any similar unrestricted securities of the issuer at the time of purchase and liquidation values of the issuer. The fair values determined in accordance with these procedures may differ significantly from the amounts which would be realized upon disposition of the securities.
Under current market conditions, certain securities owned by the Funds may be deemed to be illiquid. “Illiquid securities” are generally those that cannot be sold or disposed of in the ordinary course of business at approximately the prices at which they are valued. This may result in illiquid securities being disposed of at a price different from the recorded value since the market price of illiquid securities generally is more volatile than that of more liquid securities. This illiquidity of certain securities may result in the Funds incurring greater losses on the sale of some securities than under more stable market conditions.
The current credit market instability has made it more difficult to obtain market quotations on certain securities owned by the Funds. In the absence of observable and reliable market quotations, portfolio securities are valued at their “fair value” under procedures established by the Adviser. Fair values
| 56 |
Third Avenue Trust
Notes to Financial Statements (continued)
October 31, 2015
assigned to the investments by the Adviser are based upon available information believed to be reliable, which may be affected by conditions in the financial markets. Different market participants may reach different opinions as to the value of any particular security, based on their varying market outlooks, the market information available to them, and the particular circumstances of their portfolios.
Fair value measurements:
In accordance with FASB ASC 820-10, Fair Value Measurements and Disclosures, the Funds disclose the fair value of their investments in a hierarchy that prioritizes the inputs to valuation techniques used to measure the fair value. Fair value is defined as the price that a Fund would receive upon selling an investment in an orderly transaction to an independent buyer in the principal or most advantageous market for the investment under current market conditions. The hierarchy gives the highest priority to valuations based upon unadjusted quoted prices in active markets for identical assets or liabilities (Level 1 measurement) and the lowest priority to valuations based upon unobservable inputs that are significant to the valuation (Level 3 measurements). The three levels of the fair value hierarchy are as follows:
• Level 1 – Inputs that reflect unadjusted quoted prices in active markets for identical assets or liabilities that the Funds have the ability to access at the measurement date;
• Level 2 – Inputs other than quoted prices that are observable for the asset or liability either directly or indirectly, including inputs in markets that are not considered to be active;
• Level 3 – Significant unobservable inputs (including the Funds’ own assumptions in determining the fair value of investments)
A financial instrument’s level within the fair value hierarchy is based on the lowest level of any input both individually and in aggregate that is significant to the fair value measurement. However, the determination of what constitutes “observable” requires significant judgment by the Funds. The Funds consider observable data to be market data which is readily available, regularly distributed or updated, reliable and verifiable, not proprietary, and provided by independent sources that are actively involved in the relevant market. The inputs or methodology used for valuing investments are not necessarily an indication of the risk associated with investing in those investments.
The Funds use valuation techniques to measure fair value that are consistent with the market approach and/or income approach, depending on the type of security and the particular circumstance. The market approach uses prices and other relevant information generated by market transactions involving identical or comparable securities. The income approach uses valuation techniques to discount estimated future cash flows to present value.
The following are certain inputs and techniques that the Funds generally use to evaluate how to classify each major category of assets and liabilities for Level 2 and Level 3, in accordance with U.S. GAAP.
Equity Securities (Common Stocks, Preferred Stocks, and Warrants)—Equity securities traded in inactive markets and certain foreign equity securities are valued using inputs which include broker-dealer quotes, recently executed transactions adjusted for changes in the benchmark index, or evaluated price quotes received from independent pricing services or brokers that take into account the integrity of the market sector and issuer, the individual characteristics of the security, and information received from broker-dealers and other market sources pertaining to the issuer or security. To the extent that these inputs are observable, the values of equity securities are categorized as Level 2. To the extent that these inputs are unobservable, the values are categorized as Level 3.
U.S. Government Obligations—U.S. Government obligations are valued by independent pricing services based on pricing models that evaluate the mean between the most recently quoted bid and ask price. The models also take into consideration data received from active market makers and broker-dealers, yield curves, and the spread over comparable U.S. Government issues. The spreads change daily in response to market conditions and are generally obtained from the new issue market and broker-dealer sources. To the extent that these inputs are observable, the values of U.S. Government obligations are categorized as Level 2. To the extent that these inputs are unobservable, the values are categorized as Level 3.
Corporate Bonds & Notes—Corporate bonds and notes are generally comprised of two main categories: investment grade bonds and high yield bonds. Investment grade bonds are valued by independent pricing services or brokers using various inputs and techniques, which include broker-dealer quotations, live trading levels, recently executed transactions in securities of the issuer or comparable issuers, and option adjusted spread models that include base curve and spread curve inputs. Adjustments to individual bonds can be applied to recognize trading differences compared to other bonds issued by the same issuer. High yield bonds are valued by independent pricing services or brokers based primarily on broker-dealer quotations from relevant market makers and recently executed transactions in securities of the issuer or comparable issuers. The broker-dealer quotations received are supported by credit analysis of the issuer that takes into consideration credit quality assessments, daily trading activity, and the activity of the underlying equities, listed bonds and sector specific trends. To the extent that these inputs are observable, the values of corporate bonds and notes are categorized as Level 2. To the extent that these inputs are unobservable, the values are categorized as Level 3.
| 57 |
Third Avenue Trust
Notes to Financial Statements (continued)
October 31, 2015
Forward Foreign Currency Contracts—Forward foreign currency contracts are valued by independent pricing services using various inputs and techniques, which include broker-dealer quotations, actual trading information and foreign currency exchange rates gathered from leading market makers and foreign currency exchange trading centers throughout the world. To the extent that these inputs are observable, the values of forward foreign currency contracts are categorized as Level 2. To the extent that these inputs are unobservable, the values are categorized as Level 3.
Claims—Claims are valued by brokers based on pricing models that take into account, among other factors, both cash and non-cash assets. The valuation is derived from expected cash flow of the claims and the non-cash assets, which include all real estate, private equity or other securities within the estate. To the extent that these inputs are observable, the values of the claims are categorized as Level 2. To the extent that these inputs are unobservable, the values are categorized as Level 3.
Term Loans—Term loans are valued by independent pricing services based on the average of evaluated quoted prices received from multiple dealers or valued relative to other benchmark securities when broker-dealer quotes are unavailable. Inputs may include quoted prices for similar investments in active markets, interest rates, coupon rates, yield curves, option adjusted spreads, default rates, credit spreads and other unique security features in order to estimate the relevant cash flows which is then discounted to calculate fair values. To the extent that these inputs are observable, the values of term loans are categorized as Level 2. To the extent that these inputs are unobservable, the values are categorized as Level 3.
Municipal Bonds—Municipal bonds are valued by independent pricing services based on pricing models that take into account, among other factors, information received from market makers and broker-dealers, current trades, bid-ask lists, offerings, market movements, the callability of the bond, state of issuance, benchmark yield curves, and bond insurance. To the extent that these inputs are observable, the values of municipal bonds are categorized as Level 2. To the extent that these inputs are unobservable, the values are categorized as Level 3.
Options (Written and Purchased)—Options are valued by independent pricing services or by brokers based on pricing models that take into account, among other factors, foreign exchange rate, time until expiration, and volatility of the underlying foreign currency security. To the extent that these inputs are observable, the values of options are categorized as Level 2. To the extent that these inputs are unobservable, the values are categorized as Level 3.
The following is a Summary by Level of Inputs used to value the Funds’ investments as of October 31, 2015:
| Third Avenue Value Fund | Third Avenue Small-Cap Value Fund | Third Avenue Real Estate Value Fund | Third Avenue International Value Fund | Third Avenue Focused Credit Fund | ||||||||||||||||
| Level 1: Quoted Prices† | ||||||||||||||||||||
| Investments in Securities: | ||||||||||||||||||||
| Common Stocks & Warrants: | ||||||||||||||||||||
| Consumer Products | $ | 76,977,570 | $ | — | $ | — | $ | — | $ | — | ||||||||||
| Diversified Holding Companies | 158,295,600 | — | — | 19,298,207 | — | |||||||||||||||
| Forest Products & Paper | 97,029,799 | 8,389,022 | 297,839,872 | 8,668,294 | — | |||||||||||||||
| U.S. Real Estate Operating Companies | 27,552,431 | 17,722,622 | 193,708,395 | — | — | |||||||||||||||
| Utilities | 60,448,409 | — | — | — | — | |||||||||||||||
| Other** | 1,149,957,670 | 345,945,333 | 2,496,897,336 | 117,165,927 | 13,658,063 | |||||||||||||||
| Preferred Stocks: | ||||||||||||||||||||
| Financials | — | — | — | — | 17,232,182 | |||||||||||||||
| Closed-End Funds: | ||||||||||||||||||||
| Financials | — | — | — | — | 46,317,567 | |||||||||||||||
| Exchange-Traded Funds: | ||||||||||||||||||||
| Financials | — | — | — | — | 20,086,787 | |||||||||||||||
| Total for Level 1 Securities | 1,570,261,479 | 372,056,977 | 2,988,445,603 | 145,132,428 | 97,294,599 | |||||||||||||||
| Level 2: Other Significant Observable Inputs† | ||||||||||||||||||||
| Investments in Securities: | ||||||||||||||||||||
| Common Stocks: | ||||||||||||||||||||
| Building & Construction Products/Services | — | — | — | 18,487,869 | — | |||||||||||||||
| Diversified Holding Companies | — | 8,115,166 | — | — | — | |||||||||||||||
| Forest Products & Paper | — | — | — | 12,691,710 | — | |||||||||||||||
| Services | — | — | — | — | 89,043,291 | |||||||||||||||
| Transportation Services | — | — | — | — | 2,649,324 | |||||||||||||||
| Utilities | — | — | — | — | 38,675,000 | |||||||||||||||
| Convertible Preferred Stocks: | ||||||||||||||||||||
| Transportation Services | — | — | — | — | 9,268,412 | |||||||||||||||
| 58 |
Third Avenue Trust
Notes to Financial Statements (continued)
October 31, 2015
Summary by Level of Inputs (continued)
| Third Avenue Value Fund | Third Avenue Small-Cap Value Fund | Third Avenue Real Estate Value Fund | Third Avenue International Value Fund | Third Avenue Focused Credit Fund | ||||||||||||||||
| Preferred Stocks: | ||||||||||||||||||||
| Financials | $ | — | $ | — | $ | — | $ | — | $ | 18,186,456 | ||||||||||
| Debt Securities issued by the U.S. Treasury and other government corporations and agencies: | ||||||||||||||||||||
| Municipal Bonds | — | — | — | — | 1,560,000 | |||||||||||||||
| Corporate Bonds & Notes | 10,912,460 | — | — | 5,142,375 | 458,080,989 | |||||||||||||||
| Foreign Government Bonds | — | — | — | 7,698,979 | — | |||||||||||||||
| Term Loans | — | — | — | — | 28,300,978 | |||||||||||||||
| Purchased Options: | ||||||||||||||||||||
| Foreign Currency Put Options | — | — | 155,364 | — | — | |||||||||||||||
| Foreign Currency Call Options | — | — | 2,196,476 | — | — | |||||||||||||||
| Short-Term Investments: | ||||||||||||||||||||
| U.S. Government Obligations | — | — | 199,992,667 | — | 149,999,458 | |||||||||||||||
| Total for Level 2 Securities | 10,912,460 | 8,115,166 | 202,344,507 | 44,020,933 | 795,763,908 | |||||||||||||||
| Level 3: Significant Unobservable Inputs | ||||||||||||||||||||
| Investments in Securities: | ||||||||||||||||||||
| Common Stocks & Warrants: | ||||||||||||||||||||
| Consumer Products | — | * | — | — | — | — | ||||||||||||||
| Energy | — | — | — | — | 16,493,010 | * | ||||||||||||||
| Financial Insurance | 389,302 | — | — | — | — | |||||||||||||||
| Manufacturing | — | — | — | — | 21,782,361 | * | ||||||||||||||
| Services | — | — | — | — | 1,063,538 | * | ||||||||||||||
| U.S. Real Estate Operating Companies | — | — | 19,909,988 | — | — | |||||||||||||||
| Limited Partnerships: | ||||||||||||||||||||
| Insurance & Reinsurance | 34,315 | — | — | — | — | |||||||||||||||
| Convertible Preferred Stocks: | ||||||||||||||||||||
| Services | — | — | — | — | 355,023 | |||||||||||||||
| Preferred Stocks: | ||||||||||||||||||||
| Energy | — | — | — | — | 2,143,843 | |||||||||||||||
| Non-U.S. Real Estate Operating Companies | — | — | 38,086,911 | — | — | |||||||||||||||
| Corporate Bonds & Notes | 15,069,133 | — | — | — | 153,024,527 | * | ||||||||||||||
| Term Loans | — | — | 3,213,452 | — | 56,279,495 | |||||||||||||||
| Private Equities: | ||||||||||||||||||||
| Automotive | — | — | — | — | 4,250,000 | |||||||||||||||
| Chemicals | — | — | — | — | 14,643,720 | |||||||||||||||
| Consumer Products | — | — | — | — | 6,864,045 | |||||||||||||||
| Energy | — | — | — | — | 487,769 | |||||||||||||||
| U.S. Real Estate Operating Companies | — | — | 109,980,014 | — | — | |||||||||||||||
| Total for Level 3 Securities | 15,492,750 | — | 171,190,365 | — | 277,387,331 | |||||||||||||||
| Total Value of Investments | $ | 1,596,666,689 | $ | 380,172,143 | $ | 3,361,980,475 | $ | 189,153,361 | $ | 1,170,445,838 | ||||||||||
| Investments in Other Financial Instruments: | ||||||||||||||||||||
| Level 2: Other Significant Observable Inputs | ||||||||||||||||||||
| Written Equity Options | $ | (215,628 | ) | $ | — | $ | — | $ | — | $ | — | |||||||||
| Written Foreign Currency Options | — | — | (70,790 | ) | — | — | ||||||||||||||
| Forward Foreign Currency Contracts - Assets | — | — | 1,813,500 | — | 953,281 | |||||||||||||||
| Total Value or Appreciation/(Depreciation) of Other Financial Instruments | $ | (215,628 | ) | $ | — | $ | 1,742,710 | $ | — | $ | 953,281 | |||||||||
| † | The value of securities that were transferred from Level 2 on to Level 1 for Third Avenue Focused Credit Fund was $2,117,222. The transfer was due to the availability of quoted prices in active market at period end. The value of securities that were transferred from Level 1 to Level 2 for Third Avenue Focused Credit Fund was $9,769,850. The transfer was due to lack of quoted prices in active market at period end. |
| * | Includes investments fair valued at zero. |
| ** | Please refer to the Portfolios of Investments for industry specifics of the portfolio holdings. |
Transfers from Level 1 to Level 2, or from Level 2 to Level 1 are recorded utilizing values as of the beginning of the period.
| 59 |
Third Avenue Trust
Notes to Financial Statements (continued)
October 31, 2015
Following is a reconciliation of Level 3 investments for which significant unobservable inputs were used to determine fair value:
Third Avenue Value Fund
| Common Stocks | Corporate Bonds & Notes | Limited Partnerships | Total | |||||||||||||
| Balance as of 10/31/14 (fair value) | ||||||||||||||||
| Consumer Products | $ | —* | $ | 4,507,464 | $ | — | $ | 4,507,464 | ||||||||
| Financial Insurance | 259,000 | — | — | 259,000 | ||||||||||||
| Insurance & Reinsurance | 40,800 | — | 92,941 | 133,741 | ||||||||||||
| Payment-in-kind | ||||||||||||||||
| Consumer Products | — | 1,309,659 | — | 1,309,659 | ||||||||||||
| Sales | ||||||||||||||||
| Insurance & Reinsurance | (49,673 | ) | — | — | (49,673 | ) | ||||||||||
| Net change in unrealized gain/(loss) | ||||||||||||||||
| Consumer Products | — | 9,252,010 | — | 9,252,010 | ||||||||||||
| Financial Insurance | 130,302 | — | — | 130,302 | ||||||||||||
| Insurance & Reinsurance | 11,870,336 | — | (58,626 | ) | 11,811,710 | |||||||||||
| Net realized gain/(loss) | ||||||||||||||||
| Insurance & Reinsurance | (11,861,463 | ) | — | — | (11,861,463 | ) | ||||||||||
| Balance as of 10/31/15 (fair value) | ||||||||||||||||
| Consumer Products | — | * | 15,069,133 | — | 15,069,133 | |||||||||||
| Financial Insurance | 389,302 | — | — | 389,302 | ||||||||||||
| Insurance & Reinsurance | — | — | 34,315 | 34,315 | ||||||||||||
| Total | $ | 389,302 | $ | 15,069,133 | $ | 34,315 | $ | 15,492,750 | ||||||||
| Net change in unrealized gain/(loss) related to securities still held as of October 31, 2015: | ||||||||||||||||
| $ | 130,302 | $ | 9,252,010 | $ | (58,626 | ) | $ | 9,323,686 | ||||||||
| * | Investments fair valued at zero. |
Third Avenue Real Estate Value Fund
| Common Stocks | Preferred Stocks | Private Equities | Term Loans | Total | ||||||||||||||||
| Balance as of 10/31/14 (fair value) | ||||||||||||||||||||
| Non-U.S. Real Estate Operating Companies | $ | — | $ | 33,993,569 | $ | — | $ | 3,337,522 | $ | 37,331,091 | ||||||||||
| U.S. Real Estate Operating Companies | 19,295,656 | — | 100,965,259 | — | 120,260,915 | |||||||||||||||
| Purchases | ||||||||||||||||||||
| Non-U.S. Real Estate Operating Companies | — | 14,407,763 | — | — | 14,407,763 | |||||||||||||||
| Payment-in-kind | ||||||||||||||||||||
| Non-U.S. Real Estate Operating Companies | — | — | — | 291,537 | 291,537 | |||||||||||||||
| Net change in unrealized gain/(loss) | ||||||||||||||||||||
| Non-U.S. Real Estate Operating Companies | — | (10,314,421 | ) | — | (415,607 | ) | (10,730,028 | ) | ||||||||||||
| U.S. Real Estate Operating Companies | 614,332 | — | 9,014,755 | — | 9,629,087 | |||||||||||||||
| Balance as of 10/31/15 (fair value) | ||||||||||||||||||||
| Non-U.S. Real Estate Operating Companies | — | 38,086,911 | — | 3,213,452 | 41,300,363 | |||||||||||||||
| U.S. Real Estate Operating Companies | 19,909,988 | — | 109,980,014 | — | 129,890,002 | |||||||||||||||
| Total | $ | 19,909,988 | $ | 38,086,911 | $ | 109,980,014 | $ | 3,213,452 | $ | 171,190,365 | ||||||||||
| Net change in unrealized gain/(loss) related to securities still held as of October 31, 2015: | ||||||||||||||||||||
| $ | 614,332 | $ | (10,314,421 | ) | $ | 9,014,755 | $ | (415,607 | ) | $ | (1,100,941 | ) | ||||||||
| 60 |
Third Avenue Trust
Notes to Financial Statements (continued)
October 31, 2015
Third Avenue Focused Credit Fund
| Preferred and | ||||||||||||||||||||||||
| Convertible | Private | |||||||||||||||||||||||
| Corporate | Common Stocks | Preferred | Equities | |||||||||||||||||||||
| Bonds & Notes | Term Loans | and Warrants | Stocks | and Claims | Total | |||||||||||||||||||
| Balance as of 10/31/14 (fair value) | ||||||||||||||||||||||||
| Automotive | $ | — | $ | — | $ | — | $ | — | $ | 10,625,000 | (c) | $ | 10,625,000 | |||||||||||
| Chemicals | — | 57,938,000 | 71,883,570 | — | — | 129,821,570 | ||||||||||||||||||
| Consumer Products | 61,765,296 | — | — | — | 4,354,901 | (c) | 66,120,197 | |||||||||||||||||
| Energy | 22,979,360 | * | 40,703,101 | 21,193,777 | * | 3,120,358 | (a) | 1,043,306 | (c) | 89,039,902 | ||||||||||||||
| Financials | — | 2,147,439 | — | 21,642,730 | (a) | — | 23,790,169 | |||||||||||||||||
| Food & Beverage | — | — | — | — | 9,431,221 | *(d) | 9,431,221 | |||||||||||||||||
| Gaming & Entertainment | — | 19,600,000 | — | — | — | 19,600,000 | ||||||||||||||||||
| Healthcare | — | 21,296,632 | — | — | — | 21,296,632 | ||||||||||||||||||
| Media/Cable | — | * | — | — | — | — | — | |||||||||||||||||
| Metals & Mining | 41,652,303 | — | — | — | — | 41,652,303 | ||||||||||||||||||
| Services | — | — | 1,005,503 | — | — | 1,005,503 | ||||||||||||||||||
| Technology | 4,358,290 | — | — | — | — | 4,358,290 | ||||||||||||||||||
| Transportation Services | — | — | 4,533,288 | 15,623,470 | (b) | — | 20,156,758 | |||||||||||||||||
| Utilities | — | 70,353,585 | — | — | — | 70,353,585 | ||||||||||||||||||
| Transfer in/(out) of Level 3^ | ||||||||||||||||||||||||
| Chemicals | 65,009,764 | — | — | — | — | 65,009,764 | ||||||||||||||||||
| Metals & Mining | (41,652,303 | ) | — | — | — | — | (41,652,303 | ) | ||||||||||||||||
| Transportation Services | — | — | (4,533,288 | ) | (15,623,470 | )(b) | — | (20,156,758 | ) | |||||||||||||||
| Purchases | ||||||||||||||||||||||||
| Chemicals | — | 7,960,860 | — | — | 9,965,778 | (c) | 17,926,638 | |||||||||||||||||
| Energy | — | 13,418,141 | 26,615,862 | — | — | 40,034,003 | ||||||||||||||||||
| Gaming & Entertainment | — | 17,345,653 | — | — | — | 17,345,653 | ||||||||||||||||||
| Manufacturing | 59,101,778 | 23,750,000 | 1,743,600 | † | — | — | 84,595,378 | |||||||||||||||||
| Services | 33,658,828 | † | — | 24,230,163 | 8,267,095 | (b) | — | 66,156,086 | ||||||||||||||||
| Utilities | — | 5,066,895 | — | — | — | 5,066,895 | ||||||||||||||||||
| Sales | ||||||||||||||||||||||||
| Chemicals | (49,798,790 | ) | (57,872,500 | ) | (41,699,641 | ) | — | — | (149,370,931 | ) | ||||||||||||||
| Consumer Products | (5,236,445 | ) | — | — | — | — | (5,236,445 | ) | ||||||||||||||||
| Energy | (10,554,360 | ) | (37,975,176 | ) | — | — | — | (48,529,536 | ) | |||||||||||||||
| Financials | — | — | — | (15,805,148 | )(a) | — | (15,805,148 | ) | ||||||||||||||||
| Food & Beverage | — | — | — | — | (14,819,694 | )‡(d) | (14,819,694 | ) | ||||||||||||||||
| Gaming & Entertainment | — | (20,635,716 | ) | — | — | — | (20,635,716 | ) | ||||||||||||||||
| Healthcare | — | (22,106,044 | ) | — | — | — | (22,106,044 | ) | ||||||||||||||||
| Manufacturing | (12,858,000 | ) | (2,650,000 | ) | — | — | — | (15,508,000 | ) | |||||||||||||||
| Utilities | — | (56,661,553 | ) | — | — | — | (56,661,553 | ) | ||||||||||||||||
| Bond discount/(premium) | ||||||||||||||||||||||||
| Chemicals | (115,161 | ) | 511,688 | — | — | — | 396,527 | |||||||||||||||||
| Consumer Products | 1,681,829 | — | — | — | — | 1,681,829 | ||||||||||||||||||
| Energy | 91,881 | 491,672 | — | — | — | 583,553 | ||||||||||||||||||
| Gaming & Entertainment | — | 99,179 | — | — | — | 99,179 | ||||||||||||||||||
| Healthcare | — | 210,349 | — | — | — | 210,349 | ||||||||||||||||||
| Manufacturing | 23,780 | 56,594 | — | — | — | 80,374 | ||||||||||||||||||
| Payment-in-kind | ||||||||||||||||||||||||
| Chemicals | — | 455,422 | — | — | — | 455,422 | ||||||||||||||||||
| Consumer Products | 11,145,232 | — | — | — | — | 11,145,232 | ||||||||||||||||||
| Energy | — | 1,660,049 | — | — | — | 1,660,049 | ||||||||||||||||||
| Financials | — | 188,740 | — | — | — | 188,740 | ||||||||||||||||||
| Healthcare | — | 161,871 | — | — | — | 161,871 | ||||||||||||||||||
| Manufacturing | 2,281,986 | — | — | — | — | 2,281,986 | ||||||||||||||||||
| Return of capital | ||||||||||||||||||||||||
| Energy | — | — | (261,000 | ) | — | — | (261,000 | ) | ||||||||||||||||
| Food & Beverage | — | — | — | — | (497,284 | )(d) | (497,284 | ) | ||||||||||||||||
| Net change in unrealized gain/(loss) | ||||||||||||||||||||||||
| Automotive | — | — | — | — | (6,375,000 | )(c) | (6,375,000 | ) | ||||||||||||||||
| Chemicals | 5,180,070 | (3,126,794 | ) | 5,298,157 | — | 4,677,942 | (c) | 12,029,375 | ||||||||||||||||
| 61 |
Third Avenue Trust
Notes to Financial Statements (continued)
October 31, 2015
Third Avenue Focused Credit Fund (continued)
| Preferred and | ||||||||||||||||||||||||
| Convertible | Private | |||||||||||||||||||||||
| Corporate | Common Stocks | Preferred | Equities | |||||||||||||||||||||
| Bonds & Notes | Term Loans | and Warrants | Stocks | and Claims | Total | |||||||||||||||||||
| Consumer Products | $ | (2,075,488 | ) | $ | — | $ | — | $ | — | $ | 2,509,144 | (c) | $ | 433,656 | ||||||||||
| Energy | 998,254 | (8,014,798 | ) | (31,055,629 | ) | (976,515 | )(a) | (555,537 | )(c) | (39,604,225 | ) | |||||||||||||
| Financials | — | (268,544 | ) | — | (4,117,086 | )(a) | — | (4,385,630 | ) | |||||||||||||||
| Food & Beverage | — | — | — | — | 21,364,846 | (d) | 21,364,846 | |||||||||||||||||
| Gaming & Entertainment | — | 137,480 | — | — | — | 137,480 | ||||||||||||||||||
| Healthcare | — | (49,083 | ) | — | — | — | (49,083 | ) | ||||||||||||||||
| Manufacturing | 409,442 | (439,857 | ) | 20,038,761 | — | — | 20,008,346 | |||||||||||||||||
| Services | — | — | (24,172,128 | ) | (7,912,072 | )(b) | — | (32,084,200 | ) | |||||||||||||||
| Technology | (1,124,720 | ) | — | — | — | — | (1,124,720 | ) | ||||||||||||||||
| Utilities | — | (4,868,956 | ) | — | — | — | (4,868,956 | ) | ||||||||||||||||
| Net realized gain/(loss) | ||||||||||||||||||||||||
| Chemicals | (20,275,883 | ) | 3,123,246 | (35,482,086 | ) | — | — | (52,634,723 | ) | |||||||||||||||
| Consumer Products | (107,281 | ) | — | — | — | — | (107,281 | ) | ||||||||||||||||
| Energy | (13,515,135 | ) | (2,483,257 | ) | — | — | — | (15,998,392 | ) | |||||||||||||||
| Financials | — | — | — | (1,720,496 | )(a) | — | (1,720,496 | ) | ||||||||||||||||
| Food & Beverage | — | — | — | — | (15,479,089 | )(d) | (15,479,089 | ) | ||||||||||||||||
| Gaming & Entertainment | — | 179,355 | — | — | — | 179,355 | ||||||||||||||||||
| Healthcare | — | 486,275 | — | — | — | 486,275 | ||||||||||||||||||
| Manufacturing | — | (20,482 | ) | — | — | — | (20,482 | ) | ||||||||||||||||
| Utilities | — | (13,889,971 | ) | — | — | — | (13,889,971 | ) | ||||||||||||||||
| Balance as of 10/31/15 (fair value) | ||||||||||||||||||||||||
| Automotive | — | — | — | — | 4,250,000 | (c) | 4,250,000 | |||||||||||||||||
| Chemicals | — | * | 8,989,922 | — | — | 14,643,720 | (c) | 23,633,642 | ||||||||||||||||
| Consumer Products | 67,173,143 | — | — | — | 6,864,045 | (c) | 74,037,188 | |||||||||||||||||
| Energy | — | * | 7,799,732 | 16,493,010 | * | 2,143,843 | (a) | 487,769 | (c) | 26,924,354 | ||||||||||||||
| Financials | — | 2,067,635 | — | — | — | 2,067,635 | ||||||||||||||||||
| Food & Beverage | — | — | — | — | — | — | ||||||||||||||||||
| Gaming & Entertainment | — | 16,725,951 | — | — | — | 16,725,951 | ||||||||||||||||||
| Healthcare | — | — | — | — | — | — | ||||||||||||||||||
| Manufacturing | 48,958,986 | 20,696,255 | 21,782,361 | * | — | — | 91,437,602 | |||||||||||||||||
| Media/Cable | — | * | — | — | — | — | — | |||||||||||||||||
| Metals & Mining | — | — | — | — | — | — | ||||||||||||||||||
| Services | 33,658,828 | * | — | 1,063,538 | * | 355,023 | (b) | — | 35,077,389 | |||||||||||||||
| Technology | 3,233,570 | — | — | — | — | 3,233,570 | ||||||||||||||||||
| Transportation Services | — | — | — | — | — | — | ||||||||||||||||||
| Utilities | — | — | — | — | — | — | ||||||||||||||||||
| Total | $ | 153,024,527 | $ | 56,279,495 | $ | 39,338,909 | $ | 2,498,866 | $ | 26,245,534 | $ | 277,387,331 | ||||||||||||
| Net change in unrealized gain/(loss) related to securities still held as of October 31, 2015: | ||||||||||||||||||||||||
| $ | 2,389,304 | $ | (11,117,563 | ) | $ | (35,188,996 | ) | $ | (8,888,587 | ) | $ | 256,549 | $ | (52,549,293 | ) | |||||||||
| ^ | Transfers in/out of level 3 are recorded utilizing values as of the beginning of the period. The transfers are due to increase/decrease in trading activities at period end. |
| * | Includes investments fair valued at zero. |
| † | Investments acquired through corporate actions with zero cost. |
| ‡ | Includes investments sold with $0 proceeds. |
| (a) | Preferred Stocks |
| (b) | Convertible Preferred Stocks |
| (c) | Private Equities |
| (d) | Claims |
| 62 |
Third Avenue Trust
Notes to Financial Statements (continued)
October 31, 2015
Quantitative Information about Level 3 Fair Value Measurements
(amounts in thousands)
| Third Avenue Value Fund | Fair Value at 10/31/15 | Valuation Technique(s) | Unobservable Inputs(s) | Range (Weighted Average) | ||||||
| Corporate Bonds | $15,069 | Book Value | Restructuring value | $66.05 | ||||||
| Other (b) | 424 | |||||||||
| $15,493 | ||||||||||
| Third Avenue Real Estate Value Fund | Fair Value at 10/31/15 | Valuation Technique(s) | Unobservable Inputs(s) | Range (Weighted Average) | ||||||
| Private Equities | $109,980 | Broker Quote | # | $3.81 | ||||||
| Preferred Stocks | 38,087 | Broker Quote | # | $129.21 | ||||||
| Common Stocks | 19,910 | Option Pricing Model (a) | Share volatility | 1.52%(N/A) | ||||||
| Term Loans | 3,213 | Book Value | Restructuring value | $109.96-$109.98 | ||||||
| $171,190 | ||||||||||
| Third Avenue Focused Credit Fund | Fair Value at 10/31/15 | Valuation Technique(s) | Unobservable Inputs(s) | Range (Weighted Average) | ||||||
| Corporate Bonds | $149,791 | Book Value | Restructuring value | 1.0x (1.0x) | ||||||
| Common Stocks | 38,150 | Book Value | Restructuring value | $1.62-$67,203.55 | ||||||
| Term Loans | 37,422 | Broker Quote | # | $93.25-$96.00 | ||||||
| Private Equities | 21,996 | Book Value | Restructuring value | $0.00*-$504.00 | ||||||
| Term Loans | 18,857 | Book Value | Restructuring value | $50.00-$109.97 | ||||||
| Private Equities | 4,250 | Broker Quote | # | $0.43 | ||||||
| Corporate Bonds | 3,234 | Broker Quote | # | $11.50 | ||||||
| Preferred Stocks | 2,144 | Book Value | Restructuring value | $1.91 | ||||||
| Common Stocks | 1,189 | Broker Quote | # | $0.01-$25.00 | ||||||
| Other(b) | 354 | |||||||||
| $277,387 | ||||||||||
| # | Valuation techniques and significant unobservable inputs used by third-party pricing vendors or brokers, which are described in Note 1, were not provided to the Adviser. The appropriateness of fair values for these securities is based on results of back testing, broker due diligence, unchanged price review and consideration of macro or security specific events. |
| (a) | Represents amounts used when the reporting entity has determined that market participants would take into account premiums and discounts, as applicable, when pricing the investments. |
| (b) | Includes securities less than 0.50% of net assets within each respective Fund. |
| * | Amount less than $0.01. |
| The significant unobservable inputs used in the fair value measurement of the Funds’ investments are listed above. Generally, a change in the assumptions used in any input in isolation may be accompanied by a change in another input. Significant changes in any of the unobservable inputs may significantly impact the fair value measurement. The impact is based on the relationship between each unobservable input and the fair value measurement. Significant increases (decreases) in enterprise multiples may increase (decrease) the fair value measurement. Significant increases (decreases) in the discount for marketability may decrease (increase) the fair value measurement. |
Security transactions and investment income:
Security transactions for financial statement purposes are accounted for on a trade date basis. Dividend income is recorded on the ex-dividend date or, for certain foreign dividends, as soon as the Funds become aware of the dividends. Interest income is determined on the basis of coupon interest accrued using the effective interest method which adjusts for amortization of premiums and accretion of discounts. Dividend income on the Statement of Operations are shown net of any foreign taxes withheld on income from foreign securities. Payments received from certain investments held by the Funds may be comprised of dividends, capital gains and return of capital. The Funds originally estimate the expected classification of such payments. These amounts may subsequently be reclassified upon receipt of information from the issuer. Realized gains and losses from securities transactions are recorded on an identified cost basis.
Foreign currency translation and foreign investments:
The books and records of the Funds are maintained in U.S. dollars. Foreign currency amounts are translated into U.S. dollars as follows:
| • | Investments and assets and liabilities denominated in foreign currencies: At the prevailing rates of exchange on the valuation date. | |
| • | Investment transactions and investment income: At the prevailing rates of exchange on the date of such transactions. |
The net assets of the Funds are presented at market values using the foreign exchange rates at the close of the period. The Funds do not generally isolate that portion of the results of operations arising as a result of changes in the foreign exchange rates from the fluctuations arising from changes in the market prices of the investments held.
Similarly, the Funds do not isolate the effect of changes in foreign exchange rates from the fluctuations arising from changes in the market prices of investments sold during the period. Accordingly, realized and unrealized foreign currency gains/(losses) are included in the reported net realized.
| 63 |
Third Avenue Trust
Notes to Financial Statements (continued)
October 31, 2015
gain/(loss) and unrealized appreciation/(depreciation) on investments transactions and balances.
Net realized gains/(losses) on foreign currency transactions represent net foreign exchange gains/(losses) from foreign currency exchange contracts, disposition of foreign currencies, currency gains or losses realized between the trade and settlement dates on securities transactions, and the difference between the amount of investment income and foreign withholding taxes recorded on the Funds’ books and the U.S. dollar equivalent amounts actually received or paid. Net unrealized currency gains/(losses) from valuing foreign currency denominated assets and liabilities at period end exchange rates are reflected as a component of net unrealized appreciation/(depreciation) on the Statement of Assets and Liabilities. The change in net unrealized currency gains/(losses) for the period is reflected on the Statement of Operations.
Pursuant to U.S. federal income tax regulations, gains and losses from certain foreign currency transactions and the foreign currency portion of gains and losses realized on sales and maturities of foreign denominated debt securities are generally treated as ordinary income.
Payment-in-kind securities:
The Funds may invest in payment-in-kind securities (“PIKs”). PIKs give the issuer the option at each interest payment date of making interest payments in either cash or additional debt securities. Those additional debt securities usually have the same terms, including maturity dates and interest rates, and associated risks as the original bonds. The daily market quotations of the original bonds may include the accrued interest (referred to as a “dirty” price) and require a pro-rata adjustment from the unrealized appreciation or depreciation on investments to interest receivable on the Statement of Assets and Liabilities.
For the year ended October 31, 2015, the total in-kind payments with respect to PIK securities that were received by the Third Avenue Value Fund and the Third Avenue Focused Credit Fund in the amounts of $1,309,659 or 3.69% of total investment income and $57,452,521 or 25.50% of total investment income, respectively, are shown as a separate line item on the Statement of Operations.
Term loans:
The Funds typically invest in loans which are structured and administered by a third party entity (the “Agent”) that acts on behalf of a group of lenders that make or hold interests in the loan. These securities generally pay interest at rates which are periodically pre-determined by reference to a base lending rate plus a premium. These base lending rates are generally either the lending rate offered by one or more major European banks, such as the London Interbank Offered Rate (“LIBOR”) or the prime rate offered by one or more major United States banks, or the certificate of deposit rate.
These securities are generally considered to be restricted, as the Funds are ordinarily contractually obligated to receive approval from the Agent bank and/or borrower prior to disposition. Remaining maturities of term loans may be less than the stated maturities shown as a result of contractual or optional payments by the borrower. Such prepayments cannot be predicted with certainty. The interest rate disclosed reflects the rate in effect on October 31, 2015.
Forward foreign currency contracts:
The Funds may be exposed to foreign currency risks associated with portfolio investments and therefore may use forward foreign currency contracts to hedge or manage these exposures. The Funds also may buy forward foreign currency contracts to gain exposure to currencies. Forward foreign currency contracts are valued at the forward rate and are marked-to-market daily. The change in market value is included in unrealized appreciation/(depreciation) on investments and foreign currency translations. When the contract is closed, the Funds record a realized gain or loss equal to the difference between the value of the contract at the time it was opened and the value at the time it was closed.
The use of forward foreign currency contracts does not eliminate fluctuations in the underlying prices of the Funds’ portfolio securities, but it does establish a rate of exchange that can be achieved in the future. Although forward foreign currency contracts limit the risk of loss due to a decline in the value of the hedged currency, they also limit any potential gain that might result should the value of the currency increase. In addition, the Funds could be exposed to risks if the counterparties to the contracts are unable to meet the terms of their contracts.
During the year ended October 31, 2015, Third Avenue Real Estate Value Fund and Third Avenue Focused Credit Fund used forward foreign currency contracts for hedging against foreign currency risks.
Option contracts:
The Funds may purchase and sell (“write”) put and call options on various instruments including investments, indices, and foreign currency to manage and hedge exchange rate risks within their portfolios and also to gain long or short exposure to the underlying instruments.
An option contract gives the buyer the right, but not the obligation, to buy (call) or sell (put) an underlying item at a fixed exercise price on a certain date or during a specified period. The cost of the underlying instruments acquired through the exercise of a call option is increased by the premiums paid. The proceeds from the underlying instruments sold through the exercise of a purchased put option are decreased by the premiums paid.
| 64 |
Third Avenue Trust
Notes to Financial Statements (continued)
October 31, 2015
Investments in over-the-counter option contracts require the Funds to fair value or mark-to market the options on a daily basis, which reflects the change in the market value of the contracts at the close of each day’s trading. The cost of purchased options that expire unexercised are treated by the Funds, on expiration date, as realized losses on investments or foreign currency transactions.
When the Funds write an option, an amount equal to the premium received by the Funds is recorded as a liability and is subsequently adjusted to the current fair value of the option written. Premiums received from writing options that expire unexercised are treated by the Funds, on the expiration date, as realized gains on written options or foreign currency. The difference between the premium and the amount paid on effecting a closing purchase transaction, including brokerage commissions, is also treated as a realized gain, or, if the premium is less than the amount paid for the closing purchase transaction, as a realized loss. If a call option is exercised, the premium is added to the proceeds from the sale of the underlying security or currency in determining whether the Funds have a realized gain or loss. If a put option is exercised, the premium reduces the cost basis of the security or currency purchased by the Funds. In purchasing and writing options, the Funds bear the market risk of an unfavorable change in the price of the underlying security or the risk that the Funds may not be able to enter into a closing transaction due to an illiquid market. Exercise of a written option could result in the Funds purchasing a security or currency at a price different from the current market value. The Funds may execute transactions in both listed and over-the-counter options. Listed options involve minimal counterparty risk since listed options are guaranteed against default by the exchange on which they trade. When purchasing over-the-counter options, the Funds bear the risk of economic loss from counterparty default, equal to the market value of the option.
During the year ended October 31, 2015, Third Avenue Real Estate Value Fund used purchased options on foreign currency for hedging purposes and/or to protect against losses in foreign currencies.
During the year ended October 31, 2015, Third Avenue Value Fund used written put and call options on equities to gain long exposure to the underlying instruments and enhance the yield of the Fund. Third Avenue Real Estate Value Fund used written call options on foreign currency for hedging purposes and written put options on equities to gain long exposure to the underlying instruments. As of October 31, 2015, the Third Avenue Real Estate Value Fund no longer held any written options on equities.
Summary of derivatives information:
The following tables present the value of derivatives held as of October 31, 2015, by their primary underlying risk exposure and respective location on the Statements of Assets and Liabilities:
Third Avenue Value Fund
| Statement of Assets and | ||||||
| Derivative Contract | Liabilities Locations | Options | ||||
| Liabilties: | ||||||
| Equity contracts | Written equity options at value | $(215,628) | ||||
Third Avenue Real Estate Value Fund
| Derivative Contract | Statement of Assets and Liabilities Locations | Options | Forward Foreign Currency Contracts | ||||||||
| Assets: | |||||||||||
| Foreign currency contracts | Purchased foreign currency options | $ | 2,351,840 | $ | — | ||||||
| Foreign currency contracts | Unrealized appreciation for forward foreign currency contracts | — | 1,813,500 | ||||||||
| Total | $ | 2,351,840 | $ | 1,813,500 | |||||||
| Liabilties: | |||||||||||
| Foreign currency contracts | Written foreign currency options at value | $ | (70,790 | ) | |||||||
Third Avenue Focused Credit Fund
| Derivative Contract | Statement of Assets and Liabilities Locations | Forward Foreign Currency Contracts | ||
| Assets: | ||||
| Foreign currency contracts | Unrealized appreciation for forward foreign currency contracts | $953,281 |
| 65 |
Third Avenue Trust
Notes to Financial Statements (continued)
October 31, 2015
The following tables present the effect of derivatives on the Statement of Operations during the year ended October 31, 2015, by primary risk exposure:
Third Avenue Value Fund
| Amount of Realized Gain/(Loss) on Derivatives Recognized in Income | ||||
| Written | ||||
| Derivative Contract | Options | |||
| Equity contracts | $315,500(b) | |||
| Amount of Change in Unrealized Appreciation/(Depreciation) on Derivatives Recognized in Income | ||||
| Written | ||||
| Derivative Contract | Options | |||
| Equity contracts | $(110,166)(a) | |||
Third Avenue Real Estate Value Fund
| Amount of Realized Gain/(Loss) on Derivatives Recognized in Income | ||||||||||||||||
| Derivative Contract | Purchased Options | Written Options | Forward Foreign Currency Contracts | Total | ||||||||||||
| Equity Contracts | $ | — | $ | 1,892,007 | (b) | $ | — | $ | 1,892,007 | |||||||
| Foreign currency contracts | 4,842,325 | (c) | 3,881,775 | (c) | 37,803,263 | (c) | 46,527,363 | |||||||||
| Total | $ | 4,842,325 | $ | 5,773,782 | $ | 37,803,263 | $ | 48,419,370 | ||||||||
| Amount of Change in Unrealized Appreciation/(Depreciation) on Derivatives Recognized in Income | ||||||||||||||||
| Derivative Contract | Purchased Options | Written Options | Forward Foreign Currency Contracts | Total | ||||||||||||
| Equity Contracts | $ | — | $ | (1,726,607 | )(a) | $ | — | $ | (1,726,607 | ) | ||||||
| Foreign currency contracts | (835,338 | )(d) | 14,315 | (d) | (390,318 | )(d) | (1,211,341 | ) | ||||||||
| Total | $ | (835,338 | ) | $ | (1,712,292 | ) | $ | (390,318 | ) | $ | (2,937,948 | ) | ||||
Third Avenue Focused Credit Fund
| Amount of Realized Gain/(Loss) on Derivatives Recognized in Income | ||
| Forward Foreign | ||
| Derivative Contract | Currency Contracts | |
| Foreign currency contracts | $31,318,369(c) | |
| Amount of Change in Unrealized Appreciation/(Depreciation) on Derivatives Recognized in Income | ||
| Forward Foreign | ||
| Derivative Contract | Currency Contracts | |
| Foreign currency contracts | $(1,181,487)(d) |
| (a) | Included in “Net change in unrealized depreciation on written equity options”. |
| (b) | Included in “Net realized gain on written equity options”. |
| (c) | Included in “Net realized gain/(loss) on foreign currency transactions”. |
| (d) | Included in “Net change in unrealized appreciation/(depreciation) on translation of other assets and liabilities denominated in foreign currency” |
| 66 |
Third Avenue Trust
Notes to Financial Statements (continued)
October 31, 2015
Derivatives volume:
The tables below disclose the volume of the Funds’ forward foreign currency contracts and options activities during the year ended October 31, 2015 (amounts denominated in U.S. Dollars unless otherwise noted, except number of contracts). Please refer to the tables in the Summary of derivatives information for derivative-related gains and losses associated with volume activity (measured at each month-end).
| Third Avenue Value Fund | Third Avenue Real Estate Value Fund | Third Avenue Focused Credit Fund | ||||||||||
| Exchange Traded and OTC Equity Options: | ||||||||||||
| Average Ending Value Written | 32,433 | 12,723 | — | |||||||||
| Foreign Currency Options: | ||||||||||||
| Average Notional Balance Purchased | — | 89,646,154 | AUD | — | ||||||||
| Average Notional Balance Purchased | — | 116,923,077 | — | |||||||||
| Average Notional Balance Written | — | 89,646,154 | AUD | — | ||||||||
| Forward Foreign Currency Contracts: | ||||||||||||
| Average Settlement Value Purchased | — | — | 2,636,312 | |||||||||
| Average Settlement Value Sold | — | 283,285,219 | 196,055,690 |
AUD: Australian Dollar
Floating rate obligations:
The Funds may invest in debt securities with interest payments or maturity values that are not fixed, but float in conjunction with an underlying index or price. These securities may be backed by corporate issuers. The indices and prices upon which such securities can be based include interest rates and currency rates. Floating rate securities pay interest according to a coupon which is reset periodically.
Dividends and distributions to shareholders:
The amount of dividends and distributions paid to shareholders from net investment income and net realized capital gains on disposition of securities, respectively are determined in accordance with U.S. federal income tax law and regulations which may differ from U.S. GAAP. Such dividends and distributions are recorded on the ex-dividend date. The majority of dividends and capital gains distributions from a Fund may be automatically reinvested into additional shares of that Fund, based upon the discretion of the Fund’s shareholders.
Income tax information:
The Funds have complied and intend to continue to comply with the requirements of the Internal Revenue Code applicable to regulated investment companies, and each Fund intends to distribute all of its taxable net investment income and net realized capital gains, if any, to its shareholders. Therefore, no provision for U.S. federal income taxes is included on the accompanying financial statements.
Income, including capital gains, from investments in foreign securities received by the Funds may be subject to income, withholding or other taxes imposed by foreign countries.
Management has analyzed the tax positions taken on the Funds’ U.S. federal income tax returns for all open tax years (generally the current and prior three tax years), and has concluded that no provision for U.S. federal income tax is required in the Funds’ financial statements. This conclusion may be subject to future review and adjustment at a later date based upon factors including, but not limited to, on-going analyses of and changes to tax laws, regulations and interpretations thereof. The Funds are subject to possible examination by the relevant taxing authorities for tax years for which the applicable statutes of limitations have not expired.
Expense allocation:
Expenses attributable to a specific Fund are charged to that Fund. Expenses attributable to the Trust are generally allocated using the ratio of each Fund’s average net assets relative to the total average net assets of the Trust. Certain expenses are shared with Third Avenue Variable Series Trust, an affiliated fund group. Such costs are allocated using the ratio of the Funds’ average net assets relative to the total average net assets of the Funds and Third Avenue Variable Series Trust.
Share class accounting:
Investment income, common expenses and realized/unrealized gains/(losses) on investments are allocated to the two classes of shares of each Fund on the basis of daily net assets of each class. Fees relating to a specific class are charged directly to that share class.
| 67 |
Third Avenue Trust
Notes to Financial Statements (continued)
October 31, 2015
Trustees’ and officers’ fees:
The Trust does not pay any fees to its officers for their services as such, except for the Chief Compliance Officer and the Associate Director of Compliance, to whom the Trust paid $343,684 for the year ended October 31, 2015. The Trust does pay, together with Third Avenue Variable Series Trust, Trustees a fee of $5,000 for each meeting of the Board that each Trustee attends, in addition to reimbursing all Trustees for travel and incidental expenses incurred by them in connection with their attendance at meetings. If a special meeting is required, Trustees will each receive $2,500. The Trust, together with Third Avenue Variable Series Trust, also pays each independent Trustee an annual retainer of $65,000 (the lead independent Trustee receives an additional retainer of $12,000). The Trustees on the Audit Committee each receive $2,000 for each audit committee meeting and the audit committee chairman receives an annual retainer of $6,000.
2. INVESTMENTS
Purchases and sales/conversions:
The aggregate cost of purchases and aggregate proceeds from sales and conversions of investments, excluding short-term investments, from unaffiliated and affiliated issuers (as defined in the Investment Company Act of 1940 as ownership of 5% or more of the outstanding voting securities of these issuers) for the year ended October 31, 2015 were as follows:
| Purchases | Sales | |||||||
| Third Avenue Value Fund | ||||||||
| Affiliated | $ | 1,309,659 | $ | 22,059,917 | ||||
| Unaffiliated | 434,917,454 | 803,341,297 | ||||||
| Third Avenue Small-Cap Value Fund | ||||||||
| Unaffiliated | 127,250,131 | 262,204,977 | ||||||
| Third Avenue Real Estate Value Fund | ||||||||
| Affiliated | 35,578,253 | — | ||||||
| Unaffiliated | 923,218,546 | 502,863,655 | ||||||
| Third Avenue International Value Fund | ||||||||
| Affiliated | — | 956,178 | ||||||
| Unaffiliated | 61,887,914 | 180,835,650 | ||||||
| Third Avenue Focused Credit Fund | ||||||||
| Affiliated | 321,382,996 | 128,419,484 | ||||||
| Unaffiliated | 568,124,927 | 1,749,456,717 |
Written options transactions during the period are summarized as follows:
Third Avenue Value Fund
| Equity Options Written | ||||||||
| Number of Contracts | Premiums Received | |||||||
| Options outstanding at October 31, 2014 | 2,000 | $ | 315,500 | |||||
| Options written | 3,171 | 214,962 | ||||||
| Options expired | (2,000 | ) | (315,500 | ) | ||||
| Options outstanding at October 31, 2015 | 3,171 | $ | 214,962 | |||||
| 68 |
Third Avenue Trust
Notes to Financial Statements (continued)
October 31, 2015
Third Avenue Real Estate Value Fund
| Currency Options Written | Equity Options Written | |||||||||||||||
| Notional Amount‡ | Premiums Received | Number of Contracts | Premiums Received | |||||||||||||
| Options outstanding at October 31, 2014 | 81,000,000 | $ | 634,536 | 14,000 | $ | 1,892,007 | ||||||||||
| Options written | 545,700,000 | 3,551,314 | — | — | ||||||||||||
| Options expired | (538,700,000 | ) | (3,881,775 | ) | (14,000 | ) | (1,892,007 | ) | ||||||||
| Options outstanding at October 31, 2015 | 88,000,000 | $ | 304,075 | — | $ | — | ||||||||||
| ‡ | In Australian Dollars. |
3. INVESTMENT ADVISORY SERVICES, ADMINISTRATION AND SERVICE FEE AGREEMENTS AND EXPENSE OFFSET ARRANGEMENT
Each Fund has an Investment Advisory Agreement with the Adviser for investment advice and certain management functions. The terms of the Investment Advisory Agreements provide the annual advisory fees based on the total average daily net assets for the Funds which are indicated as below. These fees are calculated daily and paid monthly.
| Annual | ||||
| Fund | Management Fee | |||
| Third Avenue Value Fund | 0.90% | |||
| Third Avenue Small-Cap Value Fund | 0.90% | |||
| Third Avenue Real Estate Value Fund | 0.90% | |||
| Third Avenue International Value Fund | 1.25% | |||
| Third Avenue Focused Credit Fund | 0.75% | |||
Additionally, the Adviser pays certain expenses on behalf of the Funds which are partially reimbursed by the Funds, including service fees due to third parties, the compensation expense for the Funds’ Chief Compliance Officer and Associate Director of Compliance and other miscellaneous expenses. At October 31, 2015, Third Avenue Value Fund, Third Avenue Small-Cap Value Fund, Third Avenue Real Estate Value Fund, Third Avenue International Value Fund and Third Avenue Focused Credit Fund had amounts payable to the Adviser of $14,176, $4,310, $21,790, $1,554 and $11,261, respectively, for reimbursement of expenses paid by the Adviser.
Until March 1, 2016 (subject to renewal), whenever each Fund’s normal operating expenses, including the investment advisory fee and most other operating expenses, but excluding taxes, interest, brokerage commissions, acquired fund fees and expenses, and extraordinary items, exceeds the expense limitation based on each Fund’s average daily net assets, the Adviser has agreed to waive a portion of its advisory fees and/or reimburse each Fund in an amount equal to that excess. The expense limitations for each Fund are disclosed in its corresponding Financial Highlights. Below are the corresponding contingent liabilities to the Adviser in effect as of October 31, 2015:
| Expenses Waived through Fiscal Periods ending | |||||||||||||||
| October 31, 2013 | October 31, 2014 | October 31, 2015 | |||||||||||||
| Subject to Repayment until October 31, | |||||||||||||||
| Fund | Expiration Date | 2016 | 2017 | 2018 | |||||||||||
| Third Avenue International Value Fund | 2/28/2016 | $ | 383,912 | $ | 517,819 | $ | 547,840 | ||||||||
The waived fees and reimbursed expenses may be paid to the Adviser during the following three-year period after the end of the fiscal year in which an expense is waived or reimbursed by the Adviser, to the extent that the payment of such fees and expenses would not cause a Fund to exceed the expense limitations.
The Trust has entered into an Administration Agreement with the Adviser pursuant to which the Adviser, as administrator, is responsible for providing various administrative services to the Trust. The Adviser has in turn entered into a Sub-Administration Agreement with BNY Mellon Investment Servicing (U.S.) Inc. (“BNY Mellon”) pursuant to which BNY Mellon provides certain of these administrative services on behalf of the Adviser. Each Fund pays the Adviser a fee calculated at an annual rate of 0.0055% of the average daily net assets of each respective Fund for such services. The Adviser pays BNY Mellon an annual sub-administration fee for sub-administration services provided to the Trust equal to $202,020.
| 69 |
Third Avenue Trust
Notes to Financial Statements (continued)
October 31, 2015
Both the Trust and the Adviser have entered into agreements with financial intermediaries to provide recordkeeping, processing, shareholder communications and other services to customers of the intermediaries investing in the Funds and have agreed to compensate the intermediaries for providing those services. Certain of those services would be provided by the Funds if the shares of each customer were registered directly with the Funds’ transfer agent. Accordingly, the Funds have agreed to reimburse a portion of the intermediary fees paid by the Adviser pursuant to provisions adopted by the Board. Each Fund pays a portion of the intermediary fees attributable to shares of the Fund not exceeding the estimated expense the Fund would have paid its transfer agent had each customer’s shares been registered directly with the transfer agent instead of held through the intermediary accounts. The Adviser pays the remainder of the fees. The fees incurred by the Funds are reflected as shareholder servicing fees in the Statements of Operations. For the year ended October 31, 2015, such fees amounted to $1,672,000 for Third Avenue Value Fund, $430,001 for Third Avenue Small-Cap Value Fund, $4,236,978 for Third Avenue Real Estate Value Fund, $312,000 for Third Avenue International Value Fund and $1,480,000 for Third Avenue Focused Credit Fund.
The Funds have an expense offset arrangement in connection with their custodian contract. Credits realized as a result of uninvested cash balances are used to reduce a portion of the Funds’ custodian expenses. The following amounts are the reduction of expenses due to this arrangement for the year ended October 31, 2015. These amounts are reflected as “Expenses reduced by custodian fee expense offset arrangement” in the Statements of Operations.
| Fund | Custody Credit | |||
| Third Avenue Value Fund | $ | 38,479 | ||
| Third Avenue Small-Cap Value Fund | 4,443 | |||
| Third Avenue Real Estate Value Fund | 105,613 | |||
| Third Avenue International Value Fund | 4,923 | |||
| Third Avenue Focused Credit Fund | 57,929 | |||
4. LINE OF CREDIT
Each Fund and Third Avenue Variable Series Trust are participants in a single committed, unsecured $100,000,000 line of credit with The Bank of Nova Scotia, to be used only for temporary or emergency purposes. The interest on the loan is calculated at a variable rate based on the LIBOR, Federal Funds or Prime Rates. A commitment fee of 0.25% per annum of the available line of credit is charged, of which each participating Fund and Third Avenue Variable Series Trust pays its pro rata share, based on the ratio of its individual net assets to the net assets of all participants at the time the fee is due and payable. The fee is paid quarterly in arrears and is included in “Miscellaneous” expenses in the Statement of Operations. Because all of the Funds in Third Avenue Trust and Third Avenue Variable Series Trust participate, there is no assurance that an individual Fund will have access to all or any part of the $100,000,000 at any particular time. During the year ended October 31, 2015, there were no loans outstanding under the line of credit.
5. RELATED PARTY TRANSACTIONS
Investment in affiliates:
A summary of the Funds’ transactions in securities of affiliated issuers for the year ended October 31, 2015 is set forth below:
Third Avenue Value Fund
| Name of Issuer: | Shares/ Principal Amount Held at Oct. 31, 2014 | Gross Purchases and Additions | Gross Sales and Reductions | Shares/ Principal Amount Held at Oct. 31, 2015 | Value at Oct. 31, 2015 | Investment Income Nov. 1, 2014- Oct. 31, 2015 | ||||||||||||||||||
| Cavco Industries, Inc. | 1,566,626 | — | 287,145 | 1,279,481 | $ | 126,156,827 | $ | — | ||||||||||||||||
| Home Products International, Inc. | 526,368 | — | — | 526,368 | — | — | ||||||||||||||||||
| Home Products International, Inc., 2nd Lien, Convertible, 6.000% Payment-in-kind Interest, due 3/20/17 | 21,505,076 | 1,309,659 | 1 | — | 22,814,735 | 15,069,133 | 1,309,659 | 1 | ||||||||||||||||
| Lai Sun Garment International, Ltd.* | 151,543,880 | — | 76,410,000 | 75,133,880 | 9,306,186 | 214,739 | ||||||||||||||||||
| Manifold Capital LLC | 37 | — | — | 37 | 389,302 | — | ||||||||||||||||||
| Tejon Ranch Co. | 1,221,894 | — | — | 1,221,894 | 27,529,272 | — | ||||||||||||||||||
| Tejon Ranch Co., Warrants, expire 8/31/16 | 200,255 | — | — | 200,255 | 23,159 | — | ||||||||||||||||||
| Total Affiliates | $ | 178,473,879 | $ | 1,524,398 | ||||||||||||||||||||
| 1 | Payment-in-kind interest. |
| * | As of October 31, 2015, no longer an affiliate. |
| 70 |
Third Avenue Trust
Notes to Financial Statements (continued)
October 31, 2015
Third Avenue Real Estate Value Fund
| Name of Issuer: | Shares/Units Held at Oct. 31, 2014 | Gross Purchases and Additions | Gross Sales and Reductions | Shares/Units Held at Oct. 31, 2015 | Value at Oct. 31, 2015 | Investment Income Nov. 1, 2014- Oct. 31, 2015 | ||||||||||||||||||
| First Industrial Realty Trust, Inc.** | 5,208,031 | 1,813,000 | — | 7,021,031 | $ | 152,215,952 | $ | 2,886,516 | ||||||||||||||||
| Newhall Holding Co. LLC, Class A Units | 28,847,217 | — | — | 28,847,217 | 109,980,014 | — | ||||||||||||||||||
| Starwood Waypoint Residential Trust* | 2,515,510 | — | 2,515,510 | — | — | 704,343 | ||||||||||||||||||
| Total Affiliates | $ | 262,195,966 | $ | 3,590,859 | ||||||||||||||||||||
| * | As of October 31, 2015, no longer an affiliate. |
| ** | As of October 31, 2014, not an affiliate. |
Third Avenue International Value Fund
| Name of Issuer: | Shares Held at Oct. 31, 2014 | Gross Purchases and Additions | Gross Sales and Reductions | Shares Held at Oct. 31, 2015 | Value at Oct. 31, 2015 | Investment Income Nov. 1, 2014- Oct. 31, 2015 | ||||||||||||||||||
| GP Investments, Ltd., BDR* | 6,054,307 | — | 6,054,307 | — | $ | ��� | $ | — | ||||||||||||||||
| Rubicon, Ltd. | 57,024,696 | — | 228,138 | 56,796,558 | 12,691,710 | — | ||||||||||||||||||
| Tenon, Ltd. | 10,350,426 | — | 599,528 | 9,750,898 | 18,487,869 | 331,281 | ||||||||||||||||||
| Total Affiliates | $ | 31,179,579 | $ | 331,281 | ||||||||||||||||||||
| BDR: | Brazilian Depositary Receipt |
| * | As of October 31, 2015, no longer an affiliate. |
Third Avenue Focused Credit Fund
| Name of Issuer: | Shares/ Principal Amount† Held at Oct. 31, 2014 | Gross Purchases and Additions | Gross Sales and Reductions | Shares/ Principal Amount† Held at Oct. 31, 2015 | Value at Oct. 31, 2015 | Investment Income Nov. 1, 2014- Oct. 31, 2015 | ||||||||||||||||||
| Altegrity, Inc., Escrow, due 7/1/20** | — | 36,181,786 | 1 | — | 36,181,786 | $ | — | $ | — | |||||||||||||||
| Altegrity, Inc., Escrow, due 7/1/20** | — | 120,047,350 | 1 | — | 120,047,350 | — | — | |||||||||||||||||
| Corporate Risk Holdings Corp.** | — | 31,594 | 1 | — | 31,594 | — | — | |||||||||||||||||
| Corporate Risk Holdings I, Inc.** | — | 6,248,652 | 1 | — | 6,248,652 | 89,043,291 | — | |||||||||||||||||
| Corporate Risk Holdings LLC, 11.500% Cash or 13.500% Payment-in-kind Interest, due 1/2/20** | — | 33,658,828 | 1 | — | 33,658,828 | 33,658,828 | 650,504 | |||||||||||||||||
| Global Geophysical Services, Inc.** | — | 3,786,564 | 1 | — | 3,786,564 | — | — | |||||||||||||||||
| Global Geophysical Services, Inc., Escrow, due 5/1/14** | — | 15,599,000 | 1 | — | 15,599,000 | — | — | |||||||||||||||||
| Global Geophysical Services, Inc., Escrow, due 5/1/17** | — | 45,925,000 | 1 | — | 45,925,000 | — | — | |||||||||||||||||
| Global Geophysical Services, Inc., Term Loan B, 15.500% Cash or Payment-in-kind Interest, due 8/9/17** | — | 15,599,464 | 2 | — | 15,599,464 | 7,799,732 | 1,729,407 | 4 | ||||||||||||||||
| Global Geophysical Services, Inc., Warrants** | — | 262,913 | 1 | — | 262,913 | — | — | |||||||||||||||||
| Ideal Standard International S.A., Series B, 11.750% Cash or 15.750% Payment-in-kind Interest, due 5/1/18** | 28,614,938 | EUR | 4,290,559 | 3,EUR | 5,000,000 | EUR | 27,905,497 | EUR | 30,686,288 | 5,411,045 | 4 | |||||||||||||
| Ideal Standard International S.A., Series C, 11.750% Cash or 17.750% Payment-in-kind Interest, due 5/1/18** | 27,991,455 | EUR | 5,188,961 | 3,EUR | — | 33,180,416 | EUR | 36,486,855 | 5,572,464 | 4 | ||||||||||||||
| Ideal Standard International Equity S.A. Alpecs** | 1,451,633,736,282 | — | — | 1,451,633,736,282 | 6,864,045 | 487,068 | ||||||||||||||||||
| Liberty Tire Recycling Holdco, LLC, Term Loan B, 9.000%, due 7/7/20** | — | 25,003,750 | 2,809,375 | 22,194,375 | 20,696,255 | — | ||||||||||||||||||
| Liberty Tire Recycling LLC, 2nd Lien, 11.000% Payment-in-kind Interest, due 3/31/21** | — | 61,816,986 | 2 | 12,858,000 | 48,958,986 | 48,958,986 | 4,033,070 | 4 | ||||||||||||||||
| Longview Intermediate Holdings C, LLC** | — | 4,550,000 | 1 | — | 4,550,000 | 38,675,000 | — | |||||||||||||||||
| LTR Holdings, Inc.** | — | 3,430,293 | 1 | — | 3,430,293 | 21,782,361 | — | |||||||||||||||||
| LTR Holdings, Inc., Warrants, expire 12/12/19** | — | 45,000 | 1 | — | 45,000 | — | — | |||||||||||||||||
| Phosphate Holdings, Inc. | 478,500 | — | — | 478,500 | 15,767 | — | ||||||||||||||||||
| Radio One, Inc., Class D | 2,311,360 | — | — | 2,311,360 | 4,969,424 | — | ||||||||||||||||||
| 71 |
Third Avenue Trust
Notes to Financial Statements (continued)
October 31, 2015
Third Avenue Focused Credit Fund
| Name of Issuer: | Shares/ Principal Amount† Held at Oct. 31, 2014 | Gross Purchases and Additions | Gross Sales and Reductions | Shares/ Principal Amount† Held at Oct. 31, 2015 | Value at Oct. 31, 2015 | Investment Income Nov. 1, 2014- Oct. 31, 2015 | ||||||||||||||||||
| Reichhold Cayman L.P.** | — | 29,055 | 1 | — | 29,055 | $ | 14,643,720 | $ | — | |||||||||||||||
| Reichhold Holdings International B.V., DIP Loan, 12.000% Cash or 14.000% Payment-in-kind Interest, due 3/31/17** | 33,388,000 | 6,256,438 | 2 | 35,222,712 | 5 | 4,421,726 | 4,421,726 | 1,888,616 | 4 | |||||||||||||||
| Reichhold Holdings International B.V., Term Loan, 15.000% Cash or Payment-in-kind Interest, due 3/31/17** | — | 2,667,984 | 2 | — | 2,667,984 | 2,667,984 | 268,850 | 4 | ||||||||||||||||
| Reichhold Industries, Inc., due 5/8/17** | 118,199,570 | — | 100,720,796 | 5 | 17,478,774 | — | — | |||||||||||||||||
| Reichhold LLC II, DIP Loan, 12.000% Cash or 14.000% Payment-in-kind Interest, due 3/31/17** | 24,550,000 | — | 22,649,788 | 5 | 1,900,212 | 1,900,212 | 1,072,353 | |||||||||||||||||
| Spanish Broadcasting System, Inc., Class A | 681,637 | — | — | 681,637 | 3,892,147 | — | ||||||||||||||||||
| Total Affiliates | $ | 367,162,621 | $ | 21,113,377 | ||||||||||||||||||||
| 1 | Amount increase due to corporate action. |
| 2 | Amount increase due to corporate action and payment-in-kind interest. |
| 3 | Payment-in-kind interest. |
| 4 | Include interest and payment-in-kind interest. |
| 5 | Amount decrease due to corporate action. |
| ** | As of October 31, 2014, not an affiliate. |
| † | Denominated in U.S. Dollars unless otherwise noted. |
| EUR | Euro |
Certain employees of the Adviser serve as members of the board of directors of companies in which the Funds have investments. As a result of such service, for the year ended October 31, 2015, the Funds received the following board member fees from these companies that board members employed by the Adviser agreed to have paid directly to the benefit of the Funds. These fees are included in “Other Income” on the accompanying Statements of Operations.
| Fund | Fees | |||
| Third Avenue Value Fund | $ | 101,645 | ||
| Third Avenue Real Estate Value Fund | 39,358 | |||
6. DISTRIBUTION EXPENSES
The Board has adopted a distribution plan (the “Plan”) pursuant to Rule 12b-1 under the Investment Company Act. The Plan provides that, as compensation for distribution and related services provided to Third Avenue Value Fund Investor Class (“TVFVX”), Third Avenue Small-Cap Value Fund Investor Class (“TVSVX”), Third Avenue Real Estate Value Fund Investor Class (“TVRVX”), Third Avenue International Value Fund Investor Class (“TVIVX”), and Third Avenue Focused Credit Fund Investor Class (“TFCVX”), each Fund’s Investor Class accrues a fee calculated at the annual rate of 0.25% of average daily net assets of the class. Such fees may be paid to institutions that provide distribution services. The amount of fees paid during any period may be more or less than the cost of distribution and other services provided. Financial Industry Regulatory Authority (“FINRA”) rules impose a ceiling on the cumulative distribution fees paid. The Plan complies with those rules.
For the year ended October 31, 2015, distribution expenses were as follows:
| Fund | Distribution Fees | |||
| Third Avenue Value Fund | $ | 82,201 | ||
| Third Avenue Small-Cap Value Fund | 25,171 | |||
| Third Avenue Real Estate Value Fund | 1,053,073 | |||
| Third Avenue International Value Fund | 19,593 | |||
| Third Avenue Focused Credit Fund | 1,680,121 | |||
7. CAPITAL SHARE TRANSACTIONS
Each Fund is authorized to issue an unlimited number of shares of each class of beneficial interest with $0.001 par value.
Transactions in capital stock of each class were as follows:
| 72 |
Third Avenue Trust
Notes to Financial Statements (continued)
October 31, 2015
Third Avenue Value Fund
| For the Year Ended October 31, 2015 | For the Year Ended October 31, 2014 | |||||||||||||||
| Investor Class | Investor Class | |||||||||||||||
| Shares | Amount | Shares | Amount | |||||||||||||
| Shares sold | 80,064 | $ | 4,564,619 | 128,958 | $ | 7,522,597 | ||||||||||
| Shares Issued upon reinvestment of dividends and distributions | 30,896 | 1,758,912 | 19,744 | 1,110,369 | ||||||||||||
| Shares redeemed* | (146,758 | ) | (8,205,313 | ) | (216,421 | ) | (12,890,194 | ) | ||||||||
| Net decrease | (35,798 | ) | $ | (1,881,782 | ) | (67,719 | ) | $ | (4,257,228 | ) | ||||||
| For the Year Ended October 31, 2015 | For the Year Ended October 31, 2014 | |||||||||||||||
| Institutional Class | Institutional Class | |||||||||||||||
| Shares | Amount | Shares | Amount | |||||||||||||
| Shares sold | 593,598 | $ | 33,445,497 | 1,394,237 | $ | 81,320,497 | ||||||||||
| Shares Issued upon reinvestment of dividends and distributions | 1,898,244 | 108,086,010 | 1,404,457 | 79,028,753 | ||||||||||||
| Shares redeemed* | (7,716,816 | ) | (437,794,891 | ) | (11,933,084 | ) | (703,200,517 | ) | ||||||||
| Net decrease | (5,224,974 | ) | $ | (296,263,384 | ) | (9,134,390 | ) | $ | (542,851,267 | ) | ||||||
| Third Avenue Small-Cap Value Fund | ||||||||||||||||
| For the Year Ended October 31, 2015 | For the Year Ended October 31, 2014 | |||||||||||||||
| Investor Class | Investor Class | |||||||||||||||
| Shares | Amount | Shares | Amount | |||||||||||||
| Shares sold | 97,876 | $ | 2,380,380 | 97,022 | $ | 2,676,320 | ||||||||||
| Shares Issued upon reinvestment of dividends and distributions | 88,642 | 2,021,921 | 27,798 | 749,981 | ||||||||||||
| Shares redeemed* | (116,738 | ) | (2,749,020 | ) | (200,461 | ) | (5,455,727 | ) | ||||||||
| Net increase(decrease) | 69,780 | $ | 1,653,281 | (75,641 | ) | $ | (2,029,426 | ) | ||||||||
| For the Year Ended October 31, 2015 | For the Year Ended October 31, 2014 | |||||||||||||||
| Institutional Class | Institutional Class | |||||||||||||||
| Shares | Amount | Shares | Amount | |||||||||||||
| Shares sold | 485,190 | $ | 11,425,840 | 665,083 | $ | 18,260,584 | ||||||||||
| Shares Issued upon reinvestment of dividends and distributions | 4,170,137 | 95,537,834 | 1,498,269 | 40,453,273 | ||||||||||||
| Shares redeemed* | (5,374,897 | ) | (126,795,093 | ) | (7,835,804 | ) | (215,396,119 | ) | ||||||||
| Net decrease | (719,570 | ) | $ | (19,831,419 | ) | (5,672,452 | ) | $ | (156,682,262 | ) | ||||||
| 73 |
Third Avenue Trust
Notes to Financial Statements (continued)
October 31, 2015
Third Avenue Real Estate Value Fund
| For the Year Ended October 31, 2015 | For the Year Ended October 31, 2014 | |||||||||||||||
| Investor Class | Investor Class | |||||||||||||||
| Shares | Amount | Shares | Amount | |||||||||||||
| Shares sold | 5,862,169 | $ | 186,764,845 | 9,071,471 | $ | 271,817,715 | ||||||||||
| Shares Issued upon reinvestment of dividends and distributions | 390,789 | 12,259,047 | 140,095 | 3,963,299 | ||||||||||||
| Shares redeemed* | (3,723,575 | ) | (117,704,165 | ) | (2,597,093 | ) | (79,984,262 | ) | ||||||||
| Net increase | 2,529,383 | $ | 81,319,727 | 6,614,473 | $ | 195,796,752 | ||||||||||
| For the Year Ended October 31, 2015 | For the Year Ended October 31, 2014 | |||||||||||||||
| Institutional Class | Institutional Class | |||||||||||||||
| Shares | Amount | Shares | Amount | |||||||||||||
| Shares sold | 27,069,838 | $ | 865,549,605 | 30,409,505 | $ | 934,896,558 | ||||||||||
| Shares Issued upon reinvestment of dividends and distributions | 2,983,065 | 94,026,227 | 1,608,740 | 45,704,316 | ||||||||||||
| Shares redeemed* | (23,007,435 | ) | (735,032,997 | ) | (10,577,919 | ) | (322,617,599 | ) | ||||||||
| Net increase | 7,045,468 | $ | 224,542,835 | 21,440,326 | $ | 657,983,275 | ||||||||||
| Third Avenue International Value Fund | ||||||||||||||||
| For the Year Ended October 31, 2015 | For the Year Ended October 31, 2014 | |||||||||||||||
| Investor Class | Investor Class | |||||||||||||||
| Shares | Amount | Shares | Amount | |||||||||||||
| Shares sold | 69,961 | $ | 1,137,094 | 308,783 | $ | 6,102,443 | ||||||||||
| Shares Issued upon reinvestment of dividends and distributions | 40,798 | 681,324 | 19,726 | 389,379 | ||||||||||||
| Shares redeemed* | (417,525 | ) | (6,921,918 | ) | (1,384,742 | ) | (27,293,669 | ) | ||||||||
| Net decrease | (306,766 | ) | $ | (5,103,500 | ) | (1,056,233 | ) | $ | (20,801,847 | ) | ||||||
| For the Year Ended October 31, 2015 | For the Year Ended October 31, 2014 | |||||||||||||||
| Institutional Class | Institutional Class | |||||||||||||||
| Shares | Amount | Shares | Amount | |||||||||||||
| Shares sold | 561,097 | $ | 9,172,035 | 2,308,070 | $ | 45,751,820 | ||||||||||
| Shares Issued upon reinvestment of dividends and distributions | 1,227,087 | 20,443,272 | 730,534 | 14,428,040 | ||||||||||||
| Shares redeemed* | (8,259,316 | ) | (136,252,544 | ) | (44,920,114 | ) | (872,331,104 | ) | ||||||||
| Net decrease | (6,471,132 | ) | $ | (106,637,237 | ) | (41,881,510 | ) | $ | (812,151,244 | ) | ||||||
| 74 |
Third Avenue Trust
Notes to Financial Statements (continued)
October 31, 2015
Third Avenue Focused Credit Fund
| For the Year Ended October 31, 2015 | For the Year Ended October 31, 2014 | |||||||||||||||
| Investor Class | Investor Class | |||||||||||||||
| Shares | Amount | Shares | Amount | |||||||||||||
| Shares sold | 20,542,816 | $ | 190,873,062 | 84,897,396 | $ | 986,124,742 | ||||||||||
| Shares Issued upon reinvestment of dividends and distributions | 6,477,929 | 60,668,559 | 6,954,244 | 80,285,714 | ||||||||||||
| Shares redeemed* | (61,127,281 | ) | (561,668,709 | ) | (72,968,925 | ) | (860,699,914 | ) | ||||||||
| Net increase(decrease) | (34,106,536 | ) | $ | (310,127,088 | ) | 18,882,715 | $ | 205,710,542 | ||||||||
| For the Year Ended October 31, 2015 | For the Year Ended October 31, 2014 | |||||||||||||||
| Institutional Class | Institutional Class | |||||||||||||||
| Shares | Amount | Shares | Amount | |||||||||||||
| Shares sold | 73,136,327 | $ | 693,102,296 | 140,734,447 | $ | 1,653,016,104 | ||||||||||
| Shares Issued upon reinvestment of dividends and distributions | 13,254,166 | 123,438,008 | 7,400,932 | 84,797,094 | ||||||||||||
| Shares redeemed* | (157,428,382 | ) | (1,445,005,500 | ) | (46,620,041 | ) | (539,102,312 | ) | ||||||||
| Net increase/(decrease) | (71,037,889 | ) | $ | (628,465,196 | ) | 101,515,338 | $ | 1,198,710,886 | ||||||||
| * | Redemption fees are netted with redemption amounts. |
Third Avenue Value Fund, Third Avenue Small-Cap Value Fund, Third Avenue Real Estate Value Fund, Third Avenue International Value Fund, and Third Avenue Focused Credit Fund charge a redemption fee of 1%, 1%, 1%, 2%, and 2%, respectively, for shares redeemed or exchanged for shares of another Fund within 60 days or less of the purchase date.
8. COMMITMENTS AND CONTINGENCIES
At October 31, 2015, Third Avenue Focused Credit Fund had the following commitments and contingencies:
| Issuer | Type | Amount of Commitment | Funded Commitment | Value of Segregated Cash | ||||||||||
| Affinion International Holdings Ltd. | Corporate Notes | $ | 24,516,000 | $ | — | $ | 24,516,000 | |||||||
| Codere Finance Luxembourg S.A. | Corporate Notes | 25,024,229 | — | 25,024,229 | ||||||||||
| Hercules Offshore, Inc. | Debtor-In-Procession Loan | 37,558,696 | — | 37,558,696 | ||||||||||
| Longview Power LLC | Revolver | 1,250,000 | — | 1,250,000 | ||||||||||
| Total | $ | 88,348,925 | $ | — | $ | 88,348,925 | ||||||||
In the normal course of business, the Funds enter into contracts that contain a variety of representations and warranties and which provide general indemnifications. The Funds’ maximum exposure under these arrangements is unknown, as this would involve future claims that may be made against the Funds that have not yet occurred. However, based on experience, the Funds expect the risk of loss to be remote.
Third Avenue Focused Credit Fund is a plaintiff in two separate litigations each pertaining to counterparties not performing their contractual obligations. The Fund is seeking damages from both counterparties.
Third Avenue Focused Credit Fund is a defendant in an action initiated by the issuer of bonds currently held by the Fund pertaining to the validity of a notice of default sent to the issuer. The Fund expects the risk of any loss from this action to be remote.
9. RISKS RELATING TO CERTAIN INVESTMENTS
Foreign securities:
Investments in the securities of foreign issuers may involve investment risks different from those of U.S. issuers including possible political or economic instability of the country of the issuer, the difficulty of predicting international trade patterns, the possibility of currency exchange controls, the possible imposition of foreign taxes on income from and transactions in such instruments, the possible establishment of foreign controls, the possible seizure or
| 75 |
Third Avenue Trust
Notes to Financial Statements (continued)
October 31, 2015
nationalization of foreign deposits or assets, or the adoption of other foreign government restrictions that might adversely affect the foreign securities held by the Funds. Foreign securities may also be subject to greater fluctuations in price than securities of domestic corporations or the U.S. Government.
High yield debt:
The Funds may invest in high yield, lower grade debt (sometimes referred to as “junk bonds”). The market values of these higher yielding debt securities tend to be more sensitive to economic conditions and individual corporate developments than those of higher rated securities. In addition, the secondary market for these bonds is generally less liquid and could result in lower prices than those used in calculating the Fund’s net asset value. These securities are considered to be high risk investments. Securities rated below investment grade are speculative in nature, involve greater risk of default by the issuing entity and are generally unsecured and subordinated to other creditors’ claims.
Claims:
An investment in claims is speculative and carries a high degree of risk. Claims are illiquid instruments which generally do not pay interest. Claims may also be allowed or disallowed in whole or part. If allowed, they may be settled by a pro-rata distribution of the assets of the estate. The markets in claims are not regulated by federal securities laws or the SEC. Because claims are unsecured, holders of claims may have a lower priority in terms of payment than certain other creditors in a bankruptcy proceeding.
Credit and interest rate risk:
The market value of debt securities is affected by changes in prevailing interest rates and the perceived credit quality of the issuer. When prevailing interest rates fall or perceived credit quality improves, the market value of the affected debt securities generally rises. Conversely, when interest rates rise or perceived credit quality weakens, the market value of the affected debt securities generally declines.
Market risk:
Prices of securities (and stocks in particular) have historically fluctuated. The value of the Funds will similarly fluctuate and you could lose money.
Counterparty risk:
The Funds are exposed to counterparty risk, or the risk that an institution or other entity with which the Funds have unsettled or open transactions will default. The potential loss to the Funds could exceed the value of the financial assets recorded in the Funds’ financial statements. Financial assets, which potentially expose the Funds to counterparty risk, consist principally of cash due from counterparties and investments. The Adviser seeks to minimize the Funds’ counterparty risk by performing reviews of each counterparty and by minimizing concentration of counterparty risk by undertaking transactions with multiple customers and counterparties on recognized and reputable exchanges. Delivery of securities sold is only made once the Funds have received payment. Payment is made on a purchase once the securities have been delivered by the counterparty. The trade will fail if either party fails to meet its obligation.
At October 31, 2015, the Funds had counterparty concentration of credit risk primarily with Goldman, Sachs International, JPMorgan Chase Bank, N.A., Macquarie Bank Ltd., Morgan Stanley Capital Services LLC and UBS AG.
The Funds are party to International Swaps and Derivatives Association, Inc. Master Agreements (“ISDA Master Agreements”) with select counterparties that govern transactions, over-the-counter derivatives and foreign exchange contracts entered into by the Funds and those counterparties. The ISDA Master Agreements contain provisions for general obligations, representations, agreements, collateral and events of default or termination. Events of termination include conditions that may entitle counterparties to elect to terminate early and cause settlement of all outstanding transactions under the applicable ISDA Master Agreement. Any election to terminate early could be material to the financial statements of the Funds.
The considerations and factors surrounding the settlement of certain purchases and sales made on a delayed-delivery basis are governed by Master Securities Forward Transaction Agreements (“Master Forward Agreements”) between the Funds and select counterparties. The Master Forward Agreements maintain provisions for, among other things, initiation and confirmation, payment and transfer, events of default, termination, and maintenance of collateral.
The counterparty risk associated with certain contracts may be reduced by master netting arrangements to the extent that if an event of default occurs, all amounts with the counterparty are terminated and settled on a net basis. The Funds’ overall exposure to counterparty risk with respect to transactions subject to master netting arrangements can change substantially within a short period, as it is affected by each transaction subject to the arrangement.
Collateral requirements:
For derivatives traded under an ISDA Master Agreement and/or Master Forward Agreement, the collateral requirements are typically calculated by netting the mark-to-market amount for each transaction under such agreement and comparing that amount to the value of any collateral currently pledged by the Fund and the counterparty.
| 76 |
Third Avenue Trust
Notes to Financial Statements (continued)
October 31, 2015
Cash collateral that has been pledged to cover obligations of a Fund and cash collateral received from the counterparty, if any, is reported separately on the Statement of Assets and Liabilities as cash pledged as collateral and cash received as collateral, respectively. Non-cash collateral pledged by the Fund, if any, is noted in the Schedule of Investments. Generally, the amount of collateral due from or to a party has to exceed a minimum transfer amount threshold (e.g. $500,000) before a transfer is required, which is determined at the close of business of a Fund and any additional required collateral is delivered to/pledged by a Fund on the next business day. Typically, a Fund and its counterparties are not permitted to sell, re-pledge or use the collateral they receive. To the extent amounts due to a Fund from its counterparties are not fully collateralized, contractually or otherwise, a Fund bears the risk of loss from counterparty non-performance. The Funds attempt to mitigate counterparty risk by entering into agreements only with counterparties that it believes have the financial resources to honor their obligations and by monitoring the financial stability of those counterparties.
For financial reporting purposes, the Funds do not offset derivative assets and derivative liabilities that are subject to netting arrangements in the Statement of Assets and Liabilities.
Third Avenue Value Fund
At October 31, 2015, the Fund’s derivative assets and liabilities (by type) on a gross basis are as follows:
| Assets | Liabilities | |||||||
| Derivative Financial Instruments: | ||||||||
| Options | $ | — | $ | 215,628 | ||||
| Total derivative assets and liabilties in the Statement of Assets and Liabilities | — | 215,628 | ||||||
| Derivatives not subject to a master netting agreement or similiar agreement (“MNA”) | — | — | ||||||
| Total derivative assets and liabilities subject to a MNA | $ | — | $ | 215,628 | ||||
The following tables present the Fund’s derivative liabilities by counterparty net of amounts available for offset under a MNA and net of the related collateral pledged by the Fund as of October 31, 2015:
| Counterparty | Amount of Liabilities Subject to a MNA by Counterparty | Derivatives Available for Offset1 | Non-cash Collateral Pledged2 | Cash Collateral Pledged2 | Net Amount of Derivative Liabilities3 | |||||||||||||||
| Morgan Stanley Capital Services LLC | $ | 215,628 | $ | — | $ | — | $ | — | $ | 215,628 | ||||||||||
| 1 | The amount of derviatives for offset is limited to the amount of assets and/or liabilites that are subject to a MNA. |
| 2 | Excess of collateral pledged to the individual counterparty may not be shown for financial reporting purposes. |
| 3 | Net amount represents the net amount payable to the counterparty in the event of default. |
Third Avenue Real Estate Value Fund
At October 31, 2015, the Fund’s derivative assets and liabilities (by type) on a gross basis are as follows:
| Assets | Liabilities | |||||||
| Derivative Financial Instruments: | ||||||||
| Options | $ | 2,351,840 | $ | 70,790 | ||||
| Forward Foreign Currency Contracts | 1,813,500 | — | ||||||
| Total derivative assets and liabilities in the Statement of Assets and Liabilities | 4,165,340 | 70,790 | ||||||
| Derivatives not subject to a master netting agreement or similar agreement (“MNA”) | — | — | ||||||
| Total derivative assets and liabilities subject to a MNA | $ | 4,165,340 | $ | 70,790 | ||||
| 77 |
Third Avenue Trust
Notes to Financial Statements (continued)
October 31, 2015
The following tables present the Fund’s derivative assets by counterparty net of amounts available for offset under a MNA and net of the related collateral received by the Fund as of October 31, 2015:
| Counterparty | Amount of Assets Subject to a MNA by Counterparty | Derivatives Available for Offset1 | Non-cash Collateral Received2 | Cash Collateral Received2 | Net Amount of Derivative Assets3 | |||||||||||||||
| Goldman Sachs International | $ | 1,082,258 | $ | (19,803 | ) | $ | — | $ | (1,062,455 | ) | $ | — | ||||||||
| Macquarie Bank Ltd. | 56 | (56 | ) | — | — | — | ||||||||||||||
| Morgan Stanley Capital Services LLC | 886,550 | — | — | (886,550 | ) | — | ||||||||||||||
| UBS AG | 2,196,476 | — | — | (2,196,476 | ) | — | ||||||||||||||
| $ | 4,165,340 | $ | (19,859 | ) | $ | — | $ | (4,145,481 | ) | $ | — | |||||||||
| 1 | The amount of derviatives for offset is limited to the amount of assets and/or liabilites that are subject to a MNA. |
| 2 | Excess of collateral received from the individual counterparty may not be shown for financial reporting purposes. |
| 3 | Net amount represents the net amount receivable from the counterparty in the event of default. |
The following tables present the Fund’s derivative liabilities by counterparty net of amounts available for offset under a MNA and net of the related collateral pledged by the Fund as of October 31, 2015:
| Counterparty | Amount of Liabilities Subject to a MNA by Counterparty | Derivatives Available for Offset1 | Non-cash Collateral Pledged2 | Cash Collateral Pledged2 | Net Amount of Derivative Liabilities3 | |||||||||||||||
| Goldman Sachs International | $ | 19,803 | $ | (19,803 | ) | $ | — | $ | — | $ | — | |||||||||
| Macquarie Bank Ltd. | 50,987 | (56 | ) | — | (30,000 | ) | 20,931 | |||||||||||||
| $ | 70,790 | $ | (19,859 | ) | $ | — | $ | (30,000 | ) | $ | 20,931 | |||||||||
| 1 | The amount of derviatives for offset is limited to the amount of assets and/or liabilites that are subject to a MNA. |
| 2 | Excess of collateral pledged to the individual counterparty may not be shown for financial reporting purposes. |
| 3 | Net amount represents the net amount payable to the counterparty in the event of default. |
Third Avenue Focused Credit Fund
At October 31, 2015, the Fund’s derivative assets and liabilities (by type) on a gross basis are as follows:
| Assets | Liabilities | |||||||
| Derivative Financial Instruments: | ||||||||
| Forward Foreign Currency Contracts | $ | 953,281 | $ | — | ||||
| Total derivative assets and liabilties in the Statement of Assets and Liabilities | 953,281 | — | ||||||
| Derivatives not subject to a master netting agreement or similiar agreement (“MNA”) | — | — | ||||||
| Total derivative assets and liabilities subject to a MNA | $ | 953,281 | $ | — | ||||
The following tables present the Fund’s derivative assets by counterparty net of amounts available for offset under a MNA and net of the related collateral received by the Fund as of October 31, 2015:
| Counterparty | Amount of Assets Subject to a MNA by Counterparty | Derivatives Available for Offset1 | Non-cash Collateral Received2 | Cash Collateral Received2 | Net Amount of Derivative Assets3 | |||||||||||||||
| Goldman Sachs International | $ | 404,781 | $ | — | $ | — | $ | — | $ | 404,781 | ||||||||||
| JPMorgan Chase Bank N.A. | 403,204 | — | — | — | 403,204 | |||||||||||||||
| Macquarie Bank Ltd. | 145,296 | — | — | — | 145,296 | |||||||||||||||
| $ | 953,281 | $ | — | $ | — | $ | — | $ | 953,281 | |||||||||||
| 1 | The amount of derviatives for offset is limited to the amount of assets and/or liabilites that are subject to a MNA. |
| 2 | Excess of collateral received from the individual counterparty may not be shown for financial reporting purposes. |
| 3 | Net amount represents the net amount receivable from the counterparty in the event of default. |
| 78 |
Third Avenue Trust
Notes to Financial Statements (continued)
October 31, 2015
Loans and other direct debt instruments:
The Funds may invest in loans and other direct debt instruments issued by corporate borrowers. These loans represent amounts owed to lenders or lending syndicates (loans and loan participations) or to other parties. Direct debt instruments may involve a risk of loss in case of default or insolvency of the borrower and may offer less legal protection to the Fund in the event of fraud or misrepresentation. In addition, loan participations involve a risk of insolvency of the lending bank or other financial intermediary. The markets in loans are not regulated by federal securities laws or the SEC.
Cash concentration:
The Funds’ cash balances are held at a major regional U.S. bank. The Funds’ cash balances, which typically exceed Federal Deposit Insurance Corporation insurance coverage, subject the Funds to a concentration of credit risk. The Funds regularly monitor the credit ratings of this financial institution in order to mitigate the credit risk that exists with the balances in excess of insured amounts.
Off-balance sheet risk:
The Fund enters into derivatives which may represent off-balance sheet risk. Off-balance sheet risk exists when the maximum potential loss on a particular investment is greater than the value of such investment as reflected in the Statement of Assets and Liabilities.
Focused Investing:
The Funds hold relatively concentrated portfolios that may contain fewer securities or industries than the portfolios of other mutual funds. Holding a relatively concentrated portfolio may increase the risk that the value of a Fund could decrease because of the poor performance of one or a few investments. Additionally, the Funds may encounter some difficulty in liquidating securities of concentrated positions.
Liquidity risk:
The Funds hold investments in private debt instruments, restricted securities, and securities having substantial market and/or credit risk which may be difficult to sell at certain periods of time and thus may not be able to dispose of at the value the Fund places on them. At October 31, 2015, the percentages of total net assets of such securities in each Fund as determined by the Adviser are: Third Avenue Value Fund, 0.92%; Third Avenue Small-Cap Value Fund, 2.04%; Third Avenue Real Estate Value Fund, 3.96%; Third Avenue International Value Fund, 15.47%; Third Avenue Focused Credit Fund, 13.40%.
10. FEDERAL INCOME TAXES
The amount of dividends and distributions paid by the Funds from net investment income and net realized capital gains are determined in accordance with U.S. federal income tax law and regulations which may differ from U.S. GAAP. Such dividends and distributions are recorded by the Funds on the ex-dividend date. In order to present accumulated undistributed net investment income (loss), accumulated net realized gain (loss) on investments and foreign currency transactions and capital stock on the Statement of Assets and Liabilities that more closely represent their tax character, certain adjustments have been made. “Book/tax” differences are either temporary or permanent in nature. To the extent these differences are permanent in nature, such amounts are reclassified within the capital accounts based on their tax-basis treatment. Temporary differences do not require reclassification. Permanent differences are primarily due to reclassification of certain transactions involving foreign securities and currencies, investments in passive foreign investment companies, real estate investment trusts (“REITs”) and partnerships, the difference in the treatment of amortization of discount on certain debt instruments, certain derivative instruments and other book to tax adjustments. Net investment income (loss), net realized capital gain (loss) on investments and foreign currency transactions and net assets were not affected by these changes. For the year ended October 31, 2015, the adjustments were as follows:
| Increase/(Decrease) to Capital Stock | Increase/(Decrease) to Accumulated Net Investment Income (Loss) | Increase/(Decrease) to Undistributed Net Realized Gain (Loss) on Investments and Foreign Currency Transactions | ||||||||||
| Third Avenue Value Fund | $ | 161 | $ | 18,356,166 | $ | (18,356,327 | ) | |||||
| Third Avenue Small-Cap Value Fund | — | 2,809,878 | (2,809,878 | ) | ||||||||
| Third Avenue Real Estate Value Fund | — | 24,848,686 | (24,848,686 | ) | ||||||||
| Third Avenue International Value Fund | — | (1,070,727 | ) | 1,070,727 | ||||||||
| Third Avenue Focused Credit Fund | (1,357 | ) | (49,517,939 | ) | 49,519,296 | |||||||
| 79 |
Third Avenue Trust
Notes to Financial Statements (continued)
October 31, 2015
The tax character of dividends and distributions paid during the year ended October 31, 2015 was as follows:
| Ordinary Income | Net Capital Gains | Total | ||||||||||
| Third Avenue Value Fund | $ | 78,644,432 | $ | 39,157,507 | $ | 117,801,939 | ||||||
| Third Avenue Small-Cap Value Fund(a) | 11,449,218 | 89,550,031 | 100,999,249 | |||||||||
| Third Avenue Real Estate Value Fund | 42,607,116 | 70,314,067 | 112,921,183 | |||||||||
| Third Avenue International Value Fund | 22,150,205 | — | 22,150,205 | |||||||||
| Third Avenue Focused Credit Fund(a) | 212,620,716 | — | 212,620,716 | |||||||||
The tax character of dividends and distributions paid during the fiscal year ended October 31, 2014 was as follows:
| Ordinary Income | Net Capital Gains | Total | ||||||||||
| Third Avenue Value Fund | $ | 85,235,294 | $ | — | $ | 85,235,294 | ||||||
| Third Avenue Small-Cap Value Fund(a) | 9,492,508 | 32,952,885 | 42,445,393 | |||||||||
| Third Avenue Real Estate Value Fund(a) | 42,288,878 | 9,894,934 | 52,183,812 | |||||||||
| Third Avenue International Value Fund | 16,093,749 | — | 16,093,749 | |||||||||
| Third Avenue Focused Credit Fund | 195,742,489 | — | 195,742,489 | |||||||||
At October 31, 2015, the accumulated undistributed earnings on a tax basis were:
| Undistributed Ordinary Income | Net Capital Gains | |||||||
| Third Avenue Value Fund | $ | 20,706,732 | $ | 97,699,381 | ||||
| Third Avenue Small-Cap Value Fund(a) | 447,591 | 46,694,656 | ||||||
| Third Avenue Real Estate Value Fund(a) | 29,363,908 | 139,561,331 | ||||||
| Third Avenue International Value Fund | 63,831 | 2,350,660 | ||||||
| Third Avenue Focused Credit Fund | 5,380,941 | — | ||||||
This differs from the amount shown on the Statement of Assets and Liabilities primarily due to cumulative timing differences.
(a) Includes short-term capital gains, which are taxed as ordinary income.
Third Avenue International Value Fund used $10,996,313, the full amount of its capital loss carryforward from prior years to offset net capital gains recognized during the year ended October 31, 2015.
As of October 31, 2015, Third Avenue Focused Credit Fund has a capital loss carryforward which should be available to offset certain capital gains generated in future years as follows:
| Capital Losses incurred in a post-enactment year | Short-Term | Long-Term | Total | |||||||||
| No Expiration Date | $ | 89,676,165 | $ | 218,494,859 | $ | 308,171,024 | ||||||
The Regulated Investment Company Modernization Act of 2010 generally allows capital losses incurred in a taxable year beginning after December 22, 2010 (“post-enactment year”) to be carried forward for an unlimited period to the extent not utilized. Post-enactment capital loss carryforwards will retain their character as either short-term or long-term capital losses.
| 80 |
Third Avenue Trust
Notes to Financial Statements (continued)
October 31, 2015
The U.S. federal income tax basis of the Funds’ investments and the total unrealized appreciation/(depreciation) as of October 31, 2015 were as follows:
| Tax Basis of Investments | Appreciation | (Depreciation) | Total Unrealized Appreciation/ (Depreciation) | Other Cost Basis Adjustments | Total Net Unrealized Appreciation/ (Depreciation) | |||||||||||||||||||
| Third Avenue Value Fund | $ | 1,388,592,444 | $ | 223,359,007 | $ | (15,284,762 | ) | $ | 208,074,245 | $ | (42,940 | ) | $ | 208,031,305 | ||||||||||
| Third Avenue Small-Cap Value Fund | 312,190,918 | 83,131,049 | (15,149,824 | ) | 67,981,225 | (51,954 | ) | 67,929,271 | ||||||||||||||||
| Third Avenue Real Estate Value Fund | 2,836,627,271 | 665,197,786 | (139,844,582 | ) | 525,353,204 | 215,589 | 525,568,793 | |||||||||||||||||
| Third Avenue International Value Fund | 235,324,367 | 31,414,463 | (77,585,469 | ) | (46,171,006 | ) | (334,031 | ) | (46,505,037 | ) | ||||||||||||||
| Third Avenue Focused Credit Fund | 1,690,430,723 | 85,804,540 | (605,789,425 | ) | (519,984,885 | ) | (4,754,507 | ) | (524,739,392 | ) | ||||||||||||||
The difference between book and tax basis total unrealized appreciation/(depreciation) is primarily attributable to deferred losses on wash sales, mark-to-market treatment of investments in certain passive foreign investment companies, investments in REITs and partnerships, differences in the treatment of amortization of discount on certain debt instruments, and other timing differences. Other cost basis adjustments are primarily attributable to unrealized appreciation/(depreciation) on receivables and payables on foreign currency, written options and other book to tax differences.
11. SUBSEQUENT EVENTS
The Adviser has evaluated the impact of all subsequent events on the Funds through the date the financial statements were issued, and has determined that there were no events, except those listed below, that would require additional disclosure in the Funds’ financial statements.
On December 8, 2015, the Funds made the following per share distribution to shareholders of record on December 7, 2015. The information would not be used in completing your income tax returns as it may not represent final tax information.
| Ordinary Income | Short-Term Capital Gains | Long-Term Capital Gains | Total Distributions | ||||||||
| Third Avenue Value Fund Investor Class | $ | 0.6127 | $ | — | $ | 3.2822 | $ | 3.8949 | |||
| Third Avenue Value Fund Institutional Class | 0.7703 | — | 3.2822 | 4.0525 | |||||||
| Third Avenue Small-Cap Value Fund Investor Class | — | 0.0464 | 2.7102 | 2.7566 | |||||||
| Third Avenue Small-Cap Value Fund Institutional Class | — | 0.0464 | 2.7102 | 2.7566 | |||||||
| Third Avenue Real Estate Value Fund Investor Class | 0.1337 | 0.1147 | 1.2837 | 1.5321 | |||||||
| Third Avenue Real Estate Value Fund Institutional Class | 0.2104 | 0.1147 | 1.2837 | 1.6088 | |||||||
| Third Avenue International Value Fund Investor Class | — | — | 0.2032 | 0.2032 | |||||||
| Third Avenue International Value Fund Institutional Class | 0.0295 | — | 0.2032 | 0.2327 | |||||||
| Third Avenue Focused Credit Fund Investor Class | 0.2030 | — | — | 0.2030 | |||||||
| Third Avenue Focused Credit Fund Institutional Class | 0.2086 | — | — | 0.2086 | |||||||
On December 9, 2015, the Trustees adopted a plan of liquidation (the “Plan of Liquidation”) for Third Avenue Focused Credit Fund (“FCF”). Pursuant to the Plan of Liquidation, a cash distribution of $69 million (the “Cash Distribution”) was paid to shareholders and the remaining assets of FCF were contributed to a liquidating trust, FCF Liquidation Trust (the “Liquidating Trust”). Sales of FCF shares were terminated. Interests in the Liquidating Trust would then be distributed in-kind to FCF shareholders. Subsequent to the Board’s adoption of the Plan of Liquidation, the Plan of Liquidation was modified (the “Modified Plan of Liquidation”). Pursuant to the Modified Plan of Liquidation, the Cash Distribution was paid to FCF shareholders, however, the remaining assets which had been contributed to the Liquidating Trust were returned to the Third Avenue Focused Credit Fund which will serve as the vehicle to liquidate the FCF remaining assets. Pursuant to an exemptive order issued by the SEC on December 16, 2015, all redemptions in FCF are suspended and subscriptions to FCF are not accepted, retroactive to December 10, 2015. Effective December 10, 2015, the Adviser has waived its investment advisory & administration fees on the Third Avenue Focused Credit Fund. The Cash Distribution of $0.58613 per share was paid on December 16, 2015, to shareholders of record of FCF Institutional and Investor classes as of December 9, 2015. The application for the exemptive order filed by Third Avenue Focused Credit Fund and approved by the SEC can be found on the Funds’ website at thirdavenuefunds.com.
| 81 |
Third Avenue Trust
Report of Independent Registered Public Accounting Firm
To the Trustees and Shareholders of
Third Avenue Trust
In our opinion, the accompanying statements of assets and liabilities, including the portfolios of investments, and the related statements of operations, of cash flows (Third Avenue Focused Credit Fund only), and of changes in net assets and the financial highlights present fairly, in all material respects, the financial position of Third Avenue Value Fund, Third Avenue Small-Cap Value Fund, Third Avenue Real Estate Value Fund, Third Avenue International Value Fund and Third Avenue Focused Credit Fund (collectively constituting Third Avenue Trust, hereafter referred to as the “Trust”) at October 31, 2015, the results of each of their operations and cash flows (Third Avenue Focused Credit Fund only) for the year then ended, the changes in each of their net assets for each of the two years in the period then ended and the financial highlights for each of the periods presented, in conformity with accounting principles generally accepted in the United States of America. These financial statements and financial highlights (hereafter referred to as “financial statements”) are the responsibility of the Trust’s management. Our responsibility is to express an opinion on these financial statements based on our audits. We conducted our audits of these financial statements in accordance with the standards of the Public Company Accounting Oversight Board (United States). Those standards require that we plan and perform the audit to obtain reasonable assurance about whether the financial statements are free of material misstatement. An audit includes examining, on a test basis, evidence supporting the amounts and disclosures in the financial statements, assessing the accounting principles used and significant estimates made by management, and evaluating the overall financial statement presentation. We believe that our audits, which included confirmation of securities at October 31, 2015 by correspondence with the custodian, agent banks and brokers, and the application of alternative auditing procedures where securities purchased had not been received, provide a reasonable basis for our opinion. As discussed in Note 11 to the financial statements, subsequent to year end the Board of Trustees adopted a plan of liquidation for the Third Avenue Focused Credit Fund. Our opinion is not modified with respect to this matter.
PricewaterhouseCoopers LLP
New York, New York
December 24, 2015
| 82 |
Third Avenue Trust
Annual Renewal of Investment Advisory Agreements
October 31, 2015 (Unaudited)
At a meeting of the Board of Trustees of the Trust (the “Board”) held on June 10-11, 2015, the Trustees, by a unanimous vote (including a separate vote of those Trustees who are not “interested persons” (as the term is defined in the Investment Company Act) of the Funds (the “Independent Trustees”)), approved the renewal of each Fund’s Investment Advisory Agreement (collectively, the “Agreements”). Prior to voting on the Agreements, the Independent Trustees met separately with their independent legal counsel for a discussion of the Adviser’s presentation and materials referred to below.
In advance of the meeting, the Independent Trustees, through their independent legal counsel, requested extensive materials, and the Adviser provided them, to assist the Board in considering the renewal of the Agreements. The Independent Trustees also constituted an ad hoc committee to work with representatives of the Adviser to evaluate the adequacy and extent of the information to be provided for their consideration. This committee communicated frequently with the Adviser’s representatives and independent legal counsel. At its June 10-11, 2015 meeting, the Board engaged in a detailed discussion of the materials with the Adviser. In considering the Agreements, the Trustees did not identify any single overriding factor and instead considered all factors collectively. As a part of their decision making process, the Trustees considered information derived from their service on the Trust’s Board and their familiarity with the Adviser and its investment process. Among other things, they noted that the Adviser has managed each Fund since its inception, and expressed their belief that a long-term relationship with a capable, conscientious adviser is in the best interest of the Funds. The following is a summary of the discussions and conclusions regarding the material factors that formed the basis for the Board’s approval.
Factors Considered
A. Financial Condition of the Adviser; Advisory Fees; Profitability
The Trustees received a presentation from representatives of the Adviser, including a report prepared by Lipper Inc., and reviewed, among other things:
| 1. | the financial condition of the Adviser to determine that the Adviser is solvent and sufficiently well capitalized to perform its ongoing responsibilities to the Fund; |
| 2. | the information sources and methodology used in the selection of funds included in the comparison universe and the competitive fund group used in comparative analyses of each Fund’s advisory fees and expense ratio and in analyzing the Fund’s performance; |
| 3. | each Fund’s advisory fee and total expenses versus those of the comparison universe and competitive fund group, focusing on the total expense ratio of each Fund and the funds in its respective comparison universe and competitive fund group; |
| 4. | performance analyses of each Fund and funds in its comparison universe and competitive fund group; |
| 5. | a comparison of fees paid to the Adviser versus fees paid by similar funds advised and sub-advised by the Adviser, as well as any similar separate advisory accounts; |
| 6. | information presented in respect of economies of scale, noting that each Fund’s assets had declined significantly over the last five years (except for the Real Estate Value Fund, which has had a steady increase in assets since 2009 and a lower expense ratio in 2014 than 2011); that the Adviser has agreed to waive its fees and/or reimburse expenses to maintain an expense limitation for each Fund; and the extensive resources that the Adviser continues to dedicate to its business even while Fund assets generally have declined in recent years; |
| 7. | the profitability to the Adviser resulting from each Agreement (including the fall-out benefits noted below), reviewing the dollar amount of expenses allocated and revenue received by the Adviser and the method used to determine such expenses and corresponding profit; and |
| 8. | fallout benefits, including (i) fees for providing administrative services and (ii) research services received by the Adviser in connection with executing Fund Portfolio transactions. |
B. Description of Personnel and Services Provided by the Adviser
The Trustees reviewed with representatives of the Adviser, and considered:
| 1. | the nature, extent and quality of services rendered to the Funds, including the Adviser’s investments, senior management and operational personnel (and additions to them), and the oversight of day-to-day operations of the Funds provided by the Adviser; |
| 2. | the Adviser’s research and portfolio management capabilities, particularly the intensive research undertaken in connection with the Adviser’s deep value philosophy; and |
| 3. | the value added over time through the Adviser’s active management style that includes participation in corporate restructurings and other activist investments. |
| 83 |
Third Avenue Trust
Annual Renewal of Investment Advisory Agreements (continued)
October 31, 2015 (Unaudited)
C. Investment Performance of the Funds and Adviser
| 1. | The Trustees reviewed total return information for each Fund versus the comparison universe and competitive funds group for various periods. The Trustees also reviewed information pertaining to the Funds’ risk adjusted performance and risk measures. |
Conclusions
The Trustees concluded that the nature, extent and quality of the services provided by the Adviser are adequate and appropriate. The Trustees considered and evaluated each Fund’s performance over the various time periods in light of market conditions, the Adviser’s investing style and circumstances particular to that Fund. The Trustees understood the relevant circumstances and the efforts the Adviser was making to improve performance over time. They also considered the advisory fee and expense ratio of each Fund and evaluated the comparisons to those of funds in the comparable universe and competitive fund group and the performance analysis, as discussed in the Adviser’s presentation.
The Trustees discussed the Adviser’s profitability, and it was noted that the profitability percentage for each Fund was well below the maximum profitability levels found in relevant court cases upholding board approval of particular advisory agreements. The Trustees concluded that in light of considerations noted above, each Fund’s fee paid to the Adviser was reasonable, although for certain Funds the Trustees agreed to continue to closely monitor the Funds’ performance, fees and expenses. The Trustees also considered the advisory fees charged for similar funds advised and sub-advised by the Adviser, as well as any separate advisory accounts, and reviewed the nature of the services provided and differences, from the Adviser’s perspective, in managing the Funds as compared to advisory services provided to other advised and sub-advised funds and any separate accounts. The Trustees recognized that differences in fees paid were consistent with the differences in services provided by the Adviser.
The Trustees considered whether material economies of scale are present and, if present, are shared with the Funds and considered each Fund’s fee structure and the extensive resources that the Adviser dedicates to its investment advisory process to the benefit of the Funds. The Trustees concluded that, because of declining overall assets in the majority of the Funds, material economies of scale were not present to be shared with the Funds. The Trustees concluded that while assets of the Real Estate Value Fund have increased over the past year, its limited mandate created more challenges for the investment team and, given the considerable resources devoted to management of the Fund, economies of scale were difficult to realize.
| 84 |
Third Avenue Trust
Management of the Trust
(Unaudited)
Information pertaining to the Trustees and officers of the Trust is set forth below. The fund complex includes five portfolios in the Third Avenue Trust and one portfolio in the Third Avenue Variable Series Trust. The Statement of Additional Information (SAI) includes additional information about the Trustees and is available upon request, without charge, by calling (800) 443-1021.
Interested Trustee
| Name, Date of Birth & Address | Term of Office and Length of Time Served* | Position(s) Held With Registrant | Principal Occupations(s) During Past 5 Years | Other Directorships held by Trustee | ||||
| Martin J. Whitman** DOB: September 1924 622 Third Avenue New York, NY 10017 | Trustee since 11/90 | Chairman and Trustee | Chairman (3/90 to Present) (5 funds) of Third Avenue Trust; Chairman (7/99 to Present) of Third Avenue Variable Series Trust; Co-Chief Investment Officer (2003 to 2010) of Third Avenue Management LLC; CEO, President and Director (10/74 to Present) of Martin J. Whitman & Co., Inc. (formerly M.J. Whitman & Co., Inc.) (private investment company); Distinguished Management Fellow (1972 to 2007) of the Yale School of Management at Yale University; Chartered Financial Analyst. | Director (1991 to 2011) of Nabors Industries, Inc. (international oil drilling services). | ||||
| David M. Barse** DOB: June 1962 622 Third Avenue New York, NY 10017 | Trustee from 9/01 to 12/15 | President, CEO and Trustee | President (5/98 to 12/15), Trustee (9/01 to 12/15), CEO (9/03 to 12/15) (5 funds) of Third Avenue Trust; President (7/99 to 12/15), Trustee (9/01 to 12/15) and CEO (9/03 to 12/15) of Third Avenue Variable Series Trust; CEO (4/03 to 12/15), President (2/98 to 9/12) of Third Avenue Management LLC; CEO (7/99 to 12/15), President (6/95 to 12/15), Director (1/95 to 12/15) of M.J. Whitman, Inc. and its successor, M.J. Whitman LLC (registered broker-dealer); Director (5/13 to 12/15) of Third Avenue Capital Plc. (5 funds); Director of other private funds advised by Third Avenue Management LLC (6/99 to 12/15). | Director (7/96 to Present) of Covanta Holding Corp. (utilities/waste management); Trustee (3/01 to Present) of Manifold Capital LLC. (credit enhancement). |
| 85 |
Third Avenue Trust
Management of the Trust (continued)
(Unaudited)
Independent Trustees
Correspondence intended for any Independent Trustee may be sent to: Third Avenue Management LLC, 622 Third Avenue, 32nd Floor, New York, NY 10017.
| Name & Date of Birth | Term of Office and Length of Time Served* | Position(s) Held With Registrant | Principal Occupation(s) During Past 5 Years | Other Directorships held by Trustee | ||||
| William E. Chapman, II DOB: September 1941 | Trustee since 8/02 | Trustee | President and Owner (1998 to Present) of Longboat Retirement Planning Solutions (consulting firm); part-time employee delivering retirement and investment education seminars (1/00 to 11/09) for Hewitt Associates, LLC (consulting firm). | Trustee, The AMG Funds (1999 to Present) (43 portfolios); Director of Harding, Loevner Funds, Inc. (2008 to Present) (6 portfolios); Trustee of Aston Funds (2010 to Present) (25 portfolios); Trustee (5/02 to 6/13) of Bowdoin College; Director, The Mutual Fund Directors Forum (2010 to Present); Director, Sarasota Memorial Healthcare Foundation (2011 to Present). Trustee of Third Avenue Variable Series Trust (8/02 to Present). | ||||
| Lucinda Franks DOB: July 1946 | Trustee since 2/98 | Trustee | Journalist and author (1969 to Present). | Trustee of Third Avenue Variable Series Trust (7/99 to Present). | ||||
| Edward J. Kaier DOB: September 1945 | Trustee since 8/02 | Trustee | Partner (7/07 to Present) at Teeters Harvey Gillboy & Kaier LLP (law firm). | Trustee, The AMG Funds (1999 to Present) (43 portfolios); Trustee of Aston Funds (2010 to Present) (25 portfolios) and Trustee of Third Avenue Variable Series Trust (8/02 to Present). |
| 86 |
Third Avenue Trust
Management of the Trust (continued)
(Unaudited)
Independent Trustees
| Name & Date of Birth | Term of Office and Length of Time Served* | Position(s) Held With Registrant | Principal Occupation(s) During Past 5 Years | Other Directorships held by Trustee | ||||
| Eric Rakowski DOB: June 1958 | Trustee since 8/02 | Trustee | Professor (1990 to Present) at University of California at Berkeley School of Law. | Trustee, The AMG Funds (1999 to Present) (43 portfolios); Director of Harding, Loevner Funds, Inc. (2008 to Present) (6 portfolios); Trustee of Aston Funds (2010 to Present) (25 portfolios) and Trustee of Third Avenue Variable Series Trust (8/02 to Present). | ||||
| Patrick Reinkemeyer DOB: March 1965 | Trustee since 1/15 | Trustee | President, SilverPepper LLC (2011 to Present); Executive Officer, Morningstar Inc., President, Morningstar Associates LLC and Global Head, Morningstar Investment Management (1996 to 2010). | Trustee of Third Avenue Variable Series Trust (1/15 to Present). | ||||
| Martin Shubik DOB: March 1926 | Trustee since 11/90 | Trustee | Seymour H. Knox Professor (1975 to 2007) of Mathematical Institutional Economics, Yale University; Emeritus (2007 to Present). | Trustee of Third Avenue Variable Series Trust or its predecessor (7/99 to Present). | ||||
| Charles C. Walden DOB: July 1944 | Trustee since 5/96 | Trustee | President and Owner (2006 to Present) of Sound Capital Associates, LLC (consulting firm); Chartered Financial Analyst. | Director, Special Opportunities Fund, Inc. (2009 to Present) and Trustee of Third Avenue Variable Series Trust (7/99 to Present). |
| * | Each trustee serves until his successor is duly elected and qualified. |
| ** | As of October 31, 2015, Messrs. Whitman and Barse were “interested trustees” of the Trust due to their employment with and indirect ownership interests in the Adviser and the Distributor, M.J. Whitman LLC. In December 2015, Mr. Barse resigned as a Trustee of the Third Avenue Trust and of the Third Avenue Variable Series Trust. Mr. Barse also separated by mutual agreement from all positions in the Adviser, the Distributor and their affiliated private funds. |
| 87 |
Third Avenue Trust
Management of the Trust (continued)
(Unaudited)
Principal Trust Officers Who Are Not Trustees
| Name, Date of Birth & Address | Position(s) Held With Registrant | Principal Occupation(s) During Past 5 Years | Other Directorships held by Officer | |||
| Vincent J. Dugan DOB: September 1965 622 Third Avenue New York, NY 10017 | Treasurer and CFO | Treasurer and Chief Financial Officer (CFO) (9/04 to Present) (5 funds) of Third Avenue Trust; Treasurer and CFO (9/04 to Present) of Third Avenue Variable Series Trust; Chief Operating Officer (COO) and CFO (8/04 to Present) of Third Avenue Management LLC; COO and CFO (8/04 to Present) of Third Avenue Holdings Delaware LLC; COO and CFO (8/04 to Present) of M.J. Whitman LLC and subsidiaries; COO and CFO (8/04 to Present) of certain other funds advised by Third Avenue Management LLC (8/04 to Present). | N/A | |||
| Michael A. Buono DOB: May 1967 622 Third Avenue New York, NY 10017 | Controller | Controller (5/06 to Present) (5 funds) of Third Avenue Trust, Third Avenue Variable Series Trust, Third Avenue Management LLC and M.J. Whitman LLC and subsidiaries. | N/A | |||
| W. James Hall III DOB: July 1964 622 Third Avenue New York, NY 10017 | President and General Counsel | General Counsel and Secretary (6/00 to Present) (5 funds) and President (12/15 to Present) of Third Avenue Trust; General Counsel and Secretary (9/00 to Present) and President (12/15 to Present) of Third Avenue Variable Series Trust; General Counsel and Secretary (9/00 to Present) of EQSF Advisers, Inc., and its successor, Third Avenue Management LLC; General Counsel and Secretary (5/00 to Present) of M.J. Whitman, Inc. and its successor, M.J. Whitman LLC; General Counsel and Secretary of certain other funds advised by Third Avenue Management LLC (7/02 to Present). | N/A | |||
| Joseph J. Reardon DOB: April 1960 622 Third Avenue New York, NY 10017 | Chief Compliance Officer | Chief Compliance Officer (4/05 to Present) (5 funds) of Third Avenue Trust, Third Avenue Variable Series Trust and Third Avenue Management LLC. | N/A |
| 88 |
Third Avenue Trust
Schedule of Shareholder Expenses
(Unaudited)
As a shareholder of a Fund, you incur two types of costs: (1) transaction costs, such as redemption fees; and (2) ongoing costs, including management fees, shareholder servicing fees, distribution fees (if applicable) and other Fund expenses. This example is intended to help you understand your ongoing costs (in dollars) of investing in the Funds and to compare these costs with the ongoing costs of investing in other mutual funds.
The example is based on an investment of $1,000 invested at the beginning of the period, May 1, 2015 and held for the six month period ended October 31, 2015.
Actual Expenses
For each Class of each Fund in the table below, the first line provides information about actual account values and actual expenses. You may use the information in this line, together with the amount you invested, to estimate the expenses that you paid over the period. Simply divide your account value by $1,000 (for example, an $8,600 account value divided by $1,000 = 8.6), then multiply the result by the number in the first line under the heading entitled “Expenses Paid During the Period” to estimate the expenses you paid on your account during this period.
Hypothetical Example for Comparison Purposes
The second line of each Class in the table below provides information about hypothetical account values and hypothetical expenses based on the Class’ actual expense ratio and an assumed rate of return of 5% per year before expenses, which is not the Class’ actual return. The hypothetical account values and expenses may not be used to estimate the actual ending account balance or expenses you paid for the period. You may use this information to compare the ongoing costs of investing in the Class of the Fund and other funds. To do so, compare this 5% hypothetical example with the 5% hypothetical examples that appear in the shareholder reports of the other funds.
Please note that the expenses shown in the table are meant to highlight your ongoing costs only and do not reflect any transactional costs, such as redemption fees. Therefore, the second line of each Class in the table is useful in comparing ongoing costs only, and will not help you determine the relative total costs of owning different funds. In addition, if these transactional costs were included, your costs would have been higher. The example also assumes all dividends and distributions have been reinvested.
| Third Avenue Value Fund | Beginning Account Value May 1, 2015 | Ending Account Value October 31, 2015 | Expenses Paid During the Period April 30, 2015 to October 31, 2015* | Annualized Expense Ratio | ||||||||||||||||
| Investor Class | ||||||||||||||||||||
| Actual | $1,000 | $ | 926.30 | $6.41 | 1.32% | |||||||||||||||
| Hypothetical | $1,000 | $ | 1,018.55 | $6.72 | 1.32% | |||||||||||||||
| Institutional Class | ||||||||||||||||||||
| Actual | $1,000 | $ | 927.50 | $5.20 | 1.07% | |||||||||||||||
| Hypothetical | $1,000 | $ | 1,019.81 | $5.45 | 1.07% | |||||||||||||||
| Third Avenue Small-Cap Value Fund | ||||||||||||||||||||
| Investor Class | ||||||||||||||||||||
| Actual | $1,000 | $ | 944.10 | $6.76 | 1.38% | |||||||||||||||
| Hypothetical | $1,000 | $ | 1,018.25 | $7.02 | 1.38% | |||||||||||||||
| Institutional Class | ||||||||||||||||||||
| Actual | $1,000 | $ | 945.20 | $5.54 | 1.13% | |||||||||||||||
| Hypothetical | $1,000 | $ | 1,019.51 | $5.75 | 1.13% | |||||||||||||||
| Third Avenue Real Estate Value Fund | ||||||||||||||||||||
| Investor Class | ||||||||||||||||||||
| Actual | $1,000 | $ | 961.40 | $6.72 | 1.36% | |||||||||||||||
| Hypothetical | $1,000 | $ | 1,018.35 | $6.92 | 1.36% | |||||||||||||||
| Institutional Class | ||||||||||||||||||||
| Actual | $1,000 | $ | 962.60 | $5.49 | 1.11% | |||||||||||||||
| Hypothetical | $1,000 | $ | 1,019.61 | $5.65 | 1.11% | |||||||||||||||
| Third Avenue International Value Fund | ||||||||||||||||||||
| Investor Class | ||||||||||||||||||||
| Actual | $1,000 | $ | 883.30 | $7.83 | 1.65% | |||||||||||||||
| Hypothetical | $1,000 | $ | 1,016.89 | $8.39 | 1.65% | |||||||||||||||
| Institutional Class | ||||||||||||||||||||
| Actual | $1,000 | $ | 884.30 | $6.65 | 1.40% | |||||||||||||||
| Hypothetical | $1,000 | $ | 1,018.15 | $7.12 | 1.40% | |||||||||||||||
| Third Avenue Focused Credit Fund | ||||||||||||||||||||
| Investor Class | ||||||||||||||||||||
| Actual | $1,000 | $ | 864.90 | $5.69 | 1.21% | |||||||||||||||
| 89 |
Third Avenue Trust
Schedule of Shareholder Expenses (continued)
(Unaudited)
| Third Avenue Focused Credit Fund | ||||||||||||||||||||
| Hypothetical | $ | 1,000 | $ | 1,019.11 | $ | 6.16 | 1.21 | % | ||||||||||||
| Institutional Class | ||||||||||||||||||||
| Actual | $ | 1,000 | $ | 867.00 | $ | 4.52 | 0.96 | % | ||||||||||||
| Hypothetical | $ | 1,000 | $ | 1,020.37 | $ | 4.89 | 0.96 | % | ||||||||||||
| * | Expenses (net of fee waivers and expense offset arrangement) are equal to the Class’, annualized expense ratio, multiplied by the average account value over the period, multiplied by the number of days in the most recent fiscal year (184) divided by 365. |
| 90 |
Third Avenue Trust
Federal Tax Status of Dividends and Distributions
(Unaudited)
The following information represents the tax status of dividends and distributions paid by the Funds during the fiscal year ended October 31, 2015. This information is presented to meet regulatory requirements and no current action on your part is required. The information reported below will differ from the actual amounts taxable to shareholders for the calendar year ending December 31, 2015.
Information necessary to complete your income tax returns for the calendar year ending December 31, 2015 will be issued by the Funds in the early part of 2016.
The Funds are required to make certain designations including to designate the portion of any distributions made to shareholders during their fiscal year beginning on November 1, 2014 and ending on October 31, 2015 that were from capital gains. Depending upon your instructions, distributions from the Funds were either paid to you in cash or reinvested into your account.
Following is the breakdown of dividends and distributions paid by each Fund during fiscal year ended October 31, 2015.
| Third Avenue Value Fund | Third Avenue Small-Cap Value Fund | Third Avenue Real Estate Value Fund | Third Avenue Focused Credit Fund | |||||||||||||||||||||||||||||
| Institutional CL | Investor CL | Institutional CL | Investor CL | Institutional CL | Investor CL | Institutional CL | Investor CL | |||||||||||||||||||||||||
| Ordinary Income | $ | 2.223 | $ | 2.059 | $ | — | $ | — | $ | 0.434 | $ | 0.365 | $ | 0.807 | $ | 0.782 | ||||||||||||||||
| Short-Term Capital Gains Distributions (treated as ordinary income) | — | — | 0.638 | 0.638 | — | — | 0.058 | 0.058 | ||||||||||||||||||||||||
| Long-Term Capital Gains Distributions | 1.095 | 1.095 | 4.972 | 4.972 | 0.701 | 0.701 | — | — | ||||||||||||||||||||||||
| Total Dividends and Distributions | $ | 3.318 | $ | 3.154 | $ | 5.610 | $ | 5.610 | $ | 1.135 | $ | 1.066 | $ | 0.865 | $ | 0.840 | ||||||||||||||||
For the fiscal year ended October 31, 2015, the Funds designate the maximum amount allowable under section 854 of the Internal Revenue Code, but not less than, for ordinary dividends paid as follows:
| Qualified Dividend Income for Individuals | Dividends Received Deduction for Corporations | |||
| Third Avenue Value Fund | $70,752,649 | 19.21% | ||
| Third Avenue Small-Cap Value Fund | 4,970,725 | 42.03% | ||
| Third Avenue Real Estate Value Fund | 16,032,407 | 3.46% | ||
| Third Avenue International Value Fund | 22,090,359 | 1.43% | ||
| The following Funds intend to elect to pass through to shareholders the income taxes paid to foreign countries which may be eligible for the foreign tax credit in accordance with Section 853 of the Internal Revenue Code. Gross foreign source income and foreign tax expenses for the year ended October 31, 2015 are as follows: | ||||
| Gross Foreign Source Income | Foreign Tax Pass Through | |||
| Third Avenue International Value Fund | $5,590,881 | $444,254 | ||
| 91 |
BOARD OF TRUSTEES
| William E. Chapman, II | Patrick Reinkemeyer |
| Lucinda Franks | Martin Shubik |
| Edward J. Kaier | Charles C. Walden |
| Eric Rakowski | Martin J. Whitman |
OFFICERS
Martin J. Whitman — Chairman of the Board
Vincent J. Dugan — Chief Financial Officer, Treasurer
Michael A. Buono — Controller
W. James Hall — President, General Counsel, Secretary
Joseph J. Reardon — Chief Compliance Officer
TRANSFER AGENT
BNY Mellon Investment Servicing (U.S.) Inc.
P.O. Box 9802
Providence, RI 02940-8002
610-239-4600
800-443-1021 (toll-free)
INVESTMENT ADVISER
Third Avenue Management LLC
622 Third Avenue
New York, NY 10017
INDEPENDENT REGISTERED PUBLIC ACCOUNTING FIRM
PricewaterhouseCoopers LLP
300 Madison Avenue
New York, NY 10017
CUSTODIAN
JPMorgan Chase Bank, N.A.
14201 Dallas Parkway, 2nd Floor
Dallas, TX 75254
ABOUT THIRD AVENUE MANAGEMENT
Third Avenue Management LLC is a New York-based global asset manager that
has adhered to a proven value investment philosophy since its founding in 1986.
Third Avenue’s disciplined approach seeks to maximize long-term, risk-adjusted
returns by focusing on corporate financial stability, and price conscious,
opportunistic security selection throughout the capital structure.
If you would like further information about Third Avenue Funds, please contact
your relationship manager or email clientservice@thirdave.com

Item 2. Code of Ethics.
At October 31, 2015, the Trust had a code of ethics (the “Code of Ethics”) that applies to its principal executive officer and principal financial officer. This Code of Ethics is attached as Exhibit (a) (1) hereto.
Item 3. Audit Committee Financial Expert.
The Trust’s Board of Trustees has determined that Messrs. William Chapman, Martin Shubik and Charles Walden, members of the Audit Committee of the Board, are “audit committee financial experts” (“ACFE”) as defined by the Securities and Exchange Commission (“SEC”) and has designated Mr. Chapman as the Committee’s ACFE. Each of Messrs. Chapman, Shubik and Walden are “independent” as defined by the SEC for purposes of ACFE determinations. Under applicable securities laws, a person who is determined to be an ACFE will not be deemed an “expert” for any purpose, including without limitation for the purposes of Section 11 of the Securities Act of 1933, as a result of being designated or identified as an ACFE. The designation or identification of a person as an ACFE does not impose on such person any duties, obligations, or liabilities that are greater than the duties, obligations, and liabilities imposed on such person as a member of the Audit Committee and Board of Trustees in the absence of such designation or identification.
Item 4. Principal Accountant Fees and Services.
(a) Audit Fees. The aggregate fees billed for each of the last two fiscal years for professional services rendered by the Trust’s principal accountant for the audit of the Trust’s annual financial statements or services that are normally provided by the accountant in connection with statutory and regulatory filings or engagements for those fiscal years were $420,000, including out of pocket expenses of approximately $7,000, for the fiscal year ended October 31, 2015 and $400,000, including out of pocket expenses of approximately $7,000, for the fiscal year ended October 31, 2014.
(b) Audit-Related Fees. There were no fees billed in each of the last two fiscal years for assurance and related services by the Trust’s principal accountant that are reasonably related to the performance of the audit of the Trust’s financial statements and are not reported above in Item 4(a). There were no audit-related services provided to the Trust’s investment adviser or any entity controlling, controlled by, or under common control with
the Trust’s investment adviser that provides ongoing services to the Trust (“Service Affiliates”) during each of the last two years that were required to be pre-approved by the Trust’s Audit Committee.
(c) Tax Fees. The aggregate fees billed in each of the last two fiscal years for professional services rendered by the Trust’s principal accountant for tax compliance, tax advice and tax planning were $265,000 for the fiscal year ended October 31, 2015 and $265,000 for the fiscal year ended October 31, 2014. These services related to the preparation of tax returns and the review of tax-related issues. There were no tax services provided to Service Affiliates during each of the last two fiscal years that were required to be pre-approved by the Trust’s Audit Committee.
(d) All Other Fees. There were no fees billed in each of the last two fiscal years for products and services provided by the Trust’s principal accountant, other than the services reported above in Items 4(a) through (c). There were no other services provided to Service Affiliates during each of the last two fiscal years that were required to be pre-approved by the Trust’s Audit Committee.
(e) Audit Committee Pre-Approval Policies and Procedures.
(i) The Audit Committee pre-approves the Trust’s accountant’s engagement for audit and non-audit services to the Trust and certain non-audit services to the Service Affiliates on a case-by-case basis. Pre-approval considerations include whether the proposed services are compatible with maintaining the accountant’s independence.
(ii) There were no services provided to the Trust or Service Affiliates during the last two fiscal years for which the pre-approval requirement was waived pursuant to paragraph (c)(7)(i)(C) of Rule 2-01 of Regulation S-X.
(f) Not Applicable.
(g) The aggregate non-audit fees billed by the Trust’s accountant for services rendered to the Trust and Service Affiliates for each of the last two fiscal years were $265,000 for the fiscal year ended October 31, 2015 and $265,000 for the fiscal year ended October 31, 2014.
(h) The Audit Committee has considered whether the provision of non-audit services to the Service Affiliates that were not pre-approved pursuant to paragraph (c)(7)(ii) of Rule 2-01 of Regulation S-X is compatible with maintaining the independence of the Trust’s accountant.
Item 5. Audit Committee of Listed Registrants.
Not applicable.
Item 6. Schedule of Investments.
Not applicable.
Item 7. Disclosure of Proxy Voting Policies and Procedures for Closed-End Management Investment Companies.
Not applicable.
Item 8. Portfolio Managers of Closed-End Management Investment Companies.
Not applicable.
Item 9. Purchase of Equity Securities by Closed-End Management Investment Company and Affiliated Purchasers.
Not applicable.
Item 10. Submission of Matters to a Vote of Security Holders.
Not applicable.
Item 11. Controls and Procedures.
(a) The Trust’s principal executive officer and principal financial officer have evaluated the Trust’s disclosure controls and procedures within 90 days of this filing and have concluded that the Trust’s disclosure controls and procedures are reasonably designed to ensure that information required to be disclosed by the Trust in this Form N-CSR is recorded, processed, summarized, and reported within the required time periods and that information required to be disclosed by the Trust in the report that it files or submits on Form N-CSR is accumulated and communicated to the Trust’s management, including its principal executive and principal financial officers, as appropriate to allow timely decisions regarding required disclosure.
(b) The Trust’s principal executive officer and principal financial officer are aware of no changes in the Trust’s internal control over financial reporting that occurred during the second fiscal quarter of the period covered by this report that have materially affected, or are reasonably likely to materially affect, the Trust’s internal control over financial reporting.
Item 12. Exhibits.
(a)(1) Code of Ethics
(a)(2) Certifications pursuant to Rule 30a-2(a) under the 1940 Act.
(a)(3) Not applicable
(b) Certifications pursuant to Rule 30a-2(b) under the 1940 Act.
SIGNATURES
Pursuant to the requirements of the Securities Exchange Act of 1934 and the 1940 Act, the registrant has duly caused this report to be signed on its behalf by the undersigned, thereunto duly authorized.
(Registrant) Third Avenue Trust
| By: | /s/ W. James Hall |
| Name: | W. James Hall |
| Title: | Principal Executive Officer |
| Date: | December 24, 2015 |
Pursuant to the requirements of the Securities Exchange Act of 1934 and the 1940 Act, this report has been signed by the following persons on behalf of the registrant and in the capacities and on the dates indicated.
| By: | /s/ W. James Hall |
| Name: | W. James Hall |
| Title: | Principal Executive Officer |
| Date: | December 24, 2015 |
| By: | /s/ Vincent J. Dugan |
| Name: | Vincent J. Dugan |
| Title: | Principal Financial Officer |
| Date: | December 24, 2015 |