UNITED STATES
SECURITIES AND EXCHANGE COMMISSION
Washington, D.C. 20549
FORM N-CSR
CERTIFIED SHAREHOLDER REPORT OF REGISTERED
MANAGEMENT INVESTMENT COMPANIES
Investment Company Act file number: 811-08061
Diamond Hill Funds
(Exact name of registrant as specified in charter)
325 John H. McConnell Boulevard, Suite 200, Columbus, Ohio 43215
(Address of principal executive offices) (Zip code)
James F. Laird, Jr., 325 John H. McConnell Boulevard, Suite 200, Columbus, Ohio 43215
(Name and address of agent for service)
Registrant’s telephone number, including area code: 614-255-3333
Date of fiscal year end: December 31
Date of reporting period: June 30, 2014
| Item 1. | Reports to Stockholders. |

Semi-Annual Report
June 30, 2014
| | |
| Small Cap Fund | | Long-Short Fund |
| Small-Mid Cap Fund | | Research Opportunities Fund |
| Mid Cap Fund | | Financial Long-Short Fund |
| Large Cap Fund | | Strategic Income Fund |
| Select Fund | | |
This material must be preceded or accompanied by a current prospectus.
Not FDIC Insured. May Lose Value. No Bank Guarantee.

Table of Contents
Cautionary Statement: At Diamond Hill, we pledge that, “we will communicate with our clients about our investment performance in a manner that will allow them to properly assess whether we are deserving of their trust.” Our views and opinions regarding the investment prospects of our portfolio holdings and Funds are “forward looking statements” which may or may not be accurate over the long term. While we believe we have a reasonable basis for our opinions, actual results may differ materially from those we anticipate. Information provided in this report should not be considered a recommendation to purchase or sell any particular security.
You can identify forward looking statements by words like “believe,” “expect,” “anticipate,” or similar expressions when discussing prospects for particular portfolio holdings and/or one of the Funds. We cannot assure future results. You should not place undue reliance on forward-looking statements, which speak only as of the date of this report. We disclaim any obligation to update or alter any forward-looking statements, whether as a result of new information, future events, or otherwise.
This material is not authorized for distribution to prospective investors unless preceded or accompanied by a Prospectus. Investors should consider the investment objectives, risks, charges, and expenses of the Diamond Hill Funds carefully before investing. The prospectus or summary prospectus contain this and other important information about the Fund(s) and are available at diamond-hill.com or by calling 888.226.5595. Please read the prospectus or summary prospectus carefully before investing. The Diamond Hill Funds are distributed by BHIL Distributors, Inc. (Member FINRA), an affiliated company. Diamond Hill Capital Management, Inc., a registered investment adviser, serves as Investment Adviser to the Diamond Hill Funds and is paid a fee for its services. Diamond Hill Funds are not FDIC insured, may lose value, and have no bank guarantee.
Letter to Shareholders
Dear fellow shareholder:
We are pleased to provide this 2014 mid-year update for the Diamond Hill Funds. Since our firm’s inception, our primary goal has been to achieve the best value-added returns for our clients over rolling five-year periods. Our long-term focus is evident in our relatively low portfolio turnover, portfolio manager compensation that is directly tied to five-year investment results, and significant personal investment in our strategies. At Diamond Hill, our Code of Ethics prohibits employees from purchasing individual equity securities and third-party mutual funds that invest primarily in U.S. equity securities. As a result, substantially all employees’ equity investments are in Diamond Hill Funds. This is rare in our industry and clearly demonstrates our commitment to aligning our interests with those of our clients and our strong belief in our investment philosophy. You can be confident that our portfolio managers and analysts are spending their time managing your money – because it is also their own.
2014 Year-to-Date Market Review
U.S. equity markets rose during the first six months of 2014 with the Russell 1000 and Russell 2000 Indexes posting total returns of 7.27% and 3.19%, respectively. Equity markets were uneven during the first quarter of 2014, but the broad indexes managed to close higher as many of the big picture concerns weighing on the market faded. Europe, which had been a clear laggard over the past few years, continued to show signs of improvement, while most of Asia appeared to be growing at a healthy rate. In the U.S., some of the fiscal uncertainty was eliminated and employment showed signs of steady improvement, allowing the economy to continue its healing process.
U.S. stocks moved higher during the second quarter of 2014 as the primary factors supporting market valuations remained intact. The world’s major central banks remained extraordinarily accommodative, flooding the financial markets with money and providing a key tailwind for overall economic growth. The U.S. markets were also supported by the expectation that the U.S. economy, although still sluggish, will grow fast enough to support corporate profit growth. We continue to believe that the Federal Reserve is likely to maintain a very accommodative overall monetary policy well into 2015.
Sector Results
Year-to-date, the utilities sector was the best performing sector, followed by the energy and health care sectors. This represented a reversal from 2013 when the utilities sector was the worst performing sector. Higher usage rates due to the cold winter, as well as attractive dividend yields in a low interest rate environment, played a role in the outperformance. With interest rates remaining stubbornly low, investors have turned to equity securities that can provide a steady income stream through dividend payments, and utilities typically pay out bigger dividends relative to their share prices than most other sectors. However, we have tended to be underweight the utilities sector in most of our strategies over the past few
| | | | | | | | | | | | | | | | |
| DIAMOND HILL FUNDS | | | | | SEMI-ANNUAL REPORT | | | | | JUNE 30, 2014 | | | | | DIAMOND-HILL.COM | | | 1 | |
Letter to Shareholders
years. We believe utility company valuations in general are high given the limited growth opportunities within the highly regulated industry. We continue to have significant exposure to the financial sector across most of our strategies, finding value in insurance, insurance brokers, money center banks, and asset managers.
Market Outlook
We continue to be encouraged by the modest deleveraging of the U.S. household sector over the past five years. The slightly lower debt levels combined with very low interest rates has allowed consumer debt-service burdens to improve to relatively low levels by historical standards. Clearly this healthy debt service picture remains very much tied to historically low interest/mortgage rates, and any meaningful increase in those rates is likely to present an important headwind for growth.
Although the U.S. economy appears to be healing at a steady pace and looks poised to improve in the near term, we continue to expect positive but below average equity market returns over the next five years. Our conclusion is primarily based on the combination of above average price/earnings multiples applied to already very strong levels of corporate profit margins, which likely tempers prospective returns. We believe that we can achieve better than market returns over the next five years through active portfolio management and stock selection independent of benchmark weights.
| | |
 | |  |
| |
Chris Bingaman, CFA Portfolio Manager, Co-Chief Investment Officer | | Chris Welch, CFA Portfolio Manager, Co-Chief Investment Officer |
The views expressed are those of the portfolio manager as of June 30, 2014, are subject to change, and may differ from the views of other portfolio managers or the firm as a whole. These opinions are not intended to be a forecast of future events, a guarantee of future results, or investment advice. All data referenced are from sources deemed to be reliable but cannot be guaranteed. Securities and sectors referenced should not be construed as a solicitation or recommendation or be used as the sole basis for any investment decision.
| | | | | | | | | | | | | | |
| 2 | | DIAMOND HILL FUNDS | | | | | SEMI-ANNUAL REPORT | | | | | JUNE 30, 2014 | | | | | DIAMOND-HILL.COM |
Our Mission
At Diamond Hill, we serve our clients by providing investment strategies that deliver lasting value through a shared commitment to our intrinsic value-based investment philosophy, long-term perspective, disciplined approach and alignment with our clients’ interests.
VALUE
We believe market price and intrinsic value are independent in the short-term but tend to converge over time.
LONG-TERM
We maintain a long-term focus both in investment analysis and management of our business.
DISCIPLINE
We invest with discipline to increase potential return and protect capital.
PARTNERSHIP
We align our interests with those of our clients through significant personal investment in our strategies.
| | | | | | | | | | | | | | | | |
| DIAMOND HILL FUNDS | | | | | SEMI-ANNUAL REPORT | | | | | JUNE 30, 2014 | | | | | DIAMOND-HILL.COM | | | 3 | |
Fundamental Principles
The Importance of Valuation
We believe that a company’s intrinsic value is independent of its stock price and that intrinsic value can be reasonably estimated using a discounted cash flow methodology. Our entire investment team shares the same investment philosophy, which drives our investment process.
We focus on the fundamentals of intrinsic value, which are far less volatile than market price, and our actions are ultimately dictated by the price to intrinsic value relationship.
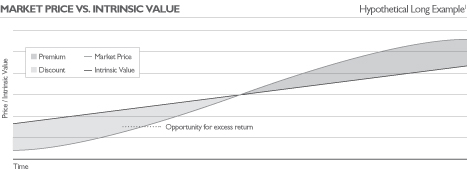
| | There is no guarantee that a discount to intrinsic value will be achieved or that market price and/or intrinsic value will increase over time. |
| 1 | The inverse is true for short position |
| | | | | | | | | | | | | | |
| 4 | | DIAMOND HILL FUNDS | | | | | SEMI-ANNUAL REPORT | | | | | JUNE 30, 2014 | | | | | DIAMOND-HILL.COM |
Fundamental Principles
Equity Investment Principles
Valuation
| Ÿ | | We believe that every share of stock has an intrinsic value that is independent of its current market price, and at any point in time, the market price may be higher or lower than intrinsic value. |
| Ÿ | | Over short periods of time, the market price is heavily influenced by the emotions of market participants, which are far more difficult to predict than intrinsic value. While market prices may experience extreme fluctuations on a particular day, we believe intrinsic value is far less volatile. |
| Ÿ | | Over sufficiently long periods of time, five years or longer, the stock market price tends to converge with intrinsic value. |
Intrinsic Value Estimate
| Ÿ | | We believe that we can determine a reasonable approximation of intrinsic value if we are confident in projecting the future cash flows of a business and use an appropriate discount rate. |
Suitable Investments
| Ÿ | | We only invest when the market price is lower than our conservative assessment of per share intrinsic value (or at a premium for short positions). |
| Ÿ | | We concentrate our investments in businesses whose per share intrinsic value is likely to increase. We invest in businesses that possess a competitive advantage, conservative balance sheet, and outstanding managers and employees. For short positions, the inverse is often true, and a growing intrinsic value is a detriment to the performance of the position. |
Risk & Return
| Ÿ | | We intend to achieve our return from both the closing of the gap between our purchase price and intrinsic value and the increase in per share intrinsic value. For short positions, an increasing intrinsic value may shorten the holding period. |
| Ÿ | | We define risk as the permanent loss of capital rather than price volatility. We manage risk by investing in companies selling at a discount (premium for short positions) to our estimate of intrinsic value. |
| | | | | | | | | | | | | | | | |
| DIAMOND HILL FUNDS | | | | | SEMI-ANNUAL REPORT | | | | | JUNE 30, 2014 | | | | | DIAMOND-HILL.COM | | | 5 | |
Fundamental Principles
Fixed Income Investment Principles
Business Analysis
| Ÿ | | We believe we can leverage our research team’s industry analysis of the fundamental economic drivers of the business to identify attractive corporate bonds and other senior corporate securities. |
| Ÿ | | We evaluate the quality of a firm’s management and their treatment of bondholders and stockholders. We believe managements that focus on growth, without regard to return on invested capital or long-term cost of capital, are more likely to destroy value for bondholders and stockholders. In contrast, managements that understand the competitive dynamics of their business and prudent capital allocation often produce value for both bondholders and stockholders. |
Valuation
| Ÿ | | We focus on the intrinsic value of the business in relation to the amount of debt in the capital structure. We also evaluate the sources and uses of cash for the business. |
| Ÿ | | The liquidity and expected volatility of a corporate bond are also important factors in valuation. Because of our long-term time horizon, we will invest in less liquid or more volatile securities; however, we require a higher yield as compensation. |
Suitable Investments
| Ÿ | | We generally invest in corporate bonds of companies with improving competitive positions and return on invested capital. |
| Ÿ | | Our core competency is the evaluation of credit risk. We typically favor lower duration, shorter maturity corporate bonds. We focus almost entirely on the secondary market for corporate bonds rather than the primary (new issue) market. We primarily invest in investment grade and below-investment grade (high yield) corporate bonds, including a significant allocation to defensive high yield corporate bonds (due to low duration and higher credit quality). |
Risk & Return
| Ÿ | | We define risk as the permanent loss of capital. We seek to avoid a permanent loss of capital and to earn a sufficient return on capital to grow our purchasing power. |
| Ÿ | | We expect to achieve our return objective by investing in corporate bonds when we believe the market price discounts a greater risk of default or a greater loss upon default than is warranted. An additional source of return exists when the market price provides attractive compensation for short-term illiquidity or volatility, both of which are of less concern to a long-term investor. |
| Ÿ | | We focus on credit risk, interest rate risk, liquidity risk, call risk, reinvestment risk and other risks when evaluating corporate bonds. |
| | | | | | | | | | | | | | |
| 6 | | DIAMOND HILL FUNDS | | | | | SEMI-ANNUAL REPORT | | | | | JUNE 30, 2014 | | | | | DIAMOND-HILL.COM |
Diamond Hill Small Cap Fund
Schedule of Investments
June 30, 2014 (Unaudited)
| | | | | | | | |
| | | Shares | | | Fair
Value | |
|
| Common Stocks — 81.6% | |
| Consumer Discretionary — 9.6% | |
Aaron’s, Inc.^ | | | 575,835 | | | $ | 20,522,759 | |
Callaway Golf Co.^ | | | 375,583 | | | | 3,124,851 | |
Carter’s, Inc.^ | | | 96,830 | | | | 6,674,492 | |
Global Sources Ltd.*^ | | | 749,948 | | | | 6,209,569 | |
Hillenbrand, Inc.^ | | | 372,900 | | | | 12,163,998 | |
Liquidity Services, Inc.*^ | | | 242,920 | | | | 3,828,419 | |
Live Nation Entertainment, Inc.* | | | 471,085 | | | | 11,631,089 | |
Steiner Leisure Ltd.*^ | | | 729,752 | | | | 31,590,965 | |
Tenneco, Inc.*^ | | | 368,580 | | | | 24,215,706 | |
Vail Resorts, Inc.^ | | | 198,385 | | | | 15,311,354 | |
| | | | | | | | 135,273,202 | |
|
| Consumer Staples — 4.1% | |
B&G Foods, Inc.^ | | | 623,325 | | | | 20,376,494 | |
Energizer Holdings, Inc.^ | | | 129,105 | | | | 15,754,683 | |
Flowers Foods, Inc.^ | | | 1,041,839 | | | | 21,961,967 | |
| | | | | | | | 58,093,144 | |
|
| Energy — 10.8% | |
Carrizo Oil & Gas, Inc.*^ | | | 235,411 | | | | 16,304,566 | |
Cimarex Energy Co.^ | | | 241,295 | | | | 34,616,181 | |
Contango Oil & Gas Co.*^ | | | 200,162 | | | | 8,468,854 | |
Denbury Resources, Inc.^ | | | 638,515 | | | | 11,786,987 | |
Rosetta Resources, Inc.*^ | | | 777,845 | | | | 42,664,798 | |
Southwestern Energy Co.* | | | 177,485 | | | | 8,073,793 | |
Whiting Petroleum Corp.* | | | 375,300 | | | | 30,117,825 | |
| | | | | | | | 152,033,004 | |
|
| Financials — 27.0% | |
Alleghany Corp.*^ | | | 36,757 | | | | 16,103,977 | |
American Equity Investment Life Holding Co.^ | | | 766,500 | | | | 18,855,900 | |
Assured Guaranty Ltd.^ | | | 379,152 | | | | 9,289,224 | |
Brown & Brown, Inc. | | | 742,790 | | | | 22,811,081 | |
Endurance Specialty Holdings Ltd. | | | 321,160 | | | | 16,568,644 | |
Enstar Group Ltd.*^ | | | 154,852 | | | | 23,340,842 | |
First Horizon National Corp.^ | | | 791,280 | | | | 9,384,581 | |
First Niagara Financial Group, Inc.^ | | | 648,415 | | | | 5,667,147 | |
First of Long Island Corp., The#^ | | | 159,419 | | | | 6,230,095 | |
| | | | | | | | |
| | | Shares | | | Fair
Value | |
|
| Financials — 27.0% continued | |
Fortress Investment Group LLC, Class A | | | 1,514,980 | | | $ | 11,271,451 | |
Greenlight Capital Re Ltd., Class A*^ | | | 580,240 | | | | 19,113,106 | |
HCC Insurance Holdings, Inc.^ | | | 727,735 | | | | 35,615,351 | |
Infinity Property & Casualty Corp.^ | | | 89,440 | | | | 6,013,051 | |
iStar Financial, Inc. REIT*^ | | | 2,559,945 | | | | 38,347,976 | |
Mid-America Apartment Communities, Inc. REIT^ | | | 224,204 | | | | 16,378,102 | |
National Penn Bancshares, Inc.^ | | | 856,140 | | | | 9,057,961 | |
Nationstar Mortgage Holdings, Inc.*^ | | | 199,105 | | | | 7,227,512 | |
Navigators Group, Inc.*^ | | | 550,828 | | | | 36,933,017 | |
Popular, Inc.*^ | | | 1,001,633 | | | | 34,235,816 | |
Reinsurance Group of America | | | 170,360 | | | | 13,441,404 | |
State Bank Financial Corp.^ | | | 208,585 | | | | 3,527,172 | |
Sterling Bancorp^ | | | 775,960 | | | | 9,311,520 | |
Winthrop Realty Trust REIT^ | | | 884,650 | | | | 13,579,378 | |
| | | | | | | | 382,304,308 | |
|
| Health Care — 5.9% | |
Alere, Inc.*^ | | | 762,615 | | | | 28,537,053 | |
Greatbatch, Inc.* | | | 374,260 | | | | 18,361,196 | |
LifePoint Hospitals, Inc.*^ | | | 75,750 | | | | 4,704,075 | |
Natus Medical, Inc.*^ | | | 847,635 | | | | 21,309,544 | |
Universal American Financial Corp.^ | | | 1,326,486 | | | | 11,049,628 | |
| | | | | | | | 83,961,496 | |
|
| Industrials — 16.9% | |
AAR Corp.^ | | | 343,967 | | | | 9,479,731 | |
Aircastle Ltd.^ | | | 620,323 | | | | 11,023,140 | |
Alaska Air Group, Inc.^ | | | 119,280 | | | | 11,337,564 | |
Avis Budget Group, Inc.*^ | | | 1,042,705 | | | | 62,239,060 | |
Brink’s Co., The^ | | | 364,190 | | | | 10,277,442 | |
Corrections Corp. of America^ | | | 641,908 | | | | 21,086,678 | |
Hub Group, Inc., Class A*^ | | | 478,215 | | | | 24,102,036 | |
Hyster-Yale Materials Handling, Inc.^ | | | 111,100 | | | | 9,836,794 | |
Kennametal, Inc.^ | | | 389,230 | | | | 18,013,564 | |
Toro Co., The | | | 188,380 | | | | 11,980,968 | |
| | | | | | | | | | | | | | | | |
| DIAMOND HILL FUNDS | | | | | SEMI-ANNUAL REPORT | | | | | JUNE 30, 2014 | | | | | DIAMOND-HILL.COM | | | 7 | |
Diamond Hill Small Cap Fund
Schedule of Investments (Continued)
June 30, 2014 (Unaudited)
| | | | | | | | |
| | | Shares | | | Fair
Value | |
|
| Common Stocks — 81.6% continued | |
| Industrials — 16.9% continued | |
TriMas Corp.*^ | | | 371,725 | | | $ | 14,173,874 | |
Trinity Industries, Inc.^ | | | 724,510 | | | | 31,675,578 | |
Xpo Logistics, Inc.*^ | | | 97,657 | | | | 2,794,943 | |
| | | | | | | | 238,021,372 | |
|
| Information Technology — 4.3% | |
Broadridge Financial | | | | | | | | |
Solutions, Inc. | | | 534,710 | | | | 22,265,324 | |
CSG Systems | | | | | | | | |
International, Inc.^ | | | 209,772 | | | | 5,477,147 | |
DST Systems, Inc. | | | 339,200 | | | | 31,264,064 | |
Rovi Corp.*^ | | | 85,985 | | | | 2,060,201 | |
| | | | | | | | 61,066,736 | |
|
| Utilities — 3.0% | |
Cleco Corp.^ | | | 205,390 | | | | 12,107,740 | |
ITC Holdings Corp.^ | | | 265,083 | | | | 9,670,228 | |
UGI Corp.^ | | | 402,620 | | | | 20,332,310 | |
| | | | | | | | 42,110,278 | |
| |
| Total Common Stocks | | | $ | 1,152,863,540 | |
|
| Registered Investment Companies — 28.3% | |
JPMorgan Prime Money Market Fund,
0.04%S | | | 2,914,297 | | | | 2,914,297 | |
State Street Institutional Liquid Reserves Fund, Premier Class, 0.06%S | | | 259,347,944 | | | | 259,347,944 | |
State Street Navigator Securities Lending Prime Portfolio, 0.14%†S | | | 137,192,511 | | | | 137,192,511 | |
| |
| Total Registered Investment Companies | | | $ | 399,454,752 | |
|
| Total Investment Securities — 109.9% | |
(Cost $1,151,207,707)** | | | $ | 1,552,318,292 | |
| |
Net Other Assets
(Liabilities) — (9.9)% | | | | (140,411,989 | ) |
| |
| Net Assets — 100.0% | | | $ | 1,411,906,303 | |
| ^ | All or a portion of the security is on loan. The total fair value of the securities on loan, as of June 30, 2014, was $134,534,587. |
| * | Non-income producing security. |
| † | This security, which was purchased using cash collateral received from securities on loan, represents collateral for securities loaned as of June 30, 2014. |
| S | Rate represents the daily yield on June 30, 2014. |
| ** | Represents cost for financial reporting purposes. |
| # | This security has been deemed illiquid: |
| | | | | | | | | | | | | | | | |
| | | Acquisition
Date | | | Current
Cost | | | Fair
Value | | | Value
as a
% of
Net
Assets | |
First of Long Island Corp., The | |
| February-13
through
April-13 |
| | $ | 4,767,707 | | | $ | 6,230,095 | | | | 0.4% | |
REIT – Real Estate Investment Trust
See accompanying Notes to Financial Statements
| | | | | | | | | | | | | | |
| 8 | | DIAMOND HILL FUNDS | | | | | SEMI-ANNUAL REPORT | | | | | JUNE 30, 2014 | | | | | DIAMOND-HILL.COM |
Diamond Hill Small-Mid Cap Fund
Schedule of Investments
June 30, 2014 (Unaudited)
| | | | | | | | |
| | | Shares | | | Fair
Value | |
|
| Common Stocks — 91.8% | |
| Consumer Discretionary — 10.3% | |
Aaron’s, Inc. | | | 146,305 | | | $ | 5,214,310 | |
Gannett Co., Inc.^ | | | 263,180 | | | | 8,240,166 | |
Jarden Corp.* | | | 168,130 | | | | 9,978,516 | |
Staples, Inc.^ | | | 876,175 | | | | 9,497,737 | |
Steiner Leisure Ltd.* | | | 223,275 | | | | 9,665,575 | |
Whirlpool Corp. | | | 49,565 | | | | 6,900,439 | |
| | | | | | | | 49,496,743 | |
|
| Consumer Staples — 12.4% | |
B&G Foods, Inc. | | | 306,968 | | | | 10,034,784 | |
ConAgra Foods, Inc. | | | 180,505 | | | | 5,357,388 | |
Coty, Inc.^ | | | 219,850 | | | | 3,766,031 | |
Energizer Holdings, Inc. | | | 75,895 | | | | 9,261,467 | |
Flowers Foods, Inc. | | | 557,273 | | | | 11,747,314 | |
Molson Coors Brewing | | | | | | | | |
Co., Class B | | | 145,600 | | | | 10,797,696 | |
Post Holdings, Inc.*^ | | | 171,172 | | | | 8,714,367 | |
| | | | | | | | 59,679,047 | |
|
| Energy — 9.5% | |
Cimarex Energy Co. | | | 128,435 | | | | 18,425,285 | |
Contango Oil & Gas Co.* | | | 56,084 | | | | 2,372,914 | |
Denbury Resources, Inc.^ | | | 138,653 | | | | 2,559,534 | |
Energen Corp. | | | 89,258 | | | | 7,933,251 | |
Noble Energy, Inc.^ | | | 71,750 | | | | 5,557,755 | |
Whiting Petroleum Corp.* | | | 109,110 | | | | 8,756,078 | |
| | | | | | | | 45,604,817 | |
|
| Financials — 29.0% | |
American Equity | | | | | | | | |
Investment Life | | | | | | | | |
Holding Co. | | | 273,460 | | | | 6,727,116 | |
Brown & Brown, Inc. | | | 418,185 | | | | 12,842,461 | |
Endurance Specialty Holdings Ltd. | | | 186,565 | | | | 9,624,888 | |
Enstar Group Ltd.* | | | 16,615 | | | | 2,504,379 | |
First Horizon National Corp. | | | 370,345 | | | | 4,392,292 | |
First Niagara Financial Group, Inc. | | | 631,340 | | | | 5,517,912 | |
First Republic Bank^ | | | 147,515 | | | | 8,111,850 | |
Greenlight Capital Re Ltd., Class A* | | | 191,715 | | | | 6,315,092 | |
HCC Insurance Holdings, Inc. | | | 152,520 | | | | 7,464,329 | |
Infinity Property & Casualty Corp. | | | 41,680 | | | | 2,802,146 | |
iStar Financial, Inc. REIT* | | | 624,065 | | | | 9,348,493 | |
Mid-America Apartment Communities, Inc. REIT | | | 87,955 | | | | 6,425,113 | |
National Penn Bancshares, Inc. | | | 410,310 | | | | 4,341,080 | |
| | | | | | | | |
| | | Shares | | | Fair
Value | |
|
| Financials — 29.0% continued | |
Nationstar Mortgage Holdings, Inc.*^ | | | 102,450 | | | $ | 3,718,935 | |
Navigators Group, Inc.* | | | 76,790 | | | | 5,148,770 | |
Popular, Inc.* | | | 261,392 | | | | 8,934,378 | |
Reinsurance Group of America | | | 85,025 | | | | 6,708,473 | |
Willis Group Holdings plc^ | | | 542,495 | | | | 23,490,033 | |
XL Group plc^ | | | 150,560 | | | | 4,927,829 | |
| | | | | | | | 139,345,569 | |
|
| Health Care — 10.7% | |
Boston Scientific Corp.*^ | | | 1,098,660 | | | | 14,029,888 | |
CareFusion Corp.* | | | 108,755 | | | | 4,823,284 | |
Catamaran Corp.* | | | 176,565 | | | | 7,797,110 | |
LifePoint Hospitals, Inc.* | | | 135,530 | | | | 8,416,413 | |
Orthofix International NV*^ | | | 211,922 | | | | 7,682,173 | |
Quest Diagnostics, Inc.^ | | | 55,250 | | | | 3,242,623 | |
Universal American Financial Corp. | | | 665,670 | | | | 5,545,031 | |
| | | | | | | | 51,536,522 | |
|
| Industrials — 11.5% | |
Aircastle Ltd. | | | 125,570 | | | | 2,231,379 | |
Brink’s Co., The | | | 142,015 | | | | 4,007,663 | |
Corrections Corp. of America | | | 193,411 | | | | 6,353,552 | |
Dover Corp. | | | 139,953 | | | | 12,728,725 | |
Hub Group, Inc., Class A* | | | 318,495 | | | | 16,052,148 | |
Kennametal, Inc. | | | 145,380 | | | | 6,728,186 | |
Knowles Corp.*^ | | | 67,051 | | | | 2,061,148 | |
Parker Hannifin Corp.^ | | | 21,700 | | | | 2,728,341 | |
Southwest Airlines Co.^ | | | 87,865 | | | | 2,360,054 | |
| | | | | | | | 55,251,196 | |
|
| Information Technology — 5.5% | |
Broadridge Financial Solutions, Inc. | | | 111,040 | | | | 4,623,706 | |
Juniper Networks, Inc.*^ | | | 448,100 | | | | 10,996,374 | |
Linear Technology Corp.^ | | | 69,975 | | | | 3,293,723 | |
Vantiv, Inc., Class A* | | | 231,245 | | | | 7,774,457 | |
| | | | | | | | 26,688,260 | |
|
| Utilities — 2.9% | |
Cleco Corp. | | | 33,005 | | | | 1,945,645 | |
ITC Holdings Corp. | | | 114,420 | | | | 4,174,041 | |
UGI Corp. | | | 152,660 | | | | 7,709,330 | |
| | | | | | | | 13,829,016 | |
| |
| Total Common Stocks | | | $ | 441,431,170 | |
| | | | | | | | | | | | | | | | |
| DIAMOND HILL FUNDS | | | | | SEMI-ANNUAL REPORT | | | | | JUNE 30, 2014 | | | | | DIAMOND-HILL.COM | | | 9 | |
Diamond Hill Small-Mid Cap Fund
Schedule of Investments (Continued)
June 30, 2014 (Unaudited)
Diamond Hill Mid Cap Fund
Schedule of Investments
June 30, 2014 (Unaudited)
| | | | | | | | |
| | | Shares | | | Fair
Value | |
|
| Registered Investment Companies — 15.5% | |
JPMorgan Prime Money Market Fund,
0.04%S | | | 111,379 | | | $ | 111,379 | |
State Street Institutional Liquid Reserves Fund, Premier Class,
0.06%S | | | 38,287,762 | | | | 38,287,762 | |
State Street Navigator Securities Lending Prime Portfolio, 0.14%†S | | | 36,431,533 | | | | 36,431,533 | |
| |
| Total Registered Investment Companies | | | $ | 74,830,674 | |
|
| Total Investment Securities — 107.3% | |
(Cost $444,666,447)** | | | $ | 516,261,844 | |
| |
Net Other Assets
(Liabilities) — (7.3)% | | | | (35,293,616 | ) |
| |
| Net Assets — 100.0% | | | $ | 480,968,228 | |
| ^ | All or a portion of the security is on loan. The total fair value of the securities on loan, as of June 30, 2014, was $35,899,859. |
| * | Non-income producing security. |
| † | This security, which was purchased using cash collateral received from securities on loan, represents collateral for securities loaned as of June 30, 2014. |
| S | Rate represents the daily yield on June 30, 2014. |
| ** | Represents cost for financial reporting purposes. |
REIT – Real Estate Investment Trust
See accompanying Notes to Financial Statements
| | | | | | | | |
| | | Shares | | | Fair
Value | |
|
| Common Stocks — 93.9% | |
| Consumer Discretionary — 10.8% | |
Aaron’s, Inc. | | | 3,594 | | | $ | 128,090 | |
Dollar General Corp.* | | | 1,908 | | | | 109,443 | |
Gannett Co., Inc. | | | 6,800 | | | | 212,908 | |
Jarden Corp.* | | | 4,377 | | | | 259,775 | |
Mattel, Inc.^ | | | 3,247 | | | | 126,536 | |
Ross Stores, Inc. | | | 1,835 | | | | 121,349 | |
Staples, Inc. | | | 17,765 | | | | 192,572 | |
Whirlpool Corp. | | | 1,706 | | | | 237,509 | |
| | | | | | | | 1,388,182 | |
|
| Consumer Staples — 13.6% | |
B&G Foods, Inc. | | | 7,970 | | | | 260,539 | |
ConAgra Foods, Inc. | | | 4,855 | | | | 144,096 | |
Coty, Inc. | | | 6,005 | | | | 102,866 | |
Energizer Holdings, Inc. | | | 2,000 | | | | 244,060 | |
Flowers Foods, Inc. | | | 15,526 | �� | | | 327,288 | |
Molson Coors Brewing Co., | | | | | | | | |
Class B | | | 4,092 | | | | 303,463 | |
Post Holdings, Inc.* | | | 3,709 | | | | 188,825 | |
Sysco Corp.^ | | | 4,735 | | | | 177,326 | |
| | | | | | | | 1,748,463 | |
| | |
| Energy — 10.8% | | | | | | | | |
Cimarex Energy Co. | | | 3,733 | | | | 535,537 | |
Energen Corp. | | | 2,435 | | | | 216,423 | |
Noble Energy, Inc. | | | 4,551 | | | | 352,520 | |
Southwestern Energy Co.* | | | 1,313 | | | | 59,728 | |
Whiting Petroleum Corp.* | | | 2,789 | | | | 223,817 | |
| | | | | | | | 1,388,025 | |
| | |
| Financials — 29.2% | | | | | | | | |
Alleghany Corp.* | | | 218 | | | | 95,510 | |
American Equity Investment | | | | | | | | |
Life Holding Co. | | | 7,228 | | | | 177,809 | |
Brown & Brown, Inc. | | | 11,370 | | | | 349,173 | |
Endurance Specialty Holdings Ltd. | | | 5,880 | | | | 303,349 | |
Enstar Group Ltd.* | | | 845 | | | | 127,367 | |
First Horizon National Corp. | | | 9,455 | | | | 112,136 | |
First Niagara Financial Group, Inc. | | | 18,938 | | | | 165,518 | |
First Republic Bank | | | 3,295 | | | | 181,192 | |
HCC Insurance Holdings, Inc. | | | 4,985 | | | | 243,966 | |
KeyCorp^ | | | 4,286 | | | | 61,418 | |
Mid-America Apartment | | | | | | | | |
Communities, Inc. REIT | | | 3,311 | | | | 241,869 | |
National Penn Bancshares, Inc. | | | 12,683 | | | | 134,186 | |
Nationstar Mortgage Holdings, Inc.* | | | 3,521 | | | | 127,812 | |
| | | | | | | | | | | | | | |
| 10 | | DIAMOND HILL FUNDS | | | | | SEMI-ANNUAL REPORT | | | | | JUNE 30, 2014 | | | | | DIAMOND-HILL.COM |
Diamond Hill Mid Cap Fund
Schedule of Investments (Continued)
June 30, 2014 (Unaudited)
| | | | | | | | |
| | | Shares | | | Fair
Value | |
|
| Common Stocks — 93.9% continued | |
| Financials — 29.2% continued | |
Popular, Inc.* | | | 7,001 | | | $ | 239,295 | |
Progressive Corp. | | | 4,217 | | | | 106,943 | |
Reinsurance Group of America | | | 2,314 | | | | 182,575 | |
SunTrust Banks, Inc.^ | | | 2,342 | | | | 93,821 | |
Willis Group Holdings plc | | | 14,657 | | | | 634,648 | |
XL Group plc | | | 5,411 | | | | 177,102 | |
| | | | | | | | 3,755,689 | |
|
| Health Care — 9.1% | |
Boston Scientific Corp.* | | | 38,478 | | | | 491,364 | |
CareFusion Corp.* | | | 3,671 | | | | 162,809 | |
Catamaran Corp.* | | | 4,680 | | | | 206,669 | |
LifePoint Hospitals, Inc.* | | | 3,525 | | | | 218,902 | |
Quest Diagnostics, Inc.^ | | | 1,561 | | | | 91,615 | |
| | | | | | | | 1,171,359 | |
|
| Industrials — 11.6% | |
Brink’s Co., The | | | 3,364 | | | | 94,932 | |
Corrections Corp. of America | | | 6,272 | | | | 206,035 | |
Dover Corp. | | | 4,455 | | | | 405,183 | |
Hub Group, Inc., Class A* | | | 7,315 | | | | 368,676 | |
Kennametal, Inc. | | | 4,001 | | | | 185,166 | |
Knowles Corp.*^ | | | 2,082 | | | | 64,001 | |
Parker Hannifin Corp. | | | 1,336 | | | | 167,975 | |
| | | | | | | | 1,491,968 | |
|
| Information Technology — 5.7% | |
Broadridge Financial Solutions, Inc. | | | 2,530 | | | | 105,349 | |
Juniper Networks, Inc.* | | | 12,141 | | | | 297,940 | |
Linear Technology Corp. | | | 2,525 | | | | 118,852 | |
Vantiv, Inc., Class A* | | | 6,180 | | | | 207,772 | |
| | | | | | | | 729,913 | |
|
| Utilities — 3.1% | |
Cleco Corp. | | | 1,123 | | | | 66,201 | |
ITC Holdings Corp. | | | 3,304 | | | | 120,530 | |
UGI Corp. | | | 4,163 | | | | 210,231 | |
| | | | | | | | 396,962 | |
| | |
| Total Common Stocks | | | | | | $ | 12,070,561 | |
|
| Registered Investment Companies — 11.6% | |
JPMorgan Prime Money Market Fund,
0.04%S | | | 2,939 | | | $ | 2,939 | |
State Street Institutional Liquid Reserves Fund, Premier Class,
0.06%S | | | 963,366 | | | | 963,366 | |
| | | | | | | | |
| | | Shares | | | Fair
Value | |
|
| Registered Investment Companies — 11.6% continued | |
State Street Navigator Securities Lending Prime Portfolio,
0.14%†S | | | 536,486 | | | $ | 536,486 | |
| | |
| Total Registered Investment Companies | | | | | | $ | 1,502,791 | |
|
| Total Investment Securities — 105.5% | |
(Cost $12,931,924)** | | | $ | 13,573,352 | |
| | |
Net Other Assets
(Liabilities) — (5.5)% | | | | | | | (711,762 | ) |
| |
| Net Assets — 100.0% | | | $ | 12,861,590 | |
| ^ | All or a portion of the security is on loan. The total fair value of the securities on loan, as of June 30, 2014, was $521,275. |
| * | Non-income producing security. |
| † | This security, which was purchased using cash collateral received from securities on loan, represents collateral for securities loaned as of June 30, 2014. |
| S | Rate represents the daily yield on June 30, 2014. |
| ** | Represents cost for financial reporting purposes. |
REIT – Real Estate Investment Trust
See accompanying Notes to Financial Statements
| | | | | | | | | | | | | | | | |
| DIAMOND HILL FUNDS | | | | | SEMI-ANNUAL REPORT | | | | | JUNE 30, 2014 | | | | | DIAMOND-HILL.COM | | | 11 | |
Diamond Hill Large Cap Fund
Schedule of Investments
June 30, 2014 (Unaudited)
| | | | | | | | |
| | | Shares | | | Fair
Value | |
|
| Common Stocks — 97.9% | |
| Consumer Discretionary — 12.9% | |
Comcast Corp., Class A^ | | | 1,141,410 | | | $ | 61,270,889 | |
Gannett Co., Inc. | | | 1,309,405 | | | | 40,997,471 | |
McDonald’s Corp. | | | 504,849 | | | | 50,858,488 | |
TJX Cos., Inc., The | | | 951,175 | | | | 50,554,951 | |
Twenty-First Century Fox, Inc. | | | 692,570 | | | | 23,706,671 | |
VF Corp. | | | 943,840 | | | | 59,461,920 | |
Walt Disney Co., The^ | | | 703,965 | | | | 60,357,959 | |
Whirlpool Corp. | | | 275,790 | | | | 38,395,484 | |
| | | | | | | | 385,603,833 | |
|
| Consumer Staples — 11.9% | |
General Mills, Inc.^ | | | 788,973 | | | | 41,452,641 | |
Kimberly-Clark Corp. | | | 531,165 | | | | 59,076,171 | |
PepsiCo, Inc. | | | 825,755 | | | | 73,772,952 | |
Philip Morris International | | | 489,810 | | | | 41,295,881 | |
Procter & Gamble Co., The | | | 1,227,137 | | | | 96,440,697 | |
Sysco Corp.^ | | | 1,166,084 | | | | 43,669,846 | |
| | | | | | | | 355,708,188 | |
|
| Energy — 11.8% | |
Cimarex Energy Co. | | | 453,330 | | | | 65,034,722 | |
Devon Energy Corp. | | | 1,229,407 | | | | 97,614,915 | |
EOG Resources, Inc. | | | 729,456 | | | | 85,244,228 | |
Noble Energy, Inc.^ | | | 417,610 | | | | 32,348,071 | |
Occidental Petroleum Corp. | | | 703,270 | | | | 72,176,600 | |
| | | | | | | | 352,418,536 | |
|
| Financials — 25.5% | |
American International | | | | | | | | |
Group, Inc. | | | 1,667,820 | | | | 91,029,615 | |
Citigroup, Inc. | | | 1,885,585 | | | | 88,811,054 | |
Franklin Resources, Inc.^ | | | 794,720 | | | | 45,966,605 | |
JPMorgan Chase & Co. | | | 1,551,768 | | | | 89,412,871 | |
Marsh & McLennan Cos., Inc.^ | | | 1,172,545 | | | | 60,761,282 | |
MetLife, Inc. | | | 692,175 | | | | 38,457,243 | |
Morgan Stanley | | | 2,904,745 | | | | 93,910,406 | |
PNC Financial Services | | | | | | | | |
Group, Inc. | | | 751,215 | | | | 66,895,696 | |
Progressive Corp. | | | 2,335,635 | | | | 59,231,704 | |
Prudential Financial, Inc. | | | 840,989 | | | | 74,654,593 | |
Wells Fargo & Co. | | | 1,104,990 | | | | 58,078,274 | |
| | | | | | | | 767,209,343 | |
| | | | | | | | |
| | | Shares | | | Fair
Value | |
|
| Health Care — 13.1% | |
Abbott Laboratories | | | 2,036,802 | | | $ | 83,305,202 | |
Baxter International, Inc. | | | 505,262 | | | | 36,530,443 | |
Boston Scientific Corp.* | | | 4,563,720 | | | | 58,278,704 | |
Express Scripts Holding Co.*^ | | | 667,810 | | | | 46,299,267 | |
Medtronic, Inc.^ | | | 1,342,682 | | | | 85,609,404 | |
Pfizer, Inc. | | | 2,744,392 | | | | 81,453,555 | |
| | | | | | | | 391,476,575 | |
|
| Industrials — 10.9% | |
3M Co.^ | | | 400,707 | | | | 57,397,271 | |
Dover Corp. | | | 653,038 | | | | 59,393,807 | |
Illinois Tool Works, Inc.^ | | | 551,579 | | | | 48,296,257 | |
Parker Hannifin Corp.^ | | | 450,899 | | | | 56,691,531 | |
United Technologies Corp. | | | 897,612 | | | | 103,629,305 | |
| | | | | | | | 325,408,171 | |
|
| Information Technology — 10.8% | |
Apple Computer, Inc. | | | 525,952 | | | | 48,876,719 | |
Cisco Systems, Inc. | | | 2,094,143 | | | | 52,039,454 | |
International Business | | | | | | | | |
Machines Corp.^ | | | 281,610 | | | | 51,047,444 | |
Juniper Networks, Inc.* | | | 1,234,445 | | | | 30,293,280 | |
Linear Technology Corp.^ | | | 597,800 | | | | 28,138,446 | |
Microsoft Corp. | | | 1,760,385 | | | | 73,408,055 | |
Vantiv, Inc., Class A*^ | | | 1,192,680 | | | | 40,097,902 | |
| | | | | | | | 323,901,300 | |
|
| Materials — 1.0% | |
Air Products & | | | | | | | | |
Chemicals, Inc.^ | | | 119,155 | | | | 15,325,716 | |
Praxair, Inc. | | | 121,245 | | | | 16,106,186 | |
| | | | | | | | 31,431,902 | |
| |
| Total Common Stocks | | | $ | 2,933,157,848 | |
|
| Registered Investment Companies — 7.9% | |
JPMorgan Prime Money Market Fund,
0.04%S | | | 1,033,868 | | | | 1,033,868 | |
State Street Institutional Liquid Reserves Fund, Premier Class,
0.06%S | | | 94,571,726 | | | | 94,571,726 | |
| | | | | | | | | | | | | | |
| 12 | | DIAMOND HILL FUNDS | | | | | SEMI-ANNUAL REPORT | | | | | JUNE 30, 2014 | | | | | DIAMOND-HILL.COM |
Diamond Hill Large Cap Fund
Schedule of Investments (Continued)
June 30, 2014 (Unaudited)
Diamond Hill Select Fund
Schedule of Investments
June 30, 2014 (Unaudited)
| | | | | | | | |
| | | Shares | | | Fair
Value | |
|
| Common Stocks — 97.9% continued | |
| Registered Investment Companies — 7.9% continued | |
State Street Navigator Securities Lending Prime Portfolio,
0.14%†S | | | 142,804,377 | | | $ | 142,804,377 | |
| |
| Total Registered Investment Companies | | | $ | 238,409,971 | |
|
Total Investment Securities — 105.8% | |
(Cost $2,344,693,084)** | | | $ | 3,171,567,819 | |
| |
Net Other Assets
(Liabilities) — (5.8)% | | | | (175,103,213 | ) |
| |
| Net Assets — 100.0% | | | $ | 2,996,464,606 | |
| ^ | All or a portion of the security is on loan. The total fair value of the securities on loan, as of June 30, 2014, was $139,362,595. |
| * | Non-income producing security. |
| † | This security, which was purchased using cash collateral received from securities on loan, represents collateral for securities loaned as of June 30, 2014. |
| S | Rate represents the daily yield on June 30, 2014. |
| ** | Represents cost for financial reporting purposes. |
See accompanying Notes to Financial Statements
| | | | | | | | |
| | | Shares | | | Fair
Value | |
|
| Common Stocks — 94.6% | |
| Consumer Discretionary — 13.3% | |
Jarden Corp.* | | | 35,548 | | | $ | 2,109,774 | |
TJX Cos., Inc., The | | | 21,665 | | | | 1,151,495 | |
Twenty-First Century Fox, Inc. | | | 49,307 | | | | 1,687,779 | |
VF Corp. | | | 26,935 | | | | 1,696,905 | |
Whirlpool Corp. | | | 16,947 | | | | 2,359,361 | |
| | | | | | | | 9,005,314 | |
|
| Consumer Staples — 5.3% | |
PepsiCo, Inc. | | | 20,583 | | | | 1,838,885 | |
Philip Morris International | | | 20,683 | | | | 1,743,784 | |
| | | | | | | | 3,582,669 | |
|
| Energy — 6.5% | |
Cimarex Energy Co. | | | 20,361 | | | | 2,920,989 | |
EOG Resources, Inc. | | | 12,510 | | | | 1,461,919 | |
| | | | | | | | 4,382,908 | |
|
| Financials — 27.5% | |
American International | | | | | | | | |
Group, Inc. | | | 37,064 | | | | 2,022,953 | |
Brown & Brown, Inc. | | | 54,380 | | | | 1,670,010 | |
Citigroup, Inc. | | | 24,137 | | | | 1,136,853 | |
Endurance Specialty Holdings Ltd. | | | 34,424 | | | | 1,775,934 | |
Franklin Resources, Inc.^ | | | 31,989 | | | | 1,850,244 | |
iStar Financial, Inc. REIT* | | | 108,803 | | | | 1,629,869 | |
MetLife, Inc. | | | 25,528 | | | | 1,418,336 | |
Navigators Group, Inc.* | | | 24,307 | | | | 1,629,784 | |
Popular, Inc.* | | | 59,937 | | | | 2,048,646 | |
Willis Group Holdings plc | | | 78,552 | | | | 3,401,302 | |
| | | | | | | | 18,583,931 | |
|
| Health Care — 15.6% | |
Boston Scientific Corp.* | | | 203,263 | | | | 2,595,669 | |
GlaxoSmithKline plc^ | | | 29,282 | | | | 1,566,001 | |
Pfizer, Inc.^ | | | 64,287 | | | | 1,908,038 | |
Teva Pharmaceutical Industries Ltd., SP ADR^ | | | 39,185 | | | | 2,054,078 | |
Valeant Pharmaceuticals | | | | | | | | |
International, Inc.* | | | 19,613 | | | | 2,473,591 | |
| | | | | | | | 10,597,377 | |
|
| Industrials — 9.8% | |
Dover Corp. | | | 13,062 | | | | 1,187,989 | |
Hub Group, Inc., Class A* | | | 43,825 | | | | 2,208,780 | |
Parker Hannifin Corp. | | | 7,804 | | | | 981,197 | |
United Technologies Corp.^ | | | 19,388 | | | | 2,238,344 | |
| | | | | | | | 6,616,310 | |
| | | | | | | | | | | | | | | | |
| DIAMOND HILL FUNDS | | | | | SEMI-ANNUAL REPORT | | | | | JUNE 30, 2014 | | | | | DIAMOND-HILL.COM | | | 13 | |
Diamond Hill Select Fund
Schedule of Investments (Continued)
June 30, 2014 (Unaudited)
Diamond Hill Long-Short Fund
Schedule of Investments
June 30, 2014 (Unaudited)
| | | | | | | | |
| | | Shares | | | Fair
Value | |
|
| Common Stocks — 94.6% continued | |
| Information Technology — 16.6% | |
Apple Computer, Inc.^ | | | 19,936 | | | $ | 1,852,652 | |
Cisco Systems, Inc. | | | 99,726 | | | | 2,478,191 | |
International Business | | | | | | | | |
Machines Corp.^ | | | 16,414 | | | | 2,975,366 | |
Juniper Networks, Inc.* | | | 65,421 | | | | 1,605,431 | |
Microsoft Corp. | | | 56,531 | | | | 2,357,343 | |
| | | | | | | | 11,268,983 | |
| |
| Total Common Stocks | | | $ | 64,037,492 | |
|
| Registered Investment Companies — 21.2% | |
JPMorgan Prime Money Market Fund,
0.04%S | | | 31,458 | | | | 31,458 | |
State Street Institutional Liquid Reserves Fund, Premier Class,
0.06%S | | | 3,175,000 | | | | 3,175,000 | |
State Street Navigator Securities Lending Prime Portfolio,
0.14%†S | | | 11,186,369 | | | | 11,186,369 | |
| |
| Total Registered Investment Companies | | | $ | 14,392,827 | |
|
| Total Investment Securities — 115.8% | |
(Cost $65,377,330)** | | | | | | $ | 78,430,319 | |
| |
Net Other Assets
(Liabilities) — (15.8%) | | | | (10,715,110 | ) |
| |
| Net Assets — 100.0% | | | $ | 67,715,209 | |
| * | Non-income producing security. |
| ^ | All or a portion of the security is on loan. The total fair value of the securities on loan, as of June 30, 2014, was $10,906,495. |
| * | Non-income producing security. |
| † | This security, which was purchased using cash collateral received from securities on loan, represents collateral for securities loaned as of June 30, 2014. |
| S | Rate represents the daily yield on June 30, 2014. |
| ** | Represents cost for financial reporting purposes. |
ADR – American Depositary Receipt
REIT – Real Estate Investment Trust
See accompanying Notes to Financial Statements
| | | | | | | | |
| | | Shares | | | Fair
Value | |
|
| Common Stocks — 80.4% | |
| Consumer Discretionary — 10.6% | |
Comcast Corp., Class A | | | 1,003,725 | | | $ | 53,879,958 | |
Gannett Co., Inc. | | | 1,398,655 | | | | 43,791,888 | |
Jarden Corp.*^ | | | 653,180 | | | | 38,766,233 | |
TJX Cos., Inc., The^ | | | 856,785 | | | | 45,538,122 | |
Twenty-First Century Fox, Inc. | | | 822,194 | | | | 28,143,701 | |
VF Corp.^ | | | 1,084,320 | | | | 68,312,160 | |
Walt Disney Co., The | | | 810,326 | | | | 69,477,352 | |
Whirlpool Corp. | | | 236,260 | | | | 32,892,117 | |
| | | | | | | | 380,801,531 | |
|
| Consumer Staples — 8.2% | |
General Mills, Inc.^ | | | 666,227 | | | | 35,003,567 | |
Kimberly-Clark Corp. | | | 610,210 | | | | 67,867,556 | |
PepsiCo, Inc. | | | 678,940 | | | | 60,656,500 | |
Procter & Gamble Co., The^ | | | 1,028,375 | | | | 80,819,991 | |
Sysco Corp.^ | | | 1,295,577 | | | | 48,519,358 | |
| | | | | | | | 292,866,972 | |
|
| Energy — 10.7% | |
Cimarex Energy Co. | | | 631,914 | | | | 90,654,382 | |
Devon Energy Corp. | | | 1,166,370 | | | | 92,609,778 | |
EOG Resources, Inc. | | | 995,522 | | | | 116,336,702 | |
Noble Energy, Inc. | | | 365,259 | | | | 28,292,962 | |
Occidental Petroleum Corp. | | | 528,608 | | | | 54,251,039 | |
| | | | | | | | 382,144,863 | |
|
| Financials — 23.1% | |
American International Group, Inc.^ | | | 1,886,355 | | | | 102,957,257 | |
Brown & Brown, Inc. | | | 1,754,420 | | | | 53,878,238 | |
Citigroup, Inc. | | | 1,876,569 | | | | 88,386,400 | |
Franklin Resources, Inc.^ | | | 1,357,850 | | | | 78,538,044 | |
JPMorgan Chase & Co.^ | | | 1,469,890 | | | | 84,695,062 | |
MetLife, Inc.^ | | | 798,475 | | | | 44,363,271 | |
Morgan Stanley^ | | | 1,531,170 | | | | 49,502,726 | |
PNC Financial Services Group, Inc.^ | | | 394,845 | | | | 35,160,947 | |
Popular, Inc.* | | | 2,725,517 | | | | 93,158,170 | |
Progressive Corp. | | | 1,222,760 | | | | 31,009,194 | |
Prudential Financial, Inc.^ | | | 496,853 | | | | 44,105,641 | |
Wells Fargo & Co.^ | | | 681,060 | | | | 35,796,514 | |
Willis Group Holdings plc^ | | | 1,990,690 | | | | 86,196,877 | |
| | | | | | | | 827,748,341 | |
| | | | | | | | | | | | | | |
| 14 | | DIAMOND HILL FUNDS | | | | | SEMI-ANNUAL REPORT | | | | | JUNE 30, 2014 | | | | | DIAMOND-HILL.COM |
Diamond Hill Long-Short Fund
Schedule of Investments (Continued)
June 30, 2014 (Unaudited)
| | | | | | | | |
| | | Shares | | | Fair
Value | |
|
| Common Stocks — 80.4% continued | |
| Health Care — 9.2% | |
Abbott Laboratories | | | 1,858,130 | | | $ | 75,997,517 | |
Baxter International, Inc.^ | | | 505,971 | | | | 36,581,703 | |
Boston Scientific Corp.* | | | 6,147,073 | | | | 78,498,123 | |
Medtronic, Inc.^ | | | 1,069,182 | | | | 68,171,044 | |
Pfizer, Inc.^ | | | 2,416,690 | | | | 71,727,359 | |
| | | | | | | | 330,975,746 | |
|
| Industrials — 8.9% | |
3M Co.^ | | | 395,140 | | | | 56,599,854 | |
Dover Corp. | | | 680,835 | | | | 61,921,943 | |
Illinois Tool Works, Inc.^ | | | 591,915 | | | | 51,828,077 | |
Parker Hannifin Corp. | | | 497,560 | | | | 62,558,219 | |
United Technologies Corp.^ | | | 741,835 | | | | 85,644,851 | |
| | | | | | | | 318,552,944 | |
|
| Information Technology — 9.7% | |
Apple Computer, Inc. | | | 721,826 | | | | 67,079,290 | |
Cisco Systems, Inc. | | | 2,478,925 | | | | 61,601,286 | |
International Business Machines Corp.^ | | | 360,255 | | | | 65,303,423 | |
Juniper Networks, Inc.* | | | 1,827,355 | | | | 44,843,292 | |
Microsoft Corp. | | | 1,411,309 | | | | 58,851,585 | |
Vantiv, Inc., Class A* | | | 1,527,580 | | | | 51,357,239 | |
| | | | | | | | 349,036,115 | |
| |
| Total Common Stocks | | | $ | 2,882,126,512 | |
|
| Registered Investment Companies — 21.0% | |
JPMorgan Prime Money Market Fund,
0.04%S | | | 20,907,419 | | | | 20,907,419 | |
State Street Institutional Liquid Reserves Fund, Premier Class, 0.06%S | | | 551,181,615 | | | | 551,181,615 | |
| | | | | | | | |
| | | Shares | | | Fair
Value | |
|
| Registered Investment Companies — 21.0% continued | |
State Street Navigator Securities Lending Prime Portfolio, 0.14%†S | | | 181,537,422 | | | $ | 181,537,422 | |
| |
| Total Registered Investment Companies | | | $ | 753,626,456 | |
|
| Total Investment Securities — 101.4% | |
Cost ($2,730,015,952)** | | | $ | 3,635,752,968 | |
| |
| Segregated Cash With Brokers — 21.1% | | | | 757,058,380 | |
|
| Securities Sold Short — (18.7)% | |
(Proceeds $534,429,779) | | | | (671,931,567 | ) |
| |
Net Other Assets
(Liabilities) — (3.8)% | | | | (136,866,019 | ) |
| |
| Net Assets — 100.0% | | | $ | 3,584,013,762 | |
| ^ | All or a portion of the security is on loan. The total fair value of the securities on loan, as of June 30, 2014, was $ 176,696,893. |
| * | Non-income producing security. |
| † | This security, which was purchased using cash collateral received from securities on loan, represents collateral for securities loaned as of June 30, 2014. |
| S | Rate represents the daily yield on June 30, 2014. |
| ** | Represents cost for financial reporting purposes. |
See accompanying Notes to Financial Statements
| | | | | | | | | | | | | | | | |
| DIAMOND HILL FUNDS | | | | | SEMI-ANNUAL REPORT | | | | | JUNE 30, 2014 | | | | | DIAMOND-HILL.COM | | | 15 | |
Diamond Hill Long-Short Fund
Schedule of Investments Sold Short
June 30, 2014 (Unaudited)
| | | | | | | | |
| | | Shares | | | Fair
Value | |
|
| Common Stocks — 18.7% | |
| Consumer Discretionary — 7.1% | |
Brunswick Corp. | | | 1,643,465 | | | $ | 69,239,180 | |
Gap, Inc., The | | | 810,465 | | | | 33,691,030 | |
Grand Canyon Education, Inc.* | | | 405,595 | | | | 18,645,202 | |
Life Time Fitness, Inc.* | | | 754,799 | | | | 36,788,903 | |
Macy’s, Inc. | | | 917,305 | | | | 53,222,036 | |
Sonic Corp.* | | | 424,345 | | | | 9,369,538 | |
Sotheby’s Holdings, Inc. | | | 341,050 | | | | 14,320,690 | |
Tractor Supply Co. | | | 334,043 | | | | 20,176,197 | |
| | | | | | | | 255,452,776 | |
|
| Consumer Staples — 1.9% | |
Campbell Soup Co. | | | 361,820 | | | | 16,574,974 | |
Colgate-Palmolive Co. | | | 502,860 | | | | 34,284,995 | |
Kellogg Co. | | | 252,630 | | | | 16,597,791 | |
| | | | | | | | 67,457,760 | |
|
| Financials — 2.6% | |
BancorpSouth, Inc. | | | 732,265 | | | | 17,991,751 | |
Cincinnati Financial Corp. | | | 609,315 | | | | 29,271,493 | |
First American Financial Corp. | | | 526,735 | | | | 14,637,966 | |
Hanover Insurance Group, Inc. | | | 249,050 | | | | 15,727,508 | |
Moody’s Corp. | | | 114,325 | | | | 10,021,730 | |
Rouse Properties, Inc. | | | 476,925 | | | | 8,160,187 | |
| | | | | | | | 95,810,635 | |
|
| Health Care — 1.4% | |
Bristol-Myers Squibb Co. | | | 577,590 | | | | 28,018,891 | |
Healthcare Services Group | | | 418,510 | | | | 12,320,934 | |
Intuitive Surgical, Inc.* | | | 23,185 | | | | 9,547,583 | |
| | | | | | | | 49,887,408 | |
|
| Industrials — 3.1% | |
Boeing Co., The | | | 666,090 | | | | 84,746,630 | |
Kansas City Southern Industries, Inc. | | | 155,700 | | | | 16,739,307 | |
Navistar International Corp.* | | | 236,580 | | | | 8,867,018 | |
| | | | | | | | 110,352,955 | |
|
| Information Technology — 1.2% | |
Advent Software, Inc. | | | 847,115 | | | | 27,590,536 | |
Ubiquiti Networks, Inc.* | | | 394,095 | | | | 17,809,153 | |
| | | | | | | | 45,399,689 | |
| | | | | | | | |
| | | Shares | | | Fair
Value | |
|
| Materials — 0.5% | |
Intrepid Potash, Inc.* | | | 968,840 | | | $ | 16,237,758 | |
|
| Telecommunication Services — 0.9% | |
AT&T, Inc. | | | 598,235 | | | | 21,153,589 | |
Level 3 Communications, Inc.* | | | 231,815 | | | | 10,178,997 | |
| | | | | | | | 31,332,586 | |
|
| Total Securities Sold Short — 18.7% | |
(Proceeds $534,429,779) | | | $ | 671,931,567 | |
| * | Non-dividend expense producing security. |
Percentages disclosed are based on total net assets of the Fund at June 30, 2014.
See accompanying Notes to Financial Statements
| | | | | | | | | | | | | | |
| 16 | | DIAMOND HILL FUNDS | | | | | SEMI-ANNUAL REPORT | | | | | JUNE 30, 2014 | | | | | DIAMOND-HILL.COM |
Diamond Hill Research Opportunities Fund
Schedule of Investments
June 30, 2014 (Unaudited)
| | | | | | | | |
| | | Shares | | | Fair
Value | |
|
| Common Stocks — 80.9% | |
| Consumer Discretionary — 12.4% | |
Aaron’s, Inc. | | | 9,274 | | | $ | 330,525 | |
Comcast Corp., Class A | | | 6,625 | | | | 355,630 | |
Dollar General Corp.* | | | 8,045 | | | | 461,461 | |
Dolphin Capital Investors Ltd. GB* | | | 900,000 | | | | 564,584 | |
Gannett Co., Inc. | | | 14,240 | | | | 445,854 | |
Groupon, Inc.*^ | | | 51,025 | | | | 337,786 | |
Jarden Corp.* | | | 15,200 | | | | 902,120 | |
LVMH Moet Hennessy Louis Vuitton SA FR | | | 2,300 | | | | 443,798 | |
Ross Stores, Inc.^ | | | 4,670 | | | | 308,827 | |
Staples, Inc.^ | | | 43,230 | | | | 468,614 | |
Steiner Leisure Ltd.* | | | 15,531 | | | | 672,337 | |
TJX Cos., Inc., The^ | | | 8,056 | | | | 428,176 | |
Twenty-First Century Fox, Inc. | | | 13,095 | | | | 448,242 | |
Vail Resorts, Inc. | | | 10,300 | | | | 794,954 | |
VF Corp.^ | | | 15,200 | | | | 957,600 | |
Whirlpool Corp. | | | 8,000 | | | | 1,113,760 | |
| | | | | | | | 9,034,268 | |
|
| Consumer Staples — 5.8% | |
B&G Foods, Inc. | | | 45,165 | | | | 1,476,443 | |
Coty, Inc. | | | 35,500 | | | | 608,115 | |
Philip Morris International | | | 5,000 | | | | 421,550 | |
Post Holdings, Inc.* | | | 26,298 | | | | 1,338,831 | |
Tesco plc | | | 31,635 | | | | 463,453 | |
| | | | | | | | 4,308,392 | |
|
| Energy — 2.8% | |
Cimarex Energy Co. | | | 10,250 | | | | 1,470,465 | |
Whiting Petroleum Corp.* | | | 6,750 | | | | 541,688 | |
| | | | | | | | 2,012,153 | |
|
| Financials — 21.0% | |
American International Group, Inc.^ | | | 18,910 | | | | 1,032,108 | |
Ashmore Group plc | | | 95,005 | | | | 599,776 | |
Brown & Brown, Inc. | | | 35,350 | | | | 1,085,599 | |
Endurance Specialty Holdings Ltd. | | | 13,930 | | | | 718,649 | |
Fortress Investment Group LLC, Class A | | | 173,786 | | | | 1,292,968 | |
Franklin Resources, Inc.^ | | | 13,945 | | | | 806,579 | |
iStar Financial, Inc. REIT* | | | 92,700 | | | | 1,388,646 | |
MetLife, Inc. | | | 8,655 | | | | 480,872 | |
Nationstar Mortgage Holdings, Inc.* | | | 14,000 | | | | 508,200 | |
Navigators Group, Inc.* | | | 26,435 | | | | 1,772,466 | |
Popular, Inc.* | | | 62,955 | | | | 2,151,802 | |
| | | | | | | | |
| | | Shares | | | Fair
Value | |
|
| Financials — 21.0% continued | |
Scor SA | | | 7,930 | | | $ | 273,035 | |
Willis Group Holdings plc | | | 57,005 | | | | 2,468,317 | |
Winthrop Realty Trust REIT | | | 42,500 | | | | 652,375 | |
| | | | | | | | 15,231,392 | |
|
| Health Care — 14.7% | |
Alere, Inc.* | | | 35,467 | | | | 1,327,175 | |
Boston Scientific Corp.* | | | 119,999 | | | | 1,532,386 | |
Catamaran Corp.* | | | 18,825 | | | | 831,311 | |
Express Scripts Holding Co.*^ | | | 11,400 | | | | 790,362 | |
GlaxoSmithKline plc^ | | | 14,902 | | | | 796,959 | |
Ipsen SA | | | 10,975 | | | | 496,096 | |
LifePoint Hospitals, Inc.* | | | 8,130 | | | | 504,873 | |
Natus Medical, Inc.* | | | 30,000 | | | | 754,200 | |
Orthofix International NV* | | | 18,032 | | | | 653,660 | |
Teva Pharmaceutical Industries Ltd., SP ADR^ | | | 8,600 | | | | 450,812 | |
UnitedHealth Group, Inc.^ | | | 5,430 | | | | 443,903 | |
Universal American Financial Corp. | | | 80,550 | | | | 670,982 | |
Valeant Pharmaceuticals International, Inc.* | | | 11,125 | | | | 1,403,085 | |
| | | | | | | | 10,655,804 | |
|
| Industrials — 8.4% | |
Aircastle Ltd. | | | 43,155 | | | | 766,864 | |
Corrections Corp. of America | | | 8,600 | | | | 282,510 | |
Hub Group, Inc., Class A* | | | 36,400 | | | | 1,834,560 | |
Kennametal, Inc. | | | 22,300 | | | | 1,032,044 | |
Parker Hannifin Corp. | | | 8,300 | | | | 1,043,559 | |
United Technologies Corp. | | | 8,800 | | | | 1,015,960 | |
Xpo Logistics, Inc.*^ | | | 6,390 | | | | 182,882 | |
| | | | | | | | 6,158,379 | |
|
| Information Technology — 15.8% | |
Apple Computer, Inc.^ | | | 9,975 | | | | 926,977 | |
Cisco Systems, Inc.^ | | | 70,444 | | | | 1,750,534 | |
International Business Machines Corp. | | | 15,167 | | | | 2,749,322 | |
Juniper Networks, Inc.* | | | 65,250 | | | | 1,601,235 | |
Linear Technology Corp. | | | 19,083 | | | | 898,237 | |
Microsoft Corp. | | | 66,610 | | | | 2,777,637 | |
Rovi Corp.* | | | 13,605 | | | | 325,976 | |
Samsung Electronics Co., Ltd. | | | 310 | | | | 404,884 | |
| | | | | | | | 11,434,802 | |
| |
| Total Common Stocks | | | $ | 58,835,190 | |
| | | | | | | | | | | | | | | | |
| DIAMOND HILL FUNDS | | | | | SEMI-ANNUAL REPORT | | | | | JUNE 30, 2014 | | | | | DIAMOND-HILL.COM | | | 17 | |
Diamond Hill Research Opportunities Fund
Schedule of Investments (Continued)
June 30, 2014 (Unaudited)
Diamond Hill Research Opportunities Fund
Schedule of Investments Sold Short
June 30, 2014 (Unaudited)
| | | | | | | | |
| | | Shares | | | Fair
Value | |
|
| Common Stocks — 80.9% continued | |
| Registered Investment Company — 22.7% | |
State Street Institutional Liquid Reserves Fund, Premier Class, 0.06%S | | | 12,503,325 | | | $ | 12,503,325 | |
State Street Navigator Securities Lending Prime Portfolio, 0.14%†S | | | 3,959,216 | | | | 3,959,216 | |
| |
| Total Registered Investment Companies | | | $ | 16,462,541 | |
|
| Total Investment Securities — 103.6% | |
Cost ($64,137,689)** | | | | | | $ | 75,297,731 | |
| |
Segregated Cash
With Brokers — 9.6% | | | | 6,975,598 | |
|
| Securities Sold Short — (9.4)% | |
(Proceeds $6,165,788) | | | | | | | (6,903,675 | ) |
| |
Net Other Assets
(Liabilities) — (3.8)% | | | | (2,693,923 | ) |
| |
| Net Assets — 100.0% | | | $ | 72,675,731 | |
| ^ | All or a portion of the security is on loan. The total fair value of the securities on loan, as of June 30, 2014, was $3,869,853. |
| * | Non-income producing security. |
| † | This security, which was purchased using cash collateral received from securities on loan, represents collateral for securities loaned as of June 30, 2014. |
| S | Rate represents the daily yield on June 30, 2014. |
| ** | Represents cost for financial reporting purposes. |
GB – British Security
FR – French Security
REIT – Real Estate Investment Trust
ADR – American Depositary Receipt
See accompanying Notes to Financial Statements
| | | | | | | | |
| | | Shares | | | Fair
Value | |
|
| Common Stocks — 9.4% | |
| Consumer Discretionary — 2.4% | |
Brunswick Corp. | | | 900 | | | $ | 37,917 | |
Gap, Inc., The | | | 6,145 | | | | 255,448 | |
Grand Canyon Education, Inc.* | | | 7,638 | | | | 351,119 | |
Life Time Fitness, Inc.* | | | 7,391 | | | | 360,237 | |
Macy’s, Inc. | | | 5,101 | | | | 295,960 | |
Sonic Corp.* | | | 8,200 | | | | 181,056 | |
Sotheby’s Holdings, Inc. | | | 5,511 | | | | 231,407 | |
| | | | | | | | 1,713,144 | |
|
| Financials — 2.9% | |
BancorpSouth, Inc. | | | 17,000 | | | | 417,690 | |
Cincinnati Financial Corp. | | | 11,745 | | | | 564,230 | |
First American Financial Corp. | | | 16,535 | | | | 459,508 | |
Hanover Insurance Group, Inc. | | | 9,555 | | | | 603,397 | |
Rouse Properties, Inc. | | | 4,880 | | | | 83,497 | |
| | | | | | | | 2,128,322 | |
|
| Health Care — 0.8% | |
Bristol-Myers Squibb Co. | | | 6,134 | | | | 297,560 | |
Healthcare Services Group | | | 4,500 | | | | 132,480 | |
Intuitive Surgical, Inc.* | | | 350 | | | | 144,130 | |
| | | | | | | | 574,170 | |
|
| Industrials — 1.0% | |
Boeing Co., The | | | 3,600 | | | | 458,028 | |
Kansas City Southern Industries, Inc. | | | 1,600 | | | | 172,016 | |
Navistar International Corp.* | | | 3,900 | | | | 146,172 | |
| | | | | | | | 776,216 | |
|
| Information Technology — 2.0% | |
Advent Software, Inc. | | | 17,674 | | | | 575,642 | |
Ubiquiti Networks, Inc.* | | | 19,950 | | | | 901,541 | |
| | | | | | | | 1,477,183 | |
|
| Materials — 0.3% | |
Intrepid Potash, Inc.* | | | 14,000 | | | | 234,640 | |
|
| Total Securities Sold Short — 9.4% | |
(Proceeds $6,165,788) | | | | | | $ | 6,903,675 | |
| * | Non-dividend expense producing security. |
Percentages disclosed are based on total net assets of the Fund at June 30, 2014.
See accompanying Notes to Financial Statements
| | | | | | | | | | | | | | |
| 18 | | DIAMOND HILL FUNDS | | | | | SEMI-ANNUAL REPORT | | | | | JUNE 30, 2014 | | | | | DIAMOND-HILL.COM |
Diamond Hill Financial Long-Short Fund
Schedule of Investments
June 30, 2014 (Unaudited)
| | | | | | | | |
| | | Shares | | | Fair
Value | |
|
| Common Stocks — 87.1% | |
| Banking Services — 32.5% | |
Bank of Marin Bancorp^ | | | 7,395 | | | $ | 337,138 | |
Bridge Bancorp, Inc.^ | | | 6,510 | | | | 156,175 | |
Capital City Bank Group, Inc. | | | 14,045 | | | | 204,074 | |
Citigroup, Inc. | | | 33,060 | | | | 1,557,126 | |
First Horizon National Corp. | | | 41,825 | | | | 496,045 | |
First Niagara Financial Group, Inc. | | | 20,535 | | | | 179,476 | |
First of Long Island Corp., The | | | 5,630 | | | | 220,020 | |
First Republic Bank | | | 6,360 | | | | 349,736 | |
JPMorgan Chase & Co. | | | 23,605 | | | | 1,360,120 | |
KeyCorp^ | | | 13,575 | | | | 194,530 | |
National Penn Bancshares, Inc. | | | 31,930 | | | | 337,819 | |
PNC Financial Services Group, Inc. | | | 6,119 | | | | 544,897 | |
Popular, Inc.* | | | 50,750 | | | | 1,734,633 | |
State Bank Financial Corp. | | | 16,390 | | | | 277,155 | |
Sterling Bancorp | | | 14,673 | | | | 176,076 | |
SunTrust Banks, Inc.^ | | | 7,417 | | | | 297,125 | |
Wells Fargo & Co. | | | 10,486 | | | | 551,144 | |
| | | | | | | | 8,973,289 | |
|
| Capital Markets — 11.5% | |
Fortress Investment Group LLC, Class A | | | 155,700 | | | | 1,158,408 | |
Franklin Resources, Inc.^ | | | 19,915 | | | | 1,151,884 | |
Morgan Stanley | | | 26,380 | | | | 852,865 | |
| | | | | | | | 3,163,157 | |
|
| Consumer Financial Services — 1.2% | |
Capital One Financial Corp. | | | 4,125 | | | | 340,725 | |
|
| Financial Services — 0.8% | |
Bank of New York Mellon Corp., The^ | | | 5,679 | | | | 212,849 | |
| | |
| Insurance — 32.5% | | | | | | | | |
ACE Ltd.^ | | | 3,080 | | | | 319,396 | |
American Equity Investment Life Holding Co. | | | 19,070 | | | | 469,122 | |
American International Group, Inc. | | | 30,265 | | | | 1,651,864 | |
Brown & Brown, Inc. | | | 27,005 | | | | 829,324 | |
Endurance Specialty Holdings Ltd. | | | 10,085 | | | | 520,285 | |
Enstar Group Ltd.* | | | 3,065 | | | | 461,987 | |
Greenlight Capital Re Ltd., Class A* | | | 9,315 | | | | 306,836 | |
HCC Insurance Holdings, Inc. | | | 4,875 | | | | 238,583 | |
| | | | | | | | |
| | | Shares | | | Fair
Value | |
|
| Insurance — 32.5% continued | |
Infinity Property & Casualty Corp. | | | 2,205 | | | $ | 148,242 | |
MetLife, Inc. | | | 12,655 | | | | 703,112 | |
Navigators Group, Inc.* | | | 10,355 | | | | 694,303 | |
Progressive Corp. | | | 12,790 | | | | 324,354 | |
Prudential Financial, Inc. | | | 7,900 | | | | 701,283 | |
Reinsurance Group of America | | | 3,285 | | | | 259,187 | |
Willis Group Holdings plc | | | 30,765 | | | | 1,332,125 | |
| | | | | | | | 8,960,003 | |
| | |
| IT Services — 2.1% | | | | | | | | |
Vantiv, Inc., Class A* | | | 17,465 | | | | 587,173 | |
|
| REITs & Real Estate Management — 5.0% | |
iStar Financial, Inc. REIT* | | | 79,273 | | | | 1,187,510 | |
Winthrop Realty Trust REIT | | | 13,337 | | | | 204,723 | |
| | | | | | | | 1,392,233 | |
|
| Thrifts & Mortgage Finance — 1.5% | |
Nationstar Mortgage Holdings, Inc.*^ | | | 11,105 | | | | 403,112 | |
| |
| Total Common Stocks | | | $ | 24,032,541 | |
|
| Registered Investment Company — 19.8% | |
State Street Institutional Liquid Reserves Fund, Premier Class, 0.06%S | | | 2,826,703 | | | $ | 2,826,703 | |
State Street Navigator Securities Lending Prime Portfolio, 0.14%†S | | | 2,630,168 | | | | 2,630,168 | |
| |
| Total Registered Investment Companies | | | $ | 5,456,871 | |
|
| Total Investment Securities — 106.9% | |
(Cost $24,112,811)** | | | | | | $ | 29,489,412 | |
| |
Segregated Cash
With Brokers — 10.8% | | | | 2,988,196 | |
|
| Securities Sold Short — (9.4)% | |
(Proceeds $2,237,880) | | | | (2,592,565 | ) |
| |
Net Other Assets
(Liabilities) — (8.3)% | | | | (2,299,689 | ) |
| |
| Net Assets — 100.0% | | | $ | 27,585,354 | |
| | | | | | | | | | | | | | | | |
| DIAMOND HILL FUNDS | | | | | SEMI-ANNUAL REPORT | | | | | JUNE 30, 2014 | | | | | DIAMOND-HILL.COM | | | 19 | |
Diamond Hill Financial Long-Short Fund
Schedule of Investments (Continued)
June 30, 2014 (Unaudited)
Diamond Hill Financial Long-Short Fund
Schedule of Investments Sold Short
June 30, 2014 (Unaudited)
| ^ | All or a portion of the security is on loan. The total fair value of the securities on loan, as of June 30, 2014, was $2,589,277. |
| * | Non-income producing security. |
| † | This security, which was purchased using cash collateral received from securities on loan, represents collateral for securities loaned as of June 30, 2014. |
| S | Rate represents the daily yield on June 30, 2014. |
| ** | Represents cost for financial reporting purposes. |
REIT – Real Estate Investment Trust
See accompanying Notes to Financial Statements
| | | | | | | | |
| | | Shares | | | Fair
Value | |
|
| Common Stocks — 9.4% | |
| Banking Services — 3.0% | |
BancorpSouth, Inc. | | | 17,230 | | | $ | 423,341 | |
Bank of The Ozarks, Inc. | | | 8,270 | | | | 276,632 | |
Home Bancshares, Inc. | | | 4,060 | | | | 133,249 | |
| | | | | | | | 833,222 | |
|
| Financial Services — 0.8% | |
Moody’s Corp. | | | 2,415 | | | | 211,699 | |
|
| Insurance — 4.8% | |
Cincinnati Financial Corp. | | | 11,190 | | | | 537,566 | |
First American Financial Corp. | | | 13,835 | | | | 384,475 | |
Hanover Insurance Group, Inc. | | | 6,425 | | | | 405,739 | |
| | | | | | | | 1,327,780 | |
|
| REITs & Real Estate Management — 0.8% | |
Rouse Properties, Inc. | | | 12,850 | | | | 219,864 | |
|
| Total Securities Sold Short — 9.4% | |
(Proceeds $2,237,880) | | | | | | $ | 2,592,565 | |
Percentages disclosed are based on total net assets of the Fund at June 30, 2014.
See accompanying Notes to Financial Statements
| | | | | | | | | | | | | | |
| 20 | | DIAMOND HILL FUNDS | | | | | SEMI-ANNUAL REPORT | | | | | JUNE 30, 2014 | | | | | DIAMOND-HILL.COM |
Diamond Hill Strategic Income Fund
Schedule of Investments
June 30, 2014 (Unaudited)
| | | | | | | | |
| | | Shares/
Par Value | | | Fair
Value | |
|
| Collateralized Debt Obligations — 0.4% | |
Alesco Preferred Funding Ltd., Class PPNE, 3/23/35#* | | $ | 336,608 | | | $ | 95,876 | |
Alesco Preferred Funding VI, Class PNN, 3/23/35#* | | | 621,631 | | | | 185,756 | |
Fort Sheridan ABS CDO Ltd., Class PPN2, 11/5/41#* | | | 611,948 | | | | 209,353 | |
Taberna Preferred Funding Ltd.,
Class PPN2, 7/5/35#* | | | 1,175,564 | | | | 350,836 | |
| |
| Total Collateralized Debt Obligations | | | $ | 841,821 | |
|
| Corporate Bonds — 91.2% | |
| Consumer Discretionary — 18.5% | |
Avis Budget Car Rental, LLC/Avis Budget Finance, Inc.,
4.88%, 11/15/17^ | | $ | 5,304,000 | | | | 5,516,159 | |
Expedia, Inc., 5.95%, 8/15/20^ | | | 4,600,000 | | | | 5,203,828 | |
Goodyear Tire & Rubber Co., The,
8.25%, 8/15/20 | | | 2,900,000 | | | | 3,182,750 | |
Goodyear Tire & Rubber Co., The,
8.75%, 8/15/20 | | | 3,957,000 | | | | 4,689,045 | |
Jarden Corp.,
6.13%, 11/15/22 | | | 2,614,000 | | | | 2,774,108 | |
Live Nation Entertainment,
7.00%, 9/1/20†† | | | 5,254,000 | | | | 5,753,129 | |
QVC, Inc.,
3.13%, 4/1/19^ | | | 4,275,000 | | | | 4,347,094 | |
Tenneco, Inc.,
6.88%, 12/15/20 | | | 4,436,000 | | | | 4,829,695 | |
Vail Resorts, Inc.,
6.50%, 5/1/19 | | | 3,543,000 | | | | 3,724,579 | |
| | | | | | | | 40,020,387 | |
|
| Consumer Staples — 2.1% | |
Post Holdings, Inc.,
7.38%, 2/15/22 | | | 4,295,000 | | | | 4,649,338 | |
|
| Energy — 6.9% | |
Carrizo Oil & Gas, Inc.,
7.50%, 9/15/20 | | | 2,730,000 | | | | 2,996,175 | |
| | | | | | | | |
| | | Shares/
Par Value | | | Fair
Value | |
|
| Energy — 6.9% continued | |
Carrizo Oil & Gas, Inc.,
8.63%, 10/15/18 | | $ | 4,150,000 | | | $ | 4,373,063 | |
Cimarex Energy Co.,
5.88%, 5/1/22 | | | 2,025,000 | | | | 2,237,625 | |
Diamondback Energy, Inc.,
7.63%, 10/1/21^†† | | | 4,796,000 | | | | 5,275,600 | |
| | | | | | | | 14,882,463 | |
|
| Financials — 26.3% | |
CNA Financial Corp.,
6.50%, 8/15/16 | | | 2,165,000 | | | | 2,411,238 | |
Cogent Communications Finance, Inc.,
5.63%, 4/15/21 | | | 4,750,000 | | | | 4,714,375 | |
Discover Financial Services,
6.45%, 6/12/17 | | | 2,700,000 | | | | 3,070,867 | |
First Horizon National Corp.,
5.38%, 12/15/15 | | | 3,000,000 | | | | 3,173,412 | |
First Tennessee Bank NA,
5.05%, 1/15/15 | | | 1,150,000 | | | | 1,175,550 | |
iStar Financial, Inc.,
4.88%, 7/1/18 | | | 4,725,000 | | | | 4,736,812 | |
iStar Financial, Inc.,
Series B,
9.00%, 6/1/17 | | | 3,605,000 | | | | 4,163,775 | |
MGIC Investment Corp.,
5.38%, 11/1/15 | | | 2,105,000 | | | | 2,194,463 | |
Nationstar Mortgage LLC/Nationstar Capital Corp.,
6.50%, 8/1/18 | | | 6,540,000 | | | | 6,719,849 | |
Popular, Inc.,
7.00%, 7/1/19 | | | 4,000,000 | | | | 4,060,000 | |
Radian Group, Inc.,
9.00%, 6/15/17 | | | 4,840,000 | | | | 5,566,000 | |
Regions Financial Corp.,
5.75%, 6/15/15 | | | 4,000,000 | | | | 4,180,679 | |
Symetra Financial Corp.,
6.13%, 4/1/16†† | | | 4,750,000 | | | | 5,097,520 | |
Synovus Financial Corp.,
7.88%, 2/15/19 | | | 1,775,000 | | | | 2,032,375 | |
Synovus Financial Corp.,
5.13%, 6/15/17 | | | 3,350,000 | | | | 3,492,375 | |
| | | | | | | | 56,789,290 | |
| | | | | | | | | | | | | | | | |
| DIAMOND HILL FUNDS | | | | | SEMI-ANNUAL REPORT | | | | | JUNE 30, 2014 | | | | | DIAMOND-HILL.COM | | | 21 | |
Diamond Hill Strategic Income Fund
Schedule of Investments (Continued)
June 30, 2014 (Unaudited)
| | | | | | | | |
| | | Shares/
Par Value | | | Fair
Value | |
|
| Corporate Bonds — 91.2% continued | |
| Health Care — 13.6% | |
Biomet, Inc.,
6.50%, 10/1/20 | | $ | 5,792,000 | | | $ | 6,182,960 | |
DaVita, Inc.,
6.63%, 11/1/20 | | | 5,184,000 | | | | 5,508,000 | |
HealthSouth Corp.,
7.75%, 9/15/22 | | | 2,747,000 | | | | 2,997,664 | |
HealthSouth Corp.,
7.25%, 10/1/18 | | | 3,439,000 | | | | 3,593,755 | |
Hospira, Inc.,
5.20%, 8/12/20 | | | 4,175,000 | | | | 4,568,803 | |
Valeant Pharmaceuticals International,
6.38%, 10/15/20†† | | | 4,000,000 | | | | 4,250,000 | |
Warner Chilcott Co. LLC, 7.75%, 9/15/18 | | | 2,335,000 | | | | 2,454,762 | |
| | | | | | | | 29,555,944 | |
|
| Industrials — 12.6% | |
Continental Airlines, Inc.,
6.75%, 9/15/15†† | | | 6,525,000 | | | | 6,582,094 | |
United Continental Holdings, Inc.,
6.38%, 6/1/18 | | | 5,392,000 | | | | 5,823,360 | |
United Rentals North America,
7.38%, 5/15/20^ | | | 6,733,000 | | | | 7,439,964 | |
US Airways Group, Inc.,
6.13%, 6/1/18^ | | | 6,970,000 | | | | 7,362,063 | |
| | | | | | | | 27,207,481 | |
|
| Information Technology — 2.4% | |
KLA-Tencor Corp.,
6.90%, 5/1/18 | | | 4,478,000 | | | | 5,268,054 | |
|
| Materials — 3.4% | |
Owens-Illinois, Inc., 7.80%, 5/15/18 | | | 6,321,000 | | | | 7,379,768 | |
|
| Telecommunication Services — 3.5% | |
Level 3 Financing, Inc.,
8.13%, 7/1/19 | | | 6,957,000 | | | | 7,591,826 | |
| | |
| Utilities — 1.9% | | | | | | | | |
Source Gas LLC,
5.90%, 4/1/17†† | | | 4,000,000 | | | | 4,213,816 | |
| |
| Total Corporate Bonds | | | $ | 197,558,367 | |
| | | | | | | | |
| | | Shares/
Par Value | | | Fair
Value | |
|
| Registered Investment Companies — 15.8% | |
JPMorgan Prime Money Market Fund,
0.04%S | | $ | 2,121,271 | | | $ | 2,121,271 | |
State Street Institutional Liquid Reserves Fund, Premier Class,0.06%S | | | 17,846,206 | | | | 17,846,206 | |
State Street Navigator Securities Lending Prime Portfolio, 0.14%†S | | | 14,366,588 | | | | 14,366,588 | |
| |
| Total Registered Investment Companies | | | | 34,334,065 | |
|
| Total Investment Securities — 107.4% | |
(Cost $227,333,201)** | | | $ | 232,734,253 | |
| |
Net Other Assets (Liabilities) — (7.4)% | | | | (16,058,957 | ) |
| |
| Net Assets —100.0% | | | $ | 216,675,296 | |
| * | Non-income producing security. |
| ** | Represents cost for financial reporting purposes. |
| †† | Restricted securities not registered under the Securities Act of 1933 and deemed liquid based on procedures approved by the Board of Trustees are as follows: |
| | | | | | | | | | | | | | | | |
| | | Acquisition
Date | | | Current
Cost | | | Fair Value | | | Value
as a
% of
Net
Assets | |
Continental Airlines, Inc. | | | December-11 | | | $ | 6,383,875 | | | $ | 6,582,094 | | | | 3.0% | |
Diamondback Energy, Inc. | | | September-13 | | | | 4,994,577 | | | | 5,275,600 | | | | 2.4% | |
Live Nation Entertainment | | | February-14 | | | | 5,760,945 | | | | 5,753,129 | | | | 2.7% | |
Source Gas LLC | | | March-10 | | | | 3,840,000 | | | | 4,213,816 | | | | 1.9% | |
Symetra Financial Corp. | | | February-11 | | | | 4,973,773 | | | | 5,097,520 | | | | 2.4% | |
Valeant Pharmaceuticals International | | | July-12 | | | | 4,340,000 | | | | 4,250,000 | | | | 2.0% | |
| | | | | | | | | | | | | | | | |
| | | | | | $ | 30,293,170 | | | $ | 31,172,159 | | | | 14.4% | |
| | | | | | | | | | | | | | | | |
| | | | | | | | | | | | | | |
| 22 | | DIAMOND HILL FUNDS | | | | | SEMI-ANNUAL REPORT | | | | | JUNE 30, 2014 | | | | | DIAMOND-HILL.COM |
Diamond Hill Strategic Income Fund
Schedule of Investments (Continued)
June 30, 2014 (Unaudited)
| # | Restricted and illiquid securities not registered under the Securities Act of 1933 and valued at fair value by management: |
| | | | | | | | | | | | | | | | |
| | | Acquisition
Date | | | Current
Cost | | | Fair Value | | | Value
as a
% of
Net
Assets | |
Alesco Preferred Funding Ltd., Series 6A, Class PPNE | | | March-05 | | | $ | 336,608 | | | $ | 95,876 | | | | 0.0% | |
Alesco Preferred Funding VI, Class PNN | | | December-04 | | | | 621,631 | | | | 185,756 | | | | 0.1% | |
Fort Sheridan ABS CDO Ltd., Series 2005-1A, Class PPN2 | | | March-05 | | | | 509,448 | | | | 209,353 | | | | 0.1% | |
Taberna Preferred Funding Ltd., Series 2005-1A, Class PPN2 | | | March-05 | | | | 1,035,359 | | | | 350,836 | | | | 0.2% | |
| | | | | | | | | | | | | | | | |
| | | | | | $ | 2,503,046 | | | $ | 841,821 | | | | 0.4% | |
| | | | | | | | | | | | | | | | |
| ^ | All or a portion of the security is on loan. The total fair value of the securities on loan, as of June 30, 2014, was $14,012,622. |
| † | This security, which was purchased using cash collateral received from securities on loan, represents collateral for securities loaned as of June 30, 2014. |
| S | Rate represents the daily yield on June 30, 2014. |
See accompanying Notes to Financial Statements.
| | | | | | | | | | | | | | | | |
| DIAMOND HILL FUNDS | | | | | SEMI-ANNUAL REPORT | | | | | JUNE 30, 2014 | | | | | DIAMOND-HILL.COM | | | 23 | |
Diamond Hill Funds
Tabular Presentation of Schedules of Investments
June 30, 2014
| | | | |
Diamond Hill Small Cap Fund | |
Small Cap Fund
Sector Allocation | | % of
Net Assets | |
Financials | | | 27.0% | |
Industrials | | | 16.9% | |
Energy | | | 10.8% | |
Consumer Discretionary | | | 9.6% | |
Health Care | | | 5.9% | |
Information Technology | | | 4.3% | |
Consumer Staples | | | 4.1% | |
Utilities | | | 3.0% | |
Cash and Cash Equivalents | | | 28.3% | |
Other | | | | |
Net Other Assets (Liabilities) | | | -9.9% | |
| | | | | |
| | | | 100% | |
| | | | | |
Russell 2000 Index
Sector Allocation | | % of
Index | |
Financials | | | 22.9% | |
Industrials | | | 14.6% | |
Energy | | | 5.5% | |
Consumer Discretionary | | | 13.3% | |
Health Care | | | 13.3% | |
Information Technology | | | 17.1% | |
Consumer Staples | | | 3.1% | |
Utilities | | | 3.6% | |
Materials | | | 5.5% | |
Telecom | | | 0.9% | |
Other | | | 0.2% | |
| | | | | |
| | | | 100% | |
| | | | | |
| | | | | |
| | | | |
Diamond Hill Small-Mid Cap Fund | |
Small-Mid Cap Fund
Sector Allocation | | % of
Net Assets | |
Financials | | | 29.0% | |
Consumer Staples | | | 12.4% | |
Industrials | | | 11.5% | |
Health Care | | | 10.7% | |
Consumer Discretionary | | | 10.3% | |
Energy | | | 9.5% | |
Information Technology | | | 5.5% | |
Utilities | | | 2.9% | |
Cash and Cash Equivalents | | | 15.5% | |
Other | | | | |
Net Other Assets (Liabilities) | | | -7.3% | |
| | | | | |
| | | | 100% | |
| | | | | |
Russell 2500 Index
Sector Allocation | | % of
Index | |
Financials | | | 22.4% | |
Consumer Staples | | | 3.0% | |
Industrials | | | 16.4% | |
Health Care | | | 11.1% | |
Consumer Discretionary | | | 14.0% | |
Energy | | | 5.6% | |
Information Technology | | | 14.9% | |
Utilities | | | 4.7% | |
Materials | | | 7.1% | |
Telecom | | | 0.9% | |
Other | | | 0.1% | |
| | | | | |
| | | | 100% | |
| | | | | |
| | | | | |
| | | | | | | | | | | | | | |
| 24 | | DIAMOND HILL FUNDS | | | | | SEMI-ANNUAL REPORT | | | | | JUNE 30, 2014 | | | | | DIAMOND-HILL.COM |
Diamond Hill Funds
Tabular Presentation of Schedules of Investments (Continued)
June 30, 2014
| | | | |
Diamond Hill Mid Cap Fund | |
Mid Cap Fund Sector Allocation | | % of
Net Assets | |
Financials | | | 29.2% | |
Consumer Staples | | | 13.6% | |
Industrials | | | 11.6% | |
Energy | | | 10.8% | |
Consumer Discretionary | | | 10.8% | |
Health Care | | | 9.1% | |
Information Technology | | | 5.7% | |
Utilities | | | 3.1% | |
Cash and Cash Equivalents | | | 11.6% | |
Other | | | | |
Net Other Assets (Liabilities) | | | -5.5% | |
| | | | | |
| | | | 100% | |
| | | | | |
Russell Midcap Index Sector Allocation | | % of
Index | |
Financials | | | 19.9% | |
Consumer Staples | | | 5.6% | |
Industrials | | | 13.2% | |
Energy | | | 6.2% | |
Consumer Discretionary | | | 16.5% | |
Health Care | | | 10.8% | |
Information Technology | | | 14.3% | |
Utilities | | | 6.6% | |
Materials | | | 6.0% | |
Telecom | | | 1.0% | |
| | | | | |
| | | | 100% | |
| | | | | |
| | | | | |
| | | | |
Diamond Hill Large Cap Fund | |
Large Cap Fund Sector Allocation | | % of
Net Assets | |
Financials | | | 25.5% | |
Health Care | | | 13.1% | |
Consumer Discretionary | | | 12.9% | |
Consumer Staples | | | 11.9% | |
Energy | | | 11.8% | |
Industrials | | | 10.9% | |
Information Technology | | | 10.8% | |
Materials | | | 1.0% | |
Cash and Cash Equivalents | | | 7.9% | |
Other | | | | |
Net Other Assets (Liabilities) | | | -5.8% | |
| | | | | |
| | | | 100% | |
| | | | | |
Russell 1000 Index Sector Allocation | | % of
Index | |
Financials | | | 16.7% | |
Health Care | | | 13.0% | |
Consumer Discretionary | | | 12.9% | |
Consumer Staples | | | 8.1% | |
Energy | | | 9.9% | |
Industrials | | | 11.4% | |
Information Technology | | | 18.4% | |
Materials | | | 3.9% | |
Utilities | | | 3.4% | |
Telecom | | | 2.4% | |
| | | | | |
| | | | 100% | |
| | | | | |
| | | | | |
| | | | | | | | | | | | | | | | |
| DIAMOND HILL FUNDS | | | | | SEMI-ANNUAL REPORT | | | | | JUNE 30, 2014 | | | | | DIAMOND-HILL.COM | | | 25 | |
Diamond Hill Funds
Tabular Presentation of Schedules of Investments (Continued)
June 30, 2014
| | | | |
Diamond Hill Select Fund | |
Select Fund Sector Allocation | | % of
Net Assets | |
Financials | | | 27.5% | |
Information Technology | | | 16.6% | |
Health Care | | | 15.6% | |
Consumer Discretionary | | | 13.3% | |
Industrials | | | 9.8% | |
Energy | | | 6.5% | |
Consumer Staples | | | 5.3% | |
Cash and Cash Equivalents | | | 21.2% | |
Other | | | | |
Net Other Assets (Liabilities) | | | -15.8% | |
| | | | | |
| | | | 100% | |
| | | | | |
Russell 3000 Index Sector Allocation | | % of
Index | |
Financials | | | 17.2% | |
Information Technology | | | 18.2% | |
Health Care | | | 13.0% | |
Consumer Discretionary | | | 13.0% | |
Industrials | | | 11.6% | |
Energy | | | 9.6% | |
Consumer Staples | | | 7.7% | |
Materials | | | 4.0% | |
Utilities | | | 3.4% | |
Telecom | | | 2.3% | |
| | | | | |
| | | | 100% | |
| | | | | |
| | | | | |
| | | | |
Diamond Hill Long-Short Fund | |
Long Portfolio Sector Allocation | | % of
Net Assets | |
Financials | | | 23.1% | |
Energy | | | 10.7% | |
Consumer Discretionary | | | 10.6% | |
Information Technology | | | 9.8% | |
Health Care | | | 9.2% | |
Industrials | | | 8.9% | |
Consumer Staples | | | 8.3% | |
Cash and Cash Equivalents | | | 21.0% | |
| | |
Short Portfolio Sector Allocation | | % of
Net Assets | |
Materials | | | -0.5% | |
Telecommunication Services | | | -0.9% | |
Information Technology | | | -1.3% | |
Health Care | | | -1.4% | |
Consumer Staples | | | -2.0% | |
Financials | | | -2.6% | |
Industrials | | | -3.1% | |
Consumer Discretionary | | | -7.1% | |
Other | | | | |
Segregated Cash With Brokers | | | 21.1% | |
Net Other Assets (Liabilities) | | | -3.8% | |
| | | | | |
| | | | 100% | |
| | | | | |
Russell 1000 Index Sector Allocation | | % of
Index | |
Financials | | | 16.7% | |
Energy | | | 9.9% | |
Consumer Discretionary | | | 12.9% | |
Information Technology | | | 18.4% | |
Health Care | | | 13.0% | |
Industrials | | | 11.4% | |
Consumer Staples | | | 8.1% | |
Telecom | | | 2.4% | |
Materials | | | 3.9% | |
Utilities | | | 3.4% | |
| | | | | |
| | | | 100% | |
| | | | | |
| | | | | |
| | | | | | | | | | | | | | |
| 26 | | DIAMOND HILL FUNDS | | | | | SEMI-ANNUAL REPORT | | | | | JUNE 30, 2014 | | | | | DIAMOND-HILL.COM |
Diamond Hill Funds
Tabular Presentation of Schedules of Investments (Continued)
June 30, 2014
| | | | |
Diamond Hill Research Opportunities Fund | |
Long Portfolio Sector Allocation | | % of
Net Assets | |
Financials | | | 21.0% | |
Information Technology | | | 15.8% | |
Health Care | | | 14.7% | |
Consumer Discretionary | | | 12.4% | |
Industrials | | | 8.4% | |
Consumer Staples | | | 5.8% | |
Energy | | | 2.8% | |
Cash and Cash Equivalents | | | 22.7% | |
| | |
Short Portfolio Sector Allocation | | % of
Net Assets | |
Materials | | | -0.3% | |
Health Care | | | -0.8% | |
Industrials | | | -1.0% | |
Information Technology | | | -2.0% | |
Consumer Discretionary | | | -2.4% | |
Financials | | | -2.9% | |
Other | | | | |
Segregated Cash With Brokers | | | 9.6% | |
Net Other Assets (Liabilities) | | | -3.8% | |
| | | | | |
| | | | 100% | |
| | | | | |
Russell 3000 Index Sector Allocation | | % of
Index | |
Financials | | | 17.2% | |
Information Technology | | | 18.2% | |
Health Care | | | 13.0% | |
Consumer Discretionary | | | 13.0% | |
Industrials | | | 11.6% | |
Consumer Staples | | | 7.7% | |
Energy | | | 9.6% | |
Materials | | | 4.0% | |
Utilities | | | 3.4% | |
Telecom | | | 2.3% | |
| | | | | |
| | | | 100% | |
| | | | | |
| | | | | |
| | | | |
Diamond Hill Financial Long-Short Fund | |
Long Portfolio Sector Allocation | | % of
Net Assets | |
Banking Services | | | 32.5% | |
Insurance | | | 32.5% | |
Capital Markets | | | 11.5% | |
REITs & Real Estate Management | | | 5.0% | |
IT Services | | | 2.1% | |
Thrifts & Mortgage Finance | | | 1.5% | |
Consumer Financial Services | | | 1.2% | |
Financial Services | | | 0.8% | |
Cash and Cash Equivalents | | | 19.8% | |
| | |
Short Portfolio Sector Allocation | | % of
Net Assets | |
Financial Services | | | -0.8% | |
REITs & Real Estate Management | | | -0.8% | |
Banking Services | | | -3.0% | |
Insurance | | | -4.8% | |
Other | | | | |
Segregated Cash With Brokers | | | 10.8% | |
Net Other Assets (Liabilities) | | | -8.3% | |
| | | | | |
| | | | 100% | |
| | | | | |
S&P Composite 1500 Financials Index Sector Allocation | | % of
Index | |
Banking Services | | | 35.0% | |
Insurance | | | 18.0% | |
Capital Markets | | | 12.6% | |
REITs & Real Estate Management | | | 17.9% | |
Financial Services | | | 10.9% | |
Consumer Financial Services | | | 5.5% | |
| | | | | |
| | | | 100% | |
| | | | | |
| | | | | |
| | | | | | | | | | | | | | | | |
| DIAMOND HILL FUNDS | | | | | SEMI-ANNUAL REPORT | | | | | JUNE 30, 2014 | | | | | DIAMOND-HILL.COM | | | 27 | |
Diamond Hill Funds
Tabular Presentation of Schedules of Investments (Continued)
June 30, 2014
| | | | |
Diamond Hill Strategic Income Fund | |
Strategic Income Fund Sector Allocation | | % of
Net Assets | |
Financials | | | 26.3% | |
Consumer Discretionary | | | 18.5% | |
Health Care | | | 13.6% | |
Industrials | | | 12.6% | |
Energy | | | 6.9% | |
Telecommunication Services | | | 3.5% | |
Materials | | | 3.4% | |
Information Technology | | | 2.4% | |
Consumer Staples | | | 2.1% | |
Utilities | | | 1.9% | |
Other | | | 0.4% | |
Cash and Cash Equivalents | | | 15.8% | |
Other | | | | |
Net Other Assets (Liabilities) | | | -7.4% | |
| | | | | |
| | | | 100% | |
| | | | | |
| | | | | |
| | | | | | | | | | | | | | |
| 28 | | DIAMOND HILL FUNDS | | | | | SEMI-ANNUAL REPORT | | | | | JUNE 30, 2014 | | | | | DIAMOND-HILL.COM |
(Page intentionally left blank)
| | | | | | | | | | | | | | | | |
| DIAMOND HILL FUNDS | | | | | SEMI-ANNUAL REPORT | | | | | JUNE 30, 2014 | | | | | DIAMOND-HILL.COM | | | 29 | |
Diamond Hill Funds
Statements of Assets & Liabilities
June 30, 2014 (Unaudited)
| | | | | | | | | | | | |
| | | Small Cap
Fund | | | Small-Mid
Cap
Fund | | | Mid Cap
Fund | |
Assets | | | | | | | | | | | | |
Total investment securities, at cost | | $ | 1,151,207,707 | | | $ | 444,666,447 | | | $ | 12,931,924 | |
Investment securities, at fair value — including $134,534,587, $35,899,859, $521,275, $139,362,595, $10,906,495, $176,696,893, $3,869,853, $2,589,277 and $14,012,622 of securities loaned | | $ | 1,552,318,292 | | | $ | 516,261,844 | | | $ | 13,573,352 | |
Cash | | | — | | | | — | | | | — | |
Deposits with brokers for securities sold short | | | — | | | | — | | | | — | |
Receivable for fund shares issued | | | 1,362,654 | | | | 5,462,064 | | | | 25,000 | |
Receivable for dividends and interest | | | 1,305,313 | | | | 603,964 | | | | 14,612 | |
Receivable for investments sold | | | — | | | | 1,276,353 | | | | 21,585 | |
Total Assets | | | 1,554,986,259 | | | | 523,604,225 | | | | 13,634,549 | |
| | | |
Liabilities | | | | | | | | | | | | |
Securities sold short, at fair value (proceeds $—, $—, $—, $—, $—, $534,429,779, $6,165,188, $2,237,880 and $—) | | | — | | | | — | | | | — | |
Cash overdraft | | | — | | | | — | | | | — | |
Payable for securities purchased | | | 1,685,324 | | | | 5,601,043 | | | | 228,992 | |
Payable for expenses and fees on securities sold short | | | — | | | | — | | | | — | |
Payable for fund shares redeemed | | | 2,856,787 | | | | 216,240 | | | | — | |
Payable for return of collateral received | | | 137,192,511 | | | | 36,431,533 | | | | 536,486 | |
Payable to Investment Adviser | | | 910,355 | | | | 275,008 | | | | 6,259 | |
Payable to Administrator | | | 265,666 | | | | 74,892 | | | | 1,073 | |
Accrued distribution and service fees | | | 164,775 | | | | 36,491 | | | | 131 | |
Payable to accountant and custodian | | | 4,538 | | | | 790 | | | | 18 | |
Total Liabilities | | | 143,079,956 | | | | 42,635,997 | | | | 772,959 | |
| | | |
Net Assets | | $ | 1,411,906,303 | | | $ | 480,968,228 | | | $ | 12,861,590 | |
| | | |
Components of Net Assets | | | | | | | | | | | | |
Paid-in capital | | $ | 946,804,741 | | | $ | 382,261,896 | | | $ | 12,055,024 | |
Accumulated net investment income (loss) | | | (1,732,985 | ) | | | 652,576 | | | | 42,881 | |
Accumulated net realized gains (losses) from investment transactions | | | 65,723,962 | | | | 26,458,359 | | | | 122,257 | |
Net unrealized appreciation (depreciation) on investments | | | 401,110,585 | | | | 71,595,397 | | | | 641,428 | |
Net Assets | | $ | 1,411,906,303 | | | $ | 480,968,228 | | | $ | 12,861,590 | |
| | | |
Net Assets | | | | | | | | | | | | |
Class A Shares | | $ | 615,072,271 | | | $ | 107,875,313 | | | $ | 614,184 | |
Class C Shares | | $ | 51,466,171 | | | $ | 23,256,885 | | | $ | 21,601 | |
Class I Shares | | $ | 592,207,011 | | | $ | 213,127,848 | | | $ | 1,268,354 | |
Class Y Shares | | $ | 153,160,850 | | | $ | 136,708,182 | | | $ | 10,957,451 | |
| | | |
Shares of beneficial interest outstanding (unlimited number of shares authorized, no par value) | | | | | | | | | | | | |
Class A Shares | | | 17,377,412 | | | | 5,659,780 | | | | 57,286 | |
Class C Shares | | | 1,607,753 | | | | 1,292,877 | | | | 2,021 | |
Class I Shares | | | 16,518,366 | | | | 11,085,882 | | | | 118,048 | |
Class Y Shares | | | 4,269,474 | | | | 7,102,578 | | | | 1,019,623 | |
| | | |
Net Asset Value, offering (except Class A Shares) and redemption price per share: | | | | | | | | | | | | |
Class A Shares | | $ | 35.39 | | | $ | 19.06 | | | $ | 10.72 | |
Class C Shares(A) | | $ | 32.01 | | | $ | 17.99 | | | $ | 10.69 | |
Class I Shares | | $ | 35.85 | | | $ | 19.23 | | | $ | 10.74 | |
Class Y Shares | | $ | 35.87 | | | $ | 19.25 | | | $ | 10.75 | |
| | | |
Maximum Offering Price | | | | | | | | | | | | |
Maximum sales charge — Class A Shares | | | 5.00% | | | | 5.00% | | | | 5.00% | |
(100%/(100%-maximum sales charge) of net asset value adjusted to the nearestcent) per share — Class A Shares | | $ | 37.25 | | | $ | 20.06 | | | $ | 11.28 | |
| (A) | Redemption price per share varies based upon holding period. |
See accompanying Notes to Financial Statements.
| | | | | | | | | | | | | | |
| 30 | | DIAMOND HILL FUNDS | | | | | SEMI-ANNUAL REPORT | | | | | JUNE 30, 2014 | | | | | DIAMOND-HILL.COM |
| | | | | | | | | | | | | | | | | | | | | | |
Large Cap
Fund | | | Select
Fund | | | Long-Short
Fund | | | Research
Opportunities
Fund | | | Financial
Long-Short
Fund | | | Strategic
Income
Fund | |
| | | | | | | | | | | | | | | | | | | | | | |
| $ | 2,344,693,084 | | | $ | 65,377,330 | | | $ | 2,730,015,952 | | | $ | 64,137,689 | | | $ | 24,112,811 | | | $ | 227,333,201 | |
$ | 3,171,567,819 | | | $ | 78,430,319 | | | $ | 3,635,752,968 | | | $ | 75,297,731 | | | $ | 29,489,412 | | | $ | 232,734,253 | |
| | — | | | | 1,924 | | | | 13,006,899 | | | | — | | | | 68,215 | | | | — | |
| | — | | | | — | | | | 757,058,381 | | | | 6,975,598 | | | | 2,988,196 | | | | — | |
| | 2,737,872 | | | | 101,742 | | | | 13,081,687 | | | | 492,544 | | | | 60,286 | | | | 53,069 | |
| | 2,639,185 | | | | 69,882 | | | | 2,689,019 | | | | 92,022 | | | | 18,565 | | | | 2,784,772 | |
| | 15,293,199 | | | | 865,741 | | | | 25,766,068 | | | | 1,053,140 | | | | 227,293 | | | | — | |
| | 3,192,238,075 | | | | 79,469,608 | | | | 4,447,355,022 | | | | 83,911,035 | | | | 32,851,967 | | | | 235,572,094 | |
| | | | | |
| | | | | | | | | | | | | | | | | | | | | | |
| — | | | | — | | | | 671,931,567 | | | | 6,903,675 | | | | 2,592,565 | | | | — | |
| | — | | | | — | | | | — | | | | 20,256 | | | | — | | | | 282 | |
| | 48,606,834 | | | | 505,080 | | | | 2,563,013 | | | | 266,604 | | | | — | | | | 4,095,000 | |
| | — | | | | — | | | | 838,326 | | | | 10,357 | | | | 6,837 | | | | — | |
| | 2,156,837 | | | | 270 | | | | 2,861,012 | | | | 883 | | | | 4,883 | | | | 271,257 | |
| | 142,804,377 | | | | 11,186,370 | | | | 181,537,422 | | | | 3,959,215 | | | | 2,630,168 | | | | 14,366,588 | |
| | 1,336,761 | | | | 40,476 | | | | 2,591,268 | | | | 59,572 | | | | 22,281 | | | | 88,901 | |
| | 571,602 | | | | 13,368 | | | | 691,839 | | | | 12,811 | | | | 5,570 | | | | 42,587 | |
| | 291,780 | | | | 8,776 | | | | 296,400 | | | | 1,931 | | | | 4,309 | | | | 31,733 | |
| | 5,278 | | | | 59 | | | | 30,413 | | | | — | | | | — | | | | 450 | |
| | 195,773,469 | | | | 11,754,399 | | | | 863,341,260 | | | | 11,235,304 | | | | 5,266,613 | | | | 18,896,798 | |
| | | | | |
| $ | 2,996,464,606 | | | $ | 67,715,209 | | | $ | 3,584,013,762 | | | $ | 72,675,731 | | | $ | 27,585,354 | | | $ | 216,675,296 | |
| | | | | |
| | | | | | | | | | | | | | | | | | | | | | |
| $ | 2,083,107,462 | | | $ | 44,515,154 | | | $ | 3,055,112,352 | | | $ | 57,696,379 | | | $ | 32,618,766 | | | $ | 225,646,279 | |
| | 19,073,612 | | | | 495,514 | | | | (2,949,989 | ) | | | (98,725 | ) | | | (31,002 | ) | | | 106,659 | |
| 67,408,797 | | | | 9,651,552 | | | | (236,383,829 | ) | | | 4,655,922 | | | | (10,024,326 | ) | | | (14,478,694 | ) |
| | 826,874,735 | | | | 13,052,989 | | | | 768,235,228 | | | | 10,422,155 | | | | 5,021,916 | | | | 5,401,052 | |
| $ | 2,996,464,606 | | | $ | 67,715,209 | | | $ | 3,584,013,762 | | | $ | 72,675,731 | | | $ | 27,585,354 | | | $ | 216,675,296 | |
| | | | | |
| | | | | | | | | | | | | | | | | | | | | | |
| $ | 1,147,579,972 | | | $ | 12,522,469 | | | $ | 760,468,341 | | | $ | 9,163,517 | | | $ | 12,925,718 | | | $ | 45,590,558 | |
| $ | 72,311,549 | | | $ | 7,612,521 | | | $ | 151,933,320 | | | $ | 579,629 | | | $ | 2,171,456 | | | $ | 26,525,875 | |
| $ | 1,486,732,754 | | | $ | 38,636,917 | | | $ | 2,424,324,671 | | | $ | 45,850,035 | | | $ | 12,488,180 | | | $ | 129,434,300 | |
| $ | 289,840,331 | | | $ | 8,943,302 | | | $ | 247,287,430 | | | $ | 17,082,550 | | | $ | — | | | $ | 15,124,563 | |
| | | | | |
| | | | | | | | | | | | | | | | | | | | | | |
| | 50,443,352 | | | | 902,341 | | | | 32,328,795 | | | | 381,489 | | | | 688,171 | | | | 4,057,807 | |
| | 3,315,747 | | | | 565,083 | | | | 6,989,021 | | | | 24,577 | | | | 123,692 | | | | 2,364,679 | |
| | 64,983,072 | | | | 2,786,321 | | | | 101,722,378 | | | | 1,900,426 | | | | 665,077 | | | | 11,543,865 | |
| | 12,657,406 | | | | 643,777 | | | | 10,368,236 | | | | 706,797 | | | | — | | | | 1,349,495 | |
| | | | | |
| | | | | | | | | | | | | | | | | | | | | | |
| $ | 22.75 | | | $ | 13.88 | | | $ | 23.52 | | | $ | 24.02 | | | $ | 18.78 | | | $ | 11.24 | |
| $ | 21.81 | | | $ | 13.47 | | | $ | 21.74 | | | $ | 23.58 | | | $ | 17.56 | | | $ | 11.22 | |
| $ | 22.88 | | | $ | 13.87 | | | $ | 23.83 | | | $ | 24.13 | | | $ | 18.78 | | | $ | 11.21 | |
| $ | 22.90 | | | $ | 13.89 | | | $ | 23.85 | | | $ | 24.17 | | | $ | — | | | $ | 11.21 | |
| | | | | |
| | | | | | | | | | | | | | | | | | | | | | |
| | 5.00% | | | | 5.00% | | | | 5.00% | | | | 5.00% | | | | 5.00% | | | | 3.50% | |
$ | 23.95 | | | $ | 14.61 | | | $ | 24.76 | | | $ | 25.28 | | | $ | 19.77 | | | $ | 11.65 | |
| | | | | | | | | | | | | | | | |
| DIAMOND HILL FUNDS | | | | | SEMI-ANNUAL REPORT | | | | | JUNE 30, 2014 | | | | | DIAMOND-HILL.COM | | | 31 | |
Diamond Hill Funds
Statements of Operations
For the period ended June 30, 2014 (Unaudited)
| | | | | | | | | | | | | | | | |
| | | Small Cap
Fund | | | Small-Mid
Cap
Fund | | | Mid Cap
Fund | | | Large Cap
Fund | |
Investment Income | | | | | | | | | | | | | | | | |
Dividends | | $ | 6,110,286 | | | $ | 2,521,837 | | | $ | 82,574 | | | $ | 27,847,692 | |
Securities lending income | | | 217,201 | | | | 90,022 | | | | — | | | | 5,107 | |
Total Investment Income | | | 6,327,487 | | | | 2,611,859 | | | | 82,574 | | | | 27,852,799 | |
| | | | |
Expenses | | | | | | | | | | | | | | | | |
Investment advisory fees | | | 5,202,311 | | | | 1,425,258 | | | | 33,849 | | | | 7,425,666 | |
Administration fees | | | 1,528,430 | | | | 386,056 | | | | 5,409 | | | | 3,157,590 | |
Distribution fees — Class A | | | 717,137 | | | | 87,652 | | | | 220 | | | | 1,231,961 | |
Distribution and service fees — Class C | | | 236,021 | | | | 102,897 | | | | 94 | | | | 307,307 | |
Accounting and custody fees | | | 15,388 | | | | 4,670 | | | | 121 | | | | 31,843 | |
Total Expenses | | | 7,699,287 | | | | 2,006,533 | | | | 39,693 | | | | 12,154,367 | |
| | | | |
Net Investment Income (Loss) | | | (1,371,800 | ) | | | 605,326 | | | | 42,881 | | | | 15,698,432 | |
| | | | |
Realized and Unrealized Gains (Losses) on Investments | | | | | | | | | | | | | | | | |
Net realized gains (losses) on security sales | | | 58,388,043 | | | | 21,364,121 | | | | 122,257 | | | | 43,220,646 | |
Net change in unrealized appreciation (depreciation) on investments | | | 50,409,191 | | | | 8,365,269 | | | | 641,428 | | | | 109,826,437 | |
Net Realized and Unrealized Gains (Losses) on Investments | | | 108,797,234 | | | | 29,729,390 | | | | 763,685 | | | | 153,047,083 | |
| | | | |
Change in Net Assets from Operations | | $ | 107,425,434 | | | $ | 30,334,716 | | | $ | 806,566 | | | $ | 168,745,515 | |
See accompanying Notes to Financial Statements.
| | | | | | | | | | | | | | |
| 32 | | DIAMOND HILL FUNDS | | | | | SEMI-ANNUAL REPORT | | | | | JUNE 30, 2014 | | | | | DIAMOND-HILL.COM |
Diamond Hill Funds
Statements of Operations
For the period ended June 30, 2014 (Unaudited)
| | | | | | | | | | | | | | | | | | | | |
| | | Select
Fund | | | Long-Short
Fund | | | Research
Opportunities
Fund | | | Financial
Long-Short
Fund | | | Strategic
Income
Fund | |
Investment Income | | | | | | | | | | | | | | | | | | | | |
Dividends | | $ | 610,482 | | | $ | 24,108,508 | | | $ | 452,928 | | | $ | 212,811 | | | $ | 1,867 | |
Interest | | | — | | | | — | | | | — | | | | — | | | | 5,566,085 | |
Securities lending income | | | 338 | | | | 4,921 | | | | 11,297 | | | | 9,138 | | | | 7,491 | |
Foreign taxes withheld | | | — | | | | — | | | | (9,627 | ) | | | — | | | | — | |
Total Investment Income | | | 610,820 | | | | 24,113,429 | | | | 454,598 | | | | 221,949 | | | | 5,575,443 | |
| | | | | |
Expenses | | | | | | | | | | | | | | | | | | | | |
Investment advisory fees | | | 254,375 | | | | 14,356,810 | | | | 353,278 | | | | 133,655 | | | | 516,307 | |
Administration fees | | | 85,000 | | | | 3,847,397 | | | | 76,336 | | | | 33,414 | | | | 248,660 | |
Distribution fees — Class A | | | 13,385 | | | | 1,062,783 | | | | 10,330 | | | | 16,294 | | | | 56,917 | |
Distribution and service fees — Class C | | | 33,519 | | | | 687,573 | | | | 2,704 | | | | 11,720 | | | | 131,558 | |
Accounting and custody fees | | | 909 | | | | 37,682 | | | | 904 | | | | 411 | | | | 2,928 | |
Expenses and fees on securities sold short | | | — | | | | 7,071,173 | | | | 80,929 | | | | 30,438 | | | | — | |
Total Expenses | | | 387,188 | | | | 27,063,418 | | | | 524,481 | | | | 225,932 | | | | 956,370 | |
| | | | | |
Net Investment Income (Loss) | | | 223,632 | | | | (2,949,989 | ) | | | (69,883 | ) | | | (3,983 | ) | | | 4,619,073 | |
| | | | | |
Realized and Unrealized Gains (Losses) on Investments | | | | | | | | | | | | | | | | | | | | |
Net realized gains (losses) on security sales | | | 8,369,282 | | | | 88,717,540 | | | | 3,456,316 | | | | 953,994 | �� | | | (32,865 | ) |
Net realized gains (losses) on closed short positions | | | — | | | | — | | | | (368,247 | ) | | | — | | | | — | |
Net change in unrealized appreciation (depreciation) on investments | | | (3,581,257 | ) | | | 101,456,861 | | | | 698,207 | | | | (75,509 | ) | | | 987,303 | |
Net Realized and Unrealized Gains (Losses) on Investments | | | 4,788,025 | | | | 190,174,401 | | | | 3,786,276 | | | | 878,485 | | | | 954,438 | |
| | | | | |
Change in Net Assets from Operations | | $ | 5,011,657 | | | $ | 187,224,412 | | | $ | 3,716,393 | | | $ | 874,502 | | | $ | 5,573,511 | |
See accompanying Notes to Financial Statements.
| | | | | | | | | | | | | | | | |
| DIAMOND HILL FUNDS | | | | | SEMI-ANNUAL REPORT | | | | | JUNE 30, 2014 | | | | | DIAMOND-HILL.COM | | | 33 | |
Diamond Hill Funds
Statements of Changes in Net Assets
| | | | | | | | | | | | | | | | | | |
| | | Small Cap Fund | | | | | Small-Mid Cap Fund | |
| | | For the six
months ended
June 30, 2014
(Unaudited) | | | For the year
ended
December 31,
2013 | | | | | For the six
months ended
June 30, 2014
(Unaudited) | | | For the year
ended
December 31,
2013 | |
From Operations | | | | | | | | | | | | | | | | | | |
Net investment income (loss) | | $ | (1,371,800 | ) | | $ | 879,674 | | | | | $ | 605,326 | | | $ | 1,062,307 | |
Net realized gains (losses) on security sales | | | 58,388,043 | | | | 95,774,634 | | | | | | 21,364,121 | | | | 20,192,524 | |
Net change in unrealized appreciation (depreciation) on investments | | | 50,409,191 | | | | 234,355,040 | | | | | | 8,365,269 | | | | 47,504,291 | |
Change in Net Assets from Operations | | | 107,425,434 | | | | 331,009,348 | | | | | | 30,334,716 | | | | 68,759,122 | |
| | | | | |
Distributions to Shareholders | | | | | | | | | | | | | | | | | | |
From net investment income: | | | | | | | | | | | | | | | | | | |
Class A | | | — | | | | (533,519 | ) | | | | | — | | | | (115,412 | ) |
Class C | | | — | | | | — | | | | | | — | | | | — | |
Class I | | | — | | | | (1,791,199 | ) | | | | | — | | | | (478,883 | ) |
Class Y | | | — | | | | (444,562 | ) | | | | | — | | | | (441,840 | ) |
From net realized gains on investments | | | | | | | | | | | | | | | | | | |
Class A | | | — | | | | (34,347,875 | ) | | | | | — | | | | (2,423,480 | ) |
Class C | | | — | | | | (3,002,406 | ) | | | | | — | | | | (817,146 | ) |
Class I | | | — | | | | (32,082,848 | ) | | | | | — | | | | (5,974,114 | ) |
Class Y | | | — | | | | (5,666,701 | ) | | | | | — | | | | (4,110,398 | ) |
Change in Net Assets from Distributions to Shareholders | | | — | | | | (77,869,110 | ) | | | | | — | | | | (14,361,273 | ) |
Change in net assets from capital transactions | | | 34,968,559 | | | | 234,171,643 | | | | | | 114,891,541 | | | | 168,113,682 | |
| | | | | |
Total Change in Net Assets | | | 142,393,993 | | | | 487,311,881 | | | | | | 145,226,257 | | | | 222,511,531 | |
| | | | | |
Net Assets: | | | | | | | | | | | | | | | | | | |
Beginning of period | | | 1,269,512,310 | | | | 782,200,429 | | | | | | 335,741,971 | | | | 113,230,440 | |
End of period | | $ | 1,411,906,303 | | | $ | 1,269,512,310 | | | | | $ | 480,968,228 | | | $ | 335,741,971 | |
Accumulated Net Investment Income (Loss) | | $ | (1,733,636 | ) | | $ | (361,185 | ) | | | | $ | 652,456 | | | $ | 47,250 | |
See accompanying Notes to Financial Statements.
| | | | | | | | | | | | | | |
| 34 | | DIAMOND HILL FUNDS | | | | | SEMI-ANNUAL REPORT | | | | | JUNE 30, 2014 | | | | | DIAMOND-HILL.COM |
Diamond Hill Funds
Statements of Changes in Net Assets
| | | | | | | | | | | | | | | | | | |
| | | Small Cap Fund | | | | | Small-Mid Cap Fund | |
| | | For the six
months ended
June 30, 2014
(Unaudited) | | | For the year
ended
December 31,
2013 | | | | | For the six
months ended
June 30, 2014
(Unaudited) | | | For the year
ended
December 31,
2013 | |
Capital Transactions: | | | | | | | | | | | | | | | | | | |
Class A | | | | | | | | | | | | | | | | | | |
Proceeds from shares sold | | $ | 87,435,458 | | | $ | 165,177,369 | | | | | $ | 54,782,783 | | | $ | 38,242,590 | |
Reinvested distributions | | | — | | | | 30,242,858 | | | | | | — | | | | 2,421,734 | |
Payments for shares redeemed | | | (90,007,406 | ) | | | (138,668,826 | ) | | | | | (14,054,813 | ) | | | (7,936,194 | ) |
Change in Net Assets from Class A Share Transactions | | | (2,571,948 | ) | | | 56,751,401 | | | | | | 40,727,970 | | | | 32,728,130 | |
Class C | | | | | | | | | | | | | | | | | | |
Proceeds from shares sold | | | 4,183,460 | | | | 9,707,889 | | | | | | 3,644,890 | | | | 7,652,948 | |
Reinvested distributions | | | — | | | | 2,629,701 | | | | | | — | | | | 662,650 | |
Payments for shares redeemed | | | (2,898,650 | ) | | | (4,847,800 | ) | | | | | (1,091,232 | ) | | | (1,866,100 | ) |
Change in Net Assets from Class C Share Transactions | | | 1,284,810 | | | | 7,489,790 | | | | | | 2,553,658 | | | | 6,449,498 | |
Class I | | | | | | | | | | | | | | | | | | |
Proceeds from shares sold | | | 107,450,337 | | | | 225,280,544 | | | | | | 63,819,940 | | | | 83,551,819 | |
Reinvested distributions | | | — | | | | 28,099,503 | | | | | | — | | | | 6,179,065 | |
Payments for shares redeemed | | | (111,982,595 | ) | | | (101,483,831 | ) | | | | | (13,485,190 | ) | | | (18,344,466 | ) |
Change in Net Assets from Class I Share Transactions | | | (4,532,258 | ) | | | 151,896,216 | | | | | | 50,334,750 | | | | 71,386,418 | |
Class Y | | | | | | | | | | | | | | | | | | |
Proceeds from shares sold | | | 54,288,273 | | | | 33,561,017 | | | | | | 32,264,257 | | | | 64,314,644 | |
Reinvested distributions | | | — | | | | 3,773,497 | | | | | | — | | | | 3,290,464 | |
Payments for shares redeemed | | | (13,500,318 | ) | | | (19,300,278 | ) | | | | | (10,989,094 | ) | | | (10,055,472 | ) |
Change in Net Assets from Class Y Share Transactions | | | 40,787,955 | | | | 18,034,236 | | | | | | 21,275,163 | | | | 57,549,636 | |
Change in net assets from capital transactions: | | $ | 34,968,559 | | | $ | 234,171,643 | | | | | $ | 114,891,541 | | | $ | 168,113,682 | |
Share Transactions: | | | | | | | | | | | | | | | | | | |
Class A | | | | | | | | | | | | | | | | | | |
Issued | | | 2,633,376 | | | | 5,415,775 | | | | | | 2,981,136 | | | | 2,330,744 | |
Reinvested | | | — | | | | 945,435 | | | | | | — | | | | 140,712 | |
Redeemed | | | (2,714,172 | ) | | | (4,550,379 | ) | | | | | (792,797 | ) | | | (493,468 | ) |
Change in shares outstanding | | | (80,796 | ) | | | 1,810,831 | | | | | | 2,188,339 | | | | 1,977,988 | |
Class C | | | | | | | | | | | | | | | | | | |
Issued | | | 139,112 | | | | 345,369 | | | | | | 215,044 | | | | 488,475 | |
Reinvested | | | — | | | | 90,648 | | | | | | — | | | | 40,754 | |
Redeemed | | | (96,305 | ) | | | (175,434 | ) | | | | | (64,084 | ) | | | (118,701 | ) |
Change in shares outstanding | | | 42,807 | | | | 260,583 | | | | | | 150,960 | | | | 410,528 | |
Class I | | | | | | | | | | | | | | | | | | |
Issued | | | 3,216,033 | | | | 7,187,816 | | | | | | 3,499,492 | | | | 5,033,134 | |
Reinvested | | | — | | | | 866,046 | | | | | | — | | | | 355,716 | |
Redeemed | | | (3,341,415 | ) | | | (3,248,208 | ) | | | | | (749,359 | ) | | | (1,105,337 | ) |
Change in shares outstanding | | | (125,382 | ) | | | 4,805,654 | | | | | | 2,750,133 | | | | 4,283,513 | |
Class Y | | | | | | | | | | | | | | | | | | |
Issued | | | 1,614,568 | | | | 1,042,811 | | | | | | 1,768,531 | | | | 4,004,439 | |
Reinvested | | | — | | | | 116,151 | | | | | | — | | | | 189,056 | |
Redeemed | | | (398,010 | ) | | | (623,502 | ) | | | | | (599,972 | ) | | | (602,726 | ) |
Change in shares outstanding | | | 1,216,558 | | | | 535,460 | | | | | | 1,168,559 | | | | 3,590,769 | |
Change in shares | | | 1,053,187 | | | | 7,412,528 | | | | | | 6,257,991 | | | | 10,262,798 | |
See accompanying Notes to Financial Statements.
| | | | | | | | | | | | | | | | |
| DIAMOND HILL FUNDS | | | | | SEMI-ANNUAL REPORT | | | | | JUNE 30, 2014 | | | | | DIAMOND-HILL.COM | | | 35 | |
Diamond Hill Funds
Statements of Changes in Net Assets
| | | | | | | | | | | | | | |
| | | Mid Cap Fund | | | | | Large Cap Fund | |
| | | For the period
December 31,
2013(A) through
June 30, 2014
(Unaudited) | | | | | For the six
months ended
June 30, 2014
(Unaudited) | | | For the year
ended
December 31,
2013 | |
From Operations | | | | | | | | | | | | | | |
Net investment income (loss) | | $ | 42,881 | | | | | $ | 15,698,432 | | | $ | 23,081,746 | |
Net realized gains (losses) on security sales | | | 122,257 | | | | | | 43,220,646 | | | | 138,434,603 | |
Net change in unrealized appreciation (depreciation) on investments | | | 641,428 | | | | | | 109,826,437 | | | | 483,885,254 | |
Change in Net Assets from Operations | | | 806,566 | | | | | | 168,745,515 | | | | 645,401,603 | |
| | | | |
Distributions to Shareholders | | | | | | | | | | | | | | |
From net investment income: | | | | | | | | | | | | | | |
Class A | | | — | | | | | | — | | | | (6,747,239 | ) |
Class C | | | — | | | | | | — | | | | (139,928 | ) |
Class I | | | — | | | | | | — | | | | (12,890,969 | ) |
Class Y | | | — | | | | | | — | | | | (3,306,084 | ) |
From net realized gains on investments | | | | | | | | | | | | | | |
Class A | | | — | | | | | | — | | | | (33,542,957 | ) |
Class C | | | — | | | | | | — | | | | (2,081,765 | ) |
Class I | | | — | | | | | | — | | | | (48,662,043 | ) |
Class Y | | | — | | | | | | — | | | | (11,860,159 | ) |
Change in Net Assets from Distributions to Shareholders | | | — | | | | | | — | | | | (119,231,144 | ) |
Change in net assets from capital transactions | | | 12,055,024 | | | | | | 297,639,279 | | | | 338,093,297 | |
| | | | |
Total Change in Net Assets | | | 12,861,590 | | | | | | 466,384,794 | | | | 864,263,756 | |
| | | | |
Net Assets: | | | | | | | | | | | | | | |
Beginning of period | | | — | | | | | | 2,530,079,812 | | | | 1,665,816,056 | |
End of period | | $ | 12,861,590 | | | | | $ | 2,996,464,606 | | | $ | 2,530,079,812 | |
Accumulated Net Investment Income (Loss) | | $ | 42,881 | | | | | $ | 19,073,980 | | | $ | 3,375,180 | |
See accompanying Notes to Financial Statements.
| | | | | | | | | | | | | | |
| 36 | | DIAMOND HILL FUNDS | | | | | SEMI-ANNUAL REPORT | | | | | JUNE 30, 2014 | | | | | DIAMOND-HILL.COM |
Diamond Hill Funds
Statements of Changes in Net Assets
| | | | | | | | | | | | | | |
| | | Mid Cap Fund | | | | | Large Cap Fund | |
| | | For the period
December 31,
2013(A) through
June 30, 2014
(Unaudited) | | | | | For the six
months ended
June 30, 2014
(Unaudited) | | | For the year
ended
December 31,
2013 | |
Capital Transactions: | | | | | | | | | | | | | | |
Class A | | | | | | | | | | | | | | |
Proceeds from shares sold | | $ | 636,275 | | | | | $ | 293,666,031 | | | $ | 248,239,786 | |
Reinvested distributions | | | — | | | | | | — | | | | 38,836,172 | |
Payments for shares redeemed | | | (50,841 | ) | | | | | (89,449,108 | ) | | | (215,590,426 | ) |
Change in Net Assets from Class A Share Transactions | | | 585,434 | | | | | | 204,216,923 | | | | 71,485,532 | |
Class C | | | | | | | | | | | | | | |
Proceeds from shares sold | | | 20,000 | | | | | | 17,790,088 | | | | 14,413,166 | |
Reinvested distributions | | | — | | | | | | — | | | | 1,983,502 | |
Payments for shares redeemed | | | — | | | | | | (2,408,276 | ) | | | (6,639,393 | ) |
Change in Net Assets from Class C Share Transactions | | | 20,000 | | | | | | 15,381,812 | | | | 9,757,275 | |
Class I | | | | | | | | | | | | | | |
Proceeds from shares sold | �� | | 1,251,843 | | | | | | 255,566,737 | | | | 460,966,189 | |
Reinvested distributions | | | — | | | | | | — | | | | 56,849,085 | |
Payments for shares redeemed | | | — | | | | | | (147,579,646 | ) | | | (265,423,375 | ) |
Change in Net Assets from Class I Share Transactions | | | 1,251,843 | | | | | | 107,987,091 | | | | 252,391,899 | |
Class Y | | | | | | | | | | | | | | |
Proceeds from shares sold | | | 10,198,156 | | | | | | 32,826,663 | | | | 94,306,770 | |
Reinvested distributions | | | — | | | | | | — | | | | 14,585,063 | |
Payments for shares redeemed | | | (409 | ) | | | | | (62,773,210 | ) | | | (104,433,242 | ) |
Change in Net Assets from Class Y Share Transactions | | | 10,197,747 | | | | | | (29,946,547 | ) | | | 4,458,591 | |
Change in net assets from capital transactions: | | $ | 12,055,024 | | | | | $ | 297,639,279 | | | $ | 338,093,297 | |
Share Transactions: | | | | | | | | | | | | | | |
Class A | | | | | | | | | | | | | | |
Issued | | | 62,236 | | | | | | 13,652,382 | | | | 12,461,646 | |
Reinvested | | | — | | | | | | — | | | | 1,856,512 | |
Redeemed | | | (4,950 | ) | | | | | (4,107,811 | ) | | | (10,745,402 | ) |
Change in shares outstanding | | | 57,286 | | | | | | 9,544,571 | | | | 3,572,756 | |
Class C | | | | | | | | | | | | | | |
Issued | | | 2,021 | | | | | | 856,165 | | | | 742,624 | |
Reinvested | | | — | | | | | | — | | | | 99,272 | |
Redeemed | | | — | | | | | | (115,304 | ) | | | (350,984 | ) |
Change in shares outstanding | | | 2,021 | | | | | | 740,861 | | | | 490,912 | |
Class I | | | | | | | | | | | | | | |
Issued | | | 118,048 | | | | | | 11,700,262 | | | | 22,942,850 | |
Reinvested | | | — | | | | | | — | | | | 2,697,837 | |
Redeemed | | | — | | | | | | (6,734,918 | ) | | | (13,258,578 | ) |
Change in shares outstanding | | | 118,048 | | | | | | 4,965,344 | | | | 12,382,109 | |
Class Y | | | | | | | | | | | | | | |
Issued | | | 1,019,663 | | | | | | 1,504,741 | | | | 4,870,973 | |
Reinvested | | | — | | | | | | — | | | | 691,318 | |
Redeemed | | | (40 | ) | | | | | (2,857,890 | ) | | | (5,050,304 | ) |
Change in shares outstanding | | | 1,019,623 | | | | | | (1,353,149 | ) | | | 511,987 | |
Change in shares | | | 1,196,978 | | | | | | 13,897,627 | | | | 16,957,764 | |
| (A) | Inception date of the fund is December 31, 2013. Fund commenced public offering and investment operations on January 2, 2014. |
See accompanying Notes to Financial Statements.
| | | | | | | | | | | | | | | | |
| DIAMOND HILL FUNDS | | | | | SEMI-ANNUAL REPORT | | | | | JUNE 30, 2014 | | | | | DIAMOND-HILL.COM | | | 37 | |
Diamond Hill Funds
Statements of Changes in Net Assets
| | | | | | | | | | | | | | | | | | |
| | | Select Fund | | | | | Long-Short Fund | |
| | | For the six
months ended
June 30, 2014
(Unaudited) | | | For the year
ended
December��31,
2013 | | | | | For the six
months ended
June 30, 2014
(Unaudited) | | | For the year
ended
December 31,
2013 | |
From Operations | | | | | | | | | | | | | | | | | | |
Net investment income (loss) | | $ | 223,632 | | | $ | 349,042 | | | | | $ | (2,949,989 | ) | | $ | (2,747,916 | ) |
Net realized gains (losses) on security sales | | | 8,369,282 | | | | 12,311,674 | | | | | | 88,717,540 | | | | 203,510,573 | |
Net realized gains (losses) on closed short positions | | | — | | | | — | | | | | | — | | | | (42,885,934 | ) |
Net change in unrealized appreciation (depreciation) on investments | | | (3,581,257 | ) | | | 9,446,142 | | | | | | 101,456,861 | | | | 386,363,411 | |
Change in Net Assets from Operations | | | 5,011,657 | | | | 22,106,858 | | | | | | 187,224,412 | | | | 544,240,134 | |
| | | | | |
Distributions to Shareholders | | | | | | | | | | | | | | | | | | |
From net investment income: | | | | | | | | | | | | | | | | | | |
Class A | | | — | | | | (58,077 | ) | | | | | — | | | | (1,895,312 | ) |
Class C | | | — | | | | (12,751 | ) | | | | | — | | | | — | |
Class I | | | — | | | | (420,708 | ) | | | | | — | | | | (7,019,064 | ) |
Class Y | | | — | | | | (67,107 | ) | | | | | — | | | | (713,266 | ) |
From net realized gains on investments | | | | | | | | | | | | | | | | | | |
Class A | | | — | | | | (1,126,599 | ) | | | | | — | | | | — | |
Class C | | | — | | | | (717,235 | ) | | | | | — | | | | — | |
Class I | | | — | | | | (5,839,372 | ) | | | | | — | | | | — | |
Class Y | | | — | | | | (823,726 | ) | | | | | — | | | | — | |
Change in Net Assets from Distributions to Shareholders | | | — | | | | (9,065,575 | ) | | | | | — | | | | (9,627,642 | ) |
Change in net assets from capital transactions | | | (5,054,710 | ) | | | (3,982,244 | ) | | | | | 380,400,863 | | | | 206,628,459 | |
| | | | | |
Total Change in Net Assets | | | (43,053 | ) | | | 9,059,039 | | | | | | 567,625,275 | | | | 741,240,951 | |
| | | | | |
Net Assets: | | | | | | | | | | | | | | | | | | |
Beginning of period | | | 67,758,262 | | | | 58,699,223 | | | | | | 3,016,388,487 | | | | 2,275,147,536 | |
End of period | | $ | 67,715,209 | | | $ | 67,758,262 | | | | | $ | 3,584,013,762 | | | $ | 3,016,388,487 | |
Accumulated Net Investment Income (Loss) | | $ | 495,514 | | | $ | 271,882 | | | | | $ | (2,949,989 | ) | | $ | — | |
See accompanying Notes to Financial Statements.
| | | | | | | | | | | | | | |
| 38 | | DIAMOND HILL FUNDS | | | | | SEMI-ANNUAL REPORT | | | | | JUNE 30, 2014 | | | | | DIAMOND-HILL.COM |
Diamond Hill Funds
Statements of Changes in Net Assets
| | | | | | | | | | | | | | | | | | |
| | | Select Fund | | | | | Long-Short Fund | |
| | | For the six
months ended
June 30, 2014
(Unaudited) | | | For the year
ended
December 31,
2013 | | | | | For the six
months ended
June 30, 2014
(Unaudited) | | | For the year
ended
December 31,
2013 | |
Capital Transactions: | | | | | | | | | | | | | | | | | | |
Class A | | | | | | | | | | | | | | | | | | |
Proceeds from shares sold | | $ | 4,378,430 | | | $ | 5,520,970 | | | | | $ | 187,641,625 | | | $ | 423,707,255 | |
Reinvested distributions | | | — | | | | 1,053,131 | | | | | | — | | | | 1,400,669 | |
Payments for shares redeemed | | | (1,508,349 | ) | | | (7,262,672 | ) | | | | | (332,066,958 | ) | | | (236,227,305 | ) |
Change in Net Assets from Class A Share Transactions | | | 2,870,081 | | | | (688,571 | ) | | | | | (144,425,333 | ) | | | 188,880,619 | |
Class C | | | | | | | | | | | | | | | | | | |
Proceeds from shares sold | | | 1,948,241 | | | | 1,604,721 | | | | | | 20,994,890 | | | | 21,761,845 | |
Reinvested distributions | | | — | | | | 511,932 | | | | | | — | | | | — | |
Payments for shares redeemed | | | (319,087 | ) | | | (560,024 | ) | | | | | (6,926,925 | ) | | | (17,232,284 | ) |
Change in Net Assets from Class C Share Transactions | | | 1,629,154 | | | | 1,556,629 | | | | | | 14,067,965 | | | | 4,529,561 | |
Class I | | | | | | | | | | | | | | | | | | |
Proceeds from shares sold | | | 7,566,447 | | | | 14,747,954 | | | | | | 776,918,455 | | | | 826,268,492 | |
Reinvested distributions | | | — | | | | 6,137,359 | | | | | | — | | | | 3,004,906 | |
Payments for shares redeemed | | | (9,417,002 | ) | | | (25,003,837 | ) | | | | | (332,128,823 | ) | | | (882,010,369 | ) |
Payments for shares redeemed in-kind | | | (9,554,431 | ) | | | — | | | | | | — | | | | — | |
Change in Net Assets from Class I Share Transactions | | | (11,404,986 | ) | | | (4,118,524 | ) | | | | | 444,789,632 | | | | (52,736,971 | ) |
Class Y | | | | | | | | | | | | | | | | | | |
Proceeds from shares sold | | | 1,855,302 | | | | 986,885 | | | | | | 123,134,227 | | | | 107,214,613 | |
Reinvested distributions | | | — | | | | 849,213 | | | | | | — | | | | 536,170 | |
Payments for shares redeemed | | | (4,261 | ) | | | (2,567,876 | ) | | | | | (57,165,628 | ) | | | (41,795,533 | ) |
Change in Net Assets from Class Y Share Transactions | | | 1,851,041 | | | | (731,778 | ) | | | | | 65,968,599 | | | | 65,955,250 | |
Change in net assets from capital transactions: | | $ | (5,054,710 | ) | | $ | (3,982,244 | ) | | | | $ | 380,400,863 | | | $ | 206,628,459 | |
Share Transactions: | | | | | | | | | | | | | | | | | | |
Class A | | | | | | | | | | | | | | | | | | |
Issued | | | 333,297 | | | | 420,223 | | | | | | 8,350,280 | | | | 20,427,417 | |
Reinvested | | | — | | | | 83,536 | | | | | | — | | | | 63,009 | |
Redeemed | | | (115,957 | ) | | | (563,124 | ) | | | | | (14,574,470 | ) | | | (11,342,338 | ) |
Change in shares outstanding | | | 217,340 | | | | (59,365 | ) | | | | | (6,224,190 | ) | | | 9,148,088 | |
Class C | | | | | | | | | | | | | | | | | | |
Issued | | | 152,694 | | | | 122,894 | | | | | | 1,004,934 | | | | 1,122,301 | |
Reinvested | | | — | | | | 41,871 | | | | | | — | | | | — | |
Redeemed | | | (24,478 | ) | | | (46,966 | ) | | | | | (331,042 | ) | | | (915,518 | ) |
Change in shares outstanding | | | 128,216 | | | | 117,799 | | | | | | 673,892 | | | | 206,783 | |
Class I | | | | | | | | | | | | | | | | | | |
Issued | | | 582,214 | | | | 1,232,972 | | | | | | 33,763,117 | | | | 39,656,689 | |
Reinvested | | | — | | | | 486,641 | | | | | | — | | | | 133,613 | |
Redeemed | | | (1,190,087 | ) | | | (2,127,353 | ) | | | | | (14,579,005 | ) | | | (41,967,509 | ) |
Redemptions in-kind | | | (212,226 | ) | | | — | | | | | | — | | | | — | |
Change in shares outstanding | | | (820,099 | ) | | | (407,740 | ) | | | | | 19,184,112 | | | | (2,177,207 | ) |
Class Y | | | | | | | | | | | | | | | | | | |
Issued | | | 140,988 | | | | 82,490 | | | | | | 5,362,045 | | | | 4,902,596 | |
Reinvested | | | — | | | | 67,243 | | | | | | — | | | | 23,840 | |
Redeemed | | | (320 | ) | | | (201,479 | ) | | | | | (2,489,904 | ) | | | (1,975,140 | ) |
Change in shares outstanding | | | 140,668 | | | | (51,746 | ) | | | | | 2,872,141 | | | | 2,951,296 | |
Change in shares | | | (333,875 | ) | | | (401,052 | ) | | | | | 16,505,955 | | | | 10,128,960 | |
See accompanying Notes to Financial Statements.
| | | | | | | | | | | | | | | | |
| DIAMOND HILL FUNDS | | | | | SEMI-ANNUAL REPORT | | | | | JUNE 30, 2014 | | | | | DIAMOND-HILL.COM | | | 39 | |
Diamond Hill Funds
Statements of Changes in Net Assets
| | | | | | | | | | | | | | | | | | |
| | | Research Opportunities Fund | | | | | Financial Long-Short Fund | |
| | | For the six
months ended
June 30, 2014
(Unaudited) | | | For the year
ended
December 31,
2013 | | | | | For the six
months ended
June 30, 2014
(Unaudited) | | | For the year
ended
December 31,
2013 | |
From Operations | | | | | | | | | | | | | | | | | | |
Net investment income (loss) | | $ | (69,883 | ) | | $ | (71,707 | ) | | | | $ | (3,983 | ) | | $ | (67,827 | ) |
Net realized gains (losses) on security sales | | | 3,456,316 | | | | 5,898,271 | | | | | | 953,994 | | | | 2,622,718 | |
Net realized gains (losses) on closed short positions | | | (368,247 | ) | | | (247,513 | ) | | | | | — | | | | (124,201 | ) |
Net realized gains (losses) on foreign currency transactions | | | — | | | | (12 | ) | | | | | — | | | | — | |
Net change in unrealized appreciation (depreciation) on investments | | | 698,207 | | | | 7,153,341 | | | | | | (75,509 | ) | | | 3,423,470 | |
Change in Net Assets from Operations | | | 3,716,393 | | | | 12,732,380 | | | | | | 874,502 | | | | 5,854,160 | |
| | | | | |
Distributions to Shareholders | | | | | | | | | | | | | | | | | | |
From net investment income: | | | | | | | | | | | | | | | | | | |
Class I | | | — | | | | (15,692 | ) | | | �� | | — | | | | — | |
Class Y | | | — | | | | (19,853 | ) | | | | | — | | | | — | |
From net realized gains on investments | | | | | | | | | | | | | | | | | | |
Class A | | | — | | | | (378,678 | ) | | | | | — | | | | — | |
Class C | | | — | | | | (30,078 | ) | | | | | — | | | | — | |
Class I | | | — | | | | (2,519,666 | ) | | | | | — | | | | — | |
Class Y | | | — | | | | (952,360 | ) | | | | | — | | | | — | |
Change in Net Assets from Distributions to Shareholders | | | — | | | | (3,916,327 | ) | | | | | — | | | | — | |
Change in net assets from capital transactions | | | 3,143,141 | | | | 28,182,596 | | | | | | (4,915,684 | ) | | | 13,159,707 | |
| | | | | |
Total Change in Net Assets | | | 6,859,534 | | | | 36,998,649 | | | | | | (4,041,182 | ) | | | 19,013,867 | |
| | | | | |
Net Assets: | | | | | | | | | | | | | | | | | | |
Beginning of period | | | 65,816,197 | | | | 28,817,548 | | | | | | 31,626,536 | | | | 12,612,669 | |
End of period | | $ | 72,675,731 | | | $ | 65,816,197 | | | | | $ | 27,585,354 | | | $ | 31,626,536 | |
Accumulated Net Investment Income (Loss) | | $ | (98,725 | ) | | $ | (28,842 | ) | | | | $ | (31,002 | ) | | $ | (27,019 | ) |
See accompanying Notes to Financial Statements.
| | | | | | | | | | | | | | |
| 40 | | DIAMOND HILL FUNDS | | | | | SEMI-ANNUAL REPORT | | | | | JUNE 30, 2014 | | | | | DIAMOND-HILL.COM |
Diamond Hill Funds
Statements of Changes in Net Assets
| | | | | | | | | | | | | | | | | | |
| | | Research Opportunities Fund | | | | | Financial Long-Short Fund | |
| | | For the six
months ended
June 30, 2014
(Unaudited) | | | For the year
ended
December 31,
2013 | | | | | For the six
months ended
June 30, 2014
(Unaudited) | | | For the year
ended
December 31,
2013 | |
Capital Transactions: | | | | | | | | | | | | | | | | | | |
Class A | | | | | | | | | | | | | | | | | | |
Proceeds from shares sold | | $ | 2,329,183 | | | $ | 5,961,001 | | | | | $ | 1,313,768 | | | $ | 10,490,996 | |
Reinvested distributions | | | — | | | | 375,385 | | | | | | — | | | | — | |
Payments for shares redeemed | | | (436,326 | ) | | | (1,119,135 | ) | | | | | (6,604,346 | ) | | | (3,967,741 | ) |
Change in Net Assets from Class A Share Transactions | | | 1,892,857 | | | | 5,217,251 | | | | | | (5,290,578 | ) | | | 6,523,255 | |
Class C | | | | | | | | | | | | | | | | | | |
Proceeds from shares sold | | | 65,910 | | | | 304,069 | | | | | | 166,846 | | | | 1,904,919 | |
Reinvested distributions | | | — | | | | 19,039 | | | | | | — | | | | — | |
Payments for shares redeemed | | | (7,678 | ) | | | (21,266 | ) | | | | | (1,004,029 | ) | | | (180,733 | ) |
Change in Net Assets from Class C Share Transactions | | | 58,232 | | | | 301,842 | | | | | | (837,183 | ) | | | 1,724,186 | |
Class I | | | | | | | | | | | | | | | | | | |
Proceeds from shares sold | | | 7,541,253 | | | | 21,221,626 | | | | | | 3,368,157 | | | | 9,827,355 | |
Reinvested distributions | | | — | | | | 2,425,927 | | | | | | — | | | | — | |
Payments for shares redeemed | | | (7,098,786 | ) | | | (1,938,550 | ) | | | | | (2,156,080 | ) | | | (4,915,089 | ) |
Change in Net Assets from Class I Share Transactions | | | 442,467 | | | | 21,709,003 | | | | | | 1,212,077 | | | | 4,912,266 | |
Class Y | | | | | | | | | | | | | | | | | | |
Proceeds from shares sold | | | 1,005,490 | | | | 971,712 | | | | | | — | | | | — | |
Reinvested distributions | | | — | | | | 127,533 | | | | | | — | | | | — | |
Payments for shares redeemed | | | (255,905 | ) | | | (144,745 | ) | | | | | — | | | | — | |
Change in Net Assets from Class Y
Share Transactions | | | 749,585 | | | | 954,500 | | | | | | — | | | | — | |
Change in net assets from capital transactions: | | $ | 3,143,141 | | | $ | 28,182,596 | | | | | $ | (4,915,684 | ) | | $ | 13,159,707 | |
Share Transactions: | | | | | | | | | | | | | | | | | | |
Class A | | | | | | | | | | | | | | | | | | |
Issued | | | 100,671 | | | | 271,231 | | | | | | 72,845 | | | | 629,506 | |
Reinvested | | | — | | | | 16,924 | | | | | | — | | | | — | |
Redeemed | | | (18,727 | ) | | | (49,664 | ) | | | | | (369,553 | ) | | | (238,627 | ) |
Change in shares outstanding | | | 81,944 | | | | 238,491 | | | | | | (296,708 | ) | | | 390,879 | |
Class C | | | | | | | | | | | | | | | | | | |
Issued | | | 2,948 | | | | 13,931 | | | | | | 9,967 | | | | 120,474 | |
Reinvested | | | — | | | | 871 | | | | | | — | | | | — | |
Redeemed | | | (340 | ) | | | (950 | ) | | | | | (60,216 | ) | | | (12,077 | ) |
Change in shares outstanding | | | 2,608 | | | | 13,852 | | | | | | (50,249 | ) | | | 108,397 | |
Class I | | | | | | | | | | | | | | | | | | |
Issued | | | 326,295 | | | | 985,371 | | | | | | 188,125 | | | | 598,221 | |
Reinvested | | | — | | | | 108,978 | | | | | | — | | | | — | |
Redeemed | | | (304,747 | ) | | | (85,942 | ) | | | | | (120,769 | ) | | | (298,665 | ) |
Change in shares outstanding | | | 21,548 | | | | 1,008,407 | | | | | | 67,356 | | | | 299,556 | |
Class Y | | | | | | | | | | | | | | | | | | |
Issued | | | 43,034 | | | | 45,740 | | | | | | — | | | | — | |
Reinvested | | | — | | | | 5,716 | | | | | | — | | | | — | |
Redeemed | | | (11,156 | ) | | | (6,810 | ) | | | | | — | | | | — | |
Change in shares outstanding | | | 31,878 | | | | 44,646 | | | | | | — | | | | — | |
Change in shares | | | 137,978 | | | | 1,305,396 | | | | | | (279,601 | ) | | | 798,832 | |
See accompanying Notes to Financial Statements.
| | | | | | | | | | | | | | | | |
| DIAMOND HILL FUNDS | | | | | SEMI-ANNUAL REPORT | | | | | JUNE 30, 2014 | | | | | DIAMOND-HILL.COM | | | 41 | |
Diamond Hill Funds
Statements of Changes in Net Assets
| | | | | | | | |
| | | Strategic Income Fund | |
| | | For the six
months ended
June 30, 2014
(Unaudited) | | | For the year
ended
December 31,
2013 | |
From Operations | | | | | | | | |
Net investment income (loss) | | $ | 4,619,073 | | | $ | 9,044,832 | |
Net realized gains (losses) on security sales | | | (32,865 | ) | | | 2,476,137 | |
Net change in unrealized appreciation (depreciation) on investments | | | 987,303 | | | | (2,572,800 | ) |
Change in Net Assets from Operations | | | 5,573,511 | | | | 8,948,169 | |
| | |
Distributions to Shareholders | | | | | | | | |
From net investment income: | | | | | | | | |
Class A | | | (1,031,672 | ) | | | (2,028,579 | ) |
Class C | | | (500,236 | ) | | | (1,115,927 | ) |
Class I | | | (2,924,491 | ) | | | (5,535,511 | ) |
Class Y | | | (319,293 | ) | | | (213,357 | ) |
Change in Net Assets from Distributions to Shareholders | | | (4,775,692 | ) | | | (8,893,374 | ) |
Change in net assets from capital transactions | | | 29,013,447 | | | | 8,381,314 | |
| | |
Total Change in Net Assets | | | 29,811,266 | | | | 8,436,109 | |
| | |
Net Assets: | | | | | | | | |
Beginning of period | | | 186,864,030 | | | | 178,427,921 | |
End of period | | $ | 216,675,296 | | | $ | 186,864,030 | |
Accumulated Net Investment Income (Loss) | | $ | 106,659 | | | $ | 263,278 | |
| See | accompanying Notes to Financial Statements. |
| | | | | | | | | | | | | | |
| 42 | | DIAMOND HILL FUNDS | | | | | SEMI-ANNUAL REPORT | | | | | JUNE 30, 2014 | | | | | DIAMOND-HILL.COM |
Diamond Hill Funds
Statements of Changes in Net Assets
| | | | | | | | |
| | | Strategic Income Fund | |
| | | For the six
months ended
June 30, 2014
(Unaudited) | | | For the year
ended
December 31,
2013 | |
Capital Transactions: | | | | | | | | |
Class A | | | | | | | | |
Proceeds from shares sold | | $ | 12,931,202 | | | $ | 12,464,286 | |
Reinvested distributions | | | 836,831 | | | | 1,545,137 | |
Payments for shares redeemed | | | (8,154,396 | ) | | | (18,588,448 | ) |
Change in Net Assets from Class A Share Transactions | | | 5,613,637 | | | | (4,579,025 | ) |
Class C | | | | | | | | |
Proceeds from shares sold | | | 1,798,167 | | | | 4,441,821 | |
Reinvested distributions | | | 254,530 | | | | 589,609 | |
Payments for shares redeemed | | | (1,761,829 | ) | | | (6,689,744 | ) |
Change in Net Assets from Class C Share Transactions | | | 290,868 | | | | (1,658,314 | ) |
Class I | | | | | | | | |
Proceeds from shares sold | | | 20,326,930 | | | | 27,028,588 | |
Reinvested distributions | | | 2,318,306 | | | | 4,243,707 | |
Payments for shares redeemed | | | (10,708,391 | ) | | | (18,070,663 | ) |
Change in Net Assets from Class I Share Transactions | | | 11,936,845 | | | | 13,201,632 | |
Class Y | | | | | | | | |
Proceeds from shares sold | | | 10,978,939 | | | | 4,100,685 | |
Reinvested distributions | | | 319,183 | | | | 202,958 | |
Payments for shares redeemed | | | (126,025 | ) | | | (2,886,622 | ) |
Change in Net Assets from Class Y Share Transactions | | | 11,172,097 | | | | 1,417,021 | |
Change in net assets from capital transactions: | | $ | 29,013,447 | | | $ | 8,381,314 | |
Share Transactions: | | | | | | | | |
Class A | | | | | | | | |
Issued | | | 1,149,833 | | | | 1,114,827 | |
Reinvested | | | 74,479 | | | | 138,609 | |
Redeemed | | | (724,239 | ) | | | (1,663,010 | ) |
Change in shares outstanding | | | 500,073 | | | | (409,574 | ) |
Class C | | | | | | | | |
Issued | | | 160,167 | | | | 397,803 | |
Reinvested | | | 22,681 | | | | 52,965 | |
Redeemed | | | (156,880 | ) | | | (600,972 | ) |
Change in shares outstanding | | | 25,968 | | | | (150,204 | ) |
Class I | | | | | | | | |
Issued | | | 1,809,755 | | | | 2,425,873 | |
Reinvested | | | 206,768 | | | | 381,497 | |
Redeemed | | | (954,066 | ) | | | (1,619,623 | ) |
Change in shares outstanding | | | 1,062,457 | | | | 1,187,747 | |
Class Y | | | | | | | | |
Issued | | | 980,388 | | | | 366,054 | |
Reinvested | | | 28,464 | | | | 18,272 | |
Redeemed | | | (11,222 | ) | | | (257,975 | ) |
Change in shares outstanding | | | 997,630 | | | | 126,351 | |
Change in shares | | | 2,586,128 | | | | 754,320 | |
See accompanying Notes to Financial Statements.
| | | | | | | | | | | | | | | | |
| DIAMOND HILL FUNDS | | | | | SEMI-ANNUAL REPORT | | | | | JUNE 30, 2014 | | | | | DIAMOND-HILL.COM | | | 43 | |
Small Cap Fund
Financial Highlights
Selected data for a share outstanding throughout the periods indicated
| | | | | | | | | | | | | | | | |
| Small Cap Fund | | Net asset
value,
beginning
of period | | | Net
investment
income
(loss) | | | Net
realized
and
unrealized
gains
(losses) on
investments | | | Total from
investment
operations | |
| | | | |
Class A | | | | | | | | | | | | | | | | |
For the six months ended June 30, 2014 (Unaudited) | | | $32.72 | | | | (0.05 | ) | | | 2.72 | | | | 2.67 | |
For the year ended December 31, 2013 | | | $24.95 | | | | — | (E) | | | 9.86 | | | | 9.86 | |
For the year ended December 31, 2012 | | | $23.04 | | | | 0.07 | (E) | | | 2.88 | | | | 2.95 | |
For the year ended December 31, 2011 | | | $25.80 | | | | (0.08 | ) | | | (1.80 | ) | | | (1.88 | ) |
For the year ended December 31, 2010 | | | $21.31 | | | | (0.05 | ) | | | 4.95 | | | | 4.90 | |
For the year ended December 31, 2009 | | | $16.53 | | | | (0.01 | ) | | | 4.79 | | | | 4.78 | |
| | | | |
Class C | | | | | | | | | | | | | | | | |
For the six months ended June 30, 2014 (Unaudited) | | | $29.70 | | | | (0.16 | ) | | | 2.47 | | | | 2.31 | |
For the year ended December 31, 2013 | | | $22.94 | | | | (0.21 | )(E) | | | 9.03 | | | | 8.82 | |
For the year ended December 31, 2012 | | | $21.34 | | | | (0.10 | )(E) | | | 2.65 | | | | 2.55 | |
For the year ended December 31, 2011 | | | $24.14 | | | | (0.25 | ) | | | (1.67 | ) | | | (1.92 | ) |
For the year ended December 31, 2010 | | | $20.12 | | | | (0.16 | ) | | | 4.59 | | | | 4.43 | |
For the year ended December 31, 2009 | | | $15.72 | | | | (0.13 | ) | | | 4.53 | | | | 4.40 | |
| | | | |
Class I | | | | | | | | | | | | | | | | |
For the six months ended June 30, 2014 (Unaudited) | | | $33.10 | | | | (0.01 | ) | | | 2.76 | | | | 2.75 | |
For the year ended December 31, 2013 | | | $25.21 | | | | 0.07 | (E) | | | 9.98 | | | | 10.05 | |
For the year ended December 31, 2012 | | | $23.27 | | | | 0.14 | (E) | | | 2.90 | | | | 3.04 | |
For the year ended December 31, 2011 | | | $26.01 | | | | (0.01 | ) | | | (1.82 | ) | | | (1.83 | ) |
For the year ended December 31, 2010 | | | $21.41 | | | | — | (F) | | | 5.01 | | | | 5.01 | |
For the year ended December 31, 2009 | | | $16.55 | | | | 0.04 | | | | 4.83 | | | | 4.87 | |
| | | | |
Class Y(G) | | | | | | | | | | | | | | | | |
For the six months ended June 30, 2014 (Unaudited) | | | $33.09 | | | | 0.02 | | | | 2.76 | | | | 2.78 | |
For the year ended December 31, 2013 | | | $25.20 | | | | 0.12 | (E) | | | 9.97 | | | | 10.09 | |
For the year ended December 31, 2012 | | | $23.27 | | | | 0.20 | (E) | | | 2.88 | | | | 3.08 | |
| (A) | Total returns shown exclude the effect of applicable sales charges. |
| (B) | Portfolio turnover rate is calculated on the basis of the Fund as a whole without distinguishing between classes of shares issued. |
See accompanying Notes to Financial Statements.
| | | | | | | | | | | | | | |
| 44 | | DIAMOND HILL FUNDS | | | | | SEMI-ANNUAL REPORT | | | | | JUNE 30, 2014 | | | | | DIAMOND-HILL.COM |
| | | | | | | | | | | | | | | | | | | | | | | | | | | | | | | | | | |
Dividends
from net
investment
income | | | Distributions
from net
realized
gains | | | Total
distributions | | | Net asset
value at
end of
period | | | Total
return(A) | | | Net assets
at end
of period
(000’s) | | | Ratio
of total
expenses
to average
net assets | | | Ratio
of net
investment
income
(loss) to
average
net assets | | | Portfolio
turnover
rate(B) | |
| | | | | | | | |
| | | | | | | | | | | | | | | | | | | | | | | | | | | | | | | | | | |
| | — | | | | — | | | | — | | | | $35.39 | | | | 8.16 | %(C) | | | $615,072 | | | | 1.30 | %(D) | | | (0.33 | )%(D) | | | 12 | %(C) |
| | (0.03 | ) | | | (2.06 | ) | | | (2.09 | ) | | | $32.72 | | | | 39.70 | % | | | $571,167 | | | | 1.31 | % | | | (0.01 | )% | | | 43 | % |
| | (0.09 | ) | | | (0.95 | ) | | | (1.04 | ) | | | $24.95 | | | | 12.88 | % | | | $390,371 | | | | 1.31 | % | | | 0.30 | % | | | 13 | % |
| | — | | | | (0.88 | ) | | | (0.88 | ) | | | $23.04 | | | | (7.17 | )% | | | $431,313 | | | | 1.33 | % | | | (0.32 | )% | | | 28 | % |
| | — | | | | (0.41 | ) | | | (0.41 | ) | | | $25.80 | | | | 22.99 | % | | | $501,237 | | | | 1.37 | % | | | (0.24 | )% | | | 35 | % |
| | — | | | | — | | | | — | | | | $21.31 | | | | 28.92 | %�� | | | $438,722 | | | | 1.38 | % | | | (0.09 | )% | | | 47 | % |
| | | | | | | | |
| | | | | | | | | | | | | | | | | | | | | | | | | | | | | | | | | | |
| | — | | | | — | | | | — | | | | $32.01 | | | | 7.78 | %(C) | | | $51,466 | | | | 2.05 | %(D) | | | (1.08 | )%(D) | | | 12 | %(C) |
| | — | | | | (2.06 | ) | | | (2.06 | ) | | | $29.70 | | | | 38.64 | % | | | $46,476 | | | | 2.06 | % | | | (0.76 | )% | | | 43 | % |
| | — | | | | (0.95 | ) | | | (0.95 | ) | | | $22.94 | | | | 12.04 | % | | | $29,917 | | | | 2.06 | % | | | (0.45 | )% | | | 13 | % |
| | — | | | | (0.88 | ) | | | (0.88 | ) | | | $21.34 | | | | (7.83 | )% | | | $31,664 | | | | 2.08 | % | | | (1.07 | )% | | | 28 | % |
| | — | | | | (0.41 | ) | | | (0.41 | ) | | | $24.14 | | | | 22.01 | % | | | $35,093 | | | | 2.12 | % | | | (0.96 | )% | | | 35 | % |
| | — | | | | — | | | | — | | | | $20.12 | | | | 27.99 | % | | | $23,172 | | | | 2.13 | % | | | (0.83 | )% | | | 47 | % |
| | | | | | | | |
| | | | | | | | | | | | | | | | | | | | | | | | | | | | | | | | | | |
| | — | | | | — | | | | — | | | | $35.85 | | | | 8.31 | %(C) | | | $592,207 | | | | 1.05 | %(D) | | | (0.08 | )%(D) | | | 12 | %(C) |
| | (0.10 | ) | | | (2.06 | ) | | | (2.16 | ) | | | $33.10 | | | | 40.08 | % | | | $550,844 | | | | 1.06 | % | | | 0.22 | % | | | 43 | % |
| | (0.15 | ) | | | (0.95 | ) | | | (1.10 | ) | | | $25.21 | | | | 13.17 | % | | | $298,473 | | | | 1.06 | % | | | 0.56 | % | | | 13 | % |
| | (0.03 | ) | | | (0.88 | ) | | | (0.91 | ) | | | $23.27 | | | | (6.91 | )% | | | $314,149 | | | | 1.04 | % | | | (0.03 | )% | | | 28 | % |
| | — | | | | (0.41 | ) | | | (0.41 | ) | | | $26.01 | | | | 23.39 | % | | | $312,295 | | | | 1.00 | % | | | 0.20 | % | | | 35 | % |
| | (0.01 | ) | | | — | | | | (0.01 | ) | | | $21.41 | | | | 29.43 | % | | | $106,561 | | | | 0.99 | % | | | 0.30 | % | | | 47 | % |
| | | | | | | | |
| | | | | | | | | | | | | | | | | | | | | | | | | | | | | | | | | | |
| | — | | | | — | | | | — | | | | $35.87 | | | | 8.40 | %(C) | | | $153,161 | | | | 0.90 | %(D) | | | 0.09 | %(D) | | | 12 | %(C) |
| | (0.14 | ) | | | (2.06 | ) | | | (2.20 | ) | | | $33.09 | | | | 40.25 | % | | | $101,026 | | | | 0.91 | % | | | 0.40 | % | | | 43 | % |
| | (0.20 | ) | | | (0.95 | ) | | | (1.15 | ) | | | $25.20 | | | | 13.34 | % | | | $63,439 | | | | 0.91 | % | | | 0.82 | % | | | 13 | % |
| (E) | Net investment income (loss) per share has been calculated using the average daily shares outstanding during the period. |
| (F) | Amount is less than $0.005. |
| (G) | Inception date of Class Y is December 30, 2011. Class Y commenced public offering and investment operations on January 3, 2012. |
See accompanying Notes to Financial Statements.
| | | | | | | | | | | | | | | | |
| DIAMOND HILL FUNDS | | | | | SEMI-ANNUAL REPORT | | | | | JUNE 30, 2014 | | | | | DIAMOND-HILL.COM | | | 45 | |
Small-Mid Cap Fund
Financial Highlights
Selected data for a share outstanding throughout the periods indicated
| | | | | | | | | | | | | | | | |
| Small-Mid Cap Fund | | Net asset
value,
beginning
of period | | | Net
investment
income
(loss) | | | Net
realized
and
unrealized
gains
(losses) on
investments | | | Total from
investment
operations | |
| | | | |
Class A | | | | | | | | | | | | | | | | |
For the six months ended June 30, 2014 (Unaudited) | | | $17.73 | | | | 0.01 | | | | 1.32 | | | | 1.33 | |
For the year ended December 31, 2013 | | | $13.13 | | | | 0.04 | (E) | | | 5.35 | | | | 5.39 | |
For the year ended December 31, 2012 | | | $11.71 | | | | 0.02 | (E) | | | 1.78 | | | | 1.80 | |
For the year ended December 31, 2011 | | | $12.56 | | | | — | (F) | | | (0.53 | ) | | | (0.53 | ) |
For the year ended December 31, 2010 | | | $10.22 | | | | (0.04 | ) | | | 2.38 | | | | 2.34 | |
For the year ended December 31, 2009 | | | $7.26 | | | | 0.03 | | | | 2.93 | | | | 2.96 | |
| | | | |
Class C | | | | | | | | | | | | | | | | |
For the six months ended June 30, 2014 (Unaudited) | | | $16.80 | | | | (0.05 | ) | | | 1.24 | | | | 1.19 | |
For the year ended December 31, 2013 | | | $12.54 | | | | (0.07 | )(E) | | | 5.09 | | | | 5.02 | |
For the year ended December 31, 2012 | | | $11.28 | | | | (0.07 | )(E) | | | 1.71 | | | | 1.64 | |
For the year ended December 31, 2011 | | | $12.21 | | | | (0.06 | ) | | | (0.55 | ) | | | (0.61 | ) |
For the year ended December 31, 2010 | | | $10.00 | | | | (0.05 | ) | | | 2.26 | | | | 2.21 | |
For the year ended December 31, 2009 | | | $7.15 | | | | (0.04 | ) | | | 2.89 | | | | 2.85 | |
| | | | |
Class I | | | | | | | | | | | | | | | | |
For the six months ended June 30, 2014 (Unaudited) | | | $17.87 | | | | 0.03 | | | | 1.33 | | | | 1.36 | |
For the year ended December 31, 2013 | | | $13.21 | | | | 0.09 | (E) | | | 5.38 | | | | 5.47 | |
For the year ended December 31, 2012 | | | $11.78 | | | | 0.05 | (E) | | | 1.80 | | | | 1.85 | |
For the year ended December 31, 2011 | | | $12.61 | | | | 0.04 | | | | (0.54 | ) | | | (0.50 | ) |
For the year ended December 31, 2010 | | | $10.23 | | | | 0.02 | | | | 2.37 | | | | 2.39 | |
For the year ended December 31, 2009 | | | $7.25 | | | | 0.04 | | | | 2.96 | | | | 3.00 | |
| | | | |
Class Y(H) | | | | | | | | | | | | | | | | |
For the six months ended June 30, 2014 (Unaudited) | | | $17.87 | | | | 0.05 | | | | 1.33 | | | | 1.38 | |
For the year ended December 31, 2013 | | | $13.20 | | | | 0.12 | (E) | | | 5.38 | | | | 5.50 | |
For the year ended December 31, 2012 | | | $11.78 | | | | 0.09 | (E) | | | 1.77 | | | | 1.86 | |
| (A) | Total returns shown exclude the effect of applicable sales charges. |
| (B) | Portfolio turnover rate is calculated on the basis of the Fund as a whole without distinguishing between classes of shares issued. |
See accompanying Notes to Financial Statements.
| | | | | | | | | | | | | | |
| 46 | | DIAMOND HILL FUNDS | | | | | SEMI-ANNUAL REPORT | | | | | JUNE 30, 2014 | | | | | DIAMOND-HILL.COM |
| | | | | | | | | | | | | | | | | | | | | | | | | | | | | | | | | | |
Dividends
from net
investment
income | | | Distributions
from net
realized
gains | | | Total
distributions | | | Net asset
value at
end of
period | | | Total
return(A) | | | Net assets
at end
of period
(000’s) | | | Ratio
of total
expenses
to average
net assets | | | Ratio
of net
investment
income
(loss) to
average
net assets | | | Portfolio
turnover
rate(B) | |
| | | | | | | | |
| | | | | | | | | | | | | | | | | | | | | | | | | | | | | | | | | | |
| | — | | | | — | | | | — | | | | $19.06 | | | | 7.50 | %(C) | | | $107,875 | | | | 1.25 | %(D) | | | 0.16 | %(D) | | | 19 | %(C) |
| | (0.03 | ) | | | (0.76 | ) | | | (0.79 | ) | | | $17.73 | | | | 41.25 | % | | | $61,563 | | | | 1.26 | % | | | 0.27 | % | | | 35 | % |
| | — | (F) | | | (0.38 | ) | | | (0.38 | ) | | | $13.13 | | | | 15.43 | % | | | $19,607 | | | | 1.26 | % | | | 0.15 | % | | | 26 | % |
| | — | | | | (0.32 | ) | | | (0.32 | ) | | | $11.71 | | | | (4.19 | )% | | | $17,461 | | | | 1.28 | % | | | — | %(G) | | | 48 | % |
| | — | | | | — | (F) | | | — | (F) | | | $12.56 | | | | 23.03 | % | | | $17,216 | | | | 1.32 | % | | | (0.17 | )% | | | 35 | % |
| | — | | | | — | | | | — | | | | $10.22 | | | | 40.77 | % | | | $8,616 | | | | 1.33 | % | | | 0.17 | % | | | 74 | % |
| | | | | | | | |
| | | | | | | | | | | | | | | | | | | | | | | | | | | | | | | | | | |
| | — | | | | — | | | | — | | | | $17.99 | | | | 7.08 | %(C) | | | $23,257 | | | | 2.00 | %(D) | | | (0.64 | )%(D) | | | 19 | %(C) |
| | — | | | | (0.76 | ) | | | (0.76 | ) | | | $16.80 | | | | 40.21 | % | | | $19,184 | | | | 2.01 | % | | | (0.45 | )% | | | 35 | % |
| | — | | | | (0.38 | ) | | | (0.38 | ) | | | $12.54 | | | | 14.57 | % | | | $9,169 | | | | 2.01 | % | | | (0.59 | )% | | | 26 | % |
| | — | | | | (0.32 | ) | | | (0.32 | ) | | | $11.28 | | | | (4.89 | )% | | | $8,110 | | | | 2.02 | % | | | (0.74 | )% | | | 48 | % |
| | — | | | | — | (F) | | | — | (F) | | | $12.21 | | | | 22.14 | % | | | $7,417 | | | | 2.07 | % | | | (0.90 | )% | | | 35 | % |
| | — | | | | — | | | | — | | | | $10.00 | | | | 39.86 | % | | | $4,361 | | | | 2.08 | % | | | (0.59 | )% | | | 74 | % |
| | | | | | | | |
| | | | | | | | | | | | | | | | | | | | | | | | | | | | | | | | | | |
| | — | | | | — | | | | — | | | | $19.23 | | | | 7.61 | %(C) | | | $213,128 | | | | 1.00 | %(D) | | | 0.37 | %(D) | | | 19 | %(C) |
| | (0.05 | ) | | | (0.76 | ) | | | (0.81 | ) | | | $17.87 | | | | 41.64 | % | | | $148,927 | | | | 1.01 | % | | | 0.54 | % | | | 35 | % |
| | (0.04 | ) | | | (0.38 | ) | | | (0.42 | ) | | | $13.21 | | | | 15.74 | % | | | $53,514 | | | | 1.01 | % | | | 0.42 | % | | | 26 | % |
| | (0.01 | ) | | | (0.32 | ) | | | (0.33 | ) | | | $11.78 | | | | (3.86 | )% | | | $43,485 | | | | 0.99 | % | | | 0.29 | % | | | 48 | % |
| | (0.01 | ) | | | — | (F) | | | (0.01 | ) | | | $12.61 | | | | 23.43 | % | | | $44,711 | | | | 0.95 | % | | | 0.22 | % | | | 35 | % |
| | (0.02 | ) | | | — | | | | (0.02 | ) | | | $10.23 | | | | 41.36 | % | | | $26,110 | | | | 0.94 | % | | | 0.54 | % | | | 74 | % |
| | | | | | | | |
| | | | | | | | | | | | | | | | | | | | | | | | | | | | | | | | | | |
| | — | | | | — | | | | — | | | | $19.25 | | | | 7.72 | %(C) | | | $136,708 | | | | 0.85 | %(D) | | | 0.50 | %(D) | | | 19 | %(C) |
| | (0.07 | ) | | | (0.76 | ) | | | (0.83 | ) | | | $17.87 | | | | 41.88 | % | | | $106,068 | | | | 0.86 | % | | | 0.73 | % | | | 35 | % |
| | (0.06 | ) | | | (0.38 | ) | | | (0.44 | ) | | | $13.20 | | | | 15.84 | % | | | $30,940 | | | | 0.86 | % | | | 0.68 | % | | | 26 | % |
| (E) | Net investment income (loss) per share has been calculated using the average daily shares outstanding during the period. |
| (F) | Amount is less than $0.005. |
| (G) | Amount is less than 0.005%. |
| (H) | Inception date of Class Y is December 30, 2011. Class Y commenced public offering and investment operations on January 3, 2012. |
See accompanying Notes to Financial Statements.
| | | | | | | | | | | | | | | | |
| DIAMOND HILL FUNDS | | | | | SEMI-ANNUAL REPORT | | | | | JUNE 30, 2014 | | | | | DIAMOND-HILL.COM | | | 47 | |
Mid Cap Fund
Financial Highlights
Selected data for a share outstanding throughout the periods indicated
| | | | | | | | | | | | | | | | |
| Mid Cap Fund | | Net asset
value,
beginning
of period | | | Net
investment
income
(loss) | | | Net
realized
and
unrealized
gains
(losses) on
investments | | | Total from
investment
operations | |
| | | | |
Class A | | | | | | | | | | | | | | | | |
December 31, 2013 through June 30, 2014 (Unaudited) | | | $10.00 | | | | 0.03 | | | | 0.69 | | | | 0.72 | |
| | | | |
Class C | | | | | | | | | | | | | | | | |
December 31, 2013 through June 30, 2014 (Unaudited) | | | $10.00 | | | | (0.01 | ) | | | 0.70 | | | | 0.69 | |
| | | | |
Class I | | | | | | | | | | | | | | | | |
December 31, 2013 through June 30, 2014 (Unaudited) | | | $10.00 | | | | 0.13 | | | | 0.61 | | | | 0.74 | |
| | | | |
Class Y(E) | | | | | | | | | | | | | | | | |
December 31, 2013 through June 30, 2014 (Unaudited) | | | $10.00 | | | | 0.04 | | | | 0.71 | | | | 0.75 | |
| (A) | Total returns shown exclude the effect of applicable sales charges. |
| (B) | Portfolio turnover rate is calculated on the basis of the Fund as a whole without distinguishing between classes of shares issued. |
See accompanying Notes to Financial Statements.
| | | | | | | | | | | | | | |
| 48 | | DIAMOND HILL FUNDS | | | | | SEMI-ANNUAL REPORT | | | | | JUNE 30, 2014 | | | | | DIAMOND-HILL.COM |
| | | | | | | | | | | | | | | | | | | | | | | | | | | | | | | | | | |
Dividends
from net
investment
income | | | Distributions
from net
realized
gains | | | Total
distributions | | | Net asset
value at
end of
period | | | Total
return(A) | | | Net assets
at end
of period
(000’s) | | | Ratio
of total
expenses
to average
net assets | | | Ratio
of net
investment
income
(loss) to
average
net assets | | | Portfolio
turnover
rate(B) | |
| | | | | | | | |
| | | | | | | | | | | | | | | | | | | | | | | | | | | | | | | | | | |
| | — | | | | — | | | | — | | | | $10.72 | | | | 7.20 | %(C) | | | $614 | | | | 1.14 | %(D) | | | 0.60 | %(D) | | | 17 | % |
| | | | | | | | |
| | | | | | | | | | | | | | | | | | | | | | | | | | | | | | | | | | |
| | — | | | | — | | | | — | | | | $10.69 | | | | 6.90 | %(C) | | | $22 | | | | 1.90 | %(D) | | | (0.26 | )%(D) | | | 17 | % |
| | | | | | | | |
| | | | | | | | | | | | | | | | | | | | | | | | | | | | | | | | | | |
| | — | | | | — | | | | — | | | | $10.74 | | | | 7.40 | %(C) | | | $1,268 | | | | 0.88 | %(D) | | | 2.48 | %(D) | | | 17 | % |
| | | | | | | | |
| | | | | | | | | | | | | | | | | | | | | | | | | | | | | | | | | | |
| | — | | | | — | | | | — | | | | $10.75 | | | | 7.50 | %(C) | | | $10,957 | | | | 0.75 | %(D) | | | 0.81 | %(D) | | | 17 | % |
| (E) | Inception date of the Mid Cap Fund is December 31, 2013. The Fund commenced public offering and investment operations on January 2, 2014. |
See accompanying Notes to Financial Statements.
| | | | | | | | | | | | | | | | |
| DIAMOND HILL FUNDS | | | | | SEMI-ANNUAL REPORT | | | | | JUNE 30, 2014 | | | | | DIAMOND-HILL.COM | | | 49 | |
Large Cap Fund
Financial Highlights
Selected data for a share outstanding throughout the periods indicated
| | | | | | | | | | | | | | | | |
| Large Cap Fund | | Net asset
value,
beginning
of period | | | Net
investment
income
(loss) | | | Net
realized
and
unrealized
gains
(losses) on
investments | | | Total from
investment
operations | |
| | | | |
Class A | | | | | | | | | | | | | | | | |
For the six months ended June 30, 2014 (Unaudited) | | | $21.49 | | | | 0.11 | | | | 1.15 | | | | 1.26 | |
For the year ended December 31, 2013 | | | $16.54 | | | | 0.18 | (E) | | | 5.79 | | | | 5.97 | |
For the year ended December 31, 2012 | | | $14.96 | | | | 0.22 | (E) | | | 1.62 | | | | 1.84 | |
For the year ended December 31, 2011 | | | $14.78 | | | | 0.18 | (E) | | | 0.17 | | | | 0.35 | |
For the year ended December 31, 2010 | | | $13.62 | | | | 0.10 | | | | 1.17 | | | | 1.27 | |
For the year ended December 31, 2009 | | | $10.47 | | | | 0.10 | | | | 3.06 | | | | 3.16 | |
| | | | |
Class C | | | | | | | | | | | | | | | | |
For the six months ended June 30, 2014 (Unaudited) | | | $20.68 | | | | 0.03 | | | | 1.10 | | | | 1.13 | |
For the year ended December 31, 2013 | | | $15.98 | | | | 0.03 | (E) | | | 5.58 | | | | 5.61 | |
For the year ended December 31, 2012 | | | $14.46 | | | | 0.10 | (E) | | | 1.56 | | | | 1.66 | |
For the year ended December 31, 2011 | | | $14.29 | | | | 0.06 | | | | 0.16 | | | | 0.22 | |
For the year ended December 31, 2010 | | | $13.18 | | | | 0.02 | | | | 1.09 | | | | 1.11 | |
For the year ended December 31, 2009 | | | $10.19 | | | | 0.02 | | | | 2.97 | | | | 2.99 | |
| | | | |
Class I | | | | | | | | | | | | | | | | |
For the six months ended June 30, 2014 (Unaudited) | | | $21.58 | | | | 0.14 | | | | 1.16 | | | | 1.30 | |
For the year ended December 31, 2013 | | | $16.61 | | | | 0.24 | (E) | | | 5.80 | | | | 6.04 | |
For the year ended December 31, 2012 | | | $15.01 | | | | 0.26 | (E) | | | 1.63 | | | | 1.89 | |
For the year ended December 31, 2011 | | | $14.82 | | | | 0.22 | | | | 0.17 | | | | 0.39 | |
For the year ended December 31, 2010 | | | $13.65 | | | | 0.13 | | | | 1.20 | | | | 1.33 | |
For the year ended December 31, 2009 | | | $10.49 | | | | 0.11 | | | | 3.11 | | | | 3.22 | |
| | | | |
Class Y(G) | | | | | | | | | | | | | | | | |
For the six months ended June 30, 2014 (Unaudited) | | | $21.59 | | | | 0.16 | | | | 1.15 | | | | 1.31 | |
For the year ended December 31, 2013 | | | $16.60 | | | | 0.26 | (E) | | | 5.83 | | | | 6.09 | |
For the year ended December 31, 2012 | | | $15.01 | | | | 0.30 | (E) | | | 1.62 | | | | 1.92 | |
| (A) | Total returns shown exclude the effect of applicable sales charges. |
| (B) | Portfolio turnover rate is calculated on the basis of the Fund as a whole without distinguishing between classes of shares issued. |
See accompanying Notes to Financial Statements.
| | | | | | | | | | | | | | |
| 50 | | DIAMOND HILL FUNDS | | | | | SEMI-ANNUAL REPORT | | | | | JUNE 30, 2014 | | | | | DIAMOND-HILL.COM |
| | | | | | | | | | | | | | | | | | | | | | | | | | | | | | | | | | |
Dividends
from net
investment
income | | | Distributions
from net
realized
gains | | | Total
distributions | | | Net asset
value at
end of
period | | | Total
return(A) | | | Net assets
at end
of period
(000’s) | | | Ratio
of total
expenses
to average
net assets | | | Ratio
of net
investment
income
(loss) to
average
net assets | | | Portfolio
turnover
rate(B) | |
| | | | | | | | |
| | | | | | | | | | | | | | | | | | | | | | | | | | | | | | | | | | |
| | — | | | | — | | | | — | | | | $22.75 | | | | 5.86 | %(C) | | | $1,147,580 | | | | 1.05 | %(D) | | | 1.00 | %(D) | | | 10 | %(C) |
| | (0.16 | ) | | | (0.86 | ) | | | (1.02 | ) | | | $21.49 | | | | 36.33 | % | | | $878,903 | | | | 1.06 | % | | | 0.92 | % | | | 21 | % |
| | (0.21 | ) | | | (0.05 | ) | | | (0.26 | ) | | | $16.54 | | | | 12.29 | % | | | $617,407 | | | | 1.06 | % | | | 1.37 | % | | | 28 | % |
| | (0.17 | ) | | | — | | | | (0.17 | ) | | | $14.96 | | | | 2.35 | % | | | $593,124 | | | | 1.12 | % | | | 1.19 | % | | | 16 | % |
| | (0.11 | ) | | | — | | | | (0.11 | ) | | | $14.78 | | | | 9.29 | % | | | $459,659 | | | | 1.18 | % | | | 0.90 | % | | | 16 | % |
| | (0.01 | ) | | | — | | | | (0.01 | ) | | | $13.62 | | | | 30.21 | % | | | $344,456 | | | | 1.18 | % | | | 0.91 | % | | | 31 | % |
| | | | | | | | |
| | | | | | | | | | | | | | | | | | | | | | | | | | | | | | | | | | |
| | — | | | | — | | | | — | | | | $21.81 | | | | 5.46 | %(C) | | | $72,312 | | | | 1.80 | %(D) | | | 0.25 | %(D) | | | 10 | %(C) |
| | (0.05 | ) | | | (0.86 | ) | | | 0.91 | | | | $20.68 | | | | 35.33 | % | | | $53,241 | | | | 1.81 | % | | | 0.18 | % | | | 21 | % |
| | (0.09 | ) | | | (0.05 | ) | | | (0.14 | ) | | | $15.98 | | | | 11.49 | % | | | $33,305 | | | | 1.81 | % | | | 0.62 | % | | | 28 | % |
| | (0.05 | ) | | | — | | | | (0.05 | ) | | | $14.46 | | | | 1.55 | % | | | $30,465 | | | | 1.87 | % | | | 0.45 | % | | | 16 | % |
| | — | (F) | | | — | | | | — | (F) | | | $14.29 | | | | 8.45 | % | | | $29,274 | | | | 1.93 | % | | | 0.15 | % | | | 16 | % |
| | — | | | | — | | | | — | | | | $13.18 | | | | 29.34 | % | | | $25,454 | | | | 1.93 | % | | | 0.17 | % | | | 31 | % |
| | | | | | | | |
| | | | | | | | | | | | | | | | | | | | | | | | | | | | | | | | | | |
| | — | | | | — | | | | — | | | | $22.88 | | | | 6.02 | %(C) | | | $1,486,733 | | | | 0.80 | %(D) | | | 1.26 | %(D) | | | 10 | %(C) |
| | (0.21 | ) | | | (0.86 | ) | | | (1.07 | ) | | | $21.58 | | | | 36.60 | % | | | $1,295,477 | | | | 0.81 | % | | | 1.18 | % | | | 21 | % |
| | (0.24 | ) | | | (0.05 | ) | | | (0.29 | ) | | | $16.61 | | | | 12.62 | % | | | $791,031 | | | | 0.81 | % | | | 1.62 | % | | | 28 | % |
| | (0.20 | ) | | | — | | | | (0.20 | ) | | | $15.01 | | | | 2.60 | % | | | $684,156 | | | | 0.83 | % | | | 1.49 | % | | | 16 | % |
| | (0.16 | ) | | | — | | | | (0.16 | ) | | | $14.82 | | | | 9.72 | % | | | $623,147 | | | | 0.81 | % | | | 1.29 | % | | | 16 | % |
| | (0.06 | ) | | | — | | | | (0.06 | ) | | | $13.65 | | | | 30.71 | % | | | $347,998 | | | | 0.79 | % | | | 1.28 | % | | | 31 | % |
| | | | | | | | |
| | | | | | | | | | | | | | | | | | | | | | | | | | | | | | | | | | |
| | — | | | | — | | | | — | | | | $22.90 | | | | 6.07 | %(C) | | | $289,840 | | | | 0.65 | %(D) | | | 1.44 | %(D) | | | 10 | %(C) |
| | (0.24 | ) | | | (0.86 | ) | | | (1.10 | ) | | | $21.59 | | | | 36.87 | % | | | $302,458 | | | | 0.66 | % | | | 1.32 | % | | | 21 | % |
| | (0.28 | ) | | | (0.05 | ) | | | (0.33 | ) | | | $16.60 | | | | 12.79 | % | | | $224,073 | | | | 0.66 | % | | | 1.87 | % | | | 28 | % |
| (E) | Net investment income (loss) per share has been calculated using the average daily shares outstanding during the period. |
| (F) | Amount is less than $0.005. |
| (G) | Inception date of Class Y is December 30, 2011. Class Y commenced public offering and investment operations on January 3, 2012. |
See accompanying Notes to Financial Statements.
| | | | | | | | | | | | | | | | |
| DIAMOND HILL FUNDS | | | | | SEMI-ANNUAL REPORT | | | | | JUNE 30, 2014 | | | | | DIAMOND-HILL.COM | | | 51 | |
Select Fund
Financial Highlights
Selected data for a share outstanding throughout the periods indicated
| | | | | | | | | | | | | | | | |
| Select Fund | | Net asset
value,
beginning
of period | | | Net
investment
income
(loss) | | | Net
realized
and
unrealized
gains
(losses) on
investments | | | Total from
investment
operations | |
| | | | |
Class A | | | | | | | | | | | | | | | | |
For the six months ended June 30, 2014 (Unaudited) | | | $13.00 | | | | 0.03 | | | | 0.85 | | | | 0.88 | |
For the year ended December 31, 2013 | | | $10.45 | | | | 0.05 | (E) | | | 4.48 | | | | 4.53 | |
For the year ended December 31, 2012 | | | $9.69 | | | | 0.12 | (E) | | | 0.97 | | | | 1.09 | |
For the year ended December 31, 2011 | | | $9.99 | | | | 0.08 | | | | (0.33 | ) | | | (0.25 | ) |
For the year ended December 31, 2010 | | | $9.02 | | | | 0.07 | | | | 0.91 | | | | 0.98 | |
For the year ended December 31, 2009 | | | $6.82 | | | | 0.04 | | | | 2.16 | | | | 2.20 | |
| | | | |
Class C | | | | | | | | | | | | | | | | |
For the six months ended June 30, 2014 (Unaudited) | | | $12.67 | | | | (0.02 | ) | | | 0.82 | | | | 0.80 | |
For the year ended December 31, 2013 | | | $10.25 | | | | (0.04 | )(E) | | | 4.38 | | | | 4.34 | |
For the year ended December 31, 2012 | | | $9.51 | | | | 0.04 | (E) | | | 0.95 | | | | 0.99 | |
For the year ended December 31, 2011 | | | $9.83 | | | | 0.02 | | | | (0.34 | ) | | | (0.32 | ) |
For the year ended December 31, 2010 | | | $8.94 | | | | (0.01 | ) | | | 0.90 | | | | 0.89 | |
For the year ended December 31, 2009 | | | $6.78 | | | | 0.01 | | | | 2.15 | | | | 2.16 | |
| | | | |
Class I | | | | | | | | | | | | | | | | |
For the six months ended June 30, 2014 (Unaudited) | | | $12.97 | | | | 0.05 | | | | 0.85 | | | | 0.90 | |
For the year ended December 31, 2013 | | | $10.43 | | | | 0.09 | (E) | | | 4.46 | | | | 4.55 | |
For the year ended December 31, 2012 | | | $9.68 | | | | 0.15 | (E) | | | 0.96 | | | | 1.11 | |
For the year ended December 31, 2011 | | | $9.98 | | | | 0.11 | | | | (0.33 | ) | | | (0.22 | ) |
For the year ended December 31, 2010 | | | $9.02 | | | | 0.07 | | | | 0.94 | | | | 1.01 | |
For the year ended December 31, 2009 | | | $6.75 | | | | 0.05 | | | | 2.22 | | | | 2.27 | |
| | | | |
Class Y(F) | | | | | | | | | | | | | | | | |
For the six months ended June 30, 2014 (Unaudited) | | | $12.99 | | | | 0.06 | | | | 0.84 | | | | 0.90 | |
For the year ended December 31, 2013 | | | $10.43 | | | | 0.11 | (E) | | | 4.48 | | | | 4.59 | |
For the year ended December 31, 2012 | | | $9.68 | | | | 0.17 | (E) | | | 0.96 | | | | 1.13 | |
| (A) | Total returns shown exclude the effect of applicable sales charges. |
| (B) | Portfolio turnover rate is calculated on the basis of the Fund as a whole without distinguishing between classes of shares issued. |
See accompanying Notes to Financial Statements.
| | | | | | | | | | | | | | |
| 52 | | DIAMOND HILL FUNDS | | | | | SEMI-ANNUAL REPORT | | | | | JUNE 30, 2014 | | | | | DIAMOND-HILL.COM |
| | | | | | | | | | | | | | | | | | | | | | | | | | | | | | | | | | |
Dividends
from net
investment
income | | | Distributions
from net
realized
gains | | | Total
distributions | | | Net asset
value at
end of
period | | | Total
return(A) | | | Net assets
at end
of period
(000’s) | | | Ratio
of total
expenses
to average
net assets | | | Ratio
of net
investment
income
(loss) to
average
net assets | | | Portfolio
turnover
rate(B) | |
| | | | | | | | |
| | | | | | | | | | | | | | | | | | | | | | | | | | | | | | | | | | |
| | — | | | | — | | | | — | | | | $13.88 | | | | 6.77 | %(C) | | | $12,522 | | | | 1.20 | %(D) | | | 0.47 | %(D) | | | 37 | %(C) |
| | (0.09 | ) | | | (1.89 | ) | | | (1.98 | ) | | | $13.00 | | | | 44.04 | % | | | $8,905 | | | | 1.22 | % | | | 0.42 | % | | | 70 | % |
| | (0.08 | ) | | | (0.25 | ) | | | (0.33 | ) | | | $10.45 | | | | 11.27 | % | | | $7,778 | | | | 1.21 | % | | | 1.15 | % | | | 38 | % |
| | (0.05 | ) | | | — | | | | (0.05 | ) | | | $9.69 | | | | (2.53 | )% | | | $8,071 | | | | 1.23 | % | | | 0.92 | % | | | 26 | % |
| | (0.01 | ) | | | — | | | | (0.01 | ) | | | $9.99 | | | | 10.83 | % | | | $7,437 | | | | 1.28 | % | | | 0.67 | % | | | 18 | % |
| | — | | | | — | | | | — | | | | $9.02 | | | | 32.26 | % | | | $6,910 | | | | 1.28 | % | | | 0.60 | % | | | 57 | % |
| | | | | | | | |
| | | | | | | | | | | | | | | | | | | | | | | | | | | | | | | | | | |
| | — | | | | — | | | | — | | | | $13.47 | | | | 6.31 | %(C) | | | $7,613 | | | | 1.95 | %(D) | | | (0.28 | )%(D) | | | 37 | %(C) |
| | (0.03 | ) | | | (1.89 | ) | | | (1.92 | ) | | | $12.67 | | | | 43.08 | % | | | $5,533 | | | | 1.97 | % | | | (0.35 | )% | | | 70 | % |
| | — | | | | (0.25 | ) | | | (0.25 | ) | | | $10.25 | | | | 10.44 | % | | | $3,271 | | | | 1.96 | % | | | 0.41 | % | | | 38 | % |
| | — | | | | — | | | | — | | | | $9.51 | | | | (3.26 | )% | | | $3,630 | | | | 1.98 | % | | | 0.15 | % | | | 26 | % |
| | — | | | | — | | | | — | | | | $9.83 | | | | 9.96 | % | | | $4,254 | | | | 2.03 | % | | | (0.08 | )% | | | 18 | % |
| | — | | | | — | | | | — | | | | $8.94 | | | | 31.86 | % | | | $3,472 | | | | 2.03 | % | | | 0.07 | % | | | 57 | % |
| | | | | | | | |
| | | | | | | | | | | | | | | | | | | | | | | | | | | | | | | | | | |
| | — | | | | — | | | | — | | | | $13.87 | | | | 6.94 | %(C) | | | $38,637 | | | | 0.95 | %(D) | | | 0.73 | %(D) | | | 37 | %(C) |
| | (0.12 | ) | | | (1.89 | ) | | | (2.01 | ) | | | $12.97 | | | | 44.35 | % | | | $46,787 | | | | 0.97 | % | | | 0.66 | % | | | 70 | % |
| | (0.11 | ) | | | (0.25 | ) | | | (0.36 | ) | | | $10.43 | | | | 11.54 | % | | | $41,862 | | | | 0.96 | % | | | 1.44 | % | | | 38 | % |
| | (0.08 | ) | | | — | | | | (0.08 | ) | | | $9.68 | | | | (2.25 | )% | | | $34,388 | | | | 0.95 | % | | | 1.21 | % | | | 26 | % |
| | (0.05 | ) | | | — | | | | (0.05 | ) | | | $9.98 | | | | 11.19 | % | | | $31,619 | | | | 0.91 | % | | | 1.05 | % | | | 18 | % |
| | — | | | | — | | | | — | | | | $9.02 | | | | 33.63 | % | | | $23,122 | | | | 0.89 | % | | | 1.29 | % | | | 57 | % |
| | | | | | | | |
| | | | | | | | | | | | | | | | | | | | | | | | | | | | | | | | | | |
| | — | | | | — | | | | — | | | | $13.89 | | | | 6.93 | %(C) | | | $8,943 | | | | 0.80 | %(D) | | | 0.86 | %(D) | | | 37 | %(C) |
| | (0.14 | ) | | | (1.89 | ) | | | (2.03 | ) | | | $12.99 | | | | 44.70 | % | | | $6,534 | | | | 0.82 | % | | | 0.82 | % | | | 70 | % |
| | (0.13 | ) | | | (0.25 | ) | | | (0.38 | ) | | | $10.43 | | | | 11.69 | % | | | $5,788 | | | | 0.81 | % | | | 1.62 | % | | | 38 | % |
| (E) | Net investment income (loss) per share has been calculated using the average daily shares outstanding during the period. |
| (F) | Inception date of Class Y is December 30, 2011. Class Y commenced public offering and investment operations on January 3, 2012. |
See accompanying Notes to Financial Statements.
| | | | | | | | | | | | | | | | |
| DIAMOND HILL FUNDS | | | | | SEMI-ANNUAL REPORT | | | | | JUNE 30, 2014 | | | | | DIAMOND-HILL.COM | | | 53 | |
Long-Short Fund
Financial Highlights
Selected data for a share outstanding throughout the periods indicated
| | | | | | | | | | | | | | | | |
| Long-Short Fund | | Net asset
value,
beginning
of period | | | Net
investment
income
(loss) | | |
Net
realized
and
unrealized
gains
(losses) on
investments | | | Total from
investment
operations | |
| | | | |
Class A | | | | | | | | | | | | | | | | |
For the six months ended June 30, 2014 (Unaudited) | | | $22.26 | | | | (0.04 | ) | | | 1.30 | | | | 1.26 | |
For the year ended December 31, 2013 | | | $18.15 | | | | (0.05 | )(E) | | | 4.21 | | | | 4.16 | |
For the year ended December 31, 2012 | | | $16.75 | | | | 0.06 | (E) | | | 1.36 | | | | 1.42 | |
For the year ended December 31, 2011 | | | $16.26 | | | | 0.03 | (E) | | | 0.46 | | | | 0.49 | |
For the year ended December 31, 2010 | | | $16.31 | | | | — | (F) | | | (0.05 | ) | | | (0.05 | ) |
For the year ended December 31, 2009 | | | $13.83 | | | | — | (F) | | | 2.48 | | | | 2.48 | |
| | | | |
Class C | | | | | | | | | | | | | | | | |
For the six months ended June 30, 2014 (Unaudited) | | | $20.65 | | | | (0.11 | ) | | | 1.20 | | | | 1.09 | |
For the year ended December 31, 2013 | | | $16.93 | | | | (0.19 | )(E) | | | 3.91 | | | | 3.72 | |
For the year ended December 31, 2012 | | | $15.72 | | | | (0.07 | )(E) | | | 1.28 | | | | 1.21 | |
For the year ended December 31, 2011 | | | $15.37 | | | | (0.08 | )(E) | | | 0.43 | | | | 0.35 | |
For the year ended December 31, 2010 | | | $15.54 | | | | (0.19 | ) | | | 0.02 | | | | (0.17 | ) |
For the year ended December 31, 2009 | | | $13.28 | | | | (0.12 | ) | | | 2.38 | | | | 2.26 | |
| | | | |
Class I | | | | | | | | | | | | | | | | |
For the six months ended June 30, 2014 (Unaudited) | | | $22.52 | | | | (0.01 | ) | | | 1.32 | | | | 1.31 | |
For the year ended December 31, 2013 | | | $18.35 | | | | — | (E) | | | 4.26 | | | | 4.26 | |
For the year ended December 31, 2012 | | | $16.93 | | | | 0.10 | (E) | | | 1.38 | | | | 1.48 | |
For the year ended December 31, 2011 | | | $16.42 | | | | 0.09 | (E) | | | 0.45 | | | | 0.54 | |
For the year ended December 31, 2010 | | | $16.42 | | | | 0.04 | | | | (0.03 | ) | | | 0.01 | |
For the year ended December 31, 2009 | | | $13.87 | | | | 0.05 | | | | 2.50 | | | | 2.55 | |
| | | | |
Class Y(H) | | | | | | | | | | | | | | | | |
For the six months ended June 30, 2014 (Unaudited) | | | $22.52 | | | | 0.01 | | | | 1.32 | | | | 1.33 | |
For the year ended December 31, 2013 | | | $18.35 | | | | 0.04 | (E) | | | 4.25 | | | | 4.29 | |
For the year ended December 31, 2012 | | | $16.93 | | | | 0.14 | (E) | | | 1.37 | | | | 1.51 | |
| (A) | Total returns shown exclude the effect of applicable sales charges. |
| (B) | Portfolio turnover rate is calculated on the basis of the Fund as a whole without distinguishing between classes of shares issued. |
See accompanying Notes to Financial Statements.
| | | | | | | | | | | | | | |
| 54 | | DIAMOND HILL FUNDS | | | | | SEMI-ANNUAL REPORT | | | | | JUNE 30, 2014 | | | | | DIAMOND-HILL.COM |
| | | | | | | | | | | | | | | | | | | | | | | | | | | | | | | | | | | | | | |
Dividends
from net
investment
income | | | Distributions
from net
realized
gains | | | Total
distributions | | | Net asset
value at
end of
period | | | Total
return(A) | | | Net assets
at end
of period
(000’s) | | | Ratio
of total
expenses
to average
net assets | | | Ratio
of net
investment
income
(loss) to
average
net assets | | | Ratio
of total
expenses to
average net
assets,
excluding
expenses
and fees on
securities
sold short | | | Portfolio
turnover
rate(B) | |
| | | | | | | | | |
| | | | | | | | | | | | | | | | | | | | | | | | | | | | | | | | | | | | | | |
| | — | | | | — | | | | — | | | | $23.52 | | | | 5.66 | %(C) | | | $760,468 | | | | 1.84 | %(D) | | | (0.33 | )%(D) | | | 1.40 | %(D) | | | 28 | %(C) |
| | (0.05 | ) | | | — | | | | (0.05 | ) | | | $22.26 | | | | 22.92 | % | | | $858,112 | | | | 1.83 | % | | | (0.25 | )% | | | 1.41 | % | | | 30 | % |
| | (0.02 | ) | | | — | | | | (0.02 | ) | | | $18.15 | | | | 8.46 | % | | | $533,722 | | | | 1.75 | % | | | 0.32 | % | | | 1.41 | % | | | 39 | % |
| | — | | | | — | | | | — | | | | $16.75 | | | | 3.01 | % | | | $512,870 | | | | 1.67 | % | | | 0.21 | % | | | 1.43 | % | | | 50 | % |
| | — | | | | — | | | | — | | | | $16.26 | | | | (0.31 | )% | | | $698,670 | | | | 1.81 | % | | | 0.01 | % | | | 1.48 | % | | | 43 | % |
| | — | | | | — | | | | — | | | | $16.31 | | | | 17.93 | % | | | $965,382 | | | | 1.85 | % | | | — | %(G) | | | 1.48 | % | | | 44 | % |
| | | | | | | | | |
| | | | | | | | | | | | | | | | | | | | | | | | | | | | | | | | | | | | | | |
| | — | | | | — | | | | — | | | | $21.74 | | | | 5.28 | %(C) | | | $151,933 | | | | 2.59 | %(D) | | | (1.08 | )%(D) | | | 2.15 | %(D) | | | 28 | %(C) |
| | — | | | | — | | | | — | | | | $20.65 | | | | 21.97 | % | | | $130,388 | | | | 2.58 | % | | | (0.99 | )% | | | 2.16 | % | | | 30 | % |
| | — | | | | — | | | | — | | | | $16.93 | | | | 7.70 | % | | | $103,393 | | | | 2.50 | % | | | (0.43 | )% | | | 2.16 | % | | | 39 | % |
| | — | | | | — | | | | — | | | | $15.72 | | | | 2.28 | % | | | $119,850 | | | | 2.43 | % | | | (0.54 | )% | | | 2.19 | % | | | 50 | % |
| | — | | | | — | | | | — | | | | $15.37 | | | | (1.09 | )% | | | $179,214 | | | | 2.56 | % | | | (0.73 | )% | | | 2.23 | % | | | 43 | % |
| | — | | | | — | | | | — | | | | $15.54 | | | | 17.02 | % | | | $256,445 | | | | 2.60 | % | | | (0.76 | )% | | | 2.23 | % | | | 44 | % |
| | | | | | | | | |
| | | | | | | | | | | | | | | | | | | | | | | | | | | | | | | | | | | | | | |
| | — | | | | — | | | | — | | | | $23.83 | | | | 5.82 | %(C) | | | $2,424,325 | | | | 1.59 | %(D) | | | (0.09 | )%(D) | | | 1.15 | %(D) | | | 28 | %(C) |
| | (0.09 | ) | | | — | | | | (0.09 | ) | | | $22.52 | | | | 23.19 | % | | | $1,859,054 | | | | 1.58 | % | | | — | % | | | 1.16 | % | | | 30 | % |
| | (0.06 | ) | | | — | | | | (0.06 | ) | | | $18.35 | | | | 8.77 | % | | | $1,554,623 | | | | 1.50 | % | | | 0.58 | % | | | 1.16 | % | | | 39 | % |
| | (0.03 | ) | | | — | | | | (0.03 | ) | | | $16.93 | | | | 3.29 | % | | | $1,213,122 | | | | 1.39 | % | | | 0.52 | % | | | 1.15 | % | | | 50 | % |
| | (0.01 | ) | | | — | | | | (0.01 | ) | | | $16.42 | | | | 0.03 | % | | | $1,045,686 | | | | 1.46 | % | | | 0.42 | % | | | 1.11 | % | | | 43 | % |
| | — | | | | — | (F) | | | — | (F) | | | $16.42 | | | | 18.39 | % | | | $733,909 | | | | 1.47 | % | | | 0.37 | % | | | 1.10 | % | | | 44 | % |
| | | | | | | | | |
| | | | | | | | | | | | | | | | | | | | | | | | | | | | | | | | | | | | | | |
| | — | | | | — | | | | — | | | | $23.85 | | | | 5.91 | %(C) | | | $247,287 | | | | 1.44 | %(D) | | | 0.05 | %(D) | | | 1.00 | %(D) | | | 28 | %(C) |
| | (0.12 | ) | | | — | | | | (0.12 | ) | | | $22.52 | | | | 23.39 | % | | | $168,835 | | | | 1.43 | % | | | 0.18 | % | | | 1.01 | % | | | 30 | % |
| | (0.09 | ) | | | — | | | | (0.09 | ) | | | $18.35 | | | | 8.95 | % | | | $83,409 | | | | 1.35 | % | | | 0.79 | % | | | 1.01 | % | | | 39 | % |
| (E) | Net investment income (loss) per share has been calculated using the average daily shares outstanding during the period. |
| (F) | Amount is less than $0.005. |
| (G) | Amount is less than 0.005%. |
| (H) | Inception date of Class Y is December 30, 2011. Class Y commenced public offering and investment operations on January 3, 2012. |
See accompanying Notes to Financial Statements.
| | | | | | | | | | | | | | | | |
| DIAMOND HILL FUNDS | | | | | SEMI-ANNUAL REPORT | | | | | JUNE 30, 2014 | | | | | DIAMOND-HILL.COM | | | 55 | |
Research Opportunities Fund
Financial Highlights
Selected data for a share outstanding throughout the periods indicated
| | | | | | | | | | | | | | | | |
| Research Opportunities Fund(C) | | Net asset
value,
beginning
of period | | | Net
investment
income
(loss) | | |
Net
realized
and
unrealized
gains
(losses) on
investments | | | Total from
investment
operations | |
| | | | |
Class A | | | | | | | | | | | | | | | | |
For the six months ended June 30, 2014 (Unaudited) | | | $22.82 | | | | (0.05 | ) | | | 1.25 | | | | 1.20 | |
For the year ended December 31, 2013 | | | $18.34 | | | | (0.10 | )(F) | | | 6.01 | | | | 5.91 | |
For the year ended December 31, 2012 | | | $16.60 | | | | 0.02 | (F) | | | 1.93 | | | | 1.95 | |
| | | | |
Class C | | | | | | | | | | | | | | | | |
For the six months ended June 30, 2014 (Unaudited) | | | $22.49 | | | | (0.13 | ) | | | 1.22 | | | | 1.09 | |
For the year ended December 31, 2013 | | | $18.22 | | | | (0.26 | )(F) | | | 5.96 | | | | 5.70 | |
For the year ended December 31, 2012 | | | $16.60 | | | | (0.09 | )(F) | | | 1.90 | | | | 1.81 | |
| | | | |
Class I | | | | | | | | | | | | | | | | |
For the six months ended June 30, 2014 (Unaudited) | | | $22.90 | | | | (0.02 | ) | | | 1.25 | | | | 1.23 | |
For the year ended December 31, 2013 | | | $18.36 | | | | (0.04 | )(F) | | | 6.01 | | | | 5.97 | |
For the year ended December 31, 2012 | | | $16.60 | | | | 0.05 | (F) | | | 1.95 | | | | 2.00 | |
| | | | |
Class Y | | | | | | | | | | | | | | | | |
For the six months ended June 30, 2014 (Unaudited) | | | $22.92 | | | | — | (G) | | | 1.25 | | | | 1.25 | |
For the year ended December 31, 2013 | | | $18.36 | | | | — | (F) | | | 6.02 | | | | 6.02 | |
For the year ended December 31, 2012 | | | $16.60 | | | | 0.08 | (F) | | | 1.94 | | | | 2.02 | |
| (A) | Total returns shown exclude the effect of applicable sales charges. |
| (B) | Portfolio turnover rate is calculated on the basis of the Fund as a whole without distinguishing between classes of shares issued. |
| (C) | Inception date of the Fund is December 30, 2011. Fund commenced public offering and investment operations on January 3, 2012. |
See accompanying Notes to Financial Statements.
| | | | | | | | | | | | | | |
| 56 | | DIAMOND HILL FUNDS | | | | | SEMI-ANNUAL REPORT | | | | | JUNE 30, 2014 | | | | | DIAMOND-HILL.COM |
| | | | | | | | | | | | | | | | | | | | | | | | | | | | | | | | | | | | | | |
Dividends
from net
investment
income | | | Distributions
from net
realized
gains | | | Total
distributions | | | Net asset
value at
end of
period | | | Total
return(A) | | | Net assets
at end
of period
(000’s) | | | Ratio
of total
expenses
to average
net assets | | | Ratio
of net
investment
income
(loss) to
average
net assets | | | Ratio
of total
expenses to
average net
assets,
excluding
expenses
and fees on
securities
sold short | | | Portfolio
turnover
rate(B) | |
| | | | | | | | | |
| | | | | | | | | | | | | | | | | | | | | | | | | | | | | | | | | | | | | | |
| | — | | | | — | | | | — | | | | $24.02 | | | | 5.26 | %(D) | | | $9,164 | | | | 1.73 | %(E) | | | (0.43 | )%(E) | | | 1.50 | %(E) | | | 32 | %(D) |
| | — | | | | (1.43 | ) | | | (1.43) | | | | $22.82 | | | | 32.43 | % | | | $6,836 | | | | 1.77 | % | | | (0.45 | )% | | | 1.51 | % | | | 72 | % |
| | (0.02 | ) | | | (0.19 | ) | | | (0.21) | | | | $18.34 | | | | 11.73 | % | | | $1,120 | | | | 1.63 | % | | | 0.10 | % | | | 1.53 | % | | | 35 | % |
| | | | | | | | | |
| | | | | | | | | | | | | | | | | | | | | | | | | | | | | | | | | | | | | | |
| | — | | | | — | | | | — | | | | $23.58 | | | | 4.85 | %(D) | | | $580 | | | | 2.48 | %(E) | | | (1.18 | )%(E) | | | 2.25 | %(E) | | | 32 | %(D) |
| | — | | | | (1.43 | ) | | | (1.43) | | | | $22.49 | | | | 31.48 | % | | | $494 | | | | 2.52 | % | | | (1.19 | )% | | | 2.26 | % | | | 72 | % |
| | — | | | | (0.19 | ) | | | (0.19) | | | | $18.22 | | | | 10.91 | % | | | $148 | | | | 2.38 | % | | | (0.51 | )% | | | 2.28 | % | | | 35 | % |
| | | | | | | | | |
| | | | | | | | | | | | | | | | | | | | | | | | | | | | | | | | | | | | | | |
| | — | | | | — | | | | — | | | | $24.13 | | | | 5.37 | %(D) | | | $45,850 | | | | 1.48 | %(E) | | | (0.20 | )%(E) | | | 1.25 | %(E) | | | 32 | %(D) |
| | — | | | | (1.43 | ) | | | (1.43) | | | | $22.90 | | | | 32.76 | % | | | $43,018 | | | | 1.52 | % | | | (0.17 | )% | | | 1.26 | % | | | 72 | % |
| | (0.05 | ) | | | (0.19 | ) | | | (0.24) | | | | $18.36 | | | | 12.03 | % | | | $15,978 | | | | 1.38 | % | | | 0.30 | % | | | 1.28 | % | | | 35 | % |
| | | | | | | | | |
| | | | | | | | | | | | | | | | | | | | | | | | | | | | | | | | | | | | | | |
| | — | | | | — | | | | — | | | | $24.17 | | | | 5.45 | %(D) | | | $17,083 | | | | 1.33 | %(E) | | | (0.04 | )%(E) | | | 1.10 | %(E) | | | 32 | %(D) |
| | (0.03 | ) | | | (1.43 | ) | | | (1.46) | | | | $22.92 | | | | 32.99 | % | | | $15,468 | | | | 1.37 | % | | | 0.02 | % | | | 1.11 | % | | | 72 | % |
| | (0.07 | ) | | | (0.19 | ) | | | (0.26) | | | | $18.36 | | | | 12.17 | % | | | $11,572 | | | | 1.23 | % | | | 0.45 | % | | | 1.13 | % | | | 35 | % |
| (F) | Net investment income (loss) per share has been calculated using the average daily shares outstanding during the period. |
| (G) | Amount is less than $0.005. |
See accompanying Notes to Financial Statements.
| | | | | | | | | | | | | | | | |
| DIAMOND HILL FUNDS | | | | | SEMI-ANNUAL REPORT | | | | | JUNE 30, 2014 | | | | | DIAMOND-HILL.COM | | | 57 | |
Financial Long-Short Fund
Financial Highlights
Selected data for a share outstanding throughout the periods indicated
| | | | | | | | | | | | | | | | |
| Financial Long-Short Fund | | Net asset
value,
beginning
of period | | | Net
investment
income
(loss) | | |
Net
realized
and
unrealized
gains
(losses) on
investments | | | Total from
investment
operations | |
| | | | |
Class A | | | | | | | | | | | | | | | | |
For the six months ended June 30, 2014 (Unaudited) | | | $18.13 | | | | (0.01 | ) | | | 0.66 | | | | 0.65 | |
For the year ended December 31, 2013 | | | $13.24 | | | | (0.05 | )(E) | | | 4.94 | | | | 4.89 | |
For the year ended December 31, 2012 | | | $10.51 | | | | 0.06 | (E) | | | 2.74 | | | | 2.80 | |
For the year ended December 31, 2011 | | | $12.18 | | | | 0.02 | | | | (1.65 | ) | | | (1.63 | ) |
For the year ended December 31, 2010 | | | $10.43 | | | | 0.02 | | | | 1.73 | | | | 1.75 | |
For the year ended December 31, 2009 | | | $8.48 | | | | 0.16 | (E) | | | 1.94 | | | | 2.10 | |
| | | | |
Class C | | | | | | | | | | | | | | | | |
For the six months ended June 30, 2014 (Unaudited) | | | $17.00 | | | | (0.07 | ) | | | 0.63 | | | | 0.56 | |
For the year ended December 31, 2013 | | | $12.51 | | | | (0.17 | )(E) | | | 4.66 | | | | 4.49 | |
For the year ended December 31, 2012 | | | $9.96 | | | | (0.02 | )(E) | | | 2.57 | | | | 2.55 | |
For the year ended December 31, 2011 | | | $11.58 | | | | (0.07 | )(E) | | | (1.55 | ) | | | (1.62 | ) |
For the year ended December 31, 2010 | | | $9.99 | | | | (0.10 | ) | | | 1.69 | | | | 1.59 | |
For the year ended December 31, 2009 | | | $8.12 | | | | 0.09 | (E) | | | 1.84 | | | | 1.93 | |
| | | | |
Class I | | | | | | | | | | | | | | | | |
For the six months ended June 30, 2014 (Unaudited) | | | $18.10 | | | | 0.01 | | | | 0.67 | | | | 0.68 | |
For the year ended December 31, 2013 | | | $13.18 | | | | (0.02 | )(E) | | | 4.94 | | | | 4.92 | |
For the year ended December 31, 2012 | | | $10.47 | | | | 0.10 | (E) | | | 2.72 | | | | 2.82 | |
For the year ended December 31, 2011 | | | $12.14 | | | | 0.07 | | | | (1.67 | ) | | | (1.60 | ) |
For the year ended December 31, 2010 | | | $10.37 | | | | 0.08 | | | | 1.71 | | | | 1.79 | |
For the year ended December 31, 2009 | | | $8.43 | | | | 0.21 | (E) | | | 1.92 | | | | 2.13 | |
| (A) | Total returns shown exclude the effect of applicable sales charges. |
| (B) | Portfolio turnover rate is calculated on the basis of the Fund as a whole without distinguishing between classes of shares issued. |
See accompanying Notes to Financial Statements.
| | | | | | | | | | | | | | |
| 58 | | DIAMOND HILL FUNDS | | | | | SEMI-ANNUAL REPORT | | | | | JUNE 30, 2014 | | | | | DIAMOND-HILL.COM |
| | | | | | | | | | | | | | | | | | | | | | | | | | | | | | | | | | | | | | |
Dividends
from net
investment
income | | | Distributions
from net
realized
gains | | | Total
distributions | | | Net asset
value at
end of
period | | | Total
return(A) | | | Net assets
at end
of period
(000’s) | | | Ratio
of total
expenses
to average
net assets | | | Ratio
of net
investment
income
(loss) to
average
net assets | | | Ratio
of total
expenses to
average net
assets,
excluding
expenses
and fees on
securities
sold short | | | Portfolio
turnover
rate(B) | |
| | | | | | | | | |
| | | | | | | | | | | | | | | | | | | | | | | | | | | | | | | | | | | | | | |
| | — | | | | — | | | | — | | | | $18.78 | | | | 3.59 | %(C) | | | $12,926 | | | | 1.73 | %(D) | | | (0.06 | )%(D) | | | 1.50 | %(D) | | | 27 | %(C) |
| | — | | | | — | | | | — | | | | $18.13 | | | | 36.93 | % | | | $17,852 | | | | 1.70 | % | | | (0.31 | )% | | | 1.52 | % | | | 66 | % |
| | (0.07 | ) | | | — | | | | (0.07 | ) | | | $13.24 | | | | 26.62 | % | | | $7,862 | | | | 1.76 | % | | | 0.49 | % | | | 1.56 | % | | | 58 | % |
| | (0.04 | ) | | | — | | | | (0.04 | ) | | | $10.51 | | | | (13.39 | )% | | | $6,650 | | | | 1.66 | % | | | 0.14 | % | | | 1.54 | % | | | 52 | % |
| | — | | | | — | | | | — | | | | $12.18 | | | | 16.78 | % | | | $8,543 | | | | 1.71 | % | | | 0.09 | % | | | 1.56 | % | | | 60 | % |
| | (0.15 | ) | | | — | | | | (0.15 | ) | | | $10.43 | | | | 24.73 | % | | | $8,053 | | | | 1.77 | % | | | 1.92 | % | | | 1.58 | % | | | 85 | % |
| | | | | | | | | |
| | | | | | | | | | | | | | | | | | | | | | | | | | | | | | | | | | | | | | |
| | — | | | | — | | | | — | | | | $17.56 | | | | 3.29 | %(C) | | | $2,171 | | | | 2.48 | %(D) | | | (0.80 | )%(D) | | | 2.25 | %(D) | | | 27 | %(C) |
| | — | | | | — | | | | — | | | | $17.00 | | | | 35.89 | % | | | $2,958 | | | | 2.45 | % | | | (1.06 | )% | | | 2.27 | % | | | 66 | % |
| | — | | | | — | | | | — | | | | $12.51 | | | | 25.60 | % | | | $820 | | | | 2.51 | % | | | (0.20 | )% | | | 2.31 | % | | | 58 | % |
| | — | | | | — | | | | — | | | | $9.96 | | | | (13.99 | )% | | | $795 | | | | 2.41 | % | | | (0.60 | )% | | | 2.29 | % | | | 52 | % |
| | — | | | | — | | | | — | | | | $11.58 | | | | 15.92 | % | | | $1,381 | | | | 2.46 | % | | | (0.66 | )% | | | 2.31 | % | | | 60 | % |
| | (0.06 | ) | | | — | | | | (0.06 | ) | | | $9.99 | | | | 23.81 | % | | | $1,295 | | | | 2.52 | % | | | 1.17 | % | | | 2.35 | % | | | 85 | % |
| | | | | | | | | |
| | | | | | | | | | | | | | | | | | | | | | | | | | | | | | | | | | | | | | |
| | — | | | | — | | | | — | | | | $18.78 | | | | 3.76 | %(C) | | | $12,488 | | | | 1.48 | %(D) | | | 0.16 | %(D) | | | 1.25 | %(D) | | | 27 | %(C) |
| | — | | | | — | | | | — | | | | $18.10 | | | | 37.33 | % | | | $10,817 | | | | 1.45 | % | | | (0.12 | )% | | | 1.27 | % | | | 66 | % |
| | (0.11 | ) | | | — | | | | (0.11 | ) | | | $13.18 | | | | 26.94 | % | | | $3,931 | | | | 1.51 | % | | | 0.85 | % | | | 1.31 | % | | | 58 | % |
| | (0.07 | ) | | | — | | | | (0.07 | ) | | | $10.47 | | | | (13.21 | )% | | | $1,584 | | | | 1.37 | % | | | 0.47 | % | | | 1.25 | % | | | 52 | % |
| | (0.02 | ) | | | — | | | | (0.02 | ) | | | $12.14 | | | | 17.29 | % | | | $1,873 | | | | 1.34 | % | | | 0.45 | % | | | 1.19 | % | | | 60 | % |
| | (0.19 | ) | | | — | | | | (0.19 | ) | | | $10.37 | | | | 25.31 | % | | | $671 | | | | 1.38 | % | | | 2.45 | % | | | 1.19 | % | | | 85 | % |
| (E) | Net investment income (loss) per share has been calculated using the average daily shares outstanding during the period. |
See accompanying Notes to Financial Statements.
| | | | | | | | | | | | | | | | |
| DIAMOND HILL FUNDS | | | | | SEMI-ANNUAL REPORT | | | | | JUNE 30, 2014 | | | | | DIAMOND-HILL.COM | | | 59 | |
Strategic Income Fund
Financial Highlights
Selected data for a share outstanding throughout the periods indicated
| | | | | | | | | | | | | | | | |
| Strategic Income Fund | | Net asset
value,
beginning
of period | | | Net
investment
income
(loss) | | | Net
realized
and
unrealized
gains
(losses) on
investments | | | Total from
investment
operations | |
| | | | |
Class A | | | | | | | | | | | | | | | | |
For the six months ended June 30, 2014 (Unaudited) | | | $11.19 | | | | 0.25 | | | | 0.05 | | | | 0.30 | |
For the year ended December 31, 2013 | | | $11.18 | | | | 0.56 | (E) | | | — | | | | 0.56 | |
For the year ended December 31, 2012 | | | $10.79 | | | | 0.62 | (E) | | | 0.39 | | | | 1.01 | |
For the year ended December 31, 2011 | | | $10.86 | | | | 0.65 | | | | (0.09 | ) | | | 0.56 | |
For the year ended December 31, 2010 | | | $10.15 | | | | 0.64 | | | | 0.69 | | | | 1.33 | |
For the year ended December 31, 2009 | | | $8.28 | | | | 0.69 | | | | 1.86 | | | | 2.55 | |
| | | | |
Class C | | | | | | | | | | | | | | | | |
For the six months ended June 30, 2014 (Unaudited) | | | $11.17 | | | | 0.20 | | | | 0.06 | | | | 0.26 | |
For the year ended December 31, 2013 | | | $11.17 | | | | 0.47 | (E) | | | — | | | | 0.47 | |
For the year ended December 31, 2012 | | | $10.78 | | | | 0.53 | (E) | | | 0.40 | | | | 0.93 | |
For the year ended December 31, 2011 | | | $10.85 | | | | 0.56 | | | | (0.08 | ) | | | 0.48 | |
For the year ended December 31, 2010 | | | $10.15 | | | | 0.54 | | | | 0.70 | | | | 1.24 | |
For the year ended December 31, 2009 | | | $8.27 | | | | 0.58 | | | | 1.91 | | | | 2.49 | |
| | | | |
Class I | | | | | | | | | | | | | | | | |
For the six months ended June 30, 2014 (Unaudited) | | | $11.16 | | | | 0.26 | | | | 0.06 | | | | 0.32 | |
For the year ended December 31, 2013 | | | $11.16 | | | | 0.58 | (E) | | | — | | | | 0.58 | |
For the year ended December 31, 2012 | | | $10.77 | | | | 0.64 | (E) | | | 0.40 | | | | 1.04 | |
For the year ended December 31, 2011 | | | $10.84 | | | | 0.67 | | | | (0.08 | ) | | | 0.59 | |
For the year ended December 31, 2010 | | | $10.13 | | | | 0.64 | | | | 0.72 | | | | 1.36 | |
For the year ended December 31, 2009 | | | $8.26 | | | | 0.73 | | | | 1.85 | | | | 2.58 | |
| | | | |
Class Y(F) | | | | | | | | | | | | | | | | |
For the six months ended June 30, 2014 (Unaudited) | | | $11.16 | | | | 0.27 | | | | 0.06 | | | | 0.33 | |
For the year ended December 31, 2013 | | | $11.15 | | | | 0.60 | (E) | | | — | | | | 0.60 | |
For the year ended December 31, 2012 | | | $10.77 | | | | 0.66 | (E) | | | 0.38 | | | | 1.04 | |
| (A) | Total returns shown exclude the effect of applicable sales charges. |
| (B) | Portfolio turnover rate is calculated on the basis of the Fund as a whole without distinguishing between classes of shares issued. |
See accompanying Notes to Financial Statements.
| | | | | | | | | | | | | | |
| 60 | | DIAMOND HILL FUNDS | | | | | SEMI-ANNUAL REPORT | | | | | JUNE 30, 2014 | | | | | DIAMOND-HILL.COM |
| | | | | | | | | | | | | | | | | | | | | | | | | | | | | | | | | | |
Dividends
from net
investment
income | | | Distributions
from net
realized
gains | | | Total
distributions | | | Net asset
value at
end of
period | | | Total
return(A) | | | Net assets
at end
of period
(000’s) | | | Ratio
of total
expenses
to average
net assets | | | Ratio
of net
investment
income
(loss) to
average
net assets | | | Portfolio
turnover
rate(B) | |
| | | | | | | | |
| | | | | | | | | | | | | | | | | | | | | | | | | | | | | | | | | | |
| | (0.25) | | | | — | | | | (0.25 | ) | | | $11.24 | | | | 2.72 | %(C) | | | $45,591 | | | | 1.00 | %(D) | | | 4.39 | %(D) | | | 18 | %(C) |
| | (0.55) | | | | — | | | | (0.55 | ) | | | $11.19 | | | | 5.13 | % | | | $39,801 | | | | 1.02 | % | | | 5.00 | % | | | 60 | % |
| | (0.62) | | | | — | | | | (0.62 | ) | | | $11.18 | | | | 9.55 | % | | | $44,374 | | | | 1.02 | % | | | 5.57 | % | | | 33 | % |
| | (0.63) | | | | — | | | | (0.63 | ) | | | $10.79 | | | | 5.21 | % | | | $38,895 | | | | 1.02 | % | | | 5.80 | % | | | 36 | % |
| | (0.62) | | | | — | | | | (0.62 | ) | | | $10.86 | | | | 13.33 | % | | | $42,360 | | | | 1.06 | % | | | 5.81 | % | | | 68 | % |
| | (0.68) | | | | — | | | | (0.68 | ) | | | $10.15 | | | | 32.13 | % | | | $41,048 | | | | 1.08 | % | | | 7.64 | % | | | 83 | % |
| | | | | | | | |
| | | | | | | | | | | | | | | | | | | | | | | | | | | | | | | | | | |
| | (0.21) | | | | — | | | | (0.21 | ) | | | $11.22 | | | | 2.36 | %(C) | | | $26,526 | | | | 1.75 | %(D) | | | 3.65 | %(D) | | | 18 | %(C) |
| | (0.47) | | | | — | | | | (0.47 | ) | | | $11.17 | | | | 4.26 | % | | | $26,126 | | | | 1.77 | % | | | 4.25 | % | | | 60 | % |
| | (0.54) | | | | — | | | | (0.54 | ) | | | $11.17 | | | | 8.76 | % | | | $27,801 | | | | 1.77 | % | | | 4.81 | % | | | 33 | % |
| | (0.55) | | | | — | | | | (0.55 | ) | | | $10.78 | | | | 4.48 | % | | | $23,717 | | | | 1.77 | % | | | 5.06 | % | | | 36 | % |
| | (0.54) | | | | — | | | | (0.54 | ) | | | $10.85 | | | | 12.39 | % | | | $24,264 | | | | 1.81 | % | | | 5.06 | % | | | 68 | % |
| | (0.61) | | | | — | | | | (0.61 | ) | | | $10.15 | | | | 31.34 | % | | | $22,120 | | | | 1.83 | % | | | 6.88 | % | | | 83 | % |
| | | | | | | | |
| | | | | | | | | | | | | | | | | | | | | | | | | | | | | | | | | | |
| | (0.27) | | | | — | | | | (0.27 | ) | | | $11.21 | | | | 2.85 | %(C) | | | $129,434 | | | | 0.75 | %(D) | | | 4.64 | %(D) | | | 18 | %(C) |
| | (0.58) | | | | — | | | | (0.58 | ) | | | $11.16 | | | | 5.30 | % | | | $117,009 | | | | 0.77 | % | | | 5.24 | % | | | 60 | % |
| | (0.65) | | | | — | | | | (0.65 | ) | | | $11.16 | | | | 9.83 | % | | | $103,738 | | | | 0.77 | % | | | 5.81 | % | | | 33 | % |
| | (0.66) | | | | — | | | | (0.66 | ) | | | $10.77 | | | | 5.53 | % | | | $83,418 | | | | 0.73 | % | | | 6.10 | % | | | 36 | % |
| | (0.65) | | | | — | | | | (0.65 | ) | | | $10.84 | | | | 13.77 | % | | | $76,893 | | | | 0.69 | % | | | 6.18 | % | | | 68 | % |
| | (0.71) | | | | — | | | | (0.71 | ) | | | $10.13 | | | | 32.69 | % | | | $64,407 | | | | 0.69 | % | | | 8.05 | % | | | 83 | % |
| | | | | | | | |
| | | | | | | | | | | | | | | | | | | | | | | | | | | | | | | | | | |
| | (0.28) | | | | — | | | | (0.28 | ) | | | $11.21 | | | | 2.94 | %(C) | | | $15,125 | | | | 0.60 | %(D) | | | 4.76 | %(D) | | | 18 | %(C) |
| | (0.59) | | | | — | | | | (0.59 | ) | | | $11.16 | | | | 5.55 | % | | | $3,927 | | | | 0.62 | % | | | 5.35 | % | | | 60 | % |
| | (0.66) | | | | — | | | | (0.66 | ) | | | $11.15 | | | | 9.90 | % | | | $2,515 | | | | 0.62 | % | | | 5.95 | % | | | 33 | % |
| (E) | Net investment income (loss) per share has been calculated using the average daily shares outstanding during the period. |
| (F) | Inception date of Class Y is December 30, 2011. Class Y commenced public offering and investment operations on January 3, 2012. |
See accompanying Notes to Financial Statements.
| | | | | | | | | | | | | | | | |
| DIAMOND HILL FUNDS | | | | | SEMI-ANNUAL REPORT | | | | | JUNE 30, 2014 | | | | | DIAMOND-HILL.COM | | | 61 | |
Diamond Hill Funds
Notes to Financial Statements
June 30, 2014
Organization
The Diamond Hill Small Cap Fund (“Small Cap Fund”), Diamond Hill Small-Mid Cap Fund (“Small-Mid Cap Fund”), Diamond Hill Mid Cap Fund (“Mid Cap Fund”), Diamond Hill Large Cap Fund (“Large Cap Fund”), Diamond Hill Select Fund (“Select Fund”), Diamond Hill Long-Short Fund (“Long-Short Fund”), Diamond Hill Research Opportunities Fund (“Research Opportunities Fund”), Diamond Hill Financial Long-Short Fund (“Financial Long-Short Fund”) and Diamond Hill Strategic Income Fund (“Strategic Income Fund”), are each a series of the Diamond Hill Funds (the “Trust”) (each a “Fund” and collectively the “Funds”). The Trust is an Ohio business trust, which is registered under the Investment Company Act of 1940, as amended, (the “1940 Act”) as an open-end, management investment company. Each Fund is a diversified series of the Trust.
On January 2, 2014, the Diamond Hill Mid Cap Fund commenced public offering and investment operations.
With the exception of the Financial Long-Short Fund, the Funds offer four classes of shares: Class A, Class C, Class I and Class Y. The Financial Long-Short Fund offers three classes of shares: Class A, Class C and Class I. Each class of shares for each Fund has identical rights and privileges except with respect to distribution (12b-1) and service fees, voting rights on matters affecting a single class of shares, exchange privileges of each class of shares and sales charges. Class A has a maximum sales charge on purchases of 5.00% as a percentage of the original purchase price except for Strategic Income Fund which is 3.50%. Class C has a contingent deferred sales charge of 1.00% for shares redeemed within a year of the purchase date.
Significant Accounting Policies
The following is a summary of the Funds’ significant accounting policies:
Estimates — The preparation of financial statements in conformity with U.S. generally accepted accounting principles (“GAAP”) requires management to make estimates and assumptions that affect the reported amounts of assets and liabilities and disclosure of contingent assets and liabilities at the date of the financial statements and the reported amounts of income and expenses during the reporting period. Actual results could differ from those estimates.
Security valuation — The Funds record their investments at fair value. Fair value is defined as the price that would be received to sell an asset or paid to transfer a liability in an orderly transaction between market participants at the measurement date. The valuation techniques used by the Funds maximize the use of observable inputs and minimize the use of unobservable inputs in determining fair value. These inputs are summarized in the three broad levels listed below:
| Ÿ | | Level 1 — quoted prices in active markets for identical securities |
| | | | | | | | | | | | | | |
| 62 | | DIAMOND HILL FUNDS | | | | | SEMI-ANNUAL REPORT | | | | | JUNE 30, 2014 | | | | | DIAMOND-HILL.COM |
Diamond Hill Funds
Notes to Financial Statements (Continued)
June 30, 2014
| Ÿ | | Level 2 — other significant observable inputs (including quoted prices for similar securities, interest rates, prepayment speeds, credit risk, etc.) |
| Ÿ | | Level 3 — significant unobservable inputs (including the Funds’ own assumptions in determining the fair value of investments) |
Listed securities for which market quotations are readily available are valued at the closing prices as determined by the primary exchange where the securities are traded. Unlisted securities or listed securities for which the latest sales prices are not readily available are valued at the closing bid price in the principal market where such securities are normally traded. Investments in other investment companies are valued at their reported net asset value. In each of these types of situations, valuations are typically categorized as Level 1 in the fair value hierarchy.
Debt securities are valued on the basis of valuations provided by dealers or by an independent pricing service that determines valuations based upon market transactions for normal, institutional-size trading units of similar securities. Short-term debt investments of sufficient credit quality maturing in less than 61 days are valued at amortized cost, which approximates fair value. In each of these situations, valuations are typically categorized as Level 2 in the fair value hierarchy.
Securities for which market quotations are not readily available (e.g., an approved pricing service does not provide a price, certain stale prices, or an event occurs that materially affects the furnished price) are valued by the Fair Value Committee. In these cases, the Fair Value Committee, established and appointed by the Trustees, determines in good faith, subject to Trust procedures, the fair value of portfolio securities held by a Fund (“good faith fair valuation”). When a good faith fair valuation of a security is required, consideration is generally given to a number of factors, including, but not limited to the following: dealer quotes, published analyses by dealers or analysts of the situation at issue, transactions implicitly valuing the security (such as a merger, tender offer, etc.), the value of other securities or contracts which derive their value from the security at issue, and the implications (whether negative or positive) of the circumstances which have caused trading in the security to halt. Depending on the source and relative significance of the valuation inputs in these instances, the valuations for these securities may be classified as Level 2 or Level 3 in the fair value hierarchy.
In accordance with procedures adopted by the Board of Trustees, fair value pricing may be used if events materially affecting the value of foreign securities occur between the time the exchange on which they are traded closes and the time the Funds’ net asset values are securities. These valuations are considered as Level 2 in the fair value hierarchy.
Approximately 0.4% of the Strategic Income Fund’s June 30, 2014 net assets are being valued using estimates provided by the Fair Value Committee. The Fair Value Committee relied heavily upon analysis of the Strategic Income Fund’s portfolio manager in the
| | | | | | | | | | | | | | | | |
| DIAMOND HILL FUNDS | | | | | SEMI-ANNUAL REPORT | | | | | JUNE 30, 2014 | | | | | DIAMOND-HILL.COM | | | 63 | |
Diamond Hill Funds
Notes to Financial Statements (Continued)
June 30, 2014
absence of readily ascertainable fair values. These values may differ from the values that would have been used had a ready market for these securities existed, and the differences could be material.
Changes in valuation techniques may result in transfers in or out of an assigned level within the disclosure hierarchy. The Trust determines transfers between fair value hierarchy levels at the reporting period end. There were no transfers between Levels 1, 2 or 3 as of June 30, 2014 based on input levels assigned at December 31, 2013.
The inputs or methodology used for valuing securities are not necessarily an indication of the risk associated with investing in those securities. For example, short-term debt securities of sufficient credit quality maturing in less than 61 days are valued using amortized cost in accordance with rules under the 1940 Act. Generally, amortized cost approximates the current fair value of a security, but since the value is not obtained from a quoted price in an active market, such securities are reflected as Level 2.
The following is a summary of the inputs used to value the Funds’ investments as of June 30, 2014:
| | | | | | | | |
| | | Level 1 –
Quoted
Prices | | | Level 2 –
Other
Significant
Observable
Inputs | |
Investments in Securities: (Assets) | | | | | | | | |
Small Cap Fund | | | | | | | | |
Common Stocks* | | $ | 1,152,863,540 | | | $ | — | |
Registered Investment Companies | | | 399,454,752 | | | | — | |
| | | | | | | | |
Total | | | 1,552,318,292 | | | | — | |
Small-Mid Cap Fund | | | | | | | | |
Common Stocks* | | | 441,431,170 | | | | — | |
Registered Investment Companies | | | 74,830,674 | | | | — | |
| | | | | | | | |
Total | | | 516,261,844 | | | | — | |
Mid Cap Fund | | | | | | | | |
Common Stocks* | | | 12,070,561 | | | | — | |
Registered Investment Companies | | | 1,502,791 | | | | — | |
| | | | | | | | |
Total | | | 13,573,352 | | | | — | |
Large Cap Fund | | | | | | | | |
Common Stocks* | | | 2,933,157,848 | | | | — | |
Registered Investment Companies | | | 238,409,971 | | | | — | |
| | | | | | | | |
Total | | | 3,171,567,819 | | | | — | |
| | | | | | | | | | | | | | |
| 64 | | DIAMOND HILL FUNDS | | | | | SEMI-ANNUAL REPORT | | | | | JUNE 30, 2014 | | | | | DIAMOND-HILL.COM |
Diamond Hill Funds
Notes to Financial Statements (Continued)
June 30, 2014
| | | | | | | | |
| | | Level 1 –
Quoted
Prices | | | Level 2 –
Other
Significant
Observable
Inputs | |
Select Fund | | | | | | | | |
Common Stocks* | | $ | 64,037,492 | | | $ | — | |
Registered Investment Companies | | | 14,392,827 | | | | — | |
| | | | | | | | |
Total | | | 78,430,319 | | | | — | |
Long-Short Fund | | | | | | | | |
Common Stocks* | | | 2,882,126,512 | | | | — | |
Registered Investment Companies | | | 753,626,456 | | | | — | |
| | | | | | | | |
Total | | | 3,635,752,968 | | | | — | |
Research Opportunities Fund | | | | | | | | |
Common Stocks* | | | 58,835,190 | | | | — | |
Money Markets | | | 16,462,541 | | | | — | |
| | | | | | | | |
Total | | | 75,297,731 | | | | — | |
Financial Long-Short Fund | | | | | | | | |
Common Stocks* | | | 24,032,541 | | | | — | |
Registered Investment Companies | | | 5,456,871 | | | | — | |
| | | | | | | | |
Total | | | 29,489,412 | | | | — | |
Strategic Income Fund | | | | | | | | |
Collateralized Debt Obligations | | | — | | | | 841,821 | |
Corporate Bonds* | | | — | | | | 197,558,367 | |
Registered Investment Companies | | | 34,334,065 | | | | — | |
| | | | | | | | |
Total | | | 34,334,065 | | | | 198,400,188 | |
| | |
Investments in Securities Sold Short: (Liabilities) | | | | | | | | |
Long-Short Fund | | | | | | | | |
Common Stocks* | | | (671,931,567 | ) | | | — | |
Research Opportunities Fund | | | | | | | | |
Common Stocks* | | | (6,903,675 | ) | | | — | |
Financial Long-Short Fund | | | | | | | | |
Common Stocks* | | | (2,592,565 | ) | | | — | |
| * | See Schedule of Investments and Schedule of Investments Sold Short for industry classification. |
The Funds did not hold any Level 3 securities during the six months ended June 30, 2014.
Short sales — The Long-Short Fund, Research Opportunities Fund, Financial Long-Short Fund and Strategic Income Fund are permitted to make short sales of securities. Short sales are effective when it is believed that the price of a particular security will decline, and
| | | | | | | | | | | | | | | | |
| DIAMOND HILL FUNDS | | | | | SEMI-ANNUAL REPORT | | | | | JUNE 30, 2014 | | | | | DIAMOND-HILL.COM | | | 65 | |
Diamond Hill Funds
Notes to Financial Statements (Continued)
June 30, 2014
involves the sale of a security which the Fund does not own in hope of purchasing the same security at a later date at a lower price. To make delivery to the buyer, a Fund must borrow the security, and the Fund is obligated to return the security to the lender, which is accomplished by a later purchase of the security by the Fund. Cash received from short sales is maintained by brokers and is used to meet margin requirements for short calls. It is included as “Deposits with brokers for securities sold short” on the Statements of Assets & Liabilities and “Segregated Cash With Brokers” on the Schedules of Investments.
A Fund will incur a loss as a result of a short sale if the price of the security increases between the date of the short sale and the date on which the Fund purchases the security to replace the borrowed security. The use of short sales may cause a Fund to have higher expenses (especially dividend expenses) than those of other equity mutual funds. Short sales are speculative transactions and involve special risks, including greater reliance on the ability of the Funds’ investment advisor, Diamond Hill Capital Management, Inc. (“DHCM”) to accurately anticipate the future value of a security.
Securities lending — State Street Bank and Trust Company (“State Street”) replaced Citibank, N.A. as the securities lending agent for the Funds on June 23, 2014. Under the terms of the securities lending agreement with State Street, State Street is authorized to loan securities on behalf of the Funds to approved borrowers. In exchange, the Funds receive cash collateral in the amount of at least 100% of the value of the securities loaned. Any collateral shortfalls due to changes in security market prices are adjusted the next business day. The cash collateral is invested in short-term instruments as noted in each Fund’s schedule of Investments. Although risk is mitigated by the collateral, the Funds could experience a delay in recovering their securities and possible loss of income or value if the borrower fails to return them. The agreement indemnifies the Funds from losses incurred in the event of a borrower’s material default of the terms and conditions of the borrower agreement. The agreement provides that after predetermined rebates to brokers, the Funds pay State Street 15% of the net securities lending income.
As of June 30, 2014, the value of securities loaned and the collateral held were as follows:
| | | | | | | | |
| | | Fair Value of
Securities Loaned | | | Fair Value of
Collateral Received | |
Small Cap Fund | | $ | 134,534,587 | | | $ | 137,192,511 | |
Small-Mid Cap Fund | | | 35,899,859 | | | | 36,431,533 | |
Mid Cap Fund | | | 521,275 | | | | 536,486 | |
Large Cap Fund | | | 139,362,595 | | | | 142,804,377 | |
Select Fund | | | 10,906,495 | | | | 11,186,369 | |
Long-Short Fund | | | 176,696,893 | | | | 181,537,422 | |
Research Opportunities Fund | | | 3,869,853 | | | | 3,959,215 | |
Financial Long-Short Fund | | | 2,589,277 | | | | 2,630,168 | |
Strategic Income Fund | | | 14,012,622 | | | | 14,366,588 | |
| | | | | | | | | | | | | | |
| 66 | | DIAMOND HILL FUNDS | | | | | SEMI-ANNUAL REPORT | | | | | JUNE 30, 2014 | | | | | DIAMOND-HILL.COM |
Diamond Hill Funds
Notes to Financial Statements (Continued)
June 30, 2014
Security transactions — Throughout the reporting period, investment transactions are recorded no later than the first business day following trade date. For financial reporting purposes, investments are reported on trade date on the last business day of the reporting period. The specific identification method is used for determining realized gains or losses for financial statements and income tax purposes. Dividend income is recognized on the ex-dividend date and interest income is recognized on an accrual basis. Discounts and premiums on securities purchased are amortized using the daily effective yield method. The Funds record distributions received from investments in Real Estate Investment Trusts (“REITS”) in excess of income from underlying investments as a reduction of cost of investments and/or realized gain. Such amounts are based on estimates if actual amounts are not available and actual amounts of income, realized gain and return of capital may differ from the estimated amounts. The Funds adjust the estimated amounts once the issuers provide information about the actual composition of the distributions.
Share valuation — The net asset value per share of each class of shares of each Fund is calculated daily by dividing the total value of a Fund’s assets attributable to that class, less liabilities attributable to that class, by the number of shares of that class outstanding.
Federal income taxes — Each Fund’s policy is to continue to comply with the requirements of the Internal Revenue Code that are applicable to regulated investment companies and to distribute substantially all of its taxable net investment income and any net realized capital gains to its shareholders. The Funds have analyzed their tax positions taken on Federal income tax returns for all open tax years (tax years ended December 31, 2010 through 2013) and have concluded that no provision for income tax is required in their financial statements.
Distributions to shareholders — Dividends from net investment income are declared and paid monthly for the Strategic Income Fund. Dividends from net investment income are declared and paid on an annual basis for the Small Cap Fund, Small-Mid Cap Fund, Mid Cap Fund, Large Cap Fund, Select Fund, Long-Short Fund, Research Opportunities Fund, and Financial Long-Short Fund. Dividends are declared separately for each class. No class has preferential dividend rights; differences in per share rates are due to differences in separate class expenses. Net realized capital gains, if any, are distributed at least annually. Distributions from net investment income and from net capital gains are determined in accordance with U.S. income tax regulations, which may differ from GAAP. These differences are primarily due to differing treatments for paydown gains and losses on mortgage-backed securities, expiring capital loss carry-forwards and deferrals of certain losses. Permanent book and tax basis differences are reclassified among the components of net assets. Certain Funds may utilize earnings and profits distributed to shareholders on redemption of shares as part of the dividends paid deduction for income tax purposes.
Allocations — Investment income earned, realized capital gains and losses, and unrealized appreciation and depreciation for the Funds are allocated daily to each class of shares based upon its proportionate share of total net assets of the Fund. Class specific expenses
| | | | | | | | | | | | | | | | |
| DIAMOND HILL FUNDS | | | | | SEMI-ANNUAL REPORT | | | | | JUNE 30, 2014 | | | | | DIAMOND-HILL.COM | | | 67 | |
Diamond Hill Funds
Notes to Financial Statements (Continued)
June 30, 2014
are charged directly to the class incurring the expense. Common expenses, which are not attributable to a specific class, are allocated daily to each class of shares based upon its proportionate share of total net assets of the Fund. Expenses not directly billed to a Fund are allocated proportionally among all Funds daily in relation to net assets of each Fund or another reasonable measure.
Foreign securities country risk — Investing in non-U.S. securities may entail risk due to foreign economic and political developments; this risk may be higher when investing in emerging markets. Changes in currency exchange rates and differences in accounting and taxation policies outside the U.S. can raise or lower returns.
Foreign currency translation — The books and records of the Funds are maintained in U.S. dollars. Investment securities and other assets and liabilities denominated in a foreign currency are translated into U.S. dollars on the date of valuation. The Funds do not isolate that portion of realized or unrealized gains and losses resulting from changes in the foreign exchange rate from fluctuations arising from changes in the market prices of the securities. These gains and losses are included in net realized and unrealized gains and losses on investments in the Statements of Operations. Net realized and unrealized gains and losses on foreign currency transactions represent net foreign exchange gains or losses from foreign currency exchange contracts, disposition of foreign currencies, currency gains or losses realized between trade and settlement dates in securities transactions and the difference between the amount of the investment income and foreign withholding taxes recorded on the Funds’ books and the U.S. dollar equivalent amounts actually received or paid.
Investment Transactions
For the six months ended June 30, 2014, purchases and sales (including maturities) of investment securities (excluding short-term securities and U.S. government obligations) were as follows:
| | | | | | | | |
| | | Purchases | | | Sales | |
Small Cap Fund | | $ | 124,746,840 | | | $ | 134,440,201 | |
Small-Mid Cap Fund | | | 166,132,971 | | | | 68,826,681 | |
Mid Cap Fund | | | 13,050,030 | | | | 1,743,155 | |
Large Cap Fund | | | 556,055,269 | | | | 273,255,657 | |
Select Fund | | | 29,613,178 | | | | 25,279,333 | |
Long-Short Fund | | | 815,987,388 | | | | 640,195,716 | |
Research Opportunities Fund | | | 18,713,646 | | | | 16,651,043 | |
Financial Long-Short Fund | | | 5,980,562 | | | | 7,148,785 | |
Strategic Income Fund | | | 53,611,055 | | | | 35,526,597 | |
| | | | | | | | | | | | | | |
| 68 | | DIAMOND HILL FUNDS | | | | | SEMI-ANNUAL REPORT | | | | | JUNE 30, 2014 | | | | | DIAMOND-HILL.COM |
Diamond Hill Funds
Notes to Financial Statements (Continued)
June 30, 2014
The Funds pay commissions on the purchase and sale of investment securities. The commissions are treated as transaction costs and, therefore, are included as part of the cost of purchases or net proceeds on the sale of investment securities and are not included in the presentation of Fund expenses on the Statements of Operations. The Funds paid the following commissions during the six months ended June 30, 2014:
| | | | | | | | |
| | | Total
Commissions | | | Commissions
as a % of
Average
Net Assets | |
Small Cap Fund | | $ | 179,187 | | | | 0.01 | % |
Small-Mid Cap Fund | | | 147,555 | | | | 0.04 | % |
Mid Cap Fund | | | 9,007 | | | | 0.09 | % |
Large Cap Fund | | | 438,653 | | | | 0.02 | % |
Select Fund | | | 23,078 | | | | 0.03 | % |
Long-Short Fund | | | 706,630 | | | | 0.02 | % |
Research Opportunities Fund | | | 18,768 | | | | 0.03 | % |
Financial Long-Short Fund | | | 7,136 | | | | 0.03 | % |
Investment Advisory Fees and Other Transactions with Affiliates
The Small Cap Fund, Small-Mid Cap Fund, Mid Cap Fund, Large Cap Fund, Select Fund, Long-Short Fund, Research Opportunities Fund, Financial Long-Short Fund and Strategic Income Fund each receive investment management and advisory services from DHCM under management agreements that provide for fees to be paid at an annual rate of 0.80%, 0.75%, 0.65%, 0.55%, 0.70%, 0.90%, 1.00%, 1.00% and 0.50% of the Fund’s average daily net assets, respectively. The advisory agreements are subject to annual approval by the Board of Trustees. In addition, each Fund has entered into an administrative services agreement whereby DHCM is paid a fee at an annual rate of 0.25% for Class A Shares, Class C Shares and Class I Shares and 0.10% for Class Y shares of each class’ average daily net assets. These administrative fees are used to pay most of the Funds’ operating expenses except advisory, distribution, custody, brokerage, taxes, interest and dividend expense on securities sold short and extraordinary expenses.
Pursuant to Rule 12b-1 under the 1940 Act, the Trust has adopted a distribution plan on behalf of each Fund’s Class A and Class C shares (together, the “Plan”). Under the Plan, Class A shares pay a distribution fee at an annual rate of 0.25% of Class A average daily net assets. Class C shares pay a distribution and shareholder-servicing fee at an annual rate of 0.75% and 0.25%, respectively, of Class C average daily net assets. Class I and Class Y shares are not subject to any distribution or shareholder-servicing fees. The Trust entered into a Distribution Agreement on behalf of the Funds with BHIL Distributors, Inc. (“Distributor”), an affiliate of DHCM. Pursuant to the Distribution Agreement, the Distributor acts as principal underwriter of each Fund’s shares.
| | | | | | | | | | | | | | | | |
| DIAMOND HILL FUNDS | | | | | SEMI-ANNUAL REPORT | | | | | JUNE 30, 2014 | | | | | DIAMOND-HILL.COM | | | 69 | |
Diamond Hill Funds
Notes to Financial Statements (Continued)
June 30, 2014
For the six months ended June 30, 2014, the Distributor retained the following amounts in sales commissions from the sales of Class A shares of the Funds as follows:
| | | | |
Small Cap Fund | | $ | 13,750 | |
Small-Mid Cap Fund | | | 9,031 | |
Mid Cap Fund | | | — | |
Large Cap Fund | | | 29,192 | |
Select Fund | | | 3,056 | |
Long-Short Fund | | | 35,341 | |
Research Opportunities Fund | | | 92 | |
Financial Long-Short Fund | | | 116 | |
Strategic Income Fund | | | 1,620 | |
DHCM, as the financing agent for Class C shares, received contingent deferred sales charges relating to the redemptions of Class C shares of the Funds for the six months ended June 30, 2014 as follows:
| | | | |
Small Cap Fund | | $ | 2,398 | |
Small-Mid Cap Fund | | | 333 | |
Mid Cap Fund | | | — | |
Large Cap Fund | | | 1,425 | |
Select Fund | | | 54 | |
Long-Short Fund | | | 1,366 | |
Research Opportunities Fund | | | 71 | |
Financial Long-Short Fund | | | 227 | |
Strategic Income Fund | | | 29 | |
Certain Officers of the Trust are affiliated with DHCM or the Distributor. Such Officers receive no compensation from the Funds for serving in their respective roles.
Trustee Fees
The Independent Trustees are compensated for their services to the Funds by DHCM as part of the administration services agreement. Collectively, the Independent Trustees were paid $124,250 in fees during the six months ended June 30, 2014.
Commitments and Contingencies
The Funds indemnify the Trust’s Officers and Trustees for certain liabilities that might arise from their performance of their duties to the Funds. Additionally, in the normal course of business, the Funds enter into contracts that contain a variety of representations and warranties and which provide general indemnifications. The Funds’ maximum exposure
| | | | | | | | | | | | | | |
| 70 | | DIAMOND HILL FUNDS | | | | | SEMI-ANNUAL REPORT | | | | | JUNE 30, 2014 | | | | | DIAMOND-HILL.COM |
Diamond Hill Funds
Notes to Financial Statements (Continued)
June 30, 2014
under these arrangements is unknown, as this would involve future claims that may be made against the Funds that have not yet occurred. However, based on experience, the Funds expect the risk of loss to be remote.
Federal Tax Information
The amount and character of income and capital gain distributions paid by the Funds are determined in accordance with Federal income tax regulations which may differ from GAAP. The tax character of distributions paid may differ from the character of distributions shown on the Statements of Changes in Net Assets, as items such as short-term capital gains are treated as ordinary income for tax purposes.
The tax character of distributions paid during 2013 was as follows:
| | | | | | | | | | | | | | | | |
| | | Small Cap
Fund | | | Small-Mid
Cap Fund | | | Large Cap
Fund | | | Select
Fund | |
Distributions paid from: | | | | | | | | | | | | | | | | |
Ordinary income | | $ | 2,703,544 | | | $ | 4,874,171 | | | $ | 34,611,591 | | | $ | 3,269,690 | |
Long-term capital gains | | | 75,165,566 | | | | 9,487,102 | | | | 84,619,553 | | | | 5,795,885 | |
| | | | | | | | | | | | | | | | |
Total distributions | | $ | 77,869,110 | | | $ | 14,361,273 | | | $ | 119,231,144 | | | $ | 9,065,575 | |
| | | | | | | | | | | | | | | | |
| | | | |
| | | Long-Short
Fund | | | Research
Opportunities
Fund | | | Financial
Long-Short
Fund | | | Strategic
Income
Fund | |
Distributions paid from: | | | | | | | | | | | | | | | | |
Ordinary income | | $ | 9,627,642 | | | $ | 1,405,970 | | | $ | — | | | $ | 8,893,374 | |
Long-term capital gains | | | — | | | | 2,510,357 | | | | — | | | | — | |
| | | | | | | | | | | | | | | | |
Total distributions | | $ | 9,627,642 | | | $ | 3,916,327 | | | $ | — | | | $ | 8,893,374 | |
| | | | | | | | | | | | | | | | |
The following information is computed on a tax basis for each item as of December 31, 2013:
| | | | | | | | | | | | | | | | |
| | | Small Cap
Fund | | | Small-Mid
Cap Fund | | | Large Cap
Fund | | | Select
Fund | |
Net unrealized appreciation on portfolio investments | | $ | 350,207,106 | | | $ | 63,009,081 | | | $ | 715,867,930 | | | $ | 16,110,905 | |
Undistributed ordinary income | | | — | | | | 376,326 | | | | 3,900,198 | | | | 1,120,883 | |
Undistributed capital gains | | | 7,469,022 | | | | 4,986,209 | | | | 24,843,501 | | | | 956,610 | |
| | | | | | | | | | | | | | | | |
Accumulated earnings | | $ | 357,676,128 | | | $ | 68,371,616 | | | $ | 744,611,629 | | | $ | 18,188,398 | |
| | | | | | | | | | | | | | | | |
| | | | | | | | | | | | | | | | |
| DIAMOND HILL FUNDS | | | | | SEMI-ANNUAL REPORT | | | | | JUNE 30, 2014 | | | | | DIAMOND-HILL.COM | | | 71 | |
Diamond Hill Funds
Notes to Financial Statements (Continued)
June 30, 2014
| | | | | | | | | | | | | | | | |
| | | Long-Short
Fund | | | Research
Opportunities
Fund | | | Financial
Long-Short
Fund | | | Strategic
Income
Fund | |
Net unrealized appreciation on portfolio investments | | $ | 646,391,636 | | | $ | 9,638,036 | | | $ | 4,933,463 | | | $ | 4,387,824 | |
Undistributed ordinary income | | | — | | | | 362,960 | | | | — | | | | 289,203 | |
Undistributed capital gains | | | — | | | | 1,261,963 | | | | — | | | | — | |
Capital loss carryforwards | | | (304,714,638 | ) | | | — | | | | (10,841,377 | ) | | | (14,445,829 | ) |
| | | | | | | | | | | | | | | | |
Accumulated earnings (deficit) | | $ | 341,676,998 | | | $ | 11,262,959 | | | $ | (5,907,914 | ) | | $ | (9,768,802 | ) |
| | | | | | | | | | | | | | | | |
As of 6/30/2014, the Funds’ federal tax cost of investment securities and net unrealized appreciation (depreciation) were as follows:
| | | | | | | | | | | | | | | | | | | | |
| | | Small Cap
Fund | | | Small-Mid
Cap Fund | | | Mid Cap
Fund | | | Large Cap
Fund | | | Select
Fund | |
Tax cost of portfolio investments | | $ | 1,149,659,523 | | | $ | 444,854,697 | | | $ | 12,931,923 | | | $ | 2,345,029,155 | | | $ | 65,457,215 | |
| | | | | | | | | | | | | | | | | | | | |
Gross unrealized appreciation | | | 409,624,136 | | | | 74,315,292 | | | | 837,156 | | | | 829,796,160 | | | | 13,155,428 | |
Gross unrealized depreciation | | | (6,965,368 | ) | | | (2,908,145 | ) | | | (195,727 | ) | | | (3,257,496 | ) | | | (182,324 | ) |
| | | | | | | | | | | | | | | | | | | | |
Net unrealized appreciation on portfolio investments | | $ | 402,658,769 | | | $ | 71,407,147 | | | $ | 641,429 | | | $ | 826,538,664 | | | $ | 12,973,104 | |
| | | | | | | | | | | | | | | | | | | | |
| | | | | |
| | | Long-Short
Fund | | | Research
Opportunities
Fund | | | Financial
Long-Short
Fund | | | Strategic
Income
Fund | | | | |
Tax cost of long portfolio investments | | $ | 2,731,745,746 | | | $ | 64,112,971 | | | $ | 24,215,578 | | | $ | 227,359,125 | | | | | |
| | | | | | | | | | | | | | | | | | | | |
Gross unrealized appreciation | | | 907,900,934 | | | | 11,566,690 | | | | 5,422,593 | | | | 7,339,403 | | | | | |
Gross unrealized depreciation | | | (3,893,712 | ) | | | (381,930 | ) | | | (148,759 | ) | | | (1,964,275 | ) | | | | |
| | | | | | | | | | | | | | | | | | | | |
Net unrealized appreciation on long portfolio investments | | $ | 904,007,222 | | | $ | 11,184,760 | | | $ | 5,273,834 | | | $ | 5,375,128 | | | | | |
| | | | | | | | | | | | | | | | | | | | |
The difference between book basis and tax basis net unrealized appreciation (depreciation) is attributable primarily to the tax deferral of losses on wash sales.
As of the latest tax year ended December 31, 2013, the following Funds have capital loss carry forwards (“CLCFs”) as summarized in the tables below. CLCFs subject to expiration are applied as short-term capital loss regardless of whether the originating capital loss was short-term or long-term. CLCFs that are not subject to expiration must be utilized before those that are subject to expire. As of June 30, 2014, all CLCFs were subject to expiration.
| | | | | | | | | | | | | | |
| 72 | | DIAMOND HILL FUNDS | | | | | SEMI-ANNUAL REPORT | | | | | JUNE 30, 2014 | | | | | DIAMOND-HILL.COM |
Diamond Hill Funds
Notes to Financial Statements (Continued)
June 30, 2014
CLCFs subject to expiration:
| | | | | | | | |
| | | Amount | | | Expires
December 31, | |
Long-Short Fund | | $ | 235,537,541 | | | | 2017 | |
| | | 69,177,097 | | | | 2018 | |
| | | | | | | | |
| | $ | 304,714,638 | | | | | |
| | | | | | | | |
Financial Long-Short Fund | | $ | 4,301,249 | | | | 2016 | |
| | | 6,540,128 | | | | 2017 | |
| | | | | | | | |
| | $ | 10,841,377 | | | | | |
| | | | | | | | |
Strategic Income Fund | | $ | 9,173,975 | | | | 2016 | |
| | | 5,271,854 | | | | 2017 | |
| | | | | | | | |
| | $ | 14,445,829 | | | | | |
| | | | | | | | |
As of the latest tax year ended December 31, 2013, Long-Short Fund, Financial Long-Short Fund and Strategic Income Fund utilized $177,979,854, $2,340,228 and $1,993,448, respectively, of CLCFs.
The Funds also elected to defer until their subsequent tax year capital losses incurred after October 31, 2013. The CLCFs and “Qualified Late Year Capital Losses” losses may be utilized in future years to offset net realized capital gains, if any, prior to distributing such gains to shareholders.
The tax character of current year distributions paid and the tax basis of the current components of accumulated earnings (deficit) and any net CLCFs will be determined at the end of the current tax year.
In-kind Redemption Transaction
During the six months ended June 30, 2014, the Select Fund delivered securities in lieu of cash for shareholder redemptions. The value of the redemption was as follows:
| | | | | | | | | | | | | | | | | | | | |
Date | | Redemption | | | Securities | | | Cash | | | Realized
gain | | | Class I
Shares
Redeemed | |
June 9, 2014 | | $ | 9,554,431 | | | $ | 8,963,850 | | | | 590,581 | | | $ | 2,675,416 | | | | 212,226 | |
Subsequent Events
The Funds evaluated events from June 30, 2014 through the date that these financial statements were issued. There were no subsequent events to report that would have a material impact on the Funds’ financial statements.
| | | | | | | | | | | | | | | | |
| DIAMOND HILL FUNDS | | | | | SEMI-ANNUAL REPORT | | | | | JUNE 30, 2014 | | | | | DIAMOND-HILL.COM | | | 73 | |
Diamond Hill Funds
Other Items
June 30, 2014 (Unaudited)
Proxy Voting
The investment adviser is responsible for exercising the voting rights associated with the securities purchased and held by the Funds. A description of the policies and procedures that the adviser uses in fulfilling this responsibility and information regarding how those proxies were voted during the twelve month period ended June 30 are available without charge upon request by calling toll free 1-888-226-5595 or on the Securities and Exchange Commission’s website at www.sec.gov.
Portfolio Disclosure
The Trust files a complete listing of portfolio holdings for each Fund as of the end of the first and third quarters of each fiscal year on Form N-Q and each second and fourth quarters of each fiscal year on Form N-CSR. The complete listing (i) is available on the Commission’s website; (ii) may be reviewed and copied at the Commission’s Public Reference Room in Washington, DC; and (iii) will be made available to shareholders upon request by calling 1-888-226-5595. Information on the operation of the Public Reference Room may be obtained by calling 1-800-SEC-0330. Monthly portfolio holdings are also available on www.diamond-hill.com.
| | | | | | | | | | | | | | |
| 74 | | DIAMOND HILL FUNDS | | | | | SEMI-ANNUAL REPORT | | | | | JUNE 30, 2014 | | | | | DIAMOND-HILL.COM |
Diamond Hill Funds
Schedule of Shareholder Expenses
Hypothetical Example of a $1,000 Investment at Beginning of Period
(Unaudited)
As a Fund shareholder, you may incur two types of costs: (1) transaction costs, including wire redemption fees and sales charges (loads) as applicable; and (2) ongoing costs, including management fees; distribution and service (12b-1) fees; and other Fund expenses. These examples are intended to help you understand your ongoing costs (in dollars) of investing in a Fund and to compare these costs with the ongoing costs of investing in other mutual funds. Please note that the expenses shown in the tables are meant to highlight your ongoing costs only and do not reflect any transactional costs or other fees that may apply, such as fees for low balance accounts. Therefore, the examples are useful in comparing ongoing costs only and will not help you determine the relative total cost of owning different funds. In addition, if these transactional costs and other fees were included, your costs would have been higher.
These examples are based on an investment of $1,000 invested at January 1, 2014 and held for the entire period from January 1, 2014 through June 30, 2014.
The Actual Expense example below provides information about actual account values and actual expenses. You may use this information, together with the amount you invested, to estimate the expenses that you paid over the period. Simply divide your account value by $1,000 (for example, an $8,600 account value divided by $1,000 = 8.6), then multiply the result by the number in the table under the heading entitled “Expenses paid during the period” to estimate the expenses you paid on your account during this period.
The Hypothetical Expense example below provides information about hypothetical account values and hypothetical expenses based on each Fund’s actual expense ratio and an assumed rate of return of 5% per year before expenses, which is not each Fund’s actual return. The hypothetical account values and expenses may not be used to estimate the actual ending account balance or expenses you paid for the period. You may use this information to compare the ongoing costs of investing in this Fund and other funds. To do so, compare this 5% hypothetical example with the 5% hypothetical examples that appear in the shareholder reports of the other funds.
| | | | | | | | | | | | | | | | | | | | | | | | | | | | |
| | | Account value
at the beginning
of the period ($) | | | Account value
at the end
of the period ($) | | | Expenses paid
during
the period ($)* | | | Funds
annualized
expense
ratio (%) | |
| | | Actual | | | Hypothetical | | | Actual | | | Hypothetical | | | Actual | | | Hypothetical | | | Actual | |
Small Cap Fund | | | | | | | | | | | | | | | | | | | | | |
Class A | | | 1,000.00 | | | | 1,000.00 | | | | 1,081.60 | | | | 1,018.35 | | | | 6.71 | | | | 6.51 | | | | 1.30 | |
Class C | | | 1,000.00 | | | | 1,000.00 | | | | 1,077.80 | | | | 1,014.63 | | | | 10.56 | | | | 10.24 | | | | 2.05 | |
Class I | | | 1,000.00 | | | | 1,000.00 | | | | 1,083.10 | | | | 1,019.59 | | | | 5.42 | | | | 5.26 | | | | 1.05 | |
Class Y | | | 1,000.00 | | | | 1,000.00 | | | | 1,084.00 | | | | 1,020.33 | | | | 4.65 | | | | 4.51 | | | | 0.90 | |
Small-Mid Cap Fund | | | | | | | | | | | | | | | | | | | | | |
Class A | | | 1,000.00 | | | | 1,000.00 | | | | 1,075.00 | | | | 1,018.60 | | | | 6.43 | | | | 6.26 | | | | 1.25 | |
Class C | | | 1,000.00 | | | | 1,000.00 | | | | 1,070.80 | | | | 1,014.88 | | | | 10.27 | | | | 9.99 | | | | 2.00 | |
Class I | | | 1,000.00 | | | | 1,000.00 | | | | 1,076.10 | | | | 1,019.84 | | | | 5.15 | | | | 5.01 | | | | 1.00 | |
Class Y | | | 1,000.00 | | | | 1,000.00 | | | | 1,077.20 | | | | 1,020.58 | | | | 4.38 | | | | 4.26 | | | | 0.85 | |
| | | | | | | | | | | | | | | | |
| DIAMOND HILL FUNDS | | | | | SEMI-ANNUAL REPORT | | | | | JUNE 30, 2014 | | | | | DIAMOND-HILL.COM | | | 75 | |
Diamond Hill Funds
Schedule of Shareholder Expenses
Hypothetical Example of a $1,000 Investment at Beginning of Period
(Unaudited) (Continued)
| | | | | | | | | | | | | | | | | | | | | | | | | | | | |
| | | Account value
at the beginning
of the period ($) | | | Account value
at the end
of the period ($) | | | Expenses paid
during
the period ($)* | | | Funds
annualized
expense
ratio (%) | |
| | | Actual | | | Hypothetical | | | Actual | | | Hypothetical | | | Actual | | | Hypothetical | | | Actual | |
Large Cap Fund | | | | | | | | | | | | | | | | | | | | | |
Class A | | | 1,000.00 | | | | 1,000.00 | | | | 1,058.60 | | | | 1,019.59 | | | | 5.36 | | | | 5.26 | | | | 1.05 | |
Class C | | | 1,000.00 | | | | 1,000.00 | | | | 1,054.60 | | | | 1,015.87 | | | | 9.17 | | | | 9.00 | | | | 1.80 | |
Class I | | | 1,000.00 | | | | 1,000.00 | | | | 1,060.20 | | | | 1,020.83 | | | | 4.09 | | | | 4.01 | | | | 0.80 | |
Class Y | | | 1,000.00 | | | | 1,000.00 | | | | 1,060.70 | | | | 1,021.57 | | | | 3.32 | | | | 3.26 | | | | 0.65 | |
Select Fund | | | | | | | | | | | | | | | | | | | | | |
Class A | | | 1,000.00 | | | | 1,000.00 | | | | 1,067.70 | | | | 1,018.84 | | | | 6.15 | | | | 6.01 | | | | 1.20 | |
Class C | | | 1,000.00 | | | | 1,000.00 | | | | 1,063.10 | | | | 1,015.12 | | | | 9.97 | | | | 9.74 | | | | 1.95 | |
Class I | | | 1,000.00 | | | | 1,000.00 | | | | 1,069.40 | | | | 1,020.08 | | | | 4.87 | | | | 4.76 | | | | 0.95 | |
Class Y | | | 1,000.00 | | | | 1,000.00 | | | | 1,069.30 | | | | 1,020.83 | | | | 4.10 | | | | 4.01 | | | | 0.80 | |
Long-Short Fund | | | | | | | | | | | | | | | | | | | | | |
Class A | | | 1,000.00 | | | | 1,000.00 | | | | 1,056.60 | | | | 1,015.67 | | | | 9.38 | | | | 9.20 | | | | 1.84 | |
Class C | | | 1,000.00 | | | | 1,000.00 | | | | 1,052.80 | | | | 1,011.95 | | | | 13.18 | | | | 12.92 | | | | 2.59 | |
Class I | | | 1,000.00 | | | | 1,000.00 | | | | 1,058.20 | | | | 1,016.91 | | | | 8.11 | | | | 7.95 | | | | 1.59 | |
Class Y | | | 1,000.00 | | | | 1,000.00 | | | | 1,059.10 | | | | 1,017.65 | | | | 7.35 | | | | 7.20 | | | | 1.44 | |
Research Opportunities Fund | | | | | | | | | | | | | | | | | | | | | |
Class A | | | 1,000.00 | | | | 1,000.00 | | | | 1,052.60 | | | | 1,016.22 | | | | 8.80 | | | | 8.65 | | | | 1.73 | |
Class C | | | 1,000.00 | | | | 1,000.00 | | | | 1,048.50 | | | | 1,012.50 | | | | 12.60 | | | | 12.37 | | | | 2.48 | |
Class I | | | 1,000.00 | | | | 1,000.00 | | | | 1,053.70 | | | | 1,017.46 | | | | 7.54 | | | | 7.40 | | | | 1.48 | |
Class Y | | | 1,000.00 | | | | 1,000.00 | | | | 1,054.50 | | | | 1,018.20 | | | | 6.78 | | | | 6.66 | | | | 1.33 | |
Financial Long-Short Fund | | | | | | | | | | | | | | | | | | | | | |
Class A | | | 1,000.00 | | | | 1,000.00 | | | | 1,035.90 | | | | 1,016.22 | | | | 8.73 | | | | 8.65 | | | | 1.73 | |
Class C | | | 1,000.00 | | | | 1,000.00 | | | | 1,032.90 | | | | 1,012.50 | | | | 12.50 | | | | 12.37 | | | | 2.48 | |
Class I | | | 1,000.00 | | | | 1,000.00 | | | | 1,037.60 | | | | 1,017.46 | | | | 7.48 | | | | 7.40 | | | | 1.48 | |
Strategic Income Fund | | | | | | | | | | | | | | | | | | | | | |
Class A | | | 1,000.00 | | | | 1,000.00 | | | | 1,027.20 | | | | 1,019.84 | | | | 5.03 | | | | 5.01 | | | | 1.00 | |
Class C | | | 1,000.00 | | | | 1,000.00 | | | | 1,023.60 | | | | 1,016.12 | | | | 8.78 | | | | 8.75 | | | | 1.75 | |
Class I | | | 1,000.00 | | | | 1,000.00 | | | | 1,028.50 | | | | 1,021.08 | | | | 3.77 | | | | 3.76 | | | | 0.75 | |
Class Y | | | 1,000.00 | | | | 1,000.00 | | | | 1,029.40 | | | | 1,021.82 | | | | 3.02 | | | | 3.01 | | | | 0.60 | |
Mid Cap Fund Class | | | | | | | | | | | | | | | | | | | | | |
Class A | | | 1,000.00 | | | | 1,000.00 | | | | 1,072.00 | | | | 1,019.14 | | | | 5.86 | | | | 5.71 | | | | 1.14 | |
Class C | | | 1,000.00 | | | | 1,000.00 | | | | 1,069.00 | | | | 1,015.37 | | | | 9.75 | | | | 9.49 | | | | 1.90 | |
Class I | | | 1,000.00 | | | | 1,000.00 | | | | 1,074.00 | | | | 1,020.43 | | | | 4.53 | | | | 4.41 | | | | 0.88 | |
Class Y | | | 1,000.00 | | | | 1,000.00 | | | | 1,075.00 | | | | 1,021.08 | | | | 3.86 | | | | 3.76 | | | | 0.75 | |
| * | Expenses are equal to the Fund’s annualized expense ratio, multiplied by the average account value over the period, multiplied by the number of days in the most recent fiscal half-year divided by the number of days in the fiscal year (to reflect the one-half year period). |
You can find more information about the Fund’s expenses, including annual expense ratios for historical periods in the Financial Statements section of this report. For additional information on operating expenses and other shareholder costs, please refer to the Fund’s prospectus. The prospectus presents hypothetical shareholder costs over various time periods based upon a $10,000 investment and a return of 5% a year. The standardized example, which appears in all mutual fund prospectuses, may be useful to you in comparing the costs of investing in different funds.
| | | | | | | | | | | | | | |
| 76 | | DIAMOND HILL FUNDS | | | | | SEMI-ANNUAL REPORT | | | | | JUNE 30, 2014 | | | | | DIAMOND-HILL.COM |
NOTICE OF PRIVACY POLICY FOR DIAMOND HILL FUNDS
We value you as a shareholder and take your personal privacy seriously. In order to enhance our ability to provide you with the best service possible, Diamond Hill Funds (referred to as “we” or “us” or the “Funds”) collect, use and share certain information about you. This policy explains what information we collect and with whom we share it. The practices described in this policy are applicable to all customers, including prospective, current and former customers. The policy also explains how we protect the security and confidentiality of certain customer information.
SAFEGUARDING PRIVACY
Diamond Hill Funds maintain physical, electronic and procedural safeguards that comply with federal standards to ensure the safety of non-public personal customer information. In addition, we require service providers to the Funds to maintain policies and procedures designed to assure only appropriate access to, and use of, information about customers and to maintain physical, electronic and procedural safeguards that comply with federal standards to guard non-public personal customer information.
INFORMATION WE COLLECT AND SOURCES OF INFORMATION
We may collect information about our customers to help identify you, evaluate your application, service and manage your account and offer services and products you may find valuable. We collect this information from a variety of sources including:
| Ÿ | | Information we receive from you on applications or other forms, such as your name, address, date of birth, social security number and investment information; |
| Ÿ | | Information about your transactions and experiences with us, such as your account balance, transaction history and investment selections; and |
| Ÿ | | Information you supply in written, telephonic or electronic communications with the Funds or service providers to the Funds. |
INFORMATION WE SHARE
We may disclose all non-public personal information we collect, as described above, to companies that perform services on our behalf, including those that assist us in responding to inquiries, processing transactions, preparing and mailing account statements and other forms of shareholder services, provided they use the information solely for these purposes and they enter into a confidentiality agreement regarding the information. We also may disclose non-public personal information as otherwise permitted by law.
QUESTIONS?
Questions regarding this policy may be directed to: 888-226-5595
| | | | | | | | | | | | | | | | |
| DIAMOND HILL FUNDS | | | | | SEMI-ANNUAL REPORT | | | | | JUNE 30, 2014 | | | | | DIAMOND-HILL.COM | | | 77 | |
INVESTMENT ADVISER: DIAMOND HILL CAPITAL MANAGEMENT, INC.
DISTRIBUTOR: BHIL DISTRIBUTORS, INC. (MEMBER FINRA), AN AFFILIATE OF THE DIAMOND HILL FUNDS
| | | | | | | | | | | | | | | | | | | | |
| DIAMOND-HILL.COM | | | | | 855.255.8955 | | | | | 325 JOHN H. MCCONNELL BLVD | | | | | SUITE 200 | | | | | COLUMBUS, OHIO | | | | | 43214 |
DH-SAR063014
Not applicable.
| Item 3. | Audit Committee Financial Expert. |
Not applicable.
| Item 4. | Principal Accountant Fees and Services. |
Not applicable.
| Item 5. | Audit Committee of Listed Registrants. |
Not applicable.
| Item 6. | Schedule of Investments. |
(a) Not applicable.
(b) Not applicable.
| Item 7. | Disclosure of Proxy Voting Policies and Procedures for Closed-End Management Investment Companies. |
Not applicable.
| Item 8. | Portfolio Managers of Closed-End Management Investment Companies. |
Not applicable.
| Item 9. | Purchases of Equity Securities by Closed-End Management Investment Company and Affiliated Purchasers. |
Not applicable.
| Item 10. | Submission of Matters to a Vote of Security Holders. |
Not applicable.
| Item 11. | Controls and Procedures. |
(a) The registrant’s principal executive officer and principal financial officer have concluded, based on their evaluation of the registrant’s disclosure controls and procedures as conducted within 90 days of the filing date of this report, that these disclosure controls and procedures are adequately designed and are operating effectively to ensure that information required to be disclosed by the registrant on Form N-CSR is recorded, processed, summarized and reported within the time periods specified in the Securities and Exchange Commission’s rules and forms.
(b) There were no changes in the registrant’s internal control over financial reporting (as defined in Rule 30a-3(d) under the Act (17 CFR 270.30a-3(d))) that occurred during the second fiscal quarter of the period covered by this report that have materially affected or are reasonably likely to be materially affected, the registrant’s internal control over financial reporting.
| | |
| (a)(1) | | Not applicable. |
| |
| (a)(2) | | Certifications required by Item 12(a) of Form N-CSR are filed herewith. |
| |
| (a)(3) | | Not applicable. |
| |
| (b) | | Certification required by Item 12(b) of Form N-CSR is furnished herewith. |
SIGNATURES
Pursuant to the requirements of the Securities Exchange Act of 1934 and the Investment Company Act of 1940, the registrant has duly caused this report to be signed on its behalf by the undersigned, thereunto duly authorized.
| | |
| (Registrant) Diamond Hill Funds |
| |
| By (Signature and Title) | | /s/ James F. Laird, Jr. |
| | James F. Laird, Jr., President |
| |
| Date August 28, 2014 | | |
Pursuant to the requirements of the Securities Exchange Act of 1934 and the Investment Company Act of 1940, this report has been signed below by the following persons on behalf of the registrant and in the capacities and on the dates indicated.
| | |
| By (Signature and Title) | | /s/ James F. Laird, Jr. |
| | James F. Laird, Jr., President |
Date August 28, 2014
| | |
| By (Signature and Title) | | /s/ Trent M. Statczar |
| | Trent M. Statczar, Treasurer |
Date August 28, 2014