UNITED STATES
SECURITIES AND EXCHANGE COMMISSION
Washington, D.C. 20549
FORM N-CSR
CERTIFIED SHAREHOLDER REPORT OF REGISTERED
MANAGEMENT INVESTMENT COMPANIES
Investment Company Act file number: 811-08061
Diamond Hill Funds
(Exact name of registrant as specified in charter)
325 John H. McConnell Boulevard, Suite 200, Columbus, Ohio 43215
(Address of principal executive offices) (Zip code)
Thomas E. Line, 325 John H. McConnell Boulevard, Suite 200, Columbus, Ohio 43215
(Name and address of agent for service)
Registrant’s telephone number, including area code: 614-255-3333
Date of fiscal year end: December 31
Date of reporting period: June 30, 2016
Item 1. Reports to Stockholders.

Semi-Annual Report
June 30, 2016
| | |
| Small Cap Fund | | Long-Short Fund |
| Small-Mid Cap Fund | | Research Opportunities Fund |
| Mid Cap Fund | | Financial Long-Short Fund |
| Large Cap Fund | | Corporate Credit Fund |
| Select Fund | | High Yield Fund |
This material must be preceded or accompanied by a current prospectus.
Not FDIC Insured. May Lose Value. No Bank Guarantee.

Table of Contents
Cautionary Statement: At Diamond Hill, we pledge that, “we will communicate with our clients about our investment performance in a manner that will allow them to properly assess whether we are deserving of their trust.” Our views and opinions regarding the investment prospects of our portfolio holdings and Funds are “forward looking statements” which may or may not be accurate over the long term. While we believe we have a reasonable basis for our opinions, actual results may differ materially from those we anticipate. Information provided in this report should not be considered a recommendation to purchase or sell any particular security.
You can identify forward looking statements by words like “believe,” “expect,” “anticipate,” or similar expressions when discussing prospects for particular portfolio holdings and/or one of the Funds. We cannot assure future results. You should not place undue reliance on forward-looking statements, which speak only as of the date of this report. We disclaim any obligation to update or alter any forward-looking statements, whether as a result of new information, future events, or otherwise.
This material is not authorized for distribution to prospective investors unless preceded or accompanied by a Prospectus. Investors should consider the investment objectives, risks, charges, and expenses of the Diamond Hill Funds carefully before investing. The prospectus or summary prospectus contain this and other important information about the Fund(s) and are available at diamond-hill.com or by calling 888.226.5595. Please read the prospectus or summary prospectus carefully before investing. The Diamond Hill Funds are distributed by BHIL Distributors, LLC (Member FINRA/SIPC). Diamond Hill Capital Management, Inc., a registered investment adviser, serves as Investment Adviser to the Diamond Hill Funds and is paid a fee for its services. Diamond Hill Funds are not FDIC insured, may lose value, and have no bank guarantee.
Letter to Shareholders
Dear Fellow Shareholder:
We are pleased to provide this 2016 mid-year update for the Diamond Hill Funds. At Diamond Hill, we believe in true active portfolio management, managing high conviction, concentrated portfolios constructed independent of benchmark weights. We have intentionally structured our firm to maximize the potential to generate returns for our clients in excess of a passive alternative. Our long-term investment horizon also allows us to focus on company fundamentals rather than short-term market noise.
Our primary focus is always on achieving value-added results for existing clients. We believe the best way to achieve that goal is to manage relatively concentrated portfolios, which becomes more difficult as the size of the portfolio increases. Our portfolio managers have the authority to close their strategies before they reach an asset size where they believe they can no longer add sufficient value over a passive alternative, helping to protect our existing clients. With this in mind, last June, we closed the Diamond Hill Long-Short Fund to most new investors. In December, we closed the Diamond Hill Small Cap Fund, and in April of this year, we closed the Diamond Hill Small-Mid Cap Fund to most new investors.
2016 Year-to-Date Market Review
Despite a tumultuous six months for global financial markets, year-to-date total returns for the Russell 1000 and Russell 3000 Indices were 3.74% and 3.62%, respectively.
U.S. equity markets experienced losses early in the year due to slow economic growth, weakness in the energy sector, and uncertainty around central bank policy. A solid recovery in March was driven primarily by a potential bottom in oil prices and increased investor confidence that the Federal Reserve would take a less aggressive approach than previously expected to raising interest rates in 2016. March’s gains were extended throughout most of the second quarter, but stock markets took a hit in late June with the U.K. Brexit vote. However, they rebounded in the following days to end the quarter near all-time highs.
During the second quarter, bond yields fell to record lows as demand for the safety of U.S. Treasuries increased. Bond returns outpaced equity returns, and the top-performing stocks were those that provided bond-like income and stability, such as utilities, telecommunications, and consumer staples.
Sector Results
Year-to-date within the Russell 1000 Index of primarily large cap stocks, the utilities sector (+24%) was the best performer as investors sought dividend-yielding stocks as an alternative source of income in a low interest rate environment. This is a sharp reversal from one year ago when utilities was the worst-performing sector. The worst performer year-to-date has been the financial services sector (-2%). Declining interest rates and the likelihood of fewer-than-expected Fed rate increases in 2016 have created a headwind for financial companies, primarily banks and life insurers.
| | | | | | | | | | | | | | | | |
| DIAMOND HILL FUNDS | | | | | SEMI-ANNUAL REPORT | | | | | JUNE 30, 2016 | | | | | DIAMOND-HILL.COM | | | 1 | |
Letter to Shareholders
Market Outlook
While the U.S. economy appears to be continuing the healing process, the recent Brexit vote is the type of global political event that could exert near-term pressure on economic growth. The surprising event caused significant uncertainty in global financial markets, so we would expect the Federal Reserve to take a cautious approach towards normalizing monetary policy, causing U.S. interest rates to remain low in the near term.
The decline in the price of oil over the past two years has improved household budgets through moderating expenditures on gasoline. Thus far, it appears that the majority of savings have gone towards improving household balance sheets rather than increased spending. However, we would expect increases in household spending associated with lower gasoline prices to occur with a meaningful lag as consumers gain confidence that the decline is permanent.
The modest deleveraging of the U.S. household sector over the past several years continues to be a positive story. These lower debt levels combined with very low interest rates have allowed consumer debt-service burdens to improve to very low levels by historical standards. Clearly, this healthy debt service picture remains very much tied to historically low interest/mortgage rates, and any sharp, meaningful increase in those rates is likely to present an important headwind for growth.
We continue to expect positive but below-average equity market returns over the next five years. Our conclusion is primarily based on the combination of above average price/earnings multiples applied to already very strong levels of corporate profit margins, which likely tempers prospective returns. This expectation also seems consistent with the current interest rate environment.
On the credit side, we will likely continue to see global central bank policies remain supportive to credit through the remainder of 2016 in light of slowing global growth. We would expect ongoing bouts of volatility driven by uncertainty as the impact to broad credit fundamentals of the U.K. referendum evolves. We believe that by taking a longer-term view of valuations and fundamentals within credit, superior credit selection powered by individual credit analysis will ultimately drive returns in this type of environment.
Assessing the impact of macro-economic factors has been a more important part of estimating the long-term intrinsic value of companies in recent years; however, it is still just one of many factors that we consider. In our view, when stocks move for an extended period of time based on factors other than fundamental valuation, it generally creates investment opportunities as correlations eventually break down and individual stocks again trade on company fundamentals rather than macro-economic or headline news. Because a company’s stock market price tends to converge with its intrinsic value over sufficiently long periods of time (five years or longer), we believe the economic performance of the underlying business in relation to the price paid for its stock will determine long-term investment return. Our intrinsic value investment philosophy is shared by all of our
| | | | | | | | | | | | | | |
| 2 | | DIAMOND HILL FUNDS | | | | | SEMI-ANNUAL REPORT | | | | | JUNE 30, 2016 | | | | | DIAMOND-HILL.COM |
Letter to Shareholders
portfolio managers and research analysts, allowing us to apply our investment discipline consistently across all equity and credit strategies.
| | |
 | |  |
| |
Chris Welch, CFA Portfolio Manager, Co-Chief Investment Officer | | Austin Hawley, CFA Portfolio Manager, Co-Chief Investment Officer |
The views expressed are those of the portfolio managers as of June 30, 2016, are subject to change, and may differ from the views of other portfolio managers or the firm as a whole. These opinions are not intended to be a forecast of future events, a guarantee of future results, or investment advice. All data referenced are from sources deemed to be reliable but cannot be guaranteed. Securities and sectors referenced should not be construed as a solicitation or recommendation or be used as the sole basis for any investment decision.
The Russell 1000 Index is an unmanaged market capitalization-weighted index compromised of the largest 1,000 companies by total market capitalization in the Russell 3000 Index. The Russell 3000 Index is an unmanaged market capitalization-weighted index compromised of the 3,000 largest U.S. companies by total market capitalization. These indexes do not incur fees and expenses (which would lower the return) and are not available for direct investment.
| | | | | | | | | | | | | | | | |
| DIAMOND HILL FUNDS | | | | | SEMI-ANNUAL REPORT | | | | | JUNE 30, 2016 | | | | | DIAMOND-HILL.COM | | | 3 | |
Our Mission
At Diamond Hill, we serve our clients by providing investment strategies that deliver lasting value through a shared commitment to our intrinsic value-based investment philosophy, long-term perspective, disciplined approach and alignment with our clients’ interests.
VALUE
We believe market price and intrinsic value are independent in the short-term but tend to converge over time.
LONG-TERM
We maintain a long-term focus both in investment analysis and management of our business.
DISCIPLINE
We invest with discipline to increase potential return and protect capital.
PARTNERSHIP
We align our interests with those of our clients through significant personal investment in our strategies.
| | | | | | | | | | | | | | |
| 4 | | DIAMOND HILL FUNDS | | | | | SEMI-ANNUAL REPORT | | | | | JUNE 30, 2016 | | | | | DIAMOND-HILL.COM |
Fundamental Principles
The Importance of Valuation
We believe that a company’s intrinsic value is independent of its stock price and that intrinsic value can be reasonably estimated using a discounted cash flow methodology. Our entire investment team shares the same investment philosophy, which drives our investment process.
We focus on the fundamentals of intrinsic value, which are far less volatile than market price, and our actions are ultimately dictated by the price to intrinsic value relationship.
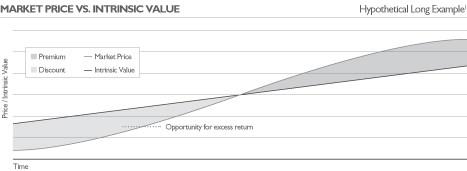
| | There is no guarantee that a discount to intrinsic value will be achieved or that market price and/or intrinsic value will increase over time. |
| 1 | The inverse is true for short position |
| | | | | | | | | | | | | | | | |
| DIAMOND HILL FUNDS | | | | | SEMI-ANNUAL REPORT | | | | | JUNE 30, 2016 | | | | | DIAMOND-HILL.COM | | | 5 | |
Fundamental Principles
Equity Investment Principles
Valuation
| • | | We believe that every share of stock has an intrinsic value that is independent of its current market price, and at any point in time, the market price may be higher or lower than intrinsic value. |
| • | | Over short periods of time, the market price is heavily influenced by the emotions of market participants, which are far more difficult to predict than intrinsic value. While market prices may experience extreme fluctuations on a particular day, we believe intrinsic value is far less volatile. |
| • | | Over sufficiently long periods of time, five years or longer, the stock market price tends to converge with intrinsic value. |
Intrinsic Value Estimate
| • | | We believe that we can determine a reasonable approximation of intrinsic value if we are confident in projecting the future cash flows of a business and use an appropriate discount rate. |
Suitable Investments
| • | | We only invest when the market price is lower than our conservative assessment of per share intrinsic value (or at a premium for short positions). |
| • | | We concentrate our investments in businesses whose per share intrinsic value is likely to increase. We invest in businesses that possess a competitive advantage, conservative balance sheet, and outstanding managers and employees. For short positions, the inverse is often true, and a growing intrinsic value is a detriment to the performance of the position. |
Risk & Return
| • | | We intend to achieve our return from both the closing of the gap between our purchase price and intrinsic value and the increase in per share intrinsic value. For short positions, an increasing intrinsic value may shorten the holding period. |
| • | | We define risk as the permanent loss of capital rather than price volatility. We manage risk by investing in companies selling at a discount (premium for short positions) to our estimate of intrinsic value. |
| | | | | | | | | | | | | | |
| 6 | | DIAMOND HILL FUNDS | | | | | SEMI-ANNUAL REPORT | | | | | JUNE 30, 2016 | | | | | DIAMOND-HILL.COM |
Fundamental Principles
Fixed Income Investment Principles
Fundamental Credit Analysis
| • | | We work closely with our research team to understand the fundamental economic drivers of the business and to assess whether there is adequate financial strength and flexibility to meet ongoing commitments. |
| • | | We evaluate the quality of a firm’s management and their treatment of bondholders and stockholders. We believe managements that focus on growth, without regard to return on invested capital or long-term cost of capital, are more likely to destroy value for bondholders and stockholders. In contrast, managements that understand the competitive dynamics of their business and employ prudent capital allocation often produce value for both bondholders and stockholders. |
Valuation
| • | | Bond investors are senior to equity investors in the capital structure, and the equity value of the company is the starting point for measuring our discount or premium to intrinsic value. To estimate the intrinsic value of the company, we look at discounted cash flows as well as private and public comparable firms. |
| • | | The liquidity and expected volatility of a corporate bond are also important factors in valuation. Because of our long-term time horizon, we will invest in less liquid or more volatile securities when we receive compensation that exceeds what we deem necessary. |
Suitable Investments
| • | | We generally invest in corporate bonds of companies with stable-to-improving fundamentals that are likely to meet our return objectives over the long term (five years). |
| • | | Our core competency is the evaluation of credit risk. We are committed to maintaining an asset level that will allow us to always be nimble in the secondary market and selective in the new issue market, even if that means closing strategies. We are comfortable owning (across all of our strategies) 5% of an issue but generally do not want to own more than 10%. We are willing to commit meaningful client capital to our best ideas. |
Risk & Return
| • | | We define risk as the permanent loss of capital rather than short-term price volatility. We also focus on limiting longer-term downside volatility and drawdowns. |
| • | | We expect to achieve our return objective by investing in corporate bonds when we believe the market price discounts a greater risk of default or a greater loss upon default than is warranted. An additional source of return exists when the market price provides attractive compensation for short-term illiquidity or volatility, both of which are of less concern to a long-term investor. |
| • | | Our primary focus is on valuing the underlying business and associated credit risk, rather than interest rate risk. |
| | | | | | | | | | | | | | | | |
| DIAMOND HILL FUNDS | | | | | SEMI-ANNUAL REPORT | | | | | JUNE 30, 2016 | | | | | DIAMOND-HILL.COM | | | 7 | |
Diamond Hill Small Cap Fund
Schedule of Investments
June 30, 2016 (Unaudited)
| | | | | | | | |
| | | Shares | | | Fair
Value | |
|
| Common Stocks — 82.0% | |
| Consumer Discretionary — 9.4% | |
Aaron’s, Inc. | | | 1,172,035 | | | $ | 25,655,847 | |
Callaway Golf Co. | | | 375,583 | | | | 3,834,702 | |
Carter’s, Inc. | | | 126,105 | | | | 13,426,399 | |
Global Sources Ltd.* | | | 178,656 | | | | 1,638,276 | |
Horizon Global Corp.* | | | 171,140 | | | | 1,942,439 | |
Live Nation Entertainment, Inc.* | | | 1,504,290 | | | | 35,350,815 | |
Red Rock Resorts, Inc., Class A* | | | 765,760 | | | | 16,831,405 | |
Tenneco, Inc.* | | | 564,350 | | | | 26,304,354 | |
Vail Resorts, Inc.^ | | | 269,545 | | | | 37,259,205 | |
| | | | | | | | 162,243,442 | |
|
| Consumer Staples — 5.8% | |
B&G Foods, Inc.^ | | | 736,950 | | | | 35,520,990 | |
Edgewell Personal Care Co.* | | | 158,880 | | | | 13,411,061 | |
Flowers Foods, Inc.^ | | | 1,136,289 | | | | 21,305,419 | |
Post Holdings, Inc.*^ | | | 372,670 | | | | 30,816,082 | |
| | | | | | | | 101,053,552 | |
|
| Energy — 2.8% | |
Carrizo Oil & Gas, Inc.*^ | | | 141,561 | | | | 5,074,962 | |
Cimarex Energy Co. | | | 322,910 | | | | 38,529,621 | |
Noble Energy, Inc. | | | 161,642 | | | | 5,798,099 | |
| | | | | | | | 49,402,682 | |
|
| Financials — 27.0% | |
Alleghany Corp.* | | | 36,757 | | | | 20,200,912 | |
American Equity Investment Life Holding Co. | | | 477,320 | | | | 6,801,810 | |
Assured Guaranty Ltd. | | | 335,697 | | | | 8,516,633 | |
BankUnited, Inc. | | | 908,705 | | | | 27,915,418 | |
BOK Financial Corp.^ | | | 186,835 | | | | 11,714,555 | |
Brown & Brown, Inc. | | | 1,334,470 | | | | 50,002,591 | |
Colony Capital, Inc., Class A^ | | | 848,335 | | | | 13,021,942 | |
Endurance Specialty Holdings Ltd. | | | 331,645 | | | | 22,273,278 | |
Enstar Group Ltd.* | | | 213,307 | | | | 34,553,601 | |
First Horizon National Corp.^ | | | 817,415 | | | | 11,263,979 | |
First Niagara Financial Group, Inc. | | | 658,720 | | | | 6,415,933 | |
First of Long Island Corp., The | | | 265,980 | | | | 7,625,647 | |
Fortress Investment Group LLC, Class A | | | 2,766,755 | | | | 12,229,057 | |
| | | | | | | | |
| | | Shares | | | Fair
Value | |
|
| Financials — 27.0% continued | |
Greenlight Capital Re Ltd., Class A*^ | | | 185,365 | | | $ | 3,736,958 | |
iStar Financial, Inc. REIT*^ | | | 3,417,105 | | | | 32,770,037 | |
Mid-America Apartment Communities, Inc. REIT^ | | | 177,749 | | | | 18,912,493 | |
Nationstar Mortgage Holdings, Inc.*^ | | | 1,086,530 | | | | 12,234,327 | |
Navigators Group, Inc. | | | 556,258 | | | | 51,159,048 | |
Popular, Inc. | | | 1,277,883 | | | | 37,441,971 | |
ProAssurance Corp. | | | 459,670 | | | | 24,615,329 | |
Reinsurance Group of America | | | 127,270 | | | | 12,343,917 | |
State Bank Financial Corp. | | | 381,390 | | | | 7,761,287 | |
Sterling Bancorp^ | | | 709,860 | | | | 11,144,802 | |
Tanger Factory Outlet Center, Inc. | | | 356,555 | | | | 14,326,380 | |
Winthrop Realty Trust REIT^ | | | 1,033,435 | | | | 9,083,894 | |
| | | | | | | | 468,065,799 | |
|
| Health Care — 8.5% | |
Alere, Inc.* | | | 968,160 | | | | 40,352,909 | |
BioScrip, Inc.*^ | | | 4,487,945 | | | | 11,444,260 | |
Concordia International Corp.^ | | | 1,252,625 | | | | 26,981,542 | |
Greatbatch, Inc.* | | | 354,530 | | | | 10,965,613 | |
LifePoint Hospitals, Inc.* | | | 361,310 | | | | 23,618,834 | |
Natus Medical, Inc.* | | | 571,060 | | | | 21,586,068 | |
Nuvectra Corp.* | | | 34,222 | | | | 253,243 | |
Universal American Financial Corp.^ | | | 1,609,669 | | | | 12,201,291 | |
| | | | | | | | 147,403,760 | |
|
| Industrials — 18.0% | |
Aircastle Ltd.^ | | | 1,666,085 | | | | 32,588,623 | |
Alaska Air Group, Inc. | | | 281,310 | | | | 16,397,560 | |
Avis Budget Group, Inc.*^ | | | 2,775,385 | | | | 89,450,658 | |
Brink’s Co., The | | | 265,460 | | | | 7,562,955 | |
Colfax Corp.*^ | | | 422,385 | | | | 11,176,307 | |
Corrections Corp. of America | | | 252,233 | | | | 8,833,200 | |
Hillenbrand, Inc. | | | 444,955 | | | | 13,366,448 | |
Hub Group, Inc., Class A* | | | 906,855 | | | | 34,796,026 | |
Hyster-Yale Materials Handling, Inc. | | | 232,882 | | | | 13,854,150 | |
Kennametal, Inc.^ | | | 139,960 | | | | 3,094,516 | |
Kirby Corp.*^ | | | 268,195 | | | | 16,732,686 | |
| | | | | | | | | | | | | | |
| 8 | | DIAMOND HILL FUNDS | | | | | SEMI-ANNUAL REPORT | | | | | JUNE 30, 2016 | | | | | DIAMOND-HILL.COM |
Diamond Hill Small Cap Fund
Schedule of Investments (Continued)
June 30, 2016 (Unaudited)
| | | | | | | | |
| | | Shares | | | Fair
Value | |
|
| Common Stocks — 82.0% continued | |
| Industrials — 18.0% continued | |
SPX FLOW, Inc.* | | | 465,890 | | | $ | 12,145,752 | |
Toro Co., The | | | 188,380 | | | | 16,615,116 | |
TriMas Corp.* | | | 427,850 | | | | 7,701,300 | |
Trinity Industries, Inc.^ | | | 1,514,860 | | | | 28,130,951 | |
| | | | | | | | 312,446,248 | |
|
| Information Technology — 7.2% | |
Anixter International, Inc.* | | | 204,360 | | | | 10,888,301 | |
Broadridge Financial Solutions, Inc. | | | 447,970 | | | | 29,207,644 | |
CommScope Holding, Inc.*^ | | | 925,575 | | | | 28,720,592 | |
CSG Systems International, Inc.^ | | | 36,982 | | | | 1,490,744 | |
DST Systems, Inc. | | | 421,130 | | | | 49,032,167 | |
Rovi Corp.*^ | | | 361,885 | | | | 5,659,881 | |
| | | | | | | | 124,999,329 | |
|
| Telecommunication Services — 0.2% | |
Cincinnati Bell, Inc.* | | | 923,250 | | | | 4,219,253 | |
|
| Utilities — 3.1% | |
ITC Holdings Corp. | | | 441,623 | | | | 20,676,789 | |
UGI Corp. | | | 740,970 | | | | 33,528,892 | |
| | | | | | | | 54,205,681 | |
| |
| Total Common Stocks | | | $ | 1,424,039,746 | |
|
| Registered Investment Companies — 29.0% | |
State Street Institutional Liquid Reserves Fund, Premier Class, 0.47%S | | | 320,354,406 | | | | 320,354,406 | |
State Street Navigator Securities Lending Prime Portfolio, 0.51%†S | | | 181,089,534 | | | | 181,089,534 | |
| |
| Total Registered Investment Companies | | | $ | 501,443,940 | |
|
| Total Investment Securities — 111.0% | |
(Cost $1,673,045,175)** | | | $ | 1,925,483,686 | |
| |
Net Other Assets
(Liabilities) — (11.0)% | | | | (192,015,944 | ) |
| |
| Net Assets — 100.0% | | | $ | 1,733,467,742 | |
| * | Non-income producing security. |
| ^ | All or a portion of the security is on loan. The total fair value of the securities on loan as of June 30, 2016 was $176,308,780. |
| † | This security, which was purchased using cash collateral received from securities on loan, represents collateral for securities loaned as of June 30, 2016. |
| S | Rate represents the daily yield on June 30, 2016. |
| ** | Represents cost for financial reporting purposes. |
REIT – Real Estate Investment Trust
See accompanying Notes to Financial Statements
| | | | | | | | | | | | | | | | |
| DIAMOND HILL FUNDS | | | | | SEMI-ANNUAL REPORT | | | | | JUNE 30, 2016 | | | | | DIAMOND-HILL.COM | | | 9 | |
Diamond Hill Small-Mid Cap Fund
Schedule of Investments
June 30, 2016 (Unaudited)
| | | | | | | | |
| | | Shares | | | Fair
Value | |
|
| Common Stocks — 91.3% | |
| Consumer Discretionary — 14.9% | |
Aaron’s, Inc. | | | 1,752,676 | | | $ | 38,366,078 | |
BorgWarner, Inc.^ | | | 1,281,352 | | | | 37,825,511 | |
Goodyear Tire & Rubber Co., The | | | 734,299 | | | | 18,842,112 | |
Hanesbrands, Inc. | | | 955,300 | | | | 24,006,689 | |
Newell Brands, Inc. | | | 890,301 | | | | 43,241,919 | |
NVR, Inc.* | | | 11,803 | | | | 21,013,353 | |
Staples, Inc. | | | 2,847,074 | | | | 24,541,778 | |
TEGNA, Inc. | | | 1,580,811 | | | | 36,627,391 | |
Whirlpool Corp. | | | 186,853 | | | | 31,137,184 | |
| | | | | | | | 275,602,015 | |
|
| Consumer Staples — 11.5% | |
B&G Foods, Inc.^ | | | 1,051,771 | | | | 50,695,362 | |
Coty, Inc., Class A^ | | | 379,493 | | | | 9,863,023 | |
Edgewell Personal Care Co.* | | | 228,390 | | | | 19,278,400 | |
Flowers Foods, Inc.^ | | | 1,718,905 | | | | 32,229,469 | |
Molson Coors Brewing Co., Class B | | | 456,068 | | | | 46,122,157 | |
Post Holdings, Inc.* | | | 643,230 | | | | 53,188,688 | |
| | | | | | | | 211,377,099 | |
|
| Energy — 3.5% | |
Cimarex Energy Co. | | | 534,036 | | | | 63,721,176 | |
|
| Financials — 27.6% | |
BankUnited, Inc. | | | 1,320,019 | | | | 40,550,984 | |
BOK Financial Corp.^ | | | 507,982 | | | | 31,850,471 | |
Brown & Brown, Inc. | | | 1,179,545 | | | | 44,197,550 | |
Colony Capital, Inc., Class A^ | | | 856,818 | | | | 13,152,156 | |
Endurance Specialty Holdings Ltd. | | | 440,807 | | | | 29,604,598 | |
Enstar Group Ltd.*^ | | | 61,927 | | | | 10,031,555 | |
First Horizon National Corp.^ | | | 1,790,920 | | | | 24,678,878 | |
First Republic Bank | | | 552,910 | | | | 38,698,170 | |
Infinity Property & Casualty Corp. | | | 99,972 | | | | 8,063,742 | |
iStar Financial, Inc. REIT*^ | | | 1,990,918 | | | | 19,092,904 | |
Mid-America Apartment Communities, Inc. REIT^ | | | 219,105 | | | | 23,312,772 | |
Nationstar Mortgage Holdings, Inc.*^ | | | 2,425,159 | | | | 27,307,290 | |
Navigators Group, Inc. | | | 204,847 | | | | 18,839,779 | |
Popular, Inc. | | | 951,529 | | | | 27,879,800 | |
| | | | | | | | |
| | | Shares | | | Fair
Value | |
|
| Financials — 27.6% continued | |
Reinsurance Group of America | | | 239,510 | | | $ | 23,230,075 | |
SVB Financial Group* | | | 147,630 | | | | 14,048,471 | |
Willis Towers Watson plc | | | 785,646 | | | | 97,663,653 | |
XL Group plc | | | 502,212 | | | | 16,728,682 | |
| | | | | | | | 508,931,530 | |
|
| Health Care — 8.3% | |
Boston Scientific Corp.* | | | 2,637,860 | | | | 61,646,789 | |
LifePoint Hospitals, Inc.* | | | 733,803 | | | | 47,968,702 | |
Orthofix International NV* | | | 691,841 | | | | 29,334,058 | |
Universal American Financial Corp. | | | 1,899,897 | | | | 14,401,219 | |
| | | | | | | | 153,350,768 | |
|
| Industrials — 11.2% | |
Aircastle Ltd.^ | | | 694,910 | | | | 13,592,440 | |
Avis Budget Group, Inc.* | | | 642,175 | | | | 20,697,300 | |
Brink’s Co., The | | | 432,104 | | | | 12,310,643 | |
Colfax Corp.*^ | | | 1,296,106 | | | | 34,294,965 | |
Dover Corp. | | | 277,475 | | | | 19,234,567 | |
Hub Group, Inc., Class A* | | | 1,277,913 | | | | 49,033,522 | |
Kirby Corp.*^ | | | 541,367 | | | | 33,775,887 | |
Parker Hannifin Corp. | | | 91,703 | | | | 9,908,509 | |
SPX FLOW, Inc.* | | | 546,873 | | | | 14,256,979 | |
| | | | | | | | 207,104,812 | |
|
| Information Technology — 9.2% | |
Anixter International, Inc.* | | | 317,572 | | | | 16,920,236 | |
Broadridge Financial Solutions, Inc. | | | 157,630 | | | | 10,277,476 | |
CommScope Holding, Inc.*^ | | | 960,369 | | | | 29,800,250 | |
Juniper Networks, Inc. | | | 1,547,884 | | | | 34,811,911 | |
Keysight Technologies, Inc.* | | | 420,610 | | | | 12,235,545 | |
Linear Technology Corp.^ | | | 658,788 | | | | 30,653,406 | |
Vantiv, Inc., Class A* | | | 632,206 | | | | 35,782,860 | |
| | | | | | | | 170,481,684 | |
|
| Materials — 1.8% | |
Axalta Coating Systems Ltd.* | | | 1,285,822 | | | | 34,112,858 | |
| | | | | | | | | | | | | | |
| 10 | | DIAMOND HILL FUNDS | | | | | SEMI-ANNUAL REPORT | | | | | JUNE 30, 2016 | | | | | DIAMOND-HILL.COM |
Diamond Hill Small-Mid Cap Fund
Schedule of Investments (Continued)
June 30, 2016 (Unaudited)
Diamond Hill Mid Cap Fund
Schedule of Investments
June 30, 2016 (Unaudited)
| | | | | | | | |
| | | Shares | | | Fair
Value | |
|
| Common Stocks — 91.3% continued | |
| Utilities — 3.3% | |
ITC Holdings Corp. | | | 441,374 | | | $ | 20,665,131 | |
UGI Corp. | | | 902,925 | | | | 40,857,356 | |
| | | | | | | | 61,522,487 | |
| |
| Total Common Stocks | | | $ | 1,686,204,429 | |
|
| Registered Investment Companies — 17.1% | |
State Street Institutional Liquid Reserves Fund, Premier Class, 0.47%S | | | 159,197,251 | | | | 159,197,251 | |
State Street Navigator Securities Lending Prime Portfolio, 0.51%†S | | | 156,066,879 | | | | 156,066,879 | |
| |
| Total Registered Investment Companies | | | $ | 315,264,130 | |
|
| Total Investment Securities — 108.4% | |
(Cost $1,863,920,168)** | | | $ | 2,001,468,559 | |
| |
Net Other Assets
(Liabilities) — (8.4)% | | | | (156,504,907 | ) |
| |
| Net Assets — 100.0% | | | $ | 1,844,963,652 | |
| * | Non-income producing security. |
| ^ | All or a portion of the security is on loan. The total fair value of the securities on loan as of June 30, 2016 was $152,358,897. |
| † | This security, which was purchased using cash collateral received from securities on loan, represents collateral for securities loaned as of June 30, 2016. |
| S | Rate represents the daily yield on June 30, 2016. |
| ** | Represents cost for financial reporting purposes. |
PLC – Public Limited Company
REIT – Real Estate Investment Trust
See accompanying Notes to Financial Statements
| | | | | | | | |
| | | Shares | | | Fair
Value | |
|
| Common Stocks — 92.7% | |
| Consumer Discretionary — 17.5% | |
Aaron’s, Inc.^ | | | 26,074 | | | $ | 570,760 | |
BorgWarner, Inc. | | | 25,450 | | | | 751,284 | |
Dollar General Corp.^ | | | 4,313 | | | | 405,422 | |
Goodyear Tire & Rubber Co., The | | | 14,490 | | | | 371,813 | |
Hanesbrands, Inc.^ | | | 18,975 | | | | 476,842 | |
Newell Brands, Inc.^ | | | 15,501 | | | | 752,884 | |
NVR, Inc.* | | | 235 | | | | 418,380 | |
Staples, Inc.^ | | | 54,245 | | | | 467,592 | |
TEGNA, Inc.^ | | | 25,435 | | | | 589,329 | |
VF Corp. | | | 8,430 | | | | 518,360 | |
Whirlpool Corp.^ | | | 6,231 | | | | 1,038,334 | |
| | | | | | | | 6,361,000 | |
|
| Consumer Staples — 12.0% | |
B&G Foods, Inc.^ | | | 14,820 | | | | 714,324 | |
Coty, Inc., Class A^ | | | 7,915 | | | | 205,711 | |
Edgewell Personal Care Co.*^ | | | 2,270 | | | | 191,611 | |
Flowers Foods, Inc.^ | | | 31,371 | | | | 588,206 | |
Molson Coors Brewing Co., Class B | | | 9,087 | | | | 918,968 | |
Post Holdings, Inc.*^ | | | 13,090 | | | | 1,082,412 | |
Sysco Corp. | | | 12,830 | | | | 650,994 | |
| | | | | | | | 4,352,226 | |
|
| Energy — 3.5% | |
Cimarex Energy Co. | | | 10,813 | | | | 1,290,207 | |
|
| Financials — 28.2% | |
BankUnited, Inc.^ | | | 27,675 | | | | 850,176 | |
BOK Financial Corp.^ | | | 7,635 | | | | 478,715 | |
Brown & Brown, Inc.^ | | | 20,570 | | | | 770,758 | |
Discover Financial Services^ | | | 9,460 | | | | 506,961 | |
Endurance Specialty Holdings Ltd. | | | 6,050 | | | | 406,318 | |
Enstar Group Ltd.* | | | 1,895 | | | | 306,971 | |
First Horizon National Corp.^ | | | 25,865 | | | | 356,420 | |
First Republic Bank^ | | | 10,310 | | | | 721,597 | |
Franklin Resources, Inc.^ | | | 15,690 | | | | 523,575 | |
Loews Corp. | | | 26,075 | | | | 1,071,422 | |
Mid-America Apartment Communities, Inc. REIT^ | | | 2,946 | | | | 313,454 | |
Nationstar Mortgage Holdings, Inc.*^ | | | 39,911 | | | | 449,398 | |
Popular, Inc.^ | | | 17,261 | | | | 505,747 | |
Reinsurance Group of America^ | | | 4,479 | | | | 434,418 | |
SVB Financial Group* | | | 3,065 | | | | 291,665 | |
Willis Towers Watson plc^ | | | 15,589 | | | | 1,937,868 | |
| | | | | | | | | | | | | | | | |
| DIAMOND HILL FUNDS | | | | | SEMI-ANNUAL REPORT | | | | | JUNE 30, 2016 | | | | | DIAMOND-HILL.COM | | | 11 | |
Diamond Hill Mid Cap Fund
Schedule of Investments (Continued)
June 30, 2016 (Unaudited)
| | | | | | | | |
| | | Shares | | | Fair
Value | |
|
| Common Stocks — 92.7% continued | |
| Financials — 28.2% continued | |
XL Group plc^ | | | 10,036 | | | $ | 334,299 | |
| | | | | | | | 10,259,762 | |
|
| Health Care — 6.2% | |
Boston Scientific Corp.* | | | 53,648 | | | | 1,253,754 | |
LifePoint Hospitals, Inc.*^ | | | 15,375 | | | | 1,005,064 | |
| | | | | | | | 2,258,818 | |
|
| Industrials — 11.0% | |
Avis Budget Group, Inc.*^ | | | 11,685 | | | | 376,608 | |
Colfax Corp.*^ | | | 23,935 | | | | 633,320 | |
Deere & Co.^ | | | 6,275 | | | | 508,526 | |
Dover Corp. | | | 4,675 | | | | 324,071 | |
Hub Group, Inc., Class A*^ | | | 15,560 | | | | 597,037 | |
Kirby Corp.*^ | | | 9,830 | | | | 613,294 | |
Parker Hannifin Corp.^ | | | 5,796 | | | | 626,258 | |
United Continental Holdings, Inc.* | | | 8,085 | | | | 331,808 | |
| | | | | | | | 4,010,922 | |
|
| Information Technology — 8.4% | |
Broadridge Financial Solutions, Inc. | | | 3,515 | | | | 229,178 | |
CommScope Holding, Inc.*^ | | | 18,765 | | | | 582,278 | |
Juniper Networks, Inc.^ | | | 31,736 | | | | 713,743 | |
Keysight Technologies, Inc.* | | | 7,600 | | | | 221,084 | |
Linear Technology Corp.^ | | | 12,900 | | | | 600,237 | |
Vantiv, Inc., Class A* | | | 12,350 | | | | 699,010 | |
| | | | | | | | 3,045,530 | |
|
| Materials — 2.7% | |
Axalta Coating Systems Ltd.*^ | | | 25,810 | | | | 684,739 | |
Eastman Chemical Co.^ | | | 4,470 | | | | 303,513 | |
| | | | | | | | 988,252 | |
|
| Utilities — 3.2% | |
ITC Holdings Corp. | | | 8,004 | | | | 374,747 | |
UGI Corp.^ | | | 17,494 | | | | 791,604 | |
| | | | | | | | 1,166,351 | |
| |
| Total Common Stocks | | | $ | 33,733,068 | |
| | | | | | | | |
| | | Shares | | | Fair
Value | |
|
| Registered Investment Companies — 34.4% | |
State Street Institutional Liquid Reserves Fund, Premier Class, 0.47%S | | | 2,479,173 | | | $ | 2,479,173 | |
State Street Navigator Securities Lending Prime Portfolio, 0.51%†S | | | 10,020,993 | | | | 10,020,993 | |
| |
| Total Registered Investment Companies | | | $ | 12,500,166 | |
|
| Total Investment Securities — 127.1% | |
(Cost $44,092,177)** | | | $ | 46,233,234 | |
| |
Net Other Assets
(Liabilities) — (27.1)% | | | | (9,861,330 | ) |
| |
| Net Assets — 100.0% | | | $ | 36,371,904 | |
| * | Non-income producing security. |
| ^ | All or a portion of the security is on loan. The total fair value of the securities on loan as of June 30, 2016 was $9,791,680. |
| † | This security, which was purchased using cash collateral received from securities on loan, represents collateral for securities loaned as of June 30, 2016. |
| S | Rate represents the daily yield on June 30, 2016. |
| ** | Represents cost for financial reporting purposes. |
PLC – Public Limited Company
REIT – Real Estate Investment Trust
See accompanying Notes to Financial Statements
| | | | | | | | | | | | | | |
| 12 | | DIAMOND HILL FUNDS | | | | | SEMI-ANNUAL REPORT | | | | | JUNE 30, 2016 | | | | | DIAMOND-HILL.COM |
Diamond Hill Large Cap Fund
Schedule of Investments
June 30, 2016 (Unaudited)
| | | | | | | | |
| | | Shares | | | Fair
Value | |
|
| Common Stocks — 97.8% | |
| Consumer Discretionary — 19.1% | |
BorgWarner, Inc. | | | 1,811,025 | | | $ | 53,461,458 | |
Charter Communications, Inc., Class A*^ | | | 178,470 | | | | 40,805,381 | |
Comcast Corp., Class A | | | 1,158,555 | | | | 75,526,199 | |
Ford Motor Co.^ | | | 5,616,820 | | | | 70,603,427 | |
Goodyear Tire & Rubber Co., The^ | | | 1,480,385 | | | | 37,986,679 | |
Hanesbrands, Inc.^ | | | 1,898,339 | | | | 47,705,259 | |
TEGNA, Inc.^ | | | 1,904,920 | | | | 44,136,996 | |
TJX Cos., Inc., The^ | | | 1,281,660 | | | | 98,982,602 | |
Twenty-First Century Fox, Inc. | | | 1,253,490 | | | | 34,157,603 | |
VF Corp.^ | | | 999,895 | | | | 61,483,544 | |
Walt Disney Co., The^ | | | 692,675 | | | | 67,757,469 | |
Whirlpool Corp.^ | | | 418,070 | | | | 69,667,185 | |
| | | | | | | | 702,273,802 | |
|
| Consumer Staples — 10.6% | |
Kimberly-Clark Corp. | | | 733,875 | | | | 100,893,135 | |
Philip Morris International^ | | | 604,275 | | | | 61,466,853 | |
Procter & Gamble Co., The^ | | | 1,507,936 | | | | 127,676,941 | |
Sysco Corp.^ | | | 1,986,647 | | | | 100,802,469 | |
| | | | | | | | 390,839,398 | |
|
| Energy — 3.5% | |
Cimarex Energy Co.^ | | | 716,724 | | | | 85,519,508 | |
EOG Resources, Inc.^ | | | 533,351 | | | | 44,492,140 | |
| | | | | | | | 130,011,648 | |
|
| Financials — 25.7% | |
American International Group, Inc.^ | | | 1,127,871 | | | | 59,653,097 | |
Capital One Financial Corp. | | | 1,545,445 | | | | 98,151,212 | |
Citigroup, Inc.^ | | | 2,769,965 | | | | 117,418,817 | |
Franklin Resources, Inc.^ | | | 1,322,565 | | | | 44,133,994 | |
JPMorgan Chase & Co.^ | | | 1,836,283 | | | | 114,106,626 | |
Loews Corp.^ | | | 1,251,155 | | | | 51,409,959 | |
Marsh & McLennan Cos., Inc.^ | | | 1,392,835 | | | | 95,353,484 | |
MetLife, Inc.^ | | | 1,725,935 | | | | 68,743,991 | |
Morgan Stanley | | | 4,278,680 | | | | 111,160,106 | |
PNC Financial Services Group, Inc.^ | | | 525,970 | | | | 42,808,698 | |
Progressive Corp.^ | | | 2,241,065 | | | | 75,075,678 | |
| | | | | | | | |
| | | Shares | | | Fair
Value | |
|
| Financials — 25.7% continued | |
Wells Fargo & Co. | | | 1,473,356 | | | $ | 69,733,939 | |
| | | | | | | | 947,749,601 | |
|
| Health Care — 13.6% | |
Abbott Laboratories^ | | | 3,437,405 | | | | 135,124,392 | |
Aetna, Inc.^ | | | 396,019 | | | | 48,365,800 | |
Medtronic plc^ | | | 952,072 | | | | 82,611,287 | |
Pfizer, Inc.^ | | | 3,862,252 | | | | 135,989,893 | |
Stryker Corp.^ | | | 435,405 | | | | 52,174,581 | |
Thermo Fisher Scientific, Inc.^ | | | 305,294 | | | | 45,110,241 | |
| | | | | | | | 499,376,194 | |
|
| Industrials — 8.2% | |
Illinois Tool Works, Inc.^ | | | 669,004 | | | | 69,683,457 | |
Parker Hannifin Corp.^ | | | 624,709 | | | | 67,499,807 | |
United Parcel Service, Inc.^ | | | 441,853 | | | | 47,596,405 | |
United Technologies Corp.^ | | | 1,153,672 | | | | 118,309,064 | |
| | | | | | | | 303,088,733 | |
|
| Information Technology — 14.8% | |
Alphabet, Inc., Class A* | | | 123,559 | | | | 86,927,463 | |
Apple Computer, Inc. | | | 828,262 | | | | 79,181,847 | |
Cisco Systems, Inc.^ | | | 3,735,603 | | | | 107,174,450 | |
International Business Machines Corp.^ | | | 361,340 | | | | 54,844,185 | |
Juniper Networks, Inc.^ | | | 1,466,035 | | | | 32,971,127 | |
Linear Technology Corp.^ | | | 1,102,050 | | | | 51,278,387 | |
Microsoft Corp. | | | 1,468,715 | | | | 75,154,147 | |
Vantiv, Inc., Class A*^ | | | 1,016,410 | | | | 57,528,806 | |
| | | | | | | | 545,060,412 | |
|
| Materials — 2.3% | |
Eastman Chemical Co.^ | | | 466,194 | | | | 31,654,573 | |
Praxair, Inc.^ | | | 477,612 | | | | 53,678,812 | |
| | | | | | | | 85,333,385 | |
| |
| Total Common Stocks | | | $ | 3,603,733,173 | |
| | | | | | | | | | | | | | | | |
| DIAMOND HILL FUNDS | | | | | SEMI-ANNUAL REPORT | | | | | JUNE 30, 2016 | | | | | DIAMOND-HILL.COM | | | 13 | |
Diamond Hill Large Cap Fund
Schedule of Investments (Continued)
June 30, 2016 (Unaudited)
Diamond Hill Select Fund
Schedule of Investments
June 30, 2016 (Unaudited)
| | | | | | | | |
| | | Shares | | | Fair
Value | |
|
| Registered Investment Companies — 12.9% | |
State Street Institutional Liquid Reserves Fund, Premier Class, 0.47%S | | | 57,302,851 | | | $ | 57,302,851 | |
State Street Navigator Securities Lending Prime Portfolio, 0.51%†S | | | 419,942,141 | | | | 419,942,141 | |
| |
| Total Registered Investment Companies | | | $ | 477,244,992 | |
|
| Total Investment Securities — 110.7% | |
(Cost $3,488,297,282)** | | | $ | 4,080,978,165 | |
| |
| Net Other Assets (Liabilities) — (10.7)% | | | | (393,332,748 | ) |
| |
| Net Assets — 100.0% | | | $ | 3,687,645,417 | |
| * | Non-income producing security. |
| ^ | All or a portion of the security is on loan. The total fair value of the securities on loan as of June 30, 2016 was $403,527,235. |
| † | This security, which was purchased using cash collateral received from securities on loan, represents collateral for securities loaned as of June 30, 2016. |
| S | Rate represents the daily yield on June 30, 2016. |
| ** | Represents cost for financial reporting purposes. |
PLC – Public Limited Company
See accompanying Notes to Financial Statements
| | | | | | | | |
| | | Shares | | | Fair
Value | |
|
| Common Stocks — 95.8% | |
| Consumer Discretionary — 18.1% | |
BorgWarner, Inc. | | | 152,225 | | | $ | 4,493,682 | |
Liberty Global plc, Class A*^ | | | 234,755 | | | | 6,821,980 | |
Newell Brands, Inc. | | | 30,488 | | | | 1,480,802 | |
TJX Cos., Inc., The | | | 36,292 | | | | 2,802,831 | |
Twenty-First Century Fox, Inc. | | | 203,433 | | | | 5,543,549 | |
Whirlpool Corp. | | | 25,732 | | | | 4,287,981 | |
| | | | | | | | 25,430,825 | |
|
| Consumer Staples — 1.7% | |
Post Holdings, Inc.* | | | 29,616 | | | | 2,448,947 | |
|
| Energy — 1.0% | |
Cimarex Energy Co. | | | 11,788 | | | | 1,406,544 | |
|
| Financials — 30.5% | |
BankUnited, Inc. | | | 94,210 | | | | 2,894,131 | |
Berkshire Hathaway, Inc., Class B* | | | 31,585 | | | | 4,573,192 | |
Brown & Brown, Inc. | | | 13,996 | | | | 524,430 | |
Citigroup, Inc. | | | 105,613 | | | | 4,476,935 | |
Franklin Resources, Inc. | | | 153,553 | | | | 5,124,064 | |
Loews Corp. | | | 113,688 | | | | 4,671,440 | |
MetLife, Inc. | | | 144,672 | | | | 5,762,286 | |
Nationstar Mortgage Holdings, Inc.*^ | | | 682,660 | | | | 7,686,752 | |
Popular, Inc. | | | 96,077 | | | | 2,815,056 | |
Willis Towers Watson plc | | | 34,863 | | | | 4,333,820 | |
| | | | | | | | 42,862,106 | |
|
| Health Care — 11.6% | |
Abbott Laboratories | | | 107,220 | | | | 4,214,818 | |
Allergan plc* | | | 18,611 | | | | 4,300,816 | |
LifePoint Hospitals, Inc.* | | | 68,706 | | | | 4,491,311 | |
Valeant Pharmaceuticals International, Inc.*^ | | | 164,443 | | | | 3,311,882 | |
| | | | | | | | 16,318,827 | |
|
| Industrials — 23.2% | |
Avis Budget Group, Inc.*^ | | | 217,875 | | | | 7,022,111 | |
Colfax Corp.*^ | | | 177,143 | | | | 4,687,204 | |
Deere & Co.^ | | | 63,005 | | | | 5,105,925 | |
Hub Group, Inc., Class A* | | | 160,321 | | | | 6,151,517 | |
Parker Hannifin Corp.^ | | | 26,847 | | | | 2,900,818 | |
United Continental Holdings, Inc.* | | | 93,125 | | | | 3,821,850 | |
United Technologies Corp. | | | 27,554 | | | | 2,825,663 | |
| | | | | | | | 32,515,088 | |
| | | | | | | | | | | | | | |
| 14 | | DIAMOND HILL FUNDS | | | | | SEMI-ANNUAL REPORT | | | | | JUNE 30, 2016 | | | | | DIAMOND-HILL.COM |
Diamond Hill Select Fund
Schedule of Investments (Continued)
June 30, 2016 (Unaudited)
Diamond Hill Long-Short Fund
Schedule of Investments
June 30, 2016 (Unaudited)
| | | | | | | | |
| | | Shares | | | Fair
Value | |
|
| Common Stocks — 95.8% continued | |
| Information Technology — 9.7% | |
Alphabet, Inc., Class A* | | | 5,100 | | | $ | 3,588,003 | |
Alphabet, Inc., Class C* | | | 2,310 | | | | 1,598,751 | |
Apple Computer, Inc. | | | 65,809 | | | | 6,291,340 | |
Linear Technology Corp. | | | 45,315 | | | | 2,108,507 | |
| | | | | | | | 13,586,601 | |
| |
| Total Common Stocks | | | $ | 134,568,938 | |
|
| Registered Investment Companies — 11.8% | |
State Street Institutional Liquid Reserves Fund, Premier Class, 0.47%S | | | 959,749 | | | | 959,749 | |
State Street Navigator Securities Lending Prime Portfolio, 0.51%†S | | | 15,478,929 | | | | 15,478,929 | |
| |
| Total Registered Investment Companies | | | $ | 16,438,678 | |
|
| Total Investment Securities — 107.6% | |
(Cost $154,815,257)** | | | $ | 151,007,616 | |
| |
| Net Other Assets (Liabilities) — (7.6)% | | | | (10,772,345 | ) |
| |
| Net Assets — 100.0% | | | $ | 140,235,271 | |
| * | Non-income producing security. |
| ^ | All or a portion of the security is on loan. The total fair value of the securities on loan as of June 30, 2016 was $15,124,192. |
| † | This security, which was purchased using cash collateral received from securities on loan, represents collateral for securities loaned as of June 30, 2016. |
| S | Rate represents the daily yield on June 30, 2016. |
| ** | Represents cost for financial reporting purposes. |
PLC – Public Limited Company
See accompanying Notes to Financial Statements
| | | | | | | | |
| | | Shares | | | Fair
Value | |
|
| Common Stocks — 87.1% | |
| Consumer Discretionary — 18.6% | |
BorgWarner, Inc.^ | | | 3,099,415 | | | $ | 91,494,731 | |
Comcast Corp., Class A | | | 1,169,695 | | | | 76,252,417 | |
Goodyear Tire & Rubber Co., The^ | | | 1,811,895 | | | | 46,493,226 | |
Hanesbrands, Inc. | | | 1,072,995 | | | | 26,964,364 | |
Newell Brands, Inc.^ | | | 1,313,742 | | | | 63,808,449 | |
TEGNA, Inc.^ | | | 3,000,388 | | | | 69,518,990 | |
TJX Cos., Inc., The | | | 994,790 | | | | 76,827,632 | |
Twenty-First Century Fox, Inc. | | | 3,592,620 | | | | 97,898,894 | |
VF Corp.^ | | | 1,063,055 | | | | 65,367,253 | |
Walt Disney Co., The^ | | | 670,326 | | | | 65,571,289 | |
Whirlpool Corp.^ | | | 581,445 | | | | 96,891,994 | |
| | | | | | | | 777,089,239 | |
|
| Consumer Staples — 4.3% | |
Kimberly-Clark Corp.^ | | | 398,810 | | | | 54,828,399 | |
Procter & Gamble Co., The^ | | | 823,770 | | | | 69,748,606 | |
Sysco Corp.^ | | | 1,069,587 | | | | 54,270,844 | |
| | | | | | | | 178,847,849 | |
|
| Energy — 2.9% | |
Cimarex Energy Co.^ | | | 713,134 | | | | 85,091,149 | |
EOG Resources, Inc.^ | | | 432,712 | | | | 36,096,835 | |
| | | | | | | | 121,187,984 | |
|
| Financials — 28.6% | |
BankUnited, Inc.^ | | | 2,113,415 | | | | 64,924,109 | |
Berkshire Hathaway, Inc., Class B*^ | | | 414,175 | | | | 59,968,398 | |
Brown & Brown, Inc.^ | | | 238,070 | | | | 8,920,483 | |
Capital One Financial Corp.^ | | | 1,868,795 | | | | 118,687,169 | |
Citigroup, Inc.^ | | | 3,922,064 | | | | 166,256,294 | |
Franklin Resources, Inc.^ | | | 2,571,190 | | | | 85,800,610 | |
JPMorgan Chase & Co.^ | | | 1,092,985 | | | | 67,918,088 | |
Loews Corp.^ | | | 1,604,480 | | | | 65,928,083 | |
MetLife, Inc.^ | | | 2,867,659 | | | | 114,218,859 | |
Morgan Stanley | | | 2,974,470 | | | | 77,276,731 | |
PNC Financial Services Group, Inc. | | | 299,370 | | | | 24,365,724 | |
Popular, Inc.^ | | | 3,337,163 | | | | 97,778,876 | |
Prudential Financial, Inc.^ | | | 479,918 | | | | 34,237,350 | |
Wells Fargo & Co. | | | 1,789,177 | | | | 84,681,747 | |
Willis Towers Watson plc^ | | | 1,009,285 | | | | 125,464,219 | |
| | | | | | | | 1,196,426,740 | |
| | | | | | | | | | | | | | | | |
| DIAMOND HILL FUNDS | | | | | SEMI-ANNUAL REPORT | | | | | JUNE 30, 2016 | | | | | DIAMOND-HILL.COM | | | 15 | |
Diamond Hill Long-Short Fund
Schedule of Investments (Continued)
June 30, 2016 (Unaudited)
| | | | | | | | |
| | | Shares | | | Fair
Value | |
|
| Common Stocks — 87.1% continued | |
| Health Care — 8.7% | |
Abbott Laboratories^ | | | 4,001,550 | | | $ | 157,300,932 | |
Boston Scientific Corp.*^ | | | 899,493 | | | | 21,021,151 | |
Medtronic plc^ | | | 556,107 | | | | 48,253,404 | |
Pfizer, Inc.^ | | | 3,927,990 | | | | 138,304,528 | |
| | | | | | | | 364,880,015 | |
|
| Industrials — 10.6% | |
Avis Budget Group, Inc.*^ | | | 1,146,765 | | | | 36,960,236 | |
Colfax Corp.*^ | | | 1,834,105 | | | | 48,530,418 | |
Deere & Co.^ | | | 761,710 | | | | 61,728,978 | |
Illinois Tool Works, Inc. | | | 418,625 | | | | 43,603,980 | |
Parker Hannifin Corp.^ | | | 761,400 | | | | 82,269,271 | |
United Continental Holdings, Inc.* | | | 1,531,450 | | | | 62,850,708 | |
United Technologies Corp.^ | | | 1,033,685 | | | | 106,004,397 | |
| | | | | | | | 441,947,988 | |
|
| Information Technology — 12.8% | |
Alphabet, Inc., Class A* | | | 172,470 | | | | 121,337,818 | |
Apple Computer, Inc. | | | 1,059,116 | | | | 101,251,490 | |
Cisco Systems, Inc.^ | | | 2,955,650 | | | | 84,797,599 | |
International Business Machines Corp.^ | | | 415,270 | | | | 63,029,681 | |
Juniper Networks, Inc.^ | | | 1,794,266 | | | | 40,353,042 | |
Microsoft Corp.^ | | | 1,283,664 | | | | 65,685,087 | |
Vantiv, Inc., Class A* | | | 1,037,925 | | | | 58,746,555 | |
| | | | | | | | 535,201,272 | |
|
| Materials — 0.6% | |
Axalta Coating Systems Ltd.* | | | 1,041,690 | | | | 27,636,036 | |
| |
| Total Common Stocks | | | $ | 3,643,217,123 | |
| | | | | | | | |
| | | Shares | | | Fair
Value | |
|
| Registered Investment Companies — 26.0% | |
State Street Institutional Liquid Reserves Fund, Premier Class, 0.47%S | | | 539,852,167 | | | $ | 539,852,167 | |
State Street Navigator Securities Lending Prime Portfolio, 0.51%†S | | | 548,681,030 | | | | 548,681,030 | |
| |
| Total Registered Investment Companies | | | $ | 1,088,533,197 | |
|
| Total Investment Securities — 113.1% | |
Cost ($4,245,103,364)** | | | $ | 4,731,750,318 | |
| |
| Segregated Cash With Custodian — 30.4% | | | | 1,269,791,609 | |
|
| Securities Sold Short — (30.1)% | |
(Proceeds $1,115,523,564) | | | | (1,258,946,572 | ) |
| |
| Net Other Assets (Liabilities) — (13.4)% | | | | (559,713,075 | ) |
| |
| Net Assets — 100.0% | | | $ | 4,182,882,282 | |
| * | Non-income producing security. |
| ^ | All or a portion of the security is on loan. The total fair value of the securities on loan as of June 30, 2016 was $536,558,016. |
| † | This security, which was purchased using cash collateral received from securities on loan, represents collateral for securities loaned as of June 30, 2016. |
| S | Rate represents the daily yield on June 30, 2016. |
| ** | Represents cost for financial reporting purposes. |
PLC – Public Limited Company
See accompanying Notes to Financial Statements
| | | | | | | | | | | | | | |
| 16 | | DIAMOND HILL FUNDS | | | | | SEMI-ANNUAL REPORT | | | | | JUNE 30, 2016 | | | | | DIAMOND-HILL.COM |
Diamond Hill Long-Short Fund
Schedule of Investments Sold Short
June 30, 2016 (Unaudited)
| | | | | | | | |
| | | Shares | | | Fair
Value | |
|
| Common Stocks — 30.1% | |
| Consumer Discretionary — 6.8% | |
American Eagle Outfitters, Inc. | | | 852,580 | | | $ | 13,581,599 | |
Best Buy Co., Inc. | | | 1,828,060 | | | | 55,938,634 | |
Big Lots, Inc. | | | 247,110 | | | | 12,382,682 | |
lululemon athletica, Inc.* | | | 495,210 | | | | 36,576,211 | |
McDonald’s Corp. | | | 391,500 | | | | 47,113,110 | |
New York Times Co., The, Class A | | | 237,934 | | | | 2,879,001 | |
Polaris Industries, Inc. | | | 260,070 | | | | 21,263,323 | |
Tractor Supply Co. | | | 302,453 | | | | 27,577,665 | |
Under Armour, Inc., Class A* | | | 314,305 | | | | 12,613,060 | |
Wal-Mart Stores, Inc. | | | 743,110 | | | | 54,261,892 | |
| | | | | | | | 284,187,177 | |
|
| Consumer Staples — 4.7% | |
Campbell Soup Co. | | | 1,285,735 | | | | 85,539,949 | |
Coca-Cola Co., The | | | 958,390 | | | | 43,443,819 | |
Colgate-Palmolive Co. | | | 296,700 | | | | 21,718,440 | |
ConAgra Foods, Inc. | | | 334,680 | | | | 16,001,051 | |
Kellogg Co. | | | 373,415 | | | | 30,489,335 | |
| | | | | | | | 197,192,594 | |
|
| Energy — 0.5% | |
Southwestern Energy Co.* | | | 1,676,325 | | | | 21,088,169 | |
|
| Financials — 5.3% | |
Bank of Hawaii Corp. | | | 274,090 | | | | 18,857,392 | |
Cincinnati Financial Corp. | | | 1,284,730 | | | | 96,213,429 | |
First American Financial Corp. | | | 727,035 | | | | 29,241,348 | |
Hanover Insurance Group, Inc. | | | 327,990 | | | | 27,754,514 | |
Mercury General Corp. | | | 203,968 | | | | 10,842,939 | |
Selective Insurance Group, Inc. | | | 980,850 | | | | 37,478,279 | |
| | | | | | | | 220,387,901 | |
|
| Health Care — 3.4% | |
Abbvie, Inc. | | | 278,210 | | | | 17,223,981 | |
Bristol-Myers Squibb Co. | | | 751,100 | | | | 55,243,405 | |
DENTSPLY SIRONA, Inc. | | | 339,735 | | | | 21,077,159 | |
IDEXX Laboratories, Inc.* | | | 281,355 | | | | 26,126,625 | |
Illumina, Inc.* | | | 60,215 | | | | 8,452,982 | |
Myriad Genetics, Inc.* | | | 400,500 | | | | 12,255,300 | |
| | | | | | | | 140,379,452 | |
| | | | | | | | |
| | | Shares | | | Fair
Value | |
|
| Industrials — 2.0% | |
Boeing Co., The | | | 490,955 | | | $ | 63,760,326 | |
Cintas Corp. | | | 193,375 | | | | 18,975,889 | |
| | | | | | | | 82,736,215 | |
|
| Information Technology — 3.4% | |
Arista Networks, Inc.* | | | 282,235 | | | | 18,170,289 | |
LogMeIn, Inc.* | | | 426,792 | | | | 27,071,417 | |
Mobileye NV* | | | 756,895 | | | | 34,923,135 | |
NETGEAR, Inc.* | | | 398,105 | | | | 18,925,912 | |
Ubiquiti Networks, Inc.* | | | 573,978 | | | | 22,189,989 | |
Western Union Co. | | | 1,183,700 | | | | 22,703,366 | |
| | | | | | | | 143,984,108 | |
|
| Materials — 0.3% | |
Bemis Co., Inc. | | | 256,495 | | | | 13,206,928 | |
|
| Telecommunication Services — 0.8% | |
AT&T, Inc. | | | 793,090 | | | | 34,269,419 | |
|
| Utilities — 1.7% | |
Consolidated Edison, Inc. | | | 858,670 | | | | 69,071,415 | |
| |
| Total Common Stocks | | | $ | 1,206,503,378 | |
|
| Registered Investment Company — 1.2% | |
| Industrials — 1.2% | |
Industrial Select Sector SPDR Fund 2.07% | | | 937,155 | | | | 52,443,194 | |
|
| Total Securities Sold Short — 30.1% | |
(Proceeds 1,115,523,564) | | | $ | 1,258,946,572 | |
| * | Non-dividend expense producing security. |
Percentages disclosed are based on total net assets of the Fund at June 30, 2016.
See accompanying Notes to Financial Statements
| | | | | | | | | | | | | | | | |
| DIAMOND HILL FUNDS | | | | | SEMI-ANNUAL REPORT | | | | | JUNE 30, 2016 | | | | | DIAMOND-HILL.COM | | | 17 | |
Diamond Hill Research Opportunities Fund
Schedule of Investments
June 30, 2016 (Unaudited)
| | | | | | | | |
| | | Shares | | | Fair
Value | |
|
| Common Stocks — 102.4% | |
| Consumer Discretionary — 17.7% | |
Aaron’s, Inc. | | | 24,350 | | | $ | 533,022 | |
Charter Communications, Inc., Class A* | | | 2,137 | | | | 488,604 | |
Dollar General Corp.^ | | | 4,030 | | | | 378,820 | |
Hanesbrands, Inc. | | | 10,200 | | | | 256,326 | |
Liberty Global plc, Class A*^ | | | 65,605 | | | | 1,906,481 | |
Liberty Lilac Group* | | | 856 | | | | 27,615 | |
Newell Brands, Inc.^ | | | 19,300 | | | | 937,401 | |
Red Rock Resorts, Inc., Class A* | | | 30,906 | | | | 679,314 | |
TJX Cos., Inc., The | | | 5,276 | | | | 407,465 | |
Twenty-First Century Fox, Inc. | | | 26,680 | | | | 727,030 | |
Vail Resorts, Inc. | | | 11,800 | | | | 1,631,114 | |
VF Corp.^ | | | 12,000 | | | | 737,881 | |
| | | | | | | | 8,711,073 | |
|
| Consumer Staples — 4.0% | |
B&G Foods, Inc.^ | | | 10,165 | | | | 489,953 | |
Post Holdings, Inc.*^ | | | 8,928 | | | | 738,256 | |
Tesco plc ADR* | | | 108,240 | | | | 759,845 | |
| | | | | | | | 1,988,054 | |
|
| Energy — 0.6% | |
Cimarex Energy Co.^ | | | 2,655 | | | | 316,795 | |
|
| Financials — 19.2% | |
Capital One Financial Corp.^ | | | 14,050 | | | | 892,315 | |
Discover Financial Services | | | 16,540 | | | | 886,379 | |
Fortress Investment Group LLC, Class A | | | 131,931 | | | | 583,135 | |
Franklin Resources, Inc.^ | | | 25,701 | | | | 857,642 | |
iStar Financial, Inc. REIT* | | | 69,685 | | | | 668,279 | |
Julius Baer Group, Ltd. (SW) | | | 15,210 | | | | 612,365 | |
MetLife, Inc. | | | 22,149 | | | | 882,195 | |
Nationstar Mortgage Holdings, Inc.*^ | | | 134,100 | | | | 1,509,966 | |
Popular, Inc.^ | | | 28,585 | | | | 837,541 | |
State Street Corp.^ | | | 14,325 | | | | 772,404 | |
SVB Financial Group* | | | 2,800 | | | | 266,448 | |
Willis Towers Watson plc^ | | | 5,550 | | | | 689,921 | |
| | | | | | | | 9,458,590 | |
|
| Health Care — 16.5% | |
Alere, Inc.* | | | 7,986 | | | | 332,856 | |
Allergan plc*^ | | | 1,425 | | | | 329,303 | |
BioScrip, Inc.*^ | | | 690,239 | | | | 1,760,110 | |
Concordia International Corp.^ | | | 9,200 | | | | 198,168 | |
| | | | | | | | |
| | | Shares | | | Fair
Value | |
|
| Health Care — 16.5% continued | |
Express Scripts Holding Co.*^ | | | 2,125 | | | $ | 161,075 | |
GlaxoSmithKline plc ADR | | | 60,098 | | | | 2,604,647 | |
H. Lundbeck A/S (DK)* | | | 9,096 | | | | 341,038 | |
LifePoint Hospitals, Inc.*^ | | | 7,620 | | | | 498,119 | |
McKesson Corp. | | | 1,140 | | | | 212,781 | |
Stryker Corp.^ | | | 2,950 | | | | 353,499 | |
Thermo Fisher Scientific, Inc. | | | 1,355 | | | | 200,214 | |
Universal American Financial Corp. | | | 26,518 | | | | 201,006 | |
Valeant Pharmaceuticals International, Inc.*^ | | | 43,325 | | | | 872,566 | |
| | | | | | | | 8,065,382 | |
|
| Industrials — 16.7% | |
Aircastle Ltd.^ | | | 30,000 | | | | 586,799 | |
Avis Budget Group, Inc.*^ | | | 31,050 | | | | 1,000,742 | |
Colfax Corp.*^ | | | 19,940 | | | | 527,613 | |
Emerson Electric Co. | | | 4,640 | | | | 242,022 | |
Hub Group, Inc., Class A* | | | 74,755 | | | | 2,868,350 | |
Kirby Corp.* | | | 23,280 | | | | 1,452,439 | |
SPX FLOW, Inc.* | | | 11,360 | | | | 296,155 | |
United Continental Holdings, Inc.* | | | 29,000 | | | | 1,190,160 | |
| | | | | | | | 8,164,280 | |
|
| Information Technology — 23.6% | |
Alphabet, Inc., Class A* | | | 1,526 | | | | 1,073,587 | |
Anixter International, Inc.* | | | 18,660 | | | | 994,205 | |
Apple Computer, Inc. | | | 4,055 | | | | 387,658 | |
Cisco Systems, Inc.^ | | | 54,856 | | | | 1,573,818 | |
CommScope Holding, Inc.* | | | 46,661 | | | | 1,447,891 | |
International Business Machines Corp.^ | | | 8,992 | | | | 1,364,806 | |
Juniper Networks, Inc. | | | 65,999 | | | | 1,484,318 | |
Keysight Technologies, Inc.*^ | | | 35,205 | | | | 1,024,113 | |
Microsoft Corp.^ | | | 43,390 | | | | 2,220,266 | |
| | | | | | | | 11,570,662 | |
|
| Materials — 1.5% | |
Axalta Coating Systems Ltd.*^ | | | 15,410 | | | | 408,827 | |
Fuchs Petrolub SE (GE) | | | 9,295 | | | | 334,351 | |
| | | | | | | | 743,178 | |
|
| Telecommunication Services — 2.6% | |
Cincinnati Bell, Inc.* | | | 283,134 | | | | 1,293,922 | |
| |
| Total Common Stocks | | | $ | 50,311,936 | |
| | | | | | | | | | | | | | |
| 18 | | DIAMOND HILL FUNDS | | | | | SEMI-ANNUAL REPORT | | | | | JUNE 30, 2016 | | | | | DIAMOND-HILL.COM |
Diamond Hill Research Opportunities Fund
Schedule of Investments (Continued)
June 30, 2016 (Unaudited)
| | | | | | | | |
| | | Shares | | | Fair
Value | |
|
| Corporate Bonds — 2.0% | |
| Consumer Discretionary — 1.3% | |
Laureate Education, Inc., 10.00%, 09/01/19†† | | | 750,000 | | | $ | 656,250 | |
|
| Energy — 0.7% | |
Energen Corp.,
7.13%, 02/15/28 | | | 400,000 | | | | 340,000 | |
| |
| Total Corporate Bonds | | | | 996,250 | |
|
| Registered Investment Company — 22.6% | |
State Street Navigator Securities Lending Prime Portfolio, 0.51%†S | | | 11,114,437 | | | $ | 11,114,437 | |
|
| Total Investment Securities — 127.0% | |
Cost ($62,141,842)** | | | | | | $ | 62,422,623 | |
| |
| Segregated Cash With Custodian — 24.5% | | | | 11,993,082 | |
| |
| Securities Sold Short — (30.2)% | | | | | |
(Proceeds $13,606,071) | | | | (14,828,249 | ) |
| |
Net Other Assets
(Liabilities) — (21.3)% | | | | (10,458,075 | ) |
| | |
| Net Assets — 100.0% | | | | | | $ | 49,129,381 | |
| * | Non-income producing security. |
| ^ | All or a portion of the security is on loan. The total fair value of the securities on loan as of June 30, 2016 was $10,820,019. |
| † | This security, which was purchased using cash collateral received from securities on loan, represents collateral for securities loaned as of June 30, 2016. |
| †† | Restricted securities not registered under the Securities Act of 1933 are as follows: |
| | | | | | | | | | | | | | | | |
| | | Acquisition
Date | | | Current
Cost | | | Fair Value | | | Value
as a
% of
Net
Assets | |
Laureate Education, Inc. | | | April-15 | | | $ | 670,180 | | | $ | 656,250 | | | | 1.3% | |
| S | Rate represents the daily yield on June 30, 2016. |
| ** | Represents cost for financial reporting purposes. |
ADR – American Depositary Receipt
DK – Danish Security
GE – German Security
PLC – Public Limited Company
REIT – Real Estate Investment Trust
SW – Swiss Security
See accompanying Notes to Financial Statements
| | | | | | | | | | | | | | | | |
| DIAMOND HILL FUNDS | | | | | SEMI-ANNUAL REPORT | | | | | JUNE 30, 2016 | | | | | DIAMOND-HILL.COM | | | 19 | |
Diamond Hill Research Opportunities Fund
Schedule of Investments Sold Short
June 30, 2016 (Unaudited)
| | | | | | | | |
| | | Shares | | | Fair
Value | |
|
| Common Stocks — 30.2% | |
| Consumer Discretionary — 6.7% | |
American Eagle Outfitters, Inc. | | | 29,910 | | | $ | 476,465 | |
Best Buy Co., Inc. | | | 33,185 | | | | 1,015,461 | |
Big Lots, Inc. | | | 3,330 | | | | 166,866 | |
lululemon athletica, Inc.* | | | 7,300 | | | | 539,178 | |
Polaris Industries, Inc. | | | 7,120 | | | | 582,131 | |
Under Armour, Inc., Class A* | | | 5,850 | | | | 234,761 | |
Wal-Mart Stores, Inc. | | | 4,040 | | | | 295,001 | |
| | | | | | | | 3,309,863 | |
|
| Consumer Staples — 1.5% | |
Campbell Soup Co. | | | 11,375 | | | | 756,778 | |
|
| Energy — 1.4% | |
Southwestern Energy Co.* | | | 54,695 | | | | 688,064 | |
|
| Financials — 4.1% | |
Bank of Hawaii Corp. | | | 4,635 | | | | 318,888 | |
Cincinnati Financial Corp. | | | 9,016 | | | | 675,208 | |
First American Financial Corp. | | | 3,880 | | | | 156,054 | |
Hanover Insurance Group, Inc. | | | 2,764 | | | | 233,890 | |
Selective Insurance Group, Inc. | | | 5,153 | | | | 196,896 | |
Westamerica BanCorp. | | | 8,973 | | | | 442,010 | |
| | | | | | | | 2,022,946 | |
|
| Health Care — 4.3% | |
Abbvie, Inc. | | | 4,133 | | | | 255,874 | |
Bristol-Myers Squibb Co. | | | 2,700 | | | | 198,585 | |
Celgene Corp.* | | | 1,698 | | | | 167,474 | |
DENTSPLY SIRONA, Inc. | | | 9,924 | | | | 615,685 | |
IDEXX Laboratories, Inc.* | | | 3,770 | | | | 350,082 | |
Illumina, Inc.* | | | 1,130 | | | | 158,629 | |
Merck & Co., Inc. | | | 3,290 | | | | 189,537 | |
Myriad Genetics, Inc.* | | | 5,267 | | | | 161,170 | |
| | | | | | | | 2,097,036 | |
|
| Industrials — 1.8% | |
Boeing Co., The | | | 3,400 | | | | 441,558 | |
Cintas Corp. | | | 4,350 | | | | 426,866 | |
| | | | | | | | 868,424 | |
|
| Information Technology — 8.6% | |
Arista Networks, Inc.* | | | 4,359 | | | | 280,632 | |
LogMeIn, Inc.* | | | 15,948 | | | | 1,011,582 | |
Mobileye NV* | | | 17,971 | | | | 829,182 | |
NETGEAR, Inc.* | | | 16,515 | | | | 785,123 | |
| | | | | | | | |
| | | Shares | | | Fair
Value | |
|
| Information Technology — 8.6% continued | |
Ubiquiti Networks, Inc.* | | | 15,690 | | | $ | 606,575 | |
Western Union Co. | | | 37,764 | | | | 724,314 | |
| | | | | | | | 4,237,408 | |
|
| Materials — 0.7% | |
Bemis Co., Inc. | | | 6,325 | | | | 325,674 | |
|
| Utilities — 1.1% | |
Consolidated Edison, Inc. | | | 6,490 | | | | 522,056 | |
|
| Total Securities Sold Short — 30.2% | |
(Proceeds 13,606,071) | | | | | | $ | 14,828,249 | |
| * | Non-dividend expense producing security. |
Percentages disclosed are based on total net assets of the Fund at June 30, 2016.
See accompanying Notes to Financial Statements
| | | | | | | | | | | | | | |
| 20 | | DIAMOND HILL FUNDS | | | | | SEMI-ANNUAL REPORT | | | | | JUNE 30, 2016 | | | | | DIAMOND-HILL.COM |
Diamond Hill Financial Long-Short Fund
Schedule of Investments
June 30, 2016 (Unaudited)
| | | | | | | | |
| | | Shares | | | Fair Value | |
|
| Common Stocks — 98.1% | |
| Banks, Thrifts & Mortgage Finance — 39.5% | |
Berkshire Hathaway, Inc., Class B*^ | | | 3,685 | | | $ | 533,551 | |
BOK Financial Corp.^ | | | 9,370 | | | | 587,499 | |
Bridge Bancorp, Inc. | | | 17,480 | | | | 496,432 | |
Citigroup, Inc.^ | | | 44,395 | | | | 1,881,905 | |
Comerica, Inc. | | | 8,355 | | | | 343,641 | |
First Horizon National Corp.^ | | | 24,155 | | | | 332,856 | |
First of Long Island Corp., The | | | 14,002 | | | | 401,437 | |
First Republic Bank^ | | | 6,710 | | | | 469,633 | |
Nationstar Mortgage Holdings, Inc.*^ | | | 118,980 | | | | 1,339,715 | |
PNC Financial Services Group, Inc.^ | | | 1,034 | | | | 84,157 | |
Popular, Inc.^ | | | 59,840 | | | | 1,753,312 | |
State Bank Financial Corp. | | | 26,475 | | | | 538,766 | |
Sterling Bancorp | | | 18,148 | | | | 284,924 | |
SunTrust Banks, Inc.^ | | | 1,517 | | | | 62,318 | |
SVB Financial Group*^ | | | 8,175 | | | | 777,933 | |
Wells Fargo & Co. | | | 18,495 | | | | 875,368 | |
| | | | | | | | 10,763,447 | |
|
| Capital Markets — 8.5% | |
Fortress Investment Group LLC, Class A | | | 280,670 | | | | 1,240,561 | |
Franklin Resources, Inc.^ | | | 32,065 | | | | 1,070,009 | |
| | | | | | | | 2,310,570 | |
|
| Consumer Financial Services — 9.3% | |
American Express Co. | | | 6,335 | | | | 384,915 | |
Capital One Financial Corp.^ | | | 19,785 | | | | 1,256,545 | |
Discover Financial Services | | | 16,405 | | | | 879,144 | |
| | | | | | | | 2,520,604 | |
|
| Diversified Financial Services — 10.0% | |
BankUnited, Inc. | | | 25,050 | | | | 769,536 | |
JPMorgan Chase & Co.^ | | | 10,530 | | | | 654,334 | |
Morgan Stanley^ | | | 33,990 | | | | 883,060 | |
State Street Corp.^ | | | 7,900 | | | | 425,968 | |
| | | | | | | | 2,732,898 | |
|
| Insurance — 20.4% | |
American Equity Investment Life Holding Co. | | | 13,115 | | | | 186,889 | |
American International Group, Inc.^ | | | 1,180 | | | | 62,410 | |
Brown & Brown, Inc.^ | | | 6,965 | | | | 260,979 | |
Enstar Group Ltd.* | | | 2,500 | | | | 404,975 | |
Loews Corp.^ | | | 31,680 | | | | 1,301,731 | |
MetLife, Inc. | | | 33,685 | | | | 1,341,674 | |
ProAssurance Corp. | | | 5,050 | | | | 270,428 | |
Progressive Corp. | | | 2,250 | | | | 75,375 | |
| | | | | | | | |
| | | Shares | | | Fair
Value | |
|
| Insurance — 20.4% continued | |
Prudential Financial, Inc. | | | 4,245 | | | $ | 302,838 | |
Willis Towers Watson plc^ | | | 10,858 | | | | 1,349,758 | |
| | | | | | | | 5,557,057 | |
|
| IT Services/Other — 0.8% | |
Vantiv, Inc., Class A* | | | 4,085 | | | | 231,211 | |
|
| REITs & Real Estate Management — 9.6% | |
Colony Capital, Inc., Class A^ | | | 68,330 | | | | 1,048,866 | |
iStar Financial, Inc. REIT* | | | 131,733 | | | | 1,263,319 | |
Jones Lang LaSalle, Inc. | | | 3,200 | | | | 311,840 | |
| | | | | | | | 2,624,025 | |
| |
| Total Common Stocks | | | $ | 26,739,812 | |
|
| Registered Investment Companies — 33.3% | |
State Street Institutional Liquid Reserves Fund, Premier Class, 0.47%S | | | 1,710,433 | | | | 1,710,433 | |
State Street Navigator Securities Lending Prime Portfolio, 0.51%†S | | | 7,349,108 | | | | 7,349,108 | |
| |
| Total Registered Investment Companies | | | $ | 9,059,541 | |
|
| Total Investment Securities — 131.4% | |
(Cost $37,411,170)** | | | | | | $ | 35,799,353 | |
| |
Segregated Cash
With Custodian — 16.9% | | | | 4,606,883 | |
|
| Securities Sold Short — (17.2)% | |
(Proceeds $3,881,016) | | | | | | | (4,685,398 | ) |
| |
Net Other Assets
(Liabilities) — (31.1)% | | | | (8,471,974 | ) |
| | |
| Net Assets — 100.0% | | | | | | $ | 27,248,864 | |
| * | Non-income producing security. |
| ^ | All or a portion of the security is on loan. The total fair value of the securities on loan as of June 30, 2016 was $7,184,571. |
| † | This security, which was purchased using cash collateral received from securities on loan, represents collateral for securities loaned as of June 30, 2016. |
| S | Rate represents the daily yield on June 30, 2016. |
| ** | Represents cost for financial reporting purposes. |
PLC – Public Limited Company
REIT – Real Estate Investment Trust
See accompanying Notes to Financial Statements
| | | | | | | | | | | | | | | | |
| DIAMOND HILL FUNDS | | | | | SEMI-ANNUAL REPORT | | | | | JUNE 30, 2016 | | | | | DIAMOND-HILL.COM | | | 21 | |
Diamond Hill Financial Long-Short Fund
Schedule of Investments Sold Short
June 30, 2016 (Unaudited)
Diamond Hill Corporate Credit Fund
Schedule of Investments
June 30, 2016 (Unaudited)
| | | | | | | | |
| | | Shares | | | Fair
Value | |
|
| Common Stocks — 17.2% | |
| Banks, Thrifts & Mortgage Finance — 3.6% | |
Bank of Hawaii Corp. | | | 3,725 | | | $ | 256,280 | |
Washington Federal, Inc. | | | 5,270 | | | | 127,850 | |
Westamerica BanCorp. | | | 12,100 | | | | 596,046 | |
| | | | | | | | 980,176 | |
|
| Insurance — 10.2% | |
Cincinnati Financial Corp. | | | 12,850 | | | | 962,337 | |
First American Financial Corp. | | | 10,610 | | | | 426,734 | |
Hanover Insurance Group, Inc. | | | 6,950 | | | | 588,109 | |
Mercury General Corp. | | | 4,710 | | | | 250,384 | |
Selective Insurance Group, Inc. | | | 14,420 | | | | 550,988 | |
| | | | | | | | 2,778,552 | |
|
| IT Services/Other — 1.3% | |
Western Union Co. | | | 18,245 | | | | 349,939 | |
|
| REITs & Real Estate Management — 2.1% | |
Government Properties Income Trust | | | 25,010 | | | | 576,731 | |
|
| Total Securities Sold Short — 17.2% | |
(Proceeds $3,881,016) | | | $ | 4,685,398 | |
Percentages disclosed are based on total net assets of the Fund at June 30, 2016.
See accompanying Notes to Financial Statements
| | | | | | | | |
| | | Shares/
Par Value | | | Fair
Value | |
|
| Collateralized Debt Obligations — 0.3% | |
Alesco Preferred Funding Ltd., Class PPNE, 3/23/35#* | | $ | 336,608 | | | $ | 122,966 | |
Alesco Preferred Funding VI, Class PNN, 3/23/35#* | | | 621,631 | | | | 238,234 | |
Fort Sheridan ABS CDO Ltd., Class PPN2, 11/5/41#* | | | 611,948 | | | | 280,309 | |
Taberna Preferred Funding Ltd., Class PPN2, 7/5/35#* | | | 1,175,564 | | | | 449,959 | |
| |
| Total Collateralized Debt Obligations | | | $ | 1,091,468 | |
|
| Corporate Bonds — 85.0% | |
| Automotive — 0.7% | | | | | |
Optimas OE Solution Holding,
8.63%, 6/1/21†† | | $ | 4,375,000 | | | | 3,062,500 | |
| |
| Banking — 5.2% | | | | | |
Popular, Inc.,
7.00%, 7/1/19 | | | 18,986,000 | | | | 18,606,280 | |
Synovus Financial Corp.,
7.88%, 2/15/19 | | | 1,775,000 | | | | 1,965,813 | |
Synovus Financial Corp.,
5.13%, 6/15/17 | | | 1,006,000 | | | | 1,023,303 | |
| | | | | | | | 21,595,396 | |
| |
| Basic Industry — 7.3% | | | | | |
Axalta Coating Systems Dutch Holding,
7.38%, 5/1/21†† | | | 2,330,000 | | | | 2,455,238 | |
Cemex Finance LLC,
9.38%, 10/12/22^†† | | | 2,500,000 | | | | 2,750,000 | |
Century Communities, Inc.,
6.88%, 5/15/22 | | | 5,995,000 | | | | 5,755,199 | |
GCP Applied Technologies, Inc.,
9.50%, 2/1/23†† | | | 3,300,000 | | | | 3,687,750 | |
NCI Building Systems, Inc.,
8.25%, 1/15/23†† | | | 2,597,000 | | | | 2,791,230 | |
| | | | | | | | | | | | | | |
| 22 | | DIAMOND HILL FUNDS | | | | | SEMI-ANNUAL REPORT | | | | | JUNE 30, 2016 | | | | | DIAMOND-HILL.COM |
Diamond Hill Corporate Credit Fund
Schedule of Investments (Continued)
June 30, 2016 (Unaudited)
| | | | | | | | |
| | | Shares/
Par Value | | | Fair
Value | |
|
| Corporate Bonds — 85.0% continued | |
| Basic Industry — 7.3% continued | | | | | |
Platform Specialty Products Corp.,
6.50%, 2/1/22^†† | | $ | 4,950,000 | | | $ | 4,356,000 | |
Platform Specialty Products Corp.,
10.38%, 5/1/21†† | | | 335,000 | | | | 337,513 | |
Summit Materials LLC,
8.50%, 4/15/22†† | | | 7,725,000 | | | | 8,178,843 | |
| | | | | | | | 30,311,773 | |
| |
| Energy — 6.0% | | | | | |
Carrizo Oil & Gas, Inc.,
7.50%, 9/15/20 | | | 3,085,000 | | | | 3,123,563 | |
Cimarex Energy Co.,
5.88%, 5/1/22 | | | 1,302,000 | | | | 1,363,902 | |
Diamondback Energy, Inc.,
7.63%, 10/1/21^ | | | 5,876,000 | | | | 6,206,525 | |
Energen Corp.,
4.63%, 9/1/21 | | | 780,000 | | | | 733,200 | |
Energen Corp.,
7.13%, 2/15/28 | | | 950,000 | | | | 807,500 | |
McDermott International, Inc.,
8.00%, 5/1/21†† | | | 4,594,000 | | | | 3,950,840 | |
Oceaneering International, Inc.,
4.65%, 11/15/24 | | | 9,097,000 | | | | 8,799,701 | |
| | | | | | | | 24,985,231 | |
| |
| Financial Services — 7.8% | | | | | |
Nationstar Mortgage/Capital Corp.,
6.50%, 7/1/21 | | | 15,225,000 | | | | 13,017,375 | |
Nationstar Mortgage/Capital Corp.,
9.63%, 5/1/19^ | | | 6,809,000 | | | | 7,047,315 | |
Quicken Loans, Inc., 5.75%, 5/1/25†† | | | 6,846,000 | | | | 6,606,390 | |
Springleaf Finance Corp.,
8.25%, 12/15/20 | | | 5,825,000 | | | | 5,839,563 | |
| | | | | | | | 32,510,643 | |
| |
| Health Care — 9.6% | | | | | |
BioScrip, Inc.,
8.88%, 2/15/21 | | | 6,200,000 | | | | 5,735,000 | |
Centene Escrow Corp.,
6.13%, 2/15/24†† | | | 2,725,000 | | | | 2,897,016 | |
| | | | | | | | |
| | | Shares/
Par Value | | | Fair
Value | |
| |
| Health Care — 9.6% continued | | | | | |
Concordia Healthcare Corp.,
9.50%, 10/21/22^†† | | $ | 2,800,000 | | | $ | 2,611,000 | |
Endo Finance LLC,
6.00%, 7/15/23^†† | | | 1,750,000 | | | | 1,540,000 | |
Greatbatch Ltd.,
9.13%, 11/1/23†† | | | 4,840,000 | | | | 4,821,850 | |
Horizon Pharma plc,
6.63%, 5/1/23^ | | | 6,075,000 | | | | 5,649,750 | |
Kindred Healthcare, Inc.,
8.75%, 1/15/23 | | | 7,800,000 | | | | 7,697,663 | |
Kindred Healthcare, Inc.,
6.38%, 4/15/22 | | | 625,000 | | | | 557,813 | |
Valeant Pharmaceuticals International, Inc.,
6.38%, 10/15/20†† | | | 10,415,000 | | | | 8,956,899 | |
| | | | | | | | 40,466,991 | |
| |
| Insurance — 3.3% | | | | | |
Compass Investors, Inc.,
7.75%, 1/15/21†† | | | 5,025,000 | | | | 4,974,750 | |
Radian Group, Inc.,
5.25%, 6/15/20 | | | 8,545,000 | | | | 8,609,088 | |
| | | | | | | | 13,583,838 | |
| |
| Leisure — 8.0% | | | | | |
Boyd Gaming Corp.,
9.00%, 7/1/20 | | | 247,000 | | | | 259,504 | |
CCA Club Operations Holdings LLC,
8.25%, 12/15/23†† | | | 3,155,000 | | | | 3,139,225 | |
CCM Merger, Inc.,
9.13%, 5/1/19†† | | | 6,055,000 | | | | 6,342,613 | |
Isle of Capri Casinos, Inc.,
8.88%, 6/15/20 | | | 1,845,000 | | | | 1,923,413 | |
Live Nation Entertainment,
7.00%, 9/1/20†† | | | 6,329,000 | | | | 6,590,071 | |
Rivers Pittsburgh Borrower LP/Finance,
9.50%, 6/15/19†† | | | 13,450,000 | | | | 13,786,249 | |
Station Casinos LLC,
7.50%, 3/1/21 | | | 1,715,000 | | | | 1,815,756 | |
| | | | | | | | 33,856,831 | |
| | | | | | | | | | | | | | | | |
| DIAMOND HILL FUNDS | | | | | SEMI-ANNUAL REPORT | | | | | JUNE 30, 2016 | | | | | DIAMOND-HILL.COM | | | 23 | |
Diamond Hill Corporate Credit Fund
Schedule of Investments (Continued)
June 30, 2016 (Unaudited)
| | | | | | | | |
| | | Shares/
Par Value | | | Fair
Value | |
|
| Corporate Bonds — 85.0% continued | |
| Media — 6.1% | | | | | |
Activision Blizzard, Inc., 5.63%, 9/15/21†† | | $ | 2,250,000 | | | $ | 2,356,875 | |
Altice SA,
7.75%, 5/15/22^†† | | | 5,300,000 | | | | 5,353,000 | |
Cimpress NV,
7.00%, 4/1/22†† | | | 9,225,000 | | | | 9,132,750 | |
Liberty Interactive LLC,
8.25%, 2/1/30 | | | 4,305,000 | | | | 4,466,438 | |
Radio One, Inc.,
7.38%, 10/15/22†† | | | 2,745,000 | | | | 2,621,475 | |
Radio One, Inc.,
9.25%, 2/15/20†† | | | 1,528,000 | | | | 1,352,280 | |
| | | | | | | | 25,282,818 | |
| |
| Real Estate — 2.7% | | | | | |
iStar Financial, Inc.,
5.00%, 7/1/19 | | | 4,230,000 | | | | 3,944,475 | |
iStar Financial, Inc.,
4.88%, 7/1/18 | | | 4,725,000 | | | | 4,559,625 | |
iStar, Inc.,
6.50%, 7/1/21 | | | 2,750,000 | | | | 2,598,750 | |
| | | | | | | | 11,102,850 | |
| |
| Retail — 3.0% | | | | | |
Rent-A-Center, Inc.,
4.75%, 5/1/21 | | | 10,659,000 | | | | 8,900,265 | |
The Fresh Market, Inc.,
9.75%, 5/1/23^†† | | | 3,810,000 | | | | 3,579,019 | |
| | | | | | | | 12,479,284 | |
| |
| Services — 4.6% | | | | | |
Ashtead Capital, Inc.,
6.50%, 7/15/22†† | | | 1,970,000 | | | | 2,050,021 | |
BlueLine Rental LLC,
7.00%, 2/1/19†† | | | 2,865,000 | | | | 2,463,900 | |
Casella Waste Systems, Inc.,
7.75%, 2/15/19 | | | 9,883,000 | | | | 10,086,837 | |
Laureate Education, Inc.,
10.00%, 9/1/19^†† | | | 5,125,000 | | | | 4,484,375 | |
| | | | | | | | 19,085,133 | |
|
| Technology & Electronics — 4.9% | |
Bankrate, Inc.,
6.13%, 8/15/18†† | | | 9,998,000 | | | | 10,053,789 | |
Diebold, Inc.,
8.50%, 4/15/24†† | | | 5,980,000 | | | | 5,935,150 | |
| | | | | | | | |
| | | Shares/
Par Value | | | Fair
Value | |
|
| Technology & Electronics — 4.9% continued | |
Interface Security Systems Holdings, Inc.,
9.25%, 1/15/18 | | $ | 4,485,000 | | | $ | 4,307,394 | |
| | | | | | | | 20,296,333 | |
| |
| Telecommunications — 7.8% | | | | | |
Cincinnati Bell, Inc.,
8.38%, 10/15/20 | | | 10,515,000 | | | | 10,966,199 | |
Cogent Communications Finance, Inc.,
5.63%, 4/15/21†† | | | 15,175,000 | | | | 14,871,500 | |
Frontier Communications Corp.,
11.00%, 9/15/25 | | | 6,275,000 | | | | 6,518,156 | |
| | | | | | | | 32,355,855 | |
| |
| Transportation — 7.0% | | | | | |
Air Canada 2013-1 Pass-Through Trust Class B,
5.38%, 11/15/22†† | | | 2,625,794 | | | | 2,638,923 | |
American Airlines, Inc., Class B, Series 2013-1,
5.63%, 1/15/21†† | | | 7,062,702 | | | | 7,274,583 | |
Norwegian Air Shuttle ASA 2016-1 Pass-Through Trust Class A Series 2016-1, 7.50%, 5/10/25†† | | | 1,800,000 | | | | 1,755,144 | |
U.S. Airways,
8.00%, 10/1/19 | | | 2,383,669 | | | | 2,638,769 | |
U.S. Airways 2012-1 Pass-Through Trust, Class B,
Series 2012-2B,
6.75%, 6/3/21 | | | 4,174,595 | | | | 4,466,817 | |
U.S. Airways 2013-1 Pass-Through Trust, Class B,
Series 2013-1,
5.38%, 5/15/23 | | | 1,536,786 | | | | 1,577,127 | |
| | | | | | | | | | | | | | |
| 24 | | DIAMOND HILL FUNDS | | | | | SEMI-ANNUAL REPORT | | | | | JUNE 30, 2016 | | | | | DIAMOND-HILL.COM |
Diamond Hill Corporate Credit Fund
Schedule of Investments (Continued)
June 30, 2016 (Unaudited)
| | | | | | | | |
| | | Shares/
Par Value | | | Fair
Value | |
|
| Corporate Bonds — 85.0% continued | |
| Transportation — 7.0% continued | |
United Airlines, Inc., Class A,
Series 2007-1,
6.64%, 7/2/22 | | $ | 4,360,124 | | | $ | 4,621,731 | |
XPO Logistics, Inc.,
6.50%, 6/15/22^†† | | | 4,219,000 | | | | 4,023,871 | |
| | | | | | | | 28,996,965 | |
|
| Utilities — 1.0% | |
Source Gas LLC,
5.90%, 4/1/17†† | | | 4,000,000 | | | | 4,095,992 | |
| |
| Total Corporate Bonds | | | $ | 354,068,433 | |
|
| Registered Investment Companies — 20.3% | |
State Street Institutional Liquid Reserves Fund, Premier Class, 0.47%S | | | 48,266,449 | | | | 48,266,449 | |
State Street Navigator Securities Lending Prime Portfolio, 0.51%†S | | | 36,206,143 | | | | 36,206,143 | |
| |
| Total Registered Investment Companies | | | $ | 84,472,592 | |
|
| Total Investment Securities — 105.6% | |
(Cost $443,478,110)** | | | | | | $ | 439,632,493 | |
| |
Net Other Assets
(Liabilities) — (5.6)% | | | | (23,394,243 | ) |
| |
| Net Assets — 100.0% | | | $ | 416,238,250 | |
| * | Non-income producing security. |
| ** | Represents cost for financial reporting purposes. |
| †† | Restricted securities not registered under the Securities Act of 1933 are as follows: |
| | | | | | | | | | | | | | | | |
| | | Acquisition
Date | | | Current
Cost | | | Fair Value | | | Value
as a
% of
Net
Assets | |
Activision Blizzard, Inc. | | | August-14 | | | $ | 2,360,100 | | | $ | 2,356,875 | | | | 0.6% | |
Air Canada 2013-1 Pass-Through Trust, Class B | | | April-16 | | | | 2,615,947 | | | | 2,638,923 | | | | 0.7% | |
Altice SA | | | May-15 | | | | 5,232,750 | | | | 5,353,000 | | | | 1.3% | |
American Airlines, Inc., Series 2013-1, Class B | | | October-14 | | | | 7,220,970 | | | | 7,274,583 | | | | 1.7% | |
Ashtead Capital, Inc. | | | January-16 | | | | 2,033,040 | | | | 2,050,021 | | | | 0.5% | |
Axalta Coating Systems Dutch Holding | | | September-15 | | | | 2,431,655 | | | | 2,455,238 | | | | 0.6% | |
Bankrate, Inc. | | | September-14 | | | | 9,871,235 | | | | 10,053,789 | | | | 2.5% | |
BlueLine Rental LLC | | | July-14 | | | | 2,908,600 | | | | 2,463,900 | | | | 0.6% | |
CCA Club Operations Holdings LLC | | | January-16 | | | | 3,084,978 | | | | 3,139,225 | | | | 0.8% | |
CCM Merger, Inc. | | | September-15 | | | | 6,329,111 | | | | 6,342,613 | | | | 1.5% | |
Cemex Finance LLC | | | September-15 | | | | 2,611,500 | | | | 2,750,000 | | | | 0.7% | |
Centene Escrow Corp. | | | January-16 | | | | 2,775,000 | | | | 2,897,016 | | | | 0.7% | |
Cimpress NV | | | November-15 | | | | 9,116,922 | | | | 9,132,750 | | | | 2.2% | |
Cogent Communications Finance, Inc. | | | April-14 | | | | 14,815,548 | | | | 14,871,500 | | | | 3.6% | |
Compass Investors, Inc. | | | August-15 | | | | 4,834,639 | | | | 4,974,750 | | | | 1.2% | |
Concordia Healthcare Corp. | | | October-15 | | | | 2,721,923 | | | | 2,611,000 | | | | 0.6% | |
Diebold, Inc. | | | April-16 | | | | 6,027,940 | | | | 5,935,150 | | | | 1.4% | |
Endo Finance LLC | | | June-15 | | | | 1,750,000 | | | | 1,540,000 | | | | 0.4% | |
GCP Applied Technologies, Inc. | | | January-16 | | | | 3,385,500 | | | | 3,687,750 | | | | 0.9% | |
Greatbatch Ltd. | | | October-15 | | | | 4,840,350 | | | | 4,821,850 | | | | 1.2% | |
Laureate Education, Inc. | | | August-14 | | | | 4,884,363 | | | | 4,484,375 | | | | 1.1% | |
Live Nation Entertainment | | | February-14 | | | | 6,887,927 | | | | 6,590,071 | | | | 1.5% | |
McDermott International, Inc. | | | July-14 | | | | 4,448,164 | | | | 3,950,840 | | | | 0.9% | |
NCI Building Systems, Inc. | | | January-15 | | | | 2,657,087 | | | | 2,791,230 | | | | 0.7% | |
Norwegian Air Shuttle ASA 2016-1 Pass-Through Trust,
Series 2016-1, Class A | | | May-16 | | | | 1,761,894 | | | | 1,755,144 | | | | 0.4% | |
Optimas OE Solution Holding | | | April-15 | | | | 4,417,375 | | | | 3,062,500 | | | | 0.7% | |
Platform Specialty Products Corp. | | | February-15 | | | | 5,157,709 | | | | 4,693,513 | | | | 1.1% | |
Quicken Loans, Inc. | | | September-16 | | | | 6,391,448 | | | | 6,606,390 | | | | 1.6% | |
Radio One, Inc. | | | July-14 | | | | 4,294,494 | | | | 3,973,755 | | | | 0.9% | |
Rivers Pittsburgh Borrower LP/Finance | | | November-14 | | | | 14,054,996 | | | | 13,786,249 | | | | 3.2% | |
Source Gas LLC | | | March-10 | | | | 3,840,000 | | | | 4,095,992 | | | | 1.0% | |
Summit Materials LLC | | | February-16 | | | | 7,882,187 | | | | 8,178,843 | | | | 1.9% | |
| | | | | | | | | | | | | | | | |
| DIAMOND HILL FUNDS | | | | | SEMI-ANNUAL REPORT | | | | | JUNE 30, 2016 | | | | | DIAMOND-HILL.COM | | | 25 | |
Diamond Hill Corporate Credit Fund
Schedule of Investments (Continued)
June 30, 2016 (Unaudited)
Diamond Hill High Yield Fund
Schedule of Investments
June 30, 2016 (Unaudited)
| | | | | | | | | | | | | | | | |
| | | Acquisition
Date | | | Current
Cost | | | Fair Value | | | Value
as a
% of
Net
Assets | |
The Fresh Market, Inc. | | | April-16 | | | $ | 3,757,392 | | | $ | 3,579,019 | | | | 0.9% | |
Valeant Pharmaceuticals International, Inc. | | | April-14 | | | | 9,481,339 | | | | 8,956,899 | | | | 2.1% | |
XPO Logistics, Inc. | | | June-15 | | | | 4,054,378 | | | | 4,023,871 | | | | 1.0% | |
| | | | | | | | | | | | | | | | |
| | | | | | $ | 180,938,461 | | | $ | 177,878,624 | | | | 42.7% | |
| | | | | | | | | | | | | | | | |
| # | Restricted and illiquid securities not registered under the Securities Act of 1933 and valued at fair value by the Fair Value Committee based on procedures approved by the Board of Trustees are as follows: |
| | | | | | | | | | | | | | | | |
| | | Acquisition
Date | | | Current
Cost | | | Fair Value | | | Value
as a
% of
Net
Assets | |
Alesco Preferred Funding Ltd., Series 6A, Class PPNE | | | March-05 | | | $ | 336,608 | | | $ | 122,966 | | | | 0.0% | |
Alesco Preferred Funding VI, Class PNN | | | December-04 | | | | 621,631 | | | | 238,234 | | | | 0.1% | |
Fort Sheridan ABS CDO Ltd., Series 2005-1A, Class PPN2 | | | March-05 | | | | 509,448 | | | | 280,309 | | | | 0.1% | |
Taberna Preferred Funding Ltd., Series 2005-1A, Class PPN2 | | | March-05 | | | | 1,035,359 | | | | 449,959 | | | | 0.1% | |
| | | | | | | | | | | | | | | | |
| | | | | | $ | 2,503,046 | | | $ | 1,091,468 | | | | 0.3% | |
| | | | | | | | | | | | | | | | |
| ^ | All or a portion of the security is on loan. The total fair value of the securities on loan as of June 30, 2016 was $34,846,249. |
| † | This security, which was purchased using cash collateral received from securities on loan, represents collateral for securities loaned as of June 30, 2016. |
| S | Rate represents the daily yield on June 30, 2016. |
See accompanying Notes to Financial Statements
| | | | | | | | |
| | | Shares/
Par Value | | | Fair
Value | |
|
| Corporate Bonds — 95.6% | |
| Automotive — 0.6% | |
Optimas OE Solution Holding,
8.63%, 6/1/21†† | | $ | 225,000 | | | $ | 157,500 | |
|
| Banking — 5.3% | |
Popular, Inc.,
7.00%, 7/1/19^ | | | 1,310,000 | | | | 1,283,800 | |
|
| Basic Industry — 10.1% | |
Allegheny Technologies, Inc.,
7.88%, 8/15/23 | | | 500,000 | | | | 417,500 | |
Century Communities, Inc.,
6.88%, 5/15/22 | | | 600,000 | | | | 576,000 | |
GCP Applied Technologies, Inc.,
9.50%, 2/1/23^†† | | | 150,000 | | | | 167,625 | |
NCI Building Systems, Inc.,
8.25%, 1/15/23†† | | | 205,000 | | | | 220,332 | |
Platform Specialty Products Corp.,
10.38%, 5/1/21†† | | | 500,000 | | | | 503,750 | |
Summit Materials LLC,
8.50%, 4/15/22†† | | | 550,000 | | | | 582,312 | |
| | | | | | | | 2,467,519 | |
|
| Energy — 5.1% | |
Diamondback Energy, Inc.,
7.63%, 10/1/21^ | | | 200,000 | | | | 211,250 | |
Energen Corp.,
4.63%, 9/1/21 | | | 142,000 | | | | 133,480 | |
Energen Corp.,
7.13%, 2/15/28 | | | 350,000 | | | | 297,500 | |
McDermott International, Inc.,
8.00%, 5/1/21†† | | | 210,000 | | | | 180,600 | |
Oceaneering International, Inc.,
4.65%, 11/15/24 | | | 425,000 | | | | 411,111 | |
| | | | | | | | 1,233,941 | |
|
| Financial Services — 9.2% | |
Nationstar Mortgage/Capital Corp.,
6.50%, 7/1/21 | | | 1,475,000 | | | | 1,261,125 | |
Nationstar Mortgage/Capital Corp.,
9.63%, 5/1/19^ | | | 144,000 | | | | 149,040 | |
| | | | | | | | | | | | | | |
| 26 | | DIAMOND HILL FUNDS | | | | | SEMI-ANNUAL REPORT | | | | | JUNE 30, 2016 | | | | | DIAMOND-HILL.COM |
Diamond Hill High Yield Fund
Schedule of Investments (Continued)
June 30, 2016 (Unaudited)
| | | | | | | | |
| | | Shares/
Par Value | | | Fair
Value | |
|
| Corporate Bonds — 95.6% continued | |
| Financial Services — 9.2% continued | |
Quicken Loans, Inc.,
5.75%, 5/1/25†† | | $ | 300,000 | | | $ | 289,500 | |
Springleaf Finance Corp.,
8.25%, 12/15/20^ | | | 550,000 | | | | 551,375 | |
| | | | | | | | 2,251,040 | |
|
| Health Care — 12.5% | |
BioScrip, Inc.,
8.88%, 2/15/21 | | | 500,000 | | | | 462,500 | |
Centene Escrow Corp.,
6.13%, 2/15/24†† | | | 50,000 | | | | 53,156 | |
Concordia Healthcare Corp.,
9.50%, 10/21/22^†† | | | 200,000 | | | | 186,500 | |
Endo Finance LLC,
6.00%, 7/15/23^†† | | | 100,000 | | | | 88,000 | |
Greatbatch Ltd.,
9.13%, 11/1/23†† | | | 326,000 | | | | 324,778 | |
Horizon Pharma plc,
6.63%, 5/1/23^ | | | 525,000 | | | | 488,250 | |
Kindred Healthcare, Inc.,
8.75%, 1/15/23 | | | 600,000 | | | | 592,127 | |
Kindred Healthcare, Inc.,
6.38%, 4/15/22^ | | | 275,000 | | | | 245,438 | |
Valeant Pharmaceuticals International, Inc.,
7.25%, 7/15/22^†† | | | 100,000 | | | | 85,770 | |
Valeant Pharmaceuticals International, Inc.,
6.38%, 10/15/20^†† | | | 600,000 | | | | 515,999 | |
| | | | | | | | 3,042,518 | |
|
| Insurance — 2.2% | |
Compass Investors, Inc.,
7.75%, 1/15/21†† | | | 375,000 | | | | 371,250 | |
Radian Group, Inc.,
5.25%, 6/15/20 | | | 175,000 | | | | 176,313 | |
| | | | | | | | 547,563 | |
|
| Leisure — 8.0% | |
Boyd Gaming Corp.,
9.00%, 7/1/20 | | | 250,000 | | | | 262,656 | |
CCA Club Operations Holdings LLC,
8.25%, 12/15/23†† | | | 200,000 | | | | 199,000 | |
CCM Merger, Inc.,
9.13%, 5/1/19†† | | | 325,000 | | | | 340,438 | |
Isle of Capri Casinos, Inc.,
8.88%, 6/15/20 | | | 125,000 | | | | 130,313 | |
| | | | | | | | |
| | | Shares/
Par Value | | | Fair
Value | |
|
| Leisure — 8.0% continued | |
Live Nation Entertainment,
7.00%, 9/1/20†† | | $ | 75,000 | | | $ | 78,094 | |
Rivers Pittsburgh Borrower LP/Finance,
9.50%, 6/15/19†† | | | 800,000 | | | | 819,999 | |
Station Casinos LLC,
7.50%, 3/1/21 | | | 100,000 | | | | 105,875 | |
| | | | | | | | 1,936,375 | |
|
| Media — 7.4% | |
Activision Blizzard, Inc., 5.63%, 9/15/21†† | | | 110,000 | | | | 115,225 | |
Altice SA,
7.75%, 5/15/22^†† | | | 300,000 | | | | 303,000 | |
Cimpress NV,
7.00%, 4/1/22†† | | | 425,000 | | | | 420,750 | |
Liberty Interactive LLC,
8.25%, 2/1/30^ | | | 450,000 | | | | 466,875 | |
Quad Graphics, Inc.,
7.00%, 5/1/22 | | | 135,000 | | | | 119,138 | |
Radio One, Inc.,
7.38%, 10/15/22†† | | | 250,000 | | | | 238,750 | |
Radio One, Inc.,
9.25%, 2/15/20†† | | | 160,000 | | | | 141,600 | |
| | | | | | | | 1,805,338 | |
|
| Real Estate — 2.3% | |
iStar Financial, Inc.,
5.00%, 7/1/19 | | | 400,000 | | | | 373,000 | |
iStar, Inc.,
6.50%, 7/1/21 | | | 200,000 | | | | 189,000 | |
| | | | | | | | 562,000 | |
|
| Retail — 4.5% | |
Rent-A-Center, Inc., 4.75%, 5/1/21 | | | 700,000 | | | | 584,500 | |
The Fresh Market, Inc., 9.75%, 5/1/23^†† | | | 550,000 | | | | 516,656 | |
| | | | | | | | 1,101,156 | |
|
| Services — 3.8% | |
BlueLine Rental LLC,
7.00%, 2/1/19†† | | | 50,000 | | | | 43,000 | |
Casella Waste Systems, Inc.,
7.75%, 2/15/19 | | | 337,000 | | | | 343,951 | |
Laureate Education, Inc.,
10.00%, 9/1/19^†† | | | 625,000 | | | | 546,875 | |
| | | | | | | | 933,826 | |
| | | | | | | | | | | | | | | | |
| DIAMOND HILL FUNDS | | | | | SEMI-ANNUAL REPORT | | | | | JUNE 30, 2016 | | | | | DIAMOND-HILL.COM | | | 27 | |
Diamond Hill High Yield Fund
Schedule of Investments (Continued)
June 30, 2016 (Unaudited)
| | | | | | | | |
| | | Shares/
Par Value | | | Fair
Value | |
|
| Corporate Bonds — 95.6% continued | |
| Technology & Electronics — 7.0% | |
Bankrate, Inc.,
6.13%, 8/15/18†† | | $ | 825,000 | | | $ | 829,604 | |
Diebold, Inc.,
8.50%, 4/15/24^†† | | | 600,000 | | | | 595,500 | |
Interface Security Systems Holdings, Inc.,
9.25%, 1/15/18 | | | 300,000 | | | | 288,120 | |
| | | | | | | | 1,713,224 | |
|
| Telecommunications — 8.1% | |
CenturyLink, Inc., Series Y,
7.50%, 4/1/24^ | | | 300,000 | | | | 303,000 | |
Cincinnati Bell, Inc.,
8.38%, 10/15/20 | | | 423,000 | | | | 441,151 | |
Cogent Communications Finance, Inc.,
5.63%, 4/15/21†† | | | 640,000 | | | | 627,200 | |
Frontier Communications Corp.,
11.00%, 9/15/25 | | | 560,000 | | | | 581,700 | |
| | | | | | | | 1,953,051 | |
|
| Transportation — 9.5% | |
Air Canada 2013-1 Pass-Through Trust Class B,
5.38%, 11/15/22†† | | | 201,984 | | | | 202,994 | |
American Airlines, Inc., Class B, Series 2013-1,
5.63%, 1/15/21†† | | | 449,445 | | | | 462,928 | |
Continental Airlines 2012-1, Class B, Series 2012-1,
6.25%, 4/11/20 | | | 24,358 | | | | 25,917 | |
Continental Airlines 2012-2, Class B, Series 2012-2,
5.50%, 4/29/22 | | | 161,836 | | | | 166,691 | |
Norwegian Air Shuttle ASA 2016-1 Pass-Through Trust Class A Series 2016-1,
7.50%, 5/10/25†† | | | 200,000 | | | | 195,016 | |
U.S. Airways 2011-1 Pass-Through Trust, Class A, Series 2011-1,
7.13%, 4/22/25 | | | 28,997 | | | | 34,361 | |
| | | | | | | | |
| | | Shares/
Par Value | | | Fair
Value | |
|
| Transportation — 9.5% continued | |
U.S. Airways 2012-1 Pass-Through Trust, Class B, Series 2012-2B,
6.75%, 6/3/21 | | $ | 179,698 | | | $ | 192,277 | |
U.S. Airways 2013-1 Pass-Through Trust, Class B, Series 2013-1,
5.38%, 5/15/23 | | | 135,999 | | | | 139,569 | |
United Airlines, Inc., Class B, Series 2013-1B,
5.38%, 2/15/23 | | | 82,037 | | | | 84,908 | |
United Airlines, Inc., Class A, Series 2007-1,
6.64%, 7/2/22 | | | 444,306 | | | | 470,964 | |
XPO Logistics, Inc.,
6.50%, 6/15/22^†† | | | 350,000 | | | | 333,813 | |
| | | | | | | | 2,309,438 | |
| |
| Total Corporate Bonds | | | $ | 23,298,289 | |
|
| Registered Investment Companies — 26.4% | |
State Street Institutional Liquid Reserves Fund, Premier Class, 0.47%S | | | 732,610 | | | | 732,610 | |
State Street Navigator Securities Lending Prime Portfolio, 0.51%†S | | | 5,694,157 | | | | 5,694,157 | |
| |
| Total Registered Investment Companies | | | $ | 6,426,767 | |
|
| Total Investment Securities 122.0% | |
(Cost $29,677,859)** | | | $ | 29,725,056 | |
| |
Net Other Assets
(Liabilities) — (22.0)% | | | | (5,359,778 | ) |
| |
| Net Assets — 100.0% | | | $ | 24,365,278 | |
| ** | Represents cost for financial reporting purposes. |
| †† | Restricted securities not registered under the Securities Act of 1933 are as follows: |
| | | | | | | | | | | | | | | | |
| | | Acquisition
Date | | | Current
Cost | | | Fair Value | | | Value
as a
% of
Net
Assets | |
Activision Blizzard, Inc. | | | December-14 | | | $ | 115,200 | | | $ | 115,225 | | | | 0.5% | |
Air Canada 2013-1 Pass-Through Trust, Class B | | | April-16 | | | | 201,227 | | | | 202,994 | | | | 0.8% | |
| | | | | | | | | | | | | | |
| 28 | | DIAMOND HILL FUNDS | | | | | SEMI-ANNUAL REPORT | | | | | JUNE 30, 2016 | | | | | DIAMOND-HILL.COM |
Diamond Hill High Yield Fund
Schedule of Investments (Continued)
June 30, 2016 (Unaudited)
| | | | | | | | | | | | | | | | |
| | | Acquisition
Date | | | Current
Cost | | | Fair Value | | | Value
as a
% of
Net
Assets | |
Altice SA | | | January-15 | | | $ | 300,500 | | | $ | 303,000 | | | | 1.2% | |
American Airlines, Inc., Series 2013-1, Class B | | | December-14 | | | | 460,493 | | | | 462,928 | | | | 1.9% | |
Bankrate, Inc. | | | June-15 | | | | 820,597 | | | | 829,604 | | | | 3.4% | |
BlueLine Rental LLC | | | March-16 | | | | 40,500 | | | | 43,000 | | | | 0.2% | |
CCA Club Operations Holdings LLC | | | January-16 | | | | 191,813 | | | | 199,000 | | | | 0.8% | |
CCM Merger, Inc. | | | July-15 | | | | 341,704 | | | | 340,438 | | | | 1.4% | |
Centene Escrow Corp. | | | January-16 | | | | 50,000 | | | | 53,156 | | | | 0.2% | |
Cimpress NV | | | November-15 | | | | 421,028 | | | | 420,750 | | | | 1.7% | |
Cogent Communications Finance, Inc. | | | December-14 | | | | 619,722 | | | | 627,200 | | | | 2.7% | |
Compass Investors, Inc. | | | December-14 | | | | 357,024 | | | | 371,250 | | | | 1.5% | |
Concordia Healthcare Corp. | | | October-15 | | | | 193,578 | | | | 186,500 | | | | 0.8% | |
Diebold, Inc. | | | April-16 | | | | 606,250 | | | | 595,500 | | | | 2.4% | |
Endo Finance LLC | | | June-15 | | | | 100,000 | | | | 88,000 | | | | 0.4% | |
GCP Applied Technologies, Inc. | | | January-16 | | | | 153,000 | | | | 167,625 | | | | 0.7% | |
Greatbatch Ltd. | | | October-15 | | | | 324,624 | | | | 324,778 | | | | 1.3% | |
Laureate Education, Inc. | | | December-14 | | | | 530,983 | | | | 546,875 | | | | 2.2% | |
Live Nation Entertainment | | | December-14 | | | | 78,904 | | | | 78,094 | | | | 0.3% | |
McDermott International, Inc. | | | December-14 | | | | 154,950 | | | | 180,600 | | | | 0.7% | |
NCI Building Systems, Inc. | | | January-15 | | | | 208,863 | | | | 220,332 | | | | 0.9% | |
Norwegian Air Shuttle ASA 2016-1 Pass-Through Trust, Series 2016-1, Class A | | | May-16 | | | | 195,766 | | | | 195,016 | | | | 0.8% | |
Optimas OE Solution Holding | | | April-15 | | | | 226,625 | | | | 157,500 | | | | 0.6% | |
Platform Specialty Products Corp. | | | November-15 | | | | 490,750 | | | | 503,750 | | | | 2.1% | |
Quicken Loans, Inc. | | | January-16 | | | | 278,708 | | | | 289,500 | | | | 1.2% | |
Radio One, Inc. | | | February-15 | | | | 393,735 | | | | 380,350 | | | | 1.6% | |
Rivers Pittsburgh Borrower LP/Finance | | | December-14 | | | | 832,980 | | | | 819,999 | | | | 3.5% | |
Summit Materials LLC | | | February-16 | | | | 561,813 | | | | 582,312 | | | | 2.4% | |
The Fresh Market, Inc. | | | April-16 | | | | 542,160 | | | | 516,656 | | | | 2.1% | |
Valeant Pharmaceuticals International, Inc. | | | October-15 | | | | 619,288 | | | | 601,769 | | | | 2.5% | |
XPO Logistics, Inc. | | | June-15 | | | | 333,564 | | | | 333,813 | | | | 1.4% | |
| | | | | | | | | | | | | | | | |
| | | | | | $ | 10,746,349 | | | $ | 10,737,514 | | | | 44.2% | |
| | | | | | | | | | | | | | | | |
| ^ | All or a portion of the security is on loan. The total fair value of the securities on loan as of June 30, 2016 was $5,469,406. |
| † | This security, which was purchased using cash collateral received from securities on loan, represents collateral for securities loaned as of June 30, 2016. |
| S | Rate represents the daily yield on June 30, 2016. |
See accompanying Notes to Financial Statements
| | | | | | | | | | | | | | | | |
| DIAMOND HILL FUNDS | | | | | SEMI-ANNUAL REPORT | | | | | JUNE 30, 2016 | | | | | DIAMOND-HILL.COM | | | 29 | |
Diamond Hill Funds
Tabular Presentation of Schedules of Investments June 30, 2016
| | | | |
Diamond Hill Small Cap Fund | |
Sector Allocation | | % of
Net Assets | |
Financials | | | 27.0% | |
Industrials | | | 18.0% | |
Consumer Discretionary | | | 9.4% | |
Health Care | | | 8.5% | |
Information Technology | | | 7.2% | |
Consumer Staples | | | 5.8% | |
Utilities | | | 3.1% | |
Energy | | | 2.8% | |
Telecommunication Services | | | 0.2% | |
Cash and Cash Equivalents | | | 29.0% | |
Other | | | | |
Net Other Assets (Liabilities) | | | -11.0% | |
| | | | | |
| | | | 100% | |
| | | | | |
Russell 2000 Index Sector Allocation | | % of
Index | |
Financials | | | 25.8% | |
Industrials | | | 13.7% | |
Consumer Discretionary | | | 13.6% | |
Health Care | | | 13.8% | |
Information Technology | | | 17.2% | |
Consumer Staples | | | 3.1% | |
Utilities | | | 4.3% | |
Energy | | | 3.0% | |
Telecommunication Services | | | 0.9% | |
Materials | | | 4.6% | |
| | | | | |
| | | | 100% | |
| | | | | |
| | | | | |
| | | | |
Diamond Hill Small-Mid Cap Fund | |
Sector Allocation | | % of
Net Assets | |
Financials | | | 27.6% | |
Consumer Discretionary | | | 14.9% | |
Consumer Staples | | | 11.5% | |
Industrials | | | 11.2% | |
Information Technology | | | 9.2% | |
Health Care | | | 8.3% | |
Energy | | | 3.5% | |
Utilities | | | 3.3% | |
Materials | | | 1.8% | |
Cash and Cash Equivalents | | | 17.1% | |
Other | | | | |
Net Other Assets (Liabilities) | | | -8.4% | |
| | | | | |
| | | | 100% | |
| | | | | |
Russell 2500 Index Sector Allocation | | % of
Index | |
Financials | | | 25.8% | |
Consumer Discretionary | | | 12.9% | |
Consumer Staples | | | 3.5% | |
Industrials | | | 16.0% | |
Information Technology | | | 14.6% | |
Health Care | | | 11.3% | |
Energy | | | 4.4% | |
Utilities | | | 4.9% | |
Materials | | | 5.8% | |
Telecom | | | 0.8% | |
| | | | | |
| | | | 100% | |
| | | | | |
| | | | | |
| | | | | | | | | | | | | | |
| 30 | | DIAMOND HILL FUNDS | | | | | SEMI-ANNUAL REPORT | | | | | JUNE 30, 2016 | | | | | DIAMOND-HILL.COM |
Diamond Hill Funds
Tabular Presentation of Schedules of Investments (Continued) June 30, 2016
| | | | |
Diamond Hill Mid Cap Fund | |
Sector Allocation | | % of
Net Assets | |
Financials | | | 28.2% | |
Consumer Discretionary | | | 17.5% | |
Consumer Staples | | | 12.0% | |
Industrials | | | 11.0% | |
Information Technology | | | 8.4% | |
Health Care | | | 6.2% | |
Energy | | | 3.5% | |
Utilities | | | 3.2% | |
Materials | | | 2.7% | |
Cash and Cash Equivalents | | | 34.4% | |
Other | | | | |
Net Other Assets (Liabilities) | | | -27.1% | |
| | | | | |
| | | | 100% | |
| | | | |
Russell Midcap Index
Sector Allocation | | % of
Index | |
Financials | | | 22.2% | |
Consumer Discretionary | | | 15.4% | |
Consumer Staples | | | 5.5% | |
Industrials | | | 13.4% | |
Information Technology | | | 13.9% | |
Health Care | | | 9.7% | |
Energy | | | 5.9% | |
Utilities | | | 7.5% | |
Materials | | | 5.5% | |
Telecom | | | 1.0% | |
| | | | | |
| | | | 100% | |
| | | | | |
| | | | | |
| | | | |
Diamond Hill Large Cap Fund | |
Sector Allocation | | % of
Net Assets | |
Financials | | | 25.7% | |
Consumer Discretionary | | | 19.1% | |
Information Technology | | | 14.8% | |
Health Care | | | 13.6% | |
Consumer Staples | | | 10.6% | |
Industrials | | | 8.2% | |
Energy | | | 3.5% | |
Materials | | | 2.3% | |
Cash and Cash Equivalents | | | 12.9% | |
Other | | | | |
Net Other Assets (Liabilities) | | | -10.7% | |
| | | | | |
| | | | 100% | |
| | | | | |
Russell 1000 Index Sector Allocation | | % of
Index | |
Financials | | | 16.7% | |
Consumer Discretionary | | | 13.3% | |
Information Technology | | | 19.3% | |
Health Care | | | 14.2% | |
Consumer Staples | | | 9.3% | |
Industrials | | | 10.5% | |
Energy | | | 7.0% | |
Materials | | | 3.2% | |
Utilities | | | 3.7% | |
Telecom | | | 2.8% | |
| | | | | |
| | | | 100% | |
| | | | | |
| | | | | |
| | | | | | | | | | | | | | | | |
| DIAMOND HILL FUNDS | | | | | SEMI-ANNUAL REPORT | | | | | JUNE 30, 2016 | | | | | DIAMOND-HILL.COM | | | 31 | |
Diamond Hill Funds
Tabular Presentation of Schedules of Investments (Continued) June 30, 2016
| | | | |
Diamond Hill Select Fund | |
Sector Allocation | | % of
Net Assets | |
Financials | | | 30.5% | |
Industrials | | | 23.2% | |
Consumer Discretionary | | | 18.1% | |
Health Care | | | 11.6% | |
Information Technology | | | 9.7% | |
Consumer Staples | | | 1.7% | |
Energy | | | 1.0% | |
Cash and Cash Equivalents | | | 11.8% | |
Other | | | | |
Net Other Assets (Liabilities) | | | -7.6% | |
| | | | | |
| | | | 100% | |
| | | | | |
Russell 3000 Index
Sector Allocation | | % of
Index | |
Financials | | | 17.4% | |
Industrials | | | 10.8% | |
Consumer Discretionary | | | 13.3% | |
Health Care | | | 14.1% | |
Information Technology | | | 19.2% | |
Consumer Staples | | | 8.8% | |
Energy | | | 6.7% | |
Utilities | | | 3.8% | |
Materials | | | 3.3% | |
Telecom | | | 2.6% | |
| | | | | |
| | | | 100% | |
| | | | | |
| | | | | |
| | | | |
Diamond Hill Long-Short Fund | |
Long Portfolio
Sector Allocation | | % of
Net Assets | |
Financials | | | 28.6% | |
Consumer Discretionary | | | 18.6% | |
Information Technology | | | 12.8% | |
Industrials | | | 10.6% | |
Health Care | | | 8.7% | |
Consumer Staples | | | 4.3% | |
Energy | | | 2.9% | |
Materials | | | 0.6% | |
Cash and Cash Equivalents | | | 26.0% | |
| | |
Short Portfolio
Sector Allocation | | % of
Net Assets | |
Materials | | | -0.3% | |
Energy | | | -0.5% | |
Telecommunication Services | | | -0.8% | |
Utilities | | | -1.7% | |
Industrials | | | -3.2% | |
Information Technology | | | -3.4% | |
Health Care | | | -3.4% | |
Consumer Staples | | | -4.7% | |
Financials | | | -5.3% | |
Consumer Discretionary | | | -6.8% | |
Other | | | | |
Segregated Cash With Brokers | | | 30.4% | |
Net Other Assets (Liabilities) | | | -13.4% | |
| | | | | |
| | | | 100% | |
| | | | | |
Russell 1000 Index
Sector Allocation | | % of
Index | |
Financials | | | 16.7% | |
Consumer Discretionary | | | 13.3% | |
Information Technology | | | 19.3% | |
Industrials | | | 10.5% | |
Health Care | | | 14.2% | |
Consumer Staples | | | 9.3% | |
Energy | | | 7.0% | |
Materials | | | 3.2% | |
Utilities | | | 3.7% | |
Telecom | | | 2.8% | |
| | | | | |
| | | | 100% | |
| | | | | |
| | | | | |
| | | | | | | | | | | | | | |
| 32 | | DIAMOND HILL FUNDS | | | | | SEMI-ANNUAL REPORT | | | | | JUNE 30, 2016 | | | | | DIAMOND-HILL.COM |
Diamond Hill Funds
Tabular Presentation of Schedules of Investments (Continued) June 30, 2016
| | | | |
Diamond Hill Research Opportunities Fund | |
Long Portfolio
Sector Allocation | | % of
Net Assets | |
Information Technology | | | 23.6% | |
Financials | | | 19.2% | |
Consumer Discretionary | | | 19.0% | |
Industrials | | | 16.7% | |
Health Care | | | 16.5% | |
Consumer Staples | | | 4.0% | |
Telecommunication Services | | | 2.6% | |
Materials | | | 1.5% | |
Energy | | | 1.3% | |
Cash and Cash Equivalents | | | 22.6% | |
| | |
Short Portfolio
Sector Allocation | | % of
Net Assets | |
Materials | | | -0.7% | |
Utilities | | | -1.1% | |
Energy | | | -1.4% | |
Consumer Staples | | | -1.5% | |
Industrials | | | -1.8% | |
Financials | | | -4.1% | |
Health Care | | | -4.3% | |
Consumer Discretionary | | | -6.7% | |
Information Technology | | | -8.6% | |
Other | | | | |
Segregated Cash With Brokers | | | 24.5% | |
Net Other Assets (Liabilities) | | | -21.3% | |
| | | | | |
| | | | 100% | |
| | | | | |
Russell 3000 Index
Sector Allocation | | % of
Index | |
Information Technology | | | 19.2% | |
Financials | | | 17.4% | |
Consumer Discretionary | | | 13.3% | |
Industrials | | | 10.8% | |
Health Care | | | 14.1% | |
Consumer Staples | | | 8.8% | |
Telecommunication Services | | | 2.6% | |
Materials | | | 3.3% | |
Energy | | | 6.7% | |
Utilities | | | 3.8% | |
| | | | | |
| | | | 100% | |
| | | | | |
| | | | | |
| | | | |
Diamond Hill Financial Long-Short Fund | |
Long Portfolio
Sector Allocation | | % of
Net Assets | |
Banks, Thrifts & Mortgage Finance | | | 39.5% | |
Insurance | | | 20.4% | |
Diversified Financial Services | | | 10.0% | |
REITs & Real Estate Management | | | 9.6% | |
Consumer Financial Services | | | 9.3% | |
Capital Markets | | | 8.5% | |
IT Services/Other | | | 0.8% | |
Cash and Cash Equivalents | | | 33.3% | |
| | |
Short Portfolio
Sector Allocation | | % of
Net Assets | |
IT Services/Other | | | -1.3% | |
REITs & Real Estate Management | | | -2.1% | |
Banks, Thrifts & Mortgage Finance | | | -3.6% | |
Insurance | | | -10.2% | |
Other | | | | |
Segregated Cash With Brokers | | | 16.9% | |
Net Other Assets (Liabilities) | | | -31.1% | |
| | | | | |
| | | | 100% | |
| | | | | |
Russell 3000 Index
Sector Allocation | | % of
Index | |
Banks, Thrifts & Mortgage Finance | | | 27.7% | |
Insurance | | | 14.4% | |
Diversified Financial Services | | | 13.7% | |
REITs & Real Estate Management | | | 24.1% | |
Consumer Financial Services | | | 3.3% | |
Capital Markets | | | 6.0% | |
IT Services/Other | | | 10.8% | |
| | | | | |
| | | | 100% | |
| | | | | |
| | | | | |
| | | | | | | | | | | | | | | | |
| DIAMOND HILL FUNDS | | | | | SEMI-ANNUAL REPORT | | | | | JUNE 30, 2016 | | | | | DIAMOND-HILL.COM | | | 33 | |
Diamond Hill Funds
Tabular Presentation of Schedules of Investments (Continued) June 30, 2016
| | | | |
Diamond Hill Corporate Credit Fund | |
Sector Allocation | | % of
Net Assets | |
Health Care | | | 9.6% | |
Leisure | | | 8.0% | |
Telecommunications | | | 7.8% | |
Financial Services | | | 7.8% | |
Basic Industry | | | 7.3% | |
Transportation | | | 7.0% | |
Media | | | 6.1% | |
Energy | | | 6.0% | |
Banking | | | 5.2% | |
Technology & Electronics | | | 4.9% | |
Services | | | 4.6% | |
Insurance | | | 3.3% | |
Retail | | | 3.0% | |
Real Estate | | | 2.7% | |
Utilities | | | 1.0% | |
Automotive | | | 0.7% | |
Collateralized Mortgage Obligations | | | 0.3% | |
Cash and Cash Equivalents | | | 20.3% | |
Other | | | | |
Net Other Assets (Liabilities) | | | -5.6% | |
| | | | | |
| | | | 100% | |
| | | | | |
| | | | | |
| | | | |
Diamond Hill High Yield | |
Sector Allocation | | % of
Net Assets | |
Health Care | | | 12.5% | |
Basic Industry | | | 10.1% | |
Financial Services | | | 9.2% | |
Transportation | | | 9.5% | |
Telecommunications | | | 8.1% | |
Leisure | | | 8.0% | |
Media | | | 7.4% | |
Technology & Electronics | | | 7.0% | |
Banking | | | 5.3% | |
Energy | | | 5.1% | |
Retail | | | 4.5% | |
Services | | | 3.8% | |
Real Estate | | | 2.3% | |
Insurance | | | 2.2% | |
Automotive | | | 0.6% | |
Cash and Cash Equivalents | | | 26.4% | |
Other | | | | |
Net Other Assets (Liabilities) | | | -22.0% | |
| | | | | |
| | | | 100% | |
| | | | | |
| | | | | |
| | | | | | | | | | | | | | |
| 34 | | DIAMOND HILL FUNDS | | | | | SEMI-ANNUAL REPORT | | | | | JUNE 30, 2016 | | | | | DIAMOND-HILL.COM |
(Page intentionally left blank)
| | | | | | | | | | | | | | | | |
| DIAMOND HILL FUNDS | | | | | SEMI-ANNUAL REPORT | | | | | JUNE 30, 2016 | | | | | DIAMOND-HILL.COM | | | 35 | |
Diamond Hill Funds
Statements of Assets & Liabilities
June 30, 2016 (Unaudited)
| | | | | | | | | | | | |
| | | Small Cap
Fund | | | Small-Mid
Cap
Fund | | | Mid Cap
Fund | |
Assets | | | | | | | | | | | | |
Total investment securities, at cost | | $ | 1,673,045,175 | | | $ | 1,863,920,168 | | | $ | 44,092,177 | |
Investment securities, at fair value — including $176,308,780, $152,358,897, $9,791,680, $403,527,235, $15,124,192, $536,558,016, $10,820,019, $7,184,571, $34,846,249 and $5,469,406 of securities loaned | | $ | 1,925,483,686 | | | $ | 2,001,468,559 | | | $ | 46,233,234 | |
Cash | | | — | | | | 100,442 | | | | 1,534 | |
Cash deposits with custodian for securities sold short | | | — | | | | — | | | | — | |
Receivable for fund shares issued | | | 1,740,642 | | | | 2,960,419 | | | | 56,531 | |
Receivable for dividends and interest | | | 3,295,192 | | | | 2,519,656 | | | | 51,970 | |
Receivable for investments sold | | | 2,488,309 | | | | — | | | | 108,938 | |
Prepaid expenses and other assets | | | 363 | | | | 1,071 | | | | 12 | |
Total Assets | | | 1,933,008,192 | | | | 2,007,050,147 | | | | 46,452,219 | |
| | | |
Liabilities | | | | | | | | | | | | |
Securities sold short, at fair value (proceeds $—, $—, $—, $—, $—, $1,115,523,564, $13,606,071, $3,881,016, $— and $—) | | | — | | | | — | | | | — | |
Cash overdraft | | | — | | | | — | | | | — | |
Payable for securities purchased | | | 15,088,337 | | | | 3,036,692 | | | | 32,244 | |
Payable for expenses and fees on securities sold short | | | — | | | | — | | | | — | |
Payable for fund shares redeemed | | | 1,787,497 | | | | 1,521,885 | | | | 1,917 | |
Payable for return of collateral received | | | 181,089,534 | | | | 156,066,879 | | | | 10,020,993 | |
Payable to Investment Adviser | | | 1,142,718 | | | | 1,126,865 | | | | 19,185 | |
Payable to Administrator | | | 284,049 | | | | 248,628 | | | | 4,823 | |
Accrued distribution and service fees | | | 145,802 | | | | 85,546 | | | | 1,153 | |
Payable to accountant and custodian | | | 2,513 | | | | — | | | | — | |
Total Liabilities | | | 199,540,450 | | | | 162,086,495 | | | | 10,080,315 | |
| | | |
Net Assets | | $ | 1,733,467,742 | | | $ | 1,844,963,652 | | | $ | 36,371,904 | |
| | | |
Components of Net Assets | | | | | | | | | | | | |
Paid-in capital | | $ | 1,442,615,001 | | | $ | 1,691,851,974 | | | $ | 34,185,397 | |
Accumulated net investment income (loss) | | | (266,411 | ) | | | 2,938,148 | | | | 99,158 | |
Accumulated net realized gains (losses) from investment transactions | | | 38,680,641 | | | | 12,625,139 | | | | (53,708 | ) |
Net unrealized appreciation (depreciation) on investments | | | 252,438,511 | | | | 137,548,391 | | | | 2,141,057 | |
Net Assets | | $ | 1,733,467,742 | | | $ | 1,844,963,652 | | | $ | 36,371,904 | |
| | | |
Net Assets | | | | | | | | | | | | |
Class A Shares | | $ | 481,035,567 | | | $ | 253,857,224 | | | $ | 5,829,426 | |
Class C Shares | | $ | 55,692,927 | | | $ | 40,520,107 | | | $ | — | |
Class I Shares | | $ | 961,313,443 | | | $ | 798,317,388 | | | $ | 15,534,746 | |
Class Y Shares | | $ | 235,425,805 | | | $ | 752,268,933 | | | $ | 15,007,732 | |
| | | |
Shares of beneficial interest outstanding (unlimited number of shares authorized, no par value) | | | | | | | | | | | | |
Class A Shares | | | 15,213,516 | | | | 13,204,355 | | | | 516,677 | |
Class C Shares | | | 1,985,101 | | | | 2,268,051 | | | | — | |
Class I Shares | | | 29,978,556 | | | | 41,098,565 | | | | 1,371,748 | |
Class Y Shares | | | 7,336,349 | | | | 38,664,375 | | | | 1,322,761 | |
| | | |
Net Asset Value, offering (except Class A Shares) and redemption price per share: | | | | | | | | | | | | |
Class A Shares | | $ | 31.62 | | | $ | 19.23 | | | $ | 11.28 | |
Class C Shares(A) | | $ | 28.06 | | | $ | 17.87 | | | $ | — | |
Class I Shares | | $ | 32.07 | | | $ | 19.42 | | | $ | 11.32 | |
Class Y Shares | | $ | 32.09 | | | $ | 19.46 | | | $ | 11.35 | |
| | | |
Maximum Offering Price | | | | | | | | | | | | |
Maximum sales charge — Class A Shares | | | 5.00% | | | | 5.00% | | | | 5.00% | |
(100%/(100%-maximum sales charge) of net asset value adjusted to the nearest cent) per share — Class A Shares | | $ | 33.28 | | | $ | 20.24 | | | $ | 11.87 | |
| (A) | Redemption price per share varies based on the holding period. |
See accompanying Notes to Financial Statements.
| | | | | | | | | | | | | | |
| 36 | | DIAMOND HILL FUNDS | | | | | SEMI-ANNUAL REPORT | | | | | JUNE 30, 2016 | | | | | DIAMOND-HILL.COM |
| | | | | | | | | | | | | | | | | | | | | | | | | | |
Large Cap
Fund | | | Select
Fund | | | Long-Short
Fund | | | Research
Opportunities
Fund | | | Financial
Long-Short
Fund | | | Corporate
Credit
Fund | | | High
Yield
Fund | |
| | | | | | | | | | | | | | | | | | | | | | | | | | |
| $ | 3,488,297,282 | | | $ | 154,815,257 | | | $ | 4,245,103,364 | | | $ | 62,141,842 | | | $ | 37,411,170 | | | $ | 443,478,110 | | | $ | 29,677,859 | |
$ |
4,080,978,165 |
| | $ | 151,007,616 | | | $ | 4,731,750,318 | | | $ | 62,422,623 | | | $ | 35,799,353 | | | $ | 439,632,493 | | | $ | 29,725,056 | |
| | — | | | | — | | | | — | | | | — | | | | — | | | | — | | | | — | |
| | — | | | | — | | | | 1,269,791,609 | | | | 11,993,082 | | | | 4,606,883 | | | | — | | | | — | |
| | 6,397,340 | | | | 74,590 | | | | 5,361,113 | | | | 3,762 | | | | 410 | | | | 3,240,007 | | | | 18,400 | |
| | 3,267,137 | | | | 116,083 | | | | 3,308,715 | | | | 111,303 | | | | 54,059 | | | | 7,505,036 | | | | 519,665 | |
| | 25,806,880 | | | | 6,140,882 | | | | 24,140,028 | | | | 1,876,128 | | | | 111,207 | | | | 6,019,750 | | | | 56,550 | |
| | 466 | | | | 98 | | | | 201 | | | | 518 | | | | 140 | | | | — | | | | — | |
| | 4,116,449,988 | | | | 157,339,269 | | | | 6,034,351,984 | | | | 76,407,416 | | | | 40,572,052 | | | | 456,397,286 | | | | 30,319,671 | |
| | | | | | |
| | | | | | | | | | | | | | | | | | | | | | | | | | |
|
— |
| | | — | | | | 1,258,946,572 | | | | 14,828,249 | | | | 4,685,398 | | | | — | | | | — | |
| | 162 | | | | — | | | | — | | | | 5,333 | | | | 16 | | | | 1,025 | | | | — | |
| | 3,230,112 | | | | 650,635 | | | | 31,644,690 | | | | 1,201,002 | | | | 1,248,481 | | | | 3,220,544 | | | | 246,834 | |
| | — | | | | — | | | | 1,662,245 | | | | 14,828 | | | | 4,654 | | | | — | | | | — | |
| | 3,228,499 | | | | 848,385 | | | | 6,440,479 | | | | 61,536 | | | | 6,753 | | | | 476,876 | | | | — | |
| | 419,942,141 | | | | 15,478,929 | | | | 548,681,030 | | | | 11,114,437 | | | | 7,349,108 | | | | 36,206,143 | | | | 5,694,157 | |
| | 1,504,898 | | | | 85,899 | | | | 3,145,422 | | | | 41,198 | | | | 20,962 | | | | 151,362 | | | | 9,939 | |
| | 600,444 | | | | 24,327 | | | | 697,567 | | | | 7,335 | | | | 4,558 | | | | 68,794 | | | | 3,435 | |
| | 297,880 | | | | 15,823 | | | | 227,515 | | | | 4,117 | | | | 3,258 | | | | 34,214 | | | | 28 | |
| | 435 | | | | — | | | | 24,182 | | | | — | | | | — | | | | 78 | | | | — | |
| | 428,804,571 | | | | 17,103,998 | | | | 1,851,469,702 | | | | 27,278,035 | | | | 13,323,188 | | | | 40,159,036 | | | | 5,954,393 | |
| | | | | | |
| $ | 3,687,645,417 | | | $ | 140,235,271 | | | $ | 4,182,882,282 | | | $ | 49,129,381 | | | $ | 27,248,864 | | | $ | 416,238,250 | | | $ | 24,365,278 | |
| | | | | | |
| | | | | | | | | | | | | | | | | | | | | | | | | | |
| $ | 2,917,713,457 | | | $ | 154,830,645 | | | $ | 3,728,299,778 | | | $ | 51,854,769 | | | $ | 34,991,080 | | | $ | 430,560,211 | | | $ | 24,232,930 | |
| | 23,471,520 | | | | 166,442 | | | | (2,718,158 | ) | | | (306,472 | ) | | | 13,629 | | | | 1,039,391 | | | | 24,546 | |
|
153,779,557 |
| | | (10,954,175 | ) | | | 114,076,716 | | | | (1,477,500 | ) | | | (5,339,646 | ) | | | (11,515,735 | ) | | | 60,605 | |
| | 592,680,883 | | | | (3,807,641 | ) | | | 343,223,946 | | | | (941,416 | ) | | | (2,416,199 | ) | | | (3,845,617 | ) | | | 47,197 | |
| $ | 3,687,645,417 | | | $ | 140,235,271 | | | $ | 4,182,882,282 | | | $ | 49,129,381 | | | $ | 27,248,864 | | | $ | 416,238,250 | | | $ | 24,365,278 | |
| | | | | | |
| | | | | | | | | | | | | | | | | | | | | | | | | | |
| $ | 1,109,504,487 | | | $ | 21,046,643 | | | $ | 472,383,896 | | | $ | 4,316,640 | | | $ | 9,278,837 | | | $ | 58,176,327 | | | $ | 140,057 | |
| $ | 87,067,625 | | | $ | 12,523,810 | | | $ | 150,797,029 | | | $ | 3,791,200 | | | $ | 1,525,566 | | | $ | 28,276,840 | | | $ | — | |
| $ | 1,994,673,863 | | | $ | 89,890,675 | | | $ | 3,292,288,357 | | | $ | 27,092,228 | | | $ | 16,444,461 | | | $ | 314,143,679 | | | $ | 17,470,971 | |
| $ | 496,399,442 | | | $ | 16,774,143 | | | $ | 267,413,000 | | | $ | 13,929,313 | | | $ | — | | | $ | 15,641,404 | | | $ | 6,754,250 | |
| | | | | | |
| | | | | | | | | | | | | | | | | | | | | | | | | | |
| | 50,676,319 | | | | 1,828,099 | | | | 20,496,376 | | | | 222,294 | | | | 547,067 | | | | 5,351,785 | | | | 13,325 | |
| | 4,177,402 | | | | 1,138,797 | | | | 7,190,002 | | | | 202,622 | | | | 97,305 | | | | 2,607,609 | | | | — | |
| | 90,503,812 | | | | 7,779,668 | | | | 140,222,771 | | | | 1,386,011 | | | | 969,643 | | | | 28,990,295 | | | | 1,662,279 | |
| | 22,503,299 | | | | 1,448,867 | | | | 11,352,444 | | | | 712,350 | | | | — | | | | 1,443,797 | | | | 642,698 | |
| | | | | | |
| | | | | | | | | | | | | | | | | | | | | | | | | | |
| $ | 21.89 | | | $ | 11.51 | | | $ | 23.05 | | | $ | 19.42 | | | $ | 16.96 | | | $ | 10.87 | | | $ | 10.51 | |
| $ | 20.84 | | | $ | 11.00 | | | $ | 20.97 | | | $ | 18.71 | | | $ | 15.68 | | | $ | 10.84 | | | $ | — | |
| $ | 22.04 | | | $ | 11.55 | | | $ | 23.48 | | | $ | 19.55 | | | $ | 16.96 | | | $ | 10.84 | | | $ | 10.51 | |
| $ | 22.06 | | | $ | 11.58 | | | $ | 23.56 | | | $ | 19.55 | | | $ | — | | | $ | 10.83 | | | $ | 10.51 | |
| | | | | | |
| | | | | | | | | | | | | | | | | | | | | | | | | | |
| | 5.00% | | | | 5.00% | | | | 5.00% | | | | 5.00% | | | | 5.00% | | | | 3.50% | | | | 3.50% | |
$ |
23.04 |
| | $ | 12.12 | | | $ | 24.26 | | | $ | 20.44 | | | $ | 17.85 | | | $ | 11.26 | | | $ | 10.89 | |
| | | | | | | | | | | | | | | | |
| DIAMOND HILL FUNDS | | | | | SEMI-ANNUAL REPORT | | | | | JUNE 30, 2016 | | | | | DIAMOND-HILL.COM | | | 37 | |
Diamond Hill Funds
Statements of Operations
For the period ended June 30, 2016 (Unaudited)
| | | | | | | | | | | | | | | | | | | | |
| | | Small Cap
Fund | | | Small-Mid
Cap
Fund | | | Mid Cap
Fund | | | Large Cap
Fund | | | Select
Fund | |
Investment Income | | | | | | | | | | | | | | | | | | | | |
Dividends | | $ | 16,427,385 | | | $ | 10,326,018 | | | $ | 179,634 | | | $ | 37,213,632 | | | $ | 760,121 | |
Securities lending income | | | 709,287 | | | | 998,956 | | | | 15,701 | | | | 225,117 | | | | 83,407 | |
Foreign taxes withheld | | | (61,996 | ) | | | (26,598 | ) | | | (412 | ) | | | — | | | | (3,178 | ) |
Total Investment Income | | | 17,074,676 | | | | 11,298,376 | | | | 194,923 | | | | 37,438,749 | | | | 840,350 | |
| | | | | |
Expenses | | | | | | | | | | | | | | | | | | | | |
Investment advisory fees | | | 6,598,381 | | | | 5,811,299 | | | | 79,310 | | | | 8,704,891 | | | | 536,014 | |
Administration fees | | | 1,648,323 | | | | 1,277,970 | | | | 18,518 | | | | 3,495,480 | | | | 155,203 | |
Distribution fees — Class A | | | 587,747 | | | | 274,198 | | | | 5,192 | | | | 1,343,054 | | | | 39,336 | |
Distribution and service fees — Class C(A) | | | 276,718 | | | | 179,893 | | | | 295 | | | | 421,524 | | | | 69,153 | |
Other fees | | | 2,791 | | | | 3,615 | | | | 2,478 | | | | 2,280 | | | | 4,072 | |
Total Expenses | | | 9,113,960 | | | | 7,546,975 | | | | 105,793 | | | | 13,967,229 | | | | 803,778 | |
| | | | | |
Net Investment Income (Loss) | | | 7,960,716 | | | | 3,751,401 | | | | 89,130 | | | | 23,471,520 | | | | 36,572 | |
| | | | | |
Realized and Unrealized Gains (Losses) on Investments | | | | | | | | | | | | | | | | | | | | |
Net realized gains (losses) on security sales | | | 936,342 | | | | 191,889 | | | | (9,168 | ) | | | 108,512,637 | | | | (4,469,104 | ) |
Net change in unrealized appreciation (depreciation) on investments and foreign currency translations | | | 34,060,326 | | | | 91,874,864 | | | | 1,297,850 | | | | (47,799,367 | ) | | | (5,277,867 | ) |
Net Realized and Unrealized Gains (Losses) on Investments | | | 34,996,668 | | | | 92,066,753 | | | | 1,288,682 | | | | 60,713,270 | | | | (9,746,971 | ) |
| | | | | |
Change in Net Assets from Operations | | $ | 42,957,384 | | | $ | 95,818,154 | | | $ | 1,377,812 | | | $ | 84,184,790 | | | $ | (9,710,399 | ) |
| (A) | The Mid Cap Fund Class C shares liquidated effective June 28, 2016. |
See accompanying Notes to Financial Statements.
| | | | | | | | | | | | | | |
| 38 | | DIAMOND HILL FUNDS | | | | | SEMI-ANNUAL REPORT | | | | | JUNE 30, 2016 | | | | | DIAMOND-HILL.COM |
Diamond Hill Funds
Statements of Operations
For the period ended June 30, 2016 (Unaudited)
| | | | | | | | | | | | | | | | | | | | |
| | | Long-Short
Fund | | | Research
Opportunities
Fund | | | Financial
Long-Short
Fund | | | Corporate
Credit
Fund | | | High
Yield | |
Investment Income | | | | | | | | | | | | | | | | | | | | |
Dividends | | $ | 35,664,767 | | | $ | 452,297 | | | $ | 327,196 | | | $ | 73,310 | | | $ | 3,600 | |
Interest | | | — | | | | 129,550 | | | | — | | | | 12,858,706 | | | | 726,739 | |
Securities lending income | | | 383,233 | | | | 6,635 | | | | 3,529 | | | | 82,645 | | | | 4,075 | |
Foreign taxes withheld | | | (107,160 | ) | | | (2,030 | ) | | | (1,835 | ) | | | — | | | | — | |
Total Investment Income | | | 35,940,840 | | | | 586,452 | | | | 328,890 | | | | 13,014,661 | | | | 734,414 | |
| | | | | |
Expenses | | | | | | | | | | | | | | | | | | | | |
Investment advisory fees | | | 19,093,692 | | | | 244,214 | | | | 126,545 | | | | 829,901 | | | | 46,536 | |
Administration fees | | | 4,250,363 | | | | 43,654 | | | | 27,589 | | | | 376,380 | | | | 14,535 | |
Distribution fees — Class A | | | 636,151 | | | | 6,637 | | | | 11,833 | | | | 63,032 | | | | 88 | |
Distribution and service fees — Class C | | | 798,479 | | | | 20,301 | | | | 8,043 | | | | 125,725 | | | | — | |
Other fees | | | 4,636 | | | | 7,309 | | | | 2,299 | | | | 2,337 | | | | 920 | |
Expenses and fees on securities sold short | | | 13,875,677 | | | | 158,973 | | | | 53,163 | | | | — | | | | — | |
Total Expenses | | | 38,658,998 | | | | 481,088 | | | | 229,472 | | | | 1,397,375 | | | | 62,079 | |
| | | | | |
Net Investment Income (Loss) | | | (2,718,158 | ) | | | 105,364 | | | | 99,418 | | | | 11,617,286 | | | | 672,335 | |
| | | | | |
Realized and Unrealized Gains (Losses) on Investments | | | | | | | | | | | | | | | | | | | | |
Net realized gains (losses) on security sales | | | 113,019,010 | | | | 72,913 | | | | 576,067 | | | | (670,688 | ) | | | 60,605 | |
Net realized gains (losses) on closed short positions | | | 5,697,371 | | | | 43,078 | | | | (12,886 | ) | | | — | | | | — | |
Net realized gains (losses) on foreign currency transactions | | | — | | | | (19 | ) | | | — | | | | — | | | | — | |
Net change in unrealized appreciation (depreciation) on investments and foreign currency translations | | | (171,382,648 | ) | | | (1,415,202 | ) | | | (2,957,274 | ) | | | 13,073,400 | | | | 47,197 | |
Net Realized and Unrealized Gains (Losses) on Investments | | | (52,666,267 | ) | | | (1,299,230 | ) | | | (2,394,093 | ) | | | 12,402,712 | | | | 107,802 | |
| | | | | |
Change in Net Assets from Operations | | $ | (55,384,425 | ) | | $ | (1,193,866 | ) | | $ | (2,294,675 | ) | | $ | 24,019,998 | | | $ | 780,137 | |
See accompanying Notes to Financial Statements.
| | | | | | | | | | | | | | | | |
| DIAMOND HILL FUNDS | | | | | SEMI-ANNUAL REPORT | | | | | JUNE 30, 2016 | | | | | DIAMOND-HILL.COM | | | 39 | |
Diamond Hill Funds
Statements of Changes in Net Assets
| | | | | | | | | | | | | | | | | | | | |
| | | Small Cap Fund | | | | | | Small-Mid Cap Fund | |
| | | For the six
months ended
June 30, 2016
(Unaudited) | | | For the year
ended
December 31,
2015 | | | | | | For the six
months ended
June 30, 2016
(Unaudited) | | | For the year
ended
December 31,
2015 | |
From Operations | | | | | | | | | | | | | | | | | | | | |
Net investment income (loss) | | $ | 7,960,716 | | | $ | 630,932 | | | | | | | $ | 3,751,401 | | | $ | 3,465,069 | |
Net realized gains (losses) on security sales | | | 936,342 | | | | 61,854,520 | | | | | | | | 191,889 | | | | 24,745,917 | |
Net change in unrealized appreciation (depreciation) on investments and foreign currency translations | | | 34,060,326 | | | | (124,772,396 | ) | | | | | | | 91,874,864 | | | | (28,553,481 | ) |
Change in Net Assets from Operations | | | 42,957,384 | | | | (62,286,944 | ) | | | | | | | 95,818,154 | | | | (342,495 | ) |
| | | | | |
Distributions to Shareholders | | | | | | | | | | | | | | | | | | | | |
From net investment income: | | | | | | | | | | | | | | | | | | | | |
Class A | | | — | | | | (1,478,191 | ) | | | | | | | — | | | | (235,006 | ) |
Class I | | | — | | | | (5,604,727 | ) | | | | | | | — | | | | (1,681,410 | ) |
Class Y | | | — | | | | (1,670,446 | ) | | | | | | | — | | | | (2,566,167 | ) |
From net realized gains on investments | | | | | | | | | | | | | | | | | | | | |
Class A | | | — | | | | (6,430,005 | ) | | | | | | | — | | | | (1,545,869 | ) |
Class C | | | — | | | | (854,771 | ) | | | | | | | — | | | | (339,284 | ) |
Class I | | | — | | | | (10,939,941 | ) | | | | | | | — | | | | (4,932,534 | ) |
Class Y | | | — | | | | (2,834,619 | ) | | | | | | | — | | | | (5,285,728 | ) |
Change in Net Assets from Distributions to Shareholders | | | — | | | | (29,812,700 | ) | | | | | | | — | | | | (16,585,998 | ) |
Change in net assets from capital transactions | | | 35,850,692 | | | | 306,160,162 | | | | | | | | 450,379,443 | | | | 623,960,173 | |
| | | | | |
Total Change in Net Assets | | | 78,808,076 | | | | 214,060,518 | | | | | | | | 546,197,597 | | | | 607,031,680 | |
| | | | | |
Net Assets: | | | | | | | | | | | | | | | | | | | | |
Beginning of period | | | 1,654,659,666 | | | | 1,440,599,148 | | | | | | | | 1,298,766,055 | | | | 691,734,375 | |
End of period | | $ | 1,733,467,742 | | | $ | 1,654,659,666 | | | | | | | $ | 1,844,963,652 | | | $ | 1,298,766,055 | |
Accumulated Net Investment Income (Loss) | | $ | (266,411 | ) | | $ | (8,227,127 | ) | | | | | | $ | 2,938,148 | | | $ | (813,253 | ) |
See accompanying Notes to Financial Statements.
| | | | | | | | | | | | | | |
| 40 | | DIAMOND HILL FUNDS | | | | | SEMI-ANNUAL REPORT | | | | | JUNE 30, 2016 | | | | | DIAMOND-HILL.COM |
Diamond Hill Funds
Statements of Changes in Net Assets
| | | | | | | | | | | | | | | | | | | | |
| | | Small Cap Fund | | | | | | Small-Mid Cap Fund | |
| | | For the six
months ended
June 30, 2016
(Unaudited) | | | For the year
ended
December 31,
2015 | | | | | | For the six
months ended
June 30, 2016
(Unaudited) | | | For the year
ended
December 31,
2015 | |
Capital Transactions: | | | | | | | | | | | | | | | | | | | | |
Class A | | | | | | | | | | | | | | | | | | | | |
Proceeds from shares sold | | $ | 56,141,124 | | | $ | 163,984,100 | | | | | | | $ | 104,422,715 | | | $ | 80,279,604 | |
Reinvested distributions | | | — | | | | 7,080,943 | | | | | | | | — | | | | 1,710,659 | |
Payments for shares redeemed | | | (78,384,625 | ) | | | (224,067,186 | ) | | | | | | | (25,555,631 | ) | | | (24,404,965 | ) |
Change in Net Assets from Class A Share Transactions | | | (22,243,501 | ) | | | (53,002,143 | ) | | | | | | | 78,867,084 | | | | 57,585,298 | |
Class C | | | | | | | | | | | | | | | | | | | | |
Proceeds from shares sold | | | 2,209,332 | | | | 18,654,572 | | | | | | | | 8,885,340 | | | | 12,183,360 | |
Reinvested distributions | | | — | | | | 806,755 | | | | | | | | — | | | | 301,197 | |
Payments for shares redeemed | | | (5,419,378 | ) | | | (9,715,442 | ) | | | | | | | (3,177,515 | ) | | | (4,377,301 | ) |
Change in Net Assets from Class C Share Transactions | | | (3,210,046 | ) | | | 9,745,885 | | | | | | | | 5,707,825 | | | | 8,107,256 | |
Class I | | | | | | | | | | | | | | | | | | | | |
Proceeds from shares sold | | | 154,863,738 | | | | 460,433,412 | | | | | | | | 313,053,399 | | | | 334,255,108 | |
Reinvested distributions | | | — | | | | 14,553,562 | | | | | | | | — | | | | 6,158,097 | |
Payments for shares redeemed | | | (101,428,517 | ) | | | (204,740,459 | ) | | | | | | | (61,107,870 | ) | | | (90,731,981 | ) |
Change in Net Assets from Class I Share Transactions | | | 53,435,221 | | | | 270,246,515 | | | | | | | | 251,945,529 | | | | 249,681,224 | |
Class Y | | | | | | | | | | | | | | | | | | | | |
Proceeds from shares sold | | | 19,482,302 | | | | 132,713,949 | | | | | | | | 172,166,207 | | | | 362,017,776 | |
Reinvested distributions | | | — | | | | 4,505,061 | | | | | | | | — | | | | 7,525,610 | |
Payments for shares redeemed | | | (11,613,284 | ) | | | (58,049,105 | ) | | | | | | | (58,307,202 | ) | | | (60,956,991 | ) |
Change in Net Assets from Class Y Share Transactions | | | 7,869,018 | | | | 79,169,905 | | | | | | | | 113,859,005 | | | | 308,586,395 | |
Change in net assets from capital transactions: | | $ | 35,850,692 | | | $ | 306,160,162 | | | | | | | $ | 450,379,443 | | | $ | 623,960,173 | |
Share Transactions: | | | | | | | | | | | | | | | | | | | | |
Class A | | | | | | | | | | | | | | | | | | | | |
Issued | | | 1,858,969 | | | | 5,004,907 | | | | | | | | 6,068,181 | | | | 4,225,045 | |
Reinvested | | | — | | | | 229,358 | | | | | | | | — | | | | 93,708 | |
Redeemed | | | (2,598,805 | ) | | | (6,817,882 | ) | | | | | | | (1,398,388 | ) | | | (1,285,463 | ) |
Change in shares outstanding | | | (739,836 | ) | | | (1,583,617 | ) | | | | | | | 4,669,793 | | | | 3,033,290 | |
Class C | | | | | | | | | | | | | | | | | | | | |
Issued | | | 82,033 | | | | 635,982 | | | | | | | | 522,566 | | | | 690,711 | |
Reinvested | | | — | | | | 29,465 | | | | | | | | — | | | | 17,728 | |
Redeemed | | | (200,605 | ) | | | (334,013 | ) | | | | | | | (186,395 | ) | | | (245,334 | ) |
Change in shares outstanding | | | (118,572 | ) | | | 331,434 | | | | | | | | 336,171 | | | | 463,105 | |
Class I | | | | | | | | | | | | | | | | | | | | |
Issued | | | 5,089,397 | | | | 13,937,293 | | | | | | | | 17,018,584 | | | | 17,539,516 | |
Reinvested | | | — | | | | 463,830 | | | | | | | | — | | | | 333,524 | |
Redeemed | | | (3,316,508 | ) | | | (6,144,341 | ) | | | | | | | (3,375,765 | ) | | | (4,753,680 | ) |
Change in shares outstanding | | | 1,772,889 | | | | 8,256,782 | | | | | | | | 13,642,819 | | | | 13,119,360 | |
Class Y | | | | | | | | | | | | | | | | | | | | |
Issued | | | 630,320 | | | | 3,931,177 | | | | | | | | 9,200,081 | | | | 19,121,662 | |
Reinvested | | | — | | | | 143,436 | | | | | | | | — | | | | 406,591 | |
Redeemed | | | (376,819 | ) | | | (1,762,405 | ) | | | | | | | (3,168,790 | ) | | | (3,167,008 | ) |
Change in shares outstanding | | | 253,501 | | | | 2,312,208 | | | | | | | | 6,031,291 | | | | 16,361,245 | |
Change in shares | | | 1,167,982 | | | | 9,316,807 | | | | | | | | 24,680,074 | | | | 32,977,000 | |
See accompanying Notes to Financial Statements.
| | | | | | | | | | | | | | | | |
| DIAMOND HILL FUNDS | | | | | SEMI-ANNUAL REPORT | | | | | JUNE 30, 2016 | | | | | DIAMOND-HILL.COM | | | 41 | |
Diamond Hill Funds
Statements of Changes in Net Assets
| | | | | | | | | | | | | | | | | | | | |
| | | Mid Cap Fund | | | | | | Large Cap Fund | |
| | | For the six
months ended
June 30, 2016
(Unaudited) | | | For the year
ended
December 31,
2015 | | | | | | For the six
months ended
June 30, 2016
(Unaudited) | | | For the year
ended
December 31,
2015 | |
From Operations | | | | | | | | | | | | | | | | | | | | |
Net investment income (loss) | | $ | 89,130 | | | $ | 115,633 | | | | | | | $ | 23,471,520 | | | $ | 34,358,640 | |
Net realized gains (losses) on security sales | | | (9,168 | ) | | | 17,349 | | | | | | | | 108,512,637 | | | | 153,357,141 | |
Net change in unrealized appreciation (depreciation) on investments and foreign currency translations | | | 1,297,850 | | | | (53,554 | ) | | | | | | | (47,799,367 | ) | | | (219,309,609 | ) |
Change in Net Assets from Operations | | | 1,377,812 | | | | 79,428 | | | | | | | | 84,184,790 | | | | (31,593,828 | ) |
| | | | | |
Distributions to Shareholders | | | | | | | | | | | | | | | | | | | | |
From net investment income: | | | | | | | | | | | | | | | | | | | | |
Class A | | | — | | | | (10,631 | ) | | | | | | | — | | | | (9,117,086 | ) |
Class C | | | — | | | | (107 | ) | | | | | | | — | | | | (145,150 | ) |
Class I | | | — | | | | (18,513 | ) | | | | | | | — | | | | (19,842,489 | ) |
Class Y | | | — | | | | (78,987 | ) | | | | | | | — | | | | (5,258,725 | ) |
From net realized gains on investments | | | | | | | | | | | | | | | | | | | | |
Class A | | | — | | | | — | | | | | | | | — | | | | (42,511,645 | ) |
Class C | | | — | | | | — | | | | | | | | — | | | | (3,355,736 | ) |
Class I | | | — | | | | — | | | | | | | | — | | | | (67,211,166 | ) |
Class Y | | | — | | | | — | | | | | | | | — | | | | (16,037,907 | ) |
Change in Net Assets from Distributions to Shareholders | | | — | | | | (108,238 | ) | | | | | | | — | | | | (163,479,904 | ) |
Change in net assets from capital transactions | | | 16,420,618 | | | | 2,298,834 | | | | | | | | 163,047,783 | | | | 389,042,080 | |
| | | | | |
Total Change in Net Assets | | | 17,798,430 | | | | 2,270,024 | | | | | | | | 247,232,573 | | | | 193,968,348 | |
| | | | | |
Net Assets: | | | | | | | | | | | | | | | | | | | | |
Beginning of period | | | 18,573,474 | | | | 16,303,450 | | | | | | | | 3,440,412,844 | | | | 3,246,444,496 | |
End of period | | $ | 36,371,904 | | | $ | 18,573,474 | | | | | | | $ | 3,687,645,417 | | | $ | 3,440,412,844 | |
Accumulated Net Investment Income (Loss) | | $ | 99,158 | | | $ | 10,028 | | | | | | | $ | 23,471,520 | | | $ | — | |
See accompanying Notes to Financial Statements.
| | | | | | | | | | | | | | |
| 42 | | DIAMOND HILL FUNDS | | | | | SEMI-ANNUAL REPORT | | | | | JUNE 30, 2016 | | | | | DIAMOND-HILL.COM |
Diamond Hill Funds
Statements of Changes in Net Assets
| | | | | | | | | | | | | | | | | | | | |
| | | Mid Cap Fund | | | | | | Large Cap Fund | |
| | | For the six
months ended
June 30, 2016
(Unaudited) | | | For the year
ended
December 31,
2015 | | | | | | For the six
months ended
June 30, 2016
(Unaudited) | | | For the year
ended
December 31,
2015 | |
Capital Transactions: | | | | | | | | | | | | | | | | | | | | |
Class A | | | | | | | | | | | | | | | | | | | | |
Proceeds from shares sold | | $ | 2,790,396 | | | $ | 1,108,834 | | | | | | | $ | 80,900,060 | | | $ | 264,797,180 | |
Reinvested distributions | | | — | | | | 10,630 | | | | | | | | — | | | | 50,751,629 | |
Payments for shares redeemed | | | (294,806 | ) | | | (132,759 | ) | | | | | | | (114,749,978 | ) | | | (311,900,741 | ) |
Change in Net Assets from Class A Share Transactions | | | 2,495,590 | | | | 986,705 | | | | | | | | (33,849,918 | ) | | | 3,648,068 | |
Class C | | | | | | | | | | | | | | | | | | | | |
Proceeds from shares sold | | | — | | | | 58,656 | | | | | | | | 8,225,999 | | | | 15,926,061 | |
Reinvested distributions | | | — | | | | 92 | | | | | | | | — | | | | 3,293,098 | |
Payments for shares redeemed | | | (80,186 | ) | | | — | | | | | | | | (7,303,559 | ) | | | (13,413,048 | ) |
Change in Net Assets from Class C Share Transactions | | | (80,186 | ) | | | 58,748 | | | | | | | | 922,440 | | | | 5,806,111 | |
Class I | | | | | | | | | | | | | | | | | | | | |
Proceeds from shares sold | | | 12,001,229 | | | | 827,197 | | | | | | | | 365,150,329 | | | | 598,498,015 | |
Reinvested distributions | | | — | | | | 18,242 | | | | | | | | — | | | | 75,414,430 | |
Payments for shares redeemed | | | (167,711 | ) | | | (241,799 | ) | | | | | | | (222,945,893 | ) | | | (375,299,825 | ) |
Change in Net Assets from Class I Share Transactions | | | 11,833,518 | | | | 603,640 | | | | | | | | 142,204,436 | | | | 298,612,620 | |
Class Y | | | | | | | | | | | | | | | | | | | | |
Proceeds from shares sold | | | 2,572,193 | | | | 650,076 | | | | | | | | 105,640,757 | | | | 138,505,316 | |
Reinvested distributions | | | — | | | | 8,681 | | | | | | | | — | | | | 20,470,934 | |
Payments for shares redeemed | | | (400,497 | ) | | | (9,016 | ) | | | | | | | (51,869,932 | ) | | | (78,000,969 | ) |
Change in Net Assets from Class Y Share Transactions | | | 2,171,696 | | | | 649,741 | | | | | | | | 53,770,825 | | | | 80,975,281 | |
Change in net assets from capital transactions: | | $ | 16,420,618 | | | $ | 2,298,834 | | | | | | | $ | 163,047,783 | | | $ | 389,042,080 | |
Share Transactions: | | | | | | | | | | | | | | | | | | | | |
Class A | | | | | | | | | | | | | | | | | | | | |
Issued | | | 259,033 | | | | 100,678 | | | | | | | | 3,832,301 | | | | 11,692,415 | |
Reinvested | | | — | | | | 985 | | | | | | | | — | | | | 2,338,656 | |
Redeemed | | | (30,016 | ) | | | (12,137 | ) | | | | | | | (5,491,464 | ) | | | (13,741,083 | ) |
Change in shares outstanding | | | 229,017 | | | | 89,526 | | | | | | | | (1,659,163 | ) | | | 289,988 | |
Class C | | | | | | | | | | | | | | | | | | | | |
Issued | | | — | | | | 5,281 | | | | | | | | 410,737 | | | | 735,551 | |
Reinvested | | | — | | | | 9 | | | | | | | | — | | | | 159,679 | |
Redeemed | | | (7,311 | ) | | | — | | | | | | | | (360,107 | ) | | | (616,874 | ) |
Change in shares outstanding | | | (7,311 | ) | | | 5,290 | | | | | | | | 50,630 | | | | 278,356 | |
Class I | | | | | | | | | | | | | | | | | | | | |
Issued | | | 1,076,819 | | | | 74,986 | | | | | | | | 17,265,606 | | | | 26,269,684 | |
Reinvested | | | — | | | | 1,687 | | | | | | | | — | | | | 3,450,704 | |
Redeemed | | | (15,856 | ) | | | (21,859 | ) | | | | | | | (10,420,844 | ) | | | (16,440,230 | ) |
Change in shares outstanding | | | 1,060,963 | | | | 54,814 | | | | | | | | 6,844,762 | | | | 13,280,158 | |
Class Y | | | | | | | | | | | | | | | | | | | | |
Issued | | | 236,944 | | | | 58,896 | | | | | | | | 4,925,653 | | | | 6,087,546 | |
Reinvested | | | — | | | | 801 | | | | | | | | — | | | | 935,616 | |
Redeemed | | | (37,329 | ) | | | (815 | ) | | | | | | | (2,391,565 | ) | | | (3,418,942 | ) |
Change in shares outstanding | | | 199,615 | | | | 58,882 | | | | | | | | 2,534,088 | | | | 3,604,220 | |
Change in shares | | | 1,482,284 | | | | 208,512 | | | | | | | | 7,770,317 | | | | 17,452,722 | |
See accompanying Notes to Financial Statements.
| | | | | | | | | | | | | | | | |
| DIAMOND HILL FUNDS | | | | | SEMI-ANNUAL REPORT | | | | | JUNE 30, 2016 | | | | | DIAMOND-HILL.COM | | | 43 | |
Diamond Hill Funds
Statements of Changes in Net Assets
| | | | | | | | | | | | | | | | | | | | |
| | | Select Fund | | | | | | Long-Short Fund | |
| | | For the six
months ended
June 30, 2016
(Unaudited) | | | For the year
ended
December 31,
2015 | | | | | | For the six
months ended
June 30, 2016
(Unaudited) | | | For the year
ended
December 31,
2015 | |
From Operations | | | | | | | | | | | | | | | | | | | | |
Net investment income (loss) | | $ | 36,572 | | | $ | 129,870 | | | | | | | $ | (2,718,158 | ) | | $ | (11,874,489 | ) |
Net realized gains (losses) on security sales | | | (4,469,104 | ) | | | (1,306,472 | ) | | | | | | | 113,019,010 | | | | 282,565,938 | |
Net realized gains (losses) on closed short positions | | | — | | | | — | | | | | | | | 5,697,371 | | | | (145,044,409 | ) |
Net change in unrealized appreciation (depreciation) on investments and foreign currency translations | | | (5,277,867 | ) | | | (9,625,023 | ) | | | | | | | (171,382,648 | ) | | | (195,033,861 | ) |
Change in Net Assets from Operations | | | (9,710,399 | ) | | | (10,801,625 | ) | | | | | | | (55,384,425 | ) | | | (69,386,821 | ) |
| | | | | |
Distributions to Shareholders | | | | | | | | | | | | | | | | | | | | |
From net realized gains on investments | | | | | | | | | | | | | | | | | | | | |
Class A | | | — | | | | (1,452,241 | ) | | | | | | | — | | | | (2,769,878 | ) |
Class C | | | — | | | | (502,498 | ) | | | | | | | — | | | | (892,455 | ) |
Class I | | | — | | | | (2,650,605 | ) | | | | | | | — | | | | (15,735,080 | ) |
Class Y | | | — | | | | (346,711 | ) | | | | | | | — | | | | (1,388,802 | ) |
Change in Net Assets from Distributions to Shareholders | | | — | | | | (4,952,055 | ) | | | | | | | — | | | | (20,786,215 | ) |
Change in net assets from capital transactions | | | (825,782 | ) | | | 104,552,163 | | | | | | | | (174,436,280 | ) | | | 530,760,922 | |
| | | | | |
Total Change in Net Assets | | | (10,536,181 | ) | | | 88,798,483 | | | | | | | | (229,820,705 | ) | | | 440,587,886 | |
| | | | | |
Net Assets: | | | | | | | | | | | | | | | | | | | | |
Beginning of period | | | 150,771,452 | | | | 61,972,969 | | | | | | | | 4,412,702,987 | | | | 3,972,115,101 | |
End of period | | $ | 140,235,271 | | | $ | 150,771,452 | | | | | | | $ | 4,182,882,282 | | | $ | 4,412,702,987 | |
Accumulated Net Investment Income (Loss) | | $ | 166,442 | | | $ | 129,870 | | | | | | | $ | (2,718,158 | ) | | $ | — | |
See accompanying Notes to Financial Statements.
| | | | | | | | | | | | | | |
| 44 | | DIAMOND HILL FUNDS | | | | | SEMI-ANNUAL REPORT | | | | | JUNE 30, 2016 | | | | | DIAMOND-HILL.COM |
Diamond Hill Funds
Statements of Changes in Net Assets
| | | | | | | | | | | | | | | | | | | | |
| | | Select Fund | | | | | | Long-Short Fund | |
| | | For the six
months ended
June 30, 2016
(Unaudited) | | | For the year
ended
December 31,
2015 | | | | | | For the six
months ended
June 30, 2016
(Unaudited) | | | For the year
ended
December 31,
2015 | |
Capital Transactions: | | | | | | | | | | | | | | | | | | | | |
Class A | | | | | | | | | | | | | | | | | | | | |
Proceeds from shares sold | | $ | 3,315,264 | | | $ | 46,758,363 | | | | | | | $ | 29,688,927 | | | $ | 206,033,175 | |
Reinvested distributions | | | — | | | | 1,248,087 | | | | | | | | — | | | | 2,488,265 | |
Payments for shares redeemed | | | (23,001,790 | ) | | | (12,804,427 | ) | | | | | | | (117,853,252 | ) | | | (329,536,806 | ) |
Change in Net Assets from Class A Share Transactions | | | (19,686,526 | ) | | | 35,202,023 | | | | | | | | (88,164,325 | ) | | | (121,015,366 | ) |
Class C | | | | | | | | | | | | | | | | | | | | |
Proceeds from shares sold | | | 823,447 | | | | 8,977,380 | | | | | | | | 3,180,515 | | | | 30,172,350 | |
Reinvested distributions | | | — | | | | 400,489 | | | | | | | | — | | | | 768,315 | |
Payments for shares redeemed | | | (2,218,976 | ) | | | (1,481,802 | ) | | | | | | | (19,422,016 | ) | | | (26,093,019 | ) |
Change in Net Assets from Class C Share Transactions | | | (1,395,529 | ) | | | 7,896,067 | | | | | | | | (16,241,501 | ) | | | 4,847,646 | |
Class I | | | | | | | | | | | | | | | | | | | | |
Proceeds from shares sold | | | 39,623,893 | | | | 120,581,528 | | | | | | | | 542,528,725 | | | | 1,485,217,775 | |
Reinvested distributions | | | — | | | | 2,542,802 | | | | | | | | — | | | | 12,003,836 | |
Payments for shares redeemed | | | (26,269,830 | ) | | | (64,201,194 | ) | | | | | | | (592,976,615 | ) | | | (866,062,430 | ) |
Change in Net Assets from Class I Share Transactions | | | 13,354,063 | | | | 58,923,136 | | | | | | | | (50,447,890 | ) | | | 631,159,181 | |
Class Y | | | | | | | | | | | | | | | | | | | | |
Proceeds from shares sold | | | 9,925,995 | | | | 2,636,273 | | | | | | | | 14,324,118 | | | | 119,279,729 | |
Reinvested distributions | | | — | | | | 346,711 | | | | | | | | — | | | | 836,382 | |
Payments for shares redeemed | | | (3,023,785 | ) | | | (452,047 | ) | | | | | | | (33,906,682 | ) | | | (104,346,650 | ) |
Change in Net Assets from Class Y Share Transactions | | | 6,902,210 | | | | 2,530,937 | | | | | | | | (19,582,564 | ) | | | 15,769,461 | |
Change in net assets from capital transactions: | | $ | (825,782 | ) | | $ | 104,552,163 | | | | | | | $ | (174,436,280 | ) | | $ | 530,760,922 | |
Share Transactions: | | | | | | | | | | | | | | | | | | | | |
Class A | | | | | | | | | | | | | | | | | | | | |
Issued | | | 287,314 | | | | 3,409,632 | | | | | | | | 1,298,432 | | | | 8,726,389 | |
Reinvested | | | — | | | | 101,553 | | | | | | | | — | | | | 106,291 | |
Redeemed | | | (1,990,034 | ) | | | (980,738 | ) | | | | | | | (5,167,475 | ) | | | (13,940,659 | ) |
Change in shares outstanding | | | (1,702,720 | ) | | | 2,530,447 | | | | | | | | (3,869,043 | ) | | | (5,107,979 | ) |
Class C | | | | | | | | | | | | | | | | | | | | |
Issued | | | 74,171 | | | | 690,808 | | | | | | | | 153,729 | | | | 1,376,619 | |
Reinvested | | | — | | | | 33,969 | | | | | | | | — | | | | 35,919 | |
Redeemed | | | (202,934 | ) | | | (116,456 | ) | | | | | | | (924,028 | ) | | | (1,199,867 | ) |
Change in shares outstanding | | | (128,763 | ) | | | 608,321 | | | | | | | | (770,299 | ) | | | 212,671 | |
Class I | | | | | | | | | | | | | | | | | | | | |
Issued | | | 3,460,961 | | | | 8,827,777 | | | | | | | | 23,361,885 | | | | 61,485,773 | |
Reinvested | | | — | | | | 206,396 | | | | | | | | — | | | | 504,151 | |
Redeemed | | | (2,253,268 | ) | | | (4,932,725 | ) | | | | | | | (25,478,455 | ) | | | (36,001,773 | ) |
Change in shares outstanding | | | 1,207,693 | | | | 4,101,448 | | | | | | | | (2,116,570 | ) | | | 25,988,151 | |
Class Y | | | | | | | | | | | | | | | | | | | | |
Issued | | | 840,041 | | | | 195,011 | | | | | | | | 619,171 | | | | 4,939,472 | |
Reinvested | | | — | | | | 28,097 | | | | | | | | — | | | | 35,024 | |
Redeemed | | | (253,872 | ) | | | (35,381 | ) | | | | | | | (1,474,869 | ) | | | (4,335,659 | ) |
Change in shares outstanding | | | 586,169 | | | | 187,727 | | | | | | | | (855,698 | ) | | | 638,837 | |
Change in shares | | | (37,621 | ) | | | 7,427,943 | | | | | | | | (7,611,610 | ) | | | 21,731,680 | |
See accompanying Notes to Financial Statements.
| | | | | | | | | | | | | | | | |
| DIAMOND HILL FUNDS | | | | | SEMI-ANNUAL REPORT | | | | | JUNE 30, 2016 | | | | | DIAMOND-HILL.COM | | | 45 | |
Diamond Hill Funds
Statements of Changes in Net Assets
| | | | | | | | | | | | | | | | | | | | |
| | | Research Opportunities Fund | | | | | | Financial Long-Short Fund | |
| | | For the six
months ended
June 30, 2016
(Unaudited) | | | For the year
ended
December 31,
2015 | | | | | | For the six
months ended
June 30, 2016
(Unaudited) | | | For the year
ended
December 31,
2015 | |
From Operations | | | | | | | | | | | | | | | | | | | | |
Net investment income (loss) | | $ | 105,364 | | | $ | (68,791 | ) | | | | | | $ | 99,418 | | | $ | 26,945 | |
Net realized gains (losses) on security sales | | | 72,913 | | | | 5,018,282 | | | | | | | | 576,067 | | | | 3,341,781 | |
Net realized gains (losses) on closed short positions | | | 43,078 | | | | (1,252,359 | ) | | | | | | | (12,886 | ) | | | (82,958 | ) |
Net realized gains (losses) on foreign currency transactions | | | (19 | ) | | | (2,578 | ) | | | | | | | — | | | | — | |
Net change in unrealized appreciation (depreciation) on investments and foreign currency translations | | | (1,415,202 | ) | | | (9,014,463 | ) | | | | | | | (2,957,274 | ) | | | (4,875,135 | ) |
Change in Net Assets from Operations | | | (1,193,866 | ) | | | (5,319,909 | ) | | | | | | | (2,294,675 | ) | | | (1,589,367 | ) |
| | | | | |
Distributions to Shareholders | | | | | | | | | | | | | | | | | | | | |
From net investment income: | | | | | | | | | | | | | | | | | | | | |
Class A | | | — | | | | — | | | | | | | | — | | | | (43,179 | ) |
Class I | | | — | | | | (52,987 | ) | | | | | | | — | | | | (91,032 | ) |
Class Y | | | — | | | | (77,016 | ) | | | | | | | — | | | | — | |
From net realized gains on investments | | | | | | | | | | | | | | | | | | | | |
Class A | | | — | | | | (662,379 | ) | | | | | | | — | | | | — | |
Class C | | | — | | | | (360,854 | ) | | | | | | | — | | | | — | |
Class I | | | — | | | | (2,063,440 | ) | | | | | | | — | | | | — | |
Class Y | | | — | | | | (1,216,539 | ) | | | | | | | — | | | | — | |
Change in Net Assets from Distributions to Shareholders | | | — | | | | (4,433,215 | ) | | | | | | | — | | | | (134,211 | ) |
Change in net assets from capital transactions | | | (4,881,849 | ) | | | (12,428,112 | ) | | | | | | | 2,127,072 | | | | (446,293 | ) |
| | | | | |
Total Change in Net Assets | | | (6,075,715 | ) | | | (22,181,236 | ) | | | | | | | (167,603 | ) | | | (2,169,871 | ) |
| | | | | |
Net Assets: | | | | | | | | | | | | | | | | | | | | |
Beginning of period | | | 55,205,096 | | | | 77,386,332 | | | | | | | | 27,416,467 | | | | 29,586,338 | |
End of period | | $ | 49,129,381 | | | $ | 55,205,096 | | | | | | | $ | 27,248,864 | | | $ | 27,416,467 | |
Accumulated Net Investment Income (Loss) | | $ | (306,472 | ) | | $ | (411,836 | ) | | | | | | $ | 13,629 | | | $ | (85,789 | ) |
See accompanying Notes to Financial Statements.
| | | | | | | | | | | | | | |
| 46 | | DIAMOND HILL FUNDS | | | | | SEMI-ANNUAL REPORT | | | | | JUNE 30, 2016 | | | | | DIAMOND-HILL.COM |
Diamond Hill Funds
Statements of Changes in Net Assets
| | | | | | | | | | | | | | | | | | | | |
| | | Research Opportunities Fund | | | | | | Financial Long-Short Fund | |
| | | For the six
months ended
June 30, 2016
(Unaudited) | | | For the year
ended
December 31,
2015 | | | | | | For the six
months ended
June 30, 2016
(Unaudited) | | | For the year
ended
December 31,
2015 | |
Capital Transactions: | | | | | | | | | | | | | | | | | | | | |
Class A | | | | | | | | | | | | | | | | | | | | |
Proceeds from shares sold | | $ | 559,128 | | | $ | 7,998,672 | | | | | | | $ | 254,187 | | | $ | 2,028,899 | |
Reinvested distributions | | | — | | | | 639,430 | | | | | | | | — | | | | 25,963 | |
Payments for shares redeemed | | | (4,606,349 | ) | | | (7,702,776 | ) | | | | | | | (782,139 | ) | | | (2,753,690 | ) |
Change in Net Assets from Class A Share Transactions | | | (4,047,221 | ) | | | 935,326 | | | | | | | | (527,952 | ) | | | (698,828 | ) |
Class C | | | | | | | | | | | | | | | | | | | | |
Proceeds from shares sold | | | 224,874 | | | | 6,880,044 | | | | | | | | 10,293 | | | | 162,132 | |
Reinvested distributions | | | — | | | | 341,164 | | | | | | | | — | | | | — | |
Payments for shares redeemed | | | (1,398,058 | ) | | | (1,799,883 | ) | | | | | | | (158,164 | ) | | | (437,261 | ) |
Change in Net Assets from Class C Share Transactions | | | (1,173,184 | ) | | | 5,421,325 | | | | | | | | (147,871 | ) | | | (275,129 | ) |
Class I | | | | | | | | | | | | | | | | | | | | |
Proceeds from shares sold | | | 8,039,701 | | | | 16,175,668 | | | | | | | | 4,618,476 | | | | 10,129,768 | |
Reinvested distributions | | | — | | | | 2,108,795 | | | | | | | | — | | | | 80,737 | |
Payments for shares redeemed | | | (6,483,124 | ) | | | (37,170,502 | ) | | | | | | | (1,815,581 | ) | | | (9,682,841 | ) |
Change in Net Assets from Class I Share Transactions | | | 1,556,577 | | | | (18,886,039 | ) | | | | | | | 2,802,895 | | | | 527,664 | |
Class Y | | | | | | | | | | | | | | | | | | | | |
Proceeds from shares sold | | | 995,307 | | | | 1,523,034 | | | | | | | | — | | | | — | |
Reinvested distributions | | | — | | | | 399,089 | | | | | | | | — | | | | — | |
Payments for shares redeemed | | | (2,213,328 | ) | | | (1,820,847 | ) | | | | | | | — | | | | — | |
Change in Net Assets from Class Y Share Transactions | | | (1,218,021 | ) | | | 101,276 | | | | | | | | — | | | | — | |
Change in net assets from capital transactions: | | $ | (4,881,849 | ) | | $ | (12,428,112 | ) | | | | | | $ | 2,127,072 | | | $ | (446,293 | ) |
Share Transactions: | | | | | | | | | | | | | | | | | | | | |
Class A | | | | | | | | | | | | | | | | | | | | |
Issued | | | 29,101 | | | | 344,138 | | | | | | | | 14,719 | | | | 104,825 | |
Reinvested | | | — | | | | 32,657 | | | | | | | | — | | | | 1,388 | |
Redeemed | | | (245,172 | ) | | | (359,951 | ) | | | | | | | (45,453 | ) | | | (142,522 | ) |
Change in shares outstanding | | | (216,071 | ) | | | 16,844 | | | | | | | | (30,734 | ) | | | (36,309 | ) |
Class C | | | | | | | | | | | | | | | | | | | | |
Issued | | | 11,886 | | | | 306,509 | | | | | | | | 588 | | | | 9,305 | |
Reinvested | | | — | | | | 18,013 | | | | | | | | — | | | | — | |
Redeemed | | | (76,725 | ) | | | (87,434 | ) | | | | | | | (10,067 | ) | | | (24,834 | ) |
Change in shares outstanding | | | (64,839 | ) | | | 237,088 | | | | | | | | (9,479 | ) | | | (15,529 | ) |
Class I | | | | | | | | | | | | | | | | | | | | |
Issued | | | 407,530 | | | | 697,619 | | | | | | | | 280,006 | | | | 518,918 | |
Reinvested | | | — | | | | 106,915 | | | | | | | | — | | | | 4,322 | |
Redeemed | | | (343,672 | ) | | | (1,690,625 | ) | | | | | | | (106,953 | ) | | | (508,801 | ) |
Change in shares outstanding | | | 63,858 | | | | (886,091 | ) | | | | | | | 173,053 | | | | 14,439 | |
Class Y | | | | | | | | | | | | | | | | | | | | |
Issued | | | 52,034 | | | | 65,960 | | | | | | | | — | | | | — | |
Reinvested | | | — | | | | 20,180 | | | | | | | | — | | | | — | |
Redeemed | | | (111,599 | ) | | | (78,760 | ) | | | | | | | — | | | | — | |
Change in shares outstanding | | | (59,565 | ) | | | 7,380 | | | | | | | | — | | | | — | |
Change in shares | | | (276,617 | ) | | | (624,779 | ) | | | | | | | 132,840 | | | | (37,399 | ) |
See accompanying Notes to Financial Statements.
| | | | | | | | | | | | | | | | |
| DIAMOND HILL FUNDS | | | | | SEMI-ANNUAL REPORT | | | | | JUNE 30, 2016 | | | | | DIAMOND-HILL.COM | | | 47 | |
Diamond Hill Funds
Statements of Changes in Net Assets
| | | | | | | | | | | | | | | | |
| | | Corporate Credit Fund | | | | | | High Yield Fund | |
| | | For the six
months ended
June 30, 2016
(Unaudited) | | | For the year
ended
December 31,
2015 | | | | | | For the period
December 31,2015
through
June 30, 2016
(Unaudited)(A) | |
From Operations | | | | | | | | | | | | | | | | |
Net investment income (loss) | | $ | 11,617,286 | | | $ | 13,875,096 | | | | | | | $ | 672,335 | |
Net realized gains (losses) on security sales | | | (670,688 | ) | | | 629,391 | | | | | | | | 60,605 | |
Net change in unrealized appreciation (depreciation) on investments and foreign currency translations | | | 13,073,400 | | | | (12,614,587 | ) | | | | | | | 47,197 | |
Change in Net Assets from Operations | | | 24,019,998 | | | | 1,889,900 | | | | | | | | 780,137 | |
| | | | |
Distributions to Shareholders | | | | | | | | | | | | | | | | |
From net investment income: | | | | | | | | | | | | | | | | |
Class A | | | (1,520,425 | ) | | | (1,772,505 | ) | | | | | | | (2,614 | ) |
Class C | | | (671,109 | ) | | | (1,033,624 | ) | | | | | | | — | |
Class I | | | (8,765,261 | ) | | | (9,849,445 | ) | | | | | | | (384,313 | ) |
Class Y | | | (530,461 | ) | | | (961,840 | ) | | | | | | | (260,862 | ) |
Change in Net Assets from Distributions to Shareholders | | | (11,487,256 | ) | | | (13,617,414 | ) | | | | | | | (647,789 | ) |
Change in net assets from capital transactions | | | 70,167,732 | | | | 125,326,622 | | | | | | | | 24,232,930 | |
| | | | |
Total Change in Net Assets | | | 82,700,474 | | | | 113,599,108 | | | | | | | | 24,365,278 | |
| | | | |
Net Assets: | | | | | | | | | | | | | | | | |
Beginning of period | | | 333,537,776 | | | | 219,938,668 | | | | | | | | — | |
End of period | | $ | 416,238,250 | | | $ | 333,537,776 | | | | | | | $ | 24,365,278 | |
Accumulated Net Investment Income (Loss) | | $ | 1,039,391 | | | $ | 909,361 | | | | | | | $ | 24,546 | |
| (A) | Inception date of the Fund is December 31, 2015. The fund commenced public offering and investment operations on January 4, 2016. |
See accompanying Notes to Financial Statements.
| | | | | | | | | | | | | | |
| 48 | | DIAMOND HILL FUNDS | | | | | SEMI-ANNUAL REPORT | | | | | JUNE 30, 2016 | | | | | DIAMOND-HILL.COM |
Diamond Hill Funds
Statements of Changes in Net Assets
| | | | | | | | | | | | | | | | |
| | | Corporate Credit Fund | | | | | | High Yield Fund | |
| | | For the six
months ended
June 30, 2016
(Unaudited) | | | For the year
ended
December 31,
2015 | | | | | | For the period
December 31,2015
through
June 30, 2016
(Unaudited)(A) | |
Capital Transactions: | | | | | | | | | | | | | | | | |
Class A | | | | | | | | | | | | | | | | |
Proceeds from shares sold | | $ | 24,562,084 | | | $ | 25,002,825 | | | | | | | $ | 139,940 | |
Reinvested distributions | | | 1,283,552 | | | | 1,449,226 | | | | | | | | 2,614 | |
Payments for shares redeemed | | | (13,692,434 | ) | | | (11,790,094 | ) | | | | | | | (81 | ) |
Change in Net Assets from Class A Share Transactions | | | 12,153,202 | | | | 14,661,957 | | | | | | | | 142,473 | |
Class C | | | | | | | | | | | | | | | | |
Proceeds from shares sold | | | 5,762,670 | | | | 4,711,613 | | | | | | | | — | |
Reinvested distributions | | | 455,389 | | | | 617,137 | | | | | | | | — | |
Payments for shares redeemed | | | (2,405,040 | ) | | | (4,870,148 | ) | | | | | | | — | |
Change in Net Assets from Class C Share Transactions | | | 3,813,019 | | | | 458,602 | | | | | | | | — | |
Class I | | | | | | | | | | | | | | | | |
Proceeds from shares sold | | | 90,459,775 | | | | 145,139,779 | | | | | | | | 16,859,049 | |
Reinvested distributions | | | 8,019,570 | | | | 8,919,431 | | | | | | | | 379,679 | |
Payments for shares redeemed | | | (41,284,897 | ) | | | (46,810,896 | ) | | | | | | | (349,673 | ) |
Change in Net Assets from Class I Share Transactions | | | 57,194,448 | | | | 107,248,314 | | | | | | | | 16,889,055 | |
Class Y | | | | | | | | | | | | | | | | |
Proceeds from shares sold | | | 2,096,194 | | | | 3,740,291 | | | | | | | | 13,440,548 | |
Reinvested distributions | | | 530,461 | | | | 961,840 | | | | | | | | 260,862 | |
Payments for shares redeemed | | | (5,619,592 | ) | | | (1,744,382 | ) | | | | | | | (6,500,008 | ) |
Change in Net Assets from Class Y Share Transactions | | | (2,992,937 | ) | | | 2,957,749 | | | | | | | | 7,201,402 | |
Change in net assets from capital transactions: | | $ | 70,167,732 | | | $ | 125,326,622 | | | | | | | $ | 24,232,930 | |
Share Transactions: | | | | | | | | | | | | | | | | |
Class A | | | | | | | | | | | | | | | | |
Issued | | | 2,295,147 | | | | 2,289,120 | | | | | | | | 13,082 | |
Reinvested | | | 120,442 | | | | 132,730 | | | | | | | | 251 | |
Redeemed | | | (1,274,881 | ) | | | (1,069,893 | ) | | | | | | | (8 | ) |
Change in shares outstanding | | | 1,140,708 | | | | 1,351,957 | | | | | | | | 13,325 | |
Class C | | | | | | | | | | | | | | | | |
Issued | | | 541,204 | | | | 432,305 | | | | | | | | — | |
Reinvested | | | 42,878 | | | | 56,561 | | | | | | | | — | |
Redeemed | | | (226,311 | ) | | | (444,919 | ) | | | | | | | — | |
Change in shares outstanding | | | 357,771 | | | | 43,947 | | | | | | | | — | |
Class I | | | | | | | | | | | | | | | | |
Issued | | | 8,554,826 | | | | 13,431,461 | | | | | | | | 1,659,443 | |
Reinvested | | | 755,176 | | | | 819,468 | | | | | | | | 36,432 | |
Redeemed | | | (3,892,279 | ) | | | (4,308,315 | ) | | | | | | | (33,596 | ) |
Change in shares outstanding | | | 5,417,723 | | | | 9,942,614 | | | | | | | | 1,662,279 | |
Class Y | | | | | | | | | | | | | | | | |
Issued | | | 203,159 | | | | 340,930 | | | | | | | | 1,258,116 | |
Reinvested | | | 50,140 | | | | 88,211 | | | | | | | | 25,681 | |
Redeemed | | | (525,250 | ) | | | (164,616 | ) | | | | | | | (641,099 | ) |
Change in shares outstanding | | | (271,951 | ) | | | 264,525 | | | | | | | | 642,698 | |
Change in shares | | | 6,644,251 | | | | 11,603,043 | | | | | | | | 2,318,302 | |
| (A) | Inception date of the Fund is December 31, 2015. The fund commenced public offering and investment operations on January 4, 2016. |
See accompanying Notes to Financial Statements.
| | | | | | | | | | | | | | | | |
| DIAMOND HILL FUNDS | | | | | SEMI-ANNUAL REPORT | | | | | JUNE 30, 2016 | | | | | DIAMOND-HILL.COM | | | 49 | |
Small Cap Fund
Financial Highlights
Selected data for a share outstanding throughout the periods indicated
| | | | | | | | | | | | | | | | |
| Small Cap Fund | | Net asset
value,
beginning
of period | | | Net
investment
income
(loss) | | | Net
realized
and
unrealized
gains
(losses) on
investments | | | Total from
investment
operations | |
| | | | |
Class A | | | | | | | | | | | | | | | | |
For the six months ended June 30, 2016 (Unaudited) | | | $30.89 | | | | 0.12 | (C) | | | 0.61 | | | | 0.73 | |
For the year ended December 31, 2015 | | | $32.61 | | | | (0.05 | )(C) | | | (1.17 | ) | | | (1.22 | ) |
For the year ended December 31, 2014 | | | $32.72 | | | | (0.11 | )(C) | | | 1.57 | | | | 1.46 | |
For the year ended December 31, 2013 | | | $24.95 | | | | — | (C)(F) | | | 9.86 | | | | 9.86 | |
For the year ended December 31, 2012 | | | $23.04 | | | | 0.07 | (C) | | | 2.88 | | | | 2.95 | |
For the year ended December 31, 2011 | | | $25.80 | | | | (0.08 | ) | | | (1.80 | ) | | | (1.88 | ) |
| | | | |
Class C | | | | | | | | | | | | | | | | |
For the six months ended June 30, 2016 (Unaudited) | | | $27.51 | | | | — | (C)(F) | | | 0.55 | | | | 0.55 | |
For the year ended December 31, 2015 | | | $29.23 | | | | (0.25 | )(C) | | | (1.06 | ) | | | (1.31 | ) |
For the year ended December 31, 2014 | | | $29.70 | | | | (0.33 | )(C) | | | 1.43 | | | | 1.10 | |
For the year ended December 31, 2013 | | | $22.94 | | | | (0.21 | )(C) | | | 9.03 | | | | 8.82 | |
For the year ended December 31, 2012 | | | $21.34 | | | | (0.10 | )(C) | | | 2.65 | | | | 2.55 | |
For the year ended December 31, 2011 | | | $24.14 | | | | (0.25 | ) | | | (1.67 | ) | | | (1.92 | ) |
| | | | |
Class I | | | | | | | | | | | | | | | | |
For the six months ended June 30, 2016 (Unaudited) | | | $31.28 | | | | 0.17 | (C) | | | 0.62 | | | | 0.79 | |
For the year ended December 31, 2015 | | | $33.04 | | | | 0.05 | (C) | | | (1.20 | ) | | | (1.15 | ) |
For the year ended December 31, 2014 | | | $33.10 | | | | (0.02 | )(C) | | | 1.59 | | | | 1.57 | |
For the year ended December 31, 2013 | | | $25.21 | | | | 0.07 | (C) | | | 9.98 | | | | 10.05 | |
For the year ended December 31, 2012 | | | $23.27 | | | | 0.14 | (C) | | | 2.90 | | | | 3.04 | |
For the year ended December 31, 2011 | | | $26.01 | | | | (0.01 | ) | | | (1.82 | ) | | | (1.83 | ) |
| | | | |
Class Y(G) | | | | | | | | | | | | | | | | |
For the six months ended June 30, 2016 (Unaudited) | | | $31.29 | | | | 0.18 | (C) | | | 0.62 | | | | 0.80 | |
For the year ended December 31, 2015 | | | $33.05 | | | | 0.12 | (C) | | | (1.23 | ) | | | (1.11 | ) |
For the year ended December 31, 2014 | | | $33.09 | | | | 0.03 | (C) | | | 1.60 | | | | 1.63 | |
For the year ended December 31, 2013 | | | $25.20 | | | | 0.12 | (C) | | | 9.97 | | | | 10.09 | |
For the year ended December 31, 2012 | | | $23.27 | | | | 0.20 | (C) | | | 2.88 | | | | 3.08 | |
| (A) | Total returns shown exclude the effect of applicable sales charges. |
| (B) | Portfolio turnover rate is calculated on the basis of the Fund as a whole without distinguishing between classes of shares issued. |
| (C) | Net investment income (loss) per share has been calculated using the average daily shares outstanding during the period. |
See accompanying Notes to Financial Statements.
| | | | | | | | | | | | | | |
| 50 | | DIAMOND HILL FUNDS | | | | | SEMI-ANNUAL REPORT | | | | | JUNE 30, 2016 | | | | | DIAMOND-HILL.COM |
| | | | | | | | | | | | | | | | | | | | | | | | | | | | | | | | | | |
Dividends
from net
investment
income | | | Distributions
from net
realized
gains | | | Total
distributions | | | Net asset
value at
end of
period | | | Total
return(A) | | | Net assets
at end
of period
(000’s) | | | Ratio
of total
expenses
to average
net assets | | | Ratio
of net
investment
income
(loss) to
average
net assets | | | Portfolio
turnover
rate(B) | |
| | | | | | | | |
| | | | | | | | | | | | | | | | | | | | | | | | | | | | | | | | | | |
| | — | | | | — | | | | — | | | | $31.62 | | | | 2.36 | %(D) | | | $481,036 | | | | 1.29 | %(E) | | | 0.77 | %(E) | | | 6 | % |
| | (0.09) | | | | (0.41 | ) | | | (0.50 | ) | | | $30.89 | | | | (3.73 | )% | | | $492,810 | | | | 1.29 | % | | | (0.15 | )% | | | 17 | % |
| | — | | | | (1.57 | ) | | | (1.57 | ) | | | $32.61 | | | | 4.60 | % | | | $571,941 | | | | 1.30 | % | | | (0.34 | )% | | | 16 | % |
| | (0.03) | | | | (2.06 | ) | | | (2.09 | ) | | | $32.72 | | | | 39.70 | % | | | $571,167 | | | | 1.31 | % | | | (0.01 | )% | | | 43 | % |
| | (0.09) | | | | (0.95 | ) | | | (1.04 | ) | | | $24.95 | | | | 12.88 | % | | | $390,371 | | | | 1.31 | % | | | 0.30 | % | | | 13 | % |
| | — | | | | (0.88 | ) | | | (0.88 | ) | | | $23.04 | | | | (7.17 | )% | | | $431,313 | | | | 1.33 | % | | | (0.32 | )% | | | 28 | % |
| | | | | | | | |
| | | | | | | | | | | | | | | | | | | | | | | | | | | | | | | | | | |
| | — | | | | — | | | | — | | | | $28.06 | | | | 2.00 | %(D) | | | $55,693 | | | | 2.04 | %(E) | | | 0.01 | %(E) | | | 6 | % |
| | — | | | | (0.41 | ) | | | (0.41 | ) | | | $27.51 | | | | (4.47 | )% | | | $57,875 | | | | 2.04 | % | | | (0.87 | )% | | | 17 | % |
| | — | | | | (1.57 | ) | | | (1.57 | ) | | | $29.23 | | | | 3.86 | % | | | $51,794 | | | | 2.05 | % | | | (1.07 | )% | | | 16 | % |
| | — | | | | (2.06 | ) | | | (2.06 | ) | | | $29.70 | | | | 38.64 | % | | | $46,476 | | | | 2.06 | % | | | (0.76 | )% | | | 43 | % |
| | — | | | | (0.95 | ) | | | (0.95 | ) | | | $22.94 | | | | 12.04 | % | | | $29,917 | | | | 2.06 | % | | | (0.45 | )% | | | 13 | % |
| | — | | | | (0.88 | ) | | | (0.88 | ) | | | $21.34 | | | | (7.83 | )% | | | $31,664 | | | | 2.08 | % | | | (1.07 | )% | | | 28 | % |
| | | | | | | | |
| | | | | | | | | | | | | | | | | | | | | | | | | | | | | | | | | | |
| | — | | | | — | | | | — | | | | $32.07 | | | | 2.53 | %(D) | | | $961,313 | | | | 1.00 | %(E) | | | 1.08 | %(E) | | | 6 | % |
| | (0.20) | | | | (0.41 | ) | | | (0.61 | ) | | | $31.28 | | | | (3.47 | )% | | | $882,350 | | | | 1.02 | % | | | 0.16 | % | | | 17 | % |
| | (0.06) | | | | (1.57 | ) | | | (1.63 | ) | | | $33.04 | | | | 4.86 | % | | | $659,199 | | | | 1.05 | % | | | (0.06 | )% | | | 16 | % |
| | (0.10) | | | | (2.06 | ) | | | (2.16 | ) | | | $33.10 | | | | 40.08 | % | | | $550,844 | | | | 1.06 | % | | | 0.22 | % | | | 43 | % |
| | (0.15) | | | | (0.95 | ) | | | (1.10 | ) | | | $25.21 | | | | 13.17 | % | | | $298,473 | | | | 1.06 | % | | | 0.56 | % | | | 13 | % |
| | (0.03) | | | | (0.88 | ) | | | (0.91 | ) | | | $23.27 | | | | (6.91 | )% | | | $314,149 | | | | 1.04 | % | | | (0.03 | )% | | | 28 | % |
| | | | | | | | |
| | | | | | | | | | | | | | | | | | | | | | | | | | | | | | | | | | |
| | — | | | | — | | | | — | | | | $32.09 | | | | 2.56 | %(D) | | | $235,426 | | | | 0.90 | %(E) | | | 1.17 | %(E) | | | 6 | % |
| | (0.24) | | | | (0.41 | ) | | | (0.65 | ) | | | $31.29 | | | | (3.36 | )% | | | $221,624 | | | | 0.90 | % | | | 0.37 | % | | | 17 | % |
| | (0.10) | | | | (1.57 | ) | | | (1.67 | ) | | | $33.05 | | | | 5.06 | % | | | $157,665 | | | | 0.90 | % | | | 0.10 | % | | | 16 | % |
| | (0.14) | | | | (2.06 | ) | | | (2.20 | ) | | | $33.09 | | | | 40.25 | % | | | $101,026 | | | | 0.91 | % | | | 0.40 | % | | | 43 | % |
| | (0.20) | | | | (0.95 | ) | | | (1.15 | ) | | | $25.20 | | | | 13.34 | % | | | $63,439 | | | | 0.91 | % | | | 0.82 | % | | | 13 | % |
| (F) | Amount is less than $0.005. |
| (G) | Inception date of Class Y is December 30, 2011. Class Y commenced public offering on January 3, 2012. |
See accompanying Notes to Financial Statements.
| | | | | | | | | | | | | | | | |
| DIAMOND HILL FUNDS | | | | | SEMI-ANNUAL REPORT | | | | | JUNE 30, 2016 | | | | | DIAMOND-HILL.COM | | | 51 | |
Small-Mid Cap Fund
Financial Highlights
Selected data for a share outstanding throughout the periods indicated
| | | | | | | | | | | | | | | | |
| Small-Mid Cap Fund | | Net asset
value,
beginning
of period | | | Net
investment
income
(loss) | | | Net
realized
and
unrealized
gains
(losses) on
investments | | | Total from
investment
operations | |
| | | | |
Class A | | | | | | | | | | | | | | | | |
For the six months ended June 30, 2016 (Unaudited) | | | $18.29 | | | | 0.02 | (C) | | | 0.92 | | | | 0.94 | |
For the year ended December 31, 2015 | | | $18.33 | | | | 0.01 | (C) | | | 0.17 | | | | 0.18 | |
For the year ended December 31, 2014 | | | $17.73 | | | | 0.03 | (C) | | | 1.23 | | | | 1.26 | |
For the year ended December 31, 2013 | | | $13.13 | | | | 0.04 | (C) | | | 5.35 | | | | 5.39 | |
For the year ended December 31, 2012 | | | $11.71 | | | | 0.02 | (C) | | | 1.78 | | | | 1.80 | |
For the year ended December 31, 2011 | | | $12.56 | | | | — | (F) | | | (0.53 | ) | | | (0.53 | ) |
| | | | |
Class C | | | | | | | | | | | | | | | | |
For the six months ended June 30, 2016 (Unaudited) | | | $17.06 | | | | (0.05 | )(C) | | | 0.86 | | | | 0.81 | |
For the year ended December 31, 2015 | | | $17.21 | | | | (0.12 | )(C) | | | 0.16 | | | | 0.04 | |
For the year ended December 31, 2014 | | | $16.80 | | | | (0.10 | )(C) | | | 1.15 | | | | 1.05 | |
For the year ended December 31, 2013 | | | $12.54 | | | | (0.07 | )(C) | | | 5.09 | | | | 5.02 | |
For the year ended December 31, 2012 | | | $11.28 | | | | (0.07 | )(C) | | | 1.71 | | | | 1.64 | |
For the year ended December 31, 2011 | | | $12.21 | | | | (0.06 | ) | | | (0.55 | ) | | | (0.61 | ) |
| | | | |
Class I | | | | | | | | | | | | | | | | |
For the six months ended June 30, 2016 (Unaudited) | | | $18.46 | | | | 0.05 | (C) | | | 0.91 | | | | 0.96 | |
For the year ended December 31, 2015 | | | $18.47 | | | | 0.07 | (C) | | | 0.17 | | | | 0.24 | |
For the year ended December 31, 2014 | | | $17.87 | | | | 0.08 | (C) | | | 1.22 | | | | 1.30 | |
For the year ended December 31, 2013 | | | $13.21 | | | | 0.09 | (C) | | | 5.38 | | | | 5.47 | |
For the year ended December 31, 2012 | | | $11.78 | | | | 0.05 | (C) | | | 1.80 | | | | 1.85 | |
For the year ended December 31, 2011 | | | $12.61 | | | | 0.04 | | | | (0.54 | ) | | | (0.50 | ) |
| | | | |
Class Y(H) | | | | | | | | | | | | | | | | |
For the six months ended June 30, 2016 (Unaudited) | | | $18.48 | | | | 0.05 | (C) | | | 0.93 | | | | 0.98 | |
For the year ended December 31, 2015 | | | $18.49 | | | | 0.09 | (C) | | | 0.17 | | | | 0.26 | |
For the year ended December 31, 2014 | | | $17.87 | | | | 0.11 | (C) | | | 1.23 | | | | 1.34 | |
For the year ended December 31, 2013 | | | $13.20 | | | | 0.12 | (C) | | | 5.38 | | | | 5.50 | |
For the year ended December 31, 2012 | | | $11.78 | | | | 0.09 | (C) | | | 1.77 | | | | 1.86 | |
| (A) | Total returns shown exclude the effect of applicable sales charges. |
| (B) | Portfolio turnover rate is calculated on the basis of the Fund as a whole without distinguishing between classes of shares issued. |
| (C) | Net investment income (loss) per share has been calculated using the average daily shares outstanding during the period. |
See accompanying Notes to Financial Statements.
| | | | | | | | | | | | | | |
| 52 | | DIAMOND HILL FUNDS | | | | | SEMI-ANNUAL REPORT | | | | | JUNE 30, 2016 | | | | | DIAMOND-HILL.COM |
| | | | | | | | | | | | | | | | | | | | | | | | | | | | | | | | | | |
Dividends
from net
investment
income | | | Distributions
from net
realized
gains | | | Total
distributions | | | Net asset
value at
end of
period | | | Total
return(A) | | | Net assets
at end
of period
(000’s) | | | Ratio
of total
expenses
to average
net assets | | | Ratio
of net
investment
income
(loss) to
average
net assets | | | Portfolio
turnover
rate(B) | |
| | | | | | | | |
| | | | | | | | | | | | | | | | | | | | | | | | | | | | | | | | | | |
| | — | | | | — | | | | — | | | | $19.23 | | | | 5.14 | %(D) | | | $253,857 | | | | 1.23 | %(E) | | | 0.24 | %(E) | | | 9 | % |
| | (0.03) | | | | (0.19 | ) | | | (0.22 | ) | | | $18.29 | | | | 0.98 | % | | | $156,122 | | | | 1.24 | % | | | 0.06 | % | | | 21 | % |
| | (0.02) | | | | (0.64 | ) | | | (0.66 | ) | | | $18.33 | | | | 7.17 | % | | | $100,820 | | | | 1.25 | % | | | 0.18 | % | | | 27 | % |
| | (0.03) | | | | (0.76 | ) | | | (0.79 | ) | | | $17.73 | | | | 41.25 | % | | | $61,563 | | | | 1.26 | % | | | 0.27 | % | | | 35 | % |
| | — | (F) | | | (0.38 | ) | | | (0.38 | ) | | | $13.13 | | | | 15.43 | % | | | $19,607 | | | | 1.26 | % | | | 0.15 | % | | | 26 | % |
| | — | | | | (0.32 | ) | | | (0.32 | ) | | | $11.71 | | | | (4.19 | )% | | | $17,461 | | | | 1.28 | % | | | — | %(G) | | | 48 | % |
| | | | | | | | |
| | | | | | | | | | | | | | | | | | | | | | | | | | | | | | | | | | |
| | — | | | | — | | | | — | | | | $17.87 | | | | 4.75 | %(D) | | | $40,520 | | | | 1.98 | %(E) | | | (0.55 | )%(E) | | | 9 | % |
| | — | | | | (0.19 | ) | | | (0.19 | ) | | | $17.06 | | | | 0.24 | % | | | $32,963 | | | | 1.99 | % | | | (0.69 | )% | | | 21 | % |
| | — | | | | (0.64 | ) | | | (0.64 | ) | | | $17.21 | | | | 6.33 | % | | | $25,276 | | | | 2.00 | % | | | (0.59 | )% | | | 27 | % |
| | — | | | | (0.76 | ) | | | (0.76 | ) | | | $16.80 | | | | 40.21 | % | | | $19,184 | | | | 2.01 | % | | | (0.45 | )% | | | 35 | % |
| | — | | | | (0.38 | ) | | | (0.38 | ) | | | $12.54 | | | | 14.57 | % | | | $9,169 | | | | 2.01 | % | | | (0.59 | )% | | | 26 | % |
| | — | | | | (0.32 | ) | | | (0.32 | ) | | | $11.28 | | | | (4.89 | )% | | | $8,110 | | | | 2.02 | % | | | (0.74 | )% | | | 48 | % |
| | | | | | | | |
| | | | | | | | | | | | | | | | | | | | | | | | | | | | | | | | | | |
| | — | | | | — | | | | — | | | | $19.42 | | | | 5.20 | %(D) | | | $798,317 | | | | 0.95 | %(E) | | | 0.51 | %(E) | | | 9 | % |
| | (0.06) | | | | (0.19 | ) | | | (0.25 | ) | | | $18.46 | | | | 1.32 | % | | | $506,730 | | | | 0.97 | % | | | 0.35 | % | | | 21 | % |
| | (0.06) | | | | (0.64 | ) | | | (0.70 | ) | | | $18.47 | | | | 7.36 | % | | | $264,824 | | | | 1.00 | % | | | 0.42 | % | | | 27 | % |
| | (0.05) | | | | (0.76 | ) | | | (0.81 | ) | | | $17.87 | | | | 41.64 | % | | | $148,927 | | | | 1.01 | % | | | 0.54 | % | | | 35 | % |
| | (0.04) | | | | (0.38 | ) | | | (0.42 | ) | | | $13.21 | | | | 15.74 | % | | | $53,514 | | | | 1.01 | % | | | 0.42 | % | | | 26 | % |
| | (0.01) | | | | (0.32 | ) | | | (0.33 | ) | | | $11.78 | | | | (3.86 | )% | | | $43,485 | | | | 0.99 | % | | | 0.29 | % | | | 48 | % |
| | | | | | | | |
| | | | | | | | | | | | | | | | | | | | | | | | | | | | | | | | | | |
| | — | | | | — | | | | — | | | | $19.46 | | | | 5.30 | %(D) | | | $752,269 | | | | 0.85 | %(E) | | | 0.59 | %(E) | | | 9 | % |
| | (0.08) | | | | (0.19 | ) | | | (0.27 | ) | | | $18.48 | | | | 1.41 | % | | | $602,951 | | | | 0.85 | % | | | 0.48 | % | | | 21 | % |
| | (0.08) | | | | (0.64 | ) | | | (0.72 | ) | | | $18.49 | | | | 7.60 | % | | | $300,815 | | | | 0.85 | % | | | 0.62 | % | | | 27 | % |
| | (0.07) | | | | (0.76 | ) | | | (0.83 | ) | | | $17.87 | | | | 41.88 | % | | | $106,068 | | | | 0.86 | % | | | 0.73 | % | | | 35 | % |
| | (0.06) | | | | (0.38 | ) | | | (0.44 | ) | | | $13.20 | | | | 15.84 | % | | | $30,940 | | | | 0.86 | % | | | 0.68 | % | | | 26 | % |
| (F) | Amount is less than $0.005. |
| (G) | Amount is less than 0.005%. |
| (H) | Inception date of Class Y is December 30, 2011. Class Y commenced public offering on January 3, 2012. |
See accompanying Notes to Financial Statements.
| | | | | | | | | | | | | | | | |
| DIAMOND HILL FUNDS | | | | | SEMI-ANNUAL REPORT | | | | | JUNE 30, 2016 | | | | | DIAMOND-HILL.COM | | | 53 | |
Mid Cap Fund
Financial Highlights
Selected data for a share outstanding throughout the periods indicated
| | | | | | | | | | | | | | | | |
| Mid Cap Fund(A) | | Net asset
value,
beginning
of period | | | Net
investment
income
(loss)(B) | | | Net
realized
and
unrealized
gains
(losses) on
investments | | | Total from
investment
operations | |
| | | | |
Class A | | | | | | | | | | | | | | | | |
For the six months ended June 30, 2016 (Unaudited) | | | $10.71 | | | | 0.02 | | | | 0.55 | | | | 0.57 | |
For the year ended December 31, 2015 | | | $10.70 | | | | 0.04 | | | | 0.01 | | | | 0.05 | |
For the year ended December 31, 2014 | | | $10.00 | | | | 0.06 | | | | 0.70 | | | | 0.76 | |
| | | | |
Class I | | | | | | | | | | | | | | | | |
For the six months ended June 30, 2016 (Unaudited) | | | $10.74 | | | | 0.05 | | | | 0.53 | | | | 0.58 | |
For the year ended December 31, 2015 | | | $10.72 | | | | 0.07 | | | | 0.01 | | | | 0.08 | |
For the year ended December 31, 2014 | | | $10.00 | | | | 0.09 | | | | 0.70 | | | | 0.79 | |
| | | | |
Class Y | | | | | | | | | | | | | | | | |
For the six months ended June 30, 2016 (Unaudited) | | | $10.75 | | | | 0.04 | | | | 0.56 | | | | 0.60 | |
For the year ended December 31, 2015 | | | $10.73 | | | | 0.08 | | | | 0.01 | | | | 0.09 | |
For the year ended December 31, 2014 | | | $10.00 | | | | 0.09 | | | | 0.71 | | | | 0.80 | |
| (A) | Inception date of the Fund is December 31, 2013. Fund commenced public offering on January 2, 2014. |
| (B) | Net investment income (loss) per share has been calculated using the average daily shares outstanding during the period. |
| (C) | Total returns shown exclude the effect of applicable sales charges. |
See accompanying Notes to Financial Statements.
| | | | | | | | | | | | | | |
| 54 | | DIAMOND HILL FUNDS | | | | | SEMI-ANNUAL REPORT | | | | | JUNE 30, 2016 | | | | | DIAMOND-HILL.COM |
| | | | | | | | | | | | | | | | | | | | | | | | | | | | | | | | | | |
Dividends
from net
investment
income | | | Distributions
from net
realized
gains | | | Total
distributions | | | Net asset
value at
end of
period | | | Total
return(C) | | | Net assets
at end
of period
(000’s) | | | Ratio
of total
expenses
to average
net assets | | | Ratio
of net
investment
income
(loss) to
average
net assets | | | Portfolio
turnover
rate(D) | |
| | | | | | | | |
| | | | | | | | | | | | | | | | | | | | | | | | | | | | | | | | | | |
| | — | | | | — | | | | — | | | | $11.28 | | | | 5.32 | %(E) | | | $5,829 | | | | 1.16 | %(F) | | | 0.40 | %(F) | | | 8 | % |
| | (0.04) | | | | — | | | | (0.04 | ) | | | $10.71 | | | | 0.44 | % | | | $3,082 | | | | 1.14 | % | | | 0.35 | % | | | 29 | % |
| | (0.06) | | | | — | | | | (0.06 | ) | | | $10.70 | | | | 7.57 | % | | | $2,120 | | | | 1.15 | % | | | 0.59 | % | | | 28 | % |
| | | | | | | | |
| | | | | | | | | | | | | | | | | | | | | | | | | | | | | | | | | | |
| | — | | | | — | | | | — | | | | $11.32 | | | | 5.40 | %(E) | | | $15,535 | | | | 0.87 | %(F) | | | 0.88 | %(F) | | | 8 | % |
| | (0.06) | | | | — | | | | (0.06 | ) | | | $10.74 | | | | 0.74 | % | | | $3,337 | | | | 0.87 | % | | | 0.61 | % | | | 29 | % |
| | (0.07) | | | | — | | | | (0.07 | ) | | | $10.72 | | | | 7.91 | % | | | $2,743 | | | | 0.90 | % | | | 0.87 | % | | | 28 | % |
| | | | | | | | |
| | | | | | | | | | | | | | | | | | | | | | | | | | | | | | | | | | |
| | — | | | | — | | | | — | | | | $11.35 | | | | 5.58 | %(E) | | | $15,008 | | | | 0.77 | %(F) | | | 0.76 | %(F) | | | 8 | % |
| | (0.07) | | | | — | | | | (0.07 | ) | | | $10.75 | | | | 0.84 | % | | | $12,077 | | | | 0.75 | % | | | 0.72 | % | | | 29 | % |
| | (0.07) | | | | — | | | | (0.07 | ) | | | $10.73 | | | | 8.02 | % | | | $11,419 | | | | 0.75 | % | | | 0.87 | % | | | 28 | % |
| (D) | Portfolio turnover rate is calculated on the basis of the Fund as a whole without distinguishing between classes of shares issued. |
See accompanying Notes to Financial Statements.
| | | | | | | | | | | | | | | | |
| DIAMOND HILL FUNDS | | | | | SEMI-ANNUAL REPORT | | | | | JUNE 30, 2016 | | | | | DIAMOND-HILL.COM | | | 55 | |
Large Cap Fund
Financial Highlights
Selected data for a share outstanding throughout the periods indicated
| | | | | | | | | | | | | | | | |
| Large Cap Fund | | Net asset
value,
beginning
of period | | | Net
investment
income
(loss) | | | Net
realized
and
unrealized
gains
(losses) on
investments | | | Total from
investment
operations | |
| | | | |
Class A | | | | | | | | | | | | | | | | |
For the six months ended June 30, 2016 (Unaudited) | | | $21.44 | | | | 0.12 | (C) | | | 0.33 | | | | 0.45 | |
For the year ended December 31, 2015 | | | $22.71 | | | | 0.19 | (C) | | | (0.43 | ) | | | (0.24 | ) |
For the year ended December 31, 2014 | | | $21.49 | | | | 0.21 | (C) | | | 2.01 | | | | 2.22 | |
For the year ended December 31, 2013 | | | $16.54 | | | | 0.18 | (C) | | | 5.79 | | | | 5.97 | |
For the year ended December 31, 2012 | | | $14.96 | | | | 0.22 | (C) | | | 1.62 | | | | 1.84 | |
For the year ended December 31, 2011 | | | $14.78 | | | | 0.18 | (C) | | | 0.17 | | | | 0.35 | |
| | | | |
Class C | | | | | | | | | | | | | | | | |
For the six months ended June 30, 2016 (Unaudited) | | | $20.49 | | | | 0.04 | (C) | | | 0.31 | | | | 0.35 | |
For the year ended December 31, 2015 | | | $21.77 | | | | 0.02 | (C) | | | (0.41 | ) | | | (0.39 | ) |
For the year ended December 31, 2014 | | | $20.68 | | | | 0.04 | (C) | | | 1.93 | | | | 1.97 | |
For the year ended December 31, 2013 | | | $15.98 | | | | 0.03 | (C) | | | 5.58 | | | | 5.61 | |
For the year ended December 31, 2012 | | | $14.46 | | | | 0.10 | (C) | | | 1.56 | | | | 1.66 | |
For the year ended December 31, 2011 | | | $14.29 | | | | 0.06 | | | | 0.16 | | | | 0.22 | |
| | | | |
Class I | | | | | | | | | | | | | | | | |
For the six months ended June 30, 2016 (Unaudited) | | | $21.55 | | | | 0.15 | (C) | | | 0.34 | | | | 0.49 | |
For the year ended December 31, 2015 | | | $22.83 | | | | 0.25 | (C) | | | (0.44 | ) | | | (0.19 | ) |
For the year ended December 31, 2014 | | | $21.58 | | | | 0.27 | (C) | | | 2.03 | | | | 2.30 | |
For the year ended December 31, 2013 | | | $16.61 | | | | 0.24 | (C) | | | 5.80 | | | | 6.04 | |
For the year ended December 31, 2012 | | | $15.01 | | | | 0.26 | (C) | | | 1.63 | | | | 1.89 | |
For the year ended December 31, 2011 | | | $14.82 | | | | 0.22 | | | | 0.17 | | | | 0.39 | |
| | | | |
Class Y(F) | | | | | | | | | | | | | | | | |
For the six months ended June 30, 2016 (Unaudited) | | | $21.56 | | | | 0.16 | (C) | | | 0.34 | | | | 0.50 | |
For the year ended December 31, 2015 | | | $22.84 | | | | 0.28 | (C) | | | (0.44 | ) | | | (0.16 | ) |
For the year ended December 31, 2014 | | | $21.59 | | | | 0.31 | (C) | | | 2.02 | | | | 2.33 | |
For the year ended December 31, 2013 | | | $16.60 | | | | 0.26 | (C) | | | 5.83 | | | | 6.09 | |
For the year ended December 31, 2012 | | | $15.01 | | | | 0.30 | (C) | | | 1.62 | | | | 1.92 | |
| (A) | Total returns shown exclude the effect of applicable sales charges. |
| (B) | Portfolio turnover rate is calculated on the basis of the Fund as a whole without distinguishing between classes of shares issued. |
| (C) | Net investment income (loss) per share has been calculated using the average daily shares outstanding during the period. |
See accompanying Notes to Financial Statements.
| | | | | | | | | | | | | | |
| 56 | | DIAMOND HILL FUNDS | | | | | SEMI-ANNUAL REPORT | | | | | JUNE 30, 2016 | | | | | DIAMOND-HILL.COM |
| | | | | | | | | | | | | | | | | | | | | | | | | | | | | | | | | | |
Dividends
from net
investment
income | | | Distributions
from net
realized
gains | | | Total
distributions | | | Net asset
value at
end of
period | | | Total
return(A) | | | Net assets
at end
of period
(000’s) | | | Ratio
of total
expenses
to average
net assets | | | Ratio
of net
investment
income
(loss) to
average
net assets | | | Portfolio
turnover
rate(B) | |
| | | | | | | | |
| | | | | | | | | | | | | | | | | | | | | | | | | | | | | | | | | | |
| | — | | | | — | | | | — | | | | $21.89 | | | | 2.10 | %(D) | | | $1,109,504 | | | | 0.99 | %(E) | | | 1.17 | %(E) | | | 10 | % |
| | (0.18) | | | | (0.85 | ) | | | (1.03 | ) | | | $21.44 | | | | (1.10 | )% | | | $1,122,165 | | | | 1.04 | % | | | 0.85 | % | | | 20 | % |
| | (0.19) | | | | (0.81 | ) | | | (1.00 | ) | | | $22.71 | | | | 10.42 | % | | | $1,182,155 | | | | 1.05 | % | | | 0.94 | % | | | 24 | % |
| | (0.16) | | | | (0.86 | ) | | | (1.02 | ) | | | $21.49 | | | | 36.33 | % | | | $878,903 | | | | 1.06 | % | | | 0.92 | % | | | 21 | % |
| | (0.21) | | | | (0.05 | ) | | | (0.26 | ) | | | $16.54 | | | | 12.29 | % | | | $617,407 | | | | 1.06 | % | | | 1.37 | % | | | 28 | % |
| | (0.17) | | | | — | | | | (0.17 | ) | | | $14.96 | | | | 2.35 | % | | | $593,124 | | | | 1.12 | % | | | 1.19 | % | | | 16 | % |
| | | | | | | | |
| | | | | | | | | | | | | | | | | | | | | | | | | | | | | | | | | | |
| | — | | | | — | | | | — | | | | $20.84 | | | | 1.71 | %(D) | | | $87,068 | | | | 1.74 | %(E) | | | 0.41 | %(E) | | | 10 | % |
| | (0.04) | | | | (0.85 | ) | | | (0.89 | ) | | | $20.49 | | | | (1.83 | )% | | | $84,550 | | | | 1.79 | % | | | 0.10 | % | | | 20 | % |
| | (0.07) | | | | (0.81 | ) | | | (0.88 | ) | | | $21.77 | | | | 9.60 | % | | | $83,781 | | | | 1.80 | % | | | 0.19 | % | | | 24 | % |
| | (0.05) | | | | (0.86 | ) | | | (0.91 | ) | | | $20.68 | | | | 35.33 | % | | | $53,241 | | | | 1.81 | % | | | 0.18 | % | | | 21 | % |
| | (0.09) | | | | (0.05 | ) | | | (0.14 | ) | | | $15.98 | | | | 11.49 | % | | | $33,305 | | | | 1.81 | % | | | 0.62 | % | | | 28 | % |
| | (0.05) | | | | — | | | | (0.05 | ) | | | $14.46 | | | | 1.55 | % | | | $30,465 | | | | 1.87 | % | | | 0.45 | % | | | 16 | % |
| | | | | | | | |
| | | | | | | | | | | | | | | | | | | | | | | | | | | | | | | | | | |
| | — | | | | — | | | | — | | | | $22.04 | | | | 2.27 | %(D) | | | $1,994,674 | | | | 0.70 | %(E) | | | 1.45 | %(E) | | | 10 | % |
| | (0.24) | | | | (0.85 | ) | | | (1.09 | ) | | | $21.55 | | | | (0.85 | )% | | | $1,803,130 | | | | 0.77 | % | | | 1.11 | % | | | 20 | % |
| | (0.24) | | | | (0.81 | ) | | | (1.05 | ) | | | $22.83 | | | | 10.74 | % | | | $1,606,797 | | | | 0.80 | % | | | 1.20 | % | | | 24 | % |
| | (0.21) | | | | (0.86 | ) | | | (1.07 | ) | | | $21.58 | | | | 36.60 | % | | | $1,295,477 | | | | 0.81 | % | | | 1.18 | % | | | 21 | % |
| | (0.24) | | | | (0.05 | ) | | | (0.29 | ) | | | $16.61 | | | | 12.62 | % | | | $791,031 | | | | 0.81 | % | | | 1.62 | % | | | 28 | % |
| | (0.20) | | | | — | | | | (0.20 | ) | | | $15.01 | | | | 2.60 | % | | | $684,156 | | | | 0.83 | % | | | 1.49 | % | | | 16 | % |
| | | | | | | | |
| | | | | | | | | | | | | | | | | | | | | | | | | | | | | | | | | | |
| | — | | | | — | | | | — | | | | $22.06 | | | | 2.32 | %(D) | | | $496,399 | | | | 0.60 | %(E) | | | 1.54 | %(E) | | | 10 | % |
| | (0.27) | | | | (0.85 | ) | | | (1.12 | ) | | | $21.56 | | | | (0.74 | )% | | | $430,568 | | | | 0.65 | % | | | 1.23 | % | | | 20 | % |
| | (0.27) | | | | (0.81 | ) | | | (1.08 | ) | | | $22.84 | | | | 10.89 | % | | | $373,711 | | | | 0.65 | % | | | 1.36 | % | | | 24 | % |
| | (0.24) | | | | (0.86 | ) | | | (1.10 | ) | | | $21.59 | | | | 36.87 | % | | | $302,458 | | | | 0.66 | % | | | 1.32 | % | | | 21 | % |
| | (0.28) | | | | (0.05 | ) | | | (0.33 | ) | | | $16.60 | | | | 12.79 | % | | | $224,073 | | | | 0.66 | % | | | 1.87 | % | | | 28 | % |
| (F) | Inception date of Class Y is December 30, 2011. Class Y commenced public offering on January 3, 2012. |
See accompanying Notes to Financial Statements.
| | | | | | | | | | | | | | | | |
| DIAMOND HILL FUNDS | | | | | SEMI-ANNUAL REPORT | | | | | JUNE 30, 2016 | | | | | DIAMOND-HILL.COM | | | 57 | |
Select Fund
Financial Highlights
Selected data for a share outstanding throughout the periods indicated
| | | | | | | | | | | | | | | | |
| Select Fund | | Net asset
value,
beginning
of period | | | Net
investment
income
(loss) | | | Net
realized
and
unrealized
gains
(losses) on
investments | | | Total from
investment
operations | |
| | | | |
Class A | | | | | | | | | | | | | | | | |
For the six months ended June 30, 2016 (Unaudited) | | | $12.36 | | | | (0.01 | )(C) | | | (0.84 | ) | | | (0.85 | ) |
For the year ended December 31, 2015 | | | $12.96 | | | | — | (C)(F) | | | (0.19 | ) | | | (0.19 | ) |
For the year ended December 31, 2014 | | | $13.00 | | | | 0.05 | (C) | | | 1.38 | | | | 1.43 | |
For the year ended December 31, 2013 | | | $10.45 | | | | 0.05 | (C) | | | 4.48 | | | | 4.53 | |
For the year ended December 31, 2012 | | | $9.69 | | | | 0.12 | (C) | | | 0.97 | | | | 1.09 | |
For the year ended December 31, 2011 | | | $9.99 | | | | 0.08 | | | | (0.33 | ) | | | (0.25 | ) |
| | | | |
Class C | | | | | | | | | | | | | | | | |
For the six months ended June 30, 2016 (Unaudited) | | | $11.85 | | | | (0.05 | )(C) | | | (0.80 | ) | | | (0.85 | ) |
For the year ended December 31, 2015 | | | $12.54 | | | | (0.10 | )(C) | | | (0.18 | ) | | | (0.28 | ) |
For the year ended December 31, 2014 | | | $12.67 | | | | (0.05 | )(C) | | | 1.34 | | | | 1.29 | |
For the year ended December 31, 2013 | | | $10.25 | | | | (0.04 | )(C) | | | 4.38 | | | | 4.34 | |
For the year ended December 31, 2012 | | | $9.51 | | | | 0.04 | (C) | | | 0.95 | | | | 0.99 | |
For the year ended December 31, 2011 | | | $9.83 | | | | 0.02 | | | | (0.34 | ) | | | (0.32 | ) |
| | | | |
Class I | | | | | | | | | | | | | | | | |
For the six months ended June 30, 2016 (Unaudited) | | | $12.39 | | | | 0.01 | (C) | | | (0.85 | ) | | | (0.84 | ) |
For the year ended December 31, 2015 | | | $12.95 | | | | 0.03 | (C) | | | (0.18 | ) | | | (0.15 | ) |
For the year ended December 31, 2014 | | | $12.97 | | | | 0.09 | (C) | | | 1.38 | | | | 1.47 | |
For the year ended December 31, 2013 | | | $10.43 | | | | 0.09 | (C) | | | 4.46 | | | | 4.55 | |
For the year ended December 31, 2012 | | | $9.68 | | | | 0.15 | (C) | | | 0.96 | | | | 1.11 | |
For the year ended December 31, 2011 | | | $9.98 | | | | 0.11 | | | | (0.33 | ) | | | (0.22 | ) |
| | | | |
Class Y(G) | | | | | | | | | | | | | | | | |
For the six months ended June 30, 2016 (Unaudited) | | | $12.41 | | | | 0.02 | (C) | | | (0.85 | ) | | | (0.83 | ) |
For the year ended December 31, 2015 | | | $12.96 | | | | 0.05 | (C) | | | (0.19 | ) | | | (0.14 | ) |
For the year ended December 31, 2014 | | | $12.99 | | | | 0.10 | (C) | | | 1.39 | | | | 1.49 | |
For the year ended December 31, 2013 | | | $10.43 | | | | 0.11 | (C) | | | 4.48 | | | | 4.59 | |
For the year ended December 31, 2012 | | | $9.68 | | | | 0.17 | (C) | | | 0.96 | | | | 1.13 | |
| (A) | Total returns shown exclude the effect of applicable sales charges. |
| (B) | Portfolio turnover rate is calculated on the basis of the Fund as a whole without distinguishing between classes of shares issued. |
| (C) | Net investment income (loss) per share has been calculated using the average daily shares outstanding during the period. |
See accompanying Notes to Financial Statements.
| | | | | | | | | | | | | | |
| 58 | | DIAMOND HILL FUNDS | | | | | SEMI-ANNUAL REPORT | | | | | JUNE 30, 2016 | | | | | DIAMOND-HILL.COM |
| | | | | | | | | | | | | | | | | | | | | | | | | | | | | | | | | | |
Dividends
from net
investment
income | | | Distributions
from net
realized
gains | | | Total
distributions | | | Net asset
value at
end of
period | | | Total
return(A) | | | Net assets
at end
of period
(000’s) | | | Ratio
of total
expenses
to average
net assets | | | Ratio
of net
investment
income
(loss) to
average
net assets | | | Portfolio
turnover
rate(B) | |
| | | | | | | | |
| | | | | | | | | | | | | | | | | | | | | | | | | | | | | | | | | | |
| | — | | | | — | | | | — | | | | $11.51 | | | | (6.88 | )%(D) | | | $21,047 | | | | 1.19 | %(E) | | | (0.12 | )%(E) | | | 40 | % |
| | — | | | | (0.41 | ) | | | (0.41 | ) | | | $12.36 | | | | (1.44 | )% | | | $43,638 | | | | 1.19 | % | | | (0.01 | )% | | | 89 | % |
| | (0.05) | | | | (1.42 | ) | | | (1.47 | ) | | | $12.96 | | | | 11.30 | % | | | $12,963 | | | | 1.20 | % | | | 0.36 | % | | | 53 | % |
| | (0.09) | | | | (1.89 | ) | | | (1.98 | ) | | | $13.00 | | | | 44.04 | % | | | $8,905 | | | | 1.22 | % | | | 0.42 | % | | | 70 | % |
| | (0.08) | | | | (0.25 | ) | | | (0.33 | ) | | | $10.45 | | | | 11.27 | % | | | $7,778 | | | | 1.21 | % | | | 1.15 | % | | | 38 | % |
| | (0.05) | | | | — | | | | (0.05 | ) | | | $9.69 | | | | (2.53 | )% | | | $8,071 | | | | 1.23 | % | | | 0.92 | % | | | 26 | % |
| | | | | | | | |
| | | | | | | | | | | | | | | | | | | | | | | | | | | | | | | | | | |
| | — | | | | — | | | | — | | | | $11.00 | | | | (7.17 | )%(D) | | | $12,524 | | | | 1.95 | %(E) | | | (0.86 | )%(E) | | | 40 | % |
| | — | | | | (0.41 | ) | | | (0.41 | ) | | | $11.85 | | | | (2.21 | )% | | | $15,022 | | | | 1.94 | % | | | (0.78 | )% | | | 89 | % |
| | — | | | | (1.42 | ) | | | (1.42 | ) | | | $12.54 | | | | 10.46 | % | | | $8,265 | | | | 1.95 | % | | | (0.39 | )% | | | 53 | % |
| | (0.03) | | | | (1.89 | ) | | | (1.92 | ) | | | $12.67 | | | | 43.08 | % | | | $5,533 | | | | 1.97 | % | | | (0.35 | )% | | | 70 | % |
| | — | | | | (0.25 | ) | | | (0.25 | ) | | | $10.25 | | | | 10.44 | % | | | $3,271 | | | | 1.96 | % | | | 0.41 | % | | | 38 | % |
| | — | | | | — | | | | — | | | | $9.51 | | | | (3.26 | )% | | | $3,630 | | | | 1.98 | % | | | 0.15 | % | | | 26 | % |
| | | | | | | | |
| | | | | | | | | | | | | | | | | | | | | | | | | | | | | | | | | | |
| | — | | | | — | | | | — | | | | $11.55 | | | | (6.78 | )%(D) | | | $89,891 | | | | 0.90 | %(E) | | | 0.20 | %(E) | | | 40 | % |
| | — | | | | (0.41 | ) | | | (0.41 | ) | | | $12.39 | | | | (1.14 | )% | | | $81,408 | | | | 0.92 | % | | | 0.25 | % | | | 89 | % |
| | (0.07) | | | | (1.42 | ) | | | (1.49 | ) | | | $12.95 | | | | 11.57 | % | | | $31,999 | | | | 0.95 | % | | | 0.64 | % | | | 53 | % |
| | (0.12) | | | | (1.89 | ) | | | (2.01 | ) | | | $12.97 | | | | 44.35 | % | | | $46,787 | | | | 0.97 | % | | | 0.66 | % | | | 70 | % |
| | (0.11) | | | | (0.25 | ) | | | (0.36 | ) | | | $10.43 | | | | 11.54 | % | | | $41,862 | | | | 0.96 | % | | | 1.44 | % | | | 38 | % |
| | (0.08) | | | | — | | | | (0.08 | ) | | | $9.68 | | | | (2.25 | )% | | | $34,388 | | | | 0.95 | % | | | 1.21 | % | | | 26 | % |
| | | | | | | | |
| | | | | | | | | | | | | | | | | | | | | | | | | | | | | | | | | | |
| | — | | | | — | | | | — | | | | $11.58 | | | | (6.69 | )%(D) | | | $16,774 | | | | 0.80 | %(E) | | | 0.32 | %(E) | | | 40 | % |
| | — | | | | (0.41 | ) | | | (0.41 | ) | | | $12.41 | | | | (1.06 | )% | | | $10,703 | | | | 0.80 | % | | | 0.35 | % | | | 89 | % |
| | (0.10) | | | | (1.42 | ) | | | (1.52 | ) | | | $12.96 | | | | 11.74 | % | | | $8,746 | | | | 0.80 | % | | | 0.76 | % | | | 53 | % |
| | (0.14) | | | | (1.89 | ) | | | (2.03 | ) | | | $12.99 | | | | 44.70 | % | | | $6,534 | | | | 0.82 | % | | | 0.82 | % | | | 70 | % |
| | (0.13) | | | | (0.25 | ) | | | (0.38 | ) | | | $10.43 | | | | 11.69 | % | | | $5,788 | | | | 0.81 | % | | | 1.62 | % | | | 38 | % |
| (F) | Amount is less than $0.005. |
| (G) | Inception date of Class Y is December 30, 2011. Class Y commenced public offering on January 3, 2012. |
See accompanying Notes to Financial Statements.
| | | | | | | | | | | | | | | | |
| DIAMOND HILL FUNDS | | | | | SEMI-ANNUAL REPORT | | | | | JUNE 30, 2016 | | | | | DIAMOND-HILL.COM | | | 59 | |
Long-Short Fund
Financial Highlights
Selected data for a share outstanding throughout the periods indicated
| | | | | | | | | | | | | | | | |
| Long-Short Fund | | Net asset
value,
beginning
of period | | | Net
investment
income
(loss)(A) | | | Net
realized
and
unrealized
gains
(losses) on
investments | | | Total from
investment
operations | |
| | | | |
Class A | | | | | | | | | | | | | | | | |
For the six months ended June 30, 2016 (Unaudited) | | | $23.36 | | | | (0.04 | ) | | | (0.27 | ) | | | (0.31 | ) |
For the year ended December 31, 2015 | | | $23.87 | | | | (0.11 | ) | | | (0.29 | ) | | | (0.40 | ) |
For the year ended December 31, 2014 | | | $22.26 | | | | (0.08 | ) | | | 1.69 | | | | 1.61 | |
For the year ended December 31, 2013 | | | $18.15 | | | | (0.05 | ) | | | 4.21 | | | | 4.16 | |
For the year ended December 31, 2012 | | | $16.75 | | | | 0.06 | | | | 1.36 | | | | 1.42 | |
For the year ended December 31, 2011 | | | $16.26 | | | | 0.03 | | | | 0.46 | | | | 0.49 | |
| | | | |
Class C | | | | | | | | | | | | | | | | |
For the six months ended June 30, 2016 (Unaudited) | | | $21.34 | | | | (0.11 | ) | | | (0.26 | ) | | | (0.37 | ) |
For the year ended December 31, 2015 | | | $21.98 | | | | (0.27 | ) | | | (0.26 | ) | | | (0.53 | ) |
For the year ended December 31, 2014 | | | $20.65 | | | | (0.23 | ) | | | 1.56 | | | | 1.33 | |
For the year ended December 31, 2013 | | | $16.93 | | | | (0.19 | ) | | | 3.91 | | | | 3.72 | |
For the year ended December 31, 2012 | | | $15.72 | | | | (0.07 | ) | | | 1.28 | | | | 1.21 | |
For the year ended December 31, 2011 | | | $15.37 | | | | (0.08 | ) | | | 0.43 | | | | 0.35 | |
| | | | |
Class I | | | | | | | | | | | | | | | | |
For the six months ended June 30, 2016 (Unaudited) | | | $23.77 | | | | (0.01 | ) | | | (0.28 | ) | | | (0.29 | ) |
For the year ended December 31, 2015 | | | $24.22 | | | | (0.05 | ) | | | (0.29 | ) | | | (0.34 | ) |
For the year ended December 31, 2014 | | | $22.52 | | | | (0.02 | ) | | | 1.72 | | | | 1.70 | |
For the year ended December 31, 2013 | | | $18.35 | | | | — | (H) | | | 4.26 | | | | 4.26 | |
For the year ended December 31, 2012 | | | $16.93 | | | | 0.10 | | | | 1.38 | | | | 1.48 | |
For the year ended December 31, 2011 | | | $16.42 | | | | 0.09 | | | | 0.45 | | | | 0.54 | |
| | | | |
Class Y(J) | | | | | | | | | | | | | | | | |
For the six months ended June 30, 2016 (Unaudited) | | | $23.83 | | | | 0.01 | | | | (0.28 | ) | | | (0.27 | ) |
For the year ended December 31, 2015 | | | $24.25 | | | | (0.02 | ) | | | (0.29 | ) | | | (0.31 | ) |
For the year ended December 31, 2014 | | | $22.52 | | | | 0.01 | | | | 1.72 | | | | 1.73 | |
For the year ended December 31, 2013 | | | $18.35 | | | | 0.04 | | | | 4.25 | | | | 4.29 | |
For the year ended December 31, 2012 | | | $16.93 | | | | 0.14 | | | | 1.37 | | | | 1.51 | |
| (A) | Net investment income (loss) per share has been calculated using the average daily shares outstanding during the period. |
| (B) | Total returns shown exclude the effect of applicable sales charges. |
| (C) | The fund invests in short positions and as such incurs certain expenses and fees. If such expenses and fees had not occurred, the ratios of total expenses to average net assets would have been 1.39% for Class A, 2.14% for Class C, 1.10% for Class I and 1.00% for Class Y. |
| (D) | Portfolio turnover rate is calculated on the basis of the Fund as a whole without distinguishing between classes of shares issued. |
See accompanying Notes to Financial Statements.
| | | | | | | | | | | | | | |
| 60 | | DIAMOND HILL FUNDS | | | | | SEMI-ANNUAL REPORT | | | | | JUNE 30, 2016 | | | | | DIAMOND-HILL.COM |
| | | | | | | | | | | | | | | | | | | | | | | | | | | | | | | | | | |
Dividends
from net
investment
income | | | Distributions
from net
realized
gains | | | Total
distributions | | | Net asset
value at
end of
period | | | Total
return(B) | | | Net assets
at end
of period
(000’s) | | | Ratio
of total
expenses
to average
net assets(C) | | | Ratio
of net
investment
income
(loss) to
average
net assets | | | Portfolio
turnover
rate(D)(E) | |
| | | | | | | | |
| | | | | | | | | | | | | | | | | | | | | | | | | | | | | | | | | | |
| | — | | | | — | | | | — | | | | $23.05 | | | | (1.33 | )%(F) | | | $472,384 | | | | 2.03 | %(G) | | | (0.34 | )%(G) | | | 21 | % |
| | — | | | | (0.11 | ) | | | (0.11 | ) | | | $23.36 | | | | (1.67 | )% | | | $569,218 | | | | 1.89 | % | | | (0.47 | )% | | | 81 | % |
| | — | | | | — | | | | — | | | | $23.87 | | | | 7.23 | % | | | $703,572 | | | | 1.83 | % | | | (0.33 | )% | | | 60 | % |
| | (0.05) | | | | — | | | | (0.05 | ) | | | $22.26 | | | | 22.92 | % | | | $858,112 | | | | 1.83 | % | | | (0.25 | )% | | | 30 | % |
| | (0.02) | | | | — | | | | (0.02 | ) | | | $18.15 | | | | 8.46 | % | | | $533,722 | | | | 1.75 | % | | | 0.32 | % | | | 39 | % |
| | — | | | | — | | | | — | | | | $16.75 | | | | 3.01 | % | | | $512,870 | | | | 1.67 | % | | | 0.21 | % | | | 50 | % |
| | | | | | | | |
| | | | | | | | | | | | | | | | | | | | | | | | | | | | | | | | | | |
| | — | | | | — | | | | — | | | | $20.97 | | | | (1.73 | )%(F) | | | $150,797 | | | | 2.77 | %(G) | | | (1.10 | )%(G) | | | 21 | % |
| | — | | | | (0.11 | ) | | | (0.11 | ) | | | $21.34 | | | | (2.40 | )% | | | $169,861 | | | | 2.64 | % | | | (1.22 | )% | | | 81 | % |
| | — | �� | | | — | | | | — | | | | $21.98 | | | | 6.44 | % | | | $170,278 | | | | 2.58 | % | | | (1.09 | )% | | | 60 | % |
| | — | | | | — | | | | — | | | | $20.65 | | | | 21.97 | % | | | $130,388 | | | | 2.58 | % | | | (0.99 | )% | | | 30 | % |
| | — | | | | — | | | | — | | | | $16.93 | | | | 7.70 | % | | | $103,393 | | | | 2.50 | % | | | (0.43 | )% | | | 39 | % |
| | — | | | | — | | | | — | | | | $15.72 | | | | 2.28 | % | | | $119,850 | | | | 2.43 | % | | | (0.54 | )% | | | 50 | % |
| | | | | | | | |
| | | | | | | | | | | | | | | | | | | | | | | | | | | | | | | | | | |
| | — | | | | — | | | | — | | | | $23.48 | | | | (1.22 | )%(F) | | | $3,292,288 | | | | 1.74 | %(G) | | | (0.06 | )%(G) | | | 21 | % |
| | — | | | | (0.11 | ) | | | (0.11 | ) | | | $23.77 | | | | (1.40 | )% | | | $3,382,697 | | | | 1.62 | % | | | (0.21 | )% | | | 81 | % |
| | — | | | | — | | | | — | | | | $24.22 | | | | 7.55 | % | | | $2,817,671 | | | | 1.58 | % | | | (0.09 | )% | | | 60 | % |
| | (0.09) | | | | — | | | | (0.09 | ) | | | $22.52 | | | | 23.19 | % | | | $1,859,054 | | | | 1.58 | % | | | — | %(I) | | | 30 | % |
| | (0.06) | | | | — | | | | (0.06 | ) | | | $18.35 | | | | 8.77 | % | | | $1,554,623 | | | | 1.50 | % | | | 0.58 | % | | | 39 | % |
| | (0.03) | | | | — | | | | (0.03 | ) | | | $16.93 | | | | 3.29 | % | | | $1,213,122 | | | | 1.39 | % | | | 0.52 | % | | | 50 | % |
| | | | | | | | |
| | | | | | | | | | | | | | | | | | | | | | | | | | | | | | | | | | |
| | — | | | | — | | | | — | | | | $23.56 | | | | (1.13 | )%(F) | | | $267,413 | | | | 1.64 | %(G) | | | 0.04 | %(G) | | | 21 | % |
| | — | | | | (0.11 | ) | | | (0.11 | ) | | | $23.83 | | | | (1.27 | )% | | | $290,928 | | | | 1.50 | % | | | (0.08 | )% | | | 81 | % |
| | — | | | | — | | | | — | | | | $24.25 | | | | 7.68 | % | | | $280,595 | | | | 1.43 | % | | | 0.06 | % | | | 60 | % |
| | (0.12) | | | | — | | | | (0.12 | ) | | | $22.52 | | | | 23.39 | % | | | $168,835 | | | | 1.43 | % | | | 0.18 | % | | | 30 | % |
| | (0.09) | | | | — | | | | (0.09 | ) | | | $18.35 | | | | 8.95 | % | | | $83,409 | | | | 1.35 | % | | | 0.79 | % | | | 39 | % |
| (E) | In 2016, the Funds changed the methodology for calculating the portfolio turnover rate to better reflect short selling activity. The portfolio turnover rates in the prior years ended in 2015, 2014, 2013, 2012 and 2011 would have been 47%, 39%, 24%, 32% and 37%, respectively, using this same calculation methodology. |
| (H) | Amount is less than $0.005. |
| (I) | Amount is less than 0.005%. |
| (J) | Inception date of Class Y is December 30, 2011. Class Y commenced public offering on January 3, 2012. |
See accompanying Notes to Financial Statements.
| | | | | | | | | | | | | | | | |
| DIAMOND HILL FUNDS | | | | | SEMI-ANNUAL REPORT | | | | | JUNE 30, 2016 | | | | | DIAMOND-HILL.COM | | | 61 | |
Research Opportunities Fund
Financial Highlights
Selected data for a share outstanding throughout the periods indicated
| | | | | | | | | | | | | | | | |
| Research Opportunities Fund(A) | | Net asset
value,
beginning
of period | | | Net
investment
income
(loss)(B) | | | Net
realized
and
unrealized
gains
(losses) on
investments | | | Total from
investment
operations | |
| | | | |
Class A | | | | | | | | | | | | | | | | |
For the six months ended June 30, 2016 (Unaudited) | | | $19.70 | | | | 0.02 | | | | (0.30 | ) | | | (0.28 | ) |
For the year ended December 31, 2015 | | | $22.52 | | | | (0.06 | ) | | | (1.14 | ) | | | (1.20 | ) |
For the year ended December 31, 2014 | | | $22.82 | | | | (0.07 | ) | | | 1.62 | | | | 1.55 | |
For the year ended December 31, 2013 | | | $18.34 | | | | (0.10 | ) | | | 6.01 | | | | 5.91 | |
For the year ended December 31, 2012 | | | $16.60 | | | | 0.02 | | | | 1.93 | | | | 1.95 | |
| | | | |
Class C | | | | | | | | | | | | | | | | |
For the six months ended June 30, 2016 (Unaudited) | | | $19.06 | | | | (0.05 | ) | | | (0.30 | ) | | | (0.35 | ) |
For the year ended December 31, 2015 | | | $22.00 | | | | (0.21 | ) | | | (1.11 | ) | | | (1.32 | ) |
For the year ended December 31, 2014 | | | $22.49 | | | | (0.24 | ) | | | 1.58 | | | | 1.34 | |
For the year ended December 31, 2013 | | | $18.22 | | | | (0.26 | ) | | | 5.96 | | | | 5.70 | |
For the year ended December 31, 2012 | | | $16.60 | | | | (0.09 | ) | | | 1.90 | | | | 1.81 | |
| | | | |
Class I | | | | | | | | | | | | | | | | |
For the six months ended June 30, 2016 (Unaudited) | | | $19.81 | | | | 0.05 | | | | (0.31 | ) | | | (0.26 | ) |
For the year ended December 31, 2015 | | | $22.61 | | | | (0.01 | ) | | | (1.13 | ) | | | (1.14 | ) |
For the year ended December 31, 2014 | | | $22.90 | | | | (0.01 | ) | | | 1.62 | | | | 1.61 | |
For the year ended December 31, 2013 | | | $18.36 | | | | (0.04 | ) | | | 6.01 | | | | 5.97 | |
For the year ended December 31, 2012 | | | $16.60 | | | | 0.05 | | | | 1.95 | | | | 2.00 | |
| | | | |
Class Y | | | | | | | | | | | | | | | | |
For the six months ended June 30, 2016 (Unaudited) | | | $19.80 | | | | 0.06 | | | | (0.31 | ) | | | (0.25 | ) |
For the year ended December 31, 2015 | | | $22.64 | | | | 0.02 | | | | (1.14 | ) | | | (1.12 | ) |
For the year ended December 31, 2014 | | | $22.92 | | | | 0.03 | | | | 1.62 | | | | 1.65 | |
For the year ended December 31, 2013 | | | $18.36 | | | | — | (I) | | | 6.02 | | | | 6.02 | |
For the year ended December 31, 2012 | | | $16.60 | | | | 0.08 | | | | 1.94 | | | | 2.02 | |
| (A) | Inception date of the Fund is December 30, 2011. The Fund commenced public offering on January 3, 2012. |
| (B) | Net investment income (loss) per share has been calculated using the average daily shares outstanding during the period. |
| (C) | Total returns shown exclude the effect of applicable sales charges. |
See accompanying Notes to Financial Statements.
| | | | | | | | | | | | | | |
| 62 | | DIAMOND HILL FUNDS | | | | | SEMI-ANNUAL REPORT | | | | | JUNE 30, 2016 | | | | | DIAMOND-HILL.COM |
| | | | | | | | | | | | | | | | | | | | | | | | | | | | | | | | | | |
Dividends
from net
investment
income | | | Distributions
from net
realized
gains | | | Total
distributions | | | Net asset
value at
end of
period | | | Total
return(C) | | | Net assets
at end
of period
(000’s) | | | Ratio
of total
expenses
to average
net assets(D) | | | Ratio
of net
investment
income
(loss) to
average
net assets | | | Portfolio
turnover
rate(E)(F) | |
| | | | | | | | |
| | | | | | | | | | | | | | | | | | | | | | | | | | | | | | | | | | |
| | — | | | | — | | | | — | | | | $19.42 | | | | (1.42 | )%(G) | | | $4,317 | | | | 2.19 | %(H) | | | 0.26 | %(H) | | | 39 | % |
| | — | | | | (1.62 | ) | | | (1.62 | ) | | | $19.70 | | | | (5.29 | )% | | | $8,637 | | | | 1.83 | % | | | (0.27 | )% | | | 147 | % |
| | (0.02) | | | | (1.83 | ) | | | (1.85 | ) | | | $22.52 | | | | 6.96 | % | | | $9,492 | | | | 1.74 | % | | | (0.29 | )% | | | 57 | % |
| | — | | | | (1.43 | ) | | | (1.43 | ) | | | $22.82 | | | | 32.43 | % | | | $6,836 | | | | 1.77 | % | | | (0.45 | )% | | | 72 | % |
| | (0.02) | | | | (0.19 | ) | | | (0.21 | ) | | | $18.34 | | | | 11.73 | % | | | $1,120 | | | | 1.63 | % | | | 0.10 | % | | | 35 | % |
| | | | | | | | |
| | | | | | | | | | | | | | | | | | | | | | | | | | | | | | | | | | |
| | — | | | | — | | | | — | | | | $18.71 | | | | (1.84 | )%(G) | | | $3,791 | | | | 2.94 | %(H) | | | (0.50 | )%(H) | | | 39 | % |
| | — | | | | (1.62 | ) | | | (1.62 | ) | | | $19.06 | | | | (5.96 | )% | | | $5,097 | | | | 2.58 | % | | | (0.96 | )% | | | 147 | % |
| | — | | | | (1.83 | ) | | | (1.83 | ) | | | $22.00 | | | | 6.17 | % | | | $668 | | | | 2.49 | % | | | (1.03 | )% | | | 57 | % |
| | — | | | | (1.43 | ) | | | (1.43 | ) | | | $22.49 | | | | 31.48 | % | | | $494 | | | | 2.52 | % | | | (1.19 | )% | | | 72 | % |
| | — | | | | (0.19 | ) | | | (0.19 | ) | | | $18.22 | | | | 10.91 | % | | | $148 | | | | 2.38 | % | | | (0.51 | )% | | | 35 | % |
| | | | | | | | |
| | | | | | | | | | | | | | | | | | | | | | | | | | | | | | | | | | |
| | — | | | | — | | | | — | | | | $19.55 | | | | (1.31 | )%(G) | | | $27,092 | | | | 1.90 | %(H) | | | 0.50 | %(H) | | | 39 | % |
| | (0.04) | | | | (1.62 | ) | | | (1.66 | ) | | | $19.81 | | | | (5.00 | )% | | | $26,186 | | | | 1.57 | % | | | (0.03 | )% | | | 147 | % |
| | (0.07) | | | | (1.83 | ) | | | (1.90 | ) | | | $22.61 | | | | 7.21 | % | | | $49,920 | | | | 1.49 | % | | | (0.05 | )% | | | 57 | % |
| | — | (I) | | | (1.43 | ) | | | (1.43 | ) | | | $22.90 | | | | 32.76 | % | | | $43,018 | | | | 1.52 | % | | | (0.17 | )% | | | 72 | % |
| | (0.05) | | | | (0.19 | ) | | | (0.24 | ) | | | $18.36 | | | | 12.03 | % | | | $15,978 | | | | 1.38 | % | | | 0.30 | % | | | 35 | % |
| | | | | | | | |
| | | | | | | | | | | | | | | | | | | | | | | | | | | | | | | | | | |
| | — | | | | — | | | | — | | | | $19.55 | | | | (1.26 | )%(G) | | | $13,929 | | | | 1.80 | %(H) | | | 0.65 | %(H) | | | 39 | % |
| | (0.10) | | | | (1.62 | ) | | | (1.72 | ) | | | $19.80 | | | | (4.91 | )% | | | $15,285 | | | | 1.44 | % | | | 0.10 | % | | | 147 | % |
| | (0.10) | | | | (1.83 | ) | | | (1.93 | ) | | | $22.64 | | | | 7.37 | % | | | $17,307 | | | | 1.34 | % | | | 0.11 | % | | | 57 | % |
| | (0.03) | | | | (1.43 | ) | | | (1.46 | ) | | | $22.92 | | | | 32.99 | % | | | $15,468 | | | | 1.37 | % | | | 0.02 | % | | | 72 | % |
| | (0.07) | | | | (0.19 | ) | | | (0.26 | ) | | | $18.36 | | | | 12.17 | % | | | $11,572 | | | | 1.23 | % | | | 0.45 | % | | | 35 | % |
| (D) | The fund invests in short positions and as such incurs certain expenses and fees. If such expenses and fees had not occurred, the ratios of total expenses to average net assets would have been 1.52% for Class A, 2.27% for Class C, 1.23% for Class I and 1.13% for Class Y. |
| (E) | Portfolio turnover rate is calculated on the basis of the Fund as a whole without distinguishing between classes of shares issued. |
| (F) | In 2016, the Funds changed the methodology for calculating the portfolio turnover rate to better reflect short selling activity. The portfolio turnover rates in the prior years ended in 2015, 2014, 2013 and 2012 would have been 103%, 46%, 64% and 32%, respectively, using this same calculation methodology. |
| (I) | Amount is less than $0.005. |
See accompanying Notes to Financial Statements.
| | | | | | | | | | | | | | | | |
| DIAMOND HILL FUNDS | | | | | SEMI-ANNUAL REPORT | | | | | JUNE 30, 2016 | | | | | DIAMOND-HILL.COM | | | 63 | |
Financial Long-Short Fund
Financial Highlights
Selected data for a share outstanding throughout the periods indicated
| | | | | | | | | | | | | | | | |
| Financial Long-Short Fund | | Net asset
value,
beginning
of period | | | Net
investment
income
(loss) | | | Net
realized
and
unrealized
gains
(losses) on
investments | | | Total from
investment
operations | |
| | | | |
Class A | | | | | | | | | | | | | | | | |
For the six months ended June 30, 2016 (Unaudited) | | | $18.62 | | | | 0.05 | (E) | | | (1.71 | ) | | | (1.66 | ) |
For the year ended December 31, 2015 | | | $19.61 | | | | — | (E)(H) | | | (0.92 | ) | | | (0.92 | ) |
For the year ended December 31, 2014 | | | $18.13 | | | | (0.02 | )(E) | | | 1.50 | | | | 1.48 | |
For the year ended December 31, 2013 | | | $13.24 | | | | (0.05 | )(E) | | | 4.94 | | | | 4.89 | |
For the year ended December 31, 2012 | | | $10.51 | | | | 0.06 | (E) | | | 2.74 | | | | 2.80 | |
For the year ended December 31, 2011 | | | $12.18 | | | | 0.02 | | | | (1.65 | ) | | | (1.63 | ) |
| | | | |
Class C | | | | | | | | | | | | | | | | |
For the six months ended June 30, 2016 (Unaudited) | | | $17.28 | | | | (0.01 | )(E) | | | (1.59 | ) | | | (1.60 | ) |
For the year ended December 31, 2015 | | | $18.26 | | | | (0.13 | )(E) | | | (0.85 | ) | | | (0.98 | ) |
For the year ended December 31, 2014 | | | $17.00 | | | | (0.15 | )(E) | | | 1.41 | | | | 1.26 | |
For the year ended December 31, 2013 | | | $12.51 | | | | (0.17 | )(E) | | | 4.66 | | | | 4.49 | |
For the year ended December 31, 2012 | | | $9.96 | | | | (0.02 | )(E) | | | 2.57 | | | | 2.55 | |
For the year ended December 31, 2011 | | | $11.58 | | | | (0.07 | )(E) | | | (1.55 | ) | | | (1.62 | ) |
| | | | |
Class I | | | | | | | | | | | | | | | | |
For the six months ended June 30, 2016 (Unaudited) | | | $18.59 | | | | 0.08 | (E) | | | (1.71 | ) | | | (1.63 | ) |
For the year ended December 31, 2015 | | | $19.57 | | | | 0.05 | (E) | | | (0.91 | ) | | | (0.86 | ) |
For the year ended December 31, 2014 | | | $18.10 | | | | 0.02 | (E) | | | 1.50 | | | | 1.52 | |
For the year ended December 31, 2013 | | | $13.18 | | | | (0.02 | )(E) | | | 4.94 | | | | 4.92 | |
For the year ended December 31, 2012 | | | $10.47 | | | | 0.10 | (E) | | | 2.72 | | | | 2.82 | |
For the year ended December 31, 2011 | | | $12.14 | | | | 0.07 | | | | (1.67 | ) | | | (1.60 | ) |
| (A) | Total returns shown exclude the effect of applicable sales charges. |
| (B) | The fund invests in short positions and as such incurs certain expenses and fees. If such expenses and fees had not occurred, the ratios of total expenses to average net assets would have been 1.50% for Class A, 2.25% for Class C and 1.22% for Class I. |
| (C) | Portfolio turnover rate is calculated on the basis of the Fund as a whole without distinguishing between classes of shares issued. |
| (D) | In 2016, the Funds changed the methodology for calculating the portfolio turnover rate to better reflect short selling activity. The portfolio turnover rates in the prior years ended in 2015, 2014, 2013, 2012 and 2011 would have been 49%, 43%, 59%, 53% and 45%, respectively, using this same calculation methodology. |
See accompanying Notes to Financial Statements.
| | | | | | | | | | | | | | |
| 64 | | DIAMOND HILL FUNDS | | | | | SEMI-ANNUAL REPORT | | | | | JUNE 30, 2016 | | | | | DIAMOND-HILL.COM |
| | | | | | | | | | | | | | | | | | | | | | | | | | | | | | | | | | |
Dividends
from net
investment
income | | | Distributions
from net
realized
gains | | | Total
distributions | | | Net asset
value at
end of
period | | | Total
return(A) | | | Net assets
at end
of period
(000’s) | | | Ratio
of total
expenses
to average
net assets(B) | | | Ratio
of net
investment
income
(loss) to
average
net assets | | | Portfolio
turnover
rate(C)(D) | |
| | | | | | | | |
| | | | | | | | | | | | | | | | | | | | | | | | | | | | | | | | | | |
| | — | | | | — | | | | — | | | | $16.96 | | | | (8.92 | )%(F) | | | $9,279 | | | | 1.92 | %(G) | | | 0.64 | %(G) | | | 16 | % |
| | (0.07) | | | | — | | | | (0.07 | ) | | | $18.62 | | | | (4.67 | )% | | | $10,760 | | | | 1.85 | % | | | 0.02 | % | | | 63 | % |
| | — | | | | — | | | | — | | | | $19.61 | | | | 8.16 | % | | | $12,043 | | | | 1.74 | % | | | (0.10 | )% | | | 51 | % |
| | — | | | | — | | | | — | | | | $18.13 | | | | 36.93 | % | | | $17,852 | | | | 1.70 | % | | | (0.31 | )% | | | 66 | % |
| | (0.07) | | | | — | | | | (0.07 | ) | | | $13.24 | | | | 26.62 | % | | | $7,862 | | | | 1.76 | % | | | 0.49 | % | | | 58 | % |
| | (0.04) | | | | — | | | | (0.04 | ) | | | $10.51 | | | | (13.39 | )% | | | $6,650 | | | | 1.66 | % | | | 0.14 | % | | | 52 | % |
| | | | | | | | |
| | | | | | | | | | | | | | | | | | | | | | | | | | | | | | | | | | |
| | — | | | | — | | | | — | | | | $15.68 | | | | (9.26 | )%(F) | | | $1,526 | | | | 2.67 | %(G) | | | (0.12 | )%(G) | | | 16 | % |
| | — | | | | — | | | | — | | | | $17.28 | | | | (5.37 | )% | | | $1,845 | | | | 2.60 | % | | | (0.75 | )% | | | 63 | % |
| | — | | | | — | | | | — | | | | $18.26 | | | | 7.41 | % | | | $2,233 | | | | 2.49 | % | | | (0.86 | )% | | | 51 | % |
| | — | | | | — | | | | — | | | | $17.00 | | | | 35.89 | % | | | $2,958 | | | | 2.45 | % | | | (1.06 | )% | | | 66 | % |
| | — | | | | — | | | | — | | | | $12.51 | | | | 25.60 | % | | | $820 | | | | 2.51 | % | | | (0.20 | )% | | | 58 | % |
| | — | | | | — | | | | — | | | | $9.96 | | | | (13.99 | )% | | | $795 | | | | 2.41 | % | | | (0.60 | )% | | | 52 | % |
| | | | | | | | |
| | | | | | | | | | | | | | | | | | | | | | | | | | | | | | | | | | |
| | — | | | | — | | | | — | | | | $16.96 | | | | (8.77 | )%(F) | | | $16,444 | | | | 1.63 | %(G) | | | 0.99 | %(G) | | | 16 | % |
| | (0.12) | | | | — | | | | (0.12 | ) | | | $18.59 | | | | (4.40 | )% | | | $14,812 | | | | 1.58 | % | | | 0.24 | % | | | 63 | % |
| | (0.05) | | | | — | | | | (0.05 | ) | | | $19.57 | | | | 8.42 | % | | | $15,310 | | | | 1.49 | % | | | 0.12 | % | | | 51 | % |
| | — | | | | — | | | | — | | | | $18.10 | | | | 37.33 | % | | | $10,817 | | | | 1.45 | % | | | (0.12 | )% | | | 66 | % |
| | (0.11) | | | | — | | | | (0.11 | ) | | | $13.18 | | | | 26.94 | % | | | $3,931 | | | | 1.51 | % | | | 0.85 | % | | | 58 | % |
| | (0.07) | | | | — | | | | (0.07 | ) | | | $10.47 | | | | (13.21 | )% | | | $1,584 | | | | 1.37 | % | | | 0.47 | % | | | 52 | % |
| (E) | Net investment income (loss) per share has been calculated using the average daily shares outstanding during the period. |
| (H) | Amount is less than $0.005. |
See accompanying Notes to Financial Statements.
| | | | | | | | | | | | | | | | |
| DIAMOND HILL FUNDS | | | | | SEMI-ANNUAL REPORT | | | | | JUNE 30, 2016 | | | | | DIAMOND-HILL.COM | | | 65 | |
Corporate Credit Fund
Financial Highlights
Selected data for a share outstanding throughout the periods indicated
| | | | | | | | | | | | | | | | |
| Corporate Credit Fund | | Net asset
value,
beginning
of period | | | Net
investment
income
(loss) | | | Net
realized
and
unrealized
gains
(losses) on
investments | | | Total from
investment
operations | |
| | | | |
Class A | | | | | | | | | | | | | | | | |
For the six months ended June 30, 2016 (Unaudited) | | | $10.53 | | | | 0.32 | (C) | | | 0.33 | | | | 0.65 | |
For the year ended December 31, 2015 | | | $10.94 | | | | 0.58 | (C) | | | (0.44 | ) | | | 0.14 | |
For the year ended December 31, 2014 | | | $11.19 | | | | 0.51 | (C) | | | (0.28 | ) | | | 0.23 | |
For the year ended December 31, 2013 | | | $11.18 | | | | 0.56 | (C) | | | — | (F) | | | 0.56 | |
For the year ended December 31, 2012 | | | $10.79 | | | | 0.62 | (C) | | | 0.39 | | | | 1.01 | |
For the year ended December 31, 2011 | | | $10.86 | | | | 0.65 | | | | (0.09 | ) | | | 0.56 | |
| | | | |
Class C | | | | | | | | | | | | | | | | |
For the six months ended June 30, 2016 (Unaudited) | | | $10.51 | | | | 0.28 | (C) | | | 0.33 | | | | 0.61 | |
For the year ended December 31, 2015 | | | $10.92 | | | | 0.49 | (C) | | | (0.43 | ) | | | 0.06 | |
For the year ended December 31, 2014 | | | $11.17 | | | | 0.42 | (C) | | | (0.27 | ) | | | 0.15 | |
For the year ended December 31, 2013 | | | $11.17 | | | | 0.47 | (C) | | | — | (F) | | | 0.47 | |
For the year ended December 31, 2012 | | | $10.78 | | | | 0.53 | (C) | | | 0.40 | | | | 0.93 | |
For the year ended December 31, 2011 | | | $10.85 | | | | 0.56 | | | | (0.08 | ) | | | 0.48 | |
| | | | |
Class I | | | | | | | | | | | | | | | | |
For the six months ended June 30, 2016 (Unaudited) | | | $10.50 | | | | 0.34 | (C) | | | 0.33 | | | | 0.67 | |
For the year ended December 31, 2015 | | | $10.91 | | | | 0.60 | (C) | | | (0.43 | ) | | | 0.17 | |
For the year ended December 31, 2014 | | | $11.16 | | | | 0.54 | (C) | | | (0.27 | ) | | | 0.27 | |
For the year ended December 31, 2013 | | | $11.16 | | | | 0.58 | (C) | | | — | (F) | | | 0.58 | |
For the year ended December 31, 2012 | | | $10.77 | | | | 0.64 | (C) | | | 0.40 | | | | 1.04 | |
For the year ended December 31, 2011 | | | $10.84 | | | | 0.67 | | | | (0.08 | ) | | | 0.59 | |
| | | | |
Class Y(G) | | | | | | | | | | | | | | | | |
For the six months ended June 30, 2016 (Unaudited) | | | $10.50 | | | | 0.34 | (C) | | | 0.32 | | | | 0.66 | |
For the year ended December 31, 2015 | | | $10.91 | | | | 0.62 | (C) | | | (0.44 | ) | | | 0.18 | |
For the year ended December 31, 2014 | | | $11.16 | | | | 0.55 | (C) | | | (0.27 | ) | | | 0.28 | |
For the year ended December 31, 2013 | | | $11.15 | | | | 0.60 | (C) | | | — | (F) | | | 0.60 | |
For the year ended December 31, 2012 | | | $10.77 | | | | 0.66 | (C) | | | 0.38 | | | | 1.04 | |
| (A) | Total returns shown exclude the effect of applicable sales charges. |
| (B) | Portfolio turnover rate is calculated on the basis of the Fund as a whole without distinguishing between classes of shares issued. |
| (C) | Net investment income (loss) per share has been calculated using the average daily shares outstanding during the period. |
See accompanying Notes to Financial Statements.
| | | | | | | | | | | | | | |
| 66 | | DIAMOND HILL FUNDS | | | | | SEMI-ANNUAL REPORT | | | | | JUNE 30, 2016 | | | | | DIAMOND-HILL.COM |
| | | | | | | | | | | | | | | | | | | | | | | | | | | | | | | | | | |
Dividends
from net
investment
income | | | Distributions
from net
realized
gains | | | Total
distributions | | | Net asset
value at
end of
period | | | Total
return(A) | | | Net assets
at end
of period
(000’s) | | | Ratio
of total
expenses
to average
net assets | | | Ratio
of net
investment
income
(loss) to
average
net assets | | | Portfolio
turnover
rate(B) | |
| | | | | | | | |
| | | | | | | | | | | | | | | | | | | | | | | | | | | | | | | | | | |
| | (0.31) | | | | — | | | | (0.31 | ) | | | $10.87 | | | | 6.31 | %(D) | | | $58,176 | | | | 0.94 | %(E) | | | 6.10 | %(E) | | | 33 | % |
| | (0.55) | | | | — | | | | (0.55 | ) | | | $10.53 | | | | 1.19 | % | | | $44,354 | | | | 0.95 | % | | | 5.24 | % | | | 48 | % |
| | (0.48) | | | | — | | | | (0.48 | ) | | | $10.94 | | | | 2.10 | % | | | $31,282 | | | | 1.00 | % | | | 4.52 | % | | | 56 | % |
| | (0.55) | | | | — | | | | (0.55 | ) | | | $11.19 | | | | 5.13 | % | | | $39,801 | | | | 1.02 | % | | | 5.00 | % | | | 60 | % |
| | (0.62) | | | | — | | | | (0.62 | ) | | | $11.18 | | | | 9.55 | % | | | $44,374 | | | | 1.02 | % | | | 5.57 | % | | | 33 | % |
| | (0.63) | | | | — | | | | (0.63 | ) | | | $10.79 | | | | 5.21 | % | | | $38,895 | | | | 1.02 | % | | | 5.80 | % | | | 36 | % |
| | | | | | | | |
| | | | | | | | | | | | | | | | | | | | | | | | | | | | | | | | | | |
| | (0.28) | | | | — | | | | (0.28 | ) | | | $10.84 | | | | 5.87 | %(D) | | | $28,277 | | | | 1.69 | %(E) | | | 5.36 | %(E) | | | 33 | % |
| | (0.47) | | | | — | | | | (0.47 | ) | | | $10.51 | | | | 0.44 | % | | | $23,649 | | | | 1.70 | % | | | 4.47 | % | | | 48 | % |
| | (0.40) | | | | — | | | | (0.40 | ) | | | $10.92 | | | | 1.37 | % | | | $24,088 | | | | 1.75 | % | | | 3.80 | % | | | 56 | % |
| | (0.47) | | | | — | | | | (0.47 | ) | | | $11.17 | | | | 4.26 | % | | | $26,126 | | | | 1.77 | % | | | 4.25 | % | | | 60 | % |
| | (0.54) | | | | — | | | | (0.54 | ) | | | $11.17 | | | | 8.76 | % | | | $27,801 | | | | 1.77 | % | | | 4.81 | % | | | 33 | % |
| | (0.55) | | | | — | | | | (0.55 | ) | | | $10.78 | | | | 4.48 | % | | | $23,717 | | | | 1.77 | % | | | 5.06 | % | | | 36 | % |
| | | | | | | | |
| | | | | | | | | | | | | | | | | | | | | | | | | | | | | | | | | | |
| | (0.33) | | | | — | | | | (0.33 | ) | | | $10.84 | | | | 6.48 | %(D) | | | $314,144 | | | | 0.65 | %(E) | | | 6.40 | %(E) | | | 33 | % |
| | (0.58) | | | | — | | | | (0.58 | ) | | | $10.50 | | | | 1.49 | % | | | $247,522 | | | | 0.68 | % | | | 5.51 | % | | | 48 | % |
| | (0.52) | | | | — | | | | (0.52 | ) | | | $10.91 | | | | 2.38 | % | | | $148,737 | | | | 0.75 | % | | | 4.82 | % | | | 56 | % |
| | (0.58) | | | | — | | | | (0.58 | ) | | | $11.16 | | | | 5.30 | % | | | $117,009 | | | | 0.77 | % | | | 5.24 | % | | | 60 | % |
| | (0.65) | | | | — | | | | (0.65 | ) | | | $11.16 | | | | 9.83 | % | | | $103,738 | | | | 0.77 | % | | | 5.81 | % | | | 33 | % |
| | (0.66) | | | | — | | | | (0.66 | ) | | | $10.77 | | | | 5.53 | % | | | $83,418 | | | | 0.73 | % | | | 6.10 | % | | | 36 | % |
| | | | | | | | |
| | | | | | | | | | | | | | | | | | | | | | | | | | | | | | | | | | |
| | (0.33) | | | | — | | | | (0.33 | ) | | | $10.83 | | | | 6.44 | %(D) | | | $15,641 | | | | 0.55 | %(E) | | | 6.51 | %(E) | | | 33 | % |
| | (0.59) | | | | — | | | | (0.59 | ) | | | $10.50 | | | | 1.60 | % | | | $18,013 | | | | 0.56 | % | | | 5.62 | % | | | 48 | % |
| | (0.53) | | | | — | | | | (0.53 | ) | | | $10.91 | | | | 2.54 | % | | | $15,831 | | | | 0.60 | % | | | 4.96 | % | | | 56 | % |
| | (0.59) | | | | — | | | | (0.59 | ) | | | $11.16 | | | | 5.55 | % | | | $3,927 | | | | 0.62 | % | | | 5.35 | % | | | 60 | % |
| | (0.66) | | | | — | | | | (0.66 | ) | | | $11.15 | | | | 9.90 | % | | | $2,515 | | | | 0.62 | % | | | 5.95 | % | | | 33 | % |
| (F) | Amount is less than $0.005. |
| (G) | Inception date of Class Y is December 30, 2011. Class Y commenced public offering on January 3, 2012. |
See accompanying Notes to Financial Statements.
| | | | | | | | | | | | | | | | |
| DIAMOND HILL FUNDS | | | | | SEMI-ANNUAL REPORT | | | | | JUNE 30, 2016 | | | | | DIAMOND-HILL.COM | | | 67 | |
High Yield Fund
Financial Highlights
Selected data for a share outstanding throughout the periods indicated
| | | | | | | | | | | | | | | | |
| High Yield Fund(A) | | Net asset
value,
beginning
of period | | | Net
investment
income
(loss)(B) | | | Net
realized
and
unrealized
gains
(losses) on
investments | | | Total from
investment
operations | |
| | | | |
Class A | | | | | | | | | | | | | | | | |
December 31, 2015 through June 30, 2016 (Unaudited) | | | $10.14 | | | | 0.36 | | | | 0.32 | | | | 0.68 | |
| | | | |
Class I | | | | | | | | | | | | | | | | |
December 31, 2015 through June 30, 2016 (Unaudited) | | | $10.14 | | | | 0.37 | | | | 0.33 | | | | 0.70 | |
| | | | |
Class Y | | | | | | | | | | | | | | | | |
December 31, 2015 through June 30, 2016 (Unaudited) | | | $10.14 | | | | 0.37 | | | | 0.33 | | | | 0.70 | |
| (A) | Inception date of the Fund is December 31, 2015. The Fund commenced public offering and operations on January 4, 2016. |
| (B) | Net investment income (loss) per share has been calculated using the average daily shares outstanding during the period. |
| (C) | Total returns shown exclude the effect of applicable sales charges. |
See accompanying Notes to Financial Statements.
| | | | | | | | | | | | | | |
| 68 | | DIAMOND HILL FUNDS | | | | | SEMI-ANNUAL REPORT | | | | | JUNE 30, 2016 | | | | | DIAMOND-HILL.COM |
| | | | | | | | | | | | | | | | | | | | | | | | | | | | | | | | | | |
Dividends
from net
investment
income | | | Distributions
from net
realized
gains | | | Total
distributions | | | Net asset
value at
end of
period | | | Total
return(C)(D) | | | Net assets
at end
of period
(000’s) | | | Ratio
of total
expenses
to average
net assets(E) | | | Ratio
of net
investment
income
(loss) to
average
net assets(E) | | | Portfolio
turnover
rate(F) | |
| | | | | | | | |
| | | | | | | | | | | | | | | | | | | | | | | | | | | | | | | | | | |
| | (0.31) | | | | — | | | | (0.31 | ) | | | $10.51 | | | | 6.86 | % | | | $140 | | | | 1.00 | % | | | 6.85 | % | | | 41 | % |
| | | | | | | | |
| | | | | | | | | | | | | | | | | | | | | | | | | | | | | | | | | | |
| | (0.33) | | | | — | | | | (0.33 | ) | | | $10.51 | | | | 7.02 | % | | | $17,471 | | | | 0.71 | % | | | 7.09 | % | | | 41 | % |
| | | | | | | | |
| | | | | | | | | | | | | | | | | | | | | | | | | | | | | | | | | | |
| | (0.33) | | | | — | | | | (0.33 | ) | | | $10.51 | | | | 7.06 | % | | | $6,754 | | | | 0.61 | % | | | 7.33 | % | | | 41 | % |
| (F) | Portfolio turnover rate is calculated on the basis of the Fund as a whole without distinguishing between classes of shares issued. |
See accompanying Notes to Financial Statements.
| | | | | | | | | | | | | | | | |
| DIAMOND HILL FUNDS | | | | | SEMI-ANNUAL REPORT | | | | | JUNE 30, 2016 | | | | | DIAMOND-HILL.COM | | | 69 | |
Diamond Hill Funds
Notes to Financial Statements
June 30, 2016 (Unaudited)
Organization
The Diamond Hill Small Cap Fund (“Small Cap Fund”), Diamond Hill Small-Mid Cap Fund (“Small-Mid Cap Fund”), Diamond Hill Mid Cap Fund (“Mid Cap Fund”), Diamond Hill Large Cap Fund (“Large Cap Fund”), Diamond Hill Select Fund (“Select Fund”), Diamond Hill Long-Short Fund (“Long-Short Fund”), Diamond Hill Research Opportunities Fund (“Research Opportunities Fund”), Diamond Hill Financial Long-Short Fund (“Financial Long-Short Fund”), Diamond Hill Corporate Credit Fund (“Corporate Credit Fund”), formerly Strategic Income Fund, and the Diamond Hill High Yield Fund (“High Yield Fund”) are each a series of the Diamond Hill Funds (the “Trust”) (each a “Fund” and collectively the “Funds”). The Trust is an Ohio business trust, which is registered under the Investment Company Act of 1940, as amended, (the “1940 Act”) as an open-end, management investment company and thus follows accounting and reporting guidance for investment companies. Each Fund is a diversified series of the Trust.
Effective June 12, 2015, the Long-Short Fund closed to most new investors. Effective December 31, 2015, the Small Cap Fund closed to most new investors. Effective April 30, 2016, the Small-Mid Cap Fund closed to most new investors.
With the exception of the Financial Long-Short Fund and the High Yield Fund, the Funds offer four classes of shares: Class A, Class C, Class I and Class Y. The Financial Long-Short Fund offers three classes of shares: Class A, Class C and Class I. The High Yield Fund offers three classes of shares: Class A, Class I and Class Y. Each class of shares for each Fund has identical rights and privileges except with respect to distribution (12b-1) and service fees, voting rights on matters affecting a single class of shares, exchange privileges of each class of shares and sales charges. Class A has a maximum sales charge on purchases of 5.00% as a percentage of the original purchase price with the exception of the Corporate Credit Fund and the High Yield Fund which are 3.50%. Class C has a contingent deferred sales charge of 1.00% for shares redeemed within a year of the purchase date.
Significant Accounting Policies
The following is a summary of the Funds’ significant accounting policies:
Estimates — The preparation of financial statements in conformity with U.S. generally accepted accounting principles (“GAAP”) requires management to make estimates and assumptions that affect the reported amounts of assets and liabilities and disclosure of contingent assets and liabilities at the date of the financial statements and the reported amounts of income and expenses during the reporting period. Actual results could differ from those estimates.
Security valuation — The Funds record their investments at fair value. Fair value is defined as the price that would be received to sell an asset or paid to transfer a liability in an orderly transaction between market participants at the measurement date. The valuation techniques
| | | | | | | | | | | | | | |
| 70 | | DIAMOND HILL FUNDS | | | | | SEMI-ANNUAL REPORT | | | | | JUNE 30, 2016 | | | | | DIAMOND-HILL.COM |
Diamond Hill Funds
Notes to Financial Statements (Continued)
June 30, 2016 (Unaudited)
used by the Funds maximize the use of observable inputs and minimize the use of unobservable inputs in determining fair value. These inputs are summarized in the three broad levels listed below:
| • | | Level 1 — quoted prices in active markets for identical securities |
| • | | Level 2 — other significant observable inputs (including quoted prices for similar securities, interest rates, prepayment speeds, credit risk, etc.) |
| • | | Level 3 — significant unobservable inputs (including the Funds’ own assumptions in determining the fair value of investments) |
Listed securities for which market quotations are readily available are valued at the closing prices as determined by the primary exchange where the securities are traded. Unlisted securities or listed securities for which the latest sales prices are not readily available are valued at the closing bid price in the principal market where such securities are normally traded. Investments in other investment companies are valued at their reported net asset value. In each of these types of situations, valuations are typically categorized as Level 1 in the fair value hierarchy.
Debt securities are valued on the basis of valuations provided by dealers or by an independent pricing service that determines valuations based upon market transactions for normal, institutional-size trading units of similar securities. Short-term debt investments of sufficient credit quality maturing in less than 61 days may be valued at amortized cost, which may approximate fair value. In each of these situations, valuations are typically categorized as Level 2 in the fair value hierarchy.
Securities for which market quotations are not readily available (e.g., an approved pricing service does not provide a price, certain stale prices, or an event occurs that materially affects the furnished price) are valued by the Fair Value Committee. In these cases, the Fair Value Committee, established and appointed by the Trustees, determines in good faith, subject to Trust procedures, the fair value of portfolio securities held by a Fund (“good faith fair valuation”). When a good faith fair valuation of a security is required, consideration is generally given to a number of factors, including, but not limited to the following: dealer quotes, published analyses by dealers or analysts of the situation at issue, transactions implicitly valuing the security (such as a merger, tender offer, etc.), the value of other securities or contracts which derive their value from the security at issue, and the implications (whether negative or positive) of the circumstances which have caused trading in the security to halt. Depending on the source and relative significance of the valuation inputs in these instances, the valuations for these securities may be classified as Level 2 or Level 3 in the fair value hierarchy.
In accordance with procedures adopted by the Board of Trustees, fair value pricing may be used if events materially affecting the value of foreign securities occur between the time the
| | | | | | | | | | | | | | | | |
| DIAMOND HILL FUNDS | | | | | SEMI-ANNUAL REPORT | | | | | JUNE 30, 2016 | | | | | DIAMOND-HILL.COM | | | 71 | |
Diamond Hill Funds
Notes to Financial Statements (Continued)
June 30, 2016 (Unaudited)
exchange on which they are traded closes and the time the Funds’ net asset values are calculated. The Funds use a systematic valuation model, provided daily by an independent third party to fair value their international equity securities. These valuations are considered as Level 2 in the fair value hierarchy.
Approximately 0.3% of the Corporate Credit Fund’s June 30, 2016 net assets are being valued using estimates provided by the Fair Value Committee.
Changes in valuation techniques may result in transfers in or out of an assigned level within the disclosure hierarchy. The Trust determines transfers between fair value hierarchy levels at the reporting period end. There were no transfers between Levels 1, 2 or 3 as of June 30, 2016 based on input levels assigned at December 31, 2015.
The inputs or methodology used for valuing securities are not necessarily an indication of the risk associated with investing in those securities. For example, short-term debt securities of sufficient credit quality maturing in less than 61 days may be valued using amortized cost in accordance with rules under the 1940 Act. Generally, amortized cost approximates the current fair value of a security, but since the value is not obtained from a quoted price in an active market, such securities are reflected as Level 2.
The following is a summary of the inputs used to value the Funds’ investments as of June 30, 2016:
| | | | | | | | |
| | | Level 1 –
Quoted
Prices | | | Level 2 –
Other
Significant
Observable
Inputs | |
Investments in Securities: (Assets) | | | | | | | | |
Small Cap Fund | | | | | | | | |
Common Stocks* | | $ | 1,424,039,746 | | | $ | — | |
Registered Investment Companies | | | 501,443,940 | | | | — | |
| | | | | | | | |
Total | | | 1,925,483,686 | | | | — | |
Small-Mid Cap Fund | | | | | | | | |
Common Stocks* | | | 1,686,204,429 | | | | — | |
Registered Investment Companies | | | 315,264,130 | | | | — | |
| | | | | | | | |
Total | | | 2,001,468,559 | | | | — | |
Mid Cap Fund | | | | | | | | |
Common Stocks* | | | 33,733,068 | | | | — | |
Registered Investment Companies | | | 12,500,166 | | | | — | |
| | | | | | | | |
Total | | | 46,233,234 | | | | — | |
| | | | | | | | | | | | | | |
| 72 | | DIAMOND HILL FUNDS | | | | | SEMI-ANNUAL REPORT | | | | | JUNE 30, 2016 | | | | | DIAMOND-HILL.COM |
Diamond Hill Funds
Notes to Financial Statements (Continued)
June 30, 2016 (Unaudited)
| | | | | | | | |
| | | Level 1 –
Quoted
Prices | | | Level 2 –
Other
Significant
Observable
Inputs | |
Large Cap Fund | | | | | | | | |
Common Stocks* | | $ | 3,603,733,173 | | | $ | — | |
Registered Investment Companies | | | 477,244,992 | | | | — | |
| | | | | | | | |
Total | | | 4,080,978,165 | | | | — | |
Select Fund | | | | | | | | |
Common Stocks* | | | 134,568,938 | | | | — | |
Registered Investment Companies | | | 16,438,678 | | | | — | |
| | | | | | | | |
Total | | | 151,007,616 | | | | — | |
Long-Short Fund | | | | | | | | |
Common Stocks* | | | 3,643,217,123 | | | | — | |
Registered Investment Companies | | | 1,088,533,197 | | | | — | |
| | | | | | | | |
Total | | | 4,731,750,320 | | | | — | |
Research Opportunities Fund | | | | | | | | |
Common Stocks* | | | 49,024,182 | | | | 1,287,754 | |
Corporate Bonds* | | | — | | | | 996,250 | |
Registered Investment Company | | | 11,114,437 | | | | — | |
| | | | | | | | |
Total | | | 60,138,619 | | | | 2,284,004 | |
Financial Long-Short Fund | | | | | | | | |
Common Stocks* | | | 26,739,812 | | | | — | |
Registered Investment Companies | | | 9,059,541 | | | | — | |
| | | | | | | | |
Total | | | 35,799,353 | | | | — | |
Corporate Credit Fund | | | | | | | | |
Collateralized Debt Obligations | | | — | | | | 1,091,468 | |
Corporate Bonds* | | | — | | | | 354,068,433 | |
Registered Investment Companies | | | 84,472,592 | | | | — | |
| | | | | | | | |
Total | | | 84,472,592 | | | | 355,159,901 | |
High Yield | | | | | | | | |
Corporate Bonds* | | | — | | | | 23,298,289 | |
Registered Investment Companies | | | 6,426,767 | | | | — | |
| | | | | | | | |
Total | | | 6,426,767 | | | | 23,298,289 | |
| | | | | | | | | | | | | | | | |
| DIAMOND HILL FUNDS | | | | | SEMI-ANNUAL REPORT | | | | | JUNE 30, 2016 | | | | | DIAMOND-HILL.COM | | | 73 | |
Diamond Hill Funds
Notes to Financial Statements (Continued)
June 30, 2016 (Unaudited)
| | | | | | | | |
| | | Level 1 –
Quoted
Prices | | | Level 2 –
Other
Significant
Observable
Inputs | |
Investments in Securities Sold Short: (Liabilities) | | | | | | | | |
Long-Short Fund | | | | | | | | |
Common Stocks* | | $ | (1,206,503,378 | ) | | $ | — | |
Registered Investment Company | | | (52,443,194 | ) | | | — | |
| | | | | | | | |
Total | | | (1,258,946,572 | ) | | | — | |
Research Opportunities Fund | | | | | | | | |
Common Stocks* | | | (14,828,249 | ) | | | — | |
| | | | | | | | |
Total | | | (14,828,249 | ) | | | — | |
Financial Long-Short Fund | | | | | | | | |
Common Stocks* | | | (4,685,398 | ) | | | — | |
| | | | | | | | |
Total | | | (4,685,398 | ) | | | — | |
| * | See Schedule of Investments and Schedule of Investments Sold Short for industry classification. |
The Funds did not hold any Level 3 securities during the six months ended June 30, 2016.
Short sales — The Long-Short Fund, Research Opportunities Fund, Financial Long-Short Fund, Corporate Credit Fund and High Yield Fund are permitted to make short sales of securities. Short sales are effective when it is believed that the price of a particular security will decline, and involves the sale of a security which the Fund does not own in hope of purchasing the same security at a later date at a lower price. To make delivery to the buyer, a Fund must borrow the security, and the Fund is obligated to return the security to the lender, which is accomplished by a later purchase of the security by the Fund. Cash received from short sales is maintained by the custodian and is used as collateral. It is included as “Cash deposits with custodian for securities sold short” on the Statements of Assets & Liabilities and “Segregated Cash With Custodian” on the Schedules of Investments.
A Fund will incur a loss as a result of a short sale if the price of the security increases between the date of the short sale and the date on which the Fund purchases the security to replace the borrowed security. The use of short sales may cause a Fund to have higher expenses (especially dividend expenses) than those of other equity mutual funds. Short sales are speculative transactions and involve special risks, including greater reliance on the ability of the Funds’ investment advisor, Diamond Hill Capital Management, Inc. (“DHCM”) to accurately anticipate the future value of a security.
Securities lending — Under the terms of the securities lending agreements with State Street Bank and Trust Company (“State Street”), State Street is authorized to loan securities on
| | | | | | | | | | | | | | |
| 74 | | DIAMOND HILL FUNDS | | | | | SEMI-ANNUAL REPORT | | | | | JUNE 30, 2016 | | | | | DIAMOND-HILL.COM |
Diamond Hill Funds
Notes to Financial Statements (Continued)
June 30, 2016 (Unaudited)
behalf of the Funds to approved borrowers. The contractual maturity of securities lending transactions are on an overnight and continuous basis. In exchange, the Funds receive cash collateral in the amount of at least 100% of the value of the securities loaned. Any collateral shortfalls due to changes in security market prices are adjusted the next business day. The cash collateral is invested in short-term instruments as noted in each Fund’s Schedule of Investments. Although risk is mitigated by the collateral, the Funds could experience a delay in recovering their securities and possible loss of income or value if the borrower fails to return them. The agreements provide that after predetermined rebates to borrowers, the Funds each retain a portion of their respective net securities lending income and pay State Street the remaining portion.
As of June 30, 2016, the fair value of securities loaned and the collateral held were as follows:
| | | | | | | | |
| | | Fair Value of
Securities Loaned | | | Fair Value of
Collateral Received | |
Small Cap Fund | | $ | 176,308,780 | | | $ | 181,089,534 | |
Small-Mid Cap Fund | | | 152,358,897 | | | | 156,066,879 | |
Mid Cap Fund | | | 9,791,680 | | | | 10,020,993 | |
Large Cap Fund | | | 403,527,235 | | | | 419,942,141 | |
Select Fund | | | 15,124,192 | | | | 15,478,929 | |
Long-Short Fund | | | 536,558,016 | | | | 548,681,030 | |
Research Opportunities Fund | | | 10,820,019 | | | | 11,114,437 | |
Financial Long-Short Fund | | | 7,184,571 | | | | 7,349,108 | |
Corporate Credit Fund | | | 34,846,249 | | | | 36,206,143 | |
High Yield Fund | | | 5,469,406 | | | | 5,694,157 | |
Security transactions — Throughout the reporting period, investment transactions are recorded no later than the first business day following trade date. For financial reporting purposes, investments are reported on trade date on the last business day of the reporting period. The specific identification method is used for determining realized gains or losses for financial statements and income tax purposes. Dividend income is recognized on the ex-dividend date and interest income is recognized on an accrual basis. Discounts and premiums on securities purchased are amortized using the daily effective yield method. The Funds record distributions received from investments in Real Estate Investment Trusts (“REITS”) in excess of income from underlying investments as a reduction of cost of investments and/or realized gain. Such amounts are based on estimates if actual amounts are not available and actual amounts of income, realized gain and return of capital may differ from the estimated amounts. The Funds adjust the estimated amounts once the issuers provide information about the actual composition of the distributions.
| | | | | | | | | | | | | | | | |
| DIAMOND HILL FUNDS | | | | | SEMI-ANNUAL REPORT | | | | | JUNE 30, 2016 | | | | | DIAMOND-HILL.COM | | | 75 | |
Diamond Hill Funds
Notes to Financial Statements (Continued)
June 30, 2016 (Unaudited)
Share valuation — The net asset value per share of each class of shares of each Fund is calculated daily by dividing the total value of a Fund’s assets attributable to that class, less liabilities attributable to that class, by the number of shares of that class outstanding.
Federal income taxes — Each Fund’s policy is to continue to comply with the requirements of the Internal Revenue Code that are applicable to regulated investment companies and to distribute substantially all of its taxable net investment income and any net realized capital gains to its shareholders. The Funds have analyzed their tax positions taken on Federal income tax returns for all open tax years (tax years ended December 31, 2012 through 2015) and have concluded that no provision for income tax is required in their financial statements.
Distributions to shareholders — Dividends from net investment income are declared and paid monthly for the Corporate Credit Fund and High Yield Fund. Dividends from net investment income are declared and paid on an annual basis for the Small Cap Fund, Small-Mid Cap Fund, Mid Cap Fund, Large Cap Fund, Select Fund, Long-Short Fund, Research Opportunities Fund, and Financial Long-Short Fund. Dividends are declared separately for each class. No class has preferential dividend rights; differences in per share rates are due to differences in separate class expenses. Net realized capital gains, if any, are distributed at least annually. Distributions from net investment income and from net capital gains are determined in accordance with U.S. income tax regulations, which may differ from GAAP. These differences are primarily due to differing treatments for paydown gains and losses on mortgage-backed securities, expiring capital loss carry-forwards and deferrals of certain losses. Permanent book and tax basis differences are reclassified among the components of net assets. Certain Funds may utilize earnings and profits distributed to shareholders on redemption of shares as part of the dividends paid deduction for income tax purposes.
Allocations — Investment income earned, realized capital gains and losses, and unrealized appreciation and depreciation for the Funds are allocated daily to each class of shares based upon its proportionate share of total net assets of the Fund. Class specific expenses are charged directly to the class incurring the expense. Common expenses, which are not attributable to a specific class, are allocated daily to each class of shares based upon its proportionate share of total net assets of the Fund. Expenses not directly billed to a Fund are allocated proportionally among all Funds daily in relation to net assets of each Fund or another reasonable measure.
Foreign securities country risk — Investing in non-U.S. securities may entail risk due to foreign economic and political developments; this risk may be higher when investing in emerging markets. Changes in currency exchange rates and differences in accounting and taxation policies outside the U.S. can raise or lower returns.
Foreign currency translation — The books and records of the Funds are maintained in U.S. dollars. Investment securities and other assets and liabilities denominated in a foreign
| | | | | | | | | | | | | | |
| 76 | | DIAMOND HILL FUNDS | | | | | SEMI-ANNUAL REPORT | | | | | JUNE 30, 2016 | | | | | DIAMOND-HILL.COM |
Diamond Hill Funds
Notes to Financial Statements (Continued)
June 30, 2016 (Unaudited)
currency are translated into U.S. dollars on the date of valuation. The Funds do not isolate that portion of realized or unrealized gains and losses resulting from changes in the foreign exchange rate from fluctuations arising from changes in the market prices of the securities. These gains and losses are included in net realized and unrealized gains and losses on investments in the Statements of Operations. Net realized and unrealized gains and losses on foreign currency transactions represent net foreign exchange gains or losses from foreign currency exchange contracts, disposition of foreign currencies, currency gains or losses realized between trade and settlement dates on securities transactions and the difference between the amount of the investment income and foreign withholding taxes recorded on the Funds’ books and the U.S. dollar equivalent amounts actually received or paid.
Investment Transactions
For the six months ended June 30, 2016, purchases and sales (including maturities) of investment securities (excluding short-term securities and U.S. government obligations) were as follows:
| | | | | | | | |
| | | Purchases | | | Sales | |
Small Cap Fund | | $ | 142,972,703 | | | $ | 78,363,541 | |
Small-Mid Cap Fund | | | 540,837,160 | | | | 125,773,423 | |
Mid Cap Fund | | | 17,302,771 | | | | 1,958,375 | |
Large Cap Fund | | | 485,958,283 | | | | 346,882,753 | |
Select Fund | | | 59,310,103 | | | | 62,113,105 | |
Long-Short Fund | | | 1,012,999,397 | | | | 1,269,723,436 | |
Research Opportunities Fund | | | 25,724,287 | | | | 33,650,532 | |
Financial Long-Short Fund | | | 6,785,005 | | | | 4,813,667 | |
Corporate Credit Fund | | | 178,153,333 | | | | 108,184,965 | |
High Yield Fund | | | 19,847,830 | | | | 7,118,924 | |
The Funds pay commissions on the purchase and sale of investment securities. The commissions are treated as transaction costs and, therefore, are included as part of the cost of purchases or net proceeds on the sale of investment securities and are not included in the presentation of Fund expenses on the Statements of Operations. The Funds paid the following commissions during the six months ended June 30, 2016:
| | | | | | | | |
| | | Total
Commissions | | | Commissions
as a % of
Average
Net Assets | |
Small Cap Fund | | $ | 153,155 | | | | 0.01 | % |
Small-Mid Cap Fund | | | 37,376 | | | | 0.02 | % |
Mid Cap Fund | | | 6,182 | | | | 0.03 | % |
| | | | | | | | | | | | | | | | |
| DIAMOND HILL FUNDS | | | | | SEMI-ANNUAL REPORT | | | | | JUNE 30, 2016 | | | | | DIAMOND-HILL.COM | | | 77 | |
Diamond Hill Funds
Notes to Financial Statements (Continued)
June 30, 2016 (Unaudited)
| | | | | | | | |
| | | Total
Commissions | | | Commissions
as a % of
Average
Net Assets | |
Large Cap Fund | | $ | 455,502 | | | | 0.01 | % |
Select Fund | | | 46,389 | | | | 0.03 | % |
Long-Short Fund | | | 1,145,856 | | | | 0.03 | % |
Research Opportunities Fund | | | 28,373 | | | | 0.06 | % |
Financial Long-Short Fund | | | 4,286 | | | | 0.02 | % |
Investment Advisory Fees and Other Transactions with Affiliates
As of June 30, 2016, the Small Cap Fund, Small-Mid Cap Fund, Mid Cap Fund, Large Cap Fund, Select Fund, Long-Short Fund, Research Opportunities Fund, Financial Long-Short Fund, Corporate Credit Fund and High Yield Fund each receive investment management and advisory services from DHCM under management agreements that provide for fees to be paid at an annual rate of 0.80%, 0.75%, 0.65%, 0.50%, 0.70%, 0.90%, 1.00%, 1.00%, 0.45% and 0.50% of the Fund’s average daily net assets, respectively. Prior to January 1, 2016, the annual rate for the Large Cap Fund was 0.55% of the Fund’s average daily net assets. The advisory agreements are subject to annual approval by the Board of Trustees. In addition, each Fund entered into an administrative services agreement whereby DHCM is paid a fee at an annual rate of 0.24% for Class A Shares and Class C Shares, 0.20% for Class I Shares and 0.10% for Class Y shares of each class’ average daily net assets. Prior to January 1, 2016, the fees paid by Class I shares under the administrative services agreement were 0.21% of each class’ average daily net assets. These administrative fees are used to pay most of the Funds’ operating expenses except advisory fees, distribution fees, custody fees, brokerage fees, taxes, interest and dividend expense on securities sold short and extraordinary expenses.
Pursuant to Rule 12b-1 under the 1940 Act, the Trust has adopted a distribution plan on behalf of each Fund’s Class A and Class C Shares (the “Plan”). Under the Plan, Class A shares pay a distribution fee at an annual rate of 0.25% of Class A average daily net assets. Class C shares pay distribution and shareholder-servicing fees at an annual rate of 0.75% and 0.25%, respectively, of Class C’s average daily net assets. Class I and Class Y shares are not subject to any distribution or shareholder-servicing fees. The Trust entered into a Distribution Agreement on behalf of the Funds with BHIL Distributors, LLC (“Distributor”). Pursuant to the Distribution Agreement, the Distributor acts as principal underwriter of each Fund’s shares.
| | | | | | | | | | | | | | |
| 78 | | DIAMOND HILL FUNDS | | | | | SEMI-ANNUAL REPORT | | | | | JUNE 30, 2016 | | | | | DIAMOND-HILL.COM |
Diamond Hill Funds
Notes to Financial Statements (Continued)
June 30, 2016 (Unaudited)
For the six months ended June 30, 2016, the Distributor retained the following amounts in sales commissions from the sales of Class A shares of the Funds as follows:
| | | | |
Small Cap Fund | | $ | 7,184 | |
Small-Mid Cap Fund | | | 13,600 | |
Mid Cap Fund | | | 2,625 | |
Large Cap Fund | | | 15,213 | |
Select Fund | | | 960 | |
Long-Short Fund | | | 3,431 | |
Financial Long-Short Fund | | | 223 | |
Corporate Credit Fund | | | 3,279 | |
DHCM, as the financing agent for Class C shares, received contingent deferred sales charges relating to the redemptions of Class C shares of the Funds for the six months ended June 30, 2016 as follows:
| | | | |
Small Cap Fund | | $ | 755 | |
Small-Mid Cap Fund | | | 1,204 | |
Large Cap Fund | | | 975 | |
Select Fund | | | 741 | |
Long-Short Fund | | | 1,762 | |
Research Opportunities Fund | | | 148 | |
Certain Officers of the Trust are affiliated with DHCM or the Distributor. Such Officers receive no compensation from the Funds for serving in their respective roles.
Trustee Fees
The Independent Trustees are compensated for their services to the Funds by DHCM as part of the administration services agreement. Collectively, the Independent Trustees were paid $161,000 in fees during the six months ended June 30, 2016.
Commitments and Contingencies
The Funds indemnify the Trust’s Officers and Trustees for certain liabilities that might arise from their performance of their duties to the Funds. Additionally, in the normal course of business, the Funds enter into contracts that contain a variety of representations and warranties and which provide general indemnifications. The Funds’ maximum exposure under these arrangements is unknown, as this would involve future claims that may be made against the Funds that have not yet occurred. However, based on experience, the Funds expect the risk of loss to be remote.
| | | | | | | | | | | | | | | | |
| DIAMOND HILL FUNDS | | | | | SEMI-ANNUAL REPORT | | | | | JUNE 30, 2016 | | | | | DIAMOND-HILL.COM | | | 79 | |
Diamond Hill Funds
Notes to Financial Statements (Continued)
June 30, 2016 (Unaudited)
Federal Tax Information
The amount and character of income and capital gain distributions paid by the Funds are determined in accordance with Federal income tax regulations which may differ from GAAP. The tax character of distributions paid may differ from the character of distributions shown on the Statements of Changes in Net Assets, as items such as short-term capital gains are treated as ordinary income for tax purposes.
The tax character of distributions paid during 2015 was as follows:
| | | | | | | | | | | | | | | | | | | | |
| | | Small Cap
Fund | | | Small-Mid
Cap Fund | | | Mid Cap Fund | | | Large Cap
Fund | | | Select
Fund | |
Distributions paid from: | | | | | | | | | | | | | | | | | | | | |
Ordinary income | | $ | 8,403,924 | | | $ | 3,498,225 | | | $ | 108,238 | | | $ | 34,363,450 | | | $ | 359,589 | |
Long-term capital gains | | | 21,408,776 | | | | 13,087,774 | | | | — | | | | 129,116,454 | | | | 4,592,466 | |
| | | | | | | | | | | | | | | | | | | | |
Total distributions | | $ | 29,812,700 | | | $ | 16,585,999 | | | $ | 108,238 | | | $ | 163,479,904 | | | $ | 4,952,055 | |
| | | | | | | | | | | | | | | | | | | | |
| | | | | |
| | | | | | Long-Short
Fund | | | Research
Opportunities
Fund | | | Financial
Long-Short
Fund | | | Corporate
Credit
Fund | |
Distributions paid from: | | | | | | | | | | | | | | | | | | | | |
Ordinary income | | | | | | $ | — | | | $ | 340,851 | | | $ | 134,211 | | | $ | 13,617,414 | |
Long-term capital gains | | | | | | | 20,786,215 | | | | 4,092,364 | | | | — | | | | — | |
| | | | | | | | | | | | | | | | | | | | |
Total distributions | | | | | | $ | 20,786,215 | | | $ | 4,433,215 | | | $ | 134,211 | | | $ | 13,617,414 | |
| | | | | | | | | | | | | | | | | | | | |
The following information is computed on a tax basis for each item as of December 31, 2015:
| | | | | | | | | | | | | | | | | | | | |
| | | Small Cap
Fund | | | Small-Mid
Cap Fund | | | Mid Cap
Fund | | | Large Cap
Fund | | | Select
Fund | |
Net unrealized appreciation (depreciation) on portfolio investments | | $ | 212,255,508 | | | $ | 44,137,744 | | | $ | 845,840 | | | $ | 639,704,687 | | | $ | (6,758,361 | ) |
Undistributed ordinary income | | | — | | | | — | | | | 7,395 | | | | 2,113,996 | | | | 666,648 | |
Undistributed capital gains | | | 38,108,187 | | | | 13,155,779 | | | | — | | | | 43,928,487 | | | | 1,206,738 | |
Capital loss carryforwards | | | — | | | | — | | | | (44,539 | ) | | | — | | | | — | |
Late-year ordinary losses deferred | | | (2,468,339 | ) | | | — | | | | — | | | | — | | | | — | |
| | | | | | | | | | | | | | | | | | | | |
Accumulated earnings (deficit) | | $ | 247,895,356 | | | $ | 57,293,523 | | | $ | 808,696 | | | $ | 685,747,170 | | | $ | (4,884,975 | ) |
| | | | | | | | | | | | | | | | | | | | |
| | | | | | | | | | | | | | |
| 80 | | DIAMOND HILL FUNDS | | | | | SEMI-ANNUAL REPORT | | | | | JUNE 30, 2016 | | | | | DIAMOND-HILL.COM |
Diamond Hill Funds
Notes to Financial Statements (Continued)
June 30, 2016 (Unaudited)
| | | | | | | | | | | | | | | | | | | | |
| | | | | | Long-Short
Fund | | | Research
Opportunities
Fund | | | Financial
Long-Short
Fund | | | Corporate
Credit Fund | |
Net unrealized appreciation (depreciation) on portfolio investments | | | | | | $ | 512,410,508 | | | $ | (1,070,244 | ) | | $ | 282,885 | | | $ | (16,992,688 | ) |
Undistributed ordinary income | | | | | | | — | | | | — | | | | 31,152 | | | | 943,989 | |
Undistributed capital gains | | | | | | | — | | | | 10,325 | | | | — | | | | — | |
Capital loss carryforwards | | | | | | | — | | | | — | | | | (5,761,578 | ) | | | (10,806,004 | ) |
Post-October capital losses deferred | | | | | | | (2,443,579 | ) | | | (356,313 | ) | | | — | | | | — | |
Late-year ordinary losses deferred | | | | | | | — | | | | (115,290 | ) | | | — | | | | — | |
| | | | | | | | | | | | | | | | | | | | |
Accumulated earnings (deficit) | | | | | | $ | 509,966,929 | | | $ | (1,531,522 | ) | | $ | (5,447,541 | ) | | $ | (26,854,703 | ) |
| | | | | | | | | | | | | | | | | | | | |
Qualified late-year losses (Late-year Ordinary losses and Post October Capital losses listed above) incurred after October 31, 2015 and within the taxable year, are deemed to arise on the first day of the Funds’ next taxable year.
As of June 30, 2016, the Funds’ federal tax cost of investment securities and net unrealized appreciation (depreciation) were as follows:
| | | | | | | | | | | | | | | | | | | | |
| | | Small Cap
Fund | | | Small-Mid
Cap Fund | | | Mid Cap
Fund | | | Large Cap
Fund | | | Select
Fund | |
Tax cost of portfolio investments | | $ | 1,672,609,623 | | | $ | 1,867,171,207 | | | $ | 44,093,806 | | | $ | 3,487,743,787 | | | $ | 166,850,051 | |
| | | | | | | | | | | | | | | | | | | | |
Gross unrealized appreciation | | | 329,259,919 | | | | 209,681,935 | | | | 3,334,250 | | | | 728,849,908 | | | | 10,488,680 | |
Gross unrealized depreciation | | | (76,385,856 | ) | | | (75,384,583 | ) | | | (1,194,822 | ) | | | (135,615,530 | ) | | | (26,331,115 | ) |
| | | | | | | | | | | | | | | | | | | | |
Net unrealized appreciation (depreciation) on portfolio investments | | $ | 252,874,063 | | | $ | 134,297,352 | | | $ | 2,139,428 | | | $ | 593,234,378 | | | $ | (15,842,435 | ) |
| | | | | | | | | | | | | | | | | | | | |
| | | | | |
| | | Long-Short
Fund | | | Research
Opportunities
Fund | | | Financial
Long-Short
Fund | | | Corporate
Credit Fund | | | High Yield
Fund | |
Tax cost of long portfolio investments | | $ | 4,247,433,720 | | | $ | 63,701,218 | | | $ | 37,470,705 | | | $ | 443,789,475 | | | $ | 29,684,062 | |
| | | | | | | | | | | | | | | | | | | | |
Gross unrealized appreciation | | | 643,502,558 | | | | 6,033,985 | | | | 1,669,471 | | | | 5,175,328 | | | | 374,020 | |
Gross unrealized depreciation | | | (159,185,960 | ) | | | (7,312,580 | ) | | | (3,340,823 | ) | | | (9,332,310 | ) | | | (333,026 | ) |
| | | | | | | | | | | | | | | | | | | | |
Net unrealized appreciation (depreciation) on long portfolio investments | | $ | 484,316,598 | | | $ | (1,278,595 | ) | | $ | (1,671,352 | ) | | $ | (4,156,982 | ) | | $ | 40,994 | |
| | | | | | | | | | | | | | | | | | | | |
| | | | | | | | | | | | | | | | |
| DIAMOND HILL FUNDS | | | | | SEMI-ANNUAL REPORT | | | | | JUNE 30, 2016 | | | | | DIAMOND-HILL.COM | | | 81 | |
Diamond Hill Funds
Notes to Financial Statements (Continued)
June 30, 2016 (Unaudited)
The difference between book basis and tax basis net unrealized appreciation (depreciation) is attributable primarily to the tax deferral of losses on wash sales.
As of the latest tax year ended December 31, 2015, the following Funds have capital loss carry forwards (“CLCFs”) as summarized in the tables below. CLCFs subject to expiration are applied as short-term capital loss regardless of whether the originating capital loss was short-term or long-term. CLCFs that are not subject to expiration must be utilized before those that are subject to expire. The Mid Cap Fund has a short-term CLCF of $44,539 that is not subject to expiration. As of December 31, 2015, the following CLCFs were subject to expiration:
| | | | | | | | |
| | | Amount | | | Expires
December 31, | |
Financial Long-Short Fund | | $ | 5,761,578 | | | | 2017 | |
| | | | | | | | |
| | $ | 5,761,578 | | | | | |
| | | | | | | | |
Corporate Credit Fund | | $ | 5,534,150 | | | | 2016 | |
| | | 5,271,854 | | | | 2017 | |
| | | | | | | | |
| | $ | 10,806,004 | | | | | |
| | | | | | | | |
As of the latest tax year ended December 31, 2015, the following funds utilized CLCFs:
| | | | |
| | | Amount
of CLCFs | |
Mid Cap Fund | | $ | 18,308 | |
Long-Short Fund | | | 118,576,181 | |
Financial Long-Short Fund | | | 3,311,081 | |
Corporate Credit Fund | | | 668,171 | |
The tax character of current year distributions paid and the tax basis of the current components of accumulated earnings (deficit) and any net CLCFs will be determined at the end of the current tax year.
Subsequent Events
The Funds evaluated events from June 30, 2016 through the date that these financial statements were issued. There were no subsequent events to report that would have a material impact on the Funds’ financial statements, other than disclosed below.
On July 5, 2016, the Diamond Hill Core Bond Fund and the Diamond Hill Short Duration Total Return Bond Fund commenced operations.
Effective August 1, 2016, the administrative fee for all Class I shares decreased from 0.20% to 0.19% and for all Class Y shares from 0.10% to 0.09%.
| | | | | | | | | | | | | | |
| 82 | | DIAMOND HILL FUNDS | | | | | SEMI-ANNUAL REPORT | | | | | JUNE 30, 2016 | | | | | DIAMOND-HILL.COM |
Diamond Hill Funds
Other Items
June 30, 2016 (Unaudited)
Trustee Approval of Investment Advisory Agreement
The Trustees of Diamond Hill Funds (the “Trust”) considered a broad range of information specifically requested and relating to its consideration of the approval of the investment advisory agreement for the Diamond Hill High Yield Fund (“HY Fund”) at a regularly scheduled meeting on November 19, 2015. By a unanimous vote, the Trustees approved the Amended and Restated Investment Management Agreement (“Management Agreement”) between the Trust and Diamond Hill Capital Management, Inc. (the “Adviser”), for the HY Fund. The Trustees discussed the following factors, in connection with the Trust’s Management Agreement:
| a) | Nature, Extent and Quality of Services. The Trustees considered the nature, extent and quality of the services provided by the Adviser under the Management Agreement, including a review of the services provided thereunder, the proposed management fee for the HY Fund, and the expenses that will be assumed. The Trustees noted that they had previously considered the Adviser’s overall reputation, integrity and mission to serve its clients through a disciplined intrinsic-value-based approach to investment that aligns the Adviser’s interests with those of its clients in connection with the annual renewal of the Management Agreement for the other funds in the Trust at a meeting held on August 20, 2015. At that same meeting, the Trustees noted the qualifications of the investment staff and other key personnel of the Adviser and that the Adviser continues to invest significant resources in human capital to attract and retain top talent. The Trustees also reviewed the Adviser’s succession plan for key investment and management staff. In addition, the Trustees reviewed information related to the compensation structure for portfolio managers and other key investment personnel. The Adviser represented that the information reviewed at the August 20, 2015, meeting was applicable to the HY Fund and had not materially changed. |
| | In evaluating performance, the Trustees reviewed the Adviser’s absolute and relative return goals for the HY Fund and performance information for the Diamond Hill High Yield Fund, L.P. (“HY LP”), noting that the HY LP will be converted into the HY Fund. The Trustees also received performance information for the Diamond Hill Corporate Credit Fund (“Corporate Credit Fund”) that is managed by the same portfolio managers and discussed similarities and differences between the HY Fund and the Corporate Credit Fund. The Trustees determined that because the HY Fund has not commenced operations, the Trustees would review performance over time. |
| b) | Reasonableness of Investment Advisory Fees. The Trustees noted that the contractual fee rate under the Management Agreement was below both the average and median rates of the Morningstar High Yield Bond Category. |
| c) | Reasonableness of Total Expenses. The Trustees noted that the estimated total expenses of each class of shares of the HY Fund were below both the average and median total expenses of the Morningstar High Yield Bond Category. |
| | | | | | | | | | | | | | | | |
| DIAMOND HILL FUNDS | | | | | SEMI-ANNUAL REPORT | | | | | JUNE 30, 2016 | | | | | DIAMOND-HILL.COM | | | 83 | |
Diamond Hill Funds
Other Items
June 30, 2016 (Unaudited) (Continued)
| d) | Profitability. The Trustees considered the profitability of the Adviser’s future relationship with the HY Fund. The Adviser discussed the level of assets the HY Fund will need to reach before becoming profitable. As such, the Adviser represented that the HY Fund will likely not generate a profit until a performance track-record has been established and asset growth begins to increase in line with expectations. After discussion, the Trustees determined that they would continue to evaluate the Adviser’s profitability in connection with the next annual renewal of the Management Agreement, and concluded that the time frame to achieve profitability was reasonable. The Trustees noted that the Adviser is also the administrator to the HY Fund (under the Amended and Restated Administrative, Fund Accounting and Transfer Agency Services Agreement (“Administrative Agreement”)). At the August 20, 2015 meeting, the Trustees had reviewed a separate profitability analysis relating to the administrative services provided to all the funds of the Trust and concluded that the Adviser’s pre-tax profit margin under the Management Agreement and the administration margin and pro-forma administration margin under the Administrative Agreement represented a fair and entrepreneurial profit for managing and providing administrative services to the Funds. The Adviser represented that the information reviewed at the August 20, 2015, meeting was applicable to the HY Fund and had not materially changed. |
| e) | Economies of Scale. The Trustees noted that in connection with the annual renewal of the Management Agreement for the other funds in the Trust on August 20, 2015, they reviewed the potential extent to which economies of scale would be realized as each of the other funds in the Trust grow and whether fee levels reflect these economies of scale for the benefit of shareholders of those funds. They noted that while many advisory firms reduce fees as assets under management increase with predetermined break points, the Adviser has adopted a different strategy. The Trustees considered that rather than instituting break points, the Adviser has targeted its advisory fees to correspond to its mission to add value, meaning that rather than charging a lower fee on assets above a certain level, the Adviser prefers to close a strategy to new investors so that it can efficiently manage the assets of these funds and attempt to fulfill its responsibility to add value to existing investors. The Trustees also noted that the Adviser has a history of voluntarily reducing its fees under the Amended and Restated Administrative, Fund Accounting and Transfer Agency Services Agreement when asset growth allows for the sharing of economies of scale. The Adviser represented that the strategy for the HY Fund will be the same as the other funds in the Trust. |
| f) | Ancillary Benefits. The Trustees considered ancillary benefits received by the Adviser as a result of its relationship with all the funds in the Trust on August 20, 2015, including the ability to negotiate favorable commissions rates and have access to research that benefits all of the Adviser’s clients, the ability to serve as sub-adviser to other mutual funds, and the ability to launch an exchange-traded fund. |
| | | | | | | | | | | | | | |
| 84 | | DIAMOND HILL FUNDS | | | | | SEMI-ANNUAL REPORT | | | | | JUNE 30, 2016 | | | | | DIAMOND-HILL.COM |
Diamond Hill Funds
Other Items
June 30, 2016 (Unaudited) (Continued)
In their deliberations, there was a comprehensive consideration of each of the factors above in connection with the HY Fund, and the Trustees, all of whom qualify as Independent Trustees under the Investment Company Act of 1940, as amended, concluded the compensation to be received by the Adviser from the HY Fund was fair and reasonable and the approval of the Management Agreement for the HY Fund was in the best interests of the HY Fund and its shareholders.
Proxy Voting
The investment advisor is responsible for exercising the voting rights associated with the securities purchased and held by the Funds. A description of the policies and procedures that the investment advisor uses in fulfilling this responsibility and information regarding how those proxies were voted during the twelve month period ended June 30 are available without charge upon request by calling toll free 1-888-226-5595 or on the Securities and Exchange Commission’s website at www.sec.gov.
Portfolio Disclosure
The Trust files a complete listing of portfolio holdings for each Fund as of the end of the first and third quarters of each fiscal year on Form N-Q and each second and fourth quarters of each fiscal year on Form N-CSR. The complete listing (i) is available on the Commission’s website; (ii) may be reviewed and copied at the Commission’s Public Reference Room in Washington, DC; and (iii) will be made available to shareholders upon request by calling 1-888-226-5595. Information on the operation of the Public Reference Room may be obtained by calling 1-800-SEC-0330. Monthly portfolio holdings are also available on www.diamond-hill.com.
| | | | | | | | | | | | | | | | |
| DIAMOND HILL FUNDS | | | | | SEMI-ANNUAL REPORT | | | | | JUNE 30, 2016 | | | | | DIAMOND-HILL.COM | | | 85 | |
Diamond Hill Funds
Schedule of Shareholder Expenses
Hypothetical Example of a $1,000 Investment at Beginning of Period
(Unaudited)
As a Fund shareholder, you may incur two types of costs: (1) transaction costs, including wire redemption fees and sales charges (loads) as applicable; and (2) ongoing costs, including management fees; distribution and service (12b-1) fees; and other Fund expenses. These examples are intended to help you understand your ongoing costs (in dollars) of investing in a Fund and to compare these costs with the ongoing costs of investing in other mutual funds. Please note that the expenses shown in the tables are meant to highlight your ongoing costs only and do not reflect any transactional costs or other fees that may apply, such as fees for low balance accounts. Therefore, the examples are useful in comparing ongoing costs only and will not help you determine the relative total cost of owning different funds. In addition, if these transactional costs and other fees were included, your costs would have been higher.
These examples are based on an investment of $1,000 invested at January 1, 2016 and held for the entire period from January 1, 2016 through June 30, 2016.
The Actual Expense example below provides information about actual account values and actual expenses. You may use this information, together with the amount you invested, to estimate the expenses that you paid over the period. Simply divide your account value by $1,000 (for example, an $8,600 account value divided by $1,000 = 8.6), then multiply the result by the number in the table under the heading entitled “Expenses paid during the period” to estimate the expenses you paid on your account during this period.
The Hypothetical Expense example below provides information about hypothetical account values and hypothetical expenses based on each Fund’s actual expense ratio and an assumed rate of return of 5% per year before expenses, which is not each Fund’s actual return. The hypothetical account values and expenses may not be used to estimate the actual ending account balance or expenses you paid for the period. You may use this information to compare the ongoing costs of investing in this Fund and other funds. To do so, compare this 5% hypothetical example with the 5% hypothetical examples that appear in the shareholder reports of the other funds.
| | | | | | | | | | | | | | | | | | | | | | | | | | | | |
| | | Account value
at the beginning
of the period ($) | | | Account value
at the end
of the period ($) | | | Expenses paid
during
the period ($)* | | | Funds
annualized
expense
ratio (%) | |
| | | Actual | | | Hypothetical | | | Actual | | | Hypothetical | | | Actual | | | Hypothetical | | | Actual | |
Small Cap Fund | |
Class A | | | 1,000.00 | | | | 1,000.00 | | | | 1,023.60 | | | | 1,018.45 | | | | 6.49 | | | | 6.47 | | | | 1.29 | |
Class C | | | 1,000.00 | | | | 1,000.00 | | | | 1,020.00 | | | | 1,014.72 | | | | 10.25 | | | | 10.22 | | | | 2.04 | |
Class I | | | 1,000.00 | | | | 1,000.00 | | | | 1,025.30 | | | | 1,019.89 | | | | 5.04 | | | | 5.02 | | | | 1.00 | |
Class Y | | | 1,000.00 | | | | 1,000.00 | | | | 1,025.60 | | | | 1,020.39 | | | | 4.53 | | | | 4.52 | | | | 0.90 | |
Small-Mid Cap Fund | |
Class A | | | 1,000.00 | | | | 1,000.00 | | | | 1,051.40 | | | | 1,018.75 | | | | 6.27 | | | | 6.17 | | | | 1.23 | |
Class C | | | 1,000.00 | | | | 1,000.00 | | | | 1,047.50 | | | | 1,015.02 | | | | 10.08 | | | | 9.92 | | | | 1.98 | |
Class I | | | 1,000.00 | | | | 1,000.00 | | | | 1,052.00 | | | | 1,020.14 | | | | 4.85 | | | | 4.77 | | | | 0.95 | |
Class Y | | | 1,000.00 | | | | 1,000.00 | | | | 1,053.00 | | | | 1,020.64 | | | | 4.34 | | | | 4.27 | | | | 0.85 | |
| | | | | | | | | | | | | | |
| 86 | | DIAMOND HILL FUNDS | | | | | SEMI-ANNUAL REPORT | | | | | JUNE 30, 2016 | | | | | DIAMOND-HILL.COM |
Diamond Hill Funds
Schedule of Shareholder Expenses
Hypothetical Example of a $1,000 Investments at Beginning of Period
(Unaudited) (Continued)
| | | | | | | | | | | | | | | | | | | | | | | | | | | | |
| | | Account value
at the beginning
of the period ($) | | | Account value
at the end
of the period ($) | | | Expenses paid
during
the period ($)* | | | Funds
annualized
expense
ratio (%) | |
| | | Actual | | | Hypothetical | | | Actual | | | Hypothetical | | | Actual | | | Hypothetical | | | Actual | |
Mid Cap Fund Class | |
Class A | | | 1,000.00 | | | | 1,000.00 | | | | 1,053.20 | | | | 1,019.10 | | | | 5.92 | | | | 5.82 | | | | 1.16 | |
Class I | | | 1,000.00 | | | | 1,000.00 | | | | 1,054.00 | | | | 1,020.54 | | | | 4.44 | | | | 4.37 | | | | 0.87 | |
Class Y | | | 1,000.00 | | | | 1,000.00 | | | | 1,055.80 | | | | 1,021.03 | | | | 3.94 | | | | 3.87 | | | | 0.77 | |
Large Cap Fund | |
Class A | | | 1,000.00 | | | | 1,000.00 | | | | 1,021.00 | | | | 1,019.94 | | | | 4.97 | | | | 4.97 | | | | 0.99 | |
Class C | | | 1,000.00 | | | | 1,000.00 | | | | 1,017.10 | | | | 1,016.21 | | | | 8.73 | | | | 8.72 | | | | 1.74 | |
Class I | | | 1,000.00 | | | | 1,000.00 | | | | 1,022.70 | | | | 1,021.38 | | | | 3.52 | | | | 3.52 | | | | 0.70 | |
Class Y | | | 1,000.00 | | | | 1,000.00 | | | | 1,023.20 | | | | 1,021.88 | | | | 3.02 | | | | 3.02 | | | | 0.60 | |
Select Fund | |
Class A | | | 1,000.00 | | | | 1,000.00 | | | | 931.20 | | | | 1,018.95 | | | | 5.71 | | | | 5.97 | | | | 1.19 | |
Class C | | | 1,000.00 | | | | 1,000.00 | | | | 928.30 | | | | 1,015.17 | | | | 9.35 | | | | 9.77 | | | | 1.95 | |
Class I | | | 1,000.00 | | | | 1,000.00 | | | | 932.20 | | | | 1,020.39 | | | | 4.32 | | | | 4.52 | | | | 0.90 | |
Class Y | | | 1,000.00 | | | | 1,000.00 | | | | 933.10 | | | | 1,020.89 | | | | 3.85 | | | | 4.02 | | | | 0.80 | |
Long-Short Fund | |
Class A | | | 1,000.00 | | | | 1,000.00 | | | | 986.70 | | | | 1,014.77 | | | | 10.03 | | | | 10.17 | | | | 2.03 | |
Class C | | | 1,000.00 | | | | 1,000.00 | | | | 982.70 | | | | 1,011.09 | | | | 13.66 | | | | 13.85 | | | | 2.77 | |
Class I | | | 1,000.00 | | | | 1,000.00 | | | | 987.80 | | | | 1,016.21 | | | | 8.60 | | | | 8.72 | | | | 1.74 | |
Class Y | | | 1,000.00 | | | | 1,000.00 | | | | 988.70 | | | | 1,016.71 | | | | 8.11 | | | | 8.22 | | | | 1.64 | |
Research Opportunities Fund | |
Class A | | | 1,000.00 | | | | 1,000.00 | | | | 985.80 | | | | 1,013.97 | | | | 10.81 | | | | 10.97 | | | | 2.19 | |
Class C | | | 1,000.00 | | | | 1,000.00 | | | | 981.60 | | | | 1,010.24 | | | | 14.49 | | | | 14.69 | | | | 2.94 | |
Class I | | | 1,000.00 | | | | 1,000.00 | | | | 986.90 | | | | 1,015.42 | | | | 9.39 | | | | 9.52 | | | | 1.90 | |
Class Y | | | 1,000.00 | | | | 1,000.00 | | | | 987.40 | | | | 1,015.91 | | | | 8.89 | | | | 9.02 | | | | 1.80 | |
Financial Long-Short Fund | |
Class A | | | 1,000.00 | | | | 1,000.00 | | | | 910.80 | | | | 1,015.32 | | | | 9.12 | | | | 9.62 | | | | 1.92 | |
Class C | | | 1,000.00 | | | | 1,000.00 | | | | 907.40 | | | | 1,011.59 | | | | 12.66 | | | | 13.35 | | | | 2.67 | |
Class I | | | 1,000.00 | | | | 1,000.00 | | | | 912.30 | | | | 1,016.76 | | | | 7.75 | | | | 8.17 | | | | 1.63 | |
Corporate Credit Fund | |
Class A | | | 1,000.00 | | | | 1,000.00 | | | | 1,063.10 | | | | 1,020.19 | | | | 4.82 | | | | 4.72 | | | | 0.94 | |
Class C | | | 1,000.00 | | | | 1,000.00 | | | | 1,058.70 | | | | 1,016.46 | | | | 8.65 | | | | 8.47 | | | | 1.69 | |
Class I | | | 1,000.00 | | | | 1,000.00 | | | | 1,064.80 | | | | 1,021.63 | | | | 3.34 | | | | 3.27 | | | | 0.65 | |
Class Y | | | 1,000.00 | | | | 1,000.00 | | | | 1,064.40 | | | | 1,022.13 | | | | 2.82 | | | | 2.77 | | | | 0.55 | |
High Yield Fund | |
Class A | | | 1,000.00 | | | | 1,000.00 | | | | 1,068.60 | | | | 1,019.89 | | | | 5.14 | | | | 5.02 | | | | 1.00 | |
Class I | | | 1,000.00 | | | | 1,000.00 | | | | 1,070.20 | | | | 1,021.33 | | | | 3.65 | | | | 3.57 | | | | 0.71 | |
Class Y | | | 1,000.00 | | | | 1,000.00 | | | | 1,070.60 | | | | 1,021.83 | | | | 3.14 | | | | 3.07 | | | | 0.61 | |
| * | Expenses are equal to the Fund’s annualized expense ratio, multiplied by the average account value over the period, multiplied by the number of days in the most recent fiscal half-year divided by the number of days in the fiscal year (to reflect the one-half year period). |
You can find more information about the Fund’s expenses, including annual expense ratios for historical periods in the Financial Statements section of this report. For additional information on operating expenses and other shareholder costs, please refer to the Fund’s prospectus. The prospectus presents hypothetical shareholder costs over various time periods based upon a $10,000 investment and a return of 5% a year. The standardized example, which appears in all mutual fund prospectuses, may be useful to you in comparing the costs of investing in different funds.
| | | | | | | | | | | | | | | | |
| DIAMOND HILL FUNDS | | | | | SEMI-ANNUAL REPORT | | | | | JUNE 30, 2016 | | | | | DIAMOND-HILL.COM | | | 87 | |
INVESTMENT ADVISER: DIAMOND HILL CAPITAL MANAGEMENT, INC.
DISTRIBUTOR: BHIL DISTRIBUTORS, LLC (MEMBER FINRA/SIPC), AN AFFILIATE OF THE DIAMOND HILL FUNDS
| | | | | | | | | | | | | | | | | | | | |
| DIAMOND-HILL.COM | | | | | 855.255.8955 | | | | | 325 JOHN H. MCCONNELL BLVD | | | | | SUITE 200 | | | | | COLUMBUS, OHIO | | | | | 43215 |
DH-SAR063016
Item 2. Code of Ethics.
Not applicable.
Item 3. Audit Committee Financial Expert.
Not applicable.
Item 4. Principal Accountant Fees and Services.
Not applicable.
Item 5. Audit Committee of Listed Registrants.
Not applicable.
Item 6. Schedule of Investments.
(a) Not applicable.
(b) Not applicable.
Item 7. Disclosure of Proxy Voting Policies and Procedures for Closed-End Management Investment Companies.
Not applicable.
Item 8. Portfolio Managers of Closed-End Management Investment Companies.
Not applicable.
Item 9. Purchases of Equity Securities by Closed-End Management Investment Company and Affiliated Purchasers.
Not applicable.
Item 10. Submission of Matters to a Vote of Security Holders.
Not applicable.
Item 11. Controls and Procedures.
(a)The registrant’s principal executive officer and principal financial officer have concluded, based on their evaluation of the registrant’s disclosure controls and procedures as conducted within 90 days of the filing date of this report, that these disclosure controls and procedures are adequately designed and are operating effectively to ensure that information required to be disclosed by the registrant on Form N-CSR is recorded, processed, summarized and reported within the time periods specified in the Securities and Exchange Commission’s rules and forms.
(b)There were no changes in the registrant’s internal control over financial reporting (as defined in Rule 30a-3(d) under the Act (17 CFR 270.30a-3(d))) that occurred during the second fiscal quarter of the period covered by this report that have materially affected or are reasonably likely to be materially affected, the registrant’s internal control over financial reporting.
Item 12. Exhibits.
| | |
| |
| (a)(1) | | Not applicable. |
| |
| (a)(2) | | Certifications required by Item 12(a) of Form N-CSR are filed herewith. |
| |
| (a)(3) | | Not applicable. |
| |
| (b) | | Certification required by Item 12(b) of Form N-CSR is furnished herewith. |
SIGNATURES
Pursuant to the requirements of the Securities Exchange Act of 1934 and the Investment Company Act of 1940, the registrant has duly caused this report to be signed on its behalf by the undersigned, thereunto duly authorized.
| | | | |
| Registrant | | Diamond Hill Funds | | |
| | |
| By (Signature and Title) | | /s/ Thomas E. Line | | |
| | Thomas E. Line, Chief Executive Officer | | |
| | |
| Date September 1, 2016 | | | | |
Pursuant to the requirements of the Securities Exchange Act of 1934 and the Investment Company Act of 1940, this report has been signed below by the following persons on behalf of the registrant and in the capacities and on the dates indicated.
| | | | |
| By (Signature and Title) | | /s/ Thomas E. Line | | |
| | Thomas E. Line, Chief Executive Officer | | |
| | |
| Date September 1, 2016 | | | | |
| | |
| By (Signature and Title) | | /s/ Trent M. Statczar | | |
| | Trent M. Statczar, Treasurer | | |
| | |
| Date September 1, 2016 | | | | |