We are pleased to present the following semi-annual report of Lazard Retirement Series, Inc. for the period of January 1 to June 30, 2004.
Global stocks faded late in the first quarter, ending with modest gains. In the second quarter, global stocks fell early on before rebounding and ending roughly flat. The first six-months of the year saw concerns over inflation replace concerns about how deflation might affect the economy. Has the U.S. Federal Reserve kept interest rates low for too long? The second quarter saw a sell-off in the bond market that pushed short- and long-term interest rates above the Federal Funds rate, resulting in one of the most difficult quarters for bond investors in almost 25 years. After raising the Federal Funds rate by 0.25 percent on June 30 (the first increase in four years), the message has been that inflation is likely to remain tame.
In the first quarter, the slow rate of job creation in the United States (and its implications for the sustainability of consumer spending) weighed on stocks, as did heightened terrorism concerns in the wake of the Madrid train bombing. Certain trends that prevailed in 2003 persisted into the early part of 2004. This included the outperformance of small caps, emerging markets securities, and smaller, domestically focused Japanese stocks. In contrast, the larger, export-oriented Japanese companies were hurt by the potential for further U.S. dollar weakness and by the continued reduction in cross-shareholdings between banks and their customers. In the second quarter, Asian markets were weak after the strong rally in the first quarter, as concerns about the sustainability of growth in China weighed particularly heavily on this region. In contrast, the European and U.S. markets managed modest gains after lagging in the first quarter of the year. Lastly, the U.S. dollar, which had been weak against major world currencies in 2003, stabilized during the first quarter, with a mixed performance against major world currencies.
In this environment, long-term investors are understandably questioning the direction of the global markets. Will there be a return to fundamentals-based investing? The low quality rally of 2003 (in which the least profitable and most leveraged companies outperformed) subsided in the first quarter of 2004, although it was not a complete reversal. History shows that, at economic turning points, low quality companies attract investors. However, investor focus usually returns to fundamentals—companies that generate a sustainable return on their capital. In the second quarter of 2004, the global markets began to rotate back to these fundamentally solid, attractively priced companies as the prospect of a tighter monetary policy began to change investors’ risk tolerances.
This reversal was felt most strongly in the U.S. markets, but the trend may spread globally. In our view, the current equity markets may present unique buying opportunities for the disciplined investor.
Looking forward, the cyclical upward trend in interest rates is underway. We believe that the United States and the United Kingdom may lead the way in raising rates and, as a result, lead the shift to flatter yield curves. In other countries, particularly those in Europe, yield curves appear to have flattened prematurely, which provides opportunity in short/intermediate maturities. It is possible that the bear market in fixed income will return before year-end.
Regardless of market trends, we believe that building a portfolio of various asset and investment classes and maintaining a long-term focus is the best approach for investors who are seeking to reach their investment goals. We seek to invest in companies that have a proven ability to generate returns in a variety of economic environments. These financially productive businesses are expected to sustain their productivity regardless of economic cycles or macroeconomic issues within the countries where they are domiciled.
Lazard Retirement Series, Inc.
Investment Overviews (continued)
The sharp rally that began in the fourth quarter of 2003 continued through much of the first quarter of 2004. Stocks faded late in the quarter, and ended with modest gains. Certain trends that prevailed in 2003 reversed during the quarter, with technology, deep cyclicals and the more speculative areas of the market lagging after dominating last year. Regionally, returns were fairly consistent during the first two months of the quarter. In March, however, Japanese stocks surged while European stocks fell, leaving the Japanese equity market well ahead for the first quarter.
In April, global stocks fell based on concerns regarding rising inflation and tightening monetary policy in the United States, but rebounded in June, resulting in the second quarter increase of 0.9% in the MSCI World Index. Stronger economic data and signs of resurgence in inflation led investors to expect that the U.S. Federal Reserve would raise interest rates sooner than anticipated—and it did so on June 30. This belief triggered a reduction in investors’ risk tolerance, particularly in the United States, since the very easy monetary policy that was in place during 2003 enabled last year’s low quality rally.
From a sector perspective, defensive groups continued to outperform after lagging dramatically in 2003. Energy was by far the best performer during the second quarter, as crude oil prices reached their highest levels in over a decade based on concerns about the potential for supply disruptions while inventories are low. Health care and consumer staples also outperformed during the second quarter. Conversely, technology and materials lagged, along with financials, which were hurt by the prospect of higher interest rates.
While Eastern European equities dramatically outshone their regional counterparts during the first few months of 2004, they generally fared poorly during the second quarter. Both the Turkish and Russian markets dropped by over 20%, hurt by the European Union’s Cyprus vote in the former and the ongoing Yukos saga in the latter. Both markets had been strong performers before the correction. Despite a stable rand, South African shares ended weaker. However, several markets performed well, including Hungary and Israel. While Latin American companies did well during the first quarter, they were largely down in May and June—apart from Venezuela, which benefited from high crude oil prices and an election recall against the unorthodox President Hugo Chavez. The largest declines occurred in commodity-rich countries such as Peru, Brazil and Argentina.
As we mentioned earlier, the higher return-on-equity and lower valuation companies tend to deliver superior returns to investors over other strategies in the long-term. As this current cycle matures and interest rates look likely to rise, the focus should return to financially productive businesses.
Lazard Retirement Equity Portfolio
Lazard Retirement Equity Portfolio posted a total return of 4.14%, as compared with the 3.44% return of the S&P 500 Index for the six months ended June 30, 2004.
During the first quarter of 2004, the Portfolio benefited from an overweight position in the finance sector, as well as from stock selection in this group. Bank One shares rose on news of its merger with JPMorgan Chase. In addition, stock selection in consumer discretionary helped performance, as Target’s shares rose after the company announced that it may sell its Mervyn’s and Marshall Field’s department stores. Conversely, the Portfolio’s performance was hurt by stock selection in the producer-manufacturing sector, where defense-oriented names like Lockheed Martin and United Technologies were negatively affected due to concerns over declining defense budgets and program cancellations.
Stock selection in health care benefited the Portfolio in the second quarter, as Johnson & Johnson reported solid results, beating analysts’ expectations. Importantly, the company also raised its 2004 earnings guidance as cost cutting measures are progressing well. Finance was mixed, as the Portfolio benefited from strong stock selection in banking, with stocks such as SouthTrust performing well after news that Wachovia Corp. would acquire it at a premium. Conversely, capital markets-related financials, particularly Citigroup and Morgan Stanley, detracted from returns due to industry concerns that fixed income revenues have likely peaked, and that M&A activity has yet to make a considerable rebound. Stock selection in util-
3
Lazard Retirement Series, Inc.
Investment Overviews (continued)
ities hurt the Portfolio, as shares of Entergy fell due to rising interest rate concerns and news that the company expected to sell two of its joint venture interests. Although the sales may dilute earnings, in the near-term, we believe that the company may reinvest these proceeds effectively and that Entergy may continue to produce solid returns.
Lazard Retirement Small Cap Portfolio
Lazard Retirement Small Cap Portfolio posted a total return of 5.85%, as compared with the 6.76% return of the Russell 2000® Index for the six months ended June 30, 2004.
During the first quarter of 2004, the Portfolio benefited from stock selection in the producer-manufacturing sector, where Toro reported first quarter earnings that exceeded consensus estimates by a wide margin. The results were driven by better sales of snow blowers, an improvement in early lawn-care equipment orders, and continued benefits from the company’s long-term strategic profit improvement efforts. Conversely, stock selection in the consumer discretionary and energy sectors negatively impacted performance. Forest Oil continues to reshape its portfolio of energy and production assets under the guidance of former Apache Corp. veteran, Craig Clark. The stock price suffered during the quarter as it wrote off substantially more reserves relative to street consensus, primarily due to disappointing production results from its Alaskan properties.
During the second quarter, the Portfolio benefited from stock selection in health care, as Beverly Enterprises, one of the leading providers of nursing home services for the elderly, announced better-than-expected results due to the ongoing restructuring of its operations. The Portfolio also benefited from positions in the consumer discretionary and producer manufacturing sectors. Conversely, the Portfolio was again hurt by stock selection in the energy sector, where our largest holding, Key Energy, continued to delay reporting results, which it owed in connection with an internal investigation regarding proper accounting procedures. We believe that the accounting issues will likely be inconsequential, and industry conditions remain positive for all of its operating divisions. We added to our position on weakness.
Lazard Retirement International Equity Portfolio
Lazard Retirement International Equity Portfolio posted a total return of 0.77%, as compared with the 4.56% return of the MSCI Europe, Australasia and Far East (EAFE®) Index for the six months ended June 30, 2004.
In the first quarter of 2004, the Portfolio benefited from stock selection in the technology sector. Nokia shares rose after the company pre-announced strong fourth quarter numbers and Canon contributed to the Portfolio because of its strong products in high-growth segments of its market, including digital cameras. Conversely, the Portfolio was hurt by stock selection in the industrials sector. Sandvik reported fourth quarter results that were hurt by an unfavorable foreign currency effect. Stock selection in the consumer staples sector also proved to be a negative. Shares of Carrefour fell after the company reported its fourth quarter sales, and as a result of concerns regarding lackluster consumer spending in France. However, new sales initiatives and first quarter price reductions ought to stimulate revenue.
During the second quarter, the Portfolio benefited from stock selection in health care as GlaxoSmith-Kline reported first quarter numbers that beat consensus estimates. Conversely, stock selection in the technology sector detracted from performance. Nokia shares fell after the company’s earnings release indicated that it had lost market share in mid-priced handsets in Europe. While the news was disappointing, Nokia’s dominant global market share and industry-leading profit margin puts the company in a strong position to defend its market share through price reductions and the introduction of new models. Stock selection in telecommunications also hurt performance. NTT DoCoMo shares declined after the company announced that operating profits and sales might fall this year due to increased competition in Japan. However, the company aims to cut handset prices and lower retailers’ commissions in response to this forecast.
Lazard Retirement Emerging Markets Portfolio
Lazard Retirement Emerging Markets Portfolio posted a total return of (0.93)%, as compared with the
4
Lazard Retirement Series, Inc.
Investment Overviews (concluded)
(0.97)% return of the MSCI Emerging Markets (EM®) Index for the six months ended June 30, 2004.
Emerging markets equities continued to perform well in the first quarter of 2004, with the MSCI EM Index climbing by more than 9.5%. Eastern Euro-pean shares witnessed impressive performance in Russian, Hungarian and Czech stocks. In both Asia and Latin America, the results were decent, although somewhat less dramatic. South Korea (despite presidential impeachment proceedings), Malaysia, Colombia, Venezuela and Mexico were strong. Some important markets, including Brazil, India, Thailand and China, exhibited profit taking. The Brazilian market was affected by a scandal and the announcement of a merger that appears to treat minority shareholders poorly. By sector, information technology and energy outperformed while utilities, consumer staples and materials underperformed.
Emerging markets equities experienced significant profit-taking in the second quarter, in response to warnings by U.S. Federal Reserve Chairman, Alan Greenspan, over the likelihood of a new, somewhat inflationary, environment and the probability of a rise in interest rates. Moreover, Chinese authorities announced measures aimed at curbing excessive investment, which had the effect of increasing investors’ perception of risk. After having risen almost 10% in the first quarter, the MSCI EM Index fell by more than 10% in the second quarter. All regional markets experienced sizeable corrections, the largest ones occurring in Eastern Europe and Asia. Economically sensitive sectors, such as energy, materials, consumer discretionary, and information technology, fared poorly. Defensive sectors, such as health care and consumer staples, performed relatively well. The U.S. dollar also rallied strongly after a sustained period of weakness.
During the first half of 2004, the Portfolio’s top contributors to relative performance were: ABSA Group Ltd. (South Africa), due to earnings growth through strong revenue growth in retail lending, increasing asset quality, and a tighter control of costs; SK Telecom (South Korea), due to improved corporate governance and expanded refining margins in its core refining and marketing business; and America Telecom SA de CV (Mexico), which continued to exceed expectations in terms of mobile telephony subscriber growth, revenue per subscriber, and profitability. The Portfolio’s top detractors from relative performance were: Kookmin Bank (Korea), due to the continued weak domestic economy; PTT (Thailand), whose shares, after a 300+% stock price appreciation in 2003, have declined over concerns about the continued strength of the local Thai economy and sentiment over the slowdown in China; and Reliance Industries (India), due to the surprise election victory in India and, as the country’s largest refiner, the negative impact of the government’s decision to reduce import tariffs and excise duties for petroleum products in an attempt to offset rising oil prices. By sector, an overweight position in telecommunications had the most positive impact on the Portfolio, while an underweight position in industrials negatively impacted the Portfolio the most. After being cautious during the first quarter of this year, we are significantly more positive in our outlook for emerging markets equities.
Notes to Investment Overviews:All returns are for the period ended June 30, 2004 and reflect reinvestment of all dividends and distributions, if any. Certain expenses of the Portfolios have been waived or reimbursed by the Fund’s Investment Manager or Administrator; without such waiver/reimbursement of expenses, the Portfolio’s returns would have been lower. Performance information does not reflect the fees and charges imposed by participating insurance companies at the separate account level, and such charges will have the effect of reducing performance.
The performance data of the indices and other market data have been prepared from sources and data that the Investment Manager believes to be reliable, but no representation is made as to their accuracy. These indices are unmanaged, have no fees or costs and are not available for investment.
Past performance is not indicative, nor a guarantee, of future results.
5
Lazard Retirement Series, Inc.
Performance Overviews
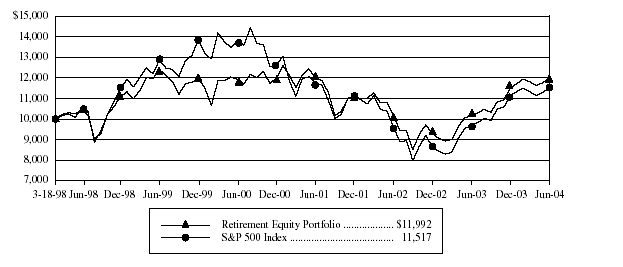
Lazard Retirement Equity Portfolio
Comparison of Changes in Value of $10,000 Investment in Lazard Retirement Equity Portfolio
and S&P 500® Index*
| Average Annual Total Returns* | | | | | | | | |
| Periods Ended June 30, 2004 | | | | | | | | |
| | One | | Five | | Since |
| | Year | | Years | | Inception** |
| |
|
| |
|
| |
|
|
| Retirement Equity Portfolio | 18.15 | % | | (0.67 | )% | | 2.93 | % |
| S&P 500 Index | 19.10 | | | (2.21 | ) | | 2.27 | |
|
| * | All returns reflect reinvestment of all dividends and distributions, if any. Certain expenses of the Portfolio have been waived or reimbursed by the Portfolio’s Investment Manager or Administrator; without such waiver/reimbursement of expenses, the Portfolio’s returns would have been lower. Performance information does not reflect the fees and charges imposed by participating insurance companies at the separate account level, and such charges will have the effect of reducing performance. Past performance is not indicative, nor a guarantee, of future results; the investment return and principal value of the Portfolio will fluctuate, so that an investor’s shares in the Portfolio, when redeemed, may be worth more or less than their original cost. Within the longer periods illustrated there may have been short-term fluctuations, counter to the overall trend of investment results, and no single period of any length may be taken as typical of what may be expected in future periods. The performance data of the index has been prepared from sources and data that the Investment Manager believes to be reliable, but no representation is made as to its accuracy. The index is unmanaged, has no fees or costs and is not available for investment. The S&P 500 Index is a market capitalization-weighted index of 500 common stocks, designed to measure performance of the broad domestic economy through changes in the aggregate market value of these stocks, which represent all major industries.
|
| | |
**
| The Portfolio’s inception date was March 18, 1998.
|
6
Lazard Retirement Series, Inc.
Performance Overviews (continued)
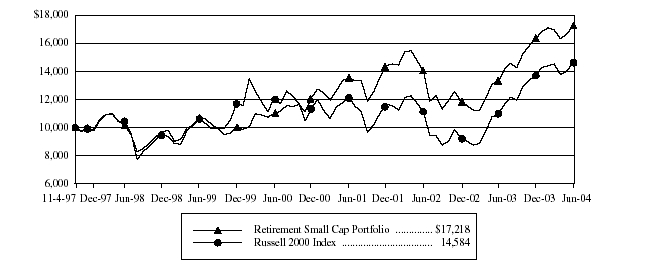
Lazard Retirement Small Cap Portfolio
Comparison of Changes in Value of $10,000 Investment in Lazard Retirement Small Cap Portfolio
and Russell 2000® Index*
| Average Annual Total Returns* | | | | | | | | |
| Periods Ended June 30, 2004 | | | | | | | | |
| | One | | Five | | Since |
| | Year | | Years | | Inception** |
| |
|
| |
|
| |
|
|
| Retirement Small Cap Portfolio | 29.97 | % | | 10.00 | % | | 8.51 | % |
| Russell 2000 Index | 33.37 | | | 6.63 | | | 5.83 | |
|
| * | All returns reflect reinvestment of all dividends and distributions, if any. Certain expenses of the Portfolio have been waived or reimbursed by the Portfolio’s Investment Manager or Administrator; without such waiver/reimbursement of expenses, the Portfolio’s returns would have been lower. Performance information does not reflect the fees and charges imposed by participating insurance companies at the separate account level, and such charges will have the effect of reducing performance. Past performance is not indicative, nor a guarantee, of future results; the investment return and principal value of the Portfolio will fluctuate, so that an investor’s shares in the Portfolio, when redeemed, may be worth more or less than their original cost. Within the longer periods illustrated there may have been short-term fluctuations, counter to the overall trend of investment results, and no single period of any length may be taken as typical of what may be expected in future periods. The performance data of the index has been prepared from sources and data that the Investment Manager believes to be reliable, but no representation is made as to its accuracy. The index is unmanaged, has no fees or costs and is not available for investment. The Russell 2000 Index is comprised of the 2,000 smallest U.S. companies included in the Russell 3000® Index (which consists of the 3,000 largest U.S. companies by capitalization).
|
| |
**
| The Portfolio’s inception date was November 4, 1997.
|
7
|
Lazard Retirement Series, Inc.
Performance Overviews (continued)
Lazard Retirement International Equity Portfolio
Comparison of Changes in Value of $10,000 Investment in Lazard Retirement International Equity Portfolio
and Morgan Stanley Capital International (MSCI®) Europe, Australasia and Far East (EAFE®) Index*

| Average Annual Total Returns* | | | | | | | | |
| Periods Ended June 30, 2004 | | | | | | | | |
| | One | | Five | | Since |
| | Year | | Years | | Inception** |
| |
|
| |
|
| |
|
|
| Retirement International Equity Portfolio | 19.90 | % | | (1.75 | )% | | 1.36 | % |
| MSCI EAFE Index | 32.37 | | | 0.06 | | | 3.46 | |
|
| * | All returns reflect reinvestment of all dividends and distributions, if any. Certain expenses of the Portfolio have been waived or reimbursed by the Portfolio’s Investment Manager or Administrator; without such waiver/reimbursement of expenses, the Portfolio’s returns would have been lower. Performance information does not reflect the fees and charges imposed by participating insurance companies at the separate account level, and such charges will have the effect of reducing performance. Past performance is not indicative, nor a guarantee, of future results; the investment return and principal value of the Portfolio will fluctuate, so that an investor’s shares in the Portfolio, when redeemed, may be worth more or less than their original cost. Within the longer periods illustrated there may have been short-term fluctuations, counter to the overall trend of investment results, and no single period of any length may be taken as typical of what may be expected in future periods. The performance data of the index has been prepared from sources and data that the Investment Manager believes to be reliable, but no representation is made as to its accuracy. The index is unmanaged, has no fees or costs and is not available for investment. The MSCI EAFE Index is a broadly diversified international index comprised of equity securities of approximately 1,000 companies located outside the United States.
|
| |
**
| The Portfolio’s inception date was September 1, 1998.
|
8
Lazard Retirement Series, Inc.
Performance Overviews (concluded)
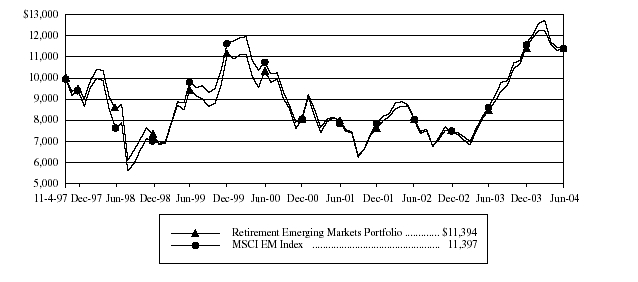
Lazard Retirement Emerging Markets Portfolio
Comparison of Changes in Value of $10,000 Investment in Lazard Retirement Emerging Markets Portfolio
and MSCI Emerging Markets (EM®) Index*
| Average Annual Total Returns* | | | | | | | | |
| Periods Ended June 30, 2004 | | | | | | | | |
| | One | | Five | | Since |
| | Year | | Years | | Inception** |
| |
|
| |
|
| |
|
|
| Retirement Emerging Markets Portfolio | 34.46 | % | | 3.73 | % | | 1.98 | % |
| MSCI EM Index | 33.15 | | | 3.01 | | | 1.98 | |
|
| * | All returns reflect reinvestment of all dividends and distributions, if any. Certain expenses of the Portfolio have been waived or reimbursed by the Portfolio’s Investment Manager or Administrator; without such waiver/reimbursement of expenses, the Portfolio’s returns would have been lower. Performance information does not reflect the fees and charges imposed by participating insurance companies at the separate account level, and such charges will have the effect of reducing performance. Past performance is not indicative, nor a guarantee, of future results; the investment return and principal value of the Portfolio will fluctuate, so that an investor’s shares in the Portfolio, when redeemed, may be worth more or less than their original cost. Within the longer periods illustrated there may have been short-term fluctuations, counter to the overall trend of investment results, and no single period of any length may be taken as typical of what may be expected in future periods. The performance data of the index has been prepared from sources and data that the Investment Manager believes to be reliable, but no representation is made as to its accuracy. The index is unmanaged, has no fees or costs and is not available for investment. The MSCI EM Index is comprised of emerging market securities in countries open to non-local investors.
|
| |
**
| The Portfolio’s inception date was November 4, 1997.
|
9
|
Lazard Retirement Series, Inc.
Portfolios of Investments
June 30, 2004 (unaudited)
| Description | Shares | | | Value |
|
| Lazard Retirement Equity Portfolio | | | | |
| Common Stocks—94.4% | | | | |
| Aerospace & Defense—2.8% | | | | |
| Lockheed Martin Corp. | 1,500 | | $ | 78,120 |
| United Technologies Corp. | 550 | | | 50,314 |
| | | | |
|
| | | | | 128,434 |
| | | | |
|
| Airlines—0.9% | | | | |
| Southwest Airlines Co. | 2,500 | | | 41,925 |
| | | | |
|
| Apparel & Textiles—1.8% | | | | |
| NIKE, Inc., Class B | 600 | | | 45,450 |
| Polo Ralph Lauren Corp. | 700 | | | 24,115 |
| Reebok International, Ltd. | 400 | | | 14,392 |
| | | | |
|
| | | | | 83,957 |
| | | | |
|
| Banking—12.6% | | | | |
| Bank of America Corp. | 1,200 | | | 101,544 |
| Bank One Corp. | 2,200 | | | 112,200 |
| City National Corp. | 400 | | | 26,280 |
| Golden West Financial Corp. | 400 | | | 42,540 |
| M&T Bank Corp. | 550 | | | 48,015 |
| North Fork Bancorporation, Inc. | 1,000 | | | 38,050 |
| Northern Trust Corp. | 1,000 | | | 42,280 |
| SouthTrust Corp. | 650 | | | 25,227 |
| SunTrust Banks, Inc. | 850 | | | 55,241 |
| U.S. Bancorp | 800 | | | 22,048 |
| Wells Fargo & Co. | 1,100 | | | 62,953 |
| | | | |
|
| | | | | 576,378 |
| | | | |
|
| Business Services & Supplies—5.0% | | | | |
| Accenture, Ltd., Class A (a) | 1,700 | | | 46,716 |
| ARAMARK Corp., Class B | 1,500 | | | 43,140 |
| Automatic Data Processing, Inc. | 1,100 | | | 46,068 |
| First Data Corp. | 900 | | | 40,068 |
| IAC/InterActiveCorp. (a) | 1,000 | | | 30,140 |
| Pitney Bowes, Inc. | 500 | | | 22,125 |
| | | | |
|
| | | | | 228,257 |
| | | | |
|
| Cable & Broadcasting—1.3% | | | | |
| Comcast Corp., Class A (a) | 2,100 | | | 57,981 |
| | | | |
|
| Chemicals—2.3% | | | | |
| Du Pont (E.I.) de Nemours & Co. | 1,150 | | | 51,083 |
| Praxair, Inc. | 1,300 | | | 51,883 |
| | | | |
|
| | | | | 102,966 |
| | | | |
|
| Computer Software—3.0% | | | | |
| Microsoft Corp. | 3,100 | | | 88,536 |
| Oracle Corp. (a) | 4,050 | | | 48,317 |
| | | | |
|
| | | | | 136,853 |
| | | | |
|
| Computers & Business Equipment—3.5% | | | |
| Cisco Systems, Inc. (a) | 1,800 | | | 42,660 |
| Hewlett-Packard Co. | 2,400 | | | 50,640 |
| International Business Machines Corp. | 775 | | | 68,316 |
| | | | |
|
| | | | | 161,616 |
| | | | |
|
| Consumer Products—0.2% | | | | |
| Altria Group, Inc. | 200 | | | 10,010 |
| | | | |
|
| Containers—1.9% | | | | |
| Pactiv Corp. (a) | 1,400 | | | 34,916 |
| Sealed Air Corp. (a) | 1,000 | | | 53,270 |
| | | | |
|
| | | | | 88,186 |
| | | | |
|
| Cosmetics & Toiletries—0.5% | | | | |
| Colgate-Palmolive Co. | 400 | | | 23,380 |
| | | | |
|
| Diversified—4.1% | | | | |
| 3M Co. | 375 | | | 33,754 |
| Emerson Electric Co. | 900 | | | 57,195 |
| General Electric Co | 3,000 | | | 97,200 |
| | | | |
|
| | | | | 188,149 |
| | | | |
|
| Drugs & Health Care—4.2% | | | | |
| Amgen, Inc. (a) | 500 | | | 27,285 |
| Anthem, Inc. (a) | 375 | | | 33,585 |
| Medco Health Solutions, Inc. (a) | 1,100 | | | 41,250 |
| Pfizer, Inc. | 2,050 | | | 70,274 |
| Wyeth | 550 | | | 19,888 |
| | | | |
|
| | | | | 192,282 |
| | | | |
|
| Environmental—1.2% | | | | |
| Republic Services, Inc. | 1,800 | | | 52,092 |
| | | | |
|
| Financial Services—7.3% | | | | |
| American Express Co. | 1,600 | | | 82,208 |
| Citigroup, Inc. | 2,700 | | | 125,550 |
| Lehman Brothers Holdings, Inc. | 450 | | | 33,862 |
| Merrill Lynch & Co., Inc. | 700 | | | 37,786 |
| Morgan Stanley | 1,000 | | | 52,770 |
| | | | |
|
| | | | | 332,176 |
| | | | |
|
| Food & Beverages—6.5% | | | | |
| General Mills, Inc. | 1,000 | | | 47,530 |
| H.J. Heinz Co. | 1,050 | | | 41,160 |
| PepsiCo, Inc. | 675 | | | 36,369 |
| Sara Lee Corp. | 1,700 | | | 39,083 |
| The Coca-Cola Co. | 1,300 | | | 65,624 |
| The Kroger Co. (a) | 2,100 | | | 38,220 |
| The Pepsi Bottling Group, Inc. | 900 | | | 27,486 |
| | | | |
|
| | | | | 295,472 |
| | | | |
|
| Forest & Paper Products—0.6% | | | | |
| International Paper Co. | 600 | | | 26,820 |
| | | | |
|
The accompanying notes are an integral part of these financial statements.
10
Lazard Retirement Series, Inc.
Portfolios of Investments (continued)
June 30, 2004 (unaudited)
| Description | Shares | | | Value |
|
| Lazard Retirement Equity Portfolio (concluded) | | | |
| Insurance—5.6% | | | | |
| American International Group, Inc. | 1,100 | | $ | 78,408 |
| Assurant, Inc. | 900 | | | 23,742 |
| Berkshire Hathaway, Inc., Class B (a) | 16 | | | 47,280 |
| Jefferson-Pilot Corp. | 800 | | | 40,640 |
| MetLife, Inc. | 650 | | | 23,302 |
| The Hartford Financial Services | | | | |
| Group, Inc. | 300 | | | 20,622 |
| XL Capital, Ltd., Class A | 300 | | | 22,638 |
| | | | |
|
| | | | | 256,632 |
| | | | |
|
| Leisure & Entertainment—0.7% | | | | |
| Mattel, Inc. | 1,800 | | | 32,850 |
| | | | |
|
| Medical Products & Services—2.7% | | | | |
| Baxter International, Inc. | 600 | | | 20,706 |
| Johnson & Johnson | 1,200 | | | 66,840 |
| MedImmune, Inc. (a) | 1,600 | | | 37,440 |
| | | | |
|
| | | | | 124,986 |
| | | | |
|
| Metals & Mining—1.2% | | | | |
| Alcoa, Inc. | 1,700 | | | 56,151 |
| | | | |
|
| Multimedia—2.6% | | | | |
| Clear Channel Communications, Inc. | 600 | | | 22,170 |
| Time Warner, Inc. (a) | 2,800 | | | 49,224 |
| Viacom, Inc., Class B | 1,300 | | | 46,436 |
| | | | |
|
| | | | | 117,830 |
| | | | |
|
| Oil & Gas—8.3% | | | | |
| Burlington Resources, Inc. | 1,200 | | | 43,416 |
| ChevronTexaco Corp. | 550 | | | 51,760 |
| ConocoPhillips | 700 | | | 53,403 |
| Exxon Mobil Corp. | 3,200 | | | 142,112 |
| GlobalSantaFe Corp. | 1,100 | | | 29,150 |
| Schlumberger, Ltd. | 400 | | | 25,404 |
| Unocal Corp. | 950 | | | 36,100 |
| | | | |
|
| | | | | 381,345 |
| | | | |
|
| Restaurants—0.5% | | | | |
| Yum! Brands, Inc. (a) | 650 | | | 24,193 |
| | | | |
|
| Retail—3.3% | | | | |
| Kohl’s Corp. (a) | 500 | | | 21,140 |
| Sears, Roebuck & Co. | 400 | | | 15,104 |
| Target Corp. | 800 | | | 33,976 |
| The Home Depot, Inc. | 2,300 | | | 80,960 |
| | | | |
|
| | | | | 151,180 |
| | | | |
|
| Semiconductors & Components—2.0% | | | | |
| Intel Corp. | 1,500 | | | 41,400 |
| Novellus Systems, Inc. (a) | 1,100 | | | 34,584 |
| Texas Instruments, Inc. | 700 | | | 16,926 |
| | | | |
|
| | | | | 92,910 |
| | | | |
|
| Telecommunications—3.6% | | | | |
| BellSouth Corp. | 2,100 | | | 55,062 |
| Motorola, Inc. | 1,400 | | | 25,550 |
| Verizon Communications, Inc. | 2,350 | | | 85,047 |
| | | | |
|
| | | | | 165,659 |
| | | | |
|
| Transportation—0.5% | | | | |
| Union Pacific Corp. | 400 | | | 23,780 |
| | | | |
|
| Utilities—3.7% | | | | |
| Ameren Corp. | 700 | | | 30,072 |
| Duke Energy Corp. | 600 | | | 12,174 |
| Entergy Corp. | 700 | | | 39,207 |
| KeySpan Corp. | 1,150 | | | 42,205 |
| The Southern Co. | 1,550 | | | 45,183 |
| | | | |
|
| | | | | 168,841 |
| | | | |
|
| Total Common Stocks | | | | |
| (Identified cost $3,758,356) | | | | 4,323,291 |
| | | | |
|
| Preferred Stock—2.7% | | | | |
| Multimedia—2.7% | | | | |
| The News Corp., Ltd. | | | | |
| Sponsored ADR | | | | |
| (Identified cost $97,518) | 3,700 | | | 121,656 |
| | | | |
|
| | | | | |
| | Principal | | | |
| | Amount | | | |
| | (000) | | | |
| |
| | | |
| Repurchase Agreement—3.2% | | | | |
| State Street Bank and Trust Co., | | | | |
| 1.20%, 07/01/04 | | | | |
| (Dated 06/30/04, collateralized by | | | | |
| $155,000 United States Treasury | | | | |
| Bill, 1.20%, 10/14/04, with a | | | | |
| value of $154,366) | | | | |
| (Identified cost $148,000) | $ 148 | | | 148,000 |
| | | | |
|
| Total Investments | | | | |
| (Identified cost $4,003,874) (b) | 100.3 | % | $ | 4,592,947 |
| Liabilities in Excess of Cash and | | | | |
| Other Assets | (0.3 | ) | (15,464) |
| |
| |
|
| Net Assets | 100.0 | % | $ | 4,577,483 |
| |
| |
|
|
The accompanying notes are an integral part of these financial statements.
11
Lazard Retirement Series, Inc.
Portfolios of Investments (continued)
June 30, 2004 (unaudited)
| Description | Shares | | | Value |
|
| Lazard Retirement Small Cap Portfolio | | | | |
| Common Stocks—97.8% | | | | |
| Aerospace & Defense—1.6% | | | | |
| DRS Technologies, Inc. (a) | 45,400 | | $ | 1,448,260 |
| | | | |
|
| Agriculture—0.8% | | | | |
| Delta & Pine Land Co. | 33,900 | | | 744,105 |
| | | | |
|
| Apparel & Textiles—4.5% | | | | |
| K-Swiss, Inc., Class A | 41,100 | | | 830,631 |
| Kellwood Co. | 26,100 | | | 1,136,655 |
| The Gymboree Corp. (a) | 51,400 | | | 789,504 |
| The Timberland Co., Class A (a) | 14,100 | | | 910,719 |
| The Warnaco Group, Inc. (a) | 16,800 | | | 357,336 |
| | | | |
|
| | | | | 4,024,845 |
| | | | |
|
| Banking—6.9% | | | | |
| First Community Bancorp | 13,200 | | | 507,408 |
| First Midwest Bancorp, Inc | 27,900 | | | 982,359 |
| First Republic Bank | 11,700 | | | 504,036 |
| Hudson United Bancorp | 10,700 | | | 398,896 |
| Sterling Bancshares, Inc. | 74,000 | | | 1,050,060 |
| Texas Regional Bancshares, Inc., | | | | |
| Class A | 5,000 | | | 229,550 |
| Umpqua Holdings Corp. | 8,900 | | | 186,811 |
| United Bankshares, Inc. | 24,400 | | | 793,000 |
| W Holding Co., Inc. | 35,857 | | | 615,665 |
| Westamerica Bancorporation | 16,100 | | | 844,445 |
| | | | |
|
| | | | | 6,112,230 |
| | | | |
|
| Building & Construction—2.1% | | | | |
| Chicago Bridge & Iron Co. NV, | | | | |
| NY Shares | 31,500 | | | 877,275 |
| The Shaw Group, Inc. (a) | 96,000 | | | 972,480 |
| | | | |
|
| | | | | 1,849,755 |
| | | | |
|
| Business Services & Supplies—8.8% | | | | |
| ADVO, Inc. | 29,900 | | | 984,308 |
| Arbitron, Inc. (a) | 22,100 | | | 807,092 |
| BearingPoint, Inc. (a) | 104,600 | | | 927,802 |
| Herman Miller, Inc. | 24,400 | | | 706,136 |
| MPS Group, Inc. (a) | 79,400 | | | 962,328 |
| PEC Solutions, Inc. (a) | 24,200 | | | 288,706 |
| ProQuest Co. (a) | 35,400 | | | 964,650 |
| Tetra Tech, Inc. (a) | 40,400 | | | 659,328 |
| The BISYS Group, Inc. (a) | 50,400 | | | 708,624 |
| Watson Wyatt & Co. Holdings | 27,500 | | | 732,875 |
| | | | |
|
| | | | | 7,741,849 |
| | | | |
|
| Chemicals—3.9% | | | | |
| Ferro Corp. | 31,100 | | | 829,748 |
| Olin Corp. | 55,800 | | | 983,196 |
| PolyOne Corp. (a) | 89,400 | | | 665,136 |
| Spartech Corp. | 39,100 | | | 1,014,254 |
| | | | |
|
| | | | | 3,492,334 |
| | | | |
|
| Computer Software—4.6% | | | | |
| Avocent Corp. (a) | 25,800 | | | 947,892 |
| Extreme Networks, Inc. (a) | 92,100 | | | 508,392 |
| Hyperion Solutions Corp. (a) | 10,900 | | | 476,548 |
| Mentor Graphics Corp. (a) | 35,600 | | | 550,732 |
| Take-Two Interactive Software, Inc. (a) | 28,400 | | | 870,176 |
| Verity, Inc. (a) | 53,600 | | | 724,136 |
| | | | |
|
| | | | | 4,077,876 |
| | | | |
|
| Computers & Business Equipment—1.5% | | | |
| Advanced Digital Information Corp. (a) | 74,500 | | | 722,650 |
| Mercury Computer Systems, Inc. (a) | 22,800 | | | 565,440 |
| | | | |
|
| | | | | 1,288,090 |
| | | | |
|
| Consumer Products—1.0% | | | | |
| The Scotts Co., Class A (a) | 10,700 | | | 683,516 |
| The Toro Co. | 3,500 | | | 245,245 |
| | | | |
|
| | | | | 928,761 |
| | | | |
|
| Diversified—1.0% | | | | |
| The Liberty Corp. | 19,000 | | | 892,050 |
| | | | |
|
| Drugs & Health Care—7.2% | | | | |
| Able Laboratories, Inc. (a) | 48,200 | | | 990,992 |
| Beverly Enterprises, Inc. (a) | 143,600 | | | 1,234,960 |
| Kindred Healthcare, Inc. (a) | 34,000 | | | 895,900 |
| LifePoint Hospitals, Inc. (a) | 22,000 | | | 818,840 |
| MIM Corp. (a) | 85,800 | | | 746,460 |
| Odyssey Healthcare, Inc. (a) | 7,000 | | | 131,740 |
| Par Pharmaceutical Cos., Inc. (a) | 13,100 | | | 461,251 |
| Select Medical Corp. | 69,500 | | | 932,690 |
| WellCare Health Plans, Inc. | 7,500 | | | 127,865 |
| | | | |
|
| | | | | 6,340,698 |
| | | | |
|
| Education—1.8% | | | | |
| Leapfrog Enterprises, Inc. (a) | 49,100 | | | 976,599 |
| Learning Tree International, Inc. (a) | 40,200 | | | 583,302 |
| | | | |
|
| | | | | 1,559,901 |
| | | | |
|
| Electrical Equipment—1.7% | | | | |
| Coherent, Inc. (a) | 23,500 | | | 701,475 |
| GrafTech International, Ltd. (a) | 77,800 | | | 813,788 |
| | | | |
|
| | | | | 1,515,263 |
| | | | |
|
The accompanying notes are an integral part of these financial statements.
12
Lazard Retirement Series, Inc.
Portfolios of Investments (continued)
June 30, 2004 (unaudited)
| Description | Shares | | | Value |
|
| Lazard Retirement Small Cap Portfolio (continued) |
| Electronics—1.9% | | | | |
| Electro Scientific Industries, Inc. (a) | 33,600 | | $ | 951,216 |
| Metrologic Instruments, Inc. (a) | 34,400 | | | 685,936 |
| | | | |
|
| | | | | 1,637,152 |
| | | | |
|
| Environmental—1.3% | | | | |
| Waste Connections, Inc. (a) | 37,950 | | | 1,125,597 |
| | | | |
|
| Financial Services—5.1% | | | | |
| eSPEED, Inc., Class A (a) | 58,700 | | | 1,036,055 |
| Financial Federal Corp. (a) | 14,000 | | | 493,640 |
| IndyMac Bancorp, Inc. | 14,000 | | | 442,400 |
| Knight Trading Group, Inc., Class A (a) | 97,900 | | | 980,958 |
| MAF Bancorp, Inc. | 19,900 | | | 849,332 |
| The South Financial Group, Inc. | 24,800 | | | 702,832 |
| | | | |
|
| | | | | 4,505,217 |
| | | | |
|
| Food & Beverages��0.6% | | | | |
| The Robert Mondavi Corp., Class A (a) | 14,200 | | | 525,684 |
| | | | |
|
| Forest & Paper Products—1.1% | | | | |
| Caraustar Industries, Inc. (a) | 17,900 | | | 252,569 |
| Packaging Corp. of America | 31,600 | | | 755,240 |
| | | | |
|
| | | | | 1,007,809 |
| | | | |
|
| Household Products & Home | | | | |
| Furnishings—1.2% | | | | |
| Cost Plus, Inc. (a) | 18,900 | | | 613,305 |
| Tempur-Pedic International, Inc. (a) | 34,300 | | | 480,543 |
| | | | |
|
| | | | | 1,093,848 |
| | | | |
|
| Industrial & Machinery—1.6% | | | | |
| Nordson Corp. | 13,400 | | | 581,158 |
| Roper Industries, Inc. | 14,400 | | | 819,360 |
| Tecumseh Products Co., Class A | 1,300 | | | 53,547 |
| | | | |
|
| | | | | 1,454,065 |
| | | | |
|
| Insurance—3.4% | | | | |
| Arch Capital Group, Ltd. (a) | 27,400 | | | 1,092,712 |
| Assured Guaranty, Ltd. (a) | 49,200 | | | 833,940 |
| Max Re Capital, Ltd. | 20,200 | | | 393,496 |
| Reinsurance Group of America, Inc. | 15,900 | | | 646,335 |
| | | | |
|
| | | | | 2,966,483 |
| | | | |
|
| Leisure & Entertainment—1.9% | | | | |
| Alliance Gaming Corp. (a) | 63,600 | | | 1,091,376 |
| AMC Entertainment, Inc. (a) | 38,600 | | | 593,282 |
| | | | |
|
| | | | | 1,684,658 |
| | | | |
|
| Medical Products & Services—4.5% | | | | |
| DJ Orthopedics, Inc. (a) | 38,600 | | | 887,800 |
| INAMED Corp. (a) | 15,150 | | | 952,177 |
| Inveresk Research Group, Inc. (a) | 28,300 | | | 872,772 |
| PSS World Medical, Inc. (a) | 59,500 | | | 666,400 |
| Varian, Inc. (a) | 13,400 | | | 564,810 |
| | | | |
|
| | | | 3,943,959 |
| | | | |
|
| Oil & Gas—7.7% | | | | |
| Cal Dive International, Inc. (a) | 15,600 | | | 472,992 |
| Denbury Resources, Inc. (a) | 37,700 | | | 789,815 |
| Forest Oil Corp. (a) | 23,400 | | | 639,288 |
| Grey Wolf, Inc. (a) | 127,900 | | | 542,296 |
| Key Energy Services, Inc. (a) | 144,800 | | | 1,366,912 |
| Kinder Morgan Management, LLC (a) | 20,733 | | | 762,352 |
| Maverick Tube Corp. (a) | 31,500 | | | 827,190 |
| Newfield Exploration Co. (a) | 11,800 | | | 657,732 |
| The Houston Exploration Co. (a) | 14,200 | | | 736,128 |
| | | | |
|
| | | | 6,794,705 |
| | | | |
|
| Printing & Publishing—2.1% | | | | |
| Journal Register Co. (a) | 35,268 | | | 705,360 |
| Pulitzer, Inc. | 7,400 | | | 361,860 |
| R. H. Donnelley Corp. (a) | 18,300 | | | 800,442 |
| | | | |
|
| | | | 1,867,662 |
| | | | |
|
| Real Estate—3.2% | | | | |
| Alexandria Real Estate Equities, Inc. | 5,500 | | | 312,290 |
| CarrAmerica Realty Corp. | 25,100 | | | 758,773 |
| Maguire Properties, Inc. | 41,200 | | | 1,020,524 |
| The Mills Corp. | 14,900 | | | 695,830 |
| | | | |
|
| | | | 2,787,417 |
| | | | |
|
| Restaurants—0.9% | | | | |
| Jack in the Box, Inc. (a) | 1,200 | | | 35,640 |
| Sonic Corp. (a) | 32,850 | | | 747,338 |
| | | | |
|
| | | | 782,978 |
| | | | |
|
| Semiconductors & Components—6.8% | | | | |
| AMIS Holdings, Inc. | 53,300 | | | 901,836 |
| Credence Systems Corp. (a) | 77,900 | | | 1,075,020 |
| Emulex Corp. (a) | 28,500 | | | 407,835 |
| Exar Corp. (a) | 56,200 | | | 823,892 |
| Microsemi Corp. (a) | 58,900 | | | 836,969 |
| OmniVision Technologies, Inc. (a) | 45,600 | | | 727,320 |
| Semtech Corp. (a) | 19,100 | | | 449,614 |
| Zoran Corp. (a) | 44,100 | | | 809,235 |
| | | | |
|
| | | | 6,031,721 |
| | | | |
|
The accompanying notes are an integral part of these financial statements.
13
Lazard Retirement Series, Inc.
Portfolios of Investments (continued)
June 30, 2004 (unaudited)
| Description | Shares | | | Value | |
| |
| Lazard Retirement Small Cap Portfolio (concluded) | |
| Telecommunications—2.2% | | | | | |
| C-COR.net Corp. (a) | 99,200 | | $ | 1,020,768 | |
| CommScope, Inc. (a) | 41,600 | | | 892,320 | |
| | | | |
| |
| | | | | 1,913,088 | |
| | | | |
| |
| Transportation—2.6% | | | | | |
| AirTran Holdings, Inc. (a) | 58,700 | | | 830,018 | |
| Forward Air Corp. (a) | 13,200 | | | 493,680 | |
| Swift Transportation Co., Inc. (a) | 55,200 | | | 990,840 | |
| | | | |
| |
| | | | | 2,314,538 | |
| | | | |
| |
| Utilities—2.3% | | | | | |
| AGL Resources, Inc. | 31,000 | | | 900,550 | |
| Cleco Corp. | 39,400 | | | 708,412 | |
| New Jersey Resources Corp. | 11,300 | | | 469,854 | |
| | | | |
| |
| | | | | 2,078,816 | |
| | | | |
| |
| Total Common Stocks | | | | | |
| (Identified cost $77,724,073) | | | | 86,531,414 | |
| | | | |
| |
| | Principal | | | |
| | Amount | | | |
Description | (000) | | Value | |
| |
| Repurchase Agreement—2.8% | | | | |
| State Street Bank and Trust Co., | | | | |
| 1.20%, 07/01/04 | | | | |
| (Dated 06/30/04, collateralized by | | | | |
| $2,555,000 United States Treasury | | | | |
| Note, 4.375%, 08/15/12, with a | | | | |
| value of $2,574,163) | | | | |
| (Identified cost $2,521,000) | $ | 2,521 | | $ | 2,521,000 | |
| | | | |
|
| |
| Total Investments | | | | | | |
| (Identified cost $80,245,073) (b) | | 100.6 | % | $ | 89,052,414 | |
| Liabilities in Excess of Cash and | | | | | | |
| Other Assets | | (0.6 | ) | (572,621 | ) |
| |
|
| |
| |
| Net Assets | | 100.0 | % | $ | 88,479,793 | |
| |
|
| |
|
| |
The accompanying notes are an integral part of these financial statements.
14
Lazard Retirement Series, Inc.
Portfolios of Investments (continued)
June 30, 2004 (unaudited)
| Description | Shares | | | Value |
|
| Lazard Retirement International Equity Portfolio | |
| Common Stocks—96.6% | | | | |
| Finland—4.4% | | | | |
| Nokia Oyj | 384,600 | | $ | 5,549,574 |
| Stora Enso Oyj, R Shares | 133,900 | | | 1,816,441 |
| | | | |
|
| Total Finland | | | | 7,366,015 |
| | | | |
|
| France—11.3% | | | | |
| Aventis SA | 38,500 | | | 2,906,486 |
| BNP Paribas SA | 26,110 | | | 1,605,808 |
| Carrefour SA | 46,500 | | | 2,256,180 |
| Credit Agricole SA | 145,100 | | | 3,530,719 |
| Lagardere SCA | 37,530 | | | 2,344,686 |
| Sanofi-Synthelabo SA | 25,700 | | | 1,629,058 |
| Total SA | 23,093 | | | 4,402,659 |
| | | | |
|
| Total France | | | | 18,675,596 |
| | | | |
|
| Germany—9.2% | | | | |
| BASF AG | 49,400 | | | 2,643,910 |
| Deutsche Telekom AG (a) | 96,000 | | | 1,686,569 |
| E.ON AG | 47,000 | | | 3,390,926 |
| Muenchener Rueckver AG | 33,800 | | | 3,664,039 |
| Schering AG | 33,500 | | | 1,973,899 |
| Siemens AG | 25,700 | | | 1,848,246 |
| | | | |
|
| Total Germany | | | | 15,207,589 |
| | | | |
|
| Hong Kong—1.0% | | | | |
| CLP Holdings, Ltd. | 313,500 | | | 1,716,256 |
| | | | |
|
| Ireland—4.3% | | | | |
| Allied Irish Banks PLC | 132,536 | | | 2,047,874 |
| Bank of Ireland | 208,100 | | | 2,779,970 |
| CRH PLC | 107,347 | | | 2,267,281 |
| | | | |
|
| Total Ireland | | | | 7,095,125 |
| | | | |
|
| Italy—2.7% | | | | |
| Eni SpA | 192,175 | | | 3,815,775 |
| Terna SpA | 309,500 | | | 670,265 |
| | | | |
|
| Total Italy | | | | 4,486,040 |
| | | | |
|
| Japan—16.3% | | | | |
| ACOM Co., Ltd. | 22,060 | | | 1,433,399 |
| Canon, Inc. Sponsored ADR | 31,400 | | | 1,676,760 |
| East Japan Railway Co. | 314 | | | 1,761,151 |
| Fanuc, Ltd. | 36,400 | | | 2,171,690 |
| Mitsubishi Estate Co., Ltd. | 169,000 | | | 2,097,108 |
| NEC Electronics Corp. | 26,000 | | | 1,596,481 |
| Nissan Motor Co., Ltd. | 320,000 | | | 3,557,348 |
| Nomura Holdings, Inc. | 209,000 | | | 3,093,388 |
| NTT DoCoMo, Inc. | 825 | | | 1,474,362 |
| Shin-Etsu Chemical Co., Ltd. | 39,800 | | | 1,422,536 |
| Takeda Pharmaceutical Co., Ltd. | 70,000 | | | 3,072,905 |
| The Sumitomo Trust and | | | | |
| Banking Co., Ltd. | 250,000 | | | 1,780,232 |
| Tokyo Gas Co., Ltd. | 544,000 | | | 1,929,414 |
| | | | |
|
| Total Japan | | | | 27,066,774 |
| | | | |
|
| Netherlands—9.9% | | | | |
| Akzo Nobel NV | 44,800 | | | 1,647,714 |
| Heineken NV | 57,663 | | | 1,894,905 |
| Koninklijke (Royal) KPN NV | 317,700 | | | 2,419,676 |
| Koninklijke (Royal) Philips | | | | |
| Electronics NV | 147,050 | | | 3,959,243 |
| Royal Dutch Petroleum Co. | 125,600 | | | 6,445,579 |
| | | | |
|
| Total Netherlands | | | | 16,367,117 |
| | | | |
|
| Norway—1.0% | | | | |
| DnB NOR ASA | 100,300 | | | 684,439 |
| Statoil ASA | 80,200 | | | 1,018,192 |
| | | | |
|
| Total Norway | | | | 1,702,631 |
| | | | |
|
| Singapore—1.2% | | | | |
| Oversea-Chinese Banking Corp., Ltd. | 276,050 | | | 1,939,217 |
| | | | |
|
| Spain—1.9% | | | | |
| Altadis SA | 82,500 | | | 2,549,490 |
| Antena 3 de Television SA (a) | 9,800 | | | 518,658 |
| | | | |
|
| Total Spain | | | | 3,068,148 |
| | | | |
|
| Switzerland—6.2% | | | | |
| Compagnie Financiere Richemont AG, | | | | |
| A Shares | 62,000 | | | 1,618,812 |
| Credit Suisse Group (a) | 114,770 | | | 4,077,982 |
| Swiss Re | 45,100 | | | 2,929,484 |
| UBS AG | 23,200 | | | 1,634,781 |
| | | | |
|
| Total Switzerland | | | | 10,261,059 |
| | | | |
|
| United Kingdom—27.2% | | | | |
| Barclays PLC | 483,000 | | | 4,114,636 |
| BP PLC | 274,420 | | | 2,423,607 |
| Cadbury Schweppes PLC | 190,740 | | | 1,645,652 |
| Diageo PLC | 209,075 | | | 2,819,036 |
| GlaxoSmithKline PLC | 287,100 | | | 5,810,518 |
| HSBC Holdings PLC | 389,786 | | | 5,796,390 |
| Imperial Tobacco Group PLC | 56,280 | | | 1,212,517 |
| Kesa Electricals PLC | 171,420 | | | 899,192 |
| Prudential PLC | 304,000 | | | 2,615,937 |
| Rentokil Initial PLC | 478,600 | | | 1,254,175 |
| Rio Tinto PLC | 108,000 | | | 2,597,077 |
| Royal Bank of Scotland Group PLC | 161,500 | | | 4,650,937 |
| Smiths Group PLC | 64,100 | | | 867,771 |
| Unilever PLC | 208,000 | | | 2,040,695 |
| Vodafone Group PLC | 2,928,000 | | | 6,411,737 |
| | | | |
|
| Total United Kingdom | | | | 45,159,877 |
| | | | |
|
The accompanying notes are an integral part of these financial statements.
15
Lazard Retirement Series, Inc.
Portfolios of Investments (continued)
June 30, 2004 (unaudited)
| Description | Shares | | Value | |
|
|
|
| |
| Lazard Retirement International Equity Portfolio | | | |
| (concluded) | | | | | |
| Total Common Stocks | | | | | |
| (Identified cost $148,496,891) | | | $ | 160,111,444 | |
| | | |
|
| |
| Preferred Stock—0.6% | | | | | |
| Germany—0.6% | | | | | |
| Porsche AG | | | | | |
| (Identified cost $742,931) | 1,480 | | | 990,443 | |
| | | |
|
| |
| | Principal | | | |
| | Amount | | | |
Description | (000) | | Value | |
| |
| Repurchase Agreement—3.8% | | | | |
| State Street Bank and Trust Co., | | | | |
| 1.20%, 07/01/04 | | | | |
| (Dated 06/30/04, collateralized by | | | | |
| $6,350,000 United States Treasury | | | | |
| Note, 4.375%, 08/15/12, with a | | | | |
| value of $6,397,625) | | | | |
| (Identified cost $6,268,000) | $ | 6,268 | | $ | 6,268,000 | |
| | | | |
|
| |
| Total Investments | | | | | | |
| (Identified cost $155,507,822) (b) | | 101.0 | % | $ | 167,369,887 | |
| Liabilities in Excess of Cash and | | | | | | |
| Other Assets | | (1.0 | ) | (1,584,208 | ) |
| |
|
| |
| |
| Net Assets | | 100.0 | % | $ | 165,785,679 | |
| |
|
| |
|
| |
The accompanying notes are an integral part of these financial statements.
16
Lazard Retirement Series, Inc.
Portfolios of Investments (continued)
June 30, 2004 (unaudited)
| Description | Shares | | Value |
|
| Lazard Retirement Emerging Markets Portfolio | | | |
| Common Stocks—90.5% | | | | |
| Argentina—0.9% | | | | |
| Tenaris SA ADR | 5,144 | | $ | 168,466 |
| | | | |
|
| Brazil—8.3% | | | | |
| Brasil Telecom Participacoes SA ADR | 4,100 | | | 125,870 |
| Companhia de Concessoes Rodoviarias | 20,900 | | | 239,503 |
| Companhia Vale do Rio Doce ADR | 8,100 | | | 385,155 |
| Empresa Brasileira de Aeronautica SA | | | | |
| ADR | 9,300 | | | 265,887 |
| Petroleo Brasileiro SA ADR | 10,600 | | | 297,542 |
| Souza Cruz SA | 20,800 | | | 198,127 |
| | | | |
|
| Total Brazil | | | | 1,512,084 |
| | | | |
|
| Chile—1.6% | | | | |
| Administradora de Fondos de Pensiones | | | | |
| Provida SA Sponsored ADR | 11,360 | | | 287,862 |
| | | | |
|
| China—0.9% | | | | |
| People's Food Holdings, Ltd. | 43,000 | | | 28,210 |
| Sinotrans, Ltd. | 363,000 | | | 130,311 |
| | | | |
|
| Total China | | | | 158,521 |
| | | | |
|
| Croatia—1.1% | | | | |
| Pliva d.d. GDR (c) | 13,400 | | | 197,598 |
| | | | |
|
| Egypt—2.6% | | | | |
| Commercial International Bank | 85,100 | | | 319,918 |
| MobiNil | 11,778 | | | 141,756 |
| Orascom Construction Industries | 911 | | | 13,524 |
| | | | |
|
| Total Egypt | | | | 475,198 |
| | | | |
|
| Hong Kong—3.1% | | | | |
| China Mobile (Hong Kong), Ltd. | | | | |
| Sponsored ADR | 16,220 | | | 245,895 |
| CNOOC, Ltd. ADR | 6,400 | | | 273,600 |
| Texwinca Holdings, Ltd. | 64,000 | | | 50,463 |
| | | | |
|
| Total Hong Kong | | | | 569,958 |
| | | | |
|
| Hungary—4.1% | | | | |
| Gedeon Richter Rt. | 3,850 | | | 386,645 |
| MOL Magyar Olaj-es Gazipari Rt. | 8,800 | | | 350,302 |
| | | | |
|
| Total Hungary | | | | 736,947 |
| | | | |
|
| India—7.7% | | | | |
| Hero Honda Motors, Ltd. | 14,900 | | | 164,475 |
| Hindalco Industries, Ltd. GDR (c) | 10,800 | | | 235,980 |
| Hindustan Lever, Ltd. | 59,100 | | | 163,642 |
| Reliance Industries, Ltd. | 29,700 | | | 277,523 |
| Satyam Computer Services, Ltd. | 37,000 | | | 245,822 |
| State Bank of India | 34,000 | | | 318,479 |
| | | | |
|
| Total India | | | | 1,405,921 |
| | | | |
|
| Indonesia—3.7% | | | | |
| PT Hanjaya Mandala Sampoerna Tbk | 720,900 | | | 391,023 |
| PT Telekomunikasi Indonesia Tbk | | | | |
| Sponsored ADR | 18,600 | | | 289,230 |
| | | | |
|
| Total Indonesia | | | | 680,253 |
| | | | |
|
| Israel—0.9% | | | | |
| Bank Hapoalim, Ltd. | 64,400 | | | 171,266 |
| | | | |
|
| Mexico—7.5% | | | | |
| America Telecom SA de CV, | | | | |
| Series A1 Shares (a) | 64,100 | | | 123,387 |
| Cemex SA de CV Sponsored ADR | 2,904 | | | 84,506 |
| Fomento Economico Mexicano SA | | | | |
| de CV Sponsored ADR | 3,510 | | | 160,898 |
| Grupo Televisa SA Sponsored ADR | 4,200 | | | 190,134 |
| Kimberly-Clark de Mexico SA de CV, | | | | |
| Series A Shares | 51,300 | | | 139,671 |
| Telefonos de Mexico SA de CV, | | | | |
| Series L Shares Sponsored ADR | 14,900 | | | 495,723 |
| Urbi, Desarrollos Urbanos, SA de CV | 50,800 | | | 163,857 |
| | | | |
|
| Total Mexico | | | | 1,358,176 |
| | | | |
|
| Peru—0.9% | | | | |
| Credicorp, Ltd. | 13,000 | | | 169,000 |
| | | | |
|
| Philippines—0.9% | | | | |
| Philippine Long Distance | | | | |
| Telephone Co. Sponsored ADR (a) | 7,600 | | | 158,536 |
| | | | |
|
| Russia—1.5% | | | | |
| LUKOIL Sponsored ADR | 1,320 | | | 137,940 |
| Wimm-Bill-Dann Foods OJSC ADR (a) | 9,100 | | | 126,945 |
| | | | |
|
| Total Russia | | | | 264,885 |
| | | | |
|
| South Africa—13.0% | | | | |
| ABSA Group, Ltd | 56,000 | | | 459,736 |
| Harmony Gold Mining Co., Ltd. | | | | |
| Sponsored ADR | 19,400 | | | 205,446 |
| Impala Platinum Holdings, Ltd. | 3,500 | | | 265,363 |
| Kumba Resources, Ltd. | 28,000 | | | 148,738 |
| Old Mutual PLC | 168,000 | | | 319,140 |
| Sanlam, Ltd. | 95,300 | | | 134,998 |
| Sappi, Ltd. | 21,400 | | | 326,223 |
| Sasol, Ltd. | 15,300 | | | 236,682 |
| Steinhoff International Holdings, Ltd. | 192,703 | | | 259,016 |
| | | | |
|
| Total South Africa | | | | 2,355,342 |
| | | | |
|
The accompanying notes are an integral part of these financial statements.
17
Lazard Retirement Series, Inc.
Portfolios of Investments (concluded)
June 30, 2004 (unaudited)
| Description | Shares | | Value |
|
| Lazard Retirement Emerging Markets Portfolio | | | |
| (concluded) | | | | |
| South Korea—20.9% | | | | |
| Daewoo Shipbuilding & Marine | | | | |
| Engineering Co., Ltd. GDR (c) | 10,400 | | $ | 248,872 |
| Hite Brewery Co., Ltd | 2,400 | | | 170,316 |
| Hyundai Motor Co. | 4,800 | | | 184,647 |
| Kookmin Bank (a) | 16,990 | | | 527,859 |
| KT Corp. Sponsored ADR | 18,790 | | | 338,972 |
| LG Chem, Ltd. | 3,200 | | | 108,282 |
| LG Electronics, Inc. | 2,900 | | | 137,533 |
| LG Household & Health Care, Ltd. | 7,900 | | | 225,275 |
| POSCO ADR | 9,840 | | | 329,738 |
| Samsung Electronics Co., Ltd. | | | | |
| GDR (c) | 3,376 | | | 694,612 |
| Samsung Fire & Marine | | | | |
| Insurance Co., Ltd. | 3,642 | | | 232,924 |
| Samsung SDI Co., Ltd. | 1,660 | | | 174,548 |
| SK Telecom Co., Ltd. | 1,200 | | | 197,317 |
| SK Telecom Co., Ltd. ADR | 10,945 | | | 229,736 |
| | | |
|
|
| Total South Korea | | | | 3,800,631 |
| | | |
|
|
| Taiwan—7.2% | | | | |
| Advantech Co., Ltd. | 109,330 | | | 222,625 |
| Chinatrust Financial Holding Co., Ltd. | 166,770 | | | 185,906 |
| Compal Electronics, Inc. | 53,450 | | | 57,994 |
| Compal Electronics, Inc. GDR | 13,502 | | | 73,721 |
| Fubon Financial Holding Co., Ltd. | 240,000 | | | 209,037 |
| Hon Hai Precision Industry Co., Ltd. | 80,782 | | | 300,171 |
| United Microelectronics Corp. (a) | 191,733 | | | 142,489 |
| United Microelectronics Corp. | | | | |
| ADR (a) | 29,093 | | | 125,390 |
| | | |
|
|
| Total Taiwan | | | | 1,317,333 |
| | | |
|
|
| Thailand—1.2% | | | | |
| Delta Electronics (Thailand) PCL | 244,800 | | | 138,911 |
| Thai Union Frozen Products PCL | 140,900 | | | 69,614 |
| | | |
|
|
| Total Thailand | | | | 208,525 |
| | | |
|
|
| Turkey—1.0% | | | | |
| Akbank TAS | 51,901,750 | | | 188,861 |
| | | |
|
|
| Venezuela—1.5% | | | | | |
| Compania Anonima Nacional | | | | | |
| Telefonos de Venezuela ADR | 13,085 | | | 263,663 |
| | | |
|
|
| Total Common Stocks | | | | | |
| (Identified cost $14,894,095) | | | | | 16,449,026 |
| | | | |
|
|
| Preferred Stocks—6.5% | | | | | |
| Brazil—6.5% | | | | | |
| Caemi Mineracao e Metalurgia SA (a) | 802,000 | | | 305,573 |
| Companhia Brasileira de | | | | | |
| Distribuicao Grupo Pao de | | | | | |
| Acucar Sponsored ADR | | 7,000 | | | 121,100 |
| Companhia de Bebidas das | | | | | |
| Americas ADR | | 9,070 | | | 182,035 |
| Companhia Paranaense de | | | | | |
| Energia-Copel Sponsored ADR | 56,700 | | | 183,708 |
| Telemar Norte Leste SA | 14,165,000 | | | 243,325 |
| Usinas Siderurgicas de Minas | | | | | |
| Gerais SA | 14,100 | | | 146,600 |
| | | |
|
|
| Total Brazil | | | | | 1,182,341 |
| | | | |
|
|
| Total Preferred Stocks | | | | | |
| (Identified cost $1,087,846) | | | | | 1,182,341 |
| | | | |
|
|
| | | | | | |
| | Principal | | | |
| | Amount | | | |
| | (000) | | | |
| |
| | | |
| Repurchase Agreement—2.9% | | | | | |
| State Street Bank and Trust Co., | | | | | |
| 1.20%, 07/01/04 | | | | | |
| (Dated 06/30/04, collateralized by | | | | | |
| $545,000 United States Treasury | | | | | |
| Note, 2.50%, 05/31/06, with a | | | | | |
| value of $543,638) | | | | | |
| (Identified cost $531,000) | $ | 531 | | | 531,000 |
| | | | |
|
|
| Total Investments | | | | | |
| (Identified cost $16,512,941) (b) | 99.9 | % | $ | 18,162,367 |
| Cash and Other Assets in Excess | | | | | |
| of Liabilities | 0.1 | | 24,390 |
| |
| |
|
| Net Assets | 100.0 | % | $ | 18,186,757 |
| |
|
| |
|
|
The accompanying notes are an integral part of these financial statements.
18
Lazard Retirement Series, Inc.
Notes to Portfolios of Investments
June 30, 2004 (unaudited)
| (a) | Non-income producing security. |
| | |
| (b) | For federal income tax purposes, the aggregate cost, aggregate gross unrealized appreciation, aggregate gross unrealized depreciation and the net unrealized appreciation is as follows: |
| | | | Aggregate | | Aggregate | | | |
| | | | Gross | | Gross | | Net | |
| | Aggregate | | Unrealized | | Unrealized | | Unrealized | |
Portfolio | Cost | | Appreciation | | Depreciation | | Appreciation | |
|
| |
| |
| |
| |
| Retirement Equity | $ | 4,003,874 | | $ | 614,459 | | $ | 25,386 | | $ | 589,073 | |
| Retirement Small Cap | | 80,245,073 | | | 10,966,975 | | 2,159,634 | | | 8,807,341 | |
| Retirement International Equity | | 155,507,822 | | | 14,302,549 | | 2,440,484 | | | 11,862,065 | |
| Retirement Emerging Markets | | 16,512,941 | | | 2,295,898 | | | 646,472 | | | 1,649,426 | |
| |
| (c) Pursuant to Rule 144A under the Securities Act of 1933, these securities may only be traded among “qualified institutional buyers.” |
| |
| Security Abbreviations: |
|
| ADR —American Depositary Receipt |
| GDR—Global Depositary Receipt |
The accompanying notes are an integral part of these financial statements.
19
Lazard Retirement Series, Inc.
Notes to Portfolios of Investments (concluded)
June 30, 2004 (unaudited)
Portfolio holdings by industry, for those Portfolios previously presented by country:
| | Lazard Retirement | | Lazard Retirement |
| | International Equity | | Emerging Markets |
| | Portfolio | | Portfolio |
| |
| |
|
| INDUSTRY | | | | | | | |
| Aerospace & Defense | | — | % | | | 1.5 | % |
| Apparel & Textiles | | — | | | | 0.3 | |
| Automotive | | 2.7 | | | | 1.9 | |
| Banking | | 19.7 | | | | 9.4 | |
| Brewery | | 1.1 | | | | 2.8 | |
| Broadcasting | | — | | | | 1.0 | |
| Building & Construction | | 1.4 | | | | 1.4 | |
| Chemicals | | 3.4 | | | | 2.1 | |
| Computers & Business Equipment | | — | | | | 5.0 | |
| Diversified | | 5.0 | | | | — | |
| Drugs & Health Care | | 9.3 | | | | 3.2 | |
| Electronics | | 4.7 | | | | 7.8 | |
| Financial Services | | 3.9 | | | | 6.2 | |
| Food & Beverages | | 2.7 | | | | 1.2 | |
| Forest & Paper Products | | 1.1 | | | | 2.6 | |
| Household Products & Home Furnishings | | — | | | | 3.6 | |
| Insurance | | 5.6 | | | | 3.8 | |
| Metals & Mining | | 1.6 | | | | 8.5 | |
| Oil & Gas | | 10.9 | | | | 8.1 | |
| Real Estate | | 1.3 | | | | — | |
| Retail | | 2.9 | | | | 0.7 | |
| Semiconductors & Components | | 1.0 | | | | — | |
| Shipping | | — | | | | 1.4 | |
| Steel | | — | | | | 2.6 | |
| Telecommunications | | 10.9 | | | | 15.7 | |
| Tobacco | | 2.3 | | | | 3.2 | |
| Transportation | | 1.1 | | | | 2.0 | |
| Utilities | | 4.6 | | | | 1.0 | |
| | |
| | | |
| |
| Subtotal | | 97.2 | | | | 97.0 | |
| Repurchase Agreements | | 3.8 | | | | 2.9 | |
| | |
| | | |
| |
| Total Investments | | 101.0 | % | | | 99.9 | % |
| | |
| | | |
| |
The accompanying notes are an integral part of these financial statements.
20
Lazard Retirement Series, Inc.
Statements of Assets and Liabilities
June 30, 2004 (unaudited)
| | | | | | Lazard | | Lazard | |
| | Lazard | | Lazard | | Retirement | | Retirement | |
| | Retirement | | Retirement | | International | | Emerging | |
| | Equity | | Small Cap | | Equity | | Markets | |
| | Portfolio | | Portfolio | | Portfolio | | Portfolio | |
|
|
|
|
|
|
|
| |
| | | | | | | | | |
| ASSETS | | | | | | | | |
| Investments in securities, at value | $ | 4,592,947 | | $ | 89,052,414 | | $ | 167,369,887 | | $ | 18,162,367 | |
| Cash | | 96 | | | 255 | | | 655 | | | 199 | |
| Foreign currency | | — | | | — | | | 34,822 | | | 52,566 | |
| Receivables for: | | | | | | | | | | | | |
| Investments sold | | 2,774 | | | 513,914 | | | 1,714,221 | | | 222,884 | |
| Dividends and interest | | 3,822 | | | 60,932 | | | 328,232 | | | 46,589 | |
| Capital stock sold | | 13,003 | | | 29,576 | | | 8,214 | | | — | |
| Due from Investment Manager | 4,620 | | — | | — | | — | |
| |
| |
| |
| |
| |
| Total assets | 4,617,262 | | 89,657,091 | | 169,456,031 | | 18,484,605 | |
| |
| |
| |
| |
| |
| LIABILITIES | | | | | | | | | | | | |
| Payables for: | | | | | | | | | | | | |
| Investments purchased | | 14,477 | | | 1,012,620 | | | 3,478,623 | | | 203,634 | |
| Capital stock repurchased | | 1,347 | | | 58,905 | | | 678 | | | 35,346 | |
| Management fees | | — | | | 52,105 | | | 99,226 | | | 3,351 | |
| Accrued distribution fees | | 935 | | | 17,330 | | | 32,780 | | | 3,709 | |
| Accrued directors’ fees | | 75 | | | 1,270 | | | 2,235 | | | 273 | |
| Other accrued expenses and payables | 22,945 | | 35,068 | | 56,810 | | 51,535 | |
| |
| |
| |
| |
| |
| Total liabilities | 39,779 | | 1,177,298 | | 3,670,352 | | 297,848 | |
| |
| |
| |
| |
| |
| Net assets | $ | 4,577,483 | | $ | 88,479,793 | | $ | 165,785,679 | | $ | 18,186,757 | |
| |
|
| |
|
| |
|
| |
|
| |
| NET ASSETS | | | | | | | | | | | | |
| Paid in capital | $ | 4,795,965 | | $ | 74,356,178 | | $ | 154,077,915 | | $ | 15,962,415 | |
| Undistributed (distributions in excess of) | | | | | | | | | | | | |
| investment income—net | | 38,695 | | | (67,231 | ) | | 2,034,232 | | | 282,309 | |
| Unrealized appreciation (depreciation) on: | | | | | | | | | | | | |
| Investments—net | | 589,073 | | | 8,807,341 | | | 11,862,065 | | | 1,649,426 | |
| Foreign currency—net | | — | | | — | | | (1,823 | ) | | (1,370 | ) |
| Accumulated undistributed realized gain (loss)—net | (846,250 | ) | 5,383,505 | | (2,186,710 | ) | 293,977 | |
| |
| |
| |
| |
| |
| Net assets | $ | 4,577,483 | | $ | 88,479,793 | | $ | 165,785,679 | | $ | 18,186,757 | |
| |
|
| |
|
| |
|
| |
|
| |
| Shares of capital stock outstanding* | | 454,711 | | | 5,681,420 | | | 15,832,350 | | | 1,710,571 | |
| Net asset value, offering and redemption price per share | $ | 10.07 | | $ | 15.57 | | $ | 10.47 | | $ | 10.63 | |
| Cost of investments in securities | $ | 4,003,874 | | $ | 80,245,073 | | $ | 155,507,822 | | $ | 16,512,941 | |
| Cost of foreign currency | $ | — | | $ | — | | $ | 35,262 | | $ | 53,073 | |
*$0.001 par value, 500,000,000 shares authorized for the Portfolios in total.
The accompanying notes are an integral part of these financial statements.
21
Lazard Retirement Series, Inc.
Statements of Operations
For the six months ended June 30, 2004 (unaudited)
| | | | | | Lazard | | Lazard | |
| | Lazard | | Lazard | | Retirement | | Retirement | |
| | Retirement | | Retirement | | International | | Emerging | |
| | Equity | | Small Cap | | Equity | | Markets | |
| | Portfolio | | Portfolio | | Portfolio | | Portfolio | |
|
|
|
|
|
|
|
| |
| | | | | | | | | |
| INVESTMENT INCOME (LOSS) | | | | | | | | |
| Income: | | | | | | | | |
| Interest | $ | 553 | | $ | 16,742 | | $ | 26,652 | | $ | 4,558 | |
| Dividends | 39,369 | | 407,741 | | 2,272,918 | | 276,266 | |
| |
| |
| |
| |
| |
| Total investment income* | 39,922 | | 424,483 | | 2,299,570 | | 280,824 | |
| |
| |
| |
| |
| |
| Expenses: | | | | | | | | | | | | |
| Management fees | | 17,753 | | | 310,761 | | | 563,244 | | | 92,552 | |
| Administration fees | | 19,198 | | | 26,985 | | | 33,719 | | | 20,575 | |
| Distribution fees | | 5,918 | | | 103,587 | | | 187,748 | | | 23,138 | |
| Custodian fees | | 17,845 | | | 41,794 | | | 117,437 | | | 69,513 | |
| Professional services | | 14,045 | | | 24,075 | | | 32,189 | | | 15,721 | |
| Shareholders’ services | | 6,827 | | | 7,348 | | | 6,756 | | | 6,723 | |
| Shareholders’ reports | | 220 | | | 3,674 | | | 6,468 | | | 796 | |
| Directors’ fees and expenses | | 131 | | | 2,234 | | | 3,922 | | | 485 | |
| Other | 395 | | 1,492 | | 2,299 | | 558 | |
| |
| |
| |
| |
| |
| Total expenses—gross | | 82,332 | | | 521,950 | | | 953,782 | | | 230,061 | |
| Management fees waived and expenses reimbursed | | (43,240 | ) | | (4,359 | ) | | (15,078 | ) | | (72,619 | ) |
| Administration fees waived | | (9,375 | ) | | — | | | — | | | (9,375 | ) |
| Expense reductions | (128 | ) | (93 | ) | (32 | ) | — | |
| |
| |
| |
| |
| |
| Total expenses—net | 29,589 | | 517,498 | | 938,672 | | 148,067 | |
| |
| |
| |
| |
| |
| Investment income (loss)—net | 10,333 | | (93,015 | ) | 1,360,898 | | 132,757 | |
| |
| |
| |
| |
| |
| REALIZED AND UNREALIZED GAIN (LOSS) ON | | | | | | | | | | | | |
| INVESTMENTS AND FOREIGN CURRENCY—NET | | | | | | | | | | | | |
| Realized gain (loss) on: | | | | | | | | | | | | |
| Investments—net** | | 219,673 | | | 8,562,344 | | | 7,780,866 | | | 1,304,733 | |
| Foreign currency—net | | — | | | — | | | (139,318 | ) | | (16,307 | ) |
| Change in net unrealized appreciation (depreciation) on: | | | | | | | | | | | | |
| Investments—net | | (43,646 | ) | | (3,865,088 | ) | | (8,208,268 | ) | | (1,808,856 | ) |
| Foreign currency—net | — | | — | | (13,231 | ) | (1,296 | ) |
| |
| |
| |
| |
| |
| Realized and unrealized gain (loss) on | | | | | | | | | | | | |
| investments and foreign currency—net | 176,027 | | 4,697,256 | | (579,951 | ) | (521,726 | ) |
| |
| |
| |
| |
| |
| Net increase (decrease) in net assets resulting | | | | | | | | | | | | |
| from operations | $ | 186,360 | | $ | 4,604,241 | | $ | 780,947 | | $ | (388,969 | ) |
| |
|
| |
|
| |
|
| |
|
| |
| *Net of foreign withholding taxes of | $ | 166 | | $ | 670 | | $ | 303,539 | | $ | 26,515 | |
| |
|
| |
|
| |
|
| |
|
| |
| **Net of foreign capital gains taxes of | $ | — | | $ | — | | $ | — | | $ | 39,052 | |
| |
|
| |
|
| |
|
| |
|
| |
The accompanying notes are an integral part of these financial statements.
22
Lazard Retirement Series, Inc.
Statements of Changes in Net Assets
| | Lazard Retirement | | Lazard Retirement | |
| | Equity Portfolio | | Small Cap Portfolio | |
| |
| |
| |
| | Six Months Ended | | Year Ended | | Six Months Ended | | Year Ended | |
| | June 30, 2004 | | December 31, | | June 30, 2004 | | December 31, | |
| (unaudited) | | 2003 | | (unaudited) | | 2003 | |
| |
| Increase (Decrease) in Net Assets: | | | | | | | | |
| Operations: | | | | | | | | |
| Investment income (loss)—net | $ | 10,333 | | $ | 28,647 | | $ | (93,015 | ) | $ | 18,430 | |
| Realized gain (loss) on investments and | | | | | | | | | | | | |
| foreign currency—net | | 219,673 | | | (92,184 | ) | | 8,562,344 | | | 686,179 | |
| Change in unrealized appreciation (depreciation)—net | (43,646 | ) | 902,615 | | (3,865,088 | ) | 17,431,107 | |
| |
| |
| |
| |
| |
| Net increase (decrease) in net assets resulting | | | | | | | | | | | | |
| from operations | 186,360 | | 839,078 | | 4,604,241 | | 18,135,716 | |
| |
| |
| |
| |
| |
| Distributions to shareholders: | | | | | | | | | | | | |
| From investment income—net | — | | (27,594 | ) | — | | — | |
| |
| |
| |
| |
| |
| Net decrease in net assets resulting from distributions | — | | (27,594 | ) | — | | — | |
| |
| |
| |
| |
| |
| Capital stock transactions: | | | | | | | | | | | | |
| Net proceeds from sales | | 569,700 | | | 1,551,110 | | | 14,272,824 | | | 26,651,205 | |
| Net proceeds from reinvestment of distributions | | — | | | 27,594 | | | — | | | — | |
| Cost of shares redeemed | (769,233 | ) | (1,549,867 | ) | (7,032,776 | ) | (15,604,009 | ) |
| |
| |
| |
| |
| |
| Net increase (decrease) in net assets from | | | | | | | | | | | | |
| capital stock transactions | (199,533 | ) | 28,837 | | 7,240,048 | | 11,047,196 | |
| |
| |
| |
| |
| |
| Total increase (decrease) in net assets | | (13,173 | ) | | 840,321 | | | 11,844,289 | | | 29,182,912 | |
| Net assets at beginning of period | 4,590,656 | | 3,750,335 | | 76,635,504 | | 47,452,592 | |
| |
| |
| |
| |
| |
| Net assets at end of period* | $ | 4,577,483 | | $ | 4,590,656 | | $ | 88,479,793 | | $ | 76,635,504 | |
| |
|
| |
|
| |
|
| |
|
| |
| Shares issued and repurchased: | | | | | | | | | | | | |
| Shares outstanding at beginning of period | 474,564 | | 477,899 | | 5,208,046 | | 4,426,956 | |
| |
| |
| |
| |
| |
| Shares sold | | 57,618 | | | 183,710 | | | 938,121 | | | 2,115,827 | |
| Shares issued to shareholders from reinvestment | | | | | | | | | | | | |
| of distributions | | — | | | 3,146 | | | — | | | — | |
| Shares repurchased | (77,471 | ) | (190,191 | ) | (464,747 | ) | (1,334,737 | ) |
| |
| |
| |
| |
| |
| Net increase (decrease) | (19,853 | ) | (3,335 | ) | 473,374 | | 781,090 | |
| |
| |
| |
| |
| |
| Shares outstanding at end of period | 454,711 | | 474,564 | | 5,681,420 | | 5,208,046 | |
| |
| |
| |
| |
| |
| *Includes undistributed (distributions in excess of) | | | | | | | | | | | | |
| investment income—net | $ | 38,695 | | $ | 28,362 | | $ | (67,231 | ) | $ | 25,784 | |
| |
|
| |
|
| |
|
| |
|
| |
The accompanying notes are an integral part of these financial statements.
23
Lazard Retirement Series, Inc.
Statements of Changes in Net Assets (concluded)
| | Lazard Retirement | | Lazard Retirement | |
| | International Equity Portfolio | | Emerging Markets Portfolio | |
| |
| |
| |
| | Six Months Ended | | Year Ended | | Six Months Ended | | Year Ended | |
| | June 30, 2004 | | December 31, | | June 30, 2004 | | December 31, | |
| (unaudited) | | 2003 | | (unaudited) | | 2003 | |
| |
| Increase (Decrease) in Net Assets: | | | | | | | | |
| Operations: | | | | | | | | |
| Investment income (loss)—net | $ | 1,360,898 | | $ | 974,620 | | $ | 132,757 | | $ | 173,586 | |
| Realized gain (loss) on investments and | | | | | | | | | | | | |
| foreign currency—net | | 7,641,548 | | | (280,978 | ) | | 1,288,426 | | | 725,996 | |
| Change in unrealized appreciation (depreciation)—net | (8,221,499 | ) | 22,845,803 | | (1,810,152 | ) | 3,845,344 | |
| |
| |
| |
| |
| |
| Net increase (decrease) in net assets resulting | | | | | | | | | | | | |
| from operations | 780,947 | | 23,539,445 | | (388,969 | ) | 4,744,926 | |
| |
| |
| |
| |
| |
| Distributions to shareholders: | | | | | | | | | | | | |
| From investment income—net | — | | (277,086 | ) | — | | (6,053 | ) |
| |
| |
| |
| |
| |
| Net decrease in net assets resulting from distributions | — | | (277,086 | ) | — | | (6,053 | ) |
| |
| |
| |
| |
| |
| Capital stock transactions: | | | | | | | | | | | | |
| Net proceeds from sales | | 35,474,791 | | | 63,763,176 | | | 4,841,098 | | | 7,220,084 | |
| Net proceeds from reinvestment of distributions | | — | | | 277,085 | | | — | | | 6,053 | |
| Cost of shares redeemed | (913,371 | ) | (5,772,339 | ) | (2,202,600 | ) | (3,993,091 | ) |
| |
| |
| |
| |
| |
| Net increase (decrease) in net assets from | | | | | | | | | | | | |
| capital stock transactions | 34,561,420 | | 58,267,922 | | 2,638,498 | | 3,233,046 | |
| |
| |
| |
| |
| |
| Total increase (decrease) in net assets | | 35,342,367 | | | 81,530,281 | | | 2,249,529 | | | 7,971,919 | |
| Net assets at beginning of period | 130,443,312 | | 48,913,031 | | 15,937,228 | | 7,965,309 | |
| |
| |
| |
| |
| |
| Net assets at end of period* | $ | 165,785,679 | | $ | 130,443,312 | | $ | 18,186,757 | | $ | 15,937,228 | |
| |
|
| |
|
| |
|
| |
|
| |
| Shares issued and repurchased: | | | | | | | | | | | | |
| Shares outstanding at beginning of period | 12,557,244 | | 6,029,034 | | 1,485,424 | | 1,134,215 | |
| |
| |
| |
| |
| |
| Shares sold | | 3,361,853 | | | 7,205,275 | | | 434,248 | | | 846,872 | |
| Shares issued to shareholders from reinvestment | | | | | | | | | | | | |
| of distributions | | — | | | 30,822 | | | — | | | 711 | |
| Shares repurchased | (86,747 | ) | (707,887 | ) | (209,101 | ) | (496,374 | ) |
| |
| |
| |
| |
| |
| Net increase (decrease) | 3,275,106 | | 6,528,210 | | 225,147 | | 351,209 | |
| |
| |
| |
| |
| |
| Shares outstanding at end of period | 15,832,350 | | 12,557,244 | | 1,710,571 | | 1,485,424 | |
| |
| |
| |
| |
| |
| *Includes undistributed (distributions in excess of) | | | | | | | | | | | | |
| investment income—net | $ | 2,034,232 | | $ | 673,334 | | $ | 282,309 | | $ | 149,552 | |
| |
|
| |
|
| |
|
| |
|
| |
The accompanying notes are an integral part of these financial statements.
24
Lazard Retirement Series, Inc.
Financial Highlights
Selected data for a share of capital stock outstanding throughout each period:
LAZARD RETIREMENT EQUITY PORTFOLIO
| | | | | | | | | | | | | |
| | | | | |
| | Six Months | | Year Ended | |
| | Ended | |
| |
| | 6/30/04† | | 12/31/03 | | 12/31/02 | | 12/31/01 | | 12/31/00 | | 12/31/99 | |
| |
| |
| |
| |
| |
| |
| |
| Net asset value, beginning of period | $ | 9.67 | | $ | 7.85 | | $ | 9.38 | | $ | 10.20 | | $ | 11.53 | | $ | 11.05 | |
| |
|
| |
|
| |
|
| |
|
| |
|
| |
|
| |
| Income (loss) from investment operations: | | | | | | | | | | | | | | | | | | |
| Net investment income (loss) | | 0.03 | | | 0.06 | | | 0.06 | | | 0.06 | | | 0.07 | | | 0.06 | |
| Net realized and unrealized gain (loss) | 0.37 | | 1.82 | | (1.58 | ) | (0.82 | ) | (0.10 | ) | 0.83 | |
| |
| |
| |
| |
| |
| |
| |
| Total from investment operations | 0.40 | | 1.88 | | (1.52 | ) | (0.76 | ) | (0.03 | ) | 0.89 | |
| |
| |
| |
| |
| |
| |
| |
| Less distributions from: | | | | | | | | | | | | | | | | | | |
| Net investment income | | — | | | (0.06 | ) | | (0.01 | ) | | (0.06 | ) | | (0.07 | ) | | (0.06 | ) |
| Net realized gains | — | | — | | — | | — | | (1.23 | ) | (0.35 | ) |
| |
| |
| |
| |
| |
| |
| |
| Total distributions | — | | (0.06 | ) | (0.01 | ) | (0.06 | ) | (1.30 | ) | (0.41 | ) |
| |
| |
| |
| |
| |
| |
| |
| Net asset value, end of period | $ | 10.07 | | $ | 9.67 | | $ | 7.85 | | $ | 9.38 | | $ | 10.20 | | $ | 11.53 | |
| |
|
| |
|
| |
|
| |
|
| |
|
| |
|
| |
| Total Return (a) | | 4.14 | % | 24.01 | % | (16.25 | )% | (7.47 | )% | (0.09 | )% | 8.16 | % |
| Ratios and Supplemental Data: | | | | | | | | | | | | | | | | | | |
| Net assets, end of period (in thousands) | $ | 4,577 | | $ | 4,591 | | $ | 3,750 | | $ | 5,015 | | $ | 3,232 | | $ | 2,835 | |
| Ratios to average net assets: | | | | | | | | | | | | | | | | | | |
| Net expenses (c) | | 1.25 | % | | 1.25 | % | | 1.25 | % | | 1.25 | % | | 1.25 | % | 1.33 | % |
| Gross expenses (c) | | 3.48 | % | | 3.89 | % | | 3.74 | % | | 3.25 | % | | 5.07 | % | 5.63 | % |
| Net investment income (loss) (c) | | 0.44 | % | | 0.73 | % | | 0.58 | % | | 0.63 | % | | 0.74 | % | 0.42 | % |
| Portfolio turnover rate | | 33 | % | | 56 | % | | 94 | % | | 141 | % | | 133 | % | | 35 | % |
| | | | | | | | | | | | | | | | | | | |
| LAZARD RETIREMENT SMALL CAP PORTFOLIO | | | | | | | | | | | | | | | | | | |
| | | | | | | | | | | | | | | | | | |
| | | | | | |
| | Six Months | | Year Ended | |
| | Ended | |
| |
| | 6/30/04† | | 12/31/03 | | 12/31/02 | | 12/31/01 | | 12/31/00 | | 12/31/99 | |
| |
| |
| |
| |
| |
| |
| |
| Net asset value, beginning of period | $ | 14.71 | | $ | 10.72 | | $ | 13.08 | | $ | 11.75 | | $ | 9.82 | | $ | 9.52 | |
| |
|
| |
|
| |
|
| |
|
| |
|
| |
|
| |
| Income (loss) from investment operations: | | | | | | | | | | | | | | | | | | |
| Net investment income (loss) | | (0.02 | ) | | — | (b) | | 0.01 | | | 0.01 | | | 0.03 | | | 0.02 | |
| Net realized and unrealized gain (loss) | 0.88 | | 3.99 | | (2.32 | ) | 2.15 | | 2.03 | | 0.46 | |
| |
| |
| |
| |
| |
| |
| |
| Total from investment operations | 0.86 | | 3.99 | | (2.31 | ) | 2.16 | | 2.06 | | 0.48 | |
| |
| |
| |
| |
| |
| |
| |
| Less distributions from: | | | | | | | | | | | | | | | | | | |
| Net investment income | | — | | | — | | | — | | | (0.01 | ) | | (0.03 | ) | | (0.02 | ) |
| Net realized gains | — | | — | | (0.05 | ) | (0.82 | ) | (0.10 | ) | (0.16 | ) |
| |
| |
| |
| |
| |
| |
| |
| Total distributions | — | | — | | (0.05 | ) | (0.83 | ) | (0.13 | ) | (0.18 | ) |
| |
| |
| |
| |
| |
| |
| |
| Net asset value, end of period | $ | 15.57 | | $ | 14.71 | | $ | 10.72 | | $ | 13.08 | | $ | 11.75 | | $ | 9.82 | |
| |
|
| |
|
| |
|
| |
|
| |
|
| |
|
| |
| Total Return (a) | | 5.85 | % | 37.22 | % | (17.68 | )% | 18.63 | % | 21.05 | % | 5.13 | % |
| Ratios and Supplemental Data: | | | | | | | | | | | | | | | | | | |
| Net assets, end of period (in thousands) | $ | 88,480 | | $ | 76,636 | | $ | 47,453 | | $ | 42,164 | | $ | 15,205 | | $ | 2,709 | |
| Ratios to average net assets: | | | | | | | | | | | | | | | | | | |
| Net expenses (c) | | 1.25 | % | | 1.25 | % | | 1.25 | % | | 1.25 | % | | 1.25 | % | 1.32 | % |
| Gross expenses (c) | | 1.26 | % | | 1.37 | % | | 1.42 | % | | 1.67 | % | | 2.76 | % | 7.31 | % |
| Net investment income (loss) (c) | (0.22 | )% | | 0.03 | % | (0.17 | )% | | 0.09 | % | | 0.42 | % | 0.16 | % |
| Portfolio turnover rate | | 51 | % | | 78 | % | | 108 | % | | 78 | % | | 67 | % | | 73 | % |
| † | Unaudited. |
| | |
| (a) | Total returns reflect changes in share price and reinvestment of all dividends and distributions. Periods of less than one year are not annualized. |
| | |
(b)
| Amount is less than $0.01 per share. |
| | |
(c)
| Annualized for periods of less than one year. |
The accompanying notes are an integral part of these financial statements.
25
Lazard Retirement Series, Inc.
Financial Highlights (concluded)
Selected data for a share of capital stock outstanding throughout each period:
LAZARD RETIREMENT INTERNATIONAL EQUITY PORTFOLIO
| | | | | | | | | | | | | |
| | | | | |
| | Six Months | | Year Ended | |
| | Ended | |
| |
| | 6/30/04† | | 12/31/03 | | 12/31/02 | | 12/31/01 | | 12/31/00 | | 12/31/99 | |
| |
| |
| |
| |
| |
| |
| |
| Net asset value, beginning of period | $ | 10.39 | | $ | 8.11 | | $ | 9.09 | | $ | 12.01 | | $ | 13.49 | | $ | 11.23 | |
| |
|
| |
|
| |
|
| |
|
| |
|
| |
|
| |
| Income (loss) from investment operations: | | | | | | | | | | | | | | | | | | |
| Net investment income (loss) | | 0.07 | | | 0.04 | | | 0.05 | | | 0.01 | | | 0.10 | | | 0.08 | |
| Net realized and unrealized gain (loss) | 0.01 | | 2.27 | | (1.02 | ) | (2.90 | ) | (1.40 | ) | 2.32 | |
| |
| |
| |
| |
| |
| |
| |
| Total from investment operations | 0.08 | | 2.31 | | (0.97 | ) | (2.89 | ) | (1.30 | ) | 2.40 | |
| |
| |
| |
| |
| |
| |
| |
| Less distributions from: | | | | | | | | | | | | | | | | | | |
| Net investment income | | — | | | (0.03 | ) | | (0.01 | ) | | — | (b) | | (0.08 | ) | | (0.07 | ) |
| Net realized gains | — | | — | | — | | (0.03 | ) | (0.10 | ) | (0.07 | ) |
| |
| |
| |
| |
| |
| |
| |
| Total distributions | — | | (0.03 | ) | (0.01 | ) | (0.03 | ) | (0.18 | ) | (0.14 | ) |
| |
| |
| |
| |
| |
| |
| |
| Net asset value, end of period | $ | 10.47 | | $ | 10.39 | | $ | 8.11 | | $ | 9.09 | | $ | 12.01 | | $ | 13.49 | |
| |
|
| |
|
| |
|
| |
|
| |
|
| |
|
| |
| Total Return (a) | | 0.77 | % | | 28.52 | % | (10.71 | )% | (24.06 | )% | (9.62 | )% | 21.41 | % |
| Ratios and Supplemental Data: | | | | | | | | | | | | | | | | | | |
| Net assets, end of period (in thousands) | $ | 165,786 | | $ | 130,443 | | $ | 48,913 | | $ | 32,311 | | $ | 20,937 | | $ | 6,308 | |
| Ratios to average net assets: | | | | | | | | | | | | | | | | | | |
| Net expenses (c) | | 1.25 | % | | 1.25 | % | | 1.25 | % | | 1.25 | % | | 1.25 | % | 1.31 | % |
| Gross expenses (c) | | 1.27 | % | | 1.40 | % | | 1.65 | % | | 1.94 | % | | 2.32 | % | 12.94 | % |
| Net investment income (loss) (c) | | 1.81 | % | | 1.25 | % | | 0.98 | % | | 0.50 | % | | 0.72 | % | 0.85 | % |
| Portfolio turnover rate | | 31 | % | | 38 | % | | 49 | % | | 58 | % | | 32 | % | | 22 | % |
| | | | | | | | | | | | | | | | | | | |
| LAZARD RETIREMENT EMERGING MARKETS PORTFOLIO | | | | | | | | | | | | | | | | |
| | | | | | | | | | | | | | | | | | | |
| | Six Months | | Year Ended | |
| | Ended | |
| |
| | 6/30/04† | | 12/31/03 | | 12/31/02 | | 12/31/01 | | 12/31/00 | | 12/31/99 | |
| |
| |
| |
| |
| |
| |
| |
| Net asset value, beginning of period | $ | 10.73 | | $ | 7.02 | | $ | 7.17 | | $ | 7.59 | | $ | 11.01 | | $ | 7.26 | |
| |
|
| |
|
| |
|
| |
|
| |
|
| |
|
| |
| Income (loss) from investment operations: | | | | | | | | | | | | | | | | | | |
| Net investment income (loss) | | 0.06 | | | 0.10 | | | 0.05 | | | 0.03 | | | 0.03 | | | 0.02 | |
| Net realized and unrealized gain (loss) | (0.16 | ) | 3.61 | | (0.16 | ) | (0.42 | ) | (3.12 | ) | 3.76 | |
| |
| |
| |
| |
| |
| |
| |
| Total from investment operations | (0.10 | ) | 3.71 | | (0.11 | ) | (0.39 | ) | (3.09 | ) | 3.78 | |
| |
| |
| |
| |
| |
| |
| |
| Less distributions from: | | | | | | | | | | | | | | | | | | |
| Net investment income | | — | | | — | (b) | | (0.04 | ) | | (0.03 | ) | | (0.01 | ) | | (0.03 | ) |
| Net realized gains | — | | — | | — | | — | | (0.32 | ) | — | |
| |
| |
| |
| |
| |
| |
| |
| Total distributions | — | | — | | (0.04 | ) | (0.03 | ) | (0.33 | ) | (0.03 | ) |
| |
| |
| |
| |
| |
| |
| |
| Net asset value, end of period | $ | 10.63 | | $ | 10.73 | | $ | 7.02 | | $ | 7.17 | | $ | 7.59 | | $ | 11.01 | |
| |
|
| |
|
| |
|
| |
|
| |
|
| |
|
| |
| Total Return (a) | | (0.93 | )% | | 52.94 | % | (1.50 | )% | (5.07 | )% | (28.07 | )% | 52.09 | % |
| Ratios and Supplemental Data: | | | | | | | | | | | | | | | | | | |
| Net assets, end of period (in thousands) | $ | 18,187 | | $ | 15,937 | | $ | 7,965 | | $ | 4,907 | | $ | 4,789 | | $ | 4,568 | |
| Ratios to average net assets: | | | | | | | | | | | | | | | | | | |
| Net expenses (c) | | 1.60 | % | | 1.60 | % | | 1.60 | % | | 1.60 | % | | 1.60 | % | 1.64 | % |
| Gross expenses (c) | | 2.49 | % | | 2.96 | % | | 3.92 | % | | 4.21 | % | | 4.15 | % | 9.59 | % |
| Net investment income (loss) (c) | | 1.43 | % | | 1.69 | % | | 0.95 | % | | 0.52 | % | | 0.42 | % | 0.39 | % |
| Portfolio turnover rate | | 23 | % | | 41 | % | | 53 | % | | 63 | % | | 54 | % | | 45 | % |
| † | Unaudited. |
| | |
| (a) | Total returns reflect changes in share price and reinvestment of all dividends and distributions. Periods of less than one year are not annualized. |
| | |
| (b) | Amount is less than $0.01 per share. |
| | |
| (c) | Annualized for periods of less than one year. |
The accompanying notes are an integral part of these financial statements.
26
Lazard Retirement Series, Inc.
Notes to Financial Statements
June 30, 2004 (unaudited)
1. Organization
Lazard Retirement Series, Inc. (the “Fund”) was incorporated in Maryland on February 13, 1997 and is registered under the Investment Company Act of 1940, as amended (the “Act”), as an open-end management investment company. The Fund is comprised of six no-load portfolios (each referred to as a “Portfolio”), which are offered only to separate accounts established by insurance companies to fund variable annuity contracts and variable life insurance policies. The Fund may also be offered to certain qualified pension and retirement plans and accounts permitting accumulation of assets on a tax-deferred basis. Currently, only the following four Portfolios, each of which is “diversified”, as defined in the Act, are offered: Lazard Retirement Equity Portfolio (“Equity Portfolio”), Lazard Retirement Small Cap Portfolio (“Small Cap Portfolio”), Lazard Retirement International Equity Portfolio (“International Equity Portfolio”) and Lazard Retirement Emerging Markets Portfolio (“Emerging Markets Portfolio”). Each of the other two Portfolios had not commenced operations as of June 30, 2004.
2. Significant Accounting Policies
The following is a summary of significant accounting policies:
(a) Valuation of Investments—Market values for equity securities listed on the New York Stock Exchange (“NYSE”), NASDAQ national market or other U.S. exchanges or markets are based on the closing market price on the principal exchange or market on which the security is traded, generally as of the close of regular trading on the NYSE (normally 4:00 p.m. Eastern time) on each valuation date; securities not traded on the valuation date are valued at the closing bid price. Any securities not listed, for which current over-the-counter market quotations or bids are readily available, are valued at the last quoted bid price or, if available, the mean of two such prices. Securities listed on foreign exchanges are valued at the last reported sales price, except as described below.
If events materially affecting the value of securities occur between the close of the exchange or market on which the security is principally traded and the time when a Portfolio’s net asset value is calculated, such securities will be valued at their fair values as determined by, or in accordance with procedures approved by, the Board of Directors. Fair valuing of foreign securities may be determined with the assistance of a pricing service, using correlations between the movement of prices of such securities and indices of domestic securities and other appropriate indicators, such as closing market prices of relevant ADRs or futures contracts. The effect of using fair value pricing is that the net asset value of a Portfolio will be subject to the judgment of the Board of Directors or its designee instead of being determined by the market. Using a fair value pricing methodology to price securities may result in a value that is different from the most recent closing price of a security and from the prices used by other investment companies to calculate their portfolios’ net asset values. Securities not traded on the valuation date are valued at the last quoted bid price, except as described below.
Securities for which current market quotations are not readily available are valued at fair value as determined in good faith in accordance with procedures approved by the Board of Directors.
Under these procedures, in the event that Lazard Asset Management LLC (the “Investment Manager”) determines that a significant event has occurred after the close of a market on which a foreign security is traded but before the close of regular trading on the NYSE, such that current market quotations for a security or securities is not readily available, a Valuation Committee on the Investment Manager will evaluate a variety of factors to determine the fair value of the affected securities. These factors include, but are not limited to, the type of security, the value of comparable securities, observations from financial institutions and relevant news events. Input from the Investment Manager’s analysts will also be considered.
(b) Portfolio Securities Transactions and Investment Income—Portfolio securities transactions are accounted for on trade date. Realized gain (loss) on sales of investments are recorded on a specific identification basis. Dividend income is recorded on the ex-dividend date and interest income is accrued daily.
(c) Repurchase Agreements—In connection with transactions in repurchase agreements, the Fund’s custodian takes possession of the underlying collateral securities, the fair value of which at all times is required to be at least equal to the principal amount, plus accrued interest, of the repurchase transaction. If the seller defaults, and the fair value of the collateral declines, realization of the collateral by a Portfolio may be delayed or limited.
(d) Foreign Currency Translation—The accounting records of the Portfolios are maintained in U.S. dollars. Portfolio securities and other assets and liabilities denominated in a foreign currency are translated daily into U.S. dollars at the prevailing rates of exchange. Purchases and sales of securities, income receipts and expense payments are translated into U.S. dollars at the prevailing exchange rates on the respective transaction dates.
The Portfolios do not isolate the portion of operations resulting from changes in foreign exchange rates on investments from the fluctuations arising from changes in their
27
Lazard Retirement Series, Inc.
Notes to Financial Statements (continued)
June 30, 2004 (unaudited)
market prices. Such fluctuations are included in net realized and unrealized gain (loss) on investments. Net realized gain (loss) on foreign currency transactions represents net foreign currency gain (loss) from disposition of foreign currencies, currency gain (loss) realized between the trade and settlement dates on securities transactions, and the difference between the amount of dividends, interest and foreign withholding taxes recorded on a Portfolio’s accounting records and the U.S. dollar equivalent amounts actually received or paid. Net unrealized foreign currency gain (loss) arises from changes in the value of assets and liabilities, other than investments in securities, as a result of changes in exchange rates.
(e) Federal Income Taxes—The Fund’s policy is to continue to have each Portfolio qualify as a regulated investment company under Subchapter M of the Internal Revenue Code and to distribute all its taxable income, including any realized net capital gains, to shareholders. Therefore, no federal income tax provision is required.
At December 31, 2003, the following Portfolios had available for federal income tax purposes unused realized capital losses which can be used to offset future realized capital gains as follows:
| Portfolio | Expiring 2009 | | Expiring 2010 |
|
| |
|
| Equity | $ | 88,896 | | $ | 761,551 |
| Small Cap | | — | | 2,966,770 |
| International Equity | | 2,886,750 | | 5,759,225 |
| Emerging Markets | | — | | | 399,206 |
| | | | | |
| Portfolio | Expiring 2011 | | | |
|
| | | |
| Equity | $ | 114,878 | | | |
| International Equity | | 468,181 | | | |
Under current tax law, certain capital and net foreign currency losses realized after October 31 within the taxable year may be deferred and treated as occurring on the first day of the following tax year. For the tax year ended December 31, 2003, the Equity Portfolio elected to defer net capital and currency losses of $2,452 arising between November 1, 2003 and December 31, 2003.
(f) Dividends and Distributions—Each Portfolio intends to declare and to pay dividends annually from net investment income. During any particular year, net realized gains from investment transactions in excess of available capital loss carryforwards would be taxable to the Portfolio if not distributed. The Portfolios intend to declare and distribute these amounts, at least annually, to shareholders; however, to avoid taxation, a second distribution may be required.
Income dividends and capital gains distributions are determined in accordance with federal income tax regulations which may differ from accounting principles generally accepted in the United States of America. These book/tax differences, which may result in distribution reclassifications, are primarily due to differing treatments of foreign currency transactions. Book/tax differences relating to shareholder distributions may result in reclassifications among certain capital accounts.
| (g) Allocation of Expenses—Expenses not directly chargeable to a specific Portfolio are allocated among the Portfolios primarily on the basis of relative net assets. |
| |
| (h) Expense Reductions—Portfolios leaving excess cash in demand deposit accounts may receive credits which are available to offset custody expenses. The Statements of Operations report gross custody expenses, and report the amount of such credits separately as an expense reduction. |
| |
| (i) Estimates—The preparation of financial statements in conformity with accounting principles generally accepted in the United States of America requires the Fund to make estimates and assumptions that affect the reported amounts of assets and liabilities and disclosure of contingent assets and liabilities at the date of the financial statements and the reported amounts of increases and decreases in net assets from operations during the reporting period. Actual results could differ from those estimates. |
| | |
| 3. | Investment Management, Administrative and Distribution Agreements |
| |
The Fund has entered into an investment management agreement (the “Management Agreement”) with Lazard Asset Management LLC, a majority-owned subsidiary of Lazard Frères & Co. LLC (“Lazard”). Pursuant to the Management Agreement, the Investment Manager regularly provides each Portfolio with investment research, advice and supervision and furnishes continuously an investment program for each Portfolio consistent with its investment objective and policies, including the purchase, retention and disposition of securities. Each Portfolio pays the Investment Manager a management fee, accrued daily and payable monthly, at the annual rate set forth below as a percentage of its average daily net assets:
|
| Portfolio | Annual Rate |
|
|
| Equity | 0.75 | % |
| Small Cap | 0.75 | |
| International Equity | 0.75 | |
| Emerging Markets | 1.00 | |
The Investment Manager has voluntarily agreed to reduce its fees and, if necessary, reimburse the following Portfolios if annualized operating expenses exceed the following percentages of average daily net assets:
28
Lazard Retirement Series, Inc.
Notes to Financial Statements (concluded)
June 30, 2004 (unaudited)
| | Annual |
Portfolio | Operating Expenses |
|
|
| Equity | 1.25 | % |
| Small Cap | 1.25 | |
| International Equity | 1.25 | |
| Emerging Markets | 1.60 | |
The Fund has entered into an administrative agreement with State Street Bank and Trust Company (“State Street”) to provide certain administrative services. Each Portfolio bears the cost of such services at a fixed annual rate of $37,500, plus 0.02% of average daily net assets up to $1 billion and 0.01% of average daily net assets over $1 billion. State Street has agreed to waive one half of the $37,500 fixed annual rate for each of the Equity and Emerging Markets Portfolios until each Portfolio’s net assets reach $25 million.
The Fund has a distribution agreement with Lazard Asset Management Securities LLC (the “Distributor”) to serve as the distributor of each Portfolio’s shares and bears the cost of printing and mailing prospectuses to potential investors and of certain expenses in connection with the offering of Portfolio shares.
The Distributor provides each Portfolio with distribution services pursuant to a Distribution and Servicing Plan (the “Plan”) in accordance with Rule 12b-1 under the Act. Under the Plan, each Portfolio pays a monthly fee to the Distributor, at an annual rate of 0.25% of the average daily net assets of the Portfolio, for distribution and servicing of accounts. The Distributor may make payments to participating insurance companies, certain financial institutions, securities dealers and other industry professionals for providing these services.
Certain Directors of the Fund are Managing Directors of the Investment Manager. The Fund pays each Director who is not an employee or an affiliated person of the Investment Manager its allocated portion of a fixed fee of $50,000 per year, plus $2,500 per meeting attended ($1,000 per meeting attended by telephone) for the Fund, The Lazard Funds, Inc. (“LFI”) and Lazard Global Total Return & Income Fund, Inc. (“LGI”) (collectively, the “Lazard Funds”), each a registered management investment company advised by the Investment Manager, and reimburses such Directors for travel and other out of pocket expenses. In addition, the Chairman of the Audit Committee for each of the Lazard Funds also receives an annual fee of $5,000.
4. Securities Transactions and Transactions with Affiliates
Purchases and sales of portfolio securities (excluding short-term securities) for the period ended June 30, 2004 were as follows:
| Portfolio | Purchases | | Sales |
|
| |
|
| Equity | $ | 1,525,757 | | $ | 1,718,055 |
| Small Cap | | 48,875,619 | | | 40,671,768 |
| International Equity | | 82,117,849 | | | 46,025,098 |
| Emerging Markets | | 6,926,730 | | | 3,956,289 |
For the period ended June 30, 2004, brokerage commissions of $185 were paid to Lazard for portfolio transactions executed on behalf of the Small Cap Portfolio.
5. Foreign Securities Investment Risks
Certain Portfolios invest in securities of foreign entities and securities denominated in foreign currencies which involve risks not typically involved in domestic investments. Foreign securities carry special risks, such as exposure to currency fluctuations, less developed or less efficient trading markets, political instability, a lack of company information, differing auditing and legal standards, and potentially less liquidity. To the extent a Portfolio invests in companies in emerging market countries it is exposed to additional volatility. A Portfolio’s performance will be influenced by political, social and economic factors affecting companies in emerging market countries. Emerging market countries generally have economic structures that are less diverse and mature and political systems that are less stable than those of developed countries.
6. Proxy Voting
A description of the policies and procedures that the Fund uses to determine how to vote proxies relating to its portfolio securities is available (1) without charge, upon request, by calling (800) 823-6300 or (2) on the Securities and Exchange Commission (“SEC”) website at www.sec.gov.
On and after August 31, 2004, the Fund’s proxy voting record for the most recent 12-month period ended June 30 is available (1) without charge, upon request, by calling (800) 823-6300 or (2) on the SEC’s website at www.sec.gov. Information as of June 30 each year will generally be available by the following August 31.
29
Lazard Retirement Series, Inc.
Board of Directors and Officers Information
(unaudited)
| Name (Age) | Position(s) and Term | Principal Occupation(s) During Past 5 Years |
| Address(1) | with the Fund(2) | and Other Directorships Held |
|
| Non-Interested Directors: | | |
| | | |
| John J. Burke (75) | Director | Lawyer and Private Investor; Director, Lazard Alternative Strategies Fund, |
| | | LLC; Director, Pacific Steel & Recycling; Director, Sletten Construction |
| | | Company; Trustee Emeritus, The University of Montana Foundation. |
| | | |
| Kenneth S. Davidson (59) | Director | President, Davidson Capital Management Corporation; Trustee, The Juilliard |
| | | School; Chairman of the Board, Bridgehampton Chamber Music Festival; |
| | | Trustee, American Friends of the National Gallery/London. |
| | | |
| William Katz (49) | Director | Retired President and Chief Executive Officer, BBDO New York, an |
| | | advertising agency; Retired Director, BBDO Worldwide. |
| | | |
| Lester Z. Lieberman (73) | Director | Private Investor; Chairman, Healthcare Foundation of NJ; Director, Cives |
| | | Steel Co.; Director, Northside Power Transmission Co.; Advisory Trustee, New |
| | | Jersey Medical School; Director, Public Health Research Institute; Trustee |
| | | Emeritus, Clarkson University; Council of Trustees, New Jersey Performing |
| | | Arts Center. |
| | | |
| Richard Reiss, Jr. (60) | Director | Chairman, Georgica Advisors LLC, an investment manager; Director, |
| | | Lazard Alternative Strategies Fund, LLC; Director, O’Charley’s, Inc., a |
| | | restaurant chain. |
| | | |
| Interested Directors(3): | | |
| | | |
| Charles Carroll (44) | President and Director | Managing Director and Deputy Chairman of Global Marketing of the |
| | | Investment Manager. |
| | | |
| Norman Eig (63) | Chairman of the Board | Chairman of the Investment Manager since March 2004; previously Co-Chief |
| | | Executive Officer of the Investment Manager and Member of the Management |
| | | Committee of Lazard. |
| | |
| (1) | The address of each Director is Lazard Asset Management LLC, 30 Rockefeller Plaza, New York, New York 10112-6300. |
| | |
| (2) | Each Director became a Director in April 1997, except that Mr. Carroll became a Director and President in June 2004, and serves as a Director for each of the Lazard Funds (total comprised of 15 investment portfolios). Each Director serves an indefinite term, until his successor is elected, and serves in the same capacity for LFI. |
| | |
| (3) | Mr. Carroll and Mr. Eig are “interested persons” (as defined in the Act) of the Fund because of their positions with the Investment Manager. |
| |
| The Fund’s Statement of Additional Information contains further information about the Directors and is available without charge by calling 800-887-4929. |
30
Lazard Retirement Series, Inc.
Board of Directors and Officers Information (concluded)
(unaudited)
| Name (Age) | Position(s) and Term | |
| Address(1) | with the Fund(2) | Principal Occupation(s) During Past 5 Years |
|
| Officers: | | |
| | | |
| Nathan A. Paul (31) | Vice President | Managing Director and General Counsel of the Investment Manager; from |
| | and Secretary | September 1997 to October 2000, an Associate at Schulte Roth & Zabel LLP, |
| | since April 2002 | a law firm. |
| | | |
| Stephen St. Clair (45) | Treasurer | Vice President of the Investment Manager. |
| | since April 2003 | |
| | | |
| Brian D. Simon (41) | Assistant Secretary | Senior Vice President of the Investment Manager; from July 1999 to October |
| | since November 2002 | 2002, Vice President, Law & Regulation at J. & W. Seligman & Co. |
| | |
| (1) | The address of each officer is Lazard Asset Management LLC, 30 Rockefeller Plaza, New York, New York 10112-6300. |
| | |
| (2) | Each officer serves for an indefinite term, until his successor is elected and qualified, and serves in the same capacity for the other Lazard Funds, except that Mr. Paul is not Vice President of LGI. |
31
[This page intentionally left blank]
Lazard Retirement Series, Inc.
30 Rockefeller Plaza
New York, New York 10112-6300
Telephone: 800-887-4929
http://www.LazardNet.com
Investment Manager
Lazard Asset Management LLC
30 Rockefeller Plaza
New York, New York 10112-6300
Telephone: 800-887-4929
Distributor
Lazard Asset Management Securities LLC
30 Rockefeller Plaza
New York, New York 10112-6300
Custodian
State Street Bank and Trust Company
225 Franklin Street
Boston, Massachusetts 02110
Transfer Agent and Dividend Disbursing Agent
Boston Financial Data Services, Inc.
P.O. Box 8514
Boston, Massachusetts 02266-8514
Telephone: 800-986-3455
Independent Auditors
Anchin, Block & Anchin LLP
1375 Broadway
New York, New York 10018
http://www.anchin.com
Legal Counsel
Stroock & Stroock & Lavan LLP
180 Maiden Lane
New York, New York 10038-4982
http://www.stroock.com
Performance information as of the most recent month end is available online at www.LazardNet.com.

 | Lazard Retirement Series, Inc. | 30 Rockefeller Plaza | Tel 800-887-4929 |
| | New York, NY 10112- 6300 | www.LazardNet.com |
| | | |
RT03101
ITEM 2.  CODE OF ETHICS.

         Not Applicable.

ITEM 3.  AUDIT COMMITTEE FINANCIAL EXPERT.

         Not Applicable.

ITEM 4.  PRINCIPAL ACCOUNTANT FEES AND SERVICES

         Not Applicable.

ITEM 5.  AUDIT COMMITTEE OF LISTED REGISTRANTS.

         Not Applicable.

ITEM 6.  SCHEDULE OF INVESTMENTS.

         Not Applicable.

ITEM 7.  DISCLOSURE OF PROXY VOTING POLICIES AND PROCEDURES FOR
         CLOSED-END MANAGEMENT INVESTMENT COMPANIES.

         Not Applicable.

ITEM 8.  PURCHASES OF EQUITY SECURITIES BY CLOSED-END MANAGEMENT
         INVESTMENT COMPANIES AND AFFILIATED PURCHASERS.

         Not Applicable.

ITEM 9.  SUBMISSION OF MATTERS TO A VOTE OF SECURITY HOLDERS.

         The Registrant has a Nominating Committee (the "Committee") of the
Board of Directors (the "Board"). The function of the Committee is to select and
nominate all candidates for election to the Fund's Board. The Committee does not
normally consider nominees recommended by shareholders.

ITEM 10. CONTROLS AND PROCEDURES.

(a)      The Registrant's principal executive and principal financial officers
have concluded, based on their evaluation of the Registrant's disclosure
controls and procedures as of a date within 90 days of the filing date of this
report, that the Registrant's disclosure controls and procedures are reasonably
designed to ensure that information required to be disclosed by the Registrant
on Form N-CSR is recorded, processed, summarized and reported within the
required time periods and that information required to be disclosed by the
Registrant in the reports that it files or submits on Form N-CSR is accumulated
and communicated to the Registrant's management, including its principal
executive and principal financial officers, as appropriate to allow timely
decisions regarding required disclosure.

(b)      There were no changes to the Registrant's internal control over
financial reporting that occurred during the Registrant's most recently ended
fiscal half-year that have materially affected, or are reasonably likely to
materially affect, the Registrant's internal control over financial reporting.

ITEM 11. EXHIBITS.

(a)(1)   Not Applicable.

(a)(2)   Certifications of principal executive and principal financial officers
as required by Rule 30a-2(a) under the Investment Company Act of 1940.

(a)(3)   Not Applicable.

(b)      Certification of principal executive and principal financial officers
as required by Rule 30a-2(b) under the Investment Company Act of 1940.


                                   SIGNATURES

Pursuant to the requirements of the Securities Exchange Act of 1934 and the
Investment Company Act of 1940, the Registrant has duly caused this Report to be
signed on its behalf by the undersigned, thereunto duly authorized.

LAZARD RETIREMENT SERIES, INC.

By:      /s/ Norman Eig
         --------------
         Norman Eig
         Chief Executive Officer

Date:    August 20, 2004

Pursuant to the requirements of the Securities Exchange Act of 1934 and the
Investment Company Act of 1940, this Report has been signed below by the
following persons on behalf of the Registrant and in the capacities and on the
dates indicated.

By:      /s/ Norman Eig
         --------------
         Norman Eig
         Chief Executive Officer

Date:    August 20, 2004

By:      /s/ Stephen St. Clair
         ---------------------
         Stephen St. Clair
         Chief Financial Officer

Date:    August 20, 2004


                                  EXHIBIT INDEX

         (a)(2)   Certifications of principal executive and principal financial
         officers as required by Rule 30a-2(a) under the Investment Company Act
         of 1940. (EX-99.CERT)

         (b)      Certification of principal executive and principal financial
         officers as required by Rule 30a-2(b) under the Investment Company Act
         of 1940. (EX-99.906CERT)