floods in the third quarter. Thai and Malaysian shares finished sharply higher despite ongoing political disharmony in Thailand, and due to the prospect of greater capital markets activity (in the form of possible privatizations) in Malaysia. Indonesian and Philippine equities experienced a continuing period of strong performance. Chinese shares, harmed by concerns over real estate prices and industrial production, performed relatively poorly.
All Latin American markets witnessed significant rises over the period. Argentinean, Chilean, and Peruvian equities were the best performers, helped by strong commodity prices and the aftermath of a debt renegotiation in Argentina. Mexican stocks also rose strongly, helped by the improving U.S. economic outlook. Brazilian shares rose by a more modest amount, held back by the record size of Petro-bras’s secondary offering and despite the election of Dilma Rousseff as president.
Mixed performance was registered across most of Eastern Europe, the Middle East, and Africa. Share prices rose sharply in South Africa and Russia towards year-end as commodity prices rose, and investor concerns over changes in the taxation treatment of oil in Russia appeared to dissipate. Elsewhere, despite buoyant economic conditions, Turkish stocks experienced considerable profit-taking after a period of impressive performance, due to a weaker lira caused by a reduction in money market rates. Hungarian and Czech equities fell, and Polish shares finished modestly higher over the year as the European fiscal crises negatively impacted conditions.
All sectors in the EM Index finished the year higher. The consumer discretionary, consumer staples, industrials, health care, and materials sectors outperformed the EM Index. The utilities, energy, and telecom services sectors were the weakest performers over the year.
Lazard Retirement U.S. Strategic Equity Portfolio
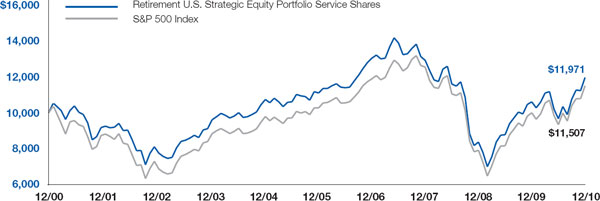
For the year ended December 31, 2010, the Lazard Retirement U.S. Strategic Equity Portfolio’s Service Shares posted a total return of 12.85%, as compared with the 15.06% return for the S&P 500® Index.
During the year, the Portfolio benefited from stock selection in the consumer discretionary sector. Shares of AutoZone, a leading auto parts retailer, performed well on a series of strong quarterly earnings. Stock selection in the energy sector also helped returns. Shares of ConocoPhillips, one of the largest U.S. integrated oil companies, rose as the company
executed on its strategy to sell non-core assets in order to fund debt reduction and share buybacks.
In contrast, stock selection in the consumer staples sector detracted from performance. Shares of retailer Wal-Mart underperformed as the market focused on consumer names with more exposure to discretionary spending. The company also had slightly negative U.S. year-over-year comparisons, largely due to food deflation. Stock selection in the information technology sector also hurt returns. Shares of Symantec, an information technology security and management firm, were weak as the company faced execution issues and market headwinds. However, the company’s latest quarter saw an implementation improvement, and maintenance/subscription revenues remained a solid generator of cash flow.
Lazard Retirement U.S. Small-Mid Cap Equity Portfolio
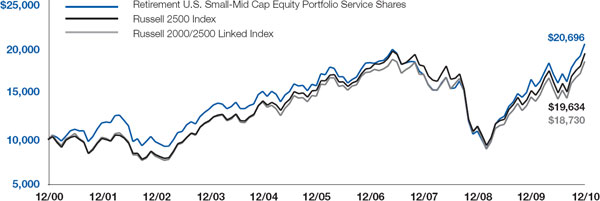
For the year ended December 31, 2010, the Lazard Retirement U.S. Small-Mid Cap Equity Portfolio’s Service Shares posted a total return of 23.72%, as compared with the 26.71% return for the Russell 2500® Index.
For the year 2010, stock selection in the health care and information technology sectors detracted from performance, while stock selection in the consumer discretionary and materials sectors helped returns.
Stock selection in the health care sector was the leading detractor over the year. Shares of XenoPort, a biotechnology company, fell significantly, as the U.S. Food and Drug Administration surprisingly rejected one of its later-stage pipeline drugs. This failure broke the investment thesis for this stock, and we eliminated the position from the Portfolio in 2010. Tenet Healthcare declined following an announcement that it was considering acquiring a large Australian hospital corporation, as investors were worried about the company’s debt levels if such an acquisition occurred. The company also declined based on lower-than-expected first-quarter 2010 volumes. We sold our position in Tenet during the year.
Stock selection in the information technology sector, especially the technology hardware and equipment space, also detracted from returns during 2010. Early in the year, Brocade Communications Systems missed earnings estimates by a large margin, structurally changing our outlook for the company and leading us to eliminate the position. FLIR Systems, a maker of thermal imaging systems, also fell early in 2010 on weaker-than-expected guidance due to uncer-
tainty about its order book. SMART Technologies, a developer of interactive technology solutions such as digital whiteboards, fell short of consensus revenue expectations during the year. The company went on to reduce its full-year revenue estimates based on weaker education budgets, causing its share price to drop. Following this, we sold our position in SMART Technologies.
The Portfolio’s performance in 2010 was helped by stock selection in the consumer discretionary sector. Tenneco, a designer and manufacturer of automotive emission control and ride control products, benefited from the recovery in automobile demand and posted very strong second-quarter earnings. In the retail segment, Family Dollar Stores, a discount retail chain, performed well, as its business remained strong during what proved to be a volatile year for consumers. Gymboree, a children’s clothing retailer, agreed to be acquired by asset management firm Bain Capital Partners in October 2010. We exited the position following the strong rally in Gymboree’s share price after the announcement of the acquisition.
Lazard Retirement International Equity Portfolio
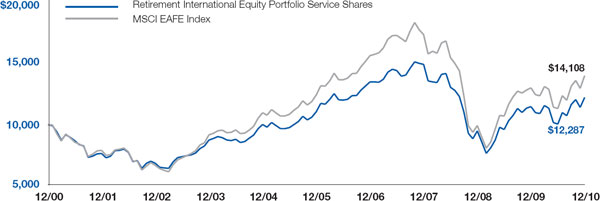
For the year ended December 31, 2010, the Lazard Retirement International Equity Portfolio’s Service Shares posted a total return of 6.72%, as compared with the 7.75% return of the MSCI Europe, Australasia and Far East (EAFE®) Index.
The strongest positive effect on the Portfolio stemmed from stock selection in the financials sector. Banks and real estate were the primary drivers, as positions in U.K. banks Barclays and Lloyds, emerging markets bank Banco do Brasil, and Japanese real estate company Daito Trust Construction, contributed to positive returns. We exited the position in Barclays during 2010.
Stock selection in the energy sector also contributed to returns as the Portfolio benefited by minimizing losses with the early sale of a position in BP following the oil spill. Positions in oil services companies AMEC, Aker Solutions, and Technip were also beneficial.
In contrast, the largest drag on the Portfolio’s performance over the year was a low exposure to, and stock selection in, the industrials sector, which performed well on improved global demand and capital expenditure growth. Within the sector, positions in Atlantia and TNT hurt performance.
The Portfolio’s low exposure to the materials sector also detracted from returns, as the sector performed well on renewed demand and commodity price strength. Stock selection partially offset this low exposure, as Xstrata and Potash performed well.
Lazard Retirement Emerging Markets Equity Portfolio
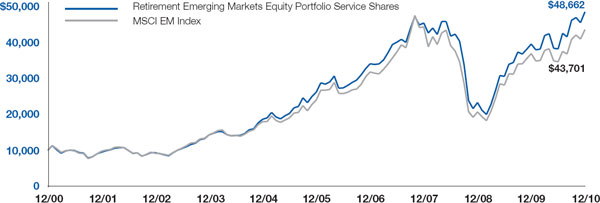
For the year ended December 31, 2010, the Lazard Retirement Emerging Markets Equity Portfolio’s Service Shares posted a total return of 22.69%, while Investor Shares posted a total return of 23.05%, as compared with the 18.88% return for the EM Index.
Stock selection in the financials sector helped the Portfolio’s performance over the year, as a position in Banco do Brasil, a Brazilian bank, rose on improved sentiment following a capital raise. Stock selection in Brazil also added to returns, as a position in Brazilian tobacco company Souza Cruz benefited from strong operating trends.
Additionally, a higher-than-index exposure to consumer staples and a lower-than-index exposure to China helped performance. A lower-than-index exposure and stock selection in the energy sector also added to returns.
HTC, a Taiwanese smartphone designer and manufacturer, was one of the top-performing positions during the year. The company performed well on the successful introduction of new products. The Portfolio also benefited from holding shares of Kumba Iron Ore, a South African iron ore producer, which rose on sharply higher iron ore prices.
In contrast, stock selection in Korea hurt performance during the year. A position in Hite, a Korean beer producer, experienced profit-taking on expectation of lower volumes and concerns over corporate structure.
Stock selection in the telecom services sector also hurt performance. Shares of the Egyptian Company for Mobile Services (or Mobinil), an Egyptian cellular operator, performed poorly following a weaker-than-expected earnings release.
A position in Redecard was one of the worst performers over the year. Shares of the Brazilian credit card operator declined on disappointing earnings results.
Annual Report 5
Notes to Investment Overviews:
All returns reflect reinvestment of all dividends and distributions, if any. Certain expenses of the Portfolios may have been waived or reimbursed by Lazard Asset Management LLC, the Fund’s Investment Manager (the “Investment Manager”), or State Street Bank and Trust Company, the Fund’s Administrator (“State Street”); without such waiver/reimbursement of expenses, the Portfolios’ returns would have been lower. Performance information does not reflect the fees and charges imposed by participating insurance companies at the separate account level, and such charges will have the effect of reducing performance. Past performance is not indicative, or a guarantee, of future results.
The performance data of the indices and other market data have been prepared from sources and data that the Investment Manager believes to be reliable, but no representation is made as to their accuracy. These indices are unmanaged, have no fees or costs and are not available for investment.
The views of the Investment Manager and the securities described in this report are as of December 31, 2010; these views and portfolio holdings may have changed subsequent to this date. Nothing herein should be construed as a recommendation to buy, sell, or hold a particular security. There is no assurance that the securities discussed herein will remain in each Portfolio at the time you receive this report, or that securities sold will not have been repurchased. The specific securities discussed may, in aggregate, represent only a small percentage of each Portfolio’s holdings. It should not be assumed that securities identified and discussed were, or will be, profitable, or that the investment decisions made in the future will be profitable, or equal the investment performance of the securities discussed herein.
The views and opinions expressed are provided for general information only, and do not constitute specific tax, legal, or investment advice to, or recommendations for, any person. There can be no guarantee as to the accuracy of the outlooks for markets, sectors and securities as discussed herein. You should read the Fund’s prospectus or each Portfolio’s summary prospectus for a more detailed discussion of each Portfolio’s investment objective, strategies, risks and fees.
6 Annual Report
|
|
Lazard Retirement Series, Inc. Performance Overviews |
|
Lazard Retirement U.S. Strategic Equity Portfolio
Comparison of Changes in Value
of $10,000 Investment in the
Service Shares of Lazard Retire-
ment U.S. Strategic Equity
Portfolio and S&P 500® Index*
| | | | | | | |
Average Annual Total Returns* | | | | | | | |
Year Ended December 31, 2010 | | One | | Five | | Ten | |
| | Year | | Years | | Years | |
| | | | | | | | |
| | | | | | | |
Service Shares | | 12.85% | | 1.51% | | 1.82% | |
| | | | | | | |
| | | | | | | | |
| | | | | | | |
S&P 500 Index | | 15.06% | | 2.29% | | 1.41% | |
| | | | | | | |
| | | | | | | | |
| |
* | All returns reflect reinvestment of all dividends and distributions, if any. Certain expenses of the Portfolio have been waived or reimbursed by the Portfolio’s Investment Manager or State Street; without such waiver/reimbursement of expenses, the Portfolio’s returns would have been lower. Performance information does not reflect the fees and charges imposed by participating insurance companies at the separate account level, and such charges will have the effect of reducing performance. |
| |
| The performance quoted represents past performance. Current performance may be lower or higher than the performance quoted. Past performance is not indicative, or a guarantee, of future results; the investment return and principal value of the Portfolio will fluctuate, so that Portfolio shares, when redeemed, may be worth more or less than their original cost. Within the longer periods illustrated there may have been short-term fluctuations, counter to the overall trend of investment results, and no single period of any length may be taken as typical of what may be expected in future periods. |
| |
| The performance data of the index has been prepared from sources and data that the Investment Manager believes to be reliable, but no representation is made as to its accuracy. The S&P 500 Index is a market capitalization-weighted index of 500 common stocks, designed to measure performance of the broad domestic economy through changes in the aggregate market value of these stocks, which represent all major industries. The index is unmanaged, has no fees or costs and is not available for investment. |
| |
| Before May 1, 2007, the Portfolio was known as Lazard Retirement Equity Portfolio and had a different investment strategy. |
Annual Report 7
Lazard Retirement U.S. Small-Mid Cap Equity Portfolio
Comparison of Changes in Value
of $10,000 Investment in the Ser-
vice Shares of Lazard Retirement
U.S. Small-Mid Cap Equity Port-
folio, Russell 2500® Index and
Russell 2000/2500 Linked Index*
| | | | | | | |
Average Annual Total Returns*
Year Ended December 31, 2010 | | One | | Five | | Ten | |
| | Year | | Years | | Years | |
| | | | | | | | |
| | | | | | | |
Service Shares | | 23.72% | | 5.27% | | 7.54% | |
| | | | | | | |
| | | | | | | | |
| | | | | | | |
Russell 2500 Index | | 26.71% | | 4.86% | | 6.98% | |
| | | | | | | |
| | | | | | | | |
| | | | | | | |
Russell 2000/2500 Linked Index | | 26.71% | | 4.76% | | 6.48% | |
| | | | | | | |
| | | | | | | | |
| |
* | All returns reflect reinvestment of all dividends and distributions, if any. Certain expenses of the Portfolio have been waived or reimbursed by the Portfolio’s Investment Manager or State Street; without such waiver/reimbursement of expenses, the Portfolio’s returns would have been lower. Performance information does not reflect the fees and charges imposed by participating insurance companies at the separate account level, and such charges will have the effect of reducing performance. |
| |
| The performance quoted represents past performance. Current performance may be lower or higher than the performance quoted. Past performance is not indicative, or a guarantee, of future results; the investment return and principal value of the Portfolio will fluctuate, so that Portfolio shares, when redeemed, may be worth more or less than their original cost. Within the longer periods illustrated there may have been short-term fluctuations, counter to the overall trend of investment results, and no single period of any length may be taken as typical of what may be expected in future periods. |
| |
| The performance data of the indices have been prepared from sources and data that the Investment Manager believes to be reliable, but no representation is made as to their accuracy. The Russell 2500 Index is comprised of the 2,500 smallest U.S. companies included in the Russell 3000® Index (which consists of the 3,000 largest U.S. companies by capitalization). The Russell 2000/2500 Linked Index is an index created by the Portfolio’s Investment Manager, which links the performance of the Russell 2000® Index for all periods prior to June 1, 2009 and the Russell 2500 Index for all periods thereafter. The Russell 2000 Index is comprised of the 2,000 smallest U.S. companies included in the Russell 3000 Index. The indices are unmanaged, have no fees or costs and are not available for investment. |
| |
| The Portfolio was previously known as Lazard Retirement U.S. Small Cap Equity Portfolio. As of June 1, 2009, the Portfolio changed its name to Lazard U.S. Small-Mid Cap Equity Portfolio and changed its investment strategy to invest in equity securities of small-mid cap U.S. companies. |
8 Annual Report
Lazard Retirement International Equity Portfolio
Comparison of Changes in Value
of $10,000 Investment in the
Service Shares of Lazard Retire-
ment International Equity
Portfolio and Morgan Stanley
Capital International (MSCI®)
Europe, Australasia and Far East
(EAFE®) Index*
| | | | | | | |
Average Annual Total Returns*
Year Ended December 31, 2010 | | One | | Five | | Ten | |
| | Year | | Years | | Years | |
| | | | | | | | |
| | | | | | | |
Service Shares | | 6.72% | | 2.08% | | 2.08% | |
| | | | | | | |
| | | | | | | | |
| | | | | | | |
MSCI EAFE Index | | 7.75% | | 2.46% | | 3.50% | |
| | | | | | | |
| | | | | | | | |
| |
* | All returns reflect reinvestment of all dividends and distributions, if any. Certain expenses of the Portfolio have been waived or reimbursed by the Portfolio’s Investment Manager or State Street; without such waiver/reimbursement of expenses, the Portfolio’s returns would have been lower. Performance information does not reflect the fees and charges imposed by participating insurance companies at the separate account level, and such charges will have the effect of reducing performance. |
| |
| The performance quoted represents past performance. Current performance may be lower or higher than the performance quoted. Past performance is not indicative, or a guarantee, of future results; the investment return and principal value of the Portfolio will fluctuate, so that Portfolio shares, when redeemed, may be worth more or less than their original cost. Within the longer periods illustrated there may have been short-term fluctuations, counter to the overall trend of investment results, and no single period of any length may be taken as typical of what may be expected in future periods. |
| |
| The performance data of the index has been prepared from sources and data that the Investment Manager believes to be reliable, but no representation is made as to its accuracy. The MSCI EAFE Index is a broadly diversified international index comprised of equity securities of approximately 1,000 companies located outside the United States. The index is unmanaged, has no fees or costs and is not available for investment. |
Annual Report 9
Lazard Retirement Emerging Markets Equity Portfolio
Comparison of Changes in Value
of $10,000 Investment in the
Service Shares of Lazard Retire-
ment Emerging Markets Equity
Portfolio and MSCI Emerging
Markets (EM®) Index*
| | | | | | | | | | | |
Average Annual Total Returns*
Periods Ended December 31, 2010 | | Service Shares | | Investor Shares | |
| | One | | Five | | Ten | | One | | Since | |
| | Year | | Years | | Years | | Year | | Inception | † |
| | | | | | | | | | | | |
| | | | | | | | | | | |
Retirement Emerging Markets Equity Portfolio** | | 22.69% | | 13.11% | | 17.14% | | 23.05% | | 10.47% | |
| | | | | | | | | | | |
| | | | | | | | | | | | |
| | | | | | | | | | | |
MSCI EM Index | | 18.88% | | 12.78% | | 15.89% | | 18.88% | | 8.96% | |
| | | | | | | | | | | |
| | | | | | | | | | | | |
| |
* | All returns reflect reinvestment of all dividends and distributions, if any. Certain expenses of the Portfolio have been waived or reimbursed by the Portfolio’s Investment Manager or State Street; without such waiver/reimbursement of expenses, the Portfolio’s returns would have been lower. Performance information does not reflect the fees and charges imposed by participating insurance companies at the separate account level, and such charges will have the effect of reducing performance. |
| |
| The performance quoted represents past performance. Current performance may be lower or higher than the performance quoted. Past performance is not indicative, or a guarantee, of future results; the investment return and principal value of the Portfolio will fluctuate, so that Portfolio shares, when redeemed, may be worth more or less than their original cost. Within the longer periods illustrated there may have been short-term fluctuations, counter to the overall trend of investment results, and no single period of any length may be taken as typical of what may be expected in future periods. |
| |
| The performance data of the index has been prepared from sources and data that the Investment Manager believes to be reliable, but no representation is made as to its accuracy. The MSCI EM Index is comprised of emerging market securities in countries open to non-local investors. The index is unmanaged, has no fees or costs and is not available for investment. |
| |
** | The performance of Service Shares may be greater than or less than the performance of Investor Shares, primarily based on the differences in fees borne by shareholders investing in different classes. |
| |
† | The inception date for Investor Shares was May 1, 2006. |
10 Annual Report
|
|
Lazard Retirement Series, Inc. Information About Your Portfolio’s Expenses |
|
Expense Example
As a shareholder in a Portfolio of the Fund, you incur ongoing costs, including management fees, distribution and service (12b-1) fees (Service Shares only), and other expenses. This Example is intended to help you understand your ongoing costs (in dollars) of investing in a Portfolio and to compare these costs with the ongoing costs of investing in other mutual funds. The Example is based on an investment of $1,000 invested at the beginning of the six month period from July 1, 2010 through December 31, 2010 and held for the entire period.
Actual Expenses
For each Share class of the Portfolios, the first line of the table below provides information about actual account values and actual expenses. You may use the information in this line, together with the amount you invested, to estimate the expenses that you paid over the period. Simply divide your account value by $1,000 (for example, an $8,600 account value divided by $1,000=8.6), then multiply the result by the number in the first line under the heading entitled “Expenses Paid During Period” to estimate the expenses you paid on your account during this period.
Hypothetical Example for Comparison Purposes
For each Share class of the Portfolios, the second line of the table below provides information about hypothetical account values and hypothetical expenses based on the class’ actual expense ratio and an assumed rate of return of 5% per year before expenses, which is not the Portfolio’s actual return. The hypothetical account values and expenses may not be used to estimate the actual ending account balance or expenses you paid for the period. You may use this information to compare the ongoing costs of investing in the Portfolio and other mutual funds. To do so, compare this 5% hypothetical example with the 5% hypothetical examples that appear in the shareholders reports of the other funds.
Please note that you also bear fees and charges imposed by participating insurance companies at the separate account level, which are described in the separate prospectuses issued by the insurance companies. Such charges will have the effect of reducing account value.
| | | | | | | | | | | | | | | | | | | | | |
Portfolio | | | Beginning
Account Value
7/1/10 | | | Ending
Account Value
12/31/10 | | | Expenses Paid
During Period*
7/1/10 - 12/31/10 | | | Annualized Expense
Ratio During Period
7/1/10 - 12/31/10 | |
| | | | | | | | | | | | | | | | | | | | | |
Retirement U.S. Strategic Equity Portfolio | | | | | | | | | | | | | | | | | | | | | |
Service Shares | | | | | | | | | | | | | | | | | | | | | |
Actual | | | | $1,000.00 | | | | | $1,242.20 | | | | | $6.71 | | | | | 1.19 | % | |
Hypothetical (5% Return Before Expenses) | | | | $1,000.00 | | | | | $1,019.22 | | | | | $6.04 | | | | | 1.19 | % | |
| | | | | | | | | | | | | | | | | | | | | |
Retirement U.S. Small-Mid Cap Equity Portfolio | | | | | | | | | | | | | | | | | | | | | |
Service Shares | | | | | | | | | | | | | | | | | | | | | |
Actual | | | | $1,000.00 | | | | | $1,275.40 | | | | | $6.84 | | | | | 1.19 | % | |
Hypothetical (5% Return Before Expenses) | | | | $1,000.00 | | | | | $1,019.19 | | | | | $6.07 | | | | | 1.19 | % | |
| | | | | | | | | | | | | | | | | | | | | |
Retirement International Equity Portfolio | | | | | | | | | | | | | | | | | | | | | |
Service Shares | | | | | | | | | | | | | | | | | | | | | |
Actual | | | | $1,000.00 | | | | | $1,216.80 | | | | | $6.40 | | | | | 1.15 | % | |
Hypothetical (5% Return Before Expenses) | | | | $1,000.00 | | | | | $1,019.43 | | | | | $5.83 | | | | | 1.15 | % | |
| | | | | | | | | | | | | | | | | | | | | |
Retirement Emerging Markets Equity Portfolio | | | | | | | | | | | | | | | | | | | | | |
Service Shares | | | | | | | | | | | | | | | | | | | | | |
Actual | | | | $1,000.00 | | | | | $1,267.80 | | | | | $8.35 | | | | | 1.46 | % | |
Hypothetical (5% Return Before Expenses) | | | | $1,000.00 | | | | | $1,017.84 | | | | | $7.43 | | | | | 1.46 | % | |
Investor Shares | | | | | | | | | | | | | | | | | | | | | |
Actual | | | | $1,000.00 | | | | | $1,269.70 | | | | | $6.93 | | | | | 1.21 | % | |
Hypothetical (5% Return Before Expenses) | | | | $1,000.00 | | | | | $1,019.10 | | | | | $6.17 | | | | | 1.21 | % | |
| |
* | Expenses are equal to the annualized expense ratio of each Share class multiplied by the average account value over the period, multiplied by 184/365 (to reflect one-half year period). |
Annual Report 11
|
|
Lazard Retirement Series, Inc. Portfolio Holdings Presented by Sector December 31, 2010 |
|
| | | | | | | | | | | | | | | | | | | | | |
Sector* | | | Lazard
Retirement
U.S. Strategic
Equity Portfolio | | | Lazard
Retirement
U.S. Small-Mid Cap
Equity Portfolio | | | Lazard
Retirement
International
Equity Portfolio | | | Lazard
Retirement
Emerging Markets
Equity Portfolio | |
| | | | | | | | | | | | | | | | | | | | | |
Consumer Discretionary | | | | 13.6 | % | | | | 14.8 | % | | | | 12.7 | % | | | | 5.8 | % | |
Consumer Staples | | | | 13.1 | | | | | 3.4 | | | | | 10.0 | | | | | 11.1 | | |
Energy | | | | 12.8 | | | | | 6.8 | | | | | 8.6 | | | | | 5.8 | | |
Financials | | | | 12.6 | | | | | 19.5 | | | | | 25.1 | | | | | 22.9 | | |
Health Care | | | | 11.2 | | | | | 7.7 | | | | | 9.1 | | | | | — | | |
Industrials | | | | 9.0 | | | | | 14.1 | | | | | 9.9 | | | | | 5.4 | | |
Information Technology | | | | 19.6 | | | | | 16.9 | | | | | 11.1 | | | | | 18.4 | | |
Materials | | | | 5.7 | | | | | 8.0 | | | | | 5.2 | | | | | 16.0 | | |
Telecommunication Services | | | | — | | | | | — | | | | | 4.1 | | | | | 9.1 | | |
Utilities | | | | — | | | | | 4.5 | | | | | 1.2 | | | | | 1.3 | | |
Short-Term Investments | | | | 2.4 | | | | | 4.3 | | | | | 3.0 | | | | | 4.2 | | |
Total Investments | | | | 100.0 | % | | | | 100.0 | % | | | | 100.0 | % | | | | 100.0 | % | |
| |
* | Represents percentage of total investments. |
12 Annual Report
|
|
Lazard Retirement Series, Inc. Portfolios of Investments December 31, 2010 |
|
| | | | | | | |
| | | | | |
| | | | | |
Description | | Shares | | Value | |
| | | | | |
| | | | | | | |
Lazard Retirement U.S. Strategic Equity Portfolio | | | | | | | |
| | | | | | | |
Common Stocks | 97.2% | | | | | | | |
| | | | | | | |
| | | | | | | |
Aerospace & Defense | 2.3% | | | | | | | |
Raytheon Co. | | | 3,010 | | $ | 139,483 | |
| | | | | | | |
Agriculture | 1.1% | | | | | | | |
Monsanto Co. | | | 990 | | | 68,944 | |
| | | | | | | |
Alcohol & Tobacco | 2.1% | | | | | | | |
Molson Coors Brewing Co., Class B | | | 2,630 | | | 132,000 | |
| | | | | | | |
Automotive | 0.6% | | | | | | | |
Ford Motor Co. (a) | | | 2,325 | | | 39,037 | |
| | | | | | | |
Banking | 5.2% | | | | | | | |
Bank of America Corp. | | | 3,925 | | | 52,360 | |
JPMorgan Chase & Co. | | | 3,270 | | | 138,713 | |
Wells Fargo & Co. | | | 4,195 | | | 130,003 | |
| | | | | | 321,076 | |
Cable Television | 4.3% | | | | | | | |
Comcast Corp., Class A | | | 12,695 | | | 264,183 | |
| | | | | | | |
Chemicals | 0.9% | | | | | | | |
Dow Chemical Co. | | | 1,580 | | | 53,941 | |
| | | | | | | |
Coal | 0.5% | | | | | | | |
Massey Energy Co. | | | 580 | | | 31,117 | |
| | | | | | | |
Commercial Services | 1.7% | | | | | | | |
Apollo Group, Inc., Class A (a) | | | 770 | | | 30,407 | |
Corrections Corp. of America (a) | | | 2,890 | | | 72,423 | |
| | | | | | 102,830 | |
Computer Software | 6.8% | | | | | | | |
Microsoft Corp. | | | 6,390 | | | 178,409 | |
Oracle Corp. | | | 6,065 | | | 189,834 | |
Symantec Corp. (a) | | | 3,275 | | | 54,824 | |
| | | | | | 423,067 | |
Consumer Products | 4.2% | | | | | | | |
Avon Products, Inc. | | | 2,545 | | | 73,958 | |
Mattel, Inc. | | | 705 | | | 17,928 | |
Newell Rubbermaid, Inc. | | | 2,390 | | | 43,450 | |
Stanley Black & Decker, Inc. | | | 910 | | | 60,852 | |
The Procter & Gamble Co. | | | 1,025 | | | 65,938 | |
| | | | | | 262,126 | |
| | | | | | | |
| | | | | |
| | | | | |
Description | | Shares | | Value | |
| | | | | |
| | | | | | | |
Energy Exploration & Production | 2.8% | | | | | | | |
Apache Corp. | | | 504 | | $ | 60,092 | |
Devon Energy Corp. | | | 565 | | | 44,358 | |
EQT Corp. | | | 1,565 | | | 70,175 | |
| | | | | | 174,625 | |
Energy Integrated | 7.4% | | | | | | | |
Chevron Corp. | | | 1,120 | | | 102,200 | |
ConocoPhillips | | | 4,770 | | | 324,837 | |
CONSOL Energy, Inc. | | | 600 | | | 29,244 | |
| | | | | | 456,281 | |
Energy Services | 1.0% | | | | | | | |
Halliburton Co. | | | 810 | | | 33,072 | |
Noble Corp. | | | 800 | | | 28,616 | |
| | | | | | 61,688 | |
Financial Services | 6.7% | | | | | | | |
Ameriprise Financial, Inc. | | | 2,235 | | | 128,624 | |
MasterCard, Inc., Class A | | | 230 | | | 51,545 | |
Morgan Stanley | | | 3,400 | | | 92,514 | |
NYSE Euronext | | | 2,115 | | | 63,408 | |
State Street Corp. | | | 1,705 | | | 79,010 | |
| | | | | | 415,101 | |
Food & Beverages | 1.8% | | | | | | | |
General Mills, Inc. | | | 1,630 | | | 58,012 | |
PepsiCo, Inc. | | | 805 | | | 52,590 | |
| | | | | | 110,602 | |
Insurance | 1.5% | | | | | | | |
The Travelers Cos., Inc. | | | 1,620 | | | 90,250 | |
| | | | | | | |
Leisure & Entertainment | 1.1% | | | | | | | |
Darden Restaurants, Inc. | | | 620 | | | 28,793 | |
McDonald’s Corp. | | | 515 | | | 39,531 | |
| | | | | | 68,324 | |
Manufacturing | 4.5% | | | | | | | |
Dover Corp. | | | 1,035 | | | 60,496 | |
Emerson Electric Co. | | | 865 | | | 49,452 | |
Honeywell International, Inc. | | | 1,925 | | | 102,333 | |
Illinois Tool Works, Inc. | | | 1,200 | | | 64,080 | |
| | | | | | 276,361 | |
Medical Products | 1.1% | | | | | | | |
Medtronic, Inc. | | | 1,865 | | | 69,173 | |
| | | | | | | |
Metal & Glass Containers | 2.5% | | | | | | | |
Ball Corp. | | | 2,230 | | | 151,751 | |
| | | | | | | |
Metals & Mining | 1.3% | | | | | | | |
Nucor Corp. | | | 1,780 | | | 78,000 | |
The accompanying notes are an integral part of these financial statements.
Annual Report 13
| | | | | | | |
| | | | | |
| | | | | |
Description | | Shares | | Value | |
| | | | | |
| | | | | | | |
Lazard Retirement U.S. Strategic Equity Portfolio (concluded) | | | | | | | |
| | | | | | | |
Pharmaceutical & Biotechnology | 10.1% | | | | | | | |
Amgen, Inc. (a) | | | 1,375 | | $ | 75,488 | |
Forest Laboratories, Inc. (a) | | | 1,400 | | | 44,772 | |
Gilead Sciences, Inc. (a) | | | 1,420 | | | 51,461 | |
Johnson & Johnson | | | 1,470 | | | 90,919 | |
Merck & Co., Inc. | | | 1,539 | | | 55,466 | |
Pfizer, Inc. | | | 17,285 | | | 302,660 | |
| | | | | | 620,766 | |
Refining | 1.1% | | | | | | | |
Valero Energy Corp. | | | 2,820 | | | 65,198 | |
| | | | | | | |
Retail | 11.6% | | | | | | | |
AutoZone, Inc. (a) | | | 471 | | | 128,390 | |
Big Lots, Inc. (a) | | | 1,340 | | | 40,816 | |
Lowe’s Cos., Inc. | | | 1,150 | | | 28,842 | |
The Gap, Inc. | | | 3,970 | | | 87,896 | |
Wal-Mart Stores, Inc. | | | 3,760 | | | 202,777 | |
Walgreen Co. | | | 5,820 | | | 226,747 | |
| | | | | | 715,468 | |
Semiconductor & Components | 2.3% | | | | | | | |
Intel Corp. | | | 6,835 | | | 143,740 | |
| | | | | | | |
Technology | 3.8% | | | | | | | |
AOL, Inc. (a) | | | 1,090 | | | 25,844 | |
Computer Sciences Corp. | | | 600 | | | 29,760 | |
eBay, Inc. (a) | | | 3,620 | | | 100,745 | |
Google, Inc., Class A (a) | | | 130 | | | 77,216 | |
| | | | | | 233,565 | |
| | | | | | | |
| | | | | |
| | | | | |
Description | | Shares | | Value | |
| | | | | |
| | | | | | | |
Technology Hardware | 5.8% | | | | | | | |
Cisco Systems, Inc. (a) | | | 4,295 | | $ | 86,888 | |
EMC Corp. (a) | | | 2,185 | | | 50,037 | |
International Business Machines Corp. | | | 1,515 | | | 222,341 | |
| | | | | | 359,266 | |
Transportation | 1.1% | | | | | | | |
Norfolk Southern Corp. | | | 1,110 | | | 69,730 | |
| | | | | | | |
Total Common Stocks | | | | | | | |
(Identified cost $5,015,130) | | | | | | 5,997,693 | |
| | | | | | | |
Preferred Stock | 0.5% | | | | | | | |
| | | | | | | |
Automotive | 0.5% | | | | | | | |
Better Place, Inc., Series B | | | | | | | |
(Identified cost $31,701) | | | 10,567 | | | 31,701 | |
| | | | | | | |
Short-Term Investment | 2.4% | | | | | | | |
State Street Institutional Treasury | | | | | | | |
Money Market Fund | | | | | | | |
(Identified cost $146,204) | | | 146,204 | | | 146,204 | |
| | | | | | | |
Total Investments | 100.1% | | | | | | | |
(Identified cost $5,193,035) (b) | | | | | $ | 6,175,598 | |
| | | | | | | |
Liabilities in Excess of Cash and | | | | | | | |
Other Assets | (0.1)% | | | | | | (3,531 | ) |
| | | | | | | |
Net Assets | 100.0% | | | | | $ | 6,172,067 | |
The accompanying notes are an integral part of these financial statements.
14 Annual Report
| | | | | | | |
| | | | | | | |
| | | | | | | |
Description | | | Shares | | | Value | |
| | | | | | | |
| | | | | | | |
Lazard Retirement U.S. Small-Mid Cap Equity Portfolio |
| | | | | | | |
Common Stocks | 99.3% | | | | | | | |
| | | | | | | |
Automotive | 2.0% | | | | | | | |
Dorman Products, Inc. (a) | | | 6,500 | | $ | 235,560 | |
Modine Manufacturing Co. (a) | | | 108,670 | | | 1,684,385 | |
Tenneco, Inc. (a) | | | 24,850 | | | 1,022,826 | |
| | | | | | 2,942,771 | |
Banking | 6.3% | | | | | | | |
BancorpSouth, Inc. | | | 47,800 | | | 762,410 | |
City National Corp. | | | 33,863 | | | 2,077,834 | |
Fulton Financial Corp. | | | 140,300 | | | 1,450,702 | |
PacWest Bancorp | | | 124,550 | | | 2,662,879 | |
Wintrust Financial Corp. | | | 67,780 | | | 2,238,773 | |
| | | | | | 9,192,598 | |
Chemicals | 3.7% | | | | | | | |
GrafTech International, Ltd. (a) | | | 66,200 | | | 1,313,408 | |
Kronos Worldwide, Inc. | | | 25,700 | | | 1,091,993 | |
Rockwood Holdings, Inc. (a) | | | 42,830 | | | 1,675,510 | |
Solutia, Inc. (a) | | | 60,300 | | | 1,391,724 | |
| | | | | | 5,472,635 | |
Commercial Services | 2.3% | | | | | | | |
Equifax, Inc. | | | 42,200 | | | 1,502,320 | |
Team, Inc. (a) | | | 78,500 | | | 1,899,700 | |
| | | | | | 3,402,020 | |
Computer Software | 6.1% | | | | | | | |
Akamai Technologies, Inc. (a) | | | 19,300 | | | 908,065 | |
BMC Software, Inc. (a) | | | 45,300 | | | 2,135,442 | |
Nuance Communications, Inc. (a) | | | 69,700 | | | 1,267,146 | |
Quest Software, Inc. (a) | | | 84,600 | | | 2,346,804 | |
Red Hat, Inc. (a) | | | 50,850 | | | 2,321,302 | |
| | | | | | 8,978,759 | |
Construction & Engineering | 2.1% | | | | | | | |
Orion Marine Group, Inc. (a) | | | 85,100 | | | 987,160 | |
Quanta Services, Inc. (a) | | | 101,600 | | | 2,023,872 | |
| | | | | | 3,011,032 | |
Consumer Products | 6.5% | | | | | | | |
Central Garden & Pet Co., Class A (a) | | | 222,662 | | | 2,199,901 | |
Mattel, Inc. | | | 59,290 | | | 1,507,745 | |
Matthews International Corp., Class A | | | 42,980 | | | 1,503,440 | |
Newell Rubbermaid, Inc. | | | 79,100 | | | 1,438,038 | |
Tempur-Pedic International, Inc. (a) | | | 37,790 | | | 1,513,867 | |
The Middleby Corp. (a) | | | 17,000 | | | 1,435,140 | |
| | | | | | 9,598,131 | |
| | | | | | | |
| | | | | | | |
| | | | | | | |
Description | | | Shares | | | Value | |
| | | | | | | |
| | | | | | | |
Electric | 1.6% | | | | | | | |
Northeast Utilities | | | 74,940 | | $ | 2,389,087 | |
| | | | | | | |
Energy Integrated | 2.9% | | | | | | | |
Cimarex Energy Co. | | | 25,510 | | | 2,258,400 | |
James River Coal Co. (a) | | | 75,850 | | | 1,921,281 | |
| | | | | | 4,179,681 | |
Energy Services | 4.2% | | | | | | | |
Helmerich & Payne, Inc. | | | 46,690 | | | 2,263,531 | |
Key Energy Services, Inc. (a) | | | 128,800 | | | 1,671,824 | |
Oceaneering International, Inc. (a) | | | 30,220 | | | 2,225,099 | |
| | | | | | 6,160,454 | |
Financial Services | 3.3% | | | | | | | |
NYSE Euronext | | | 75,900 | | | 2,275,482 | |
Stifel Financial Corp. (a) | | | 41,100 | | | 2,549,844 | |
| | | | | | 4,825,326 | |
Food & Beverages | 2.1% | | | | | | | |
Ralcorp Holdings, Inc. (a) | | | 28,500 | | | 1,852,785 | |
Snyders-Lance, Inc. | | | 51,650 | | | 1,210,676 | |
| | | | | | 3,063,461 | |
Forest & Paper Products | 2.3% | | | | | | | |
Rock-Tenn Co., Class A | | | 33,500 | | | 1,807,325 | |
Schweitzer-Mauduit International, Inc. | | | 25,600 | | | 1,610,752 | |
| | | | | | 3,418,077 | |
Gas Utilities | 3.1% | | | | | | | |
New Jersey Resources Corp. | | | 57,800 | | | 2,491,758 | |
Piedmont Natural Gas Co., Inc. | | | 74,200 | | | 2,074,632 | |
| | | | | | 4,566,390 | |
Health Services | 2.1% | | | | | | | |
Community Health Systems, Inc. (a) | | | 29,000 | | | 1,083,730 | |
VCA Antech, Inc. (a) | | | 84,200 | | | 1,961,018 | |
| | | | | | 3,044,748 | |
Housing | 1.0% | | | | | | | |
Trex Co., Inc. (a) | | | 58,385 | | | 1,398,905 | |
| | | | | | | |
Insurance | 2.2% | | | | | | | |
Arch Capital Group, Ltd. (a) | | | 23,600 | | | 2,077,980 | |
Aspen Insurance Holdings, Ltd. | | | 41,200 | | | 1,179,144 | |
| | | | | | 3,257,124 | |
Leisure & Entertainment | 2.1% | | | | | | | |
Darden Restaurants, Inc. | | | 34,190 | | | 1,587,783 | |
Texas Roadhouse, Inc. (a) | | | 90,510 | | | 1,554,057 | |
| | | | | | 3,141,840 | |
The accompanying notes are an integral part of these financial statements.
Annual Report 15
| | | | | | | |
| | | | | | | |
| | | | | | | |
Description | | | Shares | | | Value | |
| | | | | | | |
| | | | | | | |
Lazard Retirement U.S. Small-Mid Cap Equity Portfolio (concluded) |
| | | | | | | |
Manufacturing | 7.9% | | | | | | | |
Altra Holdings, Inc. (a) | | | 109,930 | | $ | 2,183,210 | |
BE Aerospace, Inc. (a) | | | 37,600 | | | 1,392,328 | |
FLIR Systems, Inc. (a) | | | 70,140 | | | 2,086,665 | |
Generac Holdings, Inc. | | | 69,173 | | | 1,118,527 | |
Harsco Corp. | | | 96,400 | | | 2,730,048 | |
Regal-Beloit Corp. | | | 29,960 | | | 2,000,130 | |
| | | | | | 11,510,908 | |
Medical Products | 4.9% | | | | | | | |
CareFusion Corp. (a) | | | 66,540 | | | 1,710,078 | |
Haemonetics Corp. (a) | | | 15,140 | | | 956,545 | |
Hospira, Inc. (a) | | | 39,870 | | | 2,220,360 | |
Life Technologies Corp. (a) | | | 42,200 | | | 2,342,100 | |
| | | | | | 7,229,083 | |
Metal & Glass Containers | 1.8% | | | | | | | |
Ball Corp. | | | 20,470 | | | 1,392,983 | |
Owens-Illinois, Inc. (a) | | | 42,010 | | | 1,289,707 | |
| | | | | | 2,682,690 | |
Metals & Mining | 1.4% | | | | | | | |
Schnitzer Steel Industries, Inc., Class A | | | 29,930 | | | 1,987,053 | |
| | | | | | | |
Pharmaceutical & Biotechnology | 1.0% | | | | | | | |
Warner Chilcott PLC, Class A | | | 67,030 | | | 1,512,197 | |
| | | | | | | |
Real Estate | 8.6% | | | | | | | |
CB Richard Ellis Group, Inc., Class A (a) | | | 38,500 | | | 788,480 | |
Digital Realty Trust, Inc. REIT | | | 26,250 | | | 1,352,925 | |
Extra Space Storage, Inc. REIT | | | 123,800 | | | 2,154,120 | |
Kilroy Realty Corp. REIT | | | 39,850 | | | 1,453,330 | |
LaSalle Hotel Properties REIT | | | 75,100 | | | 1,982,640 | |
The Macerich Co. REIT | | | 51,022 | | | 2,416,912 | |
UDR, Inc. REIT | | | 101,400 | | | 2,384,928 | |
| | | | | | 12,533,335 | |
Retail | 6.7% | | | | | | | |
American Eagle Outfitters, Inc. | | | 101,020 | | | 1,477,922 | |
Brown Shoe Co., Inc. | | | 139,100 | | | 1,937,663 | |
Family Dollar Stores, Inc. | | | 30,270 | | | 1,504,722 | |
Iconix Brand Group, Inc. (a) | | | 100,120 | | | 1,933,317 | |
Liz Claiborne, Inc. (a) | | | 199,230 | | | 1,426,487 | |
Williams-Sonoma, Inc. | | | 41,700 | | | 1,488,273 | |
| | | | | | 9,768,384 | |
| | | | | | | |
| | | | | | | |
| | | | | | | |
Description | | | Shares | | | Value | |
| | | | | | | |
| | | | | | | |
Semiconductor & Components | 3.4% | | | | | | | |
FARO Technologies, Inc. (a) | | | 11,400 | | $ | 374,376 | |
ON Semiconductor Corp. (a) | | | 224,200 | | | 2,215,096 | |
Xilinx, Inc. | | | 82,200 | | | 2,382,156 | |
| | | | | | 4,971,628 | |
Technology | 1.8% | | | | | | | |
SS&C Technologies Holdings, Inc. | | | 131,200 | | | 2,690,912 | |
| | | | | | | |
Technology Hardware | 3.6% | | | | | | | |
EchoStar Corp., Class A (a) | | | 3,300 | | | 82,401 | |
Ingram Micro, Inc., Class A (a) | | | 86,400 | | | 1,649,376 | |
Polycom, Inc. (a) | | | 46,900 | | | 1,828,162 | |
Teradyne, Inc. (a) | | | 121,100 | | | 1,700,244 | |
| | | | | | 5,260,183 | |
Transportation | 2.3% | | | | | | | |
Echo Global Logistics, Inc. (a) | | | 154,460 | | | 1,859,699 | |
UTI Worldwide, Inc. | | | 74,226 | | | 1,573,591 | |
| | | | | | 3,433,290 | |
Total Common Stocks | | | | | | | |
(Identified cost $116,977,188) | | | | | | 145,622,702 | |
| | | | | | | |
Preferred Stock | 0.6% | | | | | | | |
| | | | | | | |
Automotive | 0.6% | | | | | | | |
Better Place, Inc., Series B | | | | | | | |
(Identified cost $864,900) | | | 288,300 | | | 864,900 | |
| | | | | | | |
Short-Term Investment | 4.5% | | | | | | | |
State Street Institutional Treasury | | | | | | | |
Money Market Fund | | | | | | | |
(Identified cost $6,572,154) | | | 6,572,154 | | | 6,572,154 | |
| | | | | | | |
Total Investments | 104.4% | | | | | | | |
(Identified cost $124,414,242) (b) | | | | | $ | 153,059,756 | |
| | | | | | | |
Liabilities in Excess of Cash and | | | | | | | |
Other Assets | (4.4)% | | | | | | (6,416,009 | ) |
| | | | | | | |
Net Assets | 100.0% | | | | | $ | 146,643,747 | |
The accompanying notes are an integral part of these financial statements.
16 Annual Report
| | | | | | | |
| | | | | | | |
| | | | | | | |
Description | | | Shares | | | Value | |
| | | | | | | |
| | | | | | | |
Lazard Retirement International Equity Portfolio |
| | | | | | | |
Common Stocks | 95.6% | | | | | | | |
| | | | | | | |
Australia | 2.2% | | | | | | | |
QBE Insurance Group, Ltd. | | | 217,100 | | $ | 4,030,206 | |
Telstra Corp., Ltd. | | | 2,159,700 | | | 6,162,948 | |
Total Australia | | | | | | 10,193,154 | |
| | | | | | | |
Belgium | 2.2% | | | | | | | |
Anheuser-Busch InBev NV | | | 177,400 | | | 10,146,151 | |
| | | | | | | |
Brazil | 2.6% | | | | | | | |
Banco do Brasil SA | | | 366,842 | | | 6,943,479 | |
Cielo SA | | | 645,600 | | | 5,230,916 | |
Total Brazil | | | | | | 12,174,395 | |
| | | | | | | |
Canada | 1.7% | | | | | | | |
Potash Corp. of Saskatchewan, Inc. | | | 27,200 | | | 4,225,123 | |
Rogers Communications, Inc. | | | 109,600 | | | 3,813,900 | |
Total Canada | | | | | | 8,039,023 | |
| | | | | | | |
China | 1.5% | | | | | | | |
Industrial and Commercial Bank of | | | | | | | |
China, Ltd., Class H | | | 5,695,600 | | | 4,228,028 | |
Weichai Power Co., Ltd., Class H | | | 491,000 | | | 3,035,270 | |
Total China | | | | | | 7,263,298 | |
| | | | | | | |
Denmark | 1.2% | | | | | | | |
Novo Nordisk A/S, Class B | | | 50,400 | | | 5,683,276 | |
| | | | | | | |
Finland | 0.9% | | | | | | | |
Sampo Oyj, A Shares | | | 158,900 | | | 4,257,378 | |
| | | | | | | |
France | 9.9% | | | | | | | |
BNP Paribas SA | | | 115,080 | | | 7,321,532 | |
Danone SA | | | 112,870 | | | 7,091,941 | |
Sanofi-Aventis | | | 171,280 | | | 10,951,977 | |
Technip SA | | | 72,900 | | | 6,731,464 | |
Total SA | | | 126,572 | | | 6,706,328 | |
Valeo SA (a) | | | 141,400 | | | 8,023,881 | |
Total France | | | | | | 46,827,123 | |
| | | | | | | |
| | | | | | | |
| | | | | | | |
Description | | | Shares | | | Value | |
| | | | | | | |
| | | | | | | |
Germany | 4.4% | | | | | | | |
Bayerische Motoren Werke AG | | | 72,300 | | $ | 5,685,762 | |
SAP AG | | | 89,000 | | | 4,531,259 | |
Siemens AG | | | 82,838 | | | 10,261,558 | |
Total Germany | | | | | | 20,478,579 | |
| | | | | | | |
Hong Kong | 1.2% | | | | | | | |
AIA Group, Ltd. | | | 377,600 | | | 1,061,466 | |
Esprit Holdings, Ltd. | | | 1 | | | 5 | |
Kerry Properties, Ltd. | | | 858,600 | | | 4,451,623 | |
Total Hong Kong | | | | | | 5,513,094 | |
| | | | | | | |
Israel | 0.9% | | | | | | | |
Teva Pharmaceutical Industries, Ltd., | | | | | | | |
Sponsored ADR | | | 80,600 | | | 4,201,678 | |
| | | | | | | |
Italy | 1.0% | | | | | | | |
Atlantia SpA | | | 240,802 | | | 4,913,637 | |
| | | | | | | |
Japan | 19.3% | | | | | | | |
Asics Corp. | | | 199,960 | | | 2,571,231 | |
Benesse Holdings, Inc. | | | 88,400 | | | 4,072,127 | |
Canon, Inc. | | | 191,600 | | | 9,935,164 | |
Daito Trust Construction Co., Ltd. | | | 140,900 | | | 9,649,021 | |
Don Quijote Co., Ltd. | | | 107,800 | | | 3,283,525 | |
eAccess, Ltd. | | | 5,615 | | | 3,395,695 | |
Honda Motor Co., Ltd. | | | 209,300 | | | 8,287,960 | |
Hoya Corp. | | | 256,800 | | | 6,237,340 | |
JS Group Corp. | | | 190,500 | | | 4,192,924 | |
Keyence Corp. | | | 14,900 | | | 4,316,394 | |
Kubota Corp. | | | 1 | | | 10 | |
Mitsubishi Corp. | | | 178,600 | | | 4,835,113 | |
Mitsubishi Estate Co., Ltd. | | | 319,000 | | | 5,917,157 | |
Nidec Corp. | | | 49,500 | | | 5,005,481 | |
Sumitomo Mitsui Financial Group, Inc. | | | 193,900 | | | 6,906,747 | |
Yahoo Japan Corp. | | | 18,343 | | | 7,116,695 | |
Yamada Denki Co., Ltd. | | | 77,080 | | | 5,259,554 | |
Total Japan | | | | | | 90,982,138 | |
| | | | | | | |
Mexico | 0.8% | | | | | | | |
Grupo Televisa SA Sponsored ADR (a) | | | 150,900 | | | 3,912,837 | |
The accompanying notes are an integral part of these financial statements.
Annual Report 17
| | | | | | |
| | | | | | |
| | | | | |
Description | | Shares | | Value | |
| | | | | | |
| | | | | | |
Lazard Retirement International Equity Portfolio (concluded) |
| | | | | | |
Netherlands | 2.6% | | | | | | |
ING Groep NV (a) | | 673,430 | | $ | 6,551,305 | |
TNT NV | | 210,337 | | | 5,551,198 | |
Total Netherlands | | | | | 12,102,503 | |
| | | | | | |
Norway | 0.9% | | | | | | |
Aker Solutions ASA | | 245,400 | | | 4,174,077 | |
| | | | | | |
Russia | 0.9% | | | | | | |
Sberbank | | 1,284,500 | | | 4,376,292 | |
| | | | | | |
Singapore | 0.9% | | | | | | |
Singapore Telecommunications, Ltd. | | 1,819,200 | | | 4,327,627 | |
| | | | | | |
South Korea | 2.3% | | | | | | |
Hyundai Mobis (a) | | 21,300 | | | 5,339,545 | |
Samsung Electronics Co., Ltd. GDR (c) | | 13,100 | | | 5,526,890 | |
Total South Korea | | | | | 10,866,435 | |
| | | | | | |
Spain | 1.1% | | | | | | |
Amadeus IT Holding SA, A Shares | | 252,700 | | | 5,294,869 | |
| | | | | | |
Sweden | 0.9% | | | | | | |
Assa Abloy AB, Class B | | 151,500 | | | 4,268,621 | |
| | | | | | |
Switzerland | 7.0% | | | | | | |
Julius Baer Group, Ltd. | | 103,300 | | | 4,839,080 | |
Nestle SA | | 133,140 | | | 7,796,166 | |
Novartis AG | | 217,800 | | | 12,800,117 | |
UBS AG (a) | | 445,160 | | | 7,308,242 | |
Total Switzerland | | | | | 32,743,605 | |
| | | | | | |
Turkey | 0.8% | | | | | | |
Turkiye Garanti Bankasi AS ADR | | 772,700 | | | 3,979,405 | |
| | | | | | |
| | | | | | |
| | | | | | |
Description | | Shares | | Value | |
| | | | | | |
| | | | | | |
United Kingdom | 28.4% | | | | | | |
AMEC PLC | | 154,800 | | $ | 2,775,508 | |
BAE Systems PLC | | 778,900 | | | 4,007,462 | |
BG Group PLC | | 245,900 | | | 4,968,637 | |
BHP Billiton PLC | | 228,100 | | | 9,072,135 | |
British Airways PLC (a) | | 1 | | | 4 | |
British American Tobacco PLC | | 172,840 | | | 6,638,509 | |
GlaxoSmithKline PLC | | 453,200 | | | 8,761,639 | |
HSBC Holdings PLC | | 998,791 | | | 10,139,022 | |
Informa PLC | | 969,324 | | | 6,158,435 | |
International Power PLC | | 823,900 | | | 5,621,155 | |
Lloyds Banking Group PLC (a) | | 6,391,578 | | | 6,547,073 | |
Prudential PLC | | 1,017,330 | | | 10,595,271 | |
Royal Dutch Shell PLC, A Shares | | 304,400 | | | 10,149,103 | |
Standard Chartered PLC | | 278,875 | | | 7,502,367 | |
Tullow Oil PLC | | 233,700 | | | 4,594,598 | |
Unilever PLC | | 308,000 | | | 9,426,376 | |
Vodafone Group PLC | | 1,822,541 | | | 4,711,244 | |
William Morrison Supermarkets PLC | | 1,295,900 | | | 5,406,689 | |
WPP PLC | | 483,000 | | | 5,945,290 | |
Xstrata PLC | | 453,400 | | | 10,642,313 | |
Total United Kingdom | | | | | 133,662,830 | |
| | | | | | |
Total Common Stocks
(Identified cost $382,880,058) | | | | | 450,382,025 | |
| | | | | | |
Short-Term Investment | 2.9% | | | | | | |
State Street Institutional Treasury | | | | | | |
Money Market Fund | | | | | | |
(Identified cost $13,681,301) | | 13,681,301 | | | 13,681,301 | |
| | | | | | |
Total Investments | 98.5%
(Identified cost $396,561,359) (b) | | | | $ | 464,063,326 | |
| | | | | | |
Cash and Other Assets in | | | | | | |
Excess of Liabilities | 1.5% | | | | | 6,967,139 | |
| | | | | | |
Net Assets | 100.0% | | | | $ | 471,030,465 | |
The accompanying notes are an integral part of these financial statements.
18 Annual Report
| | | | | | |
| | | | | | |
| | | | | | |
Description | | Shares | | Value | |
| | | | | | |
| | | | | | |
Lazard Retirement Emerging Markets Equity Portfolio | | | | | | |
| | | | | | |
Common Stocks | 92.2% | | | | | | |
| | | | | | |
Brazil | 17.4% | | | | | | |
Banco do Brasil SA | | 1,769,566 | | $ | 33,493,834 | |
Cielo SA | | 2,916,600 | | | 23,631,488 | |
Companhia de Concessoes Rodoviarias | | 258,800 | | | 7,311,879 | |
Companhia Energetica de Minas | | | | | | |
Gerais SA Sponsored ADR | | 624,710 | | | 10,363,939 | |
Companhia Siderurgica Nacional SA | | | | | | |
Sponsored ADR | | 801,600 | | | 13,362,672 | |
Natura Cosmeticos SA | | 422,800 | | | 12,146,585 | |
Redecard SA | | 1,683,657 | | | 21,349,988 | |
Souza Cruz SA | | 160,311 | | | 8,729,224 | |
Vale SA Sponsored ADR | | 865,800 | | | 29,930,706 | |
Total Brazil | | | | | 160,320,315 | |
| | | | | | |
Canada | 1.7% | | | | | | |
First Quantum Minerals, Ltd. | | 145,000 | | | 15,749,774 | |
| | | | | | |
China | 2.5% | | | | | | |
China Construction Bank Corp., Class H | | 10,038,390 | | | 9,040,337 | |
NetEase.com, Inc. Sponsored ADR (a) | | 248,300 | | | 8,976,045 | |
Weichai Power Co., Ltd., Class H | | 847,000 | | | 5,235,996 | |
Total China | | | | | 23,252,378 | |
| | | | | | |
Egypt | 3.1% | | | | | | |
Commercial International Bank | | 1,195,442 | | | 9,750,935 | |
Eastern Co. | | 159,553 | | | 3,298,253 | |
Egyptian Company for Mobile Services | | 120,465 | | | 3,405,393 | |
Orascom Construction Industries | | 242,444 | | | 12,019,877 | |
Total Egypt | | | | | 28,474,458 | |
| | | | | | |
France | 0.7% | | | | | | |
CFAO SA | | 142,659 | | | 6,208,989 | |
| | | | | | |
| | | | | | |
Hong Kong | 0.0% | | | | | | |
China High Speed Transmission | | | | | | |
Equipment Group Co., Ltd. | | 91,000 | | | 140,490 | |
Shougang Concord International | | | | | | |
Enterprises Co., Ltd. (a) | | 1,565,500 | | | 227,590 | |
Total Hong Kong | | | | | 368,080 | |
| | | | | | |
| | | | | | |
| | | | | | |
Description | | Shares | | Value | |
| | | | | | |
| | | | | | |
Hungary | 1.2% | | | | | | |
OTP Bank Nyrt (a) | | 443,258 | | $ | 10,694,989 | |
| | | | | | |
| | | | | | |
India | 4.6% | | | | | | |
Bank of India | | 889,272 | | | 9,028,950 | |
Infosys Technologies, Ltd. | | | | | | |
Sponsored ADR | | 91,200 | | | 6,938,496 | |
Jindal Steel & Power, Ltd. | | 579,759 | | | 9,228,949 | |
Punjab National Bank, Ltd. | | 646,817 | | | 17,677,350 | |
Total India | | | | | 42,873,745 | |
| | | | | | |
Indonesia | 4.7% | | | | | | |
PT Bank Mandiri Tbk | | 8,047,100 | | | 5,805,344 | |
PT Semen Gresik (Persero) Tbk | | 6,560,500 | | | 6,880,880 | |
PT Tambang Batubara Bukit Asam Tbk | | 2,832,000 | | | 7,213,585 | |
PT Telekomunikasi Indonesia Tbk | | | | | | |
Sponsored ADR | | 483,600 | | | 17,240,340 | |
PT United Tractors Tbk | | 2,496,450 | | | 6,594,396 | |
Total Indonesia | | | | | 43,734,545 | |
| | | | | | |
Malaysia | 0.5% | | | | | | |
British American Tobacco Malaysia Berhad | | 335,000 | | | 4,888,925 | |
| | | | | | |
Mexico | 6.5% | | | | | | |
America Movil SAB de CV ADR, Series L | | 232,900 | | | 13,354,486 | |
Desarrolladora Homex SAB de CV ADR (a) | | 149,390 | | | 5,050,876 | |
Fomento Economico Mexicano | | | | | | |
SAB de CV Sponsored ADR | | 161,590 | | | 9,036,113 | |
Grupo Mexico SAB de CV, Series B | | 3,773,854 | | | 15,535,444 | |
Grupo Televisa SA Sponsored ADR (a) | | 454,600 | | | 11,787,778 | |
Kimberly-Clark de Mexico SAB de CV, | | | | | | |
Series A | | 907,200 | | | 5,535,022 | |
Total Mexico | | | | | 60,299,719 | |
| | | | | | |
Pakistan | 1.2% | | | | | | |
Oil & Gas Development Co., Ltd. | | 2,377,200 | | | 4,722,501 | |
Pakistan Petroleum, Ltd. | | 2,543,244 | | | 6,444,467 | |
Total Pakistan | | | | | 11,166,968 | |
| | | | | | |
Philippines | 1.9% | | | | | | |
Philippine Long Distance Telephone Co. | | | | | | |
Sponsored ADR | | 293,700 | | | 17,113,899 | |
The accompanying notes are an integral part of these financial statements.
Annual Report 19
| | | | | | | |
| | | | | | | |
| | | | | | | |
Description | | Shares | | Value | |
| | | | | | | |
| | | | | | | |
Lazard Retirement Emerging Markets Equity Portfolio (concluded) | |
| | | | | | | |
Russia | 6.4% | | | | | | | |
Magnit OJSC Sponsored GDR (c), (d) | | | 243,275 | | $ | 7,127,958 | |
Mobile TeleSystems Sponsored ADR | | | 604,500 | | | 12,615,915 | |
OAO LUKOIL Sponsored ADR | | | 213,100 | | | 12,058,834 | |
Oriflame Cosmetics SA SDR | | | 131,230 | | | 6,907,202 | |
TNK-BP Holding | | | 2,774,636 | | | 7,352,785 | |
Uralkali Sponsored GDR | | | 345,952 | | | 12,703,357 | |
Total Russia | | | | | | 58,766,051 | |
| | | | | | | |
South Africa | 11.0% | | | | | | | |
Bidvest Group, Ltd. | | | 88,347 | | | 2,102,223 | |
Kumba Iron Ore, Ltd. | | | 265,116 | | | 17,084,135 | |
Massmart Holdings, Ltd. | | | 379,486 | | | 8,450,944 | |
Murray & Roberts Holdings, Ltd. | | | 1,428,865 | | | 8,713,094 | |
Nedbank Group, Ltd. | | | 395,135 | | | 7,818,725 | |
Pretoria Portland Cement Co., Ltd. | | | 1,725,893 | | | 9,156,730 | |
Sanlam, Ltd. | | | 3,002,628 | | | 12,726,129 | |
Shoprite Holdings, Ltd. | | | 536,293 | | | 8,112,577 | |
Standard Bank Group, Ltd. | | | 513,586 | | | 8,384,998 | |
Tiger Brands, Ltd. | | | 302,441 | | | 8,889,814 | |
Truworths International, Ltd. | | | 896,727 | | | 9,753,395 | |
Total South Africa | | | | | | 101,192,764 | |
| | | | | | | |
South Korea | 13.3% | | | | | | | |
Hite Brewery Co., Ltd. (a) | | | 38,295 | | | 4,066,039 | |
Hyundai Mobis (a) | | | 42,245 | | | 10,590,098 | |
KB Financial Group, Inc. (a) | | | 140,600 | | | 7,433,254 | |
Korea Life Insurance Co., Ltd. | | | 1,683,452 | | | 11,792,619 | |
KT&G Corp. (a) | | | 247,810 | | | 14,127,506 | |
NHN Corp. (a) | | | 85,271 | | | 17,055,703 | |
Samsung Electronics Co., Ltd. GDR (c) | | | 50,673 | | | 21,378,939 | |
Shinhan Financial Group Co., Ltd. (a) | | | 570,858 | | | 26,608,854 | |
Woongjin Coway Co., Ltd. (a) | | | 268,786 | | | 9,544,520 | |
Total South Korea | | | | | | 122,597,532 | |
| | | | | | | |
Taiwan | 7.5% | | | | | | | |
Advanced Semiconductor | | | | | | | |
Engineering, Inc. | | | 6,653,516 | | | 7,701,753 | |
Delta Electronics, Inc. | | | 1,558,000 | | | 7,614,597 | |
Hon Hai Precision Industry Co., Ltd. | | | 3,287,959 | | | 13,250,396 | |
HTC Corp. | | | 220,385 | | | 6,802,823 | |
MediaTek, Inc. | | | 1,014,675 | | | 14,529,412 | |
Taiwan Semiconductor | | | | | | | |
Manufacturing Co., Ltd. | | | 7,727,642 | | | 18,817,848 | |
Total Taiwan | | | | | | 68,716,829 | |
| | | | | | | |
| | | | | | | |
| | | | | | | |
Description | | | Shares | | | Value | |
| | | | | | | |
| | | | | | | |
Thailand | 1.7% | | | | | | | |
Banpu Public Co., Ltd. | | | 350,800 | | $ | 9,170,025 | |
Kasikornbank Public Co., Ltd. | | | 1,473,600 | | | 6,379,326 | |
Total Thailand | | | | | | 15,549,351 | |
| | | | | | | |
Turkey | 6.3% | | | | | | | |
Akbank TAS | | | 1,833,796 | | | 10,190,395 | |
Koc Holding AS | | | 1,368,119 | | | 6,663,377 | |
Turkcell Iletisim Hizmetleri AS | | | 2,806,857 | | | 19,178,978 | |
Turkiye Is Bankasi AS, C Shares | | | 6,067,162 | | | 21,612,300 | |
Total Turkey | | | | | | 57,645,050 | |
| | | | | | | |
Total Common Stocks | | | | | | | |
(Identified cost $671,085,834) | | | | | | 849,614,361 | |
| | | | | | | |
Preferred Stocks | 2.6% | | | | | | | |
| | | | | | | |
Brazil | 2.6% | | | | | | | |
Companhia de Bebidas das Americas SA | | | | | | | |
Sponsored ADR | | | 9,600 | | | 297,888 | |
Eletropaulo Metropolitana SA | | | 92,000 | | | 1,779,590 | |
Ultrapar Participacoes SA | | | 100,200 | | | 6,343,988 | |
Usinas Siderurgicas de Minas Gerais SA, | | | | | | | |
A Shares | | | 1,297,000 | | | 14,970,193 | |
Vale Fertilizantes SA (a) | | | 75,500 | | | 863,702 | |
Total Brazil | | | | | | 24,255,361 | |
| | | | | | | |
Total Preferred Stocks | | | | | | | |
(Identified cost $23,896,916) | | | | | | 24,255,361 | |
| | | | | | | |
Short-Term Investment | 4.2% | | | | | | | |
State Street Institutional Treasury | | | | | | | |
Money Market Fund | | | | | | | |
(Identified cost $38,605,417) | | | 38,605,417 | | | 38,605,417 | |
| | | | | | | |
Total Investments | 99.0% | | | | | | | |
(Identified cost $733,588,167) (b) | | | | | $ | 912,475,139 | |
| | | | | | | |
Cash and Other Assets in | | | | | | | |
Excess of Liabilities | 1.0% | | | | | | 9,282,671 | |
| | | | | | | |
Net Assets | 100.0% | | | | | $ | 921,757,810 | |
The accompanying notes are an integral part of these financial statements.
20 Annual Report
|
|
Lazard Retirement Series, Inc. Notes to Portfolios of Investments December 31, 2010 |
|
| |
(a) | Non-income producing security. |
| |
(b) | For federal income tax purposes, the aggregate cost, aggregate gross unrealized appreciation, aggregate gross unrealized depreciation and the net unrealized appreciation are as follows: |
| | | | | | | | | | | | | | | | | | | |
| | | | | | | | | | | | | |
Portfolio | | Aggregate
Cost | | Aggregate Gross
Unrealized
Appreciation | | Aggregate Gross
Unrealized
Depreciation | | Net Unrealized
Appreciation | |
| | | | | | | | | | | | | | | | | | | |
| | | | | | | | | | | | | | | | | | | |
Retirement U.S. Strategic Equity | | $ | 5,279,084 | | | $ | 927,329 | | | | $ | 30,815 | | | | $ | 896,514 | | |
Retirement U.S. Small-Mid Cap Equity | | | 124,578,910 | | | | 29,003,836 | | | | | 522,990 | | | | | 28,480,846 | | |
Retirement International Equity | | | 408,341,905 | | | | 61,097,342 | | | | | 5,375,921 | | | | | 55,721,421 | | |
Retirement Emerging Markets Equity | | | 746,134,424 | | | | 179,149,883 | | | | | 12,809,168 | | | | | 166,340,715 | | |
| |
(c) | Pursuant to Rule 144A under the Securities Act of 1933, these securities may only be traded among “qualified institutional buyers.” At December 31, 2010, these securities amounted to 1.2% and 3.1% of net assets of Lazard Retirement International Equity Portfolio and Lazard Retirement Emerging Markets Equity Portfolio, respectively, and are considered to be liquid. |
| |
(d) | Categorized based on Level 2 inputs. (Note 8) |
| | |
Security Abbreviations: |
ADR | — | American Depositary Receipt |
GDR | — | Global Depositary Receipt |
REIT | — | Real Estate Investment Trust |
SDR | — | Swedish Depositary Receipt |
The accompanying notes are an integral part of these financial statements.
Annual Report 21
Portfolio holdings by industry (as percentage of net assets), for those Portfolios previously presented by country:
| | | | | | | | | | | |
| | | | | | | |
Industry | | Lazard
Retirement
International
Equity Portfolio | | Lazard
Retirement
Emerging Markets
Equity Portfolio | |
| | | | | | | | | | | |
| | | | | | | | | | | |
Agriculture | | | 0.9 | % | | | | 1.5 | % | | |
Alcohol &Tobacco | | | 3.6 | | | | | 3.9 | | | |
Automotive | | | 4.7 | | | | | — | | | |
Banking | | | 11.9 | | | | | 17.1 | | | |
Building Materials | | | — | | | | | 1.0 | | | |
Commercial Services | | | 4.5 | | | | | 3.2 | | | |
Computer Software | | | 1.0 | | | | | 2.8 | | | |
Construction & Engineering | | | 0.6 | | | | | 2.2 | | | |
Consumer Products | | | — | | | | | 3.1 | | | |
Diversified | | | — | | | | | 0.9 | | | |
Electric | | | 1.2 | | | | | 1.3 | | | |
Energy Exploration & Production | | | 1.0 | | | | | 1.2 | | | |
Energy Integrated | | | 4.6 | | | | | 3.9 | | | |
Energy Services | | | 2.3 | | | | | — | | | |
Financial Services | | | 4.3 | | | | | 6.6 | | | |
Food & Beverages | | | 5.2 | | | | | 1.9 | | | |
Forest & Paper Products | | | — | | | | | 0.6 | | | |
Gas Utilities | | | — | | | | | 0.7 | | | |
Housing | | | 2.9 | | | | | 1.3 | | | |
Insurance | | | 4.2 | | | | | 1.3 | | | |
Leisure & Entertainment | | | 3.0 | | | | | 1.3 | | | |
Manufacturing | | | 6.6 | | | | | 2.4 | | | |
Metals & Mining | | | 4.2 | | | | | 12.6 | | | |
Pharmaceutical & Biotechnology | | | 9.0 | | | | | — | | | |
Real Estate | | | 2.2 | | | | | — | | | |
Retail | | | 3.5 | | | | | 3.6 | | | |
Semiconductors & Components | | | 4.6 | | | | | 7.6 | | | |
Technology | | | 2.6 | | | | | 0.8 | | | |
Technology Hardware | | | — | | | | | 2.2 | | | |
Telecommunications | | | 4.8 | | | | | 9.0 | | | |
Transportation | | | 2.2 | | | | | 0.8 | | | |
Subtotal | | | 95.6 | | | | | 94.8 | | | |
Short-Term Investments | | | 2.9 | | | | | 4.2 | | | |
Total Investments | | | 98.5 | % | | | | 99.0 | % | | |
The accompanying notes are an integral part of these financial statements.
22 Annual Report
|
|
Lazard Retirement Series, Inc. Statements of Assets and Liabilities |
|
| | | | | | | | | | | | | | | | | | | | | |
| | | | | | | | | |
December 31, 2010 | | Lazard
Retirement
U.S. Strategic
Equity Portfolio | | Lazard
Retirement
U.S. Small-Mid Cap
Equity Portfolio | | Lazard
Retirement
International
Equity Portfolio | | Lazard
Retirement
Emerging Markets
Equity Portfolio | |
| | | | | | | | | |
| | | | | | | | | | | | | |
ASSETS | | | | | | | | | | | | | |
Investments in securities, at value | | | $ | 6,175,598 | | | | $ | 153,059,756 | | | | $ | 464,063,326 | | | | $ | 912,475,139 | | |
Foreign currency | | | | — | | | | | — | | | | | 127,092 | | | | | 2,928,496 | | |
Receivables for: | | | | | | | | | | | | | | | | | | | | | |
Capital stock sold | | | | 3,716 | | | | | 162,248 | | | | | 7,519,185 | | | | | 5,906,250 | | |
Investments sold | | | | 5,123 | | | | | 263,057 | | | | | — | | | | | 2,481,648 | | |
Dividends and interest | | | | 3,495 | | | | | 105,676 | | | | | 910,378 | | | | | 1,708,441 | | |
Amount due from Investment Manager (Note 3) | | | | 6,009 | | | | | — | | | | | — | | | | | — | | |
Total assets | | | | 6,193,941 | | | | | 153,590,737 | | | | | 472,619,981 | | | | | 925,499,974 | | |
| | | | | | | | | | | | | | | | | | | | | |
LIABILITIES | | | | | | | | | | | | | | | | | | | | | |
Payables for: | | | | | | | | | | | | | | | | | | | | | |
Management fees | | | | — | | | | | 94,995 | | | | | 289,550 | | | | | 745,401 | | |
Accrued distribution fees | | | | 1,292 | | | | | 31,514 | | | | | 95,420 | | | | | 117,400 | | |
Accrued directors’ fees | | | | 10 | | | | | 224 | | | | | 680 | | | | | 1,318 | | |
Capital stock redeemed | | | | 2,776 | | | | | 6,529,731 | | | | | 529,465 | | | | | 217,263 | | |
Investments purchased | | | | 9,835 | | | | | 270,769 | | | | | 617,064 | | | | | 1,380,626 | | |
Foreign capital gains taxes | | | | — | | | | | — | | | | | — | | | | | 1,124,674 | | |
Other accrued expenses and payables | | | | 7,961 | | | | | 19,757 | | | | | 57,337 | | | | | 155,482 | | |
Total liabilities | | | | 21,874 | | | | | 6,946,990 | | | | | 1,589,516 | | | | | 3,742,164 | | |
Net assets | | | $ | 6,172,067 | | | | $ | 146,643,747 | | | | $ | 471,030,465 | | | | $ | 921,757,810 | | |
| | | | | | | | | | | | | | | | | | | | | |
NET ASSETS | | | | | | | | | | | | | | | | | | | | | |
Paid in capital | | | $ | 6,353,389 | | | | $ | 115,126,040 | | | | $ | 503,045,908 | | | | $ | 802,632,040 | | |
Undistributed net investment income | | | | 11,531 | | | | | — | | | | | 1,528,413 | | | | | 1,506,840 | | |
Accumulated undistributed net realized gain (loss) | | | | (1,175,416 | ) | | | | 2,872,193 | | | | | (101,083,771 | ) | | | | (60,143,330 | ) | |
Net unrealized appreciation (depreciation) on: | | | | | | | | | | | | | | | | | | | | | |
Investments | | | | 982,563 | | | | | 28,645,514 | | | | | 67,501,967 | | | | | 177,762,298 | | |
Foreign currency | | | | — | | | | | — | | | | | 37,948 | | | | | (38 | ) | |
Net assets | | | $ | 6,172,067 | | | | $ | 146,643,747 | | | | $ | 471,030,465 | | | | $ | 921,757,810 | | |
| | | | | | | | | | | | | | | | | | | | | |
Service Shares | | | | | | | | | | | | | | | | | | | | | |
Net assets | | | $ | 6,172,067 | | | | $ | 146,643,747 | | | | $ | 471,030,465 | | | | $ | 581,859,134 | | |
Shares of capital stock outstanding* | | | | 671,997 | | | | | 13,285,662 | | | | | 45,824,607 | | | | | 24,938,452 | | |
Net asset value, offering and redemption price per share | | | $ | 9.18 | | | | $ | 11.04 | | | | $ | 10.28 | | | | $ | 23.33 | | |
| | | | | | | | | | | | | | | | | | | | | |
Investor Shares | | | | | | | | | | | | | | | | | | | | | |
Net assets | | | | — | | | | | — | | | | | — | | | | $ | 339,898,676 | | |
Shares of capital stock outstanding* | | | | — | | | | | — | | | | | — | | | | | 14,669,543 | | |
Net asset value, offering and redemption price per share | | | | — | | | | | — | | | | | — | | | | $ | 23.17 | | |
| | | | | | | | | | | | | | | | | | | | | |
Cost of investments in securities | | | $ | 5,193,035 | | | | $ | 124,414,242 | | | | $ | 396,561,359 | | | | $ | 733,588,167 | | |
Cost of foreign currency | | | | — | | | | | — | | | | $ | 126,165 | | | | $ | 2,918,785 | | |
* $0.001 par value 1,400,000,000 shares authorized for the Portfolios in total.
The accompanying notes are an integral part of these financial statements.
Annual Report 23
|
|
Lazard Retirement Series, Inc. Statements of Operations |
|
| | | | | | | | | | | | | | | | | | | | | |
| | | | | | | | | |
For the Year Ended December 31, 2010 | | Lazard
Retirement
U.S. Strategic
Equity Portfolio | | Lazard
Retirement
U.S. Small-Mid Cap
Equity Portfolio | | Lazard
Retirement
International
Equity Portfolio | | Lazard
Retirement
Emerging Markets
Equity Portfolio | |
| | | | | | | | | | | | | |
| | | | | | | | | | | | | |
Investment Income | | | | | | | | | | | | | |
Income | | | | | | | | | | | | | | | | | | | | | |
Dividends | | | $ | 104,351 | | | | $ | 2,076,616 | | | | $ | 9,925,278 | | | | $ | 20,804,558 | | |
Interest | | | | 16 | | | | | 807 | | | | | 1,209 | | | | | 3,571 | | |
Total investment income* | | | | 104,367 | | | | | 2,077,423 | | | | | 9,926,487 | | | | | 20,808,129 | | |
| | | | | | | | | | | | | | | | | | | | | |
Expenses | | | | | | | | | | | | | | | | | | | | | |
Management fees (Note 3) | | | | 40,993 | | | | | 1,065,091 | | | | | 2,917,845 | | | | | 6,717,508 | | |
Distribution fees (Service Shares) | | | | 13,783 | | | | | 355,030 | | | | | 972,615 | | | | | 1,090,520 | | |
Custodian fees | | | | 51,138 | | | | | 57,263 | | | | | 219,346 | | | | | 935,902 | | |
Administration fees | | | | 43,603 | | | | | 70,903 | | | | | 120,310 | | | | | 176,851 | | |
Professional services | | | | 32,372 | | | | | 55,484 | | | | | 89,486 | | | | | 126,819 | | |
Shareholders’ reports | | | | 13,704 | | | | | 40,105 | | | | | 57,069 | | | | | 91,344 | | |
Shareholders’ services | | | | 13,820 | | | | | 15,717 | | | | | 18,618 | | | | | 33,598 | | |
Directors’ fees and expenses | | | | 187 | | | | | 4,803 | | | | | 13,072 | | | | | 22,445 | | |
Registration fees | | | | — | | | | | — | | | | | 10,989 | | | | | 27,141 | | |
Other | | | | 2,179 | | | | | 6,014 | | | | | 12,420 | | | | | 19,221 | | |
Total gross expenses | | | | 211,779 | | | | | 1,670,410 | | | | | 4,431,770 | | | | | 9,241,349 | | |
Management fees waived and expenses reimbursed | | | | (125,897 | ) | | | | — | | | | | — | | | | | — | | |
Administration fees waived | | | | (18,750 | ) | | | | — | | | | | — | | | | | — | | |
Expense reductions (Note 2(h)) | | | | — | | | | | (39 | ) | | | | — | | | | | — | | |
Total net expenses | | | | 67,132 | | | | | 1,670,371 | | | | | 4,431,770 | | | | | 9,241,349 | | |
Net investment income | | | | 37,235 | | | | | 407,052 | | | | | 5,494,717 | | | | | 11,566,780 | | |
| | | | | | | | | | | | | | | | | | | | | |
Net Realized and Unrealized Gain (Loss) on Investments | | | | | | | | | | | | | | | | | | | | | |
and Foreign Currency | | | | | | | | | | | | | | | | | | | | | |
Net realized gain (loss) on: | | | | | | | | | | | | | | | | | | | | | |
Investments** | | | | 414,434 | | | | | 23,617,156 | | | | | (6,210,216 | ) | | | | 42,367,287 | | |
Foreign currency | | | | — | | | | | — | | | | | (268,889 | ) | | | | (644,440 | ) | |
Net change in unrealized appreciation (depreciation) on: | | | | | | | | | | | | | | | | | | | | | |
Investments† | | | | 246,291 | | | | | 3,521,513 | | | | | 34,880,828 | | | | | 89,371,218 | | |
Foreign currency | | | | — | | | | | — | | | | | 6,596 | | | | | (7,952 | ) | |
Net realized and unrealized gain on investments and
foreign currency | | | | 660,725 | | | | | 27,138,669 | | | | | 28,408,319 | | | | | 131,086,113 | | |
Net increase in net assets resulting from operations | | | $ | 697,960 | | | | $ | 27,545,721 | | | | $ | 33,903,036 | | | | $ | 142,652,893 | | |
| | | | | | | | | | | | | | | | | | | | | |
* Net of foreign withholding taxes of | | | $ | — | | | | $ | — | | | | $ | 818,765 | | | | $ | 1,749,582 | | |
** Net of foreign capital gains taxes of | | | $ | — | | | | $ | — | | | | $ | — | | | | $ | 140,536 | | |
† Includes net change in unrealized foreign capital gains taxes of | | | $ | — | | | | $ | — | | | | $ | — | | | | $ | 563,328 | | |
The accompanying notes are an integral part of these financial statements.
24 Annual Report
|
|
Lazard Retirement Series, Inc. Statements of Changes in Net Assets |
|
| | | | | | | | | | | | | | | | | | | | | |
| | | | | |
| | | Lazard Retirement
U.S. Strategic Equity Portfolio | | Lazard Retirement
U.S. Small-Mid Cap Equity Portfolio | | |
| | Year Ended
December 31,
2010 | | Year Ended
December 31,
2009 | | Year Ended
December 31,
2010 | | Year Ended
December 31,
2009 | |
| | | | | | | | | | | | | |
| | | | | | | | | | | | | |
Increase in Net Assets | | | | | | | | | | | | | |
Operations | | | | | | | | | | | | | |
Net investment income (loss) | | | $ | 37,235 | | | | $ | 43,169 | | | | $ | 407,052 | | | | $ | (163,976 | ) | |
Net realized gain (loss) on investments | | | | 414,434 | | | | | (400,565 | ) | | | | 23,617,156 | | | | | 5,740,143 | | |
Net change in unrealized appreciation on investments | | | | 246,291 | | | | | 1,460,002 | | | | | 3,521,513 | | | | | 34,363,003 | | |
Net increase in net assets resulting from operations | | | | 697,960 | | | | | 1,102,606 | | | | | 27,545,721 | | | | | 39,939,170 | | |
| | | | | | | | | | | | | | | | | | | | | |
Distributions to shareholders | | | | | | | | | | | | | | | | | | | | | |
Service Shares | | | | | | | | | | | | | | | | | | | | | |
From net investment income | | | | (39,648 | ) | | | | (43,552 | ) | | | | (408,572 | ) | | | | — | | |
From net realized gains | | | | — | | | | | — | | | | | (11,603,165 | ) | | | | — | | |
Net decrease in net assets resulting from distributions | | | | (39,648 | ) | | | | (43,552 | ) | | | | (12,011,737 | ) | | | | — | | |
| | | | | | | | | | | | | | | | | | | | | |
Capital stock transactions | | | | | | | | | | | | | | | | | | | | | |
Service Shares | | | | | | | | | | | | | | | | | | | | | |
Net proceeds from sales | | | | 1,637,305 | | | | | 2,846,505 | | | | | 42,239,882 | | | | | 95,420,237 | | |
Net proceeds from reinvestment of distributions | | | | 39,648 | | | | | 43,552 | | | | | 12,011,737 | | | | | — | | |
Cost of shares redeemed | | | | (1,527,855 | ) | | | | (1,896,364 | ) | | | | (66,963,260 | ) | | | | (26,507,142 | ) | |
Net increase (decrease) in net assets from capital stock transactions | | | | 149,098 | | | | | 993,693 | | | | | (12,711,641 | ) | | | | 68,913,095 | | |
Total increase in net assets | | | | 807,410 | | | | | 2,052,747 | | | | | 2,822,343 | | | | | 108,852,265 | | |
Net assets at beginning of year | | | | 5,364,657 | | | | | 3,311,910 | | | | | 143,821,404 | | | | | 34,969,139 | | |
Net assets at end of year* | | | $ | 6,172,067 | | | | $ | 5,364,657 | | | | $ | 146,643,747 | | | | $ | 143,821,404 | | |
* Includes undistributed net investment income of | | | $ | 11,531 | | | | $ | 13,944 | | | | $ | — | | | | $ | — | | |
| | | | | | | | | | | | | | | | | | | | | |
Shares issued and redeemed | | | | | | | | | | | | | | | | | | | | | |
Service Shares | | | | | | | | | | | | | | | | | | | | | |
Shares outstanding at beginning of year | | | | 654,699 | | | | | 508,605 | | | | | 14,853,900 | | | | | 5,516,390 | | |
Shares sold | | | | 194,439 | | | | | 416,416 | | | | | 4,119,893 | | | | | 12,596,356 | | |
Shares issued to shareholders from reinvestment of distributions | | | | 4,512 | | | | | 5,422 | | | | | 1,085,071 | | | | | — | | |
Shares redeemed | | | | (181,653 | ) | | | | (275,744 | ) | | | | (6,773,202 | ) | | | | (3,258,846 | ) | |
Net increase (decrease) | | | | 17,298 | | | | | 146,094 | | | | | (1,568,238 | ) | | | | 9,337,510 | | |
Shares outstanding at end of year | | | | 671,997 | | | | | 654,699 | | | | | 13,285,662 | | | | | 14,853,900 | | |
The accompanying notes are an integral part of these financial statements.
Annual Report 25
| | | | | | | | | | | | | |
| | | | | | | | | | | | | |
| | | | | | | | | | | | | |
| | Lazard Retirement
International Equity Portfolio | | Lazard Retirement
Emerging Markets Equity Portfolio | |
| | Year Ended
December 31,
2010 | | Year Ended
December 31,
2009 | | Year Ended
December 31,
2010 | | Year Ended
December 31,
2009 | |
| | | | | | | | | |
| | | | | | | | | | | | | |
Increase in Net Assets | | | | | | | | | | | | | |
Operations | | | | | | | | | | | | | |
Net investment income | | $ | 5,494,717 | | $ | 4,859,670 | | $ | 11,566,780 | | $ | 6,885,545 | |
Net realized gain (loss) on investments and foreign currency | | | (6,479,105 | ) | | (81,731,677 | ) | | 41,722,847 | | | (66,900,922 | ) |
Net change in unrealized appreciation on investments | | | | | | | | | | | | | |
and foreign currency | | | 34,887,424 | | | 123,081,264 | | | 89,363,266 | | | 245,608,815 | |
| | | | | | | | | | | | | |
Net increase in net assets resulting from operations | | | 33,903,036 | | | 46,209,257 | | | 142,652,893 | | | 185,593,438 | |
| | | | | | | | | | | | | |
| | | | | | | | | | | | | |
Distributions to shareholders | | | | | | | | | | | | | |
From net investment income | | | | | | | | | | | | | |
Service Shares | | | (5,831,608 | ) | | (7,551,839 | ) | | (6,122,781 | ) | | (8,447,777 | ) |
Investor Shares | | | — | | | — | | | (4,875,768 | ) | | (4,531,305 | ) |
| | | | | | | | | | | | | |
Net decrease in net assets resulting from distributions | | | (5,831,608 | ) | | (7,551,839 | ) | | (10,998,549 | ) | | (12,979,082 | ) |
| | | | | | | | | | | | | |
| | | | | | | | | | | | | |
Capital stock transactions | | | | | | | | | | | | | |
Net proceeds from sales | | | | | | | | | | | | | |
Service Shares | | | 168,354,826 | | | 201,710,808 | | | 241,679,378 | | | 163,522,304 | |
Investor Shares | | | — | | | — | | | 180,327,574 | | | 81,664,428 | |
Net proceeds from reinvestment of distributions | | | | | | | | | | | | | |
Service Shares | | | 5,831,608 | | | 7,551,839 | | | 6,122,781 | | | 8,447,777 | |
Investor Shares | | | — | | | — | | | 4,875,768 | | | 4,531,304 | |
Cost of shares redeemed | | | | | | | | | | | | | |
Service Shares | | | (74,694,460 | ) | | (188,593,451 | ) | | (121,478,378 | ) | | (97,290,179 | ) |
Investor Shares | | | — | | | — | | | (58,900,881 | ) | | (25,804,605 | ) |
| | | | | | | | | | | | | |
Net increase in net assets from capital stock transactions | | | 99,491,974 | | | 20,669,196 | | | 252,626,242 | | | 135,071,029 | |
| | | | | | | | | | | | | |
Total increase in net assets | | | 127,563,402 | | | 59,326,614 | | | 384,280,586 | | | 307,685,385 | |
Net assets at beginning of year | | | 343,467,063 | | | 284,140,449 | | | 537,477,224 | | | 229,791,839 | |
| | | | | | | | | | | | | |
Net assets at end of year* | | $ | 471,030,465 | | $ | 343,467,063 | | $ | 921,757,810 | | $ | 537,477,224 | |
| | | | | | | | | | | | | |
* Includes undistributed net investment income of | | $ | 1,528,413 | | $ | 91,104 | | $ | 1,506,840 | | $ | 1,723,585 | |
| | | | | | | | | | | | | |
| | | | | | | | | | | | | |
Shares issued and redeemed | | | | | | | | | | | | | |
Service Shares | | | | | | | | | | | | | |
Shares outstanding at beginning of year | | | 35,197,641 | | | 34,537,314 | | | 19,101,582 | | | 14,562,340 | |
| | | | | | | | | | | | | |
Shares sold | | | 17,863,719 | | | 23,841,316 | | | 11,494,698 | | | 10,655,282 | |
Shares issued to shareholders from reinvestment of distributions | | | 582,833 | | | 779,489 | | | 271,023 | | | 441,201 | |
Shares redeemed | | | (7,819,586 | ) | | (23,960,478 | ) | | (5,928,851 | ) | | (6,557,241 | ) |
| | | | | | | | | | | | | |
Net increase | | | 10,626,966 | | | 660,327 | | | 5,836,870 | | | 4,539,242 | |
| | | | | | | | | | | | | |
Shares outstanding at end of year | | | 45,824,607 | | | 35,197,641 | | | 24,938,452 | | | 19,101,582 | |
| | | | | | | | | | | | | |
| | | | | | | | | | | | | |
Investor Shares | | | | | | | | | | | | | |
Shares outstanding at beginning of year | | | | | | | | | 8,896,581 | | | 5,281,810 | |
| | | | | | | | | | | | | |
Shares sold | | | | | | | | | 8,543,810 | | | 5,063,770 | |
Shares issued to shareholders from reinvestment of distributions | | | | | | | | | 218,823 | | | 239,126 | |
Shares redeemed | | | | | | | | | (2,989,671 | ) | | (1,688,125 | ) |
| | | | | | | | | | | | | |
Net increase | | | | | | | | | 5,772,962 | | | 3,614,771 | |
| | | | | | | | | | | | | |
Shares outstanding at end of year | | | | | | | | | 14,669,543 | | | 8,896,581 | |
| | | | | | | | | | | | | |
The accompanying notes are an integral part of these financial statements.
|
|
Lazard Retirement Series, Inc. Financial Highlights |
|
LAZARD RETIREMENT U.S. STRATEGIC EQUITY PORTFOLIO
| | | | | | | | | | | | | | | | | |
| | | | | | | | | | | | | | | | | |
| | | | | | | | | | | | | | | | | |
| Selected data for a share of capital | | Year Ended | |
| stock outstanding throughout each year | | 12/31/10 | | 12/31/09 | | 12/31/08 | | 12/31/07 | | 12/31/06 | |
| | | | | | | | | | | | |
| | | | | | | | | | | | |
| Service Shares | | | | | | | | | | | | | | | | |
| Net asset value, beginning of year | | $ | 8.19 | | $ | 6.51 | | $ | 10.17 | | $ | 12.86 | | $ | 11.02 | |
| | | | | | | | | | | | | | | | | |
| Income (loss) from investment operations: | | | | | | | | | | | | | | | | |
| Net investment income | | | 0.06 | | | 0.06 | | | 0.10 | | | 0.07 | | | 0.09 | |
| Net realized and unrealized gain (loss) | | | 0.99 | | | 1.69 | | | (3.69 | ) | | (0.14 | ) | | 1.83 | |
| | | | | | | | | | | | | | | | | |
| Total from investment operations | | | 1.05 | | | 1.75 | | | (3.59 | ) | | (0.07 | ) | | 1.92 | |
| | | | | | | | | | | | | | | | | |
| Less distributions from: | | | | | | | | | | | | | | | | |
| Net investment income | | | (0.06 | ) | | (0.07 | ) | | (0.07 | ) | | (0.15 | ) | | (0.08 | ) |
| Net realized gains | | | — | | | — | | | — | | | (2.47 | ) | | — | |
| | | | | | | | | | | | | | | | | |
| Total distributions | | | (0.06 | ) | | (0.07 | ) | | (0.07 | ) | | (2.62 | ) | | (0.08 | ) |
| | | | | | | | | | | | | | | | | |
| Net asset value, end of year | | $ | 9.18 | | $ | 8.19 | | $ | 6.51 | | $ | 10.17 | | $ | 12.86 | |
| | | | | | | | | | | | | | | | | |
| Total Return (a) | | | 12.85 | % | | 26.84 | % | | –35.28 | % | | –0.95 | % | | 17.48 | % |
| | | | | | | | | | | | | | | | | |
| Ratios and Supplemental Data: | | | | | | | | | | | | | | | | |
| Net assets, end of year (in thousands) | | $ | 6,172 | | $ | 5,365 | | $ | 3,312 | | $ | 4,959 | | $ | 5,078 | |
| Ratios to average net assets: | | | | | | | | | | | | | | | | |
| Net expenses | | | 1.22 | % | | 1.25 | % | | 1.25 | % | �� | 1.25 | % | | 1.25 | % |
| Gross expenses | | | 3.84 | % | | 4.67 | % | | 4.88 | % | | 4.21 | % | | 4.45 | % |
| Net investment income | | | 0.68 | % | | 1.03 | % | | 1.27 | % | | 0.62 | % | | 0.68 | % |
| Portfolio turnover rate | | | 55 | % | | 79 | % | | 86 | % | | 101 | % | | 102 | % |
LAZARD RETIREMENT U.S. SMALL-MID CAP EQUITY PORTFOLIO
| | | | | | | | | | | | | | | | | |
| | | | | | | | | | | | | | | | | |
| | | | | | | | | | | | | | | | | |
| Selected data for a share of capital | | Year Ended | |
| stock outstanding throughout each year | | 12/31/10 | | 12/31/09 | | 12/31/08 | | 12/31/07 | | 12/31/06 | |
| | | | | | | | | | | | | | | | | |
| | | | | | | | | | | | | | | | | |
| Service Shares | | | | | | | | | | | | | | | | |
| Net asset value, beginning of year | | $ | 9.68 | | $ | 6.34 | | $ | 9.98 | | $ | 17.31 | | $ | 16.31 | |
| | | | | | | | | | | | | | | | | |
| Income (loss) from investment operations: | | | | | | | | | | | | | | | | |
| Net investment income (loss) | | | 0.03 | | | (0.01 | ) | | (0.01 | ) | | (0.02 | ) | | (0.06 | ) |
| Net realized and unrealized gain (loss) | | | 2.27 | | | 3.35 | | | (3.63 | ) | | (0.87 | ) | | 2.49 | |
| | | | | | | | | | | | | | | | | |
| Total from investment operations | | | 2.30 | | | 3.34 | | | (3.64 | ) | | (0.89 | ) | | 2.43 | |
| | | | | | | | | | | | | | | | | |
| Less distributions from: | | | | | | | | | | | | | | | | |
| Net investment income | | | (0.03 | ) | | — | | | — | | | — | | | — | |
| Net realized gains | | | (0.91 | ) | | — | | | — | | | (6.44 | ) | | (1.43 | ) |
| | | | | | | | | | | | | | | | | |
| Total distributions | | | (0.94 | ) | | — | | | — | | | (6.44 | ) | | (1.43 | ) |
| | | | | | | | | | | | | | | | | |
| Net asset value, end of year | | $ | 11.04 | | $ | 9.68 | | $ | 6.34 | | $ | 9.98 | | $ | 17.31 | |
| | | | | | | | | | | | | | | | | |
| Total Return (a) | | | 23.72 | % | | 52.68 | % | | –36.47 | % | | –7.20 | % | | 16.07 | % |
| | | | | | | | | | | | | | | | | |
| Ratios and Supplemental Data: | | | | | | | | | | | | | | | | |
| Net assets, end of year (in thousands) | | $ | 146,644 | | $ | 143,821 | | $ | 34,969 | | $ | 62,772 | | $ | 82,514 | |
| Ratios to average net assets: | | | | | | | | | | | | | | | | |
| Net expenses | | | 1.18 | % | | 1.25 | % | | 1.25 | % | | 1.25 | % | | 1.18 | % |
| Gross expenses | | | 1.18 | % | | 1.31 | % | | 1.41 | % | | 1.33 | % | | 1.18 | % |
| Net investment income (loss) | | | 0.29 | % | | –0.21 | % | | –0.11 | % | | –0.17 | % | | –0.22 | % |
| Portfolio turnover rate | | | 122 | % | | 171 | % | | 139 | % | | 102 | % | | 87 | % |
| |
(a) | Total returns reflect reinvestment of all dividends and distributions, if any. Certain expenses of the Portfolio have been waived or reimbursed by the Portfolio’s Investment Manager or State Street; without such waiver/reimbursement of expenses, the Portfolio’s returns would have been lower. Performance information does not reflect the fees and charges imposed by participating insurance companies at the separate account level, and such charges will have the effect of reducing performance. |
The accompanying notes are an integral part of these financial statements.
Annual Report 27
| | | | | | | | | | | | | | | | |
LAZARD RETIREMENT INTERNATIONAL EQUITY PORTFOLIO |
|
| | | | | | | | | | | | | | | | |
Selected data for a share of capital | | Year Ended | |
stock outstanding throughout each year | | 12/31/10 | | 12/31/09 | | 12/31/08 | | 12/31/07 | | 12/31/06 | |
| | | | | | | | | | | |
|
Service Shares | | | | | | | | | | | | | | | | |
Net asset value, beginning of year | | $ | 9.76 | | $ | 8.23 | | $ | 13.35 | | $ | 14.89 | | $ | 12.83 | |
Income (loss) from investment operations: | | | | | | | | | | | | | | | | |
Net investment income | | | 0.12 | | | 0.16 | | | 0.21 | | | 0.19 | | | 0.21 | |
Net realized and unrealized gain (loss) | | | 0.53 | | | 1.60 | | | (5.15 | ) | | 1.24 | | | 2.61 | |
| | | | | | | | | | | | | | | | |
Total from investment operations | | | 0.65 | | | 1.76 | | | (4.94 | ) | | 1.43 | | | 2.82 | |
Less distributions from: | | | | | | | | | | | | | | | | |
Net investment income | | | (0.13 | ) | | (0.23 | ) | | (0.14 | ) | | (0.37 | ) | | (0.15 | ) |
Net realized gains | | | – | | | – | | | (0.04 | ) | | (2.60 | ) | | (0.61 | ) |
| | | | | | | | | | | | | | | | |
Total distributions | | | (0.13 | ) | | (0.23 | ) | | (0.18 | ) | | (2.97 | ) | | (0.76 | ) |
| | | | | | | | | | | | | | | | |
Net asset value, end of year | | $ | 10.28 | | $ | 9.76 | | $ | 8.23 | | $ | 13.35 | | $ | 14.89 | |
| | | | | | | | | | | | | | | | |
Total Return (a) | | | 6.72 | % | | 21.46 | % | | –37.02 | % | | 10.78 | % | | 22.53 | % |
| | | | | | | | | | | | | | | | |
Ratios and Supplemental Data: | | | | | | | | | | | | | | | | |
Net assets, end of year (in thousands) | | $ | 471,030 | | $ | 343,467 | | $ | 284,140 | | $ | 391,465 | | $ | 308,693 | |
Ratios to average net assets: | | | | | | | | | | | | | | | | |
Net expenses | | | 1.14 | % | | 1.17 | % | | 1.17 | % | | 1.18 | % | | 1.19 | % |
Gross expenses | | | 1.14 | % | | 1.17 | % | | 1.17 | % | | 1.18 | % | | 1.19 | % |
Net investment income | | | 1.41 | % | | 1.89 | % | | 2.15 | % | | 1.60 | % | | 1.51 | % |
Portfolio turnover rate | | | 53 | % | | 104 | % | | 43 | % | | 48 | % | | 75 | % |
| |
(a) | Total returns reflect reinvestment of all dividends and distributions, if any. Performance information does not reflect the fees and charges imposed by participating insurance companies at the separate account level, and such charges will have the effect of reducing performance. |
The accompanying notes are an integral part of these financial statements.
28 Annual Report
| | | | | | | | | | | | | | | | |
LAZARD RETIREMENT EMERGING MARKETS EQUITY PORTFOLIO |
|
| | | | | | | | | | | | | | | | |
Selected data for a share of capital | | Year Ended | |
stock outstanding throughout each year | | 12/31/10 | | 12/31/09 | | 12/31/08 | | 12/31/07 | | 12/31/06 | |
| | | | | | | | | | | | | | | | |
|
Service Shares | | | | | | | | | | | | | | | | |
Net asset value, beginning of year | | $ | 19.23 | | $ | 11.59 | | $ | 25.64 | | $ | 22.69 | | $ | 18.81 | |
Income (loss) from investment operations: | | | | | | | | | | | | | | | | |
Net investment income (a) | | | 0.34 | | | 0.29 | | | 0.58 | | | 0.29 | | | 0.27 | |
Net realized and unrealized gain (loss) | | | 4.02 | | | 7.80 | | | (12.77 | ) | | 7.03 | | | 5.08 | |
| | | | | | | | | | | | | | | | |
Total from investment operations | | | 4.36 | | | 8.09 | | | (12.19 | ) | | 7.32 | | | 5.35 | |
Less distributions from: | | | | | | | | | | | | | | | | |
Net investment income | | | (0.26 | ) | | (0.45 | ) | | (0.47 | ) | | (0.30 | ) | | (0.10 | ) |
Net realized gains | | | – | | | – | | | (1.39 | ) | | (4.07 | ) | | (1.37 | ) |
| | | | | | | | | | | | | | | | |
Total distributions | | | (0.26 | ) | | (0.45 | ) | | (1.86 | ) | | (4.37 | ) | | (1.47 | ) |
| | | | | | | | | | | | | | | | |
Net asset value, end of year | | $ | 23.33 | | $ | 19.23 | | $ | 11.59 | | $ | 25.64 | | $ | 22.69 | |
| | | | | | | | | | | | | | | | |
Total Return (b) | | | 22.69 | % | | 69.85 | % | | –48.72 | % | | 33.30 | % | | 29.95 | % |
| | | | | | | | | | | | | | | | |
Ratios and Supplemental Data: | | | | | | | | | | | | | | | | |
Net assets, end of year (in thousands) | | $ | 581,859 | | $ | 367,260 | | $ | 168,787 | | $ | 251,665 | | $ | 129,306 | |
Ratios to average net assets: | | | | | | | | | | | | | | | | |
Net expenses | | | 1.46 | % | | 1.56 | % | | 1.52 | % | | 1.57 | % | | 1.60 | % |
Gross expenses | | | 1.46 | % | | 1.56 | % | | 1.52 | % | | 1.57 | % | | 1.69 | % |
Net investment income | | | 1.66 | % | | 1.86 | % | | 2.81 | % | | 1.12 | % | | 1.30 | % |
Portfolio turnover rate | | | 27 | % | | 51 | % | | 53 | % | | 52 | % | | 48 | % |
| | | | | | | | | | | | | | | | | | |
| | | | | | | | | | | | | | | | |
| | | | | | | | | | | | | | | | |
| | | | | | | | | | For the Period
5/1/06* to
12/31/06 | |
Selected data for a share of capital | | Year Ended | | |
stock outstanding throughout each period | | 12/31/10 | | 12/31/09 | | 12/31/08 | | 12/31/07 | | |
| | | | | | | | | | | | | | | | |
|
Investor Shares | | | | | | | | | | | | | | | | |
Net asset value, beginning of period | | $ | 19.13 | | $ | 11.55 | | $ | 25.60 | | $ | 22.71 | | | $ | 22.13 | | |
Income (loss) from investment operations: | | | | | | | | | | | | | | | | | | |
Net investment income (a) | | | 0.38 | | | 0.32 | | | 0.64 | | | 0.35 | | | | 0.19 | | |
Net realized and unrealized gain (loss) | | | 4.01 | | | 7.79 | | | (12.78 | ) | | 7.04 | | | | 1.88 | | |
| | | | | | | | | | | | | | | | | | |
Total from investment operations | | | 4.39 | | | 8.11 | | | (12.14 | ) | | 7.39 | | | | 2.07 | | |
Less distributions from: | | | | | | | | | | | | | | | | | | |
Net investment income | | | (0.35 | ) | | (0.53 | ) | | (0.52 | ) | | (0.43 | ) | | | (0.12 | ) | |
Net realized gains | | | – | | | – | | | (1.39 | ) | | (4.07 | ) | | | (1.37 | ) | |
| | | | | | | | | | | | | | | | | | |
Total distributions | | | (0.35 | ) | | (0.53 | ) | | (1.91 | ) | | (4.50 | ) | | | (1.49 | ) | |
| | | | | | | | | | | | | | | | | | |
Net asset value, end of period | | $ | 23.17 | | $ | 19.13 | | $ | 11.55 | | $ | 25.60 | | | $ | 22.71 | | |
| | | | | | | | | | | | | | | | | | |
Total Return (b) | | | 23.05 | % | | 70.23 | % | | –48.59 | % | | 33.63 | % | | | 10.64 | % | |
| | | | | | | | | | | | | | | | | | |
Ratios and Supplemental Data: | | | | | | | | | | | | | | | | | | |
Net assets, end of period (in thousands) | | $ | 339,899 | | $ | 170,217 | | $ | 61,005 | | $ | 145,530 | | | $ | 42,009 | | |
Ratios to average net assets: | | | | | | | | | | | | | | | | | | |
Net expenses (c) | | | 1.21 | % | | 1.31 | % | | 1.28 | % | | 1.32 | % | | | 1.35 | % | |
Gross expenses (c) | | | 1.21 | % | | 1.31 | % | | 1.28 | % | | 1.32 | % | | | 1.54 | % | |
Net investment income (c) | | | 1.83 | % | | 2.03 | % | | 3.02 | % | | 1.34 | % | | | 1.38 | % | |
Portfolio turnover rate | | | 27 | % | | 51 | % | | 53 | % | | 52 | % | | | 48 | % | |
| |
* | The inception date for Investor Shares was May 1, 2006. |
(a) | Beginning with the fiscal year ended 12/31/06, net investment income has been computed using the average shares method. |
(b) | Total returns reflect reinvestment of all dividends and distributions, if any. Certain expenses of the Portfolio have been waived or reimbursed by the Portfolio’s Investment Manager; without such waiver/reimbursement of expenses, the Portfolio’s returns would have been lower. Performance information does not reflect the fees and charges imposed by participating insurance companies at the separate account level, and such charges will have the effect of reducing performance. A period of less than one year is not annualized. |
(c) | Annualized for a period of less than one year. |
The accompanying notes are an integral part of these financial statements.
Annual Report 29
|
|
Lazard Retirement Series, Inc. Notes to Financial Statements December 31, 2010 |
|
1. Organization
Lazard Retirement Series, Inc. (the “Fund”) was incorporated in Maryland on February 13, 1997 and is registered under the Investment Company Act of 1940, as amended (the “Act”), as an open-end management investment company. The Fund is comprised of eleven no-load portfolios (each referred to as a “Portfolio”), which are currently offered only to separate accounts established by insurance companies to fund variable annuity contracts and variable life insurance policies. Portfolio shares may also be offered to certain qualified pension and retirement plans and to accounts permitting accumulation of assets on a tax-deferred basis. Effective January 31, 2006, the Fund designated its existing class of shares as Service Shares and commenced offering Investor Shares. Investor Shares and Service Shares are identical, except as to the services offered to and expenses borne by each class of shares. Currently, only the following four Portfolios, each of which is “diversified”, as defined in the Act, are offered: Lazard Retirement U.S. Strategic Equity Portfolio (“U.S. Strategic Equity Portfolio”), Lazard Retirement U.S. Small-Mid Cap Equity Portfolio (“U.S. Small-Mid Cap Equity Portfolio”), Lazard Retirement International Equity Portfolio (“International Equity Portfolio”) and Lazard Retirement Emerging Markets Equity Portfolio (“Emerging Markets Equity Portfolio”). Each of the other seven Portfolios had not commenced operations as of December 31, 2010.
2. Significant Accounting Policies
The accompanying financial statements are presented in conformity with accounting principles generally accepted in the United States of America (“GAAP”). The following is a summary of significant accounting policies:
(a) Valuation of Investments—Market values for securities listed on the New York Stock Exchange (“NYSE”), NAS-DAQ national market or other U.S. exchanges or markets are generally based on the last reported sales price on the principal exchange or market on which the security is traded, generally as of the close of regular trading on the NYSE (normally 4:00 p.m. Eastern time) on each valuation date; securities not traded on the valuation date are valued at the closing bid price. The Fund values NASDAQ-traded securities at the NASDAQ Official Closing Price, which may not be the last reported sales price in certain instances. Any securities not listed, for which current over-the-counter market quotations or bids are readily available, are valued at the last
quoted bid price or, if available, the mean of two such prices. Except as described below, securities listed on foreign exchanges are valued at the last reported sales price; securities listed on foreign exchanges not traded on the valuation date are valued at the last quoted bid price. Investments in money market funds are valued at the fund’s net asset value.
If a significant event materially affecting the value of securities occurs between the close of the exchange or market on which the security is principally traded and the time when a Portfolio’s net asset value is calculated, or when current market quotations otherwise are determined not to be readily available or reliable (including restricted or other illiquid securities such as derivative instruments), such securities will be valued at their fair values as determined by, or in accordance with procedures approved by, the Board of Directors (the “Board”). The Valuation Committee of the Investment Manager may evaluate a variety of factors to determine the fair value of securities for which market quotations are determined not to be readily available or reliable. These factors include, but are not limited to, the type of security, the value of comparable securities, observations from financial institutions and relevant news events. Input from the Investment Manager’s analysts also will be considered. The fair value of foreign securities may be determined with the assistance of a pricing service, using correlations between the movement of prices of such securities and indices of domestic securities and other appropriate indicators, such as closing market prices of relevant ADRs or futures contracts. The effect of using fair value pricing is that the net asset value of a Portfolio will reflect the affected securities’ values as determined in the judgment of the Board, or its designee, instead of being determined by the market. Using a fair value pricing methodology to price securities may result in a value that is different from the most recent closing price of a security and from the prices used by other investment companies to calculate their portfolios’ net asset values.
(b) Portfolio Securities Transactions and Investment Income—Portfolio securities transactions are accounted for on trade date. Realized gain (loss) on sales of investments are recorded on a specific identification basis. Dividend income is recorded on the ex-dividend date and interest income is accrued daily.
The Portfolios may be subject to taxes imposed by foreign countries in which they invest. Such taxes are generally
30 Annual Report
based upon income earned or capital gains, realized or unrealized. The Portfolios accrue and apply such taxes to net investment income, net realized gains and net unrealized gains concurrent with the recognition of income or capital gains (realized and unrealized) from the applicable portfolio securities.
(c) Repurchase Agreements—In connection with transactions in repurchase agreements, the Fund’s custodian takes possession of the underlying collateral securities, the fair value of which, at all times, is required to be at least equal to the principal amount, plus accrued interest, of the repurchase transaction. If the seller defaults, and the fair value of the collateral declines, realization of the collateral by a Portfolio may be delayed or limited.
(d) Foreign Currency Translation—The accounting records of the Portfolios are maintained in U.S. dollars. Portfolio securities and other assets and liabilities denominated in a foreign currency are translated daily into U.S. dollars at the prevailing rates of exchange. Purchases and sales of securities, income receipts and expense payments are translated into U.S. dollars at the prevailing exchange rates on the respective transaction dates.
The Portfolios do not isolate the portion of operations resulting from changes in foreign exchange rates on investments from the fluctuations arising from changes in their market prices. Such fluctuations are included in net realized and unrealized gain (loss) on investments. Net realized gain (loss) on foreign currency transactions represents net foreign currency gain (loss) from disposition of foreign currencies, currency gain (loss) realized between the trade and settlement dates on securities transactions, and the difference between the amount of dividends, interest and foreign withholding taxes recorded on a Portfolio’s accounting records and the U.S. dollar equivalent amounts actually received or paid. Net change in unrealized appreciation (depreciation) on foreign currency reflects the impact of changes in exchange rates on the value of assets and liabilities, other than investments in securities, during the year.
(e) Federal Income Taxes—The Fund’s policy is to continue to have each Portfolio qualify as a regulated investment company under Subchapter M of the Internal Revenue Code and to distribute all of its taxable income, including any net
realized capital gains, to shareholders. Therefore, no federal income tax provision is required.
At December 31, 2010, the Portfolios had available, for federal income tax purposes, unused realized capital losses which can be used to offset future realized capital gains as follows:
| | | | | | | | | | | | | | | | |
Portfolio | | | Expiring 2016 | | | Expiring 2017 | | | Expiring 2018 | |
U.S. Strategic Equity | | | $ | 406,197 | | | | $ | 683,170 | | | | $ | — | | |
U.S. Small-Mid Cap
Equity | | | | — | | | | | — | | | | | — | | |
International Equity | | | | 6,022,728 | | | | | 71,571,550 | | | | | 7,205,218 | | |
Emerging Markets
Equity | | | | — | | | | | 48,721,785 | | | | | — | | |
Under current tax law, certain capital and net foreign currency losses realized after October 31 within the taxable year may be deferred and treated as occurring on the first day of the following tax year. For the tax year ended December 31, 2010, International Equity Portfolio elected to defer net capital losses of $5,649,194 arising between November 1, 2010 and December 31, 2010.
Management has analyzed the Fund’s tax positions, and has concluded that no liability for unrecognized tax benefits should be recorded related to uncertain tax positions taken on returns filed for open tax years (2007-2009), or expected to be taken in the Fund’s 2010 tax returns.
(f) Dividends and Distributions—Each Portfolio intends to declare and to pay dividends annually from net investment income. During any particular year, net realized gains from investment transactions in excess of available capital loss carryforwards would be taxable to the Portfolio, if not distributed. The Portfolios intend to declare and distribute these amounts, at least annually, to shareholders; however, to avoid taxation, a second distribution may be required.
Income dividends and capital gains distributions are determined in accordance with federal income tax regulations which may differ from GAAP. These book/tax differences, which may result in distribution reclassifications, are primarily due to differing treatments of foreign currency transactions, wash sales and distributions from real estate investment trusts. The book/tax differences relating to shareholder distributions may result in reclassifications among certain capital accounts.
Annual Report 31
The tax character of dividends and distributions paid during the years ended December 31, was as follows:
| | | | | | | | | | | | | |
| | | | | |
| | Ordinary Income | | Long-Term Capital Gain | |
Portfolio | | 2010 | | 2009 | | 2010 | | 2009 | |
| | | | | | | | | | | | | |
| | | | |
U.S. Strategic | | | | | | | | | | | | | |
Equity | | $ | 39,648 | | $ | 43,552 | | $ | — | | $ | — | |
U.S. Small-Mid | | | | | | | | | | | | | |
Cap Equity | | | 8,841,561 | | | — | | | 3,170,176 | | | — | |
International Equity | | | 5,831,608 | | | 7,551,839 | | | — | | | — | |
Emerging Markets | | | | | | | | | | | | | |
Equity | | | 10,998,549 | | | 12,979,082 | | | — | | | — | |
As of December 31, 2010, the components of distributable earnings, on a tax basis, not disclosed elsewhere, were as follows:
| | | | | | | | | | |
| | | | | | | |
Portfolio | | Undistributed
Ordinary
Income | | Undistributed
Long-Term
Capital Gain | | Net Unrealized
Appreciation
Including
Foreign Currency | |
| | | | | | | |
| | | | |
U.S. Strategic Equity | | $ | 11,531 | | $ | — | | $ | 896,514 | |
U.S. Small-Mid Cap | | | | | | | | | | |
Equity | | | 432,034 | | | 2,604,827 | | | 28,480,846 | |
International Equity | | | 2,680,383 | | | — | | | 55,752,864 | |
Emerging Markets | | | | | | | | | | |
Equity | | | 1,511,791 | | | — | | | 166,335,764 | |
(g) Allocation of Expenses—Expenses not directly chargeable to a specific Portfolio are allocated among the Portfolios primarily on the basis of relative net assets. A Portfolio accrues distribution and service (12b-1) fees to its Service Shares. Each Portfolio’s income, expenses (other than class specific expenses) and realized and unrealized gains and losses are allocated proportionally each day between the classes based upon the relative net assets of each class.
(h) Expense Reductions—The Portfolios’ excess cash in demand deposit accounts may receive credits that are available to offset custody expenses. The Statements of Operations report gross custody expenses, and report the amount of such credits separately as an expense reduction.
(i) Estimates—The preparation of financial statements in conformity with GAAP requires the Fund to make estimates and assumptions that affect the reported amounts of assets and liabilities and disclosure of contingent assets and liabilities at the date of the financial statements and the reported amounts of increases and decreases in net assets from operations during the reporting year. Actual results could differ from those estimates.
3. Investment Management, Administration and Distribution Agreements
The Fund, on behalf of the Portfolios, has entered into an investment management agreement (the “Management Agreement”) with the Investment Manager. Pursuant to the Management Agreement, the Investment Manager regularly provides each Portfolio with investment research, advice and supervision and furnishes continuously an investment program for each Portfolio consistent with its investment objective and policies, including the purchase, retention and disposition of securities. For its services provided to the Fund, the Investment Manager earns a management fee, accrued daily and payable by each Portfolio monthly, at the annual rate set forth below as a percentage of its average daily net assets:
| | | | |
| | | |
Portfolio | | Annual Rate | |
| | | |
| | | | |
U.S. Strategic Equity* | | 0.70 | % | |
U.S. Small-Mid Cap Equity | | 0.75 | | |
International Equity | | 0.75 | | |
Emerging Markets Equity | | 1.00 | | |
| |
* | Effective November 19, 2010, the management fee has been reduced from an annual rate of 0.75% to 0.70%. |
The Investment Manager has voluntarily agreed to reduce its fees and, if necessary, reimburse the Portfolios if annualized operating expenses exceed the following percentages of average daily net assets for the respective Shares:
| | | | | | | |
| | | | | |
Portfolio | | Service Shares | | Investor Shares | |
| | | | | |
| | | | |
U.S. Strategic Equity* | | 1.00 | % | | N/A | | |
U.S. Small-Mid Cap Equity | | 1.25 | | | N/A | | |
International Equity | | 1.25 | | | N/A | | |
Emerging Markets Equity | | 1.60 | | | 1.35 | % | |
| |
* | Effective November 19, 2010, the Investment Manager voluntarily agreed to lower the expense cap from 1.25% to 1.00%. |
During the year ended December 31, 2010, the Investment Manager waived its management fee and reimbursed the U.S. Strategic Equity Portfolio $125,897 for other expenses.
The Fund has entered into an administration agreement with State Street to provide certain administrative services to the Portfolios. Each Portfolio bears the cost of such services at a fixed annual rate of $42,500, plus 0.02% of average daily net assets up to $1 billion and 0.01% of average daily net assets over $1 billion. State Street has agreed to waive $18,750 of the $42,500 annual fee for the U.S. Strategic
32 Annual Report
Equity Portfolio until the Portfolio’s net assets reach $25 million.
The Fund has a distribution agreement with Lazard Asset Management Securities LLC (the “Distributor”), a wholly-owned subsidiary of the Investment Manager, to serve as the distributor for shares of each Portfolio. The Distributor bears the cost of printing and mailing prospectuses to potential investors and certain expenses in connection with the offering of Portfolio shares.
Under a Distribution and Servicing Plan, in accordance with Rule 12b-1 under the Act, each Portfolio pays a monthly fee to the Distributor, at an annual rate of 0.25% of the average daily net assets of its Service Shares, for distribution and servicing of accounts. The Distributor may make payments to participating insurance companies, certain financial institutions, securities dealers and other industry professionals for providing these services.
4. Directors’ Compensation
Certain Directors of the Fund are officers of the Investment Manager. Each Director who is not an affiliated person of the Investment Manager or any of its affiliates is paid by the Fund, The Lazard Funds, Inc., Lazard Global Total Return and Income Fund, Inc. and Lazard World Dividend & Income Fund, Inc. (collectively with the Fund, the “Lazard Funds”), each a registered management investment company advised by the Investment Manager: (1) an annual retainer of $80,000, (2) a per meeting in person regular or special meeting fee of $5,000 ($1,500 for telephonic participation), including Board, committee, subcommittee or other special meetings specifically authorized by the Board and held in connection with delegated Fund business, and (3) a telephone Audit Committee or special Board meeting fee of $1,500, with an additional annual fee for the Audit Committee Chairman, Lester Z. Lieberman, of $5,000. (Prior to July 1, 2010, the compensation consisted of: (1) an annual retainer of $60,000, (2) $4,000 per meeting attended in person ($1,500 per meeting attended by telephone) and (3) $1,000 for each committee, subcommittee or other special meetings specifically authorized by the Board and held in connection with delegated Fund business.) The Independent Directors also are reimbursed for travel and other out-of-pocket expenses for attending Board and committee meetings. No additional compensation is provided in respect of committee meetings held in conjunction with a
meeting of the Board. Compensation is divided among the Lazard Funds based on relative net assets. The Directors do not receive benefits from the Fund pursuant to any pension, retirement or similar arrangement.
5. Securities Transactions and Transactions with Affiliates
Purchases and sales of portfolio securities (excluding short-term investments) for the year ended December 31, 2010 were as follows:
| | | | | | | |
| | | | | | | |
Portfolio | | | Purchases | | | Sales | |
| | | | | | | |
| | | | |
U.S. Strategic Equity | | $ | 2,995,342 | | $ | 3,103,874 | |
U.S. Small-Mid Cap Equity | | | 164,184,601 | | | 186,809,838 | |
International Equity | | | 297,035,962 | | | 194,087,095 | |
Emerging Markets Equity | | | 401,574,583 | | | 173,899,574 | |
For the year ended December 31, 2010, no brokerage commissions were paid to affiliates of the Investment Manager or other affiliates of the Fund for portfolio transactions executed on behalf of the Fund.
6. Foreign Securities Investment Risks
Certain Portfolios invest in securities of foreign entities and in instruments denominated in foreign currencies which involve risks not typically associated with investments in domestic securities. Non-domestic securities carry special risks, such as exposure to currency fluctuations, less developed or less efficient trading markets, political instability, a lack of company information, differing auditing and legal standards, and, potentially, less liquidity. A Portfolio’s investments in emerging market countries are exposed to additional volatility. A Portfolio’s performance will be influenced by political, social and economic factors affecting companies in emerging markets countries. Emerging market countries generally have economic structures that are less diverse and mature, and political systems that are less stable, than those of developed countries.
7. Contractual Obligations
The Fund enters into contracts in the normal course of business that contain a variety of indemnifications. The Fund’s maximum exposure under these arrangements is unknown. Management has reviewed the Fund’s existing contracts and expects the risk of loss to be remote.
Annual Report 33
8. Fair Value Measurements
Fair value is defined as the price that a Portfolio would receive to sell an asset, or would pay to transfer a liability, in an orderly transaction between market participants at the date of measurement. The Fair Value Measurements and Disclosures provisions of GAAP also establish a framework for measuring fair value, and a three-level hierarchy for fair value measurement that is based upon the transparency of inputs to the valuation of an asset or liability. Inputs may be observable or unobservable and refer, broadly, to the assumptions that market participants would use in pricing the asset or liability. Observable inputs reflect the assumptions that market participants would use in pricing the asset or liability based on market data obtained from sources independent of the Fund. Unobservable inputs reflect the Fund’s own assumptions about the assumptions that market participants would use in pricing the asset or liability, developed based on the best information available in the circumstances. Each investment’s fair value measurement level within the fair value hierarchy is based on the lowest level of any input that is significant to the overall fair value measurement. The three-level hierarchy of inputs is summarized below.
| |
• | Level 1 – unadjusted quoted prices in active markets for identical investments |
• | Level 2 – other significant observable inputs (including unadjusted quoted prices for similar investments, interest rates, prepayment speeds, credit risk, etc.) |
• | Level 3 – significant unobservable inputs (including the Fund’s own assumptions in determining the fair value of investments) |
The inputs or methodology used for valuing securities are not necessarily an indication of the risks associated with investing in these securities.
The following table summarizes the valuation of the Portfolios’ investments by each fair value hierarchy level as of December 31, 2010:
| | | | | | | | | | | | | |
| | | | | | | | | |
Description | | Unadjusted
Quoted Prices in
Active Markets
for Identical
Investments
(Level 1) | | Significant
Other
Observable
Inputs
(Level 2) | | Significant
Unobservable
Inputs
(Level 3) | | Balance as of
December 31,
2010 | |
| | | | | | | | | | | | | |
| | | | | | | | | | | | | |
U.S. Strategic Equity Portfolio |
| | | | | | | | | | | | | |
Common Stocks | | $ | 5,997,693 | | $ | — | | $ | — | | $ | 5,997,693 | |
Preferred Stock | | | — | | | — | | | 31,701 | | | 31,701 | |
Short-Term | | | | | | | | | | | | | |
Investment | | | — | | | 146,204 | | | — | | | 146,204 | |
Total | | $ | 5,997,693 | | $ | 146,204 | | $ | 31,701 | | $ | 6,175,598 | |
| | | | | | | | | | | | | |
U.S. Small-Mid Cap Equity Portfolio |
| | | | | | | | | | | | | |
Common Stocks | | $ | 145,622,702 | | $ | — | | $ | — | | $ | 145,622,702 | |
Preferred Stock | | | — | | | — | | | 864,900 | | | 864,900 | |
Short-Term | | | | | | | | | | | | | |
Investment | | | — | | | 6,572,154 | | | — | | | 6,572,154 | |
Total | | $ | 145,622,702 | | $ | 6,572,154 | | $ | 864,900 | | $ | 153,059,756 | |
| | | | | | | | | | | | | |
International Equity Portfolio |
| | | | | | | | | | | | | |
Common Stocks | | $ | 450,382,025 | | $ | — | | $ | — | | $ | 450,382,025 | |
Short-Term | | | | | | | | | | | | | |
Investment | | | — | | | 13,681,301 | | | — | | | 13,681,301 | |
Total | | $ | 450,382,025 | | $ | 13,681,301 | | $ | — | | $ | 464,063,326 | |
| | | | | | | | | | | | | |
Emerging Markets Equity Portfolio |
| | | | | | | | | | | | | |
Common Stocks | | $ | 842,486,403 | | $ | 7,127,958 | | $ | — | | $ | 849,614,361 | |
Preferred Stocks | | | 24,255,361 | | | — | | | — | | | 24,255,361 | |
Short-Term | | | | | | | | | | | | | |
Investment | | | — | | | 38,605,417 | | | — | | | 38,605,417 | |
Total | | $ | 866,741,764 | | $ | 45,733,375 | | $ | — | | $ | 912,475,139 | |
The common stock included in Level 2 was valued based on reference to a similar security from the same issuer which was trading on an active market. The preferred stock included in Level 3 was valued by reference to comparable entities and evaluation of fundamental data relating to the issuer.
In connection with the periodic implementation of fair value pricing procedures with respect to foreign securities (see Note 2(a)), certain securities in the International Equity and Emerging Market Equity Portfolios are transferred from Level 1 to Level 2 and revert to Level 1 when the fair value pricing procedure triggers are no longer met. Since the fair value pricing procedure triggers were not met at December 31, 2010, any securities which had been valued under these procedures as of December 31, 2009 which remained in the Portfolios as of December 31, 2010 were transferred to Level 1. There were no significant transfers into or out of Level 3 as of December 31, 2010.
For further information regarding security characteristics see Portfolios of Investments.
34 Annual Report
Following is a reconciliation of investments in which significant unobservable inputs (Level 3) were used in determining fair value during the year ended December 31, 2010:
| | | | | | | | | | | | | | | | | | | | | | | | | | | | | | | | | | | | | | | | | | | | | | | | | | | |
| | | | | | | | | | | | | | | | | | | | | |
Description | | Balance as of
December 31,
2009 | | Accrued
Discounts
(Premiums) | | Realized
Gain
(Loss) | | Change in
Unrealized
Appreciation
(Depreciation) | | Purchases | | Sales | | Net Transfers
Into
Level 3 | | Net Transfers
Out of
Level 3 | | Balance as of
December 31,
2010 | | Net Change in
Unrealized
Appreciation
(Depreciation)
from Investments
Still Held at
December 31,
2010 | |
| | | | | | | | | | | | | | | | | | | | | |
| | | | | | | | | | | | | | | | | | | | | | | | | | | | | | | |
U.S. Strategic | | | | | | | | | | | | | | | | | | | | | | | | | | | | | | | | | | | | | | | | | | | | | | | | | | | |
Equity Portfolio | | | | | | | | | | | | | | | | | | | | | | | | | | | | | | | | | | | | | | | | | | | | | | | | | | | |
Preferred Stock | | | $ | — | | | | $ | — | | | | $ | — | | | | $ | — | | | | $ | 31,701 | | | | $ | — | | | | $ | — | | | | $ | — | | | | $ | 31,701 | | | | $ | — | | |
| | | | | | | | | | | | | | | | | | | | | | | | | | | | | | | | | | | | | | | | | | | | | | | | | | | |
U.S. Small-Mid Cap | | | | | | | | | | | | | | | | | | | | | | | | | | | | | | | | | | | | | | | | | | | | | | | | | | | |
Equity Portfolio | | | | | | | | | | | | | | | | | | | | | | | | | | | | | | | | | | | | | | | | | | | | | | | | | | | |
Preferred Stock | | | $ | — | | | | $ | — | | | | $ | — | | | | $ | — | | | | $ | 864,900 | | | | $ | — | | | | $ | — | | | | $ | — | | | | $ | 864,900 | | | | $ | — | | |
9. Subsequent Events
Management has evaluated the possibility of subsequent events affecting the Fund’s financial statements and has determined that there are no such subsequent events that would require disclosure.
Annual Report 35
|
|
Lazard Retirement Series, Inc. Report of Independent Registered Public Accounting Firm |
|
The Board of Directors and Shareholders
Lazard Retirement Series, Inc.
We have audited the accompanying statements of assets and liabilities, including the portfolios of investments, of Lazard Retirement Series, Inc. (the “Fund”, comprised of Lazard Retirement U.S. Strategic Equity Portfolio, Lazard Retirement U.S. Small-Mid Cap Equity Portfolio, Lazard Retirement International Equity Portfolio and Lazard Retirement Emerging Markets Equity Portfolio) as of December 31, 2010 and the related statements of operations for the year then ended, the statements of changes in net assets for each of the two years in the period then ended and the financial highlights for each of the five years in the period then ended. These financial statements and financial highlights are the responsibility of the Fund’s management. Our responsibility is to express an opinion on these financial statements and financial highlights based on our audits.
We conducted our audits in accordance with the standards of the Public Company Accounting Oversight Board (United States). Those standards require that we plan and perform the audit to obtain reasonable assurance about whether the financial statements and financial highlights are free of material misstatement. The Fund is not required to have, nor were we engaged to perform, an audit of its internal control over financial reporting. Our audits included consideration of internal control over financial reporting as a basis for designing audit procedures that are appropriate in the circumstances, but not for the purpose of expressing an opinion on the effectiveness of the Fund’s internal control over financial reporting. Accordingly, we express no such opinion. An audit also includes examining, on a test basis, evidence supporting the amounts and disclosures in the financial statements, assessing the accounting principles used and significant estimates made by management, as well as evaluating the overall financial statement presentation. Our procedures included confirmation of securities owned as of December 31, 2010, by correspondence with the custodian and brokers or by other appropriate auditing procedures where replies from brokers were not received. We believe that our audits provide a reasonable basis for our opinion.
In our opinion, the financial statements and financial highlights as stated above, present fairly, in all material respects, the financial position of each of the respective portfolios constituting Lazard Retirement Series, Inc. as of December 31, 2010, the results of their operations for the year then ended, changes in their net assets for each of the two years in the period then ended and the financial highlights for each of the five years in the period then ended in conformity with U.S. generally accepted accounting principles.
ANCHIN, BLOCK & ANCHIN LLP
New York, New York
February 15, 2011
36 Annual Report
|
|
Lazard Retirement Series, Inc. Board of Directors and Officers Information (unaudited) |
|
| | | | |
| | | | |
Name (Age)
Address(1) | | Position(s) with the Fund
(Since) and Term(2) | | Principal Occupation(s) During Past 5 Years
and Other Directorships Held(2) |
| | | | |
| | | | |
Non-Interested Directors: |
Kenneth S. Davidson (65)(3) | | Director
(April 1997) | | President, Davidson Capital Management Corporation, an investment manager; Partner, Aquiline Holdings LLC, an investment manager; Trustee, The Juilliard School; Chairman of the Board, Bridgehampton Chamber Music Festival; Trustee, American Friends of the National Gallery, London |
| | | | |
Nancy A. Eckl (48) | | Director
(May 2007) | | Former Vice President, Trust Investments, American Beacon Advisors, Inc. (“American Beacon”) and Vice President of certain funds advised by American Beacon; Trustee, College Retirement Equities Fund (eight accounts); Trustee, TIAA-CREF Funds (49 funds) and TIAA-CREF Life Funds (10 funds), and Member of the Management Committee of TIAA Separate Account VA-1 |
| | | | |
Lester Z. Lieberman (80) | | Director
(April 1997) | | Private Investor; Chairman, Healthcare Foundation of New Jersey; Director, Cives Steel Co.; Director, Northside Power Transmission Co.; Advisory Trustee, New Jersey Medical School; Director, Public Health Research Institute; Trustee Emeritus, Clarkson University; Council of Trustees, New Jersey Performing Arts Center |
| | | | |
Leon M. Pollack (70) | | Director
(August 2006) | | Former Managing Director, Donaldson, Lufkin & Jenrette; Trustee, Adelphi University |
| | | | |
Richard Reiss, Jr. (66) | | Director
(April 1997) | | Chairman, Georgica Advisors LLC, an investment manager; Director, O’Charley’s, Inc., a restaurant chain |
| | | | |
Robert M. Solmson (63) | | Director
(September 2004) | | President, Fairwood Capital, LLC, a private investment corporation engaged primarily in real estate and hotel investments; Director, Colonial Williamsburg Co.; Former Chief Executive Officer and Chairman, RFS Hotel Investors, Inc.; Former Director, Morgan Keegan & Co., Inc.; Former Director, Independent Bank, Memphis |
| | | | |
Interested Directors (4): |
Charles L. Carroll (50) | | Chief Executive Officer,
President and Director
(June 2004) | | Deputy Chairman and Head of Global Marketing of the Investment Manager |
| | | | |
Ashish Bhutani (50) | | Director
(July 2005) | | Chief Executive Officer of the Investment Manager; Vice Chairman and Director of Lazard Ltd (since January 2010) |
Annual Report 37
| |
(1) | The address of each Director is Lazard Asset Management LLC, 30 Rockefeller Plaza, New York, New York 10112-6300. |
| |
(2) | Each Director also serves as a Director for each of the Lazard Funds (comprised of, as of January 31, 2011, 22 active investment portfolios). Each Director serves an indefinite term, until his or her successor is elected, and each Director serves in the same capacity for the other Lazard Funds. All of the Independent Directors, except Mr. Lieberman, are also board members of Lazard Alternative Strategies Fund, L.L.C., a privately-offered fund registered under the Act and advised by an affiliate of the Investment Manager. |
| |
(3) | It is possible that Mr. Davidson could be deemed to be an affiliate of a company that has an indirect ownership interest in a broker-dealer that the Investment Manager may use to execute portfolio transactions for clients other than the Portfolios, and thus an “interested person” (as defined in the Act) of the Fund. However, due to the structure of Mr. Davidson’s relationship with the company and the remote nature of any deemed affiliation with the broker-dealer, Mr. Davidson is not identified as an “interested person” (as defined in the Act) of the Fund. Mr. Davidson participates in Fund Board meetings as if his status were that of an “interested person” (as defined in the Act). |
| |
(4) | Messrs. Bhutani and Carroll are “interested persons” (as defined in the Act) of the Fund because of their positions with the Investment Manager. |
| |
The Fund’s Statement of Additional Information contains further information about the Directors and is available without charge by calling 800-823-6300. |
38 Annual Report
| | | | |
| | | | |
Name (Age)
Address(1) | | Position(s) with the Fund
(Since) and Term(2) | | Principal Occupation(s) During Past 5 Years |
| | | | |
| | | | |
Officers (3): | | | | |
Nathan A. Paul (38) | | Vice President
and Secretary
(April 2002) | | Managing Director and General Counsel of the Investment Manager |
| | | | |
Stephen St. Clair (52) | | Treasurer
(May 2003) | | Vice President of the Investment Manager |
| | | | |
Brian D. Simon (48) | | Chief Compliance Officer
(January 2009) and
Assistant Secretary
(November 2002) | | Director and Chief Compliance Officer (since January 2009) of the Fund and the Investment Manager |
| | | | |
Tamar Goldstein (35) | | Assistant Secretary
(February 2009) | | Vice President (since March 2009) and previously Counsel (November 2006 to February 2009) of the Investment Manager; Associate at Schulte Roth & Zabel LLP, a law firm, from May 2004 to October 2006 |
| | | | |
Cesar A. Trelles (36) | | Assistant Treasurer
(December 2004) | | Fund Administration Manager of the Investment Manager |
| |
(1) | The address of each officer is Lazard Asset Management LLC, 30 Rockefeller Plaza, New York, New York 10112-6300. |
| |
(2) | Each officer serves for an indefinite term, until his or her successor is elected and qualifies or until his or her earlier resignation or removal. Each officer serves in the same capacity for the other Lazard Funds. |
| |
(3) | In addition to Charles L. Carroll, President, whose information is included in the Interested Directors section. |
Annual Report 39
|
|
Lazard Retirement Series, Inc. Other Information (unaudited) |
|
Proxy Voting
A description of the policies and procedures used to determine how proxies relating to Fund portfolio securities are voted is available (1) without charge, upon request, by calling (800) 823-6300 or (2) on the Securities and Exchange Commission (the “SEC”) website at http://www.sec.gov.
The Fund’s proxy voting record for the most recent 12-month period ended June 30 is available (1) without charge, upon request, by calling (800) 823-6300 or (2) on the SEC’s website at http://www.sec.gov. Information as of June 30 each year will generally be available by the following August 31.
Form N-Q
The Fund files a complete schedule of each Portfolio’s holdings for the first and third quarters of its fiscal year with the SEC on Form N-Q. The Fund’s Forms N-Q are available on the SEC’s website at http://www.sec.gov and may be reviewed and copied at the SEC’s Public Reference Room in Washington, D.C. Information on the operation of the SEC’s Public Reference Room may be obtained by calling 1-800-SEC-0330.
Board Consideration of Management Agreement
At the meeting of the Fund’s Board held on November 17-18, 2010, the Board considered the approval, for an additional annual period, of the Management Agreement between the Fund, on behalf of its Portfolios, and the Investment Manager. The Independent Directors were assisted in their review by Stroock & Stroock & Lavan LLP (“Stroock”) and met with Stroock in executive session separate from representatives of the Investment Manager.
Services Provided
Representatives of the Investment Manager discussed with the Board the Investment Manager’s written presentation provided in advance of the meeting addressing, among other matters, the nature, extent and quality of services that the Investment Manager provides the Fund, including a discussion of the Investment Manager and its clients (of which the Lazard funds complex of 20 active funds comprises approximately $20.3 billion of the nearly $130 billion of total assets under the management of the Investment Manager and its global affiliates as of September 30, 2010). The representatives of the Investment Manager noted that the Investment Manager believes that the Fund continues to benefit significantly from the infrastructure and services provided by the
Investment Manager’s global investment management platform, technology, operational and legal and compliance support and significant marketing infrastructure across broad distribution channels. The Directors also considered information provided by the Investment Manager regarding its personnel, resources, financial condition and experience. The representatives of the Investment Manager reviewed the Fund’s distribution channels, the relationships with various intermediaries, marketing activities on behalf of the Portfolios over the past year and Portfolio asset flows and the growth or decline in asset levels.
The Directors considered the various services provided by the Investment Manager including the Investment Manager’s research and portfolio management capabilities and oversight of day-to-day operations, including fund accounting and administration and assistance in meeting legal and regulatory requirements. The Directors also considered the Investment Manager’s infrastructure and agreed that the Fund benefits from the services and infrastructure provided by the Investment Manager. The Directors accepted management’s assertion that such services and infrastructure are greater than those typically provided to a $20.3 billion fund complex not managed by a large, global firm such as the Investment Manager.
Comparative Management Fee, Expense Ratio and Performance Information
The Directors reviewed comparative management fee, expense ratio and performance (through September 30, 2010) information prepared by Lipper, noting the limitations of certain Lipper comparison groups (each, a “Group”). Lipper’s materials stated that Lipper’s reports are specifically designed to provide boards of directors the necessary fee, expense and investment performance information to help fulfill their advisory contract renewal responsibilities under Section 15(c) of the Act.
Management Fees and Expense Ratios. The Directors discussed the management fees and expense ratios for each Portfolio. They note the methodology and assumptions used by Lip-per, including that management fee comparisons include administrative fees (which, for the Fund, is paid to the Fund’s third party administrator that is not affiliated with the Investment Manager) and that the quintile rankings used therein (referred to below) did not include fixed dollar amounts paid to administrators. It was noted that such fixed
40 Annual Report
fees were not material relative to the Portfolios’ management fees, but could affect management fee quintile rankings if included in Lipper’s analysis.
In reviewing Lipper’s analyses (which was for the Service shares class of all Portfolios except for the Emerging Markets Equity Portfolio, which has both Service and Investor class shares), it was noted that, except for Global Listed Infrastructure and Capital Allocator Opportunistic Strategies Portfolios (which are not active Portfolios), contractual management fees are at or lower or, in the case of the U.S. Equity Value and U.S. Strategic Equity Portfolios, only slightly higher than each Portfolio’s relevant Group median. They also noted that, except for International Strategic Equity and Global Listed Infrastructure Portfolios (which are not active Portfolios), expense ratios were within the range of those of the funds in the relevant Group. The Directors considered that the Investment Manager continues to voluntarily enter into fee waiver and expense reimbursement agreements for all of the active Portfolios and that for certain of these Portfolios the Investment Manager was waiving management fees and/or reimbursing expenses. For the U.S. Equity Value and U.S. Strategic Equity Portfolios, Fund management proposed, and the Directors approved, a reduction in the contractual management fee which would have ranked the fees below the respective Group medians.
The Directors also considered management fees paid to the Investment Manager by funds advised or sub-advised by the Investment Manager utilizing the same investment strategies as the Portfolios, as well as the Investment Manager’s separately managed accounts with similar investment objectives, policies and strategies (for each Portfolio, collectively with such funds, “Similar Accounts”). The Directors discussed the fees paid to the Investment Manager by the Fund’s Portfolios compared to the fees paid to the Investment Manager by Similar Accounts. Representatives of the Investment Manager discussed the nature of the Similar Accounts and the differences, from the Investment Manager’s perspective, in services provided to the different types of Similar Accounts as compared to the services provided to the Portfolios. The Directors considered the relevance of the fee information provided for Similar Accounts managed by the Investment Manager, in light of the differences in services provided, to evaluate the appro-
priateness and reasonableness of the Portfolios’ management fees.
Performance. The Directors noted that, as discussed below, the Portfolios’ investment returns were variously above, at or below the median ranges of the relevant Group and/or Lipper universe (“Universe”) over measurement periods up to ten years through September 30, 2010.
The Directors noted that performance of U.S. Strategic Equity Portfolio was above or equal to the Group median in half of the periods; U.S. Small-Mid Cap Equity Portfolio was above or equal to the Group median in all periods; International Equity Portfolio was at or below the Group and Universe medians for most of the periods; and the Emerging Markets Equity Portfolio was above the median of the Group and Universe in each time period.
The Directors had received regular updates on the Investment Manager’s efforts in respect of underperforming Portfolios.
Investment Manager Profitability and Economies of Scale
The Directors reviewed information prepared by the Investment Manager for each Portfolio concerning the estimated expenses incurred, and profits realized, by the Investment Manager and its affiliates resulting from the Management Agreement, including the projected dollar amount of expenses allocated and profit received by the Investment Manager for the calendar year ending December 31, 2010 (assuming that asset levels were unchanged from September 30, 2010 to December 31, 2010) and for calendar year 2011 assuming that the average net assets used in the 2010 projection increased by 20%, and the method used to determine such expenses and profits. The representatives of the Investment Manager stated that neither the Investment Manager nor its affiliates receive any significant indirect benefits from the Investment Manager acting as investment adviser to the Portfolios. The Investment Manager’s representatives stated that the broker-dealer that is treated as an affiliate of the Investment Manager did not effect trades for the Portfolios from January 1, 2010 through September 30, 2010 and the Investment Manager did not benefit from money flow (float) in connection with transactions in the Portfolios’ shares. The Investment Manager’s representatives reviewed with the Board information provided on the Investment Manager’s brokerage practices and the Portfolios’ brokerage allocation,
Annual Report 41
commission payments and soft dollar commissions and benefits. The representatives of the Investment Manager reminded the Board that the Investment Manager is continuing to support distribution relationships through direct payments from its or its affiliates’ own resources to third parties in connection with distribution and shareholder servicing and/or administrative and recordkeeping services, and noted that the Fund does not bear any related costs other than the 0.25% 12b-1 fee pursuant to the Distribution and Servicing Plan adopted for the Portfolios’ Service Shares.
The profitability percentages were within ranges determined by relevant court cases not to be so disproportionately large that they bore no reasonable relationship to the services rendered. Representatives of the Investment Manager stated that the Investment Manager believed the profits are not unreasonable in light of the services provided and other factors. The Directors considered the Investment Manager’s estimated and projected profitability with respect to each Portfolio as part of their evaluation of whether the Portfolio’s fee under the Management Agreement bears a reasonable relationship to the mix of services provided by the Investment Manager, including the nature, extent and quality of such services, and evaluated profitability in light of the relevant circumstances for each Portfolio, including the size of each Portfolio and the trend in asset growth or decline. Representatives of the Investment Manager and the Directors discussed ways economies of scale could be realized and how they could be shared, including the Investment Manager’s reinvestment of money back into its business, waiving or reimbursing Portfolio expenses, adding discounts to a Portfolio’s management fee schedule as a Portfolio’s assets increase or by instituting relatively low management fees from inception. It was noted that, for Portfolios with declining or stable assets, the extent to which the Investment Manager may have realized any economies of scale would be reduced. The Directors determined that they would continue to consider potential material economies of scale. Specifically, the Independent Directors requested a further presentation from the Investment Manager (the “Supplemental Presentation”).
At the conclusion of these discussions, each of the Directors expressed the opinion that, subject to receipt of the Supplemental Presentation, he or she had been furnished with sufficient information to make an informed business decision with respect to the renewal of the Management Agreement. Based on its discussions and considerations as described above, the Board made the following conclusions and determinations.
| |
• | The Board concluded that the nature, extent and quality of the services provided by the Investment Manager are adequate and appropriate, noting the benefits of advisory and research services and other services and infrastructure (as discussed above) associated with a nearly $130 billion global asset management business. |
| |
• | The Board was generally satisfied with the overall performance of the Portfolios, but would continue to monitor performance of the Portfolios with performance that was not generally above or competitive with Group or Universe medians. |
| |
• | The Board concluded that each Portfolio’s fee paid to the Investment Manager was reasonable in light of the considerations discussed above. |
| |
• | The Board recognized that economies of scale may be realized as the assets of the Portfolios increase and determined that they would continue to consider potential material economies of scale. |
The Board considered these conclusions and determinations in their totality and, without any one factor being dispositive, determined that approval of the Management Agreement for the Fund, on behalf of the Portfolios (subject to receipt of the Supplemental Presentation), was in the best interests of the Portfolio and its shareholders.
On December 14, 2010, the Board received a satisfactory Supplemental Presentation and took no further action in respect of its previous approval of the Management Agreement.
42 Annual Report
|
|
Lazard Retirement Series, Inc. Tax Information Year Ended December 31, 2010 (unaudited) |
|
Of the dividends paid by the Portfolios, the corresponding percentage represents the amount of each dividend which will qualify for the dividends received deduction available to corporate shareholders.
| | | | |
| | | | |
| | | | |
Portfolio | | Percentage | |
| | | |
| | | |
U.S. Strategic Equity | | 100.00 | % | |
U.S. Small-Mid Cap Equity | | 11.71 | % | |
International Equity | | — | | |
Emerging Markets Equity | | — | | |
The 2010 foreign source income and foreign tax expense, by country, is illustrated below.
| | | | | | | | | | | | | |
| | | | | | | | | | |
| | International Equity Portfolio | | Emerging Markets Equity Portfolio | |
Country | | Foreign
Source Income
Per Country
Factor | | Foreign
Tax Expense
Per Country
Factor | | Foreign
Source Income
Per Country
Factor | | Foreign
Tax Expense
Per Country
Factor | |
| | | | | | | | | |
Australia | | 2.07 | % | | — | | | — | | | — | | |
Belgium | | 0.73 | % | | 1.47 | % | | — | | | — | | |
Bermuda | | 2.13 | % | | — | | | — | | | — | | |
Brazil | | 6.70 | % | | 3.29 | % | | 34.43 | % | | 12.62 | % | |
Canada | | 2.26 | % | | 4.54 | % | | 0.32 | % | | 0.61 | % | |
China | | 1.17 | % | | 1.57 | % | | 1.02 | % | | 1.29 | % | |
Denmark | | 0.74 | % | | 1.49 | % | | — | | | — | | |
Egypt | | — | | | — | | | 3.71 | % | | — | | |
France | | 9.65 | % | | 19.12 | % | | 0.53 | % | | 0.22 | % | |
Germany | | 2.50 | % | | 5.03 | % | | — | | | — | | |
India | | — | | | — | | | 2.12 | % | | — | | |
Indonesia | | — | | | — | | | 4.84 | % | | 11.11 | % | |
Ireland | | 1.60 | % | | — | | | — | | | — | | |
Israel | | 0.27 | % | | 0.33 | % | | 2.92 | % | | 3.42 | % | |
Italy | | 2.58 | % | | 5.19 | % | | — | | | — | | |
Japan | | 16.16 | % | | 15.17 | % | | — | | | — | | |
Jersey, Channel Islands | | 1.54 | % | | — | | | — | | | — | | |
Luxembourg | | — | | | — | | | 0.63 | % | | 1.20 | % | |
Malaysia | | — | | | — | | | 0.96 | % | | — | | |
Mexico | | — | | | — | | | 2.57 | % | | — | | |
Netherlands | | 4.35 | % | | 8.76 | % | | — | | | — | | |
Norway | | 1.25 | % | | 2.51 | % | | — | | | — | | |
Pakistan | | — | | | — | | | 1.34 | % | | 1.69 | % | |
Philippines | | — | | | — | | | 4.96 | % | | 17.65 | % | |
Republic of Korea | | 0.15 | % | | 0.33 | % | | 4.29 | % | | 8.96 | % | |
Russia | | 0.74 | % | | 1.00 | % | | 7.05 | % | | 8.92 | % | |
Singapore | | 1.86 | % | | — | | | — | | | — | | |
South Africa | | — | | | — | | | 14.64 | % | | — | | |
Spain | | 3.83 | % | | 5.78 | % | | — | | | — | | |
Sweden | | — | | | — | | | — | | | — | | |
Switzerland | | 12.13 | % | | 24.42 | % | | — | | | — | | |
Taiwan | | — | | | — | | | 6.92 | % | | 17.49 | % | |
Thailand | | — | | | — | | | 1.27 | % | | 9.48 | % | |
Turkey | | 0.25 | % | | — | | | 5.48 | % | | 5.34 | % | |
United Kingdom | | 25.34 | % | | — | | | — | | | — | | |
| | | | | | | | | | | | | |
Total Foreign | | 100.00 | % | | 100.00 | % | | 100.00 | % | | 100.00 | % | |
| | | | | | | | | | | | | |
Annual Report 43
NOTES
NOTES
NOTES
NOTES
NOTES
|
Lazard Retirement Series, Inc. |
30 Rockefeller Plaza |
New York, New York 10112-6300 |
Telephone: 800-823-6300 |
http://www.LazardNet.com |
|
Investment Manager |
Lazard Asset Management LLC |
30 Rockefeller Plaza |
New York, New York 10112-6300 |
Telephone: 800-823-6300 |
|
Distributor |
Lazard Asset Management Securities LLC |
30 Rockefeller Plaza |
New York, New York 10112-6300 |
|
Custodian |
State Street Bank and Trust Company |
One Lincoln Street |
Boston, Massachusetts 02111 |
|
Transfer Agent and Dividend Disbursing Agent |
Boston Financial Data Services, Inc. |
P.O. Box 8514 |
Boston, Massachusetts 02266-8514 |
Telephone: 800-986-3455 |
|
Independent Registered Public Accounting Firm |
Anchin, Block & Anchin LLP |
1375 Broadway |
New York, New York 10018 |
http://www.anchin.com |
|
Legal Counsel |
Stroock & Stroock & Lavan LLP |
180 Maiden Lane |
New York, New York 10038-4982 |
http://www.stroock.com |

Performance information as of the most recent month end is available online at www.LazardNet.com.
Lazard Asset Management LLC
30 Rockefeller Plaza
New York, NY 10112-6300
800-823-6300
www.LazardNet.com
© 2011 Lazard Asset Management LLC
12/10 LZDPS010
Lazard Retirement Series
ITEM 2. CODE OF ETHICS.
The Registrant has adopted a code of ethics that applies to the Registrant’s principal executive officer, principal financial officer, principal accounting officer or controller, or persons performing similar functions.
ITEM 3. AUDIT COMMITTEE FINANCIAL EXPERT.
The Registrant’s Board of Directors (the “Board”) has determined that Lester Z. Lieberman, Robert M. Solmson and Nancy A. Eckl, members of the Audit Committee of the Board, are audit committee financial experts as defined by the Securities and Exchange Commission (the “SEC”). Mr. Lieberman, Mr. Solmson and Ms. Eckl are “independent” as defined by the SEC for purposes of audit committee financial expert determinations.
ITEM 4. PRINCIPAL ACCOUNTANT FEES AND SERVICES.
(a) Audit Fees. The aggregate fees billed for each of the last two fiscal years (the “Reporting Periods”) for professional services rendered by the Registrant’s principal accountant (the “Auditor”) for the audit of the Registrant’s annual financial statements, or services that are normally provided by the Auditor in connection with the statutory and regulatory filings or engagements for the Reporting Periods, were $99,800 in 2009 and $99,800 in 2010.
(b) Audit-Related Fees. There were no fees billed in the Reporting Periods by the Auditor to the Registrant for assurance and related services that are reasonably related to the performance of the audit of the Registrant’s financial statements and are not reported under paragraph (a) of this Item 4. There were no fees billed in the Reporting Periods for assurance and related services by the Auditor to the Registrant’s investment adviser or any entity controlling, controlled by or under common control with the investment adviser that provides ongoing services to the Registrant (“Service Affiliates”).
(c) Tax Fees. The aggregate fees billed in the Reporting Periods by the Auditor to the Registrant for professional services rendered by the Auditor for tax compliance, tax advice and tax planning (“Tax Services”) were $26,200 in 2009 and $26,200 in 2010. These services consisted of (i) review or preparation of U.S. federal, state, local and excise tax returns; (ii) U.S. federal, state and local tax planning, advice and assistance regarding statutory, regulatory or administrative developments, and (iii) tax advice regarding tax qualification matters and/or treatment of various financial instruments held or proposed to be acquired or held.
There were no fees billed in the Reporting Periods for Tax Services by the Auditor to Service Affiliates.
(d) All Other Fees. There were no fees billed in the Reporting Periods by the Auditor to the Registrant for products and services other than the services reported in paragraphs (a) through (c) of this Item.
There were no fees billed in the Reporting Periods by the Auditor to Service Affiliates.
(e) Audit Committee Pre-Approval Policies and Procedures. The Registrant’s Audit Committee pre-approves the Auditor’s engagements for audit and non-audit services to the Registrant and, as required, non-audit services to Service Affiliates on a case-by-case basis. Pre-approval considerations include whether the proposed services are compatible with maintaining the Auditor’s independence. There were no services provided by the Auditor to the Registrant or Service Affiliates that were approved pursuant to (c)(7)(i)(C) of Rule 2-01 of Regulation S-X during the Reporting Periods.
(f) None.
(g) Non-Audit Fees. The aggregate non-audit fees billed by the Auditor for services rendered to the Registrant for the Reporting Periods were $26,200 in 2009 and $26,200 in 2010. There were no fees billed in the Reporting Periods by the Auditor to Service Affiliates.
(h) Not applicable.
ITEM 5. AUDIT COMMITTEE OF LISTED REGISTRANTS.
Not applicable.
ITEM 6. INVESTMENTS
Not applicable.
ITEM 7. DISCLOSURE OF PROXY VOTING POLICIES AND PROCEDURES FOR CLOSED END MANAGEMENT INVESTMENTCOMPANIES.
Not applicable.
ITEM 8. PORTFOLIO MANAGERS OF CLOSED-END MANAGEMENT INVESTMENT COMPANIES.
Not applicable.
ITEM 9. PURCHASES OF EQUITY SECURITIES BY CLOSED-END MANAGEMENT INVESTMENT COMPANY AND AFFILIATED PURCHASERS.
Not applicable.
ITEM 10. SUBMISSION OF MATTERS TO A VOTE OF SECURITY HOLDERS.
There were no material changes to the procedures by which shareholders may recommend nominees to the Registrant’s Board during the period covered by this report.
ITEM 11. CONTROLS AND PROCEDURES.
(a) The Registrant’s principal executive and principal financial officers have concluded, based on their evaluation of the Registrant’s disclosure controls and procedures as of a date within 90 days of the filing date of this report, that the Registrant’s disclosure controls and procedures are reasonably designed to ensure that information required to be disclosed by the Registrant on Form N-CSR is
recorded, processed, summarized and reported within the required time periods and that information required to be disclosed by the Registrant in the reports that it files or submits on Form N-CSR is accumulated and communicated to the Registrant’s management, including its principal executive and principal financial officers, as appropriate to allow timely decisions regarding required disclosure.
(b) There were no changes to the Registrant’s internal control over financial reporting that occurred during the second fiscal quarter of the period covered by this report that have materially affected, or are reasonably likely to materially affect, the Registrant’s internal control over financial reporting.
ITEM 12. EXHIBITS.
(a)(1) Code of Ethics referred to in Item 2.
(a)(2) Certifications of principal executive and principal financial officers as required by Rule 30a-2(a) under the Investment Company Act of 1940.
(a)(3) Not applicable.
(b) Certifications of principal executive and principal financial officers as required by Rule 30a-2(b) under the Investment Company Act of 1940.
SIGNATURES
Pursuant to the requirements of the Securities Exchange Act of 1934 and the Investment Company Act of 1940, the registrant has duly caused this report to be signed on its behalf by the undersigned, thereunto duly authorized.
| | |
Lazard Retirement Series, Inc. |
| | |
By | /s/ Charles L. Carroll | |
| | |
| Charles L. Carroll | |
| Chief Executive Officer |
| | |
Date | February 24, 2011 | |
Pursuant to the requirements of the Securities Exchange Act of 1934 and the Investment Company Act of 1940, this report has been signed below by the following persons on behalf of the registrant and in the capacities and on the dates indicated.
| | |
By | /s/ Charles L. Carroll | |
| | |
| Charles L. Carroll | |
| Chief Executive Officer |
| | |
Date | February 24, 2011 | |
| | |
By | /s/ Stephen St. Clair | |
| | |
| Stephen St. Clair | |
| Chief Financial Officer |
| | |
Date | February 24, 2011 | |