UNITED STATES
SECURITIES AND EXCHANGE COMMISSION
Washington, D.C. 20549
FORM N-CSR
CERTIFIED SHAREHOLDER REPORT OF REGISTERED MANAGEMENT
INVESTMENT COMPANIES
Investment Company Act file number 811-08071
Lazard Retirement Series, Inc.
(Exact name of registrant as specified in charter)
30 Rockefeller Plaza
New York, New York 10112
(Address of principal executive offices) (Zip code)
Nathan A. Paul, Esq.
Lazard Asset Management LLC
30 Rockefeller Plaza
New York, New York 10112
(Name and address of agent for service)
Registrant’s telephone number, including area code: (212) 632-6000
Date of fiscal year end: 12/31
Date of reporting period: 12/31/12
1. REPORTS TO STOCKHOLDERS.

December 31, 2012
Lazard Retirement Series Annual Report
| | |
| U.S. Equity | Emerging Markets |
| Lazard Retirement U.S. Strategic Equity Portfolio | Lazard Retirement Emerging Markets Equity Portfolio |
| Lazard Retirement U.S. Small-Mid Cap Equity Portfolio | |
| | Targeted Volatility |
| International Equity | Lazard Retirement Multi-Asset Targeted Volatility Portfolio |
| Lazard Retirement International Equity Portfolio | |

Lazard Retirement Series, Inc. Table of Contents
Shares of the Portfolios are currently offered only to separate accounts established by insurance companies to fund variable annuity contracts and variable life insurance policies. Portfolio shares may also be offered to certain qualified pension and retirement plans and to accounts permitting accumulation of assets on a tax-deferred basis.
Please consider a Portfolio’s investment objective, risks, charges and expenses carefully before investing. For more complete information about Lazard Retirement Series, Inc. (the “Fund”), you may obtain a prospectus or summary prospectus by calling 800-823-6300, or online, at www.LazardNet.com. Read the prospectus or each Portfolio’s summary prospectus carefully before you invest. The prospectus and summary prospectus contain investment objective, risks, charges, expenses and other information about Portfolios of the Fund, which are not detailed in this report.
Distributed by Lazard Asset Management Securities LLC.
Annual Report 1

Lazard Retirement Series, Inc. A Message from Lazard
Dear Shareholder,
Global equities rebounded strongly in 2012, with several major stock indices recording gains in the low double digits. Fixed-income markets continued to perform well. Although uncertainty created by global deleveraging and political transition gave investors pause throughout the year, sentiment was buoyed by looser monetary policy, progress toward resolving the euro zone debt crisis, and an upturn in U.S. house prices.
Corporate profitability and cash generation remain robust and valuations remain attractive by historical standards. During the year, emerging-market equities modestly outperformed their developed-market counterparts amid central bank action and signs of greater economic stability, both globally and in specific regions and countries, particularly China.
At Lazard Asset Management, we remain focused on fundamental, active management, particularly during these challenging financial times.
We believe that financial markets offer attractive opportunities, and that we possess and continually cultivate the skills, knowledge, and experience to take advantage of these opportunities. We are committed to leveraging our strengths to help you, a valued shareholder in Lazard Funds, achieve your financial goals.
We appreciate your continued confidence in our management capabilities, and feel privileged that you have turned to Lazard for your investment needs.
Sincerely,
Lazard Asset Management LLC
2 Annual Report

Lazard Retirement Series, Inc. Investment Overviews
U.S. Equities
During the first quarter of 2012, the U.S. market rallied due to heightened global growth prospects, continued loose monetary policy, and positive developments in the European debt crisis. In the second quarter, the market declined, primarily due to concerns about Europe, particularly the prospect that Greece would exit the euro zone and cause subsequent contagion in the financial markets. Investors were also disappointed as U.S. employment and economic indicators were lower than expected. During the third quarter of 2012, the market gained as investors were encouraged by a relatively strong earnings season and improving house prices. The U.S. Federal Reserve (the Fed) announced another round of quantitative easing and the European Central Bank (ECB) declared it would begin purchasing sovereign debt in the secondary market alongside the European Stability Mechanism (ESM) for countries which agreed to certain conditions, both of which buoyed markets. While the market was volatile during the fourth quarter due to the presidential election and worries about the impending fiscal cliff, there were bright spots over the period. Housing continued to strengthen and third-quarter GDP growth was revised to 3.1%.
International Equities
The twelve-month period ended December 31, 2012 was eventful and volatile, but ultimately ended with an increase for international equity markets. Slowing global economic growth concerned investors. Sovereign debt problems also weighed on investor sentiment; however, European Union (EU) and ECB actions helped allay market concerns. In December, the ECB announced a plan to backstop the banking system through liquidity provisions. The Long Term Refinancing Operation (LTRO) program provided over a trillion dollars of three-year financing at 1% interest rates, easing financing concerns for banks and sovereigns. In June, an EU summit proposed two things: the establishment of a single banking supervisor, and the allowance for the ESM to directly inject capital into troubled banks. In July, ECB President Mario Draghi signaled that the bank is committed to preserving the euro zone, and would do “whatever it takes” to do so. In September, the Outright Monetary Transactions program, focused on unlimited purchases of sovereign bonds, was introduced. Lastly, Germany’s Constitutional Court ruled in favor of the ESM, the euro zone’s permanent bailout facility, bolstering investor confidence. In the United States, uncertainty leading up to the November election, and surrounding the fiscal cliff, was tempered as
the Fed announced further quantitative easing. Fed Chairman Ben Bernanke stated that the quantitative easing, which focused on mortgage-backed securities, would remain open-ended until the U.S. labor market improved, raising some concerns internationally. In December, Standard & Poor’s upgraded Greece’s credit rating by six notches from “selective default” to “B-” following the country’s demonstration of its commitment to the euro, while the ECB announced it would accept Greek government debt as collateral. Elsewhere, in Japan, the Liberal Democratic Party reclaimed power in the December elections, fueling speculation of policy efforts to stimulate inflation and change Bank of Japan inflation targets. In emerging markets, the Chinese government underwent its once-a-decade leadership transition, which is expected to be followed by stimulative policies. In Latin America, Mexico’s new government assumed control. Mexico and Peru both reported robust GDP numbers in November while Brazil disappointed, increasing pressure on the government to impose pro-growth reforms.
Emerging Markets Equities
Once more, issues in the developed world had a dominant effect on capital markets worldwide in 2012. Pressured by concern over the adequacy of global economic growth, but supported by universally low interest rates and highly stimulative central bank policies, the prices of equities in the developing world fluctuated significantly during 2012. Close to the year’s beginning, the ECB introduced its LTRO as a stabilizing tool, which bolstered global capital markets’ returns markedly. However, this was significantly counterbalanced by new, serious concerns regarding European debt sustainability in the second quarter, and commodity prices finished the period significantly weaker. In the third quarter, ECB President Mario Draghi publicly stated that the bank would do “whatever it takes” to preserve the euro and stabilize the European economy. This comment, in addition to other stimulatory policy activity from the ECB, reassured markets substantially. U.S. President Barack Obama’s re-election in November, and his focus on increasing tax revenues in order to avert the fiscal cliff of automatic cost reductions and new taxes, finished the year on a shrill but ascending note. Over each of the months in 2012, emerging markets gained relatively strongly, rising by more than 18% in total for 2012, as measured by the Morgan Stanley Capital International (MSCI®) Emerging Markets Index (the EM Index). Returns were positive across all regions, as Asian shares performed marginally worse than equities in the eastern European,
Annual Report 3

Middle Eastern, and African (EMEA) region. Although still positive, performance in Latin America was held back by its substantial materials and energy sector exposures and sensitivity.
With the exception of Argentina, which is not an index constituent, other Latin American markets recorded positive returns. Brazilian equities finished flat, restrained by poor share performance from oil and gas companies and some materials exporters, as well as by the effects of periodic anti-corporate rhetoric from President Dilma Rousseff. Elsewhere in the region, countries such as Colombia and Peru had excellent performance, where stable economic conditions were accompanied by sensible economic policies. Mexican equities also recorded a strong year, reinforced by the election of President Enrique Peña Nieto. Despite the Argentinean government’s partial expropriation of YPF, the recent announcement of higher gas tariffs in the country, as well as a possible exploration and production agreement, helped the company’s share price recover some of its decline.
Almost all Asian emerging markets performed positively over the year. China and the Philippines were among the best performers, aided by improving economic conditions. In China, concerns about economic growth persisted following its official guidance of 7.5% economic growth in the first half of the year until some encouraging Purchasing Managers’ Index (PMI) readings appeared to change the sentiment. The autumn unveiling of the Chinese Communist Party’s new Politburo Standing Committee appeared to reinvigorate the country’s economic direction. The Philip-pine economy has also endured a long recovery period, but the government’s anti-corruption efforts have not gone unnoticed. Despite a persistently divided political environment, Thai shares were aided by signs of greater economic activity and rose significantly. The broad strength of semiconductor company stocks had a positive effect on such companies in South Korea and Taiwan. Despite beginning the year at relatively expensive valuations, Indian equities continued to generate decent rates of return, helped by the Reserve Bank’s accommodative monetary policy. Indonesia, which had been impressive in the 2009-2011 period, generated muted returns during the year, to some degree due to its vulnerability to higher inflation.
Markets in the EMEA region exhibited strong performance during 2012. Despite the European sovereign debt crises and austerity programs, shares in the Czech Republic and
Hungary finished higher. Poland’s resilient economy recorded a market rise of almost 40%. Elsewhere, following President Mohammed Morsi’s election as Egypt’s first democratically elected head of state, and despite other political factors, Egyptian shares also rose considerably during the year. Russian equities were generally supported by reasonable crude oil prices and corporations commenting publicly concerning better capital management and corporate governance. Finally, Turkish equities were the best performers of any emerging-market country, aided by low valuations, strong corporate profits, and a lesser need for unorthodox monetary policy.
In terms of sector returns, health care, financials, information technology, and consumer staples performed relatively well. The energy, materials, utilities, and telecom services sectors underperformed the EM Index.
Lazard Retirement U.S. Strategic Equity Portfolio
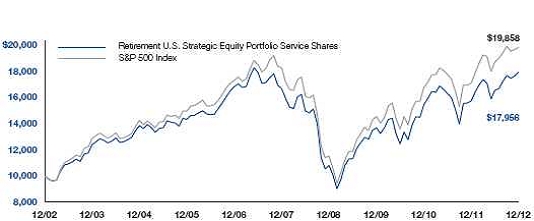
For the year ended December 31, 2012, the Lazard Retirement U.S. Strategic Equity Portfolio’s Service Shares posted a total return of 14.01%, as compared with the 16.00% return for the S&P 500® Index.
Stock selection and an overweight position in the health care sector contributed to performance. Shares of Baxter International, a company that focuses on treatments for hemo-philia, kidney disease, immune disorders, and other chronic medical conditions, rose after the company reported strong earnings and increased its dividend and share repurchase program. In December, the company announced that it would be acquiring dialysis machine maker Gambro. Stock selection and an overweight position in the consumer discretionary sector also helped returns. Shares of cable and media operator Comcast rose after the company reported strong earnings, led by consistently solid performance in its cable division. Management also announced an increase in both its dividend and share repurchase programs during the year.
In contrast, stock selection in the materials sector detracted from performance. Shares of metallurgical coal producer Walter Energy fell after the company reported disappointing earnings, stemming from a slowdown in global steel demand. Stock selection in the information technology sector also hurt returns. The Portfolio’s relative underweight in Apple detracted from returns as the company had a robust return during the year.
4 Annual Report

Lazard Retirement U.S. Small-Mid Cap Equity Portfolio
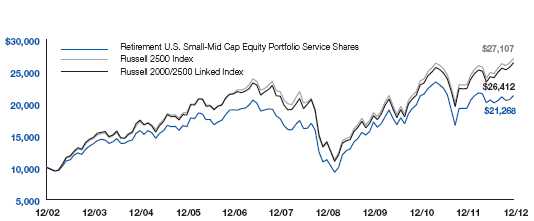
For the year ended December 31, 2012, the Lazard Retirement U.S. Small-Mid Cap Equity Portfolio’s Service Shares posted a total return of 10.38%, as compared with the 17.88% return for the Russell 2500® Index.
For the year, stock selection in the energy and consumer discretionary sectors detracted from performance, while stock selection in the industrials and financials sectors helped returns.
The main detractor in the energy sector was GulfMark Offshore, a provider of marine support services to the energy industry. Shares of the company declined after it announced earnings in May that missed expectations. We exited the position in September 2012. Key Energy Services, a provider of onshore, rig-based well services, and Rosetta Resources, an oil and gas exploration and production company, also detracted from returns in the energy sector.
Performance in the consumer discretionary sector was hurt by Tempur-Pedic International, a mattress manufacturer, after the company announced lower-than-anticipated earnings guidance. We exited the position in Tempur-Pedic in June 2012. Modine Manufacturing, a manufacturer of heat-transfer and heat-storage technology products for the automotive market, also detracted from returns. Shares of the company declined after it reduced its full-year earnings target during the year amid slowing sales in Europe.
In the industrials sector, TriMas, a diversified manufacturer for the commercial, manufacturing, and consumer markets, outperformed throughout the year based on consistently strong earnings. MasTec, a specialty contractor for buildings, installation, and maintenance, outperformed due to better-than-expected revenues and increased revenue guidance announced in the third quarter. A position in Regal-Beloit, which manufactures solutions to control motion, torque, and electrical products, performed well based on stronger-than-expected guidance early in the year and on maintenance of their longer-term guidance throughout the year.
Extra Space Storage, a real estate investment trust (REIT) focused on self-storage properties, was the best performer in the financials sector. The company consistently beat consensus earnings estimates throughout the year, and there is general optimism about the potential of future earnings from the company’s 2012 acquisitions. Shares of PacWest Ban-
corp, a provider of commercial banking services focused in California, outperformed based on generally improved conditions and growth in the loan market, a recovery in Califor-nia, and optimism surrounding an acquisition the company announced in November. Shares of Wintrust Financial, a provider of community-based banking services, also helped performance in the sector.
Lazard Retirement International Equity Portfolio
For the year ended December 31, 2012, the Lazard Retirement International Equity Portfolio’s Service Shares posted a total return of 21.11%, as compared with the 17.32% return for the MSCI EAFE® Index (Europe, Australasia, Far East), or the EAFE Index.
The Portfolio’s strong outperformance over the twelve months ended December 31, 2012 was primarily driven by stock selection. Within the materials sector, Australian building materials supplier James Hardie Industries performed well due to strong demand from a recovering U.S. housing industry. A position in U.K. global beverage can manufacturer Rexam contributed to relative returns due to progress in restructuring and operational performance. In the information technology sector, South Korean electronics producer Sam-sung continued to outperform on strong smartphone sales.
The Portfolio was negatively impacted by the financials sector. Banco do Brasil detracted from relative returns as the government increased pressure on banks to reduce borrowing costs thereby impacting net interest margins. In addition, Swiss financial services firm Credit Suisse Group underperformed following a report which called for a strengthening of its capital base. Both positions were exited during the year. Low exposure to Asia ex-Japan also detracted from relative returns.
Lazard Retirement Emerging Markets Equity Portfolio
For the year ended December 31, 2012, the Lazard Retirement Emerging Markets Equity Portfolio’s Service Shares posted a total return of 22.05%, while Investor Shares posted a total return of 22.34%, as compared with the 18.22% return for the EM Index.
Stock selection in the telecom services and consumer staples sectors and in Brazil and South Africa helped performance, as shares of Cielo, a Brazilian credit card processing company, improved due to better-than-expected fourth-quarter
Annual Report 5

results, as well as a tender offer to the minority shareholders of Cielo’s competitor, Redecard, by Itau Unibanco Holding. Shoprite Holdings, a South African operator of supermarkets, benefited from strong execution in a buoyant domestic retail market, and from market optimism regarding its growth strategy for the rest of Africa. A higher-than-benchmark exposure to Turkey also added value as Turkiye Is Bankasi, a Turkish bank, bounced back from prior weakness amid reduced concerns over a potential investigation by the market regulator into claims of influence by the opposition party on company policies and as a result of positive economic data in Turkey.
Samsung Electronics, a South Korean manufacturer of electronics equipment, outperformed based on continued strong sales of its Galaxy smartphones. Taiwan Semiconductor Manufacturing, a producer of integrated circuits, performed well amid increased speculation that it would secure Apple A7 chip orders in 2014.
In contrast, stock selection in the energy sector and in India hurt performance. Shares of YPF, an Argentine energy company, weakened after the government announced plans to expropriate a majority of the company from its primary owner, Repsol. HTC, Taiwan’s leading smartphone manufacturer performed poorly due to disappointing results. Companhia Siderurgica Nacional (CSN), a Brazilian steel manufacturer, declined as a result of slowing demand for its products. Our holdings in HTC and CSN were sold during the fourth quarter. Shares of United Tractors, an Indonesian distributor of heavy construction equipment and provider of mining contract services, retreated as heavy equipment sales declined, and based on expectations that coal companies would reduce capital spending as a result of falling coal prices. NetEase, a Chinese online gaming and internet provider, was pressured by concerns that the Chinese gaming market is slowing.
Lazard Retirement Multi-Asset Targeted Volatility Portfolio
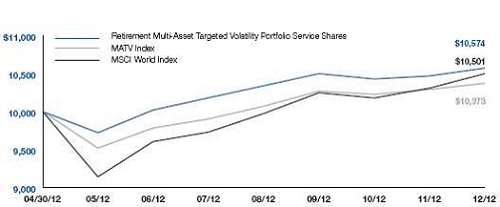
For the period from April 30, 2012 (the Portfolio’s inception) through December 31, 2012, the Lazard Retirement Multi-
Asset Targeted Volatility Portfolio’s Service Shares posted a total return of 5.74%, as compared with the 3.73% return of its benchmark, which is a 50/50 blend of the MSCI World® Index and the Barclays Capital Global Aggregate Bond® Index (the MATV Index).
The Portfolio’s assets are allocated among various of Lazard Asset Management LLC’s, the Fund’s investment manager (the “Investment Manager”), domestic and foreign equity and fixed-income strategies utilizing qualitative and quantitative analysis. The Investment Manager considers broad economic contexts pertinent to allocation decisions among the strategies.
Changes made to the weighting of these economic contexts during the period reflected a consideration of many factors, including: 1) the euro zone sovereign debt crisis; 2) global macro data readings, particularly of the PMI (which measures economic activity) in China, the United States, and the euro zone; 3) inflation in emerging and developed markets; 4) commodity prices; 5) investment flows into emerging markets; 6) central bank policies, notably those of the Fed and the ECB; 7) U.S., European and Chinese policymakers’ initiatives; 8) employment data, and 9) the U.S. housing sector.
From the Portfolio’s inception through December 31, 2012, stock selection in the technology, energy, and consumer discretionary sectors, and stock selection in the United States, Japan and Germany added value within the Portfolio’s equity allocation. Within fixed-income, performance was helped by country allocations, primarily through overweight positions in Poland, Australia, and New Zealand. Security selection in Europe and the United States, along with tactical currency exposure, also contributed to returns from the fixed-income allocation. In contrast, stock selection in the materials and health care sectors and an underweight exposure to financials, stock selection in the United Kingdom, and an underweight exposure to Swiss equities detracted from performance, as did avoiding government bonds in peripheral Europe (specifically Italy), which recorded attractive, albeit volatile, returns for the year.
6 Annual Report

Notes to Investment Overviews:
All returns reflect reinvestment of all dividends and distributions, if any. Certain expenses of the Portfolios may have been waived or reimbursed by the Investment Manager, State Street Bank and Trust Company, the Fund’s Administrator (“State Street”), or Boston Financial Data Services, Inc., the Fund’s transfer and dividend disbursing agent (“BFDS”); without such waiver/reimbursement of expenses, the Portfolios’ returns would have been lower. Performance information does not reflect the fees and charges imposed by participating insurance companies at the separate account level, and such charges will have the effect of reducing performance. Past performance is not indicative, or a guarantee, of future results.
The performance data of the indices and other market data have been prepared from sources and data that the Investment Manager believes to be reliable, but no representation is made as to their accuracy. These indices are unmanaged, have no fees or costs and are not available for investment.
The views of the Investment Manager and the securities described in this report are as of December 31, 2012; these views and portfolio holdings may have changed subsequent to this date. Nothing herein should be construed as a recommendation to buy, sell, or hold a particular security. There is no assurance that the securities discussed herein will remain in each Portfolio at the time you receive this report, or that securities sold will not have been repurchased. The specific securities discussed may, in aggregate, represent only a small percentage of each Portfolio’s holdings. It should not be assumed that securities identified and discussed were, or will be, profitable, or that the investment decisions made in the future will be profitable, or equal the investment performance of the securities discussed herein.
The views and opinions expressed are provided for general information only, and do not constitute specific tax, legal, or investment advice to, or recommendations for, any person. There can be no guarantee as to the accuracy of the outlooks for markets, sectors and securities as discussed herein. You should read the Fund’s prospectus or each Portfolio’s summary prospectus for a more detailed discussion of each Portfolio’s investment objective, strategies, risks and fees.
Annual Report 7

Lazard Retirement Series, Inc. Performance Overviews
Lazard Retirement U.S. Strategic Equity Portfolio
Comparison of Changes in Value of $10,000 Investment in the Service Shares of Lazard Retirement U.S. Strategic Equity Portfolio and S&P 500® Index*
Average Annual Total Returns*
Years Ended December 31, 2012
| | | One
Year | | | Five
Years | | | Ten
Years | |
| Service Shares | | | 14.01% | | | | 1.49% | | | | 6.03% | |
|
| S&P 500 Index | | | 16.00% | | | | 1.66% | | | | 7.10% | |
| * | All returns reflect reinvestment of all dividends and distributions, if any. Certain expenses of the Portfolio have been waived or reimbursed by the Portfo- lio’s Investment Manager or State Street; without such waiver/reimbursement of expenses, the Portfolio’s returns would have been lower. Performance information does not reflect the fees and charges imposed by participating insurance companies at the separate account level, and such charges will have the effect of reducing performance. |
| | |
| | The performance quoted represents past performance. Current performance may be lower or higher than the performance quoted. Past performance is not indicative, or a guarantee, of future results; the investment return and principal value of the Portfolio will fluctuate, so that Portfolio shares, when re- deemed, may be worth more or less than their original cost. Within the longer periods illustrated there may have been short-term fluctuations, counter to the overall trend of investment results, and no single period of any length may be taken as typical of what may be expected in future periods. |
| | |
| The performance data of the index has been prepared from sources and data that the Investment Manager believes to be reliable, but no representation is made as to its accuracy. The S&P 500 Index is a market capitalization-weighted index of 500 common stocks, designed to measure performance of the broad domestic economy through changes in the aggregate market value of these stocks, which represent all major industries. The index is unman- aged, has no fees or costs and is not available for investment. |
| | |
| Before May 1, 2007, the Portfolio was known as Lazard Retirement Equity Portfolio and had a different investment strategy. |
8 Annual Report

Lazard Retirement U.S. Small-Mid Cap Equity Portfolio
Comparison of Changes in Value of $10,000 Investment in the Service Shares of Lazard Retirement U.S. Small-Mid Cap Equity Portfolio, Russell 2500® Index and Russell 2000/2500 Linked Index*
Average Annual Total Returns*
Years Ended December 31, 2012
| | | One
Year | | | Five
Years | | | Ten
Years | |
| Service Shares | | | 10.38% | | | | 3.79% | | | | 7.84% | |
| Russell 2500 Index | | | 17.88% | | | | 4.34% | | | | 10.49% | |
| Russell 2000/2500 Linked Index | | | 17.88% | | | | 4.47% | | | | 10.20% | |
| * | All returns reflect reinvestment of all dividends and distributions, if any. Certain expenses of the Portfolio have been waived or reimbursed by the Portfo- lio’s Investment Manager; without such waiver/reimbursement of expenses, the Portfolio’s returns would have been lower. Performance information does not reflect the fees and charges imposed by participating insurance companies at the separate account level, and such charges will have the effect of reducing performance. |
| | |
| The performance quoted represents past performance. Current performance may be lower or higher than the performance quoted. Past performance is not indicative, or a guarantee, of future results; the investment return and principal value of the Portfolio will fluctuate, so that Portfolio shares, when re- deemed, may be worth more or less than their original cost. Within the longer periods illustrated there may have been short-term fluctuations, counter to the overall trend of investment results, and no single period of any length may be taken as typical of what may be expected in future periods. |
| | |
| The Portfolio was previously known as Lazard Retirement U.S. Small Cap Equity Portfolio. As of June 1, 2009, the Portfolio changed its name to Lazard Retirement U.S. Small-Mid Cap Equity Portfolio and changed its investment strategy to invest in equity securities of small-mid cap U.S. companies. |
| | |
| The performance data of the indices have been prepared from sources and data that the Investment Manager believes to be reliable, but no representa- tion is made as to their accuracy. The Russell 2500 Index is comprised of the 2,500 smallest U.S. companies included in the Russell 3000® Index (which consists of the 3,000 largest U.S. companies by capitalization). The Russell 2000/2500 Linked Index is an index created by the Portfolio’s Investment Manager, which links the performance of the Russell 2000® Index for all periods through May 31, 2009 and the Russell 2500 Index for all periods there- after. The Russell 2000 Index is comprised of the 2,000 smallest U.S. companies included in the Russell 3000 Index. The indices are unmanaged, have no fees or costs and are not available for investment. |
Annual Report 9

Lazard Retirement International Equity Portfolio
Comparison of Changes in Value
of $10,000 Investment in the
Service Shares of Lazard
Retirement International Equity
Portfolio and EAFE Index* | | 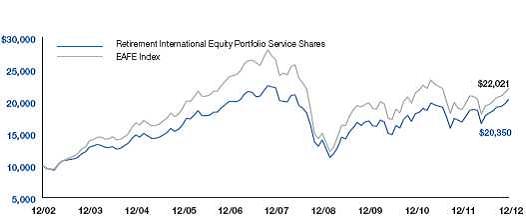 |
Average Annual Total Returns*
Years Ended December 31, 2012
| | | One
Year | | Five
Years | | Ten
Years | |
| Service Shares | | 21.11% | | -1.72% | | 7.36% | |
| EAFE Index | | 17.32% | | -3.69% | | 8.21% | |
| * | All returns reflect reinvestment of all dividends and distributions, if any. Certain expenses of the Portfolio have been waived or reimbursed by the Portfo- lio’s Investment Manager; without such waiver/reimbursement of expenses, the Portfolio’s returns would have been lower. Performance information does not reflect the fees and charges imposed by participating insurance companies at the separate account level, and such charges will have the effect of reducing performance. |
| | The performance quoted represents past performance. Current performance may be lower or higher than the performance quoted. Past performance is not indicative, or a guarantee, of future results; the investment return and principal value of the Portfolio will fluctuate, so that Portfolio shares, when re- deemed, may be worth more or less than their original cost. Within the longer periods illustrated there may have been short-term fluctuations, counter to the overall trend of investment results, and no single period of any length may be taken as typical of what may be expected in future periods. |
| | The performance data of the index has been prepared from sources and data that the Investment Manager believes to be reliable, but no representation is made as to its accuracy. The EAFE Index is a broadly diversified international index comprised of equity securities of approximately 1,000 companies located in developed countries outside the United States. The index is unmanaged, has no fees or costs and is not available for investment. |
10 Annual Report

Lazard Retirement Emerging Markets Equity Portfolio
Comparison of Changes in Value
of $10,000 Investment in the
Service Shares of Lazard Retire-
ment Emerging Markets Equity
Portfolio and EM Index* | | 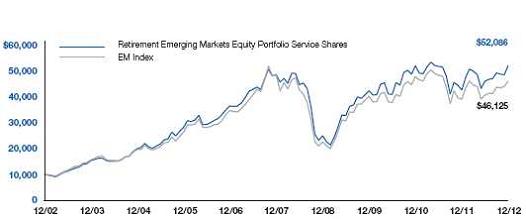 |
Average Annual Total Returns*
Years Ended December 31, 2012
| | | Service Shares | Investor Shares |
| | | One
Year | | Five
Years | | Ten
Years | | One
Year | | Five
Years | | Since
Inception† | |
| Retirement Emerging Markets Equity Portfolio** | | 22.05% | | 1.35% | | 17.94% | | 22.34% | | 1.61% | | 7.32% | |
| EM Index | | 18.22% | | -0.92% | | 16.52% | | 18.22% | | -0.92% | | 5.62% | |
| * | All returns reflect reinvestment of all dividends and distributions, if any. Certain expenses of the Portfolio have been waived or reimbursed by the Portfo- lio’s Investment Manager or State Street; without such waiver/reimbursement of expenses, the Portfolio’s returns would have been lower. Performance information does not reflect the fees and charges imposed by participating insurance companies at the separate account level, and such charges will have the effect of reducing performance. |
| | The performance quoted represents past performance. Current performance may be lower or higher than the performance quoted. Past performance is not indicative, or a guarantee, of future results; the investment return and principal value of the Portfolio will fluctuate, so that Portfolio shares, when re- deemed, may be worth more or less than their original cost. Within the longer periods illustrated there may have been short-term fluctuations, counter to the overall trend of investment results, and no single period of any length may be taken as typical of what may be expected in future periods. |
| | The performance data of the index has been prepared from sources and data that the Investment Manager believes to be reliable, but no representation is made as to its accuracy. The EM Index is comprised of emerging market securities in countries open to non-local investors. The index is unmanaged, has no fees or costs and is not available for investment. |
| ** | The performance of Service Shares may be greater than or less than the performance of Investor Shares, primarily based on the differences in fees borne by shareholders investing in different classes. |
| † | The inception date for Investor Shares was May 1, 2006. |
Annual Report 11

Lazard Retirement Multi-Asset Targeted Volatility Portfolio
Comparison of Changes in Value of $10,000 Investment in the Service Shares of Lazard Retirement Multi-Asset Targeted Volatility Portfolio, MATV Index and MSCI World® Index*
Total Returns*
Period Ended December 31, 2012
| | | | Since
Inception† |
| Service Shares | | | 5.74% |
| MATV Index | | | 3.73% |
| MSCI World Index | | | 5.01% |
| * | All returns reflect reinvestment of all dividends and distributions, if any. Certain expenses of the Portfolio have been waived or reimbursed by the Portfo- lio’s Investment Manager, State Street or BFDS; without such waiver/reimbursement of expenses, the Portfolio’s returns would have been lower. Per- formance information does not reflect the fees and charges imposed by participating insurance companies at the separate account level, and such charges will have the effect of reducing performance. |
| | |
| | The performance quoted represents past performance. Current performance may be lower or higher than the performance quoted. Past performance is not indicative, or a guarantee, of future results; the investment return and principal value of the Portfolio will fluctuate, so that Portfolio shares, when re- deemed, may be worth more or less than their original cost. No single period of any length may be taken as typical of what may be expected in future periods. |
| | |
| | The performance data of the indices have been prepared from sources and data that the Investment Manager believes to be reliable, but no representa- tion is made as to their accuracy. The MATV Index is a 50/50 blend of the MSCI World Index and the Barclays Capital Global Aggregate Bond® Index.The MSCI World Index is a market capitalization-weighted index of companies representative of the market structure of 24 developed market countries in North America, Europe, and the Asia/Pacific region. The Barclays Capital Global Aggregate Bond Index provides a broad-based measure of global investment-grade fixed-income debt markets, including government-related debt, corporate debt, securitized debt and global Treasury. It covers the investment-grade, U.S. dollar-denominated, fixed-rate taxable bond market, including Treasuries, government-related and corporate securities, MBS, ABS, and CMBS, with maturities of no less than one year. The indices are unmanaged, have no fees or costs and are not available for investment. |
| | |
| † | The inception date for the Portfolio was April 30, 2012. |
12 Annual Report

Lazard Retirement Series, Inc. Information About Your Portfolio’s Expenses
Expense Example
As a shareholder in a Portfolio of the Fund, you incur ongoing costs, including management fees, distribution and service (12b-1) fees (Service Shares only), and other expenses. This Example is intended to help you understand your ongoing costs (in dollars) of investing in a Portfolio and to compare these costs with the ongoing costs of investing in other mutual funds. The Example is based on an investment of $1,000 invested at the beginning of the six month period from July 1, 2012 through December 31, 2012 and held for the entire period.
Actual Expenses
For each Share class of the Portfolios, the first line of the table below provides information about actual account values and actual expenses. You may use the information in this line, together with the amount you invested, to estimate the expenses that you paid over the period. Simply divide your account value by $1,000 (for example, an $8,600 account value divided by $1,000=8.6), then multiply the result by the number in the first line under the heading entitled “Expenses Paid During Period” to estimate the expenses you paid on your account during this period.
Hypothetical Example for Comparison Purposes
For each Share class of the Portfolios, the second line of the table below provides information about hypothetical account values and hypothetical expenses based on the class’ actual expense ratio and an assumed rate of return of 5% per year before expenses, which is not the Portfolio’s actual return. The hypothetical account values and expenses may not be used to estimate the actual ending account balance or expenses you paid for the period. You may use this information to compare the ongoing costs of investing in the Portfolio and other mutual funds. To do so, compare this 5% hypothetical example with the 5% hypothetical examples that appear in the shareholders reports of the other funds.
Please note that you also bear fees and charges imposed by participating insurance companies at the separate account level, which are described in the separate prospectuses issued by the insurance companies. Such charges will have the effect of reducing account value.
Annual Report 13

| Portfolio | | Beginning
Account Value
7/1/12 | | Ending
Account Value
12/31/12 | | Expenses Paid
During Period*
7/1/12 - 12/31/12 | | Annualized Expense
Ratio During Period
7/1/12 - 12/31/12 |
| Retirement U.S. Strategic Equity | | | | | | | | |
| Service Shares | | | | | | | | |
| Actual | | $1,000.00 | | $1,083.90 | | $5.24 | | 1.00% |
| Hypothetical (5% Return Before Expenses) | | $1,000.00 | | $1,020.11 | | $5.08 | | 1.00% |
| | | | | | | | | |
| Retirement U.S. Small-Mid Cap Equity | | | | | | | | |
| Service Shares | | | | | | | | |
| Actual | | $1,000.00 | | $1,032.10 | | $7.31 | | 1.43% |
| Hypothetical (5% Return Before Expenses) | | $1,000.00 | | $1,017.94 | | $7.26 | | 1.43% |
| | | | | | | | | |
| Retirement International Equity | | | | | | | | |
| Service Shares | | | | | | | | |
| Actual | | $1,000.00 | | $1,148.20 | | $5.95 | | 1.10% |
| Hypothetical (5% Return Before Expenses) | | $1,000.00 | | $1,019.59 | | $5.60 | | 1.10% |
| | | | | | | | | |
| Retirement Emerging Markets Equity | | | | | | | | |
| Service Shares | | | | | | | | |
| Actual | | $1,000.00 | | $1,129.90 | | $7.45 | | 1.39% |
| Hypothetical (5% Return Before Expenses) | | $1,000.00 | | $1,018.15 | | $7.05 | | 1.39% |
| Investor Shares | | | | | | | | |
| Actual | | $1,000.00 | | $1,131.20 | | $6.12 | | 1.14% |
| Hypothetical (5% Return Before Expenses) | | $1,000.00 | | $1,019.39 | | $5.80 | | 1.14% |
| | | | | | | | | |
| Retirement Multi-Asset Targeted Volatility** | | | | | | | | |
| Service Shares | | | | | | | | |
| Actual | | $1,000.00 | | $1,055.30 | | $5.42 | | 1.05% |
| Hypothetical (5% Return Before Expenses) | | $1,000.00 | | $1,019.87 | | $5.32 | | 1.05% |
| * | Expenses are equal to the annualized expense ratio of each Share class multiplied by the average account value over the period, multiplied by 184/366 (to reflect one-half year period). |
| | |
| ** | Retirement Multi-Asset Targeted Volatility Portfolio commenced investment operations on April 30, 2012. |
14 Annual Report

Lazard Retirement Series, Inc. Portfolio Holdings Presented by Sector December 31, 2012
| Sector* |
| Lazard
Retirement
U.S. Strategic
Equity Portfolio |
| Lazard
Retirement
U.S. Small-Mid Cap
Equity Portfolio |
| Lazard
Retirement
International
Equity Portfolio |
| Lazard
Retirement
Emerging Markets
Equity Portfolio |
|
| | | | | | | | | | | | | | | | | | |
| Consumer Discretionary | | | 16.5 | % | | | 12.9 | % | | | 13.5 | % | | | 6.9 | % | |
| Consumer Staples | | | 11.6 | | | | 2.1 | | | | 9.5 | | | | 12.7 | | |
| Energy | | | 8.7 | | | | 5.5 | | | | 8.4 | | | | 7.5 | | |
| Financials | | | 11.5 | | | | 23.3 | | | | 18.4 | | | | 27.0 | | |
| Health Care | | | 16.8 | | | | 7.9 | | | | 14.0 | | | | – | | |
| Industrials | | | 11.0 | | | | 17.1 | | | | 11.7 | | | | 8.5 | | |
| Information Technology | | | 19.8 | | | | 18.8 | | | | 6.1 | | | | 14.2 | | |
| Materials | | | 2.9 | | | | 9.3 | | | | 9.5 | | | | 9.0 | | |
| Telecommunication Services | | | – | | | | – | | | | 4.0 | | | | 13.3 | | |
| Utilities | | | – | | | | 1.6 | | | | 2.4 | | | | – | | |
| Short-Term Investments | | | 1.2 | | | | 1.5 | | | | 2.5 | | | | 0.9 | | |
| Total Investments | | | 100.0 | % | | | 100.0 | % | | | 100.0 | % | | | 100.0 | % | |
Sector* | | Lazard
Retirement
Multi-Asset Targeted
Volatility Portfolio | |
| | | | | | | |
| Consumer Discretionary | | | 9.2 | % | | |
| Consumer Staples | | | 10.3 | | | |
| Energy | | | 8.1 | | | |
| Financials | | | 15.2 | | | |
| Health Care | | | 8.6 | | | |
| Industrials | | | 10.4 | | | |
| Information Technology | | | 11.1 | | | |
| Materials | | | 4.0 | | | |
| Municipal | | | 0.4 | | | |
| Telecommunication Services | | | 2.5 | | | |
| Utilities | | | 3.3 | | | |
| Sovereign Debt | | | 13.4 | | | |
| Short-Term Investment | | | 3.5 | | | |
| Total Investments | | | 100.0 | % | | |
* Represents percentage of total investments.
Annual Report 15

Lazard Retirement Series, Inc. Portfolios of Investments December 31, 2012
| Description | | Shares | | | Value | |
| | | | | | | | | |
| Lazard Retirement U.S. Strategic Equity Portfolio |
| | | | | | | | | |
| Common Stocks | 98.8% | | | | | | | | |
| | | | | | | | | |
| Aerospace & Defense | 3.3% | | | | | | | | |
| Raytheon Co. | | | 1,515 | | | $ | 87,203 | |
| Rockwell Collins, Inc. | | | 635 | | | | 36,938 | |
| The Boeing Co. | | | 1,265 | | | | 95,331 | |
| | | | | | | | 219,472 | |
| Agriculture | 1.2% | | | | | | | | |
| The Mosaic Co. | | | 1,380 | | | | 78,149 | |
| | | | | | | | | |
| Alcohol & Tobacco | 2.0% | | | | | | | | |
| Molson Coors Brewing Co., Class B | | | 3,080 | | | | 131,793 | |
| | | | | | | | | |
| Automotive | 1.6% | | | | | | | | |
| General Motors Co. (a) | | | 1,300 | | | | 37,479 | |
| Lear Corp. | | | 1,485 | | | | 69,557 | |
| | | | | | | | 107,036 | |
| Banking | 2.0% | | | | | | | | |
| Bank of America Corp. | | | 11,245 | | | | 130,442 | |
| | | | | | | | | |
| Cable Television | 4.1% | | | | | | | | |
| Comcast Corp., Class A | | | 7,720 | | | | 277,534 | |
| | | | | | | | | |
| Chemicals | 1.1% | | | | | | | | |
| E.l. du Pont de Nemours & Co. | | | 1,665 | | | | 74,875 | |
| | | | | | | | | |
| Commercial Services | 2.9% | | | | | | | | |
| ADT Corp. | | | 1,567 | | | | 72,850 | |
| Corrections Corp. of America | | | 1,850 | | | | 65,620 | |
| Republic Services, Inc. | | | 1,910 | | | | 56,020 | |
| | | | | | | | 194,490 | |
| Computer Software | 3.8% | | | | | | | | |
| BMC Software, Inc. (a) | | | 1,925 | | | | 76,346 | |
| Microsoft Corp. | | | 2,400 | | | | 64,152 | |
| Oracle Corp. | | | 3,385 | | | | 112,788 | |
| | | | | | | | 253,286 | |
| Consumer Products | 1.4% | | | | | | | | |
| Hasbro, Inc. | | | 1,415 | | | | 50,798 | |
| Newell Rubbermaid, Inc. | | | 2,055 | | | | 45,765 | |
| | | | | | | | 96,563 | |
| Energy Exploration & Production | 1.8% | | | | | | | | |
| Devon Energy Corp. | | | 2,315 | | | | 120,473 | |
| Description | | Shares | | | Value | |
| | | | | | | | | |
| Energy Integrated | 5.8% | | | | | | | | |
| Chevron Corp. | | | 1,500 | | | $ | 162,210 | |
| ConocoPhillips | | | 2,200 | | | | 127,578 | |
| Consol Energy, Inc. | | | 3,150 | | | | 101,115 | |
| | | | | | | | 390,903 | |
| Energy Services | 1.1% | | | | | | | | |
| Halliburton Co. | | | 2,185 | | | | 75,798 | |
| | | | | | | | | |
| Financial Services | 8.0% | | | | | | | | |
| American Express Co. | | | 1,510 | | | | 86,795 | |
| Ameriprise Financial, Inc. | | | 1,905 | | | | 119,310 | |
| Capital One Financial Corp. | | | 1,230 | | | | 71,254 | |
| Citigroup, Inc. | | | 5,195 | | | | 205,514 | |
| Janus Capital Group, Inc. | | | 6,260 | | | | 53,335 | |
| | | | | | | | 536,208 | |
| Food & Beverages | 2.9% | | | | | | | | |
| PepsiCo, Inc. | | | 950 | | | | 65,009 | |
| Sysco Corp. | | | 4,175 | | | | 132,180 | |
| | | | | | | | 197,189 | |
| Health Services | 1.1% | | | | | | | | |
| UnitedHealth Group, Inc. | | | 1,385 | | | | 75,122 | |
| | | | | | | | | |
| Insurance | 1.6% | | | | | | | | |
| The Hartford Financial Services Group, Inc. | | | 1,520 | | | | 34,109 | |
| The Travelers Cos., Inc. | | | 985 | | | | 70,743 | |
| | | | | | | | 104,852 | |
| Leisure & Entertainment | 3.3% | | | | | | | | |
| Viacom, Inc., Class B | | | 4,215 | | | | 222,299 | |
| | | | | | | | | |
| Manufacturing | 4.8% | | | | | | | | |
| Caterpillar, Inc. | | | 625 | | | | 55,988 | |
| Honeywell International, Inc. | | | 1,490 | | | | 94,570 | |
| Parker Hannifin Corp. | | | 1,195 | | | | 101,647 | |
| Tyco International, Ltd. | | | 2,345 | | | | 68,591 | |
| | | | | | | | 320,796 | |
| Medical Products | 7.0% | | | | | | | | |
| Baxter International, Inc. | | | 1,910 | | | | 127,320 | |
| CareFusion Corp. (a) | | | 5,510 | | | | 157,476 | |
| McKesson Corp. | | | 1,905 | | | | 184,709 | |
| | | | | | | | 469,505 | |
| Metals & Mining | 0.6% | | | | | | | | |
| Walter Energy, Inc. | | | 1,085 | | | | 38,930 | |
The accompanying notes are an integral part of these financial statements.
16 Annual Report

| Description | | Shares | | | Value | |
| | | | | | | | | |
| Lazard Retirement U.S. Strategic Equity Portfolio (concluded) |
| | | | | | | | | |
| Pharmaceutical & Biotechnology | 8.7% | | | | | | | | |
| Gilead Sciences, Inc. (a) | | | 1,530 | | | $ | 112,379 | |
| Johnson & Johnson | | | 1,930 | | | | 135,293 | |
| Merck & Co., Inc. | | | 1,459 | | | | 59,731 | |
| Pfizer, Inc. | | | 11,000 | | | | 275,880 | |
| | | | | | | | 583,283 | |
| Retail | 12.7% | | | | | | | | |
| American Eagle Outfitters, Inc. | | | 5,355 | | | | 109,831 | |
| AutoZone, Inc. (a) | | | 197 | | | | 69,823 | |
| Big Lots, Inc. (a) | | | 1,945 | | | | 55,354 | |
| CVS Caremark Corp. | | | 3,945 | | | | 190,741 | |
| Lowe’s Cos., Inc. | | | 2,540 | | | | 90,221 | |
| Macy’s, Inc. | | | 2,000 | | | | 78,040 | |
| Wal-Mart Stores, Inc. | | | 3,800 | | | | 259,274 | |
| | | | | | | | 853,284 | |
| Semiconductors & Components | 2.2% | | | | | | | | |
| Intel Corp. | | | 2,735 | | | | 56,423 | |
| Texas Instruments, Inc. | | | 2,850 | | | | 88,179 | |
| | | | | | | | 144,602 | |
| Technology | 2.0% | | | | | | | | |
| Google, Inc., Class A (a) | | | 193 | | | | 136,908 | |
| | | | | | | | | |
| Technology Hardware | 11.8% | | | | | | | | |
| Apple, Inc. | | | 273 | | | | 145,517 | |
| Cisco Systems, Inc. | | | 15,375 | | | | 302,119 | |
| EMC Corp. (a) | | | 4,150 | | | | 104,995 | |
| International Business Machines Corp. | | | 630 | | | | 120,676 | |
| Lexmark International, Inc., Class A | | | 1,710 | | | | 39,655 | |
| Qualcomm, Inc. | | | 1,245 | | | | 77,215 | |
| | | | | | | | 790,177 | |
| Total Common Stocks | | | | | | | | |
| (Identified cost $5,839,347) | | | | | | | 6,623,969 | |
| Description | | | Shares | | | | Value | |
| | | | | | | | | |
| Preferred Stock | 0.0% | | | | | | | | |
| | | | | | | | | |
| Automotive | 0.0% | | | | | | | | |
| Better Place, Inc., Series B | | | | | | | | |
| (Identified cost $31,701) (a), (c) | | | 12,681 | | | $ | 1,649 | |
| | | | | | | | | |
| Short-Term Investment | 1.3% | | | | | | | | |
| State Street Institutional Treasury | | | | | | | | |
| Money Market Fund | | | | | | | | |
| (Identified cost $83,834) | | | 83,834 | | | | 83,834 | |
| | | | | | | | | |
| Total Investments | 100.1% | | | | | | | | |
| (Identified cost $5,954,882) (b) | | | | | | $ | 6,709,452 | |
| | | | | | | | | |
| Liabilities in Excess of Cash and | | | | | | | | |
| Other Assets | (0.1)% | | | | | | | (7,499 | ) |
| | | | | | | | | |
| Net Assets | 100.0% | | | | | | $ | 6,701,953 | |
The accompanying notes are an integral part of these financial statements.
Annual Report 17

| Description | | Shares | | | Value | |
| |
| Lazard Retirement U.S. Small-Mid Cap Equity Portfolio | | | |
| |
| Common Stocks | 98.8% | | | | | | |
| |
| Automotive | 1.9% | | | | | | | | |
| Modine Manufacturing Co. (a) | | | 55,570 | | | $ | 451,784 | |
| Tenneco, Inc. (a) | | | 12,150 | | | | 426,587 | |
| | | | | | | | 878,371 | |
| Banking | 8.0% | | | | | | | | |
| Associated Banc-Corp | | | 46,500 | | | | 610,080 | |
| East West Bancorp, Inc. | | | 32,600 | | | | 700,574 | |
| PacWest Bancorp | | | 33,750 | | | | 836,325 | |
| Signature Bank (a) | | | 12,500 | | | | 891,750 | |
| Wintrust Financial Corp. | | | 19,480 | | | | 714,916 | |
| | | | | | | | 3,753,645 | |
| Chemicals | 2.7% | | | | | | | | |
| Cytec Industries, Inc. | | | 5,400 | | | | 371,682 | |
| Innophos Holdings, Inc. | | | 9,700 | | | | 451,050 | |
| Rockwood Holdings, Inc. | | | 9,430 | | | | 466,408 | |
| | | | | | | | 1,289,140 | |
| Commercial Services | 2.0% | | | | | | | | |
| ARC Document Solutions, Inc. (a) | | | 86,628 | | | | 221,768 | |
| KAR Auction Services, Inc. | | | 26,300 | | | | 532,312 | |
| Realogy Holdings Corp. | | | 4,100 | | | | 172,036 | |
| | | | | | | | 926,116 | |
| Computer Software | 6.4% | | | | | | | | |
| Autodesk, Inc. (a) | | | 21,780 | | | | 769,923 | |
| BMC Software, Inc. (a) | | | 13,400 | | | | 531,444 | |
| Informatica Corp. (a) | | | 15,300 | | | | 463,896 | |
| j2 Global, Inc. | | | 18,800 | | | | 574,904 | |
| Red Hat, Inc. (a) | | | 12,650 | | | | 669,944 | |
| | | | | | | | 3,010,111 | |
| Construction & Engineering | 2.6% | | | | | | | | |
| MasTec, Inc. (a) | | | 27,200 | | | | 678,096 | |
| Quanta Services, Inc. (a) | | | 20,200 | | | | 551,258 | |
| | | | | | | | 1,229,354 | |
| Consumer Products | 3.4% | | | | | | | | |
| Central Garden & Pet Co., Class A (a) | | | 60,362 | | | | 630,783 | |
| Hasbro, Inc. | | | 18,000 | | | | 646,200 | |
| The Middleby Corp. (a) | | | 2,665 | | | | 341,679 | |
| | | | | | | | 1,618,662 | |
| Diversified | 0.7% | | | | | | | | |
| SPX Corp. | | | 4,700 | | | | 329,705 | |
| Description | | Shares | | | Value | |
| |
| Energy Exploration & Production | 2.4% | | | | | | | | |
| Bill Barrett Corp. (a) | | | 25,270 | | | $ | 449,553 | |
| Diamondback Energy, Inc. | | | 15,695 | | | | 300,089 | |
| Rosetta Resources, Inc. (a) | | | 8,400 | | | | 381,024 | |
| | | | | | | | 1,130,666 | |
| Energy Integrated | 2.1% | | | | | | | | |
| PBF Energy, Inc. | | | 17,700 | | | | 514,185 | |
| Targa Resources Corp. | | | 8,600 | | | | 454,424 | |
| | | | | | | | 968,609 | |
| Energy Services | 2.0% | | | | | | | | |
| Key Energy Services, Inc. (a) | | | 50,700 | | | | 352,365 | |
| Rowan Cos. PLC, Class A (a) | | | 19,100 | | | | 597,257 | |
| | | | | | | | 949,622 | |
| Financial Services | 3.1% | | | | | | | | |
| Raymond James Financial, Inc. | | | 19,700 | | | | 759,041 | |
| Waddell & Reed Financial, Inc., Class A | | | 20,100 | | | | 699,882 | |
| | | | | | | | 1,458,923 | |
| Food & Beverages | 0.8% | | | | | | | | |
| TreeHouse Foods, Inc. (a) | | | 6,800 | | | | 354,484 | |
| |
| Forest & Paper Products | 3.0% | | | | | | | | |
| Rock-Tenn Co., Class A | | | 7,000 | | | | 489,370 | |
| Schweitzer-Mauduit International, Inc. | | | 23,900 | | | | 932,817 | |
| | | | | | | | 1,422,187 | |
| Gas Utilities | 1.6% | | | | | | | | |
| New Jersey Resources Corp. | | | 19,400 | | | | 768,628 | |
| |
| Health Services | 1.9% | | | | | | | | |
| VCA Antech, Inc. (a) | | | 42,500 | | | | 894,625 | |
| |
| Insurance | 3.6% | | | | | | | | |
| Arch Capital Group, Ltd. (a) | | | 19,700 | | | | 867,194 | |
| Validus Holdings, Ltd. | | | 23,700 | | | | 819,546 | |
| | | | | | | | 1,686,740 | |
| Leisure & Entertainment | 3.6% | | | | | | | | |
| Bally Technologies, Inc. (a) | | | 10,715 | | | | 479,068 | |
| Churchill Downs, Inc. | | | 4,400 | | | | 292,380 | |
| Texas Roadhouse, Inc. | | | 34,810 | | | | 584,808 | |
| Weight Watchers International, Inc. | | | 6,300 | | | | 329,868 | |
| | | | | | | | 1,686,124 | |
| Manufacturing | 11.2% | | | | | | | | |
| B/E Aerospace, Inc. (a) | | | 12,600 | | | | 622,440 | |
| Carpenter Technology Corp. | | | 12,600 | | | | 650,538 | |
| FLIR Systems, Inc. | | | 37,740 | | | | 841,979 | |
| Harsco Corp. | | | 23,000 | | | | 540,500 | |
| Kennametal, Inc. | | | 11,400 | | | | 456,000 | |
| Littelfuse, Inc. | | | 11,300 | | | | 697,323 | |
The accompanying notes are an integral part of these financial statements.
18 Annual Report

| Description | | Shares | | | Value | |
| |
| Lazard Retirement U.S. Small-Mid Cap Equity Portfolio (concluded) |
| |
| Regal-Beloit Corp. | | | 7,850 | | | $ | 553,190 | |
| TriMas Corp. (a) | | | 32,400 | | | | 905,904 | |
| | | | | | | | 5,267,874 | |
| Medical Products | 5.1% | | | | | | | | |
| CareFusion Corp. (a) | | | 32,500 | | | | 928,850 | |
| Haemonetics Corp. (a) | | | 20,780 | | | | 848,655 | |
| Henry Schein, Inc. (a) | | | 7,500 | | | | 603,450 | |
| | | | | | | | 2,380,955 | |
| Metals & Mining | 2.2% | | | | | | | | |
| US Silica Holdings, Inc. | | | 38,765 | | | | 648,538 | |
| Walter Energy, Inc. | | | 10,200 | | | | 365,976 | |
| | | | | | | | 1,014,514 | |
| Pharmaceutical & Biotechnology | 1.0% | | | | | | | | |
| Vertex Pharmaceuticals, Inc. (a) | | | 11,020 | | | | 462,179 | |
| | | | | | | | | |
| Real Estate | 7.4% | | | | | | | | |
| Extra Space Storage, Inc. REIT | | | 21,700 | | | | 789,663 | |
| Kilroy Realty Corp. REIT | | | 14,850 | | | | 703,444 | |
| Mid-America Apartment Communities, Inc. REIT | | | 10,300 | | | | 666,925 | |
| PS Business Parks, Inc. REIT | | | 8,700 | | | | 565,326 | |
| The Macerich Co. REIT | | | 12,822 | | | | 747,523 | |
| | | | | | | | 3,472,881 | |
| Retail | 6.0% | | | | | | | | |
| Aeropostale, Inc. (a) | | | 33,400 | | | | 434,534 | |
| American Eagle Outfitters, Inc. | | | 32,390 | | | | 664,319 | |
| ANN, Inc. (a) | | | 10,700 | | | | 362,088 | |
| Iconix Brand Group, Inc. (a) | | | 27,120 | | | | 605,318 | |
| Vera Bradley, Inc. (a) | | | 30,500 | | | | 765,550 | |
| | | | | | | | 2,831,809 | |
| Semiconductors & Components | 6.5% | | | | | | | | |
| II-VI, Inc. (a) | | | 37,200 | | | | 679,644 | |
| Microsemi Corp. (a) | | | 36,400 | | | | 765,856 | |
| ON Semiconductor Corp. (a) | | | 104,100 | | | | 733,905 | |
| Xilinx, Inc. | | | 24,900 | | | | 893,910 | |
| | | | | | | | 3,073,315 | |
| Description | | Shares | | | Value | |
| |
| Technology | 4.1% | | | | | | | | |
| FleetMatics Group PLC | | | 14,500 | | | $ | 364,820 | |
| NetScout Systems, Inc. (a) | | | 36,100 | | | | 938,239 | |
| SS&C Technologies Holdings, Inc. (a) | | | 27,100 | | | | 626,552 | |
| | | | | | | | 1,929,611 | |
| Transportation | 3.5% | | | | | | | | |
| Alaska Air Group, Inc. (a) | | | 11,900 | | | | 512,771 | |
| Echo Global Logistics, Inc. (a) | | | 26,160 | | | | 470,095 | |
| Hub Group, Inc., Class A (a) | | | 20,100 | | | | 675,360 | |
| | | | | | | | 1,658,226 | |
| Total Common Stocks | | | | | | | | |
| (Identified cost $41,544,150) | | | | | | | 46,447,076 | |
| | | | | | | | | |
| Preferred Stock | 0.1% | | | | | | | | |
| | | | | | | | | |
| Automotive | 0.1% | | | | | | | | |
| Better Place, Inc., Series B | | | | | | | | |
| (Identified cost $864,900) (a), (c) | | | 345,960 | | | | 44,975 | |
| | | | | | | | | |
| Short-Term Investment | 1.6% | | | | | | | | |
State Street Institutional Treasury
Money Market Fund
(Identified cost $737,593) | | | 737,593 | | | | 737,593 | |
| | | | | | | | | |
| Total Investments | 100.5% | | | | | | | | |
| (Identified cost $43,146,643) (b) | | | | | | $ | 47,229,644 | |
| | | | | | | | | |
| Liabilities in Excess of Cash and Other Assets | (0.5)% | | | | | | | (251,687 | ) |
| | | | | | | | | |
| Net Assets | 100.0% | | | | | | $ | 46,977,957 | |
The accompanying notes are an integral part of these financial statements.
Annual Report 19

| Description | | Shares | | | Value | |
| |
| Lazard Retirement International Equity Portfolio | | |
| |
| Common Stocks | 100.7% | | | | | | |
| |
| Australia | 2.6% | | | | | | | | |
| James Hardie Industries PLC | | | 997,822 | | | $ | 9,653,143 | |
| Orica, Ltd. | | | 207,514 | | | | 5,456,899 | |
| | | | | | | | 15,110,042 | |
| Belgium | 3.6% | | | | | | | | |
| Anheuser-Busch InBev NV | | | 240,962 | | | | 21,057,336 | |
| | | | | | | | | |
| Bermuda | 0.7% | | | | | | | | |
| Signet Jewelers, Ltd. | | | 73,889 | | | | 3,896,586 | |
| | | | | | | | | |
| Brazil | 1.6% | | | | | | | | |
| Anhanguera Educacional Participacoes SA | | | 266,900 | | | | 4,559,709 | |
| Cielo SA | | | 182,627 | | | | 5,113,541 | |
| | | | | | | | 9,673,250 | |
| Canada | 2.9% | | | | | | | | |
| MacDonald Dettwiler & Associates, Ltd. | | | 16,600 | | | | 933,886 | |
| Potash Corp. of Saskatchewan, Inc. | | | 173,870 | | | | 7,075,759 | |
| Rogers Communications, Inc., Class B | | | 199,500 | | | | 9,057,424 | |
| | | | | | | | 17,067,069 | |
| Finland | 1.3% | | | | | | | | |
| Sampo Oyj, A Shares | | | 242,653 | | | | 7,846,524 | |
| | | | | | | | | |
| France | 9.8% | | | | | | | | |
| BNP Paribas SA | | | 201,472 | | | | 11,356,404 | |
| Cie Generale de Geophysique-Veritas (a) | | | 210,419 | | | | 6,341,737 | |
| Rexel SA | | | 332,733 | | | | 6,798,960 | |
| Sanofi SA | | | 197,922 | | | | 18,769,975 | |
| Technip SA | | | 67,704 | | | | 7,794,709 | |
| Valeo SA | | | 136,038 | | | | 6,897,995 | |
| | | | | | | | 57,959,780 | |
| Germany | 10.1% | | | | | | | | |
| Bayer AG | | | 146,244 | | | | 13,887,700 | |
| Bayerische Motoren Werke AG | | | 94,290 | | | | 9,093,516 | |
| Merck KGaA | | | 98,332 | | | | 12,973,718 | |
| RWE AG | | | 185,944 | | | | 7,676,275 | |
| SAP AG | | | 138,736 | | | | 11,113,660 | |
| ThyssenKrupp AG | | | 226,206 | | | | 5,314,996 | |
| | | | | | | | 60,059,865 | |
| Indonesia | 0.8% | | | | | | | | |
| PT Bank Mandiri (Persero) Tbk ADR | | | 585,900 | | | | 4,912,186 | |
| Description | | Shares | | | Value | |
| |
| Ireland | 0.8% | | | | | | | | |
| Ryanair Holdings PLC Sponsored ADR | | | 138,472 | | | $ | 4,746,820 | |
| | | | | | | | | |
| Italy | 3.0% | | | | | | | | |
| Atlantia SpA | | | 426,759 | | | | 7,740,133 | |
| Eni SpA | | | 410,098 | | | | 10,116,930 | |
| | | | | | | | 17,857,063 | |
| Japan | 15.7% | | | | | | | | |
| Asics Corp. | | | 556,660 | | | | 8,480,629 | |
| Canon, Inc. | | | 180,000 | | | | 7,059,990 | |
| Daikin Industries, Ltd. | | | 212,100 | | | | 7,287,854 | |
| Daito Trust Construction Co., Ltd. | | | 103,100 | | | | 9,701,935 | |
| Don Quijote Co., Ltd. | | | 243,600 | | | | 8,924,181 | |
| Fanuc Corp. | | | 27,800 | | | | 5,169,794 | |
| Komatsu, Ltd. | | | 304,800 | | | | 7,799,670 | |
| LIXIL Group Corp. | | | 423,300 | | | | 9,426,438 | |
| Seven & I Holdings Co., Ltd. | | | 234,400 | | | | 6,597,177 | |
| SoftBank Corp. | | | 134,600 | | | | 4,925,248 | |
| Sumitomo Mitsui Financial Group, Inc. | | | 344,400 | | | | 12,511,715 | |
| Yahoo Japan Corp. | | | 16,093 | | | | 5,208,805 | |
| | | | | | | | 93,093,436 | |
| Mexico | 0.9% | | | | | | | | |
Genomma Lab Internacional SAB
de CV, B Shares (a) | | | 2,624,000 | | | | 5,391,600 | |
| | | | | | | | | |
| Netherlands | 2.0% | | | | | | | | |
| ING Groep NV (a) | | | 1,256,568 | | | | 12,016,173 | |
| | | | | | | | | |
| New Zealand | 0.7% | | | | | | | | |
| Telecom Corp. of New Zealand, Ltd. | | | 2,262,517 | | | | 4,278,725 | |
| | | | | | | | | |
| Philippines | 0.6% | | | | | | | | |
| BDO Unibank, Inc. (a) | | | 1,901,060 | | | | 3,377,450 | |
| | | | | | | | | |
| Russia | 1.5% | | | | | | | | |
| Sberbank of Russia (d) | | | 2,928,597 | | | | 8,906,953 | |
| | | | | | | | | |
| South Africa | 1.1% | | | | | | | | |
| Mediclinic International, Ltd. | | | 1,023,323 | | | | 6,623,359 | |
| | | | | | | | | |
| South Korea | 2.6% | | | | | | | | |
| Hyundai Mobis | | | 26,907 | | | | 7,297,897 | |
| Samsung Electronics Co., Ltd. GDR | | | 11,293 | | | | 8,025,982 | |
| | | | | | | | 15,323,879 | |
The accompanying notes are an integral part of these financial statements.
20 Annual Report

| Description | | Shares | | | Value | |
| |
| Lazard Retirement International Equity Portfolio (concluded) |
| |
| Spain | 2.5% | | | | | | | | |
| Mediaset Espana Comunicacion SA | | | 1,137,732 | | | $ | 7,834,394 | |
| Red Electrica Corporacion SA | | | 141,002 | | | | 6,966,566 | |
| | | | | | | | 14,800,960 | |
| Sweden | 5.6% | | | | | | | | |
| Assa Abloy AB, Class B | | | 258,219 | | | | 9,723,357 | |
| Getinge AB, B Shares | | | 197,289 | | | | 6,683,383 | |
| Sandvik AB | | | 555,939 | | | | 8,935,345 | |
| Swedbank AB, A Shares | | | 383,632 | | | | 7,549,262 | |
| | | | | | | | 32,891,347 | |
| Switzerland | 4.7% | | | | | | | | |
| Novartis AG | | | 337,917 | | | | 21,394,037 | |
| Swatch Group AG | | | 12,534 | | | | 6,450,428 | |
| | | | | | | | 27,844,465 | |
| Thailand | 1.0% | | | | | | | | |
| Krung Thai Bank Public Co., Ltd. (d) | | | 9,700,300 | | | | 6,215,295 | |
| | | | | | | | | |
| Turkey | 1.7% | | | | | | | | |
| Koc Holding AS | | | 731,721 | | | | 3,806,772 | |
| Turkcell Iletisim Hizmetleri AS (a) | | | 962,159 | | | | 6,225,150 | |
| | | | | | | | 10,031,922 | |
| United Kingdom | 22.9% | | | | | | | | |
| BG Group PLC | | | 299,420 | | | | 5,020,754 | |
| BHP Billiton PLC | | | 490,774 | | | | 17,245,554 | |
| British American Tobacco PLC | | | 236,134 | | | | 11,964,917 | |
| Direct Line Insurance Group PLC | | | 1,714,466 | | | | 5,995,575 | |
| Informa PLC | | | 1,695,139 | | | | 12,540,564 | |
| Petrofac, Ltd. | | | 199,309 | | | | 5,399,845 | |
| Prudential PLC | | | 849,193 | | | | 11,849,028 | |
| Reed Elsevier PLC | | | 672,041 | | | | 7,056,360 | |
| Rexam PLC | | | 1,899,633 | | | | 13,348,968 | |
| Royal Dutch Shell PLC, A Shares | | | 466,673 | | | | 16,489,670 | |
| Standard Chartered PLC | | | 415,963 | | | | 10,544,108 | |
| Unilever PLC | | | 482,121 | | | | 18,300,262 | |
| | | | | | | | 135,755,605 | |
| Total Common Stocks | | | | | | | | |
| (Identified cost $500,970,169) | | | | | | | 596,737,690 | |
| Description | | Shares | | | Value | |
| |
| Short-Term Investment | 2.6% | | | | | | | | |
State Street Institutional Treasury
Money Market Fund
(Identified cost $15,525,065) | | | 15,525,065 | | | $ | 15,525,065 | |
| | | | | | | | | |
| Total Investments | 103.3% | | | | | | | | |
| (Identified cost $516,495,234) (b) | | | | | | $ | 612,262,755 | |
| | | | | | | | | |
| Liabilities in Excess of Cash and Other Assets | (3.3)% | | | | | | | (19,826,061 | ) |
| | | | | | | | | |
| Net Assets | 100.0% | | | | | | $ | 592,436,694 | |
The accompanying notes are an integral part of these financial statements.
Annual Report 21

| Description | | Shares | | | Value | |
| | | | | | | | | |
| Lazard Retirement Emerging Markets Equity Portfolio | |
| | | | | | | | | |
| Common Stocks | 98.3% | | | | | | | | |
| | | | | | | | | |
| Argentina | 0.5% | | | | | | | | |
| YPF Sociedad Anonima Sponsored ADR | | | 343,334 | | | $ | 4,995,510 | |
| | | | | | | | | |
| Brazil | 12.6% | | | | | | | | |
| Banco do Brasil SA | | | 2,909,166 | | | | 37,112,418 | |
| CCR SA | | | 1,479,300 | | | | 14,028,136 | |
| Cielo SA | | | 1,005,484 | | | | 28,153,469 | |
| Natura Cosmeticos SA | | | 444,000 | | | | 12,740,081 | |
| Souza Cruz SA | | | 768,355 | | | | 11,635,574 | |
| Vale SA Sponsored ADR | | | 1,195,900 | | | | 25,066,064 | |
| | | | | | | | 128,735,742 | |
| | | | | | | | | |
| Canada | 0.6% | | | | | | | | |
| First Quantum Minerals, Ltd. | | | 259,000 | | | | 5,704,926 | |
| | | | | | | | | |
| China | 7.1% | | | | | | | | |
| Baidu, Inc. Sponsored ADR (a) | | | 108,200 | | | | 10,851,378 | |
| China Construction Bank Corp., Class H | | | 44,297,390 | | | | 36,102,563 | |
| CNOOC, Ltd. | | | 4,948,000 | | | | 10,864,603 | |
| NetEase, Inc. Sponsored ADR (a) | | | 142,200 | | | | 6,050,610 | |
| Weichai Power Co., Ltd., Class H | | | 1,746,400 | | | | 7,941,935 | |
| | | | | | | | 71,811,089 | |
| Colombia | 1.1% | | | | | | | | |
| Pacific Rubiales Energy Corp. | | | 498,000 | | | | 11,570,102 | |
| | | | | | | | | |
| Egypt | 1.8% | | | | | | | | |
| Commercial International Bank Egypt SAE | | | 1,403,765 | | | | 7,614,763 | |
| Eastern Tobacco SAE | | | 20,479 | | | | 321,997 | |
| Orascom Construction Industries (a) | | | 262,389 | | | | 10,458,429 | |
| | | | | | | | 18,395,189 | |
| | | | | | | | | |
| Hong Kong | 2.7% | | | | | | | | |
| China Mobile, Ltd. Sponsored ADR | | | 362,349 | | | | 21,277,133 | |
| Huabao International Holdings, Ltd. | | | 13,021,000 | | | | 6,423,217 | |
| | | | | | | | 27,700,350 | |
| | | | | | | | | |
| Hungary | 1.3% | | | | | | | | |
| OTP Bank PLC | | | 707,792 | | | | 13,453,009 | |
| Description | | Shares | | | Value | |
| | | | | | | | | |
| India | 4.8% | | | | | | | | |
| Bank of India | | | 1,011,981 | | | $ | 6,431,680 | |
| Bharat Heavy Electricals, Ltd. | | | 2,066,029 | | | | 8,738,805 | |
| Jindal Steel & Power, Ltd. | | | 1,172,749 | | | | 9,611,450 | |
| Punjab National Bank, Ltd. | | | 902,028 | | | | 14,456,206 | |
| Tata Consultancy Services, Ltd. | | | 418,488 | | | | 9,602,465 | |
| | | | | | | | 48,840,606 | |
| | | | | | | | | |
| Indonesia | 5.8% | | | | | | | | |
| PT Bank Mandiri (Persero) Tbk | | | 17,546,429 | | | | 14,838,552 | |
| PT Semen Indonesia (Persero) Tbk | | | 5,115,900 | | | | 8,427,665 | |
| PT Tambang Batubara Bukit Asam (Persero) Tbk | | | 2,144,500 | | | | 3,375,850 | |
| | | | | | | | | |
| PT Telekomunikasi Indonesia (Persero) Tbk Sponsored ADR | | | 579,900 | | | | 21,427,305 | |
| PT United Tractors Tbk | | | 5,244,040 | | | | 10,778,570 | |
| | | | | | | | 58,847,942 | |
| | | | | | | | | |
| Macau | 0.7% | | | | | | | | |
| Wynn Macau, Ltd. (a) | | | 2,514,800 | | | | 6,930,615 | |
| | | | | | | | | |
| Malaysia | 0.8% | | | | | | | | |
| British American Tobacco Malaysia Berhad | | | 392,100 | | | | 7,959,341 | |
| | | | | | | | | |
| Mexico | 4.1% | | | | | | | | |
| America Movil SAB de CV, Series L ADR | | | 521,100 | | | | 12,058,254 | |
| Grupo Mexico SAB de CV, Series B | | | 2,995,797 | | | | 10,806,961 | |
| Grupo Televisa SAB Sponsored ADR | | | 409,200 | | | | 10,876,536 | |
Kimberly-Clark de Mexico SAB de CV,
Series A | | | 3,173,200 | | | | 8,150,069 | |
| | | | | | | | 41,891,820 | |
| | | | | | | | | |
| Pakistan | 1.3% | | | | | | | | |
| Oil & Gas Development Co., Ltd. | | | 3,098,500 | | | | 6,150,326 | |
| Pakistan Petroleum, Ltd. | | | 3,803,585 | | | | 6,920,839 | |
| | | | | | | | 13,071,165 | |
| | | | | | | | | |
| Philippines | 1.9% | | | | | | | | |
| Philippine Long Distance Telephone Co. | | | | | | | | |
| Sponsored ADR | | | 317,700 | | | | 19,478,187 | |
The accompanying notes are an integral part of these financial statements.
22 Annual Report

| Description | | Shares | | | Value | |
| | | | | | | | | |
| Lazard Retirement Emerging Markets Equity Portfolio (concluded) | |
| | | | | | | | | |
| Russia | 10.3% | | | | | | | | |
| Gazprom OAO Sponsored ADR | | | 1,211,070 | | | $ | 11,612,796 | |
| Lukoil OAO Sponsored ADR | | | 120,378 | | | | 8,048,018 | |
| Magnit OJSC Sponsored GDR (d), (e) | | | 225,375 | | | | 9,037,538 | |
| MegaFon OAO GDR (a), (d), (e) | | | 351,600 | | | | 8,368,080 | |
| Mobile TeleSystems OJSC Sponsored ADR | | | 1,133,400 | | | | 21,137,910 | |
| Oriflame Cosmetics SA SDR | | | 155,985 | | | | 4,980,894 | |
| Sberbank of Russia (d) | | | 10,132,039 | | | | 30,815,300 | |
| TNK-BP Holding (d) | | | 2,329,808 | | | | 4,438,927 | |
| Uralkali OJSC Sponsored GDR | | | 176,819 | | | | 6,812,412 | |
| | | | | | | | 105,251,875 | |
| South Africa | 12.8% | | | | | | | | |
| Bidvest Group, Ltd. | | | 611,160 | | | | 15,635,557 | |
| Imperial Holdings, Ltd. | | | 3,149 | | | | 74,709 | |
| Murray & Roberts Holdings, Ltd. (a) | | | 2,199,913 | | | | 6,444,839 | |
| Nedbank Group, Ltd. | | | 453,251 | | | | 10,135,945 | |
| PPC, Ltd. | | | 1,957,075 | | | | 7,914,670 | |
| Sanlam, Ltd. | | | 1,900,636 | | | | 10,167,636 | |
| Shoprite Holdings, Ltd. | | | 1,052,145 | | | | 25,571,797 | |
| Standard Bank Group, Ltd. | | | 589,129 | | | | 8,336,081 | |
| Tiger Brands, Ltd. | | | 286,639 | | | | 11,037,199 | |
| Truworths International, Ltd. | | | 1,099,329 | | | | 14,250,969 | |
| Vodacom Group, Ltd. | | | 782,558 | | | | 11,583,545 | |
| Woolworths Holdings, Ltd. | | | 1,053,876 | | | | 8,851,704 | |
| | | | | | | | 130,004,651 | |
| | | | | | | | | |
| South Korea | 14.5% | | | | | | | | |
| Coway Co., Ltd. (a) | | | 302,216 | | | | 12,329,101 | |
| Hanwha Life Insurance Co., Ltd. | | | 1,925,742 | | | | 13,997,866 | |
| Hyundai Mobis | | | 62,586 | | | | 16,974,994 | |
| KB Financial Group, Inc. | | | 488,470 | | | | 17,428,802 | |
| KT&G Corp. | | | 215,984 | | | | 16,379,533 | |
| NHN Corp. | | | 60,703 | | | | 12,943,571 | |
| Samsung Electronics Co., Ltd. | | | 23,040 | | | | 32,975,429 | |
| Shinhan Financial Group Co., Ltd. | | | 677,251 | | | | 24,634,431 | |
| | | | | | | | 147,663,727 | |
| Description | | Shares | | | Value | |
| | | | | | | | | |
| Taiwan | 4.4% | | | | | | | | |
| Hon Hai Precision Industry Co., Ltd. | | | 3,004,269 | | | $ | 9,261,237 | |
| MediaTek, Inc. | | | 710,675 | | | | 7,949,752 | |
| Taiwan Semiconductor Manufacturing Co., Ltd. | | | 8,114,642 | | | | 27,158,997 | |
| | | | | | | | 44,369,986 | |
| | | | | | | | | |
| Thailand | 2.9% | | | | | | | | |
| CP All Public Co. Ltd. (d) | | | 5,826,400 | | | | 8,761,504 | |
| PTT Exploration & Production Public Co. Ltd. (d) | | | 1,680,335 | | | | 9,008,661 | |
| The Siam Cement Public Co. Ltd. | | | 767,500 | | | | 11,808,814 | |
| | | | | | | | 29,578,979 | |
| | | | | | | | | |
| Turkey | 6.3% | | | | | | | | |
| Akbank TAS | | | 2,566,808 | | | | 12,691,798 | |
| Koc Holding AS | | | 2,552,415 | | | | 13,278,915 | |
| Turkcell Iletisim Hizmetleri AS (a) | | | 3,175,977 | | | | 20,548,510 | |
| Turkiye Is Bankasi AS, C Shares | | | 5,056,305 | | | | 17,574,440 | |
| | | | | | | | 64,093,663 | |
| | | | | | | | | |
| Total Common Stocks | | | | | | | | |
| (Identified cost $908,413,137) | | | | | | | 1,000,348,474 | |
| | | | | | | | | |
| Preferred Stock | 1.3% | | | | | | | | |
| | | | | | | | | |
| Brazil | 1.3% | | | | | | | | |
| Companhia de Bebidas das Americas SA Sponsored ADR (Identified cost $9,390,146) | | | 316,100 | | | | 13,273,039 | |
| | | | | | | | | |
| Short-Term Investment | 1.0% | | | | | | | | |
| State Street Institutional Treasury Money Market Fund (Identified cost $9,721,492) | | | 9,721,492 | | | | 9,721,492 | |
| | | | | | | | | |
| Total Investments | 100.6% | | | | | | | | |
| (Identified cost $927,524,775) (b) | | | | | | $ | 1,023,343,005 | |
| | | | | | | | | |
| Liabilities in Excess of Cash and Other Assets | (0.6)% | | | | | | | (6,048,619 | ) |
| | | | | | | | | |
| Net Assets | 100.0% | | | | | | $ | 1,017,294,386 | |
The accompanying notes are an integral part of these financial statements.
Annual Report 23

| Description | | Shares | | | Value | |
| | | | | | | | | |
| Lazard Retirement Multi-Asset Targeted Volatility Portfolio | |
| | | | | | | | | |
| Common Stocks | 73.3% | | | | | | | | |
| | | | | | | | | |
| Australia | 2.3% | | | | | | | | |
| AGL Energy, Ltd. | | | 502 | | | $ | 8,062 | |
| Amcor, Ltd. | | | 7,246 | | | | 61,271 | |
| carsales.com, Ltd. | | | 1,382 | | | | 10,615 | |
| CFS Retail Property Trust Group REIT | | | 8,730 | | | | 17,492 | |
| Coca-Cola Amatil, Ltd. | | | 3,545 | | | | 49,841 | |
| Commonwealth Property Office Fund REIT | | | 27,206 | | | | 29,087 | |
| CSL, Ltd. | | | 964 | | | | 54,458 | |
| DuluxGroup, Ltd. | | | 10,697 | | | | 42,154 | |
| Evolution Mining, Ltd. (a) | | | 9,170 | | | | 16,611 | |
| Insurance Australia Group, Ltd. | | | 3,296 | | | | 16,210 | |
| Metcash, Ltd. | | | 11,436 | | | | 39,826 | |
| Newcrest Mining, Ltd. | | | 1,007 | | | | 23,510 | |
Shopping Centres Australasia Property Group
REIT (a) | | | 417 | | | | 649 | |
| Spark Infrastructure Group | | | 7,224 | | | | 12,644 | |
| St Barbara, Ltd. (a) | | | 6,441 | | | | 9,963 | |
| Stockland REIT | | | 3,029 | | | | 11,167 | |
| Tatts Group, Ltd. | | | 13,021 | | | | 40,998 | |
| Telstra Corp., Ltd. | | | 17,788 | | | | 81,033 | |
| Westfield Group REIT | | | 3,439 | | | | 37,947 | |
| Westfield Retail Trust REIT | | | 11,019 | | | | 34,680 | |
| Woolworths, Ltd. | | | 2,990 | | | | 91,387 | |
| | | | | | | | 689,605 | |
| | | | | | | | | |
| Belgium | 1.8% | | | | | | | | |
| Anheuser-Busch InBev NV Sponsored ADR | | | 4,990 | | | | 436,176 | |
| Belgacom SA | | | 1,123 | | | | 33,102 | |
| Colruyt SA | | | 701 | | | | 34,806 | |
| Delhaize Group SA | | | 714 | | | | 28,599 | |
| | | | | | | | 532,683 | |
| | | | | | | | | |
| Bermuda | 0.2% | | | | | | | | |
| Everest Re Group, Ltd. | | | 355 | | | | 39,032 | |
| Montpelier Re Holdings, Ltd. | | | 450 | | | | 10,287 | |
| PartnerRe, Ltd. | | | 261 | | | | 21,008 | |
| | | | | | | | 70,327 | |
| Description | | Shares | | | Value | |
| | | | | | | | | |
| Canada | 2.7% | | | | | | | | |
| Agnico-Eagle Mines, Ltd. | | | 290 | | | $ | 15,198 | |
| Aimia, Inc. | | | 846 | | | | 12,647 | |
| Barrick Gold Corp. | | | 922 | | | | 32,275 | |
| BCE, Inc. | | | 539 | | | | 23,100 | |
| Bell Aliant, Inc. | | | 2,171 | | | | 57,445 | |
| Canadian Apartment Properties REIT | | | 743 | | | | 18,599 | |
| Canadian National Railway Co. | | | 194 | | | | 17,617 | |
| Canadian Tire Corp., Ltd., Class A | | | 437 | | | | 30,481 | |
| CGI Group, Inc., Class A (a) | | | 2,464 | | | | 56,825 | |
| Cineplex, Inc. | | | 1,039 | | | | 33,247 | |
| Constellation Software, Inc. | | | 322 | | | | 38,843 | |
| Goldcorp, Inc. | | | 246 | | | | 9,044 | |
| Imperial Oil, Ltd. | | | 620 | | | | 26,634 | |
| Intact Financial Corp. | | | 167 | | | | 10,874 | |
| Kinross Gold Corp. | | | 1,591 | | | | 15,451 | |
| MacDonald Dettwiler & Associates, Ltd. | | | 239 | | | | 13,446 | |
| Potash Corp. of Saskatchewan, Inc. | | | 6,385 | | | | 259,806 | |
| Rogers Communications, Inc., Class B | | | 1,797 | | | | 81,585 | |
| Tim Hortons, Inc. | | | 1,460 | | | | 71,672 | |
| | | | | | | | 824,789 | |
| | | | | | | | | |
| China | 0.0% | | | | | | | | |
| AAC Technologies Holdings, Inc. | | | 2,500 | | | | 8,807 | |
| | | | | | | | | |
| Denmark | 0.8% | | | | | | | | |
| Chr. Hansen Holding A/S | | | 2,048 | | | | 66,771 | |
| Coloplast A/S, Class B | | | 1,750 | | | | 85,768 | |
| Novo Nordisk A/S, Class B | | | 598 | | | | 97,665 | |
| | | | | | | | 250,204 | |
| | | | | | | | | |
| Finland | 1.6% | | | | | | | | |
| Orion Oyj, Class B | | | 1,151 | | | | 33,830 | |
| Sampo Oyj, A Shares ADR | | | 28,805 | | | | 461,744 | |
| | | | | | | | 495,574 | |
| | | | | | | | | |
| France | 2.0% | | | | | | | | |
| Cie Generale de Geophysique-Veritas | | | | | | | | |
| Sponsored ADR (a) | | | 5,165 | | | | 157,636 | |
| LVMH Moet Hennessy Louis Vuitton SA ADR | | | 5,105 | | | | 192,407 | |
| Sanofi SA | | | 233 | | | | 22,097 | |
| Technip SA ADR | | | 5,105 | | | | 150,444 | |
| Teleperformance SA | | | 693 | | | | 25,115 | |
| Total SA | | | 937 | | | | 48,497 | |
| | | | | | | | 596,196 | |
The accompanying notes are an integral part of these financial statements.
24 Annual Report

| Description | | Shares | | | Value | |
| | | | | | | | | |
| Lazard Retirement Multi-Asset Targeted Volatility Portfolio (continued) | |
| | | | | | | | | |
| Germany | 1.0% | | | | | | | | |
| Hannover Rueckversicherung AG | | | 654 | | | $ | 50,904 | |
| Kabel Deutschland Holding AG | | | 88 | | | | 6,581 | |
| Muenchener Rueckversicherungs AG | | | 72 | | | | 12,927 | |
| Sky Deutschland AG ADR (a) | | | 35,485 | | | | 190,554 | |
| Suedzucker AG | | | 173 | | | | 7,079 | |
| | | | | | | | 268,045 | |
| Guernsey | 0.0% | | | | | | | | |
| Resolution, Ltd. | | | 3,340 | | | | 13,333 | |
| | | | | | | | | |
| Hong Kong | 0.6% | | | | | | | | |
| Cheung Kong Infrastructure Holdings, Ltd. | | | 2,000 | | | | 12,286 | |
| CLP Holdings, Ltd. | | | 2,500 | | | | 21,042 | |
| HKT Trust and HKT, Ltd. | | | 55,000 | | | | 53,970 | |
| Jardine Matheson Holdings, Ltd. | | | 400 | | | | 24,876 | |
| Power Assets Holdings, Ltd. | | | 2,000 | | | | 17,166 | |
| Swire Properties, Ltd. | | | 4,600 | | | | 15,470 | |
| The Link REIT | | | 9,000 | | | | 45,071 | |
| | | | | | | | 189,881 | |
| Ireland | 1.6% | | | | | | | | |
| DCC PLC | | | 1,038 | | | | 33,125 | |
| Experian PLC Sponsored ADR | | | 21,470 | | | | 344,808 | |
| Paddy Power PLC | | | 193 | | | | 15,908 | |
| Ryanair Holdings PLC Sponsored ADR | | | 2,677 | | | | 91,768 | |
| | | | | | | | 485,609 | |
| Isle of Man | 0.1% | | | | | | | | |
| Playtech, Ltd. | | | 2,672 | | | | 18,847 | |
| | | | | | | | | |
| Israel | 0.7% | | | | | | | | |
| Teva Pharmaceutical Industries, Ltd., | | | | | | | | |
| Sponsored ADR | | | 5,285 | | | | 197,342 | |
| | | | | | | | | |
| Italy | 1.4% | | | | | | | | |
| Eni SpA | | | 574 | | | | 14,160 | |
| Eni SpA Sponsored ADR | | | 7,750 | | | | 380,835 | |
| Lottomatica Group SpA | | | 559 | | | | 12,721 | |
| Terna SpA | | | 7,029 | | | | 28,150 | |
| | | | | | | | 435,866 | |
| Description | | | Shares | | | | Value | |
| | | | | | | | | |
| Japan | 9.5% | | | | | | | | |
| Ain Pharmaciez, Inc. | | | 200 | | | $ | 10,885 | |
| Ajinomoto Co., Inc. | | | 2,000 | | | | 26,462 | |
| All Nippon Airways Co., Ltd. | | | 9,000 | | | | 18,869 | |
| Avex Group Holdings, Inc. | | | 800 | | | | 16,071 | |
| Central Japan Railway Co. | | | 1,000 | | | | 81,136 | |
| Century Tokyo Leasing Corp. | | | 800 | | | | 16,512 | |
| COMSYS Holdings Corp. | | | 1,000 | | | | 12,866 | |
| Cosmos Pharmaceutical Corp. | | | 100 | | | | 9,910 | |
| Daito Trust Construction Co., Ltd. | | | 600 | | | | 56,461 | |
| Daito Trust Construction Co., Ltd. ADR | | | 18,205 | | | | 428,364 | |
| Daiwa House Industry Co., Ltd. | | | 1,000 | | | | 17,207 | |
| DCM Holdings Co., Ltd. | | | 1,700 | | | | 11,157 | |
| East Japan Railway Co. | | | 1,400 | | | | 90,519 | |
| Electric Power Development Co., Ltd. | | | 1,300 | | | | 30,817 | |
| Hikari Tsushin, Inc. | | | 300 | | | | 11,567 | |
| Hino Motors, Ltd. | | | 2,000 | | | | 17,935 | |
| Hogy Medical Co., Ltd. | | | 300 | | | | 14,288 | |
| ITOCHU Corp. | | | 1,000 | | | | 10,556 | |
| Kaken Pharmaceutical Co., Ltd. | | | 2,000 | | | | 29,397 | |
| Kewpie Corp. | | | 3,100 | | | | 42,786 | |
| Lawson, Inc. | | | 400 | | | | 27,189 | |
| LIXIL Group Corp. ADR | | | 5,285 | | | | 235,235 | |
| Medipal Holdings Corp. | | | 2,600 | | | | 28,647 | |
| Mitsubishi Estate Co., Ltd. ADR | | | 19,300 | | | | 462,042 | |
| Nippon Express Co., Ltd. | | | 5,000 | | | | 20,652 | |
| Nippon Shinyaku Co., Ltd. | | | 1,000 | | | | 11,291 | |
| Nitori Holdings Co., Ltd. | | | 400 | | | | 29,283 | |
| Osaka Gas Co., Ltd. | | | 17,000 | | | | 61,748 | |
| Otsuka Corp. | | | 200 | | | | 15,132 | |
| Otsuka Holdings Co., Ltd. | | | 3,600 | | | | 101,069 | |
| Park24 Co., Ltd. | | | 800 | | | | 12,616 | |
| Resona Holdings, Inc. | | | 7,500 | | | | 34,004 | |
| Sawai Pharmaceutical Co., Ltd. | | | 200 | | | | 20,062 | |
| Sekisui House, Ltd. | | | 2,000 | | | | 21,892 | |
| SKY Perfect JSAT Holdings, Inc. | | | 43 | | | | 17,864 | |
| Sumitomo Mitsui Financial Group, Inc. | | | | | | | | |
| Sponsored ADR | | | 64,825 | | | | 475,815 | |
| Sumitomo Osaka Cement Co., Ltd. | | | 8,000 | | | | 28,930 | |
| Suzuken Co., Ltd. | | | 300 | | | | 8,454 | |
| The Chugoku Bank, Ltd. | | | 1,000 | | | | 13,960 | |
| The Gunma Bank, Ltd. | | | 2,000 | | | | 9,731 | |
| The Iyo Bank, Ltd. | | | 4,000 | | | | 31,570 | |
The accompanying notes are an integral part of these financial statements.
Annual Report 25

| Description | | Shares | | | Value | |
| | | | | | | | | |
| Lazard Retirement Multi-Asset Targeted Volatility Portfolio (continued) | |
| | | | | | | | | |
| The Joyo Bank, Ltd. | | | 2,000 | | | $ | 9,451 | |
| Tobu Railway Co., Ltd. | | | 6,000 | | | | 31,752 | |
| Tokyo Gas Co., Ltd. | | | 15,000 | | | | 68,579 | |
| Tsumura & Co. | | | 300 | | | | 9,041 | |
| Unicharm Corp. | | | 400 | | | | 20,823 | |
| United Arrows, Ltd. | | | 900 | | | | 20,680 | |
| West Japan Railway Co. | | | 2,400 | | | | 94,518 | |
| | | | | | | | 2,875,795 | |
| Netherlands | 0.3% | | | | | | | | |
| Gemalto NV | | | 219 | | | | 19,827 | |
| Koninklijke Ahold NV | | | 1,743 | | | | 23,152 | |
| Koninklijke KPN NV | | | 2,689 | | | | 13,298 | |
| QIAGEN NV (a) | | | 321 | | | | 5,822 | |
| Unilever NV | | | 409 | | | | 15,433 | |
| | | | | | | | 77,532 | |
| New Zealand | 0.0% | | | | | | | | |
| Telecom Corp. of New Zealand, Ltd. | | | 4,956 | | | | 9,372 | |
| | | | | | | | | |
| Norway | 0.1% | | | | | | | | |
| Statoil ASA | | | 1,728 | | | | 43,363 | |
| | | | | | | | | |
| | | | | | | | | |
| Singapore | 0.0% | | | | | | | | |
| StarHub, Ltd. | | | 3,000 | | | | 9,368 | |
| | | | | | | | | |
| Spain | 0.3% | | | | | | | | |
| Corporacion Financiera Alba SA | | | 150 | | | | 7,125 | |
| Enagas SA | | | 691 | | | | 14,787 | |
| Grifols SA (a) | | | 240 | | | | 8,444 | |
| Inditex SA | | | 192 | | | | 26,899 | |
| Red Electrica Corporacion SA | | | 168 | | | | 8,300 | |
| Viscofan SA | | | 526 | | | | 29,349 | |
| | | | | | | | 94,904 | |
| Sweden | 0.8% | | | | | | | | |
| Assa Abloy AB ADR | | | 10,660 | | | | 197,316 | |
| Hennes & Mauritz AB, B Shares | | | 818 | | | | 28,425 | |
| | | | | | | | 225,741 | |
| Switzerland | 1.2% | | | | | | | | |
| Nestle SA | | | 1,239 | | | | 80,751 | |
| Roche Holding AG | | | 473 | | | | 96,362 | |
| Swatch Group AG ADR | | | 7,215 | | | | 183,261 | |
| | | | | | | | 360,374 | |
| Description | | Shares | | | Value | |
| | | | | | | | | |
| United Kingdom | 6.2% | | | | | | | | |
| Aberdeen Asset Management PLC | | | 3,699 | | | $ | 21,935 | |
| Amlin PLC | | | 1,197 | | | | 7,271 | |
| British American Tobacco PLC | | | 890 | | | | 45,096 | |
| British American Tobacco PLC Sponsored ADR | | | 2,375 | | | | 240,469 | |
| British Sky Broadcasting Group PLC | | | 1,882 | | | | 23,510 | |
| Centrica PLC | | | 14,637 | | | | 79,514 | |
| Delphi Automotive PLC (a) | | | 384 | | | | 14,688 | |
| Diageo PLC | | | 745 | | | | 21,689 | |
| GlaxoSmithKline PLC | | | 4,283 | | | | 92,991 | |
| Intertek Group PLC ADR | | | 5,285 | | | | 265,307 | |
| National Grid PLC | | | 798 | | | | 9,141 | |
| Next PLC | | | 512 | | | | 31,601 | |
| Pace PLC | | | 2,471 | | | | 7,668 | |
| Petrofac, Ltd. ADR | | | 13,510 | | | | 179,548 | |
| Provident Financial PLC | | | 1,525 | | | | 34,131 | |
| Randgold Resources, Ltd. | | | 92 | | | | 9,067 | |
| Reckitt Benckiser Group PLC | | | 216 | | | | 13,531 | |
| Rexam PLC Sponsored ADR | | | 6,920 | | | | 247,321 | |
| Rightmove PLC | | | 965 | | | | 22,228 | |
| Shire PLC | | | 584 | | | | 17,936 | |
| Smith & Nephew PLC | | | 674 | | | | 7,459 | |
| Tullow Oil PLC ADR | | | 13,955 | | | | 145,411 | |
| Unilever PLC Sponsored ADR | | | 4,245 | | | | 164,366 | |
| Vodafone Group PLC | | | 3,709 | | | | 9,328 | |
| Vodafone Group PLC Sponsored ADR | | | 6,265 | | | | 157,815 | |
| Wm Morrison Supermarkets PLC | | | 1,637 | | | | 7,002 | |
| | | | | | | | 1,876,023 | |
| United States | 38.1% | | | | | | | | |
| 3M Co. | | | 147 | | | | 13,649 | |
| Abbott Laboratories | | | 876 | | | | 57,378 | |
| Activision Blizzard, Inc. | | | 1,280 | | | | 13,594 | |
| Alliant Techsystems, Inc. | | | 163 | | | | 10,099 | |
| Amdocs, Ltd. | | | 244 | | | | 8,294 | |
| American Eagle Outfitters, Inc. | | | 4,070 | | | | 83,476 | |
| American Express Co. | | | 7,305 | | | | 419,891 | |
| American Water Works Co., Inc. | | | 308 | | | | 11,436 | |
| Apollo Commercial Real Estate Finance, Inc. | | | 1,003 | | | | 16,279 | |
| Apple, Inc. | | | 941 | | | | 501,581 | |
| ARMOUR Residential REIT, Inc. | | | 1,028 | | | | 6,651 | |
| AT&T, Inc. | | | 421 | | | | 14,192 | |
| AutoZone, Inc. (a) | | | 772 | | | | 273,620 | |
| Ball Corp. | | | 475 | | | | 21,256 | |
The accompanying notes are an integral part of these financial statements.
26 Annual Report

| Description | | Shares | | | Value | |
| | | | | | | | | |
| Lazard Retirement Multi-Asset Targeted Volatility Portfolio (continued) | |
| | | | | | | | | |
| Baxter International, Inc. | | | 1,342 | | | $ | 89,458 | |
| BMC Software, Inc. (a) | | | 370 | | | | 14,674 | |
| Campbell Soup Co. | | | 1,059 | | | | 36,949 | |
| CBOE Holdings, Inc. | | | 845 | | | | 24,894 | |
| Celgene Corp. (a) | | | 148 | | | | 11,651 | |
| Charter Communications, Inc., Class A (a) | | | 160 | | | | 12,198 | |
| Chevron Corp. | | | 3,988 | | | | 431,262 | |
| Church & Dwight Co., Inc. | | | 379 | | | | 20,303 | |
| Cisco Systems, Inc. | | | 29,280 | | | | 575,352 | |
| Citigroup, Inc. | | | 13,065 | | | | 516,851 | |
| Colgate-Palmolive Co. | | | 114 | | | | 11,918 | |
| Comcast Corp., Class A | | | 8,195 | | | | 294,610 | |
| ConocoPhillips | | | 524 | | | | 30,387 | |
| Consolidated Edison, Inc. | | | 1,095 | | | | 60,816 | |
| CVS Caremark Corp. | | | 7,870 | | | | 380,514 | |
| DaVita HealthCare Partners, Inc. (a) | | | 96 | | | | 10,611 | |
| DIRECTV (a) | | | 205 | | | | 10,283 | |
| Dollar General Corp. (a) | | | 758 | | | | 33,420 | |
| Dollar Tree, Inc. (a) | | | 717 | | | | 29,082 | |
| Eli Lilly & Co. | | | 226 | | | | 11,146 | |
| EMC Corp. (a) | | | 9,265 | | | | 234,404 | |
| Exxon Mobil Corp. | | | 509 | | | | 44,054 | |
| Family Dollar Stores, Inc. | | | 188 | | | | 11,921 | |
| Freeport-McMoRan Copper & Gold, Inc. | | | 4,485 | | | | 153,387 | |
| General Mills, Inc. | | | 1,739 | | | | 70,273 | |
| Google, Inc., Class A (a) | | | 386 | | | | 273,817 | |
| H.J. Heinz Co. | | | 424 | | | | 24,456 | |
| Halliburton Co. | | | 7,215 | | | | 250,288 | |
| Honeywell International, Inc. | | | 6,770 | | | | 429,692 | |
| Intel Corp. | | | 766 | | | | 15,803 | |
| International Business Machines Corp. | | | 992 | | | | 190,018 | |
| Intuit, Inc. | | | 503 | | | | 29,929 | |
| Johnson & Johnson | | | 3,800 | | | | 266,380 | |
| Joy Global, Inc. | | | 3,120 | | | | 198,994 | |
| Kellogg Co. | | | 1,424 | | | | 79,530 | |
| Kimberly-Clark Corp. | | | 1,142 | | | | 96,419 | |
| Lockheed Martin Corp. | | | 104 | | | | 9,598 | |
| MasterCard, Inc., Class A | | | 415 | | | | 203,881 | |
| Description | | | Shares | | | | Value | |
| | | | | | | | | |
| Mattel, Inc. | | | 279 | | | $ | 10,217 | |
| McDonald’s Corp. | | | 248 | | | | 21,876 | |
| McKesson Corp. | | | 4,215 | | | | 408,686 | |
| Microsoft Corp. | | | 7,150 | | | | 191,120 | |
| Monsanto Co. | | | 116 | | | | 10,979 | |
| Newmont Mining Corp. | | | 218 | | | | 10,124 | |
| Oracle Corp. | | | 17,520 | | | | 583,766 | |
| PepsiCo, Inc. | | | 140 | | | | 9,580 | |
| Perrigo Co. | | | 95 | | | | 9,883 | |
| PetSmart, Inc. | | | 217 | | | | 14,830 | |
| Pfizer, Inc. | | | 16,958 | | | | 425,307 | |
| PG&E Corp. | | | 689 | | | | 27,684 | |
| Portland General Electric Co. | | | 455 | | | | 12,449 | |
| Qualcomm, Inc. | | | 5,197 | | | | 322,318 | |
| Raytheon Co. | | | 1,004 | | | | 57,790 | |
| Realogy Holdings Corp. | | | 1,135 | | | | 47,625 | |
| Regal Entertainment Group, Class A | | | 2,302 | | | | 32,113 | |
| Ross Stores, Inc. | | | 592 | | | | 32,057 | |
| SAIC, Inc. | | | 2,026 | | | | 22,934 | |
| Schlumberger, Ltd. | | | 1,990 | | | | 137,887 | |
| Sysco Corp. | | | 8,020 | | | | 253,913 | |
| The Allstate Corp. | | | 228 | | | | 9,159 | |
| The Boeing Co. | | | 4,630 | | | | 348,917 | |
| The Clorox Co. | | | 1,230 | | | | 90,061 | |
| The Hershey Co. | | | 1,286 | | | | 92,875 | |
| The Kroger Co. | | | 409 | | | | 10,642 | |
| The Sherwin-Williams Co. | | | 394 | | | | 60,605 | |
| The Southern Co. | | | 672 | | | | 28,768 | |
| The TJX Cos., Inc. | | | 2,147 | | | | 91,140 | |
| The Walt Disney Co. | | | 305 | | | | 15,186 | |
| U.S. Bancorp | | | 318 | | | | 10,157 | |
| United Technologies Corp. | | | 2,080 | | | | 170,581 | |
| UnitedHealth Group, Inc. | | | 3,989 | | | | 216,363 | |
| Vertex Pharmaceuticals, Inc. (a) | | | 3,265 | | | | 136,934 | |
| Viacom, Inc., Class B | | | 7,600 | | | | 400,824 | |
| Wal-Mart Stores, Inc. | | | 6,723 | | | | 458,710 | |
| Watson Pharmaceuticals, Inc. (a) | | | 133 | | | | 11,438 | |
| Xcel Energy, Inc. | | | 2,517 | | | | 67,229 | |
| Yum! Brands, Inc. | | | 284 | | | | 18,858 | |
| | | | | | | | 11,522,204 | |
| Total Common Stocks | | | | | | | | |
| (Identified cost $21,453,275) | | | | | | | 22,171,784 | |
The accompanying notes are an integral part of these financial statements.
Annual Report 27

| | | | | | Principal | | | | |
| | | Security | | | Amount | | | | |
| Description | | Currency | | | (000) | | | Value | |
| | | | | | | | | | | | | |
| Lazard Retirement Multi-Asset Targeted Volatility Portfolio (continued) | |
| | | | | | | | | | | | | |
| Corporate Bonds | 7.7% | | | | | | | | | | | | |
| | | | | | | | | | | | | |
| Australia | 0.6% | | | | | | | | | | | | |
| Commonwealth Bank of Australia: | | | | | | | | | | | | |
| 6.500%, 08/13/13 | | | AUD | | | | 10 | | | $ | 10,546 | |
| 5.750%, 09/23/13 | | | AUD | | | | 35 | | | | 36,875 | |
| Telstra Corp., Ltd., | | | | | | | | | | | | |
| 6.250%, 04/15/15 | | | AUD | | | | 65 | | | | 71,476 | |
| Westpac Banking Corp., | | | | | | | | | | | | |
| 6.375%, 12/10/13 | | | AUD | | | | 60 | | | | 63,938 | |
| | | | | | | | | | | | 182,835 | |
| Brazil | 0.4% | | | | | | | | | | | | |
| Petrobras International Finance Co., | | | | | | | | | | | | |
| 7.875%, 03/15/19 (f) | | | USD | | | | 88 | | | | 109,919 | |
| | | | | | | | | | | | | |
| Canada | 0.7% | | | | | | | | | | | | |
| Shaw Communications, Inc., | | | | | | | | | | | | |
| 5.650%, 10/01/19 | | | CAD | | | | 65 | | | | 73,628 | |
| Suncor Energy, Inc., | | | | | | | | | | | | |
| 6.100%, 06/01/18 (f) | | | USD | | | | 55 | | | | 67,090 | |
| Wells Fargo Financial Canada Corp., | | | | | | | | | | | | |
| 2.774%, 02/09/17 | | | CAD | | | | 65 | | | | 66,484 | |
| | | | | | | | | | | | 207,202 | |
| Chile | 0.3% | | | | | | | | | | | | |
| Codelco, Inc., | | | | | | | | | | | | |
| 3.750%, 11/04/20 | | | USD | | | | 100 | | | | 108,132 | |
| | | | | | | | | | | | | |
| France | 0.5% | | | | | | | | | | | | |
| Electricite de France SA, | | | | | | | | | | | | |
| 5.000%, 02/05/18 | | | EUR | | | | 50 | | | | 77,723 | |
| France Telecom SA, | | | | | | | | | | | | |
| 4.750%, 02/21/17 | | | EUR | | | | 50 | | | | 75,185 | |
| | | | | | | | | | | | 152,908 | |
| Netherlands | 0.8% | | | | | | | | | | | | |
| BMW Finance NV, | | | | | | | | | | | | |
| 3.375%, 12/14/18 | | | GBP | | | | 60 | | | | 103,730 | |
| Daimler International Finance BV, | | | | | | | | | | | | |
| 6.125%, 09/08/15 | | | EUR | | | | 50 | | | | 75,057 | |
| RWE Finance BV, | | | | | | | | | | | | |
| 5.000%, 02/10/15 | | | EUR | | | | 40 | | | | 57,432 | |
| | | | | | | | | | | | 236,219 | |
| | | | | | Principal | | | | |
| | | Security | | | Amount | | | | |
| Description | | Currency | | | (000) | | | Value | |
| | | | | | | | | | | | | |
| Norway | 0.4% | | | | | | | | | | | | |
| Statoil ASA, | | | | | | | | | | | | |
| 6.875%, 03/11/31 | | | GBP | | | | 50 | | | $ | 116,387 | |
| | | | | | | | | | | | | |
| Singapore | 0.5% | | | | | | | | | | | | |
| Temasek Financial I, Ltd., | | | | | | | | | | | | |
| 4.500%, 09/21/15 (f) | | | USD | | | | 150 | | | | 164,880 | |
| | | | | | | | | | | | | |
| United Kingdom | 2.0% | | | | | | | | | | | | |
| National Grid PLC, | | | | | | | | | | | | |
| 6.125%, 04/15/14 | | | GBP | | | | 50 | | | | 86,037 | |
| Network Rail Infrastructure | | | | | | | | | | | | |
| Finance PLC, | | | | | | | | | | | | |
| 4.400%, 03/06/16 | | | CAD | | | | 300 | | | | 320,886 | |
| SSE PLC, | | | | | | | | | | | | |
| 5.000%, 10/01/18 | | | GBP | | | | 50 | | | | 92,977 | |
| Tesco PLC, | | | | | | | | | | | | |
| 6.125%, 02/24/22 | | | GBP | | | | 50 | | | | 98,362 | |
| | | | | | | | | | | | 598,262 | |
| United States | 1.5% | | | | | | | | | | | | |
| Credit Suisse USA, Inc., | | | | | | | | | | | | |
| 4.875%, 01/15/15 | | | USD | | | | 45 | | | | 48,500 | |
| Energizer Holdings, Inc., | | | | | | | | | | | | |
| 4.700%, 05/19/21 | | | USD | | | | 30 | | | | 32,152 | |
| General Electric Capital Corp., | | | | | | | | | | | | |
| 5.500%, 02/01/17 | | | NZD | | | | 90 | | | | 78,184 | |
| Goldman Sachs Group, Inc., | | | | | | | | | | | | |
| 6.250%, 09/01/17 | | | USD | | | | 50 | | | | 58,981 | |
| JPMorgan Chase & Co., | | | | | | | | | | | | |
| 3.875%, 09/23/20 | | | EUR | | | | 50 | | | | 75,096 | |
| Marathon Oil Corp., | | | | | | | | | | | | |
| 2.800%, 11/01/22 | | | USD | | | | 55 | | | | 55,341 | |
| McDonald’s Corp., | | | | | | | | | | | | |
| 1.875%, 05/29/19 | | | USD | | | | 5 | | | | 5,088 | |
| Starbucks Corp., | | | | | | | | | | | | |
| 6.250%, 08/15/17 | | | USD | | | | 35 | | | | 42,100 | |
| Valero Energy Corp., | | | | | | | | | | | | |
| 6.125%, 02/01/20 | | | USD | | | | 45 | | | | 54,719 | |
| | | | | | | | | | | | 450,161 | |
| Total Corporate Bonds | | | | | | | | | | | | |
| (Identified cost $2,309,109) | | | | | | | | | | | 2,326,905 | |
| | | | | | | | | | | | | |
| Foreign Government Obligations | 12.2% | | | | | | | | | | | | |
| | | | | | | | | | | | | |
| Australia | 0.8% | | | | | | | | | | | | |
| New South Wales Treasury Corp., | | | | | | | | | | | | |
| 5.000%, 02/25/39 | | | GBP | | | | 50 | | | | 99,495 | |
The accompanying notes are an integral part of these financial statements.
28 Annual Report

| | | | | | Principal | | | | |
| | | Security | | | Amount | | | | |
| Description | | Currency | | | (000) | | | Value | |
| | | | | | | | | | | | | |
| Lazard Retirement Multi-Asset Targeted Volatility Portfolio (continued) | |
| | | | | | | | | | | | | |
| Queensland Treasury Corp., | | | | | | | | | | | | |
| 6.250%, 02/21/20 | | | AUD | | | | 60 | | | $ | 70,976 | |
| Treasury Corp. of Victoria, | | | | | | | | | | | | |
| 4.750%, 10/15/14 | | | AUD | | | | 80 | | | | 85,753 | |
| | | | | | | | | | | | 256,224 | |
| Austria | 0.6% | | | | | | | | | | | | |
| Republic of Austria, | | | | | | | | | | | | |
| 3.900%, 07/15/20 | | | EUR | | | | 125 | | | | 195,038 | |
| | | | | | | | | | | | | |
| Bahamas | 0.4% | | | | | | | | | | | | |
| Commonwealth of Bahamas, | | | | | | | | | | | | |
| 6.950%, 11/20/29 (f) | | | USD | | | | 100 | | | | 122,000 | |
| | | | | | | | | | | | | |
| Belgium | 0.6% | | | | | | | | | | | | |
| Belgium Kingdom, | | | | | | | | | | | | |
| 5.500%, 03/28/28 | | | EUR | | | | 100 | | | | 180,375 | |
| | | | | | | | | | | | | |
| Bermuda | 0.4% | | | | | | | | | | | | |
| Government of Bermuda, | | | | | | | | | | | | |
| 5.603%, 07/20/20 (f) | | | USD | | | | 100 | | | | 117,610 | |
| | | | | | | | | | | | | |
| Brazil | 0.4% | | | | | | | | | | | | |
| Federal Republic of Brazil, | | | | | | | | | | | | |
| 11.000%, 06/26/17 | | | EUR | | | | 60 | | | | 111,430 | |
| | | | | | | | | | | | | |
| Canada | 2.1% | | | | | | | | | | | | |
| Province of Alberta, | | | | | | | | | | | | |
| 4.000%, 12/01/19 | | | CAD | | | | 40 | | | | 45,031 | |
| Province of British Columbia, | | | | | | | | | | | | |
| 3.700%, 12/18/20 | | | CAD | | | | 80 | | | | 88,207 | |
| Province of Ontario, | | | | | | | | | | | | |
| 6.250%, 06/16/15 | | | NZD | | | | 205 | | | | 180,797 | |
| Province of Quebec: | | | | | | | | | | | | |
| 3.500%, 07/29/20 (f) | | | USD | | | | 85 | | | | 94,409 | |
| 8.500%, 04/01/26 | | | CAD | | | | 55 | | | | 86,152 | |
| Province of Saskatchewan, | | | | | | | | | | | | |
| 8.500%, 07/15/22 (f) | | | USD | | | | 75 | | | | 112,992 | |
| | | | | | | | | | | | 607,588 | |
| Czech Republic | 0.5% | | | | | | | | | | | | |
| Czech Republic, | | | | | | | | | | | | |
| 5.000%, 06/11/18 | | | EUR | | | | 105 | | | | 165,920 | |
| | | | | | Principal | | | | |
| | | Security | | | Amount | | | | |
| Description | | Currency | | | (000) | | | Value | |
| | | | | | | | | | | | | |
| Denmark | 0.4% | | | | | | | | | | | | |
| Kommunekredit: | | | | | | | | | | | | |
| 4.000%, 01/01/16 | | | DKK | | | | 230 | | | $ | 44,870 | |
| 2.000%, 01/01/18 | | | DKK | | | | 430 | | | | 79,801 | |
| | | | | | | | | | | | 124,671 | |
| France | 0.6% | | | | | | | | | | | | |
| Government of France, | | | | | | | | | | | | |
| 4.250%, 10/25/23 | | | EUR | | | | 110 | | | | 174,692 | |
| | | | | | | | | | | | | |
| Mexico | 1.1% | | | | | | | | | | | | |
| Mexican Bonos, | | | | | | | | | | | | |
| 9.500%, 12/18/14 | | | MXN | | | | 2,410 | | | | 202,933 | |
| United Mexican States, | | | | | | | | | | | | |
| 6.750%, 02/06/24 | | | GBP | | | | 60 | | | | 122,019 | |
| | | | | | | | | | | | 324,952 | |
| Netherlands | 1.0% | | | | | | | | | | | | |
| Netherlands Government Bonds: | | | | | | | | | | | | |
| 3.750%, 01/15/23 | | | EUR | | | | 103 | | | | 163,467 | |
| 2.500%, 01/15/33 | | | EUR | | | | 110 | | | | 152,741 | |
| | | | | | | | | | | | 316,208 | |
| Norway | 0.4% | | | | | | | | | | | | |
| Norwegian Government Bond, | | | | | | | | | | | | |
| 4.500%, 05/22/19 | | | NOK | | | | 530 | | | | 111,189 | |
| | | | | | | | | | | | | |
| Poland | 1.7% | | | | | | | | | | | | |
| Poland Government Bonds: | | | | | | | | | | | | |
| 5.750%, 04/25/14 | | | PLN | | | | 720 | | | | 240,338 | |
| 5.250%, 10/25/17 | | | PLN | | | | 420 | | | | 147,920 | |
| Republic of Poland: | | | | | | | | | | | | |
| 3.250%, 05/15/19 | | | CHF | | | | 45 | | | | 54,955 | |
| 6.375%, 07/15/19 (f) | | | USD | | | | 50 | | | | 62,336 | |
| | | | | | | | | | | | 505,549 | |
| Qatar | 0.4% | | | | | | | | | | | | |
| State of Qatar, | | | | | | | | | | | | |
| 5.250%, 01/20/20 (f) | | | USD | | | | 100 | | | | 119,500 | |
| | | | | | | | | | | | | |
| Sweden | 0.8% | | | | | | | | | | | | |
| Kommuninvest I Sverige AB, | | | | | | | | | | | | |
| 2.750%, 08/12/15 | | | SEK | | | | 1,010 | | | | 160,704 | |
| Svensk Exportkredit AB, | | | | | | | | | | | | |
| 7.625%, 06/30/14 | | | NZD | | | | 120 | | | | 105,190 | |
| | | | | | | | | | | | 265,894 | |
| Total Foreign Government Obligations | | | | | | | | | | | | |
| (Identified cost $3,577,441) | | | | | | | | | | | 3,698,840 | |
The accompanying notes are an integral part of these financial statements.
Annual Report 29

| | | | | | Principal | | | | |
| | | Security | | | Amount | | | | |
| Description | | Currency | | | (000) | | | Value | |
| | | | | | | | | | | | | |
| Lazard Retirement Multi-Asset Targeted Volatility Portfolio (continued) | |
| | | | | | | | | | | | | |
| Quasi Government Bonds | 2.0% | | | | | | | | | | | | |
| | | | | | | | | | | | | |
| Canada | 0.6% | | | | | | | | | | | | |
| Export Development Canada, | | | | | | | | | | | | |
| 5.100%, 06/02/14 | | | CAD | | | | 75 | | | $ | 79,506 | |
| Ontario Electricity Financial Corp., | | | | | | | | | | | | |
| 10.125%, 10/15/21 | | | CAD | | | | 65 | | | | 103,363 | |
| | | | | | | | | | | | 182,869 | |
| Germany | 1.4% | | | | | | | | | | | | |
| KfW: | | | | | | | | | | | | |
| 4.000%, 12/15/14 | | | NOK | | | | 860 | | | | 161,055 | |
| 2.875%, 10/12/16 | | | NOK | | | | 670 | | | | 124,295 | |
| 3.375%, 01/18/21 | | | EUR | | | | 55 | | | | 84,217 | |
| Landeskreditbank Baden-Wuerttemberg Foerderbank, | | | | | | | | | | | | |
| 3.000%, 05/22/17 | | | NOK | | | | 250 | | | | 45,834 | |
| | | | | | | | | | | | 415,401 | |
| Total Quasi Government Bonds | | | | | | | | | | | | |
| (Identified cost $573,496) | | | | | | | | | | | 598,270 | |
| | | | | | | | | | | | | |
| Supranationals | 1.2% | | | | | | | | | | | | |
| Asian Development Bank, | | | | | | | | | | | | |
| 3.375%, 05/20/14 | | | NOK | | | | 600 | | | | 110,273 | |
| Corporacion Andina de Fomento: | | | | | | | | | | | | |
| 3.750%, 01/15/16 (f) | | | USD | | | | 80 | | | | 84,425 | |
| 8.125%, 06/04/19 | | | USD | | | | 27 | | | | 34,758 | |
| Inter-American Development Bank, | | | | | | | | | | | | |
| 6.000%, 12/15/17 | | | NZD | | | | 55 | | | | 50,591 | |
| International Bank for Reconstruction & Development, | | | | | | | | | | | | |
| 2.300%, 02/26/13 | | | KRW | | | | 100,000 | | | | 93,305 | |
| | | | | | | | | | | | | |
| Total Supranationals | | | | | | | | | | | | |
| (Identified cost $361,504) | | | | | | | | | | | 373,352 | |
| | | | | | Principal | | | | |
| | | Security | | | Amount | | | | |
| Description | | Currency | | | (000) | | | Value | |
| | | | | | | | | | | | | |
| U.S. Municipal Bonds | 0.4% | | | | | | | | | | | | |
| | | | | | | | | | | | | |
| Texas | 0.2% | | | | | | | | | | | | |
| Texas State Build America Bonds Series A, | | | | | | | | | | | | |
| 4.681%, 04/01/40 (f) | | | USD | | | | 50 | | | $ | 58,577 | |
| | | | | | | | | | | | | |
| Utah | 0.2% | | | | | | | | | | | | |
| Utah State Build America Bonds Series B, | | | | | | | | | | | | |
| 3.539%, 07/01/25 (f) | | | USD | | | | 50 | | | | 53,688 | |
| | | | | | | | | | | | | |
| Total U.S. Municipal Bonds | | | | | | | | | | | | |
| (Identified cost $111,871) | | | | | | | | | | | 112,265 | |
| | | | | | | | | | | | | |
| Description | | | | | | | Shares | | | | Value | |
| | | | | | | | | | | | | |
| Right | 0.0% | | | | | | | | | | | | |
| | | | | | | | | | | | | |
| Spain | 0.0% | | | | | | | | | | | | |
| Grifols SA, | | | | | | | | | | | | |
| Expires 01/02/13 | | | | | | | | | | | | |
| (Identified cost $281) | | | | | | | 240 | | | $ | 284 | |
| | | | | | | | | | | | | |
| Short-Term Investment | 3.5% | | | | | | | | | | | | |
| State Street Institutional Treasury | | | | | | | | | | | | |
| Money Market Fund | | | | | | | | | | | | |
| (Identified cost $1,066,221) | | | | | | | 1,066,221 | | | | 1,066,221 | |
| | | | | | | | | | | | | |
| Total Investments | 100.3% | | | | | | | | | | | | |
| (Identified cost $29,453,198) (b) | | | | | | | | | | $ | 30,347,921 | |
| | | | | | | | | | | | | |
| Liabilities in Excess of Cash and | | | | | | | | | | | | |
| Other Assets | (0.3)% | | | | | | | | | | | (86,403 | ) |
| | | | | | | | | | | | | |
| Net Assets | 100.0% | | | | | | | | | | $ | 30,261,518 | |
The accompanying notes are an integral part of these financial statements.
30 Annual Report

Lazard Retirement Multi-Asset Targeted Volatility Portfolio (continued)
Forward Currency Contracts open at December 31, 2012:
| Currency | | Counterparty | | Expiration
Date | | Foreign
Currency Amount | | U.S. $ Cost
on Origination
Date | | U.S. $
Current
Value | | Unrealized
Appreciation | | Unrealized
Depreciation |
| | | | | | | | | | | | | | | | | | | | | | | | | | |
| Forward Currency Purchase Contracts | | | | | | | | | | | | | | | | | |
| AUD | | | SSB | | 02/15/13 | | | 14,509 | | | $ | 15,000 | | | $ | 15,019 | | | $ | 19 | | | $ | — | |
| AUD | | | SSB | | 02/15/13 | | | 20,137 | | | | 21,000 | | | | 20,845 | | | | — | | | | 155 | |
| AUD | | | SSB | | 02/15/13 | | | 70,537 | | | | 73,000 | | | | 73,016 | | | | 16 | | | | — | |
| CAD | | | RBC | | 02/15/13 | | | 35,789 | | | | 36,000 | | | | 35,947 | | | | — | | | | 53 | |
| CHF | | | HSB | | 02/15/13 | | | 13,945 | | | | 15,000 | | | | 15,259 | | | | 259 | | | | — | |
| CHF | | | HSB | | 02/15/13 | | | 108,927 | | | | 115,498 | | | | 119,190 | | | | 3,692 | | | | — | |
| CHF | | | SSB | | 02/15/13 | | | 30,770 | | | | 33,000 | | | | 33,669 | | | | 669 | | | | — | |
| CHF | | | SSB | | 02/15/13 | | | 39,426 | | | | 42,000 | | | | 43,141 | | | | 1,141 | | | | — | |
| CHF | | | SSB | | 02/15/13 | | | 73,550 | | | | 77,938 | | | | 80,480 | | | | 2,542 | | | | — | |
| DKK | | | CSF | | 02/15/13 | | | 57,614 | | | | 10,000 | | | | 10,200 | | | | 200 | | | | — | |
| DKK | | | CSF | | 02/15/13 | | | 138,217 | | | | 24,000 | | | | 24,470 | | | | 470 | | | | — | |
| DKK | | | CSF | | 02/15/13 | | | 895,697 | | | | 152,965 | | | | 158,577 | | | | 5,612 | | | | — | |
| EUR | | | HSB | | 02/15/13 | | | 27,510 | | | | 35,025 | | | | 36,326 | | | | 1,301 | | | | — | |
| EUR | | | HSB | | 02/15/13 | | | 39,415 | | | | 51,000 | | | | 52,045 | | | | 1,045 | | | | — | |
| EUR | | | HSB | | 02/15/13 | | | 55,809 | | | | 71,639 | | | | 73,693 | | | | 2,054 | | | | — | |
| EUR | | | HSB | | 02/15/13 | | | 67,216 | | | | 87,000 | | | | 88,754 | | | | 1,754 | | | | — | |
| EUR | | | HSB | | 02/15/13 | | | 82,661 | | | | 106,000 | | | | 109,149 | | | | 3,149 | | | | — | |
| GBP | | | SSB | | 02/15/13 | | | 16,873 | | | | 27,000 | | | | 27,405 | | | | 405 | | | | — | |
| GBP | | | SSB | | 02/15/13 | | | 29,319 | | | | 47,000 | | | | 47,622 | | | | 622 | | | | — | |
| GBP | | | SSB | | 02/15/13 | | | 30,796 | | | | 49,000 | | | | 50,021 | | | | 1,021 | | | | — | |
| JPY | | | HSB | | 02/15/13 | | | 4,664,937 | | | | 57,000 | | | | 53,863 | | | | — | | | | 3,137 | |
| JPY | | | HSB | | 02/15/13 | | | 9,521,777 | | | | 117,460 | | | | 109,942 | | | | — | | | | 7,518 | |
| JPY | | | HSB | | 02/15/13 | | | 10,700,352 | | | | 130,000 | | | | 123,550 | | | | — | | | | 6,450 | |
| JPY | | | HSB | | 02/15/13 | | | 14,516,721 | | | | 179,000 | | | | 167,615 | | | | — | | | | 11,385 | |
| JPY | | | HSB | | 02/15/13 | | | 16,438,500 | | | | 195,000 | | | | 189,805 | | | | — | | | | 5,195 | |
| JPY | | | HSB | | 02/15/13 | | | 18,586,201 | | | | 234,011 | | | | 214,603 | | | | — | | | | 19,408 | |
| JPY | | | SSB | | 02/15/13 | | | 45,683,047 | | | | 575,100 | | | | 527,473 | | | | — | | | | 47,627 | |
| MXN | | | SSB | | 02/15/13 | | | 1,109,564 | | | | 86,000 | | | | 85,507 | | | | — | | | | 493 | |
| NZD | | | SSB | | 02/15/13 | | | 94,789 | | | | 78,000 | | | | 78,120 | | | | 120 | | | | — | |
| SGD | | | SSB | | 02/15/13 | | | 9,125 | | | | 7,461 | | | | 7,470 | | | | 9 | | | | — | |
| Total Forward Currency Purchase Contracts | | | | | $ | 2,748,097 | | | $ | 2,672,776 | | | $ | 26,100 | | | $ | 101,421 | |
| | | | | | | | | | | | | | | | | | | | |
| Forward Currency Sale Contracts | | | | | | | | | | | | | | | | | | | |
| AUD | | | SSB | | 01/16/13 | | | 186,770 | | | $ | 195,933 | | | $ | 193,764 | | | $ | 2,169 | | | $ | — | |
| AUD | | | SSB | | 02/15/13 | | | 16,510 | | | | 17,337 | | | | 17,091 | | | | 246 | | | | — | |
| AUD | | | SSB | | 02/15/13 | | | 20,778 | | | | 21,687 | | | | 21,508 | | | | 179 | | | | — | |
| AUD | | | SSB | | 02/15/13 | | | 30,895 | | | | 32,268 | | | | 31,982 | | | | 286 | | | | — | |
| AUD | | | SSB | | 02/15/13 | | | 32,537 | | | | 33,887 | | | | 33,680 | | | | 207 | | | | — | |
| AUD | | | SSB | | 02/15/13 | | | 166,376 | | | | 171,553 | | | | 172,223 | | | | — | | | | 670 | |
| CAD | | | RBC | | 02/15/13 | | | 31,380 | | | | 31,502 | | | | 31,519 | | | | — | | | | 17 | |
| CAD | | | RBC | | 02/15/13 | | | 37,056 | | | | 37,601 | | | | 37,220 | | | | 381 | | | | — | |
| CAD | | | RBC | | 02/15/13 | | | 260,853 | | | | 264,691 | | | | 262,010 | | | | 2,681 | | | | — | |
| CAD | | | RBC | | 02/15/13 | | | 384,699 | | | | 384,170 | | | | 386,404 | | | | — | | | | 2,234 | |
| CAD | | | SSB | | 01/16/13 | | | 171,732 | | | | 173,956 | | | | 172,598 | | | | 1,358 | | | | — | �� |
The accompanying notes are an integral part of these financial statements.
Annual Report 31

Lazard Retirement Multi-Asset Targeted Volatility Portfolio (continued)
Forward Currency Contracts open at December 31, 2012 (continued):
| Currency | | Counterparty | | Expiration
Date | | Foreign
Currency Amount | | U.S. $ Cost
on Origination
Date | | U.S. $
Current
Value | | Unrealized
Appreciation | | Unrealized
Depreciation |
| | | | | | | | | | | | | | | | | | | | | | | | | | |
| Forward Currency Sale Contracts (continued) | | | | | | | | | | | | | | | | |
| CHF | | | HSB | | 02/15/13 | | | 9,535 | | | $ | 10,227 | | | $ | 10,434 | | | $ | — | | | $ | 207 | |
| CHF | | | SSB | | 01/16/13 | | | 50,967 | | | | 54,669 | | | | 55,737 | | | | — | | | | 1,068 | |
| DKK | | | CSF | | 02/15/13 | | | 452,169 | | | | 79,839 | | | | 80,054 | | | | — | | | | 215 | |
| DKK | | | SSB | | 01/16/13 | | | 439,500 | | | | 76,628 | | | | 77,771 | | | | — | | | | 1,143 | |
| EUR | | | HSB | | 02/15/13 | | | 42,000 | | | | 55,537 | | | | 55,459 | | | | 78 | | | | — | |
| EUR | | | HSB | | 02/15/13 | | | 55,951 | | | | 71,234 | | | | 73,879 | | | | — | | | | 2,645 | |
| EUR | | | HSB | | 02/15/13 | | | 104,276 | | | | 134,887 | | | | 137,690 | | | | — | | | | 2,803 | |
| EUR | | | HSB | | 02/15/13 | | | 109,650 | | | | 142,290 | | | | 144,786 | | | | — | | | | 2,496 | |
| EUR | | | HSB | | 02/15/13 | | | 291,228 | | | | 370,587 | | | | 384,549 | | | | — | | | | 13,962 | |
| EUR | | | SSB | | 01/16/13 | | | 176,548 | | | | 229,518 | | | | 233,061 | | | | — | | | | 3,543 | |
| GBP | | | HSB | | 02/15/13 | | | 36,316 | | | | 57,647 | | | | 58,986 | | | | — | | | | 1,339 | |
| GBP | | | SSB | | 01/16/13 | | | 135,951 | | | | 219,059 | | | | 220,838 | | | | — | | | | 1,779 | |
| GBP | | | SSB | | 02/15/13 | | | 63,559 | | | | 101,858 | | | | 103,236 | | | | — | | | | 1,378 | |
| GBP | | | SSB | | 02/15/13 | | | 106,300 | | | | 168,737 | | | | 172,658 | | | | — | | | | 3,921 | |
| HKD | | | SSB | | 01/16/13 | | | 401,872 | | | | 51,855 | | | | 51,852 | | | | 3 | | | | — | |
| JPY | | | SSB | | 01/16/13 | | | 41,893,063 | | | | 508,945 | | | | 483,594 | | | | 25,351 | | | | — | |
| KRW | | | SCB | | 02/15/13 | | | 69,875,640 | | | | 64,253 | | | | 65,094 | | | | — | | | | 841 | |
| MXN | | | SSB | | 02/15/13 | | | 155,485 | | | | 12,071 | | | | 11,982 | | | | 89 | | | | — | |
| MXN | | | SSB | | 02/15/13 | | | 283,561 | | | | 21,822 | | | | 21,852 | | | | — | | | | 30 | |
| MXN | | | SSB | | 02/15/13 | | | 622,357 | | | | 46,745 | | | | 47,961 | | | | — | | | | 1,216 | |
| MXN | | | SSB | | 02/15/13 | | | 1,444,822 | | | | 108,149 | | | | 111,343 | | | | — | | | | 3,194 | |
| NOK | | | SSB | | 01/16/13 | | | 143,760 | | | | 25,409 | | | | 25,854 | | | | — | | | | 445 | |
| NOK | | | SSB | | 02/15/13 | | | 207,529 | | | | 36,044 | | | | 37,281 | | | | — | | | | 1,237 | |
| NOK | | | SSB | | 02/15/13 | | | 227,283 | | | | 39,933 | | | | 40,830 | | | | — | | | | 897 | |
| NOK | | | SSB | | 02/15/13 | | | 411,017 | | | | 73,105 | | | | 73,838 | | | | — | | | | 733 | |
| NOK | | | SSB | | 02/15/13 | | | 514,028 | | | | 88,729 | | | | 92,343 | | | | — | | | | 3,614 | |
| NOK | | | SSB | | 02/15/13 | | | 1,752,048 | | | | 303,553 | | | | 314,749 | | | | — | | | | 11,196 | |
| NZD | | | SSB | | 01/16/13 | | | 15,254 | | | | 12,760 | | | | 12,596 | | | | 164 | | | | — | |
| NZD | | | SSB | | 02/15/13 | | | 72,512 | | | | 60,885 | | | | 59,760 | | | | 1,125 | | | | — | |
| NZD | | | SSB | | 02/15/13 | | | 120,583 | | | | 98,774 | | | | 99,378 | | | | — | | | | 604 | |
| NZD | | | SSB | | 02/15/13 | | | 310,172 | | | | 250,451 | | | | 255,627 | | | | — | | | | 5,176 | |
| PLN | | | HSB | | 02/15/13 | | | 4,776 | | | | 1,443 | | | | 1,536 | | | | — | | | | 93 | |
| PLN | | | HSB | | 02/15/13 | | | 80,263 | | | | 25,471 | | | | 25,817 | | | | — | | | | 346 | |
| PLN | | | HSB | | 02/15/13 | | | 82,661 | | | | 24,926 | | | | 26,588 | | | | — | | | | 1,662 | |
| PLN | | | HSB | | 02/15/13 | | | 113,072 | | | | 35,821 | | | | 36,370 | | | | — | | | | 549 | |
| PLN | | | SSB | | 02/15/13 | | | 112,501 | | | | 35,427 | | | | 36,186 | | | | — | | | | 759 | |
| PLN | | | SSB | | 02/15/13 | | | 781,195 | | | | 235,658 | | | | 251,271 | | | | — | | | | 15,613 | |
| SEK | | | SSB | | 01/16/13 | | | 113,363 | | | | 17,059 | | | | 17,427 | | | | — | | | | 368 | |
| SEK | | | SSB | | 02/15/13 | | | 125,569 | | | | 18,803 | | | | 19,290 | | | | — | | | | 487 | |
The accompanying notes are an integral part of these financial statements.
32 Annual Report

Lazard Retirement Multi-Asset Targeted Volatility Portfolio (concluded)
Forward Currency Contracts open at December 31, 2012 (concluded):
| Currency | | Counterparty | | Expiration
Date | | Foreign
Currency Amount | | U.S. $ Cost
on Origination
Date | | U.S. $
Current
Value | | Unrealized
Appreciation | | Unrealized
Depreciation |
| | | | | | | | | | | | | | | | | | | | |
| Forward Currency Sale Contracts (concluded) | | | | | | | | | | | | | | | | | | | |
| SEK | | | SSB | | 02/15/13 | | | 208,913 | | | $ | 31,310 | | | $ | 32,093 | | | $ | — | | | $ | 783 | |
| SEK | | | SSB | | 02/15/13 | | | 581,810 | | | | 85,626 | | | | 89,377 | | | | — | | | | 3,751 | |
| SGD | | | SSB | | 01/16/13 | | | 10,282 | | | | 8,421 | | | | 8,417 | | | | 4 | | | | — | |
| Total Forward Currency Sale Contracts | | | | | | $ | 5,460,750 | | | $ | 5,519,443 | | | | 34,321 | | | | 93,014 | |
| Gross unrealized appreciation/depreciation on Forward Currency Purchase and Sale Contracts | | | $ | 60,421 | | | $ | 194,435 | |
The accompanying notes are an integral part of these financial statements.
Annual Report 33

Lazard Retirement Series, Inc. Notes to Portfolios of Investments December 31, 2012
| (a) | Non-income producing security. |
| (b) | For federal income tax purposes, the aggregate cost, aggregate gross unrealized appreciation, aggregate gross unrealized depreciation and the net unrealized appreciation are as follows: |
| Portfolio | | Aggregate
Cost | | Aggregate Gross
Unrealized
Appreciation | | Aggregate Gross
Unrealized
Depreciation | | Net Unrealized
Appreciation |
| | | | | | | | | | | | | | | | | |
| U.S. Strategic Equity | | $ | 5,991,862 | | | $ | 888,989 | | | $ | 171,399 | | | $ | 717,590 | |
| U.S. Small-Mid Cap Equity | | | 44,085,422 | | | | 4,860,625 | | | | 1,716,403 | | | | 3,144,222 | |
| International Equity | | | 520,562,685 | | | | 96,729,936 | | | | 5,029,866 | | | | 91,700,070 | |
| Emerging Markets Equity | | | 933,629,849 | | | | 154,794,183 | | | | 65,081,027 | | | | 89,713,156 | |
| Multi-Asset Targeted Volatility | | | 29,492,135 | | | | 1,279,248 | | | | 423,462 | | | | 855,786 | |
| (c) | Private placements. |
| | |
| (d) | Security valued using Level 2 inputs, based on reference to a similar security from the same issuer which was trading on an active market, under ac- counting principles generally accepted in the United States of America (“GAAP”) hierarchy—see Note 8. |
| | |
| (e) | Pursuant to Rule 144A under the Securities Act of 1933, these securities may only be traded among “qualified institutional buyers.” At December 31, 2012, these securities amounted to 1.7% of net assets of Emerging Markets Equity Portfolio, and are considered to be liquid. |
| | |
| (f) | Segregated security for forward currency contracts. |
| Security Abbreviations: | | |
| ADR | — American Depositary Receipt | | |
| GDR | — Global Depositary Receipt | | |
| REIT | — Real Estate Investment Trust | | |
| SDR | — Swedish Depositary Receipt | | |
| | | | |
| Currency Abbreviations: | | |
| AUD | — Australian Dollar | KRW | — South Korean Won |
| CAD | — Canadian Dollar | MXN | — Mexican New Peso |
| CHF | — Swiss Franc | NOK | — Norwegian Krone |
| DKK | — Danish Krone | NZD | — New Zealand Dollar |
| EUR | — Euro | PLN | — Polish Zloty |
| GBP | — British Pound Sterling | SEK | — Swedish Krona |
| HKD | — Hong Kong Dollar | SGD | — Singapore Dollar |
| JPY | — Japanese Yen | USD | — United States Dollar |
| | | | |
| Counterparty Abbreviations: | | |
| CSF | — Credit Suisse Group AG | SCB | — Standard Chartered Bank |
| HSB | — HSBC Bank USA | SSB | — State Street Bank and Trust Co. |
| RBC | — Royal Bank of Canada | | |
The accompanying notes are an integral part of these financial statements.
34 Annual Report

Portfolio holdings by industry (as a percentage of net assets), for those Portfolios previously presented by country:
| Industry | | | Lazard
Retirement
International
Equity
Portfolio | | | Lazard
Retirement
Emerging
Markets
Equity
Portfolio | | | Lazard
Retirement
Multi-
Asset Targeted
Volatility
Portfolio |
| | | | | | | | | | | | | |
| Aerospace & Defense | | | — | % | | | — | % | | | 1.4 | % |
| Agriculture | | | 1.2 | | | | 0.7 | | | | 0.9 | |
| Alcohol & Tobacco | | | 5.6 | | | | 4.9 | | | | 2.5 | |
| Automotive | | | 2.7 | | | | — | | | | 0.6 | |
| Banking | | | 11.0 | | | | 22.3 | | | | 3.1 | |
| Cable Television | | | — | | | | — | | | | 2.0 | |
| Chemicals | | | 0.9 | | | | 1.2 | | | | 0.3 | |
| Commercial Services | | | 2.0 | | | | 4.3 | | | | 2.5 | |
| Computer Software | | | 1.9 | | | | 2.9 | | | | 2.7 | |
| Construction & Engineering | | | — | | | | 1.7 | | | | — | |
| Consumer Products | | | 2.5 | | | | 6.8 | | | | 1.6 | |
| Diversified | | | 0.6 | | | | 1.3 | | | | — | |
| Electric | | | 2.5 | | | | — | | | | 2.5 | |
| Energy Exploration & Production | | | — | | | | 4.4 | | | | 0.7 | |
| Energy Integrated | | | 5.3 | | | | 3.2 | | | | 4.3 | |
| Energy Services | | | 3.3 | | | | — | | | | 3.2 | |
| Financial Services | | | 2.0 | | | | 3.4 | | | | 6.6 | |
| Food & Beverages | | | 3.1 | | | | 1.1 | | | | 3.4 | |
| Forest & Paper Products | | | 2.3 | | | | 0.8 | | | | 1.1 | |
| Gas Utilities | | | — | | | | — | | | | 0.7 | |
| Health Services | | | 1.1 | | | | — | | | | 0.8 | |
| Housing | | | 4.9 | | | | 1.6 | | | | 2.7 | |
| Insurance | | | 4.3 | | | | 1.4 | | | | 2.2 | |
| Leisure & Entertainment | | | 5.4 | | | | 1.7 | | | | 2.4 | |
| Manufacturing | | | 8.7 | | | | 4.4 | | | | 3.6 | |
| Medical Products | | | 1.1 | | | | — | | | | 1.8 | |
| Metal & Glass Containers | | | — | | | | — | | | | 0.1 | |
| Metals & Mining | | | 2.9 | | | | 5.0 | | | | 1.3 | |
| Pharmaceutical & Biotechnology | | | 12.2 | | | | — | | | | 6.3 | |
| Real Estate | | | — | | | | — | | | | 2.3 | |
| Retail | | | 4.7 | | | | 6.5 | | | | 7.0 | |
| Semiconductors & Components | | | 1.2 | | | | 3.4 | | | | 0.1 | |
| Technology | | | 1.9 | | | | 0.9 | | | | 1.4 | |
| Technology Hardware | | | — | | | | 0.9 | | | | 6.1 | |
| Telecommunications | | | 3.3 | | | | 13.4 | | | | 2.3 | |
| Transportation | | | 2.1 | | | | 1.4 | | | | 2.5 | |
| Subtotal | | | 100.7 | | | | 99.6 | | | | 83.0 | |
| Foreign Government Obligations | | | — | | | | — | | | | 12.2 | |
| Supranationals | | | — | | | | — | | | | 1.2 | |
| U.S. Municipal Bonds | | | — | | | | — | | | | 0.4 | |
| Short-Term Investments | | | 2.6 | | | | 1.0 | | | | 3.5 | |
| Total Investments | | | 103.3 | % | | | 100.6 | % | | | 100.3 | % |
The accompanying notes are an integral part of these financial statements.
Annual Report 35

Lazard Retirement Series, Inc. Statements of Assets and Liabilities
| December 31, 2012 | | Lazard
Retirement
U.S. Strategic
Equity Portfolio | | | Lazard
Retirement
U.S. Small-Mid Cap
Equity Portfolio | |
| | | | | | | |
| ASSETS | | | | | | | | |
| Investments in securities, at value | | $ | 6,709,452 | | | $ | 47,229,644 | |
| Foreign currency | | | — | | | | — | |
| Receivables for: | | | | | | | | |
| Capital stock sold | | | 2,637 | | | | 67,930 | |
| Dividends and interest | | | 5,344 | | | | 12,613 | |
| Investments sold | | | — | | | | 108,958 | |
| Amount due from Investment Manager (Note 3) | | | 7,849 | | | | — | |
| Other | | | — | | | | 75,885 | |
| Gross unrealized appreciation on forward currency contracts | | | — | | | | — | |
| Deferred offering costs (Note 2(f)) | | | — | | | | — | |
| Total assets | | | 6,725,282 | | | | 47,495,030 | |
| | | | | | | | | |
| LIABILITIES | | | | | | | | |
| Payables for: | | | | | | | | |
| Management fees | | | — | | | | 29,188 | |
| Due to custodian | | | — | | | | — | |
| Accrued distribution fees | | | 1,415 | | | | 9,729 | |
| Accrued directors’ fees | | | 10 | | | | 74 | |
| Capital stock redeemed | | | 13,115 | | | | 238,182 | |
| Investments purchased | | | — | | | | 220,867 | |
| Gross unrealized depreciation on forward currency contracts | | | — | | | | — | |
| Other accrued expenses and payables | | | 8,789 | | | | 19,033 | |
| Total liabilities | | | 23,329 | | | | 517,073 | |
| Net assets | | $ | 6,701,953 | | | $ | 46,977,957 | |
| | | | | | | | | |
| NET ASSETS | | | | | | | | |
| Paid in capital | | $ | 6,098,052 | | | $ | 41,139,545 | |
| Undistributed (distributions in excess of) net investment income | | | 14,289 | | | | — | �� |
| Accumulated net realized gain (loss) | | | (164,958 | ) | | | 1,755,411 | |
| Net unrealized appreciation (depreciation) on: | | | | | | | | |
| Investments | | | 754,570 | | | | 4,083,001 | |
| Foreign currency and forward currency contracts | | | — | | | | — | |
| Net assets | | $ | 6,701,953 | | | $ | 46,977,957 | |
| | | | | | | | | |
| Service Shares | | | | | | | | |
| Net assets | | $ | 6,701,953 | | | $ | 46,977,957 | |
| Shares of capital stock outstanding* | | | 642,085 | | | | 6,431,142 | |
| Net asset value, offering and redemption price per share | | $ | 10.44 | | | $ | 7.30 | |
| | | | | | | | | |
| Investor Shares | | | | | | | | |
| Net assets | | | — | | | | — | |
| Shares of capital stock outstanding* | | | — | | | | — | |
| Net asset value, offering and redemption price per share | | | — | | | | — | |
| Cost of investments in securities | | $ | 5,954,882 | | | $ | 43,146,643 | |
| Cost of foreign currency | | | — | | | | — | |
| * | $0.001 par value, 1,550,000,000 shares authorized for the Portfolios in total. |
The accompanying notes are an integral part of these financial statements.
36 Annual Report

| December 31, 2012 | | Lazard
Retirement
International
Equity Portfolio | | | Lazard
Retirement
Emerging Markets
Equity Portfolio | | | Lazard
Retirement
Multi-Asset Targeted
Volatility Portfolio | |
| | | | | | | | | | |
| ASSETS | | | | | | | | | | | | |
| Investments in securities, at value | | $ | 612,262,755 | | | $ | 1,023,343,005 | | | | $30,347,921 | |
| Foreign currency | | | 29 | | | | 410,566 | | | | 5,075 | |
| Receivables for: | | | | | | | | | | | | |
| Capital stock sold | | | 338,598 | | | | 1,123,964 | | | | 454,193 | |
| Dividends and interest | | | 580,428 | | | | 573,979 | | | | 143,452 | |
| Investments sold | | | — | | | | 285,417 | | | | 51,049 | |
| Amount due from Investment Manager (Note 3) | | | — | | | | — | | | | 27,802 | |
| Other | | | — | | | | — | | | | — | |
| Gross unrealized appreciation on forward currency contracts | | | — | | | | — | | | | 60,421 | |
| Deferred offering costs (Note 2(f)) | | | — | | | | — | | | | 32,267 | |
| Total assets | | | 613,181,810 | | | | 1,025,736,931 | | | | 31,122,180 | |
| | | | | | | | | | | | | |
| LIABILITIES | | | | | | | | | | | | |
| Payables for: | | | | | | | | | | | | |
| Management fees | | | 383,889 | | | | 837,747 | | | | — | |
| Due to custodian | | | — | | | | 359,079 | | | | 4,339 | |
| Accrued distribution fees | | | 127,963 | | | | 151,596 | | | | 1,809 | |
| Accrued directors’ fees | | | 918 | | | | 1,514 | | | | 37 | |
| Capital stock redeemed | | | 19,864,041 | | | | 6,824,917 | | | | 156,637 | |
| Investments purchased | | | 311,521 | | | | 130,366 | | | | 483,010 | |
| Gross unrealized depreciation on forward currency contracts | | | — | | | | — | | | | 194,435 | |
| Other accrued expenses and payables | | | 56,784 | | | | 137,326 | | | | 20,395 | |
| Total liabilities | | | 20,745,116 | | | | 8,442,545 | | | | 860,662 | |
| Net assets | | $ | 592,436,694 | | | $ | 1,017,294,386 | | | $ | 30,261,518 | |
| | | | | | | | | | | | | |
| NET ASSETS | | | | | | | | | | | | |
| Paid in capital | | $ | 573,115,012 | | | $ | 938,108,768 | | | $ | 29,455,593 | |
| Undistributed (distributions in excess of) net investment income | | | 1,496,937 | | | | (24,941 | ) | | | 80,147 | |
| Accumulated net realized gain (loss) | | | (77,940,694 | ) | | | (16,601,341 | ) | | | (36,832 | ) |
| Net unrealized appreciation (depreciation) on: | | | | | | | | | | | | |
| Investments | | | 95,767,521 | | | | 95,814,539 | | | | 894,723 | |
| Foreign currency and forward currency contracts | | | (2,082 | ) | | | (2,639 | ) | | | (132,113 | ) |
| Net assets | | $ | 592,436,694 | | | $ | 1,017,294,386 | | | $ | 30,261,518 | |
| | | | | | | | | | | | | |
| Service Shares | | | | | | | | | | | | |
| Net assets | | $ | 592,436,694 | | | $ | 734,698,617 | | | $ | 30,261,518 | |
| Shares of capital stock outstanding* | | | 53,294,207 | | | | 33,061,628 | | | | 2,870,304 | |
| Net asset value, offering and redemption price per share | | $ | 11.12 | | | $ | 22.22 | | | $ | 10.54 | |
| | | | | | | | | | | | | |
| Investor Shares | | | | | | | | | | | | |
| Net assets | | | — | | | $ | 282,595,769 | | | | — | |
| Shares of capital stock outstanding* | | | — | | | | 12,850,144 | | | | — | |
| Net asset value, offering and redemption price per share | | | — | | | $ | 21.99 | | | | — | |
| Cost of investments in securities | | $ | 516,495,234 | | | $ | 927,524,775 | | | $ | 29,453,198 | |
| Cost of foreign currency | | $ | 29 | | | $ | 411,056 | | | $ | 5,040 | |
| * | $0.001 par value, 1,550,000,000 shares authorized for the Portfolios in total. |
The accompanying notes are an integral part of these financial statements.
Annual Report 37

Lazard Retirement Series, Inc. Statements of Operations
| For the Year Ended December 31, 2012 | | Lazard
Retirement
U.S. Strategic
Equity Portfolio | | | Lazard
Retirement
U.S. Small-Mid Cap
Equity Portfolio | |
| | | | | | | |
| Investment Income | | | | | | | | |
| Income | | | | | | | | |
| Dividends | | $ | 138,425 | | | $ | 1,297,291 | |
| Interest | | | — | | | | — | |
| Total investment income* | | | 138,425 | | | | 1,297,291 | |
| | | | | | | | | |
| Expenses | | | | | | | | |
| Management fees (Note 3) | | | 44,819 | | | | 859,696 | |
| Distribution fees (Service Shares) | | | 16,013 | | | | 285,671 | |
| Custodian fees | | | 42,582 | | | | 54,441 | |
| Administration fees | | | 43,779 | | | | 65,356 | |
| Professional services | | | 32,917 | | | | 47,517 | |
| Shareholders’ reports | | | 9,334 | | | | 29,329 | |
| Shareholders’ services | | | 14,445 | | | | 16,378 | |
| Directors’ fees and expenses | | | 235 | | | | 4,249 | |
| Amortization of offering costs (Note 2(f)) | | | — | | | | — | |
| Other | | | 2,425 | | | | 7,353 | |
| Total gross expenses | | | 206,549 | | | | 1,369,990 | |
| Management fees waived and expenses reimbursed | | | (123,772 | ) | | | — | |
| Administration and shareholders’ services fees waived | | | (18,750 | ) | | | — | |
| Total net expenses | | | 64,027 | | | | 1,369,990 | |
| Net investment income (loss) | | | 74,398 | | | | (72,699 | ) |
| | | | | | | | | |
| Net Realized and Unrealized Gain (Loss) on Investments, Foreign Currency and Forward Currency Contracts | | | | | | | | |
| Net realized gain (loss) on: | | | | | | | | |
| Investments | | | 624,773 | | | | 15,334,108 | |
| Foreign currency and forward currency contracts | | | — | | | | — | |
| Net change in unrealized appreciation (depreciation) on: | | | | | | | | |
| Investments** | | | 153,516 | | | | (1,784,076 | ) |
| Foreign currency and forward currency contracts | | | — | | | | — | |
| Net realized and unrealized gain on investments, foreign currency and forward currency contracts | | | 778,289 | | | | 13,550,032 | |
| Net increase in net assets resulting from operations | | $ | 852,687 | | | $ | 13,477,333 | |
| | | | | | | | | |
| * Net of foreign withholding taxes of | | $ | — | | | $ | — | |
| ** Net of foreign capital gains taxes of | | $ | — | | | $ | — | |
| (a) | From Portfolio’s commencement of operations on April 30, 2012. |
The accompanying notes are an integral part of these financial statements.
38 Annual Report

| For the Year Ended December 31, 2012 | | Lazard
Retirement
International
Equity Portfolio | | | Lazard
Retirement
Emerging Markets
Equity Portfolio | | | Lazard
Retirement
Multi-Asset Targeted
Volatility Portfolio (a) | |
| | | | | | | | | | |
| Investment Income | | | | | | | | | | | | |
| Income | | | | | | | | | | | | |
| Dividends | | $ | 16,307,441 | | | $ | 28,003,278 | | | $ | 140,963 | |
| Interest | | | — | | | | 14,699 | | | | 71,251 | |
| Total investment income* | | | 16,307,441 | | | | 28,017,977 | | | | 212,214 | |
| | | | | | | | | | | | | |
| Expenses | | | | | | | | | | | | |
| Management fees (Note 3) | | | 4,214,996 | | | | 9,455,540 | | | | 86,849 | |
| Distribution fees (Service Shares) | | | 1,405,978 | | | | 1,690,822 | | | | 25,952 | |
| Custodian fees | | | 194,813 | | | | 715,663 | | | | 111,032 | |
| Administration fees | | | 154,890 | | | | 231,238 | | | | 29,541 | |
| Professional services | | | 88,160 | | | | 127,953 | | | | 45,435 | |
| Shareholders’ reports | | | 62,855 | | | | 112,638 | | | | 3,791 | |
| Shareholders’ services | | | 18,859 | | | | 37,891 | | | | 9,822 | |
| Directors’ fees and expenses | | | 20,581 | | | | 34,651 | | | | 7,548 | |
| Amortization of offering costs (Note 2(f)) | | | — | | | | — | | | | 65,878 | |
| Other | | | 16,135 | | | | 25,539 | | | | 1,937 | |
| Total gross expenses | | | 6,177,267 | | | | 12,431,935 | | | | 387,785 | |
| Management fees waived and expenses reimbursed | | | — | | | | — | | | | (265,143 | ) |
| Administration and shareholders’ services fees waived | | | — | | | | — | | | | (15,501 | ) |
| Total net expenses | | | 6,177,267 | | | | 12,431,935 | | | | 107,141 | |
| Net investment income (loss) | | | 10,130,174 | | | | 15,586,042 | | | | 105,073 | |
| | | | | | | | | | | | | |
| Net Realized and Unrealized Gain (Loss) on Investments, Foreign Currency and Forward Currency Contracts | | | | | | | | | | | | |
| Net realized gain (loss) on: | | | | | | | | | | | | |
| Investments | | | 10,804,664 | | | | 18,481,396 | | | | 90,159 | |
| Foreign currency and forward currency contracts | | | (206,461 | ) | | | (524,882 | ) | | | (53,859 | ) |
| Net change in unrealized appreciation (depreciation) on: | | | | | | | | | | | | |
| Investments** | | | 87,459,552 | | | | 149,972,004 | | | | 894,723 | |
| Foreign currency and forward currency contracts | | | 4,285 | | | | 7,700 | | | | (132,113 | ) |
| Net realized and unrealized gain on investments, foreign currency and forward currency contracts | | | 98,062,040 | | | | 167,936,218 | | | | 798,910 | |
| Net increase in net assets resulting from operations | | $ | 108,192,214 | | | $ | 183,522,260 | | | $ | 903,983 | |
| | | | | | | | | | | | |
| * Net of foreign withholding taxes of | | $ | 1,476,736 | | | $ | 3,274,460 | | | $ | 6,370 | |
| ** Net of foreign capital gains taxes of | | $ | — | | | $ | 3,691 | | | $ | — | |
| (a) | From Portfolio’s commencement of operations on April 30, 2012. |
The accompanying notes are an integral part of these financial statements.
Annual Report 39

Lazard Retirement Series, Inc. Statements of Changes in Net Assets
| | | Lazard Retirement | | Lazard Retirement |
| | | U.S. Strategic Equity Portfolio | | U.S. Small-Mid Cap Equity Portfolio |
| | | Year Ended | | Year Ended | | Year Ended | | Year Ended |
| | | December 31,
2012 | | December 31,
2011 | | December 31,
2012 | | December 31,
2011 |
| | | | | | | | | |
| Increase (Decrease) in Net Assets | | | | | | | | | | | | | | | | |
| Operations | | | | | | | | | | | | | | | | |
| Net investment income (loss) | | $ | 74,398 | | | $ | 65,203 | | | $ | (72,699 | ) | | $ | (257,654 | ) |
| Net realized gain on investments, foreign currency and forward currency contracts | | | 624,773 | | | | 385,685 | | | | 15,334,108 | | | | 8,158,409 | |
| Net change in unrealized appreciation (depreciation) on investments, foreign currency and forward currency contracts | | | 153,516 | | | | (381,509 | ) | | | (1,784,076 | ) | | | (22,778,437 | ) |
| Net increase (decrease) in net assets resulting from operations | | | 852,687 | | | | 69,379 | | | | 13,477,333 | | | | (14,877,682 | ) |
| | | | | | | | | | | | | | | | | |
| Distributions to shareholders | | | | | | | | | | | | | | | | |
| From net investment income | | | | | | | | | | | | | | | | |
| Service Shares | | | (74,439 | ) | | | (62,404 | ) | | | — | | | | — | |
| Investor Shares | | | — | | | | — | | | | — | | | | — | |
| From net realized gains | | | | | | | | | | | | | | | | |
| Service Shares | | | — | | | | — | | | | (13,385,623 | ) | | | (13,524,573 | ) |
| Investor Shares | | | — | | | | — | | | | — | | | | — | |
| Net decrease in net assets resulting from distributions | | | (74,439 | ) | | | (62,404 | ) | | | (13,385,623 | ) | | | (13,524,573 | ) |
| | | | | | | | | | | | | | | | | |
| Capital stock transactions | | | | | | | | | | | | | | | | |
| Net proceeds from sales | | | | | | | | | | | | | | | | |
| Service Shares | | | 1,309,054 | | | | 2,242,803 | | | | 16,027,344 | | | | 84,023,394 | |
| Investor Shares | | | — | | | | — | | | | — | | | | — | |
| Net proceeds from reinvestment of distributions | | | | | | | | | | | | | | | | |
| Service Shares | | | 74,439 | | | | 62,404 | | | | 13,385,623 | | | | 13,524,573 | |
| Investor Shares | | | — | | | | — | | | | — | | | | — | |
| Cost of shares redeemed | | | | | | | | | | | | | | | | |
| Service Shares | | | (1,468,248 | ) | | | (2,475,789 | ) | | | (163,050,420 | ) | | | (35,265,759 | ) |
| Investor Shares | | | — | | | | — | | | | — | | | | — | |
| Net increase (decrease) in net assets from capital stock transactions | | | (84,755 | ) | | | (170,582 | ) | | | (133,637,453 | ) | | | 62,282,208 | |
| Total increase (decrease) in net assets | | | 693,493 | | | | (163,607 | ) | | | (133,545,743 | ) | | | 33,879,953 | |
| Net assets at beginning of period | | | 6,008,460 | | | | 6,172,067 | | | | 180,523,700 | | | | 146,643,747 | |
| Net assets at end of period* | | $ | 6,701,953 | | | $ | 6,008,460 | | | $ | 46,977,957 | | | $ | 180,523,700 | |
| * Includes undistributed (distributions in excess of) net investment income of | | $ | 14,289 | | | $ | 14,330 | | | $ | — | | | $ | — | |
| | | | | | | | | | | | | | | | | |
| Shares issued and redeemed | | | | | | | | | | | | | | | | |
| Service Shares | | | | | | | | | | | | | | | | |
| Shares outstanding at beginning of period | | | 649,088 | | | | 671,997 | | | | 19,491,128 | | | | 13,285,662 | |
| Shares sold | | | 132,214 | | | | 238,042 | | | | 1,614,498 | | | | 8,027,580 | |
| Shares issued to shareholders from reinvestment of distributions | | | 7,195 | | | | 6,872 | | | | 1,846,293 | | | | 1,467,946 | |
| Shares redeemed | | | (146,412 | ) | | | (267,823 | ) | | | (16,520,777 | ) | | | (3,290,060 | ) |
| Net increase (decrease) | | | (7,003 | ) | | | (22,909 | ) | | | (13,059,986 | ) | | | 6,205,466 | |
| Shares outstanding at end of period | | | 642,085 | | | | 649,088 | | | | 6,431,142 | | | | 19,491,128 | |
| | | | | | | | | | | | | | | | | |
| Investor Shares | | | | | | | | | | | | | | | | |
| Shares outstanding at beginning of year | | | | | | | | | | | | | | | | |
| Shares sold | | | | | | | | | | | | | | | | |
| Shares issued to shareholders from reinvestment of distributions | | | | | | | | | | | | | | | | |
| Shares redeemed | | | | | | | | | | | | | | | | |
| Net decrease | | | | | | | | | | | | | | | | |
| Shares outstanding at end of year | | | | | | | | | | | | | | | | |
| (a) | Portfolio commenced operations on April 30, 2012. |
The accompanying notes are an integral part of these financial statements.
40 Annual Report

| | | | | | | Lazard Retirement |
| | | Lazard Retirement | | Lazard Retirement | | Multi-Asset Targeted |
| | | International Equity Portfolio | | Emerging Markets Equity Portfolio | | Volatility Portfolio |
| | | Year Ended | | Year Ended | | Year Ended | | Year Ended | | Period Ended |
| | | December 31,
2012 | | December 31,
2011 | | December 31,
2012 | | December 31,
2011 | | December 31,
2012 (a) |
| | | | | | | | | | | |
| Increase (Decrease) in Net Assets | | | | | | | | | | | | | | | | | | | | |
| Operations | | | | | | | | | | | | | | | | | | | | |
| Net investment income (loss) | | $ | 10,130,174 | | | $ | 9,540,484 | | | $ | 15,586,042 | | | $ | 19,165,142 | | | $ | 105,073 | |
| Net realized gain on investments, foreign currency and forward currency contracts | | | 10,598,203 | | | | 13,096,798 | | | | 17,956,514 | | | | 35,288,134 | | | | 36,300 | |
| Net change in unrealized appreciation (depreciation) on investments, foreign currency and forward currency contracts | | | 87,463,837 | | | | (59,238,313 | ) | | | 149,979,704 | | | | (231,930,064 | ) | | | 762,610 | |
| Net increase (decrease) in net assets resulting from operations | | | 108,192,214 | | | | (36,601,031 | ) | | | 183,522,260 | | | | (177,476,788 | ) | | | 903,983 | |
| | | | | | | | | | | | | | | | | | | | | |
| Distributions to shareholders | | | | | | | | | | | | | | | | | | | | |
| From net investment income | | | | | | | | | | | | | | | | | | | | |
| Service Shares | | | (9,606,473 | ) | | | (10,647,586 | ) | | | (11,326,475 | ) | | | (12,651,559 | ) | | | (8,528 | ) |
| Investor Shares | | | — | | | | — | | | | (4,994,100 | ) | | | (6,893,511 | ) | | | — | |
| From net realized gains | | | | | | | | | | | | | | | | | | | | |
| Service Shares | | | — | | | | — | | | | (8,223,171 | ) | | | — | | | | (89,530 | ) |
| Investor Shares | | | — | | | | — | | | | (3,170,007 | ) | | | — | | | | — | |
| Net decrease in net assets resulting from distributions | | | (9,606,473 | ) | | | (10,647,586 | ) | | | (27,713,753 | ) | | | (19,545,070 | ) | | | (98,058 | ) |
| | | | | | | | | | | | | | | | | | | | | |
| Capital stock transactions | | | | | | | | | | | | | | | | | | | | |
| Net proceeds from sales | | | | | | | | | | | | | | | | | | | | |
| Service Shares | | | 87,375,966 | | | | 165,281,419 | | | | 173,094,228 | | | | 261,009,494 | | | | 33,033,489 | |
| Investor Shares | | | — | | | | — | | | | 55,191,482 | | | | 59,827,932 | | | | — | |
| Net proceeds from reinvestment of distributions | | | | | | | | | | | | | | | | | | | | |
| Service Shares | | | 9,606,473 | | | | 10,647,586 | | | | 19,549,646 | | | | 12,651,559 | | | | 98,074 | |
| Investor Shares | | | — | | | | — | | | | 8,164,107 | | | | 6,893,511 | | | | — | |
| Cost of shares redeemed | | | | | | | | | | | | | | | | | | | | |
| Service Shares | | | (117,013,552 | ) | | | (85,828,787 | ) | | | (150,059,376 | ) | | | (143,280,335 | ) | | | (3,675,970 | ) |
| Investor Shares | | | — | | | | — | | | | (69,143,806 | ) | | | (97,148,515 | ) | | | — | |
| Net increase (decrease) in net assets from capital stock transactions | | | (20,031,113 | ) | | | 90,100,218 | | | | 36,796,281 | | | | 99,953,646 | | | | 29,455,593 | |
| Total increase (decrease) in net assets | | | 78,554,628 | | | | 42,851,601 | | | | 192,604,788 | | | | (97,068,212 | ) | | | 30,261,518 | |
| Net assets at beginning of period | | | 513,882,066 | | | | 471,030,465 | | | | 824,689,598 | | | | 921,757,810 | | | | — | |
| Net assets at end of period* | | $ | 592,436,694 | | | $ | 513,882,066 | | | $ | 1,017,294,386 | | | $ | 824,689,598 | | | $ | 30,261,518 | |
| * Includes undistributed (distributions in excess of) net investment income of | | $ | 1,496,937 | | | $ | 1,136,951 | | | $ | (24,941 | ) | | $ | (38,689 | ) | | $ | 80,147 | |
| | | | | | | | | | | | | | | | | | | | | |
| Shares issued and redeemed | | | | | | | | | | | | | | | | | | | | |
| Service Shares | | | | | | | | | | | | | | | | | | | | |
| Shares outstanding at beginning of period | | | 55,098,125 | | | | 45,824,607 | | | | 31,012,717 | | | | 24,938,452 | | | | — | |
| Shares sold | | | 8,621,819 | | | | 16,490,094 | | | | 8,283,260 | | | | 12,059,351 | | | | 3,211,753 | |
| Shares issued to shareholders from reinvestment of distributions | | | 877,788 | | | | 1,143,463 | | | | 898,421 | | | | 680,095 | | | | 9,305 | |
| Shares redeemed | | | (11,303,525 | ) | | | (8,360,039 | ) | | | (7,132,770 | ) | | | (6,665,181 | ) | | | (350,754 | ) |
| Net increase (decrease) | | | (1,803,918 | ) | | | 9,273,518 | | | | 2,048,911 | | | | 6,074,265 | | | | 2,870,304 | |
| Shares outstanding at end of period | | | 53,294,207 | | | | 55,098,125 | | | | 33,061,628 | | | | 31,012,717 | | | | 2,870,304 | |
| | | | | | | | | | | | | | | | | | | | | |
| Investor Shares | | | | | | | | | | | | | | | | | | | | |
| Shares outstanding at beginning of year | | | | | | | | | | | 13,191,140 | | | | 14,669,543 | | | | | |
| Shares sold | | | | | | | | | | | 2,612,839 | | | | 2,689,966 | | | | | |
| Shares issued to shareholders from reinvestment of distributions | | | | | | | | | | | 379,197 | | | | 370,181 | | | | | |
| Shares redeemed | | | | | | | | | | | (3,333,032 | ) | | | (4,538,550 | ) | | | | |
| Net decrease | | | | | | | | | | | (340,996 | ) | | | (1,478,403 | ) | | | | |
| Shares outstanding at end of year | | | | | | | | | | | 12,850,144 | | | | 13,191,140 | | | | | |
| (a) | Portfolio commenced operations on April 30, 2012. |
The accompanying notes are an integral part of these financial statements.
Annual Report 41

Lazard Retirement Series, Inc. Financial Highlights
LAZARD RETIREMENT U.S. STRATEGIC EQUITY PORTFOLIO
| Selected data for a share of capital | | Year Ended | |
| stock outstanding throughout each year | | 12/31/12 | | | 12/31/11 | | | 12/31/10 | | | 12/31/09 | | | 12/31/08 | |
| | | | | | | | | | | | | | | | | | | | | |
| Service Shares | | | | | | | | | | | | | | | | | | | | |
| Net asset value, beginning of year | | $ | 9.26 | | | $ | 9.18 | | | $ | 8.19 | | | $ | 6.51 | | | $ | 10.17 | |
| Income (loss) from investment operations: | | | | | | | | | | | | | | | | | | | | |
| Net investment income | | | 0.12 | | | | 0.10 | | | | 0.06 | | | | 0.06 | | | | 0.10 | |
| Net realized and unrealized gain (loss) | | | 1.18 | | | | 0.08 | | | | 0.99 | | | | 1.69 | | | | (3.69 | ) |
| Total from investment operations | | | 1.30 | | | | 0.18 | | | | 1.05 | | | | 1.75 | | | | (3.59 | ) |
| Less distributions from: | | | | | | | | | | | | | | | | | | | | |
| Net investment income | | | (0.12 | ) | | | (0.10 | ) | | | (0.06 | ) | | | (0.07 | ) | | | (0.07 | ) |
| Total distributions | | | (0.12 | ) | | | (0.10 | ) | | | (0.06 | ) | | | (0.07 | ) | | | (0.07 | ) |
| Net asset value, end of year | | $ | 10.44 | | | $ | 9.26 | | | $ | 9.18 | | | $ | 8.19 | | | $ | 6.51 | |
| | | | | | | | | | | | | | | | | | | | | |
| Total Return (a) | | | 14.01 | % | | | 1.96 | % | | | 12.85 | % | | | 26.84 | % | | | -35.28 | % |
| | | | | | | | | | | | | | | | | | | | | |
| Ratios and Supplemental Data: | | | | | | | | | | | | | | | | | | | | |
| Net assets, end of year (in thousands) | | $ | 6,702 | | | $ | 6,008 | | | $ | 6,172 | | | $ | 5,365 | | | $ | 3,312 | |
| Ratios to average net assets: | | | | | | | | | | | | | | | | | | | | |
| Net expenses | | | 1.00 | % | | | 1.00 | % | | | 1.22 | % | | | 1.25 | % | | | 1.25 | % |
| Gross expenses | | | 3.23 | % | | | 3.37 | % | | | 3.84 | % | | | 4.67 | % | | | 4.88 | % |
| Net investment income | | | 1.16 | % | | | 1.04 | % | | | 0.68 | % | | | 1.03 | % | | | 1.27 | % |
| Portfolio turnover rate | | | 59 | % | | | 50 | % | | | 55 | % | | | 79 | % | | | 86 | % |
LAZARD RETIREMENT U.S. SMALL-MID CAP EQUITY PORTFOLIO
| Selected data for a share of capital | | Year Ended | |
| stock outstanding throughout each year | | 12/31/12 | | | 12/31/11 | | | 12/31/10 | | | 12/31/09 | | | 12/31/08 | |
| | | | | | | | | | | | | | | | | | | | | |
| Service Shares | | | | | | | | | | | | | | | | | | | | |
| Net asset value, beginning of year | | $ | 9.26 | | | $ | 11.04 | | | $ | 9.68 | | | $ | 6.34 | | | $ | 9.98 | |
| Income (loss) from investment operations: | | | | | | | | | | | | | | | | | | | | |
| Net investment income (loss) | | | (0.01 | ) | | | (0.01 | ) | | | 0.03 | | | | (0.01 | ) | | | (0.01 | ) |
| Net realized and unrealized gain (loss) | | | 0.95 | | | | (1.01 | ) | | | 2.27 | | | | 3.35 | | | | (3.63 | ) |
| Total from investment operations | | | 0.94 | | | | (1.02 | ) | | | 2.30 | | | | 3.34 | | | | (3.64 | ) |
| Less distributions from: | | | | | | | | | | | | | | | | | | | | |
| Net investment income | | | — | | | | — | | | | (0.03 | ) | | | — | | | | — | |
| Net realized gains | | | (2.90 | ) | | | (0.76 | ) | | | (0.91 | ) | | | — | | | | — | |
| Total distributions | | | (2.90 | ) | | | (0.76 | ) | | | (0.94 | ) | | | — | | | | — | |
| Net asset value, end of year | | $ | 7.30 | | | $ | 9.26 | | | $ | 11.04 | | | $ | 9.68 | | | $ | 6.34 | |
| | | | | | | | | | | | | | | | | | | | | |
| Total Return (a) | | | 10.38 | % | | | -9.07 | % | | | 23.72 | % | | | 52.68 | % | | | -36.47 | % |
| | | | | | | | | | | | | | | | | | | | | |
| Ratios and Supplemental Data: | | | | | | | | | | | | | | | | | | | | |
| Net assets, end of year (in thousands) | | $ | 46,978 | | | $ | 180,524 | | | $ | 146,644 | | | $ | 143,821 | | | $ | 34,969 | |
| Ratios to average net assets: | | | | | | | | | | | | | | | | | | | | |
| Net expenses | | | 1.20 | % | | | 1.15 | % | | | 1.18 | % | | | 1.25 | % | | | 1.25 | % |
| Gross expenses | | | 1.20 | % | | | 1.15 | % | | | 1.18 | % | | | 1.31 | % | | | 1.41 | % |
| Net investment income (loss) | | | -0.06 | % | | | -0.16 | % | | | 0.29 | % | | | -0.21 | % | | | -0.11 | % |
| Portfolio turnover rate | | | 74 | % | | | 98 | % | | | 122 | % | | | 171 | % | | | 139 | % |
| (a) | Total returns reflect reinvestment of all dividends and distributions, if any. Certain expenses of the Portfolio have been waived or reimbursed by the Portfolio’s Investment Manager or State Street; without such waiver/reimbursement of expenses, the Portfolio’s returns would have been lower. Performance information does not reflect the fees and charges imposed by participating insurance companies at the separate account level, and such charges will have the effect of reducing performance. |
The accompanying notes are an integral part of these financial statements.
42 Annual Report

LAZARD RETIREMENT INTERNATIONAL EQUITY PORTFOLIO
| Selected data for a share of capital | | Year Ended | |
| stock outstanding throughout each year | | 12/31/12 | | | 12/31/11 | | | 12/31/10 | | | 12/31/09 | | | 12/31/08 | |
| | | | | | | | | | | | | | | | | | | | | |
| Service Shares | | | | | | | | | | | | | | | | | | | | |
| Net asset value, beginning of year | | $ | 9.33 | | | $ | 10.28 | | | $ | 9.76 | | | $ | 8.23 | | | $ | 13.35 | |
| Income (loss) from investment operations: | | | | | | | | | | | | | | | | | | | | |
| Net investment income | | | 0.19 | | | | 0.18 | | | | 0.12 | | | | 0.16 | | | | 0.21 | |
| Net realized and unrealized gain (loss) | | | 1.78 | | | | (0.93 | ) | | | 0.53 | | | | 1.60 | | | | (5.15 | ) |
| Total from investment operations | | | 1.97 | | | | (0.75 | ) | | | 0.65 | | | | 1.76 | | | | (4.94 | ) |
| Less distributions from: | | | | | | | | | | | | | | | | | | | | |
| Net investment income | | | (0.18 | ) | | | (0.20 | ) | | | (0.13 | ) | | | (0.23 | ) | | | (0.14 | ) |
| Net realized gains | | | — | | | | — | | | | — | | | | — | | | | (0.04 | ) |
| Total distributions | | | (0.18 | ) | | | (0.20 | ) | | | (0.13 | ) | | | (0.23 | ) | | | (0.18 | ) |
| Net asset value, end of year | | $ | 11.12 | | | $ | 9.33 | | | $ | 10.28 | | | $ | 9.76 | | | $ | 8.23 | |
| | | | | | | | | | | | | | | | | | | | | |
| Total Return (a) | | | 21.11 | % | | | -7.27 | % | | | 6.72 | % | | | 21.46 | % | | | -37.02 | % |
| | | | | | | | | | | | | | | | | | | | | |
| Ratios and Supplemental Data: | | | | | | | | | | | | | | | | | | | | |
| Net assets, end of year (in thousands) | | $ | 592,437 | | | $ | 513,882 | | | $ | 471,030 | | | $ | 343,467 | | | $ | 284,140 | |
| Ratios to average net assets: | | | | | | | | | | | | | | | | | | | | |
| Net expenses | | | 1.10 | % | | | 1.12 | % | | | 1.14 | % | | | 1.17 | % | | | 1.17 | % |
| Gross expenses | | | 1.10 | % | | | 1.12 | % | | | 1.14 | % | | | 1.17 | % | | | 1.17 | % |
| Net investment income | | | 1.80 | % | | | 1.89 | % | | | 1.41 | % | | | 1.89 | % | | | 2.15 | % |
| Portfolio turnover rate | | | 43 | % | | | 39 | % | | | 53 | % | | | 104 | % | | | 43 | % |
| (a) | Total returns reflect reinvestment of all dividends and distributions, if any. Performance information does not reflect the fees and charges imposed by participating insurance companies at the separate account level, and such charges will have the effect of reducing performance. |
The accompanying notes are an integral part of these financial statements.
Annual Report 43

LAZARD RETIREMENT EMERGING MARKETS EQUITY PORTFOLIO
| Selected data for a share of capital | | Year Ended | |
| stock outstanding throughout each year | | 12/31/12 | | | 12/31/11 | | | 12/31/10 | | | 12/31/09 | | | 12/31/08 | |
| | | | | | | | | | | | | | | | | | | | | |
| Service Shares | | | | | | | | | | | | | | | | | | | | |
| Net asset value, beginning of year | | $ | 18.71 | | | $ | 23.33 | | | $ | 19.23 | | | $ | 11.59 | | | $ | 25.64 | |
| Income (loss) from investment operations: | | | | | | | | | | | | | | | | | | | | |
| Net investment income (a) | | | 0.33 | | | | 0.44 | | | | 0.34 | | | | 0.29 | | | | 0.58 | |
| Net realized and unrealized gain (loss) | | | 3.78 | | | | (4.64 | ) | | | 4.02 | | | | 7.80 | | | | (12.77 | ) |
| Total from investment operations | | | 4.11 | | | | (4.20 | ) | | | 4.36 | | | | 8.09 | | | | (12.19 | ) |
| Less distributions from: | | | | | | | | | | | | | | | | | | | | |
| Net investment income | | | (0.35 | ) | | | (0.42 | ) | | | (0.26 | ) | | | (0.45 | ) | | | (0.47 | ) |
| Net realized gains | | | (0.25 | ) | | | — | | | | — | | | | — | | | | (1.39 | ) |
| Total distributions | | | (0.60 | ) | | | (0.42 | ) | | | (0.26 | ) | | | (0.45 | ) | | | (1.86 | ) |
| Net asset value, end of year | | $ | 22.22 | | | $ | 18.71 | | | $ | 23.33 | | | $ | 19.23 | | | $ | 11.59 | |
| | | | | | | | | | | | | | | | | | | | | |
| Total Return (b) | | | 22.05 | % | | | -18.00 | % | | | 22.69 | % | | | 69.85 | % | | | -48.72 | % |
| | | | | | | | | | | | | | | | | | | | | |
| Ratios and Supplemental Data: | | | | | | | | | | | | | | | | | | | | |
| Net assets, end of year (in thousands) | | $ | 734,699 | | | $ | 580,370 | | | $ | 581,859 | | | $ | 367,260 | | | $ | 168,787 | |
| Ratios to average net assets: | | | | | | | | | | | | | | | | | | | | |
| Net expenses | | | 1.39 | % | | | 1.42 | % | | | 1.46 | % | | | 1.56 | % | | | 1.52 | % |
| Gross expenses | | | 1.39 | % | | | 1.42 | % | | | 1.46 | % | | | 1.56 | % | | | 1.52 | % |
| Net investment income | | | 1.57 | % | | | 2.04 | % | | | 1.66 | % | | | 1.86 | % | | | 2.81 | % |
| Portfolio turnover rate | | | 23 | % | | | 19 | % | | | 27 | % | | | 51 | % | | | 53 | % |
| Selected data for a share of capital | | Year Ended | |
| stock outstanding throughout each year | | 12/31/12 | | | 12/31/11 | | | 12/31/10 | | | 12/31/09 | | | 12/31/08 | |
| | | | | | | | | | | | | | | | |
| Investor Shares | | | | | | | | | | | | | | | |
| Net asset value, beginning of year | | $ | 18.52 | | | $ | 23.17 | | | $ | 19.13 | | | $ | 11.55 | | | $ | 25.60 | |
| Income (loss) from investment operations: | | | | | | | | | | | | | | | | | | | | |
| Net investment income (a) | | | 0.38 | | | | 0.50 | | | | 0.38 | | | | 0.32 | | | | 0.64 | |
| Net realized and unrealized gain (loss) | | | 3.74 | | | | (4.62 | ) | | | 4.01 | | | | 7.79 | | | | (12.78 | ) |
| Total from investment operations | | | 4.12 | | | | (4.12 | ) | | | 4.39 | | | | 8.11 | | | | (12.14 | ) |
| Less distributions from: | | | | | | | | | | | | | | | | | | | | |
| Net investment income | | | (0.40 | ) | | | (0.53 | ) | | | (0.35 | ) | | | (0.53 | ) | | | (0.52 | ) |
| Net realized gains | | | (0.25 | ) | | | — | | | | — | | | | — | | | | (1.39 | ) |
| Total distributions | | | (0.65 | ) | | | (0.53 | ) | | | (0.35 | ) | | | (0.53 | ) | | | (1.91 | ) |
| Net asset value, end of year | | $ | 21.99 | | | $ | 18.52 | | | $ | 23.17 | | | $ | 19.13 | | | $ | 11.55 | |
| | | | | | | | | | | | | | | | | | | | | |
| Total Return (b) | | | 22.34 | % | | | -17.79 | % | | | 23.05 | % | | | 70.23 | % | | | -48.59 | % |
| | | | | | | | | | | | | | | | | | | | | |
| Ratios and Supplemental Data: | | | | | | | | | | | | | | | | | | | | |
| Net assets, end of year (in thousands) | | $ | 282,596 | | | $ | 244,320 | | | $ | 339,899 | | | $ | 170,217 | | | $ | 61,005 | |
| Ratios to average net assets: | | | | | | | | | | | | | | | | | | | | |
| Net expenses | | | 1.14 | % | | | 1.17 | % | | | 1.21 | % | | | 1.31 | % | | | 1.28 | % |
| Gross expenses | | | 1.14 | % | | | 1.17 | % | | | 1.21 | % | | | 1.31 | % | | | 1.28 | % |
| Net investment income | | | 1.85 | % | | | 2.31 | % | | | 1.83 | % | | | 2.03 | % | | | 3.02 | % |
| Portfolio turnover rate | | | 23 | % | | | 19 | % | | | 27 | % | | | 51 | % | | | 53 | % |
| (a) | Net investment income has been computed using the average shares method. |
| | |
| (b) | Total returns reflect reinvestment of all dividends and distributions, if any. Performance information does not reflect the fees and charges imposed by participating insurance companies at the separate account level, and such charges will have the effect of reducing performance. |
The accompanying notes are an integral part of these financial statements.
44 Annual Report

LAZARD RETIREMENT MULTI-ASSET TARGETED VOLATILITY PORTFOLIO
| | | For the Period | |
| Selected data for a share of capital | | 4/30/12* to | |
| stock outstanding throughout the period | | 12/31/12 | |
| | | | | | |
| Service Shares | | | | | |
| Net asset value, beginning of period | | $ | 10.00 | | |
| Income from investment operations: | | | | | |
| Net investment income | | | 0.03 | | |
| Net realized and unrealized gain | | | 0.54 | | |
| Total from investment operations | | | 0.57 | | |
| Less distributions from: | | | | | |
| Net investment income | | | — | (c) | |
| Net realized gains | | | (0.03 | ) | |
| Total distributions | | | (0.03 | ) | |
| Net asset value, end of period | | $ | 10.54 | | |
| | | | | | |
| Total Return (a) | | | 5.74 | % | |
| | | | | | |
| Ratios and Supplemental Data: | | | | | |
| Net assets, end of period (in thousands) | | $ | 30,262 | | |
| Ratios to average net assets: | | | | | |
| Net expenses (b) | | | 1.05 | % | |
| Gross expenses (b) | | | 3.80 | % | |
| Net investment income (b) | | | 1.03 | % | |
| Portfolio turnover rate | | | 45 | % | |
| * | Portfolio commenced operations on April 30, 2012. |
| (a) | Total return reflects reinvestment of all dividends and distributions, if any. Certain expenses of the Portfolio have been waived or reimbursed by the Portfolio’s Investment Manager, State Street or BFDS; without such waiver/reimbursement of expenses, the Portfolio’s returns would have been lower. Performance information does not reflect the fees and charges imposed by participating insurance companies at the separate account level, and such charges will have the effect of reducing performance. A period of less than one year is not annualized. |
| (b) | Annualized for a period of less than one year. |
| (c) | Amount is less than $0.01 per share. |
The accompanying notes are an integral part of these financial statements.
Annual Report 45

Lazard Retirement Series, Inc. Notes to Financial Statements December 31, 2012
1. Organization
Lazard Retirement Series, Inc. (the “Fund”) was incorporated in Maryland on February 13, 1997 and is registered under the Investment Company Act of 1940, as amended (the “Act”), as an open-end management investment company. The Fund is comprised of thirteen no-load portfolios (each referred to as a “Portfolio”), which are currently offered only to separate accounts established by insurance companies to fund variable annuity contracts and variable life insurance policies. Portfolio shares may also be offered to certain qualified pension and retirement plans and to accounts permitting accumulation of assets on a tax-deferred basis. Effective January 31, 2006, the Fund designated its existing class of shares as Service Shares and commenced offering Investor Shares. Investor Shares and Service Shares are identical, except as to the services offered to and expenses borne by each class of shares. Currently, only the following five Portfolios, each of which is “diversified,” as defined in the Act, are offered: Lazard Retirement U.S. Strategic Equity Portfolio (“U.S. Strategic Equity Portfolio”), Lazard Retirement U.S. Small-Mid Cap Equity Portfolio (“U.S. Small-Mid Cap Equity Portfolio”), Lazard Retirement International Equity Portfolio (“International Equity Portfolio”), Lazard Retirement Emerging Markets Equity Portfolio (“Emerging Markets Equity Portfolio”) and Lazard Retirement Multi-Asset Targeted Volatility Portfolio (“Multi-Asset Targeted Volatility Portfolio”). Multi-Asset Targeted Volatility Portfolio commenced investment operations on April 30, 2012. Each of the other eight Portfolios had not commenced operations as of December 31, 2012.
2. Significant Accounting Policies
The accompanying financial statements are presented in conformity with GAAP. The following is a summary of significant accounting policies:
(a) Valuation of Investments—Market values for securities listed on the New York Stock Exchange (“NYSE”), NAS-DAQ national market or other U.S. or foreign exchanges or markets are generally based on the last reported sales price on the exchange or market on which the security is principally traded, generally as of the close of regular trading on the NYSE (normally 4:00 p.m. Eastern time) on each valuation date; securities not traded on the valuation date are valued at the most recent quoted bid price. The Fund values NASDAQ-traded securities at the NASDAQ Official Closing Price, which may not be the last reported sales price in
certain instances. Forward currency contracts are valued using quotations from an independent pricing service. Investments in money market funds are valued at the fund’s net asset value.
Bonds and other fixed-income securities that are not exchange-traded are valued on the basis of prices provided by independent pricing services which are based primarily on institutional trading in similar groups of securities, or by using brokers’ quotations or a matrix system which considers such factors as other security prices, yields and maturities. Debt securities maturing in 60 days or less are valued at amortized cost, except where to do so would not accurately reflect their fair value, in which case such securities are valued at fair value as determined by, or in accordance with procedures approved by, the Board of Directors (the “Board”).
The Valuation Committee of the Investment Manager, which meets periodically under the direction of the Board, may evaluate a variety of factors to determine the fair value of securities for which market quotations are determined not to be readily available or reliable. These factors include, but are not limited to, the type of security, the value of comparable securities, observations from financial institutions and relevant news events. Input from the Investment Manager’s analysts also will be considered.
If a significant event materially affecting the value of securities occurs between the close of the exchange or market on which the security is principally traded and the time when a Portfolio’s net asset value is calculated, or when current market quotations otherwise are determined not to be readily available or reliable (including restricted or other illiquid securities such as certain derivative instruments), such securities will be valued at their fair value as determined by, or in accordance with procedures approved by, the Board. The fair value of foreign securities may be determined with the assistance of an independent pricing service, using correlations between the movement of prices of such securities and indices of domestic securities and other appropriate indicators, such as closing market prices of relevant ADRs or futures contracts. Foreign securities may trade on days when a Portfolio is not open for business, thus affecting the value of the Portfolio’s assets on days when Portfolio shareholders may not be able to buy or sell Portfolio shares.
The effect of using fair value pricing is that the net asset value of a Portfolio will reflect the affected securities’ values
46 Annual Report

as determined in the judgment of the Board or its designee instead of being determined by the market. Using a fair value pricing methodology to price securities may result in a value that is different from the most recent closing price of a security and from the prices used by other investment companies to calculate their portfolios’ net asset values.
(b) Portfolio Securities Transactions and Investment Income—
Portfolio securities transactions are accounted for on trade date. Realized gain (loss) on sales of investments are recorded on a specific identification basis. Dividend income is recorded on the ex-dividend date and interest income is accrued daily. The Portfolios amortize premiums and accrete discounts on fixed-income securities using the effective yield method. For the period ended December 31, 2012, only Multi-Asset Targeted Volatility Portfolio traded in fixed-income securities.
The Portfolios may be subject to taxes imposed by foreign countries in which they invest. Such taxes are generally based upon income earned or capital gains (realized or unrealized). The Portfolios accrue and apply such taxes to net investment income, net realized gains and net unrealized gains concurrent with the recognition of income or capital gains (realized and unrealized) from the applicable portfolio securities.
(c) Foreign Currency Translation and Forward Currency Contracts—The accounting records of the Portfolios are maintained in U.S. dollars. Portfolio securities and other assets and liabilities denominated in a foreign currency are translated daily into U.S. dollars at the prevailing rates of exchange. Purchases and sales of securities, income receipts and expense payments are translated into U.S. dollars at the prevailing exchange rates on the respective transaction dates.
The Portfolios do not isolate the portion of operations resulting from changes in foreign exchange rates on investments from the fluctuations arising from changes in their market prices. Such fluctuations are included in net realized and unrealized gain (loss) on investments. Net realized gain (loss) on foreign currency and forward currency contracts represents net foreign currency gain (loss) from forward currency contracts, disposition of foreign currencies, currency gain (loss) realized between the trade and settlement dates on securities transactions, and the difference between the
amount of dividends, interest and foreign withholding taxes recorded on a Portfolio’s accounting records and the U.S. dollar equivalent amounts actually received or paid. Net change in unrealized appreciation (depreciation) on foreign currency reflects the impact of changes in exchange rates on the value of assets and liabilities, other than investments in securities, during the period.
A forward currency contract is an agreement between two parties to buy or sell currency at a set price on a future date. Upon entering into these contracts, risks may arise from the potential inability of counterparties to meet the terms of their contracts and from unanticipated movements in the value of the foreign currency relative to the U.S. dollar.
The U.S. dollar value of forward currency contracts is determined using quotations provided by an independent pricing service. Daily fluctuations in the value of such contracts are recorded as unrealized appreciation (depreciation) on forward currency contracts. When the contract is closed, the Portfolio records a realized gain (loss) equal to the difference between the value at the time it was opened and the value at the time it was closed.
For the period ended December 31, 2012, only Multi-Asset Targeted Volatility Portfolio traded in forward currency contracts.
(d) Federal Income Taxes—The Fund’s policy is to continue to have each Portfolio qualify as a regulated investment company under Subchapter M of the Internal Revenue Code and to distribute all of its taxable income, including any net realized capital gains, to shareholders. Therefore, no federal income tax provision is required.
At December 31, 2012, the Portfolios had available, for federal income tax purposes, unused realized capital losses which can be used to offset future realized capital gains as follows:
| Portfolio | | Expiring 2017 | | | Expiring 2018 | |
| | | | | | | | | |
| U.S. Strategic Equity | | $ | — | | | $ | 127,978 | |
| International Equity | | | 67,453,721 | | | | 7,205,218 | |
Under current tax law, certain capital and net foreign currency losses realized after October 31 within the taxable year may be deferred and treated as occurring on the first day of the following tax year. For the tax year ended
Annual Report 47

December 31, 2012, Emerging Markets Equity Portfolio and Multi-Asset Targeted Volatility Portfolio elected to defer net capital and foreign currency losses of $10,521,224 and $36,336, respectively arising between November 1, 2012 and December 31, 2012.
On December 22, 2010, the Regulated Investment Company Modernization Act of 2010 (the “RIC Modernization Act”) was signed into law. The RIC Modernization Act includes numerous provisions that generally became effective for taxable years beginning after the date of enactment. Among the new provisions, net capital losses may be carried forward indefinitely, and their character is retained as short-term or long-term losses. Previously, net capital losses were carried forward for eight years and treated as short-term losses. The RIC Modernization Act also requires that post-enactment net capital losses be used before pre-enactment net capital losses. As a result, pre-enactment capital loss carry-forwards may expire unused.
Management has analyzed the Portfolios’ tax positions, and has concluded that no liability for unrecognized tax benefits should be recorded related to uncertain tax positions taken on returns filed for open tax years (2009–2011), or expected to be taken in the Portfolios’ 2012 tax returns.
(e) Dividends and Distributions—Each Portfolio intends to declare and to pay dividends annually from net investment income, if any. During any particular year, net realized gains from investment transactions in excess of available capital loss carryforwards would be taxable to the Portfolios, if not distributed. The Portfolios intend to declare and distribute these amounts, at least annually, to shareholders; however, to avoid taxation, a second distribution may be required.
Income dividends and capital gains distributions are determined in accordance with federal income tax regulations which may differ from GAAP. These book/tax differences, which may result in distribution reclassifications, are primarily due to differing treatments of foreign currency transactions, wash sales, passive foreign investment companies and distributions from real estate investment trusts and partnerships. The book/tax differences relating to shareholder distributions may result in reclassifications among certain capital accounts.
The tax character of dividends and distributions paid during the years or periods ended December 31, was as follows:
| | | Ordinary Income | | | Long-Term Capital Gain | |
| Portfolio | | 2012 | | | 2011 | | | 2012 | | | 2011 | |
| | | | | | | | | | | | | | | | | |
| U.S. Strategic Equity | | $ | 74,439 | | | $ | 62,404 | | | $ | — | | | $ | — | |
| U.S. Small-Mid Cap Equity | | | 2,214,796 | | | | 432,097 | | | | 11,170,827 | | | | 13,092,476 | |
| International Equity | | | 9,606,473 | | | | 10,647,586 | | | | — | | | | — | |
| Emerging Markets Equity | | | 16,320,575 | | | | 19,545,070 | | | | 11,393,178 | | | | — | |
| Multi-Asset Targeted Volatility | | | 97,978 | | | | — | | | | 80 | | | | — | |
As of December 31, 2012, the components of distributable earnings, on a tax basis, not disclosed elsewhere, were as follows:
| | | | | | | | | Net Unrealized | |
| | | | | | | | | Appreciation | |
| | | Undistributed | | | Undistributed | | | including | |
| | | Ordinary | | | Long-Term | | | Foreign | |
| Portfolio | | Income | | | Capital Gain | | | Currency | |
| | | | | | | | | | | | | |
| U.S. Strategic Equity | | $ | 14,289 | | | $ | — | | | $ | 717,590 | |
| U.S. Small-Mid Cap Equity | | | 2,262,271 | | | | 431,919 | | | | 3,144,222 | |
| International Equity | | | 2,281,756 | | | | — | | | | 91,698,863 | |
| Emerging Markets Equity | | | — | | | | — | | | | 89,706,842 | |
| Multi-Asset Targeted Volatility | | | — | | | | — | | | | 862,628 | |
(f) Offering Costs—Cost incurred by the Fund in connection with the offering of shares of a new Portfolio are deferred and amortized on a straight line basis over a twelve-month period from the date of commencement of operations of the Portfolio.
(g) Allocation of Expenses—Expenses not directly chargeable to a specific Portfolio are allocated among the Portfolios primarily on the basis of relative net assets. A Portfolio accrues distribution and service (12b-1) fees to its Service Shares. Each Portfolio’s income, expenses (other than class specific expenses) and realized and unrealized gains and losses are allocated proportionally each day between the classes based upon the relative net assets of each class.
48 Annual Report

(h) Expense Reductions—The Portfolios’ excess cash in demand deposit accounts, if any, may receive credits that are available to offset custody expenses. The Statements of Operations report gross custody expenses, and report the amount of any credits separately as an expense reduction.
(i) Estimates—The preparation of financial statements in conformity with GAAP requires the Fund to make estimates and assumptions that affect the reported amounts of assets and liabilities and disclosure of contingent assets and liabilities at the date of the financial statements and the reported amounts of increases and decreases in net assets from operations during the reporting period. Actual results could differ from those estimates.
3. Investment Management, Administration, Distribution and Transfer Agency Agreements
The Fund, on behalf of the Portfolios, has entered into an investment management agreement (the “Management Agreement”) with the Investment Manager. Pursuant to the Management Agreement, the Investment Manager regularly provides each Portfolio with investment research, advice and supervision and furnishes continuously an investment program for each Portfolio consistent with its investment objective and policies, including the purchase, retention and disposition of securities. For its services provided to the Fund, the Investment Manager earns a management fee, accrued daily and payable by each Portfolio monthly, at the annual rate set forth below as a percentage of its average daily net assets:
| Portfolio | | | Annual Rate | |
| | | | | | |
| U.S. Strategic Equity | | | 0.70 | % | |
| U.S. Small-Mid Cap Equity | | | 0.75 | | |
| International Equity | | | 0.75 | | |
| Emerging Markets Equity | | | 1.00 | | |
| Multi-Asset Targeted Volatility | | | 0.85 | | |
The Investment Manager has voluntarily agreed to reduce its fees and, if necessary, reimburse the Portfolios if annualized operating expenses exceed the following percentages of average daily net assets for the respective Shares:
| Portfolio | | | Service Shares | | | Investor Shares | |
| | | | | | | | | | |
| U.S. Strategic Equity | | | 1.00 | % | | | N/A | | |
| U.S. Small-Mid Cap Equity | | | 1.25 | | | | N/A | | |
| International Equity | | | 1.25 | | | | N/A | | |
| Emerging Markets Equity | | | 1.60 | | | | 1.35 | % | |
| Multi-Asset Targeted Volatility | | | 1.05 | | | | N/A | | |
During the year or period ended December 31, 2012, the Investment Manager fully waived its management fees and reimbursed the following Portfolios for other expenses as follows:
| | | Service Shares | |
| | | Management | | | Expenses | |
| Portfolio | | Fees waived | | | Reimbursed | |
| | | | | | | | | |
| U.S. Strategic Equity | | $ | 44,819 | | | $ | 78,953 | |
| Multi-Asset Targeted Volatility | | | 86,849 | | | | 178,294 | |
The Fund has entered into an administration agreement with State Street to provide certain administrative services to the Portfolios. Each Portfolio bears the cost of such services at a fixed annual rate of $42,500, plus 0.02% of average daily net assets up to $1 billion and 0.01% of average daily net assets over $1 billion. State Street has agreed to waive $18,750 of the $42,500 annual fee for the following Portfolios until each respective Portfolio’s net assets reach $25 million. During the year or period ended December 31, 2012, State Street waived its fees as follows:
| Portfolio | | Amount | |
| | | | | |
| U.S. Strategic Equity | | $ | 18,750 | |
| Multi-Asset Targeted Volatility | | | 9,375 | |
The Fund has a distribution agreement with Lazard Asset Management Securities LLC (the “Distributor”), a wholly-owned subsidiary of the Investment Manager, to serve as the distributor for shares of each Portfolio. The Distributor bears the cost of printing and mailing prospectuses to potential investors and certain expenses in connection with the offering of Portfolio shares.
Under a Distribution and Servicing Plan in accordance with Rule 12b-1 under the Act, each Portfolio pays a monthly fee to the Distributor, at an annual rate of 0.25% of the average daily net assets of its Service Shares, for distribution and servicing of accounts. The Distributor may make payments to participating insurance companies, certain financial institutions, securities dealers and other industry professionals for providing these services.
BFDS is the Fund’s transfer and dividend disbursing agent. For its services, BFDS receives a monthly fee computed on the basis of the number of shareholder accounts it maintains for the Fund during the month, subject to a minimum fee amount per share class in each Portfolio, and is reimbursed for certain out-of-pocket expenses. BFDS has agreed to
Annual Report 49

waive the monthly minimum fee for six months after a new Portfolio has commenced operations. During the period ended December 31, 2012, BFDS waived its fees of $6,126 for Multi-Asset Targeted Volatility Portfolio.
4. Directors’ Compensation
Certain Directors of the Fund are officers of the Investment Manager. Each Director who is not an affiliated person of the Investment Manager or any of its affiliates is paid by the Fund, The Lazard Funds, Inc., Lazard Global Total Return and Income Fund, Inc. and Lazard World Dividend & Income Fund, Inc. (collectively with the Fund, the “Lazard Funds”), each a registered management investment company advised by the Investment Manager: (1) an annual retainer of $100,000, (2) a per meeting in person regular or special meeting fee of $5,000 ($1,500 for telephonic participation), including Board, committee, subcommittee or other special meetings specifically authorized by the Board and held in connection with delegated Fund business, and (3) a telephone Audit Committee or special Board meeting fee of $1,500, with an additional annual fee for the Audit Committee Chairman of $5,000. Such Directors are also reimbursed for travel and other out-of-pocket expenses for attending Board and committee meetings. No additional compensation is provided in respect of committee meetings held in conjunction with a meeting of the Board. Compensation is divided among the Lazard Funds based on relative net assets. The Directors do not receive benefits from the Fund pursuant to any pension, retirement or similar arrangement.
5. Securities Transactions and Transactions with Affiliates
Purchases and sales of portfolio securities (excluding short-term investments) for the year or period ended December 31, 2012 were as follows:
| Portfolio | | Purchases | | | Sales | |
| | | | | | | | | |
| U.S. Strategic Equity | | $ | 3,763,116 | | | $ | 3,709,818 | |
| U.S. Small-Mid Cap Equity | | | 86,447,075 | | | | 225,388,747 | |
| International Equity | | | 237,656,062 | | | | 230,713,762 | |
| Emerging Markets Equity | | | 261,107,409 | | | | 210,932,162 | |
| Multi-Asset Targeted Volatility | | | 34,804,403 | | | | 6,423,095 | |
For the year or period ended December 31, 2012, no brokerage commissions were paid to affiliates of the Investment Manager or other affiliates of the Fund for portfolio transactions executed on behalf of the Fund.
6. Foreign Securities Investment Risks
Certain Portfolios invest in securities of foreign entities and in instruments denominated in foreign currencies which involve risks not typically associated with investments in domestic securities. Non-domestic securities carry special risks, such as exposure to currency fluctuations, less developed or less efficient trading markets, political instability, a lack of company information, differing auditing and legal standards, and, potentially, less liquidity. A Portfolio’s investments in emerging market countries are exposed to additional risks. A Portfolio’s performance will be influenced by political, social and economic factors affecting companies in emerging market countries. Emerging market countries generally have economic structures that are less diverse and mature, and political systems that are less stable, than those of developed countries.
7. Contractual Obligations
The Fund enters into contracts in the normal course of business that contain a variety of indemnifications. A Portfolio’s maximum exposure under these arrangements is unknown. Management has reviewed the Fund’s existing contracts and expects the risk of loss to be remote.
8. Fair Value Measurements
Fair value is defined as the price that a Portfolio would receive to sell an asset, or would pay to transfer a liability, in an orderly transaction between market participants at the date of measurement. The Fair Value Measurements and Disclosures provisions of GAAP also establish a framework for measuring fair value, and a three-level hierarchy for fair value measurement that is based upon the transparency of inputs to the valuation of an asset or liability. Inputs may be observable or unobservable and refer, broadly, to the assumptions that market participants would use in pricing the asset or liability. Observable inputs reflect the assumptions that market participants would use in pricing the asset or liability based on market data obtained from sources independent of the Fund. Unobservable inputs reflect the Fund’s own assumptions about the assumptions that market participants would use in pricing the asset or liability, developed based on the best information available in the circumstances. Each investment’s fair value measurement level within the fair value hierarchy is based on the lowest level of any input that is significant to the overall fair value measurement. The three-level hierarchy of inputs is summarized below.
50 Annual Report

| Ÿ | Level 1 – unadjusted quoted prices in active markets for identical investments |
| | |
| Ÿ | Level 2 – other significant observable inputs (including unadjusted quoted prices for similar investments, interest rates, prepayment speeds, credit risk, etc.) |
| | |
| Ÿ | Level 3 – significant unobservable inputs (including the Fund’s own assumptions in determining the fair value of investments) |
The inputs or methodology used for valuing securities are not necessarily an indication of the risks associated with investing in these securities.
The following table summarizes the valuation of the Portfolios’ investments by each fair value hierarchy level as of December 31, 2012:
| Description | | | Unadjusted
Quoted Prices in
Active Markets
for Identical
Investments
(Level 1) | | | | Significant Other
Observable
Inputs
(Level 2) | | | | Significant
Unobservable
Inputs
(Level 3) | | | | Balance as of
December 31, 2012 | |
| | | | | | | | | | | | | | | | | |
| U.S. Strategic Equity Portfolio | | | | | | | | | | | | | | | | |
| Common Stocks | | $ | 6,623,969 | | | $ | — | | | $ | — | | | $ | 6,623,969 | |
| Preferred Stock | | | — | | | | — | | | | 1,649 | | | | 1,649 | |
| Short-Term Investment | | | — | | | | 83,834 | | | | — | | | | 83,834 | |
| Total | | $ | 6,623,969 | | | $ | 83,834 | | | $ | 1,649 | $ | | | 6,709,452 | |
| | | | | | | | | | | | | | | | | |
| U.S. Small-Mid Cap Equity Portfolio | | | | | | | | | | | | | | | | |
| Common Stocks | | $ | 46,447,076 | | | $ | — | | | $ | — | | | $ | 46,447,076 | |
| Preferred Stock | | | — | | | | — | | | | 44,975 | | | | 44,975 | |
| Short-Term Investment | | | — | | | | 737,593 | | | | — | | | | 737,593 | |
| Total | | $ | 46,447,076 | | | $ | 737,593 | | | $ | 44,975 | | | $ | 47,229,644 | |
| | | | | | | | | | | | | | | | | |
| International Equity Portfolio | | | | | | | | | | | | | | | | |
| Common Stocks | | | | | | | | | | | | | | | | |
| Australia | | $ | — | | | $ | 15,110,042 | | | $ | — | | | $ | 15,110,042 | |
| Belgium | | | — | | | | 21,057,336 | | | | — | | | | 21,057,336 | |
| Bermuda | | | — | | | | 3,896,586 | | | | — | | | | 3,896,586 | |
| Brazil | | | — | | | | 9,673,250 | | | | — | | | | 9,673,250 | |
| Canada | | | 17,067,069 | | | | — | | | | — | | | | 17,067,069 | |
| Finland | | | — | | | | 7,846,524 | | | | — | | | | 7,846,524 | |
| France | | | — | | | | 57,959,780 | | | | — | | | | 57,959,780 | |
| Germany | | | — | | | | 60,059,865 | | | | — | | | | 60,059,865 | |
| Indonesia | | | 4,912,186 | | | | — | | | | — | | | | 4,912,186 | |
| Ireland | | | 4,746,820 | | | | — | | | | — | | | | 4,746,820 | |
| Italy | | | — | | | | 17,857,063 | | | | — | | | | 17,857,063 | |
| Japan | | | — | | | | 93,093,436 | | | | — | | | | 93,093,436 | |
| Mexico | | | 5,391,600 | | | | — | | | | — | | | | 5,391,600 | |
| Netherlands | | | — | | | | 12,016,173 | | | | — | | | | 12,016,173 | |
| New Zealand | | | — | | | | 4,278,725 | | | | — | | | | 4,278,725 | |
| Philippines | | | — | | | | 3,377,450 | | | | — | | | | 3,377,450 | |
| Russia | | | — | | | | 8,906,953 | | | | — | | | | 8,906,953 | |
| South Africa | | | — | | | | 6,623,359 | | | | — | | | | 6,623,359 | |
| South Korea | | | — | | | | 15,323,879 | | | | — | | | | 15,323,879 | |
| Spain | | | — | | | | 14,800,960 | | | | — | | | | 14,800,960 | |
| Sweden | | | — | | | | 32,891,347 | | | | — | | | | 32,891,347 | |
| Switzerland | | | — | | | | 27,844,465 | | | | — | | | | 27,844,465 | |
| Thailand | | | — | | | | 6,215,295 | | | | — | | | | 6,215,295 | |
| Turkey | | | — | | | | 10,031,922 | | | | — | | | | 10,031,922 | |
| United Kingdom | | | — | | | | 135,755,605 | | | | — | | | | 135,755,605 | |
| Short-Term Investment | | | — | | | | 15,525,065 | | | | — | | | | 15,525,065 | |
| Total | | $ | 32,117,675 | | | $ | 580,145,080 | | | $ | — | | | $ | 612,262,755 | |
Annual Report 51

| Description | | Unadjusted
Quoted Prices in
Active Markets
for Identical
Investments
(Level 1) | | | Significant Other
Observable
Inputs
(Level 2) | | | Significant
Unobservable
Inputs
(Level 3) | | | Balance as of
December 31, 2012 | |
| | | | | | | | | | | | | | | | | |
| Emerging Markets Equity Portfolio | | | | | | | | | | | | | | | | |
| Common Stocks | | | | | | | | | | | | | | | | |
| Argentina | | $ | 4,995,510 | | | $ | — | | | $ | — | | | $ | 4,995,510 | |
| Brazil | | | 25,066,064 | | | | 103,669,678 | | | | — | | | | 128,735,742 | |
| Canada | | | 5,704,926 | | | | — | | | | — | | | | 5,704,926 | |
| China | | | 16,901,988 | | | | 54,909,101 | | | | — | | | | 71,811,089 | |
| Colombia | | | 11,570,102 | | | | — | | | | — | | | | 11,570,102 | |
| Egypt | | | — | | | | 18,395,189 | | | | — | | | | 18,395,189 | |
| Hong Kong | | | 21,277,133 | | | | 6,423,217 | | | | — | | | | 27,700,350 | |
| Hungary | | | — | | | | 13,453,009 | | | | — | | | | 13,453,009 | |
| India | | | — | | | | 48,840,606 | | | | — | | | | 48,840,606 | |
| Indonesia | | | 21,427,305 | | | | 37,420,637 | | | | — | | | | 58,847,942 | |
| Macau | | | — | | | | 6,930,615 | | | | — | | | | 6,930,615 | |
| Malaysia | | | — | | | | 7,959,341 | | | | — | | | | 7,959,341 | |
| Mexico | | | 41,891,820 | | | | — | | | | — | | | | 41,891,820 | |
| Pakistan | | | — | | | | 13,071,165 | | | | — | | | | 13,071,165 | |
| Philippines | | | 19,478,187 | | | | — | | | | — | | | | 19,478,187 | |
| Russia | | | 21,137,910 | | | | 84,113,965 | | | | — | | | | 105,251,875 | |
| South Africa | | | — | | | | 130,004,651 | | | | — | | | | 130,004,651 | |
| South Korea | | | — | | | | 147,663,727 | | | | — | | | | 147,663,727 | |
| Taiwan | | | — | | | | 44,369,986 | | | | — | | | | 44,369,986 | |
| Thailand | | | — | | | | 29,578,979 | | | | — | | | | 29,578,979 | |
| Turkey | | | — | | | | 64,093,663 | | | | — | | | | 64,093,663 | |
| Preferred Stock | | | 13,273,039 | | | | — | | | | — | | | | 13,273,039 | |
| Short-Term Investment | | | — | | | | 9,721,492 | | | | — | | | | 9,721,492 | |
| Total | | $ | 202,723,984 | | | $ | 820,619,021 | | | $ | — | | | $ | 1,023,343,005 | |
| | | | | | | | | | | | | | | | | |
| Multi-Asset Targeted Volatility Portfolio | | | | | | | | | | | | | | | | |
| | | | | | | | | | | | | | | | | |
| Assets: | | | | | | | | | | | | | | | | |
| Common Stocks | | | | | | | | | | | | | | | | |
| Australia | | $ | 649 | | | $ | 688,956 | | | $ | — | | | $ | 689,605 | |
| Belgium | | | 436,176 | | | | 96,507 | | | | — | | | | 532,683 | |
| Bermuda | | | 70,327 | | | | — | | | | — | | | | 70,327 | |
| Canada | | | 824,789 | | | | — | | | | — | | | | 824,789 | |
| China | | | — | | | | 8,807 | | | | — | | | | 8,807 | |
| Denmark | | | — | | | | 250,204 | | | | — | | | | 250,204 | |
| Finland | | | 461,744 | | | | 33,830 | | | | — | | | | 495,574 | |
| France | | | 500,487 | | | | 95,709 | | | | — | | | | 596,196 | |
| Germany | | | 190,554 | | | | 77,491 | | | | — | | | | 268,045 | |
| Guernsey | | | — | | | | 13,333 | | | | — | | | | 13,333 | |
| Hong Kong | | | — | | | | 189,881 | | | | — | | | | 189,881 | |
| Ireland | | | 436,576 | | | | 49,033 | | | | — | | | | 485,609 | |
| Isle of Man | | | — | | | | 18,847 | | | | — | | | | 18,847 | |
| Israel | | | 197,342 | | | | — | | | | — | | | | 197,342 | |
| Italy | | | 380,835 | | | | 55,031 | | | | — | | | | 435,866 | |
| Japan | | | 1,601,456 | | | | 1,274,339 | | | | — | | | | 2,875,795 | |
| Netherlands | | | — | | | | 77,532 | | | | — | | | | 77,532 | |
| New Zealand | | | — | | | | 9,372 | | | | — | | | | 9,372 | |
| Norway | | | — | | | | 43,363 | | | | — | | | | 43,363 | |
| Singapore | | | — | | | | 9,368 | | | | — | | | | 9,368 | |
| Spain | | | — | | | | 94,904 | | | | — | | | | 94,904 | |
| Sweden | | | 197,316 | | | | 28,425 | | | | — | | | | 225,741 | |
| Switzerland | | | 183,261 | | | | 177,113 | | | | — | | | | 360,374 | |
| United Kingdom | | | 1,414,925 | | | | 461,098 | | | | — | | | | 1,876,023 | |
| United States | | | 11,522,204 | | | | — | | | | — | | | | 11,522,204 | |
52 Annual Report

| Description | | Unadjusted
Quoted Prices in
Active Markets
for Identical
Investments
(Level 1) | | | Significant Other
Observable
Inputs
(Level 2) | | | Significant
Unobservable
Inputs
(Level 3) | | | Balance as of
December 31, 2012 | |
| | | | | | | | | | | | | | | | | |
| Multi-Asset Targeted Volatility Portfolio (concluded) | | | | | | | | | | | | | | | | |
| | | | | | | | | | | | | | | | | |
| Corporate Bonds | | $ | — | | | $ | 2,326,905 | | | $ | — | | | $ | 2,326,905 | |
| Foreign Government Obligations | | | — | | | | 3,698,840 | | | | — | | | | 3,698,840 | |
| Quasi Government Bonds | | | — | | | | 598,270 | | | | — | | | | 598,270 | |
| Supranationals | | | — | | | | 373,352 | | | | — | | | | 373,352 | |
| U.S. Municipal Bonds | | | — | | | | 112,265 | | | | — | | | | 112,265 | |
| Right | | | 284 | | | | — | | | | — | | | | 284 | |
| Short-Term Investment | | | — | | | | 1,066,221 | | | | — | | | | 1,066,221 | |
| Other Financial Instruments* | | | | | | | | | | | | | | | | |
| Forward Currency Contracts | | | — | | | | 60,421 | | | | — | | | | 60,421 | |
| Total | | $ | 18,418,925 | | | $ | 11,989,417 | | | $ | — | | | $ | 30,408,342 | |
| | | | | | | | | | | | | | | | | |
| Liabilities: | | | | | | | | | | | | | | | | |
| Other Financial Instruments* | | | | | | | | | | | | | | | | |
| Forward Currency Contracts | | $ | — | | | $ | (194,435 | ) | | $ | — | | | $ | (194,435 | ) |
| * | Other financial instruments are derivative instruments which are valued at their respective unrealized appreciation/depreciation. |
Certain common stocks (see footnote (d) in the Notes to Portfolios of Investments) included in Level 2 were valued based on reference to similar securities from the same issuers which were trading on active markets. The fixed-income securities included in Level 2 were valued on the basis of prices provided by independent pricing services. The forward currency contracts included in Level 2 were valued using quotations provided by an independent pricing service. The short-term investment included in Level 2 (a pooled investment fund) was valued at the fund’s net asset value.
The fair value measurement process for the Level 3 preferred stock of Better Place, Inc., a company that is working to build the infrastructure to deliver a range of services relating to the use of electric vehicles, including battery charging and swap stations, includes significant unobservable inputs, including the continued monitoring of management changes, the implementation of the company’s business plan, the application and timeliness of financing activities. Significant increases
(decreases) in any of these inputs, in isolation or in combination, could result in a significantly higher (lower) fair value measurement.
In connection with the periodic implementation of fair value pricing procedures with respect to foreign securities (see Note 2(a)), certain securities in the International Equity, Emerging Markets Equity and Multi-Asset Targeted Volatility Portfolios are transferred from Level 1 to Level 2 when the fair value pricing procedure triggers are met and revert to Level 1 when the fair value pricing procedure triggers are no longer met (other than those securities described in footnote (d) in the Notes to Portfolios of Investments). There were no significant transfers into or out of Levels 1, 2 or 3 during the year or period ended December 31, 2012.
For further information regarding security characteristics see Portfolios of Investments.
Annual Report 53

Following is a reconciliation of investments in which significant unobservable inputs (Level 3) were used in determining fair value during the year ended December 31, 2012:
| Description | | Balance as of
December 31, 2011 | | | Accrued
Discounts
(Premiums) | | | Realized
Gain
(Loss) | | | Change in
Unrealized
Depreciation | | | Purchases | | | Sales | | | Transfers
Into
Level 3 | | | Transfers
Out of
Level 3 | | | Balance as of
December 31,
2012 | | | Net Change in
Unrealized
Depreciation
from Investments
Still Held at
December 31,
2012 | |
| | | | | | | | | | | | | | | | | | | | | | | | | | | | | | | | | | | | | | | | | |
| U.S. Strategic Equity Portfolio | | | | | | | | | | | | | | | | | | | | | | | | | | | | | | | | | | | | | | | | |
| Preferred Stock | | $ | 57,572 | | | $ | — | | | $ | — | | | $ | (55,923 | ) | | $ | — | | | $ | — | | | $ | — | | | $ | — | | | $ | 1,649 | | | $ | (55,923 | ) |
| U.S. Small-Mid Cap Equity Portfolio | | | | | | | | | | | | | | | | | | | | | | | | | | | | | | | | | | | | | | | | |
| Preferred Stock | | $ | 1,570,658 | | | $ | — | | | $ | — | | | $ | (1,525,683 | ) | | $ | — | | | $ | — | | | $ | — | | | $ | — | | | $ | 44,975 | | | $ | (1,525,683 | ) |
9. Derivative Instruments
Certain Portfolios may use derivative instruments, including forward currency contracts. Forward currency contracts may be used for hedging purposes or to seek to increase returns.
Multi-Asset Targeted Volatility Portfolio
During the period ended December 31, 2012, the cost of purchases and the proceeds from sales of forward currency contracts were $16,359,925 and $25,663,025, respectively.
The following table summarizes the fair value of derivative instruments on its Statement of Assets and Liabilities as of December 31, 2012:
| | | Fair Value | |
| | | | | |
| Asset Derivatives | | | | |
| Foreign Exchange Risk: | | | | |
| Gross unrealized appreciation on forward | | | | |
| currency contracts | | $ | 60,421 | |
| Liability Derivatives | | | | |
| Foreign Exchange Risk: | | | | |
| Gross unrealized depreciation on forward | | | | |
| currency contracts | | $ | (194,435 | ) |
The effect of derivative instruments on its Statement of Operations for the period ended December 31, 2012 was:
| | | Amount | |
| | |
| Realized Gain (Loss) on Derivatives Recognized in Income | |
| Foreign Exchange Risk: | | | | |
| Net realized loss on forward currency contracts | | $ | (45,077 | ) |
| Net Change in Unrealized Appreciation (Depreciation) on Derivatives Recognized in Income | | | | |
| Foreign Exchange Risk: | | | | |
| Net change in unrealized depreciation on forward currency contracts | | $ | (134,014 | ) |
None of the other Portfolios in the Fund traded in derivatives during the year ended December 31, 2012.
See Note 2(c) and the Portfolios of Investments for additional disclosures about derivative instruments.
10. Accounting Pronouncement
In December 2011, the Financial Accounting Standards Board issued Accounting Standards Update No. 2011–11 (“ASU 2011–11”), “Balance Sheet (Topic 210): Disclosures about Offsetting Assets and Liabilities.” The ASU 2011–11 requires disclosure of both gross and net balances for certain investments and transactions entered into under master netting agreements, better aligning US GAAP requirements with International Financial Reporting Standards.
The ASU 2011–11 is effective for annual periods beginning on or after January 1, 2013. Management is currently evaluating the impact the adoption of ASU 2011-11 will have on the Fund’s financial statements and related disclosures.
11. Subsequent Events
Management has evaluated the possibility of subsequent events affecting the Fund’s financial statements and has determined that there are no such subsequent events that require disclosure.
54 Annual Report
Lazard Retirement Series, Inc. Report of Independent Registered Public Accounting Firm
To The Board of Directors and Shareholders of
Lazard Retirement Series, Inc.
We have audited the accompanying statements of assets and liabilities, including the portfolios of investments, of Lazard Retirement Series, Inc. (the “Fund,” which comprise Lazard Retirement U.S. Strategic Equity Portfolio, Lazard Retirement U.S. Small-Mid Cap Equity Portfolio, Lazard Retirement International Equity Portfolio, Lazard Retirement Emerging Markets Equity Portfolio and Lazard Retirement Multi-Asset Targeted Volatility Portfolio (commenced operations on April 30, 2012)) as of December 31, 2012 and the related statements of operations for the year or period then ended, the statements of changes in net assets for each of the two years in the period then ended, or the period from commencement of operations to December 31, 2012, and the financial highlights for each of the periods presented. These financial statements and financial highlights are the responsibility of the Fund’s management. Our responsibility is to express an opinion on these financial statements and financial highlights based on our audits.
We conducted our audits in accordance with the standards of the Public Company Accounting Oversight Board (United States). Those standards require that we plan and perform the audit to obtain reasonable assurance about whether the financial statements and financial highlights are free of material misstatement. The Fund is not required to have, nor were we engaged to perform, an audit of its internal control over financial reporting. Our audits included consideration of internal control over financial reporting as a basis for designing audit procedures that are appropriate in the circumstances, but not for the purpose of expressing an opinion on the effectiveness of the Fund’s internal control over financial reporting. Accordingly, we express no such opinion. An audit also includes examining, on a test basis, evidence supporting the amounts and disclosures in the financial statements, assessing the accounting principles used and significant estimates made by management, as well as evaluating the overall financial statement presentation. Our procedures included confirmation of securities owned as of December 31, 2012, by correspondence with the custodian and brokers or by other appropriate auditing procedures where replies from brokers were not received. We believe that our audits provide a reasonable basis for our opinion.
In our opinion, the financial statements and financial highlights as stated above, present fairly, in all material respects, the financial position of each of the respective portfolios constituting Lazard Retirement Series, Inc. as of December 31, 2012, the results of their operations for the year or period then ended, the changes in their net assets for each of the two years in the period then ended, or the period from commencement of operations to December 31, 2012, and the financial highlights for the periods presented, in conformity with accounting principles generally accepted in the United States of America.
ANCHIN, BLOCK & ANCHIN LLP
New York, New York
February 21, 2013
Annual Report 55
Lazard Retirement Series, Inc. Board of Directors and Officers Information (unaudited)
| Name (Age) | | Position(s) with the Fund | | Principal Occupation(s) and Other Public Company |
| Address(1) | | (Since) and Term(2) | | Directorships Held During the Past Five Years(2) |
| | |
| Independent Directors(3) : | |
| Kenneth S. Davidson (67) | | Director
(April 1997) | | Davidson Capital Management Corporation, an investment manager, President (1978 – present) |
| | | | | |
| | | | | Balestra Capital Ltd., an investment manager and adviser, Senior Advisor (July 2012 – present) |
| | | | | |
| | | | | Aquiline Holdings LLC, an investment manager, Partner (2006 – June 2012) |
| | | | | |
| Nancy A. Eckl (50) | | Director
(May 2007) | | College Retirement Equities Fund (eight accounts), Trustee (2007 – present) |
| | | | | |
| | | | | TIAA-CREF Funds (58 funds) and TIAA-CREF Life Funds (10 funds), Trustee (2007 – present) |
| | | | | |
| | | | | TIAA Separate Account VA-1, Member of the Management Committee (2007 – present) |
| | | | | |
| | | | | American Beacon Advisors, Inc. (“American Beacon”) and certain funds advised by American Beacon, Vice President (1990 – 2006) |
| | | | | |
| Lester Z. Lieberman (82) | | Director
(April 1997) | | Private Investor |
| | | | | |
| Leon M. Pollack (72) | | Director
(August 2006) | | Private Investor |
| | | | | |
| Richard Reiss, Jr. (68) | | Director
(April 1997) | | Georgica Advisors LLC, an investment manager, Chairman (1997 – present) |
| | | | | |
| | | | | O’Charley’s, Inc., a restaurant chain, Director (1984 – present) |
| | | | | |
| Robert M. Solmson (65) | | Director
(September 2004) | | Fairwood Capital, LLC, a private investment corporation engaged primarily in real estate and hotel investments, President (2008 – present) |
| | | | | |
| Interested Directors(4) : | |
| Charles L. Carroll (52) | | Chief Executive Officer, President and Director
(June 2004) | | Investment Manager, Deputy Chairman and Head of Global Marketing (2004 – present) |
| | | | | |
| Ashish Bhutani (52) | | Director
(July 2005) | | Investment Manager, Chief Executive Officer (2004 – present) |
| | | | | |
| | | | | Lazard Ltd, Vice Chairman and Director (2010 – present) |
56 Annual Report
| (1) | The address of each Director is Lazard Asset Management LLC, 30 Rockefeller Plaza, New York, New York 10112–6300. |
| | |
| (2) | Each Director serves as a Director for each of the Lazard Funds (comprised of, as of January 31, 2013, 28 active investment portfolios). Each Director serves an indefinite term, until his or her successor is elected, and each Director serves in the same capacity for the other Lazard Funds. All of the Inde- pendent Directors (as defined below), except Mr. Lieberman, are also board members of Lazard Alternative Strategies Fund, L.L.C. and Lazard Alterna- tive Strategies 1099 Fund, closed-end registered management investment companies advised by an affiliate of the Investment Manager. |
| | |
| (3) | “Independent Directors” are not “interested persons” (as defined in the Act) of the Fund. |
| | |
| (4) | Messrs. Bhutani and Carroll are “interested persons” (as defined in the Act) of the Fund because of their positions with the Investment Manager. |
The Fund’s Statement of Additional Information contains further information about the Directors and is available without charge by calling 800–823–6300.
Annual Report 57
| Name (Age) | | Position(s) with the Fund | | |
| Address(1) | | (Since) and Term(2) | | Principal Occupation(s) During the Past Five Years |
| | | | | |
| Officers(3) : | | | | |
| Nathan A. Paul (40) | | Vice President and Secretary
(April 2002) | | Managing Director and General Counsel of the Investment Manager |
| | | | | |
| Stephen St. Clair (54) | | Treasurer
(May 2003) | | Vice President of the Investment Manager |
| | | | | |
| Brian D. Simon (50) | | Chief Compliance Officer
(January 2009)
and Assistant Secretary
(November 2002) | | Managing Director (since February 2011, previously Director) of the Investment Manager and Chief Compliance Officer (since January 2009) of the Investment Manager and the Fund |
| | | | | |
| Tamar Goldstein (37) | | Assistant Secretary
(February 2009) | | Senior Vice President (since February 2012, previously Vice President and Counsel) of the Investment Manager |
| | | | | |
| Cesar A. Trelles (38) | | Assistant Treasurer
(December 2004) | | Vice President (since February 2011, previously Fund Administration Manager) of the Investment Manager |
| (1) | The address of each officer is Lazard Asset Management LLC, 30 Rockefeller Plaza, New York, New York 10112–6300. |
| | |
| (2) | Each officer serves for an indefinite term, until his or her successor is elected and qualifies or until his or her earlier resignation or removal. Each officer serves in the same capacity for the other Lazard Funds. |
| | |
| (3) | In addition to Charles L. Carroll, President, whose information is included in the Interested Directors section. |
58 Annual Report
Lazard Retirement Series, Inc. Other Information (unaudited)
Proxy Voting
A description of the policies and procedures used to determine how proxies relating to Fund portfolio securities are voted is available (1) without charge, upon request, by calling (800) 823-6300 or (2) on the Securities and Exchange Commission (the “SEC”) website at http://www.sec.gov.
The Fund’s proxy voting record for the most recent 12-month period ended June 30 is available (1) without charge, upon request, by calling (800) 823-6300 or (2) on the SEC’s website at http://www.sec.gov. Information as of June 30 each year will generally be available by the following August 31.
Form N-Q
The Fund files a complete schedule of each Portfolio’s holdings for the first and third quarters of its fiscal year with the SEC on Form N-Q. The Fund’s Forms N-Q are available on the SEC’s website at http://www.sec.gov and may be reviewed and copied at the SEC’s Public Reference Room in Washington, D.C. Information on the operation of the SEC’s Public Reference Room may be obtained by calling 1-800-SEC-0330.
Board Considerations of Management Agreement
Lazard Retirement Emerging Markets Equity Blend Portfolio
At the meeting of the Board held on November 14, 2012, the Board considered the approval of amendment of the Management Agreement between the Fund, on behalf of the Lazard Retirement Emerging Markets Equity Blend Portfolio (the “Portfolio”), and the Investment Manager. The Independent Directors were assisted in their review by independent legal counsel and met with counsel in executive session separate from representatives of the Investment Manager. Since the Board had renewed the Management Agreement at a meeting held on May 30, 2012 (the “May Meeting”), and, other than as discussed below, there had been no material changes in the information presented, the Board addressed many of the relevant considerations by reference to their considerations and determinations at the May Meeting.
Services Provided
The nature, extent and quality of services that the Investment Manager provides to the Fund had been considered at the May Meeting, and there had been no material changes
in this information. Representatives of the Investment Manager stated, and the Directors considered, that the Investment Manager would continue to provide research and portfolio management and oversight of day-to-day operations, including supervision of fund accounting and administration-related services and assistance in meeting legal and regulatory requirements; the Investment Manager does not believe that the proposed amendment to the Management Agreement would have any adverse impact on the scope or quality of the services to be provided to the Portfolio by the Investment Manager; and the proposed amendment also would not result in any change to the proposed investment management of the Portfolio.
Comparative Management Fee, Expense Ratio and Performance Information
The Directors had considered comparative management fee, expense ratio and performance information at the May Meeting. The Directors considered that the amendment would reduce the management fee paid by the Portfolio and the Portfolio’s expense ratio. As a result, the Directors did not reconsider comparative fee and expense information, including fees paid to the Investment Manager by funds or separate or other accounts advised or sub-advised by the Investment Manager with investment objectives, policies and strategies similar to those of the Portfolio. In addition, the Directors did not consider the period of time since the May Meeting to be an adequate period of time for reconsideration of performance in connection with approving the amendment to the Management Agreement.
Investment Manager Profitability and Economies of Scale
The Directors had considered profitability, economies of scale and the potential benefits to the Investment Manager from acting as investment adviser at the May Meeting. As a result, the Directors did not reconsider economies of scale and potential benefits, which would not change materially under the amendment from those considered at the May Meeting. In addition, since the amendment would result in a reduction in the Investment Manager’s fee, the Directors did not reconsider profitability.
At the conclusion of these discussions, each of the Directors expressed the opinion that he or she had been furnished with sufficient information to make an informed business decision with respect to amendment of the Management Agreement with respect to the Portfolio. Based on its discus-
Annual Report 59
sions and considerations as described above, the Board made the following conclusions and determinations.
| · | The Board concluded that the nature, extent and quality of the services to be provided by the Investment Manager to the Portfolio continue to be adequate and appropriate. |
| | |
| · | The Board concluded that the fee to be paid to the Investment Manager continues to be reasonable in light of the considerations discussed above. |
The Board considered these conclusions and determinations in their totality and, without any one factor being dispositive, determined that amendment of the Management Agreement for the Fund, on behalf of the Portfolio, was in the best interests of the Portfolio and its shareholders.
60 Annual Report
Lazard Retirement Series, Inc.
30 Rockefeller Plaza
New York, New York 10112-6300
Telephone: 800-823-6300
http://www.LazardNet.com
Investment Manager
Lazard Asset Management LLC
30 Rockefeller Plaza
New York, New York 10112-6300
Telephone: 800-823-6300
Distributor
Lazard Asset Management Securities LLC
30 Rockefeller Plaza
New York, New York 10112-6300
Custodian
State Street Bank and Trust Company
One Lincoln Street
Boston, Massachusetts 02111
Transfer Agent and Dividend Disbursing Agent
Boston Financial Data Services, Inc.
P.O. Box 8514
Boston, Massachusetts 02266-8514
Telephone: 800-986-3455
Independent Registered Public Accounting Firm
Anchin, Block & Anchin LLP
1375 Broadway
New York, New York 10018
http://www.anchin.com
Legal Counsel
Stroock & Stroock & Lavan LLP
180 Maiden Lane
New York, New York 10038-4982
http://www.stroock.com


Performance information as of the most recent month end is available online at www.LazardNet.com.
Lazard Asset Management LLC
30 Rockefeller Plaza
New York, NY 10112-6300
800-823-6300
www.LazardNet.com
© 2013 Lazard Asset Management LLC 12/12 LZDPS010 | |
|---|
ITEM 2. CODE OF ETHICS.
The Registrant has adopted a code of ethics that applies to the Registrant’s principal executive officer, principal financial officer, principal accounting officer or controller, or persons performing similar functions.
ITEM 3. AUDIT COMMITTEE FINANCIAL EXPERT.
The Registrant’s Board of Directors (the “Board”) has determined that Lester Z. Lieberman, Robert M. Solmson and Nancy A. Eckl, members of the Audit Committee of the Board, are audit committee financial experts as defined by the Securities and Exchange Commission (the “SEC”). Mr. Lieberman, Mr. Solmson and Ms. Eckl are “independent” as defined by the SEC for purposes of audit committee financial expert determinations.
ITEM 4. PRINCIPAL ACCOUNTANT FEES AND SERVICES.
(a) Audit Fees. The aggregate fees billed for each of the last two fiscal years (the “Reporting Periods”) for professional services rendered by the Registrant’s principal accountant (the “Auditor”) for the audit of the Registrant’s annual financial statements, or services that are normally provided by the Auditor in connection with the statutory and regulatory filings or engagements for the Reporting Periods, were $99,800 in 2011 and $130,700 in 2012.
(b) Audit-Related Fees. There were no fees billed in the Reporting Periods by the Auditor to the Registrant for assurance and related services that are reasonably related to the performance of the audit of the Registrant’s financial statements and are not reported under paragraph (a) of this Item 4. There were no fees billed in the Reporting Periods for assurance and related services by the Auditor to the Registrant’s investment adviser or any entity controlling, controlled by or under common control with the investment adviser that provides ongoing services to the Registrant (“Service Affiliates”).
(c) Tax Fees. The aggregate fees billed in the Reporting Periods by the Auditor to the Registrant for professional services rendered by the Auditor for tax compliance, tax advice and tax planning (“Tax Services”) were $26,200 in 2011 and $33,550 in 2012. These services consisted of (i) review or preparation of U.S. federal, state, local and excise tax returns; (ii) U.S. federal, state and local tax planning, advice and assistance regarding statutory, regulatory or administrative developments, and (iii) tax advice regarding tax qualification matters and/or treatment of various financial instruments held or proposed to be acquired or held.
There were no fees billed in the Reporting Periods for Tax Services by the Auditor to Service Affiliates.
(d) All Other Fees. There were no fees billed in the Reporting Periods by the Auditor to the Registrant for products and services other than the services reported in paragraphs (a) through (c) of this Item.
There were no fees billed in the Reporting Periods by the Auditor to Service Affiliates.
(e) Audit Committee Pre-Approval Policies and Procedures. The Registrant’s Audit Committee pre-approves the Auditor’s engagements for audit and non-audit services to the Registrant and, as required, non-audit services to Service Affiliates on a case-by-case basis. Pre-approval considerations include whether the proposed services are compatible with maintaining the Auditor’s independence. There were no services provided by the Auditor to the Registrant or Service Affiliates that were approved pursuant to (c)(7)(i)(C) of Rule 2-01 of Regulation S-X during the Reporting Periods.
(f) None.
(g) Non-Audit Fees. The aggregate non-audit fees billed by the Auditor for services rendered to the Registrant for the Reporting Periods were $26,200 in 2011 and $33,550 in 2012. There were no fees billed in the Reporting Periods by the Auditor to Service Affiliates.
(h) Not applicable.
ITEM 5. AUDIT COMMITTEE OF LISTED REGISTRANTS.
Not applicable.
ITEM 6. INVESTMENTS
Not applicable.
ITEM 7. DISCLOSURE OF PROXY VOTING POLICIES AND PROCEDURES FOR CLOSED END MANAGEMENT INVESTMENT COMPANIES.
Not applicable.
ITEM 8. PORTFOLIO MANAGERS OF CLOSED-END MANAGEMENT INVESTMENT COMPANIES.
Not applicable.
ITEM 9. PURCHASES OF EQUITY SECURITIES BY CLOSED-END MANAGEMENT INVESTMENT COMPANY AND AFFILIATED PURCHASERS.
Not applicable.
ITEM 10. SUBMISSION OF MATTERS TO A VOTE OF SECURITY HOLDERS.
There were no material changes to the procedures by which shareholders may recommend nominees to the Registrant’s Board during the period covered by this report.
ITEM 11. CONTROLS AND PROCEDURES.
(a) The Registrant’s principal executive and principal financial officers have concluded, based on their evaluation of the Registrant’s disclosure controls and procedures as of a date within 90 days of the filing date of this report, that the Registrant’s disclosure controls and procedures are reasonably designed to ensure that information required to be disclosed by the Registrant on Form N-CSR is
recorded, processed, summarized and reported within the required time periods and that information required to be disclosed by the Registrant in the reports that it files or submits on Form N-CSR is accumulated and communicated to the Registrant’s management, including its principal executive and principal financial officers, as appropriate to allow timely decisions regarding required disclosure.
(b) There were no changes to the Registrant’s internal control over financial reporting that occurred during the second fiscal quarter of the period covered by this report that have materially affected, or are reasonably likely to materially affect, the Registrant’s internal control over financial reporting.
ITEM 12. EXHIBITS.
(a)(1) Code of Ethics referred to in Item 2.
(a)(2) Certifications of principal executive and principal financial officers as required by Rule 30a-2(a) under the Investment Company Act of 1940.
(a)(3) Not applicable.
(b) Certifications of principal executive and principal financial officers as required by Rule 30a-2(b) under the Investment Company Act of 1940.
SIGNATURES
Pursuant to the requirements of the Securities Exchange Act of 1934 and the Investment Company Act of 1940, the registrant has duly caused this report to be signed on its behalf by the undersigned, thereunto duly authorized.
Lazard Retirement Series, Inc.
| By | /s/ Charles L. Carroll | |
| Charles L. Carroll | |
| Chief Executive Officer | |
Date March 11, 2013
Pursuant to the requirements of the Securities Exchange Act of 1934 and the Investment Company Act of 1940, this report has been signed below by the following persons on behalf of the registrant and in the capacities and on the dates indicated.
| By | /s/ Charles L. Carroll | |
| Charles L. Carroll | |
| Chief Executive Officer | |
Date March 11, 2013
| By | /s/ Stephen St. Clair | |
| Stephen St. Clair | |
| Chief Financial Officer | |
Date March 11, 2013