UNITED STATES
SECURITIES AND EXCHANGE COMMISSION
Washington, D.C. 20549
FORM N-CSR
CERTIFIED SHAREHOLDER REPORT OF REGISTERED MANAGEMENT
INVESTMENT COMPANIES
Investment Company Act file number 811-08071
Lazard Retirement Series, Inc.
(Exact name of registrant as specified in charter)
30 Rockefeller Plaza
New York, New York 10112
(Address of principal executive offices) (Zip code)
Nathan A. Paul, Esq.
Lazard Asset Management LLC
30 Rockefeller Plaza
New York, New York 10112
(Name and address of agent for service)
Registrant’s telephone number, including area code: (212) 632-6000
Date of fiscal year end: 12/31
Date of reporting period: 12/31/16
ITEM 1. REPORTS TO STOCKHOLDERS.

Lazard Retirement Series
Annual Report
December 31, 2016
| | US Equity Lazard Retirement US Strategic Equity Portfolio Lazard Retirement US Small-Mid Cap Equity Portfolio International Equity Lazard Retirement International Equity Portfolio | Emerging Markets Lazard Retirement Emerging Markets Equity Portfolio Asset Allocation Lazard Retirement Global Dynamic Multi Asset Portfolio |
Lazard Retirement Series, Inc. Table of Contents
Shares of the Portfolios are currently offered only to separate accounts established by insurance companies to fund variable annuity contracts and variable life insurance policies. Portfolio shares may also be offered to certain qualified pension and retirement plans and accounts permitting accumulation of assets on a tax-deferred basis.
Please consider a Portfolio’s investment objectives, risks, charges and expenses carefully before investing. For more complete information about Lazard Retirement Series, Inc. (the “Fund”), you may obtain a prospectus or summary prospectus by calling 800-823-6300, or online, at www.LazardNet.com. Read the prospectus or each Portfolio’s summary prospectus carefully before you invest. The prospectus and each Portfolio’s summary prospectus contain the investment objectives, risks, charges, expenses and other information about each Portfolio of the Fund, which are not detailed in this report.
Distributed by Lazard Asset Management Securities LLC.
Lazard Retirement Series, Inc. A Message from Lazard
Dear Shareholder,
In 2016, global equity markets generally performed well despite significant bouts of volatility caused by unexpected economic and political events. In Europe, returns were muted as the United Kingdom’s June vote to leave the European Union weighed on the pound sterling and UK assets. In December, Prime Minister Matteo Renzi’s resounding defeat in the Italian referendum on constitutional reform and his subsequent resignation added to uncertainty in the region. A surprise outcome to the US presidential election caused US stocks to rally sharply at year-end in anticipation of lower corporate taxes and regulatory reform. Meanwhile, emerging markets equities snapped their negative streak and ended the year firmly higher, primarily as the price of oil and other commodities stabilized.
In the first half of 2016, yields across most global bond markets fell due to uneven news flow and seesawing risk sentiment. However, yields increased toward the end of the year in response to inflationary pressures, higher oil prices, and strong economic data. The US Federal Reserve delivered its long-awaited rate hike in December, and is widely expected to deliver additional hikes in 2017. In contrast, European monetary policy is expected to remain loose, based on announced asset purchase plans from the European Central Bank.
The US dollar continued to strengthen against other major currencies in 2016. The Japanese yen appreciated even after the Bank of Japan adopted a negative interest rate policy early in the year, but weakened considerably in November and December due to Japan’s widening interest rate differential with the United States. Over the year, the biggest currency laggards included the Mexican peso, which was hurt by Donald Trump’s election victory, and the Turkish lira, which was weighed down by a surprise coup attempt in Turkey.
At Lazard Asset Management, we remain focused on active management and are committed to responsibly pursuing the Portfolios’ investment objectives. We appreciate your continued confidence in our investment management capabilities and we feel privileged that you have turned to Lazard for your investment needs.
Sincerely,
Lazard Asset Management LLC
Lazard Retirement Series, Inc. Investment Overviews
US Equities
The S&P 500® Index rose 12.0% in 2016. Modest gains in the first half of the year masked significant volatility, as markets were down significantly in February on the back of concerns about the Chinese economy and commodity price declines. However, markets resumed their upward trend in the second half of the first quarter, as the US Federal Reserve’s lowered forecast for 2016 interest rate increases and a rebound in oil prices encouraged investors. Although markets again fell sharply in late June due to the uncertainty caused by the United Kingdom’s vote to leave the European Union (“Brexit”), they recovered in the third quarter, as investors gained more confidence in the United States economy’s ability to withstand global geopolitical risks. Economic data were mixed during the period, as employment reports generally exceeded expectations, but the economy continued to grow unevenly, culminating with a strong third quarter reading of 3.2%. In light of an improving employment and inflation picture toward the end of the year, the Federal Open Market Committee elected to raise interest rates by 25 basis points in December. By sector, energy, telecom services, financials, and industrials sectors recorded strong returns, outperforming the S&P 500 benchmark in 2016. In contrast, the consumer discretionary, consumer staples, real estate, and health care sectors underperformed the index.
International Equities
International equities rose in 2016, though in US dollar terms this was tempered by the strength of the US currency. The MSCI EAFE® Index (the “EAFE Index”) rose 1.00% in 2016 with a recovery in commodity prices the constant through most of the year. In oil, this recovery came from output cuts, first in the United States in response to much lower prices and capital expenditures, then in a production-cut agreement from oil-producing countries. In other commodities, it resulted from Chinese government policy that included government-directed spending on infrastructure and state-owned enterprises as well as restricting local coal supply.
Elsewhere, it was a year of two halves. Until the summer, low growth and low or negative interest rates supported higher-return and more defensive stocks, while a stable dollar and rising commodity prices helped
emerging markets. This dynamic peaked after the surprise United Kingdom vote to leave the European Union. Investors, however, quickly decided Brexit was not the feared disaster, and indeed started to believe that reflation was coming, aided by a shift towards more expansionary fiscal policy. Market sentiment received another boost in November with the election of Donald Trump as US president. Investors focused on the potentially stimulative impact of his policies on growth, including lower taxes, less regulation, and higher infrastructure spending, while downplaying Trump’s previous statements on trade, immigration, and foreign policy. This dynamic accelerated the market rotation into stocks perceived to benefit from rising inflation, rising rates and, possibly, rising growth.
In this environment, the commodity-related areas of energy, materials and industrials were strong all year from the commodity lows of February. Banks finished the year broadly flat, after a significant recovery in the second half of the year from weakness in the first half. The higher-return and more stable sectors of the market fell in absolute terms, especially in the fourth quarter of the year. Healthcare was the weakest sector of the year as the rotation out of defensives and into cyclicals was exacerbated by rising commercial and political pressure on pricing and regulation.
Emerging Markets Equities
Following a year of heightened deflationary pressures and concerns over the sustainability of world economic activity, equities in the developing world were able to rebound in 2016. The improvement was primarily caused by some adjustments in political policy in several countries, most prominently Brazil and Russia, coupled with a stabilizing trend in commodity prices. The MSCI Emerging Markets® Index (the “EM Index”) finished the year 11.2% higher with increasing share prices across all regions. However, in contrast to most of the last three years, Asian emerging markets recorded the worst regional return, rising by just over 6%. Latin American markets were dominated by returns in Brazil, and rose by 31%, while eastern European markets were aided by a strong rebound in Russia and increased by almost 38%.The year began with unsuccessful efforts by the People’s Bank of China (PBoC) to significantly devalue the renminbi, which
shook global markets. Investors witnessed several commodities’ prices bottoming in the first quarter, and then prices subsequently increased as capacity was removed. The Brexit vote, which resulted in a requirement that the United Kingdom leave the European Union in the near future, also surprised investors but did not, up to this point, destabilize emerging markets. An unsuccessful coup in Turkey, caused market disruption, as President Recep Tayyip Erdogan made efforts to remove members of the Gulen movement from government office. In November, the election of Donald Trump as US president had the effects of increasing confidence in US economic activity and the US dollar and again pressuring several developing markets currencies, especially the Mexican peso and Chinese renminbi.
In Asian markets, the election of President Rodrigo Duterte in the Philippines ushered in unusual law and order as well as defense policies and rhetoric resulting in poor returns. The scandal involving 1MDB, a government run strategic development company, held back equity returns in Malaysia. Indian Prime Minister Narendra Modi’s decision to prohibit larger currency bills as a means of decreasing the informal economy and raise tax receipts also caused some market disruption. Chinese company shares were adversely affected by the devaluation efforts of the PBoC but also suffered from ongoing economic lethargy and a tightening in liquidity. Several Asian markets, however, performed well. Indonesian company stocks rebounded strongly after considerable weakness in 2015. The Taiwanese market benefited especially from technology companies’ increased demand for sophisticated integrated circuits. Despite King Bhumibol Adulyadej’s death, Thai company shares rebounded on signs of improving economic activity.
The Mexican market suffered greatly during 2016 as US President-elect Donald Trump threatened to renegotiate the NAFTA trade agreement. Elsewhere in Latin America, markets finished considerably higher based on a commodity price recovery and improved political trends. In Peru, market-friendly candidate Pedro Pablo Kuczynski narrowly won the presidency. The biggest change, however, happened in Brazil. A telephone conversation between President Dilma
Rousseff and former President Lula, allegedly protecting him from an investigation, was leaked in March and set in motion her ultimate impeachment. This had the effect of markedly strengthening the real, as well as share prices, as investors became much less pessimistic about the economic trends. As a result, Brazilian equities ended the year 66% higher, outperforming all other emerging markets.
Returns were more mixed across eastern European, Middle East, and African markets. Lack of policy direction in Greece resulted in more weakness there. A decision to completely float the Egyptian pound caused a near 100% currency devaluation and considerable market weakness in Egypt. The unsuccessful coup attempt in Turkey and subsequent political and economic turbulence resulted in another weak year for that market. In South Africa, an apparent dispute between President Jacob Zuma and Finance Minister Pravin Gordhan over corruption weakened equity prices in the country until the release of a report in November, which found serious evidence of graft in Zuma’s government. The market then rallied on the higher likelihood that Zuma will not run again. Russian company shares rose by more than 54% in the year, aided by strengthening crude oil prices, conservative fiscal policies, and the possibility of improving relations with the United States following the election of Donald Trump.
By sector, materials and energy stocks recorded strong returns, outperforming the benchmark. In contrast, the consumer discretionary, consumer staples, health care, and real estate performed particularly poorly and underperformed the EM Index.
Multi Asset
Global equity markets generated fairly strong gains in 2016, rising 7.5% in US dollar terms, as measured by the MSCI World® Index, which was impressive considering the many macro and political events that buffeted markets and the inauspicious start to the year with stocks falling sharply in the first six weeks. On the other hand, global bonds as measured by the Bloomberg Barclays Capital Global Aggregate Bond® Index were up 2.09% for the year, also in US dollar terms. Early in the year, investors feared the US Federal Reserve’s rate hike in December 2015 had been a
policy error likely to push a sluggish US economy into recession and trigger an uncontrolled devaluation of China’s currency. Oil’s plunge to the mid $20s weighed further and triggered a rapid deterioration in credit markets and crushing investor sentiment. Later in the year, overcoming a string of political surprises, investor sentiment began to reverse and a durable rally ensued. Equities rebounded with oil which triggered a rotation into commodity-oriented value stocks. Credit markets more than fully reversed their earlier weakness. The mid-year shock of Brexit caused a drop in rates and outperformance of defensive growth stocks but within a few weeks rates bottomed and began to rise. This triggered a rotation into rate-sensitive value stocks (e.g., financials) and declines in the defensive growth stocks which had benefited from the earlier deflationary concerns. The election of Donald Trump, along with Republican control of both houses of Congress, was perceived as a potential end to gridlock in Washington and increased the likelihood of growth-stimulative tax cuts and infrastructure spending. This provided further evidence that an extended period of widespread deflation was unlikely and accelerated the rise in rates and rotation from defensive growth equities to more cyclical value stocks and, particularly, financials.
However, a broad array of economic indicators had begun to show that deflationary pressures were abating in the global economy even before the US elections. Secular stagnation and fears of deflation had become a strong consensus among investors earlier in the year. Fears of an additional step down in growth due to Brexit brought those deflation concerns to a fever pitch and drove bond yields to their lows. Yet inflationary pressures had been building as the shock of the mid 2014 collapse in oil and surge in the US dollar faded and the industrial sector globally regained its footing. Global inflation reports were no longer consistently below forecasts and market-based estimates of future inflation were rebounding from low levels in both the US and Europe. Forward looking indicators of manufacturing activity had seen a broad based rebound since late 2015. US wages have risen steadily over the past year and Chinese producer prices, which had been deeply negative since 2012, moved sharply
positive during the fourth quarter, signaling that China is no longer exporting deflation.
Lazard Retirement US Strategic Equity Portfolio
For the year ended December 31, 2016, the Lazard Retirement US Strategic Equity Portfolio’s Service Shares posted a total return of 9.42%, as compared with the 11.96% return for the S&P 500 Index.
Stock selection in the industrials sector contributed to performance. Shares of salvage vehicle auction holder Copart rose after the company reported quarterly earnings above expectations, driven by higher volume growth stemming from market share gains and industry-wide volume growth. Stock selection in the health care sector also helped returns. Shares of diversified managed care provider Aetna rose after the company reported third-quarter earnings above expectations, driven by continued strength in its government business. We exited our position as we saw opportunities with better risk-reward profiles elsewhere.
In contrast, stock selection in the consumer discretionary sector detracted from performance. Shares of Norwegian Cruise Line fell in response to concerns about travel demand stemming from the terrorist attacks in Brussels and Orlando and the Zika virus, as well as concerns of a macroeconomic slowdown, and the recent rise in oil prices. We trimmed our position in the fourth quarter, as our thesis had changed. Stock selection and an underweight position in the financials sector also hurt returns. Shares of OneMain fell amid continued concerns about the company’s funding costs in a rising rate environment, as well as its subprime loan exposure. We sold our position as a reassessment of our scenarios resulted in the risk-adjusted upside no longer being favorable.
Lazard Retirement US Small-Mid Cap Equity Portfolio
For the year ended December 31, 2016, the Lazard Retirement US Small-Mid Cap Equity Portfolio’s Service Shares posted a total return of 15.78%, as compared with the 17.59% return for the Russell 2500® Index.
Stock selection in the information technology sector contributed to performance. Shares of payment tech-
nology company NCR rose after the company reported quarterly earnings above expectations, driven by strong margins and order growth. Stock selection and an overweight position in the industrials sector also helped returns. Shares of B/E Aerospace rose after Rockwell Collins announced plans to acquire the company for $8.3 billion. We sold our position after the fourth quarter announcement, as the stock approached our target valuation.
In contrast, stock selection in the financials sector detracted from performance. Shares of OneMain fell amid continued concerns about the company’s funding costs in a rising rate environment, as well as its subprime loan exposure. We sold our position as our thesis had changed. Stock selection and an underweight position in the materials sector also hurt returns. Shares of Kapstone Paper and Packaging fell after the company reported quarterly earnings below expectations and management gave a cautious outlook, citing difficult market conditions. We sold our position after the announcement in February, as our thesis was no longer valid.
Lazard Retirement International Equity Portfolio
For the year ended December 31, 2016, the Lazard Retirement International Equity Portfolio’s Service Shares posted a total return of -4.29%, as compared with the 1.00% return for the EAFE Index.
During the year, in an environment that saw an extended, strong rotation into cyclicals and lower-quality stocks, the Portfolio lagged its benchmark. Much of the underperformance was due to the rally in stocks with negative to low financial productivity that occurred while stocks with higher financial productivity lagged. As we focus on companies with sustainably high, or improving, financial productivity we were not exposed to some of the best performing stocks. Furthermore, some of our holdings, despite consistent fundamentals, were negatively impacted by the strong sector rotation.
The most significant source of underperformance was our positioning in the industrials sector, where we remain overweight. The sector was generally led
higher by stocks with lower financial productivity, and additionally, some of our holdings in this sector under-performed due to the aforementioned rotation into less financially productive stocks, despite consistent fundamentals. One notable example is lock-maker Assa Abloy, which lagged its more cyclical peers.
Stock selection in the health care sector also hurt relative returns, despite low exposure which benefited the Portfolio. Some of this was due to the strong rotation out of traditionally defensive stocks and into cyclicals, which weighed on the sector. Furthermore, increased regulatory scrutiny during the US election cycle also weighed on the sector. Our position in Israeli pharmaceutical company Teva fell on worries about the viability of their Copaxone (for the treatment of multiple sclerosis) patents, as well as concerns on generics pricing.
Additionally, the Portfolio was negatively impacted by our positioning in the financials sector. The opportunity cost of not owning less financially productive financials weighed on the Portfolio. These stocks rallied on the anticipation of earnings improvement, the probability of which is less likely in Europe given the challenging regulatory, tax, and interest rate environment. Elsewhere in the sector, shares of British bank Lloyds (which was sold during the period) declined following the Brexit referendum result. We remain underweight in financials given the numerous risks still pervasive in the sector.
On a positive note, the Portfolio benefited from positioning in emerging markets, as shares of Taiwan Semiconductor rose. In Brazil, shares of insurance broker BB Seguridade performed well on improving business conditions. The Portfolio’s positioning in Canada was also beneficial, as shares of National Bank of Canada and Suncor Energy both performed well. Elsewhere, the Portfolio’s low allocation to the underperforming utilities sector was additive to relative returns.
Lazard Retirement Emerging Markets Equity Portfolio
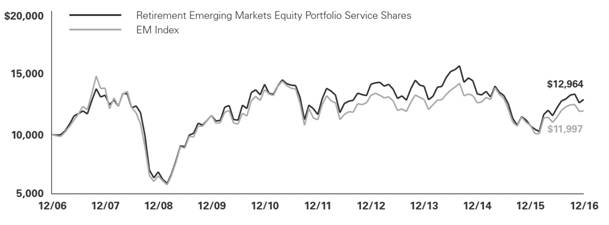
For the year ended December 31, 2016, the Lazard Retirement Emerging Markets Equity Portfolio’s Investor Shares posted a total return of 21.12%, while
Service Shares posted a total return of 20.78%, as compared with the 11.19% return for the EM Index.
During the period, shares of Sberbank, a Russian bank, rose on the back of continued strong operating performance and after management provided upbeat guidance for 2017. Banco do Brasil, a Brazilian bank, benefited from an improving return outlook with rising margins and healthier capital ratios. Taiwan Semiconductor Manufacturing, a Taiwanese semiconductor manufacturer, benefited from positive trends in the semiconductor industry as well as from reports of stronger-than-expected iPhone sales. Shares of Samsung Electronics, a Korean manufacturer of electronic goods, also rose with a display division turnaround. Stock selection, especially within the financials, industrials, and consumer discretionary sectors, and within China, Korea, and Russia helped performance. A higher-than-index exposure to Russia and Brazil, and a lower-than-benchmark exposure to China, added value.
In contrast, shares of Baidu, a Chinese search engine company, declined after management guided down expectations for the quarter amid continued weakness in one of its areas of business after a government clampdown. Shares of PLDT, a Philippine telecom services company, fell due to expectations for further weakness as the company pursues its three-year turnaround strategy. Bharat Heavy Electricals, an Indian manufacturer of power plant equipment, posted poor earnings for the third quarter of fiscal year 2016 on the back of increased competition. Shares of Hanwha Life Insurance, a Korean insurance company, fell on expectations for a continued environment of low interest rates in Korea.
Lazard Retirement Global Dynamic Multi Asset Portfolio
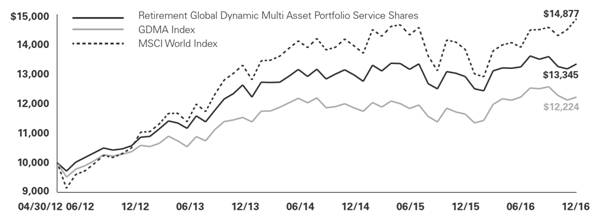
For the year ended December 31, 2016, the Lazard Retirement Global Dynamic Multi Asset Portfolio’s Service Shares posted a total return of 3.30%, as com-
pared with the 4.95% return of its blended benchmark, which is a 50/50 blend of the MSCI World Index and the Bloomberg Barclays Capital Global Aggregate Bond Index (the “GDMA Index”).
Changes made to the market forecast during 2016 reflected a consideration of many factors, including monetary policies of central banks around the globe; global macro data readings in China (particularly the Purchasing Managers Index, which measures economic activity), the United States, the euro zone, and Japan; fiscal policy in developed and emerging markets; geopolitical events and risks including elections and referenda; and equity and fixed income valuations, along with other data.
For the full year 2016, stock selection in the real estate sector and an underweight position to the energy sector added value within the equity allocation, as did stock selection in Israel and Ireland and an underweight exposure to Germany. Within fixed income, performance was helped by overweight exposures to Australia and New Zealand, underweight government bonds and overweight positioning in diversified global credit sectors, especially corporates, tactical exposure to Australia and New Zealand, and underweight exposure to the Japanese yen and Korean won.
In contrast, stock selection in the consumer discretionary and industrials sectors, underweight exposure to information technology and overweight exposure to utilities detracted from performance within equities, as did stock selection in the United States and the United Kingdom; within fixed income, performance was hurt by underweight exposure to bonds across the euro zone, Japan, United Kingdom, and the United States, overweight exposure to Mexico and overweight exposure to the Swedish krona. The positions in the currencies are implemented using non-deliverable forward contracts.
Notes to Investment Overviews:
Total returns reflect reinvestment of all dividends and distributions, if any. Certain expenses of a Portfolio may have been waived or reimbursed by Lazard Asset Management LLC, the Fund’s investment manager (the “Investment Manager”), State Street Bank and Trust Company, the Fund’s administrator (“State Street”), or Boston Financial Data Services, Inc., the Fund’s transfer and dividend disbursing agent (“BFDS”); without such waiver/reimbursement of expenses, such Portfolio’s returns would have been lower. Performance information does not reflect the fees and charges imposed by participating insurance companies at the separate account level, and such charges will have the effect of reducing performance. Past performance is not indicative, or a guarantee, of future results.
The performance data of the indices and other market data have been prepared from sources and data that the Investment Manager believes to be reliable, but no representation is made as to their accuracy. These indices are unmanaged, have no fees or costs and are not available for investment.
The views of the Investment Manager and the securities described in this report are as of December 31, 2016; these views and portfolio holdings may have changed subsequent to this date. Nothing herein should be construed as a recommendation to buy, sell, or hold a particular security. There is no assurance that the securities discussed herein will remain in a Portfolio at the time you receive this report, or that securities sold will not have been repurchased. The specific securities discussed may, in aggregate, represent only a small percentage of a Portfolio’s holdings. It should not be assumed that securities identified and discussed were, or will be, profitable, or that the investment decisions made in the future will be profitable, or equal the investment performance of the securities discussed herein.
The views and opinions expressed are provided for general information only, and do not constitute specific tax, legal, or investment advice to, or recommendations for, any person. There can be no guarantee as to the accuracy of any outlooks for markets, sectors and securities as discussed herein. You should read the Fund’s prospectus or each Portfolio’s summary prospectus for a more detailed discussion of each Portfolio’s investment objectives, strategies, risks and fees.
Lazard Retirement Series, Inc. Performance Overviews
Lazard Retirement US Strategic Equity Portfolio
Comparison of Changes in Value of $10,000 Investment in the Service Shares of Lazard Retirement US Strategic Equity Portfolio and S&P 500® Index*
Average Annual Total Returns*
Periods Ended December 31, 2016
| | One
Year | Five
Years | Ten
Years | |
| Service Shares | 9.42% | 11.62% | 4.95% | |
| S&P 500 Index | 11.96% | 14.66% | 6.95% | |
| * | Total returns reflect reinvestment of all dividends and distributions, if any. Certain expenses of the Portfolio have been waived or reimbursed by the Portfolio’s Investment Manager or State Street; without such waiver/reimbursement of expenses, the Portfolio’s returns would have been lower. Performance information does not reflect the fees and charges imposed by participating insurance companies at the separate account level, and such charges will have the effect of reducing performance. |
| | |
| | Performance results do not include adjustments made for financial reporting purposes in accordance with accounting principles generally accepted in the United States of America (“GAAP”) and may differ from amounts reported in the financial highlights. |
| | |
| | The performance quoted represents past performance. Current performance may be lower or higher than the performance quoted. Past performance is not indicative, or a guarantee, of future results; the investment return and principal value of the Portfolio will fluctuate, so that Portfolio shares, when redeemed, may be worth more or less than their original cost. Within the longer periods illustrated there may have been short-term fluctuations, counter to the overall trend of investment results, and no single period of any length may be taken as typical of what may be expected in future periods. |
| | |
| | The performance data of the index has been prepared from sources and data that the Investment Manager believes to be reliable, but no representation is made as to its accuracy. The S&P 500 Index is a market capitalization-weighted index of 500 common stocks, designed to measure performance of the broad domestic economy through changes in the aggregate market value of these stocks, which represent all major industries. The index is unmanaged, has no fees or costs and is not available for investment. |
| | |
| | Before May 1, 2007, the Portfolio was known as Lazard Retirement Equity Portfolio and had a different investment strategy. |
Lazard Retirement US Small-Mid Cap Equity Portfolio
Comparison of Changes in Value of $10,000 Investment in the Service Shares of Lazard Retirement US Small-Mid Cap Equity Portfolio, Russell 2500® Index and Russell 2000/2500 Linked Index*
Average Annual Total Returns*
Periods Ended December 31, 2016
| | One
Year | Five
Years | Ten
Years | |
| Service Shares | 15.78% | 13.35% | 6.60% | |
| Russell 2500 Index | 17.59% | 14.54% | 7.69% | |
| Russell 2000/2500 Linked Index | 17.59% | 14.54% | 7.43% | |
| * | Total returns reflect reinvestment of all dividends and distributions, if any. Certain expenses of the Portfolio have been waived or reimbursed by the Portfolio’s Investment Manager; without such waiver/reimbursement of expenses, the Portfolio’s returns would have been lower. Performance information does not reflect the fees and charges imposed by participating insurance companies at the separate account level, and such charges will have the effect of reducing performance. |
| | |
| | Performance results do not include adjustments made for financial reporting purposes in accordance with GAAP and may differ from amounts reported in the financial highlights. |
| | |
| | The performance quoted represents past performance. Current performance may be lower or higher than the performance quoted. Past performance is not indicative, or a guarantee, of future results; the investment return and principal value of the Portfolio will fluctuate, so that Portfolio shares, when redeemed, may be worth more or less than their original cost. Within the longer periods illustrated there may have been short-term fluctuations, counter to the overall trend of investment results, and no single period of any length may be taken as typical of what may be expected in future periods. |
| | |
| | The Portfolio was previously known as Lazard Retirement U.S. Small Cap Equity Portfolio. As of June 1, 2009, the Portfolio changed its name to Lazard Retirement U.S. Small-Mid Cap Equity Portfolio and changed its investment strategy to invest in equity securities of small-mid cap US companies. |
| | |
| | The performance data of the indices have been prepared from sources and data that the Investment Manager believes to be reliable, but no representation is made as to their accuracy. The Russell 2500 Index is comprised of the 2,500 smallest US companies included in the Russell 3000® Index (which consists of the 3,000 largest US companies by capitalization). The Russell 2000/2500 Linked Index is created by the Portfolio’s Investment Manager, which links the performance of the Russell 2000® Index for all periods through May 31, 2009 (when the Portfolio’s benchmark index changed) and the Russell 2500 Index for all periods thereafter. The Russell 2000 Index is comprised of the 2,000 smallest US companies included in the Russell 3000 Index. The indices are unmanaged, have no fees or costs and are not available for investment. |
Lazard Retirement International Equity Portfolio
Comparison of Changes in Value of $10,000 Investment in the Service Shares of Lazard Retirement International Equity Portfolio and EAFE Index*
Average Annual Total Returns*
Periods Ended December 31, 2016
| | One
Year | Five
Years | Ten
Years | |
| Service Shares | -4.29% | 6.41% | 1.36% | |
| EAFE Index | 1.00% | 6.53% | 0.75% | |
| * | Total returns reflect reinvestment of all dividends and distributions, if any. Certain expenses of the Portfolio have been waived or reimbursed by the Portfolio’s Investment Manager; without such waiver/reimbursement of expenses, the Portfolio’s returns would have been lower. Performance information does not reflect the fees and charges imposed by participating insurance companies at the separate account level, and such charges will have the effect of reducing performance. |
| | |
| | Performance results do not include adjustments made for financial reporting purposes in accordance with GAAP and may differ from amounts reported in the financial highlights. |
| | |
| | The performance quoted represents past performance. Current performance may be lower or higher than the performance quoted. Past performance is not indicative, or a guarantee, of future results; the investment return and principal value of the Portfolio will fluctuate, so that Portfolio shares, when redeemed, may be worth more or less than their original cost. Within the longer periods illustrated there may have been short-term fluctuations, counter to the overall trend of investment results, and no single period of any length may be taken as typical of what may be expected in future periods. |
| | |
| | The performance data of the index has been prepared from sources and data that the Investment Manager believes to be reliable, but no representation is made as to its accuracy. The EAFE Index is a broadly diversified international index comprised of equity securities of approximately 1,000 companies located in developed countries outside the United States. The index is unmanaged, has no fees or costs and is not available for investment. |
Lazard Retirement Emerging Markets Equity Portfolio
Comparison of Changes in Value of $10,000 Investment in the Service Shares of Lazard Retirement Emerging Markets Equity Portfolio and EM Index*
Average Annual Total Returns*
Periods Ended December 31, 2016
| | One
Year | Five
Years | Ten
Years | |
| Service Shares** | 20.78% | 2.11% | 2.63% | |
| Investor Shares** | 21.12% | 2.35% | 2.88% | |
| EM Index | 11.19% | 1.28% | 1.84% | |
| * | Total returns reflect reinvestment of all dividends and distributions, if any. Certain expenses of the Portfolio have been waived or reimbursed by the Portfolio’s Investment Manager; without such waiver/reimbursement of expenses, the Portfolio’s returns would have been lower. Performance information does not reflect the fees and charges imposed by participating insurance companies at the separate account level, and such charges will have the effect of reducing performance. |
| | |
| | Performance results do not include adjustments made for financial reporting purposes in accordance with GAAP, also exclude adjustments related to reimbursed custodian out-of-pocket expenses (Note 3 in the Notes to Financial Statements), and may differ from amounts reported in the financial highlights. |
| | |
| | The performance quoted represents past performance. Current performance may be lower or higher than the performance quoted. Past performance is not indicative, or a guarantee, of future results; the investment return and principal value of the Portfolio will fluctuate, so that Portfolio shares, when redeemed, may be worth more or less than their original cost. Within the longer periods illustrated there may have been short-term fluctuations, counter to the overall trend of investment results, and no single period of any length may be taken as typical of what may be expected in future periods. |
| | |
| | The performance data of the index has been prepared from sources and data that the Investment Manager believes to be reliable, but no representation is made as to its accuracy. The EM Index is comprised of emerging market securities in countries open to non-local investors. The index is unmanaged, has no fees or costs and is not available for investment. |
| | |
| ** | The performance of Service Shares and Investor Shares may vary, primarily based on the differences in fees borne by shareholders investing in different classes. |
Lazard Retirement Global Dynamic Multi Asset Portfolio
Comparison of Changes in Value of $10,000 Investment in the Service Shares of Lazard Retirement Global Dynamic Multi Asset Portfolio, GDMA Index and MSCI World® Index*
Average Annual Total Returns*
Periods Ended December 31, 2016
| | | One
Year | Since
Inception† | |
| Service Shares | | 3.30% | 6.37% | |
| GDMA Index | | 4.95% | 4.40% | |
| MSCI World Index | | 7.51% | 8.88% | |
| * | Total returns reflect reinvestment of all dividends and distributions, if any. Certain expenses of the Portfolio have been waived or reimbursed by the Portfolio’s Investment Manager, State Street or BFDS; without such waiver/reimbursement of expenses, the Portfolio’s returns would have been lower. Performance information does not reflect the fees and charges imposed by participating insurance companies at the separate account level, and such charges will have the effect of reducing performance. |
| | |
| | Performance results do not include adjustments made for financial reporting purposes in accordance with GAAP and may differ from amounts reported in the financial highlights. |
| | |
| | The performance quoted represents past performance. Current performance may be lower or higher than the performance quoted. Past performance is not indicative, or a guarantee, of future results; the investment return and principal value of the Portfolio will fluctuate, so that Portfolio shares, when redeemed, may be worth more or less than their original cost. Within the longer periods illustrated there may have been short-term fluctuations, counter to the overall trend of investment results, and no single period of any length may be taken as typical of what may be expected in future periods. |
| | |
| | The performance data of the indices have been prepared from sources and data that the Investment Manager believes to be reliable, but no representation is made as to their accuracy. The GDMA Index is created by the Portfolio’s Investment Manager and is a 50/50 blend of the MSCI World Index and the Bloomberg Barclays Capital Global Aggregate Bond® Index. The MSCI World Index is a free float-adjusted market capitalization weighted index that is designed to measure the equity market performance of developed markets. The Bloomberg Barclays Capital Global Aggregate Bond Index provides a broad-based measure of global investment-grade fixed-income debt markets, including government-related debt, corporate debt, securitized debt and global Treasury, with maturities of no less than one year. The indices are unmanaged, have no fees or costs and are not available for investment. |
| | |
| | Before April 30, 2014, the Portfolio was known as Lazard Retirement Multi-Asset Targeted Volatility Portfolio. |
| | |
| † | The inception date for the Portfolio was April 30, 2012. |
Lazard Retirement Series, Inc. Information About Your Portfolio’s Expenses
Expense Example
As a shareholder in a Portfolio of the Fund, you incur ongoing costs, including management fees, distribution and service (12b-1) fees (Service Shares only), and other expenses. This Example is intended to help you understand your ongoing costs (in dollars) of investing in a Portfolio and to compare these costs with the ongoing costs of investing in other mutual funds. The Example is based on an investment of $1,000 invested at the beginning of the six month period from July 1, 2016 through December 31, 2016 and held for the entire period.
Actual Expenses
For each Share class of the Portfolios, the first line of the table below provides information about actual account values and actual expenses. You may use the information in this line, together with the amount you invested, to estimate the expenses that you paid over the period. Simply divide your account value by $1,000 (for example, an $8,600 account value divided by $1,000=8.6), then multiply the result by the number in the first line under the heading entitled “Expenses Paid During Period” to estimate the expenses you paid on your account during this period.
Hypothetical Example for Comparison Purposes
For each Share class of the Portfolios, the second line of the table below provides information about hypothetical account values and hypothetical expenses based on the class’ actual expense ratio and an assumed rate of return of 5% per year before expenses, which is not the Portfolio’s actual return. The hypothetical account values and expenses may not be used to estimate the actual ending account balance or expenses you paid for the period. You may use this information to compare the ongoing costs of investing in the Portfolio and other mutual funds. To do so, compare this 5% hypothetical example with the 5% hypothetical examples that appear in the shareholders reports of other mutual funds.
Please note that you also bear fees and charges imposed by participating insurance companies at the separate account level, which are described in the separate prospectuses issued by the participating insurance companies. Such charges will have the effect of reducing account value.
| Portfolio | | Beginning
Account Value
7/1/16 | | Ending
Account Value
12/31/16 | | Expenses Paid
During Period*
7/1/16 - 12/31/16 | | Annualized Expense
Ratio During Period
7/1/16 - 12/31/16 |
| | | | | | | | | | | | | | | | | |
| US Strategic Equity | | | | | | | | | | | | | | | | |
| Service Shares | | | | | | | | | | | | | | | | |
| Actual | | $ | 1,000.00 | | | $ | 1,088.10 | | | | $5.25 | | | | 1.00 | % |
| Hypothetical (5% Return Before Expenses) | | $ | 1,000.00 | | | $ | 1,020.11 | | | | $5.08 | | | | 1.00 | % |
| | | | | | | | | | | | | | | | | |
| US Small-Mid Cap Equity | | | | | | | | | | | | | | | | |
| Service Shares | | | | | | | | | | | | | | | | |
| Actual | | $ | 1,000.00 | | | $ | 1,159.40 | | | | $6.79 | | | | 1.25 | % |
| Hypothetical (5% Return Before Expenses) | | $ | 1,000.00 | | | $ | 1,018.85 | | | | $6.34 | | | | 1.25 | % |
| | | | | | | | | | | | | | | | | |
| International Equity** | | | | | | | | | | | | | | | | |
| Service Shares | | | | | | | | | | | | | | | | |
| Actual | | $ | 1,000.00 | | | $ | 981.90 | | | | $5.38 | | | | 1.08 | % |
| Hypothetical (5% Return Before Expenses) | | $ | 1,000.00 | | | $ | 1,019.71 | | | | $5.48 | | | | 1.08 | % |
| | | | | | | | | | | | | | | | | |
| Emerging Markets Equity** | | | | | | | | | | | | | | | | |
| Service Shares | | | | | | | | | | | | | | | | |
| Actual | | $ | 1,000.00 | | | $ | 1,057.00 | | | | $7.08 | | | | 1.37 | % |
| Hypothetical (5% Return Before Expenses) | | $ | 1,000.00 | | | $ | 1,018.25 | | | | $6.95 | | | | 1.37 | % |
| Investor Shares | | | | | | | | | | | | | | | | |
| Actual | | $ | 1,000.00 | | | $ | 1,058.30 | | | | $5.85 | | | | 1.13 | % |
| Hypothetical (5% Return Before Expenses) | | $ | 1,000.00 | | | $ | 1,019.46 | | | | $5.74 | | | | 1.13 | % |
| | | | | | | | | | | | | | | | | |
| Global Dynamic Multi Asset | | | | | | | | | | | | | | | | |
| Service Shares | | | | | | | | | | | | | | | | |
| Actual | | $ | 1,000.00 | | | $ | 1,007.60 | | | | $5.30 | | | | 1.05 | % |
| Hypothetical (5% Return Before Expenses) | | $ | 1,000.00 | | | $ | 1,019.86 | | | | $5.33 | | | | 1.05 | % |
| * | Expenses are equal to the annualized expense ratio, net of expense waivers and reimbursements, of each Share class multiplied by the average account value over the period, multiplied by 184/366 (to reflect one-half year period). |
| ** | Excludes impact of the custodian out-of-pocket expenses that were reimbursed during the current period. Refer to Note 3 in the Notes to Financial Statements. |
Lazard Retirement Series, Inc. Portfolio Holdings Presented by Sector December 31, 2016
| Sector* | | Lazard
Retirement
US Strategic
Equity Portfolio | | Lazard
Retirement
US Small-Mid Cap
Equity Portfolio | | Lazard
Retirement
International
Equity Portfolio | | Lazard
Retirement
Emerging Markets
Equity Portfolio |
| | | | | | | | | | | | | | | | | | |
| Consumer Discretionary | | | 8.8 | % | | | 11.3 | % | | | 14.8 | % | | | 8.0 | % | |
| Consumer Staples | | | 13.1 | | | | 1.3 | | | | 12.1 | | | | 6.0 | | |
| Energy | | | 6.1 | | | | 6.7 | | | | 7.6 | | | | 8.5 | | |
| Financials | | | 11.0 | | | | 16.3 | | | | 17.8 | | | | 30.2 | | |
| Health Care | | | 14.2 | | | | 8.0 | | | | 8.3 | | | | 0.7 | | |
| Industrials | | | 10.2 | | | | 16.0 | | | | 16.3 | | | | 5.5 | | |
| Information Technology | | | 27.2 | | | | 17.0 | | | | 6.6 | | | | 22.8 | | |
| Materials | | | 1.9 | | | | 7.3 | | | | 5.1 | | | | 3.9 | | |
| Real Estate | | | 1.0 | | | | 9.9 | | | | 2.6 | | | | — | | |
| Telecommunication Services | | | 3.0 | | | | — | | | | 3.5 | | | | 10.6 | | |
| Utilities | | | — | | | | 3.1 | | | | 0.9 | | | | — | | |
| Short-Term Investments | | | 3.5 | | | | 3.1 | | | | 4.4 | | | | 3.8 | | |
| Total Investments | | | 100.0 | % | | | 100.0 | % | | | 100.0 | % | | | 100.0 | % | |
| Sector* | | Lazard Retirement
Global Dynamic
Multi Asset
Portfolio |
| | | | | | |
| Consumer Discretionary | | | 10.8 | % | |
| Consumer Staples | | | 8.2 | | |
| Energy | | | 4.0 | | |
| Financials | | | 16.1 | | |
| Health Care | | | 9.8 | | |
| Industrials | | | 9.7 | | |
| Information Technology | | | 11.8 | | |
| Materials | | | 3.5 | | |
| Real Estate | | | 2.1 | | |
| Telecommunication Services | | | 4.3 | | |
| Utilities | | | 4.6 | | |
| Municipal | | | 0.9 | | |
| Sovereign Debt | | | 10.4 | | |
| US Treasury Securities | | | 1.4 | | |
| Short-Term Investment | | | 2.4 | | |
| Total Investments | | | 100.0 | % | |
| * | Represents percentage of total investments. |
Lazard Retirement Series, Inc. Portfolios of Investments December 31, 2016
| Description | | Shares | | | Fair
Value | |
| | | | | | | | | |
| Lazard Retirement US Strategic Equity Portfolio | | | | | | | | |
| | | | | | | | | |
| Common Stocks | 96.8% | | | | | | | | |
| | | | | | | | | |
| Aerospace & Defense | 2.2% | | | | | | | | |
| United Technologies Corp. | | | 2,085 | | | $ | 228,558 | |
| | | | | | | | | |
| Auto Components | 1.3% | | | | | | | | |
| Delphi Automotive PLC | | | 1,970 | | | | 132,680 | |
| | | | | | | | | |
| Banks | 4.7% | | | | | | | | |
| Bank of America Corp. | | | 17,060 | | | | 377,026 | |
| KeyCorp. | | | 6,500 | | | | 118,755 | |
| | | | | | | | 495,781 | |
| Beverages | 5.7% | | | | | | | | |
| Molson Coors Brewing Co., Class B | | | 2,925 | | | | 284,632 | |
| The Coca-Cola Co. | | | 7,425 | | | | 307,840 | |
| | | | | | | | 592,472 | |
| Building Products | 1.2% | | | | | | | | |
| Johnson Controls International PLC | | | 3,005 | | | | 123,776 | |
| | | | | | | | | |
| Capital Markets | 3.9% | | | | | | | | |
| Intercontinental Exchange, Inc. | | | 4,100 | | | | 231,322 | |
| The Charles Schwab Corp. | | | 4,510 | | | | 178,010 | |
| | | | | | | | 409,332 | |
| Chemicals | 0.4% | | | | | | | | |
| PPG Industries, Inc. | | | 500 | | | | 47,380 | |
| | | | | | | | | |
| Commercial Services & Supplies | 0.9% | | | | | | | | |
| Copart, Inc. (a) | | | 1,685 | | | | 93,366 | |
| | | | | | | | | |
| Communications Equipment | 5.1% | | | | | | | | |
| Cisco Systems, Inc. | | | 12,795 | | | | 386,665 | |
| Motorola Solutions, Inc. | | | 1,800 | | | | 149,202 | |
| | | | | | | | 535,867 | |
| Containers & Packaging | 1.5% | | | | | | | | |
| Crown Holdings, Inc. (a) | | | 2,910 | | | | 152,979 | |
| | | | | | | | | |
| Diversified Telecommunication Services | 3.1% | | | | | | | | |
| AT&T, Inc. | | | 7,510 | | | | 319,400 | |
| | | | | | | | | |
| Electrical Equipment | 2.7% | | | | | | | | |
| Eaton Corp. PLC | | | 2,690 | | | | 180,472 | |
| Rockwell Automation, Inc. | | | 775 | | | | 104,160 | |
| | | | | | | | 284,632 | |
| Description | | Shares | | | Fair
Value | |
| | | | | | | | | |
| Energy Equipment & Services | 1.9% | | | | | | | | |
| Schlumberger, Ltd. | | | 2,415 | | | $ | 202,739 | |
| | | | | | | | | |
| Equity Real Estate Investment Trusts (REITs) | 1.0% | | | | | | | | |
| Host Hotels & Resorts, Inc. | | | 5,505 | | | | 103,714 | |
| | | | | | | | | |
| Food & Staples Retailing | 2.0% | | | | | | | | |
| Walgreens Boots Alliance, Inc. | | | 2,500 | | | | 206,900 | |
| | | | | | | | | |
| Food Products | 2.1% | | | | | | | | |
| Kellogg Co. | | | 3,010 | | | | 221,867 | |
| | | | | | | | | |
| Health Care Equipment & Supplies | 1.6% | | | | | | | | |
| Stryker Corp. | | | 1,375 | | | | 164,739 | |
| | | | | | | | | |
| Health Care Providers & Services | 1.2% | | | | | | | | |
| Humana, Inc. | | | 630 | | | | 128,539 | |
| | | | | | | | | |
| Hotels, Restaurants & Leisure | 2.0% | | | | | | | | |
| McDonald’s Corp. | | | 1,295 | | | | 157,628 | |
| Norwegian Cruise Line Holdings, Ltd. (a) | | | 1,295 | | | | 55,076 | |
| | | | | | | | 212,704 | |
| Household Products | 3.4% | | | | | | | | |
| The Procter & Gamble Co. | | | 4,165 | | | | 350,193 | |
| | | | | | | | | |
| Industrial Conglomerates | 1.0% | | | | | | | | |
| Honeywell International, Inc. | | | 885 | | | | 102,527 | |
| | | | | | | | | |
| Insurance | 2.3% | | | | | | | | |
| Aon PLC | | | 1,675 | | | | 186,812 | |
| The Hartford Financial Services Group, Inc. | | | 1,175 | | | | 55,989 | |
| | | | | | | | 242,801 | |
| Internet Software & Services | 7.4% | | | | | | | | |
| Alphabet, Inc., Class A (a) | | | 610 | | | | 483,395 | |
| Alphabet, Inc., Class C (a) | | | 53 | | | | 40,906 | |
| eBay, Inc. (a) | | | 8,335 | | | | 247,466 | |
| | | | | | | | 771,767 | |
| IT Services | 4.9% | | | | | | | | |
| Fidelity National Information Services, Inc. | | | 1,650 | | | | 124,806 | |
| Vantiv, Inc., Class A (a) | | | 2,390 | | | | 142,492 | |
| Visa, Inc., Class A | | | 3,095 | | | | 241,472 | |
| | | | | | | | 508,770 | |
| Life Sciences Tools & Services | 0.5% | | | | | | | | |
| Quintiles IMS Holdings, Inc. (a) | | | 760 | | | | 57,798 | |
The accompanying notes are an integral part of these financial statements.
| Description | | Shares | | | Fair
Value | |
| | | | | | | | | |
| Lazard Retirement US Strategic Equity Portfolio (concluded) |
| | | | | | | | | |
| Machinery | 0.9% | | | | | | | | |
| Deere & Co. | | | 885 | | | $ | 91,190 | |
| | | | | | | | | |
| Marine | 0.6% | | | | | | | | |
| Kirby Corp. (a) | | | 925 | | | | 61,513 | |
| | | | | | | | | |
| Media | 1.5% | | | | | | | | |
| The Madison Square Garden Co. Class A (a) | | | 920 | | | | 157,789 | |
| | | | | | | | | |
| Multiline Retail | 1.0% | | | | | | | | |
| J.C. Penney Co., Inc. (a) | | | 12,450 | | | | 103,460 | |
| | | | | | | | | |
| Oil, Gas & Consumable Fuels | 4.2% | | | | | | | | |
| Chevron Corp. | | | 1,680 | | | | 197,736 | |
| EOG Resources, Inc. | | | 920 | | | | 93,012 | |
| Pioneer Natural Resources Co. | | | 495 | | | | 89,134 | |
| Valero Energy Corp. | | | 815 | | | | 55,681 | |
| | | | | | | | 435,563 | |
| Pharmaceuticals | 10.9% | | | | | | | | |
| Allergan PLC (a) | | | 730 | | | | 153,307 | |
| Pfizer, Inc. | | | 14,965 | | | | 486,063 | |
| Zoetis, Inc. | | | 9,258 | | | | 495,581 | |
| | | | | | | | 1,134,951 | |
| Road & Rail | 0.8% | | | | | | | | |
| Union Pacific Corp. | | | 800 | | | | 82,944 | |
| | | | | | | | | |
| Semiconductors & Semiconductor Equipment | 2.9% | | | | | | | | |
| Applied Materials, Inc. | | | 3,775 | | | | 121,819 | |
| Skyworks Solutions, Inc. | | | 2,435 | | | | 181,797 | |
| | | | | | | | 303,616 | |
| Description | | Shares | | | Fair
Value | |
| | | | | | | | | |
| Software | 4.9% | | | | | | | | |
| Microsoft Corp. | | | 6,945 | | | $ | 431,562 | |
| Red Hat, Inc. (a) | | | 1,100 | | | | 76,670 | |
| | | | | | | | 508,232 | |
| Specialty Retail | 2.6% | | | | | | | | |
| Advance Auto Parts, Inc. | | | 838 | | | | 141,723 | |
| L Brands, Inc. | | | 700 | | | | 46,088 | |
| Lowe’s Cos., Inc. | | | 1,175 | | | | 83,566 | |
| | | | | | | | 271,377 | |
| Technology Hardware, Storage & Peripherals | 2.1% | | | | | | | | |
| Apple, Inc. | | | 1,869 | | | | 216,468 | |
| | | | | | | | | |
| Textiles, Apparel & Luxury Goods | 0.4% | | | | | | | | |
| Deckers Outdoor Corp. (a) | | | 855 | | | | 47,358 | |
| | | | | | | | | |
Total Common Stocks
(Cost $8,874,559) | | | | | | | 10,105,742 | |
| | | | | | | | | |
| Short-Term Investment | 3.5% | | | | | | | | |
State Street Institutional Treasury Money Market Fund, Premier Class, 0.40% (7 day yield)
(Cost $362,302) | | | 362,302 | | | | 362,302 | |
| | | | | | | | | |
Total Investments | 100.3%
(Cost $9,236,861) (b) | | | | | | $ | 10,468,044 | |
| | | | | | | | | |
Liabilities in Excess of Cash and
Other Assets | (0.3)% | | | | | | | (30,251 | ) |
| | | | | | | | | |
| Net Assets | 100.0% | | | | | | $ | 10,437,793 | |
The accompanying notes are an integral part of these financial statements.
| Description | | Shares | | | Fair
Value | |
| | | | | | | | | |
| Lazard Retirement US Small-Mid Cap Equity Portfolio | | | | | | | | |
| | | | | | | | | |
| Common Stocks | 96.9% | | | | | | | | |
| | | | | | | | | |
| Air Freight & Logistics | 0.7% | | | | | | | | |
| Echo Global Logistics, Inc. (a) | | | 18,460 | | | $ | 462,423 | |
| | | | | | | | | |
| Airlines | 1.5% | | | | | | | | |
| Alaska Air Group, Inc. | | | 11,335 | | | | 1,005,755 | |
| | | | | | | | | |
| Auto Components | 2.7% | | | | | | | | |
| Fox Factory Holding Corp. (a) | | | 29,825 | | | | 827,644 | |
| Modine Manufacturing Co. (a) | | | 62,170 | | | | 926,333 | |
| | | | | | | | 1,753,977 | |
| Banks | 8.7% | | | | | | | | |
| Comerica, Inc. | | | 16,455 | | | | 1,120,750 | |
| Home Bancshares, Inc. | | | 39,510 | | | | 1,097,193 | |
| PacWest Bancorp | | | 15,725 | | | | 856,069 | |
| Signature Bank (a) | | | 6,290 | | | | 944,758 | |
| TCF Financial Corp. | | | 34,400 | | | | 673,896 | |
| Webster Financial Corp. | | | 19,090 | | | | 1,036,205 | |
| | | | | | | | 5,728,871 | |
| Biotechnology | 2.1% | | | | | | | | |
| Cellectis SA ADR (a) | | | 23,655 | | | | 400,952 | |
| United Therapeutics Corp. (a) | | | 6,770 | | | | 971,021 | |
| | | | | | | | 1,371,973 | |
| Building Products | 3.2% | | | | | | | | |
| Continental Building Products, Inc. (a) | | | 29,355 | | | | 678,101 | |
| Owens Corning | | | 13,490 | | | | 695,544 | |
| PGT Innovations, Inc. (a) | | | 64,635 | | | | 740,071 | |
| | | | | | | | 2,113,716 | |
| Capital Markets | 1.2% | | | | | | | | |
| Morningstar, Inc. | | | 10,415 | | | | 766,127 | |
| | | | | | | | | |
| Chemicals | 4.6% | | | | | | | | |
| Calgon Carbon Corp. | | | 15,370 | | | | 261,290 | |
| Ingevity Corp. (a) | | | 18,285 | | | | 1,003,115 | |
| Innospec, Inc. | | | 12,030 | | | | 824,055 | |
| Valvoline, Inc. | | | 42,595 | | | | 915,793 | |
| | | | | | | | 3,004,253 | |
| Commercial Services & Supplies | 1.0% | | | | | | | | |
| Deluxe Corp. | | | 9,285 | | | | 664,899 | |
| | | | | | | | | |
| Communications Equipment | 0.7% | | | | | | | | |
| Ciena Corp. (a) | | | 18,095 | | | | 441,699 | |
|
| Description | | Shares | | | Fair
Value | |
| | | | | | | | | |
| Containers & Packaging | 2.8% | | | | | | | | |
| Crown Holdings, Inc. (a) | | | 17,950 | | | $ | 943,631 | |
| Graphic Packaging Holding Co. | | | 69,045 | | | | 861,682 | |
| | | | | | | | 1,805,313 | |
| Electric Utilities | 1.5% | | | | | | | | |
| PNM Resources, Inc. | | | 28,160 | | | | 965,888 | |
| | | | | | | | | |
| Electrical Equipment | 3.7% | | | | | | | | |
| Atkore International Group, Inc. | | | 33,700 | | | | 805,767 | |
| Generac Holdings, Inc. (a) | | | 17,735 | | | | 722,524 | |
| Regal-Beloit Corp. | | | 13,285 | | | | 919,986 | |
| | | | | | | | 2,448,277 | |
Electronic Equipment, Instruments
& Components | 2.1% | | | | | | | | |
| FLIR Systems, Inc. | | | 24,810 | | | | 897,874 | |
| Littelfuse, Inc. | | | 3,280 | | | | 497,805 | |
| | | | | | | | 1,395,679 | |
| Energy Equipment & Services | 2.3% | | | | | | | | |
| Newpark Resources, Inc. (a) | | | 67,400 | | | | 505,500 | |
| Oceaneering International, Inc. | | | 35,055 | | | | 988,902 | |
| | | | | | | | 1,494,402 | |
| Equity Real Estate Investment Trusts (REITs) | 8.9% | | | | | | | | |
| American Campus Communities, Inc. | | | 21,195 | | | | 1,054,875 | |
| DCT Industrial Trust, Inc. | | | 22,770 | | | | 1,090,228 | |
| Extra Space Storage, Inc. | | | 9,885 | | | | 763,517 | |
| Kilroy Realty Corp. | | | 14,310 | | | | 1,047,778 | |
| Tanger Factory Outlet Centers, Inc. | | | 25,580 | | | | 915,253 | |
| UDR, Inc. | | | 26,975 | | | | 984,048 | |
| | | | | | | | 5,855,699 | |
| Food & Staples Retailing | 1.3% | | | | | | | | |
| Sprouts Farmers Market, Inc. (a) | | | 43,450 | | | | 822,074 | |
| | | | | |
| Health Care Equipment & Supplies | 2.3% | | | | |
| DENTSPLY SIRONA, Inc. | | | 8,712 | | | | 502,944 | |
| STERIS PLC | | | 14,780 | | | | 996,024 | |
| | | | | | | | 1,498,968 | |
| Hotels, Restaurants & Leisure | 1.2% | | | | | | | | |
| Bloomin’ Brands, Inc. | | | 42,685 | | | | 769,611 | |
| | | | | | | | | |
| Insurance | 6.4% | | | | | | | | |
| Arch Capital Group, Ltd. (a) | | | 12,450 | | | | 1,074,310 | |
| Argo Group International Holdings, Ltd. | | | 17,594 | | | | 1,159,445 | |
| Reinsurance Group of America, Inc. | | | 8,395 | | | | 1,056,343 | |
| Validus Holdings, Ltd. | | | 16,190 | | | | 890,612 | |
| | | | | | | | 4,180,710 | |
The accompanying notes are an integral part of these financial statements.
| Description | | Shares | | | Fair
Value | |
| | | | | | | | | |
| Lazard Retirement US Small-Mid Cap Equity Portfolio (concluded) |
| | | | | | | | | |
| Internet Software & Services | 1.5% | | | | | | | | |
| j2 Global, Inc. | | | 12,055 | | | $ | 986,099 | |
| | | | | | | | | |
| IT Services | 3.4% | | | | | | | | |
| Leidos Holdings, Inc. | | | 19,210 | | | | 982,399 | |
| Vantiv, Inc., Class A (a) | | | 20,370 | | | | 1,214,460 | |
| | | | | | | | 2,196,859 | |
| Leisure Products | 0.6% | | | | | | | | |
| Vista Outdoor, Inc. (a) | | | 11,305 | | | | 417,154 | |
| | | | | | | | | |
| Life Sciences Tools & Services | 2.5% | | | | | | | | |
| INC Research Holdings, Inc., Class A (a) | | | 15,270 | | | | 803,202 | |
| VWR Corp. (a) | | | 34,300 | | | | 858,529 | |
| | | | | | | | 1,661,731 | |
| Machinery | 4.2% | | | | | | | | |
| Altra Industrial Motion Corp. | | | 18,345 | | | | 676,930 | |
| Tennant Co. | | | 6,605 | | | | 470,276 | |
| TriMas Corp. (a) | | | 43,290 | | | | 1,017,315 | |
| Woodward, Inc. | | | 8,900 | | | | 614,545 | |
| | | | | | | | 2,779,066 | |
| Marine | 1.5% | | | | | | | | |
| Kirby Corp. (a) | | | 14,565 | | | | 968,572 | |
| | | | | | | | | |
| Media | 1.3% | | | | | | | | |
| Scholastic Corp. | | | 17,380 | | | | 825,376 | |
| | | | | | | | | |
| Multi-Utilities | 1.6% | | | | | | | | |
| CMS Energy Corp. | | | 25,400 | | | | 1,057,148 | |
| | | | | | | | | |
| Oil, Gas & Consumable Fuels | 4.4% | | | | | | | | |
| Antero Resources Corp. (a) | | | 41,613 | | | | 984,147 | |
| Extraction Oil & Gas, Inc. | | | 33,115 | | | | 663,625 | |
| HollyFrontier Corp. | | | 16,275 | | | | 533,169 | |
| Matador Resources Co. (a) | | | 27,445 | | | | 706,983 | |
| | | | | | | | 2,887,924 | |
| Pharmaceuticals | 1.1% | | | | | | | | |
| Catalent, Inc. (a) | | | 27,325 | | | | 736,682 | |
| | | | | | | | | |
| Real Estate Management & Development | 0.9% | | | | | | | | |
| Jones Lang LaSalle, Inc. | | | 6,105 | | | | 616,849 | |
| Description | | Shares | | | Fair
Value | |
| | | | | | | | | |
| Semiconductors & Semiconductor Equipment | 5.3% | | | | | | | | |
| Brooks Automation, Inc. | | | 24,510 | | | $ | 418,386 | |
| Cypress Semiconductor Corp. | | | 62,125 | | | | 710,710 | |
| MACOM Technology Solutions Holdings, Inc. (a) | | | 13,430 | | | | 621,540 | |
| Microsemi Corp. (a) | | | 14,285 | | | | 770,961 | |
| Versum Materials, Inc. (a) | | | 33,400 | | | | 937,538 | |
| | | | | | | | 3,459,135 | |
| Software | 3.1% | | | | | | | | |
| Bottomline Technologies de, Inc. (a) | | | 31,645 | | | | 791,758 | |
| BroadSoft, Inc. (a) | | | 12,435 | | | | 512,944 | |
| Red Hat, Inc. (a) | | | 10,015 | | | | 698,045 | |
| | | | | | | | 2,002,747 | |
| Specialty Retail | 4.3% | | | | | | | | |
| Advance Auto Parts, Inc. | | | 3,060 | | | | 517,507 | |
| Chico’s FAS, Inc. | | | 50,020 | | | | 719,788 | |
| Foot Locker, Inc. | | | 11,070 | | | | 784,752 | |
| Sally Beauty Holdings, Inc. (a) | | | 29,080 | | | | 768,294 | |
| | | | | | | | 2,790,341 | |
| Technology Hardware, Storage & Peripherals | 1.0% | | | | | | | | |
| NCR Corp. (a) | | | 16,155 | | | | 655,247 | |
| | | | | | | | | |
| Textiles, Apparel & Luxury Goods | 1.3% | | | | | | | | |
| Steven Madden, Ltd. (a) | | | 24,205 | | | | 865,329 | |
| | | | | | | | | |
Total Common Stocks
(Cost $55,236,337) | | | | | | | 63,456,573 | |
| | | | | | | | | |
| Short-Term Investment | 3.1% | | | | | | | | |
State Street Institutional Treasury Money Market Fund, Premier Class, 0.40% (7 day yield)
(Cost $2,003,138) | | | 2,003,138 | | | | 2,003,138 | |
| | | | | | | | | |
Total Investments | 100.0%
(Cost $57,239,475) (b) | | | | | | $ | 65,459,711 | |
| | | | | | | | | |
| Cash and Other Assets in Excess of Liabilities | 0.0% | | | | | | | 18,373 | |
| | | | | | | | | |
| Net Assets | 100.0% | | | | | | $ | 65,478,084 | |
The accompanying notes are an integral part of these financial statements.
| Description | | Shares | | | Fair
Value | |
| | | | | | | | | |
| Lazard Retirement International Equity Portfolio | | | | | | | | |
| | | | | | | | | |
| Common Stocks | 95.4% | | | | | | | | |
| | | | | | | | | |
| Australia | 3.8% | | | | | | | | |
| BHP Billiton PLC | | | 937,493 | | | $ | 14,822,759 | |
| Caltex Australia, Ltd. | | | 444,449 | | | | 9,757,740 | |
| | | | | | | | 24,580,499 | |
| Belgium | 3.4% | | | | | | | | |
| Anheuser-Busch InBev SA/NV | | | 170,370 | | | | 17,992,267 | |
| KBC Group NV | | | 72,338 | | | | 4,477,605 | |
| | | | | | | | 22,469,872 | |
| Brazil | 1.1% | | | | | | | | |
| BB Seguridade Participacoes SA | | | 837,500 | | | | 7,249,704 | |
| | | | | | | | | |
| Canada | 5.8% | | | | | | | | |
| Canadian National Railway Co. | | | 122,190 | | | | 8,223,356 | |
| MacDonald Dettwiler & Associates, Ltd. | | | 91,985 | | | | 4,582,636 | |
| National Bank of Canada | | | 297,700 | | | | 12,090,702 | |
| Suncor Energy, Inc. | | | 403,540 | | | | 13,194,359 | |
| | | | | | | | 38,091,053 | |
| Denmark | 1.1% | | | | | | | | |
| Carlsberg A/S, Class B | | | 83,536 | | | | 7,209,231 | |
| | | | | | | | | |
| Finland | 2.4% | | | | | | | | |
| Sampo Oyj, A Shares | | | 343,829 | | | | 15,375,088 | |
| | | | | | | | | |
| France | 10.3% | | | | | | | | |
| Air Liquide SA | | | 101,281 | | | | 11,243,508 | |
| Airbus Group SE | | | 72,265 | | | | 4,769,388 | |
| Capgemini SA | | | 149,144 | | | | 12,578,449 | |
| Cie Generale des Etablissements Michelin | | | 85,283 | | | | 9,485,923 | |
| Valeo SA | | | 282,609 | | | | 16,238,600 | |
| Vinci SA | | | 193,162 | | | | 13,138,719 | |
| | | | | | | | 67,454,587 | |
| Germany | 2.4% | | | | | | | | |
| SAP SE | | | 179,680 | | | | 15,703,159 | |
| | | | | | | | | |
| Ireland | 4.9% | | | | | | | | |
| James Hardie Industries PLC | | | 455,855 | | | | 7,218,042 | |
| Ryanair Holdings PLC Sponsored ADR (a) | | | 89,014 | | | | 7,411,305 | |
| Shire PLC | | | 304,573 | | | | 17,258,985 | |
| | | | | | | | 31,888,332 | |
| Israel | 1.8% | | | | | | | | |
| | | | | | | | | |
| Teva Pharmaceutical Industries, Ltd. Sponsored ADR | | | 329,350 | | | | 11,938,937 | |
| Description | | Shares | | | Fair
Value | |
| | | | | | | | | |
| Italy | 0.8% | | | | | | | | |
| Azimut Holding SpA | | | 301,511 | | | $ | 5,021,857 | |
| | | | | | | | | |
| Japan | 18.0% | | | | | | | | |
| ABC-Mart, Inc. | | | 115,600 | | | | 6,539,309 | |
| Daiwa House Industry Co., Ltd. | | | 626,160 | | | | 17,081,347 | |
| Don Quijote Holdings Co., Ltd. | | | 403,700 | | | | 14,913,633 | |
| Hoshizaki Corp. | | | 14,800 | | | | 1,169,949 | |
| Isuzu Motors, Ltd. | | | 844,300 | | | | 10,658,625 | |
| Japan Tobacco, Inc. | | | 262,600 | | | | 8,627,302 | |
| KDDI Corp. | | | 347,400 | | | | 8,771,124 | |
| Makita Corp. | | | 142,400 | | | | 9,525,843 | |
| Seven & I Holdings Co., Ltd. | | | 277,500 | | | | 10,560,591 | |
| Sony Corp. | | | 511,800 | | | | 14,223,476 | |
| Sumitomo Mitsui Financial Group, Inc. | | | 305,800 | | | | 11,592,895 | |
| United Arrows, Ltd. | | | 146,400 | | | | 4,030,599 | |
| | | | | | | | 117,694,693 | |
| Luxembourg | 0.7% | | | | | | | | |
| RTL Group SA | | | 59,023 | | | | 4,326,136 | |
| | | | | | | | | |
| Netherlands | 5.4% | | | | | | | | |
| Koninklijke KPN NV | | | 1,809,326 | | | | 5,357,815 | |
| Royal Dutch Shell PLC, A Shares | | | 661,450 | | | | 18,226,060 | |
| Wolters Kluwer NV | | | 322,419 | | | | 11,659,868 | |
| | | | | | | | 35,243,743 | |
| Norway | 2.6% | | | | | | | | |
| Statoil ASA | | | 453,733 | | | | 8,267,612 | |
| Telenor ASA | | | 585,065 | | | | 8,723,085 | |
| | | | | | | | 16,990,697 | |
| Philippines | 0.3% | | | | | | | | |
| Alliance Global Group, Inc. | | | 7,886,900 | | | | 2,027,601 | |
| | | | | | | | | |
| Spain | 0.9% | | | | | | | | |
| Red Electrica Corporacion SA | | | 327,055 | | | | 6,167,061 | |
| | | | | | | | | |
| Sweden | 3.6% | | | | | | | | |
| Assa Abloy AB, Class B | | | 678,691 | | | | 12,589,714 | |
| Swedbank AB, A Shares | | | 440,531 | | | | 10,647,319 | |
| | | | | | | | 23,237,033 | |
| Switzerland | 6.1% | | | | | | | | |
| Novartis AG | | | 341,972 | | | | 24,884,735 | |
| Wolseley PLC | | | 239,026 | | | | 14,603,101 | |
| | | | | | | | 39,487,836 | |
| Taiwan | 2.3% | | | | | | | | |
| Taiwan Semiconductor Manufacturing Co., Ltd. Sponsored ADR | | | 510,000 | | | | 14,662,500 | |
The accompanying notes are an integral part of these financial statements.
| Description | | Shares | | | Fair
Value | |
| | | | | | | | | |
| Lazard Retirement International Equity Portfolio (concluded) |
| |
| Turkey | 0.6% | | | | | | | | |
| Turkiye Garanti Bankasi AS | | | 1,869,930 | | | $ | 4,042,534 | |
| | | | | | | | | |
| United Kingdom | 13.7% | | | | | | | | |
| British American Tobacco PLC | | | 322,807 | | | | 18,328,629 | |
| Diageo PLC | | | 282,746 | | | | 7,314,949 | |
| Direct Line Insurance Group PLC | | | 1,020,461 | | | | 4,628,044 | |
| Howden Joinery Group PLC | | | 957,914 | | | | 4,507,392 | |
| Informa PLC | | | 835,533 | | | | 6,997,347 | |
| Provident Financial PLC | | | 176,633 | | | | 6,209,929 | |
| Prudential PLC | | | 1,060,780 | | | | 21,158,475 | |
| RELX PLC | | | 679,304 | | | | 12,080,807 | |
| Unilever PLC | | | 209,155 | | | | 8,460,345 | |
| | | | | | | | 89,685,917 | |
| United States | 3.4% | | | | | | | | |
| Aon PLC | | | 117,975 | | | | 13,157,752 | |
| Signet Jewelers, Ltd. | | | 95,141 | | | | 8,967,990 | |
| | | | | | | | 22,125,742 | |
Total Common Stocks
(Cost $559,186,210) | | | | | | | 622,673,812 | |
| Description | | Shares | | | Fair
Value | |
| | | | | | | | | |
| Short-Term Investment | 4.4% | | | | | | | | |
State Street Institutional Treasury Money Market Fund, Premier Class, 0.40% (7 day yield)
(Cost $28,928,875) | | | 28,928,875 | | | $ | 28,928,875 | |
| | | | | | | | | |
Total Investments | 99.8%
(Cost $588,115,085) (b) | | | | | | $ | 651,602,687 | |
| | | | | | | | | |
Cash and Other Assets in Excess
of Liabilities | 0.2% | | | | | | | 1,411,588 | |
| | | | | | | | | |
| Net Assets | 100.0% | | | | | | $ | 653,014,275 | |
The accompanying notes are an integral part of these financial statements.
| Description | | Shares | | | Fair
Value | |
| | | | | | | | | |
| Lazard Retirement Emerging Markets Equity Portfolio | |
| | | | | | | | | |
| Common Stocks | 96.0% | | | | | | | | |
| | | | | | | | | |
| Argentina | 1.7% | | | | | | | | |
| YPF SA Sponsored ADR | | | 1,062,434 | | | $ | 17,530,161 | |
| | | | | | | | | |
| Brazil | 10.7% | | | | | | | | |
| Ambev SA ADR | | | 2,924,400 | | | | 14,358,804 | |
| Banco do Brasil SA | | | 3,365,266 | | | | 28,833,360 | |
| BB Seguridade Participacoes SA | | | 2,171,800 | | | | 18,799,890 | |
| CCR SA | | | 3,366,500 | | | | 16,404,609 | |
| Cielo SA | | | 2,703,554 | | | | 23,073,368 | |
| Localiza Rent a Car SA | | | 781,115 | | | | 8,179,747 | |
| Natura Cosmeticos SA | | | 702,000 | | | | 4,939,132 | |
| | | | | | | | 114,588,910 | |
| China | 15.5% | | | | | | | | |
| AAC Technologies Holdings, Inc. | | | 1,126,500 | | | | 10,134,644 | |
| Baidu, Inc. Sponsored ADR (a) | | | 169,700 | | | | 27,900,377 | |
| China Construction Bank Corp., Class H | | | 58,680,390 | | | | 44,955,861 | |
| China Mobile, Ltd. Sponsored ADR | | | 519,049 | | | | 27,213,739 | |
| China Shenhua Energy Co., Ltd., Class H | | | 4,516,829 | | | | 8,424,110 | |
| CNOOC, Ltd. | | | 5,989,000 | | | | 7,394,064 | |
| NetEase, Inc. ADR | | | 134,800 | | | | 29,027,832 | |
| Weichai Power Co., Ltd., Class H | | | 7,060,932 | | | | 10,828,568 | |
| | | | | | | | 165,879,195 | |
| Egypt | 0.9% | | | | | | | | |
| Commercial International Bank Egypt SAE GDR (Egypt) | | | 144,531 | | | | 527,539 | |
| Commercial International Bank Egypt SAE GDR (London) | | | 2,358,760 | | | | 8,606,898 | |
| | | | | | | | 9,134,437 | |
| Hong Kong | 0.4% | | | | | | | | |
| Huabao International Holdings, Ltd. (a) | | | 9,268,000 | | | | 3,922,380 | |
| | | | | | | | | |
| Hungary | 1.8% | | | | | | | | |
| OTP Bank Nyrt. | | | 682,606 | | | | 19,484,058 | |
| | | | | | | | | |
| India | 9.6% | | | | | | | | |
| Axis Bank, Ltd. | | | 2,743,029 | | | | 18,139,780 | |
| Bajaj Auto, Ltd. | | | 231,398 | | | | 8,956,496 | |
| Bharat Heavy Electricals, Ltd. | | | 2,506,622 | | | | 4,453,323 | |
| HCL Technologies, Ltd. | | | 1,086,435 | | | | 13,198,683 | |
| Hero MotoCorp, Ltd. | | | 346,621 | | | | 15,428,805 | |
| Oil and Natural Gas Corp., Ltd. | | | 110,435 | | | | 310,176 | |
| Description | | Shares | | | Fair
Value | |
| | | | | | | | | |
| Punjab National Bank (a) | | | 5,875,030 | | | $ | 9,884,741 | |
| Tata Consultancy Services, Ltd. | | | 933,069 | | | | 32,448,190 | |
| | | | | | | | 102,820,194 | |
| Indonesia | 5.8% | | | | | | | | |
| PT Astra International Tbk | | | 22,998,900 | | | | 14,064,928 | |
| PT Bank Mandiri (Persero) Tbk | | | 21,675,029 | | | | 18,534,181 | |
| PT Semen Indonesia (Persero) Tbk | | | 9,480,300 | | | | 6,428,773 | |
| PT Telekomunikasi Indonesia (Persero) Tbk Sponsored ADR | | | 791,800 | | | | 23,088,888 | |
| | | | | | | | 62,116,770 | |
| Malaysia | 0.6% | | | | | | | | |
| British American Tobacco Malaysia Berhad | | | 680,400 | | | | 6,763,165 | |
| | | | | | | | | |
| Mexico | 3.3% | | | | | | | | |
| America Movil SAB de CV, Class L Sponsored ADR | | | 1,400,927 | | | | 17,609,652 | |
| Grupo Mexico SAB de CV, Series B | | | 3,561,197 | | | | 9,670,196 | |
| Kimberly-Clark de Mexico SAB de CV, Series A | | | 4,309,662 | | | | 7,760,849 | |
| | | | | | | | 35,040,697 | |
| Pakistan | 2.4% | | | | | | | | |
| Habib Bank, Ltd. | | | 4,359,600 | | | | 11,366,356 | |
| Oil & Gas Development Co., Ltd. | | | 3,279,300 | | | | 5,199,456 | |
| Pakistan Petroleum, Ltd. | | | 5,144,402 | | | | 9,315,307 | |
| | | | | | | | 25,881,119 | |
| Philippines | 0.8% | | | | | | | | |
| PLDT, Inc. Sponsored ADR | | | 306,900 | | | | 8,455,095 | |
| | | | | | | | | |
| Russia | 10.3% | | | | | | | | |
| ALROSA PAO | | | 6,613,700 | | | | 10,452,331 | |
| Gazprom PJSC Sponsored ADR | | | 2,052,392 | | | | 10,348,782 | |
| Lukoil PJSC Sponsored ADR | | | 423,337 | | | | 23,707,454 | |
| Magnit PJSC Sponsored GDR (London) | | | 54,755 | | | | 2,412,814 | |
| Magnit PJSC Sponsored GDR (United States) | | | 2,884 | | | | 127,329 | |
| Magnit PJSC Sponsored GDR (c), (d) | | | 108,375 | | | | 4,784,756 | |
| Mobile TeleSystems PJSC Sponsored ADR | | | 1,805,420 | | | | 16,447,376 | |
| Sberbank of Russia PJSC | | | 14,898,581 | | | | 42,042,440 | |
| | | | | | | | 110,323,282 | |
| South Africa | 8.9% | | | | | | | | |
| Bid Corp., Ltd. | | | 51,881 | | | | 921,275 | |
| Imperial Holdings, Ltd. | | | 817,112 | | | | 10,795,214 | |
| Life Healthcare Group Holdings, Ltd. | | | 3,011,717 | | | | 7,119,924 | |
| Nedbank Group, Ltd. | | | 590,682 | | | | 10,173,206 | |
The accompanying notes are an integral part of these financial statements.
| Description | | Shares | | | Fair
Value | |
| | | | | | | | | |
| Lazard Retirement Emerging Markets Equity Portfolio (concluded) | |
| | | | | | | | | |
| PPC, Ltd. | | | 8,576,515 | | | $ | 3,432,903 | |
| Sanlam, Ltd. | | | 2,031,224 | | | | 9,293,320 | |
| Shoprite Holdings, Ltd. | | | 1,233,255 | | | | 15,388,886 | |
| Standard Bank Group, Ltd. | | | 983,441 | | | | 10,880,222 | |
| The Bidvest Group, Ltd. | | | 767,918 | | | | 10,087,144 | |
| Vodacom Group, Ltd. | | | 779,213 | | | | 8,623,689 | |
| Woolworths Holdings, Ltd. | | | 1,656,280 | | | | 8,517,912 | |
| | | | | | | | 95,233,695 | |
| South Korea | 12.8% | | | | | | | | |
| Coway Co., Ltd. (a) | | | 151,043 | | | | 11,031,628 | |
| Hanwha Life Insurance Co., Ltd. (a) | | | 1,805,201 | | | | 9,747,292 | |
| Hyundai Mobis Co., Ltd. (a) | | | 74,708 | | | | 16,293,823 | |
| KB Financial Group, Inc. (a) | | | 326,393 | | | | 11,532,443 | |
| KT&G Corp. (a) | | | 72,977 | | | | 6,099,763 | |
| Samsung Electronics Co., Ltd. | | | 27,862 | | | | 41,167,720 | |
| Shinhan Financial Group Co., Ltd. (a) | | | 646,348 | | | | 24,233,637 | |
| SK Hynix, Inc. (a) | | | 454,381 | | | | 16,609,107 | |
| | | | | | | | 136,715,413 | |
| Taiwan | 4.7% | | | | | | | | |
| Hon Hai Precision Industry Co., Ltd. | | | 3,295,151 | | | | 8,536,084 | |
| Taiwan Semiconductor Manufacturing Co., Ltd. | | | 7,368,642 | | | | 41,264,670 | |
| | | | | | | | 49,800,754 | |
| Thailand | 1.3% | | | | | | | | |
| Kasikornbank Public Co. Ltd. | | | 1,131,036 | | | | 5,587,348 | |
| The Siam Cement Public Co. Ltd. | | | 551,650 | | | | 7,654,809 | |
| | | | | | | | 13,242,157 | |
| Description | | Shares | | | Fair
Value | |
| | | | | | | | | |
| Turkey | 4.5% | | | | | | | | |
| Akbank TAS | | | 4,823,787 | | | $ | 10,686,938 | |
| KOC Holding AS | | | 2,217,366 | | | | 8,670,288 | |
| Tupras-Turkiye Petrol Rafinerileri AS | | | 397,659 | | | | 7,973,222 | |
| Turk Telekomunikasyon AS | | | 2,877,086 | | | | 4,303,167 | |
| Turkcell Iletisim Hizmetleri AS (a) | | | 2,738,913 | | | | 7,568,153 | |
| Turkiye Is Bankasi AS, C Shares | | | 6,153,624 | | | | 9,042,573 | |
| | | | | | | | 48,244,341 | |
Total Common Stocks
(Cost $1,041,144,809) | | | | | | | 1,025,175,823 | |
| | | | | | | | | |
| Short-Term Investment | 3.8% | | | | | | | | |
State Street Institutional Treasury Money Market Fund, Premier Class, 0.40% (7 day yield)
(Cost $40,344,509) | | | 40,344,509 | | | | 40,344,509 | |
| | | | | | | | | |
Total Investments | 99.8%
(Cost $1,081,489,318) (b) | | | | | | $ | 1,065,520,332 | |
| | | | | | | | | |
Cash and Other Assets in Excess
of Liabilities | 0.2% | | | | | | | 1,934,413 | |
| | | | | | | | | |
| Net Assets | 100.0% | | | | | | $ | 1,067,454,745 | |
The accompanying notes are an integral part of these financial statements.
| Description | | Shares | | | Fair
Value | |
| | | | | | | | | |
| Lazard Retirement Global Dynamic Multi Asset Portfolio | |
| | | | | | | | | |
| Common Stocks | 74.9% | | | | | | | | |
| | | | | | | | | |
| Australia | 2.4% | | | | | | | | |
| AGL Energy, Ltd. | | | 7,822 | | | $ | 124,450 | |
| Aristocrat Leisure, Ltd. | | | 28,638 | | | | 319,536 | |
| Cochlear, Ltd. | | | 10,191 | | | | 899,649 | |
| Credit Corp. Group, Ltd. | | | 19,030 | | | | 245,763 | |
| CSL, Ltd. | | | 19,582 | | | | 1,414,606 | |
| Goodman Group REIT | | | 20,919 | | | | 107,924 | |
| Harvey Norman Holdings, Ltd. | | | 119,637 | | | | 443,350 | |
| Investa Office Fund REIT | | | 34,452 | | | | 117,506 | |
| JB Hi-Fi, Ltd. | | | 19,054 | | | | 384,678 | |
| Magellan Financial Group, Ltd. | | | 12,516 | | | | 213,886 | |
| Newcrest Mining, Ltd. | | | 85,414 | | | | 1,204,302 | |
| Pact Group Holdings, Ltd. | | | 73,021 | | | | 354,821 | |
| Resolute Mining, Ltd. | | | 412,195 | | | | 370,124 | |
| Sandfire Resources NL | | | 24,182 | | | | 98,177 | |
| Saracen Mineral Holdings, Ltd. (a) | | | 133,618 | | | | 92,172 | |
| Telstra Corp., Ltd. | | | 59,922 | | | | 220,227 | |
| The GPT Group REIT | | | 40,972 | | | | 148,573 | |
| Whitehaven Coal, Ltd. (a) | | | 158,431 | | | | 297,364 | |
| | | | | | | | 7,057,108 | |
| Belgium | 0.6% | | | | | | | | |
| Anheuser-Busch InBev SA/NV Sponsored ADR | | | 15,005 | | | | 1,582,127 | |
| Telenet Group Holding NV (a) | | | 2,314 | | | | 128,389 | |
| | | | | | | | 1,710,516 | |
| Canada | 3.2% | | | | | | | | |
| Alimentation Couche-Tard, Inc., Class B | | | 3,397 | | | | 154,031 | |
| Atco, Ltd., Class I | | | 6,505 | | | | 216,373 | |
| BCE, Inc. | | | 8,605 | | | | 371,912 | |
| Canadian Imperial Bank of Commerce | | | 16,892 | | | | 1,378,384 | |
| Canadian National Railway Co. | | | 16,483 | | | | 1,110,773 | |
| CI Financial Corp. | | | 13,959 | | | | 300,150 | |
| Colliers International Group, Inc. | | | 2,672 | | | | 98,490 | |
| Constellation Software, Inc. | | | 244 | | | | 110,877 | |
| Corus Entertainment, Inc., B Shares | | | 8,774 | | | | 82,339 | |
| Dollarama, Inc. | | | 2,144 | | | | 157,097 | |
| Enbridge, Inc. | | | 24,121 | | | | 1,015,035 | |
| First Quantum Minerals, Ltd. | | | 13,857 | | | | 137,781 | |
| Genworth MI Canada, Inc. | | | 15,662 | | | | 392,644 | |
| Intact Financial Corp. | | | 1,327 | | | | 94,980 | |
| Inter Pipeline, Ltd. | | | 5,450 | | | | 120,313 | |
| Linamar Corp. | | | 6,205 | | | | 266,612 | |
| Description | | Shares | | | Fair
Value | |
| | | | | | | | | |
| Magna International, Inc. | | | 11,280 | | | $ | 489,796 | |
| Metro, Inc. | | | 11,357 | | | | 339,699 | |
| Pembina Pipeline Corp. | | | 6,412 | | | | 200,385 | |
| Quebecor, Inc., Class B | | | 4,924 | | | | 136,866 | |
| Saputo, Inc. | | | 6,720 | | | | 237,789 | |
| The Toronto-Dominion Bank | | | 36,472 | | | | 1,798,813 | |
| Transcontinental, Inc., Class A | | | 6,186 | | | | 102,236 | |
| | | | | | | | 9,313,375 | |
| Denmark | 0.7% | | | | | | | | |
| Carlsberg A/S, Class B Sponsored ADR | | | 44,495 | | | | 767,984 | |
| Danske Bank A/S | | | 3,768 | | | | 114,280 | |
| Jyske Bank A/S | | | 5,837 | | | | 277,759 | |
| Novo Nordisk A/S Sponsored ADR | | | 15,205 | | | | 545,251 | |
| Novo Nordisk A/S, Class B | | | 3,109 | | | | 111,674 | |
| Vestas Wind Systems A/S | | | 4,175 | | | | 271,338 | |
| | | | | | | | 2,088,286 | |
| Finland | 0.6% | | | | | | | | |
| Neste Oyj | | | 4,641 | | | | 178,161 | |
| Orion Oyj, Class B | | | 4,433 | | | | 197,302 | |
| Sampo Oyj, A Shares ADR | | | 60,930 | | | | 1,364,223 | |
| UPM-Kymmene Oyj | | | 5,090 | | | | 124,740 | |
| | | | | | | | 1,864,426 | |
| France | 1.2% | | | | | | | | |
| Airbus Group SE | | | 6,136 | | | | 404,968 | |
| AXA SA | | | 31,136 | | | | 785,683 | |
| BNP Paribas SA | | | 16,052 | | | | 1,022,535 | |
| CNP Assurances | | | 9,198 | | | | 170,368 | |
| Faurecia | | | 10,374 | | | | 402,052 | |
| Orange SA | | | 14,912 | | | | 226,301 | |
| Peugeot SA (a) | | | 10,639 | | | | 173,439 | |
| Technip SA | | | 1,774 | | | | 125,888 | |
| TOTAL SA | | | 2,877 | | | | 146,864 | |
| Valeo SA | | | 3,073 | | | | 176,573 | |
| | | | | | | | 3,634,671 | |
| Germany | 1.8% | | | | | | | | |
| Allianz SE | | | 4,792 | | | | 792,133 | |
| Bayer AG | | | 8,635 | | | | 900,855 | |
| Continental AG Sponsored ADR | | | 26,330 | | | | 1,013,705 | |
| Deutsche Lufthansa AG | | | 14,498 | | | | 187,334 | |
| Infineon Technologies AG | | | 28,764 | | | | 498,533 | |
| MTU Aero Engines AG | | | 3,000 | | | | 346,111 | |
| Muenchener Rueckversicherungs AG | | | 1,413 | | | | 267,244 | |
| ProSiebenSat.1 Media SE | | | 3,018 | | | | 116,669 | |
| Rheinmetall AG | | | 3,542 | | | | 237,989 | |
| Symrise AG ADR | | | 67,260 | | | | 1,021,007 | |
| | | | | | | | 5,381,580 | |
The accompanying notes are an integral part of these financial statements.
| Description | | Shares | | | Fair
Value | |
| | | | | | | | | |
| Lazard Retirement Global Dynamic Multi Asset Portfolio (continued) |
| | | | | | | | | |
| Hong Kong | 1.6% | | | | | | | | |
| AIA Group, Ltd. Sponsored ADR | | | 31,135 | | | $ | 699,604 | |
| CLP Holdings, Ltd. | | | 41,000 | | | | 374,628 | |
| Jardine Matheson Holdings, Ltd. | | | 19,800 | | | | 1,092,228 | |
| Link Real Estate Investment Trust | | | 42,000 | | | | 271,214 | |
| The Wharf Holdings, Ltd. | | | 96,000 | | | | 630,871 | |
| WH Group, Ltd. | | | 493,500 | | | | 397,340 | |
| Wheelock & Co., Ltd. | | | 144,000 | | | | 808,316 | |
| Xinyi Glass Holdings, Ltd. | | | 436,000 | | | | 354,669 | |
| Yue Yuen Industrial Holdings, Ltd. | | | 32,500 | | | | 117,642 | |
| | | | | | | | 4,746,512 | |
| Ireland | 0.6% | | | | | | | | |
| Experian PLC | | | 4,945 | | | | 95,716 | |
| Ryanair Holdings PLC Sponsored ADR (a) | | | 1,954 | | | | 162,690 | |
| Shire PLC ADR | | | 9,300 | | | | 1,584,534 | |
| | | | | | | | 1,842,940 | |
| Israel | 0.4% | | | | | | | | |
| Bank Hapoalim BM | | | 26,119 | | | | 155,049 | |
| Israel Discount Bank, Ltd., Class A (a) | | | 63,351 | | | | 131,515 | |
| Nice, Ltd. | | | 9,132 | | | | 626,405 | |
| Orbotech, Ltd. (a) | | | 9,732 | | | | 325,146 | |
| | | | | | | | 1,238,115 | |
| Italy | 0.1% | | | | | | | | |
| Enel SpA | | | 62,416 | | | | 274,669 | |
| Recordati SpA | | | 5,118 | | | | 144,965 | |
| | | | | | | | 419,634 | |
| Japan | 6.7% | | | | | | | | |
| Amano Corp. | | | 11,700 | | | | 205,138 | |
| Asahi Glass Co., Ltd. | | | 17,000 | | | | 115,499 | |
| Astellas Pharma, Inc. | | | 15,700 | | | | 217,621 | |
| Azbil Corp. | | | 5,300 | | | | 148,831 | |
| Central Japan Railway Co. | | | 2,600 | | | | 427,035 | |
| Daito Trust Construction Co., Ltd. | | | 11,700 | | | | 1,757,235 | |
| Daiwa House Industry Co., Ltd. | | | 8,500 | | | | 231,876 | |
| Daiwa House Industry Co., Ltd. ADR | | | 48,240 | | | | 1,309,716 | |
| Foster Electric Co., Ltd. | | | 6,200 | | | | 117,021 | |
| Haseko Corp. | | | 34,600 | | | | 350,206 | |
| Heiwa Corp. | | | 5,900 | | | | 134,976 | |
| Hitachi High-Technologies Corp. | | | 4,800 | | | | 193,200 | |
| Idemitsu Kosan Co., Ltd. | | | 15,900 | | | | 421,477 | |
| Iida Group Holdings Co., Ltd. | | | 17,700 | | | | 335,091 | |
| Japan Airlines Co., Ltd. | | | 3,900 | | | | 113,806 | |
| Description | | Shares | | | Fair
Value | |
| | | | | | | | | |
| Kakaku.com, Inc. | | | 14,300 | | | $ | 236,429 | |
| Kaken Pharmaceutical Co., Ltd. | | | 2,200 | | | | 116,483 | |
| KDDI Corp. | | | 9,100 | | | | 229,756 | |
| KDDI Corp. ADR | | | 94,240 | | | | 1,192,136 | |
| Kuraray Co., Ltd. | | | 20,400 | | | | 305,264 | |
| Kyokuto Kaihatsu Kogyo Co., Ltd. | | | 6,300 | | | | 84,514 | |
| Mazda Motor Corp. | | | 5,500 | | | | 89,334 | |
| MCJ Co., Ltd. | | | 13,300 | | | | 130,502 | |
| Mebuki Financial Group, Inc. | | | 33,000 | | | | 121,940 | |
| Mitsubishi Chemical Holdings Corp. | | | 25,500 | | | | 164,323 | |
| Mitsubishi Electric Corp. | | | 17,000 | | | | 236,327 | |
| Mitsubishi UFJ Financial Group, Inc. | | | 109,800 | | | | 675,047 | |
| Mitsui Chemicals, Inc. | | | 87,000 | | | | 389,776 | |
| Morinaga & Co., Ltd. | | | 3,100 | | | | 128,923 | |
| MS&AD Insurance Group Holdings, Inc. | | | 5,400 | | | | 166,842 | |
| Nichirei Corp. | | | 12,700 | | | | 262,787 | |
| Nihon Chouzai Co., Ltd. | | | 6,800 | | | | 253,260 | |
| Nippon Light Metal Holdings Co., Ltd. | | | 89,100 | | | | 187,576 | |
| Nippon Telegraph & Telephone Corp. | | | 22,900 | | | | 962,620 | |
| Nissan Chemical Industries, Ltd. | | | 3,300 | | | | 110,011 | |
| Nissan Motor Co., Ltd. | | | 70,800 | | | | 710,302 | |
| Nitto Denko Corp. | | | 1,200 | | | | 91,883 | |
| Oji Holdings Corp. | | | 36,000 | | | | 146,338 | |
| ORIX Corp. | | | 25,900 | | | | 401,256 | |
| Osaki Electric Co., Ltd. | | | 12,000 | | | | 124,780 | |
| Rengo Co., Ltd. | | | 36,300 | | | | 197,279 | |
| Ryohin Keikaku Co., Ltd. ADR | | | 25,730 | | | | 1,013,054 | |
| Sanyo Special Steel Co., Ltd. | | | 44,000 | | | | 208,104 | |
| Shimadzu Corp. | | | 6,000 | | | | 95,365 | |
| Showa Shell Sekiyu KK | | | 37,800 | | | | 351,167 | |
| Sumitomo Mitsui Financial Group, Inc. | | | 64,400 | | | | 2,441,408 | |
| Sumitomo Osaka Cement Co., Ltd. | | | 26,000 | | | | 97,767 | |
| Takeuchi Manufacturing Co., Ltd. | | | 7,900 | | | | 175,117 | |
| Teijin, Ltd. | | | 16,500 | | | | 333,648 | |
| Tohoku Electric Power Co., Inc. | | | 7,300 | | | | 92,111 | |
| Tokyu Fudosan Holdings Corp. | | | 41,400 | | | | 243,894 | |
| TOMONY Holdings, Inc. | | | 30,800 | | | | 158,929 | |
| Toray Industries, Inc. | | | 23,000 | | | | 185,897 | |
| West Japan Railway Co. | | | 1,800 | | | | 110,303 | |
| Yamaguchi Financial Group, Inc. | | | 8,000 | | | | 86,929 | |
| Yodogawa Steel Works, Ltd. | | | 4,100 | | | | 106,934 | |
| | | | | | | | 19,495,043 | |
| Malta | 0.1% | | | | | | | | |
| Kindred Group PLC | | | 18,681 | | | | 175,178 | |
The accompanying notes are an integral part of these financial statements.
| Description | | Shares | | | Fair
Value | |
| | | | | | | | | |
| Lazard Retirement Global Dynamic Multi Asset Portfolio (continued) | |
| | | | | | | | | |
| Netherlands | 1.1% | | | | | | | | |
| Koninklijke Vopak NV | | | 7,418 | | | $ | 349,940 | |
| NN Group NV | | | 7,949 | | | | 269,175 | |
| NXP Semiconductors NV (a) | | | 6,685 | | | | 655,197 | |
| Royal Dutch Shell PLC, A Shares | | | 26,150 | | | | 710,806 | |
| Wolters Kluwer NV | | | 2,071 | | | | 74,895 | |
| Wolters Kluwer NV Sponsored ADR | | | 34,205 | | | | 1,241,641 | |
| | | | | | | | 3,301,654 | |
| New Zealand | 0.1% | | | | | | | | |
| Fletcher Building, Ltd. | | | 20,679 | | | | 151,895 | |
| | | | | | | | | |
| Norway | 0.4% | | | | | | | | |
| Aker BP ASA | | | 41,348 | | | | 739,179 | |
| DNB ASA | | | 7,631 | | | | 113,486 | |
| Leroy Seafood Group ASA | | | 2,177 | | | | 121,191 | |
| Telenor ASA | | | 7,725 | | | | 115,177 | |
| | | | | | | | 1,089,033 | |
| Portugal | 0.3% | | | | | | | | |
| EDP-Energias de Portugal SA | | | 31,395 | | | | 95,608 | |
| Galp Energia SGPS SA | | | 48,367 | | | | 718,979 | |
| Jeronimo Martins SGPS SA | | | 5,527 | | | | 85,733 | |
| | | | | | | | 900,320 | |
| Singapore | 0.3% | | | | | | | | |
| BOC Aviation, Ltd. | | | 62,500 | | | | 306,298 | |
| CapitaLand Commercial Trust REIT | | | 138,900 | | | | 141,168 | |
| SATS, Ltd. | | | 32,500 | | | | 108,582 | |
| Singapore Airlines, Ltd. | | | 38,000 | | | | 253,098 | |
| | | | | | | | 809,146 | |
| South Africa | 0.0% | | | | | | | | |
| Mediclinic International PLC | | | 6,854 | | | | 64,772 | |
| | | | | | | | | |
| Spain | 0.8% | | | | | | | | |
| Banco Santander SA | | | 306,673 | | | | 1,600,905 | |
| CaixaBank SA | | | 179,626 | | | | 593,381 | |
| Corporacion Financiera Alba SA | | | 968 | | | | 43,677 | |
| | | | | | | | 2,237,963 | |
| Sweden | 0.7% | | | | | | | | |
| Assa Abloy AB ADR | | | 130,165 | | | | 1,204,026 | |
| Axfood AB | | | 7,764 | | | | 121,911 | |
| Electrolux AB, Series B | | | 19,946 | | | | 495,234 | |
| Mycronic AB | | | 16,109 | | | | 172,928 | |
| Nobina AB | | | 25,705 | | | | 143,148 | |
| | | | | | | | 2,137,247 | |
| Description | | Shares | | | Fair
Value | |
| | | | | | | | | |
| Switzerland | 1.7% | | | | | | | | |
| Actelion, Ltd. | | | 810 | | | $ | 175,396 | |
| Actelion, Ltd. ADR | | | 13,325 | | | | 725,546 | |
| Partners Group Holding AG | | | 3,847 | | | | 1,802,986 | |
| Roche Holding AG | | | 9,464 | | | | 2,161,766 | |
| Swiss Life Holding AG | | | 430 | | | | 121,699 | |
| | | | | | | | 4,987,393 | |
| United Kingdom | 5.7% | | | | | | | | |
| Admiral Group PLC | | | 9,321 | | | | 209,014 | |
| Ashtead Group PLC ADR | | | 10,955 | | | | 869,827 | |
| Bellway PLC | | | 4,109 | | | | 125,026 | |
| British American Tobacco PLC Sponsored ADR | | | 10,990 | | | | 1,238,243 | |
| BT Group PLC | | | 207,318 | | | | 938,807 | |
| Centrica PLC | | | 293,335 | | | | 845,117 | |
| Cineworld Group PLC | | | 7,134 | | | | 49,556 | |
| Compass Group PLC | | | 19,592 | | | | 361,126 | |
| Compass Group PLC Sponsored ADR | | | 52,385 | | | | 978,552 | |
| CVS Group PLC | | | 8,753 | | | | 118,618 | |
| Diageo PLC Sponsored ADR | | | 9,765 | | | | 1,014,974 | |
| GlaxoSmithKline PLC | | | 43,799 | | | | 836,437 | |
| Halma PLC | | | 7,458 | | | | 82,201 | |
| Hargreaves Lansdown PLC | | | 15,468 | | | | 230,896 | |
| International Consolidated Airlines Group SA | | | 45,126 | | | | 243,506 | |
| International Consolidated Airlines Group SA Sponsored ADR | | | 6,155 | | | | 66,400 | |
| JD Sports Fashion PLC | | | 67,190 | | | | 262,880 | |
| National Grid PLC | | | 11,316 | | | | 132,344 | |
| Persimmon PLC | | | 16,013 | | | | 349,420 | |
| Phoenix Group Holdings | | | 33,876 | | | | 306,487 | |
| Provident Financial PLC | | | 3,548 | | | | 124,738 | |
| Prudential PLC ADR | | | 22,555 | | | | 897,463 | |
| Reckitt Benckiser Group PLC | | | 3,735 | | | | 315,736 | |
| RELX NV Sponsored ADR | | | 84,335 | | | | 1,413,455 | |
| RELX PLC | | | 6,052 | | | | 107,629 | |
| Rentokil Initial PLC | | | 75,497 | | | | 206,526 | |
| Rightmove PLC | | | 2,473 | | | | 118,850 | |
| SSE PLC | | | 151,282 | | | | 2,891,949 | |
| Subsea 7 SA (a) | | | 32,494 | | | | 410,740 | |
| Unilever PLC Sponsored ADR | | | 15,245 | | | | 620,472 | |
| William Hill PLC | | | 31,449 | | | | 112,089 | |
| Wm Morrison Supermarkets PLC | | | 66,517 | | | | 188,968 | |
| | | | | | | | 16,668,046 | |
The accompanying notes are an integral part of these financial statements.
| Description | | Shares | | | Fair
Value | |
| | | | | | | | | |
| Lazard Retirement Global Dynamic Multi Asset Portfolio (continued) | |
| | | | | | | | | |
| United States | 43.8% | | | | | | | | |
| 3M Co. | | | 15,998 | | | $ | 2,856,763 | |
| AbbVie, Inc. | | | 6,058 | | | | 379,352 | |
| Accenture PLC, Class A | | | 22,494 | | | | 2,634,722 | |
| Adobe Systems, Inc. (a) | | | 3,259 | | | | 335,514 | |
| Aetna, Inc. | | | 1,528 | | | | 189,487 | |
| Akamai Technologies, Inc. (a) | | | 1,759 | | | | 117,290 | |
| Alaska Air Group, Inc. | | | 1,522 | | | | 135,047 | |
| Alphabet, Inc., Class A (a) | | | 2,450 | | | | 1,941,503 | |
| Alphabet, Inc., Class C (a) | | | 1,675 | | | | 1,292,799 | |
| Amdocs, Ltd. | | | 2,349 | | | | 136,829 | |
| American Electric Power Co., Inc. | | | 10,824 | | | | 681,479 | |
| American Express Co. | | | 3,369 | | | | 249,576 | |
| Amgen, Inc. | | | 22,368 | | | | 3,270,425 | |
| Aon PLC | | | 12,233 | | | | 1,364,347 | |
| Apple, Inc. | | | 29,796 | | | | 3,450,973 | |
| Applied Materials, Inc. | | | 37,340 | | | | 1,204,962 | |
| ARRIS International PLC (a) | | | 8,112 | | | | 244,415 | |
| AT&T, Inc. | | | 51,675 | | | | 2,197,738 | |
| Automatic Data Processing, Inc. | | | 2,907 | | | | 298,781 | |
| AutoZone, Inc. (a) | | | 1,220 | | | | 963,544 | |
| Baker Hughes, Inc. | | | 15,000 | | | | 974,550 | |
| Bank of America Corp. | | | 72,861 | | | | 1,610,228 | |
| Baxter International, Inc. | | | 16,294 | | | | 722,476 | |
| C.R. Bard, Inc. | | | 1,361 | | | | 305,762 | |
| Cardinal Health, Inc. | | | 1,747 | | | | 125,732 | |
| Carnival Corp. | | | 12,401 | | | | 645,596 | |
| Carnival PLC | | | 2,252 | | | | 114,096 | |
| Carrizo Oil & Gas, Inc. (a) | | | 4,821 | | | | 180,064 | |
| CBOE Holdings, Inc. | | | 4,460 | | | | 329,549 | |
| Church & Dwight Co., Inc. | | | 3,000 | | | | 132,570 | |
| Cirrus Logic, Inc. (a) | | | 1,908 | | | | 107,878 | |
| Cisco Systems, Inc. | | | 44,000 | | | | 1,329,680 | |
| Citigroup, Inc. | | | 19,543 | | | | 1,161,440 | |
| Citrix Systems, Inc. (a) | | | 1,386 | | | | 123,784 | |
| Colgate-Palmolive Co. | | | 1,680 | | | | 109,939 | |
| Comcast Corp., Class A | | | 12,041 | | | | 831,431 | |
| Comerica, Inc. | | | 10,415 | | | | 709,366 | |
| CVS Health Corp. | | | 6,225 | | | | 491,215 | |
| Darden Restaurants, Inc. | | | 5,801 | | | | 421,849 | |
| Dick’s Sporting Goods, Inc. | | | 2,836 | | | | 150,592 | |
| Dr Pepper Snapple Group, Inc. | | | 3,109 | | | | 281,893 | |
| DTE Energy Co. | | | 1,512 | | | | 148,947 | |
| Eaton Corp. PLC | | | 11,630 | | | | 780,257 | |
| Description | | Shares | | | Fair
Value | |
| | | | | | | | | |
| eBay, Inc. (a) | | | 12,120 | | | $ | 359,843 | |
| EOG Resources, Inc. | | | 7,910 | | | | 799,701 | |
| Everest Re Group, Ltd. | | | 2,902 | | | | 627,993 | |
| Exelon Corp. | | | 7,507 | | | | 266,423 | |
| F5 Networks, Inc. (a) | | | 1,401 | | | | 202,753 | |
| Facebook, Inc., Class A (a) | | | 8,637 | | | | 993,687 | |
| FactSet Research Systems, Inc. | | | 2,303 | | | | 376,379 | |
| FedEx Corp. | | | 5,515 | | | | 1,026,893 | |
| Fidelity National Information Services, Inc. | | | 11,025 | | | | 833,931 | |
| Fifth Third Bancorp | | | 5,744 | | | | 154,916 | |
| Fiserv, Inc. (a) | | | 2,314 | | | | 245,932 | |
| Foot Locker, Inc. | | | 11,258 | | | | 798,080 | |
| General Mills, Inc. | | | 8,543 | | | | 527,701 | |
| General Motors Co. | | | 22,504 | | | | 784,039 | |
| Genpact, Ltd. (a) | | | 4,309 | | | | 104,881 | |
| GoDaddy, Inc., Class A (a) | | | 3,206 | | | | 112,050 | |
| Great Plains Energy, Inc. | | | 72,452 | | | | 1,981,562 | |
| Harman International Industries, Inc. | | | 1,577 | | | | 175,299 | |
| Hasbro, Inc. | | | 3,276 | | | | 254,840 | |
| HCA Holdings, Inc. (a) | | | 5,788 | | | | 428,428 | |
| Honeywell International, Inc. | | | 10,740 | | | | 1,244,229 | |
| HP, Inc. | | | 19,507 | | | | 289,484 | |
| Humana, Inc. | | | 3,962 | | | | 808,367 | |
| IDEXX Laboratories, Inc. (a) | | | 1,791 | | | | 210,031 | |
| Intel Corp. | | | 20,894 | | | | 757,825 | |
| Intercontinental Exchange, Inc. | | | 22,005 | | | | 1,241,522 | |
| International Game Technology PLC | | | 5,518 | | | | 140,819 | |
| Intuit, Inc. | | | 3,601 | | | | 412,711 | |
| Iron Mountain, Inc. REIT | | | 2,586 | | | | 83,993 | |
| J.B. Hunt Transport Services, Inc. | | | 2,876 | | | | 279,173 | |
| Johnson & Johnson | | | 30,425 | | | | 3,505,264 | |
| Johnson Controls International PLC | | | 24,186 | | | | 996,221 | |
| Jones Lang LaSalle, Inc. | | | 1,756 | | | | 177,426 | |
| JPMorgan Chase & Co. | | | 29,713 | | | | 2,563,935 | |
| Juniper Networks, Inc. | | | 9,040 | | | | 255,470 | |
| KB Home | | | 6,268 | | | | 99,097 | |
| Kellogg Co. | | | 7,305 | | | | 538,452 | |
| Kimberly-Clark Corp. | | | 3,473 | | | | 396,339 | |
| Las Vegas Sands Corp. | | | 6,299 | | | | 336,430 | |
| Lear Corp. | | | 988 | | | | 130,782 | |
| Legg Mason, Inc. | | | 5,751 | | | | 172,012 | |
| Lowe’s Cos., Inc. | | | 19,017 | | | | 1,352,489 | |
| Manitowoc Foodservice, Inc. (a) | | | 34,010 | | | | 657,413 | |
| Marathon Petroleum Corp. | | | 8,555 | | | | 430,744 | |
| Marsh & McLennan Cos., Inc. | | | 4,993 | | | | 337,477 | |
| MasterCard, Inc., Class A | | | 2,949 | | | | 304,484 | |
The accompanying notes are an integral part of these financial statements.
| Description | | Shares | | | Fair
Value | |
| | | | | | | | | |
| Lazard Retirement Global Dynamic Multi Asset Portfolio (continued) |
| | | | | | | | | |
| Mead Johnson Nutrition Co. | | | 6,685 | | | $ | 473,031 | |
| MetLife, Inc. | | | 13,724 | | | | 739,586 | |
| Mettler-Toledo International, Inc. (a) | | | 1,388 | | | | 580,961 | |
| Microsoft Corp. | | | 71,561 | | | | 4,446,801 | |
| MKS Instruments, Inc. | | | 2,353 | | | | 139,768 | |
| Mohawk Industries, Inc. (a) | | | 3,318 | | | | 662,538 | |
| Molson Coors Brewing Co., Class B | | | 10,871 | | | | 1,057,857 | |
| Monsanto Co. | | | 6,091 | | | | 640,834 | |
| Motorola Solutions, Inc. | | | 1,307 | | | | 108,337 | |
| MSCI, Inc. | | | 2,273 | | | | 179,067 | |
| NIKE, Inc., Class B | | | 5,154 | | | | 261,978 | |
| Nordstrom, Inc. | | | 2,967 | | | | 142,208 | |
| Northrop Grumman Corp. | | | 1,741 | | | | 404,922 | |
| NVIDIA Corp. | | | 4,472 | | | | 477,341 | |
| O’Reilly Automotive, Inc. (a) | | | 1,191 | | | | 331,586 | |
| Omnicom Group, Inc. | | | 4,509 | | | | 383,761 | |
| Paychex, Inc. | | | 5,181 | | | | 315,419 | |
| PayPal Holdings, Inc. (a) | | | 2,472 | | | | 97,570 | |
| PepsiCo, Inc. | | | 30,003 | | | | 3,139,214 | |
| Phillips 66 | | | 997 | | | | 86,151 | |
| Pinnacle West Capital Corp. | | | 2,145 | | | | 167,374 | |
| Piper Jaffray Cos., Inc. (a) | | | 6,113 | | | | 443,193 | |
| Pool Corp. | | | 4,265 | | | | 445,010 | |
| Primerica, Inc. | | | 1,349 | | | | 93,283 | |
| Prudential Financial, Inc. | | | 15,486 | | | | 1,611,473 | |
| Public Service Enterprise Group, Inc. | | | 11,160 | | | | 489,701 | |
| Quest Diagnostics, Inc. | | | 9,840 | | | | 904,296 | |
| Quintiles IMS Holdings, Inc. (a) | | | 14,240 | | | | 1,082,952 | |
| Regions Financial Corp. | | | 128,092 | | | | 1,839,401 | |
| Republic Services, Inc. | | | 6,178 | | | | 352,455 | |
| Reynolds American, Inc. | | | 12,785 | | | | 716,471 | |
| Rice Energy, Inc. (a) | | | 7,815 | | | | 166,850 | |
| Rockwell Automation, Inc. | | | 9,180 | | | | 1,233,792 | |
| Rockwell Collins, Inc. | | | 3,069 | | | | 284,680 | |
| Ross Stores, Inc. | | | 19,476 | | | | 1,277,626 | |
| S&P Global, Inc. | | | 11,653 | | | | 1,253,164 | |
| Sanderson Farms, Inc. | | | 1,187 | | | | 111,863 | |
| Schlumberger, Ltd. | | | 22,830 | | | | 1,916,579 | |
| Skyworks Solutions, Inc. | | | 10,101 | | | | 754,141 | |
| Snap-on, Inc. | | | 4,870 | | | | 834,085 | |
| Southwestern Energy Co. (a) | | | 7,436 | | | | 80,458 | |
| Spirit AeroSystems Holdings, Inc., Class A | | | 3,212 | | | | 187,420 | |
| Description | | Shares | | | Fair
Value | |
| | | | | | | | | |
| St. Jude Medical, Inc. | | | 2,055 | | | $ | 164,790 | |
| Starbucks Corp. | | | 12,454 | | | | 691,446 | |
| Sysco Corp. | | | 41,973 | | | | 2,324,045 | |
| Tallgrass Energy GP LP | | | 6,538 | | | | 175,218 | |
| Teradata Corp. (a) | | | 3,561 | | | | 96,752 | |
| Tesoro Corp. | | | 2,769 | | | | 242,149 | |
| Texas Instruments, Inc. | | | 16,941 | | | | 1,236,185 | |
| The Boeing Co. | | | 7,752 | | | | 1,206,831 | |
| The Charles Schwab Corp. | | | 24,995 | | | | 986,553 | |
| The Clorox Co. | | | 1,171 | | | | 140,543 | |
| The Coca-Cola Co. | | | 24,410 | | | | 1,012,039 | |
| The Dow Chemical Co. | | | 24,086 | | | | 1,378,201 | |
| The Estee Lauder Cos., Inc., Class A | | | 4,363 | | | | 333,726 | |
| The Gap, Inc. | | | 8,974 | | | | 201,377 | |
| The Interpublic Group of Cos., Inc. | | | 27,556 | | | | 645,086 | |
| The Kroger Co. | | | 40,965 | | | | 1,413,702 | |
| The Procter & Gamble Co. | | | 12,293 | | | | 1,033,595 | |
| The Sherwin-Williams Co. | | | 4,299 | | | | 1,155,313 | |
| The Southern Co. | | | 12,974 | | | | 638,191 | |
| The TJX Cos., Inc. | | | 9,642 | | | | 724,403 | |
| The Walt Disney Co. | | | 1,697 | | | | 176,861 | |
| Thermo Fisher Scientific, Inc. | | | 6,700 | | | | 945,370 | |
| Time Warner, Inc. | | | 16,771 | | | | 1,618,905 | |
| Tyson Foods, Inc., Class A | | | 6,799 | | | | 419,362 | |
| Ubiquiti Networks, Inc. (a) | | | 2,471 | | | | 142,824 | |
| United Rentals, Inc. (a) | | | 2,684 | | | | 283,377 | |
| United Technologies Corp. | | | 14,025 | | | | 1,537,421 | |
| UnitedHealth Group, Inc. | | | 13,398 | | | | 2,144,216 | |
| Unum Group | | | 5,749 | | | | 252,554 | |
| Vantiv, Inc., Class A (a) | | | 17,130 | | | | 1,021,291 | |
| Verizon Communications, Inc. | | | 57,343 | | | | 3,060,969 | |
| Visa, Inc., Class A | | | 17,454 | | | | 1,361,761 | |
| VMware, Inc., Class A (a) | | | 3,015 | | | | 237,371 | |
| Wal-Mart Stores, Inc. | | | 4,683 | | | | 323,689 | |
| Waste Management, Inc. | | | 5,032 | | | | 356,819 | |
| Waters Corp. (a) | | | 1,706 | | | | 229,269 | |
| WellCare Health Plans, Inc. (a) | | | 5,111 | | | | 700,616 | |
| Wyndham Worldwide Corp. | | | 1,477 | | | | 112,798 | |
| Xcel Energy, Inc. | | | 13,208 | | | | 537,566 | |
| Zoetis, Inc. | | | 33,010 | | | | 1,767,025 | |
| | | | | | | | 128,457,366 | |
Total Common Stocks
(Cost $209,219,628) | | | | | | | 219,772,219 | |
The accompanying notes are an integral part of these financial statements.
| Description | | Security
Currency | | Principal
Amount
(000) | | Fair
Value | |
| | | | | | | | | | | |
| Lazard Retirement Global Dynamic Multi Asset Portfolio (continued) | |
| | | | | | | | | | | |
| Corporate Bonds | 8.4% | | | | | | | | | | |
| | | | | | | | | | | |
| Australia | 0.6% | | | | | | | | | | |
| Telstra Corp., Ltd.: | | | | | | | | | | |
| 4.000%, 11/15/17 | | AUD | | | 1,450 | | | $ | 1,059,317 | |
| 4.000%, 09/16/22 | | AUD | | | 390 | | | | 287,822 | |
Toyota Finance Australia, Ltd.,
4.250%, 05/15/19 | | AUD | | | 567 | | | | 422,539 | |
| | | | | | | | | | 1,769,678 | |
| Belgium | 0.5% | | | | | | | | | | |
| Anheuser-Busch InBev Finance, Inc.: | | | | | | | | | | |
| 2.375%, 01/25/18 | | CAD | | | 985 | | | | 742,346 | |
| 2.650%, 02/01/21 | | USD | | | 855 | | | | 858,923 | |
| | | | | | | | | | 1,601,269 | |
| Canada | 0.5% | | | | | | | | | | |
Shaw Communications, Inc.,
5.650%, 10/01/19 | | CAD | | | 400 | | | | 325,133 | |
| The Toronto-Dominion Bank: | | | | | | | | | | |
| 2.250%, 11/05/19 | | USD | | | 555 | | | | 558,030 | |
| 2.621%, 12/22/21 | | CAD | | | 665 | | | | 507,949 | |
| | | | | | | | | | 1,391,112 | |
| Denmark | 0.2% | | | | | | | | | | |
Carlsberg Breweries A/S,
2.500%, 05/28/24 | | EUR | | | 500 | | | | 578,526 | |
| | | | | | | | | | | |
| France | 0.3% | | | | | | | | | | |
Orange SA,
5.375%, 07/08/19 | | USD | | | 803 | | | | 864,975 | |
| | | | | | | | | | | |
| Germany | 0.6% | | | | | | | | | | |
BMW Finance NV,
3.375%, 12/14/18 | | GBP | | | 870 | | | | 1,126,425 | |
Daimler Finance North America LLC,
3.875%, 09/15/21 | | USD | | | 575 | | | | 603,448 | |
| | | | | | | | | | 1,729,873 | |
| Mexico | 0.1% | | | | | | | | | | |
America Movil SAB de CV,
6.450%, 12/05/22 | | MXN | | | 10,000 | | | | 438,466 | |
| | | | | | | | | | | |
| Netherlands | 0.2% | | | | | | | | | | |
Bank Nederlandse Gemeenten NV,
5.000%, 09/16/20 | | NZD | | | 615 | | | | 447,046 | |
| Description | | Security
Currency | | Principal
Amount
(000) | | Fair
Value | |
| | | | | | | | | | | |
| New Zealand | 0.3% | | | | | | | | | | |
Fonterra Cooperative Group, Ltd.,
5.500%, 02/26/24 | | AUD | | | 1,000 | | | $ | 778,370 | |
| | | | | | | | | | | |
| Norway | 0.3% | | | | | | | | | | |
Statoil ASA,
3.700%, 03/01/24 | | USD | | | 520 | | | | 543,726 | |
Telenor ASA,
1.750%, 05/22/18 | | USD | | | 480 | | | | 478,740 | |
| | | | | | | | | | 1,022,466 | |
| Spain | 0.2% | | | | | | | | | | |
Iberdrola International BV,
1.125%, 04/21/26 | | EUR | | | 600 | | | | 629,454 | |
| | | | | | | | | | | |
| United Kingdom | 0.7% | | | | | | | | | | |
Centrica PLC,
7.000%, 09/19/18 | | GBP | | | 100 | | | | 135,931 | |
Rolls-Royce PLC,
6.750%, 04/30/19 | | GBP | | | 672 | | | | 941,773 | |
SSE PLC,
5.000%, 10/01/18 | | GBP | | | 700 | | | | 926,094 | |
| | | | | | | | | | 2,003,798 | |
| United States | 3.9% | | | | | | | | | | |
Alphabet, Inc.,
3.625%, 05/19/21 | | USD | | | 305 | | | | 323,164 | |
Amazon.com, Inc.,
3.800%, 12/05/24 | | USD | | | 650 | | | | 682,209 | |
| Apple, Inc.: | | | | | | | | | | |
| 2.850%, 02/23/23 | | USD | | | 177 | | | | 177,917 | |
| 3.850%, 05/04/43 | | USD | | | 770 | | | | 734,829 | |
Citigroup, Inc.,
3.305%, 05/04/21 (e) | | AUD | | | 970 | | | | 703,056 | |
General Electric Co.,
5.500%, 02/01/17 | | NZD | | | 255 | | | | 177,555 | |
| John Deere Canada Funding, Inc.: | | | | | | | | | | |
| 2.300%, 01/17/18 | | CAD | | | 270 | | | | 203,407 | |
| 2.050%, 09/17/20 | | CAD | | | 445 | | | | 332,843 | |
John Deere Capital Corp.,
2.300%, 09/16/19 | | USD | | | 325 | | | | 328,371 | |
JPMorgan Chase & Co.,
4.500%, 01/24/22 | | USD | | | 550 | | | | 592,562 | |
Microsoft Corp.,
4.450%, 11/03/45 | | USD | | | 983 | | | | 1,045,174 | |
Morgan Stanley,
2.500%, 01/24/19 | | USD | | | 920 | | | | 929,340 | |
The accompanying notes are an integral part of these financial statements.
| Description | | Security
Currency | | Principal
Amount
(000) | | Fair
Value | |
| | | | | | | | | | | |
| Lazard Retirement Global Dynamic Multi Asset Portfolio (continued) | |
| | | | | | | | | | |
Nestle Holdings, Inc.,
2.500%, 07/10/17 | | NOK | | | 4,580 | | | $ | 533,428 | |
NIKE, Inc.,
2.375%, 11/01/26 | | USD | | | 515 | | | | 485,132 | |
| The Goldman Sachs Group, Inc.: | | | | | | | | | | |
| 5.200%, 12/17/19 | | NZD | | | 865 | | | | 618,072 | |
| 3.625%, 01/22/23 | | USD | | | 705 | | | | 719,385 | |
The Home Depot, Inc.,
2.625%, 06/01/22 | | USD | | | 725 | | | | 727,724 | |
Union Pacific Corp.,
4.163%, 07/15/22 | | USD | | | 675 | | | | 726,664 | |
Valero Energy Corp.,
6.125%, 02/01/20 | | USD | | | 399 | | | | 440,122 | |
Wells Fargo & Co.,
3.075%, 07/27/21 (e) | | AUD | | | 705 | | | | 510,524 | |
Wells Fargo Canada Corp.,
3.040%, 01/29/21 | | CAD | | | 485 | | | | 376,108 | |
| | | | | | | | | | 11,367,586 | |
Total Corporate Bonds
(Cost $25,840,655) | | | | | | | | | 24,622,619 | |
| | | | | | | | | | |
| Foreign Government Obligations | 9.1% | | | | | | | | |
| | | | | | | | | | | |
| Australia | 0.6% | | | | | | | | | | |
Queensland Treasury Corp.,
5.500%, 06/21/21 | | AUD | | | 1,105 | | | | 898,039 | |
Western Australian Treasury Corp.,
6.000%, 10/16/23 | | AUD | | | 985 | | | | 845,749 | |
| | | | | | | | | | 1,743,788 | |
| Bahamas | 0.2% | | | | | | | | | | |
Commonwealth of Bahamas,
5.750%, 01/16/24 | | USD | | | 700 | | | | 710,871 | |
| | | | | | | | | | | |
| Bermuda | 0.5% | | | | | | | | | | |
Government of Bermuda,
4.854%, 02/06/24 | | USD | | | 1,365 | | | | 1,418,467 | |
| | | | | | | | | | | |
| Canada | 1.2% | | | | | | | | | | |
City of Vancouver,
2.900%, 11/20/25 | | CAD | | | 415 | | | | 313,402 | |
Province of Alberta,
4.000%, 12/01/19 | | CAD | | | 1,430 | | | | 1,146,663 | |
| Description | | Security
Currency | | Principal
Amount
(000) | | Fair
Value | |
| | | | | | | | | | | |
Province of Ontario,
1.950%, 01/27/23 | | CAD | | | 1,330 | | | $ | 988,904 | |
Province of Quebec,
2.500%, 04/20/26 | | USD | | | 1,075 | | | | 1,033,162 | |
| | | | | | | | | | 3,482,131 | |
| Cayman Islands | 0.2% | | | | | | | | | | |
Cayman Islands Government Bond,
5.950%, 11/24/19 | | USD | | | 485 | | | | 530,469 | |
| | | | | | | | | | | |
| Chile | 0.2% | | | | | | | | | | |
Republic of Chile,
3.125%, 01/21/26 | | USD | | | 700 | | | | 689,500 | |
| | | | | | | | | | | |
| Colombia | 0.3% | | | | | | | | | | |
Republic of Colombia,
2.625%, 03/15/23 | | USD | | | 850 | | | | 800,063 | |
| | | | | | | | | | | |
| Czech Republic | 0.4% | | | | | | | | | | |
Czech Republic Government Bond,
0.060%, 12/09/20 (e) | | CZK | | | 26,140 | | | | 1,038,148 | |
| | | | | | | | | | | |
| Hungary | 0.2% | | | | | | | | | | |
Hungary Government Bond,
5.500%, 06/24/25 | | HUF | | | 172,000 | | | | 698,964 | |
| | | | | | | | | | | |
| Ireland | 0.4% | | | | | | | | | | |
Irish Treasury,
3.400%, 03/18/24 | | EUR | | | 840 | | | | 1,075,064 | |
| | | | | | | | | | | |
| Lithuania | 0.1% | | | | | | | | | | |
Republic of Lithuania,
6.625%, 02/01/22 | | USD | | | 300 | | | | 348,201 | |
| | | | | | | | | | | |
| Mexico | 1.0% | | | | | | | | | | |
| Mexican Bonos: | | | | | | | | | | |
| 5.000%, 12/11/19 | | MXN | | | 23,020 | | | | 1,052,244 | |
| 6.500%, 06/09/22 | | MXN | | | 11,520 | | | | 536,289 | |
United Mexican States,
6.750%, 02/06/24 | | GBP | | | 860 | | | | 1,270,512 | |
| | | | | | | | | | 2,859,045 | |
| New Zealand | 0.4% | | | | | | | | | | |
New Zealand Government Bond,
6.000%, 05/15/21 | | NZD | | | 1,535 | | | | 1,175,520 | |
The accompanying notes are an integral part of these financial statements.
| Description | | Security
Currency | | Principal
Amount
(000) | | Fair
Value | |
| | | | | | | | | | | |
| Lazard Retirement Global Dynamic Multi Asset Portfolio (continued) | |
| | | | | | | | | | | |
| Norway | 0.8% | | | | | | | | | | |
Kommunalbanken AS,
1.375%, 10/26/20 (d) | | USD | | | 600 | | | $ | 585,376 | |
| Oslo Kommune: | | | | | | | | | | |
| 3.550%, 02/12/21 | | NOK | | | 3,000 | | | | 367,878 | |
| 3.600%, 12/06/22 | | NOK | | | 2,000 | | | | 249,579 | |
| 2.450%, 05/24/23 | | NOK | | | 3,000 | | | | 350,220 | |
| 3.650%, 11/08/23 | | NOK | | | 3,000 | | | | 375,699 | |
| 2.350%, 09/04/24 | | NOK | | | 4,000 | | | | 462,934 | |
| | | | | | | | | | 2,391,686 | |
| Panama | 0.3% | | | | | | | | | | |
Republic of Panama,
4.000%, 09/22/24 | | USD | | | 880 | | | | 894,300 | |
| | | | | | | | | | | |
| Poland | 0.7% | | | | | | | | | | |
Poland Government Bond,
1.790%, 01/25/21 (e) | | PLN | | | 9,015 | | | | 2,118,454 | |
| | | | | | | | | | | |
| Romania | 0.2% | | | | | | | | | | |
Romanian Government Bond,
2.875%, 10/28/24 | | EUR | | | 430 | | | | 480,930 | |
| | | | | | | | | | | |
| Singapore | 0.9% | | | | | | | | | | |
Singapore Government Bond,
3.000%, 09/01/24 | | SGD | | | 3,675 | | | | 2,644,305 | |
| | | | | | | | | | | |
| Spain | 0.3% | | | | | | | | | | |
| Spain Government Bonds: | | | | | | | | | | |
| 1.600%, 04/30/25 | | EUR | | | 316 | | | | 344,300 | |
| 1.950%, 07/30/30 | | EUR | | | 636 | | | | 681,309 | |
| | | | | | | | | | 1,025,609 | |
| Sweden | 0.2% | | | | | | | | | | |
Kommuninvest I Sverige AB,
1.500%, 04/23/19 (d) | | USD | | | 500 | | | | 496,617 | |
| | | | | | | | | | | |
Total Foreign Government Obligations
(Cost $28,631,682) | | | | | | | | | 26,622,132 | |
| Description | | Security
Currency | | Principal
Amount
(000) | | Fair Value | |
| | | | | | | | | | | |
| Quasi Government Bonds | 1.6% | | | | | | | | | | |
| | | | | | | | | | | |
| Canada | 0.6% | | | | | | | | | | |
| Hydro-Quebec: | | | | | | | | | | |
| 1.037%, 12/01/19 (e) | | CAD | | | 2,140 | | | $ | 1,595,807 | |
| 9.625%, 07/15/22 | | CAD | | | 253 | | | | 264,664 | |
| | | | | | | | | | 1,860,471 | |
| Chile | 0.3% | | | | | | | | | | |
Corp. Nacional del Cobre de Chile,
4.500%, 08/13/23 | | USD | | | 830 | | | | 855,785 | |
| | | | | | | | | | | |
| Mexico | 0.3% | | | | | | | | | | |
Nacional Financiera SNC,
3.375%, 11/05/20 | | USD | | | 700 | | | | 700,962 | |
| | | | | | | | | | | |
| Singapore | 0.4% | | | | | | | | | | |
Temasek Financial I, Ltd.,
4.300%, 10/25/19 | | USD | | | 1,065 | | | | 1,133,999 | |
| | | | | | | | | | | |
Total Quasi Government Bonds
(Cost $4,657,972) | | | | | | | | | 4,551,217 | |
| | | | | | | | | | | |
| Supranationals | 1.4% | | | | | | | | | | |
African Development Bank,
2.375%, 09/23/21 | | USD | | | 510 | | | | 513,012 | |
| Asian Development Bank: | | | | | | | | | | |
| 1.875%, 04/12/19 | | USD | | | 1,000 | | | | 1,006,739 | |
| 2.125%, 03/19/25 | | USD | | | 735 | | | | 708,475 | |
Corporacion Andina de Fomento,
4.375%, 06/15/22 | | USD | | | 630 | | | | 668,342 | |
European Investment Bank,
1.125%, 09/16/21 (d) | | CAD | | | 1,065 | | | | 772,215 | |
Inter-American Development Bank,
6.000%, 12/15/17 | | NZD | | | 435 | | | | 311,767 | |
| | | | | | | | | | | |
Total Supranationals
(Cost $4,110,916) | | | | | | | | | 3,980,550 | |
| | | | | | | | | | | |
| US Municipal Bonds | 0.9% | | | | | | | | | | |
| | | | | | | | | | | |
| California | 0.5% | | | | | | | | | | |
California State Build America Bond,
7.500%, 04/01/34 | | USD | | | 1,125 | | | | 1,590,187 | |
The accompanying notes are an integral part of these financial statements.
| Description | | Security
Currency | | Principal
Amount
(000) | | Fair
Value | |
| | | | | | | | | | | |
| Lazard Retirement Global Dynamic Multi Asset Portfolio (continued) | |
| | | | | | | | | | | |
| Georgia | 0.3% | | | | | | | | | | |
| Georgia State: | | | | | | | | | | |
Build America Bond Series H,
5.014%, 11/01/27 | | USD | | | 420 | | | $ | 483,953 | |
Series B,
2.380%, 02/01/27 | | USD | | | 350 | | | | 326,134 | |
| | | | | | | | | | 810,087 | |
| Pennsylvania | 0.0% | | | | | | | | | | |
Pennsylvania State Build America
Bond Third Series B,
5.850%, 07/15/30 | | USD | | | 50 | | | | 55,523 | |
| | | | | | | | | | | |
| Texas | 0.0% | | | | | | | | | | |
Texas State Build America
Bond Series A,
4.123%, 04/01/25 | | USD | | | 100 | | | | 109,265 | |
| | | | | | | | | | | |
| Wisconsin | 0.1% | | | | | | | | | | |
Wisconsin State Build America
Bond Series D,
5.400%, 05/01/28 | | USD | | | 175 | | | | 193,627 | |
| | | | | | | | | | | |
Total US Municipal Bonds
(Cost $2,898,410) | | | | | | | | | 2,758,689 | |
| | | | | | | | | | | |
| US Treasury Securities | 1.4% | | | | | | | | | | |
| US Treasury Notes: | | | | | | | | | | |
| 2.125%, 05/15/25 | | USD | | | 2,675 | | | | 2,618,659 | |
| 1.625%, 05/15/26 | | USD | | | 782 | | | | 729,215 | |
| 2.500%, 05/15/46 | | USD | | | 760 | | | | 673,718 | |
| | | | | | | | | | | |
Total US Treasury Securities
(Cost $4,227,551) | | | | | | | | | 4,021,592 | |
| Description | | Shares | | | Fair
Value | |
| | | | | | | | | |
| Short-Term Investment | 2.3% | | | | | |
State Street Institutional Treasury Money Market Fund, Premier Class, 0.40% (7 day yield)
(Cost $6,892,111) | | | 6,892,111 | | | $ | 6,892,111 | |
| | | | | | | | | |
Total Investments | 100.0%
(Cost $286,478,925) (b), (f) | | | | | | $ | 293,221,129 | |
| | | | | | | | | |
Cash and Other Assets in Excess
of Liabilities | 0.0% | | | | | | | 65,165 | |
| | | | | | | | | |
| Net Assets | 100.0% | | | | | | $ | 293,286,294 | |
The accompanying notes are an integral part of these financial statements.
Lazard Retirement Global Dynamic Multi Asset Portfolio (continued)
Forward Currency Contracts open at December 31, 2016:
Currency
Purchased | | Quantity | | Currency
Sold | | Quantity | | Counterparty | | Settlement
Date | | Unrealized
Appreciation | | | Unrealized
Depreciation | |
| | | | | | | | | | | | | | | | | | | | | |
| AUD | | 3,973,422 | | | USD | | 2,961,551 | | | HSB | | 02/16/17 | | $ | — | | | $ | 97,170 | |
| CAD | | 234,539 | | | USD | | 173,982 | | | HSB | | 02/16/17 | | | 794 | | | | — | |
| CAD | | 1,949,092 | | | USD | | 1,474,988 | | | HSB | | 02/16/17 | | | — | | | | 22,539 | |
| CAD | | 4,631,177 | | | USD | | 3,429,061 | | | HSB | | 02/16/17 | | | 22,058 | | | | — | |
| CHF | | 716,146 | | | USD | | 732,930 | | | HSB | | 02/16/17 | | | — | | | | 27,655 | |
| CZK | | 1,549,311 | | | USD | | 63,750 | | | CIT | | 07/11/17 | | | — | | | | 2,610 | |
| DKK | | 6,100,255 | | | USD | | 861,500 | | | HSB | | 02/16/17 | | | 4,252 | | | | — | |
| EUR | | 441,056 | | | USD | | 473,826 | | | CIT | | 02/16/17 | | | — | | | | 8,569 | |
| EUR | | 469,264 | | | USD | | 504,131 | | | CIT | | 02/16/17 | | | — | | | | 9,117 | |
| EUR | | 6,747,343 | | | USD | | 7,384,258 | | | CIT | | 02/16/17 | | | — | | | | 266,674 | |
| EUR | | 465,194 | | | USD | | 495,897 | | | HSB | | 02/16/17 | | | — | | | | 5,177 | |
| EUR | | 471,483 | | | USD | | 515,925 | | | HSB | | 02/16/17 | | | — | | | | 18,571 | |
| EUR | | 778,153 | | | USD | | 844,000 | | | HSB | | 02/16/17 | | | — | | | | 23,148 | |
| EUR | | 898,919 | | | USD | | 968,900 | | | HSB | | 02/16/17 | | | — | | | | 20,655 | |
| EUR | | 11,948,993 | | | USD | | 13,075,305 | | | HSB | | 02/16/17 | | | — | | | | 470,645 | |
| EUR | | 2,686,666 | | | USD | | 2,856,007 | | | HSB | | 03/01/17 | | | — | | | | 20,233 | |
| GBP | | 2,061,548 | | | USD | | 2,569,740 | | | HSB | | 02/16/17 | | | — | | | | 26,325 | |
| GBP | | 285,237 | | | USD | | 354,948 | | | SSB | | 03/01/17 | | | — | | | | 2,944 | |
| HUF | | 92,199,120 | | | USD | | 318,406 | | | JPM | | 02/16/17 | | | — | | | | 4,197 | |
| JPY | | 1,180,058,257 | | | USD | | 10,940,800 | | | CIT | | 02/16/17 | | | — | | | | 821,865 | |
| JPY | | 44,798,314 | | | USD | | 415,313 | | | HSB | | 02/16/17 | | | — | | | | 31,169 | |
| JPY | | 135,824,164 | | | USD | | 1,229,000 | | | HSB | | 02/16/17 | | | — | | | | 64,315 | |
| JPY | | 867,507,131 | | | USD | | 8,042,415 | | | HSB | | 02/16/17 | | | — | | | | 603,588 | |
| JPY | | 77,444,595 | | | USD | | 693,327 | | | SSB | | 03/01/17 | | | — | | | | 28,897 | |
| KRW | | 938,955,600 | | | USD | | 786,000 | | | HSB | | 01/23/17 | | | — | | | | 8,590 | |
| MXN | | 19,815,603 | | | USD | | 968,895 | | | HSB | | 02/16/17 | | | — | | | | 18,582 | |
| NOK | | 9,866,106 | | | USD | | 1,151,189 | | | HSB | | 02/16/17 | | | — | | | | 8,279 | |
| NZD | | 3,200,528 | | | USD | | 2,257,973 | | | HSB | | 02/16/17 | | | — | | | | 37,542 | |
| PLN | | 4,056,807 | | | USD | | 974,646 | | | HSB | | 02/16/17 | | | — | | | | 5,940 | |
| SEK | | 4,990,792 | | | USD | | 554,148 | | | CIT | | 02/16/17 | | | — | | | | 4,924 | |
| SEK | | 925,622 | | | USD | | 101,300 | | | HSB | | 02/16/17 | | | 562 | | | | — | |
| SEK | | 2,186,011 | | | USD | | 242,966 | | | HSB | | 02/16/17 | | | — | | | | 2,401 | |
| SEK | | 6,188,616 | | | USD | | 672,800 | | | HSB | | 02/16/17 | | | 8,241 | | | | — | |
| USD | | 1,434,146 | | | AUD | | 1,357,477 | | | CIT | | 02/16/17 | | | 76,669 | | | | — | |
| USD | | 98,366 | | | AUD | | 97,266 | | | HSB | | 02/16/17 | | | 1,100 | | | | — | |
| USD | | 507,300 | | | AUD | | 499,501 | | | HSB | | 02/16/17 | | | 7,799 | | | | — | |
| USD | | 2,471,305 | | | AUD | | 2,340,004 | | | HSB | | 02/16/17 | | | 131,301 | | | | — | |
| USD | | 3,395,127 | | | AUD | | 3,214,743 | | | HSB | | 02/16/17 | | | 180,384 | | | | — | |
| USD | | 651,615 | | | AUD | | 629,277 | | | HSB | | 03/01/17 | | | 22,338 | | | | — | |
| USD | | 326,289 | | | AUD | | 315,034 | | | SSB | | 03/01/17 | | | 11,255 | | | | — | |
| USD | | 143,900 | | | CAD | | 144,897 | | | HSB | | 02/16/17 | | | — | | | | 997 | |
| USD | | 359,000 | | | CAD | | 358,571 | | | HSB | | 02/16/17 | | | 429 | | | | — | |
| USD | | 541,300 | | | CAD | | 543,968 | | | HSB | | 02/16/17 | | | — | | | | 2,668 | |
| USD | | 1,325,423 | | | CAD | | 1,322,397 | | | HSB | | 02/16/17 | | | 3,025 | | | | — | |
The accompanying notes are an integral part of these financial statements.
Lazard Retirement Global Dynamic Multi Asset Portfolio (concluded)
Currency
Purchased | | Quantity | | Currency
Sold | | Quantity | | Counterparty | | Settlement
Date | | Unrealized
Appreciation | | | Unrealized
Depreciation | |
| | | | | | | | | | | | | | | | | | | | | |
| USD | | 4,221,682 | | | CAD | | 4,240,951 | | | HSB | | 02/16/17 | | $ | — | | | $ | 19,269 | |
| USD | | 5,051,607 | | | CAD | | 5,074,664 | | | HSB | | 02/16/17 | | | — | | | | 23,057 | |
| USD | | 2,736,580 | | | CAD | | 2,733,494 | | | HSB | | 03/01/17 | | | 3,086 | | | | — | |
| USD | | 339,649 | | | CAD | | 339,271 | | | SSB | | 03/01/17 | | | 378 | | | | — | |
| USD | | 250,000 | | | CHF | | 248,199 | | | HSB | | 02/16/17 | | | 1,801 | | | | — | |
| USD | | 1,119,163 | | | CZK | | 1,048,792 | | | JPM | | 07/11/17 | | | 70,370 | | | | — | |
| USD | | 210,111 | | | EUR | | 209,549 | | | CIT | | 02/16/17 | | | 563 | | | | — | |
| USD | | 426,064 | | | EUR | | 420,945 | | | CIT | | 02/16/17 | | | 5,119 | | | | — | |
| USD | | 1,583,300 | | | EUR | | 1,563,487 | | | CIT | | 02/16/17 | | | 19,813 | | | | — | |
| USD | | 925,900 | | | EUR | | 924,948 | | | HSB | | 02/16/17 | | | 952 | | | | — | |
| USD | | 1,583,300 | | | EUR | | 1,565,983 | | | HSB | | 02/16/17 | | | 17,317 | | | | — | |
| USD | | 2,250,000 | | | EUR | | 2,274,913 | | | HSB | | 02/16/17 | | | — | | | | 24,913 | |
| USD | | 7,705,700 | | | EUR | | 7,630,845 | | | HSB | | 02/16/17 | | | 74,855 | | | | — | |
| USD | | 675,444 | | | GBP | | 658,795 | | | CIT | | 02/16/17 | | | 16,649 | | | | — | |
| USD | | 612,806 | | | GBP | | 597,751 | | | HSB | | 02/16/17 | | | 15,055 | | | | — | |
| USD | | 1,878,400 | | | GBP | | 1,875,880 | | | HSB | | 02/16/17 | | | 2,520 | | | | — | |
| USD | | 281,572 | | | GBP | | 274,593 | | | JPM | | 02/16/17 | | | 6,978 | | | | — | |
| USD | | 1,640,649 | | | HKD | | 1,640,181 | | | SSB | | 03/01/17 | | | 468 | | | | — | |
| USD | | 1,084,013 | | | HUF | | 1,046,356 | | | JPM | | 02/16/17 | | | 37,656 | | | | — | |
| USD | | 1,457,400 | | | JPY | | 1,327,920 | | | CIT | | 02/16/17 | | | 129,480 | | | | — | |
| USD | | 238,900 | | | JPY | | 235,346 | | | HSB | | 02/16/17 | | | 3,554 | | | | — | |
| USD | | 1,159,500 | | | JPY | | 1,058,852 | | | HSB | | 02/16/17 | | | 100,648 | | | | — | |
| USD | | 5,498,200 | | | JPY | | 5,197,474 | | | HSB | | 02/16/17 | | | 300,727 | | | | — | |
| USD | | 596,097 | | | JPY | | 571,288 | | | HSB | | 03/01/17 | | | 24,809 | | | | — | |
| USD | | 1,912,938 | | | MXN | | 1,922,016 | | | HSB | | 02/16/17 | | | — | | | | 9,078 | |
| USD | | 979,340 | | | MXN | | 984,109 | | | JPM | | 02/16/17 | | | — | | | | 4,769 | |
| USD | | 3,628,655 | | | NOK | | 3,510,407 | | | HSB | | 02/16/17 | | | 118,249 | | | | — | |
| USD | | 615,771 | | | NZD | | 583,054 | | | CIT | | 02/16/17 | | | 32,717 | | | | — | |
| USD | | 3,296,629 | | | NZD | | 3,121,472 | | | CIT | | 02/16/17 | | | 175,157 | | | | — | |
| USD | | 198,800 | | | NZD | | 197,194 | | | HSB | | 02/16/17 | | | 1,606 | | | | — | |
| USD | | 782,013 | | | NZD | | 740,584 | | | HSB | | 02/16/17 | | | 41,429 | | | | — | |
| USD | | 3,127,655 | | | PLN | | 3,006,396 | | | HSB | | 02/16/17 | | | 121,259 | | | | — | |
| USD | | 253,600 | | | SEK | | 257,326 | | | HSB | | 02/16/17 | | | — | | | | 3,726 | |
| USD | | 2,814,627 | | | SGD | | 2,736,802 | | | CIT | | 02/16/17 | | | 77,825 | | | | — | |
| Total gross unrealized appreciation/depreciation on Forward Currency Contracts | | | | $ | 1,871,247 | | | $ | 2,750,798 | |
The accompanying notes are an integral part of these financial statements.
Lazard Retirement Series, Inc. Notes to Portfolios of Investments December 31, 2016
| (a) | Non-income producing security. |
| (b) | For federal income tax purposes, the aggregate cost, aggregate gross unrealized appreciation, aggregate gross unrealized depreciation and the net unrealized appreciation (depreciation) were as follows: |
| Portfolio | | Aggregate
Cost | | | Aggregate Gross
Unrealized
Appreciation | | | Aggregate Gross
Unrealized
Depreciation | | | Net Unrealized
Appreciation
(Depreciation) | |
| | | | | | | | | | | | | | | | | |
| US Strategic Equity | | $ | 9,255,106 | | | $ | 1,281,801 | | | $ | 68,863 | | | $ | 1,212,938 | |
| US Small-Mid Cap Equity | | | 57,563,543 | | | | 9,104,355 | | | | 1,208,187 | | | | 7,896,168 | |
| International Equity | | | 589,456,677 | | | | 91,477,181 | | | | 29,331,171 | | | | 62,146,010 | |
| Emerging Markets Equity | | | 1,084,449,321 | | | | 132,354,292 | | | | 151,283,281 | | | | (18,928,989 | ) |
| Global Dynamic Multi Asset | | | 287,297,385 | | | | 13,965,419 | | | | 8,041,675 | | | | 5,923,744 | |
| (c) | Security valued using Level 2 inputs, based on reference to a similar security which was trading on an active market, under GAAP hierarchy — see Note 8 in the Notes to Financial Statements. |
| (d) | Pursuant to Rule 144A under the Securities Act of 1933, these securities may only be traded among “qualified institutional buyers.” At December 31, 2016, the percentage of net assets for each Portfolio was as follows: |
| Portfolio | | Percentage of
Net Assets |
| | | | | |
| Emerging Markets Equity | | | 0.4 | % |
| Global Dynamic Multi Asset | | | 0.6 | |
| (e) | Variable and floating rate securities are securities which interest rate changes are based on changes in a designated base rate. The rates shown are those in effect on December 31, 2016. |
| (f) | The Portfolio, at all times, maintains portfolio securities in sufficient amount to cover its obligations related to investments in forward currency contracts. |
Security Abbreviations:
| ADR | — | American Depositary Receipt |
| GDR | — | Global Depositary Receipt |
| PJSC | — | Public Joint Stock Company |
| REIT | — | Real Estate Investment Trust |
Currency Abbreviations:
| AUD | — | Australian Dollar | JPY | — | Japanese Yen |
| CAD | — | Canadian Dollar | KRW | — | South Korean Won |
| CHF | — | Swiss Franc | MXN | — | Mexican New Peso |
| CZK | — | Czech Koruna | NOK | — | Norwegian Krone |
| DKK | — | Danish Krone | NZD | — | New Zealand Dollar |
| EUR | — | Euro | PLN | — | Polish Zloty |
| GBP | — | British Pound Sterling | SEK | — | Swedish Krone |
| HKD | — | Hong Kong Dollar | SGD | — | Singapore Dollar |
| HUF | — | Hungarian Forint | USD | — | United States Dollar |
| | | | | | |
Counterparty Abbreviations:
| CIT | — | Citibank NA |
| HSB | — | HSBC Bank USA NA |
| JPM | — | JPMorgan Chase Bank NA |
| SSB | — | State Street Bank and Trust Co. |
The accompanying notes are an integral part of these financial statements.
Portfolio holdings by industry (as a percentage of net assets), for those Portfolios previously presented by country:
| Industry* | | Lazard
Retirement
International
Equity
Portfolio | Lazard
Retirement
Emerging
Markets Equity
Portfolio | Lazard
Retirement Global
Dynamic
Multi Asset
Portfolio |
| | | | | | | | | | | | | | |
| Aerospace & Defense | | | 1.4 | % | | | — | % | | | 1.8 | % | |
| Air Freight & Logistics | | | — | | | | — | | | | 0.4 | | |
| Airlines | | | 1.1 | | | | — | | | | 0.4 | | |
| Auto Components | | | 3.9 | | | | 1.5 | | | | 1.0 | | |
| Automobiles | | | 1.6 | | | | 3.6 | | | | 1.3 | | |
| Banks | | | 6.6 | | | | 26.7 | | | | 7.7 | | |
| Beverages | | | 5.0 | | | | 1.3 | | | | 3.8 | | |
| Biotechnology | | | 2.7 | | | | — | | | | 2.6 | | |
| Building Products | | | 1.9 | | | | — | | | | 0.8 | | |
| Capital Markets | | | 0.8 | | | | — | | | | 3.7 | | |
| Chemicals | | | 1.7 | | | | 0.4 | | | | 2.0 | | |
| Commercial Services & Suppliers | | | — | | | | — | | | | 0.3 | | |
| Communications Equipment | | | — | | | | — | | | | 0.8 | | |
| Construction & Engineering | | | 2.0 | | | | — | | | | — | | |
| Construction Materials | | | 1.1 | | | | 1.6 | | | | 0.1 | | |
| Consumer Finance | | | 1.0 | | | | — | | | | 0.2 | | |
| Containers & Packaging | | | — | | | | — | | | | 0.2 | | |
| Distributors | | | — | | | | 1.0 | | | | 0.2 | | |
| Diversified Financial Services | | | — | | | | — | | | | 0.3 | | |
| Diversified Telecommunication Services | | | 2.2 | | | | 2.6 | | | | 3.7 | | |
| Electric Utilities | | | 1.0 | | | | — | | | | 3.3 | | |
| Electrical Equipment | | | — | | | | 0.4 | | | | 0.9 | | |
| Electronic Equipment, Instruments & Components | | | — | | | | 1.8 | | | | 0.5 | | |
| Energy Equipment & Services | | | — | | | | — | | | | 1.2 | | |
| Equity Real Estate Investment Trusts (REITs) | | | — | | | | — | | | | 0.3 | | |
| Food & Staples Retailing | | | 1.6 | | | | 2.2 | | | | 1.9 | | |
| Food Products | | | — | | | | — | | | | 1.5 | | |
| Health Care Equipment & Supplies | | | — | | | | — | | | | 0.8 | | |
| Health Care Providers & Services | | | — | | | | 0.7 | | | | 1.9 | | |
| Hotels, Restaurants & Leisure | | | — | | | | — | | | | 1.5 | | |
| Household Durables | | | 2.2 | | | | 1.0 | | | | 0.9 | | |
| Household Products | | | — | | | | 0.7 | | | | 0.7 | | |
| Independent Power and Renewable Electricity Producers | | | — | | | | — | | | | 0.6 | | |
| Industrial Conglomerates | | | 0.3 | | | | 1.8 | | | | 1.9 | | |
| Insurance | | | 9.4 | | | | 3.5 | | | | 3.8 | | |
| Internet & Catalog Retail | | | — | | | | — | | | | 0.2 | | |
| Internet Software & Services | | | — | | | | 5.3 | | | | 1.9 | | |
| IT Services | | | 1.9 | | | | 6.4 | | | | 2.5 | | |
| Leisure Products | | | — | | | | — | | | | 0.1 | | |
| Life Sciences Tools & Services | | | — | | | | — | | | | 1.0 | | |
| Machinery | | | 1.6 | | | | 1.0 | | | | 0.9 | | |
| Media | | | 1.7 | | | | — | | | | 1.5 | | |
| Metals & Mining | | | 2.3 | | | | 1.9 | | | | 1.1 | | |
The accompanying notes are an integral part of these financial statements.
| Industry* | | Lazard
Retirement
International
Equity
Portfolio | Lazard
Retirement
Emerging
Markets Equity
Portfolio | Lazard
Retirement Global
Dynamic
Multi Asset
Portfolio |
| | | | | | | | | | | | | | |
| Multiline Retail | | | 2.3 | % | | | 0.8 | % | | | 0.6 | % | |
| Multi-Utilities | | | — | | | | — | | | | 0.7 | | |
| Oil, Gas & Consumable Fuels | | | 7.6 | | | | 8.5 | | | | 2.9 | | |
| Paper & Forest Products | | | — | | | | — | | | | 0.1 | | |
| Personal Products | | | 1.3 | | | | 0.5 | | | | 0.3 | | |
| Pharmaceuticals | | | 5.6 | | | | — | | | | 3.6 | | |
| Professional Services | | | 3.6 | | | | — | | | | 1.0 | | |
| Real Estate Management & Development | | | 2.6 | | | | — | | | | 1.8 | | |
| Road & Rail | | | 1.3 | | | | 0.8 | | | | 1.0 | | |
| Semiconductors & Semiconductor Equipment | | | 2.3 | | | | 5.4 | | | | 2.0 | | |
| Software | | | 2.4 | | | | — | | | | 2.5 | | |
| Specialty Retail | | | 3.0 | | | | — | | | | 2.4 | | |
| Technology Hardware, Storage & Peripherals | | | — | | | | 3.9 | | | | 1.6 | | |
| Textiles, Apparel & Luxury Goods | | | — | | | | — | | | | 0.3 | | |
| Thrifts & Mortgage Finance | | | — | | | | — | | | | 0.1 | | |
| Tobacco | | | 4.1 | | | | 1.2 | | | | 0.7 | | |
| Trading Companies & Distributors | | | 2.9 | | | | — | | | | 0.5 | | |
| Transportation Infrastructure | | | — | | | | 1.5 | | | | — | | |
| Wireless Telecommunication Services | | | 1.4 | | | | 8.0 | | | | 0.6 | | |
| Subtotal | | | 95.4 | | | | 96.0 | | | | 84.9 | | |
| Foreign Government Obligations | | | — | | | | — | | | | 9.1 | | |
| Supranationals | | | — | | | | — | | | | 1.4 | | |
| US Municipal Bonds | | | — | | | | — | | | | 0.9 | | |
| US Treasury Securities | | | — | | | | — | | | | 1.4 | | |
| Short-Term Investments | | | 4.4 | | | | 3.8 | | | | 2.3 | | |
| Total Investments | | | 99.8 | % | | | 99.8 | % | | | 100.0 | % | |
* Industry classifications may be different than those used for compliance monitoring purposes.
The accompanying notes are an integral part of these financial statements.
[This page intentionally left blank]
Lazard Retirement Series, Inc. Statements of Assets and Liabilities
| | | Lazard | | Lazard |
| | | Retirement | | Retirement |
| | | US Strategic | | US Small-Mid Cap |
| December 31, 2016 | | Equity Portfolio | | Equity Portfolio |
| | | | | | | | | |
| ASSETS | | | | | | | | |
| Investments in securities, at fair value | | $ | 10,468,044 | | | $ | 65,459,711 | |
| Foreign currency, at fair value | | | — | | | | — | |
| Receivables for: | | | | | | | | |
| Investments sold | | | — | | | | 17,287 | |
| Dividends and interest | | | 5,600 | | | | 64,909 | |
| Capital stock sold | | | 7,978 | | | | 72,820 | |
| Amount due from Investment Manager (Note 3) | | | 2,887 | | | | — | |
| Amount due from custodian (Note 3) | | | — | | | | 6,776 | |
| Gross unrealized appreciation on forward currency contracts | | | — | | | | — | |
| Total assets | | | 10,484,509 | | | | 65,621,503 | |
| | | | | | | | | |
| LIABILITIES | | | | | | | | |
| Due to custodian | | | — | | | | — | |
| Payables for: | | | | | | | | |
| Management fees | | | — | | | | 54,729 | |
| Accrued distribution fees | | | 2,213 | | | | 13,901 | |
| Accrued custodian fees | | | 7,420 | | | | 7,183 | |
| Accrued administration fees | | | 6,505 | | | | 13,710 | |
| Accrued shareholders’ reports | | | 2,392 | | | | 4,075 | |
| Accrued professional services | | | 23,896 | | | | 24,499 | |
| Investments purchased | | | — | | | | — | |
| Capital stock redeemed | | | 2,142 | | | | 23,157 | |
| Gross unrealized depreciation on forward currency contracts | | | — | | | | — | |
| Other accrued expenses and payables | | | 2,148 | | | | 2,165 | |
| Total liabilities | | | 46,716 | | | | 143,419 | |
| Net assets | | $ | 10,437,793 | | | $ | 65,478,084 | |
| | | | | | | | | |
| NET ASSETS | | | | | | | | |
| Paid in capital | | $ | 9,647,767 | | | $ | 54,715,982 | |
| Undistributed (distributions in excess of) net investment income (loss) | | | 80,766 | | | | 230,470 | |
| Accumulated net realized gain (loss) | | | (521,923 | ) | | | 2,311,396 | |
| Net unrealized appreciation (depreciation) on: | | | | | | | | |
| Investments | | | 1,231,183 | | | | 8,220,236 | |
| Foreign currency translations and forward currency contracts | | | — | | | | — | |
| Net assets | | $ | 10,437,793 | | | $ | 65,478,084 | |
| | | | | | | | | |
| Service Shares | | | | | | | | |
| Net assets | | $ | 10,437,793 | | | $ | 65,478,084 | |
| Shares of capital stock outstanding* | | | 906,860 | | | | 8,090,372 | |
| Net asset value, offering and redemption price per share | | $ | 11.51 | | | $ | 8.09 | |
| Investor Shares | | | | | | | | |
| Net assets | | | — | | | | — | |
| Shares of capital stock outstanding* | | | — | | | | — | |
| Net asset value, offering and redemption price per share | | | — | | | | — | |
| Cost of investments in securities | | $ | 9,236,861 | | | $ | 57,239,475 | |
| Cost of foreign currency | | | — | | | | — | |
* $0.001 par value, 2,450,000,000 shares authorized for the Portfolios in total.
The accompanying notes are an integral part of these financial statements.
| | Lazard | | Lazard | | Lazard | |
| | Retirement | | Retirement | | Retirement | |
| | International | | Emerging Markets | | Global Dynamic | |
| | Equity Portfolio | | Equity Portfolio | | Multi Asset Portfolio | |
| | | | | | | | | | | | | |
| | $ | 651,602,687 | | | $ | 1,065,520,332 | | | $ | 293,221,129 | | |
| | | 50,919 | | | | 189,485 | | | | 10,935 | | |
| | | 641,292 | | | | 3,111,163 | | | | — | | |
| | | 1,459,981 | | | | 973,641 | | | | 927,072 | | |
| | | 482,786 | | | | 729,810 | | | | 488,061 | | |
| | | — | | | | — | | | | — | | |
| | | 73,668 | | | | 152,980 | | | | — | | |
| | | — | | | | — | | | | 1,871,247 | | |
| | | 654,311,333 | | | | 1,070,677,411 | | | | 296,518,444 | | |
| | | | | | | | | | | | | |
| | | — | | | | — | | | | 4,533 | | |
| | | | | | | | | | | | | |
| | | 412,245 | | | | 892,867 | | | | 139,907 | | |
| | | 137,415 | | | | 183,927 | | | | 61,472 | | |
| | | 31,016 | | | | 131,766 | | | | 35,071 | | |
| | | 43,633 | | | | 62,422 | | | | 25,279 | | |
| | | 28,951 | | | | 40,170 | | | | 11,413 | | |
| | | 31,593 | | | | 36,633 | | | | 33,451 | | |
| | | 477,471 | | | | 712,837 | | | | 23,313 | | |
| | | 119,382 | | | | 589,334 | | | | 143,933 | | |
| | | — | | | | — | | | | 2,750,798 | | |
| | | 15,352 | | | | 572,710 | | | | 2,980 | | |
| | | 1,297,058 | | | | 3,222,666 | | | | 3,232,150 | | |
| | $ | 653,014,275 | | | $ | 1,067,454,745 | | | $ | 293,286,294 | | |
| | | | | | | | | | | | | |
| | $ | 610,562,632 | | | $ | 1,161,960,133 | | | $ | 289,799,879 | | |
| | | 2,233,700 | | | | 4,685,073 | | | | (3,614,604 | ) | |
| | | (23,192,411 | ) | | | (82,656,582 | ) | | | 1,239,142 | | |
| | | |
| | | 63,487,602 | | | | (16,536,799 | ) | | | 6,742,204 | | |
| | | (77,248 | ) | | | 2,920 | | | | (880,327 | ) | |
| | $ | 653,014,275 | | | $ | 1,067,454,745 | | | $ | 293,286,294 | | |
| | | | | | | | | | | | | |
| | $ | 653,014,275 | | | $ | 880,046,775 | | | $ | 293,286,294 | | |
| | | 56,443,790 | | | | 46,868,834 | | | | 24,807,688 | | |
| | $ | 11.57 | | | $ | 18.78 | | | $ | 11.82 | | |
| | | | | | | | | | | | | |
| | | — | | | $ | 187,407,970 | | | | — | | |
| | | — | | | | 10,098,734 | | | | — | | |
| | | — | | | $ | 18.56 | | | | — | | |
| | $ | 588,115,085 | | | $ | 1,081,489,318 | | | $ | 286,478,925 | | |
| | $ | 50,616 | | | $ | 189,302 | | | $ | 10,894 | | |
Lazard Retirement Series, Inc. Statements of Operations
| | | Lazard | | | Lazard |
| | | Retirement | | | Retirement |
| | | US Strategic | | | US Small-Mid Cap |
| For the Year Ended December 31, 2016 | | Equity Portfolio | | | Equity Portfolio |
| | | | | | | | | |
| Investment Income (Loss) | | | | | | | | |
| | | | | | | | | |
| Income | | | | | | | | |
| Dividends | | $ | 191,654 | | | $ | 981,717 | |
| Interest | | | — | | | | — | |
| Total investment income* | | | 191,654 | | | | 981,717 | |
| | | | | | | | | |
| Expenses | | | | | | | | |
| Management fees (Note 3) | | | 72,302 | | | | 431,117 | |
| Distribution fees (Service Shares) | | | 25,796 | | | | 143,724 | |
| Custodian fees | | | 44,811 | | | | 56,318 | |
| Administration fees | | | 44,620 | | | | 54,094 | |
| Professional services | | | 36,744 | | | | 42,075 | |
| Shareholders’ reports | | | 9,990 | | | | 9,247 | |
| Directors’ fees and expenses | | | 5,389 | | | | 7,076 | |
| Shareholders’ services | | | 13,627 | | | | 13,342 | |
| Registration fees | | | 61 | | | | 204 | |
| Other | | | 2,768 | | | | 4,113 | |
| Total gross expenses | | | 256,108 | | | | 761,310 | |
| Management fees waived and expenses reimbursed | | | (134,070 | ) | | | (36,003 | ) |
| Administration fees waived | | | (18,750 | ) | | | — | |
| Reimbursement of custodian fees (Note 3) | | | — | | | | (6,776 | ) |
| Total net expenses | | | 103,288 | | | | 718,531 | |
| Net investment income (loss) | | | 88,366 | | | | 263,186 | |
| | | | | | | | | |
| Net Realized and Unrealized Gain (Loss) on Investments, Foreign Currency Transactions and Forward Currency Contracts | | | | | | | | |
| Net realized gain (loss) on: | | | | | | | | |
| Investments | | | (517,325 | ) | | | 2,528,724 | |
| Foreign currency transactions and forward currency contracts | | | — | | | | — | |
| Total net realized gain (loss) on investments, foreign currency transactions and forward currency contracts | | | (517,325 | ) | | | 2,528,724 | |
| Net change in unrealized appreciation (depreciation) on: | | | | | | | | |
| Investments** | | | 1,326,163 | | | | 5,915,148 | |
| Foreign currency translations and forward currency contracts | | | — | | | | — | |
| Total net change in unrealized appreciation (depreciation) on investments, foreign currency translations and forward currency contracts | | | 1,326,163 | | | | 5,915,148 | |
| Net realized and unrealized gain (loss) on investments, foreign currency transactions and forward currency contracts | | | 808,838 | | | | 8,443,872 | |
| Net increase (decrease) in net assets resulting from operations | | $ | 897,204 | | | $ | 8,707,058 | |
| * Net of foreign withholding taxes of | | $ | — | | | $ | 1,281 | |
| ** Includes net change in unrealized appreciation (depreciation) foreign capital gains taxes of | | $ | — | | | $ | — | |
The accompanying notes are an integral part of these financial statements.
| | Lazard | | Lazard | | Lazard | |
| | Retirement | | Retirement | | Retirement | |
| | International | | Emerging Markets | | Global Dynamic | |
| | Equity Portfolio | | Equity Portfolio | | Multi Asset Portfolio | |
| | | | | | | | | | | | | |
| | $ | 17,679,787 | | | $ | 26,845,684 | | | $ | 4,083,317 | | |
| | | — | | | | — | | | | 1,751,788 | | |
| | | 17,679,787 | | | | 26,845,684 | | | | 5,835,105 | | |
| | | | | | | | | | | | | |
| | | 4,972,676 | | | | 10,121,612 | | | | 2,100,559 | | |
| | | 1,656,069 | | | | 2,093,572 | | | | 639,579 | | |
| | | 162,953 | | | | 756,943 | | | | 191,694 | | |
| | | 175,202 | | | | 240,681 | | | | 93,676 | | |
| | | 113,960 | | | | 163,557 | | | | 71,096 | | |
| | | 85,242 | | | | 96,138 | | | | 45,716 | | |
| | | 29,261 | | | | 40,237 | | | | 13,540 | | |
| | | 16,606 | | | | 29,909 | | | | 14,096 | | |
| | | 370 | | | | 3,046 | | | | 2,733 | | |
| | | 19,417 | | | | 27,438 | | | | 11,373 | | |
| | | 7,231,756 | | | | 13,573,133 | | | | 3,184,062 | | |
| | | — | | | | — | | | | (502,423 | ) | |
| | | — | | | | — | | | | — | | |
| | | (73,668 | ) | | | (152,980 | ) | | | — | | |
| | | 7,158,088 | | | | 13,420,153 | | | | 2,681,639 | | |
| | | 10,521,699 | | | | 13,425,531 | | | | 3,153,466 | | |
| | | | | | | | | | | | | |
| | | (22,190,283 | ) | | | (56,052,664 | ) | | | (2,785,420 | ) | |
| | | (95,306 | ) | | | (121,210 | ) | | | 416,103 | | |
| | | | | | | | | | | | | |
| | | (22,285,589 | ) | | | (56,173,874 | ) | | | (2,369,317 | ) | |
| | | | | | | | | | | | | |
| | | (18,226,371 | ) | | | 230,281,563 | | | | 8,255,529 | | |
| | | (11,088 | ) | | | (1,045 | ) | | | (1,301,349 | ) | |
| | | | | | | | | | | | | |
| | | (18,237,459 | ) | | | 230,280,518 | | | | 6,954,180 | | |
| | | | | | | | | | | | | |
| | | (40,523,048 | ) | | | 174,106,644 | | | | 4,584,863 | | |
| | $ | (30,001,349 | ) | | $ | 187,532,175 | | | $ | 7,738,329 | | |
| | $ | 1,905,045 | | | $ | 3,487,210 | | | $ | 187,809 | | |
| | $ | — | | | $ | (401,817 | ) | | $ | — | | |
Lazard Retirement Series, Inc. Statements of Changes in Net Assets
| | | Lazard Retirement US Strategic Equity Portfolio | | Lazard Retirement US Small-Mid Cap Equity Portfolio | |
| | | Year Ended | | Year Ended | | Year Ended | | Year Ended | |
| | | December 31, | | December 31, | | December 31, | | December 31, | |
| | | 2016 | | 2015 | | 2016 | | 2015 | |
| | | | | | | | | | | | | | | | | | | | | | |
| Increase (Decrease) in Net Assets | | | | | | | | | | | | | | | | | | | | | |
| Operations | | | | | | | | | | | | | | | | | | | | | |
| Net investment income (loss) | | | $ | 88,366 | | | | $ | 66,770 | | | | $ | 263,186 | | | | $ | (139,450 | ) | |
| Net realized gain (loss) on investments, foreign currency transactions and forward currency contracts | | | | (517,325 | ) | | | | 927,106 | | | | | 2,528,724 | | | | | 5,414,421 | | |
| Net change in unrealized appreciation (depreciation) on investments, foreign currency translations and forward currency contracts | | | | 1,326,163 | | | | | (1,620,763 | ) | | | | 5,915,148 | | | | | (6,818,250 | ) | |
| Net increase (decrease) in net assets resulting from operations | | | | 897,204 | | | | | (626,887 | ) | | | | 8,707,058 | | | | | (1,543,279 | ) | |
| | | | | | | | | | | | | | | | | | | | | | |
| Distributions to shareholders | | | | | | | | | | | | | | | | | | | | | |
| From net investment income | | | | | | | | | | | | | | | | | | | | | |
| Service Shares | | | | (10,679 | ) | | | | (52,360 | ) | | | | — | | | | | — | | |
| Investor Shares | | | | — | | | | | — | | | | | — | | | | | — | | |
| From net realized gains | | | | | | | | | | | | | | | | | | | | | |
| Service Shares | | | | (105,677 | ) | | | | (792,085 | ) | | | | (3,171,705 | ) | | | | (4,465,229 | ) | |
| Investor Shares | | | | — | | | | | — | | | | | — | | | | | — | | |
| Net decrease in net assets resulting from distributions | | | | (116,356 | ) | | | | (844,445 | ) | | | | (3,171,705 | ) | | | | (4,465,229 | ) | |
| | | | | | | | | | | | | | | | | | | | | | |
| Capital stock transactions | | | | | | | | | | | | | | | | | | | | | |
| Net proceeds from sales | | | | | | | | | | | | | | | | | | | | | |
| Service Shares | | | | 1,106,595 | | | | | 5,026,315 | | | | | 12,126,952 | | | | | 14,432,469 | | |
| Investor Shares | | | | — | | | | | — | | | | | — | | | | | — | | |
| Net proceeds from reinvestment of distributions | | | | | | | | | | | | | | | | | | | | | |
| Service Shares | | | | 116,356 | | | | | 844,445 | | | | | 3,171,705 | | | | | 4,465,229 | | |
| Investor Shares | | | | — | | | | | — | | | | | — | | | | | — | | |
| Cost of shares redeemed | | | | | | | | | | | | | | | | | | | | | |
| Service Shares | | | | (3,094,973 | ) | | | | (5,261,809 | ) | | | | (14,855,237 | ) | | | | (16,880,480 | ) | |
| Investor Shares | | | | — | | | | | — | | | | | — | | | | | — | | |
| Net increase (decrease) in net assets from capital stock transactions | | | | (1,872,022 | ) | | | | 608,951 | | | | | 443,420 | | | | | 2,017,218 | | |
| Total increase (decrease) in net assets | | | | (1,091,174 | ) | | | | (862,381 | ) | | | | 5,978,773 | | | | | (3,991,290 | ) | |
| Net assets at beginning of period | | | | 11,528,967 | | | | | 12,391,348 | | | | | 59,499,311 | | | | | 63,490,601 | | |
| Net assets at end of period* | | | $ | 10,437,793 | | | | $ | 11,528,967 | | | | $ | 65,478,084 | | | | $ | 59,499,311 | | |
| *Includes undistributed (distributions in excess of) net investment income (loss) of | | | $ | 80,766 | | | | $ | 10,671 | | | | $ | 230,470 | | | | $ | — | | |
| | | | | | | | | | | | | | | | | | | | | | |
| Shares issued and redeemed | | | | | | | | | | | | | | | | | | | | | |
| Service Shares | | | | | | | | | | | | | | | | | | | | | |
| Shares outstanding at beginning of period | | | | 1,083,612 | | | | | 1,020,099 | | | | | 8,047,591 | | | | | 7,764,268 | | |
| Shares sold | | | | 103,039 | | | | | 420,624 | | | | | 1,607,794 | | | | | 1,725,627 | | |
| Shares issued to shareholders from reinvestment of distributions | | | | 10,370 | | | | | 80,270 | | | | | 430,938 | | | | | 605,900 | | |
| Shares redeemed | | | | (290,161 | ) | | | | (437,381 | ) | | | | (1,995,951 | ) | | | | (2,048,204 | ) | |
| Net increase (decrease) | | | | (176,752 | ) | | | | 63,513 | | | | | 42,781 | | | | | 283,323 | | |
| Shares outstanding at end of period | | | | 906,860 | | | | | 1,083,612 | | | | | 8,090,372 | | | | | 8,047,591 | | |
| | | | | | | | | | | | | | | | | | | | | | |
| Investor Shares | | | | | | | | | | | | | | | | | | | | | |
| Shares outstanding at beginning of period | | | | | | | | | | | | | | | | | | | | | |
| Shares sold | | | | | | | | | | | | | | | | | | | | | |
| Shares issued to shareholders from reinvestment of distributions | | | | | | | | | | | | | | | | | | | | | |
| Shares redeemed | | | | | | | | | | | | | | | | | | | | | |
| Net increase (decrease) | | | | | | | | | | | | | | | | | | | | | |
| Shares outstanding at end of period | | | | | | | | | | | | | | | | | | | | | |
The accompanying notes are an integral part of these financial statements.
| | Lazard Retirement International Equity Portfolio | | Lazard Retirement Emerging Markets Equity Portfolio | | Lazard Retirement Global Dynamic Multi Asset Portfolio | | |
| | Year Ended | | Year Ended | | Year Ended | | Year Ended | | Year Ended | | Year Ended | | |
| | December 31, | | December 31, | | December 31, | | December 31, | | December 31, | | December 31, | | |
| | 2016 | | 2015 | | 2016 | | 2015 | | 2016 | | 2015 | | |
| | | | | | | | | | | | | | | | | | | | | | | | | | | | | | | | |
| | | $ | 10,521,699 | | | | $ | 10,085,261 | | | | $ | 13,425,531 | | | | $ | 15,243,474 | | | | $ | 3,153,466 | | | | $ | 2,379,616 | | | |
| | | | | | | | | | | | | | | | | | | | | | | | | | | | | | | | |
| | | | (22,285,589 | ) | | | | 27,470,767 | | | | | (56,173,874 | ) | | | | (24,302,162 | ) | | | | (2,369,317 | ) | | | | (909,955 | ) | | |
| | | | | | | | | | | | | | | | | | | | | | | | | | | | | | | | |
| | | | (18,237,459 | ) | | | | (24,202,942 | ) | | | | 230,280,518 | | | | | (208,269,416 | ) | | | | 6,954,180 | | | | | (3,041,867 | ) | | |
| | | | | | | | | | | | | | | | | | | | | | | | | | | | | | | | |
| | | | (30,001,349 | ) | | | | 13,353,086 | | | | | 187,532,175 | | | | | (217,328,104 | ) | | | | 7,738,329 | | | | | (1,572,206 | ) | | |
| | | | | | | | | | | | | | | | | | | | | | | | | | | | | | | | |
| | | | (8,837,795 | ) | | | | (11,274,502 | ) | | | | (8,897,841 | ) | | | | (9,782,582 | ) | | | | (728,536 | ) | | | | — | | | |
| | | | — | | | | | — | | | | | (2,325,656 | ) | | | | (2,497,132 | ) | | | | — | | | | | — | | | |
| | | | | | | | | | | | | | | | | | | | | | | | | | | | | | | | |
| | | | (1,500,336 | ) | | | | (12,022,244 | ) | | | | — | | | | | (2,236,910 | ) | | | | (911,504 | ) | | | | (5,417,685 | ) | | |
| | | | — | | | | | — | | | | | — | | | | | (517,868 | ) | | | | — | | | | | — | | | |
| | | | (10,338,131 | ) | | | | (23,296,746 | ) | | | | (11,223,497 | ) | | | | (15,034,492 | ) | | | | (1,640,040 | ) | | | | (5,417,685 | ) | | |
| | | | | | | | | | | | | | | | | | | | | | | | | | | | | | | | |
| | | | 88,994,820 | | | | | 108,614,054 | | | | | 155,198,810 | | | | | 201,022,412 | | | | | 109,767,981 | | | | | 78,547,519 | | | |
| | | | — | | | | | — | | | | | 39,888,122 | | | | | 29,579,712 | | | | | — | | | | | — | | | |
| | | | | | | | | | | | | | | | | | | | | | | | | | | | | | | | |
| | | | 10,338,131 | | | | | 23,296,746 | | | | | 8,897,841 | | | | | 12,019,492 | | | | | 1,640,041 | | | | | 5,417,685 | | | |
| | | | — | | | | | — | | | | | 2,325,656 | | | | | 3,015,000 | | | | | — | | | | | — | | | |
| | | | | | | | | | | | | | | | | | | | | | | | | | | | | | | | |
| | | | (87,990,969 | ) | | | | (130,279,566 | ) | | | | (185,865,415 | ) | | | | (127,926,800 | ) | | | | (46,886,208 | ) | | | | (30,978,537 | ) | | |
| | | | — | | | | | — | | | | | (42,152,216 | ) | | | | (62,096,136 | ) | | | | — | | | | | — | | | |
| | | | | | | | | | | | | | | | | | | | | | | | | | | | | | | | |
| | | | 11,341,982 | | | | | 1,631,234 | | | | | (21,707,202 | ) | | | | 55,613,680 | | | | | 64,521,814 | | | | | 52,986,667 | | | |
| | | | (28,997,498 | ) | | | | (8,312,426 | ) | | | | 154,601,476 | | | | | (176,748,916 | ) | | | | 70,620,103 | | | | | 45,996,776 | | | |
| | | | 682,011,773 | | | | | 690,324,199 | | | | | 912,853,269 | | | | | 1,089,602,185 | | | | | 222,666,191 | | | | | 176,669,415 | | | |
| | | $ | 653,014,275 | | | | $ | 682,011,773 | | | | $ | 1,067,454,745 | | | | $ | 912,853,269 | | | | $ | 293,286,294 | | | | $ | 222,666,191 | | | |
| | | | | | | | | | | | | | | | | | | | | | | | | | | | | | | | |
| | | $ | 2,233,700 | | | | $ | 316,288 | | | | $ | 4,685,073 | | | | $ | 2,560,560 | | | | $ | (3,614,604 | ) | | | $ | (1,397,040 | ) | | |
| | | | | | | | | | | | | | | | | | | | | | | | | | | | | | | | |
| | | | 55,520,320 | | | | | 55,231,355 | | | | | 48,088,227 | | | | | 43,075,583 | | | | | 19,352,557 | | | | | 14,895,028 | | | |
| | | | 7,425,970 | | | | | 8,242,943 | | | | | 8,776,015 | | | | | 11,097,828 | | | | | 9,323,596 | | | | | 6,588,954 | | | |
| | | | | | | | | | | | | | | | | | | | | | | | | | | | | | | | |
| | | | 883,446 | | | | | 1,911,335 | | | | | 477,613 | | | | | 758,566 | | | | | 136,853 | | | | | 476,062 | | | |
| | | | (7,385,946 | ) | | | | (9,865,313 | ) | | | | (10,473,021 | ) | | | | (6,843,750 | ) | | | | (4,005,318 | ) | | | | (2,607,487 | ) | | |
| | | | 923,470 | | | | | 288,965 | | | | | (1,219,393 | ) | | | | 5,012,644 | | | | | 5,455,131 | | | | | 4,457,529 | | | |
| | | | 56,443,790 | | | | | 55,520,320 | | | | | 46,868,834 | | | | | 48,088,227 | | | | | 24,807,688 | | | | | 19,352,557 | | | |
| | | | | | | | | | | | | | | | | | | | | | | | | | | | | | | | |
| | | | | | | | | | | | | | 10,186,142 | | | | | 11,645,766 | | | | | | | | | | | | | |
| | | | | | | | | | | | | | 2,210,607 | | | | | 1,623,022 | | | | | | | | | | | | | |
| | | | | | | | | | | | | | | | | | | | | | | | | | | | | | | | |
| | | | | | | | | | | | | | 126,551 | | | | | 192,541 | | | | | | | | | | | | | |
| | | | | | | | | | | | | | (2,424,566 | ) | | | | (3,275,187 | ) | | | | | | | | | | | | |
| | | | | | | | | | | | | | (87,408 | ) | | | | (1,459,624 | ) | | | | | | | | | | | | |
| | | | | | | | | | | | | | 10,098,734 | | | | | 10,186,142 | | | | | | | | | | | | | |
Lazard Retirement Series, Inc. Financial Highlights
LAZARD RETIREMENT US STRATEGIC EQUITY PORTFOLIO
| | | | |
| Selected data for a share of capital | | Year Ended | |
| stock outstanding throughout each period | | 12/31/16 | | | 12/31/15 | | | 12/31/14 | | | 12/31/13 | | | 12/31/12 | | |
| | | | | | | | | | | | | | | | | | | | | | |
| Service Shares | | | | | | | | | | | | | | | | | | | | | |
| Net asset value, beginning of period | | $ | 10.64 | | | $ | 12.15 | | | $ | 12.02 | | | $ | 10.44 | | | $ | 9.26 | | |
| Income (loss) from investment operations: | | | | | | | | | | | | | | | | | | | | | |
| Net investment income (loss) | | | 0.10 | | | | 0.06 | | | | 0.09 | | | | 0.11 | | | | 0.12 | | |
| Net realized and unrealized gain (loss) | | | 0.90 | | | | (0.73 | ) | | | 1.68 | | | | 2.80 | | | | 1.18 | | |
| | | | | | | | | | | | | | | | | | | | | | |
| Total from investment operations | | | 1.00 | | | | (0.67 | ) | | | 1.77 | | | | 2.91 | | | | 1.30 | | |
| Less distributions from: | | | | | | | | | | | | | | | | | | | | | |
| Net investment income | | | (0.01 | ) | | | (0.05 | ) | | | (0.09 | ) | | | (0.11 | ) | | | (0.12 | ) | |
| Net realized gains | | | (0.12 | ) | | | (0.79 | ) | | | (1.55 | ) | | | (1.22 | ) | | | — | | |
| | | | | | | | | | | | | | | | | | | | | | |
| Total distributions | | | (0.13 | ) | | | (0.84 | ) | | | (1.64 | ) | | | (1.33 | ) | | | (0.12 | ) | |
| | | | | | | | | | | | | | | | | | | | | | |
| Net asset value, end of period | | $ | 11.51 | | | $ | 10.64 | | | $ | 12.15 | | | $ | 12.02 | | | $ | 10.44 | | |
| | | | | | | | | | | | | | | | | | | | | | |
| Total Return (a) | | | 9.42 | % | | | -5.44 | % | | | 14.71 | % | | | 28.07 | % | | | 14.01 | % | |
| | | | | | | | | | | | | | | | | | | | | | |
| Ratios and Supplemental Data: | | | | | | | | | | | | | | | | | | | | | |
| Net assets, end of period (in thousands) | | $ | 10,438 | | | $ | 11,529 | | | $ | 12,391 | | | $ | 8,944 | | | $ | 6,702 | | |
| Ratios to average net assets: | | | | | | | | | | | | | | | | | | | | | |
| Net expenses | | | 1.00 | % | | | 1.00 | % | | | 1.00 | % | | | 1.00 | % | | | 1.00 | % | |
| Gross expenses | | | 2.48 | % | | | 2.31 | % | | | 2.59 | % | | | 2.88 | % | | | 3.23 | % | |
| Net investment income (loss) | | | 0.86 | % | | | 0.53 | % | | | 0.79 | % | | | 0.97 | % | | | 1.16 | % | |
| Portfolio turnover rate | | | 58 | % | | | 86 | % | | | 72 | % | | | 66 | % | | | 59 | % | |
| (a) | Total returns reflect reinvestment of all dividends and distributions, if any. Certain expenses of the Portfolio have been waived or reimbursed by the Portfolio’s Investment Manager or State Street; without such waiver/reimbursement of expenses, the Portfolio’s returns would have been lower. Performance information does not reflect the fees and charges imposed by participating insurance companies at the separate account level, and such charges will have the effect of reducing performance. |
The accompanying notes are an integral part of these financial statements.
LAZARD RETIREMENT US SMALL-MID CAP EQUITY PORTFOLIO
| | | | |
| Selected data for a share of capital | | Year Ended | |
| stock outstanding throughout each period | | 12/31/16 | | | 12/31/15 | | | 12/31/14 | | | 12/31/13 | | | 12/31/12 | | |
| | | | | | | | | | | | | | | | | |
| Service Shares | | | | | | | | | | | | | | | | | | | | | |
| Net asset value, beginning of period | | $ | 7.39 | | | $ | 8.18 | | | $ | 8.71 | | | $ | 7.30 | | | $ | 9.26 | | |
| Income (loss) from investment operations: | | | | | | | | | | | | | | | | | | | | | |
| Net investment income (loss) | | | 0.03 | ^ | | | (0.02 | ) | | | (0.02 | ) | | | (0.03 | ) | | | (0.01 | ) | |
| Net realized and unrealized gain (loss) | | | 1.09 | | | | (0.19 | ) | | | 0.94 | | | | 2.53 | | | | 0.95 | | |
| | | | | | | | | | | | | | | | | | | | | | |
| Total from investment operations | | | 1.12 | | | | (0.21 | ) | | | 0.92 | | | | 2.50 | | | | 0.94 | | |
| Less distributions from: | | | | | | | | | | | | | | | | | | | | | |
| Net realized gains | | | (0.42 | ) | | | (0.58 | ) | | | (1.45 | ) | | | (1.09 | ) | | | (2.90 | ) | |
| | | | | | | | | | | | | | | | | | | | | | |
| Total distributions | | | (0.42 | ) | | | (0.58 | ) | | | (1.45 | ) | | | (1.09 | ) | | | (2.90 | ) | |
| | | | | | | | | | | | | | | | | | | | | | |
| Net asset value, end of period | | $ | 8.09 | | | $ | 7.39 | | | $ | 8.18 | | | $ | 8.71 | | | $ | 7.30 | | |
| | | | | | | | | | | | | | | | | | | | | | |
| Total Return (a) | | | 15.78 | %^ | | | -2.38 | % | | | 11.03 | % | | | 35.08 | % | | | 10.38 | % | |
| | | | | | | | | | | | | | | | | | | | | | |
| Ratios and Supplemental Data: | | | | | | | | | | | | | | | | | | | | | |
| Net assets, end of period (in thousands) | | $ | 65,478 | | | $ | 59,499 | | | $ | 63,491 | | | $ | 58,923 | | | $ | 46,978 | | |
| Ratios to average net assets: | | | | | | | | | | | | | | | | | | | | | |
| Net expenses | | | 1.25 | %^ | | | 1.25 | % | | | 1.25 | % | | | 1.25 | % | | | 1.20 | % | |
| Gross expenses | | | 1.32 | % | | | 1.35 | % | | | 1.32 | % | | | 1.35 | % | | | 1.20 | % | |
| Net investment income (loss) | | | 0.46 | %^ | | | -0.22 | % | | | -0.20 | % | | | -0.33 | % | | | -0.06 | % | |
| Portfolio turnover rate | | | 94 | % | | | 89 | % | | | 92 | % | | | 101 | % | | | 74 | % | |
| ^ | Refer to Note 3 in the Notes to Financial Statements for discussion of prior period custodian out-of-pocket expenses that were reimbursed to the Portfolio in the current period. The amount of the reimbursement was on a per share basis at less than $0.005 per share. There was no impact on the total return of the Portfolio. The net expenses and net investment income (loss) ratios of the Portfolio would be unchanged as the change to current period custodian fees was offset against current period expense waivers/reimbursements with no impact to net expenses or net investment income (loss). |
| (a) | Total returns reflect reinvestment of all dividends and distributions, if any. Certain expenses of the Portfolio have been waived or reimbursed by the Portfolio’s Investment Manager; without such waiver/reimbursement of expenses, the Portfolio’s returns would have been lower. Performance information does not reflect the fees and charges imposed by participating insurance companies at the separate account level, and such charges will have the effect of reducing performance. |
The accompanying notes are an integral part of these financial statements.
LAZARD RETIREMENT INTERNATIONAL EQUITY PORTFOLIO
| | | | |
| Selected data for a share of capital | | Year Ended | |
| stock outstanding throughout each period | | 12/31/16 | | | 12/31/15 | | | 12/31/14 | | | 12/31/13 | | | 12/31/12 | | |
| | | | | | | | | | | | | | | | | |
| Service Shares | | | | | | | | | | | | | | | | | | | | | |
| Net asset value, beginning of period | | $ | 12.28 | | | $ | 12.50 | | | $ | 13.26 | | | $ | 11.12 | | | $ | 9.33 | | |
| Income (loss) from investment operations: | | | | | | | | | | | | | | | | | | | | | |
| Net investment income (loss) | | | 0.19 | ^ | | | 0.19 | | | | 0.21 | | | | 0.17 | | | | 0.19 | | |
| Net realized and unrealized gain (loss) | | | (0.71 | ) | | | 0.02 | | | | (0.76 | ) | | | 2.13 | | | | 1.78 | | |
| | | | | | | | | | | | | | | | | | | | | | |
| Total from investment operations | | | (0.52 | ) | | | 0.21 | | | | (0.55 | ) | | | 2.30 | | | | 1.97 | | |
| Less distributions from: | | | | | | | | | | | | | | | | | | | | | |
| Net investment income | | | (0.16 | ) | | | (0.21 | ) | | | (0.21 | ) | | | (0.16 | ) | | | (0.18 | ) | |
| Net realized gains | | | (0.03 | ) | | | (0.22 | ) | | | — | | | | — | | | | — | | |
| | | | | | | | | | | | | | | | | | | | | | |
| Total distributions | | | (0.19 | ) | | | (0.43 | ) | | | (0.21 | ) | | | (0.16 | ) | | | (0.18 | ) | |
| | | | | | | | | | | | | | | | | | | | | | |
| Net asset value, end of period | | $ | 11.57 | | | $ | 12.28 | | | $ | 12.50 | | | $ | 13.26 | | | $ | 11.12 | | |
| | | | | | | | | | | | | | | | | | | | | | |
| Total Return (a) | | | -4.29 | %^ | | | 1.75 | % | | | -4.21 | % | | | 20.76 | % | | | 21.11 | % | |
| | | | | | | | | | | | | | | | | | | | | | |
| Ratios and Supplemental Data: | | | | | | | | | | | | | | | | | | | | | |
| Net assets, end of period (in thousands) | | $ | 653,014 | | | $ | 682,012 | | | $ | 690,324 | | | $ | 689,512 | | | $ | 592,437 | | |
| Ratios to average net assets: | | | | | | �� | | | | | | | | | | | | | | | |
| Net expenses | | | 1.08 | %^ | | | 1.11 | % | | | 1.09 | % | | | 1.10 | % | | | 1.10 | % | |
| Gross expenses | | | 1.09 | % | | | 1.11 | % | | | 1.09 | % | | | 1.10 | % | | | 1.10 | % | |
| Net investment income (loss) | | | 1.59 | %^ | | | 1.42 | % | | | 1.59 | % | | | 1.41 | % | | | 1.80 | % | |
| Portfolio turnover rate | | | 28 | % | | | 37 | % | | | 34 | % | | | 40 | % | | | 43 | % | |
| ^ | Refer to Note 3 in the Notes to Financial Statements for discussion of prior period custodian out-of-pocket expenses that were reimbursed to the Portfolio in the current period. The amount of the reimbursement was on a per share basis at less than $0.005 per share. There was no impact on the total return of the Portfolio. There was a 0.01% impact on the net expenses and net investment income (loss) ratios of the Portfolio. |
| (a) | Total returns reflect reinvestment of all dividends and distributions, if any. Performance information does not reflect the fees and charges imposed by participating insurance companies at the separate account level, and such charges will have the effect of reducing performance. |
The accompanying notes are an integral part of these financial statements.
LAZARD RETIREMENT EMERGING MARKETS EQUITY PORTFOLIO
| | | | | | | | | | | | | | | | | |
| Selected data for a share of capital | | Year Ended | |
| stock outstanding throughout each period | | 12/31/16 | | | 12/31/15 | | | 12/31/14 | | | 12/31/13 | | | 12/31/12 | | |
| | | | | | | | | | | | | | | | | |
| Service Shares | | | | | | | | | | | | | | | | | | | | | |
| Net asset value, beginning of period | | $ | 15.70 | | | $ | 19.96 | | | $ | 21.51 | | | $ | 22.22 | | | $ | 18.71 | | |
| Income (loss) from investment operations: | | | | | | | | | | | | | | | | | | | | | |
| Net investment income (loss) (a) | | | 0.23 | ^ | | | 0.27 | | | | 0.37 | | | | 0.31 | | | | 0.33 | | |
| Net realized and unrealized gain (loss) | | | 3.04 | | | | (4.27 | ) | | | (1.35 | ) | | | (0.58 | ) | | | 3.78 | | |
| | | | | | | | | | | | | | | | | | | | | | |
| Total from investment operations | | | 3.27 | | | | (4.00 | ) | | | (0.98 | ) | | | (0.27 | ) | | | 4.11 | | |
| Less distributions from: | | | | | | | | | | | | | | | | | | | | | |
| Net investment income | | | (0.19 | ) | | | (0.21 | ) | | | (0.37 | ) | | | (0.31 | ) | | | (0.35 | ) | |
| Net realized gains | | | — | | | | (0.05 | ) | | | (0.20 | ) | | | (0.13 | ) | | | (0.25 | ) | |
| | | | | | | | | | | | | | | | | | | | | | |
| Total distributions | | | (0.19 | ) | | | (0.26 | ) | | | (0.57 | ) | | | (0.44 | ) | | | (0.60 | ) | |
| | | | | | | | | | | | | | | | | | | | | | |
| Net asset value, end of period | | $ | 18.78 | | | $ | 15.70 | | | $ | 19.96 | | | $ | 21.51 | | | $ | 22.22 | | |
| | | | | | | | | | | | | | | | | | | | | | |
| Total Return (b) | | | 20.84 | %^ | | | -20.05 | % | | | -4.64 | % | | | -1.24 | % | | | 22.05 | % | |
| | | | | | | | | | | | | | | | | | | | | | |
| Ratios and Supplemental Data: | | | | | | | | | | | | | | | | | | | | | |
| Net assets, end of period (in thousands) | | $ | 880,047 | | | $ | 754,835 | | | $ | 859,747 | | | $ | 846,233 | | | $ | 734,699 | | |
| Ratios to average net assets: | | | | | | | | | | | | | | | | | | | | | |
| Net expenses | | | 1.37 | %^ | | | 1.39 | % | | | 1.38 | % | | | 1.38 | % | | | 1.39 | % | |
| Gross expenses | | | 1.38 | % | | | 1.39 | % | | | 1.38 | % | | | 1.38 | % | | | 1.39 | % | |
| Net investment income (loss) | | | 1.29 | %^ | | | 1.43 | % | | | 1.66 | % | | | 1.42 | % | | | 1.57 | % | |
| Portfolio turnover rate | | | 12 | % | | | 9 | % | | | 12 | % | | | 14 | % | | | 23 | % | |
| | | | |
| Selected data for a share of capital | | Year Ended | |
| stock outstanding throughout each period | | 12/31/16 | | | 12/31/15 | | | 12/31/14 | | | 12/31/13 | | | 12/31/12 | | |
| | | | | | | | | | | | | | | | | |
| Investor Shares | | | | | | | | | | | | | | | | | | | | | |
| Net asset value, beginning of period | | $ | 15.51 | | | $ | 19.74 | | | $ | 21.28 | | | $ | 21.99 | | | $ | 18.52 | | |
| Income (loss) from investment operations: | | | | | | | | | | | | | | | | | | | | | |
| Net investment income (loss) (a) | | | 0.26 | ^ | | | 0.32 | | | | 0.42 | | | | 0.37 | | | | 0.38 | | |
| Net realized and unrealized gain (loss) | | | 3.02 | | | | (4.25 | ) | | | (1.34 | ) | | | (0.59 | ) | | | 3.74 | | |
| | | | | | | | | | | | | | | | | | | | | | |
| Total from investment operations | | | 3.28 | | | | (3.93 | ) | | | (0.92 | ) | | | (0.22 | ) | | | 4.12 | | |
| Less distributions from: | | | | | | | | | | | | | | | | | | | | | |
| Net investment income | | | (0.23 | ) | | | (0.25 | ) | | | (0.42 | ) | | | (0.36 | ) | | | (0.40 | ) | |
| Net realized gains | | | — | | | | (0.05 | ) | | | (0.20 | ) | | | (0.13 | ) | | | (0.25 | ) | |
| | | | | | | | | | | | | | | | | | | | | | |
| Total distributions | | | (0.23 | ) | | | (0.30 | ) | | | (0.62 | ) | | | (0.49 | ) | | | (0.65 | ) | |
| | | | | | | | | | | | | | | | | | | | | | |
| Net asset value, end of period | | $ | 18.56 | | | $ | 15.51 | | | $ | 19.74 | | | $ | 21.28 | | | $ | 21.99 | | |
| | | | | | | | | | | | | | | | | | | | | | |
| Total Return (b) | | | 21.18 | %^ | | | -19.90 | % | | | -4.38 | % | | | -1.01 | % | | | 22.34 | % | |
| | | | | | | | | | | | | | | | | | | | | | |
| Ratios and Supplemental Data: | | | | | | | | | | | | | | | | | | | | | |
| Net assets, end of period (in thousands) | | $ | 187,408 | | | $ | 158,018 | | | $ | 229,855 | | | $ | 260,330 | | | $ | 282,596 | | |
| Ratios to average net assets: | | | | | | | | | | | | | | | | | | | | | |
| Net expenses | | | 1.12 | %^ | | | 1.15 | % | | | 1.14 | % | | | 1.14 | % | | | 1.14 | % | |
| Gross expenses | | | 1.14 | % | | | 1.15 | % | | | 1.14 | % | | | 1.14 | % | | | 1.14 | % | |
| Net investment income (loss) | | | 1.52 | %^ | | | 1.71 | % | | | 1.91 | % | | | 1.71 | % | | | 1.85 | % | |
| Portfolio turnover rate | | | 12 | % | | | 9 | % | | | 12 | % | | | 14 | % | | | 23 | % | |
| ^ | Refer to Note 3 in the Notes to Financial Statements for discussion of prior period custodian out-of-pocket expenses that were reimbursed to the Portfolio in the current period. The amount of the reimbursement was on a per share basis at less than $0.005 per share. There was a 0.06% impact on the total return of the Portfolio. There was a 0.02% impact on the net expenses and net investment income (loss) ratios of the Portfolio. |
| (a) | Net investment income (loss) has been computed using the average shares method. |
| (b) | Total returns reflect reinvestment of all dividends and distributions, if any. Performance information does not reflect the fees and charges imposed by participating insurance companies at the separate account level, and such charges will have the effect of reducing performance. |
The accompanying notes are an integral part of these financial statements.
LAZARD RETIREMENT GLOBAL DYNAMIC MULTI ASSET PORTFOLIO
| | | | | | | | | | | | | | | | |
| | | | | | | | | | | | | | | For the Period | |
| Selected data for a share of capital | | Year Ended | | 4/30/12* to | |
| stock outstanding throughout each period | | 12/31/16 | | | 12/31/15 | | | 12/31/14 | | | 12/31/13 | | | 12/31/12 | |
| | | | | | | | | | | | | | | | |
| Service Shares | | | | | | | | | | | | | | | | | | | | | |
| Net asset value, beginning of period | | $ | 11.51 | | | $ | 11.86 | | | $ | 12.30 | | | $ | 10.54 | | | $ | 10.00 | | |
| Income (loss) from investment operations: | | | | | | | | | | | | | | | | | | | | | |
| Net investment income (loss) | | | 0.14 | | | | 0.13 | | | | 0.11 | | | | 0.06 | | | | 0.03 | | |
| Net realized and unrealized gain (loss) | | | 0.24 | | | | (0.19 | ) | | | 0.23 | | | | 1.99 | | | | 0.54 | | |
| | | | | | | | | | | | | | | | | | | | | | |
| Total from investment operations | | | 0.38 | | | | (0.06 | ) | | | 0.34 | | | | 2.05 | | | | 0.57 | | |
| Less distributions from: | | | | | | | | | | | | | | | | | | | | | |
| Net investment income | | | (0.03 | ) | | | — | | | | (0.07 | ) | | | (0.04 | ) | | | — | (a) | |
| Net realized gains | | | (0.04 | ) | | | (0.29 | ) | | | (0.71 | ) | | | (0.25 | ) | | | (0.03 | ) | |
| | | | | | | | | | | | | | | | | | | | | | |
| Total distributions | | | (0.07 | ) | | | (0.29 | ) | | | (0.78 | ) | | | (0.29 | ) | | | (0.03 | ) | |
| | | | | | | | | | | | | | | | | | | | | | |
| Net asset value, end of period | | $ | 11.82 | | | $ | 11.51 | | | $ | 11.86 | | | $ | 12.30 | | | $ | 10.54 | | |
| | | | | | | | | | | | | | | | | | | | | | |
| Total Return (b) | | | 3.30 | % | | | -0.44 | % | | | 2.70 | % | | | 19.49 | % | | | 5.74 | % | |
| | | | | | | | | | | | | | | | | | | | | | |
| Ratios and Supplemental Data: | | | | | | | | | | | | | | | | | | | | | |
| Net assets, end of period (in thousands) | | $ | 293,286 | | | $ | 222,666 | | | $ | 176,669 | | | $ | 99,760 | | | $ | 30,262 | | |
| Ratios to average net assets (c): | | | | | | | | | | | | | | | | | | | | | |
| Net expenses | | | 1.05 | % | | | 1.05 | % | | | 1.05 | % | | | 1.05 | % | | | 1.05 | % | |
| Gross expenses | | | 1.25 | % | | | 1.31 | % | | | 1.33 | % | | | 1.70 | % | | | 3.80 | % | |
| Net investment income (loss) | | | 1.23 | % | | | 1.18 | % | | | 1.19 | % | | | 1.01 | % | | | 1.03 | % | |
| Portfolio turnover rate | | | 105 | % | | | 114 | % | | | 105 | % | | | 62 | % | | | 45 | % | |
| * | The Portfolio commenced operations on April 30, 2012. |
| (a) | Amount is less than $0.01 per share. |
| (b) | Total returns reflect reinvestment of all dividends and distributions, if any. Certain expenses of the Portfolio have been waived or reimbursed by the Portfolio’s Investment Manager, State Street or BFDS; without such waiver/reimbursement of expenses, the Portfolio’s returns would have been lower. Performance information does not reflect the fees and charges imposed by participating insurance companies at the separate account level, and such charges will have the effect of reducing performance. Return for a period of less than one year is not annualized. |
| (c) | Annualized for a period of less than one year. |
The accompanying notes are an integral part of these financial statements.
Lazard Retirement Series, Inc. Notes to Financial Statements December 31, 2016
1. Organization
Lazard Retirement Series, Inc. (the “Fund”) was incorporated in Maryland on February 13, 1997 and is registered under the Investment Company Act of 1940, as amended (the “1940 Act”), as an open-end management investment company. The Fund, comprised of twenty-one no-load portfolios (each referred to as a “Portfolio”), is currently offered only to separate accounts established by insurance companies to fund variable annuity contracts and variable life insurance policies. Portfolio shares may also be offered to certain qualified pension and retirement plans and accounts permitting accumulation of assets on a tax-deferred basis. Effective January 31, 2006, the Fund designated its existing class of shares as Service Shares and commenced offering Investor Shares. Investor Shares and Service Shares are identical, except as to the services offered to and expenses borne by each class of shares. As of December 31, 2016, only Lazard Retirement Emerging Markets Equity Portfolio had issued Investor Shares. Currently, only the following five Portfolios, each of which is “diversified”, as defined in the 1940 Act, are offered: Lazard Retirement US Strategic Equity Portfolio (“US Strategic Equity Portfolio”), Lazard Retirement US Small-Mid Cap Equity Portfolio (“US Small-Mid Cap Equity Portfolio”), Lazard Retirement International Equity Portfolio (“International Equity Portfolio”), Lazard Retirement Emerging Markets Equity Portfolio (“Emerging Markets Equity Portfolio”), and Lazard Retirement Global Dynamic Multi Asset Portfolio (“Global Dynamic Multi Asset Portfolio”). Each of the other sixteen Portfolios had not commenced operations as of December 31, 2016.
2. Significant Accounting Policies
The accompanying financial statements are presented in conformity with GAAP. The Fund is an investment company and therefore applies specialized accounting guidance in Accounting Standards Codification Topic 946. The following is a summary of significant accounting policies consistently followed by the Fund in the preparation of the financial statements:
(a) Valuation of Investments—Market values for securities listed on the New York Stock Exchange (“NYSE”), NASDAQ national market or other US or foreign
exchanges or markets are generally based on the last reported sales price on the exchange or market on which the security is principally traded on each valuation date; securities not traded on the valuation date are valued at the most recent quoted bid price. The Fund values NASDAQ-traded securities at the NASDAQ Official Closing Price, which may not be the last reported sales price in certain instances. Forward currency contracts generally are valued using quotations from an independent pricing service. Investments in money market funds are valued at the fund’s net asset value (“NAV”) per share.
Bonds and other fixed-income securities that are not exchange-traded are valued on the basis of prices provided by independent pricing services which are based on, among other things, trading in securities with similar characteristics, brokers’ quotations and/or a matrix system which considers such factors as other security prices, yields and maturities.
Calculation of a Portfolio’s NAV may not take place contemporaneously with the determination of the prices of portfolio assets used in such calculation. Trading on Europe, Latin and South America and Far East securities exchanges and in over-the-counter markets ordinarily is completed well before the close of business on each business day in New York (i.e., a day on which the NYSE is open). In addition, European or Far Eastern securities trading generally or in a particular country or countries may not take place on all business days in New York and on which the net asset value of a Portfolio is calculated.
The Valuation Committee of the Investment Manager, which meets periodically under the direction of the Board of Directors (the “Board”), may evaluate a variety of factors to determine the fair value of securities for which market quotations are determined not to be readily available or reliable. These factors include, but are not limited to, the type of security, the value of comparable securities, observations from financial institutions and relevant news events. Input from the Investment Manager’s portfolio managers/analysts also will be considered.
If a significant event materially affecting the value of securities occurs between the close of the exchange
or market on which the security is principally traded and the time when a Portfolio’s NAV is calculated, or when current market quotations otherwise are determined not to be readily available or reliable (including restricted or other illiquid securities such as certain derivative instruments), such securities will be valued at their fair value as determined by, or in accordance with procedures approved by, the Board. The fair value of non-US securities may be determined with the assistance of an independent pricing service using correlations between the movement of prices of such securities and indices of US securities and other appropriate indicators, such as closing market prices of relevant ADRs or futures contracts. Non-US securities may trade on days when a Portfolio is not open for business, thus affecting the value of the Portfolio’s assets on days when Portfolio shareholders may not be able to buy or sell Portfolio shares.
The effect of using fair value pricing is that the NAV of a Portfolio will reflect the affected securities’ values as determined in the judgment of the Board or its designee instead of being determined by the market. Using a fair value pricing methodology to price securities may result in a value that is different from the most recent closing price of a security and from the prices used by other investment companies to calculate their portfolios’ NAVs.
(b) Portfolio Securities Transactions and Investment Income—Portfolio securities transactions are accounted for on trade date. Realized gain (loss) on sales of investments are recorded on a specific identification basis. Dividend income is recorded on the ex-dividend date except for certain dividends from non-US securities where the dividend rate is not available. In such cases, the dividend is recorded as soon as the information is received by the Portfolio. Interest income, if any, is accrued daily. The Portfolios amortize premiums and accrete discounts on fixed-income securities using the effective yield method.
A Portfolio may be subject to taxes imposed by non-US countries in which it invests. Such taxes are generally based upon income earned or capital gains (realized or unrealized). An affected Portfolio accrues and applies such taxes to net investment income, net realized gains and net unrealized gains concurrent with the recogni-
tion of income earned or capital gains (realized and unrealized) from the applicable portfolio securities.
As a result of several court cases in certain countries across the European Union, the International Equity Portfolio has filed tax reclaims for previously withheld taxes on dividends earned in those countries. These filings are subject to various administrative proceedings by the local jurisdictions’ tax authorities within the European Union, as well as a number of related judicial proceedings. Uncertainty exists as to the ultimate resolution of these proceedings, the likelihood of receipt of these claims, and the potential timing of payment, and accordingly no amounts are reflected in the financial statements. Such amounts, if and when recorded, could result in an increase in the International Equity Portfolio’s NAV per share.
(c) Foreign Currency Translation and Forward Currency Contracts—The accounting records of the Fund are maintained in US dollars. Portfolio securities and other assets and liabilities denominated in a foreign currency are translated daily into US dollars at the prevailing rates of exchange. Purchases and sales of securities, income receipts and expense payments are translated into US dollars at the prevailing exchange rates on the respective transaction dates.
The Portfolios do not isolate the portion of operations resulting from changes in foreign exchange rates on investments from the fluctuations arising from changes in their market prices. Such fluctuations are included in net realized and unrealized gain (loss) on investments. Net realized gain (loss) on foreign currency transactions and forward currency contracts represents net foreign currency gain (loss) from forward currency contracts, disposition of foreign currencies, currency gain (loss) realized between the trade and settlement dates on securities transactions, and the difference between the amount of dividends, interest and foreign withholding taxes recorded on the Portfolios’ accounting records and the US dollar equivalent amounts actually received or paid. Net change in unrealized appreciation (depreciation) on foreign currency translations reflects the impact of changes in exchange rates on the value of assets and liabilities, other than investments in securities, during the period.
A forward currency contract is an agreement between two parties to buy or sell currency at a set price on a future date. Upon entering into these contracts, risks may arise from the potential inability of counterparties to meet the terms of their contracts and from unanticipated movements in the value of the foreign currency relative to the US dollar.
The US dollar value of forward currency contracts is determined using quotations provided by an independent pricing service. Daily fluctuations in the value of such contracts are recorded as unrealized appreciation (depreciation) on forward currency contracts. When the contract is closed, a Portfolio records a realized gain (loss) equal to the difference between the value at the time it was opened and the value at the time it was closed.
During the year ended December 31, 2016, the Global Dynamic Multi Asset Portfolio traded in forward currency contracts.
(d) Federal Income Taxes—The Fund’s policy is to continue to have each Portfolio qualify as a regulated investment company under Subchapter M of the Internal Revenue Code (the “Code”) and to distribute all of its taxable income, including any net realized capital gains, to shareholders. Therefore, no federal income tax provision is required.
At December 31, 2016, the following Portfolios had unused realized capital loss carryovers which, for federal income tax purposes, could be used to offset future realized capital gains with no expiration date as follows:
| Portfolio | | Short-Term | | | Long-Term | |
| | | | | | | | | |
| US Strategic Equity | | $ | 292,328 | | | $ | 211,350 | |
| International Equity | | | 15,195,915 | | | | 7,015,348 | |
| Emerging Markets Equity | | | 2,389,844 | | | | 77,306,735 | |
Under current tax law, post-October capital losses or certain late-year ordinary losses, as defined by the Code, within the taxable year may be deferred and treated as occurring on the first day of the following tax year. For the tax year ended December 31, 2016,
the following Portfolio elected to defer such losses as follows:
| Portfolio | | Post-October
Capital Loss
Deferral | | Late-Year
Ordinary Loss
Deferral |
| |
| Global Dynamic Multi Asset | | $ | — | | | $ | (4,449,624 | ) |
Management has analyzed the Portfolios’ tax positions, and has concluded that no liability for unrecognized tax benefits should be recorded related to uncertain tax positions taken on returns filed for open tax years (2013-2015), or expected to be taken in the Portfolios’ 2016 tax returns.
(e) Dividends and Distributions—Dividends from net investment income, if any, will be declared and paid annually. During any particular year, net realized gains from investment transactions in excess of available capital loss carryforwards would be taxable to the Portfolios, if not distributed. The Portfolios intend to declare and distribute these amounts, at least annually, to shareholders; however, to avoid taxation, a second distribution may be required. Differences in per share distributions, by class, are generally due to differences in class specific expenses.
Income and capital gains distributions are determined in accordance with federal income tax regulations which may differ from GAAP. These book/tax differences, which may result in distribution reclassifications, are primarily due to differing treatments of foreign currency transactions, wash sales, passive foreign investment companies and distributions from real estate investment trusts. The book/tax differences relating to shareholder distributions resulted in reclassifications among certain capital accounts as follows:
| Portfolio | | Paid in
Capital | | Undistributed
(Distributions
in Excess of)
Net Investment
Income | | Accumulated
Net Realized
Gain (Loss) |
| | | | | | | | | | | | | |
| US Strategic Equity | | $ | — | | | $ | (7,592 | ) | | $ | 7,592 | |
| US Small-Mid Cap Equity | | | (1 | ) | | | (32,716 | ) | | | 32,717 | |
| International Equity | | | (3,266 | ) | | | 233,508 | | | | (230,242 | ) |
| Emerging Markets Equity | | | (43,689 | ) | | | (77,521 | ) | | | 121,210 | |
| Global Dynamic Multi Asset | | | (509 | ) | | | (4,642,494 | ) | | | 4,643,003 | |
The tax character of dividends and distributions paid during the years ended December 31, were as follows:
| | | Ordinary Income | | | Long-Term Capital Gain | |
| Portfolio | | 2016 | | | 2015 | | | 2016 | | | 2015 | |
| | | | | | | | | | | | | | | | | |
| US Strategic Equity | | $ | 51,023 | | | $ | 66,454 | | | $ | 65,333 | | | $ | 777,991 | |
| US Small-Mid Cap Equity | | | 86,716 | | | | 2,258,175 | | | | 3,084,989 | | | | 2,207,054 | |
| International Equity | | | 8,837,882 | | | | 11,274,502 | | | | 1,500,249 | | | | 12,022,244 | |
| Emerging Markets Equity | | | 11,223,497 | | | | 12,280,066 | | | | — | | | | 2,754,426 | |
| Global Dynamic Multi Asset | | | 728,536 | | | | 685,717 | | | | 911,504 | | | | 4,731,968 | |
At December 31, 2016, the components of distributable earnings, on a tax basis, were as follows:
| Portfolio | | Undistributed
Ordinary Income
/Deferred Late
Year Ordinary
Losses | | | Undistributed
Long-Term
Capital Gain
/Deferred Capital
Losses | | | Net Unrealized
Appreciation
(Depreciation)
Including Foreign
Currency | |
| | | | | | | | | | | | | |
| US Strategic Equity | | $ | 80,766 | | | $ | (503,678 | ) | | $ | 1,212,938 | |
| US Small-Mid Cap Equity | | | 230,470 | | | | 2,635,464 | | | | 7,896,168 | |
| International Equity | | | 2,592,993 | | | | (22,211,263 | ) | | | 62,069,913 | |
| Emerging Markets Equity | | | 4,685,336 | | | | (79,696,579 | ) | | | (19,494,145 | ) |
| Global Dynamic Multi Asset | | | (4,449,624 | ) | | | 2,000,128 | | | | 5,935,911 | |
(f) Allocation of Expenses—Expenses not directly chargeable to a specific Portfolio are allocated among all Portfolios primarily on the basis of relative net assets. Portfolios accrue distribution and service (12b-1) fees to Service Shares. The Portfolios’ income, expenses (other than class specific expenses) and realized and unrealized gains and losses are allocated proportionally each day between the classes based upon the relative net assets of each class.
(g) Estimates—The preparation of financial statements in conformity with GAAP requires management to make estimates and assumptions that affect the reported amounts of assets and liabilities and disclosure of contingent assets and liabilities at the date of the financial statements and the reported amounts of increases and decreases in net assets resulting from operations during the reporting period. Actual results could differ from those estimates.
(h) Net Asset Value—NAV per share for each class of each Portfolio is determined each day the NYSE is open for trading as of the close of regular trading on the NYSE (generally 4:00 p.m. Eastern time). The Fund will not treat an intraday unscheduled disruption in NYSE trading as a closure of the NYSE, and will price its shares as of 4:00 p.m., if the particular disruption directly affects only the NYSE. NAV per share is determined by dividing the value of the total assets of the Portfolio represented by such class, less all liabilities, by the total number of Portfolio shares of such class outstanding.
3. Investment Management, Administration, Custody, Distribution and Transfer Agency Agreements
The Fund, on behalf of the Portfolios, has entered into a management agreement (the “Management Agreement”) with the Investment Manager. Pursuant to the Management Agreement, the Investment Manager regularly provides each Portfolio with investment research, advice and supervision and furnishes continuously an investment program for each Portfolio consistent with its investment objectives and policies, including the purchase, retention and disposition of securities. For its services provided to the Portfolios, the Investment Manager earns a management fee, accrued daily as a percentage of its average daily net assets and payable by each Portfolio monthly, at the annual rate set forth below:
| Portfolio | | Annual Rate |
| | | | | |
| US Strategic Equity | | | 0.70 | % |
| US Small-Mid Cap Equity | | | 0.75 | |
| International Equity | | | 0.75 | |
| Emerging Markets Equity | | | 1.00 | |
| Global Dynamic Multi Asset (a) | | | 0.80 | |
(a) From January 1, 2016 to June 28, 2016, percentage was 0.85%.
The Investment Manager has voluntarily agreed to reduce its fees and, if necessary, reimburse the Portfolios through May 1, 2017 if annualized operating expenses, exclusive of taxes, brokerage, interest on borrowings, fees and expenses of “Acquired Funds” (as defined in Form N-1A) and extraordinary expenses, but including the management fee stated in the Management Agreement between the Investment Manager and the Fund, on behalf of the Portfolios, exceed the
following percentages of the value of the Portfolios’ average daily net assets for the respective shares:
| Portfolio | | Service Shares | | Investor Shares |
| | | | | | | | | |
| US Strategic Equity | | | 1.00 | % | | | N/A | |
| US Small-Mid Cap Equity | | | 1.25 | | | | N/A | |
| International Equity | | | 1.10 | | | | N/A | |
| Emerging Markets Equity | | | 1.55 | | | | 1.30 | % |
| Global Dynamic Multi Asset | | | 1.05 | | | | N/A | |
During the year ended December 31, 2016, the Investment Manager waived its management fees and reimbursed the following Portfolios for other expenses as follows:
| | | Service Shares | |
| Portfolio | | Management
Fees Waived | | Expenses
Reimbursed | |
| | | | | | | | | |
| US Strategic Equity | | $ | 72,302 | | | $ | 61,768 | |
| US Small-Mid Cap Equity | | | 36,003 | | | | — | |
| Global Dynamic Multi Asset | | | 502,423 | | | | — | |
The aforementioned waivers and/or reimbursements are not subject to recoupment by the Investment Manager.
The Fund has entered into an administration agreement with State Street to provide certain administrative services. Each Portfolio bears the cost of such services at a fixed annual rate of $42,500, plus 0.02% of average daily net assets up to $1 billion and 0.01% of average daily net assets over $1 billion. State Street has agreed to waive up to $18,750 of the $42,500 annual fee for the US Strategic Equity Portfolio until the Portfolio’s net assets reach $25 million. During the year ended December 31, 2016, State Street waived $18,750 of its fee for the US Strategic Equity Portfolio.
State Street also serves as custodian for the Fund in accordance with a custodian agreement to provide certain custody services.
In December 2015, State Street announced that it had identified inconsistencies in the way in which clients were invoiced for out-of-pocket expenses from 1998 until 2015. The dollar amount difference between what was charged and what should have been charged, plus interest, will be paid back to the affected Portfolios directly in February 2017 as a reimbursement. This
reimbursement was recognized as a change in accounting estimate and reflected as “Reimbursement of custodian fees” in the Statements of Operations. Pursuant to the expense limitations described in Note 3, certain Portfolios have experienced management fee waivers during the year ended December 31, 2016. Accordingly, the reimbursement of out-of-pocket expenses resulted in the reduction in the waiver of management fees for certain Portfolios for the year ended December 31, 2016.
The Fund has a distribution agreement with Lazard Asset Management Securities LLC (the “Distributor”), a wholly-owned subsidiary of the Investment Manager, to serve as the distributor for shares of each Portfolio. The Distributor bears the cost of printing and mailing prospectuses to potential investors and certain expenses in connection with the offering of Portfolio shares.
Under a distribution and servicing plan adopted pursuant to Rule 12b-1 under the 1940 Act, each Portfolio pays a monthly fee to the Distributor, at an annual rate of 0.25% of the average daily net assets of its Service Shares, for distribution and servicing of accounts. The Distributor may make payments to participating insurance companies, certain financial institutions, securities dealers and other industry professionals for providing these services.
BFDS is the Fund’s transfer and dividend disbursing agent. For its services, BFDS receives a monthly fee computed on the basis of the number of shareholder accounts it maintains, subject to a minimum fee amount per share class in each Portfolio, and is reimbursed for certain out-of-pocket expenses. BFDS has agreed to waive the monthly minimum fee for the first six months after a new Portfolio or share class has commenced operations.
4. Directors’ Compensation
Certain Directors of the Fund are officers of the Investment Manager. For the year ended December 31, 2016, each Director who is not an affiliated person of the Investment Manager or any of its affiliates was paid by the Fund, The Lazard Funds, Inc., Lazard Global Total Return and Income Fund, Inc. and Lazard World Divi-
dend & Income Fund, Inc. (collectively with the Fund, the “Lazard Fund Complex”), each a registered management investment company advised by the Investment Manager: (1) an annual retainer of $190,000, (2) an additional annual fee of $20,000 to the lead Independent Director (an “Independent Director” is a Director who is not an “interested person” (as defined in the 1940 Act) of the Fund), and (3) an additional annual fee of $10,000 to the Audit Committee Chair. Effective January 1, 2017, the aggregate compensation for Independent Directors for the Lazard Fund Complex is comprised of: (1) an annual retainer of $210,000, (2) an additional annual fee of $30,000 to the lead Independent Director, and (3) an additional annual fee of $20,000 to the Audit Committee Chair. The Independent Directors may be paid additional compensation for participation on ad hoc committees or other work performed on behalf of the Board. The Independent Directors also are reimbursed for travel and other out-of-pocket expenses for attending Board and committee meetings. The Directors do not receive benefits from the Fund pursuant to any pension, retirement or similar arrangement. Independent Directors’ fees are allocated among the portfolios in the Lazard Fund Complex at a rate of $5,000 per portfolio with the remainder allocated based upon each portfolio’s proportionate share of combined net assets. The Statements of Operations show the Independent Directors’ fees and expenses paid by each Portfolio.
5. Securities Transactions and Transactions with Affiliates
Purchases and sales of portfolio securities (excluding short-term investments) for the year ended December 31, 2016 were as follows:
| Portfolio | | Purchases | | | Sales | |
| | | | | | | | | |
| US Strategic Equity | | $ | 5,785,543 | | | $ | 7,511,665 | |
| US Small-Mid Cap Equity | | | 52,614,173 | | | | 55,064,456 | |
| International Equity | | | 194,055,808 | | | | 180,169,385 | |
| Emerging Markets Equity | | | 117,048,069 | | | | 150,049,315 | |
| Global Dynamic Multi Asset | | | 323,164,350 | | | | 256,771,117 | |
| | | US Treasury Securities | |
| Portfolio | | Purchases | | | Sales | |
| | | | | | | | | |
| Global Dynamic Multi Asset | | $ | 4,619,303 | | | $ | 2,928,476 | |
For the year ended December 31, 2016, the Portfolios did not engage in any cross-trades in accordance with Rule 17a-7 under the 1940 Act, and no brokerage commissions were paid to affiliates of the Investment Manager or other affiliates of the Fund for portfolio transactions executed on behalf of the Fund.
6. Investment Risks
(a) Non-US Securities Risk—A Portfolio’s performance will be influenced by political, social and economic factors affecting the non-US countries and companies in which the Portfolio invests. Non-US securities carry special risks, such as less developed or less efficient trading markets, political instability, a lack of company information, differing auditing and legal standards, and, potentially, less liquidity.
(b) Emerging Market Risk—Emerging market countries can generally have economic structures that are less diverse and mature, and political systems that are less stable, than those of developed countries. The economies of countries with emerging markets may be based predominantly on only a few industries, may be highly vulnerable to changes in local or global trade conditions, and may suffer from extreme debt burdens or volatile inflation rates. The securities markets of emerging market countries have historically been extremely volatile. These market conditions may continue or worsen. Investments in these countries may be subject to political, economic, legal, market and currency risks. The risks may include less protection of property rights and uncertain political and economic policies, the imposition of capital controls and/or foreign investment limitations by a country, nationalization of businesses and the imposition of sanctions by other countries, such as the US. Significant devaluation of emerging market currencies against the US dollar may occur subsequent to acquisition of investments denominated in emerging market currencies.
(c) Foreign Currency Risk—Investments denominated in currencies other than US dollars may experience a decline in value, in US dollar terms, due solely to fluctuations in currency exchange rates. The Investment Manager does not intend to actively hedge the Portfolios’ foreign currency exposure.
(d) Fixed-Income and Debt Securities Risk—The market value of a debt security may decline due to general market conditions that are not specifically related to a particular company, such as real or perceived adverse economic conditions, changes in the outlook for corporate earnings, changes in interest or currency rates or adverse investor sentiment generally. The debt securities market can be susceptible to increases in volatility and decreases in liquidity. Liquidity can decline unpredictably in response to overall economic conditions or credit tightening.
Prices of bonds and other debt securities tend to move inversely with changes in interest rates. Typically, a rise in rates will adversely affect debt securities and, accordingly, will cause the value of a Portfolio’s investments in these securities to decline. Interest rate risk is usually greater for fixed-income securities with longer maturities or durations. A rise in interest rates (or the expectation of a rise in interest rates) may result in periods of volatility, decreased liquidity and increased redemptions, and, as a result, the Portfolio may have to liquidate portfolio securities at disadvantageous prices. Risks associated with rising interest rates are heightened given that interest rates in the US and other countries are at or near historic lows.
A Portfolio’s investments in lower-rated, higher-yielding securities (“junk bonds”) are subject to greater credit risk than its higher rated investments. Credit risk is the risk that the issuer will not make interest or principal payments, or will not make payments on a timely basis. Non-investment grade securities tend to be more volatile, less liquid and are considered speculative. If there is a decline, or perceived decline, in the credit quality of a debt security (or any guarantor of payment on such security), the security’s value could fall, potentially lowering the Portfolio’s share price. The prices of non-investment grade securities, unlike investment grade debt securities, may fluctuate unpredictably and not necessarily inversely with changes in interest rates. The prices of high yield securities can fall in response to negative news about the issuer or its industry, or the economy in general to a greater extent than those of higher rated securities. The market for these securities may be less liquid and therefore these securities may be harder to value or sell at
an acceptable price, especially during times of market volatility or decline.
Some fixed-income securities may give the issuer the option to call, or redeem, the securities before their maturity. If securities held by a Portfolio are called during a time of declining interest rates (which is typically the case when issuers exercise options to call outstanding securities), the Portfolio may have to reinvest the proceeds in an investment offering a lower yield (and the Portfolio may not fully benefit from any increase in the value of its portfolio holdings as a result of declining interest rates).
(e) Derivatives Risk—Forward currency contracts, options, futures contracts and credit default swap agreements and other derivatives transactions, including those entered into for hedging purposes (i.e., seeking to protect Portfolio investments), may increase volatility, reduce returns, limit gains or magnify losses, perhaps substantially, particularly since most derivatives have a leverage component that provides investment exposure in excess of the amount invested. Forward currency contracts, swap agreements and other over-the-counter derivatives transactions are subject to the risk of default by the counterparty and can be illiquid. These derivatives transactions, as well as the exchange-traded futures in which a Portfolio may invest, are subject to many of the risks of, and can be highly sensitive to changes in the value of, the related currency, interest rate, security or other reference asset. As such, a small investment could have a potentially large impact on the Portfolio’s performance. In fact, many derivatives may be subject to greater risks than those associated with investing directly in the underlying or other reference asset. Derivatives transactions incur costs, either explicitly or implicitly, which reduce returns, and costs of engaging in such transactions may outweigh any gains or any losses averted from hedging activities. Successful use of derivatives, whether for hedging or for other investment purposes, is subject to the Investment Manager’s ability to predict correctly movements in the direction of the relevant reference asset or market and, for hedging activities, correlation of the derivative instruments used with the investments seeking to be hedged. Use of derivatives transactions, even if
entered into for hedging purposes, may cause a Portfolio to experience losses greater than if the Portfolio had not engaged in such transactions.
7. Contractual Obligations
The Fund enters into contracts in the normal course of business that contain a variety of indemnifications. A Portfolio’s maximum exposure under these arrangements is unknown. Management has reviewed the Fund’s existing contracts and expects the risk of loss to be remote.
8. Fair Value Measurements
Fair value is defined as the price that a Portfolio would receive to sell an asset, or would pay to transfer a liability, in an orderly transaction between market participants at the date of measurement. The Fair Value Measurements and Disclosures provisions of GAAP also establish a framework for measuring fair value, and a three-level hierarchy for fair value measurement that is based upon the transparency of inputs to the valuation of an asset or liability. Inputs may be observable or unobservable and refer, broadly, to the assumptions that market participants would use in pricing the asset or liability. Observable inputs reflect the assumptions that market participants would use in pricing the asset or liability based
on market data obtained from sources independent of the Fund. Unobservable inputs reflect the Fund’s own assumptions about the assumptions that market participants would use in pricing the asset or liability, developed based on the best information available in the circumstances. Each investment’s fair value measurement level within the fair value hierarchy is based on the lowest level of any input that is significant to the overall fair value measurement. The three-level hierarchy of inputs is summarized below:
| • | Level 1 – unadjusted quoted prices in active markets for identical assets and liabilities |
| • | Level 2 – other significant observable inputs (including unadjusted quoted prices for similar investments, interest rates, prepayment speeds, credit risk, etc.) |
| • | Level 3 – significant unobservable inputs (including the Fund’s own assumptions in determining the fair value of investments) |
Changes in valuation technique may result in transfer into or out of the current assigned level within the hierarchy.
The inputs or methodology used for valuing securities are not necessarily an indication of the risks associated with investing in these securities.
The following table summarizes the valuation of the Portfolios’ investments by each fair value hierarchy level as of December 31, 2016:
| Description | | Unadjusted
Quoted Prices in
Active Markets
for Identical
Assets and Liabilities
(Level 1) | | Significant Other
Observable
Inputs
(Level 2) | | Significant
Unobservable
Inputs
(Level 3) | | Balance as of
December 31, 2016 | |
| | | | | | | | | | | | | |
| US Strategic Equity Portfolio | | | | | | | | | | | | | | | | |
| Common Stocks* | | $ | 10,105,742 | | | $ | — | | | $ | — | | | $ | 10,105,742 | |
| Short-Term Investment | | | 362,302 | | | | — | | | | — | | | | 362,302 | |
| Total | | $ | 10,468,044 | | | $ | — | | | $ | — | | | $ | 10,468,044 | |
| US Small-Mid Cap Equity Portfolio | | | | | | | | | | | | | | | | |
| Common Stocks* | | $ | 63,456,573 | | | $ | — | | | $ | — | | | $ | 63,456,573 | |
| Short-Term Investment | | | 2,003,138 | | | | — | | | | — | | | | 2,003,138 | |
| Total | | $ | 65,459,711 | | | $ | — | | | $ | — | | | $ | 65,459,711 | |
| Description | | Unadjusted
Quoted Prices in
Active Markets
for Identical
Assets and Liabilities
(Level 1) | | | Significant Other
Observable
Inputs
(Level 2) | | | Significant
Unobservable
Inputs
(Level 3) | | | Balance as of
December 31, 2016 | |
| | | | | | | | | | | | | | | | | |
| International Equity Portfolio | | | | | | | | | | | | | | | | |
| Common Stocks* | | | | | | | | | | | | | | | | |
| Australia | | $ | — | | | $ | 24,580,499 | | | $ | — | | | $ | 24,580,499 | |
| Belgium | | | — | | | | 22,469,872 | | | | — | | | | 22,469,872 | |
| Brazil | | | — | | | | 7,249,704 | | | | — | | | | 7,249,704 | |
| Canada | | | 38,091,053 | | | | — | | | | — | | | | 38,091,053 | |
| Denmark | | | — | | | | 7,209,231 | | | | — | | | | 7,209,231 | |
| Finland | | | — | | | | 15,375,088 | | | | — | | | | 15,375,088 | |
| France | | | — | | | | 67,454,587 | | | | — | | | | 67,454,587 | |
| Germany | | | — | | | | 15,703,159 | | | | — | | | | 15,703,159 | |
| Ireland | | | 7,411,305 | | | | 24,477,027 | | | | — | | | | 31,888,332 | |
| Italy | | | — | | | | 5,021,857 | | | | — | | | | 5,021,857 | |
| Japan | | | — | | | | 117,694,693 | | | | — | | | | 117,694,693 | |
| Luxembourg | | | — | | | | 4,326,136 | | | | — | | | | 4,326,136 | |
| Netherlands | | | — | | | | 35,243,743 | | | | — | | | | 35,243,743 | |
| Norway | | | — | | | | 16,990,697 | | | | — | | | | 16,990,697 | |
| Philippines | | | — | | | | 2,027,601 | | | | — | | | | 2,027,601 | |
| Spain | | | — | | | | 6,167,061 | | | | — | | | | 6,167,061 | |
| Sweden | | | — | | | | 23,237,033 | | | | — | | | | 23,237,033 | |
| Switzerland | | | 24,884,735 | | | | 14,603,101 | | | | — | | | | 39,487,836 | |
| Turkey | | | — | | | | 4,042,534 | | | | — | | | | 4,042,534 | |
| United Kingdom | | | — | | | | 89,685,917 | | | | — | | | | 89,685,917 | |
| United States | | | 22,125,742 | | | | — | | | | — | | | | 22,125,742 | |
| Other | | | 26,601,437 | | | | — | | | | — | | | | 26,601,437 | |
| Short-Term Investment | | | 28,928,875 | | | | — | | | | — | | | | 28,928,875 | |
| Total | | $ | 148,043,147 | | | $ | 503,559,540 | | | $ | — | | | $ | 651,602,687 | |
| Description | | Unadjusted
Quoted Prices in
Active Markets
for Identical
Assets and Liabilities
(Level 1) | | | Significant Other
Observable
Inputs
(Level 2) | | | Significant
Unobservable
Inputs
(Level 3) | | | Balance as of
December 31, 2016 | |
| | | | | | | | | | | | | | | | | |
| Emerging Markets Equity Portfolio | | | | | | | | | | | | | | | | |
| Common Stocks* | | | | | | | | | | | | | | | | |
| Brazil | | $ | 14,358,804 | | | $ | 100,230,106 | | | $ | — | | | $ | 114,588,910 | |
| China | | | 84,141,948 | | | | 81,737,247 | | | | — | | | | 165,879,195 | |
| Egypt | | | 527,539 | | | | 8,606,898 | | | | — | | | | 9,134,437 | |
| Hong Kong | | | — | | | | 3,922,380 | | | | — | | | | 3,922,380 | |
| Hungary | | | — | | | | 19,484,058 | | | | — | | | | 19,484,058 | |
| India | | | — | | | | 102,820,194 | | | | — | | | | 102,820,194 | |
| Indonesia | | | 23,088,888 | | | | 39,027,882 | | | | — | | | | 62,116,770 | |
| Malaysia | | | — | | | | 6,763,165 | | | | — | | | | 6,763,165 | |
| Pakistan | | | — | | | | 25,881,119 | | | | — | | | | 25,881,119 | |
| Russia | | | 16,574,705 | | | | 93,748,577 | | | | — | | | | 110,323,282 | |
| South Africa | | | — | | | | 95,233,695 | | | | — | | | | 95,233,695 | |
| South Korea | | | — | | | | 136,715,413 | | | | — | | | | 136,715,413 | |
| Taiwan | | | — | | | | 49,800,754 | | | | — | | | | 49,800,754 | |
| Thailand | | | — | | | | 13,242,157 | | | | — | | | | 13,242,157 | |
| Turkey | | | — | | | | 48,244,341 | | | | — | | | | 48,244,341 | |
| Other | | | 61,025,953 | | | | — | | | | — | | | | 61,025,953 | |
| Short-Term Investment | | | 40,344,509 | | | | — | | | | — | | | | 40,344,509 | |
| Total | | $ | 240,062,346 | | | $ | 825,457,986 | | | $ | — | | | $ | 1,065,520,332 | |
| Description | | Unadjusted
Quoted Prices in
Active Markets
for Identical
Assets and Liabilities
(Level 1) | | | Significant Other
Observable
Inputs
(Level 2) | | | Significant
Unobservable
Inputs
(Level 3) | | | Balance as of
December 31, 2016 | |
| | | | | | | | | | | | | | | | | |
| Global Dynamic Multi Asset Portfolio | | | | | | | | | | | | | | | | |
| Assets: | | | | | | | | | | | | | | | | |
| Common Stocks* | | | | | | | | | | | | | | | | |
| Australia | | $ | — | | | $ | 7,057,108 | | | $ | — | | | $ | 7,057,108 | |
| Belgium | | | 1,582,127 | | | | 128,389 | | | | — | | | | 1,710,516 | |
| Denmark | | | 1,313,235 | | | | 775,051 | | | | — | | | | 2,088,286 | |
| Finland | | | 1,364,223 | | | | 500,203 | | | | — | | | | 1,864,426 | |
| France | | | — | | | | 3,634,671 | | | | — | | | | 3,634,671 | |
| Germany | | | 2,034,712 | | | | 3,346,868 | | | | — | | | | 5,381,580 | |
| Hong Kong | | | 699,604 | | | | 4,046,908 | | | | — | | | | 4,746,512 | |
| Ireland | | | 1,747,224 | | | | 95,716 | | | | — | | | | 1,842,940 | |
| Israel | | | 325,146 | | | | 912,969 | | | | — | | | | 1,238,115 | |
| Italy | | | — | | | | 419,634 | | | | — | | | | 419,634 | |
| Japan | | | 3,514,906 | | | | 15,980,137 | | | | — | | | | 19,495,043 | |
| Malta | | | — | | | | 175,178 | | | | — | | | | 175,178 | |
| Netherlands | | | 1,896,838 | | | | 1,404,816 | | | | — | | | | 3,301,654 | |
| New Zealand | | | — | | | | 151,895 | | | | — | | | | 151,895 | |
| Norway | | | — | | | | 1,089,033 | | | | — | | | | 1,089,033 | |
| Portugal | | | — | | | | 900,320 | | | | — | | | | 900,320 | |
| Singapore | | | — | | | | 809,146 | | | | — | | | | 809,146 | |
| South Africa | | | — | | | | 64,772 | | | | — | | | | 64,772 | |
| Spain | | | — | | | | 2,237,963 | | | | — | | | | 2,237,963 | |
| Sweden | | | 1,204,026 | | | | 933,221 | | | | — | | | | 2,137,247 | |
| United Kingdom | | | 7,099,386 | | | | 9,568,660 | | | | — | | | | 16,668,046 | |
| United States | | | 128,343,270 | | | | 114,096 | | | | — | | | | 128,457,366 | |
| Other | | | 14,300,768 | | | | — | | | | — | | | | 14,300,768 | |
| Corporate Bonds* | | | — | | | | 24,622,619 | | | | — | | | | 24,622,619 | |
| Foreign Government Obligations* | | | — | | | | 26,622,132 | | | | — | | | | 26,622,132 | |
| Quasi Government Bonds* | | | — | | | | 4,551,217 | | | | — | | | | 4,551,217 | |
| Supranationals | | | — | | | | 3,980,550 | | | | — | | | | 3,980,550 | |
| US Municipal Bonds | | | — | | | | 2,758,689 | | | | — | | | | 2,758,689 | |
| US Treasury Securities | | | — | | | | 4,021,592 | | | | — | | | | 4,021,592 | |
| Short-Term Investment | | | 6,892,111 | | | | — | | | | — | | | | 6,892,111 | |
| Other Financial Instruments† | | | | | | | | | | | | | | | | |
| Forward Currency Contracts | | | — | | | | 1,871,247 | | | | — | | | | 1,871,247 | |
| Total | | $ | 172,317,576 | | | $ | 122,774,800 | | | $ | — | | | $ | 295,092,376 | |
| Liabilities: | | | | | | | | | | | | | | | | |
| Other Financial Instruments† | | | | | | | | | | | | | | | | |
| Forward Currency Contracts | | $ | — | | | $ | (2,750,798 | ) | | $ | — | | | $ | (2,750,798 | ) |
| * | Please refer to Portfolios of Investments (pages 17 through 35) and Notes to Portfolios of Investments (pages 37 through 38) for portfolio holdings by country and industry. |
| | |
| † | Other financial instruments are derivative instruments which are valued at their respective unrealized appreciation (depreciation). |
Certain equity securities to which footnote (c) in the Notes to Portfolios of Investments apply are included in Level 2 and were valued based on reference to similar securities which were trading on active markets.
In connection with the implementation of fair value pricing procedures with respect to non-US securities (see Note 2(a)), certain equity securities (other than those securities described in footnote (c) in the Notes
to Portfolios of Investments) in the International Equity, Emerging Markets Equity and Global Dynamic Multi Asset Portfolios can transfer from Level 1 to Level 2 as a result of fair value pricing procedures and would revert to Level 1 when the fair value pricing procedures are no longer used. Accordingly, a significant portion of the Portfolios’ investments are categorized as Level 2 investments. A Portfolio recognizes all
transfers between levels as though they were transferred at the beginning of the reporting period.
During the year ended December 31, 2016, securities valued at the following amounts were transferred from Level 2 to Level 1:
| Portfolio | | Amount | |
| | | | | |
| International Equity | | $ | 29,065,461 | |
| Global Dynamic Multi Asset | | | 1,126,070 | |
There were no other transfers into or out of Levels 1, 2 or 3 during the year ended December 31, 2016.
For further information regarding security characteristics see Portfolios of Investments.
9. Derivative Instruments
Certain Portfolios may use derivative instruments, including forward currency contracts.
Forward currency contracts may be used for hedging purposes or to seek to increase returns.
Global Dynamic Multi Asset Portfolio
During the year ended December 31, 2016, the approximate average monthly notional exposure for derivative instruments was as follows:
| Forward currency contracts | $92,600,000 |
The following table summarizes the fair value of derivative instruments on the Statement of Assets and Liabilities as of December 31, 2016:
| | | Fair Value |
| |
| Asset Derivatives | | | | |
| Foreign Exchange Risk: | | | | |
| Gross unrealized appreciation on forward currency contracts | | $ | 1,871,247 | |
| Liability Derivatives | | | | |
| Foreign Exchange Risk: | | | | |
| Gross unrealized depreciation on forward currency contracts | | $ | 2,750,798 | |
The effect of derivative instruments on the Statement of Operations for the year ended December 31, 2016 was:
| | | Amount | |
| |
| Realized Gain (Loss) on Derivatives | | | | |
| Foreign Exchange Risk: | | | | |
| Net realized gain (loss) on foreign currency transactions and forward currency contracts | | $ | 338,404 | |
| Net Change in Unrealized Appreciation (Depreciation) on Derivatives | | | | |
| Foreign Exchange Risk: | | | | |
| Net change in unrealized appreciation (depreciation) on foreign currency translations and forward currency contracts | | $ | (1,314,968 | ) |
See Note 2(c) and the Portfolios of Investments for additional disclosures about derivative instruments.
None of the other Portfolios presented traded in derivative instruments during the year ended December 31, 2016.
As of December 31, 2016, Global Dynamic Multi Asset Portfolio holds derivative instruments that are eligible for offset in the Statement of Assets and Liabilities and are subject to master netting arrangements. A master netting arrangement is an agreement between two counterparties who have multiple contracts with each other that provides for the net settlement of all contracts, as well as any cash collateral, through a single payment in the event of default on, or termination of, any one contract.
The required information for the affected Portfolio is presented in the below table, as of December 31, 2016:
| Description | Gross Amounts of
Recognized Assets | | Gross Amounts Offset
in the Statement of
Assets and Liabilities | | Net Amounts of
Assets Presented
in the Statement of
Assets and Liabilities |
| |
| Forward Currency Contracts | | $1,871,247 | | $ — | | $1,871,247 | |
| | | | | | | Amounts Not Offset in the
Statement of Assets and Liabilities | | | |
| Counterparty | | Net Amounts of
Assets Presented
in Statement of
Assets and Liabilities | | Financial
Instruments | | Collateral
Received | | Net Amounts of
Derivative Assets |
| | | | | | | |
| Citibank NA | | | $ | 533,992 | | | $ | (533,992 | ) | | $ | — | | | $ | — | |
| HSBC Bank USA NA | | | | 1,210,150 | | | | (1,210,150 | ) | | | — | | | | — | |
| JPMorgan Chase Bank NA | | | | 115,004 | | | | (8,966 | ) | | | — | | | | 106,038 | |
| State Street Bank and Trust Co. | | | | 12,101 | | | | (12,101 | ) | | | — | | | | — | |
| Total | | | $ | 1,871,247 | | | $ | (1,765,209 | ) | | $ | — | | | $ | 106,038 | |
| Description | Gross Amounts of
Recognized Liabilities | Gross Amounts Offset
in the Statement of
Assets and Liabilities | | Net Amounts of
Liabilities Presented
in the Statement of
Assets and Liabilities |
| |
| Forward Currency Contracts | | $2,750,798 | | $ — | | $2,750,798 | |
| | | | | | Amounts Not Offset in the
Statement of Assets and Liabilities | | | |
| Counterparty | | Net Amounts of
Liabilities Presented
in Statement of
Assets and Liabilities | | Financial
Instruments | | Collateral
Pledged | | Net Amounts of
Derivative Liabilities |
| | | | |
| Citibank NA | | | $ | 1,113,759 | | | $ | (533,992 | ) | | $ | — | | | $ | 579,767 | |
| HSBC Bank USA NA | | | | 1,596,232 | | | | (1,210,150 | ) | | | — | | | | 386,082 | |
| JPMorgan Chase Bank NA | | | | 8,966 | | | | (8,966 | ) | | | — | | | | — | |
| State Street Bank and Trust Co. | | | | 31,841 | | | | (12,101 | ) | | | — | | | | 19,740 | |
| Total | | | $ | 2,750,798 | | | $ | (1,765,209 | ) | | $ | — | | | $ | 985,589 | |
10. Recent Accounting Pronouncements
In October 2016, the U.S. Securities and Exchange Commission (the “SEC”) adopted new rules and amended existing rules (together, “final rules”) intended to modernize the reporting and disclosure of information by registered investment companies. In part, the final rules amend Regulation S-X and require standardized, enhanced disclosure about derivatives in investment company financial statements, as well as other amendments. The compliance date for the amendments to Regulation S-X is August 1, 2017.
Management is currently evaluating the impact that the adoption of the amendments to Regulation S-X will have on the Fund’s financial statements and related disclosures.
11. Subsequent Events
Management has evaluated subsequent events affecting the Fund through the issuance of the financial statements and has determined that there were no subsequent events that required adjustment or disclosure.
Lazard Retirement Series, Inc. Report of Independent Registered Public Accounting Firm
To the Board of Directors of Lazard Retirement Series, Inc. and Shareholders of Lazard Retirement US Strategic Equity Portfolio, Lazard Retirement US Small-Mid Cap Equity Portfolio, Lazard Retirement International Equity Portfolio, Lazard Retirement Emerging Markets Equity Portfolio, and Lazard Retirement Global Dynamic Multi Asset Portfolio:
We have audited the accompanying statements of assets and liabilities, including the portfolios of investments, of Lazard Retirement Series, Inc. (the “Funds”) comprising Lazard Retirement US Strategic Equity Portfolio, Lazard Retirement US Small-Mid Cap Equity Portfolio, Lazard Retirement International Equity Portfolio, Lazard Retirement Emerging Markets Equity Portfolio, and Lazard Retirement Global Dynamic Multi Asset Portfolio as of December 31, 2016, and the related statements of operations for the year then ended, the statements of changes in net assets for each of the two years in the period then ended, and the financial highlights for each of the three years in the period then ended. These financial statements and financial highlights are the responsibility of the Funds’ management. Our responsibility is to express an opinion on these financial statements and financial highlights based on our audits. The financial highlights for the periods presented on or before December 31, 2013 were audited by other auditors whose report, dated February 14, 2014, expressed an unqualified opinion on those financial highlights.
We conducted our audits in accordance with the standards of the Public Company Accounting Oversight Board (United States). Those standards require that we plan and perform the audit to obtain reasonable assurance about whether the financial statements and financial highlights are free of material misstatement. The Funds are not required to have, nor were we engaged to perform, an audit of its internal control over financial reporting. Our audits included consideration of internal control over financial reporting as a basis for designing audit procedures that are appropriate in the circumstances, but not for the purpose of expressing an opinion on the effectiveness of the Funds’ internal control over financial reporting. Accordingly, we express no such opinion. An audit also includes examining, on a test basis, evidence supporting the amounts and disclosures in the financial statements, assessing the accounting principles used and significant estimates made by management, as well as evaluating the overall financial statement presentation. Our procedures included confirmation of securities owned as of December 31, 2016, by correspondence with the custodian and brokers; where replies were not received from brokers, we performed other auditing procedures. We believe that our audits provide a reasonable basis for our opinion.
In our opinion, the financial statements and financial highlights referred to above present fairly, in all material respects, the financial position of Lazard Retirement US Strategic Equity Portfolio, Lazard Retirement US Small-Mid Cap Equity Portfolio, Lazard Retirement International Equity Portfolio, Lazard Retirement Emerging Markets Equity Portfolio, and Lazard Retirement Global Dynamic Multi Asset Portfolio as of December 31, 2016, the results of their operations for the year then ended, the changes in their net assets for each of the two years in the period then ended and the financial highlights for each of the three years in the period then ended, in conformity with accounting principles generally accepted in the United States of America.
DELOITTE & TOUCHE LLP
New York, New York
February 13, 2017
Lazard Retirement Series, Inc. Board of Directors and Officers Information (unaudited)
| Name (Age) | | Position(s) with the Fund | | Principal Occupation(s) and Other Public Company |
| Address(1) | | (Since) and Term(2) | | Directorships Held During the Past Five Years(2) |
| | | | | |
| Independent Directors(3): |
| |
| Franci J. Blassberg (63) | | Director
(August 2014) | | Debevoise & Plimpton LLP, a law firm, Of Counsel (2013 – present); previously, Partner (through 2012) University of California, Berkeley School of Law, Lecturer (Spring 2017) Cornell Law School, Visiting Professor of Practice (2015 – 2016); previously, Distinguished Practitioner in Residence (Fall 2013 and Fall 2014) |
Kenneth S. Davidson (71) | | Director
(April 1997) | | Davidson Capital Management Corporation, an investment manager, President (1978 – present) Landseer Advisors LLC, an investment manager, Senior Advisor (2012 – 2014) Aquiline Holdings LLC, an investment manager, Partner (2006 – 2012) |
Nancy A. Eckl (54) | | Director
(May 2007) | | College Retirement Equities Fund (eight accounts), Trustee (2007 – present) TIAA-CREF Funds (68 funds) and TIAA-CREF Life Funds (11 funds), Trustee (2007 – present) TIAA Separate Account VA-1, Member of the Management Committee (2007 – present) American Beacon Advisors, Inc. (“American Beacon”) and certain funds advised by American Beacon, Vice President (1990 – 2006) |
| Trevor W. Morrison (45) | | Director
(April 2014) | | New York University School of Law, Dean and Eric M. and Laurie B. Roth Professor of Law (2013 – present) Columbia Law School, Professor of Law (2008 – 2013) |
Richard Reiss, Jr. (72) | | Director
(April 1997) | | Georgica Advisors LLC, an investment manager, Chairman (1997 – present) Resource Americas, Inc., a real estate asset management company, Director (2016 – present) O’Charley’s, Inc., a restaurant chain, Director (1984 – 2012) |
| Robert M. Solmson (69) | | Director
(September 2004) | | Fairwood Capital, LLC, a private investment corporation engaged primarily in real estate and hotel investments, President (2008 – present) |
| | | | | |
| Name (Age) | | Position(s) with the Fund | | Principal Occupation(s) and Other Public Company |
| Address(1) | | (Since) and Term(2) | | Directorships Held During the Past Five Years(2) |
| | | | | |
| Interested Directors(4): |
| | | | | |
| Charles L. Carroll (56) | | Chief Executive Officer, President and Director
(June 2004) | | Investment Manager, Deputy Chairman and Head of Global Marketing (2004 – present) |
| | | | | |
| Ashish Bhutani (56) | | Director
(July 2005) | | Investment Manager, Chief Executive Officer (2004 – present) Lazard Ltd, Vice Chairman and Director (2010 – present) |
| (1) | The address of each Director of the Fund is Lazard Asset Management LLC, 30 Rockefeller Plaza, New York, New York 10112-6300. |
| | |
| (2) | Each Director serves as a Director for each of the funds in the Lazard Fund Complex (comprised of, as of January 31, 2017, 40 active investment portfolios). Each Director serves an indefinite term, until his or her successor is elected, and each Director serves in the same capacity for the other funds in the Lazard Fund Complex. |
| | |
| (3) | “Independent Directors” are not “interested persons” (as defined in the 1940 Act) of the Fund. |
| | |
| (4) | Messrs. Bhutani and Carroll are “interested persons” (as defined in the 1940 Act) of the Fund because of their positions with the Investment Manager. |
The Fund’s Statement of Additional Information contains further information about the Directors and is available without charge by calling 800-823-6300, or online, at www.LazardNet.com.
| Name (Age) | | Position(s) with the Fund | | |
| Address(1) | | (Since) and Term(2) | | Principal Occupation(s) During the Past Five Years |
| | | | | |
| Officers(3): | | | | |
| | | | | |
| Nathan A. Paul (44) | | Vice President and Secretary
(April 2002) | | Managing Director and General Counsel of the Investment Manager |
| | | | | |
| Christopher Snively (32) | | Chief Financial Officer
(March 2016) | | Senior Vice President of the Investment Manager (since November 2015) Assurance Manager at PricewaterhouseCoopers LLP (2008 – November 2015) |
| Stephen St. Clair (58) | | Treasurer
(May 2003) | | Vice President of the Investment Manager |
| | | | | |
| Mark R. Anderson (46) | | Chief Compliance Officer
(September 2014) | | Director and Chief Compliance Officer of the Investment Manager (since September 2014) Senior Vice President, Counsel and Deputy Chief Compliance Officer of AllianceBernstein L.P. (2004 – August 2014) |
| Tamar Goldstein (41) | | Assistant Secretary
(February 2009) | | Director (since February 2016, previously Senior Vice President), and Director of Legal Affairs (since July 2015) of the Investment Manager |
| | | | | |
| Shari L. Soloway (35) | | Assistant Secretary
(November 2015) | | Senior Vice President, Legal and Compliance, of the Investment Manager (since September 2015) Vice President and Associate General Counsel of GE Asset Management (July 2011 – September 2015) |
| Cesar A.Trelles (42) | | Assistant Treasurer
(December 2004) | | Vice President of the Investment Manager |
| | | | | |
| (1) | The address of each officer of the Fund is Lazard Asset Management LLC, 30 Rockefeller Plaza, New York, New York 10112-6300. |
| | |
| (2) | Each officer serves for an indefinite term, until his or her successor is elected and qualifies or until his or her earlier resignation or removal. Each officer serves in the same capacity for the other funds in the Lazard Fund Complex. |
| | |
| (3) | In addition to Charles L. Carroll, President, whose information is included in the Interested Directors section. |
Lazard Retirement Series, Inc. Other Information (unaudited)
Proxy Voting
A description of the policies and procedures used to determine how proxies relating to Fund portfolio securities are voted is available (1) without charge, upon request, by calling (800) 823-6300 or (2) on the SEC website at http://www.sec.gov.
The Fund’s proxy voting record for the most recent 12-month period ended June 30 is available (1) without charge, upon request, by calling (800) 823-6300 or (2) on the SEC’s website at http://www.sec.gov. Information as of June 30 each year will generally be available by the following August 31.
Form N-Q
The Fund files a complete schedule of each Portfolio’s holdings for the first and third quarters of its fiscal year with the SEC on Form N-Q. The Fund’s Forms N-Q are available on the SEC’s website at http://www.sec.gov and may be reviewed and copied at the SEC’s Public Reference Room in Washington, D.C. Information on the operation of the SEC’s Public Reference Room may be obtained by calling 1-800-SEC-0330.
Board Consideration of Management Agreement
Lazard Retirement Real Assets and Pricing Opportunities Portfolio
At a meeting of the Board held on November 9, 2016, the Board considered the approval of the Management Agreement between the Fund, on behalf of Lazard Retirement Real Assets and Pricing Opportunities Portfolio (the “New Portfolio”), and the Investment Manager (the “New Portfolio Management Agreement”). The Independent Directors were assisted in their review by independent legal counsel, who advised the Board on relevant legal standards and met with the Independent Directors in executive session separate from representatives of the Investment Manager.
Services Provided
The Board previously had received and discussed information addressing, among other matters, the nature, extent and quality of services that the Investment Manager provides to the Fund, including a discussion of the Investment Manager and its clients (of
which the existing Lazard Funds complex of 39 active funds comprises approximately $31 billion (as of September 30, 2016) of the approximately $205 billion of total assets under the management of the Investment Manager and its global affiliates as of September 30, 2016); the Investment Manager’s global research, portfolio management, operations, technology, legal and compliance and marketing infrastructure; and the Investment Manager’s personnel, resources, financial condition and experience. The Board received a presentation on the New Portfolio from members of the New Portfolio’s proposed portfolio management team, including the strategies to be employed for the New Portfolio and the New Portfolio’s portfolio management team, including professional biographies.
The Directors considered the various services to be provided by the Investment Manager including the Investment Manager’s research and portfolio management capabilities and oversight of day-to-day operations, including supervision of fund accounting and administration-related services and assistance in meeting legal and regulatory requirements. The Directors also considered the Investment Manager’s infrastructure and agreed that the New Portfolio would be expected to benefit from the services and infrastructure provided by the Investment Manager. The Directors accepted management’s assertion that such services and infrastructure would be greater than those typically provided to a $31 billion fund complex not managed by a large, global firm such as the Investment Manager.
Comparative Fee, Expense Ratio and Performance Information
The Directors reviewed comparative fee and expense ratio information prepared by Strategic Insight, an independent provider of investment company data.
Advisory Fee and Expense Ratio. The Directors discussed the proposed management fee to be paid to the Investment Manager (referred to in the Strategic Insight materials as the “advisory fee”) and expense ratio for the New Portfolio (as limited by the Investment Manager) and the comparisons provided by Strategic Insight, which compared the contractual advisory fee and expense ratio for the New Portfolio
to its group1 of comparison funds (“Group”), and the Directors noted the methodology and assumptions used by Strategic Insight. The proposed contractual advisory fee for the New Portfolio was below the median for the Group and the expense ratio for the New Portfolio was slightly above the median for the Group. The Board also considered the fees paid by a discretionary account advised by the Investment Manager with investment objectives, policies and strategies similar to those of the New Portfolio (the “Real Assets Other Account”).
Performance. The Directors considered the performance of the Real Assets Other Account compared to a 3-month LIBOR index (the “LIBOR Index”) and certain other securities indexes (the “Other Indexes”), although the Real Assets Other Account had less than two years of performance. The performance of the Real Assets Other Account (net of fees) was above that of the LIBOR Index, and was generally competitive with the Other Indexes for most periods, and with lower volatility (since inception) than the Other Indexes.
Investment Manager Profitability and Economies of Scale
Representatives of the Investment Manager noted that because the New Portfolio is newly formed, has not commenced operations and the eventual aggregate amount of the New Portfolio’s assets was uncertain, specific information concerning the cost of services to be provided to the New Portfolio and the expected profits to be realized by the Investment Manager and its affiliates from their relationships with the New Portfolio and economies of scale would be subject to a number of assumptions and would be speculative and not meaningful. The Investment Manager’s representatives stated that they did not expect the Investment Manager to realize any current profits on the New Portfolio initially, noting the Investment Manager’s agreement to waive its fees and/or reimburse expenses of the New Portfolio for at least two years following the New Portfolio’s commencement of operations to maintain the expense ratios reflected in the Strategic Insight materials. The Board determined to revisit this issue no later than when it next reviewed the investment management fee in connec-
tion with renewal of the New Portfolio Management Agreement. The Investment Manager’s representatives noted that neither the Investment Manager nor its affiliates were expected to receive any significant indirect benefits from the Investment Manager acting as investment adviser to the New Portfolio. The Investment Manager’s representatives reviewed with the Board information provided on the Investment Manager’s brokerage and soft dollar practices. The representatives of the Investment Manager stated that the Investment Manager intends to support distribution relationships through direct payments from its or its affiliates’ own resources to third parties in connection with distribution and shareholder servicing and/or administrative and recordkeeping services, and noted that the New Portfolio would not bear any related costs other than the 0.25% 12b-1 fee pursuant to the Distribution and Servicing Plan adopted for the New Portfolio’s Service Shares.
At the conclusion of these discussions, each of the Directors expressed the opinion that he or she had been furnished with such information as may reasonably be necessary to make an informed business decision with respect to the approval of the New Portfolio Management Agreement. Based on its discussions and considerations as described above, the Board made the following conclusions and determinations with regard to the New Portfolio Management Agreement:
| • | The Board concluded that the nature, extent and quality of the services to be provided by the Investment Manager are adequate and appropriate, noting the benefits of advisory and research services and other services and infrastructure (as discussed above) associated with an approximately $205 billion global asset management business. |
| | |
| • | The Board was satisfied with the resources the Investment Manager was to devote to management of the New Portfolio. |
| | |
| • | The Board concluded that the New Portfolio’s fee to be paid to the Investment Manager supported the approval of the New Portfolio Management Agreement in light of the considerations discussed above. |
1 The New Portfolio has one comparison group, corresponding to Service Shares.
| • | The Board recognized that economies of scale may be realized as the assets of the New Portfolio increase. The Board determined it would seek to have the Investment Manager share any material economies of scale with the New Portfolio. |
In evaluating the New Portfolio Management Agreement, the Board relied on the information described above as well as other information provided by the Investment Manager. The Board considered these conclusions and determinations in their totality and deter-
mined to approve the New Portfolio Management Agreement. In deciding whether to vote to approve the New Portfolio Management Agreement, each Director may have accorded different weights to different factors so that each Director may have had a different basis for his or her decision.
NOTES
NOTES
NOTES
Lazard Retirement Series, Inc.
30 Rockefeller Plaza
New York, New York 10112-6300
Telephone: 800-823-6300
http://www.LazardNet.com
Investment Manager
Lazard Asset Management LLC
30 Rockefeller Plaza
New York, New York 10112-6300
Telephone: 800-823-6300
Distributor
Lazard Asset Management Securities LLC
30 Rockefeller Plaza
New York, New York 10112-6300
Custodian
State Street Bank and Trust
Company One Iron Street
Boston, Massachusetts 02210
Transfer Agent and Dividend Disbursing Agent
Boston Financial Data Services, Inc.
P.O. Box 8514 Boston,
Massachusetts 02266-8514
Telephone: 800-986-3455
Independent Registered Public Accounting Firm
Deloitte & Touche LLP
30 Rockefeller Plaza
New York, New York 10112-0015
Legal Counsel
Stroock & Stroock & Lavan LLP
180 Maiden Lane
New York, New York 10038-4982
http://www.stroock.com

Performance information as of the most recent month end is available online at www.LazardNet.com.
| Lazard Asset Management LLC • 30 Rockefeller Plaza • New York NY 10112 • www.lazardnet.com |  |
| | |
| LZDPS010 | |
ITEM 2. CODE OF ETHICS.
The Registrant amended its Code during the period covered by this report. These amendments consisted of the following: (1) requiring that each Covered Officer, upon becoming a Covered Officer, must affirm in writing to the Fund’s Chief Compliance Officer (the “CCO”) that he has received, read, and understands the Code, and annually thereafter affirm to the CCO that he has complied with the requirements of the Code, rather than making such affirmations to the Registrant’s Board of Directors, and (2) certain other stylistic and non-substantive changes.
ITEM 3. AUDIT COMMITTEE FINANCIAL EXPERT.
The Registrant’s Board of Directors (the “Board”) has determined that Robert M. Solmson and Nancy A. Eckl, members of the Audit Committee of the Board, are audit committee financial experts as defined by the Securities and Exchange Commission (the “SEC”). Mr. Solmson and Ms. Eckl are “independent” as defined by the SEC for purposes of audit committee financial expert determinations.
ITEM 4. PRINCIPAL ACCOUNTANT FEES AND SERVICES.
(a) Audit Fees. The aggregate fees billed for each of the last two fiscal years (the “Reporting Periods”) for professional services rendered by the Registrant’s principal accountant (the “Auditor”) for the audit of the Registrant’s annual financial statements, or services that are normally provided by the Auditor in connection with the statutory and regulatory filings or engagements for the Reporting Periods, were $149,358 in 2015 and $103,938 in 2016 (plus expenses in each case).
(b) Audit-Related Fees. There were no fees billed in the Reporting Periods by the Auditor to the Registrant for assurance and related services that are reasonably related to the performance of the audit of the Registrant’s financial statements and are not reported under paragraph (a) of this Item 4.
The aggregate fees billed in the Reporting Periods for non-audit assurance and related services provided by the Auditor to Lazard Asset Management LLC, the Registrant’s investment manager (“Lazard”) and any entity controlling, controlled by or under common control with Lazard that provides ongoing services to the Registrant (“Service Affiliates”) that were reasonably related to the performance of the annual audit of the Service Affiliate which required pre-approval by the Audit Committee were $160,000 in 2015 and $163,000 in 2016.
(c) Tax Fees. The aggregate fees billed in the Reporting Periods by the Auditor to the Registrant for professional services rendered by the Auditor for tax compliance, tax advice and tax planning (“Tax Services”) were $64,517 in 2015 and $26,379 in 2016. These Tax Services consisted of (i) review or preparation of U.S. federal, state, local and excise tax returns; (ii) U.S. federal, state and local tax planning, advice and assistance regarding statutory, regulatory or administrative developments; and (iii) tax advice regarding tax qualification matters and/or treatment of various
financial instruments held or proposed to be acquired or held. Additionally, the aggregate fees billed related to European Union tax reclaim filing services rendered by the Auditor were $58,886 in 2015 and $72,079 in 2016.
The aggregate fees billed in the Reporting Periods for Tax Services provided by the Auditor to Service Affiliates which required pre-approval by the Audit Committee were $509 in 2015 and $0 in 2016.
(d) All Other Fees. There were no fees billed in the Reporting Periods for products and services provided by the Auditor, other than the services reported in paragraphs (a) through (c) above.
There were no fees billed in the Reporting Periods for products and services provided by the Auditor, other than the services reported in paragraphs (a) through (c) above, which required pre-approval by the Audit Committee.
(e) Audit Committee Pre-Approval Policies and Procedures. The Registrant’s Audit Committee pre-approves the Auditor’s engagements for audit and non-audit services to the Registrant and, as required, non-audit services to Service Affiliates on a case-by-case basis. Pre-approval considerations include whether the proposed services are compatible with maintaining the Auditor’s independence. There were no services provided by the Auditor to either the Registrant or Service Affiliates that were approved pursuant to paragraph (c)(7)(i)(C) of Rule 2-01 of Regulation S-X during the Reporting Periods.
(f) None.
(g) Non-Audit Fees. The aggregate non-audit fees billed by the Auditor for services rendered to the Registrant and Service Affiliates for the Reporting Periods were $906,230 in 2015 and $1,152,787 in 2016.
(h) Auditor Independence. The Audit Committee considered whether provision of non-audit services to Service Affiliates that were not required to be preapproved is compatible with maintaining the Auditor’s independence.
ITEM 5. AUDIT COMMITTEE OF LISTED REGISTRANTS.
Not applicable.
ITEM 6. INVESTMENTS
Not applicable.
ITEM 7. DISCLOSURE OF PROXY VOTING POLICIES AND PROCEDURES FOR CLOSED END MANAGEMENT INVESTMENT COMPANIES.
Not applicable.
ITEM 8. PORTFOLIO MANAGERS OF CLOSED-END MANAGEMENT INVESTMENT COMPANIES.
Not applicable.
ITEM 9. PURCHASES OF EQUITY SECURITIES BY CLOSED-END MANAGEMENT INVESTMENT COMPANY AND AFFILIATED PURCHASERS.
Not applicable.
ITEM 10. SUBMISSION OF MATTERS TO A VOTE OF SECURITY HOLDERS.
There were no material changes to the procedures by which shareholders may recommend nominees to the Registrant’s Board during the period covered by this report.
ITEM 11. CONTROLS AND PROCEDURES.
(a) The Registrant’s principal executive and principal financial officers have concluded, based on their evaluation of the Registrant’s disclosure controls and procedures as of a date within 90 days of the filing date of this report, that the Registrant’s disclosure controls and procedures are reasonably designed to ensure that information required to be disclosed by the Registrant on Form N-CSR is recorded, processed, summarized and reported within the required time periods and that information required to be disclosed by the Registrant in the reports that it files or submits on Form N-CSR is accumulated and communicated to the Registrant’s management, including its principal executive and principal financial officers, as appropriate to allow timely decisions regarding required disclosure.
(b) There were no changes to the Registrant’s internal control over financial reporting that occurred during the second fiscal quarter of the period covered by this report that have materially affected, or are reasonably likely to materially affect, the Registrant’s internal control over financial reporting.
ITEM 12. EXHIBITS.
(a)(1) Code of Ethics referred to in Item 2.
(a)(2) Certifications of principal executive and principal financial officers as required by Rule 30a-2(a) under the Investment Company Act of 1940.
(a)(3) Not applicable.
(b) Certifications of principal executive and principal financial officers as required by Rule 30a-2(b) under the Investment Company Act of 1940.
SIGNATURES
Pursuant to the requirements of the Securities Exchange Act of 1934 and the Investment Company Act of 1940, the registrant has duly caused this report to be signed on its behalf by the undersigned, thereunto duly authorized.
Lazard Retirement Series, Inc.
| By | /s/ Nathan A. Paul | |
| | Nathan A. Paul | |
| | Chief Executive Officer | |
| | | |
| Date | March 9, 2017 | |
Pursuant to the requirements of the Securities Exchange Act of 1934 and the Investment Company Act of 1940, this report has been signed below by the following persons on behalf of the registrant and in the capacities and on the dates indicated.
| By | /s/ Nathan A. Paul | |
| | Nathan A. Paul | |
| | Chief Executive Officer | |
| | | |
| Date | March 9, 2017 | |
| By | /s/ Christopher Snively | |
| | Christopher Snively | |
| | Chief Financial Officer | |
| | | |
| Date | March 9, 2017 | |