UNITED STATES SECURITIES AND EXCHANGE COMMISSION
Washington, D.C. 20549
FORM N-CSR
CERTIFIED SHAREHOLDER REPORT OF REGISTERED MANAGEMENT INVESTMENT COMPANIES
Investment Company Act file number 811-08071
Lazard Retirement Series, Inc.
(Exact name of registrant as specified in charter)
30 Rockefeller Plaza
New York, New York 10112
(Address of principal executive offices) (Zip code)
Mark R. Anderson, Esq.
Lazard Asset Management LLC
30 Rockefeller Plaza
New York, New York 10112
(Name and address of agent for service)
Registrant’s telephone number, including area code: (212) 632-6000
Date of fiscal year end: 12/31
Date of reporting period: 12/31/17
ITEM 1. REPORTS TO STOCKHOLDERS.

Lazard Retirement Series
Annual Report
December 31, 2017
| | US Equity Lazard Retirement US Strategic Equity Portfolio Lazard Retirement US Small-Mid Cap Equity Portfolio International Equity Lazard Retirement International Equity Portfolio | Emerging Markets Lazard Retirement Emerging Markets Equity Portfolio Asset Allocation Lazard Retirement Global Dynamic Multi-Asset Portfolio |
Lazard Retirement Series, Inc. Table of Contents
Shares of the Portfolios are currently offered only to separate accounts established by insurance companies to fund variable annuity contracts and variable life insurance policies. Portfolio shares may also be offered to certain qualified pension and retirement plans and accounts permitting accumulation of assets on a tax-deferred basis.
Please consider a Portfolio’s investment objectives, risks, charges and expenses carefully before investing. For more complete information about Lazard Retirement Series, Inc. (the “Fund”), you may obtain a prospectus or summary prospectus by calling 800-823-6300, or online, at www.lazardassetmanagement.com. Read the prospectus or each Portfolio’s summary prospectus carefully before you invest. The prospectus and each Portfolio’s summary prospectus contain the investment objectives, risks, charges, expenses and other information about each Portfolio of the Fund, which are not detailed in this report.
Distributed by Lazard Asset Management Securities LLC.
Lazard Retirement Series, Inc. A Message from Lazard
Dear Shareholder,
Record high global stock prices were supported by synchronized global economic growth in 2017. Markets also benefited from benign inflation, accommodative central bank policy, and strong corporate profits. Volatility remained at historic lows despite tension between North Korea and the United States and political uncertainty in Brazil, Spain, and the United Kingdom.
Emerging markets equity and debt advanced strongly in 2017. Emerging markets continued to benefit from low inflation, modest but steady growth, and improving profitability as global demand recovers and businesses tighten fiscal discipline. Earnings improvement in China and Korea drove returns in emerging markets. While our outlook for the asset class remains positive, our emerging markets investment teams are vigilant about potential risks. This includes an increase in developed markets inflation that could lead to central banks raising rates too quickly and, in effect, a global growth slowdown.
European equity markets performed well in 2017 as the region’s economic recovery deepened and investors grew more confident in its underlying strength. During the year, a market-friendly result to France’s presidential election helped buoy European sentiment. UK equities generated solid absolute returns amid a challenging political backdrop and Brexit negotiations. In addition, the European Central Bank announced that it would extend its monthly bond-buying program into 2018, but plans to reduce the pace of these purchases.
The US economy also advanced strongly during 2017. A new US tax bill represented one of the most significant changes to the US tax code in over 30 years as it changes individual, corporate, and international taxes. The US yield curve continued to flatten as short-term rates moved higher, driven by the three US rate hikes during 2017 and the prospect of additional hikes in 2018.
We are privileged that you have turned to Lazard for your investment needs and value your continued confidence in our investment management capabilities. Be assured that our specialist investment teams, supported by our global infrastructure, are continuing to strive for the long-term patterns of performance that you expect.
Sincerely,
Lazard Asset Management LLC
Lazard Retirement Series, Inc. Investment Overviews
US Equities
The S&P 500® Index rose 21.8% in 2017. Markets continued to rally into 2018 as investors gained confidence in the US economy’s ability to withstand global geopolitical risks, coupled with optimism that the Trump administration would decrease regulation and work with Congress to lower corporate taxes and increase defense and infrastructure spending. Economic data were generally strong during the year, as employment reports broadly exceeded expectations and the economy posted GDP growth of 3.0% or greater in the final two quarters of the year, auto sales recovered in the latter half of the year, and consumer confidence reached a 17-year high in November. Investors were also enthusiastic about the passage of a tax reform bill in December, which carried an expectation of economic growth through lower tax rates for many businesses and individual taxpayers.
International Equities
The strength of the global economy over the past year exceeded expectations, with positive growth occurring in all major regions, albeit off low levels. Outside the United States, earnings growth of over 20% drove stock returns higher in 2017 as measured by the MSCI EAFE® Index. Sector leadership was dominated by cyclicals, and more specifically by information technology. More defensive, and some higher-quality sectors such as consumer staples, healthcare, and telecommunications, lagged in this market.
As with sectors, regions with higher exposure to the global economy outperformed, driven by rising global growth prospects, a weaker US dollar, and the improvement of industrial commodities prices. These factors especially benefited emerging markets, which generated extraordinary returns of 37.3% in 2017. Emerging markets technology companies were especially favored by investors seeking companies with higher revenue and earnings growth—as well as higher valuations. Among developed markets, Japan generated significant returns in the fourth quarter, nearly matching the EAFE benchmark for the year after lagging in the first three quarters. Continental European equities outperformed the MSCI EAFE Index in US dollar terms in 2017, boosted by stronger currencies. UK equities generated solid absolute
returns in the year but modestly lagged the broader EAFE market amidst a challenging political backdrop and Brexit negotiations, which pushed valuation multiples lower.
Market sentiment has continued to rise above already high levels, and markets are near or past their historic highs—despite continued valuation, geopolitical, and credit risks. Our general impression is that the markets appear complacent and are extrapolating the current improved economic climate into the future. This further exacerbates the disconnect between high growth expectations and interest rates, which are at historic lows.
Emerging Markets Equities
Emerging markets equities enjoyed a strong year, driven by investor optimism about higher anticipated global economic growth. The MSCI Emerging Markets® Index increased by more than 37%, as measured in US dollar terms, in 2017, driven to a large extent by earnings improvements in China and Korea. Stocks in Asia substantially outperformed stocks in Latin America and eastern Europe. Information technology was, by some margin, the best-performing sector, aided by high revenue and profit growth. Commodity prices were generally weak in the first half of the year, but then strengthened in the second half with copper and crude oil prices rising markedly. The year also had political and economic tensions, including several missile launches by North Korea and the first year of the Trump administration, which involved some changes to long-term US policy, such as protectionism, as well as some reflationary effects.
The election victory of Emmanuel Macron in France was an important factor in supporting markets in eastern Europe. Returns were decent in the Czech Republic and strong in Hungary. Returns were particularly strong in Poland, where the nationalist policies of the government had been scrutinized. Stocks in Turkey were affected by a constitutional vote and worsening relations with many European nations, but ultimately finished modestly stronger than the index as investors became more confident of corporate earnings growth. South Africa also endured a turbulent year under President Jacob Zuma’s leadership, but finally flourished
as Cyril Ramaphosa was narrowly elected the African National Congress President. Qatari equities suffered as several of its regional neighbors labeled it a sponsor of terrorism and cut off diplomatic relations.
Although all Latin American markets registered positive returns over the year, the performance within countries varied. Mexican stocks rebounded in the first half of the year as it appeared that the North American Free Trade Agreement renegotiation would proceed more smoothly only to see this trend reverse in the second half of the year. Brazilian stocks experienced high volatility and considerable weakness after a recording of President Michel Temer apparently condoning corruption were made public. Temer fought against impeachment attempts and stayed in place, although this delayed, and may still diminish, any significant reforms. Chilean equities were helped by rebounding copper prices as well as Sebastian Pinera’s presidential victory.
Chinese stocks performed very strongly in 2017. Particularly impressive returns were witnessed in the internet-related industry where stocks like Tencent and Alibaba rose sharply amid considerably high revenue growth expectations. Despite the impeachment of President Park and a jail sentence for Samsung Electronics’ acting CEO, Korean stocks were bolstered due to improving expectations for exports as well as stronger and more stable semiconductor prices. Indian equities benefited from several Bharatiya Janata Party state election victories as well as measures announced to recapitalize the government-controlled banks. Thai stocks were aided by increasing exports and a strengthening economy. Pakistan was the worst-performing country in the MSCI Emerging Markets Index, negatively affected by a corruption scandal involving the president as well as technical changes involving the country’s move between frontier and emerging markets.
All sectors recorded positive returns in 2017. Information technology substantially outperformed all other industries. In addition, real estate and consumer discretionary sectors performed well. The weakest-performing sectors during the year were utilities and telecommunication services.
Multi-Asset
Global equities had strong gains over the year. The MSCI World® Index generated positive month-end returns for twelve consecutive months in 2017 in US dollar terms. This pattern reflected a very low volatility environment. European equities outperformed despite important elections in France and Germany. The Japanese market also did well due in part to some evidence of improving corporate governance. In terms of sectors, investors continued to push up prices of technology stocks, while defensive sectors such as utilities and consumer staples lagged. The energy sector struggled throughout the period, despite a recovery in crude prices toward the second half of the year.
The global economy ended 2017 on a strong note, fueled by a supportive monetary and fiscal policy environment, solid labor markets, robust global trade and manufacturing activity, and benign inflation in many countries. Interest rate movements were relatively subdued toward year-end, as rate markets in parts of Europe and the United States sold off slightly given exceptionally strong economic growth reports in these regions. German export and inflation data continued to surge, which helped the economies of Germany’s neighboring countries, especially in eastern Europe.
During the fourth quarter, Jerome Powell was named to succeed Janet Yellen as Fed Chair and is widely expected to maintain current Fed policy. The European Central Bank (ECB) also announced that it would extend its quantitative easing program through September 2018, lowering its monthly bond purchases to 30 billion euro.
Synchronized global growth and stable inflation supported risk appetite during the year (more so in equities than fixed income) as did the passage of the US Tax Cuts and Jobs Act. This improved sentiment helped many smaller markets around the world, except for countries such as Venezuela and Turkey, which experienced events that were generally negative for interest rates and flows in these regions.
Global credit sectors and spreads continued their march forward, underpinned by strong investor demand and capital inflows, along with generally
robust equity markets. The global sovereign and corporate issuance market was active and a variety of higher and lower quality credits came to market, possibly as issuers take advantage of the relatively stable environment.
Currency markets yielded mixed results in 2017 as interest rate differentials, inflation trends, politics, and idiosyncratic events influenced price action. The US dollar weakened overall for the year despite progress on US tax reforms and stronger economic data, which propelled the US dollar higher in October.
The euro, Japanese yen, and British pound gained 14.2%, 3.8%, and 9.5% versus the US dollar in 2017, respectively. We believe the euro’s strength is supported by the ECB’s pivot toward a reduction of monetary stimulus in 2018. The Japanese yen is supported by rapidly improving growth metrics, a slight shift in monetary policy rhetoric, and supportive technical factors.
Lazard Retirement US Strategic Equity Portfolio
For the year ended December 31, 2017, the Lazard Retirement US Strategic Equity Portfolio’s Service Shares posted a total return of 18.10%, as compared with the 21.83% return for the S&P 500 Index.
Stock selection in the financials sector aided performance. Shares of diversified financial services provider Citigroup rose amid optimism around industry deregulation, tax reform, and the prospect of stronger capital returns following the Fed’s annual stress tests. A lack of exposure to utilities also helped returns, as the sector was among the worst performers in the benchmark during the period.
In contrast, stock selection in the consumer staples sector detracted from performance. Shares of Molson Coors fell following poor communication at the company’s investor day, combined with a number of transitory factors. Stock selection in the health care sector also hurt returns. Shares of Medtronic fell in response to unexpected, temporary supply constraints in its diabetes business and potential changes to reimbursements in the Chinese medical device market.
Lazard Retirement US Small-Mid Cap Equity Portfolio
For the year ended December 31, 2017, the Lazard Retirement US Small-Mid Cap Equity Portfolio’s Service Shares posted a total return of 13.95%, as compared with the 16.81% return for the Russell 2500® Index.
Stock selection in the industrials sector helped performance. Shares of Proto Labs rose after the company reported quarterly earnings above expectations, driven by strong revenues. We sold our position in December, as the stock approached our target valuation. Stock selection and an underweight position in the consumer staples sector also helped returns. Shares of Sprouts Farmers Market rose amid ongoing speculation that the company could be an acquisition target.
In contrast, stock selection in the consumer discretionary sector detracted from performance. Shares of Advance Auto Parts fell along with the peers amid weaker winter demand, delayed tax refunds, and pressure from Amazon’s expansion into the auto parts space. We sold our position in July, as our thesis had changed. Stock selection in the financials sector also hurt returns. Shares of Home BancShares fell after regulatory factors and negative impacts from Hurricane Irma worried investors.
Lazard Retirement International Equity Portfolio
For the year ended December 31, 2017, the Lazard Retirement International Equity Portfolio’s Service Shares posted a total return of 22.33%, as compared with the 25.03% return for the MSCI EAFE Index.
The majority of the underperformance occurred in January, which was a continuation of the second half of the 2016 low-quality rally. During that period, investors bid up lower-quality equities as the global economy strengthened, central banks remained mostly accommodative, and the Trump administration’s campaign promises on taxes, reform, and infrastructure drove up investor expectations for improving global growth. While the difference in performance during this period between low-quality and high-quality stocks (as defined by ROE) was not unusual, the quickness was significant in historical terms. Since the dominance of low-quality equities ended in the middle of the first quarter of 2017,
investors have increasingly focused on fundamentals, making stock selection once again the driver of attribution. International equity prices were rewarded for improved global economic growth, more margin leverage, and cheaper currencies. Strong stock selection has been a differentiator, as the tailwinds that supported markets—especially stimulative central bank policy, increasing global economic growth off low levels, few signs of inflation, and hopes of a US-led fiscal package—are now well reflected in elevated valuations of lower-quality cyclicals. This environment was favorable for skilled stock selection, as the non-idiosyncratic factors that dominated the market from the second half of 2016 through the beginning of 2017 faded further.
Stock selection in the healthcare sector detracted from performance during the year, as our holding in Shire underperformed. Despite consistently strong fundamentals and an attractive valuation, Shire has struggled due to investor concerns over debt levels, its hemophilia franchise and, most recently, the departure of its CFO. After the announcement of this departure, we met with Shire management and concluded that our investment thesis remained intact. Elsewhere, industrials sector company Assa Abloy underperformed. Despite rising slightly for the year, the stock underperformed during the fourth quarter, the result of transitory issues in China, rising materials costs, and the CEO’s retirement announcement. Lastly, cash also continued to be a significant drag on relative performance for the year. As equity markets continued to rise during the year, and valuations remain elevated in historical terms, we have trimmed or sold some investments that have reached our target valuations faster than we have been able to replace them. Our cash exposure—which historically averages less than 5% of assets—is a byproduct of our process and is not a managed allocation. Our intention, as always, is to remain fully invested.
In contrast, stock selection in the consumer discretionary sector was additive to relative returns. Shares of Japanese retailer Don Quijote rose after reporting strong results driven by better sales and cost control, leading to operating profit margin expansion, while also increasing guidance. In the industrials sector,
Dutch software company Wolters Kluwer was a strong performer throughout the year. Stock selection in the real estate sector was also beneficial to relative returns. Daiwa House was a strong performer as it rose during the year. Our long-term ownership of the company has been predicated on the belief that the valuation has been too low given the company’s financial productivity and improving orders and margins driven by the improving global economic outlook and tight labor market in Japan. Positive stock selection in the telecommunications sector was driven by Nordic telecommunications provider Telenor, which owns additional assets in emerging markets countries Malaysia and Thailand. Telenor stock rallied in the second half of the year, mostly because management reported earnings in July that beat expectations. The positive surprise was a result of operating expense reductions that were significantly ahead of guidance and which led to margin improvements in the majority of their business units. In addition, Telenor management’s capital allocation decisions were rewarded as the proceeds from recent asset sales were redistributed to shareholders through a share buyback.
Lazard Retirement Emerging Markets Equity Portfolio
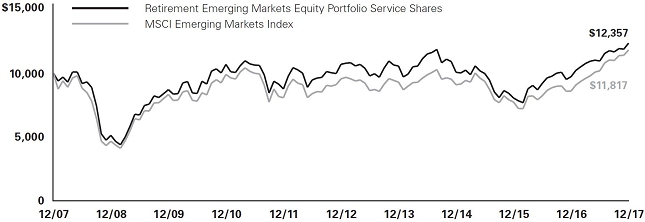
For the year ended December 31, 2017, the Lazard Retirement Emerging Markets Equity Portfolio’s Investor Shares posted a total return of 28.08%, while Service Shares posted a total return of 27.77%, as compared with the 37.28% return for the MSCI Emerging Markets Index.
During the year, Magnit, a Russian food retailer, reported disappointing results for the fourth quarter amid increased competitive pressure. Shares of Habib Bank, a Pakistani bank, fell after the company was fined $225 million by the Department of Financial Services, the New York financial regulator, over compliance failures by its New York branch, which was subsequently shut down. Shares of Gazprom, a Russian gas company, declined as hopes for an increased dividend payout ratio diminished. Shares of Life Healthcare, a South African hospital operator, declined as local health insurance companies applied pressure through the medical procedure approval process. Oil & Gas Development, a Pakistani energy company, was hurt by declining oil prices and political
concerns as the prime minister was called to testify in a “Panama Papers” probe. Stock selection within the information technology, consumer discretionary, and financials sectors and within China hurt performance. A higher-than-index exposure to the telecom services sector and to Russia and Pakistan, and lower-than-index exposure to China detracted from performance.
In contrast, Samsung Electronics, a leading Korean technology company, continued to benefit from stronger memory pricing, the acceleration of organic light-emitting diode technology, and stronger pre-orders for its Galaxy Note 8 phone. Shares of Taiwan Semiconductor Manufacturing gained amid expectations for a strong Apple-led ramp-up in the second half of the year. NetEase, a Chinese publisher of online games and web portal company, provided an upbeat assessment of its 2018 games pipeline on its third quarter earnings call. SK Hynix, a Korean semiconductor company, performed well due to stronger-than-expected memory prices. Shares of Sberbank, a Russian bank, rose after management provided an upbeat guidance for 2017 with improving loan growth and increased deposits. Stock selection within Russia, overall, added value.
Lazard Retirement Global Dynamic Multi-Asset Portfolio
For the year ended December 31, 2017, the Lazard Retirement Global Dynamic Multi-Asset Portfolio’s Service Shares posted a total return of 20.53%, as compared with the 22.40% return of the MSCI World Index and 14.69% return of its blended benchmark, which is a 50/50 blend of the MSCI World Index and
the Bloomberg Barclays Global Aggregate® Index (the “GDMA Index”).
Changes to the market forecast in 2017 reflected a generally cautious stance. However, some underlying considerations shifted to more upbeat views on the back of broadly recognized synchronized global growth and some liquidity indicators. However, our assessment of geopolitical risk remained elevated through the year.
The Portfolio’s average overweight of equity versus fixed income helped performance, as did stock selection in the financials, healthcare, and industrials sectors; underweight exposure to the energy sector; stock selection in Canada, Germany, and the United States; and country allocation within fixed income: underweight exposure to bonds across core Europe and Japan; overweight exposure to bonds in the United States, Singapore, and New Zealand. Performance was also boosted by sector selection within fixed income: underweight government bonds and overweight positioning in diversified global credit sectors; currency exposure within fixed income: tactical positioning in Australian dollar, New Zealand dollar, and Swedish krona.
In contrast, performance was hurt by stock selection in the consumer discretionary, telecommunication services, and utilities sectors; stock selection in the United Kingdom; country allocation within fixed income: exposure to bonds in the Czech Republic and Mexico; and currency exposure within fixed income: underweight positioning in the Canadian dollar.
Notes to Investment Overviews:
All Portfolios’ total returns reflect reinvestment of all dividends and distributions, if any. Certain expenses of a Portfolio may have been waived or reimbursed by Lazard Asset Management LLC, the Fund’s investment manager (the “Investment Manager”), State Street Bank and Trust Company, the Fund’s administrator (“State Street”), or Boston Financial Data Services, Inc., the Fund’s transfer and dividend disbursing agent (“BFDS”); without such waiver/reimbursement of expenses, such Portfolio’s returns would have been lower. Performance information does not reflect the fees and charges imposed by participating insurance companies at the separate account level, and such charges will have the effect of reducing performance. Past performance is not indicative, or a guarantee, of future results.
The performance data of the indices and other market data have been prepared from sources and data that the Investment Manager believes to be reliable, but no representation is made as to their accuracy. These indices are unmanaged, have no fees or costs and are not available for investment.
The views of the Investment Manager and the securities described in this report are as of December 31, 2017; these views and portfolio holdings may have changed subsequent to this date. Nothing herein should be construed as a recommendation to buy, sell, or hold a particular security. There is no assurance that the securities discussed herein will remain in a Portfolio at the time you receive this report, or that securities sold will not have been repurchased. The specific securities discussed may, in aggregate, represent only a small percentage of a Portfolio’s holdings. It should not be assumed that securities identified and discussed were, or will be, profitable, or that the investment decisions made in the future will be profitable, or equal the investment performance of the securities discussed herein.
The views and opinions expressed are provided for general information only, and do not constitute specific tax, legal, or investment advice to, or recommendations for, any person. There can be no guarantee as to the accuracy of any outlooks for markets, sectors and securities as discussed herein. You should read the Fund’s prospectus or each Portfolio’s summary prospectus for a more detailed discussion of each Portfolio’s investment objectives, strategies, risks and fees.
Lazard Retirement Series, Inc. Performance Overviews
Lazard Retirement US Strategic Equity Portfolio
Comparison of Changes in Value of $10,000 Investment in the Service Shares of Lazard Retirement US Strategic Equity Portfolio and S&P 500® Index*
Average Annual Total Returns*
Periods Ended December 31, 2017
| | One
Year | Five
Years | Ten
Years | |
| Service Shares | 18.10% | 12.41% | 6.81% | |
| S&P 500 Index | 21.83% | 15.79% | 8.50% | |
| * | Total returns reflect reinvestment of all dividends and distributions, if any. Certain expenses of the Portfolio may have been waived or reimbursed by the Investment Manager, State Street or BFDS; without such waiver/reimbursement of expenses, the Portfolio’s returns would have been lower. Performance information does not reflect the fees and charges imposed by participating insurance companies at the separate account level, and such charges will have the effect of reducing performance. |
| | Performance results do not include adjustments made for financial reporting purposes in accordance with accounting principles generally accepted in the United States of America (“GAAP”), if any, and may differ from amounts reported in the financial highlights. |
| | The performance quoted represents past performance. Current performance may be lower or higher than the performance quoted. Past performance is not indicative, or a guarantee, of future results; the investment return and principal value of the Portfolio will fluctuate, so that Portfolio shares, when redeemed, may be worth more or less than their original cost. Within the longer periods illustrated there may have been short-term fluctuations, counter to the overall trend of investment results, and no single period of any length may be taken as typical of what may be expected in future periods. |
| | The performance data of the index has been prepared from sources and data that the Investment Manager believes to be reliable, but no representation is made as to its accuracy. The S&P 500 Index is a market capitalization-weighted index of 500 companies in leading industries of the US economy. The index is unmanaged, has no fees or costs and is not available for investment. |
Lazard Retirement US Small-Mid Cap Equity Portfolio
Comparison of Changes in Value of $10,000 Investment in the Service Shares of Lazard Retirement US Small-Mid Cap Equity Portfolio, Russell 2500® Index and Russell 2000/2500 Linked Index*
Average Annual Total Returns*
Periods Ended December 31, 2017
| | One
Year | Five
Years | Ten
Years | |
| Service Shares | 13.95% | 14.07% | 8.81% | |
| Russell 2500 Index | 16.81% | 14.33% | 9.22% | |
| Russell 2000/2500 Linked Index | 16.81% | 14.33% | 9.29% | |
| * | Total returns reflect reinvestment of all dividends and distributions, if any. Certain expenses of the Portfolio may have been waived or reimbursed by the Investment Manager, State Street or BFDS; without such waiver/reimbursement of expenses, the Portfolio’s returns would have been lower. Performance information does not reflect the fees and charges imposed by participating insurance companies at the separate account level, and such charges will have the effect of reducing performance. |
| | Performance results do not include adjustments made for financial reporting purposes in accordance with GAAP, if any, and may differ from amounts reported in the financial highlights. |
| | The performance quoted represents past performance. Current performance may be lower or higher than the performance quoted. Past performance is not indicative, or a guarantee, of future results; the investment return and principal value of the Portfolio will fluctuate, so that Portfolio shares, when redeemed, may be worth more or less than their original cost. Within the longer periods illustrated there may have been short-term fluctuations, counter to the overall trend of investment results, and no single period of any length may be taken as typical of what may be expected in future periods. |
| | The Portfolio was previously known as Lazard Retirement U.S. Small Cap Equity Portfolio. As of June 1, 2009, the Portfolio changed its name to Lazard Retirement U.S. Small-Mid Cap Equity Portfolio and changed its investment strategy to invest in equity securities of small-mid cap US companies. |
| | The performance data of the indices have been prepared from sources and data that the Investment Manager believes to be reliable, but no representation is made as to their accuracy. The Russell 2500 Index measures the performance of the small-to mid-cap segment of the US equity universe, commonly referred to as “smid” cap. The Russell 2500 Index is a subset of the Russell 3000® Index. The Russell 3000 Index measures the performance of the largest 3,000 US companies, representing approximately 98% of the investable US equity market. It includes approximately 2,500 of the smallest securities based on a combination of their market cap and current index membership. The Russell 2000/2500 Linked Index is an unmanaged index created by the Investment Manager, which links the performance of the Russell 2000® Index for all periods through May 31, 2009 (when the Portfolio’s investment focus was changed from small cap companies to small-mid cap companies) and the Russell 2500 Index for all periods thereafter. The Russell 2000 Index includes approximately 2,000 of the smallest securities in the Russell 3000 Index, representing roughly 10% of the total market capitalization of Russell 3,000 companies. The indices are unmanaged, have no fees or costs and are not available for investment. |
Lazard Retirement International Equity Portfolio
Comparison of Changes in Value of $10,000 Investment in the Service Shares of Lazard Retirement International Equity Portfolio and MSCI EAFE® Index*
Average Annual Total Returns*
Periods Ended December 31, 2017
| | One
Year | Five
Years | Ten
Years | |
| Service Shares | 22.33% | 6.63% | 2.37% | |
| MSCI EAFE Index | 25.03% | 7.90% | 1.94% | |
| * | Total returns reflect reinvestment of all dividends and distributions, if any. Certain expenses of the Portfolio may have been waived or reimbursed by the Investment Manager, State Street or BFDS; without such waiver/reimbursement of expenses, the Portfolio’s returns would have been lower. Performance information does not reflect the fees and charges imposed by participating insurance companies at the separate account level, and such charges will have the effect of reducing performance. |
| | Performance results do not include adjustments made for financial reporting purposes in accordance with GAAP, if any, and may differ from amounts reported in the financial highlights. |
| | The performance quoted represents past performance. Current performance may be lower or higher than the performance quoted. Past performance is not indicative, or a guarantee, of future results; the investment return and principal value of the Portfolio will fluctuate, so that Portfolio shares, when redeemed, may be worth more or less than their original cost. Within the longer periods illustrated there may have been short-term fluctuations, counter to the overall trend of investment results, and no single period of any length may be taken as typical of what may be expected in future periods. |
| | The performance data of the index has been prepared from sources and data that the Investment Manager believes to be reliable, but no presentation is made as to its accuracy. The MSCI EAFE Index (Europe, Australasia, Far East) is a free-float-adjusted market capitalization index that is designed to measure developed markets equity performance, excluding the United States and Canada. The MSCI EAFE Index consists of 21 developed markets country indices. The index is unmanaged, has no fees or costs and is not available for investment. |
Lazard Retirement Emerging Markets Equity Portfolio
Comparison of Changes in Value of $10,000 Investment in the Service Shares of Lazard Retirement Emerging Markets Equity Portfolio and MSCI Emerging Markets® Index*
Average Annual Total Returns*
Periods Ended December 31, 2017
| | One
Year | Five
Years | Ten
Years | |
| Service Shares** | 27.77% | 3.05% | 2.20% | |
| Investor Shares** | 28.08% | 3.30% | 2.45% | |
| MSCI Emerging Markets Index | 37.28% | 4.35% | 1.68% | |
| * | Total returns reflect reinvestment of all dividends and distributions, if any. Certain expenses of the Portfolio may have been waived or reimbursed by the Investment Manager, State Street or BFDS; without such waiver/reimbursement of expenses, the Portfolio’s returns would have been lower. Performance information does not reflect the fees and charges imposed by participating insurance companies at the separate account level, and such charges will have the effect of reducing performance. |
| | Performance results do not include adjustments made for financial reporting purposes in accordance with GAAP, if any, also exclude one-time adjustments related to reimbursed custodian out-of-pocket expenses (Note 3 in the Notes to Financial Statements), and may differ from amounts reported in the financial highlights. |
| | The performance quoted represents past performance. Current performance may be lower or higher than the performance quoted. Past performance is not indicative, or a guarantee, of future results; the investment return and principal value of the Portfolio will fluctuate, so that Portfolio shares, when redeemed, may be worth more or less than their original cost. Within the longer periods illustrated there may have been short-term fluctuations, counter to the overall trend of investment results, and no single period of any length may be taken as typical of what may be expected in future periods. |
| | The performance data of the index has been prepared from sources and data that the Investment Manager believes to be reliable, but no representation is made as to its accuracy. The MSCI Emerging Markets Index is a free-float-adjusted market capitalization index that is designed to measure equity market performance in the global emerging markets. The MSCI Emerging Markets Index consists of 24 emerging-market country indices. The index is unmanaged, has no fees or costs and is not available for investment. |
| ** | The performance of Service Shares and Investor Shares may vary, primarily based on the differences in fees borne by shareholders investing in different classes. |
Lazard Retirement Global Dynamic Multi-Asset Portfolio
Comparison of Changes in Value of $10,000 Investment in the Service Shares of Lazard Retirement Global Dynamic Multi-Asset Portfolio, MSCI World® Index and GDMA Index*
Average Annual Total Returns*
Periods Ended December 31, 2017
| | One
Year | Five
Years | Since
Inception† | |
| Service Shares | 20.53% | 8.75% | 8.74% | |
| MSCI World Index | 22.40% | 11.64% | 11.16% | |
| GDMA Index | 14.69% | 6.21% | 6.14% | |
| * | Total returns reflect reinvestment of all dividends and distributions, if any. Certain expenses of the Portfolio may have been waived or reimbursed by the Investment Manager, State Street or BFDS; without such waiver/reimbursement of expenses, the Portfolio’s returns would have been lower. Performance information does not reflect the fees and charges imposed by participating insurance companies at the separate account level, and such charges will have the effect of reducing performance. |
| | Performance results do not include adjustments made for financial reporting purposes in accordance with GAAP, if any, and may differ from amounts reported in the financial highlights. |
| | The performance quoted represents past performance. Current performance may be lower or higher than the performance quoted. Past performance is not indicative, or a guarantee, of future results; the investment return and principal value of the Portfolio will fluctuate, so that Portfolio shares, when redeemed, may be worth more or less than their original cost. Within the longer periods illustrated there may have been short-term fluctuations, counter to the overall trend of investment results, and no single period of any length may be taken as typical of what may be expected in future periods. |
| | The performance data of the indices have been prepared from sources and data that the Investment Manager believes to be reliable, but no representation is made as to their accuracy. The MSCI World Index is a free-float-adjusted market capitalization index that is designed to measure global developed markets equity performance. The MSCI World Index consists of 23 developed markets country indices. The GDMA Index is an unmanaged index created by the Investment Manager and is a 50/50 blend of MSCI World Index and the Bloomberg Barclays Global Aggregate® Index. The Bloomberg Barclays Global Aggregate Index provides a broad-based measure of global investment-grade fixed-income debt markets, including government-related debt, corporate debt, securitized debt and global Treasury. The indices are unmanaged, have no fees or costs and are not available for investment. |
| † | The inception date for the Portfolio was April 30, 2012. |
Lazard Retirement Series, Inc. Information About Your Portfolio’s Expenses
Expense Example
As a shareholder in a Portfolio of the Fund, you incur ongoing costs, including management fees, distribution and service (12b-1) fees (Service Shares only), and other expenses. This Example is intended to help you understand your ongoing costs (in dollars) of investing in a Portfolio and to compare these costs with the ongoing costs of investing in other mutual funds. The Example is based on an investment of $1,000 invested at the beginning of the six month period from July 1, 2017 through December 31, 2017 and held for the entire period.
Actual Expenses
For each Share class of the Portfolios, the first line of the table below provides information about actual account values and actual expenses. You may use the information in this line, together with the amount you invested, to estimate the expenses that you paid over the period. Simply divide your account value by $1,000 (for example, an $8,600 account value divided by $1,000=8.6), then multiply the result by the number in the first line under the heading entitled “Expenses Paid During Period” to estimate the expenses you paid on your account during this period.
Hypothetical Example for Comparison Purposes
For each Share class of the Portfolios, the second line of the table below provides information about hypothetical account values and hypothetical expenses based on the class’ actual expense ratio and an assumed rate of return of 5% per year before expenses, which is not the Portfolio’s actual return. The hypothetical account values and expenses may not be used to estimate the actual ending account balance or expenses you paid for the period. You may use this information to compare the ongoing costs of investing in the Portfolio and other mutual funds. To do so, compare this 5% hypothetical example with the 5% hypothetical examples that appear in the shareholders reports of other mutual funds.
Please note that you also bear fees and charges imposed by participating insurance companies at the separate account level, which are described in the separate prospectuses issued by the participating insurance companies. Such charges will have the effect of reducing account value.
| Portfolio | | Beginning
Account Value
7/1/17 | | Ending
Account Value
12/31/17 | | Expenses Paid
During Period*
7/1/17 - 12/31/17 | | Annualized Expense
Ratio During Period
7/1/17 - 12/31/17 |
| | | | | | | | | | | | | | | | | |
| US Strategic Equity | | | | | | | | | | | | | | | | |
| Service Shares | | | | | | | | | | | | | | | | |
| Actual | | $ | 1,000.00 | | | $ | 1,094.50 | | | $ | 5.28 | | | | 1.00 | % |
| Hypothetical (5% Return Before Expenses) | | $ | 1,000.00 | | | $ | 1,020.16 | | | $ | 5.09 | | | | 1.00 | % |
| | | | | | | | | | | | | | | | | |
| US Small-Mid Cap Equity | | | | | | | | | | | | | | | | |
| Service Shares | | | | | | | | | | | | | | | | |
| Actual | | $ | 1,000.00 | | | $ | 1,093.50 | | | $ | 6.07 | | | | 1.15 | % |
| Hypothetical (5% Return Before Expenses) | | $ | 1,000.00 | | | $ | 1,019.41 | | | $ | 5.85 | | | | 1.15 | % |
| | | | | | | | | | | | | | | | | |
| International Equity | | | | | | | | | | | | | | | | |
| Service Shares | | | | | | | | | | | | | | | | |
| Actual | | $ | 1,000.00 | | | $ | 1,093.50 | | | $ | 5.91 | | | | 1.12 | % |
| Hypothetical (5% Return Before Expenses) | | $ | 1,000.00 | | | $ | 1,019.56 | | | $ | 5.70 | | | | 1.12 | % |
| | | | | | | | | | | | | | | | | |
| Emerging Markets Equity | | | | | | | | | | | | | | | | |
| Service Shares | | | | | | | | | | | | | | | | |
| Actual | | $ | 1,000.00 | | | $ | 1,131.20 | | | $ | 7.41 | | | | 1.38 | % |
| Hypothetical (5% Return Before Expenses) | | $ | 1,000.00 | | | $ | 1,018.25 | | | $ | 7.02 | | | | 1.38 | % |
| Investor Shares | | | | | | | | | | | | | | | | |
| Actual | | $ | 1,000.00 | | | $ | 1,132.40 | | | $ | 6.07 | | | | 1.13 | % |
| Hypothetical (5% Return Before Expenses) | | $ | 1,000.00 | | | $ | 1,019.51 | | | $ | 5.75 | | | | 1.13 | % |
| | | | | | | | | | | | | | | | | |
| Global Dynamic Multi-Asset | | | | | | | | | | | | | | | | |
| Service Shares | | | | | | | | | | | | | | | | |
| Actual | | $ | 1,000.00 | | | $ | 1,097.60 | | | $ | 5.55 | | | | 1.05 | % |
| Hypothetical (5% Return Before Expenses) | | $ | 1,000.00 | | | $ | 1,019.91 | | | $ | 5.35 | | | | 1.05 | % |
| * | Expenses are equal to the annualized expense ratio, net of expenses waivers and reimbursements, of each Share class multiplied by the average account value over the period, multiplied by 184/365 (to reflect one-half year period). |
Lazard Retirement Series, Inc. Portfolio Holdings Presented by Sector December 31, 2017
| Sector* | | Lazard
Retirement
US Strategic
Equity Portfolio | | Lazard
Retirement
US Small-Mid Cap
Equity Portfolio | | Lazard
Retirement
International
Equity Portfolio | | Lazard
Retirement
Emerging Markets
Equity Portfolio |
| | | | | | | | | | | | | | | | | | |
| Consumer Discretionary | | | 9.2 | % | | | 9.2 | % | | | 12.4 | % | | | 9.1 | % | |
| Consumer Staples | | | 7.4 | | | | 4.6 | | | | 10.5 | | | | 5.6 | | |
| Energy | | | 6.1 | | | | 4.6 | | | | 7.6 | | | | 7.5 | | |
| Financials | | | 14.0 | | | | 18.7 | | | | 17.3 | | | | 28.9 | | |
| Health Care | | | 11.0 | | | | 5.8 | | | | 7.4 | | | | 0.7 | | |
| Industrials | | | 11.5 | | | | 18.4 | | | | 20.0 | | | | 5.5 | | |
| Information Technology | | | 29.8 | | | | 14.3 | | | | 7.2 | | | | 24.0 | | |
| Materials | | | 3.4 | | | | 8.2 | | | | 5.5 | | | | 2.9 | | |
| Real Estate | | | 1.4 | | | | 10.1 | | | | 2.6 | | | | — | | |
| Telecommunication Services | | | 2.3 | | | | — | | | | 6.1 | | | | 11.0 | | |
| Utilities | | | — | | | | 3.4 | | | | 1.5 | | | | 1.2 | | |
| Short-Term Investments | | | 3.9 | | | | 2.7 | | | | 1.9 | | | | 3.6 | | |
| Total Investments | | | 100.0 | % | | | 100.0 | % | | | 100.0 | % | | | 100.0 | % | |
| Sector* | | Lazard Retirement
Global Dynamic
Multi-Asset
Portfolio |
| | | | | | |
| Consumer Discretionary | | | 11.2 | % | |
| Consumer Staples | | | 7.6 | | |
| Energy | | | 5.1 | | |
| Financials | | | 15.3 | | |
| Health Care | | | 10.3 | | |
| Industrials | | | 11.6 | | |
| Information Technology | | | 13.0 | | |
| Materials | | | 2.6 | | |
| Real Estate | | | 2.8 | | |
| Telecommunication Services | | | 3.5 | | |
| Utilities | | | 2.9 | | |
| Municipal | | | 0.4 | | |
| Sovereign Debt | | | 7.2 | | |
| US Treasury Securities | | | 2.1 | | |
| Short-Term Investments | | | 4.4 | | |
| Total Investments | | | 100.0 | % | |
| * | Represents percentage of total investments. |
Lazard Retirement Series, Inc. Portfolios of Investments December 31, 2017
| Description | | Shares | | | Fair
Value | |
| | | | | | | | | |
| Lazard Retirement US Strategic Equity Portfolio | | | | | | | | |
| | | | | | | | | |
| Common Stocks | 96.2% | | | | | | | | |
| | | | | | | | | |
| Aerospace & Defense | 2.2% | | | | | | | | |
| United Technologies Corp. | | | 1,670 | | | $ | 213,042 | |
| | | | | | | | | |
| Air Freight & Logistics | 2.8% | | | | | | | | |
| United Parcel Service, Inc., Class B | | | 2,335 | | | | 278,215 | |
| | | | | | | | | |
| Auto Components | 1.4% | | | | | | | | |
| Aptiv PLC | | | 1,605 | | | | 136,152 | |
| | | | | | | | | |
| Banks | 9.8% | | | | | | | | |
| Citigroup, Inc. | | | 4,340 | | | | 322,939 | |
| Citizens Financial Group, Inc. | | | 5,875 | | | | 246,633 | |
| Sterling Bancorp | | | 5,425 | | | | 133,455 | |
| SunTrust Banks, Inc. | | | 4,065 | | | | 262,558 | |
| | | | | | | | 965,585 | |
| Beverages | 6.7% | | | | | | | | |
| Molson Coors Brewing Co., Class B | | | 3,285 | | | | 269,600 | |
| The Coca-Cola Co. | | | 8,525 | | | | 391,127 | |
| | | | | | | | 660,727 | |
| Biotechnology | 1.3% | | | | | | | | |
| Biogen, Inc. (*) | | | 250 | | | | 79,642 | |
| Gilead Sciences, Inc. | | | 650 | | | | 46,566 | |
| | | | | | | | 126,208 | |
| Building Products | 0.5% | | | | | | | | |
| Johnson Controls International PLC | | | 1,225 | | | | 46,685 | |
| | | | | | | | | |
| Capital Markets | 3.3% | | | | | | | | |
| Intercontinental Exchange, Inc. | | | 3,145 | | | | 221,911 | |
| Morgan Stanley | | | 1,875 | | | | 98,381 | |
| | | | | | | | 320,292 | |
| Chemicals | 1.0% | | | | | | | | |
| Agrium, Inc. | | | 480 | | | | 55,200 | |
| PPG Industries, Inc. | | | 400 | | | | 46,728 | |
| | | | | | | | 101,928 | |
| Commercial Services & Supplies | 0.5% | | | | | | | | |
| Copart, Inc. (*) | | | 1,145 | | | | 49,453 | |
| | | | | | | | | |
| Communications Equipment | 7.0% | | | | | | | | |
| Cisco Systems, Inc. | | | 9,855 | | | | 377,446 | |
| Motorola Solutions, Inc. | | | 2,590 | | | | 233,981 | |
| Palo Alto Networks, Inc. (*) | | | 530 | | | | 76,818 | |
| | | | | | | | 688,245 | |
| Description | | Shares | | | Fair
Value | |
| | | | | | | | | |
| Containers & Packaging | 1.3% | | | | | | | | |
| Crown Holdings, Inc. (*) | | | 2,230 | | | $ | 125,437 | |
| | | | | | | | | |
| Diversified Telecommunication Services | 2.4% | | | | | | | | |
| AT&T, Inc. | | | 5,975 | | | | 232,308 | |
| | | | | | | | | |
| Electrical Equipment | 1.9% | | | | | | | | |
| Eaton Corp. PLC | | | 2,375 | | | | 187,649 | |
| | | | | | | | | |
| Energy Equipment & Services | 1.4% | | | | | | | | |
| Schlumberger, Ltd. | | | 2,115 | | | | 142,530 | |
| | | | | | | | | |
| Equity Real Estate Investment Trusts (REITs) | 1.5% | | | | | | | | |
| Prologis, Inc. | | | 2,230 | | | | 143,857 | |
| | | | | | | | | |
| Food Products | 0.6% | | | | | | | | |
| Kellogg Co. | | | 950 | | | | 64,581 | |
| | | | | | | | | |
| Health Care Equipment & Supplies | 3.9% | | | | | | | | |
| Medtronic PLC | | | 3,780 | | | | 305,235 | |
| Stryker Corp. | | | 510 | | | | 78,968 | |
| | | | | | | | 384,203 | |
| Health Care Providers & Services | 0.8% | | | | | | | | |
| Humana, Inc. | | | 330 | | | | 81,863 | |
| | | | | | | | | |
| Hotels, Restaurants & Leisure | 3.0% | | | | | | | | |
| McDonald’s Corp. | | | 1,250 | | | | 215,150 | |
| Starbucks Corp. | | | 1,320 | | | | 75,808 | |
| | | | | | | | 290,958 | |
| Industrial Conglomerates | 1.6% | | | | | | | | |
| General Electric Co. | | | 3,100 | | | | 54,095 | |
| Honeywell International, Inc. | | | 680 | | | | 104,285 | |
| | | | | | | | 158,380 | |
| Insurance | 1.0% | | | | | | | | |
| Aon PLC | | | 710 | | | | 95,140 | |
| | | | | | | | | |
| Internet Software & Services | 8.1% | | | | | | | | |
| Alphabet, Inc., Class A (*) | | | 461 | | | | 485,618 | |
| Alphabet, Inc., Class C (*) | | | 43 | | | | 44,995 | |
| eBay, Inc. (*) | | | 6,945 | | | | 262,104 | |
| | | | | | | | 792,717 | |
The accompanying notes are an integral part of these financial statements.
| Description | | Shares | | | Fair
Value | |
| | | | | | | | | |
| Lazard Retirement US Strategic Equity Portfolio (concluded) |
| | | | | | | | | |
| IT Services | 4.9% | | | | | | | | |
| CoreLogic, Inc. (*) | | | 1,900 | | | $ | 87,799 | |
| DXC Technology Co. | | | 1,390 | | | | 131,911 | |
| Vantiv, Inc., Class A (*) | | | 915 | | | | 67,298 | |
| Visa, Inc., Class A | | | 1,730 | | | | 197,255 | |
| | | | | | | | 484,263 | |
| Machinery | 1.6% | | | | | | | | |
| Deere & Co. | | | 690 | | | | 107,992 | |
| Wabtec Corp. | | | 650 | | | | 52,929 | |
| | | | | | | | 160,921 | |
| Marine | 0.4% | | | | | | | | |
| Kirby Corp. (*) | | | 545 | | | | 36,406 | |
| | | | | | | | | |
| Media | 0.5% | | | | | | | | |
| The Madison Square Garden Co., Class A (*) | | | 255 | | | | 53,767 | |
| | | | | | | | | |
| Metals & Mining | 1.1% | | | | | | | | |
| Steel Dynamics, Inc. | | | 2,550 | | | | 109,981 | |
| | | | | | | | | |
| Multiline Retail | 0.6% | | | | | | | | |
| Dollar Tree, Inc. (*) | | | 560 | | | | 60,094 | |
| | | | | | | | | |
| Oil, Gas & Consumable Fuels | 4.6% | | | | | | | | |
| Cimarex Energy Co. | | | 440 | | | | 53,684 | |
| ConocoPhillips | | | 3,040 | | | | 166,866 | |
| EOG Resources, Inc. | | | 1,255 | | | | 135,427 | |
| Pioneer Natural Resources Co. | | | 585 | | | | 101,117 | |
| | | | | | | | 457,094 | |
| Pharmaceuticals | 5.0% | | | | | | | | |
| Pfizer, Inc. | | | 9,200 | | | | 333,224 | |
| Zoetis, Inc. | | | 2,163 | | | | 155,823 | |
| | | | | | | | 489,047 | |
| Semiconductors & Semiconductor Equipment | 4.0% | | | | | | | | |
| Cypress Semiconductor Corp. | | | 4,895 | | | | 74,600 | |
| Intel Corp. | | | 2,275 | | | | 105,014 | |
| Skyworks Solutions, Inc. | | | 2,225 | | | | 211,264 | |
| | | | | | | | 390,878 | |
| Description | | Shares | | | Fair
Value | |
| | | | | | | | | |
| Software | 3.5% | | | | | | | | |
| Microsoft Corp. | | | 4,005 | | | $ | 342,588 | |
| | | | | | | | | |
| Specialty Retail | 3.0% | | | | | | | | |
| AutoZone, Inc. (*) | | | 210 | | | | 149,388 | |
| Lowe’s Cos., Inc. | | | 1,525 | | | | 141,733 | |
| | | | | | | | 291,121 | |
| Technology Hardware, Storage & Peripherals | 2.3% | | | | | | | | |
| Apple, Inc. | | | 1,364 | | | | 230,830 | |
| | | | | | | | | |
| Textiles, Apparel & Luxury Goods | 0.7% | | | | | | | | |
| Carter’s, Inc. | | | 590 | | | | 69,319 | |
| | | | | | | | | |
Total Common Stocks
(Cost $7,772,710) | | | | | | | 9,462,464 | |
| | | | | | | | | |
| Short-Term Investments | 3.9% | | | | | | | | |
State Street Institutional Treasury Money Market Fund, Premier Class, 1.15% (7 day yield)
(Cost $378,714) | | | 378,714 | | | | 378,714 | |
| | | | | | | | | |
Total Investments | 100.1%
(Cost $8,151,424) | | | | | | $ | 9,841,178 | |
| | | | | | | | | |
Liabilities in Excess of Cash and Other
Assets | (0.1)% | | | | | | | (10,974 | ) |
| | | | | | | | | |
| Net Assets | 100.0% | | | | | | $ | 9,830,204 | |
The accompanying notes are an integral part of these financial statements.
| Description | | Shares | | | Fair
Value | |
| |
| Lazard Retirement US Small-Mid Cap Equity Portfolio |
| |
| Common Stocks | 97.0% | | | | | | | | |
| |
| Air Freight & Logistics | 0.9% | | | | | | | | |
| Echo Global Logistics, Inc. (*) | | | 21,015 | | | $ | 588,420 | |
| |
| Airlines | 1.4% | | | | | | | | |
| Alaska Air Group, Inc. | | | 12,630 | | | | 928,431 | |
| |
| Auto Components | 1.1% | | | | | | | | |
| Modine Manufacturing Co. (*) | | | 35,485 | | | | 716,797 | |
| |
| Banks | 12.7% | | | | | | | | |
| Bank of the Ozarks, Inc. | | | 24,770 | | | | 1,200,106 | |
| Comerica, Inc. | | | 13,190 | | | | 1,145,024 | |
| Commerce Bancshares, Inc. | | | 23,181 | | | | 1,294,441 | |
| FCB Financial Holdings, Inc., Class A (*) | | | 20,230 | | | | 1,027,684 | |
| Home BancShares, Inc. | | | 47,635 | | | | 1,107,514 | |
| PacWest Bancorp | | | 14,585 | | | | 735,084 | |
| Sterling Bancorp | | | 40,785 | | | | 1,003,311 | |
| Texas Capital Bancshares, Inc. (*) | | | 11,170 | | | | 993,013 | |
| | | | | | | | 8,506,177 | |
| Biotechnology | 0.6% | | | | | | | | |
| Cellectis SA ADR (*) | | | 12,660 | | | | 369,039 | |
| |
| Building Products | 1.0% | | | | | | | | |
| PGT Innovations, Inc. (*) | | | 41,560 | | | | 700,286 | |
| |
| Capital Markets | 1.6% | | | | | | | | |
| Morningstar, Inc. | | | 11,205 | | | | 1,086,549 | |
| |
| Chemicals | 4.4% | | | | | | | | |
| Ingevity Corp. (*) | | | 8,750 | | | | 616,613 | |
| Innospec, Inc. | | | 16,140 | | | | 1,139,484 | |
| Valvoline, Inc. | | | 47,820 | | | | 1,198,369 | |
| | | | | | | | 2,954,466 | |
| Commercial Services & Supplies | 1.9% |
| Deluxe Corp. | | | 16,685 | | | | 1,282,075 | |
| |
| Communications Equipment | 1.1% | | | | | | | | |
| Ciena Corp. (*) | | | 35,895 | | | | 751,282 | |
| |
| Construction & Engineering | 1.0% | | | | | | | | |
| Dycom Industries, Inc. (*) | | | 5,900 | | | | 657,437 | |
| Description | | Shares | | | Fair
Value | |
| |
| Construction Materials | 1.1% | | | | | | | | |
| Eagle Materials, Inc. | | | 6,585 | | | $ | 746,081 | |
| |
| Containers & Packaging | 2.0% | | | | | | | | |
| Graphic Packaging Holding Co. | | | 87,490 | | | | 1,351,721 | |
| |
| Electric Utilities | 1.6% | | | | | | | | |
| PNM Resources, Inc. | | | 25,700 | | | | 1,039,565 | |
| |
| Electrical Equipment | 5.3% | | | | | | | | |
| Atkore International Group, Inc. (*) | | | 46,045 | | | | 987,665 | |
| EnerSys | | | 8,990 | | | | 625,974 | |
| Generac Holdings, Inc. (*) | | | 17,895 | | | | 886,160 | |
| Regal Beloit Corp. | | | 13,530 | | | | 1,036,398 | |
| | | | | | | | 3,536,197 | |
Electronic Equipment, Instruments &
Components | 2.6% |
| Belden, Inc. | | | 8,570 | | | | 661,347 | |
| FLIR Systems, Inc. | | | 23,665 | | | | 1,103,262 | |
| | | | | | | | 1,764,609 | |
| Energy Equipment & Services | 4.6% | | | | | | | | |
| NCS Multistage Holdings, Inc. | | | 33,980 | | | | 500,865 | |
| Oceaneering International, Inc. | | | 35,265 | | | | 745,502 | |
| Patterson-UTI Energy, Inc. | | | 37,545 | | | | 863,911 | |
| U.S. Silica Holdings, Inc. | | | 29,695 | | | | 966,869 | |
| | | | | | | | 3,077,147 | |
| Equity Real Estate Investment Trusts (REITs) | 10.1% |
| American Campus Communities, Inc. | | | 17,690 | | | | 725,821 | |
| Camden Property Trust | | | 9,570 | | | | 881,014 | |
| DCT Industrial Trust, Inc. | | | 16,930 | | | | 995,145 | |
| Extra Space Storage, Inc. | | | 11,890 | | | | 1,039,780 | |
| Healthcare Realty Trust, Inc. | | | 34,740 | | | | 1,115,849 | |
| Kilroy Realty Corp. | | | 12,990 | | | | 969,704 | |
| UDR, Inc. | | | 26,505 | | | | 1,020,973 | |
| | | | | | | | 6,748,286 | |
| Food & Staples Retailing | 1.2% | | | | | | | | |
| Sprouts Farmers Market, Inc. (*) | | | 32,720 | | | | 796,732 | |
| |
| Food Products | 3.4% | | | | | | | | |
| The J.M. Smucker Co. | | | 10,320 | | | | 1,282,157 | |
| The Simply Good Foods Co. (*) | | | 67,350 | | | | 960,411 | |
| | | | | | | | 2,242,568 | |
| Gas Utilities | 0.7% | | | | | | | | |
| Northwest Natural Gas Co. | | | 7,325 | | | | 436,936 | |
The accompanying notes are an integral part of these financial statements.
| Description | | Shares | | | Fair
Value | |
| |
| Lazard Retirement US Small-Mid Cap Equity Portfolio (concluded) |
| |
| Health Care Equipment & Supplies | 1.5% |
| STERIS PLC | | | 11,735 | | | $ | 1,026,460 | |
| |
| Health Care Providers & Services | 0.9% |
| AMN Healthcare Services, Inc. (*) | | | 11,635 | | | | 573,024 | |
| |
| Household Durables | 1.6% | | | | | | | | |
| Leggett & Platt, Inc. | | | 22,620 | | | | 1,079,653 | |
| |
Independent Power & Renewable
Electricity Producers | 1.2% |
| Pattern Energy Group, Inc. | | | 37,005 | | | | 795,237 | |
| |
| Insurance | 2.7% | | | | | | | | |
| Arch Capital Group, Ltd. (*) | | | 11,195 | | | | 1,016,170 | |
| Reinsurance Group of America, Inc. | | | 5,185 | | | | 808,497 | |
| | | | | | | | 1,824,667 | |
| Internet Software & Services | 1.4% | | | | | | | | |
| j2 Global, Inc. | | | 12,075 | | | | 905,987 | |
| |
| IT Services | 3.7% | | | | | | | | |
| CoreLogic, Inc. (*) | | | 24,089 | | | | 1,113,153 | |
| Leidos Holdings, Inc. | | | 15,205 | | | | 981,787 | |
| Vantiv, Inc., Class A (*) | | | 5,360 | | | | 394,228 | |
| | | | | | | | 2,489,168 | |
| Life Sciences Tools & Services | 1.8% | | | | | | | | |
| Cambrex Corp. (*) | | | 9,375 | | | | 450,000 | |
| INC Research Holdings, Inc., Class A (*) | | | 17,525 | | | | 764,090 | |
| | | | | | | | 1,214,090 | |
| Machinery | 3.5% | | | | | | | | |
| Snap-on, Inc. | | | 5,155 | | | | 898,517 | |
| TriMas Corp. (*) | | | 19,340 | | | | 517,345 | |
| Wabtec Corp. | | | 11,510 | | | | 937,259 | |
| | | | | | | | 2,353,121 | |
| Marine | 1.6% | | | | | | | | |
| Kirby Corp. (*) | | | 15,610 | | | | 1,042,748 | |
| |
| Media | 2.4% | | | | | | | | |
| Emerald Expositions Events, Inc. | | | 32,065 | | | | 652,202 | |
| Scholastic Corp. | | | 24,230 | | | | 971,865 | |
| | | | | | | | 1,624,067 | |
| Metals & Mining | 0.7% | | | | | | | | |
| Steel Dynamics, Inc. | | | 10,160 | | | | 438,201 | |
| Description | | Shares | | | Fair
Value | |
| |
| Pharmaceuticals | 1.0% | | | | | | | | |
| Catalent, Inc. (*) | | | 16,535 | | | $ | 679,258 | |
| |
| Professional Services | 1.7% | | | | | | | | |
| FTI Consulting, Inc. (*) | | | 26,835 | | | | 1,152,832 | |
| |
| Semiconductors & Semiconductor Equipment | 3.6% |
| Cypress Semiconductor Corp. | | | 62,045 | | | | 945,566 | |
| Microsemi Corp. (*) | | | 13,245 | | | | 684,104 | |
| Versum Materials, Inc. | | | 21,415 | | | | 810,558 | |
| | | | | | | | 2,440,228 | |
| Software | 1.7% | | | | | | | | |
| Bottomline Technologies de, Inc. (*) | | | 33,200 | | | | 1,151,376 | |
| |
| Specialty Retail | 1.6% | | | | | | | | |
| Floor & Decor Holdings, Inc., Class A | | | 10,660 | | | | 518,929 | |
| Tractor Supply Co. | | | 6,920 | | | | 517,270 | |
| | | | | | | | 1,036,199 | |
| Textiles, Apparel & Luxury Goods | 2.6% |
| Carter’s, Inc. | | | 7,710 | | | | 905,848 | |
| Steven Madden, Ltd. (*) | | | 17,225 | | | | 804,407 | |
| | | | | | | | 1,710,255 | |
| Thrifts & Mortgage Finance | 1.5% | | | | | | | | |
| Washington Federal, Inc. | | | 30,125 | | | | 1,031,781 | |
| |
Total Common Stocks
(Cost $55,787,703) | | | | | | | 64,849,153 | |
| |
| Short-Term Investments | 2.7% | | | | | | | | |
State Street Institutional Treasury Money Market Fund, Premier Class, 1.15% (7 day yield)
(Cost $1,788,438) | | | 1,788,438 | | | | 1,788,438 | |
| |
Total Investments | 99.7%
(Cost $57,576,141) | | | | | | $ | 66,637,591 | |
| |
| Cash and Other Assets in Excess of Liabilities | 0.3% | | | | 230,983 | |
| |
| Net Assets | 100.0% | | | | | | $ | 66,868,574 | |
The accompanying notes are an integral part of these financial statements.
| Description | | Shares | | | Fair
Value | |
| |
| Lazard Retirement International Equity Portfolio |
| |
| Common Stocks | 97.7% | | | | | | |
| |
| Australia | 3.2% | | | | | | | | |
| BHP Billiton PLC | | | 266,346 | | | $ | 5,451,757 | |
| Caltex Australia, Ltd. | | | 58,473 | | | | 1,550,856 | |
| | | | | | | | 7,002,613 | |
| Belgium | 2.5% | | | | | | | | |
| Anheuser-Busch InBev SA/NV | | | 33,399 | | | | 3,725,419 | |
| KBC Group NV | | | 20,534 | | | | 1,749,472 | |
| | | | | | | | 5,474,891 | |
| Brazil | 0.8% | | | | | | | | |
| Cielo SA | | | 268,400 | | | | 1,895,218 | |
| |
| Canada | 4.4% | | | | | | | | |
| Canadian National Railway Co. | | | 26,090 | | | | 2,151,335 | |
| National Bank of Canada | | | 68,800 | | | | 3,432,885 | |
| Suncor Energy, Inc. | | | 114,640 | | | | 4,208,939 | |
| | | | | | | | 9,793,159 | |
| Denmark | 2.5% | | | | | | | | |
| AP Moller-Maersk A/S, Class B | | | 1,587 | | | | 2,765,571 | |
| Carlsberg A/S, Class B | | | 23,713 | | | | 2,840,256 | |
| | | | | | | | 5,605,827 | |
| Finland | 1.5% | | | | | | | | |
| Sampo Oyj, A Shares | | | 59,132 | | | | 3,248,440 | |
| |
| France | 10.5% | | | | | | | | |
| Air Liquide SA | | | 31,625 | | | | 3,977,513 | |
| Capgemini SE | | | 42,337 | | | | 5,010,260 | |
| Cie Generale des Etablissements Michelin | | | 27,995 | | | | 4,010,125 | |
| Safran SA | | | 24,074 | | | | 2,475,515 | |
| Valeo SA | | | 29,762 | | | | 2,217,921 | |
| Vinci SA | | | 54,832 | | | | 5,594,344 | |
| | | | | | | | 23,285,678 | |
| Germany | 4.2% | | | | | | | | |
| Deutsche Post AG | | | 75,743 | | | | 3,598,164 | |
| SAP SE | | | 51,005 | | | | 5,719,182 | |
| | | | | | | | 9,317,346 | |
| Ireland | 3.6% | | | | | | | | |
| Ryanair Holdings PLC Sponsored ADR (*) | | | 27,754 | | | | 2,891,689 | |
| Shire PLC | | | 97,657 | | | | 5,065,309 | |
| | | | | | | | 7,956,998 | |
| Italy | 0.7% | | | | | | | | |
| UniCredit SpA (*) | | | 82,301 | | | | 1,533,209 | |
| Description | | Shares | | | Fair
Value | |
| |
| Japan | 18.4% | | | | | | | | |
| Bridgestone Corp. | | | 47,200 | | | $ | 2,195,083 | |
| Daiwa House Industry Co., Ltd. | | | 149,292 | | | | 5,735,351 | |
| Don Quijote Holdings Co., Ltd. | | | 114,700 | | | | 5,996,203 | |
| Hoshizaki Corp. | | | 12,300 | | | | 1,085,945 | |
| Isuzu Motors, Ltd. | | | 239,800 | | | | 4,010,159 | |
| Kao Corp. | | | 35,120 | | | | 2,375,439 | |
| KDDI Corp. | | | 98,700 | | | | 2,457,367 | |
| Makita Corp. | | | 90,800 | | | | 3,801,621 | |
| Shin-Etsu Chemical Co., Ltd. | | | 26,300 | | | | 2,667,472 | |
| Sony Corp. | | | 75,000 | | | | 3,368,926 | |
| Sumitomo Mitsui Financial Group, Inc. | | | 86,900 | | | | 3,753,211 | |
| United Arrows, Ltd. | | | 41,600 | | | | 1,689,412 | |
| Yamaha Corp. | | | 42,400 | | | | 1,555,169 | |
| | | | | | | | 40,691,358 | |
| Luxembourg | 0.7% | | | | | | | | |
| Tenaris SA | | | 92,708 | | | | 1,463,420 | |
| |
| Netherlands | 6.8% | | | | | | | | |
| ABN AMRO Group NV | | | 52,209 | | | | 1,679,987 | |
| Koninklijke KPN NV | | | 513,611 | | | | 1,791,849 | |
| Royal Dutch Shell PLC, A Shares | | | 205,986 | | | | 6,895,747 | |
| Wolters Kluwer NV | | | 91,524 | | | | 4,765,995 | |
| | | | | | | | 15,133,578 | |
| Norway | 2.8% | | | | | | | | |
| Statoil ASA | | | 128,801 | | | | 2,755,322 | |
| Telenor ASA | | | 166,081 | | | | 3,557,567 | |
| | | | | | | | 6,312,889 | |
| Singapore | 2.4% | | | | | | | | |
| DBS Group Holdings, Ltd. | | | 204,500 | | | | 3,786,475 | |
| NetLink NBN Trust | | | 2,511,000 | | | | 1,567,512 | |
| | | | | | | | 5,353,987 | |
| Spain | 1.7% | | | | | | | | |
| Bankia SA | | | 100,634 | | | | 480,333 | |
| Red Electrica Corporacion SA | | | 143,684 | | | | 3,221,846 | |
| | | | | | | | 3,702,179 | |
| Sweden | 3.4% | | | | | | | | |
| Assa Abloy AB, Class B | | | 192,659 | | | | 3,997,753 | |
| Nordea Bank AB | | | 293,880 | | | | 3,556,695 | |
| | | | | | | | 7,554,448 | |
| Switzerland | 6.5% | | | | | | | | |
| Ferguson PLC | | | 67,853 | | | | 4,855,066 | |
| Julius Baer Group, Ltd. | | | 44,897 | | | | 2,744,869 | |
| Novartis AG | | | 80,994 | | | | 6,847,374 | |
| | | | | | | | 14,447,309 | |
The accompanying notes are an integral part of these financial statements.
| Description | | Shares | | | Fair
Value | |
| |
| Lazard Retirement International Equity Portfolio (concluded) |
| |
| Taiwan | 1.5% | | | | | | | | |
| Taiwan Semiconductor Manufacturing Co., Ltd. Sponsored ADR | | 82,400 | | | $ | 3,267,160 | |
| |
| Turkey | 1.1% | | | | | | | | |
| Turkcell Iletisim Hizmetleri AS | | | 587,091 | | | | 2,397,485 | |
| |
| United Kingdom | 14.5% | | | | | | | | |
| British American Tobacco PLC | | | 91,635 | | | | 6,184,489 | |
| BT Group PLC | | | 445,011 | | | | 1,629,380 | |
| Diageo PLC | | | 101,543 | | | | 3,716,306 | |
| Howden Joinery Group PLC | | | 271,922 | | | | 1,712,655 | |
| Informa PLC | | | 237,182 | | | | 2,307,250 | |
| Prudential PLC | | | 301,123 | | | | 7,741,923 | |
| RELX PLC | | | 192,833 | | | | 4,517,639 | |
| Unilever PLC | | | 76,506 | | | | 4,238,400 | |
| | | | | | | | 32,048,042 | |
| Description | | Shares | | | Fair
Value | |
| |
| United States | 4.0% | | | | | | | | |
| Aon PLC | | | 33,575 | | | $ | 4,499,050 | |
| Medtronic PLC | | | 54,300 | | | | 4,384,725 | |
| | | | | | | | 8,883,775 | |
Total Common Stocks
(Cost $176,494,284) | | | | | | | 216,369,009 | |
| |
| Short-Term Investments | 1.9% | | | | | | | | |
State Street Institutional Treasury Money Market Fund, Premier Class, 1.15% (7 day yield)
(Cost $4,102,640) | | | 4,102,640 | | | | 4,102,640 | |
| |
Total Investments | 99.6%
(Cost $180,596,924) | | | | | | $ | 220,471,649 | |
| |
| Cash and Other Assets in Excess of Liabilities | 0.4% | | | | 834,948 | |
| |
| Net Assets | 100.0% | | | | | | $ | 221,306,597 | |
The accompanying notes are an integral part of these financial statements.
| Description | | Shares | | | Fair
Value | |
| |
| Lazard Retirement Emerging Markets Equity Portfolio |
| |
| Common Stocks | 96.7% | | | | | | |
| |
| Argentina | 1.6% | | | | | | | | |
| YPF SA Sponsored ADR | | | 821,734 | | | $ | 18,825,926 | |
| | | | | | | | | |
| Brazil | 10.4% | | | | | | | | |
| Ambev SA ADR | | | 2,575,900 | | | | 16,640,314 | |
| Banco do Brasil SA | | | 2,904,766 | | | | 27,756,176 | |
| BB Seguridade Participacoes SA | | | 2,101,700 | | | | 18,017,058 | |
| CCR SA | | | 3,486,400 | | | | 16,934,416 | |
| Cia de Saneamento Basico do Estado de Sao Paulo | | | 388,900 | | | | 4,050,247 | |
| Cielo SA | | | 3,258,984 | | | | 23,012,236 | |
| Localiza Rent a Car SA | | | 1,243,065 | | | | 8,262,631 | |
| Petrobras Distribuidora SA | | | 1,680,000 | | | | 8,660,577 | |
| Suzano Papel e Celulose SA | | | 35,600 | | | | 200,586 | |
| | | | | | | | 123,534,241 | |
| China | 16.7% | | | | | | | | |
| AAC Technologies Holdings, Inc. | | | 510,000 | | | | 9,070,096 | |
| Baidu, Inc. Sponsored ADR (*) | | | 121,100 | | | | 28,362,831 | |
| China Construction Bank Corp., Class H | | | 50,681,390 | | | | 46,617,972 | |
| China Mobile, Ltd. Sponsored ADR | | | 672,949 | | | | 34,010,843 | |
| China Shenhua Energy Co., Ltd., Class H | | | 4,175,829 | | | | 10,802,353 | |
| CNOOC, Ltd. | | | 5,536,000 | | | | 7,958,756 | |
| ENN Energy Holdings, Ltd. | | | 1,399,000 | | | | 9,925,785 | |
| Hengan International Group Co., Ltd. | | | 230,500 | | | | 2,558,410 | |
| NetEase, Inc. ADR | | | 97,165 | | | | 33,528,727 | |
| Weichai Power Co., Ltd., Class H | | | 13,003,864 | | | | 14,244,656 | |
| | | | | | | | 197,080,429 | |
| Egypt | 0.8% | | | | | | | | |
| Commercial International Bank Egypt SAE GDR (London) | | | 2,032,761 | | | | 8,832,152 | |
| Commercial International Bank Egypt SAE GDR (United States) | | | 144,531 | | | | 627,988 | |
| | | | | | | | 9,460,140 | |
| Hungary | 1.7% | | | | | | | | |
| OTP Bank Nyrt. | | | 485,168 | | | | 20,040,966 | |
| Description | | Shares | | | Fair
Value | |
| |
| India | 9.7% | | | | | | | | |
| Axis Bank, Ltd. | | | 2,369,138 | | | $ | 20,929,269 | |
| Bajaj Auto, Ltd. | | | 210,031 | | | | 10,949,701 | |
| HCL Technologies, Ltd. | | | 949,123 | | | | 13,243,040 | |
| Hero MotoCorp, Ltd. | | | 308,534 | | | | 18,289,724 | |
| Punjab National Bank (*) | | | 5,074,230 | | | | 13,621,434 | |
| Tata Consultancy Services, Ltd. | | | 883,863 | | | | 37,401,434 | |
| | | | | | | | 114,434,602 | |
| Indonesia | 5.2% | | | | | | | | |
| PT Astra International Tbk | | | 20,971,700 | | | | 12,819,493 | |
| PT Bank Mandiri (Persero) Tbk | | | 37,441,258 | | | | 22,051,373 | |
| PT Semen Indonesia (Persero) Tbk | | | 8,731,200 | | | | 6,371,528 | |
| PT Telekomunikasi Indonesia (Persero) Tbk Sponsored ADR | | | 618,500 | | | | 19,928,070 | |
| | | | | | | | 61,170,464 | |
| Malaysia | 0.6% | | | | | | | | |
| British American Tobacco Malaysia Berhad | | | 707,100 | | | | 6,989,020 | |
| |
| Mexico | 3.2% | | | | | | | | |
| America Movil SAB de CV, Class L Sponsored ADR | | | 1,320,432 | | | | 22,645,409 | |
| Grupo Mexico SAB de CV, Series B | | | 2,335,697 | | | | 7,710,621 | |
| Kimberly-Clark de Mexico SAB de CV, Series A | | | 4,141,762 | | | | 7,298,770 | |
| | | | | | | | 37,654,800 | |
| Pakistan | 1.4% | | | | | | | | |
| Habib Bank, Ltd. | | | 2,671,570 | | | | 4,051,858 | |
| Oil & Gas Development Co., Ltd. | | | 3,080,300 | | | | 4,539,629 | |
| Pakistan Petroleum, Ltd. | | | 4,532,002 | | | | 8,444,538 | |
| | | | | | | | 17,036,025 | |
| Philippines | 0.7% | | | | | | | | |
| PLDT, Inc. Sponsored ADR | | | 272,000 | | | | 8,181,760 | |
| |
| Russia | 8.9% | | | | | | | | |
| ALROSA PAO | | | 6,359,900 | | | | 8,275,317 | |
| Gazprom PJSC Sponsored ADR | | | 1,897,624 | | | | 8,367,391 | |
| LUKOIL PJSC Sponsored ADR | | | 377,233 | | | | 21,579,682 | |
| Magnit PJSC Sponsored GDR (‡), (#) | | | 89,175 | | | | 2,438,936 | |
| Magnit PJSC Sponsored GDR (London) | | | 144,762 | | | | 3,959,447 | |
| Magnit PJSC Sponsored GDR (United States) | | | 2,884 | | | | 78,877 | |
| Mobile TeleSystems PJSC Sponsored ADR | | | 1,669,220 | | | | 17,009,352 | |
| Sberbank of Russia PJSC | | | 11,087,621 | | | | 43,330,711 | |
| | | | | | | | 105,039,713 | |
The accompanying notes are an integral part of these financial statements.
| Description | | Shares | | | Fair
Value | |
| |
| Lazard Retirement Emerging Markets Equity Portfolio (concluded) |
| |
| South Africa | 10.2% | | | | | | | | |
| Imperial Holdings, Ltd. | | | 741,806 | | | $ | 15,699,083 | |
| Life Healthcare Group Holdings, Ltd. | | | 3,650,275 | | | | 8,181,879 | |
| Nedbank Group, Ltd. | | | 550,622 | | | | 11,395,984 | |
| PPC, Ltd. (*) | | | 7,743,992 | | | | 4,360,689 | |
| Sanlam, Ltd. | | | 1,837,285 | | | | 12,909,268 | |
| Shoprite Holdings, Ltd. | | | 1,098,098 | | | | 19,630,419 | |
| Standard Bank Group, Ltd. | | | 849,394 | | | | 13,414,647 | |
| The Bidvest Group, Ltd. | | | 898,565 | | | | 15,796,806 | |
| Vodacom Group, Ltd. | | | 913,251 | | | | 10,730,589 | |
| Woolworths Holdings, Ltd. | | | 1,506,966 | | | | 7,954,925 | |
| | | | | | | | 120,074,289 | |
| South Korea | 14.5% | | | | | | | | |
| Coway Co., Ltd. | | | 165,071 | | | | 15,039,379 | |
| Hanwha Life Insurance Co., Ltd. | | | 1,456,114 | | | | 9,388,183 | |
| Hyundai Mobis Co., Ltd. | | | 73,708 | | | | 18,119,059 | |
| KB Financial Group, Inc. | | | 281,905 | | | | 16,667,685 | |
| KT&G Corp. | | | 67,472 | | | | 7,280,776 | |
| Samsung Electronics Co., Ltd. | | | 21,829 | | | | 51,861,876 | |
| Shinhan Financial Group Co., Ltd. | | | 558,248 | | | | 25,765,075 | |
| SK Hynix, Inc. | | | 383,065 | | | | 27,047,737 | |
| | | | | | | | 171,169,770 | |
| Taiwan | 5.2% | | | | | | | | |
| Hon Hai Precision Industry Co., Ltd. | | | 3,048,151 | | | | 9,709,766 | |
| Taiwan Semiconductor Manufacturing Co., Ltd. | | | 6,702,642 | | | | 51,503,532 | |
| | | | | | | | 61,213,298 | |
| Description | | Shares | | | Fair
Value | |
| |
| Thailand | 1.2% | | | | | | | | |
| Kasikornbank Public Co. Ltd. | | | 976,836 | | | $ | 7,139,322 | |
| The Siam Cement Public Co. Ltd. | | | 510,050 | | | | 7,656,746 | |
| | | | | | | | 14,796,068 | |
| Turkey | 4.7% | | | | | | | | |
| Akbank Turk AS | | | 4,064,274 | | | | 10,561,017 | |
| KOC Holding AS | | | 2,050,156 | | | | 9,996,939 | |
| Tupras-Turkiye Petrol Rafinerileri AS | | | 251,654 | | | | 8,066,439 | |
| Turk Telekomunikasyon AS (*) | | | 4,533,122 | | | | 7,701,395 | |
| Turkcell Iletisim Hizmetleri AS | | | 2,468,000 | | | | 10,078,495 | |
| Turkiye Is Bankasi, C Shares | | | 5,314,850 | | | | 9,779,456 | |
| | | | | | | | 56,183,741 | |
Total Common Stocks
(Cost $930,681,938) | | | | | | | 1,142,885,252 | |
| |
| Short-Term Investments | 3.6% |
State Street Institutional Treasury Money Market Fund, Premier Class, 1.15% (7 day yield)
(Cost $42,142,761) | | | 42,142,761 | | | | 42,142,761 | |
| |
Total Investments | 100.3%
(Cost $972,824,699) | | | | | | $ | 1,185,028,013 | |
| |
Liabilities in Excess of Cash and
Other Assets | (0.3)% | | | (3,799,226 | ) |
| |
| Net Assets | 100.0% | | | | | | $ | 1,181,228,787 | |
The accompanying notes are an integral part of these financial statements.
| Description | | Shares | | | Fair
Value | |
| | | | | | | | | |
| Lazard Retirement Global Dynamic Multi-Asset Portfolio | |
| | | | | | | | | |
| Common Stocks | 81.2% | | | | | | | | |
| | | | | | | | | |
| Australia | 2.3% | | | | | | | | |
| AGL Energy, Ltd. | | | 7,519 | | | $ | 142,694 | |
| Aristocrat Leisure, Ltd. | | | 67,774 | | | | 1,248,916 | |
| Cochlear, Ltd. | | | 5,571 | | | | 743,740 | |
| Computershare, Ltd. | | | 11,666 | | | | 148,271 | |
| CSL, Ltd. | | | 31,839 | | | | 3,504,248 | |
| Investa Office Fund REIT | | | 35,464 | | | | 125,808 | |
| Newcrest Mining, Ltd. | | | 13,612 | | | | 241,855 | |
| Platinum Asset Management, Ltd. | | | 145,338 | | | | 872,123 | |
| Qantas Airways, Ltd. | | | 192,883 | | | | 757,188 | |
| Sandfire Resources NL | | | 25,351 | | | | 136,202 | |
| Stockland REIT | | | 183,586 | | | | 642,141 | |
| The Star Entertainment Group, Ltd. | | | 29,313 | | | | 138,592 | |
| Woodside Petroleum, Ltd. | | | 8,839 | | | | 228,450 | |
| | | | | | | | 8,930,228 | |
| Austria | 0.3% | | | | | | | | |
| Erste Group Bank AG | | | 11,100 | | | | 478,688 | |
| Lenzing AG | | | 1,379 | | | | 174,067 | |
| Raiffeisen Bank International AG (*) | | | 10,895 | | | | 394,518 | |
| | | | | | | | 1,047,273 | |
| Belgium | 0.0% | | | | | | | | |
| Proximus SADP | | | 5,310 | | | | 174,287 | |
| | | | | | | | | |
| Canada | 3.6% | | | | | | | | |
| Alimentation Couche-Tard, Inc., Class B | | | 4,579 | | | | 238,931 | |
| ARC Resources, Ltd. | | | 9,139 | | | | 107,240 | |
| BCE, Inc. | | | 3,465 | | | | 166,441 | |
| CAE, Inc. | | | 38,905 | | | | 722,077 | |
| Canadian Imperial Bank of Commerce | | | 1,218 | | | | 118,738 | |
| Canadian National Railway Co. | | | 13,206 | | | | 1,089,495 | |
| CI Financial Corp. | | | 13,392 | | | | 317,168 | |
| Colliers International Group, Inc. | | | 2,729 | | | | 164,717 | |
| Crescent Point Energy Corp. | | | 15,804 | | | | 120,447 | |
| Detour Gold Corp. (*) | | | 12,339 | | | | 145,084 | |
| Dollarama, Inc. | | | 2,047 | | | | 255,753 | |
| Genworth MI Canada, Inc. | | | 20,062 | | | | 694,270 | |
| Husky Energy, Inc. (*) | | | 94,920 | | | | 1,340,358 | |
| IAMGOLD Corp. (*) | | | 23,187 | | | | 135,211 | |
| Kirkland Lake Gold, Ltd. | | | 7,464 | | | | 114,424 | |
| Metro, Inc. | | | 3,944 | | | | 126,290 | |
| National Bank of Canada | | | 11,589 | | | | 578,251 | |
| Norbord, Inc. | | | 6,601 | | | | 223,447 | |
| Description | | Shares | | | Fair
Value | |
| | | | | | | | | |
| Royal Bank of Canada | | | 17,238 | | | $ | 1,407,701 | |
| Suncor Energy, Inc. | | | 57,740 | | | | 2,119,889 | |
| Teck Resources, Ltd., Class B | | | 22,171 | | | | 579,762 | |
| The Bank of Nova Scotia | | | 22,156 | | | | 1,429,829 | |
| The Toronto-Dominion Bank | | | 2,573 | | | | 150,757 | |
| Thomson Reuters Corp. | | | 31,173 | | | | 1,358,766 | |
| | | | | | | | 13,705,046 | |
| Denmark | 0.9% | | | | | | | | |
| Carlsberg A/S, Class B Sponsored ADR | | | 39,255 | | | | 945,260 | |
| Danske Bank A/S | | | 3,537 | | | | 137,505 | |
| Jyske Bank A/S | | | 2,715 | | | | 154,081 | |
| Novo Nordisk A/S, Class B | | | 34,189 | | | | 1,837,494 | |
| Vestas Wind Systems A/S | | | 5,320 | | | | 364,667 | |
| | | | | | | | 3,439,007 | |
| Finland | 0.2% | | | | | | | | |
| Outokumpu OYJ | | | 21,094 | | | | 195,774 | |
| Sampo Oyj, A Shares ADR | | | 26,515 | | | | 728,500 | |
| | | | | | | | 924,274 | |
| France | 2.2% | | | | | | | | |
| Air France-KLM (*) | | | 60,940 | | | | 990,743 | |
| AXA SA | | | 34,021 | | | | 1,008,329 | |
| Credit Agricole SA | | | 30,671 | | | | 506,676 | |
| Faurecia | | | 1,724 | | | | 134,440 | |
| Peugeot SA | | | 24,560 | | | | 498,901 | |
| Schneider Electric SE | | | 11,355 | | | | 963,031 | |
| Societe Generale SA | | | 3,853 | | | | 198,652 | |
| TOTAL SA | | | 56,371 | | | | 3,110,287 | |
| Ubisoft Entertainment SA ADR (*) | | | 58,115 | | | | 890,322 | |
| | | | | | | | 8,301,381 | |
| Germany | 2.3% | | | | | | | | |
| Allianz SE | | | 1,078 | | | | 246,877 | |
| Bayer AG | | | 8,380 | | | | 1,042,263 | |
| Continental AG | | | 3,596 | | | | 970,830 | |
| Continental AG Sponsored ADR | | | 20,415 | | | | 1,099,960 | |
| Covestro AG | | | 7,143 | | | | 734,460 | |
| Deutsche Lufthansa AG | | | 41,526 | | | | 1,526,503 | |
| Deutsche Telekom AG | | | 16,670 | | | | 295,636 | |
| Rheinmetall AG | | | 3,676 | | | | 466,780 | |
| RWE AG (*) | | | 10,581 | | | | 215,766 | |
| SAP SE | | | 2,077 | | | | 232,894 | |
| Siltronic AG (*) | | | 5,401 | | | | 783,923 | |
| Symrise AG ADR | | | 61,010 | | | | 1,301,953 | |
| | | | | | | | 8,917,845 | |
| Hong Kong | 1.2% | | | | | | | | |
| AIA Group, Ltd. Sponsored ADR | | | 36,090 | | | | 1,235,541 | |
| CK Asset Holdings, Ltd. | | | 86,000 | | | | 751,718 | |
The accompanying notes are an integral part of these financial statements.
| Description | | Shares | | | Fair
Value | |
| | | | | | | | | |
| Lazard Retirement Global Dynamic Multi-Asset Portfolio (continued) |
| | | | | | | | | |
| Jardine Matheson Holdings, Ltd. (Singapore) | | | 1,500 | | | $ | 91,072 | |
| Kerry Properties, Ltd. | | | 18,500 | | | | 83,222 | |
| Sun Hung Kai Properties, Ltd. | | | 10,000 | | | | 166,578 | |
| Swire Pacific, Ltd., Class A | | | 14,500 | | | | 134,209 | |
| Techtronic Industries Co., Ltd. | | | 33,000 | | | | 215,089 | |
| The Wharf Holdings, Ltd. | | | 102,000 | | | | 352,710 | |
| Wharf Real Estate Investment Co., Ltd. (*) | | | 84,875 | | | | 564,903 | |
| Wheelock & Co., Ltd. | | | 135,000 | | | | 964,565 | |
| Yue Yuen Industrial Holdings, Ltd. | | | 49,000 | | | | 192,273 | |
| | | | | | | | 4,751,880 | |
| Ireland | 0.3% | | | | | | | | |
| Shire PLC ADR | | | 8,430 | | | | 1,307,662 | |
| | | | | | | | | |
| Israel | 0.2% | | | | | | | | |
| Israel Discount Bank, Ltd., ADR (*) | | | 21,850 | | | | 654,844 | |
| Israel Discount Bank, Ltd., Class A (*) | | | 41,691 | | | | 121,101 | |
| Nice, Ltd. | | | 1,398 | | | | 127,608 | |
| | | | | | | | 903,553 | |
| Italy | 0.2% | | | | | | | | |
| Assicurazioni Generali SpA | | | 13,778 | | | | 250,848 | |
| Intesa Sanpaolo SpA | | | 163,403 | | | | 541,932 | |
| | | | | | | | 792,780 | |
| Japan | 7.3% | | | | | | | | |
| Amano Corp. | | | 5,600 | | | | 146,488 | |
| ANA Holdings, Inc. | | | 17,800 | | | | 742,875 | |
| Asahi Glass Co., Ltd. | | | 16,200 | | | | 700,695 | |
| Asahi Kasei Corp. | | | 16,500 | | | | 212,553 | |
| Central Japan Railway Co. | | | 700 | | | | 125,275 | |
| Chugai Pharmaceutical Co., Ltd. | | | 5,900 | | | | 301,688 | |
| Daito Trust Construction Co., Ltd. | | | 1,100 | | | | 224,071 | |
| Daiwa House Industry Co., Ltd. | | | 6,800 | | | | 261,236 | |
| Daiwa House Industry Co., Ltd. ADR | | | 30,850 | | | | 1,184,177 | |
| Dexerials Corp. | | | 19,000 | | | | 244,629 | |
| East Japan Railway Co. | | | 3,100 | | | | 302,222 | |
| Ferrotec Holdings Corp. | | | 14,300 | | | | 290,330 | |
| Haseko Corp. | | | 47,800 | | | | 739,835 | |
| Itochu Techno-Solutions Corp. | | | 12,900 | | | | 559,134 | |
| Japan Petroleum Exploration Co., Ltd. | | | 30,100 | | | | 796,960 | |
| Juki Corp. | | | 32,900 | | | | 543,983 | |
| Kaken Pharmaceutical Co., Ltd. | | | 2,900 | | | | 149,676 | |
| Kamigumi Co., Ltd. | | | 9,100 | | | | 201,129 | |
| Kao Corp. | | | 3,000 | | | | 202,913 | |
| Kao Corp. Sponsored ADR | | | 11,710 | | | | 791,303 | |
| Description | | Shares | | | Fair
Value | |
| | | | | | | | | |
| KDDI Corp. | | | 23,200 | | | $ | 577,618 | |
| KDDI Corp. ADR | | | 82,245 | | | | 1,017,412 | |
| Keyence Corp. | | | 400 | | | | 223,346 | |
| Kinden Corp. | | | 13,900 | | | | 226,267 | |
| Kobe Bussan Co., Ltd. | | | 4,200 | | | | 160,810 | |
| Kuraray Co., Ltd. | | | 6,800 | | | | 128,349 | |
| Maeda Corp. | | | 14,000 | | | | 192,523 | |
| Maruha Nichiro Corp. | | | 4,200 | | | | 126,346 | |
| Marvelous, Inc. | | | 27,200 | | | | 250,807 | |
| Maxell Holdings, Ltd. | | | 10,800 | | | | 230,765 | |
| Megmilk Snow Brand Co., Ltd. | | | 4,400 | | | | 130,064 | |
| Mitsubishi UFJ Financial Group, Inc. | | | 394,100 | | | | 2,891,669 | |
| Mitsui Chemicals, Inc. | | | 6,200 | | | | 199,545 | |
| Morinaga Milk Industry Co., Ltd. | | | 3,200 | | | | 144,859 | |
| MS&AD Insurance Group Holdings, Inc. | | | 3,500 | | | | 118,510 | |
| Nagoya Railroad Co., Ltd. | | | 5,600 | | | | 140,932 | |
| Nichirei Corp. | | | 5,600 | | | | 154,645 | |
| Nippon Telegraph & Telephone Corp. | | | 4,100 | | | | 192,928 | |
| Nishimatsu Construction Co., Ltd. | | | 12,300 | | | | 345,044 | |
| Nitto Denko Corp. | | | 2,700 | | | | 239,989 | |
| Nomura Holdings, Inc. | | | 38,100 | | | | 224,979 | |
| NTT DOCOMO, Inc. | | | 14,800 | | | | 349,603 | |
| Obayashi Corp. | | | 10,500 | | | | 126,972 | |
| Oji Holdings Corp. | | | 28,000 | | | | 186,132 | |
| ORIX Corp. | | | 19,700 | | | | 333,093 | |
| Penta-Ocean Construction Co., Ltd. | | | 21,400 | | | | 159,579 | |
| Prima Meat Packers, Ltd. | | | 20,000 | | | | 146,527 | |
| Rengo Co., Ltd. | | | 26,700 | | | | 194,342 | |
| Ryohin Keikaku Co., Ltd. ADR | | | 23,135 | | | | 1,447,788 | |
| Sekisui Chemical Co., Ltd. | | | 45,000 | | | | 902,342 | |
| Shionogi & Co., Ltd. | | | 2,200 | | | | 118,947 | |
| Shizuoka Bank, Ltd. | | | 14,000 | | | | 144,681 | |
| Showa Corp. | | | 24,300 | | | | 301,796 | |
| Sompo Holdings, Inc. | | | 37,400 | | | | 1,441,914 | |
| Start Today Co., Ltd. | | | 11,300 | | | | 343,645 | |
| Sumitomo Heavy Industries, Ltd. | | | 6,200 | | | | 262,620 | |
| Taisei Corp. | | | 2,800 | | | | 139,273 | |
| Takeuchi Manufacturing Co., Ltd. | | | 10,100 | | | | 240,067 | |
| Teijin, Ltd. | | | 22,100 | | | | 492,488 | |
| The Chugoku Electric Power Co., Inc. | | | 18,900 | | | | 202,883 | |
| Tokyo Electron, Ltd. | | | 4,300 | | | | 770,251 | |
| Tokyo Gas Co., Ltd. | | | 10,200 | | | | 232,933 | |
| Topcon Corp. | | | 13,200 | | | | 285,164 | |
| Toyobo Co., Ltd. | | | 7,300 | | | | 132,494 | |
| V Technology Co., Ltd. | | | 1,200 | | | | 193,555 | |
| West Japan Railway Co. | | | 1,800 | | | | 131,316 | |
The accompanying notes are an integral part of these financial statements.
| Description | | Shares | | | Fair
Value | |
| | | | | | | | | |
| Lazard Retirement Global Dynamic Multi-Asset Portfolio (continued) |
| |
| Yamaha Corp. Sponsored ADR | | | 18,800 | | | $ | 700,676 | |
| Yaskawa Electric Corp. | | | 30,100 | | | | 1,315,247 | |
| | | | | | | | 27,934,907 | |
| Luxembourg | 0.2% | | | | | | | | |
| B&M European Value Retail SA | | | 115,591 | | | | 659,155 | |
| | | | | | | | | |
| Malta | 0.0% | | | | | | | | |
| Kindred Group PLC | | | 10,940 | | | | 156,485 | |
| | | | | | | | | |
| Netherlands | 1.5% | | | | | | | | |
| BE Semiconductor Industries NV | | | 3,462 | | | | 289,256 | |
| Royal Dutch Shell PLC, A Shares | | | 118,945 | | | | 3,981,895 | |
| Wolters Kluwer NV | | | 2,650 | | | | 137,995 | |
| Wolters Kluwer NV Sponsored ADR | | | 25,030 | | | | 1,306,066 | |
| | | | | | | | 5,715,212 | |
| New Zealand | 0.1% | | | | | | | | |
| Fisher & Paykel Healthcare Corp., Ltd., Class C | | | 14,487 | | | | 146,908 | |
| Spark New Zealand, Ltd. | | | 71,687 | | | | 184,374 | |
| | | | | | | | 331,282 | |
| Norway | 1.7% | | | | | | | | |
| Aker BP ASA | | | 48,635 | | | | 1,195,711 | |
| Leroy Seafood Group ASA | | | 23,317 | | | | 124,892 | |
| Marine Harvest ASA | | | 9,582 | | | | 162,207 | |
| Statoil ASA | | | 206,349 | | | | 4,414,235 | |
| Telenor ASA | | | 20,733 | | | | 444,115 | |
| | | | | | | | 6,341,160 | |
| Singapore | 1.0% | | | | | | | | |
| Best World International, Ltd. | | | 233,400 | | | | 230,893 | |
| CapitaLand, Ltd. | | | 51,100 | | | | 134,629 | |
| Oversea-Chinese Banking Corp., Ltd. ADR | | | 44,115 | | | | 822,745 | |
| Singapore Airlines, Ltd. | | | 31,700 | | | | 252,499 | |
| United Overseas Bank, Ltd. | | | 42,300 | | | | 834,466 | |
| UOL Group, Ltd. | | | 136,500 | | | | 905,034 | |
| Venture Corp., Ltd. | | | 35,700 | | | | 545,532 | |
| | | | | | | | 3,725,798 | |
| Spain | 0.6% | | | | | | | | |
| Banco Bilbao Vizcaya Argentaria SA | | | 28,890 | | | | 245,924 | |
| Banco Santander SA | | | 226,807 | | | | 1,487,254 | |
| Corporacion Financiera Alba SA | | | 968 | | | | 55,369 | |
| Mapfre SA | | | 60,711 | | | | 194,638 | |
| Telefonica SA | | | 37,090 | | | | 361,131 | |
| | | | | | | | 2,344,316 | |
| Description | | Shares | | | Fair
Value | |
| | | | | | | | | |
| Sweden | 1.0% | | | | | | | | |
| Assa Abloy AB ADR | | | 67,465 | | | $ | 696,239 | |
| Axfood AB | | | 7,249 | | | | 139,635 | |
| Electrolux AB, Series B | | | 23,959 | | | | 770,564 | |
| Hennes & Mauritz AB, B Shares | | | 5,417 | | | | 111,620 | |
| Hexagon AB ADR | | | 15,640 | | | | 785,910 | |
| Nordea Bank AB Sponsored ADR | | | 56,860 | | | | 688,575 | |
| Svenska Cellulosa AB SCA, Class B | | | 28,434 | | | | 292,404 | |
| Swedish Orphan Biovitrum AB (*) | | | 15,596 | | | | 213,493 | |
| | | | | | | | 3,698,440 | |
| Switzerland | 1.6% | | | | | | | | |
| Adecco Group AG | | | 3,311 | | | | 253,059 | |
| Julius Baer Group, Ltd. ADR | | | 55,255 | | | | 674,111 | |
| Partners Group Holding AG | | | 2,037 | | | | 1,395,825 | |
| Roche Holding AG | | | 12,913 | | | | 3,266,256 | �� |
| STMicroelectronics NV | | | 13,631 | | | | 296,026 | |
| Swiss Life Holding AG | | | 405 | | | | 143,343 | |
| | | | | | | | 6,028,620 | |
| United Kingdom | 5.2% | | | | | | | | |
| Admiral Group PLC | | | 7,509 | | | | 202,495 | |
| Ashtead Group PLC ADR | | | 9,935 | | | | 1,080,978 | |
| Associated British Foods PLC | | | 11,623 | | | | 441,865 | |
| AstraZeneca PLC | | | 11,745 | | | | 805,977 | |
| BP PLC | | | 94,782 | | | | 668,451 | |
| British American Tobacco PLC Sponsored ADR | | | 24,765 | | | | 1,659,007 | |
| Centrica PLC | | | 231,860 | | | | 429,302 | |
| Coca-Cola European Partners PLC | | | 21,640 | | | | 862,354 | |
| Compass Group PLC | | | 12,511 | | | | 270,525 | |
| Compass Group PLC Sponsored ADR | | | 45,712 | | | | 1,003,607 | |
| Crest Nicholson Holdings PLC | | | 30,674 | | | | 224,614 | |
| CVS Group PLC | | | 11,199 | | | | 157,248 | |
| Diageo PLC Sponsored ADR | | | 8,875 | | | | 1,296,016 | |
| Electrocomponents PLC | | | 21,240 | | | | 179,405 | |
| Fevertree Drinks PLC | | | 16,667 | | | | 513,279 | |
| Hargreaves Lansdown PLC | | | 5,424 | | | | 131,940 | |
| International Consolidated Airlines Group SA | | | 135,324 | | | | 1,174,867 | |
| Land Securities Group PLC REIT | | | 14,836 | | | | 201,208 | |
| Lloyds Banking Group PLC | | | 263,827 | | | | 241,585 | |
| Moneysupermarket.com Group PLC | | | 26,464 | | | | 127,123 | |
| Persimmon PLC | | | 15,878 | | | | 586,353 | |
| Prudential PLC ADR | | | 20,420 | | | | 1,036,928 | |
| Redrow PLC | | | 14,406 | | | | 127,615 | |
| RELX NV Sponsored ADR | | | 56,135 | | | | 1,295,034 | |
| Rio Tinto PLC Sponsored ADR | | | 11,680 | | | | 618,222 | |
The accompanying notes are an integral part of these financial statements.
| Description | | Shares | | | Fair
Value | |
| | | | | | | | | |
| Lazard Retirement Global Dynamic Multi-Asset Portfolio (continued) |
| | | | | | | | | |
| Smith & Nephew PLC | | | 10,104 | | | $ | 174,833 | |
| SSE PLC | | | 100,470 | | | | 1,789,843 | |
| SSP Group PLC | | | 34,864 | | | | 320,355 | |
| Taylor Wimpey PLC | | | 179,254 | | | | 499,346 | |
| Unilever PLC | | | 14,374 | | | | 796,314 | |
| Unilever PLC Sponsored ADR | | | 13,750 | | | | 760,925 | |
| Wm Morrison Supermarkets PLC | | | 46,302 | | | | 137,417 | |
| | | | | | | | 19,815,031 | |
| United States | 47.3% | | | | | | | | |
| 3M Co. | | | 20,122 | | | | 4,736,115 | |
| AbbVie, Inc. | | | 26,547 | | | | 2,567,360 | |
| Accenture PLC, Class A | | | 29,713 | | | | 4,548,763 | |
| Adobe Systems, Inc. (*) | | | 8,130 | | | | 1,424,701 | |
| Advanced Energy Industries, Inc. (*) | | | 1,685 | | | | 113,704 | |
| Air Lease Corp. | | | 5,309 | | | | 255,310 | |
| Allergan PLC | | | 1,859 | | | | 304,095 | |
| Ally Financial, Inc. | | | 24,171 | | | | 704,826 | |
| Alphabet, Inc., Class A (*) | | | 1,847 | | | | 1,945,630 | |
| Alphabet, Inc., Class C (*) | | | 800 | | | | 837,120 | |
| Altria Group, Inc. | | | 4,076 | | | | 291,067 | |
| Amazon.com, Inc. (*) | | | 715 | | | | 836,171 | |
| AMC Networks, Inc., Class A (*) | | | 2,589 | | | | 140,013 | |
| Amdocs, Ltd. | | | 2,425 | | | | 158,789 | |
| Ameren Corp. | | | 27,245 | | | | 1,607,183 | |
| American Axle & Manufacturing Holdings, Inc. (*) | | | 37,085 | | | | 631,558 | |
| American Electric Power Co., Inc. | | | 2,555 | | | | 187,971 | |
| American Express Co. | | | 15,877 | | | | 1,576,745 | |
| Ameriprise Financial, Inc. | | | 10,949 | | | | 1,855,527 | |
| Anthem, Inc. | | | 6,121 | | | | 1,377,286 | |
| Aon PLC | | | 13,812 | | | | 1,850,808 | |
| Apple, Inc. | | | 27,150 | | | | 4,594,594 | |
| Applied Materials, Inc. | | | 34,937 | | | | 1,785,979 | |
| Aptiv PLC | | | 5,496 | | | | 466,226 | |
| AT&T, Inc. | | | 131,363 | | | | 5,107,393 | |
| Atkore International Group, Inc. (*) | | | 7,097 | | | | 152,231 | |
| AutoZone, Inc. (*) | | | 1,045 | | | | 743,382 | |
| Bank of America Corp. | | | 40,112 | | | | 1,184,106 | |
| Baxter International, Inc. | | | 3,803 | | | | 245,826 | |
| BGC Partners, Inc. Class A | | | 13,022 | | | | 196,762 | |
| Biogen, Inc. (*) | | | 3,105 | | | | 989,160 | |
| Bloomin’ Brands, Inc. | | | 6,048 | | | | 129,064 | |
| Bristol-Myers Squibb Co. | | | 20,565 | | | | 1,260,223 | |
| Campbell Soup Co. | | | 5,166 | | | | 248,536 | |
| Description | | Shares | | | Fair
Value | |
| | | | | | | | | |
| Cardtronics PLC, Class A (*) | | | 8,400 | | | $ | 155,568 | |
| Carnival Corp. | | | 14,742 | | | | 978,427 | |
| Carnival PLC | | | 8,058 | | | | 529,820 | |
| Celgene Corp. (*) | | | 9,138 | | | | 953,642 | |
| Centene Corp. (*) | | | 9,136 | | | | 921,640 | |
| Cigna Corp. | | | 6,787 | | | | 1,378,372 | |
| Cisco Systems, Inc. | | | 22,335 | | | | 855,430 | |
| Citigroup, Inc. | | | 35,269 | | | | 2,624,366 | |
| Cognizant Technology Solutions Corp., Class A | | | 6,582 | | | | 467,454 | |
| Comcast Corp., Class A | | | 95,682 | | | | 3,832,064 | |
| Comerica, Inc. | | | 13,865 | | | | 1,203,621 | |
| Commerce Bancshares, Inc. | | | 9,529 | | | | 532,085 | |
| ConocoPhillips | | | 4,965 | | | | 272,529 | |
| Consolidated Edison, Inc. | | | 6,720 | | | | 570,864 | |
| Costco Wholesale Corp. | | | 8,865 | | | | 1,649,954 | |
| Crown Holdings, Inc. (*) | | | 15,307 | | | | 861,019 | |
| Cummins, Inc. | | | 7,212 | | | | 1,273,928 | |
| CVS Health Corp. | | | 7,044 | | | | 510,690 | |
| Darden Restaurants, Inc. | | | 6,147 | | | | 590,235 | |
| Deckers Outdoor Corp. (*) | | | 1,756 | | | | 140,919 | |
| Delphi Technologies PLC (*) | | | 1,832 | | | | 96,125 | |
| Discovery Communications, Inc. (*) | | | 6,636 | | | | 140,484 | |
| DXC Technology Co. | | | 11,050 | | | | 1,048,645 | |
| Eastman Chemical Co. | | | 15,287 | | | | 1,416,188 | |
| Eaton Corp. PLC | | | 10,410 | | | | 822,494 | |
| eBay, Inc. (*) | | | 18,405 | | | | 694,605 | |
| EchoStar Corp., Class A (*) | | | 3,756 | | | | 224,984 | |
| Eli Lilly & Co. | | | 12,509 | | | | 1,056,510 | |
| Eversource Energy | | | 7,050 | | | | 445,419 | |
| Exelon Corp. | | | 2,662 | | | | 104,909 | |
| F5 Networks, Inc. (*) | | | 2,159 | | | | 283,304 | |
| Facebook, Inc., Class A (*) | | | 15,159 | | | | 2,674,957 | |
| Fifth Third Bancorp | | | 14,222 | | | | 431,495 | |
| Fiserv, Inc. (*) | | | 3,081 | | | | 404,012 | |
| Five Below, Inc. (*) | | | 10,435 | | | | 692,049 | |
| General Motors Co. | | | 9,508 | | | | 389,733 | |
| Genpact, Ltd. | | | 5,820 | | | | 184,727 | |
| Hanesbrands, Inc. | | | 6,644 | | | | 138,926 | |
| Hasbro, Inc. | | | 1,182 | | | | 107,432 | |
| HCA Healthcare, Inc. (*) | | | 13,438 | | | | 1,180,394 | |
| Honeywell International, Inc. | | | 9,695 | | | | 1,486,825 | |
| Humana, Inc. | | | 513 | | | | 127,260 | |
| Huntington Ingalls Industries, Inc. | | | 3,128 | | | | 737,270 | |
| ICON PLC (*) | | | 1,673 | | | | 187,627 | |
| IDEXX Laboratories, Inc. (*) | | | 1,379 | | | | 215,648 | |
The accompanying notes are an integral part of these financial statements.
| Description | | Shares | | | Fair
Value | |
| | | | | | | | | |
| Lazard Retirement Global Dynamic Multi-Asset Portfolio (continued) |
| |
| Intel Corp. | | | 11,299 | | | $ | 521,562 | |
| Intercontinental Exchange, Inc. | | | 19,885 | | | | 1,403,086 | |
| Intuit, Inc. | | | 4,877 | | | | 769,493 | |
| IPG Photonics Corp. (*) | | | 2,646 | | | | 566,588 | |
| IQVIA Holdings, Inc. (*) | | | 11,645 | | | | 1,140,045 | |
| Johnson & Johnson | | | 27,873 | | | | 3,894,416 | |
| Johnson Controls International PLC | | | 21,946 | | | | 836,362 | |
| JPMorgan Chase & Co. | | | 31,232 | | | | 3,339,950 | |
| Kimberly-Clark Corp. | | | 4,151 | | | | 500,860 | |
| Koppers Holdings, Inc. (*) | | | 4,718 | | | | 240,146 | |
| Las Vegas Sands Corp. | | | 8,821 | | | | 612,971 | |
| Lear Corp. | | | 2,414 | | | | 426,457 | |
| Lincoln National Corp. | | | 35,637 | | | | 2,739,416 | |
| Lockheed Martin Corp. | | | 3,712 | | | | 1,191,738 | |
| Lowe’s Cos., Inc. | | | 39,744 | | | | 3,693,807 | |
| Marsh & McLennan Cos., Inc. | | | 5,240 | | | | 426,484 | |
| Masimo Corp. (*) | | | 1,374 | | | | 116,515 | |
| MasterCard, Inc., Class A | | | 13,844 | | | | 2,095,428 | |
| Medtronic PLC | | | 10,695 | | | | 863,621 | |
| MetLife, Inc. | | | 19,442 | | | | 982,988 | |
| MGM Growth Properties LLC, Class A REIT | | | 7,043 | | | | 205,303 | |
| Michael Kors Holdings, Ltd. (*) | | | 2,268 | | | | 142,771 | |
| Microsoft Corp. | | | 33,068 | | | | 2,828,637 | |
| Mitel Networks Corp. (*) | | | 29,461 | | | | 242,464 | |
| Molson Coors Brewing Co., Class B | | | 9,526 | | | | 781,799 | |
| Monsanto Co. | | | 5,480 | | | | 639,954 | |
| Motorola Solutions, Inc. | | | 8,240 | | | | 744,402 | |
| Nasdaq, Inc. | | | 1,779 | | | | 136,681 | |
| NIKE, Inc., Class B | | | 1,835 | | | | 114,779 | |
| Northrop Grumman Corp. | | | 8,976 | | | | 2,754,824 | |
| NVIDIA Corp. | | | 4,751 | | | | 919,318 | |
| Park Hotels & Resorts, Inc. REIT | | | 9,965 | | | | 286,494 | |
| Paychex, Inc. | | | 6,978 | | | | 475,062 | |
| PayPal Holdings, Inc. (*) | | | 3,172 | | | | 233,523 | |
| PepsiCo, Inc. | | | 51,767 | | | | 6,207,899 | |
| PG&E Corp. | | | 29,665 | | | | 1,329,882 | |
| Pinnacle West Capital Corp. | | | 2,218 | | | | 188,929 | |
| Pioneer Natural Resources Co. | | | 901 | | | | 155,738 | |
| PNM Resources, Inc. | | | 3,031 | | | | 122,604 | |
| Prudential Financial, Inc. | | | 5,789 | | | | 665,619 | |
| Quest Diagnostics, Inc. | | | 1,701 | | | | 167,531 | |
| Radian Group, Inc. | | | 12,787 | | | | 263,540 | |
| Raytheon Co. | | | 889 | | | | 166,999 | |
| Regions Financial Corp. | | | 30,014 | | | | 518,642 | |
| Republic Services, Inc. | | | 3,875 | | | | 261,989 | |
| Description | | Shares | | | Fair
Value | |
| | | | | | | | | |
| Rockwell Automation, Inc. | | | 6,435 | | | $ | 1,263,512 | |
| Ross Stores, Inc. | | | 44,991 | | | | 3,610,528 | |
| Royal Caribbean Cruises, Ltd. | | | 5,700 | | | | 679,896 | |
| S&P Global, Inc. | | | 7,710 | | | | 1,306,074 | |
| Sabra Health Care REIT, Inc. | | | 8,923 | | | | 167,485 | |
| Schlumberger, Ltd. | | | 15,785 | | | | 1,063,751 | |
| Silgan Holdings, Inc. | | | 10,869 | | | | 319,440 | |
| Simon Property Group, Inc. REIT | | | 19,901 | | | | 3,417,798 | |
| Sirius XM Holdings, Inc. | | | 99,593 | | | | 533,818 | |
| Skyworks Solutions, Inc. | | | 5,616 | | | | 533,239 | |
| Snap-on, Inc. | | | 4,375 | | | | 762,562 | |
| Southwest Airlines Co. | | | 3,609 | | | | 236,209 | |
| Starbucks Corp. | | | 26,467 | | | | 1,520,000 | |
| Synopsys, Inc. (*) | | | 8,823 | | | | 752,073 | |
| Sysco Corp. | | | 12,860 | | | | 780,988 | |
| The Boeing Co. | | | 13,162 | | | | 3,881,605 | |
| The Charles Schwab Corp. | | | 21,915 | | | | 1,125,774 | |
| The Coca-Cola Co. | | | 38,420 | | | | 1,762,710 | |
| The Estee Lauder Cos., Inc., Class A | | | 11,163 | | | | 1,420,380 | |
| The Gap, Inc. | | | 4,338 | | | | 147,752 | |
| The Home Depot, Inc. | | | 4,531 | | | | 858,760 | |
| The J.M. Smucker Co. | | | 7,690 | | | | 955,406 | |
| The Procter & Gamble Co. | | | 1,240 | | | | 113,931 | |
| The TJX Cos., Inc. | | | 24,610 | | | | 1,881,681 | |
| The Toro Co. | | | 7,518 | | | | 490,399 | |
| Thermo Fisher Scientific, Inc. | | | 6,065 | | | | 1,151,622 | |
| Time Warner, Inc. | | | 8,557 | | | | 782,709 | |
| United Continental Holdings, Inc. (*) | | | 2,937 | | | | 197,954 | |
| United Rentals, Inc. (*) | | | 3,776 | | | | 649,132 | |
| United Technologies Corp. | | | 8,900 | | | | 1,135,373 | |
| UnitedHealth Group, Inc. | | | 16,594 | | | | 3,658,313 | |
| Validus Holdings, Ltd. | | | 5,983 | | | | 280,722 | |
| Vantiv, Inc., Class A (*) | | | 21,555 | | | | 1,585,370 | |
| Verizon Communications, Inc. | | | 44,030 | | | | 2,330,508 | |
| Versum Materials, Inc. | | | 10,824 | | | | 409,688 | |
| Visa, Inc., Class A | | | 26,771 | | | | 3,052,429 | |
| VMware, Inc., Class A (*) | | | 7,436 | | | | 931,880 | |
| Wal-Mart Stores, Inc. | | | 17,911 | | | | 1,768,711 | |
| Waste Management, Inc. | | | 9,902 | | | | 854,543 | |
| WEC Energy Group, Inc. | | | 1,859 | | | | 123,493 | |
| Welbilt, Inc. (*) | | | 30,770 | | | | 723,403 | |
| Wells Fargo & Co. | | | 4,458 | | | | 270,467 | |
| Williams-Sonoma, Inc. | | | 2,501 | | | | 129,302 | |
| Xcel Energy, Inc. | | | 63,778 | | | | 3,068,360 | |
| Zoetis, Inc. | | | 22,460 | | | | 1,618,018 | |
| | | | | | | | 181,873,957 | |
Total Common Stocks
(Cost $267,467,017) | | | | | | | 311,819,579 | |
The accompanying notes are an integral part of these financial statements.
| Description | | Security
Currency | | Principal
Amount
(000) | | Fair
Value | |
| | | | | | | | | |
| Lazard Retirement Global Dynamic Multi-Asset Portfolio (continued) | |
| | | | | | | | | | | |
| Corporate Bonds | 4.2% | | | | | | | | | | |
| | | | | | | | | | | |
| Australia | 0.2% | | | | | | | | | | |
Telstra Corp., Ltd.,
4.000%, 09/16/22 | | AUD | | | 670 | | | $ | 543,851 | |
Toyota Finance Australia, Ltd.,
4.250%, 05/15/19 | | AUD | | | 422 | | | | 337,479 | |
| | | | | | | | | | 881,330 | |
| Belgium | 0.2% | | | | | | | | | | |
Anheuser-Busch InBev Finance, Inc.,
2.650%, 02/01/21 | | USD | | | 635 | | | | 638,130 | |
| | | | | | | | | | | |
| Canada | 0.2% | | | | | | | | | | |
| The Toronto-Dominion Bank: | | | | | | | | | | |
| 2.250%, 11/05/19 | | USD | | | 410 | | | | 410,201 | |
| 2.621%, 12/22/21 | | CAD | | | 495 | | | | 396,681 | |
| | | | | | | | | | 806,882 | |
| Denmark | 0.2% | | | | | | | | | | |
Carlsberg Breweries A/S,
2.500%, 05/28/24 | | EUR | | | 470 | | | | 619,308 | |
| | | | | | | | | | | |
| France | 0.2% | | | | | | | | | | |
Orange SA,
5.375%, 07/08/19 | | USD | | | 598 | | | | 625,032 | |
| | | | | | | | | | | |
| Germany | 0.2% | | | | | | | | | | |
BMW Finance NV,
3.375%, 12/14/18 | | GBP | | | 650 | | | | 899,166 | |
| | | | | | | | | | | |
| Mexico | 0.1% | | | | | | | | | | |
America Movil SAB de CV,
6.450%, 12/05/22 | | MXN | | | 10,700 | | | | 502,575 | |
| | | | | | | | | | | |
| Netherlands | 0.1% | | | | | | | | | | |
Bank Nederlandse Gemeenten NV,
5.000%, 09/16/20 | | NZD | | | 455 | | | | 339,693 | |
| | | | | | | | | | | |
| New Zealand | 0.2% | | | | | | | | | | |
Fonterra Cooperative Group, Ltd.,
5.500%, 02/26/24 | | AUD | | | 1,000 | | | | 865,596 | |
| Description | | Security
Currency | | Principal
Amount
(000) | | Fair
Value | |
| | | | | | | | | | | |
| Norway | 0.1% | | | | | | | | | | |
Telenor ASA,
1.750%, 05/22/18 | | USD | | | 480 | | | $ | 479,316 | |
| | | | | | | | | | | |
| Spain | 0.1% | | | | | | | | | | |
Iberdrola International BV,
1.125%, 04/21/26 | | EUR | | | 400 | | | | 480,887 | |
| | | | | | | | | | | |
| United Kingdom | 0.2% | | | | | | | | | | |
Rolls-Royce PLC,
6.750%, 04/30/19 | | GBP | | | 502 | | | | 729,517 | |
| | | | | | | | | | | |
| United States | 2.2% | | | | | | | | | | |
Alphabet, Inc.,
3.625%, 05/19/21 | | USD | | | 225 | | | | 235,517 | |
Amazon.com, Inc.,
3.800%, 12/05/24 | | USD | | | 480 | | | | 506,846 | |
| Apple, Inc.: | | | | | | | | | | |
| 2.850%, 02/23/23 | | USD | | | 132 | | | | 133,769 | |
| 3.850%, 05/04/43 | | USD | | | 575 | | | | 596,860 | |
Citigroup, Inc.,
3.250% (BBSW 3 Month + 1.550%),
05/04/21 (§) | | AUD | | | 720 | | | | 572,915 | |
John Deere Canada Funding, Inc.,
2.050%, 09/17/20 | | CAD | | | 740 | | | | 584,830 | |
John Deere Capital Corp.,
2.300%, 09/16/19 | | USD | | | 240 | | | | 240,128 | |
Johnson & Johnson,
3.625%, 03/03/37 | | USD | | | 300 | | | | 316,703 | |
JPMorgan Chase & Co.,
4.500%, 01/24/22 | | USD | | | 405 | | | | 433,322 | |
Microsoft Corp.,
4.450%, 11/03/45 | | USD | | | 733 | | | | 858,349 | |
Morgan Stanley,
3.625%, 01/20/27 | | USD | | | 510 | | | | 521,814 | |
NIKE, Inc.,
2.375%, 11/01/26 | | USD | | | 540 | | | | 514,316 | |
| The Goldman Sachs Group, Inc.: | | | | | | | | | | |
| 5.200%, 12/17/19 | | NZD | | | 645 | | | | 477,412 | |
| 3.625%, 01/22/23 | | USD | | | 520 | | | | 537,101 | |
The Home Depot, Inc.,
2.625%, 06/01/22 | | USD | | | 565 | | | | 568,082 | |
The accompanying notes are an integral part of these financial statements.
| Description | | Security
Currency | | Principal
Amount
(000) | | Fair
Value | |
| | | | | | | | | | | |
| Lazard Retirement Global Dynamic Multi-Asset Portfolio (continued) | |
| | |
Union Pacific Corp.,
4.163%, 07/15/22 | | USD | | | 500 | | | $ | 535,894 | |
Wells Fargo & Co.,
3.010% (BBSW 3 Month + 1.320%),
07/27/21 (§) | | AUD | | | 525 | | | | 415,943 | |
Wells Fargo Canada Corp.,
3.040%, 01/29/21 | | CAD | | | 360 | | | | 292,027 | |
| | | | | | | | | | 8,341,828 | |
Total Corporate Bonds
(Cost $16,042,903) | | | | | | | | | 16,209,260 | |
| | | | | | | | | | | |
| Foreign Government Obligations | 6.6% | | | | | | | | | | |
| | | | | | | | | | | |
| Australia | 0.5% | | | | | | | | | | |
| Queensland Treasury Corp.: | | | | | | | | | | |
| 5.500%, 06/21/21 | | AUD | | | 660 | | | | 568,414 | |
| 3.000%, 03/22/24 | | AUD | | | 730 | | | | 579,063 | |
Western Australian Treasury Corp.,
6.000%, 10/16/23 | | AUD | | | 635 | | | | 582,225 | |
| | | | | | | | | | 1,729,702 | |
| Bermuda | 0.3% | | | | | | | | | | |
Government of Bermuda,
4.854%, 02/06/24 | | USD | | | 1,015 | | | | 1,098,869 | |
| | | | | | | | | | | |
| Canada | 1.0% | | | | | | | | | | |
City of Vancouver,
2.900%, 11/20/25 | | CAD | | | 415 | | | | 335,955 | |
Export Development Canada,
1.800%, 09/01/22 | | CAD | | | 190 | | | | 149,311 | |
Province of Alberta,
4.000%, 12/01/19 | | CAD | | | 1,065 | | | | 881,408 | |
Province of British Columbia Canada,
4.700%, 06/18/37 | | CAD | | | 280 | | | | 284,622 | |
Province of Ontario,
1.950%, 01/27/23 | | CAD | | | 990 | | | | 775,492 | |
| Province of Quebec: | | | | | | | | | | |
| 1.650%, 03/03/22 | | CAD | | | 330 | | | | 257,524 | |
| 2.500%, 04/20/26 | | USD | | | 1,075 | | | | 1,051,134 | |
| | | | | | | | | | 3,735,446 | |
| Description | | Security
Currency | | Principal
Amount
(000) | | Fair
Value | |
| | | | | | | | | | | |
| Cayman Islands | 0.1% | | | | | | | | | | |
Cayman Islands Government Bonds,
5.950%, 11/24/19 | | USD | | | 360 | | | $ | 385,238 | |
| | | | | | | | | | | |
| Chile | 0.1% | | | | | | | | | | |
Republic of Chile,
3.125%, 01/21/26 | | USD | | | 500 | | | | 506,875 | |
| | | | | | | | | | | |
| Czech Republic | 0.4% | | | | | | | | | | |
Czech Republic:
1.100% (PRIBOR 1Year + 0.650%),
04/18/23 (§) | | CZK | | | 16,700 | | | | 842,172 | |
| 2.500%, 08/25/28 | | CZK | | | 17,050 | | | | 859,930 | |
| | | | | | | | | | 1,702,102 | |
| France | 0.3% | | | | | | | | | | |
Government of France,
1.750%, 06/25/39 | | EUR | | | 910 | | | | 1,150,363 | |
| | | | | | | | | | | |
| Hungary | 0.3% | | | | | | | | | | |
Hungary Government Bonds,
5.500%, 06/24/25 | | HUF | | | 240,400 | | | | 1,169,019 | |
| | | | | | | | | | | |
| Italy | 0.1% | | | | | | | | | | |
Italy Buoni Poliennali Del Tesoro,
2.250%, 09/01/36 | | EUR | | | 495 | | | | 548,791 | |
| | | | | | | | | | | |
| Japan | 0.1% | | | | | | | | | | |
Japan International Cooperation Agency,
2.125%, 10/20/26 | | USD | | | 500 | | | | 471,041 | |
| | | | | | | | | | | |
| Mexico | 0.6% | | | | | | | | | | |
Mexican Bonos,
6.500%, 06/09/22 | | MXN | | | 21,880 | | | | 1,065,465 | |
United Mexican States,
6.750%, 02/06/24 | | GBP | | | 640 | | | | 1,068,240 | |
| | | | | | | | | | 2,133,705 | |
| | | | | | | | | | | |
| New Zealand | 0.4% | | | | | | | | | | |
| New Zealand Government Bonds: | | | | | | | | | | |
| 6.000%, 05/15/21 | | NZD | | | 1,145 | | | | 897,392 | |
| 4.500%, 04/15/27 | | NZD | | | 670 | | | | 505,789 | |
| | | | | | | | | | 1,403,181 | |
The accompanying notes are an integral part of these financial statements.
| Description | | Security
Currency | | Principal
Amount
(000) | | Fair
Value | |
| | | | | | | | | | | |
| Lazard Retirement Global Dynamic Multi-Asset Portfolio (continued) | |
| | | | | | | | | | | |
| Norway | 0.6% | | | | | | | | | | |
City of Oslo Norway,
4.600%, 06/22/20 | | NOK | | | 3,000 | | | $ | 396,201 | |
Kommunalbanken AS,
1.375%, 10/26/20 (#) | | USD | | | 600 | | | | 586,547 | |
| Oslo Kommune: | | | | | | | | | | |
| 3.550%, 02/12/21 | | NOK | | | 3,000 | | | | 388,880 | |
| 3.650%, 11/08/23 | | NOK | | | 3,000 | | | | 396,976 | |
| 2.350%, 09/04/24 | | NOK | | | 4,000 | | | | 497,150 | |
| | | | | | | | | | 2,265,754 | |
| Panama | 0.2% | | | | | | | | | | |
Republic of Panama,
4.000%, 09/22/24 | | USD | | | 855 | | | | 908,437 | |
| | | | | | | | | | | |
| Poland | 0.4% | | | | | | | | | | |
Poland Government Bonds:
1.810% (WIBOR 6 Month), 01/25/21 (§) | | PLN | | | 3,930 | | | | 1,129,916 | |
| 2.500%, 07/25/26 | | PLN | | | 2,090 | | | | 568,325 | |
| | | | | | | | | | 1,698,241 | |
| Romania | 0.2% | | | | | | | | | | |
Romanian Government Bonds,
2.875%, 10/28/24 | | EUR | | | 420 | | | | 556,850 | |
| | | | | | | | | | | |
| Singapore | 0.6% | | | | | | | | | | |
Singapore Government Bonds,
3.000%, 09/01/24 | | SGD | | | 2,740 | | | | 2,184,912 | |
| | | | | | | | | | | |
| Spain | 0.2% | | | | | | | | | | |
Spain Government Bonds,
1.600%, 04/30/25 | | EUR | | | 451 | | | | 565,811 | |
| | | | | | | | | | | |
| Sweden | 0.1% | | | | | | | | | | |
Kommuninvest I Sverige AB,
1.500%, 04/23/19 (#) | | USD | | | 500 | | | | 496,667 | |
| | | | | | | | | | | |
| United Kingdom | 0.1% | | | | | | | | | | |
United Kingdom Gilt,
1.500%, 07/22/47 | | GBP | | | 400 | | | | 508,205 | |
| | | | | | | | | | | |
Total Foreign Government Obligations
(Cost $24,872,856) | | | | | | | | | 25,219,209 | |
| Description | | Security
Currency | | Principal
Amount
(000) | | Fair
Value | |
| | | | | | | | | | | |
| Quasi Government Bonds | 0.5% | | | | | | | | | | |
| | | | | | | | | | | |
| Canada | 0.2% | | | | | | | | | | |
Canada Housing Trust No. 1,
2.400%, 12/15/22 | | CAD | | | 685 | | | $ | 551,357 | |
| | | | | | | | | | | |
| Mexico | 0.1% | | | | | | | | | | |
Nacional Financiera SNC,
3.375%, 11/05/20 | | USD | | | 500 | | | | 511,668 | |
| | | | | | | | | | | |
| Singapore | 0.2% | | | | | | | | | | |
Temasek Financial I, Ltd.,
4.300%, 10/25/19 | | USD | | | 795 | | | | 823,156 | |
| | | | | | | | | | | |
Total Quasi Government Bonds
(Cost $1,906,091) | | | | | | | | | 1,886,181 | |
| | | | | | | | | | | |
| Supranationals | 0.6% | | | | | | | | | | |
African Development Bank,
2.375%, 09/23/21 | | USD | | | 510 | | | | 512,072 | |
Asian Development Bank,
2.125%, 03/19/25 | | USD | | | 735 | | | | 716,706 | |
European Investment Bank,
1.125%, 09/16/21 (#) | | CAD | | | 790 | | | | 607,305 | |
International Bank for Reconstruction & Development,
3.500%, 01/22/21 | | NZD | | | 250 | | | | 181,581 | |
International Finance Corp.,
3.625%, 05/20/20 | | NZD | | | 695 | | | | 505,484 | |
| | | | | | | | | | | |
Total Supranationals
(Cost $2,538,346) | | | | | | | | | 2,523,148 | |
| | | | | | | | | | | |
| US Municipal Bonds | 0.4% | | | | | | | | | | |
| | | | | | | | | | | |
| California | 0.2% | | | | | | | | | | |
California State Build America Bonds,
7.500%, 04/01/34 | | USD | | | 575 | | | | 851,471 | |
| | | | | | | | | | | |
| Georgia | 0.1% | | | | | | | | | | |
Georgia State Build America Bonds Series B,
2.380%, 02/01/27 | | USD | | | 350 | | | | 334,044 | |
The accompanying notes are an integral part of these financial statements.
| Description | | Security
Currency | | Principal
Amount
(000) | | Fair
Value | |
| | | | | | | | | | | |
| Lazard Retirement Global Dynamic Multi-Asset Portfolio (continued) | |
| | | | | | | | | | | |
| Pennsylvania | 0.0% | | | | | | | | | | |
Pennsylvania State Build America Bonds Third Series B,
5.850%, 07/15/30 | | USD | | | 50 | | | $ | 53,643 | |
| | | | | | | | | | | |
| Wisconsin | 0.1% | | | | | | | | | | |
Wisconsin State Build America Bonds Series D,
5.400%, 05/01/28 | | USD | | | 175 | | | | 187,555 | |
| | | | | | | | | | | |
Total US Municipal Bonds
(Cost $1,456,762) | | | | | | | | | 1,426,713 | |
| | | | | | | | | | | |
| US Treasury Securities | 2.1% | | | | | | | | | | |
| US Treasury Notes: | | | | | | | | | | |
| 1.625%, 08/15/22 | | USD | | | 850 | | | | 830,052 | |
| 1.750%, 05/15/23 | | USD | | | 850 | | | | 828,907 | |
| 2.125%, 05/15/25 | | USD | | | 2,255 | | | | 2,219,990 | |
| 1.625%, 05/15/26 | | USD | | | 3,065 | | | | 2,886,020 | |
| 3.125%, 11/15/41 | | USD | | | 515 | | | | 553,085 | |
| 2.500%, 05/15/46 | | USD | | | 855 | | | | 812,396 | |
| | | | | | | | | | | |
Total US Treasury Securities
(Cost $8,225,514) | | | | | | | | | 8,130,450 | |
| Description | | | | | Shares | | | Fair
Value | |
| | | | | | | | | | | |
| Short-Term Investments | 4.4% | | | | | | | | | | |
State Street Institutional Treasury Money Market Fund, Premier Class, 1.15% (7 day yield)
(Cost $17,095,014) | | | | | 17,095,014 | | | $ | 17,095,014 | |
| | | | | | | | | | | |
Total Investments | 100.0%
(Cost $339,604,503) (¤) | | | | | | | | $ | 384,309,554 | |
| | | | | | | | | | | |
| Liabilities in Excess of Cash and Other Assets | 0.0% | | | | | | | | | (101,799 | ) |
| | | | | | | | | | | |
| Net Assets | 100.0% | | | | | | | | $ | 384,207,755 | |
The accompanying notes are an integral part of these financial statements.
Lazard Retirement Global Dynamic Multi-Asset Portfolio (continued)
Forward Currency Contracts open at December 31, 2017:
Currency
Purchased | | Quantity | | Currency
Sold | | Quantity | | Counterparty | | Settlement
Date | | Unrealized
Appreciation | | | Unrealized
Depreciation | |
| | | | | | | | | | | | | | | | | | | |
| AUD | | 43,570 | | | USD | | 33,426 | | | CIT | | 02/22/18 | | $ | 567 | | | $ | — | |
| AUD | | 118,737 | | | USD | | 91,589 | | | CIT | | 02/22/18 | | | 1,050 | | | | — | |
| AUD | | 352,289 | | | USD | | 270,000 | | | HSB | | 02/22/18 | | | 4,859 | | | | — | |
| CAD | | 781,900 | | | USD | | 616,000 | | | CIT | | 02/22/18 | | | 6,481 | | | | — | |
| CHF | | 348,132 | | | USD | | 352,825 | | | HSB | | 02/22/18 | | | 5,667 | | | | — | |
| CZK | | 1,326,253 | | | USD | | 60,462 | | | JPM | | 01/17/18 | | | 1,871 | | | | — | |
| CZK | | 1,549,311 | | | USD | | 70,630 | | | JPM | | 01/17/18 | | | 2,186 | | | | — | |
| EUR | | 227,767 | | | USD | | 274,000 | | | CIT | | 01/11/18 | | | — | | | | 584 | |
| EUR | | 355,339 | | | USD | | 420,000 | | | CIT | | 01/11/18 | | | 6,555 | | | | — | |
| EUR | | 684,226 | | | USD | | 808,103 | | | CIT | | 01/11/18 | | | 13,253 | | | | — | |
| EUR | | 8,232,970 | | | USD | | 9,724,883 | | | HSB | | 01/11/18 | | | 158,120 | | | | — | |
| EUR | | 2,686,666 | | | USD | | 3,204,207 | | | HSB | | 03/28/18 | | | 35,923 | | | | — | |
| GBP | | 159,480 | | | USD | | 216,000 | | | HSB | | 02/22/18 | | | — | | | | 335 | |
| GBP | | 228,979 | | | USD | | 304,322 | | | HSB | | 02/22/18 | | | 5,326 | | | | — | |
| GBP | | 285,237 | | | USD | | 383,203 | | | SSB | | 03/28/18 | | | 2,998 | | | | — | |
| JPY | | 33,552,892 | | | USD | | 298,000 | | | CIT | | 01/11/18 | | | — | | | | 125 | |
| JPY | | 61,365,972 | | | USD | | 551,000 | | | CIT | | 01/11/18 | | | — | | | | 6,206 | |
| JPY | | 1,076,135,176 | | | USD | | 9,623,171 | | | CIT | | 01/11/18 | | | — | | | | 69,475 | |
| JPY | | 84,216,152 | | | USD | | 753,014 | | | HSB | | 01/11/18 | | | — | | | | 5,361 | |
| JPY | | 66,588,262 | | | USD | | 591,491 | | | SSB | | 03/28/18 | | | 2,024 | | | | — | |
| KRW | | 684,045,600 | | | USD | | 629,239 | | | HSB | | 03/09/18 | | | 10,426 | | | | — | |
| NZD | | 778,011 | | | USD | | 529,094 | | | HSB | | 02/22/18 | | | 21,934 | | | | — | |
| SEK | | 4,990,792 | | | USD | | 593,524 | | | CIT | | 02/22/18 | | | 16,681 | | | | — | |
| SEK | | 503,220 | | | USD | | 59,834 | | | HSB | | 02/22/18 | | | 1,692 | | | | — | |
| USD | | 1,151,863 | | | AUD | | 1,518,087 | | | CIT | | 02/22/18 | | | — | | | | 32,562 | |
| USD | | 2,582,508 | | | AUD | | 3,403,568 | | | HSB | | 02/22/18 | | | — | | | | 72,988 | |
| USD | | 673,214 | | | AUD | | 873,199 | | | HSB | | 03/28/18 | | | — | | | | 7,981 | |
| USD | | 337,043 | | | AUD | | 437,148 | | | SSB | | 03/28/18 | | | — | | | | 3,982 | |
| USD | | 168,567 | | | CAD | | 215,026 | | | CIT | | 02/22/18 | | | — | | | | 2,618 | |
| USD | | 1,166,750 | | | CAD | | 1,484,690 | | | CIT | | 02/22/18 | | | — | | | | 15,231 | |
| USD | | 284,330 | | | CAD | | 365,043 | | | HSB | | 02/22/18 | | | — | | | | 6,285 | |
| USD | | 2,622,774 | | | CAD | | 3,337,585 | | | HSB | | 02/22/18 | | | — | | | | 34,321 | |
| USD | | 2,882,198 | | | CAD | | 3,667,638 | | | HSB | | 03/28/18 | | | — | | | | 38,820 | |
| USD | | 357,610 | | | CAD | | 455,213 | | | SSB | | 03/28/18 | | | — | | | | 4,935 | |
| USD | | 839,891 | | | CZK | | 18,169,368 | | | CIT | | 01/17/18 | | | — | | | | 14,052 | |
| USD | | 902,198 | | | CZK | | 19,790,100 | | | JPM | | 01/17/18 | | | — | | | | 27,919 | |
| USD | | 74,936 | | | CZK | | 1,611,651 | | | JPM | | 02/26/18 | | | — | | | | 950 | |
| USD | | 133,007 | | | EUR | | 111,766 | | | CIT | | 01/11/18 | | | — | | | | 1,159 | |
| USD | | 742,064 | | | GBP | | 558,346 | | | HSB | | 02/22/18 | | | — | | | | 12,988 | |
| USD | | 1,628,736 | | | HKD | | 12,715,543 | | | SSB | | 03/28/18 | | | — | | | | 1,480 | |
| USD | | 540,392 | | | HUF | | 143,827,268 | | | JPM | | 02/22/18 | | | — | | | | 16,350 | |
| USD | | 612,812 | | | HUF | | 162,365,663 | | | JPM | | 02/22/18 | | | — | | | | 15,692 | |
| USD | | 591,241 | | | JPY | | 66,588,262 | | | HSB | | 03/28/18 | | | — | | | | 2,274 | |
| USD | | 160,306 | | | MXN | | 3,106,880 | | | CIT | | 02/22/18 | | | 3,715 | | | | — | |
The accompanying notes are an integral part of these financial statements.
Lazard Retirement Global Dynamic Multi-Asset Portfolio (concluded)
Currency
Purchased | | Quantity | | Currency
Sold | | Quantity | | Counterparty | | Settlement
Date | | Unrealized
Appreciation | | | Unrealized
Depreciation | |
| | | | | | | | | | | | | | | | | | | |
| USD | | 547,930 | | | MXN | | 10,529,751 | | | HSB | | 02/22/18 | | $ | 17,215 | | | $ | — | |
| USD | | 726,551 | | | MXN | | 14,080,817 | | | HSB | | 02/22/18 | | | 16,857 | | | | — | |
| USD | | 399,832 | | | NOK | | 3,302,289 | | | CIT | | 02/22/18 | | | — | | | | 2,926 | |
| USD | | 1,268,886 | | | NOK | | 10,481,682 | | | HSB | | 02/22/18 | | | — | | | | 9,494 | |
| USD | | 2,793,644 | | | NZD | | 4,107,938 | | | HSB | | 02/22/18 | | | — | | | | 115,812 | |
| USD | | 1,527,121 | | | PLN | | 5,498,233 | | | HSB | | 02/22/18 | | | — | | | | 52,486 | |
| USD | | 2,191,818 | | | SGD | | 2,971,184 | | | CIT | | 02/22/18 | | | — | | | | 31,356 | |
| Total gross unrealized appreciation/depreciation on Forward Currency Contracts | | $ | 335,400 | | | $ | 606,747 | |
The accompanying notes are an integral part of these financial statements.
Lazard Retirement Series, Inc. Notes to Portfolios of Investments December 31, 2017
| (*) | Non-income producing security. |
| (‡) | Security valued using Level 2 inputs, based on reference to a similar security which was trading on an active market, under GAAP hierarchy — see Note 8 in the Notes to Financial Statements. |
| (#) | Pursuant to Rule 144A under the Securities Act of 1933, these securities may only be traded among “qualified institutional buyers.” At December 31, 2017, the percentage of net assets for each Portfolio was as follows: |
| Portfolio | | Percentage of
Net Assets |
| | | | | |
| Emerging Markets Equity | | | 0.2 | % |
| Global Dynamic Multi-Asset | | | 0.4 | |
| (§) | Variable and floating rate securities are securities for which interest rate changes are based on changes in a designated base rate. The rates shown are those in effect on December 31, 2017. |
| (¤) | The Portfolio, at all times, maintains portfolio securities in sufficient amount to cover its obligations related to investments in forward currency contracts. |
Security Abbreviations:
| ADR | — | American Depositary Receipt |
| BBSW | — | Bank Bill Swap Reference Rates |
| GDR | — | Global Depositary Receipt |
| PJSC | — | Public Joint Stock Company |
| PRIBOR | — | Prague Interbank Offered Rate |
| REIT | — | Real Estate Investment Trust |
| WIBOR | — | Warsaw Interbank Bid/Offered Rates |
Currency Abbreviations:
| AUD | — | Australian Dollar | KRW | — | South Korean Won |
| CAD | — | Canadian Dollar | MXN | — | Mexican New Peso |
| CHF | — | Swiss Franc | NOK | — | Norwegian Krone |
| CZK | — | Czech Koruna | NZD | — | New Zealand Dollar |
| EUR | — | Euro | PLN | — | Polish Zloty |
| GBP | — | British Pound Sterling | SEK | — | Swedish Krone |
| HKD | — | Hong Kong Dollar | SGD | — | Singapore Dollar |
| HUF | — | Hungarian Forint | USD | — | United States Dollar |
| JPY | — | Japanese Yen | | | |
Counterparty Abbreviations:
| CIT | — | Citibank NA |
| HSB | — | HSBC Bank USA NA |
| JPM | — | JPMorgan Chase Bank NA |
| SSB | — | State Street Bank and Trust Co. |
The accompanying notes are an integral part of these financial statements.
Portfolio holdings by industry (as a percentage of net assets), for those Portfolios previously presented by country:
| Industry† | | Lazard
Retirement
International
Equity
Portfolio | | Lazard
Retirement
Emerging
Markets Equity
Portfolio | | Lazard
Retirement Global
Dynamic
Multi-Asset
Portfolio |
| | | | | | | | | | | | | | |
| Aerospace & Defense | | | 1.1 | % | | | — | % | | | 2.9 | % | |
| Air Freight & Logistics | | | 1.6 | | | | — | | | | — | | |
| Airlines | | | 1.3 | | | | — | | | | 1.5 | | |
| Auto Components | | | 3.8 | | | | 1.5 | | | | 1.1 | | |
| Automobiles | | | 1.8 | | | | 3.6 | | | | 0.6 | | |
| Banks | | | 9.0 | | | | 25.6 | | | | 7.1 | | |
| Beverages | | | 4.6 | | | | 1.4 | | | | 3.6 | | |
| Biotechnology | | | 2.3 | | | | — | | | | 2.5 | | |
| Building Products | | | 1.8 | | | | — | | | | 0.6 | | |
| Capital Markets | | | 1.2 | | | | — | | | | 3.5 | | |
| Chemicals | | | 3.0 | | | | — | | | | 1.5 | | |
| Commercial Services & Suppliers | | | — | | | | — | | | | 0.3 | | |
| Communications Equipment | | | — | | | | — | | | | 0.6 | | |
| Construction & Engineering | | | 2.5 | | | | — | | | | 0.3 | | |
| Construction Materials | | | — | | | | 1.6 | | | | — | | |
| Consumer Finance | | | — | | | | — | | | | 0.6 | | |
| Containers & Packaging | | | — | | | | — | | | | 0.4 | | |
| Distributors | | | — | | | | 1.3 | | | | — | | |
| Diversified Financial Services | | | — | | | | — | | | | 0.2 | | |
| Diversified Telecommunication Services | | | 3.9 | | | | 2.3 | | | | 2.8 | | |
| Electric Utilities | | | 1.4 | | | | — | | | | 2.1 | | |
| Electrical Equipment | | | — | | | | — | | | | 0.9 | | |
| Electronic Equipment, Instruments & Components | | | — | | | | 1.6 | | | | 1.2 | | |
| Energy Equipment & Services | | | 0.7 | | | | — | | | | 0.3 | | |
| Equity Real Estate Investment Trusts (REITs) | | | — | | | | — | | | | 1.3 | | |
| Food & Staples Retailing | | | — | | | | 2.2 | | | | 1.4 | | |
| Food Products | | | — | | | | — | | | | 0.9 | | |
| Gas Utilities | | | — | | | | 0.9 | | | | 0.1 | | |
| Health Care Equipment & Supplies | | | 2.0 | | | | — | | | | 0.7 | | |
| Health Care Providers & Services | | | — | | | | 0.7 | | | | 2.3 | | |
| Hotels, Restaurants & Leisure | | | — | | | | — | | | | 2.1 | | |
| Household Durables | | | 1.5 | | | | 1.3 | | | | 1.2 | | |
| Household Products | | | — | | | | 0.6 | | | | 0.2 | | |
| Industrial Conglomerates | | | — | | | | 2.2 | | | | 1.8 | | |
| Insurance | | | 7.0 | | | | 3.4 | | | | 3.5 | | |
| Internet & Catalog Retail | | | — | | | | — | | | | 0.4 | | |
| Internet Software & Services | | | — | | | | 5.2 | | | | 1.7 | | |
| IT Services | | | 3.1 | | | | 6.2 | | | | 3.9 | | |
| Leisure Products | | | 0.7 | | | | — | | | | 0.2 | | |
| Life Sciences Tools & Services | | | — | | | | — | | | | 0.7 | | |
| Machinery | | | 2.2 | | | | 1.2 | | | | 1.3 | | |
| Marine | | | 1.2 | | | | — | | | | — | | |
| Media | | | 1.0 | | | | — | | | | 1.4 | | |
| Metals & Mining | | | 2.5 | | | | 1.4 | | | | 0.6 | | |
The accompanying notes are an integral part of these financial statements.
| Industry† | | Lazard
Retirement
International
Equity
Portfolio | | Lazard
Retirement
Emerging
Markets Equity
Portfolio | | Lazard
Retirement Global
Dynamic
Multi-Asset
Portfolio |
| | | | | | | | | | | | | | |
| Multiline Retail | | | 2.7 | % | | | 0.7 | % | | | 0.6 | % | |
| Multi-Utilities | | | — | | | | — | | | | 0.8 | | |
| Oil, Gas & Consumable Fuels | | | 7.0 | | | | 7.5 | | | | 4.8 | | |
| Paper & Forest Products | | | — | | | | — | | | | 0.2 | | |
| Personal Products | | | 3.0 | | | | 0.2 | | | | 1.1 | | |
| Pharmaceuticals | | | 3.1 | | | | — | | | | 4.2 | | |
| Professional Services | | | 4.2 | | | | — | | | | 0.8 | | |
| Real Estate Management & Development | | | 2.6 | | | | — | | | | 1.5 | | |
| Road & Rail | | | 1.0 | | | | 0.7 | | | | 0.6 | | |
| Semiconductors & Semiconductor Equipment | | | 1.5 | | | | 6.7 | | | | 1.7 | | |
| Software | | | 2.6 | | | | — | | | | 2.4 | | |
| Specialty Retail | | | 0.8 | | | | 0.7 | | | | 3.2 | | |
| Technology Hardware, Storage & Peripherals | | | — | | | | 4.4 | | | | 1.4 | | |
| Textiles, Apparel & Luxury Goods | | | — | | | | — | | | | 0.3 | | |
| Thrifts & Mortgage Finance | | | — | | | | — | | | | 0.3 | | |
| Tobacco | | | 2.8 | | | | 1.2 | | | | 0.5 | | |
| Trading Companies & Distributors | | | 3.0 | | | | — | | | | 0.5 | | |
| Transportation Infrastructure | | | — | | | | 1.4 | | | | 0.1 | | |
| Water Utilities | | | — | | | | 0.3 | | | | — | | |
| Wireless Telecommunication Services | | | 2.2 | | | | 8.7 | | | | 0.6 | | |
| Subtotal | | | 97.7 | | | | 96.7 | | | | 85.9 | | |
| Foreign Government Obligations | | | — | | | | — | | | | 6.6 | | |
| Supranationals | | | — | | | | — | | | | 0.6 | | |
| US Municipal Bonds | | | — | | | | — | | | | 0.4 | | |
| US Treasury Securities | | | — | | | | — | | | | 2.1 | | |
| Short-Term Investments | | | 1.9 | | | | 3.6 | | | | 4.4 | | |
| Total Investments | | | 99.6 | % | | | 100.3 | % | | | 100.0 | % | |
| † | Industry classifications may be different than those used for compliance monitoring purposes. |
The accompanying notes are an integral part of these financial statements.
[This page intentionally left blank]
Lazard Retirement Series, Inc. Statements of Assets and Liabilities
| December 31, 2017 | | Lazard
Retirement
US Strategic
Equity Portfolio | | Lazard
Retirement
US Small-Mid Cap
Equity Portfolio | |
| | | | | | | | | | | | |
| ASSETS | | | | | | | | | | | |
| Investments in securities, at fair value | | | $ | 9,841,178 | | | | $ | 66,637,591 | | |
| Cash | | | | — | | | | | — | | |
| Foreign currency, at fair value | | | | — | | | | | — | | |
| Receivables for: | | | | | | | | | | | |
| Dividends and interest | | | | 7,266 | | | | | 70,747 | | |
| Capital stock sold | | | | 7,478 | | | | | 119,578 | | |
| Investments sold | | | | 13,497 | | | | | 168,278 | | |
| Gross unrealized appreciation on forward currency contracts | | | | — | | | | | — | | |
| Prepaid expenses | | | | 5,532 | | | | | 7,766 | | |
| Total assets | | | | 9,874,951 | | | | | 67,003,960 | | |
| | | | | | | | | | | | |
| LIABILITIES | | | | | | | | | | | |
| Payables for: | | | | | | | | | | | |
| Management fees | | | | 3,979 | | | | | 74,910 | | |
| Accrued custodian fees | | | | 17,010 | | | | | 21,269 | | |
| Accrued distribution fees | | | | 2,060 | | | | | 14,075 | | |
| Accrued professional services | | | | 19,690 | | | | | 20,038 | | |
| Capital stock redeemed | | | | 225 | | | | | 720 | | |
| Investments purchased | | | | — | | | | | — | | |
| Gross unrealized depreciation on forward currency contracts | | | | — | | | | | — | | |
| Other accrued expenses and payables | | | | 1,783 | | | | | 4,374 | | |
| Total liabilities | | | | 44,747 | | | | | 135,386 | | |
| Net assets | | | $ | 9,830,204 | | | | $ | 66,868,574 | | |
| | | | | | | | | | | | |
| NET ASSETS | | | | | | | | | | | |
| Paid in capital | | | $ | 7,853,925 | | | | $ | 54,747,249 | | |
| Undistributed (Distributions in excess of) net investment income (loss) | | | | 6,641 | | | | | (5,449 | ) | |
| Accumulated net realized gain (loss) | | | | 279,884 | | | | | 3,065,324 | | |
| Net unrealized appreciation (depreciation) on: | | | | | | | | | | | |
| Investments | | | | 1,689,754 | | | | | 9,061,450 | | |
| Foreign currency translations and forward currency contracts | | | | — | | | | | — | | |
| Net assets | | | $ | 9,830,204 | | | | $ | 66,868,574 | | |
| | | | | | | | | | | | |
| Service Shares | | | | | | | | | | | |
| Net assets | | | $ | 9,830,204 | | | | $ | 66,868,574 | | |
| Shares of capital stock outstanding* | | | | 757,010 | | | | | 8,031,487 | | |
| Net asset value, offering and redemption price per share | | | $ | 12.99 | | | | $ | 8.33 | | |
| | | | | | | | | | | | |
| Investor Shares | | | | | | | | | | | |
| Net assets | | | | — | | | | | — | | |
| Shares of capital stock outstanding* | | | | — | | | | | — | | |
| Net asset value, offering and redemption price per share | | | | — | | | | | — | | |
| | | | | | | | | | | | |
| Cost of investments in securities | | | $ | 8,151,424 | | | | $ | 57,576,141 | | |
| Cost of foreign currency | | | | — | | | | | — | | |
| * $0.001 par value, 2,450,000,000 shares authorized for the Portfolios in total. |
The accompanying notes are an integral part of these financial statements.
| | Lazard
Retirement
International
Equity Portfolio | | Lazard
Retirement
Emerging Markets
Equity Portfolio | | Lazard
Retirement
Global Dynamic
Multi-Asset Portfolio | |
| | | | | | | | | | | | | |
| | $ | 220,471,649 | | | $ | 1,185,028,013 | | | $ | 384,309,554 | | |
| | | — | | | | — | | | | 6,068 | | |
| | | 141,660 | | | | 115,107 | | | | 181,660 | | |
| | | | | | | | | | | | | |
| | | 1,189,472 | | | | 1,126,721 | | | | 880,770 | | |
| | | 63,325 | | | | 651,015 | | | | 210,265 | | |
| | | 114 | | | | — | | | | 8 | | |
| | | — | | | | — | | | | 335,400 | | |
| | | 1,257 | | | | — | | | | — | | |
| | | 221,867,477 | | | | 1,186,920,856 | | | | 385,923,725 | | |
| | | | | | | | | | | | | |
| | | 195,915 | | | | 974,216 | | | | 223,754 | | |
| | | 48,790 | | | | 351,323 | | | | 118,139 | | |
| | | 45,055 | | | | 193,577 | | | | 79,397 | | |
| | | 23,486 | | | | 51,734 | | | | 33,496 | | |
| | | 22,088 | | | | 3,360,501 | | | | 16,698 | | |
| | | 217,270 | | | | 523,704 | | | | 615,245 | | |
| | | — | | | | — | | | | 606,747 | | |
| | | 8,276 | | | | 237,014 | | | | 22,494 | | |
| | | 560,880 | | | | 5,692,069 | | | | 1,715,970 | | |
| | $ | 221,306,597 | | | $ | 1,181,228,787 | | | $ | 384,207,755 | | |
| | | | | | | | | | | | | |
| | $ | 181,566,268 | | | $ | 1,022,531,883 | | | $ | 339,381,130 | | |
| | | 341,314 | | | | 1,040,208 | | | | (8,596 | ) | |
| | | (490,503 | ) | | | (54,412,681 | ) | | | 391,690 | | |
| | | | | | | | | | | | | |
| | | 39,874,725 | | | | 212,075,696 | | | | 44,705,051 | | |
| | | 14,793 | | | | (6,319 | ) | | | (261,520 | ) | |
| | $ | 221,306,597 | | | $ | 1,181,228,787 | | | $ | 384,207,755 | | |
| | | | | | | | | | | | | |
| | $ | 221,306,597 | | | $ | 942,572,418 | | | $ | 384,207,755 | | |
| | | 20,441,925 | | | | 39,964,765 | | | | 28,474,543 | | |
| | $ | 10.83 | | | $ | 23.59 | | | $ | 13.49 | | |
| | | | | | | | | | | | | |
| | | — | | | $ | 238,656,369 | | | | — | | |
| | | — | | | | 10,240,090 | | | | — | | |
| | | — | | | $ | 23.31 | | | | — | | |
| | $ | 180,596,924 | | | $ | 972,824,699 | | | $ | 339,604,503 | | |
| | $ | 141,929 | | | $ | 117,253 | | | $ | 181,440 | | |
Lazard Retirement Series, Inc. Statements of Operations
| For the Year Ended December 31, 2017 | | Lazard
Retirement
US Strategic
Equity Portfolio | | Lazard
Retirement
US Small-Mid Cap
Equity Portfolio | |
| | | | | | | | | | | | |
| Investment Income (Loss) | | | | | | | | | | | |
| | | | | | | | | | | | |
| Income | | | | | | | | | | | |
| Dividends | | | $ | 181,604 | | | | $ | 831,149 | | |
| Interest | | | | — | | | | | — | | |
| Total investment income* | | | | 181,604 | | | | | 831,149 | | |
| | | | | | | | | | | | |
| Expenses | | | | | | | | | | | |
| Management fees (Note 3) | | | | 69,093 | | | | | 484,559 | | |
| Distribution fees (Service Shares) | | | | 24,637 | | | | | 161,547 | | |
| Custodian fees | | | | 33,130 | | | | | 43,285 | | |
| Shareholders’ reports | | | | 8,788 | | | | | 22,288 | | |
| Professional services | | | | 36,597 | | | | | 43,404 | | |
| Administration fees | | | | 12,008 | | | | | 19,897 | | |
| Shareholders’ meeting | | | | 5,272 | | | | | 9,944 | | |
| Directors’ fees and expenses | | | | 5,341 | | | | | 7,143 | | |
| Shareholders’ services | | | | 13,607 | | | | | 12,988 | | |
| Other | | | | 2,729 | | | | | 3,987 | | |
| Total gross expenses | | | | 211,202 | | | | | 809,042 | | |
| Management fees waived and expenses reimbursed | | | | (107,809 | ) | | | | (38,329 | ) | |
| Administration fees waived | | | | (4,688 | ) | | | | — | | |
| Total net expenses | | | | 98,705 | | | | | 770,713 | | |
| Net investment income (loss) | | | | 82,899 | | | | | 60,436 | | |
| | | | | | | | | | | | |
| Net Realized and Unrealized Gain (Loss) on Investments, Foreign Currency Transactions and Forward Currency Contracts | | | | | | | | | | | |
| Net realized gain (loss) on: | | | | | | | | | | | |
| Investments** | | | | 1,078,806 | | | | | 7,517,861 | | |
| Foreign currency transactions | | | | — | | | | | — | | |
| Forward currency contracts | | | | — | | | | | — | | |
| Total net realized gain (loss) on investments, foreign currency transactions and forward currency contracts | | | | 1,078,806 | | | | | 7,517,861 | | |
| Net change in unrealized appreciation (depreciation) on: | | | | | | | | | | | |
| Investments† | | | | 458,571 | | | | | 841,214 | | |
| Foreign currency translations | | | | — | | | | | — | | |
| Forward currency contracts | | | | — | | | | | — | | |
| Total net change in unrealized appreciation (depreciation) on investments, foreign currency translations and forward currency contracts | | | | 458,571 | | | | | 841,214 | | |
| Net realized and unrealized gain (loss) on investments, foreign currency transactions and forward currency contracts | | | | 1,537,377 | | | | | 8,359,075 | | |
| Net increase (decrease) in net assets resulting from operations | | | $ | 1,620,276 | | | | $ | 8,419,511 | | |
| * Net of foreign withholding taxes of | | | $ | 192 | | | | $ | — | | |
| ** Net of foreign capital gains taxes of | | | $ | — | | | | $ | — | | |
| † Includes net change in unrealized appreciation (depreciation) of foreign capital gains taxes of | | | $ | — | | | | $ | — | | |
The accompanying notes are an integral part of these financial statements.
| | Lazard
Retirement
International
Equity Portfolio | | Lazard
Retirement
Emerging Markets
Equity Portfolio | | Lazard
Retirement
Global Dynamic
Multi-Asset Portfolio | |
| | | | | | | | | | | | | |
| | $ | 6,772,068 | | | $ | 31,324,127 | | | $ | 6,392,497 | | |
| | | — | | | | — | | | | 1,314,725 | | |
| | | 6,772,068 | | | | 31,324,127 | | | | 7,707,222 | | |
| | | | | | | | | | | | | |
| | | 2,286,719 | | | | 11,039,220 | | | | 2,642,472 | | |
| | | 749,458 | | | | 2,197,733 | | | | 826,891 | | |
| | | 109,371 | | | | 644,458 | | | | 184,056 | | |
| | | 21,986 | | | | 214,455 | | | | 47,950 | | |
| | | 114,309 | | | | 206,204 | | | | 93,897 | | |
| | | 60,266 | | | | 167,448 | | | | 57,443 | | |
| | | 16,600 | | | | 125,001 | | | | 23,649 | | |
| | | 19,566 | | | | 41,819 | | | | 15,502 | | |
| | | 15,434 | | | | 31,622 | | | | 14,398 | | |
| | | 14,839 | | | | 26,555 | | | | 18,829 | | |
| | | 3,408,548 | | | | 14,694,515 | | | | 3,925,087 | | |
| | | (13,975 | ) | | | — | | | | (456,843 | ) | |
| | | — | | | | — | | | | — | | |
| | | 3,394,573 | | | | 14,694,515 | | | | 3,468,244 | | |
| | | 3,377,495 | | | | 16,629,612 | | | | 4,238,978 | | |
| | | | | | | | | | | | | |
| | | 81,506,300 | | | | 28,012,158 | | | | 19,199,482 | | |
| | | (394,796 | ) | | | (126,441 | ) | | | 88,780 | | |
| | | — | | | | — | | | | (640,928 | ) | |
| | | | | | | | | | | | | |
| | | 81,111,504 | | | | 27,885,717 | | | | 18,647,334 | | |
| | | |
| | | (23,612,877 | ) | | | 228,612,495 | | | | 37,962,847 | | |
| | | 92,041 | | | | (9,239 | ) | | | 10,603 | | |
| | | — | | | | — | | | | 608,204 | | |
| | | | | | | | | | | | | |
| | | (23,520,836 | ) | | | 228,603,256 | | | | 38,581,654 | | |
| | | | | | | | | | | | | |
| | | 57,590,668 | | | | 256,488,973 | | | | 57,228,988 | | |
| | $ | 60,968,163 | | | $ | 273,118,585 | | | $ | 61,467,966 | | |
| | $ | 930,791 | | | $ | 4,126,860 | | | $ | 318,496 | | |
| | $ | — | | | $ | 231,743 | | | $ | — | | |
| | $ | — | | | $ | 440,195 | | | $ | — | | |
Lazard Retirement Series, Inc. Statements of Changes in Net Assets
| | | Lazard Retirement US Strategic Equity Portfolio | | Lazard Retirement US Small-Mid Cap Equity Portfolio | |
| | | Year Ended | | Year Ended | | Year Ended | | Year Ended | |
| | | December 31, 2017 | | December 31, 2016 | | December 31, 2017 | | December 31, 2016 | |
| | | | | | | | | | | | | | | | | | | | | | |
| Increase (Decrease) in Net Assets | | | | | | | | | | | | | | | | | | | | | |
| | | | | | | | | | | | | | | | | | | | | | |
| Operations | | | | | | | | | | | | | | | | | | | | | |
| Net investment income (loss) | | | $ | 82,899 | | | | $ | 88,366 | | | | $ | 60,436 | | | | $ | 263,186 | | |
| Net realized gain (loss) on investments, foreign currency transactions and forward currency contracts | | | | 1,078,806 | | | | | (517,325 | ) | | | | 7,517,861 | | | | | 2,528,724 | | |
| Net change in unrealized appreciation (depreciation) on investments, foreign currency translations and forward currency contracts | | | | 458,571 | | | | | 1,326,163 | | | | | 841,214 | | | | | 5,915,148 | | |
| Net increase (decrease) in net assets resulting from operations | | | | 1,620,276 | | | | | 897,204 | | | | | 8,419,511 | | | | | 8,707,058 | | |
| | | | | | | | | | | | | | | | | | | | | | |
| Distributions to shareholders | | | | | | | | | | | | | | | | | | | | | |
| From net investment income | | | | | | | | | | | | | | | | | | | | | |
| Service Shares | | | | (149,459 | ) | | | | (10,679 | ) | | | | (230,504 | ) | | | | — | | |
| Investor Shares | | | | — | | | | | — | | | | | — | | | | | — | | |
| From net realized gains | | | | | | | | | | | | | | | | | | | | | |
| Service Shares | | | | (284,563 | ) | | | | (105,677 | ) | | | | (6,156,719 | ) | | | | (3,171,705 | ) | |
| Net decrease in net assets resulting from distributions | | | | (434,022 | ) | | | | (116,356 | ) | | | | (6,387,223 | ) | | | | (3,171,705 | ) | |
| | | | | | | | | | | | | | | | | | | | | | |
| Capital stock transactions | | | | | | | | | | | | | | | | | | | | | |
| Net proceeds from sales | | | | | | | | | | | | | | | | | | | | | |
| Service Shares | | | | 1,999,390 | | | | | 1,106,595 | | | | | 9,107,568 | | | | | 12,126,952 | | |
| Investor Shares | | | | — | | | | | — | | | | | — | | | | | — | | |
| Net proceeds from reinvestment of distributions | | | | | | | | | | | | | | | | | | | | | |
| Service Shares | | | | 434,022 | | | | | 116,356 | | | | | 6,387,223 | | | | | 3,171,705 | | |
| Investor Shares | | | | — | | | | | — | | | | | — | | | | | — | | |
| Cost of shares redeemed | | | | | | | | | | | | | | | | | | | | | |
| Service Shares | | | | (4,227,255 | ) | | | | (3,094,973 | ) | | | | (16,136,589 | ) | | | | (14,855,237 | ) | |
| Investor Shares | | | | — | | | | | — | | | | | — | | | | | — | | |
| Net increase (decrease) in net assets from capital stock transactions | | | | (1,793,843 | ) | | | | (1,872,022 | ) | | | | (641,798 | ) | | | | 443,420 | | |
| Total increase (decrease) in net assets | | | | (607,589 | ) | | | | (1,091,174 | ) | | | | 1,390,490 | | | | | 5,978,773 | | |
| Net assets at beginning of period | | | | 10,437,793 | | | | | 11,528,967 | | | | | 65,478,084 | | | | | 59,499,311 | | |
| Net assets at end of period* | | | $ | 9,830,204 | | | | $ | 10,437,793 | | | | $ | 66,868,574 | | | | $ | 65,478,084 | | |
| *Includes undistributed (distributions in excess of) net investment income (loss) of | | | $ | 6,641 | | | | $ | 80,766 | | | | $ | (5,449 | ) | | | $ | 230,470 | | |
| | | | | | | | | | | | | | | | | | | | | | |
| Shares issued and redeemed | | | | | | | | | | | | | | | | | | | | | |
| | | | | | | | | | | | | | | | | | | | | | |
| Service Shares | | | | | | | | | | | | | | | | | | | | | |
| Shares outstanding at beginning of period | | | | 906,860 | | | | | 1,083,612 | | | | | 8,090,372 | | | | | 8,047,591 | | |
| Shares sold | | | | 160,592 | | | | | 103,039 | | | | | 1,102,955 | | | | | 1,607,794 | | |
| Shares issued to shareholders from reinvestment of distributions | | | | 33,683 | | | | | 10,370 | | | | | 790,116 | | | | | 430,938 | | |
| Shares redeemed | | | | (344,125 | ) | | | | (290,161 | ) | | | | (1,951,956 | ) | | | | (1,995,951 | ) | |
| Net increase (decrease) | | | | (149,850 | ) | | | | (176,752 | ) | | | | (58,885 | ) | | | | 42,781 | | |
| Shares outstanding at end of period | | | | 757,010 | | | | | 906,860 | | | | | 8,031,487 | | | | | 8,090,372 | | |
| | | | | | | | | | | | | | | | | | | | | | |
| Investor Shares | | | | | | | | | | | | | | | | | | | | | |
| Shares outstanding at beginning of period | | | | — | | | | | — | | | | | — | | | | | — | | |
| Shares sold | | | | — | | | | | — | | | | | — | | | | | — | | |
| Shares issued to shareholders from reinvestment of distributions | | | | — | | | | | — | | | | | — | | | | | — | | |
| Shares redeemed | | | | — | | | | | — | | | | | — | | | | | — | | |
| Net increase (decrease) | | | | — | | | | | — | | | | | — | | | | | — | | |
| Shares outstanding at end of period | | | | — | | | | | — | | | | | — | | | | | — | | |
The accompanying notes are an integral part of these financial statements.
| | Lazard Retirement International Equity Portfolio | | Lazard Retirement Emerging Markets Equity Portfolio | | Lazard Retirement Global Dynamic Multi-Asset Portfolio | | |
| | Year Ended | | Year Ended | | Year Ended | | Year Ended | | Year Ended | | Year Ended | | |
| | December 31, 2017 | | December 31, 2016 | | December 31, 2017 | | December 31, 2016 | | December 31, 2017 | | December 31, 2016 | | |
| | | | | | | | | | | | | | | | | | | | | | | | | | | | | | | | |
| | | $ | 3,377,495 | | | | $ | 10,521,699 | | | | $ | 16,629,612 | | | | $ | 13,425,531 | | | | $ | 4,238,978 | | | | $ | 3,153,466 | | | |
| | | | | | | | | | | | | | | | | | | | | | | | | | | | | | | | |
| | | | 81,111,504 | | | | | (22,285,589 | ) | | | | 27,885,717 | | | | | (56,173,874 | ) | | | | 18,647,334 | | | | | (2,369,317 | ) | | |
| | | | | | | | | | | | | | | | | | | | | | | | | | | | | | | | |
| | | | (23,520,836 | ) | | | | (18,237,459 | ) | | | | 228,603,256 | | | | | 230,280,518 | | | | | 38,581,654 | | | | | 6,954,180 | | | |
| | | | | | | | | | | | | | | | | | | | | | | | | | | | | | | | |
| | | | 60,968,163 | | | | | (30,001,349 | ) | | | | 273,118,585 | | | | | 187,532,175 | | | | | 61,467,966 | | | | | 7,738,329 | | | |
| | | | | | | | | | | | | | | | | | | | | | | | | | | | | | | | |
| | | | (5,235,528 | ) | | | | (8,837,795 | ) | | | | (15,335,733 | ) | | | | (8,897,841 | ) | | | | — | | | | | (728,536 | ) | | |
| | | | — | | | | | — | | | | | (4,580,560 | ) | | | | (2,325,656 | ) | | | | — | | | | | — | | | |
| | | | | | | | | | | | | | | | | | | | | | | | | | | | | | | | |
| | | | (46,926,172 | ) | | | | (1,500,336 | ) | | | | — | | | | | — | | | | | (20,127,755 | ) | | | | (911,504 | ) | | |
| | | | (52,161,700 | ) | | | | (10,338,131 | ) | | | | (19,916,293 | ) | | | | (11,223,497 | ) | | | | (20,127,755 | ) | | | | (1,640,040 | ) | | |
| | | | | | | | | | | | | | | | | | | | | | | | | | | | | | | | |
| | | | 73,001,825 | | | | | 88,994,820 | | | | | 168,980,904 | | | | | 155,198,810 | | | | | 86,194,773 | | | | | 109,767,981 | | | |
| | | | — | | | | | — | | | | | 46,100,850 | | | | | 39,888,122 | | | | | — | | | | | — | | | |
| | | | | | | | | | | | | | | | | | | | | | | | | | | | | | | | |
| | | | 52,161,700 | | | | | 10,338,131 | | | | | 15,335,733 | | | | | 8,897,841 | | | | | 20,127,755 | | | | | 1,640,041 | | | |
| | | | — | | | | | — | | | | | 4,580,560 | | | | | 2,325,656 | | | | | — | | | | | — | | | |
| | | | | | | | | | | | | | | | | | | | | | | | | | | | | | | | |
| | | | (565,677,666 | ) | | | | (87,990,969 | ) | | | | (325,859,757 | ) | | | | (185,865,415 | ) | | | | (56,741,278 | ) | | | | (46,886,208 | ) | | |
| | | | — | | | | | — | | | | | (48,566,540 | ) | | | | (42,152,216 | ) | | | | — | | | | | — | | | |
| | | | | | | | | | | | | | | | | | | | | | | | | | | | | | | | |
| | | | (440,514,141 | ) | | | | 11,341,982 | | | | | (139,428,250 | ) | | | | (21,707,202 | ) | | | | 49,581,250 | | | | | 64,521,814 | | | |
| | | | (431,707,678 | ) | | | | (28,997,498 | ) | | | | 113,774,042 | | | | | 154,601,476 | | | | | 90,921,461 | | | | | 70,620,103 | | | |
| | | | 653,014,275 | | | | | 682,011,773 | | | | | 1,067,454,745 | | | | | 912,853,269 | | | | | 293,286,294 | | | | | 222,666,191 | | | |
| | | $ | 221,306,597 | | | | $ | 653,014,275 | | | | $ | 1,181,228,787 | | | | $ | 1,067,454,745 | | | | $ | 384,207,755 | | | | $ | 293,286,294 | | | |
| | | | | | | | | | | | | | | | | | | | | | | | | | | | | | | | |
| | | $ | 341,314 | | | | $ | 2,233,700 | | | | $ | 1,040,208 | | | | $ | 4,685,073 | | | | $ | (8,596 | ) | | | $ | (3,614,604 | ) | | |
| | | | | | | | | | | | | | | | | | | | | | | | | | | | | | | | |
| | | | 56,443,790 | | | | | 55,520,320 | | | | | 46,868,834 | | | | | 48,088,227 | | | | | 24,807,688 | | | | | 19,352,557 | | | |
| | | | 5,964,005 | | | | | 7,425,970 | | | | | 7,889,712 | | | | | 8,776,015 | | | | | 6,565,631 | | | | | 9,323,596 | | | |
| | | | | | | | | | | | | | | | | | | | | | | | | | | | | | | | |
| | | | 4,806,678 | | | | | 883,446 | | | | | 670,092 | | | | | 477,613 | | | | | 1,499,459 | | | | | 136,853 | | | |
| | | | (46,772,548 | ) | | | | (7,385,946 | ) | | | | (15,463,873 | ) | | | | (10,473,021 | ) | | | | (4,398,235 | ) | | | | (4,005,318 | ) | | |
| | | | (36,001,865 | ) | | | | 923,470 | | | | | (6,904,069 | ) | | | | (1,219,393 | ) | | | | 3,666,855 | | | | | 5,455,131 | | | |
| | | | 20,441,925 | | | | | 56,443,790 | | | | | 39,964,765 | | | | | 46,868,834 | | | | | 28,474,543 | | | | | 24,807,688 | | | |
| | | | | | | | | | | | | | | | | | | | | | | | | | | | | | | | |
| | | | — | | | | | — | | | | | 10,098,734 | | | | | 10,186,142 | | | | | — | | | | | — | | | |
| | | | — | | | | | — | | | | | 2,190,292 | | | | | 2,210,607 | | | | | — | | | | | — | | | |
| | | | | | | | | | | | | | | | | | | | | | | | | | | | | | | | |
| | | | — | | | | | — | | | | | 202,231 | | | | | 126,551 | | | | | — | | | | | — | | | |
| | | | — | | | | | — | | | | | (2,251,167 | ) | | | | (2,424,566 | ) | | | | — | | | | | — | | | |
| | | | — | | | | | — | | | | | 141,356 | | | | | (87,408 | ) | | | | — | | | | | — | | | |
| | | | — | | | | | — | | | | | 10,240,090 | | | | | 10,098,734 | | | | | — | | | | | — | | | |
| | | | | | | | | | | | | | | | | | | | | | | | | | | | | | | | |
Lazard Retirement Series, Inc. Financial Highlights
LAZARD RETIREMENT US STRATEGIC EQUITY PORTFOLIO
| | | | |
| Selected data for a share of capital | | Year Ended | |
| stock outstanding throughout each period | | 12/31/17 | | | 12/31/16 | | | 12/31/15 | | | 12/31/14 | | | 12/31/13 | | |
| | | | | | | | | | | | | | | | | | | | | | |
| Service Shares | | | | | | | | | | | | | | | | | | | | | |
| Net asset value, beginning of period | | $ | 11.51 | | | $ | 10.64 | | | $ | 12.15 | | | $ | 12.02 | | | $ | 10.44 | | |
| Income (loss) from investment operations: | | | | | | | | | | | | | | | | | | | | | |
| Net investment income (loss) | | | 0.13 | | | | 0.10 | | | | 0.06 | | | | 0.09 | | | | 0.11 | | |
| Net realized and unrealized gain (loss) | | | 1.94 | | | | 0.90 | | | | (0.73 | ) | | | 1.68 | | | | 2.80 | | |
| | | | | | | | | | | | | | | | | | | | | | |
| Total from investment operations | | | 2.07 | | | | 1.00 | | | | (0.67 | ) | | | 1.77 | | | | 2.91 | | |
| Less distributions from: | | | | | | | | | | | | | | | | | | | | | |
| Net investment income | | | (0.20 | ) | | | (0.01 | ) | | | (0.05 | ) | | | (0.09 | ) | | | (0.11 | ) | |
| Net realized gains | | | (0.39 | ) | | | (0.12 | ) | | | (0.79 | ) | | | (1.55 | ) | | | (1.22 | ) | |
| | | | | | | | | | | | | | | | | | | | | | |
| Total distributions | | | (0.59 | ) | | | (0.13 | ) | | | (0.84 | ) | | | (1.64 | ) | | | (1.33 | ) | |
| | | | | | | | | | | | | | | | | | | | | | |
| Net asset value, end of period | | $ | 12.99 | | | $ | 11.51 | | | $ | 10.64 | | | $ | 12.15 | | | $ | 12.02 | | |
| | | | | | | | | | | | | | | | | | | | | | |
| Total Return (a) | | | 18.10 | % | | | 9.42 | % | | | -5.44 | % | | | 14.71 | % | | | 28.07 | % | |
| | | | | | | | | | | | | | | | | | | | | | |
| Ratios and Supplemental Data: | | | | | | | | | | | | | | | | | | | | | |
| Net assets, end of period (in thousands) | | $ | 9,830 | | | $ | 10,438 | | | $ | 11,529 | | | $ | 12,391 | | | $ | 8,944 | | |
| Ratios to average net assets: | | | | | | | | | | | | | | | | | | | | | |
| Net expenses | | | 1.00 | % | | | 1.00 | % | | | 1.00 | % | | | 1.00 | % | | | 1.00 | % | |
| Gross expenses | | | 2.14 | % | | | 2.48 | % | | | 2.31 | % | | | 2.59 | % | | | 2.88 | % | |
| Net investment income (loss) | | | 0.84 | % | | | 0.86 | % | | | 0.53 | % | | | 0.79 | % | | | 0.97 | % | |
| Portfolio turnover rate | | | 76 | % | | | 58 | % | | | 86 | % | | | 72 | % | | | 66 | % | |
| (a) | Total returns reflect reinvestment of all dividends and distributions, if any. Certain expenses of the Portfolio may have been waived or reimbursed by the Investment Manager, State Street or BFDS; without such waiver/reimbursement of expenses, the Portfolio’s returns would have been lower. Performance information does not reflect the fees and charges imposed by participating insurance companies at the separate account level, and such charges will have the effect of reducing performance. |
The accompanying notes are an integral part of these financial statements.
LAZARD RETIREMENT US SMALL-MID CAP EQUITY PORTFOLIO
| | | | |
| Selected data for a share of capital | | Year Ended | |
| stock outstanding throughout each period | | 12/31/17 | | | 12/31/16 | | | 12/31/15 | | | 12/31/14 | | | 12/31/13 | | |
| | | | | | | | | | | | | | | | | | | | | | |
| Service Shares | | | | | | | | | | | | | | | | | | | | | |
| Net asset value, beginning of period | | $ | 8.09 | | | $ | 7.39 | | | $ | 8.18 | | | $ | 8.71 | | | $ | 7.30 | | |
| Income (loss) from investment operations: | | | | | | | | | | | | | | | | | | | | | |
| Net investment income (loss) | | | 0.01 | | | | 0.03 | ^ | | | (0.02 | ) | | | (0.02 | ) | | | (0.03 | ) | |
| Net realized and unrealized gain (loss) | | | 1.07 | | | | 1.09 | | | | (0.19 | ) | | | 0.94 | | | | 2.53 | | |
| | | | | | | | | | | | | | | | | | | | | | |
| Total from investment operations | | | 1.08 | | | | 1.12 | | | | (0.21 | ) | | | 0.92 | | | | 2.50 | | |
| Less distributions from: | | | | | | | | | | | | | | | | | | | | | |
| Net investment income | | | (0.03 | ) | | | — | | | | — | | | | — | | | | — | | |
| Net realized gains | | | (0.81 | ) | | | (0.42 | ) | | | (0.58 | ) | | | (1.45 | ) | | | (1.09 | ) | |
| | | | | | | | | | | | | | | | | | | | | | |
| Total distributions | | | (0.84 | ) | | | (0.42 | ) | | | (0.58 | ) | | | (1.45 | ) | | | (1.09 | ) | |
| | | | | | | | | | | | | | | | | | | | | | |
| Net asset value, end of period | | $ | 8.33 | | | $ | 8.09 | | | $ | 7.39 | | | $ | 8.18 | | | $ | 8.71 | | |
| | | | | | | | | | | | | | | | | | | | | | |
| Total Return (a) | | | 13.95 | % | | | 15.78 | %^ | | | -2.38 | % | | | 11.03 | % | | | 35.08 | % | |
| | | | | | | | | | | | | | | | | | | | | | |
| Ratios and Supplemental Data: | | | | | | | | | | | | | | | | | | | | | |
| Net assets, end of period (in thousands) | | $ | 66,869 | | | $ | 65,478 | | | $ | 59,499 | | | $ | 63,491 | | | $ | 58,923 | | |
| Ratios to average net assets: | | | | | | | | | | | | | | | | | | | | | |
| Net expenses | | | 1.19 | % | | | 1.25 | %^ | | | 1.25 | % | | | 1.25 | % | | | 1.25 | % | |
| Gross expenses | | | 1.25 | % | | | 1.32 | % | | | 1.35 | % | | | 1.32 | % | | | 1.35 | % | |
| Net investment income (loss) | | | 0.09 | % | | | 0.46 | %^ | | | -0.22 | % | | | -0.20 | % | | | -0.33 | % | |
| Portfolio turnover rate | | | 79 | % | | | 94 | % | | | 89 | % | | | 92 | % | | | 101 | % | |
| | |
| ^ | Refer to Note 3 in the Notes to Financial Statements for discussion of prior period custodian out-of-pocket expenses that were reimbursed to the Portfolio in the period. The amount of the reimbursement was on a per share basis less than $0.005 per share. There was no impact on the total return of the Portfolio. The net expenses and net investment income (loss) ratios of the Portfolio would be unchanged as the change to the period custodian fees was offset against the period expense waivers/reimbursements with no impact to net expenses or net investment income (loss). |
| (a) | Total returns reflect reinvestment of all dividends and distributions, if any. Certain expenses of the Portfolio may have been waived or reimbursed by the Investment Manager, State Street or BFDS; without such waiver/reimbursement of expenses, the Portfolio’s returns would have been lower. Performance information does not reflect the fees and charges imposed by participating insurance companies at the separate account level, and such charges will have the effect of reducing performance. |
The accompanying notes are an integral part of these financial statements.
LAZARD RETIREMENT INTERNATIONAL EQUITY PORTFOLIO
| | | | |
| Selected data for a share of capital | | Year Ended | |
| stock outstanding throughout each period | | 12/31/17 | | | 12/31/16 | | | 12/31/15 | | | 12/31/14 | | | 12/31/13 | | |
| | | | | | | | | | | | | | | | | | | | | | |
| Service Shares | | | | | | | | | | | | | | | | | | | | | |
| Net asset value, beginning of period | | $ | 11.57 | | | $ | 12.28 | | | $ | 12.50 | | | $ | 13.26 | | | $ | 11.12 | | |
| Income (loss) from investment operations: | | | | | | | | | | | | | | | | | | | | | |
| Net investment income (loss) | | | 0.31 | | | | 0.19 | ^ | | | 0.19 | | | | 0.21 | | | | 0.17 | | |
| Net realized and unrealized gain (loss) | | | 2.24 | | | | (0.71 | ) | | | 0.02 | | | | (0.76 | ) | | | 2.13 | | |
| | | | | | | | | | | | | | | | | | | | | | |
| Total from investment operations | | | 2.55 | | | | (0.52 | ) | | | 0.21 | | | | (0.55 | ) | | | 2.30 | | |
| Less distributions from: | | | | | | | | | | | | | | | | | | | | | |
| Net investment income | | | (0.33 | ) | | | (0.16 | ) | | | (0.21 | ) | | | (0.21 | ) | | | (0.16 | ) | |
| Net realized gains | | | (2.96 | ) | | | (0.03 | ) | | | (0.22 | ) | | | — | | | | — | | |
| | | | | | | | | | | | | | | | | | | | | | |
| Total distributions | | | (3.29 | ) | | | (0.19 | ) | | | (0.43 | ) | | | (0.21 | ) | | | (0.16 | ) | |
| | | | | | | | | | | | | | | | | | | | | | |
| Net asset value, end of period | | $ | 10.83 | | | $ | 11.57 | | | $ | 12.28 | | | $ | 12.50 | | | $ | 13.26 | | |
| | | | | | | | | | | | | | | | | | | | | | |
| Total Return (a) | | | 22.33 | % | | | -4.29 | %^ | | | 1.75 | % | | | -4.21 | % | | | 20.76 | % | |
| | | | | | | | | | | | | | | | | | | | | | |
| Ratios and Supplemental Data: | | | | | | | | | | | | | | | | | | | | | |
| Net assets, end of period (in thousands) | | $ | 221,307 | | | $ | 653,014 | | | $ | 682,012 | | | $ | 690,324 | | | $ | 689,512 | | |
| Ratios to average net assets: | | | | | | | | | | | | | | | | | | | | | |
| Net expenses | | | 1.11 | % | | | 1.08 | %^ | | | 1.11 | % | | | 1.09 | % | | | 1.10 | % | |
| Gross expenses | | | 1.12 | % | | | 1.09 | % | | | 1.11 | % | | | 1.09 | % | | | 1.10 | % | |
| Net investment income (loss) | | | 1.11 | % | | | 1.59 | %^ | | | 1.42 | % | | | 1.59 | % | | | 1.41 | % | |
| Portfolio turnover rate | | | 44 | % | | | 28 | % | | | 37 | % | | | 34 | % | | | 40 | % | |
| | |
| ^ | Refer to Note 3 in the Notes to Financial Statements for discussion of prior period custodian out-of-pocket expenses that were reimbursed to the Portfolio in the period. The amount of the reimbursement was on a per share basis less than $0.005 per share. There was no impact on the total return of the Portfolio. There was a 0.01% impact on the net expenses and net investment income (loss) ratios of the Portfolio. |
| (a) | Total returns reflect reinvestment of all dividends and distributions, if any. Certain expenses of the Portfolio may have been waived or reimbursed by the Investment Manager, State Street or BFDS; without such waiver/reimbursement of expenses, the Portfolio’s returns would have been lower. Performance information does not reflect the fees and charges imposed by participating insurance companies at the separate account level, and such charges will have the effect of reducing performance. |
The accompanying notes are an integral part of these financial statements.
LAZARD RETIREMENT EMERGING MARKETS EQUITY PORTFOLIO
| Selected data for a share of capital | | Year Ended | |
| stock outstanding throughout each period | | 12/31/17 | | | 12/31/16 | | | 12/31/15 | | | 12/31/14 | | | 12/31/13 | | |
| | | | | | | | | | | | | | | | | | | | | | |
| Service Shares | | | | | | | | | | | | | | | | | | | | | |
| Net asset value, beginning of period | | $ | 18.78 | | | $ | 15.70 | | | $ | 19.96 | | | $ | 21.51 | | | $ | 22.22 | | |
| Income (loss) from investment operations: | | | | | | | | | | | | | | | | | | | | | |
| Net investment income (loss) (a) | | | 0.31 | | | | 0.23 | ^ | | | 0.27 | | | | 0.37 | | | | 0.31 | | |
| Net realized and unrealized gain (loss) | | | 4.89 | | | | 3.04 | | | | (4.27 | ) | | | (1.35 | ) | | | (0.58 | ) | |
| | | | | | | | | | | | | | | | | | | | | | |
| Total from investment operations | | | 5.20 | | | | 3.27 | | | | (4.00 | ) | | | (0.98 | ) | | | (0.27 | ) | |
| Less distributions from: | | | | | | | | | | | | | | | | | | | | | |
| Net investment income | | | (0.39 | ) | | | (0.19 | ) | | | (0.21 | ) | | | (0.37 | ) | | | (0.31 | ) | |
| Net realized gains | | | — | | | | — | | | | (0.05 | ) | | | (0.20 | ) | | | (0.13 | ) | |
| | | | | | | | | | | | | | | | | | | | | | |
| Total distributions | | | (0.39 | ) | | | (0.19 | ) | | | (0.26 | ) | | | (0.57 | ) | | | (0.44 | ) | |
| | | | | | | | | | | | | | | | | | | | | | |
| Net asset value, end of period | | $ | 23.59 | | | $ | 18.78 | | | $ | 15.70 | | | $ | 19.96 | | | $ | 21.51 | | |
| | | | | | | | | | | | | | | | | | | | | | |
| Total Return (b) | | | 27.76 | % | | | 20.84 | %^ | | | -20.05 | % | | | -4.64 | % | | | -1.24 | % | |
| | | | | | | | | | | | | | | | | | | | | | |
| Ratios and Supplemental Data: | | | | | | | | | | | | | | | | | | | | | |
| Net assets, end of period (in thousands) | | $ | 942,572 | | | $ | 880,047 | | | $ | 754,835 | | | $ | 859,747 | | | $ | 846,233 | | |
| Ratios to average net assets: | | | | | | | | | | | | | | | | | | | | | |
| Net expenses | | | 1.38 | % | | | 1.37 | %^ | | | 1.39 | % | | | 1.38 | % | | | 1.38 | % | |
| Gross expenses | | | 1.38 | % | | | 1.38 | % | | | 1.39 | % | | | 1.38 | % | | | 1.38 | % | |
| Net investment income (loss) | | | 1.45 | % | | | 1.29 | %^ | | | 1.43 | % | | | 1.66 | % | | | 1.42 | % | |
| Portfolio turnover rate | | | 10 | % | | | 12 | % | | | 9 | % | | | 12 | % | | | 14 | % | |
| Selected data for a share of capital | | Year Ended | |
| stock outstanding throughout each period | | 12/31/17 | | | 12/31/16 | | | 12/31/15 | | | 12/31/14 | | | 12/31/13 | | |
| | | | | | | | | | | | | | | | | | | | | | |
| Investor Shares | | | | | | | | | | | | | | | | | | | | | |
| Net asset value, beginning of period | | $ | 18.56 | | | $ | 15.51 | | | $ | 19.74 | | | $ | 21.28 | | | $ | 21.99 | | |
| Income (loss) from investment operations: | | | | | | | | | | | | | | | | | | | | | |
| Net investment income (loss) (a) | | | 0.37 | | | | 0.26 | ^ | | | 0.32 | | | | 0.42 | | | | 0.37 | | |
| Net realized and unrealized gain (loss) | | | 4.83 | | | | 3.02 | | | | (4.25 | ) | | | (1.34 | ) | | | (0.59 | ) | |
| | | | | | | | | | | | | | | | | | | | | | |
| Total from investment operations | | | 5.20 | | | | 3.28 | | | | (3.93 | ) | | | (0.92 | ) | | | (0.22 | ) | |
| Less distributions from: | | | | | | | | | | | | | | | | | | | | | |
| Net investment income | | | (0.45 | ) | | | (0.23 | ) | | | (0.25 | ) | | | (0.42 | ) | | | (0.36 | ) | |
| Net realized gains | | | — | | | | — | | | | (0.05 | ) | | | (0.20 | ) | | | (0.13 | ) | |
| | | | | | | | | | | | | | | | | | | | | | |
| Total distributions | | | (0.45 | ) | | | (0.23 | ) | | | (0.30 | ) | | | (0.62 | ) | | | (0.49 | ) | |
| | | | | | | | | | | | | | | | | | | | | | |
| Net asset value, end of period | | $ | 23.31 | | | $ | 18.56 | | | $ | 15.51 | | | $ | 19.74 | | | $ | 21.28 | | |
| | | | | | | | | | | | | | | | | | | | | | |
| Total Return (b) | | | 28.07 | % | | | 21.18 | %^ | | | -19.90 | % | | | -4.38 | % | | | -1.01 | % | |
| | | | | | | | | | | | | | | | | | | | | | |
| Ratios and Supplemental Data: | | | | | | | | | | | | | | | | | | | | | |
| Net assets, end of period (in thousands) | | $ | 238,656 | | | $ | 187,408 | | | $ | 158,018 | | | $ | 229,855 | | | $ | 260,330 | | |
| Ratios to average net assets: | | | | | | | | | | | | | | | | | | | | | |
| Net expenses | | | 1.14 | % | | | 1.12 | %^ | | | 1.15 | % | | | 1.14 | % | | | 1.14 | % | |
| Gross expenses | | | 1.14 | % | | | 1.14 | % | | | 1.15 | % | | | 1.14 | % | | | 1.14 | % | |
| Net investment income (loss) | | | 1.74 | % | | | 1.52 | %^ | | | 1.71 | % | | | 1.91 | % | | | 1.71 | % | |
| Portfolio turnover rate | | | 10 | % | | | 12 | % | | | 9 | % | | | 12 | % | | | 14 | % | |
| ^ | Refer to Note 3 in the Notes to Financial Statements for discussion of prior period custodian out-of-pocket expenses that were reimbursed to the Portfolio in the period. The amount of the reimbursement was on a per share basis less than $0.005 per share. There was a 0.06% impact on the total return of the Portfolio. There was a 0.02% impact on the net expenses and net investment income (loss) ratios of the Portfolio. |
| (a) | Net investment income (loss) has been computed using the average shares method. |
| (b) | Total returns reflect reinvestment of all dividends and distributions, if any. Performance information does not reflect the fees and charges imposed by participating insurance companies at the separate account level, and such charges will have the effect of reducing performance. |
The accompanying notes are an integral part of these financial statements.
LAZARD RETIREMENT GLOBAL DYNAMIC MULTI-ASSET PORTFOLIO
| Selected data for a share of capital | | Year Ended | |
| stock outstanding throughout each period | | 12/31/17 | | | 12/31/16 | | | 12/31/15 | | | 12/31/14 | | | 12/31/13 | | |
| | | | | | | | | | | | | | | | | | | | | | |
| Service Shares | | | | | | | | | | | | | | | | | | | | | |
| Net asset value, beginning of period | | $ | 11.82 | | | $ | 11.51 | | | $ | 11.86 | | | $ | 12.30 | | | $ | 10.54 | | |
| Income (loss) from investment operations: | | | | | | | | | | | | | | | | | | | | | |
| Net investment income (loss) | | | 0.17 | | | | 0.14 | | | | 0.13 | | | | 0.11 | | | | 0.06 | | |
| Net realized and unrealized gain (loss) | | | 2.25 | | | | 0.24 | | | | (0.19 | ) | | | 0.23 | | | | 1.99 | | |
| | | | | | | | | | | | | | | | | | | | | | |
| Total from investment operations | | | 2.42 | | | | 0.38 | | | | (0.06 | ) | | | 0.34 | | | | 2.05 | | |
| Less distributions from: | | | | | | | | | | | | | | | | | | | | | |
| Net investment income | | | — | | | | (0.03 | ) | | | — | | | | (0.07 | ) | | | (0.04 | ) | |
| Net realized gains | | | (0.75 | ) | | | (0.04 | ) | | | (0.29 | ) | | | (0.71 | ) | | | (0.25 | ) | |
| | | | | | | | | | | | | | | | | | | | | | |
| Total distributions | | | (0.75 | ) | | | (0.07 | ) | | | (0.29 | ) | | | (0.78 | ) | | | (0.29 | ) | |
| | | | | | | | | | | | | | | | | | | | | | |
| Net asset value, end of period | | $ | 13.49 | | | $ | 11.82 | | | $ | 11.51 | | | $ | 11.86 | | | $ | 12.30 | | |
| | | | | | | | | | | | | | | | | | | | | | |
| Total Return (a) | | | 20.53 | % | | | 3.30 | % | | | -0.44 | % | | | 2.70 | % | | | 19.49 | % | |
| | | | | | | | | | | | | | | | | | | | | | |
| Ratios and Supplemental Data: | | | | | | | | | | | | | | | | | | | | | |
| Net assets, end of period (in thousands) | | $ | 384,208 | | | $ | 293,286 | | | $ | 222,666 | | | $ | 176,669 | | | $ | 99,760 | | |
| Ratios to average net assets: | | | | | | | | | | | | | | | | | | | | | |
| Net expenses | | | 1.05 | % | | | 1.05 | % | | | 1.05 | % | | | 1.05 | % | | | 1.05 | % | |
| Gross expenses | | | 1.19 | % | | | 1.25 | % | | | 1.31 | % | | | 1.33 | % | | | 1.70 | % | |
| Net investment income (loss) | | | 1.28 | % | | | 1.23 | % | | | 1.18 | % | | | 1.19 | % | | | 1.01 | % | |
| Portfolio turnover rate | | | 104 | % | | | 105 | % | | | 114 | % | | | 105 | % | | | 62 | % | |
| (a) | Total returns reflect reinvestment of all dividends and distributions, if any. Certain expenses of the Portfolio may have been waived or reimbursed by the Investment Manager, State Street or BFDS; without such waiver/reimbursement of expenses, the Portfolio’s returns would have been lower. Performance information does not reflect the fees and charges imposed by participating insurance companies at the separate account level, and such charges will have the effect of reducing performance. |
The accompanying notes are an integral part of these financial statements.
Lazard Retirement Series, Inc. Notes to Financial Statements December 31, 2017
1. Organization
Lazard Retirement Series, Inc. (the “Fund”) was incorporated in Maryland on February 13, 1997 and is registered under the Investment Company Act of 1940, as amended (the “1940 Act”), as an open-end management investment company. The Fund, comprised of twenty-three no-load portfolios (each referred to as a “Portfolio”), is currently offered only to separate accounts established by insurance companies to fund variable annuity contracts and variable life insurance policies. Portfolio shares may also be offered to certain qualified pension and retirement plans and accounts permitting accumulation of assets on a tax-deferred basis. Effective January 31, 2006, the Fund designated its existing class of shares as Service Shares and commenced offering Investor Shares. Investor Shares and Service Shares are identical, except as to the services offered to and expenses borne by each class of shares. As of December 31, 2017, only Lazard Retirement Emerging Markets Equity Portfolio had issued Investor Shares. Currently, only the following five Portfolios, each of which is “diversified”, as defined in the 1940 Act, are offered: Lazard Retirement US Strategic Equity Portfolio (“US Strategic Equity Portfolio”), Lazard Retirement US Small-Mid Cap Equity Portfolio (“US Small-Mid Cap Equity Portfolio”), Lazard Retirement International Equity Portfolio (“International Equity Portfolio”), Lazard Retirement Emerging Markets Equity Portfolio (“Emerging Markets Equity Portfolio”), and Lazard Retirement Global Dynamic Multi-Asset Portfolio (“Global Dynamic Multi-Asset Portfolio”). Each of the other eighteen Portfolios had not commenced operations as of December 31, 2017.
2. Significant Accounting Policies
The accompanying financial statements are presented in conformity with GAAP. The Fund is an investment company and therefore applies specialized accounting guidance in accordance with Accounting Standards Codification Topic 946. The following is a summary of significant accounting policies consistently followed by the Fund in the preparation of the financial statements:
(a) Valuation of Investments—Equity securities traded on a securities exchange or market, including
exchange-traded option contracts, rights and warrants, are valued at the last reported sales price (for domestic equity securities) or the closing price (for foreign equity securities) on the exchange or market on which the security is principally traded or, for securities trading on the NASDAQ National Market System (“NASDAQ”), the NASDAQ Official Closing Price. If there is no available closing price for a foreign equity security, the last reported sales price is used. If there are no reported sales of a security on the valuation date, the security is valued at the most recent quoted bid price on such date reported by such principal exchange or market. Forward currency contracts generally are valued using quotations from an independent pricing service. Investments in money market funds are valued at the fund’s net asset value (“NAV”) per share.
Bonds and other fixed-income securities that are not exchange-traded are valued on the basis of prices provided by independent pricing services which are based on, among other things, trading in securities with similar characteristics, brokers’ quotations and/or a matrix system which considers such factors as other security prices, yields and maturities.
Calculation of a Portfolio’s NAV may not take place contemporaneously with the determination of the prices of portfolio assets used in such calculation. Trading on Europe, Latin and South America and Far East securities exchanges and in over-the-counter markets ordinarily is completed well before the close of business on each business day in New York (i.e., a day on which the New York Stock Exchange (the “NYSE”) is open). In addition, European or Far Eastern securities trading generally or in a particular country or countries may not take place on all business days in New York and on which the NAV of a Portfolio is calculated.
The Valuation Committee of the Investment Manager, which meets periodically under the direction of the Board of Directors (the “Board”), may evaluate a variety of factors to determine the fair value of securities for which market quotations are determined not to be readily available or reliable. These factors include, but are not limited to, the type of security, the value of
comparable securities, observations from financial institutions and relevant news events. Input from the Investment Manager’s portfolio managers/analysts also will be considered.
If a significant event materially affecting the value of securities occurs between the close of the exchange or market on which the security is principally traded and the time when a Portfolio’s NAV is calculated, or when current market quotations otherwise are determined not to be readily available or reliable (including restricted or other illiquid securities such as certain derivative instruments), such securities will be valued at their fair value as determined by, or in accordance with procedures approved by, the Board. The fair value of non-US securities may be determined with the assistance of an independent pricing service using correlations between the movement of prices of such securities and indices of US securities and other appropriate indicators, such as closing market prices of relevant ADRs or futures contracts. Non-US securities may trade on days when a Portfolio is not open for business, thus affecting the value of the Portfolio’s assets on days when Portfolio shareholders may not be able to buy or sell Portfolio shares.
The effect of using fair value pricing is that the NAV of a Portfolio will reflect the affected securities’ values as determined in the judgment of the Board or its designee instead of being determined by the market. Using a fair value pricing methodology to price securities may result in a value that is different from the most recent closing price of a security and from the prices used by other investment companies to calculate their portfolios’ NAVs.
(b) Portfolio Securities Transactions and Investment Income—Portfolio securities transactions are accounted for on trade date. Realized gain (loss) on sales of investments are recorded on a specific identification basis. Dividend income is recorded on the ex-dividend date except for certain dividends from non-US securities where the dividend rate is not available. In such cases, the dividend is recorded as soon as the information is received by a Portfolio. Interest income, if any, is accrued daily. A Portfolio amortizes
premiums and accretes discounts on fixed-income securities using the effective yield method.
A Portfolio may be subject to taxes imposed by non-US countries in which it invests. Such taxes are generally based upon income earned or capital gains (realized or unrealized). An affected Portfolio accrues and applies such taxes to net investment income, net realized gains and net unrealized gains concurrent with the recognition of income earned or capital gains (realized and unrealized) from the applicable portfolio securities.
As a result of several court cases in certain countries across the European Union, the International Equity Portfolio has filed tax reclaims for previously withheld taxes on dividends earned in those countries. These filings are subject to various administrative proceedings by the local jurisdictions’ tax authorities within the European Union, as well as a number of related judicial proceedings. Uncertainty exists as to the ultimate resolution of these proceedings, the likelihood of receipt of these claims, and the potential timing of payment, and accordingly no amounts are reflected in the financial statements. Such amounts, if and when recorded, could result in an increase in the International Equity Portfolio’s NAV per share.
(c) Foreign Currency Translation and Forward Currency Contracts—The accounting records of the Fund are maintained in US dollars. Portfolio securities and other assets and liabilities denominated in a foreign currency are translated daily into US dollars at the prevailing rates of exchange. Purchases and sales of securities, income receipts and expense payments are translated into US dollars at the prevailing exchange rates on the respective transaction dates.
The Portfolios do not isolate the portion of operations resulting from changes in foreign exchange rates on investments from the fluctuations arising from changes in their market prices. Such fluctuations are included in net realized and unrealized gain (loss) on investments. Net realized gain (loss) on foreign currency transactions and forward currency contracts represents net foreign currency gain (loss) from forward currency contracts, disposition of foreign
currencies, currency gain (loss) realized between the trade and settlement dates on securities transactions, and the difference between the amount of dividends, interest and foreign withholding taxes recorded on the Portfolios’ accounting records and the US dollar equivalent amounts actually received or paid. Net change in unrealized appreciation (depreciation) on foreign currency translations reflects the impact of changes in exchange rates on the value of assets and liabilities, other than investments in securities, during the period.
A forward currency contract is an agreement between two parties to buy or sell currency at a set price on a future date. Upon entering into these contracts, risks may arise from the potential inability of counterparties to meet the terms of their contracts and from unanticipated movements in the value of the foreign currency relative to the US dollar.
The US dollar value of forward currency contracts is determined using quotations provided by an independent pricing service. Daily fluctuations in the value of such contracts are recorded as unrealized appreciation (depreciation) on forward currency contracts. When the contract is closed, a Portfolio records a realized gain (loss) equal to the difference between the value at the time it was opened and the value at the time it was closed.
During the year ended December 31, 2017, the Global Dynamic Multi-Asset Portfolio traded in forward currency contracts.
(d) Federal Income Taxes—The Fund’s policy is to have each Portfolio qualify as a regulated investment company under Subchapter M of the Internal Revenue Code (the “Code”) and to distribute all of its taxable income, including any net realized capital gains, to shareholders. Therefore, no federal income tax provision is required.
At December 31, 2017, the following Portfolio had unused realized capital loss carryovers which, for federal income tax purposes, could be used to offset future realized capital gains with no expiration date as follows:
| Portfolio | | Short-Term | | | Long-Term | |
| | | | | | | | | |
| Emerging Markets Equity | | $ | (2,616,173 | ) | | $ | (43,779,077 | ) |
Under current tax law, post-October capital losses or certain late-year ordinary losses, as defined by the Code, within the taxable year may be deferred and treated as occurring on the first day of the following tax year. For the tax year ended December 31, 2017, the Portfolios had no such losses to defer.
For federal income tax purposes, the aggregate cost, aggregate gross unrealized appreciation, aggregate gross unrealized depreciation and the net unrealized appreciation (depreciation) were as follows:
| Portfolio | | Aggregate
Cost | | | Aggregate
Gross
Unrealized
Appreciation | | | Aggregate
Gross
Unrealized
Depreciation | | | Net
Unrealized
Appreciation
(Depreciation) | |
| | | | | | | | | | | | | | | | | |
| US Strategic Equity | | $ | 8,151,344 | | | $ | 1,706,245 | | | $ | 16,411 | | | $ | 1,689,834 | |
| US Small-Mid Cap Equity | | | 57,754,152 | | | | 9,518,783 | | | | 635,344 | | | | 8,883,439 | |
| International Equity | | | 181,087,427 | | | | 40,938,622 | | | | 1,554,319 | | | | 39,384,303 | |
| Emerging Markets Equity | | | 981,605,270 | | | | 270,823,864 | | | | 67,400,824 | | | | 203,423,040 | |
| Global Dynamic Multi-Asset | | | 340,214,924 | | | | 47,447,743 | | | | 4,110,350 | | | | 43,337,393 | |
Management has analyzed the Portfolios’ tax positions, and has concluded that no liability for unrecognized tax benefits should be recorded related to uncertain tax positions taken on tax returns filed for any open tax years (or expected to be taken on future tax returns). Open tax years are those that remain subject to examination and are based on each tax jurisdiction’s statute of limitations. The Fund files a U.S. federal income tax return annually after its fiscal year-end, which is subject to examination by the Internal Revenue Service for a period of three years from the date of filing.
(e) Dividends and Distributions—Dividends from net investment income, if any, will be declared and paid annually. During any particular year, net realized gains from investment transactions in excess of available
capital loss carryforwards would be taxable to the Portfolios, if not distributed. The Portfolios intend to declare and distribute these amounts, at least annually, to shareholders; however, to avoid taxation, a second distribution may be required. Differences in per share distributions, by class, are generally due to differences in class specific expenses.
The US Small-Mid Cap Equity and International Equity Portfolios intend, on their 2017 tax returns, to treat as a distribution of investment company taxable income and net capital gain the portion of redemption proceeds paid to redeeming shareholders that represents the redeeming shareholders’ portion of the Portfolios’ undistributed investment company taxable income and net capital gain. This practice, which involves the use of equalization accounting, will have the effect of reducing the amount of income and gains that the Portfolios would otherwise be required to distribute as dividends to shareholders in order for the Portfolios to avoid federal income and excise taxes. This practice reduces the amount of distributions required to be made to nonredeeming shareholders and defers the recognition of taxable income by such shareholders. However, since the amount of any undistributed income will be reflected in the value of the Portfolios’ shares, the total return on a shareholder’s investment is not affected by the Portfolios’ use of equalization.
Income and capital gains distributions are determined in accordance with federal income tax regulations which may differ from GAAP. These book/tax differences, which may result in distribution reclassifications, are primarily due to differing treatments of foreign currency transactions, wash sales, passive foreign investment companies and distributions from real estate investment trusts. The book/tax differences relating to shareholder distributions resulted in reclassifications among certain capital accounts as follows:
| Portfolio | | Paid in
Capital | | Undistributed
(Distributions
in Excess of)
Net Investment
Income | | | Accumulated
Net Realized
Gain (Loss) | |
| | | | | | | | | | | | |
| US Strategic Equity | | $ | 1 | | $ | (7,565 | ) | | $ | 7,564 | |
| US Small-Mid Cap Equity | | | 673,065 | | | (65,851 | ) | | | (607,214 | ) |
| International Equity | | | 11,517,777 | | | (34,353 | ) | | | (11,483,424 | ) |
| Emerging Markets Equity | | | — | | | (358,184 | ) | | | 358,184 | |
| Global Dynamic Multi-Asset | | | 1 | | | (632,970 | ) | | | 632,969 | |
The tax character of dividends and distributions paid during the years ended December 31, were as follows:
| | | Ordinary Income | | | Long-Term Capital Gain | |
| Portfolio | | 2017 | | | 2016 | | | 2017 | | | 2016 | |
| | | | | | | | | | | | | | | | | |
| US Strategic Equity | | $ | 149,459 | | | $ | 51,023 | | | $ | 284,563 | | | $ | 65,333 | |
| US Small-Mid Cap Equity | | | 230,504 | | | | 86,716 | | | | 6,156,719 | | | | 3,084,989 | |
| International Equity | | | 5,235,528 | | | | 8,837,882 | | | | 46,926,172 | | | | 1,500,249 | |
| Emerging Markets Equity | | | 19,916,293 | | | | 11,223,497 | | | | — | | | | — | |
| Global Dynamic Multi-Asset | | | 10,108,756 | | | | 728,536 | | | | 10,018,999 | | | | 911,504 | |
At December 31, 2017, the components of distributable earnings, on a tax basis, were as follows:
| Portfolio | | Undistributed
Ordinary Income/
Deferred Late-
Year Ordinary
Losses | | Undistributed
Long-Term
Capital Gain/
Deferred Capital
Losses | | | Net Unrealized
Appreciation
(Depreciation)
Including Foreign
Currency | |
| | | | | | | | | | | | |
| US Strategic Equity | | $ | 6,641 | | $ | 279,804 | | | $ | 1,689,834 | |
| US Small-Mid Cap Equity | | | 2,334,165 | | | 903,721 | | | | 8,883,439 | |
| International Equity | | | 341,233 | | | — | | | | 39,399,096 | |
| Emerging Markets Equity | | | 1,803,051 | | | (46,395,250 | ) | | | 203,289,103 | |
| Global Dynamic Multi-Asset | | | 1,233,579 | | | 253,399 | | | | 43,339,647 | |
(f) Allocation of Expenses—Expenses not directly chargeable to a specific Portfolio are allocated among the Fund, The Lazard Funds, Inc., Lazard Global Total Return and Income Fund, Inc. and Lazard World Dividend & Income Fund, Inc. (collectively with the Fund, the “Lazard Fund Complex”), each a registered management investment company advised by the Investment Manager, primarily on the basis of relative net assets. Portfolios accrue distribution and service (12b-1) fees to Service Shares. The Portfolios’ income, expenses (other than class specific expenses) and realized and unrealized gains and losses are allocated proportionally each day between the classes based upon the relative net assets of each class.
(g) Estimates—The preparation of financial statements in conformity with GAAP requires management to make estimates and assumptions that affect the reported amounts of assets and liabilities and dis-
closure of contingent assets and liabilities at the date of the financial statements and the reported amounts of increases and decreases in net assets resulting from operations during the reporting period. Actual results could differ from those estimates.
(h) Net Asset Value—NAV per share for each class of each Portfolio is determined each day the NYSE is open for trading as of the close of regular trading on the NYSE (generally 4:00 p.m. Eastern time). The Fund will not treat an intraday unscheduled disruption in NYSE trading as a closure of the NYSE, and will price its shares as of 4:00 p.m., if the particular disruption directly affects only the NYSE. NAV per share is determined by dividing the value of the total assets of the Portfolio represented by such class, less all liabilities, by the total number of Portfolio shares of such class outstanding.
3. Investment Management, Administration, Custody, Distribution and Transfer Agency Agreements
The Fund, on behalf of the Portfolios, has entered into a management agreement (the “Management Agreement”) with the Investment Manager. Pursuant to the Management Agreement, the Investment Manager regularly provides each Portfolio with investment research, advice and supervision and furnishes continuously an investment program for each Portfolio consistent with its investment objectives and policies, including the purchase, retention and disposition of securities, and provides the Portfolios with administrative, operational and compliance assistance services. For its services provided to the Portfolios, the Investment Manager earns a management fee, accrued daily as a percentage of its average daily net assets and payable by each Portfolio monthly, at the annual rate set forth below:
| Portfolio | | Annual Rate |
| | | | | |
| US Strategic Equity | | | 0.70 | % |
| US Small-Mid Cap Equity | | | 0.75 | |
| International Equity | | | 0.75 | |
| Emerging Markets Equity | | | 1.00 | |
| Global Dynamic Multi-Asset | | | 0.80 | |
The Investment Manager has voluntarily agreed to waive its fees and, if necessary, reimburse the Portfolios until May 1, 2018 if the aggregate direct expenses of the Portfolios, exclusive of taxes, brokerage, interest
on borrowings, fees and expenses of “Acquired Funds” (as defined in Form N-1A) and extraordinary expenses, but including the management fee stated in the Management Agreement between the Investment Manager and the Fund, on behalf of the Portfolios, exceed the following percentages of the value of the Portfolios’ average daily net assets for the respective shares:
| Portfolio | | Service Shares | | Investor Shares |
| | | | | | | | | |
| US Strategic Equity | | | 1.00 | % | | | N/A | |
| US Small-Mid Cap Equity (a) | | | 1.15 | | | | N/A | |
| International Equity | | | 1.10 | | | | N/A | |
| Emerging Markets Equity | | | 1.55 | | | | 1.30 | % |
| Global Dynamic Multi-Asset | | | 1.05 | | | | N/A | |
(a) From January 1, 2017 to June 6, 2017, percentage was 1.25%.
During the year ended December 31, 2017, the Investment Manager waived its management fees and reimbursed the following Portfolios for other expenses as follows:
| | | Service Shares | |
| | | Management | | Expenses | |
| Portfolio | | Fees Waived | | Reimbursed | |
| | | | | | | | | |
| US Strategic Equity | | $ | 69,093 | | | $ | 38,716 | |
| US Small-Mid Cap Equity | | | 38,329 | | | | — | |
| International Equity | | | 13,975 | | | | — | |
| Global Dynamic Multi-Asset | | | 456,843 | | | | — | |
The aforementioned waivers and/or reimbursements are not subject to recoupment by the Investment Manager.
State Street provides the Fund with custody and certain fund administration and accounting services. For the year ended December 31, 2017, State Street waived $4,688 of its fund administration fee for US Strategic Equity Portfolio.
In December 2015, State Street announced that it had identified inconsistencies in the way in which clients were invoiced for custody out-of-pocket expenses from 1998 until 2015. The dollar amount difference between what was charged and what should have been charged, plus interest, was recorded as a reimbursement when determined in 2016. Pursuant to the expense limitations described above, certain Portfolios have experienced management fee waivers during the year ended December 31, 2016. Accordingly, the reimbursement of out-of-pocket expenses resulted in the reduction in the waiver of manage-
ment fees for certain Portfolios for the year ended December 31, 2016.
The Fund has a distribution agreement with Lazard Asset Management Securities LLC (the “Distributor”), a wholly-owned subsidiary of the Investment Manager, to serve as the distributor for shares of each Portfolio. The Distributor bears the cost of printing and mailing prospectuses to potential investors and certain expenses in connection with the offering of Portfolio shares.
Under a distribution and servicing plan adopted pursuant to Rule 12b-1 under the 1940 Act, each Portfolio pays a monthly fee to the Distributor, at an annual rate of 0.25% of the average daily net assets of its Service Shares, for distribution and servicing of accounts. The Distributor may make payments to participating insurance companies, certain financial institutions, securities dealers and other industry professionals for providing these services.
BFDS is the Fund’s transfer and dividend disbursing agent. For its services, BFDS receives a monthly fee computed on the basis of the number of shareholder accounts it maintains, subject to a minimum fee amount per share class in each Portfolio, and is reimbursed for certain out-of-pocket expenses. BFDS has agreed to waive the monthly minimum fee for the first six months after a new Portfolio or share class has commenced operations.
On January 1, 2018, BFDS changed its name to DST Asset Manager Solutions, Inc.
4. Directors’ Compensation
Certain Directors of the Fund are officers of the Investment Manager. For the year ended December 31, 2017, each Director who is not an affiliated person of the Investment Manager or any of its affiliates was paid by the Lazard Fund Complex: (1) an annual retainer of $210,000, (2) an additional annual fee of $30,000 to the lead Independent Director (an “Independent Director” is a Director who is not an “interested person” (as defined in the 1940 Act) of the Fund), and (3) an additional annual fee of $20,000 to the Audit Committee Chair. Effective January 1, 2018, the aggregate com-
pensation for Independent Directors for the Lazard Fund Complex is comprised of: (1) an annual retainer of $225,000, (2) an additional annual fee of $32,500 to the lead Independent Director, and (3) an additional annual fee of $22,500 to the Audit Committee Chair. The Independent Directors may be paid additional compensation for participation on ad hoc committees or other work performed on behalf of the Board. The Independent Directors also are reimbursed for travel and other out-of-pocket expenses for attending Board and committee meetings. The Directors do not receive benefits from the Fund pursuant to any pension, retirement or similar arrangement. Independent Directors’ fees are allocated among the portfolios in the Lazard Fund Complex at a rate of $5,000 per portfolio with the remainder allocated based upon each portfolio’s proportionate share of combined net assets. The Statements of Operations show the Independent Directors’ fees and expenses paid by each Portfolio.
5. Securities Transactions and Transactions with Affiliates
Purchases and sales of portfolio securities (excluding short-term investments) for the year ended December 31, 2017 were as follows:
| Portfolio | | Purchases | | | Sales | |
| | | | | | | | | |
| US Strategic Equity | | $ | 7,295,235 | | | $ | 9,475,342 | |
| US Small-Mid Cap Equity | | | 49,695,136 | | | | 56,630,689 | |
| International Equity | | | 131,755,577 | | | | 595,953,748 | |
| Emerging Markets Equity | | | 110,775,882 | | | | 250,090,130 | |
| Global Dynamic Multi-Asset | | | 355,013,269 | | | | 334,807,756 | |
| | | US Treasury Securities | |
| Portfolio | | | Purchases | | | | Sales | |
| | | | | | | | | |
| Global Dynamic Multi-Asset | | $ | 5,076,169 | | | $ | 1,022,125 | |
For the year ended December 31, 2017, the Portfolios did not engage in any cross-trades in accordance with Rule 17a-7 under the 1940 Act, and no brokerage commissions were paid to affiliates of the Investment Manager or other affiliates of the Fund for portfolio transactions executed on behalf of the Fund.
6. Investment Risks
(a) Non-US Securities Risk—A Portfolio’s performance will be influenced by political, social and economic
factors affecting the non-US countries and companies in which the Portfolio invests. Non-US securities carry special risks, such as less developed or less efficient trading markets, political instability, a lack of company information, differing auditing and legal standards, and, potentially, less liquidity.
(b) Emerging Market Risk—Emerging market countries generally have economic structures that are less diverse and mature, and political systems that are less stable, than those of developed countries. The economies of countries with emerging markets may be based predominantly on only a few industries, may be highly vulnerable to changes in local or global trade conditions, and may suffer from extreme debt burdens or volatile inflation rates. The securities markets of emerging market countries have historically been extremely volatile. These market conditions may continue or worsen. Investments in these countries may be subject to political, economic, legal, market and currency risks. The risks may include less protection of property rights and uncertain political and economic policies, the imposition of capital controls and/or foreign investment limitations by a country, nationalization of businesses and the imposition of sanctions by other countries, such as the US. Significant devaluation of emerging market currencies against the US dollar may occur subsequent to acquisition of investments denominated in emerging market currencies.
(c) Foreign Currency Risk—Investments denominated in currencies other than US dollars may experience a decline in value, in US dollar terms, due solely to fluctuations in currency exchange rates. A Portfolio’s currency investments could be adversely affected by delays in, or a refusal to grant, repatriation of funds or conversion of emerging market currencies. The Investment Manager does not intend to actively hedge the Portfolios’ foreign currency exposure.
(d) Fixed-Income and Debt Securities Risk—The market value of a debt security may decline due to general market conditions that are not specifically related to a particular company, such as real or perceived adverse economic conditions, changes in the outlook for corporate earnings, changes in interest or currency rates or adverse investor sentiment generally.
The debt securities market can be susceptible to increases in volatility and decreases in liquidity. Liquidity can decline unpredictably in response to overall economic conditions or credit tightening.
Prices of bonds and other debt securities tend to move inversely with changes in interest rates. Typically, a rise in rates will adversely affect debt securities and, accordingly, will cause the value of a Portfolio’s investments in these securities to decline. Interest rate risk is usually greater for fixed-income securities with longer maturities or durations. A rise in interest rates (or the expectation of a rise in interest rates) may result in periods of volatility, decreased liquidity and increased redemptions, and, as a result, the Portfolio may have to liquidate portfolio securities at disadvantageous prices. Risks associated with rising interest rates are heightened given that interest rates in the US and other countries are at or near historic lows. During periods of reduced market liquidity, a Portfolio may not be able to readily sell debt securities at prices at or near their perceived value. An unexpected increase in Portfolio redemption requests, including requests from shareholders who may own a significant percentage of a Portfolio’s shares, which may be triggered by market turmoil or an increase in interest rates, could cause the Portfolio to sell its holdings at a loss or at undesirable prices and adversely affect the Portfolio’s share price and increase the Portfolio’s liquidity risk, Portfolio expenses and/or taxable distributions. Economic and other developments can adversely affect debt securities markets.
A Portfolio’s investments in lower-rated, higher-yielding securities (“junk bonds”) are subject to greater credit risk than its higher-rated investments. Credit risk is the risk that the issuer will not make interest or principal payments, or will not make payments on a timely basis. Non-investment grade securities tend to be more volatile, less liquid and are considered speculative. If there is a decline, or perceived decline, in the credit quality of a debt security (or any guarantor of payment on such security), the security’s value could fall, potentially lowering a Portfolio’s share price. The prices of non-investment grade securities, unlike investment grade debt securities, may fluctuate unpredictably and not necessarily
inversely with changes in interest rates. The prices of high yield securities can fall in response to negative news about the issuer or its industry, or the economy in general to a greater extent than those of higher-rated securities. The market for these securities may be less liquid and therefore these securities may be harder to value or sell at an acceptable price, especially during times of market volatility or decline.
Some fixed-income securities may give the issuer the option to call, or redeem, the securities before their maturity. If securities held by the Portfolio are called during a time of declining interest rates (which is typically the case when issuers exercise options to call outstanding securities), a Portfolio may have to reinvest the proceeds in an investment offering a lower yield (and the Portfolio may not fully benefit from any increase in the value of its portfolio holdings as a result of declining interest rates).
Adjustable rate securities provide a Portfolio with a certain degree of protection against rises in interest rates, although such securities will participate in any declines in interest rates as well. Certain adjustable rate securities, such as those with interest rates that fluctuate directly or indirectly based on multiples of a stated index, are designed to be highly sensitive to changes in interest rates and can subject the holders thereof to extreme reductions of yield and possibly loss of principal.
(e) Derivatives and Hedging Risk—Derivatives transactions, including those entered into for hedging purposes (i.e., seeking to protect Portfolio investments), may increase volatility, reduce returns, limit gains or magnify losses, perhaps substantially, particularly since most derivatives have a leverage component that provides investment exposure in excess of the amount invested. Over-the-counter swap agreements, forward currency contracts, writing or purchasing over-the-counter options on securities (including options on exchange-traded funds and exchange-traded notes), indexes and currencies and other over-the-counter derivatives transactions are subject to the risk of default by the counterparty and can be illiquid. Changes in liquidity may result in significant, rapid and unpredictable changes in the prices for deriva-
tives. These derivatives transactions, as well as the exchange-traded futures and options in which certain Portfolios may invest, are subject to many of the risks of, and can be highly sensitive to changes in the value of, the related index, commodity, interest rate, currency, security or other reference asset. As such, a small investment could have a potentially large impact on a Portfolio’s performance. Purchasing options will reduce returns by the amount of premiums paid for options that are not exercised. In fact, many derivatives may be subject to greater risks than those associated with investing directly in the underlying or other reference asset. Derivatives transactions incur costs, either explicitly or implicitly, which reduce returns, and costs of engaging in such transactions may outweigh any gains or any losses averted from hedging activities. Successful use of derivatives, whether for hedging or for other investment purposes, is subject to the Investment Manager’s ability to predict correctly movements in the direction of the relevant reference asset or market and, for hedging activities, correlation of the derivative instruments used with the investments seeking to be hedged. Use of derivatives transactions, even when entered into for hedging purposes, may cause a Portfolio to experience losses greater than if the Portfolio had not engaged in such transactions.
7. Contractual Obligations
The Fund enters into contracts in the normal course of business that contain a variety of indemnification provisions. A Portfolio’s maximum exposure under these arrangements is unknown. Management has reviewed the Fund’s existing contracts and expects the risk of loss to be remote.
8. Fair Value Measurements
Fair value is defined as the price that a Portfolio would receive to sell an asset, or would pay to transfer a liability, in an orderly transaction between market participants at the date of measurement. The Fair Value Measurements and Disclosures provisions of GAAP also establish a framework for measuring fair value, and a three-level hierarchy for fair value measurement that is based upon the transparency of inputs to the valuation of an asset or liability. Inputs may be observable or unobservable and refer, broadly, to the
assumptions that market participants would use in pricing the asset or liability. Observable inputs reflect the assumptions that market participants would use in pricing the asset or liability based on market data obtained from sources independent of the Fund. Unobservable inputs reflect the Fund’s own assumptions about the assumptions that market participants would use in pricing the asset or liability, developed based on the best information available in the circumstances. The fair value measurement level within the fair value hierarchy for the assets and liabilities of the Fund is based on the lowest level of any input that is significant to the overall fair value measurement. The three-level hierarchy of inputs is summarized below:
| • | Level 1 – unadjusted quoted prices in active markets for identical assets and liabilities |
| • | Level 2 – other significant observable inputs (including unadjusted quoted prices for similar assets and liabilities, interest rates, prepayment speeds, credit risk, etc.) |
| • | Level 3 – significant unobservable inputs (including the Fund’s own assumptions in determining the fair value of assets and liabilities) |
Changes in valuation technique may result in transfers into or out of the current assigned level within the hierarchy.
The inputs or methodology used for valuing securities are not necessarily an indication of the risks associated with investing in these securities.
The following table summarizes the valuation of the Portfolios’ assets and liabilities by each fair value hierarchy level as of December 31, 2017:
| Description | | Unadjusted
Quoted Prices in
Active Markets
for Identical
Assets and Liabilities
(Level 1) | | Significant Other
Observable
Inputs
(Level 2) | | Significant
Unobservable
Inputs
(Level 3) | | Balance as of
December 31, 2017 | |
| | | | | | | | | | | | | | | | | |
| US Strategic Equity Portfolio | | | | | | | | | | | | | | | | |
| Common Stocks* | | $ | 9,462,464 | | | $ | — | | | $ | — | | | $ | 9,462,464 | |
| Short-Term Investments | | | 378,714 | | | | — | | | | — | | | | 378,714 | |
| Total | | $ | 9,841,178 | | | $ | — | | | $ | — | | | $ | 9,841,178 | |
| | | | | | | | | | | | | | | | | |
| US Small-Mid Cap Equity Portfolio | | | | | | | | | | | | | | | | |
| Common Stocks* | | $ | 64,849,153 | | | $ | — | | | $ | — | | | $ | 64,849,153 | |
| Short-Term Investments | | | 1,788,438 | | | | — | | | | — | | | | 1,788,438 | |
| Total | | $ | 66,637,591 | | | $ | — | | | $ | — | | | $ | 66,637,591 | |
| Description | | Unadjusted
Quoted Prices in
Active Markets
for Identical
Assets and Liabilities
(Level 1) | | Significant Other
Observable
Inputs
(Level 2) | | Significant
Unobservable
Inputs
(Level 3) | | Balance as of
December 31, 2017 | |
| | | | | | | | | | | | | | | | | |
| International Equity Portfolio | | | | | | | | | | | | | | | | |
| Common Stocks* | | | | | | | | | | | | | | | | |
| Australia | | $ | — | | | $ | 7,002,613 | | | $ | — | | | $ | 7,002,613 | |
| Belgium | | | — | | | | 5,474,891 | | | | — | | | | 5,474,891 | |
| Brazil | | | — | | | | 1,895,218 | | | | — | | | | 1,895,218 | |
| Canada | | | 9,793,159 | | | | — | | | | — | | | | 9,793,159 | |
| Denmark | | | — | | | | 5,605,827 | | | | — | | | | 5,605,827 | |
| Finland | | | — | | | | 3,248,440 | | | | — | | | | 3,248,440 | |
| France | | | — | | | | 23,285,678 | | | | — | | | | 23,285,678 | |
| Germany | | | — | | | | 9,317,346 | | | | — | | | | 9,317,346 | |
| Ireland | | | 2,891,689 | | | | 5,065,309 | | | | — | | | | 7,956,998 | |
| Italy | | | — | | | | 1,533,209 | | | | — | | | | 1,533,209 | |
| Japan | | | — | | | | 40,691,358 | | | | — | | | | 40,691,358 | |
| Luxembourg | | | — | | | | 1,463,420 | | | | — | | | | 1,463,420 | |
| Netherlands | | | — | | | | 15,133,578 | | | | — | | | | 15,133,578 | |
| Norway | | | — | | | | 6,312,889 | | | | — | | | | 6,312,889 | |
| Singapore | | | — | | | | 5,353,987 | | | | — | | | | 5,353,987 | |
| Spain | | | — | | | | 3,702,179 | | | | — | | | | 3,702,179 | |
| Sweden | | | — | | | | 7,554,448 | | | | — | | | | 7,554,448 | |
| Switzerland | | | — | | | | 14,447,309 | | | | — | | | | 14,447,309 | |
| Taiwan | | | 3,267,160 | | | | — | | | | — | | | | 3,267,160 | |
| Turkey | | | — | | | | 2,397,485 | | | | — | | | | 2,397,485 | |
| United Kingdom | | | — | | | | 32,048,042 | | | | — | | | | 32,048,042 | |
| United States | | | 8,883,775 | | | | — | | | | — | | | | 8,883,775 | |
| Short-Term Investments | | | 4,102,640 | | | | — | | | | — | | | | 4,102,640 | |
| Total | | $ | 28,938,423 | | | $ | 191,533,226 | | | $ | — | | | $ | 220,471,649 | |
| | | | | | | | | | | | | | | | | |
| Emerging Markets Equity Portfolio | | | | | | | | | | | | | | | | |
| Common Stocks* | | | | | | | | | | | | | | | | |
| Argentina | | $ | 18,825,926 | | | $ | — | | | $ | — | | | $ | 18,825,926 | |
| Brazil | | | 25,501,477 | | | | 98,032,764 | | | | — | | | | 123,534,241 | |
| China | | | 95,902,401 | | | | 101,178,028 | | | | — | | | | 197,080,429 | |
| Egypt | | | 627,988 | | | | 8,832,152 | | | | — | | | | 9,460,140 | |
| Hungary | | | — | | | | 20,040,966 | | | | — | | | | 20,040,966 | |
| India | | | — | | | | 114,434,602 | | | | — | | | | 114,434,602 | |
| Indonesia | | | 19,928,070 | | | | 41,242,394 | | | | — | | | | 61,170,464 | |
| Malaysia | | | — | | | | 6,989,020 | | | | — | | | | 6,989,020 | |
| Mexico | | | 37,654,800 | | | | — | | | | — | | | | 37,654,800 | |
| Pakistan | | | — | | | | 17,036,025 | | | | — | | | | 17,036,025 | |
| Philippines | | | 8,181,760 | | | | — | | | | — | | | | 8,181,760 | |
| Russia | | | 17,088,229 | | | | 87,951,484 | | | | — | | | | 105,039,713 | |
| South Africa | | | — | | | | 120,074,289 | | | | — | | | | 120,074,289 | |
| South Korea | | | — | | | | 171,169,770 | | | | — | | | | 171,169,770 | |
| Taiwan | | | — | | | | 61,213,298 | | | | — | | | | 61,213,298 | |
| Thailand | | | — | | | | 14,796,068 | | | | — | | | | 14,796,068 | |
| Turkey | | | — | | | | 56,183,741 | | | | — | | | | 56,183,741 | |
| Short-Term Investments | | | 42,142,761 | | | | — | | | | — | | | | 42,142,761 | |
| Total | | $ | 265,853,412 | | | $ | 919,174,601 | | | $ | — | | | $ | 1,185,028,013 | |
| Description | | Unadjusted
Quoted Prices in
Active Markets
for Identical
Assets and Liabilities
(Level 1) | | Significant Other
Observable
Inputs
(Level 2) | | Significant
Unobservable
Inputs
(Level 3) | | Balance as of
December 31, 2017 | |
| | | | | | | | | | | | | | | | | |
| Global Dynamic Multi-Asset Portfolio | | | | | | | | | | | | | | | | |
| Assets: | | | | | | | | | | | | | | | | |
| Common Stocks* | | | | | | | | | | | | | | | | |
| Australia | | $ | — | | | $ | 8,930,228 | | | $ | — | | | $ | 8,930,228 | |
| Austria | | | — | | | | 1,047,273 | | | | — | | | | 1,047,273 | |
| Belgium | | | — | | | | 174,287 | | | | — | | | | 174,287 | |
| Canada | | | 13,705,046 | | | | — | | | | — | | | | 13,705,046 | |
| Denmark | | | 945,260 | | | | 2,493,747 | | | | — | | | | 3,439,007 | |
| Finland | | | 728,500 | | | | 195,774 | | | | — | | | | 924,274 | |
| France | | | 890,322 | | | | 7,411,059 | | | | — | | | | 8,301,381 | |
| Germany | | | 2,401,913 | | | | 6,515,932 | | | | — | | | | 8,917,845 | |
| Hong Kong | | | 1,800,444 | | | | 2,951,436 | | | | — | | | | 4,751,880 | |
| Ireland | | | 1,307,662 | | | | — | | | | — | | | | 1,307,662 | |
| Israel | | | 654,844 | | | | 248,709 | | | | — | | | | 903,553 | |
| Italy | | | — | | | | 792,780 | | | | — | | | | 792,780 | |
| Japan | | | 5,141,356 | | | | 22,793,551 | | | | — | | | | 27,934,907 | |
| Luxembourg | | | — | | | | 659,155 | | | | — | | | | 659,155 | |
| Malta | | | — | | | | 156,485 | | | | — | | | | 156,485 | |
| Netherlands | | | 1,306,066 | | | | 4,409,146 | | | | — | | | | 5,715,212 | |
| New Zealand | | | — | | | | 331,282 | | | | — | | | | 331,282 | |
| Norway | | | — | | | | 6,341,160 | | | | — | | | | 6,341,160 | |
| Singapore | | | 822,745 | | | | 2,903,053 | | | | — | | | | 3,725,798 | |
| Spain | | | — | | | | 2,344,316 | | | | — | | | | 2,344,316 | |
| Sweden | | | 2,170,724 | | | | 1,527,716 | | | | — | | | | 3,698,440 | |
| Switzerland | | | 674,111 | | | | 5,354,509 | | | | — | | | | 6,028,620 | |
| United Kingdom | | | 9,613,071 | | | | 10,201,960 | | | | — | | | | 19,815,031 | |
| United States | | | 181,344,137 | | | | 529,820 | | | | — | | | | 181,873,957 | |
| Corporate Bonds* | | | — | | | | 16,209,260 | | | | — | | | | 16,209,260 | |
| Foreign Government Obligations* | | | — | | | | 25,219,209 | | | | — | | | | 25,219,209 | |
| Quasi Government Bonds* | | | — | | | | 1,886,181 | | | | — | | | | 1,886,181 | |
| Supranationals | | | — | | | | 2,523,148 | | | | — | | | | 2,523,148 | |
| US Municipal Bonds | | | — | | | | 1,426,713 | | | | — | | | | 1,426,713 | |
| US Treasury Securities | | | — | | | | 8,130,450 | | | | — | | | | 8,130,450 | |
| Short-Term Investments | | | 17,095,014 | | | | — | | | | — | | | | 17,095,014 | |
| Other Financial Instruments† | | | | | | | | | | | | | | | | |
| Forward Currency Contracts | | | — | | | | 335,400 | | | | — | | | | 335,400 | |
| Total | | $ | 240,601,215 | | | $ | 144,043,739 | | | $ | — | | | $ | 384,644,954 | |
| | | | | | | | | | | | | | | | | |
| Liabilities: | | | | | | | | | | | | | | | | |
| Other Financial Instruments† | | | | | | | | | | | | | | | | |
| Forward Currency Contracts | | $ | — | | | $ | (606,747 | ) | | $ | — | | | $ | (606,747 | ) |
| * | Please refer to Portfolios of Investments and Notes to Portfolios of Investments for portfolio holdings by country and industry. |
| | |
| † | Other financial instruments are derivative instruments which are valued at their respective unrealized appreciation (depreciation). |
Certain equity securities to which footnote (‡) in the Notes to Portfolios of Investments applies are included in Level 2 and were valued based on reference to similar securities that were trading on active markets.
In connection with the implementation of fair value pricing procedures with respect to non-US securities
(see Note 2(a)), certain equity securities (other than those securities described in footnote (‡) in the Notes to Portfolios of Investments) in the International Equity, Emerging Markets Equity and Global Dynamic Multi-Asset Portfolios can transfer from Level 1 to Level 2 as a result of fair value pricing procedures and would revert to Level 1 when the fair value pricing procedures are no longer used. Accordingly, a signifi-
cant portion of the Portfolios’ investments are categorized as Level 2 investments. A Portfolio recognizes all transfers between levels as though they were transferred at the beginning of the reporting period.
During the year ended December 31, 2017, securities valued at the following amounts were transferred from Level 1 to Level 2:
| Portfolio | | Amount | |
| | | | | |
| International Equity | | $ | 24,884,735 | |
| Global Dynamic Multi-Asset | | | 4,086,451 | |
There were no other transfers into or out of Levels 1, 2 or 3 during the year ended December 31, 2017.
For further information regarding security characteristics see Portfolios of Investments.
9. Derivative Instruments
Certain Portfolios may use derivative instruments, including forward currency contracts.
Forward currency contracts may be used for hedging purposes or to seek to increase returns.
Global Dynamic Multi-Asset Portfolio
During the year ended December 31, 2017, the approximate average monthly notional exposure for derivative instruments was as follows:
| Forward currency contracts | $75,000,000 |
The following table summarizes the fair value of derivative instruments on the Statement of Assets and Liabilities as of December 31, 2017:
| | | Fair Value | |
| | | | | |
| Asset Derivatives | | | | |
| Foreign Exchange Risk: | | | | |
| Gross unrealized appreciation on forward currency contracts | | $ | 335,400 | |
| Liability Derivatives | | | | |
| Foreign Exchange Risk: | | | | |
| Gross unrealized depreciation on forward currency contracts | | $ | 606,747 | |
The effect of derivative instruments on the Statement of Operations for the year ended December 31, 2017 was:
| | | Amount | |
| | | | | |
| Realized Gain (Loss) on Derivatives | | | | |
| Foreign Exchange Risk: | | | | |
| Net realized gain (loss) on forward currency contracts | | $ | (640,928 | ) |
| Net Change in Unrealized Appreciation (Depreciation) on Derivatives | | | | |
| Foreign Exchange Risk: | | | | |
| Net change in unrealized appreciation (depreciation) on forward currency contracts | | $ | 608,204 | |
See Note 2(c) and the Portfolios of Investments for additional disclosures about derivative instruments.
None of the other Portfolios presented traded in derivative instruments during the year ended December 31, 2017.
As of December 31, 2017, the Global Dynamic Multi-Asset Portfolio held derivative instruments that are eligible for offset in the Statement of Assets and Liabilities and are subject to master netting arrangements. A master netting arrangement is an agreement between two counterparties who have multiple contracts with each other that provides for the net settlement of all contracts, as well as any cash collateral, through a single payment in the event of default on, or termination of, any one contract.
The required information for the affected Portfolio is presented in the below table, as of December 31, 2017:
| Description | Gross Amounts of
Recognized Assets | | Gross Amounts Offset
in the Statement of
Assets and Liabilities | | Net Amounts of
Assets Presented
in the Statement of
Assets and Liabilities |
| | | | | | | | |
| Forward Currency Contracts | | $335,400 | | $ — | | $335,400 | |
| | | | | Amounts Not Offset in the
Statement of Assets and Liabilities | | | |
| Counterparty | | Net Amounts of
Assets Presented
in the Statement of
Assets and Liabilities | | Financial
Instruments | | Collateral
Received | | Net Amounts of
Derivative Assets |
| | | | | | | | | | | | | | | | | | |
| Citibank NA | | | $ | 48,302 | | | $ | (48,302 | ) | | $ | — | | | $ | — | |
| HSBC Bank USA NA | | | | 278,019 | | | | (278,019 | ) | | | — | | | | — | |
| JPMorgan Chase Bank NA | | | | 4,057 | | | | (4,057 | ) | | | — | | | | — | |
| State Street Bank and Trust Co. | | | | 5,022 | | | | (5,022 | ) | | | — | | | | — | |
| Total | | | $ | 335,400 | | | $ | (335,400 | ) | | $ | — | | | $ | — | |
| Description | Gross Amounts of
Recognized Liabilities | | Gross Amounts Offset
in the Statement of
Assets and Liabilities | | Net Amounts of
Liabilities Presented
in the Statement of
Assets and Liabilities |
| | | | | | | | |
| Forward Currency Contracts | | $ 606,747 | | $ — | | $ 606,747 | |
| | | | | Amounts Not Offset in the
Statement of Assets and Liabilities | | | |
| Counterparty | | Net Amounts of
Liabilities Presented
in the Statement of
Assets and Liabilities | | Financial
Instruments | | Collateral
Pledged | | Net Amounts of
Derivative Liabilities |
| | | | | | | | | | | | | | | | | | |
| Citibank NA | | | $ | 176,294 | | | $ | (48,302 | ) | | $ | — | | | $ | 127,992 | |
| HSBC Bank USA NA | | | | 359,145 | | | | (278,019 | ) | | | — | | | | 81,126 | |
| JPMorgan Chase Bank NA | | | | 60,911 | | | | (4,057 | ) | | | — | | | | 56,854 | |
| State Street Bank and Trust Co. | | | | 10,397 | | | | (5,022 | ) | | | — | | | | 5,375 | |
| Total | | | $ | 606,747 | | | $ | (335,400 | ) | | $ | — | | | $ | 271,347 | |
10. Subsequent Events
Management has evaluated subsequent events affecting the Fund through the issuance of the financial statements and has determined that, aside from items previously disclosed within the Notes to Financial Statements and the following, there were no subsequent events that required adjustment or disclosure.
Subsequent to December 31, 2017, the International Equity and Emerging Markets Equity Portfolios received settlement proceeds in the amount of $102,815 and $107,481, respectively, from a foreign exchange trading class action lawsuit. The proceeds from the settlement represent a realized gain and were recorded in the period received.
Lazard Retirement Series, Inc. Report of Independent Registered Public Accounting Firm
To the Board of Directors of Lazard Retirement Series, Inc. and Shareholders of Lazard Retirement US Strategic Equity Portfolio, Lazard Retirement US Small-Mid Cap Equity Portfolio, Lazard Retirement International Equity Portfolio, Lazard Retirement Emerging Markets Equity Portfolio, and Lazard Retirement Global Dynamic Multi-Asset Portfolio:
Opinion on the Financial Statements and Financial Highlights
We have audited the accompanying statements of assets and liabilities, including the portfolios of investments, of Lazard Retirement Series, Inc. (the “Funds”) comprising Lazard Retirement US Strategic Equity Portfolio, Lazard Retirement US Small-Mid Cap Equity Portfolio, Lazard Retirement International Equity Portfolio, Lazard Retirement Emerging Markets Equity Portfolio, and Lazard Retirement Global Dynamic Multi-Asset Portfolio as of December 31, 2017, the related statements of operations for the year then ended, the statements of changes in net assets for each of the two years in the period then ended, the financial highlights for each of the four years in the period then ended, and the related notes to the financial statements. The financial highlights for the year ended December 31, 2013 were audited by other auditors whose report, dated February 14, 2014, expressed an unqualified opinion on those financial highlights. In our opinion, the financial statements and financial highlights present fairly, in all material respects, the financial position of each of the portfolios constituting the Lazard Retirement Series, Inc. as of December 31, 2017, and the results of their operations for the year then ended, the changes in their net assets for each of the two years in the period then ended, and the financial highlights for each of the four years in the period then ended, in conformity with accounting principles generally accepted in the United States of America.
Basis for Opinion
These financial statements and financial highlights are the responsibility of the Funds’ management. Our responsibility is to express an opinion on the Funds’ financial statements and financial highlights based on our audits. We are a public accounting firm registered with the Public Company Accounting Oversight Board (United States) (PCAOB) and are required to be independent with respect to the Funds in accordance with the U.S. federal securities laws and the applicable rules and regulations of the Securities and Exchange Commission and the PCAOB.
We conducted our audits in accordance with the standards of the PCAOB. Those standards require that we plan and perform the audit to obtain reasonable assurance about whether the financial statements and financial highlights are free of material misstatement, whether due to error or fraud. The Funds are not required to have, nor were we engaged to perform, an audit of their internal control over financial reporting. As part of our audits we are required to obtain an understanding of internal control over financial reporting but not for the purpose of expressing an opinion on the effectiveness of the Funds’ internal control over financial reporting. Accordingly, we express no such opinion.
Our audits included performing procedures to assess the risks of material misstatement of the financial statements and financial highlights, whether due to error or fraud, and performing procedures that respond to those risks. Such procedures included examining, on a test basis, evidence regarding the amounts and disclosures in the financial statements and financial highlights. Our audits also included evaluating the accounting principles used and significant estimates made by management, as well as evaluating the overall presentation of the financial statements and financial highlights. Our procedures included confirmation of securities owned as of December 31, 2017, by correspondence with the custodian and brokers; when replies were not received from brokers, we performed other auditing procedures. We believe that our audits provide a reasonable basis for our opinion.
DELOITTE & TOUCHE LLP
New York, New York
February 13, 2018
We have served as the auditor of one or more Lazard Fund Complex investment companies since 2004.
Lazard Retirement Series, Inc. Proxy Voting Results (unaudited)
A Joint Special Meeting of Shareholders of The Lazard Funds, Inc. and the Fund was held on October 20, 2017, to vote on the following proposals. The proposals received the required number of votes of shareholders and were adopted.
Proposal 1:
To elect each of Franci J. Blassberg, Trevor W. Morrison and Nathan A. Paul as a Fund Director.
| Director | | For | | Withhold Authority | | | |
| | | | | | | | |
| Franci J. Blassberg | | 86,848,352 | | 4,655,272 | | | |
| Trevor W. Morrison | | 86,752,185 | | 4,751,439 | | | |
| Nathan A. Paul | | 87,074,406 | | 4,429,218 | | | |
Proposal 2A:
To approve revising the Portfolio’s fundamental investment restrictions on issuing senior securities, borrowing and pledging or mortgaging its assets.
| Portfolio | | For | | Against | | Abstain | |
| | | | | | | | |
| US Strategic Equity | | 606,250 | | 15,507 | | 102,856 | |
| US Small-Mid Cap Equity | | 6,515,356 | | 681,128 | | 629,927 | |
| International Equity | | 13,923,118 | | 577,051 | | 1,093,764 | |
| Emerging Markets Equity | | 35,779,974 | | 3,013,040 | | 3,249,973 | |
| Global Dynamic Multi-Asset | | 19,692,048 | | 2,427,539 | | 3,196,094 | |
Proposal 2B:
To approve revising the Portfolio’s fundamental investment restrictions on purchasing or selling commodities or commodities contracts.
| Portfolio | | For | | Against | | Abstain | |
| | | | | | | | |
| US Strategic Equity | | 603,951 | | 15,739 | | 104,923 | |
| US Small-Mid Cap Equity | | 6,580,902 | | 643,227 | | 602,282 | |
| International Equity | | 13,880,522 | | 613,583 | | 1,099,827 | |
| Emerging Markets Equity | | 36,006,360 | | 2,779,850 | | 3,256,777 | |
| Global Dynamic Multi-Asset | | 19,964,305 | | 2,153,053 | | 3,198,322 | |
Proposal 2C:
To approve revising the Portfolio’s fundamental investment restriction on purchasing securities on margin.
| Portfolio | | For | | Against | | Abstain | |
| | | | | | | | |
| US Strategic Equity | | 549,579 | | 70,679 | | 104,355 | |
| US Small-Mid Cap Equity | | 6,266,544 | | 967,454 | | 592,413 | |
| International Equity | | 13,625,557 | | 932,237 | | 1,036,139 | |
| Emerging Markets Equity | | 35,033,686 | | 3,668,748 | | 3,340,553 | |
| Global Dynamic Multi-Asset | | 19,321,959 | | 2,761,835 | | 3,231,886 | |
Lazard Retirement Series, Inc. Board of Directors and Officers Information (unaudited)
Name (Age)
Address(1) | | Position(s) with the Fund
(Since) and Term(2) | | Principal Occupation(s) and Other Public Company
Directorships Held During the Past Five Years(2) |
| | | | | |
| Independent Directors(3): |
| | | | | |
| Franci J. Blassberg (64) | | Director
(August 2014) | | Debevoise & Plimpton LLP, a law firm, Of Counsel (2013 – present) University of California, Berkeley School of Law, Lecturer (Spring 2017) Cornell Law School, Visiting Professor of Practice (2015 – 2016); previously, Distinguished Practitioner in Residence (Fall 2013 and Fall 2014) |
| | | | | |
| Kenneth S. Davidson (72) | | Director
(April 1997) | | Davidson Capital Management Corporation, an investment manager, President (1978 – present) Landseer Advisors LLC, an investment manager, Senior Advisor (2012 – 2014) |
| | | | | |
| Nancy A. Eckl (55) | | Director
(May 2007) | | College Retirement Equities Fund (eight accounts), Trustee (2007 – present) TIAA-CREF Funds (68 funds) and TIAA-CREF Life Funds (11 funds), Trustee (2007 – present) TIAA Separate Account VA-1, Member of the Management Committee (2007 – present) |
| | | | | |
| Trevor W. Morrison (46) | | Director
(April 2014) | | New York University School of Law, Dean and Eric M. and Laurie B. Roth Professor of Law (2013 – present) |
| | | | | |
| | | | | Columbia Law School, Professor of Law (2008 – 2013) |
| | | | | |
| Richard Reiss, Jr. (73) | | Director
(April 1997) | | Georgica Advisors LLC, an investment manager, Chairman (1997 – present) Resource Americas, Inc., a real estate asset management company, Director (2016 – present) |
| | | | | |
| Robert M. Solmson (70) | | Director
(September 2004) | | Fairwood Capital, LLC, a private investment corporation engaged primarily in real estate and hotel investments, President (2008 – present) |
Name (Age)
Address(1) | | Position(s) with the Fund
(Since) and Term(2) | | Principal Occupation(s) and Other Public Company
Directorships Held During the Past Five Years(2) |
| | | | | |
| Interested Directors(4): | | | | |
| | | | | |
| Ashish Bhutani (57) | | Director
(July 2005) | | Investment Manager, Chief Executive Officer (2004 – present) Lazard Ltd, Vice Chairman and Director (2010 – present) |
| | | | | |
| Nathan A. Paul (45) | | Director (October 2017)
Chief Executive Officer and
President (February 2017) | | Investment Manager, Chief Business Officer (April 2017 – present) and Managing Director (2003 – present) Investment Manager, General Counsel (2002 – April 2017) |
| (1) | The address of each Director of the Fund is Lazard Asset Management LLC, 30 Rockefeller Plaza, New York, New York 10112-6300. |
| | |
| (2) | Each Director serves as a Director for each of the funds in the Lazard Fund Complex (comprised of, as of January 31, 2018, 41 active investment portfolios). Each Director serves an indefinite term, until his or her successor is elected, and each Director serves in the same capacity for the other funds in the Lazard Fund Complex. |
| | |
| (3) | “Independent Directors” are not “interested persons” (as defined in the 1940 Act) of the Fund. |
| | |
| (4) | Messrs. Bhutani and Paul are “interested persons” (as defined in the 1940 Act) of the Fund because of their positions with the Investment Manager. |
The Fund’s Statement of Additional Information contains further information about the Directors and is available without charge by calling 800-823-6300, or online, at www.lazardassetmanagement.com.
Name (Age)
Address(1) | | Position(s) with the Fund
(Since) and Term(2) | | Principal Occupation(s) During the Past Five Years |
| | | | | |
| Officers(3): | | | | |
| | | | | |
| Mark R. Anderson (47) | | Chief Compliance Officer
(September 2014), Vice
President and Secretary
(February 2017) | | Managing Director (since February 2017, previously Director), General Counsel (since April 2017) and Chief Compliance Officer (since September 2014) of the Investment Manager Senior Vice President, Counsel and Deputy Chief Compliance Officer of AllianceBernstein L.P. (2004 – August 2014) |
| | | | | |
| Christopher Snively (33) | | Chief Financial Officer
(March 2016) | | Senior Vice President of the Investment Manager (since November 2015) Assurance Manager at PricewaterhouseCoopers LLP (2008 – November 2015) |
| | | | | |
| Stephen St. Clair (59) | | Treasurer
(May 2003) | | Vice President of the Investment Manager |
| | | | | |
| Tamar Goldstein (42) | | Assistant Secretary
(February 2009) | | Director (since February 2016, previously Senior Vice President), and Director of Legal Affairs (since July 2015) of the Investment Manager |
| | | | | |
| Shari L. Soloway (36) | | Assistant Secretary
(November 2015) | | Senior Vice President, Legal and Compliance, of the Investment Manager (since September 2015) Vice President and Associate General Counsel of GE Asset Management (July 2011 – September 2015) |
| | | | | |
| Cesar A. Trelles (43) | | Assistant Treasurer
(December 2004) | | Vice President of the Investment Manager |
| (1) | The address of each officer of the Fund is Lazard Asset Management LLC, 30 Rockefeller Plaza, New York, New York 10112-6300. |
| | |
| (2) | Each officer serves for an indefinite term, until his or her successor is elected and qualifies or until his or her earlier resignation or removal. Each officer serves in the same capacity for the other funds in the Lazard Fund Complex. |
| | |
| (3) | In addition to Nathan A. Paul, Chief Executive Officer and President (since February 2017; previously, Vice President and Secretary since April 2002), whose information is included in the Interested Directors section. |
Lazard Retirement Series, Inc. Other Information (unaudited)
Proxy Voting
A description of the policies and procedures used to determine how proxies relating to Fund portfolio securities are voted is available (1) without charge, upon request, by calling (800) 823-6300 or (2) on the U.S. Securities and Exchange Commission (the “SEC”) website at https://www.sec.gov.
The Fund’s proxy voting record for the most recent 12-month period ended June 30 is available (1) without charge, upon request, by calling (800) 823-6300 or (2) on the SEC’s website at https://www.sec.gov. Information as of June 30 each year will generally be available by the following August 31.
Form N-Q
The Fund files a complete schedule of each Portfolio’s holdings for the first and third quarters of its fiscal year with the SEC on Form N-Q. The Fund’s Forms N-Q are available on the SEC’s website at https://www.sec.gov and may be reviewed and copied at the SEC’s Public Reference Room in Washington, D.C. Information on the operation of the SEC’s Public Reference Room may be obtained by calling 1-800-SEC-0330.
Board Consideration of Management Agreement
Lazard Retirement Equity Franchise Portfolio
At a meeting of the Board held on August 8, 2017, the Board considered the approval of the Management Agreement between the Fund, on behalf of Lazard Retirement Equity Franchise Portfolio (the “New Portfolio”), and the Investment Manager (the “New Portfolio Management Agreement”). The Independent Directors were assisted in their review by independent legal counsel, who advised the Board on relevant legal standards and met with the Independent Directors in executive session separate from representatives of the Investment Manager.
Services Provided
The Board previously had received and discussed information addressing, among other matters, the nature, extent and quality of services that the Investment Manager provides to the Fund, including a discussion of the Investment Manager and its clients (of
which the existing Lazard Funds Complex of 40 active funds comprised approximately $35 billion of the approximately $226 billion of total assets under the management of the Investment Manager and its global affiliates as of June 30, 2017); the Investment Manager’s global research, portfolio management, operations, technology, legal and compliance and marketing infrastructure; and the Investment Manager’s personnel, resources, financial condition and experience. The Board received a presentation on the New Portfolio from members of the New Portfolio’s proposed portfolio management team, including the strategies to be employed for the New Portfolio and the New Portfolio’s portfolio management team, including professional biographies.
The Directors considered the various services to be provided by the Investment Manager including the Investment Manager’s research and portfolio management capabilities and oversight of day-to-day operations, including supervision of fund accounting and administration-related services and assistance in meeting legal and regulatory requirements. The Directors also considered the Investment Manager’s infrastructure and agreed that the New Portfolio would be expected to benefit from the services and infrastructure provided by the Investment Manager. The Directors accepted management’s assertion that such services and infrastructure would be greater than those typically provided to a $35 billion fund complex not managed by a large, global firm such as the Investment Manager.
Comparative Fee, Expense Ratio and Performance Information
The Directors reviewed comparative fee and expense ratio information prepared by Strategic Insight, an independent provider of investment company data. They noted the methodology and assumptions used by Strategic Insight.
Advisory Fee and Expense Ratio. The Directors discussed the proposed management fee to be paid to the Investment Manager (referred to in the Strategic Insight materials as the “advisory fee”) and expense ratio for the New Portfolio (as limited by the Investment Manager (“net”)) and the comparisons provided
by Strategic Insight, which compared the contractual (gross) advisory fee and net expense ratio for the New Portfolio to its group1 of comparison funds (“Group”). The proposed contractual advisory fee and expense ratio for the New Portfolio were below the medians for the Group. The Board also considered the fees paid by other pooled vehicles advised by the Investment Manager with investment objectives, policies and strategies similar to those of the New Portfolio (the “Equity Franchise Other Accounts”).
Performance. The Directors considered the performance of the Equity Franchise Other Accounts compared to the MSCI World Index (the “Index”) for the one-year, three-year and since inception periods ended June 30, 2017; the second quarter of 2017; year-to-date through June 30, 2017; and calendar years 2014, 2015 and 2016. The performance of the Equity Franchise Other Accounts (net of fees) was above that of the Index for all periods, and with slightly lower volatility (since inception) than the Index.
Investment Manager Profitability and Economies of Scale
Representatives of the Investment Manager noted that because the New Portfolio is newly formed, has not commenced operations and the eventual aggregate amount of the New Portfolio’s assets was uncertain, specific information concerning the cost of services to be provided to the New Portfolio and the expected profits to be realized by the Investment Manager and its affiliates from their relationships with the New Portfolio and economies of scale would be subject to a number of assumptions and would be speculative and not meaningful. The Investment Manager’s representatives stated that they did not expect the Investment Manager to realize any current profits on the New Portfolio initially, noting the Investment Manager’s agreement to waive its fees and/or reimburse expenses of the New Portfolio for at least two years following the New Portfolio’s commencement of operations to maintain the expense ratio reflected in the Strategic Insight materials. The Board determined to revisit this issue no later than when it next reviewed the investment management fee in connection with renewal of the New Portfolio Management Agreement. The Investment Manager’s representa-
tives reviewed with the Board information provided on the Investment Manager’s brokerage and soft dollar practices. The Investment Manager’s representatives stated that neither the Investment Manager nor its affiliates were expected to receive any other significant indirect benefits from the Investment Manager acting as investment adviser to the New Portfolio. The representatives of the Investment Manager stated that the Investment Manager intends to support distribution relationships through direct payments from its or its affiliates’ own resources to third parties in connection with distribution and shareholder servicing and/or administrative and recordkeeping services, and noted that the New Portfolio would not bear any related costs other than the 0.25% 12b-1 fee pursuant to the Distribution and Servicing Plan adopted for the New Portfolio’s Service Shares.
At the conclusion of these discussions, each of the Directors expressed the opinion that he or she had been furnished with such information as may reasonably be necessary to make an informed business decision with respect to the approval of the New Portfolio Management Agreement. Based on its discussions and considerations as described above, the Board made the following conclusions and determinations with regard to the New Portfolio Management Agreement:
| • | The Board concluded that the nature, extent and quality of the services to be provided by the Investment Manager are adequate and appropriate, noting the benefits of advisory and research services and other services and infrastructure (as discussed above) associated with an approximately $226 billion global asset management business. |
| • | The Board was satisfied with the resources the Investment Manager was to devote to management of the New Portfolio. |
| • | The Board concluded that the fees to be paid to the Investment Manager were appropriate in light of the totality of the services to be provided as discussed above. |
| • | The Board recognized that economies of scale may be realized as the assets of the New Portfolio |
1 The New Portfolio has one comparison group, corresponding to Service Shares.
| | increase. The Board determined it would seek to have the Investment Manager share any material economies of scale with the New Portfolio. |
In evaluating the New Portfolio Management Agreement, the Board relied on the information described above as well as other information provided by the Investment Manager. The Board considered these con-
clusions and determinations in their totality and determined to approve the New Portfolio Management Agreement. In deciding whether to vote to approve the New Portfolio Management Agreement, each Director may have accorded different weights to different factors so that each Director may have had a different basis for his or her decision.
NOTES
Lazard Retirement Series, Inc.
30 Rockefeller Plaza
New York, New York 10112-6300
Telephone: 800-823-6300
https://www.lazardassetmanagement.com
Investment Manager
Lazard Asset Management LLC
30 Rockefeller Plaza
New York, New York 10112-6300
Telephone: 800-823-6300
Distributor
Lazard Asset Management Securities LLC
30 Rockefeller Plaza
New York, New York 10112-6300
Custodian
State Street Bank and Trust Company
One Iron Street
Boston, Massachusetts 02210
Transfer Agent and Dividend Disbursing Agent
DST Asset Manager Solutions, Inc.
P.O. Box 8514
Boston, Massachusetts 02266-8514
Telephone: 800-986-3455
Independent Registered Public Accounting Firm
Deloitte & Touche LLP
30 Rockefeller Plaza
New York, New York 10112-0015
Legal Counsel
Proskauer Rose LLP
Eleven Times Square
New York, New York 10036-8299
http://www.proskauer.com

Performance information as of the most recent month end is available online at www.lazardassetmanagement.com.
| Lazard Asset Management LLC • 30 Rockefeller Plaza • New York NY 10112 • www.lazardassetmanagement.com |  |
| | |
| LZDPS010 | |
ITEM 2. CODE OF ETHICS.
The Registrant has adopted a code of ethics that applies to the Registrant’s principal executive officer, principal financial officer, principal accounting officer or controller, or persons performing similar functions.
ITEM 3. AUDIT COMMITTEE FINANCIAL EXPERT.
The Registrant’s Board of Directors (the “Board”) has determined that Robert M. Solmson and Nancy A. Eckl, members of the Audit Committee of the Board, are audit committee financial experts as defined by the Securities and Exchange Commission (the “SEC”). Mr. Solmson and Ms. Eckl are “independent” as defined by the SEC for purposes of audit committee financial expert determinations.
ITEM 4. PRINCIPAL ACCOUNTANT FEES AND SERVICES.
(a) Audit Fees. The aggregate fees billed for each of the last two fiscal years (the “Reporting Periods”) for professional services rendered by the Registrant’s principal accountant (the “Auditor”) for the audit of the Registrant’s annual financial statements, or services that are normally provided by the Auditor in connection with the statutory and regulatory filings or engagements for the Reporting Periods, were $103,938 in 2016 and $222,172 in 2017 (plus expenses in each case).
(b) Audit-Related Fees. There were no fees billed in the Reporting Periods by the Auditor to the Registrant for assurance and related services that are reasonably related to the performance of the audit of the Registrant’s financial statements and are not reported under paragraph (a) of this Item 4. The aggregate fees billed in the Reporting Periods for non-audit assurance and related services provided by the Auditor to Lazard Asset Management LLC, the Registrant’s investment manager (“Lazard”) and any entity controlling, controlled by or under common control with Lazard that provides ongoing services to the Registrant (“Service Affiliates”) that were reasonably related to the performance of the annual audit of the Service Affiliate which required pre-approval by the Audit Committee were $163,000 in 2016 and $175,000 in 2017.
(c) Tax Fees. The aggregate fees billed in the Reporting Periods by the Auditor to the Registrant for professional services rendered by the Auditor for tax compliance, tax advice and tax planning (“Tax Services”) were $26,379 in 2016 and $81,477 in 2017. These Tax Services consisted of (i) review or preparation of U.S. federal, state, local and excise tax returns; (ii) U.S. federal, state and local tax planning, advice and assistance regarding statutory, regulatory or administrative developments; and (iii) tax advice regarding tax qualification matters and/or treatment of various financial instruments held or proposed to be acquired or held. Additionally, the aggregate fees billed related to European Union tax reclaim filing services rendered by the Auditor were $72,079 in 2016 and $53,417 in 2017. The aggregate fees billed in the Reporting Periods for
Tax Services provided by the Auditor to Service Affiliates which required preapproval by the Audit Committee were $0 in 2016 and $0 in 2017.
(d) All Other Fees. There were no fees billed in the Reporting Periods for products and services provided by the Auditor, other than the services reported in paragraphs (a) through (c) above. There were no fees billed in the Reporting Periods for products and services provided by the Auditor, other than the services reported in paragraphs (a) through (c) above, which required pre-approval by the Audit Committee.
(e) Audit Committee Pre-Approval Policies and Procedures. The Registrant’s Audit Committee pre-approves the Auditor’s engagements for audit and non-audit services to the Registrant and, as required, non-audit services to Service Affiliates on a case-by-case basis. Preapproval considerations include whether the proposed services are compatible with maintaining the Auditor’s independence. There were no services provided by the Auditor to either the Registrant or Service Affiliates that were approved pursuant to paragraph (c)(7)(i)(C) of Rule 2-01 of Regulation S-X during the Reporting Periods.
(f) None.
(g) Non-Audit Fees. The aggregate non-audit fees billed by the Auditor for services rendered to the Registrant and Service Affiliates for the Reporting Periods were $1,152,787 in 2016 and $938,003 in 2017.
(h) Auditor Independence. The Audit Committee considered whether provision of non-audit services to Service Affiliates that were not required to be preapproved is compatible with maintaining the Auditor’s independence.
ITEM 5. AUDIT COMMITTEE OF LISTED REGISTRANTS.
Not applicable.
ITEM 6. INVESTMENTS
Not applicable.
ITEM 7. DISCLOSURE OF PROXY VOTING POLICIES AND PROCEDURES FOR CLOSED END MANAGEMENT INVESTMENT COMPANIES.
Not applicable.
ITEM 8. PORTFOLIO MANAGERS OF CLOSED-END MANAGEMENT INVESTMENT COMPANIES.
Not applicable.
ITEM 9. PURCHASES OF EQUITY SECURITIES BY CLOSED-END MANAGEMENT INVESTMENT COMPANY AND AFFILIATED PURCHASERS.
Not applicable.
ITEM 10. SUBMISSION OF MATTERS TO A VOTE OF SECURITY HOLDERS.
There were no material changes to the procedures by which shareholders may recommend nominees to the Registrant’s Board during the period covered by this report.
ITEM 11. CONTROLS AND PROCEDURES.
(a) The Registrant’s principal executive and principal financial officers have concluded, based on their evaluation of the Registrant’s disclosure controls and procedures as of a date within 90 days of the filing date of this report, that the Registrant’s disclosure controls and procedures are reasonably designed to ensure that information required to be disclosed by the Registrant on Form N-CSR is recorded, processed, summarized and reported within the required time periods and that information required to be disclosed by the Registrant in the reports that it files or submits on Form N-CSR is accumulated and communicated to the Registrant’s management, including its principal executive and principal financial officers, as appropriate to allow timely decisions regarding required disclosure.
(b) There were no changes to the Registrant’s internal control over financial reporting that occurred during the second fiscal quarter of the period covered by this report that have materially affected, or are reasonably likely to materially affect, the Registrant’s internal control over financial reporting.
ITEM 12. DISCLOSURE OF SECURITIES LENDING ACTIVITIES FOR CLOSED-END MANAGEMENT INVESTMENT COMPANIES.
Not applicable.
ITEM 13. EXHIBITS.
(a)(1) Code of Ethics referred to in Item 2.
(a)(2) Certifications of principal executive and principal financial officers as required by Rule 30a-2(a) under the Investment Company Act of 1940.
(a)(3) Not applicable.
(b) Certifications of principal executive and principal financial officers as required by Rule 30a-2(b) under the Investment Company Act of 1940.
SIGNATURES
Pursuant to the requirements of the Securities Exchange Act of 1934 and the Investment Company Act of 1940, the registrant has duly caused this report to be signed on its behalf by the undersigned, thereunto duly authorized.
Lazard Retirement Series, Inc.
| By | /s/ | Nathan A. Paul | |
| | | Nathan A. Paul | |
| | | Chief Executive Officer |
Date March 9, 2018
Pursuant to the requirements of the Securities Exchange Act of 1934 and the Investment Company Act of 1940, this report has been signed below by the following persons on behalf of the registrant and in the capacities and on the dates indicated.
| By | /s/ | Nathan A. Paul | |
| | | Nathan A. Paul | |
| | | Chief Executive Officer |
Date March 9, 2018
| By | /s/ | Christopher Snively | |
| | | Christopher Snively | |
| | | Chief Financial Officer |
Date March 9, 2018